Untitled - Study Circle
125
-
Upload
khangminh22 -
Category
Documents
-
view
0 -
download
0
Transcript of Untitled - Study Circle


Appendix I
World Population : Selected Data, 2015
AFRICA
Algeria 34 452 7591 17 428 5001 17 024 2591 35 978 39 963 2 381 741
Angola 25 789 024 12 499 041 13 289 983 17 430 ... 1 246 700
Benin 10 008 749 4 887 820 5 120 929 8 7792 10 5853 114 763
Botswana 2 024 904 988 957 1 035 947 1 823 2 1954 582 000
Burkina Faso 14 196 259 6 842 560 7 353 699 15 7312 ... 272 967
Burundi 7 877 728 3 838 045 4 039 683 8 4885 9 8245 27 830
Cabo Verde 491 683 243 401 248 282 518 ... 4 033
Cameroon 17 052 134 8 408 495 8 643 639 19 4066 21 9186 475 650
Central African Republic 3 151 072 1 569 446 1 581 626 ... ... 622 984
Chad 11 175 915 5 509 522 5 666 393 ... ... 1 284 000
Comoros 575 6607 285 5907 290 0707 ... ... 2 235
Congo *3 697 490 1 821 357 1 876 133 ... ... 342 000
Côte d’Ivoire 22 224 509 11 441 896 10 782 613 ... ... 322 463
Democratic Republic of the 29 916 800 14 543 800 15 373 000 ... ... 2 344 858Congo
Djibouti *818 159 440 067 378 092 8418 ... 23 200
Egypt 72 798 031 37 219 056 35 578 975 78 685 88 958 1 002 000
Equatorial Guinea 1 222 442 651 820 570 622 1 6229 ... 28 051
Eritrea 2 748 304 1 374 452 1 373 852 ... ... 117 600
Ethiopia 73 750 932 37 217 130 36 533 802 79 63310 90 07510 1 104 300
Gabon 1 811 079 934 072 877 007 ... ... 267 668
Gambia *1 882 450 *930 699 *951 751 ... ... 11 295
Ghana 24 658 823 12 024 845 12 633 978 ... 27 6702 238 537
Guinea 10 523 261 5 084 306 5 438 955 10 5372 ... 245 857
Guinea-Bissau 1 520 830 737 634 783 196 1 4602 1 5312 36 125
Kenya *38 610 097 19 192 458 19 417 639 40 406 45 509 591 958
Lesotho 1 741 406 818 379 923 027 1 8922 ... 30 355
Liberia 3 476 608 1 739 945 1 736 663 3 627 ... 111 369
Libya *5 298 152 *2 687 513 2 610 639 5 689 6 162 1 676 198
Madagascar 12 238 914 6 088 116 6 150 798 20 142 ... 587 295
Malawi 13 077 160 6 358 933 6 718 227 13 94911 ... 118 484
Mali 14 528 662 7 204 990 7 323 672 15 37012 ... 1 240 192
Mauritania 3 460 38813 ... ... 3 3412 ... 1 030 700
Continent/Country
Total Male Female Mid-year Estimate Area
Population 2010 2015 (Sq. Km)
2020-21

Fundamentals of Human Geography104
Mauritius 1 237 000 611 053 625 947 1 28115 1 26316 1 969
Mayotte 212 645 103 164 109 481 ... *22717 ...
Morocco 33 848 242 ... ... 31 89418 ... 446 550
Mozambique 20 252 223 9 746 690 10 505 533 22 4172 25 7282 799 380
Namibia 2 113 077 1 021 912 1 091 165 2 1432 2 28119 824 116
Niger 17 138 707 8 518 818 8 619 889 15 2042 19 12520 1 267 000
Nigeria 140 431 790 71 345 488 69 086 302 159 6192 ... 923 768
Republic of South Sudan 8 260 490 4 287 300 3 973 190 9 49721 ...
Réunion 821 136 398 006 423 130 ... *84417 2 513
Rwanda 10 393 542 4 981 197 5 412 345 10 4132 11 26322 26 338
Saint Helena ex. dep. 4 534 2396 2 138 4 ... 122
Saint Helena: Ascension 712 458 254 ... ... 88
Saint Helena: Tristan da 296 139 157 ... ... 98
Cunha
Sao Tome and Principe 178 739 88 867 89 872 164 ... 964
Senegal *12 873 601 *6 428 189 *6 445 412 12 50923 14 3572 196 71224
Seychelles 90 945 46 912 44 033 90 93 457
Sierra Leone *7 075 641 *3 473 991 *3 601 650 5 747 ... 72 300
Somalia 7 114 431 3 741 664 3 372 767 ... ... 637 657
South Africa 51 770 560 25 188 791 26 581 769 50 896 ... 1 221 037
Sudan 30 894 000 15 786 677 15 107 323 32 962 38 454 ...
Swaziland 844 223 405 868 438 355 1 056 1 11917 17 363
Togo 6 191 155 3 009 095 3 182 060 6 1912 6 9742 56 785
Tunisia 10 982 754 5 472 338 5 510 416 10 547 11 154 163 610
Uganda 34 634 650 17 060 832 17 573 818 31 785 ... 241 550
United Republic of Tanzania 44 928 92325 21 869 99025 23 058 93325 43 18826 48 77622 947 303
Western Sahara 76 425 43 981 32 444 ... ... 266 000
Zambia 12 526 314 6 117 253 6 409 061 ... 15 4742 752 612
Zimbabwe 13 061 239 6 280 539 6 780 700 ... 13 94322 390 757
AMERICA, NORTH-
AMERIQUE DU NORD
Anguilla 13 572 6 707 6 865 16 15 91
Antigua and Barbuda 88 566 ... ... 91 ... 442
Aruba 101 484 48 241 53 243 102 109 180
Bahamas 351 461 170 257 181 204 3352 ... 13 940
Barbados 277 821 133 018 144 803 278 275 431
Continent/Country
Total Males Females Mid-year Estimate Area
Population 2010 2015 (Sq. Km)
2020-21

Appendix I 105
Belize 322 453 161 227 161 226 324 368 22 966
Bermuda 64 23728 30 85828 33 37928 6429 6229 53
British Virgin Islands 20 647 10 627 10 020 28 ... 151
Canada 33 476 690 16 414 225 17 062 455 34 00530 35 84931 9 984 670
Cayman Islands 55 03632 27 21832 27 81832 56 59 264
Costa Rica 4 301 712 2 106 063 2 195 649 4 53833 4 83434 51 100
Cuba 11 167 325 5 570 825 5 596 500 11 171 11 239 109 884
Curacao 150 563 68 848 81 715 14935 15836 444
Dominica *71 293 *36 411 *34 882 71 ... 750
Dominican Republic 9 445 281 4 739 038 4 706 243 9 4792 9 9802 48 671
El Salvador 5 744 113 2 719 371 3 024 742 6 18337 6 46037 21 04138
Greenland 56 46239 29 88539 26 57739 5739 5639 2 166 086
Grenada 102 632 50 481 52 151 105 111 345
Guadeloupe 403 35540 187 93240 215 42340 ... *40041 1 705
Guatemala 11 237 196 5 496 839 5 740 357 14 36226 ... 108 889
Haiti 8 373 750 4 039 272 4 334 478 10 08542 ... 27 750
Honduras 8 303 771 4 052 316 4 251 456 8 04643 8 5773 112 492
Jamaica 2 697 98344 1 334 53344 1 363 45044 2 702 *2 726 10 991
Martinique 394 173 182 073 212 100 ... *37817 1 128
Mexico 112 336 53845 54 855 23145 57 481 30745 114 2562 121 0062 1 964 375
Montserrat 4 922 2 546 2 376 5 5 103
Nicaragua 5 142 098 2 534 491 2 607 607 5 816 6 263 130 373
Panama 3 405 813 1 712 584 1 693 229 3 66229 3 97529 75 320
Puerto Rico 3 725 78946 1 785 17146 1 940 61846 3 72147 3 47447 8 868
Saint Kitts and Nevis *46 398 *22 846 *23 552 *53 ... 261
Saint Lucia 165 770 83 502 82 268 ... 173 53948
Saint Pierre and Miquelon 6 286 ... ... ... ... 242
Saint Vincent and the *109 991 *56 419 *53 572 110 110 389Grenadines
Saint-Barthelemy 9 417 ... ... ... ... ...
Saint-Martin (French part) 36 457 ... ... ... ... ...
Sint Maarten (Dutch part) 33 609 15 868 17 741 36 ... 34
Trinidad and Tobago 1 332 901 ... ... 1 31815 1 35016 5 127
Turks and Caicos Islands 31 458 16 037 15 421 ... ... 94849
United States of America 308 745 538 151 781 326 156 964 212 309 34750 321 41950 9 833 517
United States Virgin Islands 106 40546 50 854 55 45146 10651 ... 347
Continent/Country
Total Males Females Mid-year Estimate Area
Population 2010 2015 (Sq. Km)
2020-21

Fundamentals of Human Geography106
AMERICA, SOUTH -
AMERIQUE DU SUD
Argentina 40 117 096 19 523 766 20 593 330 40 78852 43 13752 2 780 400
Bolivia (Plurinational State of) 10 059 856 5 019 447 5 040 409 10 031 10 825 1 098 58153
Brazil 190 755 799 93 406 990 97 348 809 195 49854 204 45154 8 515 767
Chile 15 116 435 7 447 695 7 668 740 17 094 18 006 756 102
Colombia 41 468 384 20 336 117 21 132 267 45 51055 48 20355 1 141 748
Ecuador 14 483 499 7 177 683 7 305 816 15 01256 16 27956 257 217
Falkland Islands (Malvinas) 2 84058 1 49158 1 34958 ... ... 12 173
French Guiana 244 118 121 653 122 465 ... *25517 83 534
Guyana *747 884 *372 547 *375 337 752 742 214 969
Paraguay 5 163 198 2 603 242 2 559 956 6 45126 ... 406 752
Peru 27 412 157 13 622 640 13 789 517 29 46259 31 15259 1 285 216
Suriname 541 638 270 629 271 009 531 ... 163 820
Uruguay 3 286 314 1 577 72560 1 708 48160 3 397 3 4672 173 626
Bolivarian Republic of 27 227 930 13 549 752 13 678 178 28 524 30 620 912 050Venezuela
ASIA - ASIE
Afghanistan 13 051 35861 6 712 37761 6 338 98161 24 48662 ... 652 864
Armenia 2 871 771 1 346 729 1 525 042 3 256 3 01117 29 743
Azerbaijan 8 922 447 4 414 398 4 508 049 9 054 9 59317 86 600
Bahrain 1 234 571 768 414 466 157 1 229 ... 771
Bangladesh 144 043 697 72 109 796 71 933 901 148 620 ... 147 570
Bhutan 634 982 333 595 301 387 69663 75763 38 394
Brunei Darussalam 393 372 203 144 190 228 38735 *417 5 765
Cambodia 13 395 68264 6 516 05464 6 879 62864 14 30365 15 40565 181 035
China 1 339 724 85266 686 852 57266 652 872 28066 1 337 70067 1 371 22067 9 600 000
China, Hong Kong SAR 7 071 57668 3 303 01568 3 768 56168 7 024 7 306 1 106
China, Macao SAR 625 674 305 398 320 276 537 643 3069
Cyprus 840 40770 408 78070 431 62770 82971 *84772 9 251
Democratic People's 24 052 231 11 721 838 12 330 393 ... ... 120 538Republic of Korea
Georgia 3 713 804 1 772 864 1 940 940 4 453 3 73017 69 700
India 1 210 854 97773 623 270 25873 587 584 71973 1 182 10574 ... 3 287 263
Indonesia 237 641 326 119 630 913 118 010 413 238 519 255 462 1 910 931
Islamic Republic of Iran 75 149 669 37 905 669 37 244 000 74 34075 78 77375 1 628 75076
Iraq 19 184 54377 9 536 57077 9 647 97377 32 211 36 659 435 052
Continent/Country
Total Males Females Mid-year Estimate Area
Population 2010 2015 (Sq. Km)
2020-21

Appendix I 107
Israel 7 412 18078 3 663 91078 3 748 27078 7 62479 ... 22 072
Japan *127 110 047 *61 829 237 *65 280 810 128 07080 126 95880 377 93081
Jordan 9 531 71282 5 046 82282 4 484 89082 6 69983 9 53283 89 318
Kazakhstan 16 009 597 7 712 224 8 297 373 16 322 ... 2 724 902
Kuwait 3 065 850 1 738 372 1 327 478 2 933 3 971 17 818
Kyrgyzstan 5 362 793 2 645 921 2 716 872 5 19384 5 95785 199 949
Lao People's Democratic 6 492 400 32 254 800 3 237 600 6 23086 ... 236 800Republic
Lebanon 3 779 85987 1 840 94087 1 938 91987 ... ... 10 452
Malaysia 28 334 13588 14 562 63888 13 771 49788 28 58989 30 99689 330 323
Maldives 402 07190 227 74990 174 32290 320 348 300
Mongolia 2 647 199 1 314 246 1 332 953 2 739 3 027 1 564 116
Myanmar 50 279 90091 24 228 71491 26 051 18691 59 78092 ... 676 577
Nepal 26 494 504 12 849 041 13 645 463 28 044 28 03819 147 181
Oman 2 773 479 1 612 408 1 161 071 ... ... 309 500
Pakistan 130 579 57193 67 840 13793 62 739 43493 173 51093 191 71093 796 095
Philippines 100 979 30394 ... ... 93 13529 101 56229 300 000
Qatar 1 699 435 1 284 739 414 696 1 715 ... 11 607
Republic of Korea 48 580 29395 24 167 09895 24 413 19595 49 410 50 6172 100 284
Saudi Arabia *27 136 977 *15 306 793 *11 830 184 *27 56396 *31 01696 2 206 714
Singapore 3 771 72197 1 861 13397 1 910 58897 5 07798 5 53598 71999
Sri Lanka 20 359 439 9 856 634 10 502 805 20 675 20 966 65 610
State of Palestine 3 669 244100 1 862 027100 1 807 217100 4 048 4 682 6 020
Syrian Arab Republic *17 921 000101 *9 161 000101 *8 760 000101 20 619101 ... 185 180
Tajikistan 7 564 502 3 817 004 3 747 498 7 519 *8 840 142 600
Thailand 65 981 659 32 355 032 33 626 627 67 3122 ... 513 120
Timor-Leste *1 167 242 *588 561 *578 681 ... ... 14 919
Turkey 74 526 000102 37 431 000102 37 095 000102 73 142 77 738103 783 562
Turkmenistan 4 750 120 2 332 005 2 418 115 ... ... 488 100
United Arab Emirates 4 106 427104 2 806 141104 1 300 286104 8 264104 ... 83 600
Uzbekistan 19 810 077 9 784 156 10 025 921 28 562105 ... 448 969
Viet Nam 85 846 997 42 413 143 43 433 854 86 933 91 713 330 967
Yemen 19 685 161 10 036 953 9 648 208 23 1542 ... 527 968
EUROPE
Åland Islands 25 776106 12 700106 13 076106 2839 2939 1 581
Albania 2 800 138 1 403 059 1 397 079 2 913 2 889 28 748
Continent/Country
Total Males Females Mid-year Estimate Area
Population 2010 2015 (Sq. Km)
2020-21

Fundamentals of Human Geography108
Andorra 65 84439 34 26839 31 57639 8539 ... 468
Austria 8 401 940 4 093 938 4 308 002 8 361 8 57617 83 871
Belarus 9 503 807 4 420 039 5 083 768 9 491 9 48117 207 600
Belgium 11 000 638 5 401 718 5 598 920 10 896 11 25817 30 528
Bosnia and Herzegovina *3 791 622 ... ... 3 843 ... 51 209
Bulgaria 7 364 570 3 586 571 3 777 999 7 534 7 20217 111 002
Croatia 4 284 889 2 066 335 2 218 554 4 295 4 22517 56 594
Czech Republic 10 436 560 5 109 766 5 326 794 10 474 *10 543 78 868
Denmark 5 560 62839 2 756 58239 2 804 04639 5 54539 5 67839 42 921
Estonia 1 294 455 600 526 693 929 1 331 1 31317 45 227
Faeroe Islands 48 346 25 125 23 221 49 49 1 393
Finland 5 375 276 2 638 416 2 736 860 5 335108 5 472109 336 859110
France 61 399 541111 29 714 539111 31 685 002111 62 918111 *64 395111 551 500
Germany 80 219 695 39 145 941 41 073 754 81 757 81 198112 357 376
Gibraltar 32 194113 10 061113 16 133113 31114 ... 6
Greece 10 816 286 5 303 223 5 513 063 11 121 10 85817 131 957
Guernsey 62 612 31 028 31 584 62115 ... 64
Holy See 798117 529117 269117 0118 ... 0119
Hungary 9 937 628 4 718 479 5 219 149 10 000 *9 843120 93 024
Iceland 315 556121 158 151121 157 405121 318121 329122 103 000
Ireland *4 757 976 ... ... 4 560 4 635123 69 797
Isle of Man 84 497 41 971 42 526 83124 87124 572
Italy 59 433 744 28 745 507 30 688 237 59 277 60 79617 302 073
Jersey 97 857 48 296 49 561 97 103 116
Latvia 2 070 371 946 102 1 124 269 2 098 1 98617 64 573
Liechtenstein 36 149 17 886 18 263 36 37125 160
Lithuania 3 043 429 1 402 604 1 640 825 3 097 ... 65 286
Luxembourg 512 353 254 967 257 386 507 56317 2 586
Malta 417 432 207 625 209 807 415126 429127 315
Monaco 31 109 15 076128 15 914128 36 ... 2
Montenegro 620 029 306 236 313 793 617 622120 13 812
Netherlands 16 655 799 8 243 482 8 412 317 16 615 16 940 41 542
Norway 4 979 955129 2 495 777129 2 484 178129 4 889120 5 166130 323 772
Poland 38 044 565131 18 420 389131 19 624 176131 38 517120 38 006130 312 679
Portugal 10 282 306 4 868 755 5 413 551 10 573 10 37517 92 226
Republic of Moldova 3 386 673132 1 629 689132 1 756 984132 3 562132 3 555133 33 846
Romania 20 039 141 9 736 342 10 302 799 20 247 19 87117 238 391
Russian Federation 143 436 145 66 457 074 76 979 071 142 849 ... 17 098 246
San Marino *30 652 *14 791134 *15 818134 3339 34109 61
Serbia 7 186 862135 3 499 176135 3 687 686135 7 291135 7 114136 88 499137
Continent/Country
Total Males Females Mid-year Estimate Area
Population 2010 2015 (Sq. Km)
2020-21

Appendix I 109
Slovakia 5 397 036 2 627 772 2 769 264 5 391 5 42117 49 035138
Slovenia 2 058 051 1 019 826 1 038 225 2 049 2 063 20 273
Spain 46 815 915 23 104 350 23 711 560 46 562 46 450122 505 944
Svalbard and Jan Mayen 3 431139 2 545139 886139 ... ... 62 422
Islands
Sweden 9 482 85539 4 726 83439 4 756 02139 9 37839 9 747140 438 574
Switzerland 8 035 391 3 973 280 4 062 111 7 825 8 238141 41 291
TFYR of Macedonia 2 022 547 1 015 377 1 007 170 2 055 2 06917 25 713
Ukraine 48 240 902 22 316 317 25 924 585 45 871 *42 760142 603 500
United Kingdom of Great 63 379 787 31 126 054 32 253 733 62 759 64 875130 242 495
Britain and Northern Ireland
OCEANIA-OCEANIE
American Samoa 55 51946 28 16446 27 35546 6746 6146 199
Australia 21 727 158144 10 737 148144 10 990 010144 22 03235 *23 77816 7 692 024
Cook Islands 17 794 8 815 8 979 24 *19 236
Fiji 837 271 427 176 410 095 857 867146 18 272
French Polynesia 268 207 136 996 131 211 265 272 4 000
Guam 159 358 81 552 77 806 ... 16246 549
Kiribati 103 058 50 796 52 262 ... ... 726147
Marshall Islands 53 158 27 243 25 915 54148 ... 181
Micronesia 102 843 52 193 50 650 1082 1062 702
Nauru *10 086 *5 105 *4 979 ... ... 21
New Caledonia 268 767 ... ... 250 ... 18 575
New Zealand 4 242 048 ... ... 4 351149 4 596149 268 107
Niue 1 611 802 809 1 ... 260
Norfolk Island 2 302 1 082 1 220 ... ... 36
Northern Mariana Islands 53 883 27 746 26 137 48 ... 457
Palau 17 661 9 433 8 228 21 ... 459
Papua New Guinea *7 059 653 *3 663 249 *3 396 404 ... ... 462 840
Pitcairn 49 23 26 ... ... 5
Samoa 187 820 96 990 90 830 184 ... 2 842
Solomon Islands 515 870 264 455 251 415 5312 ... 28 896
Tokelau 1 205 600 605 ... ... 12
Tonga 103 252 51 979 51 273 ... ... 747
Tuvalu 10 782 ... ... ... ... 26
Vanuatu 234 023 119 091 114 932 239 ... 12 189
Wallis and Futuna Islands 12 197 ... ... ... ... 142
Source : unstats.un.org as on 05.12.2016
Continent/Country
Total Males Females Mid-year Estimate Area
Population 2010 2015 (Sq. Km)
2020-21
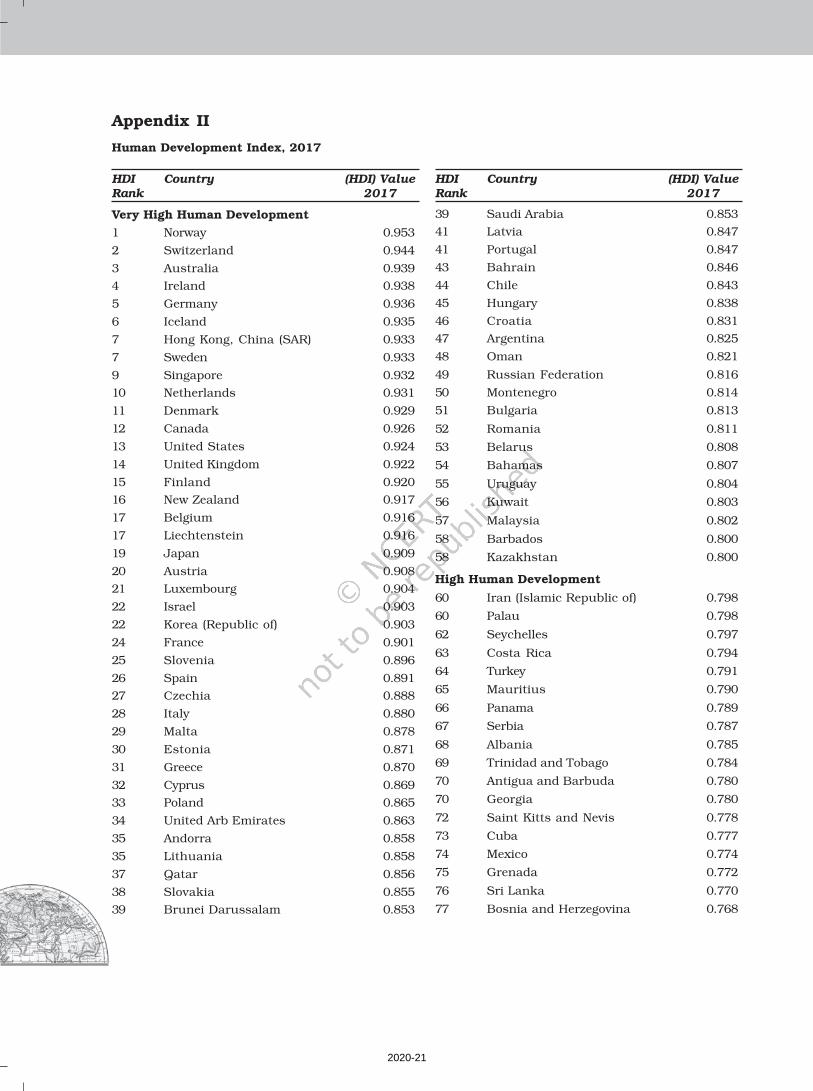
Very High Human Development
1 Norway 0.953
2 Switzerland 0.944
3 Australia 0.939
4 Ireland 0.938
5 Germany 0.936
6 Iceland 0.935
7 Hong Kong, China (SAR) 0.933
7 Sweden 0.933
9 Singapore 0.932
10 Netherlands 0.931
11 Denmark 0.929
12 Canada 0.926
13 United States 0.924
14 United Kingdom 0.922
15 Finland 0.920
16 New Zealand 0.917
17 Belgium 0.916
17 Liechtenstein 0.916
19 Japan 0.909
20 Austria 0.908
21 Luxembourg 0.904
22 Israel 0.903
22 Korea (Republic of) 0.903
24 France 0.901
25 Slovenia 0.896
26 Spain 0.891
27 Czechia 0.888
28 Italy 0.880
29 Malta 0.878
30 Estonia 0.871
31 Greece 0.870
32 Cyprus 0.869
33 Poland 0.865
34 United Arb Emirates 0.863
35 Andorra 0.858
35 Lithuania 0.858
37 Qatar 0.856
38 Slovakia 0.855
39 Brunei Darussalam 0.853
39 Saudi Arabia 0.853
41 Latvia 0.847
41 Portugal 0.847
43 Bahrain 0.846
44 Chile 0.843
45 Hungary 0.838
46 Croatia 0.831
47 Argentina 0.825
48 Oman 0.821
49 Russian Federation 0.816
50 Montenegro 0.814
51 Bulgaria 0.813
52 Romania 0.811
53 Belarus 0.808
54 Bahamas 0.807
55 Uruguay 0.804
56 Kuwait 0.803
57 Malaysia 0.802
58 Barbados 0.800
58 Kazakhstan 0.800
High Human Development
60 Iran (Islamic Republic of) 0.798
60 Palau 0.798
62 Seychelles 0.797
63 Costa Rica 0.794
64 Turkey 0.791
65 Mauritius 0.790
66 Panama 0.789
67 Serbia 0.787
68 Albania 0.785
69 Trinidad and Tobago 0.784
70 Antigua and Barbuda 0.780
70 Georgia 0.780
72 Saint Kitts and Nevis 0.778
73 Cuba 0.777
74 Mexico 0.774
75 Grenada 0.772
76 Sri Lanka 0.770
77 Bosnia and Herzegovina 0.768
Appendix II
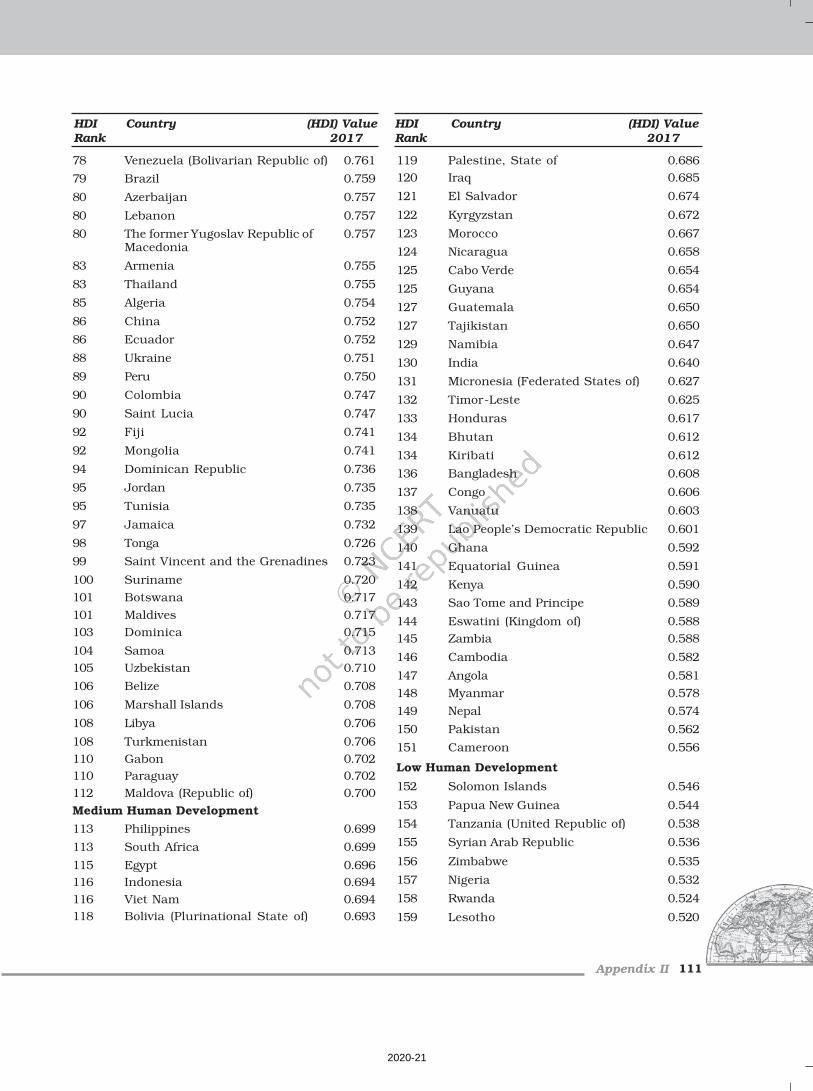
Human Development Index, 2017
HDI Country (HDI) ValueRank 2017
HDI Country (HDI) ValueRank 2017
2020-21
Appendix II 111
78 Venezuela (Bolivarian Republic of) 0.761
79 Brazil 0.759
80 Azerbaijan 0.757
80 Lebanon 0.757
80 The former Yugoslav Republic of 0.757Macedonia
83 Armenia 0.755
83 Thailand 0.755
85 Algeria 0.754
86 China 0.752
86 Ecuador 0.752
88 Ukraine 0.751
89 Peru 0.750
90 Colombia 0.747
90 Saint Lucia 0.747
92 Fiji 0.741
92 Mongolia 0.741
94 Dominican Republic 0.736
95 Jordan 0.735
95 Tunisia 0.735
97 Jamaica 0.732
98 Tonga 0.726
99 Saint Vincent and the Grenadines 0.723
100 Suriname 0.720
101 Botswana 0.717
101 Maldives 0.717103 Dominica 0.715
104 Samoa 0.713105 Uzbekistan 0.710
106 Belize 0.708
106 Marshall Islands 0.708
108 Libya 0.706
108 Turkmenistan 0.706110 Gabon 0.702110 Paraguay 0.702112 Maldova (Republic of) 0.700
Medium Human Development
113 Philippines 0.699
113 South Africa 0.699
115 Egypt 0.696116 Indonesia 0.694116 Viet Nam 0.694118 Bolivia (Plurinational State of) 0.693
119 Palestine, State of 0.686120 Iraq 0.685
121 El Salvador 0.674
122 Kyrgyzstan 0.672
123 Morocco 0.667
124 Nicaragua 0.658
125 Cabo Verde 0.654
125 Guyana 0.654
127 Guatemala 0.650
127 Tajikistan 0.650
129 Namibia 0.647
130 India 0.640
131 Micronesia (Federated States of) 0.627
132 Timor-Leste 0.625
133 Honduras 0.617
134 Bhutan 0.612
134 Kiribati 0.612
136 Bangladesh 0.608
137 Congo 0.606
138 Vanuatu 0.603
139 Lao People’s Democratic Republic 0.601
140 Ghana 0.592
141 Equatorial Guinea 0.591
142 Kenya 0.590
143 Sao Tome and Principe 0.589
144 Eswatini (Kingdom of) 0.588145 Zambia 0.588
146 Cambodia 0.582
147 Angola 0.581
148 Myanmar 0.578
149 Nepal 0.574
150 Pakistan 0.562
151 Cameroon 0.556
Low Human Development
152 Solomon Islands 0.546
153 Papua New Guinea 0.544
154 Tanzania (United Republic of) 0.538
155 Syrian Arab Republic 0.536
156 Zimbabwe 0.535
157 Nigeria 0.532
158 Rwanda 0.524
159 Lesotho 0.520
HDI Country (HDI) ValueRank 2017
HDI Country (HDI) ValueRank 2017
2020-21

Fundamentals of Human Geography112
159 Mauritania 0.520
161 Madagascar 0.519
162 Uganda 0.516
163 Benin 0.515
164 Senegal 0.505
165 Comoros 0.503
165 Togo 0.503
167 Sudan 0.502
168 Afghanistan 0.498
168 Haiti 0.498
170 Côte d’Ivoire 0.492
171 Malawi 0.477
172 Djibouti 0.476
173 Ethiopia 0.463
174 Gambia 0.460
HDI Country (HDI) ValueRank 2017
Source : http://hdr.undp.org/as on 22.08.2019
175 Guinea 0.459
176 Congo (Democratic Republic of the) 0.457
177 Guinea-Bissau 0.455
178 Yemen 0.452
179 Eritrea 0.440
180 Mozambique 0.437
181 Liberia 0.435
182 Mali 0.427
183 Burkina Faso 0.423
184 Sierra Leone 0.419
185 Burundi 0.417
186 Chad 0.404
187 South Sudan 0.388
188 Central African Republic 0.367
189 Niger 0.354
HDI Country (HDI) ValueRank 2017
2020-21

AgricultureThe science and art of cultivating the soil,raising crops and rearing livestock. It isalso called farming.
Balance of TradeThe difference between the total value of acountry’s exports and imports. An excessof export over import makes a favourablebalance of trade, and the converse an un-favourable balance.
BarterA direct exchange of excess producebetween two parties to the mutualadvantages of both, without the use oftokens, credit or money in the transaction.
CensusOfficial enumeration of population along withcertain economic and social statistics in agiven territory at some time interval.
Chemical FertilisersSubstance of natural or artificial origincontaining chemical elements such asphosphorus, potassium and nitrogem thatare necessary to plan life. They are addedto the soil for increasing its productivity.
Contour PloughingTilling or ploughing hillsides or sloping landsalong the contour lines, that is, aroundrather than up and down a slope mainlywith a view to conserving soil and water.
Crop RotationGrowing of different crops in successionon the same field from season to season tomaintain soil fertility
Dairy Farming A kind of agriculture in which majoremphasis is on breeding and rearing milchcattle. Agriculture crops are raised mainlyto feed these cattle.
Density of PopulationThe average number of inhabitants livingwithin a specified unit of area, such as asq km.
Dry FarmingA method of farming adopted in certain regionsof inadequate rainfall and devoid of irrigationfacilities by conserving moisture in the soiland by raising drought-enduring crops.
Economic GeographyThe aspect or branch of geography whichdeals with the influences of the environment,both physical and cultural, on the economicactivity of man, bringing out similarities anddifferences from place to place in the wayspeople make a living.
EnvironmentSurroundings or the conditions underwhich a person or things exist and develophis or its character. It covers both physicaland cultural elements.
ExportsGoods despatched from one country toanother.
Extensive AgricultureFarming in which the amount of capital andlabour applied to a given area is relativelysmall.
FazendaA coffee plantation in Brazil.
Foreign ExchangeThe mechanism or process by whichpayments between any two placesoperating under different national currencysystems are effected without passing ofactual money or gold, etc.
FreewaysThe wide highways on which cross-roadsare avoided by providing overhead linkswhere one turns in only one direction toensure smooth and speedy traffic.
HarbourAn extensive stretch of deep water wherevessels can anchor securely to obtainprotection from sea and swell either throughnatural features or artificial works.
GLOSSARY
HighwayPublic road connecting distant places. Sucha road of national importance is called thenational highway.
HorticultureCultivation of vegetables and fruits; often onsmall plots, involving higher intensivenessthan in field cultivation.
ImportsGoods brought into a country from anothercountry.
Industrial RevolutionThe change in manufacturing from hand-operated tools to power-driven machinerybegan in England during the middle of theeighteenth century.
IndustrySystematic production characterised bydivision of labour and extensive use ofmachinery.
Intensive AgricultureFarming in which large amounts of capitaland labour are applied per unit area ofland, in order to obtain high yield.
Inter CroppingIt is a practice of growing two or more cropstogether on the same field in the sameseason
International TradeTrade carried on between nations primarilyto exchange their surpluses and make uptheir deficits.
MetropolisA very large city or agglomeration ofpopulation in a district or a country, and isoften the chief centre or seat of some formof activity— administrative, commercial orindustrial. It generally serves a largehinterland.
MineAn excavation made in the earth fordigging out minerals such as coal, iron-ore
2020-21
Fundamentals of Human Geography114
and precious stones. A mine usuallydenotes underground working except inopen-pit mines.
MineralA substance that is found in the earth’s crust,and which generally has a definitechemical composition unlike most rocks.
Mineral FuelNon-metallic minerals such as coal andpetroleum which are used as fuel.
Mineral OilA mixture of hydrocarbons in solid,gaseous or liquid form found in the earth. Itis commonly known as petroleum. It becamea commercial product only in 1859.
Mineral OreMetals in their raw state as extracted fromthe earth.
MiningAn economic activity concerned with theextraction of commercially valuable mineralsfrom the bowels of the earth.
Mixed FarmingA type of farming in which cultivation of cropsand raising of livestock go hand in hand.Both these activities play an important partin the economy.
Natural ResourcesWealth supplied by nature-mineraldeposits, soil fertility, timber, fuel, water,potential water-power, fish and wild life, etc.
NomadismA way of life of the people who are requiredto shift their dwellings frequently from placeto place in search of pastures for theiranimals— the mainstay of their economy.
Open-cast MineA place where soil and its outward coverare first removed and a mineral or ore isextracted by quarrying. In a way, it is aquarry on a large scale. This method ofmining is known as open-cast mining.
PastoralismAn economy that solely depends uponanimals. Whereas nomadic pastoralism is
practised mainly for subsistence, themodern ranches present an example ofcommercial pastoralism.
Plantation AgricultureA large-scale one-crop farming resemblingfactory production. It is usuallycharacterised by large estate, huge capitalinvestment, and modern and scientifictechniques of cultivation and trade.
PortThe commercial part of a harbourcontaining facilities for embarking anddisembarking passengers, loading andunloading, and some facilities for the storageof cargo.
Primary Activity Activities concerned with collecting ormaking available materials, provided bynature, for example, agriculture, fishing,forestry, hunting or mining.
Quarry An open-air excavation from which stoneis obtained by cutting, blasting, etc.
RanchesLarge stock farms, usually fenced in, whereanimals are bred and reared on acommercial scale. They are foundespecially in the United States.
Rotation of Crops A systematic succession of different cropson a given piece of land carried out inorder to avoid exhaustion of the soil.
Secondary ActivityActivities which transform the materialprovided by primary activities intocommodities more directly useful to man.
Sedentary AgricultureFarming practised more or lesspermanently on the same piece of land,the same as settled agriculture.
Shaft Mine An underground excavation made deepinto the earth for digging minerals like coal,precious stones and iron. Such minescontain vertical and inclined shafts andhorizontal tunnels at various levels.
Shifting Agriculture A method of farming in which a patch ofground is cultivated for a period of fewyears until the soil is partly exhausted oroverrun by weeds, and after which theland is left to natural vegetation whilecultivation is carried on elsewhere. In duecourse, the original patch of land iscultivated again when the natural growthhas restored fertility.
Subsistence AgricultureFarming in which its produce is mainlyconsumed in the farmer’s household unlikecommercial agriculture whose productsenter into trade on a very large scale.
Transhumance A seasonal movement of herdsmen withtheir livestock and from and to themountains or between the regions ofdiffering climates.
TransportThe action of carrying persons and goodsfrom one place to another.
Truck FarmingGrowing of vegetables around the urbancentres to meet the daily demand of thepeople is known as truck farming. It isgoverned by the distance a truck can coverovernight between the farm and the market.
Urbanisation A general movement of people from smallrural or agricultural communities or villagesto larger towns engaged in varied activitiessuch as government, trade, transport andmanufacture. It also indicates theconcentration of an increasing proportionof total population in towns and cities.
2020-21

NONONONONOTESTESTESTESTES
2020-21

NONONONONOTESTESTESTESTES
2020-21
FUNDAMENTALS OF HUMAN
GEOGRAPHY
Textbook for Class XII
2020-21

First Edition
February 2007 Magha 1928
Reprinted
December 2007 Pausa 1929
December 2008 Pausa 1930
January 2010 Magha 1931
January 2011 Magha 1932
March 2012 Phalguna 1933
March 2013 Phalguna 1934
January 2014 Magha 1935
December 2014 Pausa 1936
December 2015 Agrahayna 1937
February 2017 Magha 1938
March 2018 Phalguna 1939
March 2019 Chaitra 1941
January 2020 Magha 1941
PD 140T BS
© National Council of EducationalResearch and Training, 2007
` 75.00
Printed on 80 GSM paper with NCERT
watermark
ISBN 81-7450-662-4
ALL RIGHTS RESERVED
q No part of this publication may be reproduced, stored in a retrieval system
or transmitted, in any form or by any means, electronic, mechanical,
photocopying, recording or otherwise without the prior permission of the
publisher.
q This book is sold subject to the condition that it shall not, by way of trade,
be lent, re-sold, hired out or otherwise disposed of without the publisher’s
consent, in any form of binding or cover other than that in which it is
published.
q The correct price of this publication is the price printed on this page, Any
revised price indicated by a rubber stamp or by a sticker or by any other
means is incorrect and should be unacceptable.
OFFICES OF THE PUBLICATION
DIVISION, NCERT
NCERT CampusSri Aurobindo MargNew Delhi 110 016 Phone: 011-26562708
108, 100 Feet RoadHosdakere Halli ExtensionBanashankari III StageBengaluru 560 085 Phone : 080-26725740
Navjivan Trust BuildingP.O.NavjivanAhmedabad 380 014 Phone : 079-27541446
CWC CampusOpp. Dhankal Bus StopPanihatiKolkata 700 114 Phone : 033-25530454
CWC ComplexMaligaonGuwahati 781 021 Phone : 0361-2674869
Publication Team
Head, Publication : Anup Kumar Rajput
Division
Chief Editor : Shveta Uppal
Chief Production : Arun Chitkara
Officer
Chief Business : Bibash Kumar Das
Manager
Assistant Editor : R.N. Bhardwaj
Production Assistant : Mukesh Gaur
Cover and LayoutJoel Gill
IllustrationsAnil Sharma
Varuni Sinha
CartographyCartographic Design
Agency
Published at the Publication Divisionby the Secretary, National Councilof Educational Research and Training,Sri Aurobindo Marg, New Delhi 110016and printed at New Bharat OffsetPrinters, B-16, Sector-6, Noida - 201301(U.P.)
2020-21

The National Curriculum Framework (NCF), 2005, recommends thatchildren’s life at school must be linked to their life outside the school. Thisprinciple marks a departure from the legacy of bookish learning whichcontinues to shape our system and causes a gap between the school, homeand community. The syllabi and textbooks developed on the basis of NCFsignify an attempt to implement this basic idea. They also attempt todiscourage rote learning and the maintenance of sharp boundaries betweendifferent subject areas. We hope these measures will take us significantlyfurther in the direction of a child-centred system of education outlined inthe National Policy on Education (1986).
The success of this effort depends on the steps that school principalsand teachers will take to encourage children to reflect on their own learningand to pursue imaginative activities and questions. We must recognise that,given space, time and freedom, children generate new knowledge byengaging with the information passed on to them by adults. Treating theprescribed textbook as the sole basis of examination is one of the key reasonswhy other resources and sites of learning are ignored. Inculcating creativityand initiative is possible if we perceive and treat children as participantsin learning, not as receivers of a fixed body of knowledge.
These aims imply considerable change in school routines and mode offunctioning. Flexibility in the daily time-table is as necessary as rigour inimplementing the annual calendar so that the required number of teachingdays are actually devoted to teaching. The methods used for teaching andevaluation will also determine how effective this textbook proves for makingchildren’s life at school a happy experience, rather than a source of stressor boredom. Syllabus designers have tried to address the problem ofcurricular burden by restructuring and reorienting knowledge at differentstages with greater consideration for child psychology and the time availablefor teaching. The textbook attempts to enhance this endeavour by givinghigher priority and space to opportunities for contemplation and wondering,discussion in small groups, and activities requiring hands-on experience.
The National Council of Educational Research and Training (NCERT)appreciates the hard work done by the textbook development committeeresponsible for this book. We wish to thank the Chairperson of the advisorycommittee for textbooks in Social Sciences, at the higher secondary level,Professor Hari Vasudevan and the Chief Advisor for this book, ProfessorM.H. Qureshi for guiding the work of this committee. Several teacherscontributed to the development of this textbook; we are grateful to theirprincipals for making this possible. We are indebted to the institutions andorganisations which have generously permitted us to draw upon theirresources, material and personnel. We are especially grateful to the membersof the National Monitoring Committee, appointed by the Department ofSecondary and Higher Education, Ministry of Human Resource Developmentunder the Chairpersonship of Professor Mrinal Miri and Professor G.P.Deshpande, for their valuable time and contribution. As an organisationcommitted to systemic reform and continuous improvement in the qualityof its products, NCERT welcomes comments and suggestions which willenable us to undertake further revision and refinement.
Director
New Delhi National Council of Educational20 November 2006 Research and Training
Foreword
2020-21

2020-21
Textbook Development Committee
CHAIRPERSON, ADVISORY COMMITTEE FOR TEXTBOOKS IN SOCIAL SCIENCES AT
THE HIGHER SECONDARY LEVEL
Hari Vasudevan, Professor, Department of History, University of Calcutta,Kolkata
CHIEF ADVISOR
M. H. Qureshi, Professor, Centre for the Study of Regional Development,Jawaharlal Nehru University, New Delhi
MEMBERS
Anindita Datta, Lecturer, Delhi School of Economics, Delhi University, Delhi
Anup Saikia, Reader, Gauhati University, Guwahati
Ashok Diwakar, Lecturer, Government P.G. College, Sector-9, Gurgaon
N. Kar, Reader, Rajiv Gandhi University, Itanagar
N. Nagabhushanam, Professor, S.V. Univeristy, Tirupati
N. R. Dash, Reader, M.S. University of Baroda, Vadodara
Odilia Coutinho, Reader, R.P.D. College, Belgaum
Ranjana Jasuja, PGT, Army Public School, Dhaula Kuan, New Delhi
S. Zaheen Alam, Lecturer, Dyal Singh College, University of Delhi
Swgata Basu, Lecturer, SSV (PG) College, Hapur
MEMBER-COORDINATOR
Tannu Malik, Lecturer, DESSH, NCERT, New Delhi
2020-21

Acknowledgements
The National Council of Educational Research and Training (NCERT)acknowledges the contribution of Rupa Das, PGT, DPS, R.K. Puram in thedevelopment of this textbook. Special thanks are due to Savita Sinha,Professor and Head, Department of Education in Social Sciences andHumanities for her valuable support at every stage of preparation of thistextbook.
The Council is thankful to the Survey of India for certification of mapsgiven in the textbook. It also gratefully acknowledges the support ofindividuals and organisations as listed below for providing variousphotographs and illustrations used in this textbook.
M.H. Qureshi, Professor, CSRD, JNU for Fig. 8.2 and 10.8; Seema Mathur,Reader, Sri Aurobindo College (Evening), New Delhi for a photograph on page1, Fig. 5.15(a) and 7.5; Krishan Sheoran from Austria for Fig. 5.13, 8.1, 8.4,8.15, 10.1 and 10.2; Arjun Singh, Student, Hindu College, University of Delhifor a photograph on page 90 and Fig. 7.3; Nityanand Sharma, Professor andHead, Medical College, Rohtak for a photograph on page 55; Swagata Basu,Lecturer, SSV (PG) College, Hapur for Fig. 8.17, 9.2 and 10.9; Odilia Countinho,Reader, R.P.D. College, Belgaum for Fig. 7.4; Abhimanyu Abrol for Fig. 5.10;Samiran Baruah for Fig. 9.1; Shveta Uppal, NCERT for Fig. 6.2(b), 6.3, 8.12and 10.4; Kalyan Banerjee, NCERT for Fig. 10.3, 10.5 and 10.6; Y.K. Guptaand R.C. Das, CIET, NCERT for a photograph on page 65 and Fig. 5.17(a),5.17(b) and 10.10; NCERT’s old collection of photographs for Fig. 5.5, 5.9,5.11, 5.15(b), 5.18, 6.4, 6.5, 6.6, 8.8, 8.13, 9.5, 9.6 and photographs on pages1, 31, 46 and 81; Times of India, New Delhi for news items on pages 12, 63and 69, ITDC/Ministry of Tourism, Govt. of India for Fig. 5.1 and 6.2(a);National Highway Authority of India for Fig. 8.3; Business Standard for a newsitem on pages 28 and 75; Practical Work in Geography, Part I, Class XI, NCERT(2006) for photographs on page 23; Directorate of Extension, Ministry ofAgriculture for Fig. 5.3 and 7.2; The Hindu for a news item on page 75 andwebsite: www.africa.upenn.edu for Fig. 10.7
The Council also gratefully acknowledges the contribution ofAnil Sharma, DTP Operator; Ajay Singh, Copy Editor; K.C. Patra, Proof Readerand Dinesh Kumar, Computer Incharge who have helped in giving a finalshape to this book. The contribution of the Publication Department, NCERTis also duly acknowledged.
The following are applicable to all the maps of India used inthis textbook
1. © Government of India, Copyright 2006
2. The responsibility for the correctness of internal details rests with the publisher.
3. The territorial waters of India extend into the sea to a distance of twelve nauticalmiles measured from the appropriate base line.
4. The administrative headquarters of Chandigarh, Haryana and Punjab are atChandigarh.
5. The interstate boundaries amongst Arunachal Pradesh, Assam and Meghalayashown on this map are as interpreted from the “North-Eastern Areas(Reorganisation) Act.1971,” but have yet to be verified.
6. The external boundaries and coastlines of India agree with the Record/MasterCopy certified by Survey of India.
7. The state boundaries between Uttaranchal and Uttar Pradesh, Bihar andJharkhand and Chhattisgarh and Madhya Pradesh have not been verified by theGovernments concerned.
8. The spellings of names in this map have been taken from various sources.
2020-21

FOREWORD iii
UUUUU N I TN I TN I TN I TN I T I I I I I 1 - 71 - 71 - 71 - 71 - 7
1. Human Geography
Nature and Scope 1
UUUUUNITNITNITNITNIT II II II II II 8-308-308-308-308-30
2. The World PopulationDistribution, Density and Growth 8
3. Population Composition 17
4. Human Development 22
UUUUUNITNITNITNITNIT III III III III III 31-9031-9031-9031-9031-90
5. Primary Activities 31
6. Secondary Activities 45
7. Tertiary and Quaternary Activities 55
8. Transport and Communication 65
9. International Trade 81
UUUUUNITNITNITNITNIT IV IV IV IV IV 91-10291-10291-10291-10291-102
10. Human Settlements 91
APPENDIX I 103
APPENDIX II 110
GLOSSARY 113
Contents
2020-21

2020-21

Human GeographyNature and Scope
You have already studied ‘Geography as aDiscipline’ in Chapter I of the book,Fundamentals of Physical Geography (NCERT,2006). Do you recall the contents? This chapterhas broadly covered and introduced you to thenature of geography. You are also acquaintedwith the important branches that sprout fromthe body of geography. If you re-read thechapter you will be able to recall the link ofhuman geography with the mother disciplinei.e. geography. As you know geography as afield of study is integrative, empirical, andpractical. Thus, the reach of geography isextensive and each and every event orphenomenon which varies over space and timecan be studied geographically. How do you seethe earth’s surface? Do you realise that the earthcomprises two major components: nature(physical environment) and life forms includinghuman beings? Make a list of physical andhuman components of your surroundings.Physical geography studies physicalenvironment and human geography studies“the relationship between the physical/naturaland the human worlds, the spatial distributionsof human phenomena and how they comeabout, the social and economic differencesbetween different parts of the world”.1
You are already aware of the fact that thecore concern of geography as a discipline is tounderstand the earth as home of human beingsand to study all those elements which havesustained them. Thus, emphasis is on study ofnature and human beings. You will realise thatgeography got subjected to dualism and thewide-ranging debates started whethergeography as a discipline should be a lawmaking/theorising (nomothetic) ordescriptive (idiographic). Whether its subjectmatter should be organised and approach ofthe study should be regional or systematic?Whether geographical phenomena beinterpreted theoretically or through historic-institutional approach? These have been issuesfor intellectual exercise but finally you willappreciate that the dichotomy between physicaland human is not a very valid one becausenature and human are inseparable elementsand should be seen holistically. It is interestingto note that both physical and human
1 Agnew J. Livingstone, David N. and Rogers, A.; (1996) Blackwell
Publishing Limited, Malden, U.S.A. p. 1 and 2.
Unit-IUnit-IUnit-IUnit-IUnit-I
Chapter-1
2020-21

2 Fundamentals of Human Geography
phenomena are described in metaphors usingsymbols from the human anatomy.
We often talk of the ‘face’ of the earth, ‘eye’
of the storm, ‘mouth’ of the river, ‘snout’ (nose)
of the glacier, ‘neck’ of the isthmus and ‘profile’
of the soil. Similarly regions, villages, towns
have been described as ‘organisms’. German
geographers describe the ‘state/country’ as a
‘living organism’. Networks of road, railways
and water ways have often been described as
“arteries of circulation”. Can you collect such
terms and expressions from your own
language? The basic questions now arises, can
we separate nature and human when they areso intricately intertwined?
Human Geography DefinedHuman Geography DefinedHuman Geography DefinedHuman Geography DefinedHuman Geography Defined
• “Human geography is the synthetic study
of relationship between human societies and
earth’s surface”. Ratzel
Synthesis has been emphasised in the
above definition.
• “Human geography is the study of “thechanging relationship between the unresting
man and the unstable earth.”
Ellen C. Semple
Dynamism in the relationship is the keyword
in Semple’s definition.
• “Conception resulting from a more
synthetic knowledge of thephysical laws
governing our earth and of the relations
between the living beings which inhabit it”.
Paul Vidal de la Blache
Human geography offers a new conception
of the interrelationships between earth and
human beings.
NATURE OF HUMAN GEOGRAPHY
Human geography studies the inter-relationship
between the physical environment and socio-
cultural environment created by human beings
through mutual interaction with each other. You
have already studied the elements of physicalenvironment in class XI in the book entitledFundamentals of Physical Geography (NCERT2006). You know that these elements arelandforms, soils, climate, water, natural vegetationand diverse flora and fauna. Can you make a listof elements which human beings have createdthrough their activities on the stage provided bythe physical environment? Houses, villages, cities,road-rail networks, industries, farms, ports, itemsof our daily use and all other elements of materialculture have been created by human beingsusing the resources provided by the physicalenvironment. While physical environment hasbeen greatly modified by human beings, it hasalso, in turn, impacted human lives.
Naturalisation of Humans andHumanisation of Nature
Human beings interact with their physicalenvironment with the help of technology. It isnot important what human beings produce andcreate but it is extremely important ‘with thehelp of what tools and techniques do theyproduce and create’.
Technology indicates the level of culturaldevelopment of society. Human beings wereable to develop technology after they developedbetter understanding of natural laws. Forexample, the understanding of concepts offriction and heat helped us discover fire.Similarly, understanding of the secrets of DNAand genetics enabled us to conquer manydiseases. We use the laws of aerodynamics todevelop faster planes. You can see thatknowledge about Nature is extremely importantto develop technology and technology loosensthe shackles of environment on human beings.In the early stages of their interaction with theirnatural environment humans were greatlyinfluenced by it. They adapted to the dictatesof Nature. This is so because the level oftechnology was very low and the stage ofhuman social development was also primitive.This type of interaction between primitivehuman society and strong forces of nature wastermed as environmental determinism. Atthat stage of very low technological developmentwe can imagine the presence of a naturalisedhuman, who listened to Nature, was afraid ofits fury and worshipped it.
2020-21

Human Geography: Nature and Scope 3
The Naturalisation of HumansThe Naturalisation of HumansThe Naturalisation of HumansThe Naturalisation of HumansThe Naturalisation of Humans
Benda lives in the wilds of the Abujh Maadarea of central India. His village consists ofthree huts deep in the wilds. Not even birdsor stray dogs that usually crowd villages canbe seen in these areas. Wearing a smallloin cloth and armed with his axe he slowlysurveys the penda (forest) where his tribepractices a primitive form of agriculture calledshifting cultivation. Benda and his friendsburn small patches of forest to clear themfor cultivation. The ash is used for makingthe soil fertile. Benda is happy that theMahua trees around him are in bloom. Howlucky I am to be a part of this beautifuluniverse, he thinks as he looks up to seethe Mahua, Palash and Sal trees that havesheltered him since childhood. Crossing thependa in a gliding motion, Benda makeshis way to a stream. As he bends down toscoop up a palmful of water, he remembersto thank Loi-Lugi, the spirit of the forest forallowing him to quench his thirst. Movingon with his friends, Benda chews onsucculent leaves and roots. The boys havebeen trying to collect Gajjhara and Kuchla,from the forest. These are special plantsthat Benda and his people use. He hopesthe spirits of the forest will be kind and leadhim to these herbs. These are needed tobarter in the madhai or tribal fair coming upthe next full moon. He closes his eyes andtries hard to recall what the elders had taughthim about these herbs and the places theyare found in. He wishes he had listened morecarefully. Suddenly there is a rustling ofleaves. Benda and his friends know it is theoutsiders who have come searching for themin the wilds. In a single fluid motion Bendaand his friends disappear behind the thickcanopy of trees and become one with the
spirit of the forest.
The story in the box represents the directrelationship of a household belonging to aneconomically primitive society with nature. Readabout other primitive societies which live incomplete harmony with their naturalenvironment. You will realise that in all such casesnature is a powerful force, worshipped, reveredand conserved. There is direct dependence of
human beings on nature for resources whichsustain them. The physical environment for suchsocieties becomes the “Mother Nature”.
The people begin to understand theirenvironment and the forces of nature with thepassage of time. With social and culturaldevelopment, humans develop better and moreefficient technology. They move from a state ofnecessity to a state of freedom. They createpossibilities with the resources obtained fromthe environment. The human activities createcultural landscape. The imprints of humanactivities are created everywhere; health resortson highlands, huge urban sprawls, fields,orchards and pastures in plains and rollinghills, ports on the coasts, oceanic routes on theoceanic surface and satellites in the space. Theearlier scholars termed this as possibilism.Nature provides opportunities and humanbeing make use of these and slowly nature getshumanised and starts bearing the imprints ofhuman endeavour.
Humanisation of Nature
Winters in the town of Trondheim mean fierce
winds and heavy snow. The skies are dark
for months. Kari drives to work in the dark at
8 am. She has special tyres for the winter
and keeps the headlights of her powerful car
switched on. Her office is artificially heated
at a comfortable 23 degrees Celsius. The
campus of the university she works in is built
under a huge glass dome. This dome keeps
the snow out in winter and lets in the sunshine
in the summer. The temperature is controlled
carefully and there is adequate lighting. Even
though fresh vegetables and plants don’t grow
in such harsh weather, Kari keeps an orchid
on her desk and enjoys eating tropical fruits
like banana and kiwi. These are flown in from
warmer areas regularly. With a click of the
mouse, Kari can network with colleagues in
New Delhi. She frequently takes a morning
flight to London and returns in the evening in
time to watch her favourite television serial.
Though Kari is fifty-eight years old, she is
fitter and looks younger than many thirty-
year- olds in other parts of the world.
2020-21

4 Fundamentals of Human Geography
Can you imagine what has made such alife style possible? It is technology that hasallowed the people of Trondheim and others toovercome the constraints imposed by nature. Doyou know about some other such instances?Such examples are not difficult to find.
A geographer, Griffith Taylor introducedanother concept which reflects a middle path(Madhyam Marg) between the two ideas ofenvironmental determinism and possibilism.He termed it as Neodeterminism or stop andgo determinism. Those of you who live in citiesand those who have visited a city, might haveseen that traffic is regulated by lights on thecross-roads. Red light means ‘stop’, amber lightprovides a gap between red and green lights ‘toget set’ and green light means ‘go’. The conceptshows that neither is there a situation ofabsolute necessity (environmental determinism)nor is there a condition of absolute freedom(possibilism). It means that human beings canconquer nature by obeying it. They have torespond to the red signals and can proceed intheir pursuits of development when naturepermits the modifications. It means thatpossibilities can be created within the limitswhich do not damage the environment and thereis no free run without accidents. The free runwhich the developed economies attempted totake has already resulted in the green houseeffect, ozone layer depletion, global warming,receding glaciers and degrading lands. Theneo-determinism conceptually attempts tobring a balance nullifying the ‘either’ ‘or’dichotomy.
Human Geography throughthe Corridors of Time
The process of adaptation, adjustment with andmodification of the environment started with theappearance of human beings over the surfaceof the earth in different ecological niches. Thus,if we imagine the beginning of humangeography with the interaction of environmentand human beings, it has its roots deep inhistory. Thus, the concerns of humangeography have a long temporal continuumthough the approaches to articulate them havechanged over time. This dynamism in
approaches and thrusts shows the vibrantnature of the discipline. Earlier there was littleinteraction between different societies and theknowledge about each other was limited.Travellers and explorers used to disseminateinformation about the areas of their visits.Navigational skills were not developed andvoyages were fraught with dangers. The latefifteenth century witnessed attempts ofexplorations in Europe and slowly the mythsand mysteries about countries and peoplestarted to open up. The colonial period providedimpetus to further explorations in order toaccess the resources of the regions and to obtaininventorised information. The intention here isnot to present an in-depth historical accountbut to make you aware of the processes of steadydevelopment of human geography. Thesummarised Table 1.1 will introduce you to thebroad stages and the thrust of humangeography as a sub-field of geography.
• Welfare or humanistic school of thought
in human geography was mainly concerned
with the different aspects of social well-being
of the people. These included aspects such
as housing, health and education.
Geographers have already introduced a
paper as Geography of Social well-being in
the Post Graduate curriculum’.
• Radical school of thought employed
Marxian theory to explain the basic cause
of poverty, deprivation and social inequality.
Contemporary social problems were related
to the development of capitalism.
• Behavioural school of thought laid great
emphasis on lived experience and also on
the perception of space by social categories
based on ethnicity, race and religion, etc.
Fields and Sub-fields of Human Geography
Human geography, as you have seen, attemptsto explain the relationship between all elementsof human life and the space they occur over.Thus, human geography assumes a highlyinter-disciplinary nature. It develops close
2020-21

Human Geography: Nature and Scope 5
Table 1.1: Broad Stages and Thrust of Human Geography
interface with other sister disciplines in socialsciences in order to understand and explainhuman elements on the surface of the earth.With the expansion of knowledge, new sub-fields emerge and it has also happened tohuman geography. Let us examine these fieldsand sub-fields of Human Geography (Table 1.2).
You would have noticed that the list islarge and comprehensive. It reflects the
expanding realm of human geography. Theboundaries between sub-fields often overlap.What follows in this book in the form ofchapters will provide you a fairly widespreadcoverage of different aspects of humangeography. The exercises, the activities and thecase studies will provide you with someempirical instances so as to have a betterunderstanding of its subject matter.
Broad Features
Imperial and trade interests prompted the discovery and
exploration of new areas. An encyclopaedic description of
the area formed an important aspect of the geographer’s
account.
Elaborate description of all aspects of a region were
undertaken. The idea was that all the regions were part of
a whole, i.e. (the earth); so, understanding the parts in
totality would lead to an understanding of the whole.
The focus was on identifying the uniqueness of any region
and understanding how and why it was different from
others.
Marked by the use of computers and sophisticated
statistical tools. Laws of physics were often applied to
map and analyse human phenomena. This phase was
called the quantitative revolution. The main objective was
to identify mappable patterns for different human
activities.
Discontentment with the quantitative revolution and its
dehumanised manner of doing geography led to the
emergence of three new schools of thought of human
geography in the 1970s. Human geography was made more
relevant to the socio-political reality by the emergence of
these schools of thought. Consult the box below to know
a little bit more about these schools of thought.
The grand generalisations and the applicability of universal
theories to explain the human conditions were questioned.
The importance of understanding each local context in
its own right was emphasised.
Approaches
Exploration and
description
Regional analysis
Areal differentiation
Spatial organisation
Emergence of
humanistic, radical
and behavioural
schools
Post-modernism in
geography
Period
Early Colonial
period
Later Colonial
period
1930s through the
inter-War period
Late 1950s to the
late 1960s
1970s
1990s
2020-21

6 Fundamentals of Human Geography
Table 1.2: Human Geography and Sister Disciplines of Social Sciences
EXERCISESEXERCISESEXERCISESEXERCISESEXERCISES
1. Choose the right answer from the four alternatives given below.(i) Which one of the following statements does not describe geography?
(a) an integrative discipline
(b) study of the inter-relationship between humans and environment
Fields of Sub-fields Interface with SisterHuman Disciplines of Social Sciences
Geography
Social — Social Sciences – Sociology
Geography Behavioural Geography Psychology
Geography of Social Welfare Economics
Well-being
Geography of Leisure Sociology
Cultural Geography Anthropology
Gender Geography Sociology, Anthropology, Women’s Studies
Historical Geography History
Medical Geography Epidemology
Urban — Urban Studies and Planning
Geography
Political — Political Science
Geography Electoral Geography Psephology
Military Geography Military Science
Population — Demography
Geography
Settlement — Urban/Rural Planning
Geography
Economic — Economics
Geography Geography of Resources Resource Economics
Geography of Agriculture Agricultural Sciences
Geography of Industries Industrial Economics
Geography of Marketing Business Studies, Economics, Commerce
Geography of Tourism Tourism and Travel Management
Geography of International International Trade
Trade
2020-21

Human Geography: Nature and Scope 7
(c) subjected to dualism
(d) not relevant in the present time due to the development of technology.
(ii) Which one of the following is not a source of geographical information?
(a) traveller’s accounts
(b) old maps
(c) samples of rock materials from the moon
(d) ancient epics
(iii) Which one of the following is the most important factor in the interactionbetween people and environment?
(a) human intelligence (c) technology
(b) people’s perception (d) human brotherhood
(iv) Which one of the following is not an approach in human geography?
(a) Areal differentiation (c) Quantitative revolution
(b) Spatial organisation (d) Exploration and description
2. Answer the following questions in about 30 words.
(i) Define human geography.
(ii) Name some sub-fields of human geography.
(iii) How is human geography related to other social sciences?
3. Answer the following questions in not more than 150 words.
(i) Explain naturalisation of humans.
(ii) Write a note on the scope of human geography.
2020-21

Unit-II
Chapter-2
The World Population
Distribution, Density and
Growth
The people of a country are its real wealth. Itis they, who are the actual resources and makeuse of the country’s other resources and decideits policies. Ultimately a country is known byits people.
It is important to know how many womenand men a country has, how many children areborn each year, how many people die and how?Whether they live in cities or villages, can theyread or write and what work do they do? Theseare what you will study about in this unit.
The world at the beginning of 21st centuryrecorded the presence of over 6 billionpopulation. We shall discuss the patterns oftheir distribution and density here.
Why do people prefer to live in certainregions and not in others?
The population of the world is unevenlydistributed. The remark of George B. Cresseyabout the population of Asia that “Asia has manyplaces where people are few and few place wherepeople are very many” is true about the patternof population distribution of the world also.
PATTERNS OF POPULATION
DISTRIBUTION IN THE WORLD
Patterns of population distribution and densityhelp us to understand the demographiccharacteristics of any area. The term populationdistribution refers to the way people are spacedover the earth’s surface. Broadly, 90 per cent ofthe world population lives in about 10 per centof its land area.
The 10 most populous countries of theworld contribute about 60 per cent of the world’spopulation. Of these 10 countries, 6 are locatedin Asia. Identify these six countries of Asia.
Not gold but only (Wo)men can make
a people great and strong.
(Wo)men who for truth and
honour’s sake, stand fast and suffer
long (Wo)men who toil while others
sleep – who dare while others flee –
they build a nation’s pillars deep and
lift it to the sky.
Ralph Waldo EmersonFig. 2.1: Most Populous Countries
2020-21

DENSITY OF POPULDENSITY OF POPULDENSITY OF POPULDENSITY OF POPULDENSITY OF POPULAAAAATIONTIONTIONTIONTION
Each unit of land has limited capacity tosupport people living on it. Hence, it isnecessary to understand the ratio between thenumbers of people to the size of land. This ratiois the density of population. It is usuallymeasured in persons per sq km
Population Density of Population =
Area
For example, area of Region X is 100 sq
km and the population is 1,50,000 persons.
The density of population is calculated as:
1,50,000Density
100=
= 1,500 person/sq km
What does this tell you about Region X?
Look at Table 2.1 and observe that Asia has
the highest density of population. Discuss
in the class about what could be the reason for
this.
FACTORS INFLUENCING THE
DISTRIBUTION OF POPULATION
I. Geographical Factors
(i) Availability of water: Water is the most
important factor for life. So, people preferto live in areas where fresh water is easily
The World Population: Distribution, Density and Growth 9
available. Water is used for drinking,
bathing and cooking – and also for cattle,
crops, industries and navigation. It is
because of this that river valleys are among
the most densely populated areas of the
world.
(ii) Landforms: People prefer living on flat
plains and gentle slopes. This is because
such areas are favourable for the
production of crops and to build roads
and industries. The mountainous and
hilly areas hinder the development of
transport network and hence initially do
not favour agricultural and industrial
development. So, these areas tend to be
less populated. The Ganga plains are
among the most densely populated
areas of the world while the mountains
zones in the Himalayas are scarcely
populated.
(iii) Climate: An extreme climate such as very
hot or cold deserts are uncomfortable for
human habitation. Areas with a
comfortable climate, where there is not
much seasonal variation attract more
people. Areas with very heavy rainfall or
extreme and harsh climates have low
population. Mediterranean regions were
inhabited from early periods in history due
to their pleasant climate.
Region Population Land Area Density World Share(2018) (Km2) (P/Km2) (in percentage)
Asia 4,545,133,094 31,033,131 146 59.5%
Africa 1,287,920,518 29,648,481 43 16.9%
Europe 742,648,010 22,134,900 34 9.7%
Latin America and 652,012,001 20,139,378 32 8.5%the Caribbean
Northern America 363,844,490 18,651,660 20 4.8%
Oceania 41,261,212 8,486,460 5 0.5%
Table 2.1: Region wise Density of Population
Source: http://www.worldometers.info/world-population/as on 26.10.18
2020-21

Fundamentals of Human Geography10
(iv) Soils: Fertile soils are important foragricultural and allied activities. Therefore,areas which have fertile loamy soils havemore people living on them as these cansupport intensive agriculture. Can youname some areas in India which are thinlypopulated due to poor soils?
II. Economic Factors
(i) Minerals: Areas with mineral depositsattract industries. Mining and industrialactivities generate employment. So, skilledand semi–skilled workers move to theseareas and make them densely populated.Katanga Zambia copper belt in Africa isone such good example.
(ii) Urbanisation: Cities offer betteremployment opportunities, educationaland medical facilities, better means oftransport and communication. Good civicamenities and the attraction of city life drawpeople to the cities. It leads to rural tourban migration and cities grow in size.Mega cities of the world continue to attractlarge number of migrants every year.
Yet city life can be very taxing…. thinkof some of the unpleasant aspects of citylife.
(iii) Industrialisation: Industrial belts providejob opportunities and attract largenumbers of people. These include not justfactory workers but also transportoperators, shopkeepers, bank employees,doctors, teachers and other serviceproviders. The Kobe-Osaka region ofJapan is thickly populated because of thepresence of a number of industries.
III. Social and Cultural Factors
Some places attract more people because theyhave religious or cultural significance. In thesame way – people tend to move away fromplaces where there is social and politicalunrest. Many a times governments offerincentives to people to live in sparsely
populated areas or move away fromovercrowded places. Can you think of someexamples from your region?
POPULATION GROWTH
The population growth or population changerefers to the change in number of inhabitants ofa territory during a specific period of time. Thischange may be positive as well as negative. Itcan be expressed either in terms of absolutenumbers or in terms of percentage. Populationchange in an area is an important indicator ofeconomic development, social upliftment andhistorical and cultural background of the region.
Some Basic Concepts ofPopulation Geography
Growth of Population : Change ofpopulation in particular area between twopoints of time is known as growth ofpopulation. For example, if we deduct thepopulation of India 2001 (102.70 crore) frompopulation of 2011 (121.02 crore) then weshall get the growth of population (18.15crores) in actual numbers.
Growth Rate of Population : This is thechange of population expressed inpercentage.
Natural Growth of Population: This is thepopulation increased by difference betweenbirths and deaths in a particular regionbetween two points of time.
Natural Growth = Births – Deaths
Actual Growth of Population : This is
Births – Deaths + In Migration – OutMigration
Positive Growth of Population: Thishappens when the birth rate is more thanthe death rate between two points of timeor when people from other countries migratepermanently to a region.
Negative Growth of Population: If thepopulation decreases between two pointsof time it is known as negative growth of
2020-21
The World Population: Distribution, Density and Growth 11
population. It occurs when the birth rate fallsbelow the death rate or people migrate toother countries.
Components of Population Change
There are three components of population
change – births, deaths and migration.
The crude birth rate (CBR) is expressed as
number of live births in a year per thousand of
population. It is calculated as:
BiCBR 1000
P= ¥
Here, CBR = Crude Birth Rate; Bi = livebirths during the year; P=Mid year populationof the area.
Death rate plays an active role in
population change. Population growth occurs
not only by increasing births rate but also due
to decreasing death rate. Crude Death Rate
(CDR) is a simple method of measuring
mortality of any area. CDR is expressed in terms
of number of deaths in a particular year per
thousand of population in a particular region.
CDR is calculated as:
DCDR 1000
P= ¥
Here, CDR=Crude Death Rate; D= Numberof deaths; P=Estimated mid-year population ofthat year.
By and large mortality rates are affected
by the region’s demographic structure, social
advancement and levels of its economic
development.
Migration
Apart from birth and death there is another way
by which the population size changes.
When people move from one place to
another, the place they move from is called the
Place of Origin and the place they move to is
called the Place of Destination. The place of
origin shows a decrease in population while the
population increases in the place of destination.
Migration may be interpreted as a spontaneous
effort to achieve a better balance between
population and resources.
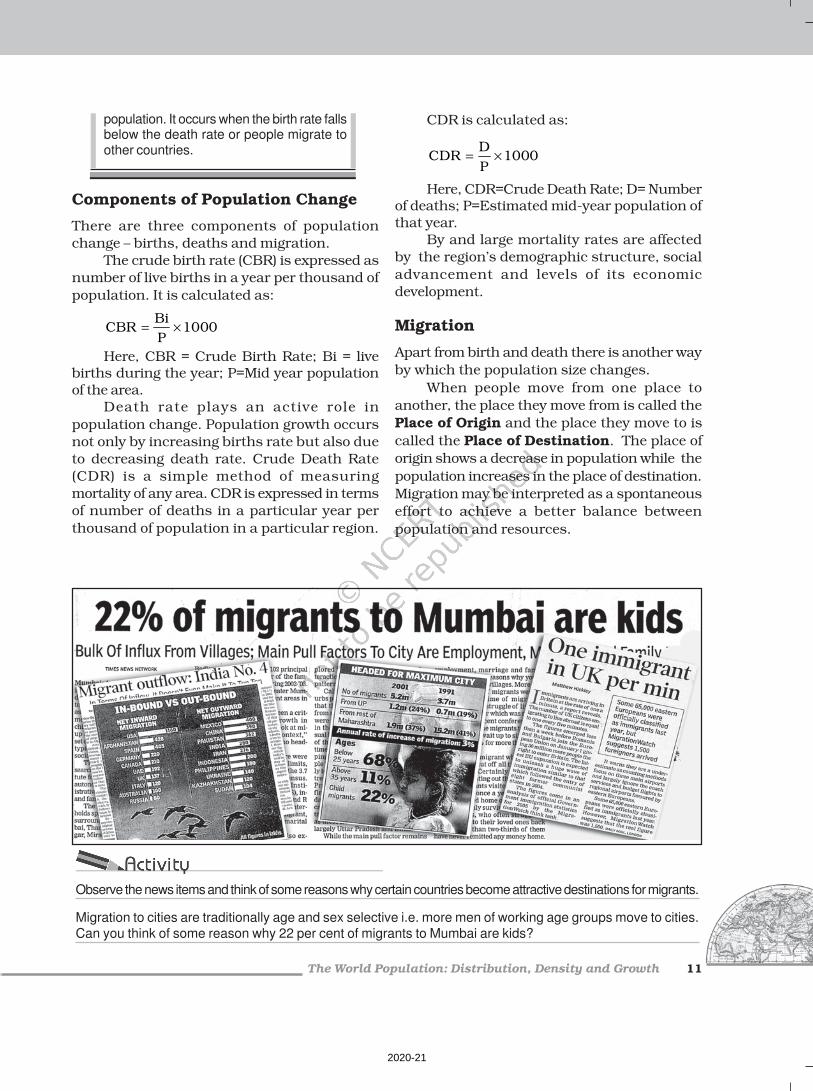
Observe the news items and think of some reasons why certain countries become attractive destinations for migrants.
Migration to cities are traditionally age and sex selective i.e. more men of working age groups move to cities.
Can you think of some reason why 22 per cent of migrants to Mumbai are kids?
2020-21

Fundamentals of Human GeographyFundamentals of Human GeographyFundamentals of Human GeographyFundamentals of Human GeographyFundamentals of Human Geography12
Fig. 2.2: Resource, Technology and Population GrowthFig. 2.2: Resource, Technology and Population GrowthFig. 2.2: Resource, Technology and Population GrowthFig. 2.2: Resource, Technology and Population GrowthFig. 2.2: Resource, Technology and Population Growth
Migration may be permanent, temporary
or seasonal. It may take place from rural to
rural areas, rural to urban areas, urban to
urban areas and urban to rural areas.
Do you realise that the same person is bothan immigrant and an emigrant?
Immigration: Migrants who move into a new
place are called Immigrants.
Emigration: Migrants who move out of a
place are called Emigrants.
Can you think of reasons why peoplemigrate?
People migrate for a better economic andsocial life. There are two sets of factors thatinfluence migration.
The Push factors make the place of origin
seem less attractive for reasons like
unemployment, poor living conditions, political
turmoil, unpleasant climate, natural disasters,
epidemics and socio-economic backwardness.
The Pull factors make the place of
destination seem more attractive than the place
of origin for reasons like better job opportunities
and living conditions, peace and stability,
security of life and property and pleasant climate.
TRENDS IN POPULATION GROWTH
The population on the earth is more than seven
billion. It has grown to this size over centuries.
In the early periods population of the world
grew very slowly. It is only during the last few
hundred years that population has increased
at an alarming rate.
Fig. 2.2 tells the story of population
growth. After the evolution and introduction
of agriculture about 12,000 to 8,000 years
ago, the size of population was small – roughly
8 million. In the first century A.D. it was below
300 million. The expanding world trade during
the sixteenth and seventeenth century, set the
stage for rapid population growth. Around
1750, at the dawn of the Industrial Revolution,
the world population was 550 million. World
population exploded in the eighteenth century
after the Industrial Revolution. Technological
advancement achieved so far helped in the
reduction of death rate and provided a stage
for accelerated population growth.
2020-21

The World Population: Distribution, Density and Growth 13
How Science and TechnologyHow Science and TechnologyHow Science and TechnologyHow Science and TechnologyHow Science and Technologyhelped Population Growth?helped Population Growth?helped Population Growth?helped Population Growth?helped Population Growth?
The steam engine replaced human andanimal energy and also providedmechanised energy of water and wind. Thisincreased agricultural and industrialproduction.
Inoculation against epidemics and othercommunicable diseases, improvement inmedical facilities and sanitation contributedto a rapid decline in death rates throughout
the world.
Human population increased more than ten times in
the past 500 hundred years.
In the twentieth century itself the population has
increased four times.
DOUBLING TIME OF WORLD POPULATION
It took more than a million years for the humanpopulation to attain the one billion mark. But
it took only 12 years for it to rise from 5 billion
to 6 billion. See the Table 2.2 carefully which
shows that doubling time of world population
is reducing fast.
There is a great variation among regions
in doubling their population.Developed
countries take more time to double their
population as compared to developing
Table 2.2: Doubling Time of World Population
Period Population Time in whichPopulation Doubles
10,000 B.C. 5 million
1650 A.D. 500 million 1,500 years1804 A.D. 1,000 million 154 years
1927 A.D. 2,000 million 123 years
1974 A.D. 4,000 million 47 years
2025 A.D. 8,000 million projected figure 51 years
countries. Most of the population growth is
taking place in the developing world, where
population is exploding. Why is this so?
SPATIAL PATTERN OF POPULATION CHANGE
Population growth in different parts of the worldcan be compared. The growth of population islow in developed countries as compared todeveloping countries. There is negativecorrelation between economic development andpopulation growth.
Although the annual rate of populationchange (1.4 per cent) seems to be low (Table2.3), it is actually not so. This is because:• When a small annual rate is applied to a
very large population, it will lead to a largepopulation change.
• Even if the growth rate continues to decline,the total population grows each year. Theinfant mortality rate may have increasedas has the death rate during childbirth.
Table 2.3: Growth of Population 2010-15 over 1990-95
Growth Rate
Region 1990-95 2010-15
World 1.6 1.2
Africa 2.4 2.6
Europe 0.2 0.1
North America 1.4 0.8
Latin America & Caribbean 1.7 1.1
Asia 1.6 1.0
Oceania 1.5 1.5(Australia, New Zealand and Fiji)
Source: Demographic Year Book, 2015
Source: Demographic Year Book, 2009–10
2020-21

Fundamentals of Human Geography14
IMPACT OF POPULATION CHANGE
A small increase in population is desirable in agrowing economy. However, population growthbeyond a certain level leads to problems. Ofthese the depletion of resources is the most
serious. Population decline is also a matter ofconcern. It indicates that resources that hadsupported a population earlier are now
insufficient to maintain the population.The deadly HIV/AIDS epidemics in Africa and
some parts of the Commonwealth of Independent
States (CIS) and Asia have pushed up death ratesand reduced average life expectancy. This hasslowed down population growth.
Population Growth Rate
The annual population growth rate in India
is 1.64 per cent. Some developed countries
will take 318 years to double their population
whereas some countries still do not show
symptoms of doubling their population.
DEMOGRAPHIC TRANSITION
Demographic transition theory can be used todescribe and predict the future population ofany area. The theory tells us that population ofany region changes from high births and highdeaths to low births and low deaths as societyprogresses from rural agrarian and illiterate tourban industrial and literate society. Thesechanges occur in stages which are collectivelyknown as the demographic cycle.
Rural,Agrarian
Urban,Industrial
Demographic
Transition
Fig. 2.3 explains the three-staged modelof Demographic Transition Theory:
The first stage has high fertility and highmortality because people reproduce more tocompensate for the deaths due to epidemicsand variable food supply. The populationgrowth is slow and most of the people are
engaged in agriculture where large families arean asset. Life expectancy is low, people aremostly illiterate and have low levels oftechnology. Two hundred years ago all thecountries of the world were in this stage.
Fertility remains high in the beginning ofsecond stage but it declines with time. This isaccompanied by reduced mortality rate.Improvements in sanitation and healthconditions lead to decline in mortality. Becauseof this gap the net addition to population ishigh.
In the last stage, both fertility and mortalitydecline considerably. The population is eitherstable or grows slowly. The population becomesurbanised, literate and has high technical know-how and deliberately controls the family size.
This shows that human beings areextremely flexible and are able to adjust theirfertility.
In the present day, different countries areat different stages of demographic transition.
POPULATION CONTROL MEASURES
Family planning is the spacing or preventingthe birth of children. Access to family planningservices is a significant factor in limitingpopulation growth and improving women’shealth. Propaganda, free availability of
35
15
High Fluctuating
StageI
StageII
StageIII
CB
R/C
DR
NaturalIncrease inPopulation
BR
DR
BangladeshRainforest
tribes
Peru Sri LankaKenya
CanadaJapanUSA
Time
PresentWorld
examples
Low Fluctuating
Expanding
Fig. 2.3: Demographic Transition Theory
2020-21

The World Population: Distribution, Density and Growth 15
contraceptives and tax disincentives for largefamilies are some of the measures which canhelp population control.
Thomas Malthus in his theory (1798)stated that the number of people wouldincrease faster than the food supply. Any
further increase would result in a populationcrash caused by famine, disease and war. Thepreventive checks are better than the physicalchecks. For the sustainability of our resources,the world will have to control the rapidpopulation increase.
EXERCISESEXERCISESEXERCISESEXERCISESEXERCISES
1. Choose the right answer from the four alternatives given below.(i) Which one of the following continents has the highest growth of
population?(a) Africa (c) Asia(b) South America (d) North America
(ii) Which one of the following is not an area of sparse population?(a) The Atacama (c) Equatorial region(b) South-east Asia (d) Polar regions
(iii) Which one of the following is not a push factor ?(a) Water shortage (c) Unemployment(b) Medical/educational facilities (d) Epidemics
(iv) Which one of the following is not a fact ?(a) Human population increased more than ten times during the past
500 years.(b) It took 100 years for the population to rise from 5 billion to 6 billion.(c) Population growth is high in the first stage of demographic transition?
2. Answer the following questions in about 30 words.(i) Name three geographical factors that influence the distribution of
population.(ii) There are a number of areas with high population density in the world.
Why does this happen?(iii) What are the three components of population change?
3. Distinguish between:(i) Birth rate and death rate.
(ii) Push factors and pull factors of migration.
2020-21

Fundamentals of Human Geography16
4. Answer the following questions in about 150 words.(i) Discuss the factors influencing the distribution and density of population
in the world.(ii) Discuss the three stages of demographic transition.
Map Skill
On the outline map of the world, show and name the following.(i) Countries of Europe and Asia with negative growth rate of population.(ii) African countries with growth rate of population more than three per
cent. (You may refer to Appendix 1).
Project/Activity
(i) Has someone in your family migrated? Write about her/his place ofdestination. What made her/him migrate?
(ii) Write a brief report on the distribution and density of population inyour state.
2020-21
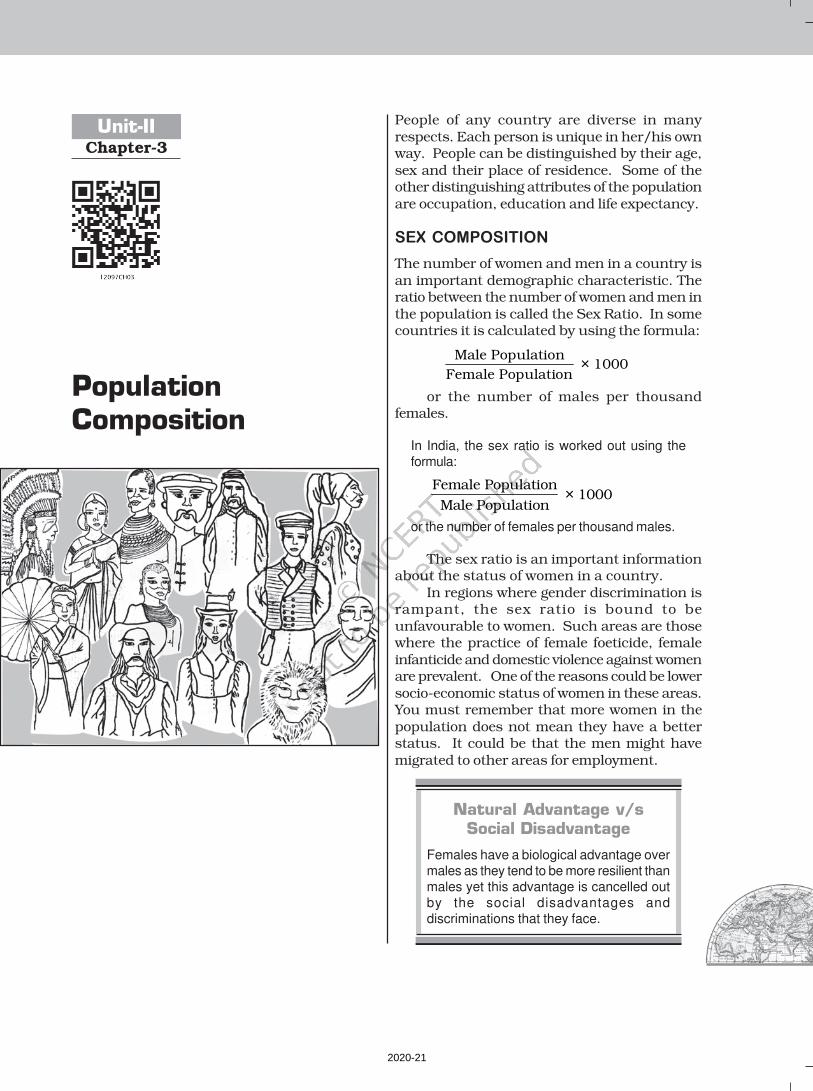
Unit-IIChapter-3
People of any country are diverse in manyrespects. Each person is unique in her/his ownway. People can be distinguished by their age,sex and their place of residence. Some of theother distinguishing attributes of the populationare occupation, education and life expectancy.
SEX COMPOSITION
The number of women and men in a country isan important demographic characteristic. Theratio between the number of women and men inthe population is called the Sex Ratio. In somecountries it is calculated by using the formula:
Male Population × 1000
Female Population
or the number of males per thousandfemales.
In India, the sex ratio is worked out using the
formula:
Female Population × 1000
Male Population
or the number of females per thousand males.
The sex ratio is an important informationabout the status of women in a country.
In regions where gender discrimination isrampant, the sex ratio is bound to beunfavourable to women. Such areas are thosewhere the practice of female foeticide, femaleinfanticide and domestic violence against womenare prevalent. One of the reasons could be lowersocio-economic status of women in these areas.You must remember that more women in thepopulation does not mean they have a betterstatus. It could be that the men might havemigrated to other areas for employment.
Natural Advantage v/sSocial Disadvantage
Females have a biological advantage over
males as they tend to be more resilient than
males yet this advantage is cancelled out
by the social disadvantages and
discriminations that they face.
PopulationComposition
2020-21

Fundamentals of Human Geography18
On an average, the world populationreflects a sex ratio of 102 males per 100 females.The highest sex ratio in the world has beenrecorded in Latvia where there are 85 males per100 females. In contrast, in Qatar there are 311males per 100 females.
The world pattern of sex ratio does notexhibit variations in the developed regions ofthe world. The sex ratio is favourable for femalesin 139 countries of the world and unfavourablefor them in the remaining 72 countries listedby the United Nations.
In general, Asia has a low sex ratio.Countries like China, India, Saudi Arabia,Pakistan, Afghanistan have a lower sex ratio.
On the other extreme is greater part ofEurope (including Russia) where males are inminority. A deficit of males in the populationsof many European countries is attributed tobetter status of women, and an excessivelymale-dominated out-migration to differentparts of the world in the past.
Age Structure
Age structure represents the number of peopleof different age groups. This is an importantindicator of population composition, since alarge size of population in the age group of 15-59 indicates a large working population. Agreater proportion of population above 60 yearsrepresents an ageing population which requiresmore expenditure on health care facilities.Similarly high proportion of young populationwould mean that the region has a high birthrate and the population is youthful.
Age-Sex Pyramid
The age-sex structure of a population refersto the number of females and males indifferent age groups. A population pyramidis used to show the age-sex structure of thepopulation.
The shape of the population pyramidreflects the characteristics of the population.The left side shows the percentage of males whilethe right side shows the percentage of womenin each age group.
Fig. 3.1, 3.2 and 3.3 show different typesof population pyramids.
Expanding Populations
The age-sex pyramid of Nigeria as you can seeis a triangular shaped pyramid with a widebase and is typical of less developed countries.These have larger populations in lower agegroups due to high birth rates. If you constructthe pyramids for Bangladesh and Mexico, itwould look the same.
Source: Demographic Year Book, 2009-10
Fig. 3.1: Expanding Population
Constant Population
Australia’s age-sex pyramid is bell shaped andtapered towards the top. This shows birth anddeath rates are almost equal leading to a nearconstant population.
Source: Demographic Year Book, 2009-10
Fig. 3.2: Constant Population
Nigeria
Per cent
Per cent
2020-21

Population Composition 19
Declining Populations
The Japan pyramid has a narrow base and atapered top showing low birth and death rates.The population growth in developed countriesis usually zero or negative.
Source: Demographic Year Book, 2009-10
Fig. 3.3: Declining Population
Draw a population pyramid of the children in your school
and describe its characteristics.
Ageing Population
Population ageing is the process by whichthe share of the older population becomesproportionally larger. This is a newphenomenon of the twentieth century. In mostof the developed countries of the world,population in higher age groups has increaseddue to increased life expectancy. With areduction in birth rates, the proportion ofchildren in the population has declined.
RURAL URBAN COMPOSITION
The division of population into rural and urbanis based on the residence. This division isnecessary because rural and urban life stylesdiffer from each other in terms of their livelihoodand social conditions. The age-sex-occupationalstructure, density of population and level ofdevelopment vary between rural and urban areas.
The criteria for differentiating rural andurban population varies from country to country.In general terms rural areas are those wherepeople are engaged in primary activities and urbanareas are those when majority of the workingpopulation is engaged in non-primary activities.
Fig. 3.4 shows rural urban sex compositionof selected countries. The rural and urbandifferences in sex ratio in Canada and WestEuropean countries like Finland are just theopposite of those in African and Asian countrieslike Zimbabwe and Nepal respectively. InWestern countries, males outnumber femalesin rural areas and females outnumber the malesin urban areas. In countries like Nepal, Pakistanand India the case is reverse. The excess offemales in urban areas of U.S.A., Canada andEurope is the result of influx of females fromrural areas to avail of the vast job opportunities.Farming in these developed countries is alsohighly mechanised and remains largely a maleoccupation. By contrast the sex ratio in Asianurban areas remains male dominated due tothe predominance of male migration. It is alsoworth noting that in countries like India, femaleparticipation in farming activity in rural area isfairly high. Shortage of housing, high cost ofliving, paucity of job opportunities and lack ofsecurity in cities, discourage women to migratefrom rural to urban areas.
Literacy
Proportion of literate population of a countryin an indicator of its socio-economicdevelopment as it reveals the standard of living,social status of females, availability ofeducational facilities and policies ofgovernment. Level of economic development isboth a cause and consequence of literacy. InIndia – literacy rate denotes the percentage ofpopulation above 7 years of age, who is able toread, write and have the ability to do arithmeticcalculations with understanding.
Occupational Structure
The working population (i.e. women and menof the age group – 15 to 59) take part in variousoccupations ranging from agriculture, forestry,
2020-21

Fundamentals of Human Geography20
EXERCISESEXERCISESEXERCISESEXERCISESEXERCISES
1. Choose the right answer from the four alternatives given below.
(i) Which one of the following has caused the sex ratio of the United ArabEmirates to be low?
(a) Selective migration of male working population
(b) High birth rate of males
(c) Low birth rate of females
(d) High out migration of females
fishing, manufacturing construction,commercial transport, services, communicationand other unclassified services.
Agriculture, forestry, fishing and miningare classified as primary activitiesmanufacturing as secondary, trade, transport,communication and other services as tertiaryand the jobs related to research, informationtechnology and developing ideas as quaternaryactivities. The proportion of working
population engaged in these four sectors is agood indicator of the levels of economicdevelopment of a nation. This is because onlya developed economy with industries andinfrastructure can accommodate more workersin the secondary, tertiary and quaternarysector. If the economy is still in the primitivestages, then the proportion of people engagedin primary activities world be high as it involvesextraction of natural resources.
Fig. 3.4: Rural Urban Sex Composition (Selected Countries)
Source: Demographic Year Book, 2015
2020-21

Population Composition 21
(ii) Which one of the following figures represents the working age group of thepopulation?
(a) 15 to 65 years (c) 15 to 66 years
(b) 15 to 64 years (d) 15 to 59 years
(iii) Which one of the following countries has the highest sex ratio in the world?
(a) Latvia (c) Japan
(b) United Arab Emirates (d) France
2. Answer the following questions in about 30 words.
(i) What do you understand by population composition?
(ii) What is the significance of age-structure?
(iii) How is sex-ratio measured?
3. Answer the following questions in not more than 150 words.
(i) Describe the rural-urban composition of the population.
(ii) Discuss the factors responsible for imbalances in the sex-age found indifferent parts of the world and occupational structure.
Project/Activity
Construct an age-sex pyramid for your district/state.
2020-21

Unit-IIChapter-4
Human Development
The words ‘growth’ and ‘development’ are notnew to you. Look around you, almost everythingthat you can see (and many that you cannot)grows and develops. These may be plants, cities,ideas, nations, relationships or even youyourself! What does this mean?
Do growth and development mean thesame thing?Do they accompany each other?
This chapter discusses the concept ofhuman development as it pertains to nationsand communities.
GROGROGROGROGROWTH AND DEVELWTH AND DEVELWTH AND DEVELWTH AND DEVELWTH AND DEVELOPMENTOPMENTOPMENTOPMENTOPMENT
Both growth and development refer to changesover a period of time. The difference is thatgrowth is quantitative and value neutral. It mayhave a positive or a negative sign. This meansthat the change may be either positive (showingan increase) or negative (indicating a decrease).
Development means a qualitative changewhich is always value positive. This means thatdevelopment cannot take place unless there isan increment or addition to the existingconditions. Development occurs when positivegrowth takes place. Yet, positive growth doesnot always lead to development. Developmentoccurs when there is a positive change inquality.
For example, if the population of a citygrows from one lakh to two lakhs over a periodof time, we say the city has grown. However, if afacilities like housing, provision of basic servicesand other characteristics remain the same, thenthis growth has not been accompanied bydevelopment.
Can you think of a few more examples todifferentiate between growth and development?
Write a short essay or draw a set of pictures illustrating
growth without development and growth with
development.
For many decades, a country’s level ofdevelopment was measured only in terms of its
2020-21
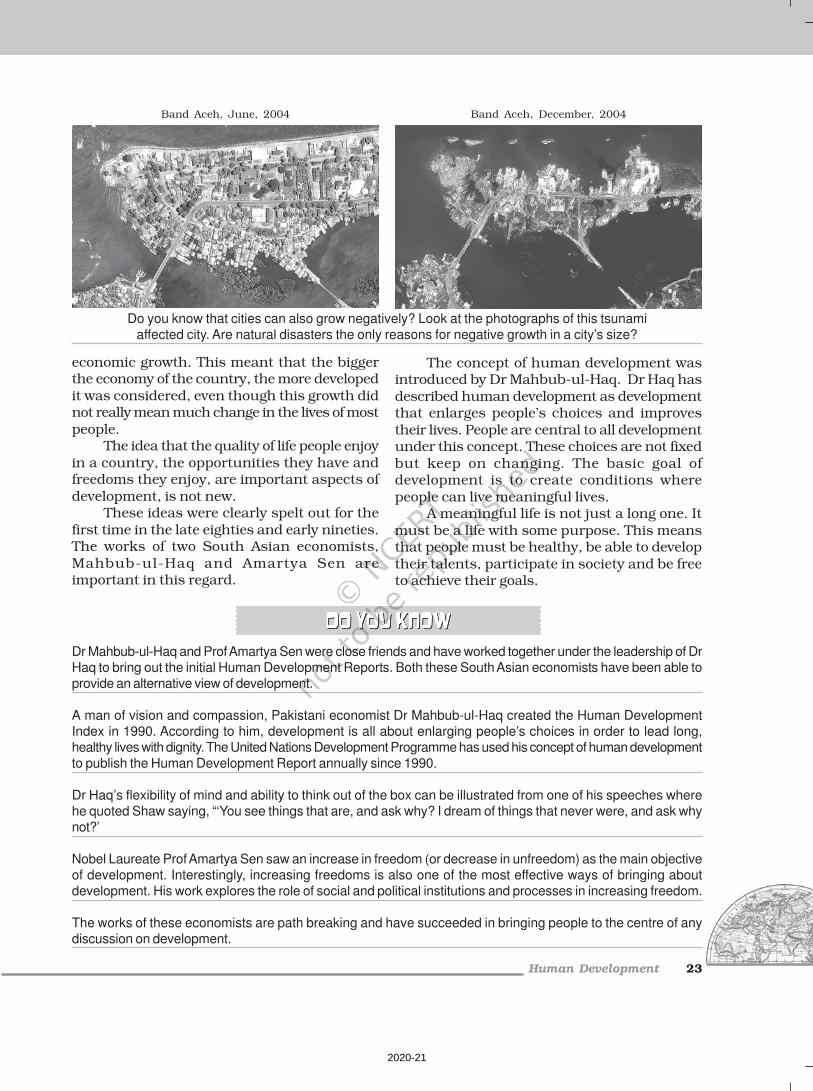
economic growth. This meant that the biggerthe economy of the country, the more developedit was considered, even though this growth didnot really mean much change in the lives of mostpeople.
The idea that the quality of life people enjoyin a country, the opportunities they have andfreedoms they enjoy, are important aspects ofdevelopment, is not new.
These ideas were clearly spelt out for thefirst time in the late eighties and early nineties.The works of two South Asian economists,Mahbub-ul-Haq and Amartya Sen areimportant in this regard.
The concept of human development wasintroduced by Dr Mahbub-ul-Haq. Dr Haq hasdescribed human development as developmentthat enlarges people’s choices and improvestheir lives. People are central to all developmentunder this concept. These choices are not fixedbut keep on changing. The basic goal ofdevelopment is to create conditions wherepeople can live meaningful lives.
A meaningful life is not just a long one. Itmust be a life with some purpose. This meansthat people must be healthy, be able to developtheir talents, participate in society and be freeto achieve their goals.
Do you know that cities can also grow negatively? Look at the photographs of this tsunami
affected city. Are natural disasters the only reasons for negative growth in a city’s size?
Band Aceh, June, 2004 Band Aceh, December, 2004
Human Development 23
Dr Mahbub-ul-Haq and Prof Amartya Sen were close friends and have worked together under the leadership of Dr
Haq to bring out the initial Human Development Reports. Both these South Asian economists have been able to
provide an alternative view of development.
A man of vision and compassion, Pakistani economist Dr Mahbub-ul-Haq created the Human Development
Index in 1990. According to him, development is all about enlarging people’s choices in order to lead long,
healthy lives with dignity. The United Nations Development Programme has used his concept of human development
to publish the Human Development Report annually since 1990.
Dr Haq’s flexibility of mind and ability to think out of the box can be illustrated from one of his speeches where
he quoted Shaw saying, “‘You see things that are, and ask why? I dream of things that never were, and ask why
not?’
Nobel Laureate Prof Amartya Sen saw an increase in freedom (or decrease in unfreedom) as the main objective
of development. Interestingly, increasing freedoms is also one of the most effective ways of bringing about
development. His work explores the role of social and political institutions and processes in increasing freedom.
The works of these economists are path breaking and have succeeded in bringing people to the centre of any
discussion on development.
2020-21

Fundamentals of Human Geography24
What is a Meaningful Life?
Which of these lives is a meaningful life?Which of these lives is a meaningful life?Which of these lives is a meaningful life?Which of these lives is a meaningful life?Which of these lives is a meaningful life?
Who do you think leads more meaningful life? What makes one of these more meaningful than the other?
The Government of India has introduced
Beti Bachao Beti Padhao programme to
address the issue of decline in child sex
ratio. Discuss with your peers how it will
lead to more meaningful life for girls.
2020-21

Human Development 25
Leading a long and healthy life, being ableto gain knowledge and having enough meansto be able to live a decent life are the mostimportant aspects of human development.
Therefore, access to resources, health andeducation are the key areas in humandevelopment. Suitable indicators have beendeveloped to measure each of these aspects. Canyou think of some?
Very often, people do not have thecapability and freedom to make even basic
choices. This may be due to their inability toacquire knowledge, their material poverty,
social discrimination, inefficiency of institutions
and other reasons. This prevents them from
leading healthy lives, being able to get educatedor to have the means to live a decent life.
Building people’s capabilities in the areas
of health, education and access to resources is
therefore, important in enlarging their choices.If people do not have capabilities in these areas,
their choices also get limited.
For example, an uneducated child cannot
make the choice to be a doctor because herchoice has got limited by her lack of education.
Similarly, very often poor people cannot choose
to take medical treatment for disease because
their choice is limited by their lack of resources.
Enact a five-minute play with your classmates showing
how choices are limited due to lack of capability in the
areas of either income, education or health.
THE FOUR PILLARS OF HUMANTHE FOUR PILLARS OF HUMANTHE FOUR PILLARS OF HUMANTHE FOUR PILLARS OF HUMANTHE FOUR PILLARS OF HUMAN
DEVELDEVELDEVELDEVELDEVELOPMENTOPMENTOPMENTOPMENTOPMENT
Just as any building is supported by pillars,the idea of human development is supportedby the concepts of equity, sustainability,
productivity and empowerment.Equity refers to making equal access to
opportunities available to everybody. Theopportunities available to people must be equalirrespective of their gender, race, income andin the Indian case, caste. Yet this is very oftennot the case and happens in almost everysociety.
For example, in any country, it is interestingto see which group the most of the schooldropouts belong to. This should then lead to anunderstanding of the reasons for such behaviour.In India, a large number of women and personsbelonging to socially and economicallybackward groups drop out of school. This showshow the choices of these groups get limited bynot having access to knowledge.
Sustainability means continuity in theavailability of opportunities. To havesustainable human development, eachgeneration must have the same opportunities.All environmental, financial and humanresources must be used keeping in mind thefuture. Misuse of any of these resources willlead to fewer opportunities for futuregenerations.
A good example is about the importanceof sending girls to school. If a community doesnot stress the importance of sending its girlchildren to school, many opportunities will belost to these young women when they grow up.Their career choices will be severely curtailedand this would affect other aspects of their lives.So each generation must ensure the availabilityof choices and opportunities to its futuregenerations.
Productivity here means human labourproductivity or productivity in terms of humanwork. Such productivity must be constantlyenriched by building capabilities in people.Ultimately, it is people who are the real wealthof nations. Therefore, efforts to increase theirknowledge, or provide better health facilitiesultimately leads to better work efficiency.
Empowerment means to have the powerto make choices. Such power comes fromincreasing freedom and capability. Goodgovernance and people-oriented policies arerequired to empower people. The empowermentof socially and economically disadvantagedgroups is of special importance.
Talk to the vegetable vendor in your neighbourhood and
find out if she has gone to school. Did she drop out of
school? Why? What does this tell you about her choices
and the freedom she has? Note how her opportunities
were limited because of her gender, caste and income.
2020-21

Fundamentals of Human Geography26
APPROACHES TO HUMAN
DEVELOPMENT
There are many ways of looking at the problemof human development. Some of the importantapproaches are: (a) The income approach; (b) Thewelfare approach; (c) Minimum needs approach;and (d) Capabilities approach (Table 4.1).
MEASURING HUMAN DEVELOPMENT
The human development index (HDI) ranks thecountries based on their performance in the keyareas of health, education and access toresources. These rankings are based on a scorebetween 0 to 1 that a country earns from itsrecord in the key areas of human development.
The indicator chosen to assess health isthe life expectancy at birth. A higher lifeexpectancy means that people have a greaterchance of living longer and healthier lives.
The adult literacy rate and the grossenrolment ratio represent access to knowledge.The number of adults who are able to read and
write and the number of children enrolled inschools show how easy or difficult it is to accessknowledge in a particular country.
Access to resources is measured in termsof purchasing power (in U.S. dollars).
Each of these dimensions is given aweightage of 1/3. The human developmentindex is a sum total of the weights assigned toall these dimensions.
The closer a score is to one, the greater isthe level of human development. Therefore, ascore of 0.983 would be considered very highwhile 0.268 would mean a very low level ofhuman development.
The human development index measuresattainments in human development. It reflectswhat has been achieved in the key areas ofhuman development. Yet it is not the mostreliable measure. This is because it does notsay anything about the distribution.
The human poverty index is related to thehuman development index. This indexmeasures the shortfall in human development.
(a) Income Approach This is one of the oldest approaches to humandevelopment. Human development is seen as beinglinked to income. The idea is that the level of incomereflects the level of freedom an individual enjoys.Higher the level of income, the higher is the level ofhuman development.
(b) Welfare Approach This approach looks at human beings as beneficiariesor targets of all development activities. The approachargues for higher government expenditure oneducation, health, social secondary and amenities.People are not participants in development but onlypassive recipients. The government is responsible forincreasing levels of human development bymaximising expenditure on welfare.
(c) Basic Needs Approach This approach was initially proposed by theInternational Labour Organisation (ILO). Six basicneeds i.e.: health, education, food, water supply,sanitation, and housing were identified. The questionof human choices is ignored and the emphasis is onthe provision of basic needs of defined sections.
(d) Capability Approach This approach is associated with Prof. Amartya Sen.Building human capabilities in the areas of health,education and access to resources is the key toincreasing human development.
Table 4.1: Approaches to Human Development
2020-21
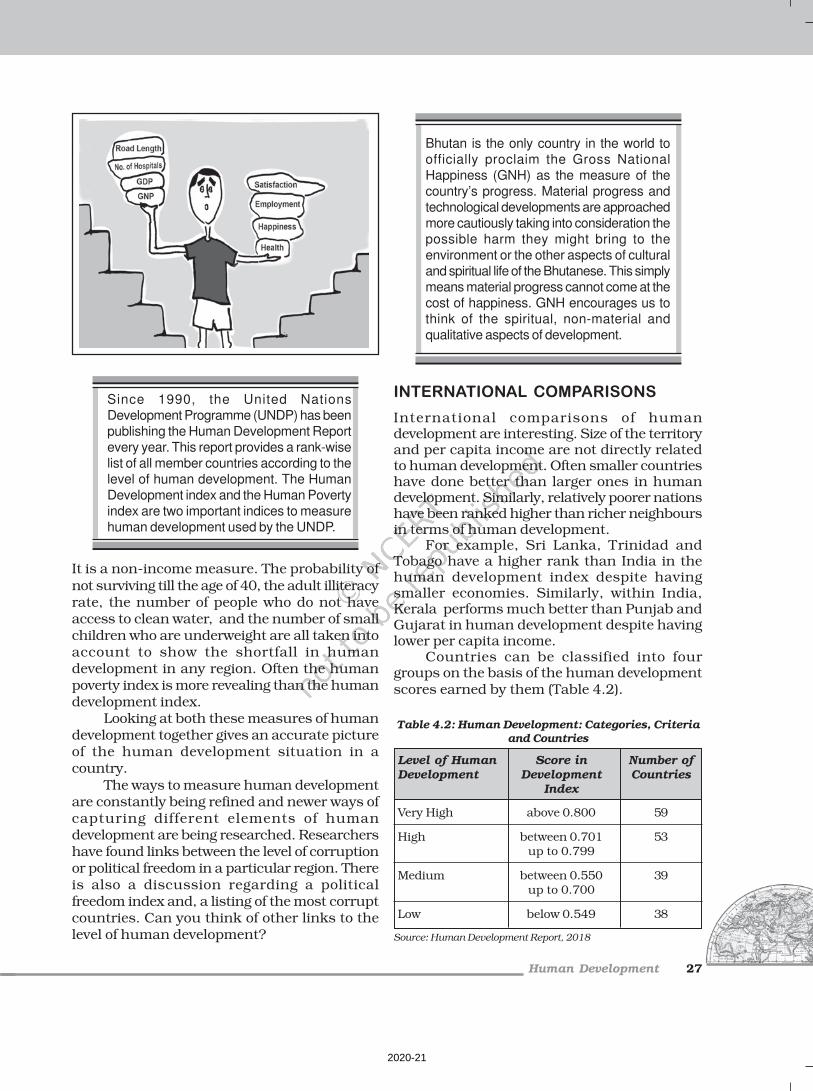
Human Development 27
It is a non-income measure. The probability ofnot surviving till the age of 40, the adult illiteracyrate, the number of people who do not haveaccess to clean water, and the number of smallchildren who are underweight are all taken intoaccount to show the shortfall in humandevelopment in any region. Often the humanpoverty index is more revealing than the humandevelopment index.
Looking at both these measures of humandevelopment together gives an accurate pictureof the human development situation in acountry.
The ways to measure human developmentare constantly being refined and newer ways ofcapturing different elements of humandevelopment are being researched. Researchershave found links between the level of corruptionor political freedom in a particular region. Thereis also a discussion regarding a politicalfreedom index and, a listing of the most corruptcountries. Can you think of other links to thelevel of human development?
Since 1990, the United Nations
Development Programme (UNDP) has been
publishing the Human Development Report
every year. This report provides a rank-wise
list of all member countries according to the
level of human development. The Human
Development index and the Human Poverty
index are two important indices to measure
human development used by the UNDP.
Bhutan is the only country in the world to
officially proclaim the Gross National
Happiness (GNH) as the measure of the
country’s progress. Material progress and
technological developments are approached
more cautiously taking into consideration the
possible harm they might bring to the
environment or the other aspects of cultural
and spiritual life of the Bhutanese. This simply
means material progress cannot come at the
cost of happiness. GNH encourages us to
think of the spiritual, non-material and
qualitative aspects of development.
INTERNATIONAL COMPARISONS
International comparisons of humandevelopment are interesting. Size of the territoryand per capita income are not directly relatedto human development. Often smaller countrieshave done better than larger ones in humandevelopment. Similarly, relatively poorer nationshave been ranked higher than richer neighboursin terms of human development.
For example, Sri Lanka, Trinidad andTobago have a higher rank than India in thehuman development index despite havingsmaller economies. Similarly, within India,Kerala performs much better than Punjab andGujarat in human development despite havinglower per capita income.
Countries can be classified into fourgroups on the basis of the human developmentscores earned by them (Table 4.2).
Table 4.2: Human Development: Categories, Criteriaand Countries
Level of Human Score in Number ofDevelopment Development Countries
Index
Very High above 0.800 59
High between 0.701 53up to 0.799
Medium between 0.550 39up to 0.700
Low below 0.549 38
Source: Human Development Report, 2018
2020-21
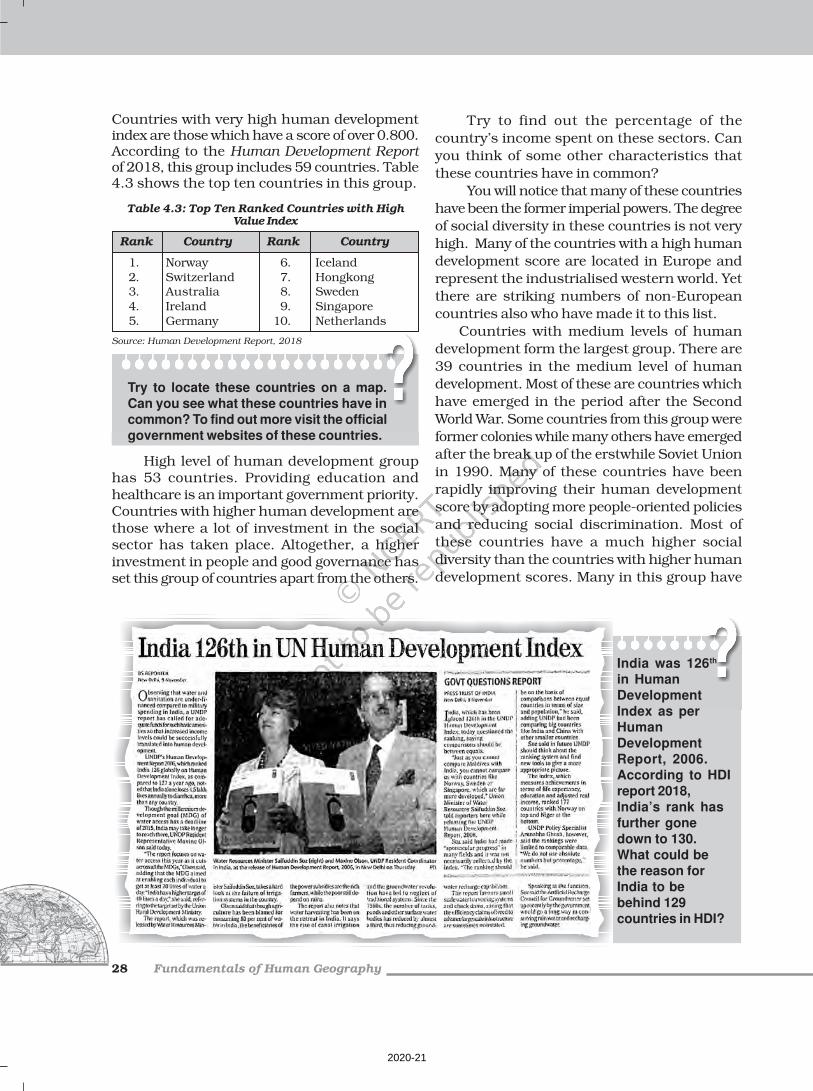
Fundamentals of Human Geography28
Try to find out the percentage of the
country’s income spent on these sectors. Can
you think of some other characteristics that
these countries have in common?
You will notice that many of these countries
have been the former imperial powers. The degree
of social diversity in these countries is not very
high. Many of the countries with a high human
development score are located in Europe and
represent the industrialised western world. Yet
there are striking numbers of non-European
countries also who have made it to this list.
Countries with medium levels of human
development form the largest group. There are
39 countries in the medium level of human
development. Most of these are countries which
have emerged in the period after the Second
World War. Some countries from this group were
former colonies while many others have emerged
after the break up of the erstwhile Soviet Union
in 1990. Many of these countries have been
rapidly improving their human development
score by adopting more people-oriented policies
and reducing social discrimination. Most of
these countries have a much higher social
diversity than the countries with higher human
development scores. Many in this group have
Countries with very high human developmentindex are those which have a score of over 0.800.According to the Human Development Reportof 2018, this group includes 59 countries. Table4.3 shows the top ten countries in this group.
Table 4.3: Top Ten Ranked Countries with HighValue Index
Rank Country Rank Country
1. Norway 6. Iceland
2. Switzerland 7. Hongkong3. Australia 8. Sweden
4. Ireland 9. Singapore
5. Germany 10. Netherlands
Source: Human Development Report, 2018
Try to locate these countries on a map.Can you see what these countries have incommon? To find out more visit the officialgovernment websites of these countries.
High level of human development grouphas 53 countries. Providing education andhealthcare is an important government priority.Countries with higher human development arethose where a lot of investment in the socialsector has taken place. Altogether, a higherinvestment in people and good governance hasset this group of countries apart from the others.
India was 126th
in HumanDevelopmentIndex as perHumanDevelopmentReport, 2006.According to HDIreport 2018,India’s rank hasfurther gonedown to 130.What could bethe reason forIndia to bebehind 129countries in HDI?
2020-21

Human Development 29
EXERCISESEXERCISESEXERCISESEXERCISESEXERCISES
1. Choose the right answer from the four alternatives given below.
(i) Which one of the following best describes development?
(a) an increase in size (c) a positive change in quality
(b) a constant in size (d) a simple change in the quality
(ii) Which one of the following scholars introduced the concept of HumanDevelopment?
(a) Prof. Amartya Sen (c) Dr Mahabub-ul-Haq
(b) Ellen C. Semple (d) Ratzel
2. Answer the following questions in about 30 words.
(i) What are the three basic areas of human development?
(ii) Name the four main components of human development?
(iii) How are countries classified on the basis of human development index?
3. Answer the following questions in not more than 150 words.
(i) What do you understand by the term human development?
(ii) What do equity and sustainability refer to within the concept of human
development?
faced political instability and social uprisings
at some point of time in their recent history.As many as 38 countries record low levels
of human development. A large proportion ofthese are small countries which have been goingthrough political turmoil and social instabilityin the form of civil war, famine or a highincidence of diseases. There is an urgent needto address the human developmentrequirements of this group through wellthought out policies.
International comparisons of humandevelopment can show some very interestingresults. Often people tend to blame low levelsof human development on the culture of thepeople. For example, X country has lowerhuman development because its people followY religion, or belong to Z community. Suchstatements are misleading.
To understand why a particular region
keeps reporting low or high levels of human
development it is important to look at the
pattern of government expenditure on the
social sector. The political environment of the
country and the amount of freedom people
have is also important. Countries with high
levels of human development invest more in
the social sectors and are generally free from
political turmoil and instability. Distribution
of the country’s resources is also far more
equitable.
On the other hand, places with low levels
of human development tend to spend more on
defence rather than social sectors. This shows
that these countries tend to be located in areas
of political instability and have not been able
to initiate accelerated economic development.
2020-21

Fundamentals of Human Geography30
Project/ActivityProject/ActivityProject/ActivityProject/ActivityProject/Activity
Make a list of the ten most corrupt countries and ten least corrupt countries.
Compare their scores on the human development index. What inferences canyou draw?
Consult the latest Human Development Report for this.
2020-21

Unit-IIIChapter-5
Primary Activities
Human activities which generate income areknown as economic activities. Economicactivities are broadly grouped into primary,secondary, tertiary and quaternary activities.Primary activities are directly dependent onenvironment as these refer to utilisation ofearth’s resources such as land, water,vegetation, building materials and minerals. It,thus includes, hunting and gathering, pastoralactivities, fishing, forestry, agriculture, andmining and quarrying.
Why are the inhabitants of coastal andplain regions engaged in fishing andagriculture respectively? What are thephysical and social factors which affect thetype of primary activities in differentregions?
People engaged in primary activities are called red-
collar workers due to the outdoor nature of their work.
HUNTING AND GATHERING
The earliest human beings depended on theirimmediate environment for their sustenance.They subsisted on: (a) animals which theyhunted; and (b) the edible plants which theygathered from forests in the vicinity.
Primitive societies depended on wildanimals. People located in very cold andextremely hot climates survived on hunting. Thepeople in the coastal areas still catch fish thoughfishing has experienced modernisation due totechnological progress. Many species, now havebecome extinct or endangered due to illegalhunting (poaching). The early hunters usedprimitive tools made of stones, twigs or arrowsso the number of animals killed was limited.Why has hunting been banned in India?
Gathering and hunting are the oldesteconomic activity known. These are carried outat different levels with different orientations.
Gathering is practised in regions withharsh climatic conditions. It often involvesprimitive societies, who extract, both plants and
2020-21

Fundamentals of Human Geography32
animals to satisfy their needs for food, shelterand clothing. This type of activity requires asmall amount of capital investment andoperates at very low level of technology. Theyield per person is very low and little or nosurplus is produced.
Fig. 5.1: Women Gathering Oranges in Mizoram
Fig. 5.2: Areas of Subsistence Gathering
Gathering is practised in: (i) high latitudezones which include northern Canada, northernEurasia and southern Chile; (ii) Low latitudezones such as the Amazon Basin, tropicalAfrica, Northern fringe of Australia and theinterior parts of Southeast Asia (Fig. 5.2).
In modern times some gathering is market-oriented and has become commercial. Gathererscollect valuable plants such as leaves, barks oftrees and medicinal plants and after simpleprocessing sell the products in the market. Theyuse various parts of the plants, for example,the bark is used for quinine, tanin extract andcork— leaves supply materials for beverages,drugs, cosmetics, fibres, thatch and fabrics;nuts for food and oils and tree trunk yieldrubber, balata, gums and resins.
The name of the part of the chewing gum after the
flavour is gone? It is called Chicle — it is made from
the milky juice of zapota tree.
Gathering has little chance of becomingimportant at the global level. Products of such an
2020-21

Primary Activities 33
activity cannot compete in the world market.Moreover, synthetic products often of betterquality and at lower prices, have replaced manyitems supplied by the gatherers in tropical forests.
PASTORALISM
At some stage in history, with the realisationthat hunting is an unsustainable activity,human beings might have thought ofdomestication of animals. People living indifferent climatic conditions selected anddomesticated animals found in those regions.Depending on the geographical factors, andtechnological development, animal rearingtoday is practised either at the subsistence orat the commercial level.
Nomadic Herding
Nomadic herding or pastoral nomadism is aprimitive subsistence activity, in which theherders rely on animals for food, clothing, shelter,tools and transport. They move from one placeto another along with their livestock, dependingon the amount and quality of pastures andwater. Each nomadic community occupies awell-identified territory as a matter of tradition.
Fig. 5.3: Nomads taking their sheep up to theMountains at the onset of summer
A wide variety of animals is kept indifferent regions. In tropical Africa, cattle arethe most important livestock, while in Saharaand Asiatic deserts, sheep, goats and camelare reared. In the mountainous areas of Tibetand Andes, yak and llamas and in the Arcticand sub Arctic areas, reindeer are the mostimportant animals.
Pastoral nomadism is associated withthree important regions. The core regionextends from the Atlantic shores of North Africaeastwards across the Arabian peninsula intoMongolia and Central China. The second regionextends over the tundra region of Eurasia. Inthe southern hemisphere there are small areasin South-west Africa and on the island ofMadagascar (Fig. 5.4)
Movement in search of pastures isundertaken either over vast horizontaldistances or vertically from one elevation toanother in the mountainous regions. Theprocess of migration from plain areas topastures on mountains during summers andagain from mountain pastures to plain areasduring winters is known as transhumance. Inmountain regions, such as Himalayas, Gujjars,Bakarwals, Gaddis and Bhotiyas migrate fromplains to the mountains in summers and to theplains from the high altitude pastures inwinters. Similarly, in the tundra regions, thenomadic herders move from south to north insummers and from north to south in winters.
The number of pastoral nomads has beendecreasing and the areas operated by themshrinking. This is due to (a) imposition ofpolitical boundaries; (b) new settlement plansby different countries.
Commercial Livestock Rearing
Unlike nomadic herding, commercial livestockrearing is more organised and capital intensive.Commercial livestock ranching is essentiallyassociated with western cultures and is practisedon permanent ranches. These ranches coverlarge areas and are divided into a number ofparcels, which are fenced to regulate the grazing.When the grass of one parcel is grazed, animalsare moved to another parcel. The number ofanimals in a pasture is kept according to thecarrying capacity of the pasture.
This is a specialised activity in which onlyone type of animal is reared. Important animalsinclude sheep, cattle, goats and horses.Products such as meat, wool, hides and skinare processed and packed scientifically andexported to different world markets.
Rearing of animals in ranching isorganised on a scientific basis. The main
2020-21

Fundamentals of Human Geography34
Fig. 5.4: Areas of Nomadic Herding
emphasis is on breeding, genetic improvement,disease control and health care of the animals.
New Zealand, Australia, Argentina,Uruguay and United States of America areimportant countries where commercial livestockrearing is practised (Fig. 5.6).
Fig. 5.5: Commercial Livestock Rearing
Reindeer rearing in the northern regions of Alaska wheremost of the Eskimos own about two-third of the stock.
AGRICULAGRICULAGRICULAGRICULAGRICULTURETURETURETURETURE
Agriculture is practised under multiple
combinations of physical and socio-economic
conditions, which gives rise to different types of
agricultural systems.
Based on methods of farming, different
types of crops are grown and livestock raised.
The following are the main agricultural systems.
Subsistence Agriculture
Subsistence agriculture is one in which the
farming areas consume all, or nearly so, of the
products locally grown. It can be grouped in
two categories — Primitive Subsistence
Agriculture and Intensive Subsistence
Agriculture.
Primitive Subsistence Agriculture
Primitive subsistence agriculture or shiftingcultivation is widely practised by many tribesin the tropics, especially in Africa, south andcentral America and south east Asia (Fig. 5.7).
2020-21

Primary Activities 35
Fig. 5.6: Areas of Commercial Livestock Rearing
Fig. 5.7: Areas of Primitive Subsistence Agriculture
2020-21

Fundamentals of Human Geography36
The vegetation is usually cleared by fire,and the ashes add to the fertility of the soil.Shifting cultivation is thus, also called slashand burn agriculture. The cultivated patchesare very small and cultivation is done with veryprimitive tools such as sticks and hoes. Aftersometime (3 to 5 years) the soil looses its fertilityand the farmer shifts to another parts and clearsother patch of the forest for cultivation. Thefarmer may return to the earlier patch aftersometime. One of the major problems of shiftingcultivation is that the cycle of jhum becomesless and less due to loss of fertility in differentparcels. It is prevalent in tropical region indifferent names, e.g. Jhuming in North easternstates of India, Milpa in central America andMexico and Ladang in Indonesia and Malaysia.Find out other areas and the names with whichshifting cultivation is done.
Intensive Subsistence Agriculture
This type of agriculture is largely found indensely populated regions of monsoon Asia.
Fig. 5.8: Areas of Intensive Subsistence Farming
Basically, there are two types of intensivesubsistence agriculture.
(i) Intensive subsistence agriculture
dominated by wet paddy cultivation: Thistype of agriculture is characterised bydominance of the rice crop. Land holdingsare very small due to the high density ofpopulation. Farmers work with the helpof family labour leading to intensive use ofland. Use of machinery is limited and mostof the agricultural operations are done bymanual labour. Farm yard manure is usedto maintain the fertility of the soil. In thistype of agriculture, the yield per unit areais high but per labour productivity is low.
(ii) Intensive subsidence agriculture
dominated by crops other than paddy:
Due to the difference in relief, climate, soiland some of the other geographical factors,it is not practical to grow paddy in manyparts of monsoon Asia. Wheat, soyabean,barley and sorghum are grown in northernChina, Manchuria, North Korea and NorthJapan. In India wheat is grown in western
2020-21

Primary Activities 37
parts of the Indo-Gangetic plains andmillets are grown in dry parts of westernand southern India. Most of thecharacteristics of this type of agricultureare similar to those dominated by wetpaddy except that irrigation is often used.
The Europeans colonised many parts inthe world and they introduced some other formsof agriculture such as plantations which weremainly profit-oriented large scale productionsystems.
Plantation Agriculture
Plantation agriculture as mentioned above wasintroduced by the Europeans in coloniessituated in the tropics. Some of the importantplantation crops are tea, coffee, cocoa, rubber,cotton, oil palm, sugarcane, bananas andpineapples.
The characteristic features of this type offarming are large estates or plantations, largecapital investment, managerial and technicalsupport, scientific methods of cultivation,single crop specialisation, cheap labour, anda good system of transportation which linksthe estates to the factories and markets for theexport of the products.
The French established cocoa and coffeeplantations in west Africa. The British set uplarge tea gardens in India and Sri Lanka,rubber plantations in Malaysia and sugarcaneand banana plantations in West Indies.Spanish and Americans invested heavily in
Fig. 5.9: Rice Transplantation
coconut and sugarcane plantations in thePhilippines. The Dutch once had monopolyover sugarcane plantation in Indonesia. Somecoffee fazendas (large plantations) in Brazil arestill managed by Europeans.
Today, ownership of the majority ofplantations has passed into the hands of thegovernment or the nationals of the countriesconcerned.
Fig. 5.10: Tea Plantation
The slopes of hills are used for tea plantations because
of favourable geographical conditions.
Extensive Commercial Grain Cultivation
Commercial grain cultivation is practised in theinterior parts of semi-arid lands of the mid-latitudes. Wheat is the principal crop, thoughother crops like corn, barley, oats and rye arealso grown. The size of the farm is very large,therefore entire operations of cultivation from
ploughing toharvesting aremechanised (Fig.5.11). There is lowyield per acre buthigh yield perperson. Why doesthis happen?
Fig. 5.11: MechanisedGrain Farming
Combine crews arecapable of harvestinggrain over manyhectares in a singleday.
2020-21

Fundamentals of Human Geography38
This type of agriculture is best developedin Eurasian steppes, the Canadian andAmerican Prairies, the Pampas of Argentina, theVelds of South Africa, the Australian Downs andthe Canterbury Plains of New Zealand. (Locatethese areas on the world map).
Mixed Farming
This form of agriculture is found in the highlydeveloped parts of the world, e.g. North-westernEurope, Eastern North America, parts ofEurasia and the temperate latitudes ofSouthern continents (Fig. 5.14).
Mixed farms are moderate in size andusually the crops associated with it are wheat,barley, oats, rye, maize, fodder and root crops.Fodder crops are an important component ofmixed farming. Crop rotation and intercroppingplay an important role in maintaining soilfertility. Equal emphasis is laid on cropcultivation and animal husbandry. Animals likecattle, sheep, pigs and poultry provide the mainincome along with crops.
Mixed farming is characterised by highcapital expenditure on farm machinery and
Fig. 5.12: Areas of Extensive Commercial Grain Farming
building, extensive use of chemical fertilisersand green manures and also by the skill andexpertise of the farmers.
Dairy Farming
Dairy is the most advanced and efficient type ofrearing of milch animals. It is highly capitalintensive. Animal sheds, storage facilities forfodder, feeding and milching machines add tothe cost of dairy farming. Special emphasis islaid on cattle breeding, health care andveterinary services.
Fig. 5.13: A Dairy Farm in Austria
2020-21

Primary Activities 39
Fig. 5.14: Areas of Mixed Farming
It is highly labour intensive as it involvesrigorous care in feeding and milching. There isno off season during the year as in the case ofcrop raising.
It is practised mainly near urban andindustrial centres which provideneighbourhood market for fresh milk and dairyproducts. The development of transportation,refrigeration, pasteurisation and otherpreservation processes have increased theduration of storage of various dairy products.
There are three main regions of commercial
dairy farming. The largest is North WesternEurope the second is Canada and the third beltincludes South Eastern Australia, New Zealand
and Tasmania (Fig. 5.16).
Mediterranean Agriculture
Mediterranean agriculture is highly specialisedcommercial agriculture. It is practised in thecountries on either side of the Mediterranean
Fig. 5.15 (a): A vineyard in Switzerland Fig. 5.15 (b): Collection ofgrapes in a collective farm of Kazakhstan
2020-21

Fundamentals of Human Geography40
sea in Europe and in north Africa from Tunisiato Atlantic coast, southern California, centralChile, south western parts of South Africa andsouth and south western parts of Australia.This region is an important supplier of citrusfruits.
Viticulture or grape cultivation is aspeciality of the Mediterranean region. Bestquality wines in the world with distinctiveflavours are produced from high quality grapesin various countries of this region. The inferiorgrapes are dried into raisins and currants. Thisregion also produces olives and figs. Theadvantage of Mediterranean agriculture is thatmore valuable crops such as fruits andvegetables are grown in winters when there isgreat demand in European and North Americanmarkets.
Market Gardening and Horticulture
Market gardening and horticulture specialisein the cultivation of high value crops such asvegetables, fruits and flowers, solely for theurban markets. Farms are small and are
located where there are good transportationlinks with the urban centre where high income
group of consumers is located. It is both labourand capital intensive and lays emphasis on theuse of irrigation, HYV seeds, fertilisers,
insecticides, greenhouses and artificial heatingin colder regions.
This type of agriculture is well developed
in densely populated industrial districts ofnorth west Europe, north eastern United Statesof America and the Mediterranean regions. The
Netherlands specialises in growing flowers andhorticultural crops especially tulips, which areflown to all major cities of Europe.
The regions where farmers specialise invegetables only, the farming is know as truckfarming. The distance of truck farms from the
market is governed by the distance that a truckcan cover overnight, hence the name truckfarming.
In addition to market gardening, a moderndevelopment in the industrial regions of WesternEurope and North America is factory farming.
Livestock, particularly poultry and cattle
Fig. 5.16: Areas of Dairy Farming
2020-21

Primary Activities 41
rearing, is done in stalls and pens, fed on
manufactured feedstuff and carefully
supervised against diseases. This requires heavy
capital investment in terms of building,
machinery for various operations, veterinary
services and heating and lighting. One of the
important features of poultry farming and cattle
rearing is breed selection and scientific
breeding.
Types of farming can also be categorised
according to the farming organisation. Farming
organisation is affected by the way in which
farmers own their farms and various policies of
the government which help to run these farms.
Co-operative Farming
A group of farmers form a co-operative society
by pooling in their resources voluntarily for
more efficient and profitable farming. Individual
farms remain intact and farming is a matter of
cooperative initiative.
Co-operative societies help farmers, to
procure all important inputs of farming, sell the
products at the most favourable terms and help
in processing of quality products at cheaper
rates.
Co-operative movement originated over a
century ago and has been successful in many
western European countries like Denmark,
Netherlands, Belgium, Sweden, Italy etc. In
Denmark, the movement has been so successful
that practically every farmer is a member of a
co-operative.
Figure 5.17 (a): Vegetables being grown in thevicinity of the city
Figure 5.17 (b): Vegetables being loaded into a truckand cycle carts for transporting to city markets
Collective Farming
The basic principle behind this types of farmingis based on social ownership of the means ofproduction and collective labour. Collectivefarming or the model of Kolkhoz wasintroduced in erstwhile Soviet Union to improveupon the inefficiency of the previous methodsof agriculture and to boost agriculturalproduction for self-sufficiency.
The farmers used to pool in all theirresources like land, livestock and labour.However, they were allowed to retain very smallplots to grow crops in order to meet their dailyrequirements.
MINING
The discovery of minerals in the history ofhuman development, is reflected in many stagesin terms of copper age, bronze age and iron age.The use of minerals in ancient times was largelyconfined to the making of tools, utensils andweapons. The actual development of miningbegan with the industrial revolution and itsimportance is continuously increasing.
Factors Affecting Mining Activity
The profitability of mining operations thus,depends on two main factors:(i) Physical factors include the size, grade and
the mode of occurrence of the deposits.(ii) Economic factors such as the demand for
the mineral, technology available and used,capital to develop infrastructure and thelabour and transport costs.
2020-21

Fundamentals of Human Geography42
Methods of Mining
Depending on the mode of occurrence and thenature of the ore, mining is of two types: surfaceand underground mining. The surface miningalso known as open-cast mining is the easiestand the cheapest way of mining minerals thatoccur close to the surface. Overhead costs suchas safety precautions and equipment isrelatively low in this method. The output is bothlarge and rapid.
When the ore lies deep below the surface,underground mining method (shaft method)
has to be used. In this method, vertical shaftshave to be sunk, from where undergroundgalleries radiate to reach the minerals.Minerals are extracted and transported to thesurface through these passages. It requiresspecially designed lifts, drills, haulage vehicles,ventilation system for safety and efficientmovement of people and material. This methodis risky. Poisonous gases, fires, floods andcaving in lead to fatal accidents. Have you everread about mine fires and flooding of coalmines in India?
The developed economies are retreatingfrom mining, processing and refining stages ofproduction due to high labour costs, while thedeveloping countries with large labour force andstriving for higher standard of living arebecoming more important. Several countriesof Africa and few of south America and Asiahave over fifty per cent of the earnings fromminerals alone.
Fig. 5.18: Oil drilling operationin the Gulf of Mexico
SHAFT MINING
OPEN-CAST OR
(STRIP MINING)
Fig. 5.19: Methods of Mining
2020-21

Primary Activities 43
EXERCISES
1. Choose the right answer from the four alternatives given below.
(i) Which one of the following is not a plantation crop?
(a) Coffee (c) Wheat
(b) Sugarcane (d) Rubber
(ii) In which one of the following countries co-operative farming was the mostsuccessful experiment?
(a) Russia (c) India
(b) Denmark (d) The Netherlands
(iii) Growing of flowers is called:
(a) Truck farming (c) Mixed farming
(b) Factory farming (d) Floriculture
(iv) Which one of the following types of cultivation was developed by Europeancolonists?
(a) Kolkoz (c) Mixed farming
(b) Viticulture (d) Plantation
(v) In which one of the following regions is extensive commercial grain cultivationnot practised?
(a) American Canadian prairies (c) Pampas of Argentina
(b) European Steppes (d) Amazon Basin
(vi) In which of the following types of agriculture is the farming of citrus fruit veryimportant?
(a) Market gardening (c) Mediterranean agriculture
(b) Plantation agriculture (d) Co-operative farming
(vii) Which one type of agriculture amongst the following is also called ‘slash andburn agriculture’?
(a) Extensive subsistence agriculture
(b) Primitive subsistence agriculture
(c) Extensive commercial grain cultivation
(d) Mixed farming
(viii) Which one of the following does not follow monoculture?
(a) Dairy farming (c) Plantation agriculture
(b) Mixed farming (d) Commercial grain farming
2. Answer the following questions in about 30 words.
(i) Future of shifting cultivation is bleak. Discuss.
(ii) Market gardening is practised near urban areas. Why?
(iii) Large scale dairy farming is the result of the development of transportationand refrigeration.
2020-21

Fundamentals of Human Geography44
3. Answer the following questions in not more than 150 words.
(i) Differentiate between Nomadic Herding and Commercial Livestock Rearing.
(ii) Discuss the important characteristic features of plantation agriculture. Namea few important plantation crops from different countries.
Project/Activity
Visit a nearby village and observe the cultivation of some crops. Askthe farmers and list the various operations.
2020-21
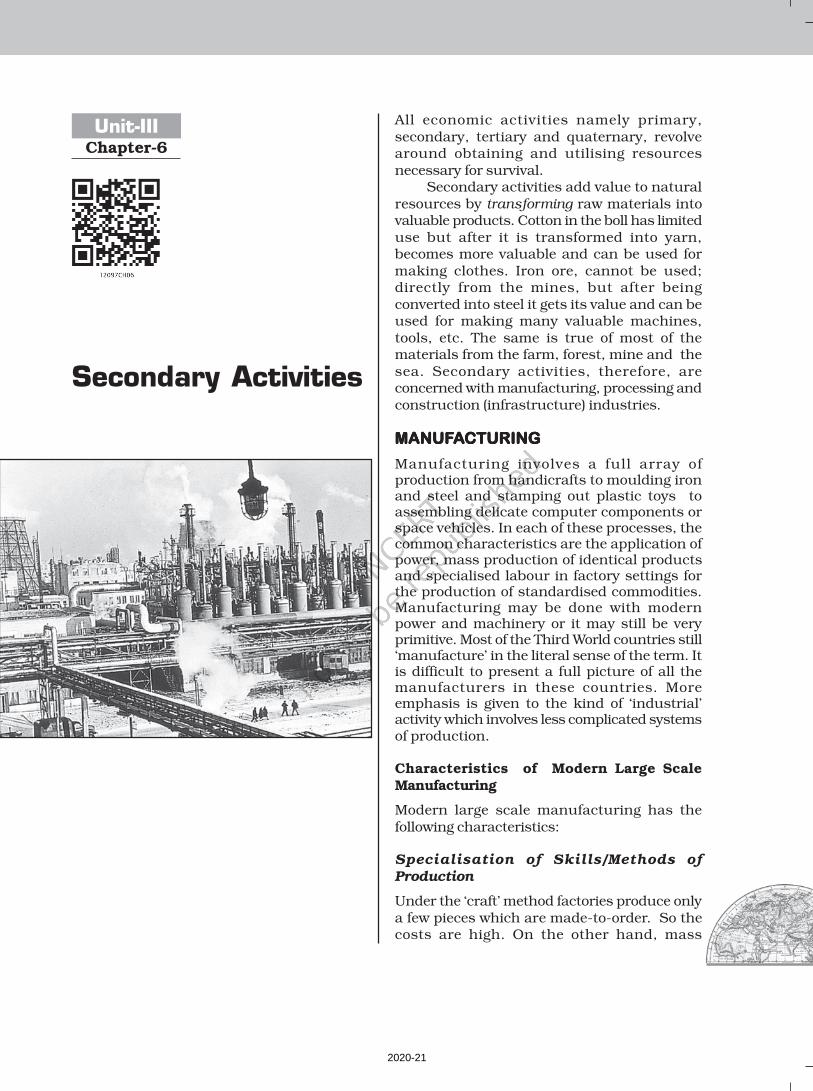
Unit-IIIChapter-6
Secondary Activities
All economic activities namely primary,secondary, tertiary and quaternary, revolvearound obtaining and utilising resourcesnecessary for survival.
Secondary activities add value to naturalresources by transforming raw materials intovaluable products. Cotton in the boll has limiteduse but after it is transformed into yarn,becomes more valuable and can be used formaking clothes. Iron ore, cannot be used;directly from the mines, but after beingconverted into steel it gets its value and can beused for making many valuable machines,tools, etc. The same is true of most of thematerials from the farm, forest, mine and thesea. Secondary activities, therefore, areconcerned with manufacturing, processing andconstruction (infrastructure) industries.
MANUFMANUFMANUFMANUFMANUFAAAAACTURINGCTURINGCTURINGCTURINGCTURING
Manufacturing involves a full array ofproduction from handicrafts to moulding ironand steel and stamping out plastic toys toassembling delicate computer components orspace vehicles. In each of these processes, thecommon characteristics are the application ofpower, mass production of identical productsand specialised labour in factory settings forthe production of standardised commodities.Manufacturing may be done with modernpower and machinery or it may still be veryprimitive. Most of the Third World countries still‘manufacture’ in the literal sense of the term. Itis difficult to present a full picture of all themanufacturers in these countries. Moreemphasis is given to the kind of ‘industrial’activity which involves less complicated systemsof production.
Characteristics of Modern Large ScaleManufacturing
Modern large scale manufacturing has thefollowing characteristics:
Specialisation of Skills/Methods ofProduction
Under the ‘craft’ method factories produce onlya few pieces which are made-to-order. So thecosts are high. On the other hand, mass
2020-21

Fundamentals of Human Geography46
production involves production of largequantities of standardised parts by each workerperforming only one task repeatedly.
‘Manufacturing’ Industry and‘Manufacturing Industry’
Manufacturing literally means ‘tomake by hand’. However, now itincludes goods ‘made by machines’.It is essentially a process whichinvolves transforming raw materialsinto finished goods of higher valuefor sale in local or distant markets.Conceptually, an industry is ageographically located manufacturingunit maintaining books of accountsand, records under a managementsystem. As the term industry iscomprehensive, it is also used assynonymous with ‘manufacturing’When one uses terms like ‘steelindustry’ and ‘chemical industry’ onethinks of factories and processes.But there are many secondaryactivities which are not carried on infactories such as what is now calledthe ‘entertainment industry’ andTourism industry, etc. So for claritythe longer expression ‘manufacturingindustry’ is used.
Mechanisation
Mechanisation refers to using gadgets whichaccomplish tasks. Automation (without aid ofhuman thinking during the manufacturingprocess) is the advanced stage of mechanisation.Automatic factories with feedback and closed-loop computer control systems where machinesare developed to ‘think’, have sprung up all overthe world.
Technological Innovation
Technological innovations through researchand development strategy are an importantaspect of modern manufacturing for qualitycontrol, eliminating waste and inefficiency, andcombating pollution.
Organisational Structure and Stratification
Modern manufacturing is characterised by:(i) a complex machine technology(ii) extreme specialisation and division of
labour for producing more goods with lesseffort, and low costs
(iii) vast capital(iv) large organisations(v) executive bureaucracy.
Uneven Geographic Distribution
Major concentrations of modern manufacturinghave flourished in a few number of places. Thesecover less than 10 per cent of the world’s landarea. These nations have become the centres ofeconomic and political power. However, in termsof the total area covered, manufacturing sitesare much less conspicuous and concentratedon much smaller areas than that of agriculturedue to greater intensity of processes. Forexample, 2.5 sq km of the American corn beltusually includes about four large farmsemploying about 10-20 workers supporting50-100 persons. But this same area couldcontain several large integrated factories andemploy thousands of workers.
Why do Large-scale Industries choosedifferent locations?
Industries maximise profits by reducingcosts. Therefore, industries should be locatedat points where the production costs areminimum. Some of the factors influencingindustrial locations are as under:
Access to Market
The existence of a market for manufacturedgoods is the most important factor in the locationof industries. ‘Market’ means people who have ademand for these goods and also have thepurchasing power (ability to purchase) to be ableto purchase from the sellers at a place. Remoteareas inhabited by a few people offer smallmarkets. The developed regions of Europe, NorthAmerica, Japan and Australia provide largeglobal markets as the purchasing power of thepeople is very high. The densely populatedregions of South and South-east Asia also
2020-21

Secondary Activities 47
provide large markets. Some industries, suchas aircraft manufacturing, have a global market.The arms industry also has global markets.
Access to Raw Material
Raw material used by industries should becheap and easy to transport. Industries basedon cheap, bulky and weight-losing material(ores) are located close to the sources of rawmaterial such as steel, sugar, and cementindustries. Perishability is a vital factor for theindustry to be located closer to the source ofthe raw material. Agro-processing and dairyproducts are processed close to the sources offarm produce or milk supply respectively.
Access to Labour Supply
Labour supply is an important factor in thelocation of industries. Some types ofmanufacturing still require skilled labour.Increasing mechanisation, automation andflexibility of industrial processes have reducedthe dependence of industry upon the labours.
Access to Sources of Energy
Industries which use more power are locatedclose to the source of the energy supply suchas the aluminium industry.
Earlier coal was the main source of energy,today hydroelectricity and petroleum are alsoimportant sources of energy for manyindustries.
Access to Transportation andCommunication Facilities
Speedy and efficient transport facilities to carryraw materials to the factory and to move finishedgoods to the market are essential for thedevelopment of industries. The cost of transportplays an important role in the location ofindustrial units. Western Europe and easternNorth America have a highly developed transportsystem which has always induced theconcentration of industries in these areas. Modernindustry is inseparably tied to transportationsystems. Improvements in transportation led tointegrated economic development and regionalspecialisation of manufacturing.
Communication is also an important needfor industries for the exchange andmanagement of information.
Government Policy
Governments adopt ‘regional policies’ topromote ‘balanced’ economic development andhence set up industries in particular areas.
Access to Agglomeration Economies/Links between Industries
Many industries benefit from nearness to aleader-industry and other industries. Thesebenefits are termed as agglomerationeconomies. Savings are derived from thelinkages which exist between differentindustries.
These factors operate together to determineindustrial location.
Foot Loose Industries
Foot loose industries can be locatedin a wide variety of places. They arenot dependent on any specific rawmaterial, weight losing or otherwise.They largely depend on componentparts which can be obtainedanywhere. They produce in smallquantity and also employ a smalllabour force. These are generally notpolluting industries. The importantfactor in their location is accessibilityby road network.
Classification of Manufacturing Industries
Manufacturing industries are classified on the
basis of their size, inputs/raw materials,
output/products and ownership (Fig. 6.1).
Industries based on Size
The amount of capital invested, number of
workers employed and volume of production
determine the size of industry. Accordingly,
industries may be classified into household or
cottage, small-scale and large-scale.
2020-21

Fundam
enta
ls o
f Hum
an G
eograph
y48
Fig. 6.1 : Classification of Industries
2020-21

Secondary Activities 49
HOUSEHOLD INDUSTRIES ORHOUSEHOLD INDUSTRIES ORHOUSEHOLD INDUSTRIES ORHOUSEHOLD INDUSTRIES ORHOUSEHOLD INDUSTRIES OR
COCOCOCOCOTTTTTTTTTTAAAAAGE MANUFGE MANUFGE MANUFGE MANUFGE MANUFAAAAACTURINGCTURINGCTURINGCTURINGCTURING
It is the smallest manufacturing unit. Theartisans use local raw materials and simpletools to produce everyday goods in their homeswith the help of their family members or part-time labour. Finished products may be forconsumption in the same household or, for salein local (village) markets, or, for barter. Capitaland transportation do not wield much influenceas this type of manufacturing has lowcommercial significance and most of the toolsare devised locally.
Some common everyday productsproduced in this sector of manufacturinginclude foodstuffs, fabrics, mats, containers,tools, furniture, shoes, and figurines from woodlot and forest, shoes, thongs and other articles fromleather; pottery and bricks from clays and stones.Goldsmiths make jewellery of gold, silver andbronze. Some artefacts and crafts are made out ofbamboo, wood obtained locally from the forests.
Small Scale Manufacturing
Small scale manufacturing is distinguishedfrom household industries by its productiontechniques and place of manufacture (aworkshop outside the home/cottage of theproducer). This type of manufacturing useslocal raw material, simple power-drivenmachines and semi-skilled labour. It providesemployment and raises local purchasing power.Therefore, countries like India, China, Indonesiaand Brazil, etc. have developed labour-intensivesmall scale manufacturing in order to provideemployment to their population.
Fig. 6.2 (a) : A man making pots in his courtyard-example of household industry in Nagaland
Fig. 6.2 (b) : A man weaving a bamboo basket by theroadside in Arunachal Pradesh
Fig. 6.3: Products of cottage industry on salein Assam
Large Scale Manufacturing
Large scale manufacturing involves a largemarket, various raw materials, enormousenergy, specialised workers, advancedtechnology, assembly-line mass production andlarge capital. This kind of manufacturingdeveloped in the last 200 years, in the UnitedKingdom, north-eastern U.S.A. and Europe. Nowit has diffused to almost all over the world.
2020-21

Fundamentals of Human Geography50
On the basis of the system of large scalemanufacturing, the world’s major industrialregions may be grouped under two broad types,namely
(i) traditional large-scale industrial regionswhich are thickly clustered in a few moredeveloped countries.
(ii) high-technology large scale industrialregions which have diffused to lessdeveloped countries.
Industries based on Inputs/Raw Materials
On the basis of the raw materials used, theindustries are classified as: (a) agro-based; (b)mineral based; (c) chemical based; (d) forestbased: and (e) animal based.
(a) Agro based Industries
Agro processing involves the processing of rawmaterials from the field and the farm into finishedproducts for rural and urban markets. Majoragro-processing industries are food processing,sugar, pickles, fruits juices, beverages (tea, coffeeand cocoa), spices and oils fats and textiles(cotton, jute, silk), rubber, etc.
Food Processing
Agro processing includes canning, producingcream, fruit processing and confectionery. Whilesome preserving techniques, such as drying,fermenting and pickling, have been known sinceancient times, these had limited applications tocater to the pre-Industrial Revolution demands.
Fig. 6.4 : Passenger car assembly hires at a plant ofthe Motor Company in Japan
Agri-business is commercial farming
on an industrial scale often financed
by business whose main interests lie
outside agriculture, for example, large
corporations in tea plantation
business. Agri-business farms are
mechanised, large in size, highly
structured, reliant on chemicals, and
may be described as ‘agro-factories’.
(b) Mineral based Industries
These industries use minerals as a raw material.
Some industries use ferrous metallic minerals
which contain ferrous (iron), such as iron and
steel industries but some use non-ferrous
metallic minerals, such as aluminium, copper
and jewellery industries. Many industries use
non-metallic minerals such as cement and
pottery industries.
(c) Chemical based Industries
Such industries use natural chemical minerals,
e.g. mineral-oil (petroleum) is used in petro-
chemical industry. Salts, sulphur and potash
industries also use natural minerals. Chemical
industries are also based on raw materials
obtained from wood and coal. Synthetic fibre,
plastic, etc. are other examples of chemical based
industries.
Fig. 6.5: Tea Garden and a Tea Factory in the NilgiriHills of Tamil Nadu
2020-21

Secondary Activities 51
(d) Forest based Raw Material usingIndustries
The forests provide many major and minor
products which are used as raw material.
Timber for furniture industry, wood, bamboo
and grass for paper industry, lac for lac
industries come from forests.
INDUSTRIES BINDUSTRIES BINDUSTRIES BINDUSTRIES BINDUSTRIES BASED ON OWNERSHIPASED ON OWNERSHIPASED ON OWNERSHIPASED ON OWNERSHIPASED ON OWNERSHIP
(a) Public Sector Industries are owned andmanaged by governments. In India, therewere a number of Public SectorUndertakings (PSUs). Socialist countrieshave many state owned industries. Mixedeconomies have both Public and Privatesector enterprises.
(b) Private Sector Industries are owned byindividual investors. These are managedby private organisations. In capitalistcountries, industries are generally ownedprivately.
(c) Joint Sector Industries are managed byjoint stock companies or sometimes theprivate and public sectors togetherestablish and manage the industries. Canyou make a list of such industries?
Traditional Large-Scale Industrial Regions
These are based on heavy industry, oftenlocated near coal-fields and engaged in metalsmelting, heavy engineering, chemicalmanufacture or textile production. Theseindustries are now known as smokestackindustries. Traditional industrial regions canbe recognised by:
• High proportion of employment inmanufacturing industry.
� High-density housing, often of inferiortype, and poor services.
� Unattractive environment, for example,pollution, waste heaps, and so on.
• Problems of unemployment, emigrationand derelict land areas caused by closureof factories because of a worldwide fall indemand.
The Ruhr Coal-field, Germany
This has been one of the major industrialregions of Europe for a long time. Coal and ironand steel formed the basis of the economy, butas the demand for coal declined, the industrystarted shrinking. Even after the iron ore wasexhausted, the industry remained, usingimported ore brought by waterways to the Ruhr.
The Ruhr region is responsible for 80 percent of Germany’s total steel production.
(e) Animal based Industries
Leather for leather industry and wool for
woollen textiles are obtained from animals.
Besides, ivory is also obtained from
elephant’s tusks.
Industries Based On Output/Product
You have seen some machines and tools made
of iron or steel. The raw material for such
machines and tools is iron and steel. Which is
itself an industry. The industry whose products
are used to make other goods by using them
as raw materials are basic industries. Can you
identify the links? Iron/steel machines
for textile industry clothes for use by
consumers.
The consumer goods industries produced
goods which are consumed by consumers
directly. For example, industries producing
breads and biscuits, tea, soaps and toiletries,
paper for writing, televisions, etc. are consumer
goods or non-basic industries.
Fig. 6.6: A pulp mill in the heart of the Ketchikan’stimber area of Alaska
2020-21

Fundamentals of Human Geography52
Changes in the industrial structure have led tothe decay of some areas, and there are problemsof industrial waste and pollution. The futureprosperity of the Ruhr is based less on theproducts of coal and steel, for which it wasinitially famous, and more on the newindustries like the huge Opel car assemblyplant, new chemical plants, universities. Out-of-town shopping centres have appearedresulting in a ‘New Ruhr’ landscape.
Iron and Steel Industry
The iron and steel industry forms the base ofall other industries and, therefore, it is called abasic industry. It is basic because it providesraw material for other industries such asmachine tools used for further production. Itmay also be called a heavy industry because ituses large quantities of bulky raw materials andits products are also heavy.
Iron is extracted from iron ore by smeltingin a blast furnace with carbon (coke) andlimestone. The molten iron is cooled andmoulded to form pig iron which is used forconverting into steel by adding strengtheningmaterials like manganese.
The large integrated steel industry istraditionally located close to the sources of rawmaterials – iron ore, coal, manganese andlimestone – or at places where these could beeasily brought, e.g. near ports. But in mini steelmills access to markets is more important thaninputs. These are less expensive to build andoperate and can be located near marketsbecause of the abundance of scrap metal, whichis the main input. Traditionally, most of the steelwas produced at large integrated plants, butmini mills are limited to just one-step process –steel making – and are gaining ground.
Distribution : The industry is one of themost complex and capital-intensive industriesand is concentrated in the advanced countriesof North America, Europe and Asia. In U.S.A,most of the production comes from the northAppalachian region (Pittsburgh), Great Lakeregion (Chicago-Gary, Erie, Cleveland, Lorain,Buffalo and Duluth) and the Atlantic Coast(Sparrows Point and Morisville). The industryhas also moved towards the southern state of
Alabama. Pittsburg area is now losing ground.It has now become the “rust bowl” of U.S.A. InEurope, U.K., Germany, France, Belgium,Luxembourgh, the Netherlands and Russia arethe leading producers. The important steelcentres are Scun Thorpe, Port Talbot,Birmingham and Sheffield in the U.K.;Duisburg, Dortmund, Dusseldorf and Essenin Germany; Le Creusot and St. Ettiennein France; and Moscow, St. Petersburgh,Lipetsk, Tula, in Russia and Krivoi Rog, andDonetsk in Ukraine. In Asia, the importantcentres include Nagasaki and Tokyo-Yokohamain Japan; Shanghai, Tienstin and Wuhan inChina; and Jamshedpur, Kulti-Burnpur,Durgapur, Rourkela, Bhilai, Bokaro, Salem,Visakhapatnam and Bhadravati in India.Consult your atlas to locate these places/centres.
Cotton Textile Industry
Cotton textile industry has three sub-sectorsi.e. handloom, powerloom and mill sectors.Handloom sector is labour-intensive andprovides employment to semi-skilled workers.It requires small capital investment. Why didMahatma Gandhi propagate Khadi as part ofthe independence movement? This sectorinvolves spinning, weaving and finishing of thefabrics. The powerloom sector introducesmachines and becomes less labour intensiveand the volume of production increases. Cottontextile mill sector is highly capital intensive andproduces fine clothes in bulk.
Cotton textile manufacturing requiresgood quality cotton as raw material. India,China, U.S.A, Pakistan, Uzbekistan, Egyptproduce more than half of the world’s rawcotton. The U.K, NW European countries andJapan also produce cotton textile made fromimported yarn. Europe alone accounts fornearly half of the world’s cotton imports. Theindustry has to face very stiff competition withsynthetic fibres hence it has now shown adeclining trend in many countries. With thescientific advancement and technologicalimprovements the structure of industrieschanges. For example, Germany recordedconstant growth in cotton textile industry since
2020-21

Secondary Activities 53
Second World War till the seventies but now ithas declined. It has shifted to less developedcountries where labour costs are low.
Concept of High Technology Industry
High technology, or simply high-tech, is thelatest generation of manufacturing activities. Itis best understood as the application ofintensive research and development (R and D)efforts leading to the manufacture of productsof an advanced scientific and engineeringcharacter. Professional (white collar) workersmake up a large share of the total workforce.These highly skilled specialists greatlyoutnumber the actual production (blue collar)workers. Robotics on the assembly line,computer -aided design (CAD) andmanufacturing, electronic controls ofsmelting and refining processes, and theconstant development of new chemical and
EXERCISES
1. Choose the right answer from the four alternatives given below.
(i) Which one of the following statements is wrong?
(a) Cheap water transport has facilitated the jute mill industry alongthe Hugli.
(b) Sugar, cotton textiles and vegetable oils are footloose industries.
(c) The development of hydro-electricity and petroleum reduced, to a greatextent, the importance of coal energy as a locational factor forindustry.
(d) Port towns in India have attracted industries.
(ii) In which one of the following types of economy are the factors of productionowned individually ?
(a) Capitalist (c) Socialist
(b) Mixed (d) None
(iii) Which one of the following types of industries produces raw materialsfor other industries?
(a) Cottage Industries (c) Basic Industries
(b) Small-scale Industries (d) Footloose Industries
pharmaceutical products are notable examplesof a high-tech industry.
Neatly spaced, low, modern, dispersed,office-plant-lab buildings rather than massiveassembly structures, factories and storageareas mark the high-tech industrial landscape.Planned business parks for high-tech start-upshave become part of regional and localdevelopment schemes.
High-tech industries which are regionallyconcentrated, self-sustained and highlyspecialised are called technopolies. The SiliconValley near San Francisco and Silicon Forestnear Seattle are examples of technopolies. Aresome technopolies developing in India?
Manufacturing contributes significantly tothe world economy. Iron and steel, textiles,automobiles, petrochemicals and electronicsare some of the world’s most importantmanufacturing industries.
2020-21
Fundamentals of Human Geography54
(iv) Which one of the following pairs is correctly matched ?
(a) Automobile industry … Los Angeles
(b) Shipbuilding industry … Lusaka
(c) Aircraft industry … Florence
(d) Iron and Steel industry … Pittsburgh
2. Write a short note on the following in about 30 words.
(i) High-Tech industry
(ii) Manufacturing
(iii) Footloose industries
3. Answer the following in not more than 150 words.
(i) Differentiate between primary and secondary activities.
(ii) Discuss the major trends of modern industrial activities especially inthe developed countries of the world.
(iii) Explain why high-tech industries in many countries are being attractedto the peripheral areas of major metropolitan centres.
(iv) Africa has immense natural resources and yet it is industrially the mostbackward continent. Comment.
Project/Activity
(i) Carry out a survey in your school premises of the factory-made goodsused by students and the staff.
(ii) Find out the meaning of the terms bio-degradable and non-biodegradable. Which kind of material is better to use? Why?
(iii) Look around and make a list of the global brands, their logos andproducts.
2020-21

Unit-IIIChapter-7
Tertiary andQuaternary Activities
When you fall ill you go to your family doctoror you call a doctor. Sometimes your parentstake you to a hospital for treatment. While inschool, you are taught by your teachers. In theevent of any dispute, legal opinion is obtainedfrom a lawyer. Likewise, there are manyprofessionals who provide their services againstpayment of their fee. Thus, all types of servicesare special skills provided in exchange ofpayments. Health, education, law, governanceand recreation etc. require professional skills.These services require other theoreticalknowledge and practical training. Tertiaryactivities are related to the service sector.Manpower is an important component of theservice sector as most of the tertiary activitiesare performed by skilled labour, professionallytrained experts and consultants.
In the initial stages of economicdevelopment, larger proportion of peopleworked in the primary sector. In a developedeconomy, the majority of workers getemployment in tertiary activity and a moderateproportion is employed in the secondary sector.
Tertiary activities include both productionand exchange. The production involves the‘provision’ of services that are ‘consumed’. Theoutput is indirectly measured in terms of wagesand salaries. Exchange, involves trade,transport and communication facilities that areused to overcome distance. Tertiary activities,therefore, involve the commercial output ofservices rather than the production of tangiblegoods. They are not directly involved in theprocessing of physical raw materials. Commonexamples are the work of a plumber, electrician,technician, launderer, barber, shopkeeper,driver, cashier, teacher, doctor, lawyer andpublisher etc. The main difference betweensecondary activities and tertiary activities is thatthe expertise provided by services relies moreheavily on specialised skills, experience andknowledge of the workers rather than on theproduction techniques, machinery and factoryprocesses.
TYPES OF TERTIARY ACTIVITIES
By now you know that you purchase yourbooks, stationery from traders shop, travel by
2020-21

Fundamentals of Human Geography56
Fig
. 7
.1:
Servic
e S
ecto
r
2020-21

Tertiary and Quaternary Activities 57
bus or rail, send letters, talk on telephone andobtain services of teachers for studies anddoctors at the time of illness.
Thus, trade, transport, communicationand services are some of the tertiary activitiesdiscussed in this section. The chart providesthe basis for classifying the tertiary activities.
Trade and commerce
Trade is essentially buying and selling of itemsproduced elsewhere. All the services in retailand wholesale trading or commerce arespecifically intended for profit. The towns andcities where all these works take place areknown us trading centres.
The rise of trading from barter at the locallevel to money-exchange of international scalehas produced many centres and institutionssuch as trading centres or collection anddistribution points.
Trading centres may be divided into ruraland urban marketing centres.
Rural marketing centres cater to nearbysettlements. These are quasi-urban centres.They serve as trading centres of the mostrudimentary type. Here personal andprofessional services are not well-developed.These form local collecting and distributingcentres. Most of these have mandis (wholesalemarkets) and also retailing areas. They are noturban centres per se but are significant centresfor making available goods and services whichare most frequently demanded by rural folk.
Fig. 7.2: A Wholesale Vegetable Market
Periodic markets in rural areas are foundwhere there are no regular markets and localperiodic markets are organised at differenttemporal intervals. These may be weekly, bi-weekly markets from where people from thesurrounding areas meet their temporallyaccumulated demand. These markets areheld on specified dates and move from oneplace to another. The shopkeepers thus,remain busy on all the days while a large areais served by them.
Urban marketing centres have more widelyspecialised urban services. They provideordinary goods and services as well as many ofthe specialised goods and services required bypeople. Urban centres, therefore, offermanufactured goods as well as manyspecialised markets develop, e.g. markets forlabour, housing, semi or finished products.Services of educational institutions andprofessionals such as teachers, lawyers,consultants, physicians, dentists and veterinarydoctors are available.
Fig. 7.3: Packed Food Market in U.S.A.
Retail Trading
This is the business activity concerned with thesale of goods directly to the consumers. Mostof the retail trading takes place in fixedestablishments or stores solely devoted toselling. Street peddling, handcarts, trucks,door-to-door, mail-order, telephone, automaticvending machines and internet are examplesof non-store retail trading.
2020-21

Fundamentals of Human Geography58
More on Stores
Consumer cooperatives were the first of
the large-scale innovations in retailing.
Departmental stores delegate the
responsibility and authority to departmental
heads for purchasing of commodities and
for overseeing the sale in different sections
of the stores.
Chain stores are able to purchase
merchandise most economically, often
going so far as to direct the goods to be
manufactured to their specification. They
employ highly skilled specialists in many
executive tasks. They have the ability to
experiment in one store and apply the
results to many.
Wholesale Trading
Wholesale trading constitutes bulk businessthrough numerous intermediary merchantsand supply houses and not through retailstores. Some large stores including chain storesare able to buy directly from the manufacturers.However, most retail stores procure suppliesfrom an intermediary source. Wholesalers oftenextend credit to retail stores to such an extentthat the retailer operates very largely on thewholesaler’s capital.
Transport
Transport is a service or facility by whichpeople, materials and manufactured goodsare physically carried from one location toanother. It is an organised industry createdto satisfy man’s basic need of mobility.Modern society requires speedy and efficienttransport systems to assist in the production,distribution and consumption of goods. Atevery stage in this complex system, the valueof the material is significantly enhanced bytransportation.
Transport distance can be measured as:km distance or actual distance of route length;time distance or the time taken to travel on a
particular route; and cost distance or theexpense of travelling on a route. In selecting themode of transport, distance, in terms of time orcost, is the determining factor. Isochrone linesare drawn on a map to join places equal in termsof the time taken to reach them.
Network and Accessibility
As transport systems develop, different
places are linked together to form a
network. Networks are made up of nodes
and links. A node is the meeting point of
two or more routes, a point of origin, a point
of destination or any sizeable town along a
route, Every road that joins two nodes is
called a link. A developed network has
many links, which means that places are
well-connected.
Factors Affecting Transport
Demand for transport is influenced by the sizeof population. The larger the population size,the greater is the demand for transport.
Routes depend on: location of cities,towns, villages, industrial centres and rawmaterials, pattern of trade between them, natureof the landscape between them, type of climate,and funds available for overcoming obstaclesalong the length of the route.
Communication
Communication services involve thetransmission of words and messages, factsand ideas. The invention of writing preservedmessages and helped to make communicationdependent on means of transport. These wereactually carried by hand, animals, boat, road,rail and air. That is why all forms of transportare also referred to as lines of communication.Where the transport network is efficient,communications are easily disseminated.Certain developments, such as mobiletelephony and satellites, have madecommunications independent of transport. Allforms are not fully disassociated because of thecheapness of the older systems. Thus, very
2020-21

Tertiary and Quaternary Activities 59
large volumes of mail continue to be handledby post offices all over the world.
Some of the communication services arediscussed below.
Telecommunications
The use of telecommunications is linked to thedevelopment of modern technology. It hasrevolutionised communications because of thespeed with which messages are sent. The timereduced is from weeks to minutes. Besides, therecent advancements like mobile telephonyhave made communications direct andinstantaneous at any time and from anywhere.The telegraph, morse code and telex have almostbecome things of the past.
Radio and television also help to relaynews, pictures, and telephone calls to vastaudiences around the world and hence they aretermed as mass media. They are vital foradvertising and entertainment. Newspapers areable to cover events in all corners of the world.Satellite communication relays information ofthe earth and from space. The internet has trulyrevolutionised the global communicationsystem .
Services
Services occur at many different levels. Someare geared to industry, some to people, and someto both industry and people, e.g. the transportsystems. Low-order services, such as groceryshops and laundries, are more common andwidespread than high-order services or morespecialised ones like those of accountants,consultants and physicians. Services areprovided to individual consumers who canafford to pay for them. For example, thegardener, the launderers and the barber doprimarily physical labour. Teacher, lawyers,physicians, musicians and others performmental labour.
Many services have now been regulated.Making and maintaining highways andbridges, maintaining fire fighting departmentsand supplying or supervising education andcustomer-care are among the importantservices most often supervised or performed bygovernments or companies. State and union
legislation have established corporations to
supervise and control the marketing of such
services as transport, telecommunication,
energy and water supply. Professional services
are primarily health care, engineering, law and
management. The location of recreational and
entertainment services depends on the market.
Multiplexes and restaurants might find location
within or near the Central Business District
(CBD), whereas a golf course would choose a
site where land costs are lower than in the CBD.
Personal services are made available to the
people to facilitate their work in daily life. The
workers migrate from rural areas in search of
employment and are unskilled. They are
employed in domestic services as
housekeepers, cooks, and gardeners. This
segment of workers is generally unorganised.
One such example in India is Mumbai’s
dabbawala (Tiffin) service provided to about
1,75,000 customers all over the city.
Fig. 7.4: Dabbawala Service in Mumbai
PEOPLE ENGAGED INPEOPLE ENGAGED INPEOPLE ENGAGED INPEOPLE ENGAGED INPEOPLE ENGAGED IN
TERTERTERTERTERTIARTIARTIARTIARTIARY ACTIVITIESY ACTIVITIESY ACTIVITIESY ACTIVITIESY ACTIVITIES
Today most people are service workers. Servicesare provided in all societies. But in moredeveloped countries a higher percentage ofworkers is employed in providing services ascompared to less developed countries. Thetrend in employment in this sector has been
2020-21

Fundamentals of Human Geography60
increasing while it has remained unchanged ordecreasing in the primary and secondaryactivities.
SOME SELECTED EXAMPLESSOME SELECTED EXAMPLESSOME SELECTED EXAMPLESSOME SELECTED EXAMPLESSOME SELECTED EXAMPLES
Tourism
Tourism is travel undertaken for purposes of
recreation rather than business. It has become
the world’s single largest tertiary activity in total
registered jobs (250 million) and total revenue
(40 per cent of the total GDP). Besides, many
local persons, are employed to provide services
like accommodation, meals, transport,
entertainment and special shops serving the
tourists. Tourism fosters the growth of
infrastructure industries, retail trading, and
craft industries (souvenirs). In some regions,
tourism is seasonal because the vacation period
is dependent on favourable weather conditions,
but many regions attract visitors all the year
round.
Fig. 7.5: Tourists skiing in the snow cappedmountain slopes of Switzerland
Tourist Regions
The warmer places around the MediterraneanCoast and the West Coast of India are some ofthe popular tourist destinations in the world.Others include winter sports regions, foundmainly in mountainous areas, and variousscenic landscapes and national parks, which
are scattered. Historic towns also attracttourists, because of the monument, heritagesites and cultural activities.
Factors Affecting Tourism
Demand : Since the last century, the demandfor holidays has increased rapidly.Improvements in the standard of living andincreased leisure time, permit many morepeople to go on holidays for leisure.
Transport : The opening-up of touristareas has been aided by improvement intransport facilities. Travel is easier by car, withbetter road systems. More significant in recentyears has been the expansion in air transport.For example, air travel allows one to travelanywhere in the world in a few hours of flying-time from their homes. The advent of packageholidays has reduced the costs.
Tourist Attractions
Climate: Most people from colder regions expectto have warm, sunny weather for beachholidays. This is one of the main reasons forthe importance of tourism in Southern Europeand the Mediterranean lands. TheMediterranean climate offers almost consistentlyhigher temperatures, than in other parts ofEurope, long hours of sunshine and low rainfallthroughout the peak holiday season. Peopletaking winter holidays have specific climaticrequirements, either higher temperatures thantheir own homelands, or snow cover suitablefor skiing.
Landscape: Many people like to spendtheir holidays in an attractive environment,which often means mountains, lakes,spectacular sea coasts and landscapes notcompletely altered by man.
History and Art: The history and art of anarea have potential attractiveness. People visitancient or picturesque towns andarchaeological sites, and enjoy exploringcastles, palaces and churches.
Culture and Economy: These attracttourists with a penchant for experiencing ethnicand local customs. Besides, if a region providesfor the needs of tourists at a cheap cost, it islikely to become very popular. Home-stay hasemerged as a profitable business such as
2020-21

Tertiary and Quaternary Activities 61
Organise an informal debate session in your class about how could theemerging medical industry of our country become a boom as well as doom?
heritage homes in Goa, Madikere and Coorgin Karnataka.
Medical Services for Overseas Patients in India
About 55,000 patients from U.S.A. visited India
in 2005 for treatment. This is still a small
number compared with the millions of surgeries
performed each year in the U.S. healthcare
system. India has emerged as the leading
country of medical tourism in the world. World
class hospitals located in metropolitan cities
cater to patients all over the world. Medical
tourism brings abundant benefits to developing
countries like India, Thailand, Singapore and
Malaysia. Beyond medical tourism, is the trendof outsourcing of medical tests and datainterpretation. Hospitals in India, Switzerlandand Australia have been performing certainmedical services – ranging from readingradiology images, to interpreting MagneticResonance Images (MRIs) and ultrasound tests.Outsourcing holds tremendous advantages forpatients, if it is focused on improving quality orproviding specialised care.
Medical Tourism
When medical treatment is combined with
international tourism activity, it lends itself
to what is commonly known as medical
tourism.
QUQUQUQUQUAAAAATERNTERNTERNTERNTERNARARARARARY ACTIVITIESY ACTIVITIESY ACTIVITIESY ACTIVITIESY ACTIVITIES
What do a CEO of an MNC in Copenhagen, atNew York and a medical transcriptionist atBangalore have in common? All these peoplework in a segment of the service sector that isknowledge oriented. This sector can be dividedinto quaternary and quinary activities.
Quaternary activities involve some of thefollowing: the collection, production anddissemination of information or even theproduction of information. Quaternary activitiescentre around research, development and maybe seen as an advanced form of services involvingspecialised knowledge and technical skills.
The Quaternary SectorThe Quaternary Sector along with the TertiarySector has replaced most of the primary andsecondary employment as the basis foreconomic growth. Over half of all workers Indeveloped economies are in the ‘KnowledgeSector’ and there has been a very high growthin demand for and consumption of information-based services from mutual fund managersto tax consultants, software developers andstatisticians. Personnel working in officebuildings, elementary schools and universityclassrooms, hospitals and doctors’ offices,theatres, accounting and brokerage firms allbelong to this category of services.
Like some of the tertiary functions,quaternary activities can also be outsourced.They are not tied to resources, affected bythe environment, or necessarily localised bymarket.
2020-21

Fundamentals of Human Geography62
QUINQUINQUINQUINQUINARARARARARY ACTIVITIESY ACTIVITIESY ACTIVITIESY ACTIVITIESY ACTIVITIES
The highest level of decision makers or policymakers perform quinary activities. These aresubtly different from the knowledge basedindustries that the quinary sector in generaldeals with.
Quinary activities are services that focus onthe creation, re-arrangement andinterpretation of new and existing ideas; datainterpretation and the use and evaluation ofnew technologies. Often referred to as ‘goldcollar’ professions, they represent anothersubdivision of the tertiary sector representingspecial and highly paid skills of seniorbusiness executives, government officials,research scientists, financial and legalconsultants, etc. Their importance in thestructure of advanced economies far
outweighs their numbers.
Outsourcing has resulted in the openingup of a large number of call centres in India,China, Eastern Europe, Israel, Philippines andCosta Rica. It has created new jobs in thesecountries. Outsourcing is coming to thosecountries where cheap and skilled workers areavailable. These are also out-migratingcountries. With the work available thoughoutsourcing, the migration in these countriesmay come down. Outsourcing countries arefacing resistance from job-seeking youths intheir respective countries. The comparativeadvantage is the main reason for continuingoutsourcing. New trends in quinary servicesinclude knowledge processing outsourcing(KPO) and ‘home shoring’, the latter as analternative to outsourcing. The KPO industryis distinct from Business Process Outsourcing(BPO) as it involves highly skilled workers. It isinformation driven knowledge outsourcing.KPO enables companies to create additionalbusiness opportunities. Examples of KPOsinclude research and development (R and D)activities, e-learning, business research,intellectual property (IP) research, legalprofession and the banking sector.
Outsourcing
Outsourcing or contracting out is giving work
to an outside agency to improve efficiency
and to reduce costs. When outsourcing
involves transferring work to overseas
locations, it is described by the term off -
shoring, although both off - shoring and
outsourcing are used together. Business
activities that are outsourced include
information technology (IT), human
resources, customer support and call centre
services and at times also manufacturing
and engineering.
Data processing is an IT related service
easily be carried out in Asian, East
European and African countries, In these
countries IT skilled staff with good English
language skills are available at lower wages
than those in the developed countries. Thus,
a company in Hyderabad or Manila does
Where Will it All Lead to?
2020-21

Tertiary and Quaternary Activities 63
work on a project based on GIS techniques
for a country like U.S.A or Japan. Overhead
costs are also much lower making it
profitable to get job-work carried out
overseas, whether it is in India, China or
even a less populous country like Botswana
in Africa.
Describe the nature of work against each colour-name
Colour of the collar Nature of work
Red ?
Gold ?
White ?
Grey ?
Blue ?
Pink ?
EXERCISES
1. Choose the right answer from the four alternatives given below.
(i) Which one of the following is a tertiary activity?
(a) Farming (c) Weaving
(b) Trading (d) Hunting
(ii) Which one of the following activities is NOT a secondary sector activity?
(a) Iron Smelting (c) Making garments
(b) Catching fish (d) Basket Weaving
(iii) Which one of the following sectors provides most of the employment in Delhi,Mumbai, Chennai and Kolkata.
(a) Primary (c) Secondary
(b) Quaternary (d) Service
(iv) Jobs that involve high degrees and level of innovations are known as:
(a) Secondary activities (c) Quinary activities
(b) Quaternary activities (d) Primary activities
(v) Which one of the following activities is related to quaternary sector?
(a) Manufacturing computers (c) University teaching
(b) Paper and Raw pulp production (d) Printing books
TTTTTHE DIGITHE DIGITHE DIGITHE DIGITHE DIGITAL DIVIDEAL DIVIDEAL DIVIDEAL DIVIDEAL DIVIDE
Opportunities emerging from the Information
and Communication Technology based
development is unevenly distributed across
the globe. There are wide ranging economic,
political and social differences among
countries. How quickly countries can provide
ICT access and benefits to its citizens is the
deciding factor. While developed countries in
general have surged forward, the developing
countries have lagged behind and this is
known as the digital divide. Similarly digital
divides exist within countries. For example,
in a large country like India or Russia, it is
inevitable that certain areas like metropolitan
centres possess better connectivity and
access to the digital world versus peripheral
rural areas.
2020-21

Fundamentals of Human Geography64
(vi) Which one out of the following statements is not true?
(a) Outsourcing reduces costs and increases efficiency.
(b) At times engineering and manufacturing jobs can also be outsourced.
(c) BPOs have better business opportunities as compared to KPOs.
(d) There may be dissatisfaction among job seekers in the countries thatoutsource the job.
2. Answer the following questions in about 30 words.
(i) Explain retail trading service.
(ii) Describe quaternary services.
(iii) Name the fast emerging countries of medical tourism in the world.
(iv) What is digital divide?
3. Answer the following questions in not more than 150 words.
(i) Discuss the significance and growth of the service sector in moderneconomic development.
(ii) Explain in detail the significance of transport and communicationservices.
Project/Activity
(i) Find out the activities of BPO.
(ii) Find out from a travel agent the documents you need to travel abroad.
2020-21

Unit-IIIChapter-8
Transport andCommunication
Natural resources, economic activities andmarkets are rarely found in one place.Transport, communication and trade establishlinks between producing centres andconsuming centres. The system of massproduction and exchange is complex. Eachregion produces the items for which it is bestsuited. Trade or the exchange of suchcommodities relies on transportation andcommunication. Likewise, the high livingstandards and quality of life depend on efficienttransportation, communications and trade. Inearlier days, the means of transport andcommunication were the same. But today bothhave acquired distinct and specialised forms.Transport provides the network of links andcarriers through which trade takes place.
TRANSPORTRANSPORTRANSPORTRANSPORTRANSPORTTTTT
Transport is a service or facility for the carriageof persons and goods from one place to the otherusing humans, animals and different kinds ofvehicles. Such movements take place over land,water and air. Roads and railways form part ofland transport; while shipping and waterwaysand airways are the other two modes. Pipelinescarry materials like petroleum, natural gas, andores in liquidified form.
Moreover, transportation is an organisedservice industry created to satisfy the basicneeds of society. It includes transport arteries,vehicles to carry people and goods, and theorganisation to maintain arteries, and to handleloading, unloading and delivery. Every nationhas developed various kinds of transportationfor defence purposes. Assured and speedytransportation, along with efficientcommunication, promote cooperation andunity among scattered peoples.
What is a Transport Network ?
Several places (nodes) joined together by a
series of routes (links) to form a pattern.
MODES OF TRANSPORMODES OF TRANSPORMODES OF TRANSPORMODES OF TRANSPORMODES OF TRANSPORTTTTTAAAAATIONTIONTIONTIONTION
The principal modes of world transportation,as already mentioned are land, water, air and
2020-21

Fundamentals of Human Geography66
pipelines. These are used for inter-regional andintra-regional transport, and each one (exceptpipelines) carries both passengers and freight.The significance of a mode depends on the typeof goods and services to be transported, costsof transport and the mode available.International movement of goods is handled byocean freighters. Road transport is cheaper andfaster over short distances and for door-to-door services. Railways are most suited for largevolumes of bulky materials over long distanceswithin a country. High-value, light andperishable goods are best moved by airways.In a well-managed transport system, thesevarious modes complement each other.
Land Transport
Most of the movement of goods and servicestakes place over land. In early days, humansthemselves were carriers. Have you ever seen abride being carried on a palanquin (palki/doli)
by four persons (Kahars in north India). Lateranimals were used as beasts of burden. Haveyou seen mules, horses and camels, carryingloads of cargo in rural areas? With the inventionof the wheel, the use of carts and wagonsbecame important. The revolution in transportcame about only after the invention of the steamengine in the eighteenth century. Perhaps thefirst public railway line was opened in 1825between Stockton and Darlington in northernEngland and then onwards, railways becamethe most popular and fastest form of transportin the nineteenth century. It opened upcontinental interiors for commercial grainfarming, mining and manufacturing in U.S.A.The invention of the internal combustion enginerevolutionised road transport in terms of roadquality and vehicles (motor cars and trucks)plying over them. Among the newerdevelopments in land transportation arepipelines, ropeways and cableways. Liquids likemineral oil, water, sludge and sewers aretransported by pipelines. The great freightcarriers are the railways, ocean vessels, barges,boats and motor trucks and pipelines.
In general, the old and elementary formslike the human porter, pack animal, cart orwagon are the most expensive means of
transportation and large freighters are thecheapest. They are important in supplementingmodern channels and carriers which penetratethe interiors in large countries. In the denselypopulated districts of India and China, overlandtransport still takes place by human porters orcarts drawn or pushed by humans.
Pack Animals
Horses are used as a draught animal even
in the Western countries. Dogs and
reindeer are used in North America, North
Europe and Siberia to draw sledges over
snow-covered ground. Mules are preferred
in the mountainous regions; while camels
are used for caravan movement in deserts.
In India, bullocks are used for pulling carts.
Fig. 8.2: A horse cart in a village Tefki,in Ethiopia
Fig. 8.1: Ropeway and Cable cars in Austria
This means of transport is usually found on steep
mountain slopes and mines which are not suitable for
building roads.
2020-21
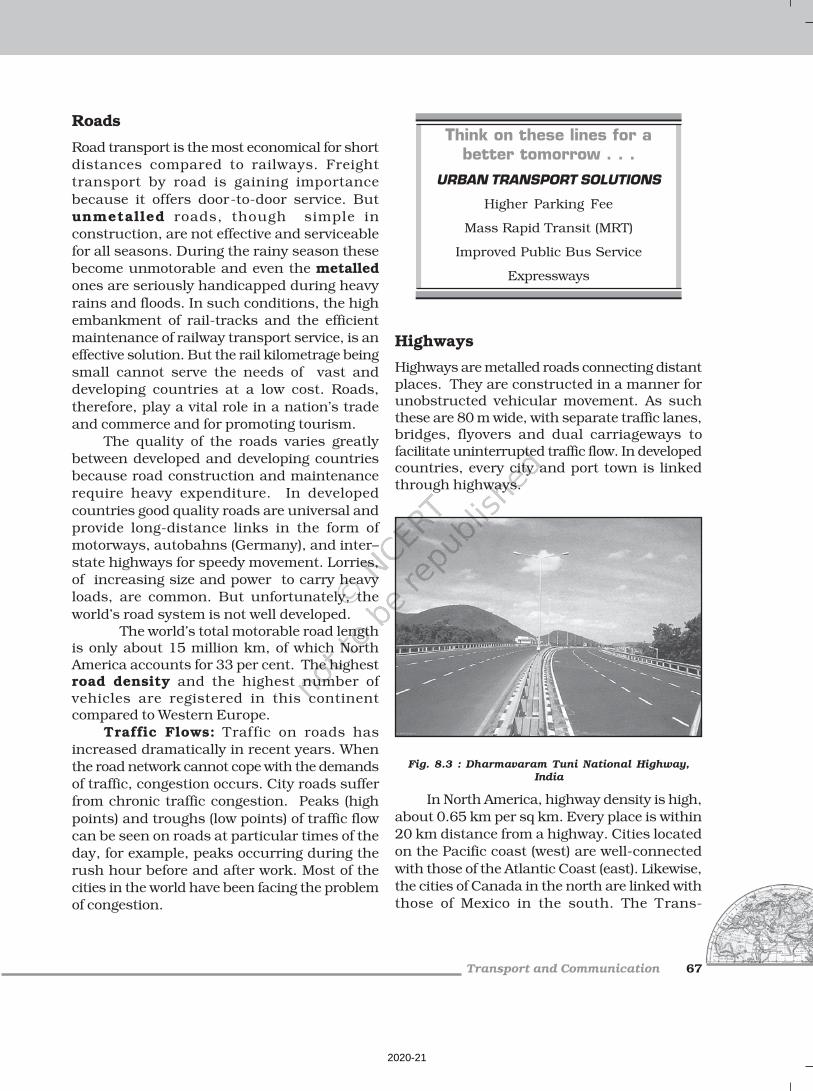
Transport and Communication 67
Roads
Road transport is the most economical for short
distances compared to railways. Freight
transport by road is gaining importance
because it offers door-to-door service. But
unmetalled roads, though simple in
construction, are not effective and serviceable
for all seasons. During the rainy season these
become unmotorable and even the metalled
ones are seriously handicapped during heavy
rains and floods. In such conditions, the high
embankment of rail-tracks and the efficient
maintenance of railway transport service, is an
effective solution. But the rail kilometrage being
small cannot serve the needs of vast and
developing countries at a low cost. Roads,
therefore, play a vital role in a nation’s trade
and commerce and for promoting tourism.
The quality of the roads varies greatly
between developed and developing countries
because road construction and maintenance
require heavy expenditure. In developed
countries good quality roads are universal and
provide long-distance links in the form of
motorways, autobahns (Germany), and inter–
state highways for speedy movement. Lorries,
of increasing size and power to carry heavy
loads, are common. But unfortunately, the
world’s road system is not well developed.The world’s total motorable road length
is only about 15 million km, of which NorthAmerica accounts for 33 per cent. The highestroad density and the highest number ofvehicles are registered in this continentcompared to Western Europe.
Traffic Flows: Traffic on roads has
increased dramatically in recent years. When
the road network cannot cope with the demands
of traffic, congestion occurs. City roads suffer
from chronic traffic congestion. Peaks (high
points) and troughs (low points) of traffic flow
can be seen on roads at particular times of the
day, for example, peaks occurring during the
rush hour before and after work. Most of the
cities in the world have been facing the problem
of congestion.
Think on these lines for abetter tomorrow . . .
URBAN TRANSPORT SOLUTIONS
Higher Parking Fee
Mass Rapid Transit (MRT)
Improved Public Bus Service
Expressways
Highways
Highways are metalled roads connecting distantplaces. They are constructed in a manner forunobstructed vehicular movement. As suchthese are 80 m wide, with separate traffic lanes,bridges, flyovers and dual carriageways tofacilitate uninterrupted traffic flow. In developedcountries, every city and port town is linkedthrough highways.
Fig. 8.3 : Dharmavaram Tuni National Highway,India
In North America, highway density is high,
about 0.65 km per sq km. Every place is within
20 km distance from a highway. Cities located
on the Pacific coast (west) are well-connected
with those of the Atlantic Coast (east). Likewise,
the cities of Canada in the north are linked with
those of Mexico in the south. The Trans-
2020-21

Fundamentals of Human Geography68
Canadian Highway links Vancouver in British
Columbia(west coast) to St. John’s City in
Newfoundland (east coast) and the Alaskan
Highway links Edmonton (Canada) to
Anchorage (Alaska).
The Pan-American Highway, a large
portion of which has been constructed, will
connect the countries of South America, Central
America and U.S.A.-Canada. The Trans-
Continental Stuart Highway connects Darwin
(north coast) and Melbourne via Tennant Creek
and Alice Springs in Australia.
Europe has a large number of vehicles and
a well-developed highway network. But
highways face a lot of competition from railways
and waterways.
In Russia, a dense highway network is
developed in the industrialised region west of
the Urals with Moscow as the hub. The
important Moscow-Vladivostok Highway serves
the region to the east. Due to the vast
geographical area, highways in Russia are not
as important as railways.
In China, highways criss-cross the country
connecting all major cities such as Tsungtso
(near Vietnam boundary), Shanghai (central
China), Guangzhou (south) and Beijing (north).
A new highway links Chengdu with Lhasa in
Tibet.
In India, there are many highways
linking the major towns and cities. For
example, National Highway No. 7 (NH 7),
connecting Varanasi with Kanya Kumari, is
the longest in the country. The Golden
Quadrilateral (GQ) or Super Expressway is
underway to connect the four metropolitan
cities — New Delhi, Mumbai, Bangalore,
Chennai, Kolkata and Hyderabad.
In Africa, a highway joins Algiers in the
north to Conakry in Guinea. Similarly, Cairo
is also connected to Cape Town.
Border Roads
Roads laid along international boundaries are
called border roads. They play an important
role in integrating people in remote areas with
major cities and providing defence. Almost all
countries have such roads to transport goods
to border villages and military camps.
Railways
Railways are a mode of land transport for
bulky goods and passengers over long
distances. The railway gauges vary in different
countries and are roughly classified as broad
(more than 1.5 m), standard (1.44 m), metre
gauge (1 m) and smaller gauges. The standard
gauge is used in the U.K.
Commuter trains are very popular in U.K.,
U.S.A, Japan and India. These carry millions
of passengers daily to and fro in the city. There
are about 13 lakh km of railways open for traffic
in the world.
Europe has one of the most dense rail
networks in the world. There are about
4,40,000 km of railways, most of which is
double or multiple-tracked. Belgium has the
highest density of 1 km of railway for every 6.5
sq kms area. The industrial regions exhibit
some of the highest densities in the world. The
important rail heads are London, Paris,
Brussels, Milan, Berlin and Warsaw. Passenger
transport is more important than freight in
many of these countries. Underground railways
are important in London and Paris. Channel
Tunnel, operated by Euro Tunnel Group
through England, connects London with Paris.
Trans-continental railway lines have now lost
Fig. 8.4: Tube Train in Vienna
2020-21

Transport and Communication 69
their importance to quicker and more flexibletransport systems of airways and roadways.
In Russia, railways account for about 90per cent of the country’s total transport with avery dense network west of the Urals. Moscowis the most important rail head with major linesradiating to different parts of the country’s vastgeographical area. Underground railways andcommuter trains are also important in Moscow.
North America has one of the mostextensive rail networks accounting for nearly40 per cent of the world’s total? In contrast tomany European countries, the railways areused more for long-distance bulky freight likeores, grains, timber and machinery than forpassengers. The most dense rail network isfound in the highly industrialised andurbanised region of East Central U.S.A. andadjoining Canada.
In Canada, railways are in the publicsector and distributed all over the sparselypopulated areas. The transcontinental railwayscarry the bulk of wheat and coal tonnage.
Australia has about 40,000 km ofrailways, of which 25 per cent are found in NewSouth Wales alone. The west-east AustralianNational Railway line runs across the countryfrom Perth to Sydney. New Zealand’s railwaysare mainly in the North Island to serve thefarming areas.
In South America, the rail network is themost dense in two regions, namely, the Pampasof Argentina and the coffee growing region ofBrazil which together account for 40 per centof South America’s total route length. Only Chile,among the remaining countries has aconsiderable route length linking coastal centreswith the mining sites in the interior. Peru, Bolivia,Ecuador, Colombia and Venezuela have shortsingle-track rail-lines from ports to the interiorwith no inter-connecting links.
There is only one trans-continental railroute linking Buenos Aires (Argentina) withValparaiso (Chile) across the Andes Mountainsthrough the Uspallatta Pass located at a heightof 3,900 m.
In Asia, rail network is the most dense inthe thickly populated areas of Japan, China andIndia. Other countries have relatively few railroutes. West Asia is the least developed in rail
facilities because of vast deserts and sparselypopulated regions.
Africa continent, despite being thesecond largest, has only 40,000 km ofrailways with South Africa alone accountingfor 18,000 km due to the concentration ofgold, diamond and copper mining activities.The important routes of the continent are: (i)the Benguela Railway through Angola toKatanga-Zambia Copper Belt; (ii) the TanzaniaRailway from the Zambian Copper Belt toDar-es-Salaam on the coast; (iii) the Railwaythrough Botswana and Zimbabwe linking thelandlocked states to the South Africannetwork; and (iv) the Blue Train from CapeTown to Pretoria in the Republic of SouthAfrica. Elsewhere, as in Algeria, Senegal,Nigeria, Kenya and Ethiopia, railway linesconnect port cities to interior centres but donot form a good network with other countries.
Trans–Continental Railways
Trans–continental railways run across thecontinent and link its two ends. They wereconstructed for economic and political reasonsto facilitate long runs in different directions.The following are the most important of these:
Trans–Siberian Railway
This is a trans–siberian Railways major railroute of Russia runs from St. Petersburg in thewest to Vladivostok on the Pacific Coast in theeast passing through Moscow, Ufa, Novosibirsk,Irkutsk, Chita and Khabarovsk. It is the mostimportant route in Asia and the longest (9,332 km)
2020-21

Fundamentals of Human Geography70
double-tracked and electrified trans–continental railway in the world. It has helpedin opening up its Asian region to West Europeanmarkets. It runs across the Ural Mountains Oband Yenisei rivers Chita is an important agro-centre and Irkutsk, a fur centre. There areconnecting links to the south, namely, to Odessa(Ukraine), Baku on the Caspian Coast,Tashkent (Uzbekistan), Ulan Bator (Mongolia),and Shenyang (Mukden) and Beijing in China.
Trans–Canadian Railways
This 7,050 km long rail-line in Canada runs fromHalifax in the east to Vancouver on the PacificCoast passing through Montreal, Ottawa,Winnipeg and Calgary (Fig. 8.6). It wasconstructed in 1886, initially as part of anagreement to make British Columbia on the westcoast join the Federation of States. Later on, it
Fig. 8.5: Trans–Siberian Railway
gained economic significance because itconnected the Quebec-Montreal IndustrialRegion with the wheat belt of the Prairie Regionand the Coniferous Forest region in the north.Thus each of these regions becamecomplementary to the other. A loop line fromWinnipeg to Thunder Bay (Lake Superior)connects this rail-line with one of the importantwaterways of the world. This line is the economicartery of Canada. Wheat and meat are theimportant exports on this route.
The Union and Pacific Railway
This rail-line connects New York on the AtlanticCoast to San Francisco on the Pacific Coastpassing through Cleveland, Chicago, Omaha,Evans, Ogden and Sacramento. The mostvaluable exports on this route are ores, grain,paper, chemicals and machinery.
2020-21
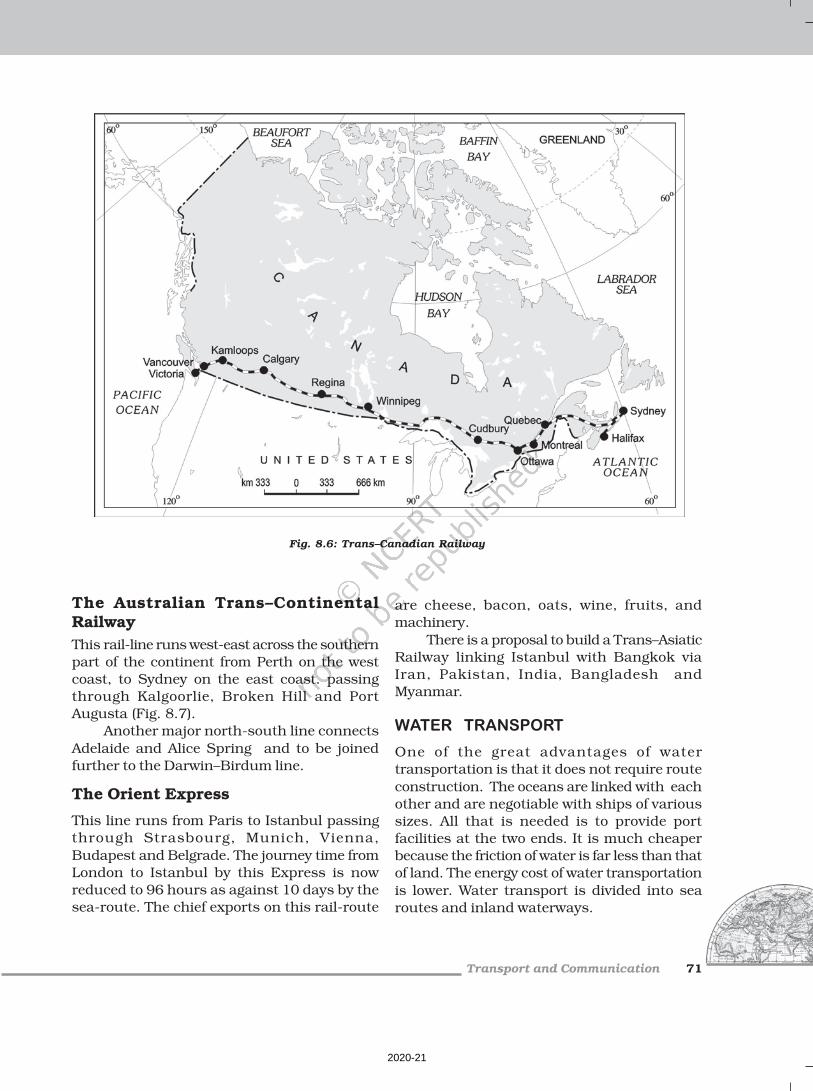
Transport and Communication 71
The Australian Trans–ContinentalRailway
This rail-line runs west-east across the southern
part of the continent from Perth on the west
coast, to Sydney on the east coast. passing
through Kalgoorlie, Broken Hill and Port
Augusta (Fig. 8.7).
Another major north-south line connects
Adelaide and Alice Spring and to be joined
further to the Darwin–Birdum line.
The Orient Express
This line runs from Paris to Istanbul passing
through Strasbourg, Munich, Vienna,
Budapest and Belgrade. The journey time from
London to Istanbul by this Express is now
reduced to 96 hours as against 10 days by the
sea-route. The chief exports on this rail-route
are cheese, bacon, oats, wine, fruits, and
machinery.
There is a proposal to build a Trans–Asiatic
Railway linking Istanbul with Bangkok via
Iran, Pakistan, India, Bangladesh and
Myanmar.
WATER TRANSPORT
One of the great advantages of water
transportation is that it does not require route
construction. The oceans are linked with each
other and are negotiable with ships of various
sizes. All that is needed is to provide port
facilities at the two ends. It is much cheaper
because the friction of water is far less than that
of land. The energy cost of water transportation
is lower. Water transport is divided into sea
routes and inland waterways.
Fig. 8.6: Trans–Canadian Railway
2020-21

Fundamentals of Human Geography72
Fig. 8.8: The view of Seine River from the EiffelTower (One can see how the river has become an
important Inland waterway)
Sea Routes
The oceans offer a smooth highway traversablein all directions with no maintenance costs. Itstransformation into a routeway by sea-goingvessels is an important development in human
adaptation to the physical environment.Compared to land and air, ocean transport is acheaper means of haulage (carrying of load) ofbulky material over long distances from onecontinent to another.
Modern passenger liners (ships) and cargoships are equipped with radar, wireless and othernavigation aids. The development of refrigeratedchambers for perishable goods, tankers andspecialised ships has also improved cargotransport. The use of containers has made cargohandling at the world’s major ports easier.
Important Sea Routes
Major sea routes are shown in the Fig. 8.9. Someimportant routes have been discussed in thefollowing pages.
The Northern Atlantic Sea Route
This links North-eastern U.S.A. and North-
western Europe, the two industrially developed
Fig. 8.7: Australian Trans–Continental Railway
2020-21

Transport and Communication 73
regions of the world. The foreign trade over thisroute is greater than that of the rest of the worldcombined. One fourth of the world’s foreigntrade moves on this route. It is, therefore, thebusiest in the world and otherwise, called theBig Trunk Route. Both the coasts have highlyadvanced ports and harbour facilities.
Find out some of the important ports on the coast of
U.S.A. and Western Europe in your atlas.
The Mediterranean–Indian Ocean SeaRoute
This sea route passes through the heart ofthe Old World and serves more countries andpeople than any other route. Port Said, Aden,Mumbai, Colombo and Singapore are someof the important ports on this route. Theconstruction of Suez Canal has greatlyreduced the distance and time as comparedto the earlier route through the Cape of GoodHope, which was longer than the routethrough Suez Canal.
The Cape of Good Hope Sea Route
This trade route connects the highlyindustrialised Western European region with WestAfrica, South Africa, South-east Asia and thecommercial agriculture and livestock economiesof Australia and New Zealand. The volume oftrade and traffic between both East and WestAfrica is on the increase due to the developmentof the rich natural resources such as gold,diamond, copper, tin, groundnut, oil palm,coffee and fruits.
The Southern Atlantic Sea Route
This sea route is another important one acrossthe Atlantic Ocean which connects WestEuropean and West African countries withBrazil, Argentina and Uruguay in SouthAmerica. The traffic is far less on this routebecause of the limited development andpopulation in South America and Africa. Onlysoutheastern Brazil and Plata estuary andparts of South Africa have large-scale industries.There is also little traffic on the route betweenRio de Janeiro and Cape Town because bothSouth America and Africa have similarproducts and resources.
Fig. 8.9: Major Sea Routes and Sea Ports
2020-21

Fundamentals of Human Geography74
The North Pacific Sea Route
Trade across the vast North Pacific Oceanmoves by several routes which converge atHonolulu. The direct route on the Great Circlelinks Vancouver and Yokohama and reducesthe travelling distance (2,480 km) by half.
This sea route links the ports on the west-coast of North America with those of Asia. Theseare Vancouver, Seattle, Portland, San Franciscoand Los Angeles on the American side andYokohama, Kobe, Shanghai, Hong Kong, Manilaand Singapore on the Asian side.
The South Pacific Sea Route
This sea route connects Western Europe and
North America with Australia, New Zealand and
the scattered Pacific islands via the Panama
Canal. This route is also used for reaching Hong
Kong, Philippines and Indonesia. The distance
covered between Panama and Sydney is
12,000 km. Honolulu is an important port on
this route.
Coastal Shipping
It is obvious that water transport is a cheaper
mode. While oceanic routes connect different
countries, coastal shipping is a convenient
mode of transportation with long coastlines,
e.g. U.S.A, China and India. Shenzhen States
in Europe are most suitably placed for coastal
shipping connecting one member’s coast with
the other. If properly developed, coastal shipping
can reduce the congestion on the land routes.
Shipping Canals
The Suez and the Panama Canals are two vital
man-made navigation canals or waterways
which serve as gateways of commerce for both
the eastern and western worlds.
The Suez Canal
This canal had been constructed in 1869 in
Egypt between Port Said in the north and Port
Suez in the south linking the Mediterranean
Sea and the Red Sea. It gives Europe a new
gateway to the Indian Ocean and reduces direct
sea-route distance between Liverpool and
Colombo compared to the Cape of Good Hope
route. It is a sea-level canal without locks
which is about 160 km and 11 to 15 m deep.
About 100 ships travel daily and each ship
takes 10-12 hours to cross this canal. The tolls
are so heavy that some find it cheaper to go by
the longer Cape Route whenever the
consequent delay is not important. A railway
follows the canal to Suez, and from Ismailia
there is a branch line to Cairo. A navigable
fresh-water canal from the Nile also joins the
Suez Canal in Ismailia to supply fresh-water to
Port Said and Suez.
The Panama Canal
This canal connects the Atlantic Ocean in the
east to the Pacific Ocean in the west. It has been
constructed across the Panama Isthmus
between Panama City and Colon by the U.S.
government which purchased 8 km of area on
either side and named it the Canal Zone. The
Canal is about 72 km. long and involves a very
Fig. 8.10 : Suez Canal
2020-21

Transport and Communication 75
deep cutting for a length of 12 km. It has a six-
lock system and ships cross the different levels
(26 m up and down) through these locks before
entering the Gulf of Panama.It shortens the distance between New York
and San Francisco by 13,000 km by sea.Likewise the distance between Western Europeand the West-coast of U.S.A.; and North-easternand Central U.S.A. and East and South-eastAsia is shortened. The economic significance ofthis Canal is relatively less than that of theSuez. However, it is vital to the economies ofLatin America.
Inland Waterways
Rivers, canals, lakes and coastal areas havebeen important waterways since timeimmemorial. Boats and steamers are used asmeans of transport for cargo and passengers.The development of inland waterways isdependent on the navigability width and depthof the channel, continuity in the water flow,and transport technology in use. Rivers arethe only means of transport in dense forests.Very heavy cargo like coal, cement, timber andmetallic ores can be transported through inlandwaterways. In ancient times, riverways were themain highways of transportation as in the caseof India. But they lost importance because ofcompetition from railways, lack of water due todiversion for irrigation, and their poormaintenance.
Fig. 8.12: Inland waterways are a major sourceof transport wherever the river is wide, deep
and free of silt
The significance of rivers as inlandwaterways for domestic and international
Fig. 8.11 : The Panama Canal
Can you think of the impact on traffic in Panama
canal after the Nicaraguan canal opens up?
2020-21

Fundamentals of Human Geography76
transport and trade has been recognisedthroughout the developed world. Despiteinherent limitations, many rivers have beenmodified to enhance their navigability bydredging, stabilising river banks, and buildingdams and barrages for regulating the flow ofwater. The following river waterways are someof the world’s important highways of commerce.
The Rhine Waterways
The Rhine flows through Germany and theNetherlands. It is navigable for 700 km fromRotterdam, at its mouth in the Netherlands toBasel in Switzerland. Ocean-going vessels canreach up to Cologne. The Ruhr river joins theRhine from the east. It flows through a richcoalfield and the whole basin has become aprosperous manufacturing area. Dusseldorf isthe Rhine port for this region. Huge tonnagemoves along the stretch south of the Ruhr. Thiswaterway is the world’s most heavily used. Eachyear more than 20,000 ocean-going ships and2,00,000 inland vessels exchange their cargoes.It connects the industrial areas of Switzerland,Germany, France, Belgium and the Netherlandswith the North Atlantic Sea Route.
The Danube Waterway
This important inland waterway serves EasternEurope. The Danube river rises in the BlackForest and flows eastwards through manycountries. It is navigable up to Taurna Severin.The chief export items are wheat, maize, timber,and machinery.
The Volga Waterway
Russia has a large number of developedwaterways, of which the Volga is one of the mostimportant. It provides a navigable waterway of11,200 km and drains into the Caspian Sea.The Volga-Moscow Canal connects it with theMoscow region and the Volga-Don Canal withthe Black Sea.
The Great Lakes – St. Lawrence Seaway
The Great Lakes of North America Superior,Huron Erie and Ontario are connected by SooCanal and Welland Canal to form an inlandwaterway. The estuary of St. Lawrence River,along with the Great Lakes, forms a uniquecommercial waterway in the northern part ofNorth America. The ports on this route likeDuluth and Buffalo are equipped with allfacilities of ocean ports. As such large ocean-going vessels are able to navigate up the riverdeep inside the continent to Montreal. But heregoods have to be trans-shipped to smallervessels due to the presence of rapids. Canalshave been constructed up to 3.5 m deep toavoid these.
Fig. 8.13: The Rhine Waterway
Fig. 8.14 : Rhine Waterway
2020-21

Transport and Communication 77
At present no place in the world is morethan 35 hours away. This startling fact has beenmade possible due to people who build and flyairplanes. Travel by air can now be measuredby hours and minutes instead of years andmonths. Frequent air services are available tomany parts of the world. Although, U.K.pioneered the use of commercial jet transport,U.S.A. developed largely post-War internationalcivil aviation. Today, more than 250commercial airlines offer regular services todifferent parts of the world. Recentdevelopments can change the future course ofair transport. Supersonic aircraft, cover thedistance between London and New York withinthree and a half hours.
Inter-Continental Air Routes
In the Northern Hemisphere, there is a distincteast-west belt of inter-continental air routes.Dense network exists in Eastern U.S.A., WesternEurope and Southeast Asia. U.S.A. aloneaccounts for 60 per cent of the airways of theworld. New York, London, Paris, Amsterdam,Frankfurt Rome, Moscow, Karachi, New Delhi,Mumbai, Bangkok, Singapore, Tokyo, SanFrancisco, Los Angeles and Chicago are thenodal points where air routes converge orradiate to all continents.
Africa, Asiatic part of Russia and SouthAmerica lack air services. There are limited airservices between 10-35 latitudes in theSouthern hemisphere due to sparserpopulation, limited landmass and economicdevelopment.
PIPELINES
Pipelines are used extensively to transportliquids and gases such as water, petroleumand natural gas for an uninterrupted flow.Water supplied through pipelines is familiarto all. Cooking gas or LPG is supplied throughpipelines in many parts of the world. Pipelinescan also be used to transport liquidified coal.In New Zealand, milk is being supplied throughpipelines from farms to factories.
In U.S.A. there is a dense network of oilpipelines from the producing areas to the
The Mississippi Waterways
The Mississippi-Ohio waterway connects theinterior part of U.S.A. with the Gulf of Mexicoin the south. Large steamers can go throughthis route up to Minneapolis.
AIR TRANSPORT
Air transport is the fastest means oftransportation, but it is very costly. Being fast,it is preferred by passengers for long-distancetravel. Valuable cargo can be moved rapidly ona world-wide scale. It is often the only meansto reach inaccessible areas. Air transport hasbrought about a connectivity revolution in theworld. The frictions created by mountainoussnow fields or inhospitable desert terrains havebeen overcome. The accessibility has increased.The airplane brings varied articles to theEskimos in Northern Canada unhindered bythe frozen ground. In the Himalayan region, theroutes are often obstructed due to landslides,avalanches or heavy snow fall. At such times,air travel is the only alternative to reach a place.Airways also have great strategic importance.The air strikes by U.S. and British forces in Iraqbears testimony to this fact. The airwaysnetwork is expanding very fast.
Fig. 8.15: An Aeroplane at Salsburg Airport
The manufacturing of aircrafts and theiroperations require elaborate infrastructure likehangars, landing, fuelling, and maintenancefacilities for the aircrafts. The construction ofairports is also very expensive and has developedmore in highly industrialised countries wherethere is a large volume of traffic.
2020-21
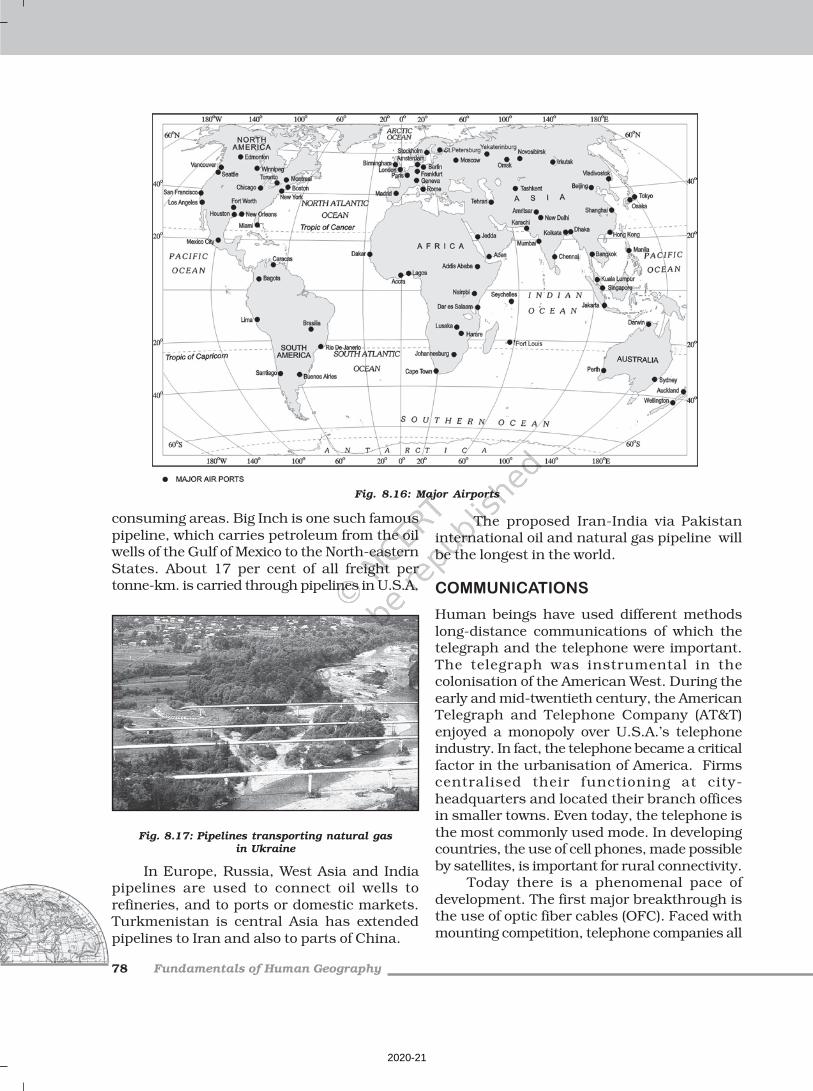
Fundamentals of Human Geography78
consuming areas. Big Inch is one such famouspipeline, which carries petroleum from the oilwells of the Gulf of Mexico to the North-easternStates. About 17 per cent of all freight pertonne-km. is carried through pipelines in U.S.A.
Fig. 8.17: Pipelines transporting natural gasin Ukraine
In Europe, Russia, West Asia and Indiapipelines are used to connect oil wells torefineries, and to ports or domestic markets.Turkmenistan is central Asia has extendedpipelines to Iran and also to parts of China.
The proposed Iran-India via Pakistaninternational oil and natural gas pipeline willbe the longest in the world.
COMMUNICATIONS
Human beings have used different methodslong-distance communications of which thetelegraph and the telephone were important.The telegraph was instrumental in thecolonisation of the American West. During theearly and mid-twentieth century, the AmericanTelegraph and Telephone Company (AT&T)enjoyed a monopoly over U.S.A.’s telephoneindustry. In fact, the telephone became a criticalfactor in the urbanisation of America. Firmscentralised their functioning at city-headquarters and located their branch officesin smaller towns. Even today, the telephone isthe most commonly used mode. In developingcountries, the use of cell phones, made possibleby satellites, is important for rural connectivity.
Today there is a phenomenal pace ofdevelopment. The first major breakthrough isthe use of optic fiber cables (OFC). Faced withmounting competition, telephone companies all
Fig. 8.16: Major Airports
2020-21

Transport and Communication 79
over the world soon upgraded their copper cablesystems to include optic fiber cables. Theseallow large quantities of data to be transmittedrapidly, securely, and are virtually error-free.With the digitisation of information in the 1990s,telecommunication slowly merged withcomputers to form integrated networks termedas Internet.
Satellite Communication
Today Internet is the largest electronic networkon the planet connecting about 1,000 millionpeople in more than 100 countries.
Satellites touch human lives in manyways. Every time you use a cell phone to
call a friend, send an SMS or watch a
popular programme on cable television. You
are using satellite communication.
Communication through satellitesemerged as a new area in communicationtechnology since the 1970s after U.S.A. andformer U.S.S.R. pioneered space research.Artificial satellites, now, are successfullydeployed in the earth’s orbit to connect eventhe remote corners of the globe with limited on-site verification. These have rendered the unitcost and time of communication invariant interms of distance. This means it costs the sameto communicate over 500 km as it does over5,000 km via satellite.
India has also made great strides insatellite development. Aryabhatt was launchedon 19 April 1979, Bhaskar-I in 1979 andRohini in 1980. On 18 June 1981, APPLE(Arian Passenger Payload Experiment) waslaunched through Arian rocket. Bhaskar,
Challenger and INSAT I-B have made long-distance communication, television and radiovery effective. Today weather forecastingthrough television is a boon.
Cyber Space – Internet
Cyberspace is the world of electroniccomputerised space. It is encompassed by theInternet such as the World Wide Web (www).In simple words, it is the electronic digitalworld for communicating or accessinginformation over computer networks withoutphysical movement of the sender and thereceiver... It is also referred to as the Internet.Cyberspace exists everywhere. It may be inan office, sailing boat, flying plane and virtuallyanywhere.
The speed at which this electronic networkhas spread is unprecedented in humanhistory. There were less than 50 millionInternet users in 1995, about 400 million in2000 A.D. and over two billion in 2010. In thelast few years there has been a shift amongglobal users from U.S.A. to the developingcountries. The percentage share of U.S.A. hasdropped from 66 in 1995 to only 25 in 2005.Now the majority of the world’s users arein U.S.A., U.K., Germany, Japan, Chinaand India.
As billions use the Internet each year,cyberspace will expand the contemporaryeconomic and social space of humans throughe-mail, e-commerce, e-learning ande-governance. Internet together with fax,television and radio will be accessible to moreand more people cutting across place and time.It is these modern communication systems,more than transportation, that has made theconcept of global village a reality.
2020-21

Fundamentals of Human Geography80
EXERCISES
1. Choose the right answer from the four alternatives given below.
(i) The Trans–Continental Stuart Highway runs between
(a) Darwin and Melbourne
(b) Edmonton and Anchorage
(c) Vancouver and St. John’s City
(d) Chengdu and Lhasa
(ii) Which country has the highest density of railway network?
(a) Brazil (c) Canada
(b) U.S.A (d) Russia
(iii) The Big Trunk Route runs through
(a) The Mediterranean – Indian ocean
(b) The North Atlantic Ocean
(c) The South Atlantic Ocean
(d) The North Pacific Ocean
(iv) The Big Inch pipeline transports
(a) Milk (c) Water
(b) Liquid petroleum gas (LGP) (d) Petroleum
(v) Which one pair of the following places is linked by Channel Tunnel?
(a) London – Berlin (c) Berlin – Paris
(b) Paris – London (d) Barcelona – Berlin
2. Answer the following questions in about 30 words.
(i) What are the problems of road transport in mountainous, desert andflood prone regions?
(ii) What is a trans–continental railway?
(iii) What are the advantages of water transport?
3. Answer the following questions in not more than 150 words.
(i) Elucidate the statement– “In a well managed transport system, variousmodes complement each other”.
(ii) Which are the major regions of the world having a dense network ofairways.
(iii) What are the modes by which cyber space will expand the contemporaryeconomic and social space of humans.
2020-21

Unit-III
Chapter-9
International Trade
You are already familiar with the term “trade”as a tertiary activity which you have studied inChapter 7 of this book. You know that trademeans the voluntary exchange of goods andservices. Two parties are required to trade. Oneperson sells and the other purchases. In certainplaces, people barter their goods. For both theparties trade is mutually beneficial.
Trade may be conducted at two levels:international and national. International tradeis the exchange of goods and services amongcountries across national boundaries.Countries need to trade to obtain commodities,they cannot produce themselves or they canpurchase elsewhere at a lower price.
The initial form of trade in primitivesocieties was the barter system, where directexchange of goods took place. In this system ifyou were a potter and were in need of a plumber,you would have to look for a plumber whowould be in need of pots and you couldexchange your pots for his plumbing service.
Fig. 9.1: Two women practising barter system inJon Beel Mela
Every January after the harvest season Jon Beel Melatakes place in Jagiroad, 35 km away from Guwahatiand it is possibly the only fair In India, where bartersystem is still alive. A big market is organised duringthis fair and people from various tribes and communi-ties exchange their products.
The difficulties of barter system wereovercome by the introduction of money. In theolden times, before paper and coin currency
2020-21

Fundamentals of Human Geography82
came into being, rare objects with very highintrinsic value served as money, like,flintstones, obsidian, cowrie shells, tiger’spaws, whale’s teeth, dogs teeth, skins, furs,cattle, rice, peppercorns, salt, small tools,copper, silver and gold.
The word salary comes from the Latin word Salarium
which means payment by salt. As in those timesproducing salt from sea water was unknown and couldonly be made from rock salt which was rare andexpensive. That is why it became a mode of payment.
HISTHISTHISTHISTHISTORORORORORY OF INTERNY OF INTERNY OF INTERNY OF INTERNY OF INTERNAAAAATIONTIONTIONTIONTIONAL TRADEAL TRADEAL TRADEAL TRADEAL TRADE
In ancient times, transporting goods over long
distances was risky, hence trade was restrictedto local markets. People then spent most of their
resources on basic necessities – food and
clothes. Only the rich people bought jewellery,
costly dresses and this resulted in trade ofluxury items.
The Silk Route is an early example of long
distance trade connecting Rome to China –along the 6,000 km route. The traders
transported Chinese silk, Roman wool and
precious metals and many other high value
commodities from intermediate points in India,Persia and Central Asia.
After the disintegration of the Roman
Empire, European commerce grew during
twelfth and thirteenth century with thedevelopment of ocean going warships trade
between Europe and Asia grew and the
Americas were discovered.
Fifteenth century onwards, the Europeancolonialism began and along with trade of exotic
commodities, a new form of trade emerged
which was called slave trade. The Portuguese,
Dutch, Spaniards, and British captured Africannatives and forcefully transported them to the
newly discovered Americas for their labour in
the plantations. Slave trade was a lucrative
business for more than two hundred years tillit was abolished in Denmark in 1792, Great
Britain in 1807 and United States in 1808.
Figure 9.2 : Advertisement for Slave Auction, 1829
This American slave auction advertised slaves for saleor temporary hire by their owners. Buyers often paid asmuch as $2,000 for a skilled, healthy slave. Such auc-tions often separated family members from one another,many of whom never saw their loved ones again.
After the Industrial Revolution the demandfor raw materials like grains, meat, wool alsoexpanded, but their monetary value declinedin relation to the manufactured goods.
The industrialised nations importedprimary products as raw materials andexported the value added finished productsback to the non-industrialised nations.
In the later half of the nineteenth century,regions producing primary goods were no moreimportant, and industrial nations became eachother’s principle customers.
During the World Wars I and II, countriesimposed trade taxes and quantitativerestrictions for the first time. During the post-war period, organisations like GeneralAgreement for Tariffs and Trade (which laterbecame the World Trade Organisation), helpedin reducing tariff.
Why Does International Trade Exist?
International trade is the result of specialisationin production. It benefits the world economy if
2020-21

International Trade 83
different countries practise specialisation anddivision of labour in the production ofcommodities or provision of services. Each kindof specialisation can give rise to trade. Thus,international trade is based on the principle ofcomparative advantage, complimentarity andtransferability of goods and services and inprinciple, should be mutually beneficial to thetrading partners.
In modern times, trade is the basis of theworld’s economic organisation and is relatedto the foreign policy of nations. With well-developed transportation and communicationsystems, no country is willing to forego thebenefits derived from participation ininternational trade.
Basis of International Trade
(i) Difference in national resources: Theworld’s national resources are unevenlydistributed because of differences in theirphysical make up i.e. geology, relief soiland climate.(a) Geological structure: It determines
the mineral resource base andtopographical differences ensurediversity of crops and animalsraised. Lowlands have greateragricultural potential. Mountainsattract tourists and promotetourism.
(b) Mineral resources: They areunevenly distributed the world over.The availability of mineral resourcesprovides the basis for industrialdevelopment.
(c) Climate: It influences the type of floraand fauna that can survive in a givenregion. It also ensures diversity inthe range of various products, e.g.wool production can take place incold regions, bananas, rubber andcocoa can grow in tropical regions.
(ii) Population factors: The size, distributionand diversity of people between countriesaffect the type and volume of goodstraded.(a) Cultural factors: Distinctive forms of
art and craft develop in certain
cultures which are valued the worldover, e.g. China produces the finestporcelains and brocades. Carpets ofIran are famous while North Africanleather work and Indonesian batikcloth are prized handicrafts.
(b) Size of population: Denselypopulated countries have largevolume of internal trade but littleexternal trade because most of theagricultural and industrialproduction is consumed in the localmarkets. Standard of living of thepopulation determines the demandfor better quality imported productsbecause with low standard of livingonly a few people can afford to buycostly imported goods.
(iii) Stage of economic development: Atdifferent stages of economic developmentof countries, the nature of items tradedundergo changes. In agriculturallyimportant countries, agro products areexchanged for manufactured goodswhereas industrialised nations exportmachinery and finished products andimport food grains and other rawmaterials.
(iv) Extent of foreign investment: Foreigninvestment can boost trade in developingcountries which lack in capital required
for the development of mining, oil drilling,heavy engineering, lumbering andplantation agriculture. By developing
such capital intensive industries indeveloping countries, the industrialnations ensure import of food stuffs,
minerals and create markets for theirfinished products. This entire cycle stepsup the volume of trade between nations.
(v) Transport: In olden times, lack ofadequate and efficient means of transportrestricted trade to local areas. Only high
value items, e.g. gems, silk and spiceswere traded over long distances. Withexpansions of rail, ocean and air
transport, better means of refrigerationand preservation, trade has experiencedspatial expansion.
2020-21
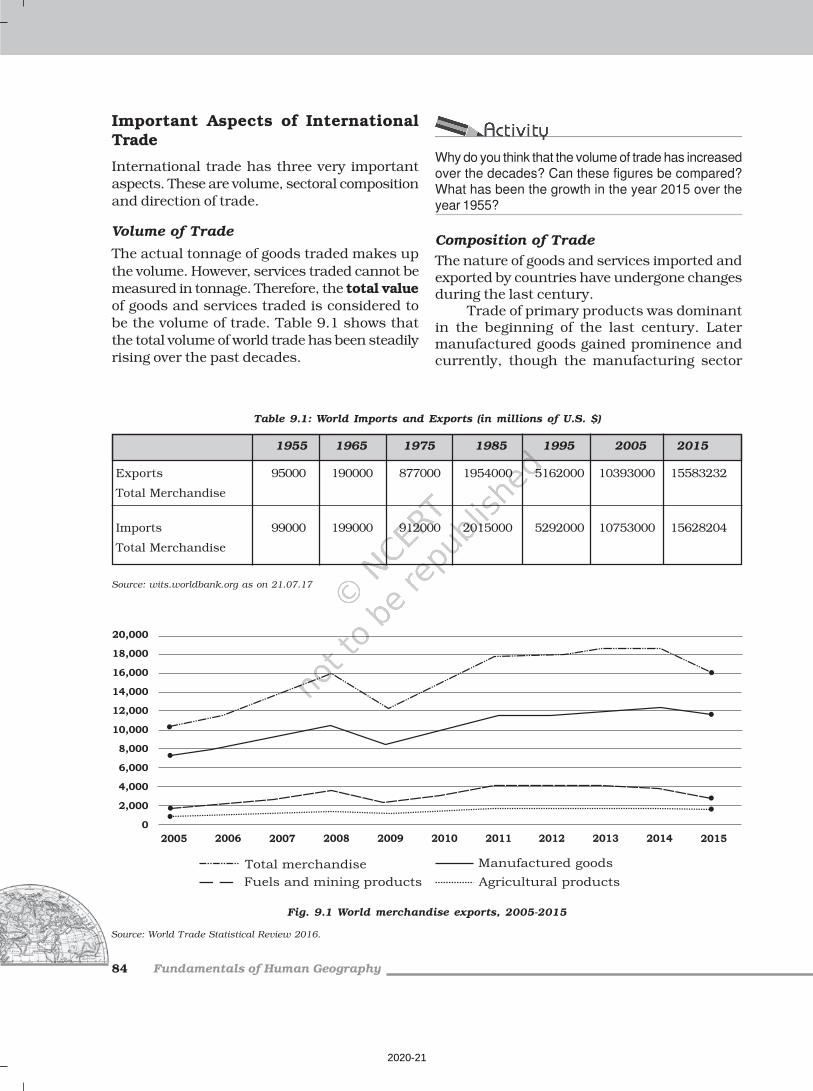
Fundamentals of Human Geography84
Important Aspects of InternationalTrade
International trade has three very important
aspects. These are volume, sectoral composition
and direction of trade.
Volume of Trade
The actual tonnage of goods traded makes up
the volume. However, services traded cannot be
measured in tonnage. Therefore, the total value
of goods and services traded is considered to
be the volume of trade. Table 9.1 shows that
the total volume of world trade has been steadily
rising over the past decades.
Why do you think that the volume of trade has increasedover the decades? Can these figures be compared?What has been the growth in the year 2015 over theyear 1955?
Composition of Trade
The nature of goods and services imported andexported by countries have undergone changesduring the last century.
Trade of primary products was dominantin the beginning of the last century. Latermanufactured goods gained prominence andcurrently, though the manufacturing sector
Table 9.1: World Imports and Exports (in millions of U.S. $)
1955 1965 1975 1985 1995 2005 2015
Exports 95000 190000 877000 1954000 5162000 10393000 15583232
Total Merchandise
Imports 99000 199000 912000 2015000 5292000 10753000 15628204
Total Merchandise
Source: wits.worldbank.org as on 21.07.17
Fig. 9.1 World merchandise exports, 2005-2015
Source: World Trade Statistical Review 2016.
2020-21

International Trade 85
commands the bulk of the global trade, service
sector which includes travel, transportation and
other commercial services have been showing
an upward trend. Table 9.1 shows that the
volume of imports and exports of the world
merchandise has been growing consistently
over the years. Looking at Figure 9.1 it becomes
evident that manufactured goods contributed
to the bulk of world merchandise exports from
2005 to 2015. Fuels and mining goods and
agricultural goods are also important
contributors of merchandise exports.
There is change in the share of continents
in the world merchandise trade as Europe’s
contribution is declining while the contribution
of Asian countries is growing.
Direction of Trade
Historically, the developing countries of the
present used to export valuable goods and
artefacts, etc., which were exported to European
countries. During the nineteenth century there
was a reversal in the direction of trade.
European countries started exporting
manufactured goods for exchange of foodstuffs
and raw materials from their colonies. Europe
and U.S.A. emerged as major trade partners in
the world and were leaders in the trade of
manufactured goods. Japan at that time was
also the third important trading country. The
world trade pattern underwent a drastic change
during the second half of the twentieth century.
Europe lost its colonies while India, China and
other developing countries started competing
with developed countries. The nature of the
goods traded has also changed.
Balance of Trade
Balance of trade records the volume of goods
and services imported as well as exported by a
country to other countries. If the value of
imports is more than the value of a country’s
exports, the country has negative or
unfavourable balance of trade. If the value of
exports is more than the value of imports, then
the country has a positive or favourable balance
of trade.
Balance of trade and balance of payments
have serious implications for a country’s
economy. A negative balance would mean that
the country spends more on buying goods than
it can earn by selling its goods. This would
ultimately lead to exhaustion of its financial
reserves.
Types of International Trade
International trade may be categorised into two
types:(a) Bilateral trade: Bilateral trade is done
by two countries with each other. They
enter into agreement to trade specified
commodities amongst them. For
example, country A may agree to trade
some raw material with agreement to
purchase some other specified item to
country B or vice versa.
(b) Multi-lateral trade: As the term suggests
multi-lateral trade is conducted with
many trading countries. The same
country can trade with a number of
other countries. The country may also
grant the status of the “Most Favoured
Nation” (MFN) on some of the trading
partners.
Case for Free Trade
The act of opening up economies for trading is
known as free trade or trade liberalisation. This
is done by bringing down trade barriers like
tariffs. Trade liberalisation allows goods and
services from everywhere to compete with
domestic products and services.
Globalisation along with free trade can
adversely affect the economies of developing
countries by not giving equal playing field by
imposing conditions which are unfavourable.
With the development of transport and
communication systems goods and services can
travel faster and farther than ever before. But
free trade should not only let rich countries
enter the markets, but allow the developed
countries to keep their own markets protected
from foreign products.
2020-21

Fundamentals of Human Geography86
Countries also need to be cautious about
dumped goods; as along with free trade
dumped goods of cheaper prices can harm the
domestic producers.
DumpingDumpingDumpingDumpingDumping
The practice of selling a commodity in twocountries at a price that differs for reasonsnot related to costs is called dumping.
World Trade Organisation
In1948, to liberalise the world from highcustoms tariffs and various other types ofrestrictions, General Agreement for Tariffs andTrade (GATT) was formed by some countries.In 1994, it was decided by the member
countries to set up a permanent institution forlooking after the promotion of free and fair tradeamongst nation and the GATT was transformedinto the World Trade Organisation from 1st
January 1995.WTO is the only international organisation
dealing with the global rules of trade betweennations. It sets the rules for the global tradingsystem and resolves disputes between itsmember nations. WTO also covers trade inservices, such as telecommunication andbanking, and others issues such as intellectualrights.
The WTO has however been criticised andopposed by those who are worried about theeffects of free trade and economic globalisation.It is argued that free trade does not makeordinary people’s lives more prosperous. It isactually widening the gulf between rich andpoor by making rich countries more rich. Thisis because the influential nations in the WTOfocus on their own commercial interests.Moreover, many developed countries have notfully opened their markets to products fromdeveloping countries. It is also argued thatissues of health, worker’s rights, child labourand environment are ignored.
WTO Headquarters are located in Geneva, Switzerland.
164 countries were members of WTO as on December2016.
India has been one of the founder member of WTO.
Regional Trade Blocs
Regional Trade Blocs have come up in order toencourage trade between countries withgeographical proximity, similarity andcomplementarities in trading items and to curbrestrictions on trade of the developing world.Today, 120 regional trade blocs generate 52 percent of the world trade. These trading blocsdeveloped as a response to the failure of the globalorganisations to speed up intra-regional trade.
Though, these regional blocs remove tradetariffs within the member nations and
Think of some reasons why dumping is becoming aserious concern among trading nations?
2020-21
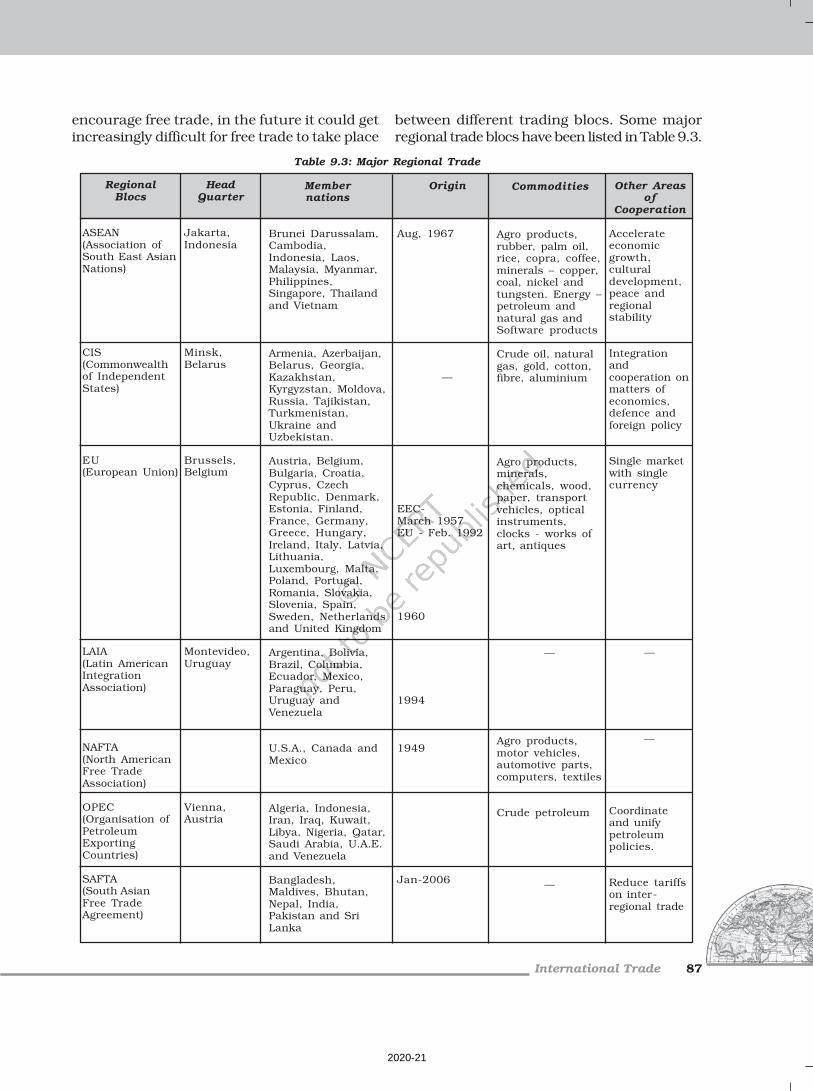
International Trade 87
encourage free trade, in the future it could getincreasingly difficult for free trade to take place
between different trading blocs. Some majorregional trade blocs have been listed in Table 9.3.
Table 9.3: Major Regional Trade
RegionalBlocs
ASEAN(Association ofSouth East AsianNations)
CIS(Commonwealthof IndependentStates)
EU(European Union)
LAIA(Latin AmericanIntegrationAssociation)
NAFTA(North AmericanFree TradeAssociation)
OPEC(Organisation ofPetroleumExportingCountries)
SAFTA(South AsianFree TradeAgreement)
HeadQuarter
Jakarta,Indonesia
Minsk,Belarus
Brussels,Belgium
Montevideo,Uruguay
Vienna,Austria
Membernations
Brunei Darussalam,Cambodia,Indonesia, Laos,Malaysia, Myanmar,Philippines,Singapore, Thailandand Vietnam
Armenia, Azerbaijan,Belarus, Georgia,Kazakhstan,Kyrgyzstan, Moldova,Russia, Tajikistan,Turkmenistan,Ukraine andUzbekistan.
Austria, Belgium,Bulgaria, Croatia,Cyprus, CzechRepublic, Denmark,Estonia, Finland,France, Germany,Greece, Hungary,Ireland, Italy, Latvia,Lithuania,Luxembourg, Malta,Poland, Portugal,Romania, Slovakia,Slovenia, Spain,Sweden, Netherlandsand United Kingdom
Argentina, Bolivia,Brazil, Columbia,Ecuador, Mexico,Paraguay, Peru,Uruguay andVenezuela
U.S.A., Canada andMexico
Algeria, Indonesia,Iran, Iraq, Kuwait,Libya, Nigeria, Qatar,Saudi Arabia, U.A.E.and Venezuela
Bangladesh,Maldives, Bhutan,Nepal, India,Pakistan and SriLanka
Origin
Aug, 1967
—
EEC-March 1957EU - Feb. 1992
1960
1994
1949
Jan-2006
Commodities
Agro products,rubber, palm oil,rice, copra, coffee,minerals – copper,coal, nickel andtungsten. Energy –petroleum andnatural gas andSoftware products
Crude oil, naturalgas, gold, cotton,fibre, aluminium
Agro products,minerals,chemicals, wood,paper, transportvehicles, opticalinstruments,clocks - works ofart, antiques
—
Agro products,motor vehicles,automotive parts,computers, textiles
Crude petroleum
—
Other Areasof
Cooperation
Accelerateeconomicgrowth,culturaldevelopment,peace andregionalstability
Integrationandcooperation onmatters ofeconomics,defence andforeign policy
Single marketwith singlecurrency
—
—
Coordinateand unifypetroleumpolicies.
Reduce tariffson inter-regional trade
2020-21

Fundamentals of Human Geography88
Concerns Related to International Trade
Undertaking international trade is mutuallybeneficial to nations if it leads to regionalspecialisation, higher level of production, betterstandard of living, worldwide availability ofgoods and services, equalisation of prices andwages and diffusion of knowledge and culture.
International trade can prove to bedetrimental to nations of it leads to dependenceon other countries, uneven levels ofdevelopment, exploitation, and commercialrivalry leading to wars. Global trade affectsmany aspects of life; it can impact everythingfrom the environment to health and well-beingof the people around the world. As countriescompete to trade more, production and the useof natural resources spiral up, resources getused up faster than they can be replenished.As a result, marine life is also depleting fast,forests are being cut down and river basins soldoff to private drinking water companies. Multi-national corporations trading in oil, gas mining,pharmaceuticals and agri-business keepexpanding their operations at all costs creatingmore pollution – their mode of work does notfollow the norms of sustainable development.If organisations are geared only towards profitmaking, and environmental and healthconcerns are not addressed, then it could leadto serious implications in the future.
GATEWAYS OF INTERNATIONAL TRADE
Ports
The chief gateways of the world of internationaltrade are the harbours and ports. Cargoes andtravellers pass from one part of the world toanother through these ports.
The ports provide facilities of docking,loading, unloading and the storage facilities forcargo. In order to provide these facilities, theport authorities make arrangements formaintaining navigable channels, arranging tugsand barges, and providing labour andmanagerial services. The importance of a portis judged by the size of cargo and the numberof ships handled. The quantity of cargo handledby a port is an indicator of the level ofdevelopment of its hinterland.
Fig. 9.5: San Francisco, the largest land-lockedharbour in the world
Types of Port
Generally, ports are classified according to thetypes of traffic which they handle.Types of port according to cargo handled:(i) Industrial Ports: These ports specialise in
bulk cargo-like grain, sugar, ore, oil,chemicals and similar materials.
(ii) Commercial Ports: These ports handlegeneral cargo-packaged products andmanufactured good. These ports alsohandle passenger traffic.
Fig. 9.6: Leningrad Commercial Port
(iii) Comprehensive Ports: Such ports handlebulk and general cargo in large volumes.
2020-21

International Trade 89
Most of the world’s great ports areclassified as comprehensive ports.
Types of port on the basis of location:
(i) Inland Ports: These ports are located awayfrom the sea coast. They are linked to thesea through a river or a canal. Such portsare accessible to flat bottom ships orbarges. For example, Manchester is linkedwith a canal; Memphis is located on theriver Mississippi; Rhine has several portslike Mannheim and Duisburg; andKolkata is located on the river Hoogli, abranch of the river Ganga.
(ii) Out Ports: These are deep water ports builtaway from the actual ports. These servethe parent ports by receiving those shipswhich are unable to approach them dueto their large size. Classic combination,for example, is Athens and its out portPiraeus in Greece.
Types of port on the basis of specialisedfunctions:
(i) Oil Ports: These ports deal in theprocessing and shipping of oil. Some ofthese are tanker ports and some arerefinery ports. Maracaibo in Venezuela,Esskhira in Tunisia, Tripoli in Lebanon are
tanker ports. Abadan on the Gulf of Persiais a refinery port.
(ii) Ports of Call: These are the ports whichoriginally developed as calling points onmain sea routes where ships used toanchor for refuelling, watering and takingfood items. Later on, they developed intocommercial ports. Aden, Honolulu andSingapore are good examples.
(iii) Packet Station: These are also known asferry ports. These packet stations areexclusively concerned with thetransportation of passengers and mailacross water bodies covering shortdistances. These stations occur in pairslocated in such a way that they face eachother across the water body, e.g. Dover inEngland and Calais in France across theEnglish Channel.
(iv) Entrepot Ports: These are collection centreswhere the goods are brought from differentcountries for export. Singapore is anentrepot for Asia. Rotterdam for Europe,and Copenhagen for the Baltic region.
(v) Naval Ports: These are ports which haveonly strategic importance. These portsserve warships and have repair workshopsfor them. Kochi and Karwar are examplesof such ports in India.
EXERCISES
1. Choose the right answer from the four alternatives given below.(i) Most of the world’s great ports are classified as:
(a) Naval Ports (c) Comprehensive Ports
(b) Oil Ports (d) Industrial Ports
(ii) Which one of the following continents has the maximum flow of globaltrade?
(a) Asia (c) Europe
(b) North America (d) Africa
2020-21

Fundamentals of Human Geography90
(iii) Which one of the following South American nation, is a part of OPEC?
(a) Brazil (c) Venezuela
(b) Chile (d) Peru
(iv) In which of the following trade blocs, is India an associate member?
(a) SAFTA (c) ASEAN
(b) OECD (d) OPEC
2. Answer the following questions in about 30 words:
(i) What is the basic function of the World Trade Organisation?
(ii) Why is it detrimental for a nation to have negative balance of payments?
(iii) What benefits do nations get by forming trading blocs?
3. Answer the following questions in not more than 150 words:
(i) How are ports helpful for trade? Give a classification of ports on the basisof their location.
(ii) How do nations gain from International Trade?
2020-21

Unit-IV
Chapter-10
Human Settlements
We all live in clusters of houses. You may call ita village, a town or a city, all are examples ofhuman settlements. The study of humansettlements is basic to human geographybecause the form of settlement in any particularregion reflects human relationship with theenvironment. A human settlement is defined asa place inhabited more or less permanently. Thehouses may be designed or redesigned,buildings may be altered, functions may changebut settlement continues in time and space.There may be some settlements which aretemporary and are occupied for short periods,may be a season.
CLCLCLCLCLASSIFICAASSIFICAASSIFICAASSIFICAASSIFICATION OF SETTLEMENTSTION OF SETTLEMENTSTION OF SETTLEMENTSTION OF SETTLEMENTSTION OF SETTLEMENTS
RURAL URBRURAL URBRURAL URBRURAL URBRURAL URBAN DICHOAN DICHOAN DICHOAN DICHOAN DICHOTTTTTOMYOMYOMYOMYOMY
It is widely accepted that settlements can bedifferentiated in terms of rural and urban, butthere is no consensus on what exactly definesa village or a town. Although population size isan important criterion, it is not a universalcriterion since many villages in denselypopulated countries of India and China havepopulation exceeding that of some towns ofWestern Europe and United States.
At one time, people living in villagespursued agriculture or other primary activities,but presently in developed countries, largesections of urban populations prefer to live invillages even though they work in the city. Thebasic difference between towns and villages isthat in towns the main occupation of the peopleis related to secondary and tertiary sectors,while in the villages most of the people areengaged in primary occupations such asagriculture, fishing, lumbering, mining, animalhusbandry, etc.
Sub Urbanisation
It is a new trend of people moving away from
congested urban areas to cleaner areas
outside the city in search of a better quality
of living. Important suburbs develop around
major cities and everyday thousands of
people commute from their homes in the
sub urbs to their work places in the city.
2020-21

Fundamentals of Human Geography92
Differentiations between rural and urbanon the basis of functions are more meaningfuleven though there is no uniformity in thehierarchy of the functions provided by rural andurban settlements. Petrol pumps are consideredas a lower order function in the United Stateswhile it is an urban function in India. Evenwithin a country, rating of functions may varyaccording to the regional economy. Facilitiesavailable in the villages of developed countriesmay be considered rare in villages of developingand less developed countries.
The census of India, 1991 defines urban
settlements as “All places which have
municipality, corporation, cantonment board
or notified town area committee and have a
minimum population of 5000 persons, at
least 75 per cent of male workers are
engaged in non-agricultural pursuits and a
density of population of at least 400 persons
per square kilometers are urban.
TYPES AND PATYPES AND PATYPES AND PATYPES AND PATYPES AND PATTERNS OF SETTLEMENTSTTERNS OF SETTLEMENTSTTERNS OF SETTLEMENTSTTERNS OF SETTLEMENTSTTERNS OF SETTLEMENTS
Settlements may also be classified by theirshape, patterns types. The major typesclassified by shape are:
(i) Compact or Nucleated settlements:
These settlements are those in whichlarge number of houses are built veryclose to each other. Such settlementsdevelop along river valleys and in fertileplains. Communities are closely knitand share common occupations.
(ii) Dispersed Settlements: In thesesettlements, houses are spaced farapart and often interspersed with fields.A cultural feature such as a place ofworship or a market, binds thesettlement together.
Fig. 10.2: Dispersed Settlements
Rural Settlements
Rural settlements are most closely and directlyrelated to land. They are dominated by primaryactivities such as agriculture, animalhusbandary, fishing etc. The settlements sizeis relatively small. Some factors affecting thelocation of rural settlements are :
Fig.10.1 : Compact Settlements
Fig. 10.3 : Siting near water
Water Supply
Usually rural settlements are located near waterbodies such as rivers, lakes, and springs wherewater can be easily obtained. Sometimes theneed for water drives people to settle in otherwisedisadvantaged sites such as islandssurrounded by swamps or low lying riverbanks. Most water based ‘wet point’ settlementshave many advantages such as water for
2020-21

Human Settlements 93
drinking, cooking and washing. Rivers andlakes can be used to irrigate farm land. Waterbodies also have fish which can be caught fordiet and navigable rivers and lakes can be usedfor transportation.
Land
People choose to settle near fertile lands suitablefor agriculture. In Europe villages grew up nearrolling country avoiding swampy, low lyingland while people in south east Asia chose tolive near low lying river valleys and coastalplains suited for wet rice cultivation. Earlysettlers chose plain areas with fertile soils.
Upland
Upland which is not prone to flooding waschosen to prevent damage to houses and lossof life. Thus, in low lying river basins peoplechose to settle on terraces and levees which are“dry points”. In tropical countries people buildtheir houses on stilts near marshy lands toprotect themselves from flood, insects andanimal pests.
Building Material
The availability of building materials- wood,stone near settlements is another advantage.Early villages were built in forest clearings wherewood was plentiful.
Defence
During the times of political instability, war,hostility of neighbouring groups villages werebuilt on defensive hills and islands. In Nigeria,upstanding inselbergs formed good defensivesites. In India most of the forts are located onhigher grounds or hills.
Planned Settlements
Sites that are not spontaneously chosen byvillagers themselves, planned settlements areconstructed by governments by providingshelter, water and other infrastructures onacquired lands. The scheme of villagisation inEthiopia and the canal colonies in IndiraGandhi canal command area in India are somegood examples.
Rural Settlement Patterns
Patterns of rural settlements reflect the way thehouses are sited in relation to each other. Thesite of the village, the surrounding topographyand terrain influence the shape and size of avillage.
Rural settlements may be classified on thebasis of a number of criteria:
(i) On the basis of setting: The main typesare plain villages, plateau villages,coastal villages, forest villages anddesert villages.
(ii) On the basis of functions: There maybe farming villages, fishermen’s villages,lumberjack villages, pastoral villages etc.
(iii) On the basis of forms or shapes of the
settlements: These may be a numberof geometrical forms and shapes suchas Linear, rectangular, circular starlike, T-shaped village, double village,cross-shaped village etc.
(a) Linear pattern: In such settlementshouses are located along a road,railway line, river, canal edge of a valleyor along a levee.
(b) Rectangular pattern: Such patterns ofrural settlements are found in plainareas or wide inter montane valleys.The roads are rectangular and cut eachother at right angles.
In loess areas of China, cave dwellings wereimportant and African Savanna’s buildingmaterials were mud bricks and the Eskimos, inpolar regions, use ice blocks to construct igloos.
Fig. 10.4 : House on stilts
2020-21

Fundamentals of Human Geography94
(c) Circular pattern: Circular villagesdevelop around lakes, tanks andsometimes the village is planned in sucha way that the central part remains openand is used for keeping the animals toprotect them from wild animals.
(d) Star like pattern: Where several roadsconverge, star shaped settlements developby the houses built along the roads.
(e) T-shaped, Y-shaped, Cross-shaped or
cruciform settlements: T -shaped
settlements develop at tri-junctions of
the roads ( ) while -shaped
settlements emerge as the places wheretwo roads converge on the third oneand houses are built along these roads.Cruciform settlements develop on thecross-roads and houses extend in allthe four direction.
Fig.10.6 : Linear pattern settlement Fig.10.7 : Y shape settlement
Linear Pattern Cross-shape Pattern Star-like Pattern
T-Shape Pattern Circular Pattern Double Pattern
Railway
Bridge
Road
Temple
River
Village
Canal
Pond
Well
Tree
Fig. 10.5: Rural Settlement Patterns
2020-21

Human Settlements 95
(f) Double village: These settlementsextend on both sides of a river wherethere is a bridge or a ferry.
Identify these patterns on any topographical sheet which
you have studied in Practical Work in Geography, Part
I (NCERT, 2006) in Class XI
Problems of Rural Settlements
Rural settlements in the developing countriesare large in number and poorly equipped withinfrastructure. They represent a great challengeand opportunity for planners.
Supply of water to rural settlements indeveloping countries is not adequate. Peoplein villages, particularly in mountainous andarid areas have to walk long distances to fetchdrinking water. Water borne diseases such ascholera and jaundice tend to be a commonproblem. The countries of South Asia faceconditions of drought and flood very often. Cropcultivation sequences, in the absence ofirrigation, also suffer.
The general absence of toilet and garbagedisposal facilities cause health related problems.
The design and use of building materialsof houses vary from one ecological region toanother. The houses made up of mud, woodand thatch, remain susceptible to damageduring heavy rains and floods, and requireproper maintenance every year. Most housedesigns are typically deficient in properventilation. Besides, the design of a houseincludes the animal shed along with its fodder-store within it. This is purposely done to keepthe domestic animals and their food properlyprotected from wild animals.
Unmetalled roads and lack of moderncommunication network creates a uniqueproblem. During rainy season, the settlementsremain cut off and pose serious difficulties inproviding emergency services. It is also difficultto provide adequate health and educationalinfrastructure for their large rural population.The problem is particularly serious whereproper villagisation has not taken place andhouses are scattered over a large area.
Urban Settlements
Rapid urban growth is a recent phenomenon.Until recent times, few settlements reached thepopulation size of more than a few thousandinhabitants. The first urban settlement to reacha population of one million was the city ofLondon by around. A.D. 1810 By 1982approximately 175 cities in the world hadcrossed the one million population mark.Presently 54 per cent of the world’s populationlives in urban settlements compared to only 3per cent in the year 1800 (Table 10.1).
Classification of Urban Settlements
The definition of urban areas varies from onecountry to another. Some of the common basisof classification are size of population,occupational structure and administrativesetup.
Population Size
It is an important criteria used by most countriesto define urban areas. The lower limit of thepopulation size for a settlement to be designatedas urban is 1,500 in Colombia, 2,000 inArgentina and Portugal, 2,500 in U.S.A. andThailand, 5,000 in India and 30,000 in Japan.Besides the size of population, density of 400persons per sq km and share of non-agriculturalworkers are taken into consideration in India.Countries with low density of population maychoose a lower number as the cut-off figurecompared to densely populated countries. InDenmark, Sweden and Finland, all places witha population size of 250 persons are calledurban. The minimum population for a city is
Year Percentage
1800 3
1850 6
1900 14
1950 30
1982 37
2001 48
2017 54
Table 10.1: Percentage of World’s Population Livingin Urban Areas
2020-21

Fundamentals of Human Geography96
300 in Iceland, whereas in Canada andVenezuela, it is 1,000 persons.
Occupational Structure
In some countries, such as India, the majoreconomic activities in addition to the size of thepopulation in designating a settlement as urbanare also taken as a criterion. Similarly, in Italy, asettlement is called urban, if more than 50 percent of its economically productive populationis engaged in non-agricultural pursuits. Indiahas set this criterion at 75 per cent.
Administration
The administrative setup is a criterion forclassifying a settlement as urban in somecountries. For example, in India, a settlementof any size is classified as urban, if it has amunicipality, Cantonment Board or NotifiedArea Council. Similarly, in Latin Americancountries, such as Brazil and Bolivia, anyadministrative centre is considered urbanirrespective of its population size.
Location
Location of urban centres is examined withreference to their function. For example, thesitting requirements of a holiday resort are quitedifferent from that of an industrial town, amilitary centre or a seaport. Strategic townsrequire sites offering natural defence; miningtowns require the presence of economicallyvaluable minerals; industrial towns generallyneed local energy supplies or raw materials;tourist centres require attractive scenery, or amarine beach, a spring with medicinal wateror historical relics, ports require a harbour etc.
Locations of the earliest urban settlementswere based on the availability of water, buildingmaterials and fertile land. Today, while theseconsiderations still remain valid, moderntechnology plays a significant role in locatingurban settlements far away from the source ofthese materials. Piped water can be suppliedto a distant settlement, building material canbe transported from long distances.
Apart from site, the situation plays animportant role in the expansion of towns. The
urban centres which are located close to animportant trade route have experienced rapiddevelopment.
Functions of Urban Centres
The earliest towns were centres ofadministration, trade, industry, defence andreligious importance. The significance of defenceand religion as differentiating functions hasdeclined in general, but other functions haveentered the list. Today, several new functions,such as, recreational, residential, transport,mining, manufacturing and most recentlyactivities related to information technology arecarried on in specialised towns. Some of thesefunctions do not necessarily require the urbancentre to have any fundamental relationshipwith their neighbouring rural areas.
What would be the effects of Informationand Communication Technology (ICT) asa function on the development of existingand new settlements?
Prepare a list of cities where earlier functions have been
replaced by newer ones.
In spite of towns performing multiplefunctions we refer to their dominant function.For example, we think of Sheffield as anindustrial city, London as a port city,Chandigarh as an administrative city and soon. Large cities have a rather greater diversityof functions. Besides, all cities are dynamic andover a period of time may develop new functions.Most of the early nineteenth-century fishingports in England have now developed tourism.Many of the old market towns are now knownfor manufacturing activities. Towns and citiesare classified into the following categories.
Administrative Towns
National capitals, which house the administrativeoffices of central governments, such as New Delhi,Canberra, Beijing, Addis Ababa, WashingtonD.C., and London etc. are called administrative
2020-21
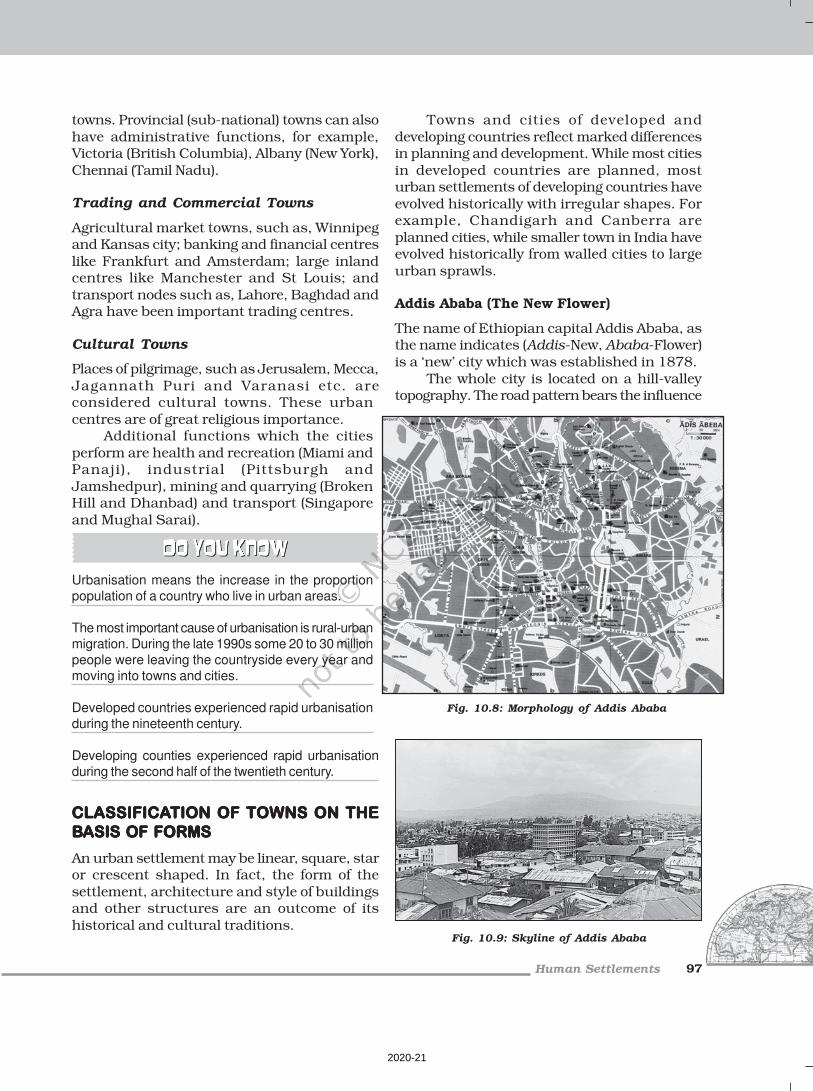
Human Settlements 97
towns. Provincial (sub-national) towns can alsohave administrative functions, for example,Victoria (British Columbia), Albany (New York),Chennai (Tamil Nadu).
Trading and Commercial Towns
Agricultural market towns, such as, Winnipegand Kansas city; banking and financial centreslike Frankfurt and Amsterdam; large inlandcentres like Manchester and St Louis; andtransport nodes such as, Lahore, Baghdad andAgra have been important trading centres.
Cultural Towns
Places of pilgrimage, such as Jerusalem, Mecca,Jagannath Puri and Varanasi etc. areconsidered cultural towns. These urbancentres are of great religious importance.
Additional functions which the citiesperform are health and recreation (Miami andPanaji), industrial (Pittsburgh andJamshedpur), mining and quarrying (BrokenHill and Dhanbad) and transport (Singaporeand Mughal Sarai).
Urbanisation means the increase in the proportion
population of a country who live in urban areas.
The most important cause of urbanisation is rural-urban
migration. During the late 1990s some 20 to 30 million
people were leaving the countryside every year and
moving into towns and cities.
Developed countries experienced rapid urbanisation
during the nineteenth century.
Developing counties experienced rapid urbanisation
during the second half of the twentieth century.
CLCLCLCLCLASSIFICAASSIFICAASSIFICAASSIFICAASSIFICATION OF TOTION OF TOTION OF TOTION OF TOTION OF TOWNS ON THEWNS ON THEWNS ON THEWNS ON THEWNS ON THE
BBBBBASIS OF FORMSASIS OF FORMSASIS OF FORMSASIS OF FORMSASIS OF FORMS
An urban settlement may be linear, square, staror crescent shaped. In fact, the form of thesettlement, architecture and style of buildingsand other structures are an outcome of itshistorical and cultural traditions.
Towns and cities of developed anddeveloping countries reflect marked differencesin planning and development. While most citiesin developed countries are planned, mosturban settlements of developing countries haveevolved historically with irregular shapes. Forexample, Chandigarh and Canberra areplanned cities, while smaller town in India haveevolved historically from walled cities to largeurban sprawls.
Addis Ababa (The New Flower)
The name of Ethiopian capital Addis Ababa, asthe name indicates (Addis-New, Ababa-Flower)is a ‘new’ city which was established in 1878.
The whole city is located on a hill-valleytopography. The road pattern bears the influence
Fig. 10.8: Morphology of Addis Ababa
Fig. 10.9: Skyline of Addis Ababa
2020-21

Fundamentals of Human Geography98
of the local topography. The roads radiate fromthe govt headquarters Piazza, Arat and AmistKilo roundabouts. Mercato has markets whichgrew with time and is supposed to be the largestmarket between Cairo and Johannesburg. Amulti-faculty university, a medical college, anumber of good schools make Addis Ababa aneducational centre. It is also the terminal stationfor the Djibouti-Addis Ababa rail route. Boleairport is a relatively new airport. The city haswitnessed rapid growth because of its multi-functional nature and being a large nodal centrelocated in the centre of Ethiopia.
Canberra
Canberra was planned as the capital ofAustralia in 1912 by American landscapearchitect, Walter Burley Griffin. He hadenvisaged a garden city for about 25,000 peopletaking into account the natural features of thelandscape. There were to be five main centres,
each with separate city functions. During thelast few decades, the city has expanded toaccommodate several satellite towns, whichhave their own centres. The city has wide-openspaces and many parks and gardens.
Types of Urban Settlements
Depending on the size and the services availableand functions rendered, urban centres aredesignated as town, city, million city,conurbation, megalopolis.
Town
The concept of ‘town’ can best be understoodwith reference to ‘village’. Population size is notthe only criterion. Functional contrasts betweentowns and villages may not always be clear-cut, but specific functions such as,manufacturing, retail and wholesale trade, andprofessional services exist in towns.
City
A city may be regarded as a leading town, whichhas outstripped its local or regional rivals. Inthe words of Lewis Mumford, “ the city is in factthe physical form of the highest and mostcomplex type of associative life”. Cities aremuch larger than towns and have a greaternumber of economic functions. They tend tohave transport terminals, major financialinstitutions and regional administrative offices.When the population crosses the one millionmark it is designated as a million city.
Conurbation
The term conurbation was coined by PatrickGeddes in 1915 and applied to a large area ofurban development that resulted from themerging of originally separate towns or cities.Greater London, Manchester, Chicago andTokyo are examples. Can you find out anexample from India?
Million City
The number of million cities in the world hasbeen increasing as never before. London
Fig. 10.10 : Morphology of a planned city – Canberra
2020-21

Human Settlements 99
reached the million mark in 1800, followed byParis in 1850, New York in 1860, and by 1950there were around 80 such cities. There were162 million cities in mid 70’s and there wasthreefold increase in 2005 and the numberreached to 438. In 2016, there were 512 citieswith at least 1 million inhabitants globally.By 2030, a projected 662 cities will have at least1 million residents.
Megalopolis
This Greek word meaning “great city”, waspopularised by Jean Gottman (1957) andsignifies ‘super- metropolitan’ region extending,as union of conurbations. The urbanlandscape stretching from Boston in the northto south of Washington in U.S.A. is the bestknown example of a megalopolis.
Distribution of Mega Cities
A mega city or megalopolis is a general termfor cities together with their suburbs with apopulation of more than 10 million people.New York was the first to attain the status ofa mega city by 1950 with a total populationof about 12.5 million. The number of megacities is now 31. The number of mega citieshas increased in the developing countriesduring the last 50 years vis-à-vis thedeveloped countries.
Problems of Human Settlementsin Developing Countries
The settlements in developing countries, sufferfrom various problems, such as unsustainableconcentration of population, congested housingand streets, lack of drinking water facilities.They also lack infrastructure such as,electricity, sewage disposal, health andeducation facilities.
Rural/Urban Problems
Can you identify the problems faced by your city/town/
village in terms of any one of the following?
Availability of potable water.
Electricity supply.
Sewerage system.
Transportation and communication facilities.
Health and educational infrastructure.
Water and air pollution.
Can you think of solutions to these problems?
Source: www.un.org as on 20.07.17
Table 10.2: Mega Cities of the World
Tokyo, Japan
Delhi, India
Shanghai, China
Mumbai (Bombay), India
São Paulo, Brazil
Beijing, China
Ciudad de Mèxico (Mexico City),
Mexico
Kinki M.M.A. (Osaka), Japan
Al-Qahirah (Cairo), Egypt
New York-Newark, USA
Dhaka, Bangladesh
Karachi, Pakistan
Buenos Aires, Argentina
Populationin 2016
(thousands)
City, CountryRank
1
2
3
4
5
6
7
8
9
10
11
12
13
38140
26454
24484
21357
21297
21240
21157
20337
19128
18604
18237
17121
15334
Kolkata (Calcutta), India
Istanbul, Turkey
Chongqing, China
Lagos, Nigeria
Manila, Philippines
Guangzhou, Guangdong, China
Rio de Janeiro, Brazil
Los Angeles-Long Beach-Santa
Ana, USA
Moskva (Moscow), Russian Federation
Kinshasa, Democratic Republic of
the Congo
Tianjin, China
Paris, France
Shenzhen, China
Jakarta, Indonesia
Bangalore, India
London, United Kingdom
Chennai (Madras), India
Lima, Peru
14
15
16
17
18
19
20
21
22
23
24
25
26
27
28
29
30
31
14980
14365
13744
13661
13131
13070
12981
12317
12260
12071
11558
10925
10828
10483
10456
10434
10163
10072
2020-21

Fundamentals of Human Geography100
Problems of Urban Settlements
People flock to cities to avail of employmentopportunities and civic amenities. Since mostcities in developing countries are unplanned,it creates severe congestion. Shortage ofhousing, vertical expansion and growth ofslums are characteristic features of moderncities of developing countries. In many citiesan increasing proportion of the populationlives in substandard housing, e.g. slums andsquatter settlements. In most million pluscities in India, one in four inhabitants lives inillegal settlements, which are growing twice asfast as the rest of the cities. Even in the AsiaPacific countries, around 60 per cent of theurban population lives in squatter settlements.
Fig. 10.11: Slums
Economic Problems
The decreasing employment opportunities inthe rural as well as smaller urban areas of thedeveloping countries consistently push thepopulation to the urban areas. The enormousmigrant population generates a pool of un-skilled and semi-skilled labour force, which isalready saturated in urban areas.
Socio-cultural Problems
Cities in the developing countries suffer fromseveral social ills. Insufficient financial resourcesfail to create adequate social infrastructurecatering to the basic needs of the hugepopulation. The available educational andhealth facilities remain beyond the reach of theurban poor. Health indices also, present agloomy picture in cities of developing countries.Lack of employment and education tends toaggravate the crime rates. Male selectivemigration to the urban areas distorts the sexratio in these cities.
Environmental Problems
The large urban population in developingcountries not only uses but also disposes off ahuge quantity of water and all types of wastematerials. Many cities of the developingcountries even find it extremely difficult toprovide the minimum required quantity ofpotable water and water for domestic andindustrial uses. An improper sewerage systemcreates unhealthy conditions. Massive use oftraditional fuel in the domestic as well as theindustrial sector severely pollutes the air. Thedomestic and industrial wastes are either letinto the general sewerages or dumped withouttreatment at unspecified locations. Hugeconcrete structures erected to accommodate thepopulation and economic play a very conduciverole to create heat islands.
Urban Strategy
The United Nations Development
Programme (UNDP) has outlined these
priorities as part of its ‘Urban Strategy’.
What is a Healthy City?
World Health Organisation (WHO) suggests
that, among other things, a ‘healthy city’
must have:
A ’Clean’ and ‘Safe’ environment.
Meets the ‘Basic Needs’ of ‘All’ its
inhabitants.
Involves the ‘Community’ in local
government.
Provides easily accessible ‘Health’ service.
2020-21

Human Settlements 101
Increasing ‘Shelter’ for the urban poor.
Provision of basic urban services such as
‘Education’, ‘Primary Health care’, ‘Clean
Water and Sanitation’.
Improving women’s access to ‘Basic
Services’ and government facilities.
Upgrading ‘Energy’ use and alternative
‘Transport’ systems.
Reducing ‘Air Pollution’.
Cities, towns and rural settlements are linkedthrough the movements of goods, resources andpeople. Urban-rural linkages are of crucialimportance for the sustainability of human
EXERCISES
1. Choose the right answer from the four alternatives given below.
(i) Which one of the following forms of settlement develops along either side ofroads, rivers or canals?
(a) circular (c) cross-shaped
(b) linear (d) square
(ii) Which one of the following types of economic activities dominates in all ruralsettlement?
(a) primary (c) secondary
(b) tertiary (d) quaternary
(iii) In which of the following regions has the oldest well-documented urbansettlement found?
(a) Huang He Valley (c) Nile Valley
(b) Indus Valley (d) Mesopotamia
(iv) How many of the following cities in India have attained the million status at thebeginning of 2006?
(a) 40 (c) 41
(b) 42 (d) 43
(v) Sufficiency of which type of resources can help to create adequate socialinfrastructure catering to the needs of the large population in the developingcountries?
(a) financial (c) natural
(b) human (d) social
settlements. As the growth of rural populationhas outpaced the generation of employment andeconomic opportunities, rural-to-urban migrationhas steadily increased, particularly in thedeveloping countries, which has put an enormouspressure on urban infrastructure and servicesthat are already under serious stress. It is urgentto eradicate rural poverty and to improve thequality of living conditions, as well as to createemployment and educational opportunities inrural settlements. Full advantage must be takenof the complementary contributions and linkagesof rural and urban areas by balancing theirdifferent economic, social and environmentalrequirements.
2020-21

Fundamentals of Human Geography102
2. Answer the following questions in about 30 words.
(i) How would you define a settlement?
(ii) Distinguish between site and situation.
(iii) What are the bases of classifying settlements?
(iv) How would you justify the study of human settlements in humangeography?
3. Answer the following questions in not more than 150 words.
(i) What are rural and urban settlements? Mention theircharacteristics.
(ii) Discuss the problems associated with urban settlements indeveloping countries.
Project/Activity
(i) Do you live in a city? If not, do you live nearby? Is your lifesomehow linked to a city?
(a) What is its name?(b) When was it first settled?(c) Why was the site chosen?(d) What is its population?(e) What are the functions it performs?(f) On a sketch of the city, try to identify the areas where
these functions are performed.Each student should make a list of five things associated with the selected city;things that cannot be found elsewhere. This is a mini definition of the city as eachstudent sees it. The lists should be shared with the class. How much agreement is
there between the lists?
(ii) Can you think of some ways by which you can singlehandedly help reduce pollution levels of your settlement
Hints :(a) Proper garbage disposal(b) Using public transport(c) Better management of domestic water consumption(d) Planting trees in the neighbourhood
2020-21