Untitled - Кафедра кібербезпеки та інформаційних...
399
-
Upload
khangminh22 -
Category
Documents
-
view
0 -
download
0
Transcript of Untitled - Кафедра кібербезпеки та інформаційних...


MINISTRY OF EDUCATION AND SCIENCE OF UKRAINE
ODESSA STATE ENVIRONMENTAL UNIVERSITY ODESSA NATIONAL UNIVERSITY N.A. MECHNIKOV
KHARKIV NATIONAL ECONOMIC UNIVERSITY N.A. S. KUZNETS
INTELLECTUAL SYSTEMS AND INFORMATION TECHNOLOGIES
13-19 September 2021 Odesa, Ukraine
International Scientific and Practical Conference
Odesa
2021

МІНІСТЕРСТВО ОСВІТИ І НАУКИ УКРАЇНИ
ОДЕСЬКИЙ ДЕРЖАВНИЙ ЕКОЛОГІЧНИЙ УНІВЕРСИТЕТ ОДЕСЬКИЙ НАЦІОНАЛЬНИЙ УНІВЕРСИТЕТ ІМЕНІ І.І. МЕЧНИКОВА
ХАРКІВСЬКИЙ НАЦІОНАЛЬНИЙ ЕКОНОМІЧНИЙ УНІВЕРСИТЕТ ІМ. С. КУЗНЕЦЯ
ІНТЕЛЕКТУАЛЬНІ СИСТЕМИ ТА ІНФОРМАЦІЙНІ ТЕХНОЛОГІЇ
13-19 вересня 2021 Одеса, Україна
Міжнародна науково-практична конференція
Одеса
2021

UDC 004:004.89 I 73
International Scientific and Practical Conference «Intellectual Systems
and Information Technologies»: Conference Proceedings / Odessa State Environmental University. Odesa, 2021. 360 p.
Міжнародна науково-практична конференція «Інтелектуальні системи та інформаційні технології»: Матеріали конференції / Одеський державний екологічний університет. Одеса, 2021, 360 с. ISBN
Збірка містить праці Міжнародної науково-практичної конференції з інформаційних технології, систем та засобів штучного інтелекту, обчислювальних машин, систем, мереж та їх компонентів, автоматизації систем та процесів керування, систем захисту інформації, кібернетики, управління проектами, електротехніки та телекомунікацій, інтелектуальних приладів та систем.
The collection contains works of the International scientific-practical conference on information technologies, systems and means of artificial intelligence, computers, systems, networks and their components, automation of control systems and processes, information security systems, cybernetics, project management, electrical engineering and telecommunications, intelligent devices and systems.
Edіtors:
Gunchenko Y., Dr. of Tech.Sc., prof., ONU Kazakova N., Dr. of Tech.Sc., prof., OSENU
Kuznichenko S., PhD, associated prof., OSENU Yevseiev S., Dr. of Tech.Sc., prof., KhNEU
Fraze-Frazenko O., PhD, associated prof., OSENU
Редактори Гунченко Ю.О., д.т.н., проф., ОНУ імені І.І.Мечникова
Казакова Н.Ф., д.т.н., проф., ОДЕКУ Кузніченко С.Д., к.г.н., доц., ОДЕКУ
Євсеєв С.П., д.т.н., проф., ХНЕУ ім. С. Кузнеця Фразе-Фразенко О.О., к.т.н., доц., ОДЕКУ
ISBN 978-617-7711-43-7 © OSENU, ONU, KhNEU, 2021

ЗМІСТ
Oleh Borovyk, Yurii Gunchenko, Serhii Lienkov, Liudmyla Borovyk, Oleksii Konovalenko and Iryna Basaraba
Actual aspects of information technologies application at the problem decision of the movement organisation
by a convoy of vehicles ..........................................................................................................................................................................8
Genady Shevchenko, Oleksander Shumeiko, Volodymyr Bilozubenko
Capabilities of Data Mining As a Cognitive Tool: Methodological Aspects ......................................................................................... 16
Valeriy Hlukhov
Implementation of Shor's Algorithm in a Digital Quantum Coprocessor ............................................................................................ 22
Farhod Asrorov, Оleg Perehuda Valentyn Sobchuk and Anna Sukretna
Behavioral properties of bounded solutions for a weakly nonlinear impulse system that describe the
dissemination of information on social networks ............................................................................................................................... 31
Maryna Demianchuk, Natalia Maslii, Olena Kniazieva
Cloud technologies and artificial intelligence as the basis of digital development of the financial sector
of the economy of Ukraine ................................................................................................................................................................. 40
Maria Tala, Serhii Holub, Yurii Lazarenko
Intelligent monitoring of software test automation of Web sites ..................................................................................................... 46
Serhii Lienkov, Alexander Myasischev, Alexander Sieliukov, Alexander Pashkov, Genadiy Zhyrov, Andrii Zinchyk,
Checking the flight stability of a rotary UAV in navigation modes for different firmware ................................................................. 52
Олександр Сєлюков, Генадій Жиров, Євген Лєнков
Шляхи оптимізації параметрів процесу технічного обслуговування за станом .......................................................................... 62
Boris Perelygin, Tatiana Tkach, Anna Gnatovskaya
Preparing data and determining parameters for a feedforward neural network used for short-term
air temperature forecasting ................................................................................................................................................................ 65
Roman Dunets, Bogdan Dzundza, Liliia Turovska, Nazariy Senkiv
Features of the implementation of methods for a comprehensive study of properties
of thermoelectric materials ................................................................................................................................................................. 71
O. Aroslankin, A. Samokish, G. Shapiro, I. Gusak, O. Safyan
Structure of the ship system for the forecasting of navigation emergencies ..................................................................................... 77
Vladimir Mescheryakov, Dmitry Mescheryakov, Anna Gnatovskaya, Dmitry Kondratyuk, Aleksandr Salabash
Non-digital information processing in biotechnical systems with biofeedback .................................................................................. 81
Anatolii Amarii, Stepan Melnychuk and Yuliya Tanasyuk
Obstacles and Traffic Signs Tracking System ....................................................................................................................................... 89
Serhii Lienkov, Viacheslav Podlipaiev, Igor Tolok, Igor Lisitsky, Oleksii Fedchenko, Nataliia Lytvynenko
Svitlana Kuznichenko
The Information and Analytical Using of Non-Structured Information Resources ............................................................................. 94
Aleksandr Tymochko, Natalia Korolyuk, Аnastasia Korolyuk and Elena Korshets
A method for formalizing knowledge about planning UAV flight routes in conditions of uncertainty ............................................. 101
Victor Solovyov, Oleg Rybalskiy, Vadim Zhuravel, Aleksandr Shablya, Yevhen Tymko
Building of a Speaker’s Identification System Based on Deep Learning Neural Networks ............................................................... 107
Viktor Strelbitskyi, Nataliia Punchenko, Oleksandra Tsyra
Shaping the future of the marine industry as a condition for adaptation in an innovative society ................................................. 116

Dmytro Tolbatov, Serhii Holub
Construction of models of monitoring agents on several reference forms ...................................................................................... 121
Pavlenko Maksim, Dmytro Kalinovskiy, Nataliya Garmash
Development of a method for deciding on the distribution of efforts to destroy the air enemy between
anti-aircraft missile forces and fighter aircraft .................................................................................................................................. 126
Dmytro Tolbatov, Serhii Holub
Monitoring agents of stock exchanges .............................................................................................................................................. 131
Svitlana Ilchenko, Vadym Gryshchenko, Iryna Gryshchenko
Definition of the concept of "competitiveness" and "competitive advantages" of water transport
in the conditions of digital transformation of Ukraine ..................................................................................................................... 133
Воронич М.С., Рачинська А.Л.
Інформаційна технологія коливань тіла змінної маси з порожниною ........................................................................................ 139
Vladimir Kononovich, Irina Kononovych, Oksana Shvets
Vulnerabilities of cyber security of technical intelligentsia in relation to social engineering ........................................................... 144
Victor Volkov, Yuliia Loboda
Object Information Models of Complicated Systems in Control Problems ...................................................................................... 154
Serhii Ivanchenko, Oleksii Gavrylenko, Anatolii Holishevskyi, Vasyl Bondarenko,
Oleh Rushchak, Yevhen Prokopenko
Leakage of information through technical channels and a set of risk-oriented indicators of its security
for modern ITS ................................................................................................................................................................................... 159
Andrey Tityapkin
On one method of a point localization in a polygon in relation to ecological and geographical problems ...................................... 165
Andrii Trystan, Ihor Hurin, Olha Matiushchenko
Multi-agent group application model of unmanned aircrafts and unmanned ground vehicles during special
mission execution .............................................................................................................................................................................. 170
O. Trofymenko, Y. Prokop, N. Loginova and A. Zadereyko
Taxonomy of Chatbots ...................................................................................................................................................................... 181
O. Gurin, N. Salna
Improvement of the Integrated Supply Center Functioning Model With The Use of the Agent-Oriented
Approach ........................................................................................................................................................................................... 186
Yurii Tuchkovenko, Dmytro Kushnir
Using the Modern Modelling Complex for Operational Forecasting Of Oceanographic Conditions In The
Ukrainian Part Of The Sea Of Azov – The Black Sea Basin ................................................................................................................. 192
Larysa Hatsenko, Anton Lutsenko, Oleg Skopintsev, Serhii Pohasii
Investigation of Measurement Errors of Electrical Signals Characteristics of Energy Supply Systems ............................................. 200
Shmatko Olexandr, Olha Korol, Andrey Tkachov
Comparison of Machine Learning Methods for a Diabetes Prediction Information System ............................................................ 208
Valerii Koval, Vitaliy Lysenko, Ihor Bolbot, Oleksandr Samkov, Oleksandr Osinskiy, Dmytro Kalian,
Vyacheslav Vakas, Inna Yakymenko, Maksym Yevtushenko
Automation of technical diagnostics of digital signal synchronization devices ................................................................................ 214
Viktor Sineglazov, Andriy Rjabokonev
Hybrid Intelligence System of Emotional Facial and Speech State Estimation ................................................................................. 219

Judyta Ciemcioch
Application of MCDA methods in solving safety problems ............................................................................................................... 225
Dmitry Petukhin, Stanislav Velykodniy and Valentina Kozlovskaya
Modeling the space of possible states of the lesson schedule in higher education institutions ...................................................... 230
Makarenko O.S., Samorodov E.L.
To the statement of tasks of research of migration processes in education and science ................................................................ 238
Mikołaj Grotowski
Possibility of implementation a real-time production planning system to reduce the environmental impact
of the production line in the case of the electroplating line ............................................................................................................. 244
Станіслав Горбаченко, Олег Дикий
Трансформація функцій менеджменту в ІТ-середовищі .............................................................................................................. 249
Dmytro Rieznik, Mykhailo Levchenko, Valerii Patalakha, Serhii Kitik, Bohdan Shkurat, Oleksandr Globa
Using A Model Of Coordinated Interaction For Estimation Of Troops Joint Missions Effectiveness ................................................ 252
Lala Bakirova, Elvin Yusubov
Design and Simulation of the Auto-Tuning TS-Fuzzy PID Controller for the DC-DC ZETA Converter ............................................... 257
Khoroshko V., Zybin S., Khokhlachova Y., Ayasrah A., Al-Dalvash A.
Optimization of the Quality Assessment of the Information Security System Functioning .............................................................. 263
Nadiia Kazakova, Artem Sokolov, Alexander Troyanskiy
Correlation Immunity of Many-Valued Logic Component Functions of Modern
Cryptographic Algorithm S-Boxes ..................................................................................................................................................... 268
Yusifov Mahammad, Lala Bakirova
Machine learning concepts and applications .................................................................................................................................... 276
Serhii Holub, Svitlana Kunytska
Formation of the Structure of Multilayer Polyagent Functionals ..................................................................................................... 282
Victor Volkov, Natalia Makoyed
Fuzzy logic in control systems for potentially explosive objects ....................................................................................................... 287
Andrzej Rychlik
The IBN Networks for 6G Technology to Optimize Investments in Telecommunications Infrastructure ......................................... 293
Victor Volkov, Yuri Kryvchenko, Nataliia Novikova
Mathematical and information modeling of grain elevators as potentially explosive objects ......................................................... 298
Larysa Martynovych , Yurii Gunchenko, Yurii Shugailo, Yurii Bercov Dmytro Slutskyi, Kostiantyn Smirnov
Design of ternary decoder ................................................................................................................................................................. 304
Daniil Shmatkov
Copyright Issues in Digital Society: Sports Video Games ................................................................................................................. 310
Andriy Verlan, Bakhtiyar Khudayarov, Anatolii Verlan, Oleksandr Fomin and Sergii Polozhaenko
Computer modeling of nonlinear flutter of Viscoelastic based plate as a sustainable mechanical engineering
approach in aircraft structures’ design ............................................................................................................................................. 317
Natalia Pasichnyk, Dmytro Komarchuk, Korenkova Hanna, Sergey Shvorov, Oleksiy Opryshko, Nikolay Kiktev
Spectral-spatial analysis of data of images of plantings for identification of stresses of technological character ........................... 324
Natalia Pasichnyk, Sergey Shvorov, Yurii Gunchenko, Miroshkin Oleksandr, Elina Zakharchenko, Oleksiy
Opryshko
Prospects for satellite spectral monitoring for automation of processes for assessing agricultural soil use ................................... 332

Oleksii Kudryk, Oleg Bisikalo, Yuliia Oleksii, Eugeni Get’man
Information System to Forecasting the Stadiness of Ree Ooss Solid Solutions for Environmental Monitoring ............................... 340
Natalia Pasichnyk, Dmytro Komarchuk, Oleksiy Opryshko, Yurii Gunchenko, Sergey Shvorov, Oksana Zui
Validation of data obtained after field sensing using UAV for management of future crops ........................................................... 347
Liudmyla Dzhuma, Oleh Dmitriiev, Oleksii Lavrynenko, Mykhailo Soroka
Adequacy verification of the of the simulation reference model of the decision-making process in the Tower
controller workplace ......................................................................................................................................................................... 354
Vladimir Beskorovainyi, Valerii Semenets
Formalization of the task of reengineering of topological structures of terrestrial ecological
monitoring networks ......................................................................................................................................................................... 362
Olga Vasylieva, Borys Butvin and Yuriy Shtyfurak
Methodological Approach to Agent-Based Modeling of Social Networks ........................................................................................ 367
Piotr Milczarski
Evaluation and comparison of the processes in the frozen vegetable production using machine learning
methods ............................................................................................................................................................................................ 373
Сергій Голуб, Володимир Метелап
Інформаційна система інтелектуального моніторингу зварних з’єднань ................................................................................... 379
Любомир Петришин, Галина Михайлишин, Михайло Петришин
Оптимізація продуктивності багатопроцесорних обчислювальних систем за часом обслуговування .................................... 382
Тетяна Терещенко, Єгор Вернігоров
Програмний модуль збору та аналізу даних про дії студентів на базі бібліотеки інтеграції Moodle xAPI ............................... 387
Svitlana Kuznichenko, Iryna Buchynska
Development of a spatial decision-making support system for the location of technogenic hazard objects ................................... 391

Actual Aspects Of Information Technologies Application At The Problem Decision Of The Movement Organisation By A Convoy Of Vehicles
Oleh Borovyk1, Yurii Gunchenko2, Serhii Lienkov3, Liudmyla Borovyk4, Oleksii Konovalenko5 and Iryna Basaraba6
1, 4, 6 The National Academy of the State Border Guard Service of Ukraine named after Bohdan Khmelnytsky, Shevchenko str., 46, Khmelnytskyi, 29000, Ukraine 2 I.I. Mechnikov National University, Dvorianska Str., 2, Odessa, 65025, Ukraine 3 Military Institute of Taras Shevchenko National University of Kyiv, Lomonosova Str., 81, Kyiv, 03189, Ukraine 5 А 3814, Kyiv, Ukraine
Abstract The analysis of the known approaches to solving the problem of organization of transportation by a convoy of vehicles showed that due to the existence of a large number of brands and types of vehicles, from which the convoys are formed, various tactical and technical characteristics of the samples of technology, a branched network of roads, multi-variants the choice of route, the possible development of the traffic situation, they do not solve the problem of efficient organization of traffic, although the article shows the urgency and weight of such a problem. Therefore, the purpose of this study is to substantiate possible approaches to the solution of the problem of organizing transportation by a convoy of vehicles, as well as their formalization. The article analyzes the problems of optimization of the military convoy composition and the choice of the optimal route for its movement from the point of their complex combination to solve the systematic problem of the organization of transportation by the convoy of vehicles. On the basis of the analysis, a multicriteria optimization problem was formulated, including criteria and a system of constraints which included all criteria and limitations of the constituent problems, and substantiation of possible approaches to its solution. The proposed approaches make it possible to: classify the tasks of organizing the march; generate algorithms for solving the problem under study in each of the productions; to evaluate the limited possibilities of the analytical methods available to solve the applied tasks of organizing a march; evaluate possible approaches to forming a mathematical apparatus to solve these problems; to conclude the need to develop information technology that would ensure the solution of the problem of organizing the march in any setting.
Keywords 1 Optimization problem, Multicriteria, Mathematical Model, Algorithms, Information technology.
1. Introduction
To date, the issue of optimization of transportation is extremely important in various fields of human activity, in particular, when solving various tasks of the logistics sphere. The successful implementation of many relocations is
EMAIL: [email protected] (A. 1); [email protected] (A. 2); [email protected] (A. 3); [email protected] (A. 4); [email protected] (A. 5); [email protected] (A. 6) ORCID: 0000-0003-3691-662X (A. 1); 0000-0003-4423-8267 (A. 2); 0000-0001-7689-239Х (A. 3); 0000-0003-2949-2187 (A. 4); 0000-0002-2179-5477 (A. 5); 0000-0002-3209-9119 (A. 6)
highly dependent on the timely arrival of the military convoy at the intended destination. For effective transportation of various cargoes by land various modern vehicles with wide possibilities are used. Before scheduling transportation, it is possible to optimize the composition of the convoy of vehicles taking into account a wide
8

range of factors [1]. In the next step, it is necessary to solve the problem of determining the optimal route of movement of the military convoy. A sufficiently extensive network of highways provides a significant number of possible routes that combine the departure point with the destination. Such variance, of course, is observed even at the small distances that need to be overcome. The choice of the optimal route can be significantly influenced by the dynamics of the development of the road situation. Due to the influence of the predicted and stochastic factors, the speed of movement of the convoy on individual sections of the route can change significantly. Failure to adequately account for changes in traffic conditions can lead to incorrect route selection, which will not ensure timely arrival of the convoy at the destination. Such delay may result in the failure of certain tasks. Therefore, the task of organizing a march is relevant, and the presence of multivariance, a large number of factors that must be considered in its solution, their complex interaction and impact on the result causes a significant computational complexity of the task and the need to use powerful computing tools and the development of appropriate information technology for solving the problem.
The issue of forming a convoy of vehicles for efficient movement of cargo has been given attention in a number of works, in particular [1-4]. Thus, in [2] the method of tactical calculations for determining the number of vehicles for transportation of goods took into account the characteristics of cargo, load capacity and speed of movement of vehicles, range of movement, loading time, unloading, refueling, rest of drivers between flights (if provided), as well as the timing of the movement of goods. The paper [3] reflects the issues of predicting the effectiveness of the march of military formation on the reliability of weapons and military equipment, as well as the impact on the march efficiency of the number of repair units, the technical state of technology in terms of reliability, the level of efficiency of repair bodies in carrying out repair work and This is the cost of repairing weapons and military equipment. In [4], a variant of a cargo transportation model for finding the optimal route of cargo transportation from one sender to several consumers is presented in the transport network. However, in the analyzed works [2-4], such requirements for the formation of the optimal composition of the convoy of vehicles, such as the level of readiness, the power reserve on
motoresource, the number of brands and samples, the availability of fuel for refueling, etc., were ignored. These requirements were reflected in the author's work [1].
The choice of movement routes 8of the military convoy for the efficient movement of goods, as well as related problems, was focused in a number of works, in particular in [5-17]. An approach to choosing the route based on "edgelabels" is given in [5]. Its application makes it possible to accelerate the search for the shortest path by 500 times compared to Dijkstra's algorithm over a large graph. In [6], an algorithm for selecting optimal routes in a multimodal mode of a public transport network is presented. According to the results of this study, the approach to routing of transit nodes was adapted to plan for relocation by public transport. In the scientific work [7], the method of contraction hierarchy was used to find the shortest path. In the study [8], based on the application of the SHARC algorithm, the possibilities of finding the shortest paths for arbitrary means of transportation in a continental-scale transport network are presented. The problem of multimodal route planning has been investigated in a scientific paper [9]. In the work [10] a model for estimating traffic delays of vehicles is presented, taking into account arbitrary loads during traffic. The study [11] provides mapping of marshrutes for military ground vehicles on the battlefield. In a scientific paper [12], an algorithm for solving the problem of finding the shortest time paths in urban commuting networks using the branch and boundary method was developed. The issues [13-14] investigate the use of geoinformation technologies in solving logistical problems in military affairs, based on the use of modern ArcGIS information systems [15-17]. In the author's work [18], the problem of choosing the optimal route of convoy movement of the border commanding rapid response technique was taken into account, taking into account the peculiarities associated with the preliminary establishment and maintenance of the reliability of the initial data based on the use of spline functions [19-21] ; mathematical models of the studied problem for three cases (discrete-stochastic, discretely-deterministic and continuous-indefinite) are constructed, which depend on the peculiarities of realization of the convoy motion; algorithms for choosing the optimal route of movement of the Rapid Response Command Border Convoy of vehicles for each possible case are proposed.
9

However, despite the sufficient attention that was given to the authors, including the tasks of forming the optimal composition of the military convoy and choosing the route of its movement, the task of organizing a march that organically combines both one and the other of these tasks has not been fully explored. This is explained by the non-obviousness of approaches to solving such a problem.
Given the above urgency and importance of the problem of efficient movement organization, the important and urgent task now is to formalize the task of organizing transportation by a convoy of vehicles. The purpose of this study is to substantiate possible approaches to the solution of the specified problem and its formalization in different formulations taking into account the criteria and the system of limits of constituent problems.
2. Formulation of the task of organizing transportation of the military convoy at a meaningful level and its formalization
At the substantive level, the problem under study looks like this.
Given: complex nxxxM ;...;; 21= vehicles from which the composition of the engineering convoy may be formed for the carriage of personnel and cargo ( ix - symbol of a definite
specific vehicle, ____
,1 ni = ) ( )1U ; the tactical and technical characteristics of
each vehicle of this group ( )2U . Also, set up a network of roads that connect the
departure point (point А) with destination (point В). The mathematical model of the road network is a marked graph G , the weight of the edges of which represents the time of movement of the convoy along them ( )3U .
It is necessary to arrange transportation from point A to point B so that:
vehicles arrived at point B with maximum readiness ( )1K ;
the number of vehicles in the convoy was minimal ( 2K );
the number of vehicle brands in the convoy was minimal ( )3K ;
the duration of the march was minimal ( 4K );
the rate of the readiness factor of each vehicle shall not be less than the permitted level ( 1O );
the total capacity of vehicles from the the convoy allowed to carry the goods ( 2O );
the total volume of the body of vehicles from the warehouse allowed to transport the cargo ( 3O);
the total passenger capacity allowed to transport personnel ( 4O );
the total fuel consumption of vehicles from the convoy did not exceed the amount of fuel available to march by fuel type ( 85 ,...,OO );
the stock of motorsource was not less than the distance of transportation ( 9O ).
However, it should be taken into account that during the movement of the convoy, the motion time along the individual edges can be variable. This condition is determined by the influence on the time of movement along a single edge of different conditions, such as climatic (rain, ice, fog, etc.), man-made (blockage of the roadway, its post-damage due to flooding of the terrain, etc.), changes in the period of day (day, night). etc.
It should also be noted that the weights of the edges can be changed:
at times when the convoy is at a certain vertex of the graph, and the matrix of weights is updated at these moments. This is a case where the decision on the further route of traffic is made at the points of branching of roads taking into account the situation regarding the condition of individual sections, which changes dynamically and the data on which appear periodically;
at the times when the convoy is at a certain vertex of the graph, and for these moments the weights matrix that will take place when the convoy enters the vertex are well known in advance. This is a case where a route decision can be made at the beginning of the traffic, taking into account the well-known situation regarding the state of the roads, which will change dynamically, but the data on which can be taken into account in advance.
At the physical level, the formulated task of organizing a march consists in the complex solution of two interrelated problems: problem 1 - choosing the appropriate composition of the convoy of vehicles; problem 2 - choosing the appropriate route of its movement.
It should be noted that each of problems 1, 2 is solved separately from each other. The corresponding solutions are given in [1, 18].
10

The problem 1 is solved as a single-criterion optimization problem of the form:
Initial data , 321 ,, UUU . (1)
Criterion ( ) min,, 321 →KKKf (2)
System of restrictions: 91,...,OO , (3)
10O . (4)
In problems (1)-(4), one-criteria is obtained by the functional combination of three separate criteria 321 ,, KKK , which appeared in the direct statement of problem 1, and restriction 10O obtained by converting the criterion 4K .
The result of solving problem 1 is some set mxxxM ;...;; 211 = , the elements of which are
specific vehicles that are part of the convoy. Herewith, nm і MM 1 . Task 2 is solved as a single-criterion
optimization problem of the form: Initial data
1M , 32 ,UU . (5)
Criterion min4 →K . (6)
Tasks (5) - (6) take into account the variability of the edges of the road network graph, and also format of such change is how it occurs, at what moments, at which stage, the dynamic matrixes of the edges are known.
The result of solving task 2 is the route of movement of the convoy svvvV ;...;; 212 = - the set of vertices through which the route of travel must be passed.
Herewith, Av =1 , Bvs = . The problem studied in the following notations
can be represented as a multicriteria optimization problem of the following form:
Initial data 321 ,, UUU . (7)
Criterion
.minmin,min,max,
4
3
2
1
→
→
→
→
KKKK
(8)
System of restrictions 91,...,OO . (9)
Find ro xxxM ;...;; 21= , (10)
zo vvvV ;...;; 21= . (11)
In the tasks (7)-(11) ro xxxM ;...;; 21= - appropriate composition of the convoy of vehicles, аnd zo vvvV ;...;; 21= - expedient route of its movement.
The analysis of task 1 in the form (1) - (4) and task 2 in the form (5) - (6) leads to the conclusion that the solution of the studied problem in the form (7) - (11) can be following
= ro xxxM ;...;; 21 mxxxM ;...;; 211 = , аnd = zo vvvV ;...;; 21 svvvV ;...;; 212 = .
3. Foundation of approaches to solving the problem of organization of transportation by a convoy of technique
Conditions for partial problems of the general task of organizing the march, justification of approaches to solving the common problem, algorithms for the implementation of each of the variants are structured below.
Variant 1. Task 1. Mathematical model: 321 ,, UUU , ,,..., 91 OO
10O , ( ) min,, 321 →KKKf . The result of the solution: The composition of
the convoy is obtained in the form of a plurality mxxxM ;...;; 211 = .
Problem Solving Technology 1. Problem 1 in statement (1) - (4) is solved as an optimization problem.
Task 2. Mathematical model: 1M , 32 ,UU , min4 →K . The result of the solution: The route of
movement of the convoy in the form of a set is obtained svvvV ;...;; 212 = .
Problem Solving Technology 2. Problem 2 in statement (5) - (6) is solved.
Investigated task. The solution to the problem under study is
following: 1MM o = , 2VVo = . Variant 2. Task 1. Mathematical model: 321 ,, UUU , 1091 ,,..., OOO . The result of the solution: The variants of the
composition of the convoy in the form of sets are obtained
11

( ) ( ) ( ) ( ) 11
12
11
11 ;...;; mxxxM = ,
( ) ( ) ( ) ( ) 22
22
21
21 ;...;; mxxxM = ,…, ( ) ( ) ( ) ( ) d
msddd xxxM ;...;; 211 = .
Problem Solving Technology 1. Problem 1 in statement (1), (3), (4) is solved as a combinatorial problem.
Task 2.
Mathematical model: ( )iM1 , 32 ,UU ____
,1 di = , min4 →K .
The result of the solution: For each fixed value, the path of the convoy motion in the form of a set is obtained
( ) ( ) ( ) ss vvvvV ;;...;; 11
121
12 −= ,
( ) ( ) ( ) ss vvvvV ;;...;; 21
221
22 −
= ,…, ( ) ( ) ( ) s
ds
dd vvvvV ;;...;; 1212 −= .
Problem Solving Technology 2. Task 2 in statement (5) - (6) is solved.
Investigated task. The solution to the problem under study is
following: ( )ko MM 1= , ( )k
o VV 2= , where ( )kM1 - is the composition of the convoy that provides ( )kV2 .
Problem Solving Technology. It is established that the set ( )kV2 of the number of sets ( )1
2V , ( )22V ,…,
( )dV2 , which corresponds to the minimum time of movement of the convoy from point A to point B, that is 4min K .
Note to variant 2. In variant 2
( ) ( ) ( ) ( ) 11
12
11
11 ;...;; mxxxM = ,
( ) ( ) ( ) ( ) 22
22
21
21 ;...;; mxxxM = , …,
( ) ( ) ( ) ( ) dmd
ddd xxxM ;...;; 211 =
- sets that determine possible composition of convoys. The elements of these sets are specific vehicles from among the elements of the set M . So, ( ) MM 1
1 , ( ) MM 21 , …, ( ) MM d 1 . should
be noted that the capacity of the sets ( )11M , ( )2
1M , …, ( )dM1 may be different, and the elements of these sets may also not coincide.
Variant 3. Task 1. Mathematical model: 321 ,, UUU , ,,..., 91 OO
13121110 ,,, OOOO The result of the solution: The variants of the
composition of the convoy in the form of sets are
obtained ( ) ( ) ( ) ( ) 1
11
21
11
1 ;...;; mxxxM = , ( ) ( ) ( ) ( ) 2
22
22
12
1 ;...;; mxxxM = ,…, ( ) ( ) ( ) ( ) d
msddd xxxM ;...;; 211 = .
Problem Solving Technology 1. Problem 1 in statement (1), (3), (4) is solved with additional restrictions 131211 ,, OOO , as a combinatorial task.
Task 2.
Mathematical model: ( )iM1 , 32 ,UU
=
____
,1 di ,
min4 →K . The result of the solution: For each fixed value
____
,1 di = the route of movement of the convoy in the form of a set is obtained
( ) ( ) ( ) ss vvvvV ;;...;; 11
121
12 −= ,
( ) ( ) ( ) ss vvvvV ;;...;; 21
221
22 −
= ,…, ( ) ( ) ( ) s
ds
dd vvvvV ;;...;; 1212 −= .
Problem Solving Technology 2. Problem 2 in statement (5) - (6) is solved at each fixed value
____
,1 di = . Investigated task. The solution to the problem under study is
following: ( )k
o MM 1= , ( )ko VV 2= . 1MM o = ,
2VVo = .
For the set ( )kM 1 the appropriate route of
movement is determined from the note ( )kV2 , as the one that suits it.
Note to variant 3. In variant 3 restriction 11O obtained by
converting the criterion 1K , restriction 12O - criterion 2K , restriction 13O - criterion 3K .
In variant 3 that determines the possible composition of the convoys,
( ) ( ) ( ) ( ) 11
12
11
11 ;...;; mxxxM = ,
( ) ( ) ( ) ( ) 22
22
21
21 ;...;; mxxxM = , …, ( ) ( ) ( ) ( ) d
mdddd xxxM ;...;; 211 = ,
and also sets that determine possible route of movement,
( ) ( ) ( ) ss vvvvV ;;...;; 11
121
12 −=
, ( ) ( ) ( ) ss vvvvV ;;...;; 2
12
212
2 −=
,…,
( ) ( ) ( ) sd
sdd vvvvV ;;...;; 1212 −
= ,
not compulsory coincide with corresponding sets
12

of variant 2. If among the variants of convoy movement
( )12V , ( )2
2V ,…, ( )dV2 are such that provide the same value of the minimum time of movement of the convoy from point A to point B, so that 4min K , for each of these routes the composition of the corresponding convoys and by criterion are determined (2) ( ) min,, 321 →KKKf expedient
composition of convoy is determined ( )kM 1 . Variant 4. Investigated task. Mathematical model: 321 ,, UUU , ,,..., 91 OO
max,1 →K min,2 →K min,3 →K .min4 →K Result of solution: The solution to the problem
under study is following: 1MM o = , 2VVo = . Here 1M і 2V are sets, that satisfy all the
restrictions of the studied problem in the formulation of variant 4, and under which the criterion is fulfilled ( ) min,,, 4321 →KKKKg .
Note to variant 4. In such formulation, the studied problem
should be reduced first to an optimization single-criterion problem. For example, this can be done by entering a criterion ( ) min,,, 4321 →KKKKg . The function g should be presented in a multiplicative form.
Next, it is nessessary to create a dynamic matrix of weights of the edges of the graph for each of the possible solutions to the task. o do this, the procedure described in [18] should be applied.
After that, the studied problem can be solved as a combinatorial optimization problem.
Variant 5. Task 1. Mathematical model: 321 ,, UUU , ,,..., 91 OO
10O . Result of the solution: The variants of the
composition of the convoy in the form of sets are obtained
( ) ( ) ( ) ( ) 11
12
11
11 ;...;; mxxxM = ,
( ) ( ) ( ) ( ) 22
22
21
21 ;...;; mxxxM = ,…,
( ) ( ) ( ) ( ) dms
ddd xxxM ;...;; 211 = .
Problem Solving Technology 1. Task 1 in statement (1), (3), (4) is solved as a combinatorial search problem.
Task 2. Mathematical model: 1M , 32 ,UU , min4 →K . Result of the solution: For every fixed value
____
,1 di = movement route of the convoy is obtained in the form of set
( ) ( ) ( ) ss vvvvV ;;...;; 11
121
12 −= ,
( ) ( ) ( ) ss vvvvV ;;...;; 21
221
22 −
= ,…, ( ) ( ) ( ) s
ds
dd vvvvV ;;...;; 1212 −= .
Problem Solving Technology 2. Problem 2 in statement (5) - (6) is solved at each fixed value
____
,1 di = . Investigated task. Solution of the investigated task is following:
( )ko MM 1= , ( )k
o VV 2= .
The pair is selected ( )kM1 , ( )kV2 among the sets in the note for which the value of the complex performance indicator is maximum.
Note to variant 5. In Option 5, to solve the problem under study
for each pair of sets ( )iM1 , ( )iV2
=
____
,1 di the
efficiency of transportation is evaluated by tactical, technical, economic and comprehensive performance index. The materials of the work are used [22].
Variant 6. Task 1. Mathematical model: 321 ,, UUU , ,,..., 91 OO
13121110 ,,, OOOO . Result of the solution: The variants of the
composition of the convoy in the form of sets are obtained
( ) ( ) ( ) ( ) 11
12
11
11 ;...;; mxxxM = ,
( ) ( ) ( ) ( ) 22
22
21
21 ;...;; mxxxM = ,…,
( ) ( ) ( ) ( ) dms
ddd xxxM ;...;; 211 = .
Problem solving technology 1. Problem 1 in statement (1), (3), (4) is solved with additional restrictions 131211 ,, OOO , as a combinatorial task.
Task 2. Mathematical model: 1M , 32 ,UU , min4 →K
. Result of the solution: For each fixed value
____
,1 di = route of convoy movement is obtained in the form of a set
( ) ( ) ( ) ss vvvvV ;;...;; 11
121
12 −= ,
( ) ( ) ( ) ss vvvvV ;;...;; 21
221
22 −
= ,…,( ) ( ) ( ) s
ds
dd vvvvV ;;...;; 1212 −= .
13

Problem solving technology 2. Problem 2 in statement (5) - (6) is solved at each fixed value
____
,1 di = . Investigated task. Solution of the investigated task is following:
( )ko MM 1= , ( )k
o VV 2= .
The pair is selected ( )kM 1 , ( )kV2 among the sets in the note for which the value of the complex performance indicator is maximum.
Note to variant 6. In variant 6, to solve the problem under study
for each pair of sets ( )iM1 , ( )iV2
=
____
,1 di the
efficiency of transportation is evaluated by tactical, technical, economic and comprehensive performance index. The materials are used in paper [22].
General note. It should be noted that the problem under study
for each of the productions given in variants 1-6 should be solved in two productions, depending on how the edges are changed.
An analysis of the approaches described in variants 1-6 to solve the problem under study indicates that each of the options has the right to exist The ability to apply individual approaches to solving application problems depends on the solution of optimization problems in each case, which, in turn, depends on the search for analytical solutions or numerical applications of modern information technologies. The appropriateness of applying this or that approach also depends on the existence and time resources. The interesting thing is the question of the coincidence of the solutions of the tasks in each of the productions.
4. Conclusions
Therefore, as a result of the conducted research, an overview of possible approaches to solving the problem of transportation organization by a military convoy was carried out. The above approaches were the result of the analysis of the optimization decisions made by the authors for the choice of the appropriate composition of the military convoy and the appropriate route of its movement. Some of the approaches are based on the application of methods that have been worked out to solve the specified march organization tasks, and some of them are based on the use of the author's method of assessing the effectiveness
of the march. In addition, the paper formalizes each of these approaches and outlines the algorithms for solving the problem under study in each statement. The proposed approaches make it possible to: classify the organization of the march; generate algorithms for solving the problem under study in each of the productions; to evaluate the limited possibilities of analytical methods available to solve the applied tasks of organizing a march; evaluate possible approaches to the formation of a mathematical tools for solving these problems; to conclude on the need to develop information technology that would provide the solution to the task of organizing the march in any setting.
5. Acknowledgements
The work was performed within the framework of joint research of the Department of General Scientific and Engineering Disciplines, the Department of Telecommunication and Information Systems and the Department of Vehicles and Engineering Support of the State Border Guard of the National Academy of the State Border Guard Service of Ukraine.
6. References
[1] O. V. Borovyk, R. V. Rachok, L. V. Borovyk, V. V. Kupelskiy, Mathematical model of the problem of formation of the composition of the transport convoy of the frontier commandant rapid response and its software-algorithmic implementation. Compilation of scientific works of the Military Institute of Kyiv National University named after Taras Shevchenko. 55, 17-30 (2017).
[2] A. Y. Vayner, Tactical calculations. Military Publishing House, Moscow (1982).
[3] M. V. Chornyi, S. S. Stepanov, Predicting the effectiveness of a march of military formation by the reliability of weapons and military equipment by analytical modeling. Military Technical Compilation. 2(14), 64–69 (2014).
[4] T. A. Matveychuk, Modeling and program implementation of the process of cargo transportation planning in military logistics. Military Technical Compilation. 14, 18–25 (2016).
[5] M. Hilger, E. Kohler, R. Mohring, H. Schilling, Fast point-to-point shortest path
14

computations with arc-flags. The Shortest Path Problem, (Discrete Mathematics and Theoretical Computer Science; vol. 74). 41–72 (2009).
[6] L. Antsfeld, T. Walsh, Finding Multi-criteria Optimal Paths in Multi-modal Public Transportation Networks using the Transit Algorithm. Artificial Intelligence and Logistics AILog 2012 Workshop Proceedings. 1, 7–11 (2012).
[7] R. Geisberger, P. Sanders, D. Schultes, Contraction Hierarchies: Faster and Simpler Hierarchical Routing in Road Networks. Experimental Algorithms, (Theoretical informatics and general questions; vol. 5038), 319–333 (2008).
[8] D. Delling, Time-dependent SHARC-routing. Cham: Springer International Publishing AG, Special Issue: European Symposium on Algorithms; vol. 60), 60–94 (2011).
[9] H. Bast, D. Delling, A. Goldberg, Route Planning in Transportation Networks. Cham: Springer International Publishing AG, (Theoretical informatics and general questions; vol. 9220), 19–80 (2016).
[10] A. Ganin, M. Kitsak, D. Marchese, Resilience and efficiency in transportation networks. Science Advances. 3, 1–8 (2017).
[11] T. Zhao, J. Huang, J. Shi, Route Planning for Military Ground Vehicles in Road Networks under Uncertain Battlefield Environment. Journal of Advanced Transportation Received. 1, 1-10 (2018).
[12] O. F. Kuzkin, Searching routes in city route networks using the branch and border method. Utilities of cities. 103, 378–388 (2012).
[13] O. V. Vasylenko, D. P. Kucherov, O. O. Zacaryshyn, Geoinformation control systems for troop navigation tasks. Geoinformation systems in military tasks. Second scientific and technical seminar. Lviv (2011).
[14] I. V. Petlyuk, S. G. Vlasenko, O. I. Petlyuk, GIS technology in military affairs. Geoinformation systems and information technologies in military and special tasks "January GIS". Third scientific and practical seminar. Lviv (2012).
[15] A. Perencsik, S. Woo, B. Booth, ArcGIS: Building a Geodatabase. Redlands: ESRI Press (2014).
[16] ArcGIS Resource Center. ESRI. http://doc.arcgis.com/ru/arcgis-online.
[17] T. G. Leys, ArcGIS. ArcMap. User Manual. MSU, Moscow (2005).
[18] O. V. Borovyk, R. V. Rachok, L. V. Borovyk, V. V. Kupelskiy, The technique of choosing the optimal route of movement of the column of equipment on a non-stationary road network. Radio electronics, informatics, control (RIC). 4(51), 111-120 (2019).
[19] B. P. Dovgiy, A. V. Loveykin, Y. S. Vakal, Y. Y. Vakal, Spline functions and their application. Publishing and Printing Center “Kyiv University”, Kyiv (2016).
[20] I. Y. Aleshin, A. V. Sycheva, D. K. Agisheva, T. A. Matveeva, Interpolation of unknown functions by cubic splines. Modern high technology. 5-2, 188-189 (2014).
[21] Y. I. Pershyna, V. O. Pasichnyk, Approximation of discontinuous functions by discontinuous splines by the minimax method. Bulletin of KhNTU . 3(66), 82–87 (2018).
[22] O. V. Borovyk, V. V., Kupelskiy, Methods of estimation of efficiency of military transportations by a convoy of equipment. Weapons systems and military equipment. 3(59), 25-35 (2019)
15

Capabilities of Data Mining As a Cognitive Tool: Methodological Aspects Genady Shevchenko 1, Oleksander Shumeiko 2 and Volodymyr Bilozubenko 3
1 Scientific Center, Noosphere Company, Gagarin avenue, 103-A, Dnipro, 49055, Ukraine 2 Dniprovsk State Technical University, Dniprobudivska Street, 2, Kamyanske, 51900, Ukraine 3 Scientific Center, Noosphere Company, Gagarin avenue 103-A, Dnipro, 49055, Ukraine
Abstract Gaining a competitive advantage in many industries is possible only if the available digitized data contains genuine knowledge. In this respect, it is necessary to take a step to preliminary identify their hidden and non-obvious regularities using Data Mining (DM) methods. It is critical to know the capabilities and limits of the use of DM methods as a cognitive tool in order to build the effective strategy for addressing the real-life business problems. The aim of this paper: within the methodology of scientific cognition to specify the capabilities and limits of the applicability of DM methods. This will enhance the efficiency of using these DM methods by experts in this field as well as by a wide range of professionals in other fields who need an analysis of empirical data. The paper specifies and supplements the basic stages of scientific cognition in terms of using DM methods. The issue regarding the contribution of DM methods to the methodology of scientific cognition was raised, and the level of cognitive value of the results of their use was determined. The scheme illustrating the relationship between the methodology of the levels of scientific cognition, which supplements the well-known schemes of their classification and demonstrates the maximum capabilities of DM methods, was developed. In terms of the methodology of scientific cognition, a crucial fact was established - the limit of applicability of any DM method is the lowest, the first level of the methodology of scientific cognition – the level of techniques. The result of the processing in the form of ER can serve as a basis for these techniques. Keywords 1 Data Mining, data, scientific cognition, methodology, empirical regularity, hypothesis.
1. Introduction
The enhanced opportunities of the existing cognitive tools and a search for new tools have always aroused a great interest, owing to their crucial importance for the development of human civilization, because knowledge gained as a result of the use of these tools is the primary means of transforming the reality.
In recent decades, Data Mining (DM) methods and tools have become widely used (Data Mining — it is not a single method, but a variety of a large number of different methods for identification of regularities. In the English-speaking world, they commonly use the term “Machine Learning”, denoting all Data Mining technologies.). This
EMAIL: [email protected] (A. 1); [email protected] (А. 2); [email protected] (A. 3) ORCID: 0000-0003-3984-9266 (A. 1); 0000-0002-8170-9606 (A. 2); 0000-0003-1269-7207 (A. 3)
happened in response to the practical needs in different sectors of the national economy, as well as in the context of evolving capacities of computers, which enabled to accumulate and process large amounts of heterogeneous data.
2. Main result
DM algorithms, implemented as computer programs, have actually developed new research tools. At the same time, a widespread use of DM methods raises methodological questions whether we have a correct understanding of their capabilities and limits as well as data processing results in terms of scientific cognition. At first glance, it seems an abstract question, but its
16

clarification will enable the concerned parties to achieve better results and organize more effective business processes.
It should be noted that, to varying degrees, the attention has already been paid to the image recognition methodology, as DM methods were formerly called, by such internationally acclaimed scientists as [1-7]. However, these scientists have not conducted an analysis in terms of the theory of cognition.
In fact, almost all the time, most studies on DM methods raise the question which is rather related to the methodology of cognition2: “What knowledge can be derived from the accomulated data and what is its level?” This question demonstrates the immaturity of our concept of DM in terms of the theory of cognition, and it also summarizes multiple practical problems of DM application, which are not addressed by enchancing the computing capabilities or parallel computing in the field of Big Data processing [6]. Besides the difficulties of the right choice and application of DM methods to the addressed problems, there is no full understanding of its capabilities and limits for the application as well as of the process (phasing) itself and the obtained results in terms of the theory of cognition. At the same time, an understanding of the capabilities and limits of DM can lead to a significant modification of the methodology for the study and for addressing the practical problems as well as improving the efficiency of applying the methods under consideration.
The practice of analytics shows that DM methods are indeed a powerful tool of scientific
2 Although, most often, it is raised in purely practical terms– how far we can trust the knowledge we gain.
cognition, which is of multidisciplinary nature. Moreover, it is DM methods that can serve as a basis for the convergence of the approaches to scientific cognition in the humanities as well as in natural sciences. Based on DM, a huge number of the applied problems is addressed, and the data mining algorithms are improved. However, in terms of the methodology, very little effort is made and almost no researches are carried out in this field, which substantially hinders further development of DM that, generally speaking, could become a basis for disciplinary revolution in the theory of cognition, and could even enable to generate major innovations in the field of intelligent technologies.
The aim of the study: to specify the capabilities and limits of applying DM methods in terms of the methodology of scientific cognition.
The process of cognition is a process of gaining and using knowledge, which is of staged nature [8]. The first stage of cognition – singling out and statement of the problem, then – experience, observation, experiment, studying the phenomenon: the second stage - summarizing the facts, identifying their essential parts, forming hypotheses and conclusions on their basis, i.e. certain abstraction from the first stage. At the third stage, the abstractions found, i.e., hypotheses or conclusions that were made before, are being tested. This is a universal scheme of cognition (Fig.1).
17

Figure 1: General Scheme of scientific cognition (using DM methods)
These issues became particularly pronounced
when computers started to be used for data mining. The key issue, being critical in terms of cognition, is what the use of DM introduced into the methodology of scientific cognition and what the application of its outcomes can result in?
The application of DM tools starts only when the data has already been prepared in the form of datasets, where the objects are represented by the sets of multidimensional data – for example, in the form of training dataset (TD). It is generally acknowledged that all DM methods are based on the inductive method of cognition, i. е., in case of DM (inductive learning), the program learns based on the presented empirical data. In other words, the program builds some kind of a general rule based on the presented empirical data, which is obtained, in particular, through observation or experiment3. When using any DM methods, the final outcome is represented in the form of one or another model that reflects certain regularities intrinsic to the data under study, which might logically be called empirical regularities (ER) and which, probably, are hypotheses in nature (that was very cautiously assumed by Zakrevsky [4].
Therefore, the major outcome of applying DM methods is ER in the subject area under study, obtained with the use of these methods, which can be represented in different forms and types. These ER are, in fact, “drafts”, a critical auxiliary material for preparation and development of dialectical “leap” or complicated transition from
3 The matters of choosing the feature vector and data pre-processing are beyond the competence of DM.
the empirical level of cognition to the theoretical one through devising hypotheses are the driver of science (Fig.1). In order to clarify the issue of the level of knowledge derived in terms of the theory of scientific cognition when analyzing the data accumulated in a certain subject area, we cannot do it without the methodology of scientific cognition that “studies the methods for building the scientific knowledge and methods which are used to gain new knowledge, i.e., methods and forms of scientific study, dealing with the technical aspect to a minimum extent” [9]. It is customary to distinguish the following levels of the methodology of scientific cognition [9]:
1. Technique – the lowest level, the examples – directions, techniques, etc.; 2. Scientific method, relying on knowledge of the respective regularities, i.e. the theory of the given subject area; 3. General scientific method – quite general method of scientific study, where the applicability extends the limits of one or another scientific discipline and relies on the existence of regularities, being common for different areas. 4. Methods used in all sciences without exception, although, in different forms and modifications. It is the most general methods of scientific cognition, and their study is the subject of philosophical methodology (philosophy of science). In view of the foregoing, it is proposed to
supplement the above classification of the levels of the methodology of scientific cognition in the
18

form of the list of items 1-4, suggested by V. Shtoff, with the scheme presented in Fig.2 – some kind of graphical supplement to these items, illustrating the outcomes of the work in a specific subject area of the inductive approach under study, which is a basis of all DM methods, related to the levels of scientific cognition.
The main purpose of this scheme is to show the relationship between the levels of cognition, and, the
most important thing, to demonstrate the limit of the capabilities of DM methods. It follows from the above statement and the illustration that the limit of the level of the scientific cognition methodology, achieved through DM methods or tools, is the lowest of these levels – the level of techniques.
Figure 2: Relationship between the levels of cognition
Abbreviations: ER – empirical regularities.
TD – training dataset. VD – validation dataset As a result, ER is quite understood by the
expert in the subject area and is applicable for further processing as a basis for possible transition to the hypothesis, which is not the automated result of induction and not an inductive inference, but one of the possible answers to the problem encountered, including in the form of assumptions, suggestions and their implications with further testing in practice. However, the emergence of hypothesis is mandatory4.
Using DM, it becomes possible to automatically generate ER, being the “bricks” for advancing and building hypotheses as a part of addressing a specific problem. That is, the emergence of hypothesis is preceded by a very important stage of generation (search) of ER - this is precisely the contribution of DM to the process of cognition! Furthermore, this stage occurs automatically, based on the algorithms invented by human beings and implemented in the
4 The need for hypothesis stems from the fact that the laws are not directly seen in individual facts, no matter how many of them are accumulated, as the essence does not coincide with phenomena. Hypothesis is the statement, the truth or falsity of which has not yet been established. The process of establishing the truth or falsity of the hypothesis is the process of cognition as a dialectic unity of
form of computer programs (a human just selects the suitable algorithm and downloads the data).
At the same time, possible transition from ER to hypothesis as a probable knowledge – is not so easy and straightforward way. There is an intersection or convergence of dialectical logic, methodology of scientific cognition and psychology of scientific creativity (Fig.3). The analysis of the structure of such a complex dialectic intersection is one of the challenges in the way of transition from the empirical basis to the theoretical building [9].
Figure 3: Transition from ER to hypothesis
practical (experimental, object-tool) and theoretical activity. However, eventually it is only confirmation by practice that converts a hypothesis into the true theory, converts probable knowledge into the credible one, and vice versa, the refutation in practice and experiment discards the hypothesis as false assumption [9].
19

This also requires performing considerable and nontrivial intellectual work, taking certain efforts by the researcher and, most probably, carrying out additional researches, which, to a large degree, can be considered an extension of DM. This is the case with almost all known DM methods. Therefore, the ultimate outcome that might be obtained directly in the application of any DM tools is ER level, and, methodologically speaking, the level of techniques. Such class of DM models as neural networks needs to be separately mentioned. The use of neural networks, in some cases, yields rather good results; however, unfortunately, they produce no effect in terms of the methodology of scientific cognition – we cannot build ER in this case and, even more, we are unable to proceed to formulate and devise hypotheses! Their level is limited by the level of “primitive” (like animals do it) recognition (classification) and nothing more, and it is not itself a new knowledge. From the cognitive and methodological points of view, it is a dead-end type of DM or a completely different paradigm of the scientific cognition. Actually, this is also discussed in the work [10] where the authors try to "feel out" the ways of understanding the work of neural networks.
It should be noted that it is advancement of ER that the cytogramm processing web service (URL: https://www.data4logic.net/ru/Services/CellsAttributes) is focused on, enabling cytologists-researchers to generate ER and, with a high probability of success, to devise on their basis the hypotheses to address the problems that they face. The pictures stipulated by the paper related to leukemia diagnostics [11, 12] can be used as an example of this approach.
In many cases, solving specific practical problems is actually limited, in terms of cognition, to the level of ER, which is used as a basis for further formulation, in a best-case scenario, of a decision-making direction or rule, and it remains at the first empirical level of cognition, being the lowest of all possible levels [13, 14, 15]. In the short run, it suits business as a sphere of practical activities; however, in the long run, the main think is lost – finding really new knowledge which can be implemented in innovations, or developing a new method, modus operandi, business model, etc., that will provide higher-order competitive advantage.
In a similar way, the level of “primitive” classification inherent to neural networks often suits business. Consequently, it can be ascertained that DM methods are capable of providing only the level
of empirical cognition in the specific subject area under study as well as the level of techniques and directions, which completely fits the scheme shown in Fig.1 and Fig.2.
Now, it becomes clear why there are no “breakthrough” inventions made using DM – because now such inventions can take place only in a specific subject area, and this requires close cooperation and interaction as well as full-fledged scientific communication with the representatives of the same subject area, which is the biggest obstacle to such kind of achievements.
Hence, the following conclusions can be drawn.
1. The methods of DM as well as Big Data is a new man-machine methodology of empirical cognition.
2. These methods have their limit in the form of ER represented in different forms.
3. ER can serve as “drafts” for preparation, generation and formulation of hypotheses aimed at further more in-depth cognition of the subject area.
4. In order to select the best strategy for the use of DM tools, a clear understanding of the goals of problem-solving is needed.
5. The use of DM tools requires a close cooperation with the experts in a specific subject area that, in its turn, raises a number of questions related to: initiation of such cooperation; skillfulness of the experts in the subject area; statement of the problem in the respective context; building the team to solve the problem, etc.
6. DM and Big Data experts’ “shifting” to the area of development of the standardized software (cloud services, web-services, desktop applications) does not solve the problem of in-depth cognition; there is still a limit represented by the empirical cognition – obtaining of ER, i.e., in fact, provisional hypothesis for the given specific subject area. In this case, the burden of solving the specific problem to deepen cognition and clarify the hypotheses is fully transferred to the experts in the subject area. The full-fledge interaction between the experts in subject areas and Data Scientist is significantly more painstaking in terms of organizational and communicative cost, but, in our opinion, this approach is able to ensure major breakthroughs in the subject area. An interim option is also possible and now it begins to be actively used in business. Many companies realized that, without efficient “task setters” and analytics well-versed in DM tools, just the use of desktop, web and cloud services was inefficient. From a methodological standpoint, the most critical fact has been established – the limits of
20

the applicability of any DM methods are the level of ER, i.e. the level of techniques and directions in a specific subject area, where data mining methods are used, or provisional (working) hypothesis. As of today, it is the only visible and obvious achievement of all DM algorithms. It should be noted that one of the available web services, suitable for researchers who have no special training on mathematics and informatics, which is designed to find ER, is implemented on ScienceHunter portal (https://www.sciencehunter.net).
3. Conclusions
Knowing the applicability limits of DM tools, it is possible to more fully understand how to set goals when selecting appropriate DM methods; for example, to choose ones that produce a relatively large set of ER, or to use those ones that produce a limited set of such patterns characterized by greater accuracy. From the methodological point of view, the most important fact has been established – the limits of applicability of DM methods is the level of ER. A huge number of methods, techniques, a variety of developed computer programs, cloud services and other software – all this ends up with one thing that is the level of ER. Currently, this is the only observable and obvious achievement of all DM algorithms. Should the result be considered important in terms of cognition? It is quite possible to answer positively. Although it should be emphasized that all this refers to a particular subject area, which applies methods of data mining. It should be noted that DM can be understood as an evidentiary or constructive method of cognition, with all the advantages and disadvantages. Finding ER today is implemented in the form of web services (for example, ScienceHunter portal: https://www.sciencehunter.net), so future research will focus on the development of an automated system concept for DM, suitable for researchers with no special training in mathematics and computer science.
4. References
[1] M.M. Bongard, Recognition problem, Nauka, Moscow, 1967.
[2] N.G. Zagoruiko, Recognition methods and their application, Soviet radio, Moscow, 1972.
[3] N.G. Zagoruiko, Applied methods of data and knowledge analysis, IM SO RAN, Novosibirsk, 1999.
[4] A.D. Zakrevsky Recognition logic. Minsk: Nauka i tekhnika, 1988, 118 p.
[5] L.G. Malinovsky, Classification processes - the basis for constructing the sciences of reality, Algorithms for processing experimental data (1986) 155-182.
[6] A. Carbon, M. Jensen, A.-H. Sato, Challenges in data science: a complex systems perspective, Chaos, Solitons & Fractals 90 (2016), 1-7. doi:10.1016/j.chaos.2016.04.020
[7] L. Cao, Data Science: Challenges and Directions, Communications of the ACM, 60(8) (2017) 59-68. doi:10.1145/3015456
[8] N.N. Moiseev, Man, environment, society. Problems of formalized description, Nauka, Moscow, 1982.
[9] V.A. Shtoff, Problems of the methodology of scientific knowledge, Vysshaia shkola, Moscow, 1978.
[10] Z. Chen, Y. Bei, C. Rudin, Concept Whitening for Interpretable Image Recognition, Nature Machine Intelligence, 2 (2020) 772-782. doi:10.1038/s42256-020-00265-z
[11] D.F. Gluzman (Ed.), Diagnosis of leukemia. Atlas and Practical Guide, MORION, 2000.
[12] V.A. Lekakh, Sick issues of modern oncology and new approaches to the treatment of oncological diseases, Librokom, Moscow, 2011.
[13] W. Chen, H. R. Pourghasemi, S. Zhang, J. Wang, 21 – A Comparative Study of Functional Data Analysis and Generalized Linear Model Data-Mining Methods for Landslide Spatial Modeling, in H. R. Pourghasemi, C. Gokceoglu (Eds.) Spatial Modeling in GIS and R for Earth and Environmental Sciences, Elsevier, 2019, pp. 467-484). doi:10.1016/B978-0-12-815226-3.00021-1
[14] K. Gibert, J. Izquierdo, M. SànchezMarrè, S.H. Hamilton, I. Rodríguez-Roda, G. Holmes, Which method to use? An assessment of data mining methods in Environmental Data Science, Environmental Modelling & Software 110 (2018) 3-27. doi:10.1016/j.envsoft.2018.09.021
[15] G. Agapito, P. Guzzi, M. Cannataro, Parallel and Distributed Association Rule Mining in Life Science: a Novel Parallel Algorithm to Mine Genomics Data, Information Sciences 26.07 (2018). doi:10.1016/j.ins.2018.07.055
21

Implementation of Shor's Algorithm in a Digital Quantum Coprocessor Valeriy Hlukhov 1
1 Lviv Polytechnic National University, 12 Bandera str., Lviv, 29013, Ukraine
Abstract The advantages of digital quantum coprocessors include a larger quantum volume, normal operating conditions, the presence of memory, the presence of a tested and reliable element base on which they can be implemented, and the availability of technology for using this element base. The element base refers to field programmable gate arrays (FPGAs). The paper presents the principles of building digital quantum gates, digital qubits and both homogeneous and heterogeneous digital quantum coprocessors. The capabilities of real quantum computers are usually illustrated by performing factorization of the number 15 using Shor's algorithm. This paper describes the implementation of quantum Shor's algorithm for factorizing the number 15 in a digital quantum coprocessor, which is implemented in FPGA. The difference between a real quantum coprocessor and a digital one is shown. A technique for determining the characteristics of a digital quantum coprocessor is described. Its probabilistic characteristics are also given. Keywords Digital qubit, digital quantum coprocessor, heterogeneous coprocessor, homogeneous coprocessor, Shor's algorithm, FPGA
1. Introduction1
A quantum computer is a heterogeneous device [1] that consists of a classical control computer and its quantum accelerator [2] - a quantum coprocessor. Real quantum coprocessors are analog and probabilistic devices. They consist of qubits, quantum gates provide a change in their states. A classical computer controls the operation of a quantum coprocessor, checks the correctness of the results of its work, and in case of an incorrect result, it restarts the coprocessor to work.
The possibility of creating logical (digital) probabilistic devices that can work according to the same formulas as real quantum coprocessors and can implement quantum algorithms is shown in previous works [3], [4]. The possibility of creating digital quantum gates, digital qubits and, based on them, digital quantum coprocessors is shown. The hardware base for digital quantum coprocessors is FPGA. Unlike real quantum coprocessors, digital ones operate at normal temperatures (like classical computers) and have
EMAIL: [email protected] (A. 1) ORCID: 0000-0002-0542-7447 (A. 1)
a larger quantum volume. This makes the development of such coprocessors actual and important.
Quantum computers possible field use is large numbers factorization [5], [6]. This operation is used to hack information security systems that use public key algorithms, such as RSA [7]. Shor's algorithm [8] is used for this. The main elements of the quantum coprocessor that implements Shor's algorithm are Hadamard elements, quantum Fourier transform, modular exponentiation [9], and qubit state meters. In real quantum coprocessors, these elements (except for meters) consist of qubits; changes in their states are provided by quantum gates.
In previous works, the implementation of digital Hadamard elements and digital quantum Fourier transform on FPGAs was shown [3], [4]. In one FPGA, it is possible to create a quantum Fourier transform from thousands of digital qubits. The internal state of a digital qubit can be represented by binary code θ in the range from 0.00...0 to 1.00...0. Also, options for encoding the states of digital qubits with binary codes of various lengths - from 3 to 32 bits were considered [3], [4].
Simulation of individual quantum gates is used to simulate quantum algorithms. To simulate the reversibility of a qubit, models of
22

reversible logic architecture [10] and gates [11] have been developed. In this work, more complex logic circuits are simulated to ensure reversibility of quantum circuits.
2. Purpose of work
The aim of the work is to show the possibility of performing quantum algorithms (using the example of factoring the number 15 by Shor's factorization algorithm) in a digital quantum coprocessor implemented on the FPGA. For this, the possibility of implementing modular exponentiation on the FPGA and the possibility of the effect of the results of this operation on the states of digital qubits is shown, which allows us to determine the period of y = axmodM function (determining the period of a function is the main task of a quantum coprocessor in the implementation of Shor's algorithm).
3. Qubit
Qubit quantum state can be represented (Figure 2) as a simple displacement of end point of unit radius [12]. The probability pj of obtaining state j as a result of quantum state
measurement is equal to 2jjp = . In this
case, the sum of all probabilities 1P1N
0j
2i ==
−
=
.
In unit circle (Figure 2) which is used in [4] 2
0 cosp = and 21 sinp = respectively.
4. Digital gates, qubits and quantum coprocessors
A digital quantum gate that is used to change the state of a digital qubit can be represented as a logic circuit Figure 1.
AAsin_f
RGALU
DataIn
InstructionB
DateO
Comparator
DateOut
'QO OQIQ
Figure 1: A digital quantum gate QGate [1]
The digital quantum gate includes an ALU, a comparator, and a pipelined register.
ALU transforms the code of the previous state DataIn of the qubit under the influence of the Instruction with the possible use of the measured state IQ of the neighboring qubit (or states of qubits). The new DataO status code is compared in a comparator with the random variable Asin_f to obtain the measured state of the qubit 'QO . The output of the gate is the qubit state code DataOut and the measured state OQ of the qubit, which are taken from the output of the pipeline register.
Figure 2: Bloch sphere for qubit complex amplitudes (left) and a unit circle for real ones (right)
In a heterogeneous digital quantum
coprocessor, a random variable at the input of each digital quantum gate is generated by a separate pseudo-random code generator (PRNG) and a Read-Only-Memory (ROM) based functional converter. The converter changes the random variable A according to the formula
AarcsinDfsin_A == (Figure 3).
QGate
Asin_f
DataIn
Instruction
DROM
AAsin_f
Random Number
AarcsinD =
2n+1 PRNG
OQIQIQ
DataIn
Instruction
OQDataOut DataOut
Figure 3: A digital quantum cell DQCell for heterogonous digital quantum coprocessor [3]
Digital qubit circuit for a heterogeneous
coprocessor Figure 4 will represent a series connection of several digital quantum cells Figure 3.
23

InstructionsInstruction1 Instructionj
Data1 Dataj-1DataIn
StateOut
1OQ OjQ
1IQ IjQ
DataIn
DQCell
DataOut
1OQ
1IQDataIn
DQCell
DataOut
1OQ
1IQ
Figure 4: A digital quantum qubit as line (QLine) of DQCells for heterogonous digital quantum coprocessor
Digital qubit circuit for a homogeneous
coprocessor Figure 5 has only one difference in comparison with the circuit in Figure 4: all random variables Asin_f for each digital quantum gate are generated using one pseudo-random code generator and one functional converter.
A schematic diagram of a digital quantum coprocessor is shown in Figure 6. In heterogeneous coprocessor, the number of pseudo-random code generators and functional transformers coincides with the number of digital quantum gates. Both oscillators and transformers are located near the digital quantum gates (Figure 3) inside the digital qubits of the Qline circuit in Figure 6.
Asin_fInstruction1 Instructionj
Data1 Dataj-1DataIn
1OQ OjQ
1IQ IjQ
DataIn
QGate
DataOut
1OQ
1IQDataIn DataOut
1OQ
1IQ
DataOut
QGate
Figure 5: A digital quantum qubit as line (QLine) of DQGates for homogenous digital quantum coprocessor
Asin_f
. . .QBim-1
DataOut1
QLine0
QLinem-1
DataIn
DataIn
DataOut
DataOutDataOutm
Switch MatrixQO0
QOm-1
QBi0
j.1m2.1m1.1m QO,...,QO,QO −−−
j.02.01.0 QO,...,QO,QO
j.1mj.1j.0 QO,...,QO,QO −
QI0
QIm-1
QBo
j.1m2.1m1.1m QI,...,QI,QI −−−
j.02.01.0 QI,...,QI,QI
DROM
AAsin_f
AarcsinD =
2n+1 PRNG
Asin_f
Asin_f
Asin_f
Figure 6: A generalized functional diagram of a digital quantum coprocessor
5. Shor’s algorithm
In Shor's algorithm [8], the problem of factorizing the number M is reduced to the problem of determining the period r of the function y = axmodM, which is calculated by the controlled units CU (Figure 7), where a is an arbitrary integer. This is precisely the problem that a quantum computer solves. It is shown that the greatest common divisor GCD(ar/2+1, M) can be a divisor of the number M. The subsequent finding of the greatest common divisor is performed by a classical computer.
H0
1
H0
H0
02aCU
00 12a
CU 1n22aCU −
QFTU
pper
Reg
iste
rLo
wer
Reg
iste
r
Mea
sure
men
t
Figure 7: Shor’s algorithm implementation in real quantum computer
If Nlogn 2= is the required number of bits to represent the number N to be factored than the upper quantum register in Figure 7 requires at least 2n qubits, because Shor’s algorithm requires x to take values between 0 and at least N2 and the modular exponentiation function can be written [9] as
1n21n2
11
00 x2x2x2x )Mmoda()Mmoda()Mmoda(Mmoda −
−
= (1)
Figure 7 of Shor's algorithm implementation illustrates quantum superiority very well. If we take only the upper part (Figure 8) of Figure 7 diagram, then the quantum Fourier transform will determine the frequency of the white noise that the Hadamard elements create. After the initial reset, each Hadamard element transfers the qubit to the neutral position, when the angle θ = π/4 and the state of each qubit with the same probability p0 =p1 = 0,5 can be measured both as 0 and as 1. And the measured state of the upper register in Figure 8 can take any value from 0 to 22n-1. The state spectrum of the upper register will include all 22n states.
24

H0
H0
H0
QFT
Upp
er R
egis
ter
Mea
sure
men
tX
Figure 8: White noise X generated by a
quantum circuit
Let's conduct a thought experiment - imagine that in some way with a period t we find out the state of the upper register without changing states of its qubits. Each time we will receive a new state code, the possible codes will be in the range from 0 to 22n-1. Now imagine that t runs to 0. Then at each moment of time the state of the upper register will contain all codes in the range from 0 to 22n-1.
If, on the other hand, modular exponentiation is performed over the outputs of the upper register (CU in Figure 7), then at each "moment" only states that give the same result of modular exponentiation at the output of the CU be in the spectrum of upper register states. That is, at each "moment" of time, the spectrum of states will be different. For example, for the function y = 2xmod15 spectrum is presented in Figure 9.
At some "moment" at the output of CU there will be a result y = 1, then in the spectrum of upper register states there will be 0, 4, 8, 12, … codes (Figure 10). The distance between the same codes, that is, the period of y = 2xmod15 function will be equal to r = 4. This period will be determined using the quantum Fourier transform (as the reciprocal of the repetition rate F of the extracted codes r = 1/F). At another "moment", the CU output will have the result y = 4, then in the spectrum of upper register states there will be 2, 6, 10, 14, ... codes (Figure 11).
y=2xmod15
0
1
2
3
4
5
6
7
8
9
0 1 2 3 4 5 6 7 8 9 10 11 12 13 14 15 x
y
Figure 9: Modular exponentiation
y=(2x)mod15=1
0 1 2 3 4 5 6 7 8 9 10 11 12 13 14 15 x Figure 10: X codes for which y = 2xmod15 =1
y=(2x)mod15=4
0 1 2 3 4 5 6 7 8 9 10 11 12 13 14 15 x Figure 11: X codes for which y = 2xmod15 =4
But the period of y = 2xmod15 function will
still be r = 4. And it will again be determined using the quantum Fourier transform. Whatever the result at the CU output, in the corresponding spectrum of states there will be only codes that allow determining the period of the function y = 2xmod15 in one measurement and this period will be r = 4. Determining the period of a function in one measurement illustrates quantum superiority. This does not take into account the time to create a quantum circuit Figure 7.
The period of the y = axmodM function can be determined not only by quantum, but also by logical (digital) methods in several clock cycles. For example, in [5], [6] it is proposed to approach the solution of the problem from the other side: fix r = 2, and determine the random variable a from the given r = 2. With this approach, a quantum computer is no longer needed. But Shor's algorithm is convenient for demonstrating quantum superiority using separate examples - for determining the result in one measurement.
Also, one of the limitations of Shor's algorithm is the requirement for the parity of the period r. It was shown in [5], [6] that this condition is optional. The period r can be odd if a is a square.
Once again, we recall that all the "moments" in a quantum computer are one and the same moment in time (Figure 10, Figure 11).
Attaching (Figure 7) an additional circuit to the upper register changes the state spectrum at any given "moment" in time. This is similar to a high-pass filter in analog technology - connecting a capacitor removes high frequencies from the spectrum, removes interference.
Convenient examples are used to illustrate the quantum superiority in determining the period of y = axmodM function. In the example considered
25

earlier, when M = 15 = 3 * 5, period r is power of 2: r = 4 = 22 and both factors are Fourier primes, they can be represented as 12
m2 + : 123
02 += , 12512 += . With such factors,
formula (1) will have the form (2): 1n2
1n21
10
0 x2x2x2x )Mmoda()Mmoda()Mmoda(Mmoda −−
= = = 1n2
1n21
10
0 x2x2x2x )15mod2()15mod2()15mod2(15mod2 −−
= = = 1n2110 xxxx )15mod1()15mod1()15mod4()15mod2( − =
= 1010 xxxx 42)15mod4()15mod2( =
(2)
Formula (2) makes it possible to find the period using a digital quantum coprocessor.
The height of the bars in Figure 10, Figure 11 illustrates the probability of receiving the code x as a result of mentally measuring the upper register state of the circuit Figure 7. Thus, Figure 10 corresponds to the upper register in Figure 7 measured 00x...xx state, and
Figure 11 corresponds to its 10x...xx state. The implementation of Shor's algorithm in a
digital quantum coprocessor is shown in Figure 12.
The lower register in Figure 12 is a classic digital logic circuit, signals at its outputs formation (for the considered example of finding the period of y = axmodM function with a = 2, M = 15) is shown by Table 1 and Table 2. Measuring the states of the developed digital quantum qubits does not change the code of this state, which is indicated by the letter D on the meter symbol in the circuit Figure 12.
The calculated values of y = axmodM function transform the state X into a state CX correlated with the function values. For the considered example, this transformation is described in Table 3.
H0
H0
H0
02aCU
0
12aCU 1n22a
CU −
QFT
Upp
er R
egis
ter
Low
er R
egis
ter
Mea
sure
men
t
Quantum State
Transformer
0
1
D D D
D
D
D
0x 1x 1n2x −
Quantum partClassical part
X CXIX
y = axmodM
Figure 12: Shor’s algorithm implementation in digital quantum coprocessor
Table 1
Controlled Unit 2aCUCU 02
= , 2a,2a02 ==
Control signal
x0=0 (multiplication by 1)
x0=1 (multiplication by 2)
Input 0001 0001
Output binary
0001 0010
Output logical
0x000
0x00 0
Output, formula
00 xx00
6. Discussions
Further, Figure 13 - Figure 20 show the results of the quantum part of Shor's algorithm (determining the period of the function y = axmodM (a = 2, M = 15) in the digital quantum coprocessor Figure 7 with 8 digital qubits in the upper register, the width of each qubit is 8 bits. The research was carried out on two types of coprocessors - homogeneous and heterogeneous. For statistic, each study was repeated 4096 times with the same input data. In this case, the frequency of occurrence of each result (the probability of the result) was recorded.
Since the upper register with 2n = 8 qubits was used, the number of different measured codes at the output of the Fourier quantum transform is N = 22n = 256.
In Figure 13 - Figure 20, these 256 codes are plotted along the horizontal axis, from 0 to 255. The figures show the codes that, as a result of the study, were found most often (high probability states – State_HP). The vertical axis shows the probability (Probability) of the occurrence of the indicated codes, the value of the probability (Value) is indicated in percent.
First of all figures show the results of white noise states generator Figure 8 study, the state of the qubits at the output of the upper register is
xxxxxxxxX = . Figure 13 and Figure 14 show how such white noise is perceived by quantum Fourier transformer in homogeneous (Figure 13) and heterogeneous (Figure 14) digital quantum coprocessors. Measurement of such quantum state can give any code in the range 0-255 with equal probability. A heterogeneous coprocessor perceives white noise more correctly.
26

Table 2
Controlled Unit 4aCUCU 12
= , 4a,2a12 ==
Control signal
x1=0 (multiplication by 1)
x1=1 (multiplication by 4)
Input 00 xx00
00 xx00
Output logical
)xx)(xx(00 0101 00)xx)(xx( 0101
Output, formula )xx)(xx)(xx)(xx( 01010101
Table 3
Controlled Unit 4aCUCU 12
= , 4a,2a12 ==
xxxxxxxxX = .
(measured x1x0)
y = axmodM CX
00 1 00x...xx
01 2 01x...xx
10 4 10x...xx
11 8 11x...xx
After the quantum Fourier transform,
determining the number of repetitions of the measured codes gives the following results: both homogeneous and heterogeneous quantum coprocessors correctly determine that there are no repetitions of codes when carrying out a large number of measurements (the number of repetitions is F = 0). A homogeneous
coprocessor generates such result with probability of 84.195% (Figure 15), and heterogeneous - with probability 32.805 % (Figure 16).
After confirming correct operation of both digital quantum elements of Hadamard and quantum Fourier transformer, which is also built from digital qubits, studies of Shor's algorithm implementation (Figure 7) were continued. Figure 17 and Figure 18 show how the quantum Fourier transform perceives correlated with y = axmodM function upper register state CX in homogeneous (Figure 17) and heterogeneous (Figure 18) digital quantum coprocessors.
And in this case, the heterogeneous coprocessor perceives correlated states more correctly.
y = 2xmod15 function has period T = 4. The discrete Fourier transform should most often form the result F = N/T = 256/4 = 64. Despite the difference in the perception of correlated upper register states, both homogeneous and heterogeneous quantum coprocessors correctly determine the repetition rate of codes when carrying out a large number of measurements, they correctly determine the number of repetitions F = 64. A homogeneous coprocessor generates such a result with probability 21.439 % (Figure 19), and heterogeneous - with probability 15.341 % (Figure 20).
Figure 13: Number of perceived white noise states at QFT input, homogeneous quantum coprocessor
27

Figure 14: Number of perceived white noise states at QFT input, heterogeneous quantum coprocessor
Figure 15: Number of repetitions of white noise states, homogeneous quantum coprocessor
Figure 16: Number of repetitions of white noise states, heterogeneous quantum coprocessor
Figure 17: Upper register states that are perceived at the input of QFT and correlated with the function y = axmodM, homogeneous quantum coprocessor
28

Figure 18: Upper register states that are perceived at the input of QFT and correlated with the function y = axmodM, heterogeneous quantum coprocessor
Figure 19: The number of states repetitions when determining the period of a function, homogeneous quantum coprocessor
Figure 20: The number of states repetitions when determining the period of a function, heterogeneous quantum coprocessor
The results of Shor's algorithm execution are
summarized in the Table 4.
7. Implementation
In this example, adding a lower register and an upper register state converter (Figure 12) adds practically nothing to the hardware costs of a discrete Fourier transform implementation (Figure 8). These costs were determined in previous works [3], [4]. It was shown that on one FPGA it is possible to implement the discrete
Fourier transform with the number of digital qubits up to 1024.
8. Conclusions
The article shows the possibility of determining the period of the y = axmodM function in a digital quantum coprocessor. Determination of the period is necessary for the execution of Shor's factorization algorithm.
29

Table 4 Probability of correct results, %
Qubits number 8
Qubits width, bit 8
Homogenous coprocessor 21.439
Heterogeneous coprocessor 15.341
The possibility of implementing Shor's
factorization algorithm using two types of implemented on FPGA digital quantum coprocessors - homogeneous and heterogeneous - is shown. For the research, the factorization of the number 15 was chosen (a = 2, M = 15). Determining the period of the y = axmodM function is a task of a quantum coprocessor.
The studies were carried out on coprocessors with 8 digital qubits, the state of each qubit was encoded using 8 bits.
A homogeneous digital quantum coprocessor has the best performance: the probability of obtaining a correct result is 21.439%, and that of a heterogeneous one is 15.341%.
The coprocessor is focused on implementation in FPGA. The presented results were obtained after simulating VHDL-descriptions of coprocessors.
The digital quantum coprocessor outputs each subsequent result at the system frequency of the FPGA. In the simulation, this frequency was 1 GHz (period was 1 ns).
9. References
[1] X. Fu et al., “A heterogeneous quantum computer architecture,” in 2016 ACM International Conference on Computing Frontiers (CF'16), 323–330, 2016, doi: http://dx.doi.org/10.1145/2903150.2906827.
[2] L. Riesebos et al., "Quantum Accelerated Computer Architectures," 2019 IEEE International Symposium on Circuits and Systems (ISCAS), 2019, pp. 1-4, doi: 10.1109/ISCAS.2019.8702488.
[3] V. Hlukhov. “FPGA-Based Digital Quantum Computer Verification”. The 11th IEEE International Conference on Dependable Systems, Services and Technologies, DESSERT’2020. 14-18 May, 2020, Kyiv, Ukraine. In press.
[4] V. Hlukhov, “FPGA-Based Homogeneous and Heterogeneous Digital Quantum Coprocessors”, Advances in Science,
Technology and Engineering Systems Journal (ASTESJ), 2020, 5(6), 1643-1650, DOI: 10.25046/aj0506195.
[5] J. A. Smolin, G. Smith, A. Vargo, Pretending to factor large numbers on a quantum computer, arXiv: 1301.7007v 1 [quant-ph] (2013). http://arxiv.org/abs/1301.7007.
[6] J. A. Smolin, G. Smith, A. Vargo, Oversimplifying quantum factoring. Nature 499, 163-165 (11 July 2013).
[7] Y. Wang, H. Zhang and H. Wang, "Quantum polynomial-time fixed-point attack for RSA," in China Communications, vol. 15, no. 2, pp. 25-32, Feb. 2018, doi: 10.1109/CC.2018.8300269.
[8] P. Shor, “Polynomial-Time Algorithms for Prime Factorization and Discrete Logarithms on a Quantum Computer,” in 35th Annual Symposium on Foundations of Computer Science, 124–134, 1994, available at: https://www.jstor.org/stable/2653075?seq=1, accessed 25 Nov. 2020.
[9] A. Pavlidis, D. Gizopoulos. Fast Quantum Modular Exponentiation Architecture for Shor's Factorization Algorithm. July 2014. Quantum Information & Computation 14(7&8):0649-0682.
[10] B. Dey, K. Khalil, A. Kumar and M. Bayoumi, "A Reversible-Logic based Architecture for Artificial Neural Network," 2020 IEEE 63rd International Midwest Symposium on Circuits and Systems (MWSCAS), 2020, pp. 505-508, doi: 10.1109/MWSCAS48704.2020.9184662.
[11] Quantum-computing.ibm.com. Shor’s algorithm. Reversible classical circuits, 2020. URL: https://quantum-computing.ibm.com/composer/docs/iqx/guide/shors-algorithm.
[12] E. Grumbling, M. Horowitz (eds.). “Quantum computing: progress and prospects”. The National Academies of Sciences, Engineering, and Medicine. Washington, DC: National Academies Press. 2019.
30

Behavioral Properties Of Bounded Solutions For A Weakly Nonlinear Impulse System That Describe The Dissemination Of Information On Social Networks Farhod Asrorov1, Оleg Perehuda2 Valentyn Sobchuk3 and Anna Sukretna4
1,2,4 Taras Shevchenko National University of Kyiv, Volodymyrska str, 64/13, Kyiv city, 01601, Ukraine 3 State University of Telecommunications, 7 Solomenska str., Kyiv, Ukraine, 03110
Abstract
Processes with instantaneous (abrupt) changes are observed in radio engineering (pulse generation), in biology (heart work, cell division, signal transmission by neurons), in control theory (work of industrial robots), in social systems (social communications, information dissemination). Therefore, the qualitative study of impulse systems in this work is an urgent task in modern theory of mathematical modeling.
The work is devoted to the study of the existence of bounded solutions along the entire real axis (on the half-axis) of weakly nonlinear systems of differential equations with impulsive perturbations at fixed moments of time. The notion of a regular and weakly regular system of equations for the class of weakly nonlinear impulse systems of differential equations is introduced.
Sufficient conditions for the existence of a bounded solution for an inhomogeneous system of differential equations in the case of weak regularity of the corresponding homogeneous system of equations are obtained. The conditions for the existence of the unique bounded solution on the whole axis for weakly nonlinear impulse systems are established. The obtained results are applied to the study of bounded solutions of impulsive SIR model that can be considered as a model which describes the dissemination of information on social networks. Keywords 1 Differential equations, impulse system, bounded solution, Green-Samoilenko function, SIR model.
1. Introduction
The information space in the modern world is constantly under the influence of various destabilizing factors of various nature. The problem of dissemination of reliable information became especially acute with the emergence and rapid development of social networks. In recent years, we have seen a comprehensive penetration of the impact of information through social networks in almost all areas of activity. It should be noted that along with the dynamic dissemination of useful and important information of a mass nature, the replication of openly harmful information messages acquires. It is not uncommon for the spread of malicious
EMAIL: [email protected] (A. 1); [email protected] (A. 2); [email protected] (A. 3); [email protected] (A. 4) ORCID: 0000-0002-3917-4724 (A. 1); 0000-0002-7465-3173 (A. 2); 0000-0002-4002-8206 (A. 3); 0000-0002-2985-1250 (A. 4)
information messages to provoke serious consequences. In particular, in the context of the SARS-CoV-2 pandemic, entire information wars are being waged on social networks to discredit the efforts of the world community to take control of the spread of the virus. A clear example is interference in the electoral process in many countries. It was the massive spread of malicious information that significantly affected the results of the US elections, the results of the Brexit referendum, and so on.
In this sense, it is extremely important to study mathematical models that make it possible to obtain constructive conditions for the existence of bounded solutions of nonlinear systems, which are described by differential equations with
31

momentum. After all, such systems allow to model the behavior of "viral impressions" both in biological systems and the circulation of information messages on social networks. And the conditions for the existence of a single limited solution on the entire axis for weakly nonlinear pulse systems that allow for qualitative analysis of the solutions of the respective systems provides an opportunity to develop strategies to reach the target audience with socially significant information messages and build protection against population "infection" social networks with harmful information fakes.
The modern natural sciences and technology development contributes to the emergence of problems described by differential equations systems with discontinuous trajectories and, in particular, to the development of mathematical impulse systems theory. In mathematical modeling of these processes, such perturbations duration can often be conveniently neglected, believing that they have the character of an impulse.
This idealization leads to the need to study of differential equations systems, the solutions of which change abruptly. But not only the idealization of the replacement of short-term perturbations by "instantaneous" leads to differential equations with discontinuous trajectories. Often breaks of certain dependencies in the studied system are its essential characteristic.
The theory of systems with impulse influence has a wide range of applications. Such systems arise in the study of automatic control impulse systems, in mathematical modeling of various mechanical, physical, biological and other processes.
For example, processes with abrupt changes are observed in mechanics (movement of a spring at impact action, functioning of the clockwork, change of the rocket speed at steps separation), in radio engineering (generation of impulses), in biology (heart work, cell division, signaling by neurons), in control theory (work of industrial robots). Therefore, the qualitative study of impulse systems in this paper is an actual problem in modern mathematical modeling theory.
The theory of nonlinear differential equations systems with impulse influence, to which a number of natural science and technology problems are reduced, has been enriched with significant results in recent decades. Among the studied systems there are systems with impulse action with weak nonlinearity. The complexity of
the mathematical formulation of the problem for the analytical study of this system type is due to the corresponding dynamic processes nonsmoothness. This leads to the need to develop methods for studying weakly nonlinear systems of differential equations with impulse effects. Therefore, the study of this type systems solutions is an urgent task today.
2. Analysis of literature sources and problem statement
The most important and effective impulse systems research have been conducted in the last decade. In [1] the conditions guaranteeing the hyperbolicity of differential equations systems with impulse action are established. The obtained hyperbolicity conditions allow us to investigate the existence of bounded solutions for inhomogeneous multidimensional differential equations systems with momentum perturbation. In [2], sufficient conditions for the existence of an asymptotically stable invariant toroidal manifold of linear extensions of a dynamic system on a torus in the case when a matrix of a system commuting with its integral are obtained. The proposed approach is applied to the study of the stability of invariant sets of some class of discontinuous dynamical systems.
In [3] the review of the most modern research methods for impulse differential equations solutions stability and their application to problems of impulse control is carried out. In [4], the trivial torus exponential stability for one class of nonlinear extensions of dynamical systems on a torus is proved. The obtained results are applied to the study of the toroidal sets stability for impulse dynamical systems. In [5,6] the problem of constructing approximate adaptive control, including the case of impulse control, is considered for one infinite-dimensional problem with a target functional of Nemytsky type. The method of averaging for obtaining approximate adaptive control is substantiated. In [6] the concept of a impulsed non-autonomous dynamical system is introduced. For it the existence and properties of a impulse attracting set are investigated. The obtained results are applied to the study of the two-dimensional impulse-perturbed Navier-Stokes system stability. In [7] the recursive properties of almost periodic motions of impulsed dynamical systems are studied. The obtained results are applied to the study of discrete systems qualitative behavior. In
32

[8] the properties of stability in relation to external (control) perturbations for differential equations systems with impulse action at fixed moments of time are considered. Necessary and sufficient stability conditions for classes of impulsive systems having a Lyapunov type function are obtained. In [9], a non-autonomous evolutionary inclusion with impulse influences at fixed moments of time is considered. A corresponding non-autonomous multivalued dynamical system is being constructed, for which the existence of a compact global attractor in phase space is proved. In [10–13], the existence of global attractors in multi-valued discontinuous infinite-dimensional dynamical systems, which can have trajectories with an infinite number of impulsed perturbations, was proved. The obtained results are applied to the asymptotic behavior study of the weakly nonlinear impulsed-perturbed parabolic equations and inclusions.
The properties of optimal sets of practical stability of differential inclusions and maximum sets of initial conditions in problems of practical stability were studied in [16-18]. In papers [19-20], the practical stability of discrete systems of discrete inclusions with spatial components is investigated.
In all the above works the bases of the qualitative theory of differential equations with impulse action are stated. In essence, the foundations of the qualitative theory of impulse systems based on the qualitative theory of differential equations, methods of asymptotic integration for such equations, the theory of difference equations and generalized functions were laid. However, the question of the solutions existence for weakly nonlinear impulse systems has not yet been fully investigated.
At the same time, the works in which important results in the field of information technologies and social communications were obtained deserve attention. In works [21–22] it is investigated Modification of the algorithm (OFM) S-box, which provides increasing crypto resistance in the post-quantum period and detection of slow DDoS attacks based on user’s behavior forecasting.
Ways to improve the quality of signal detection by taking into account interference and the method of signal detection of covert means of obtaining information were studied in [23]. The model of the accuracy of the localization of the hidden transmitter based on multi-position distance measurement and the method of obtaining estimates of the parameters of the radio
signals of the hidden means of obtaining information are described in [24–25]. The work [26–27] investigated the system of indicators and criteria for assessing the level of functional stability of information heterogeneous networks and special purpose networks. In works [28-29] studied applied control algorithm functionally sustainable production processes industry.
3. The purpose and objectives of the research
The aim of the research is to find the conditions for the existence of bounded solutions along the entire real axis for weakly nonlinear differential equations systems with momentum perturbations at fixed moments in time. The found conditions allow to model and study dynamic systems of various evolutionary processes, the parameters of which can change under the influence of external perturbations.
To achieve this goal the following tasks are solved:
• to find sufficient conditions for the existence of bounded solutions for a weakly nonlinear multidimensional differential equations system with momentum action; • to establish the conditions for the existence and the uniqueness of the bounded solution on the entire axis for weakly nonlinear impulse systems; • use the obtained conditions for the theoretical study of inhomogeneous impulse systems bounded solutions; to test the possibility of studying the solutions
on the example the model of "impulse vaccination" SIR.
4. Finding bounded solutions on the entire real axis for weakly nonlinear systems of differential equations with momentum perturbations at fixed moments of time
4.1. Sufficient conditions of the bounded solutions existence for a weakly nonlinear system with impulse action
33

Consider differential equations system with impulse perturbations
𝑑𝑥
𝑑𝑡= 𝐴(𝑡)𝑥 + 𝑓(𝑡, 𝑥), 𝑡 ≠ 𝜏𝑖 ,
𝛥𝑥|𝑡=𝜏𝑖 = 𝐵𝑖𝑥 + 𝐼𝑖(𝑥),
(1)
where 𝑥 ∈ 𝑅𝑛, the matrix 𝐴(𝑡) is continuous and bounded for all 𝑡 ∈ 𝑅, the matrices 𝐵𝑖 are uniformly on 𝑖 ∈ 𝑍 bounded and such that
inf𝑖∈𝑍
|det(𝐸 + 𝐵𝑖)| > 0. (2)
The function 𝑓(𝑥, 𝑡) is piecewise continuous on 𝑡 with first kind discontinuities at points the 𝑡 = 𝜏𝑖 , and satisfies the Lipschitz condition on 𝑥 uniformly with respect to 𝑡 ∈ 𝑅. The same condition is satisfied the functions 𝐼𝑖(𝑥):
‖𝑓(𝑡, 𝑥) − 𝑓(𝑡, 𝑦)‖ < 𝐿‖𝑥 − 𝑦‖,‖𝐼𝑖(𝑥) − 𝐼𝑖(𝑦)‖ < 𝐿‖𝑥 − 𝑦‖.
(3)
for all 𝑡 ∈ 𝑅, 𝑖 ∈ 𝑍 and some 𝐿 > 0. The sequence of moments of impulse
perturbation {𝜏𝑖} is numbered by integers so that when 𝑖 → −∞ and 𝜏𝑖 → +∞ when 𝑖 → +∞. We also consider that uniformly with respect to 𝑡 ∈ 𝑅 a finite boundary exists
lim𝑇→∞
𝑖(𝑡, 𝑡 + 𝑇)
𝑇= 𝑝 < ∞.
(4)
We are interested in the question of the existence of bounded on the whole axis solutions of equations (1) under the assumption that the corresponding linear system
𝑑𝑥
𝑑𝑡= 𝐴(𝑡)𝑥, 𝑡 ≠ 𝜏𝑖 ,
𝛥𝑥|𝑡=𝜏𝑖= 𝐵𝑖𝑥,
(5)
weakly regular on 𝑅. Consider the corresponding inhomogeneous
equation 𝑑𝑥
𝑑𝑡= 𝐴(𝑡)𝑥 + 𝑓(𝑡), 𝑡 ≠ 𝜏𝑖 ,
𝛥𝑥|𝑡=𝜏𝑖= 𝐵𝑖𝑥 + 𝑎𝑖
,
(6)
and give the necessary definitions.
Definition 1. We call a homogeneous system of equations (5) weakly regular on the whole axis 𝑅 if corresponding equation (6) for every bounded vector-function 𝑓(𝑡) has at least one bounded on 𝑅 solution, and regular on 𝑅, if this system has exactly one bounded on 𝑅 solution for every fixed bounded function 𝑓(𝑡).
According theorem 1 [1], for arbitrary bounded on 𝑅 functions 𝑓(𝑡) and sequence {𝑎𝑖} system of equations has only one solution bounded on all axis.
Theorem 1. Let system of equations (5) is weakly regular on whole numerical line and functions 𝑓(𝑡, 𝑥) and 𝐼𝑖(𝑥) satysfy for everyone
𝑡 ∈ 𝑅 and 𝑖 ∈ 𝑍 in some ball 𝑆𝑟 = {𝑥 ∈𝑅𝑛, ‖𝑥‖ ≤ 𝑟} conditions
𝐶‖𝑓(𝑡, 𝑥)‖ ≤ 𝑟, 𝐶‖𝐼𝑖(𝑥)‖ ≤ 𝑟, (7) where 𝐶 is a constant of weakly regularity. Then system of equation (1) has at least one solution bounded on all axis 𝑅.
4.2. Existence of a single bounded solution for weakly nonlinear pulse systems
Theorem 2. Let system of equation (5) is weakly nonlinear on all numerical axis 𝑅, functions 𝑓(𝑡, 𝑥) and 𝐼𝑖(𝑥) satisfy inequalities (3) with the Lipschitz constant 𝐿 <
1
𝐶 (𝐶 is constant of
weakly regularity of equations (5)) in the ball 𝐵𝑟 , where 𝑟 > 0 satisfies inequalities
𝐶 ⋅ max {sup𝑡∈𝑅
‖𝑓(𝑡, 0)‖, sup𝑖∈𝑍
‖𝐼𝑖(0)‖}
+ 𝐶𝐿𝑟 ≤ 𝑟.
(8)
When equation (1) has unique bounded on whole axis solution 𝑥 = 𝜙(𝑡), that satisfies condition 𝑃𝜙(0) = 0, and sup
𝑡∈𝑅‖𝜙(𝑡)‖ ≤ 𝑟.
We can be used Theorem 2 in the study of the existence of bounded overall axis solutions for differential equations systems with impulse influence in the form
𝑑𝑥
𝑑𝑡= 𝐴(𝑡)𝑥 + 𝑓(𝑡) + 𝑔(𝑡, 𝑥, 𝜀), 𝑡 ≠ 𝜏𝑖
𝛥𝑥|𝑡=𝜏𝑖= 𝐵𝑖𝑥 + 𝑎𝑖 + 𝐼𝑖(𝑥, 𝜀).
(9)
In (9) matrixes 𝐴(𝑡), 𝐵𝑖 and moments of time 𝜏𝑖 such as in equations (1); 𝑓(𝑡) is bounded overall axis continuous (piecewise continuous with breaks of the first kind at 𝑡 = 𝜏𝑖) function; 𝑡 = 𝜏𝑖 – is bounded sequence; function 𝑔(𝑡, 𝑥, 𝜀) is continuous (piecewise continuous with breaks of the first kind at 𝑡 = 𝜏𝑖) on 𝑡, continuous on 𝑥 and 𝜀, moreover satisfyes the Lipschitz condition according to 𝑥; functions 𝐼𝑖(𝑥, 𝜀) are also continuous over the set of their variables and satisfy the Lipschitz condition according to 𝑥, 𝜀 is a small positive parameter.
Suppose also that sup𝑡∈𝑅
‖𝑔(𝑡, 0, 𝜀)‖ ≤ 𝐿(𝜀), (10)
‖𝑔(𝑡, 𝑥1, 𝜀) − 𝑔(𝑡, 𝑥2, 𝜀)‖ ≤≤ 𝑙(𝜀)‖𝑥1 − 𝑥2‖,
‖𝐼𝑖(𝑥1, 𝜀) − 𝐼𝑖(𝑥2, 𝜀)‖ ≤ 𝑙(𝜀)‖𝑥1 − 𝑥2‖, (11) for all 𝑥1, 𝑥2 such that ‖𝑥1‖ ≤ 𝑟, ‖𝑥2‖ ≤ 𝑟, where 𝐿(𝜀) and 𝑙(𝜀) are non-negative non-decreasing functions of the parameter 𝜀, moreover 𝐿(𝜀) → 0, 𝑙(𝜀) → 0 when 𝜀 → 0.
34

Theorem 3. If system of equation (5) is weakly regular over the whole real line and number
𝑟 > 𝐶 ⋅ max {sup𝑡∈𝑅
‖𝑓(𝑡)‖, sup𝑖∈𝑍
‖𝑎𝑖‖},
where 𝐶 is a constant of weakly regularity of equations (5), then we can specify positive number 𝜀0 that for any 𝜀 ∈ [0, 𝜀0] system of equation (9) has unique bounded on the whole axis solution 𝜙(𝑡, 𝜀) that satisfies conductions 𝑃𝜙(0, 𝜀) = 0 and sup
𝑡∈𝑅‖𝜙(𝑡, 𝜀)‖ ≤ 𝑟.
Also, a function 𝜙(𝑡, 𝜀) continuous on 𝜀 and lim𝜀→0
𝜙(𝑡, 𝜀) = 𝜙0(𝑡), where 𝜙0(𝑡) is bounded on whole axis solution of equation (6), that satisfies condition.
4.3. SIR-model of "impulse vaccination" as a model of the dissemination of information on social networks
There are many mathematical models for effective diagnosis of infectious diseases, prediction and study of the pathological process dynamics, which modern medicine actively uses. One such epidemiological model is the SIR model proposed by W. O. Kermack and A. G. McKendrick [30]. It divides the population into three groups:
• healthy individuals who are at risk and can catch the infection (denoted as S - susceptible); • infected persons who are carriers of the virus (denoted as I - infected); • recovered persons who have acquired permanent immunity to this disease (denoted as R - recovered). Consider the SIR model for the “impulse
vaccination” strategy the percentage of susceptible patients is below the threshold required to start an epidemic (Figure 1).
Figure 1: The graph shows the scheme of impulse vaccination for susceptible populations at some time interval. Here the impulses of vaccination, which are carried out every year are the threshold of the epidemic
From the point of view of the SIR-model, the
mathematical component is described by a system of differential equations with impulse influence:
𝑑𝑆
𝑑𝑡= 𝑚 − (𝛽𝐼 + 𝑚)𝑆,
𝑑𝐼
𝑑𝑡= 𝛽𝐼𝑆 − (𝑚 + 𝑔)𝐼, 𝑑𝑅
𝑑𝑡= 𝑔𝐼 − 𝑚𝑅,
𝑆(𝑡𝑛) = (1 − 𝑝)𝑆(𝑡𝑛 − 0),
𝑡𝑛+1 = 𝑡𝑛 + 𝑇;
where 𝑡𝑛 is moment of times in which we apply 𝑛-th impulse of vaccination; 𝑡𝑛 − 0 is moment of time immediately before the application of the 𝑛-
th impulse; 𝑝 is the proportion of the susceptible population to which the vaccine is currently administered in the time moment 𝑡 = 𝑡𝑛; 𝑇 is period between two consecutive vaccinations.
A typical solution of the SIR-model with an impulse vaccination strategy is shown on Figure 2. We can observe how the part of favorable 𝑆(𝑡) fluctuates in a stable cycle with the use of impulse vaccine (𝑝 = 0.5 and 𝑇 = 2). Favorable ones are attracted to the periodic solution "without infection". The line 𝑆𝐶 ≈0.0556 means "epidemic threshold".
35

Figure 2: A typical solution 𝑆(𝑡) of the SIR-model with an impulse vaccination
In contrast, the part of the infected population decreases rapidly to zero, as shown in Figure 3.
In real conditions the classical SIR-model can not always accurately describe the results of the real situation. The coefficients of the model, depending on the input data, may deviate from the classical condition. Therefore, there is a need to
study appropriate systems that contain weak nonlinearity. The obtained results allow to determine and analyze the solutions of the respective systems.
Figure 3: A typical solution 𝐼(𝑡) of the SIR-model with an impulse vaccination
Therefore, if we have enough vaccines to fight
an infectious disease, it would be reasonable for the susceptible population to be vaccinated each time to be proportional to the number of susceptible individuals (here 𝜌). However, such an approximation cannot reflect the real case. Typically, the number of susceptible people that need of vaccination may exceed local medical conditions due to a shortage of vaccines and doctors, especially in rural areas of many developing countries, where reaching the entire target population can be difficult.
Now we explain how SIR model can be considered as a model which describes the dissemination of information on social networks. As in SIR model we divide the population into three groups:
• susceptible will mean uninformed subjects, to whom an information attack can be directed; • infected will mean persons who are carriers of information and actively disseminate information (harmful or useful); • recovered will mean informed persons who are information carriers and are not vulnerable to information attacks (will not change their attitude to the object of information).
"Impulse vaccination" will mean "Information stuffing", i.e., "Informing the population of the social network".
36

5. Discussion of the results of finding bounded solutions for weakly nonlinear systems with impulse action
The problem of finding and investigating bounded solutions for nonlinear differential equations with impulse action is quite important and little studied in the general case. Recent work in this direction has focused mainly on one-dimensional and two-dimensional systems of equations. When considering multidimensional systems, a method based on the analysis of qualitative properties (regularity) of the corresponding linear homogeneous systems is used. These properties, on the one hand, can be effectively tested for wide classes of impulse systems, and on the other hand, make it possible to prove a number of properties of a qualitative nature for inhomogeneous pulse-perturbed systems. Thus, the conditions for the existence of bounded solutions of linear differential equations can be extended to classes of weakly nonlinear impulse systems (Theorem 1). Also obtained are the conditions (Theorem 2) under which the existence and uniqueness of bounded solutions for weakly nonlinear systems of differential equations with momentum action at fixed moments of time is guaranteed. The results of Theorem 2 are applied to the case of piecewise continuous functions with discontinuities of the first kind (Theorem 3).
6. Conclusions
The problem of existence of bounded solutions on the whole real axis (on the half-axis) of weakly nonlinear systems of differential equations with impulse perturbations at fixed moments of time is investigated.
Sufficient conditions for the existence of bounded solutions of a weakly nonlinear multidimensional system of differential equations with momentum actions are obtained. It is important that the found conditions were formulated through the coefficients of the original problem.
Conditions of existence and uniqueness of a limited solution on the whole axis for weakly nonlinear pulse systems, which allow to make a qualitative analysis of the solutions of the respective systems.
The obtained results for the coefficients of the SIR-model allow to determine and analyze the solutions of the corresponding systems that contain weak nonlinearity depending on the input data. In this way, a tool for modeling the circulation of information messages in social networks is obtained.
Further research in this area will provide qualitative results for the development of strategies for mass information of various target groups of users of socially significant information and develop strategies to combat the spread of unreliable and harmful information through social networks.
7. References
[1] F. Asrorov, V. Sobchuk, O. Kurylko, Finding of bounded solutions to linear impulsive systems, Eastern-European Journal of Enterprise Technologies, 6 (4–102) (2019), 14–20. doi: 10.15587/1729-4061.
[2] F. Asrorov, Y. Perestyuk, P. Feketa, On the stability of invariant tori of a class of dynamical systems with the Lappo–Danilevskii condition, Memoirs on Differential Equations and Mathematical Physics, 72 (2017), 15–25.
[3] Wang, Yaqi and Jianquan Lu. Some recent results of analysis and control for impulsive systems, Communications in Nonlinear Science and Numerical Simulation (2019): 104862. doi: 10.1016/S1007-5704.
[4] O. V. Kapustyan, F. A. Asrorov, Y. M. Perestyuk, On the Exponential Stability of a Trivial Torus for One Class of Nonlinear Impulsive Systems, Journal of Mathematical Sciences (United States), 238(3) (2019), 263–270.
[5] O. A. Kapustian, V. V. Sobchuk, Approximate homogenized synthesis for distributed optimal control problem with superposition type cost functional, Statistics, Optimization and Information Computing, 6(2) (2018), 233–239. doi: 10.19139/soic.v8i3
[6] A.V. Sukretna, O.A. Kapustian Approximate averaged synthesis of the problem of optimal control for a parabolic equation, Ukrainian Mathematical Journal, 56(10) (2004), 1653–1664.
[7] E. M. Bonotto, M. C. Bortolan, T. Caraballo, R. Collegari, Impulsive non-autonomous dynamical systems and impulsive cocycle
37

attractors, Mathematical Methods in the Applied Sciences 40(4) (2017), 1095–1113.
[8] E. M. Bonotto, L. P. Gimenes, G. M. Souto, Asymptotically almost periodic motions in impulsive semidynamical systems, Topological Methods in Nonlinear Analysis 49(1) (2017), 133–163.
[9] S. Dashkovskiy, P. Feketa, Input-to-state stability of impulsive systems and their networks, Nonlinear Analysis: Hybrid Systems, 26 (2017), 190–200. doi: 10.1016/s1751-570x.
[10] M. O. Perestyuk, O. V. Kapustyan, Long-time behavior of evolution inclusion with non-damped impulsive effects, Memoirs of Differential equations and Mathematical physics, 56 (2012), 89–113.
[11] Samoilenko A.M., Samoilenko V.G., Sobchuk V.V. On periodic solutions of the equation of a nonlinear oscillator with pulse influence // Ukrainian Mathematical Journal, 1999, (51) 6, Springer New York – Р. 926–933.
[12] M. O. Perestyuk, O.V. Kapustyan, Global attractors of impulsive infinite-dimensional systems, Ukrainian Mathematical Journal, 68/4 (2016), 517–528. doi: 10.37069/1810-3200
[13] S. Dashkovskiy, O. Kapustyan, I. Romaniuk, Global attractors of impulsive parabolic inclusions, Discrete and Continuous Dynamical Systems - Series B, 22/5 (2017), 1875–1886. doi: 10.3934/dcdsb
[14] O.V. Kapustyan, P.O. Kasyanov, J. Valero, Structure of the global attractor for weak solutions of a reaction-diffusion equation, Applied Mathematics and Information Sciences, 9(5) (2015), 2257–2264.
[15] Serhii Yevseiev, Roman Korolyov, Andrii Tkachov, Oleksandr Laptiev, Ivan Opirskyy, Olha Soloviova. Modification of the algorithm (OFM) S-box, which provides increasing crypto resistance in the post-quantum period. International Journal of Advanced Trends in Computer Science and Engineering (IJATCSE) Volume 9. No. 5, September-Oktober 2020, pp 8725-8729.
[16] Garashchenko, F. G., Pichkur, V. V., Properties of optimal sets of practical stability of differential inclusions. part I. part II, Journal of Automation and Information Sciences, 38 (3) (2006), 1–11.
[17] Pichkur, V.V., Maximum sets of initial conditions in practical stability and stabilization of differential inclusions, In:
Sadovnichiy, V.A., Zgurovsky, M. (eds.) Modern Mathematics and Mechanics. Fundamentals, Problems and Challenges. Understanding Complex Systems, Springer, Berlin, 2019, 397-410.
[18] Bashnyakov, A.N., Pichkur, V.V., Hitko, I.V., On Maximal Initial Data Set in Problems of Practical Stability of Discrete System, Journal of Automation and Information Sciences, 43 (3) (2001), 1–8.
[19] Pichkur, V.V., Linder, Y.M., Practical Stability of Discrete Systems: Maximum Sets of Initial Conditions Concept, In: Sadovnichiy, V.A., Zgurovsky, M. (eds.) Contemporary Approaches and Methods in Fundamental Mathematics and Mechanics. Understanding Complex Systems, Springer, Berlin, 2021, 381-394.
[20] Pichkur, V.V., Linder, Y.M., Tairova, M.S. On the Practical Stability of Discrete Inclusions with Spatial Components. Journal of Mathematical Sciences, 2021, 254(2), pp. 280–286
[21] Vitalii Savchenko, Oleh Ilin, Nikolay Hnidenko, Olga Tkachenko, Oleksandr Laptiev, Svitlana Lehominova, Detection of Slow DDoS Attacks based on User’s Behavior Forecasting. International Journal of Emerging Trends in Engineering Research (IJETER) Volume 8. No. 5, May 2020. Scopus Indexed - ISSN 2347 – 3983. pp.2019 – 2025.
[22] Oleksandr Laptiev, Oleh Stefurak, Igor Polovinkin, Oleg Barabash, Savchenko Vitalii, Olena Zelikovska. The method of improving the signal detection quality by accounting for interference. 2020 IEEE 2nd International Conference on Advanced Trends in Information Theory (IEEE ATIT 2020) Conference Proceedings Kyiv, Ukraine, November 25-27. pp.172 –176.
[23] Oleksandr Laptiev, Savchenko Vitalii, Serhii Yevseiev, Halyna Haidur, Sergii Gakhov,Spartak Hohoniants. The new method for detecting signals of means of covert obtaining information. 2020 IEEE 2nd International Conference on Advanced Trends in Information Theory (IEEE ATIT 2020) Conference Proceedings Kyiv, Ukraine, November 25-27. pp.176 –181.
[24] Barabash Oleg, Laptiev Oleksandr, Tkachev Volodymyr, Maystrov Oleksii, Krasikov Oleksandr, Polovinkin Igor. The Indirect method of obtaining Estimates of the Parameters of Radio Signals of covert means
38

of obtaining Information. International Journal of Emerging Trends in Engineering Research (IJETER), Volume 8. No. 8, August 2020. Indexed- ISSN: 2278 – 3075. pp 4133 – 4139.
[25] Vitalii Savchenko, Oleksandr Laptiev, Oleksandr Kolos, Rostyslav Lisnevskyi, Viktoriia Ivannikova, Ivan Ablazov. Hidden Transmitter Localization Accuracy Model Based on Multi-Position Range Measurement. 2020 IEEE 2nd International Conference on Advanced Trends in Information Theory (IEEE ATIT 2020) Conference Proceedings Kyiv, Ukraine, November 25-27. pp.246 –251.
[26] Maksymuk O., Sobchuk V., Salanda I., Sachuk Yu.A system of indicators and criteria for evaluation of the level of functional stability of information heterogenic networks. // Mathematical Modeling and Computing. 2020. Vol. 7, No. 2. pp. 285–292.
[27] Obidin D., Ardelyan V., Lukova-Chuiko N., Musienko A. Estimation of Functional Stability of Special Purpose Networks Located on Vehicles / // Proceedings of 2017 IEEE 4th International Conference "Actual Problems of Unmanned Aerial Vehicles Developments (APUAVD ) ", October 17-19 2017, Kyiv, Ukraine. - Kyiv: National Aviation University, 2017. pp. 167–170.
[28] Valentyn Sobchuk, Volodymyr Pichkur, Oleg Barabash, Oleksandr Laptiev, Kovalchuk Igor, Amina Zidan. Algorithm of control of functionally stable manufacturing processes of enterprises. 2020 IEEE 2nd International Conference on Advanced Trends in Information Theory (IEEE ATIT 2020) Conference Proceedings Kyiv, Ukraine, November 25-27. pp.206 –211.
[29] Sobchuk, V., Olimpiyeva, Y., Musienko, A., Sobchuk, A. Ensuring the properties of functional stability of manufacturing processes based on the application of neural networks CEUR Workshop Proceedings, 2021, 2845, рр. 106–116.
[30] W. O. Kermack and A. G. McKendrick, A contribution to the mathematical theory of epidemics, Proc. R. Soc. Lond, 115 (1927), 700–721.
39

Cloud Technologies And Artificial Intelligence As The Basis Of Digital Development Of The Financial Sector Of The Economy Of Ukraine Maryna Demianchuk 1, 2, Natalia Maslii 1, 2 and Olena Kniazieva 3
1 Odessa I.I. Mechnikov National University, Frantsuzkyi boulevard, 24/26, Odesa, 65044, Ukraine 2 Institute of market problems and economic & ecological research of the National Academy of Sciences of Ukraine, Frantsuzkyi boulevard, 29, Odesa, 65044, Ukraine 3 State University of Intellectual Technologies and Communications, Kuznechnaya 1, Odessa, 65029, Ukraine
Abstract In the modern world, digitalization processes are the basis for stimulating the country’s economic growth. The intensity of globalization processes leads to the economic integration of the economies and financial sectors of the countries of the world. The main trend of the modern financial sector is the accelerated introduction of technological innovations, innovative financial services and tools for their implementation. The use of digital technologies helps to reduce the cost of maintenance and operational risks. Creating a digital basis for serving consumers by finance companies increases their productivity and spurs more innovation in the financial arena. This, in turn, maintains the soundness of the financial sector. Restyling of financial services is based on the use of artificial intelligence and cloud technologies by financial companies, which allows to meet the needs and expectations of consumers. The use of tools for digital transformation of the financial sector provides maximum personalization, while using a large variety of parameters. Tracking and comparing changes in regulatory documents using RegTech and NLP provides an important area of activity for financial companies - compliance. An inevitable process is the virtualization of information interaction between financial sector entities based on the use of cloud technologies. However, the imperfection of these technologies at the moment does not allow them to be fully used. Therefore, in order to create favorable conditions for the introduction of innovations in the financial sector based on cloud technologies, it is necessary to implement a number of actions proposed in the article. The studies carried out allow us to assert that due to digital transformations of the financial sector, the efficiency of business processes increases and powerful advantages of its subjects are formed. But at the same time, there are some restrictions on their full implementation and risks on the way to the development of the digital financial sector in Ukraine. The proposed potential means of accelerated digitalization of the financial sector of the economy are in the large-scale and all-encompassing use of cloud technologies and artificial intelligence. Keywords 1 financial sector, digitalization, financial innovation, ICT, artificial intelligence, cloud technologies, restyling, RegTech
1. Introduction
A significant trend in the development of the world economy in the 21st century is the spread of ICT, which provided opportunities for the development of the “digital economy” and caused the introduction of the concepts of “digitalization” into
EMAIL: [email protected] (A. 1); [email protected] (A. 2); [email protected] (A. 3) ORCID: 0000-0002-3907-3464 (A. 1); 0000-0002-3472-5646 (A. 2); 0000-0002-9853-0637 (A. 3)
scientific circulation. In the modern world, significant mega-regional changes are taking place with varying intensity and results. They are caused by the intensification of the processes of globalization of the world economy and the expansion of economic integration, changes in the structure of national economic systems [1], transformational shifts. At the same time, the process of transition from an industrial
40

society to the development of the information space is under way. Its level of development significantly affects the economy, culture, politics and financial sector of countries.
The reorientation of the traditional economy to a digital one requires the use of innovative technologies, including in the financial sector. According to the adopted “Strategy for the development of the financial sector of Ukraine until 2025” [2], the main directions of innovative development of the financial market of Ukraine are determined: development of an open architecture of the financial market and oversight; ensuring the development of the FinTech market, digital technologies and regulatory platforms; ensuring the development of SupTech & RegTech; development of the digital economy. The development of the financial sector at the present stage is associated with the use of the latest information technologies.
The development and use of technological innovations by institutions of the financial sector is one of the important areas for the successful development of the national financial services market in Ukraine. The introduction of the latest ICTs leads to a reduction in costs and an increase in labor productivity, the creation of remote jobs, the development of distance learning, etc. This will help to increase the income of financial institutions, enhance their competitiveness in the market, improve the image and increase the level of confidence on the part of non-financial corporations and households.
2. Researches of the imperatives of the digital transformation of the financial sector
The financial sector receives the greatest benefits from the use of digital technologies, therefore, scientists from different countries are studying the issues of transformation processes and digitalization of the financial sector. At the same time, the need to maintain stability in the face of growing competition and transformation into service companies investing in the development of the digital economy, rather than traditional services, is emphasized [3]. The use of artificial intelligence and RegTech provide new opportunities for high-quality regulation and settlements in the financial sector [4], influencing the banking and financial stability [5]. The introduction of new technologies (cognitive technologies, robotics, IoT / connected devices,
mobile / social media), depending on the level of investments and their place in the production process [6], affects the performance of financial companies. The effectiveness of investments in digital technologies is manifested in the indicators of the company’s performance and labor productivity. However, it is necessary to take into account their biggest threats [7], companies’ value chains, commodity risks.
The imperatives of the digital transformation of the financial sector (digital statistics, managed data, integrated customer experiences, digital marketing, digital operations, next-generation technologies and digital tools) act as a factor in maximizing the ROI of digital investments [8, 9, 10]. The use of cloud technologies in practice requires the selection of the most appropriate model for the secure deployment of such a cloud, taking into account the level of information security of the company, confidentiality and compliance with the necessary requirements [11, 12, 13]. At the same time, the introduction of cloud computing technologies and services in the financial sector of developed countries increases the efficiency of payment transactions, risk management and business processes. Ensuring digital development of the financial sector of the economy provides an opportunity to determine the further development [14] of companies from the standpoint of competition or symbiosis. Taking into account the research carried out, in order to ensure the digital development of the financial sector of the Ukrainian economy, additional research requires tools for the implementation of such development.
2.1. The financial services market in the context of digitalization
Existing studies do not fully disclose the tools for implementing the strategy for the development of the financial sector in Ukraine. This requires the determination of the main development trend of the modern financial sector; substantiation of the objective need for the use of artificial intelligence and cloud technologies, as well as actions to create favorable conditions for the introduction of innovations in the financial sector; identify the advantages, limitations, risks and means of accelerated digitalization of the financial sector of the Ukrainian economy.
The purpose of the article is to substantiation of the expediency of using cloud technologies and artificial intelligence as the main tools for ensuring the digital development of the financial sector of the Ukrainian economy.
41

2.1.1. The main development trend of the modern financial sector in Ukraine
Digital transformation is a new direction in the development of the financial sector, which involves the use of new technologies, the Internet, mobile devices and a variety of electronic channels. In turn, digitalization of the financial sector is the introduction of new technologies and data into business processes in order to increase the efficiency of its activities. The factors that contribute to the spread and development of digitalization of the financial sector are the development of new technologies, the need to reduce costs, and increased competition. It is expected that plastic cards will be replaced by smartphones with an Internet bank, but, on the other hand, this requires significant investments and investments. The National Bank should become the driver of the development of digital technologies of the financial system in Ukraine, as clients begin to turn to digital services for certain forms of financial services that are needed by a modern Internet user.
In Ukraine, there are three main challenges to expanding the digital format of the financial sector: a significant amount of paperwork and a surplus of branch network; high share of cash transactions; differences in performance levels between financial institutions. Today in Ukraine, on average, there are 2-3 times fewer clients per bank branch than in developed countries, which indicates the feasibility of further network optimization. Ukrainian banks have strict regulation of processes and a significant amount of paperwork.
The branches of Ukrainian banks are overloaded with cash transactions, which reflects the high share of the shadow economy and the underdevelopment of the payment infrastructure. There is significant potential to reduce the share of cash transactions, as well as manual processes in branches by organizing smooth operation and 24-hour availability of ATMs. Note that the performance indicators of financial institutions vary significantly. Leaders are significantly ahead of other institutions in terms of the number of retail customers served in one branch, and are successfully moving transactions to electronic channels. Consolidation and dissemination of best practices can help increase productivity in the sector. Relatively efficient financial institutions serve almost three times as many clients per branch. Building new IT infrastructures for financial institutions allows them to manage markets for profitability. The widespread
use of digital services is the future of the financial system. Ukraine has a great competitive advantage in this area, since domestic financial institutions have long and effectively used advanced innovative technologies in their practice. At the moment, the financial sector of the Ukrainian economy is undergoing a stage of qualitative transformation and is capable of large-scale use of cloud technologies and artificial intelligence.
In the context of digitalization, the financial services market has changed dramatically and is developing dynamically. Today it is not enough to apply traditional methods of providing financial services. The digital transformation of the financial sector of the economy involves the restyling of financial services. Changes are taking place from customer service to machine learning and from artificial intelligence to mobility. The financial industry is changing from complex and time-consuming transactions to a more transparent structure. The transition from the classic “product” organization to the technological one is under way, new management models based on digital strategy are being used.
To be competitive, it is necessary to create and properly use new forms of customer acquisition and service based on the implementation of cloud technologies and artificial intelligence. The gradual digitalization of the financial sector covers its various areas - payment technologies, remote customer service, developing relationships with them, developing and mastering new products, risk management, internal operations and others. The implementation of such a transformation is possible by stimulating FinTech companies and introducing sustainable financial revolutionary technologies.
To be able to quickly and flexibly adapt to changes, there is a need to use cloud platforms. They can help meet customer needs and expectations, enhance workflows and data integration, and improve analytic processes and corporate reporting. Therefore, financial companies are increasingly moving from “target audience” to personalization, thereby protecting new competitive advantages and customer loyalty.
2.1.2. The objective necessity for the use of artificial intelligence and cloud technologies
Artificial intelligence is able to quickly find information about any customer or transaction, therefore a number of banks. It is used to monitor
42

the negotiations between managers and clients and to conduct internal investigations. To do this, the program instantly analyzes recordings from many different sources and checks texts, audio and video recordings. Artificial intelligence systems help banks respond to various requests from regulators, including those connected to customer complaints, which usually take a lot of time and resources.
Big data helps finance companies maximize service levels and self-value. They form a complete data map of each client. At the same time, one of the main problems is the need to study huge volumes of information about client operations. The use of artificial intelligence can be used to solve many of such problems as modeling, scenario analysis and forecasting; conducting customer identification; monitoring of organizational culture; collection and analysis of data for risk management. Artificial intelligence algorithms analyze transactions in many more parameters than is possible with human work. Leverage machine learning to identify suspicious transactions and dramatically reduce false alerts by empowering employees to focus on real issues.
Many banks are testing artificial intelligence technologies for stress testing, as well as implementing a system for combating money laundering and terrorist financing. Corresponding algorithms scan client documents and check the received information with data from the Internet. If a discrepancy is found, the so-called “red flags” are raised, that is, a warning to bank employees about the need for additional study of the client. Artificial intelligence technologies do not replace humans in making management decisions, but help to do it faster and better.
Information technologies are being introduced quite actively into compliance, which is one of the important areas of activity of financial companies all over the world. Since the realization of risks of non-compliance can lead to the application of various sanctions, financial or reputational losses. Natural language processing (NLP) algorithms allow you to track and compare changes in regulatory documents. Therefore, the implementation of ICT for compliance is a vital necessity for financial companies and a promising field of activity for IT companies through the development of RegTech.
Digital technologies make it possible to virtualize the information interaction between customers and financial workers providing services, use cloud services that provide end users with the ability to use dynamic access to services, computing resources and applications over the
Internet remotely. With the digitalization of the financial sector, the use of cloud computing solutions is increasing.
Complementary digitalization of any financial company is taking place. There is a complementarity of financial services, in which the consumption of some services causes a constant need for others. At the same time, it is critical to modernize the business model of a financial company and transform it into a cloud platform. The use of cloud technologies allows: to reduce the time and financial costs of maintaining the physical IT infrastructure; provide customers with effective multi-channel digital interaction in real time; simplify and optimize business processes through standardization, optimization and implementation of cloud solutions; creates opportunities for the introduction of advanced technologies, in particular artificial intelligence, the Internet of things, blockchain, etc.
With cloud computing, finance companies can focus on their core business, increasing productivity during peak periods. Here’s a good example: using a smartphone, today you can make contactless payments instead of using a plastic card and paper money. The implementation of this process is based on a cloud-based approach and a specialized service. It is built using HCE (Host Card Emulation) technology, which allows you to emulate a physical card on a host system in the cloud and transfer customer payment data to a smartphone. It is noteworthy that no data remains on the device itself, since during the transaction they come from the cloud in encrypted form.
2.1.3. Accelerated digitalization of the financial sector of the Ukrainian economy: advantages, limitations, risks and means
Cloud computing and artificial intelligence provides virtually limitless opportunities for the financial sector. However, the technologies themselves are quite young and have certain problems that require solutions. Financial institutions have large and complex IT infrastructures that rely on mission-critical applications and meet stringent criteria and extremely stringent security requirements. Therefore, until now, key banking applications are not used in the cloud. The main reason is the risk of transferring confidential financial information to the cloud, since the security of the clouds is
43

uncertain. To create an enabling environment for cloud-based innovation in the financial sector, a number of actions need to be taken.
The use of cloud technologies in the financial sector leads to risks of transferring confidential information to the cloud. They are associated with a lack of visibility and control over processes in the clouds; shadow IT; the likelihood of accidental data publication; malicious data breach; distortion or loss of critical data; non-compliance with regulatory requirements; the presence of cloud-based malware; the likelihood of malware spreading to the entire corporate network To minimize these risks, it is necessary to take actions to create an enabling environment for the introduction of innovations in the financial sector based on cloud technologies. Namely: analysis and determination of the composition of cloud services on the market and regulatory barriers to their development. Creation of standard clauses for outsourcing agreements, taking into account the requirements of the financial regulator for the IT service provider, including in the field of risk management, audit and supervision. Stimulate the development of qualified auditing and cloud service provider certification practices by setting contractual and quality label requirements in line with internal control maturity.
Thanks to the digital transformations of the financial sector, the efficiency of business processes is increasing and powerful advantages of its subjects are formed. Namely: intensification of the development of the financial sector; significant increase in the return on investment in digitalization; ensuring the continuity of banking activities; minimization of the risk of the human factor; an increase in the speed of decision making; providing additional opportunities for all subjects of the financial sector; lower user costs; expanding access to finance for individuals, small and medium-sized enterprises, underserved by financial services; consolidation of information technologies by financial organizations to diversify the risks of their business; expanding the range of financial services and the circle of potential clients; reducing information asymmetry and improving pricing efficiency.
At the same time, existing restrictions (an increase in the number of cases of implementation of operational decisions in the short term; imperfection of legislation in the field of digital technologies; underdevelopment of digital infrastructure; insufficient digital culture of business and other users of banking services; lack of highly qualified personnel; insufficient level of
regulatory regulation of the use of FinTech companies that differ from traditional business model institutions; unpredictable decision-making by consumers of online services; limited access due to the inadequate level of skills and the ability of consumers’ available gadgets to carry out online transactions) prevent the full realization of the benefits.
At the same time, the pace of development of the digital financial sector is reducing macroeconomic threats, digital divide, and various kinds of risks. Macroeconomic threats to digitalization are caused by a mismatch and lack of skills, reduced spending on science and innovation, and demographic factors. Digital divide, digital divide, polarization refers to inequalities in access to social, economic, educational, cultural and other opportunities. Market risk implies the negative consequences of a significant change in market conditions. Cyber risks arise due to the specifics of the financial technology environment. Technological risk implies a disruption in the uninterrupted provision of services as a result of failures or errors in the operation of the service. Legal risks touches upon the problem of insufficient consumer protection.
Limitations and risks are not new. They can be strengthened by the rapid development of FinTech and new forms of interconnection, the regulation of which is currently insufficient. However, it is the processes of digitalization of the financial sector that contribute to the improvement of regulatory documents.
3. Conclusions
To overcome the existing limitations and risks of digitalization of the financial sector of the economy, it is necessary to increase the volume of investments in the digitalization of the sector’s activities. While paying special attention to investing in the development of mobile applications, the use of cloud technologies and artificial intelligence in activities.
Increasing the protection of data and intellectual property of financial companies, taking into account vulnerable assets exposed to the impact of cyber incidents, will optimize business processes and increase the level of competitiveness of sector entities. The creation of remote jobs / jobs of a new type will attract specialists of digital services, contributing to their popularization and effective implementation in the country.
44

Thus, the proposed potential means of accelerated digitalization of the financial sector of the economy lie in the large-scale and all-encompassing use of cloud technologies and artificial intelligence. They should be aimed at meeting the needs of financial sector entities, monitoring the degree of their digitalization, the level of provision of digital services and their quality.
4. Acknowledgements
This study was conducted at the Department of Finance, Banking and Insurance of Odessa I.I. Mechnikov National University, at the Department of transport services market of Institute of market problems and economic & ecological research of the National Academy of Sciences of Ukraine, at the Department of business economics and corporate management of State University of Intellectual Technologies and Communications. The authors would like to thank management of the Faculty of Economics for their supports. The work was carried out without any financial grant from any sources.
5. References
[1] O. Kniazieva, Digital development of economy and society under influence of Covid-19, Science and Innovation 17 (2021) 42–53. doi: 10.15407/scine17.01.042.
[2] National Bank of Ukraine, Strategy for the development of the financial sector of Ukraine until 2025, 2021. URL: https://bank.gov.ua/news/all/strategiya-rozvitku-finansovogo-sektoru-ukrayini-do-2025-roku-7686.
[3] B. Machkour, Ah. Abriane, Industry 4.0 and its Implications for the Financial Sector, Procedia Computer Science 177 (2020), 496–502. doi: 10.1016/j.procs.2020.10.068.
[4] M. Arnold, Market grows for ‘regtech’, or AI for regulation, 2016. URL: https://www.ft.com/content/fd80ac50-7383-11e6-bf48-b372cdb1043a.
[5] S. Carbó-Valverde, The Impact on Digitalization on Banking and Financial Stability, Journal of Financial Management, Markets and Institutions 1 (2017) 133–140. doi: 10.12831/87063.
[6] H. Forest, D. Rose, Delighting Customers and Democratising Finance: Digitalisation and the Future of Commercial Banking,
2015. URL: https://cib.db.com/docs_new/GTB_Digitalisation_Whitepaper_(DB0388)_v2.pdf.
[7] О. Baranovskyi, I. Boiarko, T. Zlunitsyna, Methodical approaches to the assessment of the impact of the quality of transformation processes on the development of the financial sector, Financial and credit activities: problems of theory and practice 1 (2021) 203–209. doi: 10.18371/fcaptp.v1i36.227750.
[8] M. Dietz, S. Khanna, T. Olanrewaju, K. Rajgopal, Cutting through the Noise around Financial Technology, 2016. URL: https://www.mckinsey.com/industries/financial-services/our-insights/cutting-through-the-noise-around-financial-technology.
[9] World Economic Forum, Digital Transformation Initiative. Maximizing the Return on Digital Investments, 2018. URL: http://www3.weforum.org/docs/DTI_Maximizing_Return_Digital_WP.pdf.
[10] N. Maslii, V. Riashchenko, L. Syvolap, О. Bezpartochna, Management Approach to Implementation of ERP-System and CBIP for Effective of Enterprises’ Integration, Journal of Information Technology Management (2021), 91–102. doi: 10.22059/jitm.2021.80739.
[11] F. F. Alruwaili, T. A. Gulliver, Secure migration to compliant cloud services: A case study, Journal of Information Security and Applications 38 (2018) 50–64. doi: https://doi.org/10.1016/j.jisa.2017.11.004.
[12] M. Demianchuk, M. Bezpartochnyi, L. Filipishyna, M. Živitere, The model of achieving a balanced balance between economic efficiency and ecological-social responsibility of digitalized enterprise, Journal of Optimization in Industrial Engineering 14 (2021) 63–70. doi: 10.22094/JOIE.2020.677817.
[13] O. Sazonets, Z. Los, I. Perevozova, P. Samoilov, Yu. Zhadanova, Labor and assets optimization in the context of increasing the international information company efficiency, Naukovyi Visnyk Natsionalnoho Hirnychoho Universytetu 6 (2020) 155–161. doi: 10.33271/nvngu/2020-6/155.
[14] M. Zveryakov, V. Kovalenko, S. Sheludko, E. Sharah, FinTech sector and banking business: competition or symbiosis? Economic Annals-XXI 175 (2019) 53–57. doi: 10.21003/ea.V175-09.
45

Intelligent Monitoring Of Software Test Automation Of Web Sites Maria Talakh 1, Serhii Holub 2 and Yurii Lazarenko 3
1 Yuriy Fedkovych Chernivtsi National University, Rivnenska str., 16, Chernivtsi, 58000, Ukraine 2 Cherkasy State Technological University, Shevchenko Boulevard 460, Cherkasy, 18006, Ukraine 3 Test automation engineer Softserve, Nebesnoyi Sotni st. 16a, Chernivtsi, 58018, Ukraine
Abstract The active use of test automation approaches in software development causes further automation of this process, in particular, in the field of results analysis. This paper presents the results of applying the methodology for creating information technologies of multi-level intelligent monitoring to provide data for decision-making processes by a testing engineer. Methods of text mining and machine learning are combined to build a methodology for creating intelligent multi-level monitoring systems. On the example of a set of reports, which were divided by an expert into 4 classes, the processes of coordination of interactions of different types of methods for forming an array of informative features, typical aggregates for the synthesis of classifier models at each stage of monitoring were investigated. The task of classifying the results of text research was solved to obtain the reason for the failure of the tests. A set of n-grams for each class of tests formed an array of input data for the synthesizer of models of the monitoring information system. The classification of these data was provided using an ensemble of models, where the resulting value was obtained combining predictions by meta-learning using stacking. The effectiveness of the described methodology has been experimentally proven. Keywords 1 intellectual monitoring, test automation, ensemble training.
1. Introduction
Intelligent monitoring of automatic software testing processes provides identification of the causes of errors to speed up their processing by the tester. Based on the testing results, the monitoring information system (MIS) [1] solves the problems of classifying errors and their causes. This paper describes the process of using intelligent monitoring information technology to support decision-making by a QA engineer on the choice of methods and means of eliminating errors. The work of the method is described using the example of developing a website.
The introduction of test automation into the software development process is now a must, the number of available test results is increasing significantly.
Jobs, or agents who have the role of a QA engineer and perform tests, can work around the clock, seven days a week, and in addition, the
EMAIL: [email protected] (A.1); [email protected] (A.2); [email protected] (A. 3) ORCID: 0000-0002-5067-6848 (A. 1); 0000-0002-5523-6120 (A. 2); 0000-0002-0592-2202 (A. 3)
number of test cases accumulates during each sprint. Thus, more results are obtained for management and analysis. A significant amount of data requires approaches to their processing [2].
If the time spent examining the test results exceeds the time saved by running automated tests, then the very meaning of its implementation is lost. To reap the benefits of automation, it is important to know how to properly handle the growing number of test results. Continuous Delivery requires constant testing that slows down the pace of work. In the fast pace of product development and testing, optimizing (both failed and successful) test cases is critical [3].
At the same time, there are not so many applications for tracking the history of automated tests, they are limited in functionality. And standard reports are always hard to read since the appearance is not informative enough.
46

The most common test frameworks are NUnit and TestNG, the latter of which was used in [4].
Machine learning of classifier models is based on the analysis of previous runs of auto-tests. The main stages are [1]:
1) coordination of the form and content of information about the properties of objects of observation;
2) determination of the list of diagnostic signs; 3) the formation of an array of input data (MVD); 4) construction and training of models by the
MIS synthesizer; 5) testing and using models to identify the
causes of errors. The set of the obtained classifier models is entered into the model knowledge base, forming its hierarchical structure.
The task of ensuring the information content of the Ministry of Internal Affairs, sufficient for constructing useful models by the available methods and means, implemented in the synthesizer of the MIS models, is always relevant. The effective organization of observation of research objects provides for the attraction of the latest scientific achievements in the subject area, in which the monitoring technology is implemented [1].
Now there are not many implemented ready-made products for classifying the results of automated testing. Most of them are test developments and student projects [5].
Thus, the use of machine learning technology of models through MIS for analyzing the results
of Automation tests is relevant and allows you to increase the efficiency of QA engineers, allows you to increase the coverage of web applications with new tests, and improves the quality of applications. It also reduces the time it takes to make decisions to improve on failed tests.
2. Results
A hypothesis was formulated that the list of classification features for identifying the causes of errors in programs should be obtained by using Text Mining methods [6-8]. This work examines the processes of forming a list of features and forming an array of input data by combining expert methods, Text Mining methods, and ensemble classification methods. For this, the results of the classification of samples were studied after the formation of an array of input data based on the features obtained by using text mining reports of the fall of automatic tests. The results were evaluated by the number of correctly classified samples.
Thus, at the first stage of building a monitoring information system, it is necessary to determine the format of the input and output data.
Input data for the system - are error messages, and their example was shown on Figure 1.
Figure 1: Example of input data. Error message
The initial data will be a table with the results
of automatic testing, the application of machine learning algorithms, and detailed analysis will be carried out directly by the testing engineer. They establish the reason for the fall of the test. That
is, the input data was analyzed by an expert, who allocated 4 classes of system responses to the results of automation testing. However, if necessary, this list can be expanded, that was shown on Figure 2.
47

Figure 2: Page view with the root causes of test failures, added by the administrator
For the analysis of the reports, the text Mining
approaches were used. Tokenization was carried out (with the selection of the optimal length and mixture of n-grams. In addition, from the preprocessing approaches, the text cleaning was used. The main purpose was to clean the text from specific characters (primarily specific punctuation and symbols). Also, the most frequently and rarely used words were removed, do not allow define the specifics of the text and classify it.
Algorithms for the synthesis of classifier models were constructed using artificial intelligence and machine learning [9-11].
In particular, the CountVectorizer provided by the scikit-learn library [12] was used to vectorize sentences. The method takes the words of each sentence and builds the vocabulary of all unique
words in the sentences. This vocabulary can then be used to create a vector of word count features. Now, from each sentence, we can get occurrences of words (or n-grams) in sentences based on the previous dictionary. The dictionary consists of all words with Stake trace, each of which represents one word or phrase in the vocabulary. If we take the previous sentences and implement the CountVectorizer, we will get a vector representing the number of occurrences of each word in the sentences.
After that, you can see the resulting function vectors for each sentence based on the previous dictionary, that is, Bag-of-words. Each document is represented as an n-gram vector. You can then use these vectors as function vectors for the machine learning model.
Table 1 An example of the type of input
Body of the test n-grams Root cause <i>Method arguments: </i><span class="arguments">"-229", "-57", [Ljava.lang.String;@3358cf5e</span><br> <div class="testOutput"> <a href="checkTableValuesForDateRange.png"> Click here to take a look at screenshot </a> </div> … java.lang.Thread.run(Thread.java:748)<br> </div>
'test dashboardpagetests' 'invoke nativemethodaccessorimpl’ 'costperformancewidgettest sun' 'dashboardpagetests costperformancewidgettest'
Defect
… … …
Thus, the list of informative signs contains a
mix of n-gram and the reason of the route cause, determined by the expert. The resulting value for the entire test case was determined based on the Bayes' formula:
𝑃 (𝐻𝑖
𝐴) =
𝑃(𝐻𝑖)𝑃(𝐴
𝐻𝑖)
∑ 𝑃(𝐻𝑘)𝑃(𝐴
𝐻𝑘)
𝑛
𝑘=1
, (1)
where A and B are events.
• p (A) and p (B) are the probabilities of A and B without relation to each other;
• p (A / B), the conditional probability, is the probability of A if B. is true.
• p (B / A) is the probability of observing event B, provided that A.
The general architecture of the ensemble is shown on Figure 3.
48
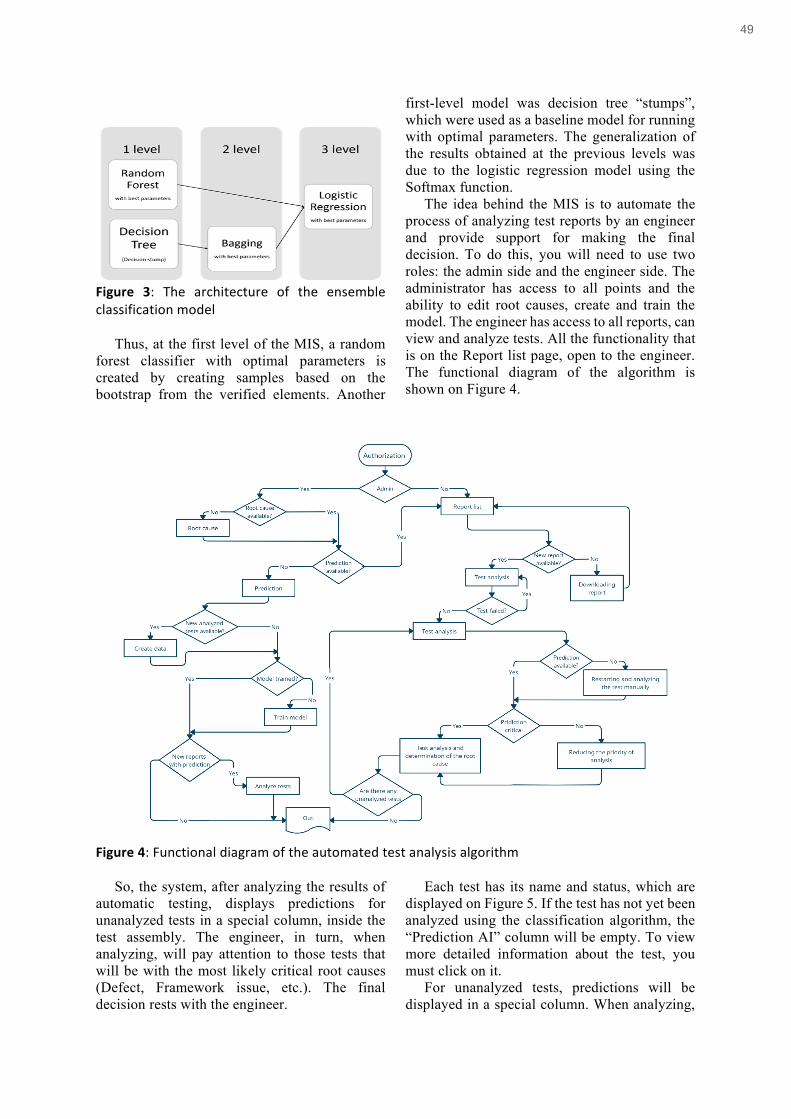
Figure 3: The architecture of the ensemble classification model
Thus, at the first level of the MIS, a random
forest classifier with optimal parameters is created by creating samples based on the bootstrap from the verified elements. Another
first-level model was decision tree “stumps”, which were used as a baseline model for running with optimal parameters. The generalization of the results obtained at the previous levels was due to the logistic regression model using the Softmax function.
The idea behind the MIS is to automate the process of analyzing test reports by an engineer and provide support for making the final decision. To do this, you will need to use two roles: the admin side and the engineer side. The administrator has access to all points and the ability to edit root causes, create and train the model. The engineer has access to all reports, can view and analyze tests. All the functionality that is on the Report list page, open to the engineer. The functional diagram of the algorithm is shown on Figure 4.
Figure 4: Functional diagram of the automated test analysis algorithm
So, the system, after analyzing the results of
automatic testing, displays predictions for unanalyzed tests in a special column, inside the test assembly. The engineer, in turn, when analyzing, will pay attention to those tests that will be with the most likely critical root causes (Defect, Framework issue, etc.). The final decision rests with the engineer.
Each test has its name and status, which are displayed on Figure 5. If the test has not yet been analyzed using the classification algorithm, the “Prediction AI” column will be empty. To view more detailed information about the test, you must click on it.
For unanalyzed tests, predictions will be displayed in a special column. When analyzing,
49
an engineer will need to first of all pay attention to those tests that will be with the most likely
critical root causes (Defect, Framework issue, etc.). The final decision rests with the engineer.
Figure 5: View of tests with the results of auto-analysis based on the proposed algorithm
Thus, the engineer pays attention, first, to those tests that have critical root causes and, in more detail, examines the causes of their occurrence and enters the results into the database. These detailed reports will also be the
basis for training the model on subsequent launches. The results of auto-analysis and engineer's analysis can be seen as a result in the table with tests. An example of these results is on Figure 6.
Figure 6: The final version of the analysis of one of the tests. The developed system was tested based on
reports of automatic testing of the website development process. The model test results are demonstrated using an error matrix and are shown in Figure 7. It is worth noting that the result c6an be influenced by different class sizes within the studied array of input data.
From the 62 studied reports, the reasons were correctly identified in 55, that is, the number of correctly identified causes of errors was 89%.
3. Conclusions
The use of MIS to provide information to decision-making processes in the field of automation testing allows you to successfully
solve the problems of classifying the analysis of the input standard reports of automated tests based on the data of the expert assessment of automation engineers.
The developed system can have a wide practical use for solving problems in the process of developing and testing software products. To quickly identify critical root causes of test failures, chronological analysis and help the engineer make decisions. The introduction of this system can lead to an increase in the ability of engineers to cover web applications with new tests and will lead to a higher quality of applications. It will also reduce the time it takes to make decisions about failed tests. The obtained accuracy allows us to assert that the
50

proposed approach for the formation of the Ministry of Internal Affairs makes it possible to form it sufficiently informative due to its application in conjunction with the proposed architecture of the ensemble.
The effectiveness of using the proposed architecture of the ensemble classifier for the synthesis of models-classifiers based on an array has been experimentally confirmed.
Figure 7: Сonfusion matrix of the classification model of automation test reports
4. References
[1] S.V. Golub Bagatorivneve modelyuvannya v tehnologiyah monitoryngu otochuyuchogo seredovyshha (Multilevel modeling in environmental monitoring technologies), Cherkasy: Vyd. ChNU imeni Bohdan Khmelnytsky, 2007, 220 p.
[2] T. Cser Why test automation needs machine learning, 2020/ URL: https://www.functionize.com/gated/eBook-Why-test-automation-needs-ML.pdf
[3] Rajesh Mathur, Scott Miles, Miao Du Adaptive Automation: Leveraging Machine Learning to Support Uninterrupted Automated Testing of Software Applications, arXiv:1508.00671v1 [cs.SE] 4 Aug 2015 URL:https://arxiv.org/pdf/1508.00671.pdf
[4] A. Trudova, M. Dolezel A. Buchalcevova Artificial Intelligence in Software Test Automation: A Systematic Literature Review, Conference: 15th International Conference on Evaluation of Novel Approaches to Software Engineering, Portugal 2020, рр. 181-192, DOI:10.5220/0009417801810192.
[5] H. Tran, M. Chechik Test Generation using Model Checking, University of Toronto, Collection of Reports from CSC2108
Automated Verification, 2018, рр. 13. URL:http://www.cs.toronto.edu/~chechik/courses00/csc2108/projects/4.pdf
[6] R. Talib M. Kashif, A. Shaeela, F. Fakeeha Text Mining: Techniques, Applications and Issues, International Journal of Advanced Computer Science and Applications 7(11), November, 2016, рр. 414-418. DOI:10.14569/IJACSA.2016.071153 URL: https://www.researchgate.net/publication/311394659_Text_Mining_Techniques_Applications_and_Issues
[7] A. M. Jadhav, D. P. Gadekar A survey on text mining and its techniques, Survey Paper, Computer Science & Engineering, India, 3(11), 2014, рр. 2110 – 2113. URL:https://www.semanticscholar.org/paper/A-Survey-on-Text-Mining-and-Its-Techniques-Jadhav-Gadekar/b46c04ad14d021ad444a71103d5c87297df3b976
[8] D. Antons, E. Grünwald, P. Cichy, T. O. Salge The application of text mining methods in innovation research: current state, evolution patterns, and development priorities, R&D management 50 (2020), pp. 329-351. doi: 10.1111/radm.12408
[9] S.V. Golub, A.S. Avramenko Udoskonalennia klasyfikatoriv v monitorynhovykh intelektualnykh systemakh (Improvement of classifiers in monitoring intelligent systems), Bulletin of the Academy of Engineering Sciences of Ukraine, 1 (2019), рр. 67-71.
[10] A. Avramenko, S. Holub Classification models in information systems for social and environmental crisis monitoring. In: Inzynier XXI wieku. Monografia: Wydawnictwo naukowe Akademii Techniczno-Humanistycznej w Bielsku-Bialej, 2016, pp. 43-46.
[11] A.S. Avramenko, S.V. Golub Decrease of time of model synthesis in intellectual monitoring systems. Mathematical machines and systems, 3 (2019), pp. 129-134. DOI: 10.34121/1028-9763-2019-3-129-134.
[12] Library scikit-learn. Machine Learning in Python, URL: https://scikit-learn.org/stable.
51

Checking The Flight Stability Of A Rotary UAV In Navigation Modes For Different Firmware Serhii Lienkov 1, Alexander Myasischev 2, Alexander Sieliukov 3, Alexander Pashkov 4, Genadiy Zhyrov 5, Andrii Zinchyk 6,
1 Military Institute of Taras Shevchenko National University of Kyiv, Lomonosova street, 81, Kyiv, 03189, Ukraine 2 Khmelnytskyi National University, Instytuts’ka str. 11, Khmelnytskyi, 29016, Ukraine 3 State enterprise "Scientific center of accurate machine building", Boryspylska street, 9, Kyiv, 02099, Ukraine, 4 Ministry of Defense of Ukraine, Povitroflostky Ave, 6, Kyiv, 03168, Ukraine 5 Department of the Radio Engineering and Radioelectronic Systems of Taras Shevchenko National University of Kyiv, Volodymyrska str., 64/13, Kyiv, 01601, Ukraine 6 Military Institute of Taras Shevchenko National University of Kyiv, Lomonosova street, 81, Kyiv, 03189, Ukraine
Abstract In this work, the stability of a rotor-type UAV based on the STM32F405 microcontroller was studied for flying in a fully automatic mode along a given trajectory during a gusty wind with an average speed of 6-7 m/s. The INAV software with firmware ver.2.6 and the Ardupilot software with arducopter firmware ver.4.0.5 were used. The possibility of correct formation of the flight trajectory in the semi-automatic mode for taking photographs, studying the radiation situation in the area, spraying fields, etc. has been established for Arducopter firmware. The development of flight mission for INAV is more primitive, it is performed only in manual mode, using preliminary calculations. The obtained results show that the INAV firmware with the UAV allows only telemetry data to be transmitted to the ground station. It is impossible to change the UAV flight trajectory from the ground station via telemetry. For the Ardupilot software, the possibility of changing the route is shown by dragging the flight point to which the UAV is approaching with the mouse pointing device. For the INAV firmware, it was experimentally not possible to connect flying over a given waypoint with the execution of an action, for example, turning on and off the sprayer nozzle, and dropping the load at a given point. Keywords 1 OMNIBUSF4V3, INAV 2.6, GPS receiver, STM32F405, UAV, OSD, ESC regulator, FlySky FS-i6, Failsafe, Arducopter, Ardupilot, Pixhawk
1. Introduction
Currently, topical issues are the study of the radiation situation in the area, performing topographic and geodetic surveys for drawing up a plan of the area, spraying agricultural fields, carrying out rescue operations [1-4]. To solve these issues, unmanned aerial vehicles (UAVs) of both rotary type (quadcopters, hexacopters, orthocopters) [1] and with a fixed wing (aircraft, flying wings) [3] can be used.
To solve the problems under consideration, the UAV should be able to operate in a fully
EMAIL: [email protected] (A.1); [email protected] (A.2); [email protected] (A.3); [email protected] (A.4); [email protected] (A.5); [email protected] (A.6). ORCID: 0000-0001-7689-239Х (A.1); 0000-0003-1269-425X (A.2); 0000-0001-7979-3434 (A.3); - (A.4); 0000-0001-7648-7992 (A.5); 0000-0003-4029-2282 (A.6)
automatic mode when flying around an area along a given route and perform actions set before the flight, for example, turn on and off the nozzles when flying over the specified waypoints. The software of the ground station should be able to automatically generate flight trajectories and actions performed during the flight over specified sites [5]. It is important that during its flight the vehicle should be sufficiently resistant to external influences, for example, to gusts of wind. It is necessary that the UAV flight is displayed on the screen of the ground station, superimposed on the geographical map of the area [6], as well as there
52

will be a possibility of changing the route by dragging the flight point with the mouse pointing device, to which the UAV is approaching. It is advisable to use the FPV flight capability [7] with displaying telemetry data on the helmet screen for maximum control over the UAV flight. In [6, 8], other ways of using UAVs are presented, for which their stability in flight and positioning at a given point are also important.
2. Problem Statement
To solve the problems described above, it is very important that the UAV is maximally resistant to changing external impacts. For example, with a constant wind of 5-6 m/s, simplified mathematical models are used to ensure flight stability. An example would be the use of complementary filters for the joint operation of a gyroscope and an accelerometer and simplified models of PID regulators. However, with a dynamically changing wind of up to 15-20 m/s, it is required to use a more complex mathematical apparatus and develop software on its basis for the flight controller. In this regard, the work considers the construction of a quadcopter according to a well-known model (X-copter) and its adjustment for modern firmware INAV and Arducopter [8, 9]. The adjustment is carried out experimentally with enumeration of a large number of parameters (including adjustment of the PID regulators), on which the flight stability of the copter with the given geometric parameters as well as the parameters of the propeller group depends.
In this study, the most common firmware, INAV and Arducopter. These firmwares are free to use, open source and user-configurable. INAV supports a large number of flight controllers based on 32-bit microcontrollers of the STM32F4 and STM32F7 sets, positioning sensors (gyroscopes, accelerometers, magnetometers, etc.), and OSD. The Arducopter firmware was developed for flight controllers APM 2.6 and Pixhawk [10]. In this work, we have studied how the ported Arducopter ver.4.0.5 firmware practically functions on the OMNIBUSF4V3 controller [11] and how stable flight will be in navigation mode for such flight controllers based on STM32F4. The OMNIBUSF4V3 controller is also used for the INAV ver.2.6 firmware. Therefore, the testing conditions are the same. The use of free firmware and common cheap flight controllers makes it possible to design low-cost UAVs. For example,
a copter assembled for experimental purposes is at a cost 2-3 times lower than commercial ones, which have similar flight modes. Pixhawk flight controller is about 5 times more expensive than OMNIBUSF4V3.
3. Research Design
For Arducopter versions, up to ver. 3.2.1, which was used by the autopilot based on atmega2560 microcontroller – for example, APM 2.6 and 2.8 – the Discrete Cosine Matrix (DCM) mathematical apparatus was used to estimate the position/orientation of the aircraft [12]. The DCM was also called the first generation attitude and position estimation system.
The current stable version of ArduPilot (4.0.5) uses EKF2 as the main source of orientation in space, with the DCM running in the background. If the autopilot has two (or more) available IMUs (the Inertial Measurement Unit contains a gyroscope and accelerometer), two EKF “cores” will work in parallel, each of which will use its own IMU. At any given time, only the output signal of one EKF core is used, and it is this core that reports the best state, which is determined by the consistency of the data of its sensors.
Figure 1 shows the evolution of the Attitude and Heading Reference System (AHRS) [13]
Figure 1: Evolution of AHRS for different versions of ArduPilot
INAV firmware for OMNIBUSF4V3 flight
controller uses Alpha-Beta filter (complementary filter) for position estimation. It allows using the accelerometer and gyroscope to obtain fairly accurate pitch and roll values. However, with large vibrations of the motors, its accuracy becomes insufficient and this filter is not suitable for using another sensor, a magnetometer. That is why aircraft behave unstable when switching to fully automatic control with INAV firmware. Therefore, in this work, along with INAV firmware, the behaviour of the craft in automatic mode, using the Kalman filter, is investigated.
53

Another alternative is the Madgwick filter [14], which gives a better result than the Kalman filter in the results of position accuracy and calculation performance.
The Advanced Kalman Filter (EKF2) algorithm used in ArduPilot provides a way to combine or consolidate data from an IMU, GPS, compass, airspeed sensor, barometer, and other sensors to calculate a more accurate and reliable estimate of the UAV position, speed and angular orientation. This algorithm evaluates a total of 22 states from different sensors.
The issues of constructing mathematical models to ensure the stability of the UAV were also discussed in [15-17].
4. Basic Material and Working Results
For testing the UAV, a quadcopter with a 250-mm frame was chosen (Figure 2). On the quadcopter, the following equipment was installed: motor 2204/2300 KV with ESC regulator 30A; propeller 5×4.5 inches; GPS receiver: u-blox NEO-6M; control equipment: FlySky FS-i6 firmware upgraded from 6 to 10 channels with a communication range of up to 1.0 km; flight controller OMNIBUSF4V3 based on STM32F405 LQFP64 microcontroller (168Mhz,
1M Flash, 192kB SRAM) with built-in gyroscope, MPU6000 accelerometer and BMP280 barometer; battery 1500 mAh/hour, 11.1 V; video camera and video transmitter TS832 with a power of 0.6 W. The flight weight of the quadcopter was about 550 g.
Figure 2: Photo of the tested quadcopter
The interconnecting network of the copter
electronic components is given in Figure 3. The video camera is connected to a separate power source. The copter sends telemetry data, which are superimposed on the image of the terrain obtained from the video camera, through the video transmitter.
Figure 3: The interconnecting network of the copter electronic components
To configure the flight controller of the copter,
the firmware file for the microcontrollers and the ground station software are used. The ground station uses Mission Planners, which is located at https://firmware.ardupilot.org/Tools/MissionPlan
ner/. The firmware for OMNIBUSF4V3 is copied from https://firmware.ardupilot.org/Copter/stable-4.0.5/omnibusf4/ under the name arducopter_with_bl.hex.
54

When sold OMNIBUSF4V3 controller is usually pre-flashed with Betaflight firmware. After Betaflight, INAV firmware is installed quite easy [9]. Setting up this firmware using the INAV navigator was considered in [18-20]. After its installation, test flights were performed with INAV ver.2.6. After completing the testing, arducopter firmware was installed. However, it is not possible to directly install arducopter firmware from Mission Planners, the ArduPilot ground station. To use ArduPilot, you need an ArduPilot compatible bootloader on the microcontroller. Therefore, _bl.hex file is used, which contains the firmware and bootloader compatible with ArduPilot. _bl.hex file can be flashed using the INAV configurator, which uses a convenient graphical interface for this purpose. Before flashing, the controller should be switched to DFU mode (Figure 4).
Figure 4: Switching OMNIBUSF4V3 controller to DFU mode
If OMNIBUSF4V3 controller is not
recognized as a com port under Windows, zadig program is downloaded from http://zadig.akeo.ie/ and installed.
It should be noted that the peculiarities of the firmware for OMNIBUSF4V3 controller compared to the typical firmware developed for Pixhawk 2.4.6 flight controller based on STM32F427 Cortex M4 processor with FPU 168 MHz/256 Kb RAM and 2 Mb flash memory. The microcontroller on OMNIBUSF4V3 has 1 Mb flash memory, so its capabilities are limited. For example, some sensors and telemetry formats may not work; some devices cannot be controlled, etc. Lua scripting is not possible due to insufficient flash memory. These scripts provide a safe sandbox environment for adding new behaviour to the autopilot without changing the main flight code.
Despite this, the flight performance with OMNIBUSF4V3 is higher than with APM 2.6 based on ATmega2560 processor due to a more advanced mathematical model of flight control when using the same type of sensors.
The quadcopter firmware is configured using MissionPlanner ver. 1.3.74 application.
A computer is connected to the flight controller using a USB cable. Then the Mission Planner application is launched, which connects to the firmware of OMNIBUSF4V3 controller by clicking on CONNECT (1) in the upper right corner. The frame type is selected step by step (Figure 5).
Figure 5: Selection of a frame type
The calibration of the accelerometer, compass,
control equipment and ESC regulators is performed. Calibrations are performed according to the step-by-step instructions on the corresponding tab. Figure 6 shows a combination of setting tabs. To calibrate the accelerometer, the copter is sequentially installed to a fixed position along 6 axes, followed by fixing each of the positions. It is best to calibrate the magnetometer in the launch field by rotating the quadcopter in six axes until the Mission Planner reports the end of the calibration. The location of the magnetometer relative to the flight controller is determined automatically.
ESC controllers are configured as described in the ESC Calibration tab.
Before setting flight modes (Flight Modes) it is necessary to configure FlySky FS-i6 control equipment. In order to do this, it is first upgraded to a 10-channel operating mode [18,19]. Then, on the FlySky FS-i6 operation panel, go to the End points and Aux channels tabs, in which the parameters shown in Figure 7 are set for the 5th channel. The Reverse tab sets the reverse for the 2nd channel.
55

Figure 6: The combination of tabs for parameter settings
Figure 7: Setting parameters on the FlySky FS-i6 operation panel for the formation of flight modes
Such an installation will allow using the three-
position SwC and two-position SwD switches to work with 6 different flight modes. Figure 8
shows the flight mode and Failsafe settings tabs. To implement Failsafe, the control hardware and receiver are preconfigured as presented here [18, 19]. FailSafe mode is set to minimum throttle. That is throttle value is equal to 1003 pulses when control equipment is on. If communication with the operation panel is broken, this value will be equal to 900 pulses. Fig. 8 shows that it is set to 950, below which FailSafe will be triggered. This will turn on the Enabled Continue mode with Mission and Auto modes, so the flight mission is continued in automatic mode.
Figure 8: Setting flight modes and FailSafe
To control the battery charge, in order to notify
about its charge via telemetry, to give an audible signal informing about a low battery charge, and
execute a command to return the copter to the takeoff point when the battery is low, the battery should be calibrated. It is performed in the tab
56

shown in Figure 9. For OMNIBUSF4V3, the values are set inked with green rectangles.
Figure 9: Battery calibration
The Extended Turning tab is used to configure
the parameters of the PID controller and some navigation flight modes (inked in a red rectangular).
For copters, the PID controllers are adjusted by manual selection based on visual control over the stability of the aircraft behaviour. At present there are no reliable mathematical models for the automatic determination of the parameters of PID
controllers. Therefore, for the convenience of adjusting the parameters during the flight, the sixth channel of the control equipment – the "spinner" – is used to set specific PID parameters and designate the range of these parameters. In Figure 10, the above said is inked in green rectangles
Figure 10: Setting up the PID regulators
The OMNIBUSF4V3 flight controllers are equipped with an OSD chip, with the help of which it is possible to overlay telemetry parameters (flight altitude, speed, distance
travelled, number of received satellites, battery charge, etc.) on the video image of the FPV camera. The Onboard OSD tab is used to configure the OSD (Figure 11).
57

Figure 11: Setting up the OSD
The FPV camera screen field with the selected
parameters is ensquared in green, and the settable parameters are selected at the bottom, ensquared in orange.
More fine adjustment of aircraft flight modes is performed in the Full Parameter List tab (Figure 12).
Figure 12: The Full Parameter List tab for fine adjustment of flight parameters
When configuring the firmware of the
ArduPilot copter, one should pay attention to setting the following parameters:
AHRS_EKF_TYPE = 2 This parameter determines which version of the Kalman filter is used to estimate orientation and position;
EK2_ENABLE = 1 This enables EKF2. Turning on EKF2 only triggers mathematical calculations, but that does not mean that it will be used for flight control. To use it, you should set AHRS_EKF_TYPE = 2. After changing the value of EK2_ENABLE, you must perform a restart procedure for the parameters to take effect;
EK2_IMU_MASK = 1. One-byte IMU bitmap for use in EKF2. A separate item of EKF2 will be launched for each selected IMU. Value = 1 only uses the first IMU (default), if value = 2 then only the second IMU is used, value 3 allows the first and second IMU to be used. Up to 6 additional IMUs can be used if memory resources and processing speed permit. There may be insufficient memory and processing resources to run multiple items. If this happens, EKF2 will not start;
EK2_ALT_SOURCE = 0 defines which sensor is used as the main one for determining the
58

altitude: 0: barometer is used (default); 1: Rangefinder is in use.
2: GPS is being used. Useful when GPS quality is very good and barometer drift can be a problem. For example, if the copter will perform long-distance missions with elevation differences> 100m;
EK2_GPS_TYPE = 0: controls the use of GPS. 0: use 3D speed and 2D position from GPS; 1:
use 2D speed and 2D position (GPS speed does not affect the altitude estimate); 2: use 2D position; 3: no GPS (it will use the optical flow from the sensor only if available);
EK2_CHECK_SCALE scales thresholds that are used to check GPS accuracy before the EKF is used. The default is 100. Values greater than 100 increase, and values less than 100 decrease the maximum GPS error that the EKF accepts. A value of 200 will double the acceptable GPS error. For EK2_CHECK_SCALE of the tested aircraft the value of 130 is set. In this case, it establishes communication with satellites faster, but also flies stably;
AHRS_GPS_GAIN = 0 parameter controls how much intensive GPS should be used to correct the position. The parameter for the airplane should not be equal to 0, as this will lead to loss of control of the airplane when turning. For an airplane, the value is 1.0. For a copter is 0. The consequence of this parameter turned on is the twitching of the horizon line when the craft is stationary if the GPS does not perfectly capture the position and drifts. With strong jumps in GPS position, the roll can reach critical values, which will lead to instability of the copter. Therefore, in copters this parameter is set to 0.
GPS_AUTO_SWITCH = 0. Setting up automatic switching between multiple GPS. For one GPS, the parameter is set to 0.
The following is how braking is performed in LOITER flight mode (holding position and altitude):
LOIT_ACC_MAX = 500 Maximum acceleration of position correction in Loiter mode in cm/s/s. Higher values cause the aircraft to correct position errors more aggressively (for example, in gusts of wind);
LOIT_BRK_ACCEL = 100 Acceleration of braking when the copter jams on the brakes, in cm/s/s. Higher values stop the copter faster when the left-to-left and front-to-back stick of the controlling equipment is moved to the centre. Large values of this parameter lead to sharp braking, which can lead to a rollover of the copter, especially in gusty winds;
LOIT_BRK_JERK Braking jerk at Loiter in cm/sec/sec/sec. Higher values will eliminate braking more if the pilot moves the sticks during a braking manoeuvre. The default setting is used.
Ardupilot software allows performing automatic formation of the flight path, for example, for taking photographs, studying the radiation situation in the area, spraying fields, etc. Figure 13 shows an example of the formation of a flight mission for fertilizing a field. The processing contour is preselected (highlighted in red) and the flight path is automatically formed to cover the area that can be treated by the spraying system (the path is represented by yellow lines) [21]. Usually, the flight altitude above the ground is set equal to 1.5-3 m, which should be provided by the ultrasonic sensor. Its use is especially important if the field surface is not flat, i.e. there are depressions and hills.
Figure 13: Formation of a flight mission in semi-automatic mode
In this work, an experimental test of the flight
stability of the quadcopter presented in Fig. 2 with INAV firmware, ver. 2.6 and Arducopter firmware, ver. 4.0.5, was carried out. The test was carried out during winds of different intensity (table 1) in navigation modes. In fig. 14 (right) shows the flight path for two firmwares, which are programmatically set in the Mission Planner ground station for Arducopter and similarly in INAV - Configurator for INAV ver.2.6 firmware. Figure 14 on the left shows the real flight path for Arducopter ver.4.0.5, which was built using the Google Earth software package based on log files from the flight controller. A similar trajectory was obtained for INAV. As can be seen from Table1, the flight of the copter in navigation mode on the firmware INAV ver.2.6 was completely unsuccessful in a wind of 6-7m / s with gusts. Loss of stability of the quadcopter was recorded with its fall at the moment of passing an arbitrary
59

waypoint, when the stability of the copter was minimal due to a sharp change in the direction of flight and a sharp gust of wind. Tests for high wind speeds were not carried out due to the obvious advantage of the Arducopter ver.4.0.5 firmware. Table 1 Experimental parameters and results
№ Wind speed, m/s
Number of tra-jectory flights
The number of crashes of the copter for firmware Ardupilot INAV
1 1-2 5 0 0 2 3-4 5 0 0 3 4-5 5 0 1 4 6-7 5 0 5
Thus, the expediency of using the
mathematical model of the extended Kalman filter was experimentally established to ensure the stability of the flight of a rotor-type UAV.
Figure 14: Copter flight trajectories according to the program (right) and obtained experimentally (left)
5. Conclusions
1. Experience has shown that the operation of Arducopter firmware for OMNIBUSF4V3 flight controller, which was developed for the Pixhawk family flight controllers is correct.
2. A test of the stability of the flight of the quadcopter on a frame of 250 mm during a gusty wind of 6-7 m/s in navigation modes Arducopter firmware was carried out. The stability of the flight in the mode of automatic flight by points and in the mode of automatic return to the starting point was noted.
3. Likewise for INAV firmware, ver. 2.6, flight stability of the same quadcopter was tested during a gusty wind of 6-7 m/s in navigation modes.
Significant flight instability was found in the auto return and point-to-point flight modes. Loss of stability of the quadcopter with its fall was recorded.
4. The expediency of using the mathematical model of the extended Kalman filter to ensure the stability of the flight of a rotor-type UAV, which is used in the arducopter 4.0.5 firmware, has been experimentally established. It provides better flight results in navigation modes than the complimentary filter based firmware (INAV 2.6 firmware). When flying in acro (gyroscope) and stabilize (gyroscope + accelerometer) modes, the behavior of the copter for these two firmwares did not differ noticeably.
5. It is deemed that the mathematical model of the extended Kalman filter is expedient to use on high-performance microcontrollers such as STM32F4 and STM32F7 for flight in navigation modes, where many sensors are simultaneously used to provide information about the position of the UAV.
6. The possibility of correct formation of the flight trajectory in the semi-automatic mode for taking photographs, studying the radiation situation of the area, spraying fields, etc. has been experimentally established for Arducopter firmware. Formation of a flight mission for INAV is more primitive, it is performed only in manual mode, using preliminary calculations.
7. It has been established that INAV firmware with the UAV only allows transmitting telemetry data to the ground station. From the ground station, changing the UAV flight trajectory through telemetry is impossible, for example, when "dragging" the flight point with the mouse manipulator [22-24]. Arducopter firmware supports the two-way MAVLink protocol for receiving and transmitting telemetry data between the flight controller and the ground station.
8. For INAV firmware, it was experimentally impossible to connect the flight over a given waypoint with the execution of an action, for example, turning on and off the sprayer nozzle, dropping the load, turning on/off the video camera. Arducopter firmware allows doing these.
6. References
[1] A. Boyko, AV applications, 2017. URL:http://robotrends.ru/robopedia/oblasti-primeneniya-bespilotnikov.
[2] The modernized Spectator drone from OJSC "Meridian" named after SP Korolyova, 2019.
60

URL:https://www.youtube.com/watch?time_continue=6&v=HvLErmgBRX4&feature=emb_logo.
[3] Spectator (UAV), 2020. URL:https://ru.wikipedia.org/wiki/Spectator_(БПЛА).
[4] A. Boyko, Spraying plants from drones, 2019. URL:http://robotrends.ru/robopedia/opryskivanie-rasteniy-s-bespilotnikov.
[5] iNavFlight Missions, 2020. URL: https://github.com/iNavFlight/inav/wiki/iNavFlight-Missions.
[6] Copter Mission Command List, 2020. URL: https://ardupilot.org/copter/docs/mission-command-list.html.
[7] FPV piloting theory, 2021, URL:https://github.com/mlutskiy/pioneer-doc/blob/master/database/pilot-module/pilot-3part.rst.
[8] ArduPilot Firmware builds, 2020, URL:https://firmware.ardupilot.org.
[9] INAV 2.6.0, 2020, URL:https://github.com/iNavFlight/inav/releases/tag/2.6.0.
[10] Pixhawk Overview, 2020, URL:https://ardupilot.org/copter/docs/common-pixhawk-overview.html.
[11] Omnibus F4 Pro (on-board current sensor) and Omnibus F4 AIO (no sensor onboard), 2020, URL: https://ardupilot.org/copter/docs/common-omnibusf4pro.html?highlight=inav.
[12] Starlino, DCM Tutorial-An Introduction to Orientation Kinematics, 2011, URL: http://www.starlino.com/dcm_tutorial.html.
[13] Extended Kalman Filter (EKF), 2020, URL: https://ardupilot.org/copter/docs/common-apm-navigation-extended-kalman-filter-overview.html.
[14] Filtr Madzhvika, 2015, URL: https://habr.com/ru/post/255661.
[15] Ibrahim K. Mohammed, Abdulla I. Abdulla, Elevation, pitch and travel axis stabilization of 3DOF helicopter with hybrid control system by GA-LQR based PID controller, International Journal of Electrical and Computer Engineering, vol. 10, no. 2, pp. 2020, 1868-1884. doi: 10.11591/ijece.v10i2.pp1868-1884.
[16] Agung Prayitno, Veronica Indrawati, Ivan Immanuel Trusulaw, Fuzzy Gain Scheduling PID Control for Position ofthe AR.Drone, International Journal of Electrical and Computer Engineering, vol. 8, no. 4, 2018,
pp. 1939-1946. doi: 10.11591/ijece.v8i4.pp1939-1946.
[17] Almido H Ginting, Oyas Wahyunggoro, Adha Imam Cahyadi, "Attitude Control of Quadrotor Using PD Plus Feedforward Controller on SO(3)," International Journal of Electrical and Computer Engineering, vol. 8, no. 1, 2018, pp. 566-575. doi: 10.11591/ijece.v8i1.
[18] S.Lienkov, A.Myasischev, O.Banzak, L.Komarova, N.Lytvynenko, O.Miroshnichenko, Construction of an Aircraft-Type UAV for Flight Along a Given Trajectory in the Automatic Mode, International Journal of Emerging Trends in Engineering Research, vol. 8, no.9, 2020, pp. 6145-6150. doi:10.30534/ijeter/2020/200892020.
[19] S. Lienkov, A. Myasischev, L. Komarova, N. Lytvynenko, V. Shvab, O. Lytvynenko, Creation of a Rotor-Type UAV with Flight Controllers, Based On a ATmega 2560 and STM32f405 Microprocessors, International Journal of Emerging Trends in Engineering Research, vol. 8, no. 8, 2020, pp. 4703-4710. doi:10.30534/ijeter/2020/104882020.
[20] S. Lienkov, A. Myasischev, O. Banzak, Y. Husak, I. Starynski, Use of rescue mode for UAV on the basis of STM32 microcontrollers, International Journal of Advanced Trends in Computer Science and Engineering, vol. 9, no. 3, 2020, pp. 3506-3513. doi:10.30534/ijatcse/2020/156932020.
[21] Mission Planning, 2021. URL: https://ardupilot.org/copter/docs/common-mission-planning.html.
[22] Flight by plane using INAV telemetry, 2021. URL:https://sites.google.com/site/webstm32/inav_25_wp_sam/telemetriy-inav.
[23] Chi-Bao Le, Dinh-Thuan Do, Employing non-orthogonal multiple access scheme in UAV-based wireless networks, Bulletin of Electrical Engineering and Informatics, vol. 10, no. 1, 2021, pp. 241-248. doi: 10.11591/eei.v10i1.2102.
[24] Deha Agus Umarhadi, Projo Danoedoro, Comparing canopy density measurement from UAV and hemispherical photography: an evaluation for medium resolution of remote sensing-based mapping," International Journal of Electrical and Computer Engineering, vol. 11, no.1, 2021, pp. 356-364. doi: 10.11591/ijece.v11i1.pp356-364.
61

Шляхи Оптимізації Параметрів Процесу Технічного Обслуговування За Станом Олександр Сєлюков 1, Генадій Жиров 2 Євген Лєнков 3
1 ДП «Центр точного машинобудування»,вул. Бориспільська,9, Київ, 02099, Україна 2 Кафедра радіотехніки та радіоелектронних систем Київського національного університету імені Траса Шевченка, вул. Володимирська, 64, Київ, 01601, Україна 3 Центральний науково-дослідний інститут Збройних Сил України, пр-т Повітрофлотський, 28, Київ, 03049, Україна
Анотація Одними з основних показників, що встановлюються при проектуванні та модернізації складних технічних засобів, є показники надійності та вартості експлуатації. Ці показники залежать від властивостей надійності та ремонтопридатності об’єкта, а також від параметрів системи технічного обслуговування і ремонту. У статті розглядається проблема визначення підходів до оптимізації параметрів процесу технічного обслуговування з постійною періодичністю контролю. Ключові слова 1 Технічне обслуговування, критерії технічного обслуговування, моделювання технічно обслуговування
Ways Of Optimization Of Parameters Of Process Of Maintenance By Condition Alexander Sieliukov 1, Genadiy Zhyrov 2 and Evgeny Lenkov 3
1 State enterprise "Scientific center of accurate machine building", Boryspylska street, 9, Kyiv, 02099, Ukraine, 2 Department of the Radio Engineering and Radioelectronic Systems of Taras Shevchenko National University of Kyiv, Volodymyrska str., 64/13, Kyiv, 01601, Ukraine 3 Central Research Institute of the Armed Forces of Ukraine, Povitroflotsky Ave, 28, Kyiv, 03049, Ukraine
Abstract One of the main indicators set in the design and modernization of complex technical means are indicators of reliability and cost of operation. These indicators depend on the properties of reliability and maintainability of the object, as well as on the parameters of the maintenance and repair system. The article considers the problem of determining approaches to optimizing the parameters of the maintenance process with a constant periodicity of control. Keywords 2 Maintenance, maintenance criteria, maintenance modeling
1. Вступ
На сьогоднішній час значна увага приділяється питанням щодо збільшення
EMAIL: [email protected] (A. 1); [email protected] (A. 2); [email protected] (A. 3) ORCID: 0000-0001-7979-3434 (A. 1); 0000-0001-7648-7992 (A. 2); 0000-0001-5819-2656 (A. 3)
заходів по підтримці безпеки в роботі різноманітних складних технічних об’єктів та систем, у тому числі спеціального призначення. Надійне функціонування
62

електронних та радіоелектронних об’єктів та систем забезпечується якісною роботою системи технічного обслуговування і ремонту (ТОіР). Необхідність проведення технічного обслуговування полягає у своєчасній заміні елементів, які знаходяться у передвідмовному стані, що призводить до поліпшення показників безвідмовності об’єкту у цілому. Ремонт проводиться з метою відновлення справного або працездатного стану об'єкта, а також відновлення ресурсу всього об'єкта або його частини [1–4].
Показники надійності та вартості експлуатації об’єктів залежать від властивостей безвідмовності та ремонтопридатності самого об’єкта, а також від параметрів системи ТОіР. Таким чином існує загальна проблема оптимізації характеристик об’єкту та параметрів системи ТОіР.
2. Заголовок першого рівня
Постановку задачі оптимізації параметрів ТОС можна звести до розв’язання задач: оптимізації за критерієм emin c (1) та оптимізації за критерієм твKmax (2):
необх0тото0 T )T,U,E(T к ;
min)T,U,E(c к →тотое , (1)
необх0тото0 T )T,U,E(T к ;
max)T,U,E(K к →тототв , (2)
де: необх0T – задана вимога до рівня
безвідмовності об’єкта; тоE ,
тоU і кT –
шукані оптимальні значення параметрів ТОС з
постійною періодичністю контролю; тоE –
множина елементів, які обслуговуються; тоU – вектор рівнів, що визначають необхідність
проведення ТО елементів; кT – періодичність контролю.
Параметри тоE ,
тоU і кT , отримані в
результаті розв’язання задач (1) і (2), будуть різними.
Простір, в якому повинен здійснюватися пошук оптимальних значень
тоE , тоU і
кT , в обох задачах однаковий і являє собою декартів добуток наступного вигляду:
),[],[}E{E
010 тото , (3)
де }E{ то – множина, що складаються з елементів, які входять до множини тоE ;
то10 E],[ – гіперкуб, кожна точка в якому
представляє собою вектор розмірністю тоE , елементами вектора є числа, що належать відрізку ],[ 10 ; ),[ 0 – числова вісь, що містить всі позитивні числа.
Породжуючим елементом простору (3) є множина обслуговуваних елементів тоE . Множина тоE визначається розробником, і в неї включаються найменш надійні елементи, для яких відомі визначальні параметри і є засоби їх вимірювання. На етапі розробки об’єкта техніки для деяких потенційно обслуговуваних елементів визначальні параметри можуть бути ще невідомі. Однак, і такі елементи можуть бути включені до множини тоE з метою перевірки доцільності в майбутньому додаткових досліджень з виявлення визначальних параметрів для цих елементів. За результатами моделювання розробник має можливість визначити очікуваний виграш в надійності об’єкта за рахунок проведення технічного обслуговування (ТО) цих елементів. Якщо виявиться, що виграш істотний, розробник може прийняти рішення про додаткові витрати на зміни конструкції об’єкта з метою забезпечення вимірювання визначальних параметрів.
Отже, множина тоE задається з урахуванням вже прийнятих рішень про необхідність ТО для частини елементів, а також із міркувань перевірки доцільності включення до кола обслуговування, інших елементів.
Задачу (1) передбачається розв’язувати як послідовність часткових задач, у яких множина обслуговуваних елементів зафіксована. На кожному кроці формується допоміжна множина +
тоE шляхом додавання в неї по одному елементу, взятому з тоE . Перед цим всі елементи множини тоE упорядковуються за зростанням середнього наробітку до відмови елементів.
На кожному кроці для зафіксованої множини +
тоE розв’язується часткова задача
визначення оптимальних параметрів +тоU і
63

+кT , що задовольняють умові
кT,Uк min)T,U,E(c
тототое →+++ . (4)
Розв’язок ++++ = кT,U,E тототоP , що
задовольняє умові (4), є умовно оптимальним рішенням, отриманим за умови, що множина обслуговуваних елементів має склад +
тоE .
При додаванні в +тоE нових елементів
середній наробіток на відмову 0T має зростати, і як тільки на деякому кроці виконається умова необ
00 TT , процес пошуку розв’язку припиняється. Отриманий в останньому кроці умовно оптимальний розв’язок +
тоP приймається як оптимальне
розв’язання тоP .
Аналогічним чином розв’язується і задача (2) з тією лише відмінністю, що замість часткової задачі (4) на кожному кроці розв’язується задача
кT,Uк max)T,U,E(K
то
тототи →+++ . (5)
Таким чином, за рахунок такого прийому ми скоротили кількість параметрів, що
оптимізуються, до двох – тоU і кT .
Параметр +тоU є вектором рівнів ТО, що
задаються для різних обслуговуваних елементів. Оптимальні значення ++ тото Uu i
повинні перебувати окремо для різних елементів + тоEei , так як ймовірнісні характеристики процесу деградації різних елементів можуть істотно різнитися. При цьому найбільший вплив на вибір оптимального значення +
iтоu , повинна давати
величина коефіцієнта варіації процесу деградації елемента iu . З іншого боку,
оптимальні значення +iтоu можуть залежати
також від періодичності контролю +кT .
3. Висновки
В статті проведений аналіз та запропоновані шляхи проведення оптимізації процеса технічного обслуговування складного
технічного об’єкта. Визначено, що при пошуку умовно оптимального вектора +
тоU необхідно здійснювати роздільну оптимізацію для кожного з його елементів. Також доведено, що при пошуку умовно оптимального рішення необхідно шукати сумісно оптимальні значення параметрів +
тоU
і +кT . Знайдені результати необхідні для
розробки методики та алгоритмів оптимізації параметрів різних видів технічного обслуговування.
4. Література
[1] S.V.Lenkov, K.F.Boriak, G.V.Banzak, V.O.Braun, V.A.Osypa, S.A.Pashkov, V.N.Tsytsarev, Iu.V. Berezovskaia, Prognozirovanie nadezhnosti slozhnyh obektov radiojelektronnoj tehniki i optimizacija parametrov ih tehnicheskoj jekspluatacii s ispolzovaniem imitacionnyh statisticheskih modelej. Odessa, VMV, 2014.
[2] G.B. Zhyrov, E.S. Lenkov, Algoritmіchna model' protsesu tehnіchnogo obslugovuvannia za stanom z postіinoiu perіodichnіstiu kontroliu, Suchasna spetsіal'na tehnіka: nauk-pr. Zhurn, no.1(48), 2017, pp. 26–29.
[3] S. Lenkov., G.Zhyrov, D.Zaitsev, I.Tolok, E.Lenkov, T.Bondarenko, Y.Gunchenko, V.Zagrebnyuk, O.Antonenko, Features of modeling failures of recoverable complex technical objects with a hierarchical constructive structure. Eastern-European Journal of Enterprise Technologies, no.4/4 (88), 2017, pp.34–42.
[4] G.B.Zhirov, E.S. Lenkov, Usovershenstvovannaia imitatsionnaia model' protsessa tehnicheskogo obsluzhivaniia i remonta slozhnogo tehnicheskogo obekta. Zhurnal Harkіvs'kogo natsіonal'nogo unіversitetu Povіtrianih Sil іmenі І.Kozheduba «Sistemi obrobki іnformatsії», no. 3 (149), 2017, pp.14–18.
64

Preparing data And Determining Parameters For a Feedforward Neural Network Used For Short-Term Air Temperature Forecasting Boris Perelygin 1, Tatiana Tkach 2, Anna
Gnatovskaya 3
1,2,3 Odessa State Environmental University, Lvivska st., 15, Odessa, 65016, Ukraine
Abstract This article presents the results of solving the problem of preparing initial data and determining specifications for an artificial feedforward neural network used for short-term forecasting of ambient air temperature values. Based on the requirements for the accuracy of forecasts, the data for network self-learning was optimized, namely, the number of training vectors and their length, the type of the source data itself, the features of creating a training sample from an array of source data were determined. Additionally, the specifications of neural network that provide the required accuracy of forecasts were selected, namely, the requirements for the network neuron activation, and the number of hidden layers. Keywords 1 Artificial neural network, short-term forecast, air temperature
1. Introduction
Forecasting is one of the most important tasks in almost all areas of science and life. Predicting weather factors is one of the oldest forecasting tasks because of their great influence on all aspects of human life. Meteorological weather forecasts are a scientifically based assumption about the future state of the weather. The success of modern short-term weather forecasts is quite high, but there are also inaccurate forecasts, especially in cases of abnormal manifestations of the weather. Therefore, research in this area remains relevant at the present time.
In recent decades, along with traditional methods of weather forecasting, the use of artificial neural networks (ANN) for forecasting is considered as a promising area of research [1, 2, 3, 4]. The initial data for weather forecasting for ANN are commonly the results of regular measurements of weather characteristics in the form of numerical values. With the help of ANN, it is possible to model the nonlinear dependence between the future value of a time series, its past values, and the values of external factors [5]. For instance, it is proposed to use fully connected
EMAIL: [email protected] (A.1); [email protected] (A.2); [email protected] (A.3) ORCID: 0000-0002-6049-8897 (A.1); 0000-0002-5403-5933 (A.2); 0000-0002-0018-5696 (A.3)
feedforward neural networks to predict the time series of mountain soils humidity [6]. Deep neural networks could be used to predict the meteorological visibility range [7]. Multi-wavelet polymorphic networks could be employed to predict geophysical time series [2]. To predict long-term series, it is proposed to use extreme learning machines [8], convolutional neural networks [9]. In particular, examples of predicting temperature values are presented [1, 3, 10]. However, a comparative analysis of the possibility of using different ANN architectures is carried out in the papers concerned with the aforementioned subject, and, as a rule, the methodology for preparing initial data, numerical estimates of forecasting quality, and the influence of the ANN parameters on these estimates are not sufficiently covered. That means, that these academic papers do not sufficiently cover solutions problems of selection of parameters of ANN for forecasting meteorological elements. This work aims to fill this gap. Therefore, when implementing this attempt, a well-known feedforward ANN was taken as the subject of research and used for short-term forecasting.
65

2. Problem statement
The object of the study is the process of using a feedforward ANN to predict air temperature values. The subject of the study is a feedforward ANN designed for short-term forecasting of air temperature values.
In the process of conducting research, it was necessary to find out the impact on the accuracy of forecasts: 1) the parameters of neural network learning data (the length of the training vectors, the number of training vectors, the location of the sample for training in the general series of observations, the types of source data) that provide the best accuracy for short-term forecasts with a lead time of 3 hours, 1 day and 3 days; 2)
the influence of the parameters of the neural network on the accuracy of forecasts with the above-mentioned lead time (the number of its hidden layers, the presence of restrictions in the activation functions of neurons of hidden layers).
3. Initial data
The air temperature values were chosen as data for the research because of the continuity of these data and the clarity of the results obtained. The data are a long 15-year series of air temperature values (43569 samples) obtained during regular eight-term observations at the weather station 33837 Odessa from February 01, 2005 to December 31, 2019 (Fig. 1) [11].
Figure 1: A fragment of data on the air temperature of the weather station 33837 Odesa
When forming an array of initial data, the missing air temperature values were interpolated as the arithmetic mean of neighboring temperature values. There were only 6 such omissions in the data, so with a row length of 43569 samples, their correction did not significantly affect the result of the study.
4. Research methodology end tools
Due to the large variability of meteorological quantities in space and in time, the specific value
of any value specified in the forecast should be considered as the most likely value that this value will have during the period of the forecast. At the end of the validity period of the short-term forecast, an assessment of its success is made, which is based on the accuracy. Accuracy is the degree of matching, with certain established tolerances, of predictive and actual meteorological values, and phenomena. The accuracy of the temperature forecast is measured alternatively. If the prognostic temperature differed from the actual one by no more than 2.0 °C, then the forecast accuracy is 100%, if the
66

difference is 3.0 °C, the accuracy is 50%, if ≥ 4.0 °C - it's 0% [12] When conducting studies, the accuracy was calculated similarly to the above method, but without an alternative, in the form of the ratio of the number of accurate forecasts (falling within the range of ±2 °C) to the total number of forecasts for a given advance.
In the context of this paper, different types of data should be understood as the actual existing series of observations, the so – called "raw" data, and its two transformations: a centered series – obtained by subtracting the arithmetic mean from all the values of the series; and a normalized series obtained by dividing all the values of the series by the maximum modular value of the series. All series of observations were divided into two large groups: the 1st group of data – for training and the 2nd group of data – for forecasting (Fig. 2).
Figure 2: Splitting the source data into groups and arrays necessary for training an artificial neural network and forecasting
The required arrays of initial data were formed
as follows from the first group of data intended for training. The whole group was divided into 3 parts. The first part (I in Fig. 2) it was used for training the network (training set). The second part (II in Fig. 2) was used as verification (validation) set to check the quality of training.
Repeated repetition of experiments leads to the fact that the control set begins to play a key role in creating the model, that is, it becomes part of the learning process. This weakens its role, as an independent criterion for the quality of the model
– with a large number of experiments, there is a risk of choosing a network that gives a good result using the control set. In order to give the final model proper reliability, the third part of the first group of data was a backup (test) set of observations (III in Fig. 2).
The final model was tested on data from this set to make sure that the results achieved using the training and validation sets are real. According to the obtained data, the indicator of the quality of training was calculated according to the methodology applied to the calculation of the forecast accuracy. During the research, the parameters of the neural network, the length and number of training vectors changed, as well as the place of the beginning of the array changed to assess the seasonal impact of data on the quality of the forecast.
For research, we used a traditional ANN of direct propagation, shown in Fig. 3, the number of inputs of which varied depending on the size of the training set, the number of hidden layers varied from 1 to 3. The neuron activation functions also changed.
Figure 3: ANN model used in research
The simulation was carried out using a
computer with a processor Intel® Core™2 Quad CPU Q8200 2.34 GHz and 12 GB of RAM.
5. Result analysis
When determining the best length of the training vector and the best number of vectors training the neural network in the context of forecasts' accuracy, multiple simulations of the training and forecasting procedure were performed (N cycles – approximately 50). At the same time, the training array size (the length of the vectors and their quantity) was selected in such a way that the training procedure was completed in no more than one hour. Otherwise, the meaning of short-term forecasting with a 3-hour lead time would have been lost, since the result could have been obtained after the forecast time. During multiple simulations, the quality of
67

training and the accuracy of all three forecasts of different timings were evaluated when changing: a) the type of source data ("raw", centered, normalized), b) when changing the number of hidden layers (1, 2, 3) and c) when changing the activation function from linear to sigmoidal for
hidden and output layers. As a result of these studies, 72‧N three-dimensional graphs were obtained. Since the volume of this paper does not allow us to present them all, two of them, as an example, are shown in Fig. 4.
a) b) Figure 4: An example of displaying the parameters of the quality of training (a) and the accuracy of forecasts (b)
A number of training vectors is drawn along the abscissa axis, the length of the vectors is drawn along the ordinate axis, and either the value of the training quality or the forecast accuracy parameter for the corresponding advance time is displayed along the application axis. Each point of these graphs was calculated for the specified vector length, the number of vectors, the number of hidden layers of the ANN, the type of activation function and the type of source data. From a mathematical standpoint, the graph in Fig. 4, a shows the quality of the network's approximation
of the training array, and in Fig. 4, b – the quality of extrapolation of data on which the network was not trained. The graph in Fig. 4, b clearly shows the instability of forecasts for any length of training vectors and for a small number of them.
The analysis of all the graphs showed that in order to obtain a specific accuracy of forecasts, the initial data for training the network should be presented in the form of 150 vectors with a length of 16 samples each (the circled area in Fig. 5, a), which also provides stable short-term forecasting, one of the results of which is shown in Fig. 6.
a) b)
68
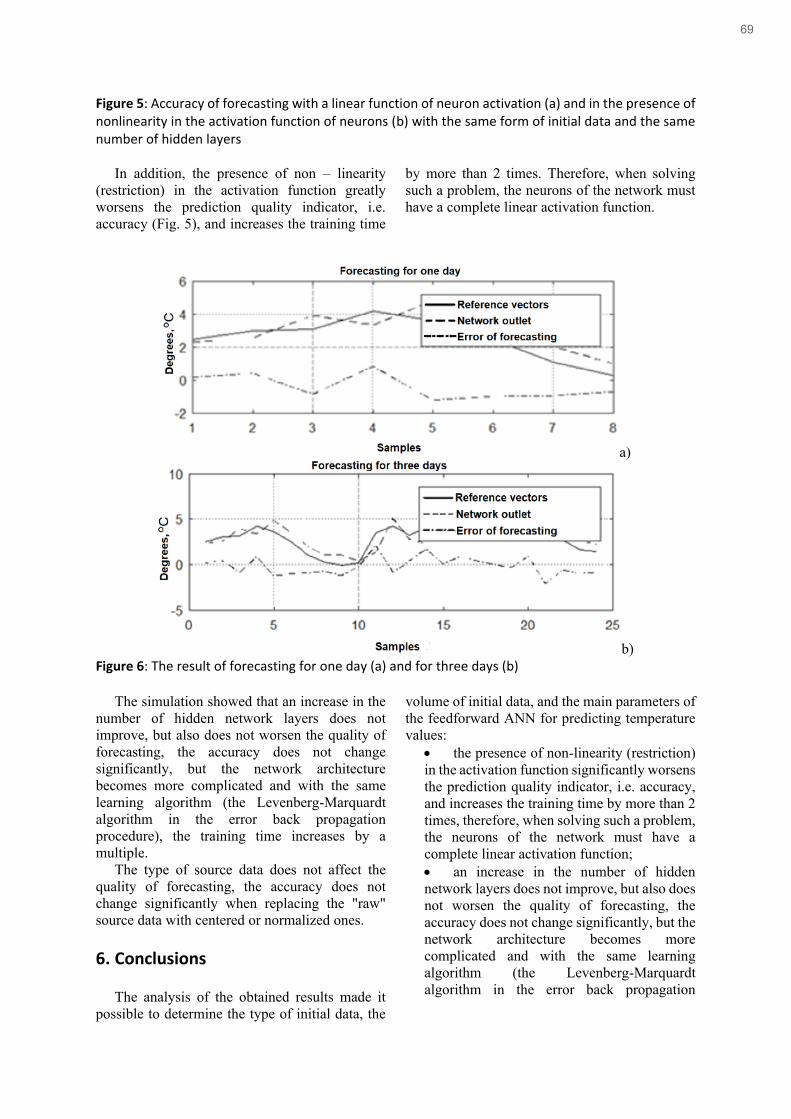
Figure 5: Accuracy of forecasting with a linear function of neuron activation (a) and in the presence of nonlinearity in the activation function of neurons (b) with the same form of initial data and the same number of hidden layers
In addition, the presence of non – linearity
(restriction) in the activation function greatly worsens the prediction quality indicator, i.e. accuracy (Fig. 5), and increases the training time
by more than 2 times. Therefore, when solving such a problem, the neurons of the network must have a complete linear activation function.
a)
b) Figure 6: The result of forecasting for one day (a) and for three days (b)
The simulation showed that an increase in the number of hidden network layers does not improve, but also does not worsen the quality of forecasting, the accuracy does not change significantly, but the network architecture becomes more complicated and with the same learning algorithm (the Levenberg-Marquardt algorithm in the error back propagation procedure), the training time increases by a multiple.
The type of source data does not affect the quality of forecasting, the accuracy does not change significantly when replacing the "raw" source data with centered or normalized ones.
6. Conclusions
The analysis of the obtained results made it possible to determine the type of initial data, the
volume of initial data, and the main parameters of the feedforward ANN for predicting temperature values:
• the presence of non-linearity (restriction) in the activation function significantly worsens the prediction quality indicator, i.e. accuracy, and increases the training time by more than 2 times, therefore, when solving such a problem, the neurons of the network must have a complete linear activation function; • an increase in the number of hidden network layers does not improve, but also does not worsen the quality of forecasting, the accuracy does not change significantly, but the network architecture becomes more complicated and with the same learning algorithm (the Levenberg-Marquardt algorithm in the error back propagation
69

procedure), the training time increases by a multiple; • the type of source data does not affect the quality of forecasting, the accuracy does not change significantly when replacing the "raw" source data with centered or normalized ones; • the initial data for training the network should be presented in the form of 150 vectors with a length of 16 samples each, which ensures stable short-term forecasting; • when training on such a small amount of data, the following condition needs to be observed: when forecasting in a certain season (time of year), earlier data for training needs to be selected, necessarily from exactly the same time of year, otherwise the forecast error increases significantly.
7. References
[1] B. F. Kuznetsov Short-term temperature prediction based on neural networks. // Topical issues of agrarian science. 2019. # 30. Pp. 59-65.
[2] S. N. Verzunov, N. M. Lychenko Multi-wavelength polymorphic network for forecasting geophysical time series // Problems of automation and control. 2017. # 1 (32). Pp. 78-87.
[3] A. S. Kozadaev, A. A. Arzamassev Forecasting of time series using the apparatus of artificial neural networks. Short-term forecast of air temperature. // Bulletin of the Tambov University. Series: Natural and Technical Sciences. 2006. Vol. 11. Issue 3. Pp. 299-304.
[4] A. S. Gribin. Application of artificial neural network algorithms for short-term prognosis: Dis. ... candidate of physical and mathematical sciences. SP-b. 2005. 154 p.
[5] J.W. Taylor, R. Buizza Neural Network Load Forecasting with Weather Ensemble Predictions. // IEEE Trans. on Power Systems, 2002, Vol. 17, Pp. 626-632. DOI: 10.1109/TPWRS.2002.800906
[6] L. I. Velikanova Short-term forecasting of humidity of mountain soils / / Problems of automation and control. – 2015, No. 4. – Pp. 158-166.
[7] S. N. Verzunov. Application of deep neural networks for short-term prediction of visibility range. Problems of automation and control. 2019, #1 (36). Pp. 118-130.
[8] LeiYu, ZhaoDanning, Cai Hongbing Prediction of length-of-day using extreme learning machine // Geodesy and geodynamics. – 2015 V. 6. N. 2. – Pp. 151-159.
[9] Koprinska, Irena et al. Convolutional Neural Networks for Energy Time Series Forecasting // 2018 International Joint Conference on Neural Networks (IJCNN). 2018: Pp. 1-8.
[10] Imran Maqsood, Muhammad Riaz Khan, Ajith Abraham An ensemble of neural networks for weather forecasting Neural Comput & Applic (2004) 13: Pp. 112-122. DOI 10.1007/s00521-004-0413-4
[11] Archive of meteorological data in Odessa. URL:https://rp5.ru/Архив_погоды_в_Одессе (Accessed 19.11.2020)
[12] Guidelines for hydrometeorological forecasting. Ukrainian Hydrometeorological Center. Kyiv, 2019. – 35 p.
70

Features Of The Implementation Of Methods For a Comprehensive Study Of Properties Of Thermoelectric Materials Roman Dunets1, Bogdan Dzundza1,2, Liliia Turovska3, Nazariy Senkiv2
1Lviv Polytechnic National University, Bandera str., 12, Lviv, 79013, Ukraine 2Vasyl Stefanyk PreCarpathian National University, Shevchenko str., 57, Ivano-Frankivsk, 76018, Ukraine 3Ivano-Frankivsk National Medical University, Halytska str. 2, Ivano-Frankivsk, 76018, Ukraine
Abstract Methods for the implementation of software and hardware tools for comprehensive nondestructive research of thermoelectric parameters of semiconductors have been analyzed and adapted. An information-measuring system has been developed, in which, due to a combination of different research methods, it is possible to perform the whole complex of thermoelectric measurements in one technological cycle and on one sample of typical configuration, in particular, thermo-EMF, electrical conductivity, Hall coefficient, magnetoresistance, Nernst-Ettingshausen coefficient, thermal conductivity, and thermoelectric figure of merit. The use of digital algorithms for filtering and processing the received data made it possible to obtain important parameters that are difficult to measure directly, in particular, the mobility and concentration of charge carriers, parameters of near-surface layers, to reconstruct the profiles of the distribution of thermoelectric parameters over the thickness. An important advantage of these methods is the absence of the need for accurate measurements of heat fluxes, which greatly simplifies and reduces the time for conducting experimental studies. Keywords 2 Thermoelectric properties, information-measuring systems, measurement methods, computer tools, signal processing, defects identification
1. Introduction
Thermoelectric materials are becoming more widespread as simple and reliable energy converters, but their efficiency is still quite low. Therefore, a large number of studies are carried out aimed at increasing the efficiency of thermoelectric materials. Such studies require measurements of electrical conductivity, Seebeck coefficient, thermal conductivity, which, when using classical techniques, is a rather laborious task, since samples of various configurations and accurate measurement of heat fluxes are required. A large number of universal tools for laboratory research have been developed, but their effective use is not always possible due to the narrow specialization of thermoelectric research. Therefore, an urgent task is the adaptation of methods and the development of tools both for the study of the main thermoelectric parameters of
EMAIL: [email protected] (A. 1); [email protected] (A. 2); [email protected] (A. 3); [email protected] (A. 4) ORCID: 0000-0002-3325-7908 (A. 1); 0000-0002-6657-5347 (A. 2); 0000-0002-3530-7518 (A. 3)
semiconductor materials and for express methods for determining the operating characteristics of thermoelectric energy conversion modules.
2. Selection and adaptation of measurement methods
When studying thermoelectric and photoelectric properties, it becomes necessary to measure a sufficiently large number of quantities of different nature (electrical conductivity, Seebeck coefficient, thermal conductivity, efficiency, etc.) depending on various factors (temperature, film thickness, production parameters, type of substrate), which makes such experiments quite laborious.
Since the preparation of a sample makes up most of the labor costs in thermoelectric research, it is urgent to develop an automated computer
71

system that will allow combining direct and indirect research methods on one sample. In particular, the implementation of the Hall methods will make it possible to study the galvanomagnetic, temperature, thickness and time dependences of the properties, in particular, to determine the electrical conductivity, the concentration of charge carriers, the Seebeck coefficient, and magnetoresistance.
Despite the rather slow processes in the implementation of Hall methods, a number of difficulties arise associated with low signal levels and the large influence of parasitic effects.
Spectral methods of analysis are especially sensitive to signal noise, in particular, methods of analysis of the "mobility spectrum" [1]. This method consists in the fact that the components of the conductivity tensor are represented in the form
of integral equations depending on the concentration and mobility of charge carriers. Such methods require a decrease in the measurement error of the Hall voltage and magnetoresistance, since in the presence of noise in the experimental data it is difficult to correctly determine the search area for the parameters.
For a more visual analysis, we have constructed a model of the measuring channel, in particular, Fig. 1 shows a model of the measuring channel in the study of the galvanomagnetic properties of the material, taking into account the influence of parasitic effects, such as EMF of nonequipotentiality, EMF of magnetoresistive effect, thermo-EMF ΣUi(B,I,T), distortions caused by electronic nodes and inaccuracies of actuators G(B,I,T), as well as the influence of external noise and interference η(B,I,T).
Figure 1: Model of the measuring channel in the study of the galvanomagnetic properties of the material.
As a result, the measured Hall voltage will
consist of a useful signal and noise, according to the expression
𝑈𝐻(𝐵, 𝐼, 𝑇) = 𝑈𝐻 +
+𝑆𝑖(𝐵, 𝐼, 𝑇)𝐺(𝐵, 𝐼, 𝑇) + 𝜂(𝐵, 𝐼, 𝑇), (1)
where UH(B,I,T) is the Hall voltage signal with both linear and nonlinear distortion. A similar situation will be in the study of other thermoelectric and photoelectric properties associated with voltage measurement.
In thermoelectric materials, parasitic effects that make the main contribution to the error include the EMF of nonequipotentiality, thermoelectric and thermomagnetic effects, which, even with a small change in the temperature gradient, significantly distort the result due to the large coefficient of thermo-EMF. A special cryostat design, where the sample is clamped between massive copper plates [2], and the measurements are carried out at a minimum sufficient current, at which there is no noticeable
heating of the sample, the power released must not exceed a few mW, has been developed to deal with the occurrence of uncontrolled temperature gradients. Low currents lead to a decrease in the useful signal, but they can effectively deal with the uncontrolled heating of the sample.
The automatic compensation circuitry has been designed to eliminate the error associated with the nonequipotentiality voltage. In the absence of a magnetic field and a given current flowing through the sample, the nonequipotentiality voltage is measured by the analog-to-digital converter ADC and compensated using the compensation circuit on the operational amplifier, which is guided by the voltage from the DAC.
In the developed hardware-software complex, several stages of data filtering are performed, in particular, at the first stage, the signal is amplified, brought to the ADC range and passed through the hardware low-pass filter. After digitizing the
72

signal, a median filter is applied to the data obtained from the ADC. This filter gets rid of the random spikes associated with the operation of the ADC. The third step is to apply a digital low-pass filter to the entire measured relationship. To reduce the noise component in the measured data, including the quantization noise level, a digital low-pass filter with a finite impulse response based on the Blackman weight function is used [3]. The use of a low-pass filter is due to the fact that the measured signals change at a rather low frequency, tenths and hundredths of hertz. Considering that the Hall voltage and magnetoresistance do not change with time, but with a change in the magnitude of the magnetic induction, the speed of the experiment, and therefore the maximum frequency of the
measured signal, can be controlled. This system can significantly reduce the noise component in the signal (Fig. 2).
Both modeling of the effect of noise on the results and experimental studies on real test samples have been carried out to study the effectiveness of noise control and the effect of digital filtering on the parameter determination error. As a result of using the developed system, it was possible to significantly reduce the error in determining the concentration and mobility of charge carriers, in particular in the presence of several types of charge carriers, the error in determining the concentration and mobility of heavy holes decreased by 4 times, light holes and electrons – by 1.5-2 times.
a b
Figure 2: Dependence of the Hall voltage on the magnetic field: noisy (a) and after digital filtering (b). The design of the cryostat provides for the
presence of a gradient heater and a differential thermocouple to determine the thermo-EMF coefficient and the Nernst-Ettingshausen coefficient by direct methods. Along with direct methods, indirect methods based on the modified Harman method [4] and impedance spectroscopy [5,6] are implemented in the measuring complex for the complete characterization of thermoelectric material and automated express diagnostics of thermoelectric elements. These methods are indirect measurement methods and are favorably distinguished by a short experiment time and do not require complex and laborious measurements of heat fluxes through the sample. This combination of methods made it possible to solve two main problems of classical methods, namely, the need for accurate measurement of heat fluxes through the sample and the need to prepare samples of various configurations to measure thermal conductivity, heat capacity, thermoelectric figure of merit, and other
quantities. The combination of direct and indirect methods makes it possible to determine electrical conductivity, carrier concentration, Seebeck coefficient, Nernst-Ettingshausen coefficient, magnetoresistance, thermal conductivity, as well as thermoelectric figure of merit, and to carry out express diagnostics of finished thermoelectric energy conversion modules on one sample in one technological cycle.
3. Hardware and software tools for research implementation
The set of methods for complex nondestructive research of thermoelectric parameters of semiconductors determines the characteristics of the system that it implements, namely, the amount of input information, the speed of information receipt and the processing time of the input information.
73

The process of measuring the parameters of the sample determines the maximum amount of input information and the maximum rate of its entry into the system. The largest amount of input information will be in the implementation of galvanomagnetic methods, and the maximum data input speed will be in the implementation of the impedance spectroscopy and will be no more than 20х106 counts/s.
The minimum processing time of the input information is determined by the process of controlling the operating conditions of the test sample, that is, the formation of control signals to the actuators, and the shortest time between two control signals will be when the Harman pulse method is implemented and will be 0.1 μs.
That is, the system that ensures the implementation of the set of these methods will not only be information-measuring, but also control at the same time. On the other hand, the implementation of the system should optimally combine the known approaches to the construction of computer systems – purely hardware implementation and software and hardware implementation. The hardware implementation provides maximum performance, but it requires redesigning each time in case of changes in the system's algorithm. The hardware and software implementation as a whole has a lower performance, but its operation can only be reprogrammed when the operation algorithm is changed. In turn, software and hardware tools are divided into universal and specialized – microprocessor tools that work without operating systems, and microcomputer tools that run under operating systems. When constructing a system for complex nondestructive research of
thermoelectric parameters of semiconductors, it is necessary to determine the solution of which problems will be implemented in hardware, and which ones – by specialized and universal tools. The criterion for this can be the comparison of the given time for solving the problem and the time for solving it by hardware or software and hardware tools, which is given in [7].
Taking this into account, the system that ensures the implementation of the set of these methods is implemented as a three-level specialized computer system (Fig. 3), optimized to obtain the maximum number of parameters that fully characterize the sample without destroying it and without the need to change the configuration of the sample for various research methods. This concept, combined with modular structuring techniques, makes it possible to design an information-measuring and control system that can be easily upgraded or expanded. At the lower level, the actuators are controlled to create the necessary conditions for the experiment; sensor polling, analog processing and filtering of signals are carried out. At the middle level, digital signal processing, control signal generation, and self-diagnostics are performed. Depending on the required performance, this level can be implemented both on a single microcontroller and on an FPGA or their combination. The upper level is implemented in software on a standard personal computer, which made it possible to develop a convenient graphical interface for control and visualization of results. In addition, the transfer of all calculations and simulations to the PC makes it easy to expand the capabilities of software data processing without interfering with the hardware.
Figure 3: General concept of a specialized computer system for comprehensive thermoelectric and photoelectric research.
74

Guided by the principles of modular structuring, all the implemented methods for studying the properties of semiconductors are combined into groups and implemented as separate subsystems.
In particular, the subsystem for studying the galvanomagnetic properties of semiconductors implements the classical methods of Hall measurements in constant magnetic fields, measurements of thermo-EMF, electrical conductivity, Hall coefficient, magnetoresistance, and Nernst-Ettingshausen coefficient.
The subsystem for express studies of thermoelectric elements implements pulse methods and, for sufficiently thin film samples, requires high frequencies and, accordingly, high speed of the system for generating and processing signals. In addition, a highly stable source of both DC and AC of 10 μA to 500 mA, with a frequency of up to 2 MHz [7], and voltage measurement from 1 μV up to 1 V with a resolution of 12 bits, up to 100 Mps with noise filtering and taking into account errors from parasitic physical processes has been implemented. Also, based on the obtained data and the adaptive algorithm, which compares not only the absolute values, but also their deviations from those typical for a given series, defects identification of the studied element with the determination of the probable type of defect is provided [7].
The generation and synchronous detection of signals with a frequency of up to 2 MHz and their mathematical processing based on fast Fourier transforms to determine the amplitude and phase shift between them have been implemented for the subsystem for studying thermoelectric properties based on impedance spectroscopy [8]. The main task of fast digitalization of an analog signal is solved using a high-speed analog-to-digital converter, for example, AD9643 (Analog Devices, USA), which has two independent high-quality sample-hold devices and a built-in reference voltage source. Generation of a signal of the required frequency, filtering and mathematical processing of data have been implemented on the FPGA, and a 32-bit microcontroller has been chosen for signal generation, control of switching and operation of operational amplifiers, and communication with a computer [7,8].
For analyzing the quality of contacts and self-diagnostics, algorithms and a subsystem for automated analysis of the ohmicity of contacts have been developed, in particular, for analysing the I–V curve for linearity by software methods, for detecting breakage and instability of contact
parameters by analyzing the scatter of the received data, which reduces the probability of receiving incorrect data and outliers.
For automated processing and visualization of the results, a software analytical module has been developed for the application of physical and mathematical models to determine the main thermoelectric parameters, including those that cannot be measured directly, such as the concentration and mobility of charge carriers, and the reconstruction of the profiles of these parameters over the sample thickness [9,10]. Approximation and fitting were carried out by the least squares method using the algorithm for minimizing functions of many variables by the Nelder-Mead deformed polyhedron method. The analytical module also provides automatic decoding of spectrograms and determination of thermoelectric parameters that are difficult to measure directly, for example, thermal conductivity and thermoelectric figure of merit, as well as automatic diagnostics and defects identification of thermoelectric elements.
4. Conclusions
The analysis has been carried out, methods for studying the thermoelectric properties of semiconductors have been selected and adapted, and a computer system has been implemented, which makes it possible to obtain all the necessary parameters of the test sample in one technological cycle on a sample of one configuration by nondestructive methods, which several times reduces the time for preparing and conducting an experiment.
A special design of a cryostat and a sample holder, an algorithm and a circuit for compensation of nonequipotential voltage have been developed, which makes it possible to minimize parasitic effects during Hall measurements. It is shown that the use of digital signal filtering algorithms to effectively reduce the noise component in the measured data has made it possible to reduce the error in determining the concentration and mobility of charge carriers by 2-4 times.
The use of indirect methods for studying thermoelectric properties made it possible to avoid the need to measure heat fluxes, to implement algorithms for fast diagnostics of thermoelements and to reduce the error in measuring thermoelectric figure of merit by 1.5-2 times.
75
A decrease in the laboriousness of processing the obtained data has been achieved by developing software tools for automated data preprocessing in accordance with physical and mathematical models that describe thermoelectric properties and make it possible to determine parameters that cannot be measured directly.
5. References
[1] Gang Du, J.R. Lindemuth, Characterizing Multi-Carrier Devices with Quantitative Mobility Spectrum Analysis and Variable Field Hall Measurements, Japanese Journal of Applied Physics 41 (2002) 1055–1064. doi:10.1143/JJAP.41.1055.
[2] B. Dzundza, L. Nykyruy, T. Parashchuk, E. Ivakin, Y. Yavorsky, Z. Dashevsky, Transport and thermoelectric performance of n-type PbTe films, Physica B: Physics of Condensed Matter 588 (2020) 412178–1–8. doi:10.1016/j.physb.2020.412178
[3] A.V. Trifanov, D.Yu. Protasov, V.Ya. Kostyuchenko, The noise suppression in results of automatic hall measurements by using low-frequency digital-data filter, Izvestiya vuz. Fizika 56 (2013) 134–136 (in Russian).
[4] B. Beltrán-Pitarch, J. Prado-Gonjal, A.V. Powell, Experimental conditions required for accurate measurements of electrical resistivity, thermal conductivity, and dimensionless figure of merit (ZT) using Harman and impedance spectroscopy methods, Journal of Applied Physics 125/2 (2019) 025111. doi: 10.1063/1.5077071.
[5] J. De Boor, E. Müller, Data analysis for Seebeck coefficient measurements, Review of scientific instruments 84 (2013) P. 065102–1–9. doi:10.1063/1.4807697.
[6] Jorge Garcıa-Canadas, Gao Min, Impedance spectroscopy models for the complete characterization of thermoelectric materials, Ournal of Applied Physics 116 (2014) 174510-1-7. doi: 10.1063/1.4901213
[7] R. Dunets, B. Dzundza, L. Turovska, M. Pavlyuk, Features for the design of a specialized information-measuring system for the study of thermoelectric properties of semiconductors, Eastern-European Journal of Enterprise Technologies 110/2 (2021) 23–31. doi:10.15587/1729-4061.2021.227135
[8] R. Dunets, B. Dzundza, O Kostyuk, Specialized software and hardware for
impedance spectroscopy of thermoelectric energy converters, ISTCMTM 81/4 (2020) 18–24. doi:10.23939/istcmtm2020.04.018
[9] R. Dunets, B. Dzundza, M. Deichakivskyi, Methods of computer tools development for measuring and analysis of electrical properties of semiconductor films, Eastern-European Journal of Enterprise Technologies 103, 1/9 (2020) 32–38 doi:10.15587/1729-4061.2020.195253
[10] Y.P. Saliy, B.S. Dzundza, I.S. Bylina, O.B. Kostyuk, The influence of the technological factors of obtaining on the surface morphology and electrical properties of the PbTe films doped Bi, Journal of Nano- and Electronic Physics 8/2 (2016) 02045 doi: 10.21272/jnep.8(2).02045.
76

Structure Of The Ship System For The Forecasting Of Navigation Emergencies O. Aroslankin 1, A. Samokish 2, G. Shapiro 3, I. Gusak 4, O. Safyan 5
1,2 Ivan Kozhedub Kharkiv National Air Force University, 61023, Ukraine 3,4,5 State University of Infrastructure and Technology, Kyiv, Ukraine
Abstract Analysis of statistical data on marine accidents and the reasons for their occurrence shows that one of the dangerous situations during the movement of the vessel is the situation of dangerous convergence (collision), especially in a complex navigational situation. Relevance of the issue of improving the safety of the implementation of displacement with navigation hazards is confirmed by the fact that not only shipping companies, state institutions and states are generally searching for the approaches of warning marine accidents, but also that the security committee for security on the security committee was created in the structure of the international maritime organization (IMO). Mori (Maritime Safety Committee, MSC) in which the concept of security of navigation is being developed. The article has developed a structure of a ship system for forecasting of navigation emergencies. The source parameter of the forecasting system is an extreme navigation situation, tied to a certain point and a particular port area. The presence of navigation hazards and the intensity of vessels largely complicate navigation in limited waters, and create increased risks of emergencies. Current forecasting is performed by a reflection of an emergency with a prejudice period directly adjacent to the time axis until the current moment. To calculate the predicted value of navigation complexity in the short-term prediction, the values that are stored in the databases of the navigation situation are used, which, if necessary, can be adjusted by current values. An automated system for forecasting of navigation emergencies, the concept of which is based on the assessment of the human factor is the most implemented option of decision support systems. It allows the captain of the vessel as promptly, and in advance to schedule measures to minimize the probability of emergency, the source of which is a navigational accident in the port water area. Keywords1 Ship, navigator, situation of dangerous approach, navigation situation, ergatic system, human factor.
1. Introduction Increasing the intensity of navigation and
volumes of transportation by sea vessels increases the risk of navigational emergencies in water area. The overwhelming majority of navigation emergencies in the port water area (violation of the course, dangerous convergence, violation of the rules of difference in vessels, mistakes in choosing a safe speed, considering the meteorological situation, etc.) associated with the human factor [1]. According to [2], "human factor" manifests themselves in specific
EMAIL: aleksandr23ar@gmail (A. 1); [email protected] (A. 2); [email protected] (A. 3); [email protected] (A. 4); [email protected] (A. 5); ORCID: 0000-0001-6364-6368 (A. 1); 0000-0003-1924-9351 (A. 2); 0000-0003-4245-9365 (A. 3); 0000-0002-1546-5914 (A. 4); 0000-0001-8866-7456 (A. 5);
conditions of their interaction in the system of "man-machine", the functioning of which is determined by the achievement of the goal. Human factor in engineering psychology - psychological and other characteristics of man, its capabilities and restrictions are determined in the specific conditions of its activities [3]. In the ship's significant contribution to the human study is made in a monograph [4], where practically all-important aspects of this phenomenon are analyzed: fatigue, competence, acquisition of crews, language problems of multinational crews, maritime education, crew conflicts, psychological
77

aspects. Separately we select the study [5-8], in which, based on materials of investigations of marine incidents and disasters, the role of human factor safety is investigated and models of evaluation of the human factor are investigated. These researchers agree with the thesis that completely eliminate the influence of "human factor" on navigation safety is impossible, since it is impossible for today's stage of development of science and technology to eliminate a person from the management of the vessel, but the reduction of the influence of the human factor is a comprehensive automation of shipping processes and systems. Support for the decision of navigational safety of navigation.
2. Structure of the ship system for the forecasting of navigation emergencies
The technical and informational provision of modern marine vessels allows us to automate the process of obtaining data necessary to determine the complexity of the navigation situation. This allows you to synthesize a ship's automated emergency forecasting system, a source of which is a navigational accident.
Under the forecasting of an emergency, we understand the advanced reflection of the probability of emergence and development of an emergency based on the analysis of possible reasons for its occurrence, its source in the past and the present time.
The composition of the forecasting of navigation emergencies has the form presented in Fig. 1.
Composition of the system for forecasting of
navigation emergencies
1. Organizational structure
2. General system model
3. Complex of technical means
4. Models of the situation
5. Information system
6. Methods of observation, data processing, analysis of the situation and
forecasting
Figure 1: Composition of the system for forecasting of navigation emergencies The organizational structure of the proposed
system includes: - a shipwreck, which is a system
management body and performs, among other things, the function of making decisions;
- automated observation subsystem, which in real time provides a system of data on the state of parameters that are subject to consideration and measurement;
- subsystem of databases of parameters that are subject to consideration and are constant within long periods of time or can be predicted by third-party services;
- a computing subsystem that performs a quantitative assessment of the probability of a navigation emergency.
The last three elements are an informational automated system that provides measurement
and data collection, preparation, storage, processing, analysis and visualization of information.
General model of the system, which reflects the possibility of developing an emergency, the source of which is the navigation incident.
The complex of technical means includes navigational, hydrometeorological and other ship equipment, which is necessary for measuring parameters that determine the state of the navigation situation component.
General models of situations are a set of basic coefficients. The complex of measured parameters includes all parameters that determine the state of the navigation situation component, as well as stress resistance of the ship. The main method of observation in the system is instrumental. Processing results,
78

analysis of the situation and forecasting are carried out on the basis of the method of quantitative assessment of the influence of the human factor on navigational navigation of the vessel [4, 7]. The source parameter of the forecasting system is an extreme navigation situation, tied to a certain point and a particular port area. Current forecasting is performed by a reflection of an emergency with a prejudice period directly adjacent to the time axis until the current moment. Thus, the operational outlook of extremity is calculated for the prospect, within which significant changes of the observed parameters of the navigation situation are expected. To calculate the predicted value of its complexity it is necessary to use the current values of the characteristics of the navigation situation component. To calculate the predicted value of navigation complexity in the short-term prediction, the values that are stored in the databases of the navigation situation are used, which, if necessary, can be adjusted by current values.
The information system consists of a set of databases and information models:
Based on the fact that the procedure for carrying a running navigation, it is possible to contact at any time with a specific assistant
captain, rather pre-preliminary (before the flight), the data on the stress resistance of all navigators included in the ship's role.
The system includes the following databases:
1) The database contains received from locations, maps, atlases and other manuals Statistical data on provision, visibility, wind, excitement, flow, intensity of shipping and local rules for various port water areas at different periods of time, this database is practically not variable;
2) the database received from external sources information on the history of the intensity of navigation in the port water area, as well as on current traffic;
3) the database contains the forecast information of the hydrometeorological situation;
4) cartographic systems (cartographic information and methods of processing);
5) information about current vessels in the water area;
6) information about the crew and its stress resistance and other evaluations of the human factor adapted to the method and time of the watch.
Information System Structure
Database of statistics (atlases,
maps, lines)
Database of movement
Intensity, current traffic
DB forecast of the hydrometeorological
situation
Cartographic system Information about ship and flight
Information about current vessels in
the water area
Information about crew and its stress
resistance
Figure 2: Information System Structure
The central place in the system
infrastructure is the server - software and hardware complex, designed to collect and process data received from a complex of technical means and from external in relation to the ship sources, storage and maintenance of databases and execution of program codes for
the calculation of extremity for different types of forecasting.
The hardware part of the server is a computer - simultaneously performs functions of control units and indication. The main control unit has a dialogue program that can be adjusted available for this setting and
79

downloads data directly to the algorithm and in the appropriate manual bases. The indication unit is intended for reproduction (visualization) of the calculated (predictable) extremity values on the server monitor and the alarm on critical current values. The reflection of the extremity of prediction is attached to the time, the place and a particular line of the path line (expecting the line), built under the previous gasket.
Both the control unit and the indication block are performed as peripheral and represent separate input, control and display devices associated with the server.
The optimal means of displaying the results of the system (directly forecast of the extreme situation) is an electronic cartographic navigation - information system. The principles of constructing this system allow you to use an additional layer (overlay) with predicted information about the probability of a navigation emergency. This layer may contain digital and graphic information to execute the forecast.
Digital information may be displayed or permanently or when you hover over a vessel or on the expected line of the path.
The graphical reflection of experimentality is determined either by the color marker of the vessel (with operational forecast), or the color of the expected line of the path (with short-term or long-term prediction).
3. Conclusions
An automated system for forecasting navigation emergencies, the concept of which is based on the assessment of the human factor is the most implemented option of decision support systems. It allows the captain of the vessel as promptly, and in advance to schedule measures to minimize the probability of emergency, the source of which is a navigational accident in the port water area.
Thus, the method allows not only to predict the impact of the human factor on navigational security of the vessel and the probability of emergencies in shipping, but also in order to control the risk of emergencies at sea, to form a set of various technical, organizational and educational measures aimed at minimizing this influence. As a point assessment of the human factor it is proposed to use a stress resistance of a ship, which is the main determinant of the
influence of the human factor on navigation safety of the vessel.
4. Acknowledgements
Express gratitude to the leadership of the State University of Infrastructure and Technology for comprehensive support and assistance.
5. References
[1] Moving in the assessment of a person factor in the seats and cards on the sea: Resolution IMO A.884 (21). (2000).
[2] Golikov V.V., Golikov V.А., "Control factor in the operations of the vessel." Ship Energy Installations: Scientific-Technology. the agility (2008) 78‒87.
[3] Dushkov, B., Smirnov, B., Korolev, A., Psychology of labor, professional, information and organizational activity: Slovar, 3rd ed. Academic Project: Mir Foundation 2005.
[4] Katsman, F.M., Control factor in the problem of ensuring the security of the vessel SPGUVК 2003.
[5] Macrae, C. "Human factors at sea: common patterns of error in groundings and collisions" Maritime Policy & Management (2009) 21‒38.
[6] Martins, M.R., Maturana, M.C., "Human error contribution in collision and grounding of oil tankers" Risk Analysis (2010) 674‒698.
[7] O’Neil, W. "The human element in shipping" WMU Journal of Maritime Affairs (2003) 95‒97.
[8] Zhang, Y., Zhan, Y., Tan, Q., "Studies on human factors in marine engine accident" Knowledge Acquisition and Modeling Conference, Wuhan, China (2009 134‒137.
[9] Vagushchenko, L.L. Moving informational technologies in judicial Odessa National Marine Academy 2013.
[10] Ignatenko, S.A., Zubkov, V.А., "Installation of a person's factor on the recovery of the tergyprising situations of man-made character" Municipal economy of cities: Scientific and technical collection. KNAMG (2010) 371‒375.
80

Non-Digital Information Processing In Biotechnical Systems With Biofeedback Vladimir Mescheryakov1, Dmitry Mescheryakov 2, Anna Gnatovskaya 3, Dmitry Kondratyuk 4, Aleksandr Salabash 5
1,3,4,5 Odessa State Environmental University, Address, Lvovskaya st., 15, Odessa, 65016, Ukraine 2 JSC PETROSOFT, Address, M. Govorova st., 18a, Odessa, 65032, Ukraine
Abstract The possibility of using statistical non-digital data processing in homeostatic biotechnical systems with biofeedback is considered. It is shown that the non-digital representation of the primary data of the connection between the input action and the output response of the organism is more consistent with the model of the physiological system. The impossibility of using arithmetic transformations when processing non-digital data for sliding windows with a small number of samples has shown the advantages of using the Kemeny median. Comparative analysis of data processing with abnormal emissions by sliding linear and nonlinear filters operating in real time mode of biological object functioning is carried out. The advantage of using nonlinear filtering when working with time sequences containing anomalous sample values has been substantiated. For biotechnical regulatory systems for medical purposes with biofeedback, an option for making decisions on the criterion of signs is presented, which increases the stability of the system. Keywords 1 Feature space, non-digital data, median of Kemeny, anomalous outliers, filtering, fuzzy transformations.
1. Introduction
Methods of non-digital statistics [1] are used in expert systems in decision-making, sociology, political science [2], psychology, in areas where there are no or difficult opportunities for unambiguous decision-making [3]. Consider the possibility of using non-numerical statistics to convert the original human signals as a reaction to the intensity of infrared radiation2 [4].
The original feature space of a biological object is probable due to the low level of output signals, the application of heterogeneous signals, noise and external influences [5]. This involves the use of statistical methods of data processing and taking into account the fact that the resulting sequence is non-stationary [6]. Nonstationary leads to the need to allocate quasi-stationary
EMAIL: [email protected] (A.1); [email protected] (A.2); [email protected] (A.3); [email protected] (A.4); [email protected] (A.5); ORCID: 0000-0003-0499-827X (A.1); 0000-0001-7224-749X (A.2); 0000-0002-0018-5696 (A.3); 0000-0002-7411-8509 (A.4); 0000-0002-3708-0505 (A.5).
sections, where you can select the moments of the stationary sequence [7].
In addition, sign signals, such as the resistance of the skin, obtained in different parts of the body, have a significant variance [8]. This is due to the uneven location on the surface of the skin of the sweat glands, different thickness of the epidermis, etc. Moreover, there is no direct relationship between skin resistance and sweat gland activation, and a change in resistance twice does not mean that their activity has changed proportionally. It follows that the original data carry information about physiological processes in the body, but these data are qualitative rather than quantitative [9]. The resistance of the skin is not equivalent to the activity of the sweat glands, so the binding of the physical readings of the device is also qualitative rather than quantitative.
81

A fundamentally different principle of information processing in biological and technical objects is a significant problem of data processing in homeostatic biotechnical systems [10]. Where decision-making technical component is made on the basis of physiological reactions of the organism [11]. The aim of this work is to improve the quality of pre-processing of data in the biotechnical system by using statistical non-digital methods of time series processing.
2. Non-digital approach to processing the original feature information
The qualitative nature of the samples in contrast to the quantitative representation has its own characteristics. Thus, the values of the samples cannot be made, because the obtained values lose their meaning. If we assume that the sequence of samples are elements nxxx ,,, 21
of a nonlinear set X , then under these restrictions it becomes clear that the determination of the average value of the sample requires other approaches compared to those adopted. Even when analyzing the samples of a series, the arithmetic mean value is acceptable only for the case of a sufficiently uniform value of the members of the series. If there is an anomalous value in the sample, the value of the arithmetic mean does not always adequately characterize the average, because the influence of this component is much more significant than others.
In non-digital statistics, the measure of difference is an indicator ],0[: 2 +→Xd , the essence of which is to capture the fact that the more ),( yxd , the more different x and y [12]. In relation to the empirical mean, this means minimizing the expression:
= ni
in XxxxdArgdE1
),,(min)( , (1)
where the mean )(dEn represents the set Xx for which the function
),(1)(1
xxdn
xfni
in
= , (2)
reaches the minimum value on the set X and is the median or mean for a sample of rankings by Kemeny. In [12] it is shown that for qualitative values for the ordinal scale as a mean it is possible to use only the median, and not the arithmetic
mean or geometric mean. Proof of the convergence of theoretical and empirical averages is based on the law of large numbers. With a limited sample, the concept of a -heel f is introduced, which is a neighborhood in terms
)min( fArg of a function that is minimized. This, in particular, removes the question of choosing metrics in space X . The size of the area is determined both by the accuracy of determining the values and by the sensitivity thresholds used, if the modulus of the difference between the samples is less than or equal to the sensitivity threshold.
It also follows from the peculiarities of qualitative representation that the increase in the sample size may not lead to an increase in the reliability of the assessment, as it is impossible to talk about the stationary and centeredness of the analyzed process, along with the negative consequences of such a statement samples. This fact is critical for real-time systems, as it introduces a delay of at least half the sampling time. The small sample size leads to a significant variation of the indicators relative to the average, because, for example, for control systems, the indicator of stability is important.
If we consider the stability as the absence of control effects on the tolerances, the reaction of a biological object of the type "cold-warm", or "comfortable-uncomfortable" is more stable than the perception of the values of ambient temperature. The feeling of warmth is perceived by each person individually, the physiological reaction of the organism is primary, and the quantitative description of conditions is secondary.
The scales of qualitative features are the ordinal scale and the scale of names [2a], the first of which corresponds to the problem to be solved. Comparison of the two samples Y and Z can be done by their average values:
),,,(),,,( 2121 nn ZZZfYYYf . (3)
If the transformation in the ordinal scale , such iY as iZ normalization, is allowed, then
)( iY and )( iZ change to and. To form the average of the data set, you can
use the sign of the distance from a given point to the points of the neighborhood, and the degree of proximity are smaller distances. Since it is not possible to use the summation operation for qualitative values, we use the difference indicator. For problems with a limited sample, it is
82

necessary to determine the empirical average, which under certain conditions provides convergence with the theoretical average.
For a space of arbitrary form X with elements nxxx ,,, 21 of a real-valued function ),( yxf
with value in X , the values of the difference function differ ),( yxf the more, the more x and
y differ. The average value _x relative to the
degree of difference ),( yxf is the solution of the optimization problem [12]:
=
→n
iXyyxf
1min,),( . (4)
The theoretical average does not differ from the classical average for the law of large numbers when →n , in accordance with Hinchin's theorem, tends to a mathematical expectation:
),(),(11
yxMfyxfn
n
ii →
=
. (5)
When yxyxf −=),( and with an odd
number of samples 12 += kn , the value of the
mean is equal to 1
_
+= kxx , i.e. we obtain a sample median. With an even number of sample members, we obtain the half-sum of the sample values kx and 1+kx . To exclude arithmetic operations, you can limit the odd number of samples.
To determine the average of Kemeny, it is necessary to rank the data. The filter delay for real-time systems is determined by half of the sample, so it cannot be large. With a limited sample, the ranking operation consists in arranging the data in a non-killing order, ie increasing with the possibility of the existence of elements with the same values. Algorithms for implementing this function are known and consist in a sequential comparison of the current element of the sample with the elements constructed in ascending order. Next, the median is determined, which is the average of Kemeny [13].
The qualitative nature of the samples leads to nonparametric models of process description. The parametric probability-statistical model is represented by a vector of fixed dimension, which does not depend on the sample size. In nonparametric models, the notion of distribution density is unacceptable, so it can be replaced by the probability of -hitting the -region. The formation of the -area in the simplest case can be the setting of the noise level and the signal
being processed, the required sensitivity or other criteria. In the initial stage it is possible to provide a variant of asymptotic approach to the purpose of regulation, and then to specify depending on existing restrictions. This solution will allow us to talk about the ability of the proposed approach.
For the task of controlling the intensity of human infrared radiation on its physiological characteristics, it is important that the stability of the determination of the physiological response is higher than the numerical values of the devices, because it is primary. It is obvious that the use in addition to the resistance of the skin, other signs of human response to infrared radiation allows you to maintain the nature of these signals. Thus, heart rate and respiration only indirectly reflect the fact of increased heat extraction by the peripheral vascular and respiratory systems.
In a biological object, the response to each reaction is accompanied by the formation of an elementary goal, the implementation of an active act, checking its achievement, adjusting the elementary goal, and so on. These actions take place within the framework of a higher level goal, such as maintaining the temperature conditions of the body's functioning. Naturally, this is a very simplified model, but it can serve as a basis for reconciling mathematical and functional models.
Sampling nxxx ,,, 21 of the initial probable
size X of a biological object due to the above reasons cannot have a known distribution function. As the sample size increases )(xF , according to the central limit theorem, the distribution function tends to the normal distribution law. For a non-parametric model, the most appropriate solution to the decision-making problem are two criteria: the criterion of signs and the criterion of sign ranks [13]. For the sign criterion 5,0)( =mF , i.e. each of the random variables is probably more than the second sample:
+
−=
0
0
,1,1
mxеслиmxесли
Rj
jj . (6)
If the value 0m corresponds to the response of the sensor in the active part of the process, the presented connection reflects the decision in the vicinity of the active therapeutic zone. The decision "-1" indicates that the radiation intensity must be increased, "+1" – the radiation intensity must be reduced, "" 0mx j = – to remain unchanged. This approach is known as the
83

principle of follow-up balancing. The main advantage of the following balance is the high stability of the conversion at a low signal-to-noise ratio, the disadvantage is the low speed of entering the mode. If the latter disadvantage is not fundamental, for example, due to the preheating of the emitters before the procedure, the decision-making on the control of infrared emitters may be limited to the criterion of signs in this case. Thus, the qualitative representation of the initial features of the biological object, which is in the feedback circuit of the biotechnical system, allows to form requests for control of the intensity of infrared radiation by the physiological response of the organism. According to the initial physiological information, both reactions to external thermal influence, and to internal adaptation of an organism to own purposes and the executed processes, change of external influence taking into account ambiguity of transformation is carried out. The implementation of the presented variant of non-digital data processing for controlling the intensity of heating of the patient in the infrared peloidotherapy chamber is made on the basis of ARDUINO technology. Limitations of radiation intensity of infrared emitters were chosen on condition of discomfort of stay indoors. This condition is met by the value of the resistance of the leather above 400 Koh. From the point of view of carrying out procedure the range is not of interest as dry epithelium signals absence of the remains of heat in an organism. The value of skin resistance is less than 100 ohms with significant sweating close to pain and can serve as the upper limit of the heating intensity range.
2.1. Processing of time series with anomalous
Modern methods of filtering anomalous emissions are based on the calculation of a sample variance followed by data substitution, in which the deviation exceeds the threshold for noise-tolerant estimation of mathematical expectation, or on rejection of emissions using statistical hypothesis testing, which provides a sufficient number of members in biotechnical systems [14].
We compare the processing of the time series of a nonstationary process, which is the characteristic information of a biological object (heart rate read with a period of 20 seconds), the sliding linear window in determining the sampling center as the arithmetic mean and the median of Kemeny. From the given fragment of
time sequence of samples it follows that process cannot be carried to a stationary series (Figure 1). The obtained data are influenced by obstacles, cyclic processes, trendy long-term processes that take place in the body during its functioning, so in the short term the time series is non-stationary. It is impossible to increase the size of the sample window due to the increase of the delay time on the analyzed effect.
Figure 1: Non-stationary source feature of a biological object
We process this fragment with a 5-element
sliding window (Figure 2).
Figure 2: Processing a fragment of the original features (1) with a linear window (2) and a nonlinear filter Kemeny (3)
We make it with the replacement of the
arithmetic mean value and the average Kemen average ranking of the sample values in the window and the selection of the median.
Analysis of curves 2 and 3 shows that there is no significant difference between them, except for sections 17–19 and 35–37, which requires a separate study and comparison of the reactions of linear and nonlinear filters. Methods of research
84

of filters are worked out in detail in the literature on filtering of signals and time series therefore their detailed analysis to result in the given work can be considered inexpedient. One of the main problems of data processing, which is characterized by the ambiguity of the values due to the reaction of the biological object to the impact, is the rejection of abnormal values, or emissions. The most commonly used method of filtering anomalous emissions is to calculate sample variances with subsequent replacement of data in which the deviation of the mean exceeds a certain specified value of the calculated variance. The general approach to emission rejection is to use noise-tolerant assessment and test statistical hypotheses. The presented simulation experiments showed that the proposed filtering of anomalous measurements effectively works up to 18% of single emissions, and at 20% no longer works [15].
The reading of primary information by contact means from mobile patients is associated with problems with the conductivity of contact connections of the epidermis with electrodes, which leads to uncontrolled changes in the recorded data, ie the appearance of artifacts in the time series. When a person moves in a peloidotherapy chamber, the skin is bent in the places of reading the primary data, ie the appearance of various contact resistances is the basis of the physiotherapeutic method.
To assess the degree of influence of anomalous emissions on the possibility of using the results of primary features on the control capabilities in the experimentally obtained nonstationary series, we make anomalous emissions and process them with a linear and nonlinear filter (Figure 3–7).
Analysis of figure 3 shows that when processing a time series with single anomalous emissions by a linear filter, the effect of the anomalous component is significant because it is included in the arithmetic mean and shifts the filtered value towards the emission. When processing the time sequence by a nonlinear filter, the anomalous emissions have almost no effect on the results, because a single emission can only affect the displacement of the selected element on the neighboring ranked from the median.
Figure 3: Time series processing with single anomalous emissions: 1 – primary series with anomalous emissions, 2 – linear filter treatment, 3 – nonlinear filter treatment
Figure 4: Time series processing with double anomalous emissions: 1 – primary series with anomalous emissions, 2 – linear filter treatment, 3 – nonlinear filter treatment
In figure 4 presents the results of time series
processing of paired anomalous emissions by linear and nonlinear filters. The results of linear filtration show that anomalous emissions significantly affect the results, shifting the filtered curve towards anomalous emissions more than for single emissions. This is obvious, because the arithmetic mean value significantly depends on the anomalous emissions that are emitted at the level of other informative members of the series. When treated with a nonlinear 5-point filter, the effect of paired anomalous emissions is insignificant and is associated only with the homogeneity of the three remaining informative members of the series. Accordingly, in contrast to [15], the limit of anomalous emissions is not 18%, 40% for a five-point filter.
85

Figure 5: Time series processing with triple anomalous emissions: 1 – primary series with anomalous emissions, 2 – linear filter treatment, 3 – nonlinear filter treatment
In figure 5 presents the results of processing
for three consecutive abnormal emissions of one sign relative to the signal. As the results of processing by a nonlinear window show, the filter does not cope with the task, because the median is anomalous value. That is, a filter with an odd number of elements (2n + 1) is operational provided that the number of consecutive anomalous emissions does not exceed n.
Figure 6: Time series processing with anomalous emissions alternating by sign: 1 – primary series with anomalous emissions, 2 – linear filter treatment, 3 – nonlinear filter treatment.
In figure 6 presents a variant of anomalous
emissions consecutive on the sign, alternating. As shown by the results of treatment with a nonlinear filter, there is a mutual compensation of anomalous emissions, and the above condition for the number of anomalous emissions n can be exceeded.
In figure 7 presents the resulting processing of the time series, which contains anomalous emissions of different signs and durations.
Figure 7: Time series processing with anomalous emissions of different duration: 1 – primary series with anomalous emissions, 2 – linear filter treatment, 3 – nonlinear filter treatment
In figure 8 presents the results of processing the experimentally obtained time series of values of the resistance of the skin under the influence of infrared radiation when moving the patient inside the chamber.
Figure 8: Processing of experimental data of a leather cover: 1 – primary signal, 2 – linear filtration, 3 – nonlinear filtration
The analysis of the primary data shows that,
according to the criterion of stability of control, they are not suitable for direct use in a feedback system. Linear filter treatment showed that the effect of anomalous emissions is significant and significantly depends on the amplitude of the anomalous emissions. Non-linear filter treatments provide clear treatment for anomalous emissions, resulting in sustainable results that can be used for biological feedback systems.
It also follows from the above analysis that the proposed method of data processing allowed to process information that contains the uncertainty
86

of the reaction of the biological object to the input effect.
A feature of nonlinear filtering compared to linear is the high dynamics of the process, because the median is not affected by neighboring ranked samples.
2.2. Fuzzy time series processing
The implementation of a fuzzy decision-making algorithm based on the resistance of the leather cover allows you to change the number of pulses of infrared emitters from 1 the central "zero" zone to the maximum, for example 8 , in the upper and lower boundary zones. This allows you to quickly get out of uncomfortable areas and ensure the stability of the therapeutic area.
Fuzzy processing of information in non-digital form is important. Consider the function of belonging )(xA to a fuzzy set A of elements x from a set X , in relation to the decision problem in the following interpretation. Define the membership function )(xA as the degree x of proximity A to the prototype or similarity of affiliation )(, xxA A= . Then A represents a set of alternatives, and the )(xA degree of preference and suitability of the choice as the value of the variable b . In this interpretation, the membership function plays the role of the ordering relation associated with the predicate A relation 'xx A , which shows that x it corresponds more to another value 'x of the same parameter in the current situation A . Continuing these considerations, we can show that inequality
),(),( ''' xxxx QQ describes a situation in
which this expression means closer 'x to x than ''' xx x . Alternatives can be represented as
fuzzy sets on a non-numerical scale, then a fuzzy set )}(,{( bBbB = in the form where ))(,( bBbthe set of fuzzy objects.
In static mode, it was possible to divide the core into components, which require a more detailed analysis of this area to improve the quality of decision-making. Thus, the use of fuzzy conversion of the original data allowed the use of biotechnical systems with biological feedback as a system for maintaining the intensity of infrared radiation for an individual patient according to the characteristic physiological response of the patient. The vague presentation of the
characteristic information of the biological object and its processing by the technical component of the biotechnical system indicates a deeper overlap of functional and cybernetic models, ie the potential emergence of the emergence effect, for example in the form of new treatments [16].
3. Conclusions
1. The expediency of qualitative representation of the initial features is substantiated and the flow of the original features is processed by the methods of non – numerical statistics with the determination of the average in the sliding window as the medians of Kemeny.
2. A comparison of the results of processing non-stationary feature data with anomalous emissions typical of biological objects, linear and nonlinear filters showed that linear filters are inoperable. The use of nonlinear filters allowed to process time series with the number of anomalous emissions up to 40% of the number of samples in the window compared to 18% for existing anomalous emission filters.
3. It is shown that the levels of resistance signs in the central and peripheral zones differ more than 2 times, and the proposed methods of non-digital representation of information in conjunction with fuzzy logic provide information processing almost invariant to the scatter of the level of signs.
4. References
[1] Arroniz I. Extracting Quantitative Information from Nonnumeric Marketing Data: An Augmented latent Semantic Analysis Approach. (2007). Electronic Theses and Dissertations, 2004-2019. 3068. https://stars.library.ucf.edu/etd/3068.
[2] Leong, E. K. F., Ewing, M. T., & Pitt, L. F. (2004). Analyzing competitors' online persuasive themes with text mining. Marketing Intelligence and Planning, 22(2), 187–200.
[3] Rust, R. T., Lemon, K. N., & Zeithaml, V. A. (2004). Return on marketing: Using customer equity to focus marketing strategy. Journal of Marketing, 68(1), 109–127.
[4] Khudenko N.P., Mescheryakov D.V. Analysis of information of an object in infrared control system with biological feedback. Engineering sciences: Development prospects in countries of
87
Europe at the Third Millennium. Collective monograph. Poland. V 2. 2018. 492 p. (p. 410–427).
[5] Khalifa Y., Coyle J.I. and Sejdic E. Non-invasive identification of swallows via deep learning in high resolution cervical auscultation recordings. Scientific Reports, volume 10, Article number: 8704 (2020). https://www.nature.com/articles/s41598-020-65492-1.
[6] Mescheryakov D. Usage of cluster analysis in a system management with a biological feedback. The scientific heritage. Hungary. № 22. 2018. P. 59–61.
[7] Burns, D., Leung, N.; Hardisty, M., Whyne, C.; Henry, P. and McLachlin, S. Shoulder Physiotherapy Exercise Recognition: Machine Learning the Inertial Signals from a Smartwatch. Physiol. Meas. 2018, 39, 075007. [Google Scholar] [CrossRef] [PubMed].
[8] Marzbani H., Marateb H. and Mansourian M. Neurofeedback: A Comprehensive Review on System Design, Methodology and Clinical Applications. Basic Clin Neurosci. 2016 Apr; 7(2): 143–158. doi: 10.15412/J.BCN.03070208.
[9] Richards, R.; van den Noort, J.C.; Dekker, J.; Harlaar, J. Gait Retraining With Real-Time Biofeedback to Reduce Knee Adduction Moment: Systematic Review of Effects and Methods Used. Arch. Phys. Med. Rehabil. 2017, 98, 137–150. [Google Scholar] [CrossRef] [PubMed].
[10] Voit E.O. Biochemical Systems Theory: A Review. International Scholarly Research Notices. 2013. URL: https://doi.org /10.1155/2013/897658.
[11] Blanquero, J.; Cortés-Vega, M.D.; García-Frasquet, M.Á.; Sánchez-Laulhé, P.R.; Nieto Díaz de los Bernardos, M.I.; Suero-Pineda, A. Exercises Using a Touchscreen Tablet Application Improved Functional Ability More than an Exercise Program Prescribed on Paper in People after Surgical Carpal Tunnel Release: A Randomised Trial. J. Physiother. 2019, 65, 81–87. [Google Scholar] [CrossRef].
[12] Orlov A.I. Non-numerical statistics. M.: MZ-Press. 2004. 513 p.
[13] William W.S. Wei. Multivariate Time Series Analysis and Applications. Wiley. 2019. 680 p. ISBN: 978-1-119-50285-2.
[14] Bhanu Chander, G.Kumaravelan. Outlier detection strategies for WSNs: A survey.
ournal of King Saud University – Computer and Information Sciences. 2021. 23 p. URL: https://doi.org/10.1016 /j.jksuci. 2021.02.012.
[15] Serysheva I.A. Emission filtering in statistical and dynamic data processing problems in time and frequency standards. Bulletin of IrSTU. Volume 2. № 10. 2018. pp. 67 – 77.
[16] Lobachev I.V., Mescheryakov D.V. Information significance of the skin's response to infrared radiation. XII International scientific-practical conference "DYNAMICS OF THE DEVELOPMENT OF WORLD SCIENCE". August 5–7, 2020. Vancouver, Canada. Pp. 265–270.
88
https://www.ncbi.nlm.nih.gov/pubmed/?term=Marzbani%20H%5BAuthor%5D&cauthor=true&cauthor_uid=27303609

Obstacles and Traffic Signs Tracking System Anatolii Amarii 1, Stepan Melnychuk 2 and Yuliya Tanasyuk 3 1,2,3 Yuriy Fedkovych Chernivtsi National University, Kotsyubynsky 2, Chernivtsi, 58012, Ukraine
Abstract The analysis, development, software implementation and testing of the methodologies for tracking obstacles and road signs have been performed. The created system utilizes artificial neural network of DeepLab for semantic segmentation of the car camera images to identify obstacles and to select traffic signs segments based on MobileNetV2. The TrafficSignNet artificial neural network is subsequently used for traffic signs classification. The software is implemented in the Python programming language using the Tensorflow machine learning platform and the OpenCV, Scipy and Skimage computer vision libraries. Keywords 1 Аrtificial neural networks, semantic segmentation, classification, computer vision
1. Introduction
Nowadays there are many different systems of human assistance in different areas. More and more often the ability to recognize images becomes the requirement for such systems. The problem of image recognition is to identify certain patterns in the picture and relate them to predefined classes.
The driver behind the wheel needs to monitor not only the road conditions, but also the indications of the car sensors, such as current speed, engine RPM, position on the GPS map. Although modern cars are designed so that all the necessary information is available in the driver’s field of vision, even occasional distraction from the road to a device can lead to unpredictable consequences.
To solve this problem, road tracking assistant systems are developed. Their operation is primarily based on the algorithms and methods of the road situation analysis with the use of computer vision. The capabilities of such systems include the detection of various obstacles and road signs in the path of the vehicle.
Similar obstacle and road tracking systems were produced at the following companies: Continental (in collaboration with DigiLens Inc.) [1] and WayRay [2]. Both companies have implemented full-fledged hardware and software solutions with the use of augmented reality.
EMAIL: [email protected] (A. 1); [email protected] (A. 2); [email protected] (A. 3) ORCID: 0000-0001-8650-0521 (A. 3)
The aim of the given research is to develop a methodology for determining obstacles and road signs in the direction of the car movement with the designation of the entities detected from the video stream in real time on a computer screen.
So, it was decided to explore this area and develop a methodology for analysis of physical objects located within the car route with the use of edge computing. And it will assist in further informing of a vehicle driver and facilitate decision-making.
2. System development methodology
To develop an obstacle and road sign tracking system the classification and semantic segmentation by artificial neural network was used. Artificial neural networks are commonly applied for image processing and show high values both in accuracy and computing speed.
The task of image classification is to determine whether its content belongs to a certain class. In contrast, semantic segmentation is designed for labelling each pixel of an image correspondingly. Therefore, instead of belonging to one certain class, an image can be related to several categories. As it is shown in Figure 1, classification would determine that there is a cat in the picture. While the segmentation would
89

identify the same image not only as a cat, but also the sky, trees and grass.
Figure 1: Difference between image classification (left side of picture, where the image of cat is recognized as cat) and image segmentation (right side of picture, where the image of cat is split up on segments of sky, trees, actual cat and grass) [3]
It the developed system neural network
semantic segmentation is used for identifying different traffic objects such as other vehicles, people, buildings, trees etc. Also, the created software utilizes capabilities of neural network to detect traffic signs, recognized by means of classification.
2.1. Model of neural network for classification
The analysis of neural network models was performed among those presented on the official GitHub repository of the open machine learning platform TensorFlow [4]. Most of the models considered either require high-power computing systems (such as ResNet and EfficientNet) or were developed for a specific purpose (MARCO). Therefore, it was decided to use a third-party model: a specially created network TraficSignNet for road sign recognition [5]. This type of a network takes advantage of a data set ready-made for training and its simple structure that does not require any complex calculations. The architecture of the deployed neural network is shown іn Figure 2.
An image (Input image) with a size of 32x32 pixels with 3 color channels is fed to network`s
input. The first convolution layer uses eight 5x5 filters with ReLU activation function and 2x2 aggregation at the maximum value.
Figure 2: Architecture of TraficSignNet
Each following layer may differ in the number
of filters and their dimensions. So, in the next two layers, 16 3x3 filters are used, with the following number of filters increased up to 32. The subsequent three layers are fully connected, where the last one contains 43 neurons, each corresponding to the number of road sign classes in the training data set.
2.2. Model of neural network for semantic segmentation
For image semantic segmentation it was decided to use the Deeplab model [6], which is an example of the "encoder-decoder" architecture.
Cat ● Sky
● Tree
● Cat
● Grass
90

The encoder is a pre-trained classification network. The MobileNetV2 model was chosen for the encoder network, the architecture of which can be seen in Figure 3.
Figure 3: Architecture of MobileNetV2
The MobileNetV2 architecture contains an
initial fully convoluted layer with 32 filters, followed by 19 residual bottleneck layers. The ReLU6 activation function is also used to provide nonlinearity due to its reliability when used with low-precision calculations. In addition, we always use 3 × 3 kernel size as a standard for modern networks, and we use screening and batch normalization during training.
In Figure 3 the blocks corresponding to the layers of the neural network contain the following notations: the dimension of the input data (h, w, k), the type of layer (conv2d - convolutional, avgpool - aggregation by the average value), the output number of channels (c), which determines the parameter k of the next layer, and the offset (stride - s), which determines the parameters h and w of the next layer and the structure of the "bottleneck". Below the layers there is the number of repetitions of layers with identical parameters.
DeepLab applies some modifications to this model, changing the ordinary convolution (Fig. 4a) to an atros convolution via kernel dilation rate addition (Fig. 4b) to obtain the characteristics calculated by deep convolutional neural networks
with arbitrary resolution. It reduces the calculation time without degrading the accuracy.
The task of the decoding network is to semantically project the discriminant features (lower resolution) learned by the encoder network onto the pixel space (higher resolution) to obtain a dense classification.
a) b) Figure 4: Types of convolutions: a) ordinary (without dilation rate); b) atrous (with dilation rate) [7]
3. Algorithm traffic signs and obstacles recognition
The algorithm of traffic signs and obstacles recognition implemented in the developed software system is shown in Figure 5. The description of the algorithm is as follows.
Figure 5: Block diagram of the algorithm
91

The video camera captures images along the car route (Fig. 6). The image is pre-processed and fed to input DeepLab segmentation model, which returns a segmentation map (Fig. 7).
The resulting segmentation map is divided into segments. Each set of segments is passed for processing to the corresponding module. When the module of road signs classification receives a sample (Fig. 8) it breaks it into separate segments omitting too small objects. After that, each of the remaining segments is further processed and applied as an input to the classification network, resulting in the road sign class definition and its corresponding designation in the frame (Fig. 9).
Figure 6: Image from car camera
Figure 7: Segmentation map
Figure 8: Segments of road signs
Figure 9: The road sign class definition (speed limit)
On the segmentation map in the Modules for selecting a vehicle and a pedestrian all segments related to these objects are highlighted (Fig. 10).
Figure 10: Segments of pedestrians
Then the segments are split up additionally and their spatial characteristics are found. When a ratio of a segment size to the original image size is greater than a value, defined by the spatial characteristics of the segment, outline in the shape of ellipse (Fig. 11) is superimposed on the original image (Fig. 12), and its brightness depends on the aspect ratio.
Figure 11: Ellipse, which highlights pedestrians
92

Figure 12: Resulting image with highlighted pedestrians and detected traffic sign
4. Testing results
The developed method of tracking obstacles and road signs was tested on personal computer equipped with CPU Intel Core i5-2400 and 8GB RAM memory by processing the car's video recordings. The test results have shown that the developed system provides rather small computing time of 0,5 sec, which with an average car speed in the city of 30 km/h is enough to understand the general road conditions and even make decisions. Identification of real pedestrians and cars in the image, distinguishing them from other objects, is performed quite accurately. Although, in the cases when several traffic signs are placed too close to each other, a separate sign can’t be clearly distinguished, the system successfully highlights the found segment. However, several shortcomings have also been revealed. Namely, due to the small depth of the artificial neural network for semantic segmentation, extraneous noise objects that do not belong to the specified classes are often distinguished. Moreover, the data set for training an artificial neural network for the classification of road signs contains a fairly limited number of classes (43 entities). In comparison the number of classes in the Ukrainian traffic rules counts 201 entities, excluding plates.
5. Conclusions
The given research considers the application of the means and methods of artificial neural networks for semantic segmentation and image classification with the intention to identify obstacles and perform road signs recognition.
For this purpose, two neural networks have been trained. One of them provides semantic segmentation of images, enabling one to define several entities of different classes as well as their
location in a given image. The second neural network is used to recognize road signs.
The test results proved the developed method to be sufficiently effective in identification of physical objects and single road signs located within the car route. Object recognition time is less than 0,5 sec, which implies the use of the proposed method for obstacles detection both in real time and with the video of car recordings. Taking into account the achieved results of testing and utilization, the developed software can be further combined with the facilities of edge computing to provide the driver with notification and decision-making system.
6. References
[1] Continental Group, Augmented-Reality HUD. URL: https://www.continental-automotive.com/en-gl/Passenger-Cars/Information-Management/Head-Up-Displays/Augmented-Reality-HUD-(1)
[2] WayRay. URL: https://wayray.com/ [3] Jasmin Kurtanović, Deep Learning –
Semantic Segmentation. URL: https://serengetitech.com/tech/deep-learning-semantic-segmentation/
[4] TensorFlow Model Garden. URL: https://github.com/tensorflow/models
[5] Adrian Rosebrock, Traffic Sign Classification with Keras and Deep Learning. URL: https://www.pyimagesearch.com/2019/11/04/traffic-sign-classification-with-keras-and-deep-learning/
[6] Liang-Chieh Chen, George Papandreou, Iasonas Kokkinos, Kevin Murphy, Alan L. Yuille, DeepLab: Semantic Image Segmentation with Deep Convolutional Nets, Atrous Convolution, and Fully Connected CRFs. IV, volume 40 of IEEE Transactions on Pattern Analysis and Machine Intelligence, 2018, pp. 834-848.
[7] Paul-Louis Pröve, An Introduction to different Types of Convolutions in Deep Learning. URL: https://towardsdatascience.com/types-of-convolutions-in-deep-learning-717013397f4d
93

The Information and Analytical Using of Non-Structured Information Resources Serhii Lienkov1, Viacheslav Podlipaiev2, Igor Tolok3, Igor Lisitsky4, Oleksii Fedchenko5, Nataliia Lytvynenko6 and Svitlana Kuznichenko7
1,3,5,6 Military Institute of Taras Shevchenko National University of Kyiv, Lomonosova Str., 81, Kyiv, 03189, Ukraine 2 Research Institute of Geodesy and Cartography, Velyka Vasyl’kivs’ka Str., Kyiv, 03150, Ukraine 4 Central Research Institute of Armament and Military Equipment of the Armed Forces of Ukraine, Povitroflots’kyy Avenue, Kyiv, 03049, Ukraine 7Dept.of Information Technologies Odessa State Environmental University, Odessa, Ukraine
Abstract Following research article describes the conditions for the formation of interactive knowledge bases, that are based on the formation of growing pyramidal networks in the analysis of textual narratives. The stability conditions of knowledge systems on the basis of their representation in the format of logical-linguistic models are determined. The authors also determined the conditions of atypical representation of linguistic constructs knowledge in the process of their transformation into a system. The use of lambda-calculus notation for the formation of stable logical-linguistic models of narrative descriptions is proposed. Keywords 1 logical-linguistic model, growing pyramidal networks, concepts, linguistic constructs, term, knowledge, narrative.
1. Introduction
The use of modern information in the activities of various specialists today is quite deep interdisciplinary. Moreover, the use of various information resources in solving applied problems requires the availability of service-developed interactive knowledge bases. And the effectiveness of their use depends on the truth of the content, which is determined by the information component.
The practical main part of productive knowledge today is concentrated in the form of text descriptions. At best, these narratives have their digital image in the form of their presentation in the formats of various editors and means of displaying texts in computer systems. However, these digital images don’t have interactive services. Therefore, it’s quite important to create intelligent services that can turn these texts into structurally organized knowledge bases.
EMAIL: [email protected] (1); [email protected] (2); [email protected] (3), [email protected] (4), [email protected] (5), [email protected] (6), [email protected] (7) ORCID: 0000-0001-7689-239X (1); 0000-0002-7264-0520 (2); 0000-0001-6309-9608 (3); 0000-0002-1505-199X (4); 0000-0003-1343-3828 (5); 0000-0002-2203-2746 (6); 0000-0001-7982-1298 (7)
There is already the problem of using a large number of narratives, which should sufficiently expand intertextual connections. It allows to create a digital image of knowledge systems used in a single display format.
The first stage of the process of transforming narrative descriptions into the format of interactive knowledge bases that are able to interact with each other is the formation of logical-linguistic models of text descriptions.
2. Research results and analysis 2.1. The constructive of logical-linguistic models formation
The information base of any interactive knowledge system consists of different data types [1,2]. These data have certain functional properties and form a rather complex structure of interdependent relations. Moreover, the very
94

information base of systems of this class is dual in nature - the data that make it up have certain logical relationships on the one hand, and also some of them are certain concepts and linguistic constructs (hereinafter concepts) on the other hand, so data have linguistic attributes [3]. The functionality of these data is displayed in the form of symbolic and numerical formulas, and we present certain sequences of computational operations [1-3]. The linguistic structures of these data are presented in the form of a sequence of certain words in the form of sentences, statements, etc. [2].
However, it should be noted that everything related to the data will be presented through the concept of the term [3]. It follows that each sequence of symbols of finite length (SSFL), including numbers, as well as their representation in the form of formulas, can be considered as a rule and can also be represented as a term. From these formulas-rules it’s possible to form in the future certain linguistic structures of the formal kind that are displayed according to the syntax defined for them.
Further we will consider the final sequences of characters that are plural in nature, that is, they can be combined into plurals on certain grounds. Moreover, these sets can be represented as hierarchically related classes. Each such class includes sequences that have at least one common property [1, 3]. Such classes of SSFLs with properties form the certain topology, and therefore they can be represented as trees [2, 3]. One of such tree types is a growing pyramidal network (GPN) [4, 5]. Their attractiveness is the ability to automatically divide the SSFL into appropriate classes based on the specified properties of each SSFL.
The condition that SSFLs are divided into classes according to certain properties defines them as intentional [2], that is those that have signs-meanings, that we will define as the contexts of SSFLs. Then SSFLs that have a defined non-empty set of contexts will be defined as concepts and denoted by the variables
,...,, zyx and the classes they form with letters ,...,, ZYX and so on. The presence of certain
contexts in SSFL-concepts will be represented according to the notation of -calculus (lambda-calculus), namely - X [3]. The bracket is called “context holes”. It’s clear that the presence of the hole determines that the concepts aren’t connected. Once we determine the term that can fill the hole, we get the connected SSFL terms.
Then all classes formed by SSFL concepts are extensional [3]. We’ll define properties of SSFL-concepts by the letter r , and set of properties through R .
The hierarchical structures formed from SSFL in the form of GPN are marked trees. Their labels are SSFL concepts, that are class names, and SSFL-concepts, which aren’t extensional, that is have only one semantic meaning. SSFL-concepts that have only one meaning can’t be reduced, that is broken down into simpler concepts. Such SSFL concepts will be defined in the future as terminal [4, 5].
All SSFL-concepts form a certain set of names , that are labels of all GPN nodes. Under such conditions, GPN is unique to the set of Bohm trees [1-3]. That is, the topology of the interaction of SSFL sets concepts can be represented as a set of - labeled trees formed by GPN nodes.
mn aaaXXX ,...,,,,...,, 2121= , (1)
where iX – class of SSFL-concepts, ja – terminal node (the non-extensional SSFL-concept).
Having determined the property classes RmRR ,...,2,1 , that implement the division of all
GPN concepts into classes, and determine the relationship between the concepts, we obtain the corresponding GPN. According to [4-6], each GPN is a taxonomy.
Based on the condition formulated at the beginning, namely that an arbitrary type of SSFL is a term, it can be argued that all names of SSFL-concepts can form the set of terms , that’s represented in the notation of lambda calculus [3]. This allows us to consider all SSFL-concepts and their meanings nominally. This condition is met on the basis that all the SSFL-concepts presented in expression (1) aren’t related by a strict ordering relationship. Moreover, when we move on to the GPN, it’s always possible to distinguish many sets of SSFL-concepts, that also aren’t related to the relationship of strict ordering.
We’ll note also one more constructive property of GPN. Nodes that are hierarchically interconnected can form truth statements that can be calculated. Thus, based on the construction of the GPN from SSFL-concepts, a certain system of knowledge in terms of -terms is formed. Its information base consists of certain linguistic structures formed from SSFL-concepts, that are terms. The values of these terms required for calculations are determined in the process of assigning them the appropriate contexts. This
95

process is interactive. According to [3], each term representing the certain SSFL-concept will be represented in the form of the Bohm tree of the form (1). Then we can say the following - there is a meta-procedure that can turn the whole set of linguistic constructs into GPN, which is a composition of Bohm trees, that in turn is also a composition of many -terms, formed by SSFL-concepts of the same GPN. Therefore, in fact, the set of -terms can be represented as a certain interactive knowledge base (IKB).
It’s clear that both functional data and linguistic structures that make up an interactive system of knowledge, that we present in the form of a set of -terms, have certain relationships with each other, that is in a certain way logically and functionally characterize each other. Therefore, it’s most effective for further consideration of the information base of arbitrary IKB to present in aggregate form, which is implemented in the form of the logical-linguistic models (LLM) class. This class of models is implemented on the basis of predicative representation of information structures of arbitrary type [7-15]. This allows us to consider them together in an arbitrary sequence without defining the relationship strictly and not strictly. Also, all LLM objects are atypical. This atypicality provides the definition of procedures that can jointly process the entire complex data structure that make up the information base of interactive knowledge systems. Then the whole set of such data will be defined as a separate class of atypical data, that allows to interpret as nominal [3, 4].
The predicativeness of the linguistic constructs of IKB, as the composition of Bohm trees, determines the nature of the formation of statements from the nodes of these trees. Moreover, the formation of GPN as the composition of Bohm trees is also predictive.
However, the process of LLM formation is realized on the basis of determining the order relation over certain sets of -terms, that leads to the loss of the nominal value of their terms. It gives the calculation of the contextual meanings of the terms semantic nature and thus implements an interactive act of interaction with the information base.
=→→→
→→
mn aaaXXX ,...,,,,...,, 2121
mn aaaXXX ,...,,,,...,, 2121= ;
(2)
→nXXX ,...,, 21 (3)
→→ PVXDXBX n ,,...,, 21 ;
mn aaaxxxU ,...,,,,...,, 2121⊥= , (4)
where ⊥ - the smallest element of all SSFL-context values; PVDB ,,, - context values.
Expressions (2) - (4) reflect the generalized metaprocedure of IKB formation on the basis of definition of context values of SSFL-concepts and their transformation.
The introduction of the smallest value of the context and the definition of the contexts themselves passively determines the order relation over the set of -terms, and thus creates the conditions for the formation of the GPN . That is, expressions (2) - (4) are recursive.
It can then be argued that an arbitrary LLM has a nonempty structure of relationships between SSFL-concepts, which has a hierarchical form and can be represented as a tree. LLM is also an open structure. This means that the information base, the logical and linguistic characteristics of which it represents, can be supplemented at any time with the latest concepts and their relationships. The open nature of LLM determines that this class of models has the property of inductance. That is, their graph model in the form of a tree can grow due to the latest concepts and their relationships. One of the effective types of graph models of LLM is a growing pyramidal network (GPN) [4, 5]. Their positive distinguishing feature is the fact that an arbitrary GPN is equivalent to an arbitrary taxonomy of narrative description [1, 2, 6].
The attributes of the concepts that make up the GPN nodes can be contexts that describe their semantics; belonging to a certain thematic class, that is determined by their semantics; relations between concepts, etc. That is, the inductive process of forming the new nodes of the GPN can be represented as a sequence of statements that are formed on the basis of the contexts of each inductively active concept. Thus, in the process of forming GPN, as a structural reflection of LLM, the formation of logical expressions of a certain set of statements is realized. Using the attributes of each concept of these statements, it’s possible to form a formal expression in the form of a record of the algebra of statements calculus [3]. And the names in this expression will be the names of concepts. This determines that the GPN is structurally unique in the formula of the algebra of expressions, which is formed in terms of the concepts of the GPN, that are propositional variables, using logical operations: conjunction
96

“ ”, disjunction “V ”, negation “ ” and following “→”.
2.2. The operational components of text transformation processes
All constructs of LLM, namely: statements, chains of knots of GPN, logical formulas are certain terms. Linguistic constructs from terms have an atypical representation and can also have a propositional character, that determines the nominal value of SSFL-concepts, which are interpreted by formulas in the notation of statements algebra. Moreover, contexts that semantically define concepts that are propositional variables also characterize these concepts as dichotomous. This means that each statement that is formed on the basis of the concepts of the GPN is characterized by one of two meanings, that is to answer arbitrary questions in the format of “YES” or “NO”.
For expressions (1) - (4), this means that they are significant in the case of “YES”, and may not be taken into account in the case of “NO”. That is, provided that the contexts of the GPN form a true expression formula (2) - (4), an interactive knowledge base is formed. If there is a case of “NO”, which means that the true statements haven’t been formed, IKB or a fragment of these GPN isn’t implemented.
This greatly simplifies the formation of a training sample for an interactive knowledge system. It can be based on concepts whose significance in relation to the question of belonging to certain classes is true. That’s, to the question of the existence of the certain certainty that the concept of GPN belongs to certain class or group of classes, we will always get the answer “YES”. But it is clear that when the latest concepts are included in the GPN, we will receive answers not only “YES” but also “NO”. And this determines the conditions for expanding the training sample of the intelligent system.
According to the homotopy type theory [1, 2], GPN is unilateral to the decision tree. Therefore, the representation of the GPN in the form of formulas with propositional variables, that are the concepts of the GPN, can be represented in the form of the certain decision tree. Each formula of propositional variables and logical operations that is formed when interacting with the LLM of the interactive knowledge base is determined by the hierarchy of the classification structure of the subject of interaction. Depending on the attributes
of the concepts of active LLM, we obtain the value of belonging of the propositional variable to certain classes of concepts, and thus form a formal notation in the notation of the statements algebra and further in the form of GPN.
The atypical nature of expressions (1) - (4), including the case of defining the contexts of SSFL using propositional variables, means that the type of meaning of these contexts isn’t important for calculations. They can be both numerical and non-numerical. Moreover, the logical expressions from propositional variables are quite stable to the order of their positioning in the formal expression, so they can occupy an arbitrary position in the record. Also, the values that they receive in the calculation don’t require determining the relationship of strict or non-strict order. That’s, transformations (2) - (4) are always able to determine the truth and objectivity of LLM values [12].
Thus, the GPN is the primary LLM taxonomy of the narrative of the document being processed. The training sample, which is the primary basis of the process of machine learning of the interactive knowledge base, is formed from the concepts of this narrative. Then formed on this basis, the GPN provides a systematic reflection of all the narratives that make up the primary information base of the interactive knowledge system. The systemology of the interactive knowledge base follows from the systemology of LLM and GPN. This provides a complete and correct interpretation of the properties of all the concepts that make it up. And as a consequence, it implements the solution of problems of classification of concepts that determine the latest nodes of GPN, diagnosing the states of all concepts on the basis of the formation of logical formulas in the notation of the statements algebra. Also, the systemology and dichotomy of propositional expressions from the concepts of GPN create conditions for predicting the presence of certain properties in the newly formed nodes of GPN.
Prediction in our view of LLM can have a truncated form of expression (2), which is supplemented by a representation of the form (6), namely:
=→→→
→→
mn aaaXXX ,...,,,,...,, 2121
mn aaaXXX ,...,,,,...,, 2121= ,
(5)
( ) → , (6)
97
where the contexts for all SSFL-concepts are defined. In this case, the set of -terms includes certain functional expressions that implement predictive calculations [12, 16].
The decision tree, that is based on the relationship between the concepts of the GPN, is a composition of Bohm trees, and can be converted into a propositional expression. Its elementary expressions, within the conditions of the specific problem, take the meaning of “true” or “denial”. The calculation of these values is realized on the basis of determining the degree of belonging of the attributes of the new concepts to the characteristic descriptions that make up the contexts of the educational sample.
Expressions (5) - (6) define not only different functionalities, but also the systemic stability of the latest concepts of GPN. To do this, the procedure of discretization of -terms set is determined, which implements the definition of the corresponding numerical scales, that consist of intervals characteristic of the contexts values of SSFL-concepts in a particular state. These procedures also take into account the frequency distribution of concepts in different classes, thereby increasing their classification features in the GPN, and as a consequence, systemic accuracy. Another consequence is the formation of more effective propositional expressions with the use of the latest concepts of the GPN, which are unique to the decision tree, and as a result define more stable systemic rules. ( ) ( ) ,,...,, 21 nxxxUMBT ⊥=→
maaa ,...,, 21
(7)
where )(MBT according to [4] - the marked tree, M - the term which has solvability, that is all statements formed from its SSFL -concepts are true.
Thus, the interactive system of knowledge, that is implemented on the basis of the formation of GPN in the process of processing documents and narratives, is determined by the high stability of the systemic features of the GPN concepts and their relations. This is ensured by the following procedural interpretation of the properties of the GPNs themselves, as certain objects of a complex hierarchical structure.
1) Formation of propositional expressions in the notation of the algebra expressions that determine the classes of GPN concepts based on the optimal definition and selection of attributes combinations that are significant in the interval of a certain scale. At the same time, due to the
application of the operation “negation”, the procedure of minimizing the descriptions length of each class defined in the GPN is also implemented.
2) Reliable classification of all concepts included in the training sample for GPN, and as a consequence of the formation of propositional expressions that dynamically reveal the patterns of both relevant classes of concepts and the relationship between them, while regulating the compactness of the training sample, excluding quality assessment of patterns, that were discovered.
3) Defining the membership function, which implements the mechanisms of fuzzy logic in calculating the characteristic characteristics of GPN concepts and their classes, and obtaining clear and fuzzy levels of reliability and their ranks, the validity of attribute features of concepts and their properties and relationships, including zero value type “I don’t know”.
All these procedural actions ensure the formation of GPN and on its basis LLM, that determines the functional structure of the interactive knowledge system. Based on them, the linguistic-semantic and conceptual analysis and processing of multilingual natural-language narrative descriptions are realized in the environment of the specified system. The selection of linguistic constructs of different length and complexity, identification and selection of intercontextual relations for all concepts that determine the semantic features of GPN and LLM, including the educational sample, is provided.
GPN and as a consequence of LLM, that are built on the basis of the above-described machine learning procedures, are characterized by the property of inductance. The further development of GPN, based on the encapsulation of new concepts, also expands the set of propositional expressions, that are in fact certain linguistic constructs, built on the application of logical operations to disordered elementary records - statements that don’t have logical operators inside.
This is functionally represented by expressions (2) - (7). When forming Bohm trees of the form (4) under conditions that the contexts of their nodes determine only the true values, we implement recursion from expressions (2) - (4).
The identification of intercontextual relations in the process of the latest concepts encapsulation and further inductive growth of the pyramidal network, realizes the discovery of new statements
98

as systems of knowledge. The intercontexts of the relationship are revealed through the logical operation “conjunction”, and the direct growth of GPN is realized by the use of logical operations “disjunction”, “negation” and “following” both direct and reverse.
If we apply the rule of Godel's theorem on incompleteness [4], we can determine that no matter how many concepts aren’t encapsulated in GPN and LLM, and no matter how many of their contexts in GPN aren’t related, GPN, LLM and interactive knowledge system are never will be complete. The result is the formation of indeterminate nodes, which are the result of applying the “conjunction” operation to selected sets of the training sample.
All undefined nodes are concepts of complex structure. Their concepts, like linguistic constructs, have logical operations inside them and can therefore take the form of complex statements. Then such concepts can also be presented in the form of propositional expressions, that are able to define and classify the latest concepts with a complex structure.
Also, uncertainty concepts based on the use of inductance properties implement the clustering procedure, that provides identification of semantically equivalent concepts and their classes. The degree of this equivalence is determined based on the application of the membership function. Depending on the significance of the degree of equivalence, the concepts of uncertainty either form the newest class or are included in an existing thematic class.
After all, the measure of equivalence allows us to apply the rule of logical inference “following” by analogy. With a predetermined degree of equivalence, it’s possible to draw conclusions about the belonging of new concepts and their classes to those already defined, and also to determine the degree of certain statements validity that are formed on the basis of concepts whose contexts are relevant.
3. Conclusions
The methodology and formation of growing pyramidal networks constructively ensures the transformation of narrative texts into the format of interactive knowledge bases. GPNs are able to determine the conditions for the stability of information databases of interactive knowledge systems, to implement the transformation into their formats of unstructured narrative
descriptions of various types, from scientific articles to catalogs of scientific and technical products, monographs and more.
The conceptual basis of such transformations in the form of atypical expressions provides the implementation of intellectual services for processing narratives by means of linguistic-semantic and conceptual analysis with their subsequent transformation into the format of logical-linguistic models and interactive knowledge bases.
4. References
[1] V. Voevodsky, Univalent Foundations of Mathematics: Proceedings of Logic, Language, Information and Computation, WoLLIC 2011, in: Lev D. Beklemishev, Ruy de Queiroz (Eds.), Lecture Notes in Computer Science, volume 6642, Berlin, Heidelber, Springer, 2011, p. 311. doi:10.1007/978-3-642-20920-8.
[2] Homotopy Type Theory: Univalent Foundations of Mathematics, Princeton: Institute for Advanced Study, 2013, 603 p.
[3] van Dalen, Dirk (2013). Logic and Structure. Universitext. Berlin: Springer. doi:10.1007/978-1-4471-4558-5.
[4] Dybjer, Peter & Kuperberg, Denis. (2012). Formal neighbourhoods, combinatory Böhm trees, and untyped normalization by evaluation. Ann. Pure Appl. Logic. 163. 122-131. 10.1016/j.apal.2011.06.021.
[5] V. Gladun, Processes of formation of new knowledge, Sophia, SD "Teacher 6", 1994.
[6] O. Strizhak, Transdisciplinary integration of information resources (Information Technology), PhD thesis, The National Academy of Sciences of Ukraine, Inst. of Telecommunications and Global. inform. Space, Kyiv, 2014.
[7] M. Dymarsky Ways to embody the predicative relationship: Acta Linguistica Petropolitana, in: Proceedings of the Institute of Linguistic Research of the Russian Academy of Sciences, in: N. N. Kazansky (Eds.), T. XI. Part 1, Categories of nouns and verbs in the system of functional grammar, in: M. D. Voeikova, E. G. Sosnovtseva (Eds.), Nauka, 2015, pp. 41-62.
[8] Understanding Predication. Series: Studies in Philosophy of Language and Linguistics / Edited By Piotr Stalmaszczyk // Peter Lang: Frankfurt am Main, Bern, Bruxelles, New
99

York, Oxford, Warszawa, Wien, 2017. – 292 pp. DOI: https://doi.org/10.3726/b11243.
[9] О. Kulbabska, Modern interpretations of the category of predication in linguistics, Ukrainian language, № 1, 2009, p. 61-73. ISSN 1682-3540.
[10] Ivanova K.B., Vanhoof K., Markov К., Velychko V. Introduction to the Natural Language Addressing International Journal "Information Technologies & Knowledge". 2013. Volume 7, Number 2. p. 139-146.
[11] N. B. Cocchiarella, Philosophical Perspectives on Formal Theories of Predication. In: Handbook of Philosophical Logic. Synthese Library (Studies in Epistemology, Logic, Methodology, and Philosophy of Science), volume 167, Springer, Dordrecht, 1989, pp. 253-326. doi.org/10.1007/978-94-009-1171-0_3.
[12] V. Velichko, Logical-linguistic models as a technological basis of interactive knowledge bases, International Journal "Information Models and Analyses", volume 8, number 4, 2019, pp. 3 25-340.
[13] O. Stryzhak, S. Dovgyi, M. Popova, R. Chepkov, Transdisciplinary Principles of Narrative Discourse as a Basis for the Use of Big Data Communicative Properties, in: Arai K. (Eds) Advances in Information and Communication, FICC 2021, Advances in Intelligent Systems and Computing, volume 1364, Springer, Cham, 2021. doi.org/10.1007/978-3-030-73103-8_17.
[14] O. Stryzhak et al. Decision-making System Based on The Ontology of The Choice Problem, J. Phys.: Conf. Ser. 1828 012007, 2021. doi:10.1088/1742-6596/1828/1/012007.
[15] S. Dovgyi, O. Stryzhak, Transdisciplinary Fundamentals of Information-Analytical Activity, in: M. Ilchenko, L. Uryvsky, L. Globa (Ed.), Advances in Information and Communication Technology and Systems. MCT 2019, Lecture Notes in Networks and Systems, volume 152, Springer, Cham, 2021. doi.org/10.1007/978-3-030-58359-0_7.
[16] A. Gonchar, O. Strizhak, L. Berkman. Transdisciplinary consolidation of information environments, Communication, № 1 (149), 2021, pp. 3–9.
100

A Method For Formalizing Knowledge About Planning UAV Flight Routes In Conditions Of Uncertainty Aleksandr Tymochko 1, Natalia Korolyuk 2, Аnastasia Korolyuk 3 and Elena Korshets 4
1,2 Ivan Kozhedub Kharkiv National University of the Air Force, Sumska street, 77/79, Kharkiv, 61023, Ukraine 3 Vasil Karazin Kharkiv National University, 4 Svobody Sq., Kharkiv, 61022, Ukraine 4 Ivan ChernyakhovskyNational Defense University, Povitroflotskyi Avenue, 28, Kyiv 03049, Ukraine
Abstract It is advisable to use heuristic methods for the task of planning the flight routes of unmanned aerial vehicles (UAVs) at the planning stage of monitoring and reconnaissance. With their help they look for solutions within some subspace of possible acceptable solutions. They are the best in terms of taking into account the practice, experience, intuition, knowledge of the decision maker. The values of individual predicted factors should be represented using the mathematical apparatus of fuzzy sets. A method of formalizing knowledge about UAV flight route planning has been developed. It is based on interval fuzzy sets. In conditions of uncertainty, they allow to formalize the factors that take into account the conditions of monitoring, search, detection and destruction of objects, the impact of the external environment on the range of UAVs. This effect is manifested in the form of linguistic and interval-estimated parameters for each option, which allow to take into account the uncertainty. The developed method allows to form the area of definition of linguistic variables. These variables are used to describe the conditions for monitoring, reconnaissance and the impact of the environment on the range of UAVs. Such variables are also used to form from the set of the most important objects of monitoring, exploration of the most significant ground objects on the basis of an assessment of the degree of non-dominance of elements. The proposed approach provides a formalization of UAV flight route options for each possible scenario of the location of objects, the impact of the external environment. The result of formalization is fuzzy production rules, where fuzzy linguistic utterances are used as the antecedent and consequent. Keywords 1 Unmanned aerial vehicle, production rules, fuzzy linguistic statements
1. Introduction
The most important task of the Armed Forces (AF) of Ukraine in the defense nature of military doctrine is the constant monitoring of the enemy. Monitoring should ensure a timely and organized transition of troops from peacetime to martial law. The main role is played by monitoring and intelligence. Their tasks are to provide the leadership and headquarters in a timely manner with complete and reliable information about the enemy. Among the available technical means capable of quickly and efficiently collecting the necessary information, one can single out unmanned aerial vehicles (UAVs). When
EMAIL: [email protected] (A. 1); [email protected] (A. 2); [email protected] (A. 3) [email protected] (A. 4) ORCID: 0000-0002-4154-7876 (A. 1); 000-0002-2865-5899 (A. 2); 0000-0003-1860-6599 (A. 3); 0000-0002-7225-0848 (A. 4)
monitoring the area, UAVs fly over the area of interest and collect the necessary data.
Thus, UAVs can be used to monitor forests, fields, borders, for environmental and meteorological monitoring, search and rescue missions, for military purposes, etc. The presence of large potential capabilities of UAVs does not guarantee the achievement of the specified efficiency of reconnaissance and monitoring. Its increase can be achieved by intelligently predicting the behavior of UAVs. This takes into account the influence of environmental factors, the behavioral nature of the objects of monitoring, knowledge and experience of UAV operators.
The experience of practical application of UAVs [1-3] in performing field monitoring tasks
101

in real combat conditions revealed the difficulty in making an informed decision on the selection and construction of rational flight routes. Managing UAVs for monitoring, searching, detecting, and destroying objects is a complex, poorly formalized task. It is resolved under the condition of opposition of the opposite party (conflict) and requires the use of methods in the field of artificial intelligence. First of all, it concerns decision support systems, methods of presentation and formalization of knowledge, models of fuzzy sets.
At present, the combination of stochastic and non-stochastic uncertainty factors influencing this process is insufficiently taken into account when selecting appropriate options for the UAV flight route. Factors of non-stochastic uncertainty have the nature of behavioral uncertainty. Therefore, it is necessary to adapt pre-designed decision-making models to change many possible situations.
Tasks of this class require increasing the level of automation of their solution. The reason for this is the dynamism, ephemerality and high degree of uncertainty of the air and ground conditions, time constraints. But the task of automating the planning of UAV flight routes is complicated by the need to take into account the experience of decision makers (DM). This requires formalizing one's own knowledge and experience in ATS. To work with knowledge, including its formalization, it is necessary to improve mathematical support and software (MSS). Trends in the development of MSS show the need for the introduction of modern information technology (IT), including intelligent IT. They are aimed at creating and using the knowledge bases (KB) of the UAV control system (CS) [13-16, 22].
The knowledge base is a set of rules, facts, derivation mechanisms and software that describe a subject area and are designed to represent the accumulated knowledge in it [17]. The most difficult stage of creating a database is the formalization of knowledge in a given subject area.
Global trends in research in the field of control theory are concentrated in two areas – artificial intelligence and machine learning, robotics and decision theory. Artificial intelligence technologies are actively used in the military sphere. Work is being actively carried out to increase the autonomy of the functioning of combat systems.
The article [4] considers the principles of construction of the distributed external and
onboard components of the control system of a group of reconnaissance and strike unmanned aerial vehicles.
In [5] the models of collective control of manned and unmanned aerial vehicles are presented. Methodical support of training of aircraft control operators and engineers of air navigation systems is offered.
In the article [6] the analysis of an estimation of efficiency and criteria of reliability of group flights of UAVs is carried out. The algorithm of search of the central repeater of group of UAV for ensuring transfer of a control signal in group is developed.
The article [7] discusses the advantages and disadvantages of centralized and decentralized architecture of UAV group management, presents tables of the dependence of the level of onboard automation and the number of UAVs in the group.
The article [8] developed a method of planning the flight path of UAVs to search for a dynamic object in the forest-steppe area, taking into account possible options for its movement.
The article [9] is devoted to the development of a meta-model of a multi-agent system for searching and influencing a ground object by a group of unmanned aerial vehicles under a centralized control variant. The base of rules of logical inference for agents according to the solved tasks and a role of the agent in group which is based on use of production model is developed.
The work [10] is devoted to the development of a method of UAV route planning when performing missions to search for a stationary object. The method allows to take into account the distribution of probabilities of importance of the area of the task.
In [11] a method of substantiation of the optimal route of air reconnaissance was developed. The paper proposes indicators and criteria for the effectiveness of the search for a dynamic object.
In [12] the issue of efficiency of decentralized control of UAV group and operator load when interacting with decentralized scheduler is considered.
In [13, 14] the factors of influence of the external environment are considered, which, in turn, make changes in the initial result of UAV flight planning. These factors are taken into account with a high degree of subjectivity of the person planning the flight route. In [14, 15] mathematical models are considered, which aim to increase the efficiency of monitoring. To determine the optimal flight route, it is necessary
102

to calculate the probability of performing reconnaissance tasks. However, the experience of using UAVs in local conflicts shows the need to take into account the factors that affect the effectiveness of monitoring and reconnaissance operations with UAVs. It is necessary to take into account the threats and limitations of natural and technical nature [16, 17], which significantly affect the final result of the flight task.
The result of the literature analysis indicates the relevance and prospects of research in the direction of developing intelligent UAV control systems. search, detection and destruction of objects.
Thus, a change in approaches to planning UAV flight routes will make it possible to better solve the problems of observation, search, detection and destruction of objects.
The purpose of the study is to develop a method of formalizing knowledge about the planning of UAV flight routes on the basis of interval fuzzy sets in the monitoring, search, detection and destruction of objects in conditions of uncertainty.
2. Problem analysis (Main part)
To formalize the knowledge of UAV flight route planning, it is advisable to use interval fuzzy sets of type 2 (IFST2). For IFST2, the values of the membership functions of the second order are constant. That is, the membership function is unified (homogeneous) in contrast to the general fuzzy sets of type 2 (FST2).
Іnterval fuzzy sets of type 2 allow you to use all the tools of interval calculations and are expressed by the degree of truth of the uncertainty. It reflects the vagueness and inaccuracy of the element belonging to a given set. IFST2 (��) are characterized by the membership function of the second type (order) 𝜇��(𝑥, 𝑢), where 𝑥 ∈ 𝑋 and 𝑢 ∈ 𝐽𝑥
𝑢 ⊆ [0,1], 0 ≤𝜇��(𝑥, 𝑢) ≤ 1,which is expressed
�� = {(𝑥, 𝑢, 𝜇��(𝑥, 𝑢))|∀𝑥 ∈ 𝑋, ∀𝑢 ∈ 𝐽𝑥𝑢
⊆ [0,1]}. (1)
The discrete �� can be represented as
�� = {∑𝜇��(𝑥)
𝑥𝑥∈𝑋
} =
= {∑ [∑ 𝑓𝑥𝑖(𝑢𝑖𝑘)/𝑢𝑖𝑘
𝑀
𝑘=1]
𝑁
𝑖=1
𝑥𝑖⁄ },
(2)
where ∑∑ is the union of x and u.
If 𝑓𝑥(𝑢) = 1, ∀𝑢 ∈ [𝐽_𝑥𝑢, 𝐽��
𝑢] ⊆ [0,1], then the
membership function of the second type 𝜇��(𝑥, 𝑢) is expressed by the lower membership function of the first type 𝐽𝑥
𝑢 ≡ 𝜇��(𝑥) and, accordingly, the upper membership function of the first type 𝐽��
𝑢 ≡����(𝑥). Then IFST2 can be represented as
�� =
{(𝑥, 𝑢, 1)|∀𝑥 ∈ 𝑋, ∀𝑢 ∈ [𝜇��(𝑥), ����(𝑥)]
⊆ [0,1]}
(3)
The article proposes the use of triangular fuzzy numbers (TFN) and trapezoidal fuzzy intervals (TFI). The expediency of their use is due to the simplicity of operations on them and visual graphical interpretation.
In the general case, the fuzzy interval is called IFST2 A
with convex upper and lower membership functions, limiting the area of uncertainty of this IFST2. The fuzzy number of IFST2 is called IFST2 A
with convex and unimodal upper and lower membership functions, which limit the area of uncertainty of this IFST2.
Features of the representation of TFN or TFI in terms of IFST2 are as follows:
– the left and right boundaries of fuzzy quantities in terms of IFST2 are not points but uncertainty intervals;
– the extreme values of the uncertainty intervals, in turn, are the boundaries of the two FST1. They are defined by the upper membership function ���� and the lower membership function 𝜇¯
��. These functions limit the occupied area of
uncertainty (FOU) TFNIFST2 or TFIIFST2 above and below, respectively;
– the upper ���� and lower 𝜇¯
�� membership
functions determine the normal convex FST1 on a non-empty carrier. Moreover, in the case of TFN IFST2 it will be unimodal normal convex FST1.
Thus, it is proposed to formally present the FOU TFNIFST2 ��𝛥 in the form of a tuple with parameters [18-22]
𝐹𝑂𝑈(��𝛥) = ⟨𝛼�� , 𝛼𝜇¯
, 𝑎�� , 𝑎𝜇¯
, 𝛽�� , 𝛽𝜇¯
⟩, (4)
where 𝛼�� – left fuzzy coefficient ����∆;
𝛼𝜇 – left fuzzy coefficient 𝜇��∆;
a
– center (modal value) ����∆;
а𝜇 – center (modal value) 𝜇��∆
𝛽�� – right fuzzy coefficient ����∆;
103

𝛽𝜇 – right fuzzy coefficient 𝜇��∆.
In this case, the triangular upper membership function ����∆
; 𝐹𝑂𝑈(��𝛥) generates a normal unimodal convex FST1 on a nonempty carrier – an open interval [𝑎�� − 𝛼�� , 𝑎�� + 𝛽��], and the triangular function 𝜇��
∆ 𝐹𝑂𝑈(��𝛥) generates a
normal unimodal convex FST1 on a nonempty carrier – open interval [𝑎𝜇
¯
− 𝛼𝜇¯
, 𝑎𝜇¯
+ 𝛽𝜇¯
].
It is also proposed to formally represent FOU TFI IFST2 in the form of a tuple with the following parameters:
𝐹𝑂𝑈(��𝛱) = = ⟨𝛼�� , 𝛼𝜇 , 𝑎�� , 𝑎𝜇 , 𝑏�� , 𝑏𝜇 , 𝛽�� , 𝛽𝜇⟩,
(5)
where 𝛼�� – left fuzzy coefficient ����п; 𝛼𝜇– left fuzzy coefficient 𝜇��п; 𝑎�� – lower modal value ����п; 𝑎𝜇– lower modal value 𝜇��п; 𝑏�� – upper modal value ����п; 𝑏𝜇– upper modal value 𝜇��п; 𝛽��– right fuzzy coefficient ����п; 𝛽𝜇– right fuzzy coefficient 𝜇��п.
In this case, the trapezoidal upper membership function ����п 𝐹𝑂𝑈(��𝛱) generates a normal convex FST1 on a nonempty carrier – an open interval [𝑎�� − 𝛼�� , 𝑏�� + 𝛽��], and the trapezoidal lower function 𝜇��п𝐹𝑂𝑈(��𝛱) generates a normal unimodal convex FST1 on a non-empty carrier – open interval.
In this case, the set of fuzzy production rules will be called the base of rules (BR). It is intended for the formal presentation of empirical knowledge or expert knowledge (DM) on a subject area based on IFST2 [22]. In the general case, there are the following BP:
• by type of fuzzy production rules [17] (depending on the formal representation of the derivation of the rule): fuzzy statements; clear statements; functions;
• by the structure of fuzzy production rules: SISO – a structure that implements one input and one output; MISO – a structure that implements many inputs and one output; MIMO is a structure that implements many inputs and many outputs.
When formalizing knowledge about the process of planning the route of the UAV flight in the form of a fuzzy production rule that describes a predetermined version of the UAV routes, we will use the rules with MISO-structure.
These conditions are factors that take into
account the conditions of monitoring, the impact of the external environment, and the conclusions – recommendations on the appropriate route of the UAV flight in specific conditions.
When developing a method of formalizing knowledge about the planning of UAV flight routes on the basis of interval fuzzy sets, the following limitations and assumptions are taken into account:
- issues related to the assessment of the adequacy and informativeness of the parameters used to describe the projected situation are considered resolved and are not considered in this study;
- construction of membership functions for conditions and conclusions of fuzzy production rules begins with the use of the simplest forms of membership functions – piecewise linear functions. Subsequently, their nature can be clarified and taken into account during the adjustment of the rules (for example, at the stage of learning a fuzzy logical system);
- issues of ensuring the completeness and consistency of a set of fuzzy production rules in this study are not considered.
The method of formalizing knowledge about the process of planning a reconnaissance flight of a UAV based on IFST2 includes the following main stages:
- presentation of factors that take into account the conditions of monitoring, exploration, environmental impact in the form of linguistic variables for each projected option;
- formation of the area of definition of linguistic variables used to describe the conditions of monitoring, exploration and environmental impact;
- formation for each linguistic variable of the term set, as elements of which use the names of fuzzy variables that describe the linguistic meanings of the conditions of monitoring, the impact of the external environment;
- description of UAV flight route options; - formation of many of the most important
objects of monitoring, intelligence based on the assessment of the degree of non-dominance of the elements;
- presentation of options for the location of ground objects, the impact of the external environment, the appropriate variant of the UAV flight route in the form of fuzzy production rules, where as an antecedent, a follower use fuzzy linguistic statements.
Thus, it is investigated that for the task of UAV flight route planning at the planning and
104

reconnaissance planning stage it is expedient to use heuristic methods. They are looking for solutions within some subspace of possible acceptable solutions. They are the best in terms of taking into account the practice, experience, intuition, knowledge of ATS. The values of individual predicted factors should be represented using the mathematical apparatus of fuzzy sets. A method for formalizing knowledge about UAV flight route planning based on interval fuzzy sets in conditions of uncertainty has been developed. With its help it is possible to formalize the factors that take into account the conditions of monitoring, search, detection and destruction of objects, the impact of the external environment on the range of UAVs.
They are presented in the form of linguistic and interval-estimated parameters for each option. This approach allows:
- take into account uncertainty; - to form the area of definition of linguistic
variables that are used to describe the conditions of monitoring, reconnaissance and the impact of the external environment on the range of UAVs;
- to form from a set of the most important objects of monitoring, reconnaissance of the most significant ground objects on the basis of an estimation of a degree of non-dominance of elements;
- to formalize the flight options of the UAV for each possible variant of the location of objects, the influence of the external environment in the form of fuzzy production rules, where fuzzy linguistic statements are used as an antecedent, a consequent.
3. Conclusions
The calculation of the mathematical expectation of the time to perform individual operations in the construction of UAV flight routes at the planning stage is carried out.
In the traditional approach, the time for information preparation and direct planning of UAV routes is up to 66% of the total time for making a decision [10, 19, 22].
The mathematical expectation of the total time for making a decision is 𝑀∗[𝑇��]=211,59 s; the time spent on entering the initial data – 𝑀∗[𝑇��]=67 s (up to 31% from 𝑀∗[𝑇��]) the waiting time for the result of solving the problem – 𝑀∗[𝑇��]=73,63 s (up to 35% from 𝑀∗[𝑇��]). Efficiency of decision-making by a decision-
maker at the stage of planning UAV flight routes may turn out to be unacceptably low (P=0.47 ... 0.9). To increase the efficiency of decision-making, it is necessary to reduce the time for preparation and the direct solution of the problem.
In the proposed approach to planning the routes of the UAV reconnaissance flight, the mathematical expectation of the total time for making a decision was 𝑀∗[𝑇��]=103,59 s, the time spent by the decision-maker for entering the initial data was – 𝑀∗[𝑇��]=13,74 s (up to 13% from 𝑀∗[𝑇��]), the waiting time for the decision result was – 𝑀∗[𝑇��]=33,71 s (up to 32% from 𝑀∗[𝑇��]).
The proposed approach to planning UAV flight routes under conditions of uncertainty makes it possible to reduce the total decision-making time by up to 2 times.
4. References
[1] Official site of DefenseUkrain. Robotic platforms for the Armed Forces of Ukraine: included in DOZ-2021 and prepared for the parade. URL: https://defence-ua.com/
[2] Official site of Ukrainian Military Pages. Vision of the Air Force 2035, approved by the Military Council of the Air Force on 15.05.2020. URL: https: //drive.google.com / file/ d/ 1N3tahxAhqpNUIoz-xbgVDKG-1YJmsK.
[3] On the new version of the Military Doctrine of Ukraine: Decree of the President of Ukraine of September 2, 2015. URL: http:// zakon.rada.gov.ua /go/555/2015.
[4] V.N. Evdokimenkov, M.N. Krasilshchikov, G.G. Sebryakov, Distributedintelligentcontrolsystemforagroupofunmannedaerialvehicles: architectureandsoftware. IzvestiyaYuFU. Technicalsciences (2016). №1. pp. 174-180.
[5] V.P. Kharchenko, T.F. Shmelyova, E.A. Znakovskaya, Methodology of situational collective control of manned and unmanned aerial vehicles in a single airspace: scientific materials. In 3 volumes. Volume 2. Integrated corporate models for collective management of manned and UAVs in a single airspace in conditions of risk and uncertainty (2017). P.120.
[6] M. L. Cummings, Operator interaction with centralized versus decentralized UAV architectures. Handbook of Unmanned Aerial Vehicles,2015. P. 977−992.
105

[7] O. Tymochko, A. Trystan, A. Berezhnyi., O. Sotnikov, VehicleswhileMonitoringBehaviorofDynamicObjectsin a Forest-SteppeArea. InternationalJournalofEmergingTrendsinEngineeringResearch. (2020),volume.8, No 7.pp.3208-3215.
[8] O.G. Matyushchenko, V.S. Kadubenko, S.P. Sedash, D.O. SizonЄ Multi-agent model of group use of unmanned aerial vehicles when performing special missions. PolishJournalOfScience. (2021),. volume1, No 35. pp 13-19.
[9] P. Yao, Z. Xie, P. Ren, Optimal UAV RoutePlanningforCoverageSearchofStationaryTargetinRiver. IEEE TransactionsonControlSystemsTechnology. (2019), № 27 (2), pp. 822−829.doi: 10.1109/TCST.2017.2781655.
[10] O. Tymochko, A. Trystan, O. Chernavina, A.Berezhnyi, The method of planning the flight route of unmanned aerial vehicles while monitoring the behavior of dynamic objects in the forest-steppe area. Information Processing Systems. (2020), № 3(162). pp. 95 - 110.
[11] M. L.Cummings, J. P.How, A. Whitten O.Toupet, The Impact of Human–Automation Collaboration in Decentralized Multiple Unmanned Vehicle Control. Proceedingsofthe IEEE. (2012),№ 100(3). pp. 660 - 671.
[12] V.V. Kaminsky, V.V. Tyurin, O.A. Korshchets, N.O. Korolyuk, Analysis of the use of unmanned aerial vehicles in modern armed conflicts and anti-terrorist operation in eastern Ukraine. Science and defense. (2017), № 3 (4). pp.4-8.
[13] G.S. Stepanov, M.A. Kaminsky, M.A. Pavlenko, Views on problematic issues of the use of the Air Force in air defense. Science and technology of the Air Force of the Armed Forces of Ukraine. (2018), №1 (30). pp. 18-23.
[14] V.V. Kaminsky, The fight against air terrorism should begin with the ground. Science and technology of the Air Force of the Armed Forces of Ukraine. (2014), № 1 (14). pp. 16-23.
[15] A. Alimpiev, P.Berdnik, N.Korolyuk, O.Korshets, Selecting model of unmanned aerial vehicle oaccept it for military purposes with regard to expert data. Eastern-uropeanJournalofEnterpriseTechnologiesISSN 1729-3774. (2017), №1/ 9 (85).рр 53-60.
[16] O.Yu.Permyakov, N.O. Korolyuk Information - telecommunication technologies and modern armed struggle. Scientific and technical conference of young scholars "Actual problems of information technology". Kyiv: NUOU. (2018). рр 5-6.
[17] S.A. Olizarenko, E.V. Brezhnev, A.V. Perepelitsa, Fuzzy sets of type 2. Information processing systems. (2010), Vip. 8 (89). рр. 131–140.
[18] S.A.Olizarenko, A.V.Perepelitsa, V.A.Kapranov, Interval fuzzy sets of type 2. Terminology, representation, operations Information processing systems. (2011), Vip. 2 (92). рр. 39 - 45.
[19] N.O. Korolyuk, Substantiation of the modern approach to automation of aviation decision-making processes. Collection of scientific works. (2019), №1 (59). рр. 32-39.
[20] T.Saatya, Structuresindecision making: On the subjective geometry of hierarchies and networks [on line]. European Journal of Operational Research, vol. 199, is. 3, 2009, рр. 867–872.
[21] N.O. Korolyuk, R.V. Korolev, O.A. Korshets, The procedure of formalization of data used in the description of the process of air traffic control. Collection of scientific works of KhNUPS. (2017), № 4 (53). рр.103-106.
[22] N.O. Korolyuk, V.V. Sinyavsky, D.O. Haustov, Improving the software of automation systems for recognizing the type of air object. Weapons and military equipment. (2017), № 1 (49). рр.122-125.
106

Building of a Speaker’s Identification System Based on Deep Learning Neural Networks Victor Solovyov 1, Oleg Rybalskiy 2, Vadim Zhuravel 3, Aleksandr Shablya 4, Yevhen Tymko 5
1 “Silentium Systems”, Hornby Str 950 – 777, BC V6Z 1S4, Vancouver, Canada, 2 National Academy of Internal Affairs, Solom’yanska Are. 1, Kyiv, 03035, Ukraine 3 Kyiv scientifically-research expertly-criminalistics center Ministries of Internal Affairs of Ukraine, Vladimirska Str. 15, Kyiv, 01001, Ukraine 4 Odessa Research Institute of Forensic Expertise of the Ministry of Justice of Ukraine, Uspenska Str. 83/85, Odesa, 65011, Ukraine 5 Kyiv Scientific Research Institute of Forensic Expertise of the Ministry of Justice of Ukraine, Smolenska Str. 6, Kyiv, Ukraine
Abstract Paper discusses the main methodological and technological features of studying and building of speaker’s identification systems built on the basis of deep learning neural networks. The problems and tasks arising in the process of creation of such systems are considered. The purpose of the research article is to show the suggested ways and methods for their elimination and solutions, which were found in the process of creation of an automated system for speaker identification and verification, built due to the use of such networks. In the process of its creation, the method of spectral analysis of speech signals at short time intervals was determined, which ensures high resolution. In addition, a solution of the problem of invariance of the system to different language groups and the duration of phonograms is proposed. This ensured the generality and efficiency of the obtained results of speaker’s identification. As a result, an automated system for forensic identification and speaker’s verification was developed on the basis of deep learning neural networks. In the process of the development of a system based on the comparison of the spectral characteristics of speech signals, several methods have been proposed and tested providing the possibility of identification (verification) of the speaker by speech messages of short duration. Keywords 1 phonogram duration, forensic identification of speaker, deep learning neural network, spectral analysis, frequency domain, efficiency.
1. Introduction
The use of modern technologies of neural networks for the examination of materials and digital sound recording equipment allows, as a rule, to obtain a more higher level of its efficiency [1,2]. Usually, the efficiency of the system is taken as a quantity determined by the probability of errors of the first and second kinds, inherent in mentioned type of examination.
According to the materials of the SRE NIST tests carried out recently, the point of cross of the
EMAIL: [email protected] (A. 1); [email protected] (A. 2); [email protected] (A. 3); [email protected] (A. 4); [email protected] (A. 5) ORCID: 0000-0003-3541-4740 (A. 1); 0000-0002-1440-8344 (A. 2); 0000-0002-2777-2102 (A. 4);
graphs of errors of both the first and second kinds for the best automated speaker identification systems is on average (3–10)%. At the same time, several tests of systems on messages of less than 10 s duration are carried out relatively rarely [3].
Similar data are provided by the materials of the working group of forensic speech and audio analyzes of the European Network of Forensic and Scientific Institutions [4].
It is generally accepted that the effectiveness of automated speaker’s identification systems is significantly lower than the effectiveness of, for
107
example, fingerprinting, video or DNA recognition.
Paper presents the results of research and development of a speaker identification system based on spectral characteristics of voice signals and on deep learning neural networks, which, we believe, can change this point of view.
During past two decades, the number of noteworthy publications related to technical systems for voice identification numbers in the thousands. Therefore, we will consider only the main methodological and technological features of research and design of such systems that are directly related to the problems and tasks solved by the conducted developments.
Despite the hundreds of different methods and algorithms for speaker’s identification based on the physical characteristics of voice signals various spectral parameters are generally recognized as physical bases. This applies to both classical methods and methods based on neural networks. But the use of various characteristics and parameters of signals with the use of classical spectral methods allows only to improve slightly the efficiency of identification, since any of them is based on a discrete orthogonal Fourier transform.
Modern research in the field of neurophysiology of hearing indicates the feasibility of spectral analysis of speech signals at short time intervals [5]. In particular, a number of important applications of processing audio information at short time intervals have already become classics, for example, when compressing audio files. Thus, the basic basis for the majority of audio file compression formats is the transformation of signals from the time domain to the frequency domain at short time intervals (16–20) ms [5]. But the discrete orthogonal Fourier transform at small time intervals (about 20 ms) has insufficient frequency resolution from the point of view of the neurophysiology of hearing. So, for a time interval of 20 ms, the use of such a transformation for the transition from the time to the frequency domain, provides a frequency resolution of 50 Hz. However, it is known from the neurophysiology of hearing that the resolution of human hearing is approximately 1 Hz [5].
As it will be described below, such a low frequency resolution at short time intervals significantly reduces the efficiency of any speaker identification systems and is one of the determining factors in the spectral analysis of audio information. And the modern practice of expert examination points to serious problems of
speaker identification for phonograms of short duration [3,4].
Another important problem, in our opinion, is that any methods and algorithms for conducting an examination within the framework of this methodology relate to certain parameters of sound signals in the frequency domain, from which some, as the most important, are selected by an expert. For example, the frequency of the main tone, the spectrum of specific sounds, etc. are compared. In this case, all comparisons are made for integrative assessments obtained as a result of averaging the spectral parameters over the entire duration of the phonogram. This approach, taking into account numerous accompanying factors and their variability, often does not provide a high generality and efficiency of the obtained results. An important property of almost all known approaches, including those based on the use of deep learning neural networks, is also the difficulty in achieving common results for large, gradually growing databases. Such databases form the bases of Big Data arrays used to train neural networks. But in most cases, the plots of errors of the first and second kinds, used to check the quality of network training, will be bound to the DataSet obtained from a specific training material. As a result, a large degree of data generalization requires, as a rule, repetition of research and calculations for a new training set.
This raises the problem of the correct quantitative assessment of the effectiveness of the forensic identification of the investigated object. The construction of graphs of the probability of errors of the first and second kinds, in our opinion, is the most informative and therefore the most preferable option for determination of the magnitude of such errors.
The use of deep learning neural networks allows us to consider the possibility of developing an effective automated universal system designed for forensic identification of a speaker. Under the universality of the system, we consider its suitability for work with the speech of speakers speaking different languages, belonging to different sexes and with phonograms of different duration (including several seconds).
Thus, in order to solve the problems that exist in the construction of an automated system for forensic identification of a speaker, we define the following tasks:
to determine the method of spectral analysis of speech signals at short time intervals, providing high resolution;
108

to propose a solution to the problem of invariance of the system to different language groups and the duration of phonograms. This will ensure the generality and effectiveness of the results obtained for the identification of the speaker.
The purpose of this paper is to show the ways and methods of solving these problems by use of the example of the results obtained during research and development of an automated system for identification and verification of a speaker (the “Avatar” system [6]).
2. Ways and methods of solving the tasks
Let us consider a discrete non-orthogonal time-frequency conversion for a 20 ms time window with a signal of the audiofrequency range. To be specific, we will use the Morlet wavelet with the basis
21 22
tFj F t bcC t F e emor b
,
(1)
where 1j – imaginary unit,
t – time, Fb – wavelet width parameter, Fc – wavelet center frequency [7]. In this case, we will consider redundant
transformations, in which the number of samples in the time domain falling on the selected area is less than the number of samples in the frequency domain. So, for example, let's take an arbitrary 20 ms fragment of the speech signal of sound [A] with a sampling rate of 44100 Hz. Then the number of discrete samples falling on a 20 ms segment is N = 882. Let us construct and compare two types of time-frequency conversion in the frequency range from 0 to 2500 Hz for the same signal segment. The first of them is non-orthogonal based on the Morlet wavelet with a
frequency step DFc = 1 Hz [7]. The total maximum possible number of frequency steps in the selected range is 2500. The second is orthogonal with a discreteness of DFc = 50 Hz (in accordance with the duration of the time window). The total maximum possible number of frequency steps in the selected range is 50.
Fig. 1 shows an illustration of a comparison of the spectra of one signal fragment obtained for two types of transformations.
Visually, these graphs are very close. However, the difference in the positions of the local maxima of the spectra for applied examination problems is very significant, since in most methods for identifying speakers an important factor is the value of the frequencies of such maxima [8]. As it is seen in Fig. 1, the values of the frequencies of the local maxima for orthogonal and non-orthogonal transformations of the same signal differ by more than 20 Hz. This circumstance significantly affects the accuracy of the assessment of the spectral parameters of speech.
It is known that when averaging any function over a large number of time windows with a duration of T = 20 ms, the calculation accuracy is proportional to the square root of the number of window transformations [7].
But this means that to achieve an accuracy of 1 Hz, obtained with a non-orthogonal transformation on an interval of 20 ms, with orthogonal transformations taking into account averaging, 400 × 20 ms = 8 sec are required.
This shows the practical impossibility of analyzing phonograms of short duration (several seconds) by use of conventional methods of time-frequency transformations, which is confirmed by the modern practice of expertise [3,4].
At the same time, as it will be shown below, the use of non-orthogonal time-frequency transformations with a higher resolution in the frequency of localization of maxima (of the order of 1 Hz) significantly increases the accuracy and efficiency of speaker’s identification by use of phonograms of short duration.
109

Figure 1: Compared spectra of one fragment of sound [A] (T = 20 ms)
The general concept of the developed speaker
identification system is based on the data of classical studies in the neurophysiology of hearing [5]. One of the important factors in the identification of a speaker by human auditory analyzers are the individual characteristics of vowel sounds [8]. Therefore, when designing the system, a separate basic module was developed for automatic extraction of vowel sounds from speech phonograms. The methodology for its development is based on deep study of neural networks.
The speaker’s identification technology used in the system is based on the automatic determination of the proximity of the spectral characteristics of two vowel sounds – [A] and [I], isolated from two different phonograms. At the same time, the proximity of the characteristics of two fragments of vowel sounds in phonograms is determined on the basis of a special model created on the basis of a deep learning neural network. Let's consider some fundamental features of this technology.
In the vowel extraction module for each of the two phonograms, arrays of fragments of sounds [A] and [I] with a duration of 20 ms are formed. Further, for all fragments, a non-orthogonal Morlet wavelet transform is implemented with a frequency resolution of local maxima of 1 Hz. The fragments are converted in the frequency range from 0 to 12000 Hz. Changing the value of the upper frequency of the range makes it possible to study the performance of neural networks for their various configurations and structures.
The obtained spectra are normalized by dividing the amplitude of each spectral peak by the sum of the amplitudes of all spectral peaks for the entire frequency range
i i
iNi i
A fA
A f
,
(2)
where AiN – normalized amplitude of the spectral component selected at the i-th scanning step, Ai(fi) – the amplitude of the spectral component selected at the i-th scanning step.
Then one of the classic technological approaches is used for further forming of the DataSet. Arrays of fragments consisting of various combinations of two spectra are formed from a set of phonograms with the speech of different speakers. In this case, for fragments of the spectra of the same speaker, marking "he" is used, and for different speakers – “not he”. Arrays of a combination of spectra and a separate array with a priori known labeling are the basis of the DataSet for training the neural network.
Thus, to transform fragments in the frequency range from 0 to 12000 Hz, the training DataSet will be composed of fragments containing 24000 spectral amplitudes in various combinations. It should be noted that for orthogonal transformations, the number of frequencies is only 480, and in this version, training of a neural network is a more simple task. Our studies of the learning process of neural networks with different structures for a DataSet with fragments containing 24000 frequency amplitudes, in practice, showed the problematicness of obtaining effective results
110

for most of the known structures of neural networks. As the analysis showed, the main reasons are known factors – gradient attenuation and retraining. In this the most general statement the structure of a deep learning neural network based on convolutional networks was used to solve the problem in effective way. It should be noted that parallel studies are conducted on the basis of fully connected networks. For these structures a preliminary selection of 50 local maxima of the spectrum (normalized and then ranked according to the magnitude of the amplitude) was applied. For this variant of neural structures, results were obtained with less efficiency.
The keras library (bakend tensorflow) was used to train the neural network. The created speaker identification model is actually intended to solve the binary classification problem. Fragments of the neural network training process are shown in Fig. 2
Figure 2: Graph of the effectiveness of training a neural network
By use of the developed model, it was possible
to obtain a high efficiency of speaker identification from the point of view of expert examination practice. But the practical implementation of the identification process requires much time to calculate phonograms. In addition, the identification model built by the neural network is a “black-box”. It is not possible to establish the causal relationships that determine the speaker's identification. At the same time, the implementation of software systems into the practice of examination requires an “internal conviction of an expert” in the correctness of made decisions. This conviction can only be based on well-known classical ideas about the characteristics of sounds and speech.
Therefore, in the process of designing a speaker’s identification system on the basis of the parameters of voice signals (the “Avatar” system
[6]), an approach was formed on the basis of classical concepts associated with a neural network model.
Analysis of various phonograms showed that for fragments of spectra with a high probability of speaker’s identification (above 0.999), the spectra of 20 ms fragments are very close. So, Fig. 3 shows the spectra in the range 0 – 2500 Hz for the same speaker (sound – [A]) with the probability of correct identification 0.9991.
Figure 3: Spectra of similar characteristics of voices
As it can be seen from the spectra of the same
two fragments, considered in the frequency band from 0 to 4000 Hz, both local maxima and formant features of the [A] sound practically coincide (Fig. 4).
Figure 4: Spectrum of similar characteristics of voices with formant signs
In accordance with the concept of the adopted approach to the practical implementation of the “Avatar” system with a good approximation in terms of efficiency, a classical heuristic criterion for the proximity of two spectra was introduced - the sum of the absolute values of the difference between the normalized amplitudes of the spectra of the sounds [A] and [I].
1 21
N
iB A A
,
(3)
111
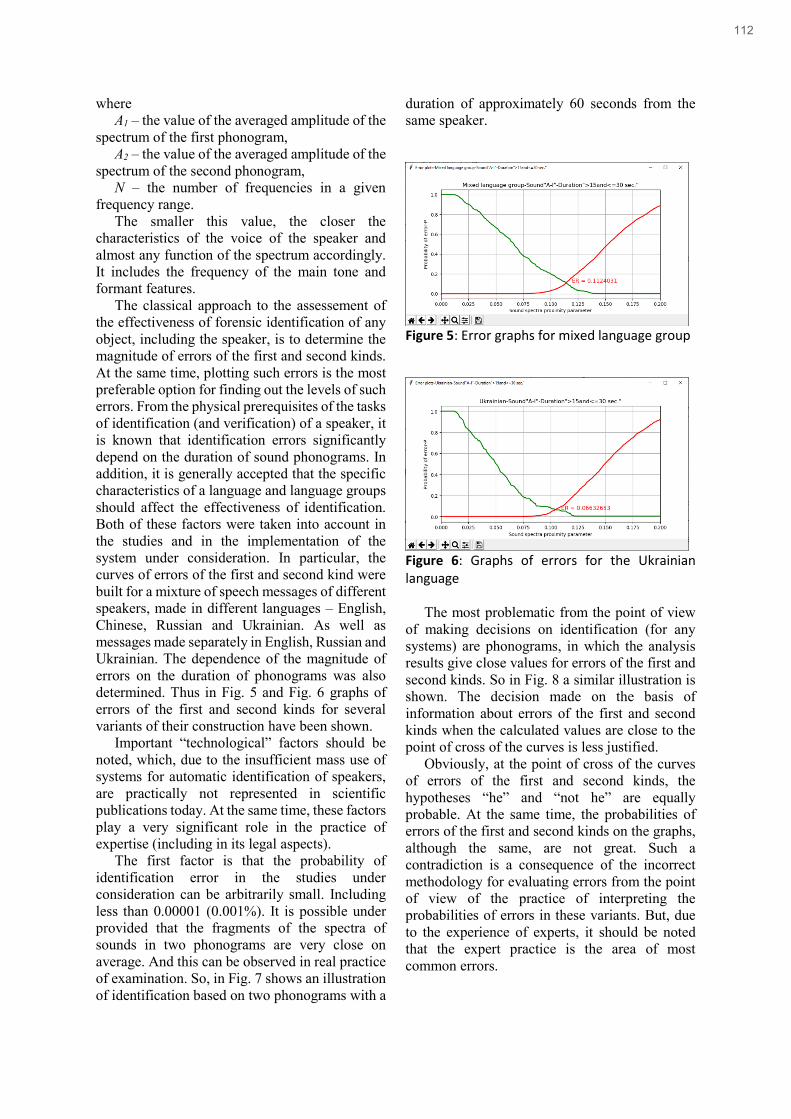
where A1 – the value of the averaged amplitude of the
spectrum of the first phonogram, A2 – the value of the averaged amplitude of the
spectrum of the second phonogram, N – the number of frequencies in a given
frequency range. The smaller this value, the closer the
characteristics of the voice of the speaker and almost any function of the spectrum accordingly. It includes the frequency of the main tone and formant features.
The classical approach to the assessement of the effectiveness of forensic identification of any object, including the speaker, is to determine the magnitude of errors of the first and second kinds. At the same time, plotting such errors is the most preferable option for finding out the levels of such errors. From the physical prerequisites of the tasks of identification (and verification) of a speaker, it is known that identification errors significantly depend on the duration of sound phonograms. In addition, it is generally accepted that the specific characteristics of a language and language groups should affect the effectiveness of identification. Both of these factors were taken into account in the studies and in the implementation of the system under consideration. In particular, the curves of errors of the first and second kind were built for a mixture of speech messages of different speakers, made in different languages – English, Chinese, Russian and Ukrainian. As well as messages made separately in English, Russian and Ukrainian. The dependence of the magnitude of errors on the duration of phonograms was also determined. Thus in Fig. 5 and Fig. 6 graphs of errors of the first and second kinds for several variants of their construction have been shown.
Important “technological” factors should be noted, which, due to the insufficient mass use of systems for automatic identification of speakers, are practically not represented in scientific publications today. At the same time, these factors play a very significant role in the practice of expertise (including in its legal aspects).
The first factor is that the probability of identification error in the studies under consideration can be arbitrarily small. Including less than 0.00001 (0.001%). It is possible under provided that the fragments of the spectra of sounds in two phonograms are very close on average. And this can be observed in real practice of examination. So, in Fig. 7 shows an illustration of identification based on two phonograms with a
duration of approximately 60 seconds from the same speaker.
Figure 5: Error graphs for mixed language group
Figure 6: Graphs of errors for the Ukrainian language
The most problematic from the point of view of making decisions on identification (for any systems) are phonograms, in which the analysis results give close values for errors of the first and second kinds. So in Fig. 8 a similar illustration is shown. The decision made on the basis of information about errors of the first and second kinds when the calculated values are close to the point of cross of the curves is less justified.
Obviously, at the point of cross of the curves of errors of the first and second kinds, the hypotheses “he” and “not he” are equally probable. At the same time, the probabilities of errors of the first and second kinds on the graphs, although the same, are not great. Such a contradiction is a consequence of the incorrect methodology for evaluating errors from the point of view of the practice of interpreting the probabilities of errors in these variants. But, due to the experience of experts, it should be noted that the expert practice is the area of most common errors.
112
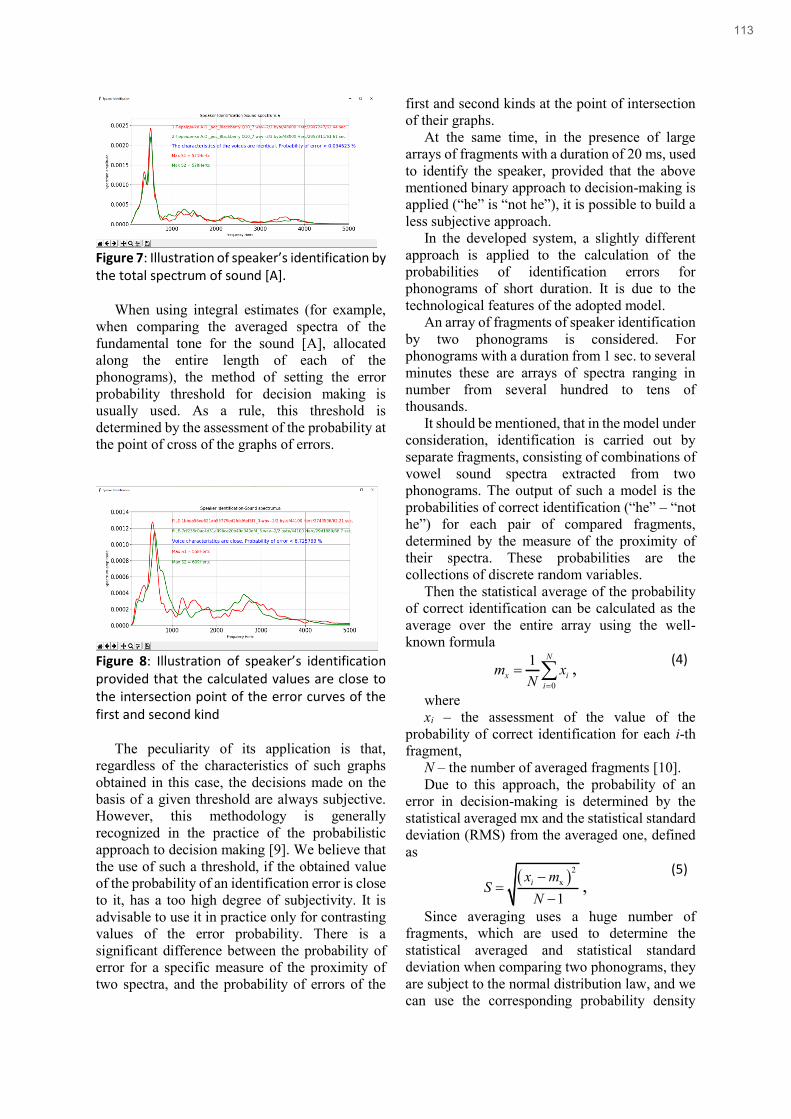
Figure 7: Illustration of speaker’s identification by the total spectrum of sound [A].
When using integral estimates (for example,
when comparing the averaged spectra of the fundamental tone for the sound [A], allocated along the entire length of each of the phonograms), the method of setting the error probability threshold for decision making is usually used. As a rule, this threshold is determined by the assessment of the probability at the point of cross of the graphs of errors.
Figure 8: Illustration of speaker’s identification provided that the calculated values are close to the intersection point of the error curves of the first and second kind
The peculiarity of its application is that,
regardless of the characteristics of such graphs obtained in this case, the decisions made on the basis of a given threshold are always subjective. However, this methodology is generally recognized in the practice of the probabilistic approach to decision making [9]. We believe that the use of such a threshold, if the obtained value of the probability of an identification error is close to it, has a too high degree of subjectivity. It is advisable to use it in practice only for contrasting values of the error probability. There is a significant difference between the probability of error for a specific measure of the proximity of two spectra, and the probability of errors of the
first and second kinds at the point of intersection of their graphs.
At the same time, in the presence of large arrays of fragments with a duration of 20 ms, used to identify the speaker, provided that the above mentioned binary approach to decision-making is applied (“he” is “not he”), it is possible to build a less subjective approach.
In the developed system, a slightly different approach is applied to the calculation of the probabilities of identification errors for phonograms of short duration. It is due to the technological features of the adopted model.
An array of fragments of speaker identification by two phonograms is considered. For phonograms with a duration from 1 sec. to several minutes these are arrays of spectra ranging in number from several hundred to tens of thousands.
It should be mentioned, that in the model under consideration, identification is carried out by separate fragments, consisting of combinations of vowel sound spectra extracted from two phonograms. The output of such a model is the probabilities of correct identification (“he” – “not he”) for each pair of compared fragments, determined by the measure of the proximity of their spectra. These probabilities are the collections of discrete random variables.
Then the statistical average of the probability of correct identification can be calculated as the average over the entire array using the well-known formula
0
1 N
x ii
m xN
,
(4)
where xi – the assessment of the value of the
probability of correct identification for each i-th fragment,
N – the number of averaged fragments [10]. Due to this approach, the probability of an
error in decision-making is determined by the statistical averaged mx and the statistical standard deviation (RMS) from the averaged one, defined as
2
x
1ix m
SN
,
(5)
Since averaging uses a huge number of fragments, which are used to determine the statistical averaged and statistical standard deviation when comparing two phonograms, they are subject to the normal distribution law, and we can use the corresponding probability density
113

distribution graph to determine the probability of errors when making a decision.
The decision error for the totality of the array of fragments with this approach is the sum over the probability density distribution in the range from
0 ≤ P ≤ 0.5 (Fig. 9). The illustration in Fig. 9 is given for the variant of the statistical average number of the probability of correct identification mx > 0.5. For mx < 0.5, the decision error is the sum over the probability density distribution in the range from 0.5 ≤ P ≤1.
In Fig. 9 the average probability of identification is P = 0.6, the number of fragments is 894, the standard deviation of the probability of identification by fragments is S = 0.21.
The accepted approach to the assessment the probabilities of identification errors contains only calculated (experimental) parameters of fragments of the identification array for two phonograms. In particular, this mx is the average value of the identification probability for the entire array of identification fragments, N is the number of fragments over which the averaging was carried out, S is the standard deviation of the statistical mean of the probabilities of correct identification. These parameters completely determine the identification errors. In this case, the dependence of the identification efficiency on the duration of the phonograms is automatically taken into account, which is determined by the value of the parameter N.
Figure 9: The density of the probability distribution of correct speaker’s identification for an array of fragments
Depending on the language of the speaker's
speech recorded on the phono-gram, the parameters mx and S will change. So, for tonal languages (for example, Chinese), due to the
greater variability of the characteristics of vowel sounds, S will increase, which, in turn, will increase the errors identification (this statement is true for the characteristics of any tonal speech).
Significant computational complexity is the disadvantage from the point of view of the implementation of this probabilistic approach in an automatic identification system is. This approach requires, for example, twice more computational time than the described above heuristic approach based on the comparisons of the averaged spectra of vowel sounds. The second important factor is the “non-standard approach” when making expert decisions on speaker identification.
2.1. Results and discussion
In the process of the development of any speaker’s identification system, the issue arises of the applicability of the system and the corresponding methodology to various language groups. The account of the dependence of the identification efficiency on the duration of phonograms, as well as the dependence of the identification efficiency on specific algorithms.
From the point of view of eliminating dependence on various algorithms, the approach based on models of deep learning neural networks is the most general one. But it works under the condition that all information is supplied to the input of the neural network. At the same time, an issue arises that determines the completeness of the model's coverage of various factors. In particular, whether a particular DataSet can cover most of the listed above factors.
Our studies indicate a high probability of covering most of the factors in the developed approach. In particular, with the number of speakers over 15 (male, female voices) and several language groups, the results practically do not change with an increase in the number of speakers in the DataSet.
Another important factor is the methodology for work with a set of 20 ms phonogram fragments, which ensures that there are practically no parameters in the system that are selected by an expert and therefore have a subjective character. This makes it possible to uniformly solve identification (and verification) problems regardless of the duration of phonograms and language groups.
114

We believe that the developed identification methodology has high versatility in the above mentioned sense.
3. Conclusions
An automated system for forensic identification and verification of the speaker based on deep learning neural networks has been developed. In the process of developing a system based on the comparison of the spectral characteristics of speech signals, methods have been suggested and tested that provide the possibility of identification (verification) of the speaker by voice messages of short duration.
4. References
[1] Solovyov V. I., Rybalskiy O. V., Zhuravel V. V. Verification of fun-damental fitness of neuron networks of the deep educating for the construction of the system of exposure of editing of digital phonograms. Cybernetics and Systems Analysis, Vol. 56, No. 2, March, 2020, pp. 326¬–330. doi: 10.1615 / 10.1007 / s10559-020-00249-2.
[2] Solovyov V.I., Rybalskiy O.V., Zhuravel V.V. Method of exposure of signs of the digital editing in phonograms with the use of neuron networks of the deep learning. Journal of Automation and Information Sciences, 2020, Vol. 52, No. 1, pp. 22–28. doi: 10.1615 / JAutomatInfScien.v 52.i1.30.
[3] NIST USA, SRE. Available at: https://www.nist.gov/itl/iad/mig/nist-2019-speaker-recognition-evaluation (accessed 24 August 2020).
[4] ENFSI working group for forensic speech and audio analysis. Availa-ble at: http: //www.Enfsi.eu/about-enfsi/structure/working-groups/speech-and-audio (accessed 24 August 2020)
[5] Alexandrova Yu.I. Psychophysiology. M.-S.P .: Nauka, 2006, 463 p.
[6] Solovyov V.I., Rybalskyi O. V., Shablya A. N., Zhuravel V. V. System of automated search for votes. Informatics and Mathematical Methods in the Model. 2015, Vol. 5, No. 4, pp. 302–307.
[7] Mallat S. A wevlet tour of signal processing. Асаdemic Ргеss, New Yогk. 1999, 671 p.
[8] Bondarenko M.F., Driuchenko A.Ya., Shabanov-Kushnarenko Yu.P. Vowel sounds
in theory and experiment. Kh .: Khark. nat. un-t radioelektroniki, 2002, 348 p.
[9] Rybalskiy O.V., Solovyov V.I., Cherniavskyi S.S., Zhuravel V.V., Zheleznyak V.K. A probabilistic approach to making expert decisions on the analysis of complex objects. Bulletin of the National Academy of Sciences of Belarus. A Series of Physical and Technical Sciences. 2019, Vol. 64, No. 3, pp. 346–352. doi: 10. 29235 / 15-8358-2019-64-3-346-352.
[10] Handbucher der industriellen Messtechnik / 3 Auflage/ Herasgeber prof., Dr., P. Profos / 1 Auflage. Vulkan-Verlag, Essen. 1984, 491p.
115

Shaping The Future Of The Marine Industry As A Condition For Adaptation In An Innovative Society Viktor Strelbitskyi 1, Nataliia Punchenko 2 and Oleksandra Tsyra 3
1 Odessa National Maritime University, Odesa, Ukraine 2,3 Odesa State Environmental University Odesa, Ukraine
Abstract The paper provides an overview of the concept design of a Rolls-Royce unmanned ship. Shipping is implementing unmanned navigation projects that combine the tasks which exist in the civil and military fleet. The work theoretically shows a description of the dynamic autonomy of a Rolls-Royce unmanned vessel project. As a result of the review, unmanned vessels have the necessary data processing units, sensors, control, and communication systems and can automatically perform various assigned tasks without the need for crew support on board. The work contains links to sources that clarify the presented material. Keywords 1 Autonomous navigation, unmanned navigation, navigation safety, innovation
1. Introduction
Comprehensive knowledge of the World Ocean to use its resources is one of the global problems of an innovative society [1].
In an innovative society, an industry such as navigation at its inception defined itself to be innovative. This definition is fully justified. This confirmation is the MariNet group, which was created within the framework of the National Technology Initiative. The group was able to bring together large companies and small start-ups in the field of marine high technology, scientific centers, authorities, and universities.
The main course has been taken, the MariNet "road map" has been approved - collection, integration, transmission, and analysis of information about the situation at sea, on board ships and ashore using electronic means to ensure navigation "from berth to berth", shipbuilding innovations and development technologies of the world ocean. The world of shipping is currently discussing, developing, and using such areas as e-navigation, energy efficient ships, unmanned navigation.
EMAIL: [email protected] (A. 1); [email protected] (A. 2); [email protected] (A. 3) ORCID: 0000-0001-7027-9498 (A. 1); 0000-0003-1382-4490 (A. 2); 0000-0003-3552-2039 (A. 3)
2. The concept of increasing the safety for navigation with the use of heading innovations
One of the most important tasks for a modern fleet is the need for its urgent renewal, because the average age of ships participating in the transportation of goods is about 32 years [2]. Despite the skepticism of many shipowners and shipbuilders on the use of innovations, the largest market players came out to discuss them on the world platform, which set a theoretical and practical basis, such as the efficiency of the development for water transport on the world market in the field of ship safety systems [3]. Rolls-Royce (UK), ABB (Finland), DCNS (France) and representatives of some Norwegian, American, and Japanese organizations can be singled out separately. Whose aim is to increase navigation safety using innovation, which based on the original principles of the phase-frequency measurement and transformation theory of the radio-signals [4]. Destinations of the latest technologies are presented in the figures: e-navigation is a technological leap in management of water transport, which allows a fully functional
116

use of IT-tools and telecommunications in fleet management. The process of moving from pier to pier in ports of departure and destination, and related services that ensure safe navigation and environmental protection presented on Figure 1 [5]; latest energy saving ships launched is not easy innovative and comfortable, but less harmful for the environment and economically more efficiently, which serves to strengthen economy and improving the quality of life, because we cannot save on people's health, crews of ships are shown in the figure 2 [6], 3 [7].
Figure 1: E-navigation
Figure 2: Energy efficient ships
Figure 3: Supervisory teleoperation for unmanned navigation
2.1. Review of the concept project of an unmanned ship from Rolls-Royce
“Autonomous shipping is the future of the maritime industry. As revolutionary as a
smartphone, a smart ship will revolutionize the design and operation of ships": Mikael Makinen, President of Rolls-Royce Marine.
The latest technologies have made it possible to develop models of remote and autonomous ships. But the search for an acceptable option for a reliable and economical combination is only just taking its first steps. Interpretation of nautical rules and regulations is not always well accepted by the programmer, which creates problems in model development. The development of decision support systems is an iterative process that will always undergo extensive testing and modeling.
Figure 4: Rolls-Royce unmanned platform ship
Figure 5: Unmanned commercial vessel option The ships of the future will still need human
involvement from land, communications will continue to be a significant component. Communication should create redundancy and minimize risk. For this, such characteristics are used as: bidirectionality, accuracy, scalability, “speed for measurement accuracy”, support by several systems. Sufficient communication channel capacity is guaranteed for monitoring ship sensors and remote control. A permanent, guaranteed connection that allows real-time monitoring of equipment.
The concept project of autonomous shipping has outlined a range of problems for the industry that await solution:
1.What technologies are needed and how best to combine them to enable the vessel to operate autonomously and for miles offshore;
117

2. How an autonomous ship can be made as safe as existing ships, what new risks it will face and how to mitigate the risks;
3. What will be the incentive for shipowners and operators to invest in autonomous ships and are autonomous ships legal and who is responsible in the event of an accident?
A
B
C
D Figure 6: Participation of operators: a-monitoring; b - evade; c - replan; d - pan-pan
One of the players in this market is Rolls-
Royce (Great Britain), which proposed a concept project for creating a family of unmanned vessels for various purposes (figure 4-5).
Depending on the needs of the customer, such ships could carry a variety of cargo or receive special equipment or weapons for solving combat missions. Dimensions, displacement, weight and composition of the payload and other parameters of a particular sample could be determined in accordance with the requirements of the market and the wishes of the customer. The automatics
will take over the driving functions as well as the safety monitoring figure 6 [7]. It is assumed that for safe navigation the unmanned ship will use the Intelligent Awareness System developed by Rolls-Royce. Which automatically collects data from various surveillance devices and sensors, analyzes, takes measures to avoid collisions or other incidents. Such complexes can be used both on automatic warships and on unmanned commercial ships. Let us analyze some of the technical steps of this offshore platform
2.2 Dynamic autonomy
A solution is being developed to integrate a complete autonomous ship navigation architecture that can leverage the capabilities of the Rolls-Royce dynamic positioning system, which is designed for future autonomous ships, and links it with an automatic navigation system, including situational awareness, collision avoidance, route planning and ship condition detection modules. Since the main challenge for autonomous systems is recognition of the surrounding reality, Rolls-Royce uses Sheridan levels of autonomy to describe the extent to which a car can autonomously operate when determining autonomy levels. In Sheridan's classification, there are 10 levels of autonomy in the "operator-computer" system, corresponding to various degrees of participation of a human operator in decision-making when controlling a complex unmanned system. An adapted version of Sheridan's classification for unmanned system control. In the Sheridan classification, there are 10 levels of autonomy, the characteristic of the level of autonomy: 1.The control of an unmanned vessel is completely carried out by the operator of the ground control complex; 2.The onboard control complex of an unmanned ship offers the operator of the ground control complex a set of action alternatives for deciding; 3. An onboard control complex for an unmanned vessel narrows the choice of the operator of the ground control complex to several alternatives; 4. The onboard control complex of an unmanned vessel offers the operator the means of the ground control complex the only solution; 5. The onboard control complex for an unmanned vessel implements the only solution, having received confirmation of operations from the operator of the ground control complex; 6. An onboard control complex for an unmanned vessel provides the operator with the means of a ground control complex for a limited
118

time to decide before automatically performing operations; 7. The on-board control complex of an unmanned vessel operates automatically, while it necessarily informs the operator of the ground control complex about the performance of operations; 8. The on-board control complex for an unmanned vessel operates automatically and, at the request of the operator of the ground control complex, informs him about the performance of operations; 9. The on-board control complex for an unmanned ship acts automatically and informs the operator of the ground control complex, if it considers it necessary, after the operations are completed; 10. The onboard control complex for an unmanned vessel independently decides on how to operate an unmanned vessel [8].
A solution to integrate a complete autonomous ship navigation architecture that takes advantage of the Rolls-Royce dynamic positioning system developed for autonomous ships and links to an automatic navigation system, including situational awareness, collision avoidance, route planning and ship condition detection modules [7].
The highest level in the system is the module for determining the state of the vessel, which is called the "virtual captain". This module brings together information from various subsystems and other ships, automation systems and the operator to determine the current state of the ship's systems. The state of the ship determines the permitted mode of operation at ship, such as autonomous, remotely controlled, or fail-safe. The status information from the virtual captain is also used to keep the operator always informed of the vessel’s status.
Dynamic Positioning Systems allow a ship to automatically maintain its position or course using propellers, rudders, and thrusters. When combined with a global or local coordinate system such as the Global Navigation Satellite System, as well as wind sensors and inertial measuring instruments, the ship can maintain its position in adverse weather conditions. Advanced dynamic positioning systems such as the Rolls Royce Icon DP can also maneuver the ship at low speed. This allows autonomous behavior to be integrated into ship handling. Since the dynamic positioning system already has information about the ship's maneuvering capabilities, it can calculate where the ship might move in the future.
These dynamic ship movement restrictions are passed on to the collision avoidance module to enable more efficient local path planning.
The route planning module is a software module that is responsible for planning a route from start to finish through predetermined waypoints, avoiding static obstacles defined in electronic navigation charts and following sea routes when appropriate. This module is closely related to the voyage planning that the ship's crew is currently involved in. However, the route planning module uses the planned voyage as information when planning the ship's actual route. A route consists of waypoints, course, and ship speed. The route planning module does not plan routes in real time, as the collision avoidance module is responsible for maneuvers to avoid obstacles.
The collision avoidance module is responsible for safe, collision-free navigation. It uses information from the route planning module to follow the path leading to its destination but may veer off course when it detects a collision risk. The Situational Awareness Module provides a local map and obstacle information that shows the current obstacles near the ship. The dynamic positioning module provides the collision avoidance module with an area in which the ship can maneuver, and thus creates boundaries for new waypoints that can be assigned. The collision avoidance module has two main functions: the first is to assess the risk of collision, and the second is to safely navigate the vessel both in harbor and on the high seas. When a risk of collision is detected, a suitable state is requested from the ship state determination module, in which the final determination of the state of the ship is based on all data from different subsystems.
The situational awareness module of the autonomous navigation system is connected to several sensor devices of different types. The Situational Awareness Module combines sensor data and extracts relevant information about the ship's surroundings for use by the collision avoidance system. The Situational Awareness Module can also perform sensor data truncation for more efficient data transmission on board. Technology development issues related to situational awareness system and ship sensors.
3. Conclusions
The transition to the era of autonomous shipping is a more complex issue than a simple technological invention. The implementation of an autonomous ship requires the systemic
119

integration of many technologies, which means that collaboration is required between different actors who can master different technological areas such as:
1. The development of decision support systems for autonomous ships is an iterative and gradual process that undergoes extensive testing and simulations;
2. The operation of remote and autonomous ships is at least as safe as existing ships. Potential to reduce human error;
3. Development and testing of specific technological solutions for autonomous operations using simulators, as well as testing at sea in various environmental conditions - the best way to combine different sensor technologies in different working and climatic conditions is a subject of discussion;
4. Research to understand the changed and new risks posed by innovation, based on the experience of the maritime industry in systematic and comprehensive risk assessment, to develop new approaches.
The viability of this business requires participants whose input makes it possible to implement the concept project. These include regulators, insurers, classification societies, ship managers, shipowners, shipyards, etc. But a viable shipping business also requires breaking certain rules, for example, the maritime industry needs to overcome its conservative nature if it wants to benefit from new solutions, and society should make digital decisions as improving the quality of life, and not threatening it.
4. Acknowledgements
We thank the anonymous reviewers for their important and valuable suggestions. We wish to thank V. Kychak, prof., I. Trotsyshyn, prof., O. Punchenko, prof., G. Bortnyk, prof. for their insightful comments on earlier drafts.
We would also like to thank Vinnitsa National Technical University for the application of theoretical and practical research in the R&D "Development of the theory and methodology of digital radio signal processing in real time" (Ministry of Education and Science of Ukraine, Vinnitsa National Technical University); R&D "Development of methods for designing a fiber-optic transmission system" (Ltd "Budivelnik-3", Vinnitsa National Technical University).
5. References
[1] N. Punchenko, G. Kovalova O.Tsyra, M. Levkovska, V. Solodka. " High-precision technologies for hydro-acoustic studies of complex bottom relief are one of the areas of the special economic zone of the high-tech park." Proceedings of the 1st International Conference on Intellectual Systems and Information Technologies (ISIT) (2019): http://ceur-ws.org ISSN 1613-0073 Published on CEUR-WS: 24-Sep-2020 ONLINE: http://ceur-ws.org/Vol-2683/URN: urn:nbn:de:0074-2683-1 ARCHIVE: http://sunsite.informatik.rwth-aachen.de/ftp/pub/publications/CEUR-WS/Vol-2683.zip, pp. 58-60.
[2] Vybornov, Ruslan A., Problems of winter navigation of river transport in the Russian Federation / Young scientist (2016), № 13.1 (117.1) pp. 27-29. URL: https://moluch.ru/archive/117/28934/ (date of access: 07/04/2021).
[3] N. Punchenko. Praxeology of unmanned water transport vehicles, risks of autonomous systems, International scientific-practical conference “Information technologies and computer modeling ITKM-2021”. July 5 - 10, 2021, Ivano-Frankivsk.
[4] Trotsyshyn, I., Shokotko, G., Strelbitskiy, V. New Technologies and Precision Measuring Transformations Radiosignals and the Perspectives of Use of their use for Systems of Control with safe Literal Appliances (UAVs) (2019) 2018 International Scientific-Practical Conference on Problems of Infocommunications Science and Technology, PIC S and T 2018 – Proceedin, pp. 685-690.
[5] S-200 Data Modelling, https://www.iala-aism.org/technical/data-modelling/
[6] https://www.spb.kp.ru/daily/27148.5/42435 34/
[7] AAWA. (2016). Autonomous ships: The next step. [Electronic resource]. URL: http://www.rollsroyce.com/~/media/Files/R/Rolls- Royce/documents/customers/marine/ship-intel/rr-ship-intel-aawa-8pg.pdf.
[8] Maltsev, G. N. Modern approaches to determining the level of autonomy of space vehicles / G. N. Maltsev, V. L. Yakimov // Information control systems (2017), № 2. — URL: https: //rucont.ru/efd/596813 (date accessed: 12.07.2021) pp. 34-43.
120

Construction Of Models Of Monitoring Agents On Several Reference Forms Dmytro Tolbatov 1, Serhii Holub 2
1 Institute of Mathematical Machines & Systems Problems of the NAS of Ukraine, Academic Glushkov 42, Kyiv, 03187, Ukraine
2 Cherkasy State Technological University, Shevchenko 460, Cherkasy, 18000, Ukraine
Abstract Various intelligent agents are already being used and studied in the world. Sometimes people may not even realize that they are using smart agents in their life. In our work, we investigated monitoring agents which task is to transform information. One of the areas of use of monitoring agents is the financial exchange, which makes this work interesting for a wide range of people. Keywords 1 Intelligent agent, GMDH, stock market
1. Introduction
The use of an agent approach to build monitoring information systems (MIS) is the basis of the concept of intelligent monitoring [7]. MIS agents perform their tasks by processing and transforming the results of observations in order to provide information on decision-making processes in a given area [8]. The results of observations are contained in databases in the form of tables with measured values of the characteristics of the monitored objects. The agent model synthesizer builds a model of the dependence of the state of the object on the signs of external influences. The agent builds its model in the form of a neural network, a polynomial obtained by genetic algorithms, GMDH algorithms [10] or various combinations of these three components [9]. An adequate, accurate and stable model is the solution of one of the typical tasks - grouping, identification, forecasting and others. The content of the task is formed in accordance with the monitoring task of the agent. This paper presents the results of research to improve the method of synthesis of the agent model by the GMDH method [10] in the process of its adaptation to the conditions of financial monitoring of stock indicators.
1EMAIL: [email protected] (A. 1); [email protected] (A. 2); ORCID: 0000-0001-6418-2075 (A. 1); 0000-0002-5523-6120 (A. 2);
2. Usage of Agents Models
In modern world, intelligent agents are widely used in various industries, social and political spheres. Agent models are a powerful tool for studying the object of monitoring, which allows to describe complex phenomena through simple objects [6]. According to Kosenko OP [2], in the modern world the monitoring of indicators is ordered and used primarily by users whose activities are related to making specific decisions. With amendments to a specific business, the multi-agent system is able to issue its forecasts at a fairly high level in various areas of economic and industrial activity. This gives us a reason to use in our work agent forecasting model of the agent to provide a potential player in the exchange with reliable data.
Different scientists give different definitions of an agent, but in general, an agent is a stand-alone complex program with a detailed description of its behavior, which is able to obtain information from the environment and based on their experience to respond correctly. Very often intellectual agents are closely intertwined in the field of use with artificial intelligence, but there is no complete identity between them [1, 4, 5].
Sometimes, smart agents are considered in combination with other agents. This structure is
121

called a multiagent system. It allows you to solve a problem even more effectively. Agents need to consider interacting with other agents for cooperation or competition. That is, if a goal is unattainable for one agent, then several agents can cope with it, or if each of the agents is developed to solve a specific problem, then the solution is the one that should have the best result [1, 4].
The most famous examples of intelligent agents in the world are Alexa (from Amazon), and Siri (from Apple). They process the user's request, collect data from the Internet and provide a response. They are often used to obtain information about the weather or weather forecast.
Professor Russell identified the following main characteristics of the agent: survivability (code works constantly and decides when to take action), autonomy (the agent makes decisions without human intervention), social behavior (they can be involved through other components) and reactivity (perceive and respond on the context in which they are) [5].
There are two reasons that led to the development of intelligent agents. The first is the use of computer science. There are more and more different technical devices in the world, such as computers, servers, mobile phones, tablets, which in turn can be connected to the network, and those to the Internet. Previously, the number of connection points was less than the number of users, but today each of us can have several different devices. Computing resources are improving day by day, but the amount of data is growing even faster. All this contributes to the complexity of systems and their algorithms. To facilitate data handling, systems are divided into smaller subsystems. It is to solve such problems that there are intelligent agents who study them at a high level of abstraction. The second reason is the development of society. Clever agents play a significant role in analyzing patterns of human interaction in different situations. People can independently predict the behavior of other people, conduct negotiations and discussions, resolve conflicts, form organizational structures. All this can also be analyzed and used by a smart system. This is done by an intelligent agent who can make decisions or execute assignments based on experience, nested data and environment. They can also be used to collect real-time information [4].
The purpose of creating an agent model and the process of building it depends on the order of the decision maker. This order can be executed by
agents of several types. Today, intelligent agents are divided into the following types [2]:
● Reflex agents. The agent responds based on pre-established rules by ignoring the history of previous responses; ● Model-based agents. They respond in the same way as reflexes, but have a fuller view of the environment. ● Goal-based agents extend model-based agents, including information about goals and desired situations. ● Utility-based agents are similar to target agents, but evaluate each possible scenario and select the one that will work best. ● Learning agents are agents who have mechanisms for continuous development and improvement through the processing of results. Vicent J. presents three works related to agent-
oriented programming [6]. The first work shows how accountability plays a central role in the development of MAS. Accountability is a well-known key resource within human organizations, and the idea of this proposal is to offer the design of agent systems where accountability is a property that is guaranteed by design. The authors proposed an interaction protocol called ADOPT, which allows the implementation of accountable organizations MAS. The proposed protocol was implemented using JaCaMo, which allows to demonstrate how to develop agents.
The second paper proposes a new methodology for developing MAS work in semantic web environments. The proposed methodology is based on a specific area. A modeling language called the Agent Semantic Web Language. The training was demonstrated through a case study conducted using the well-known JACK platform. The proposed example consists of a set of agents who exchange services or goods of the owners according to their preferences, without using any currency.
Finally, the third work presented the structure of agent development for mobile devices. The proposed structure allows users to create intelligent agents with typical agent-oriented attributes of social abilities, reactivity, proactivity and autonomy. In fact, the main contribution is the related support of the data framework. Supporting related data corresponds to the ability to convey the beliefs of the agent related data environment and use these beliefs during the planning process [6].
Previously, the effectiveness of the procedures for reducing the compatibility of signals due to the
122

use of models of several reference forms on each row of selection of a polynomial model was proved [3]. As a result, the simulation error is reduced by 11.5% compared to the better model obtained by the traditional multi-row GMDH algorithm [3]. There is an increase in the diversity of the agent synthesizer due to the increasing adaptability of the synthesis process of agent models to changes in the properties of the input data arrays.
3. Statement of the Research Task
In the process of using the described technologies to build a forecast model of the monitoring agent, it turned out that there are cases when the variety of proposed methods of model synthesis is not enough to adequately describe the processes of price changes on the stock exchange. Therefore, there is a need for additional research on the processes of synthesis of agent models with several reference forms for their adaptation to the conditions of a given subject area.
At the beginning of the synthesis of the model, the results of observations of the price of gold bonds at the close of trading on the stock exchange are known, where zt – the price of a gold bond at the time of the last observation, t – the value of the time of the last observation during the historical period;
which are recorded over a discrete period of time in one day:
Δt = t - t-1= t-1 - t-2 = 1. (1)
During historical period T: T = {t, t-1, t-2,…, t-m}. (2)
A predefined list of features of influencing factors that are used as independent variables.
X = {x1, x2, …, xn}, (3)
where n – the number of signs of influencing factors.
It is necessary to build a forecast model Zt+1 = f(X, T, Δt) (4)
4. Research and Results
We propose to improve the method of model synthesis using several reference forms in agent synthesizers. The main task of the agent is to transform information from a matrix of numerical characteristics into the form of a model.
Depending on the simulation results, the system issues a status change message. At the input, the system adopts a multi-row GMDH algorithm and a method of model synthesis, according to which, with each row of selections, models with several reference forms are generated and then the best ones are selected. In the course of the research we determined that, in contrast to the existing method, where models of 6 reference forms were generated on each row of selection [3], for the best result of forecasting the value of gold bonds we should use models of two reference forms given in Table 1.
Table 1 Reference model forms
Reference form 1
A₀ + A₁ * X₀ + A₂ * X₁ + A₃ * X₀
* X₁ + A₄ * X₀² + A₅ * X₁² + A₆ *
X₀² * X₁ + A₇ * X₀ * X₁² + A₈ *
X₀² * X₁²
Reference form 2
A₀ + A₁ * X₀ + A₂ * X₁ + A₃ * X₀
* X₁ + A₄ * X₀² + A₅ * X₁²
Data for the array of observation results were
taken from financial exchange reports on the Yahoo website [11] from 2016 to 2021. An array of 1260 observation points was fed to the input of the agent synthesizer. A fragment of this array is presented in table 2.
As a simulated feature (dependent variable) used prices at the time of closing the exchange. The following were used as influential features (independent variables):
● the stock index, the basket of which includes the US joint stock companies with the largest capitalization, ● price of Australian dollar, ● exchange-traded investment fund specializing in treasury forms under fixed-term contracts of 7-10 years, ● exchange-traded investment fund specializing in treasury forms under fixed-term contracts of 1-3 years, ● the price of the Canadian dollar, ● international treasury bonds, a stock exchange investment fund that monitors the market consolidated index of fixed income securities, ● US dollar index
123

Table 2 Exchange data (gold). A fragment of an array of input data
Date Open High Low Close Adj Close Volume
Mar 18, 2021 161.15 162.82 161.11 162.56 162.56 8,711,100 Mar 17, 2021 162.27 164.15 161.48 161.48 163.51 12,626,700 Mar 16, 2021 162.36 163.20 161.81 162.35 162.35 7,547,400 Mar 15, 2021 162.31 162.55 161.43 162.20 162.20 8,104,500 Mar 12, 2021 159.54 161.69 159.35 161.49 161.49 8,608,500 Mar 11, 2021 161.47 161.98 161.12 161.52 161.52 6,749,200 Mar 10, 2021 161.06 161.78 160.66 161.66 161.66 7,962,000 Mar 09, 2021 160.75 161.25 160.42 160.84 160.84 10,382,600 Mar 08, 2021 158.58 158.74 157.13 157.49 157.49 12,134,900 Mar 05, 2021 159.66 159.82 158.55 159.14 159.14 12,821,600
The last 10 points formed a test sequence.
These points did not participate in the creation of the model and were used to calculate the forecasting error.
In fig. 1 presents the test results of agent models.
Figure 1: Error in predicting the value of gold at
test observation points
The average signal error at the output of the agent model, built on the advanced method, became 0.9%. The error of the model built by the known method was 2.69%. Thus, the use in the synthesis process on each row of selection of models with reference forms, given in table. 1, allowed to reduce the average forecasting error by 10 points by 61.77%.
In addition, we noticed that with a relatively small amount of data, multi-row GMDH can not accurately produce results, in contrast to the algorithm with models of two forms, which even with such a large amount of data could work at standard deviation 2.146009 (see Fig.2).
If you increase the amount of data to 500, the multi-row algorithm starts to work much better (standard deviation - 6.642833), but the proposed algorithm in this case works also good (standard deviation - 5.757732) (see Fig. 3).
Figure 2: Comparison of GMDH methods with
low amount of data
Figure 3: Comparison of GMDH methods with
500 rows of data
5. Conclusions
Generation on each row of selection of models with several reference forms, allows to increase a
0,00%
1,00%
2,00%
3,00%
4,00%
5,00%
1 2 3 4 5 6 7 8 9 10
fore
cast
ing
erro
r
Predicted observation pointExisting New
0
50
100
150
Original New Standard
110
115
120
125
130
Original New Standard
124

variety of agent synthesizers. To adapt the processes of model synthesis according to the multi-row GMDH algorithm to the properties of the input data array, it is necessary to optimize the list of reference forms of models. For each input array, the list of reference forms of the models used in each row of selection must be determined separately.
Improving the process of building models with an agent synthesizer can increase the efficiency of the task of the agent as a whole. In addition, it was found that with a small amount of input data, an improved method of synthesis of models with two reference forms is able to build useful models with fewer observation points.
Future research will focus on the study of monitoring agents based on methods based on the combinatorial GMDH algorithm.
6. References
[1] Abbas H. Organization of Multi-Agent Systems [Electronic resource] / H. Abbas. – Available from: http://www.sciencepublishinggroup.com/journal/paperinfo.aspx?journalid=135&doi=10.11648/j.ijiis.20150403.11/
[2] Kosenko O. Monitoring the Commercial Potential Intellectual Technologies [Electronic resource] / O. Kosenko – Available from: http://repository.kpi.kharkov.ua/bitstream/KhPI-Press/48789/1/visnyk_NULP_2014_799_Kosenko_Monitoring.pdf
[3] Holub S.V. Znyzhenya sumishenosti sygnaliv v metodah syntezu induktyvnyh modelei / S.V. Holub // Visnyk Hmelnytskoho natsionalnoho universytetu. – 2007. – Т.2, P.1, №1. – P. 31–35.
[4] TechTarget Contributor Intelligent Agent [Electronic resource] / TechTarget Contributor – Available from: https://searchenterpriseai.techtarget.com/definition/agent-intelligent-agent
[5] Russel S., Norving P. Artificial intelligence - a modern approach . Pearson, 2021. – 1069 p.
[6] Vicente J. Multi-Agent Systems [Electronic resource] / J. Vicente. – Available from: https://www.researchgate.net/publication/332199176_Multi-Agent_Systems
[7] Holub Serhii, Kunytska Svitlana. The concept of multi-agent intellectual monitoring systems. Projekt interdyscyplinarny projektem XXI wieku - Tom 2. Processing, transmission and security of information. Monogrpahia: Wydawnictwo naukowe Akademii Techniczno-Humanistycznej w Bielsku-Bialej. – 2019. – S. 183-188. ISBN: 978-83-66249-25-7
[8] Kunytska S., Holub S. Multi-agent Monitoring Information Systems. In: Palagin A., Anisimov A., Morozov A., Shkarlet S. (eds) Mathematical Modeling and Simulation of Systems. MODS 2019. Advances in Intelligent Systems and Computing, vol 1019. pp 164-171. Springer, Cham. https://doi.org/10.1007/978-3-030-25741-5_17
[9] Holub S.V. Bahatorivneve modeliuvania v technologiah monitorynhu otochuuchogo seredovyscha. Monography. Cherkasy: Bohdan Hmelnytskii CNU, 2007. – 220 p. ISBN 978-966-353-062-8
[10] Ivakhnenko A., Stekasko V.: Impulse immunity modeling. Kyiv: Scientific Opinion, рp 216. (1985)
[11] SPDR Gold Shares [Electronic resource] – Available from: https://finance.yahoo.com/quote/GLD/history?p=GLD&guccounter=1
125

Development Of a Method For Deciding On The Distribution Of Efforts To Destroy The Air Enemy Between Anti-Aircraft Missile Forces And Fighter Aircraft Maksim Pavlenko 1, Dmytro Kalinovskiy 2, Nataliya Garmash 3
1,2,3 Ivan Kozhedub Kharkiv National Air Force University, Sumska st. 77/79, Kharkiv, 61023, Ukraine
Abstract The publication shows the possibility of using the mathematical apparatus of the multicriteria method of analysis of hierarchies in conjunction with the theory of fuzzy sets, at the stage of assessing the significance of selected parameters that affect the distribution of forces and means in accordance with the conditions of the task, during the task. Binary operations of symmetric difference and drastic sum are used to determine the set of alternatives for the joint use of fighter aircraft and anti-aircraft missile forces, taking into account the projected loss estimate. The conducted mathematical apparatus makes it possible to form a set of rules on the basis of which it is possible to make a decision on the distribution of efforts to destroy the air enemy. Using the method of analysis of hierarchies at one of the stages uses fuzzy logic to form a measure of evaluation of the parameters being evaluated, but the end result has an exact value that requires recalculation when changing at least one of the parameters. Instead, using set theory, namely the operation of symmetric difference and drastic sum, it is possible to determine the set of values that forms alternative decision-making depending on the result obtained. That is, the target that will be in a certain range will be immediately distributed relative to the fighter aircraft and anti-aircraft missile forces, without recalculating the parameters and their coefficients relative to each other. Keywords1 Method of analysis of hierarchies, fuzzy sets, evaluation criterion, symmetric difference, drastic sum.
1. Introduction
The experience of wars and armed conflicts of the twentieth and twenty-first centuries shows a significant increase in the use of air strikes [4]. The capabilities of air strikes are evolving along with scientific and technological progress, which allows them to solve not only tactical but also strategic tasks. Instead, the use of air defense is not only a defense system against air strikes but also a deterrent, the impact of which is assessed in the first place. The increase in the number of tasks before the means of air attack correlates with the number of tasks performed by air defense, namely [1, 2]:
destruction of enemy air attack means;
EMAIL: [email protected] (A. 1); [email protected] (A. 2); [email protected] (A. 3) ORCID: 0000-0003-3216-1864 (A. 1); 0000-0003-3184-6458 (A. 2); 0000-0002-8840-2797 (A. 3)
gaining and maintaining an advantage in the air;
destruction of unmanned aerial vehicles, which are used in the conditions of hybrid warfare, and represent an element of uncertainty for a set of means of automation or automated control system and require a clear definition (shock or reconnaissance);
cover of important state and military facilities, their transformation into the national defense system of Ukraine;
increasing the level of combat capability of the Armed Forces of Ukraine and other components of the defense forces with the achievement and maintenance of certain capabilities for fire defeat of the enemy.
The effectiveness of joint combat use of troops (forces) in repelling air strikes is achieved by
126

realizing their combat capabilities under the condition of coordinated interaction and centralized management, a single automated control system using the decision support system (DSS). It is also necessary to take into account the scale, nature of the actions of the means of air attack, combat composition, combat capabilities, weather and geographical conditions.
The decision on the distribution of efforts in the destruction of air between the anti-aircraft missile forces and fighter aircraft is made by the decision-maker on the basis of proposed alternative solutions to DSS. However, the decision-maker will use the received recommendations only if he trusts this system, and his trust can be built on the degree of validity of the recommendations.
Therefore, at present, the question of choosing a mathematical decision-making apparatus remains relevant, with the possibility of explaining the recommendations in DSS, which provides proposals for the distribution of efforts in the destruction of air strikes between anti-aircraft missiles and fighter aircraft.
2. The main part
The distribution of efforts is carried out in order to achieve the maximum effect in the destruction of air attack means by joint efforts, as well as to ensure the safety of their aircraft. Given the fact that anti-aircraft missile forces can be used for ground (surface) purposes, it follows that the scope is common.
Depending on the combat capabilities and the nature of the tasks to be solved, fighter aircraft and anti-aircraft missile forces share efforts:
• in space (in directions, boundaries, areas, strips, sectors, zones, altitudes);
• by time; • method of performing the task [3].
The distribution of goals according to the forces that must be allocated for their destruction is carried out by the decision-maker from a particular point of control. To make such decisions requires not only a preliminary assessment of the conditions of use of troops (forces) but also an assessment of the relative losses that can be achieved on the one hand and on the other, resource indicators and time parameters from analysis of the situation to completion of the combat mission.
Determine the sequence of calculations using the method of analysis of hierarchies (MAH) [5, 6, 7], which includes the steps:
1. Selection of troops (forces) of fighter aircraft and anti-aircraft missile forces in accordance with the existing ones;
2. Determination of sets of parameters that characterize certain troops (forces) (tactical and technical capabilities; time of readiness to perform the task; means of destruction used; training of personnel; preparation for re-use; others);
3. The choice of quality indicators that are compared (quality indicators in turn can be both local and global, which directly affects the priority of the parameter);
4. Calculation of the generalized criterion (global assessment for each fighter or anti-aircraft missile system, fighter aircraft and anti-aircraft missile forces in general relative to others).
Since MAН is based on estimates of the degree of influence of lower hierarchy factors on the criteria and indicators of higher levels of the hierarchy, we assume that the more factors and indicators will be taken into account, the more accurate the final result will be. On the other hand, the assessment of the significance of some parameters may be insignificant in comparison with other estimates of parameters, which implies the effect of insignificance of the selected parameters, which will give a negligible advantage to the parameters that should not be considered at all.
To select the optimal grouping of troops (forces) that will be tasked, we use the algorithm of expert assessment of the impact of the characteristics of complex technical systems on quality indicators, proposed by T. Saaty using a nine-point scale for comparing alternatives Tab. 1. However, this measure of comparison is not a dogma and, if necessary, it is possible to use your own.
If several experts take part in the assessment, the assessment is agreed by consensus, or each expert builds his own table, and the estimates are presented as geometric averages.
It is important to emphasize the importance of choosing the right priorities, because in the case of a gross mistake, the priority may not be important, but important will be ignored, which will lead to the accumulation of error or even error and making the wrong decision. Therefore, for a more accurate assessment, you need to specify a more accurate set of input data, assess their
127

reliability, as well as take into account possible errors.
Table 1 Comparison of alternatives
Relative importance
Definition Explanation
1 Equal importance of indicators Equal contribution of two indicators to the
assessment
3 A slight advantage of one over
the other Experience and research give a slight advantage of
one indicator over another
5 Great advantage Experience and research give a great advantage of
one indicator over another
7 A significant advantage The advantage is so strong that it becomes
significant
9 Full advantage The obvious advantage is most fully confirmed
2,4,6,8 Intermediate values Used as an alternative
After calculations, we obtain a matrix of
priorities in accordance with certain conditions (known). This will allow you to make a decision on the distribution of effort on the basis of the average value, or using special data analysis software [8] to determine at what level of the hierarchy the defined indicators have the greatest impact.
For example, using a color gradation of the appropriate range. However, changing the conditions of the task, taking into account the risks or making a decision in conditions of complete uncertainty requires a recalculation of the priorities of the parameters on the basis of new input data.
Although the set of comparative alternatives is used at the stage of expert evaluation in MAH, it affects only the initial level of evaluation of coefficients, which does not allow to determine the set of alternatives of the final result. Using instead of the specified exact value, a fuzzy unlimited multivalued estimate, we can increase the set of values, all values of which satisfy the task and are within acceptable limits. However, when considering the distribution of efforts in one area, the security of their troops (forces) remains essential, so the set of targets set for fighter aircraft should not intersect with multiple targets that will apply to anti-aircraft missile forces, unless they operate jointly in one area but separated by sometimes.
Therefore, it would be rational to apply a symmetrical difference (drastic product A B ) [9, 10, 11] of two sets where A is the set of targets that will be attributed to the targets of fighter aircraft and B is the set of targets that will be attributed to the targets of anti-aircraft missile forces.
Also ( A B ) based on the definition ( ) \ (A B)A B can be described as Fig.1., that is, a set that includes all elements of both sets that are not common to the two sets or ( \ ) (В\ А)A B , a set that includes all elements of the first set that are not included in the second set, as well as elements of the second set that are not included in the first set.
Figure 1: Image of the symmetric difference of sets A and B using Euler circles
128

Using a system of algebraic equations can be represented as follows:
( ), ( ) 1( ) ( ), ( ) 1
0 ,
B A
A B A B
m x if m x for x Xm x m x i
in other casesf m x for x X
=
= =
(1)
where X is the set of real numbers, ( )Am x is the set of targets of fighter aircraft, ( )Bm x is the set of targets of anti-aircraft missile forces.
From the point of view of the use of fighter aircraft and anti-aircraft missile forces, it can be described as used jointly in one area but divided into ranges, in the purpose for which fighter aircraft are used, anti-aircraft missile forces are not considered and vice versa.
On the other hand, it is necessary to consider the whole set of purposes for which fighter aircraft and anti-aircraft missile forces can be used based on their capabilities, given the limit of joint use to determine this set, we use a drastic sum ( A B ) which can be written as:
( ), ( ) 0( ) ( ), ( ) 0
1 ,
B A
A B A B
m x if m x for x Xm x m x i
in other casesf m x for x X
=
= =
(2)
In the case of the use of a symmetric sum, a set of purposes became known which can be considered for joint use, and in the case of the use of a drastic sum using the previously described max( )A B
, we define the boundaries of joint use, which can be described as:
max( ( )), min( ( )) 0( ) max( ( )), min( ( )) 0 ,
1
B A
A B A B
m x if m x for x Xm x m x if m x fo
in other casesr x X
=
= =
(3)
then the symmetric difference can be written as:
min( ( )), max( ( )) 1( ) min( ( )), max( ( )) 1 ,
0
B A
A B A B
m x if m x for x Xm x m x if m x fo
in other casesr x X
=
= =
(4)
Using a symmetrical difference and a drastic sum to determine the boundaries of alternatives to the decision to use fighter aircraft and anti-aircraft missile forces, there are other cases in which joint use will take place.
Let us denote the joint application by , since it is necessary to consider all possible cases, then the system of equations of the drastic sum takes the form:
( ), ( ) 0( ) ( ), ( ) 0 ,
B A
A B A B
A B
m x if m x for x Xm x m x if m x for x X
=
= =
(5)
Symmetrical difference, respectively. Given the safety of joint use, we define the set
C - the estimated estimate of the loss of fighter aircraft and D - the estimated estimate of the loss of anti-aircraft missile forces in joint use. Based on the above use, we must take into account that the projected loss estimate will be relative to the set of common use, so similarly use the symmetric difference and the drastic sum to determine
( )C Dk xand ( )C Dk x
where ( )Ck x and ( )Dk x - the set of projected losses.
To determine the set of decision-making alternatives, taking into account the projected estimate of losses when used together, consider max( )A B
, min( )A B and max( )C D
,min( )C D
, in the figure it will look like a limit, and its division is described by determining the maximum of the maximum allowable value and the minimum of the minimum allowable. We get:
max( ) max(max( ( )) max(max( ( ))A B B Am x m x = (6)
min( ) min(min( ( )) min(min( ( ))A B B Am x m x = (7)
Accordingly, for max( )C D , min( )C D
. Using Euler's circles, the set of decisions takes the form of Fig.2
Figure 2: A variant of many decision-making alternatives
To describe the knowledge for decision-making based on the given set of values, we use the production model [12, 13]. In our case we can form the following rules:
129

1. If max( ) max( )A B C D then use fighter
aircraft; 2. If min( ) min( )A B C D
then use anti-aircraft missile forces;
3. If max( ) min( )A B A B then joint use.
Otherwise, it is possible to form a set of hierarchically dependent rules depending on the level of the production model, or the level of hierarchy of the method of analysis of hierarchies.
3. Conclusions
The use of air strikes is a challenge, the response to which is the joint use of fighter aircraft and anti-aircraft missile forces, both in one air defense system and individually in certain areas. Their joint application encourages the development of methods and models that will allow the use of available forces and means with minimal costs and maximum planned effect.
Using the method of analysis of hierarchies at one of the stages uses fuzzy logic to form a measure of evaluation of the parameters being evaluated, but the end result has an exact value that requires recalculation when changing at least one of the parameters. Instead, using set theory, namely the operation of symmetric difference and drastic sum, it is possible to determine the set of values that forms alternative decision-making depending on the result obtained. That is, the target that will be in a certain range will be immediately distributed in relation to fighter aircraft or anti-aircraft missile forces, without recalculating the parameters and their coefficients relative to each other.
4. References
[1] Military Security Strategy of Ukraine. URL: https://www.president.gov.ua/documents/1212021-37661
[2] Strategic Defense Bulletin of Ukraine / NSC of Ukraine 2013. – P. 22–23.
[3] Toropchin A. Ya., Romanenko I. O. and Danik Yu. G. (2003), “Dovidnyk z protypovitrianoi oborony” [Air Defense Reference Book], Kyiv, 366 p.
[4] Yermoshin M. O. and Feday V. M. (2004), “Borotba v povitri” [Fighting in the air], Kharkiv, 384 p.
[5] Saaty T. L. Axiomatic foundation of the analytic hierarchy process//Management
Science. 1986, July. – Vol. 32, №7. – P. 841-855.
[6] Saaty T. L. Decision making. “Hierarchy analysis method" М.: 1993.- 320 p.
[7] Unmanned aerial vehicles: Methods of comparative assessment of combat capabilities / Mitrahovich M. M., Silkov V. I., Samkov A. V., Burshtynskaya H. V., Stankevich S. A., Semenov V. B. 2012. - 288 p.
[8] Perform analysis of complex data. https://support.microsoft.com
[9] Mathematical apparatus of artificial intelligence in power systems / Kirik V. V. - Kyiv: 2019. - 224p. ISBN 978-966-622-969-7
[10] Applied fuzzy systems/ edited by T. Terano, K. Asai, М. Sugeno 1993. 368 p. ISBN 5-03-002326-7
[11] Fuzzy model-digging and management / A. Pegat; lane. with English - 2nd ed. - М.: BINOM. Laboratory of Knowledge, 2013. - 798 p.: ill. - (Adaptive and intelligent systems). - ISBN 978-5-9963-1495-9
[12] Estimation of reliability of decision-making methods on the generalized indicator of quality of production with use of fuzzy sets / Zubretskaya N. A, Fedin S. S // Information processing systems. - 2015. - № 5 (130). - P. 93 - 96.
[13] Construction of a production knowledge base using an adaptive neural network / A. Savelyev // VESTNIK AGTU. - 2007. - № 1 (36) - S. 144—149.
130

Monitoring Agents Of Stock Exchanges Dmytro Tolbatov 1, Serhii Holub 2
1 Institute of Mathematical Machines & Systems Problems of the NAS of Ukraine, Academic Glushkov 42, Kyiv, 03187, Ukraine
2 Cherkasy State Technological University, Shevchenko 460, Cherkasy, 18000, Ukraine
Abstract Intelligent agents are extremely common nowadays. They are used in almost every field of activity. We decided to investigate monitoring agents, namely their use in forecasting the performance of financial exchanges. The process of synthesis of models by the multiline algorithm of group method of data handling was investigated. The method of model synthesis with generation of reference models of several types on one row of selection is improved. The list of reference types for solving the problem of forecasting stock market indicators is optimized. Keywords 1 Intelligent agent, stock exchange, agent synthesizer, model synthesis, neural network
1. Introduction
The main concept of intelligent monitoring is the use of an agent approach to build monitoring information systems (MIS) [2]. MIS agents work by processing the results of monitoring in order to provide information on decision-making processes [3]. Agent model synthesizer builds a model of the dependence of the state of the object on the signs of external influences. The agent builds its model in the form of a neural network, a polynomial obtained by genetic algorithms, group method of data handling (GMDH) algorithms [5] or various combinations of these three components [4]. An adequate, accurate and stable model is the solution of one of the typical tasks - grouping, identification, forecasting and others. The content of the task is formed in accordance with the monitoring task of the agent. This paper presents the results of research to improve the method of synthesis of the agent model by the GMDH method [5] in the process of its adaptation to the conditions of financial monitoring of stock indicators.
1EMAIL: [email protected] (A. 1); [email protected] (A. 2); ORCID: 0000-0001-6418-2075 (A. 1); 0000-0002-5523-6120 (A. 2);
2. Results of the Research
We propose to improve the method of model synthesis using several reference forms in agent synthesizers. The main task of the agent is to transform information from a matrix of numerical characteristics into the form of a model. Depending on the simulation results, the system issues a status change message. At the input, the system adopts a multi-row GMDH algorithm and a method of model synthesis, according to which, with each row of selections, models with several reference forms are generated and then the best ones are selected. In the course of the study we determined that, in contrast to the existing method, where models of 6 reference forms were generated on each row of selection [1], for the best result of forecasting the value of gold bonds we should use models of two reference forms given in table 1.
As a simulated feature (dependent variable) used prices at the time of closing the exchange. The following were used as influential features (independent variables):
● the stock index, the basket of which includes the US joint stock companies with the largest capitalization,
● price of Australian dollar,
131

● exchange-traded investment fund specializing in treasury forms under fixed-term contracts of 7-10 years,
● exchange-traded investment fund specializing in treasury forms under fixed-term contracts of 1-3 years,
● the price of the Canadian dollar, ● international treasury bonds, a stock
exchange investment fund that monitors the market consolidated index of fixed income securities,
● US dollar index.
Table 1 Reference model forms
Reference form 1 A₀ + A₁ * X₀ + A₂ * X₁ + A₃ * X₀ * X₁ + A₄ * X₀² + A₅ * X₁² + A₆ * X₀² * X₁ + A₇ * X₀ * X₁² + A₈ * X₀² * X₁²
Reference form 2 A₀ + A₁ * X₀ + A₂ * X₁ + A₃ * X₀ * X₁ + A₄ * X₀² + A₅ * X₁²
The last 10 points formed a sequence of tests.
These items were not involved in the creation of the model and were used to calculate the forecasting error.
The average signal error at the output of the agent model, built on the advanced method, was 0.9%. The error of the model constructed by the known method was 2.69%. Thus, the use in the synthesis process on each line of selection of models with reference forms, is given in table. 1, allowed to reduce the average forecasting error by 10 points by 61.77%.
In addition, we noticed that with a relatively small amount of data, the multi-row Mobile Satellite Users Association (MSUA) cannot give accurate results, in contrast to the algorithm with models of two forms, which even with such a large amount of data can work with a standard deviation of 2.146009.
3. Conclusions
Generation on each row of selection of models with several reference forms, allows to increase a variety of agent synthesizers. To adapt the processes of model synthesis according to the multi-row GMDH algorithm to the properties of the input data array, it is necessary to optimize the list of reference forms of models. For each input array, the list of reference forms of the models used in each row of selection must be determined separately.
Improving the process of building models with an agent synthesizer can increase the efficiency of the task of the agent as a whole.
4. References
[1] Holub S.V. Znyzhenya sumishenosti sygnaliv v metodah syntezu induktyvnyh modelei / S.V. Holub // Visnyk Hmelnytskoho natsionalnoho universytetu. – 2007. – Т.2, P.1, №1. – P. 31–35.
[2] Holub Serhii, Kunytska Svitlana. The concept of multi-agent intellectual monitoring systems. Projekt interdyscyplinarny projektem XXI wieku - Tom 2. Processing, transmission and security of information. Monogrpahia: Wydawnictwo naukowe Akademii Techniczno-Humanistycznej w Bielsku-Bialej. – 2019. – S. 183-188. ISBN: 978-83-66249-25-7
[3] Kunytska S., Holub S. Multi-agent Monitoring Information Systems. In: Palagin A., Anisimov A., Morozov A., Shkarlet S. (eds) Mathematical Modeling and Simulation of Systems. MODS 2019. Advances in Intelligent Systems and Computing, vol 1019. pp 164-171. Springer, Cham. https://doi.org/10.1007/978-3-030-25741-5_17
[4] Holub S.V. Bahatorivneve modeliuvania v technologiah monitorynhu otochuuchogo seredovyscha. Monography. Cherkasy: Bohdan Hmelnytskii CNU, 2007. – 220 p. ISBN 978-966-353-062-8
[5] Ivakhnenko A., Stekasko V.: Impulse immunity modeling. Kyiv: Scientific Opinion, рp 216. (1985)
132

Definition Of The Concept Of "Competitiveness" And "Competitive Advantages" Of Water Transport In The Conditions Of Digital Transformation Of Ukraine Svitlana Ilchenko 1, Vadym Gryshchenko 2 and Iryna Gryshchenko 3
1,2,3 Institute of Market Problems and Economic-Ecological Research of the National Academy of Sciences of Ukraine, Frantsuzskiy Boulevard, 29, Odesa, 65044, Ukraine.
Abstract One of the key points that determine the actuality of the study is that increasing the level of competitiveness of both individual business entities and sectors of the economy (task 8.2, SDG 8) is the basis for the sustainable economic development of Ukraine in the conditions of digitalization. Issues related to the definition of the competitiveness of water transport deserve special attention because water transport is a rather specific branch of the economy and provides the largest volume of international freight in the world. The authors of the article analyze modern approaches to the content of such categories as "competitiveness of water transport", "competitive advantages of water transport" and propose the author's definitions of these concepts taking into account the globalized processes of intellectualization of all types of economic activity, including transport. The results of the study suggest that in most cases, competitiveness can be defined as a complex indicator that covers a set of certain characteristics of the object under analysis, such as market share, productivity, and innovation capacity compared to an existing or imaginary benchmark. We propose to consider the competitiveness of water transport by separate types of water transport, each of which can be considered at one of four levels (international, sectoral, business entity level, and at the level of an individual transport service). This allows us to carefully examine the patterns of functioning and development in the face of rapid intellectualization processes of transport systems, identify gaps or inconsistencies with current global development trends at each level, and form an action algorithm for each of the four levels. Further research on competitiveness at the level of separate transport services, at business entities level, at sectoral and international levels, in general, can help to identify the competitive position of economic entities at the corresponding level and track changes in economic efficiency over time, will assess the competitiveness of water transport of Ukraine and develop recommendations for its integration into the European transport network. Such information is likely to be useful to CEOs, local governments, and public authorities in developing and implementing future policies to promote competitiveness increasing in the framework of Sustainable Development Goals for Ukraine, including tasks 8.2 (SDG 8) and task 9.1 (SDG 9). Keywords 1 Competition, competitive advantages, approach, evolution, theories of competition
1. Introduction
The results of the traditional competitiveness’ theories evolution analysis suggest that those that have most influenced the development of economic thought, from our point of view, are: the theory of absolute advantages (A. Smith [1]);
EMAIL: [email protected] (A. 1); [email protected] (A. 2); [email protected] (A. 3) ORCID: 0000-0001-6924-2225 (A. 1); 0000-0003-0009-605X (A. 2); 0000-0001-8801-3217 (A. 3)
theory of comparative advantages (D. Ricardo [2]); theory of innovative development (J. Schumpeter [3]); theory of competitive advantages (M. Porter [4, 5, 6]); theory of disruptive innovations (C. Christensen [7]), theory of "blue ocean strategy" (W. Chan Kim [8]) and the theory of competitive advantages
133

through collaboration (P. Gloor [9], A. MacCormac [10]).
Numerous scientific works of domestic and foreign authors are devoted to topical issues of sustainable economic development (B. Burkynskyi, N. Khumarova, M. Petrushenko, H. Shevchenko [11]), business development (O. Laiko, S. Kovalenko, O. Bilousov [12]), transport economics (P. Kelle, J. Song, M. Jin, H. Schneider, C. Claypool [13], S. Ilchenko, N. Khumarova, N. Maslii, M. Demianchuk, V. Skribans [14], S. Ilchenko [15], V. Gryshchenko and I. Gryshchenko [16], digitization of transport services (L. Ligonenko, A. Xripko, A. Domanskyj [17], M. Ustenko, A. Ruskyx [18], O. Gudz, S. Fedyunin, V. Shherbyna [19], M. Drashkovich, A. Dorokhov [20], V. Koval, G. Duginets, O. Plekhanova, A. Antonov, M. Petrova [21]) in the system of environmental and economic security (О. Dreval [22]). So, for example, І. Pereverzeva [23] notes that "to increase the competitiveness of transport enterprises…, in particular water transport, it is necessary to ensure the realization of the production potential of each enterprise and create a full-fledged transport infrastructure…". At the same time N. Fediai [24] notes that "in the road, maritime and aviation sectors, the Ukrainian transport system has a certain level of integration, while for inland water transport the integration process has not yet begun". It should be noted that N. Valiavska [25] emphasizes that "to increase competitiveness and unleash the potential of river transport, it is necessary to attract investment in its modernization and innovative development regularly". It is necessary to pay attention to the fact that «to most effectively disclose and use all the competitive advantages of inland water transport, and, accordingly, increase the volume of freight and passenger traffic by inland waterways, it is necessary, first of all, to have a clear action plan, to define specific strategic goals at the state level in the short and medium-term» [26]. Thus, "with this in mind, further research is needed to assess the impact of these factors on the functioning of the maritime complex of Ukraine, which positions itself as a maritime state, especially in the context of a comparative analysis of the competitiveness of Ukrainian water transport companies compared to major competitors in the world market." [27].
Most researchers theoretically describe competitiveness as a multidimensional relative concept and often associate it with market
mechanisms. Domestic and foreign scientists often consider this concept at the level of separate goods and services, at business entities level, at sectoral and international levels very close to such concepts as ability, system, relative characteristics, opportunity, competitive advantage, result, and goal.
At the same time, further research is needed to analyze modern approaches to the content of the categories "competitiveness of water transport" and "competitive advantages of water transport".
Given the above, the article aims to offer our definitions of the concepts of “competitiveness of water transport”, “competitive advantages of water transport”, and the approach to their grouping in terms of the dissemination of the processes of intellectualization of transport operations and informatization of the transport community.
2. Results
Of particular note are the issues related to the definition of the competitiveness of water transport, as water transport is a rather specific sector of the economy and provides the largest volume of international freight in the world.
The analysis of domestic and foreign literature sources suggests that there is no definition of such concepts as "competitiveness of water transport" and "competitive advantages of water transport" in the scientific literature.
In our opinion, the competitiveness of water transport can be considered at such four levels as the international level, the sectoral level, the level of the business entities, and the level of individual products or services. (Figure 1).
Competitiveness of water transport at the international level can be defined as the ability of the national transport industry to provide an adequate level of satisfaction of national needs for transportation of goods and passengers by sea and inland waterways compared to competitors, to maintain and improve its position in the international globalized transport market, and to provide the high economic efficiency in compliance with environmental standards, current legislation, and international agreements.
The competitiveness of water transport at the sectoral level is the ability of water transport to provide services, price, and non-price characteristics that are more favorable for the customer than other types of transport.
134

TYPES OF WATER
TRANSPORT
LEVELS OF COMPETITIVENESS
TYPES OF TRANSPORT
TYPES OF COMPETITIVENESS M
T
IWT
AT
RWT
RT
PLT
MT
INTERNATIONAL + + + + + +
ICWT
SECTORAL + + + + +
SCWT
BUSINESS ENTITY + + + + + +
BEC SERVICE + + + + + +
TSC
IWT
INTERNATIONAL + + + + + +
SECTORAL + + + + +
BUSINESS ENTITY + + + + + +
SERVICE + + + + + +
LEGEND: MT – maritime transport; IWT – inland water transport; AT – air transport; RWT – railway transport; RT – road transport; PLT – pipeline transport; TSC – competitiveness of individual transport service; BEC – competitiveness of business entity; SCWT – sectoral competitiveness of water transport; ICWT – international competitiveness of water transport.
Figure 1: Levels of the definition of the concept of "competitiveness of water transport"
The competitiveness of water transport at the level of the business entity can be understood as its ability to provide a better offer than competitors in the market of transport services, in the segment of freight and passenger transport by sea and inland waterways, subject to environmental standards and current legislation.
Competitiveness of water transport at the level of individual products or services is the ability of the transport service to meet a certain need of the customer (consumers) in the transport services market better than similar services of other business entities in the segment of transportation of goods and passengers by sea and inland waterways.
Competitiveness of water transport can be characterized by a set of technical (dimensional and weight parameters, compliance with the purpose, and environmental standards); organizational (frequency of shipments, speed of delivery, timeliness of services, average delay of services, delay or acceleration of delivery of goods at the request of the customer, the ability to provide the customer, if necessary, additional services, the ability to redirect delivery, the ability to complete delivery in case unforeseen changes in the conditions of transportation of goods and/or passengers, storage of goods and safety of transportation); cost (level of tariffs and total cost of transportation, availability of a discount system, profitability) and other parameters that meet a certain need. Closely related to this category is the definition of "competitive advantages" (Figure 2).
Types of competitiveness
Comp
etitiv
e adv
anta
ges o
f wat
er tr
ansp
ort
Type
s of w
ater
tran
spor
t
SPECIAL
GENERAL
SPECIAL
INTERNATIONAL
SECTORAL
BUSINESS ENTITY
SERVICE
MARITIME TRANSPORT
INLAND WATER
TRANSPORT
Levels of competitiveness
TSC BEC
SCWT ICWT
Figure 2: Grouping of competitive advantages of water transport
Competitive advantages of water transport are the unique combination of using the existing production capabilities of economic entities with their current reputation in the market, which contributes to the provision of competitive transport services to customers, allowing businesses to ensure their presence in the transport services market in the long-run perspective.
Among the general competitive advantages of water transport, which are inherent in both maritime and inland water transport, we can mention such as a rather high carrying capacity; relatively low cost of transporting a large number of goods and passengers over long distances; low tariffs for transportation of a large number of cargoes and passengers; higher environmental friendliness (compared to other types of transport); the lower level of accidents (compared to other types of transport); much lower share of investment needs (compared to other types of transport); the lower costs of ways maintenance
135

(compared to other types of transport). Among the specific competitive advantages of internal water transport, it is necessary to underline, for example, such a competitive advantage, as the simplicity of connection with maritime transport. At the same time, the specific competitive advantages of maritime transport include the possibility of transcontinental transportation of goods and passengers; waterways capacity is almost unlimited; dimensional restrictions of cargo are practically absent; high mobility; practically unlimited scope.
Competitive advantages are the main factors in ensuring the competitiveness of business entities. In the fierce competition for consumer loyalty, these factors change depending on the processes taking place in sectors of the economy, separate segments of the transport services market, etc.
It should be noted that drivers of competitiveness of business entities in the field of water transport may have the appropriate classification features, which are usually based on: a high level of training and qualification of personnel; talented management and professional marketing; proper innovation, technical and organizational levels of transport services; sufficient economic and financial support for the functioning of economic entities in the field of water transport, compliance with international agreements in its activities and, in case of legal conflicts, ensuring the compatibility of digital interaction of transport operations, and access to information resources of the transport process participants, etc.
That is, for the sake of their development, transport companies must move forward by intellectualizing their work, which will give them additional competitive advantages and increase the overall level of competitiveness by providing added value to services; establishing a high level of communication with customers and target audience; improving the image of your company through fast communication with customers; increasing customer loyalty to the company; transparency of internal and external production and communication processes; price reduction through process automation and digitization of business processes, etc. [17].
Agreeing with the results of M. Porter's research, we can identify four main levels of competitive advantages of the business entity in the field of water transport. The first level of competitive advantage is based on the availability of raw materials, labor costs, the scale of services. The second level is characterized by the
investment attractiveness of the business entity, its image, business reputation, and the establishment of effective relationships with suppliers and consumers, etc. The third level is determined by the training and qualifications of the staff, scientific and technical potential, the degree of informatization, the ability to ensure cybersecurity, the availability of their own licenses and patents. The fourth level is based on the effectiveness of the management and marketing system, their ability to respond quickly to changes in the business environment and ensure their own economic security, etc.
In our opinion, we should add to the presented four levels the fifth critical level, which takes into account the state and prospects of digitalization in transport processes and communication between its participants, creating an information environment and infrastructure that supports information processes, and information technologies, which determine how to implement these processes.
3. Conclusions
The results of the study suggest that in most cases, competitiveness can be defined as a complex indicator that covers a set of certain characteristics of the object under analysis, such as market share, productivity, and innovation capacity compared to an existing or imaginary benchmark.
We propose to consider the competitiveness of water transport by separate types of water transport, each of which can be considered at one of four levels (international, sectoral, business entity level, and at the level of separate transport services). At each of these levels, the competitiveness of water transport can be compared to the competitiveness of other facilities at the same level. For example, the competitiveness of maritime transport at the international level can be compared with the competitiveness of both maritime transports of other countries and with the competitiveness of other types of transport of foreign countries. At the sectoral level, the competitiveness of maritime transport can be compared with the competitiveness of other types of transport in Ukraine, etc. It should be noted that the competitiveness of transport services is a unique central element of the competitiveness of water transport at all other levels. That is, the competitiveness of an entity in the field of water
136

transport is based on the competitiveness of transport services that it can provide to its customers and, in turn, is the basis for the competitiveness of water transport at the industry and international levels.
Further research on competitiveness at the level of separate transport services, at business entities level, at sectoral and international levels, in general, can help to identify the competitive position of economic entities at the corresponding level and track changes in economic efficiency over time, will assess the competitiveness of water transport of Ukraine and develop recommendations for its integration into the European transport network. Such information is likely to be useful to CEOs, local governments, and public authorities in developing and implementing future policies to promote competitiveness increasing in the framework of Sustainable Development Goals for Ukraine, including tasks 8.2 (SDG 8) and task 9.1 (SDG 9).
4. Acknowledgments
This article contains the results of research conducted under the National Academy of Sciences of Ukraine grant “Institutional and economic ensure mechanisms of the water transport competitiveness in Ukraine” (0121U108151).
5. References
[1] A. Smith, An Inquiry into the Nature and Causes of the Wealth of Nations, University of Chicago Press, Chicago, 1977. URL: https://www.gutenberg.org/files/3300/3300-h/3300-h.htm
[2] D. Ricardo, On the Principles of Political Economy and Taxation, J. McCreery. Printer, Black Horse Court, London, 1817. URL: https://www.gutenberg.org/files/33310/33310-h/33310-h.htm
[3] J. A. Schumpeter, Capitalism, Socialism and Democracy. Routledge. London & New York, 2003. URL: https://eet.pixel-online.org/files/etranslation/original/Schumpeter,%20Capitalism,%20Socialism%20and%20Democracy.pdf
[4] M. E. Porter, The Five Competitive Forces That Shape Strategy, Harvard Business Review, January (2008). 79–93. URL:
https://hbr.org/2008/01/the-five-competitive-forces-that-shape-strategy
[5] M. E. Porter, The Competitive Advantage of Nations, Free Press, New York, 1998.
[6] M. E. Porter, J. E. Heppelmann, Why Every Organization Needs an Augmented Reality Strategy, Harvard Business Review, November (2017). 46-62. URL: https://hbr.org/2017/11/why-every-organization-needs-an-augmented-reality-strategy#why-every-organization-needs-an-augmented-reality-strategy
[7] C. M. Christensen, The Innovator's Dilemma: When New Technologies Cause Great Firms to Fail, Harvard Business Review Press, Boston, 2015. URL: https://www.amazon.com/s?k=9781633691797&i=stripbooks&linkCode=qs
[8] W. Chan Kim, R. Mauborgne, Blue ocean strategy: how to create uncontested market space and make the competition irrelevant, Harvard Business School Press, Boston, 2005.
[9] P. A. Gloor Swarm Creativity. Competitive advantage through Collaborative Innovation Networks. Oxford University Press, New York, 2006. URL: http://books.google.com/books?hl=en&lr=&id=5b3L8jP_IqEC&oi=fnd&pg=PP8&dq=info:ksiiMt_EMJ0J:scholar.google.com&ots=CvXUOFgSbw&sig=8Oe9uC1PJf78D1pCa8CHklg09a8
[10] A. MacCormac, T. Forbath, P. Brooks, P. Kalaher, Innovation through Global Collaboration: A new source of Competitive Advantage, Wipro Technologies. Harvard Business School. Boston, 2007. URL: https://www.hbs.edu/ris/Publication%20Files/07-079.pdf
[11] 1. H. Shevchenko, M. Petrushenko, B. Burkynskyi, N. Khumarova, SDGs and the ability to manage change within the European green deal: The case of Ukraine, Problems and Perspectives in Management, 19(1) (2021) 53-67. http://dx.doi.org/10.21511/ppm.19(1).2021.05
[12] O. Laiko, S. Kovalenko, O. Bilousov, Prospects for the development of cluster forms of entrepreneurship in Euroregions, Baltic Journal of Economic Studies, 6(5) (2020) 118-128. https://doi.org/10.30525/2256-0742/2020-6-5-118-128
137

[13] P. Kelle, J. Song, M. Jin, H. Schneider, C. Claypool, Evaluation of operational and environmental sustainability tradeoffs in multimodal freight transportation planning, International Journal of Production Economics, 209 (2019) 411-420. https://doi.org/10.1016/j.ijpe.2018.08.011
[14] S. lchenko, N. Khumarova, N. Maslii, M. Demianchuk, V. Skribans, Instruments for ensuring the balanced development of maritime and inland waterway transport in Ukraine, in: E3S Web of Conferences, Vol. 255 (2021) 01021. https://doi.org/10.1051/e3sconf/202125501021
[15] Ilchenko, S. Economic conditions of the functioning and existence of asymmetry in the development of transport services markets of Ukraine. Problems and Perspectives in Management, 15 (1) (2017) 93–98.
[16] V. Gryshchenko, I. Gryshchenko, The impact of changes in the volume of freight and passenger transportation by water on the GDP of Ukraine, in: E3S Web of Conferences, Vol. 255 (2021) 01036. URL: https://doi.org/10.1051/e3sconf/202125501036
[17] L. Ligonenko, A. Xripko, A. Domanskyj, Content and mechanism of digitalization strategy formation in business organizations, Mizhnarodnyj naukovyj zhurnal «Internauka». Ekonomichni nauky, 22(62) (2018) 21-24.
[18] M. Ustenko, A. Ruskyx, Digitalization: the basis of enterprise competitiveness in the realities of the digital economy, Visnyk ekonomiky transportu i promyslovosti, 68 (2019) 181–192.
[19] O. Gudz, S. Fedyunin, V. Shherbyna, Digitalization as a competitive advantage of enterprises, Ekonomika. Menedzhment. Biznes, 3(29) (2019) 18-24. http://journals.dut.edu.ua/index.php/emb/article/view/2215
[20] M. Drashkovich, A. Dorokhov, Directions and examples of application of information technologies in integrated logistics of seaports, Modeling in economics, organization of production and project management Information processing systems, 6(87) (2010) 233–239.
[21] V. Koval, G. Duginets, O. Plekhanova, A. Antonov, M. Petrova, On the supranational and national level of global
value chain management, Entrepreneurship and Sustainability Issues, 6(4) (2019) 1922-1937. https://doi.org/10.9770/jesi.2019.6.4(27)
[22] V. Gryshchenko, O. Dreval, I. Gryshchenko, Regional Export-Import Potential Use Management Within The System of Ecological and Economic Security, Actual Problems in Economics, 8(170) (2015) 226-238. http://www.irbis-nbuv.gov.ua/cgi-bin/irbis_nbuv/cgiirbis_64.exe?C21COM=2&I21DBN=UJRN&P21DBN=UJRN&IMAGE_FILE_DOWNLOAD=1&Image_file_name=PDF/ape_2015_8_29.pdf
[23] I. Pereverzeva, An analysis of development issues and ways to improve the competitiveness of water transport enterprises of Ukraine Danube, Water Transport, 2. (2015) 191-199. http://nbuv.gov.ua/UJRN/Vodt_2015_2_29
[24] N. Fediai, The concept of "integration imperative" in the theory of management of the national economy, Collection of abstracts of the International scientific-practical conference "Management of socio-economic transformations of economic processes: realities and challenges" (2019) 87-90. URL: http://dspace.wunu.edu.ua/bitstream/316497/37613/1/
[25] N. Valiavska, Organizational and economic mechanism of river ports development of Ukraine, Investytsiyi: praktyka ta dosvid, 4 (2016) 58-61. URL: http://www.investplan.com.ua/pdf/4_2016/14.pdf
[26] I. Sadlovska, Prerequisites for the formation of strategic directions for the development of inland water transport of Ukraine, Collection of scientific works of the State Economic and Technological University of Transport: Economics and Management, 25 (2013) 169-173. URL: http://nbuv.gov.ua/UJRN/Znpdetut_eiu_2013_25_25
[27] K. Novikova, Estimation of features of formation of the competitive environment of the enterprises of maritime transport, Scientific bulletin of Uzhhorod University: Series “Economics”, 2 (2017) 87–95. URL: http://nbuv.gov.ua/UJRN/Nvuuec_2017_2_13
138

Інформаційна Технологія Коливань Тіла Змінної Маси З Порожниною Воронич М.С.1, Рачинська А.Л. 2
1,2 Одеський національний університет ім. І.І. Мечникова, вул. Дворянська, 2, Одеса, 65000,
Анотація У роботі розроблено інформаційну технологію дослідження коливання тіла змінної маси з порожниною. Мета роботи – поліпшення моделі коливального руху тіла відносно точки підвісу шляхом створення інформаційної технології багатопараметричного моделювання такого руху. Об’єкт дослідження – коливальний рух тіла змінної маси зі сферичною порожниною відносно точки підвісу. Предмет дослідження – кут відхилення тіла відносно вертикальної вісі, що проходить через точку підвісу. В результаті виконання роботи проведено дослідження існуючих моделей коливального руху, руху маятника зі сферичною порожниною, та руху маятника зі змінною масою, на основі яких запропоновано багатопараметричну математичну модель коливального руху тіла змінної маси з порожниною. Ключові слова 1 Коливання, порожнина, зміна маса
Information Technology Of Fluctuations Of The Variable-Mass Body With a Cavity M. Voronych 1, A. Rachynska 2
1,2 Odesa I.I. Mechnikov National University, Dvoryans'ka str, 2, Odesa, 65000, Ukraine
Abstract In the work, the information technology of investigation for fluctuations of the variable-mass body with a cavity developed. The work aims to enhance the model of the oscillatory motion of the body with respect to the pivot point through the creation of information technology for multiparameter modeling of such motion. The object of the study is the oscillating motion of a variable-mass body with a spherical cavity with respect to the point of suspension. The subject of the study is the angle of deviation of the body with respect to the vertical axis passing through the point of suspension. The result of the work performed is an investigation for existing models of oscillating motion, motion with a spherical cavity, and motion with variable mass. Based on the aforementioned models, a new multiparameter mathematical model of the oscillatory motion of a variable-mass body with a cavity was proposed. Keywords 2 Fluctuations, cavity, variable mass
1. Вступ
Задачі динаміки тіл з порожнинами різної форми, що частково або повністю
EMAIL: [email protected] (A. 1); [email protected] (A. 2) ORCID: 0000-0002-1849-9802 (A. 1); 0000-0003-2430-9603 (A. 2)
заповненими в’язкою рідиною вже більше ніж сто років привертають увагу дослідників [1-3]. Такі задачі мають як теоретичний, так і практичний інтерес. Практичне застосування таких задач пов'язано з динамікою літальних
139

апаратів, теорією руху кораблів і підводних човнів, які мають на борту запас рідкого палива [4]. Останнім часом багато уваги приділяється розробці ефективних демпферів коливань різних висотних конструкцій, що робить актуальним розробку інформаційних систем дослідження коливань систем тіл з порожнинами [5].
Метою роботи є поліпшення моделі коливального руху тіла відносно точки підвісу шляхом створення інформаційної технології багатопараметричного моделювання такого руху.
Для досягнення поставленою мети необхідно розв’язати наступні задачі:
1. Проаналізувати існуючі моделі коливального руху, руху тіл зі змінною масою та руху тіл з порожнинами, що заповнені в’язкою рідиною. 2. Створити багатопараметричну математичну модель руху відносно точки підвісу тіла змінної маси зі сферичною порожниною, що цілком заповнена рідиною великої в’язкості. 3. Розробити інформаційну технологію розрахунку зазначеної моделі для визначення діапазонів значень безрозмірних коефіцієнтів моделі, що істотно впливають на рух маятнику. 4. Розробити інформаційну систему, яка реалізує модель коливального руху тіла змінної маси зі сферичною порожниною, що цілком заповнена рідиною. 5. Провести аналіз отриманих результатів та визначити критерії значень безрозмірних коефіцієнтів розробленої моделі. Об’єкт дослідження роботи – коливальний
рух тіла змінної маси зі сферичною порожниною відносно точки підвісу.
Предмет дослідження – кут відхилення тіла відносно вертикальної вісі, що проходить через точку підвісу.
2. Огляд літератури за темою
У класичній механіці математичним маятником називається важка матеріальна точка, яка рухається або по вертикальній окружності (плоский математичний маятник), або по сфері (сферичний маятник). При першому наближенні математичним маятником можна вважати вантаж невеликих
розмірів, підвішений на нерозтяжній гнучкій нитці [6].
В [6] розглянуто рух плоского математичного маятника за окружністю радіусом 𝑙 з центром у точці 𝑂 (рис. 1). Визначено положення точки 𝑀 (маятника) кутом відхилу 𝜑 радіусом 𝑂𝑀 від вертикалі.
Рисунок 1: Моделювання руху математичного маятника
В результаті дослідження було отримано
наступний закон руху плоского математичного маятника, виражений через еліптичну функцію 𝑠𝑛, у вигляді
sin𝜑
2= sin
𝜑0
2sn (√
𝑔
𝑙𝑡),
(1)
та наближений вираз періоду [2]
𝑇 ≈ 2𝜋√𝑙
𝑔(1 +
𝜑02
16).
(2)
В [7] розглянуто плоский рух тіла з порожниною, повністю заповненою нестислою в'язкою рідиною щільності 𝜌 і кінематичної в'язкості 𝑣, навколо нерухомої осі.
Рівняння руху тіла з порожниною записано у вигляді [7]
J ⋅ ε + ω × (J ⋅ ω) = M + m, (3)
де J − тензор інерції системи відносно точки 𝑂1, ω − кутова швидкість, ε − кутове прискорення тіла, M − головний момент відносно точки нерухомої точки системи всіх зовнішніх сил, що діють на тіло з рідиною, m − малий збурюючий момент, обумовлений наявністю в тілі порожнини з рідиною великої в'язкості.
140

Рівняння руху тіла (3) в [7] набуває вигляду ⅆ2𝜑
ⅆ𝑡2+
𝐺𝑙0
𝐽sin 𝜑 = −
ⅆ𝜑
ⅆ𝑡
𝜌𝑃𝐺𝑙0
𝑣𝐽2cos 𝜑. (4)
В роботі [8] отримано чисельне розв’язання рівняння (4) та проведено аналіз отриманих результатів.
Під механічною системою ми розуміємо таку сукупність матеріальних точок, в якій може змінюватися склад системи та її маса. Прикладом такої системи може бути рухомий транспортер, з якого у деякі моменти часу знімають (або на який кладуть) вантажі.
У ряді випадків процес від’єднання (або приєднання) частинок можливо вважати неперервним, а отже, розглядати як неперервний процес змінення маси системи [6, 9].
В [6, 9] складено рівняння руху точки змінної маси, маса якої змінюється внаслідок одночасного від’єднання та приєднання частинок.
В [10] побудовано модель руху маятника змінної маси в наступній постановці: однорідна матеріальна точка, що висить на нитці, є в початковий момент часу кулька з радіусом 𝑟0, що має масу 𝑚0, гойдається без тертя та поступово обмерзає. Припускаючи, що внаслідок обмерзання матеріальна точка неперервно збільшує масу, пропорційно в одиницю часу площі поверхні кульки (𝛼 – коефіціент пропорційності), остаточне рівняння руху тіла змінної маси має вигляд
ⅆ2𝜑
ⅆ𝜏2+
3
𝜏
ⅆ𝜑
ⅆ𝜏+
𝑔𝑟02
𝑙𝛾2𝜑 = 0,
(5)
де 𝜏 = 1 +𝛾
𝑟0𝑡, 𝛾 – постійна.
Основним недоліком всіх розглянутих моделей є те, що вони не дають бажаного результату окремо один від одного. Існуючи моделі не враховують вплив всіх трьох факторів (сила тяжіння, порожнина з в’язкою рідиною та змінна маса системи) одночасно, що більш відповідає практичним задачам сьогодення.
3. Плоский рух тіла змінної маси з порожниною
3.1. Математична модель руху маятника змінної маси з порожниною
Розглянемо плоский рух тіла з порожниною, повністю заповненою
нестислою в'язкою рідиною. Нехай тіло має форму кульки та перебуває в однорідному полі тяжіння, тобто є маятником з в'язкою рідиною, причому 𝜑 – кут відхилення маятника від нижнього положення рівноваги. Внаслідок обмерзання матеріальна точка неперервно збільшує масу, пропорційно в одиницю часу площі поверхні кульки (α – коефіціент пропорційності). Масою нитки можна знехтувати.
З урахування впливу моменту сили тяжіння, момент сил в’язкої рідини в порожнині та моменту реактивної сили зміни маси математична модель руху маятнику має вигляд
ⅆ2𝜑
ⅆ𝑡2+
4𝑙𝜋𝛼(𝑟0 + 𝛾𝑡)3
𝐽× (6)
× (1 +𝜌𝑃𝐺
3𝛾𝐽𝑣cos 𝜑 −
4𝑙𝜋𝛼(𝑟0 + 𝛾𝑡)3𝜌𝑃
𝐽2𝑣)
ⅆ𝜑
ⅆ𝑡+
+4𝜋𝛼𝑔𝑙(𝑟0 + 𝛾𝑡)3
3𝛾𝐽×
× (1 −4𝑙𝜋𝛼(𝑟0 + 𝛾𝑡)3𝜌𝑃
𝐽2𝑣) sin 𝜑 = 0.
Проведено обезрозмірювання рівняння (6), отримано
ⅆ2𝜑
ⅆ𝜏2+ 4𝜒3(1 + ��𝜏)3 ×
(7)
× (1 +1
3��𝜒2 cos 𝜑 − 4𝜒1(1 + ��𝜏)3)
ⅆ𝜑
ⅆ𝜏+
+4
3𝜒4
(1 + ��𝜏)3
��×
× (1 − 4𝜒1(1 + ��𝜏)3) sin 𝜑 = 0,
де 𝜏 = 𝜔0𝑡 – безрозмірний час; �� =𝛾
𝜔0𝑟0, 𝜒1 =
𝜋𝛼𝑙𝑟03𝜌𝑃
𝐽2𝜈, 𝜒2 =
𝜌𝑃𝑔
𝐽𝜈𝜔0𝑟0, 𝜒3 =
𝜋𝛼𝑙𝑟03
𝐽𝜔0, 𝜒4 =
𝜋𝛼𝑔𝑙𝑟02
𝐽𝜔03 –
безрозмірні параметри моделі, які характеризують вплив збурюючих моментів.
3.2. Чисельне дослідження багатопараметричної моделі руху
В роботі проведено дослідження впливу збурюючих моментів на рух системи. Досліджено рух системи для параметрів �� = 0, 𝜒1 = 0, 𝜒2 = 0 та 𝜒3 = 0, що моделює рух системи тільки під впливом сили тяжіння, не враховуючи вплив сил в’язкої рідини в порожнині тіла та збільшення маси.
На рис. 2 представлено результат чисельних обчислень: крива 1 відповідає 𝜒4 =0.5, крива 2 — 𝜒4 = 1, крива 3 — 𝜒4 = 2.
141

Розрахунок проведено для початкового кута відхилення маятнику 𝜑0 = 0 та початкової безрозмірної швидкості ��0 = 1. З рис. 2 видно, що система здійснює гармонічний коливальний рух, що відповідає результатам [6]. Збільшення значення параметру 𝜒4 означає збільшення маси тіла, тому коливальний рух здійснюється з меншою амплітудою для однакових початкових умов.
Рисунок 2: Кут відхилення маятнику для різних значень параметру 𝜒4
Досліджено вплив намерзання на тіло за
рахунок безрозмірного параметру ��. Чисельний розрахунок проведено для параметрів 𝜒1 = 0, 𝜒2 = 0, 𝜒3 = 0 та 𝜒4 = 1, що моделює рух системи змінної маси в полі сил тяжіння, без урахування впливу сил в’язкої рідини в порожнині тіла. На рис. 3 представлено результат чисельних обчислень: крива 1 відповідає �� = 0, крива 2 — �� = 0.1, крива 3 — �� = 0.2. Розрахунок проведено для тих самих початкового кута відхилення маятнику та початкової безрозмірної швидкості. З рис. 3 видно, що система здійснює згасаючий коливальний рух. Збільшення параметру �� відповідає збільшенню швидкості намерзання системи, що приводить до більш швидкого згасання коливань. Результати обчислень відповідають [8].
В роботі проведено дослідження впливу сил в’язкої рідини, що цілком заповнює сферичну порожнину тіла за рахунок безрозмірних параметрів 𝜒2 та 𝜒3. Чисельний розрахунок проведено для параметрів �� = 0, 𝜒1 = 0, 𝜒2 = 0.1 та 𝜒4 = 1, що моделює рух системи постійної маси в полі сил тяжіння з урахуванням впливу сил в’язкої рідини в порожнині тіла. На рис. 4 представлено результат чисельних обчислень: крива 1
відповідає 𝜒3 = 0, крива 2 — 𝜒3 = 0.05, крива 3 — 𝜒3 = 0.1. Розрахунок проведено для тих самих початкового кута відхилення маятнику та початкової безрозмірної швидкості. З рис. 4 видно, що система здійснює згасаючий коливальний рух. Збільшення параметру 𝜒3 приводить до більш швидкого згасання коливань. Результати обчислень відповідають [9].
Рисунок 3: Кут відхилення маятнику для різних значень параметру ��
Рисунок 4: Кут відхилення маятнику для різних значень параметру 𝜒3
Параметр моделі 𝜒1 характеризує взаємодію збурюючих моментів зміни маси системи та моменту сил в’язкої рідини. Досліджено вплив параметру 𝜒1 на характер руху системи 𝜒3. Чисельний розрахунок проведено для параметрів �� = 0.1, 𝜒2 = 0.1, 𝜒3 = 0.05 та 𝜒4 = 1. На рис. 5 представлено результат чисельних обчислень: крива 1 відповідає 𝜒1 = 0, крива 2 — 𝜒1 = 0.01, крива 3 — 𝜒1 = 0.04. Розрахунок проведено для тих самих початкового кута відхилення маятнику та початкової безрозмірної швидкості. З рис. 5 видно, що система може бути зруйнованою при збільшенні значення параметру 𝜒1.
142

Рисунок 5: Кут відхилення маятнику для різних значень параметру 𝜒1
4. Висновки
В роботі запропоновано багатопараметричну математичну модель руху маятника змінної маси з порожниною, що цілком заповнена рідиною великою в’язкості. Розроблено інформаційну технологію проведення дослідження рух системи з урахуванням всіх збурюючих моментів. Отримані чисельні результати показують працездатність запропонованої моделі та правильність технології дослідження. Необхідно отримати критерії параметрів моделі, при яких система може здійснювати рух.
5. Література References
[1] Румянцев В.В., Рубановский В.Н., Степанов С.Я., Колебания и устойчивость твердых тел с полостями, заполненными жидкостью, том 2, Машиностроение, 1979.
[2] Черноусько Ф.Л, Эволюция движений твердого тела относительно центра масс: монография, Ижевск: Ижевский институт компьютерных исследований, 2015.
[3] Рачинська А., Купчак О. Моделювання руху квазітвердого тіла під дією моменту сил світлового тиску, Міжнародна науково-практична конференція ISIT-2019, (2019), 179-181.
[4] Рачинская А.Л. Движение твердого тела с полостью, заполненной вязкой жидкостью, Космические исследования, том 53, (2015), 516-520.
[5] Яганов В.М., Собственные колебания вращающегося упругого стержня с демпфером, Вестник ЮУрГУ. Серия
«Математика. Механика. Физика», (2019), том 11, № 2, 36–43. doi: 10.14529/mmph190205
[6] Бухгольц Н.Н., Основной курс теоретической механики, часть 2, Динамика системы материальных точек, Таргом С.М, М.:Наука, 1965.
[7] Черноусько Ф.Л., Движение твердого тела с полостями, содержащими вязкую жидкость, М.: ВЦ АН СССР, 1968.
[8] Купчак А., Рачинская Д., Анимация движения физического маятника с полостью, матеріали Всеукраїнської науково-практичної інтернет-конференції «ВІТЧИЗНЯНА НАУКА НА ЗЛАМІ ЕПОХ: ПРОБЛЕМИ ТА ПЕРСПЕКТИВИ РОЗВИТКУ», вип. 43, (2018), 212–217.
[9] Мещерский И.В., Работы по механике тел переменной массы, М.: ГИТТЛ, 1952.
[10] Бать М.И., Джанелидзе Г.Ю., Кельзон А.С., Теоретическая механика в примерах и задачах, том 2, Динамика – М.: Наука, 1996.
143

Vulnerabilities Of Cyber Security Of Technical Intelligentsia In Relation To Social Engineering Vladimir Kononovich 1, Irina Kononovych 2, Oksana Shvets 3
1, 3 State University of Intelligent Technologies & Telecommunications, Kuzneshnaya str. 1, Odessa, 65021, Ukraine 2 National Academy of Food Technologies, Dvoryanskaya str. 1/3, Odessa, 65023, Ukraine
Abstract In the field of cybersecurity, the most critical problems are with the human factor and, in particular, the problem of cyber protection of individual and collective consciousness and subconscious. The objects of cyber defense against social engineering, among others, are the individual and collective consciousness and the subconscious. Uncontrolled influences of social networks can have serious consequences for civilization and culture. The causes of vulnerabilities are the peculiarities of the functioning of social networks and the processes of information perception and thinking. Information technology and objective factors of thought processes turned out to be unprotected. Due to the high complexity, some of our models of reality are not based on knowledge, but on faith. The rest of the models can be based on the subconscious. Collective consciousness has certain vulnerabilities due to conflicts. Educated technical intelligentsia falls under some vulnerabilities more than ordinary people. Cognitive distortion "myside bias" forces us to remain faithful to our own worldviews and those of our group. Protection from the trap of distortion is a critical attitude towards yourself and your views. Only this will help us not to get stuck in the "trap of distortion". It must be understood that belief is a conditioned reflex of the mind, a habit, a stereotypical reaction of understanding, an explanation of the situation when a certain stimulus appears. You can work with conditioned reflexes. They can be installed and removed at will. To counteract the automatic reaction and conditioned reflexes, it is recommended to analyze the origin of beliefs, their inconsistency, adequacy and impact on activities. Keywords 1 Cybersecurity, cyber defense, social engineering, individual consciousness, collective consciousness, cognitive distortion, socio-psychological methods, mathematical model, logical-linguistic model.
1. Introduction
Software and technical, organizational, cryptographic, technical, organizational and technical measures and means of cybersecurity have been significantly developed. Norms, rules, best practices are developed. At the same time, the situation with the human factor remains unsatisfactory. The share of anthropological problems with information and cyber security today reaches 85% or more [1]. One of the main reasons is the use of social engineering. Aspects of this problem are the subject of research.
There are an extremely large number of publications on this topic. It is difficult to make a
EMAIL: [email protected] (A. 1); [email protected] (A. 2); [email protected] (A. 3) ORCID: 0000-0003-2720-3337 (A. 1); 0000-0001-7146-3692 (A. 2); 0000-0001-6860-7894 (A. 3)
comprehensive review. An informative review of methods of influencing humans was provided by Alexander Wentland [2]. We will add an analysis of some of the latest publications. In [3] the ontology and examples of application of knowledge on social engineering in the field of cybersecurity are presented. Based on an interdisciplinary view of social engineering [4] provides practical recommendations for research.
Other publications consider the assessment of familiarity with social engineering in the education sector [5]; strategy of social engineering attacks on information resources [6]; modern solutions, measures, policies, tools and applications for cybersecurity and social
144

engineering [7]. Recommendations and best practices for counteraction are reflected in the standards, for example, in ISO / IEC 27032: 2012. A popular book among domestic publications [8], which conducts a systematic analysis of social engineering.A popular book [8] provides a systematic analysis of social engineering.
Researchers In the media, scientists report "that people's lack of understanding of how social networks affect us is a danger to democracy and scientific progress." Surprisingly, this also applies to the educated technical intelligentsia. In addition, operators and providers are unable to stop misinformation. "The authors warn that if such facts are left misunderstood and out of control, we may see unintended consequences of new technologies that contribute to phenomena such as elections, disease, violent extremism, famine, racism and war." Counteraction is complicated by the fact that, as indicated in 1999, Rastorguev S.P. [9], perfect information wars are being waged. In the considered publications the phenomenon of easy vulnerability to certain types of attacks on a certain social group of people remains unclear. Specifically, it is a question of cognitive distortion "myside bias", which affects the educated technical intelligentsia [10].
The purpose of this work: to provide a logical explanation of the phenomenon of significant vulnerability of individual and collective consciousness and subconscious from the attack of "cognitive distortion", myside bias, a certain social group of people, namely - a highly educated part of the technical intelligentsia - and make recommendations on methods and means attack.
Research methods - logical-linguistic and heuristic modeling.
To achieve this goal the following tasks are solved:
1. Analysis of modern characteristics of individual and collective consciousness and subconscious.
2. Modeling of methods of perception and processing of information by the person.
3. Consideration of the peculiarities of the functioning of individual and collective consciousness.
4. Development of recommendations for counteracting attacks such as "cognitive distortion".
2. Characteristics of individual and collective consciousness and subconscious as objects of cyber defense. Modern views
At the end of the twentieth century, a new science was born – "Infodynamics, which deals with the most general laws in the processes of transmission, transformation, processing and storage of information (or its related type of negentropy)." In particular, the theory of infodynamics sets out the main provisions of the negentropic theory of mental activity of man and society. This section considers some of the provisions based on a sample of materials from the work of E.Kh. Live [11].
One of the initial tenets of infodynamics is the following: "Consciousness, thought, science and other results of mental activity of man and society are secondary reality (now spread a broader term – virtual reality), ie approximate models of the real world. However, they are also objectively existing systems consisting of matter, energy and negentropy. Consciousness is determined by a set of models with the maximum possible entropy, part of which is compensated by negentropy. Approximate models are thoughts, emotions, subconscious, perception, religious views, which are also objective systems subject to cyber defense. Let us take into account that modern science is the brainchild of religion and began its development under the wing of medieval religion.
Man and science create simplified models-systems for solving problems, in particular thoughts, concepts, theories, etc. Every model that a person imagines in his mind is a system in virtual reality (in the brain). The primary reality of human thought is not reflected exactly.
Primitive logical-linguistic and mathematical models of informational influence on consciousness by the authors were considered in [12]. The science of semiotics, the theory of sign systems, and its sections deal with the qualitative and value side of information; syntax – the study of formal relations between signs; semantics – the content of information; pragmatics – the question of determining the value of information.
The main task of collective consciousness and science is to manage global processes associated with the change (increase or decrease) of generalized entropy (GE) and generalized negentropy (GNT) in the noosphere and associated with the development of human
145
civilization. If the total increase in GE in global systems exceeds the total increase in GNT, then the world is dominated by the processes of destruction, movement towards chaos and uncertainty.
Ultimately, this could lead to the destruction of an entire civilization and culture. Therefore, the accelerated growth of GNT in comparison with the growth of GE must be ensured. Advances in science and technology can fall into the hands not only of honest, conscientious people, but also of criminal organizations.
Consider the principles of information reception, important from the point of view of cybersecurity.
In any system there is a general principle of self-regulation of systems. The principles of saving negentropy, minimum energy dissipation potential, minimum energy consumption and negentropy, etc. are formulated.
Man, as a separate individual system, has a developed system of perception and processing of information: the second signal system, abstract thinking with the help of concepts, self-awareness, and language. Man can realize the existence of systems, including himself and their development in the past. A person can predict the development of systems and the position of himself in the future. Thanks to the language system, each word is a symbol of a concrete or abstract system. With the help of language, people have the opportunity to transmit, receive, process and store information in the form of entire models of systems. Consciousness with the help of thoughts is engaged in modeling real-world systems, i.e. information processing at the level of system models.
Thoughts and ideas as an objective reality depend on the subject who receives the information, on his prior awareness, education, inclinations and moods, goals and so on. The received information is compared with previous models – "picture of the world" before it will be remembered. Thoughts and consciousness cannot be considered only a reflection of the real world. It is more accurate to call it modeling.
Any real system has infinite variety, dimension and entropy. Consciousness, both mentally and mathematically, cannot operate with infinitely large quantities. Therefore, it creates simplified models that have entropy of finite magnitude.
In a complex model, entropy must be compensated by negentropy – our knowledge and scientific data. That part of entropy that is outside the model of our knowledge and consciousness
cannot be compensated by knowledge, but only by faith. Our faith should be as close as possible to real assumptions. Compensation of entropy completely to zero is impossible. In order to overcome the uncertainties of dimension, nature has developed an effective mechanism of the subconscious for humans and animals.
According to Leave E.H. the subconscious is a kind of negentropy. But unlike consciousness, it is not based on specific knowledge, but on previous experience, genetic information of previous generations, feelings, emotions, forgotten, but stored in the depths of the brain information. The experience of the past organism, both positive and negative, is also preserved in the form of changes in the structure of germ, nerve and brain cells.
Part of the hidden information is expressed in the form of instincts, reflexes, and inclinations. The subconscious is also a model, but qualitative and probabilistic. Despite the lack of clear algorithms, models of the subconscious work on the principle of analog and expert systems. They are able to store and process a huge amount of informal information. The subconscious makes it possible to make decisions in the face of a large shortage of time and / or information.
Following the scientific provisions of the work of Leve E.H., by collective system we mean any group of people who have the characteristics of the system, such as the state, family, various organizations, religious and educational societies, and so on. Collectives of people are more complex systems than the sum of individuals. Human consciousness cannot develop in isolation from others.
As a result, we can talk about the collective mind of groups, communities of people, organizations, nation, state, trade unions, and scientific councils and so on. The collective mind is not just the sum of the minds of individuals. When interacting, individual minds can be amplified or suppressed in the struggle. As a result, there is a collective consciousness. In life, this is expressed, for example, in the form of a collective spirit or traditions of scientific and economic organizations, enterprises, sports teams, educational institutions. The collective consciousness cannot be identified with the collective itself. The collective is the primary reality, the consciousness is virtual.
The most common models in the collective consciousness are different theoretical foundations and views on the development of
146

society, state, culture, economy, science, philosophy, and aesthetics.
Model thoughts contain both subconscious and intellectual components, but consciousness also contains elements of faith. Faith "explains" that part of reality that is not taken into account when compiling models. The method of creating imaginary, scientific and intuitive models opens wide opportunities for the study of the real world, to elucidate significant and insignificant factors.
Paragraph text. Paragraph text. Paragraph text. Paragraph text. Paragraph text. Paragraph text. Paragraph text. Paragraph text.
3. Ordinary models of the subject-thinker. Perception and processing of information by a person
As we can see, the process of thinking is a manipulation of a system of models (images) of different types and purposes. Thinking - as an information process - should be based on certain material or virtual media. For the functioning of thinking requires a material or virtual model of the thinking subject. We will use, developed by
authors,functionally and deductively complete hierarchical system of abstract information machines, which includes information machines: copying, functional transformation, memory, control, automaton (Turing machine), materializer (processor-designer), processor-thinker.
From a functionally complete hierarchical set of abstract information machines, you can build an information machine of any level, except transcendent, and of any complexity. In [13] it was proved that a hierarchical set of abstract information machines is equivalent to the basis of theoretical semiotics. From the latter, a model of the thinking subject GN Zvereva, which is shown in Fig.1 [14].
A person is a source of words, messages or a receiver of speech, oral or written. The language environment is a finite set of subjects - native speakers and a finite set of communication channels between subjects, which can be transmitted sign names, ie tangible media: signals, texts, images and more. “Language subjects consist of sign processors necessary for the generation, perception, transformation, storage in the subject's memory of sign structures.
Management system
The subject of the language environment
Sensors Efectors Reforas Internal
memory
Linguistic processors
Thinking processors
Outside world
External memory, Sheets of paper
L3
L3 L3 L3
L3 L3 L3
L1
L2
L1
L2
Figure 1. The structure of the objectified subject and linguistic connections In fig. 1, respectively, L1 - input, L2 - output, L3
- internal language. Any subject of the language environment, establishes language links and communicates with other subjects. Input and output language can be the same for all subjects, ie consist of the same signs and semantics of the language of the subject's linguistic processors. Processor thinkers perform operations on internal signs - the concepts of the subject, included in the internal language, the language of understanding, thinking and emotions.The main types of processors of the subjects of the speech environment (sensor, refor, efor (motor, effector), memory (memory), genor, material processor):
- sensor sm MRA →: performs selective perception of material reality Rm - the physical world and the transformation (reflection) of its properties into signs of virtual reality - a world of signs Ms, information models of physical reality - or identifies the material carriers of message signs;
- refor ss MMB →: performs reforming, transformation of the information world of signs, it is an extremely general functional model of processes of thinking, reasoning, processing of information, data, knowledge, decision-making procedures;
147

- effector ms RME →: it is an arbitrary converter of signs into material objects and actions. Alternative terms: efor, motor;
- accumulator of signs - memory of the subject, memory ss MMG →: stores knowledge, information in the same form;
- genor sM→ - internal source (generator) of signs of a certain class, model of generation of signs at modeling of the virtual world of subjects;
- material processor mmm RRF →^ - a converter of physical reality in which there are no signs, knowledge, information and sign processors».
These types are enough to build language structures, functions, and thus to describe language processes in the language environment.
Sensors (sensors, sense organs, receptors, measuring systems) and effectors (actuators, ideomotor of the body) performs direct and feedback connections of the objectified subject with material reality. The objectified subject is the main object of research of artificial intelligence and theoretical computer science. Sensors, as formal descriptions of the object-transmitter (source) of information are absent in the hierarchical system of abstract information machines. Their equivalent is considered natural and artificial sources of information. And any sensor as an information model can be built from the abstract information machines of this system.
The effector together with the genor and the material processor is the equivalent of the processor-designer (materializer of information that provides the formation, meaning of creation and the whole creation of the receiving object). The role of the reformer (character converter) is performed by abstract information machines of copying, functional transformation (including recursive functions and functionalities) in digital and analog form and automata (in theory - Turing machines) in digital form. In turn, the role of knowledge storage is played by an abstract information machine - memory. So, the model of the thinking subject is an information machine, each of the blocks of which can be built from a hierarchical set of abstract information machines, which is the basis of hierarchical information theory.
But the model of the thinking subject GN The beast can only be part of the heuristic model of the human mind. The mind can act and exist only as a continuous process of perception and processing of information. Intelligence grows in upbringing,
domestication, civilization. The process of increasing intelligence over time proceeds successively by leaps and bounds, accumulating the complexity of its structure level by level. When the amount of information at a given level reaches a certain critical value, it is structured, condensed and at the senior level forms the appropriate symbols, concepts, images and relationships. When this level is built, the next higher level begins to be built, and the previous level becomes stable and may continue to have minor changes and improvements. No floor in this building can be missed, as further development becomes impossible. V.M. Lachinov, A.A. Polyakov invented a generalized functional structure of an intelligent control system. The authors completed this structure and supplemented it with a contour of information security (Fig. 2) [15].
The intelligent control system has a system of input and evaluation of information flows for the perception of external control messages and messages from the outside world. The initial flow of information should be considered the final state of the data links that are established in the intelligent database after all the structural agreements and transformations.
The intelligent control and security system must consist of at least three dual intelligent bases that correspond to the controlling entity, the outside world and the object.
In addition, it has subsystems that receive and control information flows from the controlling entity and the outside world, as well as a subsystem for security and internal management. Receiving information flows from the outside world, the corresponding subsystem provides syntactic and semantic control, as well as identification of objects of the outside world. On the basis of these information flows, structures are formed in the intellectual database, which correspond to the knowledge, "images" of the external world and which are used further in the control circuit to compensate for the influences of the external world.
Dual intellectual bases are divided into the left half, where knowledge is accumulated and adjusted, and the right half, where previously accumulated knowledge (images) is stored and reactions to management and influences of the outside world are made using the logic of interaction (Fig. 2 does not show). The logic of interaction is constructed as follows. Intellectual base (IB) "Subject", receiving information from an external management entity immediately
148

rebuilds all its connections. Next, in the right half of the IB "Subject" is a comparison of the existing and new structure to determine the preservation of security and stability of the system, if it agrees to
such management. Similarly, there is a restructuring and control of security and stability in the chain of perception of the management of influence from the outside world.
Intellectual base “Outside world”
Intellectual basereactions to
outside world
Intellectual base "Object"та SIB
Intelligent base of internal
management
Syntactic,semantic control.
Identification, personification
Intellectual base "Subject"
Intellectual basereactions to
outside world
Syntactic,semanticcontrol
Ensuring security
and internalmanagement
External management entity
Logic of interaction
Accumulation and correction of knowledge
Figure 2 – Generalized functional structure of intelligent control and security
The intellectual base "Object" includes SIB -
security information base, which is used in the cycle of status monitoring and security management.
All three halves of the intellectual databases are brought to a new structure in accordance with the decisions made, which take into account all the structural changes in the hierarchy and correspond to the chosen security and management policy. Eventually, each of the right halves of the intelligent databases informs the left of its agreed state, and the process of generating new information is completed to begin again.
These models do not solve all the problems. Despite optimistic forecasts in recent decades, a model of the human brain has not yet been created. There is a hypothesis that information processing is performed in wave fronts that propagate in neurons. Attempts are also being made to explain the nature of mental activity by quantum effects.
We move on to the final part of our study - making recommendations.
4. Socio-psychological methods of information and cyber security system. Development of recommendation to counter attacks “myside bias”
The implementation and function of the cybersecurity system and the provision of social and psychological methods is very important, very important. Here, the subject of scientific advice is individual and collective
The implementation and operation of a system of cybersecurity by socio-psychological methods is as important as it is difficult. Here the subject of scientific research is individual and collective consciousness and individual and collective evidence and subevidence.
4.1. Features of information security systems
Social processes are formed in a complex way, all four consciousnesses act on them. Influences on each consciousness are carried out by various methods, being guided by a matrix of the purposes. Individual and collective consciousness (or mind) is not given to man at birth, but is formed during the growth and life of man. It is changeable and most people are easily affected.
As for the subconscious, it is more stable, exists at the level of instincts, but in certain situations has a decisive influence on human behavior. The subconscious is formed over centuries and millennia. It is as difficult to change it as the mentality.
It turned out that it is quite possible to manipulate people's consciousness and it is possible to form the necessary worldview and
149

individual and collective consciousness. The process of formation of individual and collective consciousness requires: development model, goal of formation (matrix of goals), scenarios of formation procedures and time from several hours for individual elements of influence to change of several generations of people also in separate elements of influence.
Consider the fragments of the information security system of consciousness in terms of socio-psychological security and social engineering. Information security, in addition to its basic importance, acts as an integral part of political, economic, defense, environmental security and more. Information security means a state of the information environment (information, information system, information resource) which guarantees the development of this environment and its use in the interests of the individual, society and the state, as well as protection from any threats. For example, it is important for society and the individual to protect their personal data from unlawful processing and accidental loss, destruction, damage due to malicious concealment, failure to provide or untimely submission, as well as protection against providing inaccurate or defamatory information, dignity and business reputation of an individual.
Cybersecurity vulnerabilities can arise as a result of conflicts. Conflict situations arise in wildlife and in human society. The description of the latter is more complicated, because in this case there is a deliberate concealment or distortion of information, special strategies for winning. According to N. Wiener, human language is a joint game of speaker and listener against forces that cause chaos. In fact, the conflicting parties can be not only the forces that cause chaos, but the speaker and the listener. Thus, even in a conversation between people, true information is not always transmitted. In these cases, it is especially important to determine which statement is information and which is noise or misinformation.
From such positions it becomes clear the necessary differences between classical information securities, for example, information in typical computer systems, from information security in a system of consolidated information.
The system of application of consolidated information in activities is generally an open system. It freely exchanges information, energy and matter with the environment and the object of influence. Information security of consolidated information concerns, first of all, the content and
essence, semantics of information. Its security must be preventive and continuous. This preserves the traditional requirements for the properties of information: confidentiality, integrity, accessibility and observation. But the protection of the media is not possible at all stages of application of information. The degree of information security changes at different stages of its life cycle. The security system cannot be separated from the process of consolidation and application of information, but must be organically woven into these processes. The security system cannot be of a boundary nature and be an external subsystem relative to the consolidation system. Information security should be formed simultaneously with the formation of goals, essence (semantics) of information. Thus, information security is one of the integral and necessary technological processes of collecting, analyzing, consolidating and applying information.
4.2. Infra-systemic means and self-protection against cognitive distortion
Man is a complex, multi-criteria system. Although it has a number of mechanisms to increase its reliability, it may not always make optimal, often unpredictable decisions and actions. The reason for this is the lack of self-criticism. She usually thinks she knows if not everything, then enough, to make decisions about managing complex systems, such as herself or people's organizations. In fact, these systems have much more entropy than humans have non-entropy on the subject. The result is uncontrollability, unpredictability of system behavior and failure to achieve the goal. A person usually does not admit his mistakes, shifts the blame on others. Unconscious lack of information creates an explosion of emotions, feelings, worries, stress in people, who greatly prevents them from effectively processing information and objectively assess all possible alternatives in the selection and management.
In a state of stress, information processing may stop altogether or, conversely, increase. The emotional state has a lot of options, respectively, and subconscious methods of information processing: fear, anger, enmity, friendship, joy, sadness, and so on. Info flows are especially sharply affected by competition, the struggle for
150

existence, conflict situations. In these cases, they try not only to pass on as little information as possible to the competitor, but even to pass on false information or misinformation. Close to this, there are cases when masking is allowed and even encouraged: sending signals with the conscious purpose of hiding the real intentions of their sender [11].
Here we will understand the peculiarities of protecting the consciousness of the elite and educated people – intellectuals.
Definition Cognitive distortion The "myside bias" is a cognitive distortion that forces us to remain true to our own worldviews and those of our group, ignoring evidence that contradicts our views [10].
In many other cognitive distortions, there is an inverse relationship with the level of intelligence – the smarter a person, the less he is exposed to them. But in this case with myside bias experiments show that everyone is equally exposed to it. This is due to a serious reason, because there is a very reasonable mechanism behind it.
Belief is a kind of generalization, once recorded in our consciousness and subconscious, on which we rely without thinking and without checking its adequacy for this context. Our brain automatically outputs these generalizations to receive some stimulus to simplify our decision-making process. Belief is an illusion of the mind, created once and by someone before, which is perceived as true. This is information that is embedded in the subconscious, which can be trusted, used as a basis for decision making. All beliefs are the fruits of upbringing, which have become entrenched in rigid linguistic forms and now govern thinking and behavior.
Beliefs are fixed in the head on the basis of: • statements received from elders in childhood and which have received the status of truth; • own experience, when repeating several similar situations; • generalization of experience of authoritative and significant for us people; • and negative thinking and appropriate conclusions about life. We should evaluate the new information in
accordance with the sound position we have. In other words, we need to be skeptical of everything "revolutionary." But you should know that there are views that we have developed through analysis, and there are those that we just want to
believe. Political views are rather the latter. We do not so much choose them consciously as we receive in the form of "memes" that infect our consciousness and that comfortably fall on our temperament and character.
And then the myside bias mechanism starts working, which makes the system of views self-supported, cutting off all inconvenient data. So people are convinced that they have chosen and thought through their position, although in reality it is more of a coincidence, which is disguised as distortion.
This distortion is most dangerous among intellectual elites because they are convinced that they are less prone to distortions than mere mortals. For most distortions, this is true, but not for myside bias – on the contrary, it makes intellectuals the most blind to this distortion. In the intellectual sphere, critical thinking, working with evidence, discussions, etc. are first needed. And only then, we need identity politics, ideological wars and so on.
It must be understood that belief is a conditioned reflex of the mind, a habit, a stereotypical reaction of understanding, an explanation of the situation when a certain stimulus appears. You can work with conditioned reflexes. They can be installed and removed at will. To counteract the automatic reaction and conditioned reflexes, it is recommended to first ask yourself the following questions: • How did I know this was really true? • Are there any examples that contradict this belief? • Why did I believe it? • What good is this belief to me? What does it protect me from? There were ancient beliefs that neither
education nor social status alone could guarantee you a deeper understanding of the world around you. This can only give a systematic and persistent work to develop certain qualities (as previously said – "virtues"). Such, as a critical attitude towards yourself and your views. Only this will help us not to get stuck in the "trap of distortion."
4.3. Outside system methods and means of protection against social engineering
The term "system" here means a person. Externally, systemic means and measures of
151

protection must be organically combined and function together with non-systemic measures and means of protection of consciousness. This creates a comprehensive system of protection against social engineering (CSPSI). We will form the following recommendations and substantiate them.
1. Man, team, society are fundamentally open systems. The goals of information security in open systems can be set as follows. In principle, open systems must constantly interact with the outside world. Closing the system, limiting its connections reduces its ability to develop and function and can lead to degradation. The information security system must ensure a certain balance between a certain degree of secrecy and the preservation of opportunities for adaptation and development.
2. Modern society is increasingly beginning to satisfy the laws of development of technical systems, not the development of society, where each person is a conditional technical unit of such a system. For example, the rhythm of oscillations of such units practically coincides with the frequency of the entire state technical system. This allows to integrate into CSPSI, first of all, a certain part of the mechanisms of information security of information resources.
3. Security mechanisms, as well as cybersecurity systems must be adaptable to dynamically changing information flows.
4. The systemic properties of self-preservation, self-organization, self-development and intelligence in terms of open system cybersecurity lead to the requirements of constant control, observation of all systems, phenomena, processes or objects.
5. Information flows between subsystems for cybersecurity and management must be controlled.
6. The tasks of the cybersecurity system can be ranked in the following order: to ensure stability and behavioral (target) aspects of the system; compensate for accidental influences that disturb the system; to reach a state in which accidental influences are compensated, external influences which do not correspond to target functioning of system are blocked.
7. Future security systems should not only and not so much limit users' access to programs and data, but define and delegate their authority in corporate problem solving, detect abnormal use of resources, predict emergencies and eliminate their consequences, flexibly adapting the structure to
failures, partial loss or prolonged blocking of resources. The functional completeness of these recommendations remains unproven.
5. Conclusions
To solve the tasks, the characteristics and features of individual and collective consciousness and the human subconscious as objects of cyber defense are considered; developed, by refining existing models of the thinking machine and intelligent control. A well-founded explanation of the phenomenon of significant vulnerability of the consciousness of the highly educated part of the technical intelligentsia from myside bias is given. Such reasons are the disregard for evidence that contradicts our views, typical of a group of highly educated technical intelligentsia.
Recommendations for counteracting social engineering attacks have been developed, in particular: general system recommendations for the system of protection against social engineering attacks; methods of self-defense against the attack of cognitive distortion "myside bias"; recommendations on non-system methods and means of protection against social engineering.
Due to the high complexity, some of our models of reality are not based on knowledge, but on faith. The rest of the models can be based on the subconscious. Collective consciousness has certain vulnerabilities due to conflicts. Protection against the trap of distortion is a critical attitude towards yourself and your views.
The direction of further work is to create a functionally and deductively complete list of protection mechanisms against social engineering as part of a comprehensive protection system.
6. Acknowledgements
We are grateful to colleagues who always support us and are ready to help. Thanks to the reviewers for carefully reading the work and constructive comments.
7. References
[1] V.L.Buryachok, V.B.Tolubko, V.O. Khoroshko, S.V Tolyupa, Informatsiyna ta kiberbezpeka: sotsiotekhnichnyy aspekt:
152

pidruchnyk; za zah. red. d-ra tekhn. nauk, prof. V. B. Tolubka. K.: DUT, 2015. 288 s.
[2] Alexander Wentland, Nina Klimburg, Hacking Humans? Social Engineering and the Construction of the “Deficient User” in Cybersecurity Discourses. Feb., 2021. URL: https://journals.sagepub.com/doi/full/10.1177/0162243921992844.
[3] Zuoguang Wang, Hongsong Zhu, Peipei Liu and Limin Sun, Social Engineering in Cybersecurity: A Domain Ontology and Knowledge Graph Application Examples. Cybersecurity. Apr. 2021. 20 p. URL: https://arxiv.org/ftp/arxiv/papers/2106/2106.01157.pdf.
[4] Amy Hetro Wadho, An interdisciplinary view of social engineering: A call to action for research. Computers in Human Behayvior Reports. Vol. 4. 2021. 23 p. URL:https://www.sciencedirect.com/ science/article/pii/S2451958821000749.
[5] Majid H. Alsulami, Fawaz D. Alharbi and etc., Measuring Awareness of Social Engineering in the Educational Sector in the Kingdom of Saudi Arabia. Information. 2021. URL: https://www.mdpi.com/journal/information.
[6] Vyacheslav Zolotareva, Anastasiya Arkhipovab, Nikolay Parotkina, Anna Lvovac, Strategies of Social Engineering Attacks on Information. Resources of Gamified Online Education Projects. SLET-2020: International Scientific Conference on Innovative Approaches to the Application of Digital Technologies in Education, November 12-13, 2020, Stavropol, Russia. URL: http://ceur-ws.org/Vol-2861/paper_45.pdf.
[7] Hussain Aldawood, Geoffrey Skinner, Contemporary Cyber Security Social Engineering Solutions, Measures, Policies, Tools and Applications: A Critical Appraisal. International Journal of Security, Volume (10) : Issue (1) : 2019. 15 p. URL: https://f.hubspotusercontent30.net/hubfs/8156085/WhitePaper%20-%20IJS%20-%20Contemporary%20Cyber%20Security%20Social%20Engineering%20Solutions%5B1%5D.pdf.
[8] Sotsialʹna inzheneriya (systemnyy analiz): navch. posib. [V.M.Petryk, V.I.Kurhanevych, V.H.Kononovych ta in.] / za zah. Red. V.I.Kurhanevycha ta V.M.Petryka. K., 2019. 200 s.
[9] S.P. Rastorguyev, Informatsionnaya voyna. M: Radio i svyaz', 1999. 416 s.
[10] Mikhail Pozharskiy. Lovushka iskazheniy: Naiboleye opasno eto sredi intellektual'nykh elit // Internet-gazeta Svobodnoy Rossii. Url: http://www.kasparov.ru/material.php? id=5F8548820D729
[11] E.Kh. Liyv, Infodinamika, Obobshchonnaya entropiya i negentropiya, Tallinn, 1998.
[12] V.G.Kononovich, I.V Kononovich,. Razdel 20. Osnovy modelirovaniya sistemy kiberbezopasnosti informatsionnogo proizvodstva pri upravlenii massovym soznaniyem, Informatsionnyye tekhnologii v upravlenii, obrazovanii, nauke i promyshlennosti : monografiya / pod red. V. S. Ponomarenko. KH. : Izdatel' Rozhko S. G., 2016. (566 s.) S. 314 - 328.
[13] Kononovych V.H., Kononovych I.V. Infodynamika protsesiv informatsiynoyi vzayemodiyi fizychnoyi ta virtualʹnoyi realʹnosti / Perspective trajectory of scientific research in technical sciences : Collective monograph. Riga, Latvia : “Baltija Publishing”, 2021 (644 p.). С. 211 – 234.
[14] Zverev G.N. Metainformatika, iskusstvennyy intellekt i osnovaniya yazyka nauki. Intellektual'nyye sistemy upravleniya. Pod red. akad. RAN S.N. Vasil'yeva. M.: Mashinostroyeniye, 2010. S. 7–16.
[15] Kononovych V.H., Kononovych I.V, Tardaskina T.M. Osnovni pryntsypy informatsiynoyi bezpeky vidkrytykh system. Chastyna 2. Vlastyvosti vidkrytykh system ta vymohy do intelektualʹnoho upravlinnya // Naukovo-tekhnichnyy zbirnyk “Pravove, normatyvne ta metrolohichne zabezpechennya systemy zakhystu informatsiyi v Ukrayini”, – vyp. 2(13), – K.: – 2006. – S. 46 - 57.
[16] O.L. Figovskiy, O.G. Penskiy, Novyye zakony razvitiya obshchestva i budushcheye chelovechestva. 5 c. URL: http://spkurdyumov.ru/future/novye-zakony-razvitiya-obshhestva-i-budushhee-chelovechestva.
153

Object Information Models of Complicated Systems in Control Problems Victor Volkov1, Yuliia Loboda2
1Odessa I.I.Mechnikov National University, Dvoryanskaya str., 2, Odessa, 65082, Ukraine 2National University "Odesa Law Academy", Academichna str., 2, Odessa, 65009, Ukraine
Abstract Methodology for mathematical and information modeling of complicated systems is developed. A complicated system is considered as a system with a complex nature of interaction between elements. The difference between complicated systems and “large” systems is shown. Complicated systems are studied as control objects. Methodology for mathematical modeling of complicated systems is based on combining of fuzzy logic and classical mathematics. Such combining makes it possible to exclude the participation of experts in the process of the development of the decision support systems. This allows you to avoid the difficulties associated with expert evaluations in organizing decision-making under uncertainty. Methodology for information modeling of complicated systems is based on the method of object-oriented analysis (Shlaer-Mellor method). Particular attention is paid to recommendations for the selection of the object attributes for objects that model complicated systems in the information models. Every value of every object attribute (except identifiers of the object) varies from zero to one as the value of a fuzzy variable. There is an example of developing an information model based on the proposed methodology. This is information model of the potentially detonative object. Information structure diagram for the complex potentially detonative object is composed for general case. Information structure diagrams for different kinds of the potentially detonative object are built in general terms. The proposed methodology is adequate for modern technological processes. It is used successfully for enlargement and improvement of DSS for explosion-proof of the grain processing enterprises of different types. Original software for real time control of risky situations is created. Keywords 1 Object-oriented analysis, complicated system, mathematical modeling, fuzzy logic, information model, object attributes, decision-making
1. Introduction
Object-oriented analysis (OOA) [1,2] assumes that software system is initially split up into domains. Every domain corresponds to a certain subject area. Each domain is independent of the each other. Domain charts are used to depict domains and their relationships. Some domains are rather “large” and complicated. These domains have to be broken down into subsystems for analyzing.
Every “all-in-one” domain or subsystem of the complicated domain must be analyzed in three steps [2]:
EMAIL: [email protected] (A. 1); [email protected] (A. 2) ORCID: 0000-0002-3990-8126(A.1); 0000-0001-7083-552(A. 2)
1. Information modeling 2. State modeling 3. Process modeling These steps are separate but integrated parts
for OOA. Information modeling is aimed at
identification of objects, which make up a system for (object-oriented) analysis.
Every object (class) corresponds to a set of the real world things. All instances of the object (elements of the set):
have the same characteristics (that can be abstracted as attributes [1,2]); subject to the same set of rules and laws.
154

There are identifiers among attributes, i.e. attributes which values identify each individual instance of an object uniquely.
There are different ways for representation of an object. It can be presented either graphically or in tabular form [1,2]. For the information model of a subsystem or domain, three products must be developed [2]:
Information structure diagram (entity-relationship diagram); Descriptions of objects and attributes; Descriptions of relationships. It is rather simple to choose attributes for
objects that correspond to such real world things which may be described as “simple systems”. But it is not so easy to choose attributes for objects that describe so-called “complicated systems”. It should be borne in mind that (from the practical point of view) values of the object attributes should be calculated relatively easily, and the attributes themselves should describe the state of the object quite accurately.
The aim of this research is to develop recommendations for the selection of attributes for objects that model complicated systems in information models.
2. Mathematical and information modeling of complicated systems
Considering the problem of mathematical and information modeling of complicated systems, one should initially define what a complicated system is.
The system is considered as an ordered set of structurally interconnected and functionally interacting elements.
At first glance, it is natural to consider a system consisting of large number of elements as a complicated system (according to the principle: the greater the number of elements, the more complicated the system is). But this point of view is obviously not correct. Indeed, a system can consist of a large number of similar (identical) elements interacting with each other on the basis of well-known and simple principles (laws). Such systems are usually pretty easily described by statistical laws. For example, an ideal gas [3], considered as a physical system, can in no way be considered a complicated system.
An ideal gas is a theoretical gas composed of many randomly moving point particles that are not subject to interparticle interactions [3]. So the ideal gas consists of large number of similar
elements. The thermodynamic properties of an ideal gas can be described by the equation of state that is known as Clapeyron equation or the ideal gas law [4]. From this equation it is evident that the state of an ideal gas is completely determined by the values of only two thermodynamic parameters (e.g., pressure and temperature). It should be noted that the ideal gas law can be considered as a consequence of the Boltzmann equation (the basic equation of the molecular kinetic theory of gases), obtained statistically.
Thus, not every "large" system, i.e. a system consisting of a large number of elements, is a complicated system. Although, naturally, a complicated system can be a " large" system.
A complicated system should be considered as a system with a complex nature of interaction between elements and, as a rule, with dissimilar elements.
A complex nature of interaction between elements suggests two different possibilities:
Mathematical equations describing this interaction can not be solved either analytically or numerically (at least, the solution of these equations by known numerical methods cannot be carried out in an acceptable time); The interaction between elements of the system cannot be described at all by the equations of classical mathematics due to the difficulties of formalization. Systems are studied primarily as control
objects. Every system interacts with the external environment (other systems or objects) and are characterized by input and output parameters.
Effective control of systems (control objects) in most cases requires the construction of an adequate mathematical and information models of these systems. This is especially true for control process based on the principle of the compensation of perturbations.
From the standpoint of the control theory, it does not matter what the complexity of the interaction of the system elements consists in (which, in fact, allows to consider the system itself as a complicated system).
For mathematical modeling of a control object, which is a complicated system, it is necessary to apply the theory of probability or fuzzy logic. This study considers the second possibility.
155

2.1. Mathematical modeling of complicated systems using fuzzy logic
Let us consider complicated system as control object, which is determined by n parameters p1, p2,…, pn. These parameters are controlled parameters of this object. A specific set of these parameters defines the object state at the moment.
To construct a mathematical model of the control object means to write down the parameters p1, p2,…, pn that fully determine the state of the object as functions of the other parameters m1, m2,…, mk that determine (from the point of view of the control problem) the state of the control object environment. Parameters m1, m2,…, mk assumed to be known as functions of time t.
Thus there are n functions from k variables 𝑝i = 𝑝i(𝑚1, 𝑚2, … , 𝑚k) (𝑖 = 1, … , 𝑛), (1)
where m1, m2,…, mk are functions of time t. So n functions pi (i=1,…,n) are composite
functions from time t: pi(m1(t),m2(t),…,mk(t))=pi(t)(i=1,…,n). (2) The main problem of this approach is that for
complicated systems it is almost impossible to define functions (1) and, as a consequence, to define functions (2). It's almost impossible even if the functions mj(t) (j=1,…,k) are accurately defined. This impossibility is usually connected with a very complicated nature of physical (mechanical, chemical) models of the control object itself (if it is a technical or technological object) and the processes in which this object participates. These processes reflect, among other things, the interaction of the object with the environment.
It should also be noted that the parameters p1, p2,…, pn may not be independent.
As a matter of fact, in some cases it is not possible to ascertain the presence or absence of the corresponding relations between these parameters. In addition, in a number of cases it makes sense to consider the obviously interdependent parameters of an object in order to organize effective control of this object.
Thus there are q (q<n) functions from n variables
ri = ri(p1, p2,…, pn) (i=1,…,q), (3) but this fact is not essential.
The proposed methodology of developing of mathematical model for a complicated system includes the following items.
Finding of simplified mathematical relations between pi (i=1,…,n) and mj
(j=1,…,k), i.e. construction of functions pi = fi(m1, m2,…, mk) (i=1,…,n). As a result, the values of the parameters pi are found only approximately. Solving of this problem is the most difficult part of the proposed method realization. It requires deep knowledge of the technical/technological process, mathematics and special sciences (mechanics, physics and/or chemistry). Finding of intervals [pi
min, pimax] for
possible changes of pi (i=1,…,n). pimin is
minimum value of pi for the technical/technological process as a whole. Accordingly, pi
max is maximum value of pi for the technological process as a whole. As a rule, pi
min and pimax are determined by production
regulations and technical propeties and capabilities of equipment. Replacement of every value pi by the corresponding interval [pi
*, pi**] (i=1,…,n),
where the inequalities pi*< pi
**, pi*< pi
max and pi
min < pi** take place, but the inequality pi
min < pi
*< pi**< pi
max is not always correct. Usually the length of the interval [pi
*, pi**] is much less
than the length of the interval [pimin, pi
max], i.e. pi
**- pi*<< pi
max-pimin (i=1,…,n). The nature of
intervals [pi*, pi
**] is defined by methods for determination of pi (i=1,…,n). Value pi can be determined by measurements (if possible) or by calculations for functions fi(m1, m2,…, mk) (i=1,…,n). In the first case the interval [pi
*,pi**]
displays the measurement error, in the second case this interval displays either calculations errors or model biases (or, may be, a combination of these two kinds of errors). Shift away from “clear”(“accurate”) values p1, p2,…, pn towards fuzzy values P1, P2, …, Pn (fuzzification). This fuzzification is based on the intervals [pi
min, pimax] and the
corresponding intervals [pi*, pi
**] (i=1,…,n). Exactly from the point of view of fuzzification the cases when pi
*≤ pimin or pi
max ≤ pi** are very
important. The last step of this fuzzification may be shift away from fuzzy values to linguistic variables (it may be done for the convenience of the decisionmaker, but sometimes it is not necessary to do it). The essential principle of the described above fuzzification lies in fuzzifying all input values into fuzzy membership functions by using formulae obtained by methods of classical mathematics (or by using experimental data). Mathematical equations for mechanical, physical or chemical processes are considered
156

only as approximate estimates. These equations have approximate solutions pi = fi(m1, m2,…, mk) (i=1,…,n) and form basis for inequalities. Those inequalities, in their turn, form the base for constructions of corresponding fuzzy membership functions [5,6]. The supposition of the approximate character of mathematical equations for complicated processes (mechanical, physical, chemical, etc.) is fully justified because of the errors of appropriate theories and inaccuracy of the input data (obtained, as a rule, from different experiments which are almost always not accurate). This way of the definition for fuzzy membership functions makes it possible to avoid bringing experts (evaluators) in and (as a result) to avoid all problems and weaknesses connected with evaluators and their interaction and cooperation with decision-makers. Such methodology for mathematical modeling
of complicated systems is based on combining of fuzzy logic with classical mathematics.
This methodology is very useful for solving some problems of the explosion-proof [5] (especially for the grain processing enterprises and chemical plants) [6].
2.2. Information modeling of complicated systems
The first stage for the development of an information model of every system is its structuring. The architecture of complicated system consists of some components (subsystems) and of the hierarchical relationships between these components. Every subsystem is also complicated system. As a matter of fact, hierarchy is the first feature of a system, since only systems with a hierarchical structure can be in principle investigated.
Every component (subsystem) is assotiated with an object in terms of OOA. This object must have attributes [2].
The selection of the attributes (except identifiers) for such object is reduced to a simple procedure of mnemonic naming of fuzzy variables P1, P2, …, Pn. The methodology for determining these variables is described above. So value of every attribute of the object (again except identifiers) varies from 0 to 1 as the value of a fuzzy variable.
The paper [7] provides an example of building an information model based on the methodology
described above for potentially detonative object (PDO). Arbitrary potentially detonative object is considered from the point of view of the system analysis as the complex hierarchical (complicated) system. This system is structurized, elementary potentially detonative objects are indicated. All kinds of these objects are described with their attributes and relationships. Information structure diagram [2] for complex PDO is composed for general case. Information structure diagrams for different kinds of PDO are also built in general terms.
3. Conclusions
Proposed methodology for mathematical and information modeling of complicated systems is very useful for developing of decision support systems (DSS) for automated control system (ACS) when the control object is complicated system.
Thus the developing of DSS is based on combining of two decision-making models: the model of choice under uncertainty (based on fuzzy logic) and the classical model (based on classical mathematics including classical numerical methods). Such combining makes it possible to exclude the participation of evaluators (experts) in the process of the DSS development. This is rather important since the difficulties associated with expert evaluations in organizing decision-making under uncertainty are well known [8,9].
This methodology is fully adequate for modern technological processes and technical systems. It is used successfully for enlargement and improvement of DSS for explosion-proof of the grain processing enterprises of different types.
Decision support systems for explosion-proof of the grain processing enterprises of different types (elevators, flour milling plants, compound feed plants) are enlarged and improved by consistent using of described above items. Original software for real time control of risky situations is created.
4. References
[1] Sally Shlaer, Stephen J. Mellor, Object Oriented Systems Analysis: Modeling the World in Data (1st. ed.), Published by Pearson, 1988.
157

[2] Sally Shlaer, Stephen J. Mellor, Object Lifecycles: Modeling the World in Data, Yourdon Press, 1991.
[3] R.K. Pathria, Paul Beale, Statistical Mechanics (4th ed.), Academic Press, 2020.
[4] Michael J. Moran, Howard N. Shapiro, Daisie D. Boettner, Margaret B. Bailey, Fundamentals of Engineering Thermodynamics (9th ed.), Wiley, 2018.
[5] V. Volkov, Y. Kryvchenko, Transition of combustion to explosion and decision support systems for explosion protection, in: Lecture Notes in Computational Intelligence and Decision Making, Advances in Intelligent Systems and Computing, volume 1246, Springer, Cham. 2021, pp. 437-447. doi: 10.1007/978-3-030-54215-3.
[6] V. Volkov, Decision support systems on hazards of industrial explosions, in: Seventh International Symposium on Hazards, Prevention and Mitigation of Industrial Explosions: Thirteenth International Colloquium on Dust Explosions and Eighth Colloquium on Gas, Vapor, Liquid, and Hybrid Explosions, St. Petersburg, Russia, 7–11 July 2008, volume 3, 2008, pp. 343–347.
[7] A. Kovalenko, V. Volkov, Information Model for Potentially Detonative Object, in: CEUR Workshop Proceedings, volume 2683, 2019, pp. 50-52.
[8] P.H. Ross, M.W. Ellipse, H.E. Freeman, Evaluation: A systematic approach (8th ed.), Sage Publications, 2021.
[9] M. Hurteau, S. Houle, S. Mongiat, ().How Legitimate and Justified are Judgments in Program Evaluation, in: Evaluation, volume 15 (3), 2009, pp. 307-319. doi:10.1177/1356389009105883
158

Leakage Of Information Through Technical Channels And A Set Of Risk-Oriented Indicators Of Its Security For Modern ITS Serhii Ivanchenko1, Oleksii Gavrylenko2, Anatolii Holishevskyi3, Vasyl Bondarenko4, Oleh Rushchak5, Yevhen Prokopenko6
1,5,6Institute of Special Communications and Information Protection of National Technical University of Ukraine "Igor Sikorsky Kyiv Polytechnic Institute", Kyiv, 03056, Ukraine 2The Department of Information Technology Security, National Aviation University, Kyiv, 03058, Ukraine 3State Scientific and Research Institute of Cybersecurity Technologies and Information Protection, Kyiv, 03142, Ukraine 4State Service of Special Communication and Information Protection of Ukraine, Kyiv, 03110, Ukraine
Abstract The set of risk-oriented indicators that will characterize the protection of modern information and telecommunication systems from information leakage through technical channels has been substantiated. The set is a hierarchical structure and allows information security risk analysis. Keywords Informational security; security risk; technical protection of information; information leakage. 1
1. Introduction
One of the threats to information security, which violates the confidentiality of information, is its leakage through technical channels formed during the operation of modern information and telecommunications systems (ITS) as a result of a number of undesirable parasitic effects (Figure 1).
Figure 1: Technical information leakage channel
Such effects are the side electromagnetic radiation of information signals into the environment, their guidance on extraneous conductors and lines beyond the control of the
EMAIL: [email protected] (A. 1); [email protected] (A. 2); [email protected] (A. 3); [email protected] (A. 4); [email protected] (A. 5); [email protected] (A. 6) ORCID: 0000-0003-1850-9596 (A. 1); 0000-0002-9552-5832 (A. 2); 0000-0001-9981-7771 (A. 3); 0000-0002-7578-3236 (A. 4); 0000-0001-6504-6315 (A. 5); 0000-0002-7582-8772 (А. 6)
object, the infiltration of signals into the grounding and power supply circuits, etc. [1 - 4].
The peculiarity of this threat is that these effects are a natural manifestation of the physical environment where information is circulated. Securing information from leakage is usually associated with minimizing these manifestations and localizing the effects, and therefore cannot be done completely. This is a threat that can only be protected by finding a compromise between the attentiveness and value of information resources and the costs of protecting them. It is considered that the protection measure should correspond to the value of the protected information. Exceeding this measure over the value of information is impractical.
State information resources are public information that requires its circulation in cyberspace and involves the use of modern ITS, which are constantly evolving and improving. Thus, today the pace of development of information and telecommunications technology is such that due to its obsolescence, the feasibility of replacing old tools with new ones comes quite quickly after they enter the market. This rather high rate does not allow the implementation of proper provision, as was done for the equipment of previous years, for which this period was decades. With the development of ITS, the speed of data processing increases, the amount of memory increases, the range of
159

signals used expands, and new functionalities appear that allow the introduction of new technologies [5].
Thus, modern ITS are software-controlled systems, where they are controlled automatically with minimal user involvement. They independently choose routes for data transmission, independently adjust the noise immunity of channels, making redundant data, independently repeat processing and transmission sessions, independently without notifying the user of the system perform backup data and so on. All this significantly affects the complexity of protection of information in ITS from leakage through technical channels and requires consideration when justifying the conditions of safe use of cyberspace for information circulation and ensuring protection of information from leakage through technical channels [6, 7].
This threat is relevant to public information in terms of information with limited access, which includes classified, official and confidential information. Accordingly, the secret information with limited access is divided into state, banking, professional secrets and the secret of the pre-trial investigation and other secrets provided by law. A separate category of information for which the threat of leakage through technical channels may be relevant is personal data. Its owners also have the right to ensure confidentiality with any level of protection. This distinction is made in the legal field of the state, takes into account the affiliation of information, their importance and value, ensures the interests of man, society and the state [5, 8].
World experience shows that the main indicator of safety is the risk, the permissible limits of which are set by the owner, which in the event of attacks or incidents may suffer damage. Obviously, the risk depends on the indicators of information security, which require periodic monitoring and analysis, and the required values for the indicators are from the specified risks [9].
Therefore, there is an urgent task to substantiate the totality of risk-oriented indicators that will characterize the protection of ITS from information leakage through technical channels and will allow the assessment and analysis of information security risk at the objects of information activities.
2. A set of risk-oriented indicators of its security for modern ITS
Let the information security risk be set according to an international standard for information security management, for example, ISO/IEC 2700x or other standards. Security risk quantifies the potential danger that leads to losses, and can be represented as the product of the probability of realization of the threat pr and Price consequences of it [10]:
(1)
In essence, risk is a general indicator of quality that quantitatively characterizes the degree or level of protection. If you set its maximum allowable value Rmax.allow, It is possible to implement a risk-oriented approach to protect information, including from leakage through technical channels. The convenience of implementing this approach in relation to the previous one, as it was done for the technology of previous years, is that on the basis of automated processing it allows to increase the efficiency of analysis, adjustment and management of information security.
Obviously, the price of possible losses Price and risk limits Rmax.allow, should be set by the owner of information, information resources, as an entity interested in the necessary degree of protection and effective management of information security of own resources [5]. The maximum allowable probability of risk pr.max.allow is a technological indicator that should provide a protection system and can be found from formula (1):
(2)
The protection system will be effective if its indicators reliably provide pr.max.allow and thus this system is proven to guarantee information security with a given risk.
Let the limit of probability of risk pr.max.allow be set – safety condition of information with limited access, which must be fulfilled in technical channels by means of technological indicators within its calculated limits. These indicators in their structured combination will represent a system of risk-oriented indicators that characterize the protection of ITS from information leakage through technical channels.
160

Security risk is a failure to meet its quality requirements, and therefore for the leakage of information through technical channels it can be considered as a leakage risk. Its maximum allowable value can be matched by such a characteristic of the channel as bandwidth – the maximum amount of information that can be allowed to flow through the technical channel of leakage [10].
(3)
where Cmax – is the maximum bandwidth of the technical channel of leakage.
The bandwidth of the channels is determined by the interference of the medium of physical media. Interference in the channel causes the probability of error p, which limits the ability of the channel to pass information. For discrete symmetric binary channels, the bandwidth is expressed by the formula:
(4)
where h (…) – is the entropy function:
(5)
From formulas (4) and (5) you can find the maximum allowable value for the probability of error in the channel, which should provide camouflage interference:
(6)
Errors in the channel are formed as a result of incorrect reception of signals at the output of the channel. They depend not only on the properties of the environment of physical media, where there are interference, but also on the methods of processing information signals at the reception, their decision schemes, algorithms and so on.
Thus, the following three situations can be considered for information interception:
1. The attacker is quite interested in obtaining information, has unlimited ability to intercept it and monitors the source of leakage continuously. 2. The attacker is quite interested in obtaining information, but to intercept it has a limited ability to observe the source of leakage indefinitely. 3. The attacker is not very interested in obtaining information, interception is carried out in fragments, sporadically.
Obviously, the second situation takes into account the real possibilities of interception, and therefore should be the most common in relation to other situations. However, here, when assessing security, it is necessary to have specific data about the receiver and its capabilities. Obviously, this is a challenge. It is also obvious that if the receiver is changed to a more efficient one, the information may become less secure and may not leak through the technical channel of leakage.
The third situation indicates that the owner has overestimated the importance (value) of his information or the information is narrow and interesting only to a limited group of attackers and of little interest to everyone else. In this case, the protection system requires a review, otherwise its use will be associated with excessive spending.
The first situation takes into account the potential for interception and is somewhat idealized in terms of reception. This situation has the least chance of prevalence. However, it is most in demand for justification of security. It is the best for interception and the worst in terms of protection, while covering the second and third situations, which mainly occur in practice. Its main disadvantage is that reasonable protection in the first situation for the other two acts with a margin and causes overspending. However, in order to ensure proper reliability of protection, it is necessary to sacrifice somewhere.
Let the first situation underlie the justification of information security. Interception is carried out constantly and in the best way. We find a condition for the environment in which, given the given security risk, interception will become impossible. At the same time we will consider that if in technical channel of leakage interception is not carried out and the receiver is absent, the channel all the same will take place with a certain representation of the receiver as if this receiver is present (Figure 1).
Assuming that Gaussian normally distributed white noise with a spectral density of N0 acts as an interference in the medium and interception is carried out using an ideal receiver, the required maximum allowable signal-to-noise ratio can be found as
(7)
161

where P – is the power of the difference signal:
(8)
s(t) – difference signal:
s(t) = s1(t) – s0(t), (9)
s0(t) and s1(t) – implementation of logical «0» and «1», T – pulse duration,
F-1(…) – inverse function to the Laplace function:
(10)
In the case of imbalance of information signs, which can sometimes occur in modern ITS, for example, the number of logical "1" exceeds the logical "0" or conversely, the ratio for find the desired signal-to-noise ratio (7) will be somewhat complicated. The error probabilities will be determined on average by all information signs xr. For binary systems [4, 9, 10 - 13]:
p = p(x0)p(y1 / x0) + p(x1)p(y0 / x1), (11)
where p(x0) and p(x1) – probabilities of information signs x0 and x1, for example, logical "0" and "1";
p(y1/x0) and p(y0/x1) – conditional probabilities of transitions in the channel of input information signs x0 and x1 to the output signs y1 and y0 accordingly:
(12)
and
(13)
It is obvious that finding the signal-to-noise ratio δ from relations (12) and (13) is much more difficult than from (7). However, with the help of modern computer technology and technology, this is possible in real time.
In case of imbalance of signs the graphic dependence on Figure 2 in quadrant III. This shows that with a fixed signal-to-noise ratio and
with an increase in the predominance of some probabilities in the distribution of the source over others, the probability of error and protection of information from leakage will decrease. In this case, according to relations (3) and (4), the channel bandwidth and security risk will increase.
Thus, if the owner of the information wants to secure his information with the maximum allowable risk Rmax.allow then the required signal-to-noise ratio can be established using a set of the following indicators:
1. the probability of security risk – pr ; 2. bandwidth of technical channel of
leakage – С ; 3. the probability of error in the
technical channel of leakage – p; 4. signal / noise ratio at the input of the
receiver of the interception means – . These indicators can be used as mandatory for
the calculation of each ITS in order to ensure the leakage of information through the technical channel of leakage. Relationships (2), (3), (6) and (7) establish a relationship between the maximum allowable values of these indicators, which can be used to create an appropriate calculation methodological apparatus.
The principle of calculation can be represented by graphs arranged by quanrants, as shown on Figure 2.
On the axis of risks R (axis of ordinates of the first quantum), the value of admissible monetary losses Rmax.allow. The admissibility of these losses is established by the subject to whom the information belongs, who also manages the security of the object as a whole and its risks.
With the help of the graph is the maximum allowable value of the probability of risk pr max.allow., which is matched by the bandwidth of the channel Cmax.allow.. Using the graph of the second quadrant on Cmax.allow. – is the maximum allowable probability of error in the channel pmax.allow. and using the graph of the third quadrant – the required maximum allowable value of the signal-to-noise ratio δmax.allow.
Execution of the received relation δmax.allow. at the input of the receiver interception in the technical channel of leakage, will ensure a given security risk Rmax.allow..
162

Figure 2: Graphical representation of the principle of calculating the set of risk-oriented indicators of information security from leakage through technical channels
These indicators represent a certain hierarchical structure, where the indicators of the lower levels ensure the implementation of the indicators of the upper levels of the hierarchy.
→ p → C → pr → R , (14)
and the established restrictions of indicators of the top levels create conditions for finding of admissible limits of indicators of the lower levels of hierarchy.
Rmax.allow. → pr max.allow. → C max.allow. → → pmax.allow. → max.allow..
(15)
A special convenience of using the proposed set of indicators is that they allow the use to protect information from leakage of technical channel of leakage not only the traditional method of noise, but also other methods, such as methods of random coding, randomization and more.
Indicators of information security with the use of modern means of receiving physical
media and processing their values during the work of object of information activity allow automation of their control, analysis and adjustment, and risk management – information security management in general.
3. Conclusions
The set of risk-oriented indicators of information security from leakage through technical channels for modern ITS is substantiated. This set represent a certain hierarchical structure, where the main risk or probability of risk is a common indicator of information security for all types of information. The other three indicators of technical channel leakage capacity, its probability of error and signal-to-noise ratio at the reception are related to the provision of a given risk on the types of information in their technological processing, circulation in technical means and circulation in the physical
163

environment. Risk is a measure of information security at the object of information activity at the general upper level of the hierarchy, at the lower, physical level – the signal-to-noise ratio. The indicators of the lower levels ensure the implementation of the indicators of the upper levels of the hierarchy, and the maximum admissibility of the indicators of the upper levels determines the degree of admissibility of the indicators of the lower levels of the hierarchy.
The set of reasonable risk-oriented security indicators take into account the imbalance of signs and allow their automated control, analysis, adjustment and management of information security. The obtained relationships that establish a relationship between indicators can be implemented by real means, in real time.
4. References
[1] Lenkov, S.V., Peregudov, D.А., Horoshko, V.А.: Methods and means of information protection. Tom І. Unauthorized receipt of information. Ariy: Kyiv (2008).
[2] Buzov G.А., Kalinin S.V., Kondratev А.V. Protection of information from leaks through technical channels, Goryachaya liniya: Moskva, Telecom (2005)
[3] Kuhn G. Compromising emanations: eavesdropping risks of computer displays. This technical report is based on a dissertation submitted June 2002 by the author for the degree of Doctor of Philosophy to the University of Cambridge, Wolfson College, (2002) http://www.cl.cam.ас.uk/techreports.
[4] Ivanchenko S., Puchkov O., Rushak O., Holishevskyi A.: Leakage by technical channels for modern information and telecommunication systems. International scientific-practical conference: "Information technologies and computer modeling", Ivano-Frankivsk, pp. 179–183 (2019) ISBN 978-617-7468-37-9.
[5] Decree Law of Ukraine "On Information" (1992).
[6] Law of Ukraine "On Basic Principles of Cyber Security of Ukraine" (2017).
[7] Decree of the President of Ukraine №392 / 2020 On the Decision of the National
Security and Defense Council of Ukraine of September 14, 2020 "On the National Security Strategy of Ukraine".
[8] Law of Ukraine "On Personal Data Protection" (2010).
[9] Information technology. Security techniques. Information security management systems. Requirements [ISO/IEC 27001:2013].
[10] Ivanchenko, S.О.: Justification safety risk information about its security from leaking by technical channels. Scientific and technical digest "Legal, regulatory and metrological support of information security in Ukraine", NTUU "KPI" SRC "Tezis": Kyiv, № 1 (31), pp. 9 – 13 (2016).
[11] Fink L. М.: The theory of transfer of discrete messages [2-d edition], Sov. Radio: Moskva, (1970).
[12] Bronshtein, Y.N., Semendiaev, K.A.: Handbook on mathematics for engineers and students of high schools. Nauka: Moskva, Ch. ed. Phys-Math. Lit. (1986).
[13] Ivanovsky, R.I.: Theory of probability and mathematical statistics. BHV: Petersburg (2008).
164

Method Of A Point Localization In A Polygon In Relation To Ecological And Geographical Problems Andrey Tityapkin 1
1 Ukrainian Scientific Center of Ecology of the Sea, 89 Frantsuzsky Blvd, Odessa, 65009, Ukraine
Abstract The problem of point localization in an arbitrary polygon is considered in relation to the problems of geophysics and ecology. An analytical solution to the problem is obtained using mathematical analysis based on the Cauchy's integral formula from the theory of functions of a complex variable. On the basis of the obtained solution a program was developed for data sampling according to a given zoning of water areas, the further development of which will make it possible to assess the ecological state of the marine environment of Ukraine. Keywords 1 Cauchy's integral formula, polygon, point localization
1. Introduction
The zoning of the Black Sea, especially its northwestern part, according to various ecological and geographical processes or performed according to a certain parameter, has been devoted to a large number of works, in particular, this can be found in the literature review of [1]. The relevance of the problem of zoning of sea areas is due to the need to solve various theoretical and practical problems: modeling and forecasting the variability of climatic and ecological processes, environmental quality management, planning environmental measures, justification of especially valuable territories, etc. [1]. When the boundaries of the regions are determined, an equally urgent problem arises about the distribution of the coordinates of the points of the monitoring study or satellite observations and the corresponding parameters over the given regions for subsequent analysis. That is, the problem arises about the point localization relative to a certain area, as a rule, given by a polygon on a plane. In general, this problem belongs to one of the directions of computational geometry, known as geometric search, in which it is customary to distinguish two main problems: localization problems and regional search problems. This task belongs to the first type. It is relevant not only for solving ecological and geographical problems. It is related to information theory, computer
EMAIL: [email protected] (A.1) ORCID: 0000-0002-7463-5442 (A.1)
graphics, robotics, data protection and compression, information security, video surveillance, etc.
2. Brief description of the known methods
Several algorithms are known for solving the point localization problem in a polygon, the main of them are ray tracing (counting the number of intersections), summing angles, point localization for convex and star polygons, stripe method, chain method, triangulation detail method, trapezoid method and others [2]-[3].
Ray tracing is one of the easiest ways to determine whether a point belongs to an arbitrary simple polygon. The algorithm is based on the idea of counting the number of intersections of a ray outgoing from a given point in the direction of the horizontal axis, with the sides of a polygon. If it is even, the point does not belong to the polygon. A problem arises in the algorithm when a ray crosses the vertex of a polygon or an edge that partially coincides with the ray. The method is simple, but generally not recommended.
The summing angle method is also simple. The algorithm is based on the idea of calculating the sum of the signed angles formed at a given point by the endpoints of each edge of a given polygon. If the sum is close to zero, the point is outside the polygon, if not, then it is inside. The number of
165

turns can be calculated by finding the closest multiple of 2π. The problem with this scheme is that it includes the square root, inverse cosine, division, point, and cross product for each edge tested. However, this method is very impractical, as it requires calculating expensive operations for each edge (inverse trigonometric functions, square roots, division), and was even called the "worst algorithm in the world" for this problem [4].
Point localization for convex and star polygons can be determined using binary search. For a convex polygon, segments are drawn from an arbitrary point inside it to the vertices of the polygon. Due to its convexity, the polygon will be split into disjoint wedges. Wedges are ordered by polar angle counterclockwise. Then a binary search is applied for the desired wedge. After the wedge is found, it is checked whether the point lies inside the wedge or outside. The target point lies inside the wedge if and only if a right turn is performed. If the turn is left, then the specified point is outside the polygon. A star polygon contains at least one arbitrary point, such that the segment from it to the desired point lies entirely inside the polygon for any vertex from the polygon. This method is quite laborious to implement.
One of the reasons for the wide variety of methods for solving this problem is that each known method, along with its advantages, has its own disadvantages and limitations, which are usually quite significant. Namely, this is the occurrence of exceptional situations, slowness, requirement of convexity, complexity in software implementation.
3. Mathematical method of a point localization in a polygon
In [3], [5]-[7] a new approach is considered based on the Cauchy's integral theorem and formula from the theory of functions of a complex variable. This approach was also discussed on the forums [8] - [10]. The following value is calculated:
𝐾 = ∫𝑑𝑧
𝑧 − 𝑧0
∆
, (1)
where Δ is the contour of a given polygon M, 𝑧0 =𝑥0 + 𝑖𝑦0 is a given point on the complex plane.
From the Cauchy's formula (1) it follows that:
𝐾 = {
0, 𝑖𝑓 𝑧0 ∉ 𝑀2𝜋𝑖, 𝑖𝑓 𝑧0 ∈ 𝑀 ∞, 𝑖𝑓 𝑧0 ∈ ∆
However, the final expression obtained in the indicated works [3], [5]-[7] using the MATEMATICA package turned out to be incorrect, possibly due to the cumbersome calculations or a technical error. To verify this, it is enough to consider an example from these works and check if the point with coordinates (1; 1) falls into the triangular region defined by the points (0; 0), (0; 1), and (1; 0). In this work, the correct expressions for calculating the value of K are obtained using mathematical analysis, without using special mathematical packages.
The integral in (1) is represented as the sum of two curvilinear integrals of the second kind:
𝐾 = ∫(𝑥 − 𝑥0)𝑑𝑥 + (𝑦 − 𝑦0)𝑑𝑦
(𝑥 − 𝑥0)2 + (𝑦 − 𝑦0)2
∆
+
+𝑖 ∫(𝑥 − 𝑥0)𝑑𝑦 − (𝑦 − 𝑦0)𝑑𝑥
(𝑥 − 𝑥0)2 + (𝑦 − 𝑦0)2
∆
, (2)
Let us calculate the first integral on the right-hand side of expression (2) using Green's formula:
∫ 𝑃(𝑥, 𝑦)𝑑𝑥 + 𝑄(𝑥, 𝑦)𝑑𝑦 =
∆
= ∬ (𝜕𝑃(𝑥, 𝑦)
𝜕𝑦−
𝑄(𝑥, 𝑦)
𝜕𝑥) 𝑑𝑥𝑑𝑦
𝑀
where Δ is the contour of a polygon M,
𝑃(𝑥, 𝑦) =(𝑥 − 𝑥0)
(𝑥 − 𝑥0)2 + (𝑦 − 𝑦0)2 ,
𝑄(𝑥, 𝑦) =(𝑦 − 𝑦0)
(𝑥 − 𝑥0)2 + (𝑦 − 𝑦0)2.
Let's find the partial derivatives:
𝜕𝑃(𝑥, 𝑦)
𝜕𝑦=
−2(𝑥 − 𝑥0)(𝑦 − 𝑦0)
[(𝑥 − 𝑥0)2 + (𝑦 − 𝑦0)2]2 ,
𝜕𝑄(𝑥, 𝑦)
𝜕𝑥=
−2(𝑥 − 𝑥0)(𝑦 − 𝑦0)
[(𝑥 − 𝑥0)2 + (𝑦 − 𝑦0)2]2.
Thus, 𝜕𝑃(𝑥,𝑦)
𝜕𝑦≡
𝜕𝑄(𝑥,𝑦)
𝜕𝑥, so, the first integral in
(2) is equal to zero and expression (2) will now take the following form:
𝐾 = 𝑖 ∫(𝑥 − 𝑥0)𝑑𝑦 − (𝑦 − 𝑦0)𝑑𝑥
(𝑥 − 𝑥0)2 + (𝑦 − 𝑦0)2
∆
, (3)
To find the integral in (3), consider one side (segment) AB of the contour Δ of an arbitrary polygon M on the plane with coordinates 𝐴(𝑥1, 𝑦1) and 𝐵(𝑥2, 𝑦2). The equation of the straight line passing through these two points (segment) has the form:
166

𝑥 − 𝑥1
𝑥2 − 𝑥1=
𝑦 − 𝑦1
𝑦2 − 𝑦1,
whence we have the following expressions: 𝑦 =
𝑦2 − 𝑦1
𝑥2 − 𝑥1
(𝑥 − 𝑥1) + 𝑦1, 𝑑𝑦 =𝑦2 − 𝑦1
𝑥2 − 𝑥1𝑑𝑥,
𝑥 =𝑥2 − 𝑥1
𝑦2 − 𝑦1
(𝑦 − 𝑦1) + 𝑥1, 𝑑𝑥 =𝑥2 − 𝑥1
𝑦2 − 𝑦1𝑑𝑦.
Thus, the integral for side AB will be equal to the following sum:
𝑖 ∫(𝑥 − 𝑥0)𝑑𝑦 − (𝑦 − 𝑦0)𝑑𝑥
(𝑥 − 𝑥0)2 + (𝑦 − 𝑦0)2
𝐴𝐵
=
= 𝑖𝑦21
𝑥21∙
∙ ∫(𝑥 − 𝑥0)𝑑𝑥
(𝑥 − 𝑥0)2 + (𝑦21𝑥21
(𝑥 − 𝑥1) + 𝑦10)2
𝑥2
𝑥1
− −𝑖
𝑥21
𝑦21∙
∙ ∫(𝑦 − 𝑦0)𝑑𝑦
(𝑦 − 𝑦0)2 + (𝑥21𝑦21
(𝑦 − 𝑦1) + 𝑥10)2
𝑥2
𝑥1
,
(4)
where 𝑥21 = 𝑥2 − 𝑥1, 𝑦21 = 𝑦2 − 𝑦1, 𝑥10 = 𝑥1 − 𝑥0 , 𝑦10 = 𝑦1 − 𝑦0.
In fact, it is necessary to solve one integral, since in the resulting sum (4) the integrands have the same form. We introduce the following substitutions to simplify further calculations: 𝑡 = 𝑥 − 𝑥0, 𝑑𝑡 = 𝑑𝑥, 𝑦20 = 𝑦2 − 𝑦0, 𝑥20 = 𝑥2 − 𝑥0.
We will consider the first integral in the last sum. Let's substitute the substitutions:
∫(𝑥 − 𝑥0)𝑑𝑥
(𝑥 − 𝑥0)2 + (𝑦21𝑥21
(𝑥 − 𝑥1) + 𝑦10)2
𝑥2
𝑥1
=
= ∫𝑡𝑑𝑡
𝑡2 + (𝑦21𝑥21
(𝑡 − 𝑥10) + 𝑦10)2
𝑥2
𝑥1
After transforming the denominator of the integrand, we obtain the integral:
𝑥212
𝑥212 + 𝑦21
2 ∫𝑡𝑑𝑡
(𝑡 +𝑦21ℎ
𝑥212 + 𝑦21
2 )2
+𝑥21
2 ℎ2
(𝑥212 + 𝑦21
2 )2
𝑥2
𝑥1
,
where ℎ = (𝑦10𝑥21 − 𝑦21𝑥10), and, therefore, its solution, the form of which after a series of transformations, will be:
1
2
𝑥212
𝑥212 + 𝑦21
2 𝑙𝑛(𝑥21𝑥20 + 𝑦21𝑦20)2 + ℎ2
(𝑥10𝑥21 + 𝑦21𝑦10)2 + ℎ2
+ (5)
+𝑦21
𝑥21
𝑥212
𝑥212 + 𝑦21
2 (𝑎𝑟𝑐𝑡𝑔𝑥10𝑥21 + 𝑦21𝑦10
𝑦10𝑥21 − 𝑦21𝑥10
−
−𝑎𝑟𝑐𝑡𝑔𝑥21𝑥20 + 𝑦21𝑦20
𝑦10𝑥21 − 𝑦21𝑥10) ,
Substituting (5) into (4), we obtain solution (4) for the side AB, and the logarithms will be canceled:
𝑖 ∫(𝑥 − 𝑥0)𝑑𝑦 − (𝑦 − 𝑦0)𝑑𝑥
(𝑥 − 𝑥0)2 + (𝑦 − 𝑦0)2
𝐴𝐵
=
= 𝑖 (𝑎𝑟𝑐𝑡𝑔𝑥10𝑥21 + 𝑦21𝑦10
𝑦10𝑥21 − 𝑦21𝑥10−
−𝑎𝑟𝑐𝑡𝑔𝑥21𝑥20 + 𝑦21𝑦20
𝑦10𝑥21 − 𝑦21𝑥10)
As a result, we obtain an expression for calculating the value of K in (1) for the entire polygon M, where the summation extends to all its sides:
𝐾 = 𝑖 ∑ (𝑎𝑟𝑐𝑡𝑔𝑥𝑘+1,𝑘𝑥𝑘0 + 𝑦𝑘+1,𝑘𝑦𝑘,0
𝑦𝑘0𝑥𝑘+1,𝑘 − 𝑦𝑘+1,𝑘𝑥𝑘,0
𝑛
𝑘
−
−𝑎𝑟𝑐𝑡𝑔𝑥𝑘+1,𝑘𝑥𝑘+1,0 + 𝑦𝑘+1,𝑘𝑦𝑘+1,0
𝑦𝑘,0𝑥𝑘+1,𝑘 − 𝑦𝑘+1,𝑘𝑥𝑘,0) ,
(6)
It's useful to note that in [8] a solution to this problem was also obtained, but in a different form, because the method of shifting coordinates is used there.
For the test triangular region from [3], [5]-[7], given by the coordinates: (0; 0), (1; 0) and (0; 1), we have the following expression:
𝐾 = 𝑎𝑟𝑐𝑡𝑔𝑥0
𝑦0+ 𝑎𝑟𝑐𝑡𝑔
1 − 𝑥0
𝑦0+
+𝑎𝑟𝑐𝑡𝑔𝑥0 − 𝑦0 − 1
𝑥0 + 𝑦0 − 1− 𝑎𝑟𝑐𝑡𝑔
𝑥0 − 𝑦0 + 1
𝑥0 + 𝑦0 − 1+
+𝑎𝑟𝑐𝑡𝑔1 − 𝑦0
𝑥0+ 𝑎𝑟𝑐𝑡𝑔
𝑦0
𝑥0
It is easy to check that the point (1; 1) does not belong to the given triangular region, the point (0.25; 0.25) belongs to the region, and the point (0.5; 0.5) belongs to the boundary.
The considered mathematical method makes it possible to solve the formulated problem of a point localization with respect to curvilinear polygonal regions. So, in studies [3], [5] an example is given in which a curvilinear boundary given by an equation 𝑦 = 𝑥2 is considered (Figure 1).
167

Figure 1: Example with curved side OA
From expression (3), we can obtain the
following integral of the function of a complex variable for a parabola from 0 to 1:
∫𝑑𝑧
𝑧 − 𝑧0
𝑂𝐴
= 𝑖 ∫(𝑥 − 𝑥0)𝑑𝑦 − (𝑦 − 𝑦0)𝑑𝑥
(𝑥 − 𝑥0)2 + (𝑦 − 𝑦0)2
𝑂𝐴
=
= |𝑦 = 𝑥2
𝑑𝑦 = 2𝑥𝑑𝑥| =
= 𝑖 ∫2𝑥(𝑥 − 𝑥0) − (𝑥2 − 𝑦0)
(𝑥 − 𝑥0)2 + (𝑥2 − 𝑦0)2
1
0
𝑑𝑥 =
= 𝑖 ∫𝑥2 − 2𝑥𝑥0 + 𝑦0
(𝑥 − 𝑥0)2 + (𝑥2 − 𝑦0)2
1
0
𝑑𝑥
Solving the resulting integral, one can obtain an expression for a given curvilinear side.
The obtained solution (6) of the problem of a point localization in a polygon is quite simple and can be implemented in any suitable programming language, for example, C ++, C #, Fortran, Python. Unfortunately, the author of this work is not aware of another similar analytical method for solving this problem.
Applied to ecological and geographical problems, a program was developed in the C ++ language in the visual object-oriented programming environment Borland C++Builder6, which allows to distribute the coordinates of points and the corresponding values of hydrological and hydrochemical parameters based on the results of monitoring or satellite observations for further analysis of the ecological state of sea waters in specified areas. Within the framework of the EMBLAS+ project, relatively homogeneous water areas (sea water bodies), presented in Figures 2 and 3, were identified to carry out a basic assessment of the ecological state of the marine environment in Ukraine [11].
Figure 2: Schematic map of the zoning of the northwestern part of the Black Sea
Figure 3: Schematic map of the zoning of the Azov Sea
The coordinates of the peaks (longitude and
latitude) of each water area (polygon) were entered into text files. Also, text files of satellite observation data on temperature, chlorophyll, transparency (longitude, latitude, parameter), as well as monitoring observations were formed in advance. The program first loads the coordinates of the vertices of the polygon. Then the observational data is loaded, a sample is performed over a given area, and the results are written to a new text file.
Further work will be aimed at clarifying the boundaries of these areas, especially coastal water bodies. developing a software package based on the developed program, which includes a database of basic hydrological and hydrochemical parameters for each water body. The database will store a table of polygons with the following columns: identifier, name and coordinates of the polygon. Taking into account the fact that there
168

are a large number of zoning options for the Black and Azov Seas according to various characteristics, it is assumed that the database will be able to provide the user with the ability to store several zoning options. Such a software package will make it possible to assess the long-term dynamics of both average annual and monthly average changes in the parameters of the marine environment, the ecological state, eutrophication trends and the quality of waters of specific water bodies using the complex indicators E-TRIX and BEAST. The author hopes that the results obtained in this work will also find application in geographic information systems.
4. Conclusions
As a result of the study, the following conclusions were made:
• An analytical solution to the problem of point localiziation in an arbitrary polygon is obtained by methods of mathematical analysis based on the Cauchy's integral formula • As noted in [3], [5]-[7], this method can be used for various curvilinear boundaries, as well as when the point is near the boundary of the region. Competing methods lead to the need to compare practically equal numbers, while in this method one has to compare values that differ significantly in magnitude: 0, 2π, ∞ • In addition, this method does not require the convexity of the polygon, unlike other known methods of computational geometry • A program has been developed to localize the coordinates of points in the areas of specific water bodies of the seas of Ukraine • Prospects for further developments and research in problems of geophysics and ecology are considered
5. References
[1] I.D. Loeva (Ed.), Hidrolohichni ta hidrohimichni pokaznyky stanu pivnichno-zahidnoho shelfu Chornoho moria: dovidkovyi posibnyk [Hydrological and hydrochemical indicators of the status of the Black Sea's northwest shelf: reference guide]. Kyiv: KNT. (in Ukr.), 2008.
[2] F.P. Preparata, M.I. Shamos. Computational Geometry. An Introduction, Springer-Verlag, New York, 1985. doi:10.1007/978-1-4612-1098-6.
[3] A.I. Nedoshivina, Ob algoritmakh lokalizatsii tochki otnositel'no razlichnykh ploskikh oblastey, Sovremennyye problemy yestestvennykh nauk [On algorithms of a point localization with respect to various plane regions, Modern problems of natural sciences], Vol. 1 (2), 2014, pp. 122-128. (in Rus.)
[4] Eric Haines. Point in Polygon Strategies. URL: http://erich.realtimerendering.com/ptinpoly/
[5] A.I. Nedoshivina, S.M. Sitnik Prilozheniya geometricheskikh algoritmov lokalizatsii tochki na ploskosti k modelirovaniyu i szhatiyu informatsii v zadachakh videonablyudeniy, Vestnik Voronezhskogo gosudarstvennogo tekhnicheskogo universiteta [Application of geometrical algorithms for point localization to modelling and data compression, Voronezh State Technical University Bulletin], Vol. 9 (4), 2013, pp. 108–111. (in Rus.)
[6] A.I. Nedoshivina, Primeneniye spetsial'nykh algoritmov lokalizatsii oblastey pri videonablyudeniyakh, Nauchnyye vedomosti. Seriya: Matematika. Fizika [Application of special algorithms for localization of areas in video surveillance, Scientific statements], №17(214), Issue 40, 2015, pp. 162–164. (in Rus.)
[7] А.I. Nedoshivina, Ob ispol'zovanii teorii funktsiy kompleksnogo peremennogo dlya lokalizatsii oblastey pri sokhranenii videoizobrazheniya, Teoriya i tekhnika radiosvyazi [On application of complex variables function theory for the areas localization under the conditions of saving video images], № 2, 2013, pp. 89-93. (in Rus.)
[8] Algorithm for determining the hit of a point in the contour based on complex analysis. Community of IT specialists. URL: https://habr.com/ru/post/125356/ (in Rus.)
[9] Does one figure lie inside another? Scientific forum dxdy. URL: https://dxdy.ru/topic75167.html. (in Rus.)
[10] Determination of belonging of a point to a closed contour. Forum of Russian Software Developer Network. URL: http://rsdn.org/forum/alg/423435.all. (in Rus.)
[11] Basic assessment of the ecological state of the marine environment of Ukraine. URL: http://www.sea.gov.ua/uploads/Initial_Assesment.pdf. (in Ukr.)
169

Multi-Agent Group Application Model Of Unmanned Aircrafts And Unmanned Ground Vehicles During Special Mission Execution Andrii Trystan 1, Ihor Hurin 2, Olha Matiushchenko 3
1,2,3 Ivan Kozhedub Kharkiv National Air Force University, Kharkiv street Sumskaya 77/79, 61023, Ukraine
Abstract Analysis of the experience of unmanned aircrafts and vehicles group application shows the imperfection of methods that would meet the requirements for special missions, namely the lack of control systems for unmanned vehicles in various environment (air and ground) that would take into account situations which arise during missions’ execution. In order to increase the efficiency of special mission execution, there was developed a model of a multi-agent search and impact system on a ground object by a group of unmanned aircrafts along with unmanned ground vehicles under different control options with regard to the conditions of the antagonistic environment. The roles of agents and their tasks in the group are determined in accordance with the payload and operational characteristics. This study also depicts an example of formation of knowledge database and database of unmanned aircrafts and vehicles; specifies rules of coordination of multiple-type unmanned systems for achievement of the special mission purpose. Keywords 1 Agent, multi-agent systems, systems for unmanned, database, command structure, principles and methods of collective command, management of a group of technical objects
1. Introduction
At present, the Armed Forces of NATO member states are aimed at integration of unmanned aircrafts and vehicles and systems into military formations in the capacity of full-fledged units capable of acting individually and in symbiosis with humans.
The use of such systems has a potential with relation to the solution of various problems when the exploitation of the manned aviation or equipment is impossible or impractical. For example, in conditions of strong resistance to enemy air defences, radiation, chemical or bacteriological contamination of the air and terrain, in conditions of high risk of complement loss or the need for an object to be under observation for a long period of time.
The main advantages of using unmanned aircrafts and vehicles compared to the conventional ones are as follows: manoeuvrability, low operating costs, small size,
EMAIL: [email protected] (A. 1); [email protected] (A. 2); [email protected] (A. 3) ORCID: 0000-0003-0494-8125 (A. 1); 0000-0002-4589-7662 (A. 2); 0000-0003-4843-8258 (A. 3)
stealth capability and zero risk to the control operator (crew).
In view of the technical features of unmanned aircrafts and vehicles, they are most commonly effective when used in small areas and are widespread in various fields of human activity: agriculture (planting monitoring, tillage), road traffic control, state border control, emergency prevention, provision of state security and national defence.
At the same time, modern unmanned systems perform various tasks, for example: intelligence (aerial surveillance, fire adjustment by ground-mounted destroyers, strikes evaluation, air guard duty over the assigned sectors), attack and fighter (land-based, surface- and air- launched target destruction ) and special ( electronic counter measures to enemy fire and support resources, complication of the air environment through the use of unmanned systems as aviation erroneous targets, relay of information and battle commands, investigation of buildings and terrain pinpoints).
170

Taking into consideration the potential of engagement of unmanned (robotic) aircrafts and vehicles in various physical environments, it seems advisable to introduce the concept of Unmanned Vehicle (hereinafter UV) in this research paper. UV means a set of software and hardware capable of performing tasks autonomously, according to a pre-prepared program or by remote control through communication channels.
UV implies the following: • unmanned aerial vehicle (hereinafter UAV); • unmanned ground vehicle (hereinafter UGV);
Integrated use complex.
2. Presenting main material
The difficulty of implementation of the UV collective control methods resides in solution of problems related to the planning of tasks and flight (relocation) of the group, communication, distribution of tasks and roles in the group.
In the process of UV group control the external and onboard control systems must perform different tasks which are shown in Fig. 1.
Figure 1: Tasks of the unmanned aerial vehicle (group) and unmanned ground vehicle (group) control system
The introduction of multi-agent systems
(MAS) has a certain potential in UV control systems. This is largely due to the widespread use
of MAS in various fields, including the development of automated control systems, automatic adjustment of neural recognition
171

networks, formation control, overload control in communication networks, interaction of groups of drones, relative alignment of satellite groups, control of mobile robot groups’ movement, synchronization in power systems [5].
The purpose of the MAS is a fundamentally new method of solving problems. In contrast to the classical method with the search for a well-defined algorithm that allows you to find the best solution to the problem, MAS gives the automatic solution as a result of the interaction of many independent goal-oriented software modules - software agents.
The agent has the ability to function fully without outside interference and to control the internal state and its actions. Unlike some adaptive systems, the agent has the ability to learn. Therefore, during changes in the external environment, it will be able to replenish its basic knowledge, which will help in the future to find better solutions to problems and will give more alternatives if one of them does not work.
The advantages of using MAS are as follows [6]:
• adaptability of agents to the environment conditions; • interaction with the other agents of the system; • up-grading and adjustment of the knowledge database in the process of work; • identification of actions required to achieve the goal. MAS involves the operation of two or more
intelligent agents. Thus, there is a problem of coordination between agents, which can be solved by self-organization of the system.
The process of self-organization of the IAS is the internal order, coherence, interaction of more or less differentiated and autonomous agents of the multi-agent system, due to its structure.
As a result, in the MAS several agents can exchange information, interact with each other and solve the set task. In such a system the tasks are distributed among agents, each of which is considered as a group member. The division of tasks involves assigning roles to each member of the group, determining the degree of its "responsibility" and the requirements for its "experience".Table 1 identifies the main roles and
tasks in the group in the search and impact mission
Additionally the following can be engaged in the group: diverting, erroneous, unmanned vehicle – a victim, which actions are aimed at execution of special tasks [11].
Figure 2: Scheme of interaction of 3 types of agents of a multi-agent system
The distribution of roles in the group is carried
out according to the UV payload. The unmanned vehicle – LEADER - is determined from among the unmanned vehicles – SCOUTS, so in case of loss of communication with the Leader, its role can be performed by an agent- Scout.
The number of unmanned vehicles as leaders or scouts is calculated according to the area of the mission territory and is comprised of at least two units due to the necessity to re-monitor the objects and with regard to the time required to make a decision. Thereat, the payload of such unmanned vehicles should be the same [11].
The group realization requires the availability of at least three types of intelligent agents (Figure 2). Agents of the first type (Scout) assess the quality of system control and its state by measuring a set of parameters В1…Вn; U1…Um - some characteristics of the system that describe its operation [3].
Agents of the second type (Leaders) after detection of any suspicious changes as a result of external flight (relocation) Z1, Z2,…Zj by the first type agents (Scouts), (for example, the appearance of new fire resources, enemy’s ambush forces or surveillance systems), analyse and predict different solutions of the problem by forecasting the future behaviour of the system Y1…Yi.
172

Table 1 The roles of unmanned vehicles and their tasks in the group
Agent Role Head 1 Payload Task in the Group
Leader Computer systems for monitoring data pre-processing, Data capture sensors, laser radar, automation systems of processes as to detection, recognition and identification of objects, optoelectronic equipment, means of communication
− route planning (re-planning);
− monitoring;
− allocation of targets;
− integration of information and specification of the scenario
communication with the control point
Scout Computer systems for monitoring data pre-processing , Data capture sensors, laser radar, automation systems of processes as to detection, recognition and identification of objects, optoelectronic equipment, means of communication
− monitoring;
− identification and classification of objects;
− guidance and adjustment ;
− re-monitoring ;
− analysis of the strikes mission results;
− Investigation of buildings, facilities and separate objects.
Special tasks Electronic counter measures systems, radio engineering reconnaissance systems, means of communication, systems for detection, recognition and identification of de-mining objects, system of delivery of necessary material and technical means to the points of destination
− radio engineering reconnaissance ;
− jamming of counter measures to the UAV group during the mission;
− detection, investigation and de-mining;
− supply of material and technical means to the points of destination
Physical effect Systems and means of destruction; guidance system, means of communication
− monitoring;
− destruction of an object, restrike
It should be noted that the process "on hold"
shown in the figure is a special case of adaptation, when the system through the exchange of information between intelligent agents forecasts changes and regulates its behaviour to respond to failure. This approach protects the entire system comprehensively rather than its individual components, and assists in reporting the problem to the control point and resolving it.
Thus, the MAS is able to solve tasks and organize its activities independently and perform the task as intended, forecast the work of all members of the group and control the stages of the task completion without human intervention.
The UV group control models are considered in Figure 3. The following models are defined for the control of intelligent UV in the group: centralized, decentralized and combined.
173

Figure 3: Unmanned vehicles group control models
Centralized control strategies can be divided
into single-level and hierarchical. Single-level control supposes that the
commander’s or operator’s group has a control device which performs the functions of planning and group control. Its advantage is the simplicity of organization and algorithmization. Disadvantages include the long decision-making time because only one operator solves the task how to optimize all members of the group to achieve the group target and fragility.
Hierarchical control supposes that the operator or commander has the control device, which controls a small number of subordinates; each of them has its own group of controlled objects. This, compared to the single-level control, significantly simplifies the task to be solved by an individual commander or operator, but the complexity of the management structure can lead to delays or failures in the transmission of commands from top to bottom level.
Decentralized control strategies are divided into collective and gregarious.
Collective control supposes that there is no commander or operator of the control device in the system, all devices are equal and each member of the group makes decisions independently,
trying to make the maximum possible contribution to the group target, and while doing that all exchange information about selected actions with each other. Due to the fact that each device solves the optimization problem only for itself, and does not try to coordinate the actions of the whole group, optimization is significantly simplified, so the task can be performed quickly, in real time.
However, group control complicates algorithmization, which requires software and hardware to ensure and maintain a high "intellectual level". If this requirement is not met, the ability of agents to understand the group task and be able to choose the actions that lead to the best performance of the mission in view of the effectiveness of the group is significantly reduced or limited.
In gregarious control there is no commander or control operator in the system, all units are equal and each device makes its own decision, trying to make the maximum possible contribution to the group target, but there is no exchange of information between the group members and each object coordinates its actions on the basis of indirect information, following the activities of others.
174

Under a centralized single-level strategy, the operator of the control device makes the optimal decision and the time for its adoption depends exponentially on the number of objects in the group.
In this case, it is possible to get the best solution, because the operator performs the optimization of all group actions as a whole. Under the hierarchical strategy the time for decision-making is reduced by breaking down the tasks which are solved by separate subgroups.
Figure 4: Group decision time for different control strategies: 1 - strategy of single-level control; 2 – strategy of hierarchical control; 3 - strategy of collective control; 4 - strategy of gregarious control
Under a decentralized collective control strategy each object of the group makes decisions independently and informs others about its intentions to optimize joint actions, so the time for decision-making increases linearly depending on the number of objects in the group.
The gregarious strategy achieves the shortest time of decision-making, because each object of the UV group takes it independently, basing only on indirect signs, so this time is slightly dependent on the number of objects in the group. However, it is clear that the gain in time is achieved by deteriorating the quality of the task execution. Accordingly, the highest quality is obtained when using a single-level control [7,17].
Basing on Figure 4 it is possible to determine the type of strategy that is most optimal in each particular case. To do this, you need to know the required group decision time tр and the number of objects in the group N. For example, if you know tр, and the number of objects in the group is less than one, it is better to use a centralized strategy, because it provides the best result. If (with known tр) the number of objects in the group ranges from one N to two N, it is advisable to use a hierarchical control system. With two N - three N the use of collective strategy will significantly reduce time expenditures compared to centralized control systems.
If the number of objects in the group is more than three N, and the time tр is limited, it is advisable to use a gregarious control system, because in this case the decision time does not depend on the number of objects in the UV group. In turn, the value of tр depends on the conditions in which the group must operate. If they are determinated and practically there is no restriction on time of the task decision in the group it is possible to make the program in advance and to put it in memory of each object of the group [16].
Provided that the situation changes slowly, for example, when drawing a map of the area, it would be more acceptable to use a hierarchical strategy, when commands (tasks) come from the control point for separate UV groups, each of which has its own local commander, who effects control within the group. If the situation changes very quickly, as in the case of military operations, the decision on group actions shall be made immediately, often without paying attention to quality, in which case one of the strategies of decentralized control is suitable: collective or gregarious [13].
The practical implementation of the above models of group control necessitates the implementation on one functional basis under different conditions and different organizational structure of the UV (single-level, hierarchical, collective or gregarious).
Figure 5 shows a schematic meta-model of the search and impact system on the object by the UV group.
175

Figure 5: Meta-model of the system of search and impact on the object by a group of unmanned vehicles
The dotted broken line shows the relationship between the executing agents used in centralized control. When the communication with operator is lost, the control model is shifted to a decentralized control model via a leader agent.
The meta-model contains two types of internal scenarios of agent behaviour: scenarios that are executed when information is received from other agents; and scenarios that are executed by the agent as a result of processing information from its own sensors and detectors [12]. For example, a Scout agent activates an identification scenario when an object is detected, while activating a detection scenario requires a control command message from the Leader agent.
MAS functioning as to object search and impact is activated by control operators and begins with a preliminary search plan for a specific object, which includes route planning for each agent (to be made by a Leader agent) and countdown of the start time of the task execution, which is synchronized between groups of agents.
The data obtained from the sensors of the agents get into the general information field, so the system obtains information about the environment and the information remains constantly updated.
Since the MAS concept provides for partial awareness of information by each agent, it is logical that each agent has its own knowledge
176

dataBase (KB) capable of operating knowledge that corresponds to the role of the agent, and "higher" level KB, which operates knowledge of each type agents – KB of the Leader agent [11].
For efficient functioning of MAS of search and impact on the object by UV group it is necessary to define rules and strategies of the agents’ behaviour that will correspond to the MAS application environment and role of each agent. The rules added to the MAS KB will allow agents to respond correctly and effectively to situations.
KB of an UV agent can be conveniently divided into three blocks:
knowledge added during preparation for the task execution, namely: data of the geographic information system (GIS), the area of the task execution, the catalogue of objects;
sensor information: information obtained from the system's own sensors and detectors;
current information: information received from group control points.
Each system agent iA has its own initial KB, which contains data about the environment:
• the area of the mission territory ( S ); • its location (
i iA Ax y );
• location of other agents ( j jA Ax y ), where,
1...j N , N is number of agents, i j ;
• restricted areas defined by polygons (set of points) kZ , where 1... mz z z= , m is the number of points in the polygon, 1...m М , where М is the number of polygons; • catalogue of objects i , where 1...i , where is the number of objects; • agent behaviour strategies i , where
1...i , where is the number of possible agent behaviour strategies. During the task execution, the agent expands
and updates its own knowledge database through data obtained from other agents (location, restricted areas) or from its own sensors. Thus, the KB is filled with data obtained as a result of logical inferences.
The facts database and knowledge database of physical effect agents are specified in detail in the research paper [11]. With regard to peculiarities of the use of UAVs and UGVs, we will consider the fact database and knowledge database for the engineering effect agent and the support agent.
Table 2 shows an example of the knowledge database of engineering effect and support agents, the rules database (Table 3) of the engineering effect agent and the rules database (Table 4) of the support agent.
Table 2 Facts database of engineering effect and support agents
No Exposition Interpretation
1 i iA Ax y S The current coordinates of the agent i iA Ax y are
located within the task execution area ( S ) 2 i i
x y S The coordinates of the object i i
x y are located
within the task execution area S 3 p i The object catalogue i contains the defined object
of impact p
4 n i Object n is one of the tasks that group i
can
perform 5 i i kx y Z The coordinates of the object
i ix y are located
within the restricted zone kZ
6 1 = Actions comply with security protocol ( ) 7 0 = Actions do not comply with security protocol ( ) 8 0 = A control command ( ) is received from the Leader
agent or control point for monitoring 9 1 = A control command ( ) is received from the Leader
agent or control point for de-mining
177

No Exposition Interpretation 10 2 = A control command ( ) is received from the Leader
agent or control point for supply of the material and technical means
11 1 = Confirmation ( ) is received for demining from the Leader agent or control point
12 0 = No Confirmation ( ) is received for demining from the Leader agent or control point
13 1 = Confirmation ( ) of demining completion and report to the Leader agent or control point
14 0 = No Confirmation ( ) of demining completion (demining is still in process)
15 1 = Confirmation ( ) is received for supply of the material and technical means
16 0 = No Confirmation ( ) is received for supply of the material and technical means from the Leader agent
or control point 17 maxrT T Time for the task (work) execution ( rT ) does not exceed
the resource ( maxT ) of the agent
18 maxrT T Time for the task (work) execution ( rT ) exceeds the
resource ( maxT ) of the agent
Table 3 Behaviour scenario of the Engineering effect agent
No Notation Interpretation
1 1 Monitoring
2 2 Formation of confirmation
request
3 3 De-mining
4 4 Confirmation of de-mining completion
Rule 1
1) ( 1))( (( 0) ( 1))(i iA A Sx y = = = →
Rule 2
max 2
( ) ( ) ( )
( ) ( ) ( 1)
( )
i i
i
i i
i
A A p i
n i k
r
S x y S
x y Z
T
y
T
x
=
→
Rule 3
max 3
( ) ( ) ( )
( ) ( ) ( 1)
( ) (( 1) ( 1))
i i
i i
i i p i
n i k
A A
r
S x y Sx
x
y
y Z
T T
=
= = →
Rule 4
4) ( 1))( (( 1) ( 1))(i iA A Sx y = = = →
Table 4 Behaviour scenario of the Supply agent
No Notation Interpretation
1 1 Monitoring
2 2 Formation of
confirmation request
3 3 Supply of the material and
technical means
Rule 1
1) ( 1))( (( 0) ( 1))(i iA A Sx y = = = →
Rule 2
max 2
( ) ( ) ( )
( ) ( ) ( 1)
( )
i i
i
i i
i
A A p i
n i k
r
S x y S
x y Z
T
y
T
x
=
→
Rule 3
max 3
( ) ( ) ( )
( ) ( ) ( 1)
( ) (( 2) ( 1))
i i
i i
i i p i
n i k
A A
r
S x y Sx
x
y
y Z
T T
=
= = →
3. Conclusions
The formation of a group of agents with the organization of group control (ground and aerial
178

groups) allows ensuring the joint solution of a set of tasks that cannot be solved in the case of non-collective behaviour.
Analysing the existing systems, principles and methods of UV groups’ collective control, we can come to a conclusion that the issues related to the development of group control systems for functioning in various environments, separately ground and aerial, are quite well elaborated and implemented in practice as specific specialized systems. At the same time, the complexity of the tasks of UV groups’ control, which are engaged in execution of special missions, has been growing significantly. The greatest difficulty of the tasks of UV joint use in various environments is the implementation of control in conditions of an organized counter measures, when decisions shall be made within a short time, close to real time, and the actions of separate groups may not necessarily be optimal. Thus, there is a need to combine the capabilities of two groups of agents with different environments for the effective solution of the problems.
The conducted researches resulted in development of a multi-agent model of UV group application during execution of special missions. This research paper has examined centralized, decentralized and combined models of multi-agent systems control. It also gives the conclusions as to the use of each control model.
A differentiating feature of this model is the consideration of the option of centralized control with a leader and decentralized control.
The choice of decentralized group control strategies increases the efficiency of functioning and probability of achieving a system-wide target, as well as the performance of the task by a separate object. The application of gregarious principles of control is expedient in the conditions of purposeful actions aimed at destruction by the opposing force.
The developed knowledge database of UV agents is based on productive rules of inference and takes into account the given situation. The synthesis of this model allows developing a system of rules and describing the UV behaviour during execution of special missions to find an appropriate method of group control.
4. References
[1] V. Moiseev, Applied theory of unmanned aerial vehicles control, Kazan, State
Financed Institution Republican Center of Education Quality Monitoring, 2013.
[2] A. Gaiduk, I. Kalyaev, S. Kapustyan, Group control systems for intelligent robots, Taganrog, Publishing house of the Southern Federal University, 2012.
[3] A. Gaiduk, I. Kalyaev, S. Kapustyan, Models and methods of large robots groups’ control, Rostov-on-Don, Publishing house of the Southern Federal University, 2014.
[4] V. Abrosimov, Group movement of intelligent aerial vehicles in an antagonistic environment, Moscow: Publishing House “Nauka”, 2013.
[5] S. Kapustyan, The method of multi-agent interaction organisation in distributed control systems of a group of robots when solving problems of covering an area. Artificial Intelligence, 2004. No. 3., pp. 715-727.
[6] A. Dodonov, M. Kuznetsova, E. Gorbachik, Organization of mobile technical objects group control, Kiev, Institute for Information Recording of the National Academy of Sciences of Ukraine, 2017.
[7] I. Puleko, Structural-parametrical synthesis of an automated control system of a group of small unmanned aerial vehicles under required structural dynamics, Problems of development, testing, application and operation of complex information systems. Zhitomir, Zhitomir Military Institute named after S.P.Korolyov of the National University of Telecommunications , No. 14., 2017, pp. 91 - 104.
[8] D. Beloglazov, Group control of mobile objects in uncertain environments, Moscow, Physmathlit, 2015.
[9] D. Bugaychenko, Development and implementation of formal-logical specification methods for self-adjusting multi-agent systems with time constraints, Website of the Faculty of Mathematics and Mechanics of St. Petersburg State University. Saint Petersburg State University, 2010.
[10] A. Kolesnikov, I. Kirikov, S. Listopad, Hybrid intelligent systems with self-organization: coordination, consistency, controversy, Moscow, Institute for Information Recording of the Russian Academy of Sciences, 2014.
[11] O. Matyushchenko, V. Kadubenko, S. Sedash, D. Sizon, Multi-agent model of unmanned aerial vehicles group application
179

in special mission execution, Polish Journal Of Science, Vol. 1, No. 35., 2021, pp. 13-19.
[12] V. Gorodetsky, O. Karsaev, V. Samoilov, S. Serebryakov, Applied multi-agent systems of group control, Artificial intelligence and decision making, No. 2., 2009, pp. 3 - 14.
[13] A. Bondarev, R. Kirichek, Review of unmanned aerial vehicles for general use and UAV air traffic control in different countries. Information technology and telecommunications, T. 4, No. 4, 2016, pp. 13–23.
[14] E. Borisov, A. Vladyko, Self-organizing communication networks of multi-agent robotic systems. Actual problems of protection and security, XIX All-Russian scientific-practical conference: collection of scientific articles, 2016, pp. 210–217.
[15] O. Tachinina, O. Lysenko, Method of path constructing of information robot on the basis of unmanned aerial vehicle, Proсeedings of the National Aviation University, Kyiv, NAU, № 4(73), 2017, pp. 60-68
[16] R. Gabasov, F. Kirillova, The maximum principle in optimal control theory, Moscow, 2011, pp. 76-89.
[17] I. Puleko, Problems of management of small, secure lithium devices from the position of the theory of robotic systems, Problems of stemming, viprobuvannya, storage and exploitation of folding information systems. Zhitomir, ZhVI FLS, VIP. 11, 2015, pp. 106-114.
[18] V. Litvin, Multiagent systems and adaptations accept solutions based on precedents and viciousness of adaptive ontology, Piecewise intelligence, No. 2, 2009, pp. 24-33.
[19] D. Pospelov, Multi-agent systems - present and future, Information technology and computing systems, No. 1, 1998, pp. 14-21.
[20] D. Puzankov, V. Miroshnikov, Intelligent agents, multi-agent systems and semantic WEB: concepts, technologies, applications, Saint Petersburg, Technolit LLC, 2018, pp. 102-108.
180

Taxonomy of Chatbots O. Trofymenko1, Y. Prokop2, N. Loginova3 and A. Zadereyko4
1,3,4 National University “Odessa Law Academy”, Fontanska doroga str., 23, Odesa, 650091, Ukraine 2 State University of Intellectual Technologies and Communications, Kuznechna str., 1 Odesa, 65029, Ukraine
Abstract The development and implementation of chatbots is a relatively young area, which is rapidly gaining popularity in various fields of life. Nowadays, chatbots are embedded everywhere on websites, in various messengers, or on other forms of communication platforms. A chatbot is a specific virtual interlocutor that can perform a variety of functions, depending on the scope. There are different types of chatbots and different visions of how to classify them. This study presents a detailed multifactorial classification of chatbots for a clear understanding of nature, approaches to creation, advantages, and disadvantages of chatbots on one basis or another. Research and analysis of the features of modern chatbots allowed to divide chatbot programs by seven criteria: purpose; location; type of interface; number of users; form of access; algorithm; functional. Each of these categories is divided into groups and subgroups on different grounds. Possible examples of chatbots of the corresponding categories are given. Also, the scope of application of chatbots is considered in the work. It is substantiated that chatbots are one of the most perspective directions of web interaction with users. This is due, firstly, to the active use of messengers, and secondly, the development of artificial intelligence technologies. In the long run, chatbots will help to minimize many routine processes but are not an alternative to man. Keywords Chatbot, virtual assistant, classification, messenger.
1. Introduction
Recently, there has been a surge of interest in chatbots as dialog interfaces for human interaction with computer systems. Nowadays, chatbots are embedded everywhere on websites, in various instant messaging chats, or on other forms of communication platforms. A chatbot is a specific virtual interlocutor that can perform a variety of functions, depending on the scope. The chatbot allows you to simulate a casual, natural conversation through messaging. These bots use artificial intelligence technologies. Chatbots are indispensable assistants in any field where there is a large amount of communication with customers. In addition, when developing chatbots, you can integrate payment systems for online payment when receiving orders, which significantly improves, simplifies, and speeds up interaction with customers, eliminates the need to call them.
EMAIL: [email protected] (A. 1); [email protected] (A. 2); [email protected] (A. 3); [email protected] (A. 4); ORCID: 0000-0001-7626-0886 (A. 1); 0000-0002-6608-3668 (A. 2); 0000-0002-9475-6188 (A. 3); 0000-0003-0497-9861 (A. 4)
Using chatbots saves a lot of time, as the customer who asked for support receives an instant response 24/7, without waiting for the operator to connect. At the same time, he does not face spam, unnecessary chatter, obsessive appeals, and receives only useful information.
There are different types of chatbots. Some are aimed at informing potential customers, others are sales-oriented, and still others are used exclusively as personal assistants. Chatbots are used in such areas as e-commerce services, call centers, the gaming industry. The use of chatbots for such purposes is usually limited by narrow specialization, and they cannot be used for a wide range of human communication. It all depends on the functionality embedded in the program.
Different scientists have different views on how to classify chatbots. There is a well-known approach when there are two types of classification [1]: 1) business classification of chatbots and 2) classification of chatbots by
181

technical type (chatbots on business rules, chatbots on artificial intelligence, hybrid chatbots. boots). There are more detailed classifications of chatbot programs. For example, in [2], a classification of chatbots according to five criteria is proposed: user, interaction with the user, access, purpose, and principle of operation. The study [3] proposes the division of chatbots into four groups: by purpose, by type of data access, by available services, and by type of response. This taxonomy is quite detailed, but it does not take into account the types of chatbots in terms of functionality and algorithm of interaction.
Within different research positions, there are different approaches to classification. These scientific approaches indicate a certain situationality of research in the field of the taxonomy of chatbots, which indicates the need for further research in this area.
The purpose of this study is to form a multifactorial classification of chatbots for a clear understanding of nature, approaches to the creation, advantages, and disadvantages of chatbots on one or another basis.
2. Classification of chatbots
It is logical to classify chatbots, distinguishing them by criteria. Research and analysis of the features of modern chatbots allowed to divide chatbot programs into seven classes (Помилка! Джерело посилання не знайдено.).
Figure 1: Classification of chatbots
By purpose: • chatbots for conversations on a wide range of topics are designed for dialogue with the user on abstract topics and do not have a clear purpose;
• chatbots focused on dialogue only on a specific topic or to solve a specific problem or goal are the most common, for example, for regular distribution of information, setting reminders, etc. By location: • on sites. Mostly, companies are willing to embed chatbots on their websites to help the customer answer their questions or resolve other communication requests or issues regarding unique tasks or settings; • in messengers. They are mostly used for fast interaction with customers, even in conditions of slow internet or roaming, as most providers do not charge for communication in messengers. The reason for the creation and popularity of certain groups in messengers within Facebook Messenger, Slack, Viber, or Telegram is the combination of people in groups with some common interests. Areas of interest are not limited to the commercial component, but on the contrary, mostly relate to the cultural and educational components of our lives. Chatbots can be created for personal and business use. For example, a logistics company may provide copies of dispatch documents through a chatbot instead of making phone calls; • in specialized software applications, the use of chatbots facilitates and accelerates the process of ordering goods or services, such as ordering food. By type of interface: • button – communication of the user with the bot is organized by pressing the selected button in the list of buttons with different options. Such an interface can resemble a voice menu "press 1 to find out ...". The vast majority of simple chatbots work on this principle. Such chatbots are widely used to order goods and services from the list of companies in their chats in messengers; • text – communication with the user is carried out in the form of text messaging. Chatbot recognizes words that are common in the user's query, clarifies questions, and offers solutions; • mixed models – to form a text response to requests, the bot can offer the user buttons with clarifying questions. An example of such chatbots is a handy tool from utilities for transmitting meter readings, with which household consumers can transmit meter readings by combining button clicks and
182

forming text messages of certain content following instructions in the messenger; • voice – the user communicates in the form of voice messages. The voice message is first converted programmatically into text, analyzed, and only then synthesized audio response to it. Voice assistants are more natural and user-friendly than graphical interfaces. Today, modeling human speech interaction with a computer, as a full-fledged interlocutor, plays an important role in the development of conversational dialogue systems and answering machines. Further research aimed at strengthening voice communication with modern network computing devices will attract more and more attention because language is one of the most effective types of human communication; • runtime interface – no dialog interface system is complete without the robust runtime interface required to connect virtual agents to external systems. This interface is needed to communicate with external systems to obtain dynamic information to continue the conversation or perform certain intended actions. After all, the bot interface is responsible not only for the way information is entered, but also for the methods of interaction of the bot with this information, i.e. for support of commands, the ability to separate commands from the user message, and the ability to understand the context of dialogue. By the number of users: • personal chatbots, which in turn can be divided into two groups: 1. for personal use without data transfer to others. These can be personal repositories of systematized data, for example, time-bots to store their memories in the form of photos taken with a possible link to the geolocations of their creation, for example, during their trips to create a memorable personal photo album, or for creation and storage of personal records and user files (photos, audio, video, etc.) with ensuring the confidentiality of access to this data; 2. interactive chatbots – a kind of user's assistants in interaction (data exchange) with other users or other programs to perform certain actions on behalf of the user, for example, to manage the calendar, send texts (for instance, the above chatbot from utilities for transmission of meter readings), receiving personal calls, searching and playing audio and
video files, etc. Assistant bots help to document the user's schedule, remind him about scheduled tasks and meetings. Virtual assistants can partially replace secretaries for some executives. Another striking example of such a bot is a bot-lawyer who provides answers to various legal questions and helps to file lawsuits, for example, to appeal fines for improper parking, to receive compensation for unexpected travel expenses; • business chatbots are designed to enable simultaneous business use in automatic communication with many customers without involving manual employees of the company in the service process. Such chatbots are used in many areas of the business to automate commercial processes of communication with customers, as well as perform analytical and other ancillary functions. Possible niches for such chatbots are information services for members of certain groups, routine information processes of election campaigns and higher education institutions, especially at the beginning of the school year, ticket booking and purchase services, support services for delivery of goods, food, flowers, etc. By form of access: • chatbots in certain groups (chats) of the messenger are a useful means of communication between members of this group and coordination of their interaction. For example, a chatbot of a faculty or the entire university can effectively combine teachers, management, and students, providing each of them with detailed information on the schedule of classes for full-time and part-time forms of education or other specialized information about the educational process; • chatbots in the messenger dialog can be called directly in any dialog by simply typing the @ symbol and the bot name after it. After launching the chatbot, you will be asked to choose options or actions, and the result can be sent to the interlocutor of the dialogue or share with his friends from the contact list; • subscribed chatbots allow you to collect a chatbot subscriber base on your site and send mass and personal mailings within Facebook Messenger, Slack, Viber, and Telegram, thereby converting users to potential buyers. You can subscribe to the chatbot in different ways: by linking to the bot on the Facebook page or in the Telegram; finding a bot by
183

@username; by the direct link to the chatbot, posted on the site or social networks; via the subscription widget or the corresponding QR-code on the site without going to the Facebook page or in Telegram. By algorithm: • simple (limited) chatbots interact with users on a pre-prepared script – a tree of decisions of a tree-like structure, which contains a set of answers to common questions, i.e. the answers are selected from the template phrases of the script by keywords. If the user does not use keywords when communicating, the bot does not understand him and performs the actions provided for such cases, for example, offers to contact the operator. Chatbots of this type usually avoid questions that require free answers and instead contain a large number of buttons. The functionality of such bots is limited, but for certain situations, they can be useful. With the help of special services, you can set up a simple chatbot for free. This will allow you to try and understand whether this option is useful for business; • intelligent ("smart") chatbots are based on an artificial neural network that "understands" the meaning of the conversation. The conversation path is determined implicitly based on the training data (training samples) used to teach the machine learning model. That is why such chatbots need large data sets for self-learning because it depends on the degree of their "reasonableness" and the adequacy of answers to questions. Such software assistants are developed individually and are much more expensive to develop because to create a high-quality chatbot a lot of effort is invested in the development of artificial intelligence (AI, Artificial Intelligence – AI) and machine learning neural networks. The core on which the intelligent chatbot is built consists of NLP (Natural Language Processing), NLU (Natural Language Understanding), and NLG (Natural Language Generation). NLP is the ability of the machine to process what is said, understand its meaning, determine the necessary action in response and respond in language understandable to the user, by converting computer text into structured data. NLU is the backbone of any chatbot and is essentially a subset of NLP processes. It is responsible for the computer's ability to choose how best to handle unstructured input and turn
it into a machine-friendly structure. This core component is extremely important for such unpredictable data as abbreviations, modified words and misspelled words, slang, unintelligible language, metaphors that a person can understand and a machine cannot understand. NLG is the process by which a computer converts structured data into text. In essence, this is the creation of a bot text to communicate with a person who understands the language. Such chatbot can collect information about users, track their actions, and then, if necessary, analyze their habits. Collected in the process of dialogue, user data allows you to personalize offers and newsletters. The bot can be used as a tool for debugging smart processes within the company and the interaction with it takes place in a familiar and user-friendly interface of a particular messenger, such as Telegram. Chat-bot API allows you to connect to external systems and synchronize with corporate systems, such as CRM, ERP, "Google Spreadsheets", etc; • hybrid chatbots are a combination of the first two types of chatbots. Bots of this type communicate with the user in a predetermined way, but use AI to recognize the user's intentions, as well as to extract valuable data from user messages (name, date, period, etc.). This type of chatbot is the most widely used in commercial applications. In medicine, such chatbots can be used primarily for rapid remote pre-diagnosis. In addition, artificial intelligence tools can be used to analyze the health data of both individual patients and predict the trend of viral diseases during seasonal fluctuations and possible epidemics [4]. In addition, such chatbots in general and clinical psychology allow users to talk about whatever they want and are smart enough to ask meaningful questions and answer them [5]. Their goal is to provide psychologicalhelp to people struggling with depression, especially if they lack attention and have no one to talk to about their problem. By functionality: • information and communication – chatbots that do not have a specific purpose and are designed solely to support communication with people, to share information about special offers and discounts, to help choose a product or service, etc. Currently, one of the main areas of application for such chatbots is the distribution of
184

advertisements, promotional offers, etc. Research [6] shows that messages in messengers are five times more effective than e-mail and SMS. At the same time, the cost of mailing is much lower. Therefore, companies are interested in expanding the base of contacts and increasing sales through appropriate chatbots; • "questions and answers" – chatbots (Q&A – questions and answers), designed to give simple answers on the principle of "one question – one answer"). The use of a such chatbot can significantly reduce the load and cost of support, as it automates the processing of simple, frequently repeated requests from customers. At the same time, there is parallel processing of an unlimited number of applications. This allows you to unload the team and involve managers only when you need to solve complex problems, thereby optimizing staff costs; • assistants – chatbots that generate data based on user responses to achieve certain goals, for example, when filling out web forms for bank statements, online mortgages, etc. Such bots are useful in the field of statistics, because they can automatically track stock prices, page views of the company's website, or the number of contacts that were created in the previous day, generate statistics in a user-friendly format, etc.; • functional – chatbots, which allow you to immediately perform certain actions, for example, transfer money to the account, specify the status of the order by its number, etc. In the field of recruitment, such chatbot is considered an effective communication system that successfully simplifies the work of HR managers and recruiters, automatically collecting and systematizing the relevant competencies, skills, and experience during the automatic online survey of candidates [7]. Such chatbots successfully identify the best candidates, automatically schedule interviews and answer questions from job candidates.
3. Conclusions
The development and implementation of chatbots is a relatively young area, which is rapidly gaining popularity in various fields of life. Therefore, the topic is relevant, and unified approaches to the classification of chatbots according to various criteria have not yet been
developed. The analysis of various approaches to the taxonomy of modern chatbots carried out in the article revealed some discrepancies and inconsistencies.
The paper forms a multifactor detailed classification of chatbots for a clear understanding of nature, approaches to the creation, advantages, and disadvantages of chatbots on one or another basis. Research and analysis of the features of modern chatbots allowed to divide chatbot programs into seven criteria: purpose; location; type of interface; the number of users; the form of access; algorithm; functional. Each of the categories is divided into groups and subgroups on different grounds. Possible examples of chatbots of the corresponding categories are given.
4. References
[1] D.A. Urayev, Classification and methods for creating chatbot applications, International scientific review (2019) Vol. LXIV, 30-33.
[2] A. Vishwakarma, A. Pandey, A Review & Comparative Analysis on Various Chatbots Design, International Journal of Computer Science and Mobile Computing (2021) Vol.10, Issue 2, 72-78. doi: 10.47760/ijcsmc.2021.v10i02.011.
[3] I. Ushakova, Approaches to creating intelligent chatbots, Information processing systems (2019) Vol. 2(157), 76-83. doi: 10.30748/soi.2019.157.10.
[4] Ch. Bulla, Ch. Parushetti, A. Teli, S. Aski, S. Koppad, A Review of AI Based Medical Assistant Chatbot (2020) Vol. 2, 1-14. doi: 10.5281/zenodo.3902215.
[5] A. Hussna, A. Laz, M. Sikder, J. Uddin, H. Tinmaz, A. Esfar-E-Alam, PRERONA: Mental Health Bengali Chatbot for Digital Counselling, Intelligent Human Computer Interaction (2021): 274-286. doi: 10.1007/978-3-030-68449-5_28.
[6] O. V. Vynogradova, N. I. Drokina, V. G. Darchuk, Feasibility of messenger-marketing for promotion of goods and services on the internet, Economics. Management. Business (2020), No 1(31), 11-20. doi: 10.31673/2415-8089.2020.011120.
[7] S. Majumder, A. Mondal, Are chatbots really useful for human resource management?, International Journal of Speech Technology (2021). doi: 10.1007/s10772-021-09834-y.
185

Improvement of the Integrated Supply Center Functioning Model With The Use of the Agent-Oriented Approach O. Gurin1, N. Salna2
1,2 Kharkiv National Air Force University n.a. Ivan Kozhedub, Kharkiv, 61023, Ukraine
Abstract The experience of using the Security and Defense Forces in the anti-terrorist operation and the Joint Forces operation in deterring armed aggression in eastern Ukraine indicates that under modern conditions the combat capabilities of the Armed Forces of Ukraine depend on timely and comprehensive support of their military units. In order to provide comprehensive support, compact institutions, bodies, structures, and military units of logistical support that respond quickly to the needs of the troops are needed. The article reveals the concept and purpose of an integrated support center; the main tasks for the logistical support of military units (separate units) during operations (combat actions) have been identified; the basic indicators of efficiency of functioning and the existing model of functioning of the united support center concerning distribution of functional powers between divisions have been determined. The list of tasks of functioning of the integrated support center where information technologies are applied is defined. The method of solving existing tasks in the process of conducting an operation (combat) is considered to be the use of multi-agent systems. The solution of the issue of integrated automation based on ERP solutions (resources management and planning concept) and WMS (the information system providing warehouse processes management automation) has been offered. The paper summarizes the conclusions that multi-agent systems allow forecasting the availability of stocks at an integrated supply center, to form a rational model of stock management, which is based on non-stochastic demand and is a combination of known models, that will ensure continuity and completeness of military units of the Armed Forces of Ukraine for their operations (combat actions). Keywords 1 Provision of military units, Information Technology, logistics, stock management model, multi-agent systems, integrated support center, stock availability forecasting.
1. Introduction 1.1. Statement of the issue
The experience of implementing logistical support measures in the anti-terrorist operation of the Joint Forces (JF) actions revealed the existence of problematic issues related to the timely, continuous and full provision of military units (separate units) (divisions) in the course of hostilities. Material supplies are delivered to military units from warehouses of higher bodies of logistical support of territorial joint centers of logistical support of the Logistics Forces Command of the Armed forces of Ukraine, realizing models of dispersed/concentrated support. The integrated support center is a
EMAIL: [email protected] (A. 1); [email protected] (A. 2) ORCID: 0000-0002-0951-3713 (A. 1); 0000-0003-1520-3989 (A. 2)
warehouse with various material supplies, which serves military units located on the area of approximately 6-7 regions of Ukraine and the operation of which is accompanied by certain problems, issues and difficulties [1] - [2].
The main issues in the functioning of the integrated support center are the automation of the processes of accounting and forecasting the need for material supplies of units (divisions) to form a reasonable need and eliminate the situation of lack of the required volume of material supplies in the warehouse [12]. Thus, in the logistical support organization theory and practice there is an issue of improvement of work of integrated support centers, as the supporting body with use of modern information technologies and tools of construction of agent-oriented systems.
186

The Objective of the Article is to improve the model of functioning of integrated support centers using the agent-oriented approach.
1.2. Analysis of Recent Research and Publications
The analysis of existing publications on the research topic allows to conditionally divide them into several interrelated groups:
• the first group of sources includes well-known papers in logistics by A.D. Hadzhinskyi, V.S. Lukinskyi, B.A. Anikin, J. Stoke, T.H. Dudara, R.M. Yatsenko where the basic theoretical models and methods of the logistics theory which can be applied and at improvement of work of the integrated support centers are presented • the second group of sources includes works on modern information technologies (IT) and multi-agent systems (MAS) by authors D.A. Pospelova, V.I. Horodetskyi, M. Wooldridge, E.O. Kharitonov, V.A. Omelianenko; this methodological base allows to improve models of work of integrated support centers [7] • the third group of sources includes scientific works on modeling business processes at industrial and commercial enterprises by E.M. Mikhailova, S.V. Peterkin, N. Kamran, K.I. Dmytryv, T.V. Marusei. These papers were used to formalize the work of the integrated support center in the form of structural models • the fourth group of sources includes papers which present the results of research on improvement of systems of logistical support of the Armed Forces of Ukraine and other armed formations held by Kivliuk V.S. [6], Gurina O.M. [9], Trehubenko S.S. [10], Rolina I.F. Moreover, it can be concluded that the issue of
effective functioning of the integrated support centers in the preparation and conduct of operations (combat actions) is considered limited.
The lack of connection between the development of information technology (IT) and multi-agent systems (MAS) to improve the processes in the integrated support centers, determines the relevance of the study.
2. Presentation of the Main Material
The integrated support center is a multifunctional structure which is intended for:
• elaboration of the needs of units (subdivisions) assigned to provide material supplies of current and inviolable stocks for peacetime and a special period according to the relevant nomenclature and classes of supply • reception, storage and issuance (shipment) of material supplies in accordance with the requirements of the governing documents • maintenance and accumulation of the established stocks of material supplies of current and inviolable stocks for the provision of military units to be supplied • timely and uninterrupted provision of units (subdivisions) with material supplies of current and inviolable stocks in peacetime and special periods • control over the completeness of the accounting of material supplies, their use within the established norms, the legality of use and write-off • control of timely refilling (renewal) of material supplies of inviolable stocks according to the relevant nomenclature and classes of supply; • operational accounting of the need, availability, movement and quality (technical) condition of technical means, determining the need for repair of technical means for units (subdivisions) • keeping records of property in quantitative and qualitative terms • keeping quantitative records of long-term items of material and technical means by years of commissioning for each separate account • organization and implementation of centralized transportation of material supplies of a certain nomenclature by road or rail to units (subdivisions) • implementation of planning of supply and refilling of material supplies of the certain nomenclature and provision of units (subdivisions) to be supported, as well as control over their timely implementation • implementation of planning of repair of technical means by repair divisions and service, inclusion (removal) of technical means from stocks • working out of receipt and accounting documents on registration of operations which are connected with movement and changes of qualitative (technical) conditions, writing off, dismantling (division, destruction) of material supplies of a certain nomenclature • organization of procurement of goods, works and services, their receipt from
187

suppliers in accordance with the legislation of Ukraine on public procurement for the needs of the Central Command, units (subdivisions) and military administration bodies to be supplied • presence of the right of proportional distribution (redistribution) of the existing material supplies of a certain nomenclature between units (subdivisions) • regular and unannounced audits of material supplies in units (subdivisions), analysis of the results of audits, inspections, inventory checks and control over the completeness of elimination of deficiencies • provision of units (subdivisions) that are not to be supported (in a special period) with material supplies of the relevant service on the basis of orders (decrees, instructions) of the military administration [4] - [5]. The main tasks of the integrated support
centers are continuous, operational and complete support of units (subdivisions) during operations (combat actions).
The following indicators of efficiency of functioning of the integrated support centers are considered to be the key ones [8,9] - [13]:
• efficiency of implementation of support measures
,,
,1)(
= −−
necttt
nec
tifte
tifttP
nec
nec
,
(1)
the ratio λ takes into account the conditions of operations (combat actions), which change the steepness of the characteristics P(t) as shown in Figure 1:
Figure 1: Dependence of the efficiency of support on the time and conditions of operations (combat actions:)
Source: developed by the authors according to
[8] - [9]. • completeness of provision of units (subdivisions)
,, trZtr
ZP VV
VVK =
(2)
where Vz is the amount of material assets stored at the integrated support center;
Vtr is the amount of need for material resources of units (subdivisions) • continuity of the process of providing units (subdivisions) with resources.
,dt
dtіcpі t
tk =
(3)
where, tdti is the duration of time when the ability to perform tasks for the purpose of the i-th part (subdivision) with material supplies, delivered during preparation (provided
dtdti tt ); tdt is designated time of performance of tasks. The value of this indicator is in the range [0,1],
since dtdti tt . The general indicator of continuity of
designated tasks of units (divisions) is calculated by the formula.
n
kk
n
icі
c
== 1
(4)
where n is the number of units (subdivisions) of the air forces of the Armed Forces of Ukraine to be supported.
Based on the physical content of the indicator, 1;0ck . The criterion for the effectiveness of
functioning of the integrated support centers will be the approximation of this indicator to the unit:
1→ck . To date, the activity of integrated support
centers is not effective by all these indicators of efficiency (the real time of execution of orders is about 14 hours with the required 12 hours, completeness of supply (no 20% in stock, no required range of stocks) with their urgent need, continuity of operations (combat actions) (under the given conditions of functioning of the integrated support centers, continuity of operations (combat actions) of units (divisions) of the Armed Forces of Ukraine up to 7 days is provided.
The existing model of functioning of integrated support centers concerning distribution of functional powers between divisions, is resulted in figure 2.
According to the results of the analysis, it is determined that IT should be used in the following tasks of the integrated support centers for:
• accounting • forecasting • planning • control.
188

Figure 2: Model of functioning of integrated support center
We will provide a justification that IT should
be used in forecasting the need for integrated support centers.
In the theory of logistics, there are a number of models of stock management, which have conditional names:
• fixed order size • fixed order time • minimum-maximum • combined. These models are effective in performing tasks
by the structures of warehouses in terms of projected (uniform demand), or demand, the nature of which is clear. During the operation (combat actions) the nature of the demand for material supplies from the units (divisions) is determined by the conditions of the situation, so the use of classical models [10] - [11] is impossible (limited). Therefore, it is necessary to build adequate forecasting models to ensure the absence of a deficit at the integrated support center (timely orders, deliveries, inventory points, the rate of deficit).
A possible method of solving this issue at the integrated support center in the process of operations (combat actions) is the use of multi-agent systems (MAS). In a distributed environment, complex issues can be solved by
interacting agents that act in parallel and asynchronously, jointly developing solutions to complex matters through self-organization. This principle is fundamentally different from the centralized approach and is similar to the processes of self-organization in wildlife.
MAS is a network of agents that interact with each other in a common environment and seek to achieve a common goal for the system.
The interaction of agents in the system occurs either directly through messaging, or indirectly, through the reaction of the external environment to the presence of other agents. The main property of the agent is autonomy, goals and ways to achieve them, reaction to changes in the environment.
MAS may consist of agents of different types with their own behavior, characteristics, limitations and goals. Agents like software can be written in different languages, run on different platforms and be distributed on a computer network. MAS are usually open and contain a variable number of agents: agents can enter the environment of interaction and leave it [7].
In logistics, order and resource agents are elements of a network of needs and capabilities that interact in the virtual space of the system. They enter into contracts to perform actions,
189

strengthening or weakening connections depending on the situation, where the state and configuration of the network corresponds to a certain dynamic schedule. Agents of needs and opportunities, in turn, if necessary, generate additional agents. The constant search for consensus by mutually acceptable compensation for fluctuations in conditions of uncertainty in the conduct of hostilities, leads to a dynamic equilibrium, organized independently [11]. To date, the automation of processes and their integration with computer systems gives a new impetus to the development of MAS in the direction of logistics, when each object of the system is associated with its corresponding agent. Such systems will operate virtually without external interference.
For complex automation of the integrated support center, ERP-based solutions (resource management and planning concept) and WMS (information system that provides automation of management of warehousing processes of the integrated support centers) are proposed. Logistics concepts allow to determine the properties and characteristics of logistics processes on a single methodological basis.
ERP is the effective planning and management of all the resources needed to produce and sell products. The purpose of the ERP concept is to integrate all departments and functions into a single computer system that can serve all the specific needs of separate departments. It combines all bodies and departments within one integrated program that works with a single database, so that everyone can more easily share information and communicate with each other.
WMS consists in active warehouse management, obtaining accurate information on the location of material supplies in stock, effective management of material supplies, which have a certain shelf life, optimizing the use of storage facilities.
When choosing a program for WMS implementation, it is necessary to take into account the capabilities of software, flexibility in customization, specifics, current and planned tasks performed by the integrated support centers and units to be supported. The advantage of using computer information systems is the formalization of processes (ordering and minimization of errors).
Since WMC is the system, which is an open source system and provides a standard warehouse topology, it is possible to expand its capabilities with MAS. In addition, the introduction of these
technologies will increase efficiency (Table 1). Source: developed by the authors according to [8]. Table 1 Comparative table of results
Indicator name Before storage
automation
After storage automation
Efficiency of implementation
of support measures
14 hours 12 hours
Completeness of provision of
units (subdivisions)
80% 90%
Continuity of the process of
providing units (subdivisions) with resources
7 days 10 days
3. Conclusions
The use of MAS allows forecasting the availability of stocks at the Central Command, to form a rational model of stock management, which is based on non-stochastic demand and is a combination of known models that will ensure continuity and completeness of military units (separate divisions) of the Armed Forces of Ukraine.
4. References
[1] On approval of the procedure for logistical support of defense forces during the performance of tasks on defense of the state, protection of its sovereignty, territorial integrity and inviolability: Resolution of the Cabinet of Ministers of Ukraine of 27.12.2018 No. 1208.
[2] On approval of the basic provisions of logistics support of the Armed Forces of Ukraine: Order of the Ministry of Defense of Ukraine dated 11.10.2016 No. 522.
[3] The doctrine of unified logistics: the order of the Commander-in-Chief of the Armed Forces of Ukraine dated 24.09.2020 No.2861. - 37 p.
[4] The doctrine of providing material and technical means, works and services: order of
190

the General Staff of the Armed Forces of Ukraine dated 21.01.2021 No. 225.
[5] On approval of the regulations on the procedure for registration, storage, write-off and use of military property in the Armed Forces: Resolution of the Cabinet of Ministers of Ukraine of 04.08.2000 No.1225.
[6] Kyvliuk V.S., Hannenko Yu. O. Improvement of the system of material resources of the Armed Forces of Ukraine [Electronic resource] / V. S. Kyvliuk, Yu. O. Hannenko // Social Development & Security. - 2018. - Vip. 2 (4), - рр. 49–58.
[7] Skobelev P.O. et al. Development of a multi-agent system for planning, forecasting and modeling of production // Mechatronics, automation, control. - 2014. - No. 1, - рр. 22–30.
[8] Horodnov V.P. A comprehensive model for evaluating the effectiveness and management of elements of material support during the preparation and during the performance of service and combat tasks by units (subdivisions) of the National Guard of Ukraine in a special period / V.P. Horodnov, V.V. Vlasiuk, V.V. Ovcharenko // Science and Technology of the Air Force of the Armed Forces of Ukraine. - 2017. - Vip. 1 (26), - рр. 123–132.
[9] Hurin O.M. Methods of forming a rational structure of the system of material support of the air command of the Air Force of the Armed Forces of Ukraine in the air operation. Collection of scientific works of Kharkiv National University of the Air Force. 2017. No.2 (51), рр. 35–39.
[10] Romanchenko I.S., Khazanovich O.I., Trehubenko S.S. Modeling of logistics systems: a monograph. Lviv: National Academy of Land Forces of the Armed Forces of Ukraine, 2015. 156 p.
[11] Smirnov E.B., Tkachenko V.I., Ruban I.V., Maliuha V.H., Tristan A.V. Theoretical bases of formation and degradation of complex organizational and technical systems: monograph. Kharkiv: FOP Panov A.M., 2018. 162 p.
[12] V.S. Kyvlyuk, V.I. Lazorenko, Y.O Hannenko, M.P. Lavruk / Problems of management of the system of provision of military property of the troops of the Armed Forces of Ukraine and ways of their solution. / Modern Information Technologies in the Sphere of Security and Defence № 1(40)
2021 ISSN 2311-7249 (Print)/ISSN 2410-7336 (Online), рр.111–116.
[13] Zalevskyi, H.S., Lekakh, A.A., Hurin, O.M., Startsev, V.V. and Kalachova, V.V. (2019), “Pokaznyky ta kryteriikompleksnoi metodyky otsiniuvannia efektyvnosti vykonannia zavdan lohistychnoho zabezpechennia viiskovykh chastyn Povitrianykh Syl Zbroinykh Syl Ukrainy u zbroinomu konflikti” [Indicators and criterias of general points of the methodology of estimative efficiency of the implementation of logistic support of the military units of the Air Force of the Armed Forces of Ukraine in the armed warfare], Scientific Works of Kharkiv National Air Force University, No. 3(61), pp. 45-52. https://doi.org/10.30748/zhups.2019.61.07.
191

Using the Modern Modelling Complex for Operational Forecasting Of Oceanographic Conditions In The Ukrainian Part Of The Sea Of Azov – The Black Sea Basin Yurii Tuchkovenko 1, Dmytro Kushnir 2
1,2 Odessa State Environmental University, 15 Lvivska Str., Odessa, 65016, Ukraine
Abstract This paper addresses one of the most pressing challenges of Ukraine today, namely the establishment of a new cutting-edge automatized system for operational forecasting of oceanographic parameters in the Sea of Azov – the Black Sea basin. To reestablish a national maritime prediction system of Ukraine, lost after the Russian Federation had annexed the Crimea in 2014, the suite of dynamically coupled numerical models Delft3D-FLOW + Delft3D-WAVE (SWAN) is considered to be applied. This set of coupled numerical models was previously adapted to the conditions of the Black Sea area with employment of meteorological forcing fields from the Global Forecast System (GFS) model. Results of the model trial runs, which were used to evaluate and predict the marine oceanographic conditions in the North-Western part of the Black Sea near the Odessa Region are presented. The current version of the automatized modelling complex allows to obtain the following predictive oceanographic data: wind conditions, sea level deviations from the undisturbed state, spatio-temporal variability of the wind waves parameters, water circulation (currents) in the coastal zones with waves taken into consideration. Embedding the automatized modelling complex ‘Delft3D-FLOW + SWAN’ into the structure of the intelligent information system for revealing a hydrographic situation in the Black Sea can meet the challenge to operationally forecast the oceanographic conditions in the present (with a hindcast up to 5 days) and in the future (up to 4 days) for the entire Black Sea basin, focusing on its northwestern part and selected coastal areas with the required spatial resolution. Keywords 1 The Black Sea, operational forecasting, oceanographic conditions, numerical models, modelling complex
1. Introduction
As a result of the occupation of the Crimean Peninsula by the Russian Federation in 2014, Ukraine lost the national automated maritime forecasting system for the Black and Azov Seas, which was established and operated on the basis of the Marine Hydro-Physical Institute of the National Academy of Sciences of Ukraine (Sevastopol, Crimea) under financial and technical support of the European Union [1, 2]. The cooperation between the Hydro-Meteorological Center of Russian Federation and Ukrainian authorities in terms of providing with
EMAIL: [email protected] (A. 1); [email protected] (A. 2) ORCID: 0000-0003-3275-9065 (A. 1); 0000-0003-4556-0143 (A. 2)
the specialized maritime forecasts for the Azov-Black Sea basin was suspended.
Consequently, there is a demanding need for re-establishing the modern national system of operational forecasting of oceanographic parameters in the Ukrainian Azov-Black Sea basin to meet the needs of the maritime complex, maritime transport infrastructure, and the Naval Forces of Ukraine.
To accomplish this task, an automated software complex, employing modern numerical models, was developed at the Odessa State Ecological University [3]. This modelling complex was integrated into the intelligent information system for revealing the hydrographic situation in the Black Sea [4, 5] and
192

designed for an operational short-term forecasting of spatio-temporal variability of oceanographic characteristics in the Black Sea waters.
This paper presents the description of the structure of automated modelling complex for operational short-term forecasting of the oceanographic conditions in the Black Sea waters, the results of verification and validation of modules, comprising this complex, and discussion of the prospects for future improvements.
2. General description of the structure of automated modelling complex
The automated modelling complex for predicting the variability of oceanographic characteristics in the Azov-Black Sea basin is built around newer generation numerical models, as compared against the ones [1, 2], which are now successfully implemented to address similar forecasting problems in Europe [6, 7], USA [8- 10], Australia and New Zealand [11], Asia [12], and designed for predicting the sea waves and water circulation in coastal areas.
The complex is based on the usage of two software modules Delft3D-FLOW and Delft3D-WAVE of the suite of integrated environmental models Delft3D [13], developed by Deltares, the Netherlands. The developer granted free access to the codes of software packages, and their use is governed by the GNU General Public License, version 3 [14].
Delft3D-FLOW is a multi-dimensional (2D or 3D) hydrodynamic (and transport) simulation program which calculates non-steady flow and transport phenomena that result from tidal and meteorological forcing on a rectilinear or a curvilinear, boundary fitted grid. It simulates thermal stratification in lakes, seas and reservoirs; stratified and density driven flows; tide and wind-driven currents (i.e. storm surges); fresh-water river discharges in bays; non-hydrostatic flows; transport of dissolved material and pollutants etc.
Delft3D-FLOW solves the Navier-Stokes equations for an incompressible fluid, under the shallow water and the Boussinesq assumptions. The system of equations consists of the horizontal momentum equations, the continuity equation, the transport equation, and a turbulence closure model [15]. The hydrodynamic equations are solved either on a Cartesian rectangular, orthogonal curvilinear (boundary fitted), or
spherical grid in the horizontal direction. In three-dimensional simulations, a boundary fitted (σ-coordinate system) or Cartesian rectangular (Z-model) approach is used for the vertical grid direction. In the σ-coordinate system the shallow water assumption is valid, which means that the vertical momentum equation is reduced to the hydrostatic pressure relation. Delft3D also provides an option to apply the so-called non-hydrostatic pressure model in the Z-model [15].
Delft3D-WAVE is based on the spectral model SWAN (Simulating Waves Nearshore Model) [16] and computes the non-steady propagation of short-crested waves over an uneven bottom, considering wind action, energy dissipation due to bottom friction, wave breaking, refraction (due to bottom topography, water levels and flow fields), shoaling and directional spreading. In SWAN, the waves are described by the discrete spectral action balance equation taking into account the source of energy density, representing the effects of generation, dissipation and non-linear wave-wave interactions. The following processes are accounted for in SWAN: wave generation by wind; dissipation by whitecapping; bottom friction and depth-induced breaking; non-linear wave-wave interaction (quadruplets and triads).
Both modules employ curvilinear computational grids in the horizontal plane and use the ‘telescoping’ technique for the results of calculations.
The modules are coupled by means of a shared interface and interact with each other. The influence of currents on the parameters of wind waves and wave propagation is taken into account in the coupled model. The computation of coastal currents and the intensity of turbulent mixing of waters incorporates wave processes as well.
A correct accounting for the effects of sea waves and currents interaction makes it possible to enhance the quality of calculation of the sea currents, water temperature and salinity in the upper layer of the water column.
The program codes of the Delft3D-FLOW and SWAN are compiled into executable files using the Visual Fortran and C ++ compilers. Both modules use the same set of computational grids and utilize all cores of workstation (or cluster nodes). The Delft3D-FLOW model splits a task for its parallel execution on processor cores (nodes) using the Message Passing Interface (MPI). The SWAN model (WAVE module), by default, uses parallel computations on all processor cores in accordance with the OpenMP (Open Multi-Processing) standard.
193

The basis of the oceanographic forecast is the data of 10-days meteorological forecast from the global weather forecast numerical model GFS (Global Forecast System). A GFS web-service (National Operational Model Archive and Distribution System – NOMADS) is situated in the United States [17]. Global Forecast System model output is being produced with 0.25-degree resolution in space and 3 hrs. in time.
The US National Weather Service provides free access to the GFS forecast data. Ongoing operational forecasts of meteorological parameters are being read from the NOMADS web resource (Data Transfer: NCEP GFS Forecasts (0.25-degree grid) [18]. In addition, all forecasts made over the past few years within a specified time are stored in the historical archive of GFS forecasts at the corresponding web resource (NCEP GFS 0.25 Degree Global Forecast Grids Historical Archive) [19] of the US
National Center for Atmospheric Research (NCAR) and can be downloaded freely. The forecasting products based on the GFS model data are used, in particular, in the operational activities of the Ukrainian Hydrometeorological Center.
The modelling complex Delft3D-FLOW + SWAN is equipped with a service shell, which includes a graphical interface for use by end users. This shell automates the procedure of reading meteorological information from the NOMADS web service, filters these data and prepares it for use in the models, facilitates the procedure of setting up the Delft3D-FLOW and Delft3D-WAVE (SWAN) software modules, performs model calculations on nested grids (NESTING procedure), provides visualization technique for input meteorological data and results of operational forecasting of oceanographic characteristics (using the QUICKPLOT software module).
Figure 1: Curvilinear grids for the Azov-Black Sea region: A – basic (1) and detailed (2) computational grids; B – nested grid for water area of the Odessa region at the North-Western parts of the Black Sea
Current version of the automated software
complex initially performs the calculations on a generalized grid for the entire Azov-Black Sea basin with a spatial resolution of Δxy = 2.5-5 km (1 in Fig. 1A). Inside the basic computational grid, the following nested computational grids with higher spatial resolution were generated:
1. Grid for the northwestern part of the Black Sea with Δxy = 0.8-1.5 km (2 in Fig.1A). 2. Grid for the water area of the Odessa region at the North-Western parts of the Black Sea, where the seaports of Chernomorsk, Odessa, Yuzhny are located (Δxy = 90-250 m) (Fig. 1B).
194

Fig. 2 presents a schematic overview of the forecasting procedure, including data processing and interconnections between modules.
Figure 2: Diagram showing the forecasting flow and the coupling process between FLOW and WAVE (SWAN) modules
3. Results of the forecasting complex trial runs
The task of ensuring the reliable oceanographic forecasts with the use of numerical models involves the implementation of procedures for models’ adaptation to the conditions of the studied water areas, their verification and validation.
Verification of the modelling complex was performed by means of comparing the results of simulated water level with observational data from the marine hydrometeorological stations of
Hydrometeorological Center of the Black and Azov Seas, located at the Chernomorsk, Odessa and Yuzhny ports. Furthermore, the modelled sea drifting currents and wind wave parameters were compared against in-situ data logged at hydro-meteorological buoy SW Midi-185 (Fugro OCEANOR, Norway) stationed in the Odessa Bay (46.484N, 30.785E) [3].
Fig. 3, 4 present several results of model verification runs for the time periods of 08.10.-18.10.2016 and 16.04.-25.04.2017, under stormy wind conditions. The assimilated meteodata from the GFS global atmospheric model was used as an input to the models.
195

The verification showed promising potential for employing the software complex of integrated numerical models ‘Delft3D-FLOW + SWAN’ as
a part of the operational forecasting system for predicting the oceanographic parameters of the Ukrainian marine environment.
Figure 3: Variability of wind-induced water level oscillations, in m, during the periods of 08.10.-18.10.2016 (A) and 16.04.-25.04.2017 (B) in the port of Chornomorsk (1 – observational data; 2 – model results)
Figure 4: Temporal variability of the drift current velocity (A, B), in cm/s, and significant wave
height (C, D), in m, during the periods of 08.10.-18.10.2016 and 16.04.-26.04.2017 (1 – data logged at the hydrometeorological buoy, 2 – model results)
196

The validation of the model complex was performed by means of making the forecasts with different warning times. The produced 10-days forecasts of storm surges and wind waves in the water area of the Odessa region at the northwestern part of the Black Sea were compared against the observed values.
Validation results show that the forecast of wind surges and wave heights with warning time
up to 5 days are in good agreement with the observation data, provided that there is no significant uncertainty of the meteorological forecast, in particular, wind conditions predicted by the GFS model.
Selected results of approbation of the modelling complex in the forecasting mode using the GFS synoptic forecasts of wind conditions over the Black Sea, are presented at fig. 5.
Figure 5: Window for remote access from the Internet to the graphical interface of the Delft3D-FLOW + SWAN modelling complex, showing results of modelled sea water currents with different warning times for water area of the Odessa region at the North-Western parts of the Black Sea
4. Conclusions
The results of the verification and validation of the complex of integrated numerical models ‘Delft3D-FLOW + SWAN’ demonstrate good prospects of using this complex as a part of the system of operational forecast of the variability of oceanographic parameters in the Ukrainian part of
the Azov-Black Sea basin with assimilation of predictive meteorological information from the GFS global atmospheric model.
Operational oceanographic information, which can be obtained as a result of the application of the automated software complex ‘Delft3D-FLOW + SWAN’, contributes to the improvement of navigation safety, especially in shallow coastal and estuarine areas of the sea, on the approaches
197
to the sea-ports and other areas of the Azov-Black Sea basin. The application of obtained prognostic information will result in increasing efficiency of the search and rescue operations due to recording the current (operational) and expected hydro-meteorological conditions, and, especially, the pattern of the distribution of currents which determine the movement of objects with different buoyancy, including wind drift.
Integration of the automated modelling complex ‘Delft3D-FLOW + SWAN’ into the structure of an intelligent information system for revealing the hydrographic situation in the Black Sea will allow to solve the problems of the operational (fast) assessment of the state of the surrounding (marine) environment by providing the information about the oceanographic situation in the present (with a hindcast up to 5 days) and future (up to 4 days) time for the entire Black Sea, its northwestern part and selected areas of the coastal zones with the necessary spatial discretization of data.
The set of oceanographic data that can be obtained with the current version of the automated modelling complex ‘Delft3D-FLOW + SWAN’ includes: wind conditions, sea level deviations from the undisturbed state under the influence of wind in the coastal zones (which determine the actual depths), spatio-temporal variability of the parameters of wind waves, waters circulation (currents) in the coastal areas of the sea, considering the influence of wind waves.
5. References
[1] Kubryakov A. S., Korotaev G. K., Dorofeev V. L., Ratner Y. B., Palazov A., Valchev N., Malciu V., Matescu R., Oguz T. Black Sea coastal forecasting system. Ocean Sci. 2012. №8. P. 183–196. DOI: https://doi.org/ 10.5194/os-8-183-2012.
[2] Korotaev G. K., Demyshev S. G., Dorofeev V. L. Et al. The architecture and results of the work of the International Black Sea Center for Marine Forecasts, created on the basis of the Marine Hydro-Physical Institute of the National Academy of Sciences of Ukraine within the framework of the European Union project ‘My Ocean’. Ecological safety of coastal and shelf zones and comprehensive use of shelf resources: Collected scientific papers. 2013. Issue 27. pp. 128–133.
[3] Kushnir D. V., Tuchkovenko Yu. S., Popov Yu. I. Results of adaptation and verification of the set of coupled numerical models for predicting the variation of oceanographic features in the north-western part of the Black Sea. Ukrainian hydrometeorological journal / Ukr. gìdrometeorol. ž. 2019. Issue 23. pp. 95–108. DOI: https://doi.org/ 10.31481/uhmj.23.2019.09.
[4] Shchyptsov O. A., Shchyptsov O. O. Prospects of the formation of the inter-agency databank for digital oceanographic data for the benefit of navigation and hydrographic support of maritime activities. Marine strategy of the state. Development and realization of the maritime potential of Ukraine: proressing of International. scientific forum. June 20-21, 2018, Kyiv, Ukraine. pp. 19–24.
[5] Shchyptsov O. A. Improving the inter-agency system for collecting and using oceanographic information regarding the situation in the Azov-Black Sea Basin and other parts of the World Ocean. Marine strategy of the state. Development and realization of the maritime potential of Ukraine: proressing of International. scientific forum. May 22-23, 2019, Kyiv, Ukraine. pp. 55–58.
[6] SWEEP (2019). Co-creating Operational and Strategic Modelling Systems to Reduce Economic and Social Impacts on Coastal Hazards: Wave modelling. Project summary. URL: https://sweep.ac.uk/wp-content/ uploads/IP-001-A4-ESummary.pdf
[7] Apecechea M. I., Verlaan M., Zijl F., Le Coz C. & Kernkamp H. (2017). Effects of self-attraction and loading at a regional scale: a test case for the Northwest European Shelf. Ocean Dynamics. , No 67 (6). pp. 729–749. URL: https://link.springer.com/article/ 10.1007/s10236-017-1053-4.
[8] Veeramony J., Orzech M. D., Edwards K. L., Gilligan M., Choi J., Terrill E. and Tony De Paolo. Navy nearshore ocean prediction systems. Oceanography. 2014. Vol. 27. No 3. pp. 80–91.
[9] Veeramony J., Condon A. J., Linzell R. S., & Watson K. (2016). Validation of Delft3D as a Coastal Surge and Inundation Prediction System. Scientific Report. Naval Research Laboratory. Oceanography Division. Stennis Space Center, MS 39529-5004. URL: https:// pdfs.semanticscholar.org/bbf0/18c6db02bcf8d63a4 8542637d531e788c32a.pdf.
198

[10] Veeramony J., Condon A., van Ormondt M. Forecasting Storm Surge and Inundation: Model Validation. Weather and Forecasting. 2017. No 32 (6). pp. 2045–2063. DOI: https://doi.org/10.1175/waf-d-17-0015.1.
[11] De Kleermaeker, Simone; Verlaan, Martin; Mortlock, Thomas; Rego, Joao Lima; Apecechea, Maialen Irazoqui; Yan, Kun and Twigt, Daniel (2017). Global-to-local scale storm surge modelling on tropical cyclone affected coasts. In: Australasian Coasts & Ports 2017: Working with Nature. Barton, ACT: Engineers Australia, PIANC Australia and Institute of Professional Engineers New Zealand, 2017: 358-364. ISBN: 9781922107916. URL: https:// search.informit.com.au/documentSummary;dn=934 516484243698; res=IELENG.
[12] Thanathanphon, Watin: Luangdilok, Narongrit: Sisomphon, Piyamarn (2016) Development of an Operational Storm Surge Forecasting System for the Gulf of Thailand. 12th International Conference on Hydroscience & EngineeringHydro-Science & Engineering for Environmental Resilience. November 6– 10, 2016, Tainan, Taiwan. URL: http://mdide.baw.de/ icheArchive/documents/2016/12-0021.pdf.
[13] Delft3D Open Source Community. URL: https://oss.deltares.nl/web/delft3d/home.
[14] Тerms of use Delft3D Community. URL: https://oss.deltares.nl/web/delft3d/terms-of-use.
[15] Deltares (2020). Delft3D-FLOW, User Manual: Simulation of multi-dimensional hydrodynamic flow sand transport phenomena, including sediments. 682 р. URL: https://content.oss.deltares.nl/delft3d/ manuals/Delft3DFLOW_User_Manual.pdf.
[16] Deltares (2020). Delft3D-WAVE, User Manual: Simulation of short-crested waves with SWAN. 196 р. URL: https://content.oss.deltares.nl/delft3d/manuals/Delft3D-WAVE_User_Manual.pdf.
[17] NOAA, National Operational Model Archive and Distribution System (NOMADS). URL: https:// nomads.ncep.noaa.gov/.
[18] NOMADS. Data Transfer: NCEP GFS Forecasts (0.25 degree grid). URL: http://nomads.ncep.noaa.gov/cgibin/filter_gfs_0p25.pl.
[19] NCAR. Research Data Archive at the Computational and Information Systems Laboratory. NCEP GFS 0.25 Degree Global
Forecast Grids Historical Archive. URL: https://rda.ucar.edu/datasets/ds084.1/.
199

Investigation of Measurement Errors of Electrical Signals Characteristics of Energy Supply Systems Larysa Hatsenko 1, Anton Lutsenko 2, Oleg Skopintsev 3 , Serhii Pohasii 4
1 State University of Infrastructure and Technology, Kyiv, Ukraine 2,3 Ivan Kozhedub Kharkiv National Air Force University, Kharkiv, Ukraine 4 Simon Kuznets Kharkiv National University of Economics, Kharkiv, Ukraine
Abstract The study substantiates the current scientific and technical problem of developing precision methods for measuring the parameters of electrical signals (usually harmonic voltages), which will allow to create a fairly simple control equipment with desired characteristics. The method of measuring the frequency (period) of a sinusoidal signal based on the conversion of voltage into the frequency of pulses is investigated. This method has pronounced filtering properties with respect to interference. In particular, if the interference is harmonic with a frequency multiple of the frequency of the measured signal, the error caused by interference is virtually absent. The method of measuring phase shift with intermediate voltage-frequency conversion is investigated. This method eliminates the dependence of the measurement result on the frequency of the studied signals. This expands the frequency range and increases accuracy. Also, this method has a short measurement time, no more than one or two periods of the studied signals, which is especially important when measuring infrared frequency signals. The method of power measurement with intermediate voltage-frequency conversion is investigated. This method reduces the power measurement error with increasing broadband interference. Keywords 1 Error, electrical signal, power supply system, method, obstacle
1. Introduction
Increasing the requirements for electricity quality indicators of energy supply systems of water transport vehicles requires improvement of methods and means of their control [1, 2]. However, the further development of such measuring instruments is largely constrained by the level of their technical characteristics (errors in measuring electricity quality indicators) at low cost. Today it is not economically necessary to use high-precision control equipment on water vehicles, which is constantly in harsh operating conditions [3, 4]. Therefore, a very important scientific and technical task is to develop precise methods for measuring the parameters of electrical signals (usually harmonic voltages), which will create a fairly simple and at the same
EMAIL: [email protected] (A. 1); [email protected] (A. 2); [email protected] (A. 3); [email protected] (A. 4); ORCID: 0000-0003-1210-5726 (A. 1); 0000-0002-7242-625X (A. 2); 0000-0002-4483-5339 (A. 3); 0000-0002-4540-3693 (A. 4)
time with the desired characteristics of the control equipment
In this regard, there is an urgent scientific and technical problem in the field of monitoring the technical condition of energy supply systems of water transport: improving methods of synthesis of equipment for monitoring the technical condition of energy supply systems of water transport by reducing their errors in measuring the characteristics of electrical signals.
2. Investigation of measurement errors of electrical signals characteristics
2.1. Literature analysis
A significant number of publications are devoted to the problem of monitoring the
200

technical condition of power supply systems of various technical systems [5 - 17].
Thus, the article [5] considers the method of monitoring the technical condition of electronic circuits that are part of power supply systems. In [6 - 9] the results of research of methods of synthesis of the equipment of control of a technical condition of radio electronic systems of water transport vehicles are presented. However, in such works the estimation of errors of measurement of parameters of the electronic equipment at control of a technical condition is not resulted.
In the publications [10 - 14] the questions of functioning of modern electric and electronic systems are considered, the factors which essentially influence definition of their technical condition are allocated.
In [15 - 17] the results of efficiency of technical condition control of a power supply systems at operation of water transport vehicles and in the field of development of the digital control equipment are presented. However, in such works there are no results of research of influence of features of operation of the control equipment in the aggressive environment (sea and river environment) on an error of measurement of electric signals characteristics at control of a technical condition.
Thus, the most critical for the synthesis of equipment for monitoring the technical condition of energy supply systems of water transport are: the lack of results of estimation errors in measuring the characteristics of electrical signals; lack of results of evaluation of the influence of interference on the measurement error of the characteristics of electrical signals; lack of a reasonable universal method for measuring the characteristics of electrical signals with minimal errors under interference.
The results of the analysis of modern literature show the lack of universal methods for the synthesis of equipment for monitoring the technical condition of energy supply systems of water transport to ensure minimal errors in measuring the characteristics of electrical signals. Therefore, the topic of the article, aimed at studying the errors in measuring the characteristics of the electrical signal of the power supply systems of water transport vehicles, is relevant.
2.2. Frequency measurement method with intermediate voltage-frequency conversion
The method of measuring the frequency (period) of a sinusoidal signal based on the conversion of voltage into pulse frequency is as follows.
Let the signal under study be described by an expression
),(sin)( tttu m += (1)
where mV is the amplitude of the measured signal; is circular frequency of the studied signal; ( )t is stationary interference that is present in
the input signal. This signal will be converted into a
proportional pulse frequency ),t(KtsinK)t(f fmf += (2)
where fK is voltage to frequency conversion factor.
Frequency-modulation pulse )t(f the signal is integrated at intervals equal to the half-cycle of the input signal, where the number of output impulses:
dt)t(fN/T
T =2
0.
(3)
Substituting the ratio (2) in the formula (3), we find
=+= dt)]t(tins[KN
T
mfT 2
0
=+= 2
0
2
0
T T
fmf dt)t(KtdtsinVK
,NNNTVK
Tmf
+=+
(4)
where
TVКN mf
T = is informative, useful
component of the measurement result, proportional to the period T of the signal )t(u ;
=2
0
dt)t(KN f is error introduced by the
obstacle. Taking into account only the useful component
of the measurement result, we write
201

Tm
T
mf
T NVK
VKNT ==
, (5)
where f
T KK
= is coefficient of proportionality.
The frequency of the studied signal will be determined from the ratio
T
mf
TT
mN
VKNK
VT
f ===1
(6)
where T
f KK 1
= .
As can be seen from ratio (6) the result of frequency measurement f depends on the amplitude Vm of harmonic signal. To eliminate this dependence, the studied signal can be subjected to amplitude normalization, ie to achieve Vm= const.
Then expression (6) can be written as
T
fNd
f = , (7)
where mff VKd = is discreteness of frequency measurement.
For error analysis N , introduced by interference, fully applied estimates that the averaging algorithm has pronounced filtering properties with respect to interference. In particular, if the interference is harmonic with a frequency multiple of the frequency of the measured signal, then error 0=N .
2.3. Method of measuring phase shift with intermediate voltage-frequency conversion
Suppose it is necessary to measure the phase shift between two sinusoidal signals described by expressions
tsinV)t(u m 11 = ;
)tsin(V)t(u m −= 22 , (8)
where mV1 , mV2 is the amplitude of the measured signals;
is circular frequency of the studied signal; is measured phase shift. The algorithm for measuring the phase shift is
as follows: a) one of the input signals, for example ),t(u2
should be differentiated
)tcos(VKt
)T(U)t(u m −=
= 2
23 , (9)
where K is the transmission factor of the differentiation unit;
b) received signal )t(V3 will become proportional to the frequency of the pulses
)tcos(VKK)t(uK)t(f mff −== 23 ; (10)
c) frequency pulses )t(f are counted (integrated) twice:
– once for the time interval between voltage transitions )t(u1 and )t(u2 through zero;
– another time during the time interval between voltage transitions )t(u2 through zero and maximum;
,sinVKK
)t(d)tcos(VKK
)t(d)t(fN
mf
mf
2
02
01
1
=
=−=
==
(11)
;VKK
)t(d)tcos(VKK
)t(d)t(fN
mf
mf
2
22
22
1
+
+
=
=−=
==
(12)
d) phase shift measurement will be determined from the following expression
2
1NNarcsin= . (13)
The considered method of phase shift measurement has the following advantages.
First, it eliminates the dependence of the measurement result (13) on the frequency of the studied signals, which ultimately leads to an expansion of the frequency range and increase accuracy, because the effect of instability of the frequency of the measured signals is eliminated. The measurement result also does not depend on the amplitude of the studied signals.
Secondly, it has a short measurement time, no more than one or two periods of the studied signals, which is especially important when measuring infrared frequency signals.
Another variant of the method of measuring the phase shift with intermediate voltage-frequency conversion is possible. In it, the signal
202

module is subjected to frequency conversion )t(u2 :
)tsin(V)t(u m −= 22 , (14)
)tsin(VK)t(f mf −= 2 . (15)
Expression (15) will be integrated twice: in the
interval from )( +
2 to
;cosVK
)t(d)tsin(VK
)t(d)t(fN
mf
mf
2
2
2
2
1
1
1
=
=−=
==
+
+
(16)
is at intervals from )( +
2 to )( +
.VK
)t(d)tsin(VK
)t(d)t(fN
mf
mf
2
2
2
2
2
1
1
=
=−=
==
+
+
+
+
(17)
In this case, the measurement result is found
by the formula Narccos= , (18)
where 21 NNN = . In addition to the instrumental error of voltage-
frequency conversion, one of the dominant errors of this method of measuring phase shifts is the error due to the inaccuracy of the formation of time intervals during which the frequency integration )t(f and the formation of intermediate results 1N і 2N . Let's estimate this error.
Denote by 1 , 2 і 3 phase errors of selection of the moments corresponding to phases:
+=21t ; =2t ; +=3t .
Given the error 1 і 2 from expression (16) we find
=−
==
+
++
+
++
mf
mf
VK)t(d)tsin(
VK)t(d)t(fN
2
2
2
2
1
2
1
2
1
1
).sinsinsincos(cos 122 −+
(19)
Given that errors 1 , 2 and 3 low, we have
12 cos ; 11 sin ;
22 sin . (20)
Then expression (19) takes the form
)sin(VK
NN mf
21
211 +−= .
(21)
Similarly, from expression (17) we obtain
++
++
++
++
=−
==
3
1
3
1
2
2
2
21
)t(d)tsin(VK
)t(d)t(fN
mf
.VK
N
)sin(cosVK
mf
mf
12
2
132
−
−=
(22)
From relations (21) and (22) we find the absolute measurement errors
)sin(VK
NNN mf
21
211 +−=−=
;
12
222
mf VK
NNN −=−= . (23)
Thinking === max21 , we obtain the error limits
)sin(VK
N mfm
+= 11
21 ;
(24)
mf
mVK
N 22 = .
(25)
Limits of change of absolute errors in measurement of sizes 1N and 2N :
221
2 mfmf VKN
VK .
(26)
mf VK
N 22 .
(27)
203

Using expressions (19) and (22), we find the absolute error of definition cos :
=−−
−+=
=−=
cossincos
sinsinsincoscosNN
NNN
13
122
2
1
2
1
13
13
122
sincossincoscos
sinsinsincoscos
−
+−
−−+
= .
Taking into account equations (20) we obtain
=−
−+
sincossinsinsincossinN
).sin(cos 11
−+−
=
(28)
The component error of phase shift measurement introduced by the inaccuracy of the integration intervals is found from expression (18)
NNN
N 21−=
=
,
(29)
where N is determined from the ratio (28)
2.4. Power measurement method with intermediate voltage-frequency conversion
The essence of the method consists in converting the voltage proportional to the instantaneous power into the pulse frequency, which is then integrated over a certain time interval, depending on the type of measured value – active, reactive or full power.
Let the voltage and current in the investigated circuit be determined by the expression
tsinU)t(u m = , )tsin(I)t(i m −= .
By signals )t(u and )t(i a voltage proportional to their product is formed
,)tcos(cosUIK)t(i)t(uK)t(u
M
M −−=
==
21
(30)
where MK is the transfer factor of the multiple block;
I,U is rms value according to voltage and current.
From the signal )t(u1 the variable component is allocated
)tcos(UIK)t(u M −−= 2 , (31)
and its module with the help of a voltage-frequency converter will be converted into a pulse frequency
)tcos(UIK)t(f M −= 2 . (32)
Depending on the type of measured power signal )t(f integrates over a period of time.
When measuring active power, the time interval of integration or frequency averaging
)t(f concluded between 2t and 8T , which is equal to the phase interval from 2 to 4 . Integrating frequency )t(f within the given limits, we find:
=−
==
)t(d)tcos(
UIKK)t(d)t(fN Mf
4
2
4
2
1
2
11
== cosUITKK Mf
2,
(33)
where cosUIP = is measured active power of the circuit;
2Mf KK
K = is coefficient of
proportionality. When measuring the reactive power, the
frequency integration is carried out in the time interval from 0 to 2t or in the phase range from 0 to 2 :
=−
==
)t(d)tcos(
UIKKtdt)t(fN Mf
2
0
2
02
2
11
,QTKsinTUIKK Mf
== 2
(34)
where sinUIQ = is measured reactive power. In the mode of measurement of full power
averaging is conducted in a time interval from 2t до 82 Tt + or in the phase range from 2 до 42 +)( :
204

=−=
==
+
+
)t(d)tcos(UIKK
)t(d)t(fN
Mf
42
2
42
2
3
21
1
STKTUIKK Mf
==2
.
(35)
where UIS = is full power in the studied circuit. To eliminate the dependence of the power
measurement results on the frequency (period) of the studied signals, it is necessary to convert the period of one of the signals into a code N, for example, by the method of discrete number. We will get TdTN = or TT NdT = , where Td is discreteness of period measurement. Substituting this equality in formulas (33), (34), (35), we get
PTT
p PPdKKNNKN === 9
19 ,
(36)
PTT
Q QQdKKNNKN === 9
29 ,
(37)
PTT
S SSdKKNNKN === 9
39 ,
(38)
where TMF
P dKKK 9
2 = is discreteness of
power measurement; 9K is the transfer factor of the code divider.
2.5. Method for measuring the RMS value of the amplitude-modulated signal with intermediate voltage-frequency conversion
The expression for the amplitude-modulated (AM) signal is written as follows
tsin)t(u)t(u M = , (39)
where )t(uM – signal enveloping or modulating the signal with a period M ;
22 == f is the circular frequency of the
carrier, the initial phase of which is simplified to zero to simplify the records;
T, f is period and carrier frequency. AM signal module
tsinU)t(u M = ,
convert to a proportional frequency of pulses
( ) ( ) tsintutf Mf = .
Frequency ( )tf we will integrate for the averaging interval equal to half of the q-th period of the carrier frequency, and obtain the number of pulses
( ) dttsintuKdt)t(fNt
t
t
t
q
q
q
q
Mfq
++
==22
. (40)
Given that in the q-th half-cycle of the carrier ( ) qqM Vtu = that is, has a strictly defined value
equal to the amplitude of the carrier, we obtain
.VVK
dttsinVKN
qf
qf
qfq
t
t
q
q
==
==
+
2
2
(41)
From expression (41) we find the amplitude of the carrier frequency in the q-th half-cycle of the AM signal
qf
qf
q NfNV
== . (42)
Knowing the amplitude of the carrier, determine the root mean square value of the amplitude-modulated signal
,N
Nn
fVn
V
n
qqAM
n
f
n
qqAM
=
==
=
===
1
2
1
2
1
21
(43)
where n
f
fAM
= is coefficient of
proportionality,
TTn M2
= is the number of samples or codes,
instantaneous values of the AM signal for the enveloping period.
The developed method of measuring the RMS value of the AM signal has a high noise immunity. Let's show it.
We present the investigated signal by the sum of the AM signal and the stationary interference
( ) )t(tsintu)t(u M += ,
where ( )t is stationary interference that is present in the input signal.
Then to the result of measuring the value qN , due to the relation (41) an error is introduced
qf
q NfN
= .
(44)
205

The variance of this error:
( ) ( ) ( ) ==
+
|t
t
|fq dtdtttN
q
q
222
( )
( ) =−=
=−=
+
+
|2
|22
|2
|22
dtdtttr
dtdtttr
t
t
q
q
q
q
f
t
tf
( )
2
222
0
22 Tdttr ff == ,
(45)
where 2 is interference dispersion;
( )|ttr − is normalized correlation function, r(0)=1;
is interference correlation time. The relative value of the error introduced by
the obstacles when measuring the q-th value of the envelope:
( )
.V
.
VN
NN
q
222
2
2
=
===
(46)
From relation (46) it follows that the relative value of the error introduced by the interference, when measuring the q-th value of the amplitude of the envelope, will decrease with increasing broadband interference, ie when the condition
.
3. Conclusions
When analyzing the error introduced by interference, when using the method of converting voltage (phase, power) into frequency when measuring electrical parameters, the estimates that characterize the averaging algorithm are fully applied, ie it has pronounced filtering properties with respect to interference. That means that this method is noise-proof.
The method of measuring phase shift with intermediate voltage-frequency conversion is presented. The considered method of phase shift measurement has the following advantages. It eliminates the dependence of the measurement
result on the frequency of the studied signals, which ultimately leads to an expansion of the frequency range and increase accuracy, because the effect of instability of the frequency of the measured signals is eliminated. The measurement result also does not depend on the amplitude of the studied signals. Has a short measurement time, no more than one or two periods of the studied signals.
4. References
[1] A. Katunin, R. Sidorenko, Y. Kozhushko, and G. Rybalka, Expansion of security functions of laser alarm systems, Information processing systems, № 2 (100), 2012, p.p. 54–57.
[2] S. Herasimov, O. Tymochko, O. Kolomiitsev, and elc., Formation Analysis Of Multi-Frequency Signals Of Laser Information Measuring System, EUREKA: Physics and Engineering, vol. 5, 2019, p.p. 19–28, https://doi.org/10.21303/2461-4262.2019.00984.
[3] High Brightness Diode Laser Modules, The catalogue of the company JENOPTIK Germany GmbH, Diode Laser Group, Germany, 2012, available at: www.jenoptik-com/en-semiconductor-lasers.
[4] Barton D. K. Radar Equations for Modern Radar (2012), London: Artech House, 264 p.
[5] О.S. Makarenko, D.А. Krushinskii, and О.S. Makarenko, Moddeling of pedestrians movement on the base of cellular automata, System research and information technologies, № 1, 2010, p.p. 100–109.
[6] S. Herasimov, V. Pavlii, O. Tymoshchuk, and elc., Testing Signals for Electronics: Criteria for Synthesis, Journal of Electronic Testing, vol. 35, is. 148, 2019, p.p. 1–9, https://doi.org/10.1007/s10836-019-05798-9.
[7] Shin Kihong, On the Selection of Sensor Locations for the Fictitious FRF based Fault Detection Method, International Journal of Emerging Trends in Engineering Research, vol. 7, is. 7, 2019, p.p. 569–575, https://doi.org/10.30534/ijeter/2019/277112019.
[8] Rybin Yu. Measuring Signal Generators. Theory and Design. – Dordrecht, Heidelberg, London, New York: Springer; 2014. – 488 p.
206

[9] S. Yevseiev, R. Korolyov, A. Tkachov et al. (2020) Modification of the algorithm (OFM) S-box, which provides increasing crypto resistance in the post-quantum period. International Journal of Advanced Trends in Computer Science and Engineering (IJATCSE) Vol. 9. No. 5, September-Oktober 2020, pp 8725–8729.
[10] Herasimov S., Belevshchuk Y., Ryapolov I. et al. (2020) Modeling technology of radar scattering of the fourth generation EF-2000 Typhoon multipurpose aircraft model, International Journal of Emerging Trends in Engineering Research, 8 (9), p.p. 5075–5082, https://doi.org/10.30534/ijeter/2020/30892020.
[11] Barabash O., Laptiev O., Tkachev V., et al. (2020) The Indirect method of obtaining Estimates of the Parameters of Radio Signals of covert means of obtaining Information. International Journal of Emerging Trends in Engineering Research (IJETER), Volume 8. No. 8, August 2020. p.p. 4133–4139.
[12] Herasimov, S., Borysenko, M., Roshchupkin, E. et al., Spectrum Analyzer Based on a Dynamic Filter. J Electron Test (2021). https://doi.org/10.1007/s10836-021-05954-0.
[13] Verba V.S., Neronsky L.B., Osipov I.G., Turuk V.E. (2010). Earth-boring space radar systems. Moskov: Radiotechnics, 680 p.
[14] Clarke F. Functional analysis, Calculus of Variations and Optimal Control / F. Clarke. – New York: Springer, 2013. – 606 p.
[15] S. Herasimov, Y. Belevshchuk, I. Ryapolov, and elc., Characteristics of radiolocation scattering of the SU-25T attack aircraft model at different wavelength ranges, Information and controlling systems, Eastern-European Journal of Enterprise Technologies, № 6/9 (96), 2018, p.р. 22–29, https://doi.org/10.15587/1729-4061.2018.152740.
[16] Yevseiev S., Kuznietsov O., Herasimov S. et al. (2021) Development of an optimization method for measuring the Doppler frequency of a packet taking into account the fluctuations of the initial phases of its radio pulses. Eastern-European Journal of Enterprise Technologies, 2/9 (110), p.p. 6–15, https://doi.org/10.15587/1729-4061.2021.229221.
[17] S. Herasimov, E. Roshchupkin, V. Kutsenko, and elc., Statistical analysis of harmonic
signals for testing of Electronic Devices, International Journal of Emerging Trends in Engineering Research, vol. 8, is. 7, 2020, p.p. 3791–3798, https://doi.org/10.30534/ijeter/2020/143872020.
207

Comparison of Machine Learning Methods for a Diabetes Prediction Information System Shmatko Olexandr 1, Olha Korol 2 , Andrey Tkachov3 , Vasyl Otenko4
1 National Technical University "Kharkiv Polytechnic Institute" st. Kirpichova, 2, Kharkiv, 61000, Ukraine 2,3,4 Simon Kuznets Kharkiv National University of Economics, ave. Nauki, 9-A, Kharkiv, 61166 Ukraine
Abstract Diabetes is a disease for which there is no permanent cure; therefore, methods and information systems are required for its early detection. This paper proposes an information system for predicting diabetes based on the use of data mining methods and machine learning (ML) algorithms. The paper discusses a number of machine learning methods such as decision trees (DT), logistic regression (LR), k-Nearest Neighbors (k-NN). For our research, we used the Pima Indian Diabetes (PID) dataset collected from the UCI machine learning repository. The dataset contains information about 768 patients and their corresponding nine unique attributes. Research has been carried out to improve the prediction index based on the Recursive Feature Elimination method. We found that the logistic regression (LR) model performed well in predicting diabetes. We have shown that in order to use the created model to predict the likelihood of diabetes mellitus with an accuracy of 78%, it is necessary and sufficient to use such indicators of the patient's health status as the number of times of pregnancy, the concentration of glucose in the blood plasma during the oral glucose tolerance test, the BMI index and the result of the calculation. heredity functions "DiabetesPedigreeFunction". Keywords 1 Machine learning, Data Mining, Neural Network, Diabetes Prediction Information System, KNN, Logistic regression, Decision tree.
1. Introduction
Diabetes mellitus is an "epidemic of the XXI century", an incurable disease of the pancreas, which develops due to absolute or relative insufficiency of the hormone insulin. It is characterized by a steady rise in blood glucose levels, which in turn can lead to complications.
To achieve compensation for diabetes, constant monitoring is required. In addition to taking oral medications and insulin, following a strict diet, exercise, daily routine, checking your blood glucose regularly, and keeping a special diary, your diabetic should see an endocrinologist regularly for advice and appropriate measures to improve or maintain the condition.
Normally, the level of glucose in the blood varies within fairly narrow limits: from 3.3 to 5.5 mmol / liter. This is due to the fact that in a healthy person, the pancreas produces or stops the release
EMAIL: [email protected] (A. 1); [email protected] (A. 2); [email protected] (A. 3); [email protected] (A. 4) ORCID: 0000-0002-2426-900X (A. 1); 0000-0002-8733-9984 (A. 2); 0000-0003-1428-0173 (A. 3); 0000-0002-5979-1084 (A. 4)
of insulin depending on the actual level of glucose in the blood. In case of insufficiency or complete absence of insulin (type 1 diabetes mellitus) or in case of impaired interaction of insulin with cells (type 2 diabetes mellitus), glucose accumulates in the blood in large quantities, and the body's cells are unable to absorb it. As of 2019, in addition to the already mentioned type 1 and type 2 diabetes, there are gestational diabetes (gestational diabetes), MODY-diabetes and LADA diabetes [2].
Depending on the specifics of the diagnosis, treatment of patients with diabetes involves the use of oral agents to improve insulin permeability to body tissues and / or replacement therapy with subcutaneous insulin injections of varying duration to mimic the normal functioning of the pancreas. With mild diabetes, you can do without medication, but a strict diet with a clear understanding of the amount of nutrients
208

consumed, moderate exercise, daily routine, blood glucose control and diary of self-monitoring are mandatory for all patients with this diagnosis.
Under conditions of poor or insufficient treatment (decompensation or subcompensation of diabetes), blood glucose levels in the human body are consistently high. Against this background, complications of diabetes develop, which not only worsen the patient's standard of living, but can also be fatal. These complications include:
ketoacidosis (accumulation of a dangerously large number of ketone bodies in the blood), hypoglycemia (decrease in blood glucose below 3.3 mmol / l), hyperosmolar and lactic acidotic coma, polyneuropathy (peripheral nerve damage), nephropathy (kidney damage), retina retinal vessels), angiopathy (impaired vascular permeability), diabetic foot syndrome, etc.
To achieve compensation for diabetes - a condition in which the patient has achieved stable normal blood glucose levels during treatment and the risk of complications is reduced - constant monitoring is required. In addition to the above measures, this control also includes regular visits to the endocrinologist for advice and appropriate measures to improve or maintain the patient's health.
2. Literature review
There are a number of studies on predicting diabetes based on machine learning (ML) methods for the Pima Indian Diabetes Dataset (PIDD). Pima Indian Diabetes Dataset (PIDD) containing: 9 attributes, 768 records describing female patients. [1], [2], [3], [4], [5].
In [2], artificial neural networks were used to predict diabetes based on the PIDD dataset, which showed a prediction accuracy of 75.7%. Sajida The authors of [3] showed that among the applied machine learning methods SVM, NB and DT on PIDD, the NB classifier shows the best accuracy - 76.30%. [4] applied logistic regression to PIDD to predict diabetes. The model proposed in this paper showed a fairly good forecast with an accuracy of 75.32%. In the study [5], all patient data were used to train and test a classifier based on Naive Bayes (NB) and decision trees (DT). The research results showed that the best algorithm is the naive Bayesian algorithm with an accuracy of 76.3021%.
The most important problem in a machine learning method is the choice of training parameters and the corresponding classifier. In our work, we used the Recursive Feature Elimination method to improve the prediction rate. Our research work is to select the best classifier for the diabetes prediction information system. In this work, various machine learning classification algorithms are used to predict diabetes in a patient, such as Linear Regression (LR), K-Nearest Neighbor (KNN), Decision Tree (DT).
3. System design
The system architecture for the Diabetes Prediction System, shown in Figure 1 below, is a conceptual model that defines the structure, behavioral interactions, and several systemic representations that underlie the system. The figure shows a formal description of the system, submodules of the system, as well as data flows between them.
Figure 1 shows the components of the system architecture.
Figure 1: System architecture.
4. Methods
Based on the comparison and analysis of the functional properties of leading software solutions in the field of medicine, it was determined that the option "Obtaining prediction of the probability of
209

the patient's disease" is not implemented in modern diabetes management information systems. However, due to statistics on the fate of patients with misdiagnosis, it becomes impossible to deny the need to implement this useful function.
The problem of predicting the incidence of diabetes can be solved using the methods of classification of machine learning.
In the tasks of medical diagnostics, patients act as objects. The characteristic description of the patient is, in fact, a formalized medical history. Having accumulated a sufficient number of precedents in electronic form, you can use the methods of classification of machine learning and predict the likelihood of the patient's disease.
4.1 An example of solving the problem of classification using machine learning to predict the incidence of diabetes
4.1.1. Description of the source data
To implement the considered methods of classification of machine learning, we will use the popular service "UCI Machine Learning Repository", which provides a large number of sets of real data, and consider the initial data presented in the sample "Pima Indians Diabetes Database" (figure 2)
Figure 2: Example data in the Pima Indians Diabetes Database sample
There are a total of 768 records in the sample,
each of which is characterized by the following nine parameters.
1. "Pregnancies" - the number of times of pregnancy 2. "Glucose" - plasma glucose concentration (in mg / dl) for two hours in an oral glucose tolerance test 3. "BlooodPressure" - diastolic blood pressure (in mm Hg) 4. "SkinThickness" - the thickness of the folds of the skin of the triceps (in mm) 5. "Insulin" - the concentration of serum insulin for two hours (in μg / ml) 6. "BMI" - body mass index, calculated by the formula: weight in kg / (height in m) 2 7. "DiabetesPedigreeFunction" - a function of diabetes heredity 8. "Age" - the age of man 9. "Outcome" - the result of a variable class (0 - no diabetes, 1 - a sick person)
The available data show the following distribution: 500 people are healthy (ie their "Outcome" parameter is zero) and 268 have diabetes (their "Outcome" parameter is equal to one).
In graphical form, the data "Pima Indians Diabetes Database" can be represented as follows (figure 3).
As can be seen from Figure 3, inaccurate data are found in the sample. For example, these are:
1. blood pressure equal to zero (35 cases); 2. zero blood glucose concentration (5 cases); 3. skin fold thickness less than 10 mm (227 cases); 4. BMI approaching zero (11 cases); 5. zero level of insulin concentration in the blood (374 cases).
210

Figure 3: Graphic representation of data distribution
To eliminate the above problems, the
following options are proposed: • Delete or ignore records. An undesirable option, because it means the loss of valuable information. The sample contains too many records with zero skin thickness and blood insulin concentration, but this tool can be applied to the fields "BMI", "Glucose", "Blood pressure". • Using averages. This option may be the case for some samples, but using a mean value, such as blood pressure, will be the wrong signal for the model. • Avoid the use of problematic characteristics. This option could work for the thickness of the skin, but at this stage it is difficult to predict the result. After analyzing possible ways to solve the
problem of incomplete data, we decide to remove from the sample rows in which the attributes "BMI", "Glucose" and "Blood pressure" are zero. As a result, 724 records remain in the database.
4.1.2. Choice of classification method
In order to choose the method of classification of machine learning, which is better suited for the
task of predicting the incidence of diabetes, it is advisable to choose the method whose accuracy in the selected sample will be the highest.
Avoidance of training and testing on the same data is a common practice, which is explained by the fact that the purpose of the model is to provide data other than the sample. In addition, the model can be overly complex, leading to retraining. To avoid the above problems, there are two precautionary methods:
• retention method - part of the training set can be postponed and used as an affirmative (test) set; • cross-checking - repeating the method of retention several times, ie repeating the division of the sample into training and approval sets. Calculations of the accuracy values of the
selected classification methods will be performed using Python programming language, namely using the methods of the library "scikit-learn" [39]. As input parameters "x" we will give models data from columns "Pregnancies", "Glucose", "Blood Pressure", "Skin Thickness", "Insulin", "BMI", "Diabetes Pedigree Function" and "Age". As the expected result "y" - data from "Outcome".
211

The results of the calculations presented in the table 1.
Table 1 The results of calculating the accuracy of the classification methods by the method of retention and the method of cross-checking
Method retention method
cross-checking
KNN 0.711521 0.711521 LR 0.776440 0.776440 DT 0.681327 0.685494
Figure 4: Comparison of the obtained results of accuracy of classification methods
Based on the obtained data, it can be stated that
the method of logistic regression has a higher accuracy of the sample "Pima Indians Diabetes Database" than the method of kNN-classification and the method of the decision tree (figure 4), and therefore it can be used to implement the function "Diabetes prediction" in the information system to automate the process of admission of patients with diabetes in endocrinologists.
4.1.3. Improving the accuracy of prediction
Usually, not all source data improve the performance of the model. In order to correctly
identify which of the available attributes have a greater impact on the resulting model, we use the method of recursive Feature Elimination (RFE).
The essence of the method is that it recursively removes attributes and builds models based on those attributes that remain. RFE uses model accuracy to determine which attributes or combinations of them contribute most to target prediction.
Using the library "scikit-learn" we build a graph of the accuracy of the prediction of diabetes from the number of initial parameters (Fig. 5).
Figure 5: Dependence of accuracy of prediction of diabetes mellitus by logistic regression method on the number of initial parameters
As you can see, the best accuracy of the model
is achieved by using only four attributes: "Pregnancies", "Glucose", "BMI", "DiabetesPedigree Function". A comparison of the results of the accuracy calculation is given in the following table 2/ Table 2 The results of calculating the accuracy of the method of logistic regression after reducing the number of output attributes
Number of output
parameters
8 4
Accuracy of logistic
regression method
0.776440 0.780588
Thus, to further use the created model to
predict the probability of diabetes with an
62,0
64,0
66,0
68,0
70,0
72,0
74,0
76,0
78,0
80,0
KNN LR DT
retention method cross-checking
212

accuracy of 78%, it is necessary and sufficient to use such indicators of the patient's health as the number of pregnancies, plasma glucose concentration in the oral glucose tolerance test, BMI and the result of calculating the heredity function "DiabetesPedigreeFunction".
5. Conclusions
Early detection of diabetes is one of the major health problems. This paper proposes a system architecture and classifier for an information system that can predict diabetes with high accuracy. We have pre-processed the data. Using the method of reducing the number of functions, we have abandoned four parameters. We used four input parameters ("Pregnancies", "Glucose", "BMI", "DiabetesPedigree Function") and one output parameter (result) in the PIMA dataset. We used three different machine learning algorithms, including DT, KNN, LR on PIDD, to predict diabetes and evaluated the performance on various parameters. All models show good results in some parameters. All models provided over 70% accuracy. LR provided an accuracy of approximately 77–78%. The use of improving the prediction index based on the Recursive Feature Elimination method allowed us to reduce the number of parameters from 8 to 4. Among all the proposed models, the forecasting accuracy for logistic regression (78.05%) was better than the accuracy in [1] (LR 75.32% ), [2] (NB - 76.30%), [3] (NB - 76.3021%), [4] (RF - 77.21%) and [5] (ANN 75.7%).
6. References
[1] Sisodia, Deepti, and Dilip Singh Sisodia. "Prediction of diabetes using classification algorithms." Procedia computer science 132 (2018): 1578-1585.
[2] Alam, Talha Mahboob, et al. "A model for early prediction of diabetes." Informatics in Medicine Unlocked 16 (2019): 100204.
[3] Tigga, Neha Prerna, and Shruti Garg. "Prediction of type 2 diabetes using machine learning classification methods." Procedia Computer Science 167 (2020): 706-716.
[4] Diwani, Salim Amour, and Anael Sam. "Diabetes forecasting using supervised learning techniques." Adv Comput Sci an Int J 3 (2014): 10-18.
[5] Zou, Quan, et al. "Predicting diabetes mellitus with machine learning techniques." Frontiers in genetics 9 (2018): 515.
213

Automation Of Technical Diagnostics Of Digital Signal Synchronization Devices Valerii Koval 1, Vitaliy Lysenko 2, Ihor Bolbot 3, Oleksandr Samkov 4, Oleksandr Osinskiy 5, Dmytro Kalian 6, Vyacheslav Vakas 7, Inna Yakymenko 8, Maksym Yevtushenko 91
1,2,3,6,8,9 National University of Life and Environmental Sciences of Ukraine, Heroyiv Oborony st., 15, Kyiv, 03041, Ukraine 4,5 Institute of Electrodynamics of the National Academy of Sciences of Ukraine, Peremohy Av., 56, Kyiv, 03057, Ukraine 7 PJS “Kyivstar GSM”, Degtyarivska str, 53, Kyiv, 03113, Ukraine
Abstract Modern digital technologies require high-quality frequency-time support. In practice, the use of digital signal synchronization devices (DSSD), the purpose of which is the formation of clock signals, has become widespread. Various methods of technical diagnostics are used to ensure the specified quality of clock signals, increase the reliability and resource of the DSSD. The paper is devoted to solving an urgent problem, which is to develop software and hardware to automate the process of technical diagnostics of DSSD. It also investigates the automated system of technical diagnostics which is constructed on technology of multichannel monitoring with use of the sensor of the adaptive digital phase discriminator protected by the patent for an invention. The authors carried out the practical development and experimental researches of the diagnostic system using the multichannel sensor and the P4000winXP software. The research results confirm the possibility of transmitting the results of measurements of clock signals using IP technologies and conducting automated processing of the obtained data in real time, which increases the reliability of the operator’s decision and simplifies the diagnostic process. Keywords: automation, technical diagnostics, digital signal synchronization devices, automated system, sensor, adaptive digital phase discriminator, data processing, IP technologies.
1. Introduction
State-of-the-art digital information and communication systems, digital substations of SMART Grid electrical networks, other technical facilities using high technology, including the country’s critical infrastructure, require high-quality time-and-frequency support. An important role in such a support is played by the processes of formation and transmission of clock signals, which are based on modern digital information processing technologies. In practice, the use of digital signal synchronization devices (DSSD), which are designed to generate and produce synchronized signals that must meet the specified
EMAIL: [email protected] (A. 1); [email protected] (A. 2); [email protected] (A. 3); [email protected] (A. 4); [email protected] (A. 5); [email protected] (A. 6); [email protected] (A. 7); [email protected] (A. 8); [email protected] (A. 9); ORCID: 0000-0003-0911-2538 (A. 1); 0000-0002-5659-6806 (A. 2); 0000-0002-5708-6007 (A. 3); 0000-0003-2790-8564 (A. 4); 0000-0002-9921-699X (A. 5); 0000-0003-2016-2253 (A. 6); 0000-0002-0378-9989 (A. 7); 0000-0002-2316-2382 (A. 8)
technical requirements, has become widespread to solve the problem of time-and-frequency support [1-6].
Various methods of technical diagnostics are used in order to ensure the desired quality of clock signals, reliability improvement and service life of the DSSD. Technical diagnostics, through the timely identification of inconsistencies and their causes, improve maintenance, reliability and efficiency of operation of DSSDs [1-8]. The result of the diagnosis should be an assessment of the state of the DSSD at the time of diagnostics, in terms of its compliance or non-compliance with the established requirements. The real indicators and characteristics of DSSD can be obtained with the help of diagnostic tools (equipment), which
214

together form a diagnostic system. Given the need to use high-precision specialized measuring equipment, which should provide continuous long-term (hour, day and even week) measurements with the formation of large arrays of real-time measurement data, the task of automating the process of technical diagnostics becomes one of the most important and urgent ones.
The current approaches to solving the problems of quality control and diagnostics of DSSD at the stages of production, introduction into service and maintenance do not meet modern requirements for functionality. The existing technical facilities in Ukraine do not have a uniform system for transmitting accurate time signals from reference standards and consequently cannot meet the requirements of all users of frequency-time information [9]; recent publications pay attention to the topical study of new solutions for the transfer of time scales using IP technologies [1-5, 9-12], the measurement of time characteristics of clock signals and the diagnosis of DSSD.
2. Principles of building an automated system for the diagnostics of synchronization devices
According to the results of the analysis of technological processes of production and technical operation (TPP TO) of DSSD, it is established that the formation of clock signals with the specified accuracy and reliability is impossible without the use of automated control of signal quality and diagnostics of the state of devices and synchronization system as a whole [1-12]. In the regulatory document on technical information protection [13], the automated system is defined as the “organizational and technical system implementing the information technology and uniting the computer system, the physical environment, personnel and the information that is processed.” As for the Automated Control System, the State Standards of DSTU 2226-93 defines it as “an automated system intended for automating the processes of collecting and forwarding information about the control object, its reprocessing and issuing control actions on the control object”.
The automated control system of these technological processes in its structure provides
for the use of an automated subsystem of control and testing, which according to DSTU 2226-93 is designed to “automate the testing of industrial products and control its performance for compliance with regulations.”
The generalized structural scheme of the automated control system of TPP TO of DSSD with the use of diagnostic results is shown in Fig. 1. The control process receives feedback through digital technologies. In this case, from the standpoint of information functioning, the control process can be represented as a process of forming data that is moved and processed. Therefore, the functional composition of the information part of the control system of TPP TO of DSSD can be represented by the following subsystems: measuring (data collection device), information processing (calculation, storage, decision making and formation of control actions) and transmission.
Figure 1: Generalized structure diagram of the automated process control system TPP TO of DSSD
The analysis of the process of diagnosing
DSSD under the conditions of their production and technical operation based on the system approach determines the expediency of using multichannel monitoring technology, which provides multiple productivity of the diagnostic process and increases the reliability of data analysis results used to make decisions on TPP TO technological process parameters [2, 3, 8, 10]. The multiple constitutive elements of an automated diagnostic system are sensors, which are measuring transducers that convert physical quantities into digital electrical signals [14]. This is due to the fact that the technology of multi-channel monitoring is based on the use of sensors (hardware), geographically distributed by objects, that perform continuous long-term measurements (days, weeks) of several clock signals. The data
215

received from the sensors are processed and transmitted via the IP network to the information processing facilities where additional processing, including statistical processing, is carried out.
Decision-making tools are specific components of an automated diagnostic system. Being a control unit, they are composed of a number of specialists and a body of knowledge, competence and methods they possess.
It is important that, in fact, it is on the basis of these sensors that a decision is made on the formation of the necessary control actions.
Measuring multichannel tools, sensors inclusive, have reference oscillators. Reference oscillators (RO) are based on the principle of automatic frequency control of a quartz oscillator with deviation control and adaptive digital phase discriminator (ADPD) [15]. GO directly or due to the process of automatic frequency control from external sources, forms the reference (sample) time readings, which serve as references for measuring the time intervals of the controlled DSSD clock signals.
It is scientifically substantiated that calculations and estimations of DSSD characteristics need to be carried out on the basis of directly measured in time domain discrete samples of an error of time which form the basic, first level [14].
In case of time error measurement at τ interval, starting from the t moment, time interval error function ТІЕt(τ) is used, which has the following mathematical definition:
,)(Т)(Т -
-)(Т)(Т)(Т)(Т -)(Т)(Т
)(ТI)(ТI)(ТІЕ
ОП
ОП
ОПОП
ОПtt
tttt
tttt
−
+−+=
=−+−+=
=−=
(1)
where ТОП(t) – time function of the reference (sample) signal;
ТІt(τ) – time interval function, which is determined from the expression:
)(Т)(Т)(ТІ t tt −+= , (2)
that “is a measure of the τ time interval, which begins at time t, for the studied signal (provided that there is an ideal reference signal)” [15], and the time function Т(t) is determined by the complete phase Р(t) for the nominal value of the frequency н of the DSSD signal out of the equation:
( )
н
tРt2
)(Т = . (3)
The next levels of the hierarchy of the process of diagnosing DSSD should provide calculations
of TIErms and MTIE, characteristics of instantaneous frequency, frequency fluctuations, DSSD operating modes.
For example, the MTIE estimate can be made for the τ0 sampling period based on the results of N measurements of evenly spaced discrete xi samples, using the formula [14, 15]:
),min
max(max)(10
inkik
inkiknNk
x
xnMTIE
+
+−
−
−
(4)
where )1(,...,2,1 −= Nn . It is possible to obtain the values of discrete
samples of time interval error ТІЕ measured in the time domain by using an adaptive digital phase discriminator (ADPD), which is protected by a patent of Ukraine for an invention [16]. The ADPD generates a code combination about the magnitude of the time interval error of two mutually independent clock signals and provides the presentation of measurement results in a digital format. Fig. 2 shows an ADPD circuit containing an input to which a controlled clock signal is applied (Input 1) and an input to which a reference signal is applied (Input 2) [17]. К-inputs of the pre-installation of the impulse counter (numbered as 1…k), are К digital inputs of the ADPD pre-installation. The digital outputs of the sensor, which form a code combination that corresponds to the error of the time interval between signals, are the n-outputs of ADPD (numbered as 1… n).
Figure 2: Structure diagram of adaptive digital phase discriminator
The multi-channel measuring tools of the
automated diagnostics system have a certain number of sensors which make it possible to measure simultaneously the control of several clock signals. In the process of measurements, the control of the periodicity, amplitude and shape of the clock signals is performed. The results of these processes, presented in digital format, are processed by a microcontroller and transmitted in text format using IP technology.
The principles of construction of multichannel measuring tools make it possible to classify their
216

implementation as intelligent sensors that work on rather complex algorithms and allow to provide the device with additional functionalities, such as signal filtering, adaptation, correction, failure detection, reconfiguration of the measuring circuit, etc.
2.1. The results of implementing the automated diagnostics system
The practical implementation of an automated diagnostic system with a multi-channel meter and the developed P4000winXP software provides the possibility of simultaneous visualization of the measurement results of four clock signals. In addition to dynamic graphs, the monitor screen displays service information (GO mode, availability and format of controlled clock signals, etc.), which expands the possibilities for analyzing the data used by the operator in the decision-making process.
Figure 3 shows an example of the visualization of measurement results obtained in real time from four sensors. Text data generated by two sensors selected by the operator is displayed as dynamic graphs in real time. The figure shows fragments of the parameters of TIE controlled clock signals (Channel C0 and Channel C1) of two DSSD, which are in different modes in the observation time interval from 443 s to 1153 s [14]. In case when four clock signals are simultaneously connected to the diagnostic system, generated by the DSSD, the productivity of measurements correspondingly increases by four times compared to the single-channel version.
Figure 3: Visualization of the measurements results of TIE controlled clock signals
This example demonstrates the ability of the developed software and hardware to provide transmission using IP technology direct and independent measurement results of TIE controlled DSSD clock signals. Automated real-time data processing with centralized accumulation provides the presentation of measurement results in an operator-friendly format, which simplifies the diagnostic process and increases the reliability of decision-making.
3. Conclusions
Based on the results of scientific and innovative project developments and experimental research performed within the state budget, it can be stated that the created software and hardware for automated diagnostics of digital signal synchronization devices is the state-of-the-art system developed in Ukraine. The automated system can be used effectively to monitor the timing of clock signals in various sectors of the country’s economy, as well as to enhance the information sovereignty, defense and security of the state.
4. References
[1] Koval, V.V. (2017). Conducted synchronization devices with periodic auto-tuning of telecommunication networks: monograph. K.: TSP “KOMPRYNT” [in Ukrainian].
[2] Koval, V.V., Samkov, O.V., Khudyntsev M.M. et al. (2018). Automated system of digital signals synchronization: monograph. K.: TOV TSP “KOMPRYNT” [in Ukrainian].
[3] Koval, V.V., Samkov, O.V., Fedorova, N.V. et al. (2019). Automated quality control of clock signals formation based on the use of ІР-technologies: monograph. К.: NUBiP of Ukraine [in Ukrainian].
[4] Koval, V.V., Samkov, O.V., Piskun, O.M. et al. (2019). Information system for transmission of reference values of the time scale of integrated electric power networks of SMART-technologies. Visnyk universytetu «Ukrayina». Seriya «Informatyka, obchyslyuvalʹna tekhnika, kibernetyka». К. (22), 231-239 [in Ukrainian].
[5] Ryzhkov A. V. (2006). Frequency and time in infocommunications of the XXI century. M .: MAS [in Russian].
217

[6] Valerii Koval, Dmytro Kalian, Oleksandr Osinskiy, Oleksandr Samkov, Mykola Khudyntsev and Vitaliy Lysenko. Diagnostics of Time Synchronization Means of the Integrated Power Grid of SMART Technologies by Using an Optimal Performance System of Automatic Frequency Adjustment // 15th International Conference on Advanced Trends in Radioelectronics, Telecommunications and Computer Engineering, TCSET 2020; Lviv-Slavske; Ukraine; 25 February 2020 до 29 February 2020/ Conference Proceedings15th International Conference on Advanced Trends in Radioelectronics, Telecommunications and Computer Engineering (TCSET 2020). 2020. – pp.269-276. https://ieeexplore.ieee.org/document/9088587
[7] Projectowanie, badania, i eksploatacja. Tom 1. Monografia. Dmytro Kalian, Nadiia Kazakova, Boris Kravchenko, Valerii Koval. Automated system for Monitoring Synchronizing precise time signals at SMART-GRID power plants. – Wydawnictwo naukowe Akademii techniczno-humanistycznej w Bielsku-Bialey. Bielsku-Bialey, Poland. 2019. – P.155-160. http://www.engineerxxi.ath.eu/book/designing-researches-and-exploitation-2019-vol-1/
[8] Koval, V.V., Dobrovenko, D.O., Samkov, O.V. et al. (2020). Multichannel monitoring of synchronizing signals of measuring systems. Zbirnyk XX Nauk.-prakt. konf. “Stvorennya ta modernizatsiya ozbroyennya i viysʹkovoyi tekhniky v suchasnykh umovakhʺʺ (p. 16) [in Ukrainian].
[9] Velychko, O.M., Koval, V.V., Samkov, O.V. et al. (2016). Modern time scale transmission protocols for intelligent power systems with reduced accident rate. Naukovyy visnyk Natsionalʹnoho universytetu bioresursiv i pryrodokorystuvannya Ukrayiny. Seriya «Tekhnika ta enerhetyka APK», 242, 41-50 [in Ukrainian].
[10] Koval, V.V., Kalian, D.O., Samkov, O.V. (2016). Automated system for transmission of clock signals using IP networks: monograph. K.: NUBiP of Ukraine [in Ukrainian].
[11] Baumgartner B., Riesch C., Rudigier M. IEEE 1588/PTP: The Future of Time Synchronization in the Electric Power
Industry, PAC World Conference 2012, Budapest, Hungary, 2012.
[12] Jackie Peer, Eric Sagen, Shankar Achanta, and Veselin Skendzic. The Future of Time: Evolving Requirements for Precise Time Synchronization in the Electric Power Industry. Presented at the 13th Annual Western Power Delivery Automation Conference Spokane, Washington, March 29–31, 2011.
[13] Normative document on Information security and information protection – 1.1-003-99. Terminology for the protection of information in computer systems from unauthorized access [in Ukrainian].
[14] Kalian, D.O. (2020). Automation of the process of quality control of devices for synchronization of digital signals of multi-item production. Extended abstract of candidate’s thesis. Kyiv: NUBiP [in Ukrainian].
[15] Breni S. (2003). Synchronization of digital communication networks. (Trans.). Moscow: Mir [in Russian].
[16] Koval, V.V., Kalian, D.O. (2015, Ukraine). Patent for the invention №113473 Ukraine, IPC (2016.01) H 03 D 13/00, H 03 D 3/04 (2006.1). Adaptive digital phase discriminator. No. a 201511981, Appl. 03.12.2015, Publ. information about the application 10.05.2016, Bull. № 9. Publ. Bull. №2, 25/01/2017.
[17] Dmytro Kalian. Performance-optimal phase-locked system for device of synchronization and formation of the exact time signal. Information and Telecommunication Sciences, Number 1(2018), National Technical University of Ukraine “Igor Sikorsky Kyiv Politechnik Institute”, P.11-18. http://infotelesc.kpi.ua/article/view/136460
218
Hybrid Intelligence System of Emotional Facial and Speech State Estimation Viktor Sineglazov1, Andriy Rjabokonev2
1,2 National Aviation University, ave. Lubomir Husar, 1, Kyiv, 03058, Ukraine
Abstract It is shown that person emotional state estimation with help of facial or speech state estimation isn’t enough. It is necessary to create Hybrid Intelligence system of emotional facial and speech state estimation. For the problem solution it is proposed to use hybrid convolutional neural networks. The data supplied to the network input are presented in the form of mel-spectrograms and facial images during conversation. Mel-spectrogram can be interpreted as a two-dimensional image, where along one axis the frequency changes, along the other time, or rather sequential frames of the spectrogram. The following characteristics are often extracted for this purpose: local characteristics, global characteristics, prosodic characteristics, qualitative characteristics. It is shown that change of emotions on a face or in speech is connected with internal reaction of the person to the questions posed. For the solution of emotional state estimation with help of facial and speech state estimation it is offered to use convolutional neural networks at a stage of micro emotions identification and voice characteristic changes. Making decision on potential threats based on determined emotional state estimation is realized by the ensemble of classifiers. Keywords 1 Hybrid Intelligence, emotional state estimation, hybrid convolutional neural networks, Mel-spectrogram, facial or speech features, making decision.
1. Introduction
Nowadays, the real importance is given to increasing the aircraft safety conditions, in particular during the passenger control. Commonly, the number of people for each security officer is too high to deal with them in restricted period of time. The employee of aircraft company is faced by a hard task, to ask the number of special questions to understand the emotional state of the passenger to successful admission of the flight. The main features that allow to solve this problem is emotional changes of the passenger during the control conversation [1].
In article [1] it is considered an intelligent system of micro emotions analysis which consists of the two-levels: at the first level the convolution neural network realizes micro emotion recognition, on the second – the fuzzy classifier supplies the solution of making decision on potential threat problem based on determined emotional state estimation.
EMAIL: [email protected] (A. 1); [email protected] (A. 2) ORCID: 0000-0002-3297-9060 (A. 1)
In article [2] it is considered an Intelligent system of analysis of musical works, where it was used mel-spectrograms as inputs for convolutional neural network.
Last researches showed that it isn’t enough to take into account only particular features, appearance because sometimes they can be formed artificially. So in addition it is necessary to consider speech state estimation.
2. Review of Existing Solutions
Generally, the facial emotion of an individual in few studies has been realized through the computer vision (CV). Facial expressions have maximum magnitude over the words during a personal conversation. Various methods have been used for automatic facial expression recognition (FER or AFER) tasks. Early papers used geometric representations, for example, vectors descriptors for the motion of the face [3], active contours for mouth and eye shape retrieval
219

[4], and using 2D deformable mesh models [5]. Other used appearance representation based methods, such as Gabor filters [6], or local binary patterns (LBP) [7]. These feature extraction methods usually were combined with one of several regressors to translate these feature vectors to emotion classification or action unit detection. The most popular regressors used in this context were support vector machines (SVM) and random forests. Many descriptive approaches to interaction forms of emotions are included in the classification of the input data, and the CNN network is an effective algorithm of deep learning.
Current research in the field of classification of the user's emotional state based on voice focuses mainly on experiments with different classifiers and characteristics and finding the best combination. A relatively small number of available recordings of emotions (databases) that can potentially be used to create a classifier has shown to be problematic, as well as the fact that people in real situations tend to suppress their emotions and not fully express them. Another obstacle in creating a universal solution is the human voice itself, which can be influenced by many factors – e.g. gender, age, state of health, etc.
An important step in designing an emotion recognition system is to recognize the facial micro changes that effectively characterize the various emotions and extract useful properties from the voice.
For these purposes it is extracted the following characteristics; facial movements (unitary movements performed by a group of muscles: tightening the cheeks, stretching the eyelids, raising the wings of the nose, raising the upper lip, deepening the nasolabial fold, raising the corners of the lips, dimpling the lips, lowering the corners of the mouth, lowering the lower lip, pulling off the lips) [8], speech (local characteristics, global characteristics, prosodic characteristics, qualitative characteristics, spectral characteristics).
2.1. Facial Movement Characteristics
Each manifestation of facial emotions of a person can be described by a set of descriptors. As the apparent facial changes there also occurs the micro emotions. They can be taken into account in more complicated recognition approaches. Table 1 describes the main facial changes
relatively to the six standard types of emotions [9].
Table 1 Relations of emotional facial features changing
Emotion Eyebrow Mouth
Surprise Rise Open Fear Rise and
wrinkled Open and
stretch
Disgust Decrease Rise and ends will decrease
Anger Decrease and wrinkled
Opens and ends will decrease
Happiness Bends down Ends will rise
Sadness End part will decrease
Ends will decrease
Motion units of the person can be divided into
three groups conditionally. 1. Static – recognition using only the photo is possible. 2. Dynamic – it is necessary to continuous frame changing, key points initialization or obtaining the average value of distances between motion units. 3. Empty – actively participate in manifestation of emotions, however are not registered search algorithms (dimples on cheeks).
Table 2 Methods for facial emitonal state recognition of human face
Methods Holistic methods
Local methods
Methods
for shapes calculations
Classificators:
Artificial Neural network,
Random Forest,
Adaboost,
Gabor filters,
2D face models:
AAM, ASM EBGM
Classificators:
Artificial Neural network, Bayes
Classificator,
Adaboost,
Geometric face models.
Own vectors:
PCA.
Local histograms:
HoG, LBP.
Methods for dynamics
calculations
Optical flow,
Dynamic models
3D dynamic
models.
Statistical models: HMM, DBN
220

Now it is possible to review the following
recognition methods of the human emotional state using methods of calculation of forms of objects, methods of calculation of dynamics of objects (Table 2) [10].
Face detection algorithms can be divided into four categories [11]: empirical method; method of invariant signs; recognition on the template implemented by the developer; method detection on external signs (the training systems).
The main stages of algorithms of empirical approach are: stay on the image of the person: eye, nose, mouth; detection: borders of the person, form, brightness, texture, color; combination of all found invariant signs and their verification.
Shortcoming is that this algorithm is very sensitive to degree of an inclination and turn of the head.
These approaches were implemented in the following software for processing video images of a human face subject to emotions [10]: Face Reader, Emotion Software and GladOrs application, Face Analysis System.
2.2. Voice Characteristics
Consider speech characteristics. Local characteristics are determined as energy or frequency of separate frames which form the speech signal. Global characteristics (maximum, minimum, variance, mean, standard deviation, sharpness, skew and other similar values) are statistically calculated from local characteristics. These values are then combined into a single global characteristics vector [12]. Global characteristics are effective only in distinguishing between energetic and low-energy emotions (e.g., anger and sadness), but fail to distinguish emotions that manifest similarly energetically (e.g. anger and joy) [13].
Prosodic characteristics is based on concept of prosody. Proshodia (ancient Greek προσῳδία - stress, chorus; also prosodyk) – a section of phonetics, which considers such features of pronunciation as height, strength / intensity, duration, aspiration, glottalization, palatalization, the type of concordance of a consonant to a vowel and other signs, which are additional to the main articulation of sound [14]. Within the framework of prosody, both the subjective level of perception of the characteristics of super-segment units (pitch, strength / loudness, duration) and their
physical aspect (frequency, intensity, time) are studied [15].
These characteristics are thought to carry useful information for recognizing emotions [16] because longer sound units are characterized by rhythm, intonation, emphasis and pause in speech [17] or tempo of speech, relative duration, and intensity [18]. The intensity is often measured as the sound pressure level [19].
The usage of qualitative characteristics is based on the assumption that emotional content in speech is related to the quality of the voice [13]. By changing the qualitative characteristics of one's voice, it is possible to reveal important information, e.g. intentions, emotions, and attitudes [18]. Qualitative characteristics are closely related to prosodic characteristics. Qualitative characteristics include jitter, shimmer and other microprosodic phenomena that reflect the properties of the voice, such as shortness of breath and hoarseness [20] jitter refers to fluctuations in fundamental frequency. There are several methods for calculating this perturbation. The simplest is the average jitter, which is defined as the average absolute difference in the length of consecutive periods. Jitter is usually expressed as a percentage. Amplitude perturbation (shimmer) is defined as fluctuations in the amplitudes of adjacent periods. As with jitter, there are many different calculation methods for shimmer. The most common is the average shimmer – the average absolute difference in the amplitudes of consecutive periods [21].
Spectral characteristics describe a spectrum of speech that is higher than the fundamental frequency – for example, harmonic and formant frequencies. Harmonic frequencies are integer multiples of the fundamental frequency – the second harmonic frequency is 2 · F0, the third harmonic frequency is 3 · F0, etc. Formant frequencies are amplifications of certain frequencies in the spectrum.
Formant is a phonetic term that denotes the acoustic characteristic of speech sounds (primarily vowels), associated with the level of the frequency of the voice tone and forming the timbre of the sound.
The spectrogram can be obtained by using a short-term Fourier transform, in which For extraction of these 5 basic types of voice characteristics it is used different software: openSMILE, PortAudio, Praat, Parselmouth, Librosa, pyAudioAnalysis.
A mel-spectrogram can be used as spectral characteristics (Mel is a psychophysical value for
221

measuring the pitch of sound, a quantitative assessment of pitch, which is based on the statistical processing of a large amount of data on the subjective perception of the pitch of sound tones). The mel-spectrogram is obtained by applying a set of overlapping triangular windows to the frequency spectrogram obtained by the discrete Fourier transform – Xk, k = 1, ..., N, where N is the number of signals of different frequencies that form the spectrogram [2]. The sound recording of the speech is first divided into short frames of equal length. By applying the Fourier transform, a spectrum (frequencies present in the frame) is obtained from each frame. The spectrogram is then created by visualizing changes in the spectrum over time. In article [2], a mel-spectrogram was used as inputs to a convolutional neural network, which was represented by a two-dimensional matrix of real numbers.
3. Hybrid Intelligence System of Emotional Facial and Speech State Estimation
Section 2 of this work pointed out the use of convolutional neural networks for emotional facial and speech state estimation. However, as indicated in a number of studies, the use of convolutional networks of standard topology does not always lead to a correct assessment of emotions when processing both video and speech signals. This leads to the need to develop new topologies of convolutional neural networks (CNN), in particular, hybrid convolutional neural networks (HCNN).
A characteristic feature of modern CNM is the presence of unique blocks that determine their essential features. For example: Squeeze and excitation block, convolutional attention module, channel attention module, spatial attention module, residual block, inception module, ResNeXt block [22]. Thus, to build a HCNN, you can use various unique blocks inherent in the CNN with the same name.
As a result, we have the problem of structural-parametric synthesis of the HCNN, the solution of which is to determine the types of unique blocks, their locations in the structure of the HCNN, to determine their connections with other blocks, to determine the types of activation functions, to calculate the values of weight coefficients, etc.
In general case [23], HCNN consists of S stages, and the sth stage, s = 1, 2 , ... , S, contains Ks nodes, denoted 𝑣𝑠,𝑘𝑠, ks = 1, 2 ,. ... ... , Ks. The nodes within each stage are ordered, and we only allow connections from a lower-numbered node to a higher numbered node. Each node corresponds to the unique block. It is assumed that the geometric dimensions (width, height, and depth) of the stage cube remain unchanged in each stage. Neighboring stages are connected via a spatial pooling operation, which may change the spatial resolution. The structure of HCNN represents the alternation of two unique blocks, followed by a layer of pooling. All convolution layers in one stage have the same number of filters or channels. To solve the problem of structural-parametric synthesis, it is used a genetic algorithm or a multicriteria genetic one, if under the training of HCNN in addition to the criterion determining accuracy, a criterion of minimal complexity is used. We do not encode the fully-connected part of a network. In each stage, we use ½ 𝐾𝑠 (𝐾𝑠 – 1) bits to encode the inter-node connections. The first bit represents the connection between (𝑣𝑠,1, 𝑣𝑠,2), then the following two bits represent the connection between (𝑣𝑠,1, 𝑣𝑠,3) and (𝑣𝑠,2, 𝑣𝑠,3), etc. This process continues until the last 𝐾𝑠 – 1 bits are used to represent the connection between vs,1, 𝑣𝑠,2,. . . 𝑣𝑠,𝐾𝑠−1 and 𝑣𝑠,𝐾𝑠 .. For 1 ≤ 𝑖 < 𝑗 ≤ 𝐾𝑠 if the code corresponding to (𝑣𝑠,𝑖 , 𝑣𝑠,𝑗) is 1, there is an edge connecting 𝑣𝑠,𝑖 and 𝑣𝑠,𝑗, i.e., 𝑣𝑠,𝑗 takes the output of 𝑣𝑠,𝑖 as a part of the element-wise summation, and vice versa.
Additional training of HCNN was performed using the Adam optimizer with a learning speed of 0.00005.
Because the Hybrid Intelligence System of Emotional Facial and Speech State Estimation contains two channels of information: micro changes in facial expression and voice, it is necessary to have two HCNNs, each of which decides on expressed emotions, for example, when answering questions.
4. Results
The results of person emotional state estimation with help of facial and speech state estimation are strongly depended of training sample quality and are different for different emotions. For example, each of the 7 emotional states was correctly identified in more than 65%
222

of cases. Facial state estimation gave good results only for separate states (Fig. 1).
Figure 1: Facial expression recognition example obtained using HCNN
These researches need in addition
experiments.
5. Conclusions
In this work the effective approach for emotional state recognition of human face and mel-spectrograms using digital images analysis is proposed. It is developed the ways of application the hybrid convolutional neural networks for assigned task and algorithms of digital image processing was applied. Because the Hybrid Intelligence System of Emotional Facial and Speech State Estimation contains two channels of information: micro changes in facial expression and voice, it is necessary to have two HCNNs. Given approach has the acceptable recognition level and good enough accuracy. This system can be successfully applied to perform the security purposes in the airports and able to increase the security level.
6. References
[1] Viktor Sineglazov, Roman Panteev, Ilya Boryndo, Intelligence system for emotional facial state estimation during inspection control, in: International Scientific-practical Conference 2019, 19–24 August, Odessa, Ukraine, 2019, pp. 202–206.
[2] V. Sineglazov, O. Chumachenko, V. Patsera, Intellectual system of analysis of musical works, in: Proceedings of the International Scientific Conference 2020, May, 20th to 25th Ivano-Frankivsk, 2020, pp. 44–47.
[3] Ira Cohen, Nicu Sebe, Ashutosh Garg, Lawrence S Chen, and Thomas S Huang. Facial expression recognition from video
sequences: temporal and static modeling. Computer Vision and image understanding, 91(1):160–187, 2003.
[4] Petar S Aleksic and Aggelos K Katsaggelos. Automatic facial expression recognition using facial animation parameters and multistream hmms. IEEE Transactions on Information Forensics and Security, 1(1):3–11, 2006.
[5] Irene Kotsia and Ioannis Pitas. Facial expression recognition in image sequences using geometric deformation features and support vector machines. IEEE transactions on image processing, 16(1):172–187, 2007.
[6] Gwen Littlewort, Marian Stewart Bartlett, Ian Fasel, Joshua Susskind, and Javier Movellan. Dynamics of facial expression extracted automatically from video. Image and Vision Computing, 24(6):615–625, 2006.
[7] Caifeng Shan, Shaogang Gong, and Peter W McOwan. Facial expression recognition based on local binary patterns: A comprehensive study. Image and Vision Computing, 27(6):803–816, 2009.
[8] A. Woubie, J. Luque, J. Hernando, Short-and Long-Term Speech Features for Hybrid HMM-i-Vector based Speaker Diarization System, in: ODYSSEY 2016-The Speaker and Language Recognition Workshop, 2016: pp. 400–406.
[9] P. Ekman and W. Friesen, Facial Action Coding System: A Technique for the Measurement of Facial Movement, consulting Psychologists Press, Palo Alto, 1978.
[10] D. Stutz, Introduction to Neural Networks. Seminar on Selected Topics in Human Language Technology and Pattern Recognition, 2014.
[11] D. A. Tatarenkov, Analysis of face recognition methods on images, 2015, p. 270.
[12] Y. Gao, B. Li, N. Wang, T. Zhu, Speech Emotion Recognition Using Local and Global Features, in: Lecture Notes in Computer Science (Including Subseries Lecture Notes in Artificial Intelligence and Lecture Notes in Bioinformatics), Springer Verlag, 2017: pp. 3–13. https://doi.org/10.1007/978-3-319-70772-3_1.
[13] M. El Ayadi, M. S. Kamel, F. Karray, Survey on speech emotion recognition: Features, classification schemes, and databases,
223

Pattern Recognition. 44 (2011) 572–587. https://doi.org/10.1016/j.patcog.2010.09.020
[14] Просодії / Светозарова Н. Д. // Напівпровідники - Пустеля. - М .: Велика російська енциклопедія, 2015. – С. 614. (Велика російська енциклопедія: [в 35 т.] / Гл. ред. Ю. С. Осипов; 2004–2017, т. 27). – ISBN 978-5-85270-364-4. (Перевірено 10 квітня 2020).
[15] Антипова А. М. Просодії // Лінгвістичний енциклопедичний словник / Головний редактор В. Н. Ярцева - М .: Радянська енциклопедія, 1990. – 685 с. ISBN 5-85270-031-2. (Перевірено 10 квітня 2020)
[16] N. Sato, Y. Obuchi, Emotion Recognition using Mel-Frequency Cepstral Coefficients, Journal of Natural Language Processing. 14 (2007) 83–96. https://doi.org/10.5715/jnlp.14.4_83.
[17] A. Woubie, J. Luque, J. Hernando, Short-and Long-Term Speech Features for Hybrid HMM-i-Vector based Speaker Diarization System, in: ODYSSEY 2016-The Speaker and Language Recognition Workshop, 2016: pp. 400–406.
[18] P. Gangamohan, S. R. Kadiri, B. Yegnanarayana, Analysis of Emotional Speech – A Review, in: Intelligent Systems Reference Library, Springer Science and Business Media Deutschland GmbH, 2016: pp. 205–238. https://doi.org/10.1007/978-3-319-31056-5_11.
[19] L. L. (Leo L. Beranek, T. J. Mellow, Acoustics: Sound Fields, Transducers and Vibration, Elsevier, 2019. https://doi.org/10.1016/C2017-0-01630-0.
[20] A. Batliner, B. Schuller, D. Seppi, S. Steidl, L. Devillers, L. Vidrascu, T. Vogt, V. Aharonson, N. Amir, The Automatic Recognition of Emotions in Speech, in: Cognitive Technologies, Springer Verlag, 2011: pp. 71–99. https://doi.org/10.1007/978-3-642-15184-2_6.
[21] J. M. Hillenbrand, Acoustic Analysis of Voice: A Tutorial, Perspectives on Speech Science and Orofacial Disorders. 21 (2011) 31–43. https://doi.org/10.1044/ssod21.2.31.
[22] Viktor Sineglazov and Anatoly Kot, Design of hybrid neural networks of the ensemble structure, Eastern-European Journal of Enterprise Technologies, vol. 1, no. 4(109) (2021): Mathematics and Cybernetics – applied aspects: https://doi.org/10.15587/ 1729-4061.2021.225301 Scopus
[23] Lingxi Xie, Alan Yuille. Genetic CNN. arXiv:1703.01513v1[cs.CV]4Mau2017
224

Application Of MCDA Methods In Solving Safety Problems Judyta Ciemcioch1
1 AGH University of Science and Technology Kraków Poland
Abstract. Multiple-criteria decision analysis (MCDA) is a constantly developing tool that allows for a quick assessment of the quality of solution options, also in the case when the assessment criteria are difficult to measure. Therefore, they are used in more and more fields. One of them is broadly understood security. The paper describes the specificity of the assessment of issues related to safety and solved with the use of MCDA methods. At the same time, the focus was on two areas of security. The first is Occupational Health and Safety, and in particular the issue of risk assessment of workplaces, the second is Data Security. The issues related to risk assessment in the workplace are traditionally examined mainly using the FMEA method. The problem is that the values that need to be entered into this method are usually only determined on the basis of expert knowledge. In complex systems this is a difficult task and often causes important cases to be missed. MCDA methods allow for an analytical approach to the problem of finding critical cases and facilitate their assessment. Data security is an increasingly important topic in today's world. It ceases to be the domain of information protection only, but due to the fact that the "Internet of Things" is developing more and more, it also affects direct physical security. MCDA methods help in assessing the security of data in systems and in identifying gaps and weaknesses. The paper presents methods that can be used in these cases and examples of their application. Keywords 1 Safety, Security, MCDA, DEMATEL
1. Introduction
Security is one of the key issues in the relevant world. Therefore, there is a need for continuous development of methods to improve it. Occupational Health and Safety is a place where law is still needed. Although there has been a decline in the number of accidents at work in Poland for several years, there is still room for improvement. In particular, the number of serious accidents remains relatively high, including fatal accidents. Another place where you should focus on improving security is data protection. There are two things in this area. One of the sequences that increment in terms of draft conformance that conforms to the policy. It improves to the resource requirements needed for error checking. The second problem is that organizations often miss out on security threats. Responsibility for its provision results from employees with a purely technical and IT education, who focus only on the technical aspect of security, ignoring aspects related to management or work organization. It
EMAIL: [email protected] (A. 1); ORCID: 0000-0002-3053-0542 (A. 1);
should be remembered that in smaller organizations, the main users of these methods will often be people specializing in other issues in the enterprise, and dealing with issues related to security for a small part of their time. As a result, the methods used in these issues must be easy to use. This is one of the reasons why the Risc Score method is a major tool in this field. Therefore, the authors decided to use it as one of the foundations for the creation of a combined method, allowing for a better safety assessment. It was decided to try to eliminate one of the key limitations of this method, which is local operation. When an element of the system, such as a workplace, for example, is analyzed with the Risc Score method, the analysis is purely local. This means that if the causes of problems to some extent lie outside a given element of the system, then in the case of these problems their real causes are not analyzed, but only local symptoms, and only an attempt is made to combat them. As a result, funds for improving the situation are not applied optimally, wasting them through applications not in the place of problems, but in every place where the effects
225
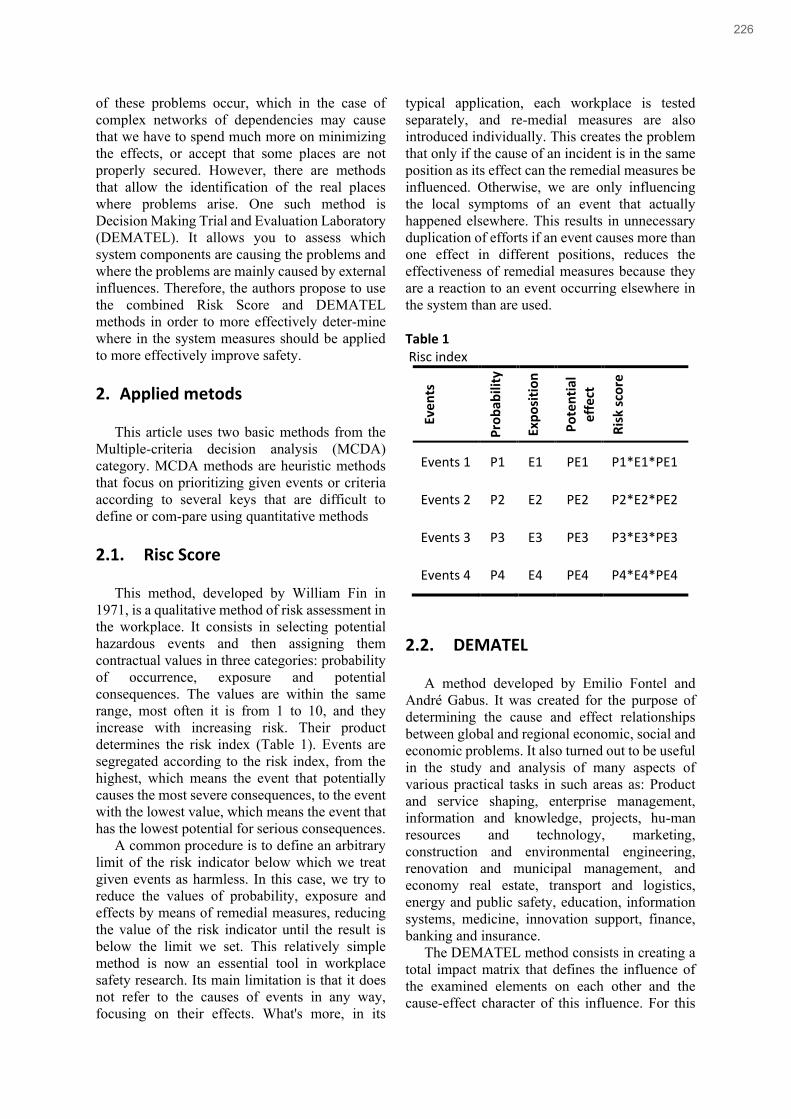
of these problems occur, which in the case of complex networks of dependencies may cause that we have to spend much more on minimizing the effects, or accept that some places are not properly secured. However, there are methods that allow the identification of the real places where problems arise. One such method is Decision Making Trial and Evaluation Laboratory (DEMATEL). It allows you to assess which system components are causing the problems and where the problems are mainly caused by external influences. Therefore, the authors propose to use the combined Risk Score and DEMATEL methods in order to more effectively deter-mine where in the system measures should be applied to more effectively improve safety.
2. Applied metods
This article uses two basic methods from the Multiple-criteria decision analysis (MCDA) category. MCDA methods are heuristic methods that focus on prioritizing given events or criteria according to several keys that are difficult to define or com-pare using quantitative methods
2.1. Risc Score
This method, developed by William Fin in 1971, is a qualitative method of risk assessment in the workplace. It consists in selecting potential hazardous events and then assigning them contractual values in three categories: probability of occurrence, exposure and potential consequences. The values are within the same range, most often it is from 1 to 10, and they increase with increasing risk. Their product determines the risk index (Table 1). Events are segregated according to the risk index, from the highest, which means the event that potentially causes the most severe consequences, to the event with the lowest value, which means the event that has the lowest potential for serious consequences.
A common procedure is to define an arbitrary limit of the risk indicator below which we treat given events as harmless. In this case, we try to reduce the values of probability, exposure and effects by means of remedial measures, reducing the value of the risk indicator until the result is below the limit we set. This relatively simple method is now an essential tool in workplace safety research. Its main limitation is that it does not refer to the causes of events in any way, focusing on their effects. What's more, in its
typical application, each workplace is tested separately, and re-medial measures are also introduced individually. This creates the problem that only if the cause of an incident is in the same position as its effect can the remedial measures be influenced. Otherwise, we are only influencing the local symptoms of an event that actually happened elsewhere. This results in unnecessary duplication of efforts if an event causes more than one effect in different positions, reduces the effectiveness of remedial measures because they are a reaction to an event occurring elsewhere in the system than are used.
Table 1 Risc index
Eve
nts
Pro
bab
ility
Exp
osi
tio
n
Po
ten
tial
eff
ect
Ris
k sc
ore
Events 1 P1 E1 PE1 P1*E1*PE1
Events 2 P2 E2 PE2 P2*E2*PE2
Events 3 P3 E3 PE3 P3*E3*PE3
Events 4 P4 E4 PE4 P4*E4*PE4
2.2. DEMATEL
A method developed by Emilio Fontel and André Gabus. It was created for the purpose of determining the cause and effect relationships between global and regional economic, social and economic problems. It also turned out to be useful in the study and analysis of many aspects of various practical tasks in such areas as: Product and service shaping, enterprise management, information and knowledge, projects, hu-man resources and technology, marketing, construction and environmental engineering, renovation and municipal management, and economy real estate, transport and logistics, energy and public safety, education, information systems, medicine, innovation support, finance, banking and insurance.
The DEMATEL method consists in creating a total impact matrix that defines the influence of the examined elements on each other and the cause-effect character of this influence. For this
226

purpose, a matrix of direct relationships is initially created. It consists in determining to what extent each two elements influence each other, assuming that the element has no influence on itself (formula 1).
(
0 𝑥12 𝑥13 ⋯ 𝑥1𝑛𝑥21 0 𝑥23 ⋯ 𝑥2𝑛𝑥31 𝑥32 0 ⋯ 𝑥3𝑛⋮ ⋮ ⋮ ⋱ ⋮𝑥𝑛1 𝑥𝑛2 𝑥𝑛3 ⋯ 0 )
(1)
The strength of connections between the elements is defined on an arbitrary scale, usually from 0 - no influence, 1 - little influence, up to 4 - very strong influence. Then we transform this matrix into the matrix of indirect connections and further into the matrix of total connections T by appropriate for the method of operation (Mirosław Dytczak, Grzegorz Ginda 2015). Based on this matrix, we determine the S + and S- indices for each element using appropriate row and column sums. The S + indicator, also denoted as D + R, is called prominence. It determines the strength of an element's interaction with other elements. The S- indicator, also known as D-R, is called a relation. It defines the nature of the influence of this element, for S-> 0 it is the causal character, and for S- <0 it is the effect character.
The DEMATEL method is often used in conjunction with other MCDA methods, such as AHP or TOPSIS. In many places, research is being carried out on the most effective combinations for various applications, including the use in safety research [Ahmed, S.K, Kabir, G 2020] [Li F 2019]
As you can see the DEMATEL method has interesting possibilities of complex analysis. Thanks to it, we can try to determine which of the events are causes and which are effects. This gives a unique opportunity to implement remedial measures where problems arise, and not where the effect is only visible.
3. Problems 3.1. Specificity of OHS problems
Risk determination in the workplace has a long history of using MCDA methods. The Risk Score method is deeply rooted in this field and is today the basic research tool. The problem today is that due to its popularity, there is little interest in other methods outside the scientific world. This is mainly due to the fact that most of the other proposals use entirely new methods. This causes that people who prepare such assessments are
afraid to use something that is foreign to them, and what seems unchecked to them. It should be remembered that in most enterprises, for people dealing with health and safety in the plant, it is a secondary function compared to other duties, or they are people hired from outside. As a result, the new method of safety assessment in this field must be both relatively easy to carry out and must use data that is relatively easy to obtain by means of simple questions to employees. Hence the authors' proposal that he should use the combination of the Risk Score method, which is well known with the DEMATEL method, for which the data is easy to obtain by means of simple questions ("how do you assess to what extent the work of position X affects the work of your position"), and the computational part of which is it can be easily implemented in a worksheet such as "EXEL". Thanks to this, the new method does not require new skills from the assessor, and there are no problems with the analysis of the results, as it is analogous to the Risk Score.
3.2. Specificity of Data Security Issues
The main problem in today's approach to data security analysis is the fact that most institutions focus only on the technical aspect of data security. This is due to several reasons. The first is that it is customary in many organizations that IT employees are responsible for data security. Therefore, the first step in securing data for them is to assess the technical aspect of data security. Meanwhile, experience shows that most of the incidents which resulted in serious data leaks have non-technical reasons. As a result, purely technical security measures are not fully effective. Another problem with technical security measures is that their operation reduces the efficiency of access to data by authorized users. Therefore, it is necessary to take a more general look at data security analysis. This has already been recognized by the institutions most dependent on data security, such as banks and defense institutions. However, the actions taken by them are mainly based on the knowledge and intuition of people responsible for security, and not on systematic research. The reason for this is the lack of appropriate simple test methods to compare the technical issues with those related to the personal aspect of data protection. The methods from the MCDA group seem to be the answer to this problem, due to their flexibility and ease of use.
227

The Risc Score and DEMATEL methods in particular seem to fit the problem. In the case of the Risc Score method, its main advantage is that it is a method known in every organization due to its application in job research. This means that there are already people trained in using it in each organization. Meanwhile, the DEMATEL method brings a unique opportunity to assess what is the cause and what the effect in a chain of events that may lead to a data leak. It can include events related to the technical aspect of data security as well as to the "human factor". At the same time, the computational part of the method is easy to implement in a typical spreadsheet, which reduces the requirements for the person who carries out the test. Also, the fact that the majority of data storage installations today has a network structure predisposes this method, because it has been successfully used many times in the safety assessment of installations such as electrical networks [Li P 2019], supply lines or pipelines.
4. Combined Risc Score and DEMATEL
The authors' proposal is to use a method combining the Risk Score and DEMATEL methods in the field of safety research. The aim is to use the potential of the well-known and widely used Risk Score method, while introducing the possibility of a systemic approach and conducting activities at the source of problems. Such possi-bilities are provided by the DEMATEL method. For this purpose, we introduce two further indicators to the Risk Score method, derived from the results of the DEMATEL method. The first is the transformed S + index and the second is the transformed S- index. The transformation consists in bringing the values of these indicators to the same range of values as the other indicators in the Risk Score method, i.e. most often to the range (0.10>. This can be easily done using the min-max normalization (formula 2)
𝑆𝑛∗ =
𝑆 −𝑚𝑖𝑛
𝑚𝑎𝑥 − 𝑚𝑖𝑛∗
∗ (𝑛𝑒𝑤_max− 𝑛𝑒𝑤_min ) + 𝑛𝑒𝑤_𝑚𝑖𝑛 (2)
When this is applied, a modified table is produced (Table 2).
Table 2 Risk Score / DEMATEL
Events Probability Exposition Potential effect
S*+ S*- Risc Score
Events 1
P1 E1 PE1 S*+1 S*-
1 P1*E1*PE1* S*+1* S*-
1
Events 2
P2 E2 PE2 S*+2 S*-
2 P2*E2*PE2* S*+2* S*-
2
Events 3
P3 E3 PE3 S*+3 S*-
3 P3*E3*PE3* S*+3* S*-
3
Events 4
P4 E4 PE4 S*+4 S*-
4 P4*E4*PE4* S*+4* S*-
4
After this modification, the risk value reflects
not only the severity of the consequences of an event at a given position, but also the impact of the event on the emergence of other hazardous situations. Thanks to this, if we are guided in the allocation of funds for improving the situation by the ranking of the risk indicator, then in the first place the funds are allocated to events that not only have serious effects in a given location, as it was in the pure Risk Score analysis, but also those that cause other events in other locations. Thanks to this, if we manage to reduce the risk of events with a high rate, the risk of some events with
lower rates that are directly or indirectly related to each other also reduces. As a result, the resources that we spend on improving the situation have a greater impact on the overall security in the organization.
5. Conclusions
they do not have an accessible set of tools to solve them. It is particularly visible in the activities of smaller organizations that are not able to maintain specialized departments dealing with security that employ specialists. This causes
228

various negative phenomena. In terms of health and safety, the main problem is that only the Risk Score method is used, regardless of its limitations. This results in a phenomenon in which health and safety problems are solved only by introducing protection against accidents, without going into what is the real reason for their occurrence. This re-duces both their effectiveness and results in ineffective spending of funds on im-proving the situation. A similar phenomenon can be observed in the field of data security. Here, it is partly due to the narrow view of people dealing with this subject, resulting from the fact that most of them deal only with the technical aspect of data security, and the fact that there are no easy and widely known methods of assessing this security in its entirety. The authors believe that the answer to this problem may be the MCDA methods, in particular the Risk Score method combined with the DEMATEL method. This is possible thanks to the relatively good knowledge of the Risk Score method in the environment of people responsible for risk assessment in the workplace, the ease of obtaining data needed for the analysis and the relative simplicity, combined with the possibility of implementing the method using soft-ware available in most offices. Therefore, the authors believe that there is room for further research here.
6. References
[1] Ahmed, S.K, Kabir, G Natural Gas Pipeline Failure Risk Prediction and Relation Analysis by Combining Rough-AHP and Rough DEMATEL Method 2020 International Conference on Decision Aid Sciences and Application, DASA 2020
[2] Dytczak M, Ginda G.: Miejsce metody DEMATEL w rozwiązywaniu złożonych zadań decyzyjnych, Wyższa Szkoła Bankowa w Wrocławiu 2015.
[3] Li, F. Wang, W, Dubljevic, S. Khan, F. Xu, J. Yi, J.a Analysis on accident-causing factors of urban buried gas pipeline network by combining DEMATEL, ISM and BN methods Journal of Loss Prevention in the Process Industries Volume 61, September 2019, Pages 49-57
[4] LI, P., LIU, J., TIAN, H., BAI, J., PANG, B., ZHONG, W., WANG, K Comprehensive Evaluation for Differentiated Development of Disaster Resistant Power Grid Based on Essential Security IOP CONFERENCE
SERIES: MATERIALS SCIENCE AND ENGINEERING VOLUME 677, ISSUE 4, 10 DECEMBER 2019, ARTICLE NUMBER 042070
[5] YADAV, S., LUTHRA, S., GARG, D Modelling Internet of things (IoT)-driven global sustainability in multi-tier agri-food supply chain under natural epidemic outbreaks Environmental Science and Pollution Research 2021
[6] Aamir AA Rahim, S Numaya Musa, S Ramesh, Ming K Lim Development of a fuzzy-TOPSIS multi-criteria decision-making model for material selection with the integration of safety, health and environment risk assessment
[7] GUO Jin-yu,ZHANG Zhong-bin, SUN Qin-yun Applications of AHP method in safety science, 2008
Mukhlis Amin, INFORMATION SECURITY AWARENESS LEVEL MEASUREMENT USING MULTIPLE CRITERIA DECISION ANALYSIS (MCDA), 2014 Jurnal Penelitian dan Pengembangan Komunikasi dan Informatika Vol. 5 No. 1
[8] Boris Yatsalo, Alexander Korobov, Different Approaches to Fuzzy Extension of an MCDA Method and Their Comparison, 2020
[9] Dorra Ayadi, Lotfi Azzabi, Abdessamad Kobi, Kaddour Bachar, Christian Robledo
[10] A multicriteria failure mode and effects analysis approach for optimizing human safety. Published in: 2013 Proceedings Annual Reliability and Maintainability Symposium (RAMS.)
229

Modeling The Space Of Possible States Of The Lesson Schedule In Higher Education Institutions Dmitry Petukhin1, Stanislav Velykodniy2 and Valentina Kozlovskaya3
1,2,3 Odessa State Environmental University, Lvivska str. 15, Odesa, 65016, Ukraine
Abstract For the task of automated scheduling of classes in the higher educational institutions, a model of the space of all possible states of the lesson schedule has been developed. The model is developed in terms of relational algebra. The solution to the problem is found by means of a relational DBMS. Using the proposed approach allows you to get an initial solution to the problem of scheduling classes in a higher educational institution. Also, the model of the space of possible states of the lessons schedule allows you to adjust the schedule when it is further optimized or if it is necessary to make changes to the finished class schedule. The initial solution to the problem is found using an iterative process, which at each step chooses the lesson with the least freedom of scheduling or the lesson of the teacher who has the most busy schedule. Freedom of scheduling classes and the density of teachers' schedules are variables that are calculated at each iteration for a subset of classes not yet scheduled. The optimality of scheduling each lesson is determined by a set of criteria that are summed up using fuzzy logic methods. Keywords 1 Relational algebra, database, space of states, subspaces, schedule classes, fuzzy logic.
1. Introduction
The multicriteria task of scheduling classes in the higher educational institutions (HEIs) still does not have a generally accepted solution. R. A. Oude Vrielink, E. A. Jansen, E. W. Hans, J. van Hillegersberg in their article “Practices in timetabling in higher education institutions: a systematic review” made a very detailed review of methods and programs for scheduling classes in higher educational institutions, developed since the 70s years of the 20th century and up to 2017 inclusive [1]. They showed that the problem of automated scheduling of classes still does not have a generally accepted solution. At the same time, the need to obtain an acceptable solution does not decrease over the years, but only increases, since the number of restrictions to the optimal schedule increases.
The works of recent years are mainly devoted to the development of genetic algorithms and swarm algorithms, sometimes modifications of the simulated annealing method are being
EMAIL: [email protected] (A. 1); [email protected] (A. 2); [email protected] (A. 3) ORCID: 0000-0002-1588-2275 (A. 1); 0000-0001-8590-7610 (A. 2); 0000-0003-0353-5281 (A. 3)
developed [2] – [7]; in this case, the initial approximation of the solution to the problem is obtained using the Tabu method or graph coloring [8].
“These approaches are defined as heuristics that solve strategies that are used for complex optimization problems. A specific set of algorithms, called heuristic algorithms, have proven to be effective in generating the best non-optimal solution. Such algorithms can give an approximation that is considered an acceptable solution. Thus, heuristic algorithms seem to be superior to traditional methods, and such algorithms are even combined to strengthen each other” [1].
The purpose of this work is to develop a new method for automated scheduling of classes and its practical implementation by means of relational DBMS. The mathematical model is built in terms of relational algebra; practical implementation involves the development of a database and server software for it.
230

The proposed method belongs to a variety of simulation methods. An algorithm based on the principles of simulation should have a set of non-formal (heuristic) rules:
1. Choosing the next lesson from the list. 2. Determining the best position for it in the schedule. 3. Evaluating the resulting schedule. To select the next lesson from the list, a
multilevel sorting of the list of unallocated lessons is used according to the criteria of increasing the freedom of the arrangement of the lesson in the schedule and decreasing the density of the teacher's lessons. Fuzzy logic methods with heuristic coefficients determining the weight of each of a large set of criteria for evaluating the optimality of the lesson schedule are used to determine the best position for taking a position in the schedule and assess the resulting schedule.
2. Mathematical model of the problem being solved in terms of relational algebra
The task of automated scheduling of classes is characterized by a large amount of data that must be stored in a database. However, the tools of relational database management systems (RDBMS), together with methods of relational algebra, can be used to solve this problem.
No international standards have been adopted for the operations of relational algebra, so there are currently at least four notations to denote these operations. This paper uses the notation of relational algebra operations, described in detail in the book by Thomas Connolly and Carolyn Begg [9].
2.1. Sections of the space of possible states of the lesson schedule
Consider the formulation of the problem of scheduling classes in a university in terms of the theory of relations and relational algebra. Let's call one academic pair in one academic group in one academic discipline “lesson”. Let the relation 𝐺 describe academic groups; 𝐻 – possible types of activities (lectures, seminars, laboratory studies); 𝐷 – academic disciplines; 𝐶 – University curricula.
The relations 𝐺, 𝐻, 𝐷, 𝐶 are tables that contain the initial data for the task of scheduling classes.
Also, the initial data is contained in the relation 𝑇 – the list of teachers, and in relation to the 𝐴 – list of recitation room.
𝐷𝐶(𝑖𝑑𝑐, 𝑖𝑑𝑑, 𝑖𝑑ℎ, ℎ𝑜𝑢𝑟) is a derived relation (associative type of entity) that describes the distribution of academic hours between different types of classes in academic disciplines of all curricula:
𝑖𝑑𝑐 – curriculum identifier; 𝑖𝑑𝑑 – discipline ID; 𝑖𝑑ℎ – activity ID. The public budget. The main purpose of the
public budget is to empower citizens and NGOs to propose their own local development projects and influence the allocation of a certain share of the budget funds by voting for certain projects.
Let the derived relation 𝐺𝐶(𝑖𝑑𝑔, 𝑖𝑑𝑐) describe the attachment of groups to curricula; here 𝑖𝑑𝑔 is academic groups ID. Then the classroom load of academic groups is described by the relation 𝑄(𝑖𝑑𝑔, 𝑖𝑑𝑐, 𝑖𝑑𝑑, 𝑖𝑑ℎ, ℎ𝑜𝑢𝑟) (1):
𝑄 ← 𝐺𝐶 ⊳⊲ 𝐷𝐶, (1) where 𝑅 ⊳⊲ 𝑆 – the relational operation of naturally joining a relation 𝑅 with a relation 𝑆 over the entire set of common attributes.
The curriculum for each course in each specialty contains data on the number of academic weeks in a semester.
From the relation Q the stored procedure of the database forms a derived relation 𝑊(𝑖𝑑𝑠, 𝑖𝑑𝑔, 𝑖𝑑𝑐, 𝑖𝑑𝑑, 𝑖𝑑ℎ, 𝑛𝑢𝑚), which contents data of classroom activities of academic groups; where 𝑖𝑑𝑠 – lesson ID.
In relation 𝑊, the 𝑛𝑢𝑚 attribute is necessary for unambiguous identification within one academic week of each pair of classes in the case when in a certain discipline for a certain type of classes, for example, lectures, 𝑁 hours are provided per week, where 𝑁 > 2. Then, for this type of lesson in this discipline, there should be 𝑛𝑝 training pairs in the schedule (2):
𝑛𝑝 = 𝑁 2⁄ , 𝑛𝑢𝑚 = 1. . 𝑛𝑝, (2) For the relation 𝑊 the set of attributes
(𝑖𝑑𝑔, 𝑖𝑑𝑐, 𝑖𝑑𝑑, 𝑖𝑑ℎ, 𝑛𝑢𝑚) is a unique key. Composite key identification is inconvenient, so the primary key 𝑖𝑑𝑠 is added to the 𝑊 relation.
Let 𝑇𝐿(𝑖𝑑𝑡, 𝑖𝑑𝑠) be a derived relation that describes the distribution of classes among teachers, where 𝑖𝑑𝑡 – teacher identifier. Then the activities to be scheduled are described by the relation 𝑆(𝑖𝑑𝑠, 𝑖𝑑𝑔, 𝑖𝑑𝑡) (3):
𝑆 ← 𝜋𝑖𝑑𝑠,𝑖𝑑𝑔,𝑖𝑑𝑡(𝑊 ⊳⊲ 𝑇𝐿) (3)
231

where 𝜋𝑎1,..,𝑎𝑘(𝑅) – the relational operation of the projection of a relation 𝑅 onto a subset of its attributes 𝑎1, … 𝑎𝑘.
Derived relations 𝑃𝑇(𝑖𝑑𝑡, 𝑖𝑑𝑝), 𝑃𝐺(𝑖𝑑𝑔, 𝑖𝑑𝑝) and 𝑃𝐹(𝑖𝑑𝑎, 𝑖𝑑𝑝) describe the lists of study pairs allowed for classes, respectively, for teachers, academic groups and classrooms; 𝑆𝐴(𝑖𝑑𝑠, 𝑖𝑑𝑎) – lists of acceptable classrooms for lessons. Here 𝑖𝑑𝑝 is the ID of the study pair; 𝑖𝑑𝑎 – classroom ID.
Let 𝑍(𝑖𝑑𝑠, 𝑖𝑑𝑔, 𝑖𝑑𝑡, 𝑖𝑑𝑝, 𝑖𝑑𝑎) be a relation that describes all possible options for a class schedule. The ratio 𝑍 is calculated using relational algebra operations by the formulas (4) – (5):
𝑇𝑇 ← (𝑆𝐴 ⊳⊲ 𝑃𝐴 ⊳⊲ 𝑃𝑇), (4) 𝑍 ← 𝜋𝑖𝑑𝑠,𝑖𝑑𝑔,𝑖𝑑𝑡,𝑖𝑑𝑝,𝑖𝑑𝑎(𝑆 ⊳⊲ 𝑇𝑇 ⊳⊲ 𝑃𝐺) (5)
where 𝑇𝑇 is an auxiliary relation (intermediate relational variable).
The 𝑆 and 𝑍 relations do not include an activity such as streaming lecture – lecture for academic stream (stream of academic groups).
To take into account this type of occupation, it is necessary to enter into the database schema two more additional entities. The basic entity type 𝑅(𝑖𝑑𝑟, 𝑅𝑛𝑎𝑚𝑒) (stReam) describes the list of streams, and the associative entity type 𝑅𝐺(𝑖𝑑𝑟, 𝑖𝑑𝑔) describes the composition of the stream: which groups are included in the stream. Let 𝐷𝑅(𝑖𝑑𝑑, 𝑖𝑑𝑐, 𝑖𝑑𝑟) be a derived relation containing data: on which disciplines of which curriculum lectures are given on streams, and on what streams.
Streaming lectures will be described by the derived relation 𝑊𝑅𝑅, which is calculated by the formula (6) – (7):
𝑇𝑇2 ← 𝑊 ⊳⊲ 𝑅𝐺 ⊳⊲ 𝐷𝑅 (6) 𝑊𝑅𝑅 ← 𝜋𝑖𝑑𝑠,𝑖𝑑𝑔,𝑖𝑑𝑑,𝑖𝑑ℎ,𝑛𝑢𝑚,𝑖𝑑𝑟(𝑇𝑇2) (7)
where 𝑇𝑇2 is intermediate relational variable. Each streaming lecture in relation 𝑊𝑅𝑅 takes
up as many tuples as there are groups in the stream. Let's introduce an additional key attribute 𝑖𝑑𝑠𝑟 – the stream lesson ID.
By projecting the 𝑊𝑅𝑅 relation onto the 𝑖𝑑𝑠𝑟, 𝑖𝑑𝑟, 𝑖𝑑𝑑,𝑛um attributes, we obtain the 𝑊𝑅 relation – a list of all streaming lectures (8):
𝑊𝑅 ← 𝜋𝑖𝑑𝑠𝑟,𝑖𝑑𝑟,𝑖𝑑𝑑,𝑛𝑢𝑚(𝑊𝑅𝑅) (8) In relation 𝑊𝑅, each streaming lecture is
described by one tuple, and the 𝑖𝑑𝑠𝑟 attribute is the primary key of this relation.
For the convenience of fetching data and calculation formulas when setting classes in the schedule, it is desirable that the 𝑖𝑑𝑠𝑟 attribute receive its values from the same domain as the 𝑖𝑑𝑠 attribute, and that the sets of values of these attributes do not overlap. This can be easily
achieved if, when assigning a streaming lecture, a database stored procedure is used, which generates the value of the 𝐼𝐷𝑠𝑟 variable, which is used as the value of the 𝑖𝑑𝑠𝑟 attribute for the new tuple of the 𝑊𝑅 relationship. 𝐼𝐷𝑠𝑟 is calculated by the formula (9):
𝐼𝐷𝑠𝑟 = MAX(MAX(𝑖𝑑𝑠), MAX(𝑖𝑑𝑠𝑟)) + 1 (9)
Streaming lectures with attached lecturers is described by the SRR relation (10):
𝑆𝑅 ← 𝜋𝑖𝑑𝑠𝑟,𝑖𝑑𝑟,𝑖𝑑𝑡(𝑊𝑅 ⊳⊲ 𝑇𝐿) (10) Then the relation 𝑍𝑅, which describes all
variants of the lesson schedule for streaming lectures, is represented by the formula (11) – (12):
𝑇𝑇3 ← 𝑆𝑅 ⊳⊲ 𝑇𝑇 ⊳⊲ 𝑃𝑅 (11) 𝑍𝑅 ← 𝜋𝑖𝑑𝑠𝑟,𝑖𝑑𝑟,𝑖𝑑𝑡,𝑖𝑑𝑝,𝑖𝑑𝑎(𝑇𝑇3) (12)
where 𝑇𝑇3 is intermediate relational variable; 𝑃𝑅 is a derived relation that describes the sets of admissible study pairs for academic streams.
The set of study pairs for each stream is equal to the intersection of the sets of admissible study pairs of all groups included in the stream.
Classes of academic groups can also be conducted with a breakdown of the academic group into subgroups, for example, when conducting laboratory classes in specialized classrooms.
The derived relation 𝐷𝑆(𝑖𝑑𝑑, 𝑖𝑑𝑔, 𝑖𝑑ℎ) stores data: in which disciplines in which groups of which types of classes are conducted with a breakdown into subgroups. Let 𝑆𝐵(𝑠𝑢𝑏) be an auxiliary relation that contains two tuples: 𝑠𝑢𝑏 = 1, 𝑠𝑢𝑏 = 2, where 𝑠𝑢𝑏 is the number of the subgroup.
𝑊𝑆 (𝑖𝑑𝑠, 𝑖𝑑𝑔, 𝑖𝑑𝑐, 𝑖𝑑𝑑, 𝑖𝑑ℎ, 𝑛𝑢𝑚, 𝑠𝑢𝑏) is a relation that describes group lessons that are carried out by dividing the group into subgroups (13):
𝑊𝑆 ← (𝑊 ⊳⊲ 𝐷𝑆) × 𝑆𝐵, (13) where 𝑆 × 𝑅 – relational operation of the Cartesian product of the relations 𝑆 and 𝑅.
The 𝑆𝑆 relation contains a list of all classes conducted with the division of groups into subgroups, with teachers attached to them (14):
𝑆𝑆 ← 𝜋𝑖𝑑𝑠,𝑖𝑑𝑔,𝑖𝑑𝑡,𝑠𝑢𝑏(𝑊𝑆 ⊳⊲ 𝑇𝐿) (14)
In relation to SS, the primary key is composite: (𝑖𝑑𝑠, 𝑠𝑢𝑏).
Then the ratio 𝑍𝑆, which describes all possible options for the schedule for classes in subgroups, is represented by the formula (15) – (16):
𝑇𝑇4 ← 𝑆𝑆 ⊳⊲ 𝑇𝑇 ⊳⊲ 𝑃𝐺 (15) 𝑍𝑆 ← 𝜋𝑖𝑑𝑠,𝑖𝑑𝑔,𝑖𝑑𝑡,𝑠𝑢𝑏,𝑖𝑑𝑝,𝑖𝑑𝑎(𝑇𝑇4) (16)
where 𝑇𝑇4 is intermediate relational variable. The relation 𝑊 contains all of the academic
group lessons according to the curriculum,
232

including those highlighted as streaming lectures and laboratory sessions conducted by subgroups. To obtain the final list of classes that are conducted for one whole group, and schedule these classes, we need to subtract from the relation 𝑊 the tuples that entered the relations 𝑊𝑅𝑅 and 𝑊𝑆 (17) – (20) using the relational difference operation:
𝑊1 ← 𝜋𝑖𝑑𝑠,𝑖𝑑𝑔,𝑖𝑑𝑑,𝑖𝑑ℎ,𝑛𝑢𝑚(𝑊𝑅𝑅), (17)
𝑊2 ← 𝜋𝑖𝑑𝑠,𝑖𝑑𝑔,𝑖𝑑𝑑,𝑖𝑑ℎ,𝑛𝑢𝑚(𝑊𝑆), (18)
𝑊3 ← 𝜋𝑖𝑑𝑠,𝑖𝑑𝑔,𝑖𝑑𝑑,𝑖𝑑ℎ,𝑛𝑢𝑚(𝑊), (19)
𝑊𝐺 ← (𝑊3 − 𝑊2) − 𝑊1, (20) where 𝑊1, 𝑊2, 𝑊3 are intermediate relational variables.
Using the 𝑊𝐺 relation, we get the 𝑆𝐺 and 𝑍𝐺 relations – a list of group lessons with attached teachers, and a list of all possible options for placing academic groups in the lessons schedule (21) – (23):
𝑆𝐺 ← 𝜋𝑖𝑑𝑠,𝑖𝑑𝑔,𝑖𝑑𝑡(𝑊𝐺 ⊳⊲ 𝑇𝐿) (21)
𝑇𝑇4 ← 𝑆𝐺 ⊳⊲ 𝑇𝑇 ⊳⊲ 𝑃𝐺 (22) 𝑍𝐺 ← 𝜋𝑖𝑑𝑠,𝑖𝑑𝑔,𝑖𝑑𝑡,𝑖𝑑𝑝,𝑖𝑑𝑎(𝑇𝑇4) (23)
where 𝑇𝑇4 is intermediate relational variable. The curriculum may include disciplines that
have an odd number of academic hours per week for some types of classes, for example, 3 hours of lectures, or 1 hour of practical training (seminar). In this case, lesson by number 𝑛𝑝 will be held once every two weeks (2). It is necessary to select these classes from the general list, since the algorithm for setting them in the schedule has its own characteristics.
To distinguish between weekly and biweekly lessons, add an attribute 𝑣 of type bit (bool) to the 𝑊 relation.
For lessons that are held weekly, 𝑣 = 1, for the rest – 𝑣 = 0. The values of the 𝑣 attribute for the tuples of the relation 𝑊 are assigned by the stored procedure, which forms the relation 𝑊 from the relation 𝑄.
The 𝑣 attribute will also be included in all projections of the 𝑊 relation, that is, in the relations 𝑊𝑅, 𝑊𝐺, 𝑊𝑆, 𝑆𝑅, 𝑆𝐺, 𝑆𝑆, 𝑍𝑅, 𝑍𝐺, 𝑍𝑆.
Then the formulas calculating the relations 𝑍𝑅1, 𝑍𝐺1, 𝑍𝑆1, for lessons that are held weekly, take the following form (24) – (26):
𝑍𝑅1 ← 𝜋𝑖𝑑𝑠𝑟,𝑖𝑑𝑟,𝑖𝑑𝑡,𝑖𝑑𝑝,𝑖𝑑𝑎(𝜎𝑣=1(𝑍𝑅)) (24)
𝑍𝐺1 ← 𝜋𝑖𝑑𝑠,𝑖𝑑𝑔,𝑖𝑑𝑡,𝑖𝑑𝑝,𝑖𝑑𝑎(𝜎𝑣=1(𝑍𝑅)) (25)
𝑍𝑆1 ← 𝜋𝑖𝑑𝑠,𝑖𝑑𝑔,𝑠𝑢𝑏,𝑖𝑑𝑡,𝑖𝑑𝑝,𝑖𝑑𝑎(𝜎𝑣=1(𝑍𝑆)) (26)
where 𝜎𝐹(𝑅) – a relational operation of fetching tuples from a relation 𝑅 satisfying predicate 𝐹.
To describe lessons that are held once every two weeks, we introduce an auxiliary relation
𝑊𝐾(𝑤) with two tuples: 𝑤 = 1 and 𝑤 = 2 – an odd-numbered academic week and an even-numbered week. Then the formulas calculating the ratios 𝑍𝑅0, 𝑍𝐺0, 𝑍𝑆0, for classes that are held biweekly, take the following form (27) – (32):
𝑅0 ← 𝜋𝑖𝑑𝑠𝑟,𝑖𝑑𝑟,𝑖𝑑𝑡,𝑖𝑑𝑝,𝑖𝑑𝑎(𝜎𝑣=0(𝑍𝑅)) (27)
𝐺0 ← 𝜋𝑖𝑑𝑠,𝑖𝑑𝑔,𝑖𝑑𝑡,𝑖𝑑𝑝,𝑖𝑑𝑎(𝜎𝑣=0(𝑍𝐺)) (28)
𝑆0 ← 𝜋𝑖𝑑𝑠,𝑖𝑑𝑔,𝑠𝑢𝑏,𝑖𝑑𝑡,𝑖𝑑𝑝,𝑖𝑑𝑎(𝜎𝑣=0(𝑍𝑆)) (29)
𝑍𝑅0 ← 𝑅0 × 𝑊𝐾 (30) 𝑍𝐺0 ← 𝐺0 × 𝑊𝐾 (31) 𝑍𝑆0 ← 𝑆0 × 𝑊𝐾 (32)
where 𝑅0, 𝐺0, 𝑆0 are intermediate relational variables.
The relations 𝑆𝑅, 𝑆𝐺, 𝑆𝑆 contain a complete list of lessons that need to be scheduled. If we write this list of lessons in one relation 𝑆, then it must contain all list of the attributes that are present in at least one of these relations: 𝑆(𝑖𝑑𝑠, 𝑖𝑑𝑠𝑟, 𝑖𝑑𝑔, 𝑖𝑑𝑟, 𝑠𝑢𝑏, 𝑖𝑑𝑡, 𝑣).
Only two attribute, 𝑖𝑑𝑡, 𝑣 from the entire set of attributes is defined for all tuples of the relation 𝑆. The remaining attributes are defined for some subsets of the tuples of this relation.
The relations 𝑍𝑅1, 𝑍𝐺1, 𝑍𝑆1, 𝑍𝑅0, 𝑍𝐺0, 𝑍𝑆0 make up the fuller space of possible states of the lesson schedule. This relations are sections of a given space. Dividing the common space into several sections is necessary to optimize the work of the class scheduling program.
If the space of possible states of the lesson schedule is described using one relation, then it should include all the attributes that are present in at least one of the 6 relations 𝑍𝑅1, 𝑍𝐺1, 𝑍𝑆1, 𝑍𝑅0, 𝑍𝐺0, 𝑍𝑆0, that is, the resulting relation 𝑍 will have the following set of attributes: 𝑍(𝑖𝑑𝑠, 𝑖𝑑𝑠𝑟, 𝑖𝑑𝑔, 𝑖𝑑𝑟, 𝑠𝑢𝑏, 𝑖𝑑𝑡, 𝑖𝑑𝑝, 𝑖𝑑𝑎, 𝑤)
Only 3 attributes from this set: 𝑖𝑑𝑡, 𝑖𝑑𝑝, 𝑖𝑑𝑎, – are defined for all tuples of the relation 𝑍. The remaining attributes are defined for some subsets of the tuples of this relation.
Undefined attribute values can be specified either with the NULL value, or we can provide some specific numeric values for them. Both of these methods lead to complex predicates in the WHERE clause of the SELECT statement when fetching data from a relation. But for relation 𝑆, the situation is more complicated, since among the set of attributes there are two keys that must uniquely identify the lesson that needs to be scheduled: 𝑖𝑑𝑠, 𝑖𝑑𝑠𝑟.
The union of a selection of data (SELECT … UNION SELECT …) from several relations with a simple structure and low cardinality is faster than a selection of data from one large table with
233

several complex predicates in the WHERE clause. Thus, the representation of the space of possible states of the lessons schedule in the form of 6 sections for different types of lessons provides a simpler design of queries to the database, as well as faster execution of them.
2.1.1. Lists of study pairs allowed for lessons
The cardinality of the relations 𝑍𝑅1, 𝑍𝐺1, 𝑍𝑆1, 𝑍𝑅0, 𝑍𝐺0, 𝑍𝑆0 depends on the cardinality of the derived relations 𝑃𝑇, 𝑃𝐺, 𝑃𝐴 and 𝑆𝐴.
The set of admissible study pairs for the lesson is equal to the intersection of the set of admissible study pairs of the group for which the classes are held, the teacher who conducts the classes and the classroom in which the classes are held. In formulas (4), (5), (11), (15), (22), the natural join operations applied to the relations 𝑃𝑇, 𝑃𝐺, 𝑃𝐴 give the same result as the applying of the sets intersection operations with a simpler syntax of relational algebra formulas and a simpler notation of the SELECT command. The connection of relations is performed according to the condition of equality of the identifiers of study pairs for a given group, a given teacher and a given classroom.
If classrooms are used for class only and are available on any class, the 𝑃𝐴 is the Cartesian product of the list of classroom IDs by the list of study pair IDs. The 𝑃𝐺 relation can also be generated automatically if, for all academic groups, all study pairs of all days of the learning week are valid for classes. If for some groups there is a predetermined set of study pairs for which lessons cannot be assigned, this information should be specified as a source data. For example, on a given day of the week, the group is assigned duty in the laboratory, greenhouse, and the like.
The 𝑃𝑇 relation is usually formed from the wishes and requirements of teachers for their timetable. The easiest way to fill in the 𝑃𝑇 data is for the teachers to list the desired pairs for the entire learning week.
It is necessary to distinguish between the wishes and requirements of teachers. All teachers can put forward their wishes. Requirements can only be formulated by teachers with a sufficiently high rating.
If there are wishes and requirements of teachers, the space of all possible states of the lesson schedule is divided into two subspaces: the
subspace of desired states (SDSLS) and the subspace of admissible states (SASLS).
Teachers can specify the desired and acceptable study pairs for classes not only in the form of a set of specific training pairs on specific days of the learning week, but also in the form of a range of possible values for the number of pairs during the day and the number of study days during the week. For example, the wishes and requirements of a teacher may look like this: no more than 3 study days a week, but preferably 2 days.
In this case, before the start of the scheduling of classes, all study pairs are considered desirable for the teacher. Therefore, all the lessons of a given teacher fall into the subset of the desired states of the lesson schedule, that is, they are tuples of relations 𝑍𝑅1, 𝑍𝐺1, 𝑍𝑆1, 𝑍𝑅0, 𝑍𝐺0, 𝑍𝑆0 – depending on the type of lesson.
Let us denote the relations of the subset of admissible states of the schedule of classes through 𝑌𝑅1, 𝑌𝐺1, 𝑌𝑆1, 𝑌𝑅0, 𝑌𝐺0, 𝑌𝑆0 – also depending on the type of lesson: streaming lecture weekly, a group lesson weekly, a subgroup lesson weekly, streaming lecture biweekly, a group lesson biweekly, a subgroup lesson biweekly.
For the example given above, with the teacher's wishes, after putting at least one study pair in the schedule of this teacher's lessons on any two days of the study week, all study pairs of all other days of the week move from the desired category to the acceptable category. That is, the tuples of relations 𝑍𝑅1, 𝑍𝐺1, 𝑍𝑆1, 𝑍𝑅0, 𝑍𝐺0, 𝑍𝑆0, corresponding to the lessons of this teacher on the remaining days of the study week, must be transferred to the relations 𝑌𝑅1, 𝑌𝐺1, 𝑌𝑆1, 𝑌𝑅0, 𝑌𝐺0, 𝑌𝑆0.
When placing each lesson in the schedule, the program first of all considers a subset of the desired states of the lesson schedule, that is, it selects from the relation 𝑍𝑅1, 𝑍𝐺1, 𝑍𝑆1, 𝑍𝑅0, 𝑍𝐺0 or 𝑍𝑆0 (depending on the type of lesson), tuples corresponding to the given lesson.
For each variant of placing a lesson in the schedule, the optimality of the position of this lesson in the space of the week's study pairs is calculated – a certain measure of the quality of this state of the schedule for the teacher and for the group (all groups in the case of a streaming lecture). This measure of quality can take into account many factors: the number of study pairs per day; number of study days per week; the appearance of a "window" in the schedule of a group or teacher; closing the "window" in the schedule of the group or teacher; the need for a
234

group or teacher to move from one educational building to another to conduct a lesson; number of lectures during the study day; the number of laboratory lessons during the study day, and more. Particular factors affecting the quality of setting a lesson in the schedule are summed up in different weights using fuzzy logic methods [10].
The optimality of the location of this lesson in the space of study pairs related to the SASLS is also considered. If the quality measure for some option from this subset exceeds all quality measures of lessons from SDSLS, then this option is chosen.
For the example described above, with the teacher's wishes and requirements for their class schedule specified as a range of values, some states of the lessons schedule may go into a subset of inadmissible states. For this example, after assigning classes to a teacher on any 3 days of the study week, all schedule states with teacher's study pairs on the remaining days of the study week become inadmissible.
These scheduling states should not be considered in further sequential scheduling of classes. However, it is not necessary to remove the corresponding tuples from the relations 𝑌𝑅1, 𝑌𝐺1, 𝑌𝑆1, 𝑌𝑅0, 𝑌𝐺0, 𝑌𝑆0, since it may be necessary to change the lessons schedule to optimize it or if a deadlock occurs when scheduling. Therefore, all the corresponding tuples are transferred to the relations 𝑋𝑅1, 𝑋𝐺1, 𝑋𝑆1, 𝑋𝑅0, 𝑋𝐺0 or 𝑋𝑆0 – in the subspace of inadmissible states of the lesson schedule (SISLS). The relations 𝑋𝑅1, 𝑋𝐺1, 𝑋𝑆1, 𝑋𝑅0, 𝑋𝐺0, are not used in the planned scheduling of classes.
2.2. Schedule classes
Classes are placed in the schedule in turn, which is formed so that at each step the lesson with the least freedom of setting in the schedule is selected, or the teacher's lesson with the most dense work schedule is selected. The freedom to schedule classes and the density of the teacher's schedule are not constants calculated before the start of scheduling. These values are variables that are recalculated after each scheduled session.
The current freedom to schedule a lesson is determined by two values 𝐾1 and 𝐾2. 𝐾1 – the number of study pairs of the week for which a lesson can be scheduled. 𝐾2 – the number of places in two-dimensional space (study pair) - (classroom) to which a lesson can be assigned.
The current density of the teacher's schedule is calculated using two values 𝐾3 and 𝐾4. 𝐾3 – the number of free teaching pairs of the teacher, to which at least one of his unallocated classes can be assigned. 𝐾4 – the number of still unallocated lessons of the teacher. The calculations use the relative density of the work schedule of the teacher 𝐶1 and the relative freedom of distribution of the lessons of the teacher 𝐾5 (33)– (34):
𝐶1 = 𝐾4 ∕ 𝐾3 (33) 𝐾5 = 𝐾3 − 𝐾4 (34)
The 𝐾1 and 𝐾2 values are calculated for each lesson not scheduled. The 𝐾3 and 𝐾4 values are calculated for each teacher who has unscheduled lessons.
Since all possible options for setting classes in the schedule are tuples of relations 𝑍𝑅1, 𝑍𝐺1, 𝑍𝑆1, 𝑍𝑅0, 𝑍𝐺0, 𝑍𝑆0 and 𝑌𝑅1, 𝑌𝐺1, 𝑌𝑆1, 𝑌𝑅0, 𝑌𝐺0, 𝑌𝑆0, the calculation of values is reduced to calculating the number of tuples in the specified relations with grouping either by class IDs or by teacher IDs.
From the variables 𝐾1, 𝐾2, 𝐾5, 𝐶1 a single value is not formed, according to which the remaining list of activities is sorted. A five-level sorting of the list of lessons is carried out:
1. Ascending 𝑁1, where 𝑁1 = 𝐾1, if 𝐾1 < 𝐾01, otherwise 𝑁1 = 𝐾01; 2. Ascending 𝑁2, where 𝑁2 = 𝐾2, if 𝐾2 < 𝐾02, otherwise 𝑁2 = 𝐾02; 3. Ascending 𝑁5, where 𝑁5 = 𝐾5, if 𝐾5 < 𝐾05, otherwise 𝑁5 = 𝐾05; 4. Descending 𝐶𝐶, where 𝐶𝐶 = 𝐶1, if 𝐶𝐶 > 𝐶01, otherwise 𝐶𝐶 = 𝐶01; 5. Descending 𝑁𝑔𝑟, where 𝑁𝑔𝑟 is the number of groups in the stream for which the lesson is held; for lessons in groups and subgroups 𝑁𝑔𝑟 = 1. 𝐾01, 𝐾02, 𝐾05, 𝐶01 are empirical
coefficients, the values of which need to be determined in further practical calculations.
When any lesson is added to the schedule, it goes into the category of realized states of the lesson schedule, and the corresponding tuple from the relation 𝑍𝑅1, 𝑍𝐺1, 𝑍𝑆1, 𝑍𝑅0, 𝑍𝐺0 or 𝑍𝑆0 is transferred, respectively, to the relation 𝑅𝑅1, 𝑅𝐺1, 𝑅𝑆1, 𝑅𝑅0, 𝑅𝐺0 or 𝑅𝑆0 – to the subspace of the realized states of the lesson schedule (SRSLS). All other states of the same lesson – all tuples from the same section of the subspaces of desired, admissible and inadmissible states of lesson schedules (SDSLS, SASLS, SISLS) with an identical lesson key (𝑖𝑑𝑠𝑟, 𝑖𝑑𝑠 or (𝑖𝑑𝑠, 𝑠𝑢𝑏)) are transferred to the subspace of unrealized lesson
235

schedule states (SUSLS), that is into one of the relations 𝑈𝑅1, 𝑈𝐺1, 𝑈𝑆1, 𝑈𝑅0, 𝑈𝐺0 or 𝑈𝑆0 (depending on the type of lesson). If it is necessary to change the schedule, each tuple from SRSLS can be exchanged with a simple set of operations for any tuple with the same primary key of the lesson from the corresponding section of SUSLS.
It is also necessary to remove from the SDSLS, SASLS, SISLS those states of the lesson schedule that cannot be realized after the current lesson is added to the timetable according to the principle: any teacher cannot conduct more than one lesson at the same time; in any group (stream, subgroup) more than one lesson cannot be conducted at the same time; no classroom can have more than one lesson at a time. All tuples that violate this principle are transferred to the subspace of unrealizable states of the lesson schedule (SVSLS) – in the relations 𝑉𝑅1, 𝑉𝐺1, 𝑉𝑆1, 𝑉𝑅0, 𝑉𝐺0, 𝑉𝑆0. In this case, the search for unrealizable states of the lesson schedule is carried out in all sections of the SDSLS, SASLS, SISLS subspaces.
If the schedule is changed to replace a tuple from some SRSLS section with a tuple from the corresponding SVSLS section, a much more complex set of operations must be performed than when replacing this tuple with a tuple from the corresponding SUSLS section.
3. Conclusions
A mathematical model of the space of all possible states of the lesson schedule in HEIs has been developed. The model is developed in terms of relational algebra. The solution to the problem of automated scheduling of classes is found by means of a relational DBMS.
The initial solution to the problem is found using an iterative process, which at each step chooses the lesson with the least freedom to schedule or the teacher's lesson with the most tight schedule. Freedom of scheduling classes and the density of teachers' schedules are variables that are calculated at each iteration for a subset of classes not yet scheduled. The list of unscheduled lessons is ordered at each step using empirical coefficients, the values of which will need to be determined during a series of practical calculations. The selected lesson is scheduled in the optimal place in a three-dimensional state (day of the school week) - (number of the study pair) - classroom. Optimality is determined by a set of criteria using fuzzy logic methods. An empirical weighting factor is assigned to each criterion. For
each possible position of the lesson in the schedule, the criteria are summarized. The value of empirical weighting factors also needs to be determined in a series of practical calculations.
The efficiency of the algorithm based on the proposed model is determined by the developed database schema, which excludes transactions of high complexity.
Several factors contribute to reducing the complexity of transactions:
1. All join operations between database relations are performed prior to starting the scheduling process. 2. Different types of lessons refer to different relations, which allows replacing a data selection from one relationship with a complex structure and high cardinality with several simple selections (connected by the UNION operation) from relations of a simpler structure and lower cardinality; this eliminates NULL-valued attributes and complex predicates in the WHERE clause of the SELECT statement. 3. Storing all possible options for the schedule of classes in the form of physical database tables, and not in the form of their virtual representation – nested queries of various types – increases the volume of the database, but significantly reduces the number of operations required for setting each class in the schedule. Storing all possible classroom scheduling
options in physical database tables also makes it easy to compute characteristics that increase the likelihood of an optimal class schedule, such as the number of unallocated lessons that might "close the window" in a group’s or teacher’s schedule.
Storing unrealized options for placing a lesson in the schedule, as well as unrealizable options (options that are superimposed on already distributed activities) in the form of separate subspaces of the common space of all possible states of the lesson schedule allows you to adjust the schedule and optimize it if necessary.
4. Acknowledgements
In assessing the current state of the problem of automated scheduling of classes in the HEIs and its relevance, the analysis performed by R. A. Oude Vrielink, E. A. Jansen, E. W. Hans, J. van Hillegersberg turned out to be very useful [1].
236

5. References
[1] R. A. Oude Vrielink, E. A. Jansen, E. W. Hans, J. van Hillegersberg, Practices in timetabling in higher education institutions: a systematic review, Ann Oper Res, doi 10.1007/s10479-017-2688-8, URL: https://d-nb.info/1149213442/34
[2] Burke, E. K., Cowling, P., Silva, J. L., & McCollum, B. Three methods to automate the space allocation process in UK universities. PATAT 2000, LNCS 2079, pp. 254–273, 2001. URL: https://citeseerx.ist.psu.edu/viewdoc/download?doi=10.1.1.720.1897&rep=rep1&type=pdf
[3] Nurlida Basir, Waidah Ismail, Norita Md Norwawi, A Simulated Annealing for Tahmidi Course Timetabling. Procedia Technology 11 ( 2013 ) 437 – 445. URL: https://www.sciencedirect.com › science › article › pii › pdf
[4] Astakhova I.F., Firas A.M., Drawing up the schedule of studies on the basis of genetic algorithm, Proceedings of VSU, Series: Systems analysis and information technologies, 2013, №2, pp. 93–99. URL: http://www.vestnik.vsu.ru/pdf/analiz/2013/02/2013-02-17.pdf
[5] Mehdi Yazdani, Bahman Naderi, Esmaeil Zeinali, Algorithms for university course scheduling problems, Tehnički vjesnik 24, Suppl. 2(2017), 241-247. URL: https://hrcak.srce.hr/186061
[6] A. Oner, S. Ozcan and D. Dengi, Optimization of university course scheduling problem with a hybrid artificial bee colony algorithm, 2011 IEEE Congress of Evolutionary Computation (CEC), 2011, pp. 339-346, doi: 10.1109/CEC.2011.5949638.
[7] Sally C. Brailsford, Chris N. Potts, Barbara M. Smith: Constraint satisfaction problems: Algorithms and applications. Eur. J. Oper. Res. 119(3): 557–581 (1999)
[8] Burke, E. K., McCollum, B., Meisels, A., Petrovic, S., & Qu, R. A graph-based hyper-heuristic for educational timetabling problems. European Journal of Operational Research, 176(1), 177–192.
[9] Database Systems: A Practical Approach to Design, Implementation, and Management, 3rd Edition, Thomas Connolly, Carolyn Begg, 2002.
[10] Tutorial on Fuzzy Logic. URL: https://coderlessons.com/tutorials/mashinnoe-obuchenie/osnovy-iskustvennogo-intellekta/11-uchebnik-po-nechetkoi-logike
237

To The Statement Of Tasks Of Research Of Migration Processes In Education And Science Makarenko O.S.1, Samorodov E.L.2
1,2 Institute of Applied System Analysis of the National Technical University of Ukraine (Kyiv Polytechnic Institute. Igor Sikorsky) Prospect Victory 37, House 35, 03056, Kiev-56, Ukraine
Abstract The issue of migration of students, postgraduates and scholars abroad (as well as within the country) are considered. The problem of migration is an important component of the general problem of sustainable development of the education system and science. General consequences of such migration are discussed. For example, if all scientists and educated students and graduates will go abroad, then the education system will fall into collapse. The positive aspects relate to the exchange of scientific knowledge with developed countries. Zero migration is also not desirable because it leads to isolation. Therefore, there is an optimal migration rate. Such questions, as well as many others, can only be solved by mathematical modeling. Therefore, in this article review of some possible models and problems of research tasks. Some classes of models for students and researchers migration are compared. Differential equations, system dynamics, cellular automata, artificial life had been considered. New types of cellular automata had been proposed as the models for migration problems. Also applications of artificial life approach for considering some problems of science development are discussed. Keywords 1 Migration of students, migration of scientists, review of models, mathematical modeling, cellular automata, system dynamics, global knowledge
1. Introduction
Knowledge and creation is one of the main factors [1] and literature there. This problem has many aspects. So indicative is the cycle of Schlesinger in American education with a period of 15 years [2]. According to his research, the US entrants periodically change their preferences in higher education (with curiosity to pragmatic business education in curiosity to study how the world built). Other problems relate to the issues of optimization of the learning process, finding new forms (for example, distance education during a coronary pandemic, as well as after, in the post-modern society). Also, questions are also adjacent to the behavior of individuals taking into account their mentality. Models for their study are described, for example, in [3].
But there are many important tasks, and fundamental. But among the various tasks here we
EMAIL: [email protected] (A. 1); [email protected] (A. 2); ORCID: 0000-0001-6728-3058 (A. 1); 0000-0002-3981-8454 (A. 2)
distinguish one of the tasks that is of great importance, namely, the issue of migration of students, postgraduates and scholars abroad (as well as within the country). Note that the problem of migration is an important component of the general problem of sustainable development of the education system and science. For example, if all scientists and educated students and graduates will go abroad, then the education system will fall into collapse. But migration has positive aspects. They relate to the exchange of scientific knowledge with developed countries. Zero migration is also not desirable because it leads to isolation. Therefore, there is an optimal migration rate. This question, as well as many others, can only be solved by mathematical modeling. In general, this is a very difficult problem in this area. Therefore, in this article we offer a review of some possible models and problems of tasks.
238

2. Possible models of scientific migration
2.1 The simplest model that is suitable for such processes is to (very simplified) consideration in terms of competitive processes. The first most famous model of this type is the Volterra model [4]. One variable of such a model corresponds to the number of students, and the second variable corresponds to the total volume of students involved. The more ready students, the more this variable will be. When students for some reason becomes little, then the magnitude of the second variable decreases. The disadvantages of this model are that it is spatially focused.
2.2 Models in the classroom of ordinary differential equations. One of the simpler options is to write a system ordinary differential equations - one for the total number of students, postgraduate students and scholars; Others for the total number of students, scientists, etc., which go abroad, as well as the quality of evaluation (or even equation) for parameters describing conditions abroad: the need for skilled migrants, financial conditions, other conditions (cultural affinity - The distance of cultures, physical distance, etc.) This is one of the ways to use models (that is, empirical).
2.3 More simplistic, but more adapted to practical tasks is the system dynamics approach, launched by J. Forrester [5]. According to the concept of systemic dynamics, it is necessary to distinguish elements, their interaction between them, reinforcing or inhibiting the connection between elements. For the field of educational migration, it is necessary to adapt system dynamics. In principle, this can be done, but it is necessary to conduct a large amount of previous work, including in detail by drawing the corresponding diagrams of system bonds.
2.4 Another class of models that suits migration modeling is a diffusion equation. Then migration is considered with the help of diffusion equations. The disadvantage of such a model is the severity of finding the diffusion coefficients and other parameters. In addition, it is very difficult to take into account the mental identities of potential migrants. In fact, important features of donors and recipients are important: financial, cultural, social, etc. Also important parameter is the attachment to the native country and relatives.
2.5 Multi-agent models (masses - multi-agent systems) [6]. The models of such class are considered by the team of artificial agents who
take some decisions in some branch, knowing the state of the environment, exchange information and decide. In migration models, educational agents can be equivalent to the identities, and the environment in which they are placed described by external factors that meet the above aspects.
2.6 Approach of the theory of games in the problem of educating migration. Another aspect of educational and scientific migration is more detailed taking into account the competitive aspects of this phenomenon. For such issues, a methodology in the field of science called the theory of games is quite well suited. In the problem of educational migration, there are also aspects of competition. Note if knowledge and those who produce this knowledge are the main resource of sustainable development [1], in the future, the struggle for the distribution of these resources becomes fierce and will take new forms (sometimes cruel). Regarding migration tasks, then part of them can be adapted to the problems of the theory of games. The country - migrant donor is also considered as a separate agent. Competition between these agents takes place for the involvement of educated frames. In principle, the game should be unanimate, because in the normal course of things, the general goal would have to ensure the progress of the aggregate of countries. In this case, a separate unit is a definition, what is this progress and which quality and quantity should be knowledge to ensure this goal.
2.7 MASTER EQUATIONS. In this division, I would like to remind you of another class of models that in principle can come to migration tasks, namely Master Equations, or kinetic equations. In this approach, an element that has certain set of values and records the laws of evolution of these states that have physical justification [8, 9] are recorded. In principle, this approach can solve all migration tasks, but it is very difficult, and it is practically impossible to apply to important applications due to the impossibility of gathering the necessary data.
3. Modeling migration in the class of cellular automata
There is another class of models that have been well established for applied tasks, namely a model with splitting space on cellular elements and a record of equations to change the state of these elements. Such models are called cellular
239

automatics models [10, 11]. Note that such statutes exist for other models [12].
3.1 Models of scientific migration on the basis of cellular machines. The idea to set up the method to migration is as follows. All available geographic space is divided into geometric elements, that is, in a simpler case, a uniform geometric grid is imposed. At the first stage, such a grid is superimposed to Ukraine. Fixed number of educated frames is one migration agent. Then the number of agents in the cell corresponds to the total number of educated frames.
Further in a simpler case model, all countries abroad can be considered as one general element. Then in the middle of Ukraine, the process of migration is considered as a sequence of steps from the cell into a cell in the middle of Ukraine with a final step behind the boundary in a conditional general element. The model can be easily refined if and a foreign cell to break into cells that meet separate foreign countries. Further, as in other applications of cellular machines to spatial evolution tasks in various fields of migration [11], the laws of changes in cell changes are recorded. These laws take into account all available information as external and mental. Note that such an approach showed acceptability in modeling the spatial distribution tasks (despite the local nature of the dynamic laws of classical cellular machines [10,11]. But you can generalize cellular machines under migration. The fact is that classical cellular machines were built on the base E - classic Euclidean Dimension Space 1D, 2D, ..., ND. The structure of the base space Es set the measure of the cells. This, in turn, set the local challenge cell and which determines the dynamic law of the cellular automaton. To the base space of classical machines in the applied Tasks are tied by various thematic layers: financial, economic, cultural, etc. These thematic layers can be replaced by E. E. Moreover that there is so formed statistics. But you can enter other measures of the cells that will be taken into account the formed Proximity of countries: historical, cultural, diplomatic.
4. The struggle for the allocation of resources in science and education
4.1 Modeling the dynamics of science as a system, with a large number of scientists, infrastructure, funding
The question of modeling the development of science that produces knowledge as a product of
evolutionary development is of great theoretical importance. A large number of studies (both specialists in scientometrics and scientists from other fields: physics, mathematics, biology, economics, sociology, etc.) are devoted to these problems. But there is still a need to attract new concepts, ideas, models, including the real management of science. Therefore, here we present one approach to modeling such processes. In science, scientific schools, the following basic components: scientists (as a rule, the association of scientists to study a particular field or more often a scientific problem, finance allocated to the scientific field, but more often to a scientific problem, the branches of science as elements). project) of theoretical, experimental knowledge, governing bodies that distribute funding (for research and training), and educational institutions (usually at the university level) that transfer knowledge, prepare new generations of researchers and shape the preferences of graduates.
Analyzing such aspects of science research as systems and its modeling, one can come to unexpected analogies with models from completely different fields of research - namely with some aspects that are inherent in the so-called "Artificial Life" (AL, ALife, artificial life) directly [13, 14]. Typical tasks there are studies of the struggle of groups - antagonists (or collaborators) for resources. Some key components of the AL approach are: 1. Cell space 2. Spatial distribution of resources needed for life 3. Agents that can move through the cell space and which can be in the search for resources, the struggle for resources, destroy each other, have different preferences for behavior 4. There may be associations of teams of agents with tactics and strategies of behavior 5. The birth of young generations of agents in the team and the death of the old 6. Rules of conduct are "embedded" in individual agents 7. The possibility of a certain combination of rules of conduct of agents of "parents" at the birth of an agent of a "child" of a new generation at a "meeting" of "parents" and "birth" of this agent of a new generation. (As well as many others).
A review of the properties 1-7 above and the properties of scientific activity allows us to draw conclusions about some analogies that allow us to apply the concept of AL to the consideration of
240

science as a system. Let's show it at first on the simplest example.
Example 1. The struggle of scientists for finance.
Let the branches of science be placed as a "scientific" space of ideas (by the way, there are now studies to build an "atlas of science", however, without cellular concepts). Let the individual scientist be presented as an agent who can move through the cellular space of "ideas" (space of science) and funding. Scientists are united in "scientific schools" (teams of agents). Note that usually there are not many schools, say 2-5. The state (or relevant institutions) provide funding for a particular field of science (distribute finance resources on different sets of resources). Then school teams look for resources (consciously or unconsciously), fight with each other, develop, survive, or die. Note that the distribution of finances by industry is the management of science (of course, under many other conditions - the rules of grants, selection criteria and much more). Even using such a model, you can try to get a model from the class AL to model and manage scenarios for the development of science). But this model is suitable for considering the competition of stable / established scientific schools.
It is clear that considering only financial issues is only one aspect of science. Thus, the intellectual attractiveness of the field of knowledge for the scientific school (as well as for the individual scientist) is also important. For example, some scientists do not want to work on the task of designing weapons of mass destruction for any money. Also important in scientific discovery is often the role of individual scientists (who are distant from colleagues, or are not in the "Core" of the scientific school). Therefore, it is important to introduce other (in addition to financial measurements) dimensions, "dimensionality" (say, attractiveness, metrics of "proximity" of different branches of science, etc.). Really important are the physical (geographical), political aspects of the development of science and science schools. Yes, many scientists will not want to go to work in science, which may be the most developed in the world, but in aggressor countries, or with dictatorial regimes. It is also important to take into account the processes of aging and generational change in science and scientific schools. Then, in principle, it is necessary to build a multidimensional cell space, where different coordinates will correspond to different aspects of science as a system, and the
echo of agents will then take place in this multidimensional space.
Example 2. Taking into account the change of generations.
In addition to the details of Example 1, aspects of generational change and sustainable development of science can be added. Again, let's illustrate this with one of the simplest examples. Suppose that only universities train and graduate young scientists. It is then that universities set priorities in the choice of scientific field and scientific tasks, ethical principles, morals. It may also be that several teachers have the greatest influence at the university. Other issues can also be considered, including external regulation of learning processes, distribution, funding strategies for universities and specialties in them, etc. Then there are also clear analogies with the approaches of AL (transfer of knowledge and preferences) to the next generation. In general, a set of such models can be important for the management of science and education.
4.2 Extending the approach of artificial life to some problems of social relations
Let us recall an approximate description of the soft approach in artificial life. There is a space in which representatives of competing groups that can move in search of resources are located. There is also some location of resources in the search space. As a rule, in AL the space consisting of association of cells is considered. In the classic examples that came from ecology, resources are edible resources and artificial life means fighting for them (the example of sugar is the best known).
It is suggested that the ideas of such a description can be transferred to some tasks of society. Such tasks can be difficult, so here we describe the idea with simpler examples.
Let us have the task of fighting some ideas for the minds of the population. Suppose there is idea A with many carriers of ideas (mass media, TV, Internet) and another (antagonistic) idea B. Imagine that the population is a resource for idea A or idea B. That is, ideas are analogs of teams in classical artificial life. Then the population is a resource, and consumption of a resource by ideas A or B is analogous to consumption of an edible resource. Here it is necessary to take into account the perception of the population to the ideas of A or B, the forms of their presentation, the attractiveness of the forms of presentation of ideas to the population, etc. Ideologists and flight consultants of different ideas are looking for ways to bring ideas to the public: what ideas; how to deliver them; how to take into account and make
241

ideas attractive to the population. Acceptance of the idea of A or B by the population is analogous to the classic AL: teams eat resources. Aspects of improving the attractiveness of ideas are analogous to management processes. Note that such a transfer of ideas is possible in the case of only one community (team, idea). Yes, migration from only one country can be considered. You can also adapt artificial life ideas to some cybersecurity issues. For example, the spread of fakes and the reaction of society to them. Then the analogy is that a fake "eats" part of the population depending on the characteristics of society.
It is also possible to consider the spread of epidemics as the spread of a virus - an analogue of the virus team, and the team, which increases in size with the spread of the epidemic. Note that further generalization of the models leads to the problems of artificial life in another (non-cellular) space, and, for example, to the problems of distribution in the network structure. You can also consider problems for the dissemination of ideas in a mental space other than the physical. A possible example is a change in scientific paradigms in a field of science.
5. Migration processes in education and science as an example of the struggle for resources
5.1 General problems of sustainable development in education and science
A separate but important task in the field of modeling is the migration processes of highly educated professionals: primarily scientists, students, graduate students and others. Scientific migration has two aspects - domestic and international aspects, ie migration abroad. Here we will point out one very important aspect of migration in education and science both for an individual country (especially, for example, for Ukraine) and for the world community as a whole (global aspect). The main problem is the sustainable development of the reproduction of necessary knowledge [1]. At the same time, there are many tasks in this issue. First, it is a problem of new knowledge. Secondly, it is the sustainable development of educational and scientific infrastructure. The problem of migration belongs to this range of problems.
5.2 General description of the migration problem
From the point of view of the approach of an artificial life it is possible to allocate such elements. In this problem, foreign sources provide resources, and the contingent of migrants is divided into communities from different countries, which implicitly compete for resources. Resources can be money, highly qualified positions and much more. It should also be noted that the same indicators should be taken into account for the internal situation in Ukraine. But we still need to take into account the "homeliness" of agents, the attractiveness of the country as a whole, the prediction of the future situation in the country and other countries. In this case, the problem can be considered locally in time, ie at short intervals with constant conditions. If it is desirable to study this in order to optimize the scientific infrastructure, it is necessary to predict changes in the world situation. At the same time there are interesting and new for the subject of artificial life issues of resource management over time. In many cases, this directly leads to a new issue of sustainable development of education and science.
Here we describe informally part of the problem. Let �� 𝑧 - resources for migrants abroad at the measurement scale [0, 1], �� 𝑣 - domestic resources in Ukraine. When, �� 𝑣 → 0, �� 𝑧 →
1everyone will emigrate from Ukraine, and when �� 𝑣 → 1,��
𝑧 → 0, everyone will stay in Ukraine.
Clearly, there should be an intermediate value 0 <
�� 𝑧 < 1 that should be optimal for the sustainable development of education and science in Ukraine. Another thing is that these productions are part of the problem of sustainable development. The main resource of the process of sustainable development is knowledge (Makarenko, 2020). With regard to Ukraine, this leads to the following issues (which still need to be addressed): what knowledge is needed now and in the future; their division into fundamental and applied; how this knowledge is generated depending on the infrastructure. And all this very much depends on the number of scientists and students 0 < 𝑁𝑣 < 1 who remain in Ukraine.
6. Discussion, conclusions and staging of new tasks
In the previous sections, a comparative review of some models of scientific migration was given. Based on such an analysis, it can be
242

assumed that there are already promising approaches to modeling the described issues. Among the models considered, models of cellular machines are particularly promising. They are now developed by their computer sales and passes the process of searching and adapting data required for simulation.
However, the solution of applied migration tasks leads to the need for consideration a global problem - namely the problem of sustainable development, the problem of the emergence and dissemination of knowledge [1]. So far, it is not solved by the end of the task of prediction of achieving the required minimum level of knowledge. This requires special research. Then this global condition may be subordinated to the task of educational migration. First of all, it is necessary to determine the minimum gain of knowledge for humanity as a whole (that is, what minimum level of knowledge is required). Then it is necessary to determine the goal for each of the countries, as well as primarily for business and industry of each country. In this case, there is a clear conflict of interest - between the global goal and the purpose of business profits. In this case, business profits can increase due to educational migration, reducing the emergence of fundamental knowledge. This problem may require the use of the theory of non-antagonistic games. Note that similar problems arise in the distribution of a limited number of abstracts between various scientific disciplines (if necessary to provide a total knowledge).
Thus, summing up, we can say that in the proposed article outlines the ways of studying the important scientific problem of educational migration in various aspects.
-SA 4.0).
7. References
[1] A. Makarenko Sustainable development and principles of social systems modeling. Generis Publisher, 2020. 173p. (https://www.generis-publishing.com/product/sustainable-developmnt-and-principles-of-social-systems-modeling/)
[2] A.M. Schlesinger The cycles of American History. Houghton Mifflin Company. Boston, 1986. 688 p.
[3] A. Makarenko Toward the Mentality Accounting in Social Systems Modeling.
Proceedins Int. Conf. SAIC-2020. October 08-10, Kyiv. 5 p.
[4] F. Brauer, C. Castilo – Chavez Mathematical models in population biology and epidemiology, Springer-Verlag. 2000.
[5] J.W. Forrester World dynamics, Productivity Press, 1971.
[6] J. Ferber Multi – agent systems: an introduction to distributed artificial intelligents. Harlow: Addison Wesley Longman, 1999.
[7] J. Watson Strategy: An inroduction to game theory (3rd edition) N.Y. W.W.Norton and Co, 2013.
[8] W. Weidlich Physics and social science – the approach of synergetics. Phys. Rep, 1991. 204.p. 1-163.
[9] M. Gaeta, G. Iovane, A. Makarenko Information theory and posible mathematical descriptions of economical and social systems based on real physical phenomena, System research&Information Technologies, 2005. N. 4. pp. 52 – 64.
[10] S. Wolfram A new kind of science. Wolfram Media, 2002.
[11] A. Makarenko, A. Musienko, A. Popova et al. Cellular automata, agents with mobility and GIS for socio – enviromental problems Journal of Earth Science Research, 2013. vol.1, n.1. p. 10- 20.
[12] A. Makarenko Toward the methodology for considering mentality properties in eGovernment problems. In: Intellectual systems and information technologies. ed. Y. Gunchenko. Vienna: Primier Publishing, 2021. pp. 155-168.
[13] V. Zavertanyy, A. Makarenko Aggressive and Peaceful Strategies in Cellular Resource Space, International Journal of Control Systems and Robotics, ISSN: 2367-8917, Volume 3, 2018, pp.8-21.
[14] V. Zavertaniy, A. Makarenko Elements of modeling tasks of artificial life. Monography. National Technical University of Ukraine "Igor Sikorsky Kyiv Polytechnic Institute", Kiev, 2020. 132 p (in Ukrainian)
243

Possibility Of Implementation A Real-Time Production Planning System To Reduce The Environmental Impact Of The Production Line In The Case Of The Electroplating Line Mikołaj Grotowski1
1 AGH University of Science and Technology, ul Antoniego Gramatyka 10, Kraków, Poland
Abstract The industry now has to increasingly reduce its negative impact on the environment. This is due to both the growing environmental awareness of consumers and the "European Green Deal" policy and the preceding "Circular Economy" policy. One of the methods of reducing the negative impact on the environment is the optimization of the production process. In the case of electroplating lines, optimization problems of this type are included in the "Hoist Scheduling Process" (HSP) category. Previous research on the optimization of this type of processes has focused solely on the aspect of increasing efficiency. This work presents the problem of creating a multi-criteria algorithm that comprehensively improves the production process, also optimizing it in terms of its overall impact on the environment. The current proposals for solutions to HSP class problems have been presented, which additional factors must be taken into account in the approach consistent with the Circular Economy and with the use of which parameters we can regulate such a process. Keywords 1 HSP, Circular Economy, European Green Deal, RHSP
1. Introduction
The electroplating processes are carried out on specific production lines. They are different for two reasons. One is the limitations of the physico-chemical processes used during production, the other is specific solutions for transporting products inside the line.
1.1. The specificity of the electroplating line
In the electroplating plant, the products must be bathed in special tubs (tanks) containing various electrolytic baths. An example of such a line is shown in Figure 1. For each product, the processing (dipping) sequence is known in advance and includes three steps: preparation operations (part cleaning and rinsing), metal coating operations, and finishing operations (rinsing, passivation and drying).
EMAIL: [email protected] (A. 1) ORCID: 0000-0002-0313-670X (A. 1);
Bathing operations in bathtubs must not be interrupted. The duration of each of them has a set minimum and possibly maximum length, due to the requirements of the technological process; for example, the thickness of the coating depends on the area to be coated, the concentration of the bath and the amperage. When the operation time is shorter than the minimum value, the coating will be too thin; if it exceeds the maximum length, the parts may be damaged or the production cost may increase because too much metal is deposited. Some operations only have a minimum time, no maximum time; which means that the product can spend any time in the bath. Other operations have a strictly defined execution time, i.e. the minimum and maximum times are the same.
244

Figure 1: An example of an electroplating line (Manier and Bloch, 2003)
Each operation is performed in one bathtub.
The product may require the same operations to be performed several times, so it can be placed in the same bathtub several times. Such a bathtub is referred to as multifunctional; the other bathtubs are single-functional.
When the bathing time in a certain tub is much longer than in others, such a bath can be duplicated, which means that it has more than one available space for a product, or that there are several bathtubs in which the same operation is performed (so-called parallel baths). processing of multiple products).
Product processing begins with loading onto a carrier (PCB frame, basket or bolt barrel). Then, handling and transport devices (cranes or hoists) move the carrier from the bathtub to the bathtub. All cranes are identical. They move along one track (above the bathtubs), so they cannot pass each other.
The transport operation consists of several stages. First, the crane moves empty from its current location to the tub containing the carrier to be transferred. Here it grabs the carrier, lifts it above the bathtub and stops so that the electrolyte can drip off (to reduce contamination of subsequent bathtubs). It then carries the carrier to the next tub in the appropriate sequence for that product. Here the crane stops again to stabilize itself and lowers the carrier to immerse it in the new tub. After that, the crane is free and can perform another transfer operation. During some bathing operations the crane must remain over the bath to hold the product; thus, in the course of such operations, both the tub and the crane are occupied.
Figure 2 (Feng et al., 2015) shows an exemplary schedule with all types of operations: product transport, empty runs, product processing (baths); the loading / unloading station 0 and the tubs 1-6 are lined up in the order shown in the diagram, and the order of the baths is according to the numbers of the tubs. In this diagram, there are three product types A, B and C. The numbers
indicate consecutive items of that type. Products A1, A2 and B1 are in the process of bathing at the initial schedule; during its duration, at the loading station 0, the production of the products A3, B2 and C1 (marked with colors) begins.
Figure 2: Gantt diagram of a sample schedule (Feng et al., 2015)
When the crane stops for a moment above the
bathtub, while the product is immersed and taken out of the bathtub (time to drip the products or stabilize the crane), both the crane and the bathtub are busy. If this time is very short, it can be omitted or added to the time of transport or bathing operation (this is what their publications say). If this time is too long for this, the schedule of transport and bathing operations will have to overlap.
All transport times are known in advance. The planning procedure must take these into account as they are as long as the processing times. No breaks in the operation of the crane are allowed during the transfer of the carrier, with the exception of the dripping and stabilization stages, the durations of which are known. Other breaks may damage the products, e.g. by oxidizing the surface of the products for too long.
In a simple system, there is one line and all transport operations are carried out by cranes traveling along one track along the line. The complex system consists of several parallel lines and includes additional cranes for transverse transport (between the lines). The synchronization of cranes moving along and between the lines must be ensured.
Scheduling is generally intended to maximize productivity, production volume per unit of time, eg per hour or shift. Sometimes other optimization criteria are taken into account, e.g. maximization of the degree of use of selected resources, or minimization of product completion times.
Scheduling may also aim at the robustness of the schedule, defined as its resilience to random fluctuations in operation times. It enables the
245

schedule to be performed without any changes (under all technological conditions). Reliability can be achieved through time buffers of all operations (schedule clearances, planned machine and product downtime), which ensure timely commencement of subsequent operations despite delays in previous operations. A robust schedule might possibly allow for minor timing changes (operation start times), but the sequence of operations and resource allocation would remain unchanged. If the schedule is not reliable and an operation is delayed, it is usually necessary to change the schedule remaining to be performed.
Regardless of the optimization goal (criterion), it should be achieved while observing all technological conditions of the process, namely the limitations related to the processing sequence, the minimum and maximum limits of processing times, the capacity of resources (tubs, cranes and carriers) and the time during which the crane must lower the carrier into the bathtub between two successive transport operations.
The planning of bathing and transport operations in electroplating plants is known in the literature as the hoist scheduling problem (HSP). At the same time, the schedule of the crane's movements determines a certain schedule of the processing (bathing) operations. Within the so-called The scheduling theory, this problem belongs to the group of scheduling tasks without waiting (between operations) and without interrupting the operation.
1.2. Algorithm classification
Highlighting task classes in the literature 1. Cyclic hoist scheduling problem (CHSP) consists in determining a cyclically repeated sequence of crane movements: • The number and type of products are known in advance and the same in each cycle. • It is necessary to minimize the length of the transition phase between two consecutive production cycles (schedules). The simplest and best-described variant is the
Cyclic hoist scheduling problem (CHSP). It occurs when we assume that the subsequent production cycles are the same, and the last element of the cycle is followed by the first one again. This allows you to plan production for larger orders, when we know in advance what products we want to put on the line and in what
number. Numerous proposals for solutions to this variant can be found in the literature.
2. Predictive hoist scheduling problem (PHSP) consists in setting the schedule for the next time period, shift or day: • The number and type of products to be made in a given period are known in advance, but different in each subsequent period. • It is necessary to take into account the initial state of the system at the beginning of a given period. 3. The dynamic hoist scheduling problem (DHSP) is the computation of a new schedule for all operations every time a new part enters the line. • The number and type of products to be made are not known in advance, new orders for products appear unexpectedly already during the execution of the schedule. • The schedule for making earlier products may be changed. Another variant is the "Dynamic Hoist
sheduling problem" (DHSP). It occurs when orders change over a short period of time, which makes it impossible to use one repeated cycle of introducing products to the production line. Along with the change of orders, the order of placing products on the line and the sequence of transport operations should be dynamically changed. The plan is defined at regular short intervals and adapted to current needs. In the literature, you can find several examples of algorithms that meet the requirements of dynamic scheduling.
4. Reactive hoist scheduling problem (RHSP) is the real-time scheduling of upcoming operations where the cranes must be dynamically assigned to subsequent transport operations. Third level heading
The last option is the " 4. Reactive hoist sheduling problem" (RHSP). In this variant, the schedule is created and modified on an ongoing basis. This allows not only to smoothly adapt to current orders, but also to react to random events on the production line. Until recently, it was not possible to create such algorithms due to the complexity of calculations and limitations in the capabilities of computers. It seems, however, that the development of both computer hardware and computational methods allows the conclusion
246

that algorithms RHSPs are now possible to create. The first articles about them appear, but so far no working RHSP algorithm has been published.
1.3. Variants of production lines
There are various configurations of production lines with transport cranes. The line with one conveyor is the easiest to describe in the algorithms. (Fig 1) Most of the algorithms in the literature it refers to such a configuration. However, there are often other variants in actual lines. A very common variant is one in which the line has two cranes moving on common tracks. This means that although in theory both cranes have access to the entire line, it is currently limited by the location of the second lift. This is due to the fact that the cranes cannot pass each other (Fig. 2). Another variant is that there are two cranes, but they have their own track sets and are mounted in a way that allows them to pass each other, this arrangement also occurs in two variants, in one of the cranes can always pass each other, and in the other one of them (external) must not carry the load when passing. These variants of settings are especially difficult to implement in algorithms. Other variants are lines with two conveyors, in which each conveyor has its own separate section of the line that serves and variants with more conveyors.
1.4. Changes in the structure of the problem resulting from the environmental approach.
The basic change in the environmental approach is that instead of a single criterion, i.e. line productivity, optimization must be multi-criteria. Productivity continues to be the primary criterion as it determines both the economic efficiency and the ecological cost of the energy used. However, there are additional criteria, such as the rate of consumption of solutions, the degree of possible use of the solutions or the possibility of utilizing the active substance after the end of production.
The second important change is that, apart from the order in which the products are put on the line, we also use the parameters of individual processing steps, such as solution temperature, concentration, process duration or current characteristics, as production control variables.
These variables are partially dependent, for example the reduction of the process time may be due to the fact that it is carried out at a higher temperature or by using a solution with a higher concentration.
These changes not only make the NP problem difficult, like all HSP problems, but also make it non-linear.
1.5. Conditions that must be met in order to be able to apply the algorithm to reduce the impact of production on the environment.
Due to the fact that many process parameters that the algorithm is to control are relatively dynamic, it seems that only RHSP class algorithms can give the appropriate effect. This is due to the fact that the existing galvanizing lines do not provide for continuous control of these parameters, but only periodic corrections. Hence, for example, the algorithm can determine the initial concentration of the solution, but it should modify the parameters on an ongoing basis when the concentration changes during the production of one batch of products. It should accordingly regulate the time of individual operations, and with its change, the sequence of subsequent products.
Due to the complexity of the calculations, it should divide the calculations into parallel threads, thanks to which it will be possible to use the methodology of parallel processing. Due to the fact that most of the electroplating lines do not have high-power computing facilities, an interesting option seems to be the optimization of calculations in terms of the use of GPUs of PC computers. The challenge in creating an algorithm in this way is the division into independent functions and adapting the computational part to the specific capabilities of graphics cards.
2. Conclusions
As presented, the problem of using heuristic algorithms to solve HSP-type tasks under the "Circular Economy" problem has not found a satisfactory solution to date. However, the analysis shows that it is possible to construct such a solution. Previous tests on the laboratory simulation scale show that although the algorithms described in the literature are not
247

sufficient to solve the problem, they can be a starting point for further research. Simulation tests of the algorithm based on the work of Henrik J. Paul, Christian Bierwirth, Herbert Kopfer, (2007) with the author's further development showed that he is able to develop solutions for individual production batches. Its further development should enable work in real real time, which will enable the implementation of multi-parameter control and multi-criteria evaluation. With the growing environmental requirements for production processes, it seems that the implementation of this type of solutions is a real and relatively cheap solution to reduce the impact of production processes in electroplating on the environment.
3. Acknowledgements
I would like to thank the employees of the Faculty of Management at AGH University of Science and Technology, especially Dr. Waldemar Kaczmarczyk for help in research.
4. References
[1] Bloch, Ch., Bachelu, A., Varnier, Ch,, Baptiste, P. (1997) Hoist Scheduling Problem: State-of-the-Art, IFAC Proceedings Volumes, 30(14), pp. 127-133,
[2] Feng, J., Che, A., Chu Ch. (2015) Dynamic hoist scheduling problem with multi-capacity reentrant machines: A mixed integer programming approach, Computers & Industrial Engineering , 87, pp. 611–620
[3] Manier, M., Bloch, C. A (2003) Classification for Hoist Scheduling Problems, International Journal of Flexible Manufacturing Systems, 15, pp. 37-55.
[4] Henrik J. Paul, Christian Bierwirth, Herbert Kopfer, (2007) A heuristic scheduling procedure for multi-item hoist production lines, Int. J. Production Economics 105, pp. 54-69.
[5] Jianguang Feng, Ada Che , Chengbin Chu Dynamic hoist scheduling problem with multi-capacity reentrant machines: A mixed integer programming approach - Computers & Industrial Engineering Volume 87, September 2015, Pages 611-620
[6] Etienne Chové, Pierre Castagna, Rosa Abbou - Hoist Scheduling Problem: Coupling reactive and predictive approaches - Proceedings of the 13th IFAC Symposium
on Information Control Problems in Manufacturing Moscow, Russia, June 3-5, 2009
[7] Sameh Chtourou, Marie-Ange Manier , Taıcir Loukil - A hybrid algorithm for the cyclic hoist scheduling problem with two transportation resources - Computers & Industrial Engineering Volume 65, Issue 3, July 2013, Pages 426-437
[8] Adnen ElAmraouia Mohsen Elhafsi - An efficient new heuristic for the hoist scheduling problem - Computers & Operations Research Volume 67, March 2016, Pages 184-192
[9] Jianguang Feng, Ada Che , Chengbin Chu Dynamic hoist scheduling problem with multi-capacity reentrant machines: A mixed integer programming approach - Computers & Industrial Engineering Volume 87, September 2015, Pages 611-620
[10] 8. Yun Jiang and Jiyin Liu - Multihoist Cyclic Scheduling With Fixed Processing and Transfer Times - IEEE Transactions on Automation Science and Engineering, Vol. 4, No. 3, July 2007
248

Трансформація Функцій Менеджменту В ІТ-Середовищі Станіслав Горбаченко 1, Олег Дикий 2 1,2 Національний університет «Одеська юридична академія», вул. Ришельєвська 28, м. Одеса, 65125, Україна
Анотація В доповіді розглядаються теоретичні та практичні питання адаптації менеджменту до вимог сучасного ІТ-середовища. Визначено вплив четвертої промислової революції на професійні аспекти менеджменту. Структуровано функції менеджменту та зроблено пропозиції щодо осучаснення їхнього змісту за рахунок інформаційних технологій. Ключові слова Менеджмент, інформаційні технології, планування, стимулювання, контроль.
Transformation Of Management Functions In The IT-environment Stanislav Gorbachenko 1, Oleh Dykyi 2
1,2 National University "Odessa Law Academy", st. Ryshelevskaya 28, Odessa, 65125, Ukraine
Annotation The report considers theoretical and practical issues of adaptation of management to the requirements of the modern IT environment. The influence of the fourth industrial revolution on the professional aspects of management is determined. Management functions are structured and proposals are made to modernize their content through information technology. Keywords Management, information technology, planning, incentives, control.
1. Вступ
Менеджмент є невід’ємною частиною соціально-економічного та культурно-історичного розвитку суспільства, реагує на зміни технологічного укладу та знаходиться під впливом національних та міжнародних господарських традицій. Становлення сучасної системи менеджменту відбувалося під впливом таких історичних передумов як формування ринкового механізму господарювання, становлення та розвиток індустріального способу виробництва, корпоратизація економіки, формування системи конкурентоспроможності інтелектуального капіталу [1]. У свою чергу певному переосмисленню системи менеджменту посприяла четверта промислова революція в контексті перетворення автоматизованого виробництва, систем обміну даних і виробничих
EMAIL: [email protected] (А. 1); [email protected] (А. 2) ORCID: 0000-0001-8442-9581 (А. 1); 0000-0002-1854-9099 (А. 2)
технологій на єдину саморегульовану систему, з мінімальним втручанням людини у виробничий процес або взагалі без нього. Це призвело до того, що сучасні успішні управлінські системи поступово відходять від ієрархічних структур і тяжіють до інноваційних моделей на основі мережевої взаємодії та співробітництва [2, с. 17].
Зрозуміло, що адаптація традиційного менеджменту до нових умов проходить досить складно, адже управлінські методики, технології та інструменти майже неможливо перенести з одного середовища в інше без відповідної адаптації зі збереженням належного рівня ефективності та результативності. При цьому мається на увазі не тільки культурне, а й технологічне середовище або їхнє переплетіння, як це відбувається у випадку інформаційних технологій.
249

2. Функції менеджменту в ІТ-середовищі
В управлінському контексті ІТ-середовище являє собою складну систему, яка об’єднує різноманітні інформаційні, програмні, технічні, людські й інші види ресурсів для досягнення поставленої мети або визначених завдань. Інформаційні технології є інструментами для підвищення ефективності діяльності підприємства, галузі або національної економіки в цілому та зміцнення їхньої конкурентоспроможності. Паралельно із цим саме інформаційні технології виступають фундаментом для формування інформаційного суспільства - історичної фази можливого еволюційного розвитку цивілізації, в межах якої інформація і знання є основним важелем розвитку і продукуються в єдиному інформаційному просторі.
В ІТ-середовищі менеджмент забезпечує управлінський супровід різних технологічних процесів і його кінцева результативність визначається появою інноваційних продуктів та послуг. При цьому серед характеристик ІТ-середовища, що здійснюють безпосередній вплив на всю систему менеджменту можна відзначити: наявність глобального інформаційного простору, зростання кількості працівників, зайнятих в ІТ-сфері та збільшення її частки у ВВП (особливо в розвинутих країнах), значущість ІТ складової в суспільних та господарських відносинах тощо. Здійснюють вказані характеристики вплив й на функції менеджменту, серед яких найчастіше виділяють планування, організацію, оперативне керівництво, координацію, контроль та мотивацію.
Планування, як функція менеджменту - це процес розробки системи заходів, спрямованих на досягнення певних цілей. Основною одиницею планування в ІТ-середовищі найчастіше виступає задача з такими характеристиками як: тип, пріоритет, компоненти, зміст, вартість, обмеження тощо.
Організаційна функція менеджменту спрямована на забезпечення впорядкування процесу управління в цілому. В цьому сенсі ІТ-середовищу не притаманні складні організаційні структури, навпаки, в ньому превалює проєктний підхід, зокрема, в процесі управління розробкою та супроводу програмних продуктів. IT-проєкти є комплексними, відрізняються від інших видів проєктів такими характеристиками як складність, масштабність і різноманітність [3, с. 107].
Оперативне керівництво в ІТ-середовищі здійснюється з використанням ітеративного підходу. При цьому кожна ітерація виглядає як мінімізований програмний проєкт і включає такі процеси як: планування, аналіз вимог, проєктування, програмування, тестування, документування. Тобто деякі з вказаних процесів є управлінськими, а деякі – технологічними. На окремих етапах до них долучаються й маркетингові процеси (вивчення ринку, формування портрету клієнта, просування готового продукту). Після завершення кожного етапу менеджмент обов’язково здійснює перегляд та переоцінку пріоритетів.
Координаційна функція передбачає погодження всіх операцій таким чином, щоб полегшити функціонування організаційної структури, надати матеріального і соціального стимулу кожному підрозділу, вивірити всі процеси та етапи за часом, оптимізувати використання ресурсів, мінімізувати ризики негативного результату. Задля виконання обох зазначених функцій може використовуватися одна з моделей Agile менеджменту, а саме, Scrum – набір принципів, який дозволяє здійснювати управління в межах чітко фіксованих та недовготривалих ітерацій, які називаються спринтами. Одним з ключових питань Scrum є також створення команди, що самоорганізується, тобто самостійно може вирішувати поточні завдання. Ефективність управлінських процесів при цьому підвищується за рахунок того, що гнучкі команди є більш продуктивними, мінімізуються об’єми непродуктивної і непотрібної роботи, а помилки в проєктах знаходяться і виправляються на ранніх стадіях [4, с. 98]
Функція контролю передбачає управлінську діяльність, спрямовану на виявлення, виправлення та попередження відхилень досягнутих результатів від намічених параметрів та цілей. В ІТ-середовищі контроль передбачає постійний моніторинг об’єкту та процесів з метою перевірки відповідності поточного стану об’єкта його прогнозованому стану, згідно з вимогами клієнтів, технологічними можливостями та законодавчими обмеженнями. Задля автоматизації контролю може використовуватися засіб відстеження задач «Jira», що відслідковує помилки і застосовується для організації взаємодії між користувачами, або учасниками проєктної команди.
250

3. Висновки
Отже, мотивація або стимулювання передбачає управлінську діяльність, спрямовану на спонукання до вибору співробітниками того або іншого типу поведінки в залежності від сили впливу стимулів, мотивів і очікуваних результатів. Вона дозволяє розкрити потенційні можливості персоналу, в тому числі й креативні здібності, а також збільшити продуктивність праці. Адже роботодавець в ІТ-сфері усвідомлює свою залежність від фахових працівників, він готовий мотивувати і берегти команду, а тому враховує матеріальні, соціальні і кар’єрні запити [5]. В ІТ-середовищі набули поширення такі інструменти мотивації як розуміння персоналом загальної мети діяльності, участь у кінцевому фінансовому результаті, забезпечення комфортних умов праці.
Таким чином адаптація функцій менеджменту до вимог ІТ-середовища передбачає не тільки підвищення рівня інноваційності, але й змін у характері і методах
управлінського супроводу технологічних, економічних, соціальних і політичних процесів.
4. Література References
[1] Кузнєцов Е. А. Управлінський капітал: майстер-клас. Одеса: Фенікс, 2020. 118 с.
[2] Шваб К. Четвертая промышленная революция ; Пер. с англ. Москва : Издательство «Э», 2018. 208 с.
[3] Сметанюк О. А., Бондарчук А. В. Особливості системи управління проєктами в it-компаніях. Агросвіт. 2020. № 10. С. 105–111. DOI: 10.32702/2306-6792.2020.10.105
[4] Kiм О. О., Козлова В. В. Перспективи застосування методології Agile менеджменту в управлінні IT-проектами. Соціальна економіка. 2020. № 58, 95-99.
[5] Орлова О. М. Особливості управління персоналом в ІТ-сфері. URL: http://www.visnyk-econom.uzhnu.uz.ua/archive/11_2017ua/28.pdf
251

Using A Model Of Coordinated Interaction For Estimation Of Troops Joint Missions Effectiveness Dmytro Rieznik1, Mykhailo Levchenko2, Valerii Patalakha3, Serhii Kitik4, Bohdan Shkurat5, Oleksandr Globa6
1,2,3,4,5,6 The National Defense University of Ukraine named after Ivan Cherniakhovskyi, Povitroflotskyi ave, 28, Kyiv, 03049, Ukraine
Abstract The paper is dedicated to the possibility of using interaction model, based on idea of troops efforts coordination, which considers the interests not only of control subsystems (command center), but also the interests of active subsystems (combat elements), for their effectiveness estimation and optimal air defense system structure choosing. To achieve the interaction process harmonization the study of control subsystems stimulating impacts is required to compensate for the loss of active elements. The additional (synergistic) effect received by the system and elements in combined interactions is studied, as well as the loss of each element while general task performing. It is shown that the implementation of coordinated interactions in the system is possible only if the additional (synergistic) effect of all its elements exceeds their losses, and if the additional (synergistic) effect is less than the losses, the interaction inside the system with certain parameters is not effective, so its elements must carry out their missions separately from each other.The theoretical basis for solving problems of coordinated interaction is the theory of active systems and set theory. Keywords 1 Interaction efficiency; coordinated interaction; combat element; joint mission; stimulating effect
1. Introduction
In modern warfare, a very important role is given to the fight against the enemy aircraft, the task of which is entrusted to the air defense system (AD System). The main task of the air defense system is the destruction of enemy aircraft attack, gaining and maintaining air superiority, protection from air strikes of groups of troops (forces), arsenals, bases, warehouses, airfields, naval bases, industrial areas, administrative and political centers, etc. [3, 8].
Therefore, special attention is paid to the organization of interaction between the Air Defense Aircraft (AD Aircraft) and the Air Defense Artillery (ADA) in order to make the most complete and effective use of their combat capabilities, as well as ensuring mutual security of
EMAIL: : [email protected] (A.1); [email protected] (A.2); [email protected] (A.3); [email protected] (A.4), [email protected] (A.5), [email protected] (A.6) ORCID: 0000-0003-3980-923X (A.1); 0000-0003-1872-2960 (A.2); 0000-0002-3105-4402(A.3); 0000-0002-0133-6521 (A.4); 0000-0002-3654-0506 (A.5), 0000-0002-1423-8365 (A.6)
their troops (forces) in performing tasks [3] to repel enemy air strikes.
Interaction is a managerial activity that is able to create a cohesive and invincible force from a handful of disparate parties that is self-learning and continuously improving [4].
Interaction is one of the basic principles of martial arts. It reflects the objective pattern of mutual influence of all troops and forces involved in the operation [3].
The problem of the interaction organizing between the AD Aircraft and the ADA is very sophisticated, as the nature of hostilities and methods of combat use of troops are interdependent. In addition, the effectiveness of AD combat operations depends on the scale and nature of the enemy's air defenses, the operational construction of covered troops, combat composition and combat capabilities of
252

interacting forces and means, meteorological conditions, time of day and so on. All of this must be taken into account during the organization and implementation of interaction [4].
Therefore, it is necessary to integrate the elements of the air defense system, taking into account the consistency of their interests. This question can be assessed by using the synergetic theory of systems analysis.
The integration of AD aircraft with GBAD in one zone, according to the synergetic theory, has an additional systemic effect - emergence [5]. To increase the combat effectiveness, it is necessary to increase this system effect, which is expressed in the coefficient of interaction, by choosing the optimal (in certain conditions) method ofinteraction. But it is possible to increase only what can be measured, so it is necessary to have a comparative assessment of the effectiveness of the interaction between AD Aircraft and ADA.
The task of synthesis of the interaction process is to choose individual or a set of its components from the standpoint of the criterion of efficiency of the active system, namely: the target functions of different levels elements, procedures for forming plans, mechanisms for evaluating activities. However, in real combat conditions, often the choice of only the functions of stimulation or only the change of the functioning parameters of the elements does not provide a coordinated interaction between the elements in the system.
This is due to the fact that the stimulation functions and parameters can vary in a certain limit, and this does not allow to fully reconcile the interests of the elements in the system [2, 7]. Therefore, there is a problem of simultaneous selection of such stimulus functions and values of parameters change, which provide the coordinated, and, consequently, effective system functioning.
The papers of many specialists are devoted to the issues of combat effectiveness assessing in general and interaction directly, as well as the search for effective forms of its implementation. [1, 2] But, despite the interest of many interaction researchers, the search for effective forms of its implementation and evaluation, the problem of assessing its effectiveness is not completely solved. Modern research modeling the process of interaction is mainly carried out in the field of economics [4, 7, 9, 10], in the military sphere, the process of interaction is seen as a creative process of the commander, but with increasing input data, their rapid changes and reducing the space of
interaction - there is a need to support commander's decision-making process for coordination the interests of all elements of interaction. The direction of research of the active systems coordinated interaction process is insufficiently studied.
Therefore, further developing of active systems coordinated management methods is important, basing on the simultaneous definition of incentive functions and variables, the implementation of which provides each element of additional effect that compensates for possible losses in the implementation practice of the higher-level element plan in the management of real combat systems.
2. Methods
The following methods were used in the research: analysis of theoretical sources based on the organization of interaction problems, study and generalization of best practices in the organization of interaction between the elements of active systems and the method of synthesis.
Figure 1: Interaction in an active multi-element system using stimulating effects
To analyze the costs required to reconcile the
interests of the elements in the system, it is possible to develop a unified approach. The article investigates the additional (synergetic) effect that the system and its elements receive due to coordinated interaction, as well as the loss of each element while performing a common task. However, the implementation of coordinated interaction in the system is possible only if the additional (synergistic) effect of all elements of the coordinated interaction exceeds their losses. If the additional (synergetic) effect is less than the
253

losses, then the coordinated interaction in the system at these parameters is inefficient and the elements must perform their missions separately [6].
The study of coordinated interaction is carried out on the model of a multi-element system. The model studied in the article includes the upper-level control subsystem - the command center and the lower-level controlled subsystems - active combat elements from the ADA and AD Aircraft participating in combat operations according to a single plan. The command center coordinates the work of the elements by giving them a plan, missions and incentives (comprehensive support), and active combat elements carry out the implementation of these missions, while determining the actual situation from the standpoint of their own interests (see Figure 1).
3. Results
The following concepts and designations necessary for formation of conditions of the coordinated interaction between the command center and combat elements are entered: 𝑥𝑛 ∈ 𝑌– planned state of the nth combat element, 𝑛 =1,𝑁 ; 𝑦𝑛 ∈ 𝑌– the actual state of the nth combat element; 𝑥 = (𝑥1, … , 𝑥𝑁) ∈ 𝑌 – the vector of combat elements planned states set by the command center; 𝑦 = (𝑦1, … , 𝑦𝑁) ∈ 𝑌 – the vector of combat elements actual states; 𝑌 = ∏ 𝑌𝑛
𝑁𝑛=1 – the set of allowable values of the
combat elements states; 𝑓𝑛(𝑦𝑛) ∈ 𝐹 – the objective function of nth combat element; 𝑓(𝑦) = (𝑓1(𝑦1), … , 𝑓𝑁(𝑦𝑁)) ∈ 𝐹 – the vector of combat elements objective functions; 𝐹 = ∏ 𝐹𝑛
𝑁𝑛=1 – the set of values of the combat
elements objective functions; 𝑃𝑛(𝑓𝑛) = 𝐴𝑟𝑔 𝑚𝑎𝑥𝑦𝑛∈𝑌𝑓𝑛(𝑦𝑛) – the set of locally-optimal states of the nth combat element; 𝑃(𝑓) = ∏ 𝑃𝑛
𝑁𝑛=1 (𝑓𝑛) – the set of the system
locally-optimal states; 𝑔𝑛(𝑓𝑛) = 𝑚𝑎𝑥𝑦𝑛∈𝑌𝑓𝑛(𝑦𝑛) – the maximum value of the objective function for the nth combat element; ∆𝑔𝑛(𝑥𝑛) = 𝑔𝑛(𝑓𝑛) − 𝑓𝑛(𝑥𝑛) –losses of nth combat element associated with the implementation of the command center plan; 𝜂𝑛(𝑥𝑛, 𝑦𝑛) ∈ 𝛩𝑛 – stimulating effect obtained by nth combat element (see Figure 1), where 𝛩𝑛 – the
allowable set of stimulating effects functionson nth combat element; 𝜂(𝑥, 𝑦) = (𝜂1(𝑥1, 𝑦1), … , 𝜂𝑁(𝑥𝑁 , 𝑦𝑁)) ∈ 𝛩– the vector of stimulating effects, where 𝛩 – the set of its types; 𝑓𝑛(𝑥𝑛, 𝑦𝑛 , 𝜂𝑛) = 𝑓𝑛(𝑦𝑛) + ∆𝑓𝑛(𝑥𝑛, 𝑦𝑛 , 𝜂𝑛) – the objective function of nth combat element including its stimulation (supply) in the𝑥𝑛-th plan implementation; ∆𝑓𝑛(𝑥𝑛, 𝑦𝑛 , 𝜂𝑛)– change in the nth combat element objective function, caused by the stimulating effect; 𝛷(𝑥) ∈ 𝛯 – the command center objective function and its possible values set 𝛯; 𝛹(𝛷) = 𝑚𝑎𝑥𝑥∈𝑌 𝛷 (𝑥)– maximum value of the command center objective function; 𝑋(𝛷) = 𝐴𝑟𝑔𝛹(𝛷)– the set of the system optimal plans as a whole; 𝛹(𝑓) = 𝑚𝑎𝑥𝑦∈𝛲(𝑓)𝛷 (𝑦)– the value of the command center objective function on the set of locally optimal states of its elements; 𝛥𝛹(𝑥) = 𝛹(𝛷) − 𝛹(𝑓)– additional (synergetic) effect obtained by the command center from the coordinated interaction; 𝛷(𝑥, 𝑦, 𝜂) = 𝛷(𝑥) − 𝛥𝛷(𝑥, 𝑦, 𝜂)– the command center objective function, including the stimulation (supply) of combat elements; 𝛥𝛷(𝑥, 𝑦, 𝜂)– change in the command center objective function, which arose as a result of stimulation (supply) of combat elements.
Taking into account the introduced designations, a description of the stimulating effects set which are given in the system𝛩(𝑥, 𝑓) =∏ 𝛩𝑛(𝑥𝑛, 𝑓𝑛)𝑁𝑛=1 , moreover, the set of stimulating
effects that provides the maximum of the objective function of the nth combat element is expressed as:
𝛩𝑛(𝑥𝑛, 𝑓𝑛)
= {𝜂𝑛(𝑥𝑛 , 𝑦𝑛) ∈ 𝛩𝑛|∀𝑦𝑛 ∈ 𝑦𝑛,
𝛥𝑓𝑛(𝑥𝑛, 𝑦𝑛, 𝜂𝑛) ≥ 𝛥𝑔𝑛(𝑥𝑛)},
(1)
and stimulating actions which exceed the additional effect of coordinated interaction over the command center outgoings for these actions will take the form:
𝛩(𝑥, 𝑓, 𝛷) = {𝜂(𝑥, 𝑦) ∈ 𝛩|∀𝑦 ∈ 𝑌,
𝛥𝛹(𝑥) ≥ 𝛥𝛷(𝑥, 𝑦, 𝜂)}. (2)
The set of interaction mechanisms, therefore, must be selected both in terms of the command center objective function, and in terms of the combat elements objective functions. For this purpose, the intersection of the stimulating influences sets coordinated on the general plan from a position of objective functions of combat
254

elements 𝛩(𝑥, 𝑓)is necessary, as well as the set of command center objective functions𝛩(𝑥, 𝑓, 𝛷)that is 𝛩(𝑥, 𝑓)𝛪𝛩(𝑥, 𝑓, 𝛷) ≠0.
Stimulating effects can be a comprehensive supply of troops, or stimulating actions can be implemented indirectly, by changing the various parameters of the combat elements operation models, for example, by redistributing targets between combat elements.
When used as stimulating effects, compensatory stimulation functions, the combat elements objective functions will be as follows:
𝑓𝑛(𝑟𝑛, 𝑥𝑛, 𝑦𝑛, 𝑢𝑛) = 𝑓𝑛(𝑟𝑛, 𝑦𝑛) +𝑢𝑛(𝑥𝑛, 𝑦𝑛)
(3)
The value
𝑢𝑛(𝑥𝑛, 𝑦𝑛) = {𝑢𝑛(𝑥𝑛), 𝑖𝑓 𝑦𝑛 = 𝑥𝑛
0, 𝑖𝑓 𝑦𝑛 ≠ 𝑥𝑛
is a stimulating effect obtained by nth combat element in the case of the command center planned missions𝑥𝑛 ∈ 𝑌𝑛(𝑟𝑛).
In this case, the set of stimulating functions 𝑢𝑛(𝑥𝑛)which take into account the interests of combat elements, will be as follows:
𝐹𝑢(𝑥) = {𝑢(𝑥)|𝑢𝑛(𝑥𝑛) ≥ 𝛥𝑔𝑛(𝑥𝑛),
𝑥𝑛 ∈ 𝑌𝑛(𝑟𝑛)}. (4)
And a set of stimulating functions that take into account the interests of the command center will look like:
𝐹𝛷(𝑥) = {𝑢(𝑥)|𝛥𝛹(𝑥) ≥ ∑𝑢𝑛
𝑁
𝑛=1
(𝑥𝑛)
≥ 0}.
(5)
For the case when the stimulation is carried out by parametric coordination, the vector of coordinating parameters for each combat element is presented as:
𝑟𝑛(𝑥𝑛 , 𝑦𝑛) = 𝑟𝑛𝐻 + 𝛥𝑟𝑛(𝑥𝑛, 𝑦𝑛), (6)
where 𝑟𝑛𝐻 – nominal value of the parameter;
𝛥𝑟𝑛(𝑥𝑛,𝑦𝑛) = {𝛥𝑟𝑛, 𝑖𝑓 𝑦𝑛 = 𝑥𝑛0, 𝑖𝑓 𝑦𝑛 ≠ 𝑥𝑛
– variable
component of the parameter, which is the coordinating influence of the command center on the nth combat element (𝜂𝑛 = 𝛥𝑟𝑛).
Moreover 𝑓𝑛(𝑥𝑛, 𝑦𝑛, 𝛥𝑟𝑛) = 𝑓𝑛(𝑦𝑛, 𝑟𝑛) + 𝛥𝑓𝑛(𝑥𝑛 , 𝑦𝑛, 𝛥𝜂𝑛)– the objective function of nth combat element, which takes to account parametric coordination in the implementation of various states𝑦𝑛, where
𝛥𝑓𝑛(𝑥𝑛,𝑦𝑛, 𝛥𝑟𝑛) = {𝛥𝑓𝑛(𝑥𝑛, 𝛥𝑟𝑛), 𝑖𝑓 𝑦𝑛 = 𝑥𝑛
0, 𝑖𝑓 𝑦𝑛 ≠ 𝑥𝑛–
change in the objective function of the nth command element, caused by changing the parameters by the value of 𝛥𝑟𝑛during the implementation of the combat element planned task 𝑥𝑛.
The set of coordinating influences 𝑅𝑐(𝑥), takes into account the interests of combat elements and must meet the following ratio: 𝛥𝑅𝑐(𝑥)
= {
𝛥𝑟 ∈ 𝑅|𝛥𝑟𝑛 ≤ 𝛥𝑟𝑛 ≤ 𝛥𝑟𝑛,
(𝑑𝑓𝑛(𝑟𝑛, 𝑥𝑛)
𝑑𝑟𝑛, 𝛥𝑟𝑛) ≥ 𝛥𝑔𝑛(𝑥𝑛)
}, (7)
where nr , nr – the lower and upper values of changing of the coordinating parameter for the nth combat element.
And the set of coordinating influences that take into account the interests of the command center is equal: 𝛥𝑅𝛷(𝑥)
=
{
𝛥𝑟 ∈ 𝑅|𝛥𝑟𝑛 ≤ 𝛥𝑟𝑛 ≤ 𝛥𝑟𝑛,
𝛥𝛹(𝑥) ≥ ∑(𝑑𝛷𝑛(𝑟, 𝑥)
𝑑𝑟𝑛, 𝛥𝑟𝑛)
𝑁
𝑛=1 }
. (8)
To implement coordinated interaction, it is necessary that many stimulating influences intersect, taking into account both the interests of the command center and all combat elements: 𝛥𝑅𝛷(𝑥)𝛪𝛥𝑅𝑐(𝑥) ≠ 0 або 𝐹𝑢(𝑥)𝛪𝐹𝛷(𝑥) ≠ 0 In the implementation of coordinated
interaction by selecting the functions of stimulation and changes in the parameters of coordination at the same time as stimulating effects, a pair 𝜂 = (𝑢, 𝛥𝑟) is selected: 𝜂𝑛(𝑥𝑛,𝑦𝑛)
= {(𝑢𝑛(𝑥𝑛), 𝛥𝑟𝑛(𝑥𝑛)), 𝑖𝑓 𝑦𝑛 = 𝑥𝑛
0, 𝑖𝑓 𝑦𝑛 ≠ 𝑥𝑛.
(9)
Then the change in the objective function of the nth element, caused by stimulating effects in the implementation of the planned task 𝑥𝑛elements:
𝛥𝑓𝑛(𝑥𝑛,𝑦𝑛, 𝜂𝑛)
= {
𝛥𝑓𝑛(𝑥𝑛, 𝛥𝑟𝑛) + 𝑢𝑛(𝑥𝑛), 𝑖𝑓 𝑦𝑛 = 𝑥𝑛0, 𝑖𝑓 𝑦𝑛 ≠ 𝑥𝑛
(10)
A set of stimulating effects that take into account the interests of combat elements will have the form:
𝛺𝑓(𝑥) = {𝜂 = (𝑢, 𝛥𝑟) |(𝑑𝑓𝑛(𝑟𝑛,𝑥𝑛)
𝑑𝑟𝑛, 𝛥𝑟𝑛) +
+𝑢𝑛(𝑥𝑛)≥
𝛥𝑔𝑛(𝑥𝑛)},
(11)
255

and the set of incentives that take into account the interests of the command center is equal to:
𝛺𝛷(𝑥) =
{𝛱 = (𝑢, 𝛥𝑟)|𝛥𝛹(𝑥) ≥ (
𝑑𝛷(𝑟,𝑥)
𝑑𝑟, 𝛥𝑟) +
+∑ 𝑢𝑛𝑁𝑛=1 (𝑥𝑛)
}. (12)
Implementation of the coordinated interaction mechanism in the system is possible if:
𝛺𝑓(𝑥)𝛪𝛺𝛷(𝑥) ≠ 0 (13)
4. Conclusions
The choice of the coordinated interaction model will provide an opportunity to assess the excess of additional (synergistic) effect of all system elements over their losses and the ability to calculate the effectiveness of interaction for the rational choice of its methods and implementation. That gives following opportunities:
- it is possible to predict the final result of joint actions taking into account the impact of the options of the organization of interaction of troops and their combat elements, in order to choose the best option of interaction;
- the influence of control and feedback with combat elements on the result that can be achieved is determined.
Depending on the available time and the required accuracy of the results, the computing power of simulation systems, the proposed model may take into account more factors, or vice versa, may be simplified to obtain a rougher but faster forecast of the results of troops joint actions.
5. Acknowledgements
This paper was created at the Anti-Aircraft Missile Troops Department of Aviation and Air Defense institute by Dmytro Rieznik, Mykhailo Levchenko, Valerii Patalakha, Serhii Kitik, Bohdan Shkurat and Oleksandr Globa.
6. References
[1] Dmitry V. Reznik. “Possible use of specified model for evaluation of interaction effective interaction troops”. Modern Information Technologies in the Sphere of Security and Defence. 1 (19) (2014).
[2] D. Rieznik, M. Levchenko, V. Patalakha, V. Melnichenko, S. Kitik, B, Shkurat. Method of the Effort Coordination Chart Creation.
International Journal of Advanced Trends in Computer Science and Engineering, , Volume 9, No.5, September – October 2020, Р. 7610-7617. https://doi.org/10.30534/ijatcse/2020/100952020
[3] Toropchin, I.O., Romanenko, U.G., Dannyk R.E., Handbook of Air Defence (Dovidnik z protypovitrianoi oborony), Ministry of Defense of Ukraine, Kyiv, 2003.
[4] Alabugin A.A. Models and methods for effective management of the enterprise development: monograph in two books: Monograph (Modeli i metody effektivnogo upravleniya razvityem predpriyatiya), SUSU, Chelyabinsk, 2005.
[5] Voronin A.N.Multicriteria decision: Models and Methods: Monograph (Mnogokriterialnie resheniya: modeli i metodi), NAU, Kyiv. p.p. 39–41, 2011.
[6] Burkov V.N., Fundamentals of mathematical theory of active systems (Osnovi matematicheskoi teoryi aktivnyh sistem), Nauka, Moscow, 1977
[7] Novikov D.A. Stimulation in organizational systems (Stimulirovanie v organizacionnih sistemah), Sinteg, Moscow. 2003.
[8] P. Shchypanskyi, V. Savchenko, O. Martyniuk, I. Kostiuk, Air Defense Planning from an Impact of a Group of Unmanned Aerial Vehicles based on Multi-Agent Modeling, International Journal of Emerging Trends in Engineering Research. Vol. 8. No. 4, pp. 1302-1308, April 2020. https://doi.org/10.30534/ijeter/2020/59842020
[9] Natalia Fabra, Massimo Motta. Assessing Coordinated Effects in Merger Cases, 2016. URL:http://nfabra.uc3m.es/wp-content/docs/Coordinated%20effects%20chchapt%2011%2029%202016_FINAL.pdf
[10] Tkachenko D.D. The Models of Competition And Cooperation Of Enterprises In The Development Of Innovations In Terms Of Freedom Of Entry And Exit To The Market Of Innovations And The Commodity Market. URL: https://cyberleninka.ru/article/n/modeli-konkurentsii-i-sotrudnichestva-predpriyatiy-v-razrabotke-innovatsiy-v-usloviyah-svobodnogo-vhoda-i-vyhoda-v-rynok-innovatsiy-i.
256

Design and Simulation of the Auto-Tuning TS-Fuzzy PID Controller for the DC-DC ZETA Converter Assoc. Prof. Lala Bakirova1, Elvin Yusubov2
1 Azerbaijan State Oil and Industry University, Azadliq Ave, Baku, AZ1010, Azerbaijan 2 Azerbaijan State Oil and Industry University, Azadliq Ave, Baku, AZ1142, Azerbaijan
Abstract In this paper, an auto-tuning fuzzy logic proportional integral derivative controller (ATFPID) based on a Takagi-Sugeno (TS) model for the DC-DC ZETA converter fed by a photovoltaic module is proposed. Having non-linear properties, ZETA converters with the classic linear proportional integral derivative (PID) controllers and fixed tuning parameters cannot demonstrate robust performance under the input voltage and load resistance variation. To tackle the problem, an adaptive fuzzy controller for each tuning parameter has been designed. The use of a Takagi-Sugeno fuzzy model compared to the famous Mamdani inference system is intended to ease the computational process. Performance analysis of both PID and TS-ATFPID controllers is carried out to evaluate output transient and steady-state responses of the converter using the fuzzy logic toolbox of the MATLAB/SIMULINK software. The results of the simulations demonstrate a significant performance improvement of TS-ATFPID over the conventional PID controller in terms of retaining output reference voltage under various stress levels and minimizing settling and rise time as well as the steady-state error and the overshoot. Keywords 1 Fuzzy logic, PID controller, DC-DC power converter, ZETA converters
1. Introduction
With the rapid increase in demand for renewable energy sources, DC-DC converters have found considerable interest in a wide variety of applications, ranging from consumer electronics to photovoltaic systems (PV) [1, 2].
A ZETA converter is a special type of DC-DC converter which is similar to a single-ended primary inductor converter (SEPIC). One of the major similarities of these two converters is the non-inverted output voltage polarity, which is not the case in the popular buck-boost topology [3]. Another similarity is the ability of both regulators to output voltages with input voltages above or below the output voltage. However, in comparison with the SEPIC, a ZETA converter is based on a buck configuration [4].
In real applications with photovoltaic systems, a ZETA converter connects the photovoltaic module with the load. External factors such as solar irradiation and temperatures can have a significant negative impact on the output
EMAIL: [email protected] (A. 1); [email protected] (A. 2); ORCID: 0000-0003-0584-7916 (A. 1); 0000-0001-6199-9266 (A. 2)
performance of the module, a problem of which can easily be tackled with the help of ZETA converters. Advancements in the control techniques of these converters are intended to improve the overall operational efficiency of the converters.
Traditional linear proportional integral derivative (PID) converters can be used to control the output of ZETA converters by changing the duty cycle applied to the switching element of the converter. However, optimal tuning of PID gains can be a challenging task, a problem of which can be eliminated by introducing a fuzzy logic controller for each PID parameter to be tuned.
The main aim of the work is to design and simulate an adaptive fuzzy tuned PID controller for the ZETA converter to address tuning problems associated with the PID controllers and achieve increased robustness to the input and load disturbances. A Sugeno type inference system must be chosen for the fuzzy PID controller to alleviate the computational process as well as their ability to work with linear control methods.
257

2. System modeling
A ZETA converter and PID, TS-ATFPID controllers for the converter must be designed and simulated since the design and simulation of the controllers are crucial to assess their respective output performances and show superiority of the TS-ATFPID controllers.
2.1. ZETA converter modeling
The Simulink model of the ZETA converter operating in continuous conduction mode (CCM) is illustrated in Fig.1. In CCM mode, the inductor current never falls to zero, compared to the discontinuous conduction mode (DCM). A simple model of the ZETA converter involves two inductors (L1, L2), two capacitors (C1, C2), a diode (D), a metal oxide semiconductor field-effect transistor (M).
Figure 1: Simulink model of the ZETA converter
The converter operates on two modes;
In the first mode, MOSFET is switched on. The diode, D starts to be in its reverse-biasing mode, which involves the block of electrical current through it. The voltage across the inductor, L1 becomes equal to the supply voltage and the linear increase of the inductor current is also observed, as time passes. The capacitor, C1 commences charging to the output voltage
In the second mode, MOSFET is switched off. Since the polarity changes, the diode, D goes to the forward-biasing mode, in which electrical current can easily flow through it. Since, the current flows the diode, the inductor, L2 starts to be in parallel with the output capacitor, 𝐶𝑜𝑢𝑡. The capacitor, C1 discharges through the inductor, L1.
The simulation parameters of the designed Zeta converter is presented in Table 1.
A pulse-width modulation (PWM) based control mechanism is employed through the
switching element of the converter, which is a MOSFET in our case, to regulate the output voltage of the ZETA converter.
Table 1 ZETA simulation parameters
Parameters Nominal value
Supply voltage (E) 24 Volts Input voltage variation Input voltage variation
16-20 Volts 20-24 Volts
Capacitance (C1, 𝐶𝑜𝑢𝑡) 19 mF Inductors (L1, L2) 4 mH
Loads Output reference
35Ω/15Ω 50 Volts
2.2. PID controller
To evaluate the improvements in the operational performance of the TS-ATFPID, a PID controller must be designed. PID controllers dominate the industry and are also considerably used in power electronics for the control circuit of the converters, due to their robustness, simple configuration, applicability in low-cost products.
Being composed of three simple proportional, integral and derivative terms, PID controllers have the following general mathematical representation:
u(t)=𝐾𝑝e(t)+ 𝐾𝑖 ∫ 𝑒(𝑡)𝑑𝑡+𝐾𝑑𝑑𝑒(𝑡)
𝑑𝑡 (1)
In the formula (1), u(t), e(t), Kp, Ki, Kd are the control signal, error, proportional coefficient, integral coefficient, derivative coefficient, respectively.
A Simulink model of the PID controller is shown in Fig.2.
A PID controller receives the error which is the difference between the reference voltage (𝑉𝑟𝑒𝑓) and actual output voltage (𝑉𝑎𝑐𝑡𝑢𝑎𝑙) and performs the relevant mathematical operations in a parallel configuration [5]. Each term of a PID controller plays an important role in improving the output response of the system.
The proportional term is intended to increase the speed of output response thereby decreasing rise time. However, as the error decreases, the effectiveness of the proportional term also reduces. Possible steady-state errors can be restricted to a tolerance level by introducing the integral term. The derivative term is considered anticipatory which operates on the rate of change of the error.
258

Figure 2: Simulink model of PID controller
Each coefficient of the relevant terms determines the strength of the terms, which requires to be optimally tuned.. The most popular traditional tuning method is the use of the Ziegler - Nichols method [6, 7].
In the design process of the PID controller, the Ziegler-Nichols method with the combination of trial-error methods has been employed. To implement this technique, first, all coefficients except for the proportional parameter is set to 0, after which the value of the proportional coefficient is increased until the system becomes unstable. The value of the proportional gain at the unstable state is recorded as 𝐾𝑚𝑎𝑥. The oscillation frequency of the system is denoted as 𝑓0. The next stage involves the calculation process of the parameters.
Proportional, integral, derivative parameters can be calculated as 0.6𝐾𝑚𝑎𝑥, 2𝑓0, 𝐾𝑚𝑎𝑥 ∕ 𝑓0 , respectively. Adopting this method, the coefficients of the PID controller are calculated as 𝐾𝑝=0.032, 𝐾𝑖 =0.65 and 𝐾𝑑 =0.18.
2.3. Fuzzy-PID controller
As is seen in the design process of the PID controller, one of the challenging tasks is the optimal tuning of the parameters. However, this problem can be tackled with the help of fuzzy logic controllers.
To design fuzzy controllers, the number of inputs must be selected and the conversion of these crisp input values to their corresponding fuzzy values with a certain range is needed. An increase in the number of inputs expands the fuzzy rule base, which increases processing power.
The error e(t) and the change in the error ∆e(t) are selected as inputs for the fuzzy logic PID controller. For each input corresponding, 7 membership functions of Gaussian type are chosen.
The input space for e(t) and ∆e(t) is defined to be in the interval of [-1,1] and [-0.001, 0.001], respectively and demonstrated in Fig.3 and Fig. 4.
Figure 3: Membership functions for the error
Figure 4: Membership for the change in error
The change in error 𝑒(𝑡) is determined by subtracting the previous output value of the error 𝑒(𝑡 − 1) from the actual value (3).
e(t)= 𝑉𝑟𝑒𝑓 − 𝑉𝑎𝑐𝑡𝑢𝑎𝑙, (2)
∆e(t)= 𝑒(𝑡) − 𝑒(𝑡 − 1). (3) The linguistic variables for the input are
selected as negative big (NB), negative medium (NM), negative small (NS), zero (ZO), positive
259

small (PS), positive medium (PM), positive big (PB).
A Takagi-Sugeno type inference system is preferred and chosen over the popular Mamdani model to ease the computational burden as well as ensuring compatibility with adaptive methods [8, 9].
The linguistic variables for output space are very small (VS), medium-small (MS), small (S), medium (M), big (B), medium-big (MB), very big
(VB), each one of them corresponds to a specific linear function with the coefficients (a, b, c) being VS=[0.12 0.012 0], MS=[0.34 0.034 0], S=[0.45 0.044 0], M=[0.455 0.046 0], B=[0.76 0.037 0], MB=[0.83 0.047 0], VB=[0.93 0.047 0].
The rules of the presented TS type fuzzy logic controller has the following mathematical common form:
If input_1 is 𝑒 and input_2 is ∆e then output is 𝑎𝑒 + 𝑏∆e + 𝑐 (4)
Table 2 The fuzzy logic rule-table for 𝑲𝒑, 𝑲𝒊, 𝑲𝒅
e\∆e NB NM NS Z PS PM PB
NB VB/ VS /B VB/ VS /B MB/ VS /M MB/MS/M B/MS/M M/M/VB M/M/VB
NM VB/ VS /S VB/ VS /S MB/MS/S B/MS/S B/S/M M/M/S S/M/MB
NS MB/MS/ VS MB/MS/ VS MB/S/MS B/S/S M/M/M S/B/B S/B/MB
Z MB/MS/ VS MB/S/MS B/S/S M/M/S S/B/M MS/B/B M/MB/MB
PS B/S/ VS B/S/MS M/M/S S/B/S S/B/M MS/MB/B MS/MB/B
PM B/M/MS M/M/S S/B/S MS/MB/S MS/MB/M MS/VB/B VS /VB/B
PB M/M/B M/M/M MS/B/M MS/MB/M MS/VB/M VS /VB/VB VS /VB/VB
The fuzzy rule base is illustrated in Table 2. The designed TS-ATFPID controller is depicted in Fig.5.
Figure 5: TS-ATFPIF controller for ZETA
260

3. Simulation Results
The performance of the controllers are tested under load and input variations and their relevant output responses are analyzed in terms of rise and settling time as well as the steady-state error and overshoot. The reference output voltage is selected to be 50 Volts (V).
In the first stage, output responses for the load resistance of 35Ω and 15Ω are plotted with the supply voltage of 24V and the reference voltage of 50V in Fig.6 and Fig.7, respectively.
In the second stage, the input voltage is varied from 20V to 24V and from 16V to 20V with the frequency of 200Hz and their relevant responses are shown in Fig.8 and Fig.9. Obtained numerical values are presented in Table 3 and Table 4.
Figure 6: Output response (35Ω with 24V supply)
Figure 7: Output response (15Ω with 24V supply)
Figure 8: Output response (35Ω with 20-24V supply with 200Hz)
Figure 9: Output response (35Ω with 16-20V supply with 200Hz) Table 3 Performance of controllers to load different load resistance
LOAD BILEVEL MEASUREMENTS
ATFPID
PID
15 Ω
Rise time (ms) 28.262 84.608 Settling time(ms) 28.860 85.934
Overshoot (%) 0.358 0.502 Steady-State error (V) 0.064 0.095
35 Ω
Rise time (ms) 27.427 74.967 Settling time (ms) 27.838 80.236
Overshoot (%) 0.347 0.506 Steady-State error(V) 0.029 0.075
Table 4 Performance of controllers to input variation
Input variation
BILEVEL MEASUREMENTS
ATFPID
PID
20-24V 35 Ω
200 Hz
Rise time (ms) 32.081 77.759 Settling time(ms) 32.360 78.234
Overshoot (%) 0.388 0.505 Steady-State error (V) 0.065 0.092
16-20V 35 Ω
200 Hz
Rise time (ms) 39.065 90.192 Settling time(ms) 40.125 90.895
Overshoot (%) 0.407 0.508 Steady-State error (V) 0.068 0.071
4. Conclusions
An auto-tuning Takagi-Sugeno type fuzzy logic PID (TS-ATFPID) controller for ZETA
261

converters has been proposed in this paper. The PID and TS-ATFPID controllers have been designed and simulated to assess their comparative performance. The simulations of the PID and TS-ATFPID controllers (TS-ATFPID and PID) are performed under load variations and supply voltage disturbances. The results of the simulations illustrate that under both conditions TS-ATFPID demonstrates superior transient and steady-state performance compared to the PID controller, thereby having substantially shorter settling and rise time as well as the steady-state error and overshoot.
5. References
[1] D. J. Arent, A. Wise, and R. Gelman, “The status and prospects of renewable energy for combating global warming,” Energy Economics, vol. 33, no. 4, pp. 584–593, Jul. 2011, doi: 10.1016/j.eneco.2010.11.003.
[2] N. Chellammal, R. C. Ilambirai, S. SekharDash and K. V. Rahul, "Integration of renewable energy resources in off GRID system using three port zeta converter," 2016 IEEE International Conference on Renewable Energy Research and Applications (ICRERA), 2016, pp. 971-976, doi: 10.1109/ICRERA.2016.7884480.
[3] K. Woranetsuttikul, K. Pinsuntia, N. Jumpasri, T. Nilsakorn and W. Khan-ngern, "Comparison on performance between synchronous single-ended primary-inductor converter (SEPIC) and synchronous ZETA converter," 2014 International Electrical Engineering Congress (iEECON), 2014, pp. 1-4, doi: 10.1109/iEECON.2014.6925855.
[4] Deepak, R. K. Pachauri and Y. K. Chauhan, "Modeling and simulation analysis of PV fed Cuk, Sepic, Zeta and Luo DC-DC converter," 2016 IEEE 1st International Conference on Power Electronics, Intelligent Control and Energy Systems (ICPEICES), 2016, pp. 1-6, doi: 10.1109/ICPEICES.2016.7853596.
[5] R. S. M. Sadigh, "Optimizing PID Controller Coefficients Using Fractional Order Based on Intelligent Optimization Algorithms for Quadcopter," 2018 6th RSI International Conference on Robotics and Mechatronics (IcRoM), 2018, pp. 146-151, doi: 10.1109/ICRoM.2018.8657616.
[6] C. A. Aung, Y. V. Hote, G. Pillai and S. Jain, "PID Controller Design for Solar Tracker via Modified Ziegler Nichols Rules," 2020 2nd
International Conference on Smart Power & Internet Energy Systems (SPIES), 2020, pp. 531-536, doi: 10.1109/SPIES48661.2020.9243009.
[7] C. A. Aung, Y. V. Hote, G. Pillai and S. Jain, "PID Controller Design for Solar Tracker via Modified Ziegler Nichols Rules," 2020 2nd International Conference on Smart Power & Internet Energy Systems (SPIES), 2020, pp. 531-536, doi: 10.1109/SPIES48661.2020.9243009.
[8] G. L. O. Serra and C. C. T. Ferreira, "Takagi-Sugeno fuzzy control method for nonlinear systems," 2009 IEEE International Symposium on Computational Intelligence in Robotics and Automation - (CIRA), 2009, pp. 492-496, doi: 10.1109/CIRA.2009.5423154.
[9] A. H. Besheer, T. M. Abdo and M. M. Halouda, "Regulation for wind generation system using ant system based Takagi Sugeno fuzzy PID," 2011 IEEE International Conference on Fuzzy Systems (FUZZ-IEEE 2011), 2011, pp. 2350-2357, doi: 10.1109/FUZZY.2011.6007484.
262

Optimization of the Quality Assessment of the Information Security System Functioning Khoroshko V.1, Zybin S.2, Khokhlachova Y.3, Ayasrah A.4, Al-Dalvash A.5
1,2,3,4,5 National aviation university, 1, Liubomyra Huzara ave., Kyiv, 03058, Ukraine
Abstract The paper proposes a method for solving the problem, which was formulated. The solution to this problem is based on comparing the characteristics of the functioning of the system under study. Characteristics compares with similar characteristics of a reference on a variety of criteria. This solution can be used when testing systems of various types, purposes and arbitrary level of complexity. This method of presenting the assessment results makes it possible to quickly navigate the totality of the data obtained. And also to carry out a quick search for unsatisfactory functioning elements of the system under study. This technique can be used to select the optimal mode of functioning of the system, to select from a certain class of functional elements to build an optimal system and to consistently modernize the system under study by improving the unsatisfactory functioning elements identified during the assessment process, etc. Keywords 1 Information security systems, quality of systems functioning, optimization of quality assessment.
1. Introduction
The study of the functioning laws for complex dynamic systems of various types (technical, economic, and social) has attracted the attention of researchers for a long time [1,2,3,4,5,6,7,8,9].
Among the eternal problems that arise in this case, the following problems can be singled out as especially important: the choice of optimal modes of operation for such systems, the choice of an optimally functioning system from a certain class of equivalent systems, the quality assessment of complex dynamic systems functioning.
The paper proposes a method for solving the problem, which was formulated. It is based on comparing the characteristics of the system's functioning under study with similar characteristics of a certain reference system according to a number of criteria.
EMAIL: [email protected] (A.1); [email protected] (A.2); [email protected] (A.3); [email protected] (A.4); [email protected] (A.5) ORCID: 0000-0001-6213-7086 (A.1); 0000-0002-2670-2823 (A.2); 0000-0002-1883-8704 (A.3); 0000-0003-4392-1806 (A.4); 0000-0002-1003-9182 (A.5)
2. Main purpose
Obviously, only a versatile, multi-criteria and multi-level assessment will be sufficiently objective. At the same time, its manual acquisition for complex dynamical systems is impossible in practically admissible periods of time. This is impossible even for any particular case due to the large volumes of processed information. One or a little territorial analysis will give only one-sided assessments, while important features of the laws of the systems functioning that are being investigated are often ignored. Therefore, a problem arises related to the development of methods for optimal processing of this information in order to quickly obtain the required estimates.
263

3. Study of the dynamic system functioning
Let's consider a dynamic system, the functioning of which is described by a set of characteristics
𝐴(𝑡) = [𝐴𝑗(𝑡)]𝑗=1𝑚 , 𝑡 ∈ [0, 𝑇],
where T is the time during which the test study was carried out. We assume that each characteristic
𝐴𝑗(𝑡) = [𝐴𝑗𝑖(𝑡)]𝑖=1
𝑛 , 𝑗 = 1, 2, 3 …,
represents a vector of constant values or a vector – a function that describes individual aspects of the system functioning under study (initial, intermediate and final state, phase vector, control vector, etc.) [5].
Let us assume that the system can operate in 𝑙 modes 𝑅𝑞 , 𝑞 = 1, 2, … 3, … , 𝑙. The characteristics of the functioning laws for an information security system (ISS) can be obtained both as a result of experimental research and by means of mathematical modelling of the dynamics of its functioning.
Let us assume that five criteria are used to assess the functioning quality of the system that is being investigated 𝐾𝑝, 𝑝 = 1, 2, 3 … , 𝑝. It is necessary to determine the limits of change of indices and t values. If there is no special need for this, it is omitted. We denote 𝐿𝑗𝑖
𝑘𝑝(𝑡) as the area of
reference values of the component 𝐴𝑗𝑖(𝑡) when the
system operates in the k-th mode according to the p-th evaluation criterion.
Equivalent systems are understood as systems of the same type and purpose, the law of functioning of which is described by a set of characteristics А(𝑡). We denote by 𝐺𝑁-class of equivalent dynamical systems, which includes N elements.
An example of a complex dynamic system is an information security system. Let's simulate the dynamics of the functioning of a ISS, which is a system with many links.
The functioning of the ISS can be described by dynamic, energetic and a number of other characteristics [2, 5]. Each of these characteristics is a multidimensional scalar vector or vector-function, the components of which describe the duration of individual phases of the system's functioning or its behaviour characteristics under various external influences. Among the evaluation criteria, one can point out the deviation from work tolerances, the effectiveness of information protection, the effectiveness of
absorption, etc. The areas of their variation are used as the areas of reference values of the characteristic components. The class of equivalent systems in this case can be a reference system that functions under optimal conditions. In general, the amount of information that needs to be analysed for a sufficiently substantiated objective assessment of the functioning quality of an ISS can clearly exceed that available for non-automated processing [10,11,12,13].
Let us assume that the investigated dynamic system (ISS) is a new (N + 1)-th element of the 𝐺𝑁 class. It is necessary to formulate the problem based on a numerical analysis of the characteristics of the system 𝐴(𝑡) = [𝐴𝑗(𝑡)]𝑗=1
𝑚 . It is necessary to form a sequence of qualitative local estimates for the behavior of the components of these characteristics 𝐴𝑗(𝑡) = [𝐴𝑗
𝑖(𝑡)]𝑗=1,𝑖=1𝑚,𝑛 .
This must be done according to a set of criteria 𝐾𝑝, 𝑝 = 1, 2, 3 … , 5, for a given set of operating modes 𝑅𝑞 , 𝑞 = 1, 2, … 3, … , 𝑙. Based on the resulting set of local estimates, it is necessary to form a sequence of weighted averaged estimates of varying degrees of generality. These assessments make it possible to analyse the features of the behaviour of both individual characteristics of the system and the quality of its functioning as a whole.
Consider a solution technique for the formulated problem. Let us assume that the system under study is assessed according to the p-th criterion when it is operating in the 𝑅𝑞-th mode. To solve the formed problem, we introduce an auxiliary function
𝛼𝑗𝑖(𝑡) = 0, ∀ 𝐴𝑗
𝑖(𝑡) ∈ 𝜃𝑗𝑖𝑘𝑝(𝑡);
𝛼𝑗𝑖(𝑡) = 𝐴𝑗
𝑖(𝑡) − 𝑚𝑎𝑥 𝜃𝑗𝑖𝑘𝑝(𝑡), ∀ 𝐴𝑗
𝑖(𝑡) >
> 𝜃𝑗𝑖𝑘𝑝(𝑡);
𝛼𝑗𝑖(𝑡) = 𝑚𝑖𝑛 𝜃𝑗𝑖
𝑘𝑝(𝑡) − 𝐴𝑗𝑖(𝑡), ∀ 𝐴𝑗
𝑖(𝑡) <
< 𝜃𝑗𝑖𝑘𝑝(𝑡).
Let us introduce the numerical parameters of the local assessment for the i-th component and the j-th characteristic of the system according to the p-th criterion in the k-th mode of operation by the relations
𝑐(𝐴𝑗𝑖 , 𝐾𝑝, 𝑅𝑞) = ||𝛼𝑗
𝑖||𝑐[0,𝑇] = max[𝛼𝑗𝑖(𝑡)],
𝑙(𝐴𝑗𝑖 , 𝐾𝑝, 𝑅𝑞) = ||𝛼𝑗
𝑖||𝐿2[0,𝑇] =
= [∫ (𝛼𝑗𝑖(𝑡))2𝑑𝑡]
1
2𝑇
0.
The system for which 𝑐(𝐴𝑗𝑖 , 𝐾𝑝, 𝑅𝑞) =
𝑙(𝐴𝑗𝑖 , 𝐾𝑝, 𝑅𝑞) = 0 ∀ 𝑗, 𝑖, 𝑅, 𝑞 will be considered a
reference system.
264

Obviously, direct analysis of the entire totality of the numerical parameters of local assessment is a complex problem. This analysis is complicated by the analysis of behaviour for the functioning of the system and functional dependences of 𝐴𝑗
𝑖(𝑡), in the form of graphs, in order to obtain generalized estimates of the functioning of the system under study, which is a dynamic system. The reason for this complexity is in the amount of parameters, which is equal to 5 = 2𝑚𝑛𝑙𝑠 and is large enough.
Suppose that for the characteristic [𝐴𝑗𝑖(𝑡)]𝑗=1
𝑚 of systems for class 𝐺𝑁 certain values
𝑐𝑚𝑖𝑛(𝐴𝑗𝑖 , 𝐾𝑝, 𝑅𝑞) = min 𝑐( 𝐴𝑗
𝑖 , 𝐾𝑝, 𝑅𝑞),
𝑐𝑚𝑎𝑥(𝐴𝑗𝑖 , 𝐾𝑝, 𝑅𝑞) = max 𝑐( 𝐴𝑗
𝑖 , 𝐾𝑝, 𝑅𝑞);
𝑙𝑚𝑖𝑛(𝐴𝑗𝑖 , 𝐾𝑝, 𝑅𝑞) = min 𝑙 (𝐴𝑗
𝑖 , 𝐾𝑝, 𝑅𝑞),
𝑙𝑚𝑎𝑥(𝐴𝑗𝑖 , 𝐾𝑝, 𝑅𝑞) = max 𝑙 (𝐴𝑗
𝑖 , 𝐾𝑝, 𝑅𝑞).
We introduce for each function 𝐴𝑗𝑖(𝑡) under
study (N+1)-th for the dynamic system the illogical arrays of local qualitative estimates:
1) 𝐶𝑗𝑖𝑞𝑝
= 1, ∀ 𝑐(𝐴𝑗𝑖 , 𝐾𝑝, 𝑅𝑞) <
𝑐𝑚𝑖𝑛(𝐴𝑗𝑖 , 𝐾𝑝, 𝑅𝑞) + [𝑐𝑚𝑎𝑥(𝐴𝑗
𝑖 , 𝐾𝑝, 𝑅𝑞) −
𝑐𝑚𝑖𝑛(𝐴𝑗𝑖 , 𝐾𝑝, 𝑅𝑞)]/4, we consider this
assessment is unsatisfactory; 2) 𝐶𝑗𝑖
𝑞𝑝=
2, ∀ 𝑐(𝐴𝑗𝑖 , 𝐾𝑝, 𝑅𝑞) 𝜖{ 𝑐𝑚𝑖𝑛(𝐴𝑗
𝑖 , 𝐾𝑝, 𝑅𝑞) +
[𝑐𝑚𝑎𝑥(𝐴𝑗𝑖 , 𝐾𝑝, 𝑅𝑞) − 𝑐𝑚𝑖𝑛(𝐴𝑗
𝑖 , 𝐾𝑝, 𝑅𝑞)]/4,
𝑐𝑚𝑎𝑥(𝐴𝑗𝑖 , 𝐾𝑝, 𝑅𝑞) − [𝑐𝑚𝑎𝑥(𝐴𝑗
𝑖 , 𝐾𝑝, 𝑅𝑞) −
𝑐𝑚𝑖𝑛(𝐴𝑗𝑖 , 𝐾𝑝, 𝑅𝑞)]/4 }, we consider this
assessment is satisfactory; 3) 𝐶𝑗𝑖
𝑞𝑝= 3, ∀ 𝑐(𝐴𝑗
𝑖 , 𝐾𝑝, 𝑅𝑞) > 𝑐𝑚𝑎𝑥(𝐴𝑗
𝑖 , 𝐾𝑝, 𝑅𝑞) − [𝑐𝑚𝑎𝑥(𝐴𝑗𝑖 , 𝐾𝑝, 𝑅𝑞) −
𝑐𝑚𝑖𝑛(𝐴𝑗𝑖 , 𝐾𝑝, 𝑅𝑞)]/4, we consider this
rating is good. Similarly, arrays 𝐿𝑗𝑖
𝑞𝑝 are introduced for primary assessment parameters. Obviously, graduation of estimates depending on the needs can be narrowed or expanded. Note that when the class 𝐺𝑁 is expanding (Introduce (N+1)-th element), the change in value 𝑐(𝑙)𝑚𝑖𝑛(𝐴𝑗
𝑖 , 𝐾𝑝, 𝑅𝑞) in order to "unreliable recognition" limits of estimation is inappropriate, unlike 𝑐(𝑙)𝑚𝑎𝑥(𝐴𝑗
𝑖 , 𝐾𝑝, 𝑅𝑞). Naturally, the wider class 𝐺𝑁, the score will be more objective, high-quality and accurate.
We formally form on the basis of a set of local qualitative assessments of varying degrees of generality until the final conclusion on the quality of the functioning of the studied dynamic system.
Such a construction will be carried out in two directions, which can be changed vertical and horizontal, which corresponds to a method for further evaluation that facilitates their perception and qualitative analysis.
The assessment in the vertical direction makes it possible to analyse the behaviour of individual characteristics or the system as a whole according to the corresponding parameter, criterion or mode, namely:
Step 1. For the separate type of estimated parameter for a set of components of each characteristics for a digital evaluation criterion
𝑉𝑗,𝑐𝑞,𝑝
= ∑ 𝜌𝐴𝑗
𝑖 𝑐𝑗𝑖𝑞𝑝𝑛
𝑖=1 / ∑ 𝜌𝐴𝑗
𝑖𝑛𝑖=1 ,
𝑉𝑗,𝐿𝑞,𝑝
= ∑ 𝜌𝐴𝑗
𝑖 𝐿𝑗𝑖𝑞𝑝𝑛
𝑖=1 / ∑ 𝜌𝐴𝑗
𝑖𝑛𝑖=1 ,
where {𝜌𝐴𝑗
𝑖 }𝑖=1
𝑛– are weight coefficients that
determine the significance of the component of the system characteristics. Here and then the values of weight coefficients are determined by the experts exploring the dynamic systems under consideration in accordance with the specifics of the latter or the objectives of the study itself. The assessment of the values 𝑉𝑗,𝑐
𝑞,𝑝 (𝑉𝑗,𝐿𝑞,𝑝) are made
similarly to the valuation by values. 𝐶𝑗𝑖𝑞𝑝 (𝐿𝑗𝑖
𝑞𝑝). Step 2. For the separate evaluation criterion for
the set of estimated parameters 𝑉𝑗,
𝑞,𝑝= (𝜌𝑐𝑉𝑗,𝑐
𝑞,𝑝+ 𝜌𝐿𝑉𝑗,𝐿
𝑞,𝑝)/(𝜌𝑐 + 𝜌𝐿),
where 𝜌𝑐 , 𝜌𝐿 – are weighing coefficients that determine the importance of evaluation parameters.
Step 3. For the certain mode, the functioning of the assessment criteria
𝑉𝑗,𝑞
= ∑ 𝜌𝐾𝑝𝑠𝑝=1 𝑉𝑗,
𝑞,𝑝/∑ 𝜌𝐾𝑝
𝑠𝑝=1 ,
where {𝜌𝐾𝑝}
𝑝=1
𝑠 – are weighing coefficients
determining the importance of evaluation criteria. The assessment in the horizontal direction
makes it possible to analyse the behaviour of individual components of the specific characteristic or characteristics of the system as a whole according to the corresponding parameter, criterion or mode, namely:
Step 1. For the separate type of estimated parameter for the aggregate evaluation criteria separately each component characteristics
𝐻𝑖,𝑐𝑗,𝑞
= ∑ 𝜌𝐾𝑝
𝑠𝑝=1 𝑐𝑗𝑖
𝑞𝑝/ ∑ 𝜌𝐾𝑝
𝑠𝑝=1 ,
𝐻𝑖,𝐿𝑗,𝑞
= ∑ 𝜌𝐾𝑝
𝑠𝑝=1 𝐿𝑗𝑖
𝑞𝑝/ ∑ 𝜌𝐾𝑝
𝑠𝑝=1 ;
Step 2. For used estimated parameters for the aggregate criteria for estimating relative each component characteristics
265

𝐻𝑖𝑗,𝑞
= (𝜌𝑐𝐻𝑖,𝑐𝑗,𝑞
+ 𝜌𝐿𝐻𝑖,𝐿𝑗,𝑞
)/(𝜌𝑐 + 𝜌𝐿);
Step 3. For the separate mode of functioning by set of components. Characteristics
𝐻𝑗,𝑞
= ∑ 𝜌𝐴𝑗
𝑖𝑛𝑖=1 𝐻𝑖,
𝑗,𝑞/ ∑ 𝜌𝐴𝑗
𝑖𝑛𝑖=1 .
Obviously, the following statement is right The statement 1. 𝐻𝑖
𝑞 ≡ 𝑉𝑗𝑞 = V𝐻𝑖
𝑞. Note that the assessments of the last level
characterize the behaviour of individual characteristics of the system in terms of the set of parameters in specified modes and functioning.
The graphic results of the first stage of the assessment are shown in Figure 1.
The values of 𝐶𝑗𝑖𝑞𝑝(𝐿𝑗𝑖
𝑞𝑝) correspond to the
elements of the table that are at the intersection of the rows 𝐴𝑗
𝑖 and the columns C(L), the rest are estimates of the 1-3rd generality.
Figure 1: The graphic results of the first stage Wherein
- good, - satisfactorily, - unsatisfactorily.
The main advantage of the proposed method
for presenting the assessment results is the ability to track the unsatisfactory functioning of individual elements of the system in order to determine the causes of failures.
The next stage of generalized weighted estimates is determined as follows: in the vertical direction – according to the totality of characteristics for the digital mode of operation, i.e.
𝑉𝐻𝑘 = ∑ 𝜌𝐴𝑗
𝑚𝑗=1 𝑉𝐻𝑗,
𝑄/∑ 𝜌𝐴𝑗
𝑚𝑗=1 ,
where {𝜌𝐴𝑗}
𝑗=1
𝑚 – are weighting factors that
determine the significance of the characteristic of the system.
In the horizontal direction, the assessment is carried out according to the set of modes for each
characteristic of the investigated dynamic protection system, i.e.
𝑉𝐻 = ∑ 𝜌𝑅𝑞
𝑙𝑞=1 𝑉𝐻𝑗,
𝑞/ ∑ 𝜌𝑅𝑗
𝑙𝑞=1 ,
where {𝜌𝑅𝑞}
𝑞=1
𝑙 – are weighting factors that
determine the significance of the modes of functioning of the system.
The following statement is obvious. The statement 2.
∑ 𝜌𝑅𝑞𝑙𝑞=1 𝑉𝐻𝑗,
𝑞/ ∑ 𝜌𝑅𝑞𝑙𝑞=1 = ∑ 𝜌𝐴𝑗
𝑚𝑗=1 𝑉𝐻𝑗/
∑ 𝜌𝐴𝑗= 𝑉𝐻𝑚
𝑗=1 .
The VH value makes it possible to make a final conclusion about the quality of the functioning of the investigated protection system (dynamic) as a whole. The graphically generalized results of the estimates obtained at the second stage are shown in Figure 2. The elements of the table, which are at the intersection of rows 𝐴𝑗 and columns Rq, correspond to the values 𝑉𝐻𝑗
𝑞, the rest are estimates of the 4th level of generalization and the final conclusion about the quality of the system.
Figure 2: The graphically generalized results
Wherein
- good, - satisfactorily, - unsatisfactorily.
Based on the results obtained, the procedure
has been developed for the transition from generalized assessments of the highest to those of the lowest level up to the possibility of a detailed qualitative and quantitative analysis of the behaviour of components for a separate characteristic of the studied protection system according to a specific criterion for a given mode of operation of the system [5, 6, 7]. This is necessary to determine the reasons for obtaining unsatisfactory quality ratings.
∙∙∙ ∙∙∙
C L ∙∙∙ C L ∙∙∙ C L
∙∙∙ ∙∙∙
∙∙∙ ∙∙∙ ∙∙∙ ∙∙∙ ∙∙∙ ∙∙∙ ∙∙∙ ∙∙∙ ∙∙∙ ∙∙∙ ∙∙∙ ∙∙∙ ∙∙∙ ∙∙∙ ∙∙∙
∙∙∙ ∙∙∙
∙∙∙ ∙∙∙ ∙∙∙ ∙∙∙ ∙∙∙ ∙∙∙ ∙∙∙ ∙∙∙ ∙∙∙ ∙∙∙ ∙∙∙ ∙∙∙ ∙∙∙ ∙∙∙ ∙∙∙
∙∙∙ ∙∙∙
∙∙∙ ∙∙∙
∙∙∙ ∙∙∙
∙∙∙ ∙∙∙
∙∙∙ ∙∙∙ ∙∙∙ ∙∙∙ ∙∙∙ ∙∙∙ ∙∙∙
∙∙∙ ∙∙∙ ∙∙∙ ∙∙∙ ∙∙∙ ∙∙∙ ∙∙∙
266

4. Conclusions
This article proposes the methodology for a versatile, multi-criteria and multi-level assessment of the functioning quality for the information security system. This system is dynamic. The technique can be used for testing systems of various types, purposes, and arbitrary levels of complexity.
The proposed method of presenting the results of the assessment makes it possible to quickly navigate in the totality of the data obtained, as well as to quickly search for unsatisfactory functioning elements of the system under study.
In addition, this technique can be used to select the optimal mode for the system operating, select from a certain class of functional elements to build an optimal system and consistently modernize the system under study by improving the unsatisfactory functioning elements identified during the assessment process, etc.
5. References
[1] Stefan Thurner, Rudolf Hanel, and Peter Klimek. Introduction to the Theory of Complex Systems. Oxford University Press. – 2018.
[2] Tymoshenko A.O. Methods for the analysis and design of systems to obtain information / A.O. Tymoshenko - K: Politechnika, 2007.
[3] Tomashevsky V.M. Model of systems / V.M. Tomashevsky – K: View. group BHV, 2007.
[4] Mark L. Agranovsky, Matania Ben-Artzi, Greg Galloway, Lavi Karp, Vladimir Maz’ya, Simeon Reich, David Shoikhet, Gilbert Weinstein, and Lawrence Zalcman, Editors. Complex Analysis and Dynamical Systems VII (Contemporary Mathematics). Amer Mathematical Society. – 2017.
[5] Ivakhnenko A.G. Modeling of complex systems based on experimental data / A.G. Ivakhnenko, Yu.P. Yurachkovsky – M: Radio and communication, 2000.
[6] Ho, Y. J.; Ruiz Estrada, M. A; Yap, S. F. "The evolution of complex systems theory and the advancement of econophysics methods in the study of stock market crashes". Labuan Bulletin of International Business & Finance. – (2016). Vol. 14: 68 – 83.
[7] Zgurovsky M.Z. Technological foresight / M. V. Zgurovsky, N. D. Pankratova – K: Polytechnic, 2005.
[8] Hiroki Sayama. Introduction to the Modeling and Analysis of Complex Systems. Open SUNY Textbooks. – 2015.
[9] Koval V.N. Applied systems for the analysis of multidimensional processes / V.N. Koval – K: Naukova Dumka, 2002.
[10] Khoroshko V.O. Bagatocriterial assessment of the efficiency of projects for the safety of cybersecurity / V.O. Khoroshko, M.Y. Shelest, Yu.M. Weaver // Technical sciences and technologies, No. 1 (19), (2020): 121–131.
[11] S. Zybin, V. Khoroshko, V. Maksymovych, I. Opirskyy. Effective Distribution of Tasks in Multiprocessor and Multi-Computers Distributed Homogeneous Systems. // International Journal of Computing. VOLUME 20(2), (2021): 211 – 220.
[12] І. Оpirskyy, S. Zybin, V. Horoshko. Analysis of Mathematical Models of Functioning Scalar Multiprocessor Systems. // Information systems and networks. Volume 6, (2019): pp. 66 – 78.
[13] V. Khoroshko, S. Zybin, N. Brailovskyi, Y. Khokhlachova. Conflict situations and interactions of the parties. // Scientific and Practical Cyber Security Journal (SPCSJ) 5(1), (2021): 22-34. URL: https://journal.scsa.ge/papers/conflict-situations-and-interactions-of-the-parties/
267

Correlation Immunity of Many-Valued Logic Component Functions of Modern Cryptographic Algorithm S-Boxes Nadiia Kazakova 1, Artem Sokolov 2 and Alexander Troyanskiy 3
1 Department of Information Technologies, Odessa State Environmental University, Odessa, 65016, Ukraine. 2 Department of Cybersecurity and Software, Odessa National Polytechnic University, Odessa, 65044, Ukraine. 3Department of Radioelectronic and Telecommunication Systems, Odessa National Polytechnic University, Odessa, 65044, Ukraine.
Abstract The development of modern cryptanalysis methods, in particular, with the use of many-valued logic functions, leads to the need for a more detailed research of the correlation properties of S-boxes of modern cryptographic algorithms. In this paper, we introduce indicators for the maximum and integral deviation of a many-valued logic functions on the basis of criterion for the independence of its output from the input variables. These indicators are a convenient tool for comparative analysis of the correlation properties of S-boxes of various lengths when they are represented using the many-valued logic functions with different bases q. The research and comparative analysis of the S-boxes of the AES and Kalyna cryptographic algorithms was performed, which showed a general tendency of a decreasing of their correlation properties with an increase in the value of representation base q, and also made it possible to establish that for all values of the representation base q, the correlation properties of the Kalyna cryptographic algorithm S-box are weaker than the correlation properties of the AES cryptographic algorithm S-box. Keywords 1 Cryptography, many-valued logic function, correlation immunity.
1. Introduction and problem statement
Block symmetric ciphers are one of the most important components of modern cybersecurity systems, the task of which is to make it impossible to access transmitted or stored information without knowing the key. Nevertheless, the rapid increase in the computing power of modern information systems, development of the mathematical methods of cryptanalysis, as well as the prospects for the creation of quantum computers lead to the need for continuous improvement of the structure and components of modern block symmetric ciphers.
The issues of improving modern cryptographic algorithms are inextricably linked with the theory of estimation of their cryptographic quality. The modern theory of estimation of the cryptographic
EMAIL: [email protected] (A. 1); [email protected] (A. 2); [email protected] (A. 3) ORCID: 0000-0003-3968-4094 (A. 1); 0000-0003-0283-7229 (A. 2); 0000-0001-9755-6010 (A. 3)
quality of block symmetric ciphers involves the representation of their constituent parts (first of all, S-boxes) using component Boolean functions [1, 2]. Further, cryptographic quality criteria are applied to the obtained Boolean functions, each of which reflects the ability of the Boolean function to resist one or another cryptanalysis attack, as well as to provide a sufficient level of diffusion and confusion [3].
However, publications in the field of cryptography [4] show an increasing need to research all possible representations of S-boxes, in particular, using functions of many-valued logic. Research [5] is devoted to the method of estimation of the nonlinearity, as well as avalanche characteristics of S-boxes of modern cryptographic algorithms, represented by functions of many-valued logic.
Nevertheless, the results of the analysis of the correspondence of the constructions of modern
268

cryptographic algorithms to the criterion of correlation immunity of functions of many-valued logic are not presented in the open sources.
The purpose of this paper is to perform a comparative analysis of the correlation immunity of the cryptographic algorithms AES (USA) and Kalyna (Ukraine) when they are represented by the many-valued logic functions.
2. Correlation immunity of many-valued logic functions
The definition of the correlation immunity of Boolean functions is widely known [6], which can be specified through the definition of a subfunction of a Boolean function.
Definition 1 [6]. A Boolean function ( )f x ,
kx V , is called as correlation-immune of order m , 1 m k if its output 1( )ky f x and any set of m its input variables are statistically independent.
Definition 2 [6]. A subfunction of a Boolean function ( )f x , kx V , is a function f obtained by substitution in f constants "0" or "1" instead of a part of variables. If we substitute constants
1, ,
si i in the function f instead of variables
1, ,
si ix x , respectively, then the resulting
subfunction is denoted 1
1
, ,, ,
i i s
i i sx xf
. If a constant is
not substituted for a variable ix , then ix is called as a free variable.
For example, let a Boolean function 1 2 3( , , )f x x x be given, then its subfunctions will
be 1 2( , ,0)f x x , 1 2( , ,1)f x x , 1( ,0,0)f x ,
1( ,0,1)f x , etc. Definition 3 [6]. Boolean function ( )f x ,
kx V , is called correlation-immune of order m , 1 m k if weight is equal to
( ) ( ) / 2mwt f wt f , for any of its subfunctions f of k m variables.
In [7], the theoretical foundations for estimating the correlation immunity of functions of many-valued logic were developed, while in [8], definitions of the independence of the output of a 3-function from its input variables, as well as the definition of the correlation immunity of a 3-function were introduced. The basis of these definitions is the definition of the imbalance of functions of many-valued logic.
Consider an arbitrary sequence over the alphabet {0,1,..., 1}q
{0,1,..., 1}, 0,1,..., 1if q i N . (1)
Note that the elements of a given sequence (1) can be represented in exponential form by an unambiguous transformation
2 π 2 π0 1
2 π( 1)0 1
1
0 ,1 ,...,
1 .
j jq q
j qq
q
z e z e
q z e
(2)
For a given sequence (1), it is possible to introduce a vector 0 1 1{ , ,..., }qK K K K , where the coefficients uK characterize the number of occurrences of a character {0,1,..., 1}u q in the sequence f .
Definition 4. An imbalance of a sequence f is the absolute value of the sum of element-wise products of vector K elements by the corresponding elements of the exponential alphabet 0 1 1{ , ,..., }qz z z
0 0 1 1 1 1( ) ... q qf K z K z K z . (3)
The definitions of the independence of the output of a 3-function from its input variables, as well as the definition of the correlation immunity of a 3-function, introduced in [8] using Definition 4 of the imbalance of a many-valued logic function can be generalized to the case of q-functions for an arbitrary value of q.
Definition 5 [8]. It is said that the output of a q-function ( )f x does not depend on the group of its input variables { }ix , 1,...,i m if, when substituting any constants
1, , {0,1,... 1}
si i q instead of these variables, the imbalance of the subfunctions
obtained in this way is ( ) fmf
q
.
Note, however, that the correlation immunity of component Boolean functions, as well as component many-valued logic functions, is a rather stringent requirement that is not met for most S-boxes used in practice. This circumstance poses the task of developing a mathematical apparatus for performing a comparative analysis of the degree of correspondence of S-boxes to the correlation immunity criterion of component q-functions.
The Definition 5 gives us the possibility to estimate the degree of deviation of the many-valued logic functions and S-boxes from the criterion of correlation immunity by introducing
269

two basic indicators of cryptographic quality: the maximum and integral deviation from the criterion of independence of the output of many-valued logic functions from their input.
Let's consider these indicators on a specific example, and then apply them to specific cryptographic algorithms.
Let an S-box of length 16N be given, which can be represented in the form of four component Boolean functions, as well as in the form of two component 4-functions.
20
21
22
23
40
41
12 0 21413113 5 1 715 910 6 4 80 0 0 0 1 1 1 1 1 1 1 1 0 0 0 00 0 1 1 0 1 1 0 0 1 1 0 1 1 0 01 0 0 1 1 0 0 1 0 1 1 0 0 1 1 01 0 0 1 1 1 0 0 0 0 1 1 1 0 0 10 0 2 2 1 3 3 1 1 3 3 1 2 2 0 03 0 0 3 3 2 0 1 0 1 3 2 2 1 1 2
Sffffff
(4)
We begin our research with the first component Boolean function 20f , for which, in accordance with Definition 3, we find all its subfunctions of three variables
20 1 2 3
20 1 2 4
20 1 3 4
20 2 3 4
20 1 2 3
20 1 2 4
( ( , , ,0) [00111100]) 4;( ( , ,0, ) [00111100]) 4;( ( ,0, , ) [00001111]) 4;( (0, , , ) [00001111]) 4;( ( , , ,1) [00111100]) 4;( ( , ,1, ) [00111100]) 4;
wt f x x xwt f x x xwt f x x xwt f x x xwt f x x xwt f x x xwt
20 1 3 4
20 2 3 4
( ( ,1, , ) [11110000]) 4;( (1, , , ) [11110000]) 4.
f x x xwt f x x x
(5)
Since the weight of each of the subfunctions (5) is equal to 4, i.e. they are balanced, the first component Boolean function 20f (4) corresponds to the criterion of correlation immunity. It is possible to verify that all other component Boolean functions of the S-box (4) also corresponds to the criterion of correlation immunity.
Consider the S-box (4) from the point of view of its possible representation by component 4-functions. Let us find the subfunctions of the component 4-function 40f of the S-box (4)
40 1
40 1
40 1
40 1
40 2
40 2
40 2
40 2
( ( ,0) [0112]) 2;( ( ,1) [0332]) 2;( ( ,2) [2330]) 2;( ( ,3) [2110]) 2;( (0, ) [0022]) 0;( (1, ) [1331]) 0;( (2, ) [1331]) 0;( (3, ) [2200]) 0.
f xf xf xf xf xf xf xf x
(6)
In a similar way, we can find subfunctions for the component function 41f of the S-box (4)
41 1
41 1
41 1
41 1
41 2
41 2
41 2
41 2
( ( ,0) [3302]) 2;( ( ,1) [0211]) 2;( ( ,2) [0031]) 2;( ( ,3) [3122]) 2;
( (0, ) [3003]) 8;( (1, ) [3201]) 0;( (2, ) [0132]) 0;
( (3, ) [2112]) 8.
f xf xf xf x
f xf xf x
f x
(7)
Analysis of expressions (6) and (7) shows that not all subfunctions of the component 4-function
40f , as well as subfunctions of the component function 41f , are balanced, which means that the S-box (4) does not correspond to the criterion of correlation immunity of component 4-functions.
To solve the problem of quantitative estimating of the compliance of the S-box with the criterion of correlation immunity, we introduce the indicators of the maximum and integral deviation from the compliance with the criterion of the independence of the S-box output from its input variables.
Definition 6. The maximum deviation of an S-box from the criterion of independence of the output from the input variables when it is represented by component q-functions is the maximum among all deviations from the criterion of independence of the output from the input variables of its component q-functions.
In our case, the S-box (4) corresponds to the criterion of correlation immunity of component Boolean functions, therefore, its maximum deviation from the criterion of independence of the output from the input variables when it is represented by component Boolean functions is equal to max 2 0if .
In the case of representation by component 4-functions, the maximum deviation from the
270

criterion for the independence of the output from the input variables is max 4 8 2.8284if .
It is obvious that the maximum possible value of the maximum deviation of the q-function from the criterion of the independence of the output from the input variables is the maximum value of the imbalance of the q-function of 1k variables, that is maxmax{ }qif N q . In the case of representing an S-box of length 16N using component 4-functions the maximum value of the maximum deviation from the criterion of independence of the output from the input variables would reach max 4max{ } 16 4 4if . I.e. the maximum deviation from the criterion of independence of the output from the input variables among the component functions for our S-box (4) is 70.71% of its maximum value.
Definition 7. The integral deviation of the S-box from the criterion of independence of the output from the input variables when it is represented by component q-functions is the total value of all deviations from the criterion of independence of the output from the input variables of its component q-functions
0
k
qi qii
f f
. (8)
In our example, in view of the compliance of the S-box (4) with the criterion of correlation immunity of component Boolean functions, its integral deviation from the criterion of the independence of the output from the input variables is equal to 2 0if .
In the case of representation using component 4-functions, and using (8), we obtain that the integral deviation of the S-box (4) from the criterion for the independence of the output from the input variables is 0 8qf for the first
component 4-function and 1 13.6569qf for the second component 4-function.
It is obvious that the maximum value of the integral deviation of the q-function from the criterion for the independence of the output from the input variables is
1max{ } kqif q z , (9)
where z is the number of subfunctions of the q-function.
In our case, the maximum value of the integral deviation of the q-function from the criterion of the independence of the output from the input variables is 4max{ } 4 8 32if , i.e. the 4-function 40f is characterized by the integral
deviation from the criterion of the independence of the output from the input variables equal to 25% of the maximum value, while for the component function 41f this indicator is 42.68%.
Note also that since the S-box (4) consists of two component 4-functions, the total value of the integral deviation for the two component 4-functions is equal to 0 1 21.6569q qf f , which is 33.84% of the maximum value equal to
4max{ } 64S . Note also that for the cryptographic algorithms
AES and Kalyna which are researched in this paper, the length of the S-boxes used is 256N , respectively, the maximum value of the maximum deviation of the Boolean function from the criterion for the independence of the output from the input variables is
max 2max{ } 256 2 128,if while the maximum value of the maximum deviation of the 4-functions from the criterion for the independence of the output from the input variables is
max 4max{ } 256 4 64if . In this case, the maximum value of the
maximum deviation of the 16-function from the criterion for the independence of the output from the input variables is
max 16max{ } 256 16 16.if The maximum value of the integral deviation
of the Boolean function from the criterion for the independence of the output from the input variables is 2max{ } 128 16 2048if , while this indicator for the entire S-box will be
2max{ } 8 2048=16384S . The maximum value of the integral deviation
of the 4-function from the criterion for the independence of the output from the input variables is 4max{ } 64 16 1024if , while this indicator for the entire S-box will be
4max{ } 4 1024=4096S . The maximum value of the integral deviation
of the 16-function from the criterion for the independence of the output from the input variables is 16max{ } 16 32 512if , while this indicator for the entire S-box will be
16max{ } 2 512=1024S .
271

3. Indicators of deviation from the criterion of correlation immunity of S-boxes of modern ciphers
In this paper, we research the deviation from the criterion of correlation immunity of S-boxes of cryptographic algorithms AES (USA) [9], as well as Kalyna (Ukraine) [10].
The cryptographic algorithm AES is based on a Nyberg construction S-box [11], which is defined using a mapping in the form of multiplicatively inverse elements of the Galois field (2 )kGF
1 modd[ ( ), ], , (2 )ky x f z p y x GF , (10)
which is generally combined with the affine transformation
, , (2 )kb A y a a b GF , (11)
where the standard AES irreducible over the field 8(2 )GF polynomial is used as a polynomial
( ),f z
A is a non-singular affine transformation matrix, a is a the shift vector, 2p is the characteristic of the extended Galois field, 8k , and 10 0 , , , ,a b x y are the elements of the extended Galois field (2 )kGF , which are considered as decimal numbers, or binary vectors, or polynomials of degree 1k .
In this paper, we consider the AES S-box of the Nyberg construction without using the affine transformation (11), as well as with its application.
The indicators of the maximum and integral deviation from the criterion of independence of the output vectors from the input variables for the AES cryptographic algorithm are presented in Table 1.
Table 1 Maximum and integral deviation from the criterion of independence of the output vectors from the input variables of the S-box of the AES cipher
S-box
Boolean representation Representation by the 4-
functions Representation by the
16-functions
max 2if ,
(%) 2if , (%) max 4if ,
(%) 4if ,
(%) max 16if ,
(%) 16if ,
(%)
AES without affine
transformation 16, (12.5%)
924, (5.64%)
11.402, (17.82%)
440.7, (10.76%)
8.676, (54.23%)
237.272, (23.17%)
AES with affine transformation
16, (12.5%) 892,
(5.44%) 14.7648, (23.07%)
383.1386, (9.35%)
7.4542, (46.59%)
214.5931, (20.95%)
Analysis of the data presented in Table 1
shows a tendency towards an increase in both the maximum and integral deviation from the criterion of independence of the output vectors from the input variables of the AES cipher with an increase in the representation base q. At the same time, the use of an affine transformation insignificantly reduces the growth of this value (except for the maximum deviation from the criterion of independence of the output vectors from the input variables of 4-functions), but the deviation even in this case is quite strong.
Ukraine has developed its own block symmetric cryptographic algorithm Kalyna, which was adopted as the standard DSTU 7624: 2014 “Information technologies. Cryptographic data security. Symmetric block transformation algorithm” [12].
Today, there are several options for the implementation of the Kalyna cryptographic algorithm, which differ in the key length: Kalyna-128, Kalyna-256 and Kalyna-512. However, they all use the same cryptographic primitives on which the cryptographic quality of the cryptographic algorithm relies.
272

The Kalyna block symmetric cipher is characterized by the use of an SP-network and thus has an AES-like structure. The basis of the Kalyna cryptographic transformation is its nonlinear elements, which are four permutations specified in [12].
The indicators of the maximum and integral deviations from the criterion for the independence of the output vectors from the input variables for the permutations 0 1 2 3, , , are presented in Table 2.
Note at the same time that in view of the fact that the overall quality of the cipher is determined by the weakest of its constituent elements [1], in order to demonstrate the overall quality of the Kalyna cryptographic algorithm, the smallest values of the maximum and integral deviations from the criterion for independence of the output from the input vectors are selected in the last row of Table 2.
Table 2 Maximum and integral deviation from the criterion for independence of the output vectors from the input variables of the Kalyna cipher S-box
S-box
Boolean representation Representation by the 4-
functions Representation by the
16-functions
max 2if ,
(%) 2if ,
(%) max 4if ,
(%) 4if ,
(%) max 16if ,
(%) 16if ,
(%)
0 20,
(15.63%) 880,
(5.37%) 15.232, (23.8%)
387.491, (9.46%)
9.251, (57.82)
238.613, (23.3%)
1 22,
(17.19%) 820,
(5.01%) 15.033,
(23.49%) 358.180, (8.74%)
8.958, (55.99)
212.275, (20.73%)
2 20,
(15.63%) 852,
(5.2%) 14.213,
(22.21%) 402.545, (9.83%)
8.237, (51.48%)
221.404, (21.62%)
3 20,
(15.63%) 964,
(5.88%) 17.493,
(27.33%) 454.290, (11.09%)
8.246, (51.54%)
241.167, (23.55%)
Overall cipher quality
22, (17.19%)
964, (5.88%)
17.493, (27.33%)
454.290, (11.09%)
9.251, (57.82)
241.167, (23.55%)
Analysis of the data presented in Table 2
shows a steady increase in both the maximum and integral deviation from the criterion for independence of the output vectors from the input variables of the S-boxes of the Kalyna cipher with an increase in the representation base q. For the convenience of comparing the correlation properties of the AES cipher S-box (with affine transformation) and the Kalyna cipher S-box the Fig. 1 shows the graphs of changes in the maximum (a) and integral (b) deviation from the criterion of independence of the output vectors from the input variables for these cryptographic algorithms.
Analysis of the data presented in Fig. 1 shows that both the maximum and integral deviation of the S-boxes of the AES and Kalyna cryptographic algorithms from the criterion for the independence of the output vectors from the input variables show an increase with an increase in the representation base q. At the same time, the Kalyna cryptographic algorithm has a significantly higher level of the maximum and integral deviation from the criterion for the independence of the output vectors from the input variables.
273

a)
b)
Figure 1: Graphs of changes in the maximum and integral deviation from the criterion for independence of the output vectors from the input variables of the ciphers AES and Kalyna
4. Conclusions
1. The development of cryptanalysis methods necessitates a more detailed research of the structure of modern cryptographic algorithms, not only when they are represented by Boolean functions, but also when they are represented by functions of many-valued logic. In this paper, on the basis of the criterion for the independence of the output of many-valued logic functions from their input variables, the indicators of the maximum and integral deviation from the
criterion for the independence of the output of many-valued logic functions from their input variables are introduced. For these indicators, the maximum possible values for the given N and q are obtained. These indicators are applicable to individual functions of many-valued logic, as well as to S-boxes of various lengths with all their possible representations, and allow a comparative analysis of the correlation properties of S-boxes of modern cryptographic algorithms when they are represented by functions of many-valued logic.
2. The analysis of S-boxes of modern cryptographic algorithms AES and Kalyna was
274

performed, which showed that S-boxes of both ciphers demonstrate a decrease in correlation properties with an increase in the representation base q. At the same time, for all values of the representation base q, the correlation properties of the Kalyna cryptographic algorithm are weaker than the correlation properties of the S-box of the AES cryptographic algorithm.
3. Research shows the possibilities for further improvement of the nonlinear transformation of the Ukrainian cryptographic algorithm Kalyna due to its representation by functions of many-valued logic, in conjunction with the fact that the DSTU 7624: 2014 standard allows the use of other, more advanced nonlinear elements, increases the relevance of the development of new cryptographic constructions, which are optimal from the point of view of criteria for the cryptographic quality of functions of many-valued logic.
5. References
[1] O.N. Zhdanov, Methodology for selecting the key information for a block cipher algorithm, Moscow, INFRA-M, 2013, 90 p.
[2] A.V. Sokolov, New methods for synthesis of nonlinear transformations of modern ciphers, Lap Lambert Academic Publishing, Germany, 2015, 100 p.
[3] C.E. Shannon, A Mathematical Theory of Cryptography, Bell System Technical Memo, 1945, MM 45-110-02.
[4] T. Baigneres, J. Stern, S. Vaudenay, Linear cryptanalysis of non binary ciphers, International Workshop on Selected Areas in Cryptography, 2007, Springer, Berlin, Heidelberg, pp. 184-211.
[5] A.V. Sokolov, O.N. Zhdanov, Cryptographic constructions based on many-valued logic functions. Monograph, Moscow: Scientific Thought, 2020, 192 p. doi:10.12737/1045434
[6] A.A. Salnikov, O.A. Logachev, Boolean Functions in Coding Theory & Cryptography, Universities Press (India) Private Limited, 2017, 334 p.
[7] K. Gopalakrishnan, D.R. Stinson, Three characterizations of non-binary correlation-immune and resilient functions, Designs, Codes and Cryptography, 5, P. 241-251. doi: 10.1007/bf01388386
[8] A.V. Sokolov, O.N. Zhdanov, Correlation immunity of three-valued logic functions,
Journal of Discrete Mathematical Sciences and Cryptography, 2020. P. 1-17. doi:10.1080/09720529.2020.1781882
[9] FIPS 197, 2001. [Electronic resource] Advanced encryption standard. http://csrc.nist.gov/publications/
[10] I. D. Gorbenko, R.V. Olyynikov, O.V. Kazimirov et al., Symmetric block cipher Kalyna is a new national standard of Ukraine, Radio engineering, 2015, (181), pp. 5-22.
[11] K. Nyberg, Differentially uniform mappings for cryptography, I Advances in cryptology, Proc. of EUROCRYPT’93. Berlin, Heidelberg, New York, Lecture Notes in Compuer Science, Springer-Verlag, vol. 765, pp. 55-65, 1994. doi:10.1007/3-540-48285-7_6
[12] DSTU 7624: 2014 Information technologies. Cryptographic data security. Symmetric block transformation algorithm, Ministry of Economic Development of Ukraine, 2016. 221 p.
275

Machine Learning Concepts And Applications Yusifov Mahammad1, Lala Bakirova 2
1,2 Azerbaijan State Oil and Industry University 1, 34 Azadliq Avenue, Baku, AZ1000, Azerbaijan
Abstract The thesis includes the main basic concepts of machine learning and its applications. For simplest possible explanation of machine learning concepts, handwritten number recognition software has been represented and on this application, concepts like artificial neurons, weights, edges, connections and others has been explained. Layered structure of artificial network, artificial neuron activation value. What is edges shapes? How the recognition process happening, what is neural network and neurons? What is weight and activation value, Sigmoid and ReLU function? What is the parameter of connections between neurons? These questions and others has been covered in this article. Keywords 1 Neural network, artificial intelligence, neurons, auto recognition, activation, weight
1. Introduction
Machine learning is a field of science that covers mathematical complex calculations and equations in order to make computers imitate the “learning” process of humans. This process involves a computer algorithm that builds models based on given training data to make proper decisions without being manually programmed by a developer [2]. Machine learning is considered as an important functionality and branch of Artificial Intelligence and the applications of this interesting technology are very wide: Speech recognition and other image recognition techniques, computer vision, email spam, and malware filtering, virtual personal assistant, online fraud detection, self-driving cars, stock market trading, and medicine. And this list can be expandable. In this thesis, main concepts and applications of machine learning will be covered.
2. Neural network
The artificial neural network is a set of connected units that each represents a neuron, like in the human brain. Every neuron can be considered as a function that takes input as a number and passes as output to the next so-called artificial neuron [1]. Figure 1 is an example of artificial neural network that consists of input,
EMAIL: [email protected] (A. 1); [email protected] (A. 2) ORCID: 0000-0002-4295-8642 (A. 1); 0000-0003-0584-7916 (A. 2)
output and some additional hidden layers that can be considered as black box for now.
Figure 1: Artificial neural network
In every layer, neurons are connected to each
other via weights that can be modified with result of learning or training process. Next, we can take simple example application handwritten number recognition and go through these concepts of neurons.
2.1. Handwritten number recognition
Although it is not so challenging to humans to understand the number on the left which is sloppy written by me, for computers it is not an easy task.
276

Figure 2 shows an example for number recognition which has been taken from this site: https://www.i-am.ai/neural-numbers.html.
Figure 2: Screenshot of number recognition AI
How this software converts or translates the
analog number given on the left to the digital mathematical number that has been given on the right by the machine? Let’s start with conceptualizing the term “neuron”.
Figure 3: Number on pixels or on “neurons”
We can consider a neuron as a unit that holds a number between 0 and 1. In figure 3 we have 28 x 28 = 784 neurons and each one of these neurons holds a value that represents the greyscale value of the corresponding pixel. For example, the neuron that value is 0 means it is black and the one with value 1 means it is white. This number is called “activation” [3].
All of these 784 neurons represent the input layer of our artificial network and the output layer consists of 10 neurons that each represents a number as a result. The activation of neurons in the output layer also represents grayscale value, the neuron with the highest activation number is
the “choice” of the machine. For example in our case, the number is 9 and the neural network of the decision process has been shown in Figure 4.
Figure 4: Artificial network with result “9”
When we try to recognize a number, our brain looks for certain patterns like loops or shapes. For example, in our example, the number 9 has circle up top and a line on the right. The number 8 has 2 circles or loops one on top and the other at the bottom. So our next inner layer can be responsible for holding each one of these patterns shapes in a neuron. If the activation of the specific neuron is close to 1, the possibility of that corresponding pattern is high. For example, suppose there is one certain neuron that represents a circle pattern, and the activation is 0.9. That means the resulting number can be: 0, 6, 8, 9.
Figure 5: Second last layer holding patterns
277

So we can suppose, our second last layer is responsible for recognizing patterns as shown in Figure 5.
But, these patterns themselves also consist of little shapes, which we can call edges. For example circle can consists of a bunch of edges.
Figure 6: Little edges of patterns
So we also need to have a layer that is responsible for recognizing these little edges. The layer that comes after the input layer can be responsible for that operation. So with 2 layered 16 neurons structure, we can suppose the working principle of our little AI is in this way: In the first layer we get input as a handwritten number with 784 neurons, and then it sends a signal to the next layer in order to detect edges and then comes third layer to detect bigger shapes as patterns and at the output we have our result as a number.
Figure 7: Overall of 2 layered neural network structure.
This structure can be also applicable for other recognition tasks like image and voice recognition. For example, detecting shapes in the pictures, or identifying syllables in human voice can be our “patterns” or “edges” in this structure.
To be able to detect that edges, we need to assign new parameter to the connections between neurons: weight which is also number. And from mathematical approach:
𝑎1𝑤1 + 𝑎2𝑤2 + … + 𝑎𝑛𝑤𝑛 , (1) This equation is weighted sum [4].
Figure 8: Edge recognition with weights
Weight with the color green means positive vale and with the red color means negative so weights with the pixel color red means darker are and it distinguishes darker and lighter areas on pixels so that it can detect edges.
When we compute weighted sum in equation 1, we can come up with any number, but for our network, we need activation values to be in the range of 0 and 1 and here we need to use the specific function that minimizes real number to the range between 0 and 1. A common function is the sigmoid function.
Figure 9: Sigmoid function
Negative inputs end up close to 0 and positive inputs end up close to 1 [5]. So the activation of a neuron in our network is a measure of how
278

positive the corresponding weighted sum is. But also we need bias for inactivity. We just need to extract that value from the weighted sum before processing the sigmoid function [1].
𝜎(𝑎1𝑤1 + 𝑎2𝑤2 + … + 𝑎𝑛𝑤𝑛 −𝑏𝑖𝑎𝑠) ,
(2)
So, the weights indicate what pattern, edges this specific neuron in the second layer is picking up on and the bias indicates how high the weighted sum needs to be before the neuron starts getting active.
But there is another better function called ReLU – REctified Linear Unit.
Figure 10: ReLU function
Using sigmoid function, was very difficult to train at some point, but ReLU solved this problem [10].
Every neuron in the first layer is connected to the 784 neurons. And each one of these 784 connections has weight and bias. So we have 784 x 16 weights with 16 biases and the connection between other layers also has weights and biases according to them. Our network has 13002 weights and biases in total.
Learning in here is, getting the machine to find a true setting for all of these many numbers so that it can solve the problem at a time [7].
The training process of the network can be done with the help of certain special databases that store collections of images of numbers handwritten. So the machine can train itself to become a better “predictor” with both having input and output from the database [8].
MNIST database is well-known example of these databases which stores 70000 images of digits handwritten by people like high school students and employees of the American Census Bureau that are published to help AI researchers.
Figure 11: Some numbers from MNIST database.
The more training data we give to the machine, the more it evolves itself by doing feedback: taking input from the picture does its operation and match the result with the real idealistic value behind the number and correct itself [6].
3. Applications
Very popular example of how powerful artificial intelligence can be is GPT-3 (Generative Pre-trained Transformer 3) launched by OpenAI company. This model uses deep learning to produce texts that are very similar to human words [9]. GPT-3 can even code by its own, you just have to give input commands like create a button that looks like rectangular and when it is pressed increase certain value or do some other operations. For example debuild.co is interesting website that uses GPT-3 to write code. User gives orders as input and it generates JavaScript code according to orders and visually shows the result at a time [10].
Figure 120: Describing google UI to GPT-3
279

GPT-3 functionalities are very wide and that shows how amazing works can be done using Machine Learning and Artificial Intelligence.
In medical field, machine learning has so many applications and they are currently being developed. One of the proper examples is Microsoft's InnerEye Project that identifies differences between healthy cells and tumor cells by using 3D radiological images as shown in Figure 13.
Figure 13: Screenshot from Inner Eye
Pfizer uses machine learning to research about how the immune system of human body can fight cancer. Insitro is a startup uses data science and machine learning to develop drugs that cures people much faster and with high level of success [11].
Besides medical field, there are many interesting fields that use machine learning. Navigation programs like google maps analyzes all roads and transportation ways and brings most relevant choice of travel from location to another. Social media programs has many features that use machine learning to process its functionality like bringing “people you may know”, face detection, image recognition and others. Self-driving cars like Tesla works on deep learning and also includes IoT because of intelligent sensors. Language translation apps, online video streaming apps and many others have a touch on machine learning and expands quickly.
Another additional machine learning application can be in psychology field. Model can be established in order to read and store different parameters of humans in a database. Database structure is shown in a following figure.
Figure 14: Simple database for model to learn
This database can be input for model and it can use machine learning to improve more correct analyses of human and better treatment for each specific patient. There are 3 tables in this simple represented database:
1. patients: stores basic information for other relations 2. health_parameters: stores vital information about a human this data is essential for identifying potential diseases 3. other_parameters: stores information about daily activites, and possible decisions that the human can make. The second and third tables are connected to
first table via foreign key on id of patient. With only this small data a well-structured AI can predict the cause of psychological disease and develop more relevant therapy for patient. For example: a married man with weight of 120kg who is accountant may have heart disease and with having no hobbies is additional risk parameter that causes psychological disease on him. That one example can be extended widely with the growth of the database. More data provided to model, more it will be decisive and correct. If there are 2 persons that have relation they can also have same problem. For instance, a partner of current patient had this certain disease 4 months ago as she registered in this database. So this AI can read all relations of humans even if they are not bound together but have same workplace that other patient had, this can be important information for model to decide. This complex relation may be difficult for us to see and decide but it is not the same for a machine. It can perform big analysis and diagnostic on a human and identify multiple treatment or therapy methods. And a doctor who is psychologist can choose one or more of those method even modify them. This kind of machine learning application is
280

not only about psychology field, it also can be about other specific fields of medical applications.
4. Conclusions
In the new era of technology, Artificial Intelligence will help humans to solve so many problems in a short time without errors. It can affect the human life as given example about identifying the disease on human by giving database as a training data for machine to learn. In medicine, special surgeries, in oil manufacturing, or in some dangerous places that humans should not be operate, machines will replace and make appropriate decisions like, or better than humans. And that complex operations is starting with handwritten number recognition task. It is considered as “Hello-World” of Machine Learning. But as we know every big roads starts with first little steps.
5. Acknowledgements
Thanks to head of cathedra: Doctor of technical sciences Mrs. Lala Bakirova.
6. References
[1] Lau, Suki. “A Walkthrough of Convolutional Neural Network – Hyperparameter Tuning": Medium. 23 August 2019.
[2] Bishop, C. M. “Pattern Recognition and Machine Learning”, Springer, 2006.
[3] Ethem Alpaydin. “Introduction to Machine Learning (Fourth ed.)” 2020
[4] "AI has cracked a key mathematical puzzle for understanding our world": MIT Technology Review 19 November 2020
[5] "Introduction to AI Part 1". Edzion. 2020-12-08. Retrieved 2020-12-09.
[6] "AN EMPIRICAL SCIENCE RESEARCH ON BIOINFORMATICS IN MACHINE LEARNING – Journal". Retrieved 28 October 2020.
[7] Berlinski, David "The Advent of the Algorithm". Harcourt Books. 2020.
[8] Zola, Andrew. "Interview Prep: 40 Artificial Intelligence Questions". Springboard Blog. 2019
[9] Sizing the prize: PwC's Global AI Study—Exploiting the AI Revolution". 11 November 2020.
[10] "Automation and anxiety". The Economist. 13 January 2018.
[11] Lohr, Steve "Robots Will Take Jobs, but Not as Fast as Some Fear, New Report Says". The New York Times. 2017
[12] Christopoulou F, Tran TT, Sahu SK, Miwa M, Ananiadou. "Adverse drug events and medication relation extraction in electronic health records with ensemble deep learning methods". Journal of the American Medical Informatics Association. 2020
[13] Brunn M, Diefenbacher A, Courtet P, Genieys W. "The Future is Knocking: How Artificial Intelligence Will Fundamentally Change Psychiatry". Academic Psychiatry. 2020
[14] Kocaballi AB, Ijaz K, Laranjo L, Quiroz JC, Rezazadegan D, Tong HL, et al. "Envisioning an artificial intelligence documentation assistant for future primary care consultations: A co-design study with general practitioners". Journal of the American Medical Informatics Association. 2020
[15] Kobie N. "DeepMind's new AI can spot breast cancer just as well as your doctor". Wired UK. Wired. 2020
281

Formation of the Structure of Multilayer Polyagent Functionals Serhii Holub1, Svitlana Kunytska2
1,2 Cherkasy State Technological University, Shevchenko Boulevard 460, Cherkasy, 18000, Ukraine
Abstract The processes of intellectual monitoring in emergencies are studied. The intelligent monitoring system is an environment for creating and using intelligent agents to provide knowledge of decision-making processes. In emergencies, objects acquire new properties quickly, and the informativeness of the results of previous observations decreases. To increase the power of data mining tools, monitoring agents are combined into agent functionalities with a multi-tier structure. The paper presents the results of research on the processes of formation of multi-echelon polyagent functionals. The efficiency of construction of a multi-echelon polyagent functional in solving the problem of predicting the incidence of the population of Ukraine on Covid-19 in conditions of low informativeness of the results of observations has been experimentally confirmed. Keywords 1 Intelligent monitoring, emergencies, polyagent functional, echelon, prognosis, Covid-19
1. Introduction
In the context of crisis monitoring, reducing the informativeness of the observations results is one of the problems that reduces the efficiency of the process of extracting knowledge from data sets. In emergencies, the monitored objects move to another state and acquire new properties. These properties are not fully reflected in the arrays of the results of previous observations. The period of time for new observations is much longer than the time during which it is necessary to provide the results of monitoring to the decision maker.
This problem is overcome by information technology of intelligent monitoring through the use of a multi-agent approach to the creation of monitoring information systems (MIS). A separate agent is built to perform monitoring tasks. When the informativeness of the input data arrays (IDA) is reduced, superagent formations are built - agents functionals. The concept of "functional" is interpreted here as "function of functions". Agent functionality (AF) is a structural element of the monitoring information system [1].
The technology of building polyagent functionalities (PAF) involves the creation of agents with structural tasks and combining them
EMAIL: [email protected] (А 1); [email protected] (А 2) ORCID: 0000-0002-5523-6120 (А 1); 0000-0001-6343-9780 (А 2)
into a system based on a matching IDA. Matching IDAs for structural agents are formed on the basis of the same array of observation results [2].
This paper presents the results of research on the process of forming a many echelon structure of the polyagent functional of the monitoring information system. The technology of construction of PAF is presented on an example of improvement of process of performance of the monitoring task on forecasting of number of diseases of the population of Ukraine on Covid-19.
2. Multi-agent systems
There are several approaches to creating many-agent systems. The problem-oriented approach is based on the assertion that several agents can achieve a goal that is beyond the power of one agent [3]. This approach involves “developing mechanisms and methods that ensure agents interact at the human level (or better) and understand the processes of interaction of intelligent computing entities. Simplifying, the result should be an algorithm that will tell who how and with whom to interact (at any time) [3].
282

The object-oriented approach assumes that MAS is a combination of autonomous intelligent agents, each of which performs its task and each interacts with other agents of this MAS [4].
The problem-oriented approach to the creation of MAS is used by information technology of intelligent monitoring (ITIM) in the process of its implementation in the form of MIS to perform the task of predicting the incidence of the population of Ukraine on Covid-19.
In case it is not possible to build an agent to perform a new monitoring task due to insufficient informativeness of the array of results of previous observations, the agent functional is built. A system approach is used to build the agent functionality. Agent functionality is built as a system. The functional emergence is formed due to the effective combination of agents and a more complete reflection of the properties of the object in the model knowledge bases of the monitoring information system. This effect is manifested by improved signal characteristics at the MIS output and increased adequacy of interpretation of monitoring results. [1].
An attempt to build an agent with a monitoring task to predict the number of diseases in Ukraine with a horizon of 7 days with this forecast task was unsuccessful. The array of observation results obtained from an open source [5] was not informative enough. This array was formed by limited data on the incidence of Covid-19 abroad, and the simulated trait is presented in the form of an average incidence rate in Ukraine. It was not possible to obtain additional data on the incidence of the population in some regions, which contain different mechanisms of emergency formation. The error in predicting the incidence of the population of Ukraine at the 7th step of the forecast horizon was 16.90% with an average value of 7 steps - 11.01% [2].
MIS did not have built agents that would perform tasks based on different information sources in other subject areas, so the construction of multi-agent functionality was impossible. To fulfill the monitoring task, the IIA built the PAF.
The construction of a single-echelon PAF allowed to obtain the forecasting result with an error of 13.99% on the horizon of 7 days and to improve the average forecasting error to 6.15% [2]. The use of feedback in the construction of the PAF structure allowed to reduce the forecasting error on the horizon of 7 days to a value of 7.49%, while the average value of the forecasting error was 3.09% [2].
3. Problem description and tasks statement
To reliably assess the influence of factors, the signs of which are included in the array of observations, it is necessary to build a model with a minimum value of forecasting error. Therefore, studies of the process of constructing a PAF to enhance the emergence of an agent combination were performed. The task of building a PAF is to create a method that would provide knowledge about the patterns of pandemic development in Ukraine in the future from previously observed results. The forecasting problem formulated in [2] has a solved:
An array of X results of population morbidity monitoring during 2020 is given:
X = {xij}, i=1,n; j=1,m , (1) where n is the number of signs that reflect the
incidence of the population, m is the number of observation points (recorded number of diseases in countries with a discreteness of 1 day).
The number of observation points is determined by the duration of the historical period of time during which the values of morbidity were recorded:
T = {t, t-1, t-2, t-m}, (2) where t is the observation time; m is the
number of observation points. The monitoring information system builds a
set of agents with structural tasks: Y = {Yx1, Yx2, Yx3, …, Yxn}, (3)
where n is the number of agents that perform structural tasks.
It is necessary to build a polyagent functional for predicting the incidence of Covid-19 population of Ukraine with a forecasting horizon of 7 steps, for which the deviation of the forecasting results from the actual values becomes minimal:
Zx1= f(T, X, Y, t+7), (4) where Zx1 – signal at the output of the agent
functional with the monitoring task of forecasting the number of diseases of the population of Ukraine; t+7 – forecast horizon (7 steps).
4. Hypotheses
Execution of new monitoring tasks on the basis of previous results of supervision is provided by construction of agent functionalities with multilevel hierarchical structure. The upper echelons of the functional are formed from agents
283

that are not included in the structure of the lower echelons. Increasing the informativeness of the signals at the output of these agents is achieved by increasing the number of features in the agent IDA due to the signals from the output of lower echelon agents. The hierarchical structure of multi-echelon agent functionals is built by the method of ascending synthesis of elements [6]. The IDA for the structural tasks of the higher echelon agents is formed from the features obtained as a result of observations and from the output signals of the agents included in the structure of the lower echelons of the functional.
5. The results of experiments and their discussion
To perform the monitoring task of forecasting the number of diseases of the population of Ukraine on Covid-19 on the horizon of 7 days, an array of signs was formed, obtained as a result of observations of morbidity of the population of other countries during 2020 with a step of 1 day. The results of observations were obtained from an open source [5]. The list of features that formed the initial description of the monitored object is given in Table 1.
Table 1 Signs of the initial description of diseases on COVID-19 [2].
Indicators Comments Observation time; morbidity in Ukraine; morbidity in France; morbidity in Belarus; morbidity in Georgia; morbidity in Germany; morbidity in Israel; morbidity in Italy; morbidity in Moldova; morbidity in Slovakia; morbidity in Slovenia; morbidity in Russia; morbidity in Portugal; morbidity in Poland; morbidity in Romania; morbidity in Spain; morbidity in Turkey; morbidity in Egypt; morbidity in Greece; morbidity in the United States; morbidity in China; incidence in England
The results of daily observations obtained during 2020
After that, the method of forming the structure
of a multi-echelon polyagent functional - ascending construction of layers was applied. Agents who did not complete their task on the lower layer of the PAF began to perform this task on the upper layer. All agents that performed the task formed the structure of the layer. The signals at the output of these agents were used as additional features in the input array of higher echelon.
Table 2 presents the characteristics of the output signals of agents that performed structural tasks in the construction of PAF layers. The characteristics of the agents that performed the structural task and entered the structure of the corresponding echelon in table 2 are highlighted in bold.
Thus, after the construction of the polyagent functional, the error in predicting the incidence of the population of Ukraine decreased by 72.96% compared to the results of forecasting this indicator by the agent who performed this task.
The input array for the upper echelon was formed from the signals at the output of the agents that entered the structure of the lower echelons.
If the error in predicting the signal at the output of the agent is less than the limit value of 12%, the structural task is considered completed, the agent acquires the state "Used" and is included in the structure of the corresponding echelon. Structural tasks that were not performed by the lower echelon PAF agents are assigned by the MIS to be performed by the upper echelon. According to Table 2, 9 structural tasks for morbidity forecasting in the respective countries were performed at the first echelon. The structure of the first echelon of PAF includes 9 agents. For execution on the second echelon MIS transferred 7 structural tasks. Of these, 3 tasks were completed.
And, accordingly, the structure of the second echelon was formed by 3 agents. The prediction errors in the signals at the output of all agents were less than the characteristics of the signals that had agents with the same tasks in the previous echelon. Therefore, unfulfilled tasks are transferred for execution to the highest echelon.
Of the 5 tasks of the third echelon, the agents did not complete any. Agents 4 and 19 at the output had prediction errors greater than those they had in the previous echelon.
284

Table 2 The average error of the forecast signals at the output of the agents
Agent Agent tasks
The echelons of polyagent functional 1 2 3 4 5 6
1 Prediction of morbidity in Ukraine on the 7th day 11,01% 2,6
0%
2 Prediction of morbidity in France on the 7th day 4,43%
3 Prediction of morbidity in Belarus on the 7th day 13,81%
4 Prediction of morbidity in Georgia on the 7th day 114,80% 18,84% 20,02%
5 Prediction of morbidity in Germany on the 7th day 5,50%
6 Prediction of morbidity in Israel on the 7th day 69,94% 7,59%
7 Prediction of morbidity in Italy on the 7th day 3,56%
8 Prediction of morbidity in Moldova on the 7th day 7,66%
9 Prediction of morbidity in Slovakia on the 7th day 101,38% 14,69% 13,78%
10 Prediction of morbidity in Slovenia on the 7th day 197,22% 14,59% 5,68%
11 Prediction of morbidity in Russia on the 7th day 14,18%
12 Prediction of morbidity in Poland on the 7th day 1,94%
13 Prediction of morbidity in Portugal on the 7th day 26,86%
14 Prediction of morbidity in Romania on the 7th day 2,94%
15 Prediction of morbidity in Spain on the 7th day 8,80%
16 Prediction of morbidity in Turkey on the 7th day 4,70%
17 Prediction of morbidity in Egypt on the 7th day 91,68% 26,75% 17,39% 16,10%
18 Prediction of morbidity in Greece on the 7th day 48,90% 5,59%
19 Prediction of morbidity in the United States on the 7th day 145,80% 14,39% 16,80%
20 Prediction of morbidity in China on the 7th day 99,98% 5,17%
21 Prediction of morbidity in England on the 7th day 2225,34% 42,59% 44,13% 43,95% 8,8
2%
22 Prediction of morbidity in Canada on the 7th day 27,00% 3,3
7%
In the fourth echelon, structural monitoring
agents managed to complete the task of predicting morbidity in Slovenia. The construction of the fifth echelon of the PAF has made it possible to
carry out morbidity forecasting tasks in England and Canada.
The output signal of the 6-tier polyagent functional performed the task of predicting the
285
number of diseases in the population of Ukraine on the 7th day after the last observation. The forecasting error on the horizon of 7 steps became 4.57% with the average value of 7 steps - 2.6%.
6. Conclusions
The construction of multilevel polyagent functionalities allows overcoming the problem of performing monitoring tasks in the conditions of insufficient informativeness of the arrays observation results. Using the results of previous research on the construction of echelons the agent functional and feedback in their structure, a method for forming a multi-echelon structure of polyagent functional is proposed.
The experimental test of the method was carried out in the process of solving the task of forecasting in the conditions of insufficient informativeness of historical data.
The results of the solving problem are predicting the incidence of the population of Ukraine on Covid-19 in conditions of low informativeness. Due to the construction of a multi-tier polyagent functional, the prediction error is reduced by 72.96%.
7. References
[1] Holub C.V., Kunytska S.YU: Poliahentni funktsionaly v informatsiynykh tekhnolohiyakh intelektualʹnoho monitorynhu. Matematychni mashyny i systemy. 2020. № 4. S. 11-19. DOI: 10.34121 / 1028-9763-2020-4-11-19.
[2] Holub C.V., Kunytska S.YU: Pobudova esheloniv u poliahentnykh funktsionalakh dlya prohnozuvannya kilʹkosti zakhvoryuvan na covid-19 v Ukrayini. Matematychni mashyny i systemy. 2021. № 2. S. 45-51. DOI: 10.34121 / 1028-9763-2021-2-45-51.
[3] Oleksiy Ihnatenko. Multyahentni systemy. Elektronnyy resurs. URL: https://rstudio-pubs-static.s3.amazonaws.com/416281_b9f248d4182641fca274928cc3857736.html.
[4] Sarangi, Lokanath and Panda, Dr. Chittaranjan: A Review on Intelligent Agent Systems, International Journal of Computer and Communication Technology: Vol. 2 (2011): Iss. 3, Article 7. DOI: 10.47893/IJCCT.2011.1092.
[5] https://ourworldindata.org/grapher/biweekly-cases-per-million-people.
[6] Holub S.V. Bahatorivneve modelyuvannya v tekhnolohiyakh monitorynhu otochuyuchoho seredovyshcha. Cherkasy: Vyd. vid. CHNU imeni Bohdana Khmelnytskoho, 2007. – 220 s. ISBN 978-966-353-062-8.
286

Fuzzy Logic In Control Systems For Potentially Explosive Objects Victor Volkov1, Natalia Makoyed2
1Odessa I.I.Mechnikov National University, Dvoryanskaya str.,2, Odessa, 65082, Ukraine 2Odessa National Academy of Food Technologies, Kanatnaya str., 112, Odessa, 65039, Ukraine
Abstract Main principles of the decision-making on hazards of industrial explosions are formulated. Classical mathematical models often are not applicable for the decision-making on hazards of industrial explosions, because explosive objects in most cases are very complicated systems. The model of decision-making under risk, that is based on the probability theory and the probability logic, is not effective also. Thus application of the model of decision-making under uncertainty, that is based on the fuzzy-set theory and fuzzy logic, is preferable for complicated industrial and transport potentially explosive objects. Application of the fuzzy logic is the first basic principle of the decision-making on hazards of industrial explosions. But fuzzy logic in this case has to be used in combination with the exact mathematical theory of combustions and explosions combined with correct application of experimental data. That is the second basic principle of the decision-making on hazards of industrial explosions. This approach provides an opportunity to avoid involvement of evaluators (experts) and thus to avoid all problems connected with evaluators and their interaction and cooperation with decision-makers. Mathematical model for decision-making in decision support systems (DSS) for automated control of potentially explosive objects is developed. This model is based on combination of the fuzzy logic and classical mathematical methods from the mathematical theory of combustions and explosions (primarily the theory of stability of combustion and detonation waves). That makes it possible to create an adequate mathematical support for the mentioned above DSS. Suitable DSS is developed for the enterprises of the grain storing and processing, which are explosive objects. Keywords 1 Decision-making, uncertainty, fuzzy logic, mathematical model, fuzzy logic, explosion, explosive object, combustion, detonation
1. Introduction
The explosion prevention is one of the most topical and most difficult problems of the present-day industry and up-to-date transport. There are lots of reasons for such state of affairs. Among these reasons there are the complications of technological processes, the emergence of new combustible materials and explosives, the chemicalization of industry, etc. But one of the main reasons is the insufficient efficiency of automatic and automated systems for preventing and suppressing explosions [1].
Nowadays the progress in computing machinery and telecommunicational equipment enlarged greatly the human potentialities in sphere of making of the high-quality decisions for solving different problems. It concerns also the
EMAIL: [email protected] (A.1); [email protected] (A.2) ORCID:0000-0002-3990-8126(A.1); 0000-0002-4591-555X(A.2)
problems of hazards, prevention and mitigation of industrial and transport explosions.
The basic idea of the present-day organization of explosion protection is to prevent the occurrence of accidental fires [2-4]. Naturally, if a fire does not occur, then an explosion is impossible. Therefore, in the process of solving the fire safety problem, the problem of explosion safety is simultaneously fully solved. Thus, the problem of explosion safety is not solved as a separate problem, but only within the fire safety problem. Thereby modern automated control systems for explosive objects are aimed at the prevention or suppression of accidental fires and spontaneous combustion [3-5]. But this approach has at least two significant drawbacks:
• For a relatively low probability of ignition, the possibility of an explosion in the
287

case of fire may be great [1,2,6]; this is true first of all for enterprises where explosive dust-air mixtures are formed during the production process [6,7], as well as for coal mines [6,8,9]; • It is not always possible to detect and suppress a fire on time [4, 7, 10]. So for lots of enterprises and for many kinds of
equipment the fire safety problem sometimes can’t be solved properly, i.e. it is impossible to guarantee almost complete absence of fires. This is critical if there is a danger of explosion.
These cases have to be specifically diagnosed, because the damages and personnel casualties from explosions are much greater than from fires. In such cases it’s necessary to have additional safety “mechanism” to prevent explosions. One of the main parts of such mechanism should be a decision support system (DSS) for the decision-making on the explosion safety problems.
The main theoretical problems for this decision-making are:
1. Problem of the flame stability. 2. Finding of the explosion induction distance. 3. Finding the time of the explosion induction. Solving of the flame stability problem allows
to answer the question about the possibility of the combustion-to-explosion transition in principle. Only instable flames accelerate and generate shock or detonation waves [11]. This problem is solved analytically [1, 12] and numerically [10, 13]. The scientific studies [10, 13] are done first of all in connection with deflagration-to-detonation transition [10] and are based on numerical simulations of premixed gas combustion. But these numerical simulations are always connected with finite perturbations, while stability of flames should be researched in relation to small perturbations (Darrieus-Landau instability). Besides, deflagration explosions are more frequent than detonations, though detonations are more dangerous and destructive. In addition, numerical simulations of the flame stability [14] and deflagration-to-detonation transition [13,15,16] require significant computer resources and time. Therefore such numerical simulations cannot be used for DSS in automated control systems for explosive objects, because the time for decision making is strictly limited. Analytical criteria [1, 12] for the flame instability are also only very rough estimates [1, 17].
Finding of the explosion induction distance makes it possible to answer the question about the possibility of the combustion-to-explosion transition for almost all kinds of channels and tubes [1], which simulate a variety of potentially explosive and detonative objects [1, 18]. Algebraic formulae for estimations of the explosive induction distance and the time of the combustion-to-explosion transition are obtained analytically [1] and are in good agreement with some experimental data. The comparative simplicity of the formulas obtained makes it possible to evaluate the possibilities and time of the transition from combustion to explosion without significant expenditure of the computational time and computer resources. This is important for on-line control of potentially explosive objects and makes such control less expansive [1, 17]. But analytical estimations of the explosive induction distance are still too inaccurate because of wall roughness and obstacles in channels and tubes. These roughness and obstacles significantly reduce explosion induction distance Xs and the time of the shock wave formation (i.e. the time of the explosion induction) τ [1, 10, 17].
Finding the time of the explosion induction is closely related to finding of the explosion induction distance. Solving of this problem helps to decide, what measures can be taken to prevent an explosion timely or to minimize the possible consequences of an explosion.
Although a simple mathematical model of the transition of combustion to explosion is constructed [1, 10] and this model is simple (for calculations) and universal (it is applicable to the combustion of both homogeneous gas mixtures and heterogeneous media, i.e. dust-air mixtures, aerosols, sprays, etc.), it cannot be used directly in DSS for the decision-making on the explosion safety problems. That is because of roughness and inaccuracy of results, obtained by using this model [1, 10, 17, 18], based on classical mathematical methods and rather primitive physical models.
The aim of the present research is the development of a mathematical model that is based on fuzzy logic and makes it possible to create an adequate mathematical support for DSS of automated control systems for explosive objects.
288

2. Main principles and mathematical modeling of the decision-making on hazards of industrial explosions
As shown above classical models for the decision-making [19] on hazards of industrial explosions often are not applicable.
2.1. Main principles
Thus for the constructing of DSS on the explosion-proof problems it is possible to use only two kinds of mathematical models:
• The model of decision-making under risk. • The model of decision-making under uncertainty. The model of decision-making under risk is
based on the probability theory and the probability logic.
The model of decision-making under uncertainty is based on the fuzzy-set theory and fuzzy logic.
It is proved that application of the latter model is preferable for complicated industrial and transport systems [1, 17].
Thus application of the fuzzy logic is the first basic principle of the decision-making on hazards of industrial explosions.
As a matter of fact a lot of parameters, which are essential for the first model of decision-making, are determined under the statistics processing. But statistics for the explosive processes are absent or very imperfect in many cases. Moreover, these statistics sometimes are also fuzzy in a way. And though it is always possible to make the probability graph for conversions from the explosion-proof state to the dangerously/highly explosive one and to build up the probability matrix for such conversions, the efficiency of this methodology does not look high.
Decision-making under uncertainty should be implemented if all possible states of object (nature, medium) are known, but their probability distribution is not known [19]. Decision-making under uncertainty leads to robust, quasi-rational decision, that means making the best possible choice when information is incomplete. Theoretical base for such decisions is fuzzy-set theory and fuzzy logic [20]. This kind of decision-making uses uncertain estimates of evaluators (experts), based on their theoretical knowledges, practical experiences, their intuition and so on.
Due to the large number of considerations involved in many decisions, computer-based DSS can be developed to assist decision makers in considering the implications of various courses of thinking. This may help to reduce the risk of different human errors.
Taking into account the foregoing, it’s necessary to offer effective methodology for constructing intellectual, universal enough DSS using the model of decision-making under uncertainty (i.e. under conditions of “fuzziness”) on the explosion-proof problems. But fuzzy logic in such DSS must be used in combination with the exact mathematical theory of combustions and explosions combined with correct application of experimental data (accounting sometimes on the “fuzziness” of those data). That is the second basic principle of the decision-making on hazards of industrial explosions.
This approach provides an opportunity to avoid involvement of evaluators and to avoid all problems connected with evaluators and their interaction and cooperation with decision-makers [21, 22].
2.2. Main principles
The basis for decision-making on hazards of industrial explosions must use fuzzy estimates for such parameters as combustibility of medium, its ability for detonation, possibility of initiation (by different ways) of combustion or detonation, possibility of transition of “slow” burning to explosive deflagration or even detonation and so on. These estimates afford grounds for making decisions on prevention or mitigation of explosions. Some of those decisions should be implemented at the stage of projecting of the potentially explosive object, the others allow for the possibility of taking operative actions such as the inhibitor injection, pressure relief, use of flame arresters and protective partitions, etc.
Let us consider the fuzzy estimate of the explosive ability of media.
Data base of the detonation concentration limits and of the deflagration concentration limits is created. For the estimation of the explosive ability a decision maker has to indicate fuel, oxidizer (if any), fuel concentration, geometrical form (round tube, flat duct, etc.) for mixture or other explosive medium and geometrical sizes, physical parameters (first of all initial pressure and initial temperature) of explosive or mixture.
289

The explosive ability of such system is expressed by fuzzy logical variable (fuzzy statement) FA, which is the conjunction of three fuzzy statements, namely:
• Fuzzy logical variable FC, expressing maintenance of the explosion concentration limits (the combustion concentration limits and the detonation concentration limits). • Fuzzy logical variable FD, expressing maintenance of the absence for the explosion suppressing distance. • Fuzzy logical variable FP, expressing exceeding of the initial pressure over the critical one. That is
FA = FC & FD & FP (1) Universal set (basic set, basic scale) for fuzzy
logical variable FC is set of values for the fuel volumetric concentration C , expressed by percentage (0 ≤ C ≤ 100). The characteristic function C for fuzzy logical variable FC is trapezoidal (Figure 1), expressed by formula
0
1
1 100100
C
C C LCELLCEL
LCEL C UCELC UCEL UCEL C
=
− −
(2)
where LCEL is the lower concentration explosive limit, UCEL is the upper concentration explosive limit. These limits are determined analytically [1, 17] or experimentally [10, 11].
For a potentially explosive object (PEO) the value of C defines the degree of the belonging to the fuzzy subset AC of those PEO, which are able for explosion by the fuel concentration. It is a fuzzy subset of the accurate set U of all possible objects of this type with specified fuel and oxidizer. If 1C = , PEO may be estimated as undoubtedly able for explosion by the fuel concentration. In the case 0C = , PEO is estimated as undoubtedly disabled for explosion.
Universal set for fuzzy logical variable FD is set of values for the duct width or the tube diameter d (d ≥ 0). The characteristic function
D for fuzzy logical variable FD is piecewise-linear (Figure 2), expressed by formula
0
1
crcrD
cr
d d dd
d d
=
(3)
Value of dcr is less than the fire cell size or the detonation cell size [10,11]. These sizes are determined analytically [1, 12] or experimentally [10, 11].
Figure 1: The characteristic function C for fuzzy
logical variable FC For PEO the value of D determines the
degree of the belonging of this PEO to the fuzzy subset AD of the objects, which are able for explosion by the geometry of walls. It is a fuzzy subset of the accurate set U1 of all possible PEO with specified fuel and oxidizer and also with specified geometry of walls (U1 U). If 1D = , PEO may be estimated as undoubtedly able for explosion by the geometry of walls. In the case
0D = , PEO is estimated as disabled for explosion.
Figure 2: The characteristic function D for
fuzzy logical variable FD Finally, universal set for fuzzy logical variable
FP is set of values for the initial pressure p. The characteristic function P for fuzzy logical variable FP is piecewise-linear (Figure 3), expressed by formula
d
μD
dcr
0
1
C
μC
LCEL
0 UCEL 100
1
290

0
1
crcrP
cr
p p pp
p p
=
(4)
Parameter pcr is the minimal initial pressure, when explosion is possible. It is determined analytically or experimentally [10, 11].
For PEO the value of P defines the degree of the belonging to the fuzzy subset Ap of the objects, which are able for explosion by the initial pressure. It is a fuzzy subset of the accurate set U2
of all possible systems of such type with specified fuel and oxidizer and also with specified geometry of walls initial pressure (U2 U). If
1P = , PEO may be estimated as undoubtedly able for explosion by the initial pressure. If
0P = , PEO is estimated as disabled for explosion.
Figure 3: The characteristic function p for fuzzy
logical variable FP Thus mathematical model for the decision-
making on hazards of industrial explosions is constructed.
3. Conclusions
Mathematical model for DSS of automated control systems of explosive objects is developed. This model is based on combination of the fuzzy logic and classical mathematical methods. That makes it possible to create an adequate mathematical support for these mentioned above DSS. Suitable DSS is developed by us for the enterprises of the grain storing and processing.
4. References
[1] V. Volkov, Y. Kryvchenko, Transition of combustion to explosion and decision support systems for explosion protection, in: Lecture Notes in Computational Intelligence and Decision Making, Advances in Intelligent Systems and Computing, volume 1246, Springer, Cham. 2021, pp. 437-447. doi: 10.1007/978-3-030-54215-3.
[2] Zarko V.E., Weiser V., Eisenreich N., Vasil'ev A.A. Prevention of Hazardous Fires and Explosions. The Transfer to Civil Applications of Military Experiences, Springer Netherlands – Kluwer Academic Publishers, 1999. doi: 10.1007/978-94-011-4712-5.
[3] Pekalski A.A., Zevenbergen J.F., Lemkowitz S.M., Pasman H.J., A Review of Explosion Prevention and Protection Systems Suitable as Ultimate Layer of Protection in Chemical Process Installations, Process Safety and Environmental Protection, volume 83, issue 1, 2005. doi:10.1205/psep.04023.
[4] Nolan D. P., Handbook of Fire and Explosion Protection Engineering Principles for Oil, Gas, Chemical and Related Facilities. William Andrew-Elsevier, 2011. doi:10.1016/B978-1-4377-7857-1.00033-1.
[5] Wei Lu, Ying-Jiazi Cao, Jerry C. Tien, Method for prevention and control of spontaneous combustion of coal seam and its application in mining field, International Journal of Mining Science and Technology, volume 27, issue 5, 2017. doi:10.1016/j.ijmst.2017.07.018.
[6] Lemkowitz S.M., Pasman H.J., A Review of the Fire and Explosion Hazards of Particulates, KONA Powder and Particle Journal, No. 31, pp. 52-81, 2014. doi:10.14356/kona.2014010.
[7] Eckhoff R. K., Dust Explosion Prevention and Mitigation, Status and Developments in Basic Knowledge and in Practical Application, International Journal of Chemical Engineering, volume 2009, pp. 1-12, 2009. doi:10.1155/2009/569825.
[8] Burgherr P., Hirschberg S., Assessment of severe accident risks in the Chinese coal chain, International Journal of Risk Assessment and Management, No.7, pp. 1157-1175, 2007. doi: 10.1504/IJRAM.2007.015299.
p
μp
pcr
0
1
291

[9] du Plessis J.J.L., Active explosion barrier performance against methane and coal dust explosions, International Journal of Coal Science and Technoogy, volume 2, issue 4, pp. 261–268, 2015. doi:10.1007/s40789-015-0097-7.
[10] Nettleton M. A., Gaseous detonations: their nature and control (1st. ed.), Springer, 1987. doi:10.1007/978-94-009-3149-7.
[11] Liberman M., Introduction to Physics and Chemistry of Combustion. Springer, Heidelberg, 2008. doi:10.1007/978-3-540-78759-4.
[12] Aslanov S., Volkov V., The integral method of studying the hydrodynamic stability of laminar flame, Combustion, Explosion and Shock Waves, volume 27, 1991,pp.553-558. doi:10.1007/BF00784941.
[13] Liberman, M., Sivashinsky, G.I., Valiev, D., Eriksson L.E., Numerical simulation of deflagration-to-detonation transition: the role of hydrodynamic instability, Int. J. Transp. Phenomena, volume 8(3), 2006, pp. 253-277.
[14] Buckmaster J., The structure and stability of laminar flames. Ann. Rev. Fluid Mechanics, volume 25, 1993, pp. 21-53. doi:10.1146/annurev.fl.25.010193.000321.
[15] Oran, E.S., Gamezo, V.N.: Origins of the deflagration-to-detonation transition in gas-phase combustion. Combustion and Flame volume 148, 2007, pp. 4-47. doi:10.1016/j.combustflame.2006.07.010
[16] Koksharov A., Bykov V., Kagan L., Sivashinsky G., Deflagration-to-detonation transition in an unconfined space, Combustion and Flame, volume 195, 2018, pp. 163-169. doi:10.1016/j.combustflame. 2018.03.006
[17] V. Volkov, Decision support systems on hazards of industrial explosions, in: Seventh International Symposium on Hazards, Prevention and Mitigation of Industrial Explosions: Thirteenth International Colloquium on Dust Explosions and Eighth Colloquium on Gas, Vapor, Liquid, and Hybrid Explosions, St. Petersburg, Russia, 7–11 July 2008, volume 3, pp. 343–347, 2008.
[18] A. Kovalenko, V. Volkov, Information Model for Potentially Detonative Object, in: CEUR Workshop Proceedings, volume 2683, pp. 50-52, 2019.
[19] Enta Y. A., Measure for the Discriminative Effect of Information, Proceedings of the
1978 Joint Automatic Control Conference, volume 3, pp.69-80,1978.
[20] Zadeh L., Fuzzy Sets Information and Control, volume 8, pp.338-353, 1965.
[21] P.H. Ross, M.W. Ellipse, H.E. Freeman, Evaluation: A systematic approach (8th ed.), Sage Publications, 2021.
[22] M. Hurteau, S. Houle, S. Mongiat, ().How Legitimate and Justified are Judgments in Program Evaluation, in: Evaluation, volume 15 (3), 2009, pp. 307-319. doi:10.1177/1356389009105883
292

The IBN Networks for 6G Technology to Optimize Investments in Telecommunications Infrastructure Andrzej Rychlik 1
1 Lodz University of Technology, Wólczańska str., 215, Łódź, 90-924, Poland
Abstract The development of the telecommunications structure for digital data transmission is taking place concurrently with the development of telecommunications services. New services generate demand for transmission with higher quality parameters. Achieving them makes it possible to create new services with a demand for transmission with even higher parameters. The 2020-2030 decade is dominated by 5G networks and SDN. A decade after 2030, it is predicted that these will be 6G networks and IBN. The 6G standard describes the equipment used to build the network in line with geographic conditions, optimized for performance. The IBN network will flexibly adapt to the needs of end users. In areas where a 5G network is being built, after 2030 it is enough to adapt it to the 6G standard, and in other areas, 6G networks should be built immediately. Obviously, this approach will not solve the interdependence of infrastructure and service development in telecommunications, but will provide clear guidance over a period of time to investors, end-users and market regulators. Keywords 1 6G, IBN, investment, market, telecommunication infrastructure
1. Introduction
Optimizing investments in telecommunications infrastructure on the basis of knowledge and data obtained before the start of the investment is not sufficient to gain a competitive advantage. The income for the investor is generated by satisfied end-users and their satisfaction varies over time. Dissatisfied end-users shift their services to a competing operator. Today's telecommunications systems cover land, air, oceans and space, and end-users are moving faster and longer. There is no stabilization on the services market either. Improving the capacity and quality of digital data transmission generates new services, and their owners, in turn, report their needs for transmission with even higher quality parameters. In military systems, the development of the enemy base forces the development of your own base. The most costly in all these processes turns out to be a human, designer, technician, and administrator. On the one hand, a person deserves remuneration for the work he has done, on the other hand, he falls ill, goes on strike, and may even sabotage.
EMAIL: [email protected] ORCID: 0000-0003-2068-9274
Also in terms of security, man is the weakest element. In terms of investment profitability, the world is divided into 3 zones: white, gray and black. The black zone brings income both in the area of investment and operation. The gray area brings income only in the area of exploitation and loss in the area of investments. The white zone generates losses both in the area of investment and operation. The world is divided into zones by people working, teaching and living in these zones. If there is a low population density and people do not need access to digital data transmission, there is a white zone in this area. If there is a high population density and end-users need high-quality digital data transmission, there is a black zone in this area. The division into zones can be stationary, e.g. cities, forests, lakes or dynamically changing e.g. stadiums, districts: day-adults at work, children at school, night-everyone at home. All these parameters are also influenced by changes in the ecosystem, e.g. wars, pandemics, earthquakes, fires, floods.
The development of network architectures and methods of their design described by the author in publications [1], [2], [3], [4] leads to the next generation of telecommunications infrastructure
293

and intent-based networks. The author proposes using 6G technology to eliminate the division into white, gray and black zones. On the other hand, IBN technology to optimize the constructed network in terms of increasing the efficiency of funds already invested in building a digital data transmission network. Replacing humans with elements of artificial intelligence in the design, construction and operation process predicts that it will increase the competitiveness of these investors in relation to the others who will use classical methods.
Resignation from Computer Aided Design systems in favour of Artificial Intelligence Aided Design systems and from manual network management in favour of Intent Based Networking is proposed because we are heading toward a society of fully automated remote management systems. Autonomous systems are becoming popular in all areas of society, including industry, health, roads, oceans, and space. In this regard, millions of sensors are integrated into cities, vehicles, homes, industries, food, toys, and other environments to provide a smart life and automated systems. Hence, a high-data-rate with reliable connectivity will be required to support these applications. It is proposed to implement the 6G paradigm, because 5G networks will not have the capacity to deliver a completely automated and intelligent network that provides everything as a service and completely immersive experiences. Although the 5G communication systems will offer significant improvements over the existing systems, they will not be able to fulfil the demands of future emerging intelligent and automation systems after ten years (2020-2030). [3] New items that may require sixth-generation (6G) system include: massive man-machine interfaces, ubiquitous computing among local devices and the cloud, multi-sensory data fusion to create multi-verse maps and different mixed-reality experiences, and precision in sensing and actuation to control the physical world. [6]
2. The Role of 6G Technology in Optimize Investments
To reach the goal of 6G and to overcome the constraints of 5G for supporting new challenges, B5G wireless systems will need to be developed with new attractive features. The 6G communication networks will fulfill the laggings of 5G system by introducing new synthesis of future services such as ambient sensing
intelligence and new human-human and human-machine interaction, a pervasive introduction of AI and the incorporation of new technologies such as terahertz (THz), 3-dimensional (3D) networking, quantum communications, holographic beam forming, backscatter communication, intelligent reflecting surface (IRS), and proactive caching [10]. The key drivers of 6G will be the convergence of all the past features, such as network densification, high throughput, high reliability, low energy consumption, and massive connectivity. The 6G system would also continue the trends of the previous generations, which included new services with the addition of new technologies. The new services include AI, smart wearable, implants, autonomous vehicles, computing reality devices, sensing, and 3D mapping. [4] The most critical requirement for 6G wireless networks is the capability of handling massive volumes of data and very high-data-rate connectivity per device [1].
Figure 1: Possible 6G communication architecture scenario. [6]
It is proposed to optimize investments in telecommunications infrastructure - the design and construction should be based on the 6G technology paradigm and the operation on the IBN paradigm.
3. The Role of IBN Technology in Optimize Investments
Intent-based networking is a software-enabled automation process that uses high levels of intelligence, analytics, and orchestration to improve network operations and uptime. When operators describe the business outcomes they
294

wish to accomplish, the network converts those objectives into the configuration necessary to achieve them, without individual tasks having to be coded and executed manually. Traditionally, networking has been driven by manual, command-line interface (CLI)-based operations, basic element management systems (EMSs), or automation scripts. Most network outages result from human errors that occur during these network operations. Intent-based networking slashes errors and risk while improving operational efficiencies in a number of ways. Validates intent objects before applying them to the network. Intent objects are high-level representations of the desired properties or outcomes to be achieved with the network. Validation is syntactic and includes semantic checks against network wide policy.[7] Operators simply apply the appropriate versioned intent object to return to a known good state if something goes wrong during a deployment push. Limits the impact and scope of failures during new intent rollout through well-defined policy. Intent-based fallback. As the system knows the desired outcomes for a specific configuration, it can maintain those outcomes even in the face of outages or device errors by reconfiguring other network elements or using different mechanisms to achieve the same results. Modern network orchestration systems have made commercial, intent-based network systems for mission-critical and scaled deployments possible. Intent-based networks dramatically reduce the time to deliver reliable services from days or weeks to minutes and help address operational challenges once the infrastructure has been deployed.[7]
Figure 2: The journey to intent-based data centre organization [5]
Each stage along the way is characterized by
increasingly automated and simpler ways of deploying and managing network operations.
Manual – Operations staff imperatively manage data centre network devices using CLI, SNMP, and basic and discrete tools.
Semi automated – Scripts and rules-based management combine with traditional tools for basic automation, visibility into network data, and alerts that enable reaction to network events.
Software-defined data centre – A software abstraction of the network infrastructure enables faster, secure deployment of services and applications.
Automation-centric data centre – Builds upon the software-defined data centre by automating provisioning, configuration, deployment, and orchestration.
Intent-based data centre – Continually collects and converts all pertinent data needed to take the automated actions that keep the network aligned with dynamic business intent, data centre conditions, and policies.[4]
Intent-based networking (IBN) has become a hot buzzword in the networking industry, with marketing departments at all sorts of vendors waving the “intent flag.” Some have legitimate products, some have cobbled together bits and pieces out of their product portfolios and called it an IBN solution, and some supposed IBN products perform only a part of what a real IBN system (IBNS) does. [7]
Figure 3: Analytics keep network operations aligned with original business intent throughout the service lifecycle. [5]
295

Intent-based networking is not only about intent fulfilment; it’s also about intent assurance. With intent-based analytics, networks remain in compliance with the original business intent throughout the service lifecycle. Intent-based analytics provide insights into network services, enabling teams to think about their network as a complete service.[9]
Using analytics, intent-based networking enables faster root-cause identification when things go awry. It informs operators of conditions and insights that need attention as with traditional unified management approaches but filters out the irrelevant “noise” so it’s easier to see what’s most important quickly, as shown in fig. 3.
Correct implementation of IBN to help manage a network that is made in 6G technology requires understanding what IBN is not. IBN is, unquestionably, a popular industry buzzword. Your challenge is to see beyond the fluff and evaluate IBN solutions based not only on what they are, but also by what it is not. Interestingly, all the functions discussed in this section can be and probably are a part of an IBN solution. What you have to be wary of is a solution that performs one or a few of these functions and claims that that, alone, is IBN.
IBN is not automation. Automation, from home-grown scripts to
platforms like Ansible and Puppet, are essential to the fast, reliable operation of a network. It’s also an essential element of IBN. But automation software says nothing about expressed intent and doesn’t by itself maintain a data store of network information to act on. You can automate bad decisions just as well as good ones.
IBN is not configuration management. A Level 0 IBNS may look like just a fancy
configuration management platform that translates intent into practical configurations. Such a system falls far short of significantly improving your operational effectiveness.
IBN is not SDN. You may be thinking that IBN is just a form
of software-defined networking (SDN). But SDN, in its usually understood role, performs only a part of what an IBNS does. SDN maintains an abstracted model of the physical network. It takes generic configuration commands as input and pushes device-specific configuration as its output. But that’s all. SDN contains no translational element to convert intent into generic configuration and it has no capability for continued compliance verification and adjustment. Like automation and configuration
management, SDN is an element of IBN, but is not itself IBN.
IBN is not orchestration. Orchestration helps all of your IT systems —
compute, storage, and network — act in sync to accomplish your higher IT objectives. IBN, as again the name implies, is concerned just with your network. That said, a good IBNS should integrate with your orchestration system so that orchestration can become a source of declared intent.
IBN is not a policy engine. Policy engines can both “push” policies to
network nodes and “pull” information from the nodes to continually verify correct policy enforcement. But the translation of intent into an actionable “how” is missing. Policies just govern aspects of the network, such as forwarding, security, and prioritization. A policy engine can use control loops to enforce these policies, but it has no concept of desired outcomes. You have to work those out yourself and specify in detail the rules to implement and enforce the policies.[5].
4. Conclusions
In order to maximize the income from investments in telecommunications infrastructure, it is necessary to take a holistic view of the process by which this income is generated. We invest in digital data transmission because the modern world does not need autonomous systems. He focused on remote control and remote transmission of digital information. In the field of military systems, each 6th generation fighter will have a certain number of drones to cooperate with. In civil systems, there will be autonomous cars, distance work, distance learning, the Internet of Things and augmented reality. In order to ensure a collision-free exchange of data, in such an organized society, a physical layer of the network is needed that is adapted to the geography of the area it is to cover. This role is best fulfilled by a network made in 6G technology. Higher layers are to be agile, reconfigurable to meet the needs of end users. The user will change his whereabouts and the demand for various services. The agility of such a network is ensured by the IBN technology, because the wishes of end users can be transformed into signals controlling the network without human participation in this process. In conclusion, the optimization of the investment process in telecommunications infrastructure will be achieved through the joint
296

implementation of 6G and IBN technologies for the design, construction and operation of next-generation networks. The above recommendations can be used not only by investors or telecommunications providers, but also for setting directions for scientific research and regulating the telecommunications market.[8].
5. References
[1] Rychlik A.: The proposal of scientific research in the area and period of 5G. 3rd International Conference on Applied Information Technology (AIT2019), Abeokuta, Ogun State, Nigeria, 8-10 October, 2019, pp. 30 – 33,
[2] Rychlik, A.: A Limit of Digitalization in 5G Technology Period, Intellectual Systems and Information Technologies, Proceedings of the International Scientific and Practical Conference 2019, August 19-24, Odessa, ISBN 978-617-7711-43-7, pp. 189-193,
[3] Rychlik, A: [0000-0003-2068-9274], The 5G Architecture for Scientific and Academic Computer Network, ICST 2020 Information Control Systems & Technologies Proceedings of the 9th International Conference "Information Control Systems & Technologies" Odessa, Ukraine, September 24–26, 2020,
[4] Rychlik, A: [0000-0003-2068-9274], The Attractiveness of Investments in VHCN , ICST 2021 Information Control Systems & Technologies Proceedings of the 10th International Conference "Information Control Systems & Technologies" Odessa, Ukraine, September 23–25, 2021,
[5] https://www.juniper.net/us/en/research-topics/what-is-intent-based-networking.html,
[6] Mustafa Zaman Chowdhury, Md. Shahjalal, Shakil Ahmed, Yeong Min Jang, 6G Wireless Communication Systems: Applications, Requirements, Technologies, Challenges, and Research Directions, DOI 10.1109/OJCOMS.2020.3010270, IEEE Open Journal of the Communications Society,
[7] https://www.juniper.net/content/dam/www/assets/ebooks/us/en/intent-based-networking-for-dummies.pdf,
[8] Yiming Wei, Mugen Peng, Yaqiong Liu, Intent-based networks for 6G: Insights and
challenges, Digital Communications and Networks 6 (2020) 270–280,
[9] https://www.juniper.net/content/dam/www/assets/ebooks/us/en/the-2020-state-of-network-automation-report.pdf,
[10] Woźniak J., Tendencje w rozwoju polskiej i światowej telekomunikacji i teleinformatyki, Wojskowa Akademia Techniczna, Warszawa 2020.
297

Mathematical And Information Modeling Of Grain Elevators As Potentially Explosive Objects Victor Volkov1, Yuri Kryvchenko2, Nataliia Novikova3
1Odessa I.I.Mechnikov National University, Dvoryanskaya str., 2, Odessa, 65082, Ukraine 2Odessa National Academy of Food Technologies, Kanatnaya str., 112, Odessa, 65039, Ukraine 3Odessa National Maritime University, Mechnikov str., 34, Odessa, 65029, Ukraine
Abstract Mathematical and information models of a grain elevator as a potentially explosive control object are developed. These models create the base for software of a decision support system for explosion safety of grain elevators. Mathematical model is based on combination of the fuzzy logic and classical mathematical methods from the mathematical theory of combustions and explosions. Information model of the grain elevator as a complex potentially explosive object is also developed. Grain elevator is considered from the point of view of system analysis as the complex hierarchical system. This system is structurized, elementary potentially explosive objects are indicated. All kinds of these objects are described with their attributes and relationships, information structure diagrams are also built Appropriate software has been developed and some calculations have been done. These calculations are useful from the point of view of the grain elevator designing. It is proved that monolithic reinforced concrete silos are noticeably less explosive than prefabricated reinforced concrete silos and metal silos are much more explosive than reinforced concrete ones. It is also proved that increasing the height of the silo increases its explosion hazard. But the most interesting result is that a low degree of fire hazard does not always corresponds to a low degree of its explosiveness. Keywords 1 Grain elevator, silo, decision-making, fuzzy logic, mathematical model, information model, explosion, potentially explosive object, explosion hazard
1. Introduction
There are lots of explosions at the grain processing enterprises and grain storages all over the world every year. Grain elevators are among the most explosive grain enterprises.
There were 15 grain dust explosions reported for the U.S. in 1994 [1]. This compares to 13 in 1993 and a ten-year average of 15 explosions. There was one fatality and 14 persons injured. Seven of the fifteen incidents occurred in grain elevators, three in flour mills, and one in a wet corn milling and malt plant [1]. A similar picture was observed from year to year [2], and until now.
A grain elevator is a facility for stockpiling and storing large quantities of grain and for bringing
EMAIL: [email protected] (A.1); [email protected] (A.2); [email protected] (A.3) ORCID:0000-0002-3990-8126 (A.1); 0000-0003-2726-317X (A.2) ; 0000-0002-6257-9703 (A.3)
and keeping the grain in good conditions. Any grain elevator contains a tower with a bucket elevator (noria) or a pneumatic conveyor, which picks up grain from a lower level and deposits it in a silo (or, sometimes, in other storage). The construction of silo buildings, tied to the working building of the grain elevator, is widespread.
If there is a sufficient concentration of flammable flour or grain dust in the air anywhere in the elevator, an explosion may occur.
The distribution of the dust-air mixture explosions at grain enterprises at the place of origin is such that silos and bunkers account for almost half of the total number of explosions [3] (Table 1).
Thus, the most explosive elements in the system of grain enterprises are silos and bunkers, as well as bucket elevators and conveyors.
298

Table 1 Distribution of explosions at grain enterprises at the place of origin
Explosion location Number of explosions in % of the total
Silos and bunkers 47,7 Bucket elevators and
conveyors 21,0
Aspiration systems, pneumatic transport
6,7
Crushers, roller mills 4,1 Grain dryers 6,1
Industrial and other premises
4
Location unknown 10
One of the reasons for the large number of
explosions at grain elevators is that the automated control systems of these elevators have certain disadvantages [3, 4]. To prevent explosions, the automated elevator control system must be equipped with a decision support system (DSS) for explosion safety with appropriate mathematical support, information support and software. In turn, the creation of such mathematical support, information support and software requires correct mathematical and information modeling of the grain elevator as a potentially explosive control object.
The development of an appropriate mathematical and information models of a grain elevator as a potentially explosive object (PEO) is the aim of this research.
2. Mathematical and information models in the decision-making on hazards of grain elevator explosions
As shown earlier [5, 6] classical models for the decision-making [5, 7] on hazards of industrial explosions often are not applicable. These models naturally are not applicable for the decision-making on hazards of grain elevator explosions, because grain elevators (and other grain processing enterprises and grain storages) are very complicated systems if they are considered as PEO from the point of view of control.
Thus for the constructing of DSS for explosion safety it is preferable to use the model of decision-making under uncertainty, that is
based on the fuzzy-set theory and fuzzy logic [8]. It is proved that application of such model is preferable for complicated industrial and transport systems [5, 6].
But fuzzy logic should be used in combination with the exact mathematical theory of combustions and explosions [5, 6]. This is the only effective methodology for constructing intellectual DSS for explosion safety of grain elevators, which provides an opportunity to avoid involvement of evaluators and also to avoid all problems and difficulties connected with cooperation between evaluators and decision-makers [9].
Mathematical modeling of the grain elevator as complex PEO consists of the following steps:
• Each separate object of the grain elevator (bucket elevator, silo, over-silo floor, sub-silo floor, working building, etc.) is considered as an elementary potentially explosive object (EPEO). Such EPEO is geometrically modeled as flat channel (unlocked, closed at one end or closed at both ends) or round cylindrical tube (also unlocked, closed at one end or closed at both ends). • For each EPEO, the concentration limits of ignition and explosion are determined separately, as well as the explosion induction distance Xs [10]. These parameters are calculated by the methods of the mathematical theory of combustion and explosion (specifically, by the methods of the linear theory of stability of combustion and detonation waves), which is based on classical mathematics (specifically, on the analytical solution of linearized partial differential equations) [6, 11]. Non-linear effects are also partly taken into account. • The estimates for the concentration limits of ignition and explosion, for explosion induction distance Xs and for the time of the fire-to-explosion transition, which are made using classical mathematical methods, form the basis of fuzzy estimates of the possibility of an explosion. The main ideas and principles of such fuzzification are demonstrated in scientific works [5, 6]. • Conjunction of the corresponding fuzzy logical variables is, naturally, a fuzzy variable (fuzzy function), which is an estimate of the explosion hazard of EPEO [5]. Thus, certain fuzzy logical variable corresponds to each EPEO. For a given moment in time, you can find the value of each of these variables (a
299

number between 0 and 1; 0 corresponds to absolute safety; 1 corresponds to situation, when an explosion on ignition is inevitable). The largest of these values (i.e. the value of the disjunction of these fuzzy logical variables [8]) is an estimate of the explosiveness of the entire complex PEO as a whole, i.e. an estimate of the explosiveness of the grain elevator itself. • The value of such a fuzzy logical function is expressed by the value of a linguistic variable that provides information for decision-makers. Thus mathematical model for the decision-
making on hazards of grain elevator explosions is constructed.
Information modeling of the grain elevator as a complex PEO is developed in accordance with the principles, which are set out in the scientific works [5, 6, 12].
Grain elevator (complex PEO) is considered from the point of view of the system analysis as the complex hierarchical system. This system is structurized, EPEO are indicated. All kinds of these objects are described with their attributes and relationships [12]. Information structure diagrams are also built.
3. Software of DSS for explosion safety of grain elevators
On the base of mathematical and information models in the decision-making on hazards of grain elevator explosions the corresponding software has been developed. The program is Russified, so all the captions in the program are made in Russian.
The following example shows how the corresponding subroutine («SilosOtdelniy») evaluates the explosion hazard of an individual silo. The silo is chosen as an example as it is the most explosive part of the elevator.
A user can choose one of the standard reinforced concrete silos or they may independently set the shape and dimensions of the silo (reinforced concrete silo or metal silo) (Figure 1).
It is assumed that each silo has a circular, square or rectangular cross-section.
More complicated cross-sectional shapes of a grain elevator silo are possible in principle, but in practice they are extremely rare. In addition, using the factor of application of fuzzy logic, the complex shape of the silo section can usually be
replaced with a simpler one (one of the three above).
Figure 1: Form of the subroutine SilosOtdelniy for specifying the shape and dimensions of the silo. The caption on the button of the canvas on the left side of the form: "Select the type of silo". The caption on the button of the canvas on the right side of the form: " Set silo parameters". The captions on the buttons at the bottom of the form: “Round silo”, “Square silo”, “Rectangular silo”
Further calculations require specifying the
type of dust-air mixture or grain product, dust concentration, humidity, temperature and dust dispersion (i.e. average size of dust particles) (Figure 2). All these values can be measured using standard metrological devices in the operating mode of a grain elevator and the software in this case should to be a part of the software of the corresponding automated control system. In some cases, the corresponding values can be set in the program by the operator or the decision-maker.
Figure 2: Form of the subroutine SilosOtdelniy for setting parameters of the dust-air mixture. The caption on the button at the bottom of the form: "Setting the parameters of the dust-air mixture"
300

The current values of temperature and dust concentration are compared with the ignition temperature and the lower concentration limit of ignition.
The ignition temperature and the lower concentration limit of ignition are obtained as a result of the approximation of the known empirical data [3, 4]. This makes it possible to evaluate the fire hazard in principle.
The result of evaluation of the possibility of ignition and fire occurrence is depicted on the monitor screen as shown in Figure 3.
As it can be seen from Figure 3, the decision-maker is not dealing with the numerical values of fuzzy logical variables, but with linguistic variables.
Figure 3: A message about the degree of fire hazard of the silo on the monitor screen. This message means: “The dust concentration is greater than the lower ignition concentration limit. Combustion is highly possible”
Evaluations for the possibility of a fire-to-explosion transition, the explosion induction distance and the time of the fire-to-explosion transition are carried out according to [6, 11] using an estimate of the width of the flame zone for dust-air mixtures.
For a monolithic reinforced concrete silo [3, 4], the calculated explosion induction distance is
reduced by 2 times in the program, both in order to increase the reliability of the explosion hazard evaluation, and due to the possibility of the presence of separate roughness on the walls of the silo.
For a prefabricated reinforced concrete silo [3, 4], the calculated explosion induction distance is reduced in the program by a factor of 20, since the walls of such silo are assembled from ribbed or even smooth volumetric elements [3, 4], or from strained curved-linear elements with a ring cut by 3 or 4 parts [3] (if the silo have a circular cross-section, i.e. if the silo is round), so the silo has periodic or quasiperiodic roughness on the walls.
For a metal silo made by rolling or winding, the explosion induction distance is reduced in the program by 50 times, since the inner wall surface of such silo resemble the Shchelkin spiral.
All the above estimates of the explosion induction distance are approximate (especially for prefabricated reinforced concrete and metal silos), therefore, the estimates of the explosiveness of the silo given below are “fuzzy”. Therefore, the corresponding fuzzy variables are introduced into consideration, over which logical operations are performed according to the laws of fuzzy logic.
The computer program (subroutine «SilosOtdelniy») displays various kinds of messages on the monitor screen as a result of the calculations.
Messages about the explosion induction distance and the time of the possible fire-to-explosion transition (Figure 4) represent the necessary information for decision-making on ensuring explosion safety and/or explosion protection.
It is obvious that if the time of the possible transition of combustion into an explosion is long enough, then it is possible to make a wide variety of decisions (organizational, technical, technological).
If this time, on the contrary, is short, then the only possible solution is to stop immediately the technological process with the simultaneous evacuation of personnel.
In the latter case, it is possible to replace the automated control with an automatic one.
Calculations show that the time of the possible fire-to-explosion transition in organic dust-air mixtures is hundreds and thousands of times longer than the development time of an explosion in combustible gas mixtures.
301

Figure 4: Messages about the explosion induction distance and the time of the possible fire-to-explosion transition. The first message means: “The detonation induction distance is 34,60558 m = 34605,58 mm”. The second message means: “If a fire can develop into an explosion, it will take 692,1116 seconds”
The type of message with a fuzzy evaluation of the explosiveness is shown in Figure 5.
An important point is that all the above estimates are made without the participation of experts (evaluators).
The complications of experts' interaction with each other are well known [13, 14]. Even greater difficulties arise when evaluators interact with decision-makers [13, 15, 16].
Therefore, it is advisable to avoid the participation of experts in solving such decision-making tasks [12, 13, 16, 17].
Figure 5: A message about the degree of the explosion hazard. This message means: “The situation is extremely explosive. An explosion is almost inevitable. Combustion is highly possible”
4. Conclusions
Mathematical and information models of a grain elevator as a potentially explosive object are developed. These models create the base for software of DSS for explosion safety of grain elevators.
Appropriate software has been developed and some calculations have been performed.
These calculations are useful not only from the point of view of testing the proposed method of mathematical modeling of a grain elevator as a potentially explosive object or testing the software itself, but also from the point of view of the grain elevator designing (i.e. appropriate decisions on the explosion safety and explosion protection can be made already at the stage of the elevator design).
The results of the calculations are summarized in the following conclusions (some of which are quite obvious in themselves):
• If the humidity rises, then both the explosion hazard and the fire hazard of the grain elevator decrease. • Temperature fluctuations within a few tens of degrees have little effect on the fire
302

hazard and explosion hazard of the grain elevator. • A decrease in the average size of dust particles in the dust-air mixture leads to the increase of the explosion hazard of this mixture. Fine dust is much more explosive than coarse dust (this conclusion is theoretically quite obvious). • Monolithic reinforced concrete silos are noticeably less explosive than prefabricated reinforced concrete silos. • Metal silos are much more explosive than reinforced concrete ones. • Increasing of the height of the silo increases its explosion hazard. • A low degree of fire hazard does not always corresponds to a low degree of its explosiveness (in this case, the explosiveness is understood as the possibility of an explosion in case of ignition).
5. References
[1] A report of grain dust explosions that took place in 1994, Department of Grain Science and Industry, Kansas State University,1994. URL: https://web.archive.org/web/20070124104804/http://www.oznet.ksu.edu/historicpublications/Pubs/1994Dust_Explosions.pdf.
[2] A report of grain dust explosions that took place in 1994, Department of Grain Science and Industry, Kansas State University, 1994. URL: https://web.archive.org/web/20070124104816/http://www.oznet.ksu.edu/historicpublications/Pubs/1997Dust_Explosions.pdf.
[3] Ya.Ya. Vasil'yev, L.I. Semenov, Vzryvobezopasnost' na predpriyatiyakh po khraneniyu i pererabotke zerna [Explosion safety at enterprises for storage and processing of grain], Kolos, Moscow, 1983. (in Russian)
[4] L.I. Semenov, L.A. Tesler, Vzryvobezopasnost' elevatorov, mukomol'nykh i kombikormovykh zavodov [Explosion safety of elevators, flour and combined feed mills], Agropromizdat, Moscow, 1991. (in Russian)
[5] V. Volkov, Decision support systems on hazards of industrial explosions, in: Seventh International Symposium on Hazards, Prevention and Mitigation of Industrial Explosions: Thirteenth International
Colloquium on Dust Explosions and Eighth Colloquium on Gas, Vapor, Liquid, and Hybrid Explosions, St. Petersburg, Russia, 7–11 July 2008, volume 3, 2008, pp. 343–347.
[6] V. Volkov, Y. Kryvchenko, Transition of combustion to explosion and decision support systems for explosion protection, in: Lecture Notes in Computational Intelligence and Decision Making, Advances in Intelligent Systems and Computing, volume 1246, Springer, Cham. 2021, pp. 437-447. doi: 10.1007/978-3-030-54215-3.
[7] Y. A. Enta, Measure for the Discriminative Effect of Information, Proceedings of the 1978 Joint Automatic Control Conference, volume 3, 1978, pp.69-80.
[8] L. Zadeh, Fuzzy Sets Information and Control, volume 8, 1965, pp.338-353.
[9] P.H. Ross, M.W. Ellipse, H.E. Freeman, Evaluation: A systematic approach (8th ed.), Sage Publications, 2021.
[10] Nettleton M. A., Gaseous detonations: their nature and control (1st. ed.), Springer, 1987. doi:10.1007/978-94-009-3149-7.
[11] Aslanov S., Volkov V., The integral method of studying the hydrodynamic stability of laminar flame, Combustion, Explosion and Shock Waves, volume 27, 1991, pp.553-558. doi:10.1007/BF00784941.
[12] A. Kovalenko, V. Volkov, Information Model for Potentially Detonative Object, in: CEUR Workshop Proceedings, volume 2683, 2019, pp. 50-52.
[13] P.H. Ross, M.W. Ellipse, H.E. Freeman, Evaluation: A systematic approach (8th ed.), Sage Publications, 2021.
[14] Carden F., Alkin M.C. () Evaluation roots: An international perspective, Journal of MultiDisciplinary Evaluation volume 8 (17), 2012, pp. 102–18.
[15] Daniel L. Stufflebeam, Chris L.S. Coryn, Evaluation Theory, Models, and Applications (2nd ed.), Wiley, 2014.
[16] Bennett W.L., Segerberg A., The logic of connective action, Information, Communication & Society, volume 15 (5), 2012, pp. 739-68.
[17] Donaldson S.I., Christie C.A., Mark M., Credible and Actionable Evidence: The Foundation of Rigorous and Influential Evaluations, Thousand Oaks, CA: SAGE, 2015.
303

Design Of Ternary Decoder Larysa Martynovych1 , Yurii Gunchenko2, Yurii Shugailo 3, Yurii Bercov 4 Dmytro Slutskyi5, Kostiantyn Smirnov 6
1,2,3,4,6 I.I.Mechnykov Odesa National University, Dvoryanska str, 2, Odesa, 65082, Ukraine 5 Odesa National Maritime University. Mechnikova str, 34 Odesa, 65000, Ukraine
Abstract The analysis of advantages of ternary logic on an example of construction of ternary RS-trigger is considered. Based on the multi-threshold element of multi-valued logic (MTEML), the structures of the different variants of single-input decoders with the different active levels are proposed. The structures of the obtained elements and their schemes for the selection of the simplest variants are analyzed. The future directions of work and expediency of development of subjects of construction of ternary elements and systems on their basis are outlined. Keywords 1 Ternary logic, multi-threshold element of multi-valued logic, methods of constructing ternary elements, decoder
1. Introduction
The relevance of the topic is due to the fact that modern computer technology needs new ways to increase computing power and speed. Binary logic is now the most common, but it has a number of disadvantages that can be eliminated through the use of ternary logic, including increasing the range of numbers, speeding up operations, reducing the amount of equipment.
The purpose of the work is the design and synthesis of logical elements for ternary computer systems.
Three-valued logic is more convenient and familiar to people than two-valued logic [1]. Consider some examples that prove this.
The first example is the weight of the levers (Fig. 1). They are a characteristic ternary device, the three states of which correspond to three possible relations: A> B, A = B, A <B. For comparison, consider also the executive scales, which can take only two states, corresponding, for example, the ratio A> B, A≤B (Fig. 2). It is clear that binary scales are less convenient than ternary. Only in the case of A> B the result of weighing on them is determined immediately, and in the other
EMAIL: [email protected] (A. 1); [email protected] (A. 2), [email protected] (A. 3); [email protected] (A. 4); [email protected] (A. 5) ORCID: 0000-0001-7351-1467 (A. 1); 0000-0003-4423-8267 (A. 2); 0000-0003-2144-0930 (A. 3); 0000-0001-9704-1121 (A. 4); 0000-0003-3734-9460 (A. 5); 0000-0001-6813-0109 (A. 6).
two cases it is necessary to re-weigh by swapping A and B [2].
Figure 1: Ternary scales
Figure 2: Binary scales The next example is branching by the sign of
the variable x (Fig. 3). This example demonstrates the fundamental difference between three-digit logic and two-digit logic. It is that one and the
304

same can be represented in a more compact form in ternary logic than in binary. In this example, the ternary branching by the sign x is described by specifying a single three-digit operation sign (x) and is performed in one step, while the same branching, which is carried out by means of two-digit logic, associated with the need for two operations and is performed by two steps. Such branching algorithms are often used in decision-making systems, in "Smart Homes" to process signals from sensors and the corresponding response to them. Ternary logic in this case will significantly accelerate this reaction [3].
a) b)
Figure 3: Branch operation by sign: a) ternary scheme; b) binary scheme
These examples show that ternary logic allows
you to reason more simply and more quickly than reasoning in terms of ambiguous logic [4]. In practice, people probably use mostly ternary logic [5,6].
Some properties of ternary logic determine its effectiveness and practical value:
• the branching command by sign takes twice less time than in binary; • the ternary adder subtracts when inverting one of the terms, from which it follows that the ternary counter is automatically reversible; • in the three-input ternary adder the transfer to the next category occurs in 8 situations out of 27, and in the binary adder - in 4 out of 8; • the three-level signal is more resistant to interference in transmission lines. This means that special methods of redundant coding of ternary information are simpler than binary [7].
2. Ternary RS-trigger
In addition to combinational circuits, the output state of which at each time depends on the
set of input signals, in computer systems are widely used circuits and nodes in which the output state depends not only on the input signals but also on their previous state, ie digital automata. As you know, the simplest device with two stable states at the output - the trigger is often used to store information.
Consider binary and ternary RS-flip-flops in comparison.
Figure 4 shows the designation of the binary RS-flip-flop.
Figure 4: Designation of a binary RS-trigger
The trigger has 2 states Q = 0 and Q = 1, which
are displayed on its outputs. The next state of the trigger depends on the current state and the combination of input signals at its two inputs.
It is known that it has a forbidden combination of input signals. If there are active signals S = 1, R = 1 on both inputs at the same time, this mode is considered forbidden, because the state of the trigger will not be determined.
In ternary logic, three allowed modes can be provided with only one input [8]. In this case, in addition to reducing the number of pins, such a device in principle cannot be the fourth, forbidden mode. Based on MTEML the ternary RS -trigger which scheme is shown in fig. 5.
Figure 5: Scheme of ternary RS-trigger
++-
+-
-
Q
Q
T
305

Feedback from the + R, -R outputs provides support for the current state of the trigger in the absence or zero value of the input signal. The input signal "+" leads to the transition of the trigger to the state "+", the signal "-" to the transition to the corresponding state "-". The ternary RS-flip-flop has another state "0", but it is unstable and is possible only when the system is initially turned on (Table 1).
When applied to the input x = 0 - the trigger is in storage mode, its state does not change. When applied to the input x = - 1 (minus) the trigger goes into reset mode, ie the output will also be minus 1, when x = + 1 the trigger goes into installation mode and the output is also +1. The state of the trigger, when the signal at its output is zero, and the input is a non-zero value (either "+" or "-") is unstable, and immediately changes depending on the signal sign. Table 1 shows the previous and subsequent states of the trigger. Table 1 Truth table of the ternary RS-trigger
№ Х -r +r q X; –r; +r
-R1 +R1
Q = -R1; +R1
0 – – 0 – - - – 0 – 1 – – + 0 – – 0 – 2 – 0 + + 0 – + 0 3 0 – 0 – – – 0 – 4 0 – + 0 0 – + 0 5 0 0 + + + 0 + + 6 + – 0 – 0 – + 0 7 + – + 0 + 0 + + 8 + 0 + + + + 0 + + 0 – – 0 – - - – 0 – 1 – – + 0 – – 0 –
In principle, a ternary RS-flip-flop can have
three different states of input and three different states of output signals, i.e. nine combinations, which are represented by terms in the table. The input signal is denoted by X, the signals of the current state and their sum - the current state are denoted by lowercase letters -r, + r, q, respectively. The signal that is directly generated at the input of the trigger is equal to the sum of these signals and is indicated in the table by column X; -r; + r, this signal determines the next combination of output signals -R, + R and the next state Q = -R; + R, which trigger will go.
3. Ternary single-input decoders
Decoders are a must-have for any computer system. They are more commonly used to identify address space and are used to select specific devices or memory cells when addressing them (setting the address on the appropriate bus).
In fact, decoders convert the input code of a given number system to unary, in which the output active signal is present only on one of the outputs, the number of which corresponds to the input combination. The maximum number of outputs for a ternary decoder is m = 3n, where n is the number of inputs. Consider the construction of one- and two-input ternary decoders.
For a single-input decoder, the number of outputs is three. Depending on what value of output signals we will consider active, and what passive - there can be six different combinations and, accordingly, schemes of construction of one-bit ternary decoders. To build decoders we use MTEML. The table 2 shows the values of the outputs of the element depending on the signal at the input X.
Table 2 Values of the outputs of the MTEML
X -L -R +L +R
- 0 - + 0 0 0 - 0 + + - 0 0 +
On the basis of MTEML variants of a ternary
one-input decoder with various active signals which structural schemes are shown in fig. 6-11.
Consider a decoder whose active value is "-",
passive value "0". The truth table for each of the three outputs is presented in the table 3. Table 3 Decoder truth table
X Y0 Y1 Y2
- - 0 0 0 0 - 0 + 0 0 -
It is easy to conclude that to obtain three output
signals you need to combine the following outputs of MTEML:
Y0= -R, +R, -L = -1, +R Y1= -R, +L
306

Y2=-L To simplify the implementation of the outputs
-R, -L, which are equal to "-1", regardless of the input signal, replace the corresponding current source. We obtain the scheme shown in Fig. 6.
Figure 6: Block diagram of a single-input decoder with active "-"
The following truth table (Table 4) shows the
case of the active signal "+", passive "0". Table 4 Decoder truth table
X Y0 Y1 Y2
- + 0 0 0 0 + 0 + 0 0 +
The following are expressions for constructing
outputs by combining and simplifying the corresponding signals. In fig. 7 shows a diagram that implements this.
Y0= +L Y1= +R, -L Y2= +R, -R, +L = +1, -R
Figure 7: Block diagram of a single-input decoder with active "-"
Tables 5 - 8 show the output signals for the cases of active "0", passive "-" (Table 5), active "0", passive "+" (Table 6), active "-", passive "+" ( Table 7) and active “+”, passive “-” (Table 8).
Figures 8 - 11 show the implementation schemes for all these cases.
Table 5 Decoder truth table. Active signal "0"
X Y0 Y1 Y2
- 0 - - 0 - 0 - + - - 0
Y0= -L, -R, +L = -1, +L Y1= -L, -R, +R, -L = -1, +R, -L
Y2= -R Figure 8: Block diagram of a single-input decoder with active "0", passive "-"
Table 6 Decoder truth table
X Y0 Y1 Y2
- 0 + + 0 + 0 + + + + 0
Y0= +R Y1= +L, +R, -R, +L = +1, -R, +L Y2= +L, +R, -L = +1, -L
307

Figure 9: Block diagram of a single-input decoder with active "0", passive "+" Table 7 Decoder truth table. Active signal "-"
X Y0 Y1 Y2
- - + + 0 + - + + + + -
Y0= +R, -R, +R, -L = -1, +R, +R Y1= +R, +L, -L, -L = +1, -L, -L Y2= +1, -R, -R, +L, +L
Figure 10: Block diagram of a single-input decoder with active "-"
Table 8 Decoder truth table Active signal "+"
X Y0 Y1 Y2
- + - - 0 - + - + - - +
Y0= -1, +L, +L Y1= -1, +R, +R, -L, -L Y2= +1, -R, -R
Figure 11: Block diagram of a single-input decoder with active "+"
Analysis of the obtained structures of single-
input decoders showed that the simpler options are when the active signal is "-" or "+", and passive is "0".
4. Conclusions
The analysis of the construction of multivalued logic and its elemental base allowed us to draw the following conclusions.
The vast majority of the implementation of ternary elements has significant disadvantages.
These solutions either do not allow the full implementation of ternary logic, or do not have a general approach to its implementation, or
308

complicate the implementation of ternary devices and their structure.
One of the obstacles hindering the development of ternary technology is the lack of element base and a common approach to the implementation of components and elements of non-binary computers.
The implementation of ternary devices based on threshold logic is a way to create ternary devices that can compete with binary in terms of equipment.
An urgent scientific and practical task is to create a general approach to the implementation of ternary nodes and methods of synthesis of ternary logical and arithmetic elements, as there are still no standards in the development and implementation of ternary elements and a single methodological approach.
Thus, for the first time, the structures of several variants of one-input decoder with active signals "-", "+" and "0" based on MTEML, which can be used in the construction of elements of ternary computer systems, were obtained.
The built devices have a much simpler architecture compared to their counterparts.
Analysis of the obtained structures of single-input decoders showed that the simpler options are when the active signal is "-" or "+", and passive is "0".
To build ternary computing and intelligent systems, it is necessary, first of all, to develop the principles of a systematic approach to the synthesis of ternary elements and software for their interaction with each other and with existing modern devices.
Therefore, in further research it is expedient to consider methods of construction and synthesis of nodes of ternary computer systems, their optimization, and development of principles of mathematical modeling and software of such systems and their elements.
5. References
[1] Multivalued logic // Philosophical encyclopedic dictionary / VI Shinkaruk (editor in chief) and others. - Kyiv: Hryhoriy Skovoroda Institute of Philosophy of the National Academy of Sciences of Ukraine: Abris, 2002. - 742 p. - 1000 copies. - BBK 87я2. - ISBN 966-531-128-X.
[2] Béziau J.-Y. 1997 What is many-valued logic ? Proceedings of the 27th International Symposium on Multiple-Valued Logic,
IEEE Computer Society, Los Alamitos, pp. 117–121.
[3] Malinowski, Gregorz, 2001, Many-Valued Logics, in Goble, Lou, ed., The Blackwell Guide to Philosophical Logic. Blackwell.
[4] D. Michael Miller; Mitchell A. Thornton (2008). Multiple valued logic: concepts and representations. Synthesis lectures on digital circuits and systems 12. Morgan & Claypool Publishers. ISBN 9781598291902.
[5] M. Ahmad, RISC-V Processor Designs Emerge, 2021, URL: https://www.eetimes.com/risc-v-processor-designs-emerge/
[6] S. Gottwald, A Treatise on Many-Valued Logics. Studies in Logic and Computation, vol. 9, Research Studies Press: Baldock, Hertfordshire, England, 2001.
[7] Yu. Gunchenko, L. Martynovych, K. Tikhonova, D. Slutsky, The concept of construction of devices for ternary logic - Proceedings of the V All-Ukrainian scientific-practical conference Perspective directions of modern electronics, information and computer systems (MEICS-2020) Dnipro , November 25–27, 2020 - pp.93-94.
[8] Y. Gunchenko, L. Martynovych, V. Mezhuyev, Y. Shugailo, Y. Bercov, Design of a ternary RS-trigger. 2021 7th International Conference on Computer Technology Applications (ICCTA 2021) online, held during July 13-15, 2021 in Vienna, Austria. To appear.
309

Copyright Issues in Digital Society: Sports Video Games Daniil Shmatkov 1
1 Scientific and Research Institute of Providing Legal Framework for the Innovative Development of the National Academy of Legal Sciences of Ukraine, Chernyshevskaya st., 80, Kharkiv, 61002, Ukraine.
Abstract This article addresses application of copyright protection to sports video games, discusses relevant important issues, and is aimed at disclosing intellectual property approaches applicable to the various elements of that entertainment and sports technology. The main focus is put on issues such as copyrightable subject matter in sports, proprietary rights in sports video games, national approaches to copyright laws, complex issues of vesting copyright, and relationships between creators and users of video games. Particular attention is paid to protecting the athletes moves that appear in video games and elaboration of the copyright issues in Ukraine. It is suggested that categorized copyright protection is an adequate and flexible approach to sports video games as an independent and significant genre containing various copyrightable objects. Keywords 1 Copyright, video games, digital society, intellectual property, e-sports, streaming video games.
1. Introduction
The video game market has been developing for over sixty years and according to various statistics its size is valued at more than USD 150 billion. There is a lot of evidence for its further growth. The video game industry has already eclipsed the music and film industries [1]. Even the COVID-19 pandemic did not slow down this dynamic; on the contrary, pandemic has accelerated it, as has the growth in the number of gamers around the world [2].
Legal issues cannot ignore such a thriving digital industry. Discussions about intellectual property in video games are not uncommon and have taken place since the advent of video games [3]. In most cases that digital systems are covered by copyright law, patent law, trademark law, and competition law [3], the right of publicity, the freedom of speech, expression, and creativity [4], and the right to privacy. But it is copyright law that penetrates the most the video game production industry [5; 6]. Modern developments contain many creative and expressive elements [7] that are covered by copyright, which creates a large number of questions on law enforcement. Creating and using video games is an intellectual
EMAIL: [email protected]. ORCID: 0000-0003-2952-4070.
property challenge [8]. Therefore, these questions are interesting for science.
Video games can be grouped into several different genres (massively multiplayer online role-playing games, action adventure, first-person shooter, sports, rhythm, driving, strategies, puzzle, board and card games, gambling, etc.) [9] and may have distinctive goals (entertainment games, serious games or educational games, applied games, and social games) [3]. Different games have a large number of game elements, game rules standards and special expression in gameplay, and therefore they may have different legal protection [10].
Among the described genres, sports video games are of interest in several ways. First, sports video games market represents one of the highest selling types of video game in the industry [11]. And given such success, it is prone to spread copying, cloning, imitation, re-engineering of other developers’ ideas [12]. Second, in 2019, the celebration of Intellectual Property Day was held under the slogan “Reach for Gold” where World Intellectual Property Organization emphasized the value of copyright among other intellectual property in the world of sport business, although it is not the only feature of the sport [13]. Sports video games are complex and complicated, which comprises different copyrightable objects [10].
310

Comparative analysis of sports and sports video games is interesting for science.
Copyright in sports is still causing debate among the scientific community, and the digitalization of sports has begun to generate even more debate.
This article addresses application of copyright protection to sports video games, discusses relevant important issues, and is aimed at disclosing intellectual property approaches applicable to the various elements of that entertainment and sports technology.
2. Copyrightable Subject Matter in Sports
In 2019, during the celebration of Intellectual Property Day, the copyright was only covered as a matter of broadcasting sports events. The portrayal of the sports performance through a picture or media coverage has good prospects for attracting intellectual property in different jurisdictions [14]. But there are also other copyrightable objects.
Sometimes courts had taken the position that sports performances meet the threshold for copyrightable subject matter [1]. A sports event per se cannot be considered as copyright [15]. Sports are divided between the following different groups, into which sports might fall, and these categories are arranged in order from the least to the most possibly copyrightable ones [16]: 1) sports events; 2) scripted sports plays; 3) routine-oriented competitive sports; and 4) routine-oriented non-competitive sports. Although this classification is not a panacea for obtaining copyright – for example, in the recent decision of the Spanish Supreme Court from October 18, 2020 regarding the claim of a professional bullfighter to obtain copyright protection, court sentenced that the bullfighter cannot register his choreography as an object of intellectual property since it cannot be expressed objectively [17]. The question of whether bullfight is a sport, perhaps, a debatable one, but the most important thing in this case is that in relation to expressive bullfight, the court referred to the decision of The Court of Justice of the European Union from October 4, 2011 with reference to Football Association Premier League, which states that competitions limited by the rules of the game leave no room for creative freedom in the sense of copyright.
Scientists note that scripted sports, adversarial and routine-oriented sports, don’t deserve
copyright protection [16; 18], while choreographies of routine-oriented/aesthetic sports [19] as well as sports celebration moves [19; 20] are copyrightable subject matter. It follows from studies and judicial practice that establishing the existence of copyright requires a number of procedures, including an identification of moves compliance to the strict rules, the number of moves performed in choreography, the presence of competition, the ability to move in a different way or simpler, peculiarity of moves, compliance of moves with the public morality, etc.
A video game, like a sports game, does not necessarily lead to a copyrighted work, which is determined by the level of originality of the work and the dichotomy of functionality and expressiveness, but the scope of the copyrightable subject matter in sports video games is much larger.
3. Proprietary Rights in Sports Video Games
Video games include different technological aspects. In these IT products, in general copyright covers the following objects [7; 10]:
Musical compositions. Sound recordings. Voices. Imported sound effects. Internal sound effects. Photographic images. Digitally captured moving images. Animations. Texts. Storylines. Characters. Primary game engine or engines. Ancillary codes. Plug-ins. Comments. In sports video games, the storyline and
characters as copyrightable objects raise controversial issues. While, in some cases, copyright holders of various management games (e.g. Fantasy Football) can claim such rights, copyright holders of realistic simulations of sports are unlikely to get copyright protection for their storyline. By analogy with the legal issues in sports discussed in the second paragraph, rules, placement of athletes on the field, etc., are not
311

copyrightable subject matter even in the digital space.
In addition, the list above lacks choreography, pantomime or parody that an athlete can display, for example, during a score celebration that is a recognizable attribute of a real athlete. Such animation elements are widely used in sports video games to enhance their believability and entertainment. In this case, the digital version of such movements can be considered, for example, as derivative work. But as the lawsuits against Epic Games [21] show, not every set of moves can be qualified as copyright, which means that it is necessary to take into account all the most common and relevant requirements for obtaining the rights of this intellectual property – the fixation requirement, the human authorship requirement, copyrightable subject matter, and the originality requirement.
4. National Approaches to Copyright Laws
Each of the EU member states, as well as the USA, Canada, China, Ukraine and other countries have their own national copyright laws, which are based on the framework of international laws and agreements such as the Berne Convention (1886), the TRIPS Agreement (1994), and the WIPO Copyright Treaty (1996). National approaches to video games can be divided into the following areas:
Video games are classified as functional software with a graphical interface. Separate or categorized protection of each creative element according to its specifics is provided. Video games are classified as audiovisual works. Video games are not classified and not clearly defined in the legislation. The first approach is used in countries such as
Canada, China, Israel, Russian Federation, Spain, and other countries; separate or categorized protection for creative elements is provided in Brazil, Denmark, Germany, Japan, USA, and other countries; video games are regarded as audiovisual works in Kenya and the Republic of Korea [22].
In Ukraine, video games are not mentioned in the legislation (in the Civil Code of Ukraine, in the Law of Ukraine “On Copyright and Related Rights”, and in the Law of Ukraine “On the Distribution of Copies of Audiovisual Works,
Phonograms, Videograms, Computer Programs, and Databases”) despite the fact that the Supreme Court back in 2006 pointed out the need to describe a video game as an object of copyright law in the Law of Ukraine "On Copyright and Related Rights" and in the Law of Ukraine “On the Distribution of Copies of Audiovisual Works, Phonograms, Videograms, Computer Programs, and Databases”. It means that the laws mention copyrightable objects such as computer programs, databases, audiovisual works, etc., which, probably, could be applied to video games, but do not directly mention video games (and, of course, do not distinguish their genres). In Ukrainian legal proceedings, there is a lack of theory and practice applicable to that digital system, but some comments [23] indicate that in Ukraine it is more likely that the approach of separate protection of each creative element of video game according to its specifics is applied.
The more legislators and courts will recognize the legal versatility of IT, the easier it will be for the creators to assess in advance the potential legal risks and opportunities and create original works, the more interesting the game will be for gamers, and the easier it will be to build a thriving national sector of the economy.
5. Complex Issues of Vesting Copyright
Both e-sports and streaming sports video games are modern trends. At first glance, the use of neighboring rights is appropriate in these activities, but research and practice indicate the need for a more detailed analysis of the approaches to these issues.
5.1. E-sports
Born in Asia and spread to Europe and Americas, e-sports has already eclipsed some of the biggest sporting events in the world [1]. It became difficult to ignore the commercial potential of e-sports, and in 2017, the International Sports Committee (IOC) began to consider “competitive e-sports” as a sporting event. In 2018, Lausanne hosted the first e-sports forum organized in cooperation between the IOC and the Global Association of International Sports Federations.
E-sports is defined as “an area of sport activities in which people develop and train
312

mental or physical abilities in the use of information and communication technologies” [24]. In addition, scientists note that escapism, acquiring knowledge about the games being played, novelty and e-sports athlete aggressiveness positively predict e-sports spectating frequency [25], i.e., even those aspects make e-sports popular and open up new market niches.
Taking into account the arguments from the previous paragraphs, e-sports is characterized by more ways of copyright protection than sports. Another difference between sports and e-sports is that copyright exists when an e-sports game is created, whereas it does not apply to sport as such [14]. There is a perception that the sports performance of e-sports can be considered as original expressions under copyright law, just like music, dance or theater [26]. At the same time, it is doubtful that “law may recognize intellectual property in a virtual eSport” [14] when it comes to scripted sport simulators. But certain opportunities still remain – since e-sports can protect the game format with copyright, and regulation of the rules of the game may be less important or even irrelevant [14]. At the same time, the widespread use of the image of an athlete as a leader of public opinion can place certain restrictions on the commercial aspects of copyright. This issue remains controversial.
Thus, copyright in e-sports generally primarily includes the corresponding rights of IT developers (or other copyright holders) to sound recordings, voices, sound effects, photographic images, moving images, animations and texts, and comments. In the second place, the rights of organizers and participants of a digital sports event to the same objects and to broadcasting as well as to possible new creative works appear. Otherwise, the relationship between e-sports players and organizers will probably develop similarly to well-known practices in real sports.
5.2. Streaming
Streaming video games is live broadcasting playing video games on the internet [27]. Research shows that in recent years, game developers have been aggressively using their copyrights to gain a share of streamers income and to control the context in which their game is shown [27]. There is a perception that freedom of expression can and should be used in this context, as game streaming is already beneficial for IT
developers (or other copyright holders) as it increases the demand for their game [27].
Today, in this type of relationship, the laws of countries justifiably give preference to the rights of copyright holders. According to all factors from the fair use checklist (the purpose and character of the use; the nature of the copyrighted work; the amount or substantiality of the portion used; and the effect of the use on the potential market or value of the work) the streamers' positions are weak.
5.3. User-Generated Content
The situation with user-generated content remains insufficiently clarified. Many video games encourage players to create and share so-called user-generated content, which can be a legal minefield for all parties [8].
Modern interactive online video games include tools for creating and developing new game elements such as characters, levels and other creative elements, in fact, they develop an entirely new category of creators whose legal status remains largely unclear [7]. Players must follow the rules of use of the game specified in the "end user license agreement" which in most cases leaves room for doubt, and IT developers should take into account various situations in order to prevent the distribution of illegal or inappropriate content on their platforms [8].
All games are interactive processes, and players perceive the game as a creative process, which undermines the copyright of the IT creator, while laws may not sufficiently protect both the copyrights of creative players and authors of video games [28].
The fact that only a specific expression of a computer program is copyrighted can be a disadvantage, because even similar visual effects by themselves sometimes cannot be proof of copying [3]. The copyright holder retains the rights to only one of the many ways of expression and its derivatives. Some confusion arises here, which includes concepts such as original work, fair use, derivative work, etc.
On the one hand, the resolution of this issue requires relevant courts decisions and explanations. Although tools for protecting the copyright of players and authors of interactive games (or other copyright holders) are still developing, it is important to understand that here, as in most cases of streaming video games [28], the value of works is low. The same cannot be said
313

for e-sports, where the financial prospects are much higher.
6. Relationships between Copyright Holders and Users of Video Games
6.1. Copyright Infringement
A thriving sector of the economy is bound to be faced with various types of law infringements. In addition, game developers are increasingly using a complex mixture of legal and illegal tools to regulate creative activities [1]. Among the most common infringements, the following should be noted [8; 10; 12]:
One-for-one code copying. Imitation of game mechanics or remixture of multiple games’ mechanics. Changing the graphics of an existing game (reskinning), while retaining the original expression and actual gameplay. Modifying other elements of an existing game, while preserving certain original elements. Hiding secret content (Easter eggs) in a video game by its developers which is taken from another copyrighted work. These tendencies are taking place at the
present stage of development of IT. Among a digital society, infringements are more widespread and more profitable for clone developers, but proportionately more detrimental to original developers [29].
6.2. Copyright Protection
Lawsuit cases regarding copyright in video games are widely reported in the scientific literature, but there is a lack of information regarding lawsuit cases which consider infringements in sports video games.
The main implications of most common lawsuits in video games are identifying significant similarities between works, balancing between freedom of speech, expression, creativity and copyright, testing genre standards (which are not protected by copyright), and publicly available noncopyrightable subject matter in a particular work.
Lawsuits involving sports video games, for example, have addressed issues such as the game's compliance with copyright vesting requirements and categorizing video game streams within the context of copyright law [30]. Most of the
disputes between the creators of sports video games are about violations of other laws (public rights, false advertising, etc.). Although video games have already become part of the 21st century media landscape, their protection under copyright law still raises difficult doctrinal issues [28], some of which were described in the previous paragraphs.
Intellectual property law, especially copyright law, is an ever-expanding doctrine [27]. But such a complex copyright system means that courts have to conduct more detailed analysis, which in turn leads to higher costs for litigating parties [7].
The revenue that independent developers make is limited [29], but in the fast-growing mobile games market, such IT developers have weight. The mobile games market is full of small and medium-sized companies that use video games for commercial purposes without obtaining all the relevant copyright and related rights [7]. An illustrative example is the removal of Flappy Bird from the Apple App Store, after which sixty Flappy Bird clone applications were sent every day for approval in the App Store [29].
Although some countries are implementing projects to simplify the handling of copyright infringement claims, in general, the high costs of litigation processes are not always within the reach of SMEs. Legislation should distinguish legitimate inspiration and plagiarism [9] in order to serve all stakeholders. Although potential copyright infringement implies certain legal remedies, the following extralegal norms of fairness, which minimize the need for strong legal interventions, underlie content creation in the gaming context [1]:
Norms of competitive integrity prevalent among video game players. Norms of wealth sharing arising out of communities of loyal consumers. Labor-based norms that allow gameplay streamers to claim ownership over their recorded stream. Internal copyright management systems [31],
which could include legal, educational, and specific aspects (such as IT applications in licenses distribution or in monetization of copyright assets, etc.), are useful to SMEs especially at the stage of development of technological elements of digital systems that are essentially copyrightable subject matter. An effective legal instrument for the protection of intellectual property rights is Directive 2004/48/EC of the European Parliament and of
314

the Council from April 29, 2004 on the enforcement of intellectual property rights, which provides effective means of presenting, obtaining and preserving evidence that is of prime importance in intellectual property lawsuits, which allows plaintiffs to claim the physical withdrawal of infringing goods and/or materials and tools used in the production and/or distribution of those goods and/or materials, an “ex parte injunction”, an interim measure for a judgment without the presence of the defendant [3]. The implementation of such rules could be adequate to the challenges of the Digital Era, and, possibly, standardize the processes of considering cases related to copyright protection and reduce the costs of litigants for conducting different tests.
7. Conclusions
Thus, as a result of the analysis, it was found that proprietary rights in sports video games are significantly different in objects from sports and slightly different from the general case of video games. Basically, this kind of entertainment and sports, like other genres of video games, contains a wide variety of copyrightable objects: mostly – primary game engine or engines (which can be considered, for example, as “literary work” or “computer program” in the language of the law), ancillary code (computer program or literary work), plug-ins (computer programs or literary works), musical compositions (musical works, including any accompanying words), sound recordings (sound recordings), images (graphic works), animations, sound-effects, and comments (motion pictures and other audiovisual works), texts (literary works), sport celebration moves (pantomimes and choreographic works), and neighboring rights for e-sports; and barely – storylines and characters.
Therefore, separate or categorized copyright protection is an adequate and flexible approach to sports video games for the digital society needs since “categorized protection is probably conducive to the innovation and iteration of the video game sector” [32]. This approach also may be applied in countries where video games are not directly indicated as copyrightable subject matter and may be considered as a complex of other copyrights.
Jurisdictions of countries in whose legislation the video games are not defined as an object of copyright and where there are no relevant court cases run the risk of facing a chaos of
unpredictable court decisions. At the same time, it is important to note that nowadays information on generalized approaches in court cases regarding sports video games is scarce, as well as on court cases regarding e-sports, streaming sports video games, and user-generated content. These questions are a prospect for further research.
8. References
[1] S. Shisha, Fairness, Copyright, and Video Games: Hate the Game, Not the Player. Fordham Intellectual Property, Media and Entertainment Law Journal, volume 31, number 3, 2021, 694–791.
[2] T. Wijman, Global Game Revenues Up an Extra $15 Billion This Year as Engagement Skyrockets, 2020. URL: https://newzoo.com/insights/articles/game-engagement-during-covid-pandemic-adds-15-billion-to-global-games-market-revenue-forecast/.
[3] F. W. Grosheide, H. Roerdink, K. Thomas, Intellectual property protection for Video Games: A view from the European Union, Journal of International Commercial Law and Technology, volume 9, number 1, 2014, 1–13.
[4] J. M. Blanke, No Doubt about It-You've got to Have Hart: Simulation Video Games May Redefine the Balance between and among the Right of Publicity, the First Amendment, and Copyright Law. Boston University Journal of Science & Technology Law, volume 19, 2013, 26.
[5] J. Quagliariello, Applying Copyright Law to Videogames: Litigation Strategies for Lawyers, Harvard Journal of Sports & Entertainment Law, volume 10, 2019, 263–276.
[6] B. Casillas, Attack of the clones: copyright protection for video game developers. Loyola of Los Angeles Entertainment Law Review, volume 33, 2012, 137.
[7] A. R. G. de la Haza, Video Games: Computer Programs or Creative Works?, WIPO Magazine, August 2014.
[8] A. Piechówka, When video games meet IP law, WIPO Magazine, June 2021.
[9] L. Elliott, A. Golub, G. Ream, E. Dunlap, Video game genre as a predictor of problem use, Cyberpsychology, Behavior, and Social Networking, volume 15, number 3, 2012, 155–161. DOI: 10.1089/cyber.2011.0387.
315

[10] Z. Li, The Copyright Protection of Video Games from Reskinning in China – A Comparative Study on UK, US and China Approaches. Tsinghua China Law Review, volume 11, 2018, 293–340.
[11] Entertainment Software Association, Essential facts about the computer and video game industry, 2015. URL: http://www.theesa.com/wp-content/uploads/2015/04/ESA-Essential-Facts-2015.pdf.
[12] C. Katzenbach, S. Herweg, L. Van Roessel, Copies, clones, and genre building: Discourses on imitation and innovation in digital games, International Journal of Communication, volume 10, 2016, 838–859.
[13] D. І. Shmatkov, Copyright protection for sports and robotics moves: new challenges, Law and Innovations, volume 34, number 2, 2021, 23–29. DOI 10.37772/2518-1718-2021-2(34)-3.
[14] S. Townley, A. Townley, eSport: everything to play for, WIPO Magazine, February 2018.
[15] S. Townley, Intellectual property and the specificity of sports, WIPO Magazine, April 2019.
[16] K. Jesien, Don't Sweat It: Copyright Protection for Yoga... Are Exercise Routines Next. Cardozo Public Law, Policy & Ethics Journal, volume 5, 2006, 623.
[17] M. Simon Altaba, Is a Bullfight a Work of Art? Not in Spain Apparently. International Review of Intellectual Property and Competition Law, volume 52, 2021, 807–819. https://doi.org/10.1007/s40319-021-01081-7.
[18] P. Mezei, Copyright Protection of Sport Moves, E. Bonadio, N. Lucchi (Eds.), Non-Conventional Copyright, Edward Elgar, Cheltenham, 2018, 271–297, http://dx.doi.org/10.2139/ssrn.2925195.
[19] H. M. Abromson, The Copyrightability of Sports Celebration Moves: Dance Fever or Just Plain Sick, Marquette Sports Law Review, volume 14, issue 2, 2003, 571–601.
[20] V. Roessler, College Athlete Rights after O'Bannon: Where Do College Athlete IP Rights Go from Here, Vanderbilt Journal of Entertainment and Technology Law, volume 18, issue 4, 2015, 935–963.
[21] Z. Crane, Fortnite is ‘dropping’ into legal land: A proposal to amend the copyright act to address artists’ and game developers’ concerns over dance moves as purchasable emotes in video games,
2019. http://dx.doi.org/10.2139/ssrn.3314693.
[22] A. Ramos, L. Lopez, A. Rodriguez, T. Meng, S. Abrams, The legal status of video games: Comparative analysis in national approaches, World Intellectual Property Organization, 2013.
[23] IP Ukraine NOW, part 3, Corvalol & Dota: Pharma and IP in e-goods, 2019. URL: https://uba.ua/eng/news/6930/print/.
[24] M. G. Wagner, On the Scientific Relevance of eSports, in: International conference on internet computing, 2006, 437–442.
[25] J. Hamari, M. Sjöblom. What is eSports and why do people watch it?, Internet research, volume 27, number 2, 2017, 211–232. https://doi.org/10.1108/IntR-04-2016-0085.
[26] D. L. Burk, Owning e-Sports: Proprietary rights in professional computer gaming, University of Pennsylvania Law Review, volume 161, number 6, 2013, 1535–1578.
[27] E. E. E. Jungar, Streaming Video Games: Copyright Infringement or Protected Speech?, Press Start, volume 3, number 2, 2016, 22–47.
[28] G. Lastowka, Copyright Law and Video Games: A Brief History of an Interactive Medium, Rochester, NY, Social Science Research Network, 2013.
[29] D. S. Dean, Hitting reset: devising a new video game copyright regime, University of Pennsylvania Law Review, volume 164, 2015, 1239.
[30] M. A. Ball, Nerf This: Copyrighting Highly Creative Video Game Streams as Sports Broadcasts, William & Mary Law Review, volume 61, 2019, 253–285.
[31] D. Shmatkov, Does Copyright Only Serve the Creative Industries?, in: International Conference on Business Management, Innovation & Sustainability (ICBMIS), 2020. http://dx.doi.org/10.2139/ssrn.3709072.
[32] Y. H. Lee, Play again? Revisiting the case for copyright protection of gameplay in videogames, European Intellectual Property Review, volume 34, number 12, 2012, 865–874.
316

Computer Modeling Of Nonlinear Flutter Of Viscoelastic Based Plate As A Sustainable Mechanical Engineering Approach In Aircraft Structures’ Design Andriy Verlan 1, Bakhtiyar Khudayarov 2, Anatolii Verlan 3, Oleksandr Fomin 4 and Sergii Polozhaenko 5
1 Norwegian University of Science and Technology, NTNU in Gjøvik, postboks 191, NO-2802 Gjøvik, Norway 2 Tashkent institute of irrigation and agricultural mechanization engineers, 39 Kari Niyazov Street, Tashkent 100000, Uzbekistan 3 Institute of modeling problems in power engineering named after G. E. Pukhov, 15, General Naumov str. Kyiv, 03164, Ukraine 4,5 Odessа Polytechnic State University, 1, Shevchenko ave., Odesa, 65044, Ukraine
Abstract The article is dedicated to computer modeling of a viscoelastic based plate flutter in design of aeronautical structures in sustainable mechanical engineering. The mathematical model of the flutter problem for viscoelastic plates with viscoelastic base is presented. Using the Bubnov-Galerkin method, discrete models of the flutter problem for viscoelastic plates streamlined by the supersonic gas jet are deduced. A numerical method is developed for solving nonlinear integro-differential equations for the viscoelasticity hereditary theory problem with weakly singular kernels. According to the above numerical method with respect to unknowns, a system of algebraic equations is obtained. To solve the system of algebraic equations, the Gauss method is used. An application program package has been developed to enable modeling and studying of the nonlinear dynamic problems for the hereditary viscoelasticity theory with weakly singular kernels. Based on the proposed model, numerical method and algorithm, nonlinear problems for the viscoelastic plates flutter with a viscoelastic base are investigated. The critical flutter velocity of the viscoelastic plates is determined for solving the stability problem in design of aircraft structures. Keywords 1 Sustainable mechanical engineering, Mathematical modeling, Computer modeling, Numerical methods and algorithms, Integro-differential equations, Plate flutter, Viscoelasticity, Viscoelastic base, Aircraft design.
1. Introduction
Currently, composite materials with pronounced viscoelastic properties are widely used in aviation and many other branches to increase the sustainability of mechanical engineering. These branches have obtained light, elegant and efficient thin-walled structures. The importance of stability calculations and strength design of the general cycle for such structures has dramatically increased. In this regard, the heredity viscoelasticity theory is attracting more and more attention of researchers. This is evidenced by
EMAIL: [email protected] (A1); [email protected] (A2); [email protected] (A3); [email protected] (A4); [email protected] (A5); ORCID: 0000-0002-0439-3214 (A1); 0000-0002-2876-8447 (A2); 0000-0002-8565-2037 (A3); 0000-0002-8816-0652 (A4); 0000-0002-4082-8270 (A5)
numerous research papers in recent years which demonstrate the latest achievements of the viscoelasticity theory. The growing interest in this theory is explained by computer technology development which makes it possible to reliably compare a computational experiment, obtained on the basis of mathematical models, with a full-scale experiment.
The study basis of the composite materials deformation processes is the heredity viscoelasticity theory whose specific application depends on the material parameters, product shape and the changes range of environmental conditions. At the same time, significant
317
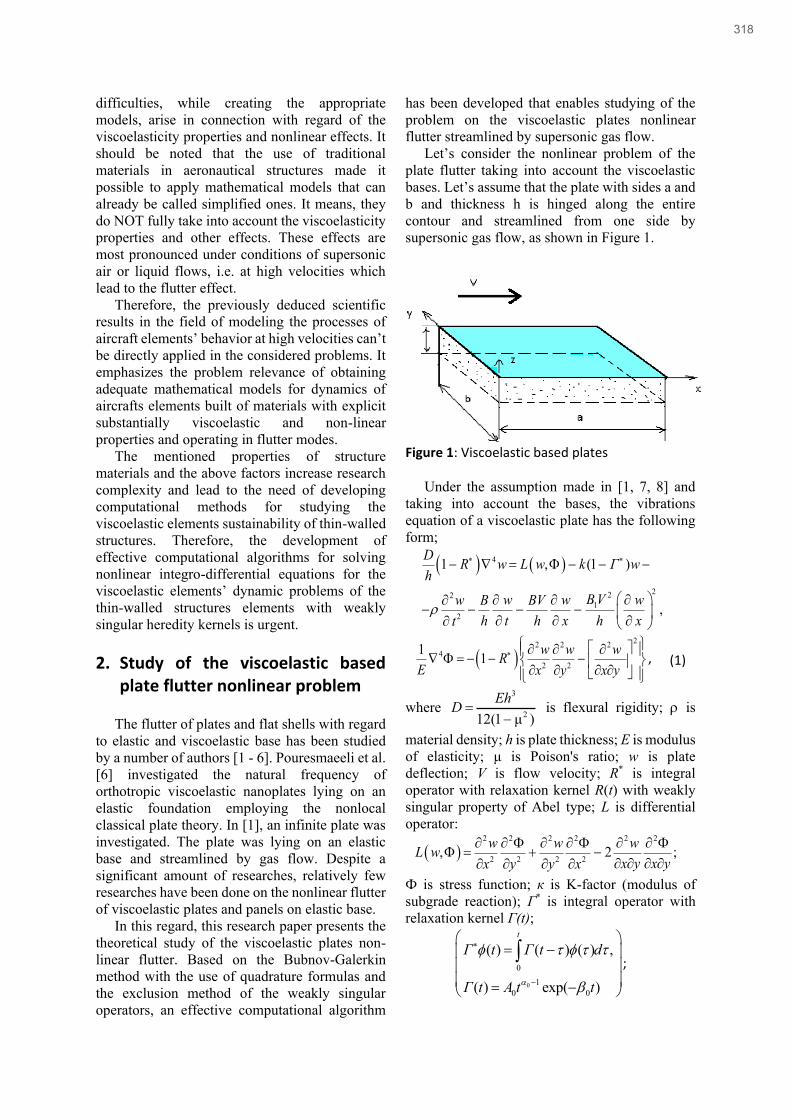
difficulties, while creating the appropriate models, arise in connection with regard of the viscoelasticity properties and nonlinear effects. It should be noted that the use of traditional materials in aeronautical structures made it possible to apply mathematical models that can already be called simplified ones. It means, they do NOT fully take into account the viscoelasticity properties and other effects. These effects are most pronounced under conditions of supersonic air or liquid flows, i.e. at high velocities which lead to the flutter effect.
Therefore, the previously deduced scientific results in the field of modeling the processes of aircraft elements’ behavior at high velocities can’t be directly applied in the considered problems. It emphasizes the problem relevance of obtaining adequate mathematical models for dynamics of aircrafts elements built of materials with explicit substantially viscoelastic and non-linear properties and operating in flutter modes.
The mentioned properties of structure materials and the above factors increase research complexity and lead to the need of developing computational methods for studying the viscoelastic elements sustainability of thin-walled structures. Therefore, the development of effective computational algorithms for solving nonlinear integro-differential equations for the viscoelastic elements’ dynamic problems of the thin-walled structures elements with weakly singular heredity kernels is urgent.
2. Study of the viscoelastic based plate flutter nonlinear problem
The flutter of plates and flat shells with regard to elastic and viscoelastic base has been studied by a number of authors [1 - 6]. Pouresmaeeli et al. [6] investigated the natural frequency of orthotropic viscoelastic nanoplates lying on an elastic foundation employing the nonlocal classical plate theory. In [1], an infinite plate was investigated. The plate was lying on an elastic base and streamlined by gas flow. Despite a significant amount of researches, relatively few researches have been done on the nonlinear flutter of viscoelastic plates and panels on elastic base.
In this regard, this research paper presents the theoretical study of the viscoelastic plates non-linear flutter. Based on the Bubnov-Galerkin method with the use of quadrature formulas and the exclusion method of the weakly singular operators, an effective computational algorithm
has been developed that enables studying of the problem on the viscoelastic plates nonlinear flutter streamlined by supersonic gas flow.
Let’s consider the nonlinear problem of the plate flutter taking into account the viscoelastic bases. Let’s assume that the plate with sides a and b and thickness h is hinged along the entire contour and streamlined from one side by supersonic gas flow, as shown in Figure 1.
Figure 1: Viscoelastic based plates
Under the assumption made in [1, 7, 8] and
taking into account the bases, the vibrations equation of a viscoelastic plate has the following form;
( ) ( )4
2221
2
1 , (1 )
,
D R w L w k Г wh
B Vw w ww B BVh t h x h xt
− = − − −
− − − −
( )22 2 2
42 2
1 1 w w wRE x y x y
= − − −
, (1)
where 3
212(1 μ )EhD =−
is flexural rigidity; is
material density; h is plate thickness; Е is modulus of elasticity; μ is Poison's ratio; w is plate deflection; V is flow velocity; R* is integral operator with relaxation kernel R(t) with weakly singular property of Abel type; L is differential operator:
( )2 2 2 2 2 2
2 2 2 2, 2 ;w w wL wx y x yx y y x
= + −
Ф is stress function; к is K-factor (modulus of subgrade reaction); Г* is integral operator with relaxation kernel Г(t);
0
01
0 0
( ) ( ) ( ) ,
( ) exp( )
t
Г t Г t d
Г t A t t
−
= −
= −
;
318

pB
V
= ,
( )1 2
1,
4p
BV
+=
where is polytrophic exponent for gas; ,p V are sound pressure and sound velocity respectively in the unperturbed flow.
Let us search the system (1) solutions in the form of
1 1
1 1
( , , ) ( )sin sin
Ф( , , ) Ф ( )sin sin
N L
nmn m
N L
nmn m
n x m yw x y t w ta b
n x m yx y t ta b
= =
= =
=
=
(2)
After performing the Bubnov-Galerkin procedure, we deduce the system of integro-differential equations (IDE) for wnm(t) and Фnm(t). Let’s exclude Фnm(t) from this system and write down the following nonlinear IDE with respect to the desired function wnm(t):
( )
( )
224 2 2
4 2 2
2 2
ln, , 1 , , 1
1
21 ln
, ,
(1 )
12 116 (1 *)
1
2
0,
kl kl
k l kl
N L
k mirjs nm ir jsn i j m r s
N
kl kl nln
N L
k mir nm irn i m r
kw l R w
g g k Г w
a w R w w
M w MM w
M M F w w
••
= =
•
=
+ + − +
− + − +
− +
+ + +
+ =
(3)
wkl(0)=w0kl , 0(0)kl klw w= , 1,k N= ; 1, ;l L=
where ( )
242 2
2,
12 1 EhMa
=
−
21pМ M = ,
2
1 ( 1)4
pMM =+ ;
VMV
= – much number;
2EEMV
= ; 2pP
MV
= ; ;ab
= 1 ;ah
=
kg , kl , lnk mirF , lnk mira – nondimensional factors.
3. A method for numerical solution of the deduced integro-differential equations for modeling nonlinear flutter of viscoelastic based plate
The systems of the nonlinear IDE (3) are solved numerically using the method proposed in [9-17]. For this purpose, let us write this system in integral form and, using a rational transformation, exclude the weakly singular properties of the integral operator R*. After having assumed that t=ti,, ti=i∆t, i=1,2,… (∆t is constant) and after having replaced the integrals with some quadrature formulas for calculating wnm = wnm(t), we deduce the following recurrence relation:
( )
( )1 1 1
1 1 1
1
00 0
1
0 1
224 2 2
0
4 2 2
ln2, , 1 , , 1
11
2
12 1
s
klikl kl kl ii
i N
j jkl i j kn jnlj n
jt
jkl s j skls
N L
k mi rj s jnmn i j m r s
ji r j
w w w Mw tA M
A M w t t MM w
k Al w B e w
a w
w w
•
−
= =
−
−
=
= =
= + + −
+
− − − − −
− + − −
− −
1 1 1 1 1
1 11
0
20
*21 ln
, 1 , 1
16
;
s
s
jt
j s s j si r j sj ss
jщ t
k l jkl s j sklsщ
N L
k mi r jnm ji rn i m r
A B e w w
Ag g k w B e w
M M F w w
−
− −
=
−
−
=
= =
− −
− − −
−
(4)
1,2,...; 1, ; 1,i n N m L= = = ; where Aj , Bs are the numerical factors applied to trapezium quadrature formulas.
Due to the proposed approach, in the algorithm for the numerical solution of the problem in formula (4) the factor at j = i takes zero(0) value, i.e. the last summand of the sum is equal to zero(0). Therefore, the summation is carried out from zero to i -1 ( 0, 1j i= − ). Thus, according to the numerical method with respect to unknowns, we obtain the system of linear algebraic equations.
The calculation results are stated in the table and reflected in the graphs shown in Fig. 2-3 at N=5, L=2. Based on the formula (4), the critical flutter velocity of viscoelastic plates is determined. As a criterion determining the critical velocity Vcr we assume that at this velocity the vibratory movement with rapidly increasing
319

amplitudes occurs, which can lead to structure destruction. In the case V < Vcr, the flow velocity is less than the critical one, the amplitude of the viscoelastic plate vibrations damps [1, 11-13].
For V=Vcr the numbers V1 and V2 are considered located in the interval (V0,V1) in such way that V0 <V1<V2<Vn. By comparison of the variation low w at V=V1 and V=V2 we can come the following conclusions:
a) if V<V1 the function variation law w is close to the harmonic, it means that Vkp can’t be located on the interval (V0,V1) , i.g. Vcr is located on the interval (V1, Vn);
b) if at V >V1 there is rapid function (w) growth (temporally), then it means that Vkp is located on the interval (V0,V1).
The processes a) and b), i.e. the exclusion process of the intervals that don’t give adverse
events, is repeated for (V0, V1), or (V1, Vn), etc. The search ends when the remaining subinterval is reduced to a sufficiently small value.
4. Investigation of the influence of the plate material viscoelastic proper-ties on the critical values of the flutter velocity
As a result of applying the given math model the critical values of the flutter velocity depending on the physical, mechanical and geometric parameters of the plate were obtained as shown in the following Table 1.
Table 1 Dependences of the critical flutter velocity of a viscoelastic based plate on the physical, mechanical and geometric parameters
A Ao o o 1 k Vcr
0 0,001 0,01 0,1
0,25 0,05 0,02 0,3 0,01 2,5 250 0,0001
1620 1595 1492 1170
0,1 0,1 0,4 0,7
0,05 0,02 0,3 0,01 2,5 250 0,0001
865 1325 1479
0,1 0,25 0,01 0,1
0,02 0,3 0,01 2,5 250 0,0001 1186 1167
0,1 0,25 0,05 0
0,05 0,3
0,3 0,01 2,5 250 0,0001
1219 1158 1137
0,1 0,25 0,05 0,02 0,1 0,5 0,9
0,01 2,5 250 0,0001
1162 1211 1230
0,1 0,25 0,05 0,02 0,3 0,1 0,5
2,5 250 0,0001 1165 1162
0,1 0,25 0,05 0,02 0,3 0,01 2
2,2 2,7
250 0,0001
718 887
1467
0,1 0,25 0,05 0,02 0,3 0,01 2,5
220 280 300 350
0,0001
1740 846 674 412
0,1 0,25 0,05 0,02 0,3 0,01 2,5 250
0 0,0002 0,0004 0,0006
107 1244 1322 1439
320

Thus, the influence of the plate viscoelastic properties on the critical values of the flutter velocity was studied.
The calculation results presented in the table show that the solutions of elastic (A = 0) and viscoelastic (A> 0) problems differ significantly from each other.
For example, as parameter A increases from zero to 0.1, the critical flutter velocity decreases by 27.7%.
Further, the influence of the singularity parameter on the critical flutter velocity was studied. With increasing of this velocity becomes bigger. For example, the difference between the critical velocity values at =0,1 and =0,4 is 53%.
The above table shows that influence of the heredity kernel damping parameter on the plate flutter velocity is low comparing to influence of viscosity А and singularity .
This once again confirms that the exponential relaxation kernel is unable for fully description the hereditary properties of the construction material.
The influence of the relative plate thickness parameter 1 on the critical flutter velocity Vcr is studied.
The calculations were made at 1= 220, 280, 300 and 350. The obtained results show that with decrease of the plate thickness (growth of the parameter 1) the critical flutter velocity of the viscoelastic declines.
The influence of the plate elongation parameter on the critical flutter velocity was investigated.
With increase of the critical flutter velocity v become higher, which is explained by the fact that growth of (at constant 1) leads to the plate size reduction perpendicular to the flow direction and, therefore, the relative rigidity of the system increases.
The tables demonstrate that taking into account the viscoelastic base, the critical flutter velocity increases in comparison to the velocity without taking into account the viscoelastic base. Especially in case of large K-factors (modulus of subgrade reaction), the flutter velocity increases markedly.
The influence of the viscoelastic material properties on the plate vibration amplitudes is shown in Figure 2, where А=0 (1); А=0,005 (2); А=0,1 (3); k=0,0001; =0,25; =0,05; =2,5; A0 = 0,1; 0 = 0,25; 0 = 0,02; 1 = 250; N = 5; L=2.
Figure 2: Viscoelastic material properties’ influence on the plate vibration amplitudes
As you can see from the Figure 2, with
increasing parameter A the oscillations amplitude and frequency decrease.
Figure 3 demonstrates plots of the dimensionless deflection changes depending on the time t for different values of the relative
321
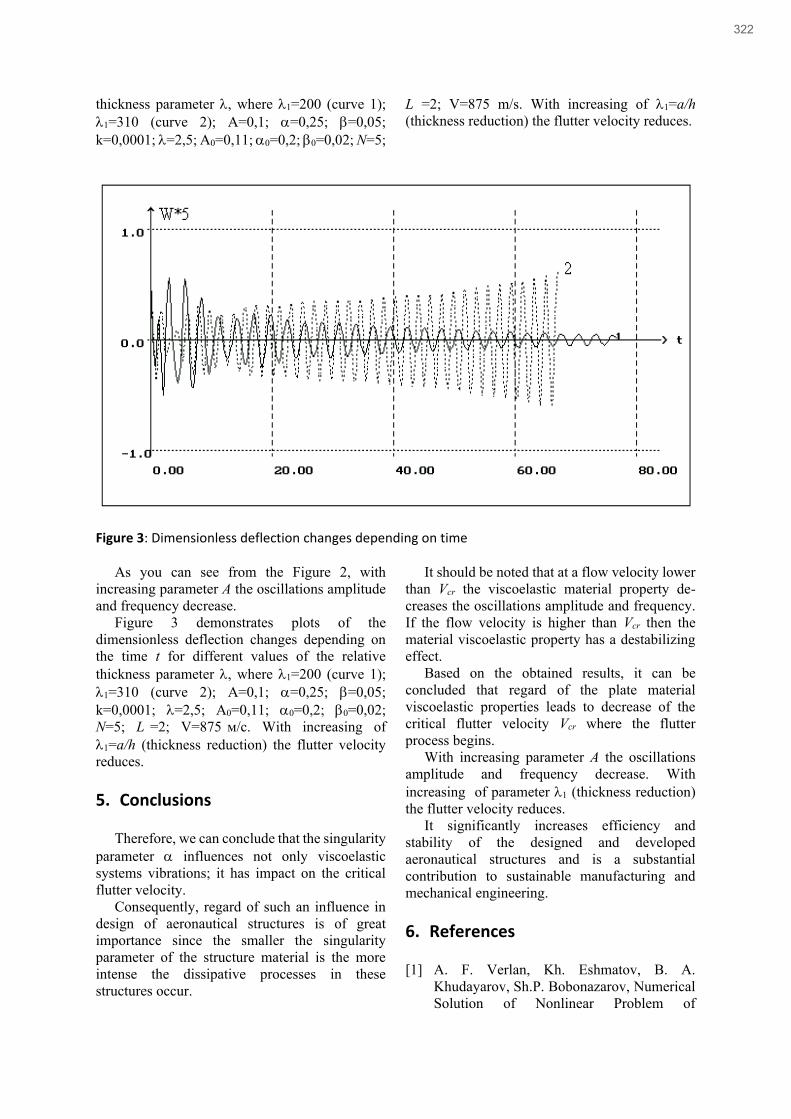
thickness parameter , where 1=200 (curve 1); 1=310 (curve 2); А=0,1; =0,25; =0,05; k=0,0001; =2,5; A0=0,11; 0=0,2; 0=0,02; N=5;
L =2; V=875 m/s. With increasing of 1=а/h (thickness reduction) the flutter velocity reduces.
Figure 3: Dimensionless deflection changes depending on time
As you can see from the Figure 2, with increasing parameter A the oscillations amplitude and frequency decrease.
Figure 3 demonstrates plots of the dimensionless deflection changes depending on the time t for different values of the relative thickness parameter , where 1=200 (curve 1); 1=310 (curve 2); А=0,1; =0,25; =0,05; k=0,0001; =2,5; A0=0,11; 0=0,2; 0=0,02; N=5; L =2; V=875 м/c. With increasing of 1=а/h (thickness reduction) the flutter velocity reduces.
5. Conclusions
Therefore, we can conclude that the singularity parameter influences not only viscoelastic systems vibrations; it has impact on the critical flutter velocity.
Consequently, regard of such an influence in design of aeronautical structures is of great importance since the smaller the singularity parameter of the structure material is the more intense the dissipative processes in these structures occur.
It should be noted that at a flow velocity lower than Vcr the viscoelastic material property de-creases the oscillations amplitude and frequency. If the flow velocity is higher than Vcr then the material viscoelastic property has a destabilizing effect.
Based on the obtained results, it can be concluded that regard of the plate material viscoelastic properties leads to decrease of the critical flutter velocity Vcr where the flutter process begins.
With increasing parameter A the oscillations amplitude and frequency decrease. With increasing of parameter 1 (thickness reduction) the flutter velocity reduces.
It significantly increases efficiency and stability of the designed and developed aeronautical structures and is a substantial contribution to sustainable manufacturing and mechanical engineering.
6. References
[1] A. F. Verlan, Kh. Eshmatov, B. A. Khudayarov, Sh.P. Bobonazarov, Numerical Solution of Nonlinear Problem of
322

Viscoelastic System Dynamics, Electronic simulation, J. 26(2004) 3-14.
[2] M. Amabili, Nonlinear Vibrations and Stability of Shells and Plates, Cambridge University Press, New York, 2008.
[3] Nguyen Dinh Duc, Pobedrya B.E., Dao Huy Bich and Pham Toan Thang, Nonlinear analysis on flutter of S-FGM thin circular cylindrical shells with metal-ceramic-metal layers surrounded on elastic foundations using Ilyushin supersonic aerodynamic theory. International Conference on Engineering Mechanics and Automation (ICEMA 3), (2014) pp.419-426.
[4] X. F. Li, S. N. Jiang, K. Y. & Lee, K.Y Surface effect on dynamic stability of microcantilevers on an elastic foundation under a subtangential follower force. International Journal of Mechanics and Materials in Design. Volume 14(1) (2018) pp. 91–104. https://doi.org/10.1007/s10999-016-9362-1.
[5] V. D. Potapov, P. Koirala, Stability of Elastic and Viscoelastic Systems under Action of Random Stationary Narrow – band Loads, Intern. J. Mech. Sci., 39(1997) 935–942.
[6] S. Pouresmaeeli, E. Ghavanloo, and S. A. Fazelzadeh, Vibration analysis of viscoelastic orthotropic nanoplates resting on viscoelastic medium, Composite Structures 96 (2013) pp. 405–410.
[7] A.S. Vol’mir, Nonlinear Dynamics of Plates and Shells, Nauka, Moscow, 1972.
[8] A. A. Ilyushin, Law of Plane Sections in the Aerodynamics of High Supersonic Velocities, Appl. Mat. Mech., 20(1956) 733–755.
[9] F.B. Badalov, H. Eshmatov, M. Yusupov, One Method of Solution of System of Integro – differential Problems of Viscoelasticity, Journal of Applied Mathematics and Mechanics, 51(1987) 867-871.
[10] B.A. Khudayarov, Flutter Analysis of Viscoelastic Sandwich Plate in Supersonic Flow, ASME 2005 International Mechanical Engineering Congress and Exposition, IMECE2005-80156, (2005).
[11] A.F. Verlan, Kh. Eshmatov, B.A. Khudayarov, Sh.P. Bobonazarov, Numerical Solution of Nonlinear Problem of Viscoelastic System Dynamics, Electronic simulation, J. 26(2004) 3-14.
[12] B. A. Khudayarov, Flutter of a Viscoelastic Plate in a Supersonic Gas Flow. International Applied Mechanics, 46(2010) 455-460.
[13] B. A. Khudayarov, F. Zh. Turaev, Mathematical Simulation of Nonlinear Oscillations of Viscoelastic Pipelines Conveying Fluid, Applied Mathematical Modelling 66 (2019) 662-679, https://doi.org/10.1016/j.apm.2018.10.008.
[14] B. A. Khudayarov, Kh.M. Komilova, Vibration and dynamic stability of composite pipelines conveying a two-phase fluid flows, Engineering Failure Analysis 104 (2019) 500-512, https://doi.org/10.1016/j.engfailanal. 2019.06.025
[15] B. A. Khudayarov, Kh. M. Komilova and F. Zh. Turaev, Numerical Simulation of Vibration of Composite Pipelines Conveying Pulsating Fluid, International Journal of Applied Mechanics 11(9), 2019, 1950090, https://doi.org/10.1142/S175882511950090X.
[16] B. A. Khudayarov, F. Zh. Turaev, Numerical simulation of nonlinear oscillations of a viscoelastic pipeline with fluid, Vestnik of Tomsk State University. Mathematics and mechanics 5(43) (2016) 90–98, DOI:10.17223/19988621/43/10.
[17] B. A. Khudayarov, Kh. M. Komilova, F. Zh. Turaev, The effect of two-parameter of Pasternak foundations on the oscillations of composite pipelines conveying gas-containing fluids, International Journal of Pressure Vessels and Piping, 176 (2019) 103946, DOI: 10.1016/j.ijpvp.2019.103946
323

Spectral-Spatial Analysis Of Data Of Images Of Plantings For Identification Of Stresses Of Technological Character Natalia Pasichnyk1, Dmytro Komarchuk2, Korenkova Hanna3, Sergey Shvorov4, Oleksiy Opryshko5 and Nikolay Kiktev6
1,2,4,5,6 National University of Life and Environmental Sciences of Ukraine, Heroyiv Oborony st., 15, Kyiv, 03041, Ukraine 3 Odessa I.I.Mechnikov National University, Dvoryanskaya str., 2, Odessa, 65082, Ukraine
Abstract
Methods of spectral-spatial analysis are promising for the identification of technological stresses. The most common solution for interpreting the causes of stress is the use of machine learning technologies, namely neural networks. As at technological stresses in particular at chemical poisoning of crops, there can be various options of the coloring of the affected plants the possibility of providing a sufficient amount of initial data for training of neural networks is doubtful. An alternative is graph analysis of the distribution of stress areas on the field map. Given the urgency of the problem for promising technologies of precision agriculture, the work aimed to develop a spectral-spatial method of monitoring technological stresses, namely the algorithm and software for its.
Experimental studies of the manifestation of technological stresses on winter crops on the example of wheat and rapeseed were conducted during 2018-2020 in production fields using universal cameras in the visible range and special multispectral Slantrange systems. For remote monitor, the state of winter crops, an algorithm for identifying technological stresses was developed, which is implemented in the developed software in Python for spectral-spatial analysis of stress index maps. It has been experimentally confirmed in the production fields that the use of the developed software allows identifying the contours of areas of plants with stresses of technological nature based on stress index distribution maps. Keywords 1 UAVs, winter crops, vegetation indices, stresses, herbicides
1. Introduction
The prospects for agricultural production management based on objective remote monitoring data were obvious both at the state level and for agricultural enterprises. Accordingly, research was carried out to develop various theories and methods for obtaining information about vegetation. Under uncertainty, M. Lotfi et al. (2009) in [1] proposed computer data processing systems for satellite data filtering and machine learning technology for object recognition. That is, in the spectral-spatial analysis, the field of the field as a whole was not
EMAIL: [email protected] (A. 1); [email protected] (A. 2); [email protected] (A. 3); [email protected] (A. 4); [email protected] (A. 5); [email protected] (A. 6); ORCID: 0000-0002-2120-1552 (A. 1); 0000-0003-3811-6183 (A. 2); 0000-0001-7207-3688 (A. 3); 0000-0003-3358-1297 (A. 4); 0000-0001-6433-3566 (A. 5)
considered as the object of research. This approach is used in particular in aviation for the implementation of orientation in the use of electronic warfare as shown in the work of S. Shvorov and others (2018) in [2]. Regarding agricultural production, Xianlong Zhang and others (2019) in [3] proposed the division of spectral-spatial monitoring methods into 2 conditional categories. The first category uses the spectral characteristics of terrestrial objects and then obtains vegetation information by comparing the difference with the results of spectral monitoring. An example of such monitoring is the identification of trees in densely populated cities
324

based on satellite images shown in S.W. Myint et al. (2013) in [4].
The second category is based on a combination of external knowledge such as decision tree for image classification shown in Andrea S. Laliberte et al. (2007) in [5], neural networks, and wavelet transforms described in Mitch Bryson and others (2010) in [6]. This promising method has not been widely used in satellite monitoring because the combination of time delay and low resolution leads to unacceptably large errors, which was shown in the article by Passang Dorji et al. (2017) in [7]. UAV monitoring is devoid of these shortcomings and accordingly, this method can be implemented on a new technological basis. Thus, in the work of J. Senthilnath et all (2017) [8], it was possible to successfully identify weeds in crops by fixing plants in automatically determining technological tracks.
Wavelet analysis methods do not require the division of the image into blocks, because the required localization properties are already embedded in the wavelet system. Accordingly, it is possible to filter out a significant number of errors inherent in pixel analysis methods. The method of wavelet analysis for the identification of affected areas due to technological stresses, namely the prolonged action of herbicides was shown in the work of M. Dolia and others (2019) in [9]. The proposed solution proved its effectiveness when, as a result of a dosing error in a part of the field, a higher dose of herbicides was applied. Since the application was made by appropriate ground equipment, the authors in the analysis of the map image focused on the search for linear functions. The authors noted some difficulties in the established systems when choosing thresholds. The complexity of this controversial issue was confirmed by Yu-Hsuan Tu et al. (2020) [10] where it was the limit values that were recommended to be studied at higher resolutions. Due to this specificity of the method, the analysis will be effective for the affected crops on a large scale, which significantly limits its effectiveness. Large-scale impressions can be easily identified by satellite technology or ground-based monitoring, but small areas will be difficult to detect. Crop management technologies need to be adapted to respond to such problem areas, as weakened plants are easily affected by pests and can become a breeding ground for them.
A possible technology for the analysis of spectral-spatial distribution is artificial neural networks which, due to the rapid development of multi-core processors, have become available to
farmers. There is a positive experience of using neural networks for various monitoring tasks which, if necessary, can be adapted to monitor technological stresses. Section 1 shows that in the initial stages of the growing season, the dimensions of plants may indicate their stress. Neural networks for estimating plant height during rice lodging are shown in Ming-Der Yang et al. (2020) [11]. According to the provided results, it was possible to detect rice lodging with acceptable accuracy based on images from universal cameras in the visible range, but the calculations were performed using cloud services, which is difficult to implement in our country. Autonomous work of neural networks is shown in the work of Wojciech Gruszczyński and others (2019) [12] to identify grass among general vegetation. When analyzing the image was segmented into parts and carried out training of the network on the distribution of the cloud of points. This approach is promising for the identification of low-growing grass because only one manifestation is considered, but under technological stress, there may be more. In principle, for neural networks, there can be several options for identifying objects. They can be used in particular to determine the state of rice yield at the stage of ripening, as shown in Qi Yang and others (2019) [13], or the state of mineral nutrition described in V. Lysenko and others (2017) [14]. Spatial distribution was also considered in Yan Pang et al. (2020) [15] to calculate the number of plants in a ridge. All these works are combined by a limited number of classification options and a large sample of source data for neural network training. In this case, in contrast to the vegetation indices, which focus on pixel-by-pixel analysis, the training of neural networks was based on crop areas obtaining more accurate results.
As at technological stresses in particular at chemical poisoning of crops, there can be various options of the coloring of the affected plants the possibility of providing a sufficient amount of initial data for training of neural networks is doubtful.
There are no ready-made software solutions for analyzing the distribution of stress areas on the field map to identify the nature of stress. Given the urgency of the problem for promising technologies of precision agriculture, the work aimed to develop a spectral-spatial method of monitoring technological stresses, namely the algorithm and software for its implementation.
325

2. The state of the issue 2.1. Identification of direction of movement of technological equipment
Stressful conditions of crops of technological character are caused by human actions which are realized by the use of the ground technological equipment. The identification of equipment directions was considered in Junfeng Gao et al. (2018) [16] regarding the detection of weeds in row crops, where all plants between rows were considered weeds. In Carlos Henrique Wachholz de Souza et al. (2017) [17], sugar cane rows were identified to estimate row gaps. In both cases, the rows were considered to be the arrangement of plants in a row, because this is how ground equipment moves. However, in agricultural practices, the directions of ground equipment movement should change from year to year, and, accordingly, the distribution of stress areas may differ from the direction of crop rows. Accordingly, the identification of stresses can be based on the assessment of the contour of the stress section, which for technological stresses must have the correct geometric shape inherent exclusively in artificial objects. In particular, in the case of chemical poisoning of plants, the boundary between affected and healthy crops will be directly linear.
2.2. Choice of the software environment
Assessing the nature of stress for crops is an urgent task to be solved both by agronomists directly in the fields and by relevant specialists using cloud services. Accordingly, for the versatility of the operating system used, it is advisable to use a cross-platform programming language such as Python, which is adapted to the fate of large data processing and machine learning. In the work of Emad Ebeid and others (2018) [18], devoted to the review of flight controllers and flight control of UAVs, the prospects of the Python language for these tasks were emphasized primarily due to the use of technical means from different manufacturers on different operating systems.
2.3. Experimental research
Experimental studies of the manifestation of technological stresses on winter crops on the example of wheat and rapeseed were conducted during 2018-2020 in production fields. Photography was performed using: in 2018-2019, to monitor the stationary experiment and fragments of production fields - hexacopter based on multi-rotor platform CD600 with a set of specialized sensor equipment in the digital action camera GoPro HERO4, in 2019-2020 - multispectral system 3p, mounted on a DJI Matrice 600 hexacopter, which allowed to obtain orthophotos of industrial fields. It is the spectral-spatial analysis of the obtained orthophoto plan that allowed us to establish the dependences on the basis of which the identification of technological stresses is carried out.
Technological stresses on winter oilseed rape can be detected by means of leaf diagnostics because in September-November there is an abnormal color of the lower leaves, which is easy to establish both by ground visual assessment and research using UAVs. For winter wheat, such manifestations suitable for reliable identification from the UAV platform on an industrial scale (height from 60 meters) could not be detected. In ground-based monitoring, it was noted that plants have a characteristic deformation of the leaves, which can be a characteristic criterion for identifying the nature of stress. Affected areas inside the field are more dangerous for industrial fields, which are difficult, often impossible to visually detect by ground monitoring means. This situation is extremely dangerous, as areas with weakened plants appear in the field, which is more susceptible to pests and can become centers for the spread of the latter. Accordingly, it is advisable to develop a technology that will identify stress areas regardless of their location. This was taken into account when choosing the experimental production field.
2.4. Analytical research
Laboratory studies accompanied all stages of plantation monitoring. A sampling of plants and soil was performed on the day of monitoring or within two days thereafter. Soil samples were taken from a layer of 0-25 cm, prepared for analysis according to DSTU ISO 11464: 2007. Agrochemical analysis was performed in scientific and research laboratories of the
326

Department of Agrochemistry and Plant Product Quality, Ukrainian Laboratory of Agricultural Products Quality, in compliance with accepted methods and techniques.
3. Algorithm for identification of technological stresses, its software implementation, and results of experimental data processing
3.1. Select the source data format
To process spectral monitoring data, the Slantrange sensor system has its own Slantview software, which allows you to save the received maps in several data formats, namely Shapefile, KMZ, GeoTiff. The shape format contains attributive information of geometric objects and is designed primarily to create tasks for ground equipment. KMZ files are 3D data in Google Earth and represent a map of the distribution of vegetation indices on satellite images. According to the results of experimental studies on the recognition of the values of vegetation indices, it was found that the data was distorted during the overlay of the images - the recorded colors were missing in the palette for the specified vegetation indices. Probable explanation in image correction for overlay on the satellite image to facilitate visual perception by the user. By comparing the data for the distribution points of the distribution map from the working window of the SlantView program, it was found that for the GeoTiff format color distortion and, consequently, the values of vegetation indices do not occur. Unlike the KMZ format, the file does not have positioning labels, but when you save the map, the program retains the scaling, and, accordingly, when using landmarks, the calculation of positioning is quite possible. In view of the above, the GeoTiff format was adopted for analysis.
3.2. Data processing 3.2.1. Evaluation of the contour of the map
To manage the harvest, farms, regardless of weather conditions, need maps of the distribution of vegetation indices in many production fields available on the farm. Based on these circumstances, the Slantrange sensor complex was created to survey up to 10,000 ha/day, which
can be provided on aircraft platforms. Since the average area of production fields in the plains of Ukraine is 70-100 hectares, it is desirable to survey several fields at once during one flight. In the analysis of a particular field, it is necessary to determine its boundaries. The Python-supported OpenCV library contains ready-made procedures for finding the contours of graphical objects that can be used in this case. An example of the result of card processing is shown in Figure 1.
Figure 1: Green Chlorophyll index distribution map (a) for wheat crops affected by the after-effects of herbicides, (b) - a photograph in pseudo-colors of the area highlighted by the square on the map, and the results of the field contour search by the proposed software (c)
It should be noted that the forest-steppe zone
of Ukraine is characterized by strong forest belts, the leaf cover of which, as well as the shadow from them are also fixed by the system. From the available experience, maintenance of forest belts and their renewal is not carried out regularly and there are many cases when tree crowns completely cover the road surface due to which significant errors are possible in determining the contours of crops. Since the field boundaries are stable, to analyze the presence of technological stresses on the maps of the distribution of vegetation indices stored in the Geotiff format, it is advisable to enter them manually, using certain reference points.
3.2.2. Estimation of the orientation of the sections of the field caused by stresses of technological character
With the identification of crop rows, the direction of crop rows was stable, but this is not a prerequisite for technological stresses. Thus, Figure 1 (a) shows the presence of a green band on the left and top, which for this index Green
327

Chlorophyll index corresponds to healthier crops than those with yellow. This condition may be due to the best condition of mineral nutrition at the field boundaries because it is there that the equipment slows down, turns, adjusts the operation of nozzles, augers, and more. The width of such a layer, as a rule, does not exceed the radius of reversal of ground equipment, which can be taken into account when analyzing the distribution of stress areas
The distribution in the field of stress areas caused by phytotoxic action (aftereffect) of herbicides, as well as violation of the seeding rate, is related to the direction of technological tracks, the organization of which meets certain rules. This is due to the fact that the introduction of chemical reagents or seeds during sowing is not carried out in an arbitrary manner, namely in compliance with the laid technological tracks. The directions of technological tracks in one field can change from year to year to maintain soil fertility, but their number usually does not exceed 2, in some cases 3 directions. Soil loosening can be carried out in any order, but technological stresses cannot be caused by this operation. Determining the direction of technological tracks has certain prerequisites, so mechanics when planning work are interested in the maximum length of the runs. Accordingly, in the absence of data from technological maps for the implementation of mechanical tillage, the orientation of the experimental field should be carried out along the maximum length of the field.
Figure 2 presents a map of the distribution of stress areas for winter wheat crops where chemical poisoning of winter wheat crops as a result of the after-effects of herbicides from the predecessor crop was recorded.
The specificity of SlantView software data processing is the observance of the north-south geographical orientation. As a result, to reduce the amount of data that does not belong to the field under study, it is necessary to change the orientation from geographical to local reference to the dimensions of the field. Due to the change in the orientation of the image, the number of pixels of the image obtained from the GeoTIFF file decreased from 1100 × 1660 to 245 × 1521, ie the amount of data decreased almost 5 times.
Figure 3 shows the interface of the developed program in python to identify stressful areas of technological nature.
Figure 2: Distribution maps of stress areas for the GreenNDVI index for winter wheat crops from April 27, 2019. Image of the Slantview software map window (left) and converted from a GeoTIFF file to jpeg format
Figure 3: Picture of the program command-line interface when entering analysis parameters
3.2.3. Convert data from color format to numeric view
Figure 4 shows the map window palette, which is used to encode data and save them in tiff format according to the method presented in S. Shvorov et all (2020) [19]. Since the NDVI indices for plants change in the range 0… 1 for visualization in the 8-bit color model, the index values were multiplied by 255 (Fig. 4)
Figure 4: The image of the Green NDVI map is listed from the Slantview software palette (encoding "shades of gray" where the index value is multiplied by 255.
328
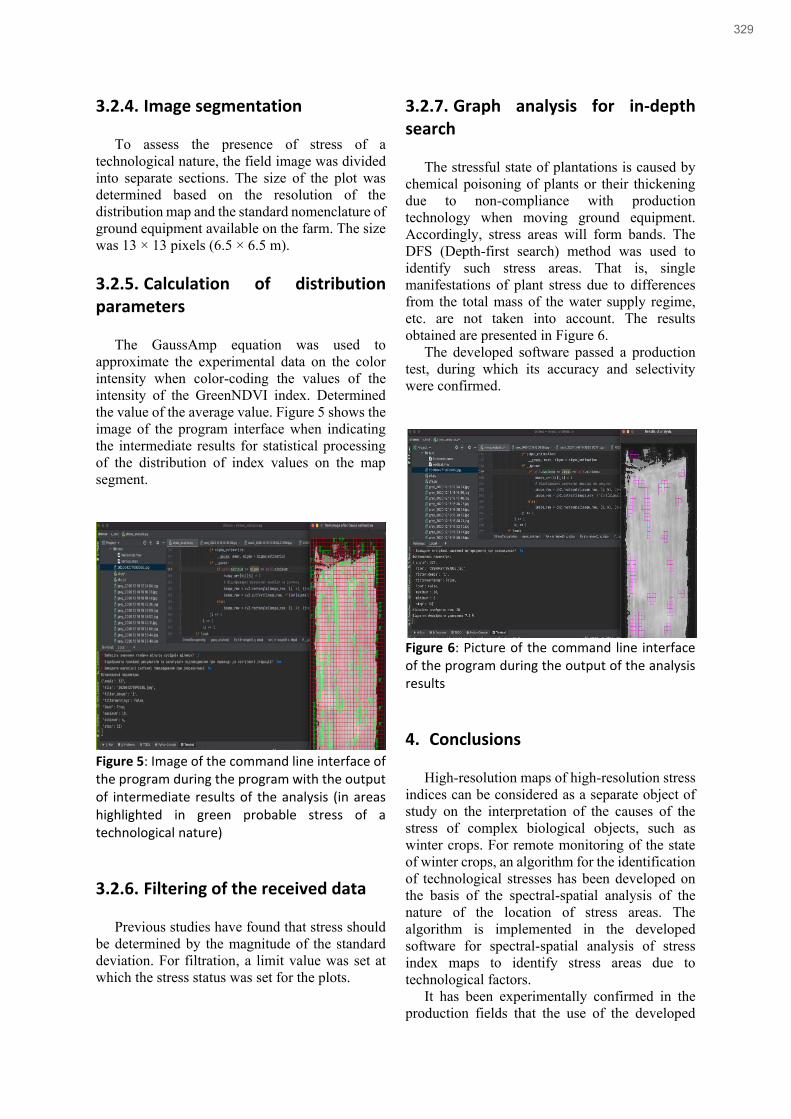
3.2.4. Image segmentation
To assess the presence of stress of a technological nature, the field image was divided into separate sections. The size of the plot was determined based on the resolution of the distribution map and the standard nomenclature of ground equipment available on the farm. The size was 13 × 13 pixels (6.5 × 6.5 m).
3.2.5. Calculation of distribution parameters
The GaussAmp equation was used to approximate the experimental data on the color intensity when color-coding the values of the intensity of the GreenNDVI index. Determined the value of the average value. Figure 5 shows the image of the program interface when indicating the intermediate results for statistical processing of the distribution of index values on the map segment.
Figure 5: Image of the command line interface of the program during the program with the output of intermediate results of the analysis (in areas highlighted in green probable stress of a technological nature)
3.2.6. Filtering of the received data
Previous studies have found that stress should be determined by the magnitude of the standard deviation. For filtration, a limit value was set at which the stress status was set for the plots.
3.2.7. Graph analysis for in-depth search
The stressful state of plantations is caused by chemical poisoning of plants or their thickening due to non-compliance with production technology when moving ground equipment. Accordingly, stress areas will form bands. The DFS (Depth-first search) method was used to identify such stress areas. That is, single manifestations of plant stress due to differences from the total mass of the water supply regime, etc. are not taken into account. The results obtained are presented in Figure 6.
The developed software passed a production test, during which its accuracy and selectivity were confirmed.
Figure 6: Picture of the command line interface of the program during the output of the analysis results
4. Conclusions
High-resolution maps of high-resolution stress indices can be considered as a separate object of study on the interpretation of the causes of the stress of complex biological objects, such as winter crops. For remote monitoring of the state of winter crops, an algorithm for the identification of technological stresses has been developed on the basis of the spectral-spatial analysis of the nature of the location of stress areas. The algorithm is implemented in the developed software for spectral-spatial analysis of stress index maps to identify stress areas due to technological factors.
It has been experimentally confirmed in the production fields that the use of the developed
329

software allows identifying the contours of areas of plants with stresses of a technological nature on the basis of stress index distribution maps.
5. References
[1] M. Lotfi (2009) Combining wavelet transforms and neural networks for image classification / M.Lotfi, A.Solimani, A.Dargazany, H.Afzal, M.Bandarabadi //. System Theory, Ssst 2009. Southeastern Symposium on. IEEE. pp. 44–48. https://doi.org/10.1109/SSST.2009.4806819.
[2] S. Shvorov (2018) UAV Navigation and Management System Based on the Spectral Portrait of Terrain / S.Shvorov, D.Komarchuk, N.Pasichnyk, О.Opryshko, Y.Gunchenko, S.Kuznichenko // 2018 IEEE 5th Int. Conf. on Methods and Systems of Navigation and Motion Control (MSNMC), – Proceedings. рр. 68-71, http://dx.doi.org/10.1109/MSNMC.2018.8576304.
[3] Xianlong Zhang (2019) New research methods for vegetation information extraction based on visible light remote sensing images from an unmanned aerial vehicle (UAV) / Xianlong Zhang, Fei Zhang, Yaxiao Qi, Laifei Deng, Xiaolong Wang, Shengtian Yang // International Journal of Applied Earth Observation and Geoinformation, Vol.78, рр.215-226, https://doi.org/10.1016/j.jag.2019.01.001.
[4] S. W. Myint (2013) Per-pixel vs. Object-based classification of urban land cover extractio n using high spatial resolution imagery / S.W.Myint, P.Gober, A.Brazel, S.Grossman-Clarke, Q. Weng // Remote Sens. Environ. Vol.115 (5), рр.1145–1161, https://doi.org/10.1016/J.RSE.2010.12.017.
[5] Andrea S. Laliberte (2007) Combining Decision Trees with Hierarchical Object-oriented Image Analysis for Mapping Arid Rangelands / Andrea S. Laliberte, Ed L.Fredrickson, Albert Rango // Photogrammetric Engineering & Remote Sensing, Vol.73(2), pp. 197-207(11), https://doi.org/10.14358/PERS.73.2.197.
[6] Mitch Bryson (2010) Airborne vision‐based mapping and classification of large farmland environments / Mitch Bryson, Alistair Reid, Fabio Ramos, Salah Sukkarieh // Special Issue: Visual Mapping and Navigation
Outdoors, Vol.27 (5), рр. 632-655, https://doi.org/10.1002/rob.20343.
[7] Passang Dorji (2017) Impact of the spatial resolution of satellite remote sensing sensors in the quantification of total suspended sediment concentration: A case study in turbid waters of Northern Western Australia / Passang Dorji, Peter Fearns // PLoS ONE, Vol.12(4), e0175042. https://doi.org/10.1371/journal.pone.0175042.
[8] J. Senthilnath (2017) Application of UAV imaging platform for vegetation analysis based on spectral-spatial methods / J.Senthilnath, M.Kandukuri, A.Dokania, K.N.Ramesh // Computers and Electronics in Agriculture. Vol.140, pp.8–24; https://doi.org/10.1016/j.compag.2017.05.027.
[9] M. Dolia (2019) Information Technology for Remote Evaluation of after Effects of Residues of Herbicides on Winter Crop Rape / M.Dolia, V.Lysenko, N.P asichnyk, O.Opryshko, D.Komarchuk, V.Miroshnyk, T.Lendiel, A.Martsyfei // 2019 3rd International Conference on Advanced Information and Communications Technologies, AICT 2019 - Proceedings рр. 469-473. https://doi.org/10.1109/AIACT.2019.8847850.
[10] Yu-Hsuan Tu (2020) Optimizing drone flight planning for measuring horticultural tree crop structure / Yu-Hsuan Tu, Stuart Phinn, Kasper Johansen, Andrew Robson, Dan Wu // ISPRS Journal of Photogrammetry and Remote Sensing, Vol. 160, рр. 83–96, https://doi.org/10.1016/j.isprsjprs.2019.12.006.
[11] Ming-Der Yang (2020) Adaptive autonomous UAV scouting for rice lodging assessment using edge computing with deep learning EDANet / Ming-Der Yang, Jayson G. Boubin, Hui Ping Tsai, Hsin-Hung Tseng, Yu-Chun Hsu, Christopher C. Stewart // Computers and Electronics in Agriculture, Vol.179, 105817, https://doi.org/10.1016/j.compag.2020.105817.
[12] Wojciech Gruszczyński (2019) Application of convolutional neural networks for low vegetation filtering from data acquired by UAVs / Wojciech Gruszczyński, Edyta Puniach, Paweł Ćwiąkała, Wojciech Matwij // ISPRS Journal of Photogrammetry and
330

Remote Sensing, Vol.158, рр.1-10, https://doi.org/10.1016/j.isprsjprs.2019.09.014.
[13] Qi Yang (2019) Deep convolutional neural networks for rice grain yield estimation at the ripening stage using UAV-based remotely sensed images / Qi Yang, Liangsheng Shi, Jinye Han, Yuanyuan Zha, Penghui Zhu // Field Crops Research, Vol.235, рр. 142-153, https://doi.org/10.1016/j.fcr.2019.02.022.
[14] V. Lysenko (2017) Determination of the not uniformity of illumination in process monitoring of wheat crops by UAVs / V.Lysenko, D.Komarchuk, O.Opryshko, N.Pasichnyk, N.Zaets, // 2017 4th International Scientific-Practical Conference Problems of Infocommunications Science and Technology, PIC S and T 2017 – Proceedings. Volume 2018-January, 28 June 2017, Pages 265-267. https://doi.org/10.1109/INFOCOMMST.2017.8246394.
[15] Yan Pang (2020) Improved crop row detection with deep neural network for early-season maize stand count in UAV imagery / Yan Pang, Yeyin Shi, Shancheng Gao, Feng Jiang, Arun-Narenthiran Veeranampalayam-Sivakumar, Laura Thompson, Joe Luck, Chao Liu // Computers and Electronics in Agriculture, Vol.178, 105766, https://doi.org/10.1016/j.compag.2020.105766.
[16] Junfeng Gao (2018) Fusion of pixel and object-based features for weed mapping using unmanned aerial vehicle imagery / Junfeng Gao, Wenzhi Liao, David Nuyttens, Peter Lootens, Jürgen Vangeyte,Aleksandra Pižurica, Yong He, Jan G. Pieters // International Journal of Applied Earth Observation and Geoinformation Vol. 67, рр.43-53, https://doi.org/10.1016/j.jag.2017.12.012.
[17] Carlos Henrique Wachholz de Souza (2017) Mapping skips in sugarcane fields using object-based analysis of unmanned aerial vehicle (UAV) images / Carlos Henrique Wachholz de Souza, Rubens Augusto Camargo Lamparelli, Jansle Vieira Rocha, Paulo Sergio Graziano Magalhães // Computers and Electronics in Agriculture, Vol.143, рр. 49–56, http://dx.doi.org/10.1016/j.compag.2017.10.006.
[18] Emad Ebeid (2018) A Survey of Open-Source UAV Flight Controllers and Flight
Simulators / Emad Ebeid, Martin Skriver, Kristian Husum Terkildsen, Kjeld Jensen, Ulrik Pagh Schultz // Micro- processors and Microsystems, https://doi.org/10.1016/j.micpro.2018.05.002.
[19] S. Shvorov (2020) The method of determining the amount of yield based on the results of remote sensing obtained using UAV on the example of wheat / S. Shvorov, V. Lysenko, N. Pasichnyk, Y. Rosamakha, А. Rudenskyi, V. Lukin, A. Martsyfei // 2020 IEEE 15th International Conference on Advanced Trends in Radioelectronics, Telecommunications and Computer Engineering (TCSET), рр. 245-248. http://dx.doi.org/10.1109/PICST47496.2019.9061238Wang, Xin, Tapani Ahonen, and Jari Nurmi. "Applying CDMA technique to network-on-chip." IEEE transactions on very large scale integration (VLSI) systems 15.10 (2007): 1091-1100.
331

Prospects For Satellite Spectral Monitoring For Automation Of Processes For Assessing Agricultural Soil Use Natalia Pasichnyk1, Sergey Shvorov2, Yurii Gunchenko3, Oleksandr Miroshkin4, Elina Zakharchenko5, Oleksiy Opryshko6
1,2,6 National University of Life and Environmental Sciences of Ukraine, Heroyiv Oborony st., 15, Kyiv, 03041, Ukraine 3 Odessa I.I.Mechnikov National University, Dvoryanskaya str., 2, Odessa, 65082, Ukraine 4Communication and Information Centre Ulm University Ulm, Germany 5Sumy National Agrarian University, Herasyma Kondratieva Str., 160, Sumy 40021, Ukraine
Abstract Means of technical vision as innovative solutions have found wide use for automation of technological processes in agriculture in general and in crop production in particular. Their introduction becomes especially important when introducing the market of agricultural land in Ukraine when it is quite possible that it is misused by tenants or owners. The use of satellite monitoring may be an effective solution, as high and ultra-high resolution (resolution) satellite images have become available to farmers in recent years. The aim of the work was to assess the prospects of satellite spectral monitoring to automate the processes of assessing agricultural soil use. The research was conducted on the production fields NUBiP of Ukraine. During 2016-2021, the fields were occupied by different crops - winter and spring. Mostly cereals were grown, some fields were occupied by sunflowers, corn for grain and silage, perennial grasses. Archival data on multispectral images from a specialized Landsat 8 satellite were used for the research. It is established that satellite spectral monitoring turned out to be suitable for automation of processes of technological soil erosion monitoring. Using a series of satellite images, it was possible to identify a field for which agricultural practices in crop production were carried out at a higher level and, accordingly, the soil has a higher fertility. To ensure one-year image accuracy, it is necessary to use images with a resolution suitable for precision atmospheric correction on terrestrial objects with stable and known spectral indices. Keywords 1 Soil quality, satellite monitoring, automation
1. Actuality
Means of technical vision as innovative solutions have found wide use for automation of technological processes in agriculture in general and in crop production in particular. Their introduction becomes especially important when introducing the market of agricultural land in Ukraine when it is quite possible that it is misused by tenants or owners. The review article Hongkun Tian at al [1] (2020) on the prospects of technical vision shows that the specificity of agricultural
EMAIL: [email protected] (A. 1); [email protected] (A. 2); [email protected] (A. 3); [email protected] (A.4); [email protected] (A. 5); [email protected] (A. 6); ORCID: 0000-0002-2120-1552 (A. 1); 0000-0003-3358-1297 (A. 2); 0000-0003-4423-8267 (A. 3); 0000-0002-9291-3389 (A. 5); 0000-0001-6433-3566 (A. 6)
production is the diversity and instability of the forms of the studied objects, when in addition to their geometry should be taken into account spectral indicators. Certain technological operations with the use of technical vision devices have been successfully completed with the automation of agricultural production. What is an example of the identification of apples in the crown of trees, presented in the work of I. Smirnov at al [2] (2021), strawberries on the ridges, described in the work of D. Khort at al [3] (2020), tomatoes, considered in work I Korobiichuk et al [4] (2017). At the same time, the
332

introduction of automation in agricultural practices is uneven, as evidenced in the analytical work Kirtan Jha at al [5] (2019), devoted to the prospects and needs of agricultural automation, which shows the need to strengthen developments to determine the state and especially soil fertility. The problem of soil fertility reproduction is extremely relevant not only on the scale of individual farms, but at the state level for European countries, which was covered in the article by Hakkı Emrah Erdogan at al [6] (2021). Ground-based devices such as the Dutch company SoilCares (https://www.soilcaresfoundation.com) and the experimental device described in Sérgio H.G. SILVA at al [7] (2021), intended for soil analysis, however, do not provide scalability of studies, as they require direct contact with the test sample. The use of satellite monitoring may be an effective solution, as high and ultra-high resolution (resolution) satellite images have become available to farmers in recent years.
The aim of the work was to assess the prospects of satellite spectral monitoring to automate the processes of assessing agricultural soil use.
1.1. The state of the issue
The issue of spectral monitoring using satellite platforms is especially relevant for tropical regions, which in the context of growing global food shortages in the future may become additional agricultural land. The potential for successful use of satellite monitoring for soil science (Pedological assessment) was predicted in the work of José A.M. Demattê at al [8] (2014). Practical implementation was shown in the works of Wanderson de S. Mendes at al [9] (2019) and Raúl R. Poppiel at al [10] (2019). In staging articles, which showed both the presence of many methodological problems and promising ways to analyze not a single image, but the dynamics of changes in the characteristics of the images over time. One of the problems was the low resolution of existing Landsat-5 satellite images, but in recent years several new satellite platforms have been launched into orbit, such as Landsat-8, with higher image resolution, and, accordingly, new opportunities are emerging for researchers. . In the work of Nélida Elizabet Quiñonez Silvero at al [11] (2021) on the prediction of soil properties in Brazil, it was possible to determine the type of parent rock and to some extent the organic content. The authors were forced to work in
conditions of significant shortage of open soil in the trails and changes in the humidity of the upper layer, so to assess the soil used the concept of "soil line", which led to the possibility of significant error even in numerous measurements. For similar climatic conditions in India, Kishan Singh Rawat at al [12] (2019) developed a modified water balance model (MWCM) based on spectral data from the LANDSAT-8 satellite. As in the previous work, the developed solution is based on the concept of the ground line, for the initial data uses the NDVI index. In the European part, soil monitoring of fields not occupied by vegetation can be carried out most often in spring and autumn. Moreover, the soil is mostly in the air-dry state, which contributes to the objectivity of its direct spectral evaluation. The open ground is characteristic of certain plantations, in particular perennials with keeping the rows unoccupied. Such objects, namely vineyards, were considered in the work of A. Brook at al [13] (2020), where the prospects of water erosion of the upper layer were successfully assessed. The authors compared the intensity of the color components compared data from satellites and UAVs, for the implementation of atmospheric correction as reflector panels used gravel roads. Considering the national specifics of Ukraine, the prospects of such standards in the production fields are currently insufficient. An alternative, as shown in the work of V. Lysenko at al [14] (2018), can be sections of dirt roads, the identification of which can be carried out according to the method described in the work of S.A.Shvorov at al [15] (2018).
In addition to traditional factors of soil erosion, such as wind and water, in intensive agriculture there is also technological erosion associated with changes in soil properties, primarily a decrease in organic matter content. According to the data covered in the work of Yawen Li at al [16] (2021), the issues of technological erosion are insufficiently studied. Thus, the authors found that for the garden erosion was higher than for industrial fields, which contradicts the results presented by Zhongwu Li at al [17] (2017).
The above analysis of the literature allows us to draw the following conclusions:
• satellite platforms can be used to assess the condition of soils, but ready-made solutions, especially regarding the nature of erosion, have not been identified; • since the values of the intensity values of the color components are informative, for atmospheric correction it is possible to use as
333

reflective panels of roads with artificial surface, as well as rolled soil; • to determine the condition of the soil, it is advisable to consider the dynamics of changes in spectral indicators over time;
erosion of both traditional (wind, water) and technological nature is possible in the fields, which must be considered when organizing research.
2. Organization of the experiment
The research was carried out on the production fields of NUBiP (https://nubip.edu.ua/en) of Ukraine "Velykosnitynske training and research farm. OV Muzychenko ”(Kyiv region; coordinates Lat: 50.09080, Lng: 30.02997). During 2016-2021, the fields were occupied by different crops - winter and spring. Mostly cereal grains were grown, some fields were occupied by sunflower, corn for grain and silage, perennial grasses (Table 1). The soil of the territory is podzolic chernozem. Table 1 Alternating cultures grown in experimental fields
Year / years
Field 1 Field 2 Field 3
2020-2021
Winter barley
Sunflower Winter wheat
2019-2020
Winter barley
Winter wheat
Corn / silage
2018-2019
Sunflower Winter wheat
Winter wheat
2017-2018
Winter wheat
Corn silage
Spring barley
2016-2017
Perennial herbs / alfalfa
Spring barley
Corn for grain
To maintain soil fertility in some fields after
harvesting the main crop sown green manure (leies). In field 3, organic fertilizers (manure from cattle) were applied.
2.1. Initial data of spectral satellite monitoring
At present, there is free access to archival data of the results of spectral imaging from the Landsat 4-5 and 8 satellites (provided by NASA / USGS). The highest resolution is in the spectral systems of
Landsat 8 and is 30 m (15 for the panchromatic band). The frequency of images is 16 days. According to the data presented in Hengbiao Zheng et al (2020) [18] regarding the identification of plantings, it was determined that the minimum possible size of the object for visual identification in the optical range is 13 × 13 pixels, respectively. Therefore, the use of local roads for atmospheric correction of dirt roads is not realized due to their small width. Therefore, the results of atmospheric correction directly from the image provider were used, namely, channels blue B2 (0.450–0.515 µm), green B3 (0.525–0.600 µm), red B4 (0.630–0.680 µm) and near infrared B5 (0.845–0.885 µm). . For ease of perception of information, consumers used not monochrome, but color images with an additive model of RGB color formation (channels 4, 3, 2) for the visible range of the spectrum and in false color composite (channels 5,4,3). The use of the infrared range is due to the need to assess the density and condition of plantations, as the analysis should be carried out for the top layer of soil. For research in the expert mode, images were selected where there are no clouds in the experimental fields and, accordingly, the shadow from them (Fig. 1).
Figure 1: Image in false color from 2020.10.12 experimental fields 1-3, where part of the second and third fields are in the shadow of the clouds. Part of field 3 is sown with leies that are not growing at the time of shooting.
To take into account the possibility of the
impact of water erosion of the soil at the choice of experimental sites, they were checked for the presence of stable puddles due to the terrain. An archive of high-resolution satellite images 0.5 m / pixel obtained (Fig. 2) from the archive data of the Google Earth Pro service (ver: 7.3.3.7786) was used for verification.
334

Figure 2: Visual identification of puddle locations on images from archival data from the Google Earth service for selection of research sites (date of shooting 2018.04.04).
2.2. Mathematical data processing
Processing of satellite images was performed using MathCad. Spectral monitoring data were saved in Jpeg format. For the data processing algorithm, two options were considered both directly for finding the average value and with the approximation of experimental data.
The first algorithm involved processing in two stages: the first determined the average intensity
of the color component in the area, and the second to remove random objects removed pixels in which the intensity of the color components differed from the average by more than 10 units. If the area of the error plots exceeded 10%, a second algorithm based on the approximation of experimental data was used. For approximation, we used the Gaussian distribution according to the method described in N. Pasichnyk at al [19] (2021). The second approach makes it possible to estimate the presence of several objects at the same time in the experimental area, although it requires a multiple of larger computing power (Fig. 3).
Statistical processing showed that the data are described by the Gaussian distribution, the coefficient of determination was ≥0.95. Comparing the results obtained by the first algorithm, the data difference did not exceed 5%. Despite the presence of plantings in field 3, the value of the standard deviation w is virtually identical, respectively, when processing spectral data with a resolution of 30 m / pixel to assess the condition of the soil, the second algorithm will not have fundamental advantages.
Statistical data processing was performed using a specialized software product OriginPro Sp4 (Origin Lab Corporation).
0 10 20 30 40
0
200
400
600
800
1000
1200
1400
1600
1800 R2, xc=18, w=2.8
R3, xc=20, w=2.3
G2, xc=16, w=2.2
G3, xc=28, w=1.3
B2, xc=12, w=2.5
B3, xc=21, w=1.9
Num
ber
of
pix
els
Color component intensity Figure 3: Intensity distribution of color components for the visible range of the spectrum for 2 and 3 fields (shooting date 2017.11.21; field 3 is occupied by leies.
335
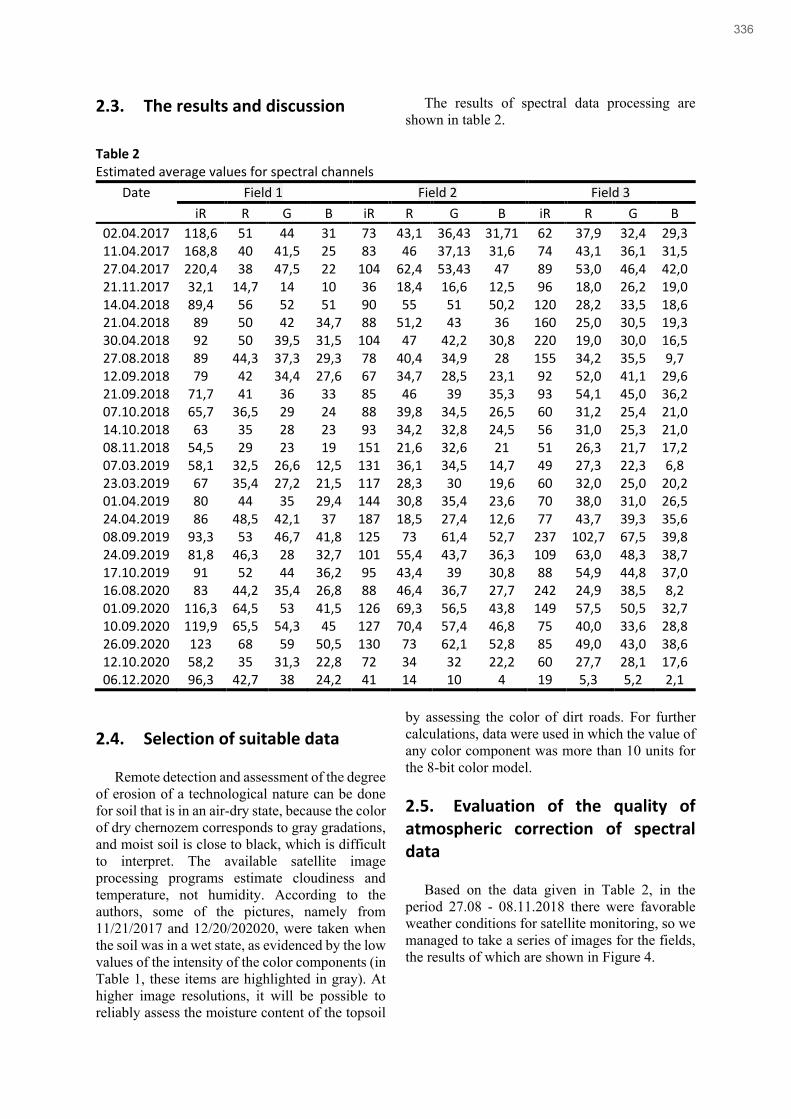
2.3. The results and discussion The results of spectral data processing are shown in table 2.
Table 2 Estimated average values for spectral channels
Date Field 1 Field 2 Field 3
iR R G B iR R G B iR R G B
02.04.2017 118,6 51 44 31 73 43,1 36,43 31,71 62 37,9 32,4 29,3 11.04.2017 168,8 40 41,5 25 83 46 37,13 31,6 74 43,1 36,1 31,5 27.04.2017 220,4 38 47,5 22 104 62,4 53,43 47 89 53,0 46,4 42,0 21.11.2017 32,1 14,7 14 10 36 18,4 16,6 12,5 96 18,0 26,2 19,0 14.04.2018 89,4 56 52 51 90 55 51 50,2 120 28,2 33,5 18,6 21.04.2018 89 50 42 34,7 88 51,2 43 36 160 25,0 30,5 19,3 30.04.2018 92 50 39,5 31,5 104 47 42,2 30,8 220 19,0 30,0 16,5 27.08.2018 89 44,3 37,3 29,3 78 40,4 34,9 28 155 34,2 35,5 9,7 12.09.2018 79 42 34,4 27,6 67 34,7 28,5 23,1 92 52,0 41,1 29,6 21.09.2018 71,7 41 36 33 85 46 39 35,3 93 54,1 45,0 36,2 07.10.2018 65,7 36,5 29 24 88 39,8 34,5 26,5 60 31,2 25,4 21,0 14.10.2018 63 35 28 23 93 34,2 32,8 24,5 56 31,0 25,3 21,0 08.11.2018 54,5 29 23 19 151 21,6 32,6 21 51 26,3 21,7 17,2 07.03.2019 58,1 32,5 26,6 12,5 131 36,1 34,5 14,7 49 27,3 22,3 6,8 23.03.2019 67 35,4 27,2 21,5 117 28,3 30 19,6 60 32,0 25,0 20,2 01.04.2019 80 44 35 29,4 144 30,8 35,4 23,6 70 38,0 31,0 26,5 24.04.2019 86 48,5 42,1 37 187 18,5 27,4 12,6 77 43,7 39,3 35,6 08.09.2019 93,3 53 46,7 41,8 125 73 61,4 52,7 237 102,7 67,5 39,8 24.09.2019 81,8 46,3 28 32,7 101 55,4 43,7 36,3 109 63,0 48,3 38,7 17.10.2019 91 52 44 36,2 95 43,4 39 30,8 88 54,9 44,8 37,0 16.08.2020 83 44,2 35,4 26,8 88 46,4 36,7 27,7 242 24,9 38,5 8,2 01.09.2020 116,3 64,5 53 41,5 126 69,3 56,5 43,8 149 57,5 50,5 32,7 10.09.2020 119,9 65,5 54,3 45 127 70,4 57,4 46,8 75 40,0 33,6 28,8 26.09.2020 123 68 59 50,5 130 73 62,1 52,8 85 49,0 43,0 38,6 12.10.2020 58,2 35 31,3 22,8 72 34 32 22,2 60 27,7 28,1 17,6 06.12.2020 96,3 42,7 38 24,2 41 14 10 4 19 5,3 5,2 2,1
2.4. Selection of suitable data
Remote detection and assessment of the degree of erosion of a technological nature can be done for soil that is in an air-dry state, because the color of dry chernozem corresponds to gray gradations, and moist soil is close to black, which is difficult to interpret. The available satellite image processing programs estimate cloudiness and temperature, not humidity. According to the authors, some of the pictures, namely from 11/21/2017 and 12/20/202020, were taken when the soil was in a wet state, as evidenced by the low values of the intensity of the color components (in Table 1, these items are highlighted in gray). At higher image resolutions, it will be possible to reliably assess the moisture content of the topsoil
by assessing the color of dirt roads. For further calculations, data were used in which the value of any color component was more than 10 units for the 8-bit color model.
2.5. Evaluation of the quality of atmospheric correction of spectral data
Based on the data given in Table 2, in the period 27.08 - 08.11.2018 there were favorable weather conditions for satellite monitoring, so we managed to take a series of images for the fields, the results of which are shown in Figure 4.
336

Figure 4: Graphs of dependence of intensity of components of color of soil on date of shooting
As can be seen from the above data, for the
visible range there is a trend to reduce the intensity of the color components, which could be explained by the gradual moistening of the soil and, accordingly, its darkening. However, in the case of soil moisture, for the infrared channel, according to the results of A. J. Richardson at al [20] (1977), there should be an increase, but a declining trend. According to the authors, the explanation for this is the imperfect atmospheric correction, which must be carried out using artificial ground or natural reflector panels. Because this is not always easy to implement, especially for low-resolution images such as Landsat 8, it may be appropriate to focus on a series of images over several years.
2.6. The results of statistical data processing
Different types and subtypes of soils can have different values of color intensity of color components, so setting a limit value that corresponds to soil without plants is a debatable issue. In addition, different crops during the growing season have different indicators of the intensity of the color component in both the optical and infrared ranges. Therefore, to determine the soil parameters, data was filtered based on the value in the infrared channel. The results are shown in Figure 5.
80 90 100 110 120
34
36
38
40
42
44
46
R1
R2
R3
The
in
tensity o
f th
e R
ED
co
lor
co
mp
on
en
t
iR filtration Figure 5: The dependence of the mean value of the intensity of the red color component, calculated for the condition of the mean value for pixels if the value of the iR pixel ≤iR filtration
First-order Exponential Decay equations were
used to approximate the experimental data. For the green and blue components of color, dependences of a similar nature were obtained.
The analysis of the obtained data showed that for the third field the color is significantly darker, which is obviously a consequence of more organic matter in the soil.
2.7. Direction of further research
In addition to the Landsat v5-8 agricultural satellites, there are alternative solutions, such as Sentinel-2 with higher image resolution, for which it is easier to choose acceptable optical templates.
Establishing the state of moisture of the upper soil layer will be of fundamental importance for the automated determination of the state of soil
0
10
20
30
40
50
60
70
80
90
100
18
.8
28
.8
7.9
17
.9
27
.9
7.1
0
17
.10
27
.10
6.1
1
16
.11
Num
ber o
f pix
els
Date
iR
R
G
B
337

erosion based on the results of spectral monitoring. It is necessary to develop a mathematical algorithm that can assess the suitability of the data.
Agricultural satellites are shooting in automatic mode, not taking into account the state of clouds. The systems provide an assessment of the state of clouds throughout the photograph, but there is a high probability that for the experimental area the state of clouds may not correspond to the average value. According to the authors, research on the introduction of machine learning to assess the suitability of images for cloud parameters in the experimental areas is promising.
3. Conclusions
1. Satellite spectral monitoring proved to be suitable for automation of processes of technological soil erosion monitoring.
2. Using a series of satellite images, it was possible to identify a field for which agricultural practices in crop production were carried out at the highest level and, accordingly, the soil has a higher fertility.
3. To ensure the accuracy of one-year images, it is necessary to use images with a resolution suitable for precision atmospheric correction on terrestrial objects with stable and known spectral indices.
4. References
[1] Hongkun Tian (2020) Computer vision
technology in agricultural automation — A review / Hongkun Tian, Tianhai Wang, Yadong Liu, Xi Qiao, Yanzhou Li // Information Processing in Agriculture, Vol.7 (1), рр. 1-19 https://doi.org/10.1016/j.inpa.2019.09.006.
[2] I. Smirnov (2021) Neural network for identifying apple fruits on the crown of a tree / I.Smirnov, A.Kutyrev, N.Kiktev // International scientific forum on computer and energy Sciences (WFCES 2021), E3S Web Conf. Vol.270, 01021, https://doi.org/10.1051/e3sconf/202127001021.
[3] Khort D. (2020) Computer vision system for recognizing the coordinates location and ripeness of strawberries (Conference Paper) / D.Khort, A.Kutyrev, I.Smirnov,
V.Osypenko, N.Kiktev // Communications in Computer and Information Science DSMP 2020, Vol.1158, рр. 334-343, https://doi.org/10.1007/978-3-030-61656-4_22.
[4] I. Korobiichuk (2017) Energy-Efficient Electrotechnical Complex of Greenhouses with Regard to Quality of Vegetable Production. In: Szewczyk R., Kaliczyńska M. (eds) / Korobiichuk I., Lysenko V., Reshetiuk V., Lendiel T., Kamiński M. // Recent Advances in Systems, Control and Information Technology. SCIT 2016. Advances in Intelligent Systems and Computing, vol. 543, рр. 243 - 251. Springer, Cham. https://doi.org/10.1007/978-3-319-48923-0_30.
[5] Kirtan Jha (2019) A comprehensive review on automation in agriculture using artificial intelligence / Kirtan Jha, Aalap Doshi, Poojan Patel, Manan Shah // Artificial Intelligence in Agriculture, Vol. 2, рр. 1-12, https://doi.org/10.1016/j.aiia.2019.05.004.
[6] Hakkı Emrah Erdogan (2021) Soil conservation and sustainable development goals(SDGs) achievement in Europe and central Asia: Which role for the European soil partnership? / Hakkı Emrah Erdogan, Elena Havlicek, Carmelo Dazzi, Luca Montanarella, Marc Van Liedekerke, Borut Vrščaj, Pavel Krasilnikov, Gulchekhra Khasankhanova, Ronald Vargas // International Soil and Water Conservation Research, Vol. 9 (3), рр. 360-369, https://doi.org/10.1016/j.iswcr.2021.02.003.
[7] Sérgio H.G. Silva (2021) Proximal sensor-enhanced soil mapping in complex soil-landscape areas of Brazil / Sérgio H.G. Silva, David C. Weindorf, Wilson M. Faria, Leandro C. Pinto, Michele D. Menezes, Luiz R.G. Guilherme, Nilton Curi // Pedosphere, Vol.31 (4), pp. 615-626, https://doi.org/10.1016/S1002-0160(21)60007-3.
[8] José A. M. Demattê (2014) Spectral pedology: A new perspective on evaluation of soils along pedogenetic alterations / José A.M. Demattê, Fabrício da Silva Terra // Pedosphere, Vol.31 (4), рр. 615-626, https://doi.org/10.1016/S1002-0160(21)60007-3.
[9] Wanderson de S. Mendes (2019) Is it possible to map subsurface soil attributes by satellite spectral transfer models? / Wanderson de S. Mendes, Luiz G. Medeiros
338

Neto, José A.M. Demattê, Bruna C. Gallo, Rodnei Rizzo, José L. Safanelli, Caio T. Fongaro // Geoderma, Vol. 343, рр. 269-279, https://doi.org/10.1016/j.geoderma.2019.01.025.
[10] Raúl R. Poppiel (2019) Pedology and soil class mapping from proximal and remote sensed data / Raúl R. Poppiel, Marilusa P.C. Lacerda, José A.M. Demattê, Manuel P. Oliveira, Bruna C. Gallo, José L. Safanelli // Geoderma, Vol. 348, рр. 189-206, https://doi.org/10.1016/j.geoderma.2019.04.028.
[11] Nélida Elizabet Quiñonez Silvero (2021) Soil variability and quantification based on Sentinel-2 and Landsat-8 bare soil images: A comparison / Nélida Elizabet Quiñonez Silvero, José Alexandre Melo Demattê, Merilyn Taynara Accorsi Amorim, Natasha Valadares dos Santos, Rodnei Rizzo, José Lucas Safanelli, Raul Roberto Poppiel, Wanderson de Sousa Mendes, Benito Roberto Bonfatti // Remote Sensing of Environment, Vol.252, 112117, https://doi.org/10.1016/j.rse.2020.112117.
[12] Kishan Singh Rawat (2019) Synergetic methodology for estimation of soil moisture over agricultural area using Landsat-8 and Sentinel-1 satellite data / Kishan Singh Rawat, Sudhir Kumar Singh, Raj Kumar Pal // Remote Sensing Applications: Society and Environment, Vol.15, 100250, https://doi.org/10.1016/j.rsase.2019.100250.
[13] Brook, A. (2020) A smart multiple spatial and temporal resolution system to support precision agriculture from satellite images: Proof of concept on Aglianico vineyard / A. Brook, V. De Micco, G. Battipaglia, A. Erbaggio, G. Ludeno, I. Catapano, A. Bonfante // Remote Sensing of Environment, Vol. 240, 111679, https://doi.org/10.1016/j.rse.2020.111679.
[14] Lysenko, V. (2018) Information Support Of The Remote Nitrogen Monitoring System In Agricultural Crops / V.Lysenko, O.Opryshko, D.Komarchuk, N.Pasichnyk, N.Zaets, A.Dudnyk // International Journal of Computing Vol 17(1) рр.47-54.
[15] Shvorov, S. A. (2018) UAV Navigation and Management System Based on the Spectral Portrait of Terrain / Sergey A Shvorov, Dmytro S Komarchuk, Natalia A Pasichnyk, Oleksiy A Opryshko, Yurii A Gunchenko, Svitlana D Kuznichenko // 2018 IEEE 5th International Conference on Methods and
Systems of Navigation and Motion Control, MSNMC 2018, рр.68-71, https://doi.org/10.1109/MSNMC.2018.8576304.
[16] Yawen Li (2021) Interactive effects of land use and soil erosion on soil organic carbon in the dry-hot valley region of southern China / Yawen Li, Xingwu Duan, Ya Li, Yuxiang Li, Lanlan Zhang // CATENA, Vol. 201, 105187, https://doi.org/10.1016/j.catena.2021.105187.
[17] Zhongwu Li (2017) Response of soil organic carbon and nitrogen stocks to soil erosion and land use types in the Loess hilly–gully region of China / Soil and Tillage Research, Vol. 166, рр. 1-9, https://doi.org/10.1016/j.still.2016.10.004.
[18] Hengbiao Zheng (2020) Early season detection of rice plants using RGB, NIR-G-B and multispectral images from unmanned aerial vehicle (UAV) / Hengbiao Zheng, Xiang Zhou, Jiaoyang He, Xia Yao, Tao Cheng, Yan Zhu, Weixing Cao, Yongchao Tian Computers and Electronics in Agriculture, Vol.169, 105223, https://doi.org/10.1016/j.compag.2020.105223.
[19] Pasichnyk, N. (2021) Technologies for Environmental Monitoring of the City / N.Pasichnyk, D.Komarchuk, O.Opryshko, S.Shvorov, V.Reshetiuk, O.Bahatska // 2021 IEEE 16th International Conference on the Experience of Designing and Application of CAD Systems (CADSM), pp. 40-43, https://doi.org/10.1109/CADSM52681. 2021.9385213.
[20] Richardson, A. J. (1977) Distinguishing vegetation from soil background information / Richardson, A.J., Wiegand, C.L. // Photogrammetric Engineering and Remote Sensing Vol.43 (2), рр.1541-1552.
339

Information System To Forecasting The Steadiness Of REE OOSS Solid Solutions For Environmental Monitoring Oleksii Kudryk1, Oleg Bisikalo2, Yuliia Oleksii3 and Eugeni Get’man4
1,2 Vinnitsa National Technical University, Khmelʹnytsʹke sh., 95, Vinnytsya, Vinnytsʹka oblastʹ, 21000, Ukraine 3,4 Vasylʹ Stus Donetsk National University, 600 richchya street, 21, Vinnytsya, Vinnytsʹka oblastʹ, 21000, Ukraine
Abstract V.S. Urusov’s crystal-energy theory of isomorphic replacements accomplished in our information system was used to calculate mixing energies and critical temperatures of disintegration (steadiness) of solid solutions in the systems (Sc1 – xLnx)[(SiO4)0.5O0.5], where Ln is rare-earth elements (REE) of Terbium – Lutetium row, and Yttrium. Steadiness temperatures of some solid solutions at x = 0.01, 0.03, 0.05, 0.10, and 0.20 were established. Based on the given calculation results, a diagram was created to estimate the areas of sustainability of solid solutions and forecast the replacement limits based on the steadiness temperature depending on the obtained replacement limits. The results of the research can be helpful for choosing the ratio of the components in the host materials and the amount of dopant in newly “hybrid” REE OOSs (OOS) (Sc1 – xLnx)[(SiO4)0.5O0.5], where Ln represent REEs of Terbium – Lutetium row, and Yttrium. Keywords 1 Information system, phase steadiness, solid solutions, mathematical modeling, model, OOSs.
1. Introduction
Solid solutions based on Scandium-OOS Sc2SiO5 are innovational materials for creating efficacious lasers for medicine, laser ranging [1], military purposes, metalworking [2], and what is important for environmental monitoring [3-5] since they have become an attractive research topic due to their huge benefits. For example, such lasers are not dangerous for eye and it has fine transparency in the atmosphere, can serve as efficient sources in optical measurements, for example, weather conditions (wind measurement), as well as the determining of the concentration of atmospheric atoms. They serve as host materials, while the triple charged Ln3+ ions, which are contained in small amounts (up to 5 at%), act as dopants. In addition to OOSs containing only Scandium cations in their matrices [6-7], we also studied materials based on “hybrid” OOS with two different cations – Sc and REEs, which are solid solutions of Sc2SiO5 — Ln2SiO5 systems [8-11]. The use of “hybrid” Sc and REE OOS is due to the purpose of synthesizing materials with better properties compared to Ln2SiO5, and which are cheaper
EMAIL: [email protected] (A. 1); [email protected] (A. 2); [email protected] (A. 3); [email protected] (A. 4) ORCID: 0000-0002-0592-6633 (A. 1); 0000-0002-7607-1943 (A. 2)); 0000-0002-7328-6674 (A. 3); 0000-0002-7665-556X (A. 4)
compared to Sc2SiO5, since the cost of Sc is higher than one of REE.
No analysis of physical and chemical foundations for the receiving of solid solutions – state diagrams and, in particular, areas of solubility based on the components of the Sc2SiO5 and Ln2SiO5 systems – has been carried out, while this result is necessary for choosing the compound of materials. As far as we know, only data about the Lu2 – xScxSiO5 [12] and ErxSc2 – xSiO5 [13] systems are available. In [12], it was reported that three compositions of polycrystalline solid solutions with x = 0.5, 0.8, 1.0 at a temperature of 1670 K were obtained, while in [13] the synthesis of ErxSc2 – xSiO5 in the form of films within the temperature range 1173 – 1373 K was studied. In [13], it was also reported that ErxSc2 – xSiO5 films could be used to create a light source with high optical gain since they have a higher Erbium concentration compared to Silicon-based materials doped with Erbium. Nevertheless, no information on the replacement limits in the Lu2 – xScxSiO5 and ErxSc2 – xSiO5 systems are available.
It is very important to determine experimentally areas of solubility in the solid
340

phase, which requires expensive equipment, additional reagents, large energy and time consumption. This forces researchers who study the properties of “hybrid” REE OOS to choose the composition of host matrix materials and activators either by analogy with similar systems or by selection method that is trial and error.
It is often not taken into account that “hybrid” REE OOS tend to decay and modification their phase composition and properties upon cooling. This can lead to the damage of materials based on them if used in applications. Accordingly, before carrying synthesis and studying it, it is recommended to evaluate the steadiness of solid solutions in the corresponding systems during their obtaining and intended use.
In view of this, the aim of this research is to forecast the phase steadiness and replacement limits in materials based on solid solutions of OOS of Scandium and REEs of Terbium – Lutetium row, and Yttrium.
Yttrium subgroup REEs and Yttrium were chosen as second cations due to the same structure with Sc2SiO5, as well as the proximity of crystalline ionic radii of Sc3+ (0.885 Å) and triply charged cations of Yttrium subgroup REEs and Yttrium (1.063 – 1.001 Å [14]), which suggests the wide presence of isomorphic replacement of Scandium by these REEs. The radii of the Cerium subgroup REE cations (1.172 – 1.078 Å) vastly differ from the ionic radius of Scandium, and their OOS are not isostructural with Sc2SiO5 [15], which, according to the theory of isomorphic miscibility [16-18], should vastly limit the solubility of components in systems with Scandium and REEs of the Lanthanum – Gadolinium series.
2. Calculation method and results
The main aim in establishing the replacement limits of solid solutions using the crystal energy method by Urusov [16-18] is to determine the mixing energy Emix. As to components with the same structure of the system and the possibility of their pseudo-binary representation, there are two contributions to the mixing energy, which are caused by the difference in the size of the substituting structural units Eδ and the difference in the degree of ionicity of the chemical bond Eε:
Emix = Eδ + Eε = Сmnzmzxδ2 + + 1390mzmzxα(Δε)2/(2D), (kJ/mol), (1)
where: С is a constant calculated from the equation C = 20(2Δχ + 1) [18] based on the difference in electronegativity χ of Ln3+ cations and anions [19]. The value χ(SO4
4-), as recommended [20], was accepted equal to χ(O2- ) [19]; m is the number of` formula units in the pseudo-binary approximation of components. Since the anionic sublattice of the crystal structure of OOS contains Orthosilicate and Oxide anions that are not bonded to the Silicon atom [15], and the replacement limits are calculated per one mole of the replaceable ion, the OOS formulas will be presented below as a pseudo-binary compound Ln[(SiO4)0.5O0.5]; n is the coordination number of the replaceable structural unit in the pseudo-binary approximation of the structure; zm, zx is the formal charges of the replaced and general structural units in the components; δ is a dimensional parameter, which for each system is characterized by the relative difference of cube roots of unit cell volumes taken from [15, 21-22], calculated by the formula:
𝛿 = (𝑉1/3𝐿𝑛 – 𝑉1/3
𝑆𝑐)/𝑉1/3
𝑆𝑐 (2) α is the reduced Madelung constant calculated
by the Hoppe formula [23]: (α / n)2 + α; Δε is the difference in the degree of ionicity of the chemical bond in the components of the systems.
For example, using an information system for forecasting the phase steadiness of solid solutions, which based on the crystal-energy theory of isomorphic miscibility, were calculated the energies of mixing Emix and critical temperatures of disintegration Tcr of (Sc1 – xLnx)[(SiO4)0.5O0.5] solid solutions (where Ln is a REE, Ln = Tb – Lu and Y). Some initial data and calculation results are summarized in Tables 1, 2 and Fig. 1. The Table 1 shows that as the number of REE in the Terbium – Lutetium row increases, the contributions of Eδ values to the total mixing energy become smaller (from 34.5 to 10.8 kJ/mol), which is explained by smaller differences in the size of substitutable structural units – Scandium and REE.
341

Table 1 Sourced data for the calculation of mixing energies and critical temperatures of disintegration of solid solutions (Sc1 – xLnx)[(SiO4)0.5O0.5], Ln = Tb – Lu and Y
Ln V, Å3 δ* Eδ, kJ/mol χLn ε Δε Tcr, K
Tb 876.80 [21] 0.0535 34.5 1.410 0.708 0.001 2060 Dy 856.57 [15] 0.0453 24.8 1.426 0.706 0.003 1480 Ho 843.04[15] 0.0398 19.1 1.433 0.704 0.005 1150 Er 836.70[15] 0.0372 16.7 1.438 0.703 0.006 1010 Tm 828.59 [15] 0.0338 13.8 1.455 0.699 0.010 860 Yb 824.07 [15] 0.0319 12.3 1.479 0.694 0.015 810 Lu 819.31[15] 0.0299 10.8 1.431 0.705 0.004 650 Sc 749.97 [22] – – 1.415 0.709 – – Y 852.25 [21] 0.0435 22.8 1.340 0.722 0.013 1400
*Note: according to the recommendations in [17-18] and considering the dependence of the interaction parameter on the difference in volumes of the unit cells of components [29], the calculation of the dimensional parameter was carried out according to the volumes of the unit cells
Contributions due to different degrees of
ionicity of chemical bonds in the components of the Eε systems are substantially smaller (in most cases, two-three times smaller) than in Eδ, and they can be neglected in this case. This agrees with the recommendation not to consider them, provided that Δε ≤ 0.05 [16-18] (in this case, Δε ≤ 0.015). Consequently, it is accepted that Emix = Eδ.
Figure 1: The diagram of thermodynamic steadiness of solid solutions in the systems (Sc1 – xLnx)[(SiO4)0.5O0.5], where х = 0.01 (a), 0.03 (b), 0.05 (c), 0.10 (d), 0.20 (e) and 0.50 (f)
Table 2 Temperatures of disintegration of (Sc1 – xLnx)[(SiO4)0.5O0.5] solid solutions for х = 0.01, 0.03, 0.05, 0.10, and 0.20
х Tb Dy Ho Er Tm Yb Lu
0.01 880 630 490 430 370 350 280 0.03 1110 800 620 550 469 440 350 0.05 1260 910 700 620 520 490 400 0.10 1500 1080 840 730 620 590 470 0.20 1780 1280 990 870 740 700 560
In all systems, the size parameter (δ) does not
exceed 0.1 with its maximum value of 0.0535 (Table 1). This, according to [16-18], makes it possible to use the approximation of regular solutions when calculating the temperatures of disintegration of solid solutions. In this case, the curve showing the dependence of the
temperatures of disintegration on the system composition will be nearly symmetric. Therefore, to calculate Tcr, the following equation was used:
Tcr = Emix/2kN, (3) where k is Boltzmann constant, N is the
Avogadro number. In order to calculate the replacement limits for a given disintegration
342

temperature of a solid solution (Td), or the disintegration temperature for a given replacement limit [24], the Becker`s equation was used [24]:
– (1 – 2 x) / ln[x/(1 – x)] = RTd/Emix, (4) where R is universal gas constant; Emix is a
mixing energy (or interaction parameter), x is a replacement limit.
As can be seen from the Table 1 and Fig. 1 (curve f), the values of maximum temperatures of disintegration, as expected, become smaller as REE number increases. The Becker`s equation was also used to calculate the temperatures of disintegration of solid solutions for the replacement limits x = 0.01, 0.03, 0.05, 0.10, and 0.20 (Table 2), and to build their dependences (Fig. 1) on the REE number (curves a, b, c, d and e, respectively). The latter can be used to determine the replacement limit of Scandium for REE based on a given temperature or calculate the disintegration temperature based on the replacement limit. In the first case, it is necessary to draw an isotherm from a given temperature to the intersection with the vertical line for this REE. The intersection point makes it possible to estimate the range of x values within which the replacement limit lies. The replacement limit should be defined by interpolating the vertical segment between the closest to the intersection point dependencies of the replacement limit on the REE number. In the second case, based on the given composition the point is determined on the vertical line of the REE, and then the horizontal line is drawn until its intersection with the temperature axis. More precise results can be obtained if using the Becker`s equation.
It is generally known that as the temperature depression, the movability of the structural units in solid solution becomes smaller due to a decrease in the diffusion rate, while the areas of solubility become narrower [17]. This happens until the diffusion rate becomes so low that the decrease in the areas of solubility practically ceases, i.e. spontaneous quenching occurs, and solid solutions become metastable. If we assume that the hardening temperature is close to the minimum temperature at which the interaction of the components in the solid phase begins that leads to the formation of a solid solution, we can estimate the temperature of spontaneous hardening and the area of metasteadiness in the system.
It was previously established (Table 3) that the temperature during the synthesis of solid solutions of Sc2 – xErxSiO5 OOS as a part of the preparation
of multinanolayer films is in the range of 1173 – 1373 K, while the temperature during the synthesis of Gadolinium, Lutetium and Yttrium OOS using the solution combustion synthesis method is 1273 K, and the temperature during solid-phase synthesis of REE OOS of the Terbium – Lutetium row, and Yttrium, using the sol-gel method is in the range of 1173 – 1323 K. Table 3 Methods and temperatures for the synthesis of REE OOS
Method of synthesis
Composition Т, К
Calcination of multinanolayer
films [13]
Sc2 – xErxSiO5 1173 – 1373
Solution combustion
synthesis (SCS) [25]
Lu2SiO5:Ce 1273
Gd2SiO5:Ce 1273
Y2SiO5:Ce 1273
Sol-gel method followed by calcination
[26]
Y2SiO5 1323
Tb2SiO5 1323
Dy2SiO5 1323
Ho2SiO5 1273
Er2SiO5 1273
Tm2SiO5 1273
Yb2SiO5 1223
Lu2SiO5 1173
In this way, at a temperature of less than
1173 K, the diffusion rate of structural units is apparently insufficient for the synthesis of REE OOS and solid solutions based on them. Consequently, it can be assumed that the disintegration of solid solutions at temperatures below ~1173 K is unlikely to occur, hence, the solid solution will be metastable.
The diagram also makes it possible to evaluate the areas of thermodynamic steadiness of solid solutions of Scandium OOS and REEs of the Terbium – Lutetium series. In the (Sc1 – xLnx)[(SiO4)0.5O0.5] systems with Ln = Tb, Dy, and Y, unlimited solid solutions are thermodynamically stable in the entire range of concentrations 0 <x <1 at temperatures above the critical one (2060 – 1400 K; Table 1, Fig. 1); when the temperature depression to the range between Tcr and ~1173 K, they become thermodynamically unstable and can decay. At T < 1173 K, solid solutions will not decay, i.e.
343

spontaneous hardening will occur, and they will become metastable.
In the systems containing REE from Erbium to Lutetium, the maximum temperatures of disintegration (1010 – 650 K) are lower than the spontaneous quenching temperature (~1173 K), unlimited solid solutions do not decay upon cooling, and remain stable at temperatures higher than critical one and metastable at temperatures lower than critical one.
The difference between the critical temperature for a system containing Holmium (1150 K) and the temperature of spontaneous quenching (~1173 K) is less than the calculation error (± 100 K [17]); therefore, it is difficult to forecast disintegration of an unlimited solid solution in this system.
Likewise, limited solid solutions with x = 0.01, 0.03, 0.05, 0.10, and 0.20 in the areas above the curves a, b, c, d, and e, respectively, are thermodynamically stable (Fig. 1), in the areas below the curves they are unstable and can decay, while at T < 1173 K they are metastable.
Notwithstanding there are numerous publications, which study the laser properties of Scandium OOS, doped with, for example, 0.5 at% of Holmium [3], 1 at% of Neodymium [9, 27], 4 at% of Thulium [7], 5 at% of Ytterbium [28] and others, and some papers on the properties of “hybrid” OOS Y(Lu,Sc)2SiO5 [2], (Sc0.5Y0.5)2SiO5 [8, 10], (Sc0.2Y0.8)2SiO5 [11], there is practically no data on the limits of isomorphic replacements in the corresponding systems. This, of course, makes it difficult to assess the reliability of our calculations. But, they do not contradict the experimental data obtained previously for Lu2 – xScxSiO5 and ErxSc2 – xSiO5 solid solutions. For example, in the Lu2 – xScxSiO5 system, a mixture of Lu2O3, Sc2O3 and SiO2 was calcined to synthesize solid solutions for compositions with x = 0.5, 0.8, 1.0 at a temperature of 1670 K [12], i.e. in the area of continuous series of solid solutions, which are thermodynamically stable according to the results of our calculation (Fig. 2).
In [13], the ErxSc2 – xSiO5 solid solutions were received by calcination of atomized multinanolayer films in the temperature range 1173 – 1373 K; i.e. also in the area of continuous series of solid solutions above the disintegration curve calculated by us (Fig. 3).
Figure 2: Dependence of the calculated temperatures of disintegration of solid solutions for the system (Sc1 – xLux)[(SiO4)0.5O0.5] (■) on the molar fraction of Lutetium, and experimental data on the synthesis temperatures (●) for the compositions with x = 0.25, 0.4, and 0.50 [12]
Figure 3: Dependence of the calculated temperatures of disintegration of solid solutions for the system (Sc1 – xLux)[(SiO4)0.5O0.5] (■) on the molar fraction of Lutetium, and experimental data on the synthesis temperatures (●) for the compositions with x = 0.25, 0.4, and 0.50 [12]
3. Conclusions
The crystal-chemical approach in the approximation of regular solutions was used to calculate the interaction parameters Emix of solid solutions based on Scandium OOS (Sc1 – xLnx)[(SiO4)0.5O0.5], modified with REEs with x = 0.01, 0.03, 0.05, 0.10, 0.20, and 0.5. With an increase in the number of the rare earth element, the calculated mixing energies and critical temperatures of disintegration of solid solutions become smaller, which is due by the decrease in the ionic radii of REE in the series from Lanthanum to Ytterbium.
344

The diagram of thermodynamic steadiness makes it possible to evaluate not only the steadiness of (Sc1 – xLnx)[(SiO4)0.5O0.5] solid solutions in a wide range of compositions and temperatures, but also to forecast for some solid solutions the replacement limits at a given disintegration temperature, or the disintegration temperature at a given replacement limit.
In the systems (Sc1 – xLnx)[(SiO4)0.5O0.5] with Ln = Tb, Dy, and Y, unlimited solid solutions are thermodynamically stable at temperatures above critical one (2060 – 1400 K), and if the temperature depression to the range between critical temperature and ~1173 K, the solutions become thermodynamically unstable and can decay. At a temperature of T < 1173 K, solid solutions will not decay, since they become metastable. In the systems containing REE from Erbium to Lutetium, where the critical temperatures of disintegration are vastly lower (1010 – 650 K) than the temperature of spontaneous quenching (~1173 K), unlimited solid solutions do not decay upon cooling, and they remain stable at temperatures higher than critical one and metastable at temperatures lower than Tcr.
The calculation results obtained do not contradict the experimental data obtained previously for (Sc1 – xLux)[(SiO4)0.5O0.5] and (Sc1 – xErx)[(SiO4)0.5O0.5 ] solid solutions, since the temperatures of their synthesis are in the limits attributed by us to thermodynamically stable ones.
Materials based on such solid solutions have budding prospects in optical remote environmental sensing, differential absorption light detection.
4. Acknowledgements
The authors note that the research results presented in the article were obtained while working on the research topic “Prediction of phase stability and isomorphic substitutions in solid solutions of different structural types” of the Department of Inorganic, Organic and Analytical Chemistry, Vasyl’ Stus Donetsk National University (Ukraine, Vinnytsia). The authors are grateful to the staff of this department and personally to the lecturer of the Department of Inorganic, Organic and Analytical Chemistry PhD, Associate Professor, Serhii V. Radio for facilitating the research.
The authors also note that the research results presented in the article were obtained while
working on the research topics “Identification of hidden dependencies in online social networks based on methods of fuzzy logic and computational linguistics” and “Information and communication technologies for solving semantic-dependent problems” of the Department of Automation and Intelligent Information Technologies of Vinnytsia National Technical University (Ukraine, Vinnytsia).
The authors are especially appreciative to the staff of the Department of Automation and Intelligent Information Technologies, personally to the head of the Department, Doctor of Technical Sciences, prof. Roman N. Kvyetnyy also personally to the professor of the Department of Computer Science and Information Technology, Vasyl’ Stus Donetsk National University, Doctor of Technical Sciences, prof. Sergiy D. Shtovba for consultations on theoretical and applied aspects of the research.
5. References
[1] Yu.D. Zavartsev, A.I. Zagumennyi , Yu.L. Kalachev, S.A. Kutovoi, V.A. Mikhailov, I.A. Shcherbakov, Study of Tm:Sc2SiO5 laser pumped into the 3H6 – 3F4 transition of Tm3+ ions. Quantum Electron, 2013, volume 43(11), pp. 989 – 993.
[2] A. Denoyer, Études optiques de nouveaux matériaux laser: des orthosilicates dopes à l’ytterbium Yb:Y(Lu,Sc)2SiO5. Thesis, Université de Sherbrooke, Sherbrooke, Québec, 2007.
[3] X. Yang, W. Xie , L. Liu , L. Li, Compact intra-cavity pumped low-threshold passively Q-switched Ho:Sc2SiO5 laser by a LD-pumped Tm:YAP laser at room temperature. Laser Phys. Lett., 2017, volume 14(8).
[4] X. Yang , L. Liu , P. Zhang , W. Xie, A Resonantly Pumped Single-Longitudinal Mode Ho:Sc2SiO5 Laser with Two Fabry – Perot Etalons. Appl. Sci., 2017, volume 7(5), p. 434.
[5] X. Yang , B. Yao , Y. Ding , X. Li , G. Aka , L. Zheng , J. Xu, Spectral properties and laser performance of Ho:Sc2SiO5 crystal at room temperature. Opt. Express, 2013, volume 21(26), pp. 32566 – 32571.
[6] L. Zheng, L. Su , J. Xu, Growth and Characterization of Ytterbium Doped Silicate Crystals for Ultra-Fast Laser Applications. In book: Modern Aspects of
345

Bulk Crystal and Thin Film Preparation. IntechOpen, 2012.
[7] L. Zheng, J. Xu, L. Su, H. Li, W. Ryba-Romanowski, R. Lisiecki, P. Solarz, Crystal structure and optical study of Tm:Sc2SiO5 single crystal. Appl. Phys. Lett., 2010, volume 96(12), p. 121908.
[8] J. Shi, B. Liu, L. Zheng , Q. Wang, H. Tang, J. Liu, L. Su, F. Wu, H. Zhao, N. He, N. Li, Q. Li, C. Guo, J. Xu, K. Yang, X. Xu, W. Ryba-Romanowski, R. Lisiecki, P. Solarz, Optical study of Tm-doped solid solution (Sc0.5Y0.5)2SiO5 crystal. J. Cryst. Growth, 2018, volume 487, pp. 83 – 86.
[9] L. Li, M. Cao , S. Liu , Y. Peng , L. Zheng, J. Xu, High-peak-power Nd:ScYSiO5 laser at 1355 nm pumped by a pulsed laser diode. Optik, 2017, volume 140, pp. 248 – 252.
[10] V. Aleksandrov, H. Iliev, L. Zheng, L. Su, J. Xu, G. Aka, I. Buchvarov, Passive Mode-locking of a Diode Pumped Nd:ScYSiO5 Laser. Proc. Conference on Lasers and Electro-Optics – International Quantum Electronics Conference, CA_P_11, 2013.
[11] V. Aleksandrov, H. Iliev, A. Trifonov, L. Zheng , J. Xu , L. Su , I. Buchvarov, Passive Mode Locking of a Diode Pumped Nd:Sc0.2Y0.8SiO5 Laser. Proc. CLEO: 2014 OSA Technical Digest (online), JTu4A.127, 2014.
[12] H. Ben Yahia, U.C. Rodewald, B. Heying , S. Balamurugan, R. Pottgen, The Solid Solution Lu2 – xScxSiO5. Naturforsch B, 2011, volune 66(11), pp. 1183 – 1187.
[13] A. Najar, H. Omi , T. Tawara, Effect of structure and composition on optical properties of Er-Sc silicates prepared from multi-nanolayer films. Opt. Express, 2015, volume 23(6), pp. 7021 – 7030.
[14] R.D. Shannon, Revised effective ionic radii and systematic studies of interatomic distances in halides and chalcogenides. Acta Cryst., 1976, volume 32, pp. 751 – 767.
[15] J. Felsche, The crystal chemistry of the rare-earth silicates. In: Rare Earths. Structure and Bonding, Springer, 1973, volume 13, pp, 99 – 197.
[16] V.S. Urusov, Energetic theory of miscibility gaps in mineral solid solutions. Fortschr Mineral, 1975, volume 52, pp, 141 – 150.
[17] V.S. Urusov, Teoriia izomorfnoi smesimosti (Theory of isomorphic miscibility). Nauka, Мoscow (in Russian), 1977.
[18] V.S. Urusov, V.L. Tauson , V.V. Akimov, Geokhimiya tverdogo tela [Geochemistry of
solid state]. GEOS, Moscow (in Russian), 1997.
[19] K. Li, D. Xue, Estimation of Electronegativity Values of Elements in Different Valence States. J. Phys.Chem. A, 2006, volume 110(39), pp. 11332 – 11337.
[20] S.S. Batsanov, The Concept of Electronegativity. Conclusions and Prospects. Russ. Chem. Rev., 1968, volume 37(5), pp. 332 – 351.
[21] Y. Liu, C.N. Xu, K. Nonaka, H. Tateyama, Strong blue, green and red light emission at elevated temperatures from Y2SiO5 doped by the rare-earth ions. J. Mater. Sci., 2001, volume 36(18), pp. 4361 – 4364.
[22] M.D. Alba, P. Chain , T. González-Carrascosa, Synthesis, Rietveld Analysis, and Solid State Nuclear Magnetic Resonance of X2-Sc2SiO5. J. Am. Ceram. Soc., 2009, volume 92(2), pp. 487 – 490.
[23] R. Hoppe, Madelung Constants as a new Guide to the Structural Chemistry of Solids. Adv. Fluor. Chem., 1970, volume 6, pp. 387 – 438.
[24] R. Becker, Über den Aufbau binarer Legierungen. Z Metallkunde, 1937, volume 29, pp. 245 – 249.
[25] E.G. Yukihara, L.G. Jacobsohn, M.W. Blair, B.L. Bennett, S.C. Tornga, R.E. Muenchausen, Luminescence properties of Ce-doped OOS nanophosphors and single crystals. J. Lumin., 2010, volume 130(12), pp. 2309 – 2316.
[26] J. Wang, S. Tian, G. Li, F. Liao, X. Jing, Preparation and X-ray characterization of low-temperature phases of R2SiO5 (R = rare earth elements). Mater. Res. Bull., 2001, volume 36(10), pp. 1855 – 1861.
[27] L. Zheng, J. Xu , L. Su , H. Li, Q. Wang, W. Ryba-Romanowski, R. Lisiecki, F. Wu, Estimation of low-temperature spectra behavior in Nd-doped Sc2SiO5 single crystal. Opt. Lett., 2009, volume 34(22), pp. 3481 – 3483.
[28] Tan W. De, D. Tang, X. Xu, J. Zhang, C. Xu, F. Xu, L. Zheng, L. Su, J. Xu, Passive femtosecond mode-locking and cw laser performance of Yb3+:Sc2SiO5. Opt. Express, 2010, volume 18(16), pp. 16739 – 16744.
[29] Y. Li, P.M. Kowalski, A. Blanca-Romero, V. Vinograd, D. Bosbach, Ab initio calculation of excess properties of La1 – x(Ln, An)xPO4 solid solutions. J. Solid State Chem., 2014, volume 220, pp. 137 – 141.
346

Validation Of Data Obtained After Field Sensing Using UAV For Management Of Future Crops Natalia Pasichnyk1, Dmytro Komarchuk2, Oleksiy Opryshko3, Yurii Gunchenko4, Sergey Shvorov5, Oksana Zui6
1,2,3,5 National University of Life and Environmental Sciences of Ukraine, Heroyiv Oborony st., 15, Kyiv, 03041, Ukraine 4,6 Odessa I.I.Mechnikov National University, Dvoryanskaya str., 2, Odessa, 65082, Ukraine
Abstract UAVs are innovative equipment for monitoring fields that are free from a lot of the disadvantages of satellites such as availability, low cost, and high image resolution. However, the issues of quality, reproducibility, and suitability for crop management processes remain relevant. Now, the issue of assessing the suitability of the results of spectral monitoring of plantations in relation to the condition of plants has not been resolved. Since spectral monitoring is a necessary component in the concept of crop management, the development of a methodology for assessing the suitability of remote monitoring spectral data for the calculation of agrochemical practices was the purpose of the work. According to the publications, the dependence of the number of pixels on the values of the intensity of color components for plants and soil is described by the Gaussian distribution. Deviation from such distribution is caused by the imposing of distributions from various objects fixed on a photo. The experimental test was carried out on the basis of wheat, using the results obtained during 2017-2020 when considering the stresses of nutrient deficiency and technological nature. The investigation found experimental evidence that the pixel distribution of plantations on the example of the wheat crop is described by the Gaussian distribution. It was found that the analysis of the correspondence of the nature of the distribution on the spectral channels, namely the presence of several max peaks that affects the value of the distribution maximum may indicate the presence of foreign inclusions or a transitional stage of vegetation. The suitability of the data can be assessed on the basis of the reference values of the width of the distribution on the spectral channels. Vegetation indices GNDVI and RNDVI were unsuitable for assessing the suitability of the data based on the parameters of the pixel distribution of the image in the experimental plots. This determines the feasibility of introducing in the sets of regular vegetation indices of geographic information systems additional packages that reflect the spectral channels. Keywords 1 UAV, spectral monitoring, crop management, data validation
1. Introduction
UAVs are innovative equipment for monitoring fields, which are deprived of a number of fundamental shortcomings of satellites in terms of availability, cost, image resolution. However, the issues of quality, reproducibility, and
EMAIL: [email protected] (A. 1); [email protected] (A. 2); [email protected] (A. 3); [email protected] (A. 4); [email protected] (A. 5); [email protected](A. 6) ORCID: 0000-0002-2120-1552 (A. 1); 0000-0003-3811-6183 (A. 2); 0000-0003-3358-1297 (A. 3); 0000-0003-4423-8267 (A. 4); 0000-0001-6433-3566 (A. 5); 0000-0001-9520-4441 (A. 6)
suitability for crop management processes remain relevant. More often, designers focus on the improvement of spectral equipment, but there are also methodological problems in the perception and interpretation of information from devices of technical vision. Thus, most of the vegetation indices currently used to interpret UAV data, such as NDVI, were developed for satellite platforms
347

with their inherent low image resolution when each pixel had a group of plants. The indices developed on the basis of the soil line concept were primarily intended to assess the availability of biomass, and crop management issues require other methodological approaches to crop monitoring. It should be borne in mind that the implementation of agrochemical measures, in particular fertilization should be carried out only at certain stages of the growing season. However, the state of plant development is determined by many factors, including the state of mineral nutrition, water supply, etc., so within one field there may be a situation when the plants are at different stages of the growing season. Accordingly, in such situations, the calculation of the mean value over the site, which is inherent in satellite solutions, is erroneous. At present, the issue of assessing the suitability of the results of spectral monitoring of plantations in relation to the condition of plants has not been resolved. Since spectral monitoring is a necessary component in the concept of crop management, the development of a methodology for assessing the suitability of remote monitoring spectral data for the calculation of agrochemical practices was the purpose of our work.
2. The state of the issue
The spectral performance of objects critically depends on the state of illumination, and the reproducibility of data is tried to ensure by a combination of technical and organizational measures. The work of Helge Aasen and others (2015) in [1] considered the construction of 3D models of plants, where to ensure accuracy, they proposed a method of combining data from several flights. Despite the interesting and encouraging results, such a technique will require several flights in a row from different directions, which is unsuitable for industrial-scale in conditions of time shortages. An approach to determine the features of the dome of plants in the mass phenotyping of plants using UAVs based on a comparison of the obtained portraits with reference templates is shown in Fusang Liu and others (2021) in [2]. Information on plant dimensions is useful for determining stress conditions, but in the early stages of the growing season, accurate image resolution is required for accurate identification, which can only be obtained from low altitudes, which will not contribute to the scalability of technology on an
industrial scale. An alternative technical means for estimating plant dimensions are LiDARs described in the review article by Yue Pan and others (2019) in [3]. However, such innovative equipment for small plants, with a leaf width of several millimeters, according to Tai Guoa and others (2019) in [4].
Another approach is based on the use of reference values of plant spectral indicators to identify the spread of forest pests described in Per-Ola Olsson and others (2016) in [5]. The estimate is based on recording the deviation from the seasonal changes of the NDVI index is designed for different stages of the growing season because satellite imagery is carried out at high intervals and you can select data for uniquely the same stage of the growing season. A similar approach to the selection of spectral data from an existing array of rapidly changing data is shown in the work of Ameer Shakayb Arsalaan and others (2016) in [6] on the example of forest fires. However, under normal conditions, farms in crop management should be able to decide on the basis of a single departure on the need for additional flights that require free equipment.
An original approach to the identification of plants in terms of changes in their dimensions on the example of sugar beet is shown in the work of Yang Cao Liu and others (2020) in [7]. Researchers have proposed a new wide-dynamic-range vegetation index (WDRVI) where an additional coefficient is introduced for the infrared channel. However, in production, the achieved accuracy increase of up to 5% should still recoup the cost of determining the dynamically changing coefficients for the infrared channel. That is, the most promising approach is based on the comparison of spectral indices with certain reference samples.
Spectral indicators of plants, even those that are in the same stage of the growing season have some differences. To obtain the average value for plants when fixing the soil in a photograph, Yaokai Liu et al. (2012) in [8] proposed the use of Gaussian distribution combinations where the ranges belonging separately to plants and soil were recorded. Positive results were obtained, but the resolution of images from a height of 3 m was very high, which is difficult to implement on an industrial scale. According to the data presented in the work of Guangjian Yan and others (2019) in [9], when the resolution of the images is reduced, the ability to select individual ranges corresponding to the soil and plants is lost. Improving identification by estimating the
348

intensity distribution of color components is shown in André Coy et al. (2016) in [10] where the CIE L * a * b * space model was used instead of the RGB color model. The authors have proposed threshold values to determine the area of the dome, but this approach will be effective only in the initial stages of the growing season when in particular the shade on the lower tiers of plant leaves can be neglected. The method was improved in the work of Linyuan Li et al. (2018) in [11], when the identification of soil and plants was attempted on the basis of the Gaussian half-distribution. This approach allows you to identify 2 components, but in the case of 3 components, its efficiency is questionable.
Thus, based on the analysis of the literature, we can conclude that the dependence of the number of pixels on the values of the intensity of the color components for plants and soil is described by the Gaussian distribution. Deviation from such distribution is caused by the imposing of distributions from various objects fixed on a
photo. However, experiments were performed in hospitals where the plants were in one phase of the growing season in the air-dry state of the soil, respectively, it is advisable to check the suitability of the method and in moist soil.
3. Materials and research software and hardware
The research was carried out on the basis of wheat, using the results obtained during 2017-2020. Stresses due to lack of nutrients were studied in the fields of the long-term stationary experiment of the Department of Agrochemistry and Plant Quality of NULES of Ukraine, where fertilizer application systems are studied. Technological stresses were studied on and in the production fields of farms in the Kyiv region. In fig. Green Chlorophyll index distribution maps are presented (Fig. 1).
Figure 1: Green Chlorophyll index distribution maps on the research hospital on the left and production fields (on the right) are created by Slantrange software. Blue intersections highlight checkpoints for accurate positioning of pixels of different spectral channels and index distribution maps
The experiments were performed in the optical range using a standard UAV camera DJI Phantom 3+. A description of the methodology of experimental research was covered in the work of V. Lysenko and others (2017) in [12] and M. Dolia and others (2019) in [13] (2019). Multispectral studies using the infrared range were performed using the Slantrange 3p system
and Slantview software (version 2.13.1.2304) designed specifically for this sensor equipment. A feature of Slantview software is the ability to quickly and autonomously create vegetation distribution maps directly in the field. Slantview software compiles a general orthophoto from images, corrects for lighting, and provides the user with ready-made maps of the distribution of
349

vegetation indices such as various NDVI variants. Slantview software can export data to geotiff format. Areas of rapeseed with and without signs of technological stress were considered for research. Data on individual spectral channels and vegetation indices calculated by the Slantview program were considered. The research methodology is described in the work of S. Shvorov and others (2020) in [14]. Maximum detail (GSD 0.04 m / pixel) was obtained from the Slantview software image window (available NDVI index variants - Green, Red, and RedEdge). Monochrome images were used to study the results on separate spectral channels (image window), which were stored in BMP format to ensure the completeness of the information. To do this, a copy of the screen was saved in Paint (Microsoft Windows 7.0 Sp.1).
4. The results and discussions were obtained
In fig. 2 shows the results of calculations for the red component for experimental data obtained on 2017.05.05 in studies of the impact on the spectral indicators of the state of mineral nutrition using a universal camera FC200 (a standard tool for UAV DJI Phantom 3).
0 20 40 60 80 100 120 140 160 180 200
0
200
400
600
800
1000 Wheat
All xc=116, w=25;
Max1 xc=118, w=22;
Max2 xc=64, w=23.
Nu
mb
er
of p
oin
ts
Red color intensity
Figure 2: The results of the approximation of the dependence of the number of pixels on the intensity of the red component of color (05.05.2017)
As can be seen from the above data when using the proposed method, it was found that the value of the maximum distribution shifted by 2 units, while reducing the width w by 3 units. The presence of the Max2 distribution can be
explained both by the presence of shadow on the lower and upper leaves and by the fixation of the soil.
The proposed approach to the processing of experimental results will be effective if the condition Max1≫ Max2 is satisfied. In practice, a situation is possible when plants of the same crop are in the field at the same time, but at different stages of the growing season or in a fundamentally different physiological state, such as the appearance of a flag leaf, which was recorded on 06.08.2018. According to the presented in fig. 3 data Max1≅Max2, so the approach was used when at the first stage separately determined separately 2 Gaussian distributions, after which the calculations were carried out according to the method proposed in section 3.
20 40 60 80 100 120 140 160 180 200 220 240 260
0
100
200
300
400
500
600
Wheat
All xc=170, w=28;
Max1 xc=156, w=16;
Max2 xc=193, w=12;
Max3 xc=118, w=17;
Max1+Max2+Max3
Nu
mb
er
of p
oin
ts
Red color intensity
Figure 3: The results of approximation of the dependence of the number of pixels on the intensity of the red component of the color for winter wheat (2018.06.08 - there is a flag sheet)
Detection of the presence of several individual maxima can be done based on the magnitude of the distribution when using to approximate the experimental data. For the presented data, the value was 28 while in the remaining sections was 18… 23.
Based on the obtained results, the results obtained by approximating all the data by a single Gaussian dependence (All) are incorrect because they do not correspond to any of the distribution maxima. That is, monitoring was performed when the plants were in a transitional state and monitoring should be repeated after a few days when the vast majority of plants in the field are in a single stage of vegetation. For automatic processing of monitoring results, reference values
350

for distribution parameters can be obtained in stationary experiments, etc.
For universal digital cameras in the optical range, such as FC200, strict compliance with the selectivity of light filters is not required, so to verify the results, a study was conducted using a specialized spectral complex Slantrange 3. The results of mineral nutrition studies are presented in Fig. 4.
20 40 60 80 100
0
500
1000
1500
2000
2500
3000 G Fertilizers MIN w=7.1, R2=0,98;
G Fertilizers MAX w=3.6, R2=1;
R Fertilizers MIN w=18, R2=0.84;
R Fertilizers MAX w=9.8, R2=0.98;
Nu
mb
er
of p
ixe
ls
Spectral channel
Figure 4: Dependence of the number of pixels on the value of the intensity of the green (G) and red (R) components of the color and the wall of mineral nutrition at a dose of mineral fertilizers (Fertilizers MAX) and without fertilizers (Fertilizers MAX). Date of research 2020.04.27
When approximating the experimental data by the GaussAmp dependence, the distribution width for the green channel was 7.1 for plants under stress and 3.6 for healthy plants, respectively, at 0,98≤R2. For the red component, regardless of the state of mineral nutrition, the imposition of 2 maxima will be recorded, which were more pronounced in the absence of nutrients. Similarly to the green channel, the calculated distribution width in healthy plants was approximately twice less than in stress plants 9, 8 and 18, respectively. The coefficient of determination at 1.5 doses of mineral fertilizers was 0.98 and for affected plants 0.84.
The results of research on the technological stress caused by the action and aftereffect of herbicides from the predecessor culture were carried out in production fields near the village of Gvardiyske with the coordinates of lat. 50,0347 long. 30,0286 is presented in fig. 5.
According to the results obtained under stress conditions, the width of distribution on both the
green and red channels is 1.5≤ times greater than in healthy plants. On the red channel, regardless of the presence of technological stresses, 2 pronounced maxima of distribution were not observed, in contrast to the results in Figs. 4, regardless of the channel, the coefficient of determination is 0.98≤R2. According to the authors, the difference in plant development is explained by the difference in climatic factors due to the location of the plots, so the production field is protected by dense forest strips in contrast to the used area of the experimental hospital.
50 100
0
20
40
60
80
100
120
140
160
180
200
220
240
260 G Teh.str. +, w=8.4;
G w=5.5;
R Teh.str. +, w=9;
R w=5,6.
Nu
mb
er
of p
ixe
ls
Spectral channel
Figure 5: Dependence of the number of pixels on the intensity of the green (G) and red (R) components of color and the presence of technological stresses (The.str). Date of research 2020.04.27
5. Wheat (distribution maps of vegetation indices)
Since the experimental plots with different fertilizer contents of the stationary experiment have a relatively small width of 5 meters for remote sensing using a UAV, the results obtained from the Slantview software map window were used for the research. The obtained results are shown in Fig. 6 for stresses caused by the state of mineral nutrition and technological stresses, respectively.
Based on the data obtained for the distribution of the NDVI index, there is a difference in the distribution of spectral channels. Thus, the width of the distribution regardless of the nature of stress in stress plants was similar or even smaller than in healthy plants. The coefficient of determination
351

was 0.85-0.95, it was much lower than in the green and red spectral channels.
0,64 0,66 0,68 0,70 0,72 0,74 0,76 0,78 0,80 0,82 0,84 0,86
0
100
200
300
400
500
600
700
800 GNDVI Fertilizers MIN, w=0,005;
GNDVI Fertilizers MAX, w=0,010;
RNDVI Fertilizers MIN, w=0,01;
RNDVI Fertilizers MAX, w=0,01.
Nu
mb
er
of p
ixe
ls
Vegetation indexes (NDVI)
0,65 0,70 0,75 0,80 0,85 0,90
0
10
20
30
40
50
60
70
80 RNDVI RNDVI Teh.stress +
GNDVI GNDVI Teh.stress +
Nu
mb
er
of p
ixe
ls
Vegetation indexes (NDVI) Figure 6: Dependence of the number of pixels on the value of the variant of the vegetation index GrennNDVI (GNDVI) and RedNDVI (RNDVI) at stresses caused by lack of mineral nutrition (upper) and technological nature (lower)
6. Conclusions
The study found experimental evidence that the pixel distribution of plantations on the example of wheat crops is described by the Gaussian distribution.
Analysis of the conformity of the nature of the distribution along the spectral channels, namely the presence of several maxima that affect the value of the maximum distribution may indicate the presence of foreign inclusions or a transitional stage of vegetation.
Data suitability can be assessed on the basis of spectral channel width reference values.
Vegetation indices GNDVI and RNDVI were unsuitable for assessing the suitability of data based on the parameters of the pixel distribution of the image in the experimental plots. This determines the feasibility of introducing in the
sets of regular vegetation indices of geographic information systems additional packages that reflect the spectral channels.
7. References
[1] Helge Aasen, Andreas Burkart, Andreas Bolten and Georg Bareth 2015 Generating 3D hyperspectral information with lightweight UAV snapshot cameras for vegetation monitoring From camera calibration to quality assurance (ISPRS Journal of Photogrammetry and Remote Sensing Vol.108) рр. 245–259 https://doi.org/10.1016/j.isprsjprs.2015.08.002
[2] Fusang Liu, Pengcheng Hu, Bangyou Zheng, Tao Duan, Binglin Zhu and Yan Guo 2021 A field-based high-throughput method for acquiring canopy architecture using unmanned aerial vehicle images Agricultural and Forest Meteorology vol.296, 108231 https://doi.org/10.1016/j.agrformet.2020.108231
[3] Yue Pan, Yu Han, Lin Wang, Jian Chen, Hao Meng, Guangqi Wang, Zichao Zhang and Shubo Wang 2019 Reconstruction of Ground Crops Based on Airborne LiDAR Technology IFAC-PapersOnLine vol.52 (24) pp.35–40 https://doi.org/10.1016/j.ifacol.2019.12.376
[4] Tai Guoa, Yuan Fanga, Tao Chenga, Yongchao Tiana, Yan Zhua, Qi Chenb, Xiaolei Qiua and Xia Yaoa 2019 Detection of wheat height using optimized multi-scan mode of LiDAR during the entire growth stages Computers and Electronics in Agriculture vol. 165, 104959 https://doi.org/10.1016/j.compag.2019.104959
[5] Per-Ola Olsson, Johan Lindström and Lars Eklundh 2016 Near real-time monitoring of insect induced defoliation in subalpine birch forests with MODIS derived NDVI Remote Sensing of Environment vol.181 рр. 42–53 https://doi.org/10.1016/j.rse.2016.03.040
[6] Ameer Shakayb Arsalaan, Hung Nguyen, Andrew Coyle and Mahrukh Fida 2021 Quality of information with minimum requirements for emergency communications Ad Hoc Networks vol.111 https://doi.org/10.1016/j.adhoc.2020.102331
[7] Yang Cao, Guo Long Li, Yuan Kai Luo, Qi Pan, and Shao Ying Zhang 2020 Monitoring
352

of sugar beet growth indicators using wide-dynamic-range vegetation index (WDRVI) derived from UAV multispectral images Computers and Electronics in Agriculture vol.171, 105331 https://doi.org/10.1016/j.compag.2020.105331
[8] Yaokai Liu, Xihan Mu, Haoxing Wang and Guangjian Yan 2012 A novel method for extracting green fractional vegetation cover fromdigital images Journal of Vegetation Science vol. 23 рр. 406–418 https://doi.org/10.1111/j.1654-1103.2011.01373.x
[9] Guangjian Yan, Linyuan Li, André Coy, Xihan Mu, Shengbo Chen, Donghui Xie, Wuming Zhang, Qingfeng Shen and Hongmin Zhou 2019 Improving the estimation of fractional vegetation cover from UAV RGB imagery by colour unmixing ISPRS Journal of Photogrammetry and Remote Sensing vol.158 рр. 23–34 https://doi.org/10.1016/j.isprsjprs.2019.09.017
[10] André Coy, Dale Rankine, Michael Taylor, David C. Nielsen and Jane Cohen 2016 Increasing the Accuracy and Automation of Fractional Vegetation Cover Estimation from Digital Photographs Remote Sensing vol.8, 474 https://doi.org/10.3390/rs8070474
[11] Linyuan Li, Xihan Mu, Craig Macfarlane, Wanjuan Song, Jun Chen, Kai Yan and Guangjian Yan 2018 A half-Gaussian fitting method for estimating fractional vegetation cover of corn crops using unmanned aerial vehicle images Agricultural and Forest Meteorology vol. 262 рр. 379-390 https://doi.org/10.1016/j.agrformet.2018.07.028
[12] V.Lysenko, D.Komarchuk, O. Opryshko, N.Pasichnyk, N.Zaets 2017 Determination of the not uniformity of illumination in process monitoring of wheat crops by UAVs 2017 4th International Scientific-Practical Conference Problems of Infocommunications Science and Technology, PIC S and T 2017 Proceedings рр. 265-267 https://doi.org/10.1109/INFOCOMMST.2017.8246394
[13] M.Dolia, V.Lysenko, N.Pasichnyk, O.Opryshko, D.Komarchuk, V.Miroshnyk, T.Lendiel and A.Martsyfei 2019 Information
Technology for Remote Evaluation of after Effects of Residues of Herbicides on Winter Crop Rape 2019 3rd International Conference on Advanced Information and Communications Technologies, AICT 2019 Proceedings рр. 469–473, https://doi.org/10.1109/AIACT.2019.8847850
[14] S.Shvorov, V.Lysenko, N.Pasichnyk, Y.Rosamakha, А.Rudenskyi, V.Lukin and A.Martsyfei 2020 The method of determining the amount of yield based on the results of remote sensing obtained using UAV on the example of wheat 2020 IEEE 15th International Conference on Advanced Trends in Radioelectronics, Telecommunications and Computer Engineering (TCSET) рр. 245–248 http://dx.doi.org/10.1109/PICST47496.2019.9061238
353
Adequacy Verification Of The Of The Simulation Reference Model Of The Decision-Making Process In The Tower Controller Workplace Liudmyla Dzhuma1, Oleh Dmitriiev2, Oleksii Lavrynenko3 and Mykhailo Soroka4
1,2,4 Flight Academy of the National Aviation University, Dobrovolskogo str., 1, Kropyvnytskyi, 25005, Ukraine 3 KYIVCENTAERO Regional Branch of UkSATSE, Airport, Boryspil, Kyiv region, 08307, Ukraine
Abstract The article examines the verification of the adequacy and verification of the simulation reference model of the decision-making process at the air traffic controller of an airport traffic control tower (Tower controller) workplace when servicing arriving aircraft. The model is obtained on the basis of the previously proposed method for forming a trainee reference model an intelligent training system using the AnyDynamics software package (Rand Model Designer). Keywords 1 Intelligent, training, system, statistics, analysis, verification
1. Introduction
Almost all spheres of human activity are in one way or another connected with information technologies, and the level of their development often determines the success of the tasks that must be solved. One of these tasks is to realize the possibility of self-training for air traffic controllers.
At the Department of Information Technology of the Flight Academy of the National Aviation University (Ukraine), research is being carried out to improve the aircraft management quality of operators of the navigation service systems and traffic control, and the work [1] presents method with the same name, which is reflected in the intelligent training system "ATC of Tower" being developed.
The specification of this system provides the following:
1. The ability to work in the modes of demonstration, training, control, in which it is assumed, respectively: • demonstration of the stages of the decision-making process when issuing permits for take-off and landing;
EMAIL: [email protected] (A. 1); [email protected] (A. 2); [email protected] (A. 3); [email protected] (A. 4) ORCID: 0000-0002-7043-3544 (A. 1); 0000-0003-1079-9744 (A. 2); 0000-0001-8783-3731 (A. 3); 0000-0003-1894-4002 (A. 4)
• display of special prompts that help the student in making the necessary decisions; • dialogue between a student and a system that provides an opportunity to introduce independently made decisions; • assessment of the student’s actions, from the point of view of quantitative and qualitative parameters of the solution formed by it.
2. Presence of the monitor of meteorological data, changing during the operation of the system, as much as possible similar to the weather display of aerodrome metrological automated system – AMAS Avia-1. 3. Availability of the aerodrome model, which reproduces the movement of aircraft along the aerodrome movement area. The system is based on a trainee (subject of
training) reference model, which in the process of functioning of the intelligent training system closely interacts with the trainee current model. As a result of their interaction, the operator's activity errors of the trainee are determined and his errors model is formed. This makes it possible to implement a mode of automatic objective control of a trainee in terms of quantitative and qualitative assessment of his qualification level
354

and to provide him with an individual learning trajectory.
To develop a reference model, a method is proposed that includes the following stages:
• Stage I – data collection and knowledge extraction; • Stage II – analysis and structuring of the revealed data and knowledge; • Stage III – identification of regularities and formalization of the components of the reference model; • Stage IV – checking the adequacy of the reference model. This method, in the process of researching the
subject area in the first three stages, makes it possible to obtain the following components, which are described in the works [2-4], for the formation of a reference model:
• an extended list of technological operations, the correctness of which is described by qualitative and quantitative parameters; • the procedure for performing technological operations depending on the situation, namely air and ground picture (situation), aircraft performance characteristics, weather conditions, etc., with graphic visualization of the decision-making process by the air traffic controller; • an information flows circulation model, developed on the basis of an analysis of the air traffic controller of the airport traffic control tower (henceforth Tower controller) workplace, for which regularities in the circulation of information have been identified; • reference values of the time that is spent on performing each of the technological operations. The basis for these values is the regularities discovered among the technological operations time characteristics of the Tower controller’s activity. For implementation of the trainee reference
model the method and means of simulation modeling were used to provide the necessary high level of detail and visualization of the processes simulated in the subject area of navigation services and air traffic control.
2. Simulation of the reference decision-making process in the Tower controller workplace
For the simulation modeling of the reference decision-making process at the workplace of the Tower controller (the trainee reference model for the intelligent training system "ATC of Tower"), we have chosen a high-performance visual environment for the development of component models of complex dynamic systems – Rand Model Designer (from January 2021 has a new name - AnyDynamics). This software environment uses a figurative, intuitive object-oriented high-level modeling language (UML – Unified Modeling Language), which allows one to quickly and efficiently create complex models. To describe the behavior of discrete and hybrid objects, a behavior map is used – a modification of the UML state diagram, in which the activity in the state is an active dynamic object, possibly having its own internal structure [5].
Based on the results obtained at the previous stages of the study, a reference training model was formed, the structural diagram of which is shown in Figure 1, a).
The structural diagram consists of classes instances (or objects) and the relationships between them. Instances, in turn, have certain states and behavior, have certain properties (attributes) and operations performed on them (methods) [6]. A link is the connection of two external variables in a structural diagram between instances of a class. A link can connect a variable of the "output" type of one instance of a class with a variable of the "input" type of another instance. A variable of the "output" type is shown on the block diagram by an output arrow. The value of a variable of the "output" type can only be changed from inside the object. A variable of the "input" type is shown on the block diagram by an input arrow. The value of a variable of the "input" type can only be changed from outside the object. In this case, "output" variables must have a general type, and can be specified by the following scalar values:
• integer (int, short, char); • logical (bool); • string; • numeric with floating-point (double), and also, the passed parameter of the external
variable can be specified as an array, vector, signal and object [7].
355

Figure 1: Visual simulation model: a) block diagram; b) meteorological data window; c) dialog box; d) time to complete the procedures; e) simulated aerodrome plan
The input data of the system are randomly generated parameters obtained on the basis of the corresponding revealed regularities. That is, at each start of the model, the values of the variables are determined by a given distribution law.
Diversification of parameters affects the variability of the air picture, which entails the need to perform various technological operations in air traffic control, changing the time of their execution, that is, it brings the situations generated by the system closer to real ones and provides a wider range of variability of these situations.
Let's consider each instance of the class in more detail.
An instance of the "Meteo" class. The main task of this instance of the class is to generate random parameters of weather conditions, as well as to determine the working runway (working course) for the entire system. The meteorological data generated by the system as a result of operation are presented in Figure 1, b).
An instance of the class "Aircraft (AC)" generates output data for the "Aircraft" class. This behavior map has a probabilistic switchpoint, which determines the presence/absence of a departing aircraft, which, in turn, depending on the position on the maneuvering area, will or will not affect the decision of the Tower controller when servicing an aircraft that arrives (approaching).
When the visual model of the system is launched, the aircraft data obtained as a result of
the operation of the “Aircraft” class instance are displayed by the first two messages in the system dialog box (Figure 1, c)). The first message informs about the approaching aircraft, with the identifier "ВСз" and contains such data as:
• radiotelephone call sign; • airport of departure; • aircraft type; • the wake turbulence category.
Example: ("ВСз", "UR-UBU Vienna, BE 350 (L)")
The second message informs about the departing aircraft, with the identifier "ВСв" and contains such data as:
• radiotelephone call sign; • destination airport; • name of the route of departure from the terminal area (SID – standard instrument departure); • aircraft type; • wake turbulence category; • aircraft parking position (stand).
Example: ("ВСв", "MSI740, Tbilisi, DITIX4A, An-74 (M), St. No. 41")
An instance of the "Ground Services (GS)" class generates data for aerodrome services supporting activities at the aerodrome through the assignment of a radiotelephone call sign and a possible request for the runway crossing.
356

Interaction is also presented in the form of radiotelephony exchange in a dialog box.
"Briefing" class instance simulates the interaction of the Tower controller and the briefing office (ARO) dispatcher – transmitting information to the Briefing Office dispatcher about the actual time (UTC) of aircraft take-off/landing, as well as receiving information about the aircraft departure from another aerodrome.
An instance of the class "Aerodrome Central Dispatcher (ACD)". The main task of this class in the simulated model is to request / receive information from the ACD about the parking for the arriving aircraft and transmit information to the ACD about the actual time (UTC) of the aircraft landing.
An instance of the "Approach Controller" class. In addition to the main task, the transmission of information about the approach type of the arriving aircraft to the aerodrome area, this instance of the class simulates the interaction and coordination between the controllers of the approach sector and the aerodrome control tower in the event of a missed approach of this aircraft – imitation of an unsuccessful approach.
An instance of the "Tower Controller" class is a model of the decision-making process by the Tower controller, which simulates the actions of the controller when servicing an approaching aircraft. That is, in this class, the technological operations of the Tower controller are concentrated during direct work with the aircraft crews. When the visual model of the system is launched, the work of this instance of the class is displayed in the form of radiotelephony phraseology (in Russian) between the air traffic controller and the aircraft crew in the dialog box (Figure 1, c)).
In addition to the "Aerodrome Plan" window, which displays the chart of the simulated aerodrome, the visual model also has a "Time" window (Figure 1, d)), which displays the time of the following procedures (sets of technological operations):
1. Procedure "1-1'" – transmission of the information about the aircraft departure from another aerodrome by the Briefing Office dispatcher. 2. Procedure "2-2'" – the Approach controller sends information about the approaching aircraft. 3. Procedure "3-3'" – the final stage of the aircraft approach. At this stage, the controller makes a decision on issuing a landing
clearance in accordance with the air picture at the aerodrome (available aircraft for departure, work on the runway) and its area (other aircraft is going-around). 4. Procedure "4-4'" – vacating the runway after landing and taxiing the aircraft to its parking position. 5. Procedure "5-5'" – transmission of information to the Briefing Office dispatcher about the actual time (UTC) of aircraft landing. The adequacy of the model was checked using
the above time parameters and time parameters of the real system.
3. Adequacy verification of the simulation model
To ensure the appropriate accuracy and reliability of the simulation results, it is necessary to check the adequacy and/or verification of the model. The purpose of these procedures is to establish identity in a certain sense (in terms of goals, functions, tasks, operations, static and dynamic parameters, indicators, etc.) of a model and a real object, or to establish the identity of two models.
The verification of the adequacy of the simulation reference model when servicing arriving aircraft, from the side of the qualitative criterion, was carried out both at the stage of constructing a formalized scheme of the process (the algorithm of actions of the Tower controller), and at the stage of its computer implementation (when the dynamic model is functioning, a logical and procedurally correct radiotelephony communications between subscribers and the air traffic controller). Checking the adequacy of the resulting model in relation to quantitative indicators can be performed using formal and informal methods [8].
Verification using methods of statistical analysis refers to formal methods. It is possible with reliable statistical estimates of the parameters of both real operations of the air traffic services system and the model. In fact, two independent groups of time characteristics data (real object and model) performed by the Tower controller of procedures, consisting of a set of corresponding technological operations, for which their inherent regularities were revealed at the previous stage of the study.
To find out which of the criteria can be used to assess the adequacy, the analysis of time
357

indicators of the execution of procedures (in seconds) of the simulation model (scan data) and the real system (timing data) was carried out using the descriptive statistics method (Table 1).
The normal distribution is determined depending on the fulfillment of certain criteria. One of these criteria is the coincidence of the average (mean), thickest value and median. The skewness, in turn, characterizing the normal distribution should be in the range from –1 to +1, and sometimes a distribution with a skewness not exceeding 2 in modulus is considered normal one [9]. Another important criterion is kurtosis. It is believed that a distribution with kurtosis in the range from –1 to +1 corresponds approximately to the normal form. Sometimes it is quite acceptable to consider a distribution as normal with kurtosis in absolute value not exceeding 2 [9].
The results obtained allow us to conclude that the distribution of data for Procedures "1-1", "2-2", "5-5" and "6-6" can be attributed to normal, and, therefore, a parametric method for comparing quantitative data in two independent groups test - Student's t-test.
When comparing the mean values in normally distributed sets of quantitative data, the Student's t-test is calculated by the formula [10]:
𝑡 =𝑀1 − 𝑀2
√𝑚12 + 𝑚2
2 (1)
where: M1 and M2 are the compared average (mean) values, m1 and m2 are the standard errors of the average (mean) values, respectively.
The obtained values of the Student's t-test are evaluated by comparison with the critical values. Differences in indicators are considered statistically significant at a significance level of p<0.05 [10].
Based on the results obtained (Table 2), we can say with a high degree of probability that the differences between the simulation model and real data are not significant (Procedures "1-1", "6-6"). Moreover, the differences continue to be insignificant even with an increasing sample size (for Procedures "2-2", "5-5" the number of degrees of freedom increases by almost a third), which indicates the adequacy of the real system of the quantitative component of the resulting model and its resiliency.
As for the Procedures "3-3", "4-4", the use of Student's t-test is not recommended due to the fact that their temporal characteristics do not agree with the normal distribution. In this case, it is possible to use the Mann-Whitney U-test. For this,
Table 1 Descriptive statistics of simulation model and real data
Procedure
Data source
Statistical parameters
Ave
rage
Stan
dar
d
erro
r
Med
ian
Thic
kest
valu
e
Stan
dar
d
dev
iate
Sam
ple
vari
ance
Ku
rto
sis
Skew
nes
s
Cla
ss
Leas
t
valu
e
Max
ima
Procedure "1-1"
Timing 8,90 0,62 8,00 8,00 2,84 8,09 2,05 1,16 12,00 5,00 17,00
Simulation model
8,75 0,32 8,58 10,80 2,27 5,14 0,78 0,51 11,60 4,20 15,80
Procedure "2-2"
Timing 8,11 0,39 8,00 8,00 2,95 8,70 –0,11 0,42 12,00 3,00 15,00
Simulation model
8,63 0,39 7,77 7,74 2,79 7,80 –0,55 0,61 10,37 4,63 15,00
Procedure "3-3"
Timing 229,33 6,67 232,00 266,00 54,58 2979,16 1,63 0,50 320,00 99,00 419,00
Simulation model
255,14 7,95 244,67 undefined 56,20 3158,33 2,14 1,33 262,80 162,27 425,07
Procedure "4-4"
Timing 246,00 13,63 222,50 327,00 69,49 4829,04 –0,97 0,32 250,00 139,00 389,00
Simulation model
352,01 14,73 327,92 undefined 104,14 10845,6 0,32 0,42 495,27 149,94 645,21
Procedure "5-5"
Timing 8,83 0,36 8,00 8,00 3,14 9,85 0,45 0,75 13,00 4,00 17,00
Simulation model
8,14 0,47 7,48 13,60 3,31 10,97 1,89 1,35 15,15 3,85 19,00
Procedure "6-6"
Timing 10,09 0,82 9,00 7,00 4,79 22,93 0,42 1,03 18,00 4,00 22,00
Simulation model
9,87 0,69 9,03 13,70 4,86 23,63 –0,57 0,21 19,16 1,24 20,40
358

Table 2 Calculation results by Student’s t-criterion
Procedure Calculated value of Student's
t-test
Critical value of Student's
t-test
Number of degrees of freedom
Conclusion
Procedure "1-1"
0,21 1,995 69 Differences are not statistically
significant (Р=0,830419) Procedure
"2-2" 0,94 1,984 105
Differences are not statistically significant (Р=0,347964)
Procedure "5-5"
1,17 1,98 123 Differences are not statistically
significant (Р=0,246098) Procedure
"6-6" 0,21 1,99 82
Differences are not statistically significant (Р=0,837865)
a single array of both compared samples is compiled, their elements are arranged according to the degree of growth of the feature, a lower value is assigned a lower rank. Then a single ranked series is divided into two, consisting of units of the first and second samples, in each of which the sum of the ranks is calculated separately. After that, the value of the U-criterion is calculated according to the following formula [11]:
𝑈 = 𝑛1 ∙ 𝑛2 +𝑛𝑥 ∙ (𝑛𝑥 + 1)
2− 𝑇𝑥 (2)
where n1 is the number of elements in the first sample, n2 is the number of elements in the second sample, nx is the number of elements in the larger sample, Tx is the sum of the ranks in the larger sample.
The calculated values of the Mann-Whitney U-test are compared with the critical values at a given significance level: if the calculated U-test value is equal to or less than the critical U-test
value, the statistical significance of the differences is recognized. Verification of two independent groups of data (the model and the real system) for Procedures "3-3" and "4-4" with a different number of time characteristics (15 and 20 values) using the Mann-Whitney U-test (Table 3) showed that differences in the level of the feature in them are statistically insignificant (р>0,05), which indicates the adequacy and sufficient stability of the model.
Verification is a determination of the correctness of a developed program, formal or practical proof of its correct operation on a computer [12]. For additional verification of the adequacy of the obtained model of this kind of dynamic stochastic system, a direct method of model verification is selected – verification by developing a model of the same object (its parts) using another mathematical method.
An alternative mathematical method is the GERT (Graphical Evaluation and Review Technique) critical path method. If we compare the statistical parameters of the average (mean) and standard deviate of the time characteristics of
Table 3 Results of calculations by the Mann-Whitney U-test
Procedure Number of values in samples
Calculated U-Test value
Critical U-test value
Conclusion on the statistical significance of differences
Procedure "3-3"
15 72 64 72 > 64 – differences in the level of the feature in the compared groups are statistically insignificant
20 170 127 170 > 127 – differences in the level of the feature in the compared groups are statistically insignificant
Procedure "4-4"
15 65 64 65 > 64 – differences in the level of the feature in the compared groups are statistically insignificant
20 159 127 159 > 127 – differences in the level of the feature in the compared groups are statistically insignificant
359

the procedures of the three sources (Table 4) – the simulation model, the timing data and the parameters of the temporal characteristics obtained on the basis of the use of GERT – we can also conclude that the difference between these indicators varies within the limits one second. Table 4 Value of the average and standard deviate of the reference model procedures based on timing data, simulation model and GERT
Procedure Data
source Average
Standard deviate
"1-1" Timing 8,90 2,84
Simulation model
8,75 2,27
GERT 8,34 2,75 "2-2" Timing 8,11 2,95
Simulation model
8,63 2,79
GERT 8,70 2,82 "5-5" Timing 8,83 3,14
Simulation model
8,14 3,31
GERT 7,85 3,07 "6-6" Timing 10,09 4,79
Simulation model
9,87 4,86
GERT 9,04 4,87
For procedures "3-3 '" and "4-4'", analytical calculations to determine the moments of the distribution function of the output quantity using GERT networks were not carried out, due to the presence of subsystem blocks in these procedures (the final stage of the aircraft approach and the vacating of the runway after landing and taxiing of the aircraft to its parking position), the execution time of which is directly proportional to the flight technical characteristics of specific aircraft, and the calculation of distribution parameters becomes possible only with simulation modeling.
4. Conclusions
The performed verification of the adequacy of the simulation reference model of the decision-making process at the workplace of the Tower controller using formal statistical criteria and its verification allow us to take up the position that
the model is adequate and sufficiently reflects the real system, which avoid the necessity for its adjustment. Satisfactory results obtained at this stage of the study also make it possible to make a positive conclusion about the efficiency of the proposed method for forming a reference model of an intelligent training system and the feasibility of its further use.
5. References
[1] O. M. Piliponok, Method of improving the aircraft management quality of operators of the navigation service systems and traffic control. The thesis for a candidate of technical science degree in speciality 05.22.13 «Navigation and traffic control». – Separated structural unit of the National Aviation University «Kirovograd flight academy of the National aviation university», Ukrane, Kropyvnytskyi, 2017, 265 p. (in Ukrainian).
[2] L. N. Dzhuma and A. S. Lavrynenko, Detalyzatsyia tekhnolohycheskykh operatsyi dyspetchera ADV s yspolzovanyem metoda khronometrazha. Upravlinnia vysokoshvydkisnymy rukhomymy obiektamy ta profesiina pidhotovka operatoriv skladnykh system. Kirovohrad: KLA NAU, 2015, pp. 195–196. URL: http://www.klanau.kr.ua/images/docs/mmnpk2627112015.pdf
[3] L. N. Dzhuma and A. S. Lavrynenko, Unyfykatsyia tekhnolohycheskykh operatsyi deiatelnosty avyadyspetchera pryrazrabotke etalonnoi modely subъekta obuchenyia. Aviatsiia ta kosmonavtyka: stan, dosiahnennia i perspektyvy, Part 1. Kirovohrad: KLA NAU, 2016, pp. 201–202. URL:http://www.klanau.kr.ua/images/docs/mvnpkxxxvip01.pdf.
[4] L. N. Dzhuma and A. S. Lavrynenko, Vyyavlenie zakonomernostey tsirkulyatsii informatsionnykh potokov na rabochem meste dispetchera aerodromnoy dispetcherskoy vyshki Tower. Upravlinnia vysokoshvydkisnymy rukhomymy obiektamy ta profesiina pidhotovka operatoriv skladnykh system. Kirovohrad: KLA NAU, 2016, pp. 94–96. URL: http://www.klanau.kr.ua/images/docs/5mnpk.pdf
[5] Yu. B. Kolesov and Yu. B. Senichenkov, Ob’ektno-orientirovannoe modelirovanie v
360

srede Rand Model Designer [Object-oriented modeling in the Rand Model Designer environment]. SPbPU Science Week: Materials of the Scientific Forum from Intern. participation. Interdisciplinary sections and plenary sessions of institutes. St. Petersburg: Polytechnic University Publishing House., 2015. pp. 18-25 (in Russian).
[6] G. Buch, Obektno-orientirovannyj analiz i proektirovanie s primerami prilozhenij na C++ [Object Oriented Analysis and Design with Sample C ++ Applications] Part 1, Vol.2, Moscow: Binom, 1998, 560 p. (in Russian).
[7] AnyDynamics – high-performance visual environment for object-oriented modeling of multi-domain component models. MvStudium. [Electronic resource]. URL: http://www.mvstudium.com.
[8] N.G. Lipatova, Imitatsionnoe modelirovanie protsessov tamozhennogo kontrolya: monografiya [Simulation modeling of customs control processes: monograph]. Moscow: Publishing house of the Russian Customs Academy, 2015. 164 p. (in Russian).
[9] E. V. Dorogon'ko, Obrabotka i analiz sotsiologicheskikh dannykh s pomoshch'yu paketa SPSS [Processing and analysis of sociological data using the SPSS package], Surgut: Publishing Center of SNU. 2010, 60 p. (in Russian).
[10] J.L. Peacock and P.J. Peacock, Oxford Handbook of Medical Statistics. Oxford University Press, 2011. 517 p.
[11] M.J. Campbell, D. Machin and S.J. Walters, Medical statistics: a textbook for the health sciences. 4th ed, John Wiley & Sons, Ltd., 2007, 331 p.
[12] I.V. Yatskiv, Problema validatsii imitatsionnoy modeli i ee vozmozhnye resheniya [The problem of validation of the simulation model and its possible solutions]. Simulation modeling. Theory and Practice (IMMOD 2003): Collection of reports of the First All-Russian Scientific and Practical Conference on Simulation Modeling and Its Application in Science and Industry, Part 2. St. Petersburg: Federal State Unitary Enterprise "Central research institute of shipbuilding technology", 2003, pp. 211-217. (in Russian).
361

Формалізація Задачі Реінжинірингу Топологічних Структур Наземних Мереж Екологічного Моніторингу Володимир Безкоровайний1, Валерій Семенець2
1,2 Харківський національний університет радіоелектроніки, пр. Науки, 14, м. Харків, 61166, Україна
Анотація Зміна вимог, умов експлуатації, розвиток технічних засобів і технологій на певному етапі призводять до необхідності проведення реінжинірингу існуючих систем екологічного моніторингу. Для забезпечення ефективності проектних рішень запропоновано спільне розв’язання задач структурної, топологічної параметричної та технологічної оптимізації мереж системи за множиною показників якості. Визначена базова постановка задачі реінжинірингу топологічних структур централізованих трирівневих наземних мереж, для якої формалізовані множина допустимих рішень і оцінки показників витрат, оперативності, надійності та живучості. Запропоновані універсальні функції для скалярного оцінювання варіантів точніше описують переваги особи, що приймає рішення, і дозволяють скоротити часову складність процедур оцінювання. Ключові слова 1 Мережа екологічного моніторингу, структура, топологія, реінжиніринг, багатокритеріальна оптимізація.
Formalization Of The Task Of Reengineering Of Topological Structures Of Terrestrial Ecological Monitoring Networks Vladimir Beskorovainyi1, Valerii Semenets2
1,2 Kharkiv National University of Radio Electronics, Nauky Ave. 14, Kharkiv, 61166, Ukraine
Abstract Changes in requirements, operating conditions, development of technical means and technologies at a certain stage lead to the need for reengineering of existing environmental monitoring systems. To ensure the effectiveness of design solutions, it is proposed to jointly solve the problems of structural, topological, parametric and technological optimization of system networks in terms of a variety of indicators. The basic formulation of the problem of reengineering of the topological structures of centralized three-level ground networks has been determined, for which a set of feasible solutions and estimates of indicators of costs, efficiency, reliability and survivability are formalized. The proposed universal functions for scalar estimation of options more accurately describe the preferences of the decision-maker and reduce the time complexity of the estimation procedures. Keywords 2 Environmental monitoring network, structure, topology, reengineering, multi criteria optimization.
EMAIL: [email protected] (A. 1); [email protected] (A. 2) ORCID: 0000-0001-7930-3984 (A. 1); 0000-0001-8969-2143 (A. 2);
362

1. Вступ
Безпечний розвиток сучасного техногенного суспільства потребує проведення систематичних спостережень, контролю, оцінки впливу людини на стан навколишнього середовища, що здійснюється системами комплексного екологічного моніторингу [1]. Однією з основних функцій таких систем є отримання, реєстрація й своєчасна передача для аналізу великих часових рядів даних [2-3]. У залежності від особливостей об’єктів контролю передача даних у системах моніторингу здійснюється з використанням мереж з різними структурами.
Удосконалення технологій збору, передачі й обробки даних відкриває нові перспективи розвитку мереж моніторингу: все частіше використовуються недорогі реєстратори даних [4]; завдяки численним перевагам автоматизованих вимірювань дані збираються безперервно з мінімальним втручанням людини [5]; збір даних у реальному часі відіграє важливу роль при прогнозуванні погоди, у гідрологічному аналізі, оцінці наслідків стихійних лих тощо [6].
Зміна умов експлуатації (вимог до надійності, оперативності та точності спостережень, кількості об'єктів спостереження) або засобів моніторингу (удосконалення технологій обробки, зберігання та передачі інформації) знижує ефективність існуючих варіантів реалізації мереж і вимагає проведення їх реінжинірингу. Процес реінжинірингу мереж моніторингу здійснюється за результатами розв’язання комплексу комбінаторних задач оптимізації їх структур, топологій, параметрів елементів і каналів передачі інформації, вибору технологій збору, передачі й обробки інформації [7].
З урахуванням того, що потужності множин допустимих технологій функціонування, параметрів елементів і зв'язків мереж є незначними, основні труднощі становить розв’язання задач оптимізації їх топологічних структур. Такі задачі розв’язуються за множиною функціональних і вартісних показників з урахуванням численних обмежень. Це потребує використання сучасних моделей і методів підтримки прийняття багатокритеріальних рішень [8-9].
Незважаючи на численні публікації, присвячені вирішенню завдань проблеми реінжинірингу топологічних структур наземних мереж екологічного моніторингу, виявлено протиріччя між необхідністю підвищення ефективності існуючих варіантів їх реалізації і обмеженістю математичних моделей багатокритеріальних задач їх оптимізації. Зокрема, необхідним є підвищення адекватності моделей для оцінки функціональних і витратних показників, переваг, особи, що приймає рішення, та моделей скалярного багатокритеріального оцінювання варіантів побудови мереж [10-11].
Метою дослідження є підвищення ефективності технологій автоматизованого проєктування наземних мереж екологічного моніторингу за рахунок розробки математичних моделей багатокритеріальних задач реінжинірингу їх топологічних структур.
2. Математична модель базової задачі реінжинірингу мережі
Із зростанням масштабів систем моніторингу їх вартісні і функціональні характеристики стають все більш залежними від топології (територіальної) організації. Як наслідок виникає необхідність спільно з традиційними задачами структурного синтезу розв’язувати задачі топологічної оптимізації. Це породжує проблему структурно-функціонально-параметричного та топологічного синтезу. У результаті декомпозиції проблеми для реінжинірингу наземних мереж екологічного моніторингу як територіально розподілених об’єктів на нижньому рівні виділяються задачі [7]:
• визначення принципів побудови мережі; • вибір структури мережі; • визначення топології елементів (вузлів, центра) і каналів мережі; • вибір технології функціонування мережі; • визначення параметрів елементів (вузлів, центра) і каналів мережі; • оцінка ефективності та вибір проєктних рішень. Після вибору принципів побудови та
технології функціонування задача
363

реінжинірингу топологічних структур трирівневих централізованих мереж моніторингу розглядається у такій постановці [12]. Задані: множина елементів існуючої мережі I { i }= , i 1,n= , які покривають усю множину об’єктів моніторингу; існуючий варіант топологічної структури s S (де S – множина допустимих варіантів), що заданий місцями розташування елементів, вузлів, центру (центр розміщується на базі елемента i = 1 ), а також зв’язками між елементами,
вузлами та центром ij[s ] , i, j 1,n= (де
ijs 1 = , якщо між елементами i та j існує
безпосередній зв’язок та ijs 0 = – в іншому випадку); витрати на створення або модернізацію вузлів i[c ] , i[d ] , i = 1,n і
зв’язків ij[c ] , ij[d ] i 1,n= .
Необхідно визначити найкращий за показниками витрат, оперативності (часу отримання інформації), надійності та живучості варіант топологічної структури мережі os S .
Множина допустимих варіантів побудови централізованої трирівневої мережі задається умовами:
ij ij 11n
iji j
n n n
ij iij 1i j i 1
ii i1
ii ij ij1 i , j n
[ s ], s {0,1}, i, j 1,n, s 1;
s 1 j 1,n;
S { s } s n s ,
s 1 s 1 i 1,n;
s s 1 ij arg min c i, j 1,n.
=
= = =
= =
=
= = = +
= → = = = → = =
(1)
Кожен з варіантів реінжинірингу мережі задається, кількістю вузлів в ній u, місцями їх розміщення та схемою зв'язків між елементами, вузлами та центром ij[s ] ,
i, j 1,n= . При цьому вважається, що: вся множина об'єктів моніторингу є підконтрольною з заданою кратністю; вузли мережі розміщуються виключно на базі елементів; елементи підключаються до вузлів за показником мінімуму витрат (відстані); обсяг запитів до кожного елемента мережі дорівнює
i iα = [α ], α = const , i 1,n= ; обсяг
відповіді від кожного з елементів дорівнює
i iβ = [β ], β = const , i 1,n= .
Спростимо цільову функцію витрат на реінжиніринг мережі [12]: витрати на
демонтаж вузлів і каналів існуючої структури і вартість ресурсів, які можуть бути повторно використані після демонтажу обладнання врахуємо у витратах на вузли і канали нової мережі. З використанням введених вище позначень подамо цільову функцію витрат у такому вигляді:
.
n
1 i ii ii i ii iii=1
n n
ij ij ij ij ij ij s Sj=1 i= j
k (s , s ) = [c (1 - s ) s + d s s ] +
+ [c (1 - s ) s + d s s ] min (2)
Критерій оперативності, що відповідає мінімізації максимального часу отримання даних моніторингу можна подати у такому вигляді:
,E
j=1 l= j
n nC( ) = + + + + + + +2 jl jj s S1 2 1 21 2
kβ α α β βαs τ τ s s min
γ γ γ γh h (3)
де Cτ , Eτ – час на видачу запиту центром та отримання інформації щодо об’єкта моніторингу елементом; , – обсяги інформації в запиті та відповіді на запит; 1γ ,
2γ – пропускні здатності каналів зв’язку «центр-вузол» і «вузол-елемент»; h1, h2 – швидкості обробки запиту та відповіді у вузлах мережі.
364

Як показник надійності мережі використаємо коефіцієнт її готовності:
( ) ( )( ) ( )
u nC U E3
u nCU UE
s S
k (s) = δ × δ × δ ×
δ × δ max
→, (4)
де Cδ , Uδ , Eδ , CUδ , UEδ – коефіцієнти готовності центра, вузла, елемента, каналів зв’язку «центр-вузол» і «вузол-елемент»; n ,
n
iii=1
u = s – кількості елементів та вузлів у
мережі. Як показник живучості 4k (s)
використаємо значення частки елементів зв’язаних з центром у працездатній мережі при одиночних пошкодженнях її компонентів. При цьому, незалежно від виду структури мережі, при пошкодженні центру
4k (s) 0 , а при пошкодженні одного елемента чи одного каналу зв’язку «вузол-елемент» ( ) /4k (s) n 1 n . З урахуванням цього критерій максимізації живучості мережі враховуватиме лише пошкодження зв’язків «центр-вузол», «вузол-елемент» і вузлів:
/4
n nji ii1 j n s Sj=2 i= j
k (s)= min n s s n max . (5)
У процесі оптимізації мережі генерується й аналізується величезна кількість варіантів за множиною показників (2)-(5). Для вибору підмножини найбільш ефективних варіантів побудови мережі екологічного моніторингу і найкращого серед них використовуються моделі скалярного багатофакторного оцінювання [8-11].
3. Скалярне оцінювання варіантів побудови мережі
Для визначення скалярних оцінок якості варіантів використаємо апарат теорії корисності [15]. Для варіантів рішень будемо встановлювати значення їхньої цінності P( s ), які будуть визначати їхнє впорядкування за якістю. При цьому
s,v S : • s v P( s ) P( v ) = ; • s v P( s ) P( v ) ;
• s v P( s ) P( v ) . Значення скалярних оцінок якості
варіантів пропонується встановлювати на основі функції узагальненої корисності, побудованої на основі поліному Колмогорова-Габора [10-11, 15]:
i i ij i j ijl i j li i j i i j i l j
P( s ) ( s ) ( s ) ( s ) ( s ) ( s ) ( s ) ... = = = = = =
= + + + 4 4 4 4 4 4
1 1 1
, (6)
i i iai i1 i1 i1ia
ii ia
iai i i2 i2 i2 iia
k ( s )a ( b 1) 1 b / b ,0 k ( s ) k ;k
( s )k ( s ) ka ( 1 a ) ( b 1) 1 b / b ,k k ( s ) 1,
1 k
+ − +
= −
+ − + − + −
(7)
де i , ij , ijl – коефіцієнти важливості
критеріїв ik ( s ) , i ,= 1 4 та добутків критеріїв
ik ( s ) , jk ( s ) , lk ( s ) ; i( s ) , – значення функції корисності часткового критерію
ik ( s ) , i ,= 1 4 для варіанту s S ; ia ik ,a –значення координат точки склеювання функції (7), ia0 k 1 , i0 a 1; i1 i2b ,b – параметри, які визначають характер функції (7) на початковому і кінцевому відрізках.
Функція узагальненої корисності (6) дозволяє описувати будь-які несуперечливі
переваги особи, що приймає рішення. Функція (7) є найкращою за комплексним показником «точність-складність» серед поширених функцій корисності часткових критеріїв [10].
4. Висновки
За результатами аналізу сучасного стану проблеми встановлено, що зміна вимог, умов експлуатації, розвиток технічних засобів й інформаційних технологій приводять до необхідності проведення реінжинірингу
365

існуючих мереж екологічного моніторингу. Для забезпечення ефективності проєктних рішень доцільним є спільне розв’язання комбінаторних задач структурної та топологічної оптимізації мереж за множиною функціональних і вартісних показників. Отримано математичні співвідношення для оцінки варіантів побудови централізованих трирівневих мереж за показниками витрат, оперативності, надійності та живучості. Їх використання дозволяє в автоматичному режимі здійснювати скалярне оцінювання альтернативних варіантів. Запропоновані функції оцінки варіантів точніше описують переваги особи, що приймає проєктні рішення, та дозволяють скоротити часову складність процедур оцінювання. Напрямком подальших досліджень можуть бути врахування в моделях задачі невизначеності функціональних і вартісних характеристик мереж з використанням апарату нечіткого чи інтервального аналізу та розробка ефективних методів оптимізації мереж за множиною показників [16-17].
5. Література References
[1] А. V. Grytsenko, О. G. Vlasenko, Problematic issues of ecological safety of Ukraine and proposals for their solution, Problems of environmental protection and ecological safety, 41 (2019).
[2] I. Šećerov, D. Dolinaj, D. Pavić, D. Milošević, S. Savić, S. Popov, Ž. Živanov, Environmental Monitoring Systems: Review and Future Development, Wireless Engineering and Technology, 10 (1) (2019).
[3] D. Sharma, S. Verma, K. Sharma, Network Topologies in Wireless Sensor Networks: A Review, International Journal of Electronics & Communication Technology, 4 (2013).
[4] T.P. Chapin, A.S. Todd, M.P. Zeigler, Robust, Low-Cost Data Loggers for Stream Temperature, Flow Intermittency, and Relative Conductivity Monitoring, Water Resources Research, 50, (2014).
[5] M.H. Abdullah, S.A.C. Ghani, Z. Zaulkafilai, S.N. Tajuddin, Development Open Source Microcontroller Based Temperature Data Logger, in: Proceedings of the 4th International Conference on Mechanical Engineering Research (ICMER 2017), 2017.
[6] K. Lwin, M. Hashimoto, Y. Murayama, Real-Time Geospatial Data Collection and Visualization with Smartphone, Journal of Geographic Information System, 6 (2014).
[7] V.V. Beskorovainyi, К. Е. Podoliaka, Development of a systemological model of the problem of structural and topological reengineering of large-scale monitoring systems, Eastern European Journal of Advanced Technologies 3(75) (2015).
[8] S. Greco, M. Ehrgott, J.R. Figueira Multiple Criteria Decision Analysis – State of the Art Surveys, New York: USA, Springer (2016).
[9] М.М. Maliar, Models and methods of multi criteria limited-rational choice, Uzhhorod, RА «АUTDOR-SHARK» (2016).
[10] V. Beskorovainyi, H. Berezovskyi, Іdentification of preferences in decision support systems, ECONTECHMOD 06 (4) (2017).
[11] V. Beskorovainyi, Parametric synthesis of models for multi criterial estimation of technological systems, Innovative Technologies and Scientific Solutions for Industries 2(2) (2017).
[12] V.V. Beskorovainyi, К.Е. Podoliaka, Development of a model of a multi criteria problem of reengineering of topological structures of large-scale monitoring systems, Eastern European Journal of Advanced Technologies 4(76) (2015).
[13] Vladimir V. Beskorovainyi, Lubomyr B. Petryshyn, Olha Yu. Shevchenko, Specific subset effective option in technology design decisions, Applied Aspects of Information Technology 3 (1) (2020).
[14] V. Beskorovainyi, Combined method of ranking options in project decision support systems, Innovative Technologies and Scientific Solutions for Industries 4(14) (2020).
[15] A. O. Ovezgheldyiev, E.G. Petrov, К. E. Petrov, Synthesis and identification of multivariate estimation and optimization models, Кyiv, Naukova Dumka (2002).
[16] L.G. Raskin, O.V. Seraja, Fuzzy Mathematics. Fundamentals of the Theory, Kharkiv, Parus, (2008).
[17] M.P. Dyvak, Problems of Mathematical Modeling of Static Systems With Interval Data, Ternopil, TNEU "Ekonomichna dumka" (2011).
366

Methodological Approach to Agent-Based Modeling of Social Networks Olga Vasylieva1, Borys Butvin2 and Yuriy Shtyfurak3
1 Foreign Intelligence Service of Ukraine, 24/1, Nahirna Street, Kyiv, 04107, Ukraine 2 Central Research Institute of the Armed Forces of Ukraine, 28b Povitroflotskyi Avenue, Kyiv, 03049, Ukraine 3 National Technical University of Ukraine “Igor Sikorsky Kyiv Polytechnic Institute”, 37, Prosp. Peremohy, Kyiv, 03056, Ukraine
Abstract The article considers social networks as an environment with a complex structure, which is dynamically changing and difficult to analyze. Here is presented the basic methodological approaches for application in the theoretical analysis of social networks. Further, it is proposed to apply the method of agent-based modeling, which today, in the authors’ opinion, can be the most adaptive for modeling internal processes of such dynamic social systems as social networks. The most popular software tools for building agent-based models are described and the software AnyLogic developed by XJTeknologies, which has a number of competitive advantages, is highlighted as the most versatile and multifunctional. Keywords 1 Agent-based modeling, social networks, information influence
1. Introduction
Aim of the study. Modeling of social processes such as information influence in the social networks by applying agent-based modeling and selecting the most appropriate software tool.
Today, the information influence on human resource has a special place in the system of management decision-making, the political component, the development of business processes, etc. This has become possible due, firstly, to the rapid development of digital technologies, including those used for data dissemination and information exchange, the creation and development of new types of information resources, increased access to information for all segments of the population. Second, the large masses of information that circulates in cyberspace, is open, easily accessible and such that with the help of technology, linguistics, psychology and other knowledge can become a tool to manipulate human communities.
The most acceptable instrument for informational influence in terms of its own structure and the availability of appropriate target
EMAIL: [email protected] (A. 1); [email protected] (A. 2); [email protected] (A. 3) ORCID: 0000-0001-8263-782X (A. 1); 0000-0001-6086-6592 (A. 2); 0000-0001-7863-8862 (A. 3)
audiences are social networks today. The term "virtual (network) community" was firstly introduced in 1993 by G. Rheingold, who defined it this way: "Virtual communities are social associations, growing out of the Web, when a group of people maintain an open discussion long enough and humanly enough to form a network of personal relations in cyberspace" [1].
Social networks today are an important element of the structure of modern society, and their influence extends to various spheres of human activity: production, daily life, culture, politics, etc. They perform communication, informational, entertaining, socializing functions in the society; they provide opportunities for self-expression, exchange of information and experience, without any age, professional or any other restrictions [2]. The statistics are provided below demonstrate significant penetration of social networks in the life of modern human society.
For example, statistics of social networks in 2021 showed that 42% of the world population - that is a colossal 3.2 billion people - use social networks. The number of social network users has increased by more than 13% over the last year,
367

with almost half a billion new users registered before 2021. On average, more than 1.3 million new accounts appeared every day in 2020, that's about 15.5 new users per second, according to the Digital Global 2021 report [3].
A social network is a set of agents (vertices) that can interact with each other, and the connections between them are social. From a formal point of view, such networks are dynamic social systems, it is convenient to present them in the form of graphs and apply the appropriate mathematical apparatus for their analysis.
This is what determines the relevance of applying methodological approaches for modeling such systems in order to further predict various social processes in networks, including information influence.
Since formalized models of information dissemination process in social networks are actually absent, taking into account their inherent subjective uncertainty, modeling the processes that occur in them, as well as modeling social network itself turns into a weakly formalized problem [4].
As a first step, we should consider the methodological approaches that are used to analyze social networks. They differ from traditional approaches in sociological sciences. The postulate that the attributes of individual actors are less important than the relationships and connections with other actors in the network comes to the fore. That is, the attributes of individual actors - friendliness or unfriendliness, level of intelligence - begin to play no major role [5].
Currently there are four main methodological approaches to the analysis of social networks:
1. Structural – emphasizes the geometric shape and intensity of interactions (weight of edges). All actors are viewed as vertices of a graph, which influence on the configuration of edges and other actors in the network. Special attention is paid to the mutual arrangement of vertices, centrality, and transitivity of interactions [6]. 2. Dynamic – attention is focused on changes in the network structure over time. The reasons of disappearance and appearance of edges of a network; changes of structure of a network in case of external influences; stationary configurations of a social network are studied [6]. 3. Normative – studies the level of trust between actors, as well as norms, rules and sanctions that affect the behavior of actors in
the social network and the processes of their interaction. In this case, the social roles associated with a particular edge of the network are analyzed [6]. 4. Resource – considers the actors' ability to attract individual and network resources to achieve certain goals and differentiates actors being in identical structural positions of the social network, according to their resources. Individual resources can be knowledge, prestige, wealth, ethnicity, gender (gender identity). Under network resources understand influence, status, information, capital [6]. In order to involve all four mentioned
approaches of social network analysis, taking into account both the structure of dynamic system and its individual actors, defining their interaction, certain rules of the game, as well as giving them certain characteristics, the authors proposed to consider such method of simulation modeling as Agent-Based Modeling [7].
Agent-based modeling is a simulation method that examines the behavior of decentralized autonomous agents, their interaction (both individual agents and collective, such as organizations or groups) and how such behavior determines the behavior of the entire system as a whole. It combines elements of game theory, complex systems, emergence, computational sociology, multi-agent systems, and evolutionary programming. It’s used in noncomputational scientific fields including biology, ecology, and social sciences.
Agent-based modeling is used to analyze decentralized systems that are quite large, have heterogeneous structures, and are dynamically changing: old connections die off and new ones appear. That is why this method is effective to study the process of spreading of information influence in social networks.
To create an agent-based model, all actors are viewed as separate agents. According to the structural approach, the social network can be viewed as vertices with certain connections between them. The network structure of the model is dynamic, it is a kind of system that is self-created, the elements of which appear and die. In such a system, the rules of behavior of each of the agents and their social roles are also defined. Finally, each of the agents is given a certain pool of personal characteristics, which determines the resource approach.
Considering the paradigms of system simulation modeling (Figure 1)
368

Figure 1: Three paradigms of system simulation modeling
it can be concluded that agent-based modeling
is the most multiple-purpose one. In contrast to discrete event modeling, which is consonant with the low and medium abstraction level, and the system dynamics approach with a high abstraction level, agent-based models can be both very detailed, when agents represent physical objects, and extremely abstract, when competing companies or state governments are modeled using agents.
The main difference between the agent-based approach and the first two is the bottom-up construction of the model. Dependencies between aggregated quantities are not set on the basis of knowledge about the real world, but are obtained in the process of modeling individual behavior of tens, hundreds or thousands of agents, their interaction with each other and with objects, which are modeling the environment.
The advantages of the agent-based approach include: the absence of determinacy in the behavior of the system at the global level that can lead to new hypotheses about its functioning during model simulation; realism and flexibility in describing the system, the ability to model the most complex nonlinear feedbacks and to use any required level of detail and abstraction. In agent-based modeling, there are no restrictions on the heterogeneity of model elements; but there is possibility to simulate communication and information exchange [8].
During simulation experiments, computational complexities can arise because agent-based models on average require more hardware and software power to run simulations than system
dynamics or discrete event simulations. Agent-based simulations can be implemented on small desktop computers, or using large clusters of computers, or any variation between the first two.
Desktop agent-based models can be simple and used mostly to teach how to model using agents, test agent-based model development concepts, and analyze the results. Desktop utilities include spreadsheets, particularly Excel, and mathematical computing systems such as Mathematica and MATLAB.
Large-scale agent-based models extends the capabilities of simple agent-based desktop models and allows a larger number of agents (thousands to millions) to participate in complex interactions. Large-scale agent-based modeling is usually performed using dedicated modeling environments that include a time-based scheduler, communication mechanisms, flexible agent interaction topologies, a wide variety of devices for storing and displaying agent state [9].
Due to the fact that the agent-based approach emerged in the 1990s in the U.S. university environment, so far most of the tools are intended for academic and educational purposes, and are not commercial products in full.
One of the most popular developments of this type is the Swarm environment. It’s a collection of C language libraries created at the Santa Fe Institute. The most famous commercial tools are RePast, AnyLogic, NetLogo and MASON.
MASO is a fast multi-agent modeling toolkit in Java that was developed as a framework for a wide range of multi-agent modeling tasks, from swarm robotics to machine learning and socially
369

complex environments. MASON makes a careful distinction between models and visualization, allowing models to be dynamically separated from or attached to visualizers, and platforms to be changed at runtime. MASON is a collaborative effort between the Computer Science Department at George Mason University and the Center for Social Complexity at George Mason University. One of interest sources is social and biological models, particularly models of economics, land use, politics, and population dynamics [10].
The REcursive Porous Agent Simulation Toolkit (Repast) is the open and free source of libraries for large-scale agent-based modeling. Repast supports the development of extremely flexible agent-based models and is used in social process modeling. Users build their model by incorporating components from the Repast library into their programs or by using visual Repast for the Python Scripting environment.
Repast has a sophisticated built-in scheduler that supports discrete-event modeling and allows using a large set of communication mechanisms with a variety of interaction topologies and includes a full set of utilities for storing and displaying agent states. The system also includes utilities for automatic integration with both commercial and freely available geographic information systems (GIS). Integration with commercial GIS includes automatic connection to widely used geographic information systems such as ESRI and ArcGIS. Moreover, since Repast is based on the Java language, the Microsoft .NET platform and Python scripts, it is fully object-oriented [9].
Swarm was the first agent-based development environment. First launched in 1994 by Chris Langton at the Santa Fe Institute Swarm is an open source and free set of libraries and is currently maintained by the Swarm Development Group (SDG). The Swarm modeling system consists of two core components. The kernel components run simulation code written in general-purpose language Objective-C, Tcl/Tk, and Java. Unlike Repast, the Swarm scheduler only supports time progression at fixed intervals. Swarm supports a full set of communication mechanisms and can simulate all major topologies. Swarm includes a good set of utilities for storing and displaying agent states. Since Swarm is based on a combination of Java and Objective-C, it is object-oriented. But this mix of languages causes some difficulties with integration into some large-scale development environments, such as Eclipse [10].
NetLogo is another cross-platform agent-based simulation environment that is widely used and supported. Originally based on the StarLogo system, NetLogo adapts agent-based systems consisting of a combination of live and software agents. It is ideal for modeling complex systems containing hundreds or thousands of agents interacting simultaneously. It allows users to explore the relationship between micro-level agents and behavior at macro-level. The language has been developed heavily influenced by Logo and is intended for users from many disciplines - economists, anthropologists, physicists and many others. The interface allows users to interact with variables within a simulation and visualize results without having to look at the code itself. The language is similar to English, which makes it easy for a non-specialist to understand the functionality of each line of code. In addition, NetLogo contains an extensive library of models that includes example programs from a wide variety of disciplines, which is very useful for teaching and learning purposes [11].
AnyLogic is a development of XJTeknologies, which has found wide application among users.
The competitive advantage of AnyLogic is the support of all three simulation paradigms and the ability to use them within a single model. AnyLogic also features a powerful productive kernel that can simulate the behavior of millions of agents; rich animation and graphical model description capabilities; support for various types of experiments, including sensitivity analysis, Monte Carlo method, built-in OptQuest optimizer; integration capabilities with databases, ERP and CRM systems; a set of library objects from logistics, business processes, and pedestrian dynamics areas.
During developing an agent-based model in AnyLogic, the user inputs agent parameters (people, companies, assets, projects, vehicles, cities, animals etc.), defines their behavior, places them in an environment, establishes possible connections and then runs the simulation. The individual behavior of each agent forms the global behavior of the simulated system [12].
There are also some "templates" that simplify model creation and are included in AnyLogic:
- standard architecture; - agent-based synchronization ("steps"); - state (continuous or discrete); - mobility and animation; - agent-based connections (networks, e.g., social networks) and communication; - dynamic creation and destruction of agents.
370

AnyLogic provides a graphical language that greatly simplifies the creation of agent-based models:
statecharts for specifying agent behavior; the action diagram for describing complex algorithms; the "Environment" element is used to describe the "world", in which agents "live" and to collect various statistics; the "Event" element is used to describe random or periodically occurring events. It should be noted that this software was used
in scientific studies regarding the prediction of the spread of Covid_19 infection in dynamic social groups, which are immanently identical to social networks. These studies showed high reliability of the obtained results: the experimental results coincided with the real ones. Fig.2 shows an example of the agent-based modeling application - model structure of the Covid_19 infection spread study on a local multiplicity (N = 10,000) of agents.
Figure 2: Structure of agent-based modeling the Covid_19 infection spread
Figure 3 shows the dynamics of epidemic
spread over time.
Figure 3: The changing dynamics of epidemic spread results over time.
It should also be noted that these tools allow
describing almost all behavioral features of agents. Moreover Java language allows simulating any special behavior or logic. Also the specific character of AnyLogic is possibility to combine agent-based models with discrete-event and system-dynamic models.
That is why the authors of the article propose to use AnyLogic software for modeling social networks.
2. Conclusions
Therefore, agent-based modeling allows creating a model of a social network, where, for example, social processes such as distribution of certain information take place, that is information influence is carried out, and all basic methodological approaches to the analysis of social networks are applied. Also, by analyzing the comparative characteristics of the most popular agent-based modeling platforms, it was determined that the most adaptive and multiple-purpose, as well as supporting a pool of platforms for optimization, is the AnyLogic platform, which among other things is designed to model such complex dynamic systems as social networks and their internal processes, such as the distribution of information influences.
371

3. References
[1] Патаракин Е.Д. Сетевые сообщества и обучение [Текст] / Е.Д. Патаракин. – М.: «ПЕР СЭ». – 2006. – 112 с.
[2] Ажмухамедов И.М., Мачуева Д.А., Жолобов Д.А. Моделирование процесса распространения информации в социальных сетях // Фундаментальные исследования. – 2017. – № 5. – С. 9-14.
[3] 3. Digital Global 2021 [Електронне джерело] – Режим доступу:https://wearesocial.com/digital-2020.
[4] Chi-Jen Lin. Assignment Problem for Team Performance Promotion under Fuzzy Environment // Hindawi Publishing Corporation. Mathematical Problems in Engineering. 2013. 10 p. [Електронне джерело] – Режим доступу: http://dx.doi.org/10.1155/2013/791415.
[5] Федонюк А.А., Деякі аспекти моделювання соціальних мереж, 2014 [Електронне джерело] – Режим доступу: http://science.lp.edu.ua/sites/default/files/Papers/plugin-56_33.pdf.
[6] Hanneman, Robert A. and Mark Riddle. Introduction to social network methods. - Riverside, CA: University of California, Riverside, 2005. - 322 p. [Електронне джерело] – Режим доступу: http://faculty.ucr.edu/~hanneman/.
[7] Бутвін Б. Л., Штифурак Ю. М. Методичні засади дослідження складних динамічних систем на основі агентного моделювання // Матеріали VII міжнародної наукової конференції «Актуальні проблеми забезпечення кібербезпеки та захисту інформації» – 2021 – С. 8-10.
[8] Сидоренко В.Н. Имитационное моделирование в науке и бизнесе: подходы, инструменты, применение Моделирование и анализ бизнес-процессов Бизнес-информатика №2(08)-2009г. ст.52-56
[9] Инструментальные средства агентного моделирования Портал студенческих и научных материалов Ozlib.com. [Електронне джерело] – Режим доступу: https://ozlib.com/847655/informatika/instrumentalnye_sredstva_agentnogo_modelirovaniya
[10] Замятина Е.Б. Современные теории имитационного моделирования.
Специальный курс/ Пермский гос. ун-т. Уч. пособие, 2007. - 119 с.
[11] Dante Sblendorio Agent-based Modeling in NetLogo [Електронне джерело] – Режим доступу: https://sweetcode.io/agent-based-modeling-netlogo/ (дата звернення 21.07.2021)
[12] М.В. Киселева Имитационное моделирование систем в среде AnyLogic: учебно- методическое пособие/ М.В. Киселёва. Екатеринбург : УГТУ - УПИ, 2009. 88 с.
372

Evaluation And Comparison Of The Processes In The Frozen Vegetable Production Using Machine Learning Methods Piotr Milczarski1
1 Faculty of Physics and Applied Informatics, University of Lodz, Pomorska str. 149/153, Lodz, Poland
Abstract In the paper, the study of the carbon footprint (CF) assessment in the frozen vegetable production processes is shown in order to receive low-carbon products. Three methods of clusterization have been chosen for the production assessment. The results of clusterization are evaluated by five classification methods: k-Nearest Neighbors, Multilayer Perceptron, C4.5, Random Forrest and Support Vector Machines with a radial basis kernel function. In the chosen model with five clusters, the best clusterization methods are k-means followed by Canopy. Keywords 1 Carbon Footprint; clusterization; Canopy, k-means, Expectation-Maximization; k-Nearest Neighbors; Multilayer Perceptron; C4.5; Random Forrest; Support Vector Machines
EMAIL: [email protected] (A. 1); ORCID: 0000-0002-0095-6796 (A. 1);
1. Introduction
Greenhouse gas emissions from human activities have been a major contributor to global warming since the mid-twentieth century. Agriculture and land-use change contributed to 17% of global anthropogenic greenhouse gas emissions in 2010 [1]. By 2050 the population will be 9 billion people [2] to ensure supplying of food, agricultural production should be increased by 60%. Climate change can affect food availability; for example, an increase in temperature, a change in the structure of rainfall or extreme weather events may result in a reduction in agricultural productivity [3, 4]. Therefore, its main challenge has become to mitigate the threats that climate change poses to food security.
In response to the emerging threats of climate change, numerous programs, both global and regional, have been developed, the purpose of which is to slow down the growth rate of GHG concentration [5]. Achieving climate policy goals requires continuous monitoring of emissions and verification of the effectiveness of solutions for the development of a low-emission economy.
The adoption of an action plan for the reduction of gaseous emissions by EU countries in 2014 requires the reduction of GHG emissions by 30% by 2030, compared to the level in 2005 [6]. The methods of calculating the carbon footprint are most often based on well-known standards. Among them, the most used are:
• ISO14040: 2006 [7] – Environmental management-life cycle assessment: principles and framework, • ISO14064-1: 2018 [8] – Greenhouse gases - Part 1: Specification with guidance at the organization level for quantification and reporting of greenhouse gas emissions and removals, • ISO/TS 14067:2018 [9] – Greenhouse gases - Carbon footprint of products - Requirements and guidelines for quantification, • PAS2050 [10] – Specification for the assessment of the life cycle greenhouse gas emissions of goods and services. Once the carbon footprint has been calculated,
its detailed data helps to identify weaknesses, i.e. high-emission areas, that can be eliminated or improved. Thus, the carbon footprint is an indicator of sustainable development
373

2. Carbon footprint assessment using Life Cycle Assessment (LCA) method
Carbon footprint calculation is used as a tool for assessing greenhouse gas emissions, helping to manage and reduce them. The carbon footprint is typically calculated using carbon emission factors and activity data that can be assessed through a Life Cycle Assessment (LCA). The carbon footprint analysis according to the LCA methodology is carried out by identifying potential environmental threats, usually throughout the entire life cycle of a product, i.e. from the extraction and processing of raw materials, their transport, through main production, distribution and use, to waste management [11]. However, in agricultural production, the emissions directly related to energy consumption are not dominant [12]. A large part of GHG emissions on farms is gas losses from farmland and livestock. While calculating the carbon footprint with the use of agricultural emission models according to the IPCC reports, all emission sources are taken into account, both those related to energy carriers and processes taking place in the agricultural environment.
LCA is a widely used approach to assess the actual environmental impact of a product from its production and use [11] [12] [13]. The standards for assessing the product carbon footprint in LCA are mainly PAS 2050 [10] and ISO / TS 14067 [9].
In the case of the CFOOD project, that is presented in the paper, the focus is on the optimization of the frozen food production process, so we consider a segment of the product life cycle from the moment of raw material delivery to the shipment of the finished frozen food to the recipient
According to the adopted LCA methodology, the carbon footprint of a product consists of carbon footprints generated at the following stages of its production. Hence the total CF for a given product or its unit value can be expressed by the following formula [14][15][16]:
=
=
r
aiiCFCF
(1)
where: i is each of the stages of the product life cycle, i = a, m, t, u, and r, relate to the extraction of raw materials, production, transport, use as
well as the recycling and disposal stage, respectively.
3. Carbon footprint assessment in CFOOD project
In the case of the CFOOD project, we focus on the optimization of the frozen food production process, so we consider a segment of the product life cycle from the moment of raw material delivery to the shipment of the finished frozen food to the recipient. The production process can be divided into several smaller stages:
• S1 – initial cooling of the raw materials before the processing; • S2 – the raw material preparation for the production; • S3 – raw material pre-processing on the production line; • S4 – product freezing in the cold tunnel; • S5 – product preparation to a coldstore. Each of the process stages is connected to
electric meter units. Each production stage has also a preparation phase that is measured separately, e.g. S1 has a preparation phase that is denoted pS1, etc.
In the research section, we have tested several clusterization methods and choose three: Canopy, k-Means (KM) and Expectation-Maximization (EM) [17][18]. We have tested several options with the cluster numbers and chosen five clusters for each method that should represent according to our experience some real-time situations that occur during the production and their accounting systems:
- Optimal production – the product has the temperature from -25oC till -18oC at the end of the line;
- Close to optimal – during the high season through-output should be higher, hence the energy consumption should be lower, the product temperature is allowed to be from the range -6oC and -18oC.
- Wrong accounting of some parameters e.g. operators mistakes resulting in too high or too low results e.g. the through-output.
- Malfunction of the energy meters. It is a different situation from the above one and might result in random results.
The clusterization model with five clusters should have at least 60 processes. After a year of the process measurement, till June 2021, we have
374

collected 152 results only for the frozen onion production and 75 for the spinach. The other vegetables have less than 50 cases. Nonetheless, the other production e.g. broccoli and cauliflower should also be optimized. That is why in the current work, the results of clusterization of 35 broccoli processes and 42 cauliflower ones are presented in the current paper.
In the previous work [15][16] to assess the onion and spinach production processes we have prepared the set of verified data and to assess the trustworthiness of the production data we have compared the results of processes classification using 5 classifiers: k-Nearest Neighbors, Multilayer Perceptron [17], C4.5, Random Forrest and Support Vector Machines with a radial basis kernel function [17]. In the current paper, the focus is on unsupervised methods i.e. clusterization [17] into the broccoli and cauliflower processes.
Table 1 K-means clusterization of broccoli production, the units for stages i-th stage pS1, S1 etc. are in kWh/ton, for pt in ton/h, for et in kWh/h
Broccoli Clusters K-Means
Attribute 0 1 2 3 4
pS1 0.08 0.32 0.04 4.19 0.09 S1 1.34 1.35 1.51 4.25 2.08 S2 0.16 0.03 0.23 0.09 0.08
pS3 0.06 0.05 0.03 0.11 0.06 S3 0.91 1.14 0.70 0.21 1.38
pS4 7.68 2.29 0.12 6.54 0.25 S4 49.10 55.69 3.07 13.19 6.40
pS5 0.01 0.18 0.00 0.18 0.01 S5 0.18 1.51 0.03 0.24 0.17 pt 1.56 1.46 1.80 2.11 2.12 et 98.67 91.01 9.91 57.77 20.32
instances 4 4 3 22 2
In Tables 1-3 and 4-6 there are clusterization results of the broccoli and cauliflower production processes. The units for stages i-th stage pS1, S1 etc. are in kWh/ton, for pt in ton/h, for et in kWh/h. The results are achieved using the chosen clusterization methods with five clusters: - Canopy: max-candidates = 100; periodic-
pruning = 10000 ; min-density = 2.0; T2 radius = 0.804 and T1 radius = 1.005
- k-Means (KM) with Euclidean distance, max-candidates = 100, periodic-pruning =
10000, min-density = 2.0, T1 = -1.25 and T2 = -1.0.
- Expectation–Maximization (EM) with max-candidates = 100, “minimum improvement in log likelihood” = 1E-5, “minimum improvement in cross-validated log likelihood” = 1E-6, and “minimum allowable standard deviation” = 1E-6.
Table 2 Canopy clusterization of broccoli production
Broccoli Cluster Canopy
Attribute 0 1 2 3 4
pS1 0.09 0.39 0.08 0.13 0.13 S1 2.85 1.53 0.13 6.92 0.71 S2 0.11 0.03 0.10 0.11 0.05
pS3 0.02 0.06 0.05 0.00 0.07 S3 0.44 1.25 0.63 0.14 0.63
pS4 1.59 1.75 5.22 0.14 5.36 S4 16.85 58.77 45.3 10.65 43.53
pS5 0.01 0.24 0.00 0.00 0.22 S5 0.21 1.74 0.00 0.21 0.42 pt 2.00 1.35 1.55 1.90 1.92 et 42.19 85.69 82.9 33.65 100.1
instances 16 3 3 8 5
Table 3 EM clusterization of broccoli production
Broccoli Cluster EM
Attribute 0 1 2 3 4
pS1 0.09 0.33 0.02 89.74 0.25 S1 3.17 13.28 1.16 6.92 1.46 S2 0.08 0.11 0.23 0.14 0.06
pS3 0.01 0.02 0.04 2.16 0.06 S3 0.27 0.55 0.77 0.14 1.01
pS4 0.30 1.86 4.55 129.4 3.27 S4 8.60 38.08 20.92 11.29 52.48
pS5 0.01 0.05 0.00 3.61 0.14 S5 0.18 0.68 0.02 0.27 1.02 pt 2.13 2.07 1.71 1.96 1.55 et 26.84 104.9 44.61 465.0 95.07
instances 19 2 5 1 8
Figures 1 and 2 show the energy consumption
during the production on the energy meters of the chosen stages S1, S2, S3 and S4 for the chosen broccoli process with ID 373 and the cauliflower process with ID 365.
375

Figure 1: Example of energy consumption for the broccoli production, process ID 373; the colors of the stages: S1 – brown, S2 – green, S3- light blue, S4 - dark blue.
Figure 2: Example of energy consumption for the cauliflower production, process ID 365; the colors of the stages: S1 – brown, S2 – green, S3- light blue, S4 - dark blue. Table 4 K-means clusterization of cauliflower production
Cauliflower Clusters K-Means
Attribute 0 1 2 3 4
pS1 0.52 0.18 5.46 6.97 519.2 S1 24.27 2.48 7.08 1.00 2.28 S2 1.13 0.10 0.14 0.06 0.05
pS3 0.17 0.06 0.16 3.20 157.7 S3 8.41 0.97 1.71 0.55 1.21
pS4 0.43 5.22 3.67 22.58 678.1 S4 28.30 57.14 17.50 3.14 5.55
pS5 0.02 0.22 0.14 0.84 48.59 S5 0.69 1.31 0.33 0.06 0.24 pt 1.86 1.37 2.07 1.64 2.22 et 127.0 92.66 79.17 81.15 3332
instances 3 5 17 15 2
Table 5 Canopy clusterization of cauliflower production
Cauliflower Cluster Canopy
Attribute 0 1 2 3 4
pS1 5.23 0.50 519.2 0.70 0.10 S1 4.52 24.42 2.28 14.62 7.16 S2 0.11 1.60 0.05 0.35 0.08
pS3 1.35 0.09 157.7 0.01 0.01 S3 1.34 8.24 1.21 0.77 2.72
pS4 11.26 0.36 678.1 0.11 0.18 S4 17.43 26.35 5.55 4.30 11.93
pS5 0.42 0.01 48.59 0.00 0.01 S5 0.37 0.55 0.24 0.13 0.58 pt 1.80 1.87 2.22 1.67 1.81 et 83.16 123.6 3332 36.75 44.63
instances 27 2 2 3 8
376

4. Evaluation of the clusterization
In the discussion presented in Tables 1-6 and, the optimal clusters have been highlighted. All values for the stages and their preprocessing phase are in kWh/ton, the production through output (pt) in [ton/h]. K-means and EM seem to provide the best assessment of the processes because it’s the best cluster that has the lowest energy consumption from the three optimal clusters for each clusterization.
Table 6 EM clusterization of cauliflower production
Cauloflower Cluster EM
Attribute 0 1 2 3 4
pS1 3.44 0.50 0.17 34.90 519.2 S1 4.13 23.95 2.13 0.06 2.28 S2 0.10 0.94 0.10 0.00 0.05
pS3 0.11 0.13 0.08 16.03 157.7 S3 1.31 6.59 0.96 0.00 1.21
pS4 2.13 0.34 5.53 113.2 678.1 S4 11.01 22.59 54.4 0.28 5.55
pS5 0.09 0.01 0.19 4.24 48.59 S5 0.23 0.58 1.11 0.01 0.24 pt 1.89 1.94 1.47 1.55 2.22 et 48.6 112.4 94.3 363.0 3332
instances 27 4 6 3 2
To assess and to choose the clusterization method we have used five machine learning methods as in our previous work [11][12]. All the clusterization results were assessed by the classification methods with the same parameters. In Tab. 5 there are classification results of the production processes using the following classifiers:
- 3NN (kNN) 3-Nearest Neighbors; - Multilayer Perceptron (MLP) with a hidden
layer with 16 nodes for both productions with a learning rate equal to 0.79 and momentum equal to 0.39 [13];
- binary tree C4.5 with a confidence factor equal to 0.25, with a minimum number of instances per leaf equal 2;
- Random Forrest (RF) with the bag size percent equal to 100, with maximum depth unlimited, number of execution slots equal to 1 and 100 iterations;
- Support Vector Machine (SVM) with a radial basis function (RBF) given by the Eq. (2):
K(x,y) = exp(-0.05*(x-y)2) (2)
Table 7 Evaluation of the broccoli clusterization by the chosen classifiers
Classifier Broccoli evaluation results [%] Canopy KM EM
3NN 85.7 97.1 97.1 C4.5 94.3 100 97.1 MLP 97.1 94.3 97.1 RF 100 100 100
SVM 100 100 100
Table 8 Evaluation of the cauliflower clusterization by the chosen classifiers
Classifier Cauliflower evaluation results [%]
Canopy KM EM
3NN 90.5 90.5 85.7 C4.5 95.2 97.6 97.6 MLP 92.9 81.0 92.9 RF 100 100 100
SVM 100 100 100
5. Conclusions
In the paper, three clusterization methods have been shown that allow us to assess the processes and their impact on energy consumption and hence, the carbon footprint. We have shown that all the clustering methods point out the processes that are proper from the manufacturing point of view. In the paper, the results for the broccoli and cauliflower production taking into account 35 and 42 corresponding processes respectively have been shown. Currently, we collect new processes for the other vegetable products. The will be analyzed using the clustering methods shown above
The k-means classifier is fast and simple, it has significant disadvantages because it is sensitive to emissions that distort the average value. Although it gives EM the best results in the assessment of the whole production it is planned to use k-SVD and fuzzy k- means methods in future work.
6. Acknowledgements
The paper is co-financed by the Polish National Center for Research and Development,
377

grant CFOOD number BIOSTRATEG3/343817/17/NCBR/2018.
7. References
[1] O. Edenhofer, R. Pichs-Madruga, Y.
Sokona, E. Farahani, S. Kadner, K. Kadner, A. Seyboth, I. Adler, S. Baum, G. Myhre, et al. “Climate Change 2014: Mitigation of Climate Change” Working Group III Contribution to the IPCC Fifth Assessment Report, Cambridge University Press: Cambridge, UK, 2015.
[2] Food and Agriculture Organization of the United Nations (FAO). Regional Strategy for Sustainable Hybrid Rice Development in Asia, Food and Agriculture Organization of the United Nations Regional Office for Asia and the Pacific: Bangkok, Thailand, 2014.
[3] D.B. Lobell, W. Schlenker, J. Costa-Roberts, “Climate trends and global crop production since 1980”, Science 2011, 333, 616–620.
[4] R.Y.M. Kangalawe, C.G. Mungongo, A.G. Mwakaje, E. Kalumanga, P.Z. Yanda, “Climate change and variability impacts on agricultural production and livelihood systems in Western Tanzania”. Clim. Dev. 2017, 9, 202–216.
[5] ECE Strategies and policies for air pollution abatement. United Nations, New York and Geneva, 2007.
[6] European Council Conclusions 2014. 2030 Climate and energy policy framework. Conclusions – 23/24 October 2014, EUCO 169/14, http://www.consilium.europa.eu/uedocs/cms_data/docs/pressdata/en/ec/145397.pdf
[7] ISO14040 - Environmental management-life cycle assessment: principles and framework. International Organization for Standardization, Geneva, 2006.
[8] ISO14064-1 - Greenhouse gases - Part 1: Specification with guidance at the organization level for quantification and reporting of greenhouse gas emissions and removals. International Organization for Standardization, Geneva, 2018.
[9] ISO/TS 14067 - Greenhouse gases - Carbon footprint of products - Requirements and guidelines for quantification. International Organization for Standardization, Geneva, 2018.
[10] PAS 2050 (2011) “The Guide to PAS2050-2011, Specification for the assessment of the life cycle greenhouse gas emissions of goods and services. British Standards Institution, 2011.
[11] M.A. Renouf, C. Renaud-Gentie, A. Perrin, C. Kanyarushoki, F. Jourjon, “Effectiveness criteria for customised agricultural life cycle assessment tools”, J. Clean. Prod. 179, 2018, 246–254
[12] D. Perez-Neira, A. Grollmus-Venegas, “Life-cycle energy assessment and carbon footprint of peri-urban horticulture. A comparative case study of local food systems in Spain”, Landscape and Urban Planning 172, 2018, 60-68
[13] A. Nabavi-Pelesaraei, S. Rafiee, S.S. Mohtasebi, H. Hosseinzadeh-Bandbafha, K. Chau, “Energy consumption enhancement and environmental life cycle assessment in paddy production using optimization techniques”, J. Clean. Prod. 162, 2017, 571-586
[14] P. Milczarski, A. Hłobaż, P. Maślanka, B. Zieliński, Z. Stawska, P.Kosiński, "Carbon footprint calculation and optimization approach for CFOOD project", CEUR Workshop Proceedings 2683 (2019) 30-34
[15] P. Milczarski, B. Zieliński, Z. Stawska, A. Hłobaż, P. Maślanka, P. Kosiński, "Machine Learning Application in Energy Consumption Calculation and Assessment in Food Processing Industry", ICAISC (2) (2020), Springer LNAI 12416, 369-379.
[16] Z. Stawska, P. Milczarski, et al., ”The carbon footprint methodology in CFOOD project.” International Journal of Electronics and Telecommunications, 2020, 66(4), 781–786
[17] P. Harrington, “Machine Learning in Action.” Manning Publ. 2012.
[18] A.P Dempster, N.M. Laird, D.B. Rubin, "Maximum Likelihood from Incomplete Data via the EM Algorithm". Journal of the Royal Statistical Society, Series B. 39 (1), 1977, 1–38
378

Інформаційна Система Інтелектуального Моніторингу Зварних З’єднань Сергій Голуб1, Володимир Метелап 2
1,2 Черкаський державний технологічний університет, бул. Шевченкка 460, м.Черкаси,18006, Україна
Анотація Запропоновано використовувати інформаційну технологію інтелектуального моніторингу (ІТІМ) для виявлення зварних з’єднань та оцінки зміни їх властивостей. Досліджено процес обробки аналітичних сигналів на виході існуючих технічних засобів діагностики на базі B&R. Експериментально доведено переваги моніторингової інформаційної системи (МІС) над існуючими засобами діагностики зварних з’єднань. Ключові слова 1 Інтелектуальний моніторинг, обробка зображень, неруйнівний контроль, інформаційна технологія, зварні з’єднання
Information Intellegent Monitoring System Seam Wealding Serhii Holub1, Volodymyr Metelap 2
1,2 Cherkasy state technological university, bul. Shevchenka 460, Cherkassy, 18006, Ukraine
Abstract It is proposed to use intelligent monitoring information technology (IMIT) to detect seam welding and changes their properties. The process of processing analytical signals at the output of existing technical diagnostic tools based on B&R is researched. The advantages of the monitoring information system (MIS) over the existing means of diagnostics of seam welding have been experimentally proved. Keywords 2 Intelligent monitoring, image processing, non-destructive testing, information technology, seam welding
1. Вступ
Актуальність роботи викликана необхідністю оцінки стану зварних з’єднань та прогнозу зміни їх властивостей під впливом зовнішніх факторів [1, 2, 3, 4].
Можна виділити наступні етапи роботи з визначення/утворення зварювального шву: визначення шву для зварювання, після зварювання для подальшої обробки та визначення надійності/якості зварного шву з
EMAIL: [email protected] (A. 1); [email protected] (A. 2) ORCID: 0000-0002-5523-6120 (A. 1); 0000-0001-5953-5972 (A. 2);
урахуванням прогнозування зміни властивостей.
Моніторингова інформаційна система (МІС) для аналізу зварних з’єднань - це програмно-апаратна реалізація інформаційної технології інтелектуального моніторингу зварних з’єднань в галузі неруйнівного контролю. У цій роботі подані результати використання синтезаторів моделей МІС для обробки вихідних сигналів технічних пристроїв контролю зварних з’єднань.
379

2. Результати досліджень
Одними з найбільш відомих компаній, які займаються реалізацією промислових систем і в цьому напрямку є Blackbird Robotersysteme GmbH, Arbicor Binzel, IGM, Roland, Acuity, SERVO-ROBOT Inc., TRUMPF, B&R та інші.
Рисунок 1: Схема програмно – апаратної моніторингової інформаційної системи на базі елементів B&R
Для дослідження було використано
наступні технічні засоби контролю (рисунок 1), які мають наступне кодування: 5APC2200.хххх та VSS122Q22.хххх.
В цій роботі описані пристрої використовуються в якості технічних засобів організації спостережень для формування масивів вхідних даних та обробки результатів цих спостережень.
Накопичення, обробка та перетворення результатів спостережень виконується моніторинговою інформаційною системою, яка розгорнута на цій же апаратній платформі.
Результатом моніторингу є відомості про розташування та зміну стану зварного з’єднання та прогноз цих змін. Горизонт прогнозування та інші характеристики залежать від властивостей об’єкта моніторингу та його стану.
Для формування масиву вхідних даних проводились спостереження за зварними з’єднаннями металевих конструкцій в різних станах.
Кількість станів зварних з’єднань та кількість спостережень визначалось експертним методом на початковому етапі навчання/налаштування системи.
Для розв’язання задачі прогнозування спостереження проводились спостереження через дискретні моменти часу та з
урахуванням можливостей апаратної частини обладнання.
Рисунок 2: Приклад вхідних та вихідних даних системи
Моделювання проводилось за кількома
алгоритмами синтезу моделей (АСМ): багаторядний та комбінаторний алгоритм МГУА [5], алгоритм Степаненко [6] , гібридні алгоритми [7]. За результатами випробування алгоритмів обирався кращий. Порівняння АСМ відбувалось за результатами роботи побудованими ними моделей.
В результаті експериментів підтвердили гіпотезу про можливість розв’язання поставлених задач шляхом поєднання технічних та програмних засобів контролю зварних з’єднань та моніторингової інформаційної системи.
3. Висновки
Обробка сигналів на виході технічних засобів контролю зварних з’єднань моніторинговою інформаційною системою дозволяє створити метод прогнозування зміни властивостей зварного шву шляхом послідовного розв’язку задач визначення місця розташування цього шва у готовому виробі (профільній металевій трубі), виявлення його стану та профілювання.
380

4. Література References
[1] Real-Time Weld Process Monitoring [Paul Kah*, Pavel Layus, Esa Hiltunen, Jukka Martikainen, Advanced Materials Research (Volume 933), Dehuai Zeng, 117-124, May 2014, URL: https://www.researchgate.net/publication/272071613_Real-Time_Weld_Process_Monitoring ]
[2] Development of a characteristic point detecting seam tracking algorithm for portable welding robots. [Doyoung Chang, Donghoon Son, Namsoo Kim, Jongwon Kim, Jungwoo Lee, Tae-Wan Kim, Kyu-Yeul Lee, Robotic and Sensors Environments (ROSE), 2010 IEEE International Workshop on Robotic and Sensors Environments, 15-16 Oct. 2010, DOI: 10.1109/ROSE.2010.5675251, URL: https://www.researchgate.net/publication/224207820_Development_of_a_characteristic_point_detecting_seam_tracking_algorithm_for_portable_welding_robots].
[3] ZouYanbiaoWangYanboZhouWeilinChenXiangzhi, School of Mechanical & Automotive Engineering, South China University of Technology, Guangzhou
510640, China, Optics & Laser Technology Volume 103, July 2018, Pages 182-192 URL: https://doi.org/10.1016/j.optlastec.2018.01.010
[4] P Kah*, M Shrestha, E Hiltunen and J Martikainen, Kahet al. International Journal of Mechanical andMaterials Engineering (2015) 10:13 DOI 10.1186/s40712-015-0042-y.
[5] Ivakhnenko, A.G.:Inductive method of self-organization of models of complex systems. Kiev, Naukova Dumka, 1981. 296 p.
[6] Голуб С.В. Моделювання об’єктів моніторингу довкілля за алгоритмом Сепаненка. Електроніка та системи управління –2006. – № 4(10). – С. 165–168.
[7] Голуб С.В. Багаторівневе моделювання в технологіях моніторингу оточуючого середовища. Монографія. Черкаси: Вид. від. ЧНУ імені Богдана Хмельницького, 2007. – 220 с. ISBN 978-966-353-062-8
381

Оптимізація Продуктивності Багатопроцесорних Обчислювальних Систем За Часом Обслуговування Любомир Петришин 1, Галина Михайлишин 2, Михайло Петришин 3
1 AGH науково-технологічний університет, ал. Міцкевича, 30, Краків, 30-059, Польща 1,2,3 Прикарпатський національний університет імені Василя Стефаника, вул. Шевченка, 57, Івано-Франківськ, 76018, Україна
Анотація Із застосуванням теорії масового обслуговування розроблені теоретичні та методичні основи оптимізації параметрів багатопроцесорних обчислювальних систем із різними методами структурної організації та обслуговування вхідних інфопотоків. Розроблені прикладні аспекти покращення процесів обслуговування. Ключові слова 1 Обчислювальна система, оптимізація, архітектура, теорія масового обслуговування
Optimization Of Multiprocessor Computer Systems Productivity On Service Time Lubomyr Petryshyn 1, Halyna Mykhailyshyn 2 and Mykhailo Petryshyn 3
1 AGH University of Science and Technology, al. Mickiewicza 30, Cracow, 30-059, Poland 1,2,3 Vasyl Stefanyk Precarpathian National University, 57 Shevchenko str., Ivano-Frankivsk, 76018, Ukraine
Abstract Using the theory of queuing, the theoretical and methodological bases of multiprocessor computer systems parameters optimization with different methods of structural organization and maintenance of input information streams are developed. Applied aspects of service process improvement have been developed. Keywords 2 Computing system, optimization, architecture, queuing theory
1. Вступ
Впровадження високопродуктивних засобів обчислювальної техніки є визначальним чинником вирішення прикладних та практичних завдань в галузі сучасних інформаційних технологій. Аналіз специфіки оброблюваних інфопотоків та проектування відповідно адаптованих архітектур багатопроцесорних обчислювальних системах (БПОС) дозволяє
EMAIL: [email protected] (A. 1); [email protected] (A. 2); [email protected] (A. 3); ORCID: 0000-0003-4168-3891 (A. 1); 0000-0003-1589-9242 (A. 2) 0000-0001-6319-3768 (A. 3)
підвищити техніко-екномічну ефективніть застосування обчислювальних потужностей та реалізації інформаційної технології [1 - 4].
2. Актуальність та проблематика дослідження
На шляху розробки однопроцесорних обчислювальних систем (ОС) стоять проблеми технологічного характеру виготовлення мікрочіпів, що накладають обмеження
382

потенційного збільшення обчислювальних потужностей технічних засобів. Єдиний шлях вирішення проблем збільшення продуктивності засобів обчислювальної техніки полягає в розпаралелюванні процедур обробки інформаційних потоків та використанні БПОС і комплексів. Практична реалізація високорозвинених розпаралелених структур передбачає значні грошові затрати на їхнє виготовлення, що вимагає коректного підходу до визначення і аналізу характеристик вхідних інформаційних потоків, а також вміння визначити техніко-економічні параметри БПОС, розробити архітектуру і визначити процедури обслуговування інфопотоків в системі [3, 4]. На сучасному рівні в достатній мірі розроблений математичний апарат теорії масового обслуговування, що дозволяє змоделювати прикладні аспекти основних процесів обробки інфопотоків в БПОС [5 - 14].
3. Мета і задачі дослідження
Метою роботи є обгрунтування ефективності застосування та аналіз математичного апарату моделювання процесів обслуговування інфорпотоків у БПОС на основі теорії масового обслуговування. Вирішено задачі розробки архітектури БПОС на стадії проектування за допомогою одного із можливих методів оптимізації процесів обслуговування за параметрами часу та інтенсивності обслуговування.
4. Оптимізація продуктивності БПОС за часом обслуговування
Показником, що характеризує продуктивність ОС, є час обслуговування, який визначає час, необхідний для обслуговування однієї задачі вхідного потоку. Якщо обслуговування задачі системою завершено, то вважають, що запит задоволений. Проте вказаний показник не дозволяє оцінити якість обслуговування запиту [15 – 30].
В ОС час обслуговування різних задач потоку може бути як постійною, так і випадковою величиною, що залежить від характеру потоку, мономорфності задач та складу системи обслуговування. В залежності від інтенсивності вхідного потоку, розмірності
задач, продуктивності та завантаженості ОС, час обслуговування в загальному випадку розглядається як випадкова величина. Це дозволяє представити час обслуговування Т відповідним законом через функцію розподілу
V(t)=P{T<t} за умови t≥0, яка визначає ймовірність того, що випадкове значення часу обслуговування T не перевищуватиме заданого значення часу t. Час обслуговування не може набувати від’ємних значень, тому
V(t)=0 за умови t<0. Як і всяка функція розподілу, V(t) є
невід’ємною монотонно висхідною функцією, що не перевищує одиниці.
БПОС можуть складатись із різного числа процесорів, кожен із яких може мати функціональну специфіку, продуктивність та конфігурацію, що в загальному випадку зумовлює різний характер законів розподілу часу обслуговування різних задач вхідних потоків як різними системами, так і різними процесорами в межах однієї системи. Дослідження характеру законів розподілу часу обслуговування потребує проведення детального аналізу ймовірнісних показників як вхідного потоку, так і самої системи. В подальших викладках, якщо на це спеціально не вказано, передбачається, що ОС складаються з однотипних процесорів типу SMP (англ. Symmetric Multiprocessing), які характеризуються єдиним законом розподілу часу обслуговування системою вхідного потоку задач.
Функція розподілу часу обслуговування V(t), яка характеризує ймовірність того, що час обслуговування не перевищить заданого значення t, визначається аналітичним виразом
V(t)=1–e-μt, де параметр μ=1/tобс. характеризує інтенсивність обслуговування і є величиною, обернено пропорційною до середнього часу обслуговування одним процесором однієї задачі. Значення tобс. є математичним очікуванням часу обслуговування M(T)= =
=
−=+−=
−
−
−
110)(
0000
ttt edteettdFt .
Показниковий закон розподілу часу обслуговування V(t) (рисунок 1) визначає, що ймовірність закінчення обслуговування відразу після його початку досить висока, а затягування обслуговування в часі є малоймовірним.
383

0 0.1 0.2 0.3 0.40
0.2
0.4
0.6
0.8
1
p1( )t
p2( )t
p3( )t
t
Рисунок 1: Закон розподілу часу обслуговування
Інша властивість показникового закону
розподілу полягає в тому, що закон розподілу значення часу, що залишився після проходження певного інтервалу часу від початку обслуговування, не залежить від інтервалу часу, що проминув від початку обслуговування. Ймовірність V0(t) того, що обслуговування, яке вже триває протягом інтервалу часу a, триватиме не менше інтервалу t, визначено із виразу
V0(t)=1–V(t)=e-μt як
V0(a+t)=e-μ(a+t), де V0(t) - ймовірність того, що час обслуговування Т вхідного потоку задач з інтенсивністю обслуговування μ не буде меншим значення часу t.
V(t)=P{T<t}, тому
V0(t)=P{T≥t}, і
V0(t)+V(t)=1, або
V0(t)=1–P{T<t}=1–V(t). Згідно з теоремою перемноження
ймовірностей V0(a+t)=V0(a)Va(t)
ймовірність V0(a+t) того, що обслуговування триватиме не менше інтервалу часу a+t буде рівна добутку ймовірності V0(a) того, що обслуговування триватиме не менше ніж значення інтервалу a, перемножену на ймовірність Va(t) того, що воно триватиме не менше ніж інтервал часу t за умови, що обслуговування уже триває протягом інтервалу часу a. Порівнюючи із попереднім
V0(a)Va(t)=e-μ(a+t), звідки
Va(t)={1/V0(a)}e-μ(a+t)=eμae-μ(a+t)=e-μt, отримуємо
Va(t)=e-μt=V0(t),
тому V0(t)=e-μt.
Із вище наведеного можна ствердити, що умовна ймовірність Va(t) збігається з ймовірністю V0(t), тому закон розподілу не залежить від тривалості інтервалу часу (0, a), в межах якого вже здійснюється обслуговування задачі.
За наявності розпаралеленої БПОС із множинними потоками команд та даних типу МКМД, в якій кожен із процесорів у стані здійснювати автономну обробку незалежних задач вхідного потоку із відповідним усередненим значенням часу обслуговування 1/μ1, 1/μ2, ..., 1/μn, математичне очікування часу обслуговування потоку системою становитиме
M(T)=1/(μ1+μ2+...+μn). Ймовірність того, що випадкове значення
часу обслуговування T не перевищуватиме заданого значення t за умови одночасного обслуговування вхідного потоку задач n процесорами різної продуктивності та показниковому характері розподілу визначається як
V(t)=P{T<t}=1–e-(μ1+μ2+...+μn)t. Якщо всі процесори ОС мають однакову
продуктивність і вхідний потік задач є однорідним, тобто
μ1=μ2=...=μn, то справедливо
M(T)=1/nμ. За умови, що ОС розпочинає одночасне
обслуговування всіх задач вхідного потоку, ймовірність того, що система завершить обслуговування протягом інтервалу часу (0, t) становить
V(t)=P{T<t}=e-nμt. Багатопроцесорним системам
обслуговування властиво зменшення дисперсії – показника степені розкиду часу обслуговування біля математичного очікування, значення якого визначається як
D[T]=M[T2]–(M[T])2=1/μ2. В ОС, у складі n процесорів, дисперсія
визначається як D[T]=1/(nμ)2. Тобто значення дисперсії зменшується в n2 разів порівнюючи зі значенням дисперсії для систем однопроцесорного обслуговування. Така властивість дозволяє більш точно планувати обчислювальне навантаження, розподіляти ресурси часу та обчислювальної потужності системи.
V(t)
t
=3 =2 =1
384

Як показує практика, показниковий закон достатньо вірогідно характеризує специфіку процесів обслуговування в БПОС, в достатній мірі вивчений, що зумовило його застосування в матеріалі дослідження та здійснення моделювання архітектур ОС на його основі.
5. Висновки
За отрианими результатами проведених досліджень обгрунтовано застосування теорії масового обслуговування для моделювання процесів обробки інформаційних потоків у БПОС. Проаналізовано один із можливих методів оптимізації процесів обслуговування за параметрами часу та інтенсивності обслуговування. Наведено аналітичні залежності та графічний характер закону розподілу часу обслуговування, за яким можна підсумувати, що ймовірність закінчення обслуговування відразу після його початку досить висока, а затягування обслуговування в часі є малоймовірним. Характер дослідження має прикладний характер та рекомендовано для застосування на стадіях розробки архітектури БПОС.
6. Література References
[1] M. Harchol-Balter, Performance modeling and design of computer systems : queueing theory in action. Publisher: New York : Cambridge University Press, 2014.
[2] L.B. Petryshyn, Theory of digital data transformation in the ICT / Lubomyr B. PETRYSHYN // In: Advances in ICT for business, industry and public sector : / eds. Maria Mach-Król, Celina M. Olszak, Tomasz Pełech-Pilichowski. — Cham ; [etc.] : Springer, 2015. — S. 157–170.
[3] T. Czachórski, Modele kolejkowe w ocenie efektywności pracy sieci i systemów komputerowych / Gliwice : Pracownia Komputerowa Jacka Skalmierskiego, 1999.
[4] Л.Б. Петришин, Теоретические основы функционального анализа информационных потоков и кодирования сообщений в системах управления — Theoretical bases of the functional analysis of information streams and coding of messages in management systems. / Lyubomyr PETRYSHYN // In: Zarządzanie produkcją – planowanie, wytwarzanie, optymalizacja i kontrola = Management of
production – planning, production, optimization and control : monografia / red. nauk. R. Barcik, M. Dudek, W. Waszkielewicz. — Bielsko-Biała : Wydaw-nictwo Akademii Techniczno-Humanistycznej, 2010. — S. 227–244.
[5] G.F. Newell, Applications of Queueing Theory. Springer Science+Business Media B.V. 1982.
[6] T. Kiesling, T. Krieger, Efficient parallel queuing system simulation, in: The 38th Conference on Winter Simulation, Winter Simulation Conference, 2006, pp. 1020–1027.
[7] N.U. Prabhu, Foundations of queueing theory. Publisher: Boston Kluwer, 2002.
[8] Л. Петришин, Теоретические основы расчета многопроцессорных информационных систем управления — Theoretical design bases of multiprocessors information systems of management / Lubomyr PETRYSHYN // In: Zarządzanie przedsiębiorstwem – teoria i praktyka : monografia. Akademia Górniczo-Hutnicza im. Stanisława Staszica w Krakowie. — Kraków : WZ AGH, 2012. — S. 1–18.
[9] Л. Петришин, Оптимизация распределенных компьютеризированных систем управления — Optimization of the distributed computerized control systems / Lubomyr PETRYSHYN // In: Informacje i marketing w działalności organizacji :monografia = Information and marketing in activities of organization : [monograph] / red. nauk. Honorata Howaniec, Irena Szewczyk, Wiesław WASZKIELEWICZ. — Bielsko-Biała : Wydawnictwo Naukowe Akademii Techniczno-Humanistycznej, 2013. — S. 9–21.
[10] J.F. Shortle, J.M. Thompson, D. Gross, C.M. Harris, Fundamentals of queueing theory, Hoboken, New Jersey : John Wiley & Sons, 2018.
[11] R.B. Cooper, Introduction to queueing theory. Publisher: Washington, DC : CEEPress Books, 1990.
[12] U.N. Bhat, An Introduction to Queueing Theory Modeling and Analysis in Applications, Birkhäuser, Boston, MA, 2008.
[13] A.M. Lee, Applied Queueing Theory. Publisher: London : Macmillan Education, Limited, 2016.
[14] Л. Петришин, Застосування теорії масового обслуговування на стадії
385

моделювання багатопроцесорних обчислювальних систем – Application of the queueing theory at the stage of multiprocessor computing systems modeling // Тези доповідей шостої міжнародної науково-практичної конференції «Методи та засоби кодування, захисту й ущільнення інформації» м. Вінниця, 24-25 жовтня 2017 року. – Вінниця: ВНТУ, 2017. – С. 135-138.
[15] F.B. Nilsen, Queuing systems: Modeling, analysis and simulation, Department of Informatics, University of Oslo, Oslo, 1998.
[16] Л. Петришин, Д. Саля, Архитектоника многопроцессорных компьютеризованных систем управления — Architecture of the multiprocessor computerized management systems / Lubomyr PETRYSHYN, Dariusz SALA // In: Zarządzanie przedsiębiorstwem : teoria i praktyka 2014 / pod red. nauk. Piotra Łebkowskiego. — Kraków : Wydawnictwa AGH, 2014. — (Monografia Wydawnictw Akademii Górniczo-Hutniczej im. S. Staszica w Krakowie). — S. 185–199.
[17] S. Palaniammal, Probability and queueing theory. Publisher: New Delhi : PHI Learning, 2012.
[18] M. Haviv, Queues : a Course in Queueing Theory. Publisher: New York, NY : Springer, 2013.
[19] P.P. Bocharov, C. D'Apice, A.V. Pechinkin, Queueing Theory. Publisher: Berlin ; Boston : De Gruyter, 2011.
[20] Queueing theory. Publisher: [Place of publication not identified] : Book On Demand, 2012.
[21] Л.Б. Петришин, В. Вашкелевич, Практика використання теорії масового обслуговування в курсі предмету «Архітектура обчислювальних систем» - The Practice of Applying the Queuing Theory in the Course «Architecture of Computing Systems // Науково-практична конференція «Інформаційні технології та компютерне моделювання ІТКМ-2016» 23-28 травня 2016 р. Івано-Франківськ : Супрун В.П., 2016. (-232 с.) – С. 58-59.
[22] В. Вашкелевич, Л.Б. Петришин, Моделирование мультипроцессорных систем управления – Modeling of Multiprocessor Control Systems // ІІ Міжнародна конференція «Комп'ютерна алгебра та інформаційні технології» КАІТ-2016, 21-26 серпня 2016 р. : Одеса,
Україна. / Одеський національний університет імені І.І.Мечникова. –Одеса: ТЕС, 2016. – С. 41-42.
[23] L. Petryshyn, Математические модели обслуживания информационных процессов в многопроцессорных компьютеризованных системах управления // In monography Information Technology in Selected Areas of Management. / Sc.Ed. Lyubomyr Petryshyn. Published by AGH University of Science and Technology Press. KU 0651. Krakow 2016. – P. 11-32.
[24] Л.Б. Петришин, Оптимізація багатопроцесорних обчислювальних систем з очікуванням – Optimization of multiprocessor computing systems with expectations // 6-я международная научно-техническая конференция Информационные системы и технологии ИСТ-2017, 11-16 сентября 2017, Харьков – Коблево. ХНУРЭ, AGH ПНУ, -C. 74-75.
[25] Е.Ю. Шемахин, Моделирование многоканальной открытой системы массового обслуживания с ограничениями. Определение аналитических формул // Молодой ученый. — 2015. — №12. — С. 20-27. — URL https://moluch.ru/archive/92/20226/ (дата обращения: 01.07.2021).
[26] А.П. Кирпичников, Методы прикладной теории массового обслуживания. Казань, Изд-во Казанского ун-та, 2011. 200 с.
[27] W.M. Kempa, Queueing models with limited access to server. Publisher: Gliwice : Wydawnictwo Politechniki Sląskiej, 2013.
[28] N. Gautam, Analysis of queues : methods and applications. Publisher: Boca Raton : CRC Press/Taylor & Francis, cop. 2012.
[29] J. Kałuski, Symulatory komputerowe systemów obsługi masowej / Poznań : Wydawnictwo Wyższej Szkoły Bankowej, 2017.
[30] R. Hassin, Rational queueing. Publisher: Boca Raton : Chapman & Hall/CRC, 2016.
386

Програмний Модуль Збору Та Аналізу Даних Про Дії Студентів На Базі Бібліотеки Інтеграції Moodle xAPI Тетяна Терещенко 1, Єгор Вернігоров2
1,2 Одеський державний екологічний університет, вул. Львівська, 15, Одеса, 65016, Україна
Анотація В роботі представлено програмний модуль, який дозволяє збирати інформацію про дії студентів в процесі онлайн-навчання. Інтелектуальний аналіз таких даних дозволяє поглибити розуміння процесів та закономірностей, які супроводжують навчання. Після проведеного аналізу існуючих варіантів та з урахуванням потреб вищого навчального закладу було обрано стандарт xAPI у якості основи створення інструментів для автоматизованого збору даних про дії студентів. Модуль розроблено з використання вбудованих в LMS Moodle функцій, які реалізують обробку операторів xAPI. Ключові слова 1 Інтелектуальний аналіз даних, програмний модуль, Moodle, xAPI, онлайн-навчання.
A Data Collecting and Analysis Software Module for Student Activities Based on the Moodle xAPI Integration Library Tetiana Tereshchenko 1, Yehor Vernihorov 2
1,2 Odessa State Environmental University, 15 Lvivska Str, Odesa, 65016, Ukraine
Abstract Abstract text. The paper presents a software module for collecting information about the actions of students in the process of online learning. Intelligent analysis of this data allows you to deepen your understanding of the processes and patterns that accompany learning. After an analysis of the existing options, the xAPI standard was chosen as the basis for creating tools for the automated collection of data on student actions. The module is developed using built-in LMS Moodle functions that handle xAPI statements. Keywords 2 Data mining, software module, Moodle, xAPI, online learning.
EMAIL: [email protected] (A. 1); [email protected] (A. 2) ORCID: 0000-0001-7691-6996 (A. 1); 0000-0002-0980-5329 (A. 2)
387

1. Вступ
Інтелектуальний аналіз даних в галузі освіти має особливе значення при вивченні навчальної поведінки студентів в умовах дистанційного навчання. Це обумовлено можливостями Data Mining в процесах виявлення прихованої інформації самих даних, аналізу отриманих результатів з метою підвищення якості навчання [1-3].
Навчальні заклади збирають і зберігають величезні обсяги даних, які пов’язані з проходженням студентом всіх етапів навчання, від зарахування до отримання документа про закінчення закладу освіти. Аналіз таких даних дозволяє поглибити розуміння процесів та закономірностей, які супроводжують навчання. Постійне зростання обсягів таких даних потребує удосконалення алгоритмів збору, збереження та обробки даних. Ця проблема привела до появи області інтелектуального аналізу даних в освіті - Educational Data Mining (EDM). Для збору даних в таких системах використовують платформи електронного навчання. Популярність платформ електронного навчання і їх широке використання на всіх рівнях освіти і навчання зробили доступними безліч даних для вилучення і аналізу. Дані збираються і зберігаються під час взаємодії студентів із середовищем електронного навчання [4-5]. Широке розповсюдження в системі національної освіти України має платформа електронного навчання LMS Moodle. Це відкрита веб-орієнтована система, яка має широкий набір засобів та інструментів для організації дистанційного навчання. Вона дозволяє створювати та зберігати навчальні курси, організовувати перевірку поточних і остаточних знань, візуалізувати та аналізувати дії всіх учасників навчального процесу.
Метою роботи є розробка та впровадження програмних інструментів для автоматизованого збору даних про дії студентів в системі онлайн-навчання.
2. Основний матеріал дослідження
LMS Moodle належить до класу систем управління навчанням. Має вбудовані функції
безпеки та конфіденційності. Дозволяє використовувати як стандартні функції, так і спеціалізовані, які реалізуються за допомогою плагінів. Система підтримує відкриті стандарти (SCORM, AICC, IMS-LTI, RSS,
LDAP), що забезпечує легку інтеграцію Moodle із зовнішніми інструментами. Наприклад, для інтеграції LMS Moodle з Microsoft Teams використовується Azure Services (рис. 1) [6].
Рисунок 1: Інтеграція LMS Moodle з Microsoft Teams
Система характеризується високою
гнучкістю, що дозволяє створювати онлайн-курси різного профілю та задовольняти потреби широкого кола користувачів. Останні версії системи стабільно працюють не тільки на стаціонарних комп’ютерах, а і на мобільних пристроях, що робить процес навчання більш доступним та зручним. Ідеологія open source надає повний контроль над даними та забезпечує конфіденційність.
Для обміну статистичними даними між електронними курсами та LRM (сховище даних) використовуються плагіни та модулі на базі стандартів SCORM або xAPI. Крім цього для виконання специфічних функцій можливо використання оригінальних API, які розробляються під потреби конкретного користувача системи онлайн-навчання. Можливості нового стандарту xAPI дозволяють створити гнучку та ефективну систему збору інформації (рис. 2). Ці дані характеризують дії, які здійснює користувач під час взаємодії з платформою (завантаження сторінок, скролінг, маніпуляції з мишею), час доступу до платформи (за сеанс або в цілому), а також оцінки за тест або підсумкові оцінки за курс. Дані, що збирає така система, пов’язані не тільки з діями користувача в системи дистанційного навчання, а і з діями при вивченні інших
388

навчальних матеріалів, в тому числі в режимі offline.
Рисунок 2: Система збору та обміну даними між LMS та LRS з використанням стандарту xAPI
Після отримання даних з системи онлайн
навчання вони аналізуються з використанням методів аналізу, класифікації та розпізнавання з метою оцінки результатів навчання. Такий аналіз дозволяє підвищити якість та ефективність освіти. Наступним етапом розробки є створення ефективної системи представлення знань, яка дозволяє приймати ефективні управлінські рішення.
Після проведеного аналізу існуючих варіантів та з урахуванням потреб вищого навчального закладу було обрано стандарт xAPI у якості основи створення інструментів для автоматизованого збору даних про дії студентів в системі онлайн-навчання. Цей стандарт дає можливість розробки навчальної екосистеми. Він підтримується великою кількістю постачальників ПЗ для створення онлайн курсів, спеціалізованих інструментів, систем онлайн-навчання. Заклад вищої освіти має можливість придбати або розробити власними ресурсами платформу, яка буде сумісна з xAPI. Також існує можливість удосконалити існуючу систему за рахунок використання додаткових інструментів та плагінів. До недоліків стандарту слід віднести складну та нетипову структуру даних, яка використовується як основа створення API.
У якості LRS може бути обрана інтегрована система або автономна, наприклад, LRS Learning Locker. Це сховище даних для зберігання інформації про навчальну діяльність, яка згенерована сумісними з xAPI інструментами [7]. Сучасний ринок програмного забезпечення пропонує велику кількість подібних систем з функціоналом, що задовольняє будь-які
потреби користувачів онлайн-навчання. Альтернативним варіантом є використання вбудованих в LMS функцій, які реалізують роботу сховища даних. Moodle має бібліотеку інтеграції для обробки операторів xAPI в будь-якому модулі. Тому було прийнято рішення не використовувати окрему LRS, а підключити бібліотеку Moodle xAPI.
Moodle підтримує основний запит xAPI – «statement» (оператор). Він використовується будь-яким плагіном для збереження активності користувача безпосередньо в Moodle без програмування додаткових веб-сервісів (actor→verb→object). Типовий оператор містить наступні елементи:
• actor (людина або група, дані про дії яких необхідно зберігати); • verb (дія, яку виконує actor); • object (об'єкт, над яким actor виконує дії). Бібліотека Moodle xAPI реалізує простий
алгоритм обробки операторів xAPI в будь-якому модулі. На даному етапі бібліотека реалізує:
• веб-сервіс core_xapi_statement_post для обробки операторів xAPI і генерації стандартних подій Moodle; • клас \core_xapi\handler, який плагін може розширити для використання xAPI і створення певних контекстів плагіна; • клас \core_xapi\iri для простого перетворення випадкової інформації в допустимі значення IRI (необхідний для xAPI objects and verbs); • клас \core_xapi\local для створення та вилучення інформації з даних оператора; • набір визначених класів в \core_xapi\ local\statement\item_XXX для генерації елементів операторів xAPI з плагінів. Набір визначених класів item надає класи
для перекладу елементів Moodle в структури xAPI. Веб-сервіс отримує оператор в кодуванні JSON та ім'я компонента в стилі frankenstyle. xAPI перевіряє структуру оператора, помилка повертається у випадку, коли будь-яка перевірка не виконана. Далі обробник компонента statement_to_event перетворює оператор в стандартну подію. Ці оператори можуть бути відправлені в JavaScript за допомогою методу «$ PAGE-> requires-> data_for_js», наприклад, генерація базового оператора реалізується простим способом (рис. 3) [8].
389

Рисунок 3: Генерація базового оператора
Функція item_agent має статичний метод
для генерації xAPI actor з запису користувача. Результат виконання цього коду представлено на рис. 4.
Рисунок 4: Результат виконання базового оператора
Використовуючи синтаксис, який
представлений на рис. 3, було розроблено опис навчальної діяльності студентів за межами системи онлайн-навчання, а саме, робота з html-сторінками та сайтами, перегляд відео-матеріалів, завантаження презентацій, підручників або файлів.
3. Висновки
В роботі створено програмний інструмент для опису навчальної діяльності студентів з матеріалами, які не включені в системи онлайн-навчання. Це дії студентів з контентом, який пов'язаний з процесом вивчення та освоєння тем та розділів дисциплін та курсів, що передбачені навчальним планом. Реалізація такої системи виконана з використанням бібліотеки Moodle xAPI.
Подальші розробки можуть бути пов'язані зі створенням алгоритмів роботи з
накопиченими даними. Подібні алгоритми використовують для контролю доступу до додаткової літератури, веб-сторінок, відео-файлів під час проходження тестів або складання іспитів. Другим напрямком використання таких алгоритмів є збір та аналіз інформації про використання додаткового контенту студентами в процесі освоєння кусів в системі онлайн-навчання.
4. Література References
[1] A. Dutt, M. A. Ismail, T. Herawan, "A Systematic Review on Educational Data Mining," IEEE Access. 5 (2017):15991-16005. doi: 10.1109/ACCESS.2017. 2654 247.
[2] Baker R.S., Inventado P.S. (2014) Educational Data Mining and Learning Analytics. In: Larusson J., White B. (eds) Learning Analytics. Springer, New York, NY. doi:10.1007/978-1-4614-3305-7_4.
[3] A. Charitopoulos, M. Rangoussi and D. Koulouriotis, "Educational data mining and data analysis for optimal learning content management: Applied in moodle for undergraduate engineering studies," 2017 IEEE Global Engineering Education Conference (EDUCON), 2017, pp. 990-998, doi: 10.1109/EDUCON.2017.7942969.
[4] Gabriela Carmen Oproiu,A Study about Using E-learning Platform (Moodle) in University Teaching Process,Procedia - Social and Behavioral Sciences,Vol. 180, 2015, pp. 426-432, ISSN 1877-0428, doi:10.1016/j.sbspro.2015.02.140.
[5] D. Benta, G. Bologa, I. Dzitac,E-learning Platforms in Higher Education. Case Study,Procedia Computer Science,Vol. 31, 2014, pp. 1170-1176, ISSN 1877-0509, doi:10.1016/j.procs.2014.05.373.
[6] Installing the Moodle integration with Microsoft Teams, 2021. URL: https://docs.microsoft.com/en-us/microsoftteams/install-moodle-integration.
[7] Learning Locker, 2021. URL: http://docs.learninglocker.net/welcome/.
[8] Experience API (xAPI), 2020. URL: https://docs.moodle.org/dev/Experience_API_(xAPI).
390

Development Of A Spatial Decision-Making Support System For The Location Of Technogenic Hazard Objects Svitlana Kuznichenko1, Iryna Buchynska2
1, 2 Odessa State Environmental University, 15 Lvivska Str, Odesa, 65016, Ukraine
Abstract The paper proposes an approach to the development of a spatial decision-making support system for the location of technogenic hazard objects. To solve the problem of ranking the territory according to the degree of suitability for placing hazard objects, methods of multiple-criteria decision-making and fuzzy models of spatial data processing are used. The use of the apparatus of fuzzy logic allows taking into account expert knowledge and judgments, partially compensates for the uncertainty of the initial information. During building the database, the concept of fuzzy relational databases was used, which allows you to extend the relational model to represent fuzzy data. This approach allows using relational structures to store the judgments of experts using the apparatus of fuzzy sets in GIS. Keywords Geographic information system, multiple-criteria decision analysis, fuzzy sets, site selection analysis.
1. Introduction
Modern geoinformation systems (GIS) are an essential component of decision support systems (DSS) due to the advanced functions of storage, processing and analysis of geodata, modeling tools, and the availability of visualization tools. Spatial problems, in particular the problem of determining the suitability of sites for construction objects, are by their nature always multiple-criteria [1]; therefore spatial DSSs are often used in cases when a large number of alternatives must be assessed on the basis of several criteria..1
GIS capabilities to generate a set of alternatives and select the best solution are usually based on surface analysis, proximity analysis, and overlay analysis. Overlay operations allow us to identify alternatives that simultaneously meet a set of criteria according to the decision rule, but they have limited opportunities to include the preferences of a decision-maker (DM). In addition, the complexity of spatial relations in some problems cannot be represented cartographically.
EMAIL: [email protected] (A. 1); [email protected] (A. 2); ORCID: 0000-0001-7982-1298 (A. 1); 0000-0002-0393-2781 (A. 2)
Therefore, for the last 20 years, GISs have been actively integrating multiple-criteria decision analysis (MCDA) methods [2-4] which expand the capabilities of GISs.
Methods of multiple-criteria decision analysis (MCDA) allow to structurize the problem of decision-making in the geographical sphere, take into account value judgments (i.e., preferences for criteria and/or alternative solutions), provide transparency of decision-making for a DM, and the ability to take into account both qualitative and quantitative criteria evaluation of all alternative solutions.
It should be noted that the major part of modern general-purpose GISs does not contain built-in full-featured tools that can fulfill a complex MCDA procedure. The use of separate software and tools and the lack of a single system for processing expert knowledge increases the duration of pre-project work, i.e., increases the life cycle of decision-making and consequently increases the probability of erroneous results at different stages. One of the possible ways to overcome the above-mentioned problems is the development and integration of software that implements the MCDA procedures into GISs.
Individual attempts to fully integrate MCDA and GIS tools within the common interface have identified problems due to the lack of flexibility and interactivity of such systems, which cannot
391

provide the needed freedom of action for analysts [5]. Therefore, the choice of procedure and appropriate methods of MCDA, which can provide a better solution to a particular problem, is an urgent task for developers.
Analysis of recent research and publications shows that the combination of MCDA and GIS is a fundamental tool for solving spatial problems in many areas [6-9]. Over the last few decades, significant progress has been made in the development of methods for the multiple-criteria analysis of the suitability of territories [10-12] and the choice of locations for spatial objects [13-15].
The peculiarity of the multiple-criteria decision analysis on the location of man-made hazardous and industrial objects is the need to take into account the ecological status and prospects of the socio-economic development of the region, the impact of this object on the environment and anthropogenic environment, as well as the current environmental legislation and sanitation. Preliminary examinations, in particular, ecological examinations at the site of the planned location of the object, are a mandatory condition. This justifies the need to take into account expert knowledge and use methods based on expert assessments.
In addition, we have to often encounter inaccuracies in the source spatial information and the need to use criteria that cannot be formalized, as well as uncertainty among experts as to the relative importance of the criteria and the acceptable decision strategy, i.e., compromise between the alternatives assessments according to different criteria. To take into account such uncertainties, an approach based on the use of "soft" computing and fuzzy set theory in MCDA methods is considered suitable [16]. Thus, in the information system based on the processing of geospatial information, in order to support decision making on the location of spatial objects, the following tasks must be solved:
• automated processing of the source heterogeneous geospatial information; • ranking of territories according to the degree of suitability for placement of objects on the basis of a combination of processing of the geospatial information with estimates and judgments of experts with the help of the MCDA methods using the instrument of fuzzy set theory and fuzzy logic;
• visualization of modeling results for different decision making strategies in the form of a comprehensive suitability map.
2. The main research material 2.1. Multiple-criteria model of technogenic hazard objects location based on fuzzy logic
Let us formulate the problem to determine the degree of suitability of the territory for the location of man-made hazardous objects on it [15]:
A,C,F,P;D , (1)
where A = {a1, a2,…, am} is a finite set of alternatives; C = {C1, C2,…, Cn} – a set of criteria by which alternatives are assessed; F – criteria-based assessment procedure; P – a system of the DM preferences, contains information on the alternatives assessments for each criterion; D – the decisive rule, specifies the procedure for performing the desired action on a set of alternatives (selection, ranking, sorting of alternatives).
In the geographical context, the MCDA process includes a set of geographically defined alternatives (e.g., land plots) and a set of assessment criteria presented as map layers. The analysis is to combine the criteria attributes according to the DM preferences using the decision rule (combining rule).
It is assumed that the criteria layers are represented in a raster data model that has the form of a two-dimensional discrete rectangular grid x×y. Each raster cell is an alternative that is described by its spatial data (geographical coordinates) and attribute data (criteria values). Let us write a set of alternatives A assessed by the criteria Cj:
ijА a |i 1 m,j 1 n ,= = = (2)
where aij – the value of the alternative attribute, i.e., the value of the attribute according to the j-th criterion and the i-th alternative; n – a number of criteria; m = mx•my – the number of alternatives (raster cells).
The MD preferences for the criteria assessment are determined by assigning the criteria weights wj, where j = 1, 2, ..., n.
A complete multiple-criteria mathematical model of the location of man-made hazardous
392

objects based on the fuzzy logic is given in [17]. The model is adapted to the location of landfills for solid domestic waste (SDW). Landfills are designed in accordance with state construction standards, which are given in Table 1.
It should be noted that the designed model allows us to enter an unlimited number of criteria, such as the prevailing wind direction, surface slope, etc
Table 1 Requirements for the construction of landfills SDW according to DBN V.2.4-2
Criterion Thresholds Distance from airports and airfields
15 km
Distance from the edge of open reservoirs, reserves, seacoast
3000 m
Distance from bridge border 1000m Distance from residential and public buildings
500 m
Distance from agricultural land, road and railways
200 m
Distance from the border of the forest and forest plant
50 m
Depth of soil water at least 2 m One of the important stages of the MCDA is
criteria standardization – the transformation of criteria attributes into comparative units, usually in a range of [0,1]. In [17], a procedure for the criteria fuzzification, i.e., transformation into a fuzzy set, is proposed for this purpose based on an expert assessment of the fuzzy membership function.
Thus, the description of spatial information based on the instrument of fuzzy set theory is based on the transformation of the attribute values of the k-th layer into the value of the membership degree of the fuzzy set Vk: k kk v vV (a, (a))|a U , (a):a [0,1],= → (3)
where a – the value of the attribute, U – a continuous set of attribute values.
As a rule, the membership function is built with the participation of an expert (group of experts) so that the membership degree is approximately equal to the intensity of the manifestation of some factor. In practice, the following types of membership functions are used (Fig. 1):
• triangular and trapezoidal (piecewise linear);
• nonlinear (Gaussian function, sigmoidal function, spline); • LR-representation of membership functions.
Figure 1: Types of membership functions: a) triangular; b) trapezoidal; c) U-shaped; d) Z-shaped; e) S-shaped
Trapezoidal MF in the general case can be given analytically by the expression:
( )Т
0,x a
(x a)/(b a),a x b
1,b x cf x;a,b,c,d (d x)/(d c),c x d
0,d x
− −
= − −
(4)
where a, b, c, d – some numerical parameters that take arbitrary real values and are ordered by the relation: a b c d.
The use of these functions reduces the numerical calculations and, correspondingly, the computational resources required to store individual values of the membership function.
Criteria fuzzification allows for the further combining of the criteria using fuzzy derivation rules. Fuzzy arithmetic intersection or combining operations can be used, which in this case can be considered as non-compensatory aggregation methods.
Thus, the use of fuzzy set theory to standardize the instrument criteria layers allows to take into account the uncertainty of the source
393

information and the experience and judgment of experts, as well as to obtain a more informative map of suitability by determining the suitability of alternatives: from 0 – "unsuitable," to 1 – "absolutely suitable". The higher the suitability rank of the alternative, the more suitable the alternative is for the object location.
2.2. Designing of the structure of spatial DSS for the location of hazardous objects
The decision support system (DSS) for the location of spatial objects was implemented as a GIS application based on the ArcGIS for Desktop platform by ESRI, which can be published on the Internet as a web service for use by an unlimited number of desktop and mobile clients using ArcGIS for Server server software.
The DSS structure is shown in Fig.2. The information needed to ensure the functioning of the system is stored in separate databases: cartographic – in a specialized geodatabase (GDB), expert information needed to process spatial data with the MCDA – in a database (DB) managed by the Microsoft SQL Server DBMS.
Figure 2: The structure of the spatial DSS for the location of technogenic hazard objects
The geodatabase of the system consists of
vector layers at a scale of 1:100000. Vector maps of land use, water bodies, settlements, railways, and highways are obtained by importing the Open Street Map database. Maps of agricultural lands, reserves, housing, forests, and afforestation were obtained by using SQL queries to the land use map attribute table. Digital terrain model (DTM), as well as the derived slope and exposure maps, were built according to ASTER space images with a raster
cell size of 27 m. Depending on the specifics of the tasks, additional specialized layers can be used (especially protected areas, fisheries, etc.).
Individual workflows have been designed as in-house tools using the ModelBuilder visual constructor and Python programming scripts.
To provide the GIS application with the necessary features and business logic, the ArcObjects SDK extension for .NET was used, with the help of which additional modules (add-ons) that perform fuzzy spatial data processing models, methods and algorithms of the MCDA procedure were developed based on C# and Windows Forms technology.
2.3. Development of a fuzzy database model
The concept of fuzzy relational databases was used in the building of the DSS database [18], which allows to expand the relational model for the presentation of fuzzy data. This approach allows storing expert judgments with the help of relational structures, using the instrument of fuzzy sets as a basis for managing certain types of uncertainty in GIS.
Fuzzy data is represented by membership functions, which can usually be determined by several numerical parameters (Fig. 1). By storing these parameters so that the requirements of adequacy and integrity are met, one can manage fuzzy data in a relational database. To do this, a fuzzy metamodel is proposed, which manages fuzzy data and connects with relational tables of real objects (Fig. 3).
The is_fuzzy table indicates which attributes and in which database tables are fuzzy. The fuzzy_link table connects the MF type with an attribute in a relational model of real objects. The fuzzy_type table defines the type of MF: triangular, trapezoidal, Z-shaped, S-shaped.
For the criteria attributes fuzzification, the system involves linear MF, each of which is presented by the numerical parameters in a separate table. For example, the trapezoidal table has the following attributes (fuzzy_id, a, b, c, d) to control the storing of trapezoidal fuzzy data. The triangular table has the (fuzzy_id, a, b, c) attributes correspondingly.
The connection of the database fuzzy metamodel with the geodatabase is shown in Fig. 4. The survey_area table contains information about the thematic raster layers of the studied area that need fuzzification.
394

Figure 3: Fuzzy metamodel of a relational database
Figure 4: Informational model of fuzzy information storing in a relational database system
395

Figure 5: The structure of the spatial DSS for the location of technogenic hazardous objects
.Using the is_fuzzy and fuzzy_link tables,
each raster of the GDB gets an assigned certain type of MF. A relational example of a fuzzy relational database is shown in Fig. 5.
From the tables shown in Fig. 5, one can recover all fuzzy as well as clear data. For example, the raster layer of distances from the transport network in the geodatabase of the system is named Road. For the fuzzification of its attributes, the trapezoidal MF will be used with numerical parameters a = 200 m, b = 500 m, c = 1000 m, d = 5000 m, i.e., the greatest degree of suitability according to this criterion will have alternatives located at a distance of 500 to 1000 m from railways and highways. Based on the available numerical parameters of the trapezoidal MF according to (4), the corresponding fuzzy values can be obtained for the entire range of clear values of the criteria attributes, and a table is formed for reclassification of the raster by the Reclassify geoprocessing ArcToolbox tool.
3. Conclusions
The paper presents a multiple-criteria decision analysis model, and the structure of the spatial decision support system for the location of hazardous objects in the form of a GIS application is developed. The use of fuzzy logic allows one to take into account expert knowledge and judgments, which partially compensates for the uncertainty of the source information through
the use of expert experience, as well as to obtain a more informative map of the suitability of territories by determining the suitability of alternatives.
A metamodel of building a spatial decision support system for the location of hazardous objects, which extends the relational model for the presentation of fuzzy data, is proposed. The metamodel allows using relational structures to store attributive information, membership functions and expert judgments, using the instrument of fuzzy sets as a basis for managing certain types of uncertainty in GIS. The relational approach to the organization of fuzzy database makes it possible to use it as part of an organized storage structure, as well as to ensure the interaction of spatial and attributive data and fuzzy database based on the use of queries received in the system, which greatly facilitates system implementation and ensures integrity and consistency of all accumulated information about hazardous objects to be located.
4. References
[1] Chakhar S., Mousseau V. Spatial multicriteria decision making // Shehkar S. and H. Xiong (Eds.), Encyclopedia of GIS, Springer-Verlag, New York, 2008. P. 747–753.
[2] Chakhar S., Martel J.M. Enhancing geographical information systems
396

capabilities with multicriteria evaluation functions, Journal of Geographic Information and Decision Analysis, 2003. Vol. 7, No. 2. P. 69–71.
[3] Malczewski J (2006) GIS-based multicriteria decision analysis: a survey of the literature. International Geographical Information Science 20(7):703–726.
[4] Malczewski J., Rinner C., Multicriteria Decision Analysis in Geographic Information Science, 2015, Springer, New York.
[5] Lidouh K. On themotivation behind MCDA and GIS integration, Int. J. Multicriteria Decision Making, 2013. Vol. 3, No. 2/3. P. 101–113.
[6] Afshari Ali, Vatanparast Mahdi, Ćoćkalo Dragan. Application of multi criteria decision making to urban planning – A review, Journal of Engineering Management and Competitiveness (JEMC), 2016. Vol. 6/03. P. 46-53.
[7] Mardani A., Jusoh A., MD Nor K., Khalifah Z., Zakwan N.,Valipour A. Multiple criteria decision-making techniques and their applications – a review of the literature from 2000 to 2014, Economic Research, 2015. Vol. 28, No. 1. P. 516-571.
[8] Kuznichenko, S., Buchynska, I., Kovalenko, L., Tereshchenko, T. Integrated information system for regional flood monitoring using internet of things. CEUR Workshop Proceedings, 2019, 2683, стр. 1–5
[9] M. Karpinski, S. Kuznichenko, N. Kazakova, O. Fraze-Frazenko, D. Jancarczyk.. Geospatial Assessment of the Territorial Road Network by Fractal Method. Future Internet. 12. 201 (2020). 10.3390/fi12110201.
[10] Lashari Z., Yousif M., Sahito N., Brohi S., Meghwar S., Khokhar U. D., Land Q. Suitability Analysis for Public Parks using the GIS Application, Sindh University Research Journal (Science Series), 2017. Vol.49(09). P. 505–512.
[11] Joerin F., Theriault M., Musy A. Using GIS and outranking multicriteria analysis for land-use suitability assessment, Int. j. of geographical information science, 2001. Vol. 15, No. 2. P. 153-174.
[12] Malczewski J (2004) GIS-based land-use suitability analysis: a critical overview. Progress in Planning, 62:3–6.
[13] Giovanni De Feo, Sabino De Gisi. Using MCDA and GIS for hazardous waste
landfill siting considering land scarcity for waste disposal. // Waste Management. 2014. No. 34. Р. 2225 – 2238.
[14] Rikalovic A., Cosic I., Lazarevic D. GIS Based Multi-Criteria Analysis for Industrial Site Selection, Procedia Engineering, 2014. Vol. 69, No. 12. Р. 1054 – 1063.
[15] Kuznichenko, S., Buchynska, I., Kovalenko, L., Gunchenko, Y. Suitable site selection using two-stage GIS-based fuzzy multi-criteria decision analysis. Advances in Intelligent Systems and Computing, 2020, 1080 AISC, стр. 214–230
[16] Zadeh L. A. Fuzzy sets. Information and Control, 1965. Vol. 8 (3). P. 338–353.
[17] Kuznichenko, S., Kovalenko, L., Buchynska, I., Gunchenko, Y. , Development of a multi-criteria model for making decisions on the location of solid waste landfills. Eastern-European Journal of Enterprise Technologies, 2018. Vol.2, No. 3(92). P. 21–31. DOI: 10.15587/1729-4061.2018.129287
[18] Petry FE (1996) Fuzzy Databases: Principles and Applications. Kluwer Academic Publishers Norwell, Boston, MA. USA, p 240.
397

Наукове електронне видання
МІЖНАРОДНА НАУКОВО-ПРАКТИЧНА КОНФЕРЕНЦІЯ «ІНТЕЛЕКТУАЛЬНІ СИСТЕМИ
ТА ІНФОРМАЦІЙНІ ТЕХНОЛОГІЇ»
МАТЕРІАЛИ КОНФЕРЕНЦІЇ
13-19 вересня 2021 Одеса, Україна
(українською та англійською мовою)
–––––––––––––––––––––––––––––––––––––––––––––––––––––––––––
Одеський державний екологічний університет 65016, м. Одеса, вул. Львівська, 15
Одеський національний університет імені І.І. Мечникова, Харківський національний економічний університет ІМ. С. Кузнеця –––––––––––––––––––––––––––––––––––––––––––––––––––––––––––
Підписано до друку 07.09.2021 Формат 60×84/16.
Папір офсетний. Гарнітура Times New Roman. Умовно-друк. арк. Тираж 100 Замовлення №
Віддруковано з готового оригінал-макета
Видавництво