Advanced Unsaturated Soil Mechanics and Engineering Charles & Bruce
Upload
independentCategory
view
1download
0
Unsaturated Fatty Acids Revert Diet-InducedHypothalamic Inflammation in ObesityDennys E. Cintra1,3, Eduardo R. Ropelle2, Juliana C. Moraes1, Jose R. Pauli2, Joseane Morari1, Claudio T.
de Souza1, Renato Grimaldi4, Marcela Stahl4, Jose B. Carvalheira2, Mario J. Saad2, Licio A. Velloso1,2*
1 Laboratory of Cell Signaling, University of Campinas, Campinas, Brazil, 2 Department of Internal Medicine, University of Campinas, Campinas, Brazil, 3 Faculty of Applied
Sciences, University of Campinas, Campinas, Brazil, 4 Faculty of Food Engineering, University of Campinas, Campinas, Brazil
Abstract
Background: In experimental models, hypothalamic inflammation is an early and determining factor in the installation andprogression of obesity. Pharmacological and gene-based approaches have proven efficient in restraining inflammation andcorrecting the obese phenotypes. However, the role of nutrients in the modulation of hypothalamic inflammation isunknown.
Methodology/Principal Findings: Here we show that, in a mouse model of diet-induced obesity, partial substitution of thefatty acid component of the diet by flax seed oil (rich in C18:3) or olive oil (rich in C18:1) corrects hypothalamicinflammation, hypothalamic and whole body insulin resistance, and body adiposity. In addition, upon icv injection in obeserats, both v3 and v9 pure fatty acids reduce spontaneous food intake and body mass gain. These effects are accompaniedby the reversal of functional and molecular hypothalamic resistance to leptin/insulin and increased POMC and CARTexpressions. In addition, both, v3 and v9 fatty acids inhibit the AMPK/ACC pathway and increase CPT1 and SCD1 expressionin the hypothalamus. Finally, acute hypothalamic injection of v3 and v9 fatty acids activate signal transduction through therecently identified GPR120 unsaturated fatty acid receptor.
Conclusions/Significance: Unsaturated fatty acids can act either as nutrients or directly in the hypothalamus, reverting diet-induced inflammation and reducing body adiposity. These data show that, in addition to pharmacological and geneticapproaches, nutrients can also be attractive candidates for controlling hypothalamic inflammation in obesity.
Citation: Cintra DE, Ropelle ER, Moraes JC, Pauli JR, Morari J, et al. (2012) Unsaturated Fatty Acids Revert Diet-Induced Hypothalamic Inflammation inObesity. PLoS ONE 7(1): e30571. doi:10.1371/journal.pone.0030571
Editor: Alicia J. Kowaltowski, Instituto de Quımica - Universidade de Sao Paulo, Brazil
Received April 8, 2011; Accepted December 20, 2011; Published January 18, 2012
Copyright: � 2012 Cintra et al. This is an open-access article distributed under the terms of the Creative Commons Attribution License, which permitsunrestricted use, distribution, and reproduction in any medium, provided the original author and source are credited.
Funding: This work was funded by grants from Fundacao de Amparo a Pesquisa do Estado de Sao Paulo and Conselho Nacional de Desenvolvimento Cientifico eTecnologico. The funders had no role in study design, data collection and analysis, decision to publish, or preparation of the manuscript.
Competing Interests: The authors have declared that no competing interests exist.
* E-mail: [email protected]
Introduction
Defective hypothalamic activity plays an important role in the
development of obesity [1,2,3]. A number of recent studies have
shown that in both diet-induced and genetically-determined
animal models of obesity, inflammation of the hypothalamus is
an important mechanism leading to the anomalous control of
caloric intake and energy expenditure [4,5,6,7,8,9]. Saturated fatty
acids, highly consumed in western diets, induce hypothalamic
inflammation by activating signal transduction though TLR4,
which leads to endoplasmic reticulum stress, in situ expression of
inflammatory cytokines and eventually, apoptosis of neurons, all
contributing to the development of adipostatic hormone resistance
and anomalous expression of the neurotransmitters involved in the
regulation of energy homeostasis [5,6].
Both genetic and pharmacological approaches, aimed at
restraining hypothalamic inflammation, have proven useful for
reducing hypothalamic dysfunction, correcting resistance to leptin
and insulin and reducing body mass. In this context, several proteins
involved in the inflammatory response in the hypothamus have
been targeted with generally positive outcomes. Some examples
include SOCS3 and IKK [8,10], which have been targeted by gene-
based approaches, and TNF-a, JNK and TLR4, which have been
targeted by pharmacological means [4,5,11]. Although these results
unveil promising approaches for the treatment of obesity, the known
pleotropy of all these inflammatory pathways, and the need to
concentrate the effect on a limited region of the brain, impose a
certain dose of uncertainty regarding the future development of
anti-inflammatory drugs to tackle obesity.
In other tissues and cell types, unsaturated fatty acids have well
known anti-inflammatory effects, which range from the inhibition
of the lipoxygenase and cycloxigenase pathways and decrease of
neutrophil adhesion [12] to the reduction of inflammatory
cytokine expression [13] and inhibition of TLR4 signaling [14].
Since nutritional approaches are the basis for all prophylactic and
therapeutic protocols employed for dealing with obesity, we
decided to evaluate the effects of two unsaturated fatty acids on
hypothalamic inflammation in obesity. Here, we show that, acting
either as nutrients or directly in the hypothalamus, linolenic
(C18:3, v3) and oleic (C18:1, v9) unsaturated fatty acids have
outstanding anti-inflammatory effects, correcting hypothalamic
dysfunction and reducing body mass.
PLoS ONE | www.plosone.org 1 January 2012 | Volume 7 | Issue 1 | e30571
Materials and Methods
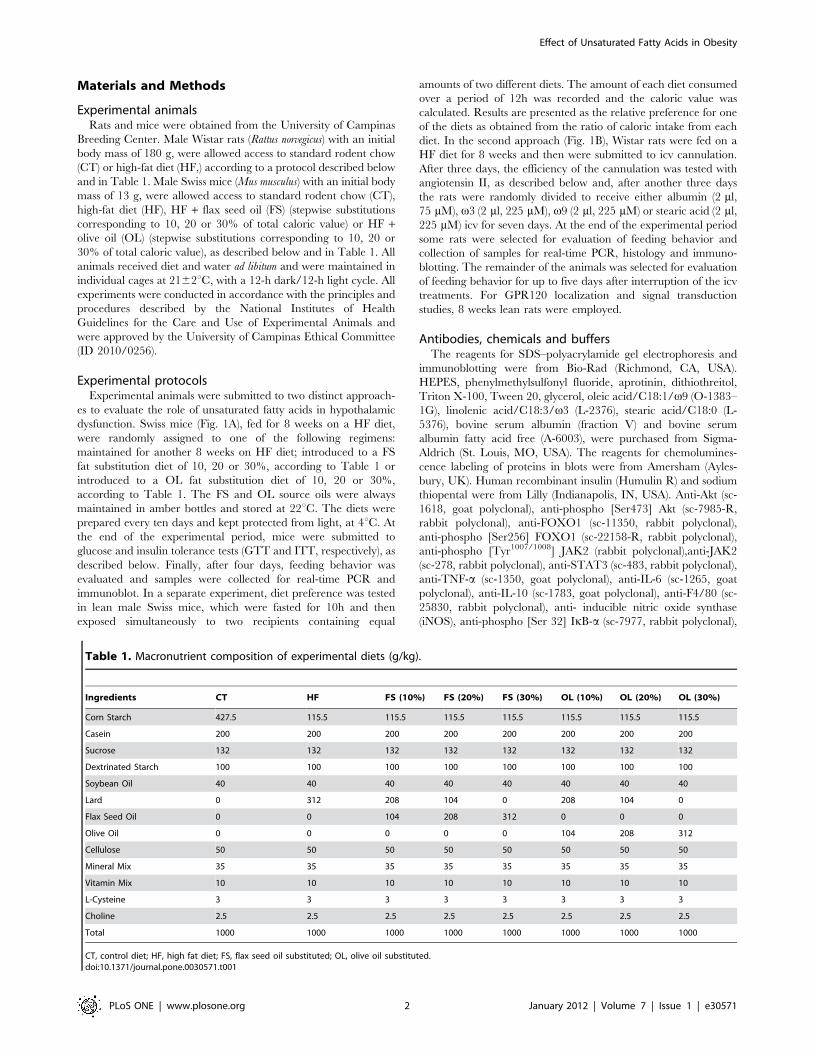
Experimental animalsRats and mice were obtained from the University of Campinas
Breeding Center. Male Wistar rats (Rattus norvegicus) with an initial
body mass of 180 g, were allowed access to standard rodent chow
(CT) or high-fat diet (HF,) according to a protocol described below
and in Table 1. Male Swiss mice (Mus musculus) with an initial body
mass of 13 g, were allowed access to standard rodent chow (CT),
high-fat diet (HF), HF + flax seed oil (FS) (stepwise substitutions
corresponding to 10, 20 or 30% of total caloric value) or HF +olive oil (OL) (stepwise substitutions corresponding to 10, 20 or
30% of total caloric value), as described below and in Table 1. All
animals received diet and water ad libitum and were maintained in
individual cages at 2162uC, with a 12-h dark/12-h light cycle. All
experiments were conducted in accordance with the principles and
procedures described by the National Institutes of Health
Guidelines for the Care and Use of Experimental Animals and
were approved by the University of Campinas Ethical Committee
(ID 2010/0256).
Experimental protocolsExperimental animals were submitted to two distinct approach-
es to evaluate the role of unsaturated fatty acids in hypothalamic
dysfunction. Swiss mice (Fig. 1A), fed for 8 weeks on a HF diet,
were randomly assigned to one of the following regimens:
maintained for another 8 weeks on HF diet; introduced to a FS
fat substitution diet of 10, 20 or 30%, according to Table 1 or
introduced to a OL fat substitution diet of 10, 20 or 30%,
according to Table 1. The FS and OL source oils were always
maintained in amber bottles and stored at 22uC. The diets were
prepared every ten days and kept protected from light, at 4uC. At
the end of the experimental period, mice were submitted to
glucose and insulin tolerance tests (GTT and ITT, respectively), as
described below. Finally, after four days, feeding behavior was
evaluated and samples were collected for real-time PCR and
immunoblot. In a separate experiment, diet preference was tested
in lean male Swiss mice, which were fasted for 10h and then
exposed simultaneously to two recipients containing equal
amounts of two different diets. The amount of each diet consumed
over a period of 12h was recorded and the caloric value was
calculated. Results are presented as the relative preference for one
of the diets as obtained from the ratio of caloric intake from each
diet. In the second approach (Fig. 1B), Wistar rats were fed on a
HF diet for 8 weeks and then were submitted to icv cannulation.
After three days, the efficiency of the cannulation was tested with
angiotensin II, as described below and, after another three days
the rats were randomly divided to receive either albumin (2 ml,
75 mM), v3 (2 ml, 225 mM), v9 (2 ml, 225 mM) or stearic acid (2 ml,
225 mM) icv for seven days. At the end of the experimental period
some rats were selected for evaluation of feeding behavior and
collection of samples for real-time PCR, histology and immuno-
blotting. The remainder of the animals was selected for evaluation
of feeding behavior for up to five days after interruption of the icv
treatments. For GPR120 localization and signal transduction
studies, 8 weeks lean rats were employed.
Antibodies, chemicals and buffersThe reagents for SDS–polyacrylamide gel electrophoresis and
immunoblotting were from Bio-Rad (Richmond, CA, USA).
HEPES, phenylmethylsulfonyl fluoride, aprotinin, dithiothreitol,
Triton X-100, Tween 20, glycerol, oleic acid/C18:1/v9 (O-1383–
1G), linolenic acid/C18:3/v3 (L-2376), stearic acid/C18:0 (L-
5376), bovine serum albumin (fraction V) and bovine serum
albumin fatty acid free (A-6003), were purchased from Sigma-
Aldrich (St. Louis, MO, USA). The reagents for chemolumines-
cence labeling of proteins in blots were from Amersham (Ayles-
bury, UK). Human recombinant insulin (Humulin R) and sodium
thiopental were from Lilly (Indianapolis, IN, USA). Anti-Akt (sc-
1618, goat polyclonal), anti-phospho [Ser473] Akt (sc-7985-R,
rabbit polyclonal), anti-FOXO1 (sc-11350, rabbit polyclonal),
anti-phospho [Ser256] FOXO1 (sc-22158-R, rabbit polyclonal),
anti-phospho [Tyr1007/1008] JAK2 (rabbit polyclonal),anti-JAK2
(sc-278, rabbit polyclonal), anti-STAT3 (sc-483, rabbit polyclonal),
anti-TNF-a (sc-1350, goat polyclonal), anti-IL-6 (sc-1265, goat
polyclonal), anti-IL-10 (sc-1783, goat polyclonal), anti-F4/80 (sc-
25830, rabbit polyclonal), anti- inducible nitric oxide synthase
(iNOS), anti-phospho [Ser 32] IkB-a (sc-7977, rabbit polyclonal),
Table 1. Macronutrient composition of experimental diets (g/kg).
Ingredients CT HF FS (10%) FS (20%) FS (30%) OL (10%) OL (20%) OL (30%)
Corn Starch 427.5 115.5 115.5 115.5 115.5 115.5 115.5 115.5
Casein 200 200 200 200 200 200 200 200
Sucrose 132 132 132 132 132 132 132 132
Dextrinated Starch 100 100 100 100 100 100 100 100
Soybean Oil 40 40 40 40 40 40 40 40
Lard 0 312 208 104 0 208 104 0
Flax Seed Oil 0 0 104 208 312 0 0 0
Olive Oil 0 0 0 0 0 104 208 312
Cellulose 50 50 50 50 50 50 50 50
Mineral Mix 35 35 35 35 35 35 35 35
Vitamin Mix 10 10 10 10 10 10 10 10
L-Cysteine 3 3 3 3 3 3 3 3
Choline 2.5 2.5 2.5 2.5 2.5 2.5 2.5 2.5
Total 1000 1000 1000 1000 1000 1000 1000 1000
CT, control diet; HF, high fat diet; FS, flax seed oil substituted; OL, olive oil substituted.doi:10.1371/journal.pone.0030571.t001
Effect of Unsaturated Fatty Acids in Obesity
PLoS ONE | www.plosone.org 2 January 2012 | Volume 7 | Issue 1 | e30571

anti-IkB-a (sc-1643, mouse monoclonal), anti-phospho [Thr 183/
185] c-Jun N terminal kinase (JNK) (sc-12882, rabbit polyclonal),
anti-JNK (sc-1648, mouse monoclonal), anti-stearoil CoA desatur-
ase-1 (SCD-1) (sc-23016, rabbit polyclonal), anti-carnitine palmi-
toyl transferase 1 (CPT1) (sc-20514, goat polyclonal), anti-fatty
acid synthase (FAS) (sc-16146, goat polyclonal), anti-ACC (#3662,
rabbit polyclonal), anti-uncoupled protein-1 (UCP-1) (sc-6529,
goat polyclonal), anti-Bcl2 (sc-783, rabbit polyclonal), anti-Bax (sc-
6236, rabbit polyclonal), anti-caspase 3 (sc-7148, rabbit polyclon-
al), anti-NPY (sc-14727, goat polyclonal), anti-GPR120 (sc-99105,
rabbit polyclonal), FITC-conjugated mice anti-rabbit and rhoda-
mine-conjugated anti-goat antibodies were from Santa Cruz
Biotechnology (Santa Cruz, CA, USA). Anti-phospho [Tyr705]
STAT3 (rabbit polyclonal, #9135), anti-TAB1 (#3225, rabbit
polyclonal), anti-TAK1 (#5206, rabbit polyclonal), anti-b-arrestin
2 (#3857, rabbit polyclonal) and anti-SOCS3 (#2923, rabbit
polyclonal) were from Cell Signaling (Danvers, MA, USA). Anti-
phospho [Ser79] acetyl CoA carboxylase (ACC) (#07-184, rabbit
polyclonal) was from Upstate Biotechnology (Charlottesville, VA,
USA). Anti b-actin (#ab6276, mouse monoclonal) was from
Abcam (Cambridge, MA). All the chemicals used in the real-time
PCR experiments and 4,6-diamidino-2-phenylindole dihydrochlo-
ride (DAPI) used in immunofluorescence staining were purchased
from Invitrogen and Applied Biosystems.
Intraperitoneal insulin tolerance test (ipITT)After 6 h of fasting, CT, HF, FS- and OL-substituted mice
groups were submitted to an insulin tolerance test (1 U/kg body
weight21 of insulin). Mice were injected with insulin and blood
samples were collected at 0, 4, 8, 12 and 16 min from the tail vein
for serum glucose determination. The constant for the rate of
serum glucose disappearance was calculated using the formula
0.693/biological half-life (t1/2). The plasma glucose t1/2 was
calculated from the slope of last square analysis of the plasma
glucose concentration during the linear phase of decline [15].
Intraperitoneal glucose tolerance test (ipGTT)After 6 h of fasting, mice were submitted to a glucose tolerance
test. After collection of an unchallenged sample (time 0), a solution
of 20% glucose (2.0 g/kg body weight) was administered into the
peritoneal cavity. Blood samples were collected from the tail vein
at 30, 60, 90 and 120 min for determination of glucose
concentrations. Results are presented as the area under glucose
curves. Serum glucose of both ipITT or ipGTT were determined
using a glucose meter (Roche Diagnostic, Rotkreuze, Switzerland).
Feeding behaviourRats deprived of food for 6 h with free access to water were icv
injected (2ml) with solutions containing albumin (75 mM) or leptin
(1.0 mM). Thereafter, diets were reintroduced and food intake was
determined at the end of a 12-h period.
Icv cannulationFor icv cannulation, Wistar rats were used after 8 weeks of
treatment with CT or HF diets. The rats were stereotaxically
instrumented under sodium thiopental [15 mg (kg body weight)21]
anesthesia using a Stoelting stereotaxic apparatus, according to a
previously described method [5]. Cannula efficiency was tested 3 d
after cannulation by the evaluation of the drinking response
elicited by icv angiotensin II [16]. Stereotaxic coordinates were
anteroposterior, 0.2 mm/lateral, 1.5 mm/depth, 4.0 mm. Icv-
cannulated rats were treated with 2 ml of each fatty acid for 7 d.
Controls were treated with a similar volume of albumin. Fatty
acids for icv injection were always diluted in ultrapure water
containing HBP detergent (0.1%) and fatty acid free BSA (75 mM).
The volumes injected were always 2 ml/dose. The final concen-
tration of fatty acids was always 225 mM. In some experiments,
rats were treated icv with pure oleic, linolenic or stearic acids
(225 mM). LPS contamination of the fatty acids, HBP and BSA
preparations were evaluated by Limulus amoebocyte lysate assay
produced by Associates of Cape Cod. LPS in the diets were
evaluated by HPLC as described below. Only trace amounts of
LPS (ranging from 0.030 to 0.070 EU/nmol) were detected in the
reagents. According to a previously study [17], these levels of LPS
do not interfere with the results.
HPLCDetermination of general lipid content and LPS in diets was
performed using a HPLC method described previously [18].
Briefly, fatty acids were derivatized with 4-bromomethyl-7-
coumarin and the analysis performed in a Shimadzu model LC-
10A liquid chromatographer. The samples were eluted using a C8
column (25 cm 6 4.6 id, 5 mm of particles) with a C8 precolumn
(2.5 cm 6 4.6 id, 5 mm of particles), 1.0 ml/min of acetonitrile/
water (77%/23%, v/v) flow and fluorescence detector (325 nm
Figure 1. Experimental protocols. A, Four-week old male Swiss mice were fed regular chow (CT) or high-fat diet (HF) for eight weeks and thenrandomly divided into eight groups: CT mice, maintained for another eight weeks on the same CT diet; or HF mice which were either maintained onthe same HF diet; or transferred to diets containing substitution of lard by olive or flax seed oils to final concentrations of 10, 20 or 30%, according toTable 1. At the end of the experimental period, the mice were submitted to a glucose tolerance test (GTT) and an insulin tolerance test (ITT), four dayslater, feeding behavior was evaluated and samples were obtained for immunobloting (IB) and real-time PCR (RT-PCR). B, Four-week old male Wistarrats were fed for eight weeks on CT or HF diets and then submitted to intracerebroventricular (icv) cannulation. Drinking response elicited byangiotensin II (AII) was tested three days after cannulation and responsive rats were treated icv with either v3, v9, stearic acid (SA) or diluents (Alb)for seven days. Feeding behavior and body mass were determined throughout the experimental period. At the end of the experimental period somerats were randomly selected for histology, IB and RT-PCR; the remainder of the rats was followed up for feeding behavior for an additional five daysafter the discontinuation of icv treatment.doi:10.1371/journal.pone.0030571.g001
Effect of Unsaturated Fatty Acids in Obesity
PLoS ONE | www.plosone.org 3 January 2012 | Volume 7 | Issue 1 | e30571

excitation and 395 nm emission). For quantification of fatty acids,
the capacity factor, elution sequence, linearity, recovery, precision,
interference, and limit of detection were determined. The lower
limit of detection was 1.0 pg and highly purified LPS was used as a
tracer.
Gas chromatographyThe relative amounts of fatty acids in the diets, blood and
hypothalami were determined by gas chromatography, using a
Shimadzu Model 17A, under the following operating conditions:
fused silica capillary column (10060.25 mm; SP-2560); hydrogen
as the carrier gas, with a flow rate of 20cm/s; oven temperature,
initially 140uC for 5 min, was increased up to 240uC at 4uC/min
and maintained at 240uCfor 30 min; injector, split ratio was 1:50,
temperature 250uC; vaporization and detector temperatures were
250uCand 260uC, respectively. The injection volume was 1 ml of
sample solution. The retention times of methyl ester standards
(Sigma Aldrich) were used to identify peaks. Lipids extracted from
diets, blood and hypothalami were stored at 220uC protected
from light.
Immunohistochemistry and histologyEpididymal fat specimens were dehydrated with ethanol,
cleared with xylene, and embedded in paraffin wax (Merck, Sao
Paulo, Brazil). After inclusion, 4 mm sections were obtained on a
microtome (CUT model 445, Olympus). Epididymal fat sections
were stained with hematoxylin and eosin (Merck). Photomicro-
graphs were obtained as described below. The mean area of
adipocytes (average surface area of 30 randomly sorted adipocytes,
per animal) was determined by the Imagelab Analysis software
(Imagelab, Modena, Italy, v. 2.4). Hydrated, 4 mm sections of
paraformaldehyde-fixed, paraffin embedded, central nervous
system specimens were obtained from rats treated for 8 weeks
with CT or HF diets plus the respective icv treatment (v3 or v9
injections). The expressions of F4/80, GPR120 and NPY were
evaluated by indirect immunofluorescence staining, as described
previously [19]. In short, hydrated sections were incubated for 30
min at room temperature with 2% rabbit pre-immune serum and
then incubated for 12 h, at 4uC, in a moister chamber, with an
anti-F4/80 (1:50) or an anti-GRP120 (1:100). Sections incubated
with the anti-F4/80 antibody were then incubated with a FITC
conjugated anti-rabbit IgG secondary antibody. Sections incubat-
ed with the anti-GRP120 antibody were then incubated with the
second primary antibody against NPY (1:50) for another 12 h, at
4uC, in the moister chamber. Finally, sections were incubated with
FITC-, and rhodamine-conjugated secondary antibodies. Analysis
and documentation of results were performed using a Leica FW
4500 B microscope. The hypothalami were sectioned from
Bregma -2.1 to -2.3 mm. The anatomical correlations were made
according to the landmarks given in a stereotaxic atlas [20]. The
topographical views of the regions to be studied were obtained by
hematoxylin-eosin staining of consecutive sections.
Protein analysis by immunoprecipitation andimmunoblotting
As soon as anaesthesia was assured by the loss of pedal and
corneal reflexes, the skull was opened and the basal diencephalon,
including the preoptic area and hypothalamus, was excised. The
hypothalami were pooled and 125 mg of protein was used as a
whole tissue extract. In some experiments, fragments of the brown
adipose tissue (BAT) were used for whole protein extract
preparation. For evaluating leptin or insulin responsive proteins,
samples were obtained 15 min after leptin/insulin (2 ml, 1 mM
solution of either leptin or insulin) injection, as shown for Kim and
colleagues [21]. We carried out similar proceedings to extract the
mice brains to collect the hypothlami. Tissues were pooled,
minced coarsely and homogenized immediately in extraction
buffer (1% Triton X-100, 100 mM Tris, pH 7.4, containing
100 mM sodium pyrophosphate, 100mM sodium fluoride,
10 mM EDTA, 10 mM sodium vanadate, 2 mM phenylmetha-
nesulphonylfluoride (PMSF) and 0.1 mg ml21 aprotinin) at 4uCwith a Polytron PTA 20S generator (Brinkmann Instruments
model PT 10/35) operated at maximum speed for 15 s. The
extracts were centrifuged at 9,000 g and 4uC in a Beckman 70.1 Ti
rotor (Palo Alto, CA, USA) for 45 min to remove insoluble
material, and the supernatants of these tissues were used for
protein quantification, using the Bradford method [22]. Proteins
were denatured by boiling in Laemmli sample buffer. Samples
containing 125 mg of protein extracts were separated by SDS–
PAGE, transferred to nitrocellulose membranes and blotted with
antibodies against TNF-a, IL-6, IL-10, iNOS, JNK, p-JNK, p-
IkB-a, SOCS3, caspase3, BAX, Bcl2, p-ACC, ACC, FAS, CPT-1,
SCD, UCP-1, JAK, p-JAK2, STAT3, p-STAT3, AKT, p-Akt,
FoxO1, and b-actin. Specific bands were labeled by chemilumi-
nescence and visualization was performed by exposure of the
membranes to RX-films. For the evaluation of GPR120 signal
transduction, rats were acutely treated with either v3 or v9 fatty
acids (225 mM) and hypothalamic protein extracts were prepared.
For each analysis, 500 mg protein was used for immunoprecipi-
Table 2. Fatty acid composition of the diets (% of total fat).
Fatty Acids CT HF FS 10% OL 10%
C14:0 0.6460.25 1.1960.05#a 0.0460.01b 0.8560.02b
C16:0 13.4660.96 21.560.33#a 16.9861.71b 18.8860.06b
C18:0 2.2460.57 11.1360.42#a 8.7260.87b 8.7260.15b
C20:0 - 0.760.09a 0.2160.01b 0.3460.03c
S SFA 16.760.1 37.4861.45#a 26.9661.81b 3161.68b
C16:1 v7 - 2.0260.14 1.460.09 1.7660.13
C18:1 v9 27.1761.94 40.5460.7#a 32.8360.03b 44.5660.8a
S MUFA 27.861.8 42.5662.2#a 38.2462.9a 49.1963.18b
C18:2 v6 49.6861.03 18.3660.4# 19.3660.62 18.2860.39
C18:3 v3 5.5360.75 1.2960.09#a 15.2160.66b 1.3160.1a
C20:4 v6 0.2960.06 0.2260.05 0.1760 0.1760.01
C22:0 - 0.0560.01 0.1260.02 0.1360.01
C20:5 v3 - 0.0160 0.0160 0.0160
C22:5 v3 - 0.0660.01 0.0460 0.0360
C22:6 v3 - 0.0260 0.0160 0.01260
S PUFA 55.562.13 19.9660.98#a 34.861.2b 19.8160.9a
S v6 49.9763.4 18.5862.7# 19.5362.1 18.4561.87
S v3 5.5360.12 1.3860.09#a 15.2761.18b 1.3660.08a
v6:v3 ratio 9.03:1 13.46:1 1.27:1 13.56:1
CT, control diet; FS 10%, flax seed oil substituted 10%; HF, high fat diet; MUFA,monounsaturated fatty acid; OL 10%, olive oil substituted 10%; PUFA,polyunsaturated fatty acid; SFA, saturated fatty acid.#, mean significant difference between CT an HF groups by Student’s test
(P,0.05).a–c, mean values followed by the same letter in the line are not different by
Tukey’s test (P, 0.05).S SFA, includes 8:0, 10:0, 12:0 and 17:0.S MUFA, includes 14:1, 17:1, 20:1(v-7) and 24:1.S PUFA, includes 18:3(v-6), 20:2(v-6), 20:3(v-6) and 22:5(v-6).doi:10.1371/journal.pone.0030571.t002
Effect of Unsaturated Fatty Acids in Obesity
PLoS ONE | www.plosone.org 4 January 2012 | Volume 7 | Issue 1 | e30571

tation with GPR120, b-arrestin 2 or TAK1 antibodies. Immuno-
precipitates were separated by SDS–PAGE and membranes were
blotted with either b-arrestin or TAB1 antibodies.
Real-time PCR. Reverse-transcription was performed using total
RNA from hypothalamic samples, as described previously [19]. NPY,
POMC, CART and MCH mRNAs were measured in the
hypothalami of rats treated with CD or HF diets and in
intracerebroventricular cannulated rats treated with linolenic and
oleic acid. Intron-skipping primers for NPY, AGRP, MCH and
POMC were obtained from Applied Biosystems. Glyceraldehyde-3-
phosphate dehydrogenase primers (Applied Biosystems) were used as
a control. Real-time PCR analysis of gene expression was performed
in an ABI Prism 7700 sequence detection system (Applied
Biosystems). The optimal concentration of cDNA and primers, as
well as the maximum efficiency of amplification, were obtained
through five-point, two-fold dilution curve analysis for each gene.
Each PCR contained 3.0 ng of reverse-transcribed RNA, 200 nM of
each specific primer, SYBR SAFE PCR master mix, and RNase free
water added to a 20 ml final volume. Real-time data were analyzed
using the Sequence Detector System 1.7 (Applied Biosystems).
Statistical analysisSpecific protein bands present in the blots were quantified by
digital densitometry (ScionCorp). Analysis of variance was used to
compare independent samples. Mean values 6 SEM obtained
from densitometry scans and from real-time PCR measurements,
body mass determination, food intake, area under glucose curves
and Kitt were compared using Tukey’s test and P,0.05 was
accepted as statistically significant. In all experiments, we used five
distinct animals from each of the experimental groups.
Results
Composition of the dietsHPLC and gas chromatography analysis of the diets showed
that the high-fat diet (HF) contained 37% saturated fat, while
chow contained 16% (Tables 1 and 2). The 10% substitution by
FS led to an increase in the v3 component of the diet from 1.3 to
15% while the 10% substitution by OL led to an increase in the v9
component of the diet from 40 to 44% (Tables 1 and 2). No LPS
contamination was detected in the diets as determined by HPLC.
Impact of diet change on blood and hypothalamic fattyacids
Consumption of the HF diet led to significant increases of
C18:0, C20:0 and C22:0, and to a significant reduction of total v3
in the blood, as compared to mice fed on chow (Table 3). The
10% FS substitution resulted in a significant increase of total v3
content in the blood and a reduction of the v6:v3 ratio from 7.1 to
3.2, as compared to mice fed on HF (Table 3). The 10% OL
substitution resulted in no significant increase of total v9 content
Table 3. Fatty acid composition of the blood (% of total fat).
Fatty Acids CT HF FS 10% OL 10%
C14:0 0.09260.009 0.16760.06 0.16560.06 0.15260.02
C16:0 19.460.82 16.760.2 16.4261.03 17.0160.91
C18:0 10.4560.57 12.0460.45# 11.5360.85 11.4560.85
C20:0 0.0260.002 0.13560.12# 0.1760.04 0.18260.04
C22:0 0.0360.004 0.13260.09# 0.16760.03 0.09760.02
S SFA 29.9260.35 29.1860.2 28.7861.5 28.9760.79
C16:1 v7 0.74260.09 0.85560.1 1.08560.2 1.03560.13
C18:1 v9 11.6260.59 12.4263.5 13.3161.12 15.1761.53
S MUFA 12.1060.65 13.9763.7 14.461.32 16.2561.51
C18:2 v6 31.7760.87 21.9261.2# 25.4763.19 19.160.66
C18:3 v3 0.56760.1 0.14260.03#a 1.82560.85b 0.18760.05a
C20:4 v6 18.9360.63 26,1965.05#a 15.2262.68b 26.8261.79a
C20:5 v3 0.56760.05 0.360.06 0.34460.94 0.24260.02
C22:5 v3 0.37760.18 0.35760.11a 0.8260.21b 0.30560.11c
C22:6 v3 5.960.18 6.9761.1 6.70560.24 5.3660.61
S PUFA 57.6260.36 54.6864.02 54.062.06 52.0261.58
S v6 50.2060.56 47.7863.95a 41.2760.85b 45.961.3ab
S v3 7.41260.34 6.89761.1a 12.761.7b 6.09760.63a
v6:v3 ratio 6.95:1 7.1:1 3.2:1 7.7:1
CT, control diet; FS 10%, flax seed oil substituted 10%; HF, high fat diet; MUFA,monounsaturated fatty acid; OL 10%, olive oil substituted 10%; PUFA,polyunsaturated fatty acid; SFA, saturated fatty acid.#, mean significant difference between CT an HF groups by Student’s test
(P,0.05).a–b, mean values followed by the same letter in the line are not different by
Tukey’s test (P, 0.05).S SFA, includes 8:0, 10:0, 12:0 and 17:0.S MUFA, includes 14:1, 17:1, 20:1(v-7) and 24:1.S PUFA, includes 18:3(v-6), 20:2(v-6), 20:3(v-6) and 22:5(v-6).doi:10.1371/journal.pone.0030571.t003
Table 4. Fatty acid composition of the hypothalamus (% oftotal fat).
Fatty Acids CT HF FS 10% OL 10%
C14:0 0.1560.03 0.17760.05 0.1160.05 0.1460.03
C16:0 22.8561.28 22.2860.68 24.7861.27 23.4760.98
C18:0 21.460.51 20.6360.19 2261.1 21.7861.1
C20:0 0.35560.09 0.4260.07#a 0.24460.12b 0.2260.015a
C22:0 0.2360.04 0.2460.01#a 0.15560.01b 0.1360.08b
S SFA 44.961.9 44.3361.1 45.660.26 44.5661.8
C16:1 v7 0.80560.03 0.7560.02 0.87760.19 0.860.2
C18:1 v9 24.9861.65 25.1760.54 24.0563.16 23.0762.12
S MUFA 26.7560.18 30.0260.46#a 26.7263.76a 25.7660.95b
C18:2 v6 1.960.71 2.5660.1 - -
C18:3 v3 0.0760.02 0.1260.002 - -
C20:4 v6 10.1760.78 9.7360.61 10.0862.87 11.5362.23
C20:5 v3 0.2260.04 0.360.07a 0.1760.07b 0.17760.07b
C22:5 v3 0.3160.09 0.1460.04#a 0.2860.11b 0.1660.09a
C22:6 v3 15.6760.72 15.3360.24 16.2761.02 17.761.4
S PUFA 28.3660.92 25.660.54#a 27.6764.03ab 29.6260.98b
S v6 12.160.11 12.362.16 10.1362 11.5761.9
S v3 16.360.7 15.961.11 16.7461.14 18.0461.15
v6:v3 ratio 1.0:1.34 1.0:1.29 1.0:1.65 1.0:1.55
CT, control diet; FS 10%, flax seed oil substituted 10%; HF, high fat diet; MUFA,monounsaturated fatty acid; OL 10%, olive oil substituted 10%; PUFA,polyunsaturated fatty acid; SFA, saturated fatty acid.#, mean significant difference between CT an HF groups by Student’s test
(P,0.05).a–b, mean values followed by the same letter in the line are not different by
Tukey’s test (P, 0.05).S SFA, includes 8:0, 10:0, 12:0 and 17:0.S MUFA, includes 14:1, 17:1, 20:1(v-7) and 24:1.S PUFA, includes 18:3(v-6), 20:2(v-6), 20:3(v-6) and 22:5(v-6).doi:10.1371/journal.pone.0030571.t004
Effect of Unsaturated Fatty Acids in Obesity
PLoS ONE | www.plosone.org 5 January 2012 | Volume 7 | Issue 1 | e30571
in the blood, but produced a significant reduction of total blood
content of saturated fatty acids, as compared to mice fed on HF
(Table 3). In the hypothalamus, the HF diet produced significant
increases of C20:0 and C22:0, as compared to mice fed on chow
(Table 4). The 10% FS substitution resulted in reductions of the
C20:0 and C22:0 levels and reduction of the v6:v3 ratio from
1:1.29 to 1:1.65 in the hypothalamus, as compared to mice fed on
HF (Table 4). The 10% OL substitution resulted in significant
reductions of the relative C20:0 and C22:0 contents in the
hypothalamus, as compared to mice fed on HF (Table 4).
FS and OL substitutions in the diet reduce food intakeand body mass gain
In order to evaluate the impact of the dietary fatty acid
composition on a number of metabolic parameters, mice were
initially fed on a saturated-rich HF diet for 8 weeks and then
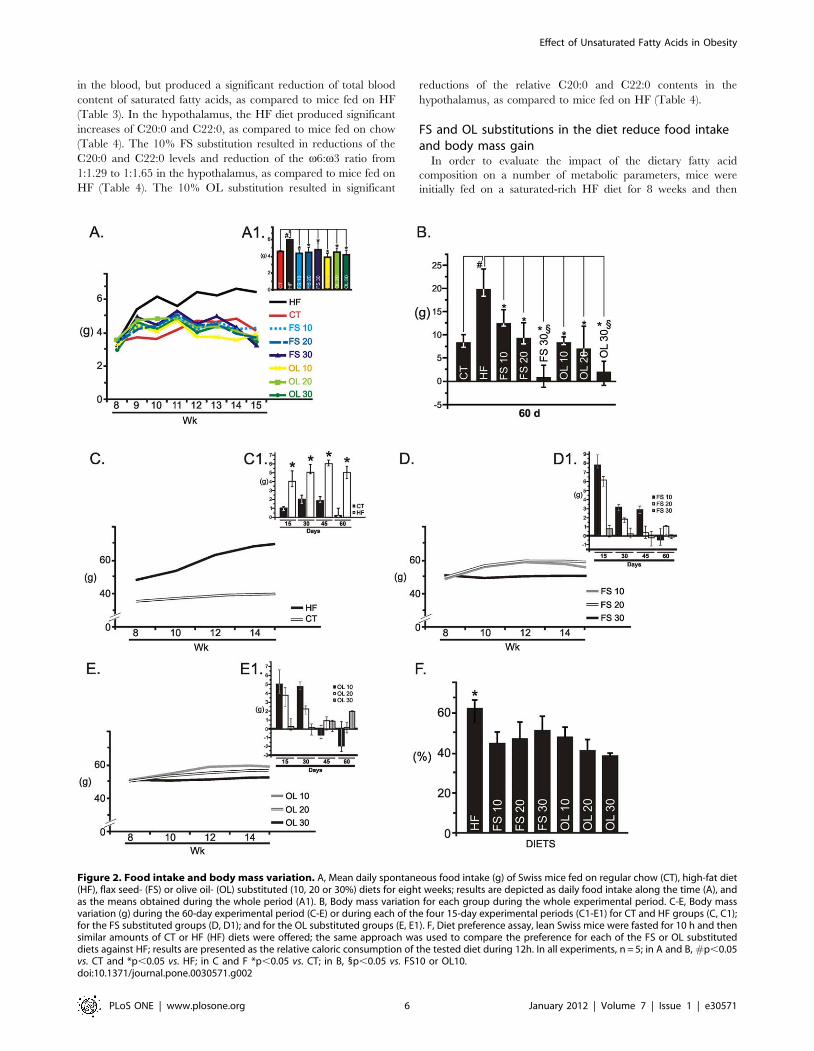
Figure 2. Food intake and body mass variation. A, Mean daily spontaneous food intake (g) of Swiss mice fed on regular chow (CT), high-fat diet(HF), flax seed- (FS) or olive oil- (OL) substituted (10, 20 or 30%) diets for eight weeks; results are depicted as daily food intake along the time (A), andas the means obtained during the whole period (A1). B, Body mass variation for each group during the whole experimental period. C-E, Body massvariation (g) during the 60-day experimental period (C-E) or during each of the four 15-day experimental periods (C1-E1) for CT and HF groups (C, C1);for the FS substituted groups (D, D1); and for the OL substituted groups (E, E1). F, Diet preference assay, lean Swiss mice were fasted for 10 h and thensimilar amounts of CT or HF (HF) diets were offered; the same approach was used to compare the preference for each of the FS or OL substituteddiets against HF; results are presented as the relative caloric consumption of the tested diet during 12h. In all experiments, n = 5; in A and B, #p,0.05vs. CT and *p,0.05 vs. HF; in C and F *p,0.05 vs. CT; in B, 1p,0.05 vs. FS10 or OL10.doi:10.1371/journal.pone.0030571.g002
Effect of Unsaturated Fatty Acids in Obesity
PLoS ONE | www.plosone.org 6 January 2012 | Volume 7 | Issue 1 | e30571
randomly assigned to diets containing stepwise substitution
fractions of FS and OL, according to Table 1. The substitution
of diet lard by FS or OL significantly reduced food intake,
independently of oil type and diet composition (Fig. 2A). The
impact of diet fatty acid substitution on body mass variation was
dependent on composition but not on unsaturated fatty acid type.
Thus, increasing the fraction of unsaturated fatty acid in the diet
significantly reduced the body mass gain during the 60-day
experimental period (Fig. 2B). Interestingly, when evaluating body
mass variation during the four 15-day periods that spanned the
whole experimental time, it was evident that diets containing lower
fractions of unsaturated fatty acids (10 and 20%) led to an initial
body mass increase, which was followed by reduction in body mass
gain, or even loss of body mass. This was not observed in diets
containing 30% FS or OL, which led to low body mass gain or
even body mass loss, in all the four 15-day periods (Fig. 2C–2E).
The effects herein described were not due to palatability, because
except for a discrete preference for HF against chow, no
differences in preference were found when comparing each of
the unsaturated fatty acid substitutions against HF (Fig. 2F).
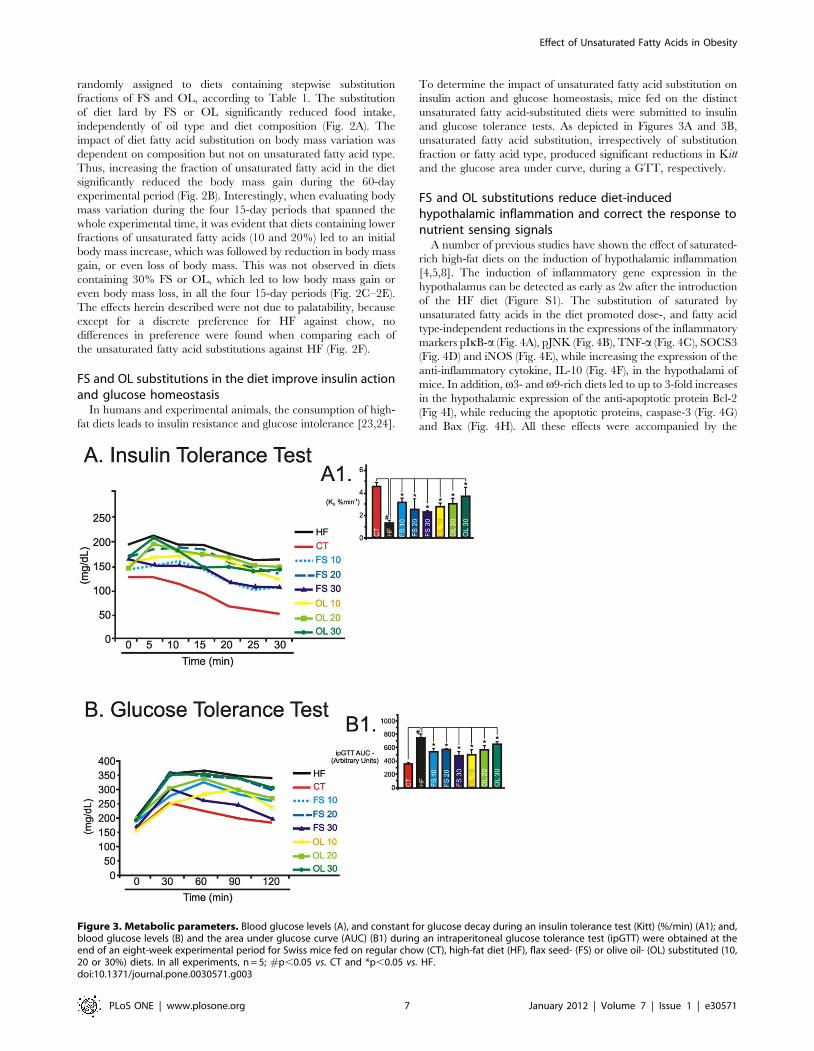
FS and OL substitutions in the diet improve insulin actionand glucose homeostasis
In humans and experimental animals, the consumption of high-
fat diets leads to insulin resistance and glucose intolerance [23,24].
To determine the impact of unsaturated fatty acid substitution on
insulin action and glucose homeostasis, mice fed on the distinct
unsaturated fatty acid-substituted diets were submitted to insulin
and glucose tolerance tests. As depicted in Figures 3A and 3B,
unsaturated fatty acid substitution, irrespectively of substitution
fraction or fatty acid type, produced significant reductions in Kitt
and the glucose area under curve, during a GTT, respectively.
FS and OL substitutions reduce diet-inducedhypothalamic inflammation and correct the response tonutrient sensing signals
A number of previous studies have shown the effect of saturated-
rich high-fat diets on the induction of hypothalamic inflammation
[4,5,8]. The induction of inflammatory gene expression in the
hypothalamus can be detected as early as 2w after the introduction
of the HF diet (Figure S1). The substitution of saturated by
unsaturated fatty acids in the diet promoted dose-, and fatty acid
type-independent reductions in the expressions of the inflammatory
markers pIkB-a (Fig. 4A), pJNK (Fig. 4B), TNF-a (Fig. 4C), SOCS3
(Fig. 4D) and iNOS (Fig. 4E), while increasing the expression of the
anti-inflammatory cytokine, IL-10 (Fig. 4F), in the hypothalami of
mice. In addition, v3- and v9-rich diets led to up to 3-fold increases
in the hypothalamic expression of the anti-apoptotic protein Bcl-2
(Fig 4I), while reducing the apoptotic proteins, caspase-3 (Fig. 4G)
and Bax (Fig. 4H). All these effects were accompanied by the
Figure 3. Metabolic parameters. Blood glucose levels (A), and constant for glucose decay during an insulin tolerance test (Kitt) (%/min) (A1); and,blood glucose levels (B) and the area under glucose curve (AUC) (B1) during an intraperitoneal glucose tolerance test (ipGTT) were obtained at theend of an eight-week experimental period for Swiss mice fed on regular chow (CT), high-fat diet (HF), flax seed- (FS) or olive oil- (OL) substituted (10,20 or 30%) diets. In all experiments, n = 5; #p,0.05 vs. CT and *p,0.05 vs. HF.doi:10.1371/journal.pone.0030571.g003
Effect of Unsaturated Fatty Acids in Obesity
PLoS ONE | www.plosone.org 7 January 2012 | Volume 7 | Issue 1 | e30571

inhibition of ACC activity (Fig. 4J), while decreasing the expression
of FAS (Fig. 4K) and increasing CPT-1 (Fig. 4L).
Icv v3 and v9 treatments reduce food intake and bodyadiposity
To determine the direct effect of unsaturated fatty acids on
hypothalamic function, rats were submitted to icv cannulation and
treated with v3, v9 or stearic acid for seven days. Daily icv
injections of v3 or v9 fatty acids significantly reduced spontaneous
food intake (Fig. 5A) and enhanced the anorexigenic effect of
leptin in both control and HF rats (Fig. 5B). This resulted in
significant body mass loss (Fig. 5C) and reduction of epididymal fat
content (Fig. 5D), with reduction of mean adipocyte diameter
(Fig. 5E and 5F). Discontinuation of the icv injections with either
Figure 4. Signal transduction in the hypothalamus. Hypothalamic total protein extracts obtained from Swiss mice fed on regular chow (CT),high-fat diet (HF), flax seed- (FS) or olive oil- (OL) substituted (10, 20 or 30%) diets for eight weeks were used in immunoblotting (IB) experiments toevaluate protein expression and/or activity. Specific antibodies against phospho-IkB-a (P-IkBa) (A), phospho-JNK (P-JNK) (B), TNF-a (C), SOCS-3 (D),iNOS (E), IL-10 (F), Caspase-3 (CASP-3) (G), BAX (H), Bcl-2 (I), phospho-ACC (P-ACC) (J), FAS (K) and CPT-1 (L) were used to identify respective proteintargets. Loading was evaluated by re-probing the membranes with anti-b-actin (A, C-I, K and L), anti-JNK (B) or anti-ACC (J) antibodies. In allexperiments, n = 5; #p,0.05 vs. CT and *p,0.05 vs. HF.doi:10.1371/journal.pone.0030571.g004
Effect of Unsaturated Fatty Acids in Obesity
PLoS ONE | www.plosone.org 8 January 2012 | Volume 7 | Issue 1 | e30571

unsaturated fatty acid resulted in a complete restoration of base-
line feeding behavior (Fig. 5A).
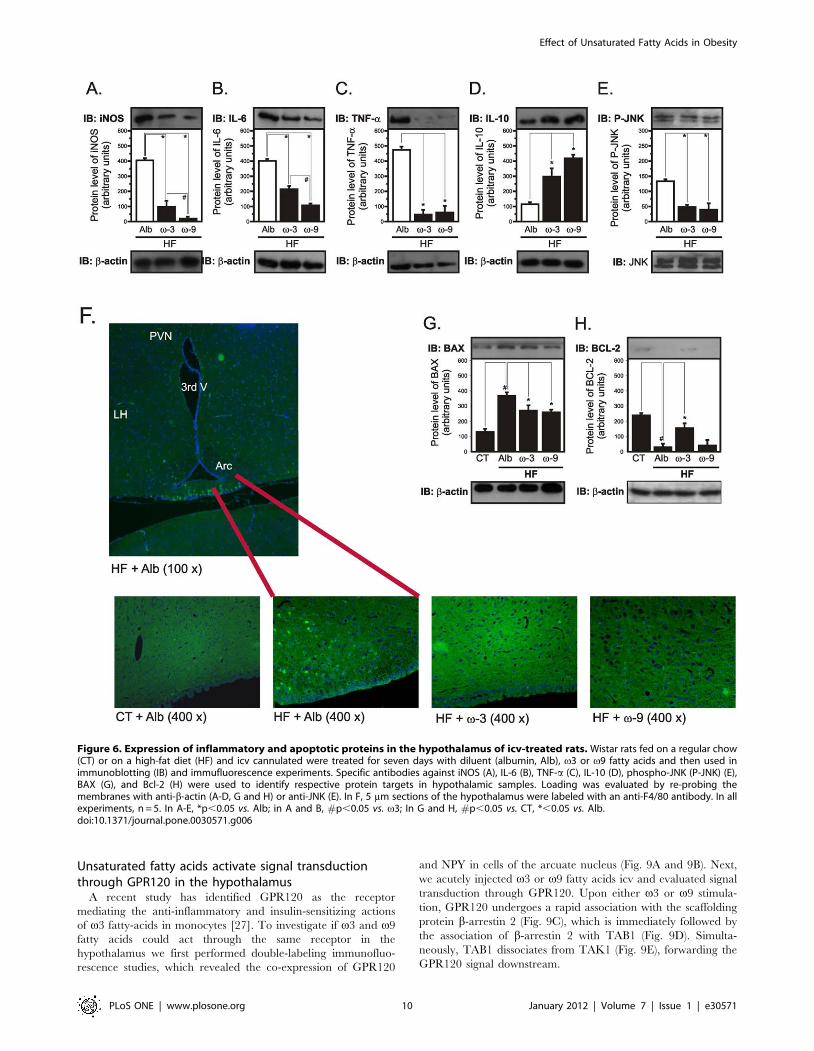
Icv v3 and v9 treatments reduce hypothalamicinflammation and the expression of apoptotic proteins
Seven days of v3 or v9 icv treatment significantly reduced the
hypothalamic expression of markers of inflammation, iNOS
(Fig. 6A), IL-6 (Fig. 6B), TNF-a (Fig. 6C) and pJNK (Fig. 6E).
The v9 fatty acid was significantly more effective in reducing
iNOS (Fig. 6A) and IL-6 (Fig. 6B), while v3 fatty acid was
significantly more effective in reducing pJNK (Fig. 6E). TNF-awas similarly affected by both unsaturated fatty acids (Fig. 6C).
The reduction in hypothalamic inflammation, induced by v3 and
v9 fatty acids, was also detected as a reduction in F4/80-positive
cells in the arcuate nucleus (Fig. 6F). In addition, the hypothalamic
expression of the anti-inflammatory cytokine, IL-10 was signifi-
cantly increased by either v3 or v9 fatty acids (Fig. 6D).
Moreover, both icv v3 and v9 produced a significant reduction
in the hypothalamic expression of the pro-apoptotic protein, Bax
(Fig. 6G), while v3, but not v9 fatty acid produced an increase in
the expression of the anti-apoptotic protein, Bcl-2 (Fig. 6H).
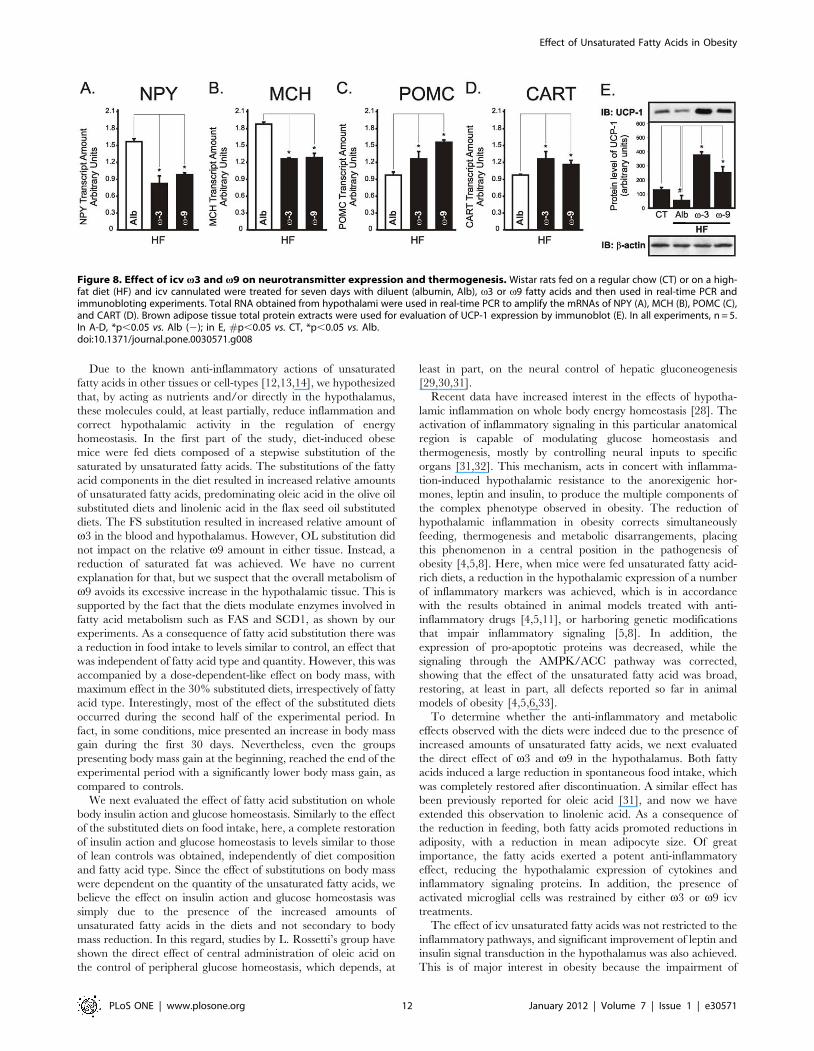
Icv v3 and v9 treatment improve anorexigenic andpro-thermogenic signaling in the hypothalamus
Leptin and insulin provide the most robust anorexigenic and
pro-thermogenic signals to the hypothalamus [25,26]. The icv
treatment of rats with either v3 or v9 fatty acids significantly
improved leptin signal transduction through JAK2 (Fig. 7A),
STAT3 (Fig. 7B) and Akt (Fig. 7C) in lean rats. In addition, in
HF rats, leptin signaling through JAK2 (Fig. 7D), STAT3
(Fig. 7E), Akt (Fig. 7F) and FOXO1 (Fig. 7G), as well as insulin
signal transduction through Akt (Fig. 7H), were significantly
improved. Proteins belonging to the hypothalamic nutrient
sensing pathway were also modulated. Thus, v3 and v9 fatty
acids produced an increase in ACC phosphorylation (Fig. 7I)
accompanied by a reduction in FAS expression (Fig. 7J) and
increased CPT1 (Fig. 7K) and SCD1 (Fig. 7L) expressions. All
these effects were accompanied by reductions in the mRNA
expressions of NPY (Fig. 8A) and MCH (Fig. 8B) and by the
increase of POMC (Fig. 8C) and CART (Fig. 8D). The pro-
thermogenic effect of the treatment with v3 and v9 was further
evidenced by the increased expression of UCP1 in BAT
(Fig. 8E).
Figure 5. Food intake, body mass and adiposity in icv-treated rats. Wistar rats fed on a regular chow (CT) or on a high-fat diet (HF) were icvcannulated and treated for five (A) or seven (B-F) days with diluent (albumin, Alb), v3-, v9-fatty acids or stearic acid (SA) and then used fordetermination of feeding behavior and adiposity. A, daily food intake (g) of rats treated icv with Alb (filled circles), v3 (filled squares) or v9 (filledtriangles) fatty acids for five days; the beginning (I) and the end (II) of treatment are labeled with arrows. B, The suppression of spontaneous foodintake (g) by leptin was evaluated at the end of the experimental period. C, Body mass variation (g) during the seven-day icv treatment period. D,Epididymal fat mass (g) at the end of the experimental period. E, Histological evaluation (hematoxilin-eosin staining of 5 mm sections) of epididymalfat. F, Mean adipocyte area obtained from histological sections. In all experiments, n = 5. In A, C and D, *p,0.05 vs. Alb; in B, #p,0.05 vs. Alb(2) and*p,0.05 vs. Alb(+); in F, #p,0.05 vs. CT, *,0.05 vs. HF.doi:10.1371/journal.pone.0030571.g005
Effect of Unsaturated Fatty Acids in Obesity
PLoS ONE | www.plosone.org 9 January 2012 | Volume 7 | Issue 1 | e30571
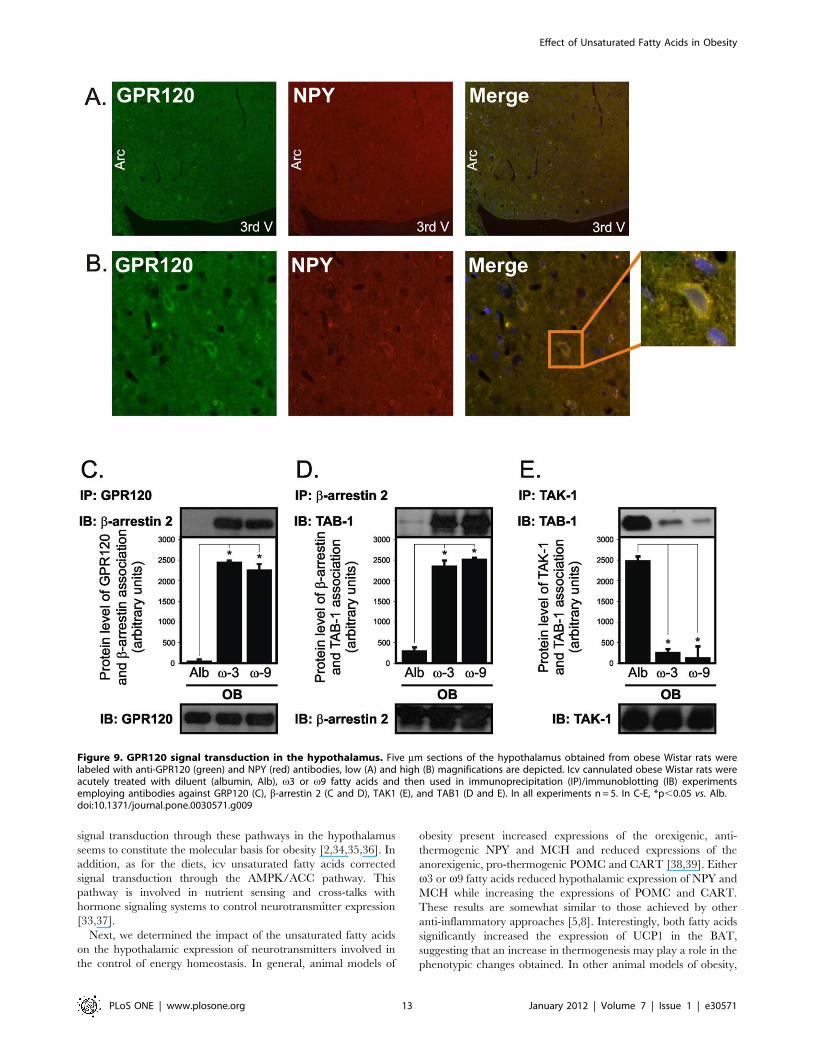
Unsaturated fatty acids activate signal transductionthrough GPR120 in the hypothalamus
A recent study has identified GPR120 as the receptor
mediating the anti-inflammatory and insulin-sensitizing actions
of v3 fatty-acids in monocytes [27]. To investigate if v3 and v9
fatty acids could act through the same receptor in the
hypothalamus we first performed double-labeling immunofluo-
rescence studies, which revealed the co-expression of GPR120
and NPY in cells of the arcuate nucleus (Fig. 9A and 9B). Next,
we acutely injected v3 or v9 fatty acids icv and evaluated signal
transduction through GPR120. Upon either v3 or v9 stimula-
tion, GPR120 undergoes a rapid association with the scaffolding
protein b-arrestin 2 (Fig. 9C), which is immediately followed by
the association of b-arrestin 2 with TAB1 (Fig. 9D). Simulta-
neously, TAB1 dissociates from TAK1 (Fig. 9E), forwarding the
GPR120 signal downstream.
Figure 6. Expression of inflammatory and apoptotic proteins in the hypothalamus of icv-treated rats. Wistar rats fed on a regular chow(CT) or on a high-fat diet (HF) and icv cannulated were treated for seven days with diluent (albumin, Alb), v3 or v9 fatty acids and then used inimmunoblotting (IB) and immufluorescence experiments. Specific antibodies against iNOS (A), IL-6 (B), TNF-a (C), IL-10 (D), phospho-JNK (P-JNK) (E),BAX (G), and Bcl-2 (H) were used to identify respective protein targets in hypothalamic samples. Loading was evaluated by re-probing themembranes with anti-b-actin (A-D, G and H) or anti-JNK (E). In F, 5 mm sections of the hypothalamus were labeled with an anti-F4/80 antibody. In allexperiments, n = 5. In A-E, *p,0.05 vs. Alb; in A and B, #p,0.05 vs. v3; In G and H, #p,0.05 vs. CT, *,0.05 vs. Alb.doi:10.1371/journal.pone.0030571.g006
Effect of Unsaturated Fatty Acids in Obesity
PLoS ONE | www.plosone.org 10 January 2012 | Volume 7 | Issue 1 | e30571

Discussion
The present study was undertaken to evaluate the effect of the
nutritional substitution of saturated by unsaturated fatty acids, and
also the direct effect of unsaturated fatty acids on the modulation
of hypothalamic inflammation and function in obesity. In modern
societies, the progressive increase in the dietary consumption of
saturated fatty acids is taken as one of the main determinants of
obesity, and dietetic approaches aimed at substituting saturated by
unsaturated fats have succeeded in reducing body mass and
improving a number of metabolic parameters in overweight
patients [23].
Saturated fatty acids, acting directly in the hypothalamus or as a
component of the diet, induce inflammation by activating TLR4
signaling and ER stress, which leads to increased inflammatory
gene transcription, hypothalamic dysfunction and eventually
neuronal apoptosis [5,6]. These local effects are accompanied by
progressive loss of the balance between food intake and energy
expenditure, which result in increased adiposity and metabolic
breakdown [2,28].
Figure 7. Effect of icv v3 and v9 on hypothalamic signaling. Wistar rats fed on a regular chow (CT) or on a high-fat diet (HF) and icvcannulated were treated for seven days with diluent (albumin, Alb), v3 or v9 fatty acids. In addition, in some experiments, rats were acutely treatedwith a single dose of either leptin (2 ml, 1026M: A-G) or insulin (2 ml, 1026M: H) and then used in immunoblotting (IB) experiments. Specific antibodiesagainst phospho-JAK2 (P-JAK2) (A and D), phospho-STAT3 (P-STAT3) (B and E), phospho-Akt (P-Akt) (C, F and H), phospho-FoxO1 (P-FoxO1) (G),phospho-ACC (P-ACC) (I), FAS (J), CPT-1 (K) and SCD-1 (L) were used to identify respective protein targets in hypothalamic tissue. Loading wasevaluated by re-probing the membranes with anti-b-actin (J-L), anti-JAK2 (A and D), anti-STAT3 (B and E), anti-Akt (C, F and H), anti-FoxO1 (G) or anti-ACC (I). In A-H, #p,0.05 vs. Alb (2), *p,0.05 vs. Alb (+); in I-L, #p,0.05 vs. CT, *p,0.05 vs. Alb.doi:10.1371/journal.pone.0030571.g007
Effect of Unsaturated Fatty Acids in Obesity
PLoS ONE | www.plosone.org 11 January 2012 | Volume 7 | Issue 1 | e30571
Due to the known anti-inflammatory actions of unsaturated
fatty acids in other tissues or cell-types [12,13,14], we hypothesized
that, by acting as nutrients and/or directly in the hypothalamus,
these molecules could, at least partially, reduce inflammation and
correct hypothalamic activity in the regulation of energy
homeostasis. In the first part of the study, diet-induced obese
mice were fed diets composed of a stepwise substitution of the
saturated by unsaturated fatty acids. The substitutions of the fatty
acid components in the diet resulted in increased relative amounts
of unsaturated fatty acids, predominating oleic acid in the olive oil
substituted diets and linolenic acid in the flax seed oil substituted
diets. The FS substitution resulted in increased relative amount of
v3 in the blood and hypothalamus. However, OL substitution did
not impact on the relative v9 amount in either tissue. Instead, a
reduction of saturated fat was achieved. We have no current
explanation for that, but we suspect that the overall metabolism of
v9 avoids its excessive increase in the hypothalamic tissue. This is
supported by the fact that the diets modulate enzymes involved in
fatty acid metabolism such as FAS and SCD1, as shown by our
experiments. As a consequence of fatty acid substitution there was
a reduction in food intake to levels similar to control, an effect that
was independent of fatty acid type and quantity. However, this was
accompanied by a dose-dependent-like effect on body mass, with
maximum effect in the 30% substituted diets, irrespectively of fatty
acid type. Interestingly, most of the effect of the substituted diets
occurred during the second half of the experimental period. In
fact, in some conditions, mice presented an increase in body mass
gain during the first 30 days. Nevertheless, even the groups
presenting body mass gain at the beginning, reached the end of the
experimental period with a significantly lower body mass gain, as
compared to controls.
We next evaluated the effect of fatty acid substitution on whole
body insulin action and glucose homeostasis. Similarly to the effect
of the substituted diets on food intake, here, a complete restoration
of insulin action and glucose homeostasis to levels similar to those
of lean controls was obtained, independently of diet composition
and fatty acid type. Since the effect of substitutions on body mass
were dependent on the quantity of the unsaturated fatty acids, we
believe the effect on insulin action and glucose homeostasis was
simply due to the presence of the increased amounts of
unsaturated fatty acids in the diets and not secondary to body
mass reduction. In this regard, studies by L. Rossetti’s group have
shown the direct effect of central administration of oleic acid on
the control of peripheral glucose homeostasis, which depends, at
least in part, on the neural control of hepatic gluconeogenesis
[29,30,31].
Recent data have increased interest in the effects of hypotha-
lamic inflammation on whole body energy homeostasis [28]. The
activation of inflammatory signaling in this particular anatomical
region is capable of modulating glucose homeostasis and
thermogenesis, mostly by controlling neural inputs to specific
organs [31,32]. This mechanism, acts in concert with inflamma-
tion-induced hypothalamic resistance to the anorexigenic hor-
mones, leptin and insulin, to produce the multiple components of
the complex phenotype observed in obesity. The reduction of
hypothalamic inflammation in obesity corrects simultaneously
feeding, thermogenesis and metabolic disarrangements, placing
this phenomenon in a central position in the pathogenesis of
obesity [4,5,8]. Here, when mice were fed unsaturated fatty acid-
rich diets, a reduction in the hypothalamic expression of a number
of inflammatory markers was achieved, which is in accordance
with the results obtained in animal models treated with anti-
inflammatory drugs [4,5,11], or harboring genetic modifications
that impair inflammatory signaling [5,8]. In addition, the
expression of pro-apoptotic proteins was decreased, while the
signaling through the AMPK/ACC pathway was corrected,
showing that the effect of the unsaturated fatty acid was broad,
restoring, at least in part, all defects reported so far in animal
models of obesity [4,5,6,33].
To determine whether the anti-inflammatory and metabolic
effects observed with the diets were indeed due to the presence of
increased amounts of unsaturated fatty acids, we next evaluated
the direct effect of v3 and v9 in the hypothalamus. Both fatty
acids induced a large reduction in spontaneous food intake, which
was completely restored after discontinuation. A similar effect has
been previously reported for oleic acid [31], and now we have
extended this observation to linolenic acid. As a consequence of
the reduction in feeding, both fatty acids promoted reductions in
adiposity, with a reduction in mean adipocyte size. Of great
importance, the fatty acids exerted a potent anti-inflammatory
effect, reducing the hypothalamic expression of cytokines and
inflammatory signaling proteins. In addition, the presence of
activated microglial cells was restrained by either v3 or v9 icv
treatments.
The effect of icv unsaturated fatty acids was not restricted to the
inflammatory pathways, and significant improvement of leptin and
insulin signal transduction in the hypothalamus was also achieved.
This is of major interest in obesity because the impairment of
Figure 8. Effect of icv v3 and v9 on neurotransmitter expression and thermogenesis. Wistar rats fed on a regular chow (CT) or on a high-fat diet (HF) and icv cannulated were treated for seven days with diluent (albumin, Alb), v3 or v9 fatty acids and then used in real-time PCR andimmunobloting experiments. Total RNA obtained from hypothalami were used in real-time PCR to amplify the mRNAs of NPY (A), MCH (B), POMC (C),and CART (D). Brown adipose tissue total protein extracts were used for evaluation of UCP-1 expression by immunoblot (E). In all experiments, n = 5.In A-D, *p,0.05 vs. Alb (2); in E, #p,0.05 vs. CT, *p,0.05 vs. Alb.doi:10.1371/journal.pone.0030571.g008
Effect of Unsaturated Fatty Acids in Obesity
PLoS ONE | www.plosone.org 12 January 2012 | Volume 7 | Issue 1 | e30571
signal transduction through these pathways in the hypothalamus
seems to constitute the molecular basis for obesity [2,34,35,36]. In
addition, as for the diets, icv unsaturated fatty acids corrected
signal transduction through the AMPK/ACC pathway. This
pathway is involved in nutrient sensing and cross-talks with
hormone signaling systems to control neurotransmitter expression
[33,37].
Next, we determined the impact of the unsaturated fatty acids
on the hypothalamic expression of neurotransmitters involved in
the control of energy homeostasis. In general, animal models of
obesity present increased expressions of the orexigenic, anti-
thermogenic NPY and MCH and reduced expressions of the
anorexigenic, pro-thermogenic POMC and CART [38,39]. Either
v3 or v9 fatty acids reduced hypothalamic expression of NPY and
MCH while increasing the expressions of POMC and CART.
These results are somewhat similar to those achieved by other
anti-inflammatory approaches [5,8]. Interestingly, both fatty acids
significantly increased the expression of UCP1 in the BAT,
suggesting that an increase in thermogenesis may play a role in the
phenotypic changes obtained. In other animal models of obesity,
Figure 9. GPR120 signal transduction in the hypothalamus. Five mm sections of the hypothalamus obtained from obese Wistar rats werelabeled with anti-GPR120 (green) and NPY (red) antibodies, low (A) and high (B) magnifications are depicted. Icv cannulated obese Wistar rats wereacutely treated with diluent (albumin, Alb), v3 or v9 fatty acids and then used in immunoprecipitation (IP)/immunoblotting (IB) experimentsemploying antibodies against GRP120 (C), b-arrestin 2 (C and D), TAK1 (E), and TAB1 (D and E). In all experiments n = 5. In C-E, *p,0.05 vs. Alb.doi:10.1371/journal.pone.0030571.g009
Effect of Unsaturated Fatty Acids in Obesity
PLoS ONE | www.plosone.org 13 January 2012 | Volume 7 | Issue 1 | e30571
anti-inflammatory approaches also produced beneficial changes in
the expression of UCP1 in BAT [40].
Finally, we showed that the unsaturated fatty acid receptor,
GPR120 is expressed in the hypothalamus and is activated in
response to v3 and v9 fatty acids. GPR120 was recently identified
as an important mediator of the anti-inflammatory and insulin-
sensitizing effects of unsaturated fatty acids in monocytes [27].
Upon ligand binding, GPR120 activates signal transduction
through b-arrestin 2/TAB1, which switches-off the TLR4 and
TNF inflammatory pathways, these effects were reproduced in the
hypothalamus of obese rats. In addition, we show that GPR120 is
expressed in NPY expressing neurons. We decided to test this
particular co-expression because of the remarkable effect of the
unsaturated fatty acids to reduce NPY expression, however, cells
other than the NPY neurons were also stained by the GPR120
antibody (not shown). Since NPY is inhibited in response to leptin,
and, in diet-induced obesity there is resistance to leptin action in
the hypothalamus, it possible that upon unsaturated fatty acid
stimulation, GPR120 present in NPY neurons can play a role
reestablishing the action of leptin towards NPY gene expression
inhibition.
In conclusion, unsaturated fatty acids can reproduce a number
of the anti-inflammatory effects of TLR4 or TNF-a inhibition and,
therefore, constitute an attractive nutritional approach to treat
obesity. At least part of this effect may be mediated by the
GPR120 receptor.
Supporting Information
Figure S1 Time course of high-fat diet (HF)-induced expression
of inflammatory markers in the hypothalamus. Swiss mice fed on
chow (CT) or HF for 2, 4 or 8 weeks were employed for
determination of the hypothalamic expression of interleukin-1b (A-
C) or tumor necrosis factor-a (D-E) transcripts by real-time PCR.
In all experiments, n = 5; *p,0.05 vs. CT.
(TIF)
Acknowledgments
We thank Dr. N. Conran for English grammar edition and Mr. M. Cruz
for technical assistance. We thank Dr. R. Sales and Dr. A. Costa for
thoughtful discussions.
Author Contributions
Conceived and designed the experiments: DEC LAV. Performed the
experiments: DEC ER JCM JRP JM CTDS MS RG. Analyzed the data:
LAV JBC MJS. Contributed reagents/materials/analysis tools: LAV MJS.
Wrote the paper: LAV DEC.
References
1. Yang L, Hotamisligil GS (2008) Stressing the brain, fattening the body. Cell 135:
20–22.
2. Velloso LA, Araujo EP, de Souza CT (2008) Diet-induced inflammation of the
hypothalamus in obesity. Neuroimmunomodulation 15: 189–193.
3. Wisse BE, Schwartz MW (2009) Does hypothalamic inflammation cause
obesity? Cell Metab 10: 241–242.
4. De Souza CT, Araujo EP, Bordin S, Ashimine R, Zollner RL, et al. (2005)
Consumption of a fat-rich diet activates a proinflammatory response and induces
insulin resistance in the hypothalamus. Endocrinology 146: 4192–4199.
5. Milanski M, Degasperi G, Coope A, Morari J, Denis R, et al. (2009) Saturated
fatty acids produce an inflammatory response predominantly through the
activation of TLR4 signaling in hypothalamus: implications for the pathogenesis
of obesity. J Neurosci 29: 359–370.
6. Moraes JC, Coope A, Morari J, Cintra DE, Roman EA, et al. (2009) High-fat
diet induces apoptosis of hypothalamic neurons. PLoS One 4: e5045.
7. Zabolotny JM, Kim YB, Welsh LA, Kershaw EE, Neel BG, et al. (2008) Protein-
tyrosine phosphatase 1B expression is induced by inflammation in vivo. J Biol
Chem 283: 14230–14241.
8. Zhang X, Zhang G, Zhang H, Karin M, Bai H, et al. (2008) Hypothalamic
IKKbeta/NF-kappaB and ER stress link overnutrition to energy imbalance and
obesity. Cell 135: 61–73.
9. Bjorbak C, Lavery HJ, Bates SH, Olson RK, Davis SM, et al. (2000) SOCS3
mediates feedback inhibition of the leptin receptor via Tyr985. J Biol Chem 275:
40649–40657.
10. Howard JK, Cave BJ, Oksanen LJ, Tzameli I, Bjorbaek C, et al. (2004)
Enhanced leptin sensitivity and attenuation of diet-induced obesity in mice with
haploinsufficiency of Socs3. Nat Med 10: 734–738.
11. Araujo EP, De Souza CT, Ueno M, Cintra DE, Bertolo MB, et al. (2007)
Infliximab restores glucose homeostasis in an animal model of diet-induced
obesity and diabetes. Endocrinology 148: 5991–5997.
12. Lee TH, Hoover RL, Williams JD, Sperling RI, Ravalese J, 3rd, et al. (1985)
Effect of dietary enrichment with eicosapentaenoic and docosahexaenoic acids
on in vitro neutrophil and monocyte leukotriene generation and neutrophil
function. N Engl J Med 312: 1217–1224.
13. Endres S, Ghorbani R, Kelley VE, Georgilis K, Lonnemann G, et al. (1989) The
effect of dietary supplementation with n-3 polyunsaturated fatty acids on the
synthesis of interleukin-1 and tumor necrosis factor by mononuclear cells.
N Engl J Med 320: 265–271.
14. Reynolds CM, Draper E, Keogh B, Rahman A, Moloney AP, et al. (2009) A
conjugated linoleic acid-enriched beef diet attenuates lipopolysaccharide-
induced inflammation in mice in part through PPARgamma-mediated
suppression of toll-like receptor 4. J Nutr 139: 2351–2357.
15. Bonora E, Moghetti P, Zancanaro C, Cigolini M, Querena M, et al. (1989)
Estimates of in vivo insulin action in man: comparison of insulin tolerance tests
with euglycemic and hyperglycemic glucose clamp studies. J Clin Endocrinol
Metab 68: 374–378.
16. Johnson AK, Epstein AN (1975) The cerebral ventricles as the avenue for the
dipsogenic action of intracranial angiotensin. Brain Res 86: 399–418.
17. Weinstein JR, Swarts S, Bishop C, Hanisch UK, Moller T (2008) Lipopolysac-
charide is a frequent and significant contaminant in microglia-activating factors.
Glia 56: 16–26.
18. Martins EF, Miyasaka CK, Newsholme P, Curi R, Carpinelli AR (2004)
Changes of fatty acid composition in incubated rat pancreatic islets. Diabetes
Metab 30: 21–27.
19. Bertelli DF, Araujo EP, Cesquini M, Stoppa GR, Gasparotto-Contessotto M,
et al. (2006) Phosphoinositide-specific inositol polyphosphate 5-phosphatase IV
inhibits inositide trisphosphate accumulation in hypothalamus and regulates
food intake and body weight. Endocrinology 147: 5385–5399.
20. Paxinos G, Watson CR, Emson PC (1980) AChE-stained horizontal sections of
the rat brain in stereotaxic coordinates. J Neurosci Methods 3: 129–149.
21. Kim MS, Pak YK, Jang PG, Namkoong C, Choi YS, et al. (2006) Role of
hypothalamic Foxo1 in the regulation of food intake and energy homeostasis.
Nat Neurosci 9: 901–906.
22. Bradford MM (1976) A rapid and sensitive method for the quantitation of
microgram quantities of protein utilizing the principle of protein-dye binding.
Anal Biochem 72: 248–254.
23. Rivellese AA, Lilli S (2003) Quality of dietary fatty acids, insulin sensitivity and
type 2 diabetes. Biomed Pharmacother 57: 84–87.
24. De Souza CT, Araujo EP, Stoppiglia LF, Pauli JR, Ropelle E, et al. (2007)
Inhibition of UCP2 expression reverses diet-induced diabetes mellitus by effects
on both insulin secretion and action. Faseb J 21: 1153–1163.
25. Plum L, Belgardt BF, Bruning JC (2006) Central insulin action in energy and
glucose homeostasis. J Clin Invest 116: 1761–1766.
26. Myers MG, Jr. (2004) Leptin receptor signaling and the regulation of
mammalian physiology. Recent Prog Horm Res 59: 287–304.
27. Oh DY, Talukdar S, Bae EJ, Imamura T, Morinaga H, et al. (2010) GPR120 is
an omega-3 fatty acid receptor mediating potent anti-inflammatory and insulin-
sensitizing effects. Cell 142: 687–698.
28. Thaler JP, Choi SJ, Schwartz MW, Wisse BE Hypothalamic inflammation and
energy homeostasis: resolving the paradox. Front Neuroendocrinol 31: 79–84.
29. Lam TK, Gutierrez-Juarez R, Pocai A, Bhanot S, Tso P, et al. (2007) Brain
glucose metabolism controls the hepatic secretion of triglyceride-rich lipopro-
teins. Nat Med 13: 171–180.
30. Morgan K, Obici S, Rossetti L (2004) Hypothalamic responses to long-chain
fatty acids are nutritionally regulated. J Biol Chem 279: 31139–31148.
31. Obici S, Feng Z, Morgan K, Stein D, Karkanias G, et al. (2002) Central
administration of oleic acid inhibits glucose production and food intake.
Diabetes 51: 271–275.
32. Arruda AP, Milanski M, Romanatto T, Solon C, Coope A, et al. Hypothalamic
actions of tumor necrosis factor alpha provide the thermogenic core for the
wastage syndrome in cachexia. Endocrinology 151: 683–694.
33. Anderson KA, Ribar TJ, Lin F, Noeldner PK, Green MF, et al. (2008)
Hypothalamic CaMKK2 contributes to the regulation of energy balance. Cell
Metab 7: 377–388.
34. Schwartz MW, Porte D, Jr. (2005) Diabetes, obesity, and the brain. Science 307:
375–379.
Effect of Unsaturated Fatty Acids in Obesity
PLoS ONE | www.plosone.org 14 January 2012 | Volume 7 | Issue 1 | e30571

35. Posey KA, Clegg DJ, Printz RL, Byun J, Morton GJ, et al. (2009) Hypothalamic
proinflammatory lipid accumulation, inflammation, and insulin resistance in ratsfed a high-fat diet. Am J Physiol Endocrinol Metab 296: E1003–1012.
36. Bjornholm M, Munzberg H, Leshan RL, Villanueva EC, Bates SH, et al. (2007)
Mice lacking inhibitory leptin receptor signals are lean with normal endocrinefunction. J Clin Invest 117: 1354–1360.
37. Cotero VE, Routh VH (2009) Insulin blunts the response of glucose-excitedneurons in the ventrolateral-ventromedial hypothalamic nucleus to decreased
glucose. Am J Physiol Endocrinol Metab 296: E1101–1109.
38. Figlewicz DP, Benoit SC (2009) Insulin, leptin, and food reward: update 2008.
Am J Physiol Regul Integr Comp Physiol 296: R9–R19.
39. van den Pol AN (2003) Weighing the role of hypothalamic feeding
neurotransmitters. Neuron 40: 1059–1061.
40. Romanatto T, Roman EA, Arruda AP, Denis RG, Solon C, et al. (2009)
Deletion of tumor necrosis factor-alpha receptor 1 (TNFR1) protects against
diet-induced obesity by means of increased thermogenesis. J Biol Chem 284:
36213–36222.
Effect of Unsaturated Fatty Acids in Obesity
PLoS ONE | www.plosone.org 15 January 2012 | Volume 7 | Issue 1 | e30571
Copyright © 2022 FDOKUMEN