Unnat Nagar Dairy A Case Study Marketing Management-II Table of Content P Particulars Page Number...
32
Unnat Nagar Dairy A Case Study Marketing Management- II Presented By: Siddhartha Singh Solanki-07 XISS-Marketing/case study/Finance-1 Page 1
Transcript of Unnat Nagar Dairy A Case Study Marketing Management-II Table of Content P Particulars Page Number...
Unnat Nagar Dairy A Case Study
Marketing Management-II
Presented By:
Siddhartha Singh Solanki-07
XISS-Marketing/case study/Finance-1 Page 1

George toppo-09 Monica Hembrom-10 Sonal E. Tirkey-11 Chandan Kumar-13 Ashish Shankar-14
XISS-Marketing/case study/Finance-1 Page 2

Table of Content
Particulars
Page Number
Objective of the case study
3
Introduction 4
Unnat Nagar District 5
Milk Consumption Pattern in the district
6
Bottle Vending System 7
Bulk Vending system 8-9
Cost analysis 10-20
Summary of cost analysis
21
Value analysis 22
Suggestions and Recommendations
23
XISS-Marketing/case study/Finance-1 Page 3
OBJECTIVE OF THE CASE STUDY
In the Given Case study, Unnat Nagar Dairy is using Bottle
Vending System to distribute milk. But Mr. Praful Sardesai ,
the General Manager, argues that the Bottle vending system is
causing certain issues in terms of Money Collection,
Adulteration, Economy. Thus to come out of this he suggested
new method of distribution i.e Bulk Vending System.
Therefore, our objective is to bring out the causes that are
causing the issues in Bottle Vending Distribution System ,
analyze the Bottle Vending distribution with Bulk Vending
distribution and give suggestions and recommendations.
XISS-Marketing/case study/Finance-1 Page 4
INTRODUCTION
In Late 1975, Mr. Praful Sardesai, the General Manager of UnnatNagar Dairy was deliberating on the possibility of delivering the major supply of milk to the Unnat Nagar city through automatic bulk vending machine. The dairy had been supplying milk to the city of Unnat Nagar for over 15 years, first only by collecting and distributing milk from village’s cooperative societies and later by processing and pasteurizing the same milk.
Initially the dairy was operated by Unnat Nagar District Cooperative Milk Producers Union, Limited; in 1965 the dairy itself started the operation. Intially the dairy supplied milk and ghee to the citizen of Unnat Nagar.
In the case study, various parameters to examine the benefits and issues of the currently used Bottle Vending distribution system have been discussed and various benefits and limitationsof Bulk vending system have been discussed by various stakeholders.
The case study has also given the expected projection of milk supply and requirements of distribution facilities, which will
XISS-Marketing/case study/Finance-1 Page 5

be helpful to analyze the two different distribution methods under the purview of Future Plan.
XISS-Marketing/case study/Finance-1 Page 6
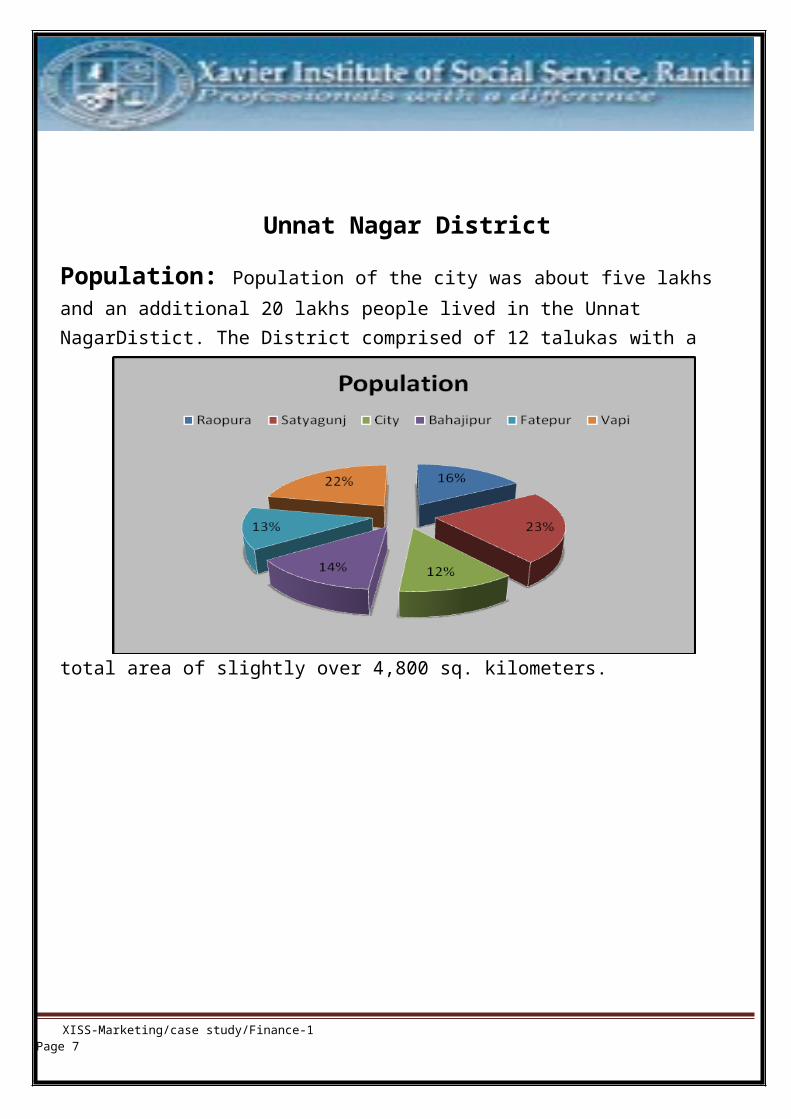
Unnat Nagar District
Population: Population of the city was about five lakhs and an additional 20 lakhs people lived in the Unnat NagarDistict. The District comprised of 12 talukas with a
total area of slightly over 4,800 sq. kilometers.
XISS-Marketing/case study/Finance-1 Page 7

Milk Consumption Pattern in the District
Unnat Nagar Dairy supplies milk through Bottle Vending System. Under this 200ml and 500 ml of bottles are supplied once in the morning and
XISS-Marketing/case study/Finance-1 Page 8
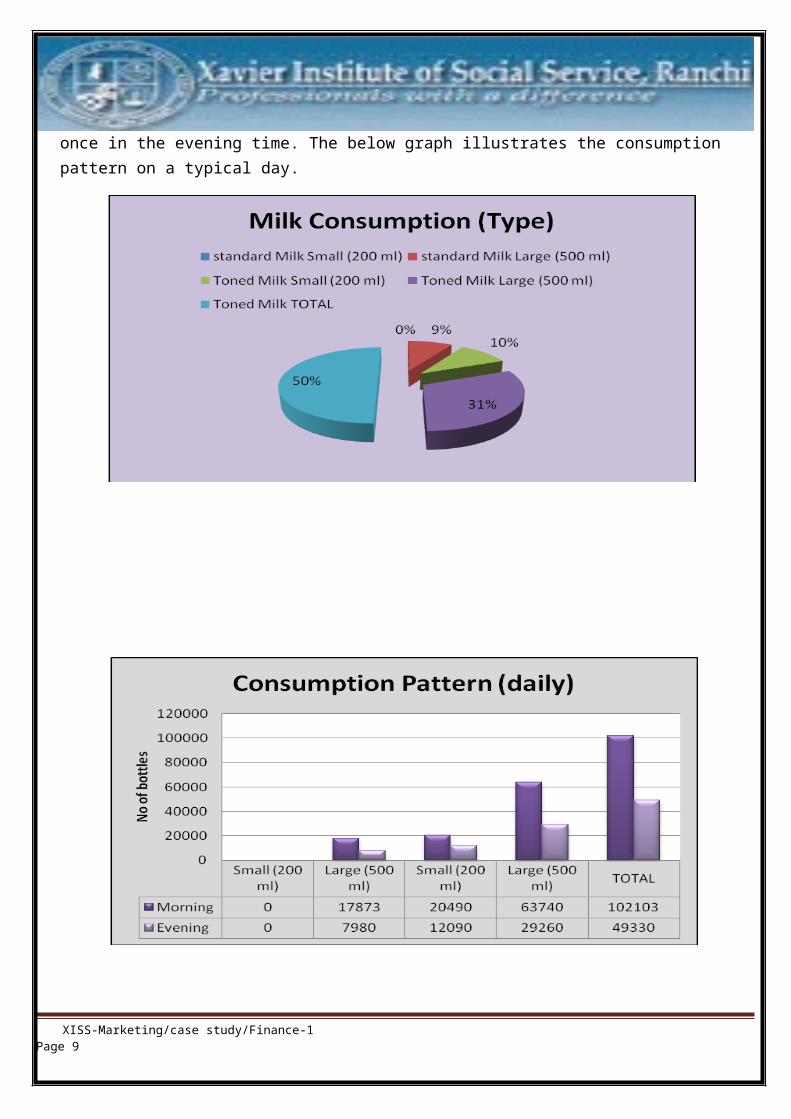
once in the evening time. The below graph illustrates the consumption pattern on a typical day.
XISS-Marketing/case study/Finance-1 Page 9

Bottle Vending SystemAdvantages:
Oldest distribution system in the region. Distribution system is as per the consumption pattern
of the district, as most consumers link their milk purchase to the morning and evening tea prepration.
Consumers are not required to bring their containers. Conveninet for higher income group. Unsold milk is returned to the plant so fresh milk is
available at the time of purchase.
Issues and Causes:
IiI Issues
Causes
Delay of payment by milk centres operators
Operators have to deposit the money collected in bank.
Problem of Adulteration
Expected cause is somemalpractice going on either during transportation or in the milk centres.
Reduction in Bottle Declining condition of XISS-Marketing/case study/Finance-1 Page 10

life plant machinery
Extra cost of alumininum caps
When bottles return toplant caps are lost.
Losses due to return of milk
Due to 0.4%-0.5% loss in fat
Only 20% sales of small bottle milk
Min. Bottle size is 200ml
Bulk Vending System Advantages:
Cost saving on bottles and on its losses due to
breakage.
Cost saving on aluminium caps.
Cost saving on crates.
Cost saving on number of vehicle needed for distribution.
Cost saving on comission paid to intedepended contractors
to sell milk.
Cost saving on unsold milk.
XISS-Marketing/case study/Finance-1 Page 11

Elimination of pilferage and adulteration of milk.
24*7 availability of fresh milk.
Less selling price of Rs. 1.80/lit as compared to Rs.
1.90/lit through Bottle vending distribution.
Elimintion of the problem of delay in payment.
Will save the investment required in the new bottling
plant, which has an expected life of 3 to 5 more years.
XISS-Marketing/case study/Finance-1 Page 12

Issues and Causes:
IiI Issues
Causes
Fixed amount of milk being dispensed
For each token inserted machine will dispense 500 ml of milk
Customer has to carry hi/her own container
Bulk vending machine
Extra Manpower required
One operator will be required to operate bulk vending centres
Greater convenience tothe customer
Because of 24*7 availability of milk
Would not appeal to High Income Group
They have to come to the milk centre with their own container tocollect milk.
Maintenance Frequent maintenance will be required to run the machine
XISS-Marketing/case study/Finance-1 Page 13
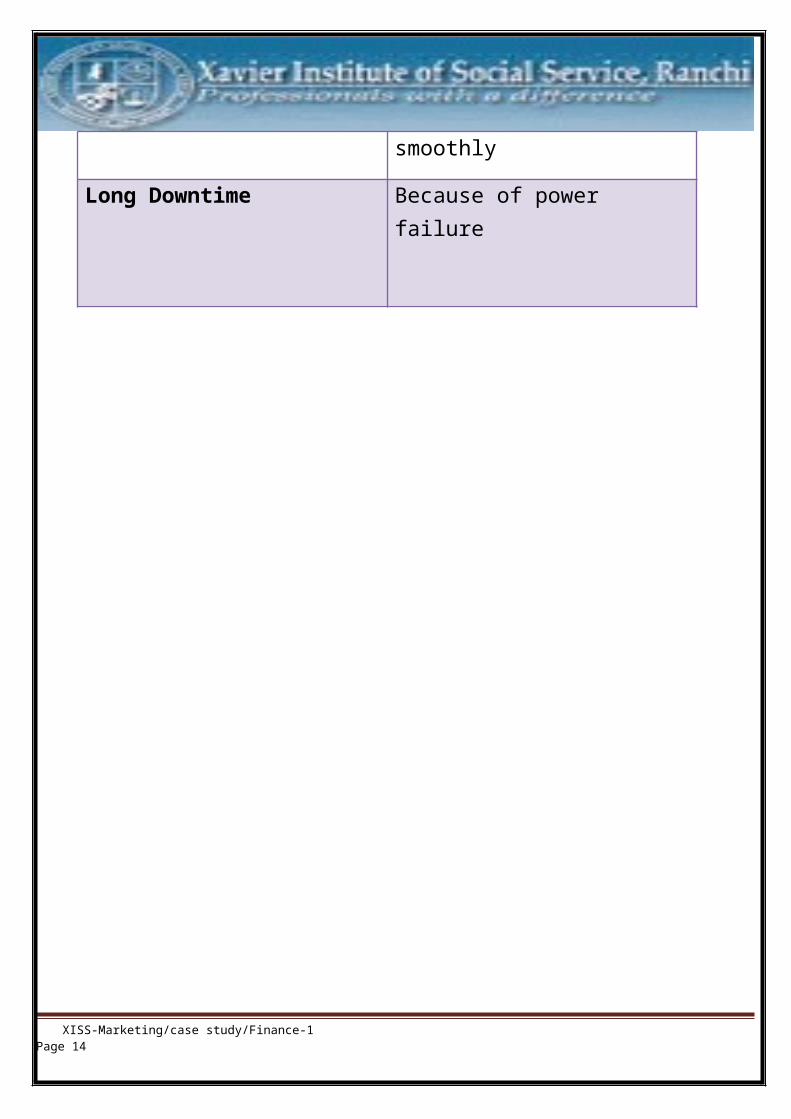
smoothly
Long Downtime Because of power failure
XISS-Marketing/case study/Finance-1 Page 14

ANALYSISa. Cost Analysis
In cost analysis we will compare the “Total Annual Expense” of the two system of distribution-
Bottle Vending Distribution System
Bulk Vending Distribution System
Given Data-
Particulars Quantity ReferencePer day supply of milk (1974-75)(In Lit)
64414Exhibit-1
Per Day Production Of milk (In Lit)
65000-75000 Exhibit-5 Foot Note
No of Booths 231 Exhibit-2No of Pilot vending machine 10 Future PlansNo of Trucks 22 Distribution
ArrangementNo of bottles used daily 151433 Exhibit 1Each crates consist of 24 bottles Distribution
ArrangementCost of 500 ml of bottle 1.10 Economy of
DistributionAverage Breakage of bottle/day
1% Economy of Distribution
Average milk distribution inmilk centres
300 lit/day Distribution Arrangement
commission of contractor 2 paisa/ litsales
Distribution Arrangements
Expected Life of Bottles80 days
Economy of Distribution
Expected Life of Bottling Plant from 1975 3-5 years Bulk Vending
Cost Associated with Bottle Vending(INR)
Fixed Cost
Depreciation on Plant 10% Exhibit 5 foot XISS-Marketing/case study/Finance-1 Page 15

structure and rolling stock noteMaintenance annual
15%Exhibit 5 foot note
Interest on capital15%
Exhibit 5 foot note
AT 1974-75 capacity, investment cost of bottle used 1750000 Exhibit 5At 1974-75, Investment cost of creates 70,000 Exhibit 5At 1974-75, Investment cost of distribution truck 18,80,000 Exhibit 5At 1974-75 , Investment costof milk cabin 2,30,000 Exhibit 5Investment cost of washer, filler etc 6,00,000 Exhibit 5
Running costs(Rs/Day)
Steam, water, electricity 2,500 Exhibit 5Detergent 120 Exhibit 5Labour 600 Exhibit 5Foil For Caps 1,200 Exhibit 5Truck (Salaries, & Fuel) 1,200 Exhibit 5Losses due to return/breakage 1,700 Exhibit 5
XISS-Marketing/case study/Finance-1 Page 16
Particulars Quantity ReferenceCost Associated with Bulk
Vending(INR)Fixed Cost
Depreciation on Plant structure and rolling stock 10%
Exhibit 5 foot note
Maintenance annual15%
Exhibit 5 foot note
Interest on capital15%
Exhibit 5 foot note
Each Vending Machine (1000 lit capacity) 1,00,000 Exhibit 6Each Tanker 2,25,000 Exhibit 6
Running costs(Rs/Day)
Each Bulk Vending MachineElectricity 20 Exhibit 6Maintenance & Clearing 3 Exhibit 6Machine attendant cum salesman 30 Exhibit 6
Each TankerSalaries 40 Exhibit 6Fuel 400 Exhibit 6

Assumptions Made
a. Total Production=Total sales
b. Cost of Each truck, crates, bottle calculated @ 1974-75 Investment cost as actual cost is not given
c. Standby stock of bottle = daily avg. breakage of 1%
d. Depreciation is calculated using Fixed Installment Method OR Straight Line Method
e. All fixed and Running cost are calculated per liter of milk sold/produced
f. Average Cost to fill up bottles lost due to breakage =Rs 1.0 (as price of 500ml of bottle given 1.10)
Initial Calculations (All cost in inr)
1. Average daily supply of milk (Lit)= Daily Average daily supply
of milk/No of Booth
= 64414/231= 278 lit./Day
2. As we have to compare two system of distribution using pilot
lot of 10 vending machine, that will be equal to no. of booth:
XISS-Marketing/case study/Finance-1 Page 17
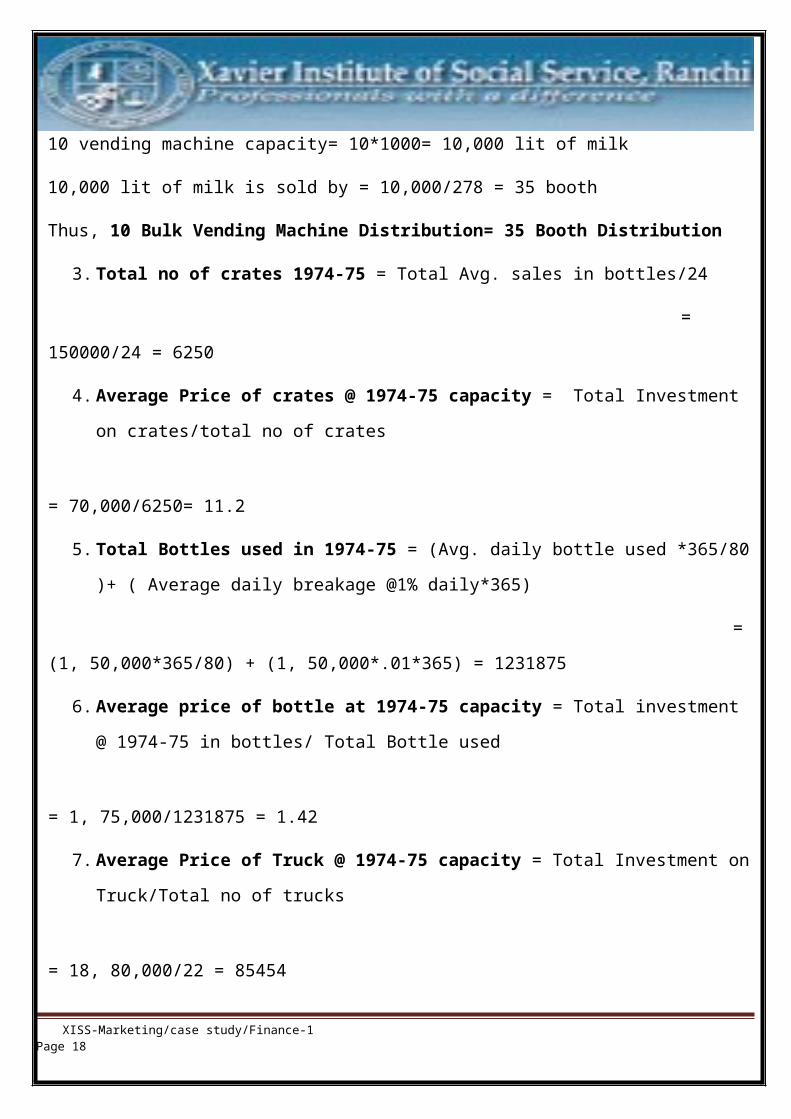
10 vending machine capacity= 10*1000= 10,000 lit of milk
10,000 lit of milk is sold by = 10,000/278 = 35 booth
Thus, 10 Bulk Vending Machine Distribution= 35 Booth Distribution
3. Total no of crates 1974-75 = Total Avg. sales in bottles/24
=
150000/24 = 6250
4. Average Price of crates @ 1974-75 capacity = Total Investment
on crates/total no of crates
= 70,000/6250= 11.2
5. Total Bottles used in 1974-75 = (Avg. daily bottle used *365/80
)+ ( Average daily breakage @1% daily*365)
=
(1, 50,000*365/80) + (1, 50,000*.01*365) = 1231875
6. Average price of bottle at 1974-75 capacity = Total investment
@ 1974-75 in bottles/ Total Bottle used
= 1, 75,000/1231875 = 1.42
7. Average Price of Truck @ 1974-75 capacity = Total Investment on
Truck/Total no of trucks
= 18, 80,000/22 = 85454
XISS-Marketing/case study/Finance-1 Page 18
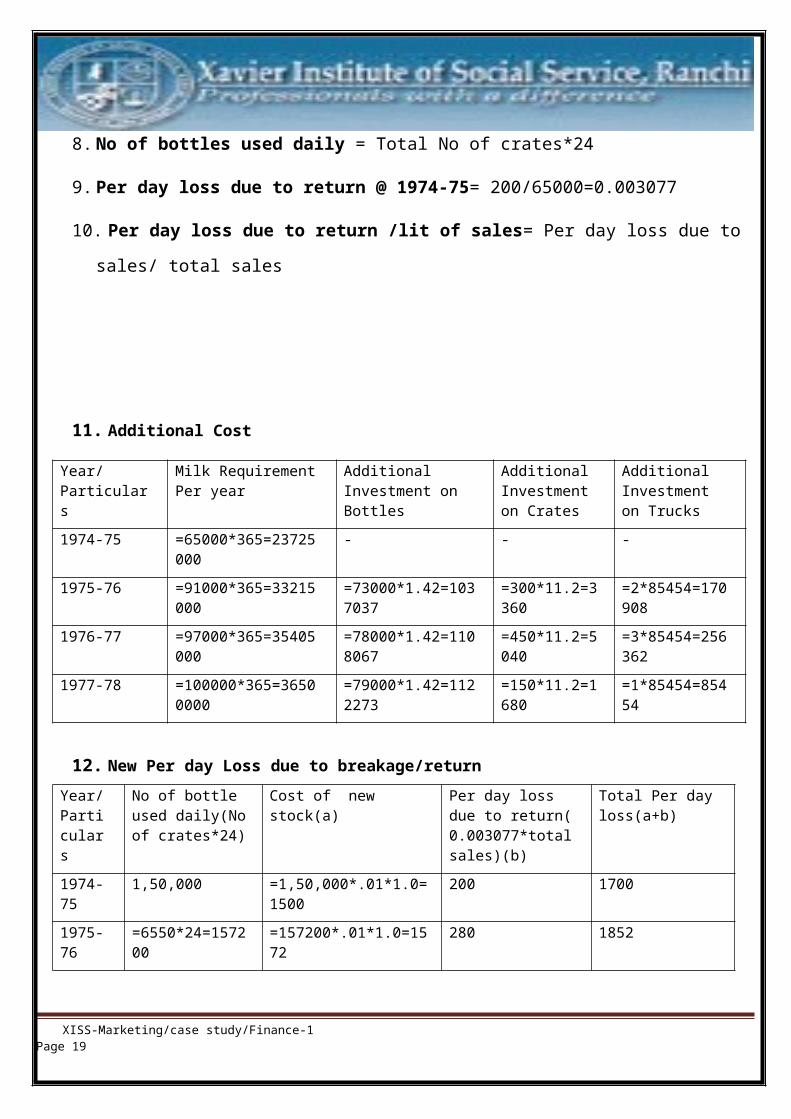
8. No of bottles used daily = Total No of crates*24
9. Per day loss due to return @ 1974-75= 200/65000=0.003077
10. Per day loss due to return /lit of sales= Per day loss due to
sales/ total sales
11. Additional Cost
Year/Particulars
Milk RequirementPer year
Additional Investment on Bottles
Additional Investment on Crates
Additional Investment on Trucks
1974-75 =65000*365=23725000
- - -
1975-76 =91000*365=33215000
=73000*1.42=1037037
=300*11.2=3360
=2*85454=170908
1976-77 =97000*365=35405000
=78000*1.42=1108067
=450*11.2=5040
=3*85454=256362
1977-78 =100000*365=36500000
=79000*1.42=1122273
=150*11.2=1680
=1*85454=85454
12. New Per day Loss due to breakage/returnYear/Particulars
No of bottle used daily(Noof crates*24)
Cost of new stock(a)
Per day loss due to return(0.003077*totalsales)(b)
Total Per day loss(a+b)
1974-75
1,50,000 =1,50,000*.01*1.0=1500
200 1700
1975-76
=6550*24=157200
=157200*.01*1.0=1572
280 1852
XISS-Marketing/case study/Finance-1 Page 19
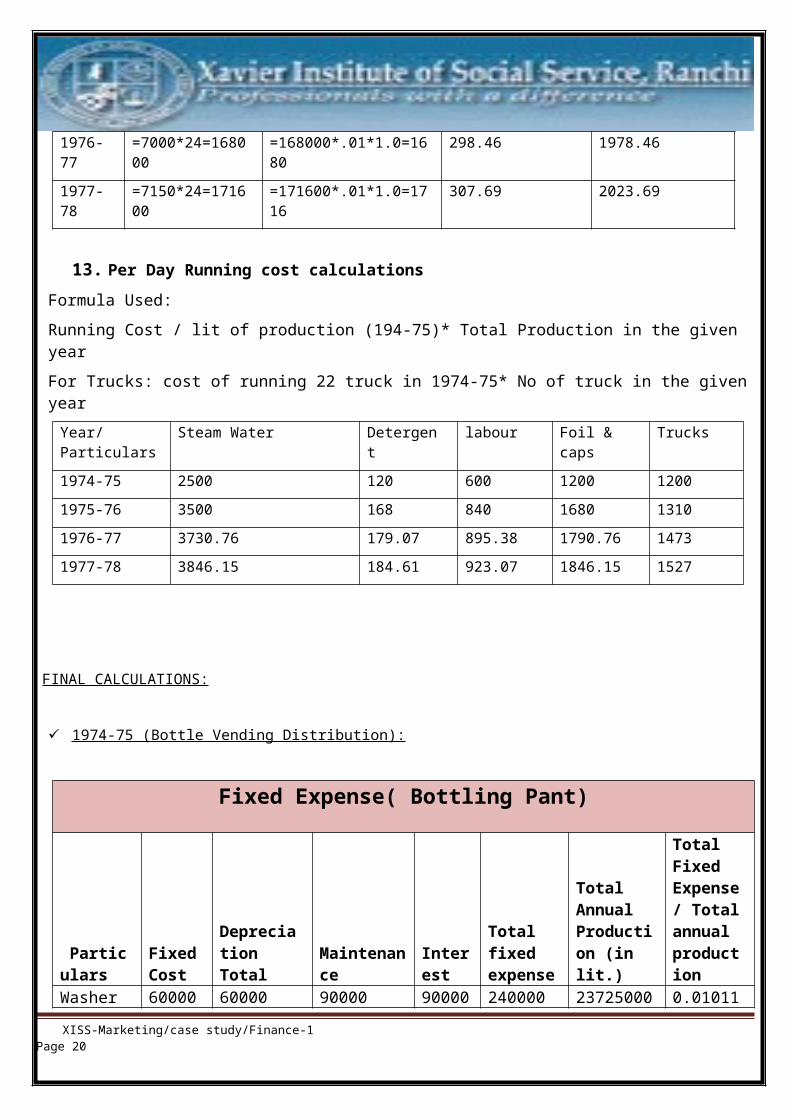
1976-77
=7000*24=168000
=168000*.01*1.0=1680
298.46 1978.46
1977-78
=7150*24=171600
=171600*.01*1.0=1716
307.69 2023.69
13. Per Day Running cost calculationsFormula Used:Running Cost / lit of production (194-75)* Total Production in the given yearFor Trucks: cost of running 22 truck in 1974-75* No of truck in the givenyearYear/Particulars
Steam Water Detergent
labour Foil & caps
Trucks
1974-75 2500 120 600 1200 12001975-76 3500 168 840 1680 13101976-77 3730.76 179.07 895.38 1790.76 14731977-78 3846.15 184.61 923.07 1846.15 1527
FINAL CALCULATIONS:
1974-75 (Bottle Vending Distribution):
Fixed Expense( Bottling Pant)
Particulars
FixedCost
Depreciation Total
Maintenance
Interest
Total fixed expense
Total Annual Production (in lit.)
Total Fixed Expense/ Totalannual production
Washer 60000 60000 90000 90000 240000 23725000 0.01011 XISS-Marketing/case study/Finance-1 Page 20

, filler etc 0 6Crates 70000 7000 10500 10500 28000 23725000 0.00118
Bottles175000 17500 26250 26250 70000 23725000 0.00295
Trucks1880000 188000 282000
282000 752000 23725000
0.031697
Milk Cabins
230000 23000 34500 34500 92000 23725000
0.003878
Total cost (1974-75)
2955000 295500 443250
443250 1182000
0.049821
1975-76
Bottle Vending Distribution:
Fixed Expense( Bottling Pant)
Particula Fixed Depreciat Maintenan Interes Total Total Annual Total
XISS-Marketing/case study/Finance-1 Page 21
Running Expense (Bottling Plant )
ParticularsPer Day Running cost
Annual Running Cost
Running cost/ Lit.of sales
steam water 2500 912500 0.0384615detergent 120 43800 0.0018462labour 600 219000 0.0092308foil and caps 1200 438000 0.0184615trucks 1200 438000 0.0184615losses 1700 620500 0.0261538Total annual Running cost/Total annualProd. 0.1126154
Total Expense (Bottling Plant)
Total Annual Expense/Lit of milk production (a)
RS/lit.
Fixed Cost + Running Cost 0.1624362
Avg. annual sale of milk in a booth (b)
Lit. =278*365 101470
Total CP on a booths (c ) Rs. a*b 16482.406Total CP on 35 Booths (d) Rs. C*35 576884.22Total Annual Commission Paid to 35 booths (e) Rs. =35*b*.02 71029Total Annual Net cost price on 35 Booths Rs. d+e 647913.22 In lakh 6.4791322

rs Cost ion (a) ce (b) t (c )fixed expense
Production (in ltr)
Fixed Expense/ Unit lit of Milk sold
Washer , filler etc 540000 54000 81000 81000 216000 33215000 0.006503Crates 66360 6636 9954 9954 26544 33215000 0.000799
Bottles 1194537 119453.7 179180.6179180.6
477814.8 33215000 0.014386
Trucks 1862909 186290.9 279436.4279436.4
745163.6 33215000 0.022435
Milk Cabins 207000 20700 31050 31050 82800 33215000 0.002493Total cost(1974-75) 3870806 387080.6 580620.9
580620.9 1548322 0.046615
Total Expense (Bottling Plant)
Total Annual Expense/Lit of Milk (a)
Rs./lit
Fixed cost+ RunningCost 0.1493624
Avg. annual sale of a booth (b)
Lit. =(91000/246)*365 135020.33
Total CP on a booth Rs a * b 20166.961Total CP on 35 booths (c ) Rs. 705843.63Total Annual Commission Paid to 35 booth (d ) Rs.
=35*.02*(91000/246)*365 94514.228
Total Annual Net cost price on 35 booth Rs. c + d 800357.86 In lakh. 8.0035786
BULK VENDING DISTRIBUTION:
Fixed Cost
Particulars Investment
Depreciation
Interest
Maintenance
Total Fixed Expense
Total Fixed Expense
Total fixed expense
XISS-Marketing/case study/Finance-1 Page 22
Running Expense (Bottling Plant )
ParticularsPer Day Running cost
Annual Running Cost
Running cost/ Lit of sales
steam water 3500 1277500 0.0384615detergent 168 61320 0.0018462labour 840 306600 0.0092308foil and caps 1680 613200 0.0184615trucks 1310 478150 0.0143956losses 1852 675980 0.0203516Total annual Running cost/Total annualProd. 0.1027473

each vending m/c
on each unit/Litof sales
on pilotper lit of sales
Each Vending M/c(1000 lit capacity) 100000 10000 15000 15000 40000
0.0012043
0.0120428
Each Tanker(9000 lit capacity) 225000 22500 33750 33750 90000
0.0027096
0.0027096
Total 1300000.0039139
0.0147524
Variable Cost
Each vending m/cper day (a)
Total expense annually (a*365*10)
Total expense/lit of sales
Electricity 20 73000 0.0021978Maintenance and clearing 3 10950 0.0003297Machine attendant 30 109500 0.0032967Total 193450 0.0058242Each Tanker
salaries 40 14600 0.0004396Fuel 400 146000 0.0043956Total variable cost of 1 tanker per lit of milk produced 0.0048352
Total Expense
Total expense on 10 booth/lit of milk produced (Total Fixed Cost+ Total Variable Cost) 0.0254117Total annual sales on 10 booth (10*365*1000) 3650000Total cp on 10 booth 92752.747In lakhs 0.9275275
XISS-Marketing/case study/Finance-1 Page 23
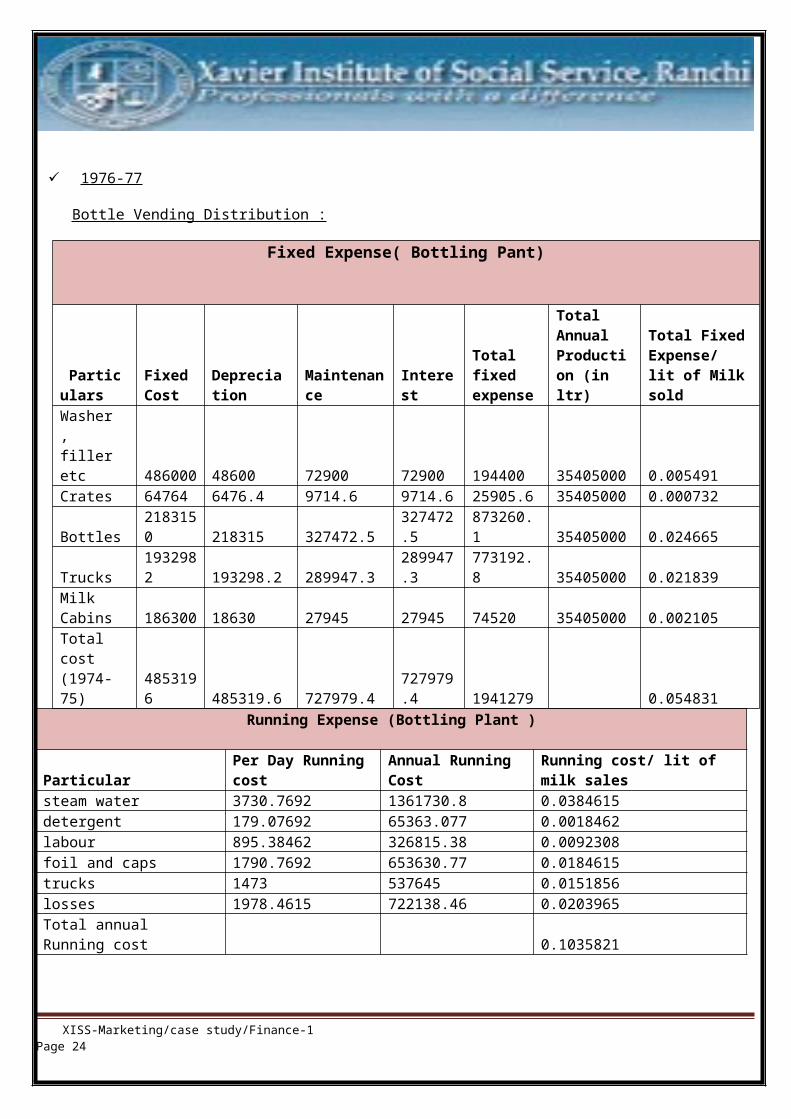
1976-77
Bottle Vending Distribution :
Fixed Expense( Bottling Pant)
Particulars
Fixed Cost
Depreciation
Maintenance
Interest
Total fixed expense
Total Annual Production (in ltr)
Total FixedExpense/ lit of Milksold
Washer , filler etc 486000 48600 72900 72900 194400 35405000 0.005491Crates 64764 6476.4 9714.6 9714.6 25905.6 35405000 0.000732
Bottles2183150 218315 327472.5
327472.5
873260.1 35405000 0.024665
Trucks1932982 193298.2 289947.3
289947.3
773192.8 35405000 0.021839
Milk Cabins 186300 18630 27945 27945 74520 35405000 0.002105Total cost (1974-75)
4853196 485319.6 727979.4
727979.4 1941279 0.054831
Running Expense (Bottling Plant )
ParticularPer Day Running cost
Annual Running Cost
Running cost/ lit of milk sales
steam water 3730.7692 1361730.8 0.0384615detergent 179.07692 65363.077 0.0018462labour 895.38462 326815.38 0.0092308foil and caps 1790.7692 653630.77 0.0184615trucks 1473 537645 0.0151856losses 1978.4615 722138.46 0.0203965Total annual Running cost 0.1035821
XISS-Marketing/case study/Finance-1 Page 24
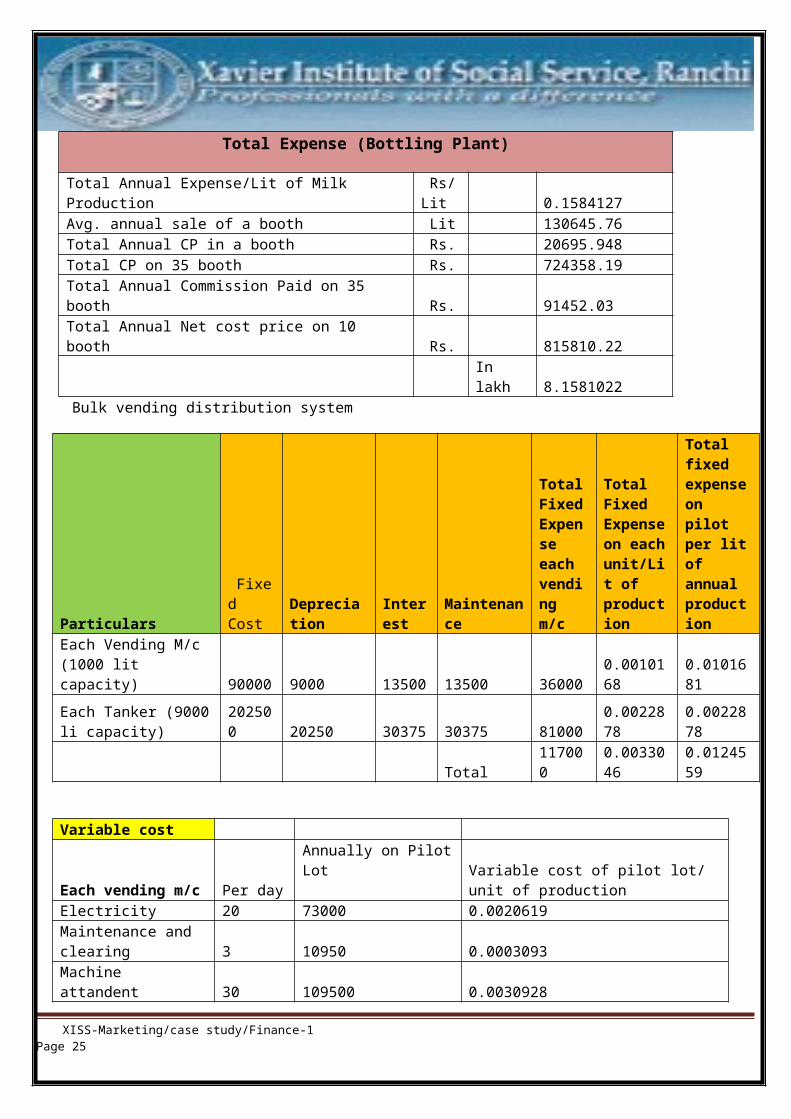
Total Expense (Bottling Plant)
Total Annual Expense/Lit of Milk Production
Rs/Lit 0.1584127
Avg. annual sale of a booth Lit 130645.76Total Annual CP in a booth Rs. 20695.948Total CP on 35 booth Rs. 724358.19Total Annual Commission Paid on 35 booth Rs. 91452.03Total Annual Net cost price on 10 booth Rs. 815810.22
In lakh 8.1581022
Bulk vending distribution system
Particulars
Fixed Cost
Depreciation
Interest
Maintenance
TotalFixedExpense each vending m/c
Total Fixed Expenseon eachunit/Lit of production
Total fixed expenseon pilot per litof annual production
Each Vending M/c (1000 lit capacity) 90000 9000 13500 13500 36000
0.0010168
0.0101681
Each Tanker (9000li capacity)
202500 20250 30375 30375 81000
0.0022878
0.0022878
Total117000
0.0033046
0.0124559
Variable cost
Each vending m/c Per day
Annually on PilotLot Variable cost of pilot lot/
unit of productionElectricity 20 73000 0.0020619Maintenance and clearing 3 10950 0.0003093Machine attandent 30 109500 0.0030928
XISS-Marketing/case study/Finance-1 Page 25

Total 0.0054639Each Tanker salaries 40 14600 0.0004124Fuel 400 146000 0.0041237Total 0.0045361
Total Expense
Total expense on 10 booth/lit of milk produced 0.0224559Total annual sales on 10 booth 3650000Total cp on 10 booth 81963.918In lakhs 0.8196392
1977-78 Bottle vending distribution system
Fixed Expense( Bottling Pant)
Particulars
FixedCost
depreciation Total
maintenance
interest
Total fixed expense
Total Annual Production(in ltr)
Total Fixed Expense/ Unit lit of Milk production
Washer , filler etc
437400 43740 65610 65610 174960 36500000 0.004793
Crates 59968 5996.8 8995.2 8995.2 23987.2 36500000 0.000657
Bottles3283588 328358.8 492538.2
492538.2 1313435 36500000 0.035985
Trucks1825138 182513.8 273770.7
273770.7 730055.2 36500000 0.020002
Milk Cabins
167670 16767 25150.5
25150.5 67068 36500000 0.001837
Total cost (1974-75)
5773764 577376.4 866064.6
866064.6 2309506 0.063274
XISS-Marketing/case study/Finance-1 Page 26
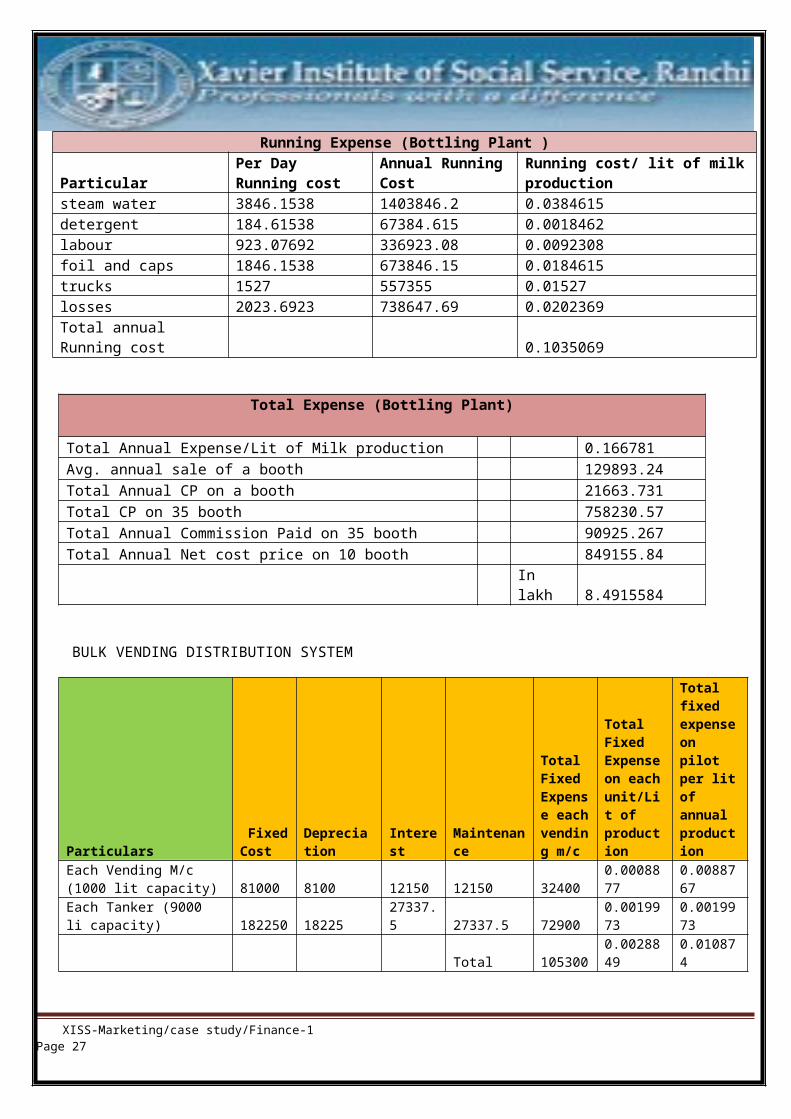
Running Expense (Bottling Plant )
ParticularPer Day Running cost
Annual RunningCost
Running cost/ lit of milkproduction
steam water 3846.1538 1403846.2 0.0384615detergent 184.61538 67384.615 0.0018462labour 923.07692 336923.08 0.0092308foil and caps 1846.1538 673846.15 0.0184615trucks 1527 557355 0.01527losses 2023.6923 738647.69 0.0202369Total annual Running cost 0.1035069
Total Expense (Bottling Plant)
Total Annual Expense/Lit of Milk production 0.166781Avg. annual sale of a booth 129893.24Total Annual CP on a booth 21663.731Total CP on 35 booth 758230.57Total Annual Commission Paid on 35 booth 90925.267Total Annual Net cost price on 10 booth 849155.84
In lakh 8.4915584
BULK VENDING DISTRIBUTION SYSTEM
Particulars FixedCost
Depreciation
Interest
Maintenance
Total Fixed Expense eachvending m/c
Total Fixed Expenseon eachunit/Lit of production
Total fixed expenseon pilot per litof annual production
Each Vending M/c (1000 lit capacity) 81000 8100 12150 12150 32400
0.0008877
0.0088767
Each Tanker (9000 li capacity) 182250 18225
27337.5 27337.5 72900
0.0019973
0.0019973
Total 1053000.0028849
0.010874
XISS-Marketing/case study/Finance-1 Page 27
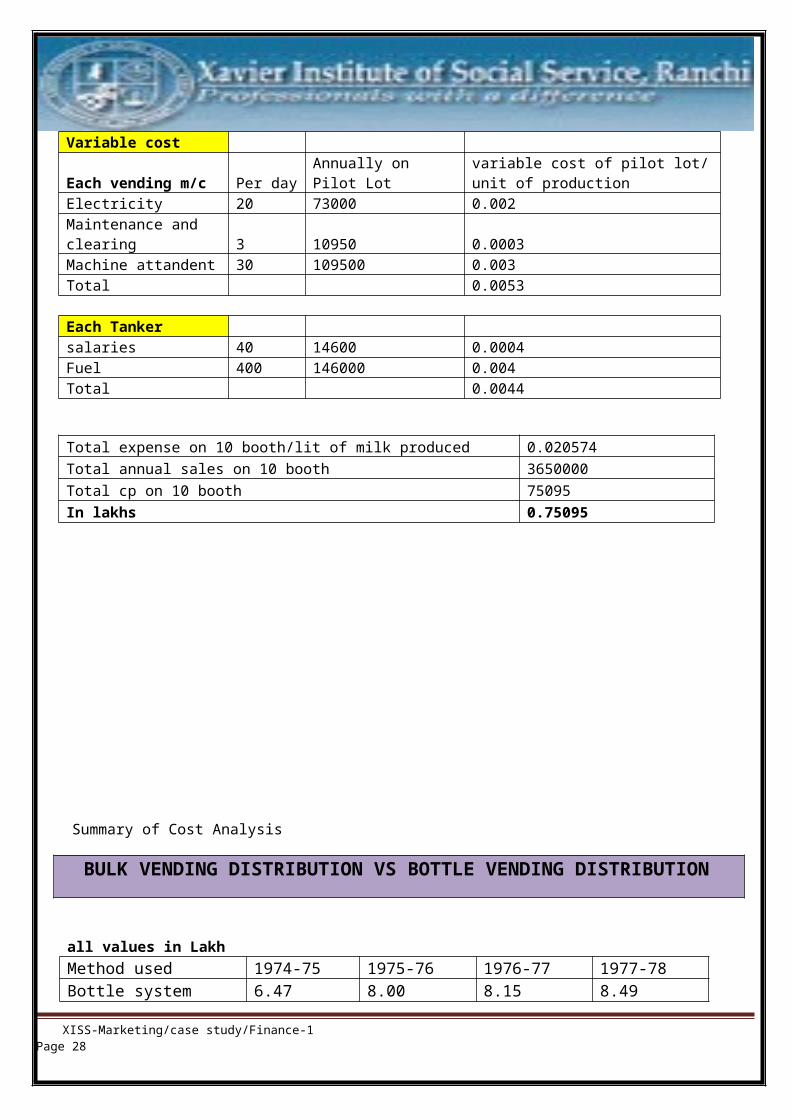
Variable cost
Each vending m/c Per dayAnnually on Pilot Lot
variable cost of pilot lot/unit of production
Electricity 20 73000 0.002Maintenance and clearing 3 10950 0.0003Machine attandent 30 109500 0.003Total 0.0053
Each Tanker salaries 40 14600 0.0004Fuel 400 146000 0.004Total 0.0044
Total expense on 10 booth/lit of milk produced 0.020574Total annual sales on 10 booth 3650000Total cp on 10 booth 75095In lakhs 0.75095
Summary of Cost Analysis
BULK VENDING DISTRIBUTION VS BOTTLE VENDING DISTRIBUTION
all values in LakhMethod used 1974-75 1975-76 1976-77 1977-78Bottle system 6.47 8.00 8.15 8.49
XISS-Marketing/case study/Finance-1 Page 28

Bulk Vending - 0.92 0.81 0.75Difference 6.47 7.080 7.340 7.740
B. VALUE ANALYSIS :
Here we will compare the two different value offrered by the two delivery process. Company exhisting infra and
XISS-Marketing/case study/Finance-1 Page 29
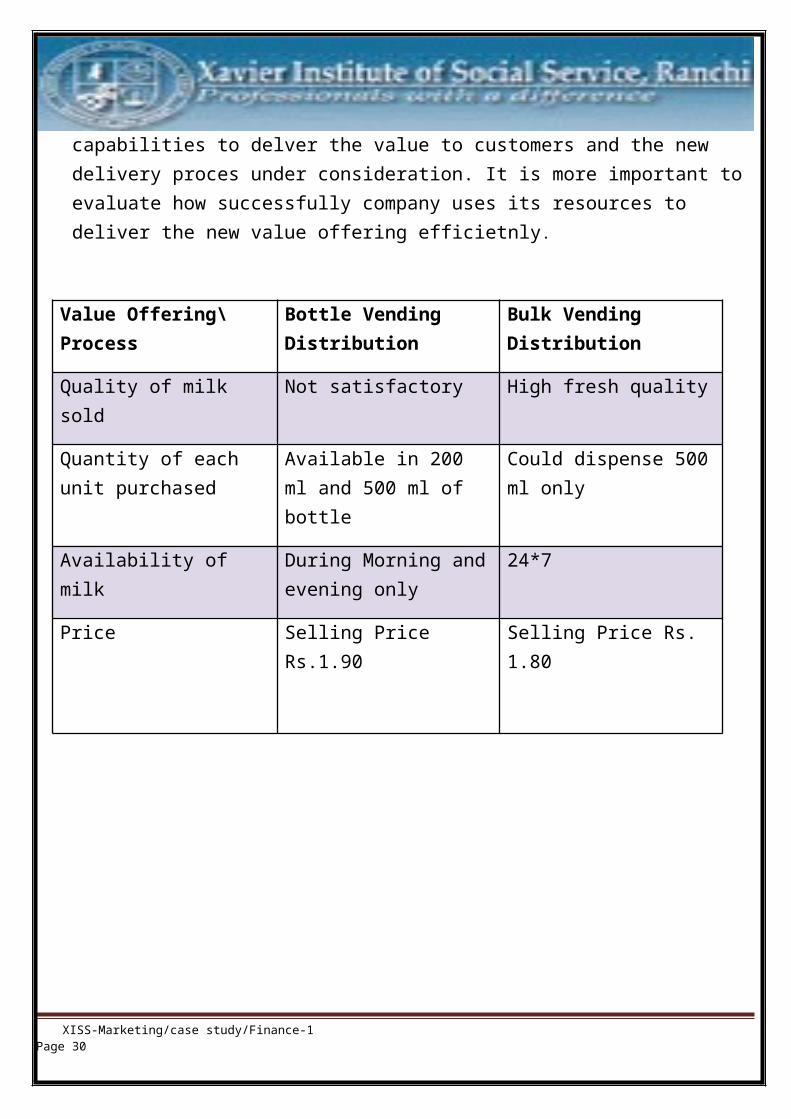
capabilities to delver the value to customers and the new delivery proces under consideration. It is more important to evaluate how successfully company uses its resources to deliver the new value offering efficietnly.
Value Offering\Process
Bottle Vending Distribution
Bulk Vending Distribution
Quality of milk sold
Not satisfactory High fresh quality
Quantity of each unit purchased
Available in 200 ml and 500 ml of bottle
Could dispense 500ml only
Availability of milk
During Morning andevening only
24*7
Price Selling Price Rs.1.90
Selling Price Rs. 1.80
XISS-Marketing/case study/Finance-1 Page 30
Suggestions and RecommendationsThrough cost analysis we have come to the conclusion that Bulk Vending system has advantage over Bottle vending system. In long run it will save lots of fixed and running costs of Unnat Nagar Dairy. Moreover, it will save the fixed investment to be made in coming three years in setting up new bottlingplant and everyday expense of commission on selling the milk though contarctor.Therefore, we recommend that Unnat Nagar Dairy should go with the proposal ofsupplying milk through automatic bulk vending machine.
But under following recommendations:
The automatic Bulk Vending distribution machine should be evenly distributed as per the population of the wards.
Unnat Nagar Dairy should also introduce quality circles to check quality of the milk dispatched.
The dairy should increase the value offering by supplying milk in even smaller quantity than 200 ml.
XISS-Marketing/case study/Finance-1 Page 31

The dairy should not implement the automatic bulk vending system in the high income group region, because that will not offer comfort to these customers who often pay some extra money to get bottle at doorstep.
Dairy should ensure adequate power supply to the automatic bulk vending centre to keep milk in fresh condition.
XISS-Marketing/case study/Finance-1 Page 32