DISTRICT ENVIRONMENTAL PLAN UDHAM SINGH NAGAR
143
` i DISTRICT ENVIRONMENTAL PLAN (As per the Hon’ble National Green Tribunal (NGT) vide order O.A. no. 360/2018 dated 26.09.2019) UDHAM SINGH NAGAR G.B. Pant National Institute of Himalayan Environment (NIHE), HQ, Kosi-Katarmal, Almora-263643, Uttarakhand, India
-
Upload
khangminh22 -
Category
Documents
-
view
3 -
download
0
Transcript of DISTRICT ENVIRONMENTAL PLAN UDHAM SINGH NAGAR

`
i
DISTRICT ENVIRONMENTAL PLAN (As per the Hon’ble National Green Tribunal (NGT) vide order O.A. no. 360/2018 dated 26.09.2019)
UDHAM SINGH NAGAR
G.B. Pant National Institute of Himalayan Environment (NIHE), HQ, Kosi-Katarmal, Almora-263643, Uttarakhand, India

`
ii
CONTRIBUTORS
Director, GBP-NIHE Project Coordinator
Dr. J.C. Kuniyal, Scientist ‘G’ & Head CEA&CC, GBP-NIHE Principal Project Investigator
Dr. G.C.S Negi, Scientist ‘G’ & Head CSED, GBP-NIHE Co-Project Investigator
Dr. I.D. Bhatt, Scientist ‘F’ & Head CBCM, GBP-NIHE Co-Project Investigator
Dr. Sumit Rai, Scientist ‘C’, GBP-NIHE Co-Project Investigator
Dr. Kapil Kesarwani, Scientist ‘C’, GBP-NIHE Co-Project Investigator
Dr. Dalbeer Singh Pharswan, Project Scientist, GBP-NIHE Team Member
Mr. Manav Sharma, Researcher, GBP-NIHE Team Member
Mr. Tapan Ghosh, Researcher, GBP-NIHE Team Member
Mr. Pramod Joshi, Field Surveyor, GBP-NIHE Team Member
Administration
District Magistrate, Udham Singh Nagar (US Nagar) Chairperson
Divisional Forest Officer, Udham Singh Nagar (US Nagar) Member Secretary

`
iii
PREFACE
Hon’ble National Green Tribunal (NGT) vide order, dated 26/09/2019 in O.A. No. 360 of 2018 filed by
Shree Nath Sharma Vs. Union of India and Others directed that Central Pollution Control Board (CPCB)
facilitate the District Magistrates in preparing the District Environmental Plan (DEP) by placing a model
plan on its website. This model plan may be adopted as per local requirements by all districts under the
supervision of the District Magistrate. The said order also directs that the Department of Environment in
respective states should collect district plans to prepare State Environment Plan (SEP), which shall be
monitored by respective Chief Secretaries of the State by 15/12/2019. Based on State Environmental Plans,
CPCB and Ministry of Environment, Forest & Climate Change (MoEFCC) shall prepare a National
Environmental Plan (NEP), under the supervision of Secretary, MoEFCC and Chairman, CPCB.
There are diverse environmental issues that address our key responsibilities to the community and its
surrounding environment. As a set of target, fourteen areas by Hon’ble NGT and one more - plastic waste
by Government of Uttarakhand were included under the district plan. These 14 areas were regarding
compliance to rules for solid waste including legacy waste, bio-medical waste, Construction & Demolition
waste (C&D), hazardous waste, Electronic waste (E-waste), polluter stretches, non-attainment cities,
Industrial clusters, the status of Sewage Treatment Plants (STPs) and re-use of treated water, the status of
Common Effluent Treatment Plants (CETPs)/ Effluent Treatment Plants (ETPs), ground water extraction/
contamination and re-charge, air pollution including noise pollution, illegal sand mining, and rejuvenation
of water bodies. In addition, plastic waste was also assessed based on consultative workshops with the state
government including State Pollution Control Board (SPCB).
The present environmental plan describes the status quo of 15 thematic areas and sets out strategies to
mitigate their impact on different environmental parameters and human health. It briefly touches upon the
basic need for bringing in mountain perspective in developmental planning. Implementation of this plan
based on selected indicators will resolve different environmental issues. Also, it will meet compliance of
different departments within a district. It will also allow a variety of environmental opportunities
associated with different activities to be further undertaken from a view point of sustainable development.
We hope this document will act as a noble reference for various stakeholders interested in sustainable
development planning for the Udham Singh Nagar. Moreover, it will help to develop comprehensive
understanding of the environmental planning process in view of socio-economic and financial situation of
the district.
Date: Principal Investigator, Co-Project Investigators &
Project staff

`
iv
ACKNOWLEDGEMENT
The present ‘District Environment Plan’ has been an outcome of coordinated efforts put together
by different stakeholders from top to bottom in the state as well as in the district. At the outset, we
thank the Chief Secretary, Uttarakhand Government and Shri S.P. Subudhi, Member Secretary,
UKPCB. We thank the Director, G.B. Pant National Institute of Himalayan Environment
(GBPNIHE), Kosi-Katarmal, Almora for providing necessary facilities, instrumental support and
encouragement. We are also thankful to Chairman & District Magistrate (DM), Divisional Forest
Officer (DFO), Member Secretary, for their time to time valuable inputs in the formulation of the
DEP. We acknowledge all the support received from different departments including the DM
office, UKPCB, Nagar Palika Parishad (NPP), Forest department, Health department, Jal
Sansthan, Irrigation Department, Mining Department, Regional Transport Officer (RTO), etc. for
providing the information in a very satisfactory manner. The guidance and support from MoEFCC
and the Government of Uttarakhand remained a constant source of inspiration at stages of this
work. We thank and acknowledge all officers/ staff who could directly or indirectly contribute
their valuable inputs in completing the work. We also extend our thanks to all the colleagues who
made this work a memorable and worthwhile experience.
In the last but not least, our especial thanks go to Uttarakhand Pollution Control Board (UKPCB),
Government of Uttarakhand, for financial support (Letter No. UKPCB/HO/Gen.183-
431/2020/2156-415, dated 05/08/2020) to conduct the study in the 13 districts as well as the state
of Uttarakhand.

`
v
TABLE OF CONTENTS CONTRIBUTORS ................................................................................................................................. II
PREFACE ........................................................................................................................................... III
ACKNOWLEDGEMENT ....................................................................................................................... IV
ABBREVIATIONS ................................................................................................................................ XI
EXECUTIVE SUMMARY .................................................................................................................... XVI
INTRODUCTION .................................................................................................................................. 1
FUNDAMENTAL PRINCIPLES OF ENVIRONMENT PROTECTION ........................................................... 3
Sustainable Development ........................................................................................................................................... 3 Precautionary Principle ............................................................................................................................................... 3 Polluter Pays Principle ................................................................................................................................................ 3 Public Trust Doctrine .................................................................................................................................................. 4 Public Liability Insurance............................................................................................................................................. 4
ENVIRONMENT MANAGEMENT SYSTEM (ISO 14001:2015) ............................................................... 5
DISTRICT PROFILE ............................................................................................................................... 5
District at a glance ...................................................................................................................................................... 6 Physiography ............................................................................................................................................................... 7 Agriculture and Drainage Patterns ............................................................................................................................. 8 Climate ........................................................................................................................................................................ 8 Rainfall ........................................................................................................................................................................ 9 Groundwater............................................................................................................................................................... 9 Forest .......................................................................................................................................................................... 9 Flora and Fauna ........................................................................................................................................................ 10 Flora .......................................................................................................................................................................... 10 Fauna ........................................................................................................................................................................ 10 Industrial scenario of district .................................................................................................................................... 10 Culture and Tradition ................................................................................................................................................ 11
ENVIRONMENTAL CONCERNS IN THE DISTRICT ............................................................................... 12
SOLID WASTE MANAGEMENT .......................................................................................................... 14
Integrated Solid Waste Management (ISWM) .......................................................................................................... 14 Solid Waste management in Udham Singh Nagar District ........................................................................................ 14 Waste management infrastructure and processing in US Nagar .............................................................................. 17 Gap identification and proposed policies for effective waste management in Udham Singh Nagar ....................... 21 Vegetation suitable for rehabilitation of dumping sites ........................................................................................... 25 Rural Solid Waste Management ............................................................................................................................... 26 Current status of Rural Waste Management in India ............................................................................................... 26 Projected Population and Waste generation in U.S. Nagar district .......................................................................... 27 Inferences drawn from the projection of waste ....................................................................................................... 28
BIO MEDICAL WASTE MANAGEMENT .............................................................................................. 30
Importance of Biomedical Waste Management in the Wake of Pandemic .............................................................. 31 Biomedical Waste Management in US Nagar ........................................................................................................... 31 Prevailing Bio-Medical Waste Management in the District ...................................................................................... 32 Current Status and proposed policies for Biomedical waste management in Udham Singh Nagar ......................... 32
CONSTRUCTION & DEMOLITION WASTE MANAGEMENT ................................................................. 34

`
vi
Implementation of 3R Principle in C&D Waste Management .................................................................................. 34 Present state of affairs .............................................................................................................................................. 34 Present infrastructure within the state .................................................................................................................... 35 C&D Waste Management in US Nagar district ......................................................................................................... 35 C&D Waste Management in Rural Areas .................................................................................................................. 36
HAZARDOUS WASTE MANAGEMENT ............................................................................................... 37
Present state of affairs .............................................................................................................................................. 37 Hazardous waste management in U.S. Nagar District .............................................................................................. 37
ELECTRONIC WASTE MANAGEMENT................................................................................................ 40
Worldwide Scenario .................................................................................................................................................. 40 Indian Scenario ......................................................................................................................................................... 41 E-waste Management in US Nagar district ............................................................................................................... 41
POLLUTED RIVER STRETCHESIN US NAGAR ...................................................................................... 43
Polluter stretches in US Nagar .................................................................................................................................. 44 Water Quality Characteristics of Polluted river stretches at Different Monitoring Stations .................................... 45 River Bhela ................................................................................................................................................................ 45 River Dhela ................................................................................................................................................................ 46 River Kichha .............................................................................................................................................................. 47 River Kalyani.............................................................................................................................................................. 47 River Nandhor ........................................................................................................................................................... 48 River Pilakhar ............................................................................................................................................................ 49 River Kosi .................................................................................................................................................................. 50 Existing situation of Polluter Stretches in Udham Singh Nagar ................................................................................ 50
NON-ATTAINMENT CITY (KASHIPUR) ................................................................................................ 53
Status of Annual Ambient Air Quality in Kashipur .................................................................................................... 54
WASTE WATER MANAGEMENT AND SEWAGE TREATMENT PLANT ................................................. 56
Sewage treatment in U.S. Nagar District .................................................................................................................. 56 Sewage management in U.S. Nagar district .............................................................................................................. 57 Liquid waste management in rural areas.................................................................................................................. 57 Current standpoint about Rural Waste Water Management in India ...................................................................... 58
INDUSTRIAL WASTE WATER MANAGEMENT (ETP/CETP) ................................................................. 59
Common Effluent Treatment Plant ........................................................................................................................... 59 CETPs in Uttarakhand ............................................................................................................................................... 59 Industrial Waste water in Udham Singh Nagar ......................................................................................................... 60 Current Status Regarding Effluent Treatment Plant in US Nagar District ................................................................. 61
INDUSTRIAL CLUSTERS ..................................................................................................................... 62
Air and Water Quality Monitoring in Industrial Areas of US Nagar .......................................................................... 63 Integrated Industrial Area Pantnagar, Rudrapur, Udham Singh Nagar .................................................................... 64 Sources of Pollution in IIA Pantnagar, Rudrapur ...................................................................................................... 65
GROUND WATER EXTRACTION/CONTAMINATION AND RE-CHARGE ................................................ 66
Groundwater extraction ........................................................................................................................................... 66 Groundwater contamination .................................................................................................................................... 66 Groundwater Recharge ............................................................................................................................................. 66 Current standpoint regarding Water Resources Management and Groundwater Quality in US Nagar district ...... 69 Artificial Recharge Potential of US Nagar District ..................................................................................................... 69
AIR AND NOISE POLLUTION MANAGEMENT .................................................................................... 71
Air Pollution Management ........................................................................................................................................ 71

`
vii
Current scenario of air pollution in Udham Singh Nagar .......................................................................................... 72 Air Quality monitoring and proposed policies forUdham Singh Nagar .................................................................... 73 Noise Pollution Management ................................................................................................................................... 75 Noise Pollution in U.S. Nagar District ........................................................................................................................ 75 Monitoring of Noise Levels in US Nagar district ....................................................................................................... 76
ILLEGAL SAND MINING ..................................................................................................................... 77
Mining activities in the district. ................................................................................................................................ 77
REJUVENATION OF WATER BODIES .................................................................................................. 79
Rejuvenation works in U.S. Nagar district................................................................................................................. 79
PLASTIC WASTE MANAGEMENT ....................................................................................................... 81
Current scenario of Plastic waste in US Nagar district .............................................................................................. 82 Identification of Gap ................................................................................................................................................. 83 Projected Population and Plastic Waste Generation in US Nagar District ................................................................ 83 Inferences drawn from plastic waste projection ...................................................................................................... 85
ASSESSMENT OF URBAN LOCAL BODIES IN US NAGAR..................................................................... 86
Observations from data assessment......................................................................................................................... 87 Action Plan for Solid Waste Management ................................................................................................................ 89 Action Plan for Rural Waste Management in India................................................................................................... 91 Phytoremediation as a Mitigation Measure (for treatment of solid waste) ............................................................. 92 Action Plan for Bio-medical Waste Management ..................................................................................................... 93 Action Plan for C&D Waste Management ................................................................................................................ 95 Action Plan for Hazardous Waste Management ....................................................................................................... 97 Action Plan for E-Waste ............................................................................................................................................ 98 Action Plan for River Polluter Stretch in US Nagar ................................................................................................. 100 Phytoremediation as a Mitigation Measure (for rejuvenation of polluter stretches) ............................................ 100 Action Plan for Non-Attainment City (Kashipur) ..................................................................................................... 102 Action Plan for Environment Management in IIA Pantnagar, Rudrapur ................................................................ 103 Action Plan for Waste Water Management (STPs) ................................................................................................. 105 Action plan for Industrial waste water management ............................................................................................. 107 Action Plan for Water Resources Management and Ground Water Extraction/Contamination ........................... 108 Action Plan for Air and Noise Pollution ................................................................................................................... 110 Action Plan for Mining activities ............................................................................................................................. 113 Action Plan for Rejuvenation of Waterbodies ........................................................................................................ 114 Action Plan for Plastic Waste Management ........................................................................................................... 115
CONCLUSION ................................................................................................................................. 117
REFERENCES .................................................................................................................................. 120

`
viii
LIST OF FIGURES
Fig. 1. Location map of Udham Singh Nagar district ................................................................... 6
Fig. 2. Segregation of Biomedical waste as per BMW rules, 2016 ............................................ 14
Fig. 3. Geographical representation of projected population .................................................. 29
Fig. 4. Projected solid waste generation ................................................................................... 29
Fig. 5. Segregation of Biomedical waste as per BMW rules, 2016 ............................................ 30
Fig. 6. Projected plastic waste generation ................................................................................ 85
Fig. 7. Different activities in US Nagar for preparation of District Environment Plan ............ 119
LIST OF TABLES
Table 1. District at a glance .......................................................................................................... 6
Table 2. Physiographic Divisions .................................................................................................. 7
Table 3. Drainage system in US Nagar ......................................................................................... 8
Table 4. Total Forest Cover of US Nagar district in 2019 survey (FSI, 2019) ............................. 10
Table 5. Major companies in the district ................................................................................... 11
Table 6. Inventory of total solid waste generation ................................................................... 15
Table 7. Waste management operations .................................................................................. 15
Table 8. Present Infrastructure for Waste Management .......................................................... 18
Table 9. Methods of treatment, disposal and recovery ............................................................ 19
Table 10. Gap identification ......................................................................................................... 21
Table 11. Proposed policies and budget requirement put forward by different stakeholders in
the District .................................................................................................................... 24
Table 12. Vegetation suitable for rehabilitation of dump sites. .................................................. 26
Table 13. Projected population and waste generation ............................................................... 27
Table 14. Projected decadal change in solid waste generation .................................................. 28
Table 15. Inventory of current healthcare infrastructure for Bio-medical waste Management 31
Table 16. Current status of biomedical waste management ...................................................... 32
Table 17. Characteristics of C&D Waste in India ......................................................................... 35
Table 18. Thumb rule for Estimation of C&D waste generation for India ................................... 35
Table 19. Current status related to C&D waste generation ........................................................ 35
Table 20. Gaps Identified in the management of C&D waste ..................................................... 36
Table 21. Hazardous Waste generation in India .......................................................................... 37
Table 22. Inventory of Hazardous waste in Udham Singh Nagar ................................................ 38
Table 23. Current status related to Hazardous waste management .......................................... 38
Table 24. Gap identification ......................................................................................................... 39
Table 25. Bifurcation of E-waste based on electronic appliances ............................................... 40
Table 26. Current standpoints regarding E-waste generation and collection............................. 41
Table 27. Gap identification in e-waste management ................................................................ 42
Table 28. Criteria for Prioritization .............................................................................................. 43
Table 29. Water Quality standards for different purposes ......................................................... 43
Table 30. River Polluter Stretches in Udham Singh Nagar .......................................................... 44
Table 31. Identification of sources of Pollution in the polluter stretches ................................... 44
Table 32. Water quality characteristics of River Bhella (2017-2021) .......................................... 46

`
ix
Table 33. Water quality characteristics of River Dhela (2017-2021) ........................................... 46
Table 34. Water quality characteristics of River Kichha (2017-2021) ......................................... 47
Table 35. Water quality characteristics of River Kalyani (2017-2021) ........................................ 48
Table 36. Water quality characteristics of River Nandhor (2017-2021) ...................................... 49
Table 37. Water quality characteristics of River Pilakhar (2017-2021) ....................................... 49
Table 38. Water quality characteristics of River Kosi (2017-2021) ............................................. 50
Table 39. Current Status of polluted stretches of rivers in Udham Singh Nagar ........................ 50
Table 40. National ambient air quality standards in India .......................................................... 53
Table 41. Air Pollution in Kashipur District .................................................................................. 54
Table 42. Air Quality monitoring in Kashipur .............................................................................. 55
Table 43. Air quality Data ............................................................................................................ 55
Table 44. Current scenario related to STPs (MLD) in Uttarakhand ............................................. 56
Table 45. Current scenario related to STPs in the US Nagar ....................................................... 57
Table 46. Current standpoint regarding sewage management in the district ............................ 57
Table 47. Policies Undertaken for Waste Water Management in Rural India ............................ 58
Table 48. State Scenario of CETPs ................................................................................................ 60
Table 49. Inventory of Industries and waste water generation in US Nagar district .................. 60
Table 50. Status of compliance by Industries .............................................................................. 61
Table 51. Monthly Report of CETP Outlet at SIDCUL Rudrapur and Sitarganj ............................ 61
Table 52. Proposed policies and desired level of compliance as per different stakeholders ..... 61
Table 53. Based on pollution Index (Categorization of Industries Based on Range Indices) ...... 62
Table 54. Based on CEPI Score ..................................................................................................... 63
Table 55. Inventory of industries in Rudrapur, Udham Singh Nagar ........................................... 63
Table 56. Existing Status of Industrial Areas in the District U.S Nagar ........................................ 63
Table 57. Air quality monitoring in the Industrial area of US Nagar ........................................... 63
Table 58. Ground water quality monitoring is performed at selected areas of US Nagar (Data
April 2021) .................................................................................................................... 64
Table 59. Ground water quality monitoring is performed at selected areas of US Nagar (April
2020) ............................................................................................................................ 64
Table 60. Classification of different scale of Industries in IIA Rudrapur ..................................... 65
Table 61. Details of CEPI score of Polluted Industrial Area, IIA Rudrapur ................................... 65
Table 62. Water Resources in the District ................................................................................... 67
Table 63. Pollution control in Water Resources .......................................................................... 67
Table 64. Groundwater availability in the district ....................................................................... 67
Table 65. Half-yearly groundwater monitoring (at 11 monitoring stations) (April 2021) ........... 68
Table 66. Half yearly ground water monitoring (at 11 monitoring stations) (April 2020) .......... 68
Table 67. Artificial recharge of groundwater in US Nagar ........................................................... 69
Table 68. Artificial recharge structures constructed in US Nagar under CACMP (Catchment area
conservation programme) ........................................................................................... 70
Table 69. Proposed artificial recharge structures with cost estimate ......................................... 70
Table 70. National ambient air quality standards in India .......................................................... 71
Table 71. Air quality monitoring and data accessibility ............................................................... 72
Table 72. Identification of sources of air pollution...................................................................... 72
Table 73. Control measures for industrial/non industrial air pollution ...................................... 73

`
x
Table 74. Air quality monitoring in Udham Singh Nagar (2018-2021 ......................................... 74
Table 75. Monthly Air quality data for the year 2022 ................................................................. 74
Table 76. Permissible noise level standards ................................................................................ 75
Table 77. Current status related to noise pollution management in US Nagar .......................... 75
Table 78. Noise levels as of January,2022 ................................................................................... 76
Table 79. Noise level monitoring carried out during Deepawali Festival (2019 and 2021) ........ 76
Table 80. Responsibility of various departments to mitigate noise pollution ............................ 76
Table 81. Current status of mining activities in US Nagar ........................................................... 78
Table 82. Prevalent Mining Activities in US Nagar ...................................................................... 78
Table 83. Compliance with environmental standards ................................................................. 78
Table 84. Water bodies rejuvenated by US Nagar ...................................................................... 79
Table 85. Inventory of water bodies in US Nagar ........................................................................ 80
Table 86. Inventory of Plastic Waste Generation ........................................................................ 82
Table 87. Present Infrastructure for Plastic Waste Management Operations ............................ 83
Table 88. Projected population and estimated plastic waste generation in U.S. Nagar district 84
Table 89. Projected decadal change in Plastic waste generation ............................................... 85
Table 90. Assessment of urban local bodies in Udham Singh Nagar........................................... 86
Table 91. Final Assessment of Urban Local bodies of Udham Singh Nagar ................................ 87
Table 92. Action plan for Solid waste management .................................................................... 89
Table 93. Proposed policies for Rural Waste Management ........................................................ 92
Table 94. Phytoremediation as a mitigation measures (for landfill) ........................................... 92
Table 95. Action plan for Bio-medical waste management ........................................................ 93
Table 96. Action plan for C&D waste management .................................................................... 95
Table 97. Action plan for Hazardous waste ................................................................................. 97
Table 98. Action plan for E-waste ................................................................................................ 98
Table 99. Action plan for polluted stretches in U.S. Nagar ....................................................... 100
Table 100. Phytoremediation as a mitigation measures (for polluter stretches) ....................... 101
Table 101. Action Plan for Non-Attainment city (Kashipur) ........................................................ 102
Table 102. Action Plan for Environment Management in IIA Pantnagar, Rudrapur ................... 103
Table 103. Action plan for waste water management (STPs) ..................................................... 105
Table 104. Action plan for industrial waste water management ................................................ 107
Table 105. Common effluent treatment plant management ...................................................... 107
Table 106. Water Resources Management ................................................................................. 108
Table 107. Ground water management ...................................................................................... 109
Table 108. Action plan for air quality management .................................................................... 110
Table 109. Action plan for mitigating noise pollution ................................................................. 112
Table 110. Mining activity management plan ............................................................................. 113
Table 111. Action plan for Rejuvenation of Water bodies .......................................................... 114
Table 112. Action plan for plastic waste management ............................................................... 115

`
xi
ABBREVIATIONS
AMRUT -Atal mission for Rejuvenation and Urban Transformation
APL -Above Poverty Line
AR -Assessment Report
As -Arsenic
ASP -Activated Sludge Process
ASSOCHAM -Associated Chambers of Commerce and Industry of India
BHEL -Bharat Heavy Electricals Limited
BMWMIS -Biomedical Waste Management Information System
BOD -Biological Oxygen Demand
BPL -Below Poverty Line
C -Carbon
C&D waste -Construction and Demolition waste
CAAQMS -Continuous Ambient Air Quality Monitoring Station
CACMP -Catchment Area Conservation Programme
CAGR -Compound Annual Growth Rate
CANTT -Cantonment Board
CBG -Compressed biogas plant
CBMWTF -Common Bio-Medical Waste Treatment Facility
Cd -Cadmium
CD -Check Dam
CEMS -Continuous Emission Monitoring System
CEPI -Comprehensive Environmental Pollution Index
CETP -Common Effluent Treatment Plant
CFL -Compact Fluorescent Lamps
CGWB -Central Ground Water Board
CH4 -Methane
CHCs -Community Health Care Centres
CK -Chal Khal
CNG -Compressed Natural Gas
CO -Carbon monoxide
CO2 -Carbon dioxide
COD -Chemical Oxygen Demand
CPCB -Central Pollution Control Board

`
xii
CPHEEO -Central Public Health and Environmental Engineering Organisation
Cr -Chromium
CSCs -Community Sanitary Complex
CT -Contour Trench
Cu -Copper
dB -Decibels
DDT -Di-chlorodiphenyltrichloroethane
DFO -Divisional Forest Officer
DIPSR -District Industrial Profile Survey Report
DM -District Magistrate
DO -Dissolved Oxygen.
DPR -District Project Report
DPRO -District Panchayati Raj Officer
EC -Environmental Clearance
EEE -Electronics and Electrical Equipment
ENVIS -Environmental Information System
EPI -Environmental Performance Index
ESIPL -Eldeco SIIDCUL Industrial Park Limited
ESS -Environment Surveillance squad
ETPs -Effluent Treatment Plants
E-Waste -Electronic Waste
F -Fluoride
FPZ -Flood Plain Zones
FSI -Forest Survey of India
FSSM -Faecal Sludge and Septage Management system
FSTP -Faecal Sludge Treatment Plant
GBPNIHE -G.B. Pant National Institute of Himalayan Environment
GDP -Gross domestic product
GES -Global Environmental Solution
GIS -Geographical Information System
GPIs -Grossly Polluting Industries
GPS -Global Positioning System
HCFs -Health Care Facilities
HCL -Hindustan Computers Limited

`
xiii
ICT -Information and Communication Technology
IEC -Information, Education and Communication
IHHLs -Individual Household Latrines
IIE -Integrated Industrial Estate
INR -Indian rupee
IPC -Inter-Personal Communication
IPCC -Intergovernmental Panel on Climate Change
IRAP -Integrated Rural Area Programme
ISO -International Organization for Standardization
ISWM -Integrated Solid Waste Management
IWRM -Integrated Water Resources Management
KFW -Kreditanstalt Fuer Wiederaufbau
KLD -Kilo Liters Per Day
LPG -Liquefied Petroleum Gas
MBBR -Moving Bed Biofilm Reactor
MDWS -Ministry of Drinking Water and Sanitation
Mg -Milligram
MGNREGA -Mahatma Gandhi National Rural Employment Guarantee Act
MLD -Millions of Litter Per Day
MMT -Million Metric Tons
MoEF&CC -Ministry of Environment, Forest &Climate Change
MoF -Ministry of Finance
MoUHA -Ministry of Urban & Housing Development
MPCC -Medical Pollution Control Committee
MPN -Most Probable Number
MRF -Material Recovery Facility
MSMEs -Micro, Small &Medium Enterprises
MSW -Municipal Solid Waste
MTPD -Metric Ton per Day
NA -Not Applicable
NAAQS -National Ambient Air Quality Standards
NACP -National Clean Air Program
NAPCC -National Action Plan on Climate Change
NASA -National Aeronautics &Space Administration

`
xiv
NATCOM -National Communication
NCEPC -National Committee on Environment Planning &Co-ordination
NGOs -Non-Governmental Organizations
NGT -National Green Tribunal
NH -National Highway
NIHL -Noise induced Hearing Loss
NITI -National Institution for Transforming India
NMHS -National Mission of Himalayan Studies
NN -Nagar Nigam
NP -Nagar Panchayat
NPP -Nagar Palika Parishad
NTFPs -Non-Timber Forest Products
O&M -Operation and Maintenance
OCEMS -Online Continuous Effluent Monitoring System
ODF -Open Defecation Free
OSHA -Occupational Safety and Health Administrations
OSS -On-site Sewage Systems
PAT -Perform, Achieve &Trade
PCC -Pollution Control Committee
pH -Potential of Hydrogen
PHCs -Primary Health Centre
PIBO -Producer, Importer and Brand Owner
PM -Particulate Matter
PPCP -Polypropylene Copolymer
PPP -Polluter Pays Principle
PRO -Producer Responsibility Organization
PSUs -Public-Sector Undertaking
PT -Percolation Tank
PUC -Pollution under Control
PWD -Public Works Department
QPD -Quintal Per Day
RBMs -Riverbed Minerals
RoHS -Restriction of Hazardous Substances
RSM -Rural Sanitary Marts

`
xv
RTO -Regional Transport Officer
RTRWH -Rooftop Rain Water Harvesting
SBC -Soil Bowl Centrifuge
SBM-G -Swachh Bharat Mission Gramin
SDGs -Sustainable Developmental Goals
SIDCUL -State Industrial Development Corporation of Uttarakhand Limited
SLWM -Solid and Liquid Waste Management
SPCB -State Pollution Control Board
SPM -Suspended Particulate Matter
SSMG -Sustainable Sand Management Guidelines
STP -Sewage Treatment Plant
TKN -Total Kjeldahl Nitrogen
TPD -Tonne Per Day
TSDF -Treatment Storage and Disposal Facilities
UKPCB -Uttarakhand Pollution Control Board
ULBs -Urban Local Bodies
UNDP -United Nations Development Programme
UREDA -Uttarakhand Renewable Energy Development Agency
WHO -World Health Organization
ZED -Zero Effect Zero Defect
ZLD -Zero Liquid Discharge
µg -Microgram

`
xvi
EXECUTIVE SUMMARY
The district is currently in development phase with new towns emerging as an Industrial hub.
There is no doubt that these industrial estate brings economic prosperity but growing
environmental concerns (such as increase in solid waste generation, air and noise pollution.,
waterbody pollution etc.) due to this development needs to be understood. While the causal
mechanisms of environmental and climate change are numerous and complex, economic growth
and population growth are the factors that can be highlighted to explain the increasing stress
imposed by human interference on the natural environment.
To analyse the current status and to furnish a comprehensive plan in view of mitigating
environmental deterioration, GBPNIHE was assigned the task to prepare district Environment
plan of Udham Singh Nagar (U.S. Nagar). Detailed deliberations were carried out to devise the
action plan focusing on explicit thematic areas which are as under:
Waste Management Operations: Solid waste generated in U.S. Nagar is amongst the highest
in the state of Uttarakhand. However, the waste management operations in each ULB are
different to a large extent. Some of them have optimum infrastructure for waste processing
and disposal while some lack even basic facilities like those required for wet waste
management.
Lack of availability of land for waste disposal is a big issue in the district. Some ULBs are
disposing the waste is some private land in mutual consonance with the owner.
Based on our estimation, solid waste generation in the district is expected to surpass 400
MTPD by 2040. This means that scientific management will become necessary to
accommodate such huge quantity of waste.
Hazardous waste generated from the industries is quantified. They are the major sources of
toxic waste. However, Hazardous waste is currently not streamlined in waste management
operations in different ULBs and exists in a mixed form
Biomedical Waste Management: Biomedical waste generated in the district is lifted regularly
by Common Biomedical Waste Treatment and Disposal Facility (CMBWTF) at Gadarpur.
Maximum healthcare facilities are operating under the consent of Uttarakhand Pollution
Control Board.
Biomedical waste generated in domestic households could not be segregated and therefore exists
as mixed waste.

`
xvii
Construction and Demolition waste management: C&D waste generated in the district is
used locally to fill some low lying area and other minor repairing works. At present, there is
no such policy that might have been framed for scientific management of C&D waste.
River Polluter Stretches in U.S. Nagar district: As much as 7 river polluter stretches have
been identified in the district which is a big ecological concern. Lack of scientific waste water
treatment, industrial effluent and illicit solid waste disposal are some of the reasons for poor
water quality of the rivers. Action plans have been prepared for restoration of each polluter
stretch as directed by Hon’ble NGT.
Non-Attainment City-Kashipur: Industrial pollution, vehicular pollution etc. are some of the
reasons for deteriorating air quality in Kashipur town. One of the monitoring stations has
recorded elevated particulate matter levels for quite some time. Action plan has been prepared
as a part of National Clean Air Program (NCAP) and directions of Hon’ble NGT for
improving air quality in the town and its vicinity.
Waste water Management: Several STPs have been proposed for scientific waste water
treatment in U.S. Nagar district (Currently, the households/commercial establishment uses
septic tanks for waste water management). Major works include interception and diversion
works of nalas in the cities which will be tapped and connected to the proposed STPs.
Sewerage connection for waste water from domestic households has also been visioned in near
future which will then form part of co-treatment as envisaged by the department.
Industrial Waste Water Management: Two CETPs are available for industrial waste water
treatment, one in IIE SIDUCL Pantnagar and another in Sitarganj. Major polluting industries
are connected with the CETP and monthly effluent discharge outlet values are available for
these two CETPs.
Industrial Clusters: IIA Pantnagar, Rudrapur has been declared as critically polluted with a
CEPI score of around 77.7 out of 100. Industries, mainly plywood industries and corn
processing units have been the major sources of pollution in this industrial area.
Action plan has been prepared as per order of Hon’ble NGT to bring down the pollution levels
in IIA Pantnagar, Rudrapur.
Air and Noise Pollution: Air pollution is one of the major environmental concerns in the
district. This pertains to the fact that the district is major industrial hub of the state. Non
industrial pollution sources such as vehicles, stubble burning etc. also contribute to the
increasing air pollution in the district.

`
xviii
Manual air quality Monitoring stations have been installed at different locations (in Kashpiur
and Rudrapur) to ascertain air quality index. Particulate matter values (specifically PM10) have
exceeded the prescribed standards almost in every year.
Noise levels are measured at 6 locations (different zones) majorly in Nagar Nigam Kashipur
and Nagar Nigam Rudrapur. Generally, the Noise levels elevates during festive times.
Surface and Groundwater Management: Most of the rivers in the district are non –perennial
and are usually dry in lean season. Some stretches of these rivers have been identified as if
polluted. Industrial and domestic drains are emptied in the river which has negative
implications for riverine ecology.
Tube wells is one of the major sources of drinking water in the district. As many as 11
groundwater monitoring stations are available in the district to ascertain the groundwater
quality. At present, major groundwater blocks are categorised as semi-critical or safe.
Mining activity: Ample revenue is generated majorly through sand mining in the river flood
plains. Some illegal mining activities have been brought to notice for which penalties were
imposed.
The execution of this management plan will require the integration and co-operation of the people,
private and public stakeholders of U.S. Nagar. This plan aims at reducing the risk on the human
health and environment with a target of sustainable development.

`
1
INTRODUCTION
Establishing a link between environmental degradation, poverty and economic sustainability has
always been a challenging task before the planners. The world's poor are significantly prone to
natural disasters pertaining to the fact that in many cases their livelihoods are directly dependent
on the natural resources. Human welfare is closely associated with the health of the environment.
Around the world, 24 percent of deaths can be traced back to avoidable environmental factors
(WHO, 2018). People are in direct need of clean air to breathe, freshwater to drink and suitable
places to live in that are free from pollutions including toxic substances and hazards. The 2030
agenda for Sustainable Development Goals (SDGs) and its 17 Goals adopted by world leaders
define a blueprint for future development trajectory to all the nations with a focus on poverty
eradication, environmental sustainability, peace and harmony (Anonymous, 2018; WHO, 2018;
Azash and Thirupalu, 2017). Recently, Intergovernmental Panel on Climate Change (IPCC)
released a Report on “Climate Change 2021- The Physical Science Basis” as a part of IPCC’s
Sixth Assessment report (AR6).The facts presented in this report raised a crucial red flag
regarding global temperatures that have already risen by about 1.1 ºC from pre-industrial times
and has warned that 1.5 ºC threshold is likely to be breached before 2040 (the stated objective of
2015 Paris Agreement, the international architecture to fight climate change, is to limit
temperature increase to within 2 ºC from pre-industrial times)(IPCC, 2021). For the Indian
perspective, the report says that waves and humid heat stress will be more intense and frequent in
21st century (IPCC, 2021). Changes in monsoon precipitation are also expected as both annual and
summer monsoon precipitation are projected to increase (Krishnan et al, 2020). In regard to the
Himalayan context, the area is one of the most fragile mountainous regions of the world. Hence, it
is susceptible to changes in Environmental conditions and ecology (Krishnan et al, 2020). These
mountains are considered to be the Water tower of South Asia, as major rivers of the Indian sub-
continent originate from the Himalayan Mountains. However, the area has become a global
hotspot since the past two decades in view of environmental degradation. The indirect impact is
also seen in the glaciological aspect of these mountains (Eriksson et al, 2019). Almost, 500
million people of South Asia are dependent upon the health aspect of the Himalayan ecosystem.
In India, the Himalayan Mountain Chain directly serves a national interest because of working as
a guard in view of defense purpose, unique ecosystem in view of permanent snow cover and
incessant sources of water and biodiversity hotspots. The people in downhill slopes and in the
Indo–Gangetic plainsrealize its significance in many more aspects in view of sustainable
development. A prerequisite for such sustainability is ecological audit in areas, which at once

`
2
would apprise about the present environmental issues and a strategy to meet the targets for the
future (Sandhu and Sandhu, 2015).
Uttarakhand being a crucial chunk of the Himalayan regime is utmost vulnerable to environmental
degradations and risks. About three fourth of the state's population is rural, therefore their
livelihoods are almost dependent on natural resources (Raj, 2015). The traditional customs and
traditional knowledge of the local people of Uttarakhand tend to be sustainable and are in
harmony with the natural ecosystem. However, these traditional customs and traditional
knowledge are often overlooked as sometimes reckless development of roads, infrastructure, and
environmental degradation takes precedence over the traditional ecological knowledge. The recent
data on SDGs indices released by NITI Aayog shows that the state is one of the top gainers with
increase in overall index by 8 points. However, a lot is needed to be done in terms of the
indicators related to Climate Action (SDG, 13) (Chopra, 2014). The tragedy of ecological
governance in most parts is that it remains trapped in Environment-Development Binary. In
contrast, the people of Uttarakhand had in past shown with movements such as the Chipko
Andolan (1953), which gave an idea of human well-being sensitive to forests, mountains, and
water bodies (Sarkar, 2018).
The art of establishing balance between economic development and sustainable development is
known to many, but how it is implemented in the ground is known to few. We need to devise a
strategy to break this trade off so that a mutually beneficial situation is achieved for the
environment and society (Messerli et al, 2019). Environment plan is a prerequisite to understand
how the social, political and economic factors are affecting the environment considering
development. Environmental planning begins in India in early 1970s after Human Environment
Conference at Stockholm held by United Nations which led to the formation of National
Committee on Environment Planning and Co-ordination (NCEPC) (NATCOM, 2012).
Subsequently, then the Ministry of Environment and Forest (MoEF) was formed in mid 1980s by
Government of India., realizing that the conservation of nature and its sustainability is a basic
requirement for sustaining healthy life on globe. The key purpose of this plan is therefore to
implement and devise programs intended to reduce pollution loads in different natural
components, suggest mitigating or minimizing impacts, conserving and protecting the
environment which could be considered together as a base for sustainable development (UNDP,
2015; Gaur, 2008).

`
3
FUNDAMENTAL PRINCIPLES OF ENVIRONMENT PROTECTION
(Judgments of the Hon’ble Supreme Court of India)
Sustainable Development
Hon’ble Supreme Court has recognized the principle of sustainable development as a basis for
balancing ecological imperatives with development goals. In rural litigation and entitlement
Kendra, Dehradun Vs. State of U.P., the Supreme Court 1985 was apprised with the problem of
the mining activities in the limestone quarries in Dehradun-Mussoorie area (Azash and Thirupalu,
2017; Anonymous, 2014). This was the first case of its kind in the country involving issues
relating to environment and ecological balance and brought into sharp focus the conflict between
development and conservation. In this case, the Supreme Court emphasized the need for
reconciling development and conservation in the larger interest of the country (Anonymous, 2014;
Sahu, 2014). Furthermore, it was realized that the necessary condition for achieving sustainable
development is ecological security, economic efficiency and social equity (Rajaram, 2005).
Precautionary Principle
The emergence of precautionary principle marked a shift in the international environmental
jurisprudence– a shift from assimilative capacity principle to precautionary principle. Basically, it
is a principle which ensures that a substance or activity posing threat to the environment is
prevented due to adversely affecting it, even if there is no conclusive scientific proof lining that
particular substance or activity to the environment damage (Kriebel et al, 2001). In Vellore
Citizens Welfare Forum Vs. Union of India, it was alleged that the untreated effluent being
discharged by tanneries in Tamil Nadu was entering into the river, agricultural fields and was
significantly polluting the water. Justice Kuldip Singh (Known to be Green Judge) observed that
“even otherwise once these principles are accepted as a part of the Customary International Law,
there would not be difficulty in accepting them as a part of domestic law (Venkat, 2012). It is
almost accepted proposition of municipal law, that the rule of customary international law, which
are not contrary to the municipal law shall be deemed to be incorporated in the domestic law and
shall also be followed by the courts of laws of the country. According to this special principle, the
burden is on the person wanting to change the status quo to show that the actions proposed will
not have any adverse effect, the presumption operating in favor of environmental protection
(Singh, 2000).
Polluter Pays Principle
Polluter Pays Principle (PPP) has become a popular slogan in recent times. “If you make a mess,
it’s your duty to clean it up”. It should be mentioned that in environmental law, this principle

`
4
doesn’t refer to Fault”. Instead, it favours a curative approach which is concerned with repairing
ecological damage (Kriebel et al, 2001). The Hon’ble Supreme Court held that as per the Polluter
Pays Principle, “once the activity carried on is hazardous or inherently dangerous, the person
carrying out such activity is liable to make good the loss caused to any other person by this
activity irrespective of the fact whether he took reasonable care while carrying on his activity.
While applying the principle of polluter pays, the Supreme Court later expressed the view that
compensation to be awarded must have some correlation not only with the magnitude and
capacity of the enterprise but also with the harms caused by it (Kriebel et al, 2001).
Public Trust Doctrine
The public trust doctrine primarily rests on the principle that certain resources like air, sea water
and forests have such a great importance to the people as a whole that it would be wholly
unjustified to make them a subject of private ownership. The said resources being a gift of nature,
they should be made freely available to everyone irrespective of the status in life. This doctrine
came up 2014 for consideration in the M.C. Mehta vs. Kamal Nath (Anonymous,2014). Though
the Supreme Court did not specifically refer to the Doctrine of Public Trust directly, in many
cases they have given impact on this doctrine implicitly (Azash and Thirupalu, 2017).
Traditionally, the doctrine of public trust was applied only for protection of access to the common
for public benefit, now the doctrine is being applied even to prevent over-exploitation of the
environmental components (Azash andThirupalu, 2017).
Public Liability Insurance
The Public Liability Insurance Act 1991 has been enacted with the objective of providing
immediate relief to the victims of accidents that might occur while handling hazardous substances.
The owner who has control over handling of hazardous substances is required under the act to pay
specified amounts to the victims as interim relief based on “No-Fault” liability. The expression
‘Handling’ is defined widely to include manufacture, trade and transport of hazardous substances.
Accidents by reason of war or radioactivity are excluded from the scope of the Act (Azash and
Thirupalu, 2017). The principle of absolute liability was propounded in case of MC Mehta vs.
Union of India with the primary question regarding the extent to which industries engaged in
hazardous and inherently dangerous industries can be held liable. This principle was further
reaffirmed in the Indian Council for Enviro Legal Action vs. Union of India in which it was held
that industries will be absolutely liable to the harm caused to villages due to pollution caused due
to soil and underground water. Hence, these are bound to take remedial measure to improve the
situation(Azash and Thirupalu, 2017).

`
5
ENVIRONMENT MANAGEMENT SYSTEM (ISO 14001:2015)
An environmental management system helps organizations identify, manage, monitor, and control
their environmental issues in a holistic manner. ISO 14001 is an internationally agreed standard
that sets out the requirements for an environmental management system (Da, 2015). It helps
organizations to improve their environmental performance through more efficient ways of
resource use and reduction of waste. Other ISO standards that look at different types of
management systems such as ISO 9001 for quality management and ISO 45001 for occupational
health and safety, all use a high-level of structure. This means that ISO 14001 can be integrated
easily into existing ISO management systems. ISO 14001 includes the need for continual
improvement of an organization system and approach to environmental concern (Da, 2015). It is
suitable for organizations of all types and sizes, let they be private, or not-profit organisation or
governmental. It is desirable that an organisation should consider all environmental issues relevant
to its operations such as air pollution, water and sewage issues, waste management, soil
contamination, climate change mitigation and adaptation, and resource use efficiency (Ferronato
and Torretta, 2019).
DISTRICT PROFILE
Contemplated to be the “Gateway of Kumaon Hills”, Udham Singh Nagar, (named after a notable
freedom fighter, Shaheed Udham Singh) is a district in the state of Uttarakhand with its
headquarters in Rudrapur.Once part of the district of Nainital,Udham Singh Nagar is a Terai
(plain) region of the state of Uttarakhand.It is bounded on the north by Nainital district, on the
northeast by Champawat district (Fig. 1). Moreover, it shares international boundary on the east
with Nepal and national boundary on the south with Uttar Pradesh. National highway 109 (NH
109), one of the most important routes, runs through the district connecting the entire Kumaon
region to the state as well as the country.The district has a rare sight seeing as it is surrounded by
Kumaon Himalayas on one side and Nepal on the other.
Also considered as the “Rice bowl of Uttarkhand”, Udham Singh Nagar is famous for its
agriculture and irrigation on synchronized pattern from the past as garner of popularity for its
productivity in paddy crops in the whole Uttarakhand state. The fertile land lends itself to
different forms of cultivation giving rise to agriculture related activities and industries. Pantnagar
University is a leading temple of learning in the field of agriculture and technology with one of
the finest built university all around the world.

`
6
Agriculture based industries are found throughout the district in all blocks and tehsils. Lately, the
industrial aspect has been transformed with the upcoming of State Industrial Development
Corporation of Uttarakhand Limited (SIDCUL) and Integrated Industrial Estate) IIE at Pantnagar
and Sitarganj, making it an agro-industrial district. The area is also evolving as a manufacturing
base for automobile parts or vehicles, paper products, food product based industries etc. In past
few years, many renowned automobile industries like TATA motor, Bajaj, Ashok Leyland,
Mahindra and Mahinda have set up their manufacturing plants in Udham Singh Nagar district.
Fig. 1. Location map of Udham Singh Nagar district
District at a glance
Various attributes such as geographical aspect, population data and administrative setup of U.S.
Nagar district are shown in Table 1.
Table 1. District at a glance
Geographical Location
Latitude 28° 53' N - 29° 23' N
Longitude 78° 45' E - 80° 08' E
Geographical Area 2542 km2

`
7
Average elevation of district headquarter 527 m
Population Data (2011 census)
Total Population 1,648,902
Male Population 858,783
Female Population 790,119
Population density 649
Decadal population growth rate 33.44%
Overall Literacy rate 73.10%
Male literacy 81.09%
Female literacy 64.45%
Sex Ratio 920
Urbanised area 122.21 km2
Rural area 2,419.79 km2
Administrative Division
Tehsils 07
Blocks 07
Nyay Panchayats 46
Village Panchayats 308
Total census villages 643
Source: Census data, 2011 &District statistical report 2019
Physiography
Since the district is seated in the Himalayan foothills, particularly the Shivalik Foothills, a very
thick column of alluvium is deposited in the region. These lower foothills were densely forested
till denuded by the British log merchants and later after independence by forest contractors. The
district is broadly divided into two physiographic units from north to south, Bhabar and Terai
respectively. The Bhabar region is exposed immediately south of the Shivaliks of the Himalayan
foothills whereas the Tarai formation (Name derived from marshy conditions) is located to the
south of the Bhabar formation. The contact between these two hydro geomorphic units is
characterised by the change in slope and groundwater effluents, which forms the spring line
(Table 2).
Table 2. Physiographic Divisions
Relief Feature Width Soil Type Major areas
Bhabar Less than 30 km Gravel, Boulders, Silt, clay
with pebbles
Northern extremities of Bazpur
and Khatima Blocks
Tarai 8- 25 km Calcareous, fine silt, sandy
clays
Immediate south to the Bhabar
formation

`
8
Agriculture and Drainage Patterns
Udham Singh Nagar has a dense network of the drainage pattern. Agriculture is the primary
occupation of the people as it justifies the title of “Chawal ki Nagri”. About 64% of the total
work force is engaged in farming the very fertile land. It is observed that the rice crop is grown
three times in a year. Owing to the diverse network of rivers, canals and major reservoirs, ample
water is available to meet the irrigation demand throughout the year.
The major rivers are perennial, whereas their tributaries originating from Sub-Himalayan zone are
ephemeral and remain dry during the non-monsoon seasons (Table 3). The overall drainage
pattern in the district is sub dendritic to sub parallel.
Table 3. Drainage system in US Nagar
Drainage system
Major Rivers and Canals Kosi
Sarada
Gola
Phikka
Sarada
Gandli
Sukhi
Katna
Kailash
Kaman
Sanedi
Major Reservoirs Tumaria (Jaspur)
Gularboj
Dron
Sarada Sagar (Khatima)
Haripura (Gadarpir)
Nanak sagar (Sitarganj)
Climate
Since the district is located in the northern plains, it experiences moderate weather all through the
year with slightly chillier winters and warm summers. The climate varies from Sub-tropical and
sub-humid with three distinct seasons i.e. summer, monsoon (rainy season) and winter season.
The maximum temperature in the district goes upto 42ºC during the summers and the minimum
temperature varies between 1ºC to 4ºC.Further north to the district, the temperature comes, dips to
0.4 ºC in winter season.

`
9
Rainfall
Rainfall spatially is highly variable depending upon the altitude. The intensity of the rainfall
increases from south to north and the amount of rainfall decreases in generally from west to east.
About 90% of the rainfall occurs in the monsoon period with average annual rainfall has been
measured to be962.00 mm (Guhathakurta et al, 2020).
Groundwater
The groundwater is the major source in the district for fulfilling the demands of irrigation,
domestic and industrial purposes. Based on the behaviour and occurrence of groundwater, the
district has been broadly classified in two hydro geomorphic units namely Bhabar and Tarai. The
contact between these two regions is characterized by the change in slope and groundwater
effluents which form the spring line. The groundwater appears to be sustained and recharged by
direct infiltration from precipitation on the land surface and infiltration from turbulent streams
flowing across the belt. Considerable amount of water is also discharged by perennial springs at
the southern limit of Bhabar region during the monsoon. The formation is favourable to percolate
the water laterally from Bhabar to Tarai and the older alluvium further south. Central groundwater
Board has established 28 groundwater monitoring wells to monitor the groundwater regime
periodically and to study the hydrogeological behaviour of the aquifers in the district. Deep tube-
well (81.3%) and Shallow tube well (18.7%) are the only two dominant water sources used for
water supply schemes over the district except for a single case using Open well. No block in
Udham Singh Nagar district is found to harvest springs for water supply, primarily due to
unavailability of springs at lower elevation.
Forest
According to the State Forest report of India 2019, the recorded forest area/forest cover of the US
Nagar is 431.79 km2which constitutes 16.98% of its geographical area. Very-dense forest
constitutes149.16 km2(5.875%), moderately dense constitutes 188.75 km2 (7.428%), and open
forest constitutes149.16 km2(3.70%) of total forest area (Table. 4) (FSI, 2019). Various important
species of trees in the Udham Singh Nagar namely, Sal (Shorea robusta), Sagon (Tectona
grandis), Popular (Populus spp.), Samel (Bombax ceiba), Bel (Aegle marmelos), Guava (Psidium
guajava), and Mango (Mangifera indica) etc. are prevalent in the forest areas of the district,
moreover the major forest produce are fruits, timbers and medicinal plants.

`
10
Table 4. Total Forest Cover of US Nagar district in 2019 survey (FSI, 2019)
Particular Geographical
Area
Very Dense
Forest
Mod. Dense
Forest
Open
Forest
Total Changes as of
2017-2019
assessment
Forest Area of
US Nagar (km2) 2542 149.16 188.75 93.88 431.79 -4.21
Flora and Fauna
Flora
Being at a transition zone between two heterogeneous domains, fertile soil with abundance of
moisture has sustained rich floristic diversity in the district. Originally, Tarai region harbours sub-
montane seasonal broadleaf forests however, the clearing of forests (due to rapid urbanization,
intensive agriculture) have led to absence of native trees, shrubs which have been replaced by
weeds and grasses. This has led to addition of more alien vegetation elements. Major part of the
floral diversity comprises of Taxa cultivated for various purposes (Crops, ornaments, germplasm
collections etc.) and the remaining exist as wild plants growing as indigenous taxa or weed.
Various important species namely, Sagon (Tectona grandis), Sal (Shorea robusta), Bel (Aegle
marmelos), Asthma Plant (Euphorbia hirta), Pomegranate (Punica granatum), and False Daisy
(Eclipta prostrata) etc. are still prevalent in US Nagar.
Fauna
The district is a natural sanctuary for Squirrel (Funambulus pennantii), Langur (Canis familiaris),
Wild boar (Sus scrofa), Monkey (Macaca mulatta), etc. The region also hosts remarkable
common bird’s species such as Common myna (Acridotheres tristis), Black Bulbul (Molpastes
cafer), Spotted Dove (Streptopelia chinensis), possessing plumage of magnificent design and
colours. Surai Forest area is a famous forest region located about 20km from Khatima which
forms an enclosure for the varied flora and fauna thriving in the range. Various species of
colourful birds can be seen throughout the region. Crocodiles are found in good numbers in this
forest range. Major attraction of this region is the abundance of wildlife species and bird species
that can be seen enhancing the ambience of the district
Industrial scenario of district
The development of industries is attributed largely to the setting up of large Integrated Industrial
Estate(IIE) under State Infrastructure and Industrial Development Corporation of Uttarakhand
Limited(SIDCUL). This has propelled the district into the forefront of industrial activity and has
attracted numerous companies. US Nagar is a hub or Automobile industries, Paper industries,
Rice mills and sugar mills industries, all large scale industries established here have more than

`
11
200 hundred vendors which sequentially offers lot of scope in vendorisation in all categories
(Table 5).
Table 5. Major companies in the district
Name of Company Type
Tata Motors Automobile
LSC Infratech Infrastructure
Delta power Solutions Power
Kumar Autowheel Pvt. Ltd. Automobile
Time Technoplast Limited Packaging
Nestlé India Food processing
Bajaj Auto Automobile
Dabur India Limited Consumer goods
TVS Motors Unimax Limited Automobile
Parle Agro Consumer goods
HCL IT services
Mahindra Tractor Automobile
Greenply Industries Ltd. Interior Infrastructure
Ashok Leyland Automobile
Hindustan Zinc limited Mining, Smelting
Britannia Industries Food Processing
Micromax Electronics
Culture and Tradition
The district is popularly known as “Mini Hindustan” for it boosts with people of diverse culture,
tradition, religion and lifestyle living together in harmony and brotherhood proving the “Unity in
Diversity” theme of India. The state maintains a secular ambience with significant number of
people belonging to different faiths like Islam, Sikhism, Buddhism and Christianity. The district is
dotted with number of shrines for Hindus and Sikh devotees. Nanak Mata an important holy
shrine of Sikh religion is visited by a large number of Sikh pilgrims every year. Atariya Temple
(dedicated to goddess Durga) is visited by hundreds of devotees every year. Other famous temples
in the district Chaiti Devi Temple, Giri Sarovar etc.

`
12
ENVIRONMENTAL CONCERNS IN THE DISTRICT
Urbanization and developmental activities have made a profound impact on the ecology of the
urban area of the district. An increasing number of vehicles in the cities have led to air pollution
due to vehicular emissions. The rapid industrialization in the district has led to the setting up of
factories which produce poisonous smoke and effluents in to the environment deteriorating the air
and water quality. This increase in the level of pollution is engulfing the hill state of Uttarkhand.
The air in the city is contaminated with toxic chemicals like carbon mono oxide (CO), oxides of
Sulphur and nitrogen reactive hydrocarbons, heavy metal lead and organic compounds. Many
industries have been found operating in violation to the environmental norms as neither Green
belts nor sufficient ETP/STPs have been developed for effluent treatment.
The urgent need for urbanization has created increasing demand for land, housing, transport,
water supply, sanitation and health facilities leading to development of buildings, houses, multi-
complexes, shops, industries in an unplanned manner causing spoilage of landscape by converting
agricultural land and forest cover putting more pressure on the already stressed ecosystem. Udham
Singh Nagar is one of the few districts which has seen negative growth in their forest area.
Introduction of several private infrastructures related schemes is one of the main reasons behind
depleting cultivable land. Moreover, unsuitable garbage management has engulfed the city of
Rudrapur where Municipal Corporation is facing the wrath of the public for improper waste
management amid rapid urbanization.
Groundwater extraction, however appears to be ecologically balanced, has increased over the time
in the district. It is observed that a few streams have disappeared in past years to compensate for
groundwater extraction. The concretization of dry streams has further elevated the issue even as
these streams are groundwater recharge windows through which monsoon replenishes the aquifer.
Most of the flowing well in the zone area are devoid of any mechanism to control and regulate
their flow. In other words, their non-capping has led to decrease in pressure heads and wastage of
the valuable groundwater resource.

`
13
DATA AND IMPACT ANALYSIS

`
14
SOLID WASTE MANAGEMENT
Ministry of Environment, Forest and Climate Change (MoEF&CC) defines Municipal Solid
Waste (MSW) as commercial and residential waste generated from a municipal area either solid
or semi-solid form excluding hazardous waste (Industrial), but including treated bio-medical
waste. Predominantly, about 0.17 kg of MSW is generated per capita per day in small towns
compared to about 0.67 kg per capita per day in cities. More than 70% of waste in India is
considered to be dumped in an unsatisfactory manner (Sharma and Jain, 2019).
Integrated Solid Waste Management (ISWM)
It is based on the waste management hierarchy, with an aim to reduce the amount of waste being
disposed while maximizing resource recovery and efficiency (Fig. 2). Based on this waste
management hierarchy, an assessment of local needs and conditions should lead to the selection of
an appropriate mix of process and technologies.
Source: CPCB (Central pollution Control Board)
Fig. 2. Segregation of Biomedical waste as per BMW rules, 2016
Solid Waste management in Udham Singh Nagar District
Waste generation in the district varies from about 50 MT in Kashipur to as low as about 1 MT in
Shaktigarh (Table 6). Primary waste management operations are optimum in some ULBs but
some of them are lacking even basic operations such as source segregation. Each ULB has
established linked with some private agencies for waste collection transportation etc. (Table 7).

`
15
Table 6. Inventory of total solid waste generation
Name of Urban Local Body Population
(2011)
Number
of Wards
Solid waste generation
(MTPD)
Dry Wet *Other
waste
Total
Nagar Nigam Kashipur 175819 40 20.80 31.20 NE 52
Nagar Nigam Rudrapur 175723 40 15 30 20 65
Nagar Palika Parisad Gadarpur 23289 11 2.59 2.58 2.83 08
Nagar Palika Parisad Bazpur 31172 13 9.5 2.5 NE 12
Nagar Palika Parisad Jaspur 50523 09 15 10 NE 25
Nagar Palika Parisad Kichha 74356 20 12 08 05 25
Nagar Palika Parisad Sitarganj 31711 13 04 15 NE 19
Nagar Palika Parisad Khatima 58494 20 NE NE NE 18
Nagar Panchyat Mahua Kheraganj 12584 09 1.4 0.6 NE 02
Nagar Panchayat Mahua Dabra 7326 07 0.54 0.9 0.36 1.8
Nagar Panchayat Sultanpur 9881 07 2.4 1.6 NE 4.0
Nagar Panchayat Kelakhera 10929 09 1.3 2.0 01 4.3
Nagar Panchayat Dineshpur 11783 09 3.0 2.5 NE 5.5
Nagar Panchayat Shaktigarh 6314 07 0.2 01 0 1.20
Nagar Panchyat Nanakmata 8478 07 NE NE NE 4.03
Nagar Panchyat Gularbhoj 6957 07 1.3 1.6 0.1 03
*Other waste may include sanitary waste, domestic hazardous waste, horticulture waste etc. (Sources: Nagar Nigam, Nagar Palika Parishad and Nagar Panchyat Udham Singh Nagar, 2021)
Table 7. Waste management operations
Waste management operations Outcome
Segregation at source
ULB Source Segregation (%)
NN Kashipur 50
NN Rudrapur 90
NPP Gadarpur 70
NPP Bajpur Not initiated
NPP Jaspur Not initiated
NPP Kichha 30-40 (in 15 wards out of 20)
NPP Sitarganj 40
NPP Khatima Not initiated
NPP Mahuwa
Khedaganj
50
NP Mahuwadabra 40-50
NP Sultanpur pati 10
NP Khelakheda 10(in 5 wards out of 9)

`
16
NP Dineshpur 70
NP Shaktigarh 60-70
NP Nanakmatta 25
NP Gularbhoj 70( in 5 wards out of 7)
Door to Door Collection All the ULBs in the district are accomplishing 100% door-to-door
collection.
Sweeping All the ULBs in the district are accomplishing 100% sweeping by
manual method (NN Rudrapur is performing mechanical sweeping in
some areas).
Segregated waste Transport
ULB Segregated Waste Transport (%)
NN Kashipur 50
NN Rudrapur 70
NPP Gadarpur 80
NPP Bajpur Not initiated (Combined transport)
NPP Jaspur Not initiated
NPP Kichha 40
NPP Sitarganj Not initiated
NPP Khatima 80
NPP Mahuwa Khedaganj 50
NP Mahuwadabra Not initiated
NP Sultanpur pati 10
NP Khelakheda 10
NP Dineshpur 70
NP Shaktigarh 60
NP Nanakmatta 25
NP Gularbhoj 80
Material Recovery Facility (MRF)
operation
ULBs having
operational Material
Recovery facility
ULBs without
Material Recovery
facility
Recovery facility
under construction
NN Kashipur
NN Rudrapur
NPP Gadarpur
NPP Jaspur
NPP Kichha
NPP Khatima
NP Mahuwadabra
NP Khelakheda
NP Dineshpur
NP Shaktigarh
NP Nanakmatta
NP Gularbhoj
Bajpur
Sitarganj
NPP Mahuwa
Khedaganj
Nagar Panchayat
Sultanpur
Involvement of Non-Governmental
Organizations (NGOs) / private
agencies
Private Agencies/NGOs ULB
K.P.S Envirotech group,
Muradabad
NPP Gadarpur
NPP Kichha
NP Khelakheda
NP Dineshpur
Public Associate,Rudrapur NP Gularbhoj

`
17
NPP Khatima
Nagar Panchayat Sultanpur
Bhagwati Enterprises NPP Sitarganj
Akanksha Enterprises NN Rudrapur
Nivarana Seva Samiti NPP Bajpur
Zero waste NPP Mahuwa Khedaganj
A.R. Service NP Mahuwadabra
Konark Global Service,
Rudrapur
NN Kashipur
Authorization and issuance of
identity cards to waste
pickers/sanitation workers
ULB Number of authorized
waste pikers
Nagar Nigam Kashipur 447
Nagar Nigam Rudrapur 346
Nagar Palika Parishad Gadarpur 32
Nagar Palika Parishad Bajpur 52
Nagar Palika Parishad Jaspur 121
Nagar Palika Parishad Kichha 166
Nagar Palika Parishad Sitarganj 64
Nagar Palika Parishad Khatima 116
Nagar Palika Parishad Mahuwa Khedaganj 50
Nagar Panchayat Mahuwadabra 23
Nagar Panchayat Sultanpur patti 34
Nagar Panchayat Khelakheda 12
Nagar Panchayat Dineshpur 43
Nagar Panchayat Shaktigarh 16
Nagar Panchayat Nanakmatta 21
Nagar Panchayat Gularbhoj 19
Linkage With Treatment Storage
and Disposal Facilities
(TSDF)/Bio-Medical Waste
Treatment Facility (CBMWTF)
Only NN Rudrapur has established linkage with a TSDF namely
Global Envirotech, Lambakhera.
(Sources: District Administration,2021)
Waste management infrastructure and processing in US Nagar
Apart from hand trolleys, mini collection trucks, some ULBs are also using E-rickshaws for waste
collection and transportation. Private land is being used for waste disposal in the ULBs with no
established landfill or dumping ground (Table 8). Wet waste composting pits have been
constructed either in the dumping ground or any other designated areas in the district. Dry waste
processing is still in its early stage as district lack scientific recovery facility in most of the ULBs
(Table 9).

`
18
Table 8. Present Infrastructure for Waste Management
Name of ULB Inventory of Infrastructure involved in waste management operation
Waste
collection
trolleys/Ri
ckshaws
Mini
collection
trucks/
tractors/
Others.
Composting
units/ on-
site
composting
facilities
Material Recovery
Facility
(Available/Not
Available)
Landfills
(Dumping
ground/
Trenching
Ground/sanitary
landfills)
Remarks
NN Kashipur 200 37 21 Available Dumping zone E-rickshaws are
being used for
waste collection
in Nagar
Nigam.
NN Rudrapur 100 42 30 Available Dumping
ground
Waste in being
disposed in a
dumping
ground of area
1.5-2.0 ha.
NPP Gadarpur 45 09 10 Not Available Dumping
ground
Waste is being
disposed in a
land leased by
Nagar Palika.
NPP Bajpur 25 11 10 Under
Construction
Trenching
ground
Material
recovery facility
is under
construction in
land near to
trenching
ground.
NPP Jaspur 100 10 Not
Available
Not Available Dumping
ground.
Waste is being
disposed in a
land leased by
Nagar Palika.
NPP Kichha 80 23 05 Not Available Dumping
ground Plastic waste
is compacted
in a transfer
point of nagar
palika.
Left over
waste is
disposed in a
private land.
NPP Sitarganj 10 55 03 Under
Construction
Trenching
Ground
Waste is
collected
through
rickshaws and
hand trolleys.
NPP Khatima 70 12 00 Not Available Dumping
Ground
Dry waste is not
processed in
Nagar Palika
Khatima.
NPP Mahuwa
Khedaganj
09 10 13 Under
Construction
Trenching
ground
Recovery
facility will be
soon provided
power supply to
make it
operational.
NP
Mahuwadabra
10 09 06 Not Available Dumping
ground
Both Rickshaws
and hand

`
19
trolleys are also
part of the fleet
for waste
collection in
Nagar Palika.
NP Sultanpur 07 06 04 Under construction Dumping
ground
Waste is being
disposed in
private land for
filling the low
lying area.
NP
Khelakheda
15 04 00 Not Available Dumping
ground
Waste is being
disposed in
private land for
filling the low
lying area.
NP Dineshpur 20 04 08 Not Available Dumping
ground
Wet waste
composting pits
have been
constructed in
different wards
and government
buildings.
NP Shaktigarh 04 10 03 Not Available Dumping
ground
Twin
compartment e-
rickshaws are
used for waste
collection and
transportation.
NP
Nanakmatta
16 09 02 Not Available Dumping
ground
Civil works
have been
started for the
construction of
new trenching
ground.
NP Gularbhoj 20 03 04 Not available Trenching
ground
Instead of hand
trolleys,
rickshaws are
used for waste
collection in
Nagar Palika.
Table 9. Methods of treatment, disposal and recovery
Name of ULB Wet waste management
Dry Waste Management (waste to
Energy/Recycling/incineration/ open
Dumping in Trenching ground/
sanitary landfill)
Remediation of the old
dump site
Nagar Nigam
Kashipur
Composting machine is
available at transfer point
for wet waste processing
of the segregated waste
received.
Manure thus formed is
sold to local people at a
rate of Rs. 3/kg.
Dry waste is being segregated
majorly into four categories (plastic,
iron, card board and paper) by
outsourcing firm Konark Enterprises.
After compaction, the plastic waste
is sold to local rag pickers.
ULB is working with
Ram Singh Agarwal Pvt.
Ltd. for the remediation
of 35000 MT legacy
waste in the old dumping
site.
Nagar Nigam
Rudrapur
Out of 30 composting
pits, 12 are available in
government colonies.
Rest 18 pits are
Dry waste is being segregated
majorly into four categories (plastic,
glass, card board and paper) by
Akanksha Enterprises.
Reclamation of part of
dump site is underway.
Daily waste processing
is a carried out in the

`
20
constructed in different
wards of Nagar Nigam. After compaction, the plastic waste
is sold to local rag pickers.
Dry Residual (Inert waste) is
dumped in the trenching ground.
segregation shed in
leftover part of dumping
zone.
Nagar Palika
Parishad Gadarpur
Wet waste is being
processed in composting
pits constructed near to
disposal site.
Dry waste is segregated into
different categories manually by
outsourcing firm K.P.S. envirotech.
The segregated plastic waste is sold
to local ragpickers under the
jurisdiction of Nagar Palika.
Left over waste is used for either
filling of low lying area or is
disposed in dump site.
No old dump site exists
within the ULB.
Nagar Palika
Parishad Bajpur
Wet waste is being
processed in the
composting pits near the
site of under construction
material recovery
facility.
Dry waste is segregated into
different categories manually by
outsourcing firm Nivaran Seva
samiti.
Plastic waste after compaction is
sold to local rag pickers.
No old dump site exists
within the ULB.
Nagar Palika
Parishad Jaspur
Not initiated Dry waste is not processed in Nagar
Palika Jaspur.
No old dump site exists
within the ULB.
Nagar Palika
Parishad Kichha Composting pits have
been constructed in
different areas of the
ULB.
Moreover, one
composting machine is
also available with the
ULB.
Dry waste is segregated in dumping
ground by outsourcing firm K.P.S.
envirotech.
Plastic waste after compaction is sold
to local ragpickers under the
jurisdiction of Nagar Palika.
No old dump site exists
within the ULB.
Nagar Palika
Parishad Sitarganj
03 composting pits have
been constructed in
different areas of the
ULB.
Collection, segregation and
transportation of waste is done by
private firm named Bhagwati
Enterprises.
Plastic waste after segregation is sold
to local rag pickers.
There is an old dump site
comprising of almost
9904 MT waste.
Nagar Palika
Parishad Khatima
Not initiated Collection and transportation of waste
to the dumping ground is done by
outsourcing firm named Public
Associates Rudrapur.
Waste is not segregated in the dumping
ground. Hence dry waste is not
quantifiable and processed.
There is an old dump
site having area of
approximately 1500m2
Nagar Palika
Parishad Mahuwa
Khedaganj
13 Composting pits and
a composting machine is
available for wet waste
processing in trenching
ground.
Collection and segregation of waste is
done by private agency named Zero
waste.
Plastic waste after compaction is sold
to local rag pickers under the
jurisdiction of Nagar Palika.
No old dump site exists
within the ULB.
Nagar Panchyat
Mahuwadabra
03 composting pits are
available in trenching
ground for wet waste
management.
Three more pits are in
construction.
Collection and segregation of waste is
done by private agency named A.R.
service.
Plastic waste is sold to local rag
pickers under the jurisdiction of Nagar
Palika.
No old dump site exists
within the ULB.

`
21
Nagar Panchyat
Sultanpur patti
Wet waste is processed
in 04 composting pits
Collection and segregation of waste is
done by private agency named Public
Associate, Rudrapur.
Plastic waste after compaction is sold
to local rag pickers under the
jurisdiction of Nagar Palika.
Legacy waste has been
excavated from the old
dumpsite in Nagar
palika.
Nagar Panchyat
Khelakheda
Not initiated. However a
site has been recognized
for centralized wet waste
composting.
Collection and segregation of waste
is done by private agency named
K.P.S. envirotech.
Plastic waste is sent to a facility in
Haldwani which is then further
processed.
No old dump site exists
within the ULB.
Nagar Panchyat
Dineshpur
08 composting pits are
operational in different
areas of the ULB.
Waste management operations are
handled by a private firm named K.P.S
enviro tech.
Plastic waste is sold to local rag
pickers under the jurisdiction of Nagar
Palika.
One old dump site has
been remediated.
Nagar Panchyat
Shaktigarh
03 composting pits are
available in dumping site
for wet waste
management.
Dry waste is not processed in the ULB. No old dump site exists
within the ULB.
Nagar Panchyat
Nanakmatta
02 composting pits are
operational for wet waste
management.
Dry waste is not processed in the ULB. No old dump site exists
within the ULB.
Nagar Panchyat
Gularbhoj
04 composting pits are
available in trenching
ground for wet waste
processing.
Collection and segregation of waste is
done by private agency named K.P.S.
envirotech.
Plastic waste after compaction is sold
to local rag pickers under the
jurisdiction of Nagar Palika.
No old dump site exists
within the ULB.
Gap identification and proposed policies for effective waste management in
Udham Singh Nagar
Source segregation is completely missing in some ULBs of Udham Singh Nagar. Except for two,
all ULBs are lacking material recovery facility which is hampering their ability to process the dry
waste accumulated. Disposal of waste has also been an issue in the district as government
authorised landfills and disposal according to SWM rules, 2016 is hard to find (Table 10).
However, each ULB has its DPR approved to overhaul their waste management operations. Most
of them have proposed integrated solid waste management in a cluster based approach (Table 11).
Table 10. Gap identification
Name of ULB Observed Shortcomings Remarks
NN Kashipur Partial source segregation of
waste
ULB has achieved only 50 % source segregation.
Partially segregated waste
transport
Complete segregated waste transport would be possible once
100% source segregation is achieved.
No Linkage with authorized
waste recyclers.
Recyclable dry waste is sold to local ragpickers, thus forming
part of informal economy.
NN Rudrapur Partial source segregation of
waste
ULB has achieved 70 % source segregation and is expecting
reach 100% mark in near future.

`
22
Partially segregated waste
transport.
Complete segregated waste transport would only be possible
once 100% source segregation is achieved.
No Linkage with authorized
waste recyclers.
Recyclable dry waste is sold to local ragpickers, thus forming
part of informal economy.
NPP Gadarpur Partial Source segregation ULB has achieved 70 % source segregation and is expecting
reach 100% mark in near future.
Partially segregated waste
transport
Complete segregated waste transport would be possible once
100% source segregation is achieved.
Non-availability of waste
recovery facility
Dry waste is handled and segregated manually in the waste
disposal site.
No linkage established with
authorized waste recyclers
Recyclable dry waste is sold to local ragpickers, thus forming
part of informal economy.
NPP Bajpur No source segregation Mixed waste is being collected from each household in Nagar
Palika.
Combined waste transport Waste is transported in combined form as source segregation is
still not practised in Nagar Palika Bajpur.
Non-availability of waste
recovery facility
Dry waste is handled and segregated manually in the waste
disposal site.
Material recovery facility is under construction.
No Linkage with authorized
waste recyclers.
Recyclable dry waste is sold to local ragpickers, thus forming
part of informal economy.
NPP Jaspur No source segregation Mixed waste is being collected from each household in Nagar
Palika.
Combined waste transport Waste is transported in combined form as source segregating is
still not practised in Nagar Palika Jaspur.
Wet waste management. Wet waste is not processed Nagar Palika Jaspur due to non-
availability of composting pits or machinery.
Non-availability of waste
recovery facility.
Dry waste is handled and segregated manually in the waste
disposal site.
No Linkage with authorized
waste recyclers.
Recyclable dry waste is sold to local ragpickers, thus forming
part of informal economy.
NPP Kichha Partial Source segregation Source segregation is performed in 15 wards out of 20.
Partially segregated waste
transport
Waste is transported in combined from in some of the
wards.(Particularly those with no source segregation).
Non-availability of waste
recovery facility
Dry waste is recovered manually by the firm handling waste
management operations for the ULB.
No Linkage with authorized
waste recyclers.
Recyclable dry waste is sold to local ragpickers, thus forming
part of informal economy.
Lack of designated waste
disposal land
Waste is disposed in some private land.
NPP Sitarganj Partial Source segregation Less than half of the population is practising segregation at
source.
Partially segregated waste
transport
Complete segregated waste transport would be possible once
100% source segregation is achieved.
Non-availability of waste
recovery facility Dry waste is handled and segregated manually in the waste
disposal site by an outsourcing form. Primarily, plastic waste
is recovered.
Material recovery facility is under construction.
No Linkage with authorized
waste recyclers.
Recyclable dry waste is sold to local ragpickers, thus forming
part of informal economy.
Remediation of old dump site One dump site comprising of almost 10000MT waste is yet to
be remediated.
NPP Khatima No estimated quantity of
segregated dry and wet waste
Nagar Palika has not provided the rough estimate of the
quantity of dry and wet waste generated.
No source segregation of Mixed waste is being collected from each household in Nagar

`
23
waste. Palika
Combined waste transport Waste is transported in combined form as source segregation is
still not practised in Nagar Palika Khatima.
Wet waste management. Wet waste is not processed Nagar Palika Khatima due to non-
availability of composting pits or machinery.
Non-availability of waste
recovery facility
Dry waste is not processed in Nagar Palika.It is collected and
dumped in the disposal site.
No Linkage with authorized
waste recyclers.
As the dry waste is not segregated , hence linkage seems
redundant.
Remediation of old dump site One dump site comprising of almost 1500 MT waste is yet to
be remediated.
NPP Mahuwa
Khedaganj
Partial Source segregation Almost half of the population is practising segregation at
source.
Partially segregated waste
transport
Complete segregated waste transport would be possible once
100% source segregation is achieved.
Non-availability of waste
recovery facility
Waste recovery facility is under construction in Nagar Palika
Mahuwa Khedaganj.
No Linkage with authorized
waste recyclers.
Plastic waste after segregation is sold to local ragpickers, thus
forming part of informal economy.
NP
Mahuwadabra
No source segregation of
waste.
Mixed waste is being collected from each household in Nagar
Palika.
Combined waste transport Waste is transported in combined form as source segregation is
still not practised in Nagar Palika Mahuwadabra.
Non-availability of waste
recovery facility Dry waste, primarily plastic waste is recovered manually by
the firm handling waste management operations for the ULB.
Waste recovery facility is under construction in Nagar Palika,
Mahuwadabra.
No Linkage with authorized
waste recyclers.
Plastic waste after segregation is sold to local ragpickers, thus
forming part of informal economy.
NP Sultanpur
patti
Minimal source segregation Source segregation is practised in only few wards.
Partially Segregated waste
transport
Waste is majorly transported in combined form as source
segregation is minimal in Nagar Palika Sultanpur patti.
Non-availability of waste
recovery facility
Dry waste is handled and segregated manually in the waste
disposal site by an outsourcing form. Primarily, plastic waste is
recovered.
No Linkage with authorized
waste recyclers.
Plastic waste after segregation is sold to local ragpickers, thus
forming part of informal economy.
Lack of designated waste
disposal land
Waste is disposed in some private land.
NP Khelakheda Minimal source segregation Source segregation is practised by only few households in 5 out
of 9 wards.
Partially segregated waste
transport
Waste is majorly transported in combined form as source
segregation is minimal in Nagar Palika Khelakheda
Non-availability of waste
recovery facility
Dry waste is handled and segregated manually in the waste
disposal site by an outsourcing form. Primarily, plastic waste is
recovered.
Lack of designated waste
disposal land
Waste is disposed in some private land.
NP Dineshpur Partial source segregation of
waste
At present, Nagar Palika is performing 70% source segregation.
Partially segregated waste
transport
Complete segregated waste transport would only be possible
once 100% source segregation is achieved.
Non-availability of waste
recovery facility
Dry waste is handled and segregated manually in the waste
disposal site by an outsourcing form. Primarily, plastic waste is
recovered.
No Linkage with authorized Plastic waste after segregation is sold to local ragpickers, thus

`
24
waste recyclers. forming part of informal economy.
NP Shaktigarh Partial source segregation of
waste
At present, Nagar Palika is performing 70% source segregation.
Partially segregated waste
transport
Complete segregated waste transport would only be possible
once 100% source segregation is achieved.
Non-availability of waste
recovery facility
Dry waste is not processed in Nagar Palika. It is collected and
dumped in the disposal site.
No Linkage with authorized
waste recyclers.
As the dry waste is not segregated , hence linkage seems
redundant.
NP Nanakmatta No estimated quantity of
segregated dry and wet waste
Nagar Palika has not provided the rough estimate of the
quantity of dry and wet waste generated.
Minimal source segregation of
waste.
Source segregation is practised by only few households
Combined waste transport Waste is majorly transported in combined form as source
segregation is minimal in Nagar Palika Sultanpur patti.
Non-availability of waste
recovery facility
Dry waste is not processed in Nagar Palika.It is collected and
dumped in the disposal site.
No Linkage with authorized
waste recyclers.
As the dry waste is not segregated , hence linkage seems
redundant.
NP Gularbhoj Partial source segregation of
waste
At present, Nagar Palika is performing 70% source segregation
covering 5 out of 7 wards.
Partially segregated waste
transport
Complete segregated waste transport would only be possible
once 100% source segregation is achieved.
Non-availability of waste
recovery facility
Dry waste is not processed in Nagar Palika. It is collected and
dumped in the trenching ground.
No Linkage with authorized
waste recyclers
As the dry waste is not segregated , hence linkage seems
redundant.
Table 11. Proposed policies and budget requirement put forward by different stakeholders in
the District
Proposed Policy Stakeholders
Responsible
Current status and Budget requirement
Integrated solid waste
management project for
Kashipur Cluster
NN Kashipur
NPP Jaspur
NP Mahuwadabra
A DPR has been approved for implementing Solid
waste management(ISWM) at an estimating cost of
INR 16.24 cr.
Three ULBs will manage their solid waste in a cluster
based approach.
Components proposed for Kashipur cluster will
include household bins for source segregation. Wheel
barrows for sweepers, processing facility
infrastructure, regional sanitary landfill at Rudrapur
etc.
Integrated solid waste
management project for
Gadarpur Cluster
NPP Gadarpur
NPP Bajpur
NP Khelakheda
NP Sultanpur
patti
A DPR has been approved for Solid waste
management under Gadarpur cluster at an estimating
cost of INR 13 cr.
Major works undertaken includes setting up of waste
processing plant in village Majra hasan with an
estimated area of around 8.77 ha.
Other works includes construction of Material
recovery facility, composting sheds, sanitary landfill
etc.
Development of monograph/templates on solid waste
management for local people improving the waste

`
25
management skills.
*Integrated waste management
under Haldwani Cluster
NN Rudrapur
NPP Kichha
Proposed works includes transportation vehicles,
construction of a CBG (Compressed biogas plant),
remediation of legacy waste in Pahadganj area,
scientific processing of dry waste etc.
A land proposal has been sent to DM office for
construction of material recovery facility.
NN Rudrapur and NPP Kichha are part of Haldwani
cluster for effective dry waste management.
Revamping solid waste
management in Nagar Palika
Parishad Kichha
NPP Sitarganj A DPR with estimated cost of INR 4.80 cr. has been
approved for improving solid waste management.
Development works will include infrastructure for
waste transportation, boundary wall for trenching
ground, construction of composting pits etc.
Revamping solid waste
management in Nagar Palika
Parishad Khatima
NPP Khatima A DPR with estimated cost of INR6.5 cr. has been
approved for improving solid waste management.
Development work will include construction of
material recovery facility, composting pits, trenching
ground etc.
Revamping solid waste
management in Nagar Palika
Parishad Mahuwa kheraganj
NPP Mahuwa
kheraganj
A DPR with estimated cost of INR1.8 cr. has been
approved for improving solid waste management.
Development works includes machinery for Material
recovery facility, transportation vehicles etc.
Revamping solid waste
management in Nagar
Panchayat Shaktigarh
NP Shaktigarh A DPR with estimated cost of INR 44 lakhs has been
approved for improving solid waste management.
Development works will include purchase of
transportation vehicles, construction of trenching
ground etc.
Revamping solid waste
management in Nagar
Panchayat Nanakmatta
NP Nanakmatta A DPR with estimated cost of INR 2.37 cr. has been
approved for improving solid waste management.
Development works will include purchase of
transportation vehicles, construction of trenching
ground and other civil works.
*Haldwani cluster also includes ULBs namely Haldwani, Nainital, Lal Kuan, Bhawali, Bhimtal which comes under
Nainital district.
Vegetation suitable for rehabilitation of dumping sites
Phytoremediation, collectively referring to all plant based technologies, uses green plants to
remediate contaminated sites (Sadowsky, 1999). Natural or planted vegetation on landfill sites has
a key role in soil erosion control and removal of contaminants, besides imparting aesthetic value
(Table 12). Moreover, it may be used in leachate treatment. Landfill vegetation often shows signs
of damage commonly caused by the presence of landfill gas in the root protection zone. The aim
for the reconstruction of a suitable medium for landfill re-vegetation is to provide a cover that is
deep and as favourable to root growth as is necessary to achieve desired plant performance
(Nagendran et al, 2006). In this context, locally available species could be hardened and resistant
in reclaiming the waste dump problem (Table 12).

`
26
Table 12. Vegetation suitable for rehabilitation of dump sites.
Botanical Name Local and
English Name
Assimilating capacity Altitude
(m)
Site/ Location
Mangifera indica Mango Absorb dust particles 100-1200 Shukla, et al, 2019
Populus nigra L. Popular Accumulation of Cd, Pb, As, and Ni 100-1800 Houda et al, 2016
Populus alba L. Black popular Accumulation of Cd and Pb 100-1400 Houda et al, 2016
Cassia fistula L. Amaltas Absorbs Arsenic and Fluoride from
wastewater
100-1500 Houda et al, 2016
Delonix regia (Bojer
ex Hook.) Raf.
Gulmohar Accumulation of (Cd, Pb, Zn and
Cu)
250-1250 Ukpebor et al, 2010
Cynodon dactylon
(L.) Persoon
Doob Absorbs Arsenic and Fluoride from
wastewater
400-2500 Kumar et al., 2011
Rural Solid Waste Management
The domestic waste generated in rural households of India is increasingly becoming an issue of
serious concern. As per reported by Ministry of Drinking Water and Sanitation (MDWS), about
0.3 to 0.4 million metric tonnes of solid waste is generated in rural India every day (Anonymous,
2016). With the objective of achieving Open Defecation Free (ODF) plus status and to improve
cleanliness, hygiene and the general quality of life in rural areas, the aspect of Solid and Liquid
Waste Management (SLWM) assumes greater significance. Most of the solid waste generated in
rural areas can be reused, because of its less generation rate as compared to urban areas.
Current status of Rural Waste Management in India
Rural waste has distinct characteristics as compared to urban waste in terms of composition and
its types. Here, majority of the waste belongs to biodegradable category. In view of management,
the rural areas are yet to formalise their solid waste management operations, hence it cannot be
easily quantified.
According to 2011 census, 68.84% of total population in India live in rural areas which generate
almost 0.3-0.4 million metric tonnes of waste per day.
Due to lack of commercial development, rural solid waste contains only domestic waste (92.4%) as
a major contributor to the total waste generation.
Rural community produces comparatively more biodegradable waste (63.5%) compared to non-
biodegradable waste (36%).
About 78% of the rural population use open dumping as storage and collection of solid waste.

`
27
Projected Population and Waste generation in U.S. Nagar district
Projecting waste quantities in a near future is as difficult as predicting changes in waste
composition for a locality or town. Storage methods, salvaging activities, exposure to the weather,
handling methods and decomposition, all have their effects on changes in waste bulk density.
Generally, lower is the level of economic development, greater will be the change between waste
generation and disposal.
In the present context, population Census data for the year 2001 and 2011 is taken for population
forecast. Decadal population and subsequent waste generation projection is done based on
following presumptions:
Arithmetic increase method is used for the decadal population forecast, hence the rate of
change of population with time is assumed constant
In view of changing waste paradigm and floating population, 1.5% yearly growth in per
capita waste generation is assumed.
Analysis includes population and waste generation estimations for only urban local bodies
and does not include peri-urban and rural areas (Table 13 and 14; Fig.3 and 4)).
Table 13. Projected population and waste generation
ULB Projected Population Existing/Projected Waste
Generation (MTPD)
2021 2031 2041 2021 2031 2041
Nagar Nigam Kashipur 150279 178935 207591 52.00 71.20 95.00
Nagar Nigam Rudrapur 220432 286310 352188 65.00 97.09 137.34
Nagar Palika Parishad Gadarpur 24957 30613 36269 8.00 11.28 15.38
Nagar Palika Parishad Bajpur 29256 32988 36720 12.00 15.56 19.92
Nagar Palika Parishad Jaspur 62109 73695 85281 25.00 34.11 45.40
Nagar Palika Parishad Kichha 53427 64889 76351 25.00 34.92 47.25
Nagar Palika Parishad Sitarganj 37903 45841 53779 19.00 26.43 35.65
Nagar Palika Parishad Khatima 15851 16609 17367 18.00 21.69 26.08
Nagar Palika Parishad Mahuwa Khedaganj 16310 20036 23762 2.00 2.83 3.85
Nagar Panchayat Mahuwadabra 8549 9772 10995 1.8 2.37 3.06
Nagar Panchayat Sultanpur patti 12048 14215 16382 4.00 5.43 7.19
Nagar Panchayat Khelakheda 14076 17223 20370 4.3 6.05 8.23
Nagar Panchayat Dineshpur 13830 16317 18804 5.5 7.46 9.89
Nagar Panchayat Shaktigarh 7842 9375 10908 1.2 1.65 2.21
Total 242.8 338.07 456.45

`
28
Table 14. Projected decadal change in solid waste generation
Name of ULB %age Rate of Growth
(2021-2031)
% age Rate of Growth
(2031-2041)
Nagar Nigam Kashipur 3.69 3.34
Nagar Nigam Rudrapur 4.94 4.15
Nagar Palika Parishad Gadarpur 4.11 3.62
Nagar Palika Parishad Bajpur 2.97 2.80
Nagar Palika Parishad Jaspur 3.65 3.31
Nagar Palika Parishad Kichha 3.97 3.53
Nagar Palika Parishad Sitarganj 3.91 3.49
Nagar Palika Parishad Khatima 2.05 2.02
Nagar Palika Parishad Mahuwa Khedaganj 4.13 3.64
Nagar Panchayat Mahuwadabra 3.15 2.94
Nagar Panchayat Sultanpur patti 3.57 3.25
Nagar Panchayat Khelakheda 4.07 3.60
Nagar Panchayat Dineshpur 3.57 3.25
Nagar Panchayat Shaktigarh 3.75 3.38
Inferences drawn from the projection of waste
Solid waste generation in the district is expected to rise in coming decades and would cross
300 MTPD by 2031.
Nagar Nigam Rudrapur and Nagar Nigam Kashipur contributes for more than half of the solid
waste generated in the district.
3 to 4 % growth rate in solid waste generation is expected in coming decades.
Increased urbanization will change the waste composition in the district. The quantity of wet
waste may decrease; however, there would be increase in e-waste, hazardous waste
generation, plastic waste etc.

`
29
Fig. 3. Geographical representation of projected population
Fig. 4. Projected solid waste generation
0
50000
100000
150000
200000
250000
300000
350000
400000
Pop
ula
tion
Name of ULB
Projection of Population Census Population - 2011
Projected Population - 2021
Projected Population - 2031
Projected Population - 2041
0
20
40
60
80
100
120
140
160
Soli
d W
aste
(M
T/D
ay)
Name of ULB
Projection of Solid Waste Projected Waste -2011
Present Waste - 2021
Projected Waste -2031
Projected Waste -2041

`
30
BIO MEDICAL WASTE MANAGEMENT
According to latest biomedical waste management rules (published in 2016 and amended in
2019), biomedical waste is defined as such waste that is generated during diagnosis, treatment or
immunization of human beings or animals, or in research activities pertaining thereto or in the
production or testing of biological experiments. The fact sheet of WHO states that 20% of the
total waste generated by health care activities is hazardous. All the biomedical waste generated is
essential to be properly collected, segregated, stored, transported, treated and disposed of in a safe
manner to prevent spreading infectious diseases. The health system of Uttarakhand constitutes a
large network of health care facilities based on three-tier system that comprises of district level
health care facilities (District hospitals, base hospitals, etc.), community health care centres
(CHCs), and primary health care centres (PHCs). Biomedical waste generation has shown a wide
variation in Uttarkhand due to its typical physiographical conditions and changing density of
population. Handling and disposal of biomedical waste is done as per BMW rules, 2016 (Fig. 5).
(Source: CPCB 2020)
Fig. 5. Segregation of Biomedical waste as per BMW rules, 2016

`
31
Importance of Biomedical Waste Management in the Wake of Pandemic
Due to the onset of covid pandemic, biomedical waste generation increased worldwide. Similar
trend was also observed in our country from 2019 to 2021. The daily biomedical waste generation
increased from 619 MTPD to 800 MTPD in India (CPCB, 2021) and from 3.8 MTPD to 6.26
MTPD in Uttarakhand state (ENVIS, 2020).
At present, the biomedical waste is being generated not only from the health care facilities but
also from the quarantine centres, and residential areas where patients were in a home isolation.
Bio-medical waste ought to be segregated in the households as well as from the municipal solid
waste. Thus, it has to be properly disposed of to get rid of the risks of infection among the workers
handling the municipal solid waste in urban local bodies.
Biomedical Waste Management in US Nagar
Sufficient government and private healthcare facilities are available in Udham Singh Nagar,
which consists of bedded and non-bedded hospitals, veterinary hospitals, pathology labs, clinics,
blood banks etc. (Table 15). Maximum healthcare facilities have established linkage with a
Common Biomedical waste treatment facility (CBMWTF) for proper treatment and disposal.
Table 15. Inventory of current healthcare infrastructure for Bio-medical waste Management
S. No. Parameter Outcome
1. Health-care facilities in
the district
Facility Numbers
Govt. Bedded HCFs 44
Private bedded HCFs 176
Govt. Non-bedded HCFs 01
Private Non-bedded HCFs 138
Veterinary Hospitals 23
Pathology Labs 65
Dental Clinics 45
Blood Banks 02
Others (Ayurvedic HCFs) 22
Total 516
2. Number of health care
facility authorized by
SPCB/PCC
Facility Numbers
Govt. Bedded HCFs 30
Private bedded HCFs 130
Govt. Non-bedded HCFs 01
Private Non-bedded HCFs 125
Govt. Veterinary HCFs 21
Pathology labs 34
Private dental clinics 16
Blood Bank 02
Other (Ayurvedic HCFs) 18

`
32
Total 377
3. Linkage with Common
Bio-medical Waste
Treatment Facility
(CBMWTF)
377Health care facilities are linked to Global Environmental
Solution (GES). However, Partially some ULBs has established
linkage with CBWTF for biomedical waste management.
4. Pre-segregation Partially pre-segregation of the biomedical waste in the district.
5. Capacity of Common
Bio-medical Waste
Treatment Facility
(CBMWTF)
GES receives Bio medical waste of entire Kumaon Region;
therefore, capacity is assessed with respect to total waste received
from other districts also.
Incineration capacity- (1600 kg/day) and (100 kg/hr)
Autoclave (10800 kg/day)/ 450 kg/hr
6. Captive disposal
facilities
NIL
(Sources: Health Department of US Nagar 2021, UKPCB, 2021)
Prevailing Bio-Medical Waste Management in the District
Current Status and proposed policies for Biomedical waste management in
Udham Singh Nagar
Unlike in other districts, the biomedical waste is segregated in healthcare facilities according to
latest Bio-medical waste management rules, 2016. Waste is segregated into different categories
according to composition and then lifted to CBMWTF (Table 16).
Table 16. Current status of biomedical waste management
S. No. Action areas Outcomes
1.
Composition of Bio-medical waste
Bio-medical waste generally comprises of
Discarded blood, used bandages, Used dressings,
discarded Gloves and other medical supplies.
Category Percentage (%)
Yellow category 26.64
Red category 46.44
White/Blue category 26.92
2. Daily Bio-medical waste lifting by
Common Bio-medical waste
treatment facility (CBMWTF)
Category Kg/day
Yellow category 108.24
Red category 188.97
White/Blue category 109.62
Total 406.83
Presently, 516 HCFs have been inventorized by the State Pollution Control Board (SPCB), out of
which 377 HCFs have valid authorization /consent to operate. Notice has been issued to rest of
HCFs. Before issuing, it is mandatory to get membership of CBWTF in order to ensure proper
collection of bio-medical waste generated by HCFs
GPS system enabled vehicles are used in order to ensure proper tracking of waste.
Routine inspection of CBMWTF is being done by the head office and regional office.

`
33
4. Pre segregation of waste by Health
care facilities.
Partial segregation
5. Segregation of BMW as per
guidelines of BMW rules, 2016
In Practice
6. Tracking of biomedical waste
(Implementation of bar code system
for tracking)
Partially
Source: UKPCB, 2020

`
34
CONSTRUCTION & DEMOLITION WASTE MANAGEMENT
Construction and Demolition (C&D) waste is produced in the construction, remodelling, repair
and demolition of residential / commercial buildings and other structures and pavements. C&D
waste mainly consists of concrete, bricks, sanitary ware, glass, steel, plastic, etc. (Table 17).
According to a general estimate, 40% of the total C&D waste originates from renovation work,
while 50% from the demolition work and remaining 10% from new construction work (CPCB,
2020) (Table 18).
Implementation of 3R Principle in C&D Waste Management
Construction and demolition waste is inert in nature. It does not create chemical or biochemical
pollution. Hence in view of its management, maximum emphasis should be given on 3R Principle.
The concept of 3R, which refers to reduce, reuse and recycle particularly in the context of
production and consumption is well known today. Waste reduction is presumed to be optimal
measure for C&D waste management due to its minimal adverse impact on environment.
Applicable building materials can be reused for original activity or to fulfil any other purpose.
Steel, doors and windows, wood, bricks and other construction items can be easily taken out and
again put to reuse without much processing. The last but not least step is to recycle the C&D
waste considered fit for recycling. This is usually done by converting the waste into recycled sand
and aggregates that have various construction applications. This principle can be applied to the
entire life cycle of products and services – starting from design and extraction of raw materials
from collection to transport, and then manufacturing, practicing scientific disposal. Hence, it is
evident that application of 3R principle would help reduce the C&D waste in the construction
industry.
Present state of affairs
According to a report by Transparency Market Research (2016), the volume of construction
waste generated worldwide every year will nearly double to 2.2 billion tonnes by 2025 (CWM,
2020).
Our country generates 150 million tonne/year C&D waste but the official recycling capacity is
a meagre 6500 tonnes/day or just about 1% (as per building material promotion council
(CWM, 2020).

`
35
Table 17. Characteristics of C&D Waste in India
Type of Debris Percentage (%)
Wood 42.4
Drywall 27.3
Concrete 12.0
Brick and Other Mixed Debris 7.3
Cardboard 5.4
Metals 1.8
Asphalt 1.4
Plastic & Foam 1.4
Other packaging 0.6
Textiles 0.4
(Source: District Administration, 2020)
Table 18. Thumb rule for Estimation of C&D waste generation for India
Range Type of construction
40-60 kg/m2 New construction
40-50 kg/m2 Building repair
300-500 kg/m2 Demolition of building
Present infrastructure within the state
C&D Waste Management in US Nagar district
Construction and demolition waste is not yet quantified in the district pertaining to the fact that its
quantity is assumed to be nominal (Table19). However, with rapid urbanization, construction
activities will rise, hence some strategy is required for scientific management of C&D waste. This
may include establishment of dumping sites, framing of byelaws etc. (Table 20).
Table 19. Current status related to C&D waste generation
S. No. Action Areas Outcomes/Remarks
1. Quantity of C&D waste
generated (KGPD)
Not estimated as collection of C&D waste is not initiated. However,
its quantity is assumed to be minimal.
2. Collection of C&D waste None of the ULBs has initiated the collection of C&D waste in the
district.
Currently, no treatment facility is available in the state for processing the C&D waste.
Rapid Urbanization has increased construction activities in plain areas, but scientific management
C&D waste is hard to find.
As the management of C&D waste is not done in the state, so it is not possible to assess the total
amount of waste generated.

`
36
3. Establishment of disposal
sites /Dumping zones
Not initiated
4. Establishment of linkage
with any C&D waste
recycling facility
There is no C&D waste treatment facility in the district. Moreover,
none of the ULBs has linkage with any common C&D waste
treatment facility.
Table 20. Gaps Identified in the management of C&D waste
S. No. Observed shortcomings Outcome / Remarks
1. Quantification of C&D
waste
As the collection of C&D waste is not initiated. Hence, quantification
of C&D waste generated in the district is not possible.
2. Establishment of
collection centre /
disposal sites / dumping
zones
District authority claims of using all the C&D waste forfilling low
lying areas and development works near the construction site.
3. Implementation of by-
laws for C&D waste
management
C&D waste is not streamlined in current waste management
operations. Hence by-laws are not framed yet.
C&D Waste Management in Rural Areas
In the rural areas of US Nagar district, construction work is observed to be limited. Therefore,
minimal amount of C&D waste is generated which mainly consists of the soil excavated from the
foundation trenches and stones from the hill slopes. This excavated soil is reused either in filling
the plinth and trenches or many times used in the low-lying areas. Stones obtained from the hill
slopes are used in masonry work. There is an issue of improper dumping of muck dumping along
the river banks or seasonal streams (khads) or construction of roads. These issues need to be
addressed within a strategy for managing construction and demolition waste.

`
37
HAZARDOUS WASTE MANAGEMENT
Hazardous Waste is any waste which because of characteristics such as physical, chemical,
biological, reactive, toxic, flammable, explosive or corrosive, causes danger or is likely to cause
danger to health or environment (whether alone or in contact with other wastes or substances).
State Pollution control board (SPCB) is responsible for tabulation of hazardous waste generating
units and quantification of waste generated in respective state. Hazardous industrial wastes in
India can be categorized broadly into two categories as under:
Hazardous wastes generated from various industries in India.
Hazardous industrial wastes transported to India from the western countries for re-processing
and recycling.
Present state of affairs
Hazardous and Other wastes (Management and Transboundary Movement) rules, 2016 govern
the collection, transfer, Processing, treatment and disposal of hazardous waste (Table 21).
The rules were amended on March 2019 keeping in consideration the ease of doing business,
boosting make in India initiative by simplifying the procedures, while at the same time
upholding the principles of sustainable development.
According to CPCB Report 2019-20, there are 69,308 hazardous waste generating units in
India having authorized annual capacity to generate about 39.46 million MT of hazardous
waste. However, about 8.78 million MT hazardous waste was generated during 2019-20,
based on the annual returns submitted by such units (CPCB, 2020).
Table 21. Hazardous Waste generation in India
(Source: CPCB, 2020)
Hazardous waste management in U.S. Nagar District
Industrial processes are the main source of hazardous waste in the district. Much of the hazardous
waste generated is quantifiable and is managed according to Hazardous and other wastes
(Management and Transboundary Movement) rules, 2016 (Table 22). TSDF is also available in
the district, which facilitates scientific management of hazardous waste in Global Environmental
Solution Ltd, Gadarpur, Udham Singh Nagar (Table23). Some hazardous waste contaminated
sites have been identified in Kashipur and Pantnagar. However, hazardous waste generated in
Type of hazardous waste Quantity / Year (MMT) % of total waste
Land-fillable 2.13 24.29
Incinerable 0.40 4.52
Recyclable 2.07 23.59
Utilizable 4.18 47.60

`
38
domestic households along with verification of records with respect to generators needs
consideration (Table 25).
Table 22. Inventory of Hazardous waste in Udham Singh Nagar
S. No. Parameter Present status
1. Quantity of hazardous waste
generated in the district
(MT/Annum)
Land fillable Incinerable Recyclable Utilizable Total
5928 4210 40978 2985 54101
2. Quantity of hazardous waste
imported from other state/UTs
(MT/Annum)
1427.49 2161.91 13739.9 605.79 17935.1
3. Quantity of Waste Processed
(MT/Year) (Listed under
Schedule -Ⅳ Hazardous waste)
Recycled 14145.72
Utilized (Co-processed in Cement Plant) 560.7
Disposed in secured landfill 1344.49
Disposed through incinerator 2178.51
3. Total number of units authorised
under Hazardous Waste
Management Rules, 2016
1334 (Each industry has display board of Hazardous Waste generation
in front of gate)
4. Number of Hazardous waste
Dumpsite
None
Table 23. Current status related to Hazardous waste management
S. No. Action Areas Outcome And Remarks
1. Method of Disposal Incinerable and land fillable waste is disposed through
Common Treatment, Storage and Disposal Facility (TSDF)
and recyclable hazardous waste is being recycled through
registered recyclers located within the state and outside the
state.
1. No. of captive / common TSDF (Treatment
storage and disposal facilities) in the district.
Sent to other district in the state (Global Environmental
Solution Ltd.) Gadarpur.
2. Industries Linkage with common TSDF 1051 Units
3. Number of industries authorized by SPCB 1051
4. Number of ULBs linked with common
TSDFs
Not Initiated
5. Contaminated sites/probable contaminated
sites within the district
Two sites are identified in the US Nagar:
1. DSM Sugar Factory Field Kashipur
2. Village Gangapur Patia Pantnagar
6. Regulation of industries & facilities
generating Hazardous waste
Industries generating hazardous waste are regularly
monitored by state pollution control board.
Compliance with Hazardous Waste and
Management Rules,2016
All the industries adhere to the Hazardous waste
management rules, 2016. Following are some notable areas
where compliance is done:
Annual inventory submitted by the units with respect to
quantity of hazardous waste generated, daily records etc.
Directory of Hazardous waste generating units in
service sector and domestic hazardous waste.
Hazardous waste disposed/stored by generator and
received by common Treatment, storage and disposal

`
39
facility (TSDF).
Display board, adequate collection and storage facility
within generator premises.
Table 24. Gap identification
Observed Shortcomings Remarks
Verification of record with respect to
generation/storage and disposal by the generator.
Random verification of industries generating
hazardous waste with respect to the manufacturing
process is required.
Record of Hazardous waste generated in service
sector especially in the Automobile sector.
Identification of hazardous waste generating units in
the service sector, physical verification of quantity and
type of waste is required.
Estimation of quantity of hazardous waste
within waste generator premises.
Special/technical support in the field of hazardous
waste management is required.
Lack of Instrumentation and additional
infrastructure.
Technical support in terms of following points is
required.
Identification of Probable contaminated site due to
improper handling of hazardous waste.
Reclamation of contaminated sites.

`
40
ELECTRONIC WASTE MANAGEMENT
The Discarded and end-of-life electronics products ranging from computers, equipment used in
Information and Communication technology (ICT), home appliances, audio and video products
and all of their peripherals are known as Electronic waste (E-waste). Computer devices
contributes to almost two third of electronic waste in India (Table 25). It is categorised into 21
types under two broad categories:
Information technology and communication equipment.
Consumer electrical and electronics.
The ill effects of e-waste could be on soil through leaching of hazardous contents from landfills;
in water due to recycling process (if not carried our properly), through inhalation of gases during
recycling, contact of the skin of the workers with hazardous substances and contact during acid
treatment used in recovery process (EEMI, 2018).
Government of India has notified E-Waste Management Rules 2016, which are expanded to
manufacturer, dealer, re-furbisher and Producer Responsibility Organization (PRO) of
components, consumables, spares and parts of Electronics and Electrical Equipment (EEE) in
addition to equipment as listed in Schedule I appended with the rules. Moreover, Compact
Fluorescent Lamps (CFL) and other mercury containing lamps are also brought under the
provisions of these Rules. Amendments were further made on March 2019 with the objective of
channelizing the E-waste generated in the country towards dismantlers and recyclers in order to
formalise the e-waste recycling sector.
Table 25. Bifurcation of E-waste based on electronic appliances
Types of Waste Contribution (%)
Computer devices 70
Telecom sector 12
Medical equipment 7
Electric equipment 8
Others 3
(Source: ASSOCHAM, 2020)
Worldwide Scenario
Electronics and Electrical Equipment (EEE) are manufactured and disposed worldwide. In
2016, 44.7 Million Metric Tons (MMT) of e-waste was generated worldwide (equivalent to
6.1kg/inhabitant). Following the current growth rate of rising e-waste, it is estimated that by
2021, quantity has already risen to 52.2 Million Metric Tons or 6.8 kg/inhabitant.

`
41
Out of the total e-waste produced in 2016, only 20% (8.9 MT) is documented to be collected
properly and recycled, while there is no record of the remaining e-waste. The quantity of e-
waste generated worldwide is expected to grow at a rate of 3.15% (CAGR).
Indian Scenario
According to Central Pollution Control Board (CPCB), India generated more than 10 Lakh
tonnes of e-waste in 2019-20. Against this, the e-waste dismantling capacity has not been
increase from 7.82 lakh tonnes since 2017-18
In 2018, the Ministry of Environment had told the tribunal that 95% of e-waste in India is
recycled by the informal sector and scrap dealers unscientifically dispose of it by burning or
dissolving it in acids.
India has emerged as fifth largest Electronic waste producer in world. City-wise, Mumbai tops
the list in producing electronic waste, followed by New Delhi, Bangalore and Chennai.
The government offices, public and private sector companies generate nearly 75% of e-waste;
with the contribution of individual household only being 16%.
India’s first e-waste clinic for segregating, processing and disposal of waste from household
and commercial units has been set-up in Bhopal, Madhya Pradesh.
E-waste Management in US Nagar district
The quantification of e-waste is not yet initiated in the district. However, the administration has
managed linkage with authorised recyclers to channelize the e-waste. (Table 26). Primary
segregation of e-waste is still a distant dream due to lack of awareness and e-waste collection
centres (Table 27).
Table 26. Current standpoints regarding E-waste generation and collection
S. No. Parameter Outcome & Remarks
1. Quantity of e-waste generated per annum
(MT)(As per State pollution control board)
Uttarakhand 16260
US Nagar Not Estimated
2. Toll-free number in the district for the
citizens to deposit e-waste
Not yet initiated in the district.
3. Collection centre established by ULBs in
the district
At present, there are no collection centres
established by any of the ULBs or the district
administration.
4. Number of authorized e-waste Recyclers /
dismantlers in the state
Currently, five authorized recyclers/dismantlers
are available in the district namely:
Attero Recycling Pvt. Ltd. Raipur, Bhagwanpur
Bharat Oil & Waste Management, Mukhimpur,
Laksar

`
42
Resource E-Waste Solution Pvt. Ltd.
Bahadrabad
Scarto Metal Recycle Plant, Mewar Khurd,
Roorkee
Anmol Paryavaran Sarakshan Samiti, Daulatpur
Budhwa Shahid, Banjarewala
5. Linkage with any e-waste recycling facility No ULB in the district has established linkage
with authorised e-waste recycling facility.
However, district administration have linkage
with the authorised e-waste recycling facility to
deposit e-waste generated from the government
offices.
6. Control over illegal trading or processing of
e-waste in the district
Controlled
Table 27. Gap identification in e-waste management
S. No. Gaps identified Remarks
1. Establishment of collection
centres & toll free number
Ample amount of e-waste is lying idle in the government
offices of the district which is not being sent for recycling.
There is no facility in the district to deposit or to collect e-
waste.
As there is no facility of toll free number to deposit or to
collect e-waste in the district. So all the e-waste generated
from the residential areas is mixed with municipal solid
waste and thus could not be treated properly.
2. Segregation of E-waste by
ULBs
As the quantity of e-waste generated is very less, so there is
no mechanism in the ULBs for segregation.
3. Linkage of ULBs with
authorised recyclers /
dismantlers
Yet to establish linkages with recyclers / dismantlers.

`
43
POLLUTED RIVER STRETCHESIN US NAGAR
The polluted locations in a continuous sequence are defined as polluted river stretches and are
categorized in five priority classes based on BOD concentration (Table 28). The Central Pollution
Control Board (CPCB) in 2018 identified 351 Polluted river stretches in India. The national-level
assessment of water quality for identification of Polluted river stretches has found that there are 31
states and Union territories having rivers and streams not meeting water quality criteria. Currently,
9 rivers are monitored in Uttarakhand at 28 different locations. It is prerequisite to maintain water
quality in accordance to the criteria set out as per designated best use (Table29).
Table 28. Criteria for Prioritization
Priority area BOD Level (mg/l)
Priority Ⅰ >30 mg/l
Priority Ⅱ 20-30 mg/l
Priority Ⅲ 10-20 mg/l
Priority Ⅳ 6-10 mg/l
Priority Ⅴ 3-6 mg/l (Sources UKPCB, 2020)
Table 29. Water Quality standards for different purposes
Designated Best Use Class Criteria
Parameter Prescribed value
Drinking water source without
Conventional treatment but after
disinfection
A pH 6.5- 8.5
DO 6 mg/l or more
BOD 2 mg/l or less
Total Coliforms (MPN/100ml) 50 or less
Outdoor Bathing (Organized) B pH 6.5-8.5
DO 5mg/l or more
BOD 3 mg/l or less
Total Coliforms 500 or less
(MPN/100ml)
Drinking water source after
conventional treatment and
disinfection
C pH 6-9
DO 4 mg/l or more
BOD 3mg/l or less
Total Coliforms (MPN/100ml) 5000 or less
Propagation of Wild life and
Fisheries
D pH 6.5-8.5
DO 4gm/l or more
BOD 2 mg/l or less
Irrigation, Industrial Cooling,
Controlled Waste Disposal.
E pH 6.0-8.5
Electrical Conductivity 2250
Sodium Absorption ratio Max.26
Boron Max. 2mg/l
Below -E Not meeting any of the above standards

`
44
Polluter stretches in US Nagar
As much as seven polluter stretches have been identified in Udham Singh Nagar district with
priority level varying from (Ⅰ) to (Ⅳ) (Table 30). Kashipur, Bajpur, Rudrapur, Sitarganj and
Sultanpur are major towns that lie in the vicinity of these polluted stretches. Effluent from
industries, sewage generated from households and dumping of solid waste in river catchment have
been major sources of water pollution in these stretches of rivers (Table 31).
Table 30. River Polluter Stretches in Udham Singh Nagar
S.
No
River Name Stretch Identified Major Cities/towns Length of
Stretch (Km)
Priority
class
1. Bhela Kashipur to Rajpura
Tanda
Kashipur 14 (I)
2. Dhela Kashipur to Garhuwala
(Thakurdwara)
Kashipur,Thakurdwara 14 (I)
3. Kichha Drains of Kiccha Gola
river
Kichha, Lalkuan 06 (II)
4. Kalyani Drains of Rudrapur Pantnagar, Rudrapur,
Sitarganj
11.5 (III)
5. Nandour/Kailash Along Sitarganj Sitarganj - (IV)
6. Pilakhar In the vicinity of
Rudrapur
Rudrapur, Bazpur - (IV)
7. Kosi Sultanpur to Pattikalan Sultanpur 06 (IV)
(Sources UKPCB, 2020)
Table 31. Identification of sources of Pollution in the polluter stretches
Potential source of
pollution
Remarks
Industrial pollution
River Stretch Number of GPIs(Grossly
polluting industries) in
polluter stretch or entire
catchment of river
Number of
Industrial
drains meeting
the river
River Bhela (Kashipur to
Rajpura Tanda
08 ( Two of them are
maintaining Zero Liquid
Discharge)
03
River Dhela (Kashipur to
Garhuwala)
14 04
Kichha (Drains of Kiccha river
Gola)
04 01
Kalyani (Drains of Rudrapur) 03 -
Nandhour (Along Sitraganj) 02 -
Pilakhar (In the vicinity of
Rudrapur)
03 ( one unit not
operational)
-
Kosi (Sultanpur to Pattikalan) 02 01

`
45
Individual effluent treatment plant and Common Effluent Treatment Plant
(CETP) are monitored by Uttarakhand Pollution Control Board (UKPCB)
Industrial hazardous waste mainly used oil/Contaminated barrels are being
recycled through registered recyclers. Rest is either disposed through Treatment,
Storage and Disposal Facility (TSDF) or incinerated.
Domestic Sewage River Stretch Number of sewage drains
meeting the river
River Bhela (Kashipur to Rajpura Tanda 02
River Dhela (Kashipur to Garhuwala) 06
Kichha (Drains of Kiccha Gola river) 06
Kalyani (Drains of Rudrapur) 22
Nandhour/Kailash (Along Sitraganj) 01
Pilakhar (In the vicinity of Rudrapur) 01
Kosi (Sultanpur to Pattikalan) 01
All the cities/towns in the periphery of these rivers have no sewage treatment
plant for waste water management.
Solid waste Name of the
river
Major Cities/Towns
in the vicinity of the
river
Remarks
Bhela Kashipur Illegal disposal of solid waste
along the river banks and flood
plain zones. Dhela Kashipur
Kichha Nagar Palika Kichha
Kalyani Rudrapur, Pantnagar
Nandhour/Kailash Sitarganj
Pilakhar Bazpur
Kosi Sultanpur Patti
Water Quality Characteristics of Polluted river stretches at Different
Monitoring Stations
River Bhela
Originating from the agriculture fields, Bhela is small spring-fed river and is a tributary of river
Kosi. The watershed of Bhela river lies in the Ramnagar and Bajpur road areas of Kashipur. This
is also the region which comprises of industries that discharge their effluent, directly or indirectly
into the river. Constant efforts are being made to improve the water quality of the river. Currently,
it has been noted that the goals can be met for Class ‘E’ (i.e. for irrigation, industrial cooling and
controlled water disposal).
Based on monitored data for the year 2016 and 2017, Bhela river stretch from Kashipur to Rajpura
Tanda (approx. 14 km) has been declared as polluted river stretch of priority (I) by Central
Control Board(CPCB). Water quality is being monitored in two locations on the upstream and
downstream of Kashipur town (Table 32). The river is still not found suitable for drinking or

`
46
bathing purpose as the BOD levels have been breached almost every year. However, no
groundwater contamination is reported in these areas.
Table 32. Water quality characteristics of River Bhella (2017-2021)
Year Name of Monitoring location pH BOD
(mg/l)
COD
(mg/L)
DO
(mg/l)
Conductivity
(umhos/cm)
TDS
(mg/l)
2021
Ramnagar Road US Nagar 6.20 7.44 32.80 3.78 334.40 228.00
Lohia Bridge Kashipur US
Nagar 6.78 26.80 122.00 1.12 672.00 445.80
2020
Ramnagar Road US Nagar 7.43 5.12 25.67 5.21 279.58 189.75
Lohia Bridge Kashipur US
Nagar 7.03 22.25 103.42 1.54 541.50 360.17
2019
Ramnagar Road US Nagar 7.31 3.61 23.62 4.86 267.80 161.80
Lohia Bridge Kashipur US
Nagar 6.97 39.67 115.17 0.58 489.42 315.42
2018
Ramnagar Road US Nagar 7.21 4.70 14.62 6.48 240.00 160.80
Lohia Bridge Kashipur US
Nagar 7.34 38.67 116.00 1.25 551.67 362.33
2017
Ramnagar Road US Nagar 7.25 4.31 17.16 6.47 222.00 156.33
Lohia Bridge Kashipur US
Nagar 7.11 35.00 151.80 0.50 571.00 351.20
(Sources UKPCB, 2020)
River Dhela
Originating from the Ramnagar forest area of Nainital district, Dhela is a tributary of Ramganga
river. It is diverted to Tumaria dam, from where the water is channelized for irrigation purpose.
Dhela is a seasonal stream and remains dry in the lean season (No natural discharge is observed).
The river gets contaminated from the industries (majorly pulp and paper industries) located in the
Moradabad and Aliganj roads leading to Kashipur.
Based on monitored data for the year 2016 and 2017, River Dhela from Kashipur to Gheruwala
Thakurdwara (approx. 14km) has been declared as polluted river stretch of priority (I) by Central
Pollution Control Board(CPCB). Water quality is being monitored in two locations on the
upstream (at Manpur bridge) and downstream (at Bhojpur) of Kashipur town (Table 33). Water
quality is still not found adequate for drinking or bathing purpose as the BOD levels have been
breached most of the time from the past three years. However, groundwater contamination is
reported in these areas.
Table 33. Water quality characteristics of River Dhela (2017-2021)
Year Name of Monitoring location pH BOD
(mg/l)
COD
(mg/l)
DO
(mg/l)
Conductivity
(umhos/cm)
TDS
(mg/l)
2021
Dhella River at Kashipur Moradabad Road
Bridge US Nagar 7.63 12.67 45.33 4.67 546.33 381.33
Dhella River D/S at Thakurdwara, US
Nagar 7.64 43.00 134.60 0.48 930.60 634.00
2020 Dhella River at Kashipur Moradabad Road 7.69 6.56 26.83 5.37 347.08 228.42

`
47
Bridge US Nagar
Dhella River D/S at Thakurdwara, US
Nagar 7.31 15.80 71.89 1.77 508.88 350.25
2019
Dhella River at Kashipur Moradabad Road
Bridge US Nagar 7.36 6.92 25.90 5.54 290.70 164.30
Dhella River D/S at Thakurdwara, US
Nagar 7.45 19.06 68.10 1.56 482.80 281.10
2018
Dhella River at Kashipur Moradabad Road
Bridge US Nagar 7.29 7.40 23.00 5.75 280.00 182.13
Dhella River D/S at Thakurdwara, US
Nagar 7.23 21.78 75.11 2.60 457.78 317.56
2017
Dhella River at Kashipur Moradabad Road
Bridge US Nagar 7.41 9.14 30.29 5.54 261.67 160.00
Dhella River D/S at Thakurdwara, US
Nagar 7.28 25.33 85.33 1.99 625.56 386.56
(Source: UKPCB, 2020)
River Kichha
Kichha, also known as Gola river originates in lesser Himalayas of Kumaon hills and flows
through Kathgodam, Haldwani and Kichha town. It is a tributary of Ramganga river and is almost
dry except in the monsoon season. Industrial wastewater from paper and pulp industries (in
Lalkuan) and municipal drains are major reason for water contamination in the river.
Based on monitored data for the year 2016 and 2017, River Kichha along the Kichha town
(approximately 6km) has been declared as polluted river stretch of priority (II) by Central
Pollution Control Board(CPCB). Water quality is being monitored in the downstream of Kichha
town (near bypass bridge (Table 34) and is still not found suitable for drinking or outdoor bathing
purpose. However, based on past two years’ data, the water quality has shown some improvement
and can be designated as a polluted stretch of priority(IV) or (V).
Table 34. Water quality characteristics of River Kichha (2017-2021)
Year Monitoring location pH BOD
(mg/L)
COD
(mg/L)
DO
(mg/L)
Conductivity
(umhos/cm)
TDS
(mg/L)
2021 Kicha (U/S Nagarbhalla, Kashipur, US
Nagar
8.02 4.06 23.00 7.62 921.60 659.40
2020 Kicha (U/S Nagarbhalla, Kashipur, US
Nagar
7.79 6.65 41.80 4.28 508.92 341.58
2019 Kicha (U/S Nagarbhalla, Kashipur, US
Nagar
7.34 6.13 32.67 4.57 503.25 342.92
2018 Kicha (U/S Nagarbhalla, Kashipur, US
Nagar
7.65 16.53 62.67 3.95 543.33 353.92
2017 Kicha (U/S Nagarbhalla, Kashipur, US
Nagar
7.66 8.62 42.50 4.80 618.50 408.67
(Sources UKPCB, 2020)
River Kalyani
Originating from Tanda forest area of district Nainital, Kalyani is a spring fed river which passes
through the agriculture fields of Pantnagar. It is a non-perennial river with minimum flow (almost

`
48
dry) during non-monsoon months. River kalyani receives treated waste water from CETP, IIE
Pantnagar and other individual industrial units. Moreover, waste water from municipal drains
(Residential areas) of Rudrapur is also discharged in the river.
Kalyani river, along IIE Pantnagar and downstream of Pantnagar (Approx. 11.5 km length) has
been declared as Polluted river stretch of priority (III) by Central Pollution Control Board(CPCB).
Water quality is being monitored in the upstream and downstream of Pantnagar industrial area.
(Table 35). Water quality has not shown much improvement over the past two years as the BOD
concentrations have exceeded the desired levels. So far, no groundwater contamination is reported
in these regions.
Table 35. Water quality characteristics of River Kalyani (2017-2021)
Year Name of Monitoring location pH BOD
(mg/l)
COD
(mg/l)
DO
(mg/l)
Conductivity
(umhos/cm)
TDS
(mg/l)
2021
Kalyani River at U/S Pantnagar Industrial
Area, US Nagar 7.42 6.88 30.00 5.40 655.20 440.20
Kalyani River at D/S Pantnagar Industrial
Area, US Nagar 8.04 26.20 134.00 0.48 1096.00 758.20
2020
Kalyani River at U/S Pantnagar Industrial
Area, US Nagar 7.52 5.66 23.58 4.68 387.17 246.25
Kalyani River at D/S Pantnagar Industrial
Area, US Nagar 7.38 11.02 49.92 2.84 559.50 334.08
2019
Kalyani River at U/S Pantnagar Industrial
Area, US Nagar 7.41 5.58 22.75 5.25 419.50 249.83
Kalyani River at D/S Pantnagar Industrial
Area, US Nagar 7.08 11.45 39.50 3.53 500.42 307.33
2018
Kalyani River at U/S Pantnagar Industrial
Area, US Nagar 7.36 3.60 16.22 7.22 415.56 267.33
Kalyani River at D/S Pantnagar Industrial
Area, US Nagar 7.20 34.52 129.83 2.53 525.00 357.42
2017
Kalyani River at U/S Pantnagar Industrial
Area, US Nagar 7.46 2.25 15.53 7.80 415.50 269.75
Kalyani River at D/S Pantnagar Industrial
Area, US Nagar 7.60 7.09 36.00 5.07 573.20 360.42
(Sources UKPCB, 2020)
River Nandhor
River Nandhor, also known as Kailash originates from Pangoot in Nainital Forest area and flows
downstream along the Eldeco SIDCUL Industrial Park (ESIPL) and Sitarganj town. As much as
96 industries are located in ESIPL. The treated waste water from CETP (in ESIPL) is disposed to
the river through land disposal (Karnal technology) and the overflow discharges into Baigul canal.
Nandhor/Kailash is a spring fed river and has no direct source of industrial waste water before
ESIPL. It has been declared a polluted river stretch of priority (IV) by Central Pollution Control
Board (CPCB). Hence, Water quality is being monitored in the upstream and downstream
Sitarganj Industrial area (Table 36). The water quality has shown some improvement in past two

`
49
years as the BOD levels have been decreasing rapidly. So far, no groundwater contamination is
reported in these regions.
Table 36. Water quality characteristics of River Nandhor (2017-2021)
Year Name of Monitoring location pH BOD
(mg/l)
COD
(mg/l)
DO
(mg/L)
Conductivity
(umhos/cm)
TDS
(mg/l)
2021
Nanduar River Sitarganj
Industrial Area US Nagar 7.20 3.30 15.00 7.30 473.00 310.00
Nanduar River D/S Sitarganj
Industrial Area, US Nagar 7.56 3.60 14.40 7.54 455.80 297.20
2020
Nanduar River Sitarganj
Industrial Area US Nagar 7.65 6.85 28.00 5.68 224.75 126.00
Nanduar River D/S Sitarganj
Industrial Area, US Nagar 7.87 7.05 32.50 4.90 342.92 221.17
2019
Nanduar River Sitarganj
Industrial Area US Nagar 7.52 6.12 26.00 5.44 203.80 121.20
Nanduar River D/S Sitarganj
Industrial Area, US Nagar 7.56 6.93 31.00 5.30 376.83 219.50
2018
Nanduar River Sitarganj
Industrial Area US Nagar 7.42 3.88 15.00 6.92 374.00 242.40
Nanduar River D/S Sitarganj
Industrial Area, US Nagar 7.62 7.22 30.91 6.42 421.82 273.45
2017
Nanduar River Sitarganj
Industrial Area US Nagar 7.40 3.60 27.33 7.33 479.33 318.00
Nanduar River D/S Sitarganj
Industrial Area, US Nagar 7.70 5.20 31.33 6.69 416.67 259.44
(Sources UKPCB, 2020)
River Pilakhar
Pilakhar is a spring fed river formed by confluence of various streams such as Ghoganadi,
Gadarinadi and Levdanadi.Bazpur town is a major urban settlement in the upper catchment of the
river. Ghoganadi receives the drainage of the town as well as industrial waste water from pulp and
paper industry as well as sugar industry.
Some section of the upper catchment of Pilakhar river has been declared as polluted river stretch
of priority (IV) by Central Pollution Control Board (CPCB). At present, water quality monitoring
is carried out in locations falling within the jurisdiction of Uttar Pradesh government (Table 37).
However; aforesaid monitoring stations will be shifted to the upstream and downstream location
of Bazpur town in near future.
Table 37. Water quality characteristics of River Pilakhar (2017-2021)
Year Monitoring location pH BOD
(mg/l)
COD
(mg/l)
DO
(mg/l)
Conductivity
(umhos/cm)
TDS
(mg/l)
2021 Bilaspur, Ramnagar, US Nagar 7.60 5.04 19.20 7.14 783.20 512.00
2020 Bilaspur, Ramnagar, US Nagar 7.60 6.82 38.44 5.62 396.22 264.89
2019 Bilaspur, Ramnagar, US Nagar 7.52 6.85 31.67 5.38 396.75 257.33
2018 Bilaspur, Ramnagar, US Nagar 7.47 8.45 35.67 5.47 408.33 254.33
2017 Bilaspur, Ramnagar, US Nagar 7.78 4.28 26.67 6.20 622.83 405.00
(Sources UKPCB, 2020)

`
50
River Kosi
Originating from the Bhakot Range near Kasauni, Kosi river is a major source of water needs in Almora
and Nainital district. It is one of the few major Himalayan rivers which do not have a glacial source. Being
a perennial river, Kosi also provides drinking water to wild animals in Jim Corbett National Park (Its
catchment lies partially in Corbett Tiger Reserve). Ramnagar town is one of the major settlement area in
the catchment of Kosi river.
The stretch of river Kosi from Sultanpur Patti to Pattikalam is identified as a polluter stretch of priority
(IV) by Central Pollution Control Board (CPCB). This region receives wastewater from paper and pulp
industries through open channels parallel to National Highway. Water Quality is being monitored in
Kashipur- Bajpur road bridge (Table 38) and is found to be consistent for the past three years (BOD levels
have been varying at a small rate).
Table 38. Water quality characteristics of River Kosi (2017-2021)
Year Monitoring location pH BOD
(mg/L)
COD
(mg/L)
DO
(mg/L)
Conductivity
(umhos/cm)
TDS
(mg/L)
2021 Bajpur Road Bridge
Kashipur, US Nagar 7.66 3.38 15.80 8.08 666.80 422.80
2020 Bajpur Road Bridge,
Kashipur, US Nagar 7.77 4.13 21.38 5.24 379.33 273.50
2019 Bajpur Road Bridge,
Kashipur, US Nagar 7.42 4.47 19.75 5.67 373.25 255.17
2018 Bajpur Road Bridge,
Kashipur, US Nagar 7.22 5.77 17.52 6.60 343.33 225.08
2017 Bajpur Road Bridge,
Kashipur, US Nagar 7.36 3.56 14.76 6.73 334.00 196.30
(Sources UKPCB, 2020)
Existing situation of Polluter Stretches in Udham Singh Nagar
The prevalent water quality in the polluted river stretches are addressed based on certain
indicators and their qualitative and quantitative analysis. The water quality has shown slight
improvement in some stretches. All the Industries, municipal drains discharging waste water have
been inventoried. Maintenance of environmental flow has become the matter of paramount
importance for the concerned authorities as almost all rivers are non-perennial (Table39).
Table 39. Current Status of polluted stretches of rivers in Udham Singh Nagar
Indicator River Polluted Stretch Remarks/Current Status
Water Quality
(from past two
years)
Bhela Kashipur to Rajpura Tanda High BOD level in Lohia Bridge
Monitoring station,Kashipur
Dhela Kashipur to Garhuwala
(Thakurdwara)
BOD level in the downstream monitoring
station(Thakurdwara) have been
significantly high.
Kichha Drains of Kiccha Gola river BOD concentration has shown slight
improvement from the past two years.
Kalyani Drains of Rudrapur BOD levels are significant in the

`
51
downstream of Pantnagar industrial area.
Huge Gap in BOD concentration is
noticeable in upstream and downstream
monitoring stations.
Nandour/Kailash Along Sitarganj BOD levels in both the monitoring
stations have shown much improvement
from the past two years
Pilkhar In the vicinity of Rudrapur BOD concentration has been consistent
(Around 5-8 mg/l)
Kosi Sultanpur to Pattikalan BOD concentration has been consistent
(Around 3-5 mg/l)
Industrial waste
water or Effluent
Bhela Kashipur to Rajpura Tanda GPIs are being monitored every quarter
with online effluent monitoring systems
provided at effluent outlet
Dhela Kashipur to Garhuwala
(Thakurdwara)
About 29490 KLD effluent is being
discharged into the river through
industrial drains.
Kichha Drains of Kiccha Gola river Significant volume of industrial waste
water is discharged from M/S Century
Pulp and Paper factory in Lalkuan
including wastewater from sugar mills.
Kalyani Drains of Rudrapur Kalyani river receives industrial waste
water from CETP (Approx.305 industrial
units connected) and ETPs from
individual units (Approx. 193).
Nandour/Kailash Along Sitarganj About 86 industrial units in ESIPL are
connected to CETP which releases the
treated waste water into the river.
Pilkhar In the vicinity of Rudrapur Effluent treatment plants particularly in
GPIs and some red category industries
discharging waste water in the river.
Kosi Sultanpur to Pattikalan An amalgamation of open channel
system and underground drain networks
carrying treated industrial waste water
meets river Kosi near Mukanpur village.
Sewage
Management
Bhela Kashipur to Rajpura Tanda Untreated sewage from Kashipur town is
discharged into the river. No STP is
available.
Dhela Kashipur to Garhuwala
(Thakurdwara)
Sewage from individual septic tanks(in
Kashipur town) is disposed in nearby
drains which ultimately joins six
municipal drains.
Kichha Drains of Kiccha Gola river Untreated sewage from Kichha town is
discharged into the river. No STP is
available.
Kalyani Drains of Rudrapur Untreated sewage from Rudrapur city is
discharged into the river. No STP is
available.
Nandour/Kailash Along Sitarganj Untreated sewage from Kichha town is
discharged into the river. No STP is
available.

`
52
Pilkhar In the vicinity of Rudrapur Untreated sewage from Bazpur town is
discharged into the river. No STP is
available.
Kosi Sultanpur to Pattikalan Untreated sewage from Sultanpur patti
town is discharged into the river. No STP
is available.
Waste
Management
Bhela Kashipur to Rajpura Tanda Unscientific disposal of waste in the river
flood plains. This may be attributed to
lack of waste processing and scientific
disposal.
Dhela Kashipur to Garhuwala
(Thakurdwara)
Kichha Drains of Kiccha Gola river
Kalyani Drains of Rudrapur
Nandour/Kailash Along Sitarganj
Pilkhar In the vicinity of Rudrapur
Kosi Sultanpur to Pattikalan
Environmental
flow
Bhela Kashipur to Rajpura Tanda As all the rivers except Kosi are non-
perennial, it has become difficult to
maintain natural flow during non-
monsoon months. Waste water from
industries is only source of flow to these
rivers during lean season.
Dhela Kashipur to Garhuwala
(Thakurdwara)
Kichha Drains of Kiccha Gola river
Kalyani Drains of Rudrapur
Nandour/Kailash Along Sitarganj
Pilkhar In the vicinity of Rudrapur
Kosi Sultanpur to Pattikalan

`
53
NON-ATTAINMENT CITY (KASHIPUR)
Noticing unprecedented levels of air pollution in the country, the government of India launched
National Clean Air Programme (NCAP) in 2019. This national level strategy aims to mitigate air
pollution across the country in a time bound manner. The main target is to achieve 20% to 30%
reduction in Particulate matter concentration by 2024 keeping 2017 as a base year for the
comparison of concentration.
This goal is primarily set for non-attainment cities, which can be defined as the cities that have
fallen short of National Ambient Air Quality Standards (NAAQS) (Table 40) for over five years.
Kashipur is one of the three towns in Uttarakhand that have been declared as non-attainment city.
This is due to that the fact that industries (primarily small scale and agriculture based) are rapidly
increasing in Kashipur and nearby areas which has led to deteriorating air quality and
overexploitation of the resources.
Table 40. National ambient air quality standards in India
Pollutant Time weighted
average
Concentration in Ambient Air
Industrial, Residential,
Rural and Other Areas
Ecologically Sensitive Area
(notified by Central
(Government)
Sulphur Dioxide (SO2), µg/m3 Annual*
24 hours**
50
80
20
80
Nitrogen Dioxide (NO2), µg/m3 Annual*
24 hours**
40
80
30
80
Particulate Matter (size less than
10 µm) or PM10 µg/m3
Annual*
24 hours**
60
100
60
100
Particulate Matter (size less than
2.5 µm) or PM2.5 µg/m3
Annual*
24 hours**
40
60
40
60
Ozone (O3) µg/m3 8 hours*
1 hour**
100
180
100
180
Lead (Pb) µg/m Annual*
24 hours**
0.50
1.0
0.50
1.0
Carbon Monoxide (CO) mg/m3 8 hours*
1 hour**
02
04
02
04
Ammonia (NH3) µg/m3 Annual*
24 hours**
100
400
100
400
Benzene (C6H6) µg/m3 Annual* 5 5
Benzo (a) Pyrene (BaP)-
particulate phase only, ng/m3
Annual* 1 1
Arsenic(As), ng/m3 Annual* 6 6
Nickel (Ni), ng/m3 Annual* 20 20
Source: National Ambient Air Quality Standards, Central Pollution Control Board Notification in the Gazette of India,
Extraordinary, New Delhi, 18th November, 2009.
* Annual arithmetic mean of minimum 104 measurements in a year at a particular site taken twice a week 24
hourly at uniform intervals.
** 24 hourly or 8 hourly or 1 hourly monitored values, as applicable, shall be complied with 98% of the time,
they may exceed the limits but not on two consecutive days of monitoring.

`
54
Identified sources of Air pollution in Kashipur
Industrial units which are mostly located in Kashipur-Thakurdwara road are one of the sources of
air pollution in Kashipur and its nearby areas. Apart from this, vehicular pollution, agriculture
residue burning, open burning of solid waste, construction activities, road dust etc. are other
potential sources of air pollution in the city (Table 41).
Table 41. Air Pollution in Kashipur District
Sources of Air Pollution Remarks Current Status/Proposed
Action
Industrial Activities Pulp and Paper, Distillery and
Chemical Industries are
prominent in the city.
More than 600 industrial units
are functional in the area
which includes agriculture
based industries, Cottage
industries etc.
Routine monitoring and
assessment of industrial
emissions is done by CPCB
and UKPCB.
Industries are major
contributors to the high level
of PM10 levels in the region.
Vehicular Pollution Three vehicle pollution
emission checking centres are
currently operational in
Kashipur.
More than 800 diesel operated
commercial vehicles are 15
years old and number is
expected to increase by 1221
in coming 5 years.
Challans are issued in
violation of vehicles not
having PUCs
Vehicle PUC centre are
proposed to be increased by
06 which will lead to rise in
vehicle surveillance by 10%
every year.
Agriculture Residue/Stubble burning From approximately 14000
hectare of farming land for
rice crop in Kashipur, nearly
13833 MT of agriculture
residue is generated.
A pilot project has been
proposed by agriculture
department to convert residue
in to fire briquettes for further
use as a fuel in industries.
Other sources include burning of domestic fuel, open burning of solid waste ,construction activities and
transportation of construction materials,
Status of Annual Ambient Air Quality in Kashipur
Air quality stations have been installed in different locations of Kashipur to ascertain the air
quality around the city (Table 42). Two monitoring locations have been installed lately in Anaj
mandi and Ganna Ayukt area of the town. The annual air quality levels (for particulate matter) of
the monitoring station located in Government hospital Kashipur have been exceeding the
prescribed standards from past five years (Table 43).

`
55
Table 42. Air Quality monitoring in Kashipur
Action Area Outcomes
Number of manual air quality
monitoring stations in the district
Three Permanent air quality monitoring stations located at the
Kashipur.
1. Government Hospital (Kashipur)
2. Anaj Mandi (Kashipur)
3. Ganna Ayukt (Kashipur)
(Monitoring stations in Anaj Mandi and Ganna ayukt have
been setup in 2021).
Number of automatic air quality
monitoring stations in the district
Not initiated
Ambient Air Quality Index
Availability of air quality monitoring
data
Air quality data is regularly updated in the website of
Uttarakhand State Pollution Control Board (UKPCB).
Table 43. Air quality Data
Year Udham Singh Nagar
Govt. Hospital, Kashipur
PM10(μg/ m3) SPM2.5 (μg/m3) SO2 (μg/m3) NO2 (μg/m3)
2021 121.40 206.18 18.54 22.89
2020 117.30 194.31 12.07 18.06
2019 126.19 220.13 13.18 22.60
2018 105.81 211.86 -- --
2017 115.47 -- -- --
Prescribed Standards 60 20 60

`
56
WASTE WATER MANAGEMENT AND SEWAGE TREATMENT
PLANT
Domestic sewage is such a waste water that is produced by a community within a certain locality.
It is characterized by a certain volume of flow and physical condition, along with chemical and
toxic constituents and its bacteriologic properties. Around 80% of water supply flows back into
the ecosystem as wastewater which can be a critical to landscape and other environmental
components (Denchak, 2018) Also, health hazard could be other issue in case it could not be
treated properly.
According to a report of the Central Pollution Control Board (2015), India has the capacity to treat
approximately 37% of its wastewater. In other words, this comes about 22,963 million litres per
day (MLD), against a daily sewage generation of approximately 61,754 MLD. Moreover, most of
the sewage treatment plants do not function at their optimum capacity and do not conform to the
standards as prescribed (Table 44).
Sewerage system with individual household latrines connecting with pipelines comes only 31.7%
of the total urban households. More than half of the urban population in the State relies on on-site
sanitation (OSS) systems like septic tanks. Septic tanks cover 53.1%of the total sludge for the
collection of faecal sludge and wastewater. Further, some individual households in the state
discharge the waste from their toilets directly into open drains.
Table 44. Current scenario related to STPs (MLD) in Uttarakhand
Number of STPs Installed in
Uttarakhand
71
Total Sewage Generation 627
Installed Capacity 448.18
Operational Treatment Capacity 345
Actual Utilization 187 (42% of installed capacity, 54% of Operational capacity)
80 % of the state’s total sewage treatment plant capacity caters to Dehradun, Rishikesh, and, Haridwar
(Plain areas). (Source: ENVIS Centre on Hygiene, sanitation, sewage treatment systems, and technology)
Sewage treatment in U.S. Nagar District
Treatment of waste water through STP is currently not practiced in the district. Domestic
households and Commercial establishment have their own Septic tank and most of them are
discharged in local drains. However, an outlay has been prepared and work has been commenced
on Interception and diversion works of major drains in the district. These drains will be tapped
and then connected to the proposed/under construction STPs in the district (Table 45).

`
57
Table 45. Current scenario related to STPs in the US Nagar
Number of towns with Sewage
Treatment Plant in the district
Currently, no town has operational Sewage treatment Plant in
the district
*Proposed/Under Construction
STPs in the district
01 No. in Kashipur Septage (18 MLD)
01 No. in Kashipur Bailjudi (500 KLD)
01 No. in Kashipur Gulariya (300 KLD)
01 No. in Dhobighat Gabiya (10 MLD)
01 No. in Jaspur Khurd (01 MLD)
01 No. in Hempur Ismail (02 MLD)
01 No. in Mukundpur (500 KLD)
01 No. in Rudrapur (FSTP) 125 KLD.
01 No. Near Bajpur (10 MLD).
01 No. Kiccha (3 MLD).
01 No. Sitarganj (3 MLD).
*Apart from these, seven more STPs have been proposed under Namami Gange Mission.
Sewage management in U.S. Nagar district
Sewerage network has been proposed for two towns of U.S. Nagar district (Kashipur and
Rudrapur). Coverage is subjected to field based study (Table 46). Scientific management of waste
water is desired for each ULB in near future (Table 47).
Table 46. Current standpoint regarding sewage management in the district
Parameter Remarks
Estimated Households to be connected with
FSTP or STP
ULB Estimated Coverage
Kashipur 12 wards out of total 40 wards
Rudrapur Approx. 100% coverage as co-treatment is
proposed as a pilot project for Rudrapur
Policy regarding decentralized wastewater
management(FSSM)
As per Uttarakhand Sewage Protocol policy
Gap in current waste water management Provision of STP/FSTP in each ULB of district for scientific
wastewater management.
Liquid waste management in rural areas
Since the water supply for domestic purposed in rural areas has improved considerably over
we4astewater management systems need to be introduced in the rural areas to mitigate the
problem of contamination in the majority of rural areas, untreated wastewater is discharged
directly into the local surroundings and water bodies. This leads to contamination of surface as
well as sub-surface water, having negative effects on the environment and human health.

`
58
Current standpoint about Rural Waste Water Management in India
Table 47. Policies Undertaken for Waste Water Management in Rural India
Current Policy Sponsoring agency Remarks
Construction and Usage
of IHHLs (Individual
Household Latrines)
Under Swachh Bharat
Mission- Gramin (SBM-G)
There are various models of toilets available
based on safe sanitation technologies like
Twin pit, Septic tank, Bio toilets etc.
Availability of Sanitation
Material through Rural
Sanitary marts (RSM),
Self-help groups (SHGs)
Under Swachh Bharat
Mission- Gramin (SBM-G)
To provide material, services and guidance
needed for constructing different types of
latrines and other sanitary facilities for clean
environment,
Community Sanitary
Complex (CSCs)
Under Swachh Bharat
Mission- Gramin (SBM-G)
Such complexes comprise of appropriated
number of toilet seats,bathing cubicles
etc.(Only where there is lack of space in the
village for construction of household toilets).
Financial Assistance Under Swachh Bharat
Mission- Gramin (SBM-G)
Up to Rs.12000 is provided to BPL (below
poverty line) households and identified APL
(Above poverty line) households for
construction of one unit of IHHL.
It is not the cost of the toilet but an incentive
amount.
Mensural Health
Management
Under Swachh Bharat
Mission- Gramin (SBM-G)
It is aimed at making behavioural change in
woman and adolescence girls using a clean
menstrual management material to absorb or
collect blood that can be changed in privacy
as often as necessary for the duration of the
menstruation period, and having access to
facilities to dispose of used menstrual
management materials.
With Population growth and rapid industrialization, wastewater management has become a
serious issue. Rural India with old or no infrastructure has reached a tipping point.
India has the highest number of people who don’t have access to clean drinking water. Even
abundance of water in certain places do not guarantee access to safe, reliable, drinking water.
United Nations Sustainable Development goal 6 focuses on access to clean water and sanitation
for all. The goal of the initiative is to sensitize communities to the advantages of hygiene and
sanitation.

`
59
INDUSTRIAL WASTE WATER MANAGEMENT (ETP/CETP)
Effluent Treatment Plant (ETP) is a process design for treating the industrial wastewater for its
reuse or safe disposal into the land. The effluent treatment plants are used for the removal of high
amount of organic compounds, debris, dirt, grit, pollution, toxic, non-toxic materials and
polymers, etc. from industrial effluent. The ETP plants use evaporation and drying methods, and
other auxiliary techniques such as centrifuging, filtration, incineration for chemical processing and
effluent treatment.
Effluent is generated in many manufacturing industries like textile, pharmaceuticals and
chemicals, tanneries, etc. Contaminated water cannot be released without treatment as it contains
toxic and non-toxic chemicals. Releasing it may cause contamination of the existing pure water
and will affect adversely the environment. As a result, ETP’s are installed in manufacturing
industries.
So far, industrial policy is focused mainly on sustained growth in productivity, optimal utilisation
of human capital and flexibility in adjusting to markets.
Common Effluent Treatment Plant
The concept of common effluent treatment plant has been accepted as a solution for collecting,
conveying, treating and disposing of the effluents from the industrial states. The CETP concept
helps small and medium scale industries to dispose of their effluents which otherwise may not be
so economic to them in disposing of as a single unit. Therefore, CETP is an option which not only
protects environment but also divides the investment and operational cost.
CETP can be changed to combined effluent treatment plant when it collects sewage from
surrounding localities and treat it with industrial wastewaters. The advantages of such systems
are:
Dilution of toxic constituents and dissolved inorganic solids from the industrial wastewaters.
Better control over the process due to continuous seeding of microorganisms from sewage.
Sewage provides sufficient nutrients (N, P).
Reduced operating cost in the form of adding chemicals.
CETPs in Uttarakhand
Currently, three CETPs are operational in the state, primarily in SIDCUL which connects more
than 900 different industrial units in different cities in Uttarakhand (Table 48).

`
60
Table 48. State Scenario of CETPs
Total CETPs in Uttarakhand (3)
IIE SIDCUL, Pantnagar
CETP Sitarganj
SIDCUL Haridwar
Total Design Capacity (MLD) 13
Members Units (Industrial Units) 920 (Source: ENVIS Centre on Hygiene, sanitation, sewage treatment systems and technology)
Industrial Waste water in Udham Singh Nagar
Two CETPs are currently operational in Udham Singh Nagar district in IIE SIDCUL, Pantnagar
and Sitarganj. About 400 industries are connected with the CETPs (Table 49). All the industries
are meeting standards for effluent discharged in the rivers (Table 50). Effluent discharged
standards are being adhered as per the data for the months of October’21 and December’21(Table
51).
Table 49. Inventory of Industries and waste water generation in US Nagar district
S. No. Parameter Present Status
1. Prominent Industries in US Nagar 1. Pulp & paper
2. Sugar & Distilleries
3. Chemical units
4. Automobile Assembling
5. Pharmaceuticals
6. Food processing unit
2. Number of industries discharging
waste water
257
3. Total quantity of industrial wastewater
generated (MLD)
40
4. Quantity of treated waste water
discharged into water bodies (MLD)
30
5. Quantity of un-treated or partially
treated Industrial waste water
discharge into lakes
NIL (Many industries operate on zero liquid
discharge)
6. Number of Common Effluent
Treatment Plant facilities (CETP)
02
7. Common Effluent
Treatment Plant
facilities
Name of CETP Member units
connected (members)
Type of
Industries
Designed
capacity (MLD)
IIE SIDCUL,
CETP, Pant Nagar 309 Mixed 4.0
CETP, Sitarganj 97 Mixed 3.8

`
61
Table 50. Status of compliance by Industries
S. No. Action Areas Outcomes
2. Number of industries not meeting standards NIL
3. Number of complaints received against industrial
pollution in last 3 months
No complaints received in last three
months regarding breeching of industrial
norms.
Current Status Regarding Effluent Treatment Plant in US Nagar District
Table 51. Monthly Report of CETP Outlet at SIDCUL Rudrapur and Sitarganj
Sampling location Month pH BOD (mg/l) COD (mg/l) TSS
(mg/l)
Common Effluent Treatment
(CETP) outlet, SIDCUL, Rudrapur
Oct-21 7.45 21.8 145 23
Dec-21 6.93 28 180 66
Common Effluent Treatment
(CETP) outlet, SIDCUL, Sitarganj
Oct-21 7.56 24 158 26
Dec-21 6.96 26 220 78
Prescribed standards 6.5-8.5 30 250 100
Table 52. Proposed policies and desired level of compliance as per different stakeholders
Strategy/Policy Purpose
Proposed CETP for Pant Nagar Industrial area To cater the growing need of safe effluent disposal
from the industrial estate.
Implementation of maximisation water recycling
extent in the grossly effluent generating units such
as paper mills, sugar mills and distillery.
To achieve Zero liquid discharge and minimization
of pollution load into surface water
streams/rivers/drains.
Enforcement in major polluting units to upgrade
augmentation/modification in manufacturing
process and effluent treatment plants.
To minimize the water consumption extent
To improve the quality of treated water for
maximum recycling in the process.
Major Industrial cluster is Integrated Industrial Estate (IEE), SIDCUL (State Industrial
Development Corporation of Uttarakhand limited), US Nagar which is well connected with
Common Effluent Treatment System (CETP) and equipped with online continuous effluent
monitoring system (OCEMS).
Uttarakhand State Pollution Control Board is doing regular Monitoring /Sampling.
Pollution load in surface water streams/rivers/drains especially in Nakti Nala, has been a
matter of concern.
Grossly Polluting Units (GPI’s) have their own treatment facility (In-house effluent treatment
plant) and are also connected with OCEMS (online continuous effluent monitoring system)

`
62
INDUSTRIAL CLUSTERS
A cluster is a geographically proximate group of interconnected companies and associated
institutions in a particular field, that share common markets, technologies, worker’s skill needs
and which are often linked by buyer-seller relationships. Industries are growing at common
centres/estates/parks as the resources, man power, transportation, marketing are feasible.
Generally, medium and small-scale industries are developed at such areas and form Industrial
clusters. Industrial clusters are increasingly recognized as an effective means of industrial
development and promotion of small and medium-sized enterprises. Due to lack of awareness and
ignorance of waste management technologies, environmental pollution has been proliferated to
surrounding environment. Therefore, such industrial areas have to be assessed for improving the
quality of the environment.
The Ministry of Environment, Forest and Climate Change (MoEFCC) has developed the criteria
for categorization of industrial sectors based on the Pollution Index, which is a function of
the emissions (air pollutants), effluents (water pollutants), hazardous waste generated and
consumption of resources (Table 53).
Moreover, Central pollution control board (CPCB) developed Comprehensive Environment
Pollution index (CEPI) to find out the index value to characterise quality of the environment.
Monitoring is carried out by CPCB through recognized environmental laboratory periodically and
CEPI is assessed based on the recorded monitoring data (Table 54). The evaluated CEPI reflects
the environmental quality of the industrial areas and serve as a standard to assess the progress
achieved in the implementation of action plans. Table 55describes number of industries in
Haridwar district based on pollution index.
Table 53. Based on pollution Index (Categorization of Industries Based on Range Indices)
Pollution Index of industrial Sectors Category
60 and above Red
Between 41 and 59 Orange
Between 21 and 40 Green
Up to 20 *White *A new category of white industries, which is practically non-polluting, does not require Environmental Clearance (EC) and Consent and will help
in getting finance from lending institutions.

`
63
Table 54. Based on CEPI Score
CEPI Score Category
Exceeding 70 Industrial cluster is treated as critically polluted
Between 60-70 Industrial cluster is treated as severally polluted
Table 55. Inventory of industries in Rudrapur, Udham Singh Nagar
Industrial-scale/category Red Orange Green Total
Small Scale 25 65 97 187
Medium Scale 10 29 24 63
Large Scale 33 64 40 137
Total Industries 68 158 161 387
Table 56. Existing Status of Industrial Areas in the District U.S Nagar
Name of Industrial area Land developed (in hectare) No. of Units in
Production
IIE SIDCUL Pant Nagar 3339 465
SIDCUL Sitarganj 1099.43 284
Bio-Tech Park Pantnagar 100.00 12
Air and Water Quality Monitoring in Industrial Areas of US Nagar
Air and Water quality parameters are monitored to check the pollution levels in the Industrial
areas of the US Nagar. Yearly data for air pollution is recorded for the past 5 years (Table59) and
half-yearly data of groundwater quality is recorded for the year 2020 and 2021. PM10value depicts
air quality as satisfactory to moderately poor. Groundwater parameters are within permissible
limits (Table 60& 61).
Table 57. Air quality monitoring in the Industrial area of US Nagar
Year Industrial area of Udham Singh Nagar
Industrial area, Kashipur Industrial area, Rudrapur
PM10 (μg/m3) SO2 (μg/m3) NO2
(μg/m3)
PM10 (μg/m3) SO2
(μg/m3)
NO2
(μg/m3)
2021 118.13 18.54 22.89 126.50 19.43 22.94
2020 116.94 12.07 18.06 114.42 11.84 17.86
2019 126.19 13.18 22.60 129.13 13.61 22.66
2018 105.81 -- -- 119.08 -- --
2017 116.49 -- -- 133.15 -- --
Standards
(Annual)
60 50 40 60 50 40

`
64
Table 58. Ground water quality monitoring is performed at selected areas of US Nagar (Data
April 2021)
Par
amet
er
Nea
r G
ov
t. P
rim
ary,
Kas
hip
ur
Nea
r C
hat
ti C
hau
rah,
Baz
pu
r ro
ad K
ash
ipu
r
Gly
col
Ind
ia L
td. K
ash
ipu
r
Nea
r K
VS
Baz
pu
r R
oad
Kas
hip
ur
Gu
rud
war
a M
ura
dab
ad
Ro
ad,
Kas
hip
ur
Sit
arg
anj
Indu
stri
al a
rea-
1
Kas
hip
ur
Sit
arg
anj
Indu
stri
al a
rea-
2
Kas
hip
ur
Pan
tnag
ar I
ndu
stri
al a
rea-
1
Pan
tnag
ar I
ndu
stri
al a
rea-
2
Kas
hip
ur
San
tipu
ri,
Kic
hh
a -1
San
tipu
ri,
Kic
hh
a -1
Acc
epta
ble
Lim
its
(As
per
IS:1
05
00
-20
12
Per
mis
sib
le L
imit
s (A
s p
er
IS:1
05
00
-20
12
pH 7.4 Dry 8.0 7.7 7.5 7.2 7.1 7.7 7.6 7.5 7.3 6.5-8.5 No
Relaxation
Total dissolved Solids
(mg/l)
215 Dry 128 188 220 208 169 191 137 184 500 2000
Chloride (mg/l) 13 Dry 19 14 30 30 28 20 19 15 23 250 1000
Magnesium Mg (mg/l) 40 Dry 60 45 203 82 80 63 64 64 74 30 100
Calcium Ca (mg/l) 148 Dry 91 65 42 124 135 111 92 131 99 1 1.5
Conductivity (uS/cm) 354 Dry 228 294 400 547 529 278 293 326 276 NA NA
Total Hardness (mg/l) 198 Dry 177 135 - 185 189 194 160 185 197 200 600
Alkalinity as CaCo3
(mg/l)
- Dry 156 158 131 208 212 144 168 183 214 200 500
Table 59. Ground water quality monitoring is performed at selected areas of US Nagar (April
2020)
Par
amet
er
Nea
r G
ov
t. P
rim
ary,
Kas
hip
ur
Nea
r C
hat
ti C
hau
rah,
Baz
pu
r ro
ad K
ash
ipu
r
Gly
col
Ind
ia L
td. K
ash
ipu
r
Nea
r K
VS
Baz
pu
r R
oad
Kas
hip
ur
Gu
rud
war
a M
ura
dab
ad
Ro
ad,
Kas
hip
ur
Sit
arg
anj
Indu
stri
al a
rea-
1
Kas
hip
ur
Sit
arg
anj
Indu
stri
al a
rea-
2
Kas
hip
ur
Pan
tnag
ar I
ndu
stri
al a
rea-
1
Pan
tnag
ar I
ndu
stri
al a
rea-
2
Kas
hip
ur
San
tipu
ri,
Kic
hh
a -1
San
tipu
ri,
Kic
hh
a -1
Acc
epta
ble
Lim
its
(As
per
IS:1
05
00
-20
12
Per
mis
sib
le L
imit
s (A
s p
er
IS:1
05
00
-20
12
pH 7.6 Dry 8.0 7.8 7.8 Dry 7.4 7.5 NA 7.9 7.8 6.5-8.5 No
Relaxatio
n
Total dissolved Solids
(mg/l)
215 Dry 190 275 Dry 368 226 NA 230 204 500 2000
Chloride (mg/l) 14 Dry 18 12 28 Dry 26 16 NA 16 24 250 1000
Magnesium Mg (mg/l) 38 Dry 63 48 216 Dry 79 54 NA 60 77 30 100
Calcium Ca (mg/l) 155 Dry 94 67 44 Dry 139 96 NA 118 100 1 1.5
Conductivity (uS/cm) 374 Dry 258 304 410 Dry 549 303 NA 312 296 NA NA
Hardness (mg/l) 193 Dry 157 115 260 Dry 216 150 NA 178 177 200 600
Alkalinity as CaCo3
(mg/l)
148 Dry 176 160 128 Dry 219 156 NA 172 200 200 500
Integrated Industrial Area Pantnagar, Rudrapur, Udham Singh Nagar
IIA Pantnagar, Rudrapur is the largest Integrated Industrial Estates owned by SIDCUL,
Government of Uttarakhand. It is one of the major Automobile hubs of the country having brand

`
65
presence of Bajaj Auto Limited, Ashok Leyland etc. Table 60 represents different scale of
industries in IIA Rudrapur which are further classified into categories based on pollution load.
Table 60. Classification of different scale of Industries in IIA Rudrapur
Industrial Scale/Category Green Orange Red
Small Scale 97 65 25
Medium Scale 24 29 10
Large Scale 40 64 33
Total Industries 161 158 68
Sources of Pollution in IIA Pantnagar, Rudrapur
Industrial units mainly Ply wood manufacturing units and corn processing units have been
identified as the major source of pollution in the industrial area. Moreover, domestic sewage is
also one of major component of surface water pollution. Based on the CEPI score monitoring
conducted by Uttarakhand State Pollution Control Board in the month of December 2019, it was
observed that the CEPI score of IIA Rudrapur was 77.7 (Table 61).
Table 61. Details of CEPI score of Polluted Industrial Area, IIA Rudrapur
Name of Industrial
Area
Environmental
parameters
Criterial Pollutants EPI score CEPI score
IIA Rudrapur Air PM10, PM2.5,CO 29.50
77.7 Water Phenol,T,Phos,TKN 76.25
Land T. Hard, Fe,Mn 21.00

`
66
GROUND WATER EXTRACTION/CONTAMINATION AND RE-
CHARGE
Groundwater is found underground in the cracks and spaces in soil, sand, and rock. Over 70% of
the earth's surface is covered in water but of that water, just 1% is readily available for human use,
out of which, 99% is stored beneath our feet as groundwater (The Groundwater Foundation,
2021).
Groundwater extraction
Over 80-85% of our country’s population depends on groundwater for drinking water.
Groundwater is also one of our most important sources of water for irrigation. Due to overuse and
leverage of high amount of groundwater water table decreasing with a rapid rate and it will very
harmful for the mankind
Groundwater contamination
Groundwater contamination occurs when man-made products (such as gasoline, oil, road, salts,
and chemicals) get into the groundwater and makes it unsafe and unfit for any kind of use for
humans and as well as other animals (The Groundwater Foundation, 2021). Unfortunately,
groundwater is susceptible to pollutants. Hazardous materials from the land surface can move
through the soil and end up in the groundwater. For example, pesticides and fertilizers can find
their way into groundwater supplies over time. Also, groundwater is contaminated by the
untreated waste from septic tanks and toxic chemicals from underground storage tanks and leaky
landfills.
Groundwater Recharge
Groundwater recharge is a hydrologic process, when water (rain, snow-melt etc.) moves
downward from surface to groundwater. Mostly groundwater recharged by naturally but due to
high amount of groundwater extraction, the water table is falling down day by day. Saving
groundwater is very important for mankind as it is the major sources of drinking water and
agricultural irrigation water (The Groundwater Foundation, 2021). A comparison of depth to
water level of August 2019 with decadal mean of august (2009-2018) indicates that there is
decline of more than 4m in the groundwater level in the state of Uttarakhand (CGWB,2019-20).
Therefore, some artificial methods (Rainwater harvesting, Injection wells) are applied nowadays
to save groundwater.

`
67
Table 62. Water Resources in the District
S. No. Water Resource Number Name and Length/Area in the
District
Rivers
Perennial Non-
perenni
al
Total Name Length (km)
(Approx.)
Feeka 20
Dhella 23
Kosi 12
Lewda 16
02
12
14
Nihal 22.5
Bhakda 24.5
Khajiya 23.5
Gola 22.5
Parveen 49
Kaman 13.7
Nihaee 8.7
Deviha 40
Kailash 32
Shukhi 21
Table 63. Pollution control in Water Resources
S. No. Parameter Current Status
1. Open Defecation in River/Nala/Khad Partially controlled
2. Dumping of Solid waste on River Banks Partially controlled
3. Control Measures for idol immersion No measures taken
4. Number of Nalas/Drains meeting Rivers 38 Drains (drains meeting 07 polluter river stretches
5. Number of directions given to Industries
for discharge of untreated industrial
wastewater in past on year
12 (Directions issued under relevant section of the
Water act, 1974)
6. Estimated number of bore-wells/hand
pumps
420 government tube wells(all are operational)
7. Groundwater polluted area in the district None
8. Monitoring of Action Plans for
rejuvenation of rivers
Monitored
9. Adequacy of groundwater availability Adequate
Table 64. Groundwater availability in the district
Assessment unit name Total Annual groundwater Recharge
(ham)
Stage of Groundwater
Extraction (%age)
Categorization
Jaspur 7039.76 80.54 Semi–Critical
Kashipur 8755.30 87.09 Semi–Critical
Bazpur 13164.14 79.70 Safe

`
68
Table 65. Half-yearly groundwater monitoring (at 11 monitoring stations) (April 2021)
Par
amet
er
Nea
r G
ov
t. P
rim
ary,
Kas
hip
ur
Nea
r C
hat
ti C
hau
rah,
Baz
pu
r
road
Kas
hip
ur
Gly
col
Ind
ia L
td. K
ash
ipu
r
Nea
r K
VS
Baz
pu
r R
oad
Kas
hip
ur
Gu
rud
war
a M
ura
dab
ad R
oad
,
Kas
hip
ur
Sit
arg
anj
Indu
stri
al a
rea-
1
Kas
hip
ur
Sit
arg
anj
Indu
stri
al a
rea-
2
Kas
hip
ur
Pan
tnag
ar I
ndu
stri
al a
rea-
1
Pan
tnag
ar I
ndu
stri
al a
rea-
2
Kas
hip
ur
San
tipu
ri,
Kic
hh
a -1
San
tipu
ri,
Kic
hh
a -1
Acc
epta
ble
Lim
its
(As
per
IS:1
05
00
-20
12
Per
mis
sib
le L
imit
s (A
s p
er
IS:1
05
00
-20
12
pH 7.4 Dry 8.0 7.7 7.5 7.2 7.1 7.7 7.6 7.5 7.3 6.5-8.5 No
Relaxatio
n
Total dissolved Solids
(mg/l)
215 Dry 128 188 220 208 169 191 137 184 500 2000
Chloride (mg/l) 13 Dry 19 14 30 30 28 20 19 15 23 250 1000
Magnesium Mg (mg/l) 40 Dry 60 45 203 82 80 63 64 64 74 30 100
Calcium Ca (mg/l) 148 Dry 91 65 42 124 135 111 92 131 99 1 1.5
Conductivity (uS/cm) 354 Dry 228 294 400 547 529 278 293 326 276 NA NA
Total Hardness (mg/l) 198 Dry 177 135 - 185 189 194 160 185 197 200 600
Alkalinity as CaCo3
(mg/l)
- Dry 156 158 131 208 212 144 168 183 214 200 500
Table 66. Half yearly ground water monitoring (at 11 monitoring stations) (April 2020)
Par
amet
er
Nea
r G
ov
t. P
rim
ary,
Kas
hip
ur
Nea
r C
hat
ti C
hau
rah,
Baz
pu
r
road
Kas
hip
ur
Gly
col
Ind
ia L
td. K
ash
ipu
r
Nea
r K
VS
Baz
pu
r R
oad
Kas
hip
ur
Gu
rud
war
a M
ura
dab
ad R
oad
,
Kas
hip
ur
Sit
arg
anj
Indu
stri
al a
rea-
1
Kas
hip
ur
Sit
arg
anj
Indu
stri
al a
rea-
2
Kas
hip
ur
Pan
tnag
ar I
ndu
stri
al a
rea-
1
Pan
tnag
ar I
ndu
stri
al a
rea-
2
Kas
hip
ur
San
tipu
ri,
Kic
hh
a -1
San
tipu
ri,
Kic
hh
a -1
Acc
epta
ble
Lim
its
(As
per
IS:1
05
00
-20
12
Per
mis
sib
le L
imit
s (A
s p
er
IS:1
05
00
-20
12
pH 7.6 Dry 8.0 7.8 7.8 Dry 7.4 7.5 NA 7.9 7.8 6.5-
8.5
No
Relaxation
Total dissolved Solids
(mg/l)
215 Dry 190 275 Dry 368 226 NA 230 204 500 2000
Chloride (mg/l) 14 Dry 18 12 28 Dry 26 16 NA 16 24 250 1000
Magnesium Mg (mg/l) 38 Dry 63 48 216 Dry 79 54 NA 60 77 30 100
Calcium Ca (mg/l) 155 Dry 94 67 44 Dry 139 96 NA 118 100 1 1.5
Conductivity (uS/cm) 374 Dry 258 304 410 Dry 549 303 NA 312 296 NA NA
Hardness (mg/l) 193 Dry 157 115 260 Dry 216 150 NA 178 177 200 600
Alkalinity as CaCo3 (mg/l) 148 Dry 176 160 128 Dry 219 156 NA 172 200 200 500

`
69
Current standpoint regarding Water Resources Management and
Groundwater Quality in US Nagar district
Artificial Recharge Potential of US Nagar District
Uttarakhand state has a very prominent drainage system varying from first to fifth order with main
drainage patterns being dendritic, trellis and rectangular. Major part of the hilly areas has a slope
of more than 20% (A slope of the magnitude of this order makes the area unsuitable for
groundwater development due to low groundwater potential). Ground water mainly occurs under
unconfined conditions and the water table follows the topography. The entire area falling in the
foot hills of the Himalayas i.e. Bhabar areas and the intermountain Doon gravel areas have been
considered as areas suitable for ground water augmentation through artificial recharge. Udham
Singh Nagar (US Nagar) has, by and large, plain topography with very shallow water levels,
hence roof top rainwater harvesting is the only feasible option available in this area.
Table 67. Artificial recharge of groundwater in US Nagar
District Area
(km2)
Area identified for
AR (Artificial
recharge) (km2)
Volume of
unsaturated
zone (MCM)
Available sub-
surface space
for AR (MCM)
Water required
for artificial
recharge
(MCM)
Surplus
available
for recharge
(MCM)
US Nagar 3055 764 1528 229 305.00 1911
Present state of affairs
Ground water quality monitoring under National Water Resources Monitoring Programme (NWMP) is
being carried by Uttarkhand Pollution Control Board (UKPCB) at 11 locations
Random Checking of groundwater quality at probable contaminated locations is also done by UKPCB.
Moreover, monitoring at two new locations at upstream and downstream of Polluted River Stretches are
also carried out at half yearly basis.
Central groundwater Water Board (CGWB) exercises assessment and computation of groundwater
resources once in every three years in consultation with State government departments. Beside this, CGWB
conducts awareness programs in several areas to solve local groundwater problems and discuss methods of
groundwater conservation through participatory approach.
Rain water harvesting techniques are encouraged in various industries of the district.

`
70
Table 68. Artificial recharge structures constructed in US Nagar under CACMP (Catchment area
conservation programme)
District Number of Structures Total Cost (in lakhs) Total
Cost
(In
lakhs) CD CK RTRWH PT CT CD CK RTRWH PT CT
US Nagar NA NA NA NA NA NA NA NA NA NA NA
CT-Contour Trench, CK –Chal Khal, RTRWH -Rooftop Rain Water Harvesting, CD- Check Dam, PT-Percolation Tank, NA-Not Available
Table 69. Proposed artificial recharge structures with cost estimate
District
Name
Structures proposed Unit cost Estimate ( in lakhs ) Total cost ( in lakhs ) Total
cost
(in
lakhs) RTRWH CD PT CK CT RTRWH CD PT CK CT RTRWH CD PT CK CT
US Nagar 700 50 0 0 0 0.5 0.3 0.07 0.15 0.015 350 15 0 0 0 365
CT-Contour Trench, CK –Chal Khal, RTRWH -Rooftop Rain Water Harvesting, CD- Check Dam, PT-Percolation Tank, NA-Not Available

`
71
AIR AND NOISE POLLUTION MANAGEMENT
Air Pollution Management
The ambient air that is the atmospheric air in its natural form consists of nearly 99.9% of
Nitrogen, Oxygen, Water vapors, Carbon dioxide, and some other gases like helium, argon,
methane, argon, etc. surrounds the earth and forms its atmosphere. Any undesirable change in the
composition of ambient air is called air pollution. The undesirable substances can be in solid,
liquid, and gaseous forms and when present in sufficient concentration for a sufficient time under
certain conditions can endanger human health and welfare of plants and animals. According to
state of Global Air report 2020, Air pollution has now become the biggest health risk in India.
Most of the cities in our country (majority of them are from the region of Indo-Gangetic plains)
are facing the problem of air pollution which has led to increase in cases of breathing discomfort
and other related diseases. To tackle the problem of air pollution in our cities, Government of
India has taken many steps, one of them being National Clean Air Programme (NCAP, 2019).
Under this Programme, 122 cities in the country are identified as non-attainment cities which
include three cities from the Uttarakhand (Dehradun, Rishikesh and Kashipur). These are the
cities that have fallen short of the National Ambient Air Quality Standards (NAAQS) for over five
years. Goal ofNational Clean Air Program (NCAP) is to meet the prescribed annual average
ambient air quality standards at all locations in the country in a stipulated timeframe. The tentative
national level target of 20% to 30% reduction of PM2.5 and PM10 concentration by 2024 is
proposed under the NCAP taking 2017 as the base year for the comparison of concentration. The
ambient air quality standards as set by Central Pollution Control Board are mentioned in Table 70.
Table 70. National ambient air quality standards in India
Pollutant Time weighted
average
Concentration in Ambient Air
Industrial, Residential,
Rural and Other Areas
Ecologically Sensitive Area
(notified by Central
(Government)
Sulphur Dioxide (SO2), µg/m3 Annual*
24 hours**
50
80
20
80
Nitrogen Dioxide (NO2), µg/m3 Annual*
24 hours**
40
80
30
80
Particulate Matter (size less than
10 µm) or PM10 µg/m3
Annual*
24 hours**
60
100
60
100
Particulate Matter (size less than
2.5 µm) or PM2.5 µg/m3
Annual*
24 hours**
40
60
40
60
Ozone (O3) µg/m3 8 hours*
1 hour**
100
180
100
180
Lead (Pb) µg/m Annual*
24 hours**
0.50
1.0
0.50
1.0
Carbon Monoxide (CO) mg/m3 8 hours* 02 02

`
72
1 hour** 04 04
Ammonia (NH3) µg/m3 Annual*
24 hours**
100
400
100
400
Benzene (C6H6) µg/m3 Annual* 5 5
Benzo (a) Pyrene (BaP)-
particulate phase only, ng/m3
Annual* 1 1
Arsenic(As), ng/m3 Annual* 6 6
Nickel (Ni), ng/m3 Annual* 20 20
Source: National Ambient Air Quality Standards, Central Pollution Control Board Notification in the Gazette of India,
Extraordinary, New Delhi, 18th November, 2009.
* Annual arithmetic mean of minimum 104 measurements in a year at a particular site taken twice a week 24
hourly at uniform intervals.
** 24 hourly or 8 hourly or 1 hourly monitored values, as applicable, shall be complied with 98% of the time,
they may exceed the limits but not on two consecutive days of monitoring.
Current scenario of air pollution in Udham Singh Nagar
Permanent air quality stations at different locations (some of them in sensitive zone) have been
installed in Kashipur and Rudrapur cities of the district. Infact, these cities are the major industrial
hubs of Uttarakhand (Table 71). Apart from industries, vehicular pollution, stubble burning, road
dust etc. are the other major causes of air pollution in the district (Table72).
Action plan has been formulated for the only non-attainment city i.e. Kashipur by State Pollution
Control Board. (Table73). The main focus of the state pollution control board has been to monitor
the air quality levels in the industrial areas of the district primarily in Kashipur and Rudrapur.
Table 71. Air quality monitoring and data accessibility
Action Area Outcomes
Number of operational manual air quality
monitoring stations in the district
Four (Permanent air quality monitoring stations) are
operational in the district at following locations:
1. Government Hospital, Kashipur
2. Anaj Mandi, Kashipur
3. Ganna Ayukt, Kashipur
4. Government Hospital,Rudrapur
Number of automatic air quality monitoring
stations in the district
Zero (Presently not installed)
Ambient Air Quality Index Moderate
Availability of air quality monitoring data Air quality data is regularly updated in the website of
Uttarakhand State Pollution Control Board (UKPCB)
Table 72. Identification of sources of air pollution
Action area Outcomes
Number of non-attainment cities in the
district
(One) Kashipur city in the district is classified as non-
attainment city according to National Clean Air
Programme(NCAP).

`
73
Prominent sources of air pollution in the
district
Industries
Vehicular Pollution
Stubble burning
Industrial Pollution Large Industries such as:
Sugar Industries
Distilleries
Pulp and Paper Industries
are majorly responsible for air pollution in the district.
Non-Industrial air pollution
Vehicular pollution Following areas have been identified as hotspots for
Vehicular pollution:
Kashipur
Pantnagar
Rudrapur
Sitarganj
Stubble burning Prominent in Winter seasons
Control of open burning of waste
Open burning of waste is prohibited, even then practices of
burning of waste is common in the district.
Other sources of Air pollution Road dust , Fuel wood and coal for cooking ( Specially in
road side dhabas /Local Restaurants)
Table 73. Control measures for industrial/non industrial air pollution
Action Areas Outcomes
Control of industrial air pollution As much as 1367 Industrial units are meeting the
prescribed air quality standards.
District level action plan for air pollution Air action plan for Kashipur Non-attainment city has
been prepared by UKPCB in 2019.
Awareness on air Quality People are not yet apprised of the health risks associated
with the air pollution when levels are high.
Development of Air pollution complaint
redressed system
Available online at the official website of Uttarakhand
Pollution Control Board (UKPCB)
Air Quality monitoring and proposed policies forUdham Singh Nagar
Air quality data is available for the past five years for two monitoring stations in Kashipur and
Rudrapur (Table 74). PM10values have exceeded the prescribed standards every year. Recently
two more monitoring stations have been installed in Kashipur monthly air quality data (Table 75)
and one more has been proposed in Rudrapur town by Uttarakhand Pollution Control
Board(UKPCB).

`
74
Table 74. Air quality monitoring in Udham Singh Nagar (2018-2021
Year Udham Singh Nagar
Govt. Hospital, Kashipur Govt. Hospital, Rudrapur
PM10
(μg/ m3)
SPM
(μg/ m3)
SO2 (μg/
m3)
NO2 (μg/
m3)
PM10
(μg/ m3)
SPM
(μg/ m3)
SO2
(μg/ m3)
NO2
(μg/
m3
2021 121.40 206.18 18.54 22.89 126.50 216.40 19.43 22.94
2020 116.94 194.31 12.07 18.06 114.42 194.64 11.84 17.86
2019 126.19 220.13 13.18 22.60 129.13 227.67 13.61 22.66
2018 105.81 211.86 -- -- 119.08 224.64 -- --
Table 75. Monthly Air quality data for the year 2022
City Kashipur Rudrapur
Location Govt. Hospital Anaj Mandi Ganna Ayukt Govt. Hospital
Zone Sensitive Sensitive
Month PM10
(μg/m3)
PM2.5
(μg/m3)
PM10
(μg/m3)
PM2.5
(μg/m3)
PM10
(μg/m3)
PM2.5
(μg/m3)
PM10
(μg/m3)
PM2.5
(μg/m3)
January 128.55 55.98 152.44 73.37 145.28 64.12 127.63 -
February 121.98 62.05 135.15 64.39 142.99 70.69 128.59 -
Average 125.27 59.02 143.50 68.88 144.14 67.41 128.11 -

`
75
Noise Pollution Management
Noise pollution may be defined as regular exposure to elevated sound levels that may lead to
adverse effects in humans or other living organisms. According to WHO sound levels less than 70
dB are not damaging to living organisms and exposure of noise level beyond 85 dB constantly for
more than 8 hrs. may be hazardous and leads to loss of hearing. Although noise pollution is not a
big issue in the district but proper monitoring is required to maintain noise level within the
desirable limits (Table76).
Table 76. Permissible noise level standards
Area code Category of area/zone Limits in dB(A) Leq
Day Time Night Time
A Industrial Zones 75 70
B Commercial Zones 65 55
C Residential Zones 55 45
D Silence Zones 50 40 Source- Noise Pollution (Regulation and Control) Rules, 2000
Day time shall mean from 6.00 a.m. to 10.00 p.m.
Night time shall mean from 10.00 p.m. to 6.00 a.m.
Silence zone is an area comprising not less than 100 metres around hospitals, educational institutions, courts, religious places or any other area which is declared as such by the competent authority
Mixed categories of areas may be declared as one of the four above mentioned categories by the competent authority.
dB(A) Leq denotes the time weighted average of the level of sound in decibels on scale ‘A’ which is relatable to human hearing.
“Decibel” is a unit in which noise is measured.
“A”, in dB(A) Leq, denotes the frequency weighting in the measurement of noise and corresponds to frequency response characteristics of the human ear.
Leq: It is an energy mean of the noise level over a specified period.
Noise Pollution in U.S. Nagar District
Routine monitoring is carried out at 6 different locations in Kashipur and Rudrapur city. Some
complaints related to noise pollution have been registered by the pollution control board in past
one year. (Table 77).
Table 77. Current status related to noise pollution management in US Nagar
S. No. Parameter Current Status
1. Number of noise level measuring devices
available with various agencies in the district.
02
2. Number of complaints received by State
pollution control board related to noise
pollution in past 1 year.
08 Complaints were registered. All of them
were redressed.
3. Implementation of ambient noise standards in
residential and silent zones.
Occasionally
4. Capability to conduct noise level monitoring
by State agency/District Authorities
Available with the competent authority
5. Noise monitoring study in district Monitoring is carried out in different zones
and locations of Kashipur and Rudrapur.
6. Setting up of Sign Boards Not installed

`
76
7. Routine monitoring of Ambient Noise level at
various locations
Initiated
8. Responsibility of departments regarding
vehicular noise pollution
Vehicular noise pollution coming under
Motor Vehicles Act,1998
State Transport department is responsible for
execution of noise standards and
implementation of noise control measures.
Monitoring of Noise Levels in US Nagar district
Noise levels are measured in Rudrapur and Kashipur city of the district at different zones (Table
78). Noise data for the month of January shows breach of prescribed standards in each zone at
different locations. Noise level monitoring is also done in festive times, especially pre Deepawali
and Deepawali day to understand the impact of noise pollution due to burning of fire crackers.
Data shows elevated sound levels on the day of Deepawali when compared to a day before (Table
79).
Table 78. Noise levels as of January,2022
Monitoring locations Zone Average Lequivalent dB(A) 2022
Govt. Hospital, Kashipur Silence 39.79
M.P.Chowk Kashipur Commercial 79.83
Residential Area Awas Vikas, Kashipur Residential 47.08
Govt. hospital, Rudrapur Silence 48.91
DD Chowk ,Rudrapur Commercial 78.41
Residential area Awas Vikas, Rudrapur Residential 57.83
Table 79. Noise level monitoring carried out during Deepawali Festival (2019 and 2021)
Monitoring locations Average Lequivalent dB(A)
Zone Pre Deepawali
Day
(21.10.2019)
Deepawali
Day
(27.10.2019)
Pre Deepawali
Day
(29.10.2021)
Deepawali
Day
(04.11.2021)
Govt. Hospital, Kashipur Silence 49.38 63.37 48.1 62.49
M.P.Chowk Kashipur Commercial 68.43 81.56 70.45 78.8
Awas Vikas, Kashipur Residential 68.67 89.90 66.77 73.99
Govt. hospital, Rudrapur Silence 56.24 70.92 48.42 61.87
DD Chowk Rudrapur Commercial 65.89 84.66 70.57 78.49
Awas Vikas, Rudrapur Residential 65.50 78.42 65.1 75.3
Table 80. Responsibility of various departments to mitigate noise pollution
Responsibility Department Responsible
Ban on use of Multi-toned horn or any other device giving an unduly harsh, shrill,
loud, or alarming noise (Nothing contained in this policy shall prevent the use on
vehicles used as an ambulance, vehicles used by police officers, Fire fighters,
Operators of construction equipment vehicles or the officers of motor vehicle
departments).
State Transport department
Execution of noise standards and implementation of Noise control measures. State Transport department

`
77
Sand being an important economic resource and the
second most used mineral after water is one of the
main ingredients of concrete and mortar. Besides its
economic importance, it also constitutes an
important abiotic component in the aquatic
ecosystem like rivers. As our country has seen
robust growth in the infrastructure sector in the
recent decade the demand for sand increased by
manifolds. Further, with the announcement of the
national infrastructure pipeline project, the demand
for sand is going to increase exponentially in the
near future. In recent years, Uttarakhand has also
seen an increase in riverbed quarrying operations.
With the establishment of the stone crusher industry
especially in the southern Terai and Bhabar region
of the state, the scale and intensity of RBM
(Riverbed Minerals) excavation has further
increased in the past few decades. Uncontrolled and
illegal mining of river bed minerals like sand has
led to the loss of revenue to the state, degradation of
aquatic and riparian habitat (through large changes
in the channel morphology) and geology of
adjoining groundwater systems.
ILLEGAL SAND MINING
The Mines and Minerals (Development and Regulation) Act, 1957 has empowered state
governments to make rules to prevent illegal mining, transportation and storage of minerals.
However, still large numbers of illegal mining cases are registered in the country and in some
cases, many of the officers even lost their
lives while executing their duties to curb
illegal mining. Ministry of Environment,
Forest & Climate Change (MoEF&CC)
put forward the sustainable sand
management guidelines (SSMG) 2016,
which focus on the management of sand
mining in India, but there is a need to
revamp the existing system for effective
enforcement of regulatory provisions and
their monitoring. Recently, in 2020, new
set of guidelines have been put forward
by (MoEF&CC) in 2020, which focuses
on the effective monitoring of sand
mining (from the identification of sand
mineral sources to its dispatch and end-
use by consumers and general public)
and uniform protocol for the whole
country. Also, states are advised to
conduct river audits and monitoring of
mining activities with night vision drones and other modern surveillance equipment.
Mining activities in the district.
Sand mining is prevalent in the district. Illegal mining activities haven’t been noticed yet in the
district as per state pollution control board record (Table 81). Cases of illegal sand mining have
been registered in the district. Subsequently, Penalties were imposed by mining department.
(Table 82) However, no pollution related complaints have been registered for past one year (Table
83).

`
78
Table 81. Current status of mining activities in US Nagar
Concerning
Department
Total number
of mining
sites
Operational
mining sites
Area
under
mining
activities
(ha)
Type of
mining
activity
(Legal/
Illegal)
Revenue
generated
(financial year
(2020-2021)
Mining Department 22 22 47.626 Legal 43,68,63,182.00
Forest Department 01 01 90.00 Legal 1,63,15,000
(Source: Mining Department US Nagar, 2021)
Table 82. Prevalent Mining Activities in US Nagar
Total area of District (km2) 2542
Type of Mining Activity River bed mining mainly sand is prevalent in the US Nagar.
Total no of sand mining sites in the district There are total 22 sand mining sites are there in the US
Nagarall sites are operational in the district.
Action against illegal mining activities in
the district (in the financial year 2020-21)
34 cases registered for illegal mining activities
Penalties charged for the illegal mining
activities
Rs. 2,02,04,917 have been imposed for illegal mining
activities in the US Nagar.
Table 83. Compliance with environmental standards
Mining areas meeting environmental clearance conditions. All
Mining areas meeting consent conditions of UKPCB. All
Mining operations were suspended for violations of environmental norms NA
Pollutions related complaints against mining operations in past one year NA

`
79
REJUVENATION OF WATER BODIES
Most of India’s major water resources (underground waterways, lakes, rivers and reservoirs)
depends on monsoon rains to replenish/recover them. Nearly 600 million Indians faced high to
extreme water stress and about 2 lakh people dies every year due to inadequate access to safe
water. The NITI Aayog in 2018 released the results of a study warning that India is facing its
“worst water crisis” in history and that demand for potable water will outstrip supply by 2030, if
concrete steps are not taken. If matters are to continue, there will be a 6% loss in the country’s
GDP by 2050.High amount of water extraction and mismanagement of water resources are
causing drought and sudden flood in several part of our country. Rejuvenation of waterbodies also
play a vital role to improve the water quality and storage of surface run off water. For these
reasons we need to store, manage and rejuvenate the existing waterbodies. We can use several
government policies/Schemes like Mahatma Gandhi National Rural Employment Guarantee Act
(MGNREGA), Atal Bhujal Mission etc. to restore and rejuvenate the water bodies. The Water
Stress Index 2019 by London-based Verisk Maplecroft ranks India as the 46th highest risk country
(Verisk Maplecroft 2019). India is also 13th on the Aqueduct’s Water Risk atlas and listed as one
of the world’s “extremely water-stressed countries” (World Resources Institute 2019).
Rejuvenation works in U.S. Nagar district
Small ponds have been constructed by district administration in U.S. Nagar to cater for the
growing water demand (Table 84). Some of them are encroached by the local people upon which
the officials have to take strict action. More than 250 Ponds have been constructed under
MNREGA and around 30 are under progress (Table 85)
Table 84. Water bodies rejuvenated by US Nagar
Water Resource
Block Name Existing ponds Ponds currently in their
serviceable situation
Lake/Pond
Jaspur 165 42
Kashipur 151 82
Bajpur 51 11
Gadarpur 81 56
Rudrapur 98 20
Kichha 172 81
Sitarganj 287 168
Khatima 229 76
Rudrapur 20 02
Kashipur 20 07
Total 1274 545

`
80
Table 85. Inventory of water bodies in US Nagar
Water Resource
Block Name Ponds constructed Ponds under construction
Lake/Pond
Jaspur 14 02
Kashipur 01 --
Bajpur 20 --
Gadarpur 15 02
Rudrapur 28 --
Kichha 07 15
Sitarganj 67 11
Khatima 108 --
NN Rudrapur 00 --
NN Kashipur 00 --
Total 260 30

`
81
PLASTIC WASTE MANAGEMENT
Plastic waste is defined as the accumulation of plastic objects (e.g. Plastic bottles, bags etc.) in the
environment that adversely affects the Wildlife and Humans. Its broad range of application is in
packaging films, wrapping materials, shopping and garbage bags, fluid containers, clothing, toys,
household and industrial products, building materials, etc. The ongoing pandemic has caused a
rapid growth in the generation of plastic waste for the medical, packaging and other services (like
PPE kit, gloves, face shield, packaged food, etc.).
Plastic products have become an integral part in our daily life pertaining to the fact that its
production has crossed 150 million tonnes per year globally (CPCB, 2013). India generates 15
million tonnes of plastic waste every year but only one fourth is recycled due to lack of a
functioning solid waste management system. This leads to burden on the landfills and poor socio-
economic conditions of the waste pickers, mostly women (UNDP, 2018-2024).
India is committed to take action for mitigation of pollution caused by littered Single Use Plastics.
In the 4th United Nations Environment Assembly held in 2019, India has piloted a resolution on
addressing single–use plastic products pollution, recognizing the urgent need for global
community to focus on this very important issue. The adoption of this resolution at UNEP was a
significant step.
Keeping in view the adverse impacts of littered plastic on both terrestrial and aquatic ecosystems,
the MOEF&CC has notified the Plastic Waste Management Amendment Rules, 2021, which
prohibits identified single use plastic items which have low utility and high littering potential by
2022.Salient features of this amendment are as follows:
The manufacture, import, stocking, distribution, sale and use of single-use plastic, including
polystyrene and expanded polystyrene, commodities shall be prohibited with effect from the
1stJuly, 2022.
In order to stop littering due to light weight plastic carry bags, with effect from 30th
September,2021, the thickness of plastic carry bags has been increase from 50 microns to 75
microns and to 125 microns with effect from 31st December,2022. This will allow reuse of
plastic carry due to increase in thickness.
The plastic packaging waste, which is not covered under the phase out of identified single use
plastic items, shall be collected and managed in an environmentally sustainable way through
extended producer’s responsibility of the Producer, Importer and Brand Owner (PIBO). For
effective implementation of Extended Producer Responsibility, the guidelines for extended

`
82
producer responsibility being brought out have been given legal force through Plastic Waste
Management Amendment Rules, 2021.
The State government and concerned Central Ministries and associated departments have also
been requested to develop a comprehensive Action plan for elimination of single use plastics
and effective implementation of Plastic Waste ManagementRules,2016 and its execution in a
time bound manner,
Directions under Section 5 of Environment (Protection) Act, 1986, have been issued to all
state for setting up for institutional mechanism for strengthening enforcement of Plastic Waste
Management rules, 2016.
Current scenario of Plastic waste in US Nagar district
Plastic waste exists as mixed waste (part of dry waste) in U.S. Nagar district. Quantities are
estimated at Transfer station/dumping site where secondary segregation is performed. Plastic
waste after compaction is sold to local rag pickers.
Table 86. Inventory of Plastic Waste Generation
Name of Urban Local Body Population
(2011
census)
Number
of
Wards
Estimated Quantity of Plastic
Waste Generated (MT/Day)
NN Kashipur 175819 40 2.98
NN Rudrapur 175723 40 2.00
NPP Gadarpur 23289 11 0.04
NPP Bajpur 31172 13 0.05
NPP Jaspur 50523 09 Not estimated
NPP Kichha 74356 20 0.02
NPP Sitarganj 31711 13 0.02
NPP Khatima 58494 20 Not estimated
NPP Mahuwa Khedaganj 12584 09 0.42
NP Mahuwadabra 7326 07 0.03
NP Sultanpur 9881 07 0.24
NP Khelakheda 10929 09 0.01
NP Dineshpur 11783 09 Not estimated
NP Shaktigarh 6314 07 0.02
NP Nanakmatta 8478 07 Not estimated
NP Gularbhoj 6957 07 0.08

`
83
Table 87. Present Infrastructure for Plastic Waste Management Operations
Name of ULB Inventory of infrastructure available for plastic waste management operation
Availability of
plastic compactor
Linkage with Plastic
waste recyclers
Remarks
NN Kashipur Available
Except Nagar
Khelakheda no other
ULB has established
linkage with any plastic
waste recycler.
Plastic waste is compacted in
dump site or transfer station. It is
then sold to local rag pickers
NN Rudrapur Available
NPP Gadarpur Available
NPP Bajpur Available
NPP Jaspur Available
NPP Kichha Available
NPP Sitarganj Available (Not
operational)
NPP Khatima Not Available
NPP Mahuwa
Khedaganj
Available
NP Mahuwadabra Not Available
NP Sultanpur
patti
Available
NP Khelakheda Not Available
NP Dineshpur Not Available
NP Shaktigarh Available
NP Nanakmatta Available
NP Gularbhoj Available
Identification of Gap
As Plastic waste is a part of Municipal Solid waste, the impediments are more or less same as
mentioned in (Table10). Most of the ULBs have compactor for plastic waste compressing
operations but minimal or no linkage with authorized recyclers have hindered the effective plastic
waste recycling in the ULBs. Moreover, linkage with Public relation officer(PROs) of producers
is missing which hampers the Extended Producer Responsibility (EPR).
Projected Population and Plastic Waste Generation in US Nagar District
Plastic waste in India has increased steadily over the past 50 years. It is expected to double over
the next 20 years. Its growth rate in India is considered to be the highest in the world.
Projecting waste quantities in coming future is a difficult task. It is because of its changing
composition over the seasons and periods due to ever changing dietary habits, economic
conditions of the people and pandemic situation like COVID-19 in the concerned region. Crop
harvesting season with adequate availability of a variety of food also affect the plastic generation.
Lower is the level of economic development, greater will be the change between plastic waste

`
84
generation and disposal. Moreover, COVID-19 like pandemic situation also caused remarkably
plastic waste generation for creating medical tools and devices. These could be syringes, insulin
pens, intravenous line (IV), surgical gloves, catheters, inflatable splits, etc. generation for creating
medical tools and devices. These could be syringes, insulin pens, intravenous line (IV), surgical
gloves, catheters, inflatable splits etc.
Census population data for the years 2001 and 2011 has been taken for population forecast (Table
89). Decadal population and subsequent waste forecast has been done based on the following
presumptions:
Arithmetic increase method is used for the decadal population forecast, hence the rate of change
of population with time is assumed constant.
The per capita generation of plastic waste was estimated to be 11 kg/annum (Centre for Science
and Environment, 2019).
It is assumed that 70% of the total plastic waste consumed is discarded as waste (CPCB, 2013).
16 % yearly growth in per capita plastic waste consumption has been taken keeping in mind the
changing waste paradigm and floating population. (Centre for Science and Environment,2019)
This analysis included population and waste generation estimations for only urban local bodies
and did not include peri-urban and rural areas (Table 88; Fig.06).
Table 88. Projected population and estimated plastic waste generation in U.S. Nagar district
ULB Projected Population Existing/Projected Plastic
Waste Generation (MTPD)
2021 2031 2041 2021 2031 2041
Nagar Nigam Kashipur 150279 178935 207591 2.98 9.23 27.83
Nagar Nigam Rudrapur 220432 286310 352188 2.00 6.75 21.60
Nagar Palika Parishad Gadarpur 24957 30613 36269 0.04 0.13 0.39
Nagar Palika Parishad Bajpur 29256 32988 36720 0.05 0.13 0.38
Nagar Palika Parishad Kichha 53427 64889 76351 0.02 0.06 0.19
Nagar Palika Parishad Sitarganj 37903 45841 53779 0.02 0.06 0.19
Nagar Palika Parishad Mahuwa
Khedaganj 16310 20036 23762 0.42 1.34 4.14
Nagar Panchayat Mahuwadabra 8549 9772 10995 0.03 0.09 0.26
Nagar Panchayat Sultanpur patti 12048 14215 16382 0.24 0.74 2.21
Nagar Panchayat Khelakheda 14076 17223 20370 0.01 0.03 0.10
Nagar Panchayat Shaktigarh 7842 9375 10908 0.02 0.06 0.19
Total 5.83 18.62 57.48

`
85
Table 89. Projected decadal change in Plastic waste generation
Name of ULB %age Rate of Growth
(2021-2031)
% age Rate of Growth
(2031-2041)
Nagar Nigam Kashipur 20.96 20.16
Nagar Nigam Rudrapur 23.77 21.98
Nagar Palika Parishad Gadarpur 21.89 20.80
Nagar Palika Parishad Bajpur 19.32 18.94
Nagar Palika Parishad Kichha 21.58 20.59
Nagar Palika Parishad Sitarganj 21.45 20.50
Nagar Palika Parishad Mahuwa Khedaganj 21.94 20.84
Nagar Panchayat Mahuwadabra 19.72 19.25
Nagar Panchayat Sultanpur patti 20.68 19.96
Nagar Panchayat Khelakheda 21.81 20.75
Nagar Panchayat Shaktigarh 21.08 20.25
Fig. 6. Projected plastic waste generation
Inferences drawn from plastic waste projection
Plastic generation in the district is expected to rise in coming decades and would cross 50
MTPD by 2041.
Amongst all ULBs, NN Kashipur and NN Rudrapur will be major contributors towards plastic
waste generation in U.S. Nagar district.
20-25% growth rate in plastic waste generation is expected in the decades to come.
0.00
5.00
10.00
15.00
20.00
25.00
30.00
Pla
stic
Was
te (
MT/
Day
)
Name of ULB
Projection of Plastic Waste
Present Waste - 2021 Projected Waste -2031 Projected Waste -2041

`
86
ASSESSMENT OF URBAN LOCAL BODIES IN US NAGAR
In order to push the Urban Local bodies to adopt effective waste management, an assessment of
their waste management operations has been carried out. The main objective of this assessment is
to let ULBs know their present status regarding various waste management operations in Solid
waste management, bio-medical waste management, C&D waste management etc. Based on the
adopted methodology, few inferences have been drawn to let administration know about their
performance in various indicators (Table 90 & 91).
Table 90. Assessment of urban local bodies in Udham Singh Nagar
Indicators Maxi
mum
Points
Urban Local Body
Ka
ship
ur
Ru
dra
pu
r
Ga
da
rpu
r
Ba
jpu
r
Ja
spu
r
Kic
hh
a
Sit
arg
an
j
Kh
ati
ma
Ma
hu
wa
Kh
eda
ga
nj
Ma
hu
wa
Da
bra
Su
lta
np
ur
pa
ti
Kh
ela
kh
eda
Din
esh
pu
r
Sh
ak
tig
arh
Na
na
km
att
a
Gu
larb
ho
j
Solid Waste Management
Segregation 4 2 3 2 0 0 2 2 0 2 2 2 2 2 2 2 2
Collection 4 4 4 4 4 4 4 4 4 4 4 4 4 4 4 4 4
Segregated Waste
Transport 4 2 2 2 0 0 2 2 0 2 2 2 2 2 2 2 2
Wet Waste Processing 2 2 2 2 2 0 2 2 0 2 2 2 0 2 2 2 2
Dry Waste Processing 4 2 2 2 2 0 2 2 0 2 2 2 2 2 0 0 2
Disposal 2 0 0 0 1 0 0 1 0 1 0 0 0 0 0 0 1
Inclusion of Informal
Sector 1 1 1 1 1 0 1 1 1 1 1 1 1 1 0 0 1
Bio-medical waste Management
Linkage with Common
Bio-medical Waste
Treatment and Disposal
Facility (CBWTF)
1 0 0 0 0 0 0 0 0 0 0 0 0 0 0 0 0
Hazardous Waste Management
Linkage with Treatment,
Storage and Disposal
Facilities (TSDF)
1 0 1 0 0 0 0 0 0 0 0 0 0 0 0 0 0
C&D Waste management
C&D Waste Processing 1 0 0 0 0 0 0 0 0 0 0 0 0 0 0 0 0
E-Waste Management
E-waste collection and
linkage with recyclers 2 0 0 0 0 0 0 0 0 0 0 0 0 0 0 0 0
General Information
Innovation and use of
indigenous techniques 2 0 0 0 0 0 0 0 0 0 0 0 0 0 0 0 0
Enforcement of bye-laws
and waste Management
Rules, 2016
2 2 2 2 2 2 2 2 2 2 2 2 2 2 2 2 2
Total 30 15 17 15 12 06 15 16 07 16 15 15 13 15 12 12 16

`
87
Table 91. Final Assessment of Urban Local bodies of Udham Singh Nagar Name of ULB Score (out of 30) Score Percentage (%)
NN Kashipur 15 50.00
NN Rudrapur 17 56.66
NPP Gadarpur 15 50.00
NPP Bajpur 12 40.00
NPP Jaspur 06 20.00
NPP Kichha 15 50.00
NPP Sitarganj 16 53.33
NPP Khatima 07 23.33
NPP Mahuwa Khedaganj 16 53.33
NP Mahuwadabra 15 50.00
NP Sultanpur pati 15 50.00
NP Khelakheda 13 43.33
NP Dineshpur 15 50.00
NP Shaktigarh 12 40.00
NP Nanakmatta 12 40.00
NP Gularbhoj 16 53.33
Observations from data assessment
Almost all the ULBs have below average performance in waste management operations in the
district.
NPP Jaspur and NPP Khatima are lacking even basic waste management facilities. Hence, a
complete overhaul is need of the hour for effective waste management.
Waste disposal is a matter of concern in U.S. Nagar district. Unavailability of land is
exaggerating the situation.

`
88
ACTION PLAN

`
89
Action Plan for Solid Waste
Management
Despite the fact that Udham Singh Nagar
district is one of the major contributors of
solid waste in the state, its management is
filled with lacuna. The district lacks in all
the major aspects of solid waste management from collection to disposal. Scientific management
of solid waste is hard to find as most of the ULBs are still practicing traditional solid waste
management which has become obsolete. Based on the analysis of data and gaps, this action plan
defines areas where each ULB need to work to overhaul their waste management operations
(Table92). Each action point is in compliance with the guidelines of Solid Waste Management
rules, 2016.
Table 92. Action plan for Solid waste management
Action
Point
Concerning ULB Purpose Strategy/Approach Stakeholder
Responsible
Estimating
quantity of
dry and wet
waste from
total waste
NPP Khatima
NP Nanakmata
Determining waste
composition in the
region.
Ascertaining the
need of equipment’s
and machinery for
waste management
operations
accordingly.
Appropriate Sampling
mechanism as per
Municipal solid waste
management manual,
Swachh Bharat Mission.
This will help in getting
informal estimate of waste
composition in the region.
Double compartment
vehicle can be used for
waste collection and
transportationas executed
by NP Shaktigarh.
Establishment of transfer
station/Secondary
segregation points.
Nagar Palika/Nagar
Panchayat
Primary
Segregation
(Segregation
at Source)
All ULBs Higher Recovery of
Recyclables.
Hygienic
environment for
handling of waste.
Separate Storage Bins.
Regular awareness
campaigns
Man power Management.
Behavioural change
Communication
techniques.
Nagar
Palika/Nagar
Palika parishad/
Nagar Panchayat
Residents and
NGOs
Focus Areas Accurate quantification and characterization of waste.
Designated dump site for waste disposal.
Scientific monitoring of disposal site
Linkage with Authorised recyclers

`
90
Segregated
Waste
Transport
All ULBs To reduce open
dumping of waste.
Reduction of
Historical waste.
To reduce
contamination of
ground water.
Reduction of
transportation
charges.
Optimizing Waste
Management
Infrastructure (Collection
trucks, trolleys).
Man power optimization
at Recovery facility.
Use of twin compartment
vehicles
Nagar Palika/Nagar
Palika parishad/
Nagar Panchayat
Wet Waste
Management
Nagar Palika
Jaspur
Nagar Palika
Khatima
Initiating scientific
solid waste
management.
Eliminating the
expense of fertilizer.
Promoting eco-
friendly organic
fertilizers
Home compositing
Constructing decentralized
composting pits.
Constructing composting
pits in dumping site or
trenching ground.
Dry waste
Management
through
waste
processing
plant/Materi
al recovery
facility.
All ULBs except:
Nagar Nigam
Kashipur
Nagar Nigam
Rudrapur
Scientific
management of dry
waste.
Higher waste
Recovery
Establishing Material
Recovery facility
Linkage with recyclers
Nagar Palika/Nagar
panchayat/Townshi
p administrator
Regular
waste audit
All ULBs To determine
changes in waste
composition
Ensuring that the
ULBs are adhering to
MSW rules, 2016.
A team of expert must be
devised to monitor
changing waste paradigm
in the district.
Nagar
Nigam/Nagar
Panchayat/Sanitary
inspectors
Designated
waste
disposal site
as per SWM
rules ,2016
Nagar Palika
Kichha
Nagar Panchayat
Sultanpur Patti
Nagar Panchayat
Khelakheda
Reducing local dump
sites and heaps of
historical waste.
A section of dumping
site can also be used
for waste segregation
and processing as
carried out by Nagar
Nigam Rudrapur.
Site selection criteria
based on factors such as
groundwater depth, land
slope, soil properties etc.
Fast tracking transfer of
land and other legal
formalities.
Nagar Palika/Nagar
panchayat
Landfill
mining/Rem
ediation of
Dump site
Nagar Palika
Sitarganj
Nagar Palika
Khatima
To mitigate
environmental
impact of waste.
(Methane emission)
Resource Recovery
of excavated waste.
ULBs can go through the
technique used by Nagar
Nigam Kashipur and
Nagar Nigam Rudrapur to
remediate or clear the
dump site.
Rehabilitation through
Phytoremediation.
Nagar Palika
Waste
recycling
All ULBs except:
Nagar Panchayat
Reducing high health
risks associated with
Registration of waste
pickers and recyclers by
Nagar
Nigam/Nagar

`
91
through
authorised
recyclers/Wa
ste pickers
Khelakheda
traditional waste
management
ULB.
Cluster based
transportation of
recyclable waste to the
authorised recycler.
Palika
Cluster
based
approach to
Solid waste
management
All ULBs Clubbing the villages
in peri-urban areas of
the town with the
nearby solid waste
management facility
for effective waste
management in rural
areas.
Executing Rurban
mission of
Government of India.
By merging schemes from
Central and state
government department
with Rurban Mission of
Ministry of Rural
development
Roorkee cluster is one
such cluster for revamping
solid waste management
practices. It includes
Roorkee, Manglaur, Piran
Kaliyar, Landhora,
Bhagwanpur and Jhabera
District
Administration
District Panchayati
Raj Officer (DPRO)
Community
participation
for waste
management
All ULBs Social and
Behavioural Change
Communication
Cleanliness drive
campaigns
throughout the
district
IEC (Information,
Education and
Communication) activities
in Educational institutions.
IPC (Inter-personal
communication): School
children and Sanitation
workers to spread
awareness amongst people
regarding waste
management.
District
Administration
Establishme
nt of Green
Protocol
All ULBs To prevent use of
disposables and
using alternatives
like glass/Stainless
steel etc.
To bring generation
of non-biodegradable
waste close to zero.
By encouraging Green
protocol in local schools,
public functions, IEC
campaigns, sports events,
annual temple festivals
and other gatherings.
District
Administration
Action Plan for Rural Waste Management in India
The Government of India as well as state government is looking up every gram panchayat to come
up with a working system to manage solid waste. At the moment there are Gram panchayats in
Tamil Nadu, Andhra Pradesh, West Bengal, Gujarat and Chhattisgarh which have created a robust
and sustainable system to manage solid waste.
Maximum population of Udham Singh Nagar lives in Urban areas. Due to this, the villages in
periphery of the ULBs are not given much attention. Moreover, amount of solid waste generation
from rural areas is unaccounted due to lack of waste management facilities and awareness.

`
92
Nevertheless, both central and state government has come up with some polices which exhibits an
array of practicable models for solid waste management in rural areas (Table 93).
Table 93. Proposed policies for Rural Waste Management
Current Policy Sponsoring agency Remarks
Decentralized Waste Management Under Swachh Bharat Mission-
Gramin (SBM-G)
Decentralized systems such as household compost
and biogas plants shall be encouraged.
Community Sanitary Complex
(CSCs)
Under Swachh Bharat Mission-
Gramin (SBM-G)
Such complexes comprise of appropriated number of
toilet seats, bathing cubicles etc. (Only where there is
lack of space in the village for construction of
household toilets).
Cluster Approach to Solid Waste
Management
Rurban Mission of Ministry of
Rural Development
It aims at developing infrastructure and livelihood
opportunities in cluster of Gram panchayats that
demonstrate economic growth potentials.
Community Participation through
Information, Education and
Communication (IEC) Activities
National Institute of Rural
Development and Panchayati Raj
All the stakeholders need to plan for a series of IEC
campaigns to educate the residents on how proper
segregation at the household levels eases the entire
process of managing waste at subsequent stages.
Phytoremediation as a Mitigation Measure (for treatment of solid waste)
Natural or planted vegetation on a landfill has an important role in erosion control and removal of
contaminants, besides imparting aesthetic value. Moreover, it may also be used in leachate
treatment. Phytoremediation is a promising, plant-based technology in which the plants and their
associated microbes are utilized to absorb and clean up environmental contamination through
engineered constructed systems. The ultimate aim is to either remove the pollutant from the
contaminated media or to alter the chemical and physical nature of the contaminant so that it
eliminates the risk to human health and the environment. Several plants are being identified to be
used in phytoremediation task (Table 94).
Table 94. Phytoremediation as a mitigation measures (for landfill)
Botanical name Local Name Altitude (m) Assimilating capacity References
Cassia fistula L. Golden Rain
Tree
100-1400 Absorbs Arsenic and Fluoride
from Industrial wastewater
Chaudhary &
Rathore, 2019
Morus alba L. Mulberry 300-2200 Absorbs Zn, Hg, As, Pb, Cu and
Cd from Industrial wastewater
Janta et al.,
2016
Dalbergia sissoo
Roxb. ex DC.
Sheesham Upto 1500 Absorbs nutrients from sludge Kapoor et al.,
2013
Calotropis gigantea
(L.) Dryand.
Crown Flower up to 1000 Helpful in absorption of
Radioactive elements from soil
Kumar et al.,
2013
Lemna minor L. Duckweed Upto 1200 Absorbs Cr and Pb from water Kaur et al.,
2021

`
93
Action Plan for Bio-medical Waste Management
Authorised health-care facilities in Udham Singh
Nagar are managing the waste in a scientific way.
Most of them have linkage with CBMWTF in
Gadarpur. Biomedical waste generated from
households needs effective segregation and
management. This action plan provides holistic approach, which includes governance,
infrastructure, training and immunization, services etc. to tackle the unprecedented growth in
biomedical waste. Some technological interventions like Plasma waste treatment technology is
desired in near future (Table 95).
Table 95. Action plan for Bio-medical waste management
Action Areas Purpose Stakeholders
Governance
Authorisation of all HCFs (Allopathic,
AYUSHetc.) by Uttarakhand state
Pollution control board (UKPCB).
To ensure compliance with the
Biomedical waste management rules
2016.
Uttarakhand state
Pollution control
board (UKPCB)
Linkage of District level hospitals and
Community Health Centres (CHCs) with
Common Biomedical waste treatment
facility (CBWTF).
To ensure proper disposal of
Biomedical waste as specified under
Biomedical waste management rules,
2016.
Health Department
Linkage of ULBs with Common
Biomedical waste treatment facility
(CBWTF).
To ensure segregation of Biomedical
waste from Municipal solid waste
and thus its proper disposal as per
Biomedical waste management rules,
2016.
All ULBs
Implementation of Kayakalp initiative To promote cleanliness, hygiene and
infection control practices in public
healthcare facilities.
Health Department
Infrastructure
Construction and maintenance of
Biomedical waste collection shed at district
level HCFs and CHCs.
To ensure proper segregation of
Biomedical waste into different
categories as specified under
Biomedical waste management rules,
2016.
Health Department
Training and Immunisation
State level and District level orientation
programs for healthcare workers to
sensitize them about effective Biomedical
waste management.
To ensure proper handling and
segregation of biomedical waste in
HCFs
Health department
Setting up of Biomedical Waste Database
at State level (specifically for primary
health-care facilities)
Training on Biomedical Waste
Management Information System
(BMWMIS) to all data entry operators
and pharmacists.
To keep records of biomedical waste
generated in every HCF of the
district (especially in PHCs at rural
areas).
Health department
Focus Areas
Linkage of ULBs with CBMWTF
Waste Inventorization
Ensure scientific distribution of waste

`
94
Immunisation (Tetanus and complete doses
of Hepatitis-B) of all hospital staff involved
in Biomedical waste management.
To avoid any kind of infection while
handling Biomedical waste.
Health department
Services
Establishing bins and bags at each
generation points in HCFs with IEC posters
displayed.
To ensure segregation at each
generation point and avoid mixing
with MSW.
To spread awareness amongst the
people related to biomedical waste
management.
Health department
Timely replacement of bags, BMW transfer
to collection shed and then prompt lifting to
biomedical waste treatment facility from
the shed.
To ensure timely disposal of
biomedical waste.
Health Department
and UKPCB.
Information
Development of an IT-enabled data
management system to keep inventory of
waste collection, consumables supply,
training programs etc. in HCFs (including
PHCs in the district)
To ensure transparency in the
biomedical waste management
system up to primary level.
Health Department
Display details regarding authorisation,
treatment and annual report of all Health-
care facilities on website.
To make the information open source
and ensure transparency.
Health Department
and UKPCB.

`
95
Action Plan for C&D Waste Management
Though it has been told that the C&D waste is being
utilized locally for filling and repairing works, the
administration still needs to devise some policy
framework for C&D waste management. This action
plan emphasizes on basic amenities required for the
effective management of C&D waste (Table 96).
Table 96. Action plan for C&D waste management
Action Point Purpose Strategy/Approach Stakeholder
Responsible
Setting up of C&D
Waste Dumping Site for
local construction
activities and road
construction debris.
To ensure
compliance with
C&D Waste
Management Rules
2016.
Transition points must be
defined to deposit C&D
waste.
Establishment of dumping
zone such that it also caters
for C&D waste of peri-
urban areas and nearby
villages.
Proper collection and
transportation systems
should be set up to aid
processing. Illegal dumping
practices should be
discouraged by imposing
penalties on open dumping.
All ULBs
Public Works
Department (PWD)
Quantification of C&D
waste generated
To keep account of
C&D waste
generated or
dumped based on
area and type of
buildings
demolished.
Giving demolition permits to
waste generators rather than
reconstruction permits.
All ULBs
Public Works
Department (PWD)
Setting up of
Construction and
demolition waste
processing plant
For stacking,
crushing,
processing and
manufacturing of
various C&D
products
C&D waste processing plant
should be setup in proximity
to the urban areas of the
district.
Nagar Nigam/Nagar
Palika
District
administration
Arrangement of Size
grading
To facilitate reuse
of C&D Waste.
This can be done by erecting
sturdy metallic screens of
different sizes at an angle and
putting the waste over them
with the help of front-end
All ULBs
PWD (Public Works
Department)
Focus Areas
Identification of dumping zones
Quantification of C&D waste
Setting up of C&D waste processing plant
Framing of bye-laws

`
96
loader.
Involvement of Private
enterprise
Assortment and
transportation of
C&D waste
Public private partnership
schemes must be encouraged
ULBs
Coordination and
Collaboration amongst
different departments.
To take care of
C&D waste in
addition to other
municipal garbage,
if there is no
consolidated Solid
Waste management
department.
Close coordination between
Sanitary department,
Municipal Engineering
Department and Town
planning department is
required for efficient
management of C&D Waste
management.
All ULBs
Public Works
Department (PWD)
Framing by-laws for
C&D waste
management.
To ensure
compliance with
C&D Waste
Management Rules
2016.
By-laws must be framed by
each ULBs as per C&D
waste management rule for
proper disposal of C&D
waste in the district.
Provision of heavy fines
should be done under these
by-laws for illegal dumping
of demolition waste such as
excavated earth material on
the banks of river or on the
hill slopes.
All ULBs and
District Panchayati
Raj officer (DPRO)
Public Works
Department (PWD)
Plantation in old
dumpsites.
Established the
slope at old
dumping zones.
Plantation at old dumping
zone should be done with the
help of community
participation to stabilize the
slope over there.
All ULBs and
District Panchayati
Raj officer (DPRO)
Public Works
Department (PWD)
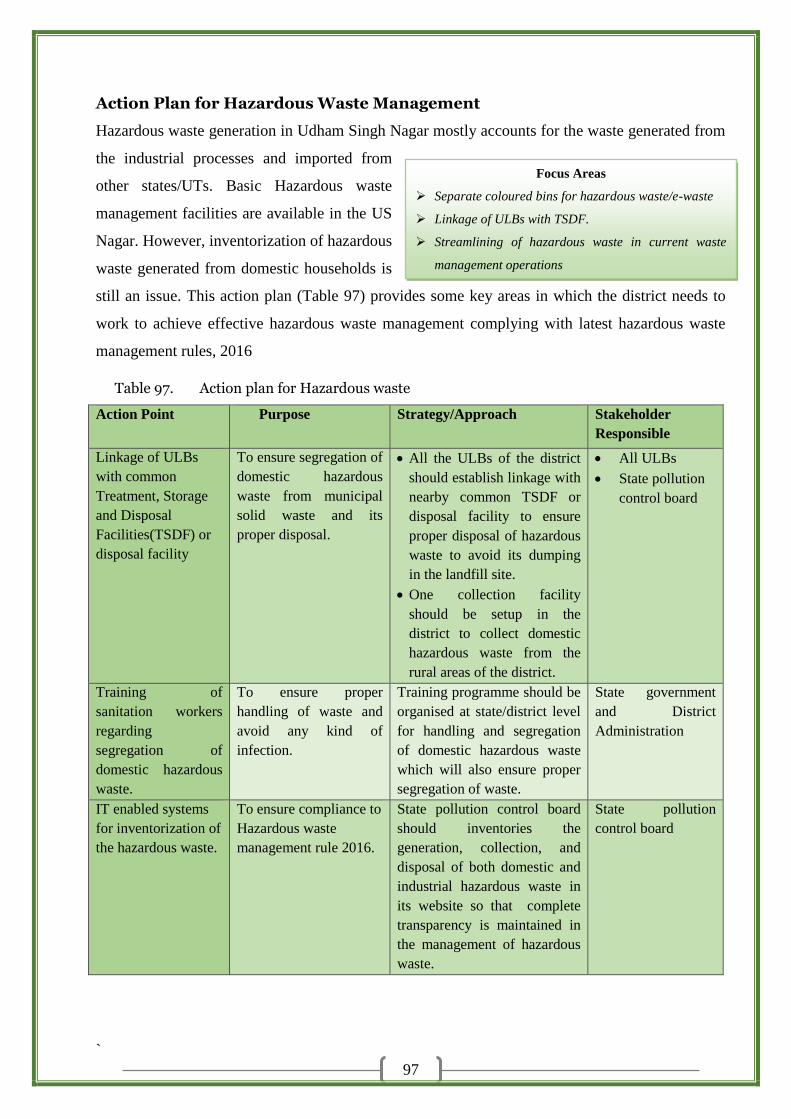
`
97
Action Plan for Hazardous Waste Management
Hazardous waste generation in Udham Singh Nagar mostly accounts for the waste generated from
the industrial processes and imported from
other states/UTs. Basic Hazardous waste
management facilities are available in the US
Nagar. However, inventorization of hazardous
waste generated from domestic households is
still an issue. This action plan (Table 97) provides some key areas in which the district needs to
work to achieve effective hazardous waste management complying with latest hazardous waste
management rules, 2016
Table 97. Action plan for Hazardous waste
Action Point Purpose Strategy/Approach Stakeholder
Responsible
Linkage of ULBs
with common
Treatment, Storage
and Disposal
Facilities(TSDF) or
disposal facility
To ensure segregation of
domestic hazardous
waste from municipal
solid waste and its
proper disposal.
All the ULBs of the district
should establish linkage with
nearby common TSDF or
disposal facility to ensure
proper disposal of hazardous
waste to avoid its dumping
in the landfill site.
One collection facility
should be setup in the
district to collect domestic
hazardous waste from the
rural areas of the district.
All ULBs
State pollution
control board
Training of
sanitation workers
regarding
segregation of
domestic hazardous
waste.
To ensure proper
handling of waste and
avoid any kind of
infection.
Training programme should be
organised at state/district level
for handling and segregation
of domestic hazardous waste
which will also ensure proper
segregation of waste.
State government
and District
Administration
IT enabled systems
for inventorization of
the hazardous waste.
To ensure compliance to
Hazardous waste
management rule 2016.
State pollution control board
should inventories the
generation, collection, and
disposal of both domestic and
industrial hazardous waste in
its website so that complete
transparency is maintained in
the management of hazardous
waste.
State pollution
control board
Focus Areas
Separate coloured bins for hazardous waste/e-waste
Linkage of ULBs with TSDF.
Streamlining of hazardous waste in current waste
management operations

`
98
Action Plan for E-Waste
E-waste generated is not paid much heed and is currently not streamlined in the waste
management operations of the ULB.
Actual quantification of electronic
waste is also unknown.
This action plan discusses key areas
where due intervention is needed to
achieve effective waste management in compliance with E-waste management rules, 2016 (Table
98). Some of the action needs to be addressed immediately such as establishment of collection
centre etc. while others can be initiated with the due course of time.
Table 98. Action plan for E-waste
Action Point Strategy/Approach Stakeholder
Responsible
Purpose
Establishing E-waste
Collection Centres
Collection centre should be
established for all ULBs in
such a way that they could also
cater the collection from
nearby rural areas.
A Toll Free Number must be
issued for the collection of E-
waste
All ULBs
UKPCB
To ensure proper
segregation of E-waste
from municipal solid
waste
Capacity building of
stakeholders to
promote effective
E‐waste management.
Authorization of E-
Waste Pickers
Identity cards should be issued to
all the waste pickers.
District
administration
and ULBs
To avoid illegal trading
and processing of E-
waste.
Linkage of ULBs with
authorized recyclers/
Dismantlers
All the ULBs in the district
should establish linkage with any
of the five authorized E-waste
recyclers.
All ULBs To ensure proper
recycling if possible and
if not then proper
disposal as per E-waste
management rule 2016.
Market survey for
identification of
brand/producers /bulk
consumers.
Physical Verification
of a Manufacturer.
Regular Auditing of an area by a
survey team. District
administration
UKPCB
To ensure compliance
with E-waste
management rules, 2016
District level
Awareness campaign
Promoting Information,
Education & Communication
(IEC) activities in educational
institutions (Schools, Colleges
etc.)
Promoting Awareness
programmes under Digital
India Initiative (Initiated by
Ministry of Electronics and
Information Technology) about
alternate methods of disposing
District
administration
Promoting behavioural
change in public.
Focus Areas
Doorstep collection of E-waste through toll free numbers or
IT enabled interventions.
To stop unregulated backyard operations of e-waste.

`
99
E-waste.
Extended Producer
Responsibility
Random sampling of electrical
and electronic equipment’s
placed on market to monitor
and verify the compliance of
Restriction of Hazardous
Substances(RoHS) provisions
as per the guidelines of Central
Pollution Control
Board(CPCB)
“E-waste Return” Programme
should be initiated to
incentivize people and bring
about behaviour change.
State
Government and
UKPCB
Proper Collection
and Disposal of E-
waste
Channelization of e-
waste generated from
the “end-of-life”
products to ensure
environmental sound
management.

`
100
Action Plan for River Polluter Stretch in US Nagar
As much as 7 polluter stretches in vicinity of major towns have been identified in Udham Singh
Nagar. All except Kosi are seasonal rivers which runs dry during lean season, hence waste water
from municipal and industrial drains being the only discharge or flow in the rivers during that
point of time. Therefore, Scientific management of sewage (through STP/FSTP) is the need of the
hour to mitigate the harmful effects of polluted water on human health and riverine ecology. This
action plan focuses key points that are required to be incorporated for rejuvenation and restoration
of polluted river stretches in the district (Table 99).
Table 99. Action plan for polluted stretches in U.S. Nagar
Action Point Stakeholders Responsible
Industrial Effluent Management
Routine/surprise Inspection of GPIs (Gross polluting industries) and Red
category industries for ensuring Compliance of effluent discharge
standards as prescribed under Environment (Protection) rules, 1986, as
amended
Special Environmental Surveillance
Task Force
Uttarakhand pollution control board
(UKPCB)
Strengthening of Environment Surveillance squad (ESS) UKPCB
Monitoring of Drains carrying industrial wastewater and CETP (Common
Effluent Treatment Plant) outlet
UKPCB
Sewage Management
Interception and diversion of all drains Uttarakhand Payjal Nigam
Installation of STPs for treatment of domestic /commercial waste water in
the district.
Solid Waste Management
Door to Door Collection of Waste in all 40 wards
Nagar Nigam, Kashipur and Rudrapur Source segregation of wastes in all 40 wards
Efficient Operation of waste processing facilities
Groundwater Quality
Groundwater quality monitoring at recognized points in the catchment of
polluted rivers.
Uttarakhand pollution control board
(UKPCB)
Flood Plain zone
Flood Plain zoning Irrigation department
Regulation restricted activities in flood plain zones Irrigation department
District Administration
Environmental Flow
Maintaining environment flow(a minimum of 15% discharge in lean
period) in river Ganga and its major tributaries
Uttarakhand Jal Vidyut Nigam Ltd.
Green Development
River training works to prevent soil erosion Forest department
Source: UKPCB
Phytoremediation as a Mitigation Measure (for rejuvenation of polluter
stretches)
Aquatic plants, demonstrate a high potential to purify river water, Industrial wastewater effluents
and contaminated water (Samal et al., 2019). The tolerant plants, planted in the riverbank, can
purify the river water by absorption, adsorption, accumulation and degradation of contaminants.

`
101
These plants exhibited significant capacity to remove nutrients such as total Nitrogen and
Phosphorus from water bodies (Tong, et al 2003). The plant roots provide strong and extensive
rhizosphere systems, which facilitate the growth of bacteria and other microorganisms
(Steenhoudt, et al., 2000; Zimmels, et al, 2008). These microorganisms play a significant role in
the removal of organic and inorganic contaminants from wastewater and contaminated water by
degradation of organic chemicals and accumulation of nutrients and other metal contaminants.
This phytoremediation process can be applied along either the riverbank or wastewater/storm
water discharge point. The technique has low cost and wider community acceptance, irrespective
of geographical locations (Table 100).
Table 100. Phytoremediation as a mitigation measures (for polluter stretches)
Botanical name Local
name
Assimilating capacity Altitude
(m)
Remarks
Pontederia cordata Removal of nutrients and organic matter by aquatic plants
and aeration. P. cordata has a strong impact on water
purification even without concurrent aeration.
< 1000
Anawar et al,
2020
Ipomoea aquatic Forssk. Water
spinach
Removal of TN and TP, Ipomoea aquatica (water spinach)
has thriving roots and high growth rates and has high
capacities to absorb nitrogen, phosphorus, and other
nutrients or pollutants
Tang et al,
2020
Persicarialapathifolia
(L.) Delarbre
Removal of BOD, COD, nutrient, metal Rudin et al,
2016
Canna indicaL. Ecological floating bed for removal of nutrients Barya, 2020
Iris pseudacorus L. Ecological floating bed for removal of nutrients
Accords calamus L Ecological floating bed for removal of nutrients
Typha domingensis Pers. Decrease in BOD, COD and total organic carbon (TOC) was
observed.
Gomber et
al, 2013
Leptochloa fusca(Lam.)
N.Snow
Decrease in BOD, COD.
Brassica juncea (L.)
Czern.
Sarso Used to remove As, Pb, and Cd concentration in
contaminated soil
Yasin et al,
2021

`
102
Action Plan for Non-Attainment City (Kashipur)
Setting up of a steering committee to achieve target deadlines has been the core strategy to
improve the air quality in Kashipur town and its vicinity. The recommended actions can be
designated as either policy, regulatory or implementation (Table 101).
Table 101. Action Plan for Non-Attainment city (Kashipur)
Source Group Action Point Stakeholders Responsible
Industrial Emissions Installation and operation of advance air pollution
control systems and continuous Ambient air quality
monitoring stations in and around Kashipur
UKPCB
Phasing out Wood and Pet Coke from Industries
Vehicular Pollution Restriction on plying and phasing out of 15 years
old commercial diesel driven vehicles.
Transport Department and
Traffic Police
Introduction of cleaner fuels (CNG/LPG) for
commercial vehicles. Promotion and
operationalization of E-rickshaw
Integration of all pollution check centres with single
web based software for ensuring control and
monitoring of polluting vehicles.
Periodic calibration test of vehicular emission
monitoring instrument.
Construction and
demolition activities
Road dust
Transportation of construction material like sand
,soil, etc. in covered system.
Nagar Nigam and
Development authority
Restriction on storage of construction material
along the road.
Water spraying on roads through tankers.
Construction of concrete pavements along the
roads.
Public Awareness Involvement of schools and other academic
institution in awareness program.
UKPCB
Nagar Nigam
Transport Department Issuing advisory to public for maintenance and
minimise use of personal vehicles.

`
103
Action Plan for Environment Management in IIA Pantnagar, Rudrapur
Higher CEPI score in IIA Pantnagar, Rudrapur is culmination of Air, Water and land pollution.
This action plan focuses on mitigating pollution not only on the core area but also on the 5km
impact area around the core area. It has to be done in a stipulated timeline (Table 102).
Table 102. Action Plan for Environment Management in IIA Pantnagar, Rudrapur
Action Point Responsible Agency Purpose
Air Pollution
Installation of Continuous
ambient air quality
monitoring station
(CAAQMS) at IIA
Pantnagar.
SIDCUL
UKPCB
It will help in dissemination of real time air
quality information to the general public in
display boards
Installation of Continuous
Stack emission system.(by
the units having investment
of more than 100 crores).
UPCB To monitor the current emission levels in
real time :24 hours a day ,7 days a week.
Prohibition on establishment
of new industries which are
based on coke and Pet Coke.
UPCB This will help reducing pollution as pet
coke releases deadly Sulphur dioxide and
nitrogen oxide fumes.
Source apportionment Study
in IIA Pantnagar and its
impact area
UKPCB An assessment study to restore the
damaged environment.
It will help prioritizing the sources that
need to be tackled.
Water Pollution
Quantification of un-
accountable discharge at
SIDCUL drains.
Identification of sources of
the drains.
SIDCUL
UKPCB
This is to make sure that there is only
storm water discharge in the drains.
Interception and diversion
works of all municipal drains
leading to Kalyani river.
Jal Nigam/Jal Sansthan It will help in restoration of water quality
in Kalyani river. Currently, it is a part of
river rejuvenation plan under UKPCB/
Mandatory Sewage
Treatment Plants at the units
having more than 05 KLD
sewage generation(except
those connected with
CETP/CSTP)
UPCB
SIDCUL
Detailed water harvesting
and re-use plan in the layout
of the plant(Existing must do
the same in a time bound
manner).
UPCB
SIDCUL
Fulfilling the high demand of water for
sanitation and drinking purpose for
employees.
This will also cut down on carbon
footprint by saving the power used in
freshwater processing,
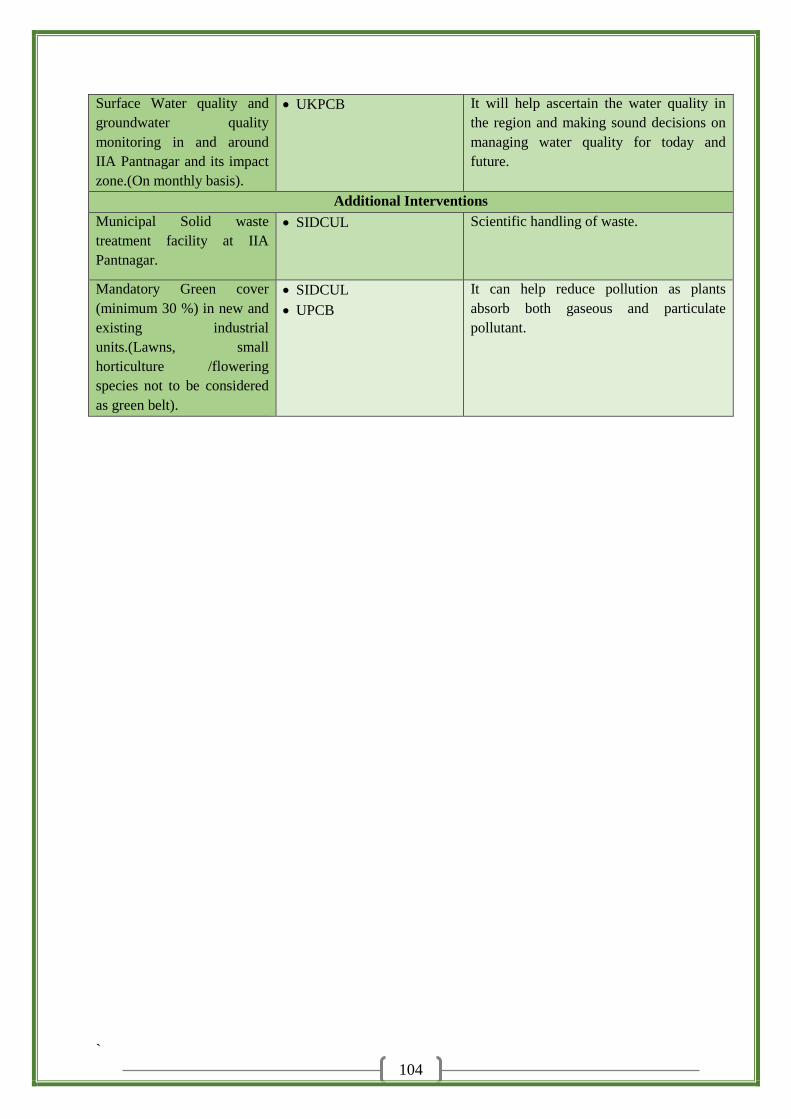
`
104
Surface Water quality and
groundwater quality
monitoring in and around
IIA Pantnagar and its impact
zone.(On monthly basis).
UKPCB It will help ascertain the water quality in
the region and making sound decisions on
managing water quality for today and
future.
Additional Interventions
Municipal Solid waste
treatment facility at IIA
Pantnagar.
SIDCUL Scientific handling of waste.
Mandatory Green cover
(minimum 30 %) in new and
existing industrial
units.(Lawns, small
horticulture /flowering
species not to be considered
as green belt).
SIDCUL
UPCB
It can help reduce pollution as plants
absorb both gaseous and particulate
pollutant.

`
105
Action Plan for Waste Water Management (STPs)
Sewage treatment facility is need of the hour in U.S. Nagar district. Municipal drains are the
major sources of water pollution in rivers. Some interception and diversion works are underway in
the district which may help in restoring the riverine ecology. This action plan will help in
formulating a policy for scientific management of waste water keeping in view various obstacle
which may occur (Table 103).
Table 103. Action plan for waste water management (STPs)
Action Point Concerning
ULB
Strategy/Approach Stakeholder
Responsible
Purpose
Continuous
Effluent
Monitoring
station
All ULBs Self-monitoring
mechanism in the
form of Online
Continuous effluent
monitoring system.
Jal
Sansthan/Jal
Nigam
State Pollution
control board
To ensure that the
STP meet out the
prescribed standards
as per Environment
Protection Act, 1986.
Decentralized
waste water
management
under Atal
mission for
Rejuvenation and
Urban
transformation
(AMRUT) by
Faecal Sludge
and Septage
Management
system (FSSM)
In line with National
FSSM policy, each
state is expected to
develop and issue an
FSSM
implementation
strategy and plan
guideline. This may
be integrated with
overall city land use
planning.
Capacity building and
training on FSSM (at
city level) to build
their personnel
capacities and
organizational
systems for delivery
of sanitation services.
Ministry of
Housing and
Urban
development,
Government of
India
Promoting
community-planned
and managed faecal
sludge and septage
management for
group of households.
Rehabilitation of old
sewerage system.
To augment limited
treatment capacity.
Recycling and reuse
of waste water for
beneficial purposes.
City Sanitation
Plan under
National Urban
Sanitation policy
All ULBs Enhance synergy
among municipal
government agencies,
the private sector,
NGOs and others.
Increase funding from
sources other than
municipal
government (such as
from the national and
provincial
Ministry of
Housing and
Urban
Development,
Government of
India
Citywide Sanitation
Sector development.
Awareness generation
and behaviour change
in field of Sanitation.
Sanitation and safe
disposal of waste.

`
106
governments, donor
agencies, the private
sector)
Use and Pay
model
All ULBs By Software as a
service (SaaS)
integrated platforms.
Jal Sansthan /Jal
Nigam
City would pay for per
litres of water treated
Automation of all
water
infrastructures
including valves
and pipelines
All ULBs Integration of new age
technologies with real
time data tracking.
Jal Sansthan /Jal
Nigam
To check any
malfunction such as
leakage, unauthorised
connection etc
Integrated Urban
Water
management
All ULBs Promoting simultaneous
planning of urban
infrastructures with
decentralised approach
for new interventions in
parallel to the existing
centralised systems.
Jal Sansthan /Jal
Nigam
This approach
encourages not to look
water supply in
isolation but in
coordination with
related sectors such as
sanitation ,storm water
and rain water
conservation and waste
water reuse

`
107
Action plan for Industrial waste water management
Two Common effluent treatment plant are currently operational in US Nagar. Other industrial
estates have their effluent treatment plant of industrial wastewater management. Some industries
are working on Zero liquid discharge in the district. The action plan below focuses on policy level
interventions to ensure effective wastewater management in the district (Table 104 and 105).
Table 104. Action plan for industrial waste water management
Action Point Stakeholders
Responsible
Purpose
Guidelines for Conducting Safety Audit as
per NGT Central Pollution Control Board
(CPCB)
(Uttarakhand State Pollution
Control Board (UKPCB) Ministry
of Environment, Forest and Climate
Change (MoEF&CC)
To mitigate industrial
accidents.
Capital subsidies and other forms of
Financial support to install ETPs Directorate of Industries,
Government of Uttarakhand
Ensuring sustainability of
Industrial units.
To encourage a calibrated
green focus.
Energy Efficiency in Industrial Sector
through Perform, Achieve and Trade (PAT)
Scheme.
Directorate of Industries,
Government of Uttarakhand
Uttarakhand State Pollution Control
Board (UKPCB)
To reduce Specific energy
consumption in energy
intensive structure.
To enhance cost
effectiveness of energy
saving through certifications
of excess savings.
Zero Effect Zero Defect (ZED)
Certification. Directorate of Industries,
Government of Uttarakhand
Uttarakhand State Pollution
Control Board (UKPCB)
To achieve high quality
manufacturing that is also
green.
To Rate Micro, Small and
Medium Enterprises
(MSMEs) on quality control
and certification for energy
efficiency.
Enforcing over ground and pressurized
effluent carrying network
To ban the carrying of effluent up to
common collection point through
underground and gravity network.
Uttarakhand State Pollution Control
Board (UKPCB)
To control unauthorised
discharge and subsequently
excessive pollutant load at
CETP inlet.
Table 105. Common effluent treatment plant management
Action Point Stakeholders
Responsible
Purpose
Dedicated Agency for Effluent
Management
Uttarakhand State Pollution
Control Board) (UKPCB)
By State pollution control
board.
Solid and Salt waste management in ZLD
CETPs
Uttarakhand State Pollution
Control Board) (UKPCB)
Promote ZLD Technologies
that does not result in waste
salt and sludge which may
cause serious disposal issues

`
108
Action Plan for Water Resources Management and Ground Water
Extraction/Contamination
Underground water is one of the major sources of water supply in the district. Ground water
studies needs to be conducted regularly so
that the local authority and people are
apprised about the present condition of
groundwater in the district. This action plan
focuses on the areas, which form the prerequisite for effective water resource management. Each
action point complies with the guidelines under Water (prevention and control of pollution act,
1974), (Amendment) Rules 2021 of water resource management act, 1986. The current action
points must be addressed in a timeframe of 5-10 year considering the financial constraints. (Table
106 & 107).
Table 106. Water Resources Management
Action Point Purpose Strategy/Approach
Integrated water resources
management (IWRM)at
River basin level
To achieve water security for
all purposes, managing risks
and to mitigate disasters
By considering basin/sub basin as a basic
unit for planning and management.
River Basin Master Plan Periodic review of
hydrological conditions
prevailing over a basin
Identification of protected
areas
By analysing River Basin Characteristics
Mapping of water scarce
areas in a district
To get estimate of vulnerable
areas in the district.
By using modern mapping tools such as
Geographical Information System (GIS)
and Remote sensing
By setting up an interdisciplinary
framework consisting of Local institution
and empowered government agency
Assessment of water
Resources in various river
basin
To collect reliable data
To assess water resources
potential and analysing water
requirements for various
uses,
Using Modern technology and
Hydrological modelling
Public Awareness and use
of Low Cost technologies
For better water application
efficiency
Using field application methods such as
Drip irrigation/micro sprinkler irrigation
systems in water scarce areas. This can be
achieved by bringing government subsidies
in this area as the local people needs
incentives to up bring this modern
technology.
Focus Areas
Mapping of water scarce areas
Assessment of Groundwater availability in
area.

`
109
Integrated Rural area
Programme (IRAP)
For constant interactive
relationships between
different departments
Location specific
programmes can be
drawn up locally under
this overall programme.
By bringing together all the programmes of
different ministries as well as rural
employment and development programme
into one for effective collaboration and
planning.
Table 107. Ground water management
Action Point Strategy/Approach Purpose
Multidisciplinary Approach (Nexus
between groundwater, agricultural
policy, urban infrastructure and
energyconsumption)
By integrated vision and coordination
amongst different departments.
For groundwater
sustainability
Mapping of aquifer at micro level By Maintaining an Aquifer information
and Management system
To quantify the available
ground water resources
To formulate plan
appropriate to the scale of
demands and aquifer
characteristics.
Designated Idol Immersion Sites
within municipal area or bank of river
By constructing temporary confined
ponds with removable synthetic liners
at the bottom.
Discouraging use if synthetic material,
Plaster of Paris, Baked clay, resin
fibres and thermocol for making of
idols.
Following CPCB evolved guidelines
for immersion of idols and other puja
materials in different water bodies.
To prevent any stray
immersion of idols in the
river or its banks.
Identification of Non-point sources of
Pollution (Pollution resulting from land
runoff, precipitation, drainage, seepage
etc.)
Controlling soil erosion by planting
more trees and covering bare soil with
vegetation.
Constructing wetlands.
Non-point source pollution
is a leading cause of
deteriorating water quality as
when the runoff moves ,it
picks up and carries away
natural and human-made
pollutants finally depositing
them in lakes, rivers and
groundwater.
Mitigating Groundwater
Contamination
Reducing the use of pesticides and
fertilizers.
Encouraging Organic farming in the
area by organising various Information,
Education and Communication (IEC)
campaigns.
To ensure the ground water
quality of an area.
To reduce health hazards
caused due to
contaminated water.

`
110
Action Plan for Air and Noise Pollution
Air pollution has become ubiquitous in U.S. Nagar district, particularly in Kashipur and Rudrapur.
This pertains to the large industrial hubs being developed in the region. Air pollution in other
areas also needs to be assessed and for that air quality
monitoring stations need to be established in all major towns
of the district. This action plan focusses on areas, which
requires collaborative efforts from different departments to
mitigate air pollution in the district (Table 108).
Presently, Noise pollution is not a major issue in the district. However, some administrative level
intervention will help to clamp down the nuisance caused due to honking in the district (Table
109). “Operation Decibel” formulated by Kerala could be a better follow up for the same.
Table 108. Action plan for air quality management
Action Areas Strategies/Approach Stakeholders Purpose
Solid waste
collection system
Door-to-Door collection of waste in
the urban areas and provision of dry
waste collection from rural areas
within the district.
After implementing proper collection
mechanism, hefty fines must be
charged on open burning of waste.
All ULBs and
District
Panchayati Raj
Office (DPRO).
To reduce emission of
harmful gases by open
burning of waste especially
in urban areas.
Vehicular Traffic
management
Checking adulteration of fuel.
Promoting intercity and intra-city
public transportation with green fuel
alternatives such e-buses etc.
Paving of road shoulders especially
in urban areas.
Department of
Police
Transport
Department
Public works
department
To reduce emissions
caused by vehicles.
To identify area specific
vehicular pollution
District level
action plan for air
pollution
A district level task force with some
experts can be formed for air quality
management in the district.
District
Administration
To improve existing air
quality.
Awareness on air
quality
Mass awareness can be promoted with
Information, education and
communication (IEC) activities by
involving institutions such as schools
and colleges for this purpose.
District
Administration
To promote awareness
among the masses regarding
the issue.
Encouraging CNG
and battery
operated public
transport vehicles
Supporting the applicability of Electric
and hybrid buses in following areas:
School Buses,
City Buses,
Tourism,
Company vehicles
District
Administration
To reduce local air
pollution
Higher efficiency of
electric propulsion system.
Focus Areas
Control on Stubble burning
Vehicular traffic management
Stack Emission Monitoring
Regular Awareness campaigns

`
111
Dust control
measures
Following Dust abatement measures
need to be taken for mitigating its
impact on health of an individual and
environment:
Sprinkling of water/fine spray to
suppress dust re-suspension
Management of Transport vehicles
by Pollution under Control (PUC)
compliance.
Dry sweeping of work areas to be
discouraged.
Development of green buffer for
construction activities site
(Preferably shrubs and trees that
have low uptake of water.
District
Administration
To control dust at source and
prevent it from becoming
airborne, since suppression is
virtually impossible once it
has become airborne.
Restriction of
heavy driven
vehicle in US
Nagar during day
time
The entry points should be decided for
non-entry of the heavy-duty diesel
vehicles.
District
Administration
For traffic regulation and
mitigating road congestion.
To improve daytime air
quality
Social Forestry
plantation
Prioritizing native trees/shrubs and
grasses of particular agro climatic
zone (as plantation of exotic
tree/shrub species often results in
low survival rate inferior
productivity and higher cost of
maintenance).
Integrating green corridor
development and management for
upcoming highway projects.
District
Administration
For environment protection
and beautification in urban
areas.
Mainstreaming
and integrating
existing policies
and programmes
of the National
Action Plan on
Climate Change
(NAPCC) and
other initiatives of
government of
India in reference
to climate change
By mainstreaming the initiatives under
eight national missions of NAPCC
namely:
National Solar Mission
National Mission for Enhanced
Energy Efficiency
National Mission on Sustainable
Habitat
National Water Mission
National mission for sustaining
Himalayan ecosystem
National mission for a Green India.
National mission for sustainable
agriculture.
National Mission on Strategic
Knowledge for Climate Change
District
Administration
For an accelerated
implementation of time-bond
plans through collaborations.
*Key points for the action areas in this thematic are influenced by NCAP (National Clean Air Programme) report by MoEFCC
and Action plan for Air quality improvement of US Nagar by UKPCB

`
112
Table 109. Action plan for mitigating noise pollution
Action Areas Strategies/Approach Stakeholders Purpose
Traffic
management
Signboards should be placed at
sensitive locations in the towns
within the districts and if required,
silent zones should be established.
Green belts can be formed along the
roads in the urban areas to reduce
noise levels.
District
Administration
Public Works
department and
ULBs
To ensure noise level within
permissible limits.
Complaint
redressing
system
Online complaint registration and
redressal system for noise pollution.
District
Administration
To sort out grievances registered
by citizens
Mass
Awareness
Mass awareness campaigns must be
organized with the help of
Information, Education and
Communication (IEC) activities by
taking the help of institutions such as
schools and colleges for this purpose.
District
Administration
To promote awareness among the
masses regarding the health
impacts such a Noise induced
Hearing Loss (NIHL), high blood
pressure, sleep disturbances, heart
disease due to noise pollution.

`
113
Action Plan for Mining activities
Sand mining is prevalent in the district and forms a
major part of the revenue for state government.
However, cases of illegal mining activities have
come into notice which may hamper the river profile
and exaggerated environmental concerns.
The action plan provided below mainly emphasize on areas, which includes monitoring of the
mining operation by using the latest technologies, regular audit of the mining sites and other
guidelines as per the Sustainable Sand Mining Guidelines 2016 (Table110).
Table 110. Mining activity management plan
Action Areas Strategies/Approach Stakeholders Purpose
Monitoring of
mining activity A district-level task force should
be formed to monitor mining
activities and to conduct river
audits and surveillance.
For the rivers marking the
boundaries with other districts, a
combined task force should be
formed to monitor mining activity
in the river.
District
Administration
To ensure sustainable mining
activity within the district.
System for
online purchase
and sale of sand
and other RBMs
An online system should be made
at the state or district level for e-
auctioning the mines to ensure
transparency in the system.
State
Government
and District
Administration
To ensure compliance to
Enforcement and Monitoring
guidelines for Sand mining,
2020.
Identification of
hotspots for
illegal mining
The district task force should
identify the possible hotspots for
illegal mining through surveillance
and patrolling.
District
Administration
To have check on the mining
activities in the district.
Community
participation
A toll-free number must be issued
for citizens in the district to register
any complaint against any illegal
mining practices as identified by
them in their vicinity
District
Administration To understand local faction’s
willingness in curbing illegal
mining from the area.
To have local check on the
illegal mining activities in the
district.
Focus Areas
Identification of hotspots of illegal mining
Digitization of trading process

`
114
Action Plan for Rejuvenation of Waterbodies
Rejuvenation works are in progress in all polluted river stretches in US Nagar. Action plan has
been prepared for the same by Uttarakhand Pollution Control Board. Apart from this, District
administration has been constructing ponds in each block under different schemes such as
MNREGA.
This action plan discusses some modalities, which includes scientific interventions as well as
convergence activities to revive the flow of any water body and its sustainable management
(Table 111).
Table 111. Action plan for Rejuvenation of Water bodies
Action Point Strategy/Approach Purpose
River Catchment /
Basin Management
Participatory and self-management
institutional framework for administering
the catchment with a combination of
engineering, social and scientific
management.
Reducing levels of potential
contaminants in raw water.
Plantation in Flood
plain zones (FPZ)
Vegetation that acts as natural resistant to
soil disturbances and standing water must
be encouraged.
To reduce shoreline erosion
Particular type of plants act as
natural barriers to dissipate
waves and back-lying areas from
flooding.
Prohibition of disposal
of Municipal Plastic
waste and Biomedical
waste (specially in
flood plain zones)
Awareness and behavioural change
activities.
Provisions of heavy fine for those found
throwing garbage in rivers.
To maintain ecological balance
of the water body
To prevent pollution activities
nearby river basin.
Spring-shed and
stream shed
management
By Constructing loose boulder check
dams.
Encouraging Information, Education and
Communication (IEC) activities in local
institutions (schools, colleges etc.)
To improve water resource
sustainability
To enhance water discharge from
springs and rivers
Convergence
Activities
By making use of Social media platforms Ensuring Community participation
*Key points for the action areas in this thematic are influenced by rejuvenation activities carries out for Kosi river (Almora),
Bhela river (Kashipur) and Heval River (Tehri Garhwal)

`
115
Action Plan for Plastic Waste Management
Plastic waste causes a plethora of problems
when it leaks into the environment. Stranded
single use plastics create visual pollution.
There is evidence that the toxic chemicals
added during the manufacture of plastic,
transfers to animal tissue, eventually entering the human food chain. Moreover, by clogging
sewers and providing breeding grounds for mosquitoes and pests, plastic bags can increase the
transmission of vector-borne diseases like malaria, cholera. Plastic waste management is still
not robust in the district. Plastic waste generation is likely to escalate with rapid urbanization in
the district. Almost one third of plastic waste generated ends up in river bodies, which has
damaged riverine ecology.
There is no separate policy framework for plastic waste management in U.S. Nagar district. In
fact, the plastic waste still forms the part of informal economy as it is handled by local waste
pickers. Amalgamation of scientific and convergence activities are required for effective plastic
waste management in the district. This action plan focusses on key areas which needs to be
addressed for plastic waste management in the district (Table 112).
Table 112. Action plan for plastic waste management
Action Point Strategy/Approach Stakeholder
Responsible
Purpose
Source segregation ULBs should distribute separate bins to
households, street vendors and other
shopkeepers as done by NP Dwarahat.
Distribution of separate bins to every
households and shopkeepers in rural
areas under Swachh Bharat Mission
Gramin should be ensured.
Mass awareness programmes regarding
source segregation with the inclusion of
institutions such as schools and
colleges.
All ULBs,
District
Panchayati raj
Officer
(DPRO),
Village
Panchayats
To ensure better
efficiency in waste
processing
Higher recovery of
resources.
Effective
Collection and
segregated waste
transport
Training waste pickers and providing
them proper equipment suitable as per
the topography of the area for door to
door collection in urban areas.
Establishing plastic waste collection
centres in rural areas where door to door
collection is not possible.
All ULBs,
District
Panchayati Raj
Officer
(DPRO),
Village
Panchayats
To reduce open
dumping of waste
To reduce monkey
menace (which is a
huge issue in the
urban areas of the
district)
Focus Areas
Streamlining of plastic waste in current waste
management operations.
Emphasis on Extended Producer Responsibly
Formalization of waste pickers

`
116
Provision of separate vehicles is done
for dry and wet waste to ensure
utilisation of manpower.
ULBs can establish linkage with the
NGOs working in this field for effective
waste collection in the urban areas.
To ensure optimum
utilisation of
manpower
To ensure
compliance with
plastic waste
management rules
2016
Linkage of ULBs
& other collection
centres with
recyclers/ cement
plants / Public
Works Department
NP Dwarahat, NP Chaukhutiya should
establish linkage with any recyclers as
other ULBs of the district already have
linkage with some of the recyclers.
Plastic waste collection centre to be
started in rural areas should also be
linked with recyclers.
Plastic waste can be used in road
construction for this ULBs should
coordinate with the construction
agencies such as Public Works
Department.
All ULBs,
District
Panchayati Raj
Officer
(DPRO),,
To avoid open
dumping of plastic
waste.
To ensure reuse
and recycle of
plastic waste.
Implementation of
extended producer
responsibility
(EPR) through
producer/Brand
owner
ULBs can ask the manufacturers
collectively or individually in line with
the principle of extended producer
responsibility (EPR) to provide the
required finance to establish plastic
waste collection centres.
All ULBs To reduce the
workload of ULBs
Community
participation for
waste management
Information, Education and
Communication (IEC) activities in
Educational institutions.
Inter-personal communication (IPC):
School children and Sanitation workers
to spread awareness amongst people
regarding waste management
District
Administration
Social and
Behavioural
Change
Communication
Cleanliness drive
campaigns
throughout the
district
Establishment of
Green Protocol
By encouraging Green protocol in local
schools, public functions, IEC
campaigns, sports events, annual temple
festivals and other gatherings.
District
Administration
To prevent use of
disposables and
using alternatives
like glass/Stainless
steel etc.
To bring
generation of non-
biodegradable
waste close to zero.

`
117
CONCLUSION
The district of U.S. Nagar is one of the most developed regions in the state. Increase in industrial
activities and growth in urban population has posed numerous challenges regarding various
environmental aspects such as land, air or water resources. In a majority of the ULBs (10 out of
16ULBs), solid waste management operations like it’s processing and scientific disposal are
lacking. Some of the ULBs such as NPP Jaspur and Khatima are not even processing the non-
biodegradable waste (wet waste) adequately. Scientific recovery of waste and allotment of proper
land areas for waste disposal is the need of the hour for effective and sustainable solid waste
management in the district. Hazardous waste from the industries is quantified and is managed in
Treatment, Storage and Disposal facility (TSDF). But hazardous waste and E-waste from
households as well as even government institutions could not be streamlined in current waste
management operations. A separate bin or collection centre for these toxic wastes is desired in
near future as open dumping of these wastes can be a potential threat to human life. An estimated
quantity of 406 kg of biomedical waste is lifted every day from the healthcare facilities to
Common Biomedical Waste Treatment and Disposal Facility (CBMWTF) which operates under
the consent of State Pollution Control Board. Biomedical waste from domestic households,
nursing homes, etc. has been increased in the wake of pandemic situation. Hence, it needs to be
managed scientifically to avoid any future outbreak. ULBs need to be linked with local HCFs and
build some kind of framework to manage the biomedical waste in a collaborative way.
Construction activities are on rise in the district but management of C&D waste is still done in an
informal way. This may lead to a false belief that there is no C&D waste in the district. ULBs
need to frame some guidelines regarding C&D waste management and need to share in public
domain. The district has as many as 07 polluter stretches which have been a cause of great
concern for the local administration. Effluents from industrial and municipal drains have been one
of the main reasons for deteriorating water quality in these rivers. With due intervention from
Hon’ble NGT, action plan is prepared for the rejuvenation of these polluted river stretches. This
focuses on short term, intermediate and long-term plan to restore the water reserve and its quality.
Moreover, STPs have been proposed under National Mission for Clean Ganga (NMCG) to treat
scientifically the waste water accumulated in the drains/nalas. Interception and diversion works
have been proposed for the same and major nalas have been tapped. Septage management and co-
treatment technologies have been proposed in the district as a part of centralized wastewater
treatment. A pilot project (125 KLD FSTP) is being run on this technology in Rudrapur city. As
per guidelines of Hon’ble NGT, two CETPs (IIE SIDCUL Pantnagar and Sitarganj) have a

`
118
capacity of more than 7 MLD which are operational in the industrial clusters of the district. As
many as 920 industrial units are connected with these two CETPs. Rest of the industries have their
individual ETPs and/or are currently working on ‘Zero Discharge’ policy. Air pollution is one of
the biggest issues in the district. Thousands of industries are currently operational in the district.
These industries are mainly in Kashipur and Rudrapur cities which contribute massively to the
deteriorating air quality in the region. IIA Pantnagar, Rudrapur industrial cluster was declared as
critically polluted in 2019 with CEPI score of about 77.7 out of 100. An action plan was prepared
as per the directions of Hon’ble NGT to address the issue of rising air and water pollutions in this
industrial cluster. Moreover, another industrial city of Kashipur was declared as non-attainment
city since it was not fulfilling the standard air quality levels for the past five years. Industrial units,
construction activities, burning of solid waste, road dust, etc. have been the major causes of air
pollution in Kashipur city. An action plan has been prepared by Uttarakhand Pollution Control
Board. This targets specific areas to mitigate air pollution in the city. Air pollution is also a major
concern in other parts of the district which is mainly at Rudrapur. This town is also another
industrial hub in the state. Four manual air quality monitoring stations have been installed in
different locations to ascertain air quality in these two cities. Major rivers in the district are non-
perennial and often turn dry during the lean season. Hence, the only discharge during the summer
season remains in these rivers which confines to that of municipal and industrial drains. This has
hampered the riverine ecology to a great extent. Plants based techniques such as phytoremediation
needs to be implied so that some of the amount of toxic chemicals could be absorbed naturally as
self-purification process becomes difficult in a dry season. Underground water is the main source
of drinking water in the district. Eleven groundwater stations are available to regularly ascertain
the draft and quality of underground water. Mining activities, specifically sand mining is
ubiquitous in the district. The Bhabar and Tarai regions have rich mining potential and are a major
source of revenue for mining department. However, illegal sand mining activities (35 cases
registered during financial year 2020-21) have also become prevalent in the district which need
due surveillance through manual as well as use of modern technology. It was also ensured that
environmental consideration could not be compromised while pursuing mining activities. This can
be established by making stringent environmental conditions for clearance and to obtain consent
for mining activities.
The district administration and other departments need to come up with practical solutions to
address the environmental concerns in the district of U.S. Nagar. Each aspect related to air, water

`
119
and land pollution need to be studied thoroughly so that locally viable and economically feasible
solutions could be envisioned.
(Source: B, C & D, Mahuwa Kheraganj, US Nagar)
Fig. 7. Different activities in US Nagar for preparation of District Environment Plan
(A) A consultative workshop/Seminar in the district on preparation for District Environment Plan
(November, 02, 2020) (B&C) Awareness campaign in Mahuwa Kheraganj regarding segregation of
waste and home composting (D) Door to Door campaign to Aware citizens.

`
120
REFERENCES
Aayog, NITI. (2018). Composite Water Management Index: a tool for water management.
Anonymous, (2018). "Uttarakhand Vision 2030"Planning Commission, Government of
Uttarakhand,
Attri, S.D., & Tyagi, A. (2010). Climate profile of India. Environment Monitoring and Research
Center, India Meteorology Department: New Delhi, India.
Azash, S.M.D. & Thirupalu, N. (2017). Fundamental Principles of Environmental Protection and
Sustainable Development, National Conference on Marketing and Sustainable
Development, Vol. 13, pp 14, ISBN 978-1-943295-10-4
Chopra, R. (2014). Uttarakhand: Development and ecological sustainability. Oxfam India
CPCB, (Central Pollution Control Board) (2013). Overview of Plastic Waste Management by
Central Pollution Control Board New Delhi
CPCB, (Central Pollution Control Board) (2019). Biomedical waste management as per
biomedical waste management rules 2016 for the year 2019.
CPCB, (Central Pollution Control Board) (2020). Annual Report 2019-20 by Central Pollution
Control Board New Delhi
CWM, (2020) Construction Waste Market, Global Industry Analysis, Size, Share, Growth,
Trends, and Forecast 2017-2025 by Energy & Natural Resources
Da, Fonseca, L.M.C.M. (2015). ISO 14001: 2015: An improved tool for sustainability." Journal
of Industrial Engineering and Management 8.1 (2015): 37-50.
Das T.M (1981) Plants and Pollution Presidential address in Section of Agricultural Sciences.
Indian Science Cong. Assessment Meeting, B.H.U. Varanasi.
Dash, P., & Punia, M. (2019). Governance and disaster: Analysis of land use policy with reference
to Uttarakhand flood 2013, India. International Journal of Disaster Risk Reduction, 36,
101090.
District Census Handbook (2011), District Census Handbook Udham Singh Nagar, Census 2011,
http://www.censusindia.gov.in/2011census/dchb/0507_PART_A_DCHB_ Udham Singh
Nagar.pdf
District Statistical Report (2018). District statistical Handbook 2018, Udham Singh Nagar, https://
Udham Singh Nagar.nic.in/document-category/statistical-report.
District Survey Report (2018). District Survey Report: District Udham Singh Nagar 2019-20.
District Survey Report of River Bed Mining of Udham Singh Nagar, Uttarakhand. In

`
121
Compliance of Ministry of Environment, Forest and Climate Change Notification No.
2827 dated: 25th July 2018
District Survey Report (2020). District Survey Report of Silica Sand, Udham Singh Nagar,
Uttarakhand Geology and Mining Unit, Uttarakhand Government, District Office, Udham
Singh Nagar, Uttarakhand
EEMI, (2018). Electricals and Electronics Manufacturing in India. NEC Technologies India
Private Limited https://in.nec.com/en_IN/pdf/
Eriksson, M., Xu, J., Shrestha, A.B., Vaidya, R.A., Santosh, N., Sandstrom, K. (2009). The
changing Himalayas: impact of climate change on water resources and livelihoods in the
greater Himalayas. International centre for integrated mountain Development (ICIMOD).
Ferronato, N., & Torretta, V. (2019). "Waste mismanagement in developing countries: A review
of global issues." International journal of environmental research and public health 16,6:
1060.
Forbes, K., Broadhead, J., Brardinoni, A. D., Gray, D., & Stokes, B. V. (2013). Forests and
landslides: The role of trees and forests in the prevention of landslides and rehabilitation of
landslide-affected areas in Asia Second edition. Rap Publication, 02.
FSI, (2019). Forest Survey of India: An Assessment Report on Forest Cover Status of India.
Government of India: Ministry of Environment and Forest (MoEF); Forest Survey of India
Dehradun. https://fsi.nic.in/forest-report-2019.
Gaur, A.C. (2008). Basic environmental engineering. New Age International.
Groundwater Brochure of District Dehradun, Uttarakhand, (2011). Central Groundwater Board,
Ministry of Water Resources, Govt. of India.
Groundwater Year Book India 2019-20, (2020) Central Ground Water Board (CGWB), Ministry
of Jal Shakti, Department of Water resources, River Development and Ganga
Rejuvenation, Government of India.
Gupta, S. (2014). Ground Water Scenario of Himalayan Region, India. Central Ground Water
Board.
Handl, G. (2012). Declaration of the United Nations conference on the human environment
(Stockholm Declaration), 1972 and the Rio Declaration on Environment and
Development, 1992, United Nations Audiovisual Library of International Law, 11
IPCC, (2021). "AR6 Climate Change 2021: The Physical Science Basis." Working Group I
contribution to the Intergovernmental Panel on Climate Change Fourth Assessment
Report. Cambridge, UK: Cambridge University Press

`
122
Kala, C.P., Dhyani, P.P., & Sajwan, B.S. (2006). Developing the medicinal plants sector in
northern India: challenges and opportunities. Journal of Ethnobiology and Ethnomedicine,
2(1), 1-15.
Khanduri, S. (2018). Landslide distribution and damages during 2013 Deluge: a case study of
Chamoli district, Uttarakhand. Journal of Geography and Natural Disasters, 8(2), 1-10.
Kriebel, D., et. al., (2001). "The Precautionary Principle in Environmental Science."
Environmental health perspectives 109, no. 9: 871-876.
Krishnan, R., Sanjay, J., Gnanaseelan, C., Mujumdar, M., Kulkarni, A., Chakraborty, S. (2020).
Assessment of climate change over the Indian region: a report of the ministry of earth
sciences (MOES), government of India. Springer Nature
Kroll, C., Warchold, A., Pradhan, P. (2019). Sustainable Development Goals (SDGs): Are we
successful in turning trade-offs into synergies. Palgrave Communications, 5(1), 1-11.
Messerli, P, et al. (2019). Global sustainable development report 2019: the future is now–science
for achieving sustainable development.
Misra, A. (1978). Chipko movement: Uttarakhand women's bid to save forest wealth (No. 1).
People's Action
MoEF&CC, (2018). Ministry of Environment, Forest and Climate Change, 2018. Beat Plastic
Pollution: Good News from India. MoEFCC, New Delhi.
MoEF&CC, (2021). Annual Report Ministry of Environment, Forest and Climate Change,
Government of India, New Delhi
MoUHA, (2016). Ministry of Urban Development, Municipal Solid Waste Management Manual-
Part II, Central Public Health and Environment Engineering Organization, p. 6.
Nagendran R., Selvam A., Joseph K., Chiemchaisri, C. (2006). Phytoremediation and
rehabilitation of municipal solid waste landfills and dumpsites: a brief review. Waste
Manage; 26:1357–69.
Nagendran, R., Selvam, A., Joseph, K., Chiemchaisri, C. (2006). Phytoremediation and
rehabilitation of municipal solid waste landfills and dumpsites: A brief review. Waste
Management, 26(12), 1357-1369.
NATCOM, (2012). India: Second National Communication to the United Nations Framework
Convention on Climate Change. Ministry of Environment and Forests, Government of
India, available at http://envfor. nic. in/, viewed on December, 10, 2013.
Negi, G.C.S., Rawal, R.S., Dhyani, P.P., Palni, L.M.S. (2012). Twenty Priority Issues for Forestry
Research with Particular Reference to Indian Himalayan Region in the RIO+20 Era.
Glimpses of Forestry Research In The Indian Himalayan Region, 1.

`
123
Anonymous, (2014). Before The National Green Tribunal, Principal Bench, New Delhi.
Pal, S.S., Kansal, A., Rawat, T. (2018). Bio-Medical Waste in Pandemic COVID 19 Uttarakhand
UKPCB Envis Newsletter 16(2): pp 1-6.
Parkash, S. (2015). A study on flash floods and landslides disaster on 3rd August 2012 along
Bhagirathi Valley in Uttarkashi District, Uttarakhand. World Centre of Excellence on
Landslide Disaster Reduction, National Institute of Disaster Management, Ministry of
Home Affairs, Government of India.
Paul, P.P. (2014). Doctrine of Public Trust and Its Application by the Judiciary in Environmental
Governance of India: A Critique. Indian JL & Just., 5, 82.
Prajapati, S.K. (2012). "Biomonitoring and speciation of road dust for heavy metals using
Calotropis procera and Delbergia sissoo."Environmental Skeptics and Critics 1(4): 61-64.
Raj, J. (2014). Uttarakhand action plan on climate change, transforming crisis into opportunity.
Government of Uttarakhand, Dehradun.
Rajaram, V., Dutta, S., Parameswaran, K. (Eds.). (2005). Sustainable mining practices: A global
perspective. CRC Press, 2005.
Sadowsky, M.J. (1999). Phytoremediation: past promises and future practices. In: Bell, C.R.,
Brylinsky, M., Johnson-Green, P. (Eds.), Proc. 8th Int. Symp. on Microbial Ecology.
Atlantic Canada Society for Microbial Ecology, Halifax, Canada.
Sahu, M. (2014). Sustainable Development: Judicial Trends in Mining Cases. Available at SSRN
2854092.
Samant, S.S., Dhar, U., Rawal, R.S. (1998). Diversity and distribution of wild edible plants of
Indian Himalaya, In: Plant diversity of the Himalaya, edited by PC Pandey & SS Samant,
(Gyanodaya Prakashan, Nainital), 2001a, 421-482.
Sandhu, H., Sandhu, S. (2015). Poverty, development, and Himalayan ecosystems. Ambio, 44(4),
297-307.
Sarkar, A. (2018) Environmental conservation in terms of contribution from women, International
Conference on Literature, Society & the Global Media, International Journal of Research
Culture Society, pp 29-30 ISSN: 2456-6683.
SBM, (2016). Swachh Bharat Mission, Municipal Solid Waste Management Manual Part II: The
manual, Central Public Health and Environmental Engineering Organisation (CPHEEO),
Ministry of Urban Development.
Sharma, K.D., Jain, S. (2019). Overview of municipal solid waste generation, composition and
management in India. Journal of Environmental Engineering 145(3), 04018143.

`
124
Singh, N.K. (2000). The Indian Constitution and Customary International Law: Problems and
Perspectives. Student Advoc, 12, 81.
The Groundwater Foundation (2020). National Groundwater Association,
https://www.groundwater.org/get-informed/groundwater/contamination.html, Accessed
(17 May 2020).
The sub-national Water Stress Index (2019), formulated by London-based risk analytics firm
Verisk Maplecroft, https://www.maplecroft.com/
UNDP. (2015). Resolution adopted by the General Assembly on 11 September 2015.
A/RES/69/315 15 September 2015. New York: United Nations (UNDP).
UNDP. (2020). Report, Plastic Waste Management Programme. (2018-2024), United Nations
Development Programme (UNDP).
Varghese, B., Jose Paul, N.I. (2013). Disaster management: a case study of Uttarakhand. Water,
climate and tourism—is it a boon or bane to mankind and economic environment.
Venkat, A. (2012). 'Polluter Pays' Principle: A Policy Principle. Available at SSRN 2458284.
Vinuesa, R., et al., (2020). The role of artificial intelligence in achieving the Sustainable
Development Goals. Nature communications, 11(1), 1-10
WHO, (2018) Delivering Quality Health Services: A Global Imperative. OECD Publishing.
World Resources Institute (2019), https://www.wri.org/insights/17-countries-home-one-quarter-
worlds-population-face-extremely-high-water-stress.
DIPSR, (2021). Brief Industrial Profile of Udham Singh Nagar District, Micro, Small & Medium
Enterprises Development Institute Kham Bangla, Kaladungi Road Haldwani, Nainital,
Uttarakhand, India pp.1-42
Gantait, S., Agarwala, DK. (2021). Bibliography and Abstracts of papers on flora of Uttar Pradesh
and Uttarakhand, under ENVIS partner on biodiversity botanical survey of India Ministry
of Environment, Forest and Climate Change
NATCOM, 2004. India’s Initial National Communication to the United Nations Framework
Convention on Climate Change. Ministry of Environment and Forests, Government of
India, New Delhi
Houda, Z., Bejaoui, Z., Albouchi, A., Gupta, D. K., & Corpas, F. J. (2016). Comparative study of
plant growth of two poplar tree species irrigated with treated wastewater, with particular
reference to accumulation of heavy metals (Cd, Pb, As, and Ni). Environmental
monitoring and assessment, 188(2), 1-10.
Ukpebor, E.E., Ukpebor, J.E., Aigbokhan, E., Goji, I., Onojeghuo, A.O., and Okonkwo, A.C.
(2010). Delonix regia and Casuarina equisetifolia as passive biomonitors and as

`
125
bioaccumulators of atmospheric trace metals. Journal of Environmental sciences, 22(7),
1073-1079.
Shukla, S., Sharma, R. B., and Sahu, M. (2019). Dust Pollution Affect Morpho-physiological
traits of Plant Mangifera indica Linn. Int. J. Bot, 15, 1-4.
Samal, K., Kar, S., Trivedi, S. (2019). Ecological floating bed (EFB) for decontamination of
polluted water bodies: Design, mechanism and performance. Journal of environmental
management, 251, 109550.
Tong, C.H., Yang, X.E., Pu, P.M. (2003) Effects and Mechanism of Hydrophytes on Control of
Release of Nutrient Salts in Lake Sediment. J. Agro Environ. Sci. 2003, 22, 673–676.
Steenhoudt, O.; Vanderleyden, J. Azospirillum, a free-living nitrogen-fixing bacterium closely
associated with grasses: Genetic, biochemical and ecological aspects. FEMS Microbiol.
Rev 2000, 24, 487–506.
Zimmels, Y.; Kirzhner, F.; Malkovskaja, A. Application and features of cascade aquatic plants
system for sewage treatment. Ecol. Eng. 200