
UNN42 Vol. 6 - World Bank Documents
414
RESTRICTED For official use only Not for . UNN42 Vol. 6 REPORT TO THE PRESIDENT OF THF, INTERNATIONAL BANK FOR RECONSTRUCTION AND DEVELOPMENT AS ADMINISTRATOR OF THE INDUS BASIN DEVELOPMENT FUND STUDY OF THIE WATER AND POWER RESOURCES OF WEST PAKISI AN VOLUME III Program for the Development of Surface Water Storage Prepared by a Group of the World Barnk Staff Headed by Dr. P. Lieftinck July 28, 1967 i R0 C FPU-F Public Disclosure Authorized Public Disclosure Authorized Public Disclosure Authorized Public Disclosure Authorized Public Disclosure Authorized Public Disclosure Authorized Public Disclosure Authorized Public Disclosure Authorized
-
Upload
khangminh22 -
Category
Documents
-
view
1 -
download
0
Transcript of UNN42 Vol. 6 - World Bank Documents
RESTRICTED
For official use onlyNot for .
UNN42Vol. 6
REPORT TO THE PRESIDENT OF THF,
INTERNATIONAL BANK FOR RECONSTRUCTION AND DEVELOPMENT
AS ADMINISTRATOR OF THE INDUS BASIN
DEVELOPMENT FUND
STUDY OF THIE WATER AND POWER RESOURCES OF WEST PAKISI AN
VOLUME III
Program for the Development of Surface Water Storage
Prepared by a Group of the World Barnk Staff
Headed by
Dr. P. Lieftinck
July 28, 1967
i R0 C FPU-F
Pub
lic D
iscl
osur
e A
utho
rized
Pub
lic D
iscl
osur
e A
utho
rized
Pub
lic D
iscl
osur
e A
utho
rized
Pub
lic D
iscl
osur
e A
utho
rized
Pub
lic D
iscl
osur
e A
utho
rized
Pub
lic D
iscl
osur
e A
utho
rized
Pub
lic D
iscl
osur
e A
utho
rized
Pub
lic D
iscl
osur
e A
utho
rized

ClJRRENCY EQUIVALENTS
4.76 rupees = U.S. $1.001 rupee = U.S. $0. 211 millior rupees = U. S. $210, 000
TABLE OF CONTENTSPage No.
I, INTRODUCTION 1..........- 1
II-.. SURFACE. WATER HYDROLOGY. .3 .. . .. , 3
Meteorological and GeographicalI Factors, .................... 3Discharge- Measurement and River. F-lows- ... ....... 4... .. ,4
Sediment-.Movement ..... v...............8....... 8.Floods- .JO,:,. ,10:
III.. HISTORICAL. USE OF SURFACE WATER, . . . . 12
Development of- the. System ....... ... 12
IV.. THE IACA APPROACH ..... 17
Method- of Analysis. ........... v.. 17Surface. Water Re.quirements;. ........ r19.Integration, of.Surface and Groundwater Supplies' .. 22Storable. Water. . 23Balancng- of Irrigation and Power..-Requi:rements.. 25Future. River Regime ... . .. 27Accuracy- of Basic. Data . ....................... , ,,.. . 27
Vt., IDENTIFICATION OF DAM'SITES AND, COMPARISON OF. PROJECTS' 29:
S'cope of-the Studies ... 29.A. The Valley of the Indus,.......... 31
Suitability of the- Valley, for: Reservoir' Storagel 31
A(l.) The Middle Indus-. . . ...........-.. 31Tarbela.Projject- . . . . .. 32Side Valley- ProjS'ectsi Associatedt w-ithTar.bela ... 36
The Gariala' Site ......... . 36The. Dhok Pathan S.te . .. ... . 39The Sanjwal-Akhori S'ites -.- , ... 40-
The Attock Site .. ......... ,41Kalabagh Project-. .-... .- ... ., 41.Side Valley Projects- Associated with,Kalabagh ....i 43
Makhad Pumped Storage .4.. . 144Gariala Pumped- Storage. ...... . 44Dhok. Abakka Pumped Storage . 44,
Summary of Middle' Indus- Sites; .v.._....r..... 44
A(2) Upper- Indus- Sites' ............ 145
Skardu . . 45Other Upper Indus Sites . .47
TABLE-OF CONTENTS(Cont'd) Page No.
A(3) Sites in the Plains ...... ................ 47
Indus Plains Reservoir ..... ......... 47.Chasma Project ...... ................ 49Sehwan-Manchar Project ..... ......... 50
Summary of Upper Indus Sites and ofSites in the Plains ...... ............... 51
B. The Jhelum River Basin ......................... 51Project for Raising Mangla ..... ................ 52Rohtas Side Valley Storage ..... ................ 54The Rajdhani and Kanshi Sites ..... ............. 54Kunhar River Project ........................... 54Summary of Storage Potentials on the Jhelum .... 55
C. The Chenab River Basin ......................... 56
D. The Kabul River Basin .......................... 56The Kabul River Sites .......................... 56The Chitral River .............................. 57The Swat River ....... .......... 57A Project at Ambahar ........................... 57Associated Projects ............................ 58Warsak Diversion Plan .......................... 58Chitral Diversion Plan ......................... 59Summary of Sites in Kabul River Basin .... ...... 59
VI. FACTORS IN THE OPERATION OF SURFACE WATER STORAGERESERVOIRS .......................................... 63
Coordination of Power and Irrigation Requirements .. 63The Drawdown Level at Mangla - Up to 1975 .... ...... 64The Drawdown Level at Mangla - After 1975 .... ...... 66The Drawdown Level at Mangla - Bank Group Studies .. 66Raising Mangla for Power ........................... 66The Sediment Problem at Tarbela ..... ............... 69The Tarbela Drawdown Problem ....................... 70The Operational Problem of Gariala .... ............. 74Operational Problems at Kalabagh ..... .............. 75Kalabagh with Sediment Sluicing ..... ............... 76Kalabagh without Sediment Sluicing ..... ............ 77
VII. THE SEQUENCE OF PROJECTS FOR DEVELOPING SURFACE WATERSTORAGE .............. ................................ 81
First Stage Storage ........ ........................ 82Alternatives for Period to 1975 ...... .............. 84Slow Growth ........... ............................. 86High Growth ............... .......................... 86Post-Tarbela ........... ............................ 87Sehwan-Manchar .......... ........................... 88
TABLE OF CONTENTS(Cont'd) Page No.
Raised Mangla ........................ 90Kalabagh ........................ 90Swat ........................ 91Gariala ........................ 91Other Projec-ts ........................ 91Conclusions ........................ 94
VIII. PROGRAM FOR INVESTIGATIONS ............. .............. 95
Past Experience .................................. 95Basis for Programming .............................. 96Type of Investigations .............................. 96
Detailed Program .................................. 97
Sehwan-Manchar ..................................... 99Raised Mangla .................................. 99Indus Plains . .................................. 99
Kalabagh ............. ..................... 99
Gariala ..... 100Skardu ............................................ 101Ambahar ..... 102
General Considerations and Conclusions .... ......... 102
IX. FINANCIAL REQUIREMENTS AND COST COMPARISONS .... ...... 105
Requirements Outside IACA Range of Growth Rates .... 110IACA Requirements .................................. 111
X. FINDINGS AND CONCLUSIONS ............................. 112
Chas. T. Main's Recommended Program .... ............ 113Tarbela ........... ................................. 114Benefits ........... ................................ 115Post-Tarbela ......... .............................. 116Sehwan-Manchar ........ ............................. 117
Raised Mangla . ...................................... 117Kalabagh ........... ................................ 117Swat . .............................................. 118
Gariala ............ ................................ 118Skardu . ............................................ 119
Investigations ........ ............................. 119
Financial Requirements ............................. 120
ARTIST'S SKETCH: Tarbela Dam Project .... ........ Frontispiece
MAPS FollowingPage No.
III.1 Development Plan for the Indus RiverSystem . ...................................... 4
III.2 Gross Commanded Areas of the Indus &
Jhelum-Cum-Chenab Rivers ...... ............... 18
TABLE OF CONTENTS(Cont 'd) Following
Page No.
III.3 Dam Sites of the Indus Basin ..... ............. 32
III.4 Tarbela and Kalabagh with Associated SideValley Storage Schemes ...... ................. 32
FIGURES
1. Mean Monthly Discharge: Indus, Jhelum andChenab Rivers ........... 6
2. Estimated Average Sediment Transport of IndusRiver at Darband .............. 10
3. Historical Usage of Available Surface Water inthe Indus River Basin of West Pakistan ....... 14
4. Projected Usage of Available Surface Water inthe Indus River Basin of West Pakistan ....... 20
5. IACA's Estimate of the Mean-year Demand forStored Water on the Jhelum and Indus Rivers .. 24
6. Average Annual Yield and Efficiency of StorageCapacity on the Indus and Jhelum Rivers ... 26
7. Schematic Plan of the Tarbela Dam Project ... 34
8. Schematic Plan of the Dhok Pathan Dam Project . 40
9. Schematic Plan of the Kalabagh Dam Project 42
10. Schematic Plan of the Skardu Dam Project ... 46
11. Development Program for the Jhelum River ... 66
12. Possible Dam Sites in West Pakistan ... 82
13. Tarbela as First Stage Development on theIndus River .82
14. Kalabagh as First Stage Development on theIndus River .84
15. Alternative Growth Rates of the Total Mean-yearDemand for Stored Water on the Jhelum and IndusRivers .86
16. IACA's Estimate of the Total Mean-year Demandfor Stored Water on the Jhelum and IndusRivers .88
TABLE OF CONTENTS(Cont') Following
Page No.
17. Kalabagh as Second Stage Development on theIndus River ............ ...................... 90
18. Gariala as Second Stage Development on theIndus River ......... 92
APPENDIX
Terms of Referenceand
Guidelines for Dam Site Consultant
ANNEXES
1 TARBELA PROJECT
2 KALABAGH PROJECT
3 GARIALA PROJECT
4 SKARDU PROJECT
5 AMBAHAR PROJECT
6 KUNHAR PROJECT
7 MANGLA/RAISED MANGLA PROJECT
8 CHASMA PROJECT
9 SEHWAN -MANCHAR AND CHOTIARI PROJECTS

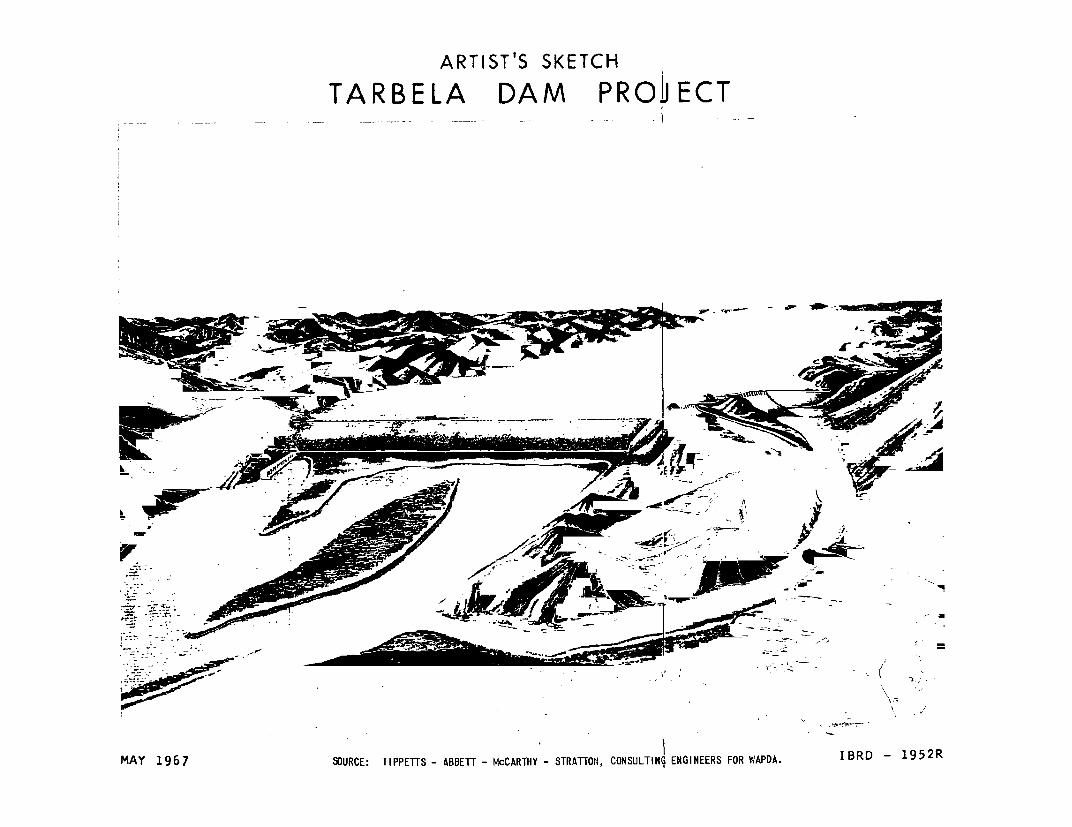
ARTIST'S SKETCH
TARBELA DAM PROJ ECT
MAY 1967 SOURCE: TIPPETfS ABBETr - McCARTHY STRATTON, CONSULTING ENGINEERS FOR WAPDA. I,BRD 1952R

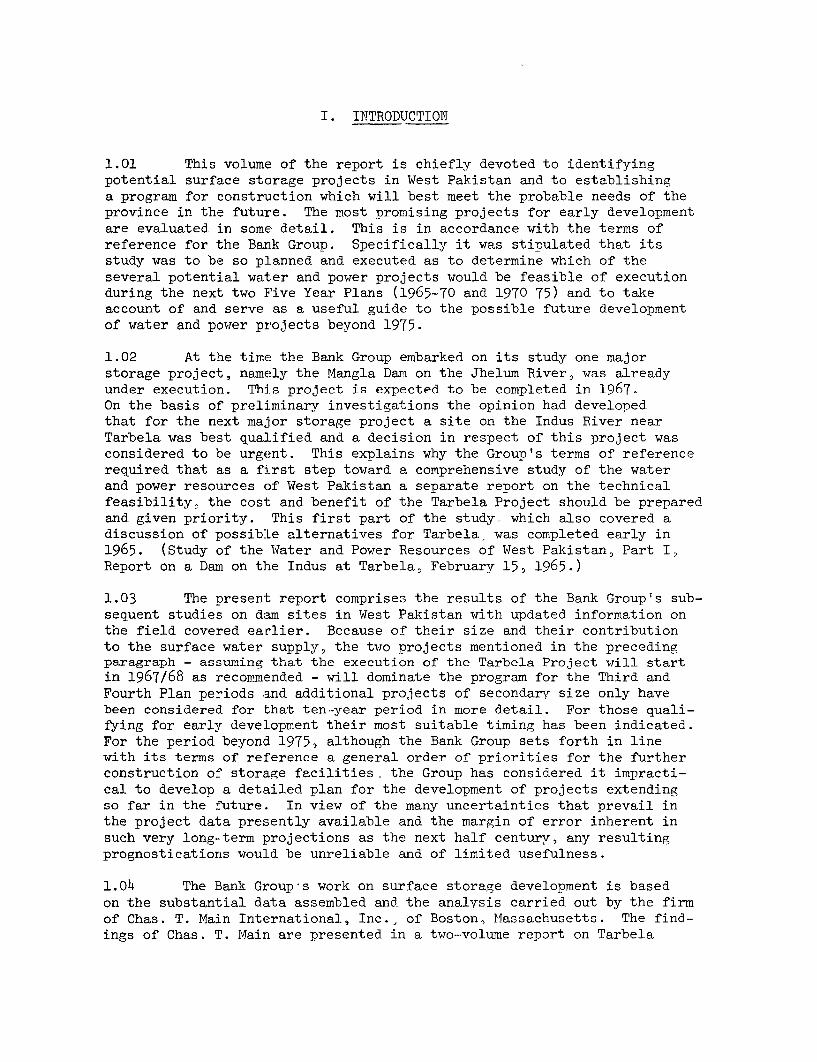
I. IFTRODUCTION
1.01 This volume of the report is chiefly devoted to identifyingpotential surface storage projects in West Pakistan and to establishinga program for construction which will best meet the probable needs of theprovince in the future. The most promising projects for early developmentare evaluated in some detail. This is in accordance with the terms ofreference for the Bank Group. Specifically it was stinulated that itsstudy was to be so planned and executed as to determine which of theseveral potential water and power projects would be feasible of executionduring the next two Five Year Plans (1965-70 and 1970 75) and to takeaccount of and serve as a useful guide to the possible future developmentof water and power projects beyond 1975.
1.02 At the time the Bank Group embarked on its study one majorstorage project, namely the Mangla Dam on the Jhelum River 9 was alreadyunder execution. This project is expected to be completed in 1967.On the basis of preliminary investigations the opinion had developedthat for the next major storage project a site on the Indus River nearTarbela was best qualified and a decision in respect of this project wasconsidered to be urgent. This explains why the Group's terms of referencerequired that as a first step toward a comprehensive study of the waterand power resources of West Pakistan a separate report on the technicalfeasibility, the cost; and benefit of the Tarbela Project should be preparedand given priority. This first part of the study. which also covered adiscussion of possib:Le alternatives for Tarbela, was completed early in1965. (Study of the lWater and Power Resources of West Pakistan, Part I,Report on a Dam on the Indus at Tarbela. February 159 1965.)
1.03 The presen-t report comprises the results of the Bank Group's sub-sequent studies on dam sites in West Pakistan with updated information onthe field covered earlier. Because of their size and their contributionto the surface water supply, the two projects mentioned in the precedingparagraph - assuming that the execution of the Tarbela Project will startin 1967/68 as recommended - will dominate the program for the Third andFourth Plan periods and additional projects of secondary size only havebeen considered for that ten-year period in more detail. For those quali-fying for early development their most suitable timing has been indicated.For the period beyond 1975, although the Bank Group sets forth in linewith its terms of reference a general order of priorities for the furtherconstruction of storage facilities, the Group has considered it impracti-cal to develop a detailed plan for the development of projects extendingso far in the future. In view of the many uncertainties that prevail inthe project data presently available and the margin of error inherent insuch very long--term projections as the next half century, any resultingprognostications would be unreliable and of limited usefulness.
l.o4 The Bank Group's work on surface storage development is basedon the substantial data assembled and the analysis carried out by the firmof Chas. T. Main International, Inc., of Boston, Massachusetts. The find-ings of Chas. T. Main are presented in a two-volume report on Tarbela

dated November 1964 and a six-volume Comprehensive Report entitledt'Program for Development of Surface Storage in the Indus Basin and Else-where within West Pakistan," dated August 1966. This part of the BankGroup's report reproduces those sections of the Chas. T. Main reportswhich are necessary to an understanding of the conclusions and recommen-dations presented herein. The power aspects of this report have beenbased on the work of Stone & Webster Overseas Consultants Inc. (Stone &Webster) of New York. The estimated surface water needs insofar as theywere basic for the storage program were developed as part of the irrigationand agriculture studies carried out for the Bank Group by the followingconsultant firms: Sir Alexander Gibb & Partners, London; InternationalLand Development Consultants N.V., (ILACO), Arnhem, Holland: and HuntingTechnical Services Limited, (HTS), London, who formed the Irrigation andAgriculture Consultants Association (IACA), under the general coordinationof Sir Alexander Gibb & Partners.
1.05 Because of the importance of giving guidance to the Bank'sconsultant, Chas. T. Main, as to which of the potential projects appearsufficiently promising for more thorough examination, an advisory com-mittee was established early in the study. This Dam Sites Committeeconsisted of a chairman and one other member from the Bank Study Groupand two members representing the Government of Pakistan. The Committeeheld eight meetings, five in Lahore, two in Boston and one in Washington.At these meetings intensive discussions took place and guidance was givento Chas. T. Main, who attended each of the sessions and provided the staffwork necessary for the Committee's deliberations. In addition to theselection of the order of priority of projects for investigation, theCommittee, on the basis of the Chas. T. Main recommendations, decided anumber of issues concerning the treatment of various aspects of water-storage sites and ensured coordination in the consideration of availableinformation.
- 3 -
EI. SURFACE WATER HYDROLOGY
2.01 An analysis of the hydrological factors affecting the Indus Basinproduces one inescapable conclusion: control of the Indus River itselfwill ultimately be essential to control of the surface water supply. Thisfollows from the simple observation that the Indus River carries 63 percentof the total surface water that is available to West Pakistan for developmentunder the terms of the Indus Waters Treaty 1960 and that 72 percent of itsflow occurs during the four-month period, June to September. Without storage,some large proportion of Indus water must inevitably run waste to the sea.
Meteorological and Geographical Factors
2.02 The hydrology of the Indus River's system as a whole, as wellas that of the Indus itself with its large floods and seasonal fluctuations,results from the annual meteorological cycle. This cycle is characterizedby four periods.
(1) October to November: - Following the humid summer heat apersistent high pressure system gradually develops overthe Ind.us Plains. It is generally a period of settledfine weather.
(2) December to March: - By mid-winter, areas of low pressurefrom the Mediterranean occasionally gain sufficient strengthto carry over the land masses and mountains to the west,forming a steady procession of secondary lows. These giverise in the northern part of the country to overcast condi-tions with steady mild rain for several days at a time.The southern part of the country remains clear.
(3) April to June: - The principal meteorological disturbancesare local convective thunderstorms. Few of them, however,produce rain and then only in small widely scattered areas.
(4) July to September: - A persistent area of low pressuredevelops over the northern central plains and humidity rises.The monsoon rains occur during this season. The southeastmonsoon moves up the Indo-Gangetic Plain from the south-east, but by the time it reaches the Punjab Plains it isnearing the end of its travel and is consequently unpredict-able as to the amount of rain it may produce. The southwestmonsoon, which moves up the lower Indus Valley is more re-liable, but weaker at its source. Occasionally, moist airmasses from both sources converge over the Punjab and theheadwaters of the Indus system. This results in intenseand sometimes prolonged rainfall.
- 4 -
2.03 It is in this last period, the July to September monsoon period,that most of the annual precipitation occurs. Torrential rains may producea third of the year's rainfall in a day. (The mean annual precipitation onthe plains ranges from less than 4 inches in parts of the Sind in the Southto more than 30 inches at the foothills of the mountains.)
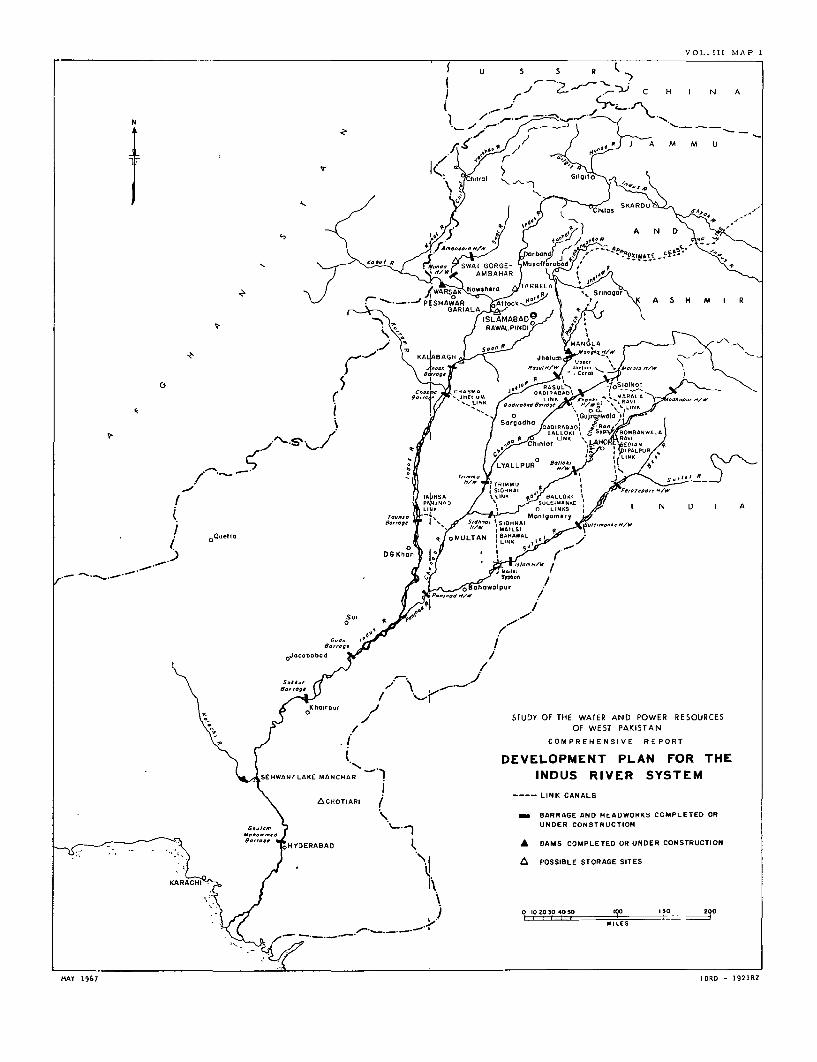
2.04 The hydrological character of the Indus River's system is alsoinfluenced by the fact that the Indus and its principal tributaries, theKabul, Jhelum, Chenab, Ravi, Beas and Sutlej, (as shown on Map III.1) allhave their sources at elevations exceeding 15,000 feet. 1/ Precipitationon the mountain ranges accumulates in the form of snow, particularly duringthe winter. The snowmelt, resulting from the rising temperatures in spring,causes an early rise in the flow of the rivers, and accounts for a consider-able proportion of their annual discharge. A study of the hydrographs ofthe Indus at Darband has led to the tentative conclusion that about half ofthe total annual flowJ is derived from snowmelt.
2.05 The runoff from the monsoon rain is superimposed on the basicflows derived from snowmelt. This results in high discharges on all riversduring July, August and early September.
Discharge Measurement and River Flows
2.o6 These river flows have fortunately been measured over a consider-able period of time. The first records of gauge height were made on theIndus at Attock in 1868; the next were on the Chenab at Alexandria Bridgein 1879. Regular discharge measurements were undertaken later by the Irri-gation Department at the various barrages on the plains as they were com-pleted. The most important gauging stations for which extensive recordsexist, are the so-called "rim"? stations, where the rivers leave the hillsand enter the plains. These records have been studied by the Bank's con-sultants, who have concluded that the discharge figures prior to 1922 areprobably less accurate than those for subsequent years. Therefore, forpurposes of this study the years 1922 through 1963 have been used. 2/ This41-year period is considered to be adequate as a basis for planning pur-poses. The network of gauging stations is being rapidly extended, 61 newstations having been installed since 1960, so that valuable information onthe secondary rivers will become available in due course.
2.07 On the basis of the rim station measurements the average annualdischarge of the rivers is shown in Table 1. Also showm are the maximnumand minimum yearly flows of record.
1/ All levels are in feet above Standard Pakistan Datum (SPD) which isbased on mean sea level, Karachi.
2/ Unless otherwise noted, hydrological years, which extend from October 1to September 30 of the following year, have been used.


VOL. 111 MAP I
U S S R
A LIAB A M C U
- ~ ~ ~w LMYALLPU ) -.
) je/ARADoS t , \~~~~~~SKA
t~~~~~~~~~~~~~~d SWA GORAWLEND -
+ / -# V hAWI~~~~~ ~ ~~~~~~~~~ ~~AMBAGHA Ar9H P -
I-.- -. esLN SA1 r STUd O T WATER A POWER,a aRESORCE
PESHAWAR toA HMO WS PA S T
> TAiNSA / COMPRKEHESV fRoEPORT /
( erOPJ$O -t ~ ~ ~~~~~~~~~~~~~ ~~GAIL zI M¢AAD Mo IgtwomeHt
i ~ ~ ~ ~ ~ ~ ~ ~ ~ EEOMN PLA FOR THEALI
SEHWAN/LAKENANCHAR INDUS RIVERASYSTEM
ACHOTIARI ~~~~~~~~A . LIN. CANAL
rBARRAN EORN C T O
UNDE CORTUCIO
1jit~~~~~~~~~~~~~n. Tf
PJNSA LIN A POSBALEL TRG IE
MAYove 1967 IBRB-. I !
oJocobobcd ~ ~ ~ ~ ~~~l~ 0 LIN
I~~~~~~~~~~~~~~~~~~~~~~~~SD MA HIWJ'>
No rs) j ~~~~~~~~~~STUDY OF THE WATER AND POWER RESOURCES
\;$ ,J . 4 ~~~~~~~~~~~~~~~~~~CO MP RE HE NS I VE R EP OR T
A | ts ~~~~DEVELOPMENT PLAN FOR THE
eEHwAN/LAKE NANCHOTARI LINK CANALS
\ ACHOTIARI ( ~~~~~~BARRAGE AND HEADWORKS COMPLETED OR
c*oJcy 5 ~~~~~~~~} ~UNDER CONSTRUCTION
R~~~~~~~ fo~~~~~~~HYDERABAD *DAMS COMPLETED OR UNDER CONSTRUCTION
[ 1/ * \'i t ~~~~~~~~~~~~~POSSIBLE STORAGE SITES
KARA MII
: - ,>! ~~~~~~~~~~~~~~~~~~~~~~0 10 20 3040 50 100OE 150 200
MAY 1967 IBRD -1921R2

- 5 -
Table 1
Annual Discharge of the Indus, Jhelum. Chenab Rivers(I¢AF) a/
DischargeRiver Location Mean Minimuim Maximum
Indus Attock 93 72 110JheLum Mangla 23 -15 33Chenab Marala 2 19 37
1)42
a/ Million acre-feet.
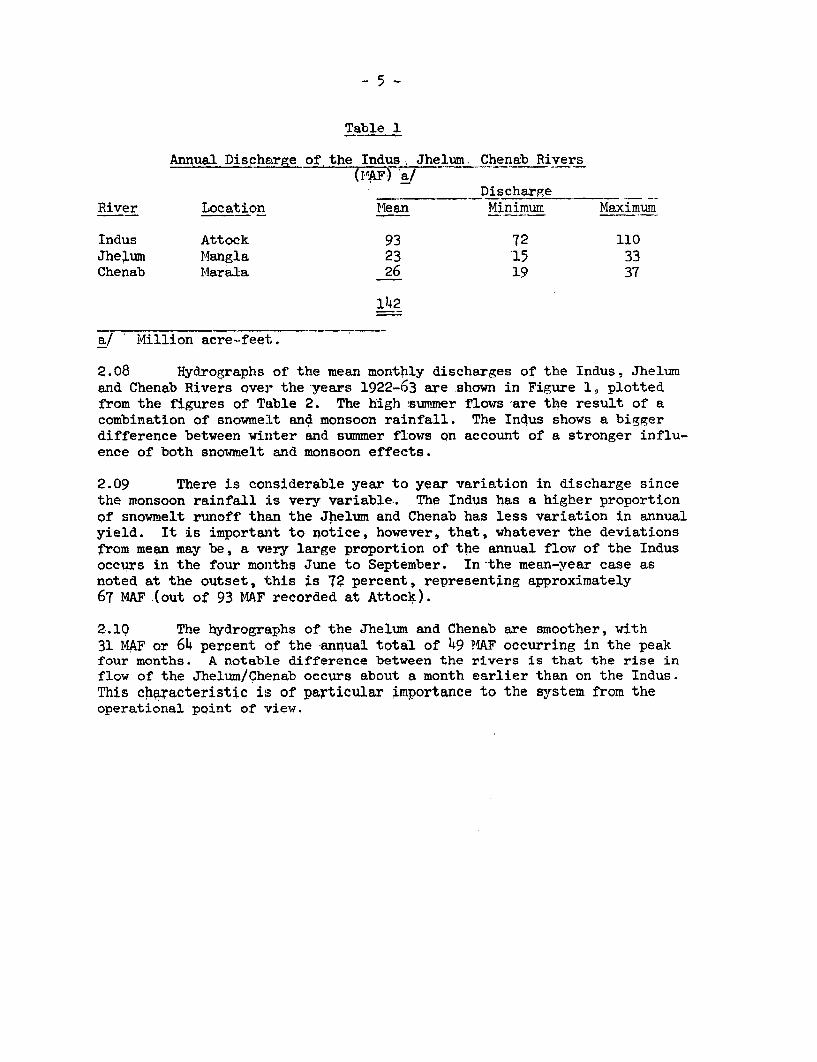
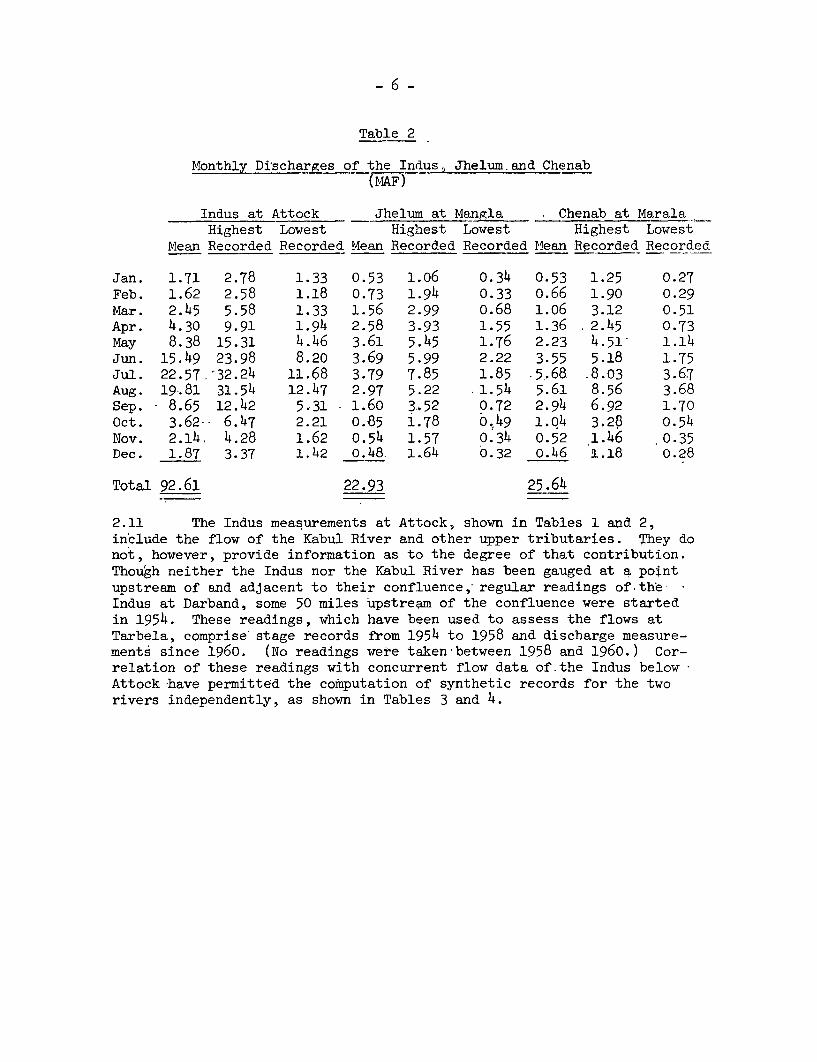
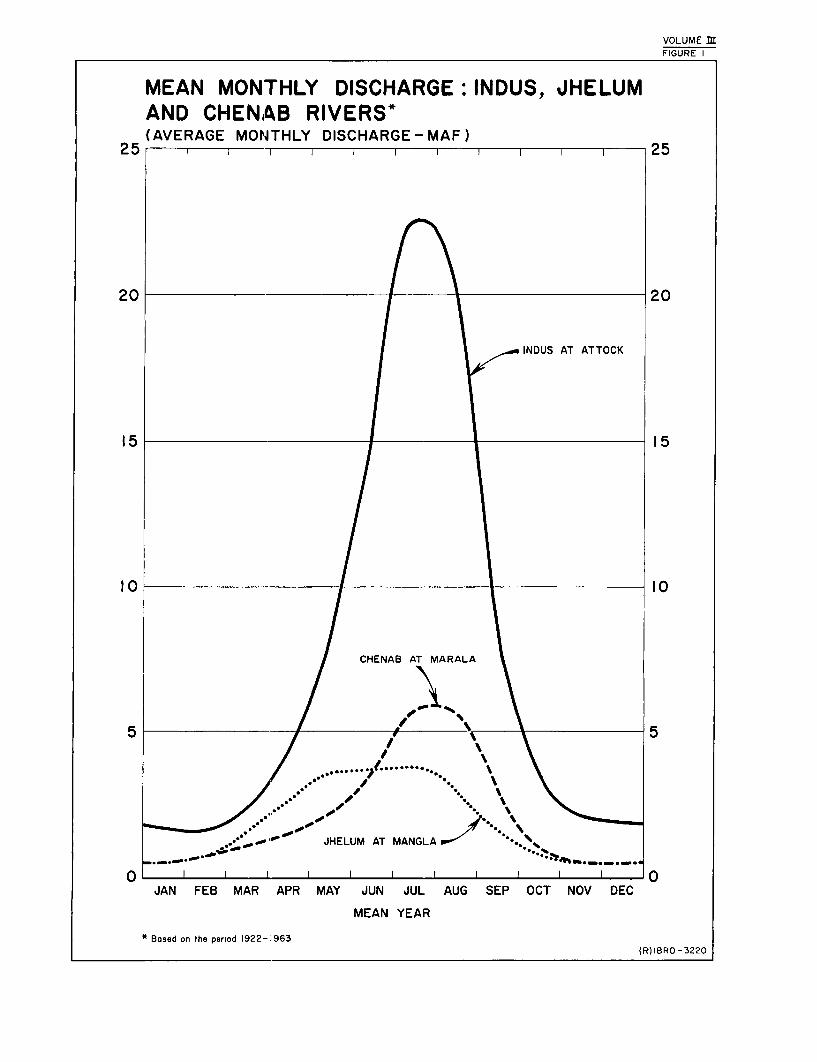
2.08 Hydrographs of the mean monthily discharges of the Indus, Jhelumand Chenab Rivers over the years 1922-63 are shown in Figure 1, plottedfrom the figures of Table 2. The high :summer flows are the result of acombination of snowmelt and monsoon rainfall. The Indus shows a biggerdifference between winter and summer fl-ows on account of a stronger influ-ence of both snowmelt and monsoon effects.
2.09 There is considerable year to year variation in discharge sincethe monsoon rainfall :is very variable.. The Indus has a higher proportionQf snowmelt runoff than the Jhelum and Chenab has less variation in annualyield. It is important to notice, however, that, whatever the deviationsfrom mean may be, a very large proportion of the annual flow of the Indusoccurs in the four months June to September. In-the mean-year case asnoted at the outset, this is 7? percent, representing approximately67 MAF (out of 93 MAF recorded at Attock).
2.10 The hydrographs of the Jhelum and Chenab are smoother, with31 MAF or 64 percent of the annual total of 49 MAF occurring in the peakfour months. A notabLe difference between the rivers is that the rise inflow of the Jhelum/?henab occurs about a month earlier than on the Indus.This characteristic is of particular importance to the system from theoperational-point of view.
- 6 -
Table 2
Monthly Discharges of the Indus, Jhelum.and Chenab(MIAF)
Indus at Attock Jhelum at Mangla Chenab at Marala
Highest Lowest Highest Lowest Highest Lowest
Mean Recorded Recorded Mean Recorded Recorded Mlean Recorded Recorded
Jan. 1.71 2.78 1.33 0.53 1.06 0.34 0.53 1.25 0.27Feb. 1.62 2.58 1.18 0.73 1.94 0.33 o.66 1.90 0.29Mar. 2.45 5.58 1.33 1.56 2.99 o.68 1.06 3.12 0.51Apr. 4.30 9.91 1.94 2.58 3.93 1.55 1.36 2.45 0.73
May 8.38 15.31 4.46 3.61 5.45 1.76 2.23 4.51' 1.14Jun. 15.49 23.98 8.20 3.69 5.99 2.22 3.55 5.18 1.75Jul. 22.57,-32.24 11.68 3.79 7.85 1.85 .5,.68 -8.03 3.67Aug. 19.81 31.54 12.47 2.97 5.22 .1.54 5.61 8.56 3.68Sep. 8.65 12.42 5.31 1.60 3.52 0.72 2.94 6.92 1.70Oct. 3.62- 6.47 2.21 0.85 1.78 0o49 1.o4 3.28 0.54Nov. 2.14 4.28 1.62 0.54 1.57 0.34 0.52 1.46 .0.35Dec. 1.87 3.37 1.42 o.48. 1i64 0.32 o.46 1.18 0.28
Total 92.61 22.93 25.64
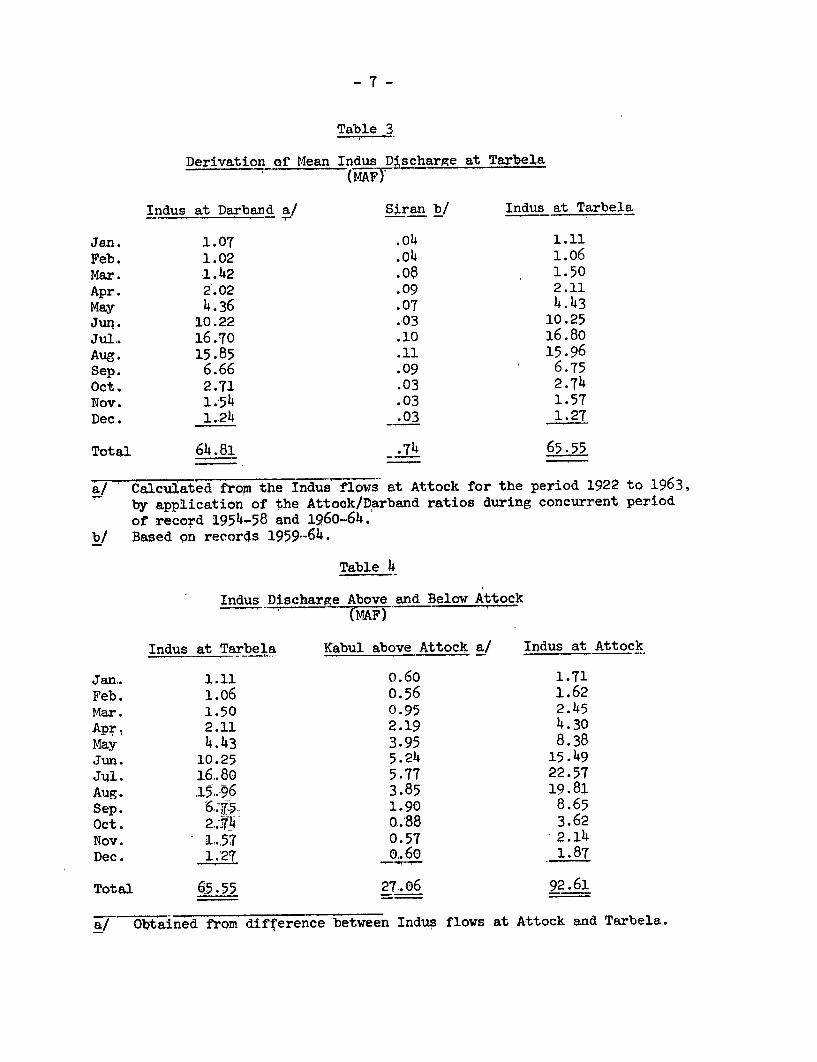
2.11 The Indus measurements at Attock, shown in Tables 1 and 2,in'clude the flow of the Kabul River and other upper tributaries. They donot, however, provide information as to the degree of that contribution.Though neither the Indus nor the Kabul River has been gauged at a pointupstream of and adjacent to their confluence,-regular readings of,the-Indus at Darband, some 50 miles 'upstream of the confluence were startedin 1954. These readings, which have been used to assess the flows atTarbela, comprise'stage records from 1954 to 1958 and discharge measure-ments since 1960. (No readings were taken between 1958 and 1960.) Cor-relation of these readings with concurrent flow data of.the Indus belowAttock-have permitted the computation of synthetic records for the tworivers independently, as shown in Tables 3 and 4.
VOLUME mFIGURE I
MEAN MONTHLY DISCHARGE: INDUS, JHELUMAND CHENAB RIVERS*(AVERAGE MONTHLY DISCHARGE-MAF)
25 I I I I I I W 25
20 20
INDUS AT ATTOCK
CHENAB AT MARALA
5 / 5
..... 1'.t.......
JHELUM AT MANGLA
JAN FEB MAR APR MAY JUN JUL AUG SEP OCT NOV DEC
MEAN YEAR
* Based on the period 1922-1963(R)IBRD-3220

-7-
Table 3
Derivation of Mean Indus Discharge at Tarbela(MAF)
Indus at Darband a/ Siran b/ Indus at Tarbela
Jan. 1.07 .04 1.11Feb, 1.02 .04 1.o6Mar. 1.42 .o8 1.50Apr. 2.02 .09 2.11May 4.36 .07 4.43Jun. 10.22 .03 10.25Jul. 16.70 .10 16.8oAug, 15.85 .11 15.96Sep. 6.66 .09 6.75
Oct. 2.71 .03 2.74Nov. 1.54 .03 1.57Dec. 1.24 .03 1.27
Total 64.81 _.74 65.55
a/ Calcuiated from the Indus flows at Attock for the period 1922 to 1963,
by application of the Attock/Darband ratios during concurrent period
of record 1954-58 and 1960-64.b/ Based on records 1959-64.
Table 4
Indus Discharge Above and Below Attock
(MAF)
Indus at Tarbela Kabul above Attock a/ Indus at Attock
Jan.. 1.11 0.60 1.71
Feb. 1.06 0.56 1.62Mar. 1.50 0.95 2.45Apr. 2.11 2.19 4.30
May 4.43 3.95 8.38Jun. 10.25 5.24 15.49
Jul. 16.80 5.77 22.57
Aug. 15.96 3.85 19.81Sep. 6.15 1.90 8.65Oct. 2.J74 o.88 3.62Nov. 1.57 0.57 2.14Dec. 1.27 o.6o 1.87
Total 65.55 27.06 92.61
a! Obtained from difference between Indus flows At Attock and Tarbela.
- 8 -
2.12 Rounding off the figures of -Tables 2, 3 and 4, the estimatedannual contribution of each of the rivers to the surface water suppliesof the Indus Basin in West Pakistan is -as follows:
Table 5
Average Annual Contribution of Principal Rivers
Contribution(MAF) (percent)
Indus above Attock 66 45Kabul above Attock 27 18Total Indus below Attock 93 63Jhelium at Mangla 23 16-Chenab at Marala 26 18Others 5 3
147 100
It follows that the main stem of the Indus must be considered aprincipal supplier in any plan for the development of surface waterstorage in West Pakistan.
Sediment Movement
2.13 Any plan for the constructiQn of reservoirs in Pakistan mustinclude serious consideration of the problem of sedimentation. This isparticularly true if a reservoir on the-Indus is envisaged. For out ofapproximately 700 million tons of sediment transported by the river system,to (or through) the plains each year, the Indus River itself carries nearly540 million. (This compares with the estimated load of the Missouri Riverat Kansas City of 131 million tons a year, and of the Mississippi Riverbelow New Orleans of 600 million tons a year.) Given this fact, it mustbe recognized that a large loss of useful capacity by sedimentation willoccur in any reservoir on the Indus. It must also be recognized that onlya continuing program of silt measurement can serve to determine the precisedimensions of this problem and provide a basis for its solution.
2.14 Because the rate of sedimentation will have such a profoundeffect on the life of any Indus reservoir it has been necessary to makethe most of all available data, hoping thereby to establish a basis fora defensible judgment about the useful life of Tarbela as well as otherpossible reservoirs of the system. Following is a brief analysis of thesituation as it is known and a summary of the broad conclusions that canbe drawn from it.
2.15 The information used dates from 1960. Before then, records ofsediment measurements are considered unreliable because of-the sampling'techniques which were employed. Since 1960, howeyer, a fairly extensivenetwork of sampling stations has been established; on the Indus River inparticular, at Darband, 5,000 samples of water have been taken using
- 9 -
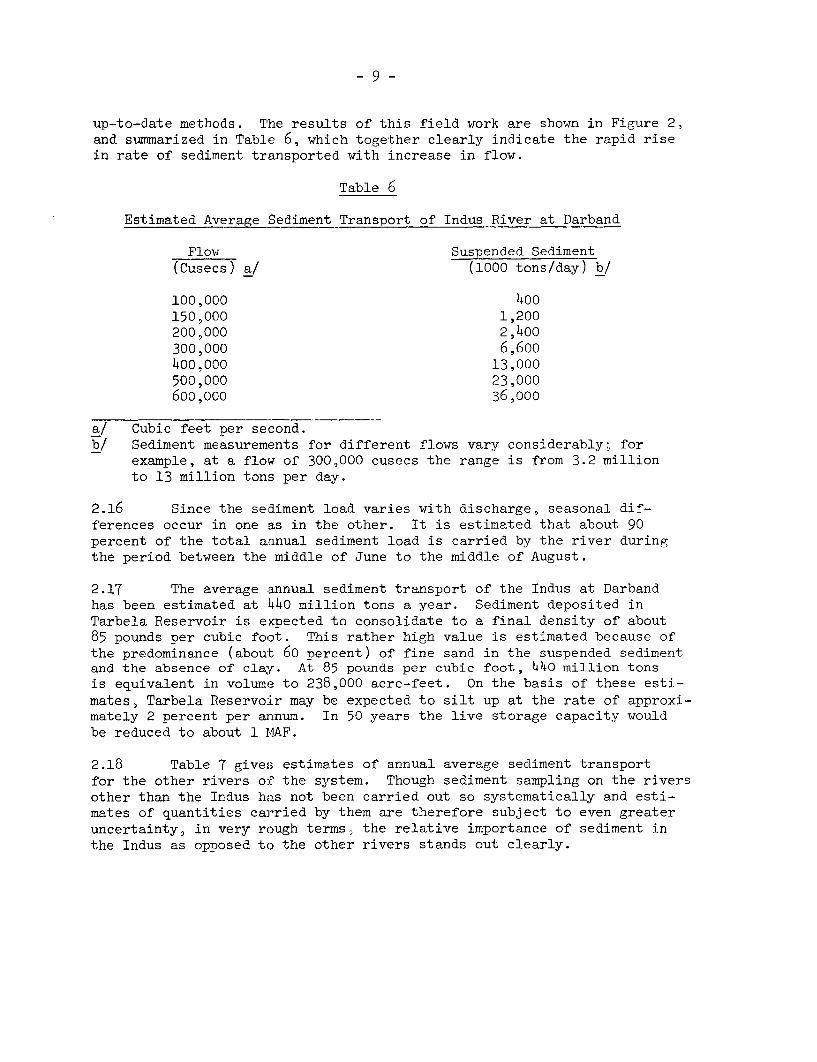
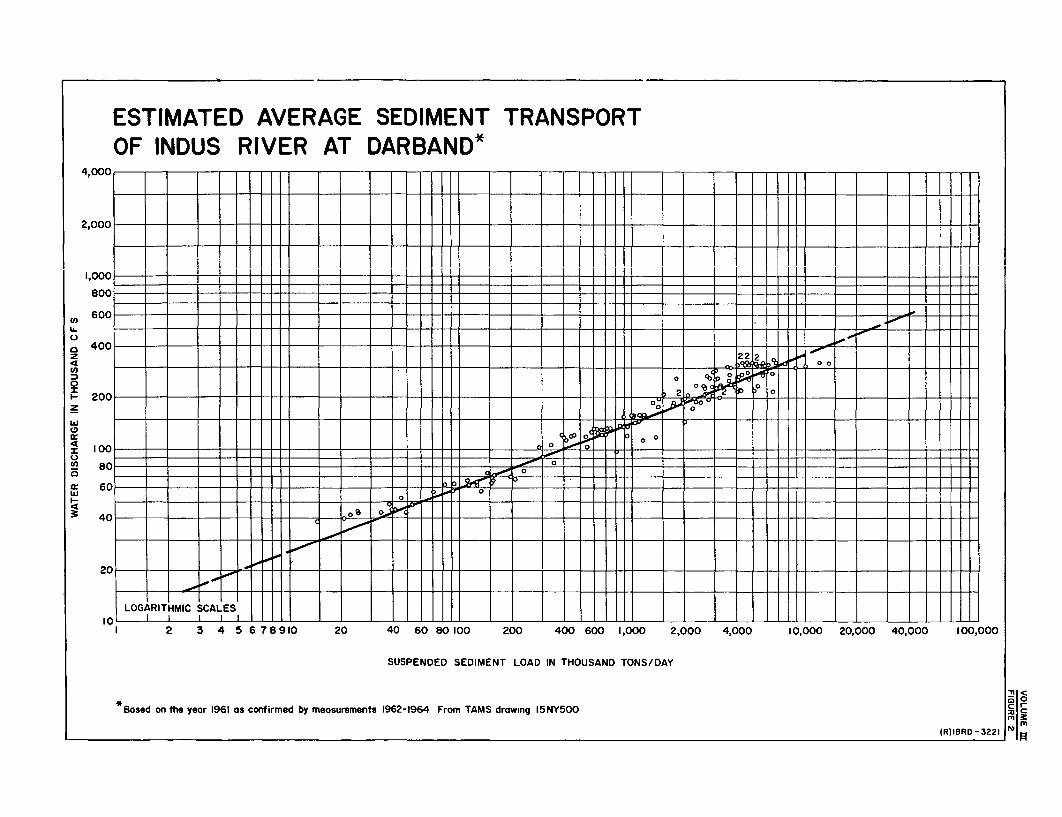
up-to-date methods. IThe results of this field work are shown in Figure 2,and summarized in Table 6, which together clearly indicate the rapid risein rate of sediment transported with increase in flow.
Table 6
Estimated Average Sediment Transport of Indus River at Darband
Flow Suspended Sediment(Cusecs) a! (1000 tons/day) b/
100,000 400150,000 1,200200,000 2,400300,000 6,600400o000 13,000500,000 23,000600,000 36,ooo
a/ Cubic feet per second.b/ Sediment measurements for different flows vary considerably; for
example, at a flow of 300,000 cusecs the range is from 3.2 millionto 13 million tons per day.
2.16 Since the sediment load varies with discharge, seasonal dif-ferences occur in one as in the other. It is estimated that about 90percent of the total aanual sediment load is carried by the river duringthe period between the middle of June to the middle of August.
2.17 The average annual sediment transport of the Indus at Darbandhas been estimated at 440 million tons a year. Sediment deposited inTarbela Reservoir is expected to consolidate to a final density of about85 pounds per cubic foot. This rather high value is estimated because ofthe predominance (about 60 percent) of fine sand in the suspended sedimentand the absence of clay. At 85 pounds per cubic foot, 440 million tonsis equivalent in volume to 238,000 acre-feet. On the basis of these esti-mates, Tarbela Reservoir may be expected to silt up at the rate of approxi-mately 2 percent per annum. In 50 years the live storage capacity wouldbe reduced to about 1 M4AF.
2.18 Table 7 gives estimates of annual average sediment transportfor the other rivers of the system. Though sediment sampling on the riversother than the Indus has not been carried out so systematically and esti-mates of quantities carried by them are therefore subject to even greateruncertainty, in very rough terms, the relative importance of sediment inthe Indus as opposed to the other rivers stands out clearly.
- 10 -
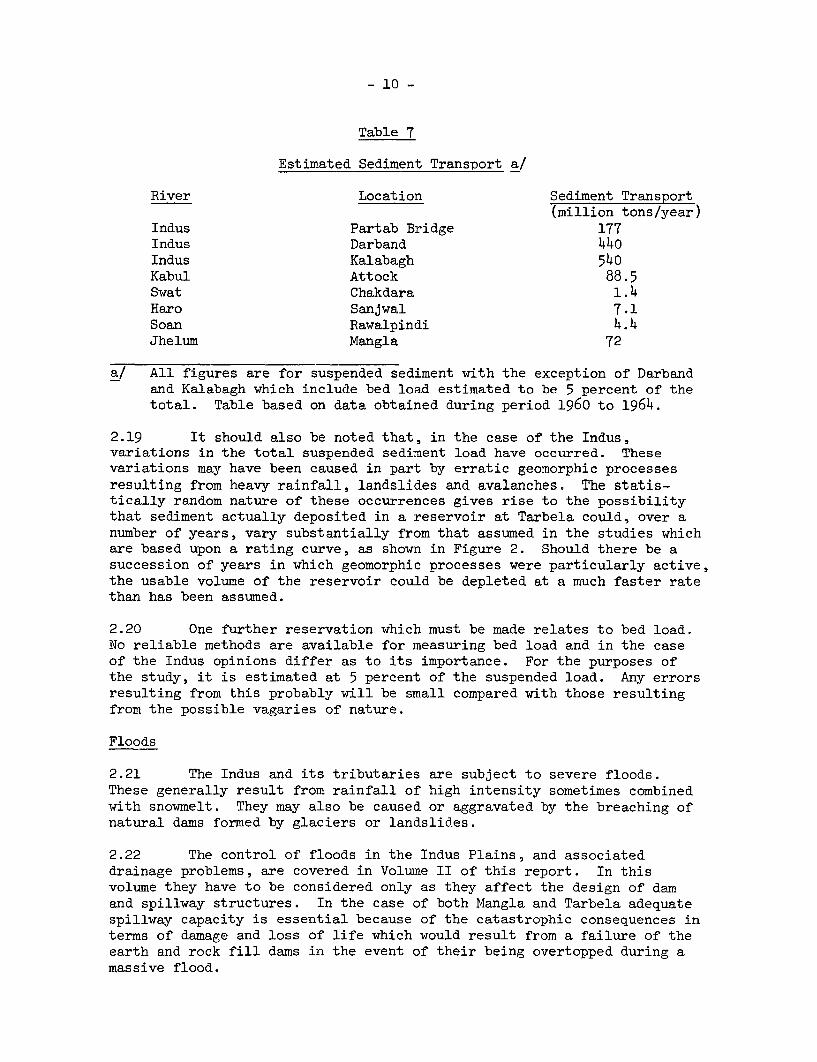
Table 7
Estimated Sediment Transport a/
River Location Sediment Transport(million tons/year)
Indus Partab Bridge 177Indus Darband 440Indus Kalabagh 540Kabul Attock 88.5Swat Chakdara 1.4Haro Sanjwal 7.1Soan Rawalpindi 4.4Jhelum Mangla 72
a/ All figures are for suspended sediment with the exception of Darbandand Kalabagh which include bed load estimated to be 5 percent of thetotal. Table based on data obtained during period 1960 to 1964.
2.19 It should also be noted that, in the case of the Indus,variations in the total suspended sediment load have occurred. Thesevariations may have been caused in part by erratic geomorphic processesresulting from heavy rainfall, landslides and avalanches. The statis-tically random nature of these occurrences gives rise to the possibilitythat sediment actually deposited in a reservoir at Tarbela could, over anumber of years, vary substantially from that assumed in the studies whichare based upon a rating curve, as shown in Figure 2. Should there be asuccession of years in which geomorphic processes were particularly active,the usable volume of the reservoir could be depleted at a much faster ratethan has been assumed.
2.20 One further reservation which must be made relates to bed load.No reliable methods are available for measuring bed load and in the caseof the Indus opinions differ as to its importance. For the purposes ofthe study, it is estimated at 5 percent of the suspended load. Any errorsresulting from this probably will be small compared with those resultingfrom the possible vagaries of nature.
Floods
2.21 The Indus and its tributaries are subject to severe floods.These generally result from rainfall of high intensity sometimes combinedwith snowmelt. They may also be caused or aggravated by the breaching ofnatural dams formed by glaciers or landslides.
2.22 The control of floods in the Indus Plains, and associateddrainage problems, are covered in Volume II of this report. In thisvolume they have to be considered only as they affect the design of damand spillway structures. In the case of both Mangla and Tarbela adequatespillway capacity is essential because of the catastrophic consequences interms of damage and loss of life which would result from a failure of theearth and rock fill dams in the event of their being overtopped during amassive flood.
ESTIMATED AVERAGE SEDIMENT TRANSPORTOF INDUS RIVER AT DARBAND*
. ~~I
1,00
80C
U.)
90so on th yea 135 . IFfre by Ieslm et 19215 Fro TAM dmsn 15Y0 ()8D
4~~~~~~~~~~~~~~~~~~~~~~~~~~~~~~~r
0~~~~~~~~~~~~~~~~~~~~~~~~~~~~~~~~~~~~0
w
10
fr 60 -___
40
LOGARITHMIC SCALESI0 I_ _II_
1 2 3 4 5 6 7 8910 20 40 60 80100 200 400 600 1,000 2,000 4,000 10,000 20,000 40,000 100,000
SUSPENDED SEDIMENT LOAD IN THOUSAND TONS/DAY
*Based on the year 1961 as conifirmed by measurements 1962-1964 From TAMS drawing 15NY500
(R)IBRD -3221' nr.

- 11 -
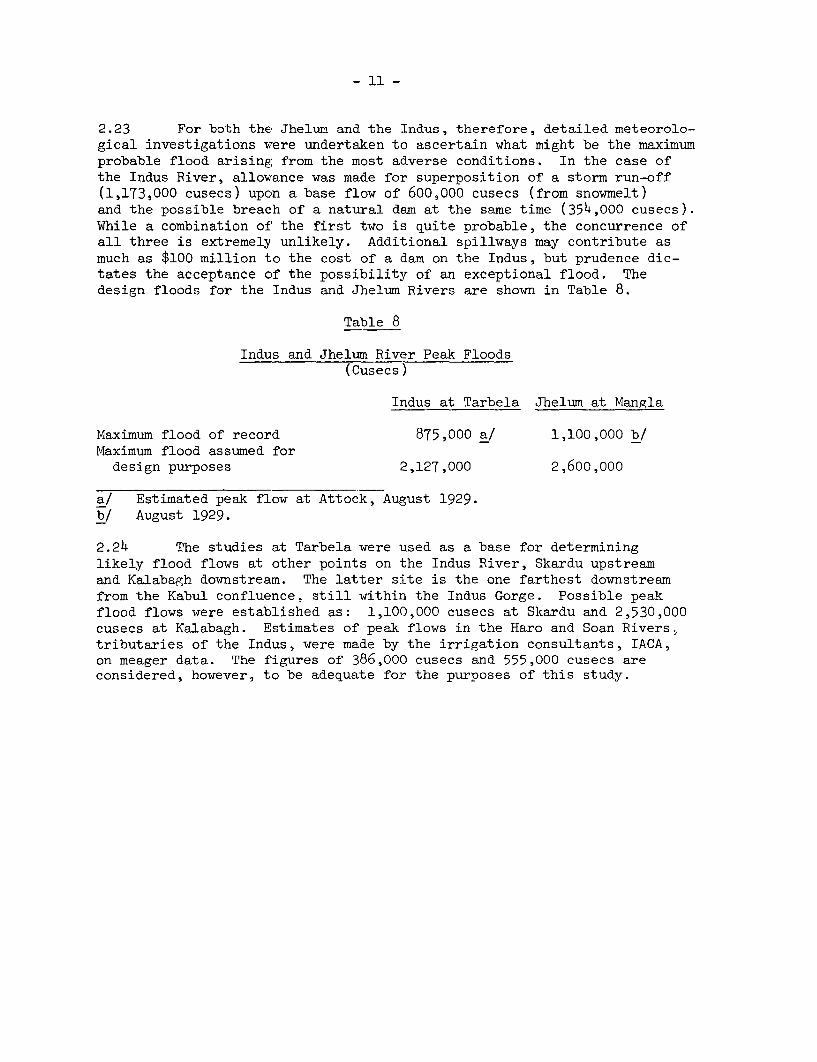
2.23 For both the Jhelum and the Indus, therefore, detailed meteorolo-gical investigations were undertaken to ascertain what might be the maximumprobable flood arising from the most adverse conditions. In the case ofthe Indus River, allowance was made for superposition of a storm run-off(1,173,000 cusecs) upon a base flow of 600,000 cusecs (from snowmelt)and the possible breach of a natural dam at the same time (354,000 cusecs).While a combination of the first two is quite probable, the concurrence ofall three is extremely unlikely. Additional spillways may contribute asmuch as $100 million to the cost of a dam on the Indus, but prudence dic-tates the acceptance of the possibility of an exceptional flood. Thedesign floods for the Indus and Jhelum Rivers are shown in Table 8.
Table 8
Indus and Jhelum River Peak Floods(Cusecs)
Indus at Tarbela Jhelum at Mangla
Maximum flood of record 875,000 a/ 1,100,000 b/Maximum flood assumed for
design purposes 2,127,000 2,600,000
a/ Estimated peak flow at Attock, August 1929.b/ August 1929.
2.24 The studies at Tarbela were used as a base for determininglikely flood flows at other points on the Indus River, Skardu upstreamand Kalabagh downstream. The latter site is the one farthest downstreamfrom the Kabul confluence, still within the Indus Gorge. Possible peakflood flows were established as: 1,100,000 cusecs at Skardu and 2,530,000cusecs at Kalabagh. Estimates of peak flows in the Haro and Soan Rivers,tributaries of the Indus, were made by the irrigation consultants, IACA,on meager data. The figures of 386,000 cusecs and 555,000 cusecs areconsidered, however, to be adequate for the purposes of this study.
- 12 -
III. HISTORICAL USE 07 SURFACE WATER
3.01 It has been indicated that the chief characteristic of theIndus is a very high seasonal variation of flow. Approximately 67 MAF,or 72 percent of the total flow, occurs in the four months from June toSeptember. The principal opportunity for future development of surfacestorage lies in the conservation of this kharif 1/ flood, a large part ofwhich flows at present to the sea. Another way of expressing this is topoint out that present diversions of water from rivers into the canalsystems average 79 MAF per year. WThen the headwaters of the Ravi, Beasand Sutlej are diverted by India, the total amount of water in the riversin West Pakistan in a mean year will be 142 MAF, excluding 5 M4AF in thelesser tributaries. However, the total amount of water in the rivers inthe critical period between the beginning of October and the end of Aprilin a mean year is only 31 MAF, and that amount is almost entirely used upby present diversions. It follows that unless the canal system is modi-fied or unless supplies are redistributed with respect to time of year,a limit to the volume of water which may be diverted has been reached.
3.02 IACA, as will be shown in Chapter IV of this volume, envisagesboth a modification of the canal system through enlargement of the diver-sion capacity and a redistribution of supplies with respect to time throughthe provision of surface storage. IACA also envisages the extensive de-velopment of groundwater. To the extent that the IACA approach has totake note of the historical pattern of surface water development, it isimportant to have some idea of what that pattern has been.
Development of the System
3.03 The present irrigation system of the Indus Plains, commanding agross area of about 38 million acres, is large by any measure of compar-ison. Evidence from archaeological sites shows that some lands near themain rivers were cultivated by flood irrigation over 3,000 years ago.The first canals were constructed some five or six centuries ago and wereextended under the great Moghul emperors. These early canals were inunda-tion channels which delivered water to the fields when rivers were high insummer, but they were rather unpredictable in operation and were subjectboth to frequent breaches and to serious siltation problems. In theriverain areas and in some depressions outside the river belt there haslong existed another type of flood-dependent cropping, sailaba, wherebycrops were grown on residual soil moisture following the recession of thesummer floods. The canal system as it is seen today, with a culturablecommanded area (CCA) of 33-1/2 million acres of which 25 million acresreceive surface water, was started in the nineteenth century. Weirsand barrages were constructed so that the supply of irrigation water wouldbe no longer dependent on the natural variation of the river level. Newcanals were cut and old inundation channels were incorporated into thesesystems and given much better regulated supplies. Since independence in
1/ Summer crop season (mid-April to mid-October).
- 13 -
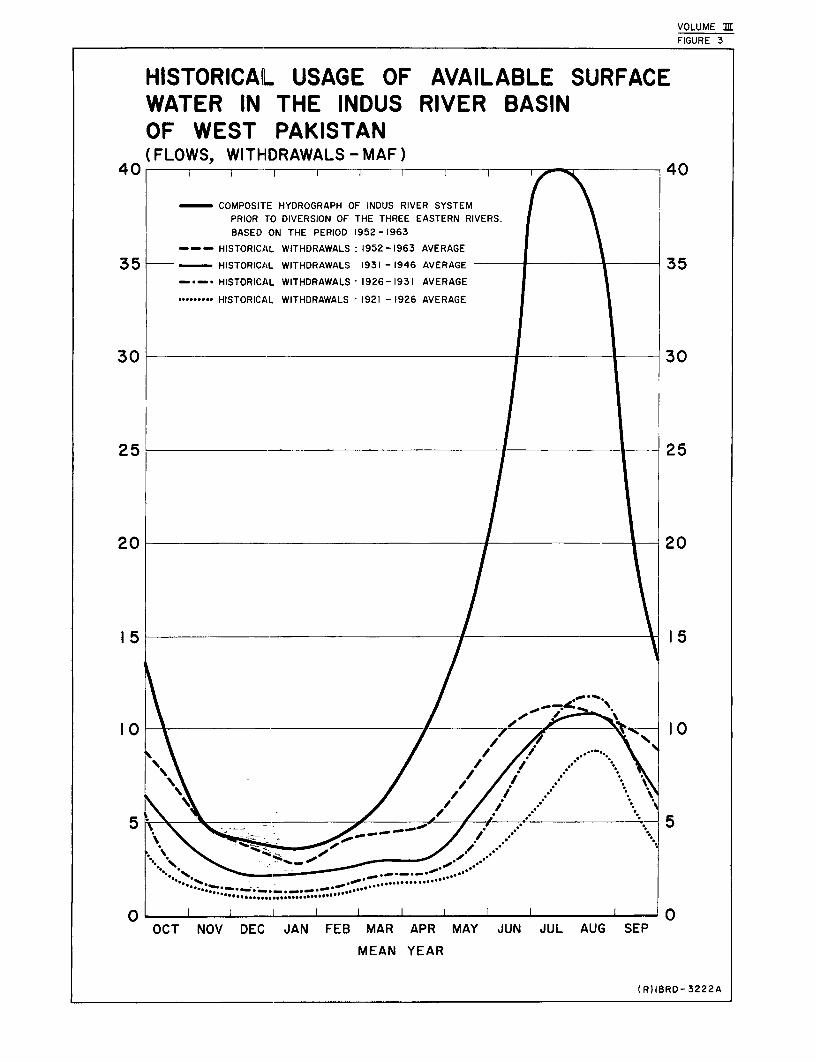
1947, Pakistan has continued the extension of the canal system and almostall the areas previously served from inundation channels are now servedfrom river barrages. The increase in the withdrawals of surface waterover the years is showm in Figure 3. The withdrawals for the early periodsinclude large discharges into the old inundation canals during the summerflood. Not all these withdrawals were used effectively. It can be seenfrom Table 9 that, historically, canal head diversions, having increasedvery substantially during the 1920's from some 38 MAF delivered annuallyto about 53 MAF, continued to increase to the present level of around79 MAF. The equivalent increases in watercourse deliveries have beenfrom 30 MAF to 40 MAF and to 58 MAF respectively. With the presentadditional use each year of about 10 MAF from groundwater sources, some68 MAF of irrigation water is now available annually to the farms. Thisamounts to an increase of 125 percent in a little over 40 years.
Table 9
Estimated Annual Canal-Head Diversions(IfAF)
Period Average Annual Diversion
1921-1926 381926-1931 531931-1946 641952-1963 78
1965 79
In addition to surface and groundwater supplies. effective rainfall con-tributes about 6 MAF in canal commands. This is equivalent to a watercoursedelivery of about 10 MAF before deduction of watercourse and field losses.
3.o4 Up to the present there has been virtually no provision forreservoir storage to regulate river flows. The only dam of consequentialsize is at Warsak on the Kabul River, and this serves primarily as a regu-lator for hydroelectric generation. Its capacity Qf 23,500 acre-feet isalmost negligible for agricultural purposes. The commissioning in 1967 ofMangla Dam on the Jhelum River with an initial live capacity of 5.22 MAF(with an assumed minimum drawdovm level of 1040 feet, and including0.28 MAF in the Jari arm below the level of Mirpur saddle) will completethe first major storage project in West Pakistan. Its main purpose, how-ever, is to provide replacement water for rabi flows to be diverted fromthe Ravi and Sutlej Rivers under the Indus Basin Settlement Plan. It willnot, therefore, go far toward meeting the needs of growth, although it willhave considerable value in regulating the flow.
3.05 The historical increases in available surface water, as noted inTable 9, were not achieved easily. The allocation of additional water, assuccessive canal projects were introduced over the past 100 years, has been
- 14 -
the subject of a long series of controversies and agreements. The funda-mental issue has been the problem of water shortages, particularly in therabi cropping season 1/ and early and late kharif.
3.o6 The early inundation canals from the Indus and its tributariestook such supplies as the river levels permitted, but withdrawals therebycomprised a small portion of the total supplies available. The introduc-tion of barrage-controlled canals in the nineteenth century enabled suppliesto be withdrawn throughout the year. During rabi. when river dischargesare low, the barrage-controlled canal withdrawals, even in the period im-mediately after the First World War, became a significant proportion of thetotal river supplies. By the late 1920's a situation had been reachedwherein large areas of the Sutlej Valley Project were found to be seriouslyshort of water because of their dependence on rivers-uncertain in themselves,which had been tapped for irrigation at upstream points. Monthly with-drawals by some of the canals of the Sutlej Valley varied from mean levelsby more than 30 percent. Large areas of the CCA were abandoned.
3.07 By the mid-1930's the whole problem of water allocation to theexisting and projected canal system had been and continued to be the subjectof extensive discussion and investigation. The complaints of the SutlejValley could not be taken in isolation but had to be seen in the context ofthe whole river and canal system. Thus the Sind had to be assured that itsSukkur Barrage Project would not suffer from the simultaneous sanctioningand construction of the Sutlej Valley Project. Its inundation canals hadto be protected from the effects of Punjab withdrawals - hence the recom-mendation for the construction of barrages at Gudu and Ghulam Mohammed.Finally, in 1945, a comprehensive agreement was drawn up by the Chief Engi-neers of the Sind and Punjab, but had not been ratified before negotiationsstopped on Independence. This agreement, known as a Draft Agreement Be-tween the Punjab and Sind Regarding the Sharing of the Waters of the Indusand Five Punjab Rivers, took account of the prior rights of old canals withestablished supplies and also made allowance for equitable apportionment tocanals which were still new or projected in 1945. When Pakistan becameindependent in 1947, the procedures based on the Draft Agreement continuedto be applied as a means of allocating natural river flows.
3.08 These effects may be described briefly as follows: (SeeMaps 6 and 7, Volume II).
(1) Allocations on the main stem of the Indus continue to bebased on historical precedent. The Thal Canal at Jinnah Barrage,the canals at Sukkur Barrage, and certain channels which previouslyreceived supplies from old inundation systems came to share firstpriority, and deliveries to the areas served by these canals are nowmaintained at fairly consistent levels. The newer canals at Taunsa,Gudu and Ghulam Mohammed-Barrages have relatively low priority.
1/ Winter cropping season (mid-October to mid-April).
VOLUME mFIGURE 3
HISTORICAL USAGE OF AVAILABLE SURFACEWATER IN THE INDUS RIVER BASINOF WEST PAKISTAN(FLOWS, WITHDRAWALS - MAF)
40 1 i I a I 1 i 1 1 40
- COMPOSITE HYDROGRAPH OF INDUS RIVER SYSTEMPRIOR TO DIVERSION OF THE THREE EASTERN RIVERS.BASED ON THE PERIOD 1952-1963
HISTORICAL WITHDRAWALS :1952-1963 AVERAGE
35 - HISTORICAL WITHDRAWALS 1931-1946 AVERAGE 35HISTORICAL WITHDRAWALS- 1926-1931 AVERAGE
......... HISTORICAL WITHDRAWALS 1921 - 1926 AVERAGE
3 0 30
25 25
20 20
1 5 1 5
10 10
..........0 I I I I I I I I I I I 0
OCT NOV DEC JAN FEB MAR APR MAY JUN JUL AUG SEP
MEAN YEAR
(R)IBRD- 3222A

- 15 -
(2) First right to the flows of the Jhelum and Chenab Riversis given equally to the Upper and Lower Jhelum, the Upper and LowerChenab and the Lower Bari Doab Canals (generally known as the fivelinked canals) whLch together supply the whole CCA of Chaj Doab,95 percent of the CCA of Rechna Doab and 27 percent of the CCA ofBari Doab.
(3) Canals on both sides of the Sutlej Valley are primarilydependent on the uncertain flows of the Sutlej River for their sup-plies. Priorities are technically equal among these canals althoughwithin the canal system the design generally favors the perennialareas.
(4) Trimmu Barrage and Panjnad Barrage, the latter of whichwas actually constructed as part of the Sutlej Valley Project, re-ceive river supplies only after priority requirements of the fivelinked canals mentioned above (viz. UJC, LJC, UCC, LCC and LBDC)have been met in full. The Rangpur, Haveli9 Sidhnai in part, Abbasiaand Panjnad Canals, which are served from these barrages, sufferaccordingly from frequent shortages which can become quite severe inthe rabi cropping season.
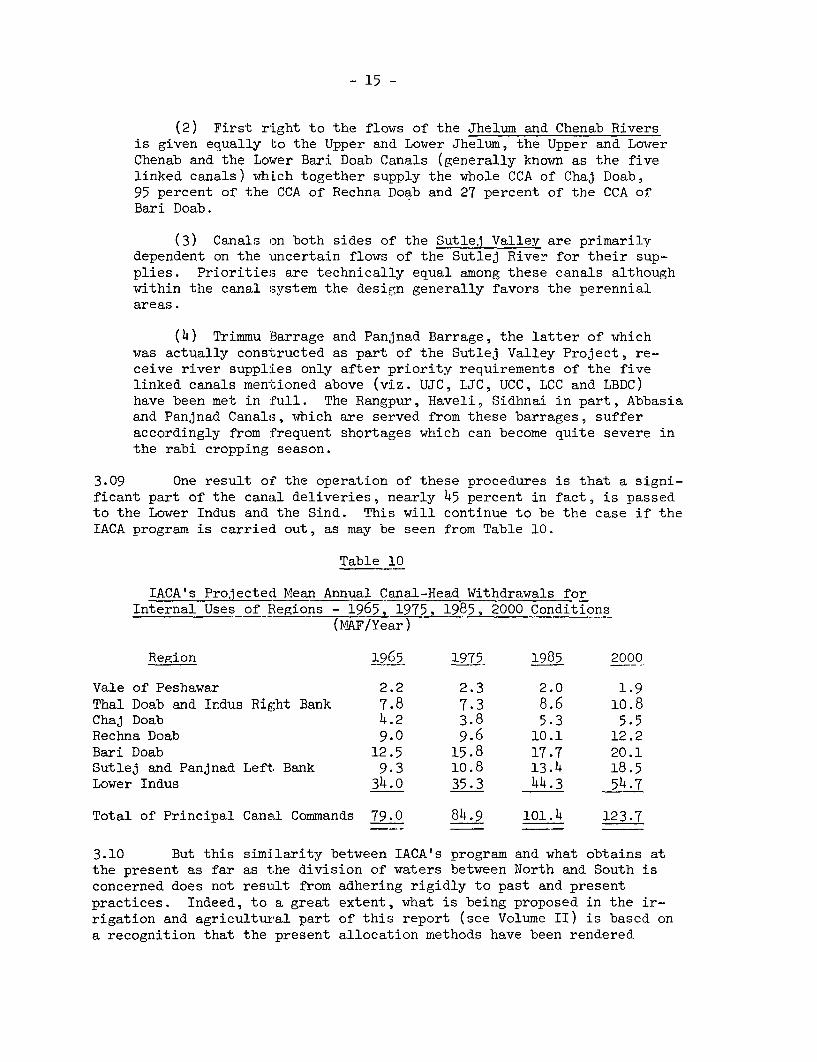
3.09 One result of the operation of these procedures is that a signi-ficant part of the canal deliveries, nearly 45 percent in fact, is passedto the Lower Indus and the Sind. This will continue to be the case if theIACA program is carried out, as may be seen from Table 10.
Table 10
IACA's Projected Mean Annual Canal-Head Withdrawals forInternal Uses of Regions - 1965, 1975, 1985, 2000 Conditions
(MAF/Year)
Region 1965 1975 1985 2000
Vale of Peshawar 2.2 2.3 2.0 1.9Thal Doab and Indus Right Bank 7.8 7.3 8.6 10.8Chaj Doab 4.2 3.8 5.3 5.5Rechna Doab 9.0 9.6 10.1 12.2Bari Doab 12.5 15.8 17.7 20.1Sutlej and Panjnad Left, Bank 9.3 10.8 13.4 18.5Lower Indus 34.0 35.3 44.3 54.7
Total of Principal Canal Commands 79.0 84.9 101.4 123.7
3.10 But this similarity between IACA's program and what obtains atthe present as far as the division of waters between North and South isconcerned does not result from adhering rigidly to past and presentpractices. Indeed, to a great extent, what is being proposed in the ir-rigation and agricultural part of this report (see Volume II) is based ona recognition that the present allocation methods have been rendered

- 16 -
obsolete by developments since independence. The present allocatingprocedures, for example, relate onlv to natural river flows and make noallowance for storage or for the development of groundwater resourcesunder the public programs which were started in 1959, and which willundoubtedly continue over the next two decades.
3.11 By departing from the old procedures for distribution, the IACAprogram will be able to meet, in very rough and aggregated terms, thepresent and foreseeable demands. Nothing less than a radical departurefrom those old concepts could compensate for the combination of a severeshortage of surface water in the rabi season plus the loss of the Raviand Sutlej River flows to India (an event not foreseen in past Punjab-Sindagreements) and at the same time meet the legitimate demands of growth anddevelopment.
- 17 -
IV. THE IACA APPROACH
Method of Analysis
4.01 The most important constraints on the present system of watersupply and distribution are that the system was designed to support a-lower cropping intensity than is required in the future and that theseasonal canal -deliveries are variable and inadequate in rabi and in lateand early kharif. Over the next 30 years, IACA expect these constraintsto be removed by three major changes which are the regulation of riversupplies by surface water storage reservoirs, the full development ofusable groundwater resources and the enlargement of many of the existingcanals.
4.02 The function of irrigation planning is both to forecast thedemand for irrigation water and to determine the best methods of meetingthe 'demand. At the outset it was necessary to determine the size andtype of unit to be adopted for analystis. The-units had to be suitablefor studies of surface water distribution, groundwater pumping and agri-cultural developments, small enough to provide sufficient detail, butnot so-small-as to result in an unmanageable number of units.
4.03 The basic Unlit adopted by IACA was the,canal command, subdividedwhere necessary to take into account the further aspects of surface waterdistribution and groundwater supply. and combined where two commands areserved from the same headworks and share the same characteristics. Theadjustments led to the 42 principal canal commands being studied in IACA'sbasin an,alysis as 61 divided canal comimand units.
4.o4 The analysis adopts as basin constraints the availability ofwater and the feasible rates of installing tubewells, enlarging canalsand constructing surface water projects. Within each command, apart fromthe individual applications of these basin constraints, there are importantagricultural constraints, which are related to the present status and poten-tial development of individual areas. In the analysis, finance is considereda constraint in the private:sector only. As a basis for the analysis IACAtook decisions on a number of factors, including the quality of water usablefor irrigation, the desirable depth to the water table and the techniquesfor developing water resources and the irrigation system.
4.05 The starting point for the analysis of canal commands is thecrop water requirements and the cropping patterns. The crop water require-ments, which already allow for precipitation, can be met either by surfacewater deliveries throuigh the canal system or by groundwater pumped bytubewells, or by a combination of the two. A computer program was developedby IACA to make the calculations for water supply in the 61 divided canalcommand units. The physical characteristics and constraints of these unitswere used-as input for the program and the-attainable intensities andmonthly water budgets represented the output.
- 18 -
4.o6 The water demand in the individual canal command units was thenexamined by IACA in terms of the river flows and the requirements forstorage and link canals. A second comnuter program was developed forthis purpose. The results of these water studies, combined with econQmiccriteria and agricultural factors form the basis for IACA's developmentprogram.
4.07 1 IACA's approach is to meet the rabi watercourse requirementsfrom three sources: with groundwater, with the river flow and withstorage releases. The quantity of the last has been calculated by IACAas a residual demand and in consequence is most sensitive to change.
4.08 The use of groundwater is not in itself a new concept. As earlyas 1890, 75 percent of the 4 million acres of land in the Punjab underirrigation was supplied with some water from Persian wheels. In recentyears exploitation has been made of this resource by the use of tubewells.But IACA's program provides a formal recognition of the economic value toWest Pakistan of a vast underground aquifer, whose volume is now estimatedat no less than 300 MAF of recoverable water. The groundwater reservoirwould be pumped on average up to the amount of recharge of the aquifer.It would also serve as a balancing reservoir to make up the shortfalls inyears of less than normal rainfall.
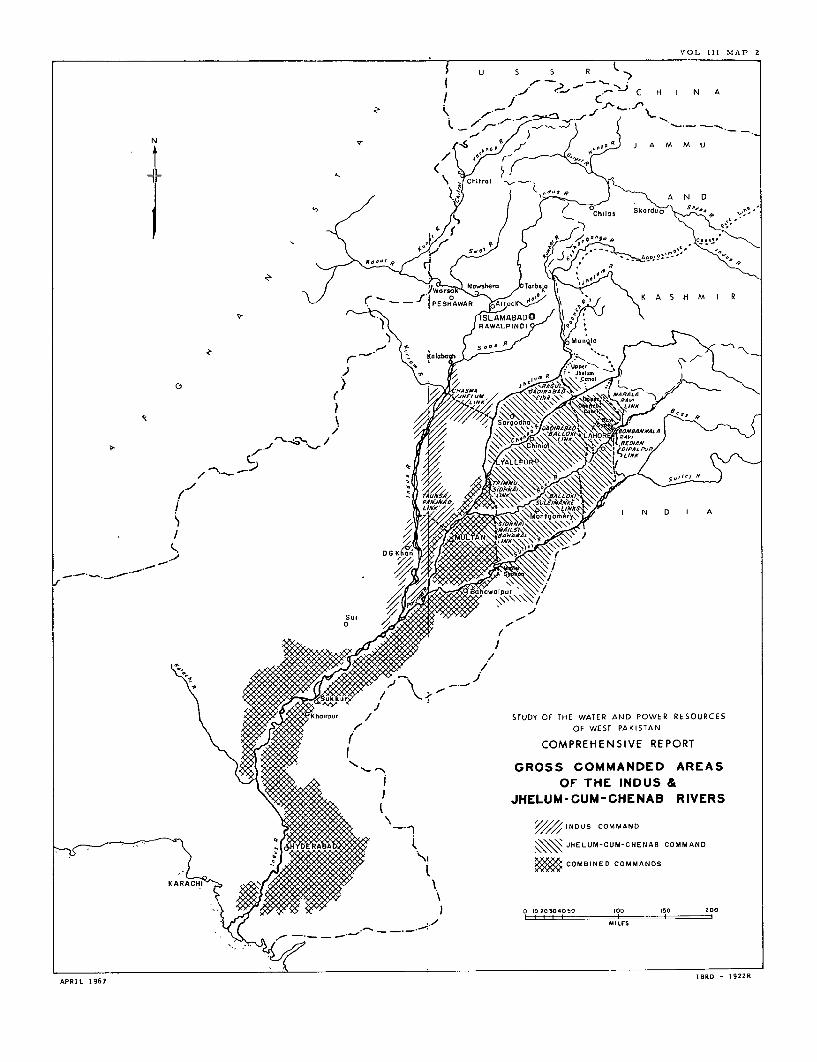
4. og In the use of river flows, IACA anticipate, among other thingsa "transfer out" of water from surplus areas (taking ground and surfacesupplies together) into deficit areas. One of the factors which will makethis possible is the physical transfer of river supplies. Ever since theconstruction of the Triple Canals Project early this century transfer.(from west to east) has been a feature of the irrigation system. In theyears following Independence the Marala-Ravi, Bambanwala-Ravi-Bedian-Dipalpur and Balloki Suleimanke Links were constructed. As the majorworks of the Indus Basin Project are completed, transfers will become in-creasingly feasible. The Jhelum and Chenab Rivers- are presently connectedby the Upper Jhelum Canal and will be further connected by the Rasul-Qadirabad Link, which will continue as the Qadirabad-Balloki Link to theRavi. The Trimmu-Sidhnai-Mailsi-Bahawal Link gives the system anotherinterconnection. When the Chasma-Jhelum Canal, scheduled to be completedin 1971, goes into operation, waters of the Indus River also will becomeavailable to the irrigated areas presently served by the Jhelum/ChenabRivers downstream from the Trimmu-Sidhnai-Mailsi.-Bahawal Link. Completionof the Taunsa-Panjnad Link in 1969 will enable water from the Indus to betransferred to areas comnanded by the Panjnad Headworks. The irrigatedareas that may in future be served from each river are shown in Map II1.2.
4.10 In the integrated system proposed by IACA, those water require-ments which cannot be met by groundwater or by natural river flows must bemet by surface water storage. The efficient operation of such a systemwill require the employment of electronic devices and adoption of the mostadvanced techniques of control and forecasting. Regular estimates of fieldrequirements in each area of the basin must be compared continuously with


VOL III MAP 2
H I N A
N 0 . B
r EHW~S o R \ A S H hl I R
) t ) ~~RAWALPIND9 QJ
+ ~~~ ~~~r i Tnlabn#
I~~~~~~~~~~~~~~~~~~~~~~~~\, C, ~ ~ ~ ~ ~ ~ ~ ~ ~ ~ ~ ~ ~ ~ ~ ~ ~ B
/~~~~~~~~~~~~~/
5~~~ ~~~~~~~~~~~~~~ FN D I a
OSul / -
t x 4K~~h-ip-r STUDY OF THE WATER AND POWER RESOURCES\ ' g g ~~~~~~~~~~~~~OF WEST PAKISTAN
S ' g g t ~~~~~~COMPREHENSIVE REPORT
)4 t s - ~~~GROSS COMMANDED AREAS§ t t i ~~~~~OF THE INDUS &
X X E W t} ~~JHELUM-CUM-CHENAB RIVERS
W } -n ~~~~~~~~~///x INDUS COMMAND)
s_- 9 ^ {t g t < ~~~~~~~~~~~~~~~JHELUM-CUM-CHENAB COMMAND
.- 6 2 2 2 g } t t ~~~~~~~~~COMBINED COMMANDS
^ 6 , v 1 xW 4, } ol 1~~~~~010 20 304|050 100 1510 200
APRIL 1967 IaRD - 1922R

- 19 -
the'current annual hydrological conditions. -Keeping in mind the electric
power requirements of the-grid system as well as pumping demands, decisions
wi'll have to be taken as to the,optimum method of operating the surface and
underground reservoirs. fOperation of such -an integrated water system wTill
-require both an effective management and extensive system analysis as a
guide for the optimum use of the water resources..
Surface Water Requirements
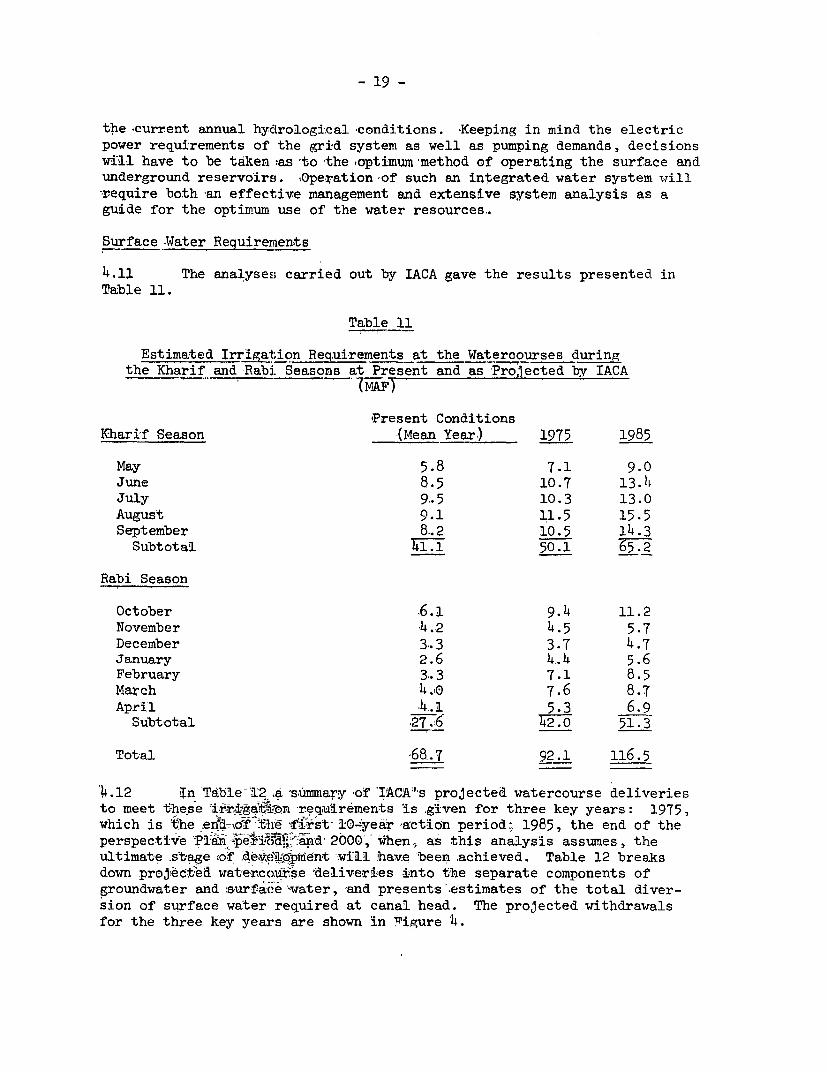
4.11 The analyses carried out by IACA gave the results presented in
Table 11.
Table 11I I
Estimated Irrigat;ion Requirements at the Watercourses duringthe Kharif and -Rabi. Seasons at Present and as Projected by IACA
(MAF)
Present Conditions
Khari'f Season (Mean 'Year) 1975 1985
May 5.8 7.1 9.0June 8.5 10.7 13.4July 9.5 10.3 13.0
August 9.1 11.5 15.5
September 8.2 10.5 14.3
Subtotal 41.1 50.1 65.2
Rabi Season
October .1 9.4 11.2
November 4.2 4.5 5.7December 3.3 3.7 4.7January 2.6 4_4 5.6February 3.3 7.1 8.5
March 4., 7.6 8.7April 4,.1 53 6.9
Subtotal ,27.6 2.0 51.3
Total 68.7 92.1 116.5
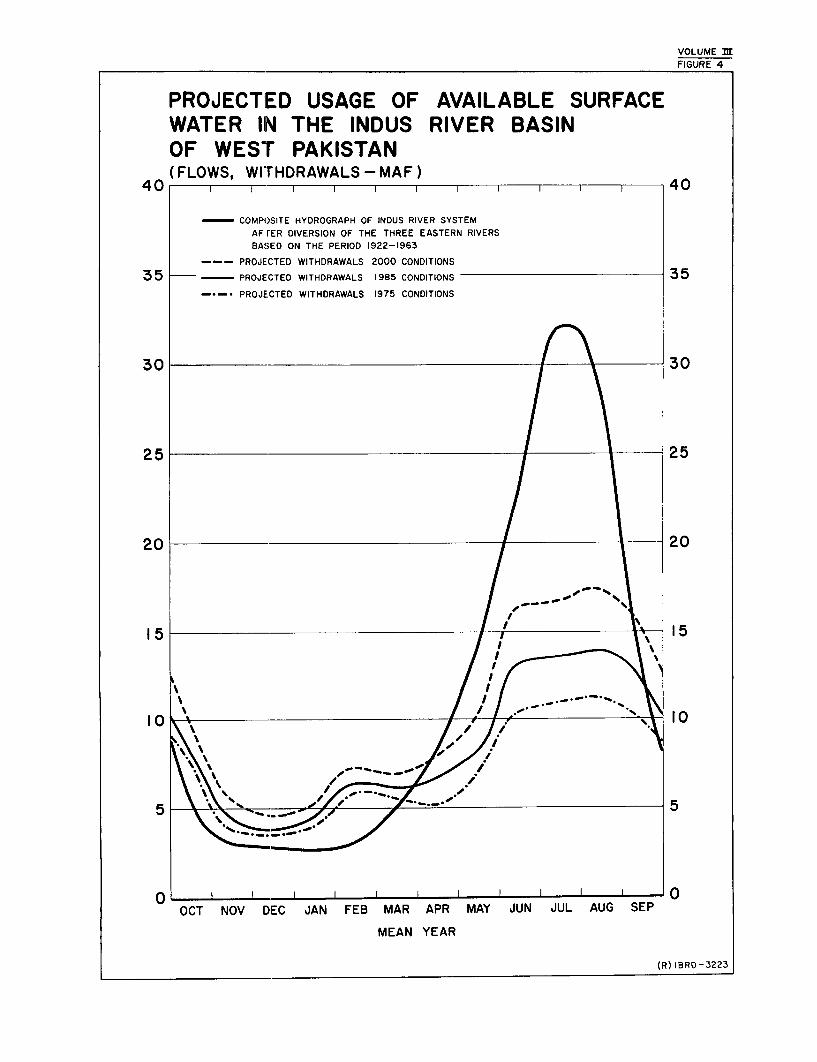
4.12 n'I 'Tab'le-12,a 'simmary 'of 'IACA's projected watercourse deliveriesto meet t-hese rxtr,atl-on req,u'Irements 'is g'iven for three key years: 1975,
which is the enrd 6o-fthe ftierst- 10-year action period; 1985, the end of the
perspective Plan .- erd, athsand s alysis assumes, the
ultimate sztage of devel§opment wi'll Jhave 'been achieved. Table 12 breaks
down projected watercouurse Ideliveries -into the separate components of
groundwater andzsurface%water, and presents.estimates of the total diver-
sion of surface water required at canal head. The projected withdrawals
for the three key years are shown in Pigure 4.
- 20 -
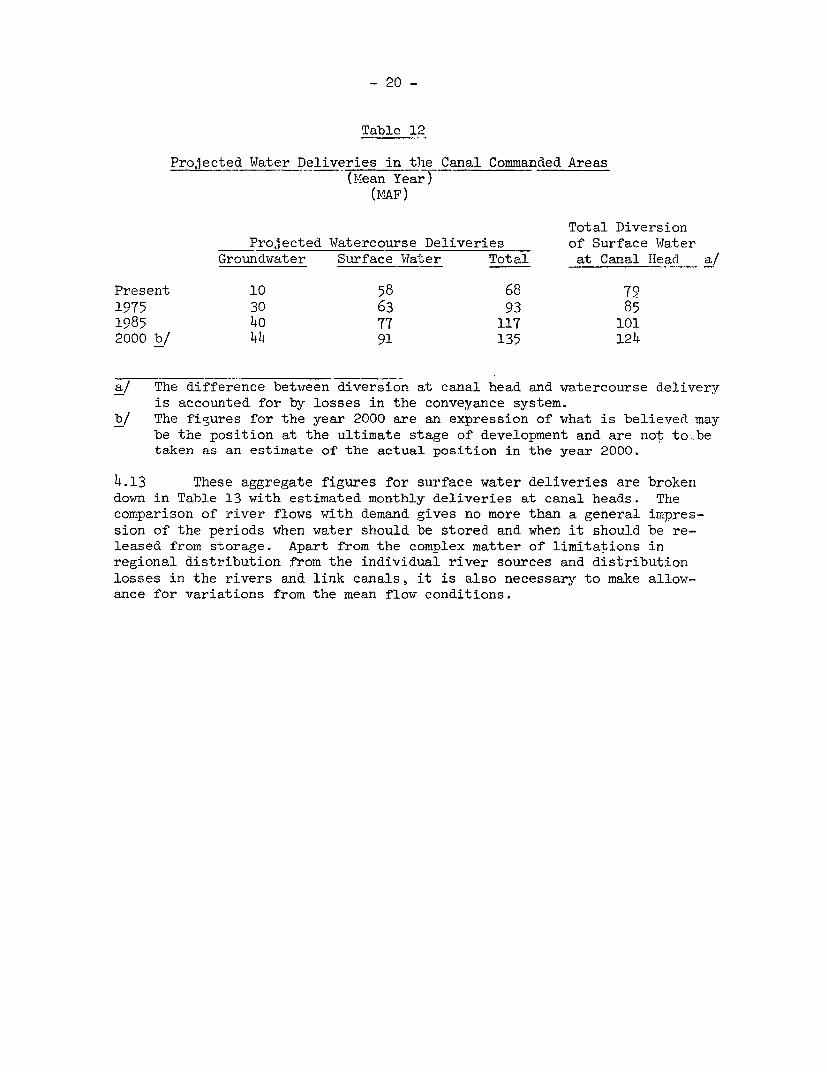
Table 12
Projected Water Deliveries in the Canal Commanded Areas(Mean Year)
(MAF)
Total DiversionProjected Watercourse Deliveries of Surface lWater
Groundwater Surface Water Total at Canal Head a/
Present 10 58 68 7'91975 30 63 93 851985 4o 77 117 1012000 b/ 44 91 135 124
a/ The difference between diversion at canal head and watercourse delivery
is accounted for by losses in the conveyance system.b/ The fiaures for the year 2000 are an expression of what is believed may
be the position at the ultimate stage of development and are not to.betaken as an estimate of the actual position in the year 2000.
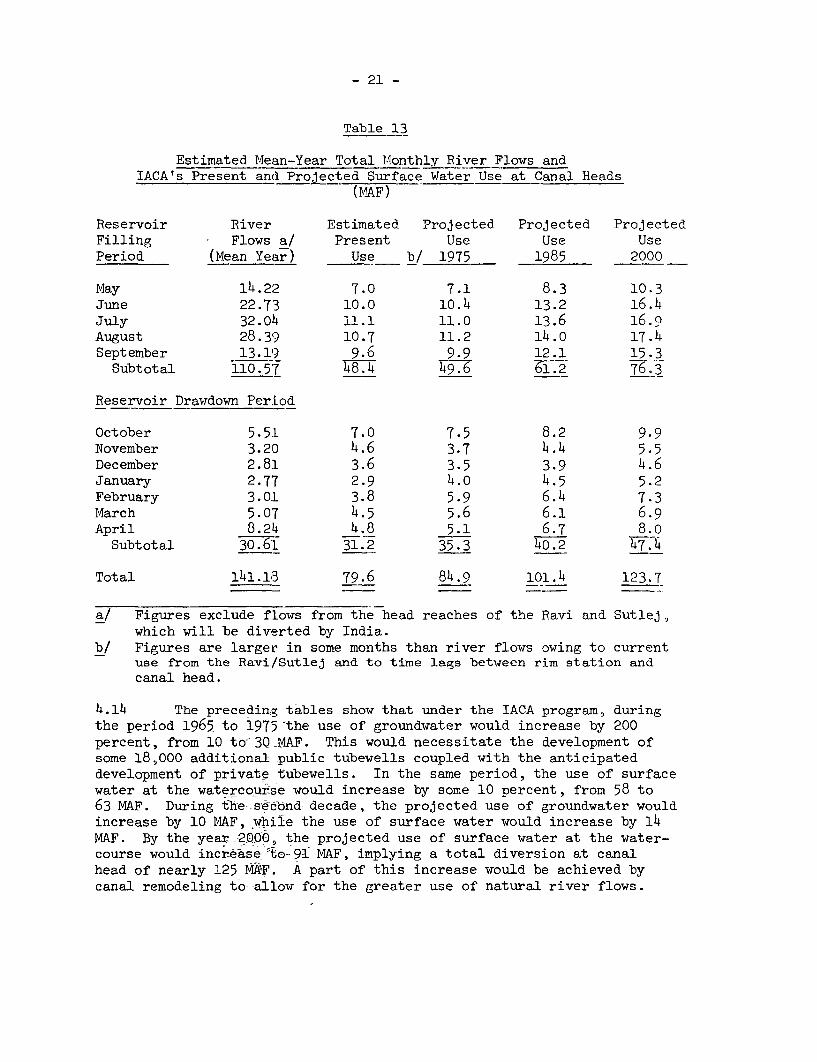
4.13 These aggregate figures for surface water deliveries are brokendown in Table 13 with estimated monthly deliveries at canal heads. The
comparison of river flows with demand gives no more than a general impres-
sion of the periods when water should be stored and when it should be re-leased from storage. Apart from the complex matter of limitations in
regional distribution from the individual river sources and distribution
losses in the rivers and link canals, it is also necessary to make allow-ance for variations from the mean flow conditions.
VOLUME mFIGURE 4
PROJECTED USAGE OF AVAILABLE SURFACEWATER IN THE INDUS RIVER BASINOF WEST PAKISTAN(FLOWS, WITHDRAWALS - MAF)
40 I 1 l E 1 I 1 I 40
- COMPOSITE HYDROGRAPH OF INDUS RIVER SYSTEMAF rER DIVERSION OF THE THREE EASTERN RIVERSBASED ON THE PERIOD 1922-1963
-- - PROJECTED WITHDRAWALS 2000 CONDITIONS
35 - PROJECTED WITHDRAWALS 1985 CONDITIONS 35---- PROJECTED WITHDRAWALS 1975 CONDITIONS
30 30
25 25
20 20
1 5 15
10 ,, /*\ 10
5 5
0 ~~~~~~~~~~~~~~0OCT NOV DEC JAN FEB MAR APR MAY JUN JUL AUG SEP
MEAN YEAR
(R) IBRD-32231

- 21 -
Table 13
Estimated Mean-Year Total Monthly River Flows andIACA's Present and Projected Surface Water Use at Canal Heads
(MAF)
Reservoir River Estimated Projected Projected ProjectedFilling Flows a/ Present Use Use UsePeriod (Mean Year) Use b/ 1975 1985 2000
May 14.22 7.0 7.1 8.3 10.3June 22.73 10.0 10.4 13.2 16.4July 32.04 11.1 11.0 13.6 16.9August 28.39 10.7 11.2 14.0 17.4September 13.19 9.6 9.9 12.1 15.3
Subtotal 110.57 T___ 4-9.6 2 76.3
Reservoir Drawdown Period
October 5.51 7.0 7.5 8.2 9.9November 3.20 4.6 3.7 4.4 5.5December 2.81 3.6 3.5 3.9 4.6January 2.77 2.9 4.0 4.5 5.2February 3.01 3.8 5.9 6.4 7.3March 5.07 4.5 5.6 6.1 6.9April 8.24 4.8 5.1 6.7 8.o
Subtotal 30.61 31.2 35.3 4o.2 47.4
Total 141.1,3 79.6 84.9 101.4 123.7
a/ Figures exclude flows from the head reaches of the Ravi and Sutlej,which will be diverted by India.
b/ Figures are larger in some months than river flows owing to currentuse from the Ravi/Sutlej and to time lags between rim station andcanal head.
4.14 The preceding tables show that under the IACA program, duringthe period 1965 to 1975=the use of groundwater would increase by 200percent, from 10 to--3Q_MAF. This would necessitate the development ofsome 18,000 additional public tubewells coupled with the anticipateddevelopment of private tubewells. In the same period, the use of surfacewater at the watercourse would increase by some 10 percent, from 58 to63 MAF. During the=second decade, the projected use of groundwater wouldincrease by 10 MAF, while the use of surface water would increase by 14MAF. By the year200Q0, the projected use of surface water at the water-course would increase:to-91 MAF, implying a total diversion at canalhead of nearly 125 MAF. A part of this increase would be achieved bycanal remodeling to--allow for the greater use of natural river flows.
- 22 -
4.15 Despite the improvement that would result from canal remodeling,a substantial increase by other means is essential. Only one means can befound to meet figures of the magnitude involved, and the finding is con-firmed in the comprehensive and detailed reports prepared by both IACA andChas. T. Main. Throughout all their reports, there is evidence of a greatneed to develop storage capacity on the Indus River and its tributariesin order to meet the needs of irrigation as formulated by IACA.
Integration of Surface and Groundwater Supplies
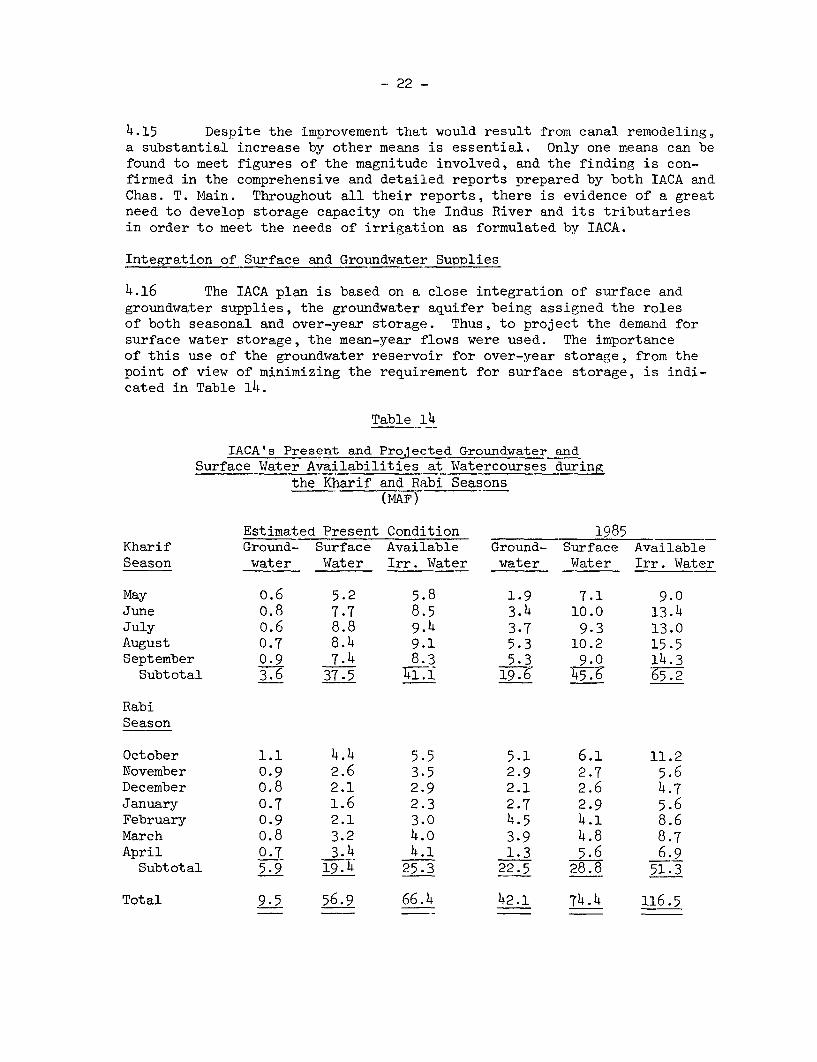
4.16 The IACA plan is based on a close integration of surface andgroundwater supplies, the groundwater aquifer being assigned the rolesof both seasonal and over-year storage. Thus, to project the demand forsurface water storage, the mean-year flows were used. The importanceof this use of the groundwater reservoir for over-year storage, from thepoint of view of minimizing the requirement for surface storage, is indi-cated in Table 14.
Table 14
IACA's Present and Projected Groundwater andSurface Water Availabilities at Watercourses during
the Kharif and Rabi Seasons(MAF)
Estimated Present Condition 1985Kharif Ground- Surface Available Ground- Surface AvailableSeason water Water Irr. Water water Water Irr. Water
May o.6 5.2 5.8 1.9 7.1 9.0June 0.8 7.7 8.5 3.4 10.0 13.4July o.6 8.8 9.4 3.7 9.3 13.0August 0.7 8.4 9.1 5.3 10.2 15.5September 0.9 7.4 8.3 5.3 9.0 14.3
Subtotal 3 37.5 41.1 19_.6 65.2
RabiSeason
October 1.1 4.4 5.5 5.1 6.1 11.2November 0.9 2.6 3.5 2.9 2.7 5.6December 0.8 2.1 2.9 2.1 2.6 4.7January 0.7 1.6 2.3 2.7 2.9 5.6February 0.9 2.1 3.0 4.5 4.1 8.6March 0.8 3.2 4.o 3.9 4.8 8.7April 0.7 3.4 4.1 1.3 5.6 6.9
Subtotal 5.9 19.4 25.3 22.5 28.8 51.3
Total 9.5 56.9 66.4 42.1 74.4 116.5
- 23' -
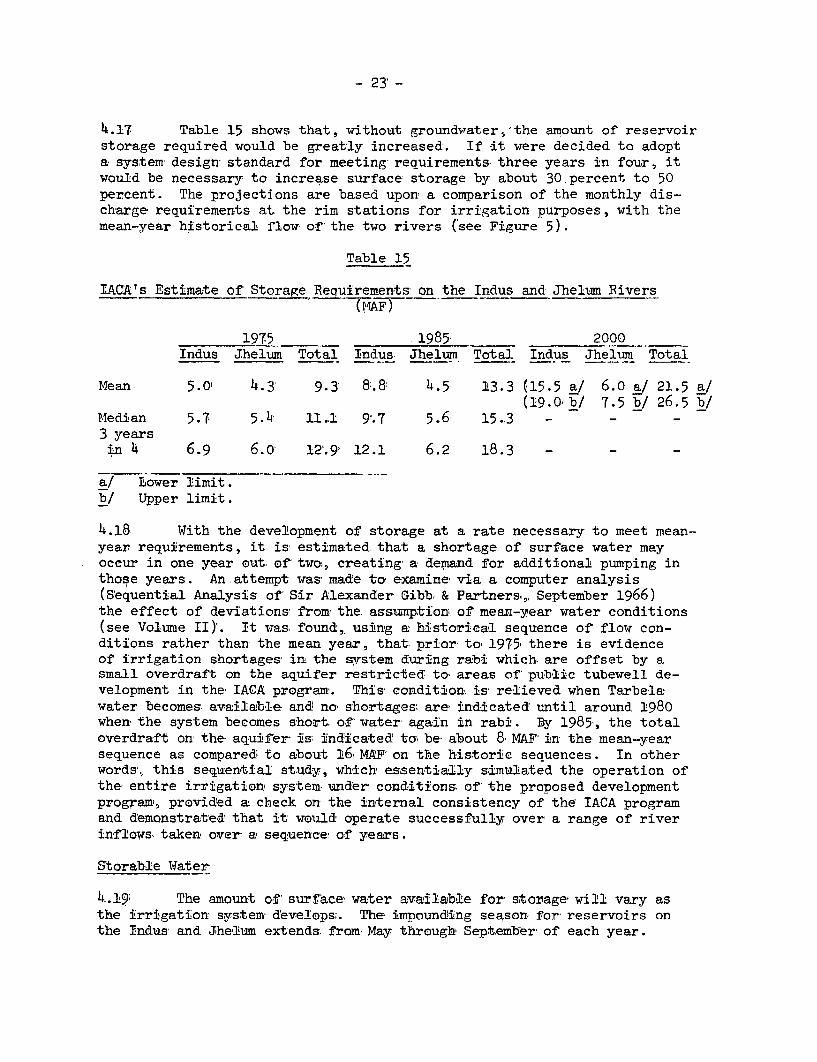
4.17 Table 15 shows that,. without groundvater5'the amount of reservoirstorage required would be greatly increased. If -it were decided to adopta system design-standard for meeting- requirements three years in four, itwould be necessary to increase surface storage by about 30,percent to 50percent. The projections are based upon a comparison of the monthly dis-charge requirements at,,the rim stations for irrigation purposes, with themean-year historical i'low-of'the two rivers ('see Figure 5).
Table 15
IACArs Estimate of'Storage Requirements on the Indus and Jhelum Rivers(MAF)
1975 I,1985- 2000Indus Jhelum Total Indus, Jhelum Total Indus Jhelum Total
Mean 5.0 4-.3 9.3- 8'.8 4.5 13.3 (15.5 a/ 6.0 a/ 21.5 a/(I9.0,b/ 7.5 b/ 26.5 b/
MIedian 5.' 5.r4 11l1 9.7 5.6 15.3 - - -
3 years,i,n 4 6.9 6.o 12'.9 12.1 6.2 18.3 - - -
a/ Lower limit.b/ Upper limit.
4.18 With the development of storage at a rate necessary to meet mean-year requirements, it is estimated that a shortage of surface water mayoccur in one year out. of two, creating- a demand for additional pumping inthose years. An.attempt was made to examine via a computer analysis(S'equential Analysis of'Sir Alexander Gibb. & Partners,, September 1966)the effect of deviations, from the- assumption of mean-year water conditions(see Volume II)'. It was, found,, using a historical sequence of flow con-ditions rather than the mean year, that-prior to 1975'there is evidenceof irrigation shortages- in the sE.rstem during rabi which are offset by asmall overdraft on the aquifer restricted to areas of'public tubewell de-velopment in the IACA program. This- condit-ion is' relieved when Tarbelawater becomes. available and no shortages are indicated' until around 1980when the system becomes short. of' water again in rabi. By 1985-, the totaloverdraft on the- aquifer- is- indicated ta be about 8 MAF'in the mean-yearsequence as compared;to about 16 MAR on the historic sequences. In otherwords', this sequential study, which' essentially simulated the operation ofthe entire irrigation' system under conditions. of- the proposed developmentprogram', provided a check on the internal consistency of the IACA programand demonstrated that it would operate successfully over a range of riverinflows- taken, over' a sequence' of years.
Storable Water..
4.19' The amount of surface- water available for storage' will vary asthe irrigation system d'evelops;. The' impounding season for reservoirs onthe Tndus- and Jhe'lum extends, from- May throughX Septemler- of each year.
- 24 -
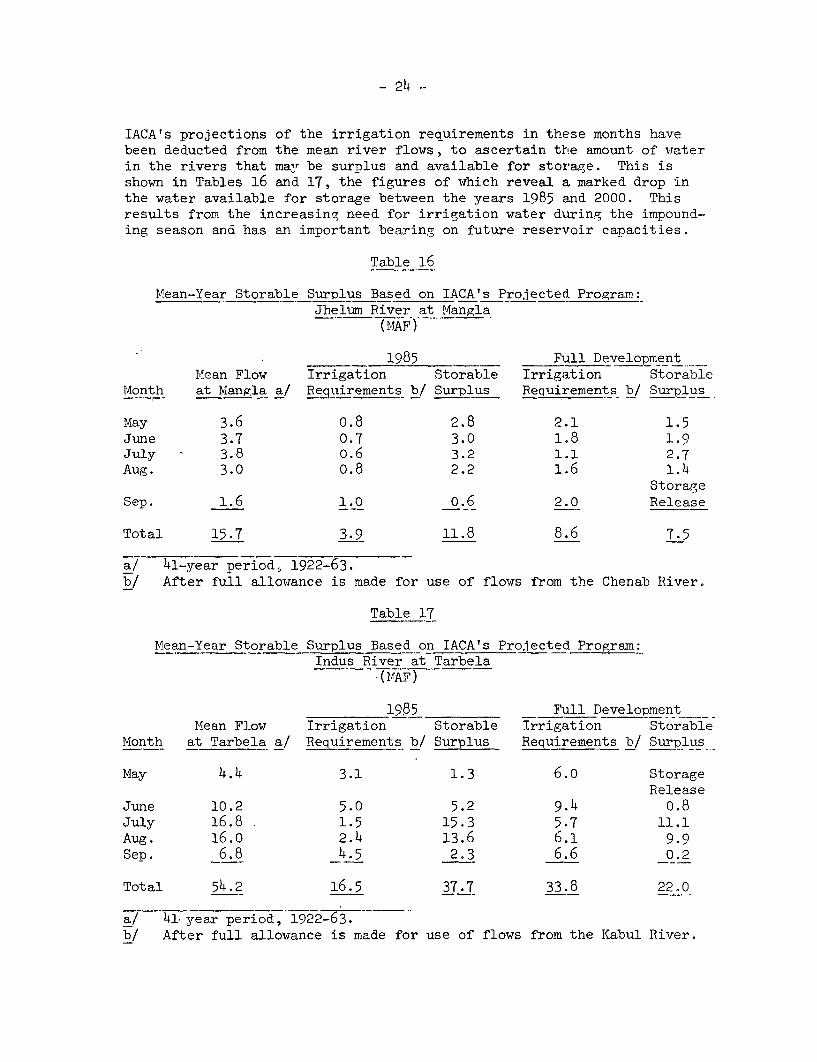
IACA's projections of the irrigation requirements in these months havebeen deducted from the mean river flows, to ascertain the amount of waterin the rivers that may be surnlus and available for storage. This isshown in Tables 16 and 17, the figures of which reveal a marked drop inthe water available for storage between the years 1985 and 2000. Thisresults from the increasing need for irrigation water during the impound-ing season and has an important bearing on future reservoir canacities.
Table 16
Mean-Year Storable Surplus Based on IACA's Projected Program:Jhelum River at Mangla
(MAF)
1985 Full DevelopmentM4ean Flow Irrigation Storable Irrigation Storable
Mdonth at Mangla a/ Requirements b/ Surplus Requirements b/ Surplus
May 3.6 o.8 2.8 2.1 1.5June 3.7 0.7 3.0 1.8 1.9July - 3.8 o.6 3.2 1.1 2.7Aug. 3.0 o.8 2.2 1.6 1.4
StorageSep. 1.6 1.0 o.6 2.0 Release
Total 15.7 3.9 11.8 8.6 7.5
a/ 41-year period. 1922-63.b/ After full allowance is made for use of flows from the Chenab River.
Table 17
Mean-Year Storable Surplus Based on IACA's Projected Program:Indus River at Tarbela
(T4AF)
1985 Full DevelopmentMean Flow Irrigation Storable Irrigation Storable
Month at Tarbela a/ Requirements b/ Surplus Requirements b/ Surplus
May 4.4 3.1 1.3 6.o StorageRelease
June 10.2 5.0 5.2 9.4 0.8July 16.8 1.5 15.3 5.7 11.1Aug. 16.0 2.4 13.6 6.1 9.9Sep. 6.8 _4.5 2.3 6.6 0.2
Total 54.2 16.5 37.7 33.8 22.0
a/ l-- year period, 1922-63.b/ After full allowance is made for use of flows from the Kabul River.
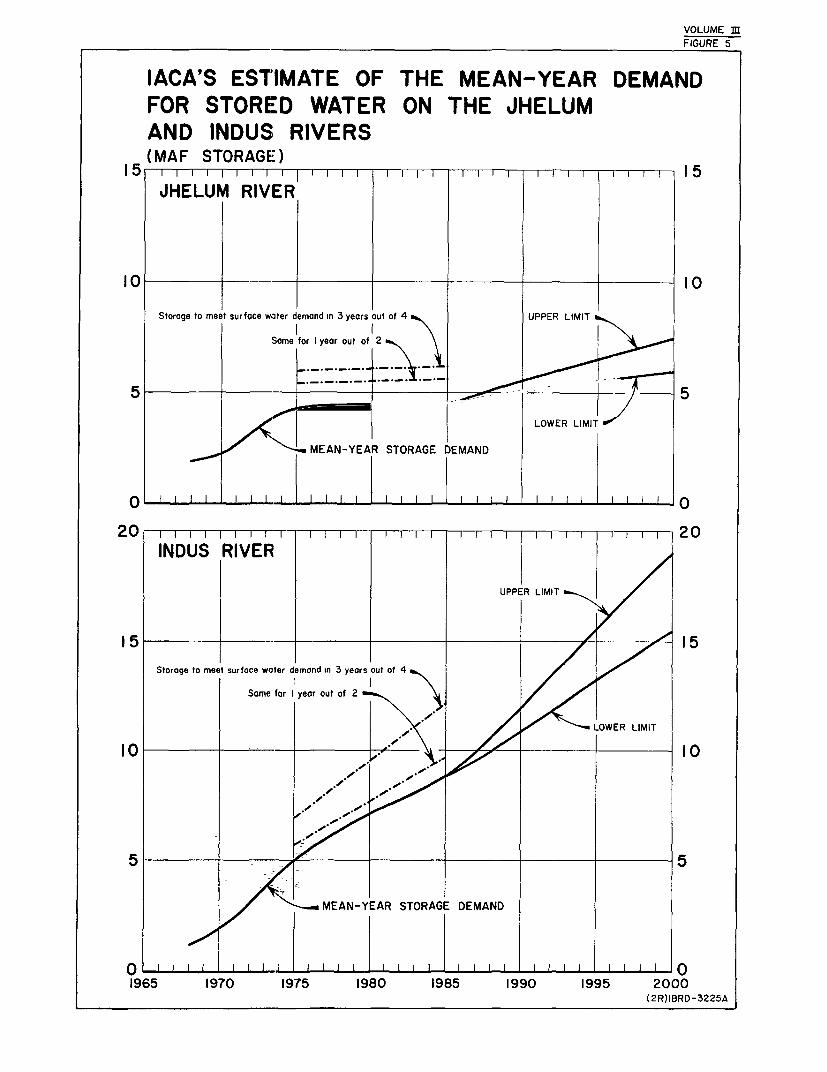
VOLUME mFIGURE 5
IACA'S ESTIMATE OF THE MEAN-YEAR DEMANDFOR STORED WATER ON THE JHELUMAND INDUS RIVERS(MAF STORAGE)
15 i 1 1 I 1 F IF21 rF F 15JHELUM RIVER
10 10
Storage to meet surface water demand in 3 years out of 4 UPPER LIMIT
I ISome for I year out of 2
5 5
LOWER LIMIT
oMEAN-YEAR STORAGE DEMAND
20 -i- -i- r m I I I I w rI Im I I 20INDUS RIVER
UPPER LIMIT
15 15
Storage to meet surfoce water demand in 3 years out of 4
Same for I year out of 2
t / . / ~~~~LOWER LIMIT
10 10
5 5
. / MEAN-YEAR STORAGE DEMAND
1965 1970 1975 1980 1985 1990 1995 2000(2R)IBRD-3225A

- 25 -
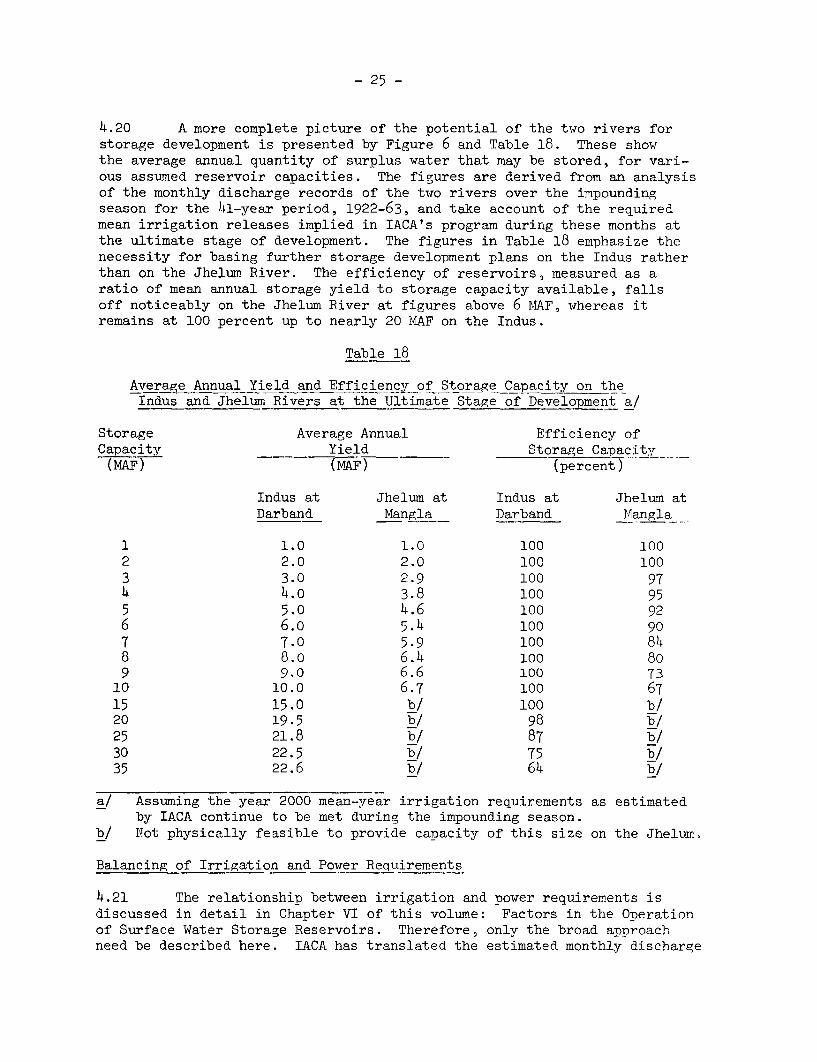
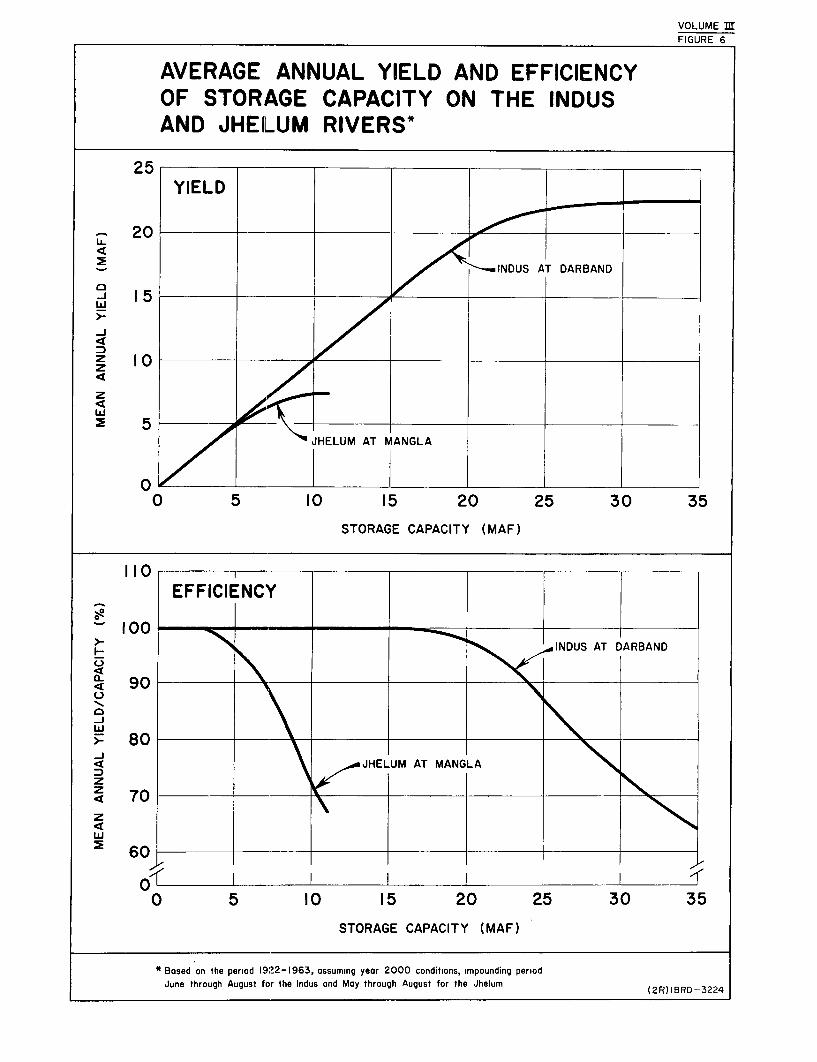
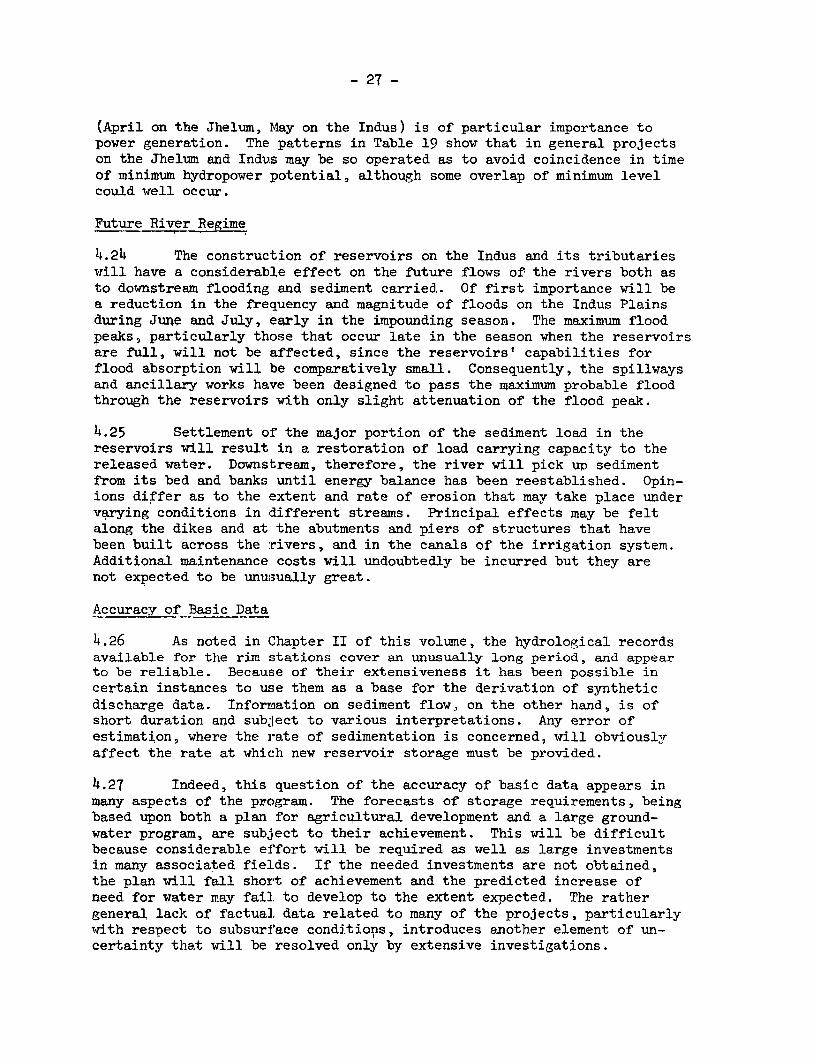
4.20 A more complete picture of the potential of the two rivers forstorage development is presented by Figure 6 and Table 18. These showthe average annual quantity of surplus water that may be stored, for vari-ous assumed reservoir capacities. The figures are derived from an analysisof the monthly discharge records of the two rivers over the impoundingseason for the 41-year period, 1922-63, and take account of the requiredmean irrigation releases implied in IACA's program during these months atthe ultimate stage of development. The figures in Table 18 emphasize thenecessity for basing further storage development plans on the Indus ratherthan on the Jhelum River. The efficiency of reservoirs, measured as aratio of mean annual storage yield to storage capacity available, fallsoff noticeably on the Jhelum River at figures above 6 MAF, whereas itremains at 100 percent up to nearly 20 MAF on the Indus.
Table 18
Average Annual Yield and Efficiency of Storage Capacity on theIndus and Jhelum Rivers at the Ultimate Stage of Development a/
Storage Average Annual Efficiency ofCapacity Yield Storage Capacity(MAF) - (MAF) (percent)
Indus at Jhelum at Indus at Jhelum atDarband Mangla Darband Mangla
1 1.0 1.0 100 1002 2.0 2.0 100 1003 3.0 2.9 100 974 4.0 3.8 100 955 5.0 4.6 100 926 6.o 5.4 100 907 7.0 5.9 100 848 8.0 6.4 100 809 9.0 6.6 100 73
10 10.0 6.7 100 6715 15.0 b/ 100 b/20 19.5 b 98 b25 21.8 b/ 8730 22.5 b/ 7535 22.6 b/ 64 b
a/ Assuming the year 2000 mean-year irrigation requirements as estimatedby IACA continue to be met during the impounding season.
b/ Not physically feasible to provide capacity of this size on the Jhelum.
Balancing of Irrigation and Power Requirements
4.21 The relationship between irrigation and power requirements isdiscussed in detail in Chapter VI of this volume: Factors in the Operationof Surface Water Storaae Reservoirs. Therefore, only the broad approachneed be described here. IACA has translated the estimated monthly discharge
- 26 -
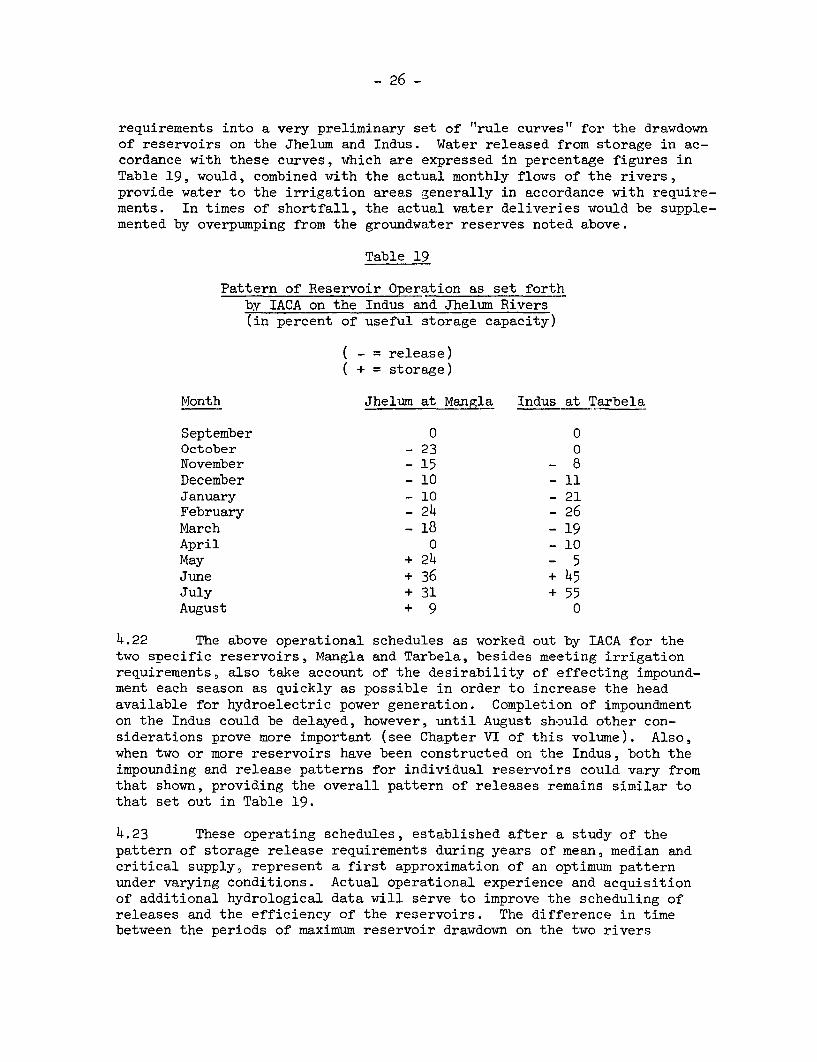
requirements into a very preliminary set of "rule curves" for the drawdownof reservoirs on the Jhelum and Indus. Water released from storage in ac-cordance with these curves, which are expressed in percentage figures inTable 19, would, combined with the actual monthly flows of the rivers,provide water to the irrigation areas generally in accordance with require-ments. In times of shortfall, the actual water deliveries would be supple-mented by overpumping from the groundwater reserves noted above.
Table 19
Pattern of Reservoir Operation as set forthby IACA on the Indus and Jhelum Rivers(in percent of useful storage capacity)
( - = release)( + = storage)
Month Jhelum at Mangla Indus at Tarbela
September 0 0October - 23 0November - 15 - 8December - 10 - 11January - 10 - 21February - 24 - 26March - 18 - 19April 0 - 10May + 24 - 5June + 36 + 45July + 31 + 55August + 9 0
4.22 The above operational schedules as worked out by IACA for thetwo specific reservoirs, Mangla and Tarbela, besides meeting irrigationrequirements, also take account of the desirability of effecting impound-ment each season as quickly as possible in order to increase the headavailable for hydroelectric power generation. Completion of impoundmenton the Indus could be delayed, however, until August should other con-siderations prove more important (see Chapter VI of this volume). Also,when two or more reservoirs have been constructed on the Indus, both theimpounding and release patterns for individual reservoirs could vary fromthat shown, providing the overall pattern of releases remains similar tothat set out in Table 19.
4.23 These operating schedules, established after a study of thepattern of storage release requirements during years of mean, median andcritical supply, represent a first approximation of an optimum patternunder varying conditions. Actual operational experience and acquisitionof additional hydrological data will serve to improve the scheduling ofreleases and the efficiency of the reservoirs. The difference in timebetween the periods of maximum reservoir drawdown on the two rivers
VOLUME mFIGURE 6
AVERAGE ANNUAL YIELD AND EFFICIENCYOF STORAGE CAPACITY ON THE INDUSAND JHELUM RIVERS*
25YIELD
20
U-a | 5 _ X <~~~~~~~--lNU AT DARBAND
5 5 >
W
E I oo0 E C
z
zw
5JHELUM AT MANGLA
0 5 10 15 20 25 30 35
STORAGE CAPACITY (MAF)
110__ _
EFFICIENCY
*0 Bosed_ ontepno_92i63_sumg___00 odton,zpudigpr
June through August for the Indus nd May thr August for thNDUS AT DARBAND
90
w
4 ~~~~~~~~JHELUM AT MANGLAzz < 70zw
60
0 5 10 15 20 25 30 35
STORAGE CAPACITY (MAF)
*Based on the period 1922-1963, assuming year 2000 conditions, impounding period
June through August for the Indus and May through August for the Jhelum (2R) IBRD-3224

- 27 -
(April on the Jhelum, May on the Indus) is of particular importance topower generation. The patterns in Table 19 show that in general projectson the Jhelum and Indus may be so operated as to avoid coincidence in timeof minimum hydropower potential, although some overlap of minimum levelcould well occur.
Future River Regime
4.24 The construction of reservoirs on the Indus and its tributarieswill have a considerable effect on the future flows of the rivers both asto downstream flooding and sediment carried. Of first importance will bea reduction in the frequency and magnitude of floods on the Indus Plainsduring June and July, early in the impounding season. The maximum floodpeaks, particularly those that occur late in the season when the reservoirsare full, will not be affected, since the reservoirs' capabilities forflood absorption will be comparatively small. Consequently, the spillwaysand ancillary works have been designed to pass the maximum probable floodthrough the reservoirs with only slight attenuation of the flood peak.
4.25 Settlement of the major portion of the sediment load in therepervoirs will result in a restoration of load carrying capacity to thereleased water. Downstream, therefore, the river will pick up sedimentfrom its bed and banks until energy balance has been reestablished. Opin-ions differ as to the extent and rate of erosion that may take place undervarying conditions in different streams. Principal effects may be feltalong the dikes and at the abutments and piers of structures that havebeen built across the rivers, and in the canals of the irrigation system.Additional maintenance costs will undoubtedly be incurred but they arenot expected to be unusually great.
Accuracy of Basic Data
4.26 As noted in Chapter II of this volume, the hydrological recordsavailable for the rim stations cover an unusually long period, and appearto be reliable. Because of their extensiveness it has been possible incertain instances to use them as a base for the derivation of syntheticdischarge data. InforTmation on sediment flow, on the other hand, is ofshort duration and subject to various interpretations. Any error ofestimation, where the rate of sedimentation is concerned, will obviouslyaffect the rate at which new reservoir storage must be provided.
4.27 Indeed, this question of the accuracy of basic data appears inmany aspects of the program. The forecasts of storage requirements, beingbased upon both a plan for agricultural development and a large ground-water program, are subject to their achievement. This will be difficultbecause considerable ef'fort will be required as well as large investmentsin many associated fields. If the needed investments are not obtained,the plan will fall short of achievement and the predicted increase ofneed for water may fail, to develop to the extent expected. The rathergeneral lack of factual data related to many of the projects, particularlywith respect to subsurface conditions, introduces another element of un-certainty that will be resolved only by extensive investigations.

- 28 -
4.28 Nevertheless, while the existence of doubt in many matters isacknowledged, and the shortage of basic data is realized, the Bank Groupis of the opinion that the information used in the preparation of thisreport is the best presently available. It also believes that this infor-mation is adequate to formulate a considered judgment on the next and sub-sequent steps that should be taken to effect beneficial control of thesurface water supplies of West Pakistan.
- 29 -
V. IDENTIFICATION OF DAM SITES AND COMPARISON OF PROJECTS
Scope of the Studies
5.01 A large number of potential surface water storage projectswere reviewed by Chas. T. Main, as consultant for dam sites. The assign-ment required that studies be made of specific sites designated by theDam Sites Committee (see Para. 1.05) and that preliminary cost estimatesbe made of dams appropriate to those locations. In addition, an appraisalof other likely sites was required as a means of determining how eachmight fit into plans separately considered for development of the riversindividually and the system as a whole. Cost estimates, essential toeconomic evaluations, were made in a number of cases from preliminarydesigns worked up for the purpose. Finally, comparisons were made ofprojects considered both in isolation and in combinations.
5.02 For purposes of economic analysis and to facilitate comparisons,the dam site consultant's terms of reference specified that project costestimates should exclude all Pakistan duties and taxes and interest duringconstruction and should be based upon the prices generally prevailing in1965. The cost estimates do not therefore, unless it is so stated, repre-sent an assessment of the financial resources that may be required forrealistic construction programs.
5.03 The data available to the consultant, on which he had to basehis findings, varied considerably among projects. For some, such asTarbela and Mangla, there was no lack of relevant information and compre-hensive studies in depth were possible. In other cases, reliable datawere limited, and some sites could not even be visited within the con-sultant's program for the time available. Variations of this kind havemade it extremely difficult to compare dam sites fairly as to the probablecosts. The Bank Group and the consultant concur that until projects canbe compared on an equal basis it is only prudent to add an appropriateuncertainty factor to those projects which have not been studied in detail.The consultant has felt that his buildup of the cost estimates used inhis report makes sufficient provision to cover the worst conditions thatmay be encountered. While not challenging this judgment the Bank Group,with a mind to future financing problems, has chosen for itself a moreconservative position as stated below.
5.o4 In developing preliminary designs for cost estimating purposes,the consultant frequently found it necessary to rely on judgment as nofacts were available. In such cases his assumptions regarding physicalconditions have -been stated. Future field exploration and subsurfaceinvestigations could, of course, reveal different conditions. Thesemight affect not onl-y the cost figures, but even the physical feasibilityof the structures conceived to be practicable. For this reason, althoughhis estimates are based on the judgment of experience and include a con-tingency item to cover unforeseen physical conditions, the Bank Group hasconsidered it advisable to indicate a possible cost range for each project
- 30 -
about which there is incomplete information, cautioning at the same timethat the higher figure of these ranges should not be taken as a firmceiling. The upper figure of the range was arrived at by independentmethods, the fj;fst of which applied a judgment factor to the total esti-mated cost. This was checked by an analysis involving the utilizationof weighted uncertainty factors. While the cost range was introducedprimarily to identify and emphasize the uncertainty relating to eachproject considered, it also serves to establish a reasonable degree ofpreference, in the present state of knowledge, for those projects whichhave been more thoroughly investigated. The salient facts pertaining tothe various storage sites which are reviewed in this,part of the report,are summarized in Table 33.
5.05 The discussion which follows has for convenience been dividedinto sections dealing first with potential projects on the Indus and thenon the rivers Jhelum, Chenab, Kabul, Chitral and Swat. The presentationis as follows:
Section A: Paras. 5.06-5.76: The Valley of the Indus.
Section A(l): Paras. 5.08-5.51: Middle Indus.
Paras. 5.09-5.19: Tarbela.
Paras. 5.20-5.35: Side valley projectsassociated with Tarbela.
Para. 5.36: Attock.
Paras. 5.37-5.43: Kalabagh.
Paras. 5.44-5.47: Side valley projectsassociated with Kalabagh.
Section A(2): Paras. 5.52-5.59: Upper IEndus.
Paras. 5.52-5.58: Skardu.
Section A(3): Paras. 5.60-5.76: Indus Plains.
Paras. 5.61-5.68: Indus Plains Reservoir.
Paras. 5.69-5.72: Chasma.
Paras. 5.73-5.74: Sehwan--Manchar.
Section B: Paras. 5.77-5.90: Jhelum River Basin.
Paras. 5. 7 9 -5.8 4 : Mangla.
Paras. 5.87-5.89: Kunhar.
- 31 -
Section C: Para. 5.91: Chenab River Basin.
Section D: Paras. 5.92-5.107: Kabul River Basin.
Para. 5.95: The Chitral.
Paras. 5.96--5.106: The Swat.
It will be noted that t,he principal emphasis of this material is on theIndus River itself. The hydrological factors which are relevant in thisconnection were presented and analyzed in Chapter II of this volume.
A. The Valley of the Indus
5.o6 The Indus rises in the highlands of Tibet and flows nearly 2,000miles to the Arabian Sea. In its upper reaches it is surrounded by moun-tains that rise to 28,000 feet in height, and its valley is inaccessiblefor practical engineering purposes for a distance of nearly 500 miles.The river then traverses a basin, in which the village of Skardu is located,before entering a deep gorge which extends for another 300 miles. Thisgorge terminates about six miles above the village of Tarbela, below whichthe valley widens. Some 32 miles doamstream from Tarbela the Indus isjoined by the Kabul. Then at Attock, it enters another series of gorgesthrough which it flows for a distance of nearly 100 miles before reachingthe broad flat plains of West Pakistan near Kalabagh. Beyond that pointthe river pursues a braided course through the alluvium of the plain for950 miles on an average direct gradient of about one foot per mile beforeentering the sea near Karachi. The annual discharge of the Indus atAttock, where it has been gauged since 1868 averages about 93 MAF. Up-stream, above the confluence of the Kabul, at Darband, its average annualdischarge has been computed at 66 MAF on the basis of correlation withthe Attock records.
Suitability of the Valley for Reservoir Storage
5.07 The uppermost site for a dam on the main stem of the Indus River,for which access may be considered reasonably easy, is at Tarbela (seeMap III.3). Some 80 miles north of that general area the mountains riseabruptly and the river flows through deep and narrow gorges. While thesegorges may provide opporttunities for the construction of high dams withconsiderable power potential, the number of potential storage sites appearsvery limited. Furthermore-, the area has been subject to little explorationand the developments of aeccess routes could rival in cost the building ofthe projects. FrQm--TarEiela south to Kalabagh the valley is relativelyopen, but either its-width is such as to preclude the economic constructionof a dam or, as at-Attock, such valuable land and properties would be sub-merged as to make--thel-proje-ct unifeasible.
A(M) The Middle Indus-
5.08 In the first part of this study, Report on a Dam on the Indus,dated February 1965, which was specifically concerned with Tarbela,
- 32 -
detailed comparisons were drawn between the construction of a dam atTarbela and at Kalabagh. In the course of this second and comprehensivephase of the study, the dam sites consultant has made a substantially moredetailed examination of a possible project at Kalabagh. In the followingpages, the previous studies of Tarbela will be sumlmarized and more detailedattention will be given to Kalabagh on the basis of the consultant's supple-mentary studies. An annex on each project is attached to this report.After discussion of those two projects, consideration will be given toUpper Indus and Indus Plain sites in that order. Although a number of goodpotential sites can be found on the so-called middle reach of the Indus,where Tarbela is located, all of them would be considered alternative toTarbela or Kalabagh and in that context those mentioned will be discussedonly briefly.
Tarbela Project
5.09 The Indus River, between the villages of Bara and Kirpalian(M4ap III.4), has been thoroughly investigated since 1959 to ascertain themost advantageous reservoir site on this promising 17-mile stretch ofriver. In 1962, WAPDA's consulting engineers, Tippetts-Abbett-McCarthy-Stratton International Corp. (TANIS) of New York, submitted a report inwhich it was concluded that the Bara site (essentially the Tarbela siteand hereinafter referred to as Tarbela) would afford the best location fora dam on the Indus in that general area. The Bara site was compared totwo alternatives, one at Kirpalian, the other at Kiara. The choice ofBara was based on the following facts and observations:
(i) The Kirpalian site, 17 miles upstream of Tarbela, wasjudged to have a maximum practical gross storage potentialof 4.3 MAF. An additional 1.3 MAF of gross storage couldbe added by diverting water by gravity flow from theKirpalian reservoir, through a conveyance canal, to areservoir formed by a dam to be constructed at Thapla onthe Siran River. The estimated cost per acre-foot of usablestorage at the Kirpalian site was found to be greater thanthe comparable storage at the Tarbela site. The cost of theconveyance system and the Thapla dam would further increasethe overall average cost of storage at Kirpalian in compari-son to that at Tarbela.
(ii) The Kiara site, only two miles upstream of Tarbela, has astorage potential about 10 percent less than that ofTarbela. Also, the physical attributes of the site arenot as favorable as those of Tarbela. The estimated costof storage at Kiara is more than that at Tarbela.
(iii) The Bara site (Tarbela) proved the most promising of thethree, primarily because of a geologically ancient streambed at the left abutment of the proposed dam, which wouldfacilitate the construction of a spillway.
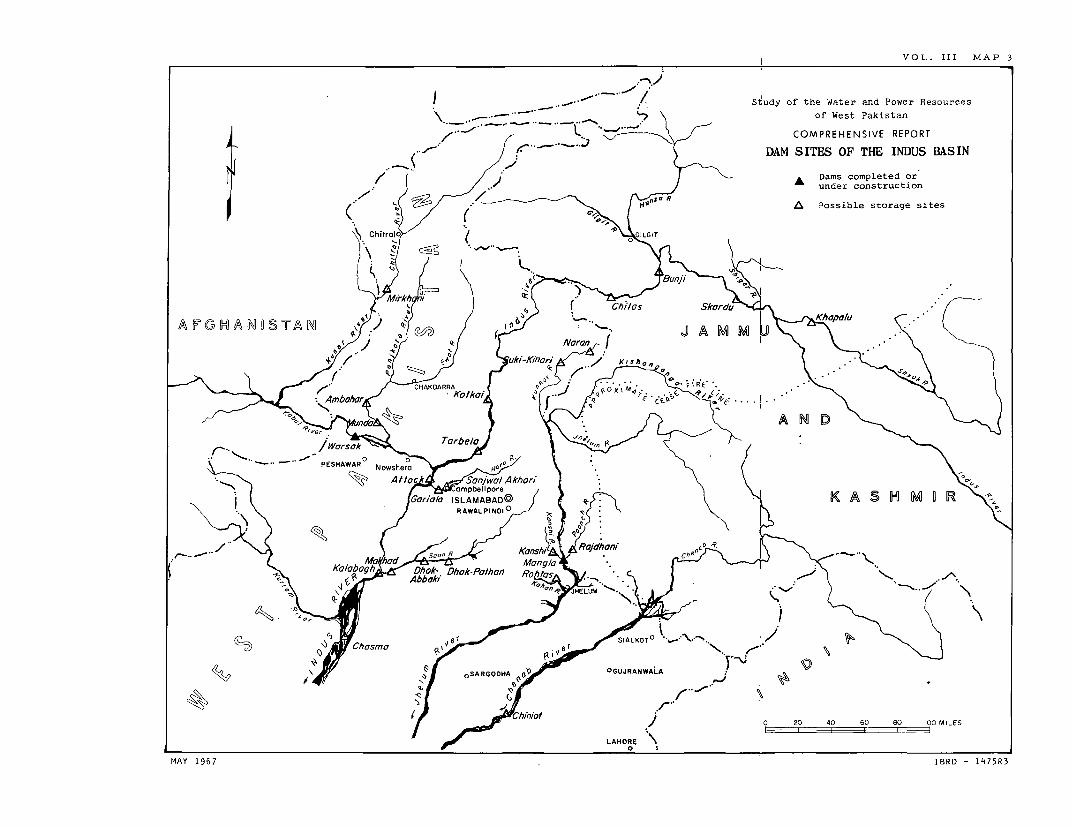
VOL. III MAP 3
} ,._ ~ / Siudy of the Water and Power Resources
.-..-..--- o~~~~~~~~~f' West Pakistan
COMPREHENSIVE REPORT
DAM SITES OF THE INDUS BASIN
Dams completed orA under construction
( ,0 9/r ~ v (> A Possible storage sites
Ch itralLGIT 20
MAY 1967 IBRD - 1'3Ch;/es
^FH^H0$T^ 449 tw7 , ,< J A M S yaau R <~~~~~~~~KAFGHAH~~~ </ .* oJSTAN % <" F wE <9<-tr;tS/k/n [X>r, ,A.m
r <\-<t_, T J X_ a H > <~~~~~~~~~~~
$ -" - ~~~PESHAWAR" Nowshera y _ /\\
f) W AttAkhori $ * a ISLA A S H Mo I R X
> \ J ~~~~~~~~~~RAWAPNI/:c |
s X 4 ~~~~~~ ~ ~~Abbaki eJEU ) -
X t 7 o~~~~~~~~~~SARGODH^7 OGUJRANWALA 0 20 40 60 80 100 MILES
MAY 1967 IBRD -1475R3

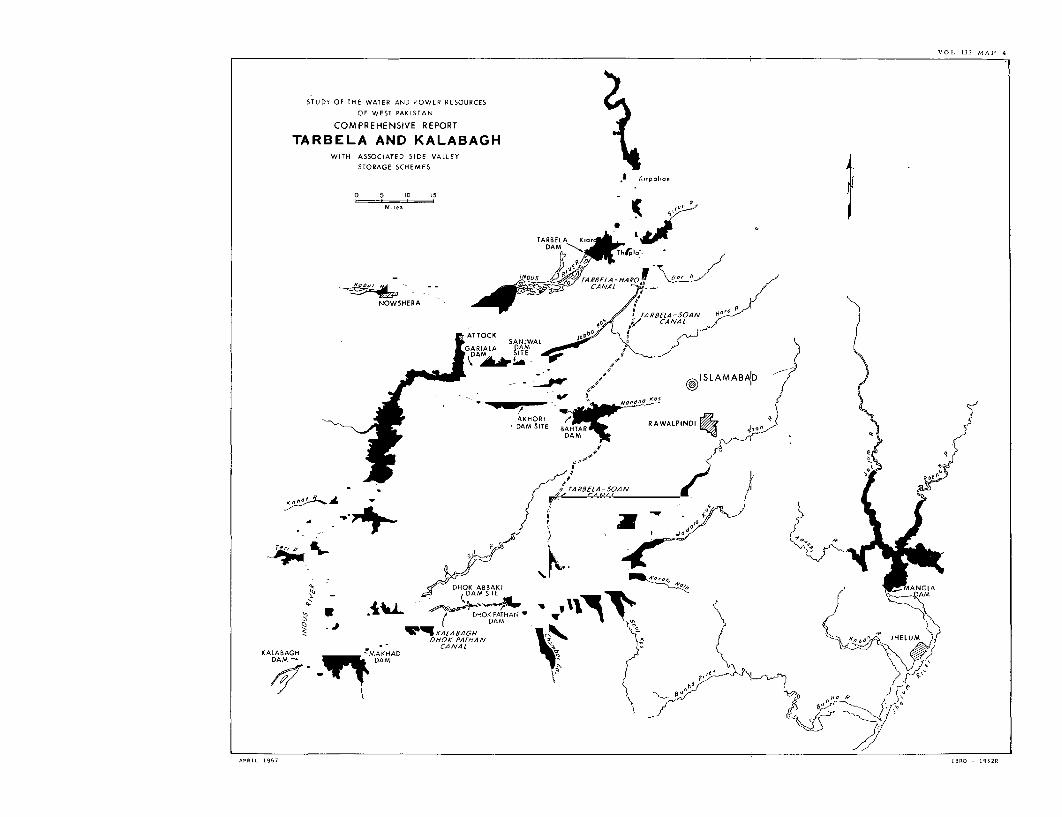
VOL [11 MA'P 4
STUDY OF THE WATER AND POWER RESOURCES
OF WEST PAKISTAN
COMPREHENSIVE REPORT
TARBELA AND KALABAGHWITH ASSOCIATED SIDE VALLEY
STORAGE SCHEMES
Z' spollon 1O S 10 5
TARBELA K.., dlDAM-
NOWSHERA i I MA
04j CA IVA I
- t ~~~~~~~SA N JWA L XGARIALA DAMA _m
g uA;L SITEt
* / ¢ t ,Da @| ~~~~~~~~SLAMABAID s '-- '* '
AKHORI LiDDAMS R BAHTAR WI
DA.
A 4 4Z4 UA I
. ,/ 4, i~~~~~ARSELA SCAN {$v
Id~~~~~~~~~~~~~
Ye, 5 ~ ~ ~ ~ ~ PN ' P
6 HOK ABBAKI GLA4 _ > , DAM SITE M
3 / ~~~~~~~~DiIOK PATHAN , "C ( DAM
CO H O-PArHIA N- CANAL 3
KALABAGH - MAKHADDAM- DAM,
APRIL 1967 1B4D - 1932R

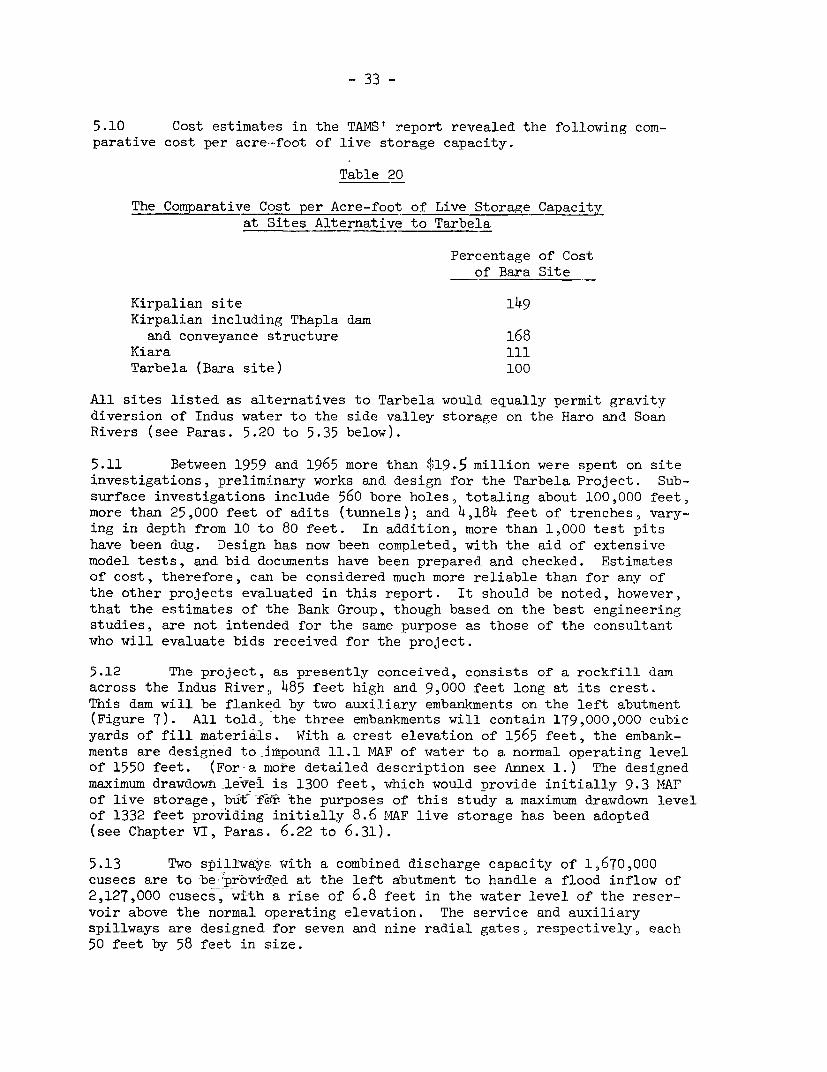
- 33 -
5.10 Cost estimates in the TAMS' report revealed the following com-
parative cost per acre-foot of live storage capacity.
Table 20
The Comparative Cost per Acre-foot of Live Storage Capacityat Sites Alternative to Tarbela
Percentage of Costof Bara Site
Kirpalian site 149Kirpalian including Thapla dam
and conveyance structure 168Kiara 111
Tarbela (Bara site) 100
All sites listed as alternatives to Tarbela would equally permit gravity
diversion of Indus water to the side valley storage on the Haro and SoanRivers (see Paras. 5.20 to 5.35 below).
5.11 Between 1959 and 1965 more than $19.5 million were spent on siteinvestigations, preliminary works and design for the Tarbela Project. Sub-
surface investigations include 560 bore holes, totaling about 100,000 feet,more than 25,000 feet of adits (tunnels); and 4,184 feet of trenches, vary-
ing in depth from 10 to 80 feet. In addition, more than 1,000 test pits
have been dug. Design has now been completed, with the aid of extensive
model tests, and bid documents have been prepared and checked. Estimatesof cost, therefore, can be considered much more reliable than for any of
the other projects evaluated in this report. It should be noted, however,
that the estimates of the Bank Group, though based on the best engineeringstudies, are not intencded for the same purpose as those of the consultant
who will evaluate bids received for the project.
5.12 The project, as presently conceived, consists of a rockfill dan
across the Indus River, 485 feet high and 9,000 feet long at its crest.
This dam will be flanked by two auxiliary embankments on the left abutment(Figure 7). All told, the three embankments will contain 179,000,000 cubic
yards of fill materials. With a crest elevation of 1565 feet, the embank-
ments are designed to imipound 11.1 MAF of water to a normal operating levelof 1550 feet. (For-a moire detailed description see Annex 1.) The designed
maximum drawdown level is 1300 feet, which would provide initially 9.3 MAF
of live storage,_but-f-ri- the purposes of this study a maximum drawdown levelof 1332 feet providing initially 8.6 MAF live storage has been adopted(see Chapter VI, Paras. 6.22 to 6.31).
5.13 Two spillways with a combined discharge capacity of 1,670,000cusecs are to be-p-prov-idced at the left abutment to handle a flood inflow of
2,127,000 cusecs, with a rise of 6.8 feet in the water level of the reser-
voir above the normal operating elevation. The service and auxiliaryspillways are designed for seven and nine radial gates, respectively, each
50 feet by 58 feet in size.
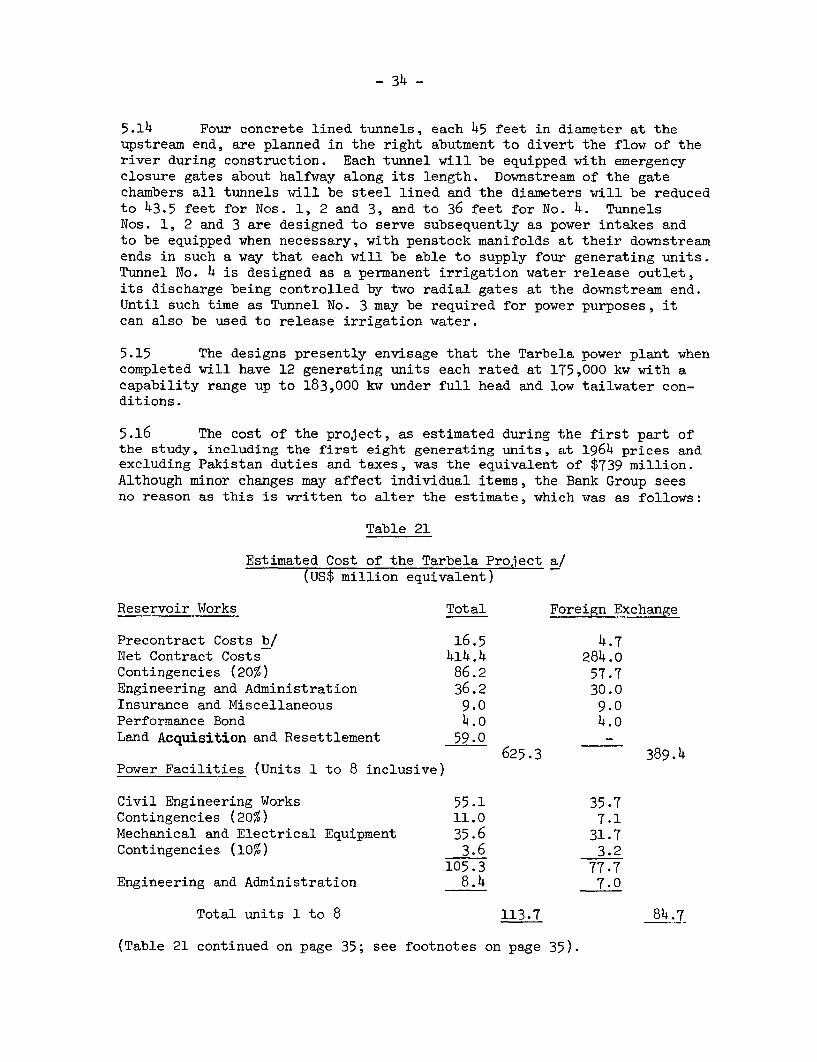
- 34 -
5.14 Four concrete lined tunnels, each 45 feet in diameter at theupstream end, are planned in the right abutment to divert the flow of theriver during construction. Each tunnel will be equipped with emergencyclosure gates about halfway along its length. Downstream of the gate
chambers all tunnels will be steel lined and the diameters will be reducedto 43.5 feet for Nos. 1, 2 and 3, and to 36 feet for No. 4. TunnelsNos. 1, 2 and 3 are designed to serve subsequently as power intakes andto be equipped when necessary, with penstock manifolds at their downstream
ends in such a way that each will be able to supply four generating units.Tunnel No. 4 is designed as a permanent irrigation water release outlet,
its discharge being controlled by two radial gates at the downstream end.Until such time as Tunnel No. 3 may be required for power purposes, itcan also be used to release irrigation water.
5.15 The designs presently envisage that the Tarbela power plant whencompleted will have 12 generating units each rated at 175,000 kw with acapability range up to 183,000 kw under full head and low tailwater con-ditions.
5.16 The cost of the project, as estimated during the first part ofthe study, including the first eight generating units, at 1964 prices andexcluding Pakistan duties and taxes, was the equivalent of $739 million.Although minor changes may affect individual items, the Bank Group seesno reason as this is written to alter the estimate, which was as follows:
Table 21
Estimated Cost of the Tarbela Project a/
(US$ million equivalent)
Reservoir Works Total Foreign Exchange
Precontract Costs b/ 16.5 4.7Net Contract Costs 414.4 284.0Contingencies (20%) 86.2 57.7Engineering and Administration 36.2 30.0Insurance and Miscellaneous 9.0 9.0Performance Bond 4.o 4.oLand Acquisition and Resettlement 59.0 -
625.3 389.4Power Facilities (Units 1 to 8 inclusive)
Civil Engineering Works 55.1 35.7Contingencies (20%) 11.0 7.1Mechanical and Electrical Equipment 35.6 31.7Contingencies (10%) 3.6 3.2
105.3 77.7Engineering and Administration 8.4 7.0
Total units 1 to 8 113.7 84.7
(Table 21 continued on page 35; see footnotes on page 35).
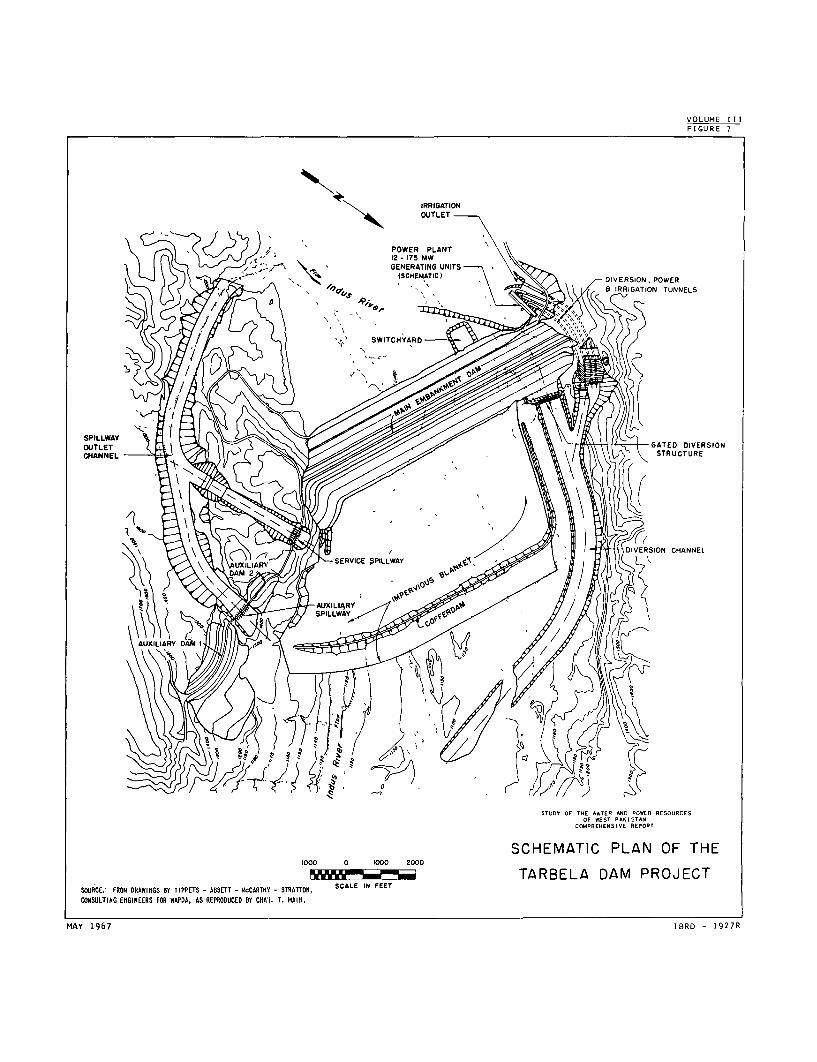
VOLUME IIIFIGURE 7
IRRIGATIONOUTLET
\/~ CA\ -??�X ) POWER PLANT12 -175 MW
A WA )>"-: \ \. NGENERATING UNITSiSCHEMCATICM DIVERSION, POWER
S IRRIGATION TUNNELS
OPIJLETA GATED DIVERSION
CHANNEL DAMESTRUCTURE
DIERSION CHANNEL
CONSULTING ENGINEERS FOR WAPDA, AS REPRODUCED ST CHA';. TCO.REHENSIE REPn.
MAYLIA-SERVICEI P N OF T
DAM 2 ~ ~ ~ ~ ABLADMPRJC
MAY 1967 IBRO - 1927R~~SPILWA

- 35 -
Table 21(Cont'd)
Total Foreign Exchange
Reservoir Works 625.3 389.4
Power Facilities 113.7 84.7
Estimated total project costincluding first 8 units 739.0 474.1
a/ As stated in Para. 5.02, the costs are for the purposes of economicanalysis and comparison and exclude provision for inflation, financialcontingencies, Pakistan duties and taxes and interest during construc-tion, etc. They do not, therefore, represent a full assessment of thefinancial resources that might be required to carry out the project(see Chapter IX).
b/ Excluding costs incurred prior to January 1965.
5.17 The project is physically adaptable to construction in more thanone stage. The following estimates relating to a two-stage project, assumingthat the dam would be constructed initially to impound water to an elevationof 1500 feet and would be raised subsequently to permit impounding to eleva-tion 1550 feet, are based on information obtained from TANS by the dam siteconsultant.
Table 22
Estimated Cost of Phased Construction of theTarbela Project: Reservoir Features Only
(US!) million equivalent)
Cost of initial Tarbela, F.S.L. 1500 588Cost of subsequent raising for F.S.L. 1550 64Cost of two stage Tarbela 652
Cost of single stage Tarbela 625
As will be indicated in Chapter VII of this volume, the construction ofTarbela by stages would( not be economically viable on the basis of therate of growth of the Tmean-year demand for stored water projected byIACA.
5.18 In Tab-le- -7 (-.§e-e Para. 2.18, Chapter II), it is estimated thatthe most probabie1sedfim ent inflow into Tarbela Reservoir will run toabout 440 milliont'ons- a year. On this basis it is estimated that about240,000 acre-.feet of' storage volume will be lost each year by sedimentation.Thus, in 50 years the live storage capacity will be reduced to about 1 MAF.A large loss of useful capacity by sedimentation will occur in any reservoiron the Indus. It is., therefore, a subject for prime consideration, not only
- 36 -
during planning stages, but continuall,y in the future. Action that shouldbe taken includes field investigations and research aimed to determinequantities of silt carried in suspension and material moved as bed load,correlating these with river discharges at critical points. Programs forwatershed improvement and management to reduce erosion should be instigated,and studies made of the possible effects of check dams and other upstreamstructures.
5.19 As noted in paragraph 5.11, design of the project is now completeand bidding documents have been prepared. The plan is to complete construc-tion to the stage where impounding could commence in a period of seven years.Thus, should the construction contract be awarded before the end of 1967,the project might be ready to store water towards the end of the summer of1974 but not to full reservoir capacity.
Side Valley Projects Associated with Tarbela
5.20 In recognition of the high rate of depletion of storage capacityat Tarbela, various proposals have been put forward by the Pakistan author-ities for auxiliary (side valley storage) reservoirs on the Haro and SoanRivers which would be filled by the diversion of Indus River waters throughcanals from Tarbela Reservoir. It has been indicated that the potentialcapacity of reservoirs on these rivers is in excess of 30 MAF. A study ofthe proposals. however, suggests that the costs of dams, considered inconnection with the cost of conveyance canals, would make construction ofside valley storage projects as expensive as reservoirs on the main stemof the Indus.
5.21 For any such undertakings Tarbela would have to be built toelevation 1565 feet in order to facilitate the transference of water acrossthe divide. Also, because diversions would be possible only when theTarbela Reservoir might be full or nearly full, it would be necessary tofill Tarbela as soon as possible each flood season. This would providesufficient time to fill the side valley reservoirs before drawdowns forirrigation. Three potential side valley projects, Gariala, Dhok Pathanand Sanjwal-Akhori, were studied in detail by the dam site consultant anddiscussed in his earlier Tarbela Report. A summary of the results isdescribed in the following paragraphs.
The Gariala Site
5.22 For side valley storage on the Haro River the dam site consultantcame to a conclusion that an earth dam at the Gariala site would providethe most suitable solution. (For a more detailed description see Annex 3.)Such a dam would be about 375 feet high and have a crest length of 40,000feet. It would contain about 189,000,000 cubic yards of embankment mater-ials. The normal high water elevation behind the dam would be 1250 feetand with a minimum drawdown level of 1020 feet, would provide a live reser-voir capacity of 8.0 MAF. This would be filled in a mean year by diverting7.6 MAF from Tarbela Reservoir, the Haro River itself contributing 0.4 MAFto storage.
- '37 -
L5,.23 TTP Scpnvey ithe I-ndus .water from Tarbela to tGarla-la, ,a tcanal some-1iy g iles long,, ~witth ,a capacity of '76,000 c-usec.s, woxuld 'be :constructed4f-rom ,the S4i$ran sarm .of 'the ;Tar,bel-a Reserv.oixr to -the Jabba Kas 'River, a-tgj-itut.ary of o-the Hiaro :(.see Map '1I..'4',). -ew -details -are 1known -of theg9,?92lgy Q9f itkhi Arkea thro-ugh which the .canal would pass *but the entire!APgth -i6 exp,eet.ed to .be in ieasiJy 'excavated, water-,deposited silt dandssand3 ,,it 1bedxppk :generTaly ,w.ell bellow invert rgrade. .A control and dropatr-u^e'r,e ,t th ,eind of the teanal xwoiild 'be .required -to -regulate the *re-le,asgs of water -into -the ,ffabba Kas , .own 'which -it -woud :fldow to the,ar-,i,,la R.,e.srv,oir,
§.2.4 'F9ur reinforced concrete conduits,.26 feet-in diameter, used todi-vert -the -fljow, of -the Haro River duri'ng construction.,-would provide the,nece9qa,y w,at,er release capacity for ,oeration -of the reservoir. These!con,duits would be the only water release structures and would, when oper-,ating a,t full d-ischarge, be used in conjunction -wiith the capacity of the-reser-voir betw,ee -f,ull supply level and the design-flood freeboard on theda,m,-to .deal with -the assumed peak flood inflow .of 386,000 cusecs.. Anse,,rg,PP9y §3pillway would b.e provided. The consultant's studies indicateth,t t,-i, arrangement would be the most economical.
T he -inatallation of turbines at the downstream end of the re-lease ptrqctures would permit the generation of power, but only during thetvqrage release period. Because there would be no discharge for several
pToiyths of t,he y,a,r-, -t-he dam site consultant did not carry out detailedsPtudies to determine what the Qptimum installation might be, but as amWatter- f- Judgment decided that three of the four release tunnels mighteach serve two, generating units. Each unit would have a rating of 85 mw4th aL, capability for sustained overload of 15 percent. Since the mainque,s,tion is w,hether any installation could be justified, further studiesdo, not. appear war-ranted at this time.
5.,26 Basic dat-a for- the preparation of feasibility designs and costestimates are pres,ently limited. Information available to the consultanthas consisted of- l l5 00Q scale topographic maps. G.T. sheets of the areaat a scale of- one- ineh to. one mnle,, air photographs and one generalized,
u.ve.y,Ze,, geolog-ical. cross-section of the dam site. No subsurface ex-pqorations;, bgae been mladle or detailed mapping carried out to date.
The dam s-ite consultant, on the basis of a desk study, estimatedth,,a, aj pr-ajec,t o-f the, scale. env-ispaged would cost the equivalent of $651million+, made. up, as fqllows.s
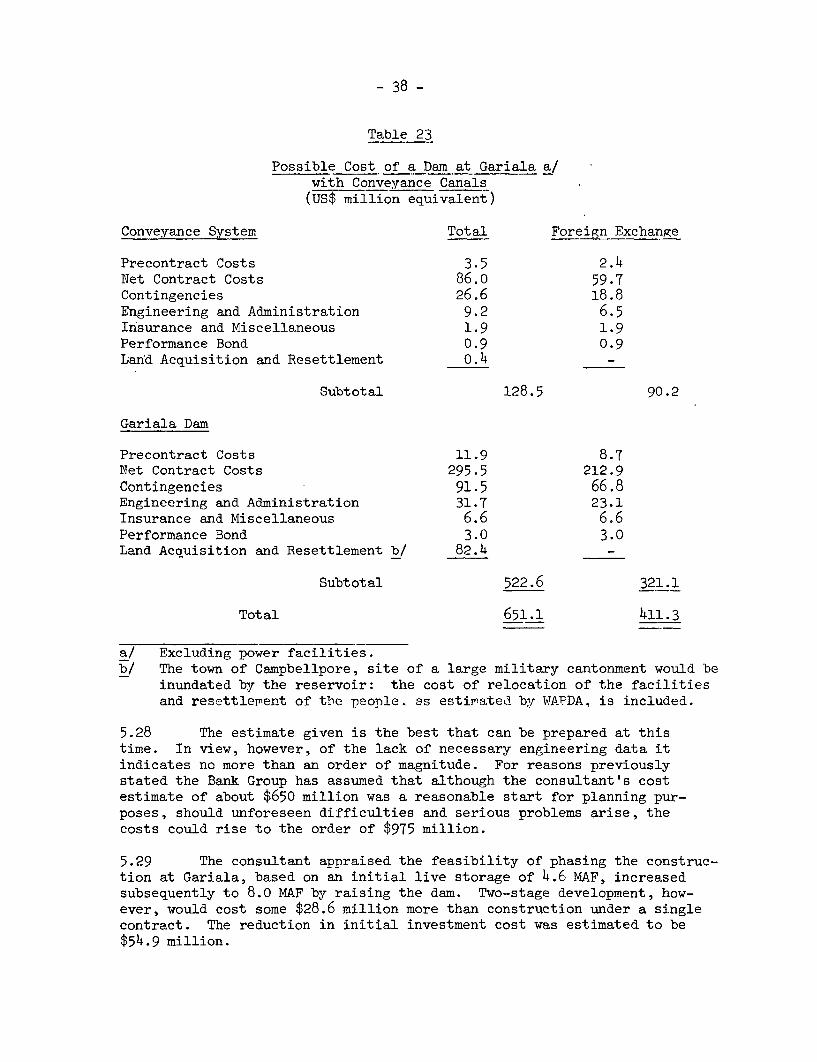
- 38 -
Table 23
Possible Cost of a Dam at Gariala a/with Conveyance Canals(US$ million equivalent)
Conveyance System Total Foreign Exchange
Precontract Costs 3.5 2.4Net Contract Costs 86.o 59.7Contingencies 26.6 18.8Engineering and Administration 9.2 6.5Insurance and Miscellaneous 1.9 1.9Performance Bond 0.9 0.9Land Acquisition and Resettlement o.4 -
Subtotal 128.5 90.2
Gariala Dam
Precontract Costs 11.9 8.7Net Contract Costs 295.5 212.9Contingencies 91.5 66.8Engineering and Administration 31.7 23.1Insurance and Miscellaneous 6.6 6.6Performance Bond 3.0 3.0Land Acquisition and Resettlement b/ 82.4 _
Subtotal 522.6 321.1
Total 651.1 411.3
a/ Excluding power facilities.b/ The town of Campbellpore, site of a large military cantonment would be
inundated by the reservoir: the cost of relocation of the facilitiesand resettlement of tho peonle. as estimated by WAPDA. is included.
5.28 The estimate given is the best that can be prepared at thistime. In view, however, of the lack of necessary engineering data itindicates no more than an order of magnitude. For reasons previouslystated the Bank Group has assumed that although the consultant's costestimate of about $650 million was a reasonable start for planning pur-poses, should unforeseen difficulties and serious problems arise, thecosts could rise to the order of $975 million.
5.29 The consultant appraised the feasibility of phasing the construc-tion at Gariala, based on an initial live storage of 4.6 MAF, increasedsubsequently to 8.0 MAF by raising the dam. Two-stage development, how-ever, would cost some $28.6 million more than construction under a singlecontract. The reduction in initial investment cost was estimated to be$54.9 million.
- 39 -
The Dhok Pathan Site
5.30 In the course of the earlier Tarbela investigations, as analternative to side valley storage on the Haro River, consideration wasgiven to storage on the Soan River and, for this, a site at Dhok Pathanappeared particularly attractive (see Map III.4). The project envisagedis shown in Figure 8, although the canal and pumping/power plant indicatedrelate to a pumped storage project which might be associated with theKalabagh Project (see Para. 5.37). Study was also made of an alternativesite at Dhok Abbaki with the possibility of a similar development in mind(see Para. 5.47). Details are incorporated in the report on the first partof the study and a summary of the results is described in subsequent para-graphs. The Makhad dam site (see Para. 5.45), some 30 miles downstreamfrom Dhok Pathan, would be inundated by the possible future development ofa reservoir at Kalabagh.
5.31 The dam at I)hok Pathan envisaged by the consultant would be anearth and rockfill structure5 some 275 feet high, with a crest length ofabout 12,000 feet, containing about 38,000,000 cubic yards of fill mater-ial. The normal top water level of the reservoir would be at elevation1225 feet which, with a minimum drawdown to 1110 feet, would provide ausable live storage capacity of about 7.5 M4AF. Two 30--foot diameter con-duits, to be used for diversion during construction, would be provided atthe right abutment to serve as water release outlets. The conduits couldalso be used as power penstocks in the event that the installation ofgenerating units became justified. The design flood of 560,000 cusecs,with a total inflow of 1.66 MAF and outlets discharging to full capacity,would raise the reservoir level by 14 feet. Since the provision of thisfreeboard would be cheaper than a service spillway, the consultant concludedthat only an emergency spillway would be needed to prevent overtopping inthe event of a catastrophic flood.
5.32 To convey water from Tarbela to Dhok Pathan Reservoir, threeparallel canals each about 70 miles long, with a combined capacity of76,000 cusecs, would be required along with ancillary structures, includingdams, syphons, aqueducts and culverts. The canals would traverse severaldifferent types of terrain, including sandy, silty alluvium, limestone,sandstone and shales. The most important ancillary structure would be adam at Bahtar, where the canal alignment crosses the Nandna Kas. This damwould add about 0.8 MAF of useful storage to the project and involve about44 million cubic yards of fill. The operation of the conveyance systemwould be complicated by the fact that it would be empty for some nine monthsin each year. Maintenance costs would be particularly heavy. Furtherstudies would appear essential to confirm operational feasibility.
5.33 The engineering and geological data available to the dam siteconsultant for study of the project was very scant, consisting of a pre-feasibility report dated 1957, a geological map to a scale of 1:4,800based on field investigations carried out in 1960 supplemented by twoboreholes, and a geological report dated 1964. Special topographic mapsof the area of the proposed reservoir and canal routes thereto at a scaleof 1:15,000 and contour intervals of ten feet were made for the study to
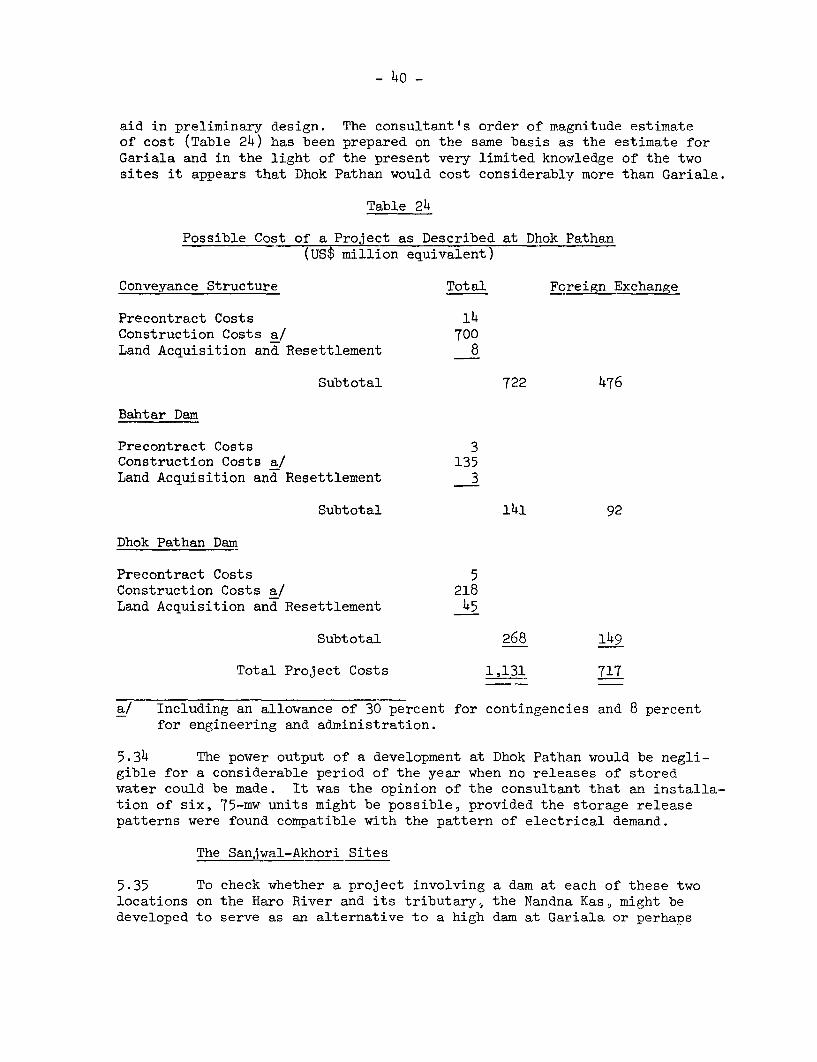
- 4o -
aid in preliminary design. The consultant's order of magnitude estimateof cost (Table 24) has been prepared on the same basis as the estimate forGariala and in the light of the present very limited knowledge of the twosites it appears that Dhok Pathan would cost considerably more than Gariala.
Table 24
Possible Cost of a Project as Described at Dhok Pathan(US$ million equivalent)
Conveyance Structure Total Foreign Exchange
Precontract Costs 14Construction Costs a/ 700Land Acquisition and Resettlement 8
Subtotal 722 476
Bahtar Dan
Precontract Costs 3Construction Costs a/ 135Land Acquisition and Resettlement 3
Subtotal 141 92
Dhok Pathan Dam
Precontract Costs 5Construction Costs a/ 218Land Acquisition and Resettlement 45
Subtotal 268 149
Total Project Costs 1,131 717
a/ Including an allowance of 30 percent for contingencies and 8 percentfor engineering and administration.
5.34 The power output of a development at Dhok Pathan would be negli-gible for a considerable period of the year when no releases of storedwater could be made. It was the opinion of the consultant that an installa-tion of six9 75-mw units might be possible, provided the storage releasepatterns were found compatible with the pattern of electrical demand.
The Sanjwal-Akhori Sites
5.35 To check whether a project involving a dam at each of these twolocations on the Haro River and its tributary, the Nandna Kas, might bedeveloped to serve as an alternative to a high dam at Gariala or perhaps
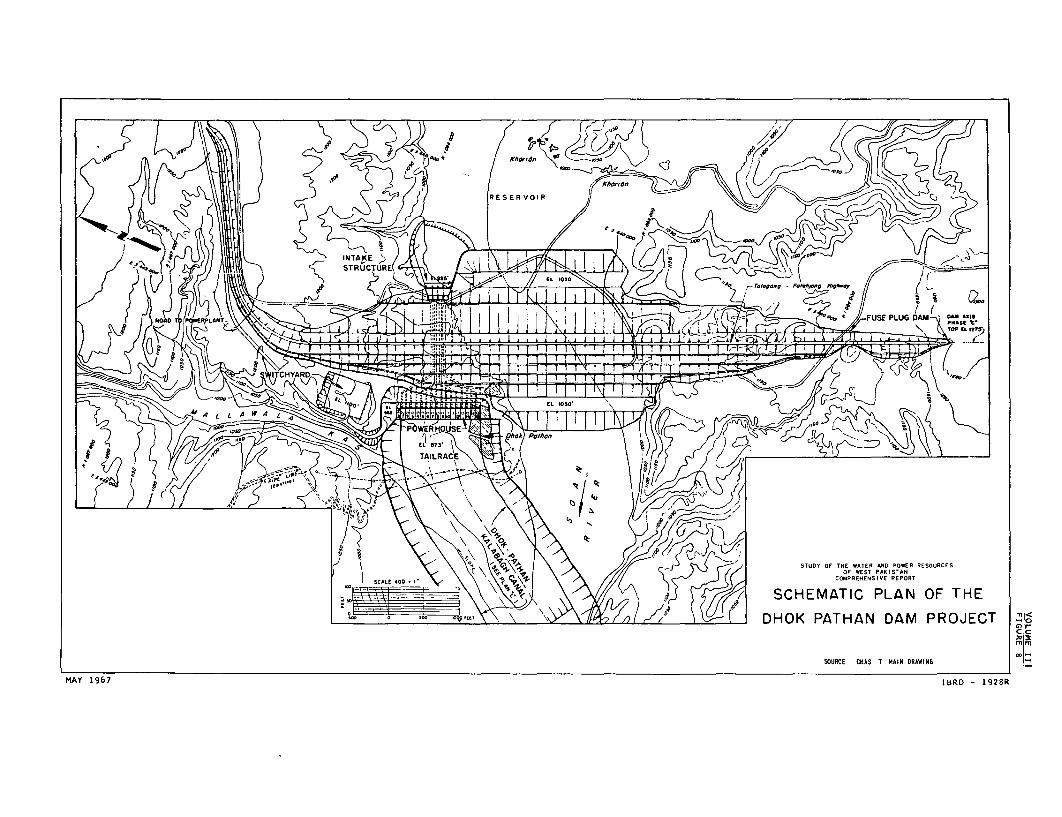
<SrC t 0~~~~~~~~~~~~~~~~~~~~~~~~~~~~~~~~~~~~~~~~~~~~~~~~~~~~~~~~~~~~~~~~~~~~~~~~~~S C
.~~~~~~~~~~~~~~ T
U ESRVORE
COF WEST PAKL STAN
SCHEMATIC PLAN OF THE' ' \1tX1 /, 0 ( DHOK PATHAN DAM PROJECT o'
c a
SOURCE CHAS T MAIN ORAWING
KAY 1967 IBRD - 1928R

- 41 -
to supplement the storage created by a low dam at the same place, the con-sultant made a preliminary study of structures that would impound 3.3 MAFof water (see Map IIIh). A detailed discussion of this project was also
incorporated in the earlier Tarbela Report. In the course of that evalu-ation it became evident that an inordinate amount of earth moving would be
involved and that serious foundation problems would be encountered at each
site. Cutoff grouting would be required along the axis of Sanjwal Dam, theembankment of which would be 12.5 miles long, and extensive treatment would
also be required at Akhori. In view of this and other considerations, the
project was deemed less favorable than Gariala.
The Attock Site
5.36 A dam on the Indus River across the gorge near Attock wouldcreate a large reservoir and, if carried to a high level, could impound asmuch as 30 MAF (see Map III.3). The river at this point has an averageannual discharge of about 93 MAF compared with about 66 MAF above its con-fluence with the Kabul. Serious consideration of such a scheme is ruledout, however, by the fact that it would inundate a major part of thePeshawar Valley as well as the cities of Peshawar and Nowshera. Asidefrom the problems that would be caused by displacing such a large popula-tion, acquisition of the property would be very costly and economic lossto the area would be great.
Kalabagh Project
5.37 The last dam site in the gorge before the Indus River reachesthe plains is at Kalabagh some 12 miles upstream of the Jinnah Barrage(see Map III.4). A project at Kalabagh was studied in the course of thepreparation of the earlier Tarbela Report. Additional studies have beenmade and are incorporated in the discussion that follows. A report onstudies of the site, based on designs for an earth and rockfill dam withan abutment overflow spillway, was prepared in 1956 for the PakistanGovernment. For preparation of that report limited subsurface investiga-tions were carried out, including 15 drill holes, 150 to 300 feet in depth,and 55 test pits. Foundation rocks at the proposed dam site are sandstonesand shales of the Siwalik series, overlain by up to 60 feet or more of allu-vium in the river channel. Since then, further reports have been preparedby WAPDA and its consultants, but no additional exploratory work has beenundertaken.
5.38 In the course of his Tarbela Report the dam site consultantevaluated several possibilities for a dam at Kalabagh. At that time hefavored a concrete dam of a multiple arch type. Since then, from themeager data available, he has prepared a preliminary study of severalpossible alternative -schemes. He concluded that the best, from a numberof different points of view, would be a central earth and rockfill dam,flanked by a concrete buttress sluiceway/spillway structure on the rightbank (see Figure 9). The project as envisaged would involve a dam of
- 42 -
about 300 feet in height impounding water to a normal operating level of925 feet which, with a minimum drawdown to 825 feet, would create a reser-voir with a live storage capacity of 6.4 MAF. The bed level assumed atthe dam site is at elevation 670 feet. The cost of the structure would beabout $540 million and seven years are estimated as necessary for itsconstruction. (For a detailed review of the Kalabagh Project see Annex 2.)
5.39 The right bank concrete sluiceway/spillway structure would re-quire the placing of about 2.7 million cubic yards of concrete. The ad-joining dikes would take about 13 million cubic yards of fill. The concretebuttress spillway would be controlled by 25 radial gates, each 40 feet wideby 28 feet high. In addition, 25 low-level sluice gates would be providedto control the outflow through an equal number of outlets, each 16 feetwide by 24 feet high, situated in the buttress section. At reservoir levelof 943 feet, the maximum outflow over the spillway would be 1,550,000cusecs. This capacity would accommodate the maximum expected flood inflowof 2,600,OOQ cusecs with an 18-foot surcharge.
5.40 Three, 40-foot diameter, concrete and steel lined tunnels, aswell as the concrete sluiceways, would be needed for diversion of the riverduring construction. At a later date, each tunnel would be connected tothree, 23-foot diameter penstocks, thus making it possible to serve a totalof nine generating units, each rated at 125 m'.'. The power station, with atotal installed capacity of 1,125 mw, would be located at the left abutmentof the dam.
5.41 A crucial aspect of the project that received special study wasthe backwater effect of the dam above the gorge, and the area of land thatmight be inundated as a result of its construction. From a detailed studyof hydrographic data from surveys carried out by the Pakistan authoritiesat the request of the Bank Group, the dam site consultant concluded thatthe restriction of the Attock Gorge is the primary cause of flooding up-stream to Nowshera. The consultant concluded, therefore, that construc-tion of a dam at Kalabagh, as proposed, would have little effect on floodlevels above Attock. He also concluded, however, that the gradual deposi-tion of sediment in the head reaches of the reservoir might cause someflooding in addition to that occuring in the Nowshera area under presentconditions. Extensive study of these aspects would be essential to deter-mine the full extent of potential damage.
5.42 It has been estimated that the sediment load of the Indus atKalabagh is in the order of 540 million tons a year. If this were alldeposited in the reservoir its capacity would be reduced at a rate of ap-proximately 300,000 acre-feet each year. Only part of this volume wouldbe deposited in the upper levels to affect live storage, but sometime,between 23 and 33 years after construction, the capacity of the reservoirwould dwindle to about 1.0 MAF. Sediment flow-through and sluicing wereproposed by the consultant as a possible means of extending the usefullife of the reservoir.
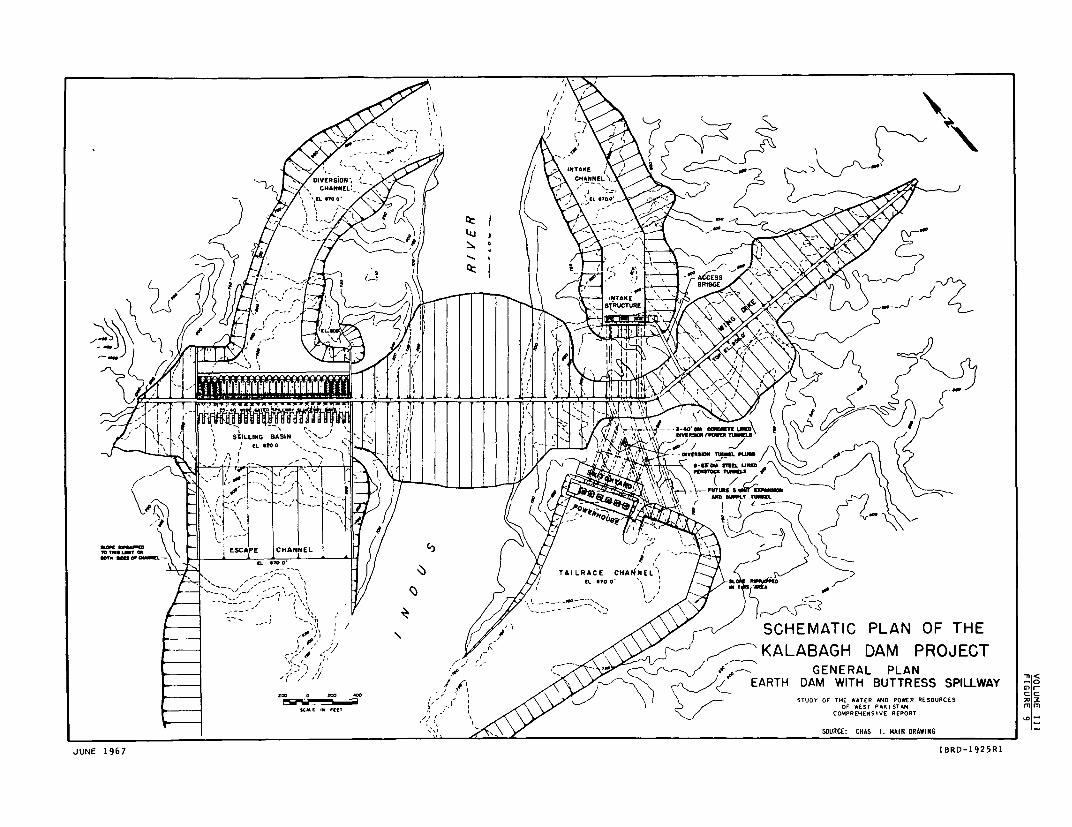
Lli~~i
DIVERSION, - ~ ~ ~ ~ ~ ~ ~ ~ ~ ~ ~ ~ ~ ~ ~~BRO
- - -~~~-
/, X t/8' / - SCHEMATIC PLAN OF THEo ' 8 .- / /,-' ~~~~~~KALABAGH DAM PROJECT/ GENERAL PLAN
- too 0 100 hoo z o' ('< EARTH DAM WITH BUTTRESS SPILLWAY 1
.~~ac ~~~ PE~,1 ,- jOF WlEST PAK ISTAN fliE3
. ~~~~~~~~~~~~~~~~~,, C \ 'COMPREHENS IVE REPORT v|
_ 'at / x >t ~~~~~~~~~~~~~~~~~~~~~~~~~ ~ ~ ~~~~~~~~~SOURCE: CHAS I. MAIN DRAWING_
JUNE 1967 IBRD-1925RI

- 43 -
5.43 The Kalabagh Project as tentatively designed by Chas. T. Mainwould cost roughly as indicated in Table 25 below. These costs do notinclude taxes, duties, levies, or interest during construction. The totalcost is estimated at $540 million of which $212 million would be in foreignexchange. The power plant of nine generating units having a total capacityof 1,125 mw is estimated to cost about $140 million. As discussed in Annex 2,in view of the gross uncertainties involved, the lack of information leadingto serious questions as to the technical feasibility of the project as pro-posed, the Bank Group feels that a cost range of $540 million to $700 millionshould be adopted as a clearer indication of the possible total cost. Theexample is cited in the annex of the possibility that a conventional spillwaymight be the only structure feasible, and in that case the costs wouldrise greatly.
Table 25
Possible Cost of Chas. T. Main's RecommendedScheme for Kalabagh
(US$ million equivalent)
Reservoir Total Foreign Exchange
Precontract Costs 8.9 5.7Net Contract Costs 228.3 147.2Contingencies (30%) 68.5 44.2Engineering and Administration (8%) 23.8 15.3Land Acquisition and Resettlement 210.8 -
540.3 212.4
Power Facilities a/
Construction Cost 100.0 76.2Contingencies (30%) 30.0 22.8Engineering and Administration 10.0 8.0
140.0 107.0
a/ Nine units installed in equally priced groups of three.
Side Valley Projects Associated with Kalabagh
5.44 The dam site consultant studied proposals for extending theuseful life of the Kalabagh Reservoir, or for augmenting its capacity bythe development of storage projects in side valleys similar to those forTarbela, described in paragraphs 5.20 to 5.35. Three of these are summar-ized below.
- 44 -
Makhad Pumped Storage
5.45 The Makhad site on the Soan River is about 30 miles downstreamfrom Dhok Pathan and about eight miles above the confluence of the Soanand Indus Rivers (see Map III.4). The river bed at the site is at aboutelevation 700, and a dam impounding to elevation 1000 would provide areservoir of about 6 MAF capacity. Previous reports had suggested thatthis project be undertaken in conjunction with a dam at Kalabagh havinga high water elevation of 825 feet, which would largely submerge Makhaddam site. Kalabagh Dam in this case would have negligible storage andserve primarily as a source of power, to pump water into Makhad Reservoir.The consultant concluded that such a project is unrealistic.
Gariala Pumped Storage
5.46 It would be feasible to pump water from Kalabagh Reservoir intoGariala but diversion by gravity from Tarbela appears less costly. Theconsultant, therefore, dropped Gariala pumped storage from detailed con-sideration.
Dhok Abakki Pumped Storage
5.47 This project would be similar in many respects to a Dhok Pathandevelopment which has been discussed in detail in the early Tarbela Reportand is summarized in paragraphs 5.30 to 5.34, except that the reservoirwould be filled by pumping from Kalabagh instead of by gravity diversionfrom Tarbela (see Map III.4). Deepening of the Soan River channel wouldbe required, however, to convey the water from Kalabagh Reservoir to thefoot of the dam, and, by siting the dam at Dhok Abakki rather than at DhokPathan, about 7-1/2 miles of channel excavation would be saved. Dams atthe two sites would be quite similar. The intake-outlet structure wouldconsist of four, 30-foot diameter conduits, each branching into four, 18-foot diameter penstocks connected to reversible pump-turbine units. Theseunits would have an approximate pumping capacity of 2,000 mw and wouldproduce 1,900 mw on generation cycle. By comparing sketch layouts of theproject with those for Dhok Pathan, the consultant estimated its probablecost to be about $634 million, which includes the pumping/generating plant.This figure should be considered as an order of magnitude estimate. Asdevelopment of this project could only take place after the constructionof Kalabagh, detailed investigations do not appear to be warranted untilKalabagh itself has been studied more fully.
Summary of Middle Indus Sites
5.48 Dam sites at Tarbela and Kalabagh provide favorable opportunitiesfor storage on the Middle Indus. Both have advantages and both presentproblems. Sedimentation and its probable effects must be given thoroughconsideration at the two sites.
- 45 -
5.49 The Tarbela Project has been extensively studied, more than$19 million having been spent on site investigations and engineeringstudies. Physical feasiblity of the project has been established. Itseconomic cost, excluding generating facilities, is reliably estimated at$625 million. If the program can be carried out as envisaged by thePakistan authorities, who contemplate awarding a construction contractin 1967, it is probable that the dam could be completed in time to beginstoring water in 1974.
5.50 Feasibility of the Kalabagh Project, as described, has not beenestablished. Field data are limited and much more exploratory work is re-quired to obtain necessary geologic and topographic data and to confirmthe physical feasibility of a high concrete buttress structure as proposedby the consultant. The consultant has estimated its cost to be somewhatless than Tarbela but so many uncertainties exist and so much engineeringinformation is required that a realistic comparison is extremely difficult.It would take approximately four years of intensive investigation and studyto bring the Kalabagh Project to the present stage of Tarbela. The con-sultant has estimated that the earliest possible completion of a projectat Kalabagh would be about 1979.
5.51 Both reservoirs would be liable to very rapid depletion by thedeposition of sediment. Kalabagh, however, would have a shorter usefullife because the river's silt load at that point is about 25 percentgreater than at TarbeLa. The feasibility of operating the Kalabagh Reser-voir in such a manner as to minimize sediment deposition is discussed laterin this volume. Although it may be within the range of possibility to passa large part of the sediment load, it should be kept in mind that operatingfor passing sediment would completely eliminate any firm power potential.Side valley storage could be developed from either reservoir but only atconsiderable cost.
A(2) Upper Indus Sites
Skardu
5.52 The most promising reservoir basin of the Upper Indus is theSkardu Valley at an elevation of about 7000 feet (see Map III.3). Accessto the area is extremely difficult as it is separated from the rest of WestPakistan by high mountain ranges. The present access rcute is throughBalakot and Bunji over the Babu-Sar Pass at an elevation of 13,000 feet.Available data, consisting mainly of reconnaissance reports prepared byWAPDA and its consultants, supplemented by aerial photographs and 1:15,000contour maps prepared at the request of the Bank Group by the Pakistanauthorities, were studied and provide the basis for the preliminary find-ings expressed below.
5.53 To compare the merits of storage in the Skardu Valley with otherpossibilities on the lndus, the consultant carried out a desk study of apossible dam in the gorge immediately downstream from the principal basin.The site selected was at Kandore, about two miles above Ayub Bridge. (Fora detailed description see Annex 4.)
- 46 -
5.54 No discharge measurements of the Indus at Skardu are available.A study, however, of downstream flow measurements at Partab Bridge, carriedout for a single year, and data on regime of the Gilgit, a tributary of theIndus some 100 miles downstream, led the consultant to estimate that theannual discharge of the river at the dam site might be in the order of35 IMAF. He concluded also that the monthly distribution of flow is suchthat, allowing for the necessary direct releases to meet downstream re-quirements9 a reservoir of about 8 M5AF capacity could probably be filledin an average year. No records of sediment discharge of the river at Skarduare available. From meager information obtained at Partab Bridge supple-mented by judgment, the consultant concluded that the reservoir capacitymight be depleted at a rate of about 0.1 MAF a year.
5.55 An earth and rockfill dam, abutting a concrete gravity spillwayand reservoir outlet structure on the right bank was conceived by theconsultant as the most promising possibility. Two heights of dam wereconsidered, one of 260 feet to impound 5.2 MAF of water, the other of 310feet to impound 8.0 MAF. The spillway in either case would be providedwith thirteen 58 feet by 50 feet radial control gates to permit dischargeof a design flood of 1,100,000 cusecs. Sluiceways at river level, throughthe concrete dam, could be used for diversion during construction and sub-sequently for releasing water from storage (see Figure 10).
5.56 Existing roads into the Skardu region are inadequate for any meansof transportation except small, four-wheel-drive vehicles and pack animals.In this rugged mountainous region the building of access roads would presentmany problems. The cost of adequate access might rival the cost of thestructures facilitated by it. Also, the creation of a reservoir of 5.2 MAFor 8.0 MAF capacity would displace a considerable number of people livingin the valley.
5.57 The dam site consultant estimated the cost of the projectedundertaking to lie between $427 million and $510 million for a 5.2 MAFreservoir and between $498 million and $588 million for an 8.0 MAF reser-voir. All figures would include the cost of an access road. While theseestimates are the best that can be made at present, they should be re-garded as indicative only of a probable order of magnitude of the costof such a project, and the Bank Group feels that a figure of $900 millionmight be taken as an upper limit if extreme and unforeseen difficultiesshould be encountered.
5.58 In view of the above, a dam at or near Skardu is generallyattractive and the development of the site is potentially promising.Access will continue to present a formidable problem, and considerablefurther investigations will be required before any specific proposalscan be formulated for a development in this area. Since investigationswill be difficult, they need to be started as soon as possible.
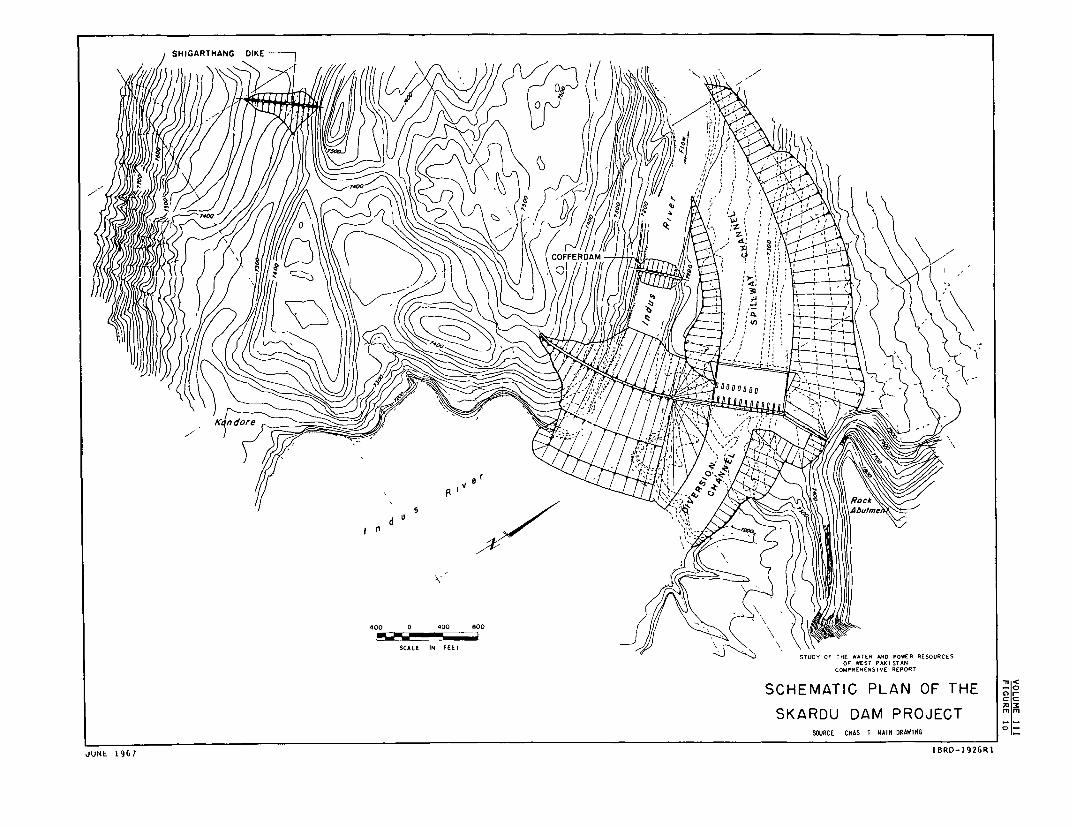
SHIGARTHANG DIKE
W ~~~~~~~~~~~~~~~~~~~~~~ I:
MV~~~~~~~~~~~~~~~~~~~~~~~~~~~~~~~~-
-d~~~~~~~-
j ~~~~~~~~~ /7* ~ ~ ~ ~ ~~FFRA
400 0 400 600
SCALE IN FEET
STUDY OF THE WATER AND POWER RESOURCESOF WEST PAKISTAN
COMPREHENSIVE REPORT
SCHEMATIC PLAN OF THE ;7,C= CZ
SKARDU DAM PROJECT mm
SOURCE CHAS T MAIM DRAWIH6G
UNE 1967 IBRD-1926RI

- 47 -
Other Upper Indus Sites
5.59 Two other sites at Bunji and Chilas, 100 and 140 miles respec-tively downstream from Skardu, have been proposed as suitable for thedevelopment of hydroelectric projects (see Map III.3). Situated asthey are in the confines of the Indus Gorge where the river flows on asteep gradient, the storage potential of any reservoirs created by themwould be small. Therefore, even as power projects, it would appear thattheir development will depend on the construction at some future date ofan upstream storage reservoir, such as Skardu, which would serve to regu-late the river flows for firm power generation. A third alternate siteis at Khapalu, in a narrow gorge of the Shyok River about 50 miles fromSkardu (see Map III.3). Few data are available as to features of thesite and the area is even less accessible than the Skardu Valley.
A(3) Sites in the Plains
5.60 Below Kalabagh, the river enters the Indus Plains, where theterrain and subsurface conditions do not lend themselves easily to thedevelopment of large storage reservoirs. However, WAPDA's consultantsfor regional planning in the Northern Indus Plains, Tipton and Kalmbach,Inc., (T & K) of Denver, Colorado, have recently produced a scheme fora large reservoir. There are, in addition, a number of smaller projectspossible and these are also described below.
Indus Plains Reservoir
5.61 In February 1967, after the Bank's consultants had submittedtheir reports and when the Bank Group's own report was already in draftform, T & K, as consultants to WAPDA, issued their Regional Plan for theNorthern Indus Plains. The plan covers the development and use of thewater resources of the Indus Basin and includes a proposal for a largereservoir in the Indus Plains to provide off-channel storage for theIndus River runoff.
5.62 The scheme provides for a great semicircular reservoir in theThal Doab, created by an encircling embankment, swinging southward in anarc between the Indus and Jhelum Rivers. This site lies to the south andeast of the present Thal Project and the reservoir, when full with a topwater level at elevation 600, would extend to within about 15 miles ofAdhi Kot on the Chasma-Jhelum Link. The gross storage capacity wouldbe 21 MAF and the live storage about 20 MAF.
5.63 The reservoir would be filled by diversion from the IndusRiver at a new barrage sited some 35 miles south of Chasma. An inletchannel approximately 12 miles long with a capacity of 80,000 cusecswould be required. Filling would also be assisted by a feeder canal of20,000 cusecs capacity offtaking from the Chasma-Jhelum Link.
5.64 The embankment - or dam - would have a length of 115 miles, amaximum height of 70 feet, an average height of 50 feet, and would in-volve 300 million cubic yards of fill. The embankment, as proposed by
- 48 -
T & K, would be constructed with the alluvium of the doab, compacted inlayers with a puddled core. Near the southernmost corner of the reservoiroutlet conduits, equipped with control gates, would convey water to anoutlet canal to deliver releases to the Jhelum River upstream of Trimmu.The capacity of the outlet would be of the order of 50,000 cusecs. Ahead of 50 feet between the minimum pool level and the Jhelum Rivermight justify the installation of power generating facilities, but thisaspect was not studied in detail by T & K.
5.65 It is recognized by T & K that such a reservoir would suffera considerable loss from evaporation and from leakage, possibly of theorder of 5 MAF a year. However, some of the leakage would be recoveredfrom the groundwater or from regeneration and the net annual loss mightbe about 3.7 MAF. Thus even in a year of minimum flow the yield of thereservoir would be about 12 MAF or with full use of Tarbela regulation,between 14 and 15 MAF.
5.66 The costs of the scheme as estimated by T & K are shown inthe following table.
Table 26
Estimated Cost of the Indus Plains Reservoir(Us$ million equivalent)
Barrage and inlet channel 142
Feeder canal from Chasma-Jhelum Link 22
Embankment (dam) 424
588
T & K estimate the cost of a similar, but smaller, development to providelive storage of 10 MAF to be about $400 million equivalent.
5.67 Associated with this scheme T & K propose a new link systemtaking off from Kalabagh Barrage to convey water from the Indus River tothe lower portions of existing canal systems in the Lower Chaj and RechnaDoabs. This link system, with a maximum capacity of about 10,000 cusecsand a total length of 235 miles, would involve new barrages on the Jhelumand Chenab Rivers and is estimated by T & K to cost in the order of$260 million equivalent.
5.68 The concept evolved by T & K appears to contain a number of at-tractive features. As off-channel storage the rate of sedimentation shouldbe low. T & K anticipate a 50 to 75 percent increase in rabi supplies to theSind and believe that with the reservoir in being it would be possible to en-hance greatly the firm power capability and energy generation at Tarbela.Yet the scheme in itself would produce no significant quantity of hydroelec-tric power. While reservoirs of the type described by T & K are commonlyconstructed on a much smaller scale, anything on the scale proposed forthe Indus Plains Reservoir would be unique. There are many features which
- 49 -
the Bank Group feel will require careful and possibly prolonged investi-gation before final conclusions can be drawn. To name only a few: evapo-ration, seepage and siltation rates, optimum reservoir size in relation towater availability, reservoir capacity based on detailed surveys, founda-tion conditions and suitability of local materials for embankment con-struction. Any or all of these items could have a pronounced effect oncosts. An operational disadvantage is that unrecoverable water losseswould be very high. These losses may be relatively unimportant for thenext 10-20 years, but would be a serious matter when towards the end ofthe century the flow of the Indus and its tributaries becomes fully com-mitted. (As pointed out in Volume II it is water and not land that repre-sents the ultimate constraint on irrigation development.) However, in viewof the late stage at which information was made available to the BankGroup, a study has not been possible, either by the Group or by the Bank'sconsultants. T & K's assessment, bearing in mind that detailed opera-tional studies have not been undertaken, is that the regional irrigationrequirements of the northern Indus Plains may not necessitate the schemeuntil 1990, although the requirements of the Sind for rabi supplies mayforce earlier consideration. The Bank Group is of the opinion that beforeconsideration can be given to assigning the scheme a place in the develop-ment program considerable investigation, which might well take five yearsor more to complete, must be carried out. In the circunstances tho BankGroup, while taking cognizance of the scheme, has not sought to integrateit into the program, but as stated in Chapter VIII, recommends an earlystart on preliminary investigation.
Chasma Project
5.69 A large storage project was considered during the study atChasma (see Map III.3). However, foundation problems were discovered tobe so severe that the Dam Sites Committee after receiving the recommenda-tions of Chas. T. Main determined that further investigation of this sitewould not be fruitful. Some investigation was made of possible additionalstorage at the nearby Chasma Barrage. (For a more detailed description seeAnnex 8.) The construction of Chasma Barrage, 35 miles downstream from theJinnah Barrage, commenced early in 1967. It will serve to divert waterfrom the Indus River to the Jhelum River, through the Chasma-Jhelum linkcanal. As originally designed, the barrage would operate under normalconditions with a head pond elevation of 640 feet with provisions to handlean additional three feet in flood. Subsequent studies by the consultantsfor the project and others indicated the feasibility of raising the barragestructure by six feet, to provide more useful storage in the head pond.This change in design was effected and it was also decided to raise theinvert of the Chasma-Jhelum link by two feet.
5.70 The central concrete section of the barrage will be 4,200 feetlong, and will be flanked on each end by closure bunds, totaling 33,000feet. The central concrete section will be provided with 41 normal sluice-ways, 60 feet wide, and with 11 sediment sluiceways adjacent to the canalhead regulators on either side of the barrage. The discharge capacity ofthe sluices will be 950,000 cusecs.
- 50 -
5.71 The water level behind the barrage will probably be held at orbelow elevation 642 feet from May to August. Subsequently, as flood flows
of the Indus recede and the sediment content of the water falls off, the
water level will be raised to a maximum storage elevation of 649 feet.Considerable quantities of sediment will therefore be deposited in the
head pond below elevation 642 feet. Above that level deposition shouldnot be significant. The dam site consultant has estimated that the stor-age capacity of the head pond will be essentially permanent at about the
following values:
Table 27
Chasma Barrage: Capacity of Head Pond
(MAF)
Elevation Range Capacity
645-642 0.18649-642 0.51649-645 0.33
Seepage losses and evaporation will reduce the usable volume in each
range by about 14 percent.
5.72 The cost of raising the pond level of the barrage by six feetless the savings in cost of raising the canal invert by two feet has beenestimated by WAPDA's consultants as follows:
Table 28
Estimated Cost of Incremental Storage at Chasma
(Us$ million equivalent)
Total Foreign Exchange
Incremental cost of raising structures 18.3 9.0Land Acquisition and Resettlement 13.3 -
31.6 9.0
Sehwan-Manchar Project
5.73 The capacities of the Rohri and Nara canals are inadequate tomeet the future demands for water in the areas they serve. Constructionof a barrage at Sehwan has therefore been proposed by WAPDA's consultants(see Map III.1). Such a barrage would divert Indus water into a new feeder
canal to serve the southern Rohri Command and the main Nara Command. Thiswould avoid remodeling long lengths of the Rohri and Nara canals. Along
with this, it is proposed to develop additional storage by taking advantageof the head created by the barrage to divert flood waters into Manchar Lake.
Water would be released from the lake when the water level behind the bar-
rage has fallen. The storage capacity available in the head pond and lake
- 51 -
is estimated at 1.8 MAF, after allowing for evaporation losses and seepage.Later, additional storage of about 0.9 MAF would be provided in ChotiariLake located close to the junction of the Sehwan Feeder and Nara Canal.(Further details on this project are provided in Annex 9.)
5.74 The estimated cost of the construction of the new barrage,feeder canal and the works associated with storage in Manchar Lake, butexcluding works related to Chotiari Lake storage, is about $177 million.WAPDA's consultants have estimated that the project would save nearly$150 million which would otherwise be spent on remodeling the Rohri andNara canals. On that basis the incremental cost of developing storage atManchar Lake would be only about $27 million. However, IACA studies indi-cate that considerable development is possible in the usable groundwaterarea of Rohri North and Rohri South by tubewells alone without recourseto canal remodeling. Furthermore, remodeling in the saline areas wouldnecessitate the installation of drainage tubewells. It may therefore beprudent for the purposes of analyses to allocate the full cost of theSehwan-Manchar Project to water storage and the Bank Group has adopteda range of between $177 million and $221 million.
Summary of Upper Indus Sites and of Sites in the Plains
5.75 To sum up, an apparently promising site for the development of astorage reservoir on the Upper Indus is the gorge immediately downstreamfrom the Skardu Valley. Construction of a dam here to regulate the rivermight warrant the development of power projects at either Bunji or Chilas,or at both sites. The area is presently difficult of access and consider-able additional exploratory work would be necessary before any projectcould be defined. It follouYs nonetheless, that development of the UpperIndus Valley for power and water storage is worthy of serious considerationas part of the long-range plans of West Pakistan.
5.76 In summary, it can also be said that the potential for developingstorage reservoirs in the plains is limited to the possible site suggestedin the Thal Doab, which has not yet been fully explored, and the site atSehwan and two off-stream reservoirs served from it, namely, at Manchar
and Chotiari.
B. The Jhelum River Basin
5.77 The basin of the Jhelum River lies in the north central part ofWest Pakistan. The principal tributaries embraced by it are the Kishanganga,the Kunhar and the Poonch Rivers (see Map III.3). The average annual dis-charge of the Jhelum at Mangla, where it has been gauged since 1922, isestimated at 22.93 MAF. This will be the inflow to Mangla Dam, presentlyunder construction and scheduled to store water in the summer of 1967 andto be completed in 1968. Any plans for the further control and use of thewaters of the Jhelum must therefore be built around the Mangla Project.
5.78 Several projects in the Jhelum Basin that have been studied byWAPDA were reviewed by the dam site consultant. With the exception of the
- 52 -
Kunhar Project, which is primarily for power, all the schemes reviewed re-late to the problems of compensating for storage lost in Mangla Reservoirby sediment deposition and of increasing its capacity. Dam sites otherthan those studied are undoubtedly available9 but few, if any, deserveconsideration except for the development of power.
Project for Raising Mangla
5.79 Mangla Dam, now in final stages of construction is part of theIndus Basin Project. The dam will impound 5.9 MAF of water at elevation1202 feet. Live storage between that elevation and drawdown level of 1040feet will be 5.22 MAF. This includes 0.28 MAF in the Jari arm below Mirpursaddle. (For a more detailed description see Annex 7.)
5.80 Principal features of the Mangla Project as it is now beingconstructed are three large earth dams, containing more than 120 millioncubic yards of fill. Mangla Dam, the largest of these, spans the JhelumRiver and is 11,000 feet long at crest. Its maximum height is 380 feet.Sukian Dyke, 17,000 feet long, closes gaps in the reservoir rim immedi-ately to the east of the main dam. Jari Dam. 5,700 feet long, spanningthe Jari Nullah, is some 12 miles east of the main dam. Two spillways,service and emergency, with a combined capacity of 1,300,000 cusecs, aredesigned to control the expected maximum inflow of 2,600,000 cusecs, witha surcharge of 26 feet over the normal operating water level of the reser-voir. Five tunnels, each 1,940 feet long, served for diversion duringconstruction. Four of these are lined with steel to an internal diameterof 26 feet to serve the needs of power and irrigation. The fifth tunnelis closed with a steel bulkhead, but could be commissioned later if re-quired for irrigation or power. A powerhouse at the discharge end of thetunnels is initially provided with three generating units, each with con-tinuous capability of 100 mw, and a fourth unit has been ordered. Twogenerating units can be connected to each penstock, thus permitting anultimate installation of up to ten units. Each turbine will be linkedwith a companion bypass valve so connected as to maintain a uniformwater release regardless of variations in load on the turbine. Atpresent, eight irrigation release valves are being provided, therebyproviding the required discharge capacity for irrigation purposes atminimum drawdown. Because Jari Dam had to be constructed downstreamfrom the Mirpur saddle for technical reasons, it has been necessary toprovide a 7-foot, concrete-lined tunnel on its right abutment to carrythe trapped water (0.4 MAF) to the Upper Jhelum Canal. A decision hasbeen taken to excavate a trench through the Mirpur saddle to enable 0.28MAF of this water to be diverted into the main reservoir and thus throughthe power plant.
5.81 The cost of the Mangla Project, including the first threegenerating units only, is $534 million equivalent, of which $18 million isfor the generating units and $12 million for specific features included inthe basic design to permit future raising of the reservoir operating level(see Paras. 5.83 and 5.84 below). The following table is based upon actualexpenditures to December 1966 and estimates to complete the work:
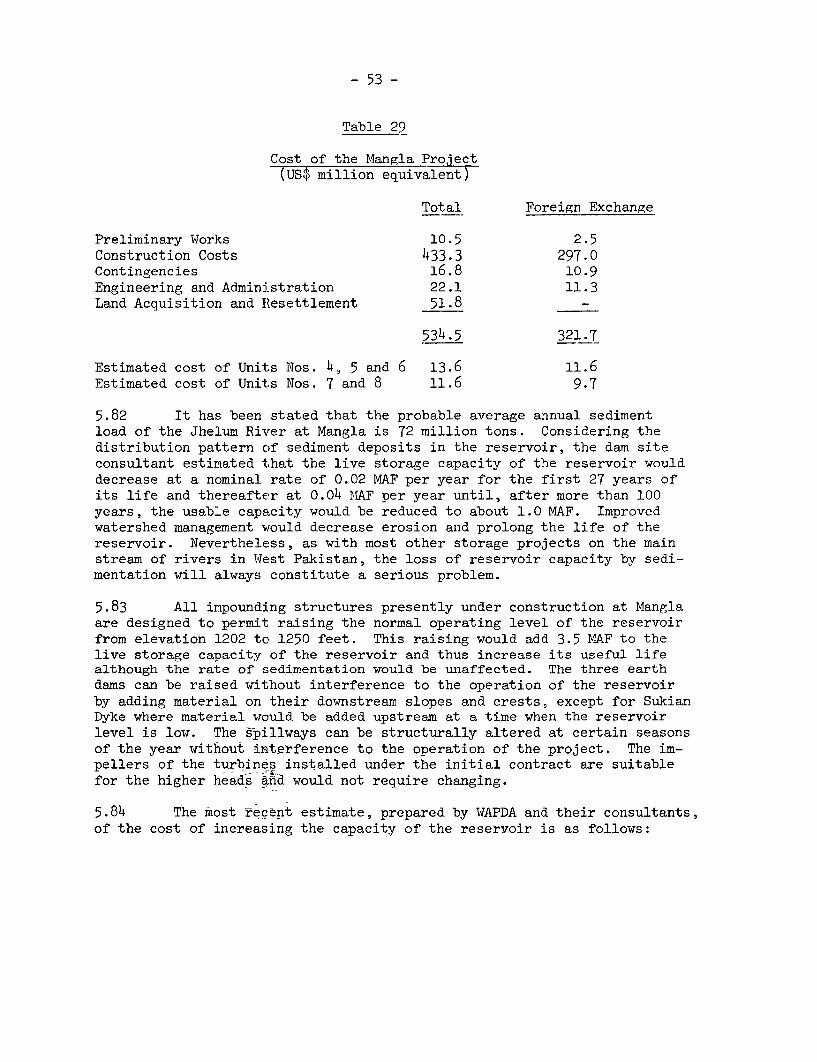
- 53 -
Table 29
Cost of the Mangla Project
(US$ million equivalent)
Total Foreign Exchange
Preliminary Works 10.5 2.5
Construction Costs 433.3 297.0Contingencies 16.8 10.9
Engineering and Administration 22.1 11.3Land Acquisition and Resettlement 51.8 -
534.5 321.7
Estimated cost of Units Nos. 4, 5 and 6 13.6 11.6Estimated cost of Units Nos. 7 and 8 11.6 9.7
5.82 It has been stated that the probable average annual sediment
load of the Jhelum River at Mangla is 72 million tons. Considering the
distribution pattern of sediment deposits in the reservoir, the dam site
consultant estimated that the live storage capacity of the reservoir would
decrease at a nominal rate of 0.02 MAF per year for the first 27 years ofits life and thereafter at 0.04 MAF per year until, after more than 100years, the usable capacity would be reduced to about 1.0 MAF. Improved
watershed management would decrease erosion and prolong the life of the
reservoir. Nevertheless, as with most other storage projects on the mainstream of rivers in West Pakistan, the loss of reservoir capacity by sedi-
mentation will always constitute a serious problem.
5.83 All impounding structures presently under construction at Mangla
are designed to permit raising the normal operating level of the reservoir
from elevation 1202 to 1250 feet. This raising would add 3.5 MAF to thelive storage capacity of the reservoir and thus increase its useful lifealthough the rate of sedimentation would be unaffected. The three earth
dams can be raised without interference to the operation of the reservoir
by adding material on their downstream slopes and crests, except for SukianDyke where material would be added upstream at a time when the reservoir
level is low. The spiliways can be structurally altered at certain seasons
of the year without interference to the operation of the project. The im-pellers of the turbines installed under the initial contract are suitable
for the higher heads anid would not require changing.
5.84 The most recent estimate, prepared by WAPDA and their consultants,
of the cost of increasing the capacity of the reservoir is as follows:
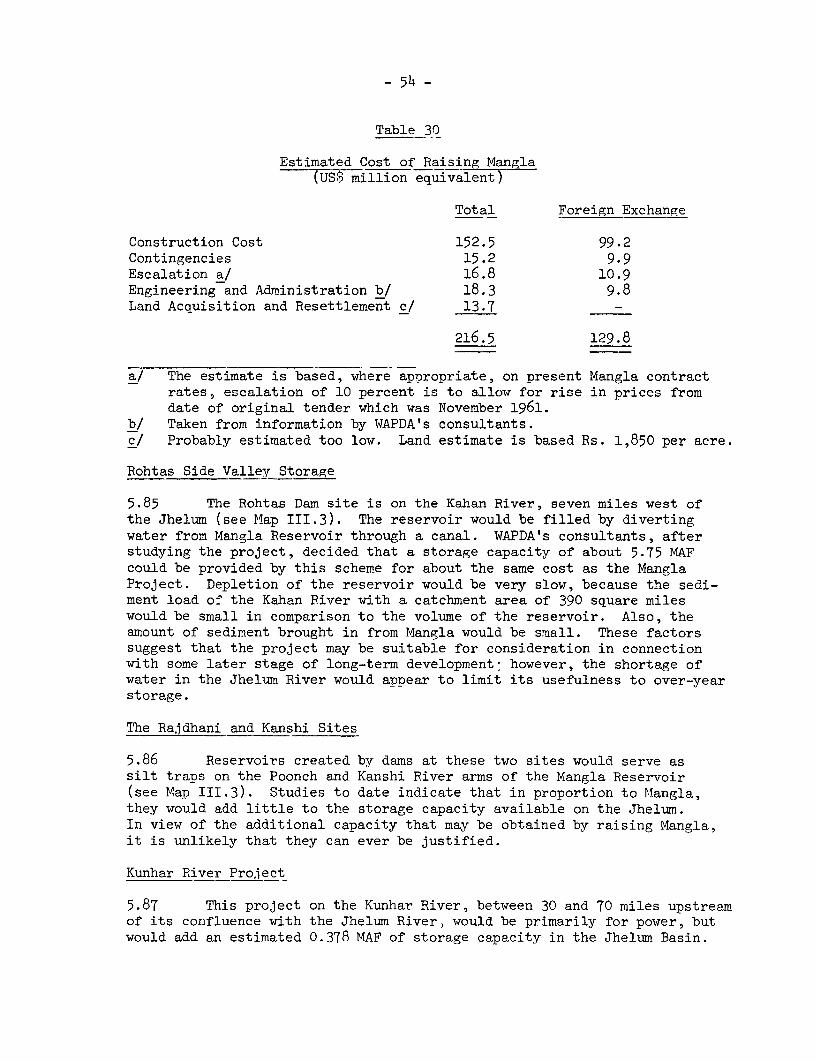
- 54 -
Table 30
Estimated Cost of Raising Mangla(USt million equivalent)
Total Foreign Exchange
Construction Cost 152.5 99.2Contingencies 15.2 9.9Escalation a/ 16.8 10.9Engineering and Administration b/ 18.3 9.8Land Acquisition and Resettlement c/ 13.7 -
216.5 129.8
a/ The estimate is based, where appropriate, on present Mangla contractrates, escalation of 10 percent is to allow for rise in prices fromdate of original tender which was November 1961.
b/ Taken from information by WAPDA's consultants.c/ Probably estimated too low. Land estimate is based Rs. 1,850 per acre.
Rohtas Side Valley Storage
5.85 The Rohtas Dam site is on the Kahan River, seven miles west ofthe Jhelum (see Map III.3). The reservoir would be filled by divertingwater from Mangla Reservoir through a canal. WAPDA's consultants, afterstudying the project, decided that a storage capacity of about 5.75 MAFcould be provided by this scheme for about the same cost as the ManglaProject. Depletion of the reservoir would be very slow, because the sedi-ment load of the Kahan River with a catchment area of 390 square mileswould be small in comparison to the volume of the reservoir. Also, theamount of sediment brought in from Mangla would be small. These factorssuggest that the project may be suitable for consideration in connectionwith some later stage of long-term development: however, the shortage ofwater in the Jhelum River would appear to limit its usefulness to over-yearstorage.
The Rajdhani and Kanshi Sites
5.86 Reservoirs created by dams at these two sites would serve assilt traps on the Poonch and Kanshi River arms of the Mangla Reservoir(see Map III.3). Studies to date indicate that in proportion to Mangla,they would add little to the storage capacity available on the Jhelum.In view of the additional capacity that may be obtained by raising Mangla,it is unlikely that they can ever be justified.
Kunhar River Project
5.87 This project on the Kunhar River, between 30 and 70 miles upstreamof its confluence with the Jhelum River, would be primarily for power, butwould add an estimated 0.378 MAF of storage capacity in the Jhelum Basin.
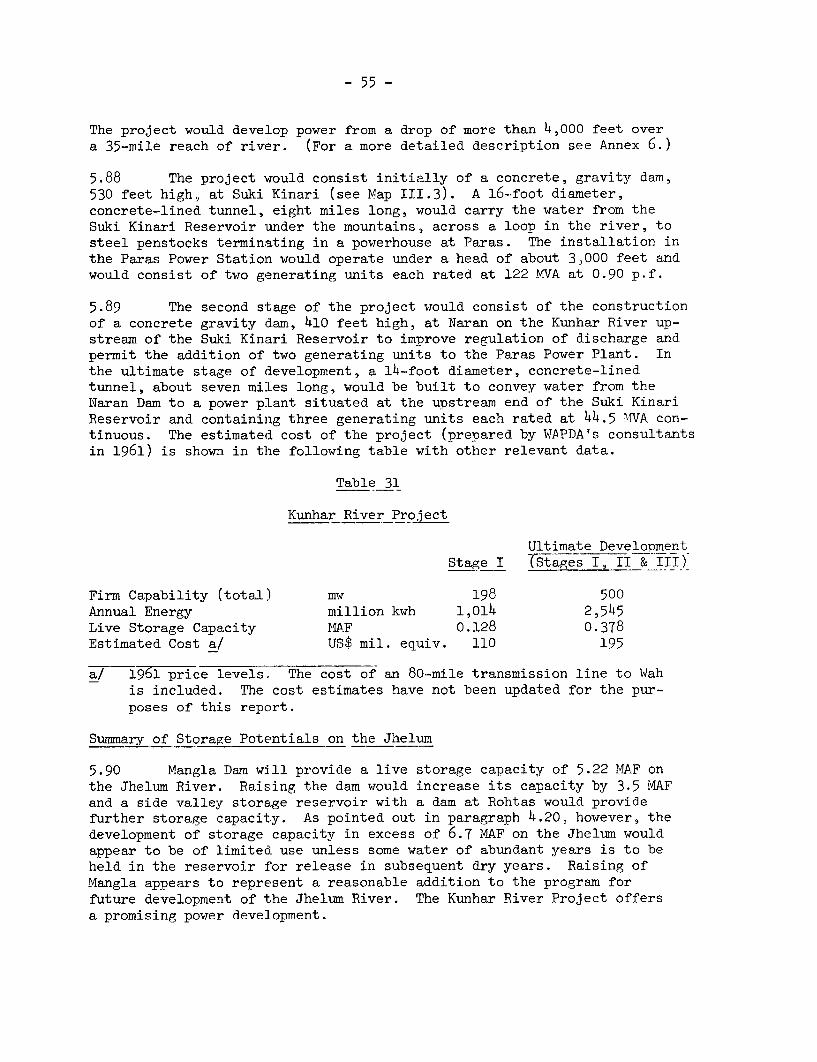
- 55 -
The project would develop power from a drop of more than 4,000 feet overa 35-mile reach of river. (For a more detailed description see Annex 6.)
5.88 The project would consist initially of a concrete, gravity dam,530 feet high, at Suki Kinari (see Map III.3). A 16-foot diameter,concrete-lined tunnel, eight miles long, would carry the water from theSuki Kinari Reservoir under the mountains, across a loop in the river, tosteel penstocks terminating in a powerhouse at Paras. The installation inthe Paras Power Station would operate under a head of about 3,000 feet andwould consist of two generating units each rated at 122 MVA at 0.90 p.f.
5.89 The second stage of the project would consist of the constructionof a concrete gravity dam, 410 feet high, at Naran on the Kunhar River up-stream of the Suki Kinari Reservoir to improve regulation of discharge andpermit the addition of two generating units to the Paras Power Plant. Inthe ultimate stage of development, a 14-foot diameter, concrete-linedtunnel, about seven mi:Les long, would be built to convey water from theNaran Dam to a power plant situated at the upstream end of the Suki KinariReservoir and containing three generating units each rated at 44.5 MVA con-tinuous. The estimated cost of the project (prepared by WAPDA's consultantsin 1961) is shown in the following table with other relevant data.
Table 31
Kunhar River Project
Ultimate DevelopmentStage I (Stages I, II &_III)
Firm Capability (total) mw 198 500Annual Energy million kwh 1,014 2,545Live Storage Capacity MAF 0.128 0.378Estimated Cost a/ US$ mil. equiv. 110 195
a/ 1961 price levels. The cost of an 80-mile transmission line to Wahis included. The cost estimates have not been updated for the pur-poses of this report.
Summary of Storage Potentials on the Jhelum
5.90 Mangla Dam will provide a live storage capacity of 5.22 MAF onthe Jhelum River. Raising the dam would increase its capacity by 3.5 MAFand a side valley storage reservoir with a dam at Rohtas would providefurther storage capacity. As pointed out in paragraph 4.20, however, thedevelopment of storage capacity in excess of 6.7 MAF on the Jhelum wouldappear to be of limited use unless some water of abundant years is to beheld in the reservoir for release in subsequent dry years. Raising ofMangla appears to represent a reasonable addition to the program forfuture development of the Jhelum River. The Kunhar River Project offersa promising power development.
- 56 -
C. The Chenab River Basin
5.91 The most promising storage sites on the Chenab are situated inJammu and Kashmir beyond the cease-fire line. Their development for thebenefit of Pakistan would involve considerations beyond the scope of thisstudy, and they have therefore not been evaluated. Within West Pakistanthe only site with known storage potential is at Chiniot (see Map III.3)some 110 miles downstream of Marala, where an offstream reservoir of 1.4 MAFcapacity might be created in an abandoned channel of the river by the con-struction of extensive earth dikes. The reservoir would be connected tothe river by a canal and filled with surplus flood flows for subsequentrelease. It could also be used to regulate minor differences between riverflows in the Chenab and irrigation demands on the canal which takes off fromit. The relatively small amount of storage involved in this project and thesubstantial uncertainties presented by the lack of data, plus its apparenthigh cost, running to between $100 million and $150 million, makes itappear of doubtful economic value.
D. The Kabul River Basin
5.92 The Kabul River rises in the mountains of Afghanistan, wherelies the major part of its catchment area. Before entering West Pakistanit is joined by the Kunar River which in its upper reaches (in WestPakistan) is known as the Chitral. The Swat River, a second tributaryof the Kabul, lies wholly in Pakistan. The average annual discharge ofthe Kabul at Attock (where it joins the Indus) is estimated at 27 MAF.At Warsak, some 75 miles above Attock, its discharge has been gauged at17 MAF for an average year, the difference being accounted for principallyby contributions of the Swat and two minor tributaries, namely, the Baraand Kalpani Rivers. Of these the Swat is the most important, with anaverage annual discharge of about 7 MAAF.
5.93 Apart from the Peshawar Valley, information relevant to the basinis scant. The terrain is generally mountainous, and difficult of access,also political considerations have discouraged methodical explorations.The river gorges were not visited by the Bank's consultant during thecourse of his studies and his findings have, of necessity, been based ona review of existing reports and such other data as have been obtainablefrom the Pakistan authorities.
The Kabul River Sites
5.94 From a study of small-scale maps, WAPDA had come to the conclusionthat a suitable site can be found for a dam in the gorge of the Kabul River,adjacent to or on the Pakistan border, which would serve to impound a largereservoir. The reservoir, however, would be almost entirely in Afghanistan.Within Pakistan, the major development on the Kabul is the Warsak multi-purpose project which was completed in 1960 (see Map III.3). This con-sists of a dam and power station with an installed capacity of 160 mw infour generating units. The addition of two more 40-mw units is planned.This increase in capacity would be principally for peaking purposes and was
- 57 -
anticipated to require the construction of a re-regulating dam doymstreamfrom the power station to even out the river flow and protect downstream ir-rigation interests. It now appears that the installation of the two extraunits may go ahead without the re-regulating reservoir. The capacity ofthe reservoir has been greatly reduced by the deposition of sediment andstill greater reduction is anticipated. Downstream from Warsak additionalirrigation canals draw their water from the Kabul River to irrigate thefertile valley surrounding Peshawar.
The Chitral River
5.95 The valley of the Chitral River is remote, generally narrow andsteep, and is not suited to the development of large storage projects.The power potential of the river could be exploited if there should developa sufficient demand to justify the cost of long-distance transmission. Itis unlikely that a local market for power in significant quantities willdevelop in the foreseeable future.
The Swat River
5.96 Existing developments on the Swat River include the Upper Swatirrigation scheme, based on the Amandara headwrorks, and the Lower Swatsystem of canals which draw their water from the Munda headworks. Ithas been estimated by the Bank's agricultural consultants that at fulldevelopment these projects will utilize in an average year all but 4.75MAF of the Swat River flow. Of this, only about 2.0 MAF would be "untimely"and therefore available for storage.
5.97 A review of available data and reports indicates that there areseveral alternative dam sites in the basin suitable for the development oflarge storage reservoirs. Basic data necessary to the preparation of pre-liminary designs are totally lacking, however, so, to assess the merits andpossible potential of a storage reservoir on the Swat River, the dam siteconsultant prepared a desk study of a dam at Ambahar in the Lower SwatGorge, about 13 miles upstream from the Munda headworks and less than twomiles downstream from the mouth of the Ambahar River (see Map III.3).
A Project at Ambahar
5.98 This proposition, as studied by the consultant, envisages arockfill dam about 710 feet high, creating a reservoir with a gross storagecapacity of 2.8 MAF of which 2.0 MAF would be live. Records of sedimentin the Swat River are not available. It is believed, however, to be solow that the capacity of the reservoir would not be adversely affected toany great degree. (For a more detailed description see Annex 5.)
5.99 An overflow spillway at the left abutment of the dam would beprovided with twelve 40--foot by 40-foot radial gates, to pass a totaldischarge of 310,000 cusecs, which is equivalent to the maximum probableflood inflow. On completion of the dam, two 34-foot diameter, concrete-lined tunnels, each 5,700 feet long, used for diversion of the riverduring construction, would be provided with steel linings and used as
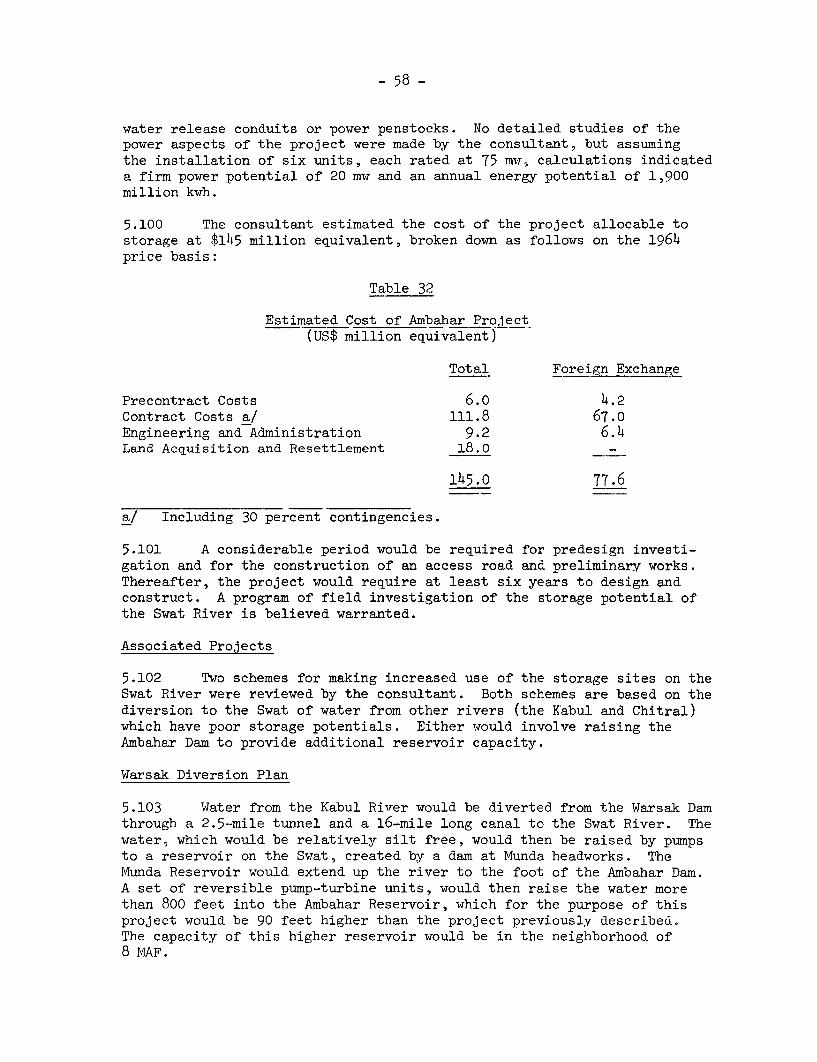
- 58 -
water release conduits or power penstocks. No detailed studies of thepower aspects of the project were made by the consultant, but assumingthe installation of six units, each rated at 75 mw, calculations indicateda firm power potential of 20 mw and an annual energy potential of 1,900million kwh.
5.100 The consultant estimated the cost of the project allocable tostorage at $145 million equivalent, broken down as follows on the 1964price basis:
Table 32
Estimated Cost of Ambahar Project(uS$ million equivalent)
Total Foreign Exchange
Precontract Costs 6.o 4.2Contract Costs a/ 111.8 67.0Engineering and Administration 9.2 6.4Land Acquisition and Resettlement 18.0 -
145.0 77.6
a/ Including 30 percent contingencies.
5.101 A considerable period would be required for predesign investi-gation and for the construction of an access road and preliminary works.Thereafter, the project would require at least six years to design andconstruct. A program of field investigation of the storage potential ofthe Swat River is believed warranted.
Associated Projects
5.102 Two schemes for making increased use of the storage sites on theSwat River were reviewed by the consultant. Both schemes are based on thediversion to the Swat of water from other rivers (the Kabul and Chitral)which have poor storage potentials. Either would involve raising theAmbahar Dam to provide additional reservoir capacity.
Warsak Diversion Plan
5.103 Water from the Kabul River would be diverted from the Warsak Damthrough a 2.5-mile tunnel and a 16-mile long canal to the Swat River. Thewater, which would be relatively silt free, would then be raised by pumpsto a reservoir on the Swat, created by a dam at Munda headworks. TheMunda Reservoir would extend up the river to the foot of the Ambahar Dam.A set of reversible pump-turbine units, would then raise the water morethan 800 feet into the Ambahar Reservoir, which for the purpose of thisproject would be 90 feet higher than the project previously described,The capacity of this higher reservoir would be in the neighborhood of8 MAF.
- 59 -
5.104 To implement the project, a 3,200-.mT pumping plant would beneeded at Ambahar and the installation at Munda would have to be of about450 mw capacity. Because of the very large power demand of these pumpinginstallations, such a project does not appear realistic at this stage ofpower and resource development.
Chitral Diversion Plan
5.105 A dam could be built in the upper reaches of the Chitral about12 miles upstream from the Afghanistan border. Such a dam would be about400 feet high and its impoundment would run to about 0.58 MAF. A tunnel,23 miles long, would convey the water to the Panjkora River, a tributaryof the Swat. To pass an average of 4 MAF a year, the tunnel would have tobe 42 feet in diameter, because of the short season during which transfer-ence of water would be feasible.
5.106 Available reports suggest that considerable power developmentcould be associated with the project, but the problems associated withthe transmission of power to the grid would be great, and the local demandfor power is likely to remain small for some time. Also, a major propor-tion of the power capacity would be unfirm, because the capability of theplant would be restricted to that period of the year during which diversiontakes place. The consultant did not prepare a cost estimate of the project,because the magnitude of the structures involved appeared to preclude itfrom comparison with other storage projects on the Indus or its tributaries.
Summary of Sites in Kabul River Basin
5.107 There would appear to be a basis for the development of hydropower in the Kabul Basin sometime in the future. A limited amount ofstorage on the Swat River may be feasible. Extensive investigations willbe necessary, however, for the development of a comprehensive basin plan.
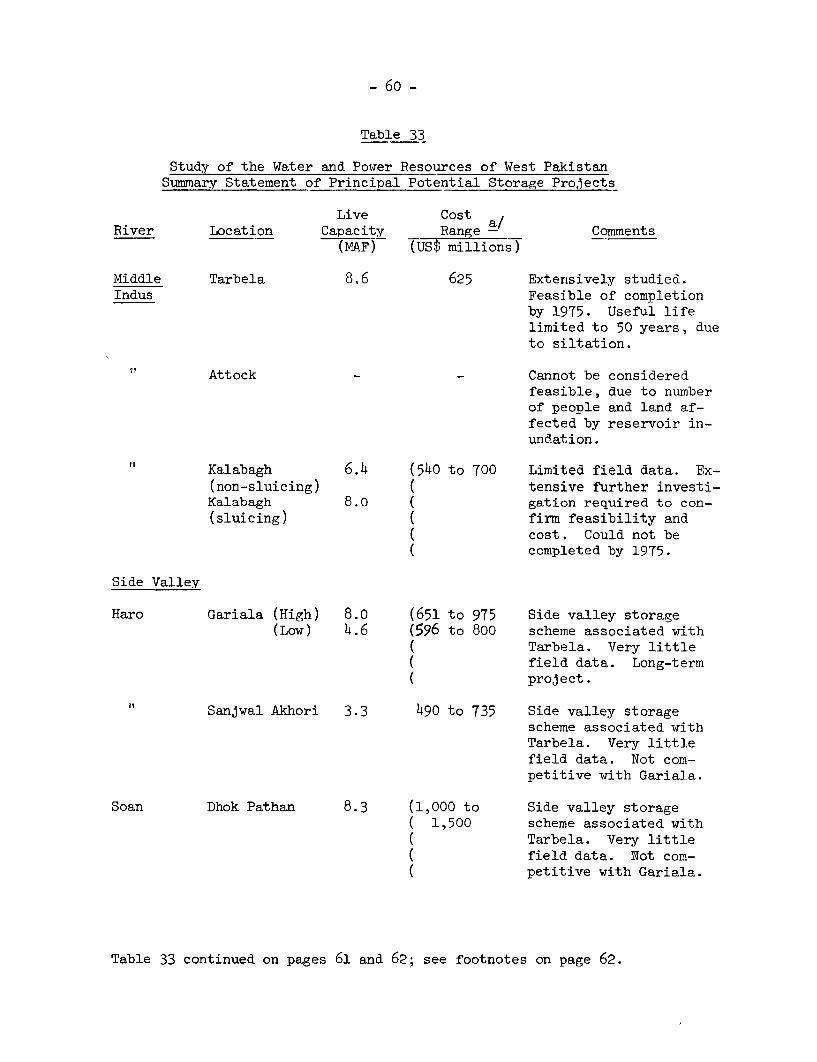
- 6o -
Table 33
Study of the Water and Power Resources of West PakistanSummary Statement of Principal Potential Storage Projects
Live Cost a/River Location Capacity Range - omments
(MAF) (US$ millions)
Middle Tarbela 8.6 625 Extensively studied.Indus Feasible of completion
by 1975. Useful lifelimited to 50 years, dueto siltation.
Attock - Cannot be consideredfeasible, due to numberof people and land af-fected by reservoir in-undation.
Kalabagh 6.4 (54o to 700 Limited field data. Ex-(non-sluicing) ( tensive further investi-Kalabagh 8.0 ( gation required to con-(sluicing) ( firm feasibility and
( cost. Could not be( completed by 1975.
Side Valley
Haro Gariala (High) 8.o (651 to 975 Side valley storage(Low) 4.6 (596 to 800 scheme associated with
Tarbela. Very little( field data. Long-term( project.
Sanjwal Akhori 3.3 490 to 735 Side valley storagescheme associated withTarbela. Very littlefield data. Not com-petitive with Gariala.
Soan Dhok Pathan 8.3 (1,000 to Side valley storage( 1,500 scheme associated with( Tarbela. Very little( field data. Not com-
petitive with Gariala.
Table 33 continued on pages 61 and 62; see footnotes on page 62.
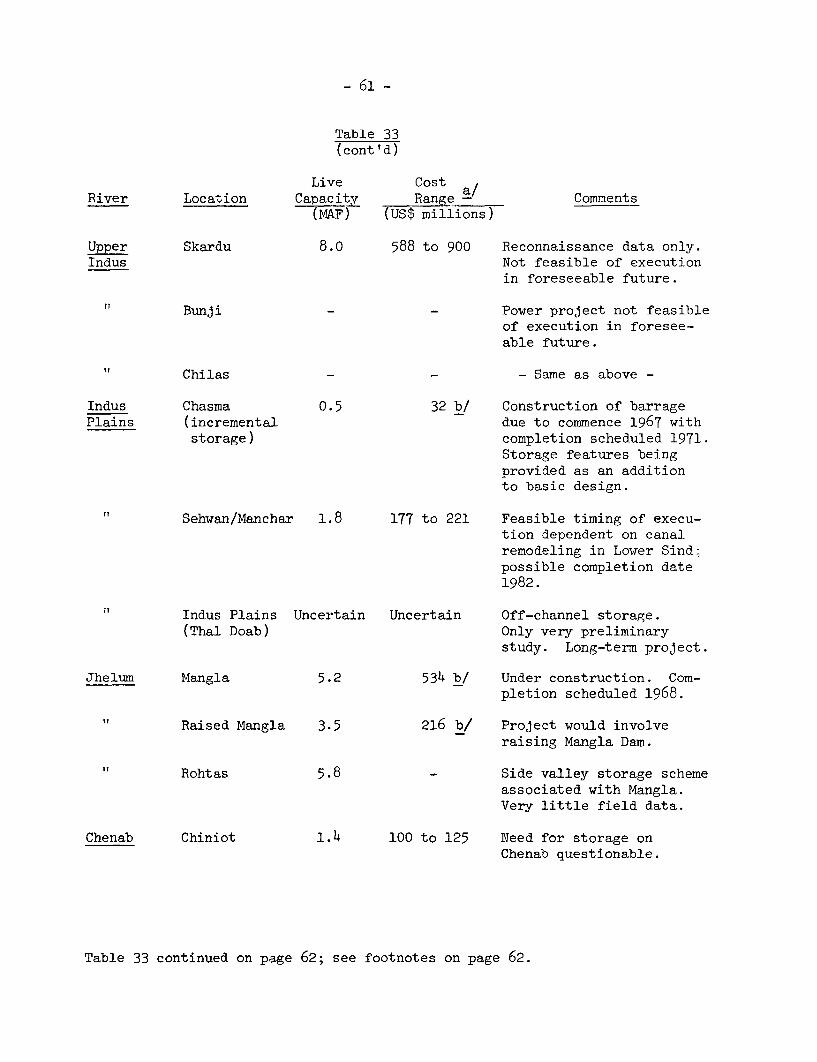
- 61 -
Table 33(cont'd)
Live CostRiver Location Capacity Range -/ Comments
(MAF) (US$ millions)
Upper Skardu 8.0 588 to 900 Reconnaissance data only.Indus Not feasible of execution
in foreseeable future.
Bunji - - Power project not feasibleof execution in foresee-able future.
Chilas - - - Same as above -
Indus Chasma 0.5 32 b/ Construction of barragePlains (incremental due to commence 1967 with
storage) completion scheduled 1971.Storage features beingprovided as an additionto basic design.
IT Sehwan/Manchar 1.8 177 to 221 Feasible timing of execu-tion dependent on canalremodeling in Lower Sind;possible completion date1982.
Indus Plains Uncertain Uncertain Off-channel storage.(Thal Doab) Only very preliminary
study. Long-term project.
Jhelum Mangla 5.2 534 b/ Under construction. Com-pletion scheduled 1968.
Raised Mangla 3.5 216 b/ Project would involveraising Mangla Dam.
Rohtas 5.8 - Side valley storage schemeassociated with Mangla.Very little field data.
Chenab Chiniot 1.4 100 to 125 Need for storage onChenab questionable.
Table 33 continued on page 62; see footnotes on page 62.
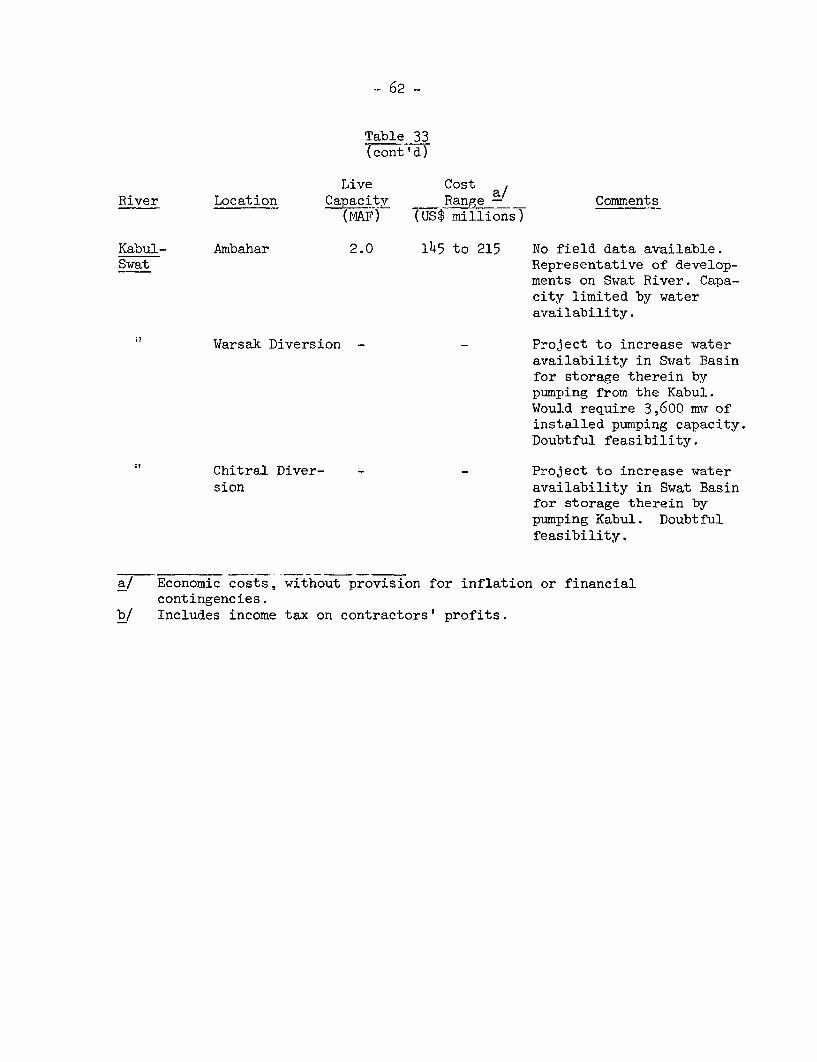
.- 62 -
Table 33(cont'd)
Live Cost a/River Location Capacity Range - Comments
(MAF) (us$ millions)
Kabul- Ambahar 2.0 145 to 215 No field data available.Swat Representative of develop-
ments on Swat River. Capa-city limited by wateravailability.
Warsak Diversion - - Project to increase wateravailability in Swat Basinfor storage therein bypumping from the Kabul.Would require 3,600 mw ofinstalled pumping capacity.Doubtful feasibility.
if Chitral Diver- - - Project to increase water
sion availability in Swat Basinfor storage therein bypumping Kabul. Doubtfulfeasibility.
a/ Economic costs, without provision for inflation or financialcontingencies.
b/ Includes income tax on contractors' profits.
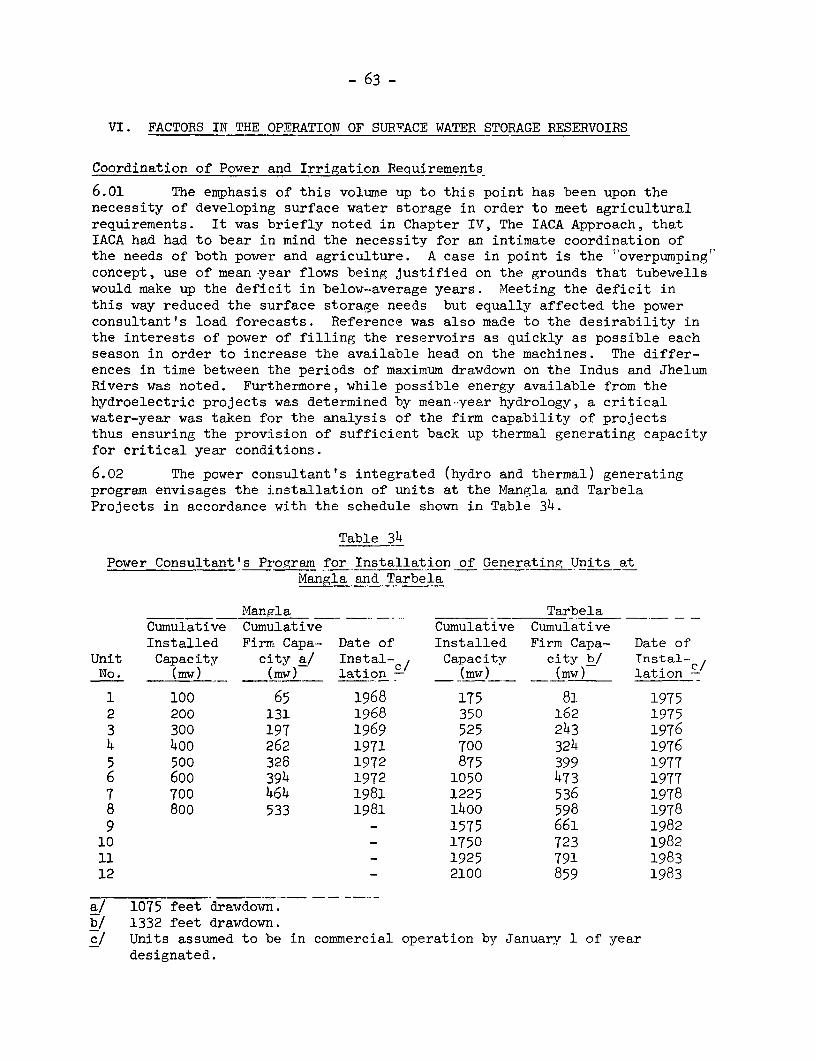
- 63 -
VI. FACTORS IN THE OPERATION OF SURFACE WATER STORAGE RESERVOIRS
Coordination of Power and Irrigation Requirements
6.01 The emphasis of this volume up to this point has been upon thenecessity of developing surface water storage in order to meet agriculturalrequirements. It was briefly noted in Chapter IV, The IACA Approach, thatIACA had had to bear in mind the necessity for an intimate coordination ofthe needs of both power and agriculture. A case in point is the "overpumping'concept, use of mean year flows being justified on the grounds that tubewellswould make up the deficit in below--average years. Meeting the deficit inthis way reduced the surface storage needs but equally affected the powerconsultant's load forecasts. Reference was also made to the desirability inthe interests of power of filling the reservoirs as quickly as possible eachseason in order to increase the available head on the machines. The differ-ences in time between the periods of maximum drawdown on the Indus and JhelumRivers was noted. Furthermore, while possible energy available from thehydroelectric projects was determined by mean-year hydrology, a criticalwater-year was taken for the analysis of the firm capability of projectsthus ensuring the provision of sufficient back up thermal generating capacityfor critical year conditions.
6.02 The power consultant's integrated (hydro and thermal) generatingprogram envisages the installation of units at the Mangla and TarbelaProjects in accordance with the schedule shown in Table 34.
Table 34
Power Consultant's Program for Installation of Generating Units atMangla and Tarbela
Mangla ._.____ TarbelaCumulative Cumulative Cumulative CumulativeInstalled Firm Capa- Date of Installed Firm Capa- Date of
Unit Capacity city a/ Instal- / Capacity city b/ Instal-,No. (mw) _ (mw) lation _(mw) _ mw) lation -
1 100 65 1968 175 81 19752 200 131 1968 350 162 19753 300 197 1969 525 243 19764 400 262 1971 700 324 19765 500 328 1972 875 399 19776 600 394 1972 1050 473 19777 700 464 1981 1225 536 19788 800 533 1981 1400 598 19789 _ 1575 661 1982
10 _ 1750 723 198211 - 1925 791 198312 - 2100 859 1983
a/ 1075 feet drawdown.b/ 1332 feet drawdown.c/ Units assumed to be in commercial operation by January 1 of year
designated.
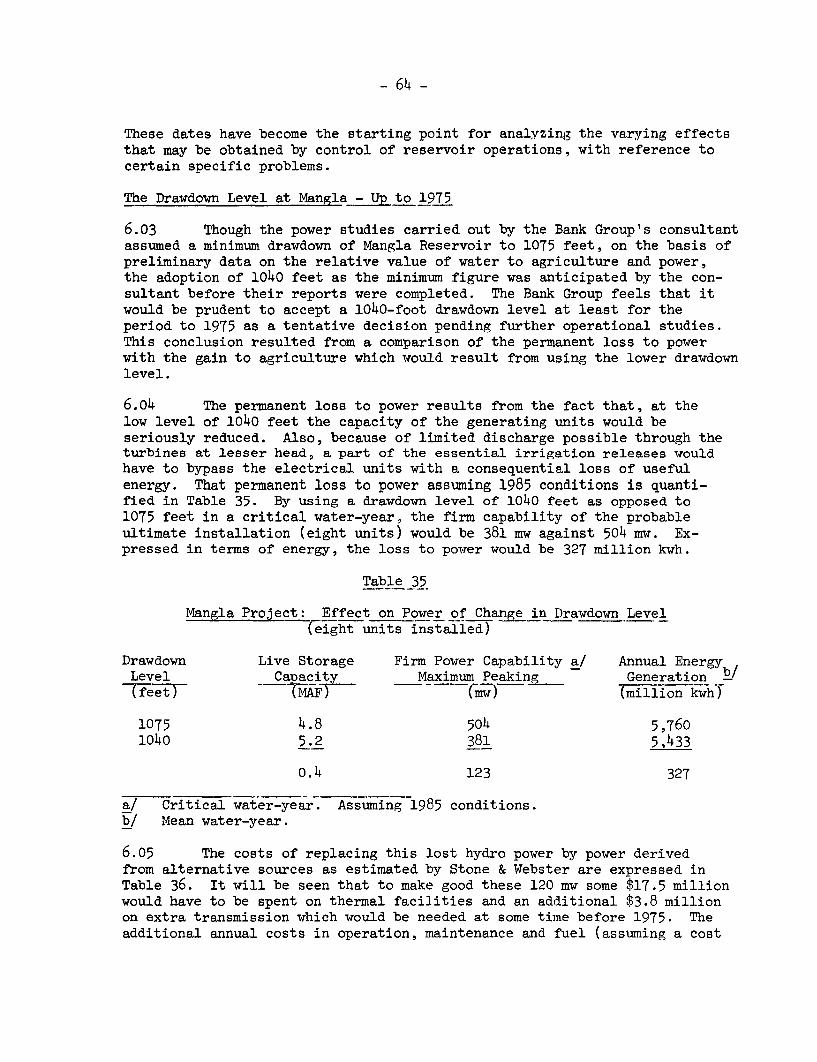
- 64 -
These dates have become the starting point for analyzing the varying effectsthat may be obtained by control of reservoir operations, with reference tocertain specific problems.
The Drawdown Level at Mangla_- Up to 1975
6.03 Though the power studies carried out by the Bank Group's consultantassumed a minimum drawdown of Mangla Reservoir to 1075 feet, on the basis ofpreliminary data on the relative value of water to agriculture and power,the adoption of 1040 feet as the minimum figure was anticipated by the con-sultant before their reports were completed. The Bank Group feels that itwould be prudent to accept a 1040-foot drawdown level at least for theperiod to 1975 as a tentative decision pending further operational studies.This conclusion resulted from a comparison of the permanent loss to powerwith the gain to agriculture which would result from using the lower drawdownlevel.
6.o4 The permanent loss to power results from the fact that, at thelow level of 1040 feet the capacity of the generating units would beseriously reduced. Also, because of limited discharge possible through theturbines at lesser head, a part of the essential irrigation releases wouldhave to bypass the electrical units with a consequential loss of usefulenergy. That permanent loss to power assuming 1985 conditions is quanti-fied in Table 35. By using a drawdown level of 1040 feet as opposed to1075 feet in a critical water-year, the firm capability of the probableultimate installation (eight units) would be 381 mw against 504 mw. Ex-pressed in terms of energy, the loss to power would be 327 million kwh.
Table 35
Mangla Project: Effect on Power of Change in Drawdown Level(eight units installed)
Drawdown Live Storage Firm Power Capability a/ Annual EnergyLevel Cat)acity Maximum Peaking Generation -/(feet) (1AF) (mw) (million kwhY
1075 4.8 504 5,7601040 5.2 381 5,433
o.4 123 327
a/ Critical water-year. Assuming 1985 conditions.b/ Mean water-year.
6.05 The costs of replacing this lost hydro power by power derivedfrom alternative sources as estimated by Stone & Webster are expressed inTable 36. It will be seen that to make good these 120 mw some $17.5 millionwould have to be spent on thermal facilities and an additional $3.8 millionon extra transmission which would be needed at some time before 1975. Theadditional annual costs in operation, maintenance and fuel (assuming a cost
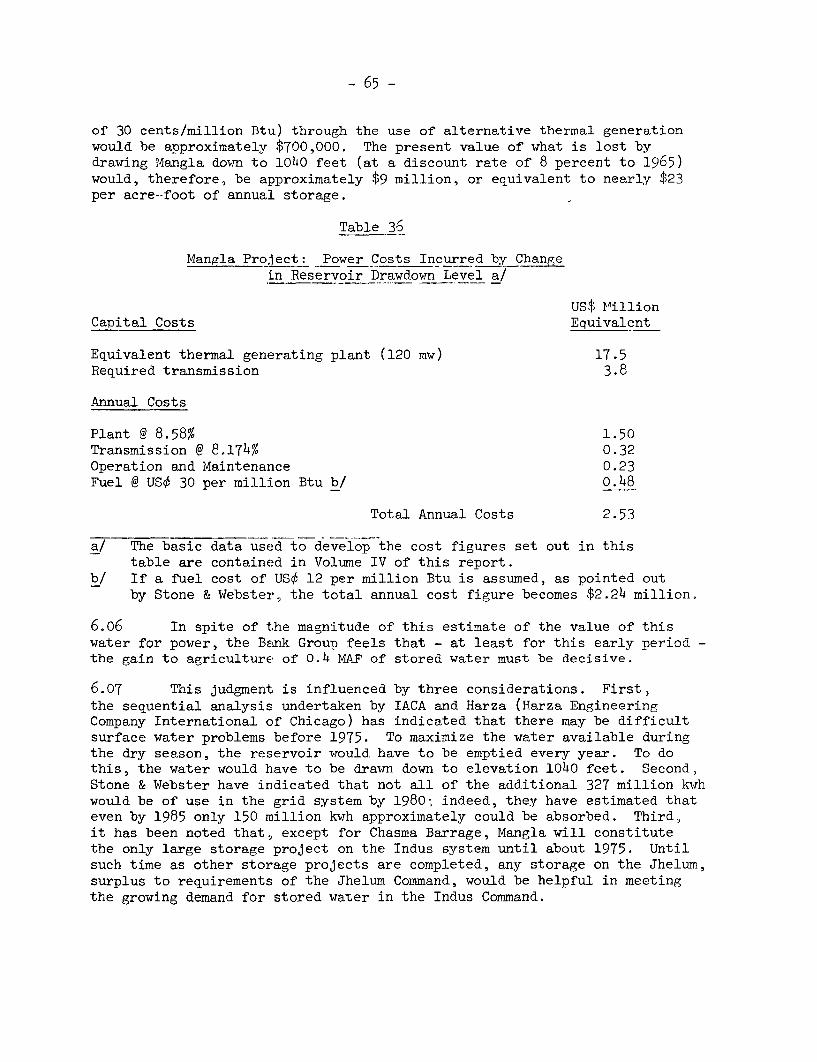
- 65 -
of 30 cents/million Btu) through the use of alternative thermal generationwould be approximately $700,000. The present value of what is lost bydrawing Mangla down to 1040 feet (at a discount rate of 8 percent to 1965)would, therefore, be approximately $9 million, or equivalent to nearly $23per acre-foot of annual storage.
Table 36
Mangla Project: Power Costs Incurred by Changein Reservoir Drawdown Level a/
US$ rMillionCapital Costs Equivalent
Equivalent thermal generating plant (120 mw) 17.5Required transmission 3.8
Annual Costs
Plant @ 8.58% 1.50Transmission @ 8.174% 0.32Operation and Maintenance 0.23Fuel @ US¢ 30 per million Btu b/ o.48
Total Annual Costs 2.53
a/ The basic data used to develop the cost figures set out in thistable are contained in Volume IV of this report.
b/ If a fuel cost of US¢ 12 per million Btu is assumed, as pointed outby Stone & Webster, the total annual cost figure becomes $2.24 million.
6.o6 In spite of the magnitude of this estimate of the value of thiswater for power, the Bank Group feels that - at least for this early period -
the gain to agriculture of 0.4 MAF of stored water must be decisive.
6.07 This judgment, is influenced by three considerations. First,the sequential analysis undertaken by IACA and Harza (Harza EngineeringCompany International of Chicago) has indicated that there may be difficultsurface water problems before 1975. To maximize the water available duringthe dry season, the reservoir would have to be emptied every year. To dothis, the water would have to be drawn down to elevation 1040 feet. Second)Stone & Webster have indicated that not all of the additional 327 million kwhwould be of use in the grid system by 1980, indeed, they have estimated thateven by 1985 only 150 million kwh approximately could be absorbed. Third,it has been noted that, except for Chasma Barrage, Mangla will constitutethe only large storage project on the Indus system until about 1975. Untilsuch time as other storage projects are completed, any storage on the Jhelum,surplus to requirements of the Jhelum Command, would be helpful in meetingthe growing demand for stored water in the Indus Command.
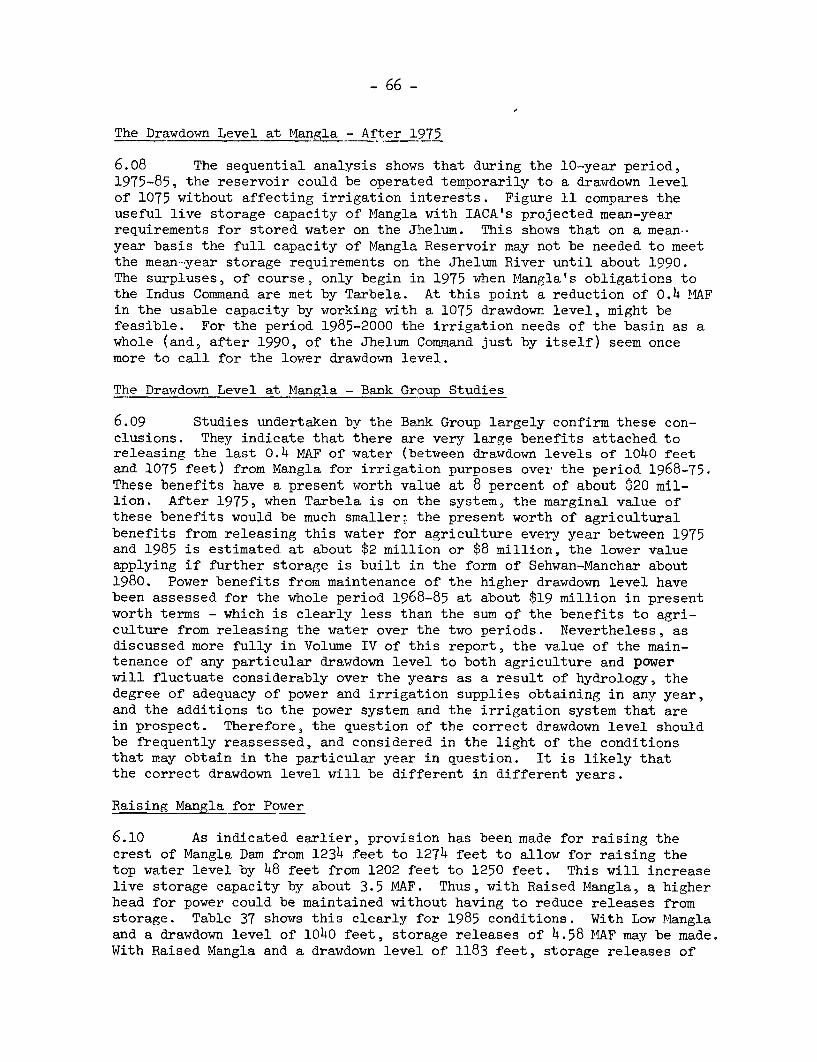
- 66 -
The Drawdowm Level at Mangla - After 1975
6.o8 The sequential analysis shows that during the 10-year period,1975-85, the reservoir could be operated temporarily to a drawdown levelof 1075 without affecting irrigation interests. Figure 11 compares theuseful live storage capacity of Mangla with IACA's projected mean-yearrequirements for stored water on the Jhelum. This shows that on a mean*-year basis the full capacity of Mangla Reservoir may not be needed to meetthe mean---year storage requirements on the Jhelum River until about 1990.The surpluses, of course, only begin in 1975 when Mangla's obligations tothe Indus Command are met by Tarbela. At this point a reduction of 0.4 MAFin the usable capacity by working with a 1075 drawdown level, might befeasible. For the period 1985-2000 the irrigation needs of the basin as awhole (and, after 1990, of the Jhelum Command just by itself) seem oncemore to call for the lower drawdown level.
The Drawdot-m Level at Mangla - Bank Group Studies
6.og Studies undertaken by the Bank Group largely confirm these con-clusions. They indicate that there are very large benefits attached toreleasing the last 0.4 MAF of water (between drawdown levels of 1040 feetand 1075 feet) from Mangla for irrigation purposes over the period 1968-75.These benefits have a present worth value at 8 percent of about $20 mil-lion. After 1975, when Tarbela is on the system, the marginal value ofthese benefits would be much smaller; the present worth of agriculturalbenefits from releasing this water for agriculture every year between 1975and 1985 is estimated at about $2 million or $8 million, the lower valueapplying if further storage is built in the form of Sehwan-Manchar about1980. Power benefits from maintenance of the higher drawdown level havebeen assessed for the whole period 1968-85 at about $19 million in presentworth terms - which is clearly less than the sum of the benefits to agri-culture from releasing the water over the two periods. Nevertheless, asdiscussed more fully in Volume IV of this report, the value of the main-tenance of any particular drawdown level to both agriculture and powerwill fluctuate considerably over the years as a result of hydrology, thedegree of adequacy of power and irrigation supplies obtaining in any year,and the additions to the power system and the irrigation system that arein prospect. Therefore, the question of the correct drawdown level shouldbe frequently reassessed, and considered in the light of the conditionsthat may obtain in the particular year in question. It is likely thatthe correct drawdown level will be different in different years.
Raising Mangla for Power
6.10 As indicated earlier, provision has been made for raising thecrest of Mangla Dam from 1234 feet to 1274 feet to allow for raising thetop water level by 48 feet from 1202 feet to 1250 feet. This will increaselive storage capacity by about 3.5 MAF. Thus, with Raised Mangla, a higherhead for power could be maintained without having to reduce releases fromstorage. Table 37 shows this clearly for 1985 conditions. With Low Manglaand a drawdown level of 1040 feet, storage releases of 4.58 MAF may be made.With Raised Mangla and a drawdowm level of 1183 feet, storage releases of
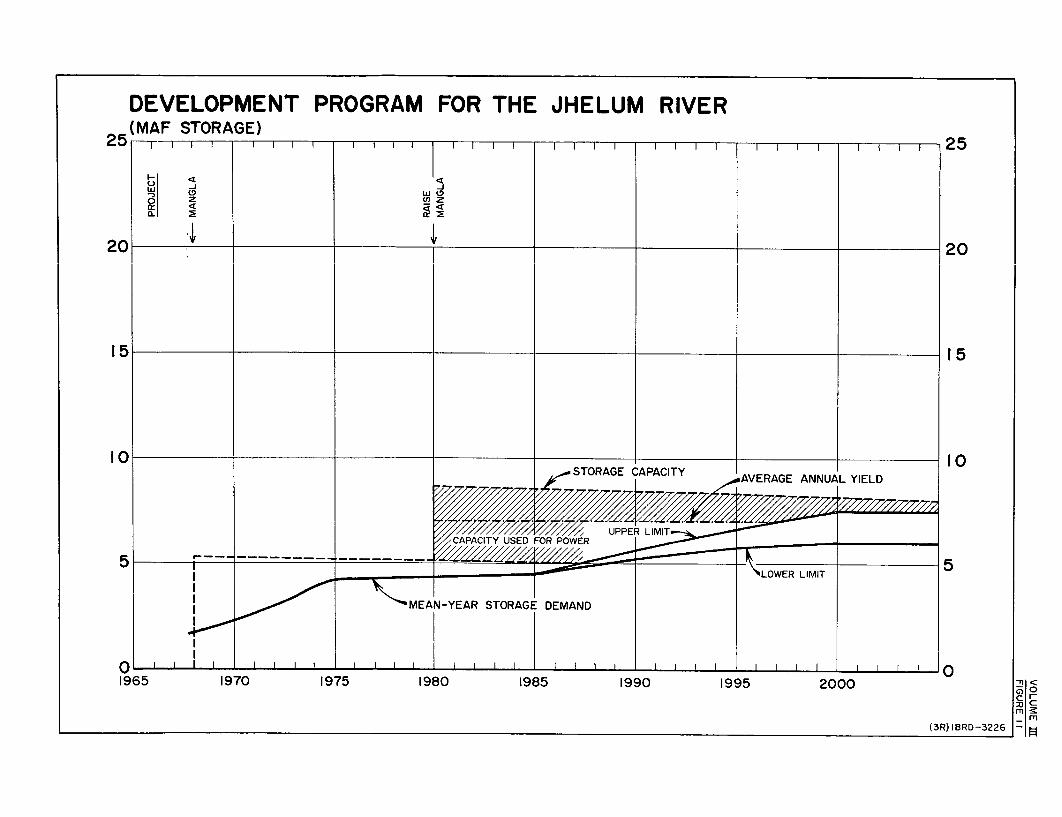
DEVELOPMENT PROGRAM FOR THE JHELUM RIVER(MAF STORAGE)25 I I 25
10~~
LL --iL WE II
o cnza. F
209 20
15 15
10 10STORAGE CAPACITY AEANNUAIL YIELD
5 -------- --------- _
I ~ ~ ~ ~ '~~~MEAN-YEAR STORAGE DEMAND
0 1 I I I I lo II
1965 1970 1975 1980 1985 1990 1995 2000<
(3R)IBRD-3226-

- 67 -
4.58 MAF are still possible, while the firm capacity of the power plant witheight units installed would be increased bv more than 600 mw. An additional2,000 million kwh could be generated in an average year.
Table 37
Comparison of Power Characteristics. Low Manglaand Raised Mangla Operated for Maximum Power Benefits
(1985 conditions, eight units installed)
Low Mangla Raised Mangla Difference
Drawdown Level (feet SPD) 1040 1183 143Annual Energy Generation (mill. kwh) a/ 5,433 7,429 1,996Firm Capability b/
limited peaking c/ (mw) 381 780 399maximum peaking d/ (mw) 395 1,025 630
Storage Release (MAF) 4.58 4.58 0
a/ Mean water-year.b/ Critical water-year.c/ Assuming restriction on the hourly variation in water releases and
plant factor not to fall below 80 percent.d/ Assuming 100 percent load factor on at least two to three machines to
maintain a constant flow in the Upper Jhelum Canal, the remaining unitsoperated to maximum peak capacity.
6.11 In the previous section, it was argued that by 1985 the demandsof the system as a whole may once more necessitate the 1040 feet drawdownlevel and that by 1990 the demands of the Jhelum Command alone will certainlydo this. IACA envisage that some time after 1985 Mangla will be raised forirrigation purposes.
6.12 Given the facts as presented in Table 37, the Bank Group had toexamine the question of raising Mangla for power earlier than, say, 1990;i.e., earlier than would be the case under the Bank consultants' program.They found that the picture presented in Table 37 had to be integrated totake account of two points.
6.13 First: It -had to be realized that raising the dam to obtain anadditional 3.5 MAF-of usefu1 capacity would not result in an equivalentincrease in average annual yield, because surplus flows in the Jhelumavailable for-storage-wtuld not be adequate in all years to fill thelarger reservoir. Gen-ally, the reservoir would be emptied in April sothat impounding could-difm6mence in all probability no earlier than Maywith completi-on in Septe,mber. A review of 41 years of historical record(1922-63) shows -that=, ?allowing for IACA's projected irrigation releasesrequired during the impounding months, Raised Mangla might yield the fol-lowing amounts of stored water:
- 68 -
Table 38
Raised Mangla: Stored Water Yields UnderConditions of IACA's Projected Irrigation IJses
Year Year1985 2000
Conditions ConditionsNumber of years out of 41 in which the
reservoir would not have been filled 7 25
Average annual storage yield duxring41-year period (IMAF) 8.3 6.8
Minimum storage yield in 41-year period (M4AF) 5.7 2.3
6.14 Second: An examination of alternative methods of operating RaisedMangla showed that the extraction of 6.75 MAF or 7.72 MAF, under IACA's 1985irrigation conditions 9 caused a reduction in the firm capability of thepower installation in May and June during critical years because of thenecessity of limiting flow through the turbines to fill the larger reser-voir. The loss of power capability, however, was very small.
6.15 Bearing both these points in mind, the Bank Group made somecalculations comparing the possibility of raising Mangla for power pur-poses with the Kunhar Project and with a thermal alternative. It alsoconsidered the possibility of raising Mangla and simultaneously install-ing units 9 and 10 there. The figures underlying the Bank Group's cal-culations, which differ slightly from those used by Stone and Webster,are presented in full in Volume IV, Annex 8 and summarized here.
Table 39
Increase in Power Output Obtainable by Raising ManglaCompared with Kunhar Power Output
(mean year)Increase due toRaising Mangla,
Increase due to adding Units 9Raising Mangla and 10 and Kunhar Projectand Drawing Dovm Drawing Down Capability andto 1175 feet to 1175 feet Energy-Output_
Capacity in CriticalPeriod (mw)
April 1 - 10 592 840 524
Energy-Output (mil. kwh)
June-September 459 589 1,170October-May 1,516 1,696 19734
Total 1,975 2,285 2,904
- 69 -
6.16 Maintenance of a minimum reservoir level at Raised Mangla of1175 feet, as opposed to 1040 feet, would result in an increase of about600 mw in the firm capability of the power plant, while installation ofa further two units would increase this firm capability by an additional240 mw. Raising Mangla and drawing down to 1175 feet would also resultin a very substantial addition to energy.output in the critical periodof the year, when it would be fully usable. In both these senses, rais-ing Mangla would be more attractive than Kunhar. However, Kunhar wouldproduce more energy over the year as a whole and also over the winterseason as a whole. By the early 1980's Tarbela will probably still becapable of producing more energy than can be absorbed in the summer,but there will be energy shortages in the winter.
6.17 The Bank Group's rough calculations suggest that raising Manglafor power purposes a few years before it is required to meet irrigationneeds does not seem attractive from the present perspective. The BankGroup used the project costs shown in the following table.
Table 4o
Comparative Costs of Raising Mangla and of Kunhar(US$ million equivalent)
Raise Mangla 217Raise MIangla and Install Units 9 & 10 235Kunhar 204
It should be borne in mind that the Raised Mangla cost estimate is veryrecent (1966) whereas the Kunhar estimate dates from 1961. The BankGroup found that raising Mangla would be preferable to gas-fired thermalunits in the early 198 0's only if the gas price were in the neighborhoodof 65 US¢ per million Btu, while Kunhar was slightly more attractivebeing preferable to gas.fired thermal plants at a gas price of about 58US} per million Btu. These calculations were made taking account of thefact that additional energy produced in the summer in the early 1980'swould not generally be usable. These gas prices are substantially abovethose foreseen by the-Bank Group for this period (see Volume IV, Annex 5)and so it was concluded that neither raising Mangla for power nor Kunharappeared likely, from the present perspective, to be attractive untilabout 1990 when more of their energy could be absorbed and gas would bemore scarce.
The Sediment Problem at Tarbela
6.18 Because-the -sediment inflow to Tarbela Reservoir will be very high,(around 440 milli6nttons a-year) the dam site consultant investigated thefeasibility of pr@vid-i-h-g sluiceways to pass the heavily charged waters ofthe monsoon season-, pricf_i ipally during June and July when over 50 percent ofthe annual load is carried. It is clear that sluicing would serve to in-crease the useful life of the reservoir, otherwise estimated at 50 years, tosome indeterminable degree. Three schemes were studied in detail, one basedon the present design and two on modifications.
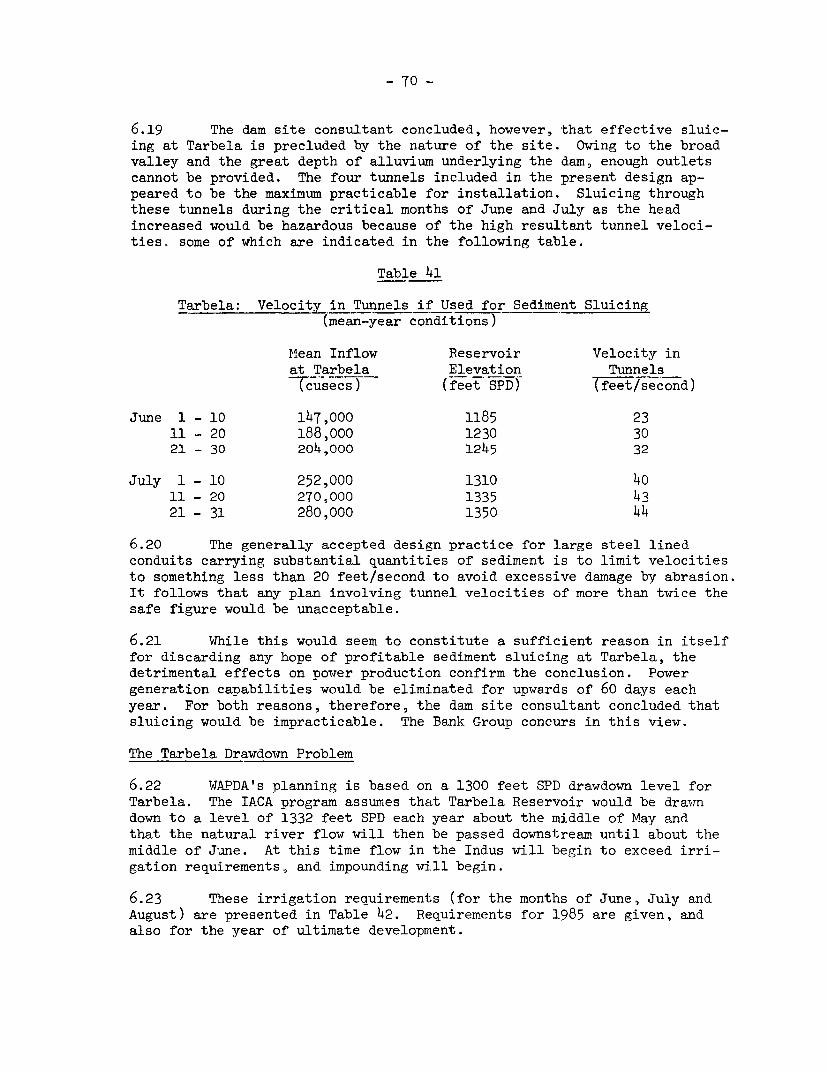
- 70 -
6.19 The dam site consultant concluded, however, that effective sluic-ing at Tarbela is precluded by the nature of the site. Owing to the broadvalley and the great depth of alluvium underlying the dam, enough outletscannot be provided. The four tunnels included in the present design ap-peared to be the maximum practicable for installation. Sluicing throughthese tunnels during the critical months of June and July as the headincreased would be hazardous because of the high resultant tunnel veloci-ties,. some of which are indicated in the following table.
Table 41
Tarbela: Velocity in Tunnels if Used for Sediment Sluicing(mean-year conditions)
Mean Inflow Reservoir Velocity inat Tarbela Elevation Tunnels(cusecs) (feet SPD) (feet/second)
June 1 - 10 147,000 1185 23
11 - 20 188,000 1230 3021 - 30 204,000 1245 32
July 1 - 10 252,000 1310 4011 - 20 270,000 1335 43
21 - 31 280,000 1350 44
6.20 The generally accepted design practice for large steel linedconduits carrying substantial quantities of sediment is to limit velocitiesto something less than 20 feet/second to avoid excessive damage by abrasion.It follows that any plan involving tunnel velocities of more than twice thesafe figure would be unacceptable.
6.21 While this would seem to constitute a sufficient reason in itselffor discarding any hope of profitable sediment sluicing at Tarbela, thedetrimental effects on power production confirm the conclusion. Powergeneration caoabilities would be eliminated for upwards of 60 days eachyear. For both reasons, therefore, the dam site consultant concluded thatsluicing would be impracticable. The Bank Group concurs in this view.
The Tarbela Drawdown Problem
6.22 WAPDA's planning is based on a 1300 feet SPD drawdown level forTarbela. The IACA program assumes that Tarbela Reservoir would be drawmdown to a level of 1332 feet SPD each year about the middle of May andthat the natural river flow will then be passed downstream until about themiddle of June. At this time flow in the Indus will begin to exceed irri-gation requirements, and impounding will begin.
6.23 These irrigation requirements (for the months of June, July andAugust) are presented in Table 42. Requirements for 1985 are given, andalso for the year of ultimate development.
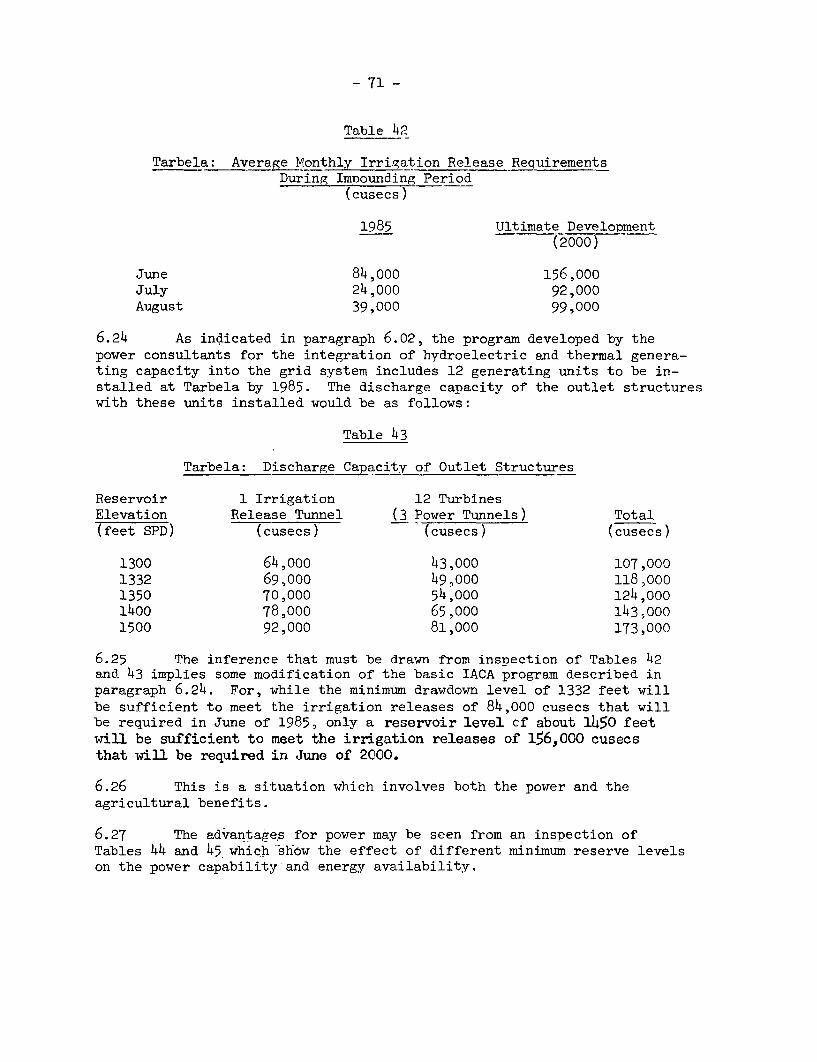
- 71 -
Table 42
Tarbela: Average Monthly Irrigation Release RequirementsDuring Impounding Period
(cusecs)
1985 Ultimate Development(2000)
June 84,ooo 156,000July 24,000 92,000August 39,000 99,000
6.24 As indicated in paragraph 6.02, the program developed by thepower consultants for the integration of hydroelectric and thermal genera-ting capacity into the grid system includes 12 generating units to be in-stalled at Tarbela by 1985. The discharge capacity of the outlet structureswith these units installed would be as follows:
Table 43
Tarbela: Discharge Capacity of Outlet Structures
Reservoir 1 Irrigation 12 TurbinesElevation Release Tunnel (3 Power Tunnels) Total(feet SPD) (cusecs) (cusecs) (cusecs)
1300 64,o0o 43,000 107,0001332 69,000 49o000 118,0001350 70,000 54,000 124,0001400 78,000 65,000 143,0001500 92,000 81,000 173,000
6.25 The inference that must be drawn from inspection of Tables 42and 43 implies some modification of the basic IACA program described inparagraph 6.24. For, while the minimum drawdown level of 1332 feet willbe sufficient to meet the irrigation releases of 84,000 cusecs that willbe required in June of 1985, only a reservoir level cf about 1450 feetwill be sufficient to meet the irrigation releases of 156,000 cusecsthat will be required in June of 2000.
6.26 This is a situation which involves both the power and theagricultural benefits.
6.27 The advantages for power may be seen from an inspection ofTables 44 and 45 which- show the effect of different minimum reserve levelson the power capability-and energy availability.

- 72 -
Table 44
Tarbela: Effect of Different Drawdown Levels on Firm Capability(1985 conditions: 12 units installed)
Minimum Reservoir Level - feet 1300 1332 1350Water Released from Storage - M4AF 7.9 7.3 6.9
Difference from Minimum Level (1300) 0 o.6 1.0Capability at Critical Period - mw 487 730 896Increment 0 243 409Annual Energy Available - million kwh 11,694 11,944 12,221
Useful Energy a! - million kwh 6,833 7,063 7,294Gain in energy - million kwh 0 230 461
a/ During July, August and September9 the amount of usable energy is thesame for all cases. If the potential energy generated in those monthsis omitted, it is estimated that the amounts which remain could all beused in the system.
Table 45
Tarbela: Evaluation of Power Benefits from Different Drawdown Levels(US$ million equivalent)
Drawdown Level - feet 1332 1350Incremental Gain in Capability (mw) over 1300 drawdown 243 409Capital Construction Costs:
alternative thermal generating plant 23.1 56.7alternative transmission 5.0 12.4
Annual Costs:plant @ 8.58% 2.0 4.8transmission @ 8.174% o.4 1.0operation and maintenance 0.3 o.6fuel @ US¢ 30 per million Btu 0.8 1.5
Total Annual Value 3.5 7.9
Quantity of Water Retained in the Reservoirbetween 1300 feet and Drawdown Level (MAF) o.6 1.0
Value of Power per acre--foot of Water Retainedin the Reservoir $5.8 $7.9
This rough calculation indicates that the value to power of water retainedin the reservoir is around $6 per acre-foot at the 1332 feet level andaround $8 per acre-foot at the 1350 level. IACA has estimated the net ad-dition to agricultural production attributable to Tarbela over the life ofthe project and discounted this agricultural benefit at 8 percent to 1965.The resultant estimate of net production value per acre-foot of water storedin the project over its life is $17. This is clearly substantially greaterthan the figure for power estimated above. However, the IACA figure is anaverage value and does not indicate the marginal benefits attributable tothe release, for irrigation purposes each year, of the 0.6/0.7 MAF lyingbetween 1332 feet and 1300 feet.
73 -
6.28 The Bank Group has attempted to measure the marginal value forpower and for agriculture for the period 1975-85 of the 0.6/0.7 MAFlying between 1332 feet and 1300 feet, and these analyses show quiteclearly that advantage lies on the side of retaining the higher drawdowmlevel at least during the first ten years of the life of Tarbela. Thebenefits to power of maintaining the higher drawdown level arise largelyin the form of postponement of the need for further additions to gener-ating capacity. Some benefit also arises in the form of reduced fuelcosts due to the greater energy output of Tarbela in the critical periodat the higher drawdown level. On the basis of its systems analysis theBank Group finds that the savings to power which result from maintenanceof the higher drawdown level over the period 1975-85 have a present worthvalue at 8 percent in the neighborhood of $19 million. The exact size ofthis figure depends on a number of things, in particular the price attrib-uted to thermal fuel in this period; since the Bank Group feels that pres-ent prices tend to underestimate the true scarcity value of fuel that lookslikely to prevail in the period 1975-85 it considers the $19 million aminimum estimate. The Bank Group's linear programming analysis of agricul-tural investment suggests that the net benefits to agriculture that wouldarise from providing over the period 1975--85, o.6/o.7 MAF of rabi irriga-tion water in addition to that available from Tarbela with a drawdown levelof 1332 feet also have a present worth value of the order of about $19 mil-lion. This makes the marginal value of small amounts of Tarbela water foragriculture and for power seem very close. However, in contrast to thepower figure, the agricultural benefit figure must be considered a maximum.The value of an additional 0.6/0.7 HAF of rabi supplies in this periodshould really be consiclered in terms of the costs of making this wateravailable by other means. By 1975 very substantial tubewell fields willbe in existence and so large amounts of water could be made available byoverpumping. Valued in these terms, i.e., the alternative cost of produc-ing the same quantity of irrigation suipplies over the period 1975-85, thewater lying between 1300 feet and 1332 feet has a present worth value ofabout $11-15 million. Since it will take some years after completion ofTarbela to achieve high agricultural benefits on marginal additions to the7--8 I'AF that will be available from Tarbela drawn down to 1332 feet andsince, especially in the later years, there will be large possibilitiesof adding to irrigation supplies by temporary overpumping., the Bank Groupfeels strongly that present evidence recommends a 1332 foot drawdownlevel at Tarbela over the period 1975-85.
6.29 Over the longer terms the relative merits of different drawdownlevels will depend-greatly on what additions to the power system and thesurface storage system have been made or are in prospect. The loss of waterto agriculture resulting from maintenance of a higher rather than a lowerdrawdown level will in-fact fall considerably over the years as a result ofsedimentation filling--up-part of the storage capacity at lower levels in thereservoir. For instairce, it is estimated that by the year 2000 the loss ofwinter irrigation supplies resulting from maintenance of a drawdown levelof 1350 feet rather than 1300 feet would be of the order of only 0.2 MAF(see Table 46).
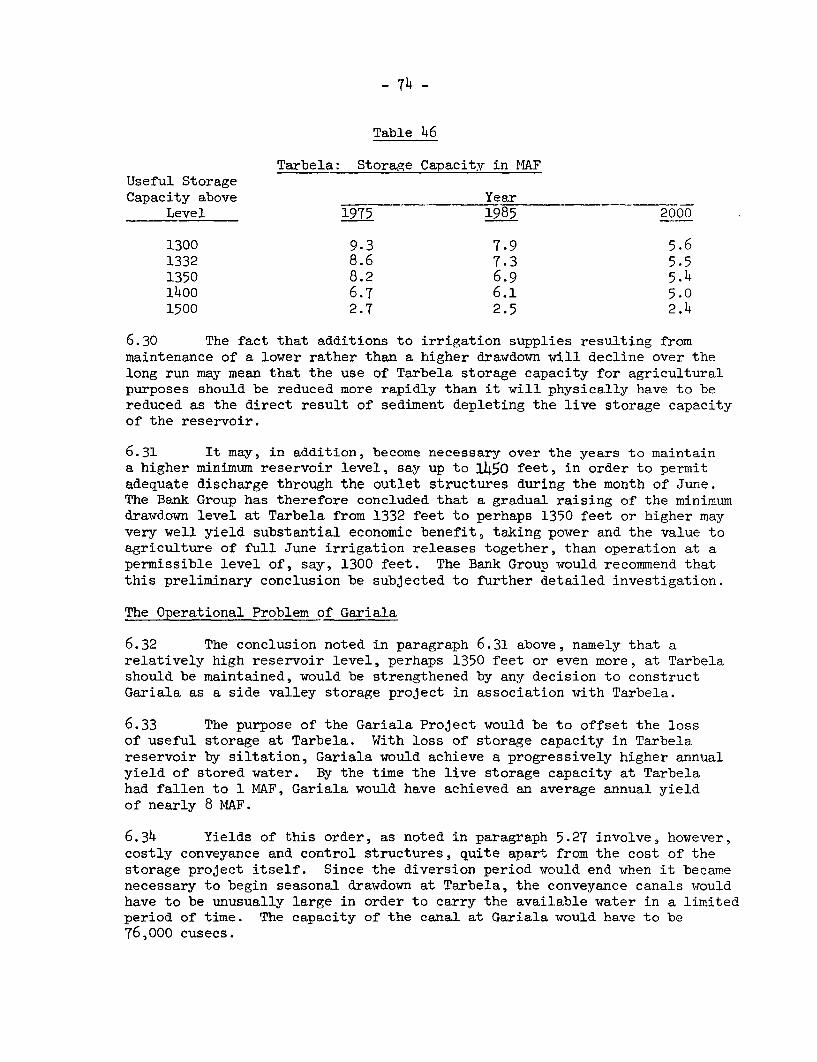
- 74 -
Table 46
Tarbela: Storage Capacity in MAFUseful StorageCapacity above Year _
Level 1975 1985 2000
1300 9.3 7.9 5-61332 8.6 7.3 5.51350 8.2 6.9 5.41400 6.7 6.1 5.01500 2.7 2.5 2.4
6.30 The fact that additions to irrigation supplies resulting frommaintenance of a lower rather than a higher drawdown will decline over thelong run may mean that the use of Tarbela storage capacity for agriculturalpurposes should be reduced more rapidly than it will physically have to bereduced as the direct result of sediment depleting the live storage capacityof the reservoir.
6.31 It may, in addition, become necessary over the years to maintaina higher minimum reservoir level, say up to 1450 feet, in order to permitadequate discharge through the outlet structures during the month of June.The Bank Group has therefore concluded that a gradual raising of the minimumdrawdown level at Tarbela from 1332 feet to perhaps 1350 feet or higher mayvery well yield substantial economic benefit, taking power and the value toagriculture of full June irrigation releases together, than operation at apermissible level of, say, 1300 feet. The Bank Group would recommend thatthis preliminary conclusion be subjected to further detailed investigation.
The Operational Problem of Gariala
6.32 The conclusion noted in paragraph 6.31 above, namely that arelatively high reservoir level, perhaps 1350 feet or even more, at Tarbelashould be maintained, would be strengthened by any decision to constructGariala as a side valley storage project in association with Tarbela.
6.33 The purpose of the Gariala Project would be to offset the lossof useful storage at Tarbela. With loss of storage capacity in Tarbelareservoir by siltation, Gariala would achieve a progressively higher annualyield of stored water. By the time the live storage capacity at Tarbelahad fallen to 1 MAF, Gariala would have achieved an average annual yieldof nearly 8 MAF.
6.34 Yields of this order, as noted in paragraph 5.27 involve, however,costly conveyance and control structures, quite apart from the cost of thestorage project itself. Since the diversion period would end when it becamenecessary to begin seasonal drawdown at Tarbela, the conveyance canals wouldhave to be unusually large in order to carry the available water in a limitedperiod of time. The capacity of the canal at Gariala would have to be76,000 cusecs.
- 75 -
6.35 Operating Tarbela to a higher than minimum drawdown level wouldextend the period of time available for the filling of Gariala.
6.36 The release pattern of Gariala Reservoir is expected to followthe pattern established for Indus Reservoir at Tarbela (see Table 19).The reservoir would be drawn down to its lowest level in May, after whichno further releases from storage would be made until October. With theperiod of minimum capability occurring at the same time as for main riverprojects and extending for more than four months it is difficult, if notimpossible, to justify the installation of power facilities in the project.However, this disadvantage would be partially offset by the higher capa-bility obtainable at Tarbela with the higher drawdown level assumed. Itis therefore concludecL that Gariala would provide useful storage but wouldnot be justified for power development.
Operational Problems at Kalabagh
6.37 The dam site consultant has stated his belief, subject to furtherinvestigation, that an earth and rockfill dam with a concrete buttresssluiceway/spillway structure can be built at Kalabagh to impound water toa level of 925 feet. The bed level is assumed to be at elevation 670 feet.He believes, further, as described in subsequent paragraphs of this chapter,that the dam could be designed and operated in such a way as to pass a largeproportion of the river's sediment load.
6.38 The Bank Group, however, believes that insufficient facts areknown at this time to justify the firm conclusion that a high, concretebuttress can be built at the Kalabagh site, with sluicing capabilities, ata cost commensurate with the benefits that may be derived. As indicatedearlier, only fragmentary information is available with respect to geologi-cal conditions and explorations have been limited. Before design could beundertaken it would be necessary to carry out extensive subsurface investi-gations involving borings, test pits and tunnels. Detailed studies wouldthen be required to evaluate the foundation conditions and determine treat-ments necessary or precautionary features to be included in the design. Ifit should develop that an overflow or submerged orifice spillway (as sug-gested by WAPDA's consultants) is the only type of structure appropriatefor the site, it would not be possible to provide for sluicing except to avery limited extent through irrigation sluices and power tunnels and further-more it would pose considerable problems in dealing with river flow duringconstruction.
6.39 Pending the results of these further investigations, which itwholeheartedly recommends, the Bank Group feels that it would be useful toset forth here some of the advantages and disadvantages that would attachto the two different types of dams (viz. sluicing or non-sluicing) or todifferent modes of operating the same dam.
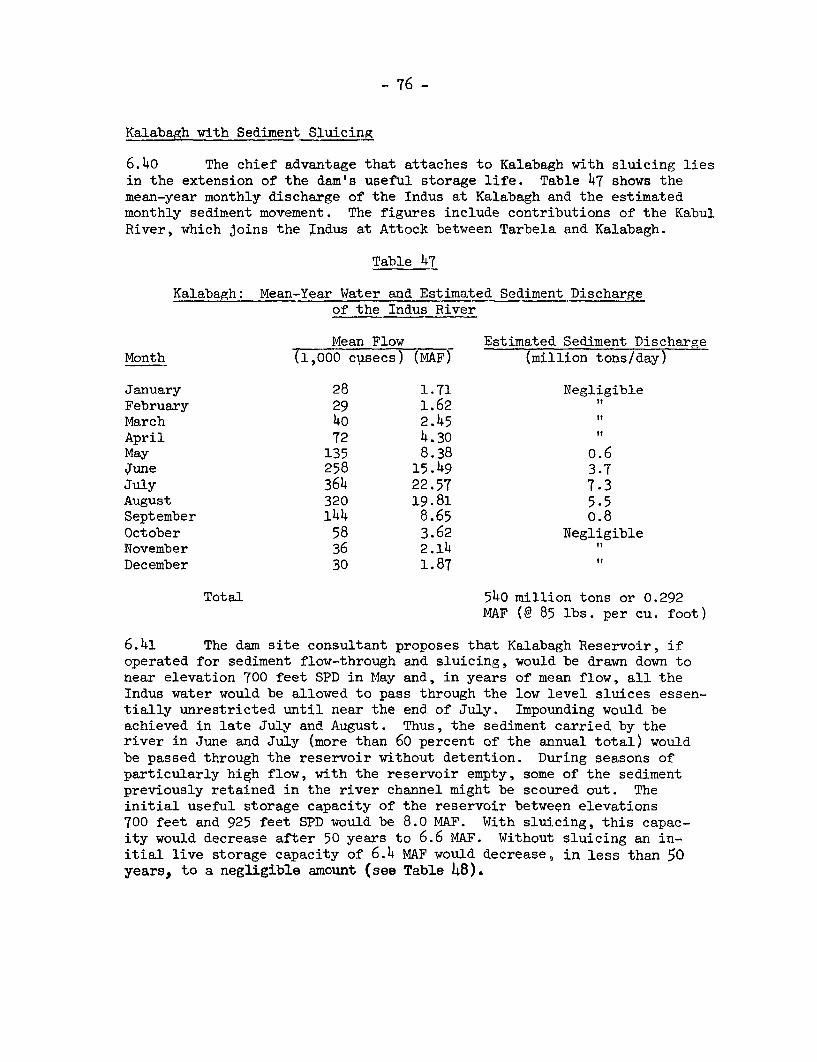
- 76 -
Kalabagh with Sediment Sluicing
6.40 The chief advantage that attaches to Kalabagh with sluicing liesin the extension of the dam's useful storage life. Table 47 shows themean-year monthly discharge of the Indus at Kalabagh and the estimatedmonthly sediment movement. The figures include contributions of the KabulRiver, which joins the [ndus at Attock between Tarbela and Kalabagh.
Table 47
Kalabagh: Mean-Year Water and Estimated Sediment Dischargeof the Indus River
Mean Flow Estimated Sediment DischargeMonth (1,000 cusecs) (MAF) (million tons/day)
January 28 1.71 NegligibleFebruary 29 1.62 ItMarch 40 2.45 "April 72 4.30 "May 135 8.38 o.6June 258 15.49 3.7July 364 22.57 7.3August 320 19.81 5.5September 144 8.65 o.8October 58 3.62 NegligibleNovember 36 2.14 "December 30 1.87
Total 540 million tons or 0.292MAF (@ 85 lbs. per cu. foot)
6.41 The dam site consultant proposes that Kalabagh Reservoir, ifoperated for sediment flow-through and sluicing, would be drawn down tonear elevation 700 feet SPD in M4ay and, in years of mean flow, all theIndus water would be allowed to pass through the low level sluices essen-tially unrestricted until near the end of July. Impounding would beachieved in late July and August. Thus, the sediment carried by theriver in June and July (more than 60 percent of the annual total) wouldbe passed through the reservoir without detention. During seasons ofparticularly high flow, with the reservoir empty, some of the sedimentpreviously retained in the river channel might be scoured out. Theinitial useful storage capacity of the reservoir between elevations700 feet and 925 feet SPD would be 8.0 MAF. With sluicing, this capac-ity would decrease after 50 years to 6.6 MAF. Without sluicing an in-itial live storage capacity of 6.4 MAF would decrease, in less than 50years, to a negligible amount (see Table 48).
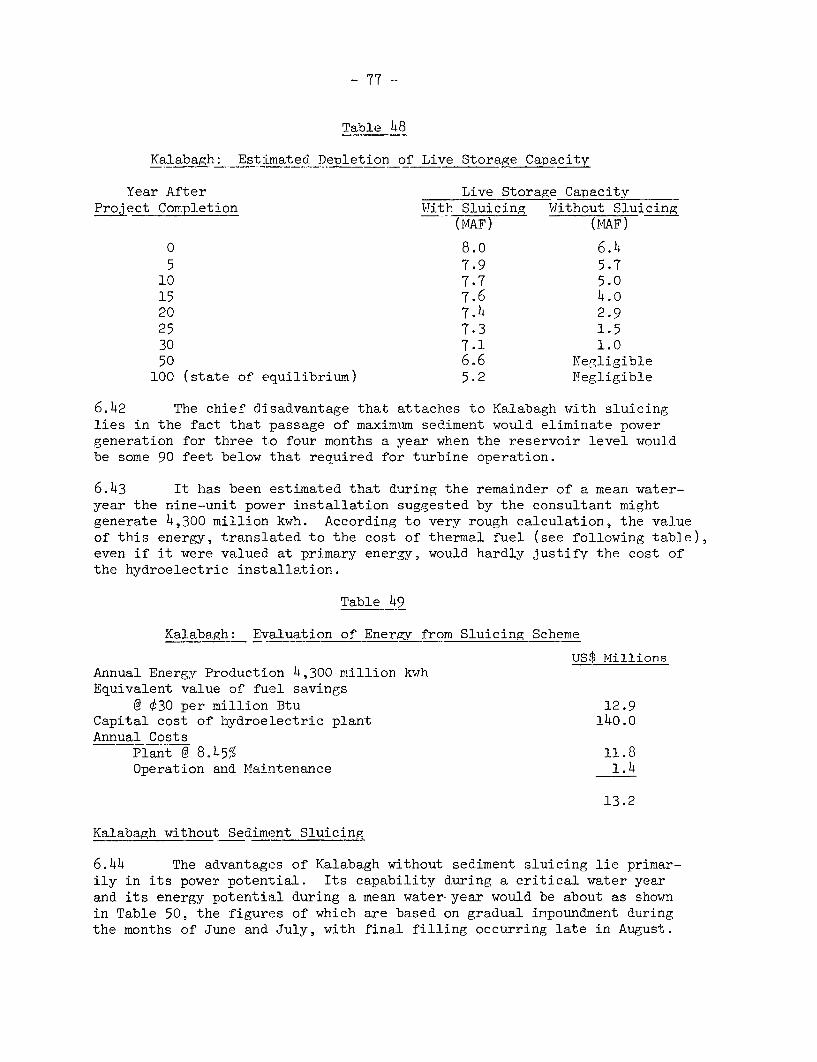
- 77 --
Table 48
Kalabagh: Estimated Depletion of Live Storage Capacity
Year After Live Storage CapacityProject Completion With Sluicing Without Sluicing
(MAF) (MAF)
0 8.0 6.45 7.9 5.7
10 7.7 5.015 7.6 4.020 7.4 2.925 7.3 1.530 7.1 1.050 6.6 Negligible
100 (state of equilibrium) 5.2 Megligible
6.42 The chief disadvantage that attaches to Kalabagh with sluicinglies in the fact that passage of maximum sediment would eliminate powergeneration for three to four months a year when the reservoir level wouldbe some 90 feet below that required for turbine operation.
6.43 It has been estimated that during the remainder of a mean water-year the nine-unit power installation suggested by the consultant mightgenerate 4,300 million kwh. According to very rough calculation, the valueof this energy, translated to the cost of thermal fuel (see following table),even if it were valued at primary energy, would hardly justify the cost ofthe hydroelectric installation.
Table 49
Kalabagh: Evaluation of Energy from Sluicing Scheme
US$ MillionsAnnual Energy Production 4,300 million kwhEquivalent value of fuel savings
@ ¢30 per million Btu 12.9Capital cost of hydroelectric plant 140.0Annual Costs
Plant @ 8.455 11.8Operation and Maintenance 1.4
13.2
Kalabagh without Sediment Sluicing
6.44 The advantages of Kalabagh without sediment sluicing lie primar-ily in its power potential. Its capability during a critical water yearand its energy potential during a mean water-year would be about as shownin Table 50, the figures of which are based on gradual impoundment duringthe months of June and July, with final filling occurring late in August.
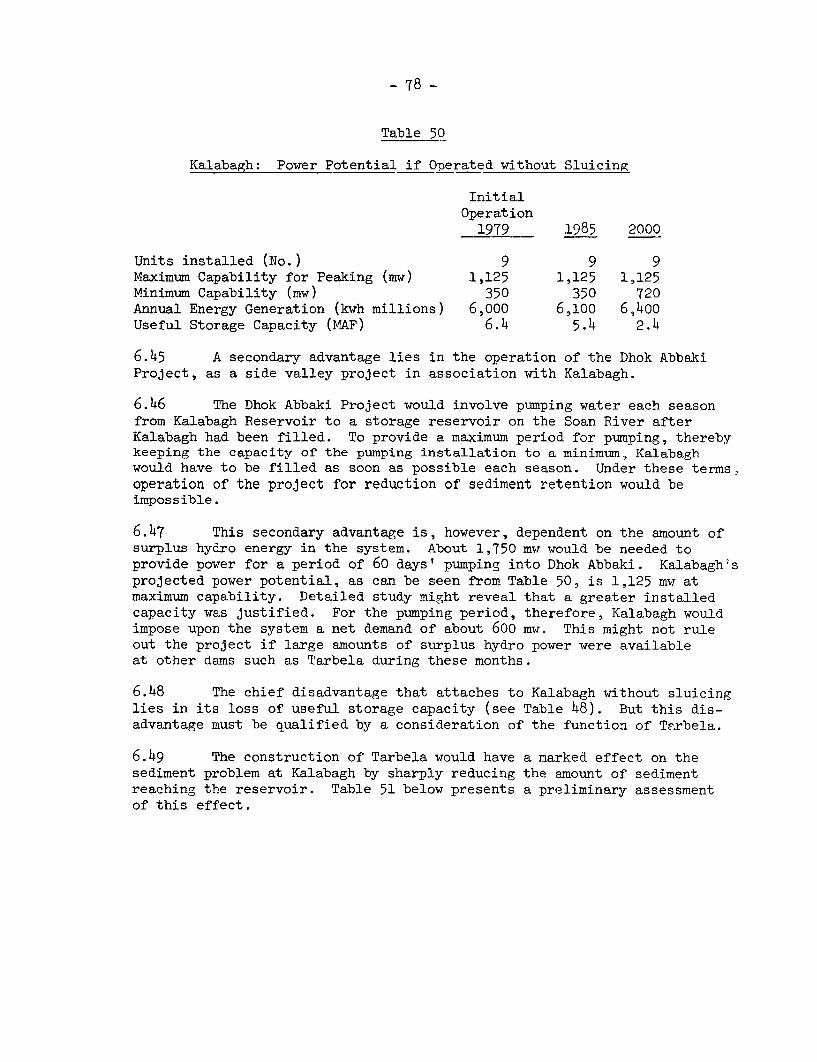
- 78 -
Table 50
Kalabagh: Power Potential if Operated without Sluicing
InitialOperation
1979 1985 2000
Units installed (No.) 9 9 9Maximum Capability for Peaking (mw) 1,125 1,125 1,125Minimum Capability (mw) 350 350 720Annual Energy Generation (kwh millions) 6,000 6,100 6,400Useful Storage Capacity (MAF) 6.4 5.4 2.4
6.45 A secondary advantage lies in the operation of the Dhok AbbakiProject, as a side valley project in association with Kalabagh.
6.46 The Dhok Abbaki Project would involve pumping water each seasonfrom Kalabagh Reservoir to a storage reservoir on the Soan River afterKalabagh had been filled. To provide a maximum period for pumping, therebykeeping the capacity of the pumping installation to a minimum, Kalabaghwould have to be filled as soon as possible each season. Under these terms,operation of the project for reduction of sediment retention would beimpossible.
6.47 This secondary advantage is, however, dependent on the amount ofsurplus hydro energy in the system. About 1,750 mw would be needed toprovide power for a period of 60 days' pumping into Dhok Abbaki. Kalabagh'sprojected power potential, as can be seen from Table 50, is 1,125 mw atmaximum capability. Detailed study might reveal that a greater installedcapacity was justified. For the pumping period, therefore, Kalabagh wouldimpose upon the system a net demand of about 600 mw. This might not ruleout the project if large amounts of surplus hydro power were availableat other dams such as Tarbela during these months.
6.48 The chief disadvantage that attaches to Kalabagh without sluicinglies in its loss of useful storage capacity (see Table 48). But this dis-advantage must be qualified by a consideration of the function of Tarbela.
6.49 The construction of Tarbela would have a marked effect on thesediment problem at Kalabagh by sharply reducing the amount of sedimentreaching the reservoir. Table 51 below presents a preliminary assessmentof this effect.
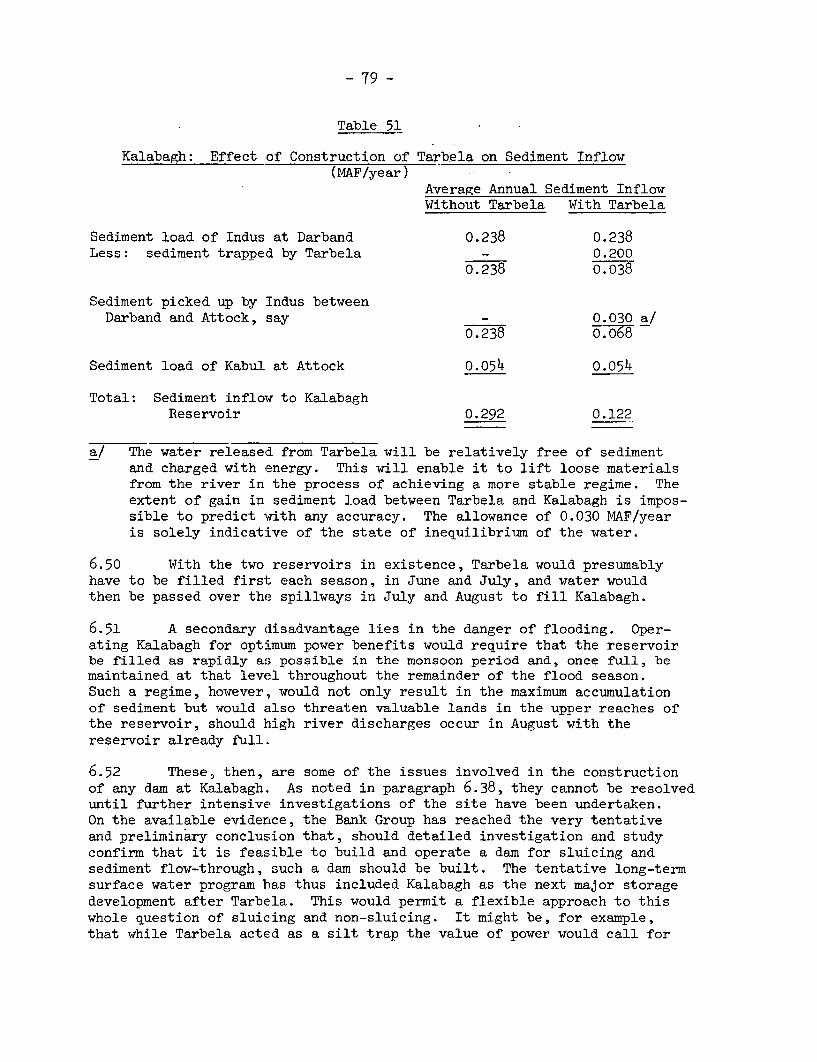
- 79 -
Table 51
Kalabagh: Effect of Construction of Tarbela on Sediment Inflow(MAF/year)
Average Annual Sediment InflowWithout Tarbela With Tarbela
Sediment load of Indus at Darband 0.238 0.238Less: sediment trapped by Tarbela - 0.200
0.238 0.038
Sediment picked up by Indus betweenDarband and Attock, say - 0.030 a/
0.238 0.068
Sediment load of Kabul at Attock 0.054 0.054
Total: Sediment inflow to KalabaghReservoir 0.292 0.122
a/ The water released from Tarbela will be relatively free of sedimentand charged with energy. This will enable it to lift loose materialsfrom the river in the process of achieving a more stable regime. Theextent of gain in sediment load between Tarbela and Kalabagh is impos-sible to predict with any accuracy. The allowance of 0.030 MAF/yearis solely indicative of the state of inequilibrium of the water.
6.50 With the two reservoirs in existence, Tarbela would presumablyhave to be filled first each season, in June and July, and water wouldthen be passed over the spillways in July and August to fill Kalabagh.
6.51 A secondary disadvantage lies in the danger of flooding. Oper-ating Kalabagh for optimum power benefits would require that the reservoirbe filled as rapidly as possible in the monsoon period and, once full, bemaintained at that level throughout the remainder of the flood season.Such a regime, however, would not only result in the maximum accumulationof sediment but would also threaten valuable lands in the upper reaches ofthe reservoir, should high river discharges occur in August with thereservoir already full.
6.52 These, then, are some of the issues involved in the constructionof any dam at Kalabagh. As noted in paragraph 6.38, they cannot be resolveduntil further intensive investigations of the site have been undertaken.On the available evidence, the Bank Group has reached the very tentativeand preliminary conclusion that, should detailed investigation and studyconfirm that it is feasible to build and operate a dam for sluicing andsediment flow-through, such a dam should be built. The tentative long-termsurface water program has thus included Kalabagh as the next major storagedevelopment after Tarbela. This would permit a flexible approach to thiswhole question of sluicing and non-sluicing. It might be, for example,that while Tarbela acted as a silt trap the value of power would call for

o 80 -
the operation of Kalabagh without sediment sluicing. On the other hand, asthe live storage capacity at Tarbela declined, so - unless further upstreamstorage reservoirs were constructed on the main stem of the Indus - thenatural sediment regime would be re-established and 0.292 MAF of depositswould reach Kalabagh every year. It might then be clear that Kalabaghshould be operated with sediment sluicing. The problems of flooding andof the role of Dhok Abbaki would meanwhile have been explored in muchgreater detail.
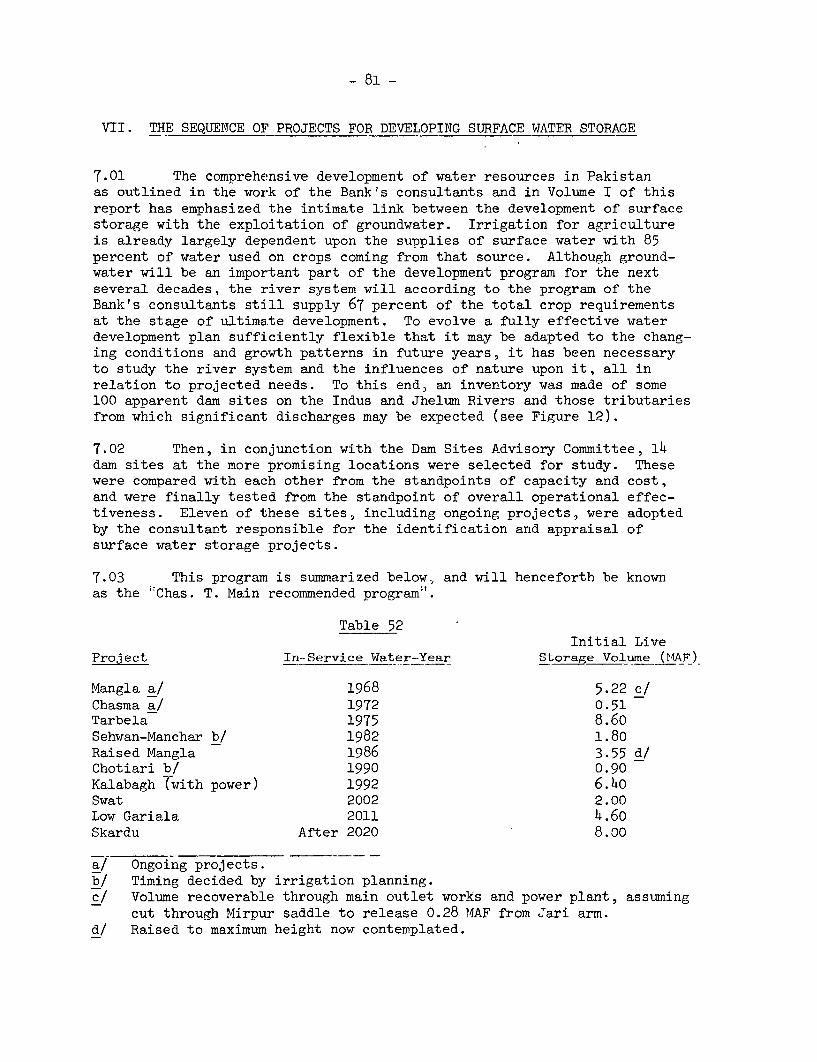
- 81 -
VII. THE SEQUENCE OF PROJECTS FOR DEVELOPING SURFACE WATER STORAGE
7.01 The comprehensive development of water resources in Pakistanas outlined in the work of the Bank's consultants and in Volume I of thisreport has emphasized the intimate link between the development of surfacestorage with the exploitation of groundwater. Irrigation for agricultureis already largely dependent upon the supplies of surface water with 85percent of water used on crops coming from that source. Although ground-water will be an important part of the development program for the nextseveral decades, the river system will according to the program of theBank's consultants still supply 67 percent of the total crop requirementsat the stage of ultimate development. To evolve a fully effective waterdevelopment plan sufficiently flexible that it may be adapted to the chang-ing conditions and growth patterns in future years, it has been necessaryto study the river system and the influences of nature upon it, all inrelation to projected needs. To this end, an inventory was made of some100 apparent dam sites on the Indus and Jhelum Rivers and those tributariesfrom which significant discharges may be expected (see Figure 12).
7.02 Then, in conjunction with the Dam Sites Advisory Committee, 14dam sites at the more promising locations were selected for study. Thesewere compared with each other from the standpoints of capacity and cost,and were finally tested from the standpoint of overall operational effec-tiveness. Eleven of these sites, including ongoing projects, were adoptedby the consultant responsible for the identification and appraisal ofsurface water storage projects.
7.03 This program is summarized below, and will henceforth be knownas the '`Chas. T. Main recommended program'.
Table 52Initial Live
Project In^Service Water-Year Storage Volume (MAF)
Mangla a/ 1968 5.22 c/Chasma a/ 1972 0.51Tarbela 1975 8.60Sehwan-Manchar b/ 1982 1.80Raised Mangla 1986 3.55 d/Chotiari b/ 1990 0.90Kalabagh (with power) 1992 6.40Swat 2002 2.00Low Gariala 2011 4.60Skardu After 2020 8.oo
a/ Ongoing projects.b/ Timing decided by irrigation planning.c/ Volume recoverable through main outlet works and power plant, assuming
cut through Mirpur saddle to release 0.28 M4AF from Jari arm.d/ Raised to maximum height now contemplated.
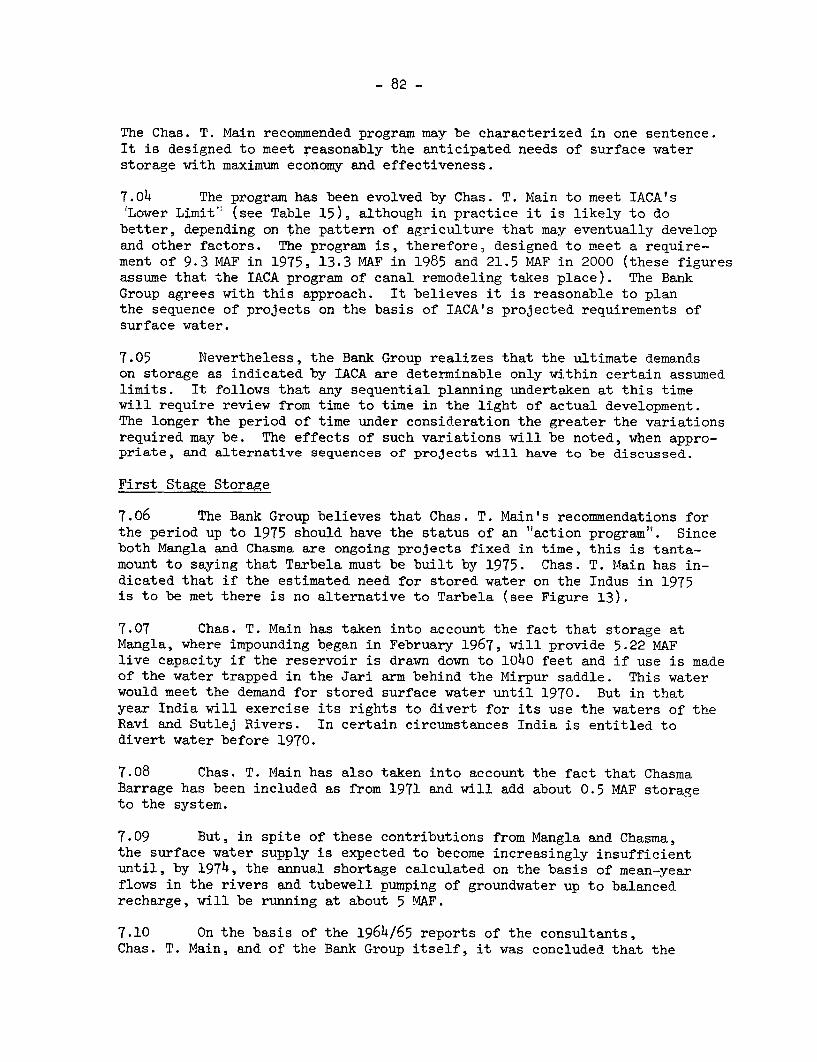
- 82 -
The Chas. T. Main recommended program may be characterized in one sentence.It is designed to meet reasonably the anticipated needs of surface waterstorage with maximum economy and effectiveness.
7.04 The program has been evolved by Chas. T. Main to meet IACA'sLower Limit" (see Table 15), although in practice it is likely to do
better, depending on the pattern of agriculture that may eventually developand other factors. The program is, therefore, designed to meet a require-ment of 9.3 MAF in 1975, 13.3 MAF in 1985 and 21.5 MAF in 2000 (these figuresassume that the IACA program of canal remodeling takes place). The BankGroup agrees with this approach. It believes it is reasonable to planthe sequence of projects on the basis of IACA's projected requirements ofsurface water.
7.05 Nevertheless, the Bank Group realizes that the ultimate demandson storage as indicated by IACA are determinable only within certain assumedlimits. It follows that any sequential planning undertaken at this timewill require review from time to time in the light of actual development.The longer the period of time under consideration the greater the variationsrequired may be. The effects of such variations will be noted, when appro-priate, and alternative sequences of projects will have to be discussed.
First Stage Storage
7.o6 The Bank Group believes that Chas. T. Main's recommendations forthe period up to 1975 should have the status of an "action program". Sinceboth Mangla and Chasma are ongoing projects fixed in time, this is tanta-mount to saying that Tarbela must be built by 1975. Chas. T. Main has in-dicated that if the estimated need for stored water on the Indus in 1975is to be met there is no alternative to Tarbela (see Figure 13).
7.07 Chas. T. Main has taken into account the fact that storage atMangla, where impounding began in February 1967, will provide 5.22 MAFlive capacity if the reservoir is drawn down to 1040 feet and if use is madeof the water trapped in the Jari arm behind the Mirpur saddle. This waterwould meet the demand for stored surface water until 1970. But in thatyear India will exercise its rights to divert for its use the waters of theRavi and Sutlej Rivers. In certain circumstances India is entitled todivert water before 1970.
7.08 Chas. T. Main has also taken into account the fact that ChasmaBarrage has been included as from 1971 and will add about 0.5 MAF storageto the system.
7.09 But, in spite of these contributions from Mangla and Chasma,the surface water supply is expected to become increasingly insufficientuntil, by 1974, the annual shortage calculated on the basis of mean-yearflows in the rivers and tubewell pumping of groundwater up to balancedrecharge, will be running at about 5 MAF.
7.10 On the basis of the 1964/65 reports of the consultants,Chas. T. Main, and of the Bank Group itself, it was concluded that the
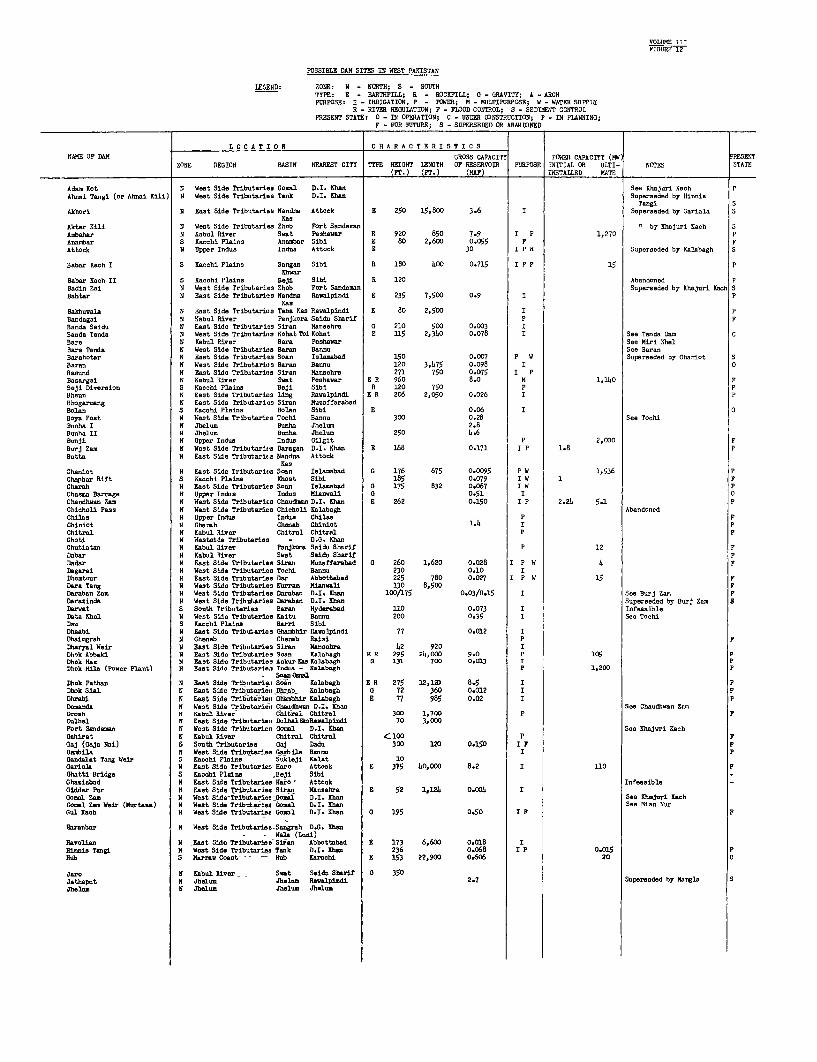
VOLUME SITI
POSSIBLE )AM SITES IN WEST PAKISTAN
IEOEND: ZONE, N - NORTH; S - SOUTHTYPE: E -EARTHFILL; R ROCKFILL, G - INANITY; A - ARCHPURPOSEs I- IRRIGATION, P- POWER; N - MULTIPURPOSE; W - WATER SUPPLY
NR RIVER REGULATION; F - FWOOD CONTROL; S - SEDIINET CONTROLPURESENT STAVE. 0- IN OPERATION; C - UNDUR OIRSTRUCYION; P - IR PIANNING;
F- FOR FUTURE; S - SUPERSEDUD OR ABANDONED
LO0C A TIO0N C HAR AC TE RI ST IC SNAME OF DAM GROSS CAPACITY POVER CAPACITY (ffW PRESENT
lONE REGION BASIN NEAREST CITY TYPE HEIGUT IENGTH OF RESERVOIR PURPOSE INITIAL OR SiTS- ROTES STATE(Fr.) (FT.) (MAP) INSTALLED MATE
Ada" Ect N West Side Tributaries GO-1a D.I. Khan See Ehajsri Each PAh-ei Ta,,gi. (or Ahsi Ei-li) N West Side Tributaries Task D.I. EKesn Super.eded by Hissnis
Tangi IAkhcrl B East Side Tributaries Nandna Attach N 250 15,850 3.6 I Superseded by Garisla S
taeAktr Eili N West Side Tributaries Zbhb Port Sa.decaa by Khjuri Each SAsbahar N Kabul Riser Ssit Peshawar N 920 850 7.9 I P 1,270 PAnaab.ar S Ea... i Plains Asuabar Sibi N 80 2,600 0.055 F pAittnk N Upper Indus Indus Attack 5 30 I F Superseded by Klalbagh S
Babar~ East I S Eaechi Plains Sangasn SIbi N 180 40O 0.715 IP F 15 PEKhar
BHater Keah II S KEa.ohi Plaies Beji Sibi. R 120 Abandoned VBadis CAL N We st Side Tributaries Zhob Pert Sandecsn Superseded by ihajuri Kash SBahtar N East Side Tributaries Nandna Rawalpisdi N 235 7,500 0.9 I p
KeeBakhuwala N East Side Tributaries Taba Kae Rawalpindi. U HO 2,500 I pBandagal N Kabul Riser Panjkora Saidu Sharif P FBand, Said. N East Side Tributaries Siras Mansabre G 210 500 0.003 IBasda Tasda N West Side Tributarl,,s Kohat ¶bi Kohat 5 115 2,340 0.078 I See Tends Sam CBare N Kabul Niver Hera Pesbawar See Miri KhelHera Tassa N West Side Tributaries Rarsan Bases See BaresBarahotar N East Side Tributaries Soss Ielasabad 150 0.007 P WN Superseded by Chariot SBare N West Side Tr,ibutaries Beras Banns 120 3,475 0.098 I 0Basund N Fast Side Tributaries Sirss Mansehra 271 750 0.075 I PBasargal B Kabul Siere Swai Pashawa E R 960 H.O N 1,140 PBeji Di"erisn S Kacchi Plains Hajil Sibi B 120 750 P PBiaun N East Side Tribustaries Stag Rawalpindi. K N 206 2,050 0.026 I pBhugarsang N East Side Tributarieas SIrea MucaffarabadBoles S Eacchi Pletas Bolan Sibi E 0.06 I 0Boya Post B West Side Tributaries Toshi Bssnu 300 0.28 See To.hi.Busts. I N Jheluza Busts Jhelus 2.HBausts II B Jhslue Bushs Jhelue 250 6.6Bunji N Upper Indus Indus Gigit p 2,000 pBurn Cs N West Side Tritutarirs9 Darsgan D.I. Khan E 168 0.171 I P 1.8 pButte N East Side Tributariss Nsndn Attach
KasChasiot N East Side Tributaries Sees Islassabd G 176 675 O.0095 P W 1,536 PChapter Rift B KE..chi Plains Khost Sibi lBS 0.079 5 W 1 FCherub N East Side Tributaries Soas leIeanbd 0 175 832 0.067 I W PChe.= Barrage N Upper Indus Indus Miansali 0:051 I 0Cheudhee las N West Bide Tributarics Cheudman D.I. Kh E 262 0.150 I P 2.24 5.1 POhisboli Pass N West Side Tributaries ChisbhNi. Kalabagh AbandonedOhilas N Upper Endue Indus Chilaw F FChiutet B Cheab Cbhaob Chisist 1.4 I PChitral. N Kabul River Chitral Chitral. P FChati N Wastaide Tributaries - D0.G. KOheChutietan N Kabul Riv- Panjkcca Saidu Sharif P 12 FDabar N Kabul River Swat Saidu Sharif FDadar N East Bide Tributaries Sires Nuzaffarabad 0 260 1,620 0.028 I PW 4 FRegarel N West Side Tributaries Techi Base 230 0.10 IUhuatour B East Side Trbutaries Bar Abbettehd 225 780 0.027 IPWN 15 FOars Tang N West Side Tributaries Karras Niasali 130 6,500 FDerabes Zas N West Side Tributaries Harshen D.I. Khan 10o/175 0.03/0.5 I Sea Rurj las FDarasinda N West Side Tributaries Iaraban D.I. Khen Superseded by Hun las BIarwat S South Tributaries Baran Hyderabad 110 0.073 I InfeasibleDate Khel N West Side Tribs,taries Kaitu Beans 200 0.35 I Boa Tschila S taecbi Plains Barrn SibiDheebi B East Side Tributaries Ghabhcsir Rawalpindi 77 0.01.2 IDhaisgrah B Chenab Chesab BaleS P FDteryal weir N East Side Tributaries Sixen Macsabre 42 9,20 IDthk Abb.ki N Fast Bids Tributeries Sees Kalabagh N N 295 24,000 9.0 p 105 PStab Bus N East Side Tributarie Askr Kwe alabghb a 131 700 0.013 I FIthk Nil. (PF..er Plent) N East Side Tributariec Ind-c - Kaabagh P 1,200 P
B -oan n.Shah Pathan N East Side Tributariea Stae -EKlabegh E R 275 312,12) 6.5 I PDtoh Sial N East Sideo Tributaries SDhrab Ea2abagh a 72 360 0.012 I PStrati N East Side Tributaisnis Shebh:Lr Kelabgh N 77 985 0.02 I pSe,sanda N West Side Tributaries Cheudhwen D.I. Khse Urn Cheudhue ZenCrash N Kabul Ri-er Chit,.1 Chitrel 300 1,700 p FDultel B East Side Tribtatri-a Dulihl ftRassalpindi 70 3, 000DFort Sandanasn N West Side Tributariec Ronal D.I. Khas See Khajwri EachOstixat N Kabul Rive - Chitrml Chitral e- .100 F FOaj (Gaja Na2i) S South Tributaries SBj eDscb 300 3120 0.150 I F FGasdbila N West Side Tributariev Oasis Li Base I FGandelat Tang Weir S Eanshi Plai.s Sukle.Ii Kalst 10Gariale N East Bids Tributerien Bars Attach K 375 40,000 8.2 I US1 FGhatti Bridge S Ea.. i Flaies ~ Beji SibiShasiabad N East Side Tributaries HaAeo- Attach Infeasible-Gidder Fur N East Side Tributaries Sires anAsebra N 52 1,134 0.004 Inasal lea N West Bide-Tributaries _ioona D.I. Ethn See Ethj=r EachBasal las Weir (urtase) N West Side Tributaries5 Goal D.1I. Stan See Mi- RN-Oal Each N West Bide Tributaries Baoml B.I. Khen 0 1.95 0.50 I F F
Narasbar N West Side Tributaries-Sasgrah D.0. EhenNa -Bla (Lani)
Hacalias B East Side Tributaiesle Siren Abbottabed E 173 6,600 0.018 CBienis Tengi N West Side Tributaries Task D.I. Sthn 236 0.68 C P 0.015 FBut S Marrm Cmeat- H - - Bu Karachi K 153 22,900 0.606 20 C
Jar N Kabul Ricer -- Swat Saida SharSf 0 350.lathapet N Jbelvan h.lblu Rewalpindi 2.7 Superseded by Mangle SJheluxa B Jtelus Jtelue Sh.lu

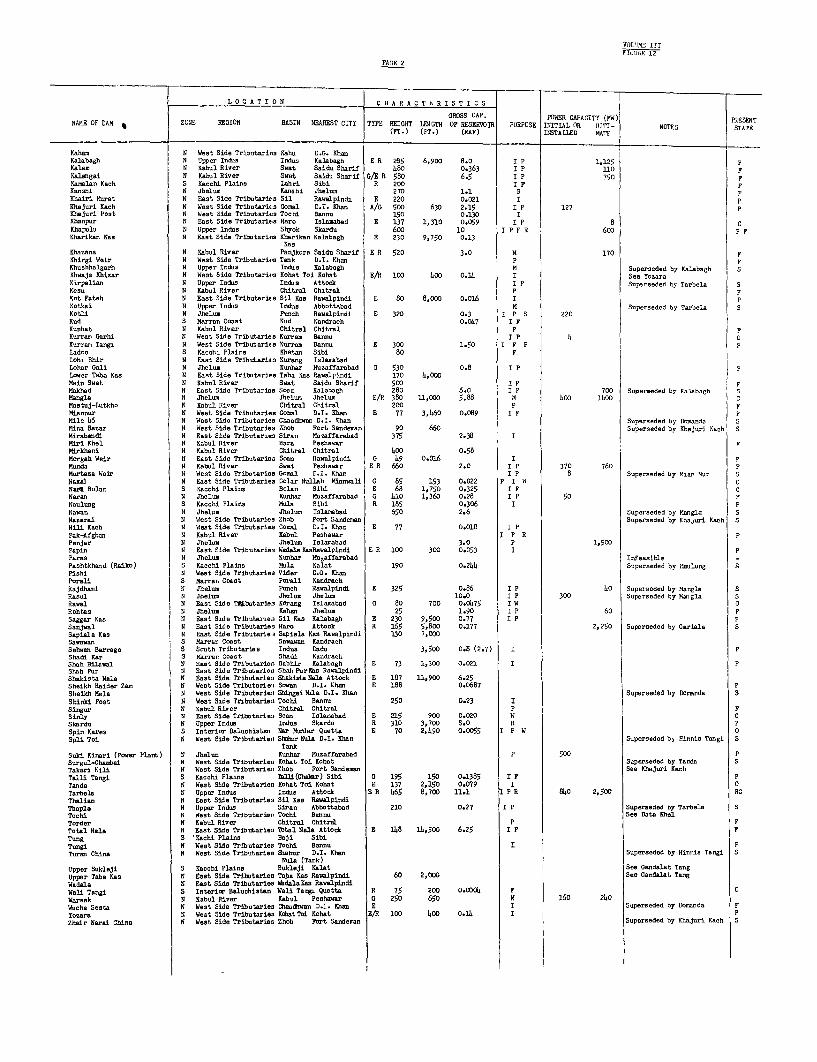
VSI)LIMC- IIIPICURC 12
PArE 2
LOC A T IO0N CNHA R AC T AR I T IC 1GRiOSS CAP. POWR CAPACITY (MW4) PIlRIST
NAMlE OF DAM ZONE REGION BASIN NEAREST CITY TYPE NSTGNT LUIGTH OF NESERVOIR PURPOSE INITIAL OR SLTI-j NOTES STATE(Fr.) (FTP.) (RAP) IROTALLED MATE
Eahas N West Side Tributaries Kahu D.0. KhsaKalab.gh N Uppe, Indss Indus Eaaba9h E A 085 6,900 8.0 I P 1,125 pKai.. N Kabu1 Riser Seat Said,. Sharif 480 0.363 I P US0 FKalungai N Kabul River Swat Said- Sharif G/N R 580 6.5 I P 750 FKassl- Each S Es..ahi Plains Lahin Sibi N 200 I F PKa-hi N jbsil, Eswahi Jhel1s 270 1.1 5 PKhiari Murat N East Side Tribstarios Sil Rawulplndi K 220 0.021 I PKhjsrt Keach N West Ride Tribstarins Gomeal D.I. Kiss A/'O 500 630 2.15 I P 127 pKhajsrl Past N West Side TrIbutaries Tochi Races 150 0.130 Kh-spur 0 East Side Tributaries Ners Islasabad E 137 1,310 0.059 C P 8 CEhapuls N Upper Indus Shyok Shards 600 10 IPPFA 600 PPEharika KC.s N East Sid. Tribtiarics Khaika- Kalabegh N 230 9,750 0.13
KeaEh.sana N Kabul River Panjkora Raid. Sharif E N 520 3.0 N 170 PKhirgi Weair N West Side Tributaries Task D.I. Kiss P PKh.shaldsairh N Upper Indus Indus Kalabagh. N Superseded by KEalaagh Kswaja Ksizar N West Side Tributaries Kohat TeL Kahat E/t 100 000 0.110 I See Yoararlirpalian N Upper IrdaN InAse Attack I P Superseded by Tarbel. SKess N Kabul River Chitral Chitrul p Ptat Fateh N East Ride TributariEs Sil K.N Rawelpindi E 00 8,000 0.016 I pKotkai N Upper Indus Induse Abbottabad N Superseded by Tarnela SKotli N Jihise Punch Rawalpiedi K 320 0.3 I P 2 20Eud 5 Marren Caset Kud Kaedrach 0.047 E PEsebat N Kabul River Chitral Chitmal P PEurree Gsrhi N West Side Tributaries Kurrn, Races I P 0 0Kurrac Tango N West Side Tribut-i-e Earran, Ranes K 300 1.50 I FPPPladee S Kacchi Plaice Khatac Sibi 80 PLeoh Rhir N East Side Tribda.rics Kurang IsisabaadLehar Gslo N Jhelse Eunhar Mzcaffanabad 0 530 0.8 I PPLaser Tabs Eas N East Side Tritataries Tabs Keas Rawalpindi 170 4,000Main Swat N Kabul River Swat Saids Sharif 500 I P PNabbed N East Side Tributaries Scan Kalabagh 280 6.0 I P 700 Superseded by KslabeEh IMacgla N Aih s J1lu Jhele E/N 380 11,000 5.88 N i00 1400 CK.stuj-LA,tkho N Kabul River Chitasi Chitral 200 P PMiaccur N West Ride Tributaries Gocal S.!. Kban K 77 3,060 0.089 I P Pmile 46 N West Side Tributaries Chsudhwss D.I. Riac Superseded by Dccsd. 5Rica Bacar N West Side Tributaries Ziab Fart Sanderac 90 660 Superseded by Khajuril Kech SMirabandl N KEst Ride Tributrues Rirns M.caffarabad 375 2.30 IMiri Khe1 N Kabul River Rars Peshawar FMlrkhani N Kabul River Chitral Chitral 000 0.58MerEah Weir N East Side Tribut-rtsa Sm.c Rawalpindi 0 09 0.016 I PMued. N Kabul River RSwt Pesawasr K N 660 2.0 I P 370 760 IpMurta.a Weis N WesWt Side Tributaries G.ceal D.I. Khac I P 8 Superseded by Mase N-r SNacel N East Side Tributaries GOclar Nullah Yiecuali 0 85 153 0.022 PI5 WCXu4 Raise S saechi Plains Balsa Sibi j K 6A 1,750 0.325 5 P CNaa S liaise Easier MNasaffarabad 0 (.10 1,360 0.28 5 P 50 PNaulasg S Eacchi Plinec Mule Sibi N 185 0.306 E pN-a-a- N Jhelu. Jheluc lslacabad 650 2.6 Superseded by Macgls SNaearai N West Side Tributaroes Zhah Fart Sacdece Superseded by ths,uri Each SROSS. Each N Wect Side Tributaries Gceal D.I. Ehac K 77 0.01.8 I PPek-Afghss N Kabul River Kabul Peshawar I PR F Peejar N Jhel-s bhela Islacabed 3.0 P 1,500Papid N Beast Side Tributaries Wadala K-Raspuinldi ER 100 300 0.053 I PParse N Jhelia Kunher Nucaffarabad Infeasible-Pasbhtkand (Raika) IS Kacehi Plaids Huola Kalat 190 0.244 Superseded by Haulacg SPAshi N West Side Tributaries Vlder D.0. KissParali S Marrec Cmsat Parali KacdrchR.Jdh.si N Jhelas Punch Rawalpiddi K 325 0.86 I P (.0 Superseded by Macgle SR-es N Jbeis ihelus, Jhel1e 10.0 I P 300 Spap-sded by Eacgla SNewel N Beast Side Tftjitarie. KOracg Isl1cbad G 80 700 0.0075 I W oR.btas N Jholsa KaSes Jhelsa 25 1.90 I P 60 PSagger tea N Easat Side Tint.utare Sil Kas Kalabugh K 230 9,500 0.77 1 P PSaciwal N East Side Tributaries Rare Atbach R 165 5,800 0.177 2,250 Superseded by CarteSs SSapiala Kas N East Side Tributarie 5 Sepiald asa Rawalpindi 130 7,00Sawa- S Ma-se Caset Sawawan, KandrechSchuss, Barrage S Scuth Tributaries Indus Dads 3,500 0.8 (2.7) I PShadi Ear iS Marae lust Shedi Kead-heShah BAlcsal IN East Ride Tributries Sabhir KaInbagh K 73 1,300 0.021 i pShah Par 8 East Side. Tributarie, Shab PurEes RawalpindiShakdeta NaSa N East Ride Tributaries Shakiete Noai Attcak K 187 11,900 6.25Sheikh Raider Zas, N West Side Tributerie-, Sc..an 0.I. Kiss E 188 0.0687 PSheikh Nela N West Side Tributaries Alidngai Ibis S.I. Kiss Superceded by Docmnde SShinkci Past N West Side Trsbutariest Tachi Races 250 0.23 ISieg.r N Kabu1 Niver Chitral Chitral P FRidly N East Side Tribu,taries aSs, 1sl1-bad K 21 5 900 0.020 W CSkardu N Upper Indus Iedas Shardu N 310 3,700 8.0 N PSpin Eases S Interier Baluchiista Ner Murder Quette N 70 2,090 0.0055 I P W Spli Toi N West Side Tributaries Slhabr Ibis D.I. Khee Superseded b2 Hinisc Tesgi S
TankSuki Kiseri (Pawe Plast) N ibeiIs Kuahar Musaffarahad P 500 PSurg.1-Chbeebl N West Side Tributaries Kahat Tat Kahat Superseded by Tend. sTakeni EilA N West Side Tributarie,s Zhab Pert Sandec,ae See Khajuri. EachTallt Tangi S Eacchi P:lass bla.i(Chalar) SARi 0 195 150 0.a385 I F PTwacd N West Side Tributaries Kohat Toi Kohat K 137 2,150 0.079 I oTarbela N Upper Indus Indus Attack K N 465 8,700 11.1 IP R 800 2,500 NCTheian N East Side Tributariec 55l Kas NawalpindiThapla N Epper Ieda Sires Abbottabad 210 0.27 I P Superseded by Tarbel. STochi N West Side Tribstari-c YTht Race See beta KhselTarder M Kabul River Chitral Chitrdl P FTYatl Bela M East Side Trlbutariec, Total MeSa Attack K 108 104,500 6.25 I P FTang S KXachi Plaids Neji SibiTongS N West Side Trlbutariezc Tobhi Races I PTurac Chim N West Ride Tributarie. NShhur S.I. EKhc Superseded by Niecin Teegi I
Nul. (Taek)Upper Sukleji S Keachi Plaice Suhieji Kalat See sandalat TangUpper labs Keas N East Side Tributariee Tabs Kas RE..alpledi 60 2,000 See Gaedalat TangWadela N East Side Tributarien h&dala Kwe RawalpiddiWalt Tacgi B Interimr Beluchistan Wali Tang. Quetta N 75 700 0.0000 F 0Warsak, N Kabul River Kabul Peshawar 0 250 650 N 160 2400Wuaha Sesta N West Side Tributaries Chsud1huan D.I. Ekes K I Superseded by DOcada Plaser N West Side Tributaries Kfdet Te Kohat K/N 100 000 0.10 I pZhair Naral Chise N West Side Tributariesa Zhsb Pert Sandeasn Superssded by Ehajui Each S

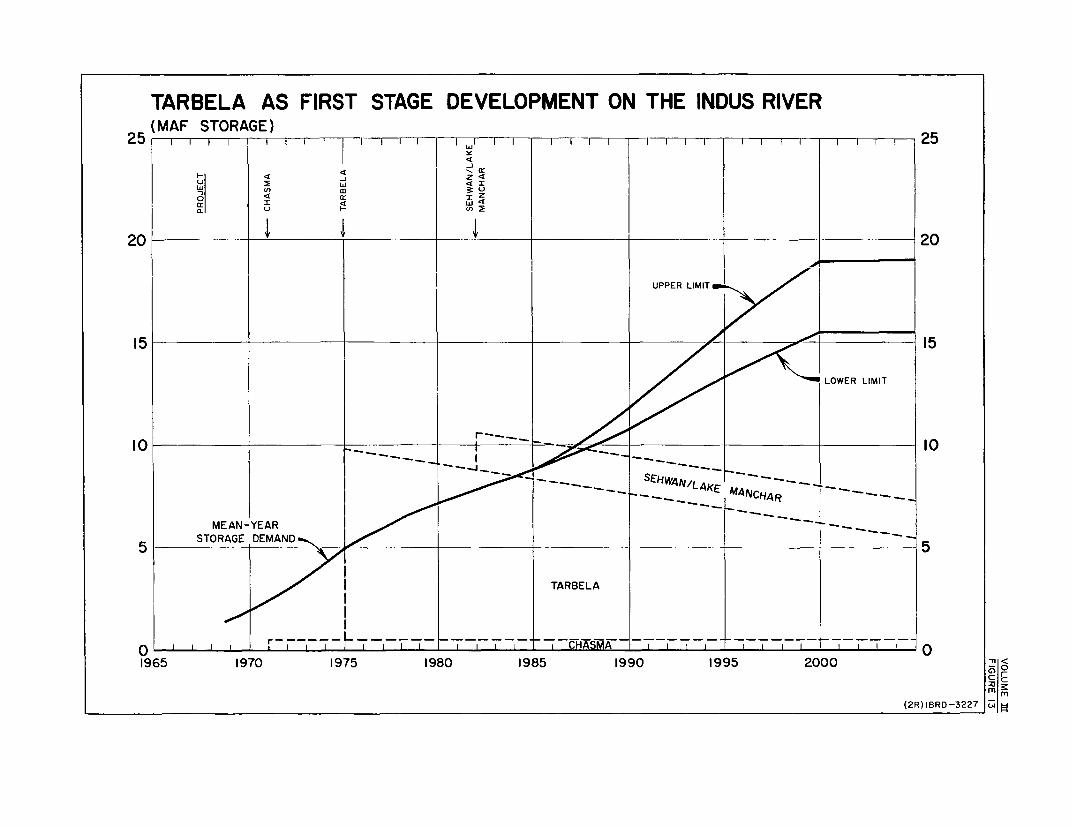
TARBELA AS FIRST STAGE DEVELOPMENT ON THE INDUS RIVER(MAF STORAGE)
25 I I E I I I I I I I F I E I I I 25
44 4 Z4
0. 0
20 20
15 15
. / / ~~~~~~LOWER LIMIT
10 10
_ --_ _ _ _ __ "~EHWA/L,4KExC ~~ *~-
MEAN-YEAR -___STORAGE DEMAND _ _ 5
TARBELA
1965 1970 1975 1980 1985 1990 1995 2000 mnr
mM(2R) IBRD-3227

- 83 -
Tarbela Project, as envisaged by TAMS (consultants to WAPDA), was techni-cally feasible. It was also concluded that the Tarbela Project comparedfavorably with other potential projects for the storage of water on theIndus River. The dam site consultant has stressed, moreover, thatTarbela is the only large-volume storage project that can be completed by1975 to meet projected stored water requirements. Tarbela's power yieldshave been demonstrated by the Bank's power consultant.
7.11 This conclusion with regard to Tarbela as first stage storageis firmly supported not only by the analysis in this volume, but also bythe discussion in Volume II. The dam site consultant, having in handplans which have now been drawn up by WAPDA and their consultants, hasreconfirmed that the project is technically feasible. The return onthe project, considered as a separate comDonent of a development plan forthe Indus Plains, is by the latest calculations of Sir Alexander Gibb &Partners, 13.3 percent. The consultants stress that this figure assumeshowever, that a full supporting program of agricultural inputs is imple-mented; otherwise the increase in production will be less and the return onthe project will be reduced.
7.12 The Bank Group has made its own evaluation of the return on theTarbela Project. Though a somewhat lower return may be indicated (seeVolume II), it has no hesitation in concluding that Tarbela should beexecuted as scheduled.
7.13 The Bank Group, in drawing this conclusion, emphasizes inVolume II, that the Tarbela Project will make a major contribution tothe projected incremental rabi crop production of the Indus Plains byregulating the natural river flows and by supplying additional water.Of the total future increment in rabi water deliveries to the farmers,from both ground and surface sources, Tarbela will by 1985 contributealmost one-quarter.
7.14 The Bank7s estimate of the power benefits from the project inVolume IV, indicates that they will be substantial and almost as importantas benefits accruing to agriculture. A study of the integration of Tarbelainto the power system of West Pakistan, carried out by the power consultant,indicates that the 12,000 million kwh of electric energy, which it wouldbe capable of generating annually would be absorbed relatively quicklyinto the system (see Volume IV). In a situation where the present knowngas reserves may soon become fully committed, Tarbela will provide abadly needed supplement to potential hydro and thermal power through 1985.Its firm capability during the critical period of the year would, of course,depend on the drawdown level assumed. For example, at 1300 feet drawdownthe firm capacity would be 487 mw and at 1396 feet it would be 1047 mw,an increase of 560 mw. With reduction of the useful storage capacity ofthe Tarbela Reservoir by sediment deposition, its firm power capability,and hence its usefulness to the power system, would gradually increase.
7.15 The Bank Group is of the opinion that there are no alternativemajor surface projects or sequence of projects that appear to offer netadvantages over the program recommended in this report which embodies
- 84 -
Tarbela for operation in the year I975.. Quite apart-from- the merits ofthe project in itself, it must be recogni'zed that there is- a degree ofinterdependence between the current;program of ongoing and of earlyfuture irrigation works on the one-hand and Tarbela on the other. Tarbelahas for some: time- now formed part of Government planning-. Thifs interde-pendence may-be chiefly seen in the-newly developing areas along the mainIndus st-em and in the Chasma-Jhelux and Taunsa-Panjnad Links, now underconstruction-, which are designed to convey stored Indus water from westto east across the northern plains.
7.16 The-re- is also an interdependence between Tarbela and. the irriga-tion or agriculture: program of development recommended in this- report.Tarbela is a major component of'that program. Without- TarbeIla, many aspectswould need to be revised incIuding, for- example., the priorities for tubewellprojects and canal eylargement-s.
7.17 Chas. T. Main reviewed the possibility of two--stage developmentof the Tarbela Project and based on figures obtained from TAMAS, foundthat while there would be an initial saving of $37 million over single-stage development, the ultimate cost would be $27 million more. Thus, atan 8 percent rate of interest, two-stage development would be economicalonly if the second stage were required more than seven years after comple-tion of the firgt stage. IACA's projections of the mean year demand forstored water-indincate that the second stage would be required within fiveyears after completion of the- ftrst stage, and therefore the conclusion isthat two-stage development is mot warranted.
Alternatives for Ferid tod 1975
7-.18 Though the Bank Group firm-ly believes and has so stated, thatT'ambelIa ghould be built by 1975, for purposes of analysis there are set outhere some alternative ways of meeting, or attemptting to meet the surfacewater requirements of I975.
7.19' Of all the proSects studied, Kalabagh (according to Chas. T. Main)i' the only project of comparable size that can be considered as an alterna-tfi've to Tarbela for near-term development. However, at least three, andm-or-e likely four ytsrs. would be required to explore the problems which areassociated with the proJect. Another seveu or eight years would be requiredfor designing, financing and constructing it. Even under an aggressive pro-gram of development, Kalabagh FroJect could not be completed and availablefor service before water-year 1979. Such a program is shown in Figure 14.
7.20 On this basis, with the need for stored water growing at the rateestimated, an additional cumulative shortage of surface water supply ofabout 14.6 MAF would occur between 1975 and 1979. The annual shortagescould amount to as much as 9 MAF per year by 1979. The available ground-water pumping facilities would not be able to make up the additional short-age from an already lowered groundwater level, owing to limitations inpumping capacity and to factors of geographical distribution.
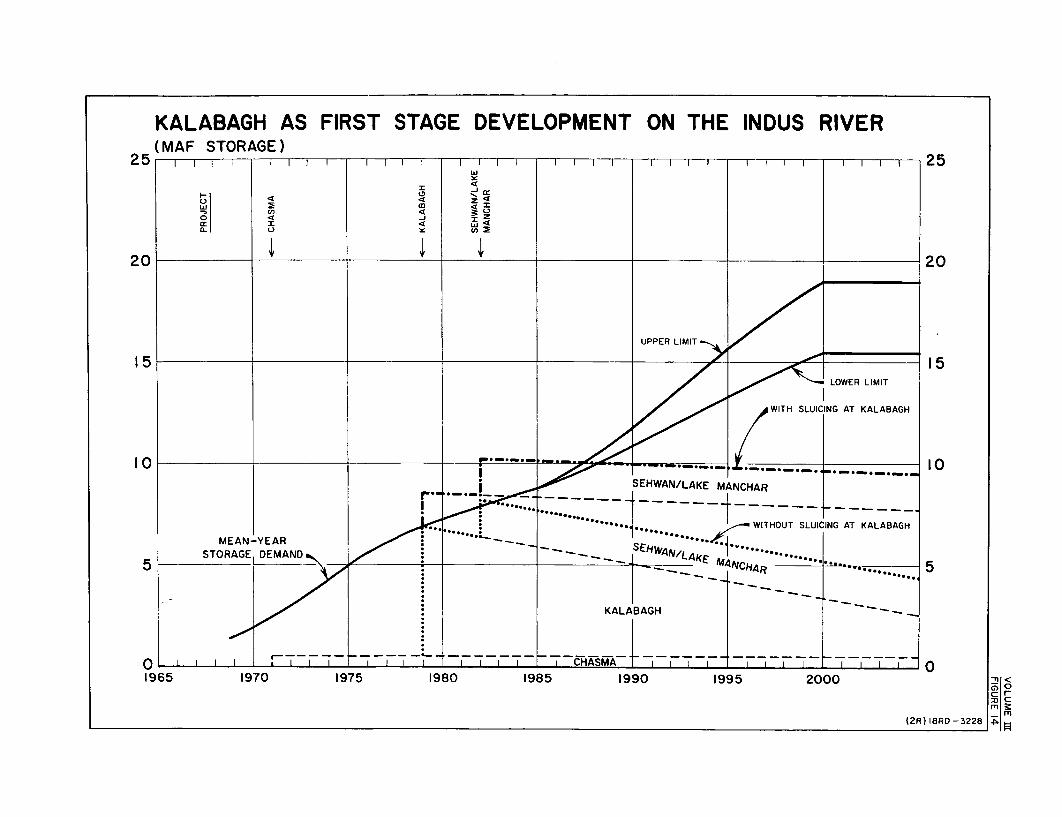
KALABAGH AS FIRST STAGE DEVELOPMENT ON THE INDUS RIVER(MAF STORAGE)
25 1 I I I 1 I I I I I I I 25
I
" 1 'D ~ ~~~~~< za. 0 n
20 20
15~~ ~~~~~~~~ LIPPER LIMIT 1 /
WITH SLUICING AT KALABAGH
*--'--'- * *' '@ j 1 _ ~~~~WITHOUT SLUICIG AT KALABAGH|
MEAN-YEAR *.
STORAGE, DEMAND I;7/ EH /L KE A.A
* ~~~~~~KALABAGH___/ -.. I-_-____ ___ --
0 01965 1970 1975 1980 1985 1990 1995 2000 cnr
(2R) IBRD-3228 4

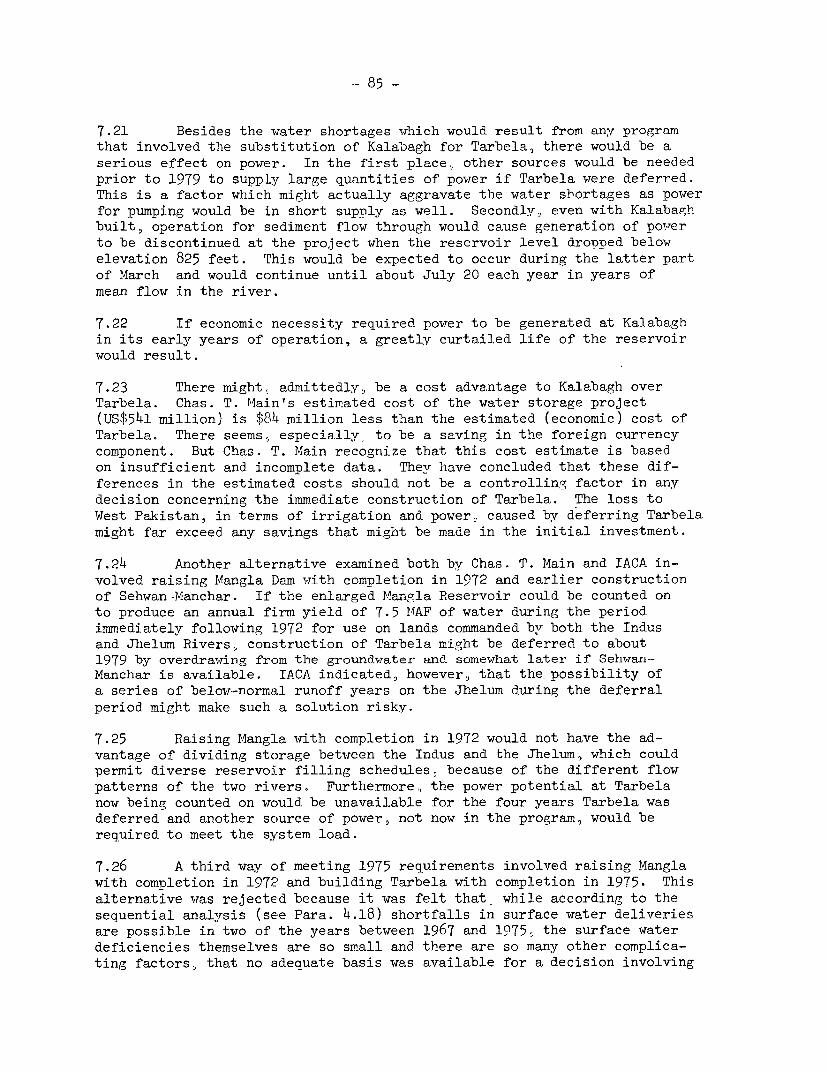
- 85 -
7.21 Besides the water shortages which would result from any programthat involved the substitution of Kalabagh for Tarbela, there would be aserious effect on power. In the first place, other sources would be neededprior to 1979 to supply large quantities of power if Tarbela were deferred.This is a factor which might actually aggravate the water shortages as powerfor pumping would be in short supply as well. Secondly,, even with Kalabaghbuilt, operation for sediment flow through would cause generation of powerto be discontinued at the project when the reservoir level dropped belowelevation 825 feet. rPhis would be expected to occur during the latter partof March and would continue until about July 20 each year in years ofmean flow in the river.
7.22 If economic necessity required power to be generated at Kalabaghin its early years of operation, a greatly curtailed life of the reservoirwould result.
7.23 There might. admittedly, be a cost advantage to Kalabagh overTarbela. Chas. T. Main's estimated cost of the water storage project(US$541 million) is $84 million less than the estimated (economic) cost ofTarbela. There seems, especially, to be a saving in the foreign currencycomponent. But Chas. T. Main recognize that this cost estimate is basedon insufficient and incomplete data. They have concluded that these dif-ferences in the estimated costs should not be a controllin,g factor in anydecision concerning the immediate construction of Tarbela. The loss toWest Pakistan, in terms of irrigation and power, caused by deferring Tarbelamight far exceed any savings that might be made in the initial investment.
7.24 Another alternative examined both by Chas. T. Main and IACA in-volved raising Mangla Dam with completion in 1972 and earlier constructionof Sehwan-Manchar. If the enlarged Mangla Reservoir could be counted onto produce an annual firm yield of 7.5 MIAF of water during the periodimmediately following 1972 for use on lands commanded by both the Indusand Jhelum Rivers, construction of Tarbela might be deferred to about1979 by overdrawing from the groundwater and somewThat later if Sehwan-Manchar is available. IACA indicated, however, that the possibility ofa series of below-normal runoff years on the Jhelum during the deferralperiod might make such a solution risky.
7.25 Raising Mangla with completion in 1972 would not have the ad-vantage of dividing storage between the Indus and the Jhelum, which couldpermit diverse reservoir filling schedules, because of the different flowpatterns of the two rivers. Furthermore,, the power potential at Tarbelanow being counted on would be unavailable for the four years Tarbela wasdeferred and another source of power, not now in the program, would berequired to meet the system load.
7.26 A third way of meeting 1975 requirements involved raising Manglawith completion in 1972 and building Tarbela with completion in 1975. Thisalternative was rejected because it was felt that while according to thesequential analysis (see Para. 4.18) shortfalls in surface water deliveriesare possible in two of the years between 1967 and 1975, the surface waterdeficiencies themselves are so small and there are so many other complica-ting factors, that no adequate basis was available for a decision involving
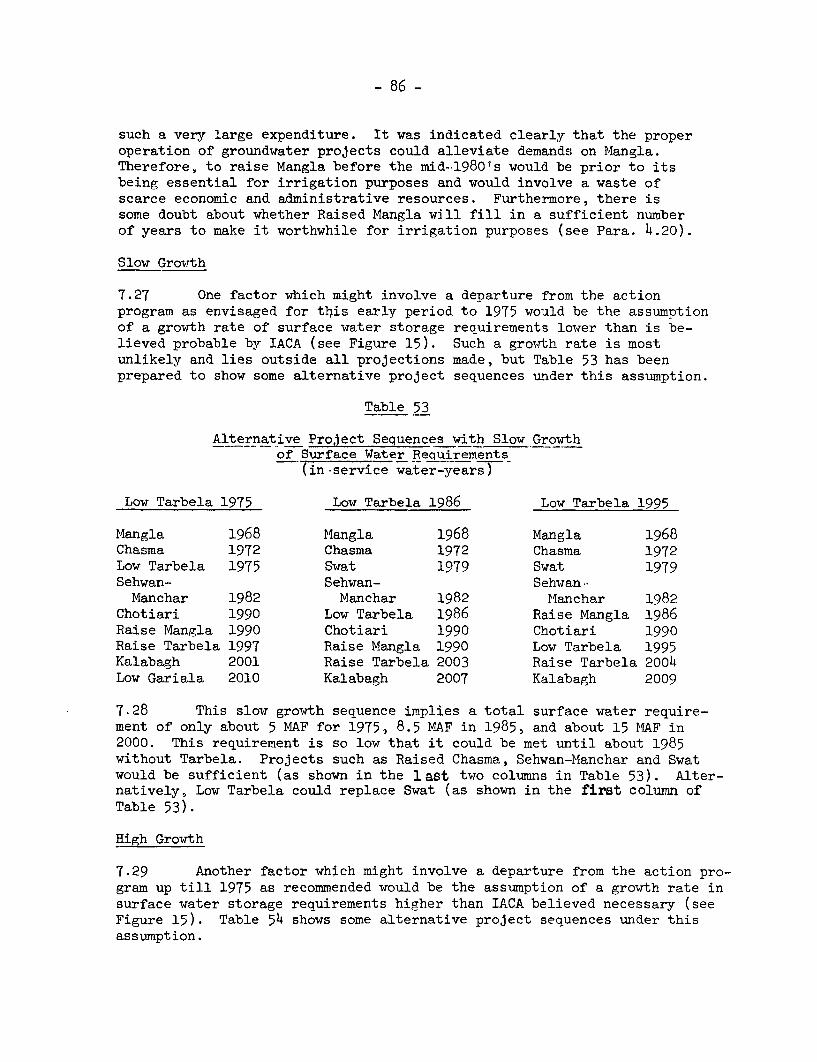
- 86 -
such a very large expenditure. It was indicated clearly that the properoperation of groundwater projects could alleviate demands on Mangla.Therefore, to raise Mangla before the mid-1980's would be prior to itsbeing essential for irrigation purposes and would involve a waste ofscarce economic and administrative resources. Furthermore, there issome doubt about whether Raised Mangla will fill in a sufficient numberof years to make it worthwhile for irrigation purposes (see Para. 4.20).
Slow Growth
7.27 One factor which might involve a departure from the actionprogram as envisaged for this early period to 1975 would be the assumptionof a growth rate of surface water storage requirements lower than is be-lieved probable by IACA (see Figure 15). Such a growth rate is mostunlikely and lies outside all projections made, but Table 53 has beenprepared to show some alternative project sequences under this assumption.
Table 53
Alternative Project Sequences with Slow Growthof Surface Water Requirements
(in-serice water-years)
Low Tarbela 1975 Low Tarbela 1986 Low Tarbela 1995
Mangla 1968 Mangla 1968 Mangla 1968Chasma 1972 Chasma 1972 Chasma 1972Low Tarbela 1975 Swat 1979 Swat 1979Sehwan- Sehwan- Sehwan-Manchar 1982 Manchar 1982 Manchar 1982
Chotiari 1990 Low Tarbela 1986 Raise Mangla 1986Raise Mangla 1990 Chotiari 1990 Chotiari 1990Raise Tarbela 1997 Raise Mangla 1990 Low Tarbela 1995Kalabagh 2001 Raise Tarbela 2003 Raise Tarbela 2004Low Gariala 2010 Kalabagh 2007 Kalabagh 2009
7.28 This slow growth sequence implies a total surface water require-ment of only about 5 MAF for 1975, 8.5 MAF in 1985, and about 15 MAF in2000. This requirement is so low that it could be met until about 1985without Tarbela. Projects such as Raised Chasma, Sehwan-Manchar and Swatwould be sufficient (as shown in the last two columns in Table 53). Alter-natively, Low Tarbela could replace Swat (as shown in the first column ofTable 53).
High Growth
7.29 Another factor which might involve a departure from the action pro-gram up till 1975 as recommended would be the assumption of a growth rate insurface water storage requirements higher than IACA believed necessary (seeFigure 15). Table 54 shows some alternative project sequences under thisassumption.
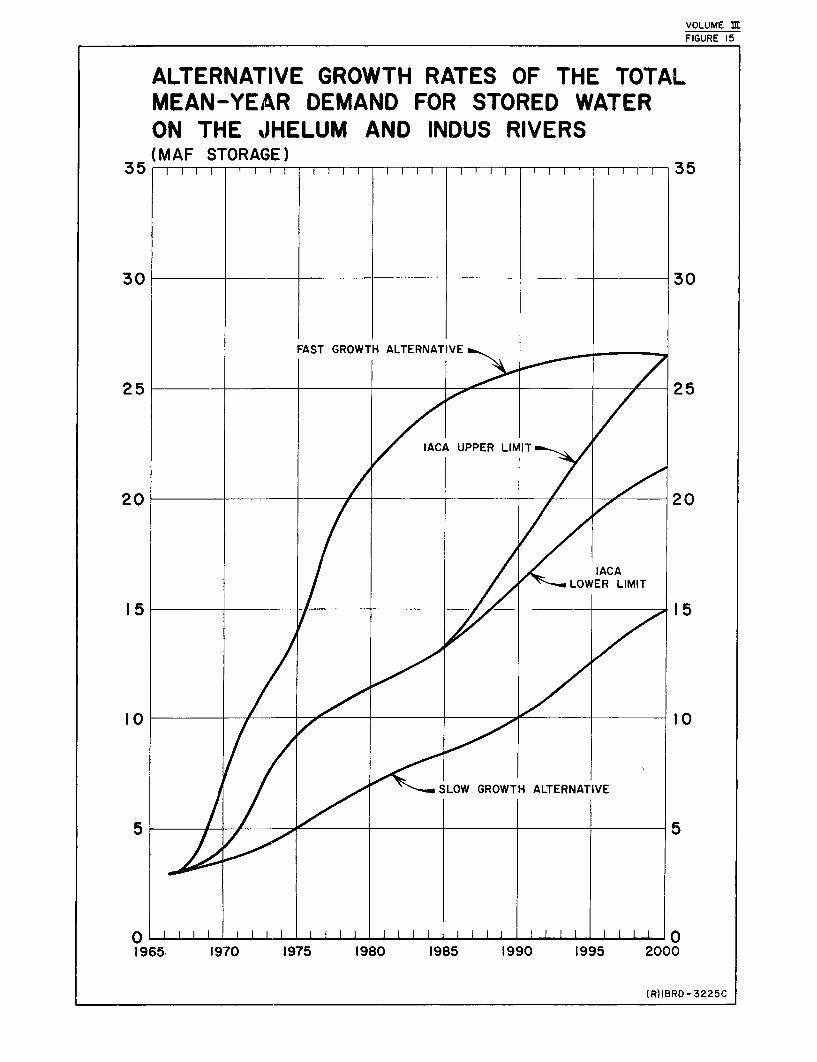
VOLUME [FIGURE 15
ALTERNATIVE GROWTH RATES OF THE TOTALMEAN-YEAR DEMAND FOR STORED WATERON THE JHELUM AND INDUS RIVERS(MAF STORAGE)
35 1 m m - -vr-i- i- - - -- v-i- i w i 35
30 30
2 5 ; I /~FST GROWTH ALER NAT VE _ >
25 25
20 2 0
/ / v z ~~~~~~LOWER LIMIT
15 15
10 10
SLOW GROWTH ALTERNATIVE
5 5
1965. 1970 1975 1980 1985 1990 1995 2000
(R)IBRD-3225C

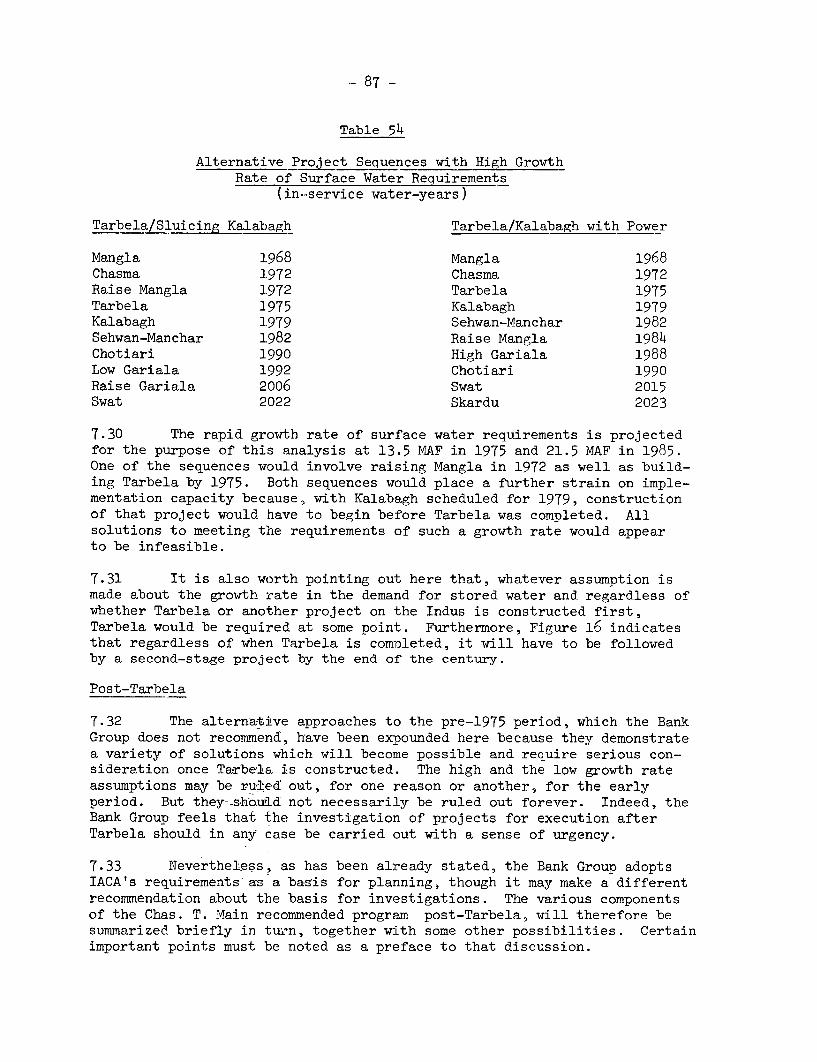
- 87 -
Table 54
Alternative Project Sequences with High GrowthRate of Surface Water Requirements
(in--service water-years)
Tarbela/Sluicing Kalabagh Tarbela/Kalabagh with Power
Mangla 1968 Mangla 1968Chasma 1972 Chasma 1972Raise Mangla 1972 Tarbela 1975Tarbela 1975 Kalabagh 1979Kalabagh 1979 Sehwan-Manchar 1982Sehwan-Manchar 1982 Raise Mangla 1984Chotiari 1990 High Gariala 1988Low Gariala 1992 Chotiari 1990Raise Gariala 2006 Swat 2015Swat 2022 Skardu 2023
7.30 The rapid growth rate of surface water requirements is projectedfor the purpose of this analysis at 13.5 MAF in 1975 and 21.5 MAF in 1985.One of the sequences would involve raising Mangla in 1972 as well as build-ing Tarbela by 1975. Both sequences would place a further strain on imple-mentation capacity because, with Kalabagh scheduled for 1979, constructionof that project would have to begin before Tarbela was completed. Allsolutions to meeting the requirements of such a growth rate would appearto be infeasible.
7.31 It is also worth pointing out here that, whatever assumption ismade about the growth rate in the demand for stored water and regardless ofwhether Tarbela or another project on the Indus is constructed first,Tarbela would be required at some point. Furthermore, Figure 16 indicatesthat regardless of when Tarbela is comnleted, it will have to be followedby a second-stage project by the end of the century.
Post-Tarbela
7.32 The alternative approaches to the pre-1975 period, which the BankGroup does not recommend, have been expounded here because they demonstratea variety of solutions which will become possible and require serious con-sideration once Tarbela is constructed. The high and the low growth rateassumptions may be rirled out, for one reason or another, for the earlyperiod. But they-shourld not necessarily be ruled out forever. Indeed, theBank Group feels that the investigation of projects for execution afterTarbela should in any case be carried out with a sense of urgency.
7.33 Nevertheless, as has been already stated, the Bank Group adoptsIACA's requiremen-ts as a basis for planning, though it may make a differentrecommendation about the basis for investigations. The various componentsof the Chas. T. Main recommended program post-Tarbela, will therefore besummarized briefly in turn, together with some other possibilities. Certainimportant points must be noted as a preface to that discussion.
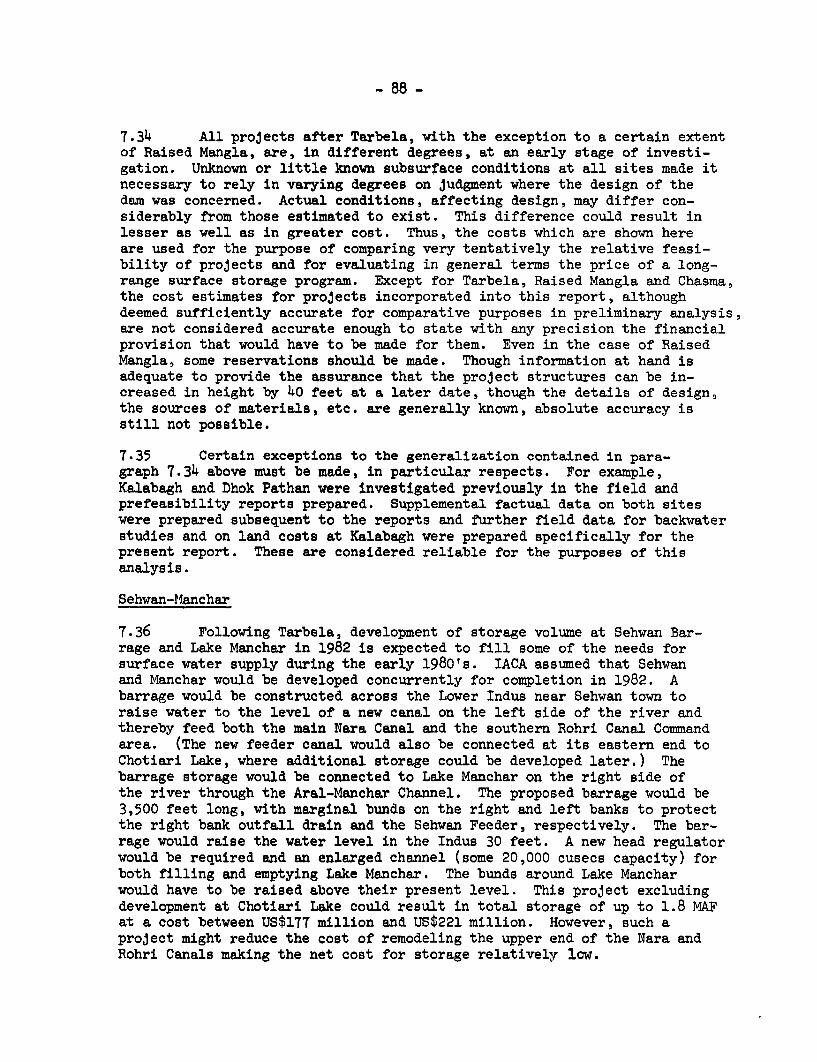
- 88 -
7.34 All projects after Tarbela, with the exception to a certain extentof Raised Mangla, are, in different degrees, at an early stage of investi-gation. Unknown or little known subsurface conditions at all sites made itnecessary to rely in varying degrees on judgment where the design of thedam was concerned. Actual conditions, affecting design, may differ con-siderably from those estimated to exist. This difference could result inlesser as well as in greater cost. Thus, the costs which are shown hereare used for the purpose of comparing very tentatively the relative feasi-bility of projects and for evaluating in general terms the price of a long-range surface storage program. Except for Tarbela, Raised Mangla and Chasma,the cost estimates for projects incorporated into this report, althoughdeemed sufficiently accurate for comparative purposes in preliminary analysis,are not considered accurate enough to state with any precision the financialprovision that would have to be made for them. Even in the case of RaisedMangla, some reservations should be made. Though information at hand isadequate to provide the assurance that the project structures can be in-creased in height by 40 feet at a later date, though the details of design,the sources of materials, etc. are generally known, absolute accuracy isstill not possible.
7.35 Certain exceptions to the generalization contained in para-graph 7.34 above must be made, in particular respects. For example,Kalabagh and Dhok Pathan were investigated previously in the field andprefeasibility reports prepared. Supplemental factual data on both siteswere prepared subsequent to the reports and further field data for backwaterstudies and on land costs at Kalabagh were prepared specifically for thepresent report. These are considered reliable for the purposes of thisanalysis.
Sehwan-Manchar
7.36 Following Tarbela, development of storage volume at Sehwan Bar-rage and Lake Manchar in 1982 is expected to fill some of the needs forsurface water supply during the early 1980's. IACA assumed that Sehwanand Manchar would be developed concurrently for completion in 1982. Abarrage would be constructed across the Lower Indus near Sehwan town toraise water to the level of a new canal on the left side of the river andthereby feed both the main Nara Canal and the southern Rohri Canal Commandarea. (The new feeder canal would also be connected at its eastern end toChotiari Lake, where additional storage could be developed later.) Thebarrage storage would be connected to Lake Manchar on the right side ofthe river through the Aral-Manchar Channel. The proposed barrage would be3,500 feet long, with marginal bunds on the right and left banks to protectthe right bank outfall drain and the Sehwan Feeder, respectively. The bar-rage would raise the water level in the Indus 30 feet. A new head regulatorwould be required and an enlarged channel (some 20,000 cusecs capacity) forboth filling and emptying Lake Manchar. The bunds around Lake Mancharwould have to be raised above their present level. This project excludingdevelopment at Chotiari Lake could result in total storage of up to 1.8 MAFat a cost between US$177 million and US$221 million. However, such aproject might reduce the cost of remodeling the upper end of the Nara andRohri Canals making the net cost for storage relatively low.
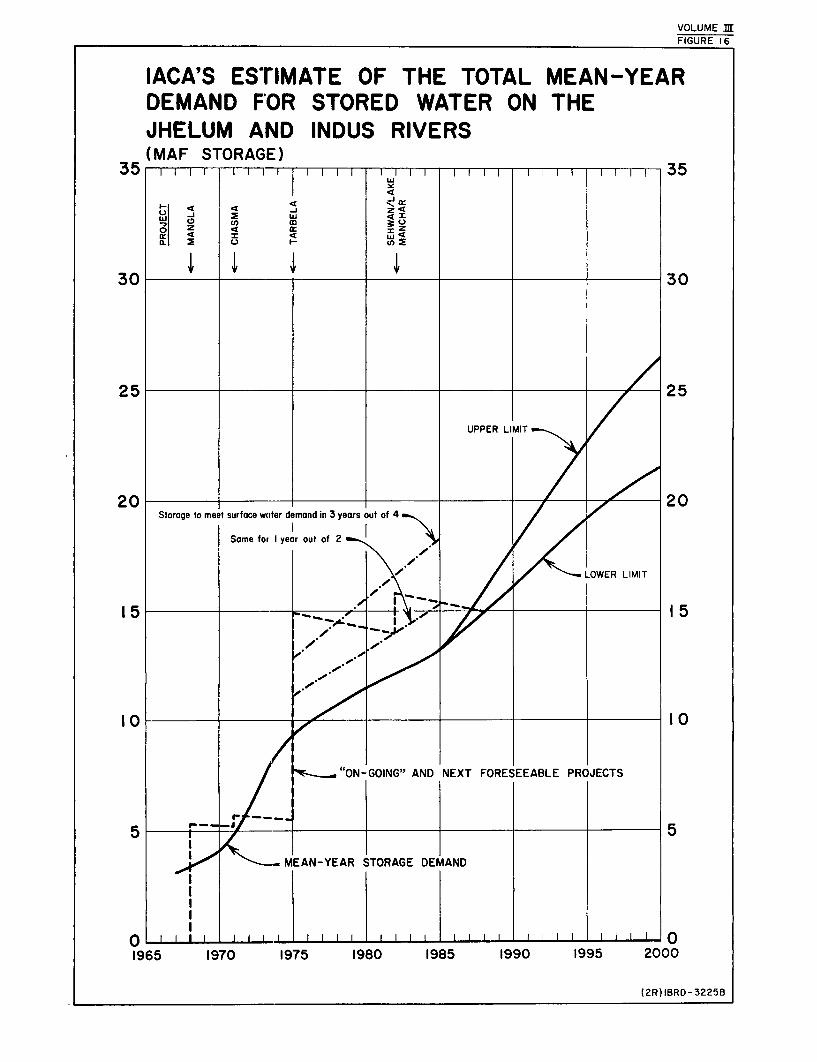
VOLUME mFIGURE 16
IACA'S ESTIMATE OF THE TOTAL MEAN-YEARDEMAND FOR STORED WATER ON THEJHELUM AND INDUS RIVERS(MAF STORAGE)
35 F5 r 35w
o Z 4 ~ _j
30 30
25 25
UPPER Li IT
20 0 20Storage to meet surface witer demand in 3 years out of 4
Same for I year out of 2
10 to~~~~~~~~~~~~~~~~~~~~~~~~~~0
15 -1~~~~~~~~~~~~~~5
MEAN-YEARNSTORAGE DEANDNETFRSABEPOCS
0 -s' .- W5.JL .~± L....L .4
1965 1970 1975 1980 1985 1990 1995 2000
(2R)IBRD-3225B

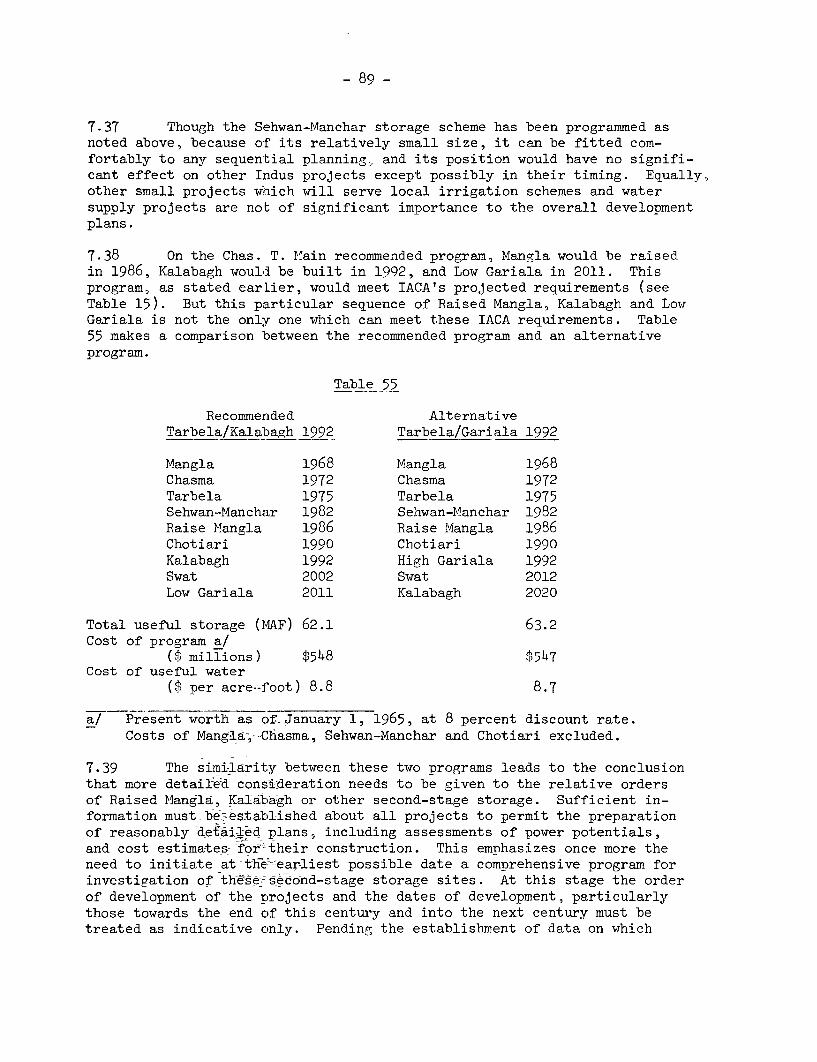
- 89 -
7.37 Though the Sehwan-Manchar storage scheme has been programmed asnoted above, because of its relatively small size, it can be fitted com-fortably to any sequential planning, and its position would have no signifi-cant effect on other Indus projects except possibly in their timing. Equally,other small projects which will serve local irrigation schemes and watersupply projects are not of significant importance to the overall developmentplans.
7.38 On the Chas. T. Main recommended program, Mangla would be raisedin 1986, Kalabagh would be built in 1992, and Low Gariala in 2011. Thisprogram, as stated earLier, would meet IACA's projected requirements (seeTable 15). But this particular sequence of Raised Mangla, Kalabagh and LowGariala is not the only one which can meet these IACA requirements. Table55 makes a comparison between the recommended program and an alternativeprogram.
Table 55
Recommended AlternativeTarbela/Kalabagh 1992 Tarbela/Gariala 1992
Mangla 1968 Mangla 1968Chasma 1972 Chasma 1972Tarbela 1975 Tarbela 1975Sehwan-Manchar 1982 Sehwan-Manchar 1982Raise Mangla 1986 Raise Mangla 1986Chotiari 1990 Chotiari 1990Kalabagh 1992 High Gariala 1992Swat 2002 Swat 2012Low Gariala 2011 Kalabagh 2020
Total useful storage (MAF) 62.1 63.2Cost of program a/
(.¢ millions) $548 $547Cost of useful water
($ per acre.-foot) 8.8 8.7
a! Present worth as of January 1, 1965, at 8 percent discount rate.Costs of Mangla',-Chasma, Sehwan-Manchar and Chotiari excluded.
7.39 The similarity between these two programs leads to the conclusionthat more detailed consi-deration needs to be given to the relative ordersof Raised Mangla, Kalab-agh or other second-stage storage. Sufficient in-formation must be'established about all projects to permit the preparationof reasonably detai-ed plans, including assessments of power potentials,and cost estimates_ for~their construction. This emphasizes once more theneed to initiate at tlie' ear=liest possible date a comprehensive program forinvestigation of the e-'second-stage storage sites. At this stage the orderof development of the projects and the dates of development, particularlythose towards the end of this century and into the next century must betreated as indicative only. Pending the establishment of data on which
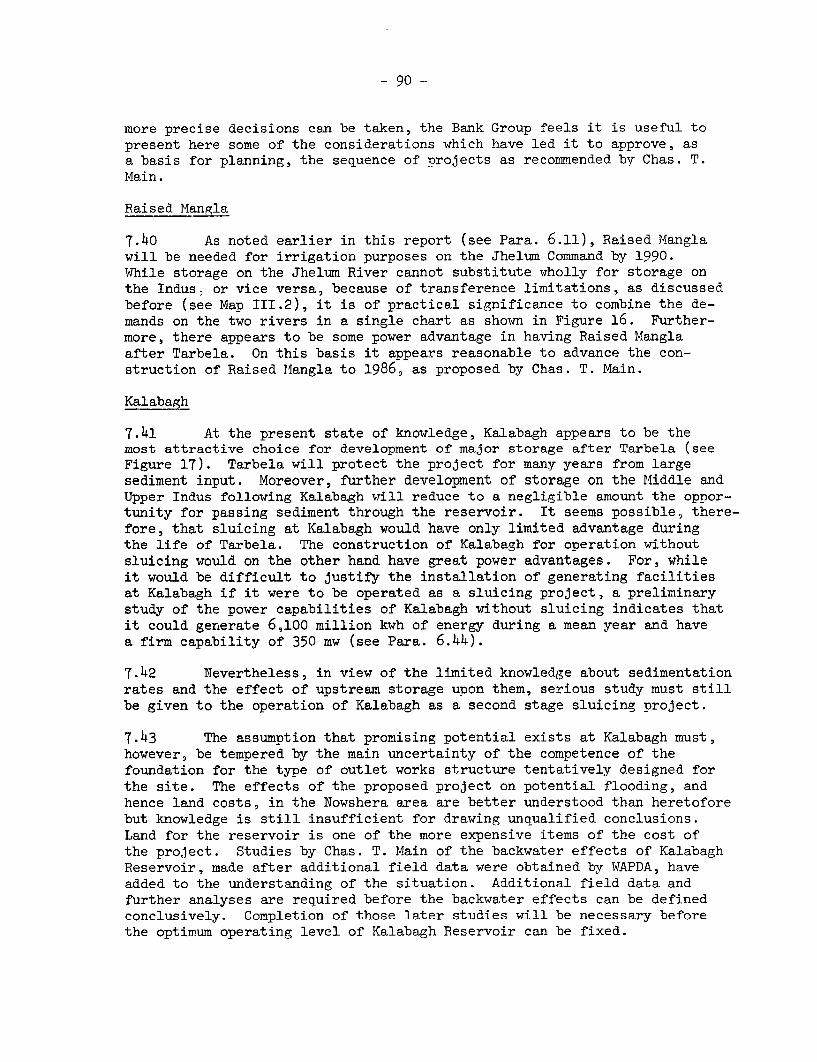
- 9o -
more precise decisions can be taken, the Bank Group feels it is useful topresent here some of the considerations which have led it to approve, asa basis for planning, the sequence of projects as recommended by Chas. T.Main.
Raised Mangla
7.40 As noted earlier in this report (see Para. 6.11), Raised Manglawill be needed for irrigation purposes on the Jhelum Command by 1990.While storage on the Jhelum River cannot substitute wholly for storage onthe Indus, or vice versa, because of transference limitations, as discussedbefore (see Map III.2), it is of practical significance to combine the de-mands on the two rivers in a single chart as shown in Figure 16. Further-more, there appears to be some power advantage in having Raised Manglaafter Tarbela. On this basis it appears reasonable to advance the con-struction of Raised Mangla to 1986, as proposed by Chas. T. Main.
Kalabagh
7.41 At the present state of knowledge, Kalabagh appears to be themost attractive choice for development of major storage after Tarbela (seeFigure 17). Tarbela will protect the project for many years from largesediment input. Moreover, further development of storage on the Middle andUpper Indus following Kalabagh will reduce to a negligible amount the oppor-tunity for passing sediment through the reservoir. It seems possible, there-fore, that sluicing at Kalabagh would have only limited advantage duringthe life of Tarbela. The construction of Kalabagh for operation withoutsluicing would on the other hand have great power advantages. For, whileit would be difficult to justify the installation of generating facilitiesat Kalabagh if it were to be operated as a sluicing project, a preliminarystudy of the power capabilities of Kalabagh without sluicing indicates thatit could generate 6,100 million kwh of energy during a mean year and havea firm capability of 350 mw (see Para. 6.44).
7.42 Nevertheless, in view of the limited knowledge about sedimentationrates and the effect of upstream storage upon them, serious study must stillbe given to the operation of Kalabagh as a second stage sluicing project.
7.43 The assumption that promising potential exists at Kalabagh must,however, be tempered by the main uncertainty of the competence of thefoundation for the type of outlet works structure tentatively designed forthe site. The effects of the proposed project on potential flooding, andhence land costs, in the Nowshera area are better understood than heretoforebut knowledge is still insufficient for drawing unqualified conclusions.Land for the reservoir is one of the more expensive items of the cost ofthe project. Studies by Chas. T. Main of the backwater effects of KalabaghReservoir, made after additional field data were obtained by WAPDA, haveadded to the understanding of the situation. Additional field data andfurther analyses are required before the backwater effects can be definedconclusively. Completion of those later studies will be necessary beforethe optimum operating level of Kalabagh Reservoir can be fixed.
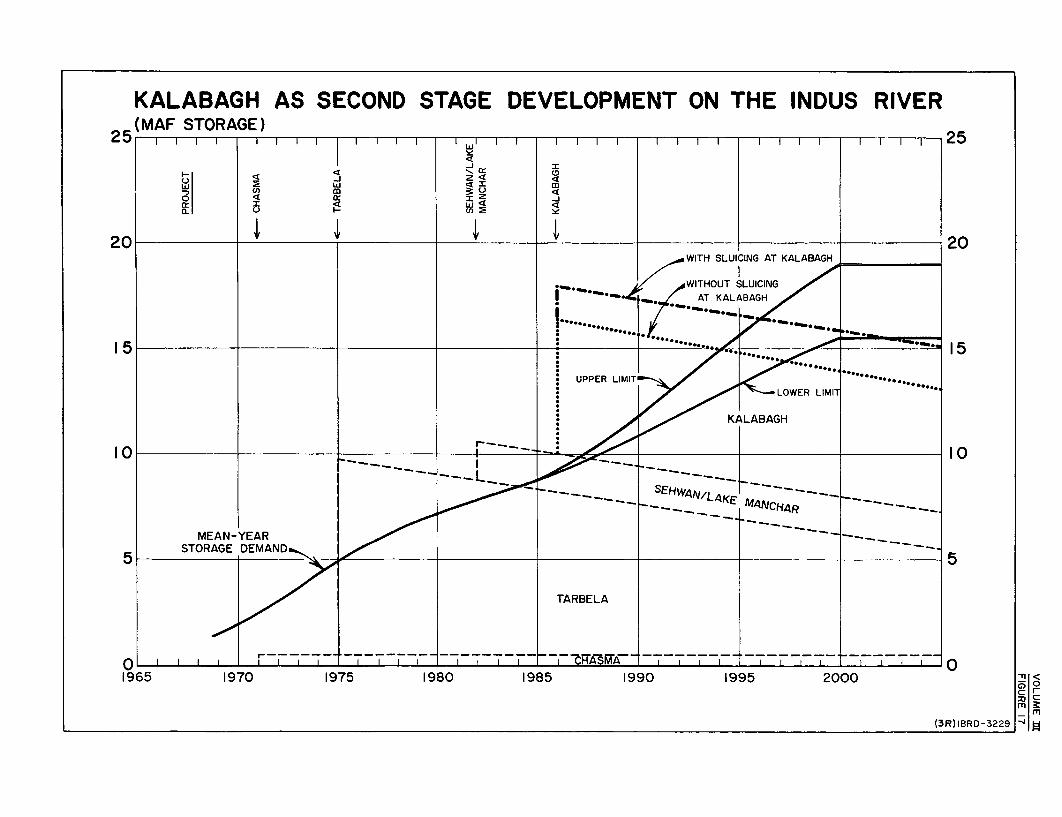
KALABAGH AS SECOND STAGE DEVELOPMENT ON THE INDUS RIVER(MAF STORAGE)
2 5 1 1 1 1 1 1 1 1 1 1 1 1 WI I I I I I I I I I I I I I 2-5w 25
w m~~~~w
I~~~~~~~~~~~~~~~~~~~~~~~~~~~~~~~~~~~~~~~~~~~~~~~~~~~~~~~~~~~~~~~~~~~~~~~~~~~~~~~~~~~~~~~~~~~~~~~~~~~~~~~~~~~~~~~~~~~~~~~~~~~~~~~20 I- cn; 20zWITH SLUIC ING AT KALABAGH ________
WITHOUT SLUICING~~ ~~ I ~AT KAL ABAGH
I..........Is~~~~~~~~~~~~~~.----t--. *...z----@@ *-_.I_
* **... ***** . ft.15 .'-----% i -- 15
UPPER LIMIT *.
*-/LOWER LIMIT
KALABAGH
10 10
SE__N/L4KE MANCHAR --
MEAN-YEAR -__STORAGE DEMAND_ _
TAR BE LA
0 IIS 7 7-o r----------__ CHSA.________.________ _____ O
1965 1970 1975 1980 1985 1990 1995 2000 <C '
(3R)IBRD-3229 s p

- 91 -
Swat
7.44 Studies of the Swat River Valley may indicate possible dam sitesof some promise. These studies have not yet been undertaken, but if by1976 investigations can be begun, it may become apparent that large volumestorage on the Swat River (at Ambahar) can be accomplished only by con-structing a very high dam. The runoff of the river, however, is small.The average storable surplus estimated on the basis of present irrigationrequirements would be about 2 MAF and large variations in storable runoffcould be expected from year to year. There are possibilities that importedadditional water could be brought from the Kabul for storage at Ambaharbut the cost would be very high. The high head available would generatea considerable amount of firm power in proportion to the relatively smallflows available. The project would have considerable value for generatingpeaking power in the low flow season, although the transmission distanceswould be substantial.
Gariala
7.45 The recommended program has Low Gariala in 2011. In the case ofGariala, the growth rate assumed is of particular importance. Stage con-struction of Gariala is economical if the growth rate in storage demand issuch that the initial 4.6 MAF in the first stage development will fill theneeds for water for at least eight to ten years after the in-service dateof the project.
7.46 The Gariala Project appears to be logical for detailed study foroffstream storage from Tarbela. The major drawback is that its cost appearsat least as much as the cost of Tarbela. And it might well be more. Asequence of development with the construction of Gariala following as thesecond major development after Tarbela is shown in Figure 18. Subsurfacegeologic conditions for most of the length of Gariala Dam are completelyunknown. The foundation treatment required for the dam structure could bedrastically different from that estimated for the design presented byChas. T. Main. The estimated cost of Gariala Project made after data areavailable for more accurate design might make what is expected to be anexpensive project prohibitively costly.
7.47 Gariala would have a long life because of the low rate of sedi-ment flow in the river relative to its size. However, the water conveyancesystem required to fill Gariala would be extremely large. Furthermore,power could be generated at the site only about eight months each year,and thus power generation at Gariala does not appear economically feasible.
Other Projects
7.48 The site for a dam in the vicinity of Skardu was selected byChas. T. Main with the thought that the reservoir created by it wouldserve to regulate the entire flow of the Indus River at that point. Thesediment transport rate at the site should be less than at Tarbela becauseof its upstream location (although no records are available to verify this)so a reservoir of similar size should have relatively longer life thanTarbela. The project as proposed would be in a remote area, at present
- 92 -
inaccessible for construction and the cost of providing access would beof such magnitude as to prejudice seriously the economic feasibility ofany proposal. The long distances over rugged inaccessible terrain topower markets would make power development at the site impracticablein the foreseeable future. Floods created by landslides and/or glacialaction are potential hazards of unknown proportions to the safety andlife of the project.
7.49 Foundation conditions at Skardu are unknown. That a suitablefoundation, as adopted for designs for this report does exist is strictlyan assumption, for Skardu site was not visited in the course of the presentstudies and previously has not been studied in any detail. Therefore, eventhough two widely varying assumed conditions were used in arriving at thedesigns for estimating costs, little reliance can be assigned to the ade-quacy of the estimated costs. The access route to the area has not beendetermined nor have the policies on allocation of costs of access to thestorage site been defined.
7.50 A potential project at Sanjwal-Akhori was considered by Chas. T.Main as an alternative to Gariala for side valley storage from Tarbela onthe Haro River. A dam at this site does not have the potential of Garialaand would be relatively more costly. The site is suitable for a smalldevelopment but such a project would be inundated by the Gariala Reservoir.
7.51 Another side valley possibility at Dhok Pathan or at the DhokAbakki site on the Soan River could be filled by gravity diversions fromthe upper levels of Tarbela Reservoir through a conveyance system 70 mileslong. Because of the short period that will be available for filling anyoffstream reservoir as the water resources approach full development, theconveyance system would require extraordinarily large capacity. The costsand problems of operating such a conveyance system make these projectsrelatively unattractive.
7.52 Water could also be stored on the Soan at Dhok Abakki or at DhokPathan by pumping from the Kalabagh Reservoir. Such a scheme could not becarried out in conjunction with sediment sluicing. Because of the shortseason when storable water would be available, large pumping facilitieswould be required. To meet the pumping load, the power system would needadditional capacity which makes this project of questionable value. Fur-thermore, power could only be generated at either Dhok Pathan or DhokAbakki for about eight months each year.
7.53 As indicated in this report Raised Mangla would probably provideall the storage feasible on the Chenab-Jhelum River to supply seasonalwater requirements. Some storage on the Chenab River may be useful toregulate heavy flood flows and to reduce sediment loads which now forcethe canals to be shut down on occasion. A dam at a potential offstreamstorage site, near the city of Chiniot, is the only known feasible loca-tion for storing water on the Chenab River in West Pakistan. A reservoirat this site could store 1.4 MAF of water but Chas. T. Main indicates itwould have to be released from storage by November, because of the per-meable nature of the reservoir floor and the danger of waterlogging
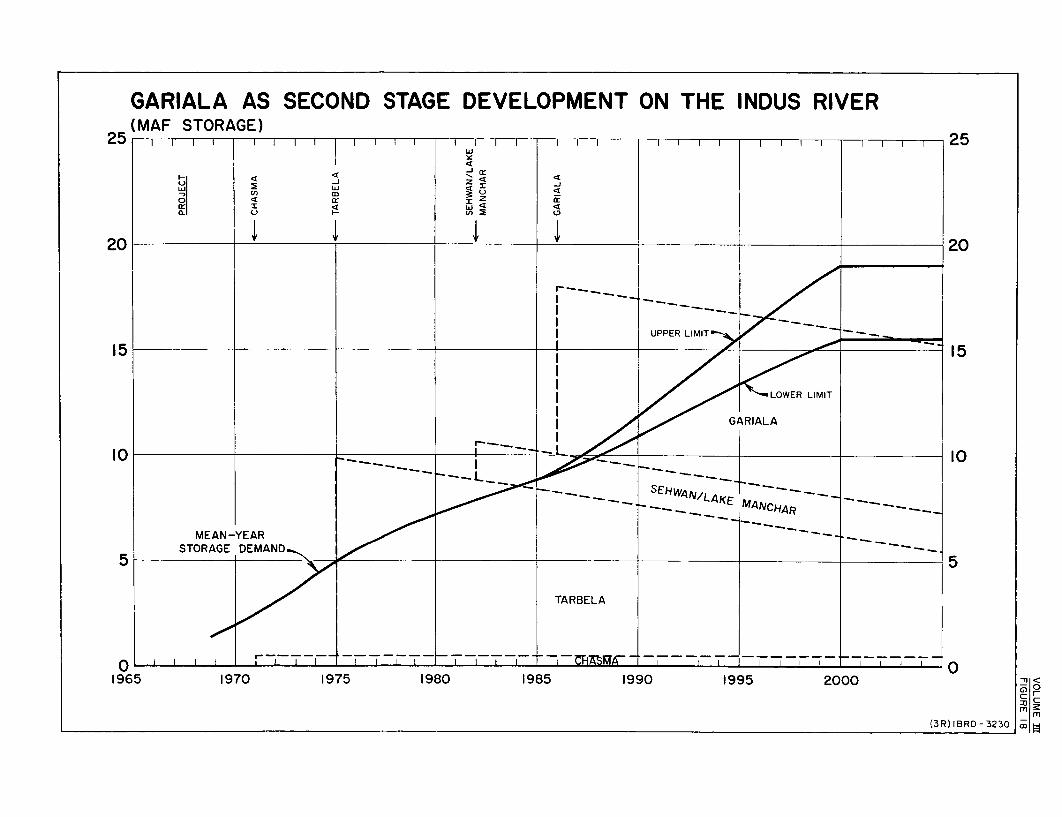
GARIALA AS SECOND STAGE DEVELOPMENT ON THE INDUS RIVER(MAF STORAGE)
25 l l l I 25
r <
w LU 4
-, //WUP LIMIT
1O | k _ G~~~~~~~~~~~~~~~~~~ARIALALll
20 20___~~.______ __ --. ___ _-_ _ __
MEAN-IYEARSTORAGE DEMAND---,
5 5
TARBELA
I---.
0 I I I I , I-__ .________-I5Xr .___ ___.____
1965 1970 1975 1980 1985 1990 1995 2000
R R-

- 93 -
surrounding farmlands. The costs would be high at over $80 million.Such a project would have no effect on water or sediment flows on theChenab to benefit operation of the canals because of its location down-stream of several of the major canals. The project would also havenegligible effect for attenuating flood flows to benefit canals fartherdownstream. Experience in operating the link canal system may, however,demonstrate a need for canal regulatory storage at the Chiniot site toavoid wastage of water.
7.54 There are, of course, a large number of potential hydro powerprojects. In the gorge between Skardu and Tarbela there are numerouspossibilities for the construction of dams suited to the development ofhydroelectric power; they would, however, all have limited storage capaci-ties. The two most promising are at Bunji and Chilas. The Bunji site isabout 100 miles below Skardu, just upstream of the confluence of the GilgitRiver. Reconnaissance studies only have been made; no detailed surveys orinvestigations have been carried out. Maps are not available. The sitewould appear to have considerable potential for power but little forstorage. Forty miles below Bunji, at Chilas, indications are that asite exists for a dam approximately 600 feet high, which would have agross storage of about 3.0 MAF. These figures are based upon reconnais-sance visits only and no detailed studies have been carried out. Thesite is not attractive for storage purposes.
7.55 A power project with incidental storage benefits has been dis-cussed (see Paras. 5.87 to 5.89) for the Kunhar River. This hydroelectricscheme was studied in 1959/60 by Chas. T. Main for WAPDA. The full projectwould develop about 500 mw of power. The feasibility of the project andthe project's potential -have been established. Chas. T. Main studies pro-posed that the first stage of the development for a firm capability of198 mw would be completed in five years in a program extending over anine-year period to bring the project to full development. The programfor developing the entire project could be compressed to about five yearsif the need arose. The project would consist of two reservoirs and twopower plants with power tunnels for conveying water from the reservoirs tothe power plants. The cost of this scheme would be about $200 millionwhich would indicate moderately expensive power but not beyond the limitof economic possibility.
7.56 The Kunhar River Project investigations are at the feasibilitystage. Both prefeasibility and feasibility stage reports are available.Sufficient field investigations and design studies were made to assurethat the project is feasible. Considerable detailed field investigationsat the sites remain to be done in order to develop definite locationsfor and designs of the structures. The quantities of work and materialsfor construction then will become more definitely known and more refinedestimates of costs can be prepared.
- 94 -
Conclusions
7.57 The development of an optimum sequence of surface storage projectswill be costly in both money and effort. It will take considerable timeand tax heavily the technical capabilities that may be available. Forthese reasons plans should be prepared early and schedules established thatwill lead to the obtainment of information necessary. The requirementsare described in some detail in the next chapter.
- 95 -
VIII. PROGRAM FOR INVESTIGATIONS
8.o0 It became apparent early in their study that many of thedata required by Chas, T. Main for the evaluation of various storagesites were lacking. In order to obtain the data necessary to evaluatea particular storage site in relation to others and to provide a basisfor constructing and operating a system of reservoirs in the Indus Basin,it is necessary to embark on an organized program of investigations.
Past Experience
8.02 When considering a timetable for the investigation of possiblefuture developments in West Pakistan, it is useful to note the experiencealready gained during the planning for Tarbela. The agreement betweenWAPDA and their consultants (TAMIS) for engineering became effective inJanuary 1960. Initial studies covered a stretch of river extending overnearly 20 miles. Three locations for a dam were considered and in May1961 the consultants recommended adoption of the Bara site, which is thesite accepted.
8.03 By January ].962 investigations and designs were sufficientlyadvanced for the preparation of a project planning report covering thepreliminary phases. At this stage many of the features of the schemewere of a tentative nature and subject to further exploratory work onsite. Towards the end of the year, in November 1962, a supplement tothe project planning report was issued. This supplement, while stillbased on the adoption of the Bara site, showed considerable changes inconcept of the dam, both in alignment and in design. The report furtherbrought out that a number of additional points required investigation onsite before the designs could be finalized. At this stage in the inves-tigations, after nearly three years of work, the cost amounted to $9.9million, of which $3.4 million was in foreign exchange. From that time,until September 1965, in the course of definite project planning, a fur-ther $9.6 million was expended, of which $3.7 million was in foreignexchange. The estimated cost of a continued program of exploratory work,detailed design and preparation of tender documents over the period ex-tending from November 1965 until the end of 1967 is about $8.8 million,including $4.2 million in foreign exchange. All the cost figures includeprovision for the necessary support work, such as temporary access andcamps, power supplies, etc., but do not include preliminary works, suchas permanent road and rail access and housing required for constructionof the project.
8.o4 Thus for Tarbela, it took a year to fix the site, two moreyears to establish project feasibility with reasonable certainty, threemore years to prepare definite plans and another two years to reach thestage when construction might start. Even then the problem of siltationand its effect on the useful life of the reservoir remained unresolved.If the rate is unchecked storage capacity will be reduced to about 1 MAFin 50 years. If means can be found to reduce the rate by even a halfthe cost of investigations leading thereto will be repaid manifold.
- 96 -
With this example in mind, it makes sense to continue a program ofinvestigations that will get to the roots of the basic problems of riverflow at the same time determining the facts necessary for planningspecific future projects.
Basis for Programming
8.05 The program for future investigations should be such thatwhatever the rate of growth of demand for stored water, timely decisionscan be taken based on a knowledge of as many of the relevant facts aspossible. For this reason the program should be related to a high growthrate, rather than to the projected growth anticipated by IACA.
8.o6 Each year the program should be reviewed in the light of therate of growth of demand achieved and suitable adjustments should bemade in the circumstances prevailing. This review would be quiteseparate from, and additional to, the continuing process of reassess-ment of the probable sequence of projects as further technical factsbecame known.
Type of Investigations
8.07 The investigations to be undertaken fall into two broad cate-gories: first, the acquisition of hydrological data and the conduct ofa general research program, and second, the mapping of promising local-ities and subsurface exploration of possible sites. The first part ofthe program is essentially broad in its approach. It is directed tolearning more about the Indus River system as a whole. Although some ofthe sites selected for regular observations will be chosen with possibleprojects in mind, the information that will be gained is intended to formthe basis on which many schemes can be considered in the future. Althoughthere have been instances where major dams have been designed and con-structed with the benefit of very limited information about the hydrologyof the river concerned, it can be an expensive or even a dangerous course.If because of lack of data a design which proves overconservative isadopted, money is wasted. If the flood potential is underestimated,damage may occur and in extreme circumstances the project may be destroyed.
8.o8 For these reasons no time should be lost in the acquisitionof complete hydrological and meteorological knowledge. Gauging stationsmust be established without delay and systems developed for obtainingaccurate and consistent readings over as long a period as possible.Fifty or a hundred years of records are not too long, when costly schemesare envisaged. Topographic surveys should be made over extensive areas,both upstream and downstream of anticipated sites. In some cases, timecan be saved by carrying out an initial reconnaissance by air, and innearly every case it will be desirable to make a thorough inspection ofthe ground before initiating a costly program of mapping. After thecontours of the ground and the visible surface geology have become known,a limited program of subsurface exploration should be undertaken toestablish foundation conditions that will have a controlling effect onthe type of structure.
- 97 -
8.og Thereafter, it should be possible to establish which of severalalternate sites should be chosen for detailed exploration. In the case oftwo apparently equal sites, it may be necessary to continue investigatingboth in more detail. Apart from direct cost comparisons, other factorssuch as accessibility, may influence the choice.
8.10 Once a site has been selected a full program of investigationswill be required, in conjunction with definitive design of the project.Work involved will comprise boreholes, shafts, adits, seismic and/orresistivity surveys., jacking and in situ shear tests, soil tests forembankments and possibly some trial grouting.
Detailed Program
8.11 The program of investigation and research should include thecollection of data on temperature, precipitation, runoff, infiltrationand percolation, evapotranspiration, sediment discharge and sediment input,effects of snowmelt and glacial movements, fragmentation of rock by temper-ature changes, and the determination of all other facts relating to oraffecting the river regime. To this end, the following field observationstations should be established as proposed by WAPDA and endorsed by IACA:
Sarrori Khawar near Kuza Banda
Nandihar Khawar at Batgrar
Panjkora River near Banda Gai
Shyok River at Yuga Village
Indus River below Shigar Confluence
Gilgit River at Alam Bridge
Hunza River at Mouth
Mastunj River near Dhok Muligram
Dir Nallah near Confluence
Shewa Khawar near Wach
Shewa Khawar near Chakdara
Kurram River near Sulaimani Chowki
Kurram River at Kurram Tangi
Kurram River at Dara Tank
Kaihi River at Data Khel
- 98 -
Tochi River near Dand Kili
Tochi River near Boya
Tochi River near Seria Gambila
Jhelum River near Chinari
Jbelum River near Mangla
Nanda Kas near Akhori
Sil Kas near Kot Fateh
Wadala Kas near Papur
Nili Nadi at Bunr
Manur Nallah at Mahandri
Indus River at Kalabagh
8.12 The frequency of measurement at existing stations should alsobe increased. Studies should then be extended to the laboratory for de-termination of the quantities and characteristics of sediment transported,the critical velocities and depths for its entrainmentmovement in suspen-sion and deposition, and finally by models to determine appropriate worksfor its retention, bypassing, side casting, or other means of disposal.In addition, the rates of sedimentation in existing and future reservoirsshould be measured.
8.13 Bearing in mind that the program of investigations should providedata suitable as a basis for decisions necessary to meet a high growth de-velopment, it appears that the following schemes require initial investiga-tion:
a) Sehwan-Manchar
b) Raised Mangla
c) Indus Plains
d) Kalabagh
e) Gariala
Furthermore, in view of the fact that virtually nothing is known aboutthe possibilities of development in the vicinity of Skardu or on the SwatRiver, it will be desirable to carry out a modest exploration program todetermine conclusively whether either scheme is likelv to compete withthe other projects named for investigation.
- 99 -
8.14 The types of investigations to be undertaken at the varioussites, as recommended by WAPDA and/or the Bank's consultants are describedin the following paragraphs. The list for each site is not exhaustive.
Sehwan-Manchar
8.15 Lower Indus Project (LIP) suggested that the study started atKalri Lake on sedimentation be continued and that a similar program be under-taken at Manchar Lake. They also suggested that investigations on reservoirevaporation should continue. Topographic and hydrographic surveys, climato-logical observations will- be required and subsurfac-e investigations will haveto be carried out.
Raised Mangla
8.16 Much of the preliminary design work for Raised Mangla has alreadybeen done in the interests of ensuring that the project as now being builtcan be raised as economically as possible in the future. It will, however,be necessary to review the various readings which will be taken regularlyas the reservoir comes into operation, to determine whether any changesin design are desirable. Sources of fill must also be identified.
Indus Plains
8.17 The proposal by Tipton & Kalmbach for a large reservoir in theIndus Plains was received too late for study by the Bank's consultantsand consideration by the Bank Group. As a project alternate to Kalabaghor Gariala - and following Tarbela and Raised Mangla, it may have merit.Considerable investigation, however, will be necessary before it is pos-sible to plan with complete confidence in the feasibility and likely cost.The evaporation, seepage and siltation rates will have a profound effectand study, possibly by the construction of a small pilot project, will berequired. The optimum reservoir size needs to be established, takingaccount of water availability, distribution and use. An aerial survey ofthe reservoir area with suitable ground control must be made to establishcapacity for different pond levels. The foundations must be investigatedalong the suggested alignment of the embankment and the local materialsshould be tested for suitability for the construction of the embankment.The effects of wind on a reservoir of the size proposed and on the embank-ment itself will have -to be considered. Investigations along these linesshould be introduced into the program at a fairly early date.
Kalabagh
8.18 In the Chas. T. Main proposals much of the economy of construc-tion and value of long life of usable storage volume at Kalabagh is to beachieved by incorporating large outlet capacity at low reservoir levels ina buttress-type sluiceway/spillway dam. Intensive investigations of thephysical properties of the foundation rock are needed for design of thisstructure. These investigations should include exploration for the posi-tions of massive sandstone beds throughout the foundation area. Thelocations of bedding zones. clayshale or silstone partings need to be
- 100 -
examined in detail. Large diameter holes permitting entry by persons fordirect examination of the foundation structure may be necessary. Labora-tory and in-place tests of the rocks should be made. The depth and natureof the overburden in the river channel must be thoroughly explored for thedesign of the earth embankment. Sources of materials must be identifiedand explored in sufficient detail to learn their physical properties fordesign and the adequacy of quantity for construction.
8.19 Backwater effects and, hence, the land acquisition problem, mustbe studied in considerable detail. Some work in this respect was carriedout in the course of this study by the establishment of gauge posts andmeasuring of cross-sections. Additional cross-sections of the rivershould be measured at strategic points. Establishment of staff gaugesand observation of stage levels on a systematic basis at the existing aswell as newly-established sections are needed. These cross-sections andstaff gauges must be tied together through their own level network andtied to the Survey of Pakistan datum. More detailed mapping, particularlyin the upper reaches of the reservoir is needed.
8.20 The problem of sediment transport through the proposed reservoirneeds to be intensively investigated. Detailed mapping of the reservoiron a large scale would be of great assistance in these studies. Systematicmeasurements of sediment concentrations in the river at various stations atthe head of the proposed reservoir and along in the reservoir area shouldbe made and recorded. When Tarbela comes into operation the behavior ofthe sediment movement in the lower river will change. The results ofmeasurements of sediment concentration in the river discharge at Attockand downstream and of sediment deposited in Tarbela when the time comeswill enable forecasting more accurately the likely behavior of sedimentmovement through Kalabagh Reservoir.
8.21 Measurements of water surface levels at the dam site and for afew miles downstream are needed for design of the outlet works, spillwaydischarge and power plant discharge characteristics. These readings shouldbe correlated with water levels and operations at Jinnah Barrage.
Gariala
8.22 Chas. T. Main recommends that the feasibility of the GarialaProject should be confirmed through a limited program of field investiga-tion followed by preliminary design work and preparation of cost estimates.
8.23 Initially, about 20 exploratory holes should be drilled alongthe axis of the dam. Fifteen of the holes should be in the foundation ofthe main dam and the remainder should be along the line of the long rightabutment dike spaced at about one mile intervals. The holes under theproposed main dam section should each penetrate about 150 feet into bedrock,while the holes along the proposed dike should be carried at least 25 feetinto bedrock. An angle boring is proposed in the limestone of the leftabutment, to determine most effectively the characteristics of the forma-tions that outcrop there. Total depth of holes required in the initialprogram is estimated to be 3,200 linear feet.
- 101 -
8.24 About 18 test pits along the axis of the dam and dike totalingabout 900 feet in depth, should be dug to sample and test the foundationsoils. Six of the holes should be in the main dam area and the remainderwould be spaced at half-mile intervals along the line of the dike.
8.25 The findings from the above minimum exploratory program willsuggest the need for and location of additional subsurface explorations.
8.26 Standard tests, such as triaxial shear, unconfined compression,and modulus of elasticity should be performed on representative undisturbedclay and shale samples of the bedrock formations in both the saturated andunsaturated states. The samples can be selected from drill cores and fromthe test pits. Porosity and permeability of bedrock and overburden shouldbe determined. Where possible, pressure tests should be made in the bore-holes, in both overburden and rock. Load bearing tests, especially alongthe outlet conduit fotmdations, are recommended. The minimum test loadsshould be several kips greater than the ultimate design loads.
Skardu
8.27 Before the feasibility of Skardu Project can be determined andthe designs and estimates of costs prepared with any greater reliabilitythan the present ones, a great amount of field investigation work isrequired.
8.28 The gauging station at Skardu is particularly needed to gatherdata useful for determining the size of reservoir for the Skardu Projectand to learn the sediment transport characteristics of the river at thatlocality. In connection with sediment, the input and output of glacialdebris in the Shigar, Shyok and Indus Rivers should be studied in con-siderable detail to ascertain over a long period of time the mechanicsof sediment movement in the valleys of those glacial streams. Snowcourses should be established for correlating snow pack with runoff. Fullknowledge of the hydrologic and hydrometeorologic aspects of the upperbasin will be invaluable for successful operation of Skardu as well as theentire storage system when full developments of the water resources of theriver basin are approached.
8.29 Other dam sites should be investigated to the extent necessaryto identify those justifying further exploration. In every case, however,before the site itself is studied in detail, and certainly before anyconsiderable program of subsurface exploration is commenced, it will bedesirable to give thorough consideration to the problem of access. Thiswill be best accomplished by a ground reconnaissance party, sent toexplore the possibility of a route close to the river but above maximumflood level. If the preliminary investigation and study of alternativeapproaches reveal that access costs are likely to be reasonable, moredetailed investigations may be justified.
8.30 Chas. T. Main has recommended that investigations be made todetermine the depth and character of overburden at all dam sites selectedfor more detailed study. Test pits should be dug and borings made to
- 102 -
determine potential sources of materials for construction and to provideestimates of quantities of materials available. Detailed studies shouldbe made of the inhabited land affected by the project, of potential landsin the area that may be developed for relocating the people affected andof the effects the project will have on the economy of the region.
Ambahar
8.31 The existing data available for studying Ambahar Project arecompletely inadequate for preparing designs, determining the economicsize of structure and for preparing accurate cost estimates. Means ofaccess will require special study. Chas. T. Main proposes that hydro-graphic work started in the river basin should be continued and expanded.The flows of the Swat River at Amandara headworks and the diversions tothe Upper Swat Canal need to be known more accurately. Discharge measure-ments of the Panjkora River should be continued. Discharge measurementsshould be taken accurately and systematically at the Munda headworks andat the confluence of the Kabul and Swat Rivers. Accurate measurements ofall canal diversions from the river from Amandara headworks downstreamto the mouth of the Swat River are required. Systematic studies of theareas being served by the several canal commands should be made period-ically to update estimated future needs for surface water when the landsare brought to full development.
8.32 Investigations should be carried out to the extent necessaryto select the optimum site for storage in the Lower Swat Gorge and thenthat site should be investigated sufficientlv to determine its feasibility.Studies should cover the complete range of reservoir sizes likely to beneeded,, including study of storage space for imported water. The prelim-inary investigations should include study of surface geology of the sitesupplemented by subsurface explorations as needed to define fully theproblems of design. Sources of materials should be located. Studiesshould' include consideration of the site selected for various types ofdam structures.
General Considerations and Conclusions
8.33 Although the proposals for investigation are considerable itis reemphasized that initially the full program for each site is notrequired. Sufficient should be done to confirm the immediate order ofdevelopment and then the detailed program for each site should be startedsome four to five years before construction is scheduled to begin.
8.34 The program of general investigation, however, should be acontinuing one. In particular, in the upper reaches of the Indus Riverand its tributaries a great deal of investigation and exploration remainsto be done. The scant literature of the area and a few superficial obser-vations suggest that some tributaries are heavily silt laden even at timesof year when others flow relatively clear. These reports require confirma-tion and explanation. If some tributaries contribute a disproportionateelement of the silt load of the Indus. means should be investigated toreduce the load. Any measurable reduction in the rate of siltation atTarbela would justify considerable effort.
- 103 -
8.35 As soon as it is established that a particular project isfeasible and likely to be constructed in the foreseeable future, stepsshould be taken to curb development in the area, so that unnecessarilyexpensive compensation is avoided. Such arrangements would involve anotification to Government departments and other agencies that mighthave plans for the area, e.g., Buildings and Roads Department, WestPakistan Railway, etc., and possibly legislation to stop or at leastrestrict private development.
8.36 It was recommended by Chas. T. Main that WAPDA be assigned thetask of collecting and analyzing the data needed to implement the develop-ment program. The Bank Group concurs in this suggestion. Specifically,the Surface Water Circle should establish the new gauging stations andintensify measurements at the existing stations. The systematic collectionof other data required in the Upper Indus region, such as glacier and snowcourse observations, and vigilance for landslides, should begin. An engi-neering group should be established to develop flow forecasting proceduresand to study sediment control and the operation of the present and futuresystem of reservoirs for optimum benefits. Procedures for surveying anddeterming rates of sedimentation in reservoirs should be established.Investigations of proposed storage sites should be undertaken to permitthe preparation of preliminary designs and cost estimates sufficient toconfirm the general feasibility of the sites.
8.37 The success of the tubewell programs and the efficient operationof the irrigation systems are of paramount importance. It is worthy ofnote that a 3 percent improvement in the efficiency of the delivery ofwater at the watercourse would be equivalent to half of one major damproject. Likewise, two tubewell projects equivalent to SCARP 1 yield atthe watercourse water equivalent to a major dam project. For this reasonthe search for improvements in operation of existing and new works mustalso have a place in the program.
8.38 The findings of all investigations and the conclusions of allstudies will require assessment in relation to the Master Planning beingconducted by WAPDA. It is recommended that this planning should continue,though once the broad framework has been established it should be fairlystraightforward to take account of the results of investigations.
8.39 The cost of implementing these proposals for investigations isestimated to average over the next eight years about $2.5 million a year,of which about a third would be devoted to the general program of basicdata collection planning and two--thirds to the study of specific projects.A preliminary schedule of costs is given in Table 56. It may take a yearor two to recruit and train the size of staff required for the investi-gations, some of the work involves special skills. The preparation ofrecords of work done is a vital part of the investigations and informationmust be retained in a state that will permit intelligent study by othersin the future. Once the team is established it is essential to maintainthe impetus and not to lose the experience gained. If promising resultsare obtained, particularly in such a field as sediment control in the
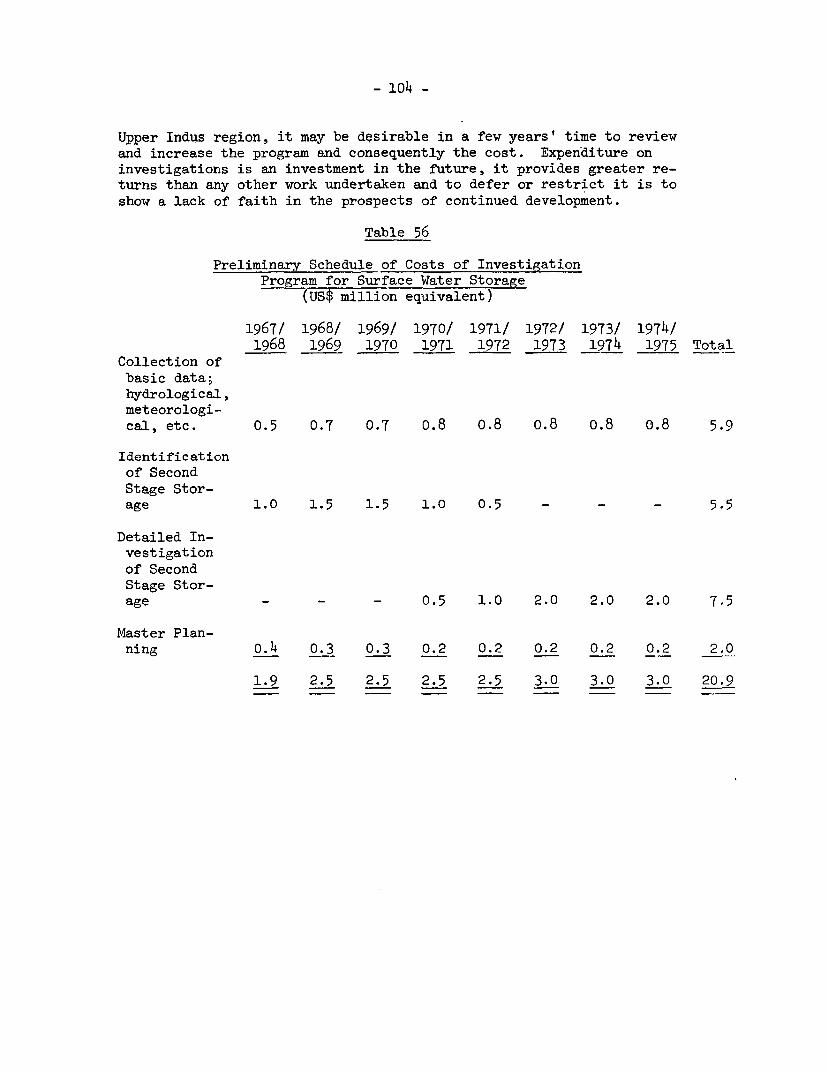
- 104 -
Upper Indus region, it may be desirable in a few years' time to reviewand increase the program and consequently the cost. Expenrditure oninvestigations is an investment in the future, it provides greater re-turns than any other work undertaken and to defer or restrict it is toshow a lack of faith in the prospects of continued development.
Table 56
Preliminary Schedule of Costs of InvestigationProgram for Surface Water Storage
(US$ million equivalent)
1967/ 1968/ 1969/ 1970/ 1971/ 1972/ 1973/ 1974/1968 1969 1970 1971 1972 1973 1974 1975 Total
Collection ofbasic data;hydrological,meteorologi-cal, etc. 0.5 0.7 0.7 0.8 o.8 o.8 o.8 o.8 5.9
Identificationof SecondStage Stor-age 1.0 1.5 1.5 1.0 0.5 - - - 5.5
Detailed In-vestigationof SecondStage Stor-age - - - 0.5 1.0 2.0 2.0 2.0 7.5
Master Plan-ning o.4 0.3 0.3 0.2 0.2 0.2 0.2 0.2 2.0
1.9 2.5 2.5 2.5 2.5 3.0 3.0 3.0 20.9
- 105 -
IX. FINANCIAL REQUIREMENTS AND COST COMPARISONS
9.01 It is difficult to quantify with any degree of accuracy theinvestment requirements of the suggested development program for surfacewater storage beyond the Tarbela stage. Uncertainties with regard to costestimates as well as price levels a decade or two away make such prognosti-cations tentative at best. However, it is possible to give an indicationof the order of magnitude of the expenditures required not only during theThird and Fourth Plan periods to 1975 but also during the decade 1975-85.
9.02 As previously noted, inasmuch as the cost estimates herein con-tained were prepared for the purposes of comparing the relative merits ofthe different projects and for economic evaluation, Pakistani duties andtaxes must be added for a proper estimate of a financial program. Otherfactors must be included besides the allowance for the duties and taxesthat would undoubtedly be paid on the goods and services required for theproject. It would be most unwise to ignore entirely, when estimating thefinancing requirements that prices tend to rise and, not the least impor-tant, that the '3economic" cost estimates represent an assessment of the"fmost probable; cost of the project. This approach to these estimates isessential in order to present their comparison with the "most probable"value of the economic benefits. The benefits are not assessed at their"maximum value, so it would be unjustifed to use a 'maximum" estimate ofthe project cost for economic comparison. It is, however, considered thatthe commitment of financial resources to a project should be based on themaximum likely" cost of the project.
9.03 The scheduling of the investment estimates over the period 1965to 1985 is indicated in Table 57. The total figure of around $1.35 billion(with a foreign exchange component of around $750 million) excludes dutiesand taxes and interest during construction. It also excludes the cost ofpower units. It does, however, provide for inflation at between one andone-half and two percent per annum, and for financial contingencies. Italso provides for continuing preliminary investigations of potentialprojects even though the actual construction of these projects may takeplace outside the 20-year period covered by this estimate.
9.04 Table 58 shows the estimated construction cost of the storagefeatures of the "recommended program,' viz. that designed to meet IACA'slow ultimate alternative. For purposes of comparison. a sequence ofprojects is also shown designed to meet IACA's high ultimate alternative.It must be noted that the cost figures given, unlike the figures givenin Table 57, have not been increased for inflation and financial con-tingency.
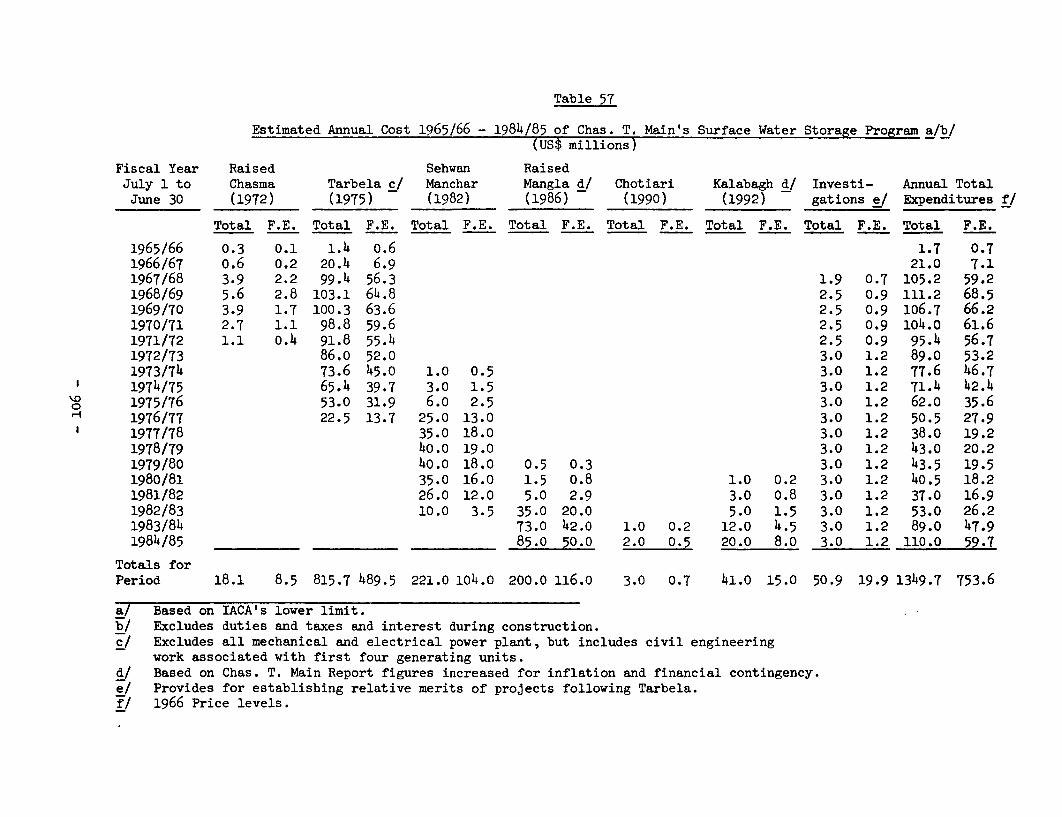
Table 57
Estimated Annual Cost 1965/66 - 1984/85 of Chas. T. Main's Surface Water Storage Program a/b/(US$ millions
Fiscal Year Raised Sehwan RaisedJuly 1 to Chasma Tarbela c/ Manchar Mangla d/ Chotiari Kalabagh d/ Investi- Annual TotalJune 30 (1972) (1975) (1982) (1986) (1990) (1992) gations e/ Expenditures f/
Total F.E. Total F.E. Total F.E. Total F.E. Total F.E. Total F.E. Total F.E. Total F.E.
1965/66 0.3 0.1 1.4 o.6 1.7 0.71966/67 o.6 0.2 20.4 6.9 21.0 7.11967/68 3.9 2.2 99.4 56.3 1.9 0.7 105.2 59.21968/69 5.6 2.8 103.1 64.8 2.5 0.9 111.2 68.51969/70 3.9 1.7 100.3 63.6 2.5 o.9 106.7 66.21970/71 2.7 1.1 98.8 59.6 2.5 o.9 104.0 61.61971/72 1.1 o.4 91.8 55.4 2.5 0.9 95.4 56.71972/73 86.0 52.0 3.0 1.2 89.0 53.21973/74 73.6 45.0 1.0 0.5 3.0 1.2 77.6 46.7
1 1974/75 65.4 39.7 3.0 1.5 3.0 1.2 71.4 42.40D 1975/76 53.0 31.9 6.0 2.5 3.0 1.2 62.0 35.6H 1976/77 22.5 13.7 25.0 13.0 3.0 1.2 50.5 27.9
1977/78 35.0 18.0 3.0 1.2 38.0 19.21978/79 40.0 19.o 3.0 1.2 43.0 20.21979/80 40.0 18.0 0.5 0.3 3.0 1.2 43.5 19.51980/81 35.0 16.0 1.5 0.8 1.0 0.2 3.0 1.2 40.5 18.21981/82 26.0 12.0 5.0 2.9 3.0 0.8 3.0 1.2 37.0 16.91982/83 10.0 3.5 35.0 20.0 5.0 1.5 3.0 1.2 53.0 26.21983/84 73.0 42.0 1.0 0.2 12.0 4.5 3.0 1.2 89.0 47.91984/85 85.0 50.0 2.0 0.5 20.0 8.0 3.0 1.2 110.0 59.7
Totals forPeriod 18.1 8.5 815.7 489.5 221.0 104.0 200.0 116.0 3.0 0.7 41.0 15.0 50.9 19.9 1349.7 753.6
a/ Based on IACA's lower limit.b/ Excludes duties and taxes and interest during construction.c/ Excludes all mechanical and electrical power plant, but includes civil engineering
work associated with first four generating units.d/ Based on Chas. T. Main Report figures increased for inflation and financial contingency.e/ Provides for establishing relative merits of projects following Tarbela.f/ 1966 Price levels.
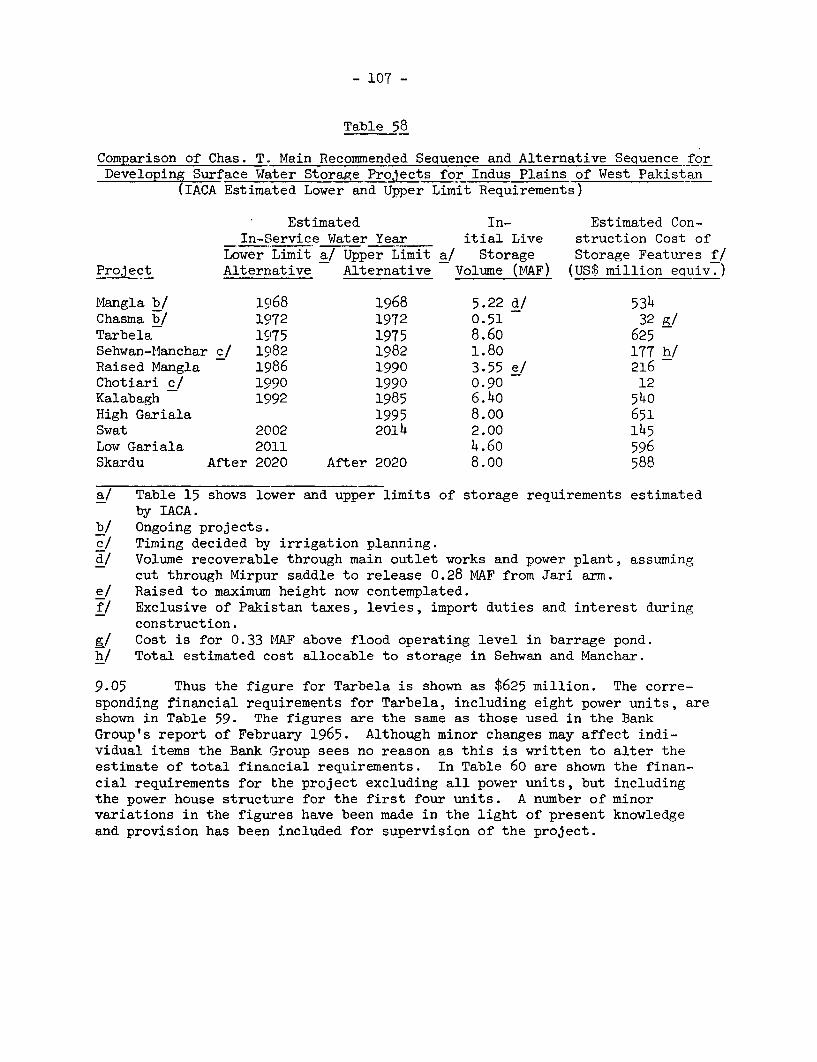
- 107 -
Table 58
Comparison of Chas. T. Main Recommended Sequence and Alternative Sequence forDeveloping Surface Water Storage Projects for Indus Plains of West Pakistan
(IACA Estimated Lower and Upper Limit Requirements)
Estimated In- Estimated Con-In-Service Water Year itial Live struction Cost of
Lower Limit a/ Upper Limit a/ Storage Storage Features f/Project Alternative Alternative Volume (MAF) (US$ million equiv.)
Mangla b/ 1968 1968 5.22 d/ 534Chasma b/ 1972 1972 0.51 32 g/Tarbela 1975 1975 8.60 625Sehwan-Mianchar c/ 1982 1982 1.80 177 h/Raised Mangla 1986 1990 3.55 e/ 216Chotiari c/ 1990 1990 0.90 12Kalabagh 1992 1985 6.40 540High Gariala 1995 8.00 651Swat 2002 2014 2.00 145Low Gariala 2011 4.60 596Skardu After 2020 After 2020 8.00 588
a/ Table 15 shows lower and upper limits of storage requirements estimatedby IACA.
b/ Ongoing projects.c/ Timing decided by irrigation planning.d/ Volume recoverable through main outlet works and power plant, assuming
cut through Mirpur saddle to release 0.28 MAF from Jari arm.e/ Raised to maximum height now contemplated.f/ Exclusive of Pakistan taxes, levies, import duties and interest during
construction.g/ Cost is for 0.33 MAF above flood operating level in barrage pond.h/ Total estimated cost allocable to storage in Sehwan and Manchar.
9.05 Thus the figure for Tarbela is shown as $625 million. The corre-sponding financial requirements for Tarbela, including eight power units, areshown in Table 59. The figures are the same as those used in the BankGroup's report of February 1965. Although minor changes may affect indi-vidual items the Bank Group sees no reason as this is written to alter theestimate of total financial requirements. In Table 60 are shown the finan-cial requirements for the project excluding all power units, but includingthe power house structure for the first four units. A number of minorvariations in the figures have been made in the light of present knowledgeand provision has been included for supervision of the project.
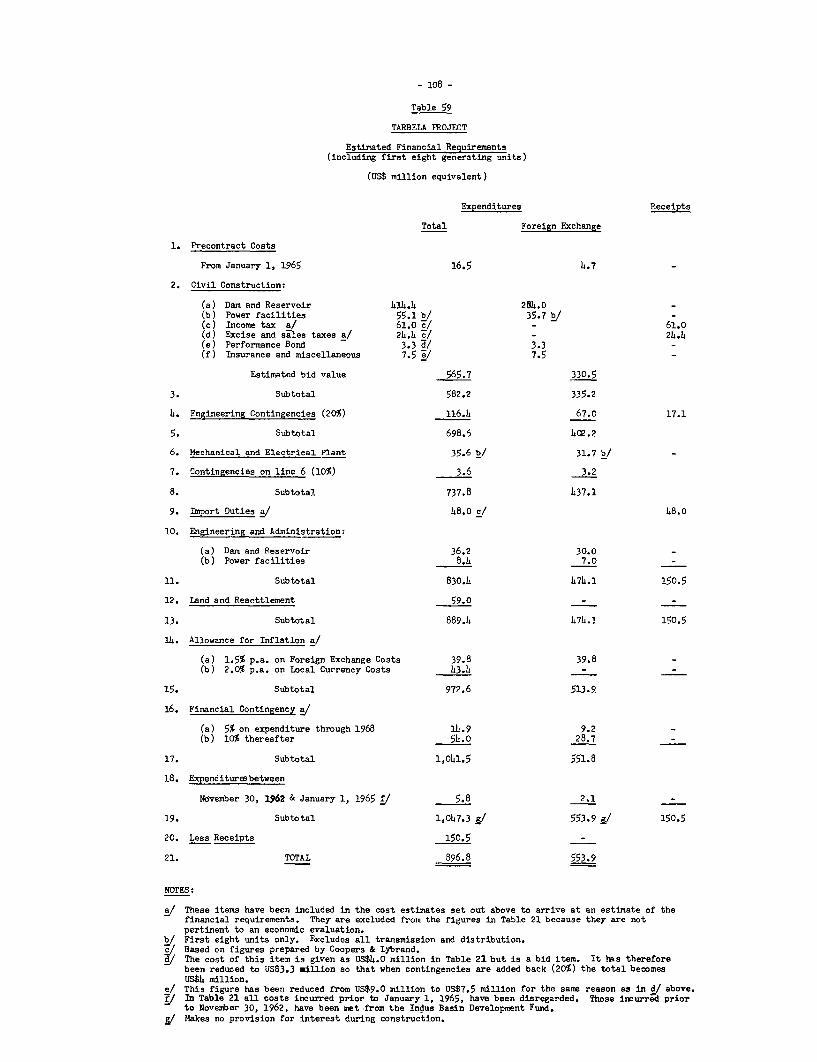
- 108 -
Table 59
TARBELA PROJECT
Estimated Financial Requirements(including first eight generating units)
(US$ million equivalent)
Expenditures Receipts
Total Foreign Exchange
1. Precontract Costs
From January 1, 1965 16.5 h.7
2. Civil Construction:
(a) Dam and Reservoir 414.h 284.0(b) Power facilities 55.1 b/ 35.7 b(c) Income tax a/ 61.0 El - 61.0(d) Excise and sales taxes a/ 24.h c/ - 24.4(e) Performance Bond 3.3 d/ 3.3(f) Insurance and miscellaneous 7.5 e/ 7.5
Estimated bid value 565.7 330.5
3. Subtotal 582.2 335.2
4. Engineering Contingencies (20%) ll6.A 67.0 17.1
5. Subtotal 698.6 hc2.2
6. Mechanical and Electrical Plant 35.6 b/ 31.7 b/ -
7. Contingencies on line 6 (o%) 3.6 3.2
8. Subtotal 737.8 h37.1
9. Import Duties a/ h8.0 c/ 48.0
10. Engineering and Administration:
(a) Dam and Reservoir 36.2 30.0 -(b) Power facilities 8.4 7.0 -
11. Subtotal 830.h 47h.1 150.5
12. Land and Resettlement 59.o
13. Subtotal 889.4 h7h.1 150.5
11. Allowance for Inflation a/
(a) 1.5% p.a. on Foreign Exchange Costs 39.8 39.8 -(b) 2.0% p.a. on Local Currency Costs 43.h -
15. Subtotal 972.6 513.9,
16. Financial Contingency a/
(a) 5% on expenditure through 1968 14.9 9.2(b) 10% thereafter 54.0 28.7
17. Subtotal 1,041.5 551.8
18. Expendituresbetween
No'vember 30, V962 & January 1, 1965 f/ 5.8 2.1
19. Subtotal 1,017.3 F/ 553.9 I/ 150.5
20. Less Receipts 150.5
21. TOTAL 896.8 553.9
NOTES:
a/ These items have been included in the oost estimates set out above to arrive at an estimate of thefinancial requirements. They are excluded from the figures in Table 21 because they are notpertinent to an economic evaluation.
bJ First eight units only. Excludes all transmission and distribution.I Based on figures prepared by Coopers & Lyborand.
The cost of this item is given as US$4.0 million in Table 21 but is a bid item. It has thereforebeen reduced to US$3.3 zllion so that when contingencies are added back (20%) the total becomesuS$4 million.
/ This figure has been reduced from US$9.0 million to US$7.5 million for the save reason as in d/ above.In Table 21 all costs incurred prior to January 1, 1965, have been disregarded. Those incurred priorto November 30, 1962, have been met from the Indus Basin Development Fund.Makes no provision for interest during construction.
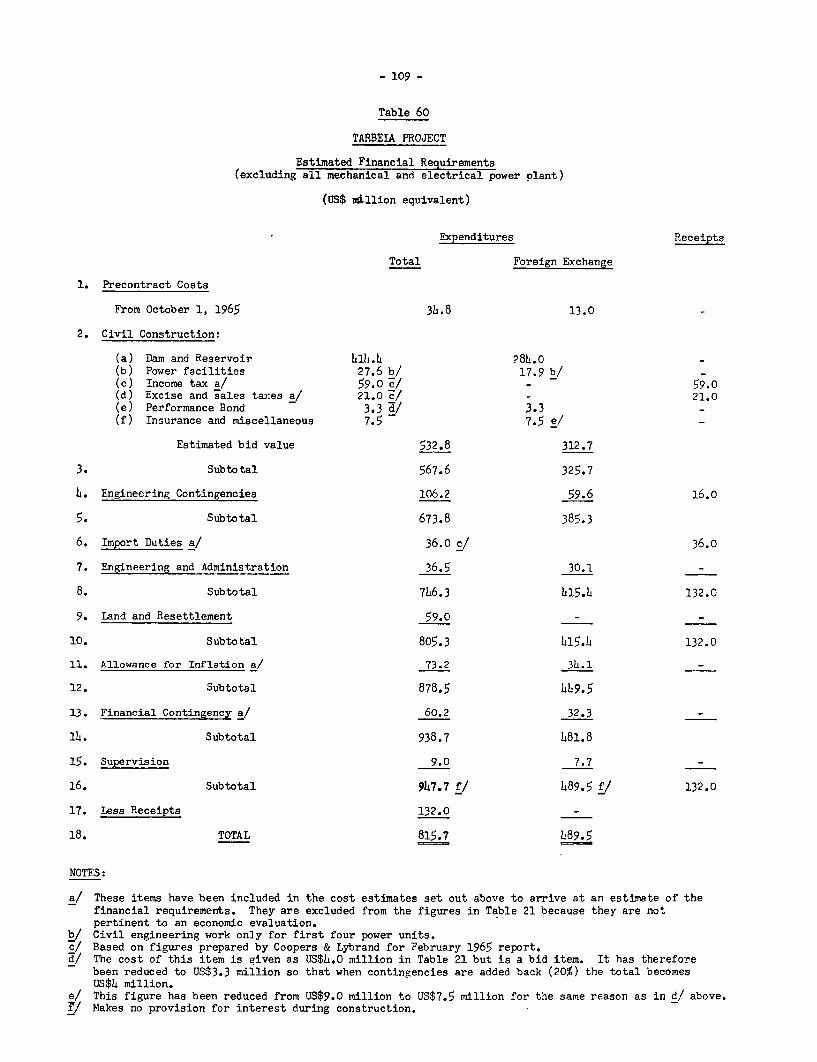
- 109 -
Table 60
TARBEIA PROJECT
Estimated Financial Requirements(excluding all mechanical and electrical power plant)
(US$ million equivalent)
Expenditures Receipts
Total Foreign Exchange
1. Precontract Costs
From October 1, 1965 34.8 13.0
2. Civil Construction:
(a) Dam and Reservoir h1h.4 28h.0(b) Power facilities 27.6 b/ 17.9 b/(c) Income tax a/ 59.o 0/ - 59.0(d) Excise and sales taxes a/ 21.0 c- 21.0(e) Performance Bond 3.3 3 3.3(f) Insurance and miscellaneous 7.5 7.5 e/
Estimated bid value 532.8 312.7
3. Subtotal 567.6 325.7
4. Engineering Contingencies 106.2 59.6 16.0
5. Subtotal 673.8 385.3
6. Import Duties a/ 36.0 c/ 36.0
7. Engineering and Administration 36.5 30.1 -
8. Subtotal 716.3 415.1 132.0
9. Land and Resettlement 59.o - -
10. Subtotal 805.3 415.4 132.0
11. Allowance for Inflation a/ 73.2 34.1 -
12. Subtotal 878.5 1±9.5
13. Financial Contingency a/ 60.2 32.3 _
11. Subtotal 938.7 181.8
15. Supervision 9.0 7.7 -
16. Subtotal 947.7 f/ 489.5 g 132.0
17. Less Receipts 132.0 -
18. TOTAL 815.7 h89.5
NOTES:
a/ These items have been included in the cost estimates set out above to arrive at an estimate of thefinancial requirements. They are excluded from the figures in Table 21 because they are notpertinent to an economic evaluation.
b/ Civil engineering work only for first four power units.c/ Based on figures prepared by Coopers & Lybrand for February 1965 report.d/ The cost of this item is given as US$L.0 million in Table 21 but is a bid item. It has therefore
been reduced to US$3.3 million so that when contingencies are added back (20%) the total becomesUS$4 million.
e/ This figure has been reduced from US$9.0 million to US$7.5 million for the same reason as in d/ above.I/ Makes no provision for interest during construction.
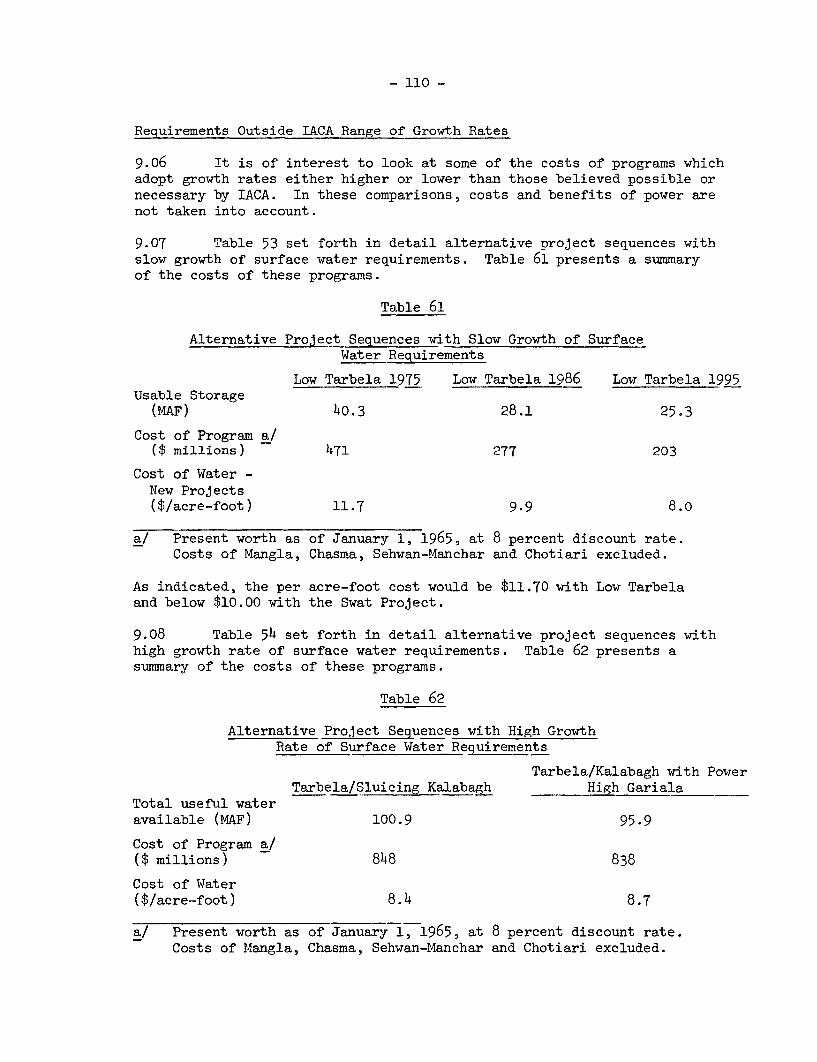
- 110 -
Requirements Outside IACA Range of Growth Rates
9.o6 It is of interest to look at some of the costs of programs whichadopt growth rates either higher or lower than those believed possible ornecessary by IACA. In these comparisons, costs and benefits of power arenot taken into account.
9.07 Table 53 set forth in detail alternative project sequences withslow growth of surface water requirements. Table 61 presents a summaryof the costs of these programs.
Table 61
Alternative Project Sequences with Slow Growth of SurfaceWater Requirements
Low Tarbela 1975 Low Tarbela 1986 Low Tarbela 1995Usable Storage
(MAF) 40.3 28.1 25.3
Cost of Program a/($ millions) 471 277 203
Cost of Water -New Projects($/acre-foot) 11.7 9.9 8.o
a/ Present worth as of January 1, 1965, at 8 percent discount rate.Costs of Mangla, Chasma, Sehwan-Manchar and Chotiari excluded.
As indicated, the per acre-foot cost would be $11.70 with Low Tarbelaand below $10.00 with the Swat Project.
9.08 Table 54 set forth in detail alternative project sequences withhigh growth rate of surface water requirements. Table 62 presents asummary of the costs of these programs.
Table 62
Alternative Project Sequences with High GrowthRate of Surface Water Requirements
Tarbela/Kalabagh with PowerTarbela/Sluicing Kalabagh High Gariala
Total useful wateravailable (MAF) 100.9 95.9
Cost of Program a/($ millions) 848 838
Cost of Water($/acre-foot) 8.4 8.7
a/ Present worth as of January 1, 1965, at 8 percent discount rate.Costs of Mangla, Chasma, Sehwan-Manchar and Chotiari excluded.
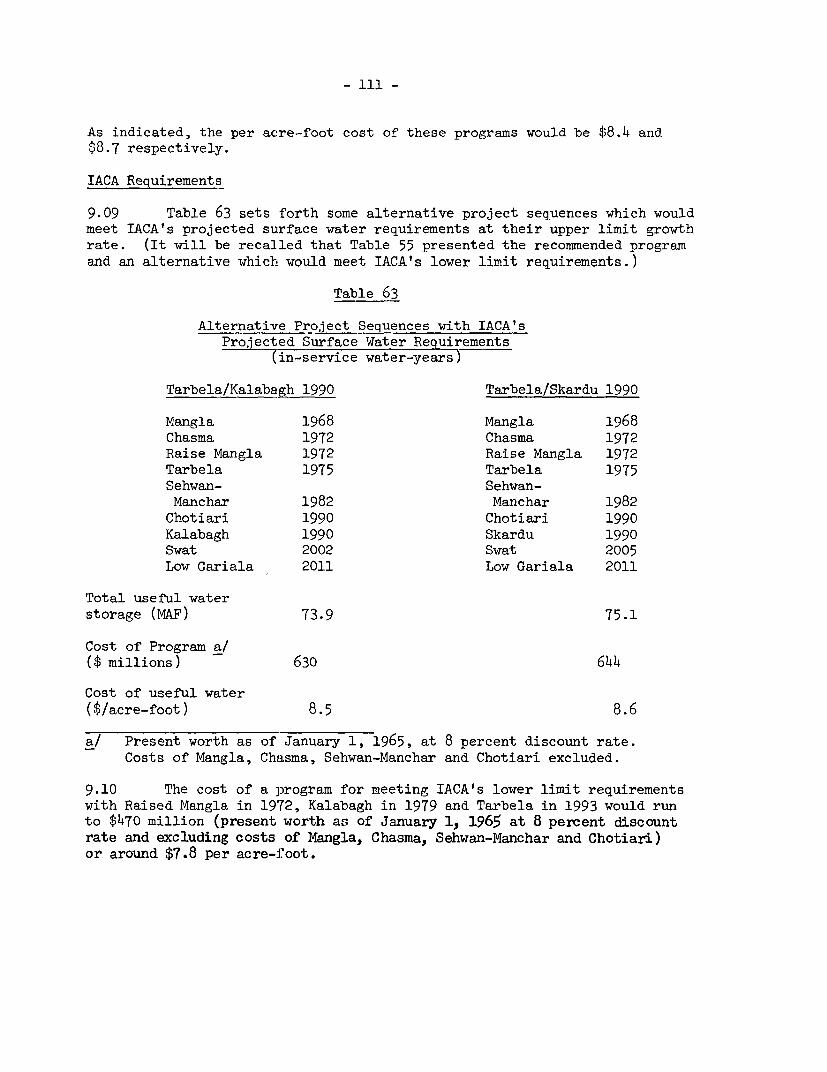
- ll -
As indicated, the per acre-foot cost of these programs would be $8.4 and$8.7 respectively.
IACA Requirements
9.09 Table 63 sets forth some alternative project sequences which wouldmeet IACA's projected surface water requirements at their upper limit growthrate. (It will be recalled that Table 55 presented the recommended programand an alternative which would meet IACA's lower limit requirements.)
Table 63
Alternative Project Sequences with IACA'sProjected Surface Water Requirements
(in-service water-years)
Tarbela/Kalabagh 1990 Tarbela/Skardu 1990
Mangla 1968 Mangla 1968Chasma 1972 Chasma 1972Raise Mangla 1972 Raise Mangla 1972Tarbela 1975 Tarbela 1975Sehwan- Sehwan-Manchar 1982 Manchar 1982
Chotiari 1990 Chotiari 1990Kalabagh 1990 Skardu 1990Swat 2002 Swat 2005Low Gariala 2011 Low Gariala 2011
Total useful waterstorage (MAF) 73.9 75.1
Cost of Program a/($ millions) 630 644
Cost of useful water($/acre-foot) 8.5 8.6
a/ Present worth as of January 1, 1965, at 8 pereent discount rate.Costs of Mangla, Chasma, Sehwan-Manchar and Chotiari excluded.
9.10 The cost of a program for meeting IACA's lower limit requirementswith Raised Mangla in 1972, Kalabagh in 1979 and Tarbela in 1993 would runto $470 million (present worth as of January 1, 1965 at 8 percent discountrate and excluding costs of Mangla, Chasma, Sehwan-Manchar and Chotiari)or around $7.8 per acre-foot.
- 112 -
X. FINDINGS AND CONCLUSIONS
10.01 This volume focuses attention on a water storage program tomeet the surface water needs of West Pakistan as forecast by IACA. Thisestimate of water demand is based on a detailed analysis of the cropwater requirements, irrigated cropping patterns and irrigation intensi-ties of each of the Indus Basin's canal commands. It is assumed thatthe water could in some cases be supplied either by pumping from thesubterranean aquifer or by delivering surface water through the canalsystem. The surface water requirements as derived are then traced backto the rim stations in order to establish storage requirements.
10.02 In their analysis IACA meet rabi watercourse requirementsfrom three sources: the groundwater available from the tubewell fields,the natural river flows and finally the releases from storage reservoirs.This last item, therefore, as a residual demand is especially sensitiveto change in the pattern of requirements. The size of the residualdemand is, in turn, influenced by the fundamental IACA assumption re-garding the integration of ground and surface water supplies, as well asthe distribution of cropped acreage between the rabi and kharif seasons.In IACA's program West Pakistan's vast underground aquifer, whose volumeis now estimated at 300 MAF of recoverable water, is assigned the roleof both seasonal and over-year storage. Thus IACA, in their calculationof the demand for surface water storage, felt able to use "mean-year"river flows. In other words, they assumed that the aquifer would serveas a balancing reservoir to make up the shortfalls in years of less thannormal snowmelt and rainfall. Other more cautious assumptions, such asproviding surface storage to meet the demand in three years in four, oreven one year in two, would increase the cost of providing surface waterstorage very considerably and are not felt justified. Yet, at the sametime, the concept of meeting only the mean year demand tends to minimizethe storage requirement.
10.03 IACA estimated that stored surface water needed to augmentthe water supply to the Indus Plains in West Pakistan during the low-flow seasons would grow from an initial requirement of about 4 MAF peryear in 1970 to about 9.3 MAF in 1975, about 13.3 MAF in 1985 and about21.5 MAF in 2000. The rate of growth cannot, of course, be forecastwith complete accuracy. Thus a decision on reservoir timing will affectthe aggregate stored water supply at any point of time. Nevertheless,IACA's estimates of storage requirements were considered sufficientlyfirm to serve as a framework within which Chas. T. Main, the dam siteconsultant, could prepare his program for development of surface storage.
10.04 Given, then, the IACA requirements for stored water; giventhe operational assumptions on which those requirements are based;Chas. T. Main looked for a program or a series of programs which couldmeet the needs which IACA projected. The direction his work took wasinevitably governed by the hydrological factors affecting the IndusBasin. Analysis of those factors produced one inescapable conclusion:control of the Indus River itself would ultimately be essential to

- 113 -
control of the surface water supply. The Indus River carries 63 percentof the total surface water that is available to West Pakistan for develop-ment under the terms of the Indus Waters Treaty, 1960. And 72 percentof its flow occurs during the four-month period, June to September.Without storage, some large proportion of Indus water must inevitablyrun waste to the sea.
10.05 The series of canals, weirs and barrages in the Indus Basincomprises the largest single irrigation system in the world. A grossarea of about 38 million acres is commanded, with about 25 millionacres presently receiving irrigation water. Development has been agradual process; since the early 1920's canal-head diversions have beenincreased from some 38 MAF delivered annually to the present level ofaround 79 MAF. Recently, the Indus Basin Project has introduced a quali-tative change in the nature of surface water development. The commis-sioning in 1967 of Mangla Dam on the Jhelum River completes the firstmajor storage in West Pakistan. With the waters of the three easternrivers reserved exclus:ively to India after the transition period in ac-cordance with the Indus Waters Treaty, and with the surplus flows ofthe Jhelum largely preempted by Mangla, the logic of both past andpresent developments (referring particularly to the main stem barragesand the IBP link canals) would seem to dictate that the next step inthe orderly exploitation of the water resources of West Pakistan mustbe storage on the Indus.
10.06 This logic was recognized in the Bank Group's terms of refer-ence which required that as a first step toward a comprehensive studyof the water and power resources of West Pakistan a separate report onthe technical feasibility, the cost and benefit of the Tarbela Projectshould be prepared and given priority. And it was recognized in a verypractical sense when, because of the favorable conclusions in February1965 of the study of Tarbela in isolation, Tarbela became a feature ofthe development plan to be devised by the dam site consultant in thecomprehensive study.
Chas. T. Main's Recommended Program
10.07 The Chas. T. Main recommended program (see Table 64) may becharacterized in one sentence. It is designed to meet the anticipatedneeds of surface water storage with maximum economy and effectiveness.As far as the period up to 1975 is concerned, the Bank Group believesthat Chas. T. Main's recommendations should have the status of an"action program." Since both Mangla and Chasma are "on-going" projectsfixed in time, this is tantamount to saying that Tarbela must be builtby 1975. Chas. T. Main has indicated that, if the estimated need forstored water on the Indus in 1975 is to be met, there is no alternativeto Tarbela. For no other storage project of a similar magnitude, whichwould also transfer the irrigation development to the main stem of theIndus, is advanced enough in preparation and design to compete effec-tively with Tarbela by :1975.
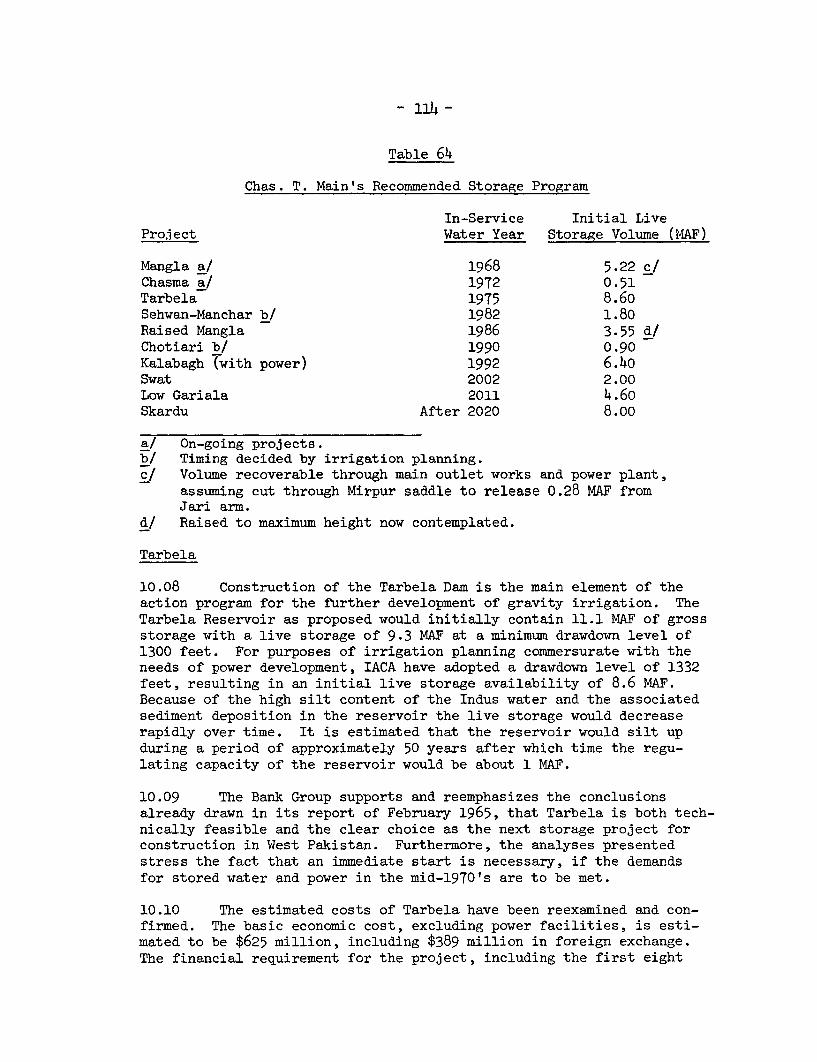
- 114 -
Table 64
Chas. T. Main's Recommended Storage Program
In-Service Initial LiveProject Water Year Storage Volume (MAF)
Mangla a/ 1968 5.22 c/Chasma a! 1972 0.51Tarbela 1975 8.60Sehwan-Manchar b/ 1982 1.80Raised Mangla 1986 3.55 d/Chotiari b/ 1990 0.90Kalabagh (with power) 1992 6.4oSwat 2002 2.00Low Gariala 2011 4.6oSkardu After 2020 8.00
a/ On-going projects.b/ Timing decided by irrigation planning.cl Volume recoverable through main outlet works and power plant,
assuming cut through Mirpur saddle to release 0.28 MAF fromJari arm.
d/ Raised to maximum height now contemplated.
Tarbela
10.08 Construction of the Tarbela Dam is the main element of theaction program for the further development of gravity irrigation. TheTarbela Reservoir as proposed would initially contain 11.1 MAF of grossstorage with a live storage of 9.3 MAF at a minimum drawdown level of1300 feet. For purposes of irrigation planning commersurate with theneeds of power development, IACA have adopted a drawdown level of 1332feet, resulting in an initial live storage availability of 8.6 MAF.Because of the high silt content of the Indus water and the associatedsediment deposition in the reservoir the live storage would decreaserapidly over time. It is estimated that the reservoir would silt upduring a period of approximately 50 years after which time the regu-lating capacity of the reservoir would be about 1 MAF.
10.09 The Bank Group supports and reemphasizes the conclusionsalready drawn in its report of February 1965, that Tarbela is both tech-nically feasible and the clear choice as the next storage project forconstruction in West Pakistan. Furthermore, the analyses presentedstress the fact that an immediate start is necessary, if the demandsfor stored water and power in the mid-1970's are to be met.
10.10 The estimated costs of Tarbela have been reexamined and con-firmed. The basic economic cost, excluding power facilities, is esti-mated to be $625 million, including $389 million in foreign exchange.The financial requirement for the project, including the first eight
- 115 -
generating units and a liberal provision for contingencies, would beabout $900 million, with a foreign exchange component- of about $555million. Without the generating units, but with a powerhouse to accom-modate four units, which would be a suitable minimum starting point,the financial requireiaents would be $815 million, with a foreignexchange component of $490 million.
10.11 The program described assumes the start of construction beforethe end of 1967, leading to partial filling of the reservoir towards theend of the flood season of 1974 for irrigation use in 1974/75 and theproduction of the first power in the early summer of 1975. Any delaywould result in a loss of agricultural production and a serious shortageof power.
Benefits
10.12 The Bank Group also concluded in its report of February 1965,that the return from the Tarbela Project to the economy from agricul-ture and power would be about 12 percent. Sir Alexander Gibb & Partnershave recalculated the return on the project at 13.3 percent, in the con-text of IACA's comprehensive study. They stress, however, that thisfigure assumes that a full supporting program of agricultural inputs isimplemented, otherwise the increase in production will be less and thereturn on the project will be reduced.
10.13 The Bank Group carried out additional studies to ascertainthe return from the Tarbela Project both as an integral part of WestPakistan's power system development as a whole and as an additionalsource of water fully integrated in the overall agricultural productionprocess. Though this analysis seems to indicate a somewhat lower rateof return, around 9 percent, the Bank Group still has no hesitation inconcluding that Tarbela is a sound investment for Pakistan.
10.14 The Bank Group undertook a further exercise to test the coststo the West Pakistan economy of a delay in the execution of the TarbelaProject. To carry out such an exercise the Bank Group evaluated a hypo-thetical water program which would provide sufficient alternative rabisupplies to compensate for a 10-year postponement of Tarbela. Thisprogram was formulated in such a way as to make it possible to assumethat, without alteration in the overall size of the public tubewell andcanal remodeling programs as proposed by IACA, but with a degree ofoverpumping and a modified surface storage development based on anearlier construction of the Sehwan-Manchar scheme and Raised Mangla,West Pakistan could attain the same gross value of agricultural outputin the reference years 1975 and 1985 as was projected with completionof Tarbela by 1975. The alternative program was also designed to meetStone & Webster's forecast of system-wide basic load together with IACA'srevised forecast of pumping loads. The Bank's calculations showed that,at the current exchange rate, the cost of delaying the construction ofTarbela from 1975 to 1985 would be in the order of Rs. 491 million($103 million) in present-worth terms, and about Rs. 226 million ($48million) if an exchange rate more nearly reflecting the scarcity offoreign exchange is used.
- 116 -
10.15 While the Bank Group thinks that such a hypothetical alter-native storage and power program may be technically feasible, it alsobelieves that the program formulated around the early completion of theTarbela Project has a degree of security that cannot be matched by anyalternative. The Tarbela Project has been extremely thoroughly inves-tigated so that the decision to complete it implies a fair degree ofcertainty that the reservoir's contribution to power and to irrigationsupplies will indeed become available as scheduled. In sum, the BankGroup believes that the above analysis provides a reasonable indicationof the savings attributable to the completion of Tarbela in 1975 ratherthan in 1985, except that it does not make allowance for the additionalvalue that should be attached to the greater degree of security thatattaches to the program formulated around the completion of the TarbelaProject by 1975.
10.16 Summarizing Tarbela's benefits, in purely physical terms, theBank Group has noted that the Tarbela Project will make a major contri-bution both to the projected incremental scarce rabi water supplies byregulating the natural river flows and to meeting the large power needsas projected. Of the total future increment in rabi water deliveriesto the farmers, from both ground and surface sources, Tarbela will by1985 contribute almost one quarter. Most of the 12,000 million kwh ofelectric energy which Tarbela would be capable of generating annually,would be absorbed relatively quickly into the system. In fact, in asituation where the present known gas reserves may soon be fully com-mitted, Tarbela will provide a badly needed supplement to potentialhydro and thermal power through 1985.
Post-Tarbela
10.17 As has been indicated, the Bank Group agrees that Tarbelashould be constructed as soon as possible and that Chas. T. Main'srecommendations up to 1975 should have the status of an "action program."The Bank Group also approves of the consultant's tentative recommenda-tions for the post-1975 period and is satisfied that a program basedthereon would meet by and large IACA's estimate of the future demand forstored water. However, it may transpire that water requirements growfaster than IACA envisaged. In such an event, then second-stage majorstorage would need to be completed earlier, say by the early or mid-1980's. In this case a firm decision would be needed on a specificproject by the early or mid-1970's.
10.18 For the post-Tarbela period Chas. T. Main has presented avariety of projects and a multiplicity of orders of developmentbecause of the many still existing uncertainties connected with lackof detailed knowledge of practically every scheme that was considered.One conclusion, houever, stands out, namely, that the most attractiveproject at this point for second-stage storage appears to be Kalabagh.If a firm decision has to be taken by the mid-1970's, considerablymore data on this project must be obtained as quickly as possible.
- 117 -
10.19 In the following paragraphs a summary is given of the maininformation available concerning the major storage works presented inthis volume, and how they fit into the "recommended program." It mustbe repeated here that all projects after Tarbela, with the exception ofRaised Mangla, are, in different degrees, at an early stage of investi-gation. Conditions different from those anticipated could result inlesser or greater costs. Thus the costs shown, although based on thebest engineering judgment of the facts known at this time, can only beused for comparing very provisionally the relative attractiveness ofprojects and for evaluating in general terms the price of a long-rangesurface storage program.
Sehwan-Manchar
10.20 Following Tarbela, the development of storage volume at SehwanBarrage and at Lake Manchar could fill some of the needs for surfacewater supply during the late 1970's or early 198 0's. The project, ex-cluding development at Chotiari Lake, could result in total storage ofup to 1.8 MAF at a cost between $177 and $221 million. Furthermore,since such a project might also reduce the cost of remodeling the upperend of the Nara and Rohri Canals, the net cost for storage might berelatively low. For these reasons, the Bank Group has included thisproject in the tentative storage program in 1982.
Raised Mangla
10.21 The Bank Group would agree with Chas. T. Main's schedulingin which Raised Mangla follows Sehwan-Manchar in 1986. All impoundingstructures presently under construction at Mangla are designed to permitraising the normal operating level of the reservoir from elevation 1202to 1250 feet. This raising would add 3.5 MAF to the live storage capac-ity of the reservoir, and also increase the permissible operating headfor power during certain times of the year. The most recent estimateof cost of increasing t'he capacity of the reservoir is about $217 mil-lion, of which $130 million is in foreign exchange. There are someuncertainties with regard to this project which require further investi-gation. In some years -the increased capacity would not fill completelybecause of the shortage of kharif flows in the Jhelum. Furthermore, inVolume IV, substantial doubt has been indicated with regard to the valueof power from Raised Mangla before 1990.
Kalabagh
10.22 At the present; state of knowledge, as indicated above,Kalabagh appears to be the most attractive choice for development ofmajor storage after Tarbela. In the Chas. T. Main program, Kalabagh(with power) would follow Sehwan-Manchar and Raised Mangla and bebuilt by 1992. The project as envisaged would create a reservoirwith a live storage capacity of 6.4 MAF and incorporate nine gener-ating units with an installed capacity of 1,125 mw. Chas. T. Main
- 18 -
estimated the most realistic cost for storage facilities at $540 mil-lion, of which $212 million would be in foreign exchange. The powerfacilties would cost about another $140 million.
10.23 Chas. T. Main studied a number of alternative solutions atKalabagh which would greatly affect costs. The consultant's studiesindicate that storage at Kalabagh would have a life of only between 25and 30 years. However, he also believes that a sluicing structure ispossible at the site; i.e., that the dam could be designed and operatedin such a way as to pass a large proportion of the river's sedimentload, thus substantially lengthening the reservoir's useful life. Thecost for such a dam, if feasible, would vary from a low of $526 millionto a high of $734 million. The Bank Group has expressed the opinionthat insufficient facts are known at this time to justify a firm con-clusion that a high, concrete buttress dam can be built at the Kalabaghsite, with sluicing capabilities. Studies to establish a basis forfirm judgement would take several years and the earliest completiondate of the project would be 1979. Furthermore, even if sluicing ispossible at Kalabagh, it seems probable that it would have only limitedadvantage during the life of Tarbela, since Tarbela would protect theproject for many years from large sediment input. In addition, ifKalabagh is operated for sluicing there would be no power output duringa number of months of each year. Since a non-sluicing Kalabagh couldgenerate some 6,100 million kwh of energy during a mean year, and havea firm capability in the low water season of 350 mw, the loss wouldbe substantial.
Swat
10.24 Chas. T. Main have proposed that a possible surface storagedevelopment could be constructed in the Swat River Valley (at Ambahar).Detailed studies have not yet been undertaken but preliminary investi-gations appear to show that storage could be accomplished by construc-ting a very high dam. Such a project, as outlined by Chas. T. Main onthe basis of relatively few data and preliminary reports, would createa reservoir with a gross storage capacity of 2.8 MAF of which 2.0 MAFwould be live, at a cost of $145 million. The Bank Group has empha-sized the lack of data, pointing out, for example, that records ofsediment in the Swat River are not even available. Nonetheless, forillustrative purposes, this project has been included in the recom-mended program for the end of the century.
Gariala
10.25 A project at Gariala on the Haro River has been recommendedfor the end of the century or later. This project could be constructedin two stages, the first stage having a live capacity of 4.6 MAF withthe possibility of a second stage adding 3.4 MAF. The power potentialwould probably not be great. Cost of the first stage of the project isestimated by Chas. T. Main to be $596 million. The second stage wouldcost an additional $84 million. If the project were carried out at onetime it would cost $651 million. Gariala would be filled each year by
- 119 -
the diversion of water from Tarbela after its reservoir had reached itshighest level. A very large canal would be required to convey thewater.
10.26 The Gariala Project appears to be the logical candidate fordetailed study for ofi'stream storage from Tarbela which may be essen-tial if its life is to be extended. The major drawback is its highcost. Subsurface geologic conditions for most of the length of GarialaDam and its large feeder canal are completely unknown. After detaileddata become available. a reexamination of the costs of the GarialaProject might show it to be prohibitively costly. Again for illustra-tive purposes, the project has been incorporated into the late yearsof the program.
Skardu
10.27 The most uncertain part of the program relates to the UpperIndus. Chas. T. Main believes that, in the Skardu Valley some 315miles to the north of Tarbela, it might be possible to construct alarge reservoir to regulate the entire flow in the upper reaches ofthe Indus River. The consultant estimated that in very rough termsit might cost between $427 million and $510 million for a 5.2 MAFreservoir and between $498 million and $588 million for an 8.0 MAFreservoir at that location. The area is presently difficult of accessand considerable exploratory work would be necessary before any projectcould be designed. But the Bank Group believes that development of theUpper Indus Valley for both power and water storage may be worthy ofserious consideration as part of the long-range plans of West Pakistan,although considerable general investigations will be necessary beforeit can even be determined whether detailed study is warranted.
Investigations
10.28 The Bank Group believes that the recommended program forsurface storage is a satisfactory starting point. However, whateversequence of projects ultimately is shown to be optimum, its develop-ment will be costly in both money and effort. It will take consider-able time and will tax heavily the technical capabilities that may beavailable. The lack of knowledge of the feasibility and cost of pos-sible projects makes early inauguration of an extensive program ofinvestigations imperative. The program should be designed firstly toincrease basic knowledge of the topography, hydrology and meteorologyof the Indus River system, particularly in the upper reaches, andsecondly to identify with assurance the next major dam site fromamong the several possibilities. Once the site is known a full in-vestigation of that site and design of the project should be initiated.The most rapid projection of the future demand for stored water shouldbe used as the basis for a program of investigations. Delays in theexecution of a project can be expensive but if detailed investigationhas not been completed delay may be inevitable. A wrong decision inthe choice of a project can also be extremely costly and only organized
- 120 -
and consistent investigations, begun now and continued over the years,can provide the basis for properly timed constructive decisions in thefuture.
Financial Requirements
10.29 Subject to all the reservations which were noted above,regarding the tentative nature of the projects, the Bank Group hasprepared estimates of the cost of the recommended 20-year program,including allowances for inflation and financial contingencies. Thisis shown in detail in Table 57 and summarized below in Table 65. Thetotal figure for the 20-year period 1965-85 of around $1.35 billion(with a foreign exchange component of around $750 million) excludesduties and taxes and interest during construction.
Table 65
Estimated Cost of Chas. T. Main's RecommendedProgram during Period 1965-85
(US$ million equivalent)
AmountForeign
Period Total Exchange
Third Plan 1965/66 - 1969/70 345.8 201.7Fourth Plan 1970/71 - 1974/75 437.4 260.6Fifth Plan 1975/76 - 1979/80 237.0 122.4Sixth Plan 1980/81 - 1984/85 329.5 168.9
Total 1,349.7 753.6

APPENDIX
TERM1S OF REFERENCE AND GUIDELINES
FOR
DAM SITE CONSULTANT

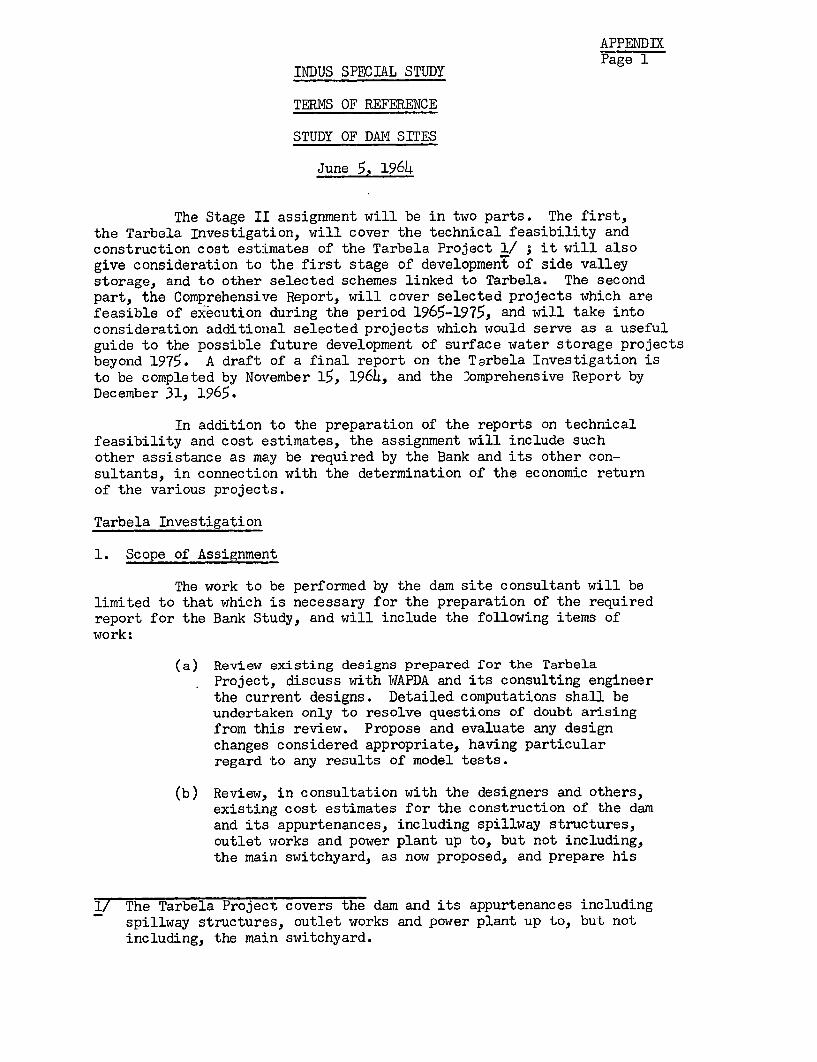
APPENDIK
INDUS SPECIAL STUDY Page 1
TERMS OF REFERENCE
STUDY OF DAM SITES
June 5, 1964
The Stage II assignment will be in two parts. The first,the Tarbela Investigation, will cover the technical feasibility andconstruction cost estimates of the Tarbela Project 1/ ; it will alsogive consideration to the first stage of development of side valleystorage, and to other selected schemes linked to Tarbela. The secondpart, the Comprehensive Report, will cover selected projects which arefeasible of execution during the period 1965-1975, and will take intoconsideration additional selected projects which would serve as a usefulguide to the possible future development of surface water storage projectsbeyond 1975. A draft of a final report on the Tarbela Investigation isto be completed by November 15, 1964, and the comprehensive Report byDecember 31, 1965.
In addition to the preparation of the reports on technicalfeasibility and cost estimates, the assignment will include suchother assistance as may be required by the Bank and its other con-sultants, in connection with the determination of the economic returnof the various projects.
Tarbela Investigation
1. Scope of Assignment
The work to be performed by the dam site consultant will belimited to that which is necessary for the preparation of the requiredreport for the Bank Study, and will include the following items ofwork:
(a) Review existing designs prepared for the TarbelaProject, discuss with WAPDA and its consulting engineerthe current designs. Detailed computations shall beundertaken only to resolve questions of doubt arisingfrom this review. Propose and evaluate any designchanges considered appropriate, having particularregard to any results of model tests.
(b) Review, in consultation with the designers and others,existing cost estimates for the construction of the damand its appurtenances, including spillway structures,outlet works and power plant up to, but not including,the main switchyard, as now proposed, and prepare his
1/ The Tarbela Project covers the dam and its appurtenances includingspillway structures, outlet works and power plant up to, but notincluding, the main switchyard.
APPENDIXPage 2
own cost estimates of construction. Compare resultsof the estimates and explain major differences. Theseestimates should be in sufficient detail to serve as abasis for investment decision. Reliable estimates ofthe annual operating costs of the project shall alsobe provided. Indicate separately the foreign currencycomponent of both investment and operating costs.
(c) Review present designs and cost estimates for alter-native heights of the dam, and prepare as necessaryother preliminary designs and cost estimates for thepurpose of developing a height versus cost relation-ship of the dam and reservoir, including stageddevelopment.
(d) In collaboration with the Bank's electric powerconsultants, review and if necessary modify, afterconsultation with the designers, the design and costestimates of the spillway structures, outlet worksand power plant up to, but not including, the mainswitchyard.
(e) Review and discuss such side valley storage siteswhich the Advisory Committee considers appropriate forextending the useful life of the Tarbela developmentand estimate their cost and value.
(f) Review and study: the siltation studies carried outto date, the probable pattern of silt deposition inthe reservoir, the prospects of passing some of thesilt through the reservoir, the probable nature ofsilt input into the proposed off-stream storage sites,facilities and methods for silt control.
(g) In particular, review and prepare as far as necessarythe tailrace water levels in relation to the designof the spillway stilling basin, the outlet works stil-ling basin, and the power house tailrace. Also prepareas necessary the backwater curves for studying theflooding effects, if any, at the head of the reservoir,for various heights of the dam.
(h) Review and study the designs and cost estimates ofsuch other storage projects on the Indus River asmay be agreed upon by the Advisory Committee, to theextent necessary to compare their contribution to thepower and irrigation system of West Pakistan as it isassumed to be in 1975, with the contribution thatTarbela could make.
(i) Prepare a report on the Tarbela Project, covering theitems set out in (a) to (h) above, and perform suchother work, in cooperation with the Bank and its other

APPENDIXPage 3
consultants, as may be necessary to ascertain theeconomic feasibility of the Tarbela Project.
2. Data to be Furnished by Others
To enable the dam site consultant to complete the work onTarbela as described above, within the time limits stated, the Bank orothers will endeavor:
(a) By May 25, 1964, to provide access to all reports pre-pared to date on Tarbela, including all back-up data andcomputations such as, but not limited to, hydrologiccomputations, hydraulic computations, stability analysesof the dam, test reports of physical properties of earthand rock construction materials, of foundation rocks andof soils, permeability and settlement characteristicsof the soils and rocks of the dam foundation and proposedembankment materials, and other similar information.In those instances where further detailed study is con-sidered necessary, arrangements will be made for reproduc-tion of the data.
(b) By June 15, 1964, to make similar arrangements relatedto such other projects as may be selected by the AdvisoryCommittee as indicated under 1(h) above.
(c) By June 1, 1964, to provide guidelines on methods ofcost determination including interest rate to be used.
(d) By August 1, 1964, to provide final inflow hydrographs,water release patterns, power release patterns, anddesign flood inflow hydrograph to be used for thisstudy.
(e) By' August 1, 1964, to provide final silt flow data,including correlation with rates of water flow, particlesize distribution compared with rates of water flow,and similar data for the purposes of making sedimentationstudies, density current studies, and similar studies.
(f) To make available reports and results of all model testson the proposed diversion arrangements and spillways atTarbela. Preliminary model tests should be completed,and reports thereon be available by October 1, 1964.
(g) To keep the consultants advised of any major changesin design and drawings.
3. Schedule for Tarbela Investigations
The dam site consultant shall commence work on the TarbelaInvestigation within 10 days of receipt of notice to proceed. A draftof a final report on the Tarbela Project shall be submitted by November15, 1964, and a final report by December 31, 1964.
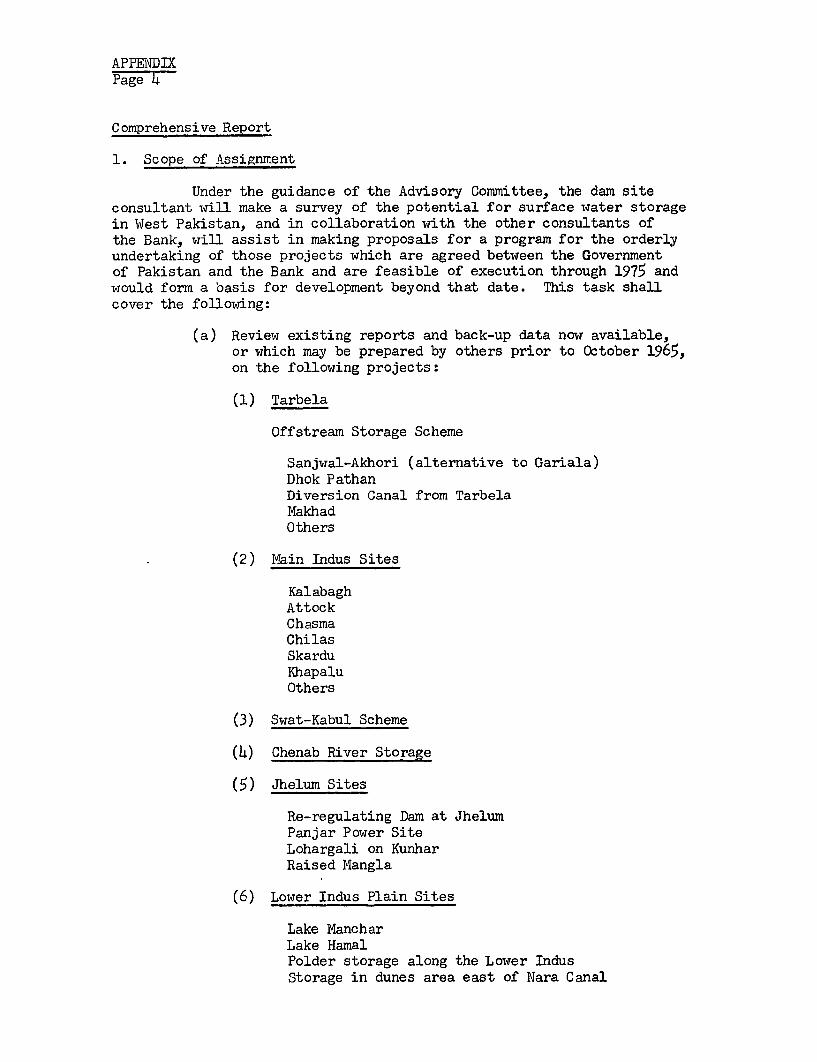
APPENDIXPage 4
Comprehensive Report
1. Scope of Assignment
Under the guidance of the Advisory Committee, the dam siteconsultant will make a survey of the potential for surface water storagein West Pakistan, and in collaboration with the other consultants ofthe Bank, will assist in making proposals for a program for the orderlyundertaking of those projects which are agreed between the Governmentof Pakistan and the Bank and are feasible of execution through 1975 andwould form a basis for development beyond that date. This task shallcover the following:
(a) Review existing reports and back-up data now available,or which may be prepared by others prior to October 1965,on the following projects:
(1) Tarbela
Offstream Storage Scheme
Sanjwal-Akhori (alternative to Gariala)Dhok PathanDiversion Canal from TarbelaMakhadOthers
(2) Main Indus Sites
KalabaghAttockChasmaChilasSkarduKhapaluOthers
(3) Swat-Kabul Scheme
(4) Chenab River Storage
(5) Jhelum Sites
Re-regulating Dam at JhelumPanjar Power SiteLohargali on KunharRaised Mangla
(6) Lower Indus Plain Sites
Lake MancharLake HamalPolder storage along the Lower IndusStorage in dunes area east of Nara Canal
APPENDIXPage 5
(b) To the extent that existing investigations are inade-quate, undertake, in agreement with the Bank, a limitedamount of field investigations at specific project sitesselected by the Advisory Committee.
(c) After review and study of the various projects which havebeen agreed between the Government of Pakistan and theBank, assist the Bank in collaboration with the Bank'sother consultants in preparation of a sound program forthe systematic development of the water and power resourcesof West Pakistan as far as needed for the Bank's Report.The degree to which each project in the program will haveto be studied will depend on the adequacy of the physicaldata that are available or can be obtained, and will beinfluenced by the project's position in the program.The degree of intensity of the studies will be determinedby the Bank from time to time during the course of thework on the advice of the Advisory Committee and on therecommendation of the Bank's consultants.
(d) Work with the Bank and its other consultants, asrequested, in preparing the Comprehensive Report.
2. Data to be Furnished by Others
To enable the dam site consultant to accomplish his portionof the work, the Bank or others will endeavor:
(a) By May 25, 1964, to provide copies of all existingreports and such back-up data as may reasonably berequired.
(b) By July 1, 1964, to provide aerial mosaics and stereopairs as necessary for dam and reservoir sites underconsideration.
(c) To provide topographic maps of dam and reservoir sitesselected by the Advisory Committee. These maps will befurnished progressively in a priority to be agreed withthe Bank between July 1, 1964 and January 1, 1965.
(d) To provide inflow hydrology, including silt flow,pattern of releases of water for irrigation and powergeneration, including peaking power patterns to be usedin the Bank Study, and the estimated changes in patternswith time. These data will be furnished as availableprogressively between August 1, 1964 and August 1, 1965.
(e) By May 15, 1965, to provide rate of growth of storedwater requirements.
(f) By May 15, 1965, to provide rate of growth of powergeneration requirements.

APPENDIXPage 6-
3. Schedule for Comprehensive Report
The dam site consultant shall commence work on the Compre-hensive Report within 10 days after receipt of the notice to proceed,but until the end of 1964 shall give priority to the work associatedwith the Tarbela Investigation. The final report shall be completedby December 31, 1965.
APPENDIXPage 7
Study of the Water and Power Resources of West Pakistan
Guidelines For That Part OfThe Comprehensive Study To Be Undertaken
ByThe Dam Sites Consultant
March 13, 1965
1. The dam site consultant shall undertake in 1965 the workoutlined for the Comprehensive Study as defined by his original Termsof Reference. The work involved in this assignment shall be con-sidered in two separate categories: (i) a detailed study of dam sitesfeasible of being constructed or started by 1975, and (ii) a surveyand identification of potential water storage projects for developmentbeyond 1975. Basic to the consultant's work shall be the understandingthat additional field work to include geological investigations, surveysand photography, is precluded by limitations of time and money.
2. The following guidelines are established within the frame-work of the Terms of Reference and shall be taken as indicative ofthe priorities which will control, unless changed by the Bank Groupupon recommendation of the Dam Sites Advisory Committee. A basicconsideration to govern the selection or identification of sitesshall be that Tarbela will be built according to a general timetableevolving from the Tarbela study. Specifically the work shall beundertaken as follows:
A. The studies of sedimentation in Tarbela Reservoirshall be updated and related to the needs for sidevalley storage.
B. Using new maps which will be available, studies shallbe made of problems relating to the diversion of flowfrom Tarbela to reservoirs on the Haro and Soan Riversand all related matters including conveyance channelsand dams.
C. Previous studies relating to a dam at Kalabagh shallbe reviewed and expanded in the light of consideringits potential usefulness for prolonging Tarbela'seffectiveness either by direct storage or by permittingpump storage to another reservoir in a side valley.These studies shall include the consideration of varioustypes of structure, including both earth and buttress,and shall result in estimates of relative costs. Back-water effects and sedimentation probabilities shall bedetermined.
APPENDIXPage
D. The effects of Mangla Dam and its reservoir shall bestudied to determine the value of additional storage andthe related cost of raising the structure. Studies re-lating to sediment inflow shall be brought up to date,employing data now available but not at the time earlierstudies were made. Effects of debris dams shall beassessed in this connection. Studies shall be made ofeffects to be derived from a re-regulatory' reservoirdownstream from Mangla, particularly with respect toits value in permitting generation of peaking power ati4angla.
E. Studies shall be discontinued of a dam at the Chasmasite and reviews only will be made of potentialsexisting on the Upper or Lower Indus, except as other-wise indicated. However, the feasibility or otherwiseof raising pond level of Chasma Barrage for temporarystorage should be studied so that the available potentialat that place is not lost.
As a result of the studies undertaken, a determination shallbe made of the physical data requirements for definite project reportsof the future and for subsequent design programs.
3. A primary purpose of the undertaking shall be to establish abroad program for comprehensive development of the water resources ofWest Pakistan with particular emphasis on the Indus Basin and to thisend priorities shall be established to serve as a basis for futureplanning.
4. In conformance with these guidelines for the study of damsites and the potentialities for developments associated therewith,the following assumptions and basic considerations shall serve as abasis for work by the dam site consultant
a. Scope of Assignment
Make a survey of the potential for surface waterstorage of the Indus Basin within West Pakistan.Make proposals for a program for the development ofprojects through 1975 and to form a basis for develop-ment beyond.
b. Basic Assumptions
Tarbela will be completed by 1973 or 1974. Low Manglawill be completed by 1967 or 1968. Groundwater pumpingwill be developed to the extent practicable for (i)drainage and (ii) water supply.Hydro power is needed for growth of the country,including power for pumping groundwater. No majorsurface water storage additional to that listed abovewill be needed (or in process of construction) before1975.
APPENDDIPage 9
c. Ultimate Potential of Streams
a. Indus at Attock 91.5 MAF average gross flow(i) Indus 69+ average gross flow(ii) Kabul-Swat 23+ average gross flow
b. Jhelum at Mangla 23+ average gross flowChenab at Marala 26+ average gross flow
5. The following dam sites will be studied and included in theComprehensive Report.
Indus River
(a) Tarbela and Side Valley Storage Appurtenent Thereto:
(i) Update the studies on Tarbela Reservoir sedimen-tation as it relates to sediment input to sidevalley storage. These include studies of thesedimentation processes in Siran Basin; physicalmeans for minimizing sediment input to SiranBasin, such as future debris barriers in TarbelaReservoir and upstream of Tarbela. Considerother possible means for extending the useful lifeof Tarbela Reservoir.
(ii) Update and expand studies for storage on the Haroand Soan Rivers by diversion from Tarbela, usingnew maps now available for the diversion canalsand reservoirs.
(iii) Determine sizes of canals required to fill Garialaand Dhok Pathan Reservoirs as water use grows onthe Indus Plains including the evaluation of finalconditions as nearly as can be estimated at thistime.
(b) Kalabagh
(i) Continue and expand studies on Kalabagh as adevelopment immediately following Tarbela andalso as following side valley developments,including studies of pumping to side valleystorage.
(ii) Study earth dam designs and cost estimates asalternatives to the multiple arch buttress damstudied for the Tarbela Report.
(iii) Study further the backwater effects of the reservoirand sedimentation that may be expected.
APPENDIXPage 10
(c) Upper Indus Sites
Additional studies of dam sites on the Indus aboveTarbela will be included in the Comprehensive Reportto the extent that additional reports and data maybecome available for review. Findings in the TarbelaReport are adequate from which to place the Upper Indussites in their proper relationship to other developmentson Indus and shall be fully presented.
(d) Chasma
Consideration of the Chasma site for a large storagedam shall be dropped for the time being. However,the possibilities of creating a temporary storage inconjunction with Chasma Barrage should be studied.
(e) Lower Indus
The potential for sizable surface storage downstreamfrom Chasma appears limited. Although a projectappears possible of development by pumping water di-verted from the Indus via Lake Manchar into a reservoiron Naing Nai, so far as determinable, no studies havebeen made for such a proposal. Limited studies willbe undertaken to ascertain the problems and value ofsuch a project as well as other projects for whichdata may be available.
Jhelum River
Mangla Dam
(i) Raising of Mangla Dam shall be studied to estimatethe value of additional storage on the Jhelum.Studies will include estimates of constructioncosts.
(ii) Sediment studies on the Jhelum shall be updated,using additional more reliable data obtainedsince previous reports on the subject were pre-pared.
(iii) Studies of means for extending the useful lifeof Mangla Reservoir will be updated and extendedto include all reasonable possibilities.
(iv) Re-regulating reservoirs have been proposed belowMangla. A check will be made as to the possibilities.
APPENDIXPage 11
Kabul-Swat Basin
Various possibilities for storage in the Kabul-Swat Basinshall be reviewed as directed by the Bank Group upon therecommendation of the Dam Sites Advisory Committee.
Chenab River
Studies of the Chiniot storage site shall be reviewed.
6. Hydro Power Sites
Investigations to date indicate the probability that additionalhydroelectric power beyond that now planned or in existence will not berequired in the near future. Therefore, studies relating to sitessolely for electric power development shall be limited to a review ofschemes already investigated.
7. Program for Implementing Project Development
The studies will determine the status of data needed tobring projects to the definite plan stage, and the ComprehensiveReport will include suggestions as to programs for developing the addi-tional data required.


ANNEX 1
TARBE,A PROJECT

ANNEX 1
LIST OF FIGURES
1. Reservoir Map
2. Tarbela Dam Project: Plan and Sections
3. Tarbela Dam Project: Outlet Rating Curves
4. Estimated Average Sediment Transport of IndusRiver at Darband
5. Tarbela Reservoir: Expected Storage Depletionby Sedimentation
6. Estimated Effect of Sediment Flow-through onTarbela Reservoir Depletion
7. Tarbela Dam Project: Tentative ConstructionSchedule Summary
8. Tarbela Dam: Estimated Contract Costs forEconomic Analysis
9. Tarbela Dam Cost Estimate for Economic Analysis

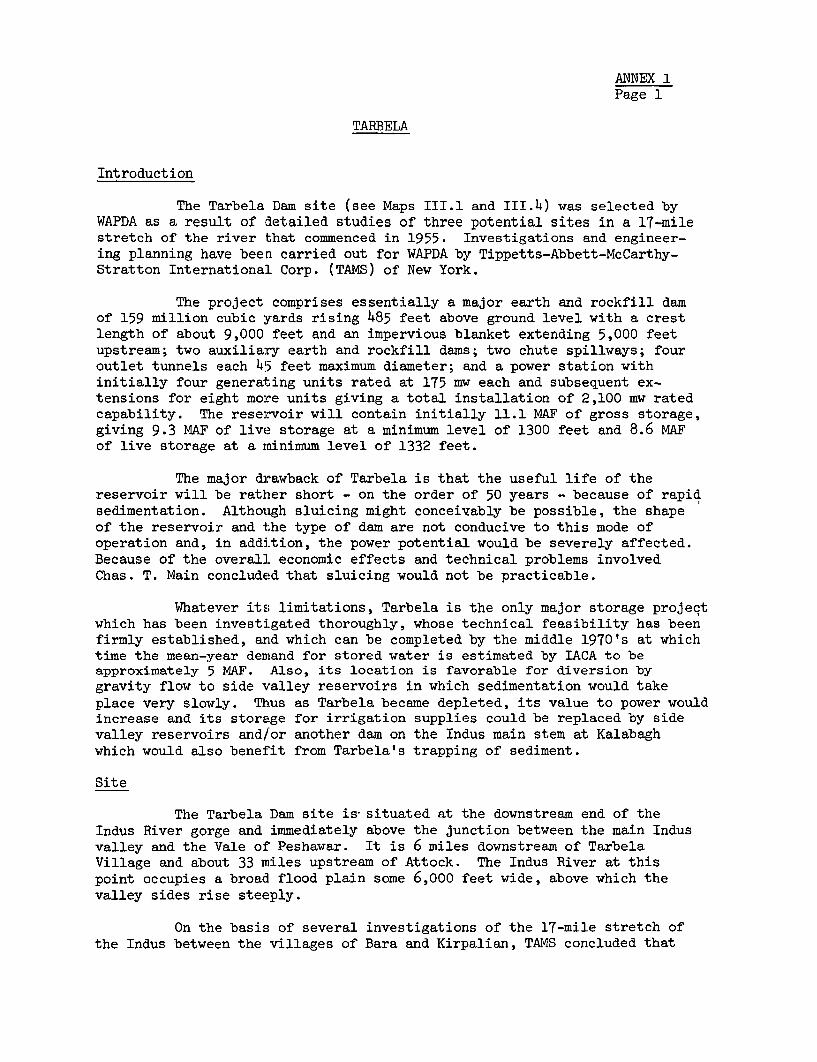
ANNEX 1Page 1
TARBELA
Introduction
The Tarbela Dam site (see Maps III.1 and III.4) was selected byWAPDA as a result of detailed studies of three potential sites in a 17-milestretch of the river that commenced in 1955. Investigations and engineer-ing planning have been carried out for WAPDA by Tippetts-Abbett-McCarthy-Stratton International Corp. (TAMS) of New York.
The project comprises essentially a major earth and rockfill damof 159 million cubic yards rising 485 feet above ground level with a crestlength of about 9,000 feet and an impervious blanket extending 5,000 feetupstream; two auxiliary earth and rockfill dams; two chute spillways; fouroutlet tunnels each 45 feet maximum diameter; and a power station withinitially four generating units rated at 175 mw each and subsequent ex-tensions for eight more units giving a total installation of 2,100 mw ratedcapability. The reservoir will contain initially 11.1 MAF of gross storage,giving 9.3 MAF of live storage at a minimum level of 1300 feet and 8.6 MAFof live storage at a mninimum level of 1332 feet.
The major drawback of Tarbela is that the useful life of thereservoir will be rather short - on the order of 50 years - because of rapidsedimentation. Although sluicing might conceivably be possible, the shapeof the reservoir and the type of dam are not conducive to this mode ofoperation and, in addition, the power potential would be severely affected.Because of the overall economic effects and technical problems involvedChas. T. Main concluded that sluicing would not be practicable.
Whatever its limitations, Tarbela is the only major storage projectwhich has been investigated thoroughly, whose technical feasibility has beenfirmly established, and which can be completed by the middle 1970's at whichtime the mean-year demand for stored water is estimated by IACA to beapproximately 5 MAF. Also, its location is favorable for diversion bygravity flow to side valley reservoirs in which sedimentation would takeplace very slowly. Thus as Tarbela became depleted, its value to power wouldincrease and its storage for irrigation supplies could be replaced by sidevalley reservoirs and/or another dam on the Indus main stem at Kalabaghwhich would also benefit from Tarbela's trapping of sediment.
Site
The Tarbela Dam site is situated at the downstream end of theIndus River gorge and immediately above the junction between the main Indusvalley and the Vale of Peshawar. It is 6 miles downstream of TarbelaVillage and about 33 miles upstream of Attock. The Indus River at thispoint occupies a broad flood plain some 6,000 feet wide, above which thevalley sides rise steeply.
On the basis of several investigations of the 17-mile stretch ofthe Indus between the villages of Bara and Kirpalian, TAMS concluded that
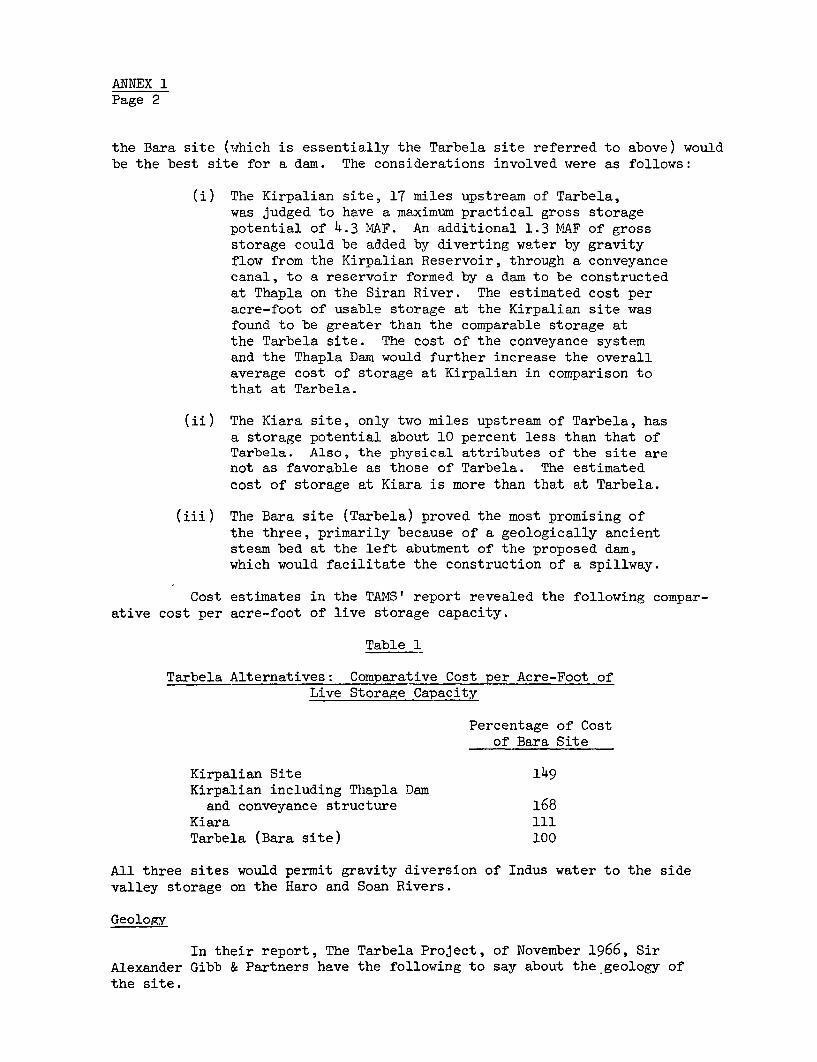
ANNEX 1Page 2
the Bara site (which is essentially the Tarbela site referred to above) wouldbe the best site for a dam. The considerations involved were as follows:
(i) The Kirpalian site, 17 miles upstream of Tarbela,was judged to have a maximum practical gross storagepotential of 4.3 MAF. An additional 1.3 M4AF of grossstorage could be added by diverting water by gravityflow from the Kirpalian Reservoir, through a conveyancecanal, to a reservoir formed by a dam to be constructedat Thapla on the Siran River. The estimated cost peracre-foot of usable storage at the Kirpalian site wasfound to be greater than the comparable storage atthe Tarbela site. The cost of the conveyance systemand the Thapla Dam would further increase the overallaverage cost of storage at Kirpalian in comparison tothat at Tarbela.
(ii) The Kiara site, only two miles upstream of Tarbela, hasa storage potential about 10 percent less than that ofTarbela. Also, the physical attributes of the site arenot as favorable as those of Tarbela. The estimatedcost of storage at Kiara is more than that at Tarbela.
(iii) The Bara site (Tarbela) proved the most promising ofthe three, primarily because of a geologically ancientsteam bed at the left abutment of the proposed dam,which would facilitate the construction of a spillway.
Cost estimates in the TAMS' report revealed the following compar-ative cost per acre-foot of live storage capacity.
Table 1
Tarbela Alternatives: Comparative Cost per Acre-Foot ofLive Storage Capacity
Percentage of Costof Bara Site
Kirpalian Site 149Kirpalian including Thapla Dam
and conveyance structure 168Kiara 111Tarbela (Bara site) 100
All three sites would permit gravity diversion of Indus water to the sidevalley storage on the Haro and Soan Rivers.
Geology
In their report, The Tarbela Project, of November 1966, SirAlexander Gibb & Partners have the following to say about the geology ofthe site.
ANNEX 1Page 3
The foundations of the various structures present a variety ofconditions which call for a range of foundation treatments. Foundationmaterials vary from hard rock to completely decomposed rock and alluvialdeposits.
The rocks of the dam site are predominantly low grade metamorphicand intrusive material, and, although thought to be from the same formation,the beds on the two sides of the river differ in some respects. Those onthe right bank are more strongly metamorphosed than on the left bank, anddifferences are observed in rock types. On the right bank the principalrock types are schists, limestones, and basic intrusives with minor bedsof quartzite and gypsum. On the left bank they are predominantly metamor-phosed thinly bedded marly limestones and slatey mudstones. Considerablejointing and minor faulting has occurred. The geological structure iscomplicated, with folding in two directions together with local doming.
An important feature of this dam site is the presence of deeppervious.alluvial filling across the river flood plain. The depth to bedrock ranges generally from 200 to 400 feet. The maximum measured at onelocation is nearly 600 feet. The bedrock below the alluvium has a veryirregular profile and is thought to contain an inactive fault along theright side of the valley. The alluvium is predominantly boulder-gravelwith elongated stones set in a sand filling.
The dam site is in a zone with occasional seismic activity forwhich due allowance is made in the design of both the main embankment damand its auxiliary structures.
Hydrology
Still quoting from the aforementioned Gibb report: No recordsare available for the dam site itself, but a river gauge was establishedin 1954 near Darband about 20 miles utrstream, and stage records have beentaken since then with the exception of 1959. Discharge measurements havebeen made since 1960, and these suggest that the rating is stable. Inorder to extend the period of record of river inflow, which is too shortto give reliable average values, comparisons have been made between therecords at Darband and Attock, where the discharge has been recorded since1868, over the concurrent period of record 1954-58 and 1960-64. As aresult the following values of the Darband - Attock ratios were establishedby TAMS as shown in Table 2.
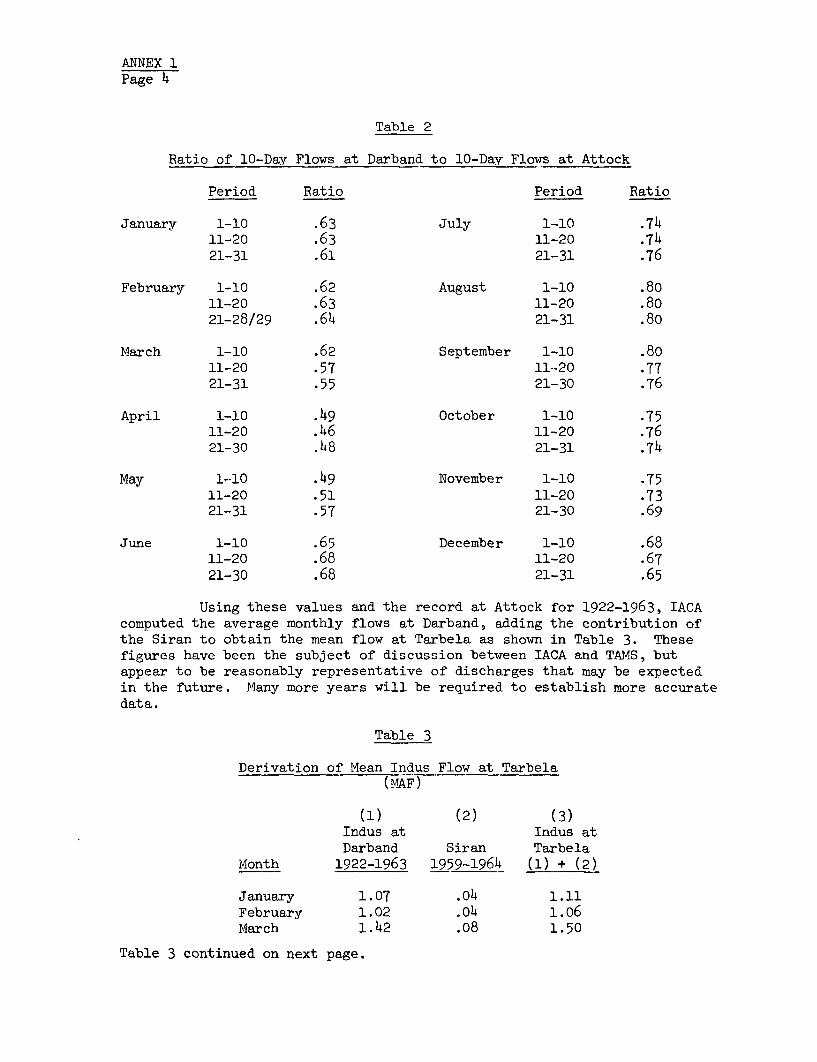
ANNEX 1Page 4
Table 2
Ratio of 10-Day Flows at Darband to 10-Day Flows at Attock
Period Ratio Period Ratio
January 1-10 .63 July 1-10 .7411-20 .63 11-20 .7421-31 .61 21-31 .76
February 1-10 .62 August 1-10 .8011-20 .63 11-20 .8021-28/29 .64 21-31 .80
March 1-10 .62 September 1-10 .8011-20 .57 11-20 .7721-31 .55 21-30 .76
April 1-10 .49 October 1-10 .7511-20 .46 11-20 .7621-30 .48 21-31 .74
May 1-10 .49 November 1-10 .7511-20 .51 11-20 .7321-31 .57 21-30 .69
June 1-10 .65 December 1-10 .6811-20 .68 11-20 .6721-30 .68 21-31 .65
Using these values and the record at Attock for 1922-1963, IACAcomputed the average monthly flows at Darband, adding the contribution ofthe Siran to obtain the mean flow at Tarbela as shown in Table 3. Thesefigures have been the subject of discussion between IACA and TAMS, butappear to be reasonably representative of discharges that may be expectedin the future. Many more years will be required to establish more accuratedata.
Table 3
Derivation of Mean Indus Flow at Tarbela(MAF)
(1) (2) (3)Indus at Indus atDarband Siran Tarbela
Month 1922-1963 1959-1964 (1) + (2)
January 1.07 .04 1.11February 1.02 .04 1.06March 1.42 .08 1.50
Table 3 continued on next page.
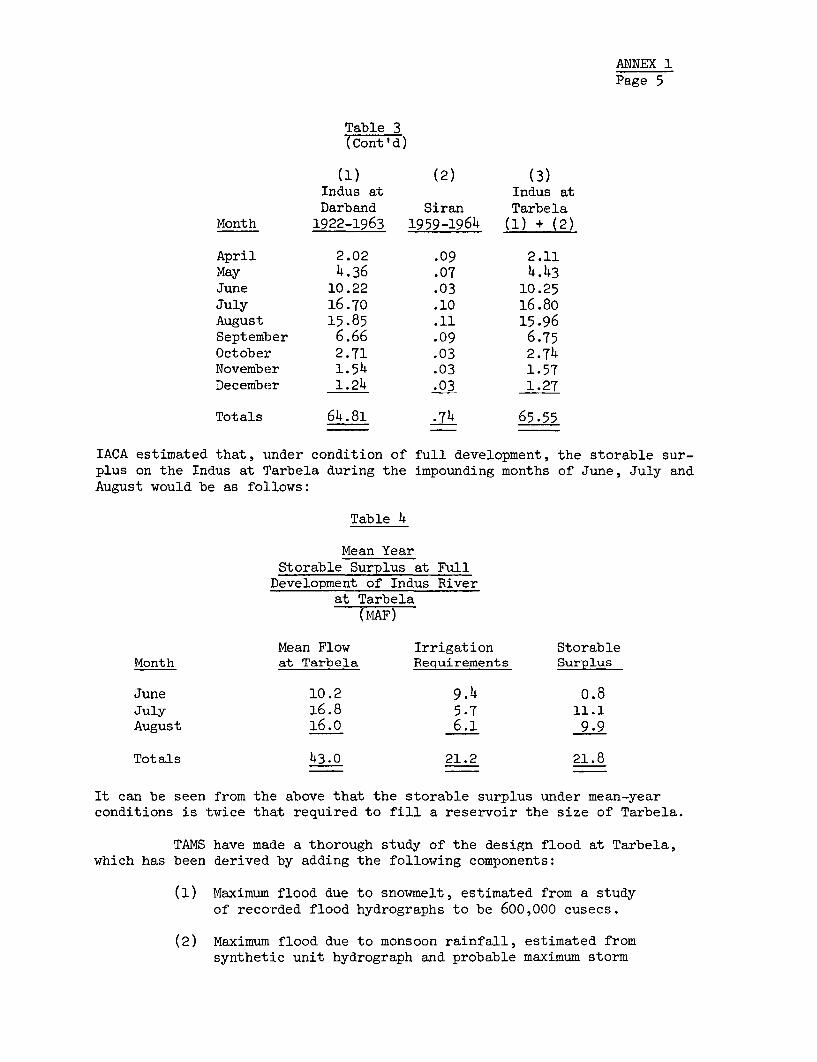
ANNEX 1Page 5
Table 3(Cont' )
(1) (2) (3)Indus at Indus atDarband Siran Tarbela
Month 1922-1963 1959-1964 (1) + (2)
April 2.02 .09 2.11
May 4.36 .07 4.43
June 10.22 .03 10.25
July 16.70 .10 16.80
August 15.85 .11 15.96
September 6.66 .09 6.75
October 2.71 .03 2.74November 1.54 .03 1.57
December 1.24 .03 1.27
Totals 64.81 .74 65.55
IACA estimated that, umder condition of full development, the storable sur-plus on the Indus at Tarbela during the impounding months of June, July andAugust would be as fo].lows:
Table 4
Mean YearStorable Surplus at Full
Development of Indus Riverat Tarbela
(MAF)
Mean Flow Irrigation StorableMonth at Tarbela Requirements Surplus
June 10.2 9.4 o.8
July 16.8 5.7 11.1August 16.0 6.1 9.9
Totals 43.0 21.2 21.8
It can be seen from the above that the storable surplus under mean-yearconditions is twice that required to fill a reservoir the size of Tarbela.
TAMS have made a thorough study of the design flood at Tarbela,which has been derived by adding the following components:
(1) Maximum flood due to snowmelt, estimated from a studyof recorded flood hydrographs to be 600,000 cusecs.
(2) Maximum flood due to monsoon rainfall, estimated fromsynthetic unit hydrograph and probable maximum storm
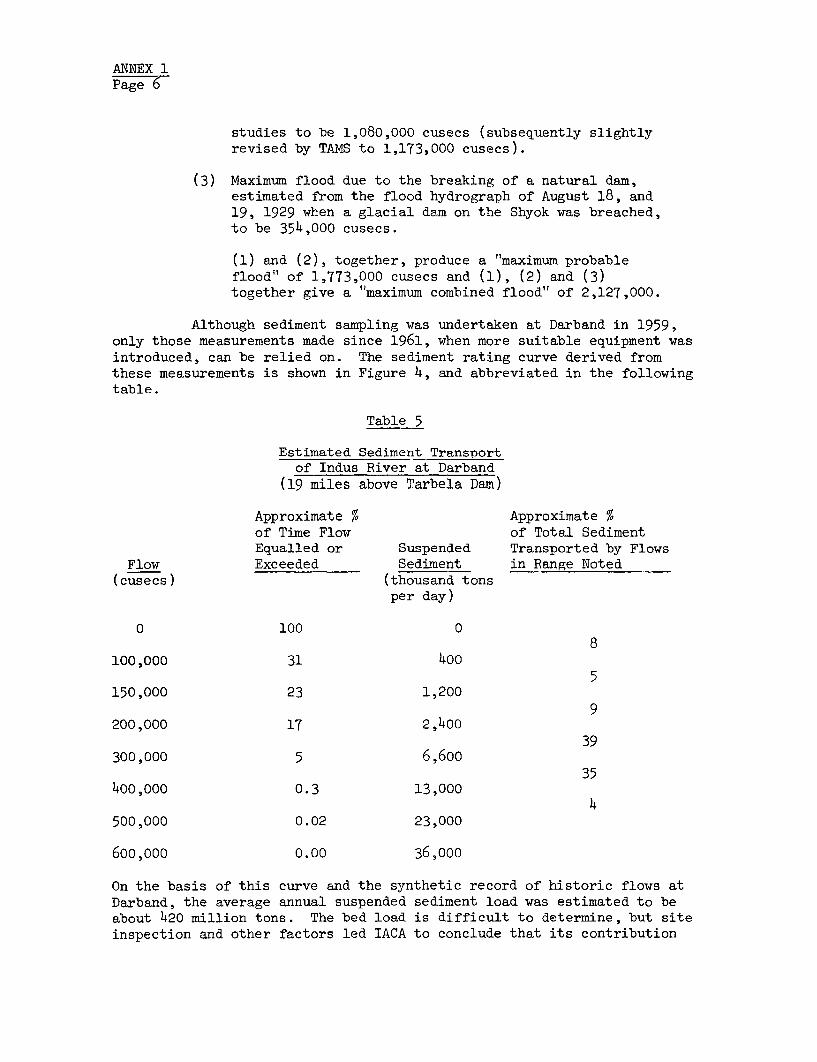
ANNEX 1Page 6
studies to be 1,080,000 cusecs (subsequently slightlyrevised by TAMS to 1,173,000 cusecs).
(3) Maximum flood due to the breaking of a natural dam,estimated from the flood hydrograph of August 18, and19, 1929 when a glacial dam on the Shyok was breached,to be 354,000 cusecs.
(1) and (2), together, produce a "maximum probableflood"' of 1,773,000 cusecs and (1), (2) and (3)together give a "maximum combined flood" of 2,127,000.
Although sediment sampling was undertaken at Darband in 1959,only those measurements made since 1961, when more suitable equipment wasintroduced, can be relied on. The seLiment rating curve derived fromthese measurements is shown in Figure 4, and abbreviated in the followingtable.
Table 5
Estimated Sediment Transportof Indus River at Darband
(19 miles above Tarbela Dam)
Approximate % Approximate %of Time Flow of Total SedimentEqualled or Suspended Transported by Flows
Flow Exceeded Sediment in Range Noted(cusecs) (thousand tons
per day)
0 100 08
100,000 31 4005
150,000 23 1,2009
200,000 17 2,40039
300,000 5 6,6oo35
400,000 0.3 13,0004
500,000 0.02 23,000
600,000 0.00 36,000
On the basis of this curve and the synthetic record of historic flows atDarband, the average annual suspended sediment load was estimated to beabout 420 million tons. The bed load is difficult to determine, but siteinspection and other factors led IACA to conclude that its contribution
ANNEX 1Page 7
is small when compared with the suspended load, and of the order of 5percent of the total. Total annual sediment transport is thus approxi-mately 440 million tons.
The progress of reservoir sedimentation at Tarbela should becarefully observed. The use of three independent but complementary methodsto measure the amount of sediment deposited in the reservoir was recommendedby Chas. T. Hain. First, the change in the reservoir storage-elevationcurve should be determined annually from the relation between measured changesin reservoir elevation and the corresponding volumes of water in storagecomputed as the difference between measured reservoir inflow and outflow.Second, direct measurements of the volume and density of the sediment depositsin the reservoir should be made periodically. Third, the unit weights ofsediment deposited in or scoured from the reservoir should be regularlycomputed as the difference between sediment inflow and sediment outflow. Atleast two new water and sediment discharge measuring stations, one above andone below the reservoir, are necessary for these measurements. The oneupstream of the reservoir should be established immediately. The use of airphotography for monitoring sedimentation should also be considered.
Status of Project
Between 1959 and 1965, more than $19.5 million were spent onintensive site investigations, preliminary works and design for the TarbelaProject. Subsurface investigations included 560 bore holes, totaling about100,000 feet; more than 25,000 feet of tunnels and 4,184 feet of trenches,varying in depth from 10 to 80 feet. In addition, more than 1,000 test pitshave been dug.
Further investigations continue. Drilling has been carried out inthe alluvial foundation for the main embankment to obtain further informationregarding its structure, composition, and permeability. Immediately afterthe main contract has been let, deep bores will be taken to confirm moreaccurately the depth of alluvium overlying bedrock. The foundations for thespillway flip buckets are being explored by means of tunnels and shafts.Exploratory tunnelling is continuing in the diversion tunnel area, particu-larly in the vicinity of the powerhouse foundations where a gypsiferousdeposit may be a potential hazard to concrete structures.
Hydraulic model tests have been made and are continuing. Natural'and distorted scale models of the Indus River in the vicinity of the TarbelaDam site, and of the spillways and outlet works stilling basins, have beenbuilt and are being tested at the Irrigation Research Station at Nandipur,West Pakistan. Model tests of the performance of the tunnels, both underdiversion and normal operating conditions and during filling of the reservoirand tunnel closure, have been conducted at the Colorado State UniversityHydraulic Laboratory near Fort Collins, Colorado. Further tests will benecessary to verify certain aspects and their performance.
The consultants (TAMS) for the Water and Power Development Authorityof West Pakistan have completed final designs and the tender documents for the
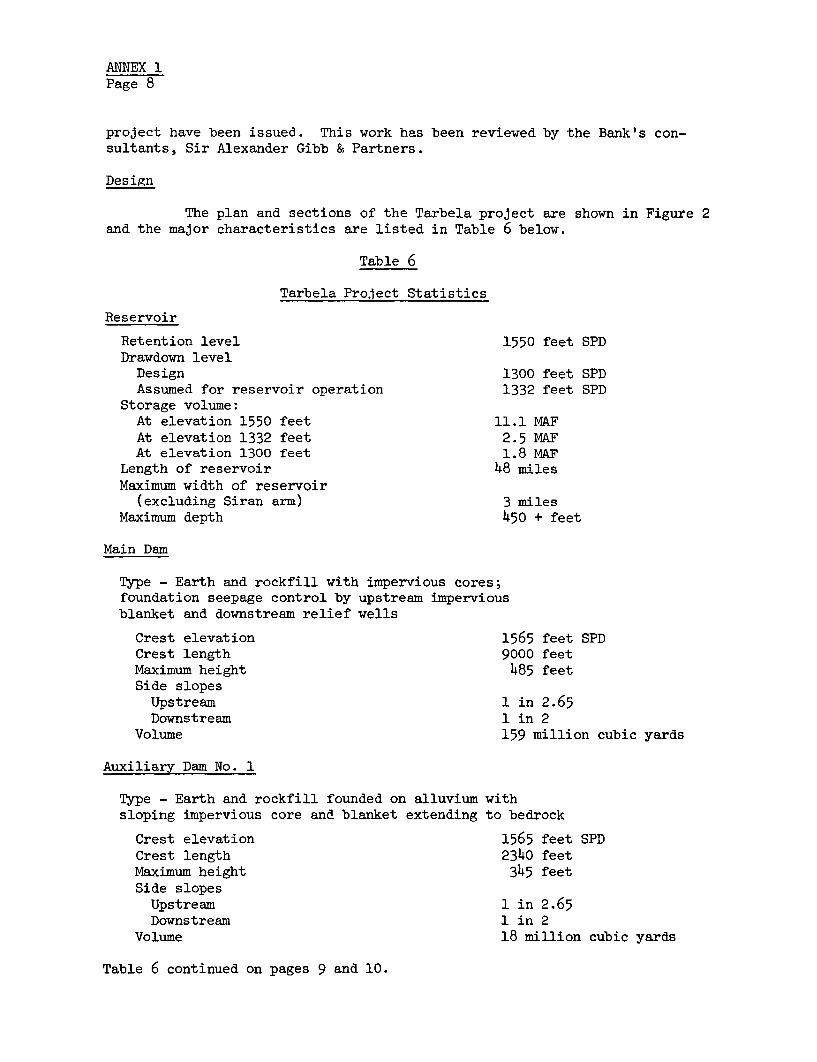
ANNEX 1Page 8
project have been issued. This work has been reviewed by the Bank's con-sultants, Sir Alexander Gibb & Partners.
Design
The plan and sections of the Tarbela project are shown in Figure 2and the major characteristics are listed in Table 6 below.
Table 6
Tarbela Project Statistics
Reservoir
Retention level 1550 feet SPDDrawdown level
Design 1300 feet SPDAssumed for reservoir operation 1332 feet SPD
Storage volume:At elevation 1550 feet 11.1 MAFAt elevation 1332 feet 2.5 MAFAt elevation 1300 feet 1.8 MAF
Length of reservoir 48 milesMaximum width of reservoir
(excluding Siran arm) 3 milesMaximum depth 450 + feet
Main Dam
Type - Earth and rockfill with impervious cores;foundation seepage control by upstream imperviousblanket and downstream relief wells
Crest elevation 1565 feet SPDCrest length 9000 feetMaximum height 485 feetSide slopesUpstream 1 in 2.65Downstream 1 in 2
Volume 159 million cubic yards
Auxiliary Dam No. 1
Type - Earth and rockfill founded on alluvium withsloping impervious core and blanket extending to bedrock
Crest elevation 1565 feet SPDCrest length 2340 feetMaximum height 345 feetSide slopesUpstream 1 in 2.65Downstream 1 in 2
Volume 18 million cubic yards
Table 6 continued on pages 9 and 10.
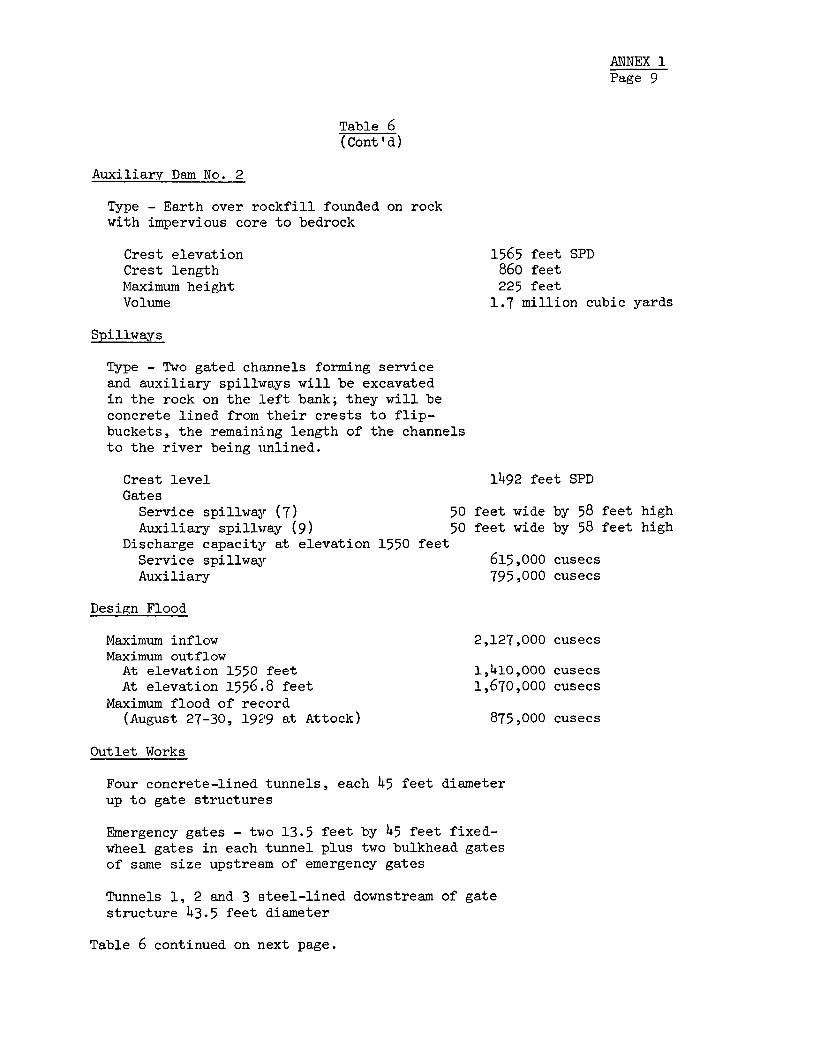
ANNEX 1Page 9
Table 6(Cont'd)
Auxiliary Dam No. 2
Type - Earth over rockfill founded on rockwith impervious core to bedrock
Crest elevation 1565 feet SPDCrest length 860 feetMaximum height 225 feetVolume 1.7 million cubic yards
Spillways
Type - Two gated channels forming serviceand auxiliary spillways will be excavatedin the rock on the Left bank; they will beconcrete lined from their crests to flip-buckets, the remaining length of the channelsto the river being unlined.
Crest level 1492 feet SPDGates
Service spillway (7) 50 feet wide by 58 feet highAuxiliary spillway (9) 50 feet wide by 58 feet high
Discharge capacity at elevation 1550 feetService spillway 615,000 cusecsAuxiliary 795,000 cusecs
Design Flood
Maximum inflow 2,127,000 cusecsMaximum outflow
At elevation 1550 feet 1,410,000 cusecsAt elevation 1556.8 feet 1,670,000 cusecs
Maximum flood of record(August 27-30, 19,29 at Attock) 875,000 cusecs
Outlet Works
Four concrete-lined tunnels, each 45 feet diameterup to gate structures
Emergency gates - two 13.5 feet by 45 feet fixed-wheel gates in each tunnel plus two bulkhead gatesof same size upstream of emergency gates
Tunnels 1, 2 and 3 steel-lined downstream of gatestructure 43.5 feet diameter
Table 6 continued on next page.
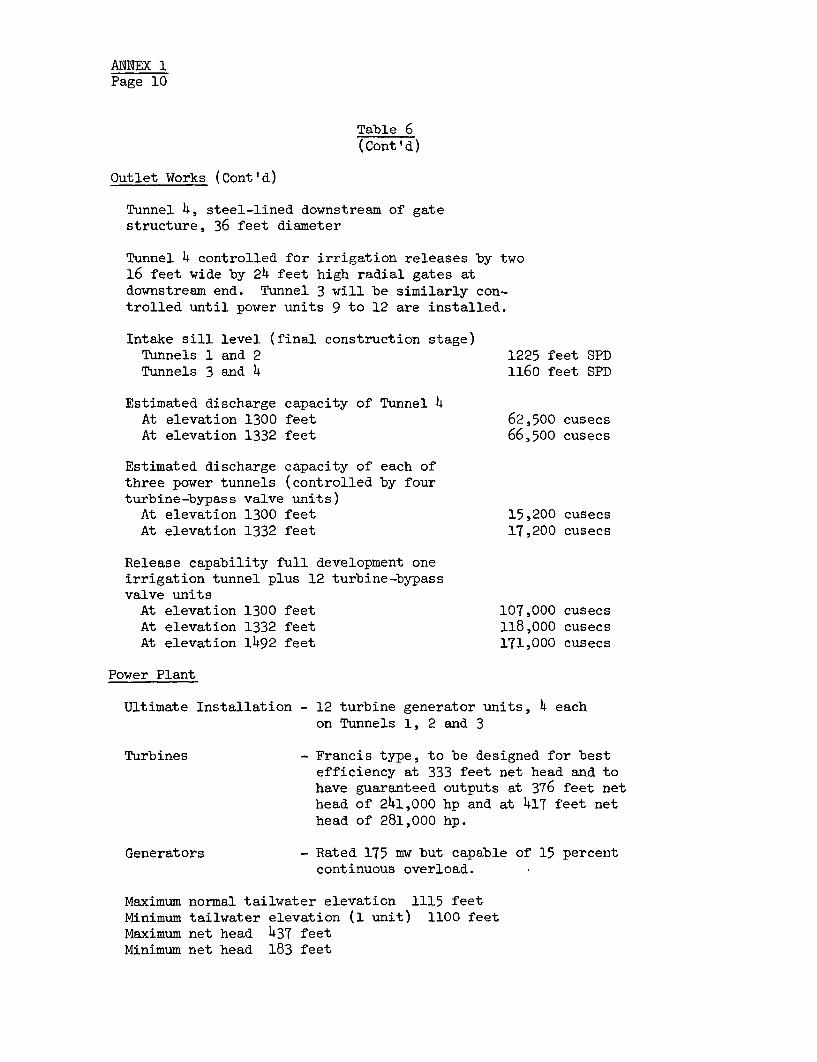
ANNEX 1Page 10
Table 6(ContI'd)
Outlet Works (Cont'd)
Tunnel 4, steel-lined downstream of gatestructure, 36 feet diameter
Tunnel 4 controlled for irrigation releases by two16 feet wide by 24 feet high radial gates atdownstream end. Tunnel 3 will be similarly con-trolled until power units 9 to 12 are installed.
Intake sill level (final construction stage)Tunnels 1 and 2 1225 feet SPDTunnels 3 and 4 1160 feet SPD
Estimated discharge capacity of Tunnel 4At elevation 1300 feet 62,500 cusecsAt elevation 1332 feet 66,500 cusecs
Estimated discharge capacity of each ofthree power tunnels (controlled by fourturbine-bypass valve units)
At elevation 1300 feet 15,200 cusecsAt elevation 1332 feet 17,200 cusecs
Release capability full development oneirrigation tunnel plus 12 turbine-bypassvalve units
At elevation 1300 feet 107,000 cusecsAt elevation 1332 feet 118,000 cusecsAt elevation 1492 feet 171,000 cusecs
Power Plant
Ultimate Installation - 12 turbine generator units, 4 eachon Tunnels 1, 2 and 3
Turbines - Francis type, to be designed for bestefficiency at 333 feet net head and tohave guaranteed outputs at 376 feet nethead of 241,000 hp and at 417 feet nethead of 281,000 hp.
Generators - Rated 175 mw but capable of 15 percentcontinuous overload.
Maximum normal tailwater elevation 1115 feetMinimum tailwater elevation (1 unit) 1100 feetMaximum net head 437 feetMinimum net head 183 feet
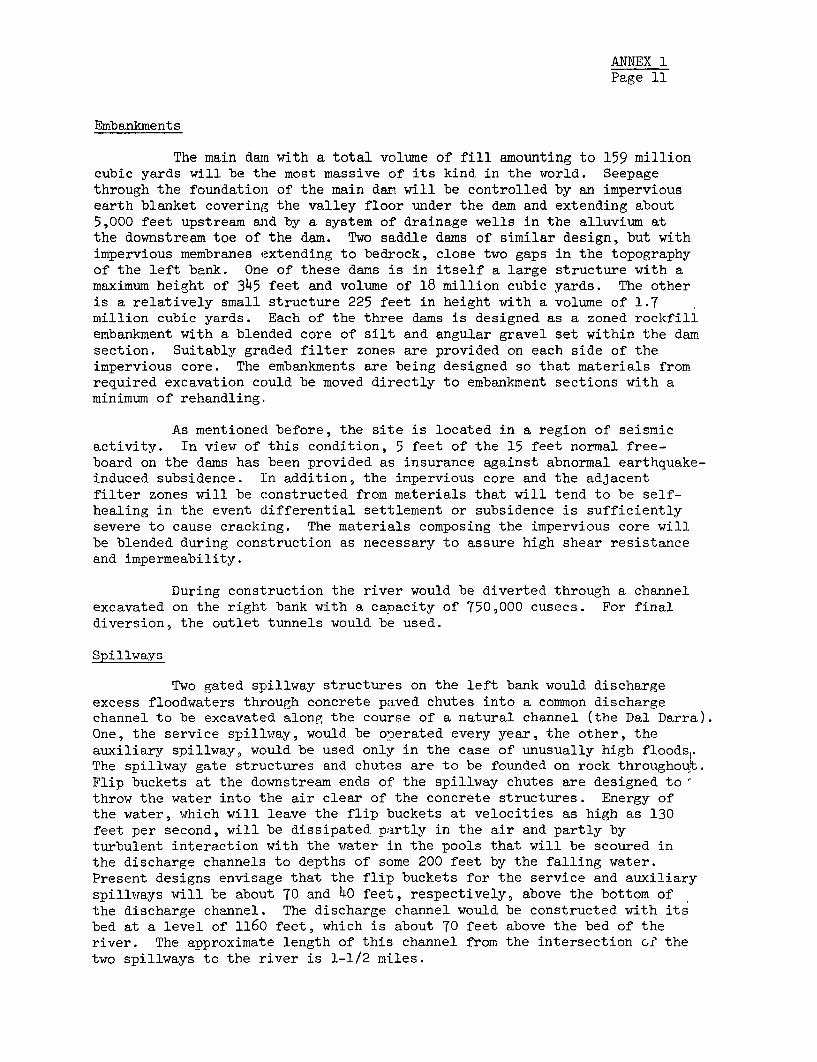
ANNEX 1Page 11
Embankments
The main dan with a total volume of fill amounting to 159 millioncubic yards will be the most massive of its kind in the world. Seepagethrough the foundation of the main dam will be controlled by an imperviousearth blanket covering the valley floor under the dam and extending about5,000 feet upstream and by a system of drainage wells in the alluvium atthe dowmstream toe of the dam. Two saddle dams of similar design, but withimpervious membranes extending to bedrock, close two gaps in the topographyof the left bank. One of these dams is in itself a large structure with amaximum height of 345 feet and volume of 18 million cubic yards. The otheris a relatively small structure 225 feet in height with a volume of 1.7million cubic yards. Each of the three dams is designed as a zoned rockfillembankment with a blended core of silt and angular gravel set within the damsection. Suitably graded filter zones are provided on each side of theimpervious core. The embankments are being designed so that materials fromrequired excavation could be moved directly to embankment sections with aminimum of rehandling..
As mentioned before, the site is located in a region of seismicactivity. In view of this condition, 5 feet of the 15 feet normal free-board on the dams has been provided as insurance against abnormal earthquake-induced subsidence. In addition, the impervious core and the adjacentfilter zones will be constructed from materials that will tend to be self-healing in the event differential settlement or subsidence is sufficientlysevere to cause cracking. The materials composing the impervious core willbe blended during construction as necessary to assure high shear resistanceand impermeability.
During construction the river would be diverted through a channelexcavated on the right bank with a capacity of 750,000 cusecs. For finaldiversion, the outlet tunnels would be used.
Spillways
Two gated spillway structures on the left bank would dischargeexcess floodwaters through concrete paved chutes into a common dischargechannel to be excavated along the course of a natural channel (the Dal Darra).One, the service spillway, would be o'erated every year, the other, theauxiliary spillway, would be used only in the case of unusually high floods,.The spillway gate structures and chutes are to be founded on rock throughout.Flip buckets at the downstream ends of the spillway chutes are designed tothrow the water into the air clear of the concrete structures. Energy ofthe water, which will leave the flip buckets at velocities as high as 130feet per second, will be dissipated partly in the air and partly byturbulent interaction with the water in the pools that will be scoured inthe discharge channels to depths of some 200 feet by the falling water.Present designs envisage that the flip buckets for the service and auxiliaryspillways will be about 70 and 40 feet, respectively, above the bottom ofthe discharge channel. The discharge channel would be constructed with itsbed at a level of 1160 feet, which is about 70 feet above the bed of theriver. The approximate length of this channel from the intersection of thetwo spillways to the river is 1-1/2 miles.
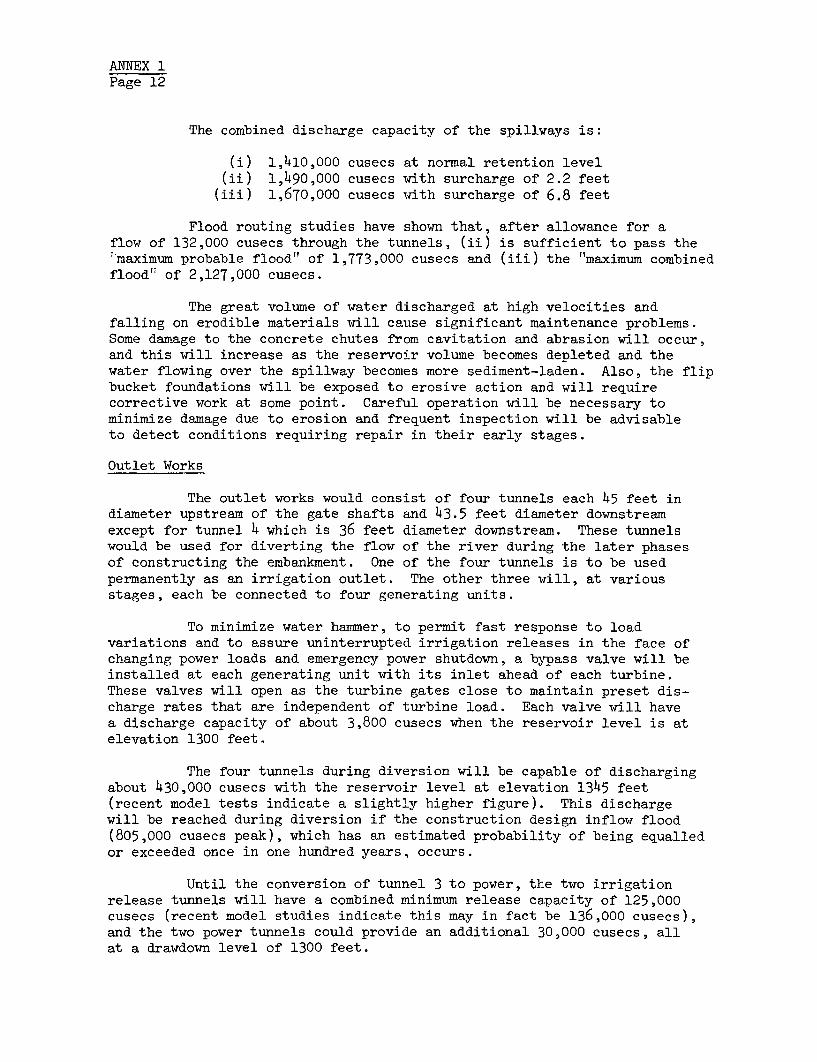
ANNEX 1Page 12
The combined discharge capacity of the spillways is:
(i) 1,410,000 cusecs at normal retention level(ii) 1,490,000 cusecs with surcharge of 2.2 feet
(iii) 1,670,000 cusecs with surcharge of 6.8 feet
Flood routing studies have shown that, after allowance for aflow of 132,000 cusecs through the tunnels, (ii) is sufficient to pass the'maximum probable flood" of 1,773,000 cusecs and (iii) the "maximum combinedflood' of 2,127,000 cusecs.
The great volume of water discharged at high velocities andfalling on erodible materials will cause significant maintenance problems.Some damage to the concrete chutes from cavitation and abrasion will occur,and this will increase as the reservoir volume becomes depleted and thewater flowing over the spillway becomes more sediment-laden. Also, the flipbucket foundations will be exposed to erosive action and will requirecorrective work at some point. Careful operation will be necessary tominimize damage due to erosion and frequent inspection will be advisableto detect conditions requiring repair in their early stages.
Outlet Works
The outlet works would consist of four tunnels each 45 feet indiameter upstream of the gate shafts and 43.5 feet diameter downstreamexcept for tunnel 4 which is 36 feet diameter downstream. These tunnelswould be used for diverting the flow of the river during the later phasesof constructing the embankment. One of the four tunnels is to be usedpermanently as an irrigation outlet. The other three will, at variousstages, each be connected to four generating units.
To minimize water hammer, to permit fast response to loadvariations and to assure uninterrupted irrigation releases in the face ofchanging power loads and emergency power shutdown, a bypass valve will beinstalled at each generating unit with its inlet ahead of each turbine.These valves will open as the turbine gates close to maintain preset dis-charge rates that are independent of turbine load. Each valve will havea discharge capacity of about 3,800 cusecs when the reservoir level is atelevation 1300 feet.
The four tunnels during diversion will be capable of dischargingabout 430,000 cusecs with the reservoir level at elevation 1345 feet(recent model tests indicate a slightly higher figure). This dischargewill be reached during diversion if the construction design inflow flood(805,000 cusecs peak), which has an estimated probability of being equalledor exceeded once in one hundred years, occurs.
Until the conversion of tunnel 3 to power, the two irrigationrelease tunnels will have a combined minimum release capacity of 125,000cusecs (recent model studies indicate this may in fact be 136,ooo cusecs),and the two power tunnels could provide an additional 30,000 cusecs, allat a drawdown level of 1300 feet.
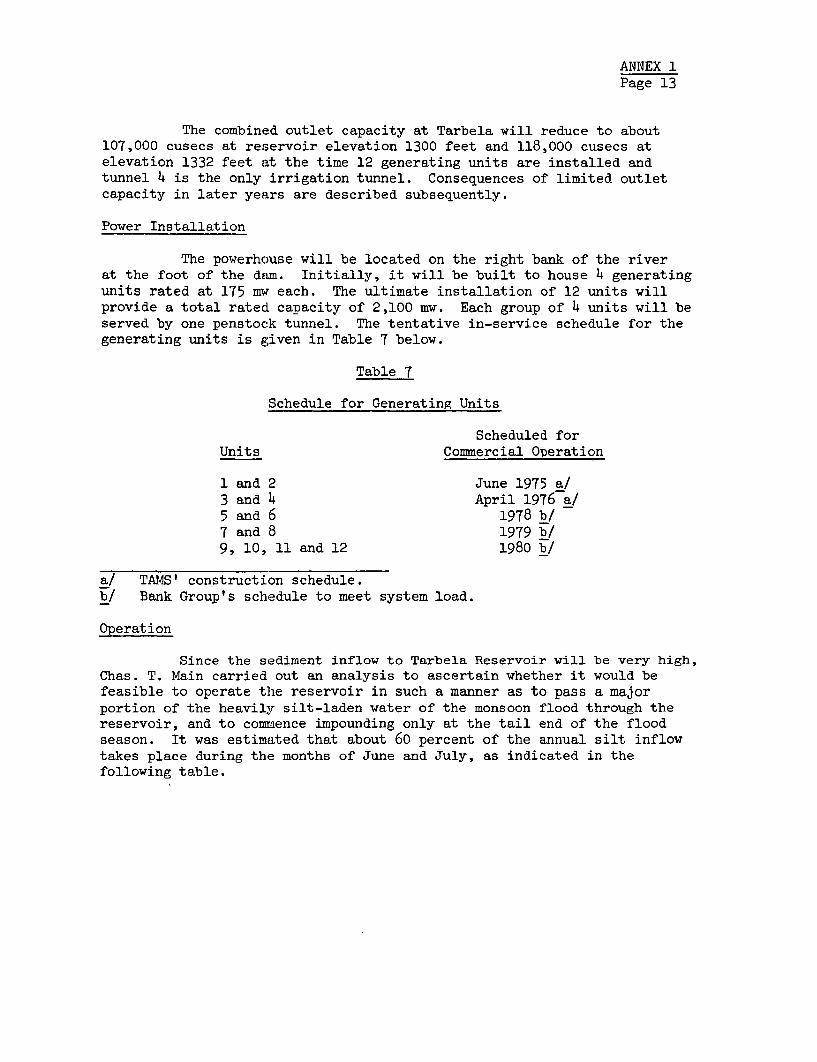
ANNEX 1Page 13
The combined outlet capacity at Tarbela will reduce to about107,000 cusecs at reservoir elevation 1300 feet and 118,000 cusecs atelevation 1332 feet at the time 12 generating units are installed andtunnel 4 is the only irrigation tunnel. Consequences of limited outletcapacity in later years are described subsequently.
Power Installation
The powerhouse will be located on the right bank of the riverat the foot of the dam. Initially, it will be built to house 4 generatingunits rated at 175 mw each. The ultimate installation of 12 units willprovide a total ratecL capacity of 2,100 mw. Each group of 4 units will beserved by one penstock tunnel. The tentative in-service schedule for thegenerating units is given in Table 7 below.
Table 7
Schedule for Generating Units
Scheduled forUnits Commercial Operation
1 and 2 June 1975 a/3 and 4 April 1976 a/5 and 6 1978 b/7 and 8 1979 b/9, 10, 11 and 12 1980 _/
a/ TAMS' construction schedule.b/ Bank Group's schedule to meet system load.
Operation
Since the sediment inflow to Tarbela Reservoir will be very high,Chas. T. Main carried out an analysis to ascertain whether it would befeasible to operate the reservoir in such a manner as to pass a majorportion of the heavily silt-laden water of the monsoon flood through thereservoir, and to commence impounding only at the tail end of the floodseason. It was estimated that about 60 percent of the annual silt inflowtakes place during the months of June and July, as indicated in thefollowing table.
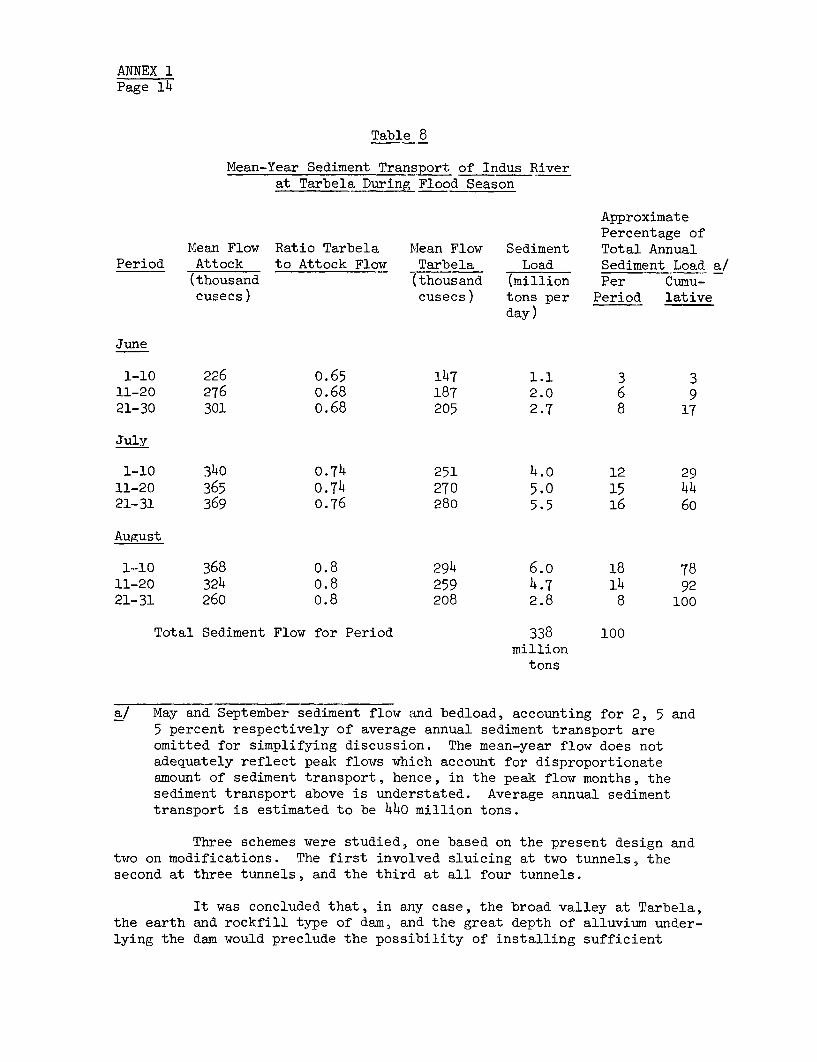
ANNEX 1Page 14
Table 8
Mean-Year Sediment Transport of Indus Riverat Tarbela During Flood Season
ApproximatePercentage of
Mean Flow Ratio Tarbela Mean Flow Sediment Total AnnualPeriod Attock to Attock Flow Tarbela Load Sediment Load a/
(thousand (thousand (million Per Cumu-cusecs) cusecs) tons per Period lative
day)
June
1-10 226 o.65 147 1.1 3 311-20 276 o.68 187 2.0 6 921-30 301 o.68 205 2.7 8 17
July
1-10 340 0.74 251 4.o 12 2911-20 365 0.74 270 5.0 15 4421-31 369 0.76 280 5.5 16 60
August
1-10 368 o.8 294 6.o 18 7811-20 324 o.8 259 4.7 14 9221-31 260 0.8 208 2.8 8 100
Total Sediment Flow for Period 338 100million
tons
a/ May and September sediment flow and bedload, accounting for 2, 5 and5 percent respectively of average annual sediment transport areomitted for simplifying discussion. The mean-year flow does notadequately reflect peak flows which account for disproportionateamount of sediment transport, hence, in the peak flow months, thesediment transport above is understated. Average annual sedimenttransport is estimated to be 440 million tons.
Three schemes were studied, one based on the present design andtwo on modifications. The first involved sluicing at two tunnels, thesecond at three tunnels, and the third at all four tunnels.
It was concluded that, in any case, the broad valley at Tarbela,the earth and rockfill type of dam, and the great depth of alluvium under-lying the dam would preclude the possibility of installing sufficient
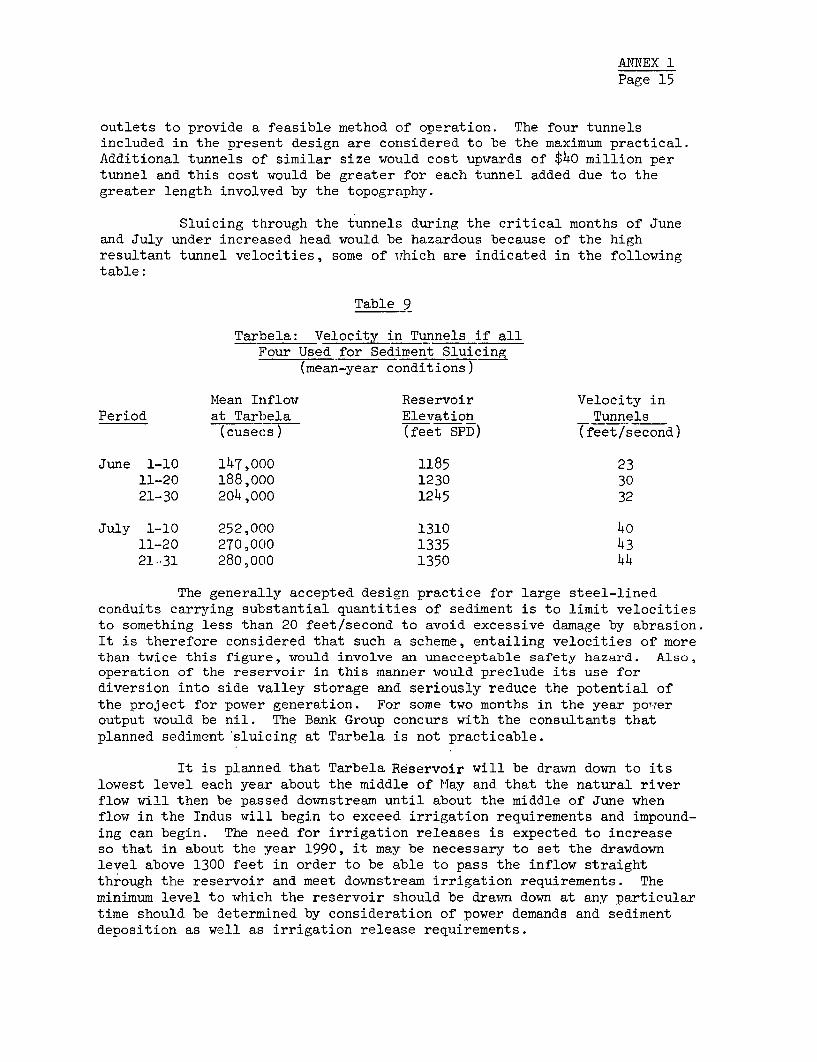
ANNEX 1Page 15
outlets to provide a feasible method of operation. The four tunnelsincluded in the present design are considered to be the maximum practical.Additional tunnels of similar size would cost upwards of $40 million pertunnel and this cost would be greater for each tunnel added due to thegreater length involved by the topography.
Sluicing through the tunnels during the critical months of Juneand July under increased head would be hazardous because of the highresultant tunnel velocities, some of rhich are indicated in the followingtable:
Table 9
Tarbela: Velocity in Tunnels if allFour Used for Sediment Sluicing
(mean-year conditions)
Mean Inflow Reservoir Velocity inPeriod at Tarbela Elevation Tunnels
(cusecs) (feet SPD) (feet/second)
June 1-10 147,000 1185 2311-20 188,000 1230 3021-30 204,000 1245 32
July 1-10 252,000 1310 4011-20 270 ,000 1335 4321- 31 280,000 1350 44
The generally accepted design practice for large steel-linedconduits carrying substantial quantities of sediment is to limit velocitiesto something less than 20 feet/second to avoid excessive damage by abrasion.It is therefore considered that such a scheme, entailing velocities of morethan twice this figure, would involve an unacceptable safety hazard. Also,operation of the reservoir in this manner would preclude its use fordiversion into side valley storage and seriously reduce the potential ofthe project for power generation. For some two months in the year poweroutput would be nil. The Bank Group concurs with the consultants thatplanned sediment sluicing at Tarbela is not practicable.
It is planned that Tarbela Reservoir will be drawn down to itslowest level each year about the middle of May and that the natural riverflow will then be passed downstream until about the middle of June whenflow in the Indus will begin to exceed irrigation requirements and impound-ing can begin. The need for irrigation releases is expected to increaseso that in about the year 1990, it may be necessary to set the drawdownlevel above 1300 feet in order to be able to pass the inflow straightthrough the reservoir and meet downstream irrigation requirements. Theminimum level to which the reservoir should be drat.m down at any particulartime should be determined by consideration of power demands and sedimentdeposition as well as irrigation release requirements.
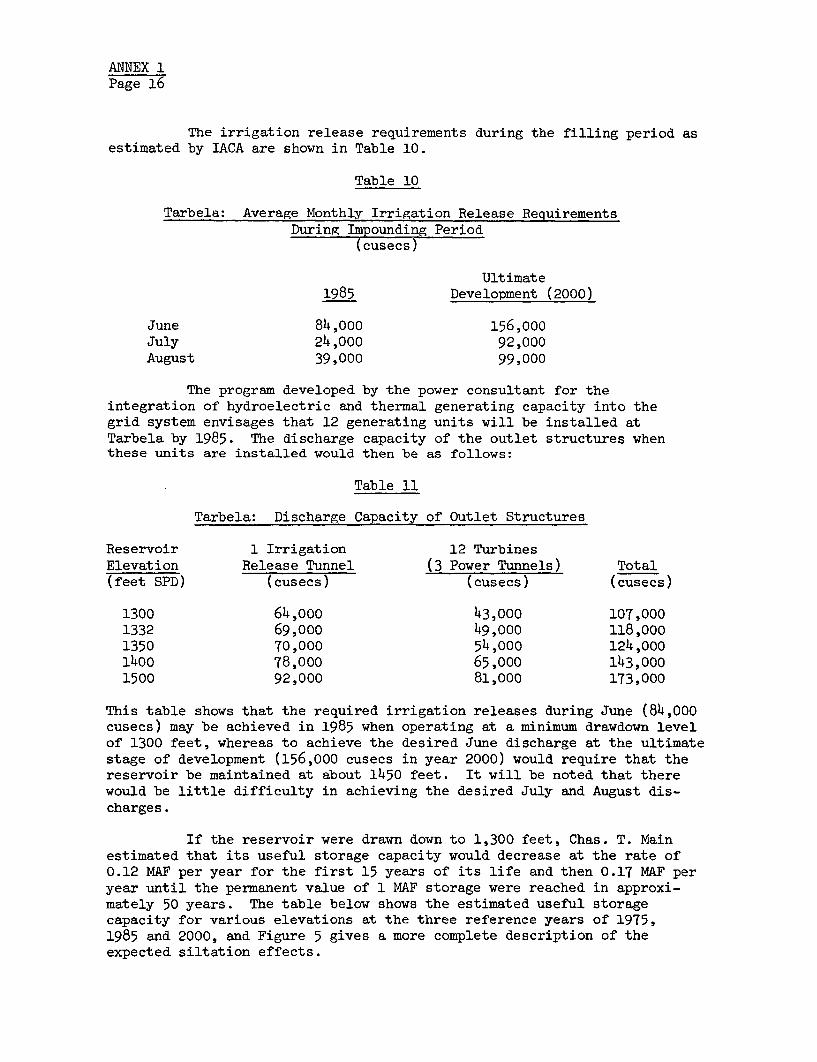
ANNEX 1Page 16
The irrigation release requirements during the filling period asestimated by IACA are shown in Table 10.
Table 10
Tarbela: Average Monthly Irrigation Release RequirementsDuring Impounding Period
(cusecs)
Ultimate1985 Development (2000)
June 84,ooo 156,oooJuly 24,000 92,000August 39,000 99,000
The program developed by the power consultant for theintegration of hydroelectric and thermal generating capacity into thegrid system envisages that 12 generating units will be installed atTarbela by 1985. The discharge capacity of the outlet structures whenthese units are installed would then be as follows:
Table 11
Tarbela: Discharge Capacity of Outlet Structures
Reservoir 1 Irrigation 12 TurbinesElevation Release Tunnel (3 Power Tunnels) Total(feet SPD) (cusecs) (cusecs) (cusecs)
1300 64,000 43,000 107,0001332 69,000 49,000 118,0001350 70,000 54,ooo 124,0001400 78,000 65,000 143,0001500 92,000 81,00o 173,000
This table shows that the required irrigation releases during June (84,000cusecs) may be achieved in 1985 when operating at a minimum drawdown levelof 1300 feet, whereas to achieve the desired June discharge at the ultimatestage of development (156,000 cusecs in year 2000) would require that thereservoir be maintained at about 1450 feet. It will be noted that therewould be little difficulty in achieving the desired July and August dis-charges.
If the reservoir were drawn down to 1,300 feet, Chas. T. Mainestimated that its useful storage capacity would decrease at the rate of0.12 MAF per year for the first 15 years of its life and then 0.17 MAF peryear until the permanent value of 1 MAF storage were reached in approxi-mately 50 years. The table below shows the estimated useful storagecapacity for various elevations at the three reference years of 1975,1985 and 2000, and Figure 5 gives a more complete description of theexpected siltation effects.
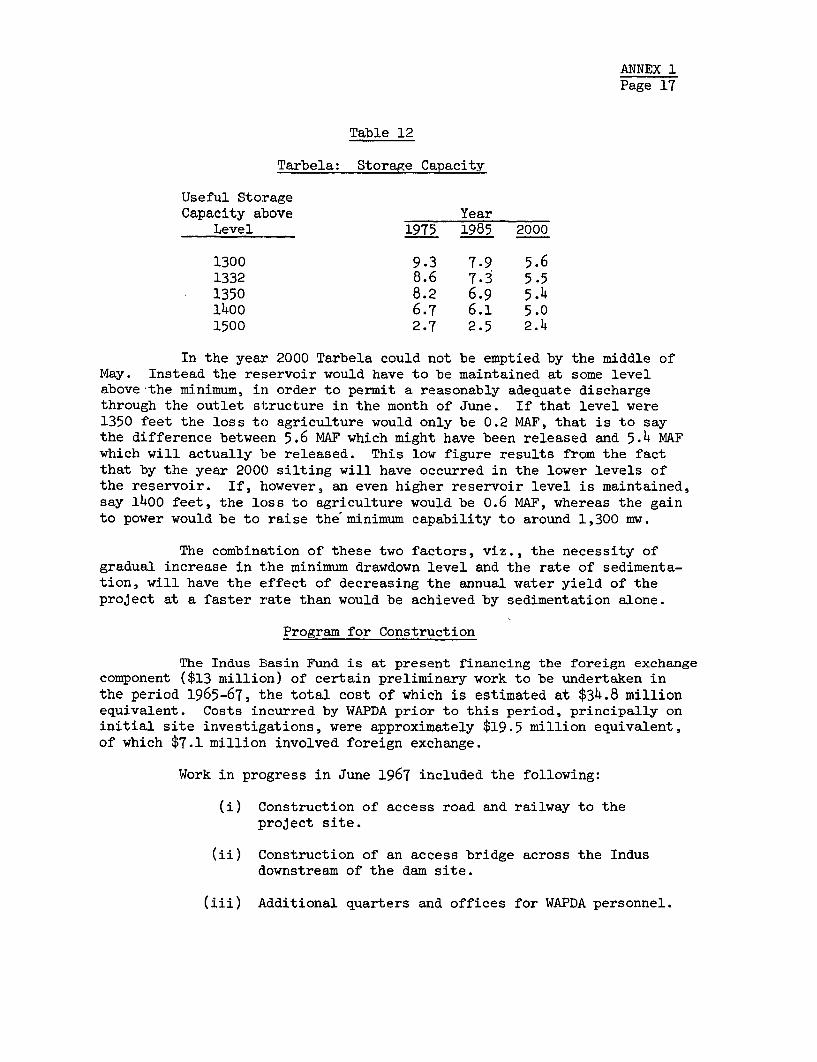
ANNEX 1Page 17
Table 12
Tarbela: Storage Capacity
Useful StorageCapacity above Year
Level 1975 1985 2000
1300 9.3 7.9 5.61332 8.6 7.3 5.51350 8.2 6.9 5.414oo 6.7 6.1 5.01500 2.7 2.5 2.4
In the year 2000 Tarbela could not be emptied by the middle ofMay. Instead the reservoir would have to be maintained at some levelabove the minimum, in order to permit a reasonably adequate dischargethrough the outlet structure in the month of June. If that level were1350 feet the loss to agriculture would only be 0.2 MAF, that is to saythe difference between 5.6 MAF which might have been released and 5.4 MAFwhich will actually be released. This low figure results from the factthat by the year 2000 silting will have occurred in the lower levels ofthe reservoir. If, however, an even higher reservoir level is maintained,say 1400 feet, the loss to agriculture would be 0.6 MAF, whereas the gainto power would be to raise the minimum capability to around 1,300 mw.
The combination of these two factors, viz., the necessity ofgradual increase in the minimum drawdown level and the rate of sedimenta-tion, will have the effect of decreasing the annual water yield of theproject at a faster rate than would be achieved by sedimentation alone.
Program for Construction
The Indus Basin Fund is at present financing the foreign exchangecomponent ($13 million) of certain preliminary work to be undertaken inthe period 1965-67, the total cost of which is estimated at $34.8 millionequivalent. Costs incurred by WAPDA prior to this period, principally oninitial site investigations, were approximately $19.5 million equivalent,of which $7.1 million involved foreign exchange.
Work in progress in June 1967 included the following:
(i) Construction of access road and railway to theproject site.
(ii) Construction of an access bridge across the Indusdownstream of the dam site.
(iii) Additional quarters and offices for WAPDA personnel.
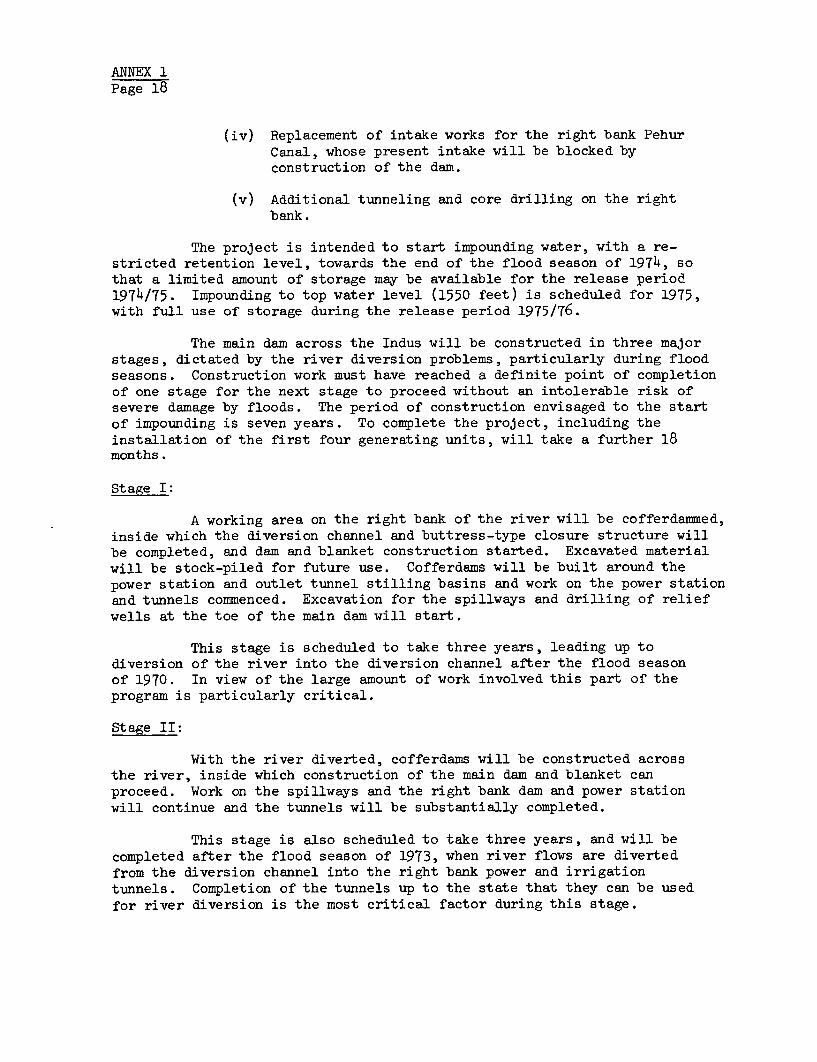
ANNEX 1Page 18
(iv) Replacement of intake works for the right bank PehurCanal, whose present intake will be blocked byconstruction of the dam.
(v) Additional tunneling and core drilling on the rightbank.
The project is intended to start impounding water, with a re-stricted retention level, towards the end of the flood season of 1974, sothat a limited amount of storage may be available for the release period1974/75. Impounding to top water level (1550 feet) is scheduled for 1975,with full use of storage during the release period 1975/76.
The main dam across the Indus will be constructed in three majorstages, dictated by the river diversion problems, particularly during floodseasons. Construction work must have reached a definite point of completionof one stage for the next stage to proceed without an intolerable risk ofsevere damage by floods. The period of construction envisaged to the startof impounding is seven years. To complete the project, including theinstallation of the first four generating units, will take a further 18months.
Stage I:
A working area on the right bank of the river will be cofferdammed,inside which the diversion channel and buttress-type closure structure willbe completed, and dam and blanket construction started. Excavated materialwill be stock-piled for future use. Cofferdams will be built around thepower station and outlet tunnel stilling basins and work on the power stationand tunnels commenced. Excavation for the spillways and drilling of reliefwells at the toe of the main dam will start.
This stage is scheduled to take three years, leading up todiversion of the river into the diversion channel after the flood seasonof 1970. In view of the large amount of work involved this part of theprogram is particularly critical.
Stage II:
With the river diverted, cofferdams will be constructed acrossthe river, inside which construction of the main dam and blanket canproceed. Work on the spillways and the right bank dam and power stationwill continue and the tunnels will be substantially completed.
This stage is also scheduled to take three years, and will becompleted after the flood season of 1973, when river flows are divertedfrom the diversion channel into the right bank power and irrigationtunnels. Completion of the tunnels up to the state that they can be usedfor river diversion is the most critical factor during this stage.
ANNEX 1Page 19
Stage III:
Following the closing of the gates in the buttress-type closurestructure the downstream end of the diversion channel will be coffer-dammed, and the closure of the main dam across the channel commenced. Toensure its safety during the flood season of 1974, the schedule callsfor the dam to be at least at elevation 1450 feet by that time. Rapidcompletion of the closure section is thus essential and is the mostcritical factor during this stage.
The substructure and superstructure for the first four units ofthe power station are scheduled for completion by July 1974. The first twogenerating units will be ready to run when penstock connections are com-pleted and at the same time erection of the-third and fourth units will bewell advanced. If the dams have reached safe elevations and the spillwaysare completed by August 1, 1974, the plan is to close the two power tunnels(Nos. 1 and 2) and store water on the receding flood flow. Immediatelyfollowing closure of these tunnels, tunnel No. 1 will be connected to thefour units of the power station, the first two units of which are scheduledto be ready for commercial operation by June 1975-.
Cost Estimates
The estimated cost of the Tarbela Project originally prepared byChas. T. Main was based on information supplied by TAMS and prices existingin July 1964. WAPDA supplied the figure for land and relocation. Thecontract cost for this estimate is shown in Figure 8. Subsequently, theBank Group revised the estimate for its Tarbela Report of February 1965,and these modifications are indicated in Figure 9. All costs are forpurposes of economic analysis and exclude provision for inflation, finan-cial contingencies, taxes, duties, levies and interest during construction.
The estimate given below is that of the Bank's Tarbela Report andincludes the estimate for the provision and installation of the first eightgenerating units. Although minor changes may affect individual items, theBank Group sees no reason to alter the total.
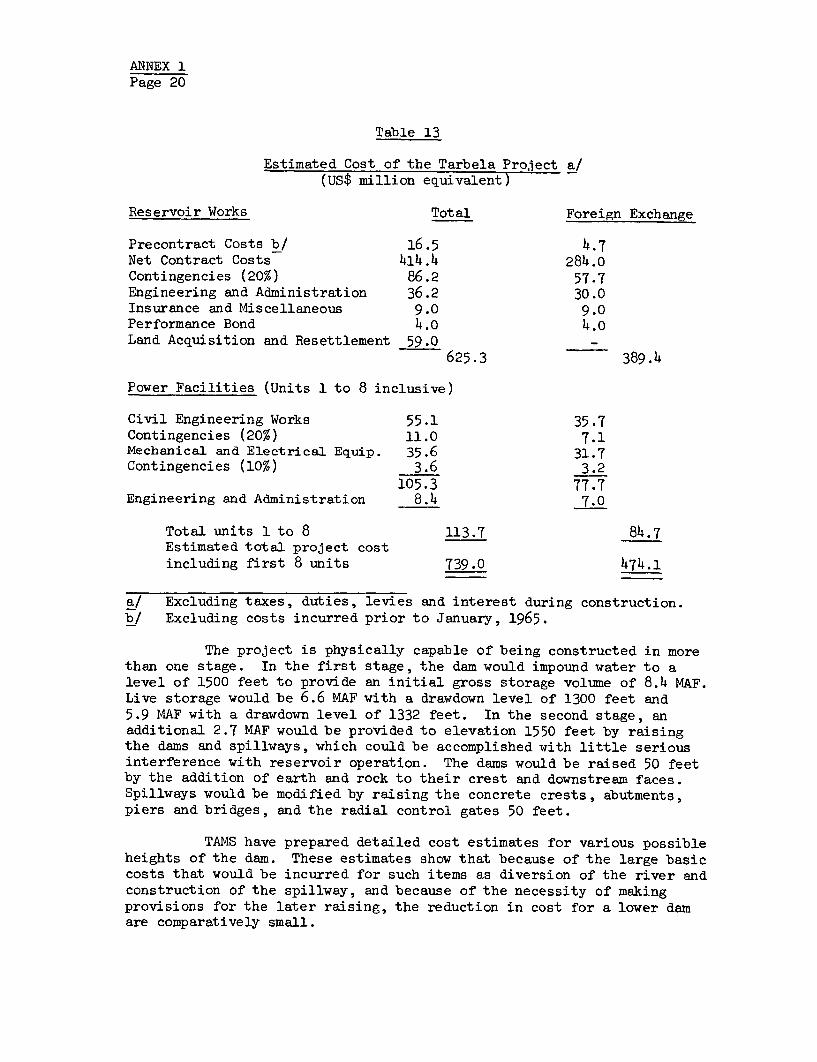
ANNEX 1Page 20
Table 13
Estimated Cost of the Tarbela Project a/(US$ million equivalent)
Reservoir Works Total Foreign Exchange
Precontract Costs b/ 16.5 4.7Net Contract Costs 414.4 284.0Contingencies (20%) 86.2 57.7Engineering and Administration 36.2 30.0Insurance and Miscellaneous 9.0 9.0Performance Bond 4.o 4.oLand Acquisition and Resettlement 59.0 -
625.3 389.4
Power Facilities (Units 1 to 8 inclusive)
Civil Engineering Works 55.1 35.7Contingencies (20%) 11.0 7.1Mechanical and Electrical Equip. 35.6 31.7Contingencies (10%) 3.6 3.2
105.3 77.7Engineering and Administration 8.4 7.0
Total units 1 to 8 113.7 84.7Estimated total project costincluding first 8 units 739.0 474.1
a! Excluding taxes, duties, levies and interest during construction.b/ Excluding costs incurred prior to January, 1965.
The project is physically capable of being constructed in morethan one stage. In the first stage, the dam would impound water to alevel of 1500 feet to provide an initial gross storage volume of 8.4 MAF.Live storage would be 6.6 MAF with a drawdown level of 1300 feet and5.9 MAF with a drawdown level of 1332 feet. In the second stage, anadditional 2.7 MAF would be provided to elevation 1550 feet by raisingthe dams and spillways, which could be accomplished with little seriousinterference with reservoir operation. The dams would be raised 50 feetby the addition of earth and rock to their crest and downstream faces.Spillways would be modified by raising the concrete crests, abutments,piers and bridges, and the radial control gates 50 feet.
TAMS have prepared detailed cost estimates for various possibleheights of the dam. These estimates show that because of the large basiccosts that would be incurred for such items as diversion of the river andconstruction of the spillway, and because of the necessity of makingprovisions for the later raising, the reduction in cost for a lower damare comparatively small.
ANWNEX 1Page 21
By pro-rating TAMS' estimates on the basis of the $625 millionfigure, Chas. T. Main determined that two-stage development would providean initial saving of $37 million over single-stage development butultimately would cost $27 million more. Justification for two-stagedevelopment depends on the value of the extra 2.7 MAF available initiallywith single-stage development, the growth of demand for stored water, andthe rate of interest assumed. If no value were assigned to the extra
storage and the requirement for stored water were increasing at a rate
such that the second stage would be needed seven years after completion of
the first stage, two-stage development would be marginal assuming an
8 percent rate of interest. If the second stage were needed sooner, single-stage development wou].d be preferred. On the basis of this analysis in the
Stage 1 report, Chas. T. Main concluded and the Bank concurred that Tarbela
should be constructed in a single stage.

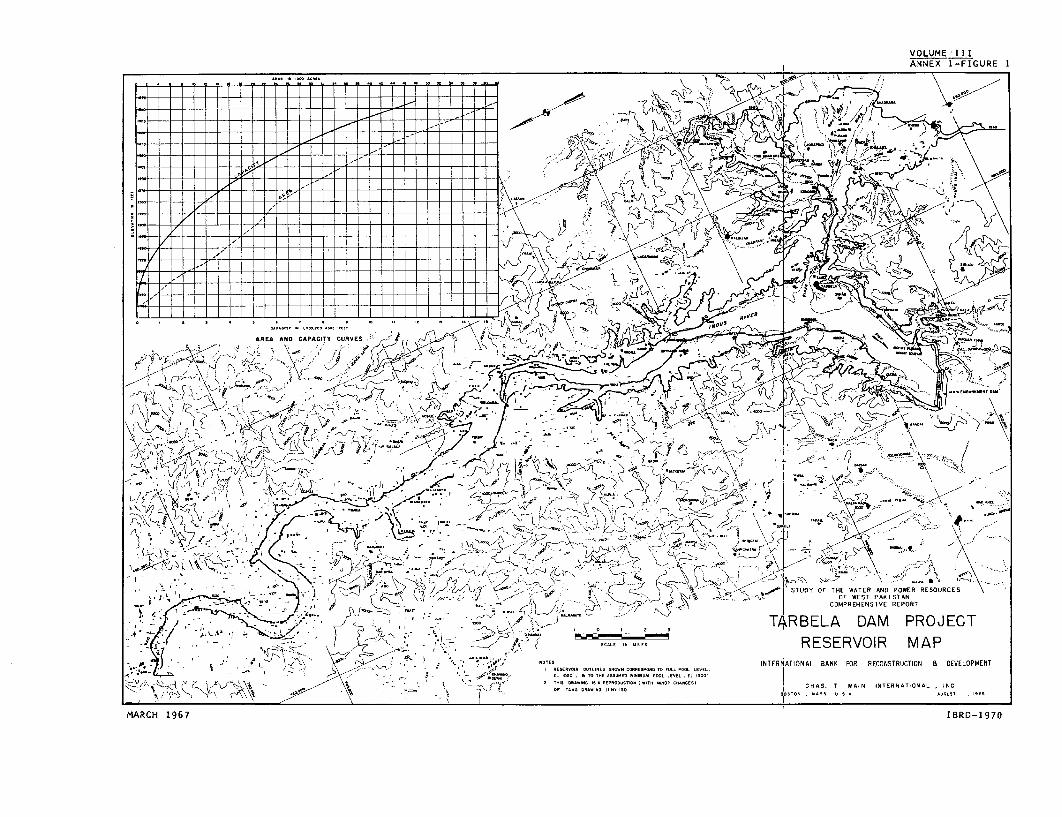
VOLUME III
ANNEX 1 FIGURE 1
- - - -~~~~~~~~~~~~~~~~~~~~~~~~~~~~~~~~~~~~~ ~~~~~ ~ ~ ~ ~ ~
- ------- -- 0 ~~~~~~~~~~~~~~~~~~~~~~~~ ~~~~i,'L~~~~~
w'.~~~~~~~~~~~~~~~~
7~ ~ ~~~~~~~- f
AREA AND CAPACITY CURVES r \'-. ~ ~ ~ ~ ~ ~ ~ ~ ~ ~ ~ ~ SUD O TEWAERAN, OWR ESURE( /~~~~~~~~~~~~~~~~~~~~~~~~~~~~~~~O ETPKSA
TARBELA DAM PROJECTN~A
I,V~~~~~~~~~~~~~~~~~~~~~~~'~~- 1 RESERVOIRA - MAP
T- -.1. ~ ~ ~ ~ I I N -~~~~~~~~~~~~~~~ '~~~~~~~~"'' ~~~~~~~~~~~~~ o \ I 0o,~~~~~~~~~~~~~~~~~~~A ~ ~ ~ I.
MARCH 967 IBY-197

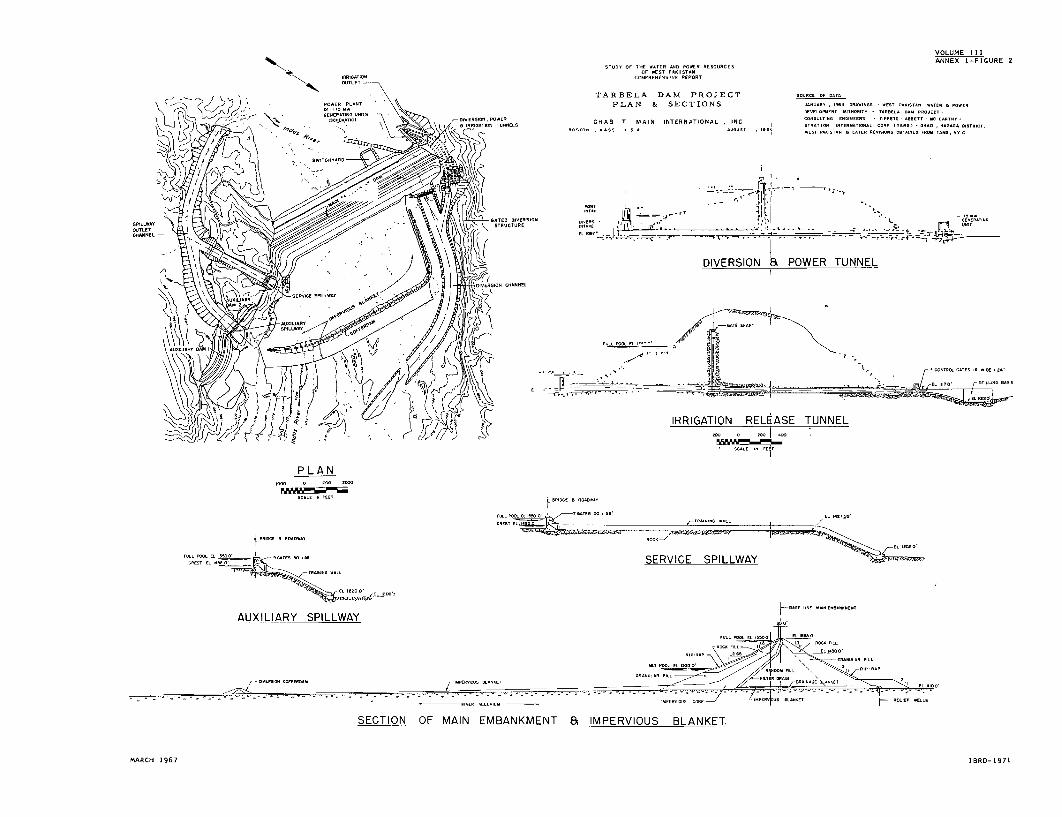
VOLUME IIIANNEX I-FIGURE 2
TARBELA DAM PROJECT SO-ROE OR 0*00
PLAN & SECTIONS DE0U0RN .100* T R T N 00000 500*00
;, .. :- : ii:__~~~~~~~~~~~~~~~~~~~~~~~~~~~~~~~~~~~A..E7=000100100 OONOLOCHCAS T MAIN INCTERNATIONCAL - NCA.'I_00 - 0 LATER 0_ , 000
DIVERSION I POWER TUNNEL
. , ,. M .,,~~~~~~E FIG~~~~~~~~~~~~~~~~~~~~LLO OLr O GO e
IRRIGATION RELEASE TUNNEL
CREST EL '4S t _ K S E R V I C E S P I L LWAY ~~~~~~~~~0O*R 0C00~7 .~ ~ ~ ~ ~ ~ ~ ~ ~ ~ ~ ~ ~ ~ ~ ~ ~ ~ ~ ~ ~ ~ ~ ~ ~ ~ ~ ~ ~~~~~~~l 1. 1^.L
PLAN
US-E P I00 1 000A*000
PULL POO EL 0 L O 0E-1 EL ~~~~~~~~~~~~~SERVICE SPILLWAY
AUXILIARY SPILLWAY
MIN~~~~PL POOL Pt 0OO0 G E//tDNFL '0000-RA
RIVER ALLUMIUS tSFERVIOUS~~~~~~~~~000 CORE- II'RVU 0000E TILLIr LL
_j70
EE E
- - - … - CL*OOO~~~~~~~~~~~~~~~~~~~~~~~_ ;,.-T -E. -
SECTION OF MAIN EMBANKMENT a IMPERVIOUS BLANKET
MARCH 1967 IBRD-1971

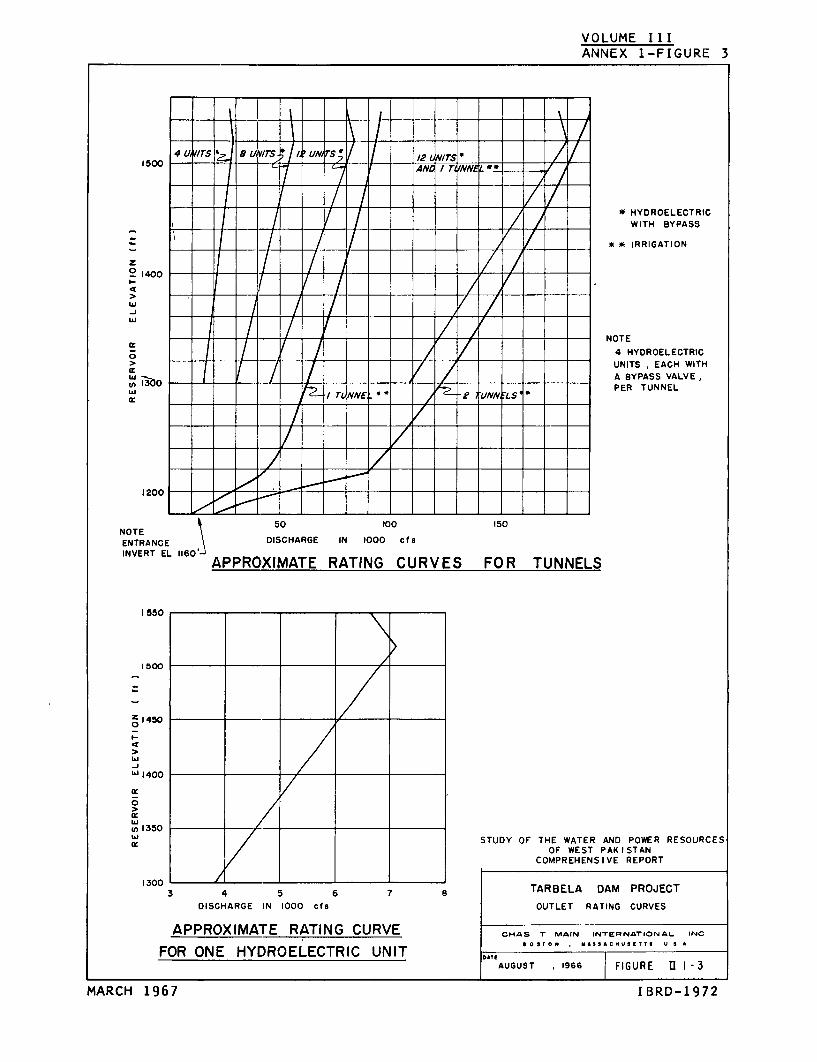
VOLUME IIIANNEX 1-FIGURE 3
_ _ _T _- -___ 4UI,I/TS - UUT /r VNr / 11/2 Itwr
1500-- -- - LIt N
*HYDROELECTRIC
_ _ T _ X _ _ Z I _ _ _ _ _ __ < WITH BYPASS
I IRRIGATION
z21400-- SO 1
NOTE
4 HYDROELECTRIC> -UNITS ,EACH WITH
__ A BYPASS VALVE,PER TUNNEL
: STUDYIOFTTHE WATERANDPOWERRNNES OUUNCELs
1200-- -
50 100 IISNOTE
ENTRANCE DISCHARGE IN 1000 c f s
I T 1 APPROXIMATE RATING CURVES FOR TUNNELS
A550
1500
1450
I-~l
M
-j
'J 1400
0
U) 1350ILl STUDY OF THE WATER AND POWER RESOURCES
OF WEST PAKISTANCOMPREHENSIVE REPORT
1300
3 4 5 6 8 TARBELA DAM PROJECTDISCHARGE IN 1000 cfs OUTLET RATING CURVES
APPROXIMATE RATING CURVE. CHAS TMAIN INTERNATIONAL INC
FOR ONE HYDROELECTRIC UNIT 9A0AUGUr 196 FIGMS. .URET TS U -3A
MARCH 1967 I BRD-1972

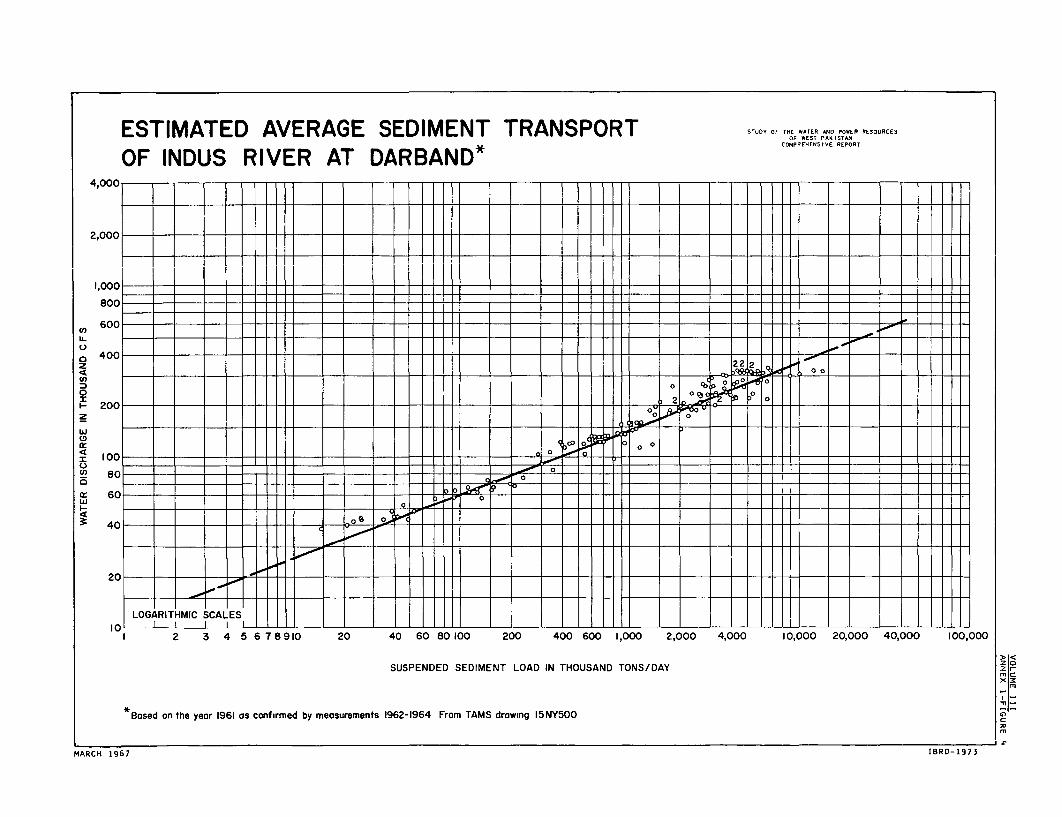
ESTIMATED AVERAGE SEDIMENT TRANSPORT STUDY OF THE WATER AD POWER RESOURCESOF WEST PAKISTAN
COMPREHENSIVE REPORTOF INDUS RIVER AT DARBAND*4,000-i- 11I
2,000 {- _
I,OOC
800
,60C0-- --- --
U-
4000
C')
o 0
Z .
I 2k 3 4 6890 2 40 6 800 20 40 60 1,0 2,0 4,0 000 0,0 4000 00,0
I 00~~~~~~~~~~~~~~~~~~~~~~~~~~~~~~~~~~~~~~~~~~~~~~~~~~
*Bsdo8h0er161a ofre ymaurmns16-94FomTMorwn 5Y00~~~~~~~~~~~~~~~~~~~~~~~~~~~~~~~~~~~~~~~~~~F
MRH167 OBRD199

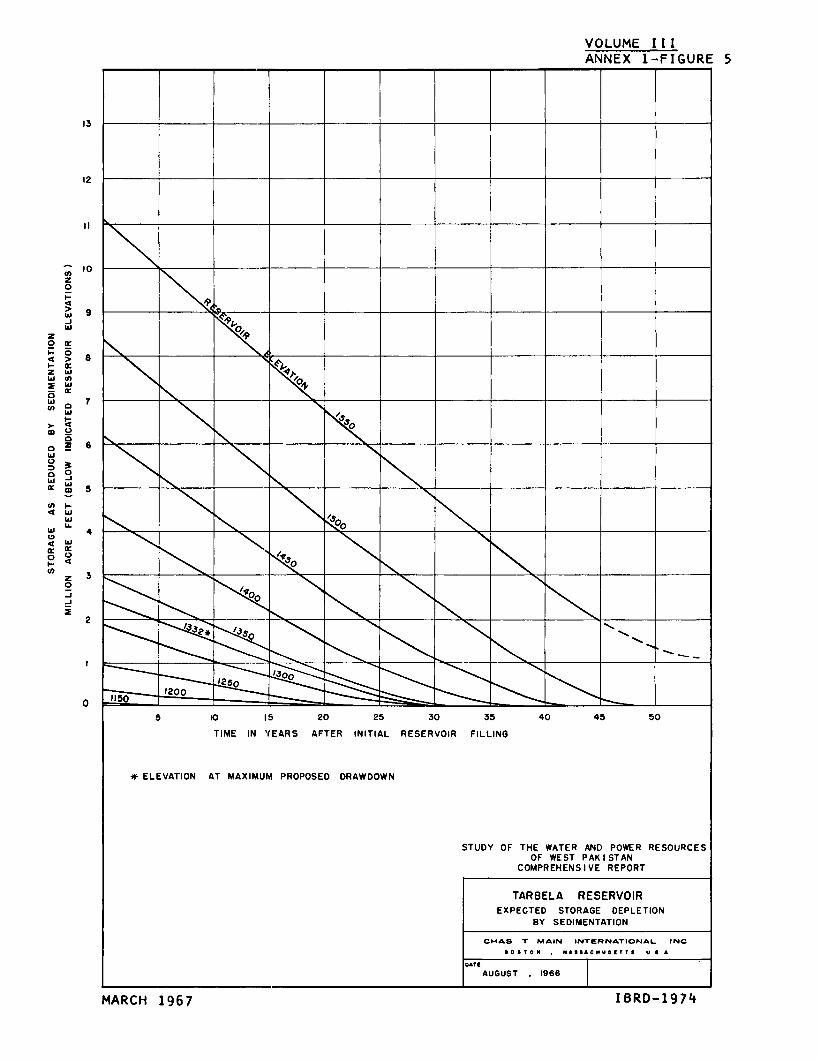
VOLUME IIIANNEX 1-FIGURE 5
> 9t
o3 ______
0- ~ ~ ~ ~ ~ ~ ~ ~ ~ ~ ~ ~~~~~~ ~CMRHN IIE EPR
z
0
> 4
w 0cn
I- wz w
w 7 IBD17
I -1w 0
4 6
w0n I,-
4WW
00
0 _______ 1 1__ _ 5 2 2 _ 3 4 4_5
TIME IN YEARS AFTER INITIAL RESERVOIR FILLING
*ELEVATION AT MAXIMUM PROPOSED DRAWDOWN
STUDY OF THE WATER AND POWER RESOURCESOF WEST PAKISTAN
COMPREHENSIVE REPORT
TARBELA RESERVOIREXPECTED STORAGE DEPLETION
BY SEDIMENTATION
CMAS T MAIN INTERNATIONAL. INCBOS 5T 0N MASSACIIUSETTS U S A
r~AUGUST I1966
MARCH 1967 IBRD-1974

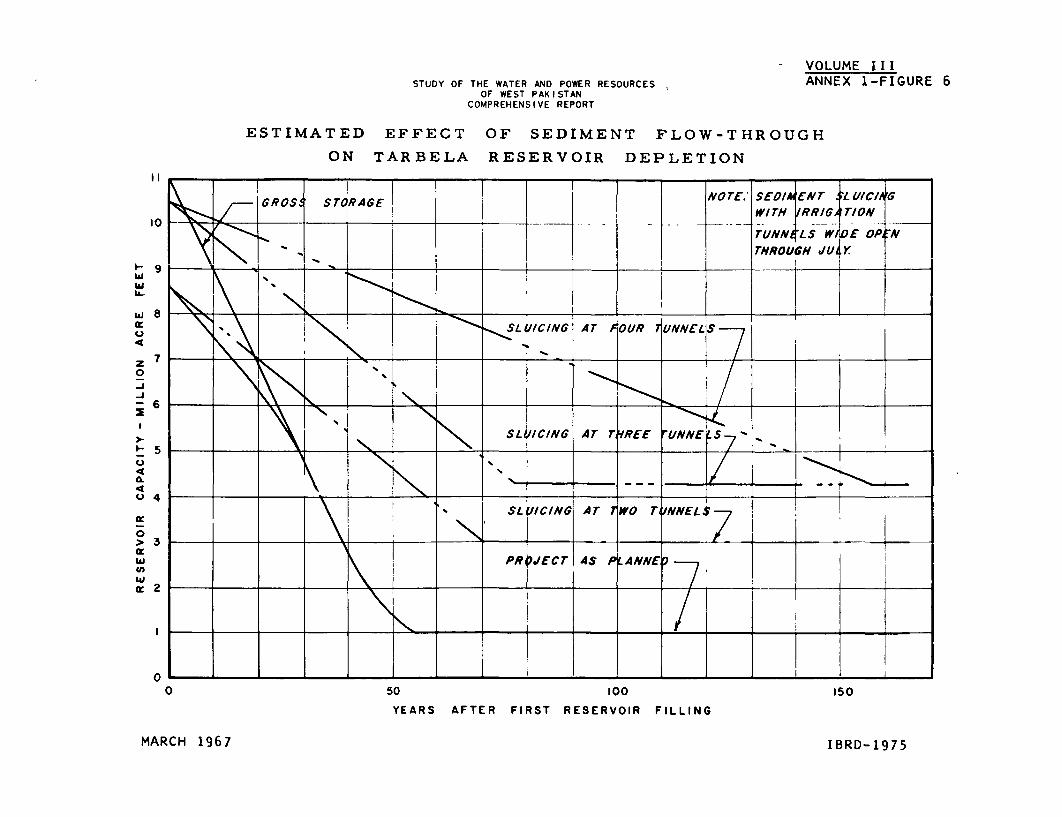
- VOLUME IIISTUDY OF THE WATER AND POWER RESOURCES ANNEX 1-FIGURE 6
OF WEST PAKISTANCOMPREHENSIVE REPORT
ESTIMATED EFFECT OF SEDIMENT FLOW-THROUGH
ON TARBELA RESERVOIR DEPLETION
GROS:STSRA6EI NO-Ej- -E .1h /U4E r /Cm\10 - ___ _ _ _ i___ ____ ____ ___ - rUNN4LS W , E OPEN
\ \ ^ > | ; t ~~~~~~~~~~~rHROUGH JV Y
e X * _ _ _ _ _ _ _ +>5
w 8
L V C- I AT OUR \1 NNELISU
z 7_
0
S~LWICINVU AT 7T REE UVNNEtS
5
4
SL ICING AT WO rvNNEL
0 5
w PR, PEcr AS PANNEDa)
0 - - -7 -
0 50 100 150
YEARS AFTER FIRST RESERVOIR FILLING
MARCH 1967 IBRD-1975


VOLUME III
ANNEX 1-FIGURE 7
WORK ITEM 1967 1968 |16 |190 |1971 |1972 19T3 19,14 1975 1976 REMARKS
C_'on I_ E syg. h -ondet o -tTAotI o ol-Id nooo d IN A_eRAL C I of,- shoe,, oIRIVE RhLOW IN Oe R,o,N cin 1 ,-/A Tqdte r tn,
f DIt eEe oRSION ANtR, CAf I
C Z 0_ 6 6_
TuNA L~~~~~~~sos>/croccJ ii ol Ersonno5= ||ln ,t bc cc_ _t bo= d= _ zo,=
T h e je ste rr2 1 c fh o g rl e /S ¢ E o nhe 0 0 ,/free , d nlt6 o f F z rk s h o n R n J T h c d l v e rs s o n c /o s u re g o te s o f /v r . b y TIRE L D A M P R O E C
9100 nod 1,010 b,er n tecD 0J hl atoeled u/O lo? n5 tD nE7
/7toooh the tonoeco dl the dwole hesn SARBEL OAM THPWTROJDPEECRSTRE
3. YoE/ scrbhdy4neo drOosto bTUD OFcotr OHE WESTE PANDISTRREOUCE TENTATIVE CONSTRUCTION SCHEDULEto 1 250to
2th do stooy.COMPREHENSIVE REPORTSUMR
MARCH 1967 ~ ~ ~ ~ ~ ~ ~ ~ ~ ~ ~ ~ ~ ~ ~ ~ ~ ~ ~ ~ ~ ~ ~ ~~~SUMRMARCH 1967 ~~~~~~~~~~~~~~~~~~~~~~~~~~~~I BRD-1976

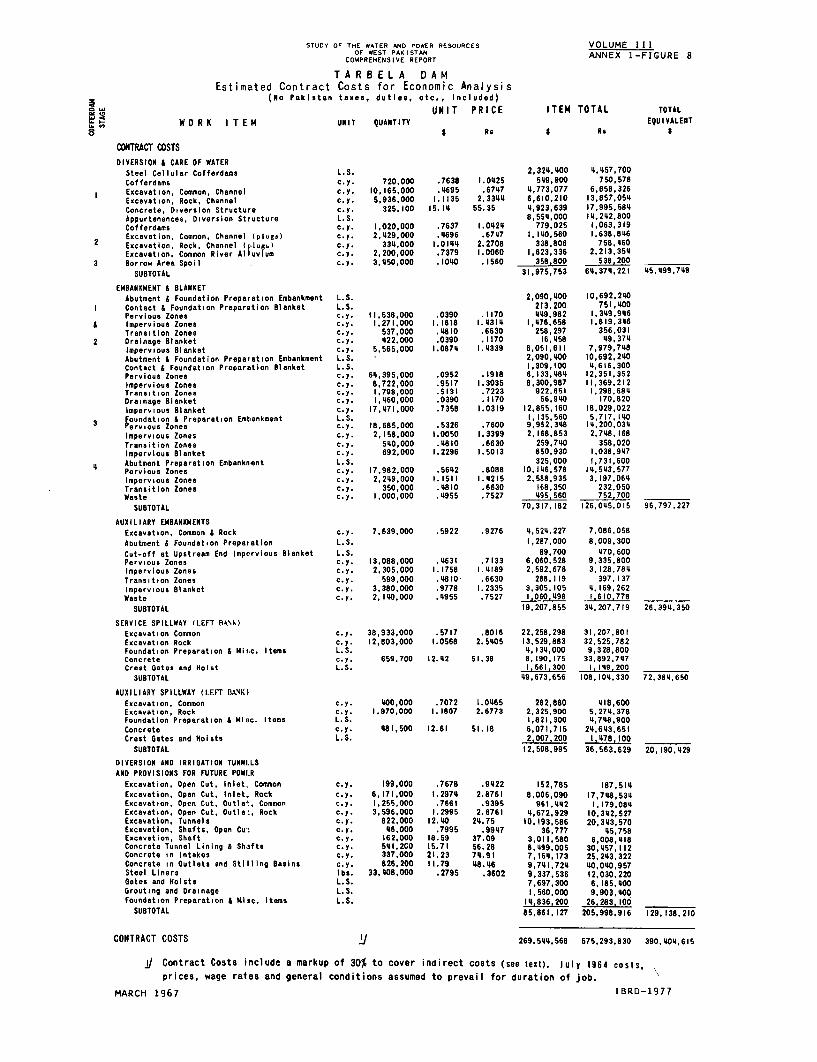
STUJCY OF THE WATER AND POWER RESOURCES VOLUME I IICOF WEST PAKISTAN ANX1FGR CMPREHENSIVE REPORT ANX 1FGR
TA R BE LA D AMEstimated Contract Costs for Economic Analysis
(No Pakistan taxes, duties, etc., included)
C U ~~~~~ ~~~~~~ ~~~~~~~~~~~UNIT P R ICE ITEM TOTAL TOTAL
WO0R K I T EM UNIT QUANTITY $ uEQUIVALENT
ODNTRACT COSTS
DIVERSION & CARE OF WATERSteei Ceiiular Cofferdams L.S. 2,32'I.100 11,157,700Cofferdams c.y. 720,000 .7638 1.01125 5119,900 750,578
1 Excavation, Common, Channel c.y. 10,165,000 .11695 .67417 11,773,077 6,658,326Excavation, Rock, Channel c.y. 5,936,000 1.1135 2.33411 6,610,210 13.857,0541Concrete, Diversion Structure c.y. 325,100 15.111 55.35 11,923,639 17.995.5841Appurtenances, Diversion Structure L.S. 8,6611,000 11.2142.800Cofferdams c.y. 1,020,000 .7637 1.01121 779,025 1,063.319Excavation, Conmon, Channel (plug.) c.y. 2,4129.000 .14696 .67117 1,1110,560 1.638,846
2 Excavatioon. Rock, Channel (pliigi) c.y. 3311,000 1.01111 2.2708 338,806 758,1160Excavation, Common River Alluvium c.y. 2,200,000 .7379 1.0060 1,623,336 2,213,3541
3 Borrow Area Spoil c.y. 3.1150.000 .10110 .1560 356,800 538.200 ____
SUBTOTAL 31,975,753 611,3711,221 115.499.7419
EMBANKMENT &BLANKETAbutment &Foundation Preparation Embankment L.S. 2,090,1100 10,692.2110
1 Contact & Foundation Preparation Blanket L.S. 213,200 751,1100Pervious Zones c.y. 11,538,000 .0390 .1170 1119,982 1,3119,9116
& Impervious Zones c.y. 1,271,000 1.1818 1.113111 1,4176,658 1,8 19, 30Transition Zones c.y. 537,000 .4810 .6630 256,297 356,031
2 Drainage Blanket c.y. 1122,000 .0390 .1170 16,1158 119.3741Impervious Blanket c.y. 5.565,000 1.08741 1.11339 6,051.611 7,979,7118Abutment & Foundation Preparation Embankment L.S. 2,090,1100 10,692,2110Contact A Foundation Preparation Blanket L.S. 1,309,100 11,616.300Pervious Zones c.y. 611,395,000 .0952 .1918 6,133,484 12,351,352Impervious Zones c.y. 8,722,000 .9517 1.3035 8,300,987 11,369,212Transition Zones c.y. 1.798,000 .5131 .7223 922.6S1 1,298,6841Drainage Blanket C.D. 1,1160,000 .0390 .1170 56,9110 170.820Impervious Blanket c.y. 17,1171,000 .7358 1.0319 12,855,160 18,029,022
3 Eoundation & Preparation Embankment L.S. 1,135,560 5,717. 110rervious Zones C.y. 18,685,000 .5326 .7600 9,952,348 111,200.0311Impervious Zones C.y. 2,158,000 1.0050 1.3399 2,168,853 2,744. 168Trannition Zones c.y. 5110,000 .4810 .6630 259,7110 358.020Impervious Blanket c.y. 692,000 1.2296 1.5013 850,930 1,038,9117
Abutment Preparation Embankmeont L.S. 325,000 1,731.6004 Pervious Zones c.y. 17,982,000 .56112 .8088 10,1116,578 141,5113,577
Impervious Zones c.y. 2,2119,000 1.1511 1.11215 2,588.935 3, 197,0641Transition Zones c.y. 350,000 .4810 .6630 168,350 232.050Waste c.y. 1,000,000 .11955 .7527 49,6 752.700 _ ___
SUBTOTAL 70,317.182 126.0115.015 96,797.227
AUXILIARY EM4BANKMENTS
Excavation, Common & Rock c.y. 7,639,000 .5922 .9276 11.5211.227 7,086,058
Abutment & Foundation Preparation L.S. 1,287,000 8.009,300
Cut-off at Upstream End Impervious Blanket L.S. 89,700 1170.600Pervious Zones c.y. 13,088,000 .11631 .7133 6.060,528 9.335.800Impervioun Zones c.y. 2.305,000 1.1758 1.11189 2,592,678 3,128,7811Transition Zones c.y. 599,000 .4810- .6630 288,119 397,137Impervious Blanket c.y. 3,380,000 .9778 1.2335 3,305,105 11,169.262Waste c.y. 2,1110.000 .11955 .7527 1,060,,98 1_610_778
SUBTOTAL 19.207,855 311,207,719 26.3911.350
SERVICE SPILLWAY (LEFT BAN,kIExcavation Common c.y. 38,933.000 .5717 .8016 22.258,298 31,207,801Excavation Rock c.V. 12,803,000 1.0568 2.51105 13,529,883 32,525,782Foundation Prepuration & Nibc. Items L.S. 41.1311,000 9.328.800Concrete c.y. 659.700 12.112 51.38 8.190.175 33,892.7117Crest Gates and Hoist L.S. 1.561.300 1,1119,200 _ ___
SUBTOTAL 119,673,656 108.1011.330 72,3811,650
AUXILIARY SPILLWAY (LEFr BANYK)
Excavation, Common c.y. 1100,000 .7072 1 .01165 282,880 1118,600Excavation, Rock c.p. 1,970,000 1.1807 2.6773 2.325,900 5.2711.378Foundation Preparation A Misc. Items L.S. 1,821,300 11,744,900Concrete c.y. 441,500 12.61 51.18 6,071,715 211,6113,651Crest Gates and Hoists L.S. 2.007,200 1.1178, 100 _____
SUBTOTAL 12,508,995 36,563,629 20,190.4129
DlIVERSION AND IRRIGATION TUNNILSAND PROVISIONS FOR FUTURE POWI.R
Excavation, Open Cut. Inlet, Common c.y. 199,000 .7678 .91122 152,785 187,5111
Excavation, Open Cut, Inlet. Rock c.y. 6,171,000 1.29711 2.8761 8,006,090 17,748,5311Excavation, Open Cut, Outlet, Common c.y. 1.255,000 .7661 .939S 961 .1112 1.179.0841Excavation. Open Cut, Outlet, Rock c.y. 3,596,000 1.2995 2.8761 11,672.929 10,3412,5277Excavation, Tunnels c.y. 822,000 12.110 211.75 10, 193.586 20,3113,570Excavation, Shafts, Open Cut c.y. 116,000 .7995 .99117 36.777 115,758Excavation, Shaft c.y. 162.000 18.59 37.09 3,011,580 6,008,1118Concrete Tunnel Lining & Shafts c.y. 541112C0 15.71 56.28 8.1199.005 30,4157,112Concrete in Intakes c.y. 337,000 21.23 711.91 7,1541,173 25,2113,322Concrete in Outlets and Stilling Basins c.y. 826,200 11.79 484.16 9,7111,721 110,0110,957Steel Liners lbs. 33,1108,000 .2795 .3602 9,337,536 12,030,220Gates and Hoists L.S. 7,697,300 6, 185,1100Grouting and Drainage L.S. 1,560,000 9,903,1100
Foundation Preparation & Misc. Items L.S. 111.836.200 26.283. 100 _____
SUBTOTAL 85,861. 127 205,998,916 129, 138,210
CONTRACT COSTS ±1269,51111.568 575,293,830 390.1104,615
Ig Contract Costs inClude a markup of 30% to cover indirect CostS (see text). july 1904 costs.
prices, wage rates and general conditions assumed to prevail for duration of job.
MARCH 1961 IBRD-1977


STUDY OF THE WATER AND POWER RESOURCES VOLUME !IIOF WEST PAKISTAN ANNEX I-FIGURE 9
COMPREHENS IVE REPORT
TARBELA UAM COST ESTIMATE FOR ECONOMIC ANALYSIS
FOREIGN TOTAL COSTEXCHANGE $ EQUIVALENT $
1. PRE-CONTRACT COSTS 4,700,000 16,490,000
2. CONTRACT COSTS 269,545,000 390,404,615
3. PRE-CONTRACT PLUS CONTRACT COSTS 274,245,000 406,894.615(MAIN - TARBELA REPORT)
DIRECT COSTS (210,957,700) (312,995,858)
INDIRECT COSTS (30% OF DIRECT) (63,287,300) (93,898,757)
4. ADJUSTED PRE-CONTRACT PLUS CONTRACT COSTS(I3RD - TARBELA REPORT)
DIRECT COSTS (MAIN) 210,957,700 312,995.858
ADDITIONAL DIRECT COSTS
EXCAVATION AND FILL 5,190,000 7.700,000
CONCRETE 1,550 000 2,300,000
6,740,000 10,000,000
ADJUSTED DIRECT COSTS 217.697,700 322,995,858
INDIRECT COSTS (MAIN) 63,287,300 93,898,757
ADDITIONAL INDIRECT COSrS 9,435,900 14,000,000
ADJUSTED INDIRECT COSTS (33.4% OF DIRECT) 72,723,200 107,898,757
DIRECT PLUS INDIRECT COSTS (ADJUSTED) 290.420,900 430,894,615
USE (430,900,000)
PRE-CONTRACT COSTS (AFTER MAY 1966) 4,700,000 16,500,000
CONTRACT COSTS 284,000,000 414.400,000
5. CONTINGENCIES (20% of 4.) 57.700,000 86,200,000
6. PRE-CONTRACT COSTS, CONlRACT 346,400,000 517,100,000
COSTS AND CONTINGENCIES
7. ENGINEERING AND ADMINISlRATION (7% of 6.) 30,000,000 36,200,000
8. INSURANCE & MISCELLANEOUS PLUS
PERFORMANCE BOND (2.52% of 6.) 13,000,000
INSURANCE AND MISCELLANEOUS (9.000,000) (9,000.000)
PERFORMANCE BOND (4,000,000) (4.000,000)
9. LAND AND RESETTLEMENT (WAPDA) -_59,000,000
10. TOTAL ( 6 + 7 + 8 $ 9 )389,400,000 $625,300,000
USE $390,000,000 $625,000,000
Note: The total cost here excludes Pakistan taxes, duties, etc., estimated to be U.S. $106.9 million,equivalent, and Interest during construction estimated at 8%, to be $215.1 million, equivalent,wIth foreign excoange component of U.S.5138.6 million, equivalent.
MARCH 1967 IBRD-1978


ANNEX 2
KALABAGH PROJECT

ANNEX 2
LIST OF FIGURES
1. Schematic Plan of the Kalabagh Dam Project:General Plan: Earth Dam with Buttress Spillway
2. Kalabagh Dam P'roject: Elevations and Sections: EarthDam with Buttress Spillway
3. Kalabagh Reservoir: Estimated Loss of Live StorageCapacity due to Sedimentation
4. Estimated Construction Costs: Kalabagh Project:Earth Dam with Buttress Spillway

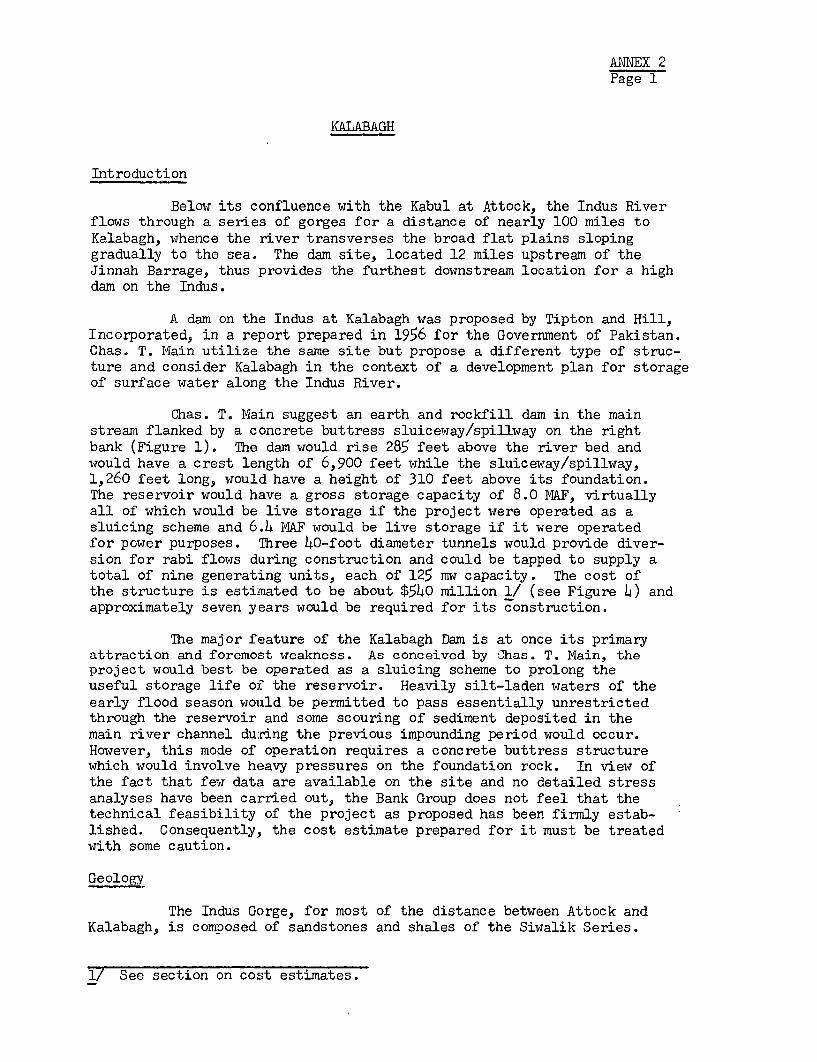
ANNEX 2Page 1
KALABAGH
Introduction
Below its confluence with the Kabul at Attock, the Indus Riverflows through a series of gorges for a distance of nearly 100 miles toKalabagh, whence the river transverses the broad flat plains slopinggradually to the sea. The dam site, located 12 miles upstream of theJinnah Barrage, thus provides the furthest downstream location for a highdam on the Indus.
A dam on the Indus at Kalabagh was proposed by Tipton and Hill,Incorporated, in a report prepared in 1956 for the Government of Pakistan.Chas. T. Main utilize the same site but propose a different type of struc-ture and consider Kalabagh in the context of a development plan for storageof surface water along the Indus River.
Chas. T. Main suggest an earth and rockfill dam in the mainstream flanked by a concrete buttress sluiceway/spillway on the rightbank (Figure 1). The dam would rise 285 feet above the river bed andwould have a crest length of 6,900 feet while the sluiceway/spillway,1,260 feet long, would have a height of 310 feet above its foundation.The reservoir would have a gross storage capacity of 8.0 MAF, virtuallyall of which would be live storage if the project were operated as asluicing scheme and 6.4 MAF would be live storage if it were operatedfor power purposes. Three 40-foot diameter tunnels would provide diver-sion for rabi flows during construction and could be tapped to supply atotal of nine generating units, each of 125 mw capacity. The cost ofthe structure is estimated to be about $540 million 1/ (see Figure 4) andapproximately seven years would be required for its construction.
The major feature of the Kalabagh Dam is at once its primaryattraction and foremost weakness. As conceived by Chas. T. Main, theproject would best be operated as a sluicing scheme to prolong theuseful storage life of the reservoir. Heavily silt-laden waters of theearly flood season would be permitted to pass essentially unrestrictedthrough the reservoir and some scouring of sediment deposited in themain river channel during the previous impounding period would occur.However, this mode of operation requires a concrete buttress structurewhich would involve heavy pressures on the foundation rock. In view ofthe fact that few data are available on the site and no detailed stressanalyses have been carried out, the Bank Group does not feel that thetechnical feasibility of the project as proposed has been firmly estab-lished. Consequently, the cost estimate prepared for it must be treatedwith some caution.
Geology
The Indus Gorge, for most of the distance between Attock andKalabagh, is composed of sandstones and shales of the Siwalik Series.
1/ See section on cost estimates.
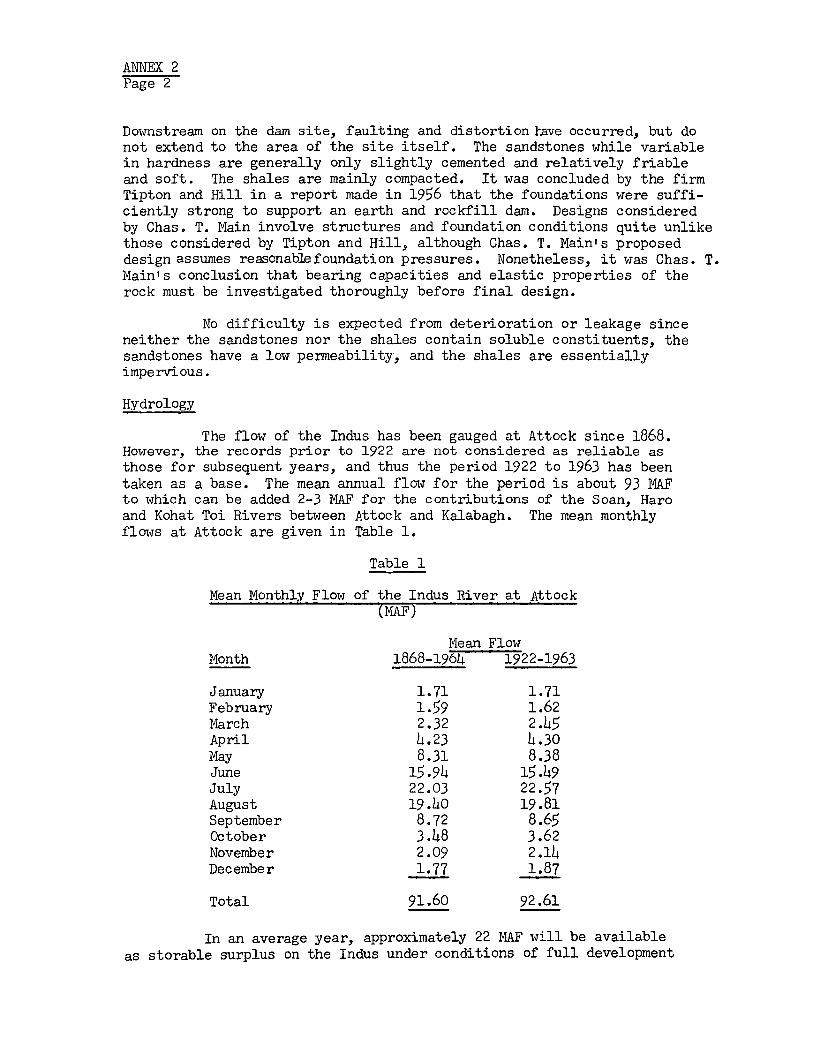
ANNEX 2Page 2
Downstream on the dam site, faulting and distortion have occurred, but donot extend to the area of the site itself. The sandstones while variablein hardness are generally only slightly cemented and relatively friableand soft. The shales are mainly compacted. It was concluded by the firmTipton and Hill in a report made in 1956 that the foundations were suffi-ciently strong to support an earth and rockfill dam. Designs consideredby Chas. T. Main involve structures and foundation conditions quite unlikethose considered by Tipton and Hill, although Chas. T. Main's proposeddesign assumes reasonablefoundation pressures. Nonetheless, it was Chas. T.Main's conclusion that bearing capacities and elastic properties of therock must be investigated thoroughly before final design.
No difficulty is expected from deterioration or leakage sinceneither the sandstones nor the shales contain soluble constituents, thesandstones have a low permeability, and the shales are essentiallyimpervious.
Hydrology
The flow of the Indus has been gauged at Attock since 1868.However, the records prior to 1922 are not considered as reliable asthose for subsequent years, and thus the period 1922 to 1963 has beentaken as a base. The mean annual flow for the period is about 93 MAFto which can be added 2-3 MAF for the contributions of the Soan, Haroand Kohat Toi Rivers between Attock and Kalabagh. The mean monthlyflows at Attock are given in Table 1.
Table 1
Mean Monthly Flow of the Indus River at Attock(MAF)
Mean FlowMonth 1868-1964 1922-1963
January 1.71 1.71February 1.59 1.62March 2.32 2.45April 4.23 4.30May 8.31 8.38June 15.94 15.49July 22.03 22.57August 19.40 19.81September 8.72 8.65October 3.48 3.62November 2.09 2.14December 1.77 1.87
Total 91.60 92.61
In an average year, approximately 22 MAF will be availableas storable surplus on the Indus under conditions of full development
ANNEX 2Page 3
as projected by IACA, although in years of low flows the surplus willbe somewhat less. Therefore, there will in general be no problem offilling reservoirs of substantial size.
Design Flood
The design flood used for Kalabagh was that derived from theone for Tarbela by increasing the ordinates of the Tarbela hydrographby 25 percent. The design flood for Tarbela is composed of the followingelements:
1) Maximurm flood due to snowmelt, estimated from a studyof recorded flood hydrographs to be 600,000 cusecs.
2) Maximum flood due to monsoon rainfall, estimated fromsynthetic unit hydrograph and probably maximum stormstudies to be 1,080,000 cusecs (subsequently revisedby Tippetts-Abbett-McCarthy-Stratton InternationalCorp. (TAMS) to be 1,173,000 cusecs).
3) Maximum flood due to the breaking of a natural dam,estimated from the flood hydrograph of August 18 and19, 1929 when a glacial dam on the Shyok was breached,to be 354,000 cusecs.
1) plus 2) provide the "probable maximum flood" of 1,773,000cusecs and 1), 2), and 3) together give the "'maximumcombined flood" of 2,127,000 cusecs. The maximumflood of record was 820,000 cusecs at Attock in 1929,but may have been as high as 1,206,000 cusecsaccording to Chas. T. Main.
The project was therefore designed to accommodate a flood having a peakdischarge at Attock of 2,600,000 cusecs. It is unlikely that this flowwould ever be reached because there would be considerable attenuationof the flood peak between Tarbela and Kalabagh and because the peak onthe Kabul tends to occur a month earlier than that on the Indus. Mostlikely, the maximum combined flood at Kalabagh would not greatly exceedthe figure of 2,127,000 cusecs assumed for Tarbela.
Backwater Effects
Considerable effort was spent by Chas. T. Main in studyingbackwater effects because of the possible danger of aggravating floodconditions at Nowshera on the Kabul (see Map III.4). The tentativeconclusion is that very little additional flooding would result in areasalready subject to darnaging floods and no new areas would be flooded.
Cross sections were obtained from 49 stations along the Indusand Kabul Rivers and staff gauges were established at 12 of the stations.
A computer program was prepared to calculate water surfaceelevations; the results were compared with rating curves obtained fromWAPDA for Attock and INowshera.
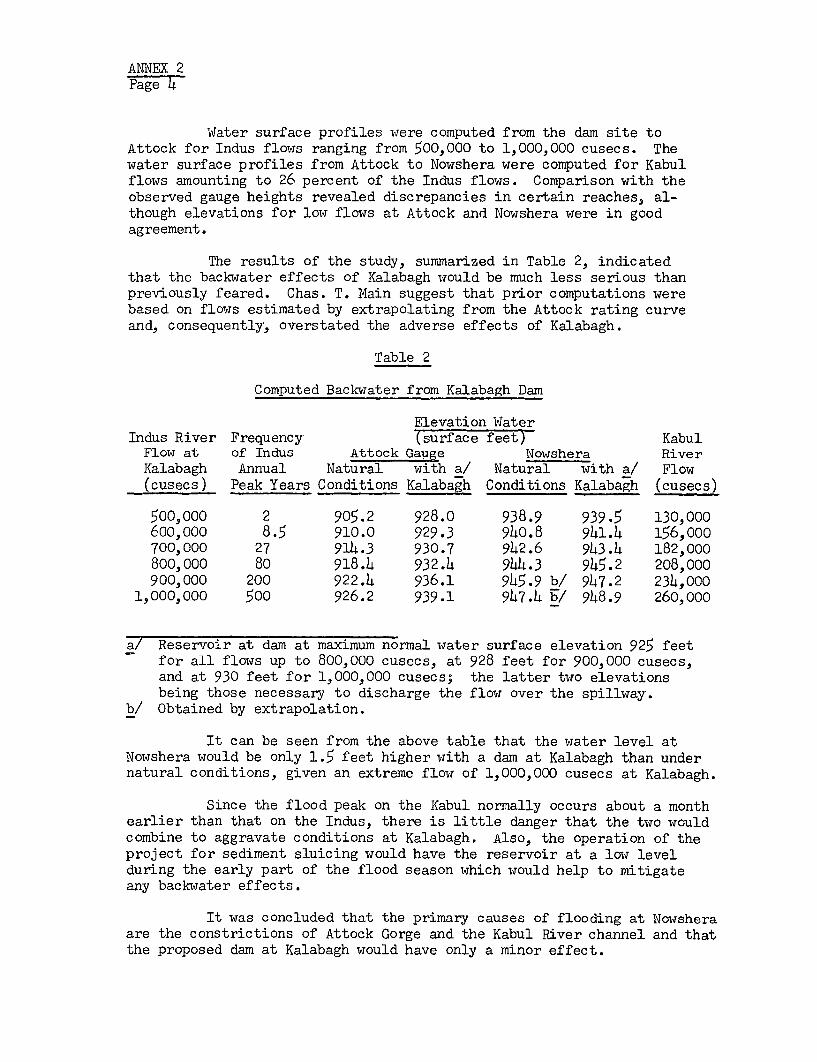
ANNEX 2Page 4
Water surface profiles were computed from the dam site toAttock for Indus flows ranging from 500,000 to 1,000,000 cusecs. Thewater surface profiles from Attock to Nowshera were computed for Kabulflows amounting to 26 percent of the Indus flows. Comparison with theobserved gauge heights revealed discrepancies in certain reaches, al-though elevations for low flows at Attock and Nowshera were in goodagreement.
The results of the study, summarized in Table 2, indicatedthat the backwater effects of Kalabagh would be much less serious thanpreviously feared. Chas. T. Main suggest that prior computations werebased on flows estimated by extrapolating from the Attock rating curveand, consequently, overstated the adverse effects of Kalabagh.
Table 2
Computed Backwater from Kalabagh Dam
Elevation WaterIndus River Frequency (surface feet) KabulFlow at of Indus Attock Gauge Nowshera RiverKalabagh Annual Natural with a/ Natural with a/ Flow(cusecs) Peak Years Conditions Kalabagh Conditions Kalabagh (cusecs)
500,000 2 905.2 928.0 938.9 939.5 1309000600,000 8.5 910.0 929.3 940.8 941.4 156,000700,000 27 914.3 930.7 942.6 943.4 182,000800,000 80 918.4 932.4 944.3 945.2 208,000900,000 200 922.4 936.1 945.9 b/ 947.2 234,000
1,000,000 500 926.2 939.1 947.4 b/ 948.9 260,000
a/ Reservoir at dam at maximum normal water surface elevation 925 feetfor all flows up to 800,000 cusecs, at 928 feet for 900,000 cusecs,and at 930 feet for 1,000,000 cusecs; the latter two elevationsbeing those necessary to discharge the flow over the spillway.
b/ Obtained by extrapolation.
It can be seen from the above table that the water level atNowshera would be only 1.5 feet higher with a dam at Kalabagh than undernatural conditions, given an extreme flow of 1,000,000 cusecs at Kalabagh.
Since the flood peak on the Kabul normally occurs about a monthearlier than that on the Indus, there is little danger that the two wouldcombine to aggravate conditions at Kalabagh. Also, the operation of theproject for sediment sluicing would have the reservoir at a low levelduring the early part of the flood season which would help to mitigateany backwater effects.
It was concluded that the primary causes of flooding at Nowsheraare the constrictions of Attock Gorge and the Kabul River channel and thatthe proposed dam at Kalabagh would have only a minor effect.
ANNEX 2Page 5
Available Data
In preparation of their report proposing an earth and rockfilldam with an abutment overflow spillway, Tipton and Hill carried outlimited subsurface investigations. These included 15 drill holes, 2 ofthem in the Indus River, varying from 150 to 300 feet in depth, and 55test pits totaling 1,300 feet in depth.
Also prepared for the report were maps of the dam site areawith a scale of1:2,400 and 10-foot contour intervals, aerial photographymaps of the area along the Indus with a scale of 1:12,C00, and topographicmaps with a scale of 1 inch to 1 mile of the area around the reservoir,
To the present time, no further exploration of the site hasbeen made, although Chas. T. Main made a brief inspection, and WAPDAmade various measurernents at several upstream points for the study ofbackwater effects.
Proposed Design
In the course of their study of possible designs, Chas. T. Maingave considerable attention to the problems of handling flood flowsduring construction. The need for diversion capacity during constructioncoupled with the irrigation release capacity required for reservoir oper-ation led to the proposal to incorporate a number of ground sluices.This arrangement suggested the concept of providing still more sluicesand operating the reservoir for sediment flow-through and sluicing.
Chas. T. Main made a study of four alternative configurationsfor the dam. The four all involve a sluiceway mechanism, but "SluicingScheme A" would have a sluiceway/spillway section in the main streamflanked by dikes, "Sluicing Scheme B" would have sluiceway structurein the main stream with an overflow spillway at the right abutment,"Buttress Sluiceway Dam with Mangla-type Spillway" would be identicalto "B" but would, as its name suggests, substitute a Mangla-type spill-way for the conventional and, finally, "Earth Dam with Buttress Spillway,"as it is called for short, would involve an earth and rockfill dam inthe main stream with a sluiceway/spillway structure at the right abutment.The comparative economic costs of the alternatives are presented inTable 3 below.
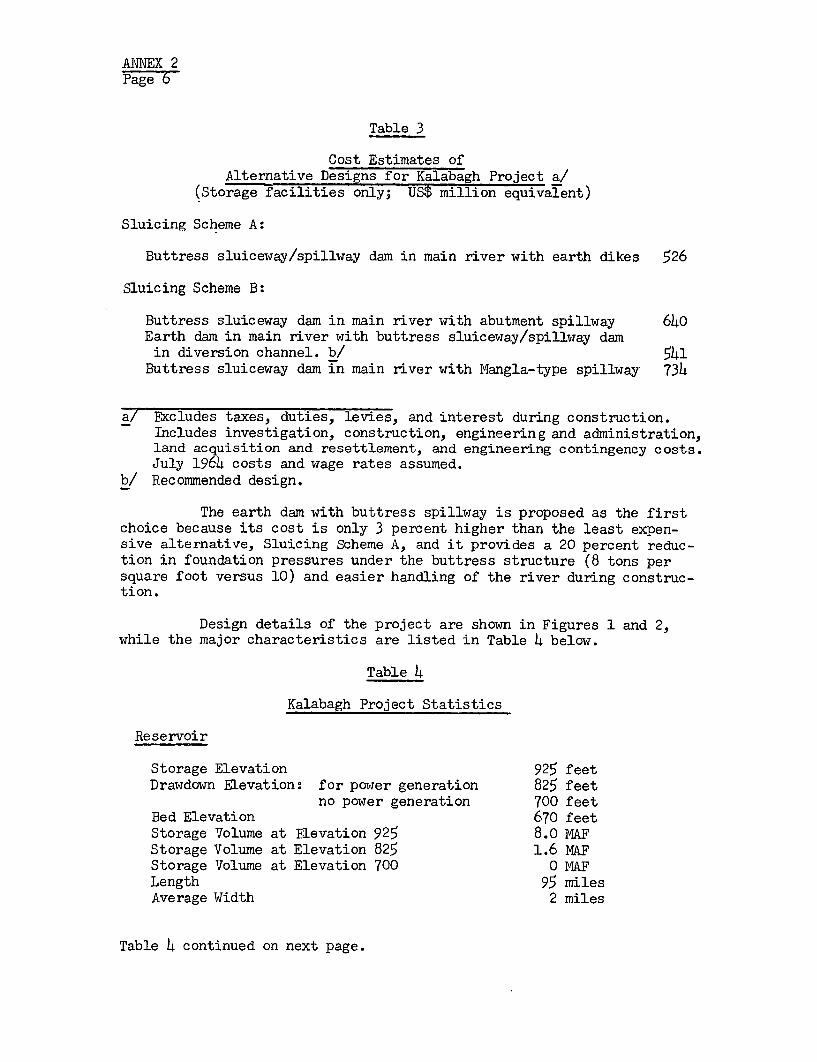
ANNEX 2Page 6
Table 3
Cost Estimates ofAlternative Designs for Kalabagh Project a/
(Storage facilities only; US$ million equivalent)
Sluicing Scheme A:
Buttress sluiceway/spillway dam in main river with earth dikes 526
Sluicing Scheme B:
Buttress sluiceway dam in main river with abutment spillway 640Earth dam in main river with buttress sluiceway/spillway dam
in diversion channel. b/ 541Buttress sluiceway dam in main river with Mangla-type spillway 734
a/ Excludes taxes, duties, levies, and interest during construction.Includes investigation, construction, engineering and administration,land acquisition and resettlement, and engineering contingency costs.July 1964 costs and wage rates assumed.
b/ Recommended design.
The earth dam with buttress spillway is proposed as the firstchoice because its cost is only 3 percent higher than the least expen-sive alternative, Sluicing Scheme A, and it provides a 20 percent reduc-tion in foundation pressures under the buttress structure (8 tons persquare foot versus 10) and easier handling of the river during construc-tion.
Design details of the project are shown in Figures 1 and 2,while the major characteristics are listed in Table 4 below.
Table 4
Kalabagh Project Statistics
Reservoir
Storage Elevation 925 feetDrawdown Elevation: for power generation 825 feet
no power generation 700 feetBed Elevation 670 feetStorage Volume at Flevation 925 8.o MAFStorage Volume at Elevation 825 1.6 MAFStorage Volume at Elevation 700 0 MAFLength 95 milesAverage Width 2 miles
Table 4 continued on next page.
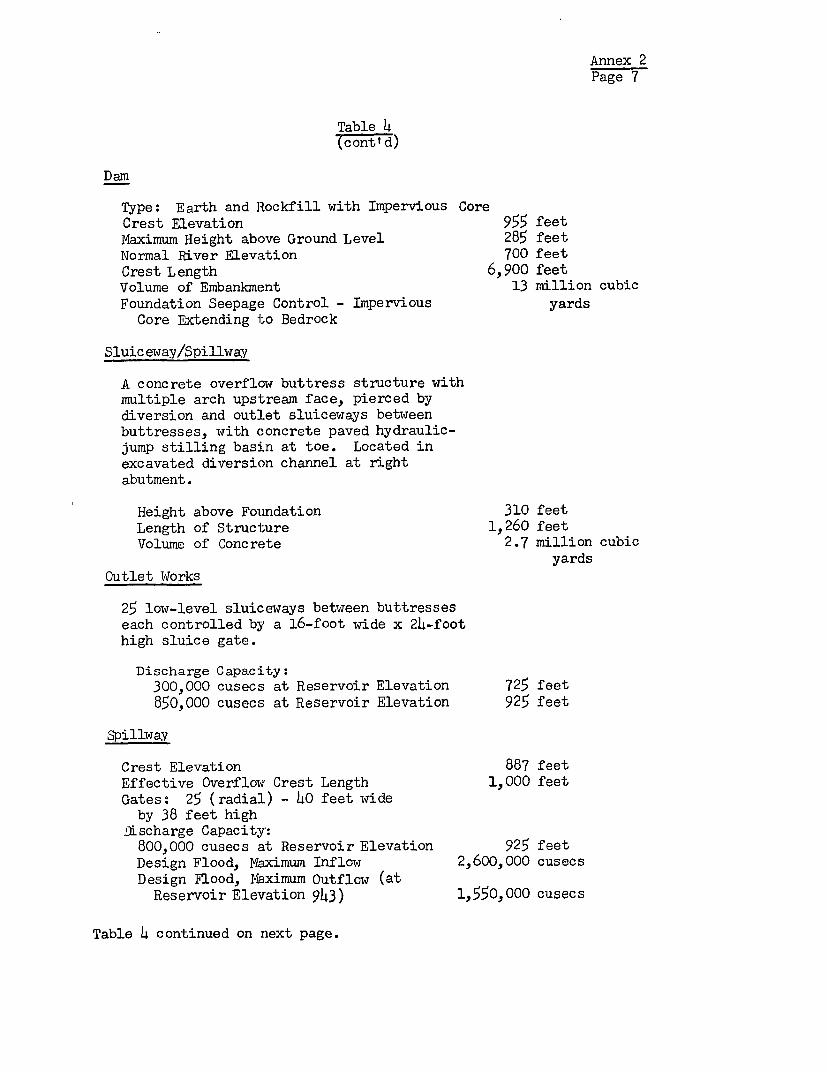
Annex 2Page 7
Table 4(cont' d)
Dam
Type: Earth and Rockfill with Impervious CoreCrest Elevation 955 feetMaximum Height above Ground Level 285 feetNormal River Elevation 700 feetCrest Length 6,900 feetVolume of Embankment 13 million cubicFoundation Seepage Control - Impervious yards
Core Extending to Bedrock
Sluiceway/Spillway
A concrete overflow buttress structure withmultiple arch upstream face, pierced bydiversion and outlet sluiceways betweenbuttresses, with concrete paved hydraulic-jump stilling basin at toe. Located inexcavated diversion channel at rightabutment.
Height above Foundation 310 feetLength of Structure 1,260 feetVolume of Concrete 2.7 million cubic
yardsOutlet Works
25 low-level sluiceways between buttresseseach controlled by a 16-foot wide x 24-foothigh sluice gate.
Discharge Capacity:300,000 cusecs at Reservoir Elevation 725 feet850,000 cusecs at Reservoir Elevation 925 feet
Spillway
Crest Elevation 887 feetEffective Overflow Crest Length 1,000 feetGates: 25 (radial) - 40 feet wide
by 38 feet highi)scharge Capacity:800,000 cusecs at Reservoir Elevation 925 feetDesign Flood, Maximum Inflow 2,600,000 cusecsDesign Flood, Maximum Outflow (at
Reservoir Elevation 943) 1,550,000 cusecs
Table 4 continued on next page.
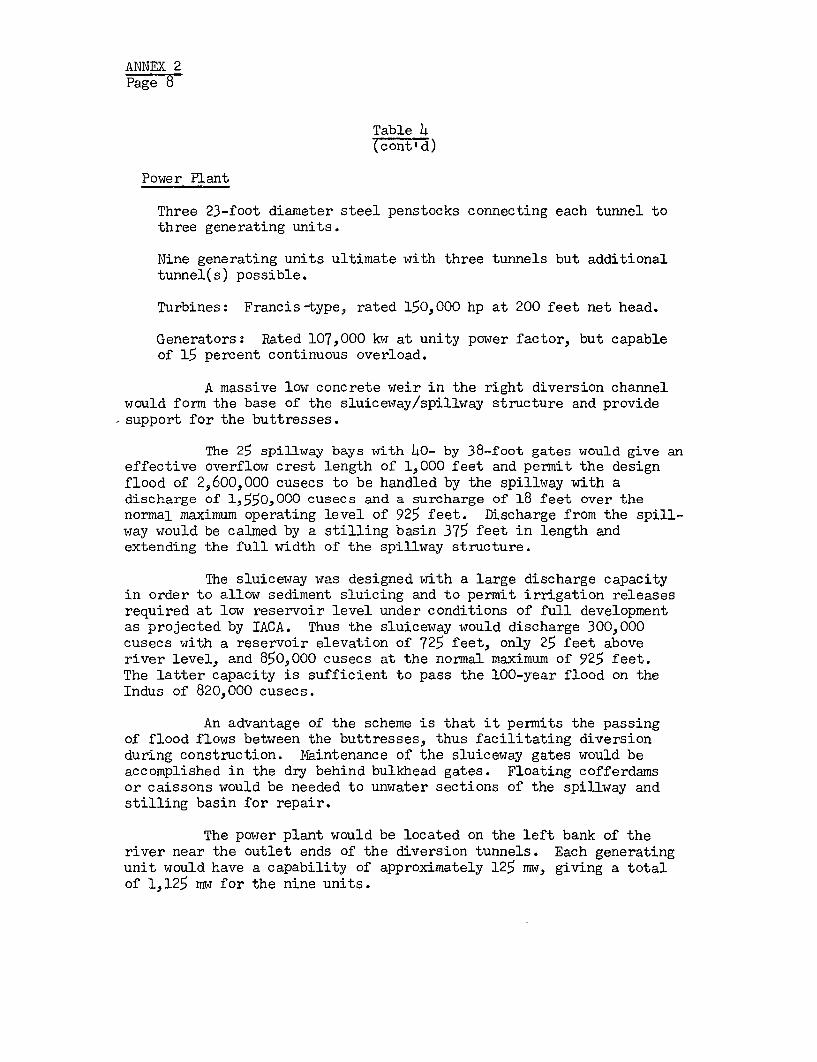
ANNEX 2Page 8
Table 4(cont' d)
Power Plant
Three 23-foot diameter steel penstocks connecting each tunnel tothree generating units.
Nine generating units ultimate with three tunnels but additionaltunnel(s) possible.
Turbines: Francis-type, rated 150,000 hp at 200 feet net head.
Generators: Rated 107,000 kw at unity power factor, but capableof 15 percent continuous overload.
A massive low concrete weir in the right diversion channelwould form the base of the sluiceway/spillway structure and providesupport for the buttresses.
The 25 spillway bays with h0- by 38-foot gates would give aneffective overflow crest length of 1,000 feet and permit the designflood of 2,600,000 cusecs to be handled by the spillway with adischarge of 1,550,000 cusecs and a surcharge of 18 feet over thenormal maximum operating level of 925 feet. Discharge from the spill-way would be calmed by a stilling basin 375 feet in length andextending the full width of the spillway structure.
The sluiceway was designed with a large discharge capacityin order to allow sediment sluicing and to permit irrigation releasesrequired at low reservoir level under conditions of full developmentas projected by IACA. Thus the sluiceway would discharge 300,000cusecs with a reservoir elevation of 725 feet, only 25 feet aboveriver level, and 850,000 cusecs at the normal maximum of 925 feet.The latter capacity is sufficient to pass the 100-year flood on theIndus of 820,000 cusecs.
An advantage of the scheme is that it permits the passingof flood flows between the buttresses, thus facilitating diversionduring construction. Maintenance of the sluiceway gates would beaccomplished in the dry behind bulkhead gates. Floating cofferdamsor caissons would be needed to unwater sections of the spillway andstilling basin for repair.
The power plant would be located on the left bank of theriver near the outlet ends of the diversion tunnels. Each generatingunit would have a capability of approximately 125 mw, giving a totalof 1,125 mw for the nine units.
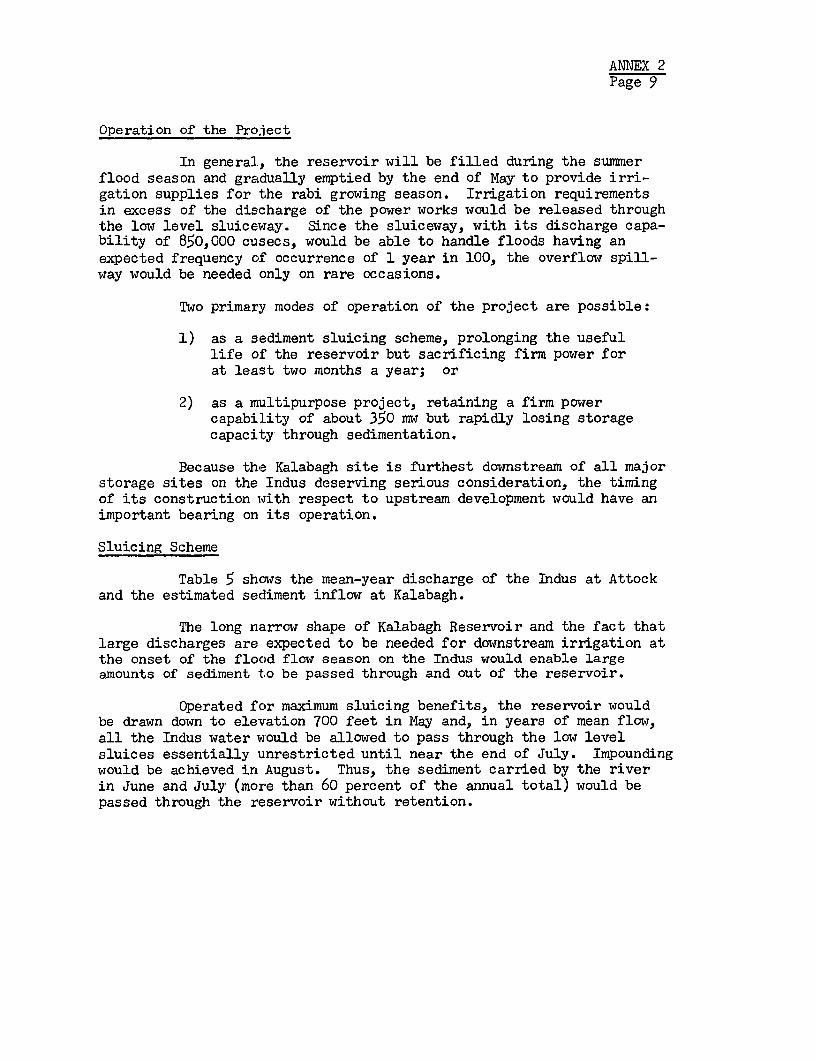
ANNEX 2Page 9
Operation of the Project
In general, the reservoir will be filled during the summerflood season and gradually emptied by the end of May to provide irri-gation supplies for the rabi growing season. Irrigation requirementsin excess of the discharge of the power works would be released throughthe low level sluiceway. Since the sluiceway, with its discharge capa-bility of 850,000 cusecs, would be able to handle floods having anexpected frequency of occurrence of 1 year in 100, the overflow spill-way would be needed only on rare occasions.
Two primary modes of operation of the project are possible:
1) as a sediment sluicing scheme, prolonging the usefullife of the reservoir but sacrificing firm power forat least two months a year; or
2) as a multipurpose project, retaining a firm powercapability of about 350 mw but rapidly losing storagecapacity through sedimentation.
Because the Kalabagh site is furthest downstream of all majorstorage sites on the Indus deserving serious consideration, the timingof its construction with respect to upstream development would have animportant bearing on its operation.
Sluicing Scheme
Table 5 shows the mean-year discharge of the Indus at Attockand the estimated sediment inflow at Kalabagh.
The long narrow shape of Kalabagh Reservoir and the fact thatlarge discharges are expected to be needed for downstream irrigation atthe onset of the flood flow season on the Indus would enable largeamounts of sediment to be passed through and out of the reservoir.
Operated for maximum sluicing benefits, the reservoir wouldbe drawn down to elevation 700 feet in May and, in years of mean flow,all the Indus water would be allowed to pass through the low levelsluices essentially unrestricted until near the end of July. Impoundingwould be achieved in August. Thus, the sediment carried by the riverin June and July (more than 60 percent of the annual total) would bepassed through the reservoir without retention.
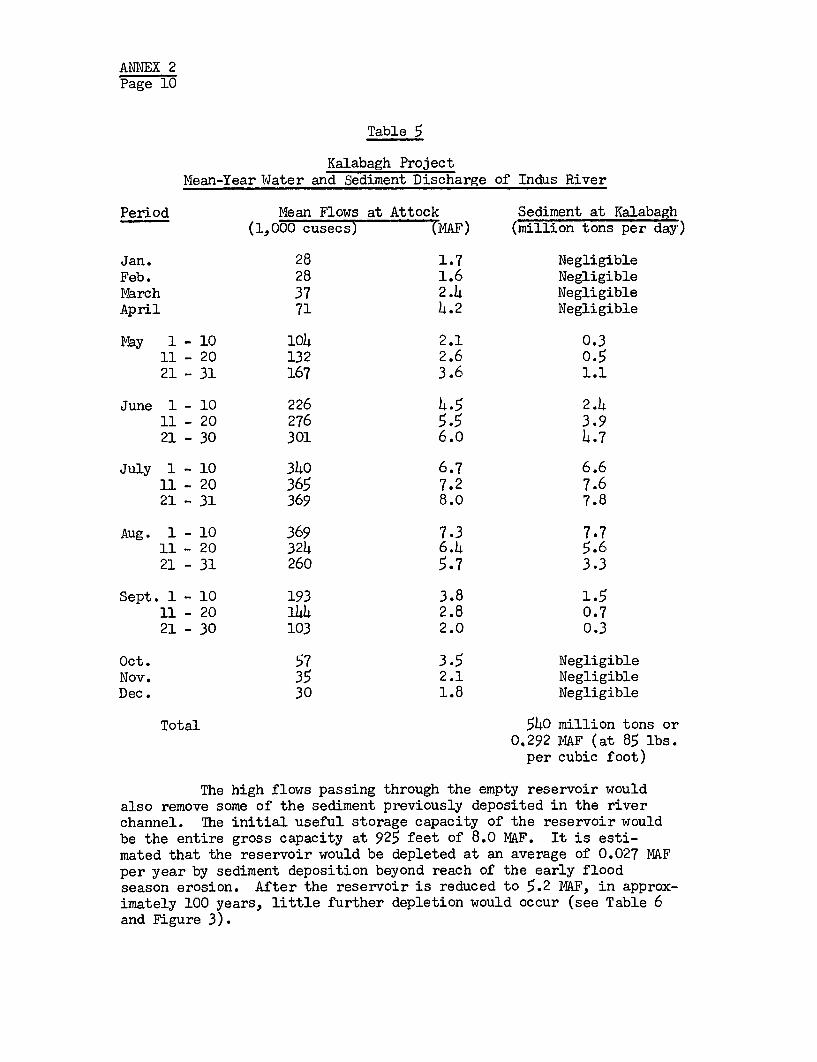
ANNEX 2Page 10
Table 5
Kalabagh ProjectMean-Year Water and Sediment Discharge of Indus River
Period Mean Flows at Attock Sediment at Kalabagh(1,000 cusecs) (MAF) (million tons per day)
Jan. 28 1.7 NegligibleFeb. 28 1.6 NegligibleMarch 37 2.4 NegligibleApril 71 4.2 Negligible
May 1 - 10 104 2.1 0.311 - 20 132 2.6 0.521 - 31 167 3.6 1.1
June 1 - 10 226 4.5 2.411 - 20 276 5.5 3.921 - 30 301 6.0 4.7
July 1 - 10 340 6.7 6.611 - 20 365 7.2 7.621 - 31 369 8.0 7.8
Aug. 1 - 10 369 7.3 7.711 - 20 324 6.4 5.621 - 31 260 5.7 3.3
Sept. 1 - 10 193 3.8 1.511 - 20 144 2.8 0.721 - 30 103 2.0 0.3
Oct. 57 3.5 NegligibleNov. 35 2.1 NegligibleDec. 30 1.8 Negligible
Total 540 million tons or0.292 MAF (at 85 lbs.per cubic foot)
The high flows passing through the empty reservoir wouldalso remove some of the sediment previously deposited in the riverchannel. The initial useful storage capacity of the reservoir wouldbe the entire gross capacity at 925 feet of 8.0 NAF. It is esti-mated that the reservoir would be depleted at an average of 0.027 MAFper year by sediment deposition beyond reach of the early floodseason erosion. After the reservoir is reduced to 5.2 MAF, in approx-imately 100 years, little further depletion would occur (see Table 6and Figure 3).

ANNEX 2Page 11
Table 6
Kalabagh Dam ProjectEstimated Depletion of Live Storage Capacity
(MAF)
Years Live Storage CapacityAfter With Without
Completion Sluicing Sluicing
0 8.0 6.h1 8.0 6.22 7.9 6.13 7.9 5.94 7.9 5.8
5 7.9 5.66 7.8 5.57 7.8 5.38 7.8 5.29 7.8 5.0
10 7.7 4.912 7.7 4.615 7.6 3.818 7.5 3.321 7.4 2.7
25 7.3 2.133 7.1 1.051 6.6 1.0
100 (state of equilibrium) 5.2 1.0
If Kalabagh were constructed after Tarbela, it could beoperated in the manner described above although the early flood flowswould be reduced in quantities and in sediment content because of thescreening effect of Tarbela. It is expected that the overall effecton the rate of depletion of the Kalabagh Reservoir would not besignificant.
At full development of water utilization on the Indus, agreater constraint on unrestricted flow through of sediment-ladenwaters would exist. If, for example, both Tarbela and Gariala werein operation, impounding at Kalabagh would have to begin during theearly part of July. Tarbela would act as a sediment trap for thefirst 50 years of its existence, but thereafter most of the Indussediment load would once again make its appearance at Kalabagh. Thenet effect of this situation would be a somewhat higher rate ofdepletion than indicated above in the early stages, and a furtherincreased rate after Tarbela were filled with sediment. Gradualreduction below the "permanent" 5.2 MAF figure would occur.
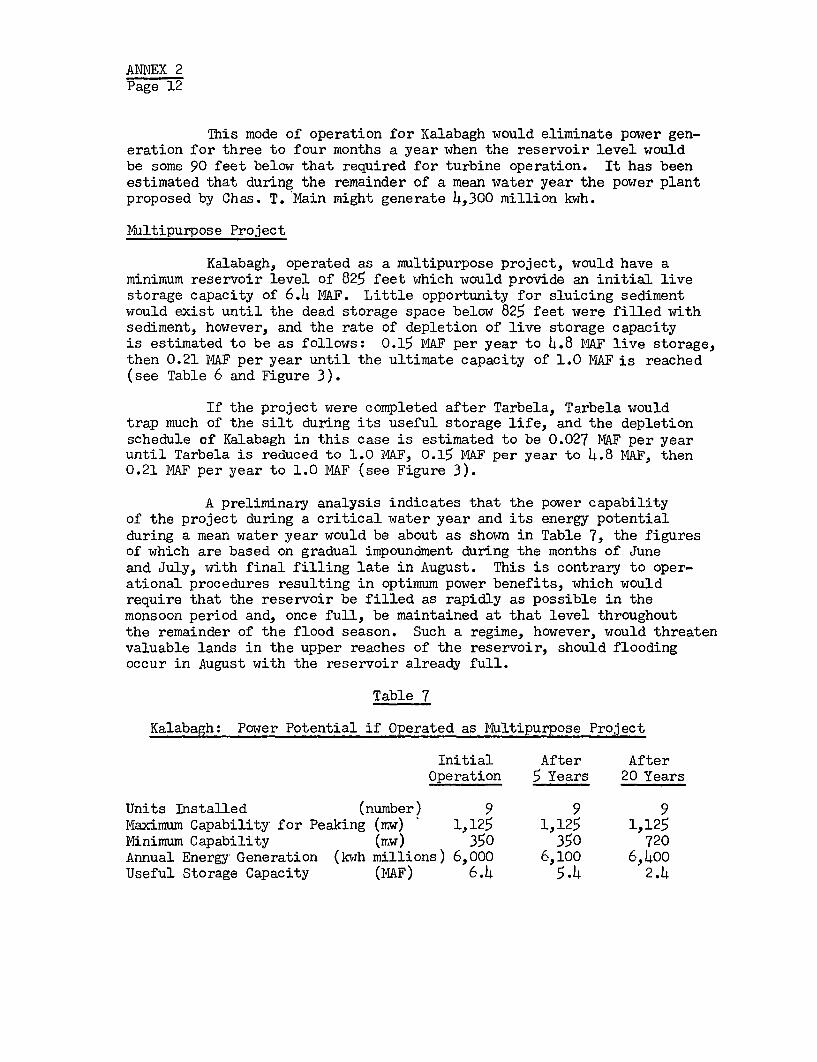
ANNEX 2Page 12
This mode of operation for Kalabagh would eliminate power gen-eration for three to four months a year when the reservoir level wouldbe some 90 feet below that required for turbine operation. It has beenestimated that during the remainder of a mean water year the power plantproposed by Chas. T. Main might generate 4,300 million kwh.
Multipurpose Project
Kalabagh, operated as a multipurpose project, would have aminimum reservoir level of 825 feet which would provide an initial livestorage capacity of 6.4 MAF. Little opportunity for sluicing sedimentwould exist until the dead storage space below 825 feet were filled withsediment, however, and the rate of depletion of live storage capacityis estimated to be as follows: 0.15 MAF per year to 4.8 MAF live storage,then 0.21 MAF per year until the ultimate capacity of 1.0 MAF is reached(see Table 6 and Figure 3).
If the project were completed after Tarbela, Tarbela wouldtrap much of the silt during its useful storage life, and the depletionschedule of Kalabagh in this case is estimated to be 0.027 MAF per yearuntil Tarbela is reduced to 1.0 MAF, 0.15 MAF per year to 4.8 MAF, then0.21 NAF per year to 1.0 MAF (see Figure 3).
A preliminary analysis indicates that the power capabilityof the project during a critical water year and its energy potentialduring a mean water year would be about as shown in Table 7, the figuresof which are based on gradual impoundment during the months of Juneand July', with final filling late in August. This is contrary to oper-ational procedures resulting in optimum power benefits, which wouldrequire that the reservoir be filled as rapidly as possible in themonsoon period and, once full, be maintained at that level throughoutthe remainder of the flood season. Such a regime, however, would threatenvaluable lands in the upper reaches of the reservoir, should floodingoccur in August with the reservoir already full.
Table 7
Kalabagh: Power Potential if Operated as Multipurpose Project
Initial After AfterOperation 5 Years 20 Years
Units Installed (number) 9 9 9Maximum Capability for Peaking (mw) 1,125 1,125 1,125Minimum Capability (mTw) 350 350 720Annual Energy, Generation (kwh millions) 6,000 6,100 6, 400Useful Storage Capacity (MAF) 6.4 5.4 2.4
ANNEX 2Page 13
Construction Program
The construction program of approximately seven years outlinedbelow is representative only, since several schemes would have to bestudied in detail before the final design is chosen.
Excavation for the right bank diversion channel and the leftbank diversion tunnels would be started simultaneously, most likely atthe beginning of the first dry season.
Construction of the buttress structure would begin as soon asthe foundation could be prepared. The weir and stilling basin, and theportions of the sidewalls and buttresses below flood level would be com-pleted before any diversion around the right bank was begun, but thearches below flood level and the sluiceways would be omitted at first.
Work would proceed on the diversion tunnels and control struc-tures which should be completed by the end of the fourth flood season.They would then be opened, and, with their 100, 000-cusec capacity, shouldbe sufficient to accommodate the entire dry season flows, permitting workon the buttress section to be carried out in the dry.
Cofferdams would be constructed across the river to enclosethe dam foundation area, the dam site unwatered, and the dam foundationprepared. Placing of the embankment would then be started and broughtup to a height sufficient to prevent overtopping before the onset ofthe ensuing flood season, the fifth.
At this stage, flood flows would be passed through the diver-sion channel and tunnels, but the tunnels would continue to be utilizedto pass the dry season flows in order to facilitate work on the buttresssection.
The sluicegates and arches would be completed by the beginningof the sixth flood season, and the dam would reach completion by thestart of the seventh flood season. At this time, the tunnel intakeswould be closed, and the river flows passed through the sluiceways and/or stored in the reservoir.
If it were decided to make an initial power installation,the downstream ends of the tunnels would be plugged, and each of thetunnels would be connected by means of the steel penstocks to threeturbines. All three penstocks would be completed to the main supplytunnel before the first turbine unit of the group were placed inservice. Butterfly valves at the downstream ends of the penstockconnections would permit the installation of future units withoutunwatering the tunnels.
The first three generators could be ready for commercialoperation some time during the dry season following the sixth floodseason.
ANNEX 2Page 14
Cost Estimates
The cost estimates prepared by Chas. T. Main and shown inFigure 4 are for storage facilities only and do not include provisionfor inflation, financial contingencies, taxes, duties, levies, orinterest during construction. The total cost is estimated at $540million of which $212 million would be in foreign exchange. The powerplant of nine generating units having a total capacity of 1,125 mw isestimated to cost about $140 million.
However, in view of the gross uncertainties involved, thelack of information leading to serious questions as to the technicalfeasibility of the project as proposed, the Bank Group feels that acost range of $540 million to $700 million should be adopted as aclearer indication of the possible total cost. If it should develop,for example, that a dam with a high level spillway were the only' struc-ture feasible, the costs would rise greatly.
Construction Costs
Costs shown are rough estimates at best because of the meagerinformation available. Subsurface conditions, in particular, are almostcompletely unknown. A few samples of the foundation rock have been taken,and it has not been tested. Depth of the alluvium was estimated on thebasis of limited borings. No sources of construction materials werespecifically identified.
Cost of materials and labor as existed in West Pakistan inJuly 1964 were assumed.
A 30 percent contingency on construction costs was added tocover changes brought about by unforeseen conditions. This figurecompares with the 20 percent contingency allowed for Tarbela.
Comprehensive field investigations and design studies arenecessary before more reliable cost estimates of the project can bemade.
Land and Relocation
Estimated costs were furnished by WAPDA 1/ for all land andthe relocation of all residents and facilities lying below elevation930 feet. Particularly important, and costly, are lands along theKabul in the vicinity of Nowshera which might be inundated by theproject. Since the reservoir most likely would not be filled untillate in the flood season, and since flood flows in the Kabul aregenerally over in June, it is expected that backwater effects from thereservoir would be relatively small. In this case, flooding of land
1/ Cable from WAPDA to IBRD-, February 2, 1966.
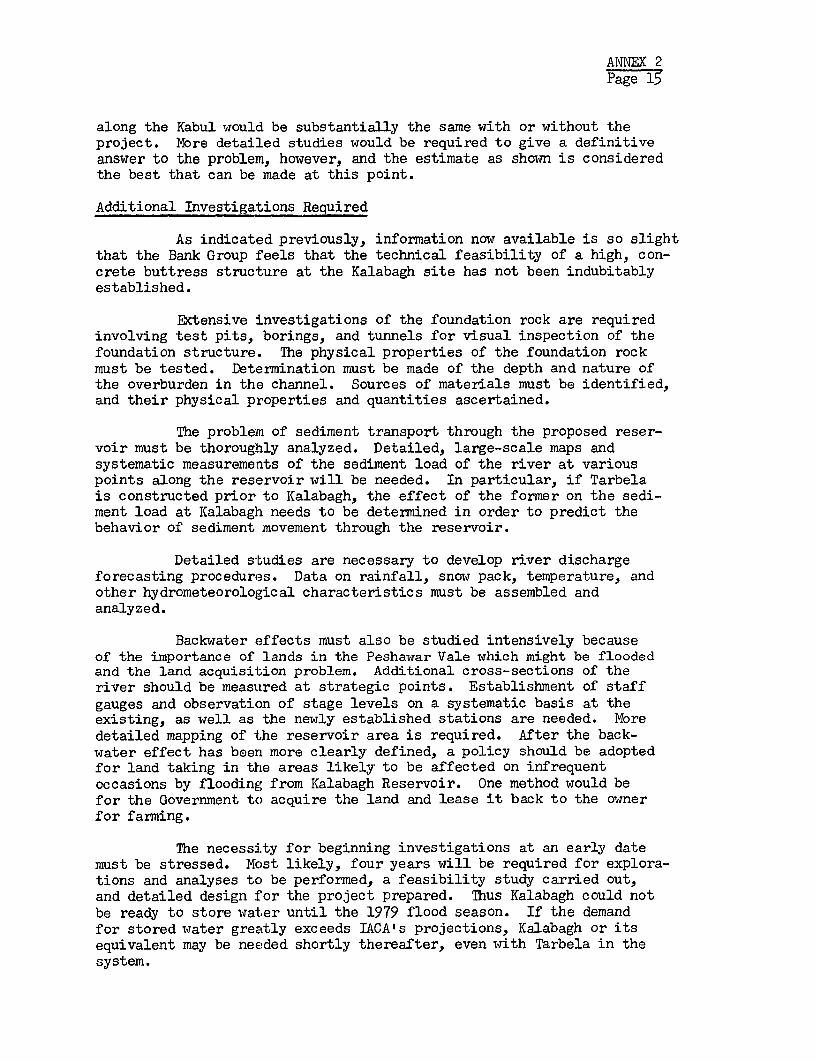
ANNEX 2Page 15
along the Kabul would be substantially the same with or without theproject. More detailed studies would be required to give a definitiveanswer to the problem, however, and the estimate as shown is consideredthe best that can be made at this point.
Additional Investigations Required
As indicated previously, information now available is so slightthat the Bank Group feels that the technical feasibility of a high, con-crete buttress structure at the Kalabagh site has not been indubitablyestablished.
Extensive investigations of the foundation rock are requiredinvolving test pits, borings, and tunnels for visual inspection of thefoundation structure. The physical properties of the foundation rockmust be tested. Determination must be made of the depth and nature ofthe overburden in the channel. Sources of materials must be identified,and their physical properties and quantities ascertained.
The problem of sediment transport through the proposed reser-voir must be thoroughly analyzed. Detailed, large-scale maps andsystematic measurements of the sediment load of the river at variouspoints along the reservoir will be needed. In particular, if Tarbelais constructed prior to Kalabagh, the effect of the former on the sedi-ment load at Kalabagh needs to be determined in order to predict thebehavior of sediment movement through the reservoir.
Detailed studies are necessary to develop river dischargeforecasting procedures. Data on rainfall, snow pack, temperature, andother hydrometeorological characteristics must be assembled andanalyzed.
Backwater effects must also be studied intensively becauseof the importance of lands in the Peshawar Vale which might be floodedand the land acquisition problem. Additional cross-sections of theriver should be measured at strategic points. Establishment of staffgauges and observation of stage levels on a systematic basis at theexisting, as well as the newly established stations are needed. Moredetailed mapping of the reservoir area is required. After the back-water effect has been more clearly defined, a policy should be adoptedfor land taking in the areas likely to be affected on infrequentoccasions by flooding from Kalabagh Reservoir. One method would befor the Government to acquire the land and lease it back to the ownerfor farming.
The necessity for beginning investigations at an early datemust be stressed. Most likely, four years will be required for explora-tions and analyses to be performed, a feasibility study carried out,and detailed design for the project prepared. Thus Kalabagh could notbe ready to store water until the 1979 flood season. If the demandfor stored water greatly exceeds IACA's projections, Kalabagh or itsequivalent may be needed shortly thereafter, even with Tarbela in thesystem.

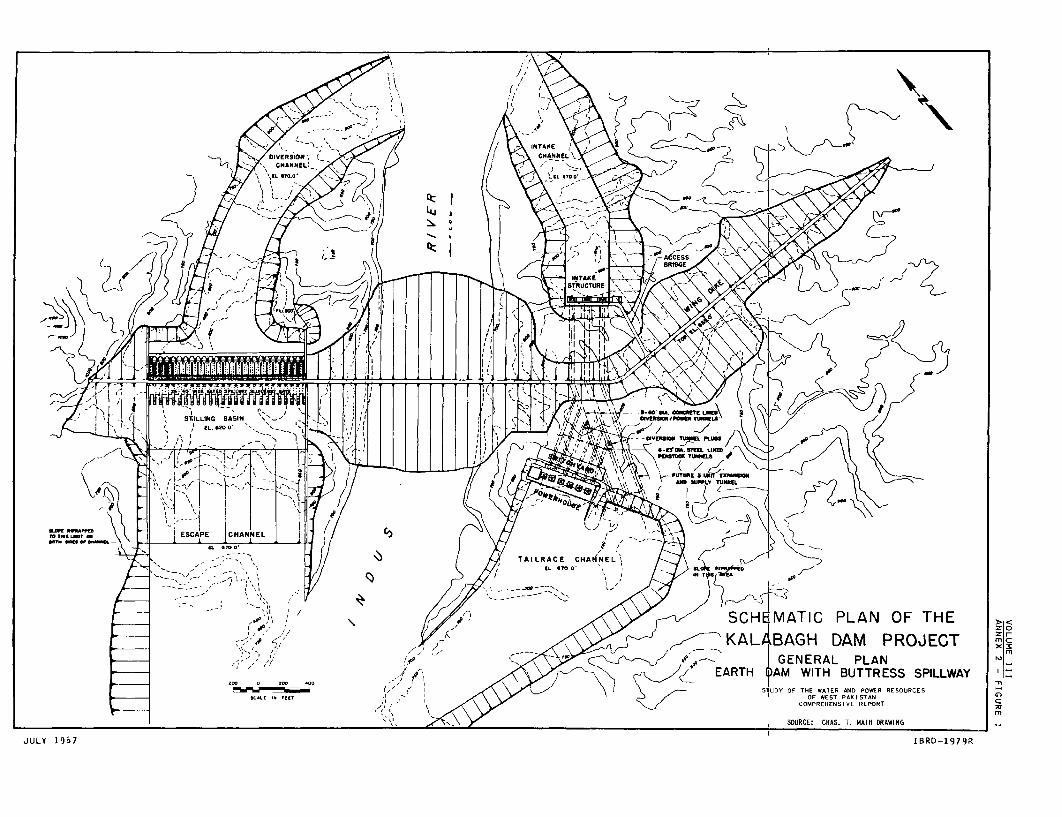
/ twA SCHE :MATIC PLAN OF THE>cI # ~ ~/ KA ,KLA BAGI- DAM PROJECT xc
riz~~~~~~~~~~~~~~~~~~~~~~~~~~~~~~~~~~~~~~~~~~~~~~~~~~n
, ' ,, >. .0' .t-- + . p~EART GENERAL PLAN __A4r_ CESS / E (DAM WITH BUTTRESS SPILLWAY '2
'I R L - ' - ' /T I E \ < > / tC O M P R F E H E N S I V E R E P O R T
SILLING BAIN DM tSOURCE: CHAS. T. MAI DRAWI
JULY 1967 IEARD-1979R

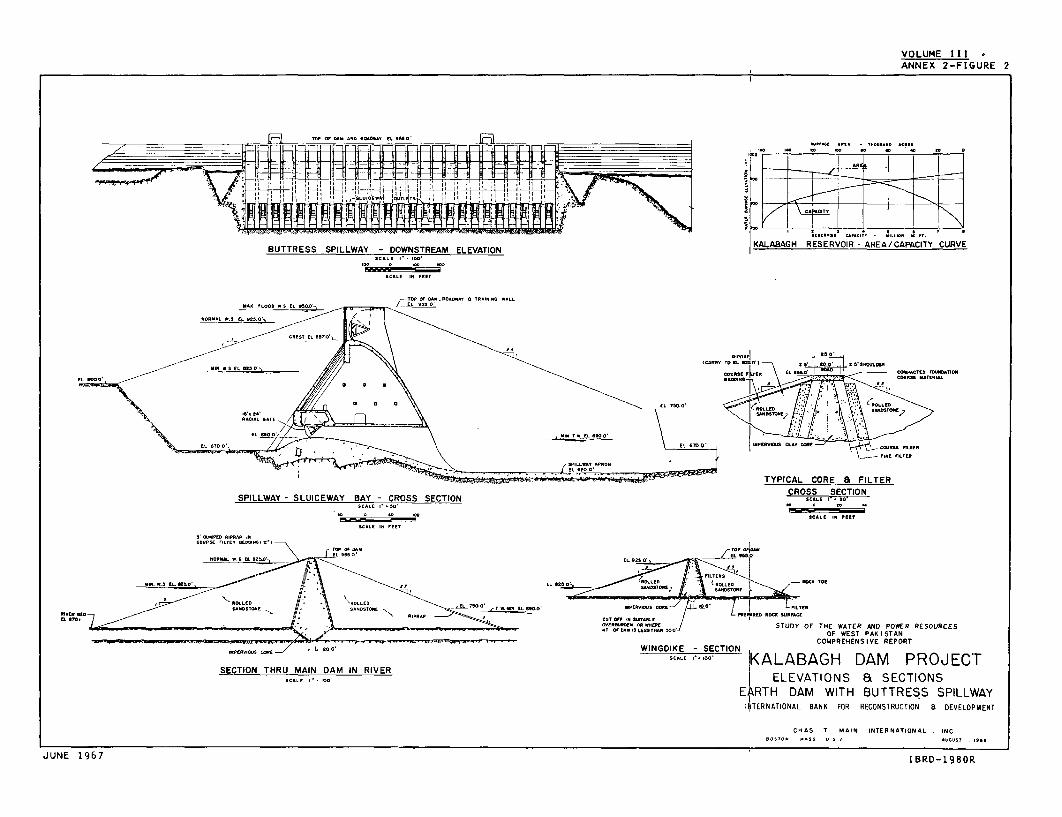
VOLUME III oANNEX 2-FIGURE 2
I~~~~~~~~~~~~~~~~~e M. rl .. ..... I
______________________________ FKALABAGIl~~~~ ~~~~ RESRVIR ... AREA/CPACITY CURVE
BUTTRESS SPILLWAY - DOWNSTREAM ELEVATION
SCALE E'' ICC -
TSP or oDA .ECAQEAT e TaDlSIA WALL
MAD rLoOD * S cL s - r EL 9M O'-
EL 6TO Q . / 4 \ ATAUD C.T DCAItSE
TYPICAL CORE& FILTERCROSS SECTION
SPILLWAY - SLUICEWAY BAY - CROSS SECTION SCALE 1. MOA
cAC E 1' ' CTA' A - "II-0 TA ACSAL I FE
M* MAMFEDAISEAP ISACATAS FILETE 6 DOMIN6 ,1 ZI
EL ATTY' El. EAST'~~~~~~~~~~~~~~~~~~~L ~5OEL -AL M E. El. M- E E L \O S
S A~~~~~~~~~~~~~~~~~~~~~~~~~~~~~~~~~~~~~~~<oLLED 1 1 LEA T aL
- t^NC$TO"FEA LD . , AL SA olLTON C 7Ow AI A L MAC OSDIA SEA S .44, |=s/ D FL[
_ODA clV OE-TTEED STUDY OF THE WATER AND POWER RESOURCESAT DDDMILSSDTD- TAO * OF WEST PAKISTAN
COMPREHENSIVE REPORT17arvicLs OoaFv _ L 200' WINGDIKE - SECTION
SC-t. KALABAGH DAM PROJECTSECTION THRU MAIN DAM IN RIVER
SLLE I.' ELEVATIONS & SECTIONSEARTH DAM WITH BUTTRESS SPILLWAY
IIITERNATIQNAL BANK FOR RECONSTRUCTION B DEVELOPMENT
CHAS T MAIN INTERNATIONAL INC
JUNE 1967 IBRD-198OR

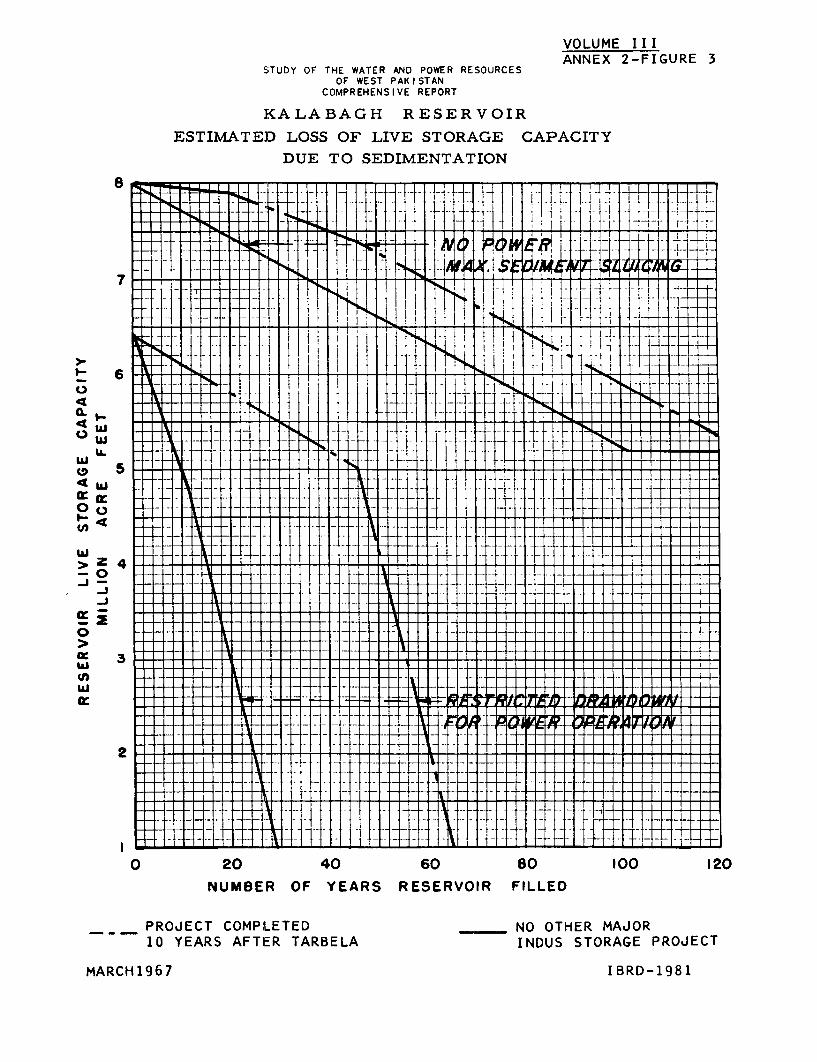
VOLUME IIIANNEX 2-FIGURE 3
STUDY OF THE WATER AND POWER RESOURCESOF WEST PAKISTAN
COMPREHENSIVE REPORT
KALABAGH RESERVOIR
ESTIMATED LOSS OF LIVE STORAGE CAPACITY
DUE TO SEDIMENTATION
8
7
_ 6
IA.
0
4 IA- J t t- t
I**
0
gx 3In~~~~~~~~~~~~~~~~~~~~~~~~~~~~~~~~~~~~~~~~~~~~~~~~~~~~~~~
W W J-1 I -[t-tH i gT
,~~~~~~~~~~~~~~~j 1- -- - -i - - -S -
0 20 40 60 80 100 120
NUMBER OF YEARS RESERVOIR FILLED
PROJECT COMPLETED NO OTHER MAJOR10 YEARS AFTER TARBELA INDUS STORAGE PROJECT
MARCH1967 IBRD-1981

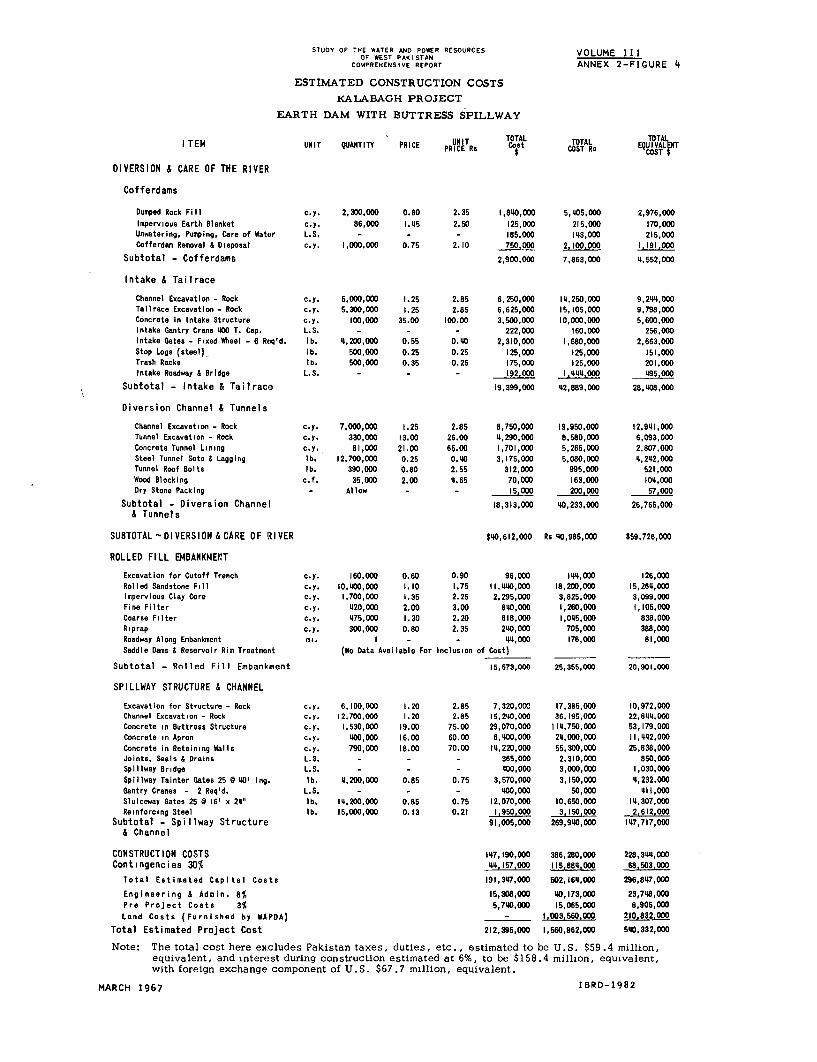
STUDY OF THE WATER AND POWER RESOURCES VOLUME IIIOF WEST PAKISTAN
COMPR EHENSIVE REPORT ANNEX 2-FIGURE 4
ESTIMATED CONSTRUCTION COSTS
KAILABAGH PROJECT
EARTH DAM WITH BUTTRESS SPILLWAY
TEN UNIT "LIANTITY UNIT ~~~~~ ~ ~~~~ ~~~~~TOTAL TOALTOTTEI UI QUNTY PRICE PRUICE Rs Coat COST Re COS~IT
DIVERSION & CARE OF THE RIVER
Cofferdams
Dumped Rock Fill c.y. 2,300,000 0.80 2.35 1,8110,000 5,1105,000 2,976,000Impervious Earth Blanket c.y. 86,000 1.115 2.50 125,000 215,000 170,000Unwatering, Pumping, Care of Watsir L.S. - - - 185,000 1113,000 215,O00Cofferdam Removal & Disposal c.y. 1,000,000 0.75 2.10 750.000 2,100.000 1.191,000
Subtotal - Cofferdams 2,900,000 7,863,000 41,552,000
Intake & Tailrace
Channel Excavation -Rock c.y. 5,000,000 1.25 2.85 6,250,000 111,250,000 9,2111,000Talirace Excavation -Rock c.y. 5,300,000 1.25 2.85 6,625,000 15I05,OS,00 9,798,000Concrete In Intake Stracture c.y. 100,000 35.00 100.00 3,500,000 10,000,000 5,600,000Intake Gantry Crane '100 T. Cap. L.S. - - - 222,000 160,000 256,000Intake Gates - Fixed Wheel - 6 Req d. l b. '4,200,000 0.55 0.110 2,310,000 1,680,000 2,663,0010Stop Logs (steel)_ lb. 500,000 0.25 0.25 125,0010 125,000 151,000Trash Racks lb. 500,000 0.35 0.25 175,000 125,000 201,000Intake Roadtway & Bridge L. S. - - - 19,0 1.114111OOD 195,000
Subtotal - Intake & Tailrace 19,399,000 112,889,000 28,1108,000
Diversion Channel & Tunnels
Channel Excavation - Rock c.y. 7,000,000 1.25 2.85 8,750,000 19,950,000 12,9411,000Tunnel Excavation - Rock c.y. 330,000 13.00 26.00 11,290,000 8,580,000 6,093,000Concrete Tunnel Lining c.y.. 81,000 21.00 65.00 1,701,000 5,265,000 2,807,0010Steel Tunnel Sets & Lagging l b. 12.700,000 0.25 0.110 3,175,000 5,080,000 41,2412,000Tunnel Roof Bolts lb. 390,000 0.80 2.55 312,000 995,000 521,000Wood Blocking C.f, 35,000 2.00 11.65 70,000 163,000 1041,000Dry Stone Packing - Allow - - 15.000 200,000 57.000
Subtotal - Diversion Channel 18,313,000 110,233,000 26,765,000& Tunnels
S UB8TO TAL - D I VE R S ION & C AR E O F RI V ER $410,612,000 Res 110,986,000 $59,726,000
ROLLED FILL EN4BANKIVID!T
Excavation for Cutoff Trench c.y. 160,000 0.60 0.90 96,000 1111,000 126,000Rolled Sandstone Fill c.y. 10,4100,000 1.10 1.75 11.1110,000 18,20D,0OD 15,2611,000Impervious Clay Core c.y. 1,700,000 1.35 2.25 2,295,000 3,825,000 3,099,000Fine Filter c.y. 1120,000 2.00 3.00 8110,000 1,260,000 1,105,000Coarae Filter c.y. 1175,000, 1.30 2.20 618,000 1,0115,000 838,000Riprap c.y. 300,000 0.80 2.35 2110,000 705,000 388,000Roadway Along Embankment Mi. I - - 111,000 178,000 81,000Saddle Dams & Reservoir Rim Treatment (No Data Availabl eFor Inclusion of Cost)_____
Subtotal - Rolled Fill Embankment 15,573,000 25,355.000 20.901.000
SPILLWAY STRUCTURE & CHANNEL
Excavation for Structure - Rock c.y. 6,100,000 1.20 2.85 7,320,0CC. 17,385,000 10,972,000Channel Excavation - Rock c.y. 12,700.000 1.20 2.85 15,2110,000 36,195,000 22,84411000Concrete in Buttress Structure c.y. 1,520,000 19.00 75.00 29,070,000 1111,750,000 53,179,000Concrete in Apron c.y. 1100,000 16.00 60.00 6,1100,000 211,000,000 I I,1112, 000Concrete in Retaining Walls c.y. 790,000 18.00 70.00 111,220,000 55,200,000 25,838,000Joints, Seals & Drains L.S. - - - 365,000 2,310,000 850,000Spillway Bridge L.S. - - - 1100,000 3,000,000 1,030,000Spillway Tainter Gates 25 @110' lng. lb. 11,200,000 0.85 0.75 3,570,000 3,150,000 11,232,000Gantry Cranes - 2 Reqld. L.S. - - - 1100,000 50,000 1111,0o0Sluiceway Gates 25 @ 16' s211 lb. 111,200,000 0.86 0.75 12,070,000 10,650,000 14,307,000Reinforcing Steel lb. 15,000,000 0.13 0.21 1.950,000 3,150,00 2,612,000
Subtotal - Spillway StruCture 91,005,000 269,9110,000 1117,717,000& Channel
CONSTRUCTION COSTS 1117,190,000 386,260,000, 228,3111,000Contingencies 30% 1114.157,000 115,8811.000 68.503.000
Total Estimated Capital Costs 191,3117,000 502,1641,O00 296,8117,000
Engineering & Admin. 8% 15,308I, 000 110,173,000 23,7118,000Pre Project Costs 3% 5,711D,000 15,065,000 8,905,000DLand Costs (Fern ished by WAPDA)- 1.003,560.000 210.832,000
Total Estimated Project Cost 212,395,000 1,560,962,001) 540,332,000
Note: The total cost here excludes Pakistan taxes, duties, etc. , estimated to be U.S. $59.4 million,equivalent, and interest during construction estimated at 6%, to be $158.4 million, equivelent,with foreign exchange component of U.S. $67.7 million, equivalent.
MARCH 1967 IBRD-1982


ANNEX 3
GARIALA PROJECT

ANNEX 3
LIST OF FIGURES
1. Gariala Project: Plan and Sections
2. Gariala Project: Plan and Sections: Detail
3. Tarbela-Haro Canal: Plan, Profile and Sections
4. Tarbela-Haro Canal: Plan, Profile and Sections: Detail
5. Estimated Construction Costs: Single-Stage Construction
6. Estimated Construction Costs: Two-Stage Construction:First Stage
7. Estimated Construction Costs: Two-Stage Construction:Second Stage
8. Fstimated Construction Costs: Tarbela-Haro Canal
9. Estimated Construction Costs: Summary

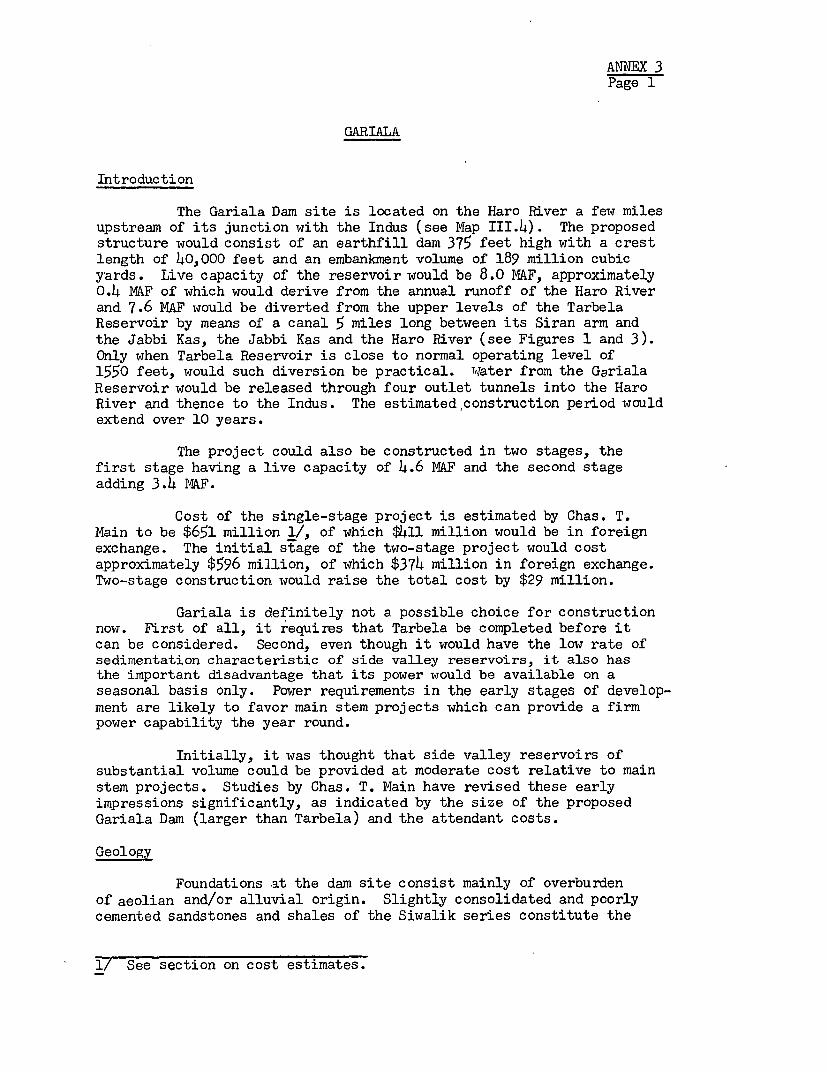
ANNEX 3Page 1
GARIALA
Introduction
The Gariala Dam site is located on the Haro River a few milesupstream of its junction with the Indus (see Map III4.). The proposedstructure would consist of an earthfill dam 375 feet high with a crestlength of 40,000 feet and an embankment volume of 189 million cubicyards. Live capacity of the reservoir would be 8.0 MAF, approximately0.4 MAF of which would derive from the annual runoff of the Haro Riverand 7.6 MAF would be diverted from the upper levels of the TarbelaReservoir by means of a canal 5 miles long between its Siran arm andthe Jabbi Kas, the Jabbi Kas and the Haro River (see Figures 1 and 3).Only when Tarbela Reservoir is close to normal operating level of1550 feet, would such diversion be practical. WATater from the GerialaReservoir would be released through four outlet tunnels into the HaroRiver and thence to the Indus. The estimated ,construction period wouldextend over 10 years.
The project could also be constructed in two stages, thefirst stage having a live capacity of 4.6 MAF and the second stageadding 3.4 MAF.
Cost of the single-stage project is estimated by Chas. T.Main to be $651 million 1/, of which $411 million would be in foreignexchange. The initial stage of the two-stage project would costapproximately $596 million, of which $374 million in foreign exchange.N%o-stage construction would raise the total cost by $29 million.
Gariala is definitely' not a possible choice for constructionnow. First of all, it requires that Tarbela be completed before itcan be considered. Second, even though it would have the low rate ofsedimentation characteristic of side valley reservoirs, it also hasthe important disadvantage that its power would be available on aseasonal basis only. Power requirements in the early stages of develop-ment are likely to favor main stem projects which can provide a firmpower capability the year round.
Initially, it was thought that side valley reservoirs ofsubstantial volume could be provided at moderate cost relative to mainstem projects. Studies by Chas. T. Main have revised these earlyimpressions significantly, as indicated by the size of the proposedGariala Dam (larger than Tarbela) and the attendant costs.
Geology
Foundations at the dam site consist mainly of overburdenof aeolian and/or alluvial origin. Slightly consolidated and poorlycemented sandstones and shales of the Siwalik series constitute the
1/ See section on cost estimates.
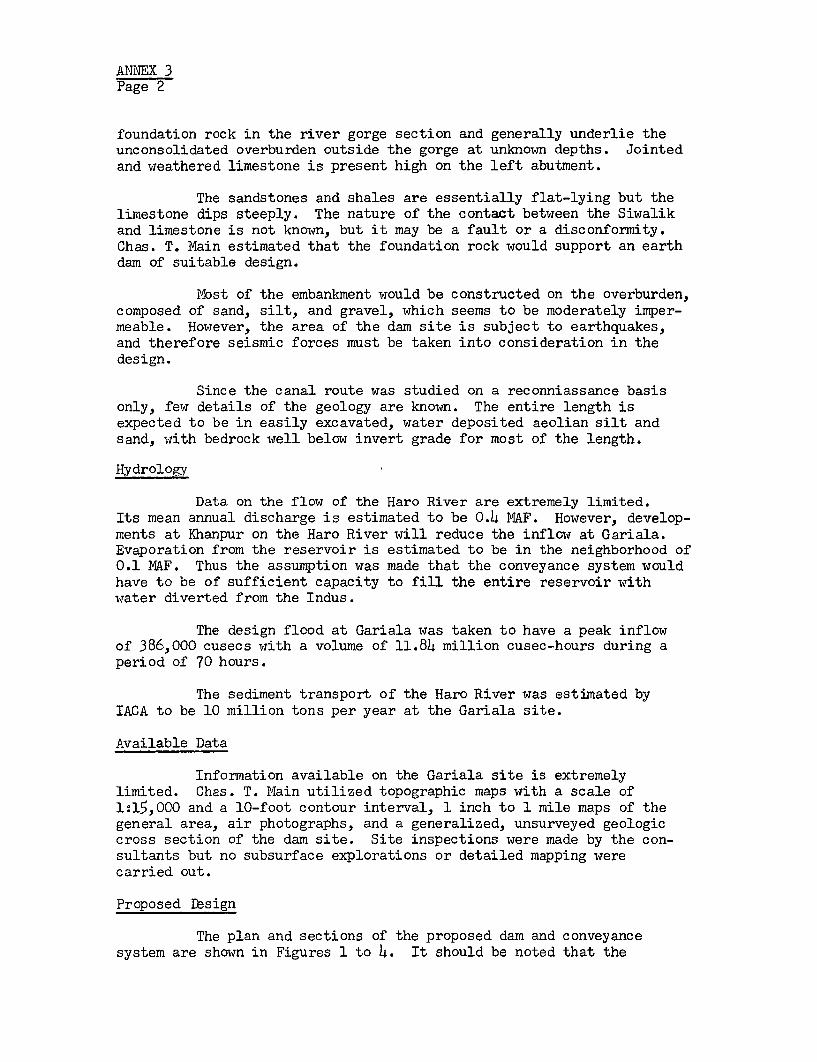
ANNEX 3Page 2
foundation rock in the river gorge section and generally underlie theunconsolidated overburden outside the gorge at unknown depths. Jointedand weathered limestone is present high on the left abutment.
The sandstones and shales are essentially flat-lying but thelimestone dips steeply. The nature of the contact between the Siwalikand limestone is not known, but it may be a fault or a disconformity.Chas. T. Main estimated that the foundation rock would support an earthdam of suitable design.
Most of the embankment would be constructed on the overburden,composed of sand, silt, and gravel, which seems to be moderately imper-meable. However, the area of the dam site is subject to earthquakes,and therefore seismic forces must be taken into consideration in thedesign.
Since the canal route was studied on a reconniassance basisonly, few details of the geology are known. The entire length isexpected to be in easily excavated, water deposited aeolian silt andsand, with bedrock well below invert grade for most of the length.
Hydrology
Data on the flow of the Haro River are extremely limited.Its mean annual discharge is estimated to be 0.4 MAF. However, develop-ments at Khanpur on the Haro River will reduce the inflow at Gariala.Evaporation from the reservoir is estimated to be in the neighborhood of0.1 MAF. Thus the assumption was made that the conveyance system wouldhave to be of sufficient capacity to fill the entire reservoir withwater diverted from the Indus.
The design flood at Gariala was taken to have a peak inflowof 386,000 cusecs with a volume of 11.84 million cusec-hours during aperiod of 70 hours.
The sediment transport of the Haro River was estimated byIACA to be 10 million tons per year at the Gariala site.
Available Data
Information available on the Gariala site is extremelylimited. Chas. T. Main utilized topographic maps with a scale of1:15,000 and a 10-foot contour interval, 1 inch to 1 mile maps of thegeneral area, air photographs, and a generalized, unsurveyed geologiccross section of the dam site. Site inspections were made by the con-sultants but no subsurface explorations or detailed mapping werecarried out.
Proposed Design
The plan and sections of the proposed dam and conveyancesystem are shown in Figures 1 to 4. It should be noted that the
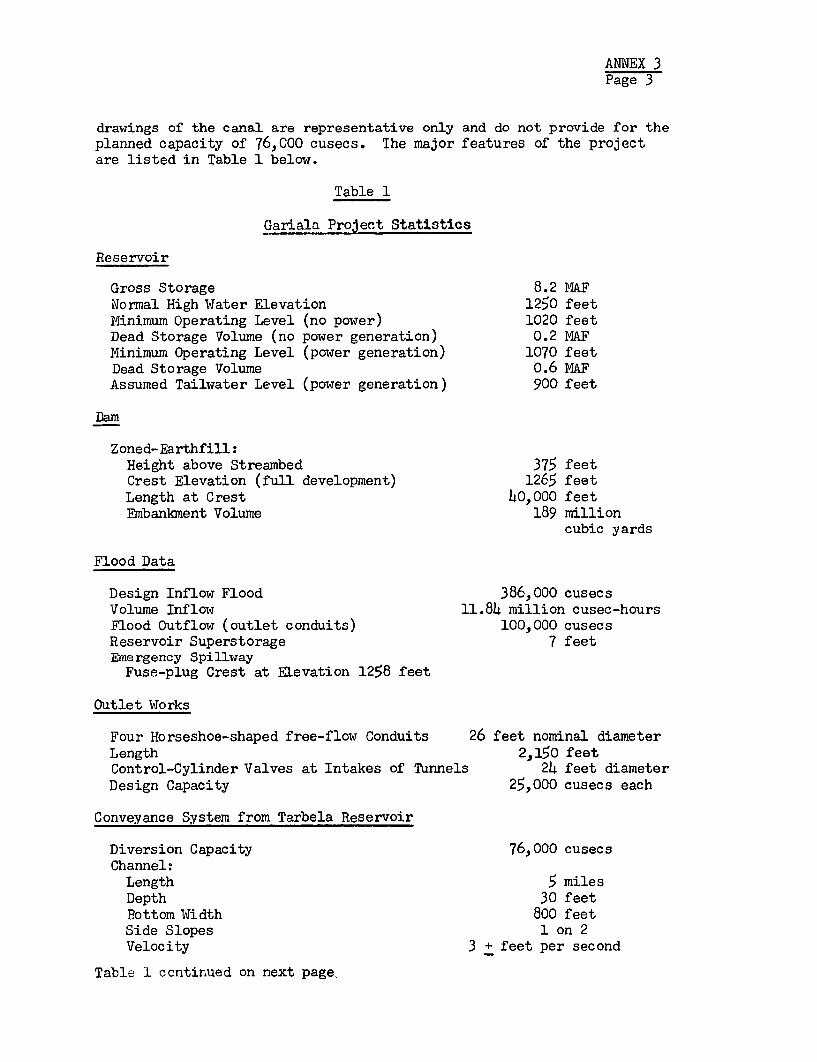
ANNEX 3Page 3
drawings of the canal are representative only and do not provide for theplanned capacity of 76,000 cusecs. The major features of the projectare listed in Table 1 below.
Table 1
Gariala Project Statistics
Reservoir
Gross Storage 8.2 MAFNormal High Water Elevation 1250 feetMinimum Operating Level (no power) 1020 feetDead Storage Volume (no power generation) 0.2 MAFMinimum Operating Level (power generation) 1070 feetDead Storage Volume 0.6 MAFAssumed Tailwater Level (power generation) 900 feet
Dam
Zoned-Earthfill:Height above Streambed 375 feetCrest Elevation (fuIl development) 1265 feetLength at Crest 4o,000 feetEmbankment Volume 189 million
cubic yards
Flood Data
Design Inflow Flood 386,000 cusecsVolume Inflow 11.84 million cusec-hoursFlood Outflow (outlet conduits) 100,000 cusecsReservoir Superstorage 7 feetEmergency SpillwayFuse-plug Crest at Elevation 1258 feet
Outlet Works
Four Horseshoe-shaped free-flow Conduits 26 feet nominal diameterLength 2,150 feetControl-Cylinder Valves at Intakes of Tunnels 24 feet diameterDesign Capacity 25,000 cusecs each
Conveyance System from Tarbela Reservoir
Diversion Capacity 76,000 cusecsChannel:Length 5 milesDepth 30 feetBottom Width 800 feetSide Slopes 1 on 2Velocity 3 + feet per second
Table 1 contir.ued on next page,

ANNEX 3Page 4
Table 1(cont'd)
Control Structure:Crest Elevation 1534 feetGates - 10 Radial 18 feet high x 30 feet wide
Control Weirs 7 overflow with stillingbasins
Head Dissipated in each 1 @ 60 feet3 ( 50 feet1 ( 40 feet1 © 30 feet1 @ 20 + feet
Power Plant (if justified)
Six Francis-type Turbines, each 100,000 hp at 245 feet headWater Discharge at Rated Head,
each Unit 4,000 cusecsSix Generators nominal output, each (capable
of 15 percent continuous overload) 85 mwPlant Capability Maximum Head (peaking) 586 mwPlant Capability Minimum Head (peaking) 230 mwAnnual Energy 1,700 million kwh
Preliminary studies indicate that, because of the large sizeof the Gariala Reservoir relative to the expected flood flows from theHaro and Jabbi Kas, it would be less costly to absorb the floods throughsuperstorage rather than to provide a service spillway to prevent over-topping. The shape of the reservoir is such that half the storage volumeis contained in the top 70 feet of the 350-foot depth of the reservoir.Thus, the amount of freeboard required to absorb the flood flows wouldbe small.
The design flood of 386,000 cusecs was assumed to occur whenthe reservoir was full. With the outlet works operating at their peakcapacity of about 100,000 cusecs, the flood would be absorbed with asurcharge of 7 feet above the normal maximum reservoir level of 1250feet. The remaining 8 feet of freeboard would be sufficient to protectthe dam without a service spillway. However, an emergency spinlway onone of the abutments with a fuse-plug at 1258 feet would be provided.
The dam would be zoned earth embankment with an imperviouscore. Both slopes would be protected against erosion by riprapblankets. Seepage through the earth foundation would be controlled byan impervious blanket upstream and relief wells or filters downstream.Where the rock foundation lies at shallow depths, the impervious corewould be constructed down to bedrock.
Materials for the embankment are available from alluvialdeposits near the site north of the Haro River. Materials for riprap
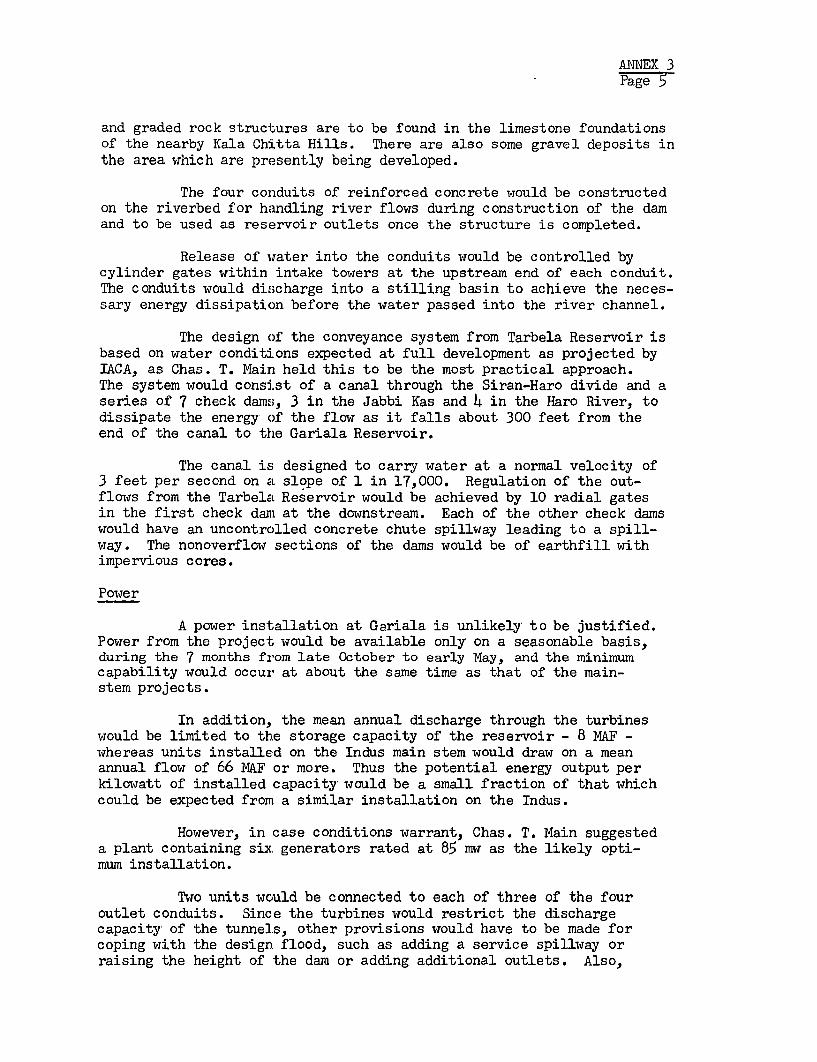
ANNEX 3Page 5
and graded rock structures are to be found in the limestone foundationsof the nearby Kala Chitta Hills. There are also some gravel deposits inthe area which are presently being developed.
The four conduits of reinforced concrete would be constructedon the riverbed for handling river flows during construction of the damand to be used as reservoir outlets once the structure is completed.
Release of water into the conduits would be controlled bycylinder gates within intake towers at the upstream end of each conduit.The conduits would discharge into a stilling basin to achieve the neces-sary energy dissipation before the water passed into the river channel.
The design of the conveyance system from Tarbela Reservoir isbased on water conditions expected at full development as projected byIACA, as Chas. T. Main held this to be the most practical approach.The system would consist of a canal through the Siran-Haro divide and aseries of 7 check dams, 3 in the Jabbi Kas and h in the Haro River, todissipate the energy of the flow as it falls about 300 feet from theend of the canal to the Gariala Reservoir.
The canal is designed to carry water at a normal velocity of3 feet per second on EL slope of 1 in 17,000. Regulation of the out-flows from the Tarbela Reservoir would be achieved by 10 radial gatesin the first check danm at the downstream. Each of the other check damswould have an uncontrolled concrete chute spillway leading to a spill-way. The nonoverflow sections of the dams would be of earthfill withimpervious cores.
Power
A power installation at Gariala is unlikely to be justified.Power from the project would be available only on a seasonable basis,during the 7 months from late October to early May, and the minimumcapability would occur' at about the same time as that of the main-stem projects.
In addition, the mean annual discharge through the turbineswould be limited to the storage capacity of the reservoir - 8 MAF -whereas units installed on the Indus main stem would draw on a meanannual flow of 66 MAF or more. Thus the potential energy output perkilowatt of installed capacity would be a small fraction of that whichcould be expected from a similar installation on the Indus.
However, in case conditions warrant, Chas. T. Main suggesteda plant containing six generators rated at 85 mw as the likely opti-mum installation.
Two units would be connected to each of three of the fouroutlet conduits. Since the turbines would restrict the dischargecapacity, of the tunnels, other provisions would have to be made forcoping with the design flood, such as adding a service spillway orraising the height of the dam or adding additional outlets. Also,
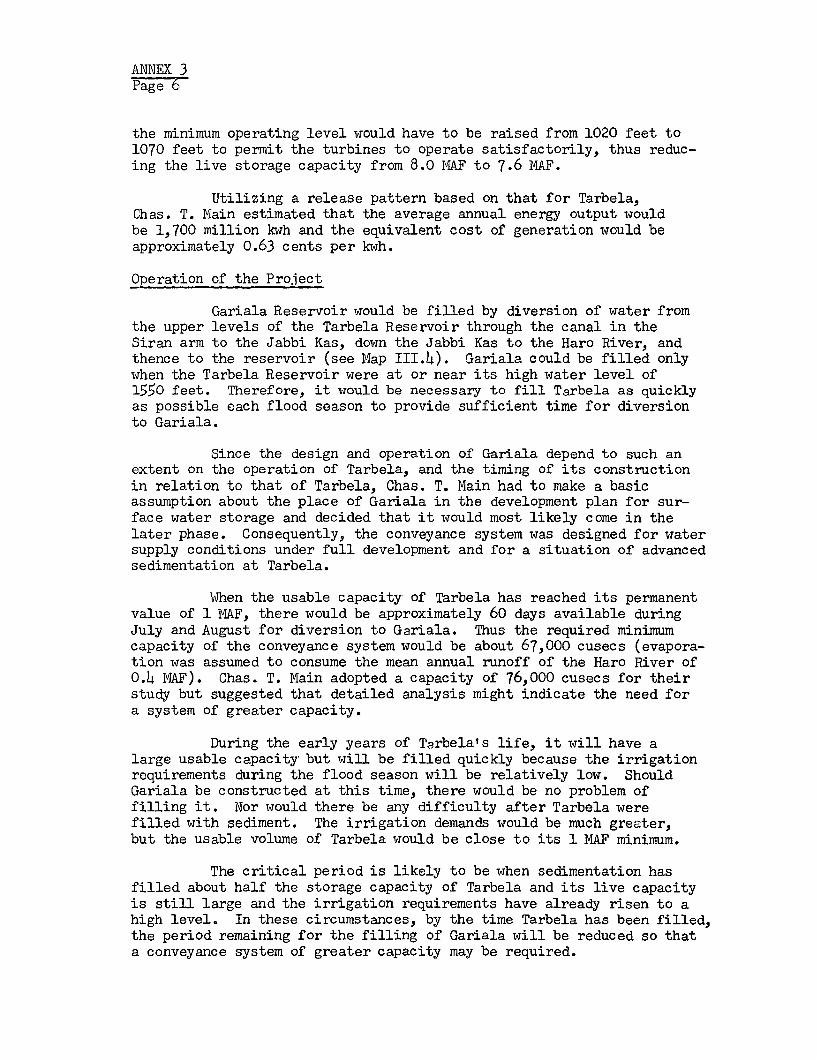
ANNEX 3Page 6
the minimum operating level would have to be raised from 1020 feet to1070 feet to permit the turbines to operate satisfactorily, thus reduc-ing the live storage capacity from 8.0 MAF to 7.6 MAF.
Utilizing a release pattern based on that for Tarbela,Chas. T. Main estimated that the average annual energy output wouldbe 1,700 million kwh and the equivalent cost of generation would beapproximately 0.63 cents per kwh.
Operation of the Project
Gariala Reservoir would be filled by diversion of water fromthe upper levels of the Tarbela Reservoir through the canal in theSiran arm to the Jabbi Kas, down the Jabbi Kas to the Haro River, andthence to the reservoir (see Map III.4). Gariala could be filled onlywhen the Tarbela Reservoir were at or near its high water level of1550 feet. Therefore, it would be necessary to fill Tarbela as quicklyas possible each flood season to provide sufficient time for diversionto Gariala.
Since the design and operation of Gariala depend to such anextent on the operation of Tarbela, and the timing of its constructionin relation to that of Tarbela, Chas. T. Main had to make a basicassumption about the place of Gariala in the development plan for sur-face water storage and decided that it would most likely come in thelater phase. Consequently, the conveyance system was designed for watersupply conditions under full development and for a situation of advancedsedimentation at Tarbela.
When the usable capacity of Tarbela has reached its permanentvalue of 1 MAF, there would be approximately 60 days available duringJuly and August for diversion to Gariala. Thus the required minimumcapacity of the conveyance system would be about 67,000 cusecs (evapora-tion was assumed to consume the mean annual runoff of the Haro River of0.4 MAF). Chas. T. Main adopted a capacity of 76,000 cusecs for theirstudy but suggested that detailed analysis might indicate the need fora system of greater capacity.
During the early years of Tarbela's life, it will have alarge usable capacity but will be filled quickly because the irrigationrequirements during the flood season will be relatively low. ShouldGariala be constructed at this time, there would be no problem offilling it. Nor would there be any difficulty after Tarbela werefilled with sediment. The irrigation demands would be much greater,but the usable volume of Tarbela would be close to its 1 MAF minimum.
The critical period is likely to be when sedimentation hasfilled about half the storage capacity of Tarbela and its live capacityis still large and the irrigation requirements have already risen to ahigh level. In these circumstances, by the time Tarbela has been filled,the period remaining for the filling of Gariala will be reduced so thata conveyance system of greater capacity may be required.
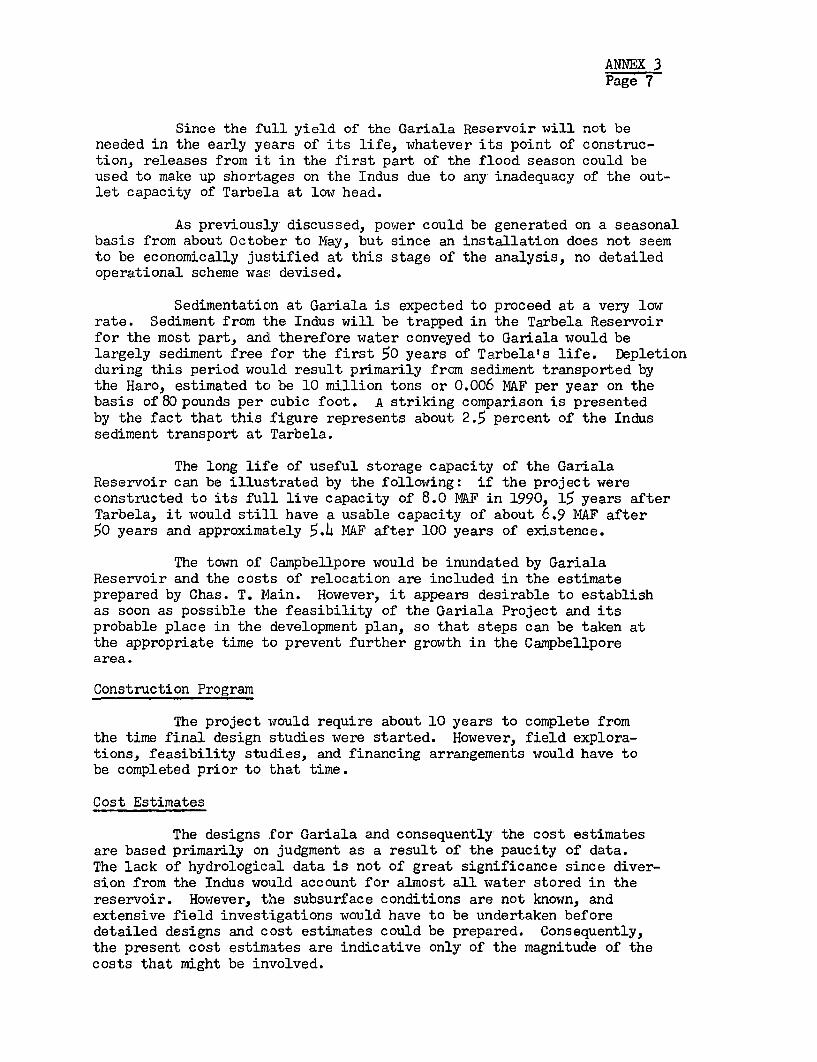
ANNEX 3Page 7
Since the full yield of the Gariala Reservoir will not beneeded in the early years of its life, whatever its point of construc-tion, releases from it in the first part of the flood season could beused to make up shortages on the Indus due to any inadequacy of the out-let capacity of Tarbela at low head.
As previously discussed, power could be generated on a seasonalbasis from about October to May, but since an installation does not seemto be economically justified at this stage of the analysis, no detailedoperational scheme was devised.
Sedimentation at Gariala is expected to proceed at a very lowrate. Sediment from the Indus will be trapped in the Tarbela Reservoirfor the most part, and therefore water conveyed to Gariala would belargely sediment free for the first 50 years of Tarbela's life. Depletionduring this period would result primarily from sediment transported bythe Haro, estimated to be 10 million tons or 0.006 NAF per year on thebasis of 80 pounds per cubic foot. A striking comparison is presentedby the fact that this figure represents about 2.5 percent of the Indussediment transport at Tarbela.
The long life of useful storage capacity of the GarialaReservoir can be illustrated by the following: if the project wereconstructed to its full live capacity of 8.0 MkF in 1990, 15 years afterTarbela, it would still have a usable capacity of about 6.9 MAF after50 years and approximately 5.4 NAF after 100 years of existence.
The town of Campbellpore would be inundated by GarialaReservoir and the costs of relocation are included in the estimateprepared by Chas. T. Main. However, it appears desirable to establishas soon as possible the feasibility of the Gariala Project and itsprobable place in the development plan, so that steps can be taken atthe appropriate time to prevent further growth in the Campbellporearea.
Construction Program
The project would require about 10 years to complete fromthe time final design studies were started. However, field explora-tions, feasibility studies, and financing arrangements would have tobe completed prior to that time.
Cost Estimates
The designs for Gariala and consequently the cost estimatesare based primarily on judgment as a result of the paucity of data.The lack of hydrological data is not of great significance since diver-sion from the Indus would account for almost all water stored in thereservoir. However, the subsurface conditions are not known, andextensive field investigations would have to be undertaken beforedetailed designs and cost estimates could be prepared. Consequently,the present cost estimates are indicative only of the magnitude of thecosts that might be involved.
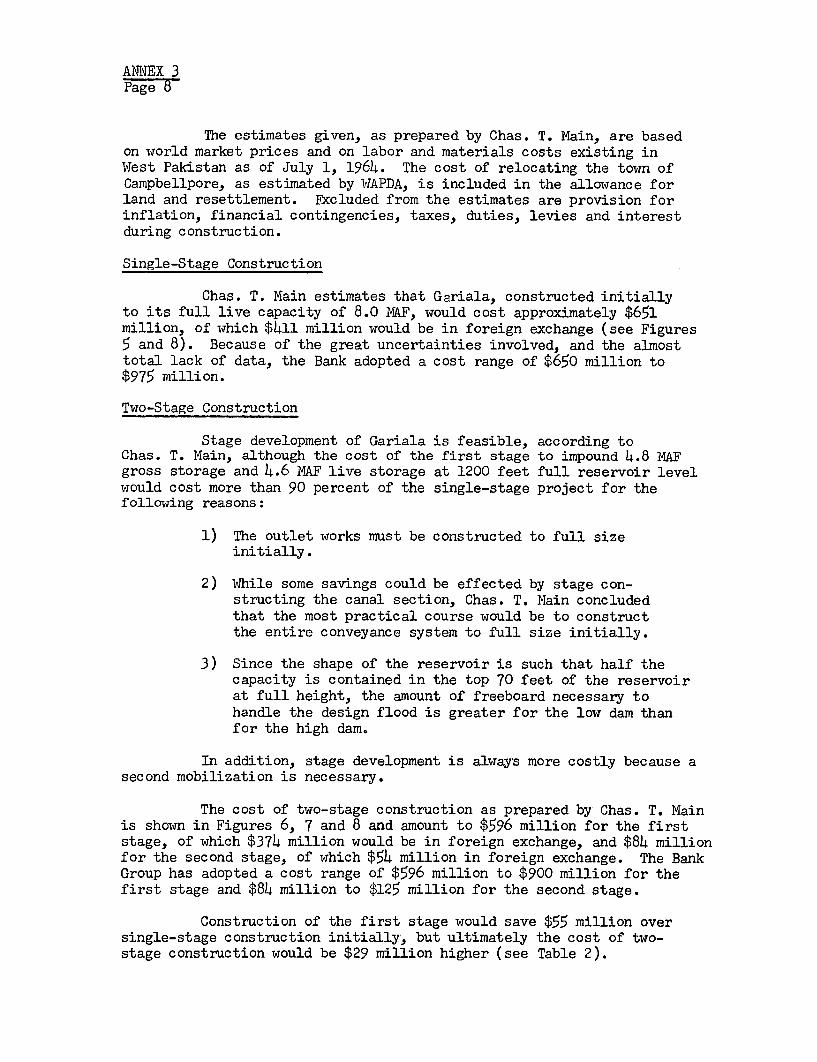
ANNEX 3Page d
The estimates given, as prepared by Chas. T. Main, are basedon world market prices and on labor and materials costs existing inWest Pakistan as of July 1, 1964. The cost of relocating the town ofCampbellpore, as estimated by WAPDA, is included in the allowance forland and resettlement. Fccluded from the estimates are provision forinflation, financial contingencies, taxes, duties, levies and interestduring construction.
Single-Stage Construction
Chas. T. Main estimates that Gariala, constructed initiallyto its full live capacity of 8.0 MAF, would cost approximately $651million, of which $411 million would be in foreign exchange (see Figures5 and 8). Because of the great uncertainties involved, and the almosttotal lack of data, the Bank adopted a cost range of $650 million to$975 million.
Two-Stage Construction
Stage development of Gariala is feasible, according toChas. T. Main, although the cost of the first stage to impound 4.8 MAFgross storage and 4.6 MAF live storage at 1200 feet full reservoir levelwould cost more than 90 percent of the single-stage project for thefollowing reasons:
1) The outlet works must be constructed to full sizeinitially.
2) While some savings could be effected by stage con-structing the canal section, Chas. T. Main concludedthat the most practical course would be to constructthe entire conveyance system to full size initially.
3) Since the shape of the reservoir is such that half thecapacity is contained in the top 70 feet of the reservoirat full height, the amount of freeboard necessary tohandle the design flood is greater for the low dam thanfor the high dam.
In addition, stage development is always more costly because asecond mobilization is necessary.
The cost of two-stage construction as prepared by Chas. T. Mainis shown in Figures 6, 7 and 8 and amount to $596 million for the firststage, of which $374 million would be in foreign exchange, and $84 millionfor the second stage, of which $54 million in foreign exchange. The BankGroup has adopted a cost range of $596 million to $900 million for thefirst stage and $84 million to $125 million for the second stage.
Construction of the first stage would save $55 million oversingle-stage construction initially, but ultimately the cost of two-stage construction would be $29 million higher (see Table 2).
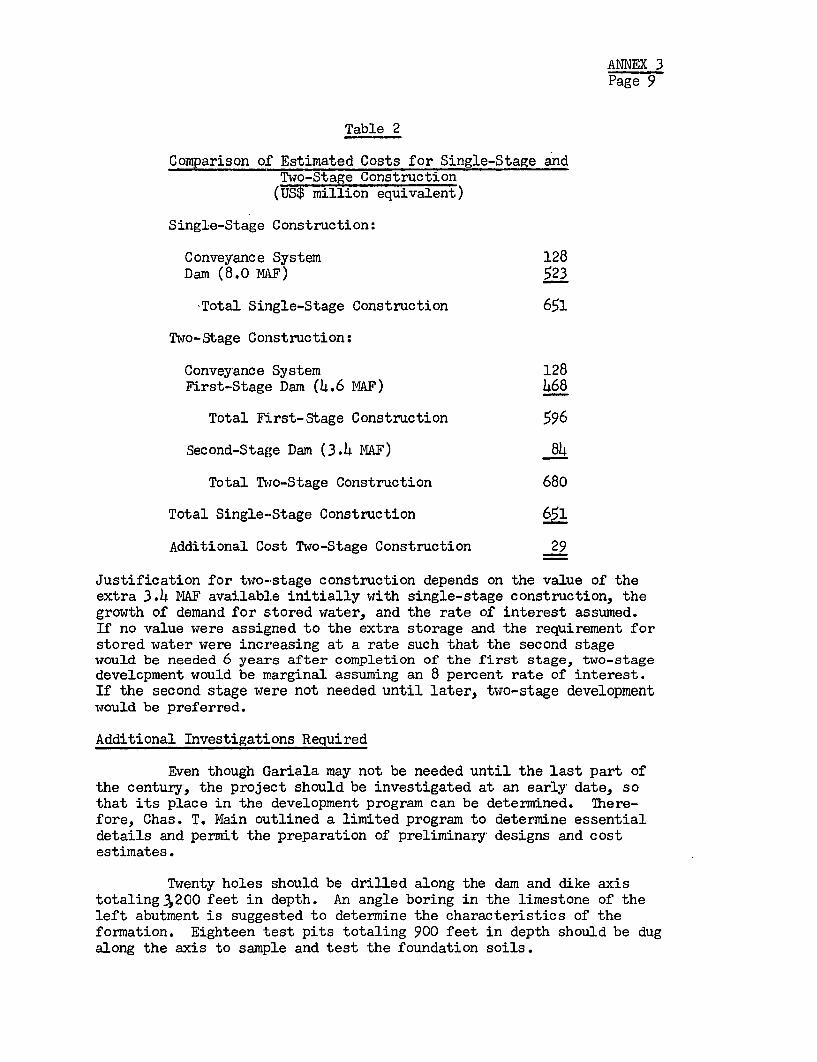
ANNEX 3Page 9
Table 2
Comparison of Estimated Costs for Single-Stage andTwo-Stage Construction(US$ million equivalent)
Single-Stage Construction:
Conveyance System 128Dam (8.0 NAF) 523
-Total Single-Stage Construction 651
Two-Stage Construction:
Conveyance System 128First-Stage Dam (4.6 MAF) 468
Total First-Stage Construction 596
Second-Stage Dam (3.4 MAF) 84
Total Two-Stage Construction 680
Total Single-Stage Construction 651
Additional Cost Two-Stage Construction 29
Justification for two-stage construction depends on the value of theextra 3.4 MAF available initially with single-stage construction, thegrowth of demand for stored water, and the rate of interest assumed.If no value were assigned to the extra storage and the requirement forstored water were increasing at a rate such that the second stagewould be needed 6 years after completion of the first stage, two-stagedevelcpment would be marginal assuming an 8 percent rate of interest.If the second stage were not needed until later, two-stage developmentwould be preferred.
Additional Investigations Required
Even though Gariala may not be needed until the last part ofthe century, the project should be investigated at an early date, sothat its place in the development program can be determined. There-fore, Chas. T. Main outlined a limited program to determine essentialdetails and permit the preparation of preliminary designs and costestimates.
Twenty holes should be drilled along the dam and dike axistotaling 3200 feet in depth. An angle boring in the limestone of theleft abutment is suggested to determine the characteristics of theformation. Eighteen test pits totaling 900 feet in depth should be dugalong the axis to sample and test the foundation soils.

ANINEX 3Page 10
Standard tests, such as triaxial shear, unconfined compression,and modules of elasticity should be performed on representative undis-turbed clay and shale samples of the bedrock formations in both thesaturated and unsaturated states.
The porosity and permeability of the overburden should bedetermined, and, where possible, pressure tests should be made in theboreholes. In addition, load bearing tests, especially along the out-let conduit foundations, are recommended.
When more data are available, other types of canals such aslined canals with higher velocities should be investigated for possibleuse in the conveyance system.
VOLUME IIIANNEX 3-FIGURE 1
22522., -I~~~~~~~~~~~~~~~~~~~~~~~M I,E
t A. ~~~~~~~~~~~~~~~~~~~~~~~~1F.~~~ __2 - __^_ __ fiII7100 - l_ _ -
_ L. T.N RIP o> =_ _ _ -.
-~1 ~JY~~'Y'~ SEE PART PLAN!
FI.12. 2A 3 E'lR
MAR W S El 1250FILTERS
RIP- RAP X
PLAN F~~~~~~~~~~~~~~REE ORAJSIO MaTRA
NW WSEI z0~2V e ~ tI \_ - ,- ROCK b 0RaEL FILL
S -LE MILES R =1 0 - PER-IOUS FILL. / I -PERRIOUS OR L I
______ __ -FILTER _ / CO*ERVOE SELECTED GRAvEL FILL _
* WER-UiC RRE -R::ORAr.o ACRES II -- ERAISACE | >1FILTER LAYERS BLAAKEY
TYPICAL DIKE SECTION ORAIAQE wELLs
F l 00 _ _ __ _ _i
O /AO _ OK! ^ EL LAST' EL 1205M TRcEK L 00A 5150 IS LLASTRFcTIVE O FR.ELN
Ioo CO_CEPTUAL RES.. _IVARKALA RCA PROJECT
RtSENV-nIR CIY -i RI acRE PEET TYPICAL DIKE SECTION AT RIVER CHANNEL PLAN B SPCTIONSIP-AT FILTES I
AREA~~~~~~~~~~~~~~~~~~~~~~~~~~~~~~~~~~~~~~~~~~~~PAAE KNIPCTYCUV
R ~~~~~~~~~~~~~~~~~~~~~~~~~~FREE DRAINISA RATEOIAL ' - / --20 EL2I0LO OC . . .R-El 1-STUDY OF THE WATER AND POWER RESOURCES
SINAS L 00 - -KOC R REVL I S OF WEST PAKI STANPJI, FIL IMFEROUS CO)E -COMPREHENSIVE REPORT
-00 ~ ~ ~ ~ ~ ~ ~ ~ ~ ~ ~ ___ 'GARIALA PROJECT
RESE-VOIR CAPACITY MILLION A-RE FEET TYPICAL DIKE SECTION AT RIVER CHANNEL PA ETOS$
AREA - CA.PACITY _CURVE,
JUNE 1967 AS.1 14IBRD-1983R

VOLUME IIIANNEX 3-FIGURE 2
iA ' X . - ,. A r _ I VER
L ~~~~~~~~~~~~--- r f ~ ~ ~ ~ ~ ~ ~ ~ ~ ~ ~ ~ ~ ~ ~~~~~~~~-A + == B .,Occ = =- - -05=e -' = - - - i = ______________ - - k A t 1 T
IL
PART PLAN G ISS .I - - - - --__ _ _CT
1--> - ~ 2 h~lm ~ ft - I I - -*_........I _GA1O
1---~~~~~~~~~~~~~~~~I - TI 525
POA R r CST-PR COULDSS -- --- - :7 _ _ii _E_
1 -:00 :0:0 ------------ U OS C -A - -
L.. ~~~~~~~~~~~STUDY OF TOE WATER AND POWRE RESOURCES/. lNtPF CUS \ _ GLT - OFF DlL-RS \ El OF WEST PAKISTAN
COMPREHENSIVE REPORT
SECTION A-A GARIALA PROJECTPLANS & SECTIONS S. 2
MARCH 1967 IBRD-1984

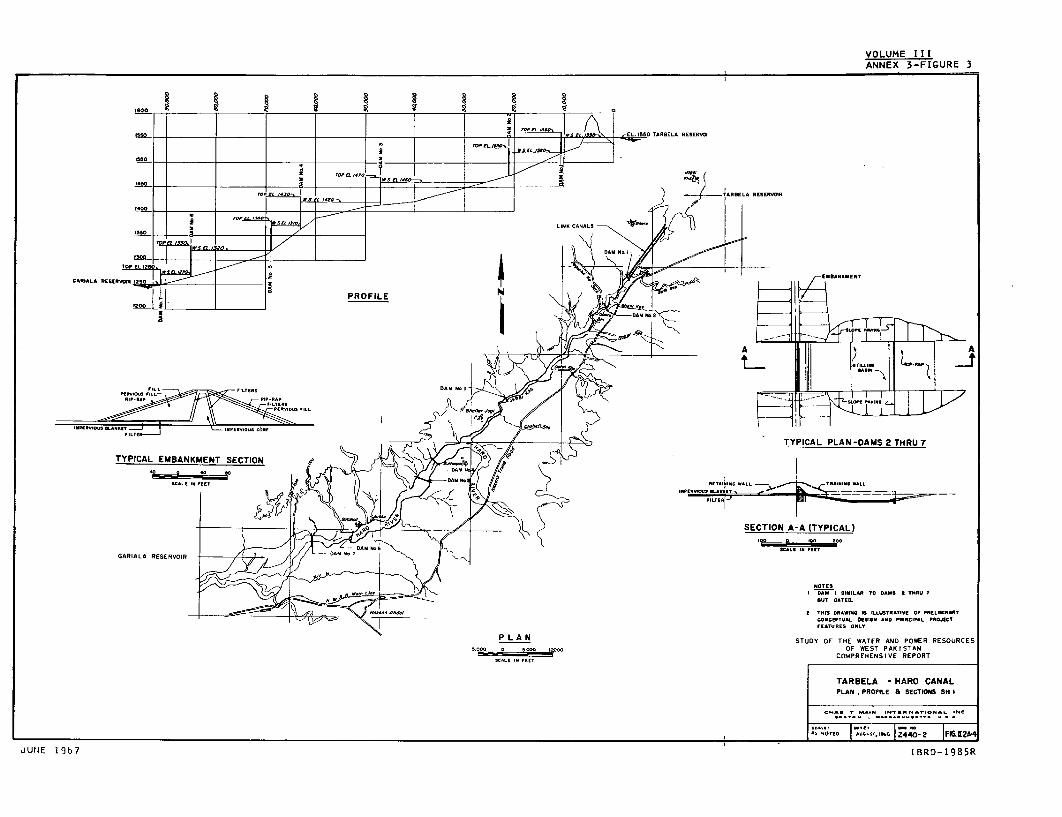
VOLUME IIIANNEX 3-FIGURE 3
GWO _ . ] = i i |Rs tt X TARIaCA RESERVOIR 2E0
1500_ LCOa-_/o ,Re
^ , 0 _ . a_ K !.FO ~~~~~~~~~~~~~~~~~~~7 -A C:_a TRSELA RESERVOIR
1 IOUS tf_K l LINI CANAS LS0
TYPICAL EMBANKMENT SECTION tt a t X t X d E
GAR IALA R ESERVOIR / Y
>\,O....... ...."R - CONCEPTUAI. OCSI" AND PTYPIC LDPLANPAMS2T RU 4T
P LA N STUDY OF THE WATER AD POWER RESOURCES
S.000050 s00 OF WEST PAK ISTAN
TAREELA - HARO CANAL
DA 16 "..TO DAM 2I4R-1985R
JUUE 1967 1 BRD-1985R~~~~~~~~~~~~~~~~~~~~~~~~~~~~~~~~~~~~~~~~~BT AE

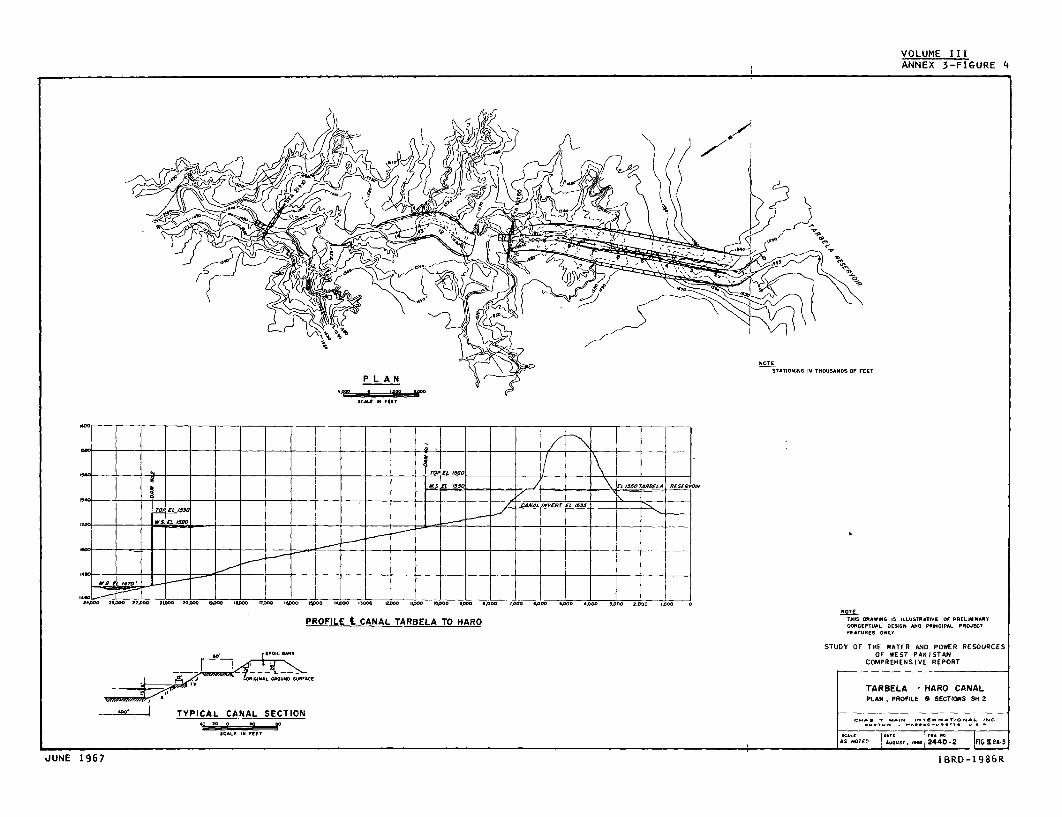
VOLUME IIIANNEX 3-FIGURE 4
NOTESTATIOMNIN IN THOOSA.DS OF FEET
'~~~~~~~~~~ L A N
PROFILE CANAL TARBELA TO HARO TIL JR I .S9T.r.l 01 PlCI.EL'...ROJC
SCOtt 2 FEET ~ ~ ~ ~ ~ ~ ~ ~ ~ ~ ~ ~ ~ ~ ~ ~ ~ ~ ~ ~ ~ ~ F-ESOL
0 fESE RPLAN, PROflEE R SECTITS SH 2
TYPICAL CANAL SECTION
1020 as O4ES -A As lT r~rowl
IrASTE | 2 ;-2 |FIG 1
JUNE 1967 I BRD-1986R

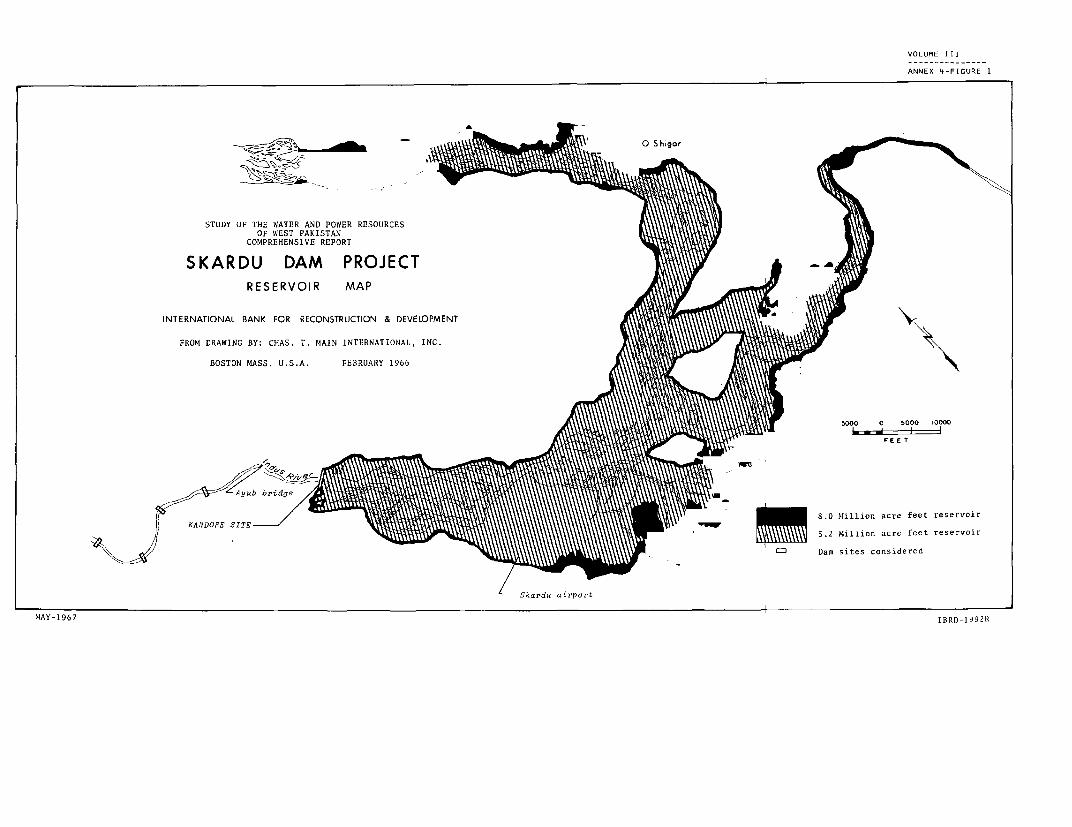
VOLUME III
ANNEX 4-FIGURE 1
STUDY OF THE WATER AND POWER RESOURCESOF WEST PAKISTAN
COMPREHENSIVE REPORT
SKARDU DAM PROJECTRESERVOIR MAP
INTERNATIONAL BANK FOR RECONSTRUCTION & DEVELOPMENT
FROM DRAWING BY: CHAS. T. MAIN INTERNATIONAL, INC.
BOSTON MASS. U.S.A. FEBRUARY 1966
5000 0 5000 10000
F e E T
8.0 Mlillion acre feet reservoir
5.2 Million acre feet reservoir
Dam sites considered
Skardu airport
MAY-1967 IBRD-1992R

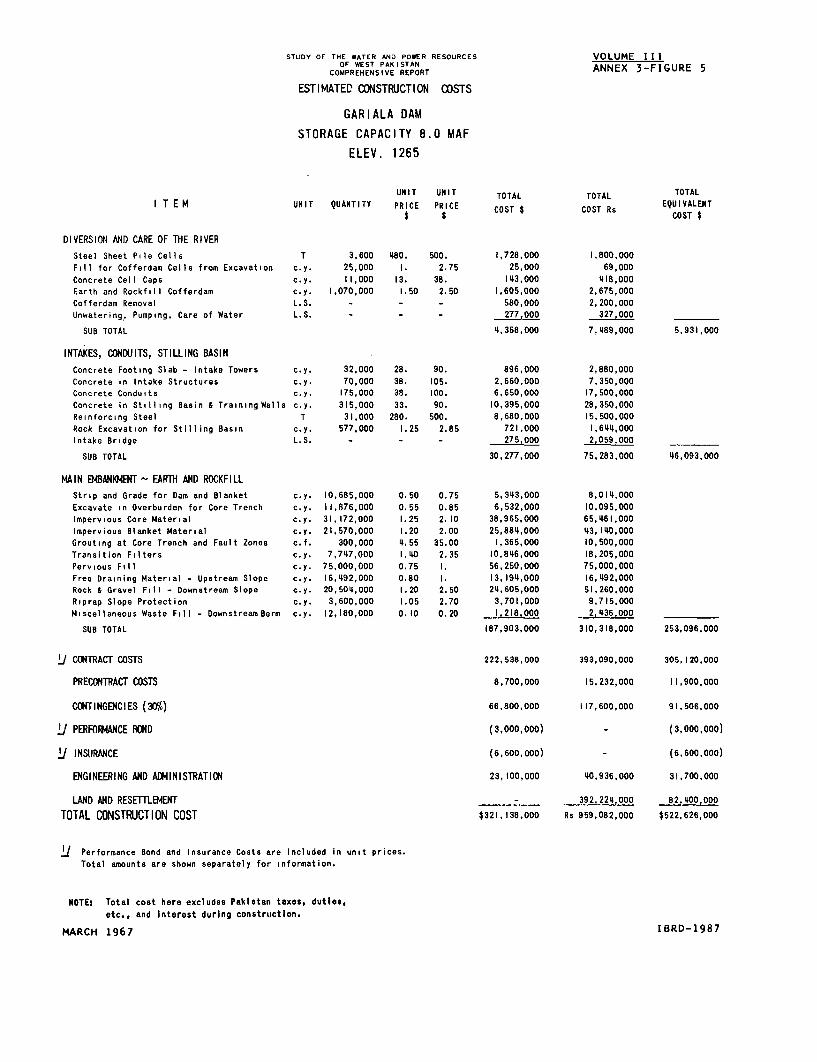
STUDY OF THE WATER AND POWER RESOURCES VOLUME IIIOF WEST PAKISTAN
COMPREHENSIVE REPORT ANNEX 3-FIGURE 5
ESTIMATED CONSTRUCTION COSTS
GARIALA DAM
STORAGE CAPACITY 8.0 MAF
ELEV. 1265
UNIT UNIT TOTAL TOTAL TOTALI T E M UNIT QUANTITY PRICE PRICE COST COST Rs EQUIVALENT
$ $ COST $ ~~~~~~~~~COST$
DIVERSIOH AND CARE OF THE RIVER
Steel Sheet Pile Cells T 3,600 480. 500. 1,728,000 1,800,000Fill for Cofferdam Cells from Excavation c.y. 25,000 1. 2.75 25,000 69,000Concrete Cell Caps c.y. 11,000 13. 38. 143,000 418,000Earth and Rockfill Cofferdam c.y. 1,070,000 1.50 2.50 1,605,000 2,675,000Cofferdam Removal L.S. - - - 580,000 2,200,000Unwatering, Pumping, Care of Water L.S. - - - 277,000 327,000
SUB TOTAL 4,358,000 7,489,000 5,931,000
INTAKES, CONDUITS, STILLING BASIN
Concrete Footing Slab - Intake Towers c.y. 32,000 28. 90. 896,000 2,880,000Concrete in Intake Structures c.y. 70,000 38. 105. 2,660,000 7,350,000Concrete Conduits c.y. 175,000 38. 100. 6,650,000 17,500,000Concrete in Stilling Basin & Training Walls c.y. 315,000 33. 90. 10,395,000 28,350,000Reinforcing Steel T 31,000 280. 500. 8,680,000 15,500,000Rock Excavation for Stilling Basin c.y. 577,000 1.25 2.85 721,000 1,644,000Intake Bridge L.S. - - - 275,000 2,059,000
SUB TOTAL 30,277,000 75,283,000 46,093,000
MAIN EMBANKO4ENT - FARTH AND ROCKFILLStrip and Grade for Dam and Blanket c.y. 10,685,000 0.50 0.75 5,343,000 8,014,000Excavate in Overburden for Core Trench c.y. 11,876,000 0.55 0.85 6,532,000 10,095,000Impervious Core Material c.y. 31,172,000 1.25 2.10 38,965,000 65,461,000Impervious Blanket Material c.y. 21,570,000 1.20 2.00 25,884,000 43,140,000Grouting at Core Trench and Fault Zones c.f. 300,000 4.55 35.00 1,365,000 10,500,000Transition Filters c.y. 7,747,000 1.40 2.35 10,846,000 18,205,000Pervious Fill c.y. 75,000,000 0.75 1. 56,250,000 75,000,000Free Draining Material - Upstream Slope c.y. 16,492,000 0.80 1. 13,194,000 16,492,000Rock & Gravel Fill - Downstream Slope c.y. 20,504,000 1.20 2.50 24,605,000 51,260,000Riprap Slope Protection c.y. 3,600,000 1.05 2.70 3,701,000 9,715,000Miscellaneous Waste Fill - DownstreamBerm c.y. 12,180,000 0.10 0.20 1,218.000 2,436.000
SUB TOTAL 187,903,000 310,318,000 253,096,000
C CTRACT COSTS 222,538,000 393,090,000 305,120,000
PRECONTRACT COSTS 8,700,000 15,232,000 11,900,000
CONTINGENCIES (3 0) 66,800,000 117,600,000 91,506,000
PERFORMANCE BOND (3,000,000) _ (3,000,000)
U INSIRANCE (6,600,000) - (6,600,000)
ENGINEERING AND ADMINISTRATION 23,100,000 40,936,000 31,700,000
LAND AND RESErTLEMENT __- _392,2, 000 82,400,000
TOTAL CONSTRUCTION COST $321,138,000 Rs 959,082,000 $522,626,000
U Performance Bond and Insurance Costs are included in unit prices.Total amounts are shown separately for information.
NOTE: Total cost here excludes Pakistan taxes, duties,etc., and interest during construction.
MARCH 1967 IBRD-1987

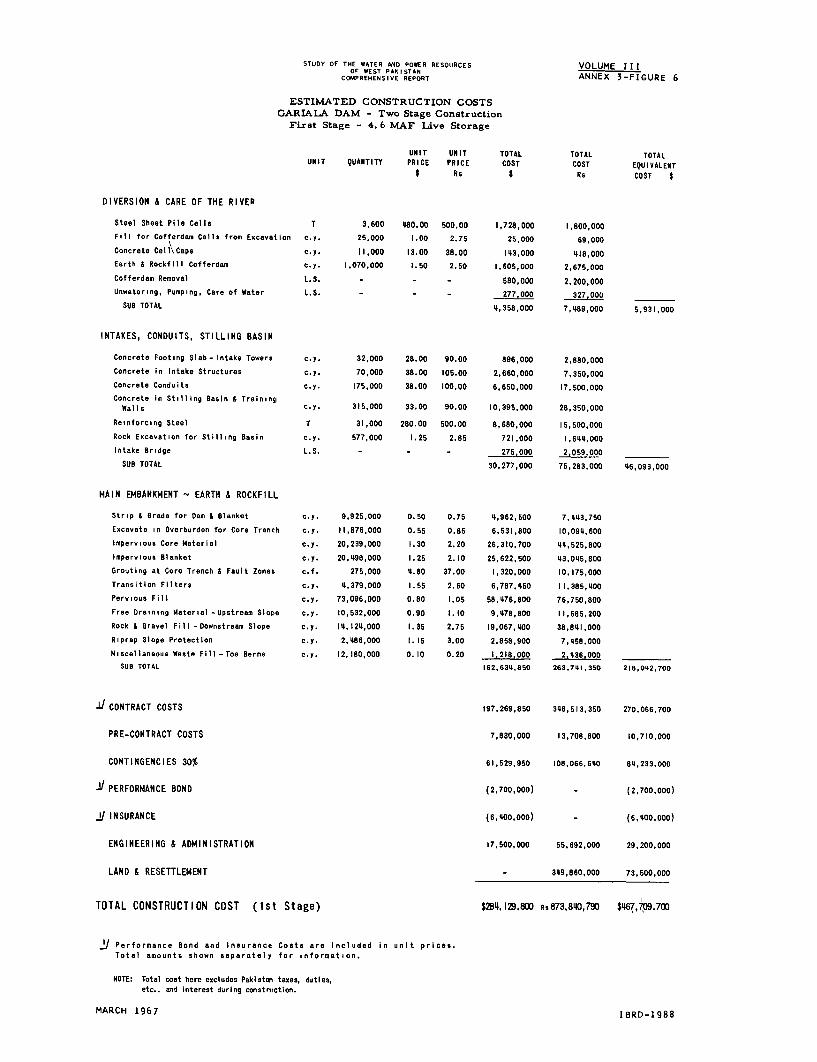
STUDY OF THE WATER AND POWER RESOURCES VOLUME I IlOF WEST PAKISTAN A I
COMIPREMENSIVE REPORT ANNEX 3-FIGURE 6
ESTIMATED CONSTRUCTION COSTSGARIALA DAM - Two Stage Construction
First Stage - 4. 6 MAF Live Storage
UNIT UNIT TOTAL TOTAL TOTALUNIT QUANTITY PRICE PRICE COST COST EQUIVALENT
I Rs S Rs COST $
DIVERSION & CARE OF THE RIVER
Steel Sheet Pile Cells T 3,600 480.00 500.00 1,728,000 1,800,000Fill for Cofferdam Cells from Excavation e.y. 25,000 1.00 2.75 25,000 69,000
Concrete Cell\Caps c.y. 11,000 13.00 38.00 143,000 418,000Earth A Rockfill Cofferdam c.y. 1,070,000 1.50 2.50 1,605,000 2,675,000
Cofferdam Removal L.S. - - - 580,000 2,200,000Unwatering, Pumping, Care of Water L.S. - - - 277,000 327,000
SUB TOTAL 4,358,000 7,489,000 5,931,000
INTAKES, CONDUITS, STILLING BASIN
Concrete Footing Slab- Intake Towers c.y. 32,000 28.00 90.00 896,000 2,880,000Concrete in Intake Structures c.y. 70,000 38.00 105.00 2,660,000 7,350,000
Concrete Conduits c.y. 175,000 38.00 100.00 6,650,000 17,500,000Concrete in Stilling Basin & Trainingi
Walls c.y. 315,000 33.00 90.00 10,395,000 28,350,000
Reinforcing Steel T 31,000 280.00 500.00 8,680,000 15,500,000
Rock Excavation for Stilling Basin c.y. 577,000 1.25 2.85 721,000 1,644,000Intake Bridge L.S. - - - 275,000 2,059,000
SUB TOTAL 30,277,000 75,283,000 48,093,000
MAIN EMBANKMENT - EARTH & ROCKFILL
Strip i Grade for Dam & Blanket c.y. 9,925,000 0.50 0.75 4,962,500 7,443,750
Excavate in Overburden for Core Trench c.y. 11,876,000 0.55 0.85 6,531,800 10,094,600
Impervious Core Material c.y. 20,239,000 1.30 2.20 26,310,700 44,525,800
Impervious Blanket c.y. 20,498,000 1.25 2.10 25,622,500 43,045,800Grouting at Core Trench & Fault Zones c.f. 275,000 4.80 37.00 1,320,000 10,175,000
Transition Filters c.y. 4,379,000 1.55 2.60 6,787,450 11,385,400
Pervious Fill c.y. 73,096,000 0.80 1.05 58,476,800 76,750,800
Free Draining Material -Upstream Slope c.y. 10,532,000 0.90 1.10 9,478,800 11,585,200
Rock A Gravel Fill -Downstream Slope c.y. 14,124,000 1.35 2.75 19,067,400 38,841,000
Rliprap Slope Protectlon c.y. 2,486,000 1.16 3.00 2,858,900 7,458,000
Miscellaneous Waste Fill-Toe Berms c.y. 12,180,000 0.10 0.20 1.218,000 2,436,000SUB TOTAL 162,634,850 263,741,350 218,042,700
. CONTRACT COSTS 197,269,850 346,513,350 270,066,700
PRE-CONTRACT COSTS 7,830,000 13,708,800 10,710,000
CONTINGENCIES 30% 61,529,950 108,066,640 84,233,000
X PERFORMANCE BOND (2,700,000) - (2,700,000)
/ INSURANCE (6,400,000) - (6,400,000)
ENGINEERING & ADMINISTRATION 17,500,000 55,692,000 29,200,000
LAND & RESETTLEMENT - 349,860,000 73,500,000
TOTAL CONSTRUCTION COST (Ist Stage) $214,129i,800 Rs873,840,790 $67,F709,700
jJ Performance Bond and Insurance Costs are included in unit prices.Total amounts shown separately for information.
NOTE: Total cost here excludes Pakistan taxes, duties,etc., and interest during constniction.
MARCH 1967 IBRD-1988

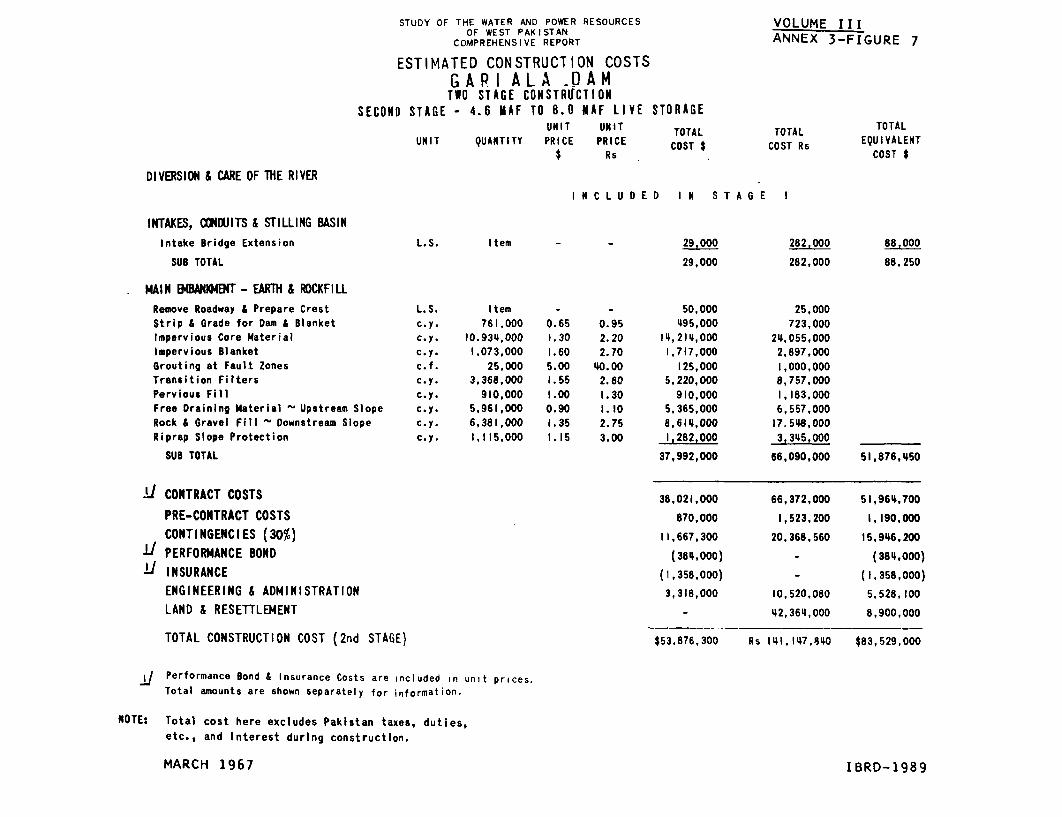
STUDY OF THE WATER AND POWER RESOURCES VOLUME IIIOF WEST PAKISTAN
COMPREHENSIVE REPORT ANNEX 3-FIGURE 7
ESTIMATED CONSTRUCTION COSTSGARI ALA P AM
TWO STAGE CONSTRIICTIONSECOND STAGE - 4.6 MAF TO 0.0 NAF LIVE STORAGE
UNIT UNIT TOTAL TOTAL TOTAL
UNIT QUANTITY PRICE PRICE COST $ COST Rs EQUIVALENT$ Rs COST$
DIVERSION & CARE OF THE RIVERI N C L U D E D I N S T A G E I
INTAKES, CONWUITS & STILLING BASINIntake Bridge Extension L.S. Item - - 29,000 282,000 88,000
SUB TOTAL 29,000 282,000 88,250
MAIN MBANi(ENT - EAM & ROCKFILLRemove Roadway 6 Prepare Crest L.S. Item - - 50,000 25,000
Strip & Grade for Dam & Blanket c.y. 761,000 0.65 0.95 495,000 723,000
Impervious Core Material c.y. 10.934,000 1.30 2.20 14,214,000 24,055,000
Impervious Blanket c.y. 1,073,000 1.60 2.70 1,717,000 2,897,000
Grouting at Fault Zones c.f. 25,000 5.00 40.00 125,000 1,000,000
Transition Filters c.y. 3,368,000 1.55 2.60 5,220,000 8,757,000
Pervious Fill c.y. 910,000 1.00 1.30 910,000 1,183,000
Free Draining Material - Upstream Slope c.y. 5,961,000 0.90 1.10 5,365,000 6,557,000
Rock 6 Gravel Fill - Downstream Slope c.y. 6,381,000 1.35 2.75 8,614,000 17.548,000
Riprap Slope Protection c.y. 1,115,000 1.15 3.00 1,282,000 3,345,000
SUB TOTAL 37,992,000 66,090,000 51,876,450
!J CONTRACT COSTS 38,021,000 66,372,000 51,964,700
PRE-CONTRACT COSTS 870,000 1,523,200 1,190,000
CONTINGENCIES (30%) 11,667,300 20,368.560 15,946,200
.1 PERFORMANCE BOND (384,000) - (384,000)
INSURANCE (1,358,000) - (1,358,000)
ENGINEERING & ADMINISTRATION 3,318,000 10,520,080 5,528,100
LAND & RESETTLEMENT - 42,364,000 8,900,000
TOTAL CONSTRUCTION COST (2nd STAGE) $53,876,300 Rs 141,147,840 $83,529,000
Performance Bond & Insurance Costs are included in unit prices.
Total amounts are shown separately for information.
NOTE: Total cost here excludes Pakistan taxes, duties,
etc., and interest during construction.
MARCH 1967 I BRD-1989

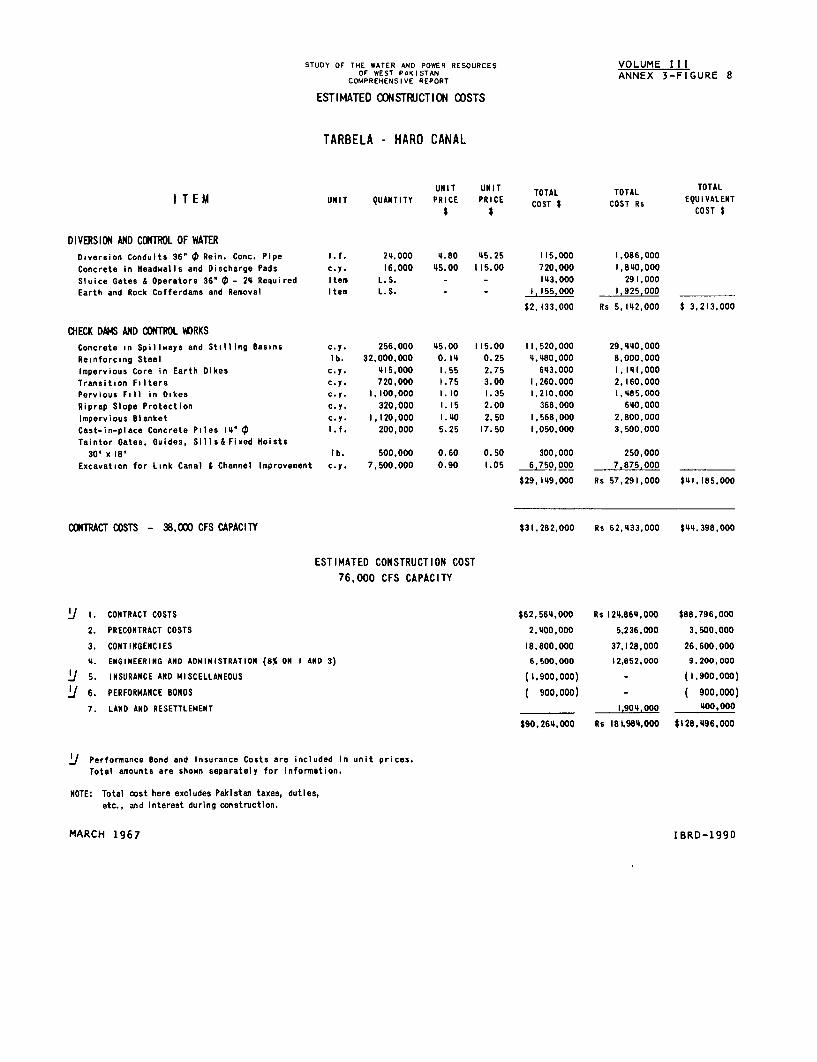
STUDY OF THE WATER AND POWER RESOURCES VOLUME IIIOF WEST PAKISTAN ANX3FGR
COMPREHENSIVE REPORT ANNEX 3-FIGURE 8
ESTIMATED CODNSTRUCTION COSTS
TARBELA - HARO CANAL
UNIT UNIT TOTAL TOTAL TOTALI T EM UNIT QUANTITY PRICE PRICE COTR EQUIVALENT
$ $ ~~~OT OT sCOST$
DIVERSION AND CONTROL OF WATERDiversion Conduits 36" 0 Rein. Conc. Pipe l.f. 24,000 4.80 45.25 115,000 1,086,000Concrete in Headwalls and Discharge Pads c.y. 16,000 45.00 115.00 720,000 1,840,000Sluice Gates & Operators 36" ¢t - 24 Required Item L.S. - - 143.000 291,000Earth and Rock Cofferdams and Removal Item L.S. - - 1,155.000 1,925,000
$2,133,000 Rs 5,142,000 $ 3,213,000
CHECK DAMS AND CONTROL WORKSConcrete in Spillways and Stilling Basins c.y. 256,000 45.00 115.00 11,520,000 29,440,000Reinforcing Steel lb. 32,000,000 0.14 0.25 4,480,000 8,000,000
Impervious Core in Earth Dikes c.y. 415,000 1.55 2.75 643,000 1,141,000Transition Filters c.y. 720,000 1.75 3.00 1,260,000 2,160,000Pervious Fill in Dikes c.y. I, 100,000 1.10 1.35 1,210,000 1,485,000Riprap Slope Protection c.y. 320,000 1.15 2.00 368,000 640,000Impervious Banket c.y. 1,120,000 1.40 2.50 1,568,000 2,800,000Cast-in-place Concrete Piles 114" t l.f. 200,000 5.25 17.50 1,050.000 3,500,000Taintor Gates, Guides, Sills& Fixed Hoists
30 ' x 18' lb. 500,000 0.60 0.50 300,000 250,000Excavation for Link Canal & Channel Improvement c.y. 7,500.000 0.90 1.05 6,750,2 00 7,875,000
$29,149,000 Rs 57.291,000 $141,185.000
CONTRACT COSTS - 38,000 CFS CAPACITY $31,282,000 Rs 62,433,000 $44.398,000
ESTIMATED CONSTRUCTION COST76,000 CFS CAPACITY
LI 1. CONTRACT COSTS $62,564,000 Rs 124,864,000 $88,796,000
2. PRECONTRACT COSTS 2.400,000 5,236,000 3,500,000
3. CONTINGENCIES 18.800,000 37,128,000 26,600,000
4. ENGINEERING AND ADMINISTRATION (8% ON I AND 3) 6,500,000 12,852,000 9,200,000
LI 5. INSURANCE AND MISCELLANEOUS (1,900,000) - (1,900,000)
LI 6. PERFORMANCE BONDS ( 900,000) - 900,000)
7. LAND AND RESETTLEMENT 1,904,000 400,000
$90,264,000 Rs 181,984,000 $128,496,000
L Performance Bond and Insurance Costs are included In unit prices.Total amounts are shown separately for information.
NOTE: Total cost here excludes Pakistan taxes, duties,etc., and interest during construction.
MARCH 1967 IBRD-1990

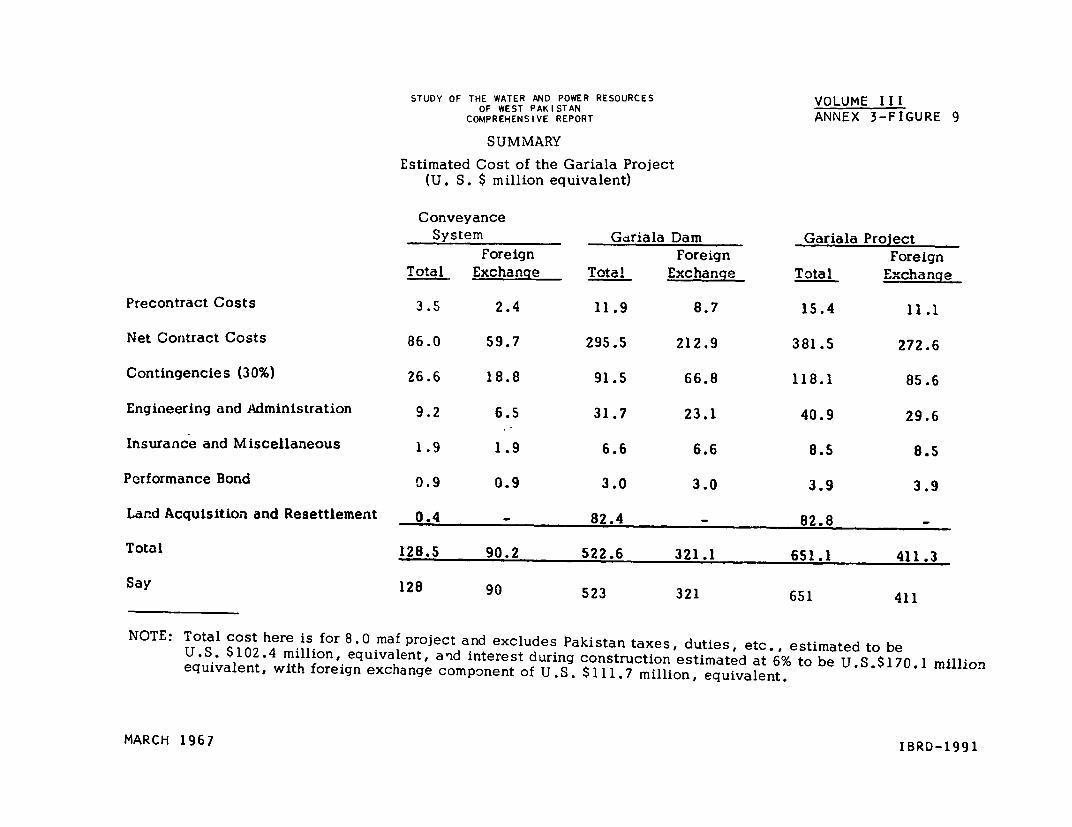
STUDY OF THE WATER AND POWER RESOURCES VOLUME IIIOF WEST PAKISTAN
COMPREHENSIVE REPORT ANNEX 3-FIGURE 9
SUMMARY
Estimated Cost of the Gariala Project(U. S. $ million equivalent)
ConveyanceSystem Gdriala Dam Gariala Project
Foreign Foreign Foreign
Total Exchange Total Exchanqe Total Exchange
Precontract Costs 3.5 2.4 11.9 8.7 15.4 11.1
Net Coritract Costs 86.0 59.7 295.5 212.9 381.5 272.6
Contingencies (30%) 26.6 18.8 91.5 66.8 118.1 85.6
Engineering and Administration 9.2 6.5 31.7 23.1 40.9 29.6
Insurance and Miscellaneous 1.9 1.9 6.6 6.6 8.5 8.5
Performance Bond 0.9 0.9 3.0 3.0 3.9 3.9
Land Acquisition and Resettlement 0.4 - 82.4 - 82.8
Total 128.5 90.2 522.6 321.1 651.1 411.3
Say 128 90 523 321 651 411
NOTE: Total cost here is for 8.0 maf project and excludes Pakistan taxes, duties, etc., estimated to beU.S. $102.4 million, equivalent, and interest during construction estimated at 6% to be U.S.$170.1 millionequivalent, with foreign exchange component of U.S. $111.7 million, equivalent.
MARCH 1967 IBRD-1991


ANNE 4
SKARDU PROJECT

ANNEX 4
LIST OF FIGURES
1. Skardu Dam Project: Reservoir Map
2. Skardu Dam Project: Plan
3. Skardu Dam Project: Sections
4. Estimated Construction Costs: Skardu Dam:5.2 MAF Capacity
5. Estimated Construction Costs: Skardu Dam:8.0 MAF Capacity

ANNEX 4Page 1
SKARDU
Introduction
The Skardu Valley appears to offer the most promising reservoirbasin on the Upper Indus. (See Map III.3) It possibly could be developedto store more than the mean annual flow of the Indus at that point, esti-mated to-be approximately 35 MAF. A large reservoir would, however, requirethe relocation of most; of the 30,000 people living in the valley at presentand completely-disrupt the farm and trading economy of the region.
Skardu lies at a general elevation of 7000 feet and is extremelydifficult to-reach, being separated from the rest of West Pakistan by highmountain ranges. Two one-way jeep routes lead into the area but are usableon a seasonable basis only.
WAPDA/Harza teams visited the region in 1960. 1962 and 1964, andidentified several possible storage sites in the immediate vicinity ofSkardu. It appeared to Chas. T. Main that superior dam sites existedfurther downstream, but the steep slope of the river in this section wouldnecessitate extremely high dams to impound a large reservoir.
Thus, for their desk study, Chas. T. Main chose the Kandore siteat the downstream end of Skardu Valley, two miles upstream from Ayub Bridgeand about 315 miles upstream from Tarbela. It was considered to be repre-sentative only, selection of the most desirable site being dependent on moreextensive investigations.
For the purpose of this study, although the data available areseverely limited, Chas. T. Main has outlined a possible development atSkardu. Such a project would consist of an earth and rockfill dam, abut-ting a concreti gravity spillway and reservoir outlet structure on theright bank. Two heights of dam were considered, one with a height of 260feet to impound 5.2 M4AF of usable storage and the other 310 feet high toimpound 8.0 MAF. The spillway in either case would be provided with 13radial control gates to permit the discharge of flood waters. Eightsluiceways at river level would be used for diversion during constructionand subsequently for releasing water from storage.
Chas. T. Main estimated that depending on foundation conditionsthe cost of the low dam might lie between $427 million and $510 million,and that of the high dam between $498 million and $588 million. Foreignexchange costs would be about 45 percent of the totals. In view of thegreat uncertainties involved, and to nake these estimates more comparableto those of projects where more data are available, the Bank Group be-lieves that cost ranges of $550 million to $825 million for the low damand $600 million to $900 million for the high dam should be assumed.
Geology
The several sites identified by the WAPDA/Harza teams have commongeologic features consisting of a rock abutment on one or the other side
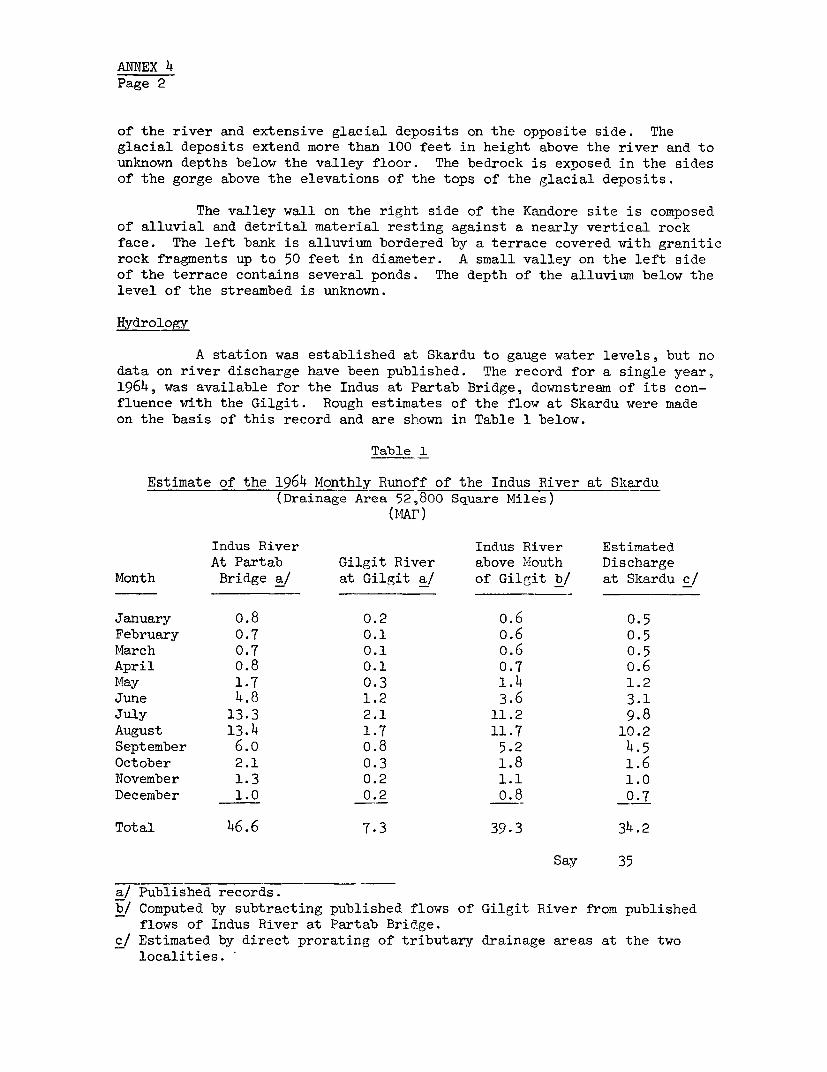
ANNEX 4Page 2
of the river and extensive glacial deposits on the opposite side. The
glacial deposits extend more than 100 feet in height above the river and to
unknown depths below the valley floor. The bedrock is exposed in the sides
of the gorge above the elevations of the tops of the glacial deposits.
The valley wall on the right side of the Kandore site is composed
of alluvial and detrital material resting against a nearly vertical rock
face. The left bank is alluvium bordered by a terrace covered with granitic
rock fragments up to 50 feet in diameter. A small valley on the left sideof the terrace contains several ponds. The depth of the alluvium below thelevel of the streambed is unknown.
Hydrology
A station was established at Skardu to gauge water levels, but nodata on river discharge have been published. The record for a single year,1964, was available for the Indus at Partab Bridge, downstream of its con-fluence with the Gilgit. Rough estimates of the flow at Skardu were madeon the basis of this record and are shown in Table 1 below.
Table 1
Estimate of the 1964 Monthly Runoff of the Indus River at Skardu(Drainage Area 52,800 Square Miles)
(MAr)
Indus River Indus River EstimatedAt Partab Gilgit River above Mouth Discharge
Month Bridge a/ at Gilgit a/ of Gilgit b/ at Skardu c/
January o.8 0.2 o.6 0.5February 0.7 0.1 o.6 0.5March 0.7 0.1 o.6 0.5April 0.8 0.1 0.7 o.6May 1.7 0.3 1.4 1.2June 4.8 1.2 3.6 3.1July 13.3 2.1 11.2 9.8August 13.4 1.7 11.7 10.2September 6.o o.8 5.2 4.5October 2.1 0.3 1.8 1.6November 1.3 0.2 1.1 1.0December 1.0 0.2 o.8 0.7
Total 46.6 7.3 39.3 34.2
Say 35
a/ Published records.b/ Computed by subtracting published flows of Gilgit River from published
flows of Indus River at Partab Bridge.c/ Estimated by direct prorating of tributary drainage areas at the two
localities.
ANNEX 4Page 3
It can be seen from the table that the discharge during the months of Julyand August is of the order of 20 MAF.
The tentative nature of these estimates must be borne in mind, ofcourse. One year is quite inadequate to establish any reliable record, andthe actual measurements may contain a substantial error because the cross-sectional areas for different gauge heights are not known. In addition,examination by Chas. T. Main indicated that many of the daily flows atPartab were estimated by correlation with the flows at Darband. This pro-cedure is not reliable during the monsoon season since the monsoons do notreach Partab. Even if the mean discherge were only half the amounts esti-mated, however, it would still be sufficient to fill an 8 MAF reservoir.
The runoff at Skardu during the flood season results almostentirely from snow andl glacial melt since, as mentioned above, the mon-soons do not penetrate to the area. While this makes seasonal variationsof river discharge easier to predict, there is still the hazard of suddenreleases that may result from the breeching of natural dams formed byglacial drift or landslides across the channel of the main river or itstributaries. With such contingencies in mind a figure of 1,100,000 cusecswas assumed for the design flood. Since no discharge records of consequenceare available, it has been impossible to establish any relationships betweenthe flows at Skardu and those further downstream as a basis for filling andrelease pattern.
As in the case of river discharge, no records of the sedimenttransport at Skardu were obtainable, but the results of sediment sampling atPartab Bridge in 1963 and 1964, and the sediment transport record at Darbandfor the period 1960-64 were available. The figures from Partab are subjectto the same reservations as the flow record.
The sediment transport for the Indus at Partab in 1964 was esti-mated by IACA at 177 million tons. Prorating on the basis of drainageareas, Chas. T. Main estimated the sediment transport at Skardu to be 140million tons.
Taking the record at Darband and using the same technique of pro-rating according to drainage areas, Chas. T. Main calculated the sedimenttransport at Skardu to be 270 million tons per year.
Therefore, Chas. T. Main estimated that the average sedimenttransport at Skardu would lie between 140 million and 270 million tons peryear or, on the basis of 85 pounds per cubic foot, between 76,000 and1467000 acre feet per year.
Access to the Project Site
Existing roads to the region are single lane and are impassableto anything except jeeps and pack animals. They are closed seven toeight months of the year by winter snow and sustain heavy damage as aresult of snowmelt runoff.
ANNEX 4Page 4
There are two routes. The first runs 240 miles from Balakot9
at the end of the Kunhar Valley, across the Babu-Sar Pass at an eleva-tion of 13000 feet9 through Bunji to Skardu. The total distance fromRawalpindi along this route is about 325 miles.
The second begins at Khavwza-Khel in the Swat Valley and followsthe Indus to connect with the above route near Chilas. This road wasscheduled for completion in 1966. The distance from Rawalpindi to Skardualong this route is about 400 miles.
No maps suitable for highway location studies were available,but the route along the Indus River from Tarbela was chosen as the mostlikely. It is longer than the Kunhar Valley route, but it should beeasier to keep open during winter since its highest elevation is about7000 feet as compared to that of the Babu-Sar Pass on the Kunhar Valleyroute of 13000 feet.
A gravel surfaced road, 40 feet wide and 340 miles long wasassumed. A typical mile of road was estimated to involve the following:
Item Quantity
Excavation 130,000 cubic yardsFill 4,000 cubic yardsCulverts (7 feet in diameter,
70 feet long) 5Bridges (20 feet by 60 feet) 1 to every 9 miles
Proposed Design as Basis for Estimates
Data available to Chas. T. Main for their study included reportsof the reconnaissance trips made by the W4APDA/Harza teams, aerial photo-graphs of the Indus from Tarbela to the Shyok Dam site upstream of theSkardu Valley at a scale of about 1:30,000, and topographic maps with ascale of 1:15,000 and a 20-foot contour interval of the Skardu area ofthe Indus and the lower portion of the Shigar River. These data wereadequate for a general appraisal only, and therefore the proposed struc-ture must be considered as merely a possible development of the site.
Dams of two different heights were considered by Chas. T. Main(see plan and sections for the higher project in Figures 2 and 3). Onewould impound live storage of 8.0 MAF and the other, 5.2 MAF. The ideawas to explore the relationship between cost and storage volume at thesite. The major features of the two dams considered are outlined inTable 2 below:
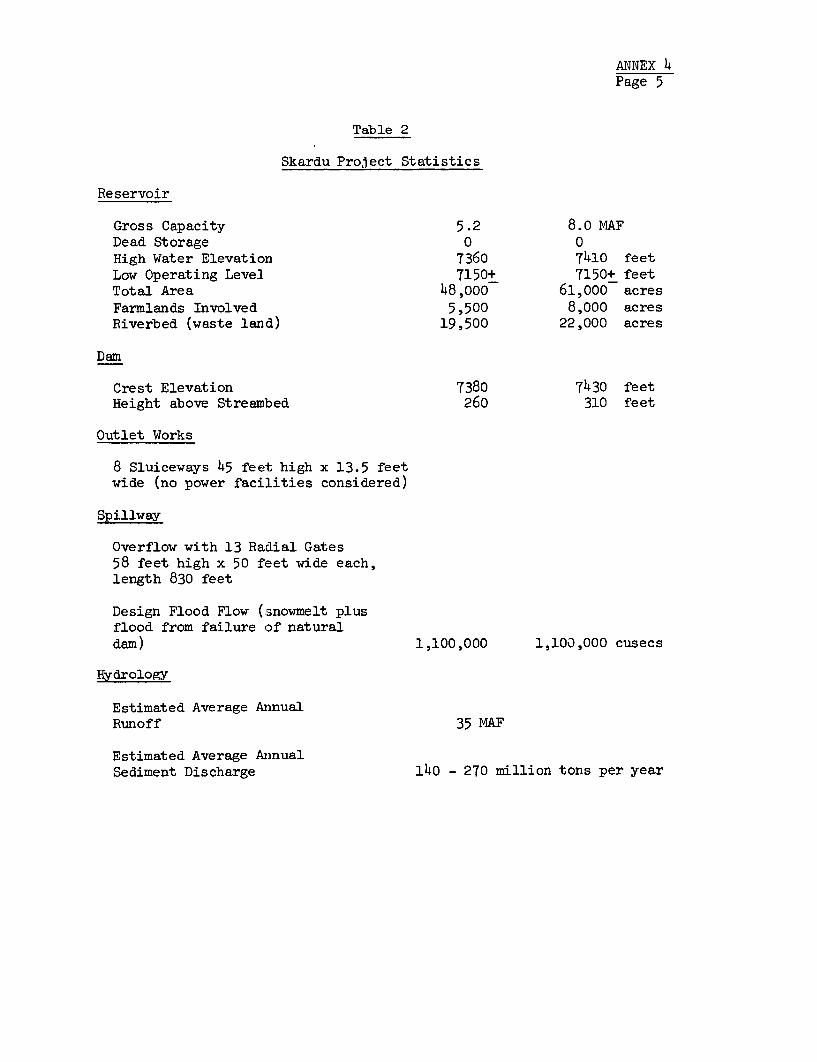
ANNEX 4Page 5
Table 2
Skardu Project Statistics
Reservoir
Gross Capacity 5.2 8.o MAFDead Storage 0 0High Water Elevation 7360 7410 feetLow Operating Level 7150+ 7150+ feetTotal Area 48,000 61,000 acresFarmlands Involved 5,500 8,000 acresRiverbed (waste land) 19,500 22,000 acres
Dam
Crest Elevation 7380 7430 feetHeight above Streambed 260 310 feet
Outlet Works
8 Sluiceways 45 feet high x 13.5 feetwide (no power facilities considered)
Spillway
Overflow with 13 Radial Gates58 feet high x 50 feet wide each,length 830 feet
Design Flood Flow (snowmelt plusflood from failure of naturaldam) 1,100,000 1,100,000 cusecs
Hydrology
Estimated Average AnnualRunoff 35 MAF
Estimated Average AinualSediment Discharge 140 - 270 million tons per year
ANNEX 4Page 6
The designs are based on the assumption that the site conditionsare less favorable for the construction and operation of diversion tunnelsthrough the abutments than for river diversion through a combination sluice-way/spillway structure of concrete gravity design constructed in a channelexcavated on the right side of the river. As bases for the alternativedesigns, assumptions were made that bedrock would be found at depths of 50feet and 200 feet respectively. These assumptions provide a basis forassessing the technical feasibility of a project at the site, but fieldinvestigations will be required to establish cost estimates with anycertainty.
The proposed dan would be of eartb and rockfill. Flows throughthe diversion channel on the right side would be controlled by the spill-way and outlet structure, constructed in stages as necessary to handle theflood flows. A concrete bulkhead section on the right side of the spillwaywould extend to the bedrock abutment. At the other end a concrete sectionwould tie into the earth and rockfill darn on the left. A loW earth damwould be constructed in a saddle about 0.7 mile beyond the left end of themain dam to close the reservoir.
The sluices at river level would be used for normal water releases.The spillway would be utilized only in cases of high floods and would dis-charge the design flood of 1,100,000 cusecs at the normal reservoir storagelevel.
Materials for construction probably would be available fromrequired excavations and from detrital deposits and bedrock near the site.The reservoir would displace a considerable number of people and inundatelarge areas of cultivated land. The 5.2-MAF reservoir would flood approxi-mately 5,000 acres of land now under cultivation and the 8.0--MAF reservoirabout 8,000 acres. Either would require the resettlement of a large pro-portion of the 30,000 people who presently inhabit the valley.
Although a power plant could be installed, Skardu was at thisstage of the analysis considered only as a storage project. The localmarket would in any case absorb a very small amount of power, and the longtransmission lines over mountainous terrain to the major markets would beextremely expensive to construct and maintain.
Operation
The operational characteristics of the reservoir can only besketched roughly at this time. The amount of water available for storage,the period of its availability, and the required release pattern will dependon the ability to predict the flows at canal heads based on correlationswith the flows at Skardu.
If the annual flows do not vary greatly from the figures listed inTable 1, the reservoir could be allowed to remain empty until about July.In this case, much of the early season sediment would be transported throughthe reservoir without detention. Also, some of the sediment deposited inprevious years would be scoured out. Chas. T. Main estimated that, on the
AmINEX 4Page 7
basis of these considerations, a depletion rate of 0.1 MAF per year wouldbe the probable maximum.
The trapping effect of Skardu is not expected to be significantfor Tarbela because it appears that the Indus below Skardu has availableto it all the sediment it can carry. The attenuation of peaks caused bySkardu would have some effect, however, since it would reduce the sedimentcarrying capacity of the river.
Cost Estimates
The cost estimates prepared for the project are highly speculativebecause data were almost completely lacking and many assumptions had to bemade. No subsurface explorations were carried out and no detailed survey ofsurface geology was available. The foundation, materials for construction,and other important site conditions may be vastly different from thoseassumed. Costs were based on world market prices and labor and materialsprices existing in West Pakistan in July 1964.
Access to the site is a point of serious question. The costs ofthe road chargeable to the project, based on quantities indicated above, wereestimated to be in the neighbourhood of $235,000 per mile. More detailedstudies might reveal the cost to be considerably higher. The total allocablecost according to Chas. T. Main, including contingencies (30 percent) andengineering and administration (8 percent) was estimated to be $112 millionof which $37 million would be in foreign exchange.
Land and resettlement costs were estimated by WAPDA in January1966 to be $1,700 or more per acre.
Chas. T. Main's detailed cost estimates for the two projectsconsidered are shown in Figures 4 and 5 based on the assumption that bed-rock would be found 200 feet below river level. Another set of estimateswas prepared on the basis of bedrock being located 50 feet below riverlevel. The cost ranges as estimated by Chas. T. Main are $427 million to$510 million for the 'Low dam and $498 million to $588 million for the highdam. Foreign exchange costs comprise about 45 percent of the totals. Ex-cluded are provision for.inflation, financial contingencies,,Pakistanntaxes and duties, and interest during construction.
Because of the very preliminary nature of the investigations andthe almost total lack of data, the Bank Group has adopted the following costranges: $550 million to $825 million for the low dam and $600 million to$900 million for the high dam.
Additional Investigations Required
Extensive investigations of the site and the compilation andevaluation of many data are required before meaningful designs and cost es-timates can be prepared.
ANNEX 4Page 8
The present network of hydrometeorological stations should beextended by installing the proposed stations on the Gilgit, Shigar and HunzaRivers. Sediment measurements in addition to discharge measurements shouldbe taken at these and the newly established station at Skardu and correlatedwith measurements downstream. The input and output of glacial debris in theShigar, Shyok and Indus Rivers should be studied over a long period to as-certain the mechanics of sediment movement. Snow courses should be estab-lished for correlating snow pack with runoff.
Understanding of the hydrometeorological processes of the UpperIndus Basin is necessary for the proper operation of the Skardu Project, butit is also invaluable to the operation of the entire storage system, espe-cially when conditions of full development are approached.
Other sites should be investigated to identify those deservingfurther exploration. The depth and character of the overburden at all sitesselected for further study should be determined. Test pits and borings ofpotential sources of materials for construction should be sufficient toidentify sources and approximate the quantities of materials available.
Studies should be made of the inhabited land affected by the pro-ject, of areas that could be developed for relocating the people affected,and of the effects of the project on the economy of the region.
The problem of access to the area requires close examination.In particular, the feasibility of constructing and maintaining passablethroughout the year a road strong enough to support heavy constructionequipment needs to be established. Also, the basis for allocating thecosts of the road to the project and to other national benefits shouldbe developed.
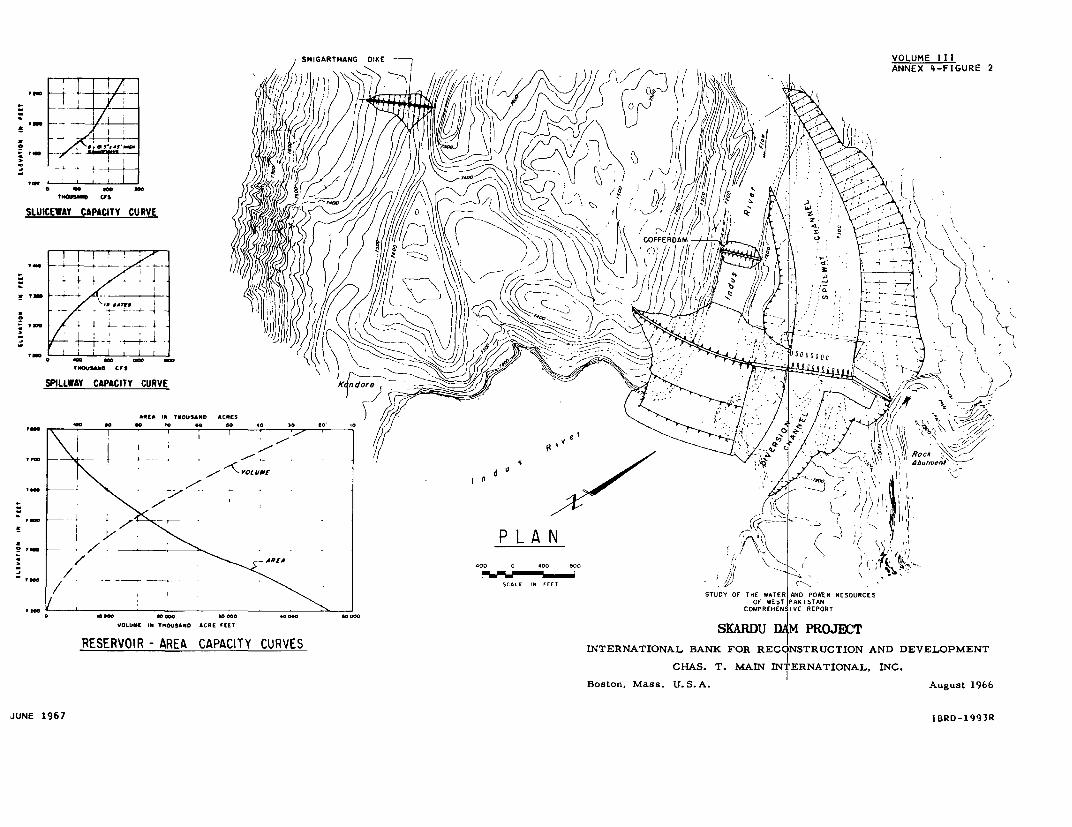
SHIGARTHANG DtKE VOLUME III
^"X->iL~ ~~~~~ 0
_ b,__ w o ht iX hf
._ [ ' \ -// ] 1 n d , , f / , e z X 4 ''tu\ & 2 \I) p'-/
_ /4 P L A N ' 4 ; , AF
. x t / , ' , . . \ O F W E S T P A K I S T A N ~
SLUICEWAY CAPACITY CURVE CA AC T CEBCTV
_______ NJ? \\ ~~~~~~~~~~~~~~~~~~~~~~~~~~~~~~~COFFERDA \
-4 'I~~~~~~~~~~~~~~~~~~~~~~~~~~~~~~~~~~~~~~~4~~~~~~~~~~~~~~~~~~~~~~~~~~~~~~~~~~~~~~~~~~~~~~~~~~~~~~~~~~~~
-OR- ~ ~ ~ ~~~~~~R
&*[A Ift TRBUSAND ACRES UA tVOLUNEff' L K6 i 6 j K
A ~~~~~~~~~~ -~P
/ _ AREA~~~~~~~~~~~~~~~~~0 0 400 8000
CMRH IVRPORO
/ O~~OLOiE IN TR0USAND ACRE FEET 00 CL TSKRu DU'FHw:E~ ::M:PR OJBCT
RESERVOIR - AREA CAPACITY CURVES INTERNATIONAL BANK FOR RECONSTRUCTION AND DEVELOPMENT
CHAS. T. MAIN INTERNATIONAL, INC.
Boston, Mass. U.S.A. August 1966
JUNE 1967
IBRD 1993R

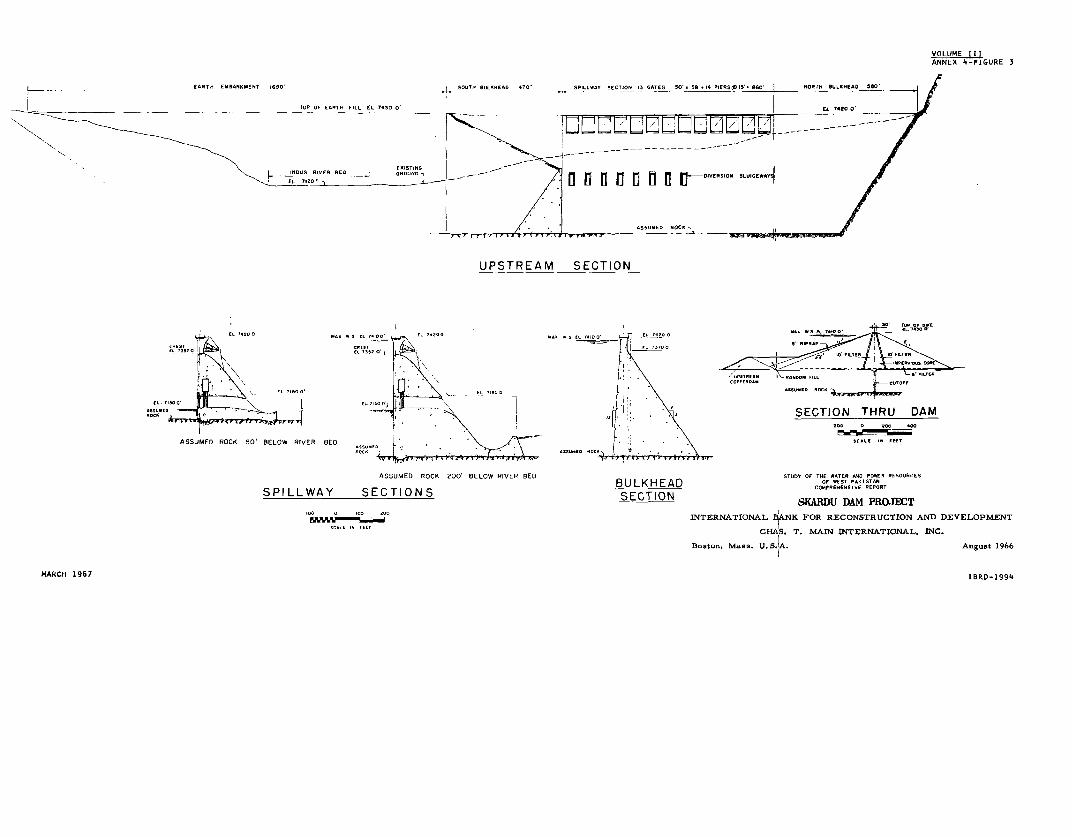
ANNEX 4M-FI GURE 3
EARTH EMBANTMENT 1690' SOUTH OULTEAE 470- SPILLW-T SECTION 15 GATES 50' 59,14 PIEASpI I. ao860' 50CR ULRLEAO 590
TOP OF EARTH FILL EL 7430 O' EL 7 O420
UPSTREAM SECTION
,~~~~~E TOO EL-2 XwSt .0 L72 S 1. SLOIOSEWAr.R720 F
E~~~~~~~~~~~~~~~~~~~~~~~~~~~~~~~~~~~~~~~~~~~~~~~T 75OP5E72O, .... \ <00
i~~~~RU R _IVE 40O RO'SE fl, u fl fL u 8 u fi fl. .- 5-0 FOECKI
{L./ItOO'~~~~~~~~~~~~~~~~~~~~~~~~~~~~~~~~W --. IO;7,0, \-,
11. O ~ ~ ~ ~ ~ ~ ~ ~ ~ ~~-OTNS 09-
oSU"10 _ - t _ << oh 1 1 XJ SECTION ~~~~~~~~~~~~~~~~THRU DAM
A- E. *SECTIONl. ,' USRA SETO
ASSUMED ROCK SO' BELOW RIVER BEDi ''' CL , .7ES40MAD ROCKO200 'OBELOW RIVEL BCD STR OF E TR'SE ELOROOSOCRES CRET i . \TTTSU"A OOX STAN
SPILLWAY ASSUMED ROCK 200 BELOW RIVER EED BULKHEAD C~~~~~~~~~~~~OMP EHENSIYE REPORTELILLWAY70 EL 73540. N S SECTON SKARDU DAM PROIST
VIFVWb___ IINTERNATIONAL BANK FOR RECONSTRUCTION AND DEVELOPMENT
A AS. T. MAIN INTERNATIONAL, INC.
0osto0. M... U. S.jA. AugSst 1966
MARCH 1967 IBRD-1994

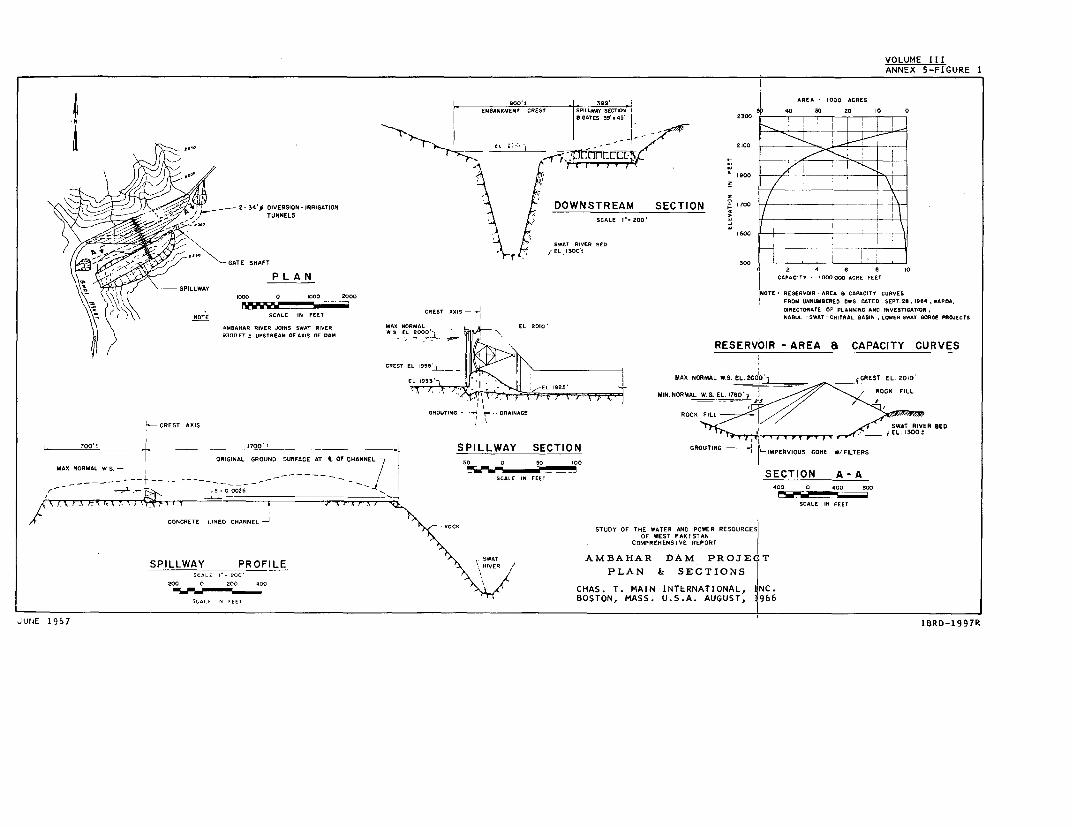
VOLUME IIIANNEX 5-FIGURE 1
; 389 R * A R E A 1 000 ACRESERILLWENT CRIET SPILLWAY SECTION- 50 AD G 2S IX 0
GATES 3 F5' 2300
/7 ~ ~ I t- I - - REEVI -v ARE - CAAIYCRE
-i ~ ~ ~ ~ ~ ~ ~ ~ ~ ~ ~ ~ ~ _
CREST EL 1955 ) _ _ 1 1- - 1
EL 1933 a 91 NIN NORN 2F0ILOL'~~~~~~~~~190
- ' 2-34, DIVERSION IRRIGATION DOWNSTREAM SECTION .,00 +
- -- TUNNEL SCALE IN FEET S ET IOTNN
P ROCK STUDYOFTHSWAT RIVER RED
SPILLWPIiiIAY GATE SHAFIT P 300 NOTE CAI -,E
SPILAY l'.000 0 lOGS 0GG PLAN & SECFRO)M UNNUMBERED GWG GATES SEPT. 2R. 1984 BAPOA.
20O o 1oD 400~~~~~~~~~~~CRS CAXS. IETRTE.O PLANING N INVETERNATIONAL CNOE SCALE IN FEET CRESTN MASS. U...AGUT 6
NOTE SCALE 1. FEET K~~~~~~~~~~~~~~~~~~~~~~~~~~~~~~~~~~ABUL -SWAT-CRITRAL BASIN , LASRER0880 AXRGE PROJECTS
A.RA.AR RIVER JGING SWAT RISER MAR NERBAL EL 2010'
R300OFT U PSTREAM OF AXIS OF BAR AS EL2 2000 -_
-_ ~~~~~~~~~~~~~~~~~~~~~~~~~~~~~~~~~~~~I
J_ ERESERV6IR AREA B CAPACITY CURVES
CREST ELI05 -
EL 933 MAX NORMAL WS.EL O p, (CREST EL. 2010'
EL 933 --. 1020 ~~~~~~~~~~INNOMAROCK FILL
GROUTING -4 r --DRAINAGE ROCK FILL
t-CREST AXIS .1 SA RIVER BED
1 300±
I 700'! TO SPILL.WAY SECTION GROUTING -- JH IPRIU OEIITR
ORIGINAL GROUND SURFACE AT t. OF CHANNEL 5 08 0 00 IO
MAR NORMAL ASW & ------ SECTION A- A-4 - - --. SCALE IN FEET4000 a
r .~~~~~~~. ,5~~~~S0 0000
SCALE IS FEET
ROCS STEDT OF TRE WATER 0N00 POWER RESOURCES~OF REST PAR STAN
COMPREHEN SIVE REPORT
SPILLWAY PROFILE RXIVERAM HR DM POJCSCALE It- 200' PLAN & SECTIONS
200 V 200 400 _______________ ~~~~~~~~~CHAS. T. MAIN INTERNATIONAL, INC.
SCALE IS FEET BOSTON, MASS. U.S.A. AUGUST, 1966
JUNE 1967 IBRD-1997R

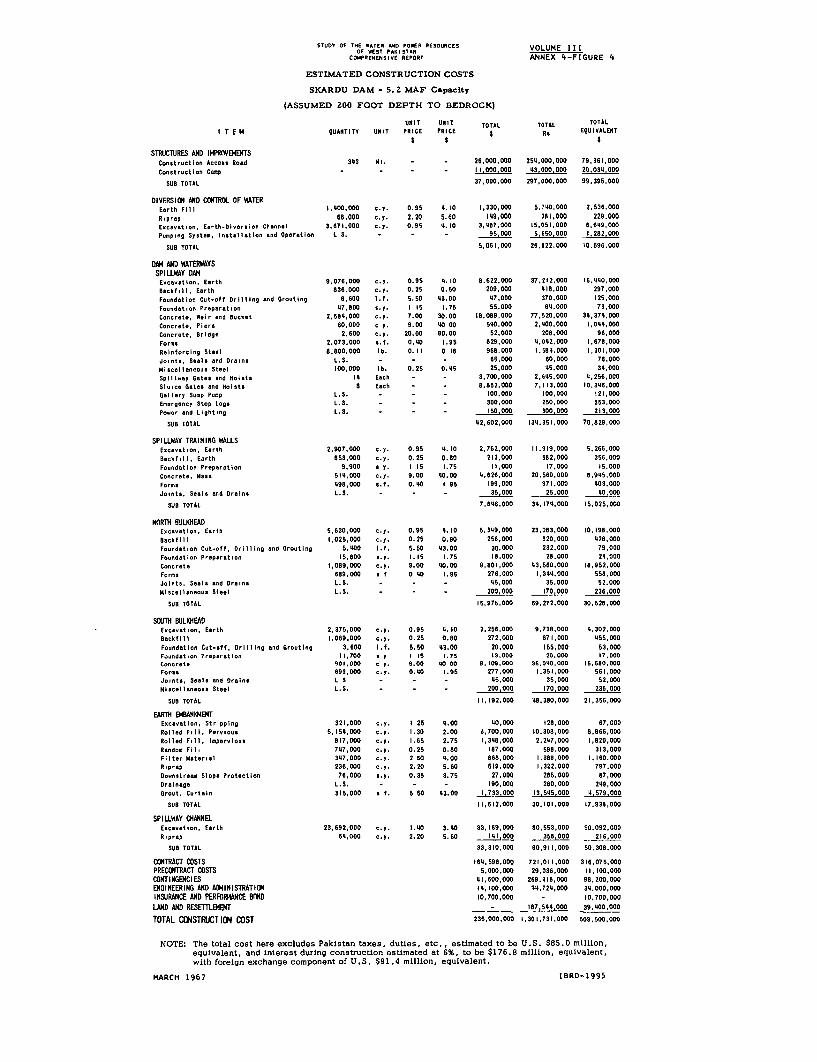
STUDY Of THE WATER AND POWER RESOURCES VOLUME IIIOF REST PAKISTAM
COMPREHENSIVE REPORT ANNEX 4-FIGURE 4
ESTIMATED CONSTRUCTION COSTS
SKARDU DAM - 5. 2 MAF Capacity
(ASSUMED 200 FOOT DEPTH TO BEDROCK)
UNIT UNIT TOTAL TOTAL TOTAL
I T E M QUANTITY UN IT PRICE PRICE Rs EQUIVALENT
STRIJCflRES AND0 IMPOEIVD4EJIConstruction Access Road 303 mi. - - 26,000,000 2511,000,000 79,361,000
Constructionl C-lp- - - j,00$,000 .3,0L0S00 20,030,000
SOB TOTAL. 37,000,000 297,000,000 00,300,000
DIVERSION MID CCOITROL OF WATEREarth Fill 1,000,000 U.p. 0.95 16.10 1,330,000 5,7O0,000 2,536.000R,prap 66,000 ED.y 2.20 5.60 1169,000 3,000 229.000
E.UR-t0 -, E-rth-DinRr.iRR CIt-flI 3.671,000 c.p. 0.916 0.10 3,057.000 IS.OSI,0OO0 6.609,000
P.ap,.g Syst.., I.stRIIREtRII And OprIatIoS L S. .. 95.000 5,650.000 1.282.000
SUB TOTAL 5,061,000 26,822,000 10.696.000
DAM4 MID WATERWYSSPILLWAY DAM4
EcOU-taiO.. E.rth 9.076,000 C. Y. 0.90 0. 10 0,622.000 37.212,000 16,000,000
B 8tl. at 36.000 c.0. 0.25 0.60 200,000 41616000 297,000Foan.dAtio:n Cot-'off Drilling and GroAting 0.600 1.1. 5.50 03.00 07,000 370,000 125,000
Foandat,on Prop ...t.ofl 07.800 .. Y. I 15 1.75 50.000 60,000 73,000
CORrcrAt, WeRir and Bucket 2.580,000 opY. 7.00 30.00 18,086.000 77,520.000 30,370,000Concrete, PiRra 60,000 C Y. 9.00 tO 00 500.000 2,4000.000 1,040,000CO...rRt.. Bridge 2.600 c.o. 20.00 60.00 52,005 200,000 90,000Fo.- 2.073,000 RIf. 0.00 1.90 029.000 ,0.02.000 1,670,000
ORintoOrUIng, StoaIl 6,6800.000 l-b. 0.11 0 la 966.000 1,060,00 1,301,000JoI A SRAl. On r.... I,S: - 65,000 60,~000 78,000
MlcIUIIr:OROA StRRI 106,000 l b. 0,25 0,05 25,000 05,000 30.000SpillARy O.tRa and Hoists 10 Each - - 3.700,000 2.005,000 0,256,000SIu UR Teat And Hoiats 6 E-1, 8 ,052,000 7,113,000 10.306.000
ORI, Sop Poop L.S. - 00,000 100,000 121.000En,RrgenUy StoptLO:o LS.$.- 300,000 250.000 353.000
Po rY and Lightin LO.S - - 150,000 300,00$0 213.000
SOB TOTAL 02,602,000 130,351,000 70,629,000
SPIL.LWAY TRAINING WALLS"Eacoal. Earth 2,907.000, C-y 0,95 0.10 2.762,000 11,919,000 0. 266,000
ack tnI;, Eart 650,00 U..Y. 0.25 0,80 213.000 662,000 356.000
FoAnda.ioR Propralo 990 a , 15 1.75 11,000 17,000 15,000
Concrete, MOss 510,000O U.n. 9.00 40000 4.626,000 20,560.000 8,900,000
For... 096,000 aUf. 0,40 I 95 199,000 971,000 003.000Jolta SRsIs and OralosL,, - 35,000 25.000 00,000
SU8 TOTAL 7.806,000 30. 170,000 15,025,000
NOR1TH BULKHEADE.coRvtl, Earth 5,0630,000 n.Y. 0,90 0,10 5,309,000 23,063,000 10. 196.000Bat h,oill 12,2.000 coY. 0,25 0.80 256.000 820,000 428,000
FoundAtOo. CUt-Uff. Drilling end Grouting 5.0100 1,f, 5.50 03.00 30,000 232,000 79,000FoondRtioo FraporAtinon15~~,, 800 a.Y. 1.15 1,75 1000 28,000 20.000
Cocrote ,09,000 op .00 0.00 9,001,000 t3,560.0000 18,952,000
CFo- 669,000 af 0 t0 1.95 276.000 1,340.000 558.000Jont, R lsad. Drama LO. - - - 00,000 30.000 52,000
MiRUIC oR at StI L.S. - - - 200,000 170,00 236,00
S08 TOTAL 15.975.000 09,272,000 30.528,000
SOVJIH BUJLKHEADE$Uaoat 'On' Earth 2,370,000 op,. 0,95 0.810 2,256.000 9,730,000 0.302,000
BaUhfili 1.069.000 co. 0.25 0.80 272,000 671,000 055.000Found:tion Cut-off. Drilling and Grouting 3,600 1.f. 5.50 03.00 20.000 155,000 03,000
Foonrdat on P-ap-rtion 11,700 a n I Is 1.75 13,000 20.000 17,000Con.r.tR 901.000 C Y. 9,00 000 R,O,00 00,000,000 165, 000 1 ,60000
Fornin 603.000 U.n 0.00 1,95 277,000 ,351.000 561,000)Jont., SealR and OraloiL0 - - 00,000 35, 000 02.000
MIac.lla-ous Steel L.S - - - 200.000 170Z,000 236,000
SU8 TOTAL 11,192.000 00,380,000 21.356,000
EARTH BIBANIO4ENTEoc aoation. St,opping 321,000 c,n. I 25 0.00 400000 128,000 07.000
Rolledd FIll, lerv,oA- 5,150,000 CoY. 1,20 2.00 d.700,000 10,308,000 8.606.000
OoldFils,pIenrOiou. 817.000 c.p. 1.65 2.75 1,308,000 2,207,000 1,820,000
Random Fu, 707.000 U..n. 0,25 0,80 187,000 598.000 313,000FiIURF Matarlal 307000 ..Y. 2 00 0,00 8600,000 1,388,000 1,160.000
Rlprap 236,000 U.n. 2.20 5.60~~~7 519.000 1,322.000 797,000
DooOR'treaa, Slope Protectio. 76,0000 sn. 0,35 3.75 27.000 285.000 87,000Draloag,. ,,,LO.S - - 190.000 280.000 209,000OroUt. otI 315,000 o f. 5 50 03.00 1,733.000 13,500.000 4.579.000
SUB TOTAL 11,612,000 30, 101.000 17,938,000
SPILLWAY CIWINELEoca-at-o, Earth 23,093,000 C.Y. 1.00 3,00 33.169,000 80.553.000 50,092,000
R,prap 00.000 .pY. 2.20 5,60 1412 ,000 35B.000 216,000
008 TOTAL 33.310.000 B0,911.000 50,30B.000
CGI8CT OOSTS 160.598.000 721.01000 316,:075,000PRECGIrRCT COSTS 5,000,000 29,003'6,000 11100.000COIRTIRGENICIES 01,6000.000 269,010,000 98.200,000ENGINEERING MID AIO41NISTRATIGN 10,100,000 10,720,000 30,000,000INSURANCE MID PERFOIN4MCE WIND0 10,700.ODO 10,700,000
LMID AND RESErrLEIENT -_ Ij7A500.O0 39~,000,000
TOTAL CGISTRUCTI COd ST 236.000,000 1,201,731,800 509,000,000
NOTE: The total cost here excludes Pakistan taXes, duties, etc. , estimated to be U.S. $85. 0 million,equivalent , and interest during construction estimated at 6%. to be $176.8 million, equivalent.with foreign exChange component of U.S. $81.4 million, equivalent.
MARCH 1967 IBRD-1995

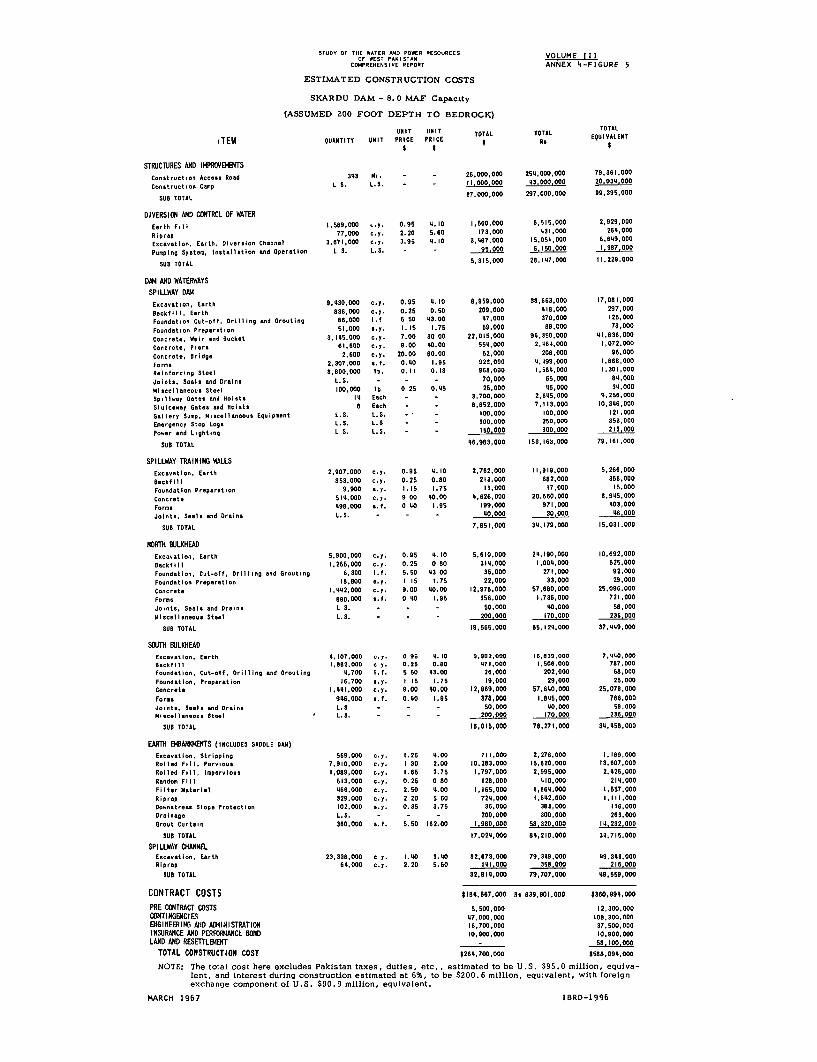
STUDY Or THE WATER MD POWER RESOURCES VOLUME IlIOF WEST PAKIST O
CONPRER ENSIE REPORT ANNEX 4-FIGURE 5
ESTIMATIED CONSTRUCTION COSTS
SKCARDU DAM - 8. 0 MAF Capacxty
(ASSUMED 200 FOOT DEPTH TO BEDROCK)
T ~~~~~~~~~~~~~TOTALUNIT UNRIT TOTAL TOTAL EQUIRALENT
ITEM QUANTITY UNIT PRICE PRICE Rs $
STRUJCTURES AND IHPROVB'2fS 7,6,0
Constroctien Acce.. WRad 3i43 Wi, - 26.000.000 2514,000.000 7,0,0ConstructIo Caap L S. L.0S. - - 11.000.000 AL$-QL9
00O 20.034.000
SU8 TOTAL 07,000,000 297,000.000 99,395,000
DIVERSIERN AND COllOL OF WATEREarth Fill i,5aR,DOO ..R. 0.95 4.10 1,560,000 6,010,000 2,929,000
Riprap 77,000 C.Y. 2.20 0.60 173,000 1431,000 2614,000
E-ac-tlon, Earth, Dlverlon- Channe 3,671,000 Eq.- 2.95 4.10 0,407,000 15,001,000 6,649,000
Pueplog System, Installation and Operatian L S. L.S. - - 95... 00AO 6.1500000 1.387,000
SUB TOTAL 0,315,000 20,147,000 11,229,000
DAM AND WATERWAYSSPILLWAY DAM
ExEc-ation, Earth 0,400,000 c.o. 0.05 4.10 6,959,000 38,603,000 17,081,000Reckfill, Earth 830,000 ..Y. 0.25 0.00 209,000 018,000 297,000
Foudation Cut-aft, Drilling and Orau.ting 96,000 1.f 5 50 43.00 47,000 370,000 125,000FoundatiRn Preparation 04,000 eqY. 1.15 1.75 59.000 89,000 78,000
CUncreta Weir and Bucket 3,145,000 ..Y. 7,00 30 00 22,015,000 94,350,000 44,836,000
Concre.te, Piara 64,500 cey. 9.00 40.00 554,000 2,464,000 1,072,000
Cancrete, Bridge 2,600 c.y. 20,00 80.00 52,000 208,000 96,000For- 2,307,000 s.f. 0.40 4.95 923,000 0,099,000 1,8600,000
Reinforcing StacI 9,800,000 Ib. 0,11 0.18 900,000 1,064,000 1,001,000
Joints, Deals and DraIns 1.S. - - - 70,000 65,000 04,000
Miscellaneous Steel 100,000 lb 0 25 0,45 25,000 45,000 34,000
Opllos.y Gate And Rolats 14 Each - - 3,700,000 2,005,000 4,250,000Slulcenay Gates and Haista 0 Each - - 8,652,000 7,113,000 40,340.000
ia11ery Dump. Niscallaneou. Equipmen.t LUS. L.S .- '- 00,000 100,000 121,000
Emer gency StRp Logs L.S. L.3 - - 300,000 250,000 353,000Po..r and Lighting L S. L.S. I 10.000 300,,000JfQ 213,000
DAB TOTAL 46,963,000 153,163,000 79,101,000
SPILLWAY TRAINING WALLS
E.ccaatlRn, Earth 2,907,000 cfy. 0.95 4.10 2,702,000 11,919,000 5,206,000
BacfIl 853.0D0 c.y. 0.25 0,80 213,000 682,000 356,000Fou.nda.tIon PreparatlRn 9,900 s.Y. 1.15 1,75 44,000 17,000 15,000
Concrte 514.000 c.Y. 9 00 40.00 4,626,000 20,560,000 8,905,000
Forma, 400,000 s.f. 0 00 1.05 199,000 971,000 403,000
J.alnts, Seals end Drains LO.S - - 40,000 30.000 4,990QQ
DUB TOTAL 7,851,000 34,179,000 15,031,000
NORTH BIULKHEADEaca-atIan, Earth 5,900,000 cfy. 0.95 4,10 5,610,000 26,190,000 10,692,000
BackfIll 1,255,000 c.Y. 0.25 0 80 344,000 1,004,000 525,000raundatnt Cut-olf, DrIlling and GUrouting 0,000 1,f. 5.50 43 00 35,000 274,000 92.000
Feundotien Praparation 10,600 s.p, I is 1.70 22,000 33,000 29,000
Concrete 1,442,000 c.y. 9.00 40.00 12,970,000 57,000,000 25,090,000
Fares 090.000 g... 0 40 1.95 350.000 1,730,000 721,000
Joints, Deals and Drains L 0. - - - 50,000 40,000 58,000
Nlacellon-eaa Steel 1.0. - - 200.000 170,,,l090 230,000
SUB TOTAL 19,505,000 85,424,000 37,449,000
SOIT BULKHEAD
occtc,Earth 4.107,000 u... 0 93 6.10 3,002,000 10,830,000 7,440,000aeckOllI ~~~~~~~~~1,862,00 c .y. 0,25 0.00 474,000 1,506,000 787.000
Feudatlen Cu-.f, Drilling and Oretieg 4,700 I.f. 50 43.00 20,000 202,000 00,000
Foundatlen, Prepra,tien 40, 700 mY. I It 1.75 19,000 29,000 25.000
Concrete 1,441,000 upy. 9.00 40.00 12,909,000 57,600,000 25,078,000
Forms 940,000 a.f. 0.40 1.95 378,000 4,045,000 766,000
Joits, Seal. and Drains 1.2 3 50,000 40.000 58,000
Nlscollane..us Steel L .3. - - -200,000 170,000 236.000
S0B TOTAL 18,015,000 78,271,000 34,450,000
EARTH S4OAN4EfS (INCLUDED SADDLE DAO)Eo...c-tlon, Stripping 509,000 c.y. 4.25 4.00 711,000 2,270,0001,000
Rolled Fill, Per-ieu 7,910,000 c.y. I 30 2.00 10,283.000 15,820,000 13,007,000Rolled Fill, lmpervleua 4,089,000 c.y. 4.65 2.75 1,797,000 2,995,000 2,426,000
Random FIll 543,000 c.y. 0.25 0 s0 420,000 410,000 214,000Filter NAtrIal 466,000 c.y. 2,50 4.00 4,405,000 4,864,000 1,557,000Rlpr.p 329.000 c.p. 2 20 U to 724,000 1.842,000 1,411,000Deonstremi Slope Pret-ctien 102,000 s.y. 0.35 3.75 36.000 283,000 116,000
Drainage 1.S. - - - 200.000 300,000 203,000
Grout Curtain 300,000 a.f. 0.50 102.00 4.980.000 58,320.000 14,232,000
SU8 TOTAL 17,024,000 04,210,000 34,715,000
SPILLWAY CHANNEL
E-acatloe, Earth 23,330,000 c y. 1.40 3.40 32,673,000 79,249,000 49.343,000Riprap 64,000 cfy. 2.20 5.00 161.000 ,58,000 21,Aj000
SUB TOTAL 32,014,000 79,707,000 49,559,000
CONTRACT COSTS $484,567,000 Rs 839,801,000 $360,994,000
PRE COONTRACT COSTS 5,500,003 12,300,GO0
CONTINGENCIES 47,000,000 108,300,000
ENIGINEERING A11D ADHII8ISTRATION 40,700,000 37,500,000
INSURANCE A140 PERFOWIASNCL 80N0 10,900,000 40,800,000
LAND AND RESETTLEMENT _____ 58.100.000
TOTAL CONSTRUCTION COST $204,700,000 $588,094,000
NOTE: The total cost bore excludes Pakistan taxes, duties, etc. , estimated to be U.S. $95. 0 million, equiva-lent, and interest during construction estimated at 6%, to be $200.06 million, equivalent, witb foreignexcbange componenit of U.S. $00.0 million, equivalent.
MARCH 1967 IB8RD-1996


ANNEX 5
AM'AHAR PROJECT


ANNEX 5
LIST OF FIGURES
1. Ambahar Dam Project: Plan and Sections

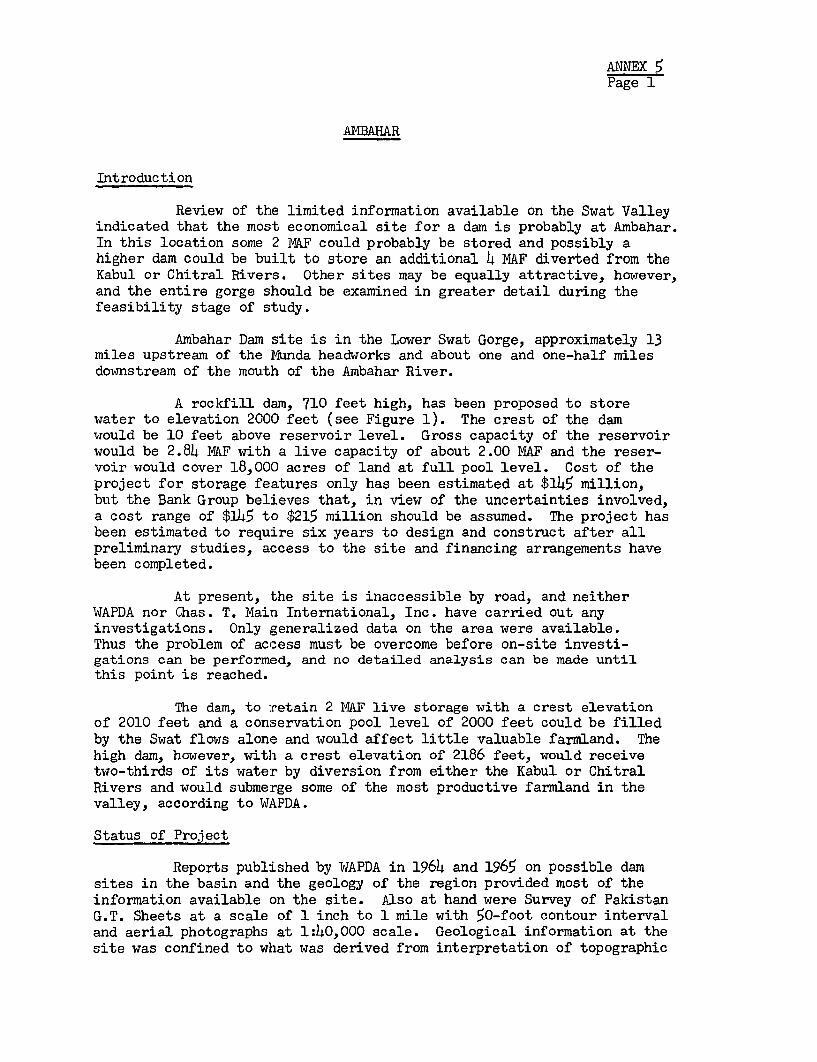
ANNEX 5Page 1
AMBAHAR
Introduction
Review of the limited information available on the Swat Valleyindicated that the most economical site for a dam is probably at Ambahar.In this location some 2 MAF could probably be stored and possibly ahigher dam could be built to store an additional 4 MAF diverted from theKabul or Chitral Rivers. Other sites may be equally attractive, however,and the entire gorge should be examined in greater detail during thefeasibility stage of study.
Ambahar Dam site is in the Lower Swat Gorge, approximately 13miles upstream of the Munda headworks and about one and one-half milesdownstream of the mouth of the Ambahar River.
A rockfill dam, 710 feet high, has been proposed to storewater to elevation 2000 feet (see Figure 1). The crest of the damwould be 10 feet above reservoir level. Gross capacity of the reservoirwould be 2.84 MAF with a live capacity of about 2.00 MAF and the reser-voir would cover 18,000 acres of land at full pool level. Cost of theproject for storage features only has been estimated at $145 million,but the Bank Group believes that, in view of the uncertainties involved,a cost range of $145 to $215 million should be assumed. The project hasbeen estimated to require six years to design and construct after allpreliminary studies, access to the site and financing arrangements havebeen completed.
At present, the site is inaccessible by road, and neitherWAPDA nor Chas. T. Main International, Inc. have carried out anyinvestigations. Only generalized data on the area were available.Thus the problem of access must be overcome before on-site investi-gations can be performed, and no detailed analysis can be made untilthis point is reached.
The dam, to retain 2 MAF live storage with a crest elevationof 2010 feet and a conservation pool level of 2000 feet could be filledby the Swat flows alone and would affect little valuable farmland. Thehigh dam, however, with a crest elevation of 2186 feet, would receivetwo-thirds of its water by diversion from either the Kabul or ChitralRivers and would submerge some of the most productive farmland in thevalley, according to WAPDA.
Status of Pro.ject
Reports published by WAPDA in 1964 and 1965 on possible damsites in the basin and the geology of the region provided most of theinformation available on the site. Also at hand were Survey of PakistanG.T. Sheets at a scale of 1 inch to 1 mile with 50-foot contour intervaland aerial photographs at 1:40,000 scale. Geological information at thesite was confined to what was derived from interpretation of topographic
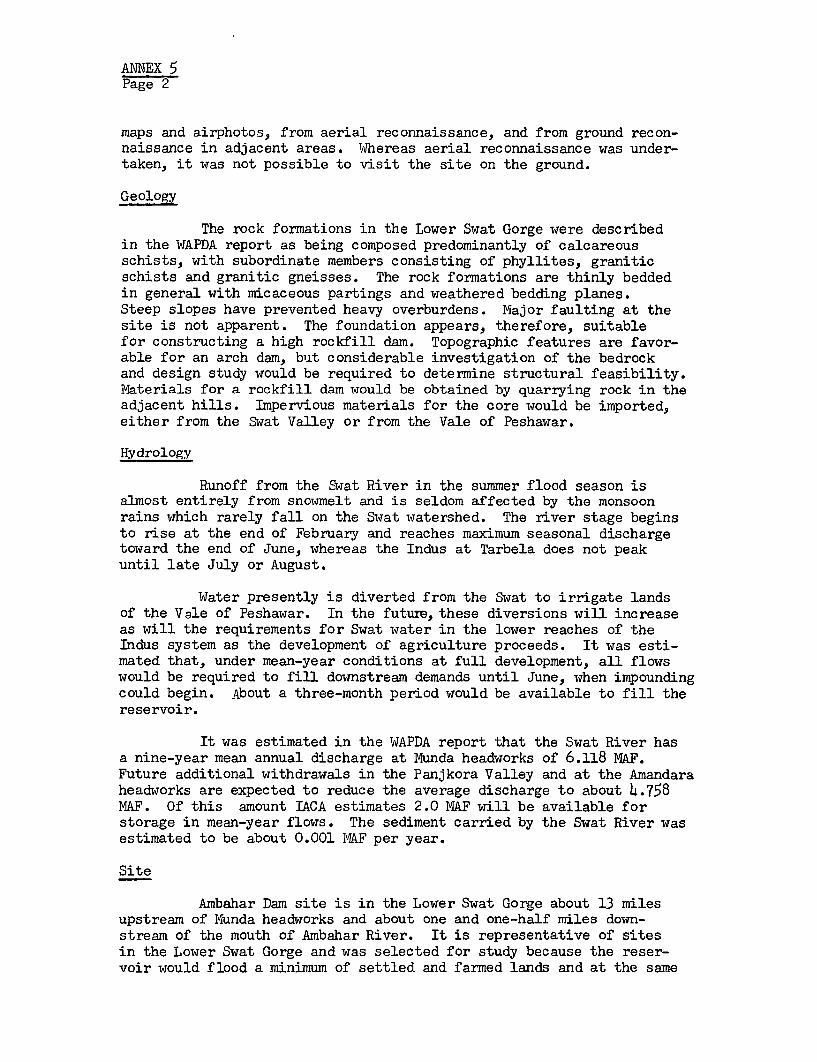
ANNEX 5Page 2
maps and airphotos, from aerial reconnaissance, and from ground recon-naissance in adjacent areas. Whereas aerial reconnaissance was under-taken, it was not possible to visit the site on the ground.
Geology
The rock formations in the Lower Swat Gorge were describedin the WAPDA report as being composed predominantly of calcareousschists, with subordinate members consisting of phyllites, graniticschists and granitic gneisses. The rock formations are thinly beddedin general with micaceous partings and weathered bedding planes.Steep slopes have prevented heavy overburdens. Major faulting at thesite is not apparent. The foundation appears, therefore, suitablefor constructing a high rockfill dam. Topographic features are favor-able for an arch dam, but considerable investigation of the bedrockand design study would be required to determine structural feasibility.Materials for a rockfill dam would be obtained by quarrying rock in theadjacent hills. Impervious materials for the core would be imported,either from the Swat Valley or from the Vale of Peshawar.
Hydrology
Runoff from the Swat River in the summer flood season isalmost entirely from snowmelt and is seldom affected by the monsoonrains which rarely fall on the Swat watershed. The river stage beginsto rise at the end of February and reaches maximum seasonal dischargetoward the end of June, whereas the Indus at Tarbela does not peakuntil late July or August.
Water presently is diverted from the Swat to irrigate landsof the Vale of Peshawar. In the future, these diversions will increaseas will the requirements for Swat water in the lower reaches of theIndus system as the development of agriculture proceeds. It was esti-mated that, under mean-year conditions at full development, all flowswould be required to fill downstream demands until June, when impoundingcould begin. About a three-month period would be available to fill thereservoir.
It was estimated in the WAPDA report that the Swat River hasa nine-year mean annual discharge at Munda headworks of 6.118 MAF.Future additional withdrawals in the Panjkora Valley and at the Amandaraheadworks are expected to reduce the average discharge to about 4.758MAF. Of this amount IACA estimates 2.0 MAF will be available forstorage in mean-year flows. The sediment carried by the Swat River wasestimated to be about 0.001 MAF per year.
Site
Ambahar Dam site is in the Lower Swat Gorge about 13 milesupstream of Munda headworks and about one and one-half miles down-stream of the mouth of Ambahar River. It is representative of sitesin the Lower Swat Gorge and was selected for study because the reser-voir would flood a minimum of settled and farmed lands and at the same
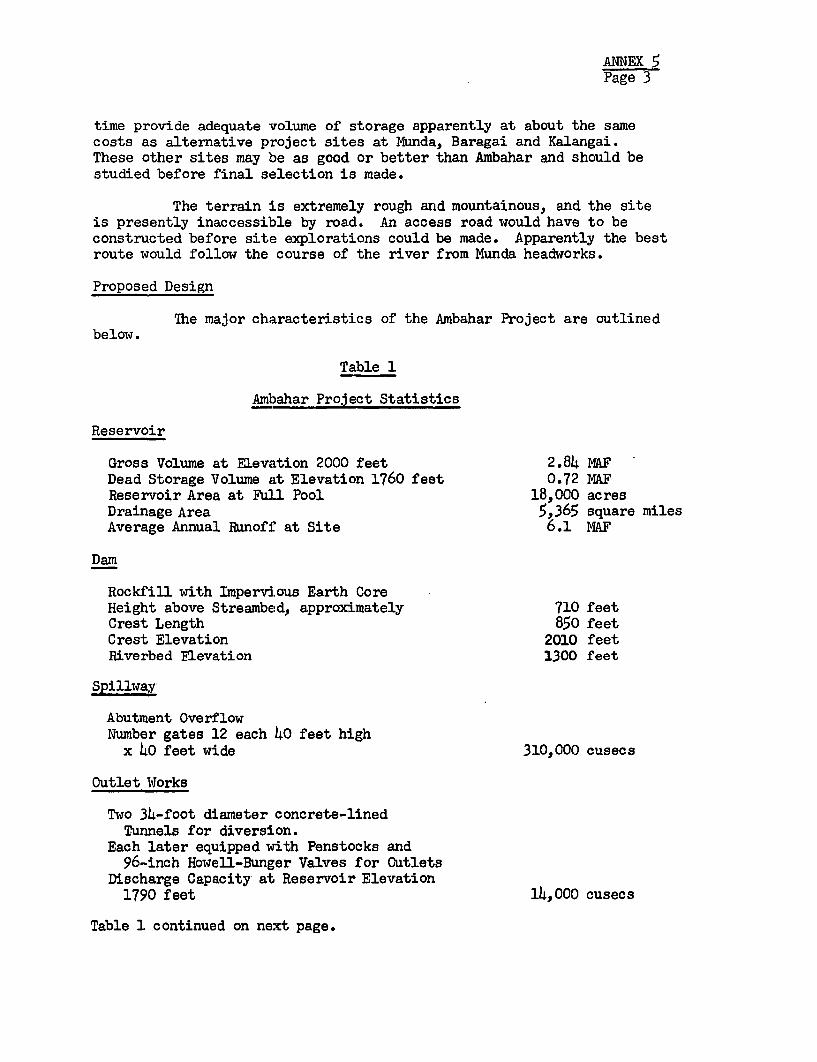
ANNEX 5Page 3
time provide adequate volume of storage apparently at about the samecosts as alternative project sites at Munda, Baragai and Kalangai.These other sites may be as good or better than Ambahar and should bestudied before final selection is made.
The terrain is extremely rough and mountainous, and the siteis presently inaccessible by road. An access road would have to beconstructed before site explorations could be made. Apparently the bestroute would follow the course of the river from Munda headworks.
Proposed Design
The major characteristics of the Ambahar Project are outlinedbelow.
Table 1
Ambahar Project Statistics
Reservoir
Gross Volume at Elevation 2000 feet 2.84 NAFDead Storage Volume at Elevation 1760 feet 0.72 MAFReservoir Area at Full Pool 18,000 acresDrainage Area 5,365 square milesAverage Annual Rbunoff at Site 6.1 MAF
Dam
Rockfill with Impervious Earth CoreHeight above Streambed, approximately 710 feetCrest Length 850 feetCrest Elevation 2010 feetRiverbed Elevation 1300 feet
Spillway
Abutment OverflowNumber gates 12 each 40 feet high
x 40 feet wide 310,000 cusecs
Outlet Works
Two 34-foot diameter concrete-linedTunnels for diversion.
Each later equipped with Penstocks and96-inch Howell-Bunger Valves for Outlets
Discharge Capacity at Reservoir Elevation1790 feet 14,000 cusecs
Table 1 continued on next page.
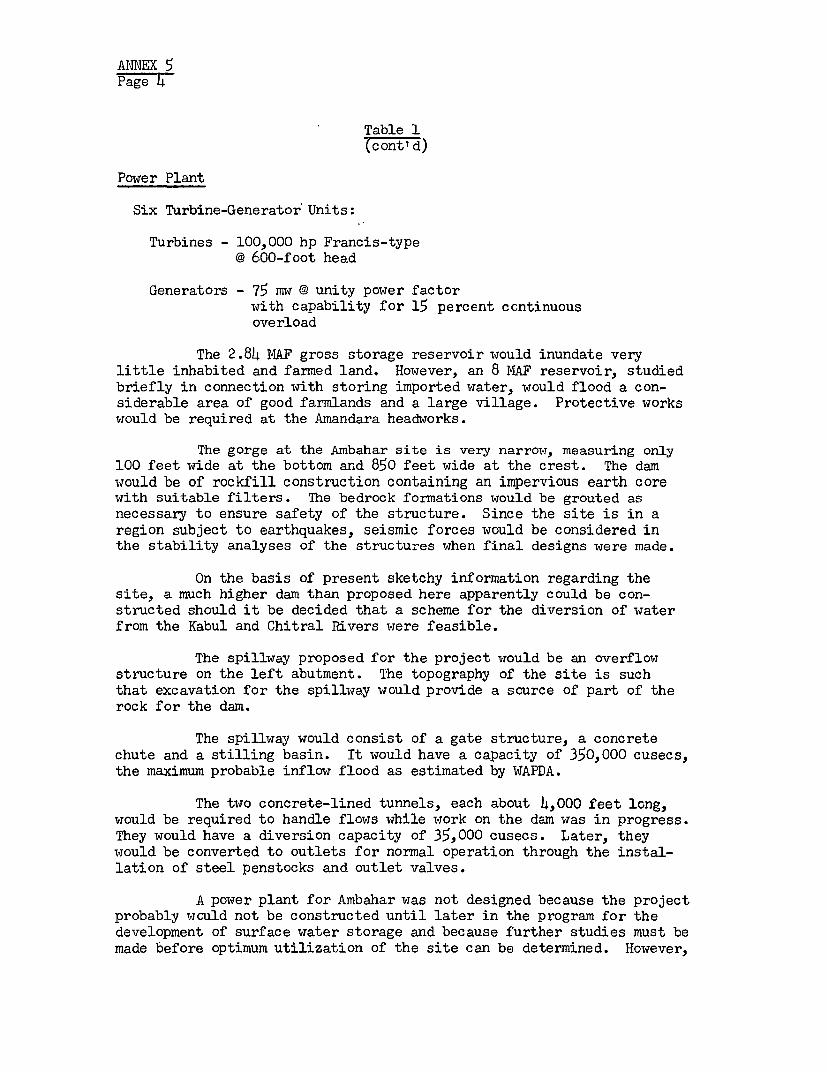
ANNEX 5Page 4
Table 1(cont' d)
Power Plant
Six Turbine-Generator Units:
Turbines - 100,000 hp Francis-type@ 600-foot head
Generators - 75 mw @ unity power factorwith capability for 15 percent ccntinuousoverload
The 2.84 NAF gross storage reservoir would inundate verylittle inhabited and farmed land. However, an 8 MAF reservoir, studiedbriefly in connection with storing imported water, would flood a con-siderable area of good farmlands and a large village. Protective workswould be required at the Amandara headworks.
The gorge at the Ambahar site is very narrow, measuring only100 feet wide at the bottom and 850 feet wide at the crest. The damwould be of rockfill construction containing an impervious earth corewith suitable filters. The bedrock formations would be grouted asnecessary to ensure safety of the structure. Since the site is in aregion subject to earthquakes, seismic forces would be considered inthe stability analyses of the structures when final designs were made.
On the basis of present sketchy information regarding thesite, a much higher dam than proposed here apparently could be con-structed should it be decided that a scheme for the diversion of waterfrom the Kabul and Chitral Rivers were feasible.
The spillway proposed for the project would be an overflowstructure on the left abutment. The topography of the site is suchthat excavation for the spillway would provide a source of part of therock for the dam.
The spillway would consist of a gate structure, a concretechute and a stilling basin. It would have a capacity of 350,000 cusecs,the maximum probable inflow flood as estimated by WAPDA.
The two concrete-lined tunnels, each about 4,000 feet long,would be required to handle flows while work on the dam was in progress.They would have a diversion capacity of 35,000 cusecs. Later, theywould be converted to outlets for normal operation through the instal-lation of steel penstocks and outlet valves.
A power plant for Ambahar was not designed because the projectprobably would not be constructed until later in the program for thedevelopment of surface water storage and because further studies must bemade before optimum utilization of the site can be determined. However,
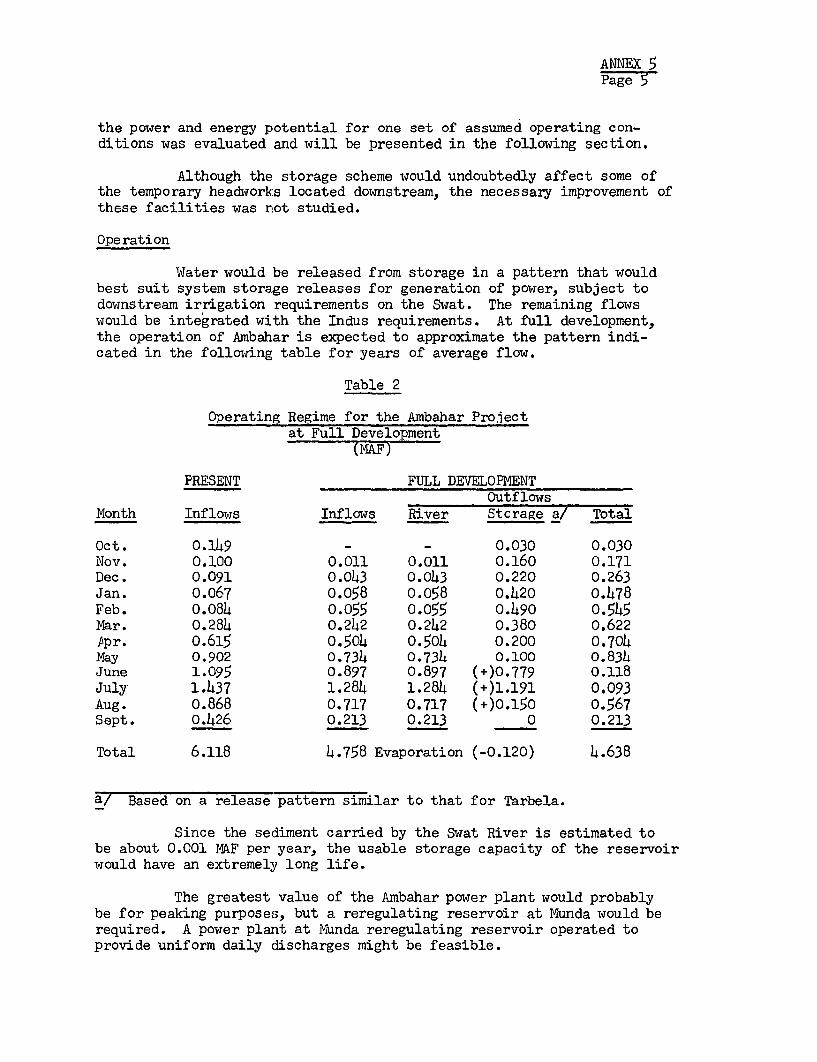
ANNEX 5Page 5
the power and energy potential for one set of assumed operating con-ditions was evaluated and will be presented in the following section.
Although the storage scheme would undoubtedly affect some ofthe temporary headworks located downstream, the necessary improvement ofthese facilities was not studied.
Operation
Water would be released from storage in a pattern that wouldbest suit system storage releases for generation of power, subject todownstream irrigation requirements on the Swat. The remaining flowswould be integrated with the Indus requirements. At full development,the operation of Ambahar is expected to approximate the pattern indi-cated in the following table for years of average flow.
Table 2
Operating Regime for the Ambahar Projectat Full Development
(MAF)
PRESENT FULL DEVELOPMENTOutflows
Month Inflows Inflows River Stcrage a/ Total
Oct. 0.149 - - 0.030 0.030Nov. 0.100 0.011 0.011 0.160 0.171Dec. 0.091 0.043 0.043 0.220 0.263Jan. 0.067 o.o58 0.o58 0.420 o.478Feb. o.084 0.055 0.055 o.49o 0-545Mar. 0.284 0.242 0.242 0.380 0.622Ppr. 0.615 0.5o4 0.504 0.200 O.704May 0.902 o.734 0.73h 0.100 0.83hJune 1.095 0.897 0.897 (+)0.779 0.118July 1.437 1.284 1.284 (+)1.191 0.093Aug. o.868 0.717 0.717 (+)0.150 0.567Sept. 0.426 0.213 0.213 0 0.213
Total 6.118 4.758 Evaporation (-0.120) 4.638
a/ Based on a release pattern similar to that for Tarbela.
Since the sediment carried by the Swat River is estimated tobe about 0.001 MAF per year, the usable storage capacity of the reservoirwould have an extremely long life.
The greatest value of the Ambahar power plant would probablybe for peaking purposes, but a reregulating reservoir at Munda would berequired. A power plant at Munda reregulating reservoir operated toprovide uniform daily discharges might be feasible.
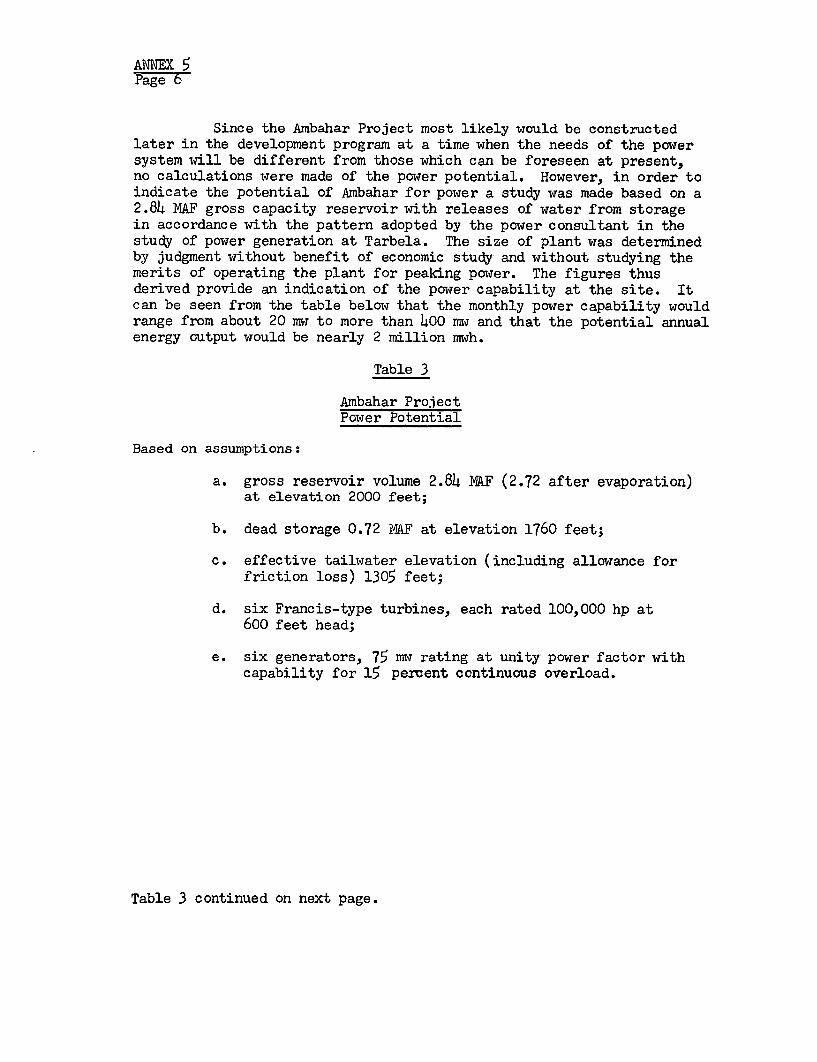
ANNEX 5Page 6
Since the Ambahar Project most likely would be constructedlater in the development program at a time when the needs of the powersystem will be different from those which can be foreseen at present,no calculations were made of the power potential. However, in order toindicate the potential of Ambahar for power a study was made based on a2.84 NAF gross capacity reservoir with releases of water from storagein accordance with the pattern adopted by the power consultant in thestudy of power generation at Tarbela. The size of plant was determinedby judgment without benefit of economic study and without studying themerits of operating the plant for peaking power. The figures thusderived provide an indication of the power capability at the site. Itcan be seen from the table below that the monthly power capability wouldrange from about 20 mw to more than 400 mw and that the potential annualenergy output would be nearly 2 million mwh.
Table 3
Ambahar ProjectPower Potential
Based on assumptions:
a. gross reservoir volume 2.84 MAF (2.72 after evaporation)at elevation 2000 feet;
b. dead storage 0.72 NAF at elevation 1760 feet;
c. effective tailwater elevation (including allowance forfriction loss) 1305 feet;
d. six Francis-type turbines, each rated 100,000 hp at600 feet head;
e. six generators, 75 mw rating at unity power factor withcapability for 15 percent continuous overload.
Table 3 continued on next page.
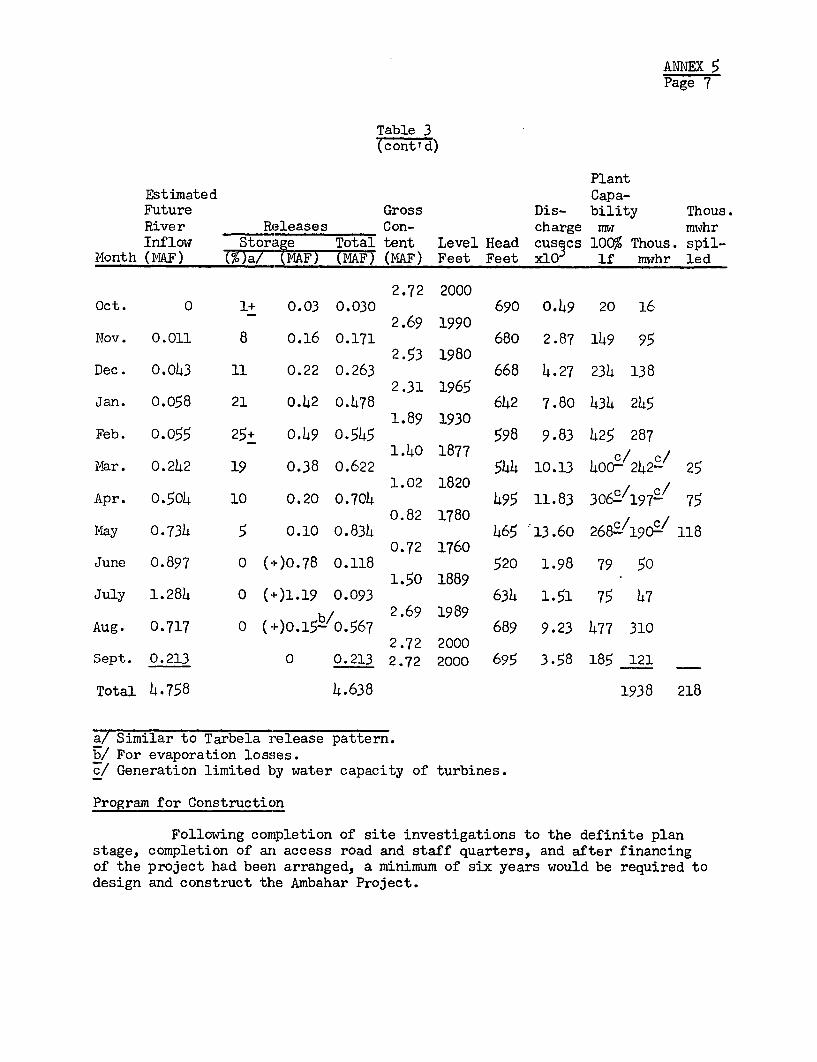
ANNEX 5Page 7
Table 3(cont' d)
PlantEstimated Capa-Future Gross Dis- bility Thous.River Releases Con- charge mw mwhrInflow Storage Total tent Level Head cusscs 100% Thous. spil-
Month (MAF) (7.)a/ (MAF) (MAF) (MAF) Feet Feet xlO lf mwhr led
2.72 2000Oct. 0 1+ 0.03 0.030 690 o.49 20 16
2.69 1990Nov. 0.011 8 0.16 0.171 680 2.87 149 95
2.53 1980Dec. 0.043 11 0.22 0.263 668 4.27 234 138
2.31 1965Jan. 0.058 21 0.42 0.478 642 7.80 434 245
1.89 1930Feb. 0.055 25+ 0.49 0.545 598 9.83 425 287
~~ 1~~.40 1877 c/ c/Mar. 0.242 19 0.38 0.622 544 10.13 400oc 242- 25
Apr. 0.504 10 0.20 0.704 1.02 1820 495 11.83 306-197 750.82 1780
May 0.734 5 0.10 0.834 465 '13.60 2682/19 / 1180.72 1760
June 0.897 0 (+)O.78 0.118 520 1.98 79 501.50 1889
July 1.284 0 (+)1.19 0.093 634 1.51 75 47
b/ 2.69 1989Aug. 0.717 0 (+)0.15- o.567 689 9.23 477 310
2.72 2000Sept. 0.213 0 0.213 2.72 2000 695 3.58 185 121
Total 4.758 4.638 1938 218
a/ Similar to Tarbela release pattern.b/ For evaporation losses.c/ Generation limited by water capacity of turbines.
Program for Construction
Following completion of site investigations to the definite planstage, completion of an access road and staff quarters, and after financingof the project had been arranged, a minimum of six years would be required todesign and construct the Ambahar Project.
ANNEX 5Page 8
Cost Estimates
The cost estimates for Ambahar Project were based on tentativedesigns and, since neither the quantities nor the site conditions affectingcosts were known accurately, are only approximate.
On the basis of information supplied by WAPDA, land and re-settlement costs for the reservoir with water surface at 2010 feet withlittle good farmlands being inundated, was judged to be about $1000 peracre.
World market conditions and prices of labor and materials inWest Pakistan as they existed in July 1964 were used as a basis forthe cost estimates.
The cost estimated by Chas. T. Main of the Ambahar Projectfor a 710-foot high rockfill dam to provide 2 MAF net storage yield is$145 million, exclusive of provision for inflation, financial contin-gencies, Pakistan duties and taxes and interest during construction.The makeup of this cost is shown in Table 4 below.
As in the case of other potential dam projects, the BankGroup assigned a cost range to suggest the degree of uncertainty involvedin the evaluation of the project at this time. The cost range for Ambahar,predicated on the fact that the site had not been visited on the groundand that only generalized information about the area exists, was fixedat $145 to $215 million.
It must also be borne in mind that a dam at the Ambahar sitewould probably require the improvement of downstream diversion works,and the costs of such improvements should be included in the cost ofthe project. In addition, protective works would be required at theupstream Amandara headworks if the larger dam of 7 MAF gross storageto accommodate diversion water were constructed.
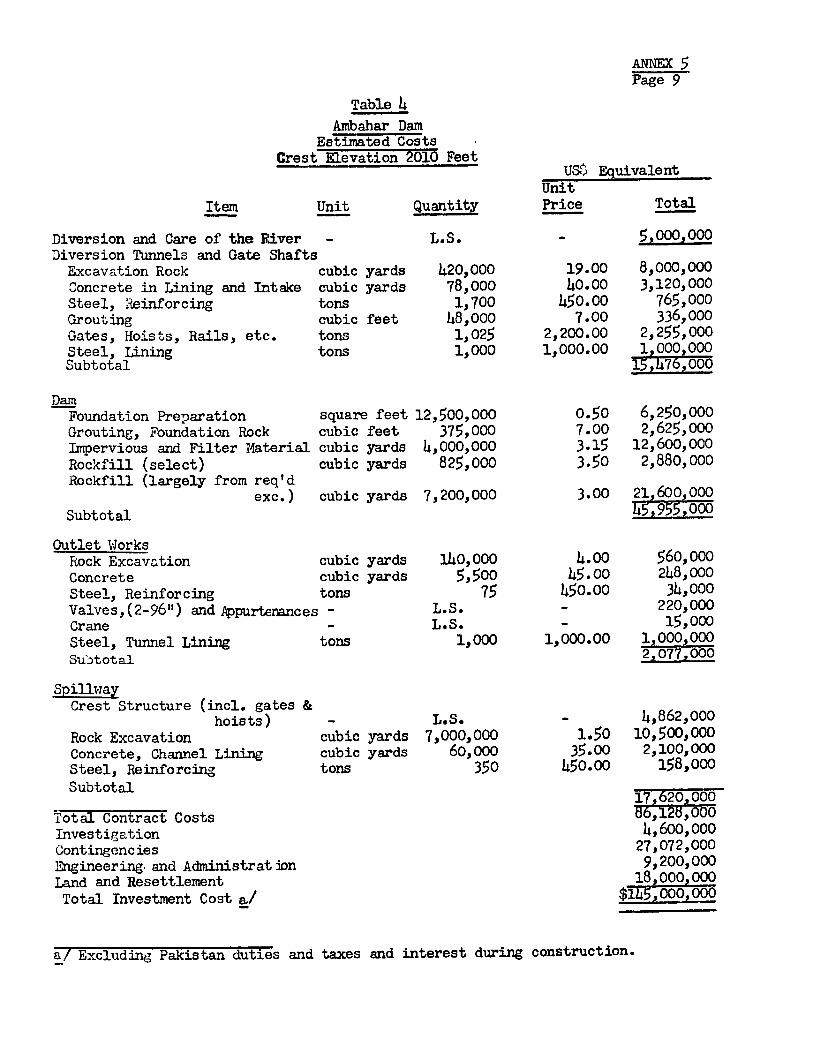
ANNEX 5Page 9
Table 4
Ambahar DamEstimated Costs
Crest Elevation 2010 FeetUS$ Equivalent
UnitItem Unit Quantity Price Total
Diversion and Care of the River - L.S. 5.oo00,oooDiversion Tunnels and Gate Shafts
Excavation Rock cubic yards 420,000 19.00 8,000,000ooncrete in Lining and Intake cubic yards 78,000 40.o0 3,120,000Steel, :ieinforcing tons 1,700 450.00 765,000Grouting cubic feet 48,000 7.00 336,000Gates, Hoists, Rails, etc. tons 1,025 2,200.00 2,255,000Steel, Lining tons 1,000 1,000.00 1 000 000Subtotal T-75oo
DamFoundation Preparation square feet 12,500,000 0.50 6,250,000Grouting, Foundation Rock cubic feet 375,000 7.00 2,625,000Impervious and Filter iMaterial cubic yards 4,000,000 3.15 12,600,000Rockfill (select) cubic yards 825,000 3.50 2,880,000Rockfill (largely from req'd
exc.) cubic yards 7,200,000 3.00 21,600,000
Subtotal 45,955,000
Outlet WorksRock Excavation cubic yards 1.40,000 4.00 560,000Concrete cubic yards 5,500 45.00 248,000Steel, Reinforcing tons 75 450.00 34,000Valves,(2-96") and ApPurtenances - L.S. - 220,000Crane _ L.S. - 15,000
Steel, Tunnel Lining tons 1,000 1,000.00 1,000,000SuUtotal 2,077,000
SpillwayCrest Structure (incl. gates &
hoists) - L.S. - 4,862,000Rock Excavation cubic yards 7,000,000 1.50 10,500,000Concrete, Channel Lining cubic yards 60,000 35.00 2,100,000Steel, Reinforcing tons 350 450-00 158,000
Subtotal17 620,000
Total Contract Costs 66128,000Investigation 4,600,000Contingencies 27,072,000Eigineering and Administration 9,200,000Land and Resettlement 18,000,000Total Investment Cost a,/ $145,00,000
a/ Excluding Pakistan duties and taxes and interest during construction.
ANNEX 5Page 10
Additional Investigations Required
The existing data available for studying the Ambahar Projectwere completely inadequate for preparing designs, determining theeconomic size of structure and preparing accurate cost estimates.
Hydrographic work started in the river basin should be con-tinued and expanded. The flows of the Swat River at Amandara headworksand the diversions to the Upper Swat Canal need to be known moreaccurately. Discharge measurements of the Panjkora River should becontinued. Discharge measurements at Munda headworks should be accuratelyand systematically measured as should be discharges of the Swat Riverat Kabul. Sediment sampling should be systematic and complete at allsites.
Accurate measurements of all canal diversions from the riverfrom Amandara headworks downstream to the mouth of the Swat River arerequired. Systematic studies of the areas being served by the severalcanal commands should be made periodically to update estimated futureneeds for surface water when the lands are brought to full development.
Investigations should be carried out to the extent necessaryto select the optimum site for storage in the Lower Swat Gorge and thenthat site should be investigated sufficiently to determine its feasi-bility. Studies should cover the complete range of reservoir sizeslikely to be needed, including study of storage space for importedwater. The preliminary investigations should include study of surfacegeology of the site supplemented by subsurface explorations as neededto define fully the problems of design. Sources of materials should belocated. Studies should include consideration of the site selectedfor various types of dam structures.
The site is in extremely rough, mountainous terrain and ispresently inaccessible by road. This problem of access should bestudied in considerable detail as should the location for an operator'scolony.
The power aspects should be studied from the standpoint ofload forecasts, etc., at the time.
Since access to the site is such a problem and since manyinvestigations must be undertaken, the program should be initiatedwell in advance of the time when the project is expected to be needed.
Diversion Schemes
Chas. T. Main reviewed two schemes proposed by WAPDA fordiverting water from other rivers for storage on the Swat. The firstwould involve diversion of about 4 MAF each year from the Kabul Riverat Warsak Reservoir and the second, transmountain diversion of thesame amount from the Chitral River at the proposed Mirkhani Dam site.
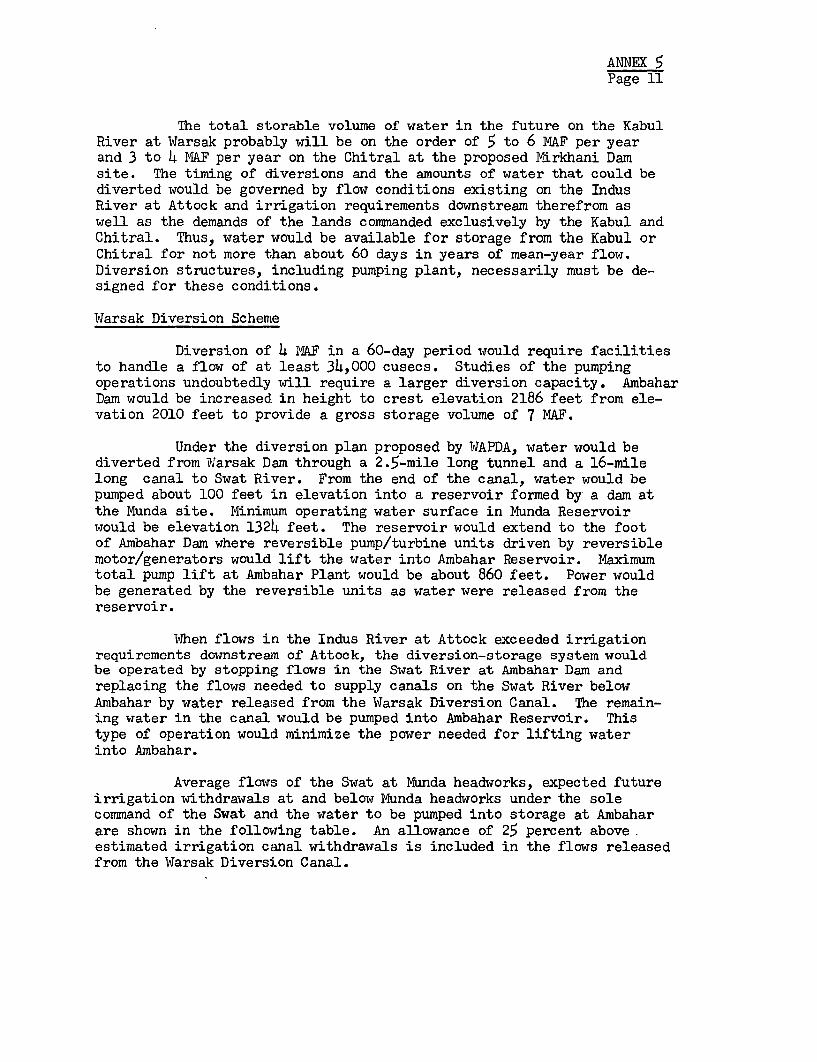
ANNEX 5Page 11
The total storable volume of water in the future on the KabulRiver at Warsak probably will be on the order of 5 to 6 MAF per yearand 3 to 4 MAF per year on the Chitral at the proposed Mirkhani Damsite. The timing of diversions and the amounts of water that could bediverted would be governed by flow conditions existing on the IndusRiver at Attock and irrigation requirements downstream therefrom aswell as the demands of the lands commanded exclusively by the Kabul andChitral. Thus, water would be available for storage from the Kabul orChitral for not more than about 60 days in years of mean-year flow.Diversion structures, including pumping plant, necessarily must be de-signed for these conditions.
Warsak Diversion Scheme
Diversion of 4 MAF in a 60-day period would require facilitiesto handle a flow of at least 34,000 cusecs. Studies of the pumpingoperations undoubtedly will require a larger diversion capacity. AmbaharDam would be increased in height to crest elevation 2186 feet from ele-vation 2010 feet to provide a gross storage volume of 7 MAF.
Under the diversion plan proposed by WAPDA, water would bediverted from Warsak Dam through a 2.5-mile long tunnel and a 16-milelong canal to Swat River. From the end of the canal, water would bepumped about 100 feet in elevation into a reservoir formed by a dam atthe Munda site. Minimum operating water surface in Munda Reservoirwould be elevation 1324 feet. The reservoir would extend to the footof Ambahar Dam where reversible pump/turbine units driven by reversiblemotor/generators would lift the water into Ambahar Reservoir. Maximumtotal pump lift at Ambahar Plant would be about 860 feet. Power wouldbe generated by the reversible units as water were released from thereservoir.
When flows in the Indus River at Attock exceeded irrigationrequirements downstream of Attock, the diversion-storage system wouldbe operated by stopping flows in the Swat River at Ambahar Dam andreplacing the flows needed to supply canals on the Swat River belowAmbahar by water released from the Warsak Diversion Canal. The remain-ing water in the canal would be pumped into Ambahar Reservoir. Thistype of operation would minimize the power needed for lifting waterinto Ambahar.
Average flows of the Swat at Munda headworks, expected futureirrigation withdrawals at and below Munda headworks under the solecommand of the Swat and the water to be pumped into storage at Ambaharare shown in the following table. An allowance of 25 percent above.estimated irrigation canal withdrawals is included in the flows releasedfrom the Warsak Diversion Canal.
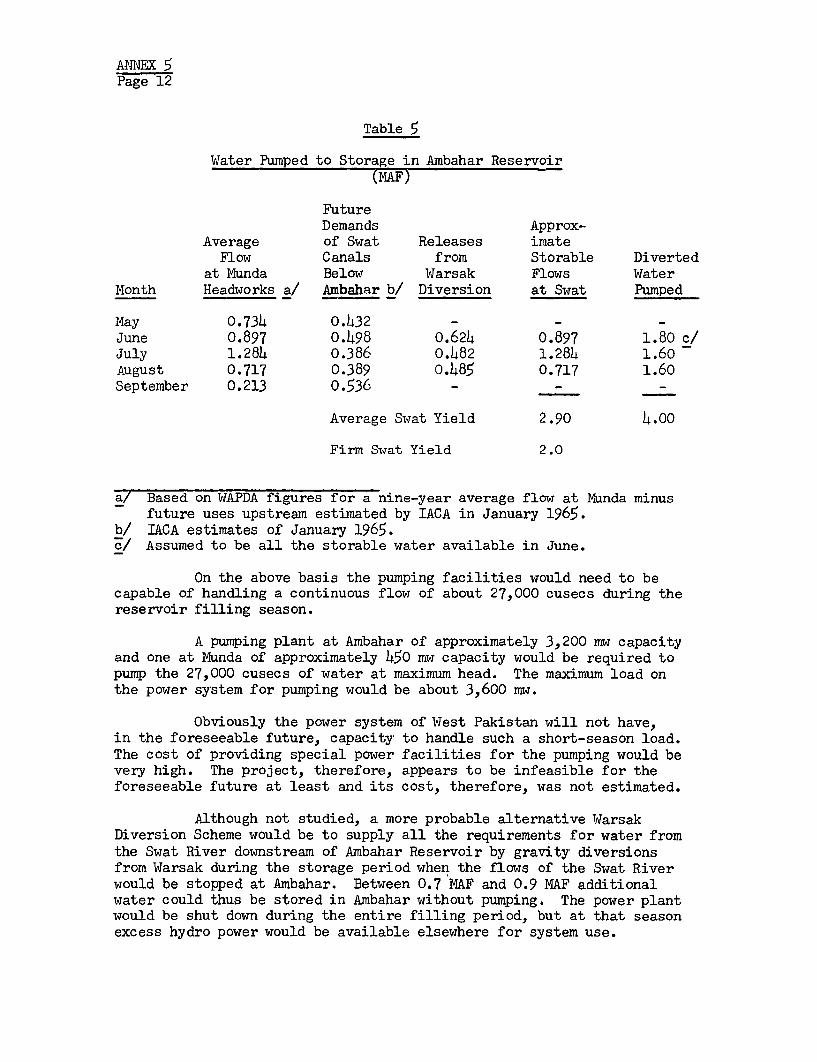
ANNEX 5Page 12
Table 5
Water Pumped to Storage in Ambahar Reservoir(MAF)
FutureDemands Approx-
Average of Swat Releases imateFlow Canals from Storable Diverted
at Munda Below Warsak Flows WaterMonth Headworks a/ Ambahar b/ Diversion at Swat Pumped
May 0.734 o.432 - -June 0.897 o.498 0.624 0.897 1.80 c/July 1.284 0.386 0.482 1.284 1.60August 0.717 0.389 o.485 0.717 1.60September 0.213 0.536 - - _
Average Swat Yield 2.90 4.00
Firm Swat Yield 2.0
a/ Based on WAPDA figures for a nine-year average flow at M.nda minusfuture uses upstream estimated by IACA in January 1965.
b/ IACA estimates of January 1965.c/ Assumed to be all the storable water available in June.
On the above basis the pumping facilities would need to becapable of handling a continuous flow of about 27,000 cusecs during thereservoir filling season.
A pumping plant at Ambahar of approximately 3,200 mw capacityand one at Munda of approximately 450 mw capacity would be required topump the 27,000 cusecs of water at maximum head. The maximum load onthe power system for pumping would be about 3,600 mw.
Obviously the power system of West Pakistan will not have,in the foreseeable future, capacity to handle such a short-season load.The cost of providing special power facilities for the pumping would bevery high. The project, therefore, appears to be infeasible for theforeseeable future at least and its cost, therefore, was not estimated.
Although not studied, a more probable alternative WarsakDiversion Scheme would be to supply all the requirements for water fromthe Swat River downstream of Ambahar Reservoir by gravity diversionsfrom Warsak during the storage period when the flows of the Swat Riverwould be stopped at Ambahar. Between 0.7 MAF and 0.9 MAF additionalwater could thus be stored in Ambahar without pumping. The power plantwould be shut down during the entire filling period, but at that seasonexcess hydro power would be available elsewhere for system use.
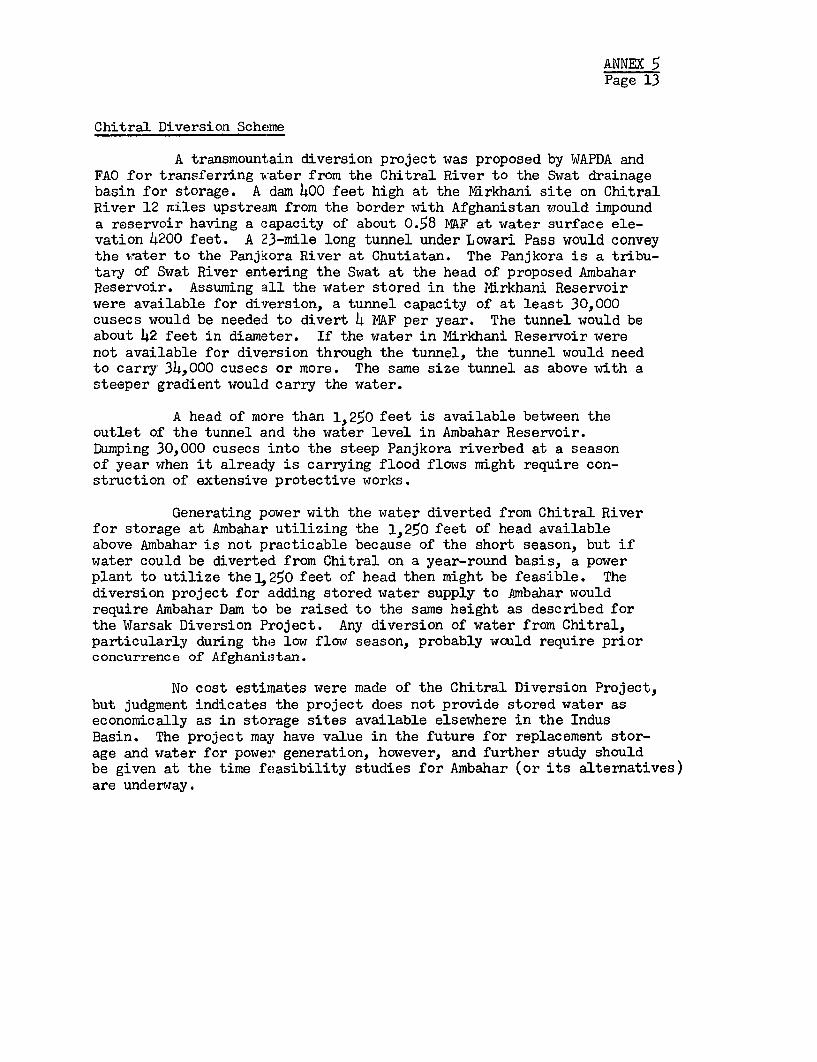
ANNEX 5Page 13
Chitral Diversion Scheme
A transmountain diversion project was proposed by WAPDA andFA0 for transferring water from the Chitral River to the Swat drainagebasin for storage. A dam 400 feet high at the Mirkhani site on ChitralRiver 12 mtiles upstream from the border with Afghanistan would impounda reservoir having a capacity of about 0.58 MAF at water surface ele-vation 4200 feet. A 23-mile long tunnel under Lowari Pass would conveythe water to the Panjkora River at Chutiatan. The Panjkora is a tribu-tary of Swat River entering the Swat at the head of proposed AmbaharReservoir. Assuming all the water stored in the MErkhani Reservoirwere available for diversion, a tunnel capacity of at least 30,000cusecs would be needed to divert 4 MAF per year. The tunnel would beabout 42 feet in diameter. If the water in Mirkhani Reservoir werenot available for diversion through the tunnel, the tunnel would needto carry 34,000 cusecs or more. The same size tunnel as above with asteeper gradient would carry the water.
A head of more than 1,250 feet is available between theoutlet of the tunnel and the water level in Ambahar Reservoir.Dumping 30,000 cusecs into the steep Panjkora riverbed at a seasonof year when it already is carrying flood flows might require con-struction of extensive protective works.
Generating power with the water diverted from Chitral Riverfor storage at Ambahar utilizing the 1,250 feet of head availableabove Ambahar is not practicable because of the short season, but ifwater could be diverted from Chitral on a year-round basis, a powerplant to utilize the1,250 feet of head then might be feasible. Thediversion project for adding stored water supply' to Ambahar wouldrequire Ambahar Dam to be raised to the same height as described forthe Warsak Diversion Project. Any diversion of water from Chitral,particularly during the low flow season, probably would require priorconcurrence of Afghanistan.
No cost estimates were made of the Chitral Diversion Project,but judgment indicates the project does not provide stored water aseconomically as in storage sites available elsewhere in the IndusBasin. The project may have value in the future for replacement stor-age and water for power generation, however, and further study shouldbe given at the time feasibility studies for Ambahar (or its alternatives)are underway.

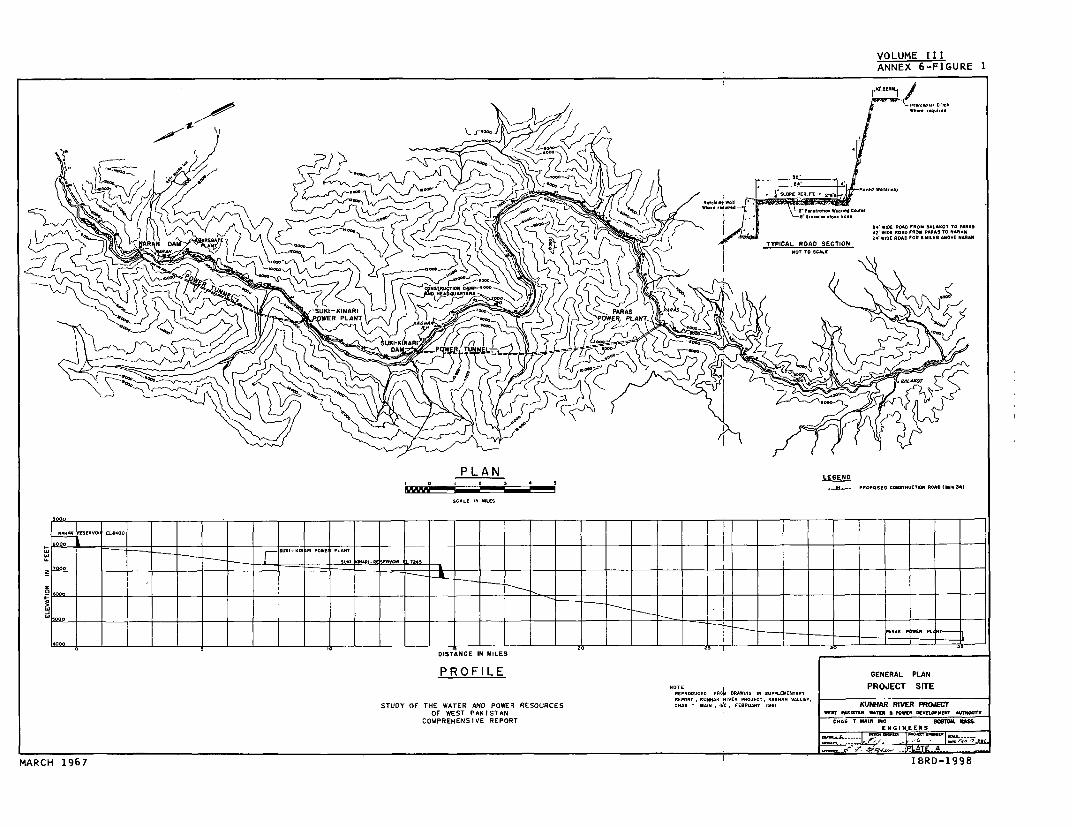
VOLUME IIIANNEX 6-FIGURE 1
EN: .,DE RO TAD S SALOAQ TO -40
D TYPICAL ROAD SECTION -'s ..O. WAR.~~~~~~~~~~~~~~~~~~~~~~~~~~~~~~~~~~~~~~~~NWOENADP0 SLS BOE004
PLAN LEGENP
j_ _ _ _ ___ _ _ _ _ _ _ _ _ __ _ _ _ _ _ _ _ __ PROACOSEC A.STRACTlIl 00*0 5 M1. 341
SCIALE SILAS
DISTANCE IN MILES
PR R IL A F IE GENLRAL PLAN
R!PoTuED R;CAIG1 UPLi- PROJECT SITESTUDY OF THE WATER AND POWER RESOURCES RECT, UNAl., E RO!T S^ ^L KUNHAIR RIVER PROJIECT
OF WEST PAK ISTAN I ,. ...T .ITER"M DE- "OW. .t!l T .iCOMPREHENSIVE REPORT COAS T AIAN ING BO1O 1R55
0- - - - _ _ - - - - …-~~~~~~~~~~~~~~~~~~~~~~~~~~~~~~~~~~~~~~~~~ c #-h - ie-A--
MARCH 1967 1IBRD-1998


ANNEX 6
KUNMAR PRCJECT
p

ANNEX 6
LIST OF FIGURES
1. Kunhar River Project: General Plan:Project Site
2. Kunhar River Project: Suki-Kinyari Dam:Plans and Details
3. Kunhar River Project: Capacity Curve:Suki-Kinyari Reservoir
4. Kunhar River Project: Paras Power Plant:Transverse Section
5. Kunhar River Project: Naran Dam and Intake:Plans and Details
6. Kunhar River Project: Suki-Kinyari Power Plant:Sections

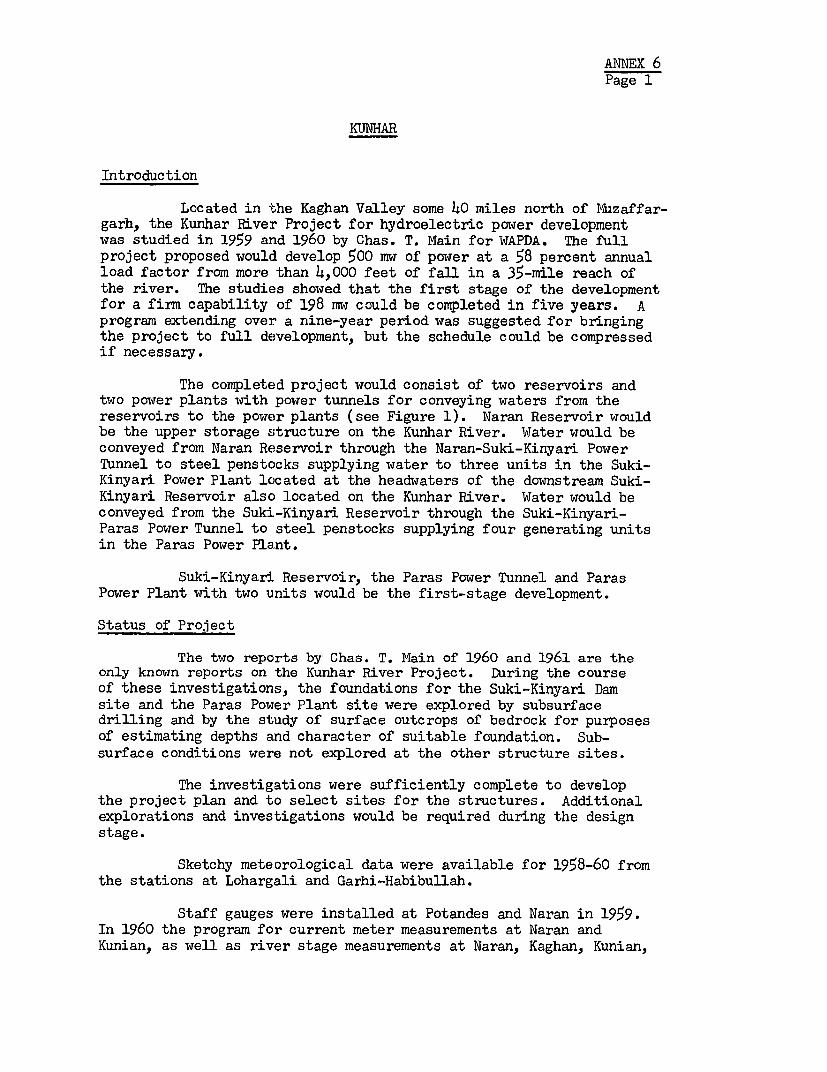
ANNEX 6Page 1
KUNHAR
Introduction
Located in the Kaghan Valley some 40 miles north of Muzaffar-garh, the Kunhar River Project for hydroelectric power developmentwas studied in 1959 and 1960 by Chas. T. Main for WAPDA. The fullproject proposed would develop 500 mw of power at a 58 percent annualload factor from more than 4,000 feet of fall in a 35-mile reach ofthe river. The studies showed that the first stage of the developmentfor a firm capability of 198 mw could be completed in five years. Aprogram extending over a nine-year period was suggested for bringingthe project to full development, but the schedule could be compressedif necessary'.
The completed project would consist of two reservoirs andtwo power plants with power tunnels for conveying waters from thereservoirs to the power plants (see Figure 1). Naran Reservoir wouldbe the upper storage structure on the Kunhar River. Water would beconveyed from Naran Reservoir through the Naran-Suki-Kinyari PowerTunnel to steel penstocks supplying water to three units in the Suki-Kinyari Power Plant located at the headwaters of the downstream Suki-Kinyari Reservoir also located on the Kunhar River. Water would beconveyed from the Suki-Kinyari Reservoir through the Suki-Kinyari-Paras Power Tunnel to steel penstocks supplying four generating unitsin the Paras Power Plant.
Suki-Kinyari Reservoir, the Paras Power Tunnel and ParasPower Plant with two units would be the first-stage development.
Status of Project
The two reports by Chas. T. Main of 1960 and 1961 are theonly known reports on the Kunhar River Project. During the courseof these investigations, the foundations for the Suki-Kinyari Damsite and the Paras Power Plant site were explored by subsurfacedrilling and by the study of surface outcrops of bedrock for purposesof estimating depths and character of suitable foundation. Sub-surface conditions were not explored at the other structure sites.
The investigations were sufficiently complete to developthe project plan and to select sites for the structures. Additionalexplorations and investigations would be required during the designstage.
Sketchy meteorological data were available for 1958-60 fromthe stations at Lohargali and Garhi-Habibullah.
Staff gauges were installed at Potandes and Naran in 1959.In 1960 the program for current meter measurements at Naran andKunian, as well as river stage measurements at Naran, Kaghan, Kunian,
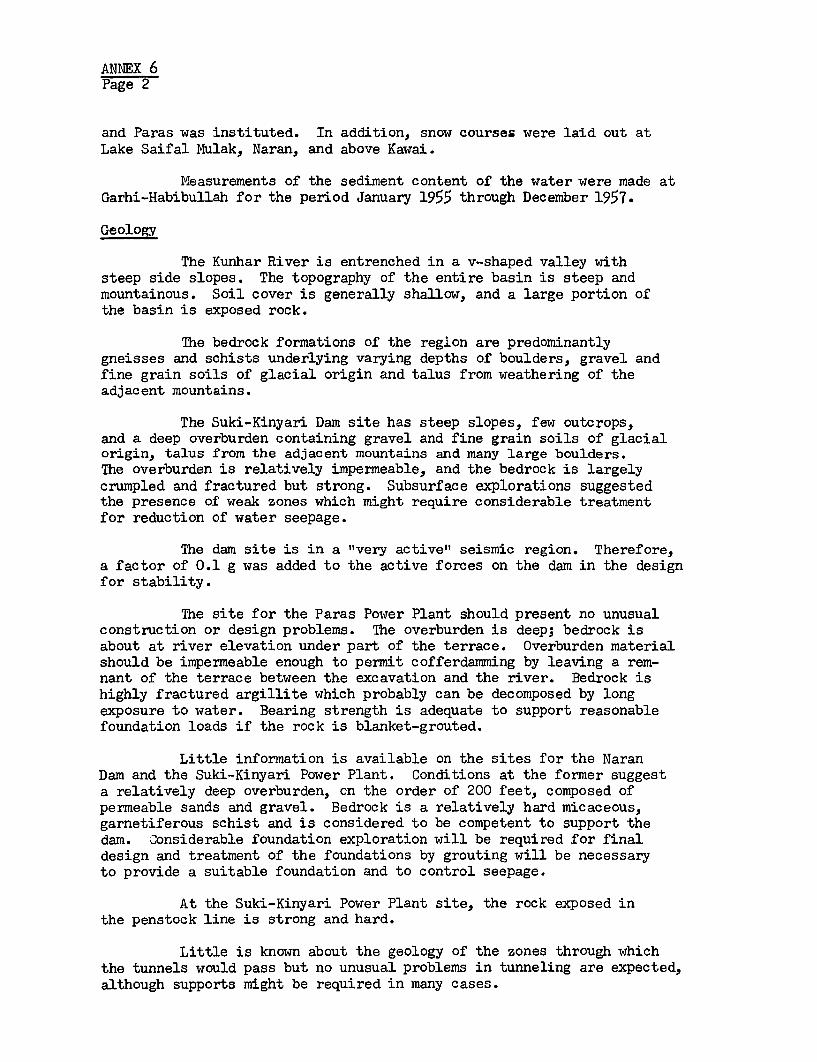
ANNEX 6Page 2
and Paras was instituted. In addition, snow courses were laid out atLake Saifal Mulak, Naran, and above Kawai.
Measurements of the sediment content of the water were made atGarhi-Habibullah for the period January 1955 through December 1957.
Geology
The Kunhar River is entrenched in a v-shaped valley withsteep side slopes. The topography of the entire basin is steep andmountainous. Soil cover is generally shallow, and a large portion ofthe basin is exposed rock.
The bedrock formations of the region are predominantlygneisses and schists underlying varying depths of boulders, gravel andfine grain soils of glacial origin and talus from weathering of theadjacent mountains.
The Suki-Kinyari Dam site has steep slopes, few outcrops,and a deep overburden containing gravel and fine grain soils of glacialorigin, talus from the adjacent mountains and many large boulders.The overburden is relatively impermeable, and the bedrock is largelycrumpled and fractured but strong. Subsurface explorations suggestedthe presence of weak zones which might require considerable treatmentfor reduction of water seepage.
The dam site is in a "very active" seismic region. Therefore,a factor of 0.1 g was added to the active forces on the dam in the designfor stability.
The site for the Paras Power Plant should present no unusualconstruction or design problems. The overburden is deep; bedrock isabout at river elevation under part of the terrace. Overburden materialshould be impermeable enough to permit cofferdamming by leaving a rem-nant of the terrace between the excavation and the river. Bedrock ishighly fractured argillite which probably can be decomposed by longexposure to water. Bearing strength is adequate to support reasonablefoundation loads if the rock is blanket-grouted.
Little information is available on the sites for the NaranDam and the Suki-Kinyari Power Plant. Conditions at the former suggesta relatively deep overburden, on the order of 200 feet, composed ofpermeable sands and gravel. Bedrock is a relatively hard micaceous,garnetiferous schist and is considered to be competent to support thedam. Considerable foundation exploration will be required for finaldesign and treatment of the foundations by grouting will be necessaryto provide a suitable foundation and to control seepage.
At the Suki-Kinyari Power Plant site, the rock exposed inthe penstock line is strong and hard.
Little is known about the geology of the zones through whichthe tunnels would pass but no unusual problems in tunneling are expected,although supports might be required in many cases.
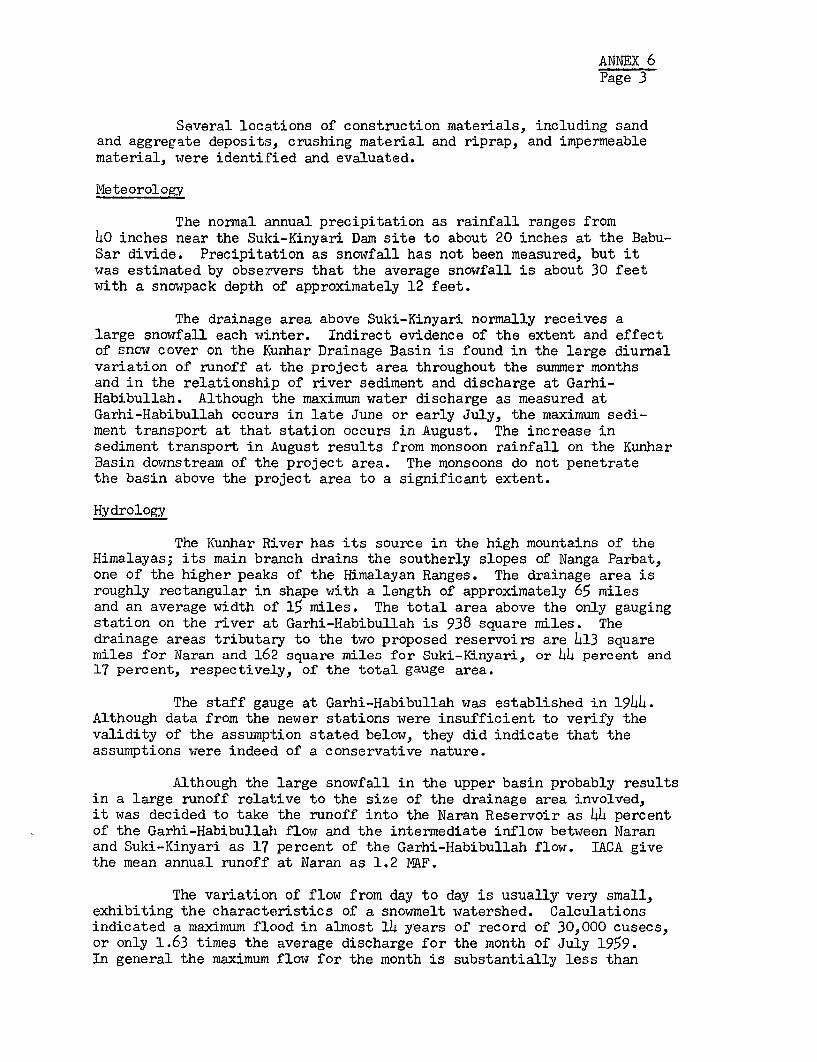
ANNEX 6Page 3
Several locations of construction materials, including sandand aggregate deposits, crushing material and riprap, and impermeablematerial, were identified and evaluated.
Meteorology
The normal annual precipitation as rainfall ranges from40 inches near the Sulci-Kinyari Dam site to about 20 inches at the Babu-Sar divide. Precipitation as snowfall has not been measured, but itwas estimated by observers that the average snowfall is about 30 feetwith a snowpack depth of approximately 12 feet.
The drainage area above Suki-Kinyari normally receives alarge snowfall each winter. Indirect evidence of the extent and effectof snow cover on the Kunhar Drainage Basin is found in the large diurnalvariation of runoff at the project area throughout the summer monthsand in the relationship of river sediment and discharge at Garhi-Habibullah. Although the maximum water discharge as measured atGarhi-Habibullah occurs in late June or early July, the maximum sedi-ment transport at that station occurs in August. The increase insediment transport in August results from monsoon rainfall on the KunharBasin downstream of the project area. The monsoons do not penetratethe basin above the project area to a significant extent.
Hydrology
The Kunhar River has its source in the high mountains of theHimalayas; its main branch drains the southerly slopes of Nanga Parbat,one of the higher peaks of the Himalayan Ranges. The drainage area isroughly rectangular in shape with a length of approximately 65 milesand an average width of 15 miles. The total area above the only gaugingstation on the river at Garhi-Habibullah is 938 square miles. Thedrainage areas tributary to the two proposed reservoirs are 413 squaremiles for Naran and 162 square miles for Suki-Kinyari, or 44 percent and17 percent, respectively, of the total gauge area.
The staff gauge at Garhi-Habibullah was established in 1944.Although data from the newer stations were insufficient to verify thevalidity of the assumption stated below, they did indicate that theassumptions were indeed of a conservative nature.
Although the large snowfall in the upper basin probably resultsin a large runoff relative to the size of the drainage area involved,it was decided to take the runoff into the Naran Reservoir as 44 percentof the Garhi-Habibullah flow and the intermediate inflow between Naranand Suki-Kinyari as 17 percent of the Garhi-Habibullah flow. IACA givethe mean annual runoff at Naran as 1.2 MAF.
The variation of flow from day to day is usually very small,exhibiting the characteristics of a snowmelt watershed. Calculationsindicated a maximum flood in almost 14 years of record of 30,000 cusecs,or only 1.63 times the average discharge for the month of July 1959.In general the maximum flow for the month is substantially less than
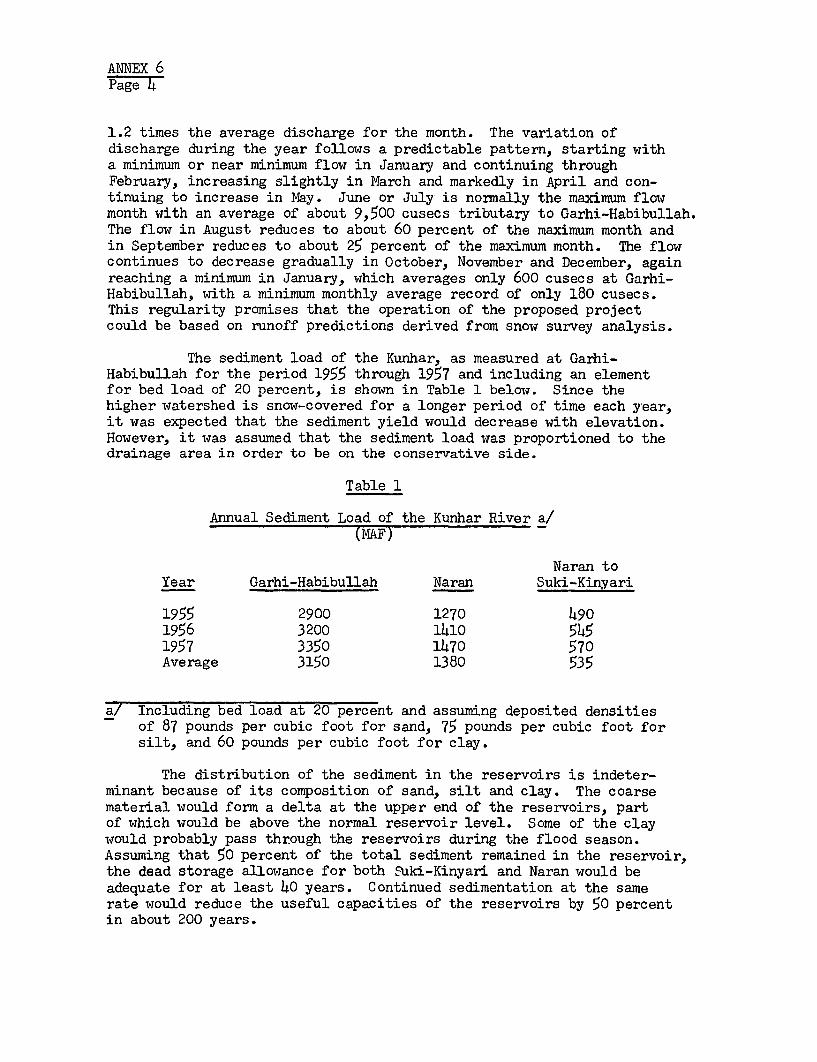
ANNEX 6Page4
1.2 times the average discharge for the month. The variation ofdischarge during the year follows a predictable pattern, starting witha minimum or near minimum flow in January and continuing throughFebruary, increasing slightly in March and markedly in April and con-tinuing to increase in May. June or July is normally the maximum flowmonth with an average of about 9,500 cusecs tributary to Garhi-Habibullah.The flow in August reduces to about 60 percent of the maximum month andin September reduces to about 25 percent of the maximum month. The flowcontinues to decrease gradually in October, November and December, againreaching a minimum in January, which averages only 600 cusecs at Garhi-Habibullah, with a minimum monthly average record of only 180 cusecs.This regularity promises that the operation of the proposed projectcould be based on runoff predictions derived from snow survey analysis.
The sediment load of the Kunhar, as measured at Garhi-Habibullah for the period 1955 through 1957 and including an elementfor bed load of 20 percent, is shown in Table 1 below. Since thehigher watershed is snow-covered for a longer period of time each year,it was expected that the sediment yield would decrease with elevation.However, it was assumed that the sediment load was proportioned to thedrainage area in order to be on the conservative side.
Table 1
Annual Sediment Load of the Kunhar River a/(MAF)
Naran toYear Garhi-Habibullah Naran Suki-Kinyari
1955 2900 1270 4901956 3200 1410 5451957 3350 1470 570Average 3150 1380 535
a/ Including bed load at 20 percent and assuming deposited densitiesof 87 pounds per cubic foot for sand, 75 pounds per cubic foot forsilt, and 60 pounds per cubic foot for clay.
The distribution of the sediment in the reservoirs is indeter-minant because of its composition of sand, silt and clay. The coarsematerial would form a delta at the upper end of the reservoirs, partof which would be above the normal reservoir level. Some of the claywould probably pass through the reservoirs during the flood season.Assuming that 50 percent of the total sediment remained in the reservoir,the dead storage allowance for both Euki-Kinyari and Naran would beadequate for at least 40 years. Continued sedimentation at the samerate would reduce the useful capacities of the reservoirs by 50 percentin about 200 years.
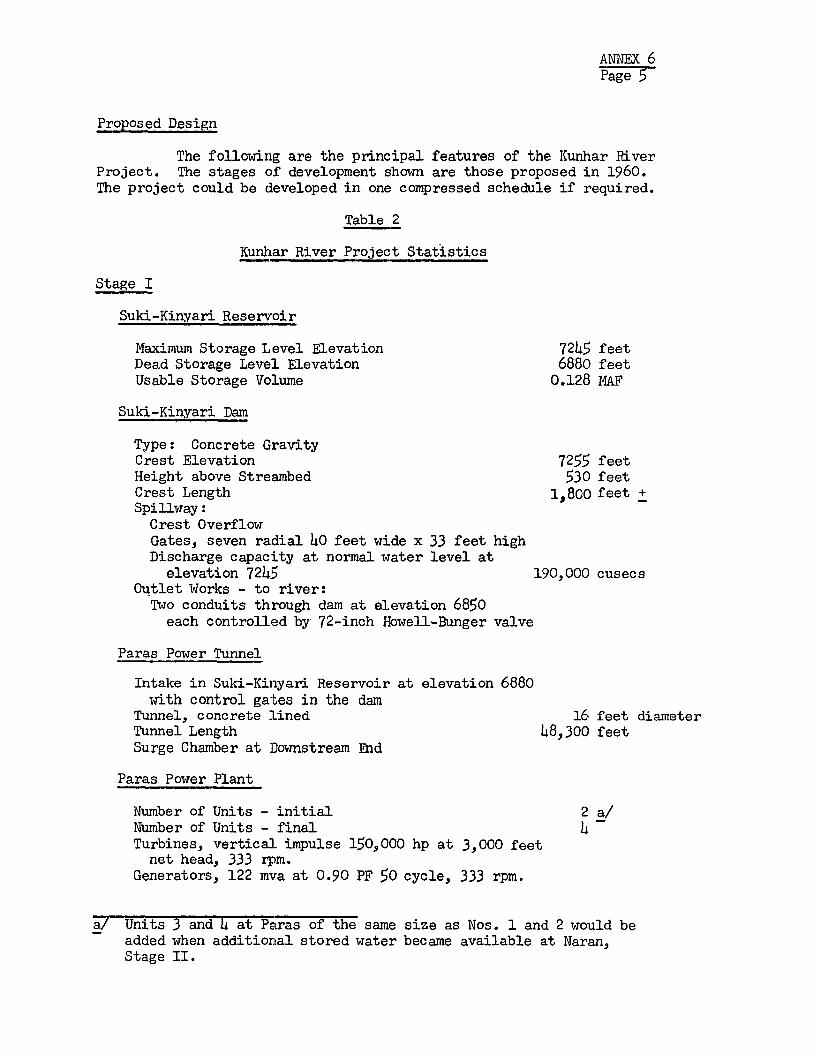
ANNEX 6Page 5
Proposed Design
The following are the principal features of the Kunhar RiverProject. The stages of development shown are those proposed in 1960.The project could be developed in one compressed schedule if required.
Table 2
Kunhar River Project Statistics
Stage I
Suki-Kinyari Reservoir
Maximum Storage Level Elevation 7245 feetDead Storage Level Elevation 6880 feetUsable Storage Volume 0.128 MAF
Suki-Kinyari Dam
Type: Concrete GravityCrest Elevation 7255 feetHeight above Streambed 530 feetCrest Length 1,800 feet +Spillway:Crest OverflowGates, seven radial 40 feet wide x 33 feet highDischarge capacity at normal water level at
elevation 7245 190,000 cusecsOutlet Works - to river:
Two conduits through dam at elevation 6850each controlled by 72-inch Howell-Bunger valve
Paras Power Tunnel
Intake in Suki-Kinyari Reservoir at elevation 6880with control ga-tes in the dam
Tunnel, concrete lined 16 feet diameterTunnel Length 48,300 feetSurge Chamber at Downstream End
Paras Power Plant
Number of Units - initial 2 a/Number of Units - final 4Turbines, vertical impulse 150,000 hp at 3,000 feetnet head, 333 rpm.
Generators, 122 mva at 0.90 PF 50 cycle, 333 rpm.
a/ Units 3 and 4 at Paras of the same size as Nos. 1 and 2 would beadded when additional stored water became available at Naran,Stage II.
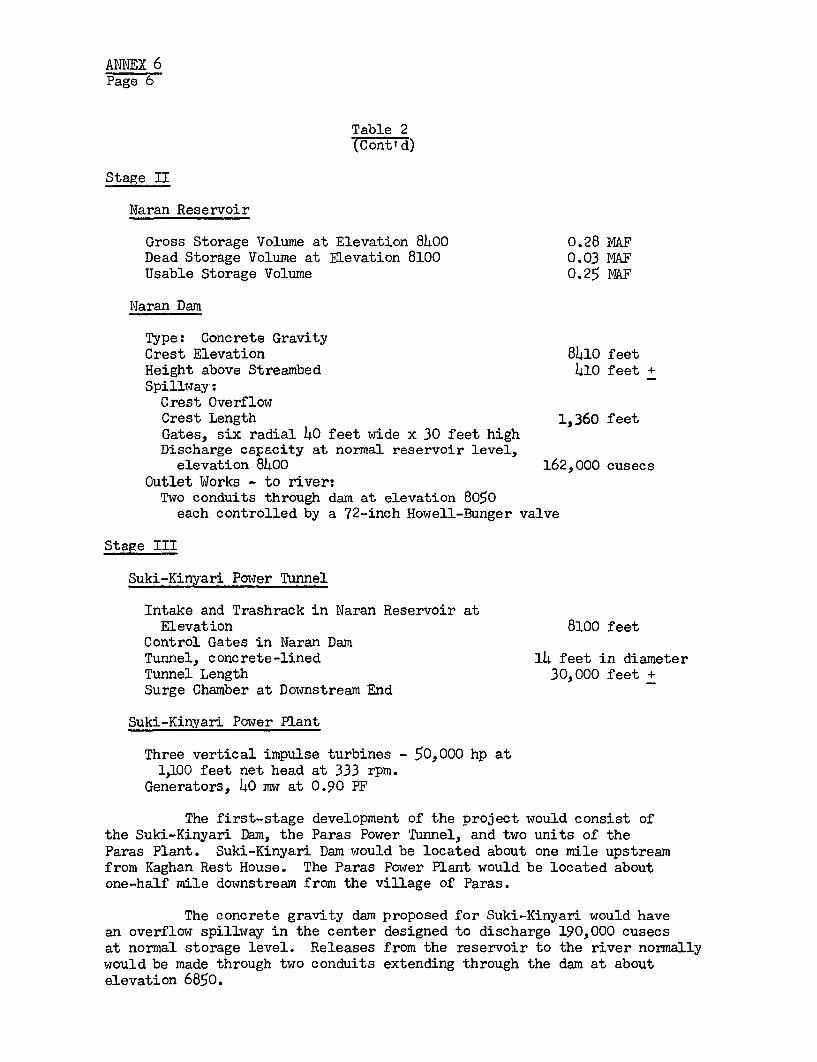
ANNEX 6Page
Table 2(Cont'd)
Stage II
Naran Reservoir
Gross Storage Volume at Elevation 8400 0.28 MAFDead Storage Volume at Elevation 8100 0.03 MAFUsable Storage Volume 0.25 MAF
Naran Dam
Type: Concrete GravityCrest Elevation 8410 feetHeight above Streamnbed 410 feet +Spillway:
Crest OverflowCrest Length 1,360 feetGates, six radial 40 feet wide x 30 feet highDischarge capacity at normal reservoir level,
elevation 8400 162,000 cusecsOutlet Works - to river:
Two conduits through dam at elevation 8050each controlled by a 72-inch Howell-Bunger valve
Stage III
Suki-Kinyari Power Tunnel
Intake and Trashrack in Naran Reservoir atElevation 8100 feet
Control Gates in Naran DamTunnel, concrete-lined 14 feet in diameterTunnel Length 30,000 feet +Surge Chamber at Downstream End
Suki-Kinyari Power Plant
Three vertical impulse turbines - 50,000 hp at1,100 feet net head at 333 rpm.
Generators, 40 mw at 0.90 PF
The first-stage development of the project would consist ofthe Suki-Kinyari Dam, the Paras Power Tunnel, and two units of theParas Plant. Suki-Kinyari Dam would be located about one mile upstreamfrom Kaghan Rest House. The Paras Power Plant would be located aboutone-half mile downstream from the village of Paras.
The concrete gravity dam proposed for Suki-Kinyari would havean overflow spillway' in the center designed to discharge 190,000 cusecsat normal storage level. Releases from the reservoir to the river normallywould be made through two conduits extending through the dam at aboutelevation 6850.
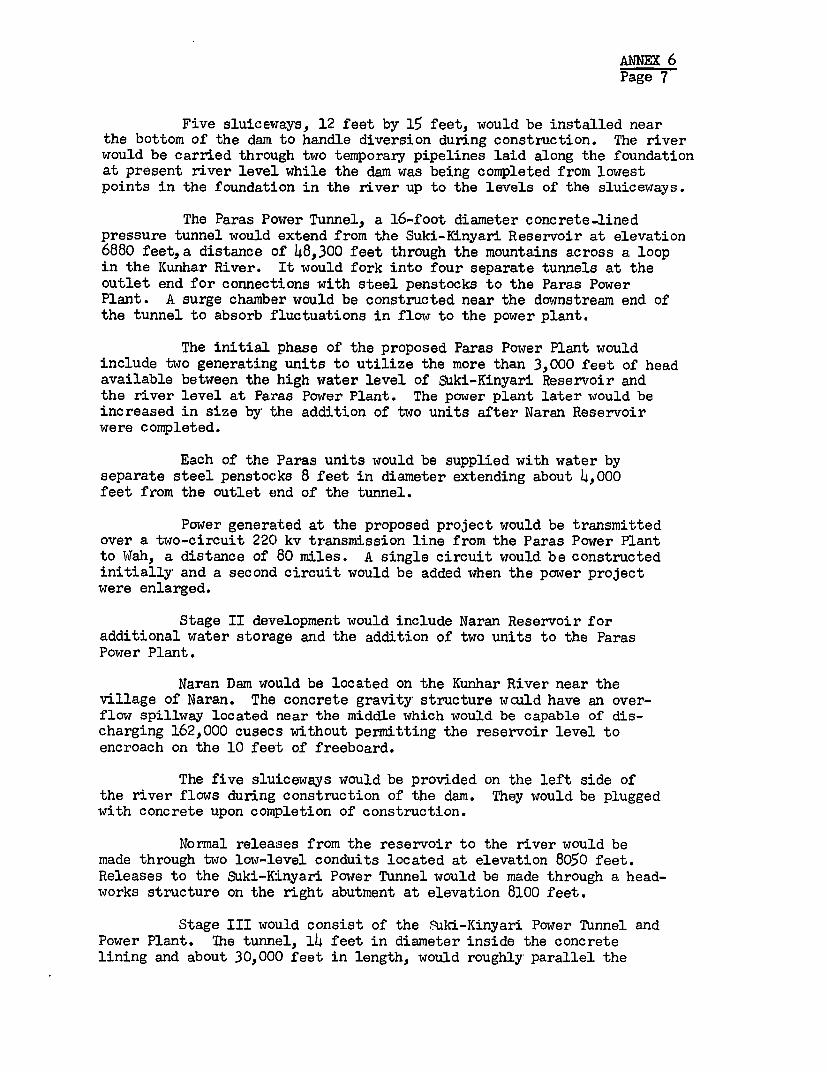
ANNEX 6Page 7
Five sluiceway's, 12 feet by 15 feet, would be installed nearthe bottom of the dam to handle diversion during construction. The riverwould be carried through two temporary pipelines laid along the foundationat present river level while the dam was being completed from lowestpoints in the foundation in the river up to the levels of the sluiceways.
The Paras Power Tunnel, a 16-foot diameter concrete-linedpressure tunnel would extend from the Suki-Kinyari Reservoir at elevation6880 feet,a distance of 48,300 feet through the mountains across a loopin the Kunhar River. It would fork into four separate tunnels at theoutlet end for connections with steel penstocks to the Paras PowerPlant. A surge chamber would be constructed near the downstream end ofthe tunnel to absorb fluctuations in flow to the power plant.
The initial phase of the proposed Paras Power Plant wouldinclude two generating units to utilize the more than 3,000 feet of headavailable between the high water level of Suki-Kinyari Reservoir andthe river level at Paras Power Plant. The power plant later would beincreased in size by the addition of two units after Naran Reservoirwere completed.
Each of the Paras units would be supplied with water byseparate steel penstocks 8 feet in diameter extending about 4,000feet from the outlet end of the tunnel.
Power generated at the proposed project would be transmittedover a two-circuit 220 kv transmission line from the Paras Power Plantto Wah, a distance of 80 miles. A single circuit would be constructedinitially' and a second circuit would be added when the power projectwere enlarged.
Stage II development would include Naran Reservoir foradditional water storage and the addition of two units to the ParasPower Plant.
Naran Dam would be located on the Kunhar River near thevillage of Naran. The concrete gravity structure wculd have an over-flow spillway located near the middle which would be capable of dis-charging 162,000 cusecs without permitting the reservoir level toencroach on the 10 feet of freeboard.
The five sluiceways would be provided on the left side ofthe river flows during construction of the dam. They would be pluggedwith concrete upon completion of construction.
Normal releases from the reservoir to the river would bemade through two low-level conduits located at elevation 8050 feet.Releases to the Suki-Kinyari Power Tunnel would be made through a head-works structure on the right abutment at elevation 8100 feet.
Stage III would consist of the Fuki-Kinyari Power Tunnel andPower Plant. The tunnel, 14 feet in diameter inside the concretelining and about 30,000 feet in length, would roughly parallel the
ANNEX 6Page 6
course of the river. The intake of the tunnel would be 300 feet belowthe high water level in Naran Reservoir. A closed surge chamber nearthe downstream end of the tunnel would absorb fluctuations in flows toreduce overpressure and to provide fast hydraulic response to changingloads on the turbines.
Three steel penstocks each 8 feet in diameter and more than800 feet long would carry water from the power tunnel to three verticalimpulse-type turbines located in the Suki-Kinyari Power Plant. Eachturbine unit would be directly' connected to a generator having an outputrating of 44.5 mva continuous. The maximum static head on the unitswould be about 1,100 feet.
Operation
The flows of the river would be regulated by the two proposedproject reservoirs, having a combined usable storage volume of 0.37 NAFfor generating electric power. The release of water from storage wouldprovide water for irrigation incidental to its use for generating power.
At the completion of Stage I, the Suki-Kinyari Reservoirwould regulate the seasonal flows of the Kunhar River and in additionwould develop part of the head for the power plant at Paras. TheParas Power Tunnel would convey water from Suki-Kinyari Reservoir tothe penstocks for the Paras Power Plant where the added fall of theriver would result in a3,000-foot power drop. The 0.128 NAF usablecapacity in Suki-Kinyari Reservoir would provide water to augmentthe low seasonal flows for a firm generating capability of 198 mw at0.58 load factor from the two units at Paras.
Stage II development would add Naran Reservoir with a livestorage capacity of 0.25 MAF. The storage capacity then availablewould permit the two Paras units to be operated continuously at fulloverload capacity for an output of 248 mw. The firm generating capa-city could be increased to 372 mw by the addition of a third unit atParas and increased to 405 mw by addition of the fourth unit, bothoutputs at 0.58 load factor.
Stage III development would be completed by the additionof the Naran-Suki-Kinyari Power Tunnel and the three-unit Suki-Kinyari Power Plant operating under aboutl,100 feet of head. Theoutput capability' of the project would then increase to 500 mw at0.58 load factor.
Power would be transmitted to Wah for delivery into thepower system of West Pakistan.
The firm capability of the entire power project at partialand full development is shown in the following table. Firm capabilityis based on 58 percent load factor.
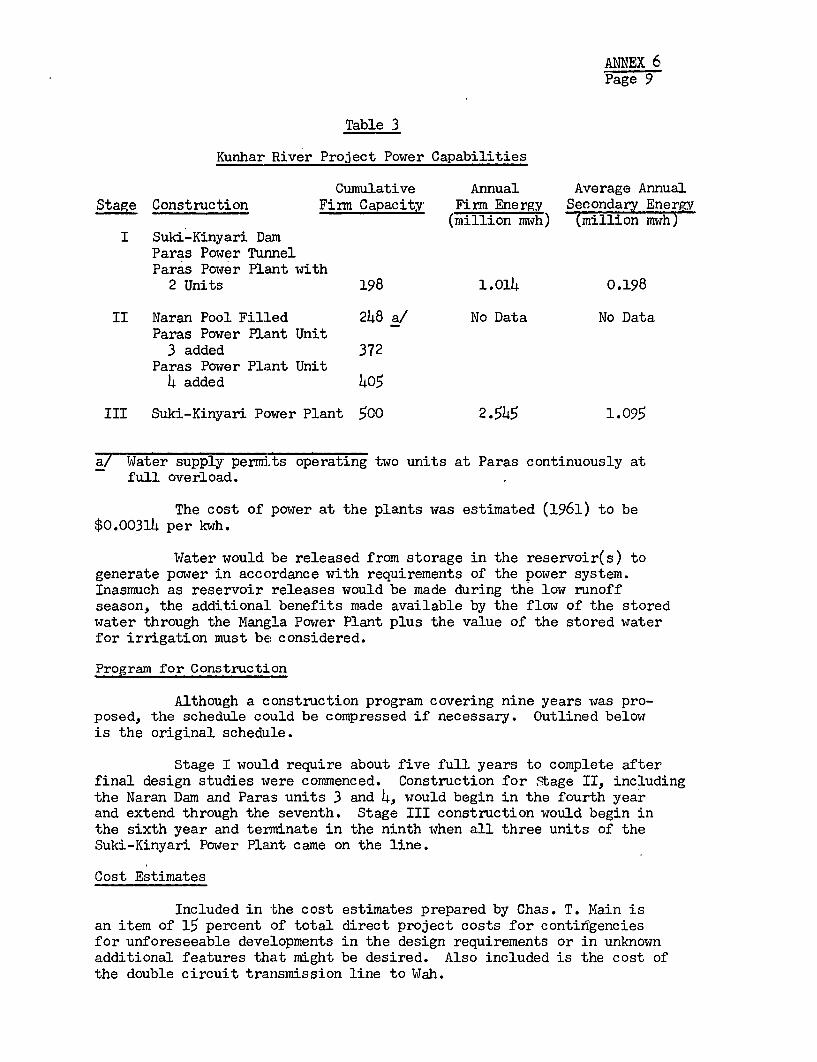
ANNEX 6Page 9
Table 3
Kunhar River Project Power Capabilities
Cumulative Annual Average AnnualStage Construction Firm Capacity Firm Energy Secondary Energy
(million mwh) (million mwh)I Suki-Kinyari Dam
Paras Power TunnelParas Power Plant with2 Units 198 l.o14 0.198
II Naran Pool Filled 248 a/ No Data No DataParas Power Plant Unit3 added 372
Paras Power Plant Unit4 added 405
III Suki-Kinyari Power Plant 500 2.545 1.095
a/ Water supply permits operating two units at Paras continuously atfull overload.
The cost of power at the plants was estimated (1961) to be$0.00314 per kwh.
Water would be released from storage in the reservoir(s) togenerate power in accordance with requirements of the power system.Inasmuch as reservoir releases would be made during the low runoffseason, the additional benefits made available by the flow of the storedwater through the Mangla Power Plant plus the value of the stored waterfor irrigation must be considered.
Program for Construction
Although a construction program covering nine years was pro-posed, the schedule could be compressed if necessary. Outlined belowis the original schedule.
Stage I would require about five full years to complete afterfinal design studies were commenced. Construction for Stage II, includingthe Naran Dam and Paras units 3 and 4, would begin in the fourth yearand extend through the seventh. Stage III construction would begin inthe sixth year and terminate in the ninth when all three units of theSuki-Kinyari Power Plant came on the line.
Cost Estimates
Included in -the cost estimates prepared by Chas. T. Main isan item of 15 percent of total direct project costs for contifigenciesfor unforeseeable developments in the design requirements or in unknownadditional features that might be desired. Also included is the cost ofthe double circuit transmission line to Wah.
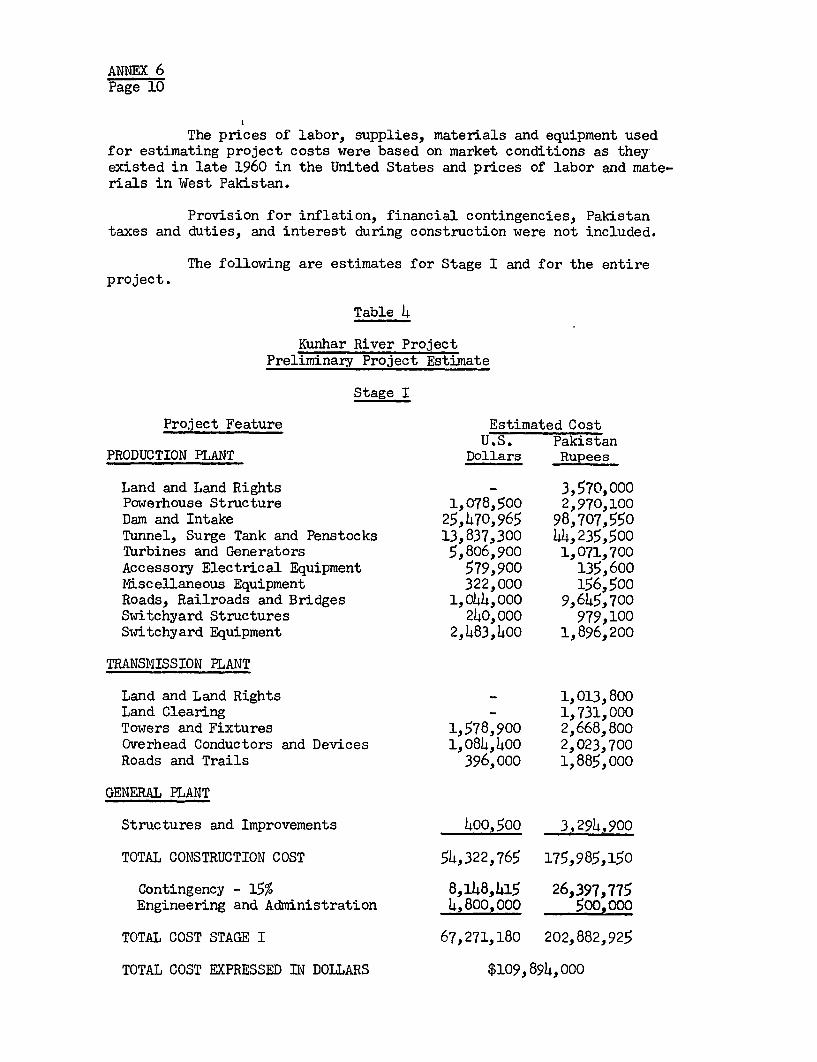
ANNEX 6Page 10
The prices of labor, supplies, materials and equipment usedfor estimating project costs were based on market conditions as theyexisted in late 1960 in the United States and prices of labor and mate-rials in West Pakistan.
Provision for inflation, financial contingencies, Pakistantaxes and duties, and interest during construction were not included.
The following are estimates for Stage I and for the entireproject.
Table 4
Kunhar River ProjectPreliminary Project Estimate
Stage I
Project Feature Estimated CostU.S. Pakistan
PRODUCTION PLANT Dollars Rupees
Land and Land Rights - 3,570,000Powerhouse Structure 1,078,500 2,970,100Dam and Intake 25,470,965 98,707,550Tunnel, Surge Tank and Penstocks 13,837,300 44,235,500Turbines and Generators 5,806,900 1,071,700Accessory Electrical Equipment 579,900 135,600Miscellaneous Equipment 322,000 156,500Roads, Railroads and Bridges 1,o44,o000 9,645,700Switchyard Structures 240,000 979,100Switchyard Equipment 2,483,400 1,896,200
TRANSMISSION PLANT
Land and Land Rights - 1,013,800Land Clearing - 1,731,000Towers and Fixtures 1,578,900 2,668,800Overhead Conductors and Devices 1,084,400 2,023,700Roads and Trails 396,000 1,885,000
GENERAL PLANT
Structures and Improvements 40o,500 3,294,900
TOTAL CONSTRUCTION COST 54,322,765 175,985,150
Contingency - 15% 8,148,415 26,397,775Engineering and Administration 4,800,000 500,000
TOTAL COST STAGE I 67,271,180 202,882,925
TOTAL COST EXPRESSED IN DOLLARS $109,894,000
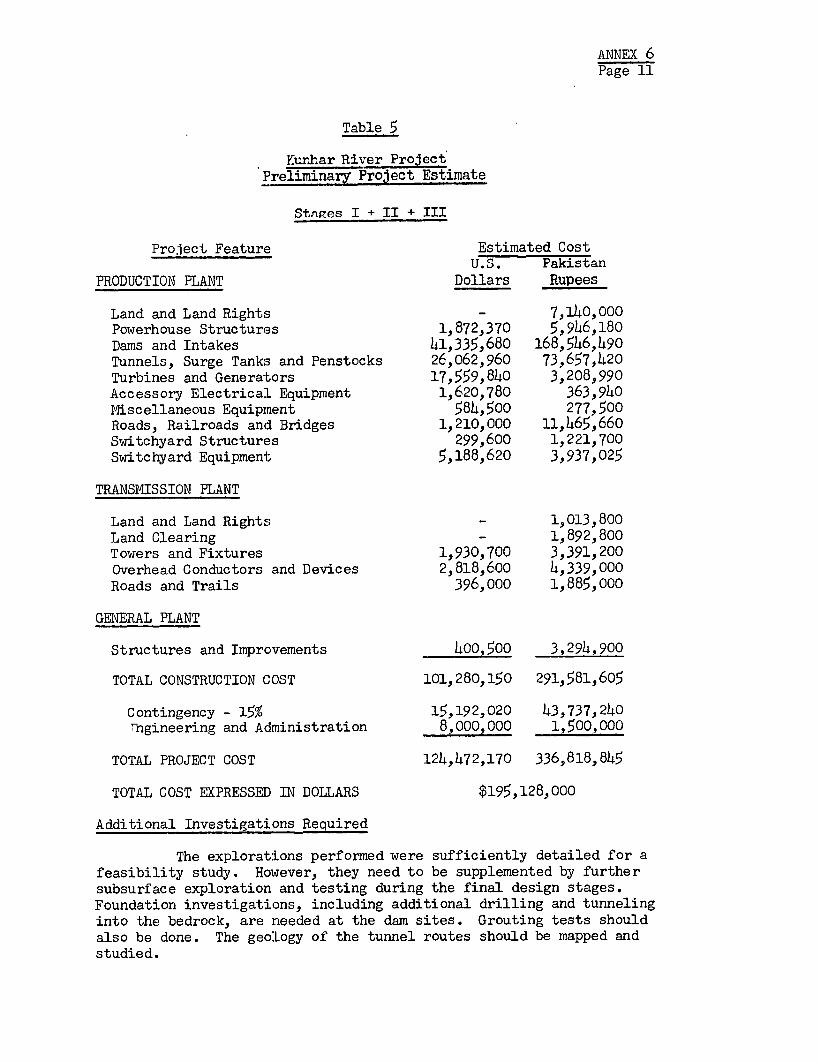
ANNEX 6Page 11
Table 5
Kunlhar River ProjectPreliminary Project Estimate
Stnaes I + II + III
Project Feature Estimated CostU.S. Pakistan
PRODUCTION PLANT Dollars Rupees
Land and Land Rights - 7,1 4 0,000Powerhouse Structures 1,872,370 5,946,180Dams and Intakes 4],335,680 168,546,490Tunnels, Surge Tanks and Penstocks 26,062,960 73,657,420Turbines and Generators 17,559,840 3,208,990Accessory Electrical Equipment 1,620,780 363,940Miscellaneous Equipment 584,500 277,500Roads, Railroads and Bridges 1,210,000 11,465,660Switchyard Structures 299,600 1,221,700Switchyard Equipment; 5,188,620 3,937,025
TRANSMISSION PLANT
Land and Land Rights - 1,013,800Land Clearing - 1,892,800Towers and Fixtures 1,930,700 3,391,200Overhead Conductors and Devices 2,818,600 4,339,000Roads and Trails 396,000 1,885,000
GENERAL PLANT
Structures and Improvements 400,500 3,294,900
TOTAL CONSTRUCTION COST 101,280,150 291,581,605
Contingency - 15% 15,192,020 43,737,240Ingineering and Administration 8,000,000 1,500,000
TOTAL PROJECT COST 124,472,170 336,818,845
TOTAL COST EXPRESSED IN DOLLARS $195,128,000
Additional Investigations Required
The explorations performed were sufficiently detailed for afeasibility study. However, they need to be supplemented by furthersubsurface exploration and testing during the final design stages.Foundation investigations, including additional drilling and tunnelinginto the bedrock, are needed at the dam sites. Grouting tests shouldalso be done. The geology of the tunnel routes should be mapped andstudied.

ANNEX 6Page 12
Investigations should include accurate large-scale topo-graphic maps of the reservoir areas and detailed mapping of the variousstructure sites and route maps for the location of access highways.Aerial photographic coverage (where not already available) is neededfor locating transmission lines.
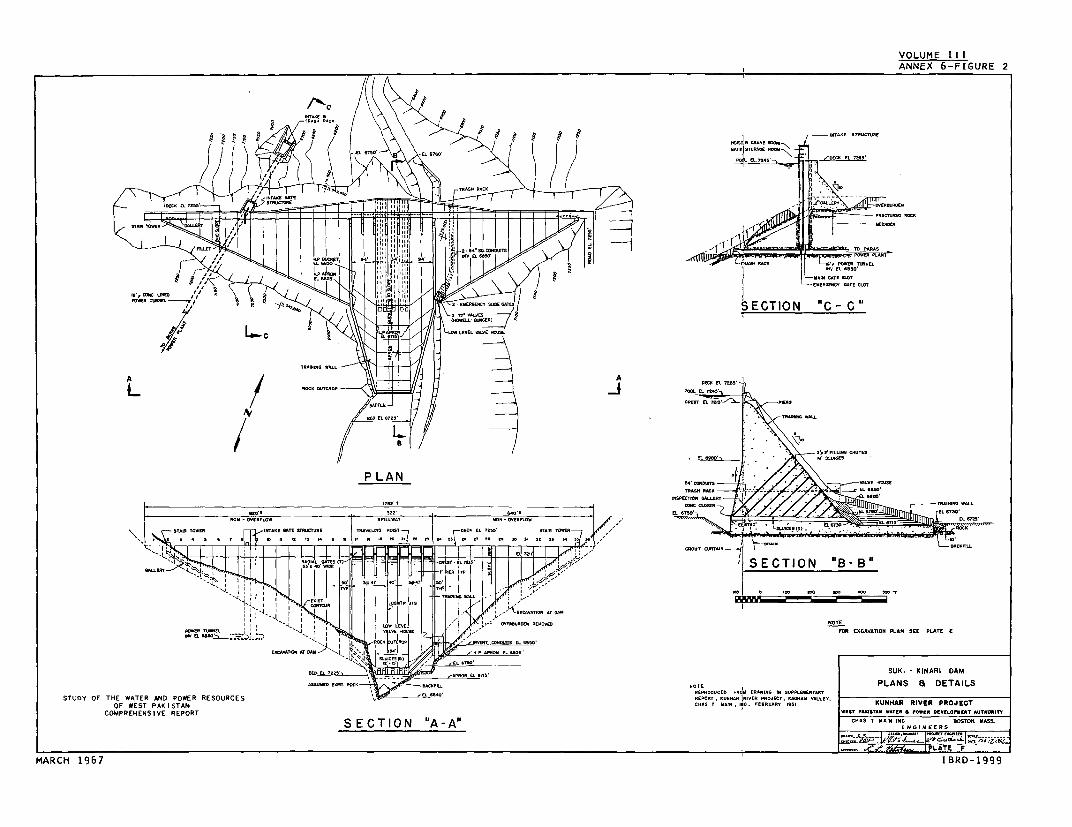
VOLUME IIIANNEX 6-FIGURE 2
". < ~~~~~~~~~~~~~~~~~~~~~~~SATITRR fRA -.
ZIfLE z ; '-CRT EL T2IE5
N"l4 / .tE_
A5GUI^0~~~~~~~~~ ~ ~ ~~~~~~~~~~~~~~~~~~~~ ~ ¶L119T TO6UAOFNEROT PLANT EAL
`0,lfA~~ E ECI N IG -N
O f A A~~~~~~~~~~~~~~~~~~~~~~~~~~~~~~~~~~~~~~~~~~~~~~~~~~~~~~~~~~~~~~~~~~~~~EAE EN
L~~ ~ ~~~~~~~~~~~~~~~~~~ 4 D_ fd, T E __,,lA £e
PMLARCS 196 I
LIE... CE~~7
EANE, LUC AAUCI
L~~~~~~~~~~~~~~~~~~~~~~~LL
a SECTION A NUVIAR
PLAN~~~~~~~~~~~~~~~~~~~~~~~~~~~~~~~F) XATINPA E LT
BURN CNN' - CAR'~ ~ ~ ~ ~ ~ ~ ~ ~ ~ ~ ~ ~ ~~~~~~~~~~~~~~SUI- IAR A
SECT- I.AIO6NlIN- "B-B"
STUDY OF THE WATER AND POWER RESOURCES TRPUET .... A. RIVET PEJ-T. EU-AN TCLLYTOF WEST PAKISTAN NSITCl. INS. 1EENNAAEI R.1 UNHAR RIVER PROJECT
COMPR0EHENSIVE REPORT ________________W_______,____T__T_____C.AS T MAIN INC 9OSTOP& MASS,SECTION "A-A" E C IC N E E S
MARCH 1967 IBNNE?~~I ~ SRDU* -19NN 99ITN

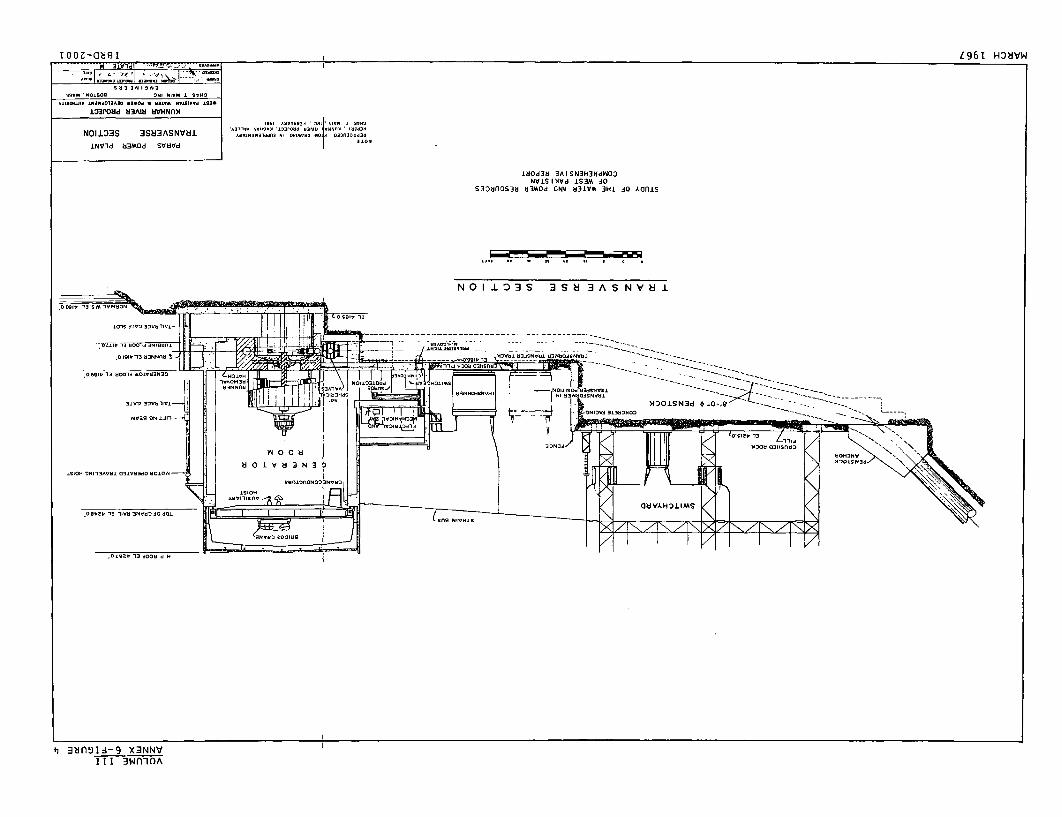
Tooz-a I L L961 HOEVW
-0-so. W* N±O i s
SSVNI NOSSON HNI NIVN 1 SVU0
1033Hd U3AIH HVHNnlx
INI ANN 61 Nl NSAdwN3 SNI HNflNISHOI
N01133S 3SS3ASNVU1 IUHININnI N NISN onoINd
INVId 83MOd SVUVd 310N
180d38 3A I SN3H3ddWOONV1S I Vd 153M 30
S3f8nOS38 83M0d ONV H31VM 3H1 30 AOlilS
N O I A S 3 S H 3 A S NV H 1
W3V3DUV- : I - - --- --E - - - --- -- - - --
,OL I9I'f3 ao 3NSfltil _- . NbI934099,.3500;; 0
l s c- D M ~~~~1 0 3 .3.d - ------ -------- 40a U| e%
3199 35993191 * .90 ~ ~ ~ ~ ~~~~~~~~~~~~~~~4~~~0LOSN3d *.0-9Q
19 0.
.09n. 3 -d ~~~~~~~.3002 30Jo
COn 13009 .
3 dn!3Id-9 X3NNVM awnfOA

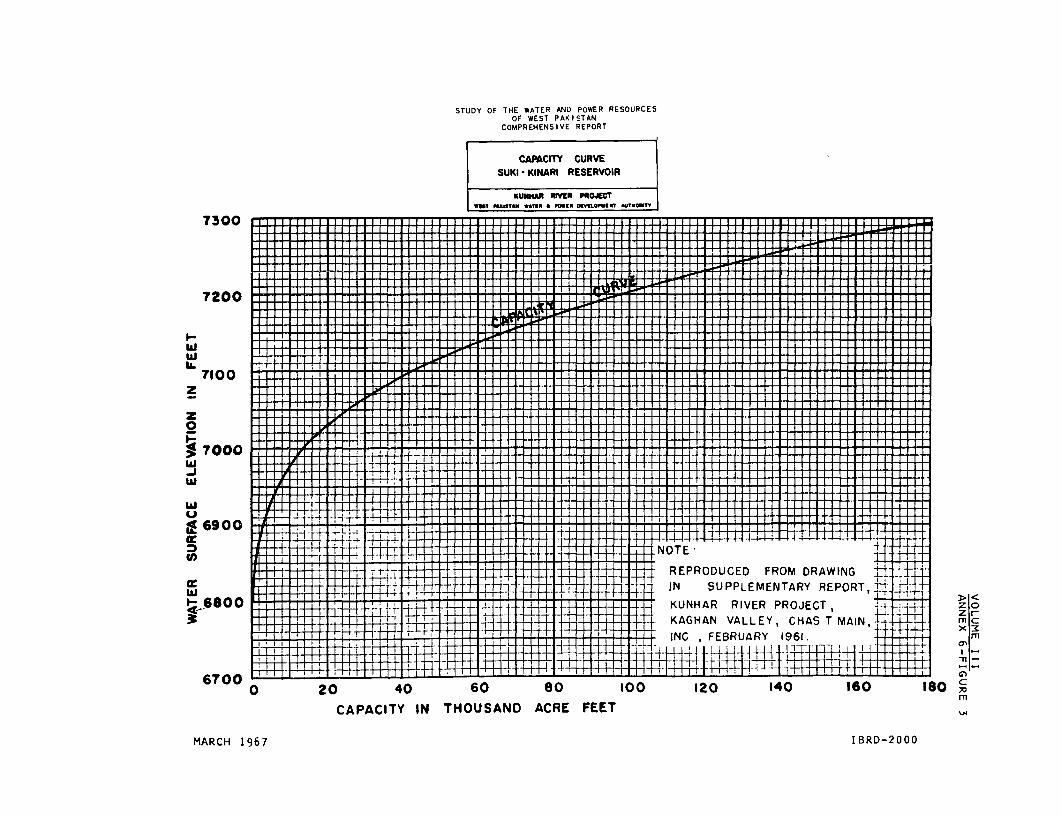
STUDY OF THE WATER AND POWER RESOURCESOF WEST PAKISTAN
COMPREHENSIVE REPORT
CAPACITY CURVESUKI- KINARI RESERVOIR
KUUNAR RVR PRO.ECWlSa MIST"
7300
7500~~~~~~~~~ f0;0Lt4lll I I I§0 IIS( II ISSl$| X t[
7200
wIL
7100z
z
7000
w
2 6900 N!_
w11: X <t ~~~~~~~~~~~~IN SUPPLEMENTARY REPORT, D<
~6800 K(UNHAR RIVER PROJECT, 40 60CA YKAGHAN VALLEY, CHAS T MAINT A
MC 19FEBRUARY 1961. I
IEH~~~~~~~~~~~~~~~~~~~~~~~~~
67000 20 40 60 80 1OO 120 140 160 ISO
CAPACITY IN THOUSAND ACRE FEET
MARCH 1967 1IBRD-2000

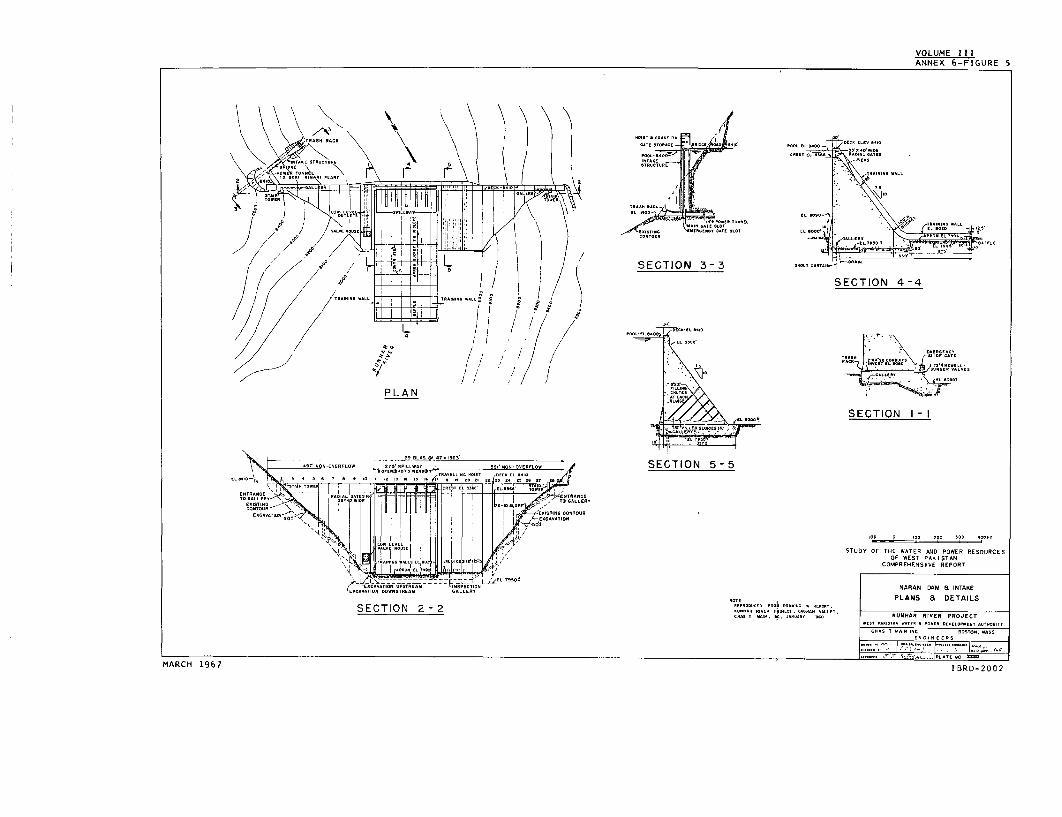
VOLUME IIIANNEX 6-FIGURE 5
P~~~~~~~~~~~~~~~~~~~~~~~~~~~~~~~AE EL EAS N A,G GAE .
SECTION 3-3 ESUAGG.
7/ I;sonot SECTION 4 4
PLAN GAE
/' ~~~~~~~~ / ,A A~~~~~~~~~~~~~tG O. ~~~~~~~~SECTIO N I- IT~n 1ELt SU * TO WR D POEEOURC
\ 1@ wi s!scw rassLs9 tIC4,,'.1< OF WESET PAITANK 5TAE EORs
\ \4 , _ ( -. ,fEL 7950+ ~~~~~~~~~~~~~~~~~~~~~COMPREHOEN51VE REPORT
PGcaTAAAAIONATGSTEEAM AIROPAGTIAG NARAN SAM Bk INTAKE
SEAAACIO ATRGEA 10N2 2ALLERT2 C2NvLLvKNARRVR RJCGATEs PLA5NSwrE OSI DETALoSNTTOIT
GREGG ~ ~ ~ ~ ~ CA GTE FOAM INC1G S0O REPORT
SECTION I 2-2TION 5 - G
I~~~~~ ~ ~~~~~~~~~~~~~~~~~~~~~~~....._-. .HI - 7|*141 *
MARCH 1967 ......... ... t ~ sE.IZ- ...... uN
OWETPKI S RDAN 0

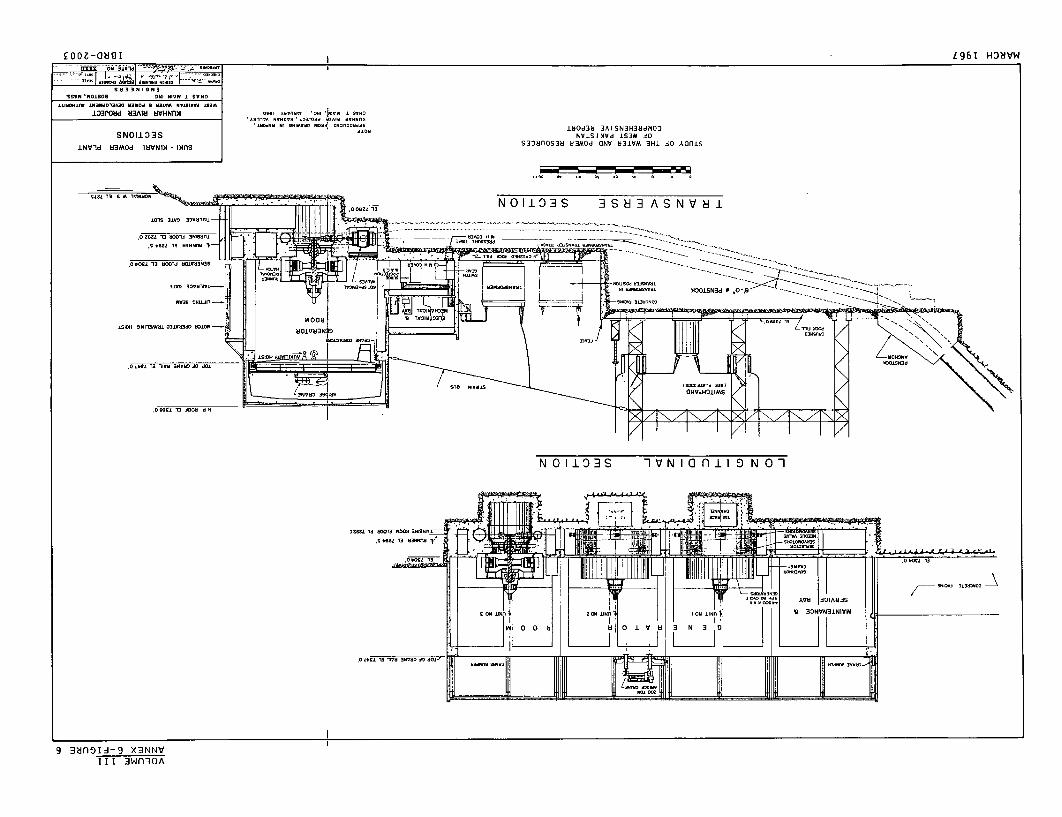
£ooZ-fISI 1 L961 H-DNVW
S H 3 N3 I D 3 SSVN 'NOlSOO OkI NI1 1 S.ND
1SPOd UEAW UVHNuM SI 00 ' N Iis ± Sowo
±MDd3bNl 0NIA514140A ~ "S14Q34001443b 180d38 3AISN3H3Hd QdPOSNOII033S ..0 NOISINVd IS3 AO
INVId d3MOd 18VNIM - onns Sf3onOS38 83MOd CNV 831VM 3H1 iO Akan15
lZ01 3 SA 10- ON 3
N001N 0 33 0 N 3 a n 3 A N N
1 3NO flS 1 IQ II NO
.G .2,S 13 .3... 6 3 01 O 3 0 SON1W .NIsj*1
.. 3.30 1 10 45 1 J04-'
40014134 45041 ~ ~ ~ ~ ~ ~ ~ M0 1NU 0,.
9 fl?iflOIY-9 X3NNVI W f IOU1OA

I
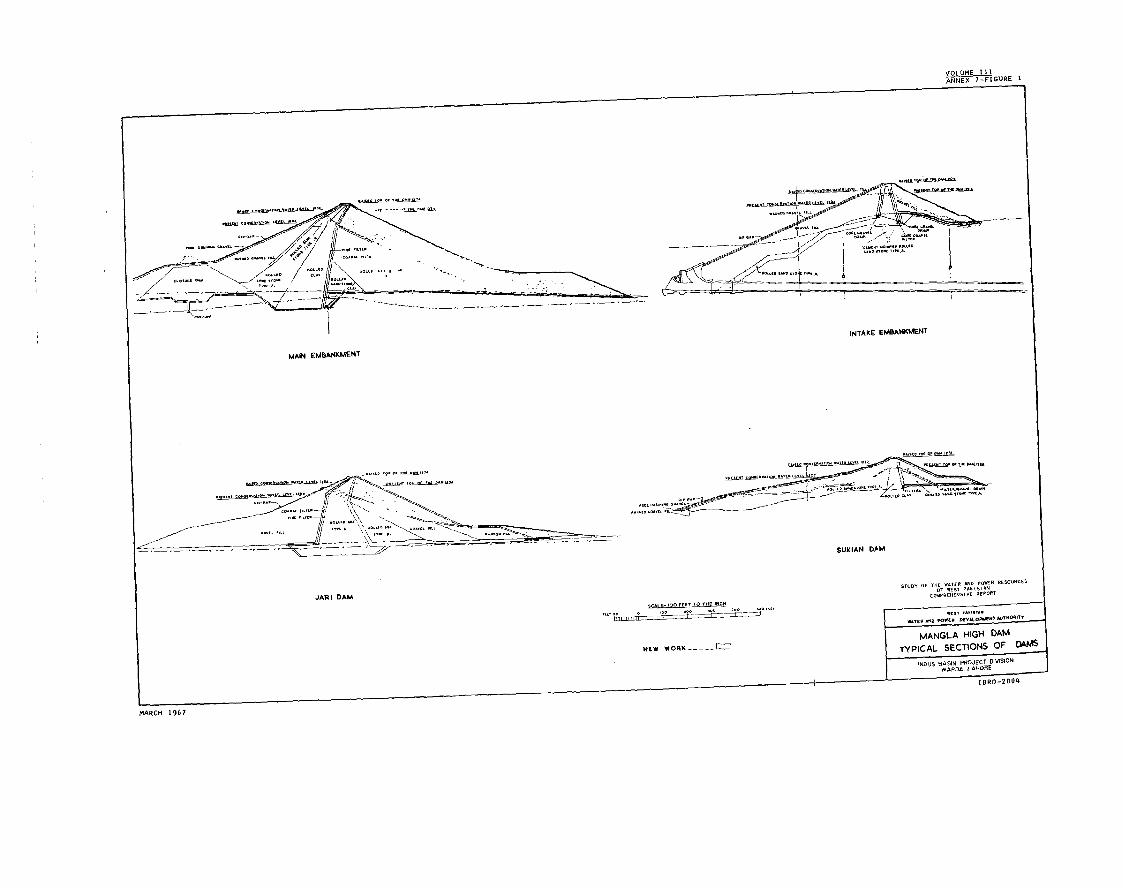
VOLUME IlI
~NN~Y7-FfGURE
JAR I DAM
REPORT
-
INTAKE EM9AN1MENT
MAIN EMBANKMENT
_ __ j K4 ,!_
-- <pSU
K IA N DAMA
SCALE 100 FEET 10 OTT INTO~~~IBR -200
RAR I DAM
NtW WORK_____ ~~~~TYPICAL SECTIONS OF OM
MARlCH 1967


ANNEX 7
MANGLA/RAISED MANGLA PROJECTS


ANNEX 7
LIST OF FIGURES
1. Mangla High Dam: Typical Sections of Dams

ANNEX 7Page 1
MANGLA
Introduction
Mangla Dam is located on the Jhelum River at the southern edgeof the Himalayan foothills and 20 miles upstream of the city of Jhelum.It occupies the only feasible site for larger storage known on the JhelumRiver within West Pakistan. Binnie & Partners, consultants to WAPDA,designed the project.
Scheduled for initial storage during the flood season of 1967,the project will have a gross capacity of 5.88 M4AF and a live capacity atelevation 1040 feet of 5.22 MAF. An additional 0.12 MAF will be trappedbehind the Mlirpur saddle but in certain circumstances may be released tothe Upper Jhelum Canal via the Jari outlet. The reservoir will inundatean area of 65,100 acres and cause the dislocation of approximately 81,000people. The estimated cost of the project is $534 million.
Design
The project consists of three earthfill embankments, with im-pervious cores carried down to impervious foundation material, which willcontain the reservoir. The Mangla Dam on the Jhelum River, the largestof the three, which g:ives the project its name, has been built to amaximum height of 380 feet, and has a crest length of 11,000 feet, and avolume of 78 million cubic yards. Su]-ian Dyke, which closes gaps in thereservoir rim east of Mangla Dam, will have a maximum height of 80 feet,a crest length of 17,000 feet, and a volume of 7.2 million cubic yards.Jari Dam will be located on the Jari Nallah, about 12 miles east of ManglaDam. This structure will have an embankment of 37 million cubic yards, amaximum height of 234 feet, and a crest length of 5,700 feet.
The dams ancd other structures have been built to a crest eleva-tion of 1234 feet for storing water to elevation 1202 feet. They aredesigned, however, for later raising to elevation 1274 feet for impoundingto elevation 1250 feet.
The project is designed to handle an inflow flood of 2,600,000cusecs occurring when the reservoir is at maximum conservation pool level,elevation 1202 feet. The flood will be handled by superstorage of nearly2 MAF in the reservoir to elevation 1228 feet while the main and emergencyspillways are discharging at their maximum capacities. The combined capa-city of the two spillways at maximum flood level is 1,300,000 cusecs. Thehighest flood of record was 1,100,000 cusecs and occurred in August of 1929.
The main spillway is of the submerged orifice type with nineopenings each controlled by a radial gate 36 feet wide by 40 feet high.The crest elevation is 1086 feet. According to Sir Alexander Gibb &Partners, the model experiments carried out by WAPDA's consultants shouthat the capacity of the spillway is 860,000 cusecs at the normal maximumreservoir elevation of 1202 feet and 1,070,000 cusecs at the maximum floodlevel of 1228 feet.
ANNEX 7Page 2
The emergency spillway is located about one-half mile beyond theright end of the dam. It discharges into Bara Kas, a small tributary ofthe Jhelum. Although its uncontrolled concrete crest is at normal maximumreservoir elevation 1202 feet, the inlet channel is blocked by an erodible"fuse plug" embankment with top at elevation 1206 feet. Thus, the emer-gency spillway will operate only during rare floods that exceed the capa-city of the main spillway. At reservoir elevation 1228 feet the capacityof the emergency spillway will be 230,000 cusecs.
Five diversion tunnels, each 1,940 feet long, were excavatedthrough the ridge at the left of Mangla Dam. Four tunnels have been linedwith steel penstocks of 26-foot inside diameter to serve for irrigationreleases and power generation. The fifth tunnel is closed with a steelbulkhead but could be commissioned later if required for irrigation orpower.
Because Jari Dam had to be constructed downstream from the Mirpursaddle for technical reasons, it was necessary to provide a 7-foot diameterconcrete lined tunnel on its right abutment to carry the trapped water(0.40 MAF down to level 1040 feet) to the Upper Jhelum Canal. It has beendecided to excavate a cut 60 feet in maximum depth through the saddle toenable 0.28 MAF of this water to be released through the power plant andmain outlet works.
A powerhouse at the discharge end of the main outlet tunnels isinitially provided with three generating units, each with a rated capabilityof 100 mw, and a fourth unit has been ordered. Two generating units can beconnected to each penstock, thus permitting an ultimate installation of upto ten units, although recent studies suggest that eight units may be theoptimum number. Bypass valves will maintain uniform water releases regard-less of the load on the turbines.
Operation
The Mangla Dam Project is being constructed as part of the systemof works constituting the Indus Basin Settlement Plan. It will providerabi irrigation supplies to the Jhelum and Chenab Commands as well as theRavi and Sutlej Commands. Thus its function will become especially impor-tant after India exercises its rights under the Indus Waters Treaty of 1960to divert the full flows of the Ravi and Sutlej Rivers.
With a minimum drawndown level of 1040 feet and the cut throughthe Mirpur saddle, 5.22 MAF useful storage will be available to meetirrigational demands. An additional 0.12 MAF from behind the Mirpur saddlecould be released through the Jari outlet but, according to Sir AlexanderGibb & Partners, there is some question as to whether under anticipatedoperating conditions the outlet capacity is sufficient to permit its useduring the very limited time when the reservoir will be down below thebottom of the cut.
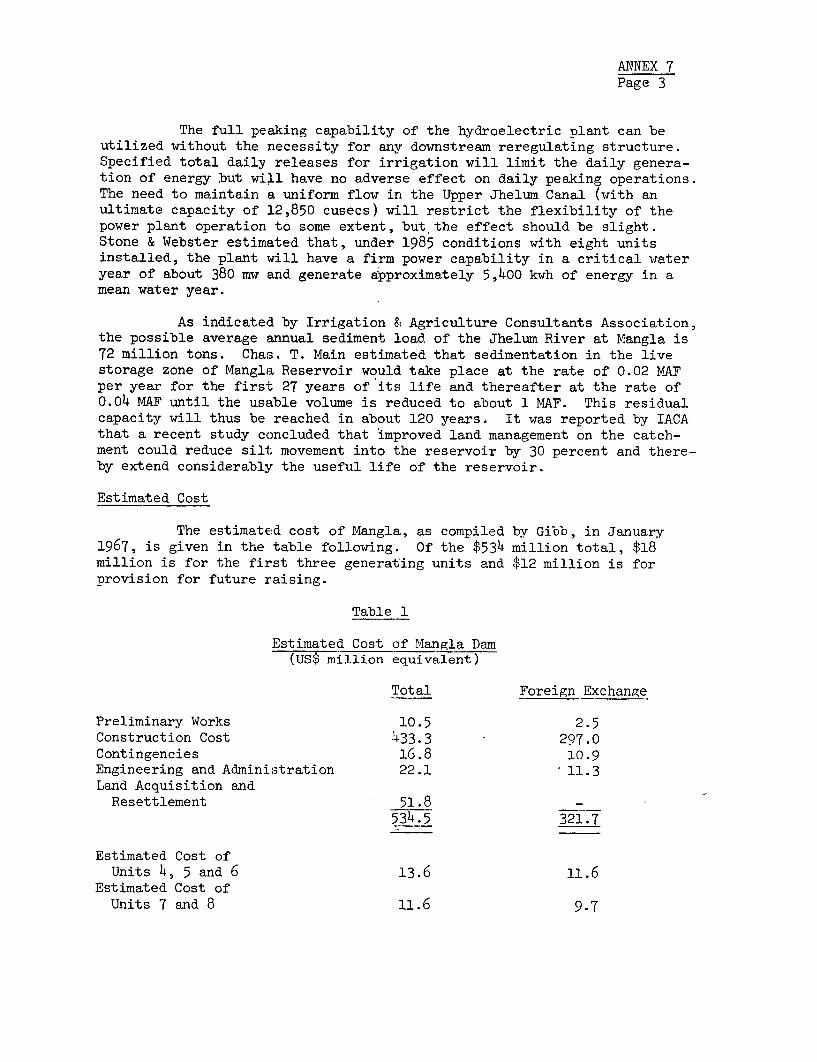
ANNEX 7Page 3
The full peaking capability of the hydroelectric plant can beutilized without the necessity for any downstream reregulating structure.Specified total daily releases for irrigation will limit the daily genera-tion of energy but will have no adverse effect on daily peaking operations.The need to maintain a uniform flow in the Upper Jhelum Canal (with anultimate capacity of 12,850 cusecs) will restrict the flexibility of thepower plant operation to some extent, but the effect should be slight.Stone & Webster estimated that, under 1985 conditions with eight unitsinstalled, the plant will have a firm power capability in a critical wateryear of about 380 mw and generate approximately 5,400 kwh of energy in amean water year.
As indicated by Irrigation & Agriculture Consultants Association,the possible average annual sediment load of the Jhelum River at Mangla is72 million tons. Chas. T. Main estimated that sedimentation in the livestorage zone of Mangla Reservoir would take place at the rate of 0.02 MAFper year for the first 27 years of its life and thereafter at the rate of0.04 M4AF until the usable volume is reduced to about 1 MAF. This residualcapacity will thus be reached in about 120 years. It was reported by IACAthat a recent study concluded that improved land management on the catch-ment could reduce silt movement into the reservoir by 30 percent and there-by extend considerably the useful life of the reservoir.
Estimated Cost
The estimated cost of Mangla, as compiled by Gibb, in January1967, is given in the table following. Of the $534 million total, $18million is for the first three generating units and $12 million is forprovision for future raising.
Table 1
Estimated Cost of Mangla Dam(uS$ million equivalent)
Total Foreign Exchange
Preliminary Works 10.5 2.5Construction Cost 433.3 297.0Contingencies 16.8 10.9Engineering and Administration 22.1 -11.3Land Acquisition andResettlement 51.8 -
534.5 321 .7
Estimated Cost ofUnits 4, 5 and 6 13.6 11.6
Estimated Cost ofUnits 7 and 8 11.6 9.7
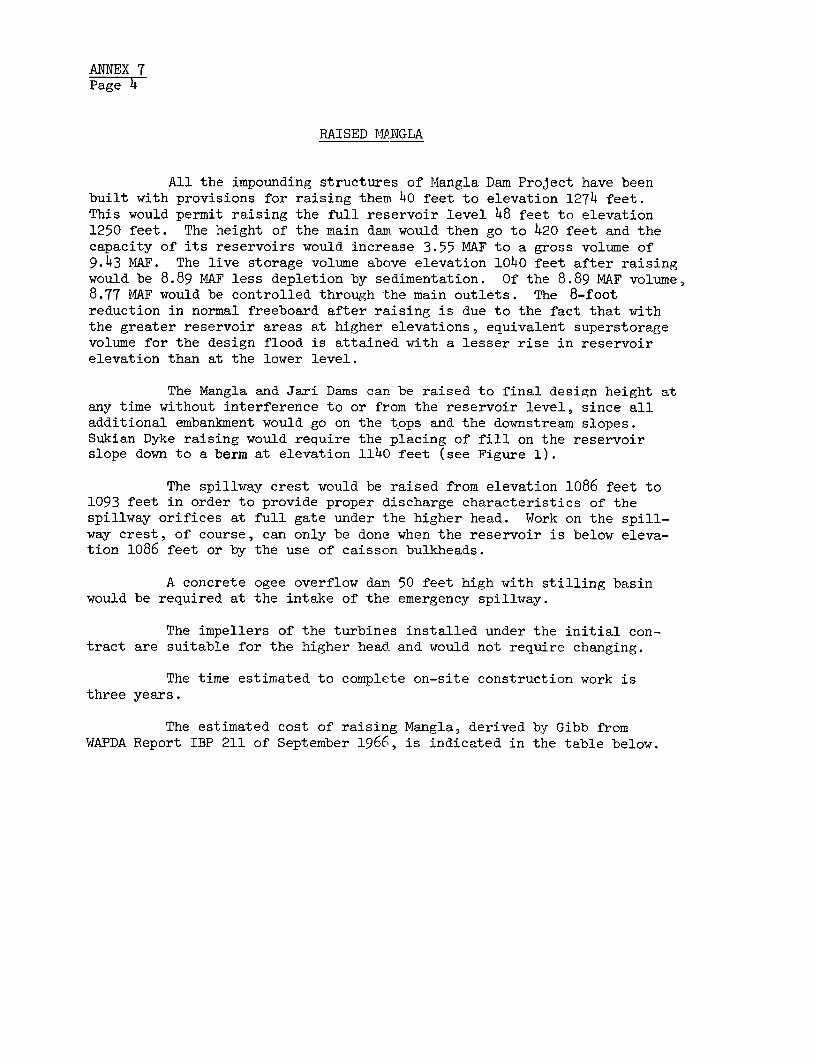
ANNEX 7Page 4
RAISED MPLNGLA
All the impounding structures of Mangla Dam Project have beenbuilt with provisions for raising them 40 feet to elevation 1274 feet.This would permit raising the full reservoir level 48 feet to elevation1250 feet. The height of the main dam would then go to 420 feet and thecapacity of its reservoirs would increase 3.55 MAF to a gross volume of9.43 MAF. The live storage volume above elevation 1040 feet after raisingwould be 8.89 MAF less depletion by sedimentation. Of the 8.89 MAF volume,8.77 MAF would be controlled through the main outlets. The 8-footreduction in normal freeboard after raising is due to the fact that withthe greater reservoir areas at higher elevations, equivalent superstoragevolume for the design flood is attained with a lesser rise in reservoirelevation than at the lower level.
The Mangla and Jari Dams can be raised to final design height atany time without interference to or from the reservoir level, since alladditional embankment would go on the tpps and the downstream slopes.Sukian Dyke raising would require the placing of fill on the reservoirslope down to a berm at elevation 1140 feet (see Figure 1).
The spillway crest would be raised from elevation 1086 feet to1093 feet in order to provide proper discharge characteristics of thespillway orifices at full gate under the higher head. Work on the spill-way crest, of course, can only be done when the reservoir is below eleva-tion 1086 feet or by the use of caisson bulkheads.
A concrete ogee overflow dam 50 feet high with stilling basinwould be required at the intake of the emergency spillway.
The impellers of the turbines installed under the initial con-tract are suitable for the higher head and would not require changing.
The time estimated to complete on-site construction work isthree years.
The estimated cost of raising Mangla, derived by Gibb fromWAPDA Report IBP 211 of September 1966, is indicated in the table below.
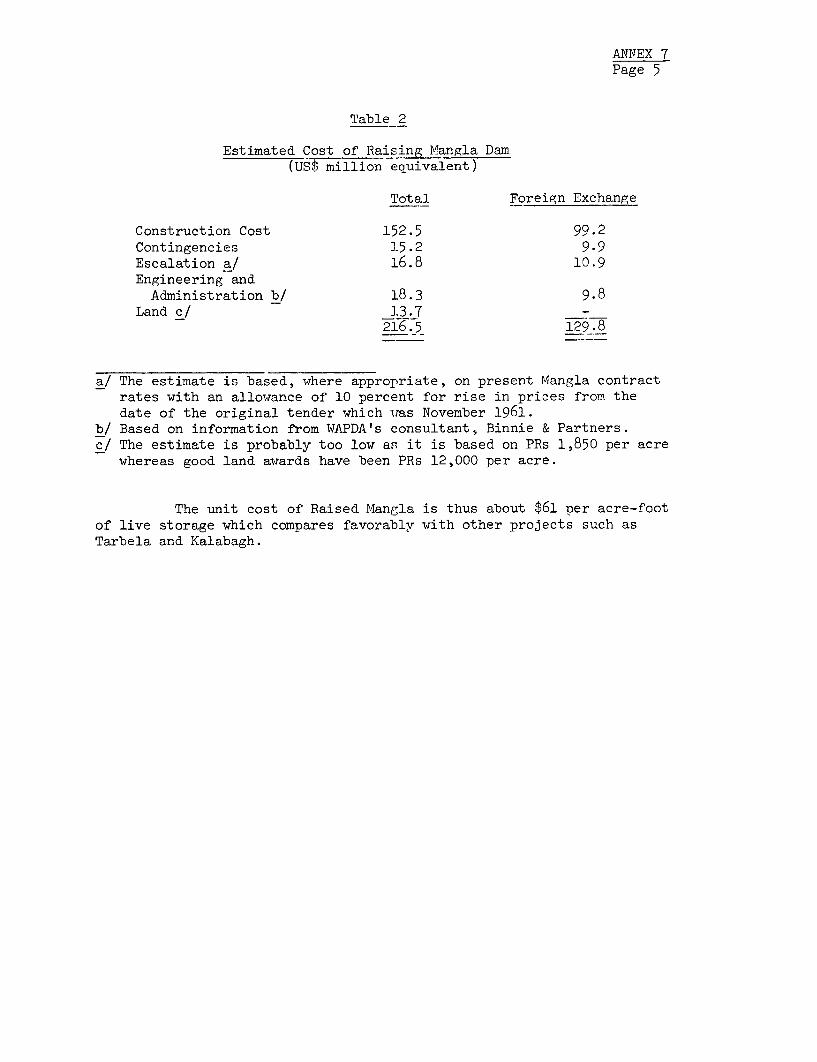
ANNEX 7Page 5
Table 2
Estimated Cost of Raising Mangla Dam(US$ million equivalent)
Total Foreign Exchange
Construction Cost 152.5 99.2Contingencies 15.2 9.9Escalation a! 16.8 10.9Engineering andAdministration b/ 18.3 9.8
Land c/ 13.7216.5 129.8
a/ The estimate is based, where appropriate, on present Mangla contractrates with an allowance of 10 percent for rise in prices from thedate of the original tender which was November 1961.
b/ Based on information from WAPDA's consultant, Binnie & Partners.c/ The estimate is probably too low as it is based on PRs 1,850 per acre
whereas good land awards have been PRs 12,000 per acre.
The unit cost of Raised Mangla is thus about $61 per acre-footof live storage which compares favorably with other projects such asTarbela and Kalabagh.

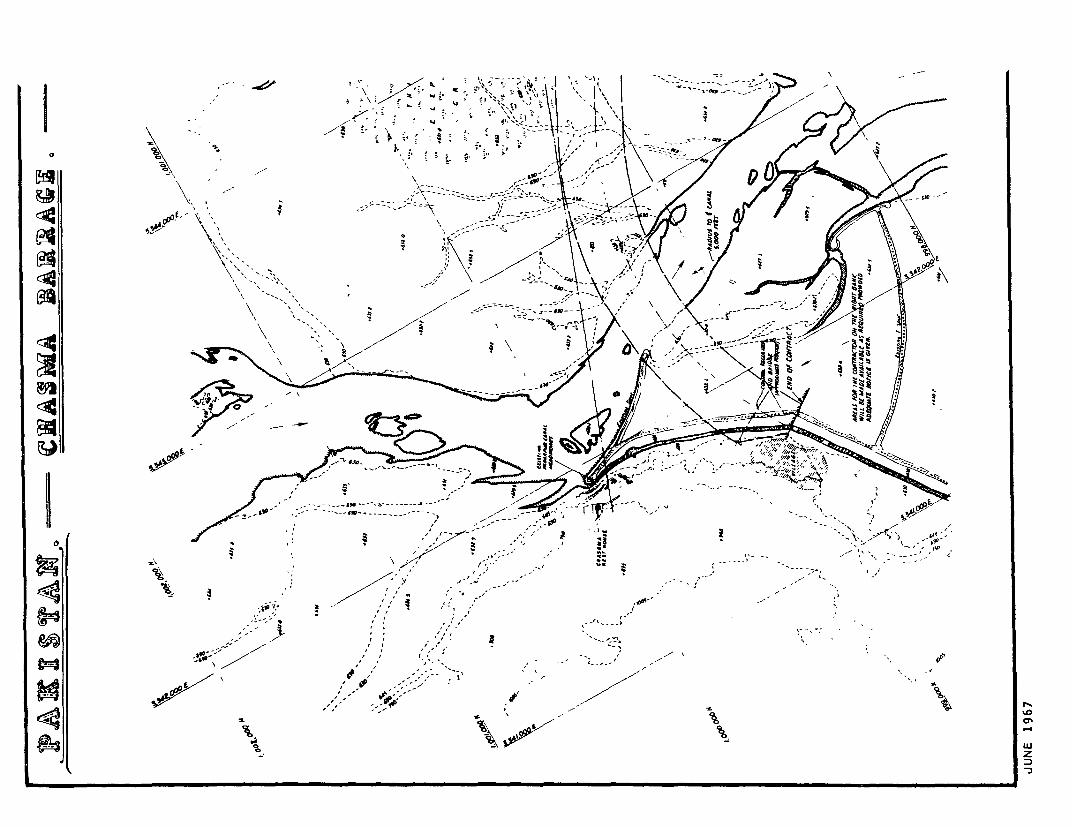
I sc ~~~~~~~~~~~~~~~~~~~~~~~~~~~- - /iW-4 --
0f I
P-~
0 i~-- -: -i ',- --- I
mi1 ~ ~ ~ ~ ~ -
-s/, , .,,'''
O1 'iSto k t _ IZ
0 ~~~~~~~~~~~~~~~~~~~~~~z

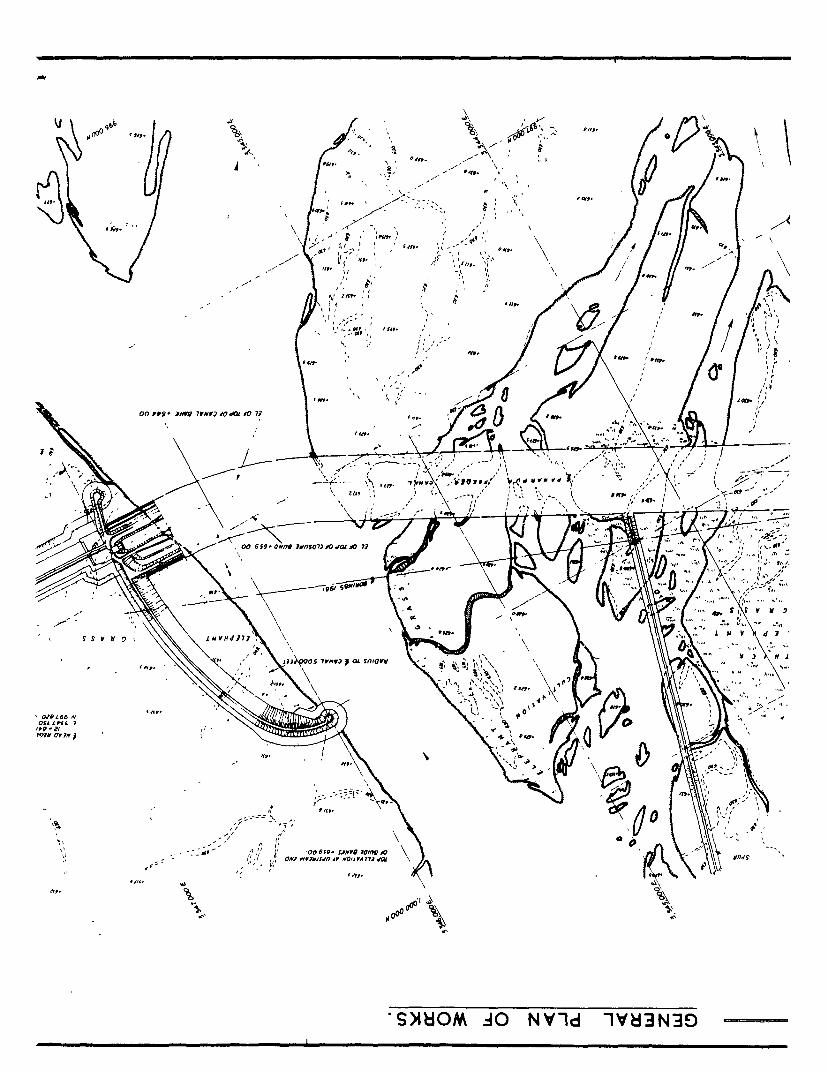
no" 4 9tb | % % ' i, 4 ge p Xe,
00 0,119 ''MV 7YNV2 i dOl -O 7 *.o*s*' \ ,lJ/r 1-
-4- t:s.;.,....-- ,,,'.f'...- 1 X \ -, 4 > ,- / ,e,w, .''~~~~Sq,
5st." I'
aA . X a a ,. F & v
00 \F O ,? 7417O dO da . D'no don
" St e 9, It, \
.9 ' ,,f-=>'-,,, X X p O ( A r,~~~~~~~~~~~~~W..'p
* X- K \ 4;,
v~~~ ~ ~ SMO SO Nti l Y E3N19
10
00 6f9001109 7a'nW7)i0daLe0 1
0055540 2'AHM 4 N-l lV3NE

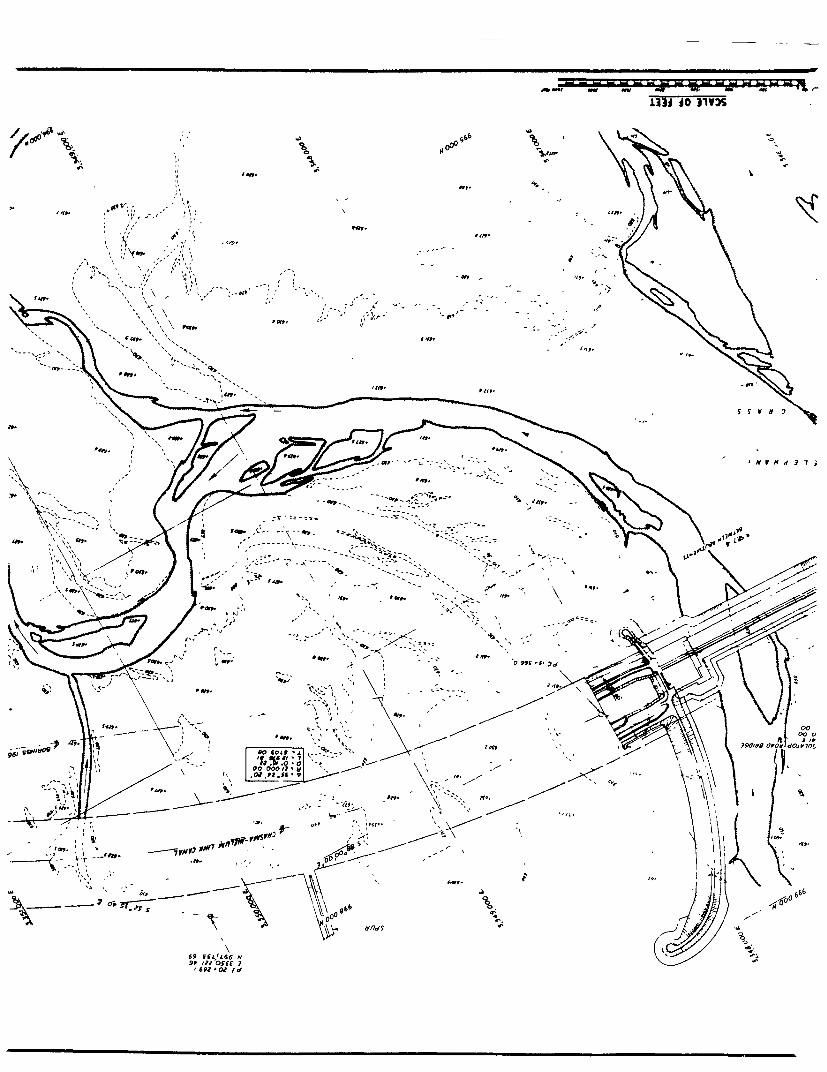
M33 40 31v3X
/o 0 S % 660'
V~~~~~~~~~~~~~~~~~~~~~~~~~~~~~~~~~~~~~~~~ M7 d> 3 tw7
41P.- ----- - At- ,^ X @o6
9t~~~~~~~~~~~~~~~~~~~~~' "28 OSf 7
692 o~~~~. t

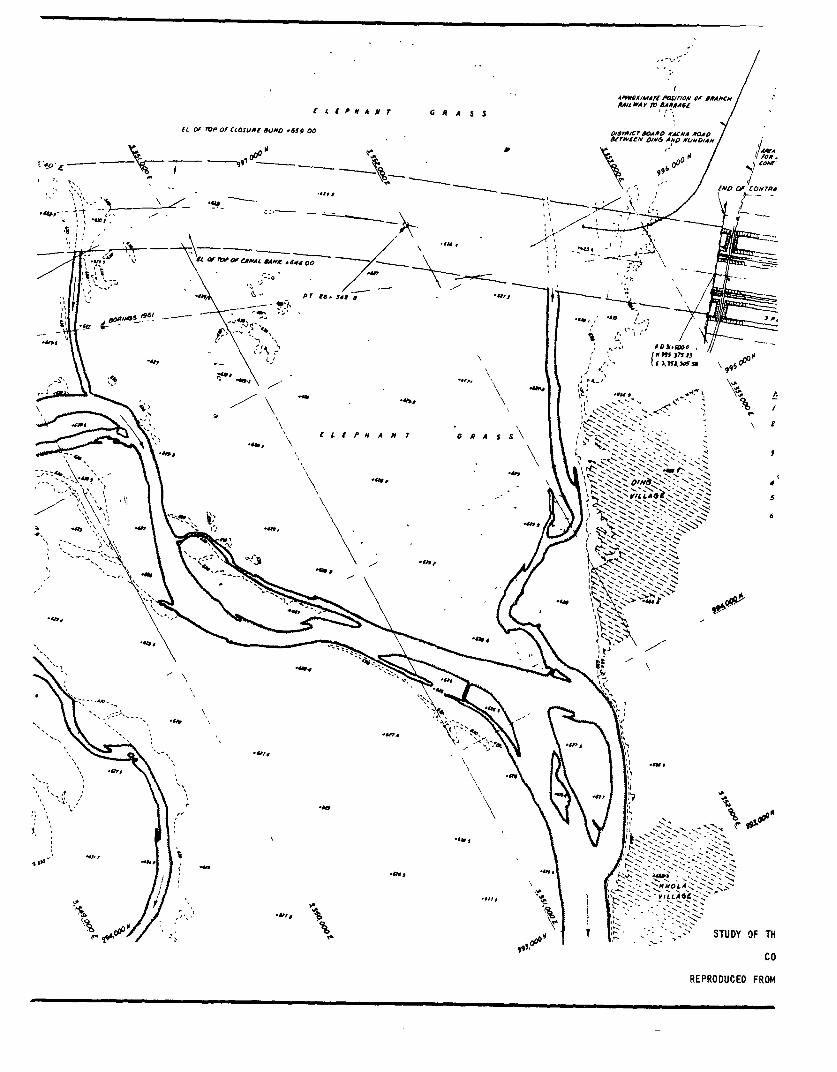
t L t P A N r G A A S S *4,4W6A Y m WA*RA6lA /
IL Of roP Of CIOSIJ*f BUND #6f2 00 o,SrP'CT /0'O 4M A OAD
N I~~~~~~~~~~~~~~~~~~~~~~~~~~~~~~~~~~~~Afvc rM-Le 0ND AI##A ILN/A/
\ ~~~~~~oOo 0 1
.WN p 7}cAr
_ j '- > V_ # = 96 00 11-;g0 C-o r70
12 Of Of W'AAL AiIMA .LNI 00 --.
*6, @ = ) 6 W o o / _ _ _ . l -Pr le .
-\ . -4' ' { lS s \9
! 5 ~ ~ - ~ \ 0 \
wooo 8 1 v p-- (£i. if. ,M-' STD\ FT
ISIPN A A4 7 0 A S S
'N Ii~~~~~~~~~~~~~~~~~~~~~~~~~-p
- -N
.0p,~~~~~~~~~~~~~~~~~m
0o R STUDY OF TH
REPRODUCED FROM

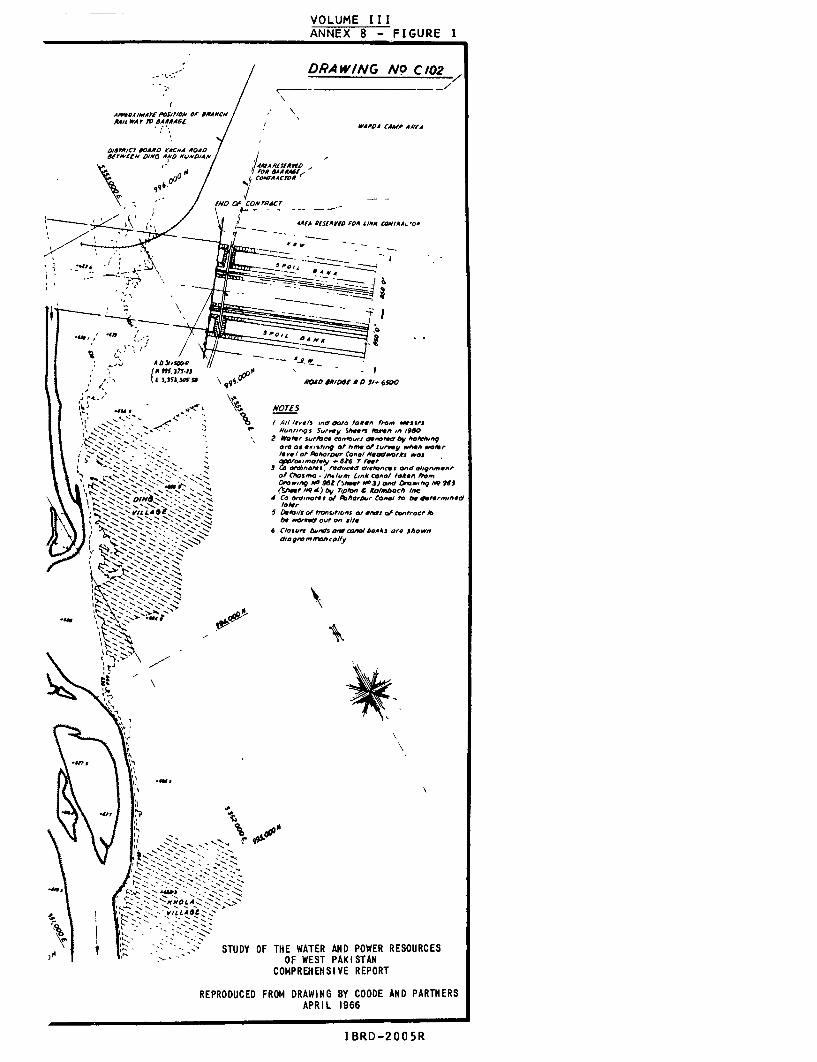
VOLUME IIIANNEX 8 - FIGURE I
DRAWING No C102
ARt,0K,MAYE P4,/r/e OP ARANC A/4A4/i WAY rdAAI*A6i WA.-DA CAMA/I AA'tA
/37r/CT 60AA'D tACNA 40408trweO/ 0/#6 AhD AW.D/4/
tj~~~~~t Ov / osm erAcre99'6./
'N / ' CONO ThRACt __ _
AAfA r fIAifD QOA LINX nCOA4A, .o,
-4Ž11X , ..- - - --
-- -- _ e A
IL Ii 00U q4.~* 800*406 4 30 50Q {, A O / N
I ~ .'6\ K / A,/e.'a/5 Inrto dte ose, 0.oe, Ass,*| 1> 9\> s ' 9s<tE < -~~ vnw,.nq s Su_ SANe/ 181,, ,,, /S980
rts - N<> N s s 2 rWaf,, Sh*cw ean1ur, denoe 6VFt
". 'SamNs^ r Os *.,Shne of hm 00 luvey _ whOn fo
N- ; c.. - -soN ,If e / orat PAa, Canlomno/ loFeoa wos
N ;N <sS' > > sv > of chasa.PoI..ft l,n nc4.4o/ t04e. fmn,
L> N t , s .43 ( N~ /OWIg NO 965 (5e . 0.3) oa" 0/0no ha A9 9S6
N.N N\ N| 0lN.j N;NX N> .s '4 co ,re,te r a' PoaApo, canal to be ffoe,mmed
Sy X ~~~~~~~~~~~~~~atgern*ey
NNNNN NN;Wf f.N IOf
NNVI& LA$ 1 ~ 5 I arat/ fmtnoldont at ~9W a, Co0nt,acp ~~NNN NNNNN .~' N be .0,540o rn'Y 0e O site~~9NNNN N - '¾N ~ N N 6 CIosu,t bm,4s wuone o/hnotAs are Shown
'e N NN N NN -
.' >RNNN_ OW N \
\ ~ ~ N ZN N,":"".'"'
I ' 8'- ~~~~~OF WEST PAKI STANCOMPREHENSI VE REPORT
REPRODUCED FROM DRAWING BY COODE AND PARTNERSAPRIL 1966
I BRD -20O0O5R


ANNEX 8
CHASNA PROJECT


ANNEX 8
LIST OF FIGURES
1. Chasma Barrage: General Plan of Works
2. Chasma Barrage: Floor of Barrage: Cross Sections

ANNEX 8Page 1
CHASMA
Introduction
Chasma Barrage, to be located on the Indus about 35 miles down-stream from the Jinnah Barrage, is a part of the Indus Settlement Planworks which implement the Indus Waters Treaty with India. It constitutesthe control structure for diverting water from the Indus to the Jhelumthrough the Chasma-Jhelum Link Canal, also a part of the Indus SettlementPlan works. The existing Paharpur Canal will also be supplied with waterfrom the new headworks.
The design of the project by WAPDA's consultants, Coode & Part-ners, as originally approved, was based on a normal operating level of theheadpond at elevation 640 feet to command the Chasma-Jhelum Link Canal.The design allowed for a 3-foot rise above normal operating level duringpassage of the project design flood. The super-storage volume to eleva-tion 643 feet was also to provide short-term storage of water for releaseafter the flood season passed.
WAPDA subsequently arranged for a study of the relative savingand cost of fixing the invert of the Chasma-Jhelum Link Canal 2 feethigher than planned and of raising the corresponding operating level inthe headpond a like amount to elevation 642 feet. Three feet of heightabove normal operating level in the headpond still would be needed forhandling the river in flood stage and would be usable in the postfloodseason for storage. This alternative arrangement was found more expen-sive than the accepted layout.
The Government of Pakistan then requested the Bank Group toconsider the feasibility and benefits of raising the barrage by 6 feet toprovide additional storage. This proposal was examined by Chas. T. Main,IACA and Sir Alexander Gibb & Partners, who found it feasible and con-firmed that the water could be used. The Government of Pakistan decidedto construct the barrage to the greater height and at the same time takeadvantage of the increased head to raise the invert of the link canal by2 feet.
The necessary changes in design have been effected by WAPDA'sconsultants and the contract for construction of the barrage was awqardedin February 1967. Completion is scheduled for March 1971.
The additional storage capacity provided between 645 feet and649 feet will be 0.33 MAF and the gross storage between the revised nor-mal operating level of 642 feet and 649 feet will be 0.51 MAF. In as-sessing usable storage both figures must be reduced by about 14 percenton account of seepage and evaporation losses.
The cost allocated to storage totals $31.6 million, of which$9.0 million is in foreign exchange.
ANNEX 8Page 2
Proposed Design
The location of Chasma Barrage was determined in conjunctionwith the siting of the Chasma-Jhelum Link Canal on the left bank. Thebarrage will create a headpond to elevation 642 feet to supply theChasma-Jhelum Canal, and also will supply water to the existing andplanned future enlargement of Paharpur Canal on the right bank.
The Chasma-Jhelum Canal is designed to carry 21,700 cusecs.The Paharpur Canal head regulator in the barrage will have a capacity of5,000 cusecs to provide for future expansion of the irrigation system.The headworks of the existing Paharpur Canal and part of the canal (1,100cusec capacity) will be submerged in the headpond of Chasma Barrage.
The barrage, with 41 normal sluiceways and 11 sediment sluice-ways will have a discharge capacity of 950,000 cusecs. Each opening willbe 60 feet wide. The sediment sluicevays will be adjacent to each of thetwo canal head regulators. Closure bunds 17,000 feet long on the leftside of the barrage and 16,000 feet long on the right side will extend tohigh ground at the banks of the flood plain. The canals will be carriedacross the flood plain of the Indus on embankment sections on the down-stream side of these bunds. The project works are shown in general de-tail in Figures 1 and 2 which are copies of drawings prepared by Coode &Partners for the project.
Operation
The operation of Chasma must take into consideration the re-quirements of the Chasma-Jhelum and Paharpur Canals and the efficientutilization of its storage capacity.
According to Tipton and Kalmbach, hydraulic considerations makeit desirable to maintain flow continuously in the Chasma-Jhelum Link pre-ferably in the range of 50 percent or more of the design capacity. Thepool levels required are 642 feet for full flow and 637 feet for halfcapacity.
IACA's water distribution analysis for the year 1975 indicatesthat the link will probably need to run between September and March.During the months of April to August the link irrigation requirement willnormally be low and this would probably afford an opportunity of drawingthe reservoir down to the pool level necessary to command the Paharpurintake only, or 635 feet.
The Indus River flows entering Chasma Pond will be the flows atKalabagh less diversions to the Thal Canal at Jinnah Barrage of up toabout 10,000 cusecs when Thal Canal is developed to full capacity. Forall practical purposes the flows at Chasma Barrage can be assumed to beequal to those at Attock.
During the months June to August river flows at Chasma are likelyto be greatly in excess of irrigation requirements, and virtually the whole
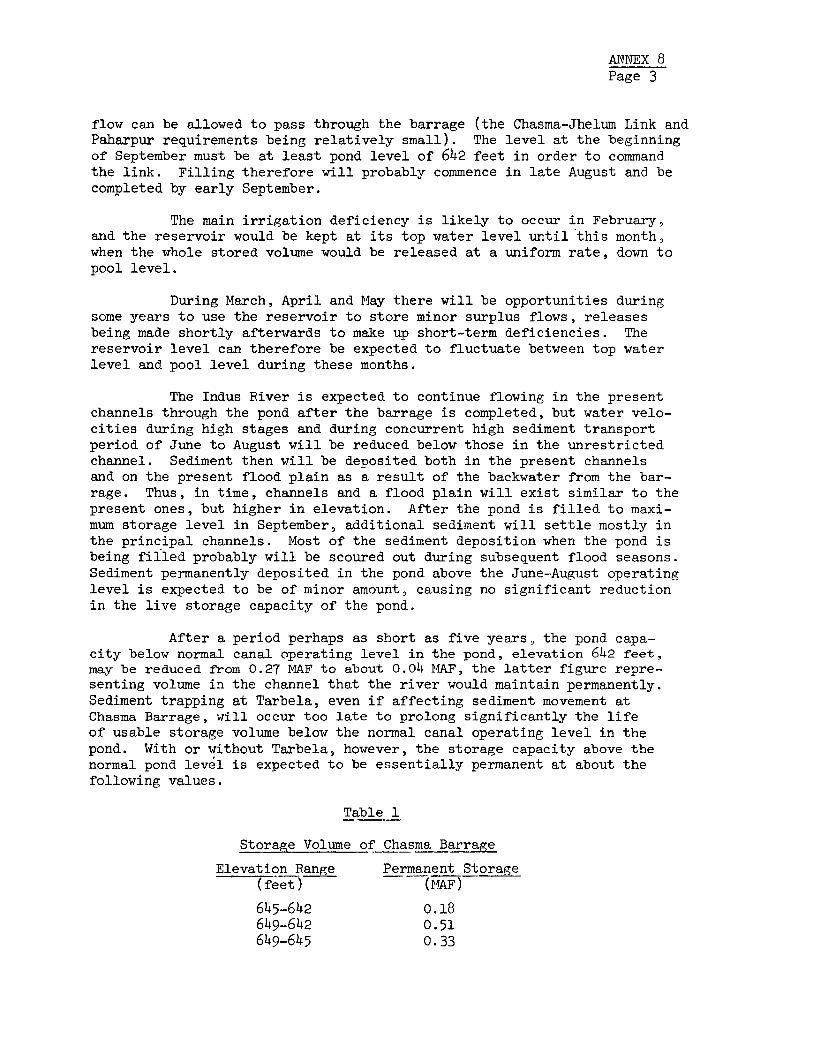
ANNEX 8Page 3
flow can be allowed to pass through the barrage (the Chasma-Jhelum Link andPaharpur requirements being relatively small). The level at the beginningof September must be at least pond level of 642 feet in order to commandthe link. Filling therefore will probably commence in late August and becompleted by early September.
The main irrigation deficiency is likely to occur in February,and the reservoir would be kept at its top water level until this month,when the whole stored volume would be released at a uniform rate, down topool level.
During March, April and May there will be opportunities duringsome years to use the reservoir to store minor surplus flows, releasesbeing made shortly afterwards to make up short-term deficiencies. Thereservoir level can therefore be expected to fluctuate between top waterlevel and pool level during these months.
The Indus River is expected to continue flowing in the presentchannels through the pond after the barrage is completed, but water velo-cities during high stages and during concurrent high sediment transportperiod of June to August will be reduced below those in the unrestrictedchannel. Sediment then will be deposited both in the present channelsand on the present flood plain as a result of the backwater from the bar-rage. Thus, in time, channels and a flood plain will exist similar to thepresent ones, but higher in elevation. After the pond is filled to maxi-mum storage level in September, additional sediment will settle mostly inthe principal channels. Most of the sediment deposition when the pond isbeing filled probably will be scoured out during subsequent flood seasons.Sediment permanently deposited in the pond above the June-August operatinglevel is expected to be of minor amount, causing no significant reductionin the live storage capacity of the pond.
After a period perhaps as short as five years, the pond capa-city below normal canal operating level in the pond, elevation 642 feet,may be reduced from 0.27 MAF to about 0.04 DIAF, the latter figure repre-senting volume in the channel that the river would maintain permanently.Sediment trapping at Tarbela, even if affecting sediment movement atChasma Barrage, will occur too late to prolong significantly the lifeof usable storage volume below the normal canal operating level in thepond. With or without Tarbela, however, the storage capacity above thenormal pond level is expected to be essentially permanent at about thefollowing values.
Table 1
Storage Volume of Chasma Barrage
Elevation Range Permanent Storage(feet) (MAF)
645-642 0.18649-642 0.51649-645 0.33
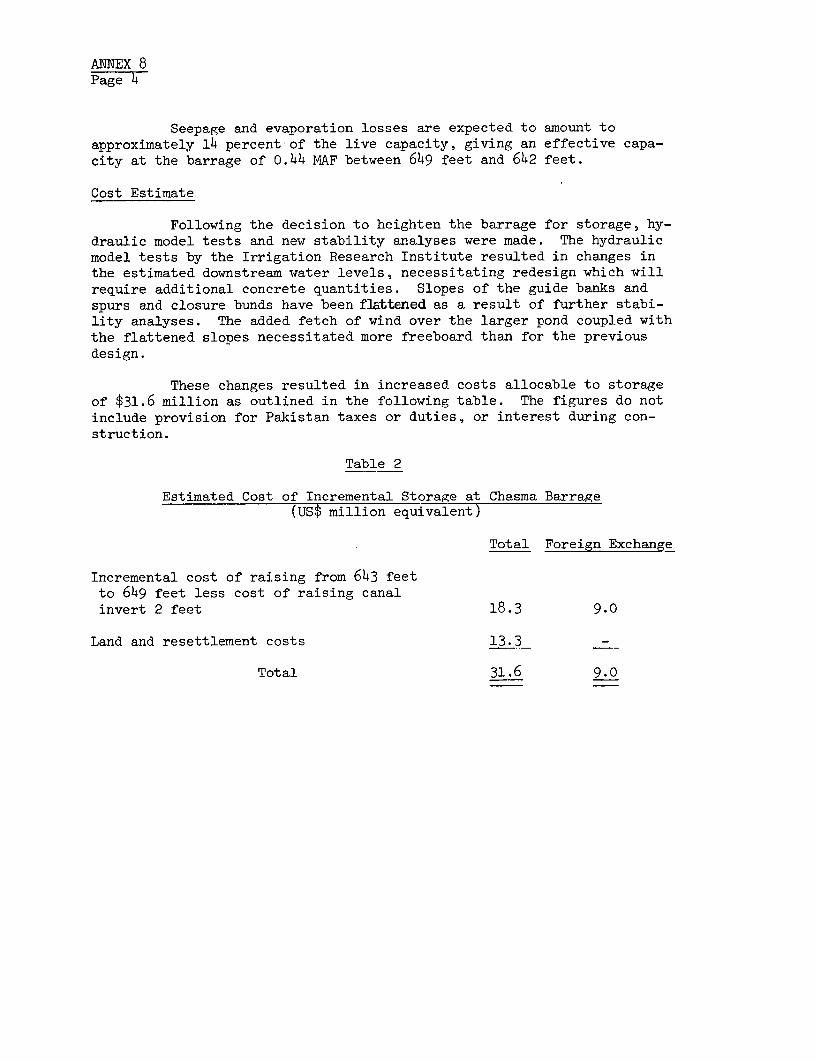
ANNEX 8Page 4
Seepage and evaporation losses are expected to amount to
approximately 14 percent of the live capacity, giving an effective capa-
city at the barrage of 0.44 MAF between 649 feet and 642 feet.
Cost Estimate
Following the decision to heighten the barrage for storage, hy-draulic model tests and new stability analyses were made. The hydraulicmodel tests by the Irrigation Research Institute resulted in changes inthe estimated downstream water levels, necessitating redesign which willrequire additional concrete quantities. Slopes of the guide banks andspurs and closure bunds have been flattened as a result of further stabi-lity analyses. The added fetch of wind over the larger pond coupled withthe flattened slopes necessitated more freeboard than for the previousdesign.
These changes resulted in increased costs allocable to storageof $31.6 million as outlined in the following table. The figures do notinclude provision for Pakistan taxes or duties, or interest during con-struction.
Table 2
Estimated Cost of Incremental Storage at Chasma Barrage(us$ million equivalent)
Total Foreign Exchange
Incremental cost of raising from 643 feetto 649 feet less cost of raising canalinvert 2 feet 18.3 9.0
Land and resettlement costs 13.3 -
Total 31.6 9.0
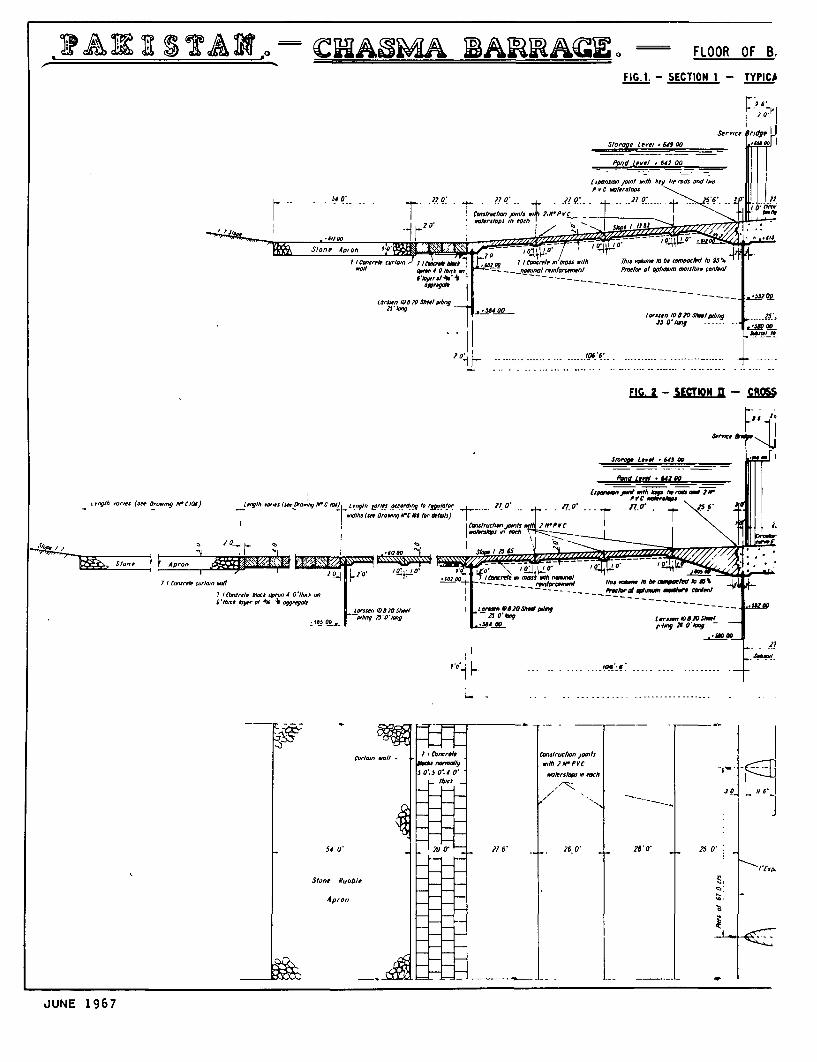
C AOMA A -A=R nZ o FLOOR OF B.
FIG .1- SECTION I - TYPICA
S/otoge Ie.e/ e 6,t oo 00
Pond level 642 00
(000 ~ ,nP,h #fy and10700 t-P v c wIrersiow
54 0' 2t0 --- J 0 206' 2 ;
eIlttg I,--_____PVC
r2rrw "festo in eo/rhnt |~-____ . 570
I,,, ' b0 -
StoneI 4pe ron *0 * -- . Oo o
ZO_~~ ~ ~ ~~~~~ p_ , t76' , at _t4w mau .of
/060 - -'I-.-.',-.
FIC. 2 - SECTIN - CROSS
51o,,qpe L-eV '4$ e0
0//kY/"I (s- e 00//ft N-C/iz) I syfi 's. 7 ' NC 104)1 L-og/h t9'w* rO to79/~ / 7' 0 ll
101/0/05(500 010wogNC1 for _14 r -r
Stone Apron
7.1 Cbcde blak apw, 4 0,1I --- - - --- --7/ fthickrre 0/0,0 2/4 0//b- - - --
6/h,oA b~~~.s- of 401 ~ x/oogqny o'e m 0006
I'l h /sg£1OAs I - 10heg>f . . X Dds -_
C_ tOSOr -10/- - F - - - - - - --n el0-/-_
,Awb w./0 .qlbN. PVCJ 0.3 0'.40 _ . 't
thick
Cvr/r/nV' el -6' - 260O' 280 '2 00n'
Slone Rubble
opron -0 /
.JUNE 1967

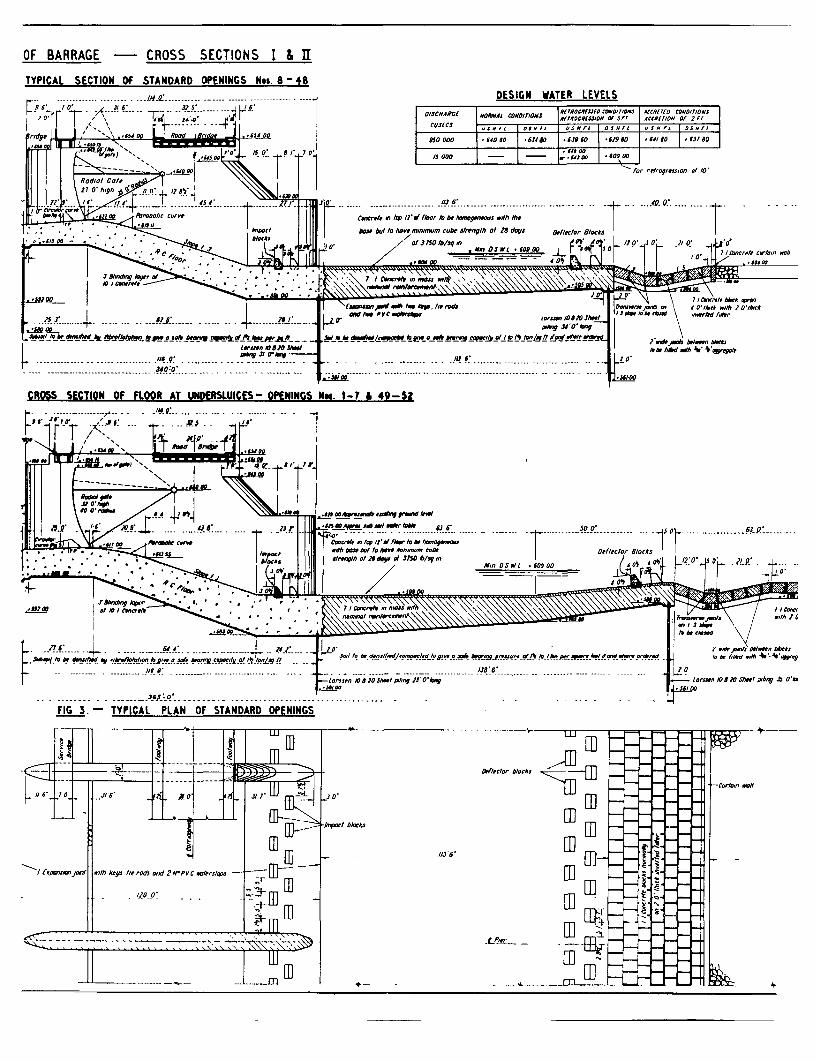
OF BARRAGE - CROSS SECTIONS I & II
TYPICAL SECTION OF STANDARD OPENINGS Nos. 8 - 48Lq-: ------ ------ ------------- - ----1 DESIGN WATER LEVELS
~~~~9 . Irt ACCRIIID COMDIIIOIVJ~~~~~~~~~~~~~~~~~~~~~to r /o t 001 UNL 1RDRIJOCu0Too ACR?0 OO/IN°Iwr r d T,,; ,, o; 2 0/5toS f7C f tIO rotto/tARG1 NORM l N N rorril ao O f 5f 3, AcRc /1o 01 2rrow 8 ; Lr ~~~~~~~~~8,- I, C'F5fC5I Cattr O tr Jt DtFIOW tt O tt
*SU Fjs''\"'°° 93;Ke',55'o,° /,70, 0000 0-0 .000 .4 0 sS110 s0o18/ w~') Do. /.0 0 7000 isooI.s0o I
= -- =--|- -. .--. - -rogre.s.o. DI /0
Z7O'~~~~~~~~~~4 4'9 J9#.! /13 t-"'l +'00/60 POIh7b0h( S' Ie C h7crW'"4o 0te 12m' floor lobe heoogwoj wdh M T '
.600/ b ' nos but to have tmw/tnwm cube ng/th of 28 dsa,s o e/leeor f0 10 0'
: ¢ = /U/ ~~~~~~~~~~~so ! ° / o/3/SOlb/4sqos . 4I/2p W "°°°l'2br?°0 1:.:-j rnt/r/n N
ea tUtne0bl$ /2y 21 O
I a^n,shtSr tw,tW/ RMP rO/DO I/O' e r. Dt - o
_inI /0'J __ ,,bl~!(A _67j2 _-~ __ Sel . P enrtr_t*wt dern/06705h"9 /J \ r/,O| / rrz ro eAD I7 ro 5._fg in Ro et /flf r
t..ll~~~~~~~~~~~~0 ,Ay3l0¶16s~~~~~~~~~~~~~~~~~~~~~..*4O,//13Wt5I ,/&340 0~~~~~~~~~~~~~~~o wPc rdA0
CRGSS SECTION OF FLOOR AT UNDERSWUICES- OPENINtS Nw. 1-7 & 49-52
10' | O r ,-- -- ---- - -- -- - - - --- - -° - -- --- -- -- -- - ----
Llil~~~~~~~~~~~l_ ....It-...... . ....------- \
CR|5 SECIO \. oF /FLORA UNOLUIES OPEING Nei.1 93------------------- : - -* * -*O _ -.. .. . I. - .. R
A O'D. 1
- 1 _ ~~~~~~~~................. ..... .. -- - -- - - J 5 _ --
| w leo ~f~Cerncrete JO "t prbn to J 0 he hONogi6 eJO
. _. . , , ,,,. . -
.4- *. . . * .1 NW lo &f Im 1 -- O,r _
lt I 11 i I t f -,MM 0 13/ho.
ll~ ~ ~ ~~~~~~- * - m - //'6 Se c/e. _
O/0l96.AglP~ eo~W ]- 3,u / Sed.s/fo.ftosool.logoesohSe .r~ WA ~ Se ,/d v/hh 4I 1 4 m
11~~~~~~~~~~~~~~~~~~~~~~~711W 1, AFR P?tt
270~~~~~ -- ,. 2 e'pc/ lekv ho/cOo> ,/r_ _ L r2
t~~~~~~1/0 w 2 J0o 180 20 sHw
11 Ij mo bI m IR
w~~~~~~jA
---_ _ --- -- -- -- -- -- ---- -- -- -- -- -- -- -

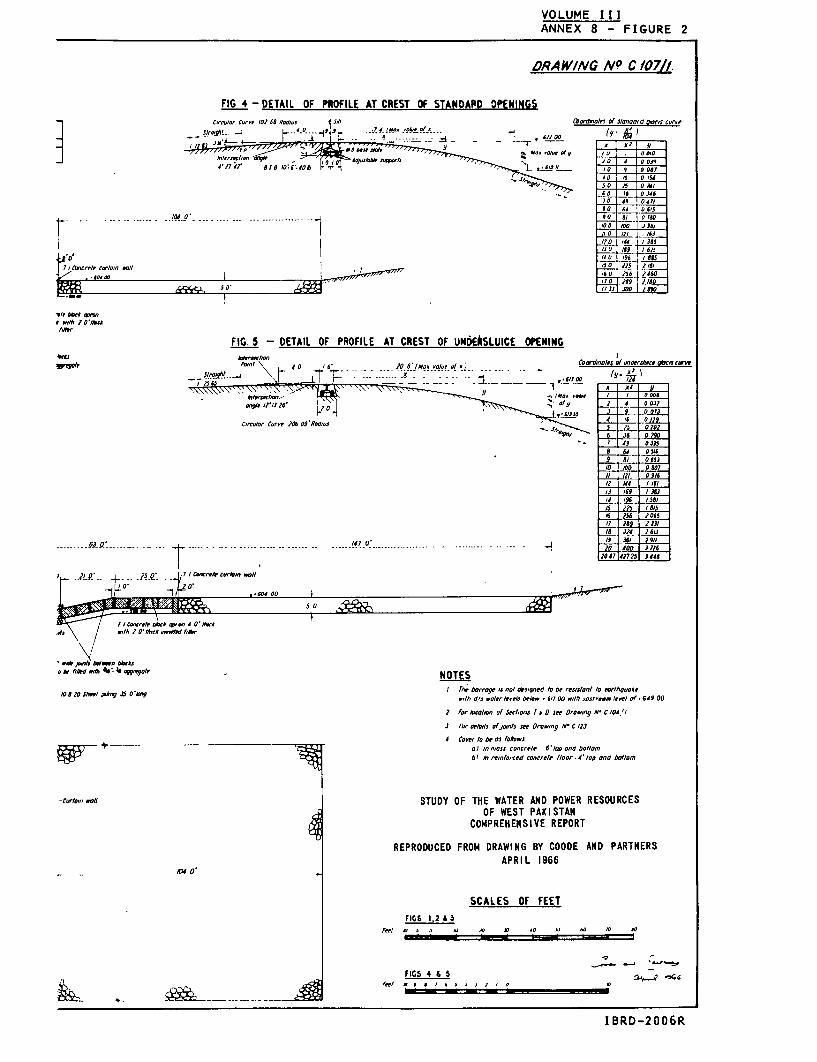
VOLUME IIIANNEX 8 - FIGURE 2
ORA WINVG N C /07/i.
FIG 4 - DETAIL OF PFOEILE AT CREST OF STANDARD OPENINGS_Com,/o C.-t.' 109 WR'//al,e s ,i (.'8wdnotes of 510/O,t 0ol oa/rs cCrUe
_ ~ ~ ~ ~ ~ ~ ~ ~ ~~- _ Sle - A 0$ o 0/ - -vr z
_ I 1Z 13 JX 5.,F w > ~~~~~~~~~~~~~~~~~~~~ < % 0. eCrr ef y x , # o e o~~~~~~~~~~~~,V ofy b o
/01 ~~~~~~~~ ~~~ 01 I
70 49 0 47/80 049 08All
/ .. 0 8 . .... _ 9 0 8/ 0 /8000 100 a 491
I/ 1/ 4-f/SO
/ICwtt c ptalp cr1n wl .. 1 a
*9/C 801o0 I , 7 1W0 6,
b'0 .. 50' r.459 I//J 20//mF 18
Awr
FIG. 5 -DETAIL OF PROFILE AT CREST OF UNDEtSLUICE OPENING'Was 40trrCo /ordyno/es lof 1*7deCOC ea CWW
--~~~ -~ ~~\h L 1 '. - - - - o5 J 9 0 073
**' 'ft0?,, 8 368 0988
pwW 4 0 1 6'~~~~~~~~~~~~~~~~~~~80 00
-- S V I9 IJ$
I 8/ 0 65/ 0 /00 0807//tI / 0018s
/ 4is 0/8/9
/3 1#. /8 /f/0
65 2 / 25
/1 28 0 S$3/
/ 8 3I4 583
/40 /w 1 S / 3 l
63. 57 _ _ 'r- --- ---------- ........ . . .. /#t O _2 20 6I00 2912[~~~~~~~~~~~~~~~~~~~~~~~~~~~28 4272sR3 3448.. 8e wOO 2 0,h/b0 //~~~~~~~~~I?/
0 14 f,2hd,16
0/_ Z!.R ... _ _. 25 0: .. f/1 I cr nr.stWO Mel0
-I I' °'OTES0 2 \81 /800101/I ofM zectIons 2/t rt II hle 0/-ow M C 0 23 P0,0.1ws of 860/ 5ff 1-000/9 N C9/2
ro e Z0 Sh l gI tn g J5 O'tDno / rhe D~~~~~~~~~~~0/ n nosro s 1 elo#ncet e 8 e /oo ren to/ 0.7/0/I? teAh d/ 0 tO//I/O/ted Conet ete foat 4 too aro"nd 1 7/-a 0
APRIL 1966 ?67~22514
~~~ 0' ~ ~ ~ 5
I~~~~~~~~~~~~~~~~~~~~~~~ Ie C-feio o/. W-on I * srOr#n C*r
bwA,$~~~~~~~~~~~~~~~~~~~~~#trrt o st/w
A OF W~~~CAEST OFK FETA
FIGSr,LE OF FEE
o be 44, 4* 4rwit NOTE~~~~~~~~~~~ee' 6 0 '0 So .6 0 / 8 / 0
FIS 1,2 & 3n
f oert be es _ ou
I BRD-2006R


ANNEX 9
SEHWAN-MANCHAR AND CHOTIARI PROJECTS

ANNEX 9Page 1
SEHWAN-MANCHAR AND CHOTIARI
Introduction 1/
The Lower Indus region does not offer large potential storagesites as are found in the North, but several small sites could be devel-oped to provide a significant addition to the rabi irrigation supplies.The most important of these are Sehwan, its associated reservoir MancharLake and Chotiari.
As proposed by the Lower Indus Project consultants (LIP), Hunt-ing Technical Services Limited, and S,r M. MacDonald & Partners, a barrage3,500 feet long would be constructed on the Indus near Sehwan to impoundwater to a maximum level of 125 feet SPD. The present river level is 93feet. Between the level necessary to command the feeder, 110 feet, andthe normal retention level of 124.5 feet9 1.0 MAF storage would be im-pounded. Of this amount, 0.8 MAF would be available at the canal headfor irrigation. The total cost of the barrage was estimated to be $114million, of which about $68 million would be in foreign exchange.
The containing bund at Manchar, 29 miles long, would be raised7 feet to about 129 feet in order to contain a normal retention level of124.5 feet. A new inlet channel of 202000 cusec capacity would be pro-vided over the course of the present Aral-Lakhi Channel and the MancharOutfall would be enlarged to 30,000 cusec capacity. The storage avail-able between 110 feet and 124.5 feet would be 1.1 MAF. An additional 0.2M4AF would be available between 105 feet and 110 feet, but it could bereleased only to the Ghulam Mohammed Command. Of the total of 1.3 MAF,about 1.0 MAF would be available at the canal head. Cost of the Mancharscheme was estimated to be $14 million.
Since full use of Manchar could not be made without the exis-tence of the Sehwan Barrage, because the operation of the two would beclosely linked and because the water stored could not be utilized in theSehwan Command without the Sehwan Feeder, the entire complex may betreated as a unit. The total cost for the barrage, feeder, and Mancharworks was estimated at $177 million. However, LIP indicated that theconstruction of the barrage would save extensive remodeling of much ofthe Rohri and Nara Canals and therefore the $150 million estimated costof remodeling should be deducted to determine the true cost of storage.The resultant cost is $27 million which produces a unit cost of about $12per acre foot and represents very low-cost storage in West Pakistan.
On the other hand, Sir Alexander Gibb & Partners examined theproject during the preparation of their Tarbela Report and concluded thata more conservative approach might be warranted. In particular, they felt
1/ Most of the information for this annex was taken from the LowerIndus Report by Hunting Technical Services Limited and Sir M.MacDonald & Partners, 1965 and 1966.
ANNEX 9Page 2
that remodeling of the Rohri and Nara Canals might not be a practicalalternative and therefore charged the entire amount of $177 million againststorage. They also added a contingency of 25 percent, or $44 million, toprovide for technical uncertainties. The total cost thus becomes $221million and the unit cost $96 per acre foot of storage.
Chotiari Reservoir would be a development of Chotiari Lakelocated on the eastern fringe of the present Sukkur Left Bank Command nearthe junction of the Khipro and Mithrao Canals. A bund 14 miles long wouldbe constructed to an elevation of 89 feet to permit impounding to a levelof 85 feet. Live capacity would be 1.1 MAF and the storage available atcanal head would be about 0.9 MAF. The reservoir would be filled by waterfrom the existing Nara Canal, which would discharge up to its present capa-city. A new outlet would be provided to the Khipro Canal. Approximately8,500 acres of additional waterlogged, abandoned land would be inundated bythe reservoir. Cost of the project was estimated to be $12 million or about$11 per acre foot. If a contingency of 25 percent for technical uncertain-ties were added, the cost would be $15 million or about $14 per acre foot.
The construction period envisaged by LIP for Sehwan Barrage extendsfrom 1969 to 1976, for Sehwan Feeder from 1970 to 1985, for Manchar from 1979to 1982, and for Chotiari from 1986 to 1990. Thus storage of 1.0 MAF wouldbe available from Sehwan in 1976, 1.3 MAF from Manchar in 1982, and 1.1 MAFfrom Chotiari in 1990. The Bank Group envisages completion of Sehwan-Mancharin 1982 and Chotiari in 1990.
Two major problems confronting storage projects in the LowerIndus region are evaporation losses and seepage losses. The reservoirsare located in shallow basins which give rise to large surface areas rela-tive to the volumes of water stored. This factor, together with the hightemperature and low humidity of the region, leads to large evaporation losses.In addition, the reservoirs are all underlain to varying depths by sandyaquifer which results in high seepage losses. It was estimated by LIP thatlosses due to evaporation and seepage during the three to four month opera-ting season would be on the order of 20 percent to 30 percent of the storagecapacity involved. Considering these conditions and the additional problemof sedimentation, LIP suggested that it would be imperative for the reser-voirs to be filled as late as possible in the flood season and drawn downrapidly at the beginning of the rabi growing season.
Investigations
Ground surveys were taken above the existing water levels. Wherethe greater part of the storage area lay under water, hydrographic surveyswere also carried out. In addition, aerial photographs were utilized wherethey were available.
A study of sedimentation was carried out at Kalri Lake. Thelake presented a good opportunity to measure the effects of sedimentationbecause it had been in use as a reservoir only a short time, and, sincethe volume of water passing through it is several times its capacity, itexperiences an accelerated rate of sedimentation.
ANNEX 9Page 3
Probings and soundings were first taken in the beginning ofhydrological year 1964 to establish the then existing and previous bedlevels. In the two successive years, soundings were taken and the dif-ferences in bed level used to determine the volume of sediment deposits.
Water samples were taken from the Indus and from the Kalri-BagharFeeder and analyzed for sediment load in order to determine the relationshipbetween the sediment load in the river and in the canal and to establish adensity for the sediment deposits.
Observations were made at several climatological stations toestablish evaporation rates. Seepage was studied in connection with canaldevelopment.
It was suggested that the study started at Kalri Lake on sedimen-tation be continued and that a similar program be undertaken at Manchar Lake.It was also suggested that investigations on reservoir evaporation shouldcontinue.
Geology
The reservoirs of the Lower Indus region are generally underlainby a sandy aquifer ranging in depth from 100 feet at Manchar to over 500feet on the Indus left bank at Sehwan. These conditions lead to heavyseepage losses.
Borings in the vicinity of the proposed Sehwan headpond indicatedthat on the right bank of the Indus, the aquifer varies in depth from about100 feet at the barrage to some 400 feet near the town of Dadu. The averagedepth on the left bank is about 500 feet. Soils in the active flood plainare mostly sandy.
At Manchar, most of the upper soil is of piedmont origin althoughin the northern part of the lake it is probably Indus alluvium. Borings inthe area produced mixed clays and sands. The nearest boring to the lake, atBubak, showed 100 feet of sand at the top. Rock outcrops to the south andeast of the lake indicate that the available depth of aquifer is restricted.
The aquifer at Chotiari is composed mainly of fine to medium sandand extends to a depth of about 250 feet.
Hydrology
In order to reduce sedimentation to a minimum and to ensure themaximum scouring of the headpond at Sehwan, it is advisable to fill thereservoirs as late in the flood season as possible. Consequently, LIP ex-amined the recession curve of the Indus upstream of Sukkar Barrage and foundthat some 50 days elapse between a 10--day average discharge of 10.0 MAF anda 10-day average discharge of 1.0 MAF. Thus, the period might extend fromthe end of August to the third week in October and would be a propitioustime for filling the reservoirs. A total flow of about 13 MAF occurs duringthe period, of which approximately 7 MAF is available for storage at thepresent time.
ANNEX 9Page 4
Studies also indicate that the sediment load of the Indus is at aminimum during this part of the flood season. The mean sediment load forthe period June through September is about 2,500 ppm. It reaches a peak ofover 3,000 ppm in August, then falls rapidly to less than 1,000 ppm at theend of September.
However, as development of the use of surface water proceeds else-where in the system, the filling of reservoirs will have to begin earlier,and the rate of sedimentation will increase.
Proposed Desigps
Sehwan Barrage, 3,500 feet in length, would be constructed toimpound water to a maximum level of 125 feet. The present river level is93 feet. It would be designed to pass a flood discharge of 1 million cusecs.A marginal bund would be provided on the right and left flanks to protectthe right bank outfall drain and the Sehwan Feeder. The bunds would be con-tinued northwards to join the existing river bunds which would be raisedalong both sides of the river to a point just north of Dadu, or a distanceof about 55 miles. The present bund level at the barrage site is 124 feet,and it would be raised to 130 feet. Head regulators would be provided onthe left bank for the Sehwan Feeder and on the right bank for the Aral-Manchar inlet channel.
Between the normal retention level of 124.5 feet and 93 feet,, theheadpond would store 1.1 MAF of water. The amount available to the SehwanCommand would be the 1.0 MAF stored between 124.5 feet and 110 feet, thelevel necessary to command the Sehwan Feeder. The volume below 110 feetcould actually be considered dead storage. It might be released to GhulamMohammed, but the headpond would have to be filled to 110 feet again beforeit could supply the feeder, and at a time when the river supplies are short.The volume release thus would represent a net loss to the Sehwan Command.Of the 1.0 MAF available to Sehwan at the headpond, about 0.8 MAF would bedelivered at the canal head.
The Sehwran Feeder would have a maximum discharge capacity of35,800 cusecs and would run about 75 miles from the barrage to the Mithraoand Khipro canal heads.
The containing bund at Manchar is presently at a level of 122 feetto impound water to 117 feet and would be raised to about 129 feet to permita normal retention level of 124.5 feet. A new inlet channel with capacityof 20,000 cusecs and a head regulator of the same capacity would be providedover the same course as the present Aral-Lakhi Channel. It would also actas an outlet for Manchar when the lake is drawn down in connection withSehwan headpond for supplying the Sehwan Command. A regulator of 30,000cusec capacity would be installed to discharge water to the Indus downstreamof Sehwan Barrage through the Manchar Outfall which would be enlarged toequal capacity. Such a large capacity would be necessary to handle flashfloods from the hill torrents.
ANNEX 9Page 5
The Main Nara Valley Drain, which will become the Right Bank Out-fall Drain, would be realigned to bypass the lake. It would pass under theinlet channel in a syphon and join the Manchar Outfall to discharge intothe river. This diversion is necessary because the high water levels en-visaged would cause serious backing in the drain and the cost of works toprevent the consequent flooding would be prohibitive.
The storage capacity of Manchar between the normal retention levelof 124.5 feet and 110 feet would be 1.1 M4AF, all of which could be used inthe Sehwan Command. An additional 0.2 MAF would be contained between 110feet and the minimum drawdown level of 105 feet, but it would be availableonly to the Ghulam Mohammed Command since the Sehwan Feeder could not becommanded below 110 feet. Of the total 1.3 M-AF storage, LIP estimated that1.0 MAF would be available at the canal head.
Chotiari Reservoir would cover a total area of more than 50,000acres, of which 8,500 acres is additional land which would be inundated asa result of the higher retention level. However, this land is at presentwaterlogged and abandoned and would not represent any significant loss. Abund 14 miles long would be constructed to a level of 89 feet to impoundwater to a level of 85 feet giving a live capacity of 1.1 MAF and an effec-tive capacity at the canal head of 0.9 MAF.
The reservoir would be filled by the existing Nara Canal whichwould be realigned to feed directly into the lake. Inlet and outlet regula-tors would be provided, the latter for controlling discharge to the KhiproCanal system.
Operation
LIP submitted two basic principles which should be observed inorder to make the most effective use of water stored in reservoirs in theLower Indus region. The first is that filling should be accomplished onthe falling hydrograph as late in the flood season as possible to reducesedimentation. This stipulation has the further advantage of shorteningthe time between impounding and depletion. The second is that depletionshould be started as soon as possible and should be accomplished rapidly.Adherence to these guidelines would not only serve to minimize permanentloss of storage capacity due to sedimentation, but would also minimizeevaporation and seepage losses.
Evaporation losses vary directly with the surface area of thereservoir and the temperature, and inversely with the humidity. Unfor-tunately9 the conditions in the region are all adverse in that the poten-tial reservoirs are shallow with large surface areas in comparison to thecapacity, the temperature is high, and the humidity is low. Eight to ninefeet of water could be lost in a full year. Although almost two-thirds ofthe losses occur during the summer months between April and November, theyare still significant during the winter months when the reservoirs would bedrawn down.
ANNEX 9Page 6
Since the reservoirs are underlain by sandy aquifer of varyingdepths, high seepage losses would result. These were estimated for eachlocation on the basis of a study of canal seepage. However, the calcula-tion thus derived produced overestimates because the hydraulic head woulddiminish as the reservoir level decreased and the rapid drawdown of thereservoir would not be accompanied by an equally rapid drawdown of theadjacent water table. Taking all factors into consideration, LIP esti-mated that the losses due to evaporation and seepage over the three tofour month operating season of the reservoirs would amount to 20 to 30percent of the live capacity.
Sedimentation rates were determined on the basis of the sedimentload/discharge relationship of the Indus and the study conducted at KalriLake. It was found that the sediment load in the river and that in theKalri-Baghar Feeder Canal were approximately the same and therefore thequantities obtaining for the Indus could be used for off-river storage aswell. By comparing the volume of sediment deposits as determined by mea-surements in Kalri Lake with the discharge into the lake, LIP found thatthe in situ density of the sediment was about 75 pounds per cubic foot.This figure was then used in estimating the useful life of the proposedreservoirs.
Sehwan and Manchar would be operated as an integrated system.Filling would begin after the flood peak in August and would be completedby the end of October. Aside from the problem of sedimentation, late fill-ing would have an added advantage in the case of Manchar because it is notuntil September that the danger of hill floods is past. Approximately 0.5MAF of Manchar's storage capacity would be filled by drainage from the MainNara Valley Drain. Sehwan would be filled until it reached the same level,then the two would be filled simultaneously. Fortunately, the greater partof Sehwan storage would be contained between the bunds in the area over theflood plain. Since both the Sehwan Feeder and the Aral-Manchar Channelcould be commanded at a level of 110 feet, at which point the Indus is stillwithin its own channel, it would not be necessary to fill the headpond be-fore supply of the feeder or the filling of Manchar in years of low drainagecould commence.
Storage would be used as soon after impoundment as possible inorder to minimize evaporation and seepage losses. To this end, the inte-gration of groundwater and surface water would be of great advantagebecause surface water would be used early in rabi and groundwater later.It was estimated by LIP that evaporation and seepage losses would amountto about 0.2 MAF in the case of Sehwan, which would benefit to some extentfrom regeneration in the Sukkur-Sehwan reach, and approximately 0.3 MAF inthe case of Manchar. Thus, of the 1.0 MAF impounded above 110 feet atSehwan, 0.8 MAF would be available at the canal head, and of the 1.3 M4AFabove 105 feet at Manchar, 1.0 MAF would be available at the canal head.
Since it would be preferable to use the stored water in the SehwanCommand, the headpond would have to be drawn down before the lake or simul-taneously with it. When the level in Manchar decreased to 110 feet, no
ANNEX 9Page 7
additional water could be supplied to the Sehwan Command, and the remainderof about 0.2 MAF down to level 105 feet would have to be discharged throughthe outfall to Ghulam Mohammed. A minimum level of 105 feet should be main-tained at Manchar to ensure fish survival.
During the major part of the flood season, it would be possibleto command the Sehwan Feeder with the gates of the barrage fully open, thusenabling the surplus flows to scour the headpond. Filling would be accom-plished late in the flood season when the sediments load of the Indus haddiminished. Under these conditions, and on the basis of the studies atKalri Lake, LIP estimated that the headpond would be reduced to half itslive storage capacity, or 0.5 MAF, in approximately 30 years. On the otherhand, Manchar, which would be filled only once each year and would not havethe great quantities of excess water passing through it, was estimated toreduce to half its live storage in some 300 years.
Since Manchar would receive a portion of its storage from the MainNara Valley Drain, the problem of salinity must be considered. If the lakereceived drainage water during July and August and were then filled withriver water, the salinity at the beginning of the release period in Novemberis expected to be in the neighborhood of 550 ppm which would have no detri-mental effect on crops. The storage would, in any case, be passed throughSehwan headpond before reaching the fields. However, the situation must bekept under review since the river water will probably become more saline asdrainage schemes are established in the North.
Chotiari would be operated on a basis similar to the Sehwancomplex, being filled from the existing Nara Canal late in the flood seasonand drawn down as rapidly as needed to meet the demands of the Khipro Canalsystem during the first part of the rabi growing season. Evaporation andseepage losses are expected to amount to about 0.2 MAF, giving an effectivestorage available at the canal head of 0.9 MAF. Again, being an off-riverreservoir and experiencing only one filling each year, Chotiari is expectedto reduce to half its live storage in about 300 years.
Program for Construction
Construction of Sehwan-Manchar as proposed by LIP would take placein two stages. During Stage 1, to be started in 1969 and completed by 1976,the barrage and headpond would be constructed to accommodate the maximumwater level of 125 feet. The Sehwan Feeder would be taken as far as theRohri Canal. During Stage 2, to be completed by 1982, the Manchar bundswould be raised to permit the normal retention level of 124.5 feet and theinlet and outlet works would be completed. The feeder would be extended tothe Nara Command. Construction of Manchar actually would be started in 1979,while the program for the feeder would be continuous from 1970 with finalcompletion by 1985. The Bank Group envisages an integrated program withcompletion of all Sehwan-Manchar works by 1982. Chotiari would be con-structed during the period from 1986 to 1990.
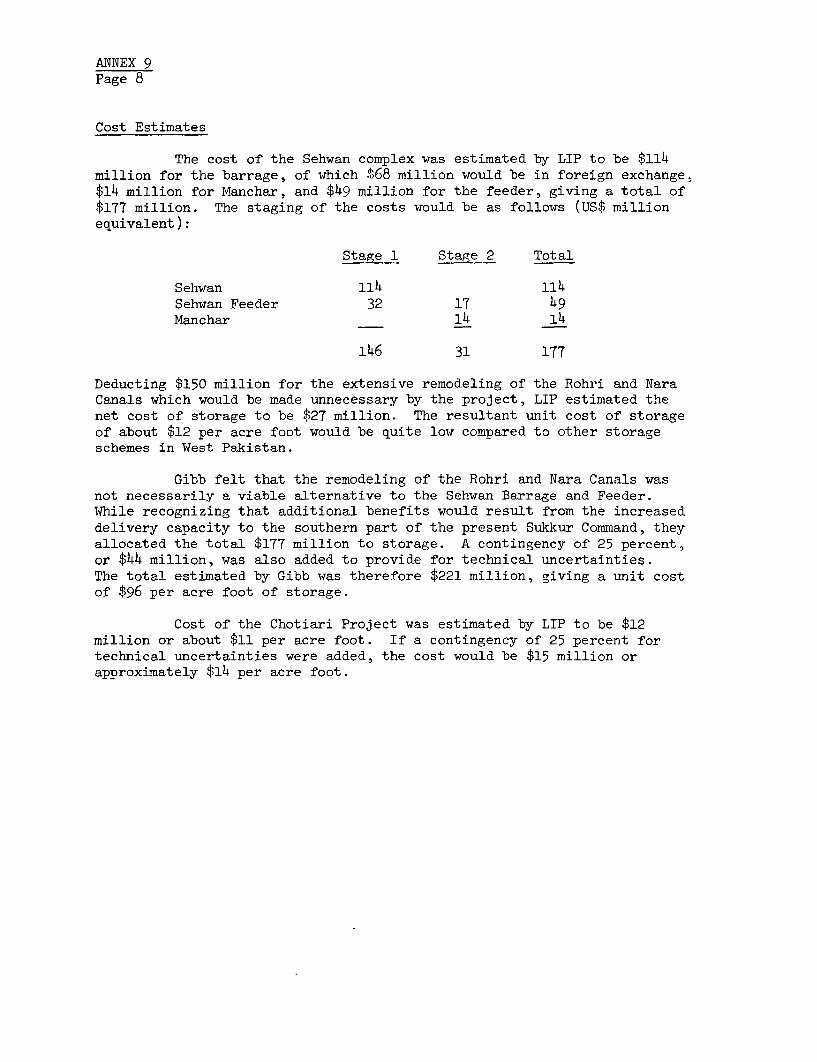
ANNEX 9Page 8
Cost Estimates
The cost of the Sehwan complex was estimated by LIP to be $114million for the barrage, of which Mt68 million would be in foreign exchange,$14 million for Manchar, and $49 million for the feeder, giving a total of$177 million. The staging of the costs would be as follows (US$ millionequivalent):
Stage 1 Stage 2 Total
Sehwan 114 114Sehwan Feeder 32 17 49Manchar 14 14
146 31 177
Deducting $150 million for the extensive remodeling of the Rohri and NaraCanals which would be made unnecessary by the project, LIP estimated thenet cost of storage to be $27 million. The resultant unit cost of storageof about $12 per acre foot would be quite low compared to other storageschemes in West Pakistan.
Gibb felt that the remodeling of the Rohri and Nara Canals wasnot necessarily a viable alternative to the Sehwan Barrage and Feeder.While recognizing that additional benefits would result from the increaseddelivery capacity to the southern part of the present Sukkur Command, theyallocated the total $177 million to storage. A contingency of 25 percent,or $44 million, was also added to provide for technical uncertainties.The total estimated by Gibb was therefore $221 million, giving a unit costof $96 per acre foot of storage.
Cost of the Chotiari Project was estimated by LIP to be $12million or about $11 per acre foot. If a contingency of 25 percent fortechnical uncertainties were added, the cost would be $15 million orapproximately $14 per acre foot.