
Vol-6 Issu-2 GJEIS
124
Global Journal of Enterprise Information System Vol. 6 / Issue. 2 April - June, 2014 Pages: 1 - 113 ISSN (Print): 0975-153X | ISSN (Online): 0975-1432 Call for Articles GJEIS in collaboration with Informatics Publishing Limited and KARAM Society, publishes a new peer-reviewed open access e-journal in Enterprise Information System (EIS) areas of business which covers IT linkages in business, finance, marketing, management, organizational behaviour, buyer behaviour and other relevant fields. It also covers many aspects in Information System and related areas. The journal provides an international forum for the exchange of ideas, principles and processes concerning the application of diverse topics of EIS to organizations, institutions and the world at large. Global Journal of Global Journal of Enterprise Information System Enterprise Information System ISSN: 0975-153X (print) ISSN: 0975-1432 (online) Submit article online: http://www.gjeis.org Type of Articles We are soliciting different types of article which mainly focused on research issues in the EIS and IT related areas. 1. Empirical Research Papers (ERP) report on completed EIS research that complies with rigorous scientific standards. ERP present original results of completed research studies with the aim of obtaining feedback from fellow researchers. [Page Limit 16 pages] 2. Theme Based Papers (TBP) are short papers that present the design and preliminary results of ongoing EIS research studies with an endeavor of obtaining early feedback and further guidance from experts and peers. TBP will be evaluated using the same academic standards as regular research papers (except for completeness requirements). [Page Limit 12 pages] 3. Case Study Based Papers (CSBP) describes real-life experiences with EIS that authors wish to share with fellow practitioners and EIS researchers. They focus on problems and solutions in specific contexts. Their aim may be to help other practitioners facing similar problems or to solicit help and possible solutions from other practitioners (or EIS researchers). [Page Limit 10 pages] 4. View Point (VP) is a situation for which something is pragmatic or considered as a point of view. The purpose of VP is to share different views about the IT related products and what individual think about that. [Page Limit 8 pages] 5. Book Review (BR) is a form of literary criticism in which a book is analyzed based on content, style, and merit. BR can be a primary source opinion piece, summary review or scholarly review. Books can be reviewed for printed periodicals, magazines and newspapers, as school work, or for book websites on the internet. A book review’s length may vary from a single paragraph to a substantial essay. Such a BR may evaluate the book on the basis of personal taste. Reviewers may use the occasion of a book review for a display of learning or to promulgate their own ideas on the topic of a fiction or non-fiction work. [Page Limit 3 pages] 6. Biographical Note of the Luminary in an Area of IS We as per our culture acknowledge in every issue a great leader, Entrepreneur, Technocrats, Academician etc., who contribute a lot to a society in an area of IS. [Page Limit 2 pages] 7. Great Enterprise Contribution to Society in Information System Perspectives deals with those enterprises contributing a lot to the society, and considering themselves a wizard in the field of Information System, we publish their profile, with the intention that their creation/contribution would be viewed and duly appreciated by the corporate and academics, all-around the globe. The purpose behind this is to broadcast the most visually powerful, immersive and engaging rich media applications on the Web. [Page Limit 2 pages] 8. Award is something given to a person or a group of people to identify their fineness in a definite field especially in an area of EIS, it is rather a certificate of excellence for their contribution in academia or in a corporate world. This start throws a light on an entity or a gamut of researcher who had been honored for their extra ordinary input. [Page Limit 1 page] Vol. 6 Issue. 2 | April - June, 2014 Dr. Subodh Kesharwani Editor-in-Chief www.gjeis.org www.informindia.co.in Co-published by GJEIS GJEIS © 2014, KARAM Society and Informatics Publishing Limited
-
Upload
independent -
Category
Documents
-
view
3 -
download
0
Transcript of Vol-6 Issu-2 GJEIS

Global Journal of E
nterprise Information S
ystemV
ol. 6 / Issue. 2 A
pril - June, 2014P
ages: 1 - 113
ISSN (Print): 0975-153X | ISSN (Online): 0975-1432
Call for ArticlesGJEIS in collaboration with Informatics Publishing Limited and KARAM Society, publishes a new peer-reviewed open access e-journal in Enterprise Information System (EIS) areas of business which covers IT linkages in business, finance, marketing, management, organizational behaviour, buyer behaviour and other relevant fields. It also covers many aspects in Information System and related areas. The journal provides an international forum for the exchange of ideas, principles and processes concerning the application of diverse topics of EIS to organizations, institutions and the world at large.
Global Journal of
Global Journal of Enterprise Information System
Enterprise Information System
ISSN: 0975-153X (print)ISSN: 0975-1432 (online)
Submit article online: http://www.gjeis.org
Type of Articles
We are soliciting different types of article which mainly focused on research issues in the EIS and IT related areas.
1. Empirical Research Papers (ERP) report on completed EIS research that complies with rigorous scientific standards. ERP present original results of completed research studies with the aim of obtaining feedback from fellow researchers. [Page Limit 16 pages]
2. Theme Based Papers (TBP) are short papers that present the design and preliminary results of ongoing EIS research studies with an endeavor of obtaining early feedback and further guidance from experts and peers. TBP will be evaluated using the same academic standards as regular research papers (except for completeness requirements). [Page Limit 12 pages]
3. Case Study Based Papers (CSBP) describes real-life experiences with EIS that authors wish to share with fellow practitioners and EIS researchers. They focus on problems and solutions in specific contexts. Their aim may be to help other practitioners facing similar problems or to solicit help and possible solutions from other practitioners (or EIS researchers). [Page Limit 10 pages]
4. View Point (VP) is a situation for which something is pragmatic or considered as a point of view. The purpose of VP is to share different views about the IT related products and what individual think about that. [Page Limit 8 pages]
5. Book Review (BR) is a form of literary criticism in which a book is analyzed based on content, style, and merit. BR can be a primary source opinion piece, summary review or scholarly review. Books can be reviewed for printed periodicals, magazines and newspapers, as school work, or for book websites on the internet. A book review’s length may vary from a single paragraph to a substantial essay. Such a BR may evaluate the book on the basis of personal taste. Reviewers may use the occasion of a book review for a display of learning or to promulgate their own ideas on the topic of a fiction or non-fiction work. [Page Limit 3 pages]
6. Biographical Note of the Luminary in an Area of IS We as per our culture acknowledge in every issue a great leader, Entrepreneur, Technocrats, Academician etc., who contribute a lot to a society in an area of IS. [Page Limit 2 pages]
7. Great Enterprise Contribution to Society in Information System Perspectives deals with those enterprises contributing a lot to the society, and considering themselves a wizard in the field of Information System, we publish their profile, with the intention that their creation/contribution would be viewed and duly appreciated by the corporate and academics, all-around the globe. The purpose behind this is to broadcast the most visually powerful, immersive and engaging rich media applications on the Web. [Page Limit 2 pages]
8. Award is something given to a person or a group of people to identify their fineness in a definite field especially in an area of EIS, it is rather a certificate of excellence for their contribution in academia or in a corporate world. This start throws a light on an entity or a gamut of researcher who had been honored for their extra ordinary input. [Page Limit 1 page]
Vol. 6 Issue. 2 | April - June, 2014
Dr. Subodh KesharwaniEditor-in-Chief
www.gjeis.org
www.informindia.co.in
Co-published byGJEIS
GJEIS
© 2014, KARAM Society and Informatics Publishing Limited

Shri Dharmasthala ManjunatheshwaraInstitute for Management Development (SDMIMD)
No.1, Chamundi Hill Road, Siddharthanagar Post Mysore - 570011, Karnataka, India
SDMIMD Journal of Management
Call for Articles
Shri Dharmasthala Manjunatheshwara Institute for Management Development (SDMIMD), Mysore, in collaboration with Informatics (India) Ltd., publishes SDMIMD Journal of Management (SDMIMD JOM) a peer-reviewed journal in the field of management, which covers all aspects of business and related areas.
The journal appears in both print and online version, published twice a year in March and September. This journal provides an international forum for exchange of ideas and developments concerning the application of management techniques in different areas and organizations.
SDMIMD Journal of Management is now indexed in EBSCO, J-Gate and is under consideration in some more indexing services.
The Journal invites articles for its next issue coming in March 2015.
Submit article online: http://www.sdmimdjournal.in/
We are soliciting the following types of articles in each issue:
Research Papers:These are typically articles focusing on any topic pertaining to a management discipline and providing a deep review and analysis to make an interesting reading. The paper addresses an issue seeking solutions to vexing problems or explores the issue to uncover the hidden facts throwing new light. The most important question to address is what is new in this paper.
Book Reviews:The book reviews are intended to provide an insight to the readers about a management classic or a recent book. The aim is to critically evaluate the contents of the book to explore its relevance and usefulness to the readers. This normally is about 1 to 2 pages long and appropriately paragraphed to make easier reading.
Case Studies:Case studies provide a glimpse of the actual situation that needs a solution or illustrates an interesting decision making scenario. All types of case studies are welcome. They could be based on primary research or secondary data.
ISSN: 0976-0652 (Print)ISSN: 2320-7906 (Online)

ScopeGlobal Journal of Enterprise Information System (GJEIS) aims to provide comprehensive coverage and understanding of the social, cultural, organizational, and cognitive impacts of information technologies and advances on an enterprise around the world. GJEIS is a peer-reviewed journal with 4 issues per year published by Informatics Publishing Limited on behalf of KARAM Society. This publica-tion expands fundamentally the body of knowledge regarding the impact of technologies and utilization in contemporary enterprise, assisting researchers and practitioners to work out more effectual systems for managing the human side of enterprise.
Editor-in-ChiefDr. Subodh KesharwaniAcademic Block-C Room-18, School of Management Studies,Indira Gandhi National Open University, New Delhi-110068, IndiaMobile: +91-8010224545 Office: +91-1129573018 E-mail: [email protected]
Subscription InformationSubscription includes print version with online access. Annual subscription rate for 4 issues: INR 3500 /USD 350. Please send a cheque in favour of Informatics Publishing Limited and send it to the below address:
Informatics Publishing LimitedNo. 194, R V Road, Basavanagudi, Bangalore-560004, India.Ph: 080-40387777
To subscribe please write to [email protected].
Submission of ManuscriptsManuscripts can be submitted online at http://www.gjeis.org. Please follow submission guidelines before submitting the manuscript.
Advertising InformationEnquiries about advertising should be directed to [email protected]
PlagiarismThe Editors of Global Journal of Enterprise Information System run the plagiarism check for all submitted manuscripts before publishing.
All correspondence regarding the journal should be addressed to:
Informatics Publishing Limited No. 194, R V Road Basavangudi Bangalore-560004, IndiaEmail : [email protected]: 080-40387777
Copyright StatementCopyright © 2014 KARAM Society and Informatics Publishing Limited. All rights reserved. No part of this publication may be repro-duced, stored in a retrieval system, or transmitted in any form or by any means without the prior written permission in writing from the copyright holder.
DisclaimerThe Publisher, Informatics Publishing Limited, KARAM Society and the Editor cannot be held responsible for errors or any consequences arising from the use of information contained in this journal. The views and opinions expressed do not necessarily reflect those of the Publisher and the Editor. Every effort is made by the editorial team and the Publisher to avoid inaccurate or misleading information appear-ing in GJEIS. Data within the individual articles and advertisements are the responsibility of the authors or advertisers. The publishers and members of editorial team accept no liability for the consequences of any such inaccurate or misleading data, opinion, or statement.
Global Journal of EntErprisE information systEm
G J E I S

Editor-in-Chief
Subodh KesharwaniSchool of Management Studies, Indira Gandhi National Open University, New Delhi [email protected]
Editorial Advisory Board
Amar NathFounder President, KARAM Society, New Delhi, India.
Mitch Charkiewicz Professor of Economics, Central Connecticut State University.
David L OlsonJames and H.K. Stuart Chancellor’s Distinguished Chair, Department of Management, University of Nebraska, United States.
Gerhard ChroustProfessor Emeritus for Systems Engineering and Automation, Institute of System Sciences at the Johannes Kepler, University of Linz, Austria.
Anthony RossRockwell Automation Endowed Chair in SCM, Sheldon B. Lubar School of Business, University of Wisconsin, Milwaukee.
M P Gupta Professor, Department of Management Studies, Indian Institute of. Technology, Delhi, India.
G S SinghAdvisor, CRISIL Limited, CRISIL House, Powai, Mumbai, India.
Abid HaleemDepartment of Mechanical Engineering, Jamia Millia Islamia, New Delhi, India.
Prem VratProfessor of Eminence, MDI, Gurgaon, India.
Pradip Peter DeyProfessor, School of Engineering and Technology, National University, San Diego, United States.
Ramendu RoyProfessor, Motilal Nehru Institute of Research & Business Administration, University of Allahabad., India.
Charles MøllerCenter for Industrial Production, Aalborg University, Fibigerstræde, Denmark.
Vinay Kumar NangiaGovt. of India Chair Professor in Knowledge Economy, India.
Jitendra K DasDirector, FORE School of Management, New Delhi, India.
Belur V DasarathyEditor-in-chief of Information Fusion, and an IEEE Fellow Huntsville, USA.
Paul HawkingDirector, SAP Academic Program, Victoria University, Australia, Austria.
Young Bai MoonProfessor. School of Information Studies Syracuse University, United States.
Paul H RosenthalProfessor of Information Systems California State University, Los Angeles.
Sohail ChaudhryVillanova School of Business, Villanova University, United States.
Kripa ShankerFormer Vice Chancellor, UP Technical University and Deputy Director, IIT Delhi, India.
Roy J GirasaProfessor of Law, Lubin School of Business, Pace University, New York.
Vinay Kumar PathakVice Chancellor,Vardhaman Mahaveer Open University, Kota, India.
A K SainiProfessor, University School of Management Studies, GGS Indraprastha University, New Delhi, India.
Prashant GhoshSenior Professor, Department of Economics, University of Allahabad, India.
Glenda EoyangExecutive Director, Human Systems Dynamics Institute, Minnesota.
Sanjaya MishraDirector, Commonwealth Educational Media Centre for Asia (CEMCA), New Delhi, India.
Katalin DobraiProfessor, Faculty of Business and Economics, University of Pécs.
Pascal ChazotElected Member of Parliament representing French Overseas, France.
C P VashistDelhi Library Association, New Delhi.
Editorial Review BoardMamoon AlameenThe Australian College of Kuwait, Kuwait.
Umashankar VenkateshProfessor of Marketing, IMI, New Delhi, India.
Rahul SharmaDirector, International Zinc Association, India.
Urvashi MakkarDirector, Institute of Management Studies, Ghaziabad.
G P SahuMotilal Nehru National Institute of Technology, New Delhi, India.
Siddhartha DashCountry Head- PSU clients, UTI Mutual Fund, India.
Nagender YadavDepartment of Commerce, Dr. Shakuntala Misra University, Lucknow, India.
Vinod DumblekarFounder and CEO Mantis. New Delhi, India.
Y S VagrechaProfessor of Psychology, Addis Ababa University,Ethiopia.
Vaidhei SubramaniHon. Executive Director, Akshay Pratishthan, New Delhi,India.
Naresh GillSecretary, Knowledge Resource Development & WelfareGroup, New Delhi, India.
Pradeep KhareMP Bhoj University, New Delhi, India.
Anurag SharmaMedanta - the Medicity, India, Gurgaon, India.
Amit AgarwalFormer Chairman Allahabad Branch CIRC of Institute ofChartered Accountants, India.
A S Durga PrasadPresident, Institute of Cost Accountants of India,Kolkata, India.
Manoj KulshreshthaHead Campus Placement Cell and Faculty at School of Engineering and Technology, IGNOU, New Delhi, India.
Brijesh RawatDirector, Seth Padam Chandra Jain, Agra University, India.
N C JainInstitute of Computer Applications and Management(BVICAM), New Delhi, India.
Sriparna BasuProfessor of HR, IMI, New Delhi, India.
Alka TomarExecutive Director and Team Leader CMS Environment,New Delhi, India.
Santosh Kumar PandeyDepartment of Information Technology, Board of Studies,ICAI, India.
Namita RajputSri Aurobindo College, University of Delhi, India.
Ashish AgarwalSchool of Engineering & Technology, IGNOU, New Delhi, India.
Ram PalanisamyGerald Schwartz School of Business and InformationSystems, St. Francis Xavier University, Canada.
Sunil ChandraDirector, Pentagon Impex International, India.
Editorial Team

D P GoyalProfessor, Information Management, MDI, Gurgaon, India.
Vinnie JauhariDirector, Institute for International Management & Technology (IIMT), Gurgaon, India.
M S TuranProfessor of Management, G J University of Sc. & Tech. Haryana, India.
Mukesh NegiProject Manager IT, Tech Mahindra, India.
Anupam NarulaArea Chairman Marketing, FORE School, New Delhi, India.
Devendra Kumar TayalDepartment of CSE & Department of IT, IGIT, GGSIPUUniversity, New Delhi.
Aftab AlamEditor-In-Chief, Pranjana Journal, New Delhi, India.
Sanjay JasolaVice-Chancellor, Uttarakhand Graphic Era HillUniversity, India.
Arun KumarMONIRBA, University of Allahabad, India.
J K BudhirajaDirector (PD & TP), Institute of Cost & Works Accountants of India, New Delhi.
Raj AgarwalDirector, AIMA, New Delhi, India.
Dharm Bir SinghDirector at IEC Group of Institutions, Greater Noida, India.
Hamid SaremiVice-Chancellor of Islamic Azad University of Iran, Quchan Branch.
Rajamohan NatarajanProfessor in Chemical Engineering, Sohar University.
Shalini VermaFounder, Pollyanna Positive Parivartan, New Delhi, India.
Naveen KumarSchool of Computer and Information Sciences, IGNOU, New Delhi, India.
Managing EditorsAmmar RashidDepartment of Business Information Systems Auckland,University of Technology, New Zealand.
Pratika MishraSchool of Management Studies, Ansal University, Gurgaon.
Jatinder SinghSecretary, Education Committee, PHD Chamber of Commerce and Industry, New Delhi, India.
Brijesh SinghDept. of Mechanical, Aryabhatt College of Engg & Technology, Baghpat.
Niraj GuptaSchool of Corporate and Public Policy, Indian Institute of Corporate Affairs, IMT Manesar.
M P MishraSchool of Computer and Information Sciences, IGNOU, India.
Asit BandyopadhayayJaypee Business School, Noida, India.
Seema VermaDepartment Of Electronics, Banasthali University, Rajasthan, India.
Nayan Tara PadhiSchool of Management Studies, IGNOU, NeIndia.
Vinay SharmaDepartment of Management Studies, Indian Institute of Technology Roorkee, India.
P KamalHead of Department , DAV PG College, Varanasi, India.
Arvind Kumar DubeySchool of Tourism and Hospitality Services Management, IGNOU, India.
Kamal VagrechaSchool of Management Studies, IGNOU, New Delhi, India.
Sanjay GuptaSchool of Science, IGNOU, New Delhi, India.
Himanshu AgrawalDepartment of Computer Engineering, Punjabi University, Patiala, India.
Vikas DixitNational Informatics Center, Delhi, India.
Rajat AgrawalDepartment of Management Studies, IIT- Roorkee, India.
Milind Kumar SharmaDepartment of Production & Industrial Engineering,Jai Narain Vyas University, Jodhpur, India.
Ashok G MataniGovt. College of Engineering, Amravati.
Amit Kumar SinghDepartment of Management, Mizoram University, Aizawl.
Vinita SharmaDepartment of Information Technology, New Delhi Institute of Management, India.
Ajay SingholiIndira Gandhi Delhi Technical University for Women, New Delhi, India.
Shrish MishraDirector, Shambhunath Institute of. Management,Allahabad, India.
Lakhvinder Singh Solanki,Sant Longowal Institute of Engineering & Technology,Punjab, India.
Arun SharmaDepartment of Computer Science and Engineering,KIET, Ghaziabad, India.
Heena K. Bijli,School of Continuing Education, IGNOU, New Delhi, India.
Vikas VadiPrincipal CoMM-IT Academy, New Delhi, India.
Neelam TikkhaFounder Confidence Foundation
Vahid H KhiabaniIndustrial and Manufacturing Engineering, North DakotaState University, USA
Associate EditorsOmar AlenezyEastern Illinois University, Urbana, Illinois
Raj Bala SimonAmity Institute of Information Technology, Noida, India.
Sudhansh SharmaSOCIS, IGNOU, New Delhi, India.
Ramesh Chandra TripathiDepartment of IT, Institute of Management Studies, Noida, India.
Sushil Kumar MauryaHead of Department of Computer Science, MangalmayInstitutions, Greater Noida, India.
Banmali SinghDeputy Registrar, IGNOU Regional Centre, Patna, New Delhi.
Assistant EditorsRaj Kumar GargDelhi Institute of Rural Development, Delhi, India.
Tushar JainMeerut Institute of Engineering & Technology, Meerut.
Anukool BajpaiComm IT Academy, GGSIP University, India.
Akanksha KhannaResearch Scholar, IGNOU, New Delhi.
Nitika SharmaMaharaja Agrasen Institute of Management Studies, GGSIPU, New Delhi.
Sanjay SinghTechnocrat, Computer Division, IGNOU, New Delhi.
Manoj KumarTeam Leader, CRM, IBM India Pvt. Ltd.
Sunil Kumar YadavDayal Singh College, Delhi University, India.
Mahender TiwariUnited Institute of Management, Allahabad, India.
Technical TeamJitendra GuptaSr. System Analyst, Soft Solvers Cyber Jaya, Malaysia.
Himanshu DhingraTechnical Developer, Open Journal Inc. New Delhi India.
Sanyukta KesharwaniTechnical Head, Open Journal Inc., New Delhi, India.


GLOBAL JOURNAL OF ENTERPRISE INFORMATION SYSTEM
Editor’s Desk 1 Message from Editor’s Desk 1
Subodh Kesharwani
Empirical Articles 2 Responsiveness of U.S. Exports to Real Exchange Rate:
Evidence from Top 10 U.S Trading Partners 3
Omar Alenezy
3 A Combinatorial Optimization Approach to Solve the Synchronous Optical Network (SONET) Problem
9
Mamoon Alameen, Mohammad Abdul-Niby, Tarek Selmi and Sadeq Damrah
4 Reluctant Workforce May Derail the Adoption of Advance Manufacturing Technology in Micro, Small and Medium Enterprises of India
12
Brijesh Singh, Amar Singh and R. C. Yadavh
5 Empirical Study of Volatility Clustering in Stock Prices of IT Index 26 Anurag Agnihotri
6 Impact of Demographic Factors on Consumer Behaviour – A Consumer Behaviour Survey in Himachal Pradesh
35
Rakesh Kumar
7 Unravelling Long Term Evolution (LTE) Ownership and Adoption Challenges
48
Rajbala Simon, Laxmi Ahuja and Priyanka
8 Survey Article on Comultiplication Modules 56 Jay Kishore Sahani
9 Analysis and Design of Optimum Interleaver for Iterative Receivers in Indoor Wireless Optical IDMA Scheme
61
Somendra Shukla, Shikha Pandey, Vipul Dixit and M. Shukla
10 Efficiency of IT Deployment of Public Sector Banks in India 67 Sanjay Dhingra
Volume 6 Issue 2, April-June 2014C
on
te
nt
sG J E I S

Co
nt
en
ts Case Study
11 Turnaround Strategies in Indian Industries: A Few Cases 75 J. R. Dikshit, P. C. Basak and Kamal Vagrecha
12 Innovative Qualities of Education Sector that Kills Quality and Employability in IT sector
86
Neelam G. Tikkha
Theme Based Papers13 DCT based Fuzzy Image Watermarking 90
Durgansh Sharma, Manish Prateek and Tanushyam Chattopadhyay
View Point14 A Critical Appraisal of Organic Food Market in India 96
Tanushree Roya
Book Review15 Crafting Cooperation: Regional International Institutions
in Comparative Perspectives 101
Sarad Kumar Yadav
16 Governance, Ethics and Social Responsibility of Business 104 Nancy Rao
Biographical Note of the Luminary in an Area of IS
17 Arun Kumar , Authority on Dr. Stephen Covey’s “The 7 Habits of Highly Effective People”
105
Editor-in-Chief
Great Enterprise Contribution to Society in Information System Perspectives
18 Experiential Learning through Simulation Games 106 Vinod Dumblekar

Co
nt
en
ts Award
19 ‛BEST DIRECTOR AWARD’ to Dr. Jitendra K. Das, Director, FORE School of Management
108
Editor-in-Chief
20 Rashtriya Shiksha Gaurav Puraskar – 2014 by CEGR to Dr. Urvashi Makkar
110
Editor-in-Chief
Conference21 International Innovation, Sustainability and Entrepreneurship
Summit 2014 26th September 2014 at IIT Delhi - www.i2ses.org
111
Editor-in-Chief


Message from Editor’s DeskInformation System bringing Demographic Change through Optimization
Dear Bookworm,Demographic trends illustrate the historical change in demographics and when these changes amalgamate with information system it takes a gargantuan prolific silhouette, which leads to innovation in totality. The impact of demographic changes is rec-ognized as one of the most significant challenges that social security institutions will visage in the future. Demographic Change (DC) makes the statistics on educational achievement even more central to technology and economy.
GJEIS really facilitating smart business leaders with its research initiatives and considering the changing face of the nation, because it also represents the changing face of business. The journal with its present volume focused on this part and highlight how changes brings a paradigm shift on the plus side and create tremendous market opportunities in products and services. Mandate of a Journal is to popularize the concept of Enterprise, Information and System in business and outside business. It is designed to enlighten people that synchronization of three words is not just a financial objective, but is more omnipresent, that is why we have to get across what the academics and the peers are doing and saying about technological pitch in creating a niche.
We have built a global team to make GJEIS an authenticity. So welcome to the world of value creation, and do join fraternity with different social networks available at www.gjeis.org
We as a team of GJEIS have locate quite some endeavor in the last couple of months, and anticipate that our ever improving skills as an editor make available the enjoyment and learning that have our readers looking forward to each issue. I would like to show appreciation to all that has helped us with this edition. Please don’t hesitate to drop a line to me, as your recommendation and support are imperative to all of us.
Global Journal of Enterprise Information SystemG J E I S
Dr. Subodh Kesharwani, Founder, Editor-in-Chief


Global Journal of Enterprise Information SystemG J E I S
Responsiveness of U.S. Exports to Real Exchange Rate: Evidence from Top 10 U.S Trading Partners Omar Alenezy1*
Eastern Illinois University; [email protected]
Abstract
This study investigates the impact of changes in the value of the US dollar on U.S exports to major trading partners of the US. The findings indicate that major trading partners are more likely to demand more US products when the value of the US dollar depreci-ates. Furthermore, a ten percent decrease in the US real effective exchange rate will cause an approximate increase of 3% of total US exports. In addition, the fluctuations in national income levels for top trading partners of the US can determine the amount of their demand of US products as well. In other words, an increase in national income for most of the trading partners will lead to an increased demand for U.S goods.
The author studies the impact of fluctuations between the value of the US dollar to U.S exports to major trading partners. The conclusion reveals that top trading partners demand more of the U.S goods when the US dollar depreciates. Furthermore, a ten percent decrease in the US real effective exchange rate leads to an increase of almost 3 % of total US exports. Changes in income level for top trading partners can determine the amount of exports as well. Moreover, a rise in income for trading partners leads to an increase demand for U.S goods.Keywords: Currency Manipulation, Exports, Imports, Dollar, Renminbi, Trade
1. IntroductionStarting from the very basic idea of economics and GDP compo-nents, trade can play a substantial role in determining the growth of one country’s GDP. Ram21 stated that there is a substan-tial positive impact of exports and trade on economic growth. Therefore, bolstering the size of exports in favor of the size of imports can be a plausible and rational idea for many coun-tries. However, much of the fluctuations in trade are determined by many exogenous factors. We can think of the value of the domestic currency as a primary reason for enhancing or curtail-ing the size of exports. Sukar1 has suggested that changes in the exchange rates explain much of the fluctuation in trade between two countries. Assuming that each country in the world has its unique trading system, government, region, language, and etc., we are going to focus on the U.S as our treatment country in this paper because of the large size the U.S has in the world economy. Obstfeld and Kenneth2 confirmed that US has a very large size in the global economy. So, enhancing exports is a very good instru-ment that can stimulate the staggered U.S economic growth. In addition, increasing the size of exports will adjust the unsustain-able current account deficit by combating the increasing size of imports. By looking at table 1 we see that U.S current account has experienced an increasing trade deficit after the year 2000. The downward trend has never been like this for the U.S before. Obstfeld and Kenneth3 agreed that US has never exceeded 4% of
* Author for correspondence
gross domestic product even when the U.S was an emerging econ-omy in the 19th century. Trade deficit can directly influence the free adjustment of the overall U.S economy. Krugman3 indicated that U.S in the past was able to achieve full employment with saving rates higher than today’s because U.S used to run a much smaller trade deficit. In order to find how US exports are influ-enced, we get data of total US exports, US exports to the top 10 trading partners, Real effective exchange rate, and the GDP of the top 10 trading partners. Top trading partners are Canada, China, Mexico, Japan, UK, Saudi Arabia, Germany, France, India, and South Korea. The goal is to see the responsiveness of US exports
Table 1. U.S. Current-account balance and its components [Annual]18
DOI: 10.15595/gjeis/2014/v6i2/51840

4
Responsiveness of U.S. Exports to Real Exchange Rate: Evidence from Top 10 U.S Trading Partners
Vol 6 | Issue 2 | April-June 2014 | www.gjeis.org GJEIS | Print ISSN: 0975-153X | Online ISSN: 0975-1432
after depreciating or appreciating the dollar. Cheung and Fujii4
any ordinary country engaged in multilateral flows do respond to relative prices presented by a trade weighted exchange rate. U.S real effective exchange rate has been really effective in bolstering exports to these countries when its value depreciates. In addi-tion, the Income of these countries is positively related with the demand of U.S exports.
2. ObjectivesA substantial number of countries who have enjoyed large sur-pluses have undervalued their currencies. Chen, and Chin5 Japan and China are major U.S trading partners that enjoy surpluses, however, U.S suffers from a large trading deficit with them. Also, U.S is running a current account deficit of more than $400 billion since the year 20002. In other words, allowing the market to determine the value of the dollar is not a better idea if the objective is to expand growth through the exports channel. So, by taking the measure of real effective exchange rate of the dollar, average trade-weighted by all U.S trading partners, into account and implementing this study, the focus relies on how do the value of U.S exports respond to the changes in $ real exchange rate. Furthermore, we want to figure out the responsiveness of US exports to the most influential trading partners with the US and extending that strategy to measure similar consequence on the top 3 trading partners. In fact, top 10 trading partners are our concern in this study because they represent the larger share of U.S exports and any change in the value of exports to these coun-tries can significantly impact our decision. Moreover, getting data for all US trading partners is never an easy task due to either missing data or because the lack of transparency. Therefore, data of the top 10 trading partners is more efficient in interpreting our concerns. How much of an income each country has is another important factor in determining the demand for U.S goods. So, the objective is to justify the effects of increasing income on the demand of U.S goods.
3. Literature ReviewThe increasing size of U.S current account deficit has inspired a substantial number of economists to implement studies on how real exchange rate directly influences trade. Sukar1 initially believed that U.S policy makers should acknowledge that a lower U.S dollar value could be a major instrument in correcting the imbalance. Krugman3 has also stated that policy makers in Israel and Switzerland have always known that sometimes a weaker currency means a stronger economy and responded by devalu-ing their currencies. If the US dollar depreciates, U.S products will be more competitive in the world market and this will help in correcting the imbalance. Evidence of depreciating the exchange
rate could promote exports is often being referred to China in most cases. Chen and Rau5 have suggested that China has fol-lowed a tight and strict exchange rate policy that caused China to become a leading world exporter. Staiger and Sykes6 mentioned governments that have adopted a fixed exchange rate regime have intervened systematically in the exchange market by soak-ing an excess supply or relieving an excess demand, which have resulted in a higher volume of Chinese exports to the world mar-kets. Carrying out the same assumptions, evidence comes from the Eurozone. Williamson and Cline have found that the depre-ciation of the Euro has strongly influenced and strengthened the European trade prospects. However, it hasn’t become as extreme as to push the Euro area into the prospect of larger surpluses17.
In fact, a rich literature is suggesting that movement of the dollar value can explain much of exports amount. Blanchard, Giavazzi and Sa7 have identified an increase in the U.S demand for foreign goods and an increase in foreign demand for U.S assets which have caused an appreciation of the value of the dol-lar, and those are the roots of the forces that are behind large U.S current deficit. However, Kraay and Ventura8 have claimed that the dot com bubble was the primary root of the increase in the current account deficit.
Different opinions have appeared on how to deal with cor-recting for the imbalance. Furthermore, Sukar1 and Cavallo and Tille9 suggested that a depreciation of the $ would make U.S goods more competitive in the world market thus, help to restore the trade deficit. On the other hand, some economists have viewed the magnitude that real exchange rate has on US exports less heavily. Fratzcher, Juvenal and Sarno10 have agreed that adjusting for the U.S real exchange rate isn’t a primary ele-ment in correcting for U.S imbalance. Although Real exchange rates of the dollar seem to be an important driving force in deter-mining the magnitude of exports, equity market shocks and housing price shocks have been major determinants of the U.S current account. Housing and equity market shocks accounts for more than 30% of the movement in the U.S trade balance while only 9% is the movement caused by real exchange rate. Also, some economists have totally neglected the role of govern-ment in adjusting real exchange rate to correct for any imbalance. Mountford and Uhlig11 found that expansionary/contractionary fiscal policies have no clear effect on the real GDP. Some econ-omists have looked at the issue from another direction; trade deficits cause a movement in the real exchange rate. Bergins and Sheffrin12 considered that account deficit is caused after a fall in the output level in an economy that lead that country to borrow in the world market and therefore, influence the movement of real exchange rates in neighboring countries.
While there was a substantial amount of literature suggest-ing a low value of U.S dollar, there was a few estimating the actual number of rise or fall in U.S exports or movement of US

5
Omar Alenezy Empirical Article
Vol 6 | Issue 2 | April-June 2014 | www.gjeis.org GJEIS | Print ISSN: 0975-153X | Online ISSN: 0975-1432
current account if the dollar value deviates. Blanchard, Giavazzi and Sa7 estimated a reduction of 1% in the US current account if the dollar depreciates by 15%. Kara indicated, although a decrease in the domestic currency is expected to have reduced imports volume and an increase exchange rate is expected to increase import volume, U.S exports and demand functions are strongly correlated with the fluctuation of the value of the Renminbi. In other words, for every 1% appreciation in the value of the RMB, the US will enjoy an increase of 2% in the value of their exports to China13. Chiu, Lee, and Sun14 conducted a heterogeneous panel co-integration causality analysis to examine the relationship between real exchange rate and the volume trade between the US and its major trading partners. Their findings indicate that a fall in the US dollar will reduce the amount of US exports to 13 trad-ing partners and increase it with 37 partners, including China. Cavallo and Tille9 predicted that the US dollar must depreciate by 30-35% against major world currencies in order to return to a balanced current account. They indicated that depreciating the dollar will entail competitiveness of U.S goods in world market.
Because Corsetti15 believes in twin deficit, trade deficit could be solved by fiscal policies. However, any expansionary policy could be ineffective if the country isn’t open to trade or, if fiscal shocks are not persistence. In addition, Kim and Roubini16 have disagreed with many authors that neglected the idea of resolving current account deficit with fiscal policies and found that expan-sionary fiscal policies could indeed improve current account if they were accompanied with a depreciation in the real exchange rate; increase in private savings and drops in investment cause current account improvement while nominal exchange rate declines.
4. Data Discussion and Methodology Gathering of data comes from the World Bank. We have picked on all of the US top trading partners GDP. World Bank also pro-vided us with data on real effective exchange rate that we chose to use on the variable REER. We also gathered data on US exports to the top 10 trading partners from United States Census Bureau. The time series data goes from year 1982 until 2012 for every variable we have. Choosing the year 1982 as a benchmark wasn’t a coincidence, however, it was for a reason. Some of the most influential US trading partners today like China, have started trading with US after 1982, so, it will make no sense if we go back in the data and include older years. Therefore, our study depends on a time series data because our main concern is the U.S exports function. By including a descent amount of years that goes from 1982 until 2012, we could explain much of the variation overtime because U.S is a huge economy in the world market. Therefore, results to the U.S illustrate a smaller image of the results if we are to measure the world wide fluctuations in
Table 2. Summary statistics
Variable Observations Mean Std. Dev. Min Max
Year 31 1997 9.09 1982 2012Log (REER) 31 4.62 0.113 4.46 4.91Log (China GDP) 31 27.7 0.867 26.23 29.1
Log (Mexico GDP) 31 27.23 0.242 26.89 27.6
Log (Canada GDP)
31 27.5 0.244 27.07 27.8
Log (top 10 trading partners GDP)
31 29.9 0.285 29.5 30.4
Log (US exports to China)
31 23.5 1.1 21.8 25.4
Log (US exports to Canada)
31 25.6 0.53 24.5 26.4
Log (US exports to Mexico
31 24.8 0.83 23.2 26.09
Log (US exports to the rest of the world)
31 27.43 .54 26.49 28.2
exports. So, we summed the total exports of the US to the top 10 trading partners in one variable, US exports. We also summed up all the GDPs for the top 10 trading partners and included them in one variable, top 10 trading partners GDP as shown in table 2. We also summed all US exports to the top 10 trading partners as well and included them in the variable, US exports. Motivation behind that method is that we want to see the overall effect of income on the overall US exports. We consider real terms for all GDPs and exports. After that, we estimate US exports to each of the top 3 trading partners independently.
5. Estimation StrategyTo determine how real effective exchange rate influence the amount of U.S exports to top 10 trading partners we develop one equation and then extend that equation to determine the impact on the top 3 trading partners independently. US export func-tion that is applied to the data comes from U.S exports to the top 10 trading partners. The exports function used is conventional because it was used by previous studies. In formulating the US

6
Responsiveness of U.S. Exports to Real Exchange Rate: Evidence from Top 10 U.S Trading Partners
Vol 6 | Issue 2 | April-June 2014 | www.gjeis.org GJEIS | Print ISSN: 0975-153X | Online ISSN: 0975-1432
exports function we follow Sukar1 and Kara13 and use the follow-ing log linear formulation:
Ln US_ex10 = β0 + β1 lnGDP_10 + β2 lnREER (1)
where US_ex10 is demand of the 10 top trading partners for US goods, GDP_10 is the total real GDP for all top 10 US trading partners, REER is the real effective exchange rate of the US dollar. REER is measured against the weight of all other trading part-ners currencies. An expected estimate of the REER coefficient to be positive. The prediction stems from the idea that at higher levels of income, trading partners demand more of US products.
Because we care more about the top 3 trading partners, Canada, China, and Mexico, we will estimate 3 more equations that are extended from the original model. We will begin with Canada. The export demand function is the same but instead it measures US exports to Canada only, GDP measures Canada GDP only, and REER is the same.
Ln US_ex_ca = β0 + β1 lnGDP_Ca + β2 lnREER (2)
where US_ex_ca is US exports to Canada, GDP_Ca is Canada GDP, and REER is US $ real effective exchange rate in terms of all
trading partners. Our expectation will still hold where we would predict a positive estimate for b1 and a negative estimate for b2. Then, we will determine the effect on US exports to China by the following equation:
Ln US_ex_Ch = β0 + β1 lnGDP_Ch + β2 lnREER (3)
where US_ex_ch is demand of China for US goods, GDP_Ch is China GDP, and REER is the same as before. The same thing holds for our expectation on beta estimates. Finally, we will determine the effect on US exports to Mexico by the following equation:
Ln US_ex_me = β0 + β1 lnGDP_me + β2 lnREER (4)
where US_ex_me is demand of Mexico for US goods, GDP_Me is Mexico GDP, and REER is the same as before. Same assump-tions hold here as well where Mexico GDP has a positive impact on US exports, REER has a negative impact on US exports.
6. Results and Discussion The results are shown in Table 3 and 4, where each column is the estimation of each model respectively. The first column is
Table 3. Results before robustness
Table 4. After robustness

7
Omar Alenezy Empirical Article
Vol 6 | Issue 2 | April-June 2014 | www.gjeis.org GJEIS | Print ISSN: 0975-153X | Online ISSN: 0975-1432
the estimation of our first model, the second column is the sec-ond model, the third column represents the third model, and the fourth column represents the fourth model. After running a regression for our first model, we see that if the total GDP for the entire top 10 trading partners rise by 1%, US exports to the top 10 trading partners will go up by 1.86 and it’s statistically sig-nificant at the 1% level. This result matches our earlier prediction about the positive impact that income has on demand for US goods. Second, we see that if real effective exchange rate rise by 1%, US exports to the top 10 trading partners will drop by 0.28 and it is statistically significant at the 1% level. This is exactly as what we’ve predicted in our assumptions. The model has an overall significance with a zero p-value. Also, adjusted R-sq is 0.99, which means that out of the total variation, we can explain .99. After running the second model, we see that when Canada’s GDP increase by 1%, US exports to Canada increase by 0.88 and it is highly significant at the 1% level. If real effective exchange rate goes up by one %, US exports to Canada will drop by 0.01, however, it is insignificant. Again, this is almost the same as what we have predicted before. Running to the third model, If China’s GDP increase by 1%, US exports to China will increase by 0.327 %, and it’s significant at the 1% level. This is exactly as what we’ve predicted. However, when real effective exchange rate of the US $ increases by one %, US exports to China rise by 0.327% and it is insignificant. This wasn’t predicted once we’ve made our assumption. What can explain that is exports to China are neces-sity goods. Also, the Yuan is a fixed exchange rate that is pigged to the major currencies, mainly $, and any rise in the dollar is actually associated with a rise in the Yuan, so that’s why we have a positive coefficient for the value of REER. The model has an overall significance with an adjusted R-sq of 0.99; out of the total variation we explained 0.99. The reason why I get high R-squares is that because I’m dealing with time-series data.
7. Statistical RobustnessWe haven’t reported one controversial variable, Chinese exchange rate due to concerns of multicollinearity. We have omitted the Chinese exchange rate because the Yuan is pigged (fixed) to a number of major currencies, mainly the dollar, and including it in our model would raise concerns about high correlation between the two variables. In order to trust my t-stats we check for heteroskedasticty by using the B-P/C-W test with the follow-ing hypothesis:
H0: Constant variance (Homo)Ha: fitted values of Y
our P-value is very high, (so we fail to reject the null, no heter-oskedasticity). In order for us to trust our error term, we check
for autocorrelation. Auto correlation is a bigger of a concern especially with time series data. So, we run the Durbin Watson test with the following hypothesis:
H0: no auto correlationHA: autocorrelation. (Reject the null)
After figuring out that we have an autocorrelation problem, we predict the residuals and generate a new variable for lagged residuals. After that, we run a regression on residuals and lagged residuals, and then we do the prais regression that will correct for our autocorrelation problem. After checking for correlation between my explanatory variables, I’m more confident that there is no multicollinearity in my model. Correlation between vari-ables didn’t exceed .56 for all variables.
8. ConclusionA current account deficit ranging from 4-6% out of the total GDP is a big of concern for the U.S especially when it’s associated with different budget deficit. Running a large trade deficit would pre-vent the whole wide U.S economy from adjusting smoothly to full employment. Therefore, enhancing exports is the best tool that allows for such a correction. In order to achieve the goal of influ-encing current account positively through exports, US should work that through the top 10 trading partners because they resemble a very big share in the U.S trade by increasing exports to them. Enhancing exports should be directly coming from the depreciating the value of the dollar. Our findings indicate that at lower dollar values, the volume of US exports to the major 10 trading partners increase. Although growth in the national income of the major trading partners could result in higher lev-els of U.S exports, US policy makers can’t react to that because increasing the growth of other countries that is not at their dis-posal. Therefore, emphasizing the idea of lowering the value of the dollar to achieve a better economy by increasing exports.
By looking at our results we see that if US real effective exchange rate rises by one percent, US exports to China go up. Mainly this is because of the pigging the Yuan to the US $, so any rise or fall in the value of the dollar would have a similar effect on the Chinese currency after China’s central bank intervention. This particular result emphasizes various suggestions for us. The first one we could think of is that pigging a currency to another is not always a favor for the pigged (the dollar in this case). This indicates that the U.S can’t benefit from depreciating their currency to increase exports to China. However, real effective exchange rate has shown a negative relationship with US exports to all of the top 10 trading partners that mostly adopt a floating exchange rate regime.

8
Responsiveness of U.S. Exports to Real Exchange Rate: Evidence from Top 10 U.S Trading Partners
Vol 6 | Issue 2 | April-June 2014 | www.gjeis.org GJEIS | Print ISSN: 0975-153X | Online ISSN: 0975-1432
9. References 1. Sukar A, Zoubi T. Real exchange rate and U.S bilateral trade. J Appl
Bus Res. 1996; 12(4):138–43. 2. Obstfelf M, Rogoff K. The unsustainable U.S current account posi-
tion revisited. University of Chicago Press; 2007. 3. Krugman P. Holding China to account. New York Times. 2011 Oct
2:3. 4. Cheung Y, Chinn D, Fujii E. China’s current account and exchange
rate. University of Chicago Press; 2010. 5. Chen K, Rau H, Chiu R. Determinant of China’s exports to the
United States and Japan. Chin Econ. 2011;44(4):19–41 6. Staiger R, Sykes A. Currency manipulation and world trade. World
Trade Rev. 2010;4(9):583–627 7. Blanchard O, Giavazzi F, Sa F. The U.S current account and the dol-
lar. National Bureau of Economic Research. Report number: 11137; 2005.
8. Kraay A, Ventura J. The dot-com bubble, the Bush deficits, and the U.S current account. University of Chicago Press; 2005.
9. Cavallo M, Tille C. Could capital gains smooth a current account rebalancing? Federal Reserve Bank of New York. Report number: 60559; 2006.
10. Fratzcher M, Juvenal L, Sarno L. Asset prices, exchange rates and the current account. Eur Econ Rev. 2010; 54(5):643–58.
11. Mountford A, Uhlig A. What are the effects of fiscal policy shocks? J Appl Econometrics. 2005; 24(6):960–92.
12. Bergin P, Sheffrin S. Interest rates, exchange rates and present value models of the current account. The Economic Journal. 2001; 110(463):553–58
13. Kara O. Responsiveness of the U.S trade flows to changes in Chinese currency; 2013. Avaibable from http://ssrn.com/abstract=2245172
14. Chiu Y, Lee C, Sun C. The US trade imbalance and real exchange rate: an application of the heterogeneous panel co-integration method. Economic Modeling. 2010; 27(3):705–16.
15. Corsetti G, Muller G. Twin deficit: squaring theory, evidence and common sense. Economic Policy. 2006; 21(48):597–638.
16. Kim S, Roubini N. Twin deficit or twin divergence? Fiscal policy, current account, and real exchange rates in the US. J Int Econ. 2008; 74(2):362–82.
17. Cline W, Williamson J. Notes on equilibrium exchange rates. Policy Brief 10–20 ed. Washington, DC: Peterson Institute for International Economics; 2010.
18. Bureau of Economic Analysis. Available from http://docbea.files.wordpress.com/2013/03/0315.png
19. Cline W. Renminbi undervaluation, China’s surplus, and the US trade deficit. Peterson Institute for International Economics; 2010.
20. Krugman P, Baldwin R. The persistence of the US trade deficit. Brookings paper on Economic Activity. 1987; 1987(1):1–55.
21. Ram R. Exports and economic growth: some additional evidence. University of Chicago Press. 1985; 33(2):415–25.

Global Journal of Enterprise Information SystemG J E I S
A Combinatorial Optimization Approach to Solve the Synchronous Optical Network (SONET) ProblemMamoon Alameen1*, Mohammad Abdul-Niby2, Tarek Selmi2 and Sadeq Damrah1
1Department of Mathematics, The Australian College of Kuwait; [email protected], [email protected] of Electronic Engineering, The Australian College of Kuwait; [email protected], [email protected]
Abstract
Synchronous Optical Network (SONET) is a network with a fast service capability. Most of businesses that deal with finance are will-ing to pay high rates of money just to get reliable continuous connections. The problem is one of assigning each customer to a ring without violating the capacity constraints. The goal is to minimize the size of each ring without sacrificing each customer demands. This paper is to introduce a new effective mathematical approach to optimize the SONET network. The main idea is to transform SONET problem formulation to the capacitated vehicle routing problem.Keywords: Branch and Cut, Capacitated Vehicle Routing Problem, Clarke and Wright, SONET
1. IntroductionSynchronous Optical Network (SONET) is known to be fast and self healing network. SONET equipment can detect the problem in less than a millisecond and react quickly to solve it then resume communication. Some industries like banks, broker houses and credit cards, prefer to pay more money just to insure safe and reliable communication network. The high level of service avail-ability offered by SONET justifies the growing demands to use the services. In the other hand, one of the crucial parts in setting SONET is optimizing SONET rings.
The SONET ring consists of a certain number of nodes. A demand between some pair of nodes (not all pairs have demands) is given in unites of DS3 (51.84Mbits/sec). The demand is an estimate of the number of circuits needed to provide commu-nications between that pair of nodes. The problem is to find a minimum cost SONET ring network (given nodes, links and demands) such that resulting equipment and fiber links have suf-ficient capacity to satisfy the demands.
The problem of Optimizing SONET ring can be seen as mix integer linear programming. Furthermore the simple form of optimizing SONET ring problem can be considered as same as (the well known) Capacitated Vehicle Routing Problem CVRP.
The Capacitated Vehicle Routing Problem CVRP was first formulated by Dantzig and Ramser1 and may be stated as a set of customers, each with a known location and a known require-ment for some commodity. The customers are to be supplied from a single depot by delivery vehicles, subject to the following conditions and constraints:
* Author for correspondence
(a) The demands of all customers must be met.(b) Each customer is served by only one vehicle. (c) The capacity of the vehicles may not be violated.
Hence, each node in SONET ring can be treated as a cus-tomer in CVRP. The capacity of the links in SONET is as same as the capacity of the vehicle in CVRP. In general, optimizing the SONET ring problem can be considered as one route CVRP.
2. CVRP Mathematical FormulationAchuthan et al.2 described the problem as follows:
Let
• C = {1, 2,…, n}: the set of customer location.• 0: depot location.• G = (N,E) : the graph representing the vehicle routing net-
work with N = {0,1,…,n} and E = {(i,j):i,j є N, i<j}.• qj : demand of customer j.• Q: common vehicle capacity.• m: number of delivery vehicles.• cij: distance or associated cost between locations i and j.• L: maximum distance a vehicle can travel.• Pj: a lower bound on the cost of traveling from the depot to
customer j.•• (S): lower bound on the number of vehicles required to visit
all locations of S in an optimal solution. Note that S Õ C and (S) ≤ 1.
DOI: 10.15595/gjeis/2014/v6i2/51841

10
A Combinatorial Optimization Approach to Solve the Synchronous Optical Network (SONET) Problem
Vol 6 | Issue 2 | April-June 2014 | www.gjeis.org GJEIS | Print ISSN: 0975-153X | Online ISSN: 0975-1432
• S: the complement of S in C• xij: 1,2, or 0
The problem is to:
subject toConstraints (1.2.2) and (1.2.3) known as degree constraints.
Constraint (1.2.2) specifies that the number of vehicles leaving and returning to the depot are m. Constraint (1.2.3) specifies that each customer is visited by only one vehicle. Constraint (1.2.4) is referred to as subtour elimination constraints, which prevent subtours from forming loops disconnected from the depot, or eliminate tours that connected to the depot but violate the capac-ity restriction. Note that a connected component of a weighted or un-weighted graph defined over the set of customers is called a subtour. The subtour will be called a tour if it’s connected to the depot in a graph defined over all locations. Constraint (1.2.5) specifies that if a vehicle travel on single trip between i and j then the value of xij will be 1,and if i=0 and (0,j,0) is a route then the value of xij will be 2, otherwise the value of xij will be 0.
3. The Advantages of Optimizing SONET Ring using CVRP Techniques
Observing the work of Bernardino et al.3, Kim et al.4, Karunanithi and Carpenter5, and many other popular publications, the fol-lowing points can be raised:• No exact method applied to optimize SONET ring.• The suggested approaches used to solve small size problems
(6–20 nodes).Hence, considering a SONET ring as one-route CVRP can
provide the followings:• Applying exact methods like branch and bound branch and
cut, etc… to get the exact solution.• The ability to solve instances with hundreds of nodes.• Apply more conditions to increase efficiency and maintain
security of the data.In addition, converting SONET ring problem to VRP pro-
vides flexibility in imposing additional constraint. A SONET ring that needs to send the signal within a certain time frame then the
(1.2.1)minimizeZ = ∈∑∑∈
c x i N, i<jij iji<ji N
x =2m, i C0ii C∈
∑ ∈ (1.2.2)
x xij jij<i i<j
i C∑ ∑+ = ∈2, (1.2.3)
x S - (S), S n-2ij i, j S, S C,3∑ ≤ ≤∈ ⊆ ≤ (1.2.4)
x or0ij =1 2, , (1.2.5)
Table 1. Benchmark ProblemsProblem number
References Number of customers
1 Eilon et al.8 132 Groetschel9 213 Eilon et al.8 314 Held and Karp10 48
problem can be converted to VRP with time window Solomon6. Similarly if a SONET ring must not exceed a certain distance then the problem can be converted to Distance Constrained Vehicle Routing Problem (DCVRP) Laporte et al.8.
Note: The depot in CVRP will be any node in SONET (single-route); also the pairs that they have a demand between each other will be treated as one customer.
4. ComputationsThis section applies the Clarke and Wright (C&W) classical heu-ristic, Simulating Annealing (SA) meta-heuristic and Branch and Cut (B&C) exact method to solve 4 CVRP benchmark problems. The problems can also consider as SONET network where every route should be seen as a ring. The details of the problems are illustrated in Table 1.
Figures 1, 2, 3 and 4 provide the results of applying C&W, SA and B&C to solve the benchmark problems.
Figure 1. Problem 1, 13 customer.
Figure 2. Problem 2, 21 customer.

11
Mamoon Alameen, Mohammad Abdul-Niby, Tarek Selmi and Sadeq Damrah Empirical Article
Vol 6 | Issue 2 | April-June 2014 | www.gjeis.org GJEIS | Print ISSN: 0975-153X | Online ISSN: 0975-1432
5. ConclusionSetting a SONET network is very expensive due to the high cost of the required equipments. Reducing the setting cost will maximize the profit rapidly. Using heuristics (both classical and meta-heuristics) may provide the optimal solution for small size problems (Figure 1). However, for bigger problems, only exact methods can give the optimal solution (Figures 2, 3 and 4). It’s clear that the obtained results showed that converting SONET to CVRP provides the accuracy and the ability to optimize large scale problems. For future research, SONET other requirements (time and distance constraints) can be investigated with more details in order to be converted to the VRP with time window and distance constrained vehicle routing problem respectively.
6. Reference 1. Dantzig GB, Ramser JH. The Truck Dispatching Problem.
Management Science. 1959; 6:80–91. 2. Achuthan NR, Caccetta L, Hill SP. A new sub tour elimination
constraint for the vehicle routing problem. Eur J Oper Res. 1996; 91:573–86.
3. Bernardino E, Bernardino A, Sanchez-Perez J, Gomez-Pulido J, Vega-Rodriguez M. Solving large-scale SONET network design problems using bee-inspired algorithms.Optical Switching and Networking. 2012; 9:97–117.
4. Kim S, Kim Il-H, Mani V, Kim H. Ant Colony Optimization for SONET Ring Loading Problem. International Journal of Innovative Computing, Information and Control. 2008; 4:1617–26.
5. Karunanithi N, Carpenter T. Sonet ring sizing with genetic algo-rithms. Comput Oper Res. 1997; 24:581–91.
6. Solomon MM. Algorithms for the vehicle routing and scheduling problems with time window constraints. Oper Res. 1987; 35:254–65.
7. Laporte G, Desrochers M, Nobert Y. Two Exact Algorithms for the distance constrained vehicle routing problem. Networks. 1984; 14:161–72.
8. Eilon S, Watson-Gandy C, Christofides N. Distribution manage-ment, mathematical modeling and practical analysis. London: Griffin; 1971.
9. Groetschel M, Monma CL, Stoer M. Computational results with a cutting plane algorithm for designing communication networks with low connectivity constraints. Oper Res. 1992; 40:309–30.
10. Held M, Karp RM. The traveling salesman problem and minimum spanning trees. Oper Res. 1970; 18; 1138–62.
Figure 3. Problem 3, 31 customer. Figure 4. Problem 4, 48 customer.

Global Journal of Enterprise Information SystemG J E I S
Reluctant Workforce May Derail the Adoption of Advance Manufacturing Technology in Micro, Small and Medium Enterprises of India Brijesh Singh1*, Amar Singh2 and R. C. Yadav3
1*Greater Noida College of Technology, Greater Noida, UP, India; [email protected], Buddha Institute of Technology, Gorakhpur, UP, India; [email protected] Nehru National Institute of Technology, Allahabad, UP, India; [email protected]
Abstract
Micro, Small and Medium Enterprises (MSMEs) contribute enormously to socio-economic development of a country. A key neces-sity for maintaining sustainable growth of MSMEs is the adoption of suitable Advance Manufacturing Technologies (AMT) that requires utmost care in human related issues. The investigations on the basis of surveyed 84 MSMEs of India, suggest that the workforce, although engaged in producing quality products, is not keen to reduce the rate of rejection. While implementing suitable AMT in the industrial processes, workforce generally did not accept the technological changes; and a process champion was rarely employed. This reluctance of the workforce towards the adoption of AMT in Indian MSMEs is a major challenge to their ability to sustain in this globally competitive environment. Thus, for improved human resources, an humanitarian and honest attention is essentially required.Keywords: Adoption of Newer Technologies, Advance Manufacturing Technology, Employees’ Culture, Ergonomic Working Conditions, Human Factors, Small and Medium Enterprises
1. Introduction The sector comprising Micro, Small and Medium Enterprises (MSMEs) can be considered as nurseries for entrepreneurship, often driven by individual creativity and innovation, and con-tributing enormously to the socio-economic development of a country. MSMEs provide employment to a large populace at a comparatively lower capital cost than the larger enterprises and helps in the industrialization of rural and backward areas, leading to a reduction in regional imbalances by assuring more equita-ble distribution of national income and wealth geographically. They increasingly play a pivotal role in the country’s economic progress and recovery, mainly due to their higher rates of employment growth than other industrial sectors, as reported in recent articles1,2. The studies conducted by many researchers like Buckley3; Burhanuddin et al.4; Dalu and Deshmukh5; Farsijani and Carruthers6; Gunasekaran et al.7; Harvie8; Koc and Bozdag9; Romijn10; Schmitt and Lane11; Shi and Li12; Subrahmanya et al.13 have also supported for significant contribution of small sectors in nation’s Gross Domestic Production (GDP), industrial pro-duction, export and employment. Such significant contribution
* Author for correspondence
has lead to an unprecedented growth in MSMEs worldwide and to increase their performance, competitiveness and productivity, the use of suitable Advance Manufacturing Technologies (AMT) is one alternative for Small and Medium Enterprises (SMEs), as suggested by Rahman and Bennett14, Gill et al.15, and Singh et al.16.
The literature cited above shows that the contribution of MSMEs towards sustainable development of any nation’s econ-omy is now well accepted. It implies that for a sustained growth of economy of India, the development and improvement in the performance of MSMEs that urges for adoption of suitable AMT, is required. However, the successful adoption of newer tech-nologies and improvement in productivity requires carefully addressing and taking care of human related issues. Motivated by this, a thorough study was undertaken in manufacturing MSMEs to analyze the state of human related factors and their participa-tion in the adoption of AMT. The study undertaken in this work covered three sectors of MSMEs, namely glassware, shoe/foot-wear and lock manufacturing, in North India. These sectors were chosen as they belong to the consumer sectors and thus affect every person in their routine life. Further, only three sectors were selected as these can be handled easily - it will make three
DOI: 10.15595/gjeis/2014/v6i2/51842

13Vol 6 | Issue 2 | April-June 2014 | www.gjeis.org GJEIS | Print ISSN: 0975-153X | Online ISSN: 0975-1432
Brijesh Singh, Amar Singh and R. C. Yadav Empirical Article
sub-groups (a sub-group comprising two sectors at a time) as used in many cases of statistical analysis, like using t-test (adopted for statistical validation of hypothesis). Aspects covered in this study include demographic profile with important issues related to the performance of the enterprises, welfare facilities, safety, employees’ participation in various activities, acceptance of newer technologies by employees, availability of process cham-pion, employees’ culture, and ergonomic working conditions. The primary objective of the research study was to investigate key human challenges facing adoption of AMT in MSME workforce in India and reveal any underlying psychological issues such as reluctance to change. A secondary objective was to understand whether the reasons for these challenges are cultural or techni-cal in nature. The role of ergonomic working conditions was also investigated. Through this investigation, viability of possible solutions, e.g. process champion, was also analyzed.
2. Review of Literature
2.1 Contribution of Small Sectors in Nations’ Economy
Existing body of literature suggests that SMEs contribute signifi-cantly in nation’s GDP, total manufacturing production, exports and employment. To support this, few examples of some of the important countries are quoted herewith. China had more than 4.3 million registered SMEs in 2009 that comprises 99% of the nation’s registered businesses. SMEs contribute about 60% to the nation’s GDP, half of its tax payments, about 70% of its exports and create about 80% of new jobs17. Further, SMEs employ nearly 80% of the country’s population18. In the latest available data for South Korea, there were approximately 3 million SMEs which accounted for 99.9% of all enterprises, employed 87.5% of the total workforce and contributed to 31.9% of total export19. As per the information given by SME Corporation of Malaysia in SME Census 2011, (reference year 2010), manufacturing SMEs consti-tute about 95.4% of total enterprises and employ approximately 0.7 million persons20.
SMEs form the backbone of the EU economy, which is accounting for 99.8% of non-financial enterprises in 2012, which equates to 20.7 million businesses (92.2% micro enter-prises, 6.5% small enterprises 1.1% medium enterprises and 0.2% large enterprises). In employment terms, SMEs provided an estimated 67.4% of jobs in non-financial business economy in 2012 21. At the start of 2012, SMEs accounted for 99.9% of all private sector businesses in the UK, 59.1% of private sec-tor employment and 48.8% of private sector turnover. SMEs employed 14.1 million people and had a combined turnover of £1,500 billion22. In India too, MSMEs contribute 8% of the coun-try’s GDP23. As per the Annual Report (2011–2012) of Ministry
of MSMEs, issued by Government of India, MSMEs account for about 45% of manufacturing output and 40% of the total exports of the country24.
2.2 Human Factors in Technology AdoptionThe customer of 21st century demands products and services that are fast, right, cheap and easy. To respond quickly and effectively to the rapidly changing needs of the customer and to maintain a high level of competitiveness in the global arena, manufacturers are adopting AMT25. Broadly, AMT refers com-puter aided technologies used by manufacturing organizations. In the past decade, manufacturers have invested significantly in the implementation of AMT in an attempt to reduce costs and gain a competitive advantage in their organization26. Taha and Tahiri27 cited that AMT plays a major role in quality and flex-ibility improvements in SMEs. Motivated from lucrative benefits offered by adoption of AMT, as suggested by Hoffmann and Orr28 and Hynek and Janecek29, it has been introduced in Indian man-ufacturing enterprises to have a competitive edge in the global market. Despite the claims that attractive benefits can accrue through the use of AMT in manufacturing enterprises, only modest benefits are reported. Productivity of AMT enterprises is found to be low even after several years of implementation of AMT. One of the reasons attributed for low productivity is the organizational structure that remains mechanistic and not com-patible with new technology in most of the AMT enterprises30,31.
A research finding of Bessant32 reflects that the effective implementation of AMT depended upon factors like employment security, a clear business rationale for using AMT and the effec-tive communication and discussion for this at all levels, priority given to planning of human resources issues in comparison with technical and physical issues, management efforts to effect cul-ture change and to support and guide the development process. Worker empowerment is considered to be critical supporting ele-ment in supporting AMT investments33. Muscatello and Greene34 stressed that the key to success in adoption of AMT included team approach, support of top management, responsibility, decision making authority, phased implementation approach, dedication, project ownership of team members and their com-mitment. The factors that affect the morale of employee and indirectly productivity are safety, ergonomic working conditions, hygiene working environment, less fatigue, human-friendly sys-tems, health hazards, superior light and ventilation and clean air, water and canteen facilities35. Further they emphasized the need of addressing human issues including employee cooperation, employee relations, employee morale/motivation, manpower planning, availability of technological champion, worker involve-ment in planning, capability of workers in skills, knowledge and attitude, recognition of work groups, training and education to reduce resistance and modification of pay system36.

14
Reluctant Workforce May Derail the Adoption of Advance Manufacturing Technology in Micro, Small and Medium Enterprises of India
Vol 6 | Issue 2 | April-June 2014 | www.gjeis.org GJEIS | Print ISSN: 0975-153X | Online ISSN: 0975-1432
The way of organization and management of production has huge impact on success or failure of entire enterprise37. Challis et al.38 observed that manufacturing managers are becom-ing increasingly committed to the need of organizational and human resources investments in order to maximize the value of employee contribution to the operational and business per-formance of their enterprise. Marketing and manufacturing that included workforce skills, capabilities and participation have larger effect on company performance than logistics39. However, an industry-based generic training process can enhance the skills of workers at all levels, allow them to dynamically cope with changing technology, give them options for personal and professional growth, cut costs, increase productivity and qual-ity of products manufactured40. Sohal et al.41 also supported for the need of worker involvement at all stages alongwith their training. Many researchers stated the importance of process champion for adoption of AMT. A professor or an interested group can promote AMT through conducting workshop and seminars, research projects and teaching42. Harney and Dundon43 presented a framework to evaluate Human Resource Management (HRM) in SMEs. Development of HRM capabili-ties allows SMEs to improve their productivity and also amplify the effect of Research and Development and AMT capabilities on productivity44. The central arguments in HRM literature is that effective and evolving HR practices lead to better and/or changed employee behaviour which helps enhance organiza-tional performance45.
Mismatches between human performance and task require-ment relate to incompatibilities, inappropriateness, unsuitabilities or inconsistencies which, if not addressed, would lead to errors46. Excessive reliance on automation technology may be undesirable if the overall goal is to enhance productivity of manufacturing enterprises. A human-centered approach to modern manufac-turing may be more effective based on actual productivity gains, economics, technical feasibility and equipment capability and reliability, and problems created by automated manufacturing technologies47.
Many enterprises fail to invest properly in workers and their training for usage of new manufacturing technolo-gies, which can lead to an alienated workforce48. Beaumont et al.49 investigated that the failures are often attributable to enterprises not making changes that support AMT, e.g. not developing skills, not exploiting the machines to make cus-tomized or higher quality products and not searching for markets for new products the machine could make. The barri-ers that affect the manufacturing system significantly include scarcity of skilled/expert workforce, training to management and its employees, lack of related infrastructure, resistance from employees to the changing conditions and disparity in pay scales of employees50.
3. Generation of Hypotheses In the light of discussed literature, it can be remarked that for sustainable development of MSMEs, adoption of suitable AMT is utmost required, even to compete in global market places. This necessitates for better care of entire set of human related affairs. SMEs are labour intensive production enterprises51 that run through workforce and hence workforce plays a significant role in the functioning, growth and needed technology adoption of an enterprise. The actual benefits of the AMT incorporation can be obtained by making the organizational structure and current design compatible with introduced changes in the manufactur-ing system52. Thus, if human factors are taken into consideration properly, it opens up for improved productivity and a higher effi-ciency. This can be achieved by redesign of jobs, job enlargement, job enrichment, team based work and assigning the planning decisions from management to individuals or group of workers to offer better production with higher flexibility53.
The mood / approach of the employees is very important while adopting and implementing AMT. It can be analyzed by measuring employee acceptance towards AMT implementations that includes acceptance with 100% motivation, acceptance as a burden, acceptance due to fear of loss of job, rejection, opposi-tion and opposition with motivating others to oppose. In this regard, the framed alternate hypothesis can be stated as :
HA1 : Employees of various sectors of MSMEs of India are gener-ally not willing to accept the adoption of newer technologies and oppose and motivate others to oppose.
It is encouraging that improvement in productivity may help in reducing the product cost as more manufacturing output can be achieved by effective utilization of available resources. Employee organizational commitment is highly valuable as commitment is vital to the productivity, quality and good performance of an organization54. Quality products are often produced by proper care of man-power where manual operations are involved. Muda and Hendry55 stated that the World Class Manufacturing (WCM) enterprises will have to achieve higher levels of flexibil-ity and worker along with to have attained higher standards in several areas including motivation, enthusiasm, housekeeping, quality assurance, preventive maintenance and machine repair. Once the employees’ mood / approach towards technology adop-tion is known, the need exists to know the employees’ culture through various aspects that include botheration of employees for reducing waste, quality improvement, reducing rejection rate, effective utilization of resources, reducing power/energy requirements and reducing pollution. To understand employees’ cultural aspect, one null hypothesis and an alternate hypothesis is generated as:

15Vol 6 | Issue 2 | April-June 2014 | www.gjeis.org GJEIS | Print ISSN: 0975-153X | Online ISSN: 0975-1432
Brijesh Singh, Amar Singh and R. C. Yadav Empirical Article
HN1: The employees of various sectors of MSMEs of India are not bothered for reducing the rejection.
HA2: The employees of various sectors of MSMEs of India are utmost bothered for improving the product quality.
4. Methodology Adopted To collect the responses of the survey, a structured questionnaire was framed. The questions pertaining to the questionnaire were on a five-point Likert scale. Enterprises were carefully selected from www.indiamart.com, directories of various industrial areas and their physical presence. In total, 271 questionnaires were mailed to different MSMEs throughout the country. These included the manufacturers of glassware (94 units), shoes/foot-wear (96 units) and locks (81 units). This survey was conducted during the period of May’2009 to February’2010. Out of 271 questionnaires mailed to the Proprietors/Managers, 2 question-naires returned undelivered, 1 unit was reported to be closed and 1 was reported to be shifted. A total of 84 valid responses were collected. This gives an effective response rate of 31.23%.
To improve the response rate of MSMEs in this study, per-sonal visits were also conducted as personnel from MSMEs are generally less motivated for participation in such activities. This sample size is low as compared to the actual numbers of existed MSMEs in the country, however quite high for such studies. Overall, this study was helpful in digging the actual practices and state of affairs related to the studied aspects.
Statistical Package for Social Sciences (SPSS) V16.0 is used for entire set of computations/analysis. Initial analysis is done by using descriptive statistics that includes mean, Standard Deviation (SD) and frequency distribution. Validity of data is evaluated by reliability and reliability is tested by comput-ing value of Cronbach’s Alpha. Further, hypotheses are tested based on mean of all the sectors, mean of the individual sectors, one-way ANOVA values with their significance for all the three sectors and t-statistics for all the three sectors in the groups. Hypothesis computations are represented in a tabular form for validation and discussion. Further, to establish relationship of few identified variables related to ergonomic working conditions with the performance parameters, factor analysis and correlation analysis has been done. Factor analysis is done by employing principal component analysis with Varimax rotation method to find potential components in the area of concern that reduces number of variables to be used further. Then, the correlation of new variables (employing Bivariate Correlation procedure) with indicators (four performance variables named as sales turn-over, market share, sales growth and export) is computed that measures how variables or rank orders are related. These com-putations are presented in respective tables and discussed in respective sections.
5. Demographic Profile of Participating Enterprises
The nature and characteristics of surveyed enterprises is included in the demographic profile (Table 1) that comprised segment wise participation and number of employees. This also consists of performance parameters like annual sales turn-over, involve-ment in export, market share, past sales growth over last three years and projected sales growth for coming year. The definition of MSMEs varies from country to country and region to region. In India, the definition of these enterprises is based on invest-ment limit. For global reference, refer Table 2.
Referring to the definition of MSMEs adopted by many coun-tries (Table 2) and surveyed data (Table 1), about 20% surveyed enterprises belong to micro (0-9 employees), 35% enterprises belong to small (10–49 employees) and 45% enterprises belong to medium enterprises (50-249 employees). It reflects that all the surveyed enterprises belong to MSMEs sector. It is important to note that the three sub-sectors are nearly equally distributed in this survey (Table 1). Nearly 70% of enterprises reported an annual sale turn-over less than 50 million INR (Indian National Rupee). About 31% enterprises reported that they are engaged in export of their produced products. Thus, it can be inferred that those enterprises which are involved in export, are having annual sales turn-over of more than 50 millions of INR as both the cases are having nearly equal percentage. Most of the participating enterprises (about 85%) had a market share of less than a single percent.
6. Findings of this Survey
6.1 Welfare Facilities Respondents were asked about the availability of welfare facilities and its effectiveness as shown in Table 3. The value of Cronbach’s Alpha for reliability of data is 0.741 (N = 11).
The most cited available facility was the facility of first aid (mean = 2.95, SD = 0.62). It included localized availability of dressing and availability of most commonly used medicines. Regarding the availability of Hospital (mean = 2.23, SD = 0.94), employees were generally registered with Employees’ State Insurance Corporation (ESIC) scheme. In case of emergency occurred during working (within the enterprise during working hours), the management used to offer medical assistance through nearly hospital depending upon its seriousness. Respondents said that safety of manpower was their prime responsibility. No other facility was cited to be offered effectively as all other facilities were having mean value of less than 2. The value of satisfaction is 3 (as taken in survey on Likert scale of 5). Figure 1 indicates the presence of welfare facilities.

16
Reluctant Workforce May Derail the Adoption of Advance Manufacturing Technology in Micro, Small and Medium Enterprises of India
Vol 6 | Issue 2 | April-June 2014 | www.gjeis.org GJEIS | Print ISSN: 0975-153X | Online ISSN: 0975-1432
Table 1. Demographic profile of participating enterprisesDemographic profile Parameters for of participating enterprises (with the number and % of the respondents)
Total Respondents,
PercentParticipation by segment
Glassware Manufacturing
Enterprises (31, 36.9%)
Shoe / Footwear Manufacturing
Enterprises (30, 35.7%)
Lock Manufacturing
Enterprises(23, 27.4%)
- 84, 100%
Number of Employees
Less than 10 (17, 20.0%)
Between 10-49 (29, 34.5%)
Between 50-199 (30, 36.0%)
Between 200-249 (8, 9.5%)
250 and Above (0, Nil)
84, 100%
Annual Sales Turn-over
Upto 50L (15, 17.9%)
Between 51-100L
(12, 14.2%)
Between 101-200L
(19, 22.6%)
Between 201-500L
(13, 15.5%)
More than 500L
(25, 29.8%)
84, 100%
EnterprisesDoing Export
Doing Export(26, 31%)
Not doing Export (58, 69%)
- 84, 100%
Market Share
Upto 1% (71, 84.5%)
Between 1-5%
(12,14.3%)
Between 6-10% (0, Nil)
Between 11-15%
(1, 1.2%)
More than 15%
(0, Nil)
84, 100%
Sales Growth (Over past 3 years)(Increase)
No Increase(1, 1.2%)
Upto 10%
(54, 64.3%)
Between 11-20%
(28, 33.3%)
Between 21 to 50% (1, 1.2%)
More than 50%
(0, Nil)
84, 100%
Source : Computed outcome of responses collected through conducted survey‘L’ means Lakhs of Rupees (INR), 10 Lakhs = 1 million, 1 US Dollar = ` (INR) 61.603500
Table 2. Defining MSMEs (Manufacturing / Production Enterprises)19,56,57,58,59
Country Micro Enterprises Small Enterprises Medium EnterprisesEuropean Economy (€)
With less than 10 persons employed AND Turn-over or Balance Sheet Total of ≤ € 2 million
With 10 to 49 persons employed AND Turn-over or Balance Sheet Total of ≤ € 10 million
With 50 to 249 persons employed AND Turn-over or Balance Sheet Total of ≤ € 50 million
India (`) Investment ceiling for Plant, Machinery or Equipments upto INR 2.5 million
Investment ceiling for Plant, Machinery or Equipments above INR 2.5 million and upto INR 50 million
Investment ceiling for Plant, Machinery or Equipments above INR 50 million and upto INR 100 million
Japan (Yen) Capital less than 300 Million yen (US$ 2.70 million) with number of employee less than 300
Malaysia (RM)
Sales turnover of less than RM250,000 OR full time employees less than 5
Sales turnover between RM250,000 and less than RM10 million OR full time employees between 5 and 50
Sales turnover between RM10 million and RM25 million OR full time employees between 51 and 150
South Korea (Won)
Less than 10 employees Less than 50 employees Less than 300 employees and Capital (and sales) of 8 billion won or less
UK (£) Turnover of not more than £6.5 million, a balance sheet total of not more than £3.26 million and not more than 50 employees. While, according to Department of Trade and Industry (UK), micro enterprises has employees less than 10
turnover of not more than £25.9 million, a balance sheet total of not more than £12.9 million and not more than 250 employees
US ($) Employees less than 10, annual turnover of less than $3 million and balance sheet total of less than $3 million
Employees from 10 to 49, annual turnover of less than $13 million and balance sheet total of less than $13 million
Employees from 50 to 249, annual turnover of less than $67 million and balance sheet total of less than $67 million
1 € = $1.354023;1 US $ = ` (INR) 61.603500; 1 Yen = $0.009590 ; 1 RM = $0.303398; 1 Won = $ 0.000942; 1 £ = $1.641500

17Vol 6 | Issue 2 | April-June 2014 | www.gjeis.org GJEIS | Print ISSN: 0975-153X | Online ISSN: 0975-1432
Brijesh Singh, Amar Singh and R. C. Yadav Empirical Article
Enterprises were not offering any facility of education of employees’ children that lead to deskilling, uneducated mass and frustrated life. Due to non-availability of schools (owing to non-payment of fee or any other), employees are eager to use their children for workforce. It may lead to child labour. Lack of recreation facility and welfare society again leaded to unhealthy working conditions as work and only work would reduce the productivity. Due to lack of accommodation facility, workforce could not do work for late night conditions as they have to go to home after completing the work. Road safety is crucial for late going employees. Facility of canteen and transport was again poor that may leaded to reduction in productivity indirectly. Retirement benefits were poor as most of the employees said that there was no such long life in an enterprise. They left the job or forced to leave the job much earlier to the retirement. While planning to invest in AMT, an honest attention should be paid to these activities.
Table 3. Welfare facilities Welfare Facilities Mean SDThe First Aid Facility 2.95 0.62Hospital Facility 2.23 0.94Facilities for Training and Re-training 1.77 1.08Transportation facility provided by Org. 1.56 1.06Awareness of Org. Rules and Regulations 1.43 0.65Availability of Canteen/Lunch and Snacks 1.39 0.75Retirement Benefits 1.33 0.55Accommodation Facility 1.08 0.45Union/Welfare Society for the Employees 1.05 0.26Recreation Facility 1.04 0.33Facility for Education of Employee’s Children 1.0 0Source : Computed outcome of collected responses concerned through survey, employing SPSS
Figure 1. Presence of welfare facilities.
Source : Computed outcome of collected responses concerned through survey, employing SPSS
6.2 Employees’ Participation Respondents were asked to rate the participation of employees in various activities. In this regard, values of mean and SD is pre-sented in Table 4. The value of Cronbach’s Alpha is 0.798 (N = 10) for collected concerned data.
From Table 4, it is clear that employees were participat-ing in filing / record keeping and communicating the working problems. Participation of employees for activities like prob-lem solving during machine failure / breakdown, cleaning of self work places, housekeeping and for preventive maintenance was somewhat poorer. Further, outcome reflected that participa-tion of employees in expansion of plant, ideas for new / latest technologies / machines, ideas for new products and ideas for solving of working problems was either not satisfied or less satis-fied. Figure 2 indicates the frequency distribution of employees’ participation in various activities.
It can be said that the reason for getting least active involve-ment is due to their inherent nature of least belongingness. They never feel that this enterprise is ours and all the works
Table 4. Employees’ participation in activitiesEmployees’ Participation Activities Mean SDFile/Record Keeping 3.68 1.18Communicating the problems related to work 3.32 1.3For solving Break-down & m/c failure State 2.74 1.05Cleaning of self work place 2.41 0.79Housekeeping 2.23 0.81For preventive maintenance 2.08 0.84Idea generation for working problem solving 1.75 1.11Ideas for new products 1.18 0.56Ideas for new machines/technologies 1.11 0.41For Expansion of Plant 1.11 0.41Source : Computed outcome of collected responses concerned through survey, employing SPSS
Figure 2. Employees’ participation in activities.
Source : Computed outcome of collected responses concerned through survey, employing SPSS

18
Reluctant Workforce May Derail the Adoption of Advance Manufacturing Technology in Micro, Small and Medium Enterprises of India
Vol 6 | Issue 2 | April-June 2014 | www.gjeis.org GJEIS | Print ISSN: 0975-153X | Online ISSN: 0975-1432
pertaining to this enterprise are ours and we have to comply with them with full dedication and effectiveness. They never feel that ‘to work for upliftment of the enterprise is our prime responsibility’.
6.3 Acceptance of Technology by Workforce Respondents were asked to rate the acceptance of newer tech-nologies or AMT by employees through accepting with 100% motivation, acceptance as burden, accepting due to fear of loss of job, not accepting, opposing, and opposing and provok-ing. Conducting reliability analysis, value of Cronbach’s Alpha appears 0.610 (N = 6). Refer Figure 3 for values of mean and SD for these considered aspects.
From Figure 3, it can be interpreted that employees were accepting introduction of newer / latest technologies / AMT only either because of fear of loss of job or as burden. In both cases, there was no self motivation and acceptance approach towards learning and introduction of AMT. While planning for AMT investment, almost entire workforce should be involved from its initial idea generation to actual working phase, including post evaluations. With their active involvement at various stages, the fear will reduce and offering training and motivation, confidence will arise. Let, discuss the generated alternate hypothesis (HA1) for its statistical validation. To validate this alternate hypothesis statistically, findings are presented in Table 5.
Results presented in Table 5 show that there is significant difference of mean (p < 0.05, at 95% confidence level) for accept-ance of AMT by employees’ of all the three sectors due to fear of job loss (based on the F-value obtained by employing one-way ANOVA). Hence, it cannot be considered as potential aspect. Further, referring values of t-test (between the two sectors, in groups), the significant difference of mean (p < 0.05, at 95% con-fidence level) is observed for accepting AMT ‘as burden’ (between manufacturer of shoe/footwear and lock), with ‘full motivation’ (between manufacturers of glassware and shoe/footwear), and ‘opposing’ (between manufacturers of glassware and shoe/foot-wear). Thus, these cannot be considered as potential behaviour offered by employees of all sectors of MSMEs of India.
Hence, it cannot be rejected that employees of various sectors of MSMEs of India are generally not willing to accept the adoption of newer technologies and oppose and motivate others to oppose. Figure 3. Acceptance of AMT by workforce.
Source : Computed outcome of collected responses concerned through survey, employing SPSS
Table 5. Computed hypothesis values for acceptance of AMT Acceptance of AMTs
Overall Glassware Manufacturing Enterprises (1)
Shoe/footwear Manufacturing Enterprises (3)
Lock Manufacturing Enterprises (5)
F-value (Sig.) t-value (Sig.)
Mean SD Mean SD Mean SD Mean SD 1-3 3-5 5-1Fear of Job Loss
3.02 1.10 3.13 0.96 3.40 1.04 2.39 1.18 6.482 (0.002) -1.061 (0.293)
3.393 (0.001)
-2.607 (0.012)
As Burden 2.81 0.90 2.84 0.74 3.03 0.93 2.49 0.99 2.610 (0.080) -0.910 (0.367)
2.093 (0.041)
-1.534 (0.131)
Full Motivation
2.49 0.90 2.61 0.76 2.20 0.76 2.70 1.15 2.547 (0.085) 2.119 (0.038)
-1.890 (0.064)
0.319 (0.751)
Not Accepting
1.08 0.28 1.03 0.18 1.17 0.38 1.04 0.21 2.166 (0.121) -1.779 (0.080)
1.402 (0.167)
0.212 (0.833)
Opposing and Motivating
1.04 0.24 1.07 0.36 1.00 0.00 1.04 0.21 0.548 (0.580) 0.983 (0.329)
-1.146 (0.257)
-0.251 (0.803)
Opposing 1.01 0.11 1.00 0.00 1.00 0.00 1.04 0.21 1.337 (0.268) 0 -1.146 (0.257)
1.165 (0.249)
Source : Computed outcome of collected responses concerned through survey, employing SPSS

19Vol 6 | Issue 2 | April-June 2014 | www.gjeis.org GJEIS | Print ISSN: 0975-153X | Online ISSN: 0975-1432
Brijesh Singh, Amar Singh and R. C. Yadav Empirical Article
Thus, the alternate hypothesis is statistically validated. Most of the employees remain unaware regarding the adoption of AMT whose decision is made solely by management without consult-ing their employees and taking them in confidence. Employees feel themselves to be unfit to newer technologies and seek no guidance, motivation and training. It generates feeling of laying-off and to save their jobs, they start opposition. Older workers feel that they cannot learn even when training will be offered, cannot be as promising and useful to enterprise as younger ones and pro-mote unions to oppose and motivate other to oppose.
6.4 Process Champion Respondents were asked to state the availability of process champion, who is having expert knowledge about the adoption of suitable AMT. Out of total respondents, 91.7% respondents ruled out the availability of process champion or technological expert. He was neither the employee of the enterprise nor hired one. Lack of availability of process champion or technical expert hamper the process of adoption of AMT. There is no one who can motivate the workforce, emphasizing its benefits to enterprises and themselves. If AMT are adopted, the problem understanding and solving is missing.
Huang and Sakurai60 observed that, in Japan, the automation systems are designed and selected by the enterprise’s own techni-cal staff. For successful adoption, an enterprise needs the support of employees with adequate training, to operate as well as design and select automated equipment. However, in USA and in a num-ber of other countries, hiring of technical consultants to design, select and evaluate automated systems has been a common prac-tice. Chen and Small61 stressed that the presence of technology champion is essential to project success. Human beings are very complex in their psychological make-up and hence, managers cannot influence employees’ inner states directly. They can create environments that encourage quality performance62. Reid et al.63
quoted that HRM managers were not involved in strategic deci-sion making either the development or implementation stage. The work of a committed and highly qualified champion can be easily frustrated by an unsupportive organizational structure.
6.5 Employees’ Culture Further, employees’ culture was tried to understand by analyzing their participation for reducing rejection rate, quality improve-ment, reducing pollution, reducing waste, effective utilization of resources and reducing power/energy requirements. The value of Cronbach’s Alpha is 0.917 (N = 06). Refer Table 6 for the values of mean and SD in this regard.
The outcomes shown in Table 6 reflect that employees were bothered for reduction in rejection rate (mean = 3.67, SD = 0.90) and for quality production (mean = 3.63, SD = 0.95). It can be
stated here that there are two type of labour wages, first - labour on fixed salary, and secondly, salary on piece count (only by produc-ing acceptable products). Thus, to maximize their earnings, more acceptable quantity is to be produced. Production of defective items along with rejection may cause deduction in salary. With adoption of AMT, benefits like reduction in waste/scrap, reduc-tion in rejections, improvement in quality, effective utilization of resources and reduction in pollution is achieved. Moreover, human error can be reduced that will lead to these benefits.
Huang and Sakurai60 discussed the importance of worker’s participation in the implementation process of automation projects. Rao and Deshmukh64 emphasized that in most cases top management takes the initiative without consulting their employees. Further, respondents were asked about the partici-pation of employees for various brain storming activities that included idea generation (mean = 1.27, SD = 0.61), problem solv-ing (mean = 1.51, SD = 0.84), new products (mean = 1.20, SD = 0.53) and learning about new / latest technologies (mean = 1.27, SD = 0.65). As all mean values are less than 2 (on a Likert scale of 5), that indicated for less satisfactory range. Thus, there was no active participation of employees in brain-storming for various activities. Top management generally did not involve their work-ers for idea generation. The decision of investing in AMT was rarely discussed with them and they never be tried to motivate / encouraged for these newer / latest technologies. Let, examine the framed null and alternate hypothesis (HN1 and HA2) for their statistical validation.
Referring the Table 7, the significant difference of mean (p < 0.05, at 95% confidence level) among all the three sectors (based on F-value obtained by applying one-way ANOVA) is observed for reducing rejection. Thus, it cannot be considered as the poten-tial employees’ culture and can be inferred as the employees of various sectors of MSMEs of India are not bothered for reducing the rejection. Hence, it cannot be rejected that the employees of various sectors of MSMEs of India are not bothered for reducing the rejection. Thus, the null hypothesis is statistically validated.
Referring the observations of Table 7 and arranging the parameters of employees’ culture in descending order of mean,
Table 6. Employees’ cultureEmployees’ Culture Mean SDReducing Waste 3.21 0.91Quality Improvement 3.63 0.95Reducing Rejection 3.67 0.90Effective Utilization of Resources 2.89 0.89Reducing Power Requirements 2.86 0.91Reducing Pollution 3.31 0.93Source : Computed outcome of collected responses concerned through survey, employing SPSS

20
Reluctant Workforce May Derail the Adoption of Advance Manufacturing Technology in Micro, Small and Medium Enterprises of India
Vol 6 | Issue 2 | April-June 2014 | www.gjeis.org GJEIS | Print ISSN: 0975-153X | Online ISSN: 0975-1432
it can be concluded here that employees of MSMEs of India are bothered for quality improvement, reducing pollution, reducing waste, effective utilization of available resources and reducing the power requirements.
Further, on the basis on the mean, as presented in Table 7, all sectors seem to be agreed that their employees’ were always both-ered for improving the product quality. It was observed that most of the MSMEs employ working persons on contractual basis and salary and wages are often dependent on successful output. Every employee wants to earn the maximum, so, he always remained eager to produce such products which could not be rejected oth-erwise he would loss his salary even-after expending his time in production. Moreover, the dedicated employees thought that the earning of the enterprise can be maintained and be improved by offering quality products to customer. Hence, it cannot be rejected that the employees of various sectors of MSMEs of India are utmost bothered for improving the product quality. Thus, the alternate hypothesis is statistically validated.
In this way, it can be remarked that the adoption of suita-ble AMT tools is essential for MSMEs of India as benefits of its adoption include not only the improvement in quality but also reduction in rate of rejection, which is the dire need of MSMEs at this stage. Further, it helps in reducing the waste and power requirements.
6.6 Ergonomic Working ConditionsIn this section, conduct of time motion study, availability of doc-tor and state of ergonomic working conditions were tried to be
analyzed. Surprisingly, none of the respondents reported that they were employing time-motion study. When asked for the availability of doctor with its regularity, only 9.5% reported that there was availability of doctor. When asked for arrangement of doctor in emergency (either in-house or at hospital), 85.7% respondents reported that they arranged doctor as a matter of concern. Further, respondents were asked about various ergo-nomic working conditions. The value of Cronbach’s Alpha is 0.848 (N = 14). Regarding these ergonomic working conditions, Figure 4 indicates the value of mean and SD in descending order of mean.
From Figure 4, it can be inferred that the top five adverse conditions included non-availability of smoking zone, non avail-ability of canteen / tea and snacks, improper rest between the
Table 7. Computed hypothesis values for employees’ cultureEmployees’ Culture
Overall Glassware Manufacturing Enterprises (1)
Shoe/footwear Manufacturing Enterprises (3)
Lock Manufacturing Enterprises (5)
F-value (Sig.)
t-value (Sig.)
Mean SD Mean SD Mean SD Mean SD 1-3 3-5 5-1Reducing Waste 3.21 0.91 3.42 0.92 3.20 0.61 2.96 1.15 1.760
(0.179)1.091
(0.280)0.995
(0.324)-1.643 (0.106)
Quality Improvement
3.63 0.95 3.74 1.03 3.63 0.72 3.48 1.12 0.498 (0.609)
0.476 (0.636)
0.611 (0.544)
-0.894 (0.375)
Reducing Rejection
3.67 0.90 3.94 0.85 3.70 0.75 3.26 1.01 4.050 (0.021)
1.143 (0.258)
1.818 (0.075)
-2.656 (0.010)
Effective Utilization of Resources
2.89 0.89 3.03 0.88 2.90 0.76 2.70 1.06 0.940 (0.395)
0.630 (0.531)
0.817 (0.418)
-1.275 (0.208)
Reducing Power Requirement
2.86 0.91 3.00 0.78 2.90 0.89 2.61 1.08 1.290 (0.281)
0.470 (0.640)
1.081 (0.285)
-1.555 (0.126)
Reducing Pollution
3.31 0.93 3.36 0.95 3.43 0.73 3.09 1.13 0.958 (0.388)
-0.361 (0.719)
1.358 (0.180)
0.947 (0.348)
Source : Computed outcome of collected responses concerned through survey, employing SPSS
Figure 4. Ergonomic aspects.
Source : Computed outcome of collected responses concerned through survey, employing SPSS

21Vol 6 | Issue 2 | April-June 2014 | www.gjeis.org GJEIS | Print ISSN: 0975-153X | Online ISSN: 0975-1432
Brijesh Singh, Amar Singh and R. C. Yadav Empirical Article
shifts, existing sweating condition and back / body ache prob-lems. It was observed workers were doing their work on sitting at ground in most of the enterprises and no tables were in use for working in standing position. The acceptable top five ergonomic aspects were approach to hand tools, availability of stair cases, availability of sun light, floor condition, and ventilation. It can be argued that with motivated workforce, quality production can be improved with less rejection. Offering ergonomic conditions and some other necessary facilities will utmost satisfy the work-force and will definitely help in working without fatigue and in improving productive time.
6.7 Impact of Ergonomic Working Conditions on Performance
Impact of ergonomic working condition on the performance was analyzed by employing factor analysis to reduce the number of variables to be used further and correlation analysis further. Factor analysis concluded the following outcome (Table 8).
Factor analysis of working conditions reduced fourteen parameters into four components (Table 8) that included Ergonomic Conditions (WC F1), Idle Time Reducing Condition (WC F2), Strain Condition (WC F3), and Refreshing Condition
(WC F4). Ergonomic Conditions included working environment for employees, ventilation at working place, comfort condition of the workers, ambient temperature at working place, effectiveness of cooling arrangements made for workers, sweating condition among the workers at production place, availability of sun light / electric light at workplace and floor condition for movement of worker. Idle time reducing conditions included approach and availability of hand tools used in production and stair conditions and its availability for workers movement. Strain conditions included back ache/body ache problem of workers and availabil-ity of smoking zone. Refreshing conditions included availability of rest in between the shifts and availability of tea / coffee / snacks etc.
Correlation among identified variables and performance variables is shown in Table 9. It is observed that ergonomic con-ditions are strongly and positively correlated (p < 0.01, at 99% confidence level) with sales growth and positively correlated with export as performance parameter (p < 0.05, at 95% confidence level), while negatively correlated with market share. It shows that improving ergonomic conditions, performance can fur-ther be improved. Idle time reducing conditions are positively correlated with annual sales turn-over and export (p < 0.05, at 95% confidence level) as it will help in improving manufacturing
Table 8. Factor analysis of working conditionsWorking Conditions Component
-1Component
-2Component
-3Component
-4Working Environment for Employees .714 .274 .089 .085Ventilation at Working Place .737 .083 .352 .289Comfort Condition of the Workers .893 .106 -.052 .129Ambient Temperature at Working Place .862 .084 -.015 .072Effectiveness of Cooling Arrangements made for workers
.832 .008 -.082 .147
Sweating Condition among the workers at Production Place
.618 .154 -.062 -.451
Back Ache/Body Ache problem of Workers .027 .092 .741 -.254Availability of Sun Light / Electric Light at Workplace
.665 .189 .267 .236
Floor Condition for Movement of Worker .607 .602 .071 -.087Approach and Availability of Hand Tools used in Production
.070 .877 .024 .052
Stair Conditions and Its Availability for Workers movement
.183 .845 -.010 .193
Availability of Rest in between the shifts .281 .041 -.033 .786Availability of Tea / Coffee / Snacks etc .103 .250 -.249 .597Availability of Smoking Zone -.072 .057 -.891 -.024Rotation converged in 5 iterations, Highlighted values are the maximum absolute values and are to be grouped to form the new variables.Source : Computed outcome of collected responses concerned through survey, employing SPSS

22
Reluctant Workforce May Derail the Adoption of Advance Manufacturing Technology in Micro, Small and Medium Enterprises of India
Vol 6 | Issue 2 | April-June 2014 | www.gjeis.org GJEIS | Print ISSN: 0975-153X | Online ISSN: 0975-1432
output. Strain conditions did not find any significant correlation with performance improvement as in MSMEs; employee has to work even in such painful conditions, failing which he may lose his salary. Mostly employees are on contractual basis and salary is proportional to produced quality products. Refreshing condition found strong positive correlation (p < 0.01, at 99% confidence level) with annual sales turn-over and market share as rest between the working shifts refreshes the employees so that they can work harder again for more duration and offering tea / snacks etc. generates personal affection that helps in improv-ing production with less rejections. All these will improve quality production with less rejection, better utilization of resources and productivity.
7. Discussion Many researchers who advocates for successful adoption of AMT, necessitate the addressing of human factors. Failures are observed when affairs related to human factors are not properly planned and taken care for action. In this research, state of affairs related to human factors in MSMEs of India is investigated. Findings reflect that welfare facility must be improved as present state of offering welfare facility is not satisfactory. Management must motivate their employees for their active participation in various activities and needs of the enterprise. The feeling should emphasis for an entire family within the enterprise. The philosophical change, motivation, training and re-training is
Table 9. Correlation matrix for working conditions and performance variablesSales
Turn-overMarket Share
Sales Growth Export WC F1 WC F2 WC F3 WC F4
Sales Turn-over 1
Market Share
0.109(0.324) 1
Sales Growth
0.338**
(0.002)-.057
(0.604) 1
Export 0.607**
(0.000)-.035
(0.749)0.297**
(0.006) 1
WC F1 0.179(0.104)
-0.251*
(0.021)0.324**
(0.003)0.267*
(0.014) 1
WC F2 0.220*
(0.045)-0.140(0.205)
0.007(0.952)
0.342*
(0.001)0.310**
(0.004) 1
WC F3 0.025(0.821)
-0.086(0.437)
-0.014(0.896)
0.191(0.081)
-0.021(0.849)
0.042(0.704) 1
WC F4 0.384**
(0.000)0.347**
(0.001)0.040
(0.721)0.209
(0.057)0.286*
(0.008)0.254*
(0.020)-0.027(0.808) 1
**. Correlation is significant at 0.01 level (2-tailed); *. Correlation is significant at 0.05 level (2-tailed).Source : Computed outcome of collected responses concerned through survey, employing SPSS
required. Adoption of newer technologies is not fruitful until and unless workforce is not accepting them with full motivation. High capital investment could not reap the benefits without the encouragement and involvement of manpower. State of avail-ability of process champion or technical expert is negligible. Thus, motivation and knowledge support is missing during plan-ning and adoption of AMT. Enterprises are mostly employing unskilled labour whose wages are less and training level is also less. This hampers quality production and adversely affects the ultimate goal of the enterprise. Employees of MSMEs of India are bothered for quality improvement, reducing pollution, reducing waste, effective utilization of available resources and reducing the power requirements. Working environment should ergonomi-cally be designed. It will definitely help in employees working without much stress and fatigue and will help in improving pro-ductivity. Thus, proper care and investment in human resources is an essential requirement for successful adoption of AMT.
8. Conclusions Although the importance of MSMEs in the growth of advanc-ing nations is undisputed, this sector suffers from the lack of technology adoption. In order to understand the affairs related to human factors during AMT adoption, a comprehensive study was conducted through questionnaire. Our major focus here was to understand cultural, welfare, ergonomic and psycho-logical factors affecting AMT adoption in MSMEs of India. The

23Vol 6 | Issue 2 | April-June 2014 | www.gjeis.org GJEIS | Print ISSN: 0975-153X | Online ISSN: 0975-1432
Brijesh Singh, Amar Singh and R. C. Yadav Empirical Article
outcomes of this study indicate that except first aid facility and hospitalization in ESIC schemes, none of the welfare facilities are available in satisfactory condition. This typically may result into minor accidents and rifts. The participation of employees for activities such as rectification of machine failure, breakdowns, cleaning of self work-places, housekeeping, preventive main-tenance, expansion of plants, ideas for the latest technologies, products and machines, was found to be quite unsatisfactory. It seems that the employees are not bothered for reduction in the product rejection rate, mainly due to psychological and cul-tural factors. However, it was quite surprising that the employees are keen for delivering highest quality product. Furthermore, employees of various sectors of MSMEs of India are generally not willing to accept the adoption of newer technologies and moti-vate others to oppose. Finally, it was found that the availability of a process champion or technical expert is almost rare in these enterprises. This is revealed as a core factor contributing to the reluctance for new technology adoption. All the respondents reported that they did not employ time-motion study. Doctor’s availability for regular check-ups was also considered negligible. Working environments were found to be lacking in good ergo-nomic design. It was reported that the top five adverse conditions include non-availability of smoking zone, non-availability of canteen for tea and snacks, improper rest between the shifts, existing sweating condition and problems related to back and body ache. The acceptable top five ergonomic aspects included approach to hand tools, availability of stair cases, availability of sun light, floor condition and ventilation. Overall, this study sug-gests that utmost care of human related affairs, in a multi-facet manner, is an essential act for any enterprise to ensure improved performance and successful adoption of AMT that also includes improved skills, training, re-training, salary and wages, and working environment as a whole for entire set of workforce.
8.1 Research ImplicationsOn the basis of this research, it can be suggested that to ensure effective and successful adoption of suitable AMT, entire work-force must be encouraged and motivated for their active and efficient involvement in all the areas of an enterprise. It can be achieved through hiring process champions, improving work-place safety and ergonomic conditions, and imparting knowledge of novel technologies to the workforce.
Future studies are essentially required to analyze the human related affairs so as to ensure smooth acceptance of adoption of newer technologies without hesitation, more participation in almost all the activities of an enterprise and thus, improved performance of MSMEs. This study cannot be taken as refer-ence in policy making or in generalizing the case as it is based on responses of participated 84 MSMEs of India only as there are large numbers of functioning manufacturing MSMEs. Further, to
broaden the aspect and coverage, the study must be planned in much larger way. Future studies and researches in this regard will help the manufacturers, policy framers and researchers to reach to a common consensus.
9. Acknowledgement The authors are very grateful to the personnel of participating enterprises for their valuable responses. The authors are thankful to the anonymous referees whose valuable comments have been incorporated to improve the quality of this paper. The authors are also thankful to the editor and entire editorial board of this journal for his availability and help in the entire process of pub-lication of this paper.
10. References 1. Acharya SS. Innovative MSMEs Financing To manage and balance
growth targets, capital requirements and achieving higher profit-ability. Compendium 12 Test Layout 1. 2012 Oct, 2012; 13–16.
2. Rose AMN, Deros BMd., Rahman MNAb, Nordin N. Lean manufacturing best practices in SMEs. Proceedings of the 2011 International Conference on Industrial Engineering and Operations Management; 2011 Jan; Kuala Lumpur, Malaysia. p. 872–77.
3. Buckley PJ. International Technology Transfer by Small and Medium Sized Enterprises. Small Business Economics. 1997; 9:67–78.
4. Burhanuddin MA, Arif F, Azizah V, Prabuono AS. Barriers and challenges for technology transfer in Malaysian small and medium enterprises. International Conference on Information Management and Engineering; April 03–05 2009; Kuala Lumpur, Malaysia. p. 258–61.
5. Dalu RS, Deshmukh SG. An exploratory study of quality manage-ment practices in small and medium scale industry. J Ind Eng. 2000; 29(12):21–7.
6. Farsijani H, Carruthers A. World class manufacturing : techniques for implementation for small and medium sized enterprises. International Conference on Engineering and Technology Management. Vancouver, BC. 1996 Aug 18–20. 112–116.
7. Gunasekaran A, Forker L, Kobu B. Improving operations perfor-mance in a small company: a case study. Int J Oper Prod Manag. 2010; 20(3):316–35.
8. Harvie C. The contribution of SMEs in the economic transition of Vietnam. J Int Bus Enterpren Dev. 2004; 2(2):1–16.
9. Koc T, Bozdag E. The impact of AMT practices on firm perfor-mance in manufacturing SMEs. Robotics and Computer-integrated Manufacturing. 2009; 25:303–13.
10. Romijn H. Technology support for small-scale Industry in Developing countries: A review of concepts and project practices. Oxford Development Studies. 2001; 29(1):57–76.
11. Schmitt J, Lane N. An international comparison of small business employment. Report published by: Center for Economic and Policy Research. 2009; 202-293-5380. Available from: www.cepr.net.

24
Reluctant Workforce May Derail the Adoption of Advance Manufacturing Technology in Micro, Small and Medium Enterprises of India
Vol 6 | Issue 2 | April-June 2014 | www.gjeis.org GJEIS | Print ISSN: 0975-153X | Online ISSN: 0975-1432
12. Shi J, Li Ping. An Initial Review of Policies for SMEs in US, Japan and China. IEEE International Conference on Management of Innovation and Technology. Jun 21–23 2006; Singapore, China. p. 270–74.
13. Subrahmanya MHB, Mathirajan M, Krishnaswamy KN. Importance of technological innovation for sme growth : evidence from India. UNU World Institute for Development Economics Research, Finland. Working Paper No. 2010/03; 2010; 1–23
14. Rahman AA, Bannett D. Advanced manufacturing technology adoption in developing countries: The role of buyer-supplier rela-tionships. J Manuf Tech Manag. 2009; 20(8):1099–18.
15. Gill HS, Singh H, Singh S. Effectiveness of advanced manufacturing technologies in SMEs of auto parts manufacturing. Proceedings of the 2010 International Conference on Industrial Engineering and Operations Management; Jan 09-10 2010; Dhaka, Bangladesh.
16. Singh B, Narain R, Yadav RC. Adoption of advance manufacturing technologies in micro, small and medium enterprises of India. Int J Indian Cult Bus Manag. 2013; 7(1):24–52.
17. Performance of SMEs in China. Available from: http://www.china-daily.com.cn/cndy/2010-09/16/content_11309318.htm
18. SMEs become major force in promoting innovation in China. News of Biz China Weekly, 51, 2012 Jun 22. Available from http://news.xinhuanet.com/english/china/2012-06/22/c_131670359.htm
19. Yang J. Small and Medium Enterprises (SME) adjustments to Information Technology (IT) in Trade Facilitation: The South Korean Experience. Asia-Pacific Research and Training Network on Trade. 2009; 61:1–39.
20. SMEs in Malaysia. Available from: http://www.smecorp.gov.my/v4/node/2681
21. SMEs in European Union (EU) in 2012: at the crossroads, Annual report on small and medium-sized enterprises in the EU, 2011/12. Available from: http://ec.europa.eu/enterprise/policies/sme/facts-figures-analysis/performance-review/files/ supporting-docu-ments/2012/annual-report_en.pdf
22. Small Business Statistics, issued by Federation of Small Business, UK. Available from: http://www.fsb.org.uk/stats
23. Economic Survey (2010-2011): Government of India. Available from: http://indiabudget.nic.in/es2010-11/echap-09.pdf
24. Annual Report (2011-2012), issued by Ministry of MSMEs, Government of India. Available from: http://msme.gov.in/MSME-Annual-Report-2011-12-English.pdf
25. Chuang M, Yang YS, Lin CT. Production technology selection: Deploying market requirements, competitive and operational strategies, and manufacturing attributes. Int J Comput Integrated Manuf. 2009; 22(4):345–55.
26. Percival J. Complementarities between information sources to sup-port the implementation of Advanced Manufacturing Technologies. Int J Manag Sci Eng Manag. 2008; 4(2):29–42.
27. Taha Z, Tahriri F. Critical Success Factors for Advanced Manufacturing Technology (AMT). International Conference on Mechanical and Electrical Technology. 2009; Paper 38.
28. Hoffmann C, Orr S. Advanced manufacturing technology adoption – the German experience. Technovation. 2005; 25:711–24.
29. Hynek J, Janecek V. Justification of Investment into Advanced Manufacturing Technology. International Journal of Circuits, Systems and Signal Processing. 2007; 1(3):282–88.
30. Ghani KA, Jayabalan V. Advanced manufacturing technology and planned organizational change. J High Tech Manag Res. 2000; 11(1):1–18.
31. Ghani KA, Jayabalan V, Sugumar M. Impact of advanced manufac-turing technology on organizational structure. J High Tech Manag Res. 2002; 13:157–75.
32. Bessant J. Towards total integrated manufacturing. Int J Prod Econ. 1994; 34: 237–51.
33. Boyer KK, Leong GK, Ward PT, Krajewski LJ. Unlocking the poten-tial of advanced manufacturing technology. J Oper Manag. 1997; 15:331–47.
34. Muscatello M, Greene TJ. The Hurdles of Manufacturing Systems Implementations. Comput Ind Eng. 1990; 19(1/4):136–39.
35. Sambasivarao KV, Deshmukh SG. Selection and implementation of advanced manufacturing technologies. Int J Oper Prod Manag. 1995; 15(10):43–62.
36. Chung CA. Human issues influencing the successful implementa-tion of advanced manufacturing technology. J Eng Tech Manag. 1996; 13:283–99.
37. Chodur M, Palka P. Impact of AMT investments on effectiveness and competitiveness of manufacturing systems. Journal of Academic Research in Economics. 2009; 1: 63–79.
38. Challis D, Samson D, Lawson B. Integrated manufacturing, employee and business performance: Australian and New Zealand evidence. Int J Prod Res, 2002; 40(8):1941–64.
39. Demeter K, Kolos K. Marketing, manufacturing and logistics: an empirical examination of their joint effect on company perfor-mance. Int J Manuf Tech Manag. 2009; 16(3):215–33.
40. Mital A, Pennathur A, Huston RL, Thompson D, Pittman M, Kaber DB, Crumpton L, Bishu RR, Rajurkar KP, Rajan V, McMulkin JEM, Deivanayagam S, Ray PS, Sule D. The need for worker training in advanced manufacturing technology (AMT) environments: a white paper. Int J Ind Ergon. 1999; 24:173–84.
41. Sohal A, Samson D, Weill P. Manufacturing and technology strategy: a survey of planning for AMT. Computer-Integrated Manufacturing System. 1991; 4(2):71–9.
42. Lyu J, Gunasekaran AQ. Implementation of advanced manu-facturing technology through industry-government-university co-operation in Taiwan. Computers in Industry. 1993; 22:187–91.
43. Harney B, Dundon T. Capturing complexity: developing an inte-grated approach to analyzing HRM in SMEs. Hum Resource Manag J. 2006; 16(1):48–73.
44. Fabi B, Lacoursiere R, Raymond L, St-Pierre J. HRM capabilities as a determinant and enabler for productivity for manufacturing SMEs. Hum Syst Manag. 2010; 29(3):115–25
45. Zheng C, O’Neill G, Morrison M. Enhancing Chinese SMEs per-formance through innovative HR practices. Personal Review. 2009; 38(2):175–94.
46. Rani MRA, Sinclair MA, Case K. Human mismatches and prefer-ences for automation. Int J Prod Res. 2000; 38(17):4033–39.

25Vol 6 | Issue 2 | April-June 2014 | www.gjeis.org GJEIS | Print ISSN: 0975-153X | Online ISSN: 0975-1432
Brijesh Singh, Amar Singh and R. C. Yadav Empirical Article
47. Mital A, Pennathur A. Advanced technologies and humans in manufacturing workplaces: an interdependent relationshipInt J Ind Ergon. 2007; 33:295–313.
48. Fawcett SE, Myers MB. Product and employee development in advanced manufacturing: implementation and impact. Int J Prod Res. 2001; 39(1):65–79.
49. Beaumont N, Schroder R, Sohal A. Do foreign-owned firms man-age advanced manufacturing technology better?. Int J Oper Prod Manag. 2002; 22(7):759–71.
50. Singh H, Khamba JS. Evaluating the barriers for Enhancing the Utilization Level of Advanced Manufacturing Technologies (AMTs) in Indian Manufacturing Industry; 2008. Available from: http://www.iiis.org/CDs2008/ CD2009SCI/IMETI2009/ PapersPdf/F565XC.pdf
51. Kishore K, Majumdar M, Kiran V. Innovative HR strategies for SMEs. IOSR Journal of Business and Management. 2012; 2(6):1-8.
52. Costa S, Lima E. Advanced manufacturing technology adoption: an integrated approach. J Manuf Tech Manag. 2009; 20(1):74–96.
53. Jensen PL, Alting L. Human Factors in the Management of Production. Annals of the CIRP. 2006; 55(1):1–4.
54. Abdullah MA, Shuib M, Muhammad Z, Khalid HN, Nor NM, Jaujar J. Employee Organizational Commitment in SMEs : Evidence from the Manufacturing Sector in Malaysia. International Review of Business Research. 2007; 3(2):12–26.
55. Muda S, Hendry L. Proposing a World class manufacturing concept for the make-to-order sector. Int J Prod Res. 2002; 40(2):353–73.
56. Singh B, Narain R, Yadav RC. Identifying critical barriers in the growth of Indian Micro, Small and Medium Enterprises (MSMEs). Int J Bus Compet Growth. 2012; 2(1):84–105.
57. Tarka D. High-growth Micro Enterprises : Managing the risk aspects of enterprise growth. International conference on Innovation / Business Education and Entrepreneurial Training, London, April 4–5 2004; 1–18. Available from: http://129.3.20.41/eps/mic/papers/0403/0403004.pdf
58. Performance of MSMEs in Japan, A report from the Economist Intelligence Unit entitled ‘SMEs in Japan: A new growth driver?; 2010. Available from: http://viewswire.eiu.com/ report_dl.asp?mode=fi&fi= 1227698307. PDF&rf=0
59. Currency Calculator. Available from: http://www.x-rates.com/cal-culator.html
60. Huang PY, Sakurai M. Factory Automation: The Japanese Experience. IEEE Trans Eng Manag. 1990; 37(2):102–8.
61. Chen IJ, Small MH. Implementing Advanced Manufacturing Technology: an integrated planning modelInt J Manag Sci. 1994; 22(1):91–103.
62. Sarma JSVG. A Study on significance of job satisfaction and com-mitment of employees in Small Scale Industries. IOSR Journal of Business and Management. 2012; 2(6):45–52.
63. Reid R, Morrow T, Kelly B, McCartan P. People management in SMEs : an analysis of human resource strategies in family and non-family business. J Small Bus Enterprise Dev. 2002; 9(3):245–59.
64. Rao KVS, Deshmukh SG. strategic framework for implementing flexible manufacturing systems in India. Int J Oper Prod Manag. 1994; 14(4):50–63.

Global Journal of Enterprise Information SystemG J E I S
Empirical Study of Volatility Clustering in Stock Prices of IT IndexAnurag Agnihotri*
College of Vocational Studies, Delhi University, India; [email protected] .
Abstract
The volatility in the stock market creates the opportunity for the investor and their uncertainties also cause the risk for the investor. Keeping this in mind this paper has looked in to the volatility and with specific reference to IT Index in Indian stock market. For this purpose we have used the closing price of the BSE-IT Index for estimation of volatility using GARCH are from 1-04-05 to 31-03-2013.This paper tries to find out if there is volatility clustering in the BSE IT (Information Technology) index in the stock market using the ARCH/GARCH Model to indicate the volatility in the stock market. The closing prices considered. After fitting the GARCH model in the data, analysis on the findings will be done. Following which the concluding part of the paper, in which the limitations of this model along with further suggestions will be elucidated. It was found that GARCH 1,1 has proved the time varying volatility in the IT sector.Keywords: BSE, Clustering, GARCH, Stock Market, Volatility
1. IntroductionThe Indian IT sector is the major sector which has played an important role in the growth and decline of Indian stock market. The BSE IT index is the true representative of the Indian stock market. The stock market is exposed to a high degree of volatil-ity; prices fluctuate within minutes and are determined by the demand and supply of stocks at a given time. In addition the inter-national trading and investment exposure has made it imperative to better operational efficiency. With the view to improve, dis-cipline and bring greater transparency in this sector, constant efforts are being made and to a certain extent improvements have been made. Due to previous trends, informed investors realise that the nature of the stock market is volatile. Volatility is the most important variable in valuating derivative instruments. It has central role in risk management, asset valuation and invest-ment in general. Actually modern risk management practices rely on volatility of asset and correlation of assets. However, it must be borne in mind that volatility is not the same thing as risk. Risk management and correct hedging are hugely important and valuable businesses and misconceptions can have disastrous effects. Therefore since volatility has such a wide scope, it may be beneficial for an investor to study it. The IT and IT enabled ser-vices industry in India has recorded a growth rate of 22.4% in the last fiscal year. Out of this figure, the domestic IT market in India accounted for 900 billion rupees. Volatility in the stock market may be attributed to several reasons. Many technical experts are confidently assuring them that the stock markets will go to higher levels in a short period of time. Due increasing volatility, analysis of stock market trends has become increasingly important.
* Author for correspondence
2. Information Technology Sector
2.1 Review of LiteratureGertler and Hubbard1 revealed that business investment spending is also influenced by stock return Volatility. Schwert4 character-ized the changes in Stock Market Volatility through time. The Stock Volatility increased by a factor of two or three during this period compared with the usual level of the series. There is no other series that experienced the similar behavior. The relation-ship between Stock Volatility and several measures of corporate profitability was also analysed. Akgiray2 discovered that daily series exhibited much higher degrees of statistical depend-ence than that had been reported in previous studies. Schwert5 explained that volatility measured by the standard deviation of rates of return to a broad Stock Market index such as the Standard and Poor’s 500. Bailey and Chang3 found that investors tend to change with risk premium return of their portfolios with regard to changing macroeconomic fundamental like inflation, interest rate, exchange rate and industrial production, which evolve the long-term trend of volatility. Sias and Starks4 associate the day of the week effects in explaining the volatility. Some research-ers relate interest rate and inflation with fluctuations in the stock market. Bekaert6 observes that in segmented capital markets, Volatility is a critical input in the cost of capital. Volatility can also be used as a decision making criterion. Chowan and Shukla have tried to analyse the following questions like, has the Stock Market Volatility increased? Has the Indian Stock Market devel-oped into a speculative bubble due to the emergence of New Economy stocks? Why is this Volatility pronounced? They tried
DOI: 10.15595/gjeis/2014/v6i2/51843

27
Anurag Agnihotri Empirical Article
Vol 6 | Issue 2 | April-June 2014 | www.gjeis.org GJEIS | Print ISSN: 0975-153X | Online ISSN: 0975-1432
to unearth the rationale for those weird movements. Poon et al.8, Volatility has a wide sphere of influence including investment, security valuation, risk management and policy making. They also put emphasis on the importance of Volatility forecasting in various things such as options pricing, financial risk manage-ment etc. Karmakar9 measured the Volatility of daily stock return in the Indian Stock Market over the period of 1961 to 2005. Using GARCH model, he found strong evidence of ’ time varying Volatility. Parikh6 had thrown flash that effect of the events on the markets are basically short lived, unless if it has the long-term implications. Joshi and Pandya10, observed that Volatility in the stock market has important bearing on earnings of individuals investors and the efficiency of stock market. The relatively small value of error coefficient of GARCH (1, 1) implied that large market surprises induced relatively small revisions in future volatility. Chou7, have found on the estimation using GARCH the analysis implied a deep drop in stock price. Therefore iden-tification of sources of uncertainty was important. More serious attention should be paid towards takeovers and computer pro-grammed trading as they cause sizable disturbances. Marko Rinaten8 conducted a research on implied volatility measures; those can be interpreted as the market’s perception on the future volatility of the underlying asset. Implied volatility seems even to bare eye present higher memory thus suggesting that higher order GARCH model would be suitable. However with only roll-ing n day measure as volatility proxy is inadequate to perform reliably more deep going analysis, and it was not in the origi-nal scope of this paper which was only meant to learn and test out the procedures related to volatility forecasting with ARCH/GARCH models.
Volatility is an area of research for many academicians, and most of the studies have been conducted on the major stock indi-ces like NIFTY and SENSEX. While the studies conducted on the volatility of the sectoral indices are very few, therefore the pre-sent study seeks to analyse the volatility of the IT sector volatility based BSE IT Index.
2.2 ObjectiveThe objective behind this paper is to check for volatil-ity in the BSE-IT (Information Technology) index, through ARCH/GARCH (Generalised Auto Regressive Conditional Heteroskedasticity) model. The aim is to theorize the statistical results to understand the behaviour of this stock market index.
2.3 Scope and CoverageThe study of volatility using ARCH/GARCH has a very wide scope. Understanding volatility is very important. In this paper volatility has been studied in the closing prices of the previ-ous years from (2005–2013) using the ARCH/GARCH model.
However this model can also be used in volatility forecasting. Volatility also has a pronounced role in modern finance as it is used in multiple risk management solutions.
2.4 Data Research and MethodologyThe data considered for estimation of volatility using ARCH/GARCH is the closing price of BSEIT index from 1–04–05 to 31–08–2013.
2.4.1 The GARCH ModelThe GARCH is a time-series technique that allows users to model the serial dependence of volatility. GARCH modelling builds on advances in the understanding and modelling of volatility in the last decade. It takes into account excess kurtosis and volatility clustering, two important characteristics of financial time series. It provides accurate forecasts of variances and covariance’s of asset returns through its ability to model time-varying condi-tional variances. Therefore, GARCH models can be applied to such diverse fields term structure of interest rates, Portfolio man-agement and asset allocation, Option pricing, Foreign exchange, Risk management
2.4.2 Unit Root Test (Stationarity Test) A unit root test has been applied to check whether a series is stationary or not. Stationarity condition has been tested using Augmented Dickey Fuller (ADF) [Dickey and Fuller (1979, 1981), Gujarati (2003), Enders (1995)].
2.5 Empirical EstimationAs mentioned above volatility will be checked for the closing price of BSEIT index for the period of 1–4–05 to 31–3–13.The necessary tests along with analysis and interpretation have been conducted:
The Graph 1 shows that the closing prices of the IT index are fluctuating and not uniform in nature. In the Table 1, observed that since chi square value is zero, it implies that heteroskedasticity is
Graph 1. Line graph of L close.

28
Empirical Study of Volatility Clustering in Stock Prices of IT Index
Vol 6 | Issue 2 | April-June 2014 | www.gjeis.org GJEIS | Print ISSN: 0975-153X | Online ISSN: 0975-1432
there, therefore this series is not stationary we will now examine stationarity with the help of correlogram and unit root tests. The Table 2 finds that the spikes in the ACF and PCF at some lags are sticking out of the bars so the series is not stationary. After exam-ining the p value of LCLOSE in the above tests, we see that it is greater than alpha, the level of significance which is taken to be 10%. So we accept the null hypothesis that LCLOSE has a unit root. So LCLOSE is not stationary. Therefore, we shall take the first difference of the LCLOSE time series and then conduct unit root test and observe the Correlogram. Table 6 observed that spikes lie within the bars therefore LCLOSE is stationary. Furthermore, we superimpose the plots of our actual and simulated time series. The aforementioned rigorous analysis and statistical testing support the conclusions concerning the results. Volatility in the stock market has important bearing on earnings of individual investors and the efficiency of stock market in general for channelising resources for its productive uses. Present study attempts to get insight into behaviour of the volatility in Indian Stock Market. The model with large value of lag coefficient shows that the volatility in the both markets is highly persistent and is predictable. The relatively small value of error coefficient of GARCH (1, 1) implies that large mar-ket surprises induce relatively small revisions in future volatility. Table 9 explains that we can find that the p value of D(LCLOSE) is 0.00 is less than the level of significance so the null hypothesis is rejected. This means that D(LCLOSE) doesn’t have a unit root. Hence, it is stationary. Now we shall generate a series on DLCOSE which is the first difference of LCLOSE.
The Graph 2 of the series Dlclose shows that there is very high volatility. There are very large and sudden variations. Table 10 explain chi square value of DLCLOSE is greater than level of sig-nificance so the Null Hypothesis (there is no Heteroskedasticity) is accepted. So the problem of Heteroskedasticity is solved. The series DLCLOSE is stationary. We will now fit the ARCH model till it fails. Since the p-value is greater than the level of signifi-cance, we can see that the ARCH model fails at (4,0). We will now fit the corresponding GARCH models. Only the models that fit the required criteria (p-value of resids and garch should be
less than level of significance) have been shown. Table 5 found that P-value of GARCH term<level of significance so the Null Hypothesis (beta2, the coefficient of RESID(-1)^2 is zero) is rejected. So there is significant GARCH effect and volatility is present. Thus the GARCH effect at (1,1) can be observed in the Graph 3.
GARCH 2, 1 show that since all the spikes are within the bars, the model has been properly fitted (Table 11). GARCH 2,1 shows that since P-value is less than level of significance, we can see that GARCH effect is present (Table 12). GARCH 2,2 present that Since P-value is less than level of significance, we can see that
Graph 2. Line graph of Dlclose.
Graph 3. GARCH graph for conditional standard deviation.
Graph 4. GARCH graph for conditional variance.
Graph 5. GARCH graph for time varying volatility.
29
Anurag Agnihotri Empirical Article
Vol 6 | Issue 2 | April-June 2014 | www.gjeis.org GJEIS | Print ISSN: 0975-153X | Online ISSN: 0975-1432
GARCH effect is present (Graphs 4 and 5). Therefore we have fitted the GARCH model at (1,1), (2,1) and (2,2). We failed in fitting the model at (1,2), (2,3) and (3,1). In order to determine the best model out of the above, we will be taken the following parameters into consideration:
1) R2 and adjusted R2 should be maximum.2) Akaike info criterion should be minimum.3) Schwarz criterion should be minimum.4) Durban Watson criterion should be closest to 2.
According the above criteria the GARCH (1,1) model is the best fit out of the above models.
3. ConclusionIt can be concluded that the BSE IT is a volatile index where time varying volatility is present as provided by the GARCH 1,1 and GARCH 2,1. After looking at the behaviour of the BSE-IT index and the volatility clustering associated with it one can come to the conclusion that volatility persists within this index. We observed that the GARCH effect was there when we fit the data within the model. However though we have completed our objective, there are a few limitations in this paper as well No focus has been given to the forecasting of future values using the GARCH model. Another drawback is not taking into consideration any other var-iables from the index whose impact may be of a certain degree of
importance. Finally, due to the study of data only between April 2005 and March 2013 we were unable to note down and study the effects before and after these dates.
4. References 1. Gertler ML, Hubbard RG. Financial factors in business fluctua-
tions. NBER Working Papers 2758, National Bureau of Economic Research, Inc; 1989.
2. Akgiray V. Conditional Heteroskedasticity in Time series of Stock Returns: Evidence and Forecasts. Journal of Business. 1989; 62(1):55–80.
3. Bailey W, Chung YP. Exchange rate fluctuation, political risk and stock market returns: some evidences from an emerging market. Journal of Financial and Quantitative Analysis. 1995; 30(4):541–61.
4. Schwert WG. Why does stock market volatility change over time? J Finance. 1989; XLIV(5); 1115–53.
5. Schwert WG. Stock market volatility. Financial Analysts Journal. 1990 May–Jun. 23–34.
6. Bekaert. Emerging equity market volatility. J Financ Econ. 1995; 43:29–77.
7. Ray Yeutien Chou, Volatility Clustering ARCH/GARCH. 8. Poon et al. The jump-risk premia implicit in options: evidence from
an integrated time-series study. J Financ Econ. 2003; 63:3–50. 9. Karmakar M. Stock market volatility, roots and results. Vikalpa.
2006 Jan–Mar; 20(1):7–48.10. Joshi K, Pandya R. Study of volatility in Indian stock markets to
understand the reasons for turbulence in the last two years- Volatility in Indian stock market. XIM, Bhubaneswar; 2000.

30
Empirical Study of Volatility Clustering in Stock Prices of IT Index
Vol 6 | Issue 2 | April-June 2014 | www.gjeis.org GJEIS | Print ISSN: 0975-153X | Online ISSN: 0975-1432
Appendix for GARCH/ ARCH/UNIT ROOT TEST tablesNote: Only relevant tables are given here.
Table 3. Unit root test of LCLOSE at level(intercept)Null Hypothesis: LCLOSE has a unit rootExogenous: ConstantLag Length: 0 (Automatic based on SIC, MAXLAG=24)
t-Statistic Prob.*Augmented Dickey-Fuller test statistic -1.560279 0.5028Test critical values:
1% level -3.433905
5% level -2.86299710% level -2.567593
Augmented Dickey-Fuller Test EquationDependent Variable: D(LCLOSE)Method: Least SquaresDate: 11/03/13 Time: 22:00Sample (adjusted): 4/04/2005 13/02/2011Included observations: 1740 after adjustmentsVariable Coefficient Std. Error t-Statistic Prob. LCLOSE(-1) -0.002479 0.001589 -1.560279 0.1189C 0.021190 0.013292 1.594142 0.1111
R-squared 0.001399 Mean dependent var 0.000463Adjusted R-squared
0.000824 S.D. dependent var 0.019325
S.E. of regression
0.019317 Akaike info criterion -5.054481
Sum squared resid
0.648550 Schwarz criterion -5.048204
Log likelihood 4399.399 Hannan-Quinn criter. -5.052160F-statistic 2.434472 Durbin-Watson stat 1.957282Prob (F-statistic)
0.118876
Table 1. Heteroskedasticity Test: ARCHF-statistic 62.37867 Prob. F(1,1736) 0.0000Obs*R-squared 60.28437 Prob. Chi-Square(1) 0.0000Test Equation:Dependent Variable: RESID^2Method: Least SquaresDate: 11/08/13 Time: 11:00Sample (adjusted): 4/06/2005 3/30/2013Included observations: 1738 after adjustmentsVariable Coefficient Std. Error t-Statistic Prob. C 4977.922 318.0004 15.65382 0.0000RESID^2(-1) 0.186274 0.023585 7.898017 0.0000
R-squared 0.034686 Mean dependent var 6115.255Adjusted R-squared
0.034130 S.D. dependent var 13027.08
S.E. of regression
11820.05 Akaike info criterion 21.59413
Sum squared resid
2.43E+11 Schwarz criterion 21.60042
Log likelihood -18763.30 Hannan-Quinn criter. 21.59646F-statistic 62.37867 Durbin-Watson stat 2.025141Prob(F-statistic) 0.000000
Table 2. Correlogram at level

31
Anurag Agnihotri Empirical Article
Vol 6 | Issue 2 | April-June 2014 | www.gjeis.org GJEIS | Print ISSN: 0975-153X | Online ISSN: 0975-1432
Table 5. Unit root test of LCLOSE at first difference (intercept)Null Hypothesis: D(LCLOSE) has a unit rootExogenous: ConstantLag Length: 1 (Automatic based on SIC, MAXLAG=24)
t-Statistic Prob.*Augmented Dickey-Fuller test statistic -31.72531 0.0000Test critical values:
1% level -3.433910
5% level -2.86299910% level -2.567594
Augmented Dickey-Fuller Test EquationDependent Variable: D(LCLOSE,2)Method: Least SquaresDate: 11/03/13 Time: 22:09Sample (adjusted): 4/06/2005 13/02/2011Included observations: 1738 after adjustments
Variable Coefficient Std. Error
t-Statistic Prob.
D(LCLOSE(-1)) -1.062711 0.033497 -31.72531 0.0000D(LCLOSE(-1),2) 0.084351 0.023932 3.524561 0.0004C 0.000498 0.000463 1.075846 0.2821R-squared 0.493511 Mean dependent var 1.64E-05Adjusted R-squared
0.492927 S.D. dependent var 0.027067
S.E. of regression 0.019274 Akaike info criterion -5.058408Sum squared resid 0.644521 Schwarz criterion -5.048983Log likelihood 4398.757 Hannan-Quinn
criter.-5.054923
F-statistic 845.2727 Durbin-Watson stat 2.007839Prob(F-statistic) 0.000000
Table 4. Unit root test of LCLOSE at level(trend and intercept)Null Hypothesis: LCLOSE has a unit rootExogenous: Constant, Linear TrendLag Length: 0 (Automatic based on SIC, MAXLAG=24)
t-Statistic Prob.*Augmented Dickey-Fuller test statistic -1.747481 0.7296Test critical values:
1% level -3.963326
5% level -3.41339410% level -3.138140
*MacKinnon (1996) one-sided p-values.Augmented Dickey-Fuller Test EquationDependent Variable: D(LCLOSE)Method: Least SquaresDate: 11/11/13 Time: 23:15Sample (adjusted): 4/04/2005 3/30/2013Included observations: 1740 after adjustments
Variable Coefficient Std. Error t-Statistic Prob. LCLOSE(-1) -0.003387 0.001938 -1.747481 0.0807C 0.027985 0.015675 1.785365 0.0744@TREND (4/01/2005)
9.20E-07 1.13E-06 0.818185 0.4134
R-squared 0.001783 Mean dependent var 0.000463Adjusted R-squared
0.000634 S.D. dependent var 0.019325
S.E. of regression
0.019319 Akaike info criterion -5.053717
Sum squared resid
0.648300 Schwarz criterion -5.044301
Log likelihood 4399.734 Hannan-Quinn criter. -5.050235F-statistic 1.551718 Durbin-Watson stat 1.956259Prob(F-statistic)
0.213177

32
Empirical Study of Volatility Clustering in Stock Prices of IT Index
Vol 6 | Issue 2 | April-June 2014 | www.gjeis.org GJEIS | Print ISSN: 0975-153X | Online ISSN: 0975-1432
Table 6. Heteroskedasticity Test: ARCHF-statistic 0.470662 Prob. F(1,1737) 0.4928Obs*R-squared 0.471076 Prob. Chi-Square(1) 0.4925
Test Equation:Dependent Variable: WGT_RESID^2Method: Least SquaresDate: 11/13/13 Time: 14:51Sample (adjusted): 4/05/2005 3/30/2013Included observations: 1739 after adjustments
Variable Coefficient Std. Error
t-Statistic Prob.
C 0.984962 0.050355 19.56027 0.0000WGT_RESID^2(-1)
0.016460 0.023992 0.686048 0.4928
R-squared 0.000271 Mean dependent var 1.001424Adjusted R-squared
-0.000305 S.D. dependent var 1.845831
S.E. of regression
1.846113 Akaike info criterion 4.065190
Sum squared resid
5919.921 Schwarz criterion 4.071471
Log likelihood -3532.683 Hannan-Quinn criter.
4.067513
F-statistic 0.470662 Durbin-Watson stat 1.999519Prob (F-statistic)
0.492774
Table 7. ARCH (1,0)Dependent Variable: D(LCLOSE)Method: ML - ARCH (Marquardt) - Normal distributionDate: 11/13/13 Time: 15:52Sample (adjusted): 4/04/2005 3/30/2013Included observations: 1740 after adjustmentsConvergence achieved after 7 iterationsPresample variance: backcast (parameter = 0.7)GARCH = C(2) + C(3)*RESID(-1)^2
Variable Coefficient Std. Error
z-Statistic Prob.
C 0.000988 0.000416 2.376424 0.0175Variance Equation
C 0.000263 8.06E-06 32.61008 0.0000RESID(-1)^2 0.297770 0.032327 9.211302 0.0000
R-squared -0.000740 Mean dependent var 0.000463Adjusted R-squared
-0.001893 S.D. dependent var 0.019325
S.E. of regression
0.019344 Akaike info criterion -5.143574
Sum squared resid
0.649939 Schwarz criterion -5.134157
Log likelihood 4477.909 Hannan-Quinn criter.
-5.140092
Durbin-Watson stat
1.957943

33
Anurag Agnihotri Empirical Article
Vol 6 | Issue 2 | April-June 2014 | www.gjeis.org GJEIS | Print ISSN: 0975-153X | Online ISSN: 0975-1432
Table 8. ARCH (2,0)Dependent Variable: D(LCLOSE)Method: ML - ARCH (Marquardt) - Normal distributionDate: 11/13/13 Time: 15:53Sample (adjusted): 4/04/2005 3/30/2013Included observations: 1740 after adjustmentsConvergence achieved after 7 iterationsPresample variance: backcast (parameter = 0.7)GARCH = C(2) + C(3)*RESID(-1)^2 + C(4)*RESID(-2)^2
Variable Coefficient Std. Error
z-Statistic Prob.
C 0.001176 0.000360 3.265006 0.0011Variance Equation
C 0.000191 9.11E-06 20.95882 0.0000RESID(-1)^2 0.274295 0.028839 9.511321 0.0000RESID(-2)^2 0.245465 0.030841 7.959009 0.0000
R-squared -0.001364 Mean dependent var 0.000463Adjusted R-squared
-0.003094 S.D. dependent var 0.019325
S.E. of regression
0.019355 Akaike info criterion -5.196699
Sum squared resid
0.650344 Schwarz criterion -5.184143
Log likelihood
4525.138 Hannan-Quinn criter. -5.192056
Durbin-Watson stat
1.956724
Table 9. GARCH (1,1)Dependent Variable: DLCLOSEMethod: ML - ARCH (Marquardt) - Normal distributionDate: 11/03/13 Time: 22:28Sample (adjusted): 4/04/2005 13/02/2011Included observations: 1740 after adjustmentsConvergence achieved after 9 iterationsPresample variance: backcast (parameter = 0.7)GARCH = C(2) + C(3)*RESID(-1)^2 + C(4)*GARCH(-1)
Variable Coefficient Std. Error z-Statistic Prob. C 0.001340 0.000361 3.432397 0.0006
Variance EquationC 1.44E-05 2.52E-06 5.707458 0.0000RESID(-1)^2 0.138932 0.017693 7.852315 0.0000R-squared -0.001621 Mean dependent var 0.000463Adjusted R-squared
-0.003351 S.D. dependent var 0.019325
S.E. of regression
0.019358 Akaike info criterion -5.275220
Sum squared resid
0.650510 Schwarz criterion -5.262664
Log likelihood
4593.441 Hannan-Quinn criter. -5.270577
Durbin-Watson stat
1.956223
Table 10. Correlogram Q-statistics

34
Empirical Study of Volatility Clustering in Stock Prices of IT Index
Vol 6 | Issue 2 | April-June 2014 | www.gjeis.org GJEIS | Print ISSN: 0975-153X | Online ISSN: 0975-1432
Table 12. GARCH (2, 2)Dependent Variable: D(LCLOSE)Method: ML - ARCH (Marquardt) - Normal distributionDate: 11/13/13 Time: 16:19Sample (adjusted): 4/04/2005 3/30/2013Included observations: 1740 after adjustments
Convergence achieved after 11 iterationsPresample variance: backcast (parameter = 0.7)GARCH = C(2) + C(3)*RESID(-1)^2 + C(4)*RESID(-2)^2 + C(5)*GARCH(-1) + C(6)*GARCH(-2)
Variable Coefficient Std. Error
z-Statistic Prob.
C 0.001390 0.000362 3.566971 0.0004Variance Equation
C 5.82E-07 3.39E-07 1.719979 0.0854RESID(-1)^2 0.160953 0.024037 6.695984 0.0000RESID(-2)^2 -0.152869 0.022782 -6.710016 0.0000GARCH(-1) 1.677141 0.062875 26.67438 0.0000GARCH(-2) -0.686809 0.058684 -11.70349 0.0000R-squared -0.001833 Mean dependent var 0.000463Adjusted R-squared
-0.004722 S.D. dependent var 0.019325
S.E. of regression
0.019371 Akaike info criterion -5.277564
Sum squared resid
0.650649 Schwarz criterion -5.258730
Log likelihood
4597.480 Hannan-Quinn criter. -5.270600
Durbin-Watson stat
1.955807
Table 11. GARCH (2, 1)Dependent Variable: D(LCLOSE)Method: ML - ARCH (Marquardt) - Normal distribution Date: 11/13/13 Time: 16:16Sample (adjusted): 4/04/2005 3/30/2013Included observations: 1740 after adjustmentsConvergence achieved after 10 iterationsPresample variance: backcast (parameter = 0.7)
GARCH = C(2) + C(3)*RESID(-1)^2 + C(4)*RESID(-2)^2 + C(5)*GARCH(-1)Variable Coefficient Std.
Errorz-Statistic Prob.
C 0.001315 0.000362 3.356416 0.0008Variance Equation
C 1.04E-05 2.32E-06 4.504452 0.0000RESID(-1)^2 0.169010 0.027300 6.190837 0.0000RESID(-2)^2 -0.060303 0.028165 -2.141023 0.0323GARCH(-1) 0.864147 0.019644 43.99135 0.0000R-squared -0.001516 Mean dependent var 0.000463Adjusted R-squared
-0.003825 S.D. dependent var 0.019325
S.E. of regression
0.019362 Akaike info criterion -5.275253
Sum squared resid
0.650443 Schwarz criterion -5.259558
Log likelihood
4594.470 Hannan-Quinn criter. -5.269449
Durbin-Watson stat
1.956427

Global Journal of Enterprise Information SystemG J E I S
Impact of Demographic Factors on Consumer Behaviour - A Consumer Behaviour Survey in Himachal PradeshRakesh Kumar*
Commerce Department, Shaheed Bhagat Singh College, University of Delhi, India; [email protected]
Abstract
Consumer behaviour doesn’t remain the same or constant in every situation it changes time to time. There are various factors which affects consumer behaviour. As the change comes in these factors, consumer behaviour also changes. The demographic factors which affect consumer behavior are: (1) age (2) sex (3) marital status (4) income (5) family background (6) education (7) occupation (8) family size (9) geographic factors (10) psychological factors. In this grim battle for snatching maximum share of market, only those producers are destined to emerge victorious who will be able to read the pulse of the buyers. And this is here, where buyer behaviour has a very important role to play. There are so many demographic factors like age, sex, income, occupation, education, marital status and family background which affects the behaviour of consumers. Here an at-tempt has been made that how and to what extent these factors affects the behaviour of consumers. It is quite necessary for the manufacturers of four-wheeler to know the behaviour of consumers. So, that they can increase their sales and capture the maximum share of the market. In this research paper an attempt has been made to know the affect of demographic factors on consumer behavior. Keywords: After Sales Services, Brand Preferences, Consumer Behaviour, Warranty Period
1. Introduction
Consumer Behaviour is the study of individuals, groups, or organizations and the processes they use to select, secure, and dispose of products, services, experiences, or ideas to satisfy needs; and the impacts that these processes have on the con-sumer and society. Consumer is the focus of all the marketing activities. Knowledge of his activities and behaviour is one of the most important aspects of the marketing. The consumers buy the goods to satisfy a number of needs and drives. Human wants are unlimited and varying time to time; from place to place and man to man. The study of consumer behaviour holds great interest for us as consumers, as students and scientists, and as marketers.
2. Factors Affecting Consumer Behaviour
Consumer behaviour doesn’t remain the same or constant in every situation it changes time to time. There are various factors which affects consumer behaviour. As the change comes in these factors, consumer behaviour also changes. Following are the fac-tors which affect consumer behaviour:
* Author for correspondence
2.1 Demographic Factors2.1.1 SexWe can classify sex into two categories—male or female. Women in our society have started purchasing most of the goods items and other household goods, independent of the decisions of their husbands. But men still make most purchasing decisions relating to automobiles, TVs, refrigerators, cameras and other consumer durables. Thus, who will purchase, the product, affect the study of consumer behaviour.
2.1.2 AgeInfant, child, adolescent, young adults, matures adults, senior citizens, etc. Our wants, needs, desires and aspirations all change with age.
2.1.3 Marital Status Single, engaged, married, separated, divorced, widow, etc. Married people always constitute a stronger market for homes, life insurance, consumer durables and children’s clothing than unmarried people. Thus the life of widow and her shopping habits are different to a great extent as compared to a typical married woman of the same age. Thus it is important to consider
DOI: 10.15595/gjeis/2014/v6i2/51844

36
Impact of Demographic Factors on Consumer Behaviour - A Consumer Behaviour Survey in Himachal Pradesh
Vol 6 | Issue 2 | April-June 2014 | www.gjeis.org GJEIS | Print ISSN: 0975-153X | Online ISSN: 0975-1432
the marital status of a consumer before studying his/her buying behaviour.
2.1.4 Ethnic FactorLow class, middle class, upper class etc. Minority group every-where have traditionally received less education, fewer cultural opportunities and earned lower incomes than others. The condition of such people are no doubt changing but still the con-sumption pattern of minority group people w.r.t. both ‘type and quality’ of goods they purchase, differ from others.
2.1.5 Income FactorLow, low middle, middle, upper middle, upper etc. An indi-vidual’s income determines to a very great extent the type and quality of products he buys. People with low income are forced to spend most of their money for food, rent, clothing and other essentials. As they become more affluent, they tend to purchase higher quality items and buy more non-essentials. Of course, people earning the same amount of money may spend it in dif-ferent ways depending upon other personal factors.
2.1.6 EducationIlliterate, primary education, high school education, college education, university education, professional education, etc. researches have shown that preferences in music, art, enter-tainment, food, clothing, automobiles etc. are influenced by the extent, kind and quality of one’s education. Generally speaking the more educated a person is, the more discriminating a shop-per he is.
2.1.7 OccupationUnskilled, semiskilled, skilled, bureaucrats, professional, busi-nessmen etc. The product preferences of white collar workers tend to be quite different from that of blue collar workers. Thus the study and prediction of the behaviour of a consumer is eased if we know exactly his occupation.
2.1.8 Family SizeSmall family, big family and joint family etc. If size of the fam-ily small it will purchase essentials in small quantity but if the size of the family is large it will purchase essential products like food, clothes, etc. in large quantity to fulfill the necessity of every member of the house9.
3. Geographic FactorsFor some good or services, geographical variations may be quite important. In United States, for example, distinctly different taste
preferences for food exist when comparing the North and the South or the East-West and the West coast, ranging from what to eat for breakfast to what to drink with dinner. These geographic differences are even greater around the world. For example in the United Kingdom, northerners prefer white pickled onions, whereas southerners prefer brown ones. Few people drink orange juice for breakfast in Aranee, but many does so during the day as refreshment. In Japan, soup is consumed mainly for breakfast. If the geographic environment of the area where the consumer is living in hot, naturally the demand for refrigerators will be high if the area is cold the demand for heater will be more. To better understand existing consumer differences based on geography, marketers go to great lengths to research and analyze behav-ioural patterns. The availability of such geographic information can help the marketer target mailings, advertisement, or personal sales pitches that will be most effective and efficient.
4. Psychological FactorsA number of psychological factors also influence buyer behav-iour, ranging from the teachings of Freud to Herberg’s discussion of dissatisfiers and satisfiers. In the context of marketing, per-haps the most widely quoted psychological approach is that of Abraham Maslow. He developed a hierarchy of needs, shaped like a pyramid, which: ranges from the most essential immedi-ate physical needs such as hunger, thirst and shelter to the most luxurious none-essentials. It was Maslow’s contention that indi-vidual addresses the most urgent need first, starting with the physiological. But as each need is satisfied and lower level physi-cal needs are satisfied, attention switches to the next higher level, resulting ultimately in the level of self-actualization or fulfil-ment. It has been argued that marketers in industrialized nations should increasingly focus their attention on the two highest lev-els for the citizens of their countries. However, it appears that even in rich countries, the elementary needs of many remain unfulfilled. An interesting phenomenon—the foreign concern emerges as an additional post-Maslowian level. Many who them-selves have achieved high level of needs fulfilment-begin to focus on individuals and countries are encouraged to seek and offer self-actualization, without addressing their won often unfulfilled basic needs such as nourishment and housing. Such approaches can lead to disagreement and even conflict, particularly in the international trade and policy areas, without necessarily improv-ing the quality of life.
5. Review of Literature
The chapter deals with the existing studies available on the related topic, to explore the existing research gap. The main con-

37Vol 6 | Issue 2 | April-June 2014 | www.gjeis.org GJEIS | Print ISSN: 0975-153X | Online ISSN: 0975-1432
Rakesh Kumar Empirical Article
sideration in reviewing the research work already done in this concerned field is to evaluate such studies, in order to formulate the present study and to avoid duplication of the work. Further, this may provide valuable information regarding the method-ologies, analytical tools, etc. already employed along with the methodological weaknesses, if any. This will not only help in tai-loring the present study, but in consonance of the objectives of the study.
Brown6, studied both the degree of loyalty and the factors appearing to affect it were studied in this project, which was based on interviews with 198 shoppers in the Muncie, Indiana, metropolitan area. Both methodology and procedures were well covered in the report. It was found that one-third of food shop-pers were completely loyal to one store; 81 percent purchased at least one private brand; one-third of the shoppers were loyal purchasers of private levels; store loyalty appeared to be a minor factor in explaining loyalty to private brands; between the two most important loyalty factors-price and quality, price tended to be more important.
Block5, attempted to analyse search behaviour of low-income households. A sample of 350 households in a St. Louis ghetto was polled to determine sources and types of information used in planning purchases. Store patronage patterns in the purchase of grocery product were also surveyed. Information related to deal-ers was far less important than product-oriented information. A very small percentage checked comparative prices and experience of others, primarily because so many had to shop within walking distance of their homes. Radios and television set were owned by 84 percent and nearly two thirds saw a newspaper daily; but their reading time was limited. Newspaper was viewed as the best source of product information. Two thirds of the group bought most groceries in a supermarket; one fourth patronized a cor-ner store. Those who read the most were concerned with prices; whereas with little reading to primary patronage factors were convenience and service.
London7, the present study presents prepurchase support for a self concept/purchase intention link and also indicates that some subjects predominantly match product-image with self-image while others tend to match product-image with ideal self-images.
Olashavsky and Granbois8, studied consumers pre-pur-chase behaviour and suggested that a substantial proportion of purchase did not involve decision making, not even in the first purchase. The heavy emphasis in current research on decision making might discourage investigation of other important kinds of consumer behaviour.
Anderson1, explained in his article that a critical relativist perspective on research in consumer and buyer behaviour. It was argued that a relativistic construal of that area was far superior to a positivistic approach because: (I) It provided a more accu-
rate description of how knowledge was actually generated in the field, (2) It offered a more rigorous and touch-minded approach to the evaluation of knowledge claims in the discipline, and (3) It suggested a framework for coming to grips with the various problems that arise in day-to-day research. The article developed a new model of the research generation process in social science and employed a well-known “case study” in consumer research to illustrate many of its key points.
Palan and Wilke9, the study presents a classification of both adolescent influence strategies and parental response strategies, developed from in –depth interviews with adolescents, mothers and fathers. In addition, the perceived effectiveness of adolescent influence strategies is examined, revealing that adolescents are most successful in their influence attempts when they emulate adult strategies. Implications of these findings for future research are discussed.
Bagozzi2, purpose of his study was to encourage research on the social aspects of consumer behaviour, particularly as found in groups of consumers and manifested through group action. Based on work by leading contemporary philosophers, a new concept of social facts is presented that is grounded in the way members of a group see themselves and the implications of this for group action. Group action, in turn, is shown to require dif-ferent conceptual schemes than commonly used for individual action or interpersonal and macro social perspectives. Among other ideas, the notion of what it means for a group member to intend that the group act and how individual intentions are con-tributory to group action are discussed.
Battolio and Fisher4, study describes the general structure of controlled economic environment and reports the results of a series of experimentally induced price changes on consumer behaviour is one such environment. The experimental results demonstrate the suitability of controlled economic environ-ments as laboratories for the experimental analysis of consumer behaviour and add to our understanding of consumer behaviour, particularly with report to the continuing effects of temporary price change on the composition of consumption.
Adval3, study reveals that participants experiencing posi-tive or negative affect judged products described by brand and attribute information. Four studies using parameter-estimation and reaction-time procedures determined whether the impact of affect on brand name was the result of its influence on (a) par-ticipant’s perception of its evaluative implications at the time of encoding or (b) the importance they attached to it while inte-grating it with other information to compute a judgment. Results showed that positive affect increased the extremity of the brands evaluative implication rather than the importance that par-ticipants attached to it. A fifth experiment demonstrated the implications of these findings for product choices made 24 hours after affect was induced.

38
Impact of Demographic Factors on Consumer Behaviour - A Consumer Behaviour Survey in Himachal Pradesh
Vol 6 | Issue 2 | April-June 2014 | www.gjeis.org GJEIS | Print ISSN: 0975-153X | Online ISSN: 0975-1432
6. Objectives of the StudyThe objectives of the present study are:
1. To provide an understanding to the concept consumer behav-ior and to highlight the need and importance of Consumer Behaviour.
2. To study the Impact of Demographic Factors on Consumer Behaviour.
7. HypothesisNull Hypothesis-H0: There is significant Impact of Demographic Factors on Consumer Behaviour. Alternative Hypothesis-H1: There is no significant Impact of Demographic Factors on Consumer Behaviour.
8. Research Methodology
8.1 Methodology of Data CollectionThe present study has been conducted with the help of primary and secondary data to understand the consumer behaviour towards Four-wheeler.
8.1.1 Primary DataThe primary data for the study has been collected with the help of interviews, personal observation, pilot survey and questionnaire.
8.1.2 Secondary DataThe secondary data has been collected from the following sources:
1. Books and journals.2. Research reports.3. Dealers.4. Magazines, articles from newspapers.5. Websites.
8.2 Sample Size and Sample DesignThe complete Himachal Pradesh acts as the universe and every consumer who has four-wheeler of any company in the state under study is the population for the study. Keeping in view the time factors for the completion of the present study only a sample of 1000 consumers has been selected. The sample constitutes pro-portionately all major brands of four-wheeler sold by different companies in the state under study. Further, designing a sample, due care has been taken to cover all demographic variables like age, sex, income, education, background of consumers, etc. in order to make the sample more representative.
8.3 Sampling Method Multiple-stage sampling has been used:
8.3.1 Stage OneAt this stage, using cluster sampling, the whole area of Himachal Pradesh has been divided into four groups, taking three districts in each group.
8.3.2 Stage TwoAt this stage, by using judgment-cum-convenience sampling each group has been divided into rural & urban area.
8.3.3 Stage ThreeAt this stage, by using quota sampling, a sample of 1,000 con-sumers has been taken proportionately from rural and urban population keeping in view the number of four-wheeler sold in rural & urban areas.
8.3.4 Stage FourAt this stage, the ultimate sample was selected on the basis of convenient-cum-judgment sampling.
9. Methods of Data Analysing and Interpretation
1. Percentage Method.2. Chi-Square Method.
9.1 Data Analysis and InterpretationIt is evident from the Table 1 that majority of the consumers belonging to all age group have responded that they have pur-chased four-wheeler for personal use. While applying χ2 test, it is found that calculated value of χ2 (4.950) is less than table value at 5% level of significance, which leads to accept null hypothesis. It means there is no significant relationship between the variable namely age of consumer and purpose of buying four-wheeler.
It has been observed from the Table 2 that service holders and agriculturists have purchased four-wheeler for personal use. Businessmen and professionals have purchased four-wheeler for business & professional purpose. While χ2 text is applied, its value (230.20) is found greater than table value at 1% level of sig-nificance which further supports the above analysis.
It is obvious from the Table 3 that the consumer who belongs to rural area, majority of them have purchased four-wheeler of Maruti Suzuki, Mahindra & Mahindra and Tata Motors, whereas consumers who belong to urban area majority of them have pur-chased four-wheeler of Maruti, Hyundai and Mahindra. So it can

39Vol 6 | Issue 2 | April-June 2014 | www.gjeis.org GJEIS | Print ISSN: 0975-153X | Online ISSN: 0975-1432
Rakesh Kumar Empirical Article
Table 1. Age of consumer and purpose of buying four-wheelerAge Purpose of buying four-wheeler Total
Personal Purpose
Business & Professional
purpose Below 30 years 132
(51.8)123
(48.2)255
(100.0)30-45 years 247
(52.2)226
(47.8)473
(100.0)Above 45 years 163
(59.9)109
(40.1)272
(100.0)Total 542
(54.2)458
(45.8)1000
(100.0)χ2 = 4.950
P > 0.05Note: Figures in parenthesis depicts the percentage Source: Data collected through questionnaire
Table 2. Occupation of consumer and purpose of buying four-wheelerOccupation Purpose of buying four-wheeler Total
Personal purpose
Business & Professional
purposeService 296
(83.4)59
(16.6)355
(100.0)Business 127
(31.8)272
(68.2)399
(100.0)Profession 47
(34.3)90
(65.7)137
(100.0)Agriculturist 72
(66.1)37
(33.9)109
(100.0)Total 542
(54.2)458
(45.8)1000
(100.0)χ2 = 230.220
P < 0.01Note: Figures in parenthesis depicts the percentage.Source: Data collected through questionnaire.
Table 3. Background of consumer and brand of four-wheelerBackground Brand of four-wheeler
Maruti Suzuki
Mahindra and
Mahindra
Tata Motors
Hyundai Motors
Toyota Motors
Any other*
Total
Rural 279(44.1)
151(23.9)
112(17.7)
50(7.9)
20(3.2)
20(3.2)
632(100.0)
Urban 171(46.5)
49(13.3)
38(10.3)
50(13.6)
30(8.2)
30(8.2)
368(100.0)
Total 450(45.0)
200(20.0)
150(15.0)
100(10.0)
50(5.0)
50(5.0)
1000(100.0)
Note: Figure in parenthesis depicts the percentageSource: Data collected through questionnaire.Any Other*: Fiat, Ford, Skoda, Honda, Chevrolet etc.
be concluded that the demand of the four-wheeler of Maruti, Mahindra and Tata Motors is higher in rural area than that of urban area. On other hand, in urban area the demand of Maruti, Hyundai, Mahindra and other brand is higher.
The Table 4 reveals that the consumers whose income level is less, they have purchased four-wheeler of Maruti Company and the consumers whose income level is higher, they have purchased four-wheeler of Tata Motors, Mahindra and other brands.
It is apparent from the Table 5 that majority of consumers irrespective of their educational background have responded that they have purchased four-wheeler from authorized dealer only. While χ2 test is applied its value (21.680) is found greater than table value at 5% level of significance.
It is obvious from Table 6 that no doubt slightly more than one-tenth of consumers opined that they would like to buy
four-wheeler from authorized dealer only. Rural consumers are highly in percentage who have replied that they would like to purchase the four-wheeler from authorized dealer only.
It has been observed from Table 7 that irrespective of their background majority of consumers have opined that they like installment method of payment for durable goods.
It is depicted from the Table 8 that majority of consumers whether they belong to lower income group or higher income group like installment method of payment.
On the basis of Table 9, it can be seen that majority of the consumers take the opinion of friends, neighbours and fam-ily before purchase of durable goods. While applying χ2 test, it is found that the calculated value of χ2 (11.620) is less than the table value at 5% level of significance, while leads to accept the null hypothesis. It means that consumers of different age group

40
Impact of Demographic Factors on Consumer Behaviour - A Consumer Behaviour Survey in Himachal Pradesh
Vol 6 | Issue 2 | April-June 2014 | www.gjeis.org GJEIS | Print ISSN: 0975-153X | Online ISSN: 0975-1432
Table 4. Income of Consumer and brand of four-wheelerIncome Brand of four-wheeler Total
MarutiSuzuki
Mahindra & Mahindra
Tata Motor
Hyundai Motors
Toyota Motor
Any Other*
Low income 48(82.8)
--- 10(17.2)
---- --- --- 58(100.0)
Middle income
209(51.5)
48(11.8)
39(9.6)
80(19.7)
20(4.9)
10(2.5)
406(100.0)
High income 150(38.6)
121(31.1)
68(17.5)
20(5.1)
20(5.1)
10(2.6)
389(100.0)
Super high income
43(29.3)
31(21.1)
33(22.4)
--- 10(6.8)
30(20.4)
147(100.0)
Total 450(45.0)
200(20.0)
150(15.0)
100(10.0)
50(5.0)
50(5.0)
1000(100.0)
Table 5. Education of consumer and selection of dealer Education Selection of dealer Total
Authorised dealer
Any other dealer
Belowmiddle
126(100.0)
--- 126(100.0)
Middle to plus two
285(93.4)
20(6.6)
305(100.0)
Graduation & above
500(87.9)
69(12.1)
569(100.0)
Total 911(91.1)
89(8.9)
1000(100.0)χ2 = 21.680
P < 0.05Note: Figures in parenthesis depicts the percentage Source: Data collection through questionnaire
Table 6. Background of consumer and selection of dealerBackground Selection of dealer Total
Authorised dealer
Any other dealer
Rural 593(93.8)
39(6.2)
632(100.0)
Urban 318(86.4)
50(13.6)
368(100.0)
Total 911(91.1)
89(8.9)
1000(100.0)
Table 7. Background of consumer and selection of mode of paymentBackground Selection of mode of
Payment Total
Cash Payment
Installment Payment
Rural 161(25.5)
471(74.5)
632(100.0)
Urban 69(18.8)
299(81.2)
368(100.0)
Total 230(23.0)
770(77.0)
1000(100.0)
Table 8. Income of consumer and selection of mode of paymentIncome Selection of mode of
payment Total
Cash payment
Installment payment
Low income 20(34.5)
38(65.5)
58(100.0)
Middle income 110(27.1)
296(72.9)
406(100.0)
High income 79(20.3)
310(79.7)
389(100.0)
Super high income 21(14.3)
126(85.7)
147(100.0)
Total 230(23.0)
770(77.0)
1000(100.0)

41Vol 6 | Issue 2 | April-June 2014 | www.gjeis.org GJEIS | Print ISSN: 0975-153X | Online ISSN: 0975-1432
Rakesh Kumar Empirical Article
consider the fact that the opinions of others must be sought before purchasing durable goods.
It is clear from the analysis of Table 10 that whether the consumers are married or unmarried they are accepting it that opinion of others should be sought before the purchase of four-wheeler. Although married consumers are larger in percentage who strongly support the argument that opinion of others should be sought before the purchase. While applying χ2 test, it is found that the calculated value of χ2 (1.367) is less than the table value at 5% level of significance, which leads to accept the null hypothesis. Thus, it can be concluded that there is no significant difference in the opinion of different marital status consumers over the opinion of friends, family and neighbours before pur-chase.
The Table 11 ‘Age of consumer and kind of four-wheeler reveals that demand for luxury is quite higher among the con-sumers of age group below 30 years. When χ2 test is applied, it is found that the calculated value of χ2 (86.542) is greater than table value at 1% level of significance which leads to reject null hypoth-esis and accept alternative hypothesis. Thus, it can be concluded that there is significant relationship between two variables age of consumer and kind of four-wheeler.
It is apparent from table 1.12 that demand of luxury four-wheeler is higher but at the same time, four-wheeler companies should also manufacture low priced ordinary four-wheeler in order to capture the market of all income groups. While apply-ing χ2 test, its value (26.125) is found greater than table value at 5% level of significance, which leads to reject null hypothesis and accept alternative hypothesis. So, it is clear that there is signifi-cant relationship between occupation of consumer and kind of four-wheeler they like.
Table 9. Age of consumer and opinion of friends, neighbours and family before purchase Age Opinion of friends, neighbours
and family before purchase Total
Strongly agree
Moderately agree
Disagree
Below 30 years 205(80.4)
50(19.6)
--- 255(100.0)
30-45 years 356(75.3)
117(24.7)
--- 473(100.0)
Above 45 years 233(85.7)
39(14.3)
--- 272(100.0)
Total 794(79.4)
206(20.6)
--- 1000(100.0)χ2 = 11.620
P > 0.05Note: Figures in parenthesis depicts the percentage Source: Data collected through questionnaire
Table 10. Marital status of consumer and opinion of friends, family and neighbours before purchase Marital status
Opinion of friends, family and neighbours before purchase
Total
Strongly agree
Moderately agree
Disagree
Married 631(80.2)
156(19.8)
--- 787(100.0)
Unmarried 163(76.5)
50(23.5)
--- 213(100.0)
Total 794(79.4)
206(20.6)
--- 1000(100.0)
χ2 = 1.367P > 0.05
Note: Figures in parenthesis depicts the percentage Source: Data collected through questionnaire
Table 11. Age of consumer and kind of four-wheelerAge Kind of four-wheeler
Ordinary Luxury Total Below 30 years 20
(7.8)235
(92.2)255
(100.0)30-45 years 184
(38.9)289
(61.1)473
(100.0)Above 45 years 59
(21.7)213
(78.3)272
(100.0)Total 794
(79.4)206
(20.6)1000
(100.0)χ2 = 86.542
P < 0.01Note: Figures in parenthesis depicts the percentage Source: Data collected through questionnaire
Table 12. Occupation of consumer and kind of four-wheelerOccupation Kind of four-wheeler Total
Ordinary LuxuryService 88
(24.8)267
(75.2)355
(100.0)Business 108
(27.1)291
(72.9)399
(100.0)Profession 20
(14.6)117
(85.4)137
(100.0)Agriculturist 47
(43.1)62
(56.9)109
(100.0)Total 263
(26.3)737
(73.7)1000
(100.0)χ2 = 26.125
P < 0.05Note: Figures in parenthesis depicts the percentage.Source: Data collected through questionnaire.

42
Impact of Demographic Factors on Consumer Behaviour - A Consumer Behaviour Survey in Himachal Pradesh
Vol 6 | Issue 2 | April-June 2014 | www.gjeis.org GJEIS | Print ISSN: 0975-153X | Online ISSN: 0975-1432
It is noted from the Table 13, that majority of consumers irre-spective of their income group prefer to have luxury four-wheeler. The demand for high priced, good quality, luxury four-wheeler is higher among the consumers who belong to higher income group, whereas the demand for low priced, average quality, ordi-nary four-wheeler is higher among the consumers who belong to lower income group. The calculated value of χ2 test (21.275) is greater than the table value at 5% significance level, which leads to reject null hypothesis. Thus, it can be concluded that there is significant relationship between income of consumer and kind of four-wheeler.
It is clear from the analysis presented in Table 14 that major-ity of married consumers take the opinion of others before purchase. On the other hand, majority of unmarried consum-ers take self decision followed by the advice of the dealer. While apply χ2 test, it is found that the calculated value of χ2 (81.246) is greater than table value at 1% level of significance
It is clear from the Table 15 that consumers of lower educa-tional group do not take the opinions of children, relative and
Table 13. Income of consumer and kind of four-wheelerIncome Kind of four-wheeler Total
Ordinary LuxuryLow income 20
(34.5)38
(65.5)58
100.0%Middle income 125
(30.8)281
(69.2)406
100.0%High income 100
(25.7)289
(74.3)389
100.0%Super high income
18(12.2)
129(87.8)
147(100.0)
Total 263(26.3)
737(73.7)
1000(100.0)
χ2 = 21.275P < 0.05
Note: Figures in parenthesis depicts the percentage.Source: Data collected through questionnaire.
Table 14. Marital status of consumer and factors influencing purchase of four-wheelerMarital status
Factors Influencing Purchase of Four-wheeler Total
Self Wife/Husband
Children Relatives Friends Dealer
Married 200(25.4)
123(15.6)
78(9.9)
39(5.0)
111(14.1)
236(30.0)
787(100.0)
Unmarried 114(53.5)
10(4.7)
11(5.2)
--- 38(17.8)
40(18.8)
213(100.0)
Total 314(31.4)
133(100.0)
89(8.9)
39(3.9)
149(14.9)
276(27.6)
1000(100.0)
χ2 = 81.246P < 0.01
Note: Figures in parenthesis depicts the percentage Source: Data collected through questionnaire
Table 15. Education of consumer and factors influencing purchase of four-wheelerEducation Factors influencing purchase of four-wheeler Total
Self Wife/ husband Children Relations Friends DealerBelow middle 28
(22.2)59(46.8)
9(7.1)
- 9(7.1)
21(16.7)
126(100.0)
Middle to plus two
91(29.8)
38(12.5)
9(3.0)
20(6.6)
70(23.0)
77(25.2)
305(100.0)
Graduation & above
195(34.3)
36(6.3)
71(12.5)
19(3.3)
70(12.3)
178(31.3)
569(100.0)
Total 314(31.4)
133(13.3)
89(8.9)
39(3.9)
149(14.9)
276(27.6)
1000(100.0)
χ2 = 194.001P < 0.01
Note: Figures in parenthesis depicts the percentage.Source: Data collected through questionnaire.

43Vol 6 | Issue 2 | April-June 2014 | www.gjeis.org GJEIS | Print ISSN: 0975-153X | Online ISSN: 0975-1432
Rakesh Kumar Empirical Article
friends before the purchase, whereas consumers of higher edu-cational group take the opinion of children, relative and friends before purchase. It is also noticed that dealers play a great role in the decision of buying four-wheeler. While χ2 test is applied, its value (194.001) is found greater than table value at 5% level of significance. Thus, it can be concluded that there is significant relationship between age of consumer and factors influencing purchase decision.
The study of the Table 16 reveals that service holders and agriculturists have bought the specific brand because it is of eco-nomical, high mileage, less maintenance art and more discount was offered, whereas businessmen and professionals have bought the specific brand because of durable and good quality, reputa-tion of the company, attractive look and luxurious. So, it can be said that there is significant relationship between occupation of the consumer and reasons to purchase any specific brand.
The study of the Table 17 reveals that rural consumers have reported that economical, high mileage, less maintenance cost, durable and good quality and more discount are the main reasons
behind the specific brand. On the other hand, urban consum-ers have opined that the reasons behind the purchase of specific brand are durable and good quality, reputation of the company, attractive look and highly luxurious. Therefore, there is a signifi-cant relationship between background of consumers and reasons to purchase any specific brand.
It is evident from the Table 18 that the consumers whose income level is quite low they replied that they have purchased the specific brand because it is of economical, high mileage, less maintenance cost, adequate after sale services and more discount. And the consumers whose education level is higher they have replied that the reasons behind the purchase of specific brand is durable and good quality, reputation of the company, attractive look and luxurious. Thus, it can be concluded that there is signifi-cant relationship between income of the consumer and reasons to purchase any specific brand.
It is evident from the Table 19 that the consumers whose education level is low, majority of them have opined that com-fortable seats, good music system and mobile charging facilities
Table 16. Occupation of consumer and reasons to purchase any specific brandOccupation Reasons of Purchase any specific brand Total
Economical Durable & Good Quality
Reputation of
Company
High Mileage
Attractive Look
Easily Available
Less Maintenance
Cost
Adequate After Sale
Services
Long Warranty
Period
More Discount
Luxurious
Service 250(70.42)
110(30.9)
85(23.9)
260(73.2)
80(22.5)
40(11.2)
86(24.2)
125(35.2)
66(46.7)
93(26.1)
72(20.)
355(100)
Business 105(26.3)
283(70.9)
180(45.1)
133(33.3)
213(54.1)
37(9.2)
78(19.5)
116(29.0)
107(26.8)
71(17.7)
203(58.8)
309(100)
Profession 57(41.6)
91(66.4)
83(60.5)
43(31.3)
79(57.6)
21(15.3)
19(13.8)
77(56.2)
65(47.4)
43(31.3)
83(60.5)
137(100)
Agriculture 84(77.0)
42(38.5)
45(41.2)
82(75.2)
40(36.6)
15(13.7)
17(13.7)
57(15.5)
27(52.2)
51(46.7)
39(35.7)
109(100)
Note: (1) Percentage of reasons to purchase any specific brand can not be equal to 100 because more than one response are given by the respondent.(2) Figures in parenthesis depicts the percentage.
Source: Data collected through questionnaire
Table 17. Background of consumer and reasons to purchase any specific brandBackground Reasons of Purchase any specific brand Total
Economical Durable & Good Quality
Reputation of
Company
High Mileage
Attractive Look
Easily Available
Less Maintenance
Cost
Adequate After Sale Services
Long Warranty
Period
More Discount
Luxurious
Rural 431(68.1)
352(55.6)
301(47.6)
360(56.9)
242(38.2)
153(24.2)
348(55.0)
247(39.0)
159(59.0)
373(59.0)
235(37.1)
632(100)
Urban 157(42.6)
271(73.6)
253(68.7)
145(39.4)
190(51.6)
70(19.0)
83(22.5)
105(28.5)
89(24.1)
93(25.2)
197(53.5)
368(100)
Note: (1) Percentage of reasons to purchase any specific brand can not be equal to 100 because more than one response arte given by the respondent.(2) Figures in parenthesis depicts the percentage.
Source: Data collected through questionnaire.

44
Impact of Demographic Factors on Consumer Behaviour - A Consumer Behaviour Survey in Himachal Pradesh
Vol 6 | Issue 2 | April-June 2014 | www.gjeis.org GJEIS | Print ISSN: 0975-153X | Online ISSN: 0975-1432
are to be required in any four-wheeler, whereas consumers whose education level have opined that comfortable seats, air-conditioner, good music system, remote control function-ing, mobile charging facilities and good video system all these facilities are required to be there is any four-wheeler. Thus, it can be concluded there is significant relationship between the variables.
It has been observed from Table 20 that the consumer whose income level is low majority of them opined that the comfort-able seats, good music system and mobile charging facilities are the basic facilities which required in any four-wheeler, whose the consumers income level in higher have opined that comfortable seats, air-conditioner, good music system, remote control func-tioning, mobile charging facilities and good music system all these facilities are to be required in any four-wheeler. So, we can say there is significant relationship between income of consum-ers and facilities requires in any four-wheeler.
It is obvious from the Table 21 that the majority of the married consumers have opined that we should take into consid-eration price, quality, mileage, authorized dealer, and nearness of showroom while purchasing four-wheeler. The majority of the consumers who are unmarried have also opined that we should take into consideration price, quality, mileage, nearness of show-room and authorized dealer while purchasing four-wheeler. So, it can be said that the opinion of different marital status consum-ers are equally distributed. So, we can say there is no significant relationship between marital status of consumers and factors to be taken into consideration while purchasing four-wheeler.
It is revealed from the table 1.22 that there is significant rela-tionship between income of consumer and factors to be taken into consideration while purchasing four wheeler.
It is observed from the table 1.23 that majority of consumers have responded that they have brought the four wheeler from particular dealer due to nearness, attractive showroom, good
Table 18. Income of consumer and reasons to purchase any specific brandIncome Reasons of Purchase any specific brand Total
Economical Durable & Good Quality
Reputation of
Company
High Mileage
Attractive Look
Easily Available
Less Maintenance
Cost
Adequate After Sale
Services
Long Warranty
Period
More Discount
Luxurious
Low inome
38(65.5)
21(36.2)
16(27.5)
39(67.2)
23(39.6)
15(25.8)
36(62.0)
27(46.5)
29(50.0)
33(56.8)
9(15.5)
58(100)
Middle income
203(50.0)
287(70.6)
158(38.9)
210(51.7)
217(53.4)
87(21.4)
150(36.9)
158(38.9)
123(30.2)
200(49.2)
45(11.0)
406(100)
Highincome
150(38.5)
295(76.6)
254(65.2)
187(48.0)
208(53.4)
49(12.5)
97(24.9)
109(28.0)
87(22.3)
93(23.9)
103(26.4)
389(100)
Super high income
58(39.4)
98(66.6)
87(59.1)
33(22.4)
71(48.2)
21(14.2)
33(22.4)
29(19.7)
27(18.3)
17(11.5)
69(46.9)
147(100)
Note: (1) Percentage of reasons to purchase any specific brand cannot be equal to 100 because more than one response are given by the respondent.(2) Figures in parenthesis depicts the percentage.
Source: Data collected through questionnaire.
Table 19. Education of consumer and facilities required in any four-wheeler
Education Facilities required in any Four Facilities Total
Comfortable Seats
Air-Conditioner Good Music System
Remote Control Functioning
Mobile Charging Facilities
Video System
Below Middle 83(65.8)
47(37.3)
78(61.9)
41(32.5)
85(67.4)
27(21.4)
126(100)
Middle-Plus Two
250(81.9)
127(41.6)
218(71.4)
150(49.1)
219(71.8)
132(43.2)
305(100)
Graduation & Above
432(75.9)
351(61.6)
431(75.7)
203(35.6)
108(78.8)
53(38.6)
137(100)
Note: (1) Parentage of facilities required in any four-wheeler can be equal to 100 because more than one response are given by the respondent.(2) Figures in parenthesis depicts the percentage.
Source: Data collection through questionnaire

45Vol 6 | Issue 2 | April-June 2014 | www.gjeis.org GJEIS | Print ISSN: 0975-153X | Online ISSN: 0975-1432
Rakesh Kumar Empirical Article
Table 20. Income of consumer and facilities required in any four-wheeler Income Facilities required in any Four Facilities Total
ComfortableSeats
Air-Conditioner Good Music System
Remote Control Functioning
Mobile Charging Facilities
VideoSystem
Low income
21(36.2)
17(29.3)
31(53.4)
13(22.4)
22(37.9)
9(15.5)
58(100)
Middle income
278(68.4)
150(36.9)
215(52.9)
135(33.2)
227(55.9)
123(30.2)
406(100)
High income
303(77.8)
251(64.5)
197(50.6)
217(55.7)
317(31.4)
203(52.1)
389(100)
Super high income
125(85.0)
103(70.0)
95(64.6)
85(57.8)
107(72.7)
83(56.4)
147(100)
Note: (1) Parentage of facilities required in any four-wheeler can be equal to 100 because more than one response are given by the respondent.(2) Figures in parenthesis depicts the percentage.
Source: Data collection through questionnaire
Table 21. Marital status of consumers and factors to be taken into consideration while purchasing four-wheelerMarital Status Factors To Be Taken Into Consideration While Purchasing Four-wheeler Total
Price Quality Mileage Maintenance Cost
After Sale
Services
Discount Attractive Look
Nearness of Showroom
Authorized Dealer
Married 521(66.2)
527(66.9)
431(54.7)
206(26.17)
185(23.5)
206(26.17)
457(58.0)
409(51.9)
732(93.0)
787(100.0)
Unmarried 123(57.7)
123(57.7)
98(46.0)
63(29.5)
48(22.5)
51(23.9)
121(56.8)
107(50.2)
193(90.6)
213(100.0)
Note: (1) Percentage of factors to be taken into considered while purchasing four-wheeler can not be equal to 100 because mote than one response are given by the respondent.(2) Figure in parenthesis depicts the percentage
Source: Data collected through questionnaire.
Table 22. Income of consumer and factors to be taken into consideration while purchasing four wheelerIncome factors to be taken into consideration while purchasing four wheeler Total
Price Quality Mileage MaintenanceCost
After sale Services
Discount Attractive Look
Nearness OfShowroom
Authorized Dealer
Lowincome
42(72.4)
30(51.7)
47(81.0)
32(55.1)
27(46.5)
19(32.7)
22(37.9)
37(63.7)
49(84.4)
58(100)
Middle income
209(51.4)
213(52.4)
243(59.8)
198(48.7)
119(29.3)
81(19.9)
181(44.5)
213(52.4)
382(94.0)
406(100)
High income
157(40.3)
253(65.0)
137(35.2)
88(22.6)
99(25.4)
29(7.45)
229(58.8)
194(49.8)
342(87.1)
389(100)
SuperHighIncome
50(34.0)
119(80.9)
48(32.6)
37(25.1)
31(12.0)
17(11.5)
89(60.5)
59(40.1)
137(93.1)
147(100)
Note: (1) Percentage of factors to be taken into considered while purchasing four wheeler cannot be equal to 100 because more than one response are given by the respondent.(2) Figure in parenthesis depicts the percentage
Source: Data collected through questionnaire.

46
Impact of Demographic Factors on Consumer Behaviour - A Consumer Behaviour Survey in Himachal Pradesh
Vol 6 | Issue 2 | April-June 2014 | www.gjeis.org GJEIS | Print ISSN: 0975-153X | Online ISSN: 0975-1432
service and authorized dealer irrespective of their sex. So, it can be concluded that whether the consumer is male or female both accept that they have purchased four wheeler from particular dealer due to nearness, altercative showroom, good service and authorized dealer. Thus, it can further concluded that there is no significant relationship between sex of consumer and reasons of buying four wheeler from particular dealer.
It is revealed from the Table 24 that majority of the consum-ers irrespective of their marital status have reported that they have bought the four wheeler from particular dealer due to near-ness, attractive showroom, good service and authorized dealer. So, it can be concluded by analysing above table that the majority of consumers are buying four wheeler from particular dealer due to nearness, altercative showroom, good service and authorized dealer. Thus, it can be concluded that opinion of all consumers over the reasons of buying four wheeler from particular dealer is equally distributed.
10. ConclusionThis research paper has been divided into two parts. The first part deals with the concept, need and importance of consumer Behaviour. The second part deals with the Impact of Demographic Factors on Consumer Behaviour. The discussions made in the first
part of research paper leads to conclude that consumer behaviour is defined as the behaviour that consumer display in searching for, purchasing, using, evaluating and disposing of product, ser-vices and ideas that they expect will satisfy their needs. The study of consumer behaviour is the study of how individual make deci-sions to spend their available resources (money, time, and effort) on consumption-related items. It includes the study of what they buy, why they buy it, how they buy it, when they buy it, where they buy it, and how often they buy it. Consumer behaviour is the process whereby, individuals decide whether, what, when, where, how, and from whom to purchase goods and services. The sec-ond part of the research paper leads to conclude that Consumer behaviour doesn’t remain the same or constant in every situation it changes time to time. There are various demographic factors which affects consumer behaviour. As the change comes in these factors, consumer behaviour also changes. The research depicted that there are so many demographic factors like age, sex, income, occupation, education, marital status and family background which significantly affects the behaviour of consumers.
11. References1. Anderson PF. Method in Consumer-Research; 1986. Available from:
http://www.uta.edu/faculty/richarme/BSAD%206310/Readings/
Table 23. Sex of consumer and reasons of buying four wheeler from particular dealersSex Reason of buying four-wheeler from particular dealer Total
Nearness ReasonablePrice
AttractiveShowroom
HigherDiscount
FriendshipWith
Dealer
GoodService
Authorized Dealer
Male 653(78.4)
253(30.4)
553(66.4)
203(24.3)
143(17.1)
348(41.8)
703(84.4)
832(100)
Female 143(85.1)
75(44.6)
78(46.4)
49(29.1)
17(10.1)
67(39.8)
131(77.9)
168(100)
Note: (1) Percentage of reasons of buying four wheeler from particular dealer can not be equal to 100 because more than one response are given by the respondents
(2) Figures in parenthesis depicts the percentage. Source: Data collected through questionnaire
Table 24. Marital status of consumer and reasons of buying four wheeler from particular dealer Marital status
Reason of Buying Four Wheeler From Particular Dealer TotalNearness Reasonable
PriceAttractive Showroom
Higher Discount
Friendshipwith dealer
Good Service
Authorized dealer
Married 597(75.8)
193(24.5)
393(49.9)
187(23.7)
207(26.3)
147(18.6)
711(90.3)
787(100)
Unmarried 185(86.8)
83(38.9)
159(74.6)
49(23.0)
37(17.3)
109(51.1)
192(90.1)
213(100)
Note: (1) Percentage of reasons of buying four wheeler from particular dealer can not be equal to 100 because more than one response are given by the respondents
(2) Figures in parenthesis depicts the percentage. Source: Data colleted through questionnaire

47Vol 6 | Issue 2 | April-June 2014 | www.gjeis.org GJEIS | Print ISSN: 0975-153X | Online ISSN: 0975-1432
Rakesh Kumar Empirical Article
anderson%201986%20on%20method%20in%20consumer%20research.pdf
2. Bagozzi RP. On the concept of intentional social action in consumer-behaviour; 2000.
3. Rashmi A. How Good Gets Better and Bad Gets Worse: understand-ing the impact of affect on Evaluations of known Brands. J Consum Res. 2003. Available from: http://www.bm.ust.hk/mark/staff/Rashmi/Rashmi%20-%20JCR%20-%202003%20Dec.pdf
4. Bottolio RC, Fisher EB. An Experimental investigation of consumer behaviour in a controlled environment. 2005. Available from: http://www.ajms.co.in/sites/ajms/index.php/ajms/article/view/291
5. Block CE. Purchase Search Behaviour of Low-income Households. J Retailing. 1972.
6. Brown JD. Consumer Loyalty for Private Food Brands. Bureau of Business Research, Ball State University. 1972.
7. London EL. Self Concept ideal self concept and consumer purchase intentions. 1974.
8. Olashavsky RW, Granbois DH. Consumer Decision Makikng-Fact or Fiction. 1979. Available from: http://www.jstor.org/discover/10.2307/2489018?uid=2&uid=4&sid=21104335055903
9. Palan KM, Wilkas RE. Adolescent-Parent Interaction in Family Decision Making. 1997. Available from: http://belkcollegeofbusi-ness.uncc.edu/jaredhansen/Teaching/Teaching%20Helps/CB%20paper%20example%202.pdf

Global Journal of Enterprise Information SystemG J E I S
Unravelling Long Term Evolution (LTE) Ownership and Adoption ChallengesRajbala Simon1*, Laxmi Ahuja1 and Priyanka2
1Amity University, Noida, India; [email protected], [email protected]*Wipro Technologies, Greater Noida, India; [email protected]
Abstract
LTE short for Long Term Evolution is most widely used 4G technology today. It is in the process of deployment around the world. It is used as a wireless communication of high-speed data for mobile phones and data terminals. More and more companies are developing it as per their own requirements. Despite of so much development, LTE faces some concerns. This paper is a means to study the ownership of LTE network, concerns faced by service providers and measures to solve them.Keywords: 3GPP, Downlink, Global System for Mobile Communications (GSM), Long Term Evolution (LTE), Quality of Service (QoS), Spectrum, Uplink
1. IntroductionNowadays, the use of devices like Laptops, smart phones, tablets etc. that offer the ease and convenience of internet applications like Email and Web browsing on the go is widespread. As these devices become common, user expectations also rise in terms of high data rates, instant internet connectivity and a much larger variety of applications to play with. 4G technologies are what make the promise of such expectations real. Long Term Evolution (LTE) is a 4G technology offering services and it is currently in the process of being deployed around the world. LTE is a 3rd Generation Partnership Project (3GPP) and it stands for Long Term Evolution. It is a wireless data communications technology standard and an evolved version of UMTS/GSM standards. LTE is used as a standard of wireless communication of high-speed data for mobile phones and data terminals.
The paper is organized as follows: In section 2, LTE is discussed. In section 3, LTE architecture is explained. In section 4, Companies that provide LTE Network is provided with detailed description of 5 companies. These are Motorola, Samsung, Nokia, Ericsson and Sony. Section 5 shows, Company that adopted LTE in a world map with operators’ list of Asia. In section 6, barriers to LTE adoption is provided. Section 7 shows key operator considerations and meas-ures to realize them and Section 8 concludes the paper.
2. ObjectiveLTE is in the process of deployment around the world. It is used as a wireless communication of high-speed data for mobile phones
* Author for correspondence
and data terminals. More and more companies are developing it as per their own requirements. Despite of so much development, LTE faces some concerns. The objective of this paper is a means to study the ownership of LTE network, concerns faced by ser-vice providers and measures to solve them.
3. Literature Review
3.1 Long Term Evolution (LTE)LTE is part of the GSM evolutionary path for mobile broadband following EDGE, UMTS, HSPA (HSDPA and HSUPA combined) and HSPA Evolution (HSPA+)1 (Figure 1).With the help of DSP (Digital Signal Processing) techniques and modulations, LTE increases the capacity and speed of wireless data networks.
LTE provides:
• 100 Mbit/s for downlink • 50 Mbit/s for uplink • QoS provisions, that permits a transfer latency of 10-15 ms
which is evolving beyond 300 Mbps.
Figure 1. 3GPP Family Technology Evolution1.
DOI: 10.15595/gjeis/2014/v6i2/51845

49Vol 6 | Issue 2 | April-June 2014 | www.gjeis.org GJEIS | Print ISSN: 0975-153X | Online ISSN: 0975-1432
Rajbala Simon, Laxmi Ahuja and Priyanka Empirical Article
LTE can manage fast-moving mobiles as well as multicast and broadcast streams.
LTE supports:
• Carrier Bandwidth scalable from 1.4 to 20 MHz Frequency Division Duplexing (FDD)
• Time Division Duplexing (TDD).
LTE standard can be used with different frequency bands and their deployment is increasing rapidly among the world.
Through Table 1 it is evident that, frequencies vary in dif-ferent continents. Therefore, phones supporting LTE from one country may not work in other countries. Moreover, availability of LTE network is operator-dependent and may vary from area to area within a country2.
Radio access of LTE is known as Evolved UMTS Terrestrial Radio Access Network (E-UTRAN).
It is expected to:
• Improve end-user throughputs and sector capacity. • Reduce user plane latency• Improved user experience with help of full mobility.
With the help of Internet Protocol (IP), LTE will support IP-based traffic with end-to-end QoS (Quality of service). Voice traffic is supported as Voice over IP (VoIP) and enables better integration with other multimedia services (Table 2).
On the downlink, LTE uses Orthogonal Frequency Division Multiple Access (OFDMA) which offers high peak data rates in high spectrum bandwidth. And for Uplinks it uses Single Carrier FDMA (SC-FDMA)1 (Table 3).
LTE relies on physical layer technologies like:
• Multiple-Input Multiple-Output (MIMO) systems• Orthogonal Frequency Division Multiplexing (OFDM) • Smart Antennas, to achieve these targets.
3.2 Main Objectives of LTE • Allow flexible spectrum deployment within existing or new
frequency spectrum • Exist peacefully with other 3GPP Radio Access Technologies
(RATs).• Minimize System and User Equipment (UE) complexities
Number of people with access to LTE technology rose from zero to more than 200 million people. Also there are 40 live LTE networks in 24 countries.
LTE has been purposely designed to work flexibly across paired and unpaired, FDD and TDD spectrum. It supports bands ranging from 1.4 MHz up to 20 MHz. Also it works seamlessly with 3G technologies3.
3.3 LTE Patents Filed by Service Operators4,10,15
Details of who pays whom for the rights to create LTE handsets aren’t public, but Peter Misek, of Jefferies & Co., checked 1,400 patents related to the next-generation mobile communications standard and advised investors (and Forbes ) of the resultant calculated ownership breakdown. LTE is the preferred 4G stand-ard. Every LTE handset will have to pay royalties to those with the patents. LG Electronics has the biggest share of the spoils with 23 per cent of the pot. Qualcomm comes second with 21 per cent. After the biggies, there is Motorola, which is now the property of Google and InterDigital. Chinese companies are also catching up with the patent thing. Nortel’s patents are owned by a cross-licensing consortium of manufacturers including Apple and Microsoft, which do not appear anywhere else in the analysis. The analysis only covers the core radio technologies, rather than covering interface or design where both the companies are amply represented14 (Figures 2 and 3).
Table 1. LTE Band deployment around the worldCountries’ Name Bands presentAsia 850, 1500, 1800, 2100, 2300 and 2600 MHzAustralia 1800 MHzEurope 800, 900, 1800, 2600 MHzNorth America 700, 850, 1900 and 1700/2100 MHzSouth America 700, 1700/2100 and 2600 MHz
Table 2. Requirements for LTE performanceMetric ValueCoverage(cellsize) 5-100 kmControl plane capacity > 200 users per callControl plane latency <100 msMobility support Upto 500kmphPeak data rate Downlink: 100Mbps
Uplink: 50MbpsSpectrum flexibility 1.25, 2.5, 5, 10, 15 and 20 MHzUser plane latency <5 ms
Table 3. LTE capabilities1
Metric FunctionalityDownlink data rate Up to 326 MbpsDownlink bandwidth 20 MHzOperate in TDD and FDDBandwidth 1.4, 3, 5, 10, 15 and 20 MHzLatency up to 10 milliseconds (ms) round-trip
between user equipment and the base station< 100 ms from inactive to active

50
Unravelling Long Term Evolution (LTE) Ownership and Adoption Challenges
Vol 6 | Issue 2 | April-June 2014 | www.gjeis.org GJEIS | Print ISSN: 0975-153X | Online ISSN: 0975-1432
3.4 LTE User Devices’ Market ShareLTE User Devices’ market share by Aug 2013 is shown in Figure 4.
3.5 LTE User Device SegmentationLTE User Device Segmentation of 3 years is shown in Figure 5.
4. LTE ArchitectureThe architecture (Figure 6) has following functional elements:a. Evolved Radio Access Network (RAN for LTE) consists of a
single node, eNodeB (or eNB) that interfaces with the UE.b. Serving Gateway (SGW) routes and forwards user data pack-
ets and also acts as the mobility anchor during inter eNB handovers and between LTE and other 3GPP technologies.
c. Mobility Management Entity (MME) is the key control node for the LTE access network. It is responsible for idle mode UE tracking and paging procedure including retransmissions.
d. Packet Data Network Gateway (PDN GW) provides connec-tivity to UE with external packet data networks by being the only entry or exit point for traffic for UE.Features of LTE include:
i) S1-flex Mechanism: This concept provides support for network redundancy and load sharing of traffic across all net-
work elements in the CN, MME and SGW. This is done by creating pools of MMEs and SGWs and allowing each eNB to be connected to multiple MMEs and SGWs in a pool.
ii) Network Sharing: LTE architecture enables service providers to reduce the cost of owning and operating the network by allowing the service providers to have separate CN (MME, SGW, PDN GW). The E-UTRAN (eNBs) is one and is jointly shared by them5.
5. Data Discussion and Methodology
Companies that Provide LTE Following companies support LTE Network:
Alcatel, Apple, Asus, AVM, BlackBerry, Casio, D-Link, HTC, Huawei, LG, Motorola, NEC, Netgear, Nokia, Nokia Siemens
Figure 4. LTE User Devices’ market share by Aug 2013.
Figure 5. LTE User Device Segmentation of 3 years.
Figure 6. High level architecture for 3GPP LTE5.
Figure 2. Distribution of patents10.
Figure 3. Peter Misek’s analysis of who owns LTE ?14.

51Vol 6 | Issue 2 | April-June 2014 | www.gjeis.org GJEIS | Print ISSN: 0975-153X | Online ISSN: 0975-1432
Rajbala Simon, Laxmi Ahuja and Priyanka Empirical Article
Networks, Novatel Wireless, Option, Pantech, Samsung, Sony, Sierra Wireless and ZTE6.
5.1 Motorolla5
Motorola has been very active in the development of LTE standards and is pushing for an architecture in which all the radio-specific functions are present at eNB, cellular specific con-trol functionality is contained in control-plane nodes and CN user-plane nodes can be based on generic IP routers.
Motorola has made important contributions on following:
• Flat Radio Access Network (RAC) architecture• Termination of RLC and PDCP protocol layers in the eNB• Distributed radio resource management using direct eNB to
eNB interaction• Control-plane and user-plane separation which resulted in
the split between MME and serving gateway• Efficient TA conception for idle mode mobility• Use of IETF mobility protocols, specifically (proxy) Mobile IP
for mobility on the different interfaces• MBMS and SFN operation.• Enabling SGW sharing between service providers• Mobility solutions in active mode which includes context
transfer at RLC/PDCP layers, location of packet reordering function etc.
Motorola’s position on the LTE architecture has been moti-vated by maximizing reuse of components and network elements across different technologies. Our position has been driven by the desire to reuse generic routers and IETF-based mobility pro-tocols and network elements, such as, Home Agent (HA) and Foreign Agent (FA).
A key issue that has been decided as per Motorola’s preference is, placement of user-plane encryption and header compression functionality at the eNB. Motorola is also actively support-ing mobility between 3GPP and non-3GPP networks such as, WiMAX, to enable seamless mobility of dual-mode devices across these technologies.
They also helped in eliminating a centralized server for inter cell RRM and also suggested that it can be performed in a distrib-uted fashion at eNBs. It was done by showing that a centralized server requires frequent measurement reports from the UE. When RRM is distributed, eNBs can report their load informa-tion to neighboring cells on the basis of events like load of cell reaching 90%. This load information can then be used by neigh-boring eNBs to decide whether handover to this particular eNB should be allowed or not.
5.2 Ericsson3
Ericsson services for LTE include:
• Consulting,• systems integration and managed services,• network deployment and integration, • education and support services.
Operators that took up managed services for LTE from Ericsson are:
1. TDC, Denmark2. Verizon3. MetroPCS, USA
Ericsson’s services for LTE helped deliver excellent user expe-rience by smartphone audits. The company is working regularly with device manufacturers to ensure that new models perform to their best in tandem with new network features.
Delivering a consistent LTE user experience requires:
• Handsets • Radio network• End-to-end knowledge of how various IP nodes interact
across the network.
Ericsson’s strategy for LTE was to deliver a high-speed and responsive network that delivers significantly better user experience.
5.3 Samsung Smart LTE Network7
Samsung’s innovation played a major part in the efficiency of the network. It delivers an enhanced mobile broadband capability to support the connectivity requirements of mobile users across the world. Its network has transformed user experience by changing the way in which information and content was received and con-sumed. This is achieved by increasing network throughput for subscribers by reducing running costs for operators.
Reduced interference provides the network with increased data transfer speed and smooth handover between cells, which resulted in an enhanced all-round performance. Samsung’s Network comes in three configurations, namely centralised, dis-tributed and hybrid. All of them are available for both Frequency Division Duplexing (FDD) and Time Division Duplexing (TDD).
Samsung Smart Cluster enhanced network connectivity by reducing inter-cell interferences and boosting the network’s operational performance. It can be easily deployed using Ethernet backhaul. This resulted in the significant reduction in capital expenditure (CAPEX) and operational expenditure (OPEX), as well as it also decreased the number of cell sites required. Improvement in cell-edge capacity offers smoother handover across cells.
5.4 Nokia Siemens Network8
Nokia has LTE centers in markets all around the world. They work closely with suppliers to ensure smooth implementation

52
Unravelling Long Term Evolution (LTE) Ownership and Adoption Challenges
Vol 6 | Issue 2 | April-June 2014 | www.gjeis.org GJEIS | Print ISSN: 0975-153X | Online ISSN: 0975-1432
and operation. They supply LTE (FDD mode) and TD-LTE to world markets.
With close cooperation with the leading LTE device suppli-ers they ensure an end-to-end interoperability. Their 4G devices complement infrastructure solutions and help operators to launch better LTE services.
Nokia provides these benefits to business:
• Delivers a very fast broadband for customers• Operates on a global standard• Offers efficient delivery • Offers smooth implementation
Nokia has provided LTE support to roughly half of the communications’ service provides. The service providers have commercially launched LTE including advanced mobile broad-band markets in North Europe, South Korea and Japan.
Nokia had deployed LTE on all major frequency bands. By September 12 2013, they had 92 commercial references in place for the delivery of LTE.
5.5 Sony9
LTE networks are getting very common, allowing us to browse web, stream content, or download movies at high-speed. LTE support can be found on a number of Xperia smartphones also.
Xperia smartphones that support LTE includes:
• Xperia ion (LT28i)• Xperia TL (LT30at)• Xperia T (LTE30a)• Xperia V (LT25i)• Xperia SX (SO-0SD)• Xperia AX (SO-01E)• Xperia Z (C6603)• Xperia ZL (LTE C6503, C6506)
6. Countries Adopted LTEFigure 7 and 8 is categorized as:
• The countries in Red have commercial LTE services. These are: Canada, USA, Brazil, Uruguay, Russia, Australia, New Zealand, Angola, Spain, Saudi Arabia Jordan, Iraq, Bahrain, Portugal, Finland, Sweden, Norway, UK, Germany, Poland, Japan, India, Sri Lanka, Austria, Hungary, Haiti and South Korea.
• Countries in Dark Blue have on-going or planned com-mercial LTE network deployment. These are: China, Nepal, Myanmar, Laos, Vietnam, France, Monaco, Ireland, Mexico, Costa Rica, Colombia, Nigeria, Indonesia, South Africa, Namibia, Lesotho, Paraguay, Romania, Bulgaria, San Marino and Taiwan.
• Countries in Light Blue have trial or pre-committed LTE net-works. These are: Ukraine, Czech Republic, Turkey, Georgia, Israel, Egypt, Uganda, Thailand, Malaysia, Peru, Bolivia and Argentina.
Some operators in Asia are shown in Table 4.
7. Results and Discussions
Barriers to LTE Adoption13
Main barriers to LTE adoption can be largely categorized as, technical, regulatory, ecosystem driven and ROI.
7.1 Technical Challenges• Complexity and Backward Compatibility
For operators considering a network update, selecting the right technology is a major concern. They have two options, either upgrade to evolved versions of 3G such as HSPA and HSPA+ or go for LTE. While upgrades within the 3G family may not require too many network architectural changes but transformation to LTE requires new radio access technology and core network expansion. This method is cost intensive and highly complex. Moreover since existing 2G and 3G networks will not be phased out anytime soon, there is an additional burden on operators: to maintain two networks, support inter-operability, seamless roaming, and handovers across multiple CSPs.
Figure 7. Adoption of LTE technology as of June 26, 2013 11.
Figure 8. Commercial LTE Networks15.
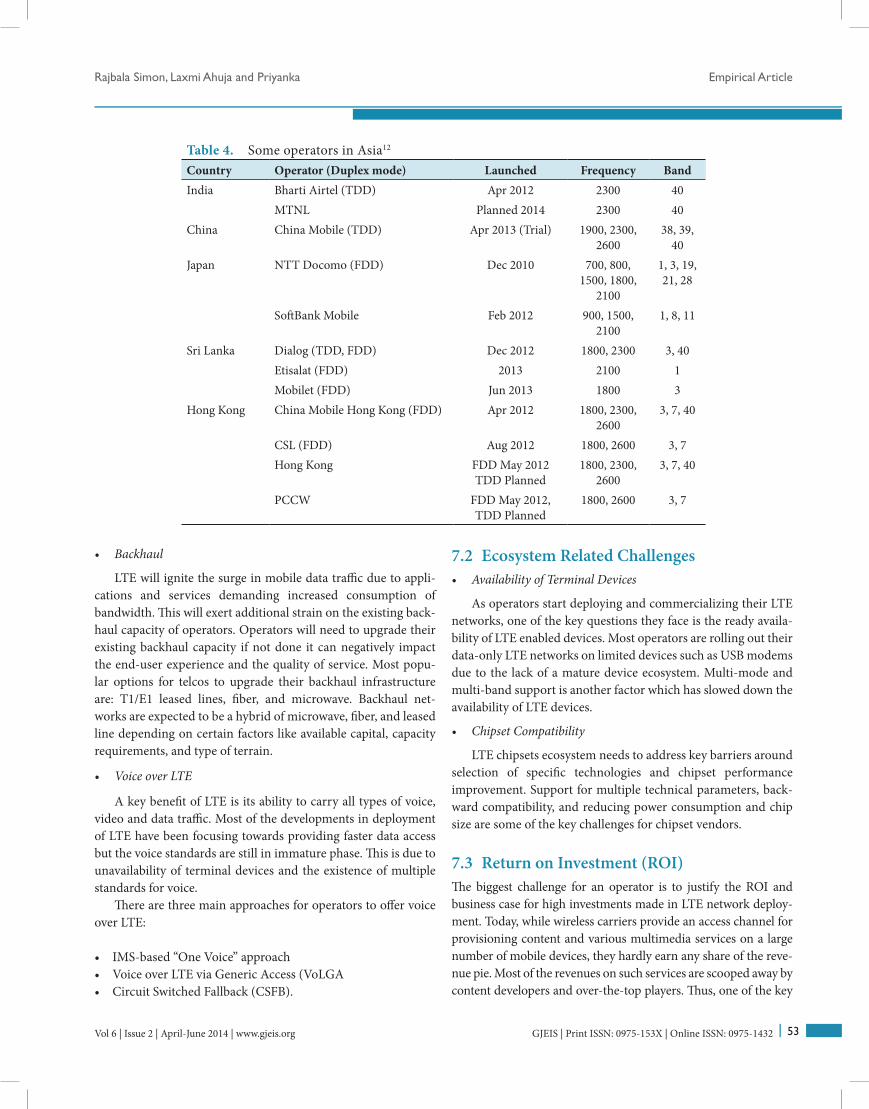
53Vol 6 | Issue 2 | April-June 2014 | www.gjeis.org GJEIS | Print ISSN: 0975-153X | Online ISSN: 0975-1432
Rajbala Simon, Laxmi Ahuja and Priyanka Empirical Article
• Backhaul
LTE will ignite the surge in mobile data traffic due to appli-cations and services demanding increased consumption of bandwidth. This will exert additional strain on the existing back-haul capacity of operators. Operators will need to upgrade their existing backhaul capacity if not done it can negatively impact the end-user experience and the quality of service. Most popu-lar options for telcos to upgrade their backhaul infrastructure are: T1/E1 leased lines, fiber, and microwave. Backhaul net-works are expected to be a hybrid of microwave, fiber, and leased line depending on certain factors like available capital, capacity requirements, and type of terrain.
• Voice over LTE
A key benefit of LTE is its ability to carry all types of voice, video and data traffic. Most of the developments in deployment of LTE have been focusing towards providing faster data access but the voice standards are still in immature phase. This is due to unavailability of terminal devices and the existence of multiple standards for voice.
There are three main approaches for operators to offer voice over LTE:
• IMS-based “One Voice” approach• Voice over LTE via Generic Access (VoLGA• Circuit Switched Fallback (CSFB).
7.2 Ecosystem Related Challenges• Availability of Terminal Devices
As operators start deploying and commercializing their LTE networks, one of the key questions they face is the ready availa-bility of LTE enabled devices. Most operators are rolling out their data-only LTE networks on limited devices such as USB modems due to the lack of a mature device ecosystem. Multi-mode and multi-band support is another factor which has slowed down the availability of LTE devices.
• Chipset Compatibility
LTE chipsets ecosystem needs to address key barriers around selection of specific technologies and chipset performance improvement. Support for multiple technical parameters, back-ward compatibility, and reducing power consumption and chip size are some of the key challenges for chipset vendors.
7.3 Return on Investment (ROI)The biggest challenge for an operator is to justify the ROI and business case for high investments made in LTE network deploy-ment. Today, while wireless carriers provide an access channel for provisioning content and various multimedia services on a large number of mobile devices, they hardly earn any share of the reve-nue pie. Most of the revenues on such services are scooped away by content developers and over-the-top players. Thus, one of the key
Table 4. Some operators in Asia12
Country Operator (Duplex mode) Launched Frequency BandIndia Bharti Airtel (TDD) Apr 2012 2300 40
MTNL Planned 2014 2300 40China China Mobile (TDD) Apr 2013 (Trial) 1900, 2300,
260038, 39,
40Japan NTT Docomo (FDD) Dec 2010 700, 800,
1500, 1800, 2100
1, 3, 19, 21, 28
SoftBank Mobile Feb 2012 900, 1500, 2100
1, 8, 11
Sri Lanka Dialog (TDD, FDD) Dec 2012 1800, 2300 3, 40Etisalat (FDD) 2013 2100 1Mobilet (FDD) Jun 2013 1800 3
Hong Kong China Mobile Hong Kong (FDD) Apr 2012 1800, 2300, 2600
3, 7, 40
CSL (FDD) Aug 2012 1800, 2600 3, 7Hong Kong FDD May 2012
TDD Planned1800, 2300,
26003, 7, 40
PCCW FDD May 2012, TDD Planned
1800, 2600 3, 7

54
Unravelling Long Term Evolution (LTE) Ownership and Adoption Challenges
Vol 6 | Issue 2 | April-June 2014 | www.gjeis.org GJEIS | Print ISSN: 0975-153X | Online ISSN: 0975-1432
operator challenges is to introduce innovative services and pricing models which leverage their advanced LTE network capabilities.
8. Key Operator Considerations and Measures to Realize Them13
Although LTE provides an efficient, future proof, and cost effec-tive long-term solution to wireless operators for upgrading their networks, the road towards LTE is not without its challenges. Following is the list of challenges faced by LTE along with meas-ures to realize them.
8.1 Customer Proposition8.1.1 Service PositioningFrom a customer perspective, the higher speeds and lower latency enabled by LTE is the key USP of this technology. As voice and SMS standards gradually evolve, operators should eventually offer these services as well. Also they need to position LTE as a faster and superior broadband access technology.
8.1.2 PricingIn order to manage network traffic volumes effectively and jus-tify the high costs of network capacity upgrades, it is critical for operators to get their LTE data price model right.
Strategies that Operators Could Follow
• They should price their LTE offering at a significant premium over existing mobile data plans and focus on maintaining a very high service quality. For example, LTE data plan of TeliaSonera in Sweden is priced at an 88% premium over its existing regular 3G subscription.
• Entry level customers should be able to surf the net at lower prices albeit with slower speeds and lower data caps, whereas heavy users and business customers should have access to higher priced faster plans with higher data caps.
• Should try to adopt a value-based pricing model where cus-tomers pay a premium for superior experience. Operators such as TeliaSonera and Vodafone have already announced the launch of such plans in the future.
8.1.3 Rollout Strategy Operators can either choose to extensively reuse their existing network infrastructure by adding LTE capability over their 3G network or plan and build a network from scratch by swapping out current infrastructure to a single RAN network. While the former method results in high cost savings and faster rollout, the latter promises a more flexible, clean, and stable upgrade for long term benefits.
In most cases, a full-scale nationwide rollout strategy may not make economic sense, since the returns on data rich LTE ser-vices in rural and semi-urban areas may not be as attractive as in urban areas. Therefore, a phased deployment strategy, targeting affluent data hungry customers in the densely populated urban areas first, makes a stronger business case. MetroPCS has rolled out its 4G LTE services in five major metropolitan cities where it anticipated maximum demand, and will gradually expand to other urban areas.
In order to increase coverage in rural areas, operators can forge partnerships with local wireless providers, and companies having towers and backhaul capabilities. Verizon is currently planning to adopt this strategy for the rural rollout of its LTE network.
8.2 Cost Savings8.2.1 Network SharingIn order to minimize the large investments required in LTE network rollout and maximize returns from its deployment, cost savings should be one of the foremost priorities for opera-tors. Operators should not only go for passive sharing of sites and tower masts but also engage in active network sharing, to effectively reduce their financial burden. LTE networks are technically more suited to active sharing due to their flat all-IP network architecture and operators sharing their active network elements can save more than 40% in CAPEX and OPEX, in a five year time, as compared to their counterparts striking only pas-sive site-sharing deals.
8.2.2 Data OffloadingMobile Data Offloading (MDO) is another strategy which oper-ators can adopt to achieve cost efficiencies. MDO is the use of complementary network technologies such as WiFi, femtocell, mobile CDNs, and media optimization for offloading data origi-nally targeted for cellular networks, thereby reducing costs and minimizing load on core operator network. It is expected that offloaded mobile data will increase threefold from 16% in 2010 to 48% in 2015.
8.2.3 Spectrum PolicyLTE can be deployed in many different frequency bands, with each band supporting multiple channel bandwidths. Operators will need to carefully evaluate the frequency bands and chan-nel bandwidth in which to deploy LTE, based on factors such as spectrum availability and price, rollout costs, and coverage.• Which Spectrum Band?
Higher frequency bands such as 2.6 GHz are readily avail-able and have been auctioned in many parts of the world. Low

55Vol 6 | Issue 2 | April-June 2014 | www.gjeis.org GJEIS | Print ISSN: 0975-153X | Online ISSN: 0975-1432
Rajbala Simon, Laxmi Ahuja and Priyanka Empirical Article
frequency bands such as 800 MHz and 700 MHz allow signals to travel farther and provide better in-building coverage than higher frequencies. Therefore, from a coverage point of view, a network built at 700 MHz is likely to require less than a tenth of the number of sites required for the same coverage at 2.6 GHz. This will translate to lower costs and enable operators to gain an edge on the pricing front. Given the high costs and competi-tion involved in the acquisition of LTE spectrum, operators can also consider the option of re-farming their existing licensed frequencies, if regulation permits, to offer LTE. The main concern with re-farming will be clearing enough spectrums to facilitate an acceptably efficient implementation of LTE while maintaining enough capacity in the remaining spectrum to support non-LTE traffic on legacy technology.• What Channel Bandwidth?
LTE can be implemented in multiple channel bandwidths ranging from 1.4 MHz to 20 MHz. It is technically possible to implement LTE as a Single Frequency Network (SFN) or using a frequency reuse pattern. In the case of SFN, bandwidth will likely to be in the order of 18 Mbit/s, but is available only over a very limited coverage area with the potential bit rate falling sharply at the cell edges. In the frequency reuse case, the bandwidth will be lower at around 7 Mbit/s, but available over a much wider area. Therefore, operator decision on channel bandwidth needs to be based on a speed versus coverage tradeoff. In dense urban areas, they can implement LTE as SFN where as in rural areas they can adopt the frequency reuse pattern.
9. ConclusionLTE presents an attractive technology choice for operators to mit-igate their most significant concerns around increase in demand for wireless broadband. However, the path towards LTE is not without its set of challenges and the decision to migrate is not easy to make. LTE is in a nascent stage with standards still evolv-ing and its ecosystem still maturing. Moreover operators have other wireless technology options also, some of which may be more cost effective in the short term than LTE. To reap the true potential benefits offered by LTE and successfully mitigate the challenges, operators should adopt the right strategies around pricing, cost savings, and rollout.
10. Future ScopeLTE has come a long way since its early development. But still a lot of work need to be done to make it work everywhere around the world. LTE operators offer different frequencies across the world which limits portability of one network from one part of world to the other. A lot of work needs to be done to bring whole world under one network so that anyone can travel anywhere and still remain connected to everyone.
11. References 1. Available from: http://www.4gamericas.org/index.cfm?fuseaction=
page§ionid=249 2. Available from: http://developer.sonymobile.com/2013/01/24/lte-
coverage-for-xperia-smartphones/ 3. LTE a global success story. Available from: https://www.google.
co.in/url?sa=t&rct=j&q=&esrc=s&source=web&cd=1&cad=rja&ved=0CCoQFjAA&url=http%3A%2F%2Fwww.ericsson.com%2Fres%2Fdocs%2F2012%2Ferix1202_lte_brochure.pdf&ei=RS5EUqH5BMLarAf424HgBg&usg=AFQjCNGMJrzlokFMNTfbfd1qhgC37YyzSw&bvm=bv.53217764,d.bmk
4. Available from: http://www.ipeg.eu/who-owns-lte-patents/ 5. LTE Technical White Paper on Long Term Evolution (LTE): A tech-
nical overview by motorola solutions. 6. Available from: http://en.wikipedia.org/wiki/List_of_devices_with_
LTE 7. Available from: http://www.samsung.com/global/business/telecom-
munication-systems/telecommunication-systems/lte/smart-lte-net-works
8. Available from: http://nsn.com/portfolio/products/mobile-broad-band/long-term-evolution-lte
9. Available from: http://developer.sonymobile.com/2013/01/24/lte-coverage-for-xperia-smartphones/
10. Availabel from: http://www.ipeg.eu/who-owns-lte-patents/11. Available from: http://en.wikipedia.org/wiki/File:3GPP_Long_
Term_Evolution_Country_Map.svg12. Available from: http://en.wikipedia.org/wiki/List_of_LTE_networks13. Available from: http://www.in.capgemini.com/node/9125114. Available from: http://www.theregister.co.uk/2011/09/23/lte_pat-
ent_pie/15. Available from: http://www.gsacom.com/

Global Journal of Enterprise Information SystemG J E I S
Survey Article on Comultiplication ModulesJay Kishore Sahani*
Department of Mathematics, Faculty of Mathematical Sciences, University of Delhi, India; [email protected]
Abstract
In this paper we will discuss some concrete results of comultiplication modules.Keywords: Multiplication Modules and Comultiplication Modules 1991 Mathematics Subject Classification.13C13 and 13C99.
1. IntroductionThe concept of comultiplication modules was first introduced by H. Ansari-Toroghy and Farshadifar4 in 2007. They used the word “comultiplication module” to those R-modules M for whom every submodule is the annhilator of some ideal of the ring R. They defined the comultiplication module by the following way:
An R-module M is called comultiplication module if for every submodule N of M , there exists an ideal I of R such that
N = annM (I).
They also proved that an R-module M is comultiplication module if and only if for any submodule N of M , N = (0 :M annR (N)). They proved that every proper submodule of a comultipli-cation module is comultiplication module. However, converse may not be true. For example, if V is a two dimensional vector space over a field k then V cannot be comultiplication module but every proper subspace of V is comultiplication as every one dimensional vector space is comultiplication module.
In 2008, Ansari and Farshadifar7, further extended their work done in4. In this paper they gave a characterization of comultipli-cation modules in terms of completely irreducible submodules. They also proved that if R is local ring then every comultiplica- tion module is cocyclic. Further they proved that a finitely generated second submodule of a comultiplication module is multiplication module. It was also shown that every non zero comultiplication module contains a minimal submodule and a characterization of minimal submodules was also given.
In the same year, Ansari and Farshadifar6 further extended their work and proved that, over a Noetherian ring, an injective multiplication modules is comultiplication. They also proved the dual notion of Nakayama’s lemma for finitely cogenerated modules.
In 2009, Atani and Atani2 studied the comultilication mod-ules over Dedekind domains and pullback of local Dedekind
* Author for correspondence
domains. They characterized the comultiplication modules over Dedekind domains with the help of localization. They com-pletely described the indecomposable comultiplication modules over pullback of local Dedekind domains. This description was given in two stages. In the first stage they described the separated indecomposable comultiplication module and proved that if M is any separated indecomposable comultiplication module over a pull- back ring R of local Dedekind domains R1 & R2 , then M is isomorphic to one of the following modules:
(1) M = (E(R1/m1) → (0) ← (0)), ((0) → (0) ← E(R2 /m2)), where E(Ri/mi) is the Ri-injective hull of Ri/mi for all i = 1, 2.
(2) M = (R1 /mn1 → R̄ ← R2/m
m2).
In second stage they explained the non-separated indecom-posable comultiplication module.
In 2011, Yousef Al-Shaniafi and Patrick F. Smith12 studied the localization of comultiplication modules over a general ring R and proved that if every maximal ideal m of R is good for M then M is comultiplication R-module if and only if Mm is a comultiplication Rm-module for every maximal ideal m of R. It was also shown that if an R-module M = ⊕
i∈I Ui is the
direct sum of simple submodules {Ui}i∈I for some index set I , then M is comultiplication module if and only if ∩j≠iannR (Uj) ⊄ annR (Ui) for all i∈I . Further, they had shown that, under certain circumstances, quasi-injective modules and comulti-plication module are related. They proved that if R is any ring and if M is a Noetherian quasi-injective R-module, then M is comultiplication module if and only if Rx = (0 :M annR (Rx)) for all x∈M.
In the same year Ansari and Fashadifar8,5 continued their work done in4,7,6. In8, they proved that if every proper submodule N of a module M is comultiplication module and if AnnR (N) ≠ AnnR (M), then M is a comultiplication module. In5, they proved that every second submodule of a Noetherian comultiplication module is simple submodule.
DOI: 10.15595/gjeis/2014/v6i2/51846

57Vol 6 | Issue 2 | April-June 2014 | www.gjeis.org GJEIS | Print ISSN: 0975-153X | Online ISSN: 0975-1432
Jay Kishore Sahani Empirical Article
In 2012, Al-Shaniafi and Smith9 explained the minimal com-pletely irreducible submodules, unique complements and Goldie dimensions of comultiplication modules. In9, they proved that every comultiplication module has unique complement and if R is semilocal ring with n distinct maximal ideals, then every comultiplication mod- ule has Goldie dimension at most n. They also extended some results of Quasi-injective module and proved that every Noetherian comultiplication R-module is an Artinian quasi- injective R-module. In the same year, Tuganbaev1 studied the comultiplication modules over non-commutative rings.
2. Characterization of Comultiplication Modules
Proposition 2.1. [12, Proposition 1.3] Let R be a ring and let M be an R-module. Then M is comultiplication module if and only if for every submodule N of M such that M/N is cocyclic, there exists an ideal I of R such that N = annM (I).
Proof. If M is comultiplication R-module then for every sub-module N of M there exists an ideal I of R such that N = annM (I) and hence the result follows.
Conversely, suppose that there exists an ideal I of R such that N = annM (I) for any submodule N of M with M/N is cocyclic.
Let L be any proper submodule of M . Then by [10, pp 2], there exists {Lj}j∈J of completely irreducible submodules of M such that L = ∩j∈J Lj and the module M/Li is cocyclic for all i ∈ ∆.
Now, by assumption, for every i ∈ ∆, there exists an ideal Ji of R such that Li = annM (Ji).
Therefore,
where K = ∑i∈∆
Ji, is an ideal of R.Hence M is a comultiplication module.Theorem 2.2. [12, Theorem 1.5] For any R-module M , the fol-
lowing are equivalent.
(1) M is a comultiplication module.(2) N = (0 :M annR (N)) for every submodule N of M .(3) The module (0 :M annR (N))/N has zero socle for every sub-
module N of M .(4) Given submodule P , L of M , annR (P) ⊆ annR (L) implies
that L ⊆ P .(5) Given any submodule N of M and x ∈ M, annR (N) ⊆ annR
(Rx) implies that x ∈ N .(6) Given any submodule N of M and x ∈ M , annR (N) ⊆ annR
(Rx) implies that (N :R x) is not a maximal ideal of R.(7) (L :R N) = (annR (N) :R annR (L)) for all submodules L and N
of M .(8) M is strongly self-cogenerated.
Proof. (1)⇔(2)Let M be a comultiplication module, then for any submod-
ule N of M , there exists an ideal I of R such that N = annM (I). This implies that I .N = 0. Therefore, I ⊆ annR (N), implies that (0 :M annR (N)) ⊆ annM (I) = N . Obviously we always have N ⊆ (0 :M annR (N)). Therefore,
N = (0 :M annR (N)).
Conversely, let M is an R-module and N is a submodule of M. Now, annR (N) is an ideal of R and N = (0 :M annR (N)). Hence by definition, M is a comultiplication module.
(2)⇔(3)(2)⇒(3) is quit obvious. We only need to prove the con-
verse. So, suppose that for every submodule N of M , the module (0 :M annR (N))/N has zero socle. If possible, suppose that N = (0 :M annR (N)) for some submodule N of M . Then by [12, Lemma 1.4], there exists a submodule P containing N such that (0 :M annR (P))/P has non zero socle. But this contradicts our ini-tial assumption. Therefore, N = (0 :M annR (N)).
(2)⇒(4)Let N = (0 :M annR (N)) for all submodule N of M . Let P and L
be submodule of M such that annR (P) ⊆ annR (L). Let x ∈ L. This implies that x ∈ (0 :M annR (L)) implies that annR (L).x = 0. Hence annR (L) ⊆ annR (Rx), that is, annR (P) ⊆ annR (L) ⊆ annR (Rx). This implies that Rx = (0 :M annR (Rx)) ⊆ (0 :M annR (P)), that is, x ∈ P . Therefore, L ⊆ P .
(4)⇒ (5) is obvious. (5) ⇒ (6)Suppose for any submodule N of M , and x ∈ M such that if
annR (N) ⊆ annR (x), then x ∈ N . Therefore, (N :R x) = R.(6)⇒ (2)Suppose (6) holds. Let N be any submodule of M such that
for any x ∈ M , annR (N) ⊆ annR (Rx). By hypothesis, (N :R x) is not a maximal ideal of R. If possible, suppose, there is a submod-ule L such that
L ≠ (0 :M annR (L)).
Note that L ⊂ (0 :M (0 :R L)). Since L = (0 :M (0 :R L)), choose x ∈ (0 :M (0 :R L)) such that x ∉ L. This implies that annR (L) ⊆ annR (Rx).
Let F be the family of all submodules x of M containing N such that annR (X) ⊆ annR (Rx) and x ∉ X . Then F is non-empty implies that L ∈ F. Now suppose {Xi| i∈∆, where ∆ is an index set} be any chain in F. Put X = ∪i∈∆ Xi. Then x is a submodule of M containing L such that
annR (X) ⊆ annR (Xi) ⊆ annR (Rx) for all i ∈ ∆.
Thus x ∈ F and is an upper bound of {Xi| i ∈ ∆}. Therefore by Zorn’s lemma F admits a maximal element. Let P be any maximal element of F. As L ⊆ P , we have annR (P) ⊆ annR (L) and hence
(0 :M annR (L)) ⊆ (0 :M annR (P)).
L L ann J ann J ann Ki i i M i M i Mi
= ∩ = ∩ ( ) =
= ( )
∈∆ ∈∆
∈∆
∑

58
Survey Article on Comultiplication Modules
Vol 6 | Issue 2 | April-June 2014 | www.gjeis.org GJEIS | Print ISSN: 0975-153X | Online ISSN: 0975-1432
Therefore, x ∈ (0 :M annR (P)) and x ∉ P . Since (P :R Rx) is a proper ideal of R, choose a ∈ R such that a ∉ (P :R Rx), that is, ax ∉ P . Therefore, we conclude that P + Rax ∉ F. Also as
annR (P + Rax) ⊆ annR (P) ⊆ annR (Rx),we have x ∈ P +Rax, that is, x = y +bax for some y ∈ P, b ∈
R, implies that (1−ba)x = y. This implies that 1 − ba ∈ (P :R Rx). Therefore, (P :R Rx) is a maximal ideal of R. But this contradicts our initial hypothesis. Hence N = (0 :M (0 :R N)) for every sub-module N of M .
(2)⇒(7)Suppose (2) holds. Let L be any submodule of M and let I =
annR (L). Note that r ∈ (L :R N) if and only if rN ⊆ L = (0 :M annR (L)) = annM (I), that is, rIN = 0 if and only if rI ⊆ annR (N), that is, r ∈ ((0 :R N) :R annR (L)). Therefore,
(L :R N) = (annR (N) :R annR (L)).(7)⇒(4)Suppose (7) holds. Let P and L be submodules of M such that
annR (P) ⊆ annR (L). By hypothesis, (P :R L) = (annR (L) :R annR (P)) = R. Therefore, L ⊆ P .
Since equivalence of (4) and (2) is already established, we have, (7)⇒(2).
(1)⇒(8)Suppose M is a comultiplication module and N be any
submodule of M. Then, there exists an ideal I of R such that N = annM (I). Now, for every a ∈ I , define a trivial endomor-phism ϕa : M → M by ϕa (x) = ax for all x ∈ M . Obviously, we have N = ∩a∈I ker ϕa. Therefore, M is strongly self-cogenerated module.
(8)⇒ (1)Suppose (8) holds. Let L be any submodule of M . By hypoth-
esis, there exists an index set J and trivial endomorphisms {θj}j∈J on M such that L = ∩j∈J ker θj . Since every endomorphism θj is trivial. Hence for every j ∈ J , there exists aj ∈ R such that
θj (x) = aj x for all x ∈ M.
Suppose that I = ∑j∈J
Raj. Thenx ∈ annM (I) ⇔ x ∈ ∩j∈J annM (Raj) = ∩j∈J ker θj = L.Therefore, L = annM (I) and hence, M is a comultiplication
module.
3. Properties of Comultiplication Modules
Proposition 3.1. [7, Proposition 3.1] The following results hold for a comultiplication R-module M .(1) If J is an ideal of R such that annM (J) = (0), then J M = M .(2) If J is an ideal of R such that annM (J) = (0), then for every
element x ∈ M, there exists an element a of J such that x = ax. In particular Rx = J x for all x ∈ M .
(3) If M is a finitely generated R-module and J is an ideal of R such that annM (J) = (0), then there exists a ∈ J such that 1 − a ∈ annR (M).
Proof. (1) Let N be any submodule of M . Then there exists an ideal I of R such that N = annM (I).
Let x ∈ (annM (I) :M J).⇔ J x ⊆ annM (I)⇔ I J x = (0)⇔ I x ⊆ annM (J) = (0)⇔ x ∈ annM (I).
Therefore, annM (I) = (annM (I) :M J) and hence N = (N :M J).Put N = J M . Therefore,J M = (J M :M J) = M.(2) Suppose that x ∈ M . Then Rx is a submodule of M. As
annM (J) = (0), we have annRx (J) = (0). By [12, Lemma 2.1], Rx is comultiplication R-module. Therefore, Rx = Jx, by (1) and hence result follows. This implies that 1x = ax for some a ∈ J .
(3) Let J be an ideal of R such that annM (J) = (0). Then by (1), J M = M . Now, since M is finitely generated R module and J M = M , hence by Nakayama Lemma, we have 1 − a ∈ annR (M) for some a ∈ J .Theorem 3.2. [7, Theorem 3.4] Let M be a faithful comultiplica-tion R-module.
(1) If M is finitely generated module then annM (I) = (0), for every proper ideal I of R.
(2) If annM (m) ≠ (0), for every maximal ideal of R then M is finitely cogenerated.
Proof. (1) Let N be finitely generated submodule of M . If possible, suppose that I is a proper ideal of R such that annM (I) = (0). Since I is a proper ideal, I ⊆ m, for some maximal ideal m of R. This implies that annM (m) ⊆ annM (I) = (0). Hence by Proposition 3.1(3), 1 − a ∈ annR (M), for some a ∈ m. Since M is faithful, we have annR (M) = (0). This implies that a = 1 ∈ m, which is a contradiction. Hence annM (I) = (0) for any proper ideal I of R.
(3) Let annM (m) = (0) for every maximal ideal m of R. Let {Mλ}λ∈Λ be a collection of submodules of M such that ∩λ∈ΛMλ = (0). Since Mλ is a submodule of M , for every λ ∈ Λ, there exists an ideal Iλ of R such that Mλ = annM (Iλ). Now,
(0) = ∩λ∈ΛMλ = ∩λ∈ΛannM (Iλ) = annM (∑λ∈Λ
Iλ).Note that ∑
λ∈Λ Iλ is an ideal of R. We assert that ∑
λ∈Λ Iλ = R. If
possible, suppose that ∑λ∈Λ
Iλ ≠ R. Then ∑λ∈Λ
Iλ ⊆ m for some maximal ideal m of R. But this implies that annM (m) ⊆ annM ( P Iλ) = (0), which is a contradiction. Therefore, ∑
λ∈Λ Iλ = R. Since 1 ∈ R, there
exists a finite subset Λ1 of Λ such that 1 = ∑λ∈Λ1
rλ, where rλ ∈ Iλ. Therefore, R = ∑
λ∈Λ1Iλ.

59Vol 6 | Issue 2 | April-June 2014 | www.gjeis.org GJEIS | Print ISSN: 0975-153X | Online ISSN: 0975-1432
Jay Kishore Sahani Empirical Article
Now, annM (R) = (0). This implies that annM ( ∑λ∈Λ1
Iλ) = (0),
that is, ∩λ∈Λ1 annM (Iλ) = (0), that is, ∩λ∈Λ1 Mλ = (0). Hence M is finitely cogenerated. Example 3.3. [7, Example 3.8] Let n be a fixed positive integer. Then
(1) Zn is a comultiplication Z-module. (2) Zn is a comultiplication Zn-module.
Proof. We prove only (1). The proof of (2) is same as that of (1).
Let N be a submodule of Zn. Let o(N) = d. Then n = md for some positive integer m. This implies that N = mZn. Put I = dZ. Then dZ is an ideal in Z such that
N = annZn (dZ).
Therefore, Zn is a comultiplication Z-module.
4. Quasi-injective Comultiplication Modules
Theorem 4.1. [12, Theorem 4.4] Let R be any ring and let M be a Noetherian R-module such that
(1) Rx = (0 :M annR (Rx)) for all x ∈ M and(2) annR (N ∩ P) = annR (N) + annR (P) for all submodules N and
P of M .Then M is quasi injective.Proof. Let M be Noetherian R-module such that (1) and (2)
holds. Since M is Noetherian module, every submodule of M is finitely generated. Now,
Rx = (0 :M annR (Rx)) for all x ∈ M
and let N and P are finitely generated submodules of M such that
annR (N ∩ P) = annR (N) + annR (P).
Let β : L → M be an R-homomorphism. Then by [12, Lemma 4.3], there exists r ∈ R such that
β(x) = rx for all x ∈ L.Therefore, β can be lifted to M , naturally by defining β(x) =
rx for all x ∈ M . Hence M is quasi-injective module.Proposition 4.2. [9, Corollary 3.12] Every Noetherian comul-
tiplication R-module is an Artinian quasi-injective R-module.Proof. Let L be any submodule of M. Then by [11, Proposition
6.2], L is finitely gener- ated. Also, as M is comultiplication module, by [9, Corollary 3.11], every homomorphism ϕ : L → M is trivial. Hence, ϕ : L → M can be lifted to M . Therefore, M is M-injective and hence quasi-injective. Now, by [12, Corollary 2.11], M is Artinian. Therefore, M is Artinian quasi-injective module.
5. Comultiplication Module over Dedekind Domain
Lemma 5.1. [2, Lemma 3.2] Let R be the pullback ring. Then the indecomposable separated comultiplication module over R are
(1) M = (E(R1/m1) → (0) ← (0)), ((0) → (0) ← E(R2/m2)), where E(Ri/mi) is the Ri-injective hull of Ri/mi for all i = 1, 2.
(2) M = (R1/m1n → R̄ ← R2/m2
m).
Proof. Let R be the pullback ring and let M = (M1 → M̄ ← M2) be separated R-module. Then by [3, Lemma 2.8],
M = (E(Ri/mi) → (0) ← (0)), ((0) → (0) ← E(R2/m2)) andM = (R1/m1
n → R̄ ← R2/m2m)
are indecomposable. Now, by [2, Theorem 2.5],
R1/m1n, R2/m2
m and E(R1/m1), E(R2/m2)
are comultiplication modules. This implies by [2, Propo-sition 3.1],
M = (E(R1/m1) → (0) ← (0)), ((0) → (0) ← E(R2/m2)) andM = (R1/m1
n → R̄ ← R2/m2m)
are comultiplication R-modules. Lemma 5.2. [2, Lemma 2.4] Every non-zero comultiplication
module over a discrete valuation domain R is indecomposable.Proof. Let R be a discrete valuation domain with m = Rp, the
unique maximal ideal generated by p. Let M be a comultiplica-tion R-module such that M = N ⊕ P with submodules N ≠(0) and P ≠ (0). Since R is a discrete valuation domain, by [11, Corollary 9.4], for any ideal I of R, there exists some positive integer n such that I = mn.
Now, M is a comultiplication R-module. By [11, Corollary 9.4], there exists some positive integer m, n with m < n such that
N = annM (mn) and P = annM (mm).
This implies that
M = N ⊕ P= annM (mn) + annM (mm)= annM (mn).
Now, we haveN ∩ P = annM (mn) ∩ annM (mm) = annM (mn + mm) ≠ (0).But this is a contradiction to the fact that N ∩ P = (0). Hence
either N = (0) or P = (0).Therefore, M is indecomposable. Theorem 5.3. [2, Theorem 3.4] Let R be a pullback ring and let
M be an indecomposable separated comultiplication R-module. Then M is isomorphic to one of the modules listed in Lemma 5.1.

60
Survey Article on Comultiplication Modules
Vol 6 | Issue 2 | April-June 2014 | www.gjeis.org GJEIS | Print ISSN: 0975-153X | Online ISSN: 0975-1432
Proof. Since M is separated comultiplication R-module, by [2, Proposition 3.3], M = L ⊕ N , where L is one of the modules as described in (1) and N is one of the module described in (2) of Lemma 5.1. Now, M is indecomposable, either M = L or M = N.
6. ConclusionIn this paper we have tried to present the whole results. These results are backbone of comultiplication modules. This paper is very useful for mathematical society.
7. References 1. Tuganbaev AA. Comultiplication modules over non-commutative
rings, Journal of Mathematical Sciences. 2012; 17(4):217–224. 2. Atani RE, Atani SE. Comultiplication modules over pullback of
Dedekind domains. Czech Math J. 2009; 59(134):1103–14. 3. Atani RE. On pure-injective modules over pullback rings. Comm
Algerbra vil. 2000; 28:4037–69.
4. Ansari-Toroghy H, Farshadifar H. The dual notion of multiplication modules. Taiwanese J Math. 2007; 11(4):1189–201.
5. Ansari-Toroghy H, Farshadifar H. On multiplication and comulti-plication modules. Acta Mathematica Scientia. 2011; 31(2):694–700.
6. Ansari-Toroghy H, Farshadifar H. Comultiplcation modules and related results, Honam Math J. 2008; 30(1):91–9.
7. Ansari-Toroghy H, Farshadifar H. On comultiplication modules. Korean Ann Math. 2008; 25(2):57–66.
8. Ansari-Toroghy H, Farshadifar H. Multiplication and comultipla-tion modules. Novi Sad J Math. 2011; 41(2):117–22.
9. Smith PF, A-Shaniafi Y. Comultiplication modules over commuta-tive rings II. Journal of Commutative Algebra. 2012; 4(2):153–74.
10. Fuchs L, Heinzer W, Olberding B. Commutative ideal theory with-out finiteness conditions: irreducibility in the quotient field. Lect Notes Pure Appl Math. 2006; 249:121–45.
11. Atiyah MF, Mackdonald IG. Introduction to commutative algebra. Westwiew Press; 1969.
12. Smith PF, A-Shaniafi Y. Comultiplication modules over commuta-tive rings. Journal of Commutative Algebra. 2011; 3(1):1–29.

Global Journal of Enterprise Information SystemG J E I S
Analysis and Design of Optimum Interleaver for Iterative Receivers in Indoor Wireless Optical IDMA SchemeSomendra Shukla1*, Shikha Pandey2, Vipul Dixit3 and M. Shukla4
1*Electronics & Communication Engineering, Department of Mewar University, Rajasthan, India; [email protected] & Communication Engineering, Department of Bhagwant University, Ajmer, India; [email protected] & Communication Engineering, Department of Maharana Pratap Engineering College, Kanpur, India; [email protected] Engineering Department, Harcourt Butler Technological Institute, Kanpur, India; [email protected]
Abstract
This paper deals with the design of interleavers in a uncoded Wireless Optical IDMA (WO-IDMA) system, where at the receiver an iterative turbo-like structure is employed to perform multiuser detection. The choice of the interleavers affects both the Maximum-Likelihood (ML) performance and the impact of the suboptimality of the iterative receiver. For implementation of the interleavers in IDMA, the challenge is to fabricate them at affordable decoding complexity with available technology. In this paper, we first introduce various interleavers like random interleaver, master random interleaver, prime interleaver and tree based interleaver in wireless optical IDMA scheme. Then, we perform comparison on their BER performance and implementation complexity.Keywords: AWGN Model, Iterative Chip-by-Chip (CBC) Detection, On-Off Keying (OOK), Optical-IDMA (OIDMA) Scheme
1 Introduction The increasing customer demands for higher data rate and higher security have motivated recent interest in indoor Optical Wireless Communications (OWC). The main advantages offered by OWC are the unlimited license-free bandwidth, high speed, high security, low coherency, free from harmful radiation inter-ferences and so on.
Initially, Time Division Multiple Access (TDMA) was the most widely used multiple access technique for high performance optical networks10. Later, this TDMA scheme was outperformed by Wavelength Division Multiple Access (WDMA) and optical code division multiple access (OCDMA)1–5.
To overcome the disadvantages of Wireless Optical CDMA systems we switched over to Wireless Optical IDMA systems. As the optical CDMA systems suffer from MAIs from other simul-taneous users and multiple access interference (MAI) and Inter Symbol Interference (ISI) are two major factors that affect the performance of wireless communication systems.
A newly developed multiple access scheme known as IDMA has demonstrated better performance to conventional CDMA
scheme16. In IDMA scheme, the user specific interleavers are referred as the only way of user separation7,17.
This work mainly focuses on the IDMA scheme to mitigate MAI and ISI. The IDMA systems provide an efficient and effec-tive solution to high rate multi user wireless communication. The low complexity and high performance properties make the IDMA scheme a competitive candidate for next generation wire-less systems. Data rate is also increased as this scheme is capable enough to handle the multipath channel.
In this paper, the performance analysis of a novel optical multiple access technique incorporating the merits of optical system along with IDMA scheme named as Optical Interleave-Division Multiple-Access technique (OIDMA) over indoor wireless channel model using various interleavers has been studied.
The paper is organized as follows: Section II presents system model of wireless optical IDMA scheme. In Section III describes different types of interleavers used in wireless OIDMA. Section IV presents a comparative study of various interleavers. Section V presents simulation results of these interleavers over new system. Finally section VI concludes the paper.
*Author for correspondence
DOI: 10.15595/gjeis/2014/v6i2/51847

62
Analysis and Design of Optimum Interleaver for Iterative Receivers in Indoor Wireless Optical IDMA Scheme
Vol 6 | Issue 2 | April–June 2014 | www.gjeis.org GJEIS | Print ISSN: 0975–153X | Online ISSN: 0975–1432
2 System Model of Wireless Optical Interleave Division Multiple Access TechniqueIn Wireless optical CDMA systems, signature sequences are used for user separation. In that system first data was converted into the optical form and then modulation is being done by different techniques. Then data is sending for encoding and then trans-mitted. Whereas in Wireless Optical IDMA system, as shown in Figure 1, consists the coder of low code rate is employed to produce a coded sequences. Coder block can be either same or unique for different users. It can be an FEC code, or a spreading sequence or a combination of both12. From performance point of view, it is advantageous to use a low-rate FEC code18,12 that can provide an added coding gain.
The key principle of IDMA is that the interleavers {π(k)} should be specific for individual users. We assume that the inter-leavers are generated independently and randomly. For simplicity, we consider time-invariant single-path channels with real channel coefficients and BPSK signaling scheme. In wireless optical IDMA system we use BPSK modulation technique along with random interleaver and then randomly generated data is transmitted9.
In wireless optical IDMA system we have also used a gauss pulse in transmission of signal and that pulse is added with the coded sequence and then transmitted through wireless optical channel by using laser8. The transmission of data can also be done through led but here we have considered laser.
2.1 Transmitter SectionThe upper part of Figure 1 shows the transmitter section of an wireless optical IDMA system. The n-th bit of ( )K
nd , n = 1, 2, …, N, k = 1, 2, …, K, in the input data stream ( )K
nd from user-k is initially spread by a length-S spreading sequence ( )KS , then interleaved by a chip level interleaver {π(k)} that maps ( )KS to
( ) ( )
( ){ }( ) ( )(1) ( ) , 1, 2,K K K Kx x x j x j j j= = . The elements
in x(K)is called “chips”15. The basic principle of IDMA is that the interleavers {π(k)} should be unique for individual users.
After the user-specific interleaver generation, electrical to optical converter (E/O) is used to get optical pulses. The electric field of mode locked laser can be given21,
( )1
0
kiwot ik w t
MLLk
E e e-
∆
=
= ∑ (1)
where, K is the number of modes in the mode locked laser, and Δw is the channel spacing between two consecutive modes in the mode locked laser. Now the output of MLL is modulated with interleaved data Xk( j) which is usually a simple OOK modula-tion. Then the transmitted data can be written as:
( ) ( )( )
1
0
kiwot ik w t
MLL k kk
E X j X j e e-
∆
=
= ∑ (2)
where ( )kX j ε(1, 0).
2.2 Optical ChannelsUsually the optical channels are optimal while employing Intensity Modulation and Direct Detection (IM/DD)19,20, as the modula-tion of the frequency or phase of the light is more difficult. When the background noise is low, the channel can be modelled as a Poisson process. In the presence of significant background light, the Additive White Gaussian Noise (AWGN) model is more appropriate20,22. In terms of calculation complexity, the Gaussian approximation is much simpler than various approaches.
Using Gaussian approximation model, the output current at the receiver section, y(t) is given by
( ) ( ) ( ) ( )y t x h t n tt t+∞
-∞
= - +∫ (3)
where, x(t) is the optical power of the transmitted signal, h(t) represents multi-path dispersion factor in channel and n(t) represents the white Gaussian noise. Also, x(t) must satisfy:
( ) ( )1
0 and lim2
T
T Tx t x t dt P
T→∞-
≥ ≤∫ (4)
Directed LOS links do not suffer from multipath dispersion19, but require alignment between transmitter and receiver, limiting user mobility.Figure 1. System model for wireless optical IDMA.

63
Somendra Shukla, Shikha Pandey, Vipul Dixit and M. Shukla Empirical Article
Vol 6 | Issue 2 | April–June 2014 | www.gjeis.org GJEIS | Print ISSN: 0975–153X | Online ISSN: 0975–1432
2.3 Receiver SectionAt the receiver section we have first used the PIN photodiode24 which receives the coded signal. Optical detectors must have a broad bandwidth and sharp response to achieve the high bit-rate which is necessary by such a system19. Resposivity of PIN photo-diode can be given23,24:
p
o
IR
P= (5)
where, Ip is the photocurrent (mA), Po is the average light power (mW).Quantum efficiency can be given23,24:
p
o
I hcqP
hl
= (6)
The probability that a specified number of photons are absorbed from an incident optical field by an PIN detector over a chip interval with Tc is given by a Poisson distribution24. The average number of absorbed photons over Tc
23,24:
os
Phfh
l = (7)
where, λs is the photon absorption rate, Po is the received laser power, η is the quantum efficiency, h is Planck’s constant (6.628*10-38 J/s), and f is the optical frequency, q is the electron charge (1.6*10-19 C).
The receiver section also consists of Elementary Signal Estimator (ESE) and A Posterior Probability (APP) Decoder (DEC). The ESE exchanges information with the DEC in a turbo-type manner18. Particularly, the constraint of Coder is ignored in the ESE. The output of the ESE is defined by the Logarithm Likelihood Ratio (LLR).
The DEC section consists of K local APP decoders. The kth local APP decoder performs an APP decoding of Coder for the kth user using eESE, after suitable deinterleaving, as its input. Its output is the so-called extrinsic LLR15 given below:
( )( ){ }( )( )
( )( )
| 1,log
| 1,j k
ESE Kj k
p r x j he x j
p r x j h
= +
=
= -
(8)
The receiver section operation is based on the received signal { , 1 }jr r j J=
with (1) ( ) ( )[ , , , , ]k Kh h h h as the channel coeffi-cients given25:
( ) ( ) ( )k k kr j h x j jz= + (9)
where
( ) ( ) ( ) ( ) ( )k k k k kj r j h x j h x j n jz = - = +∑ (10)
is the distortion (interference and additive noise) contained in r( j) with respect to the desired xk( j). Denote the mean and vari-ance as E(.) and Var(.) respectively. We will use the CBC detection algorithm in single path channel.
2.4 The CBC AlgorithmAssume
( )( ) 0DEC ke x j = (11)
( )( ) ( )( )( )tan 2k DEC kE x j h e x j= (12)
( )( ) ( )( )( )2
1k kVar x j E x j= - (13)
( )( ) ( )( )1
K
k kk
E r j h E x j′ ′
=′
= ∑ (14)
( )( ) ( )( )( )2 2
1
K
k kk
Var r j h Var x j s′ ′
=′
= +∑ (15)
( )( ) ( )( ) ( )( ),k l k kE j E r j h E x jz = - (16)
( )( ) ( )( ) ( )( )2
k k kVar j Var r j h Var x jz = - (17)
( )( )( ) ( )( )
( )( )2 k
ESE k kk
r j E je x j h
Var j
z
z
-
= ⋅ (18)
Here “h” denotes for channel coefficient for “k” data bit. After the APP decoding in the DECs is performed to generate the LLRs { ( ( )), , }DEC ke x j k j∀
( )( )( ) ( )( )( )1
S
DEC k ESE kj
e x j e x jp p=
= ∑ (19)
Then go back to equation (12) for the next iteration15,17.
3 Different Types Of InterleaverInterleaving is a method of rearranging the data sequence in a one to one deterministic format. Interleaving is a convenient method to improve the error correcting capability of coding. In turbo coding, interleaving is used before the data is encoded by the sec-ond component encoder. The fundamental role of an interleaver is to construct a long block codes from small memory convolu-tion codes, as long codes can approach the Shannon capacity limit18. Secondly, it spreads out burst errors in message sequence. The interleaver provides scrambled information to the second encoder and decorrelates inputs to the two component decod-ers so that an iterative suboptimum-decoding algorithm based on uncorrelated information exchange between the two component decoders can be applied. The final function of the interleaver is

64
Analysis and Design of Optimum Interleaver for Iterative Receivers in Indoor Wireless Optical IDMA Scheme
Vol 6 | Issue 2 | April–June 2014 | www.gjeis.org GJEIS | Print ISSN: 0975–153X | Online ISSN: 0975–1432
to split low weight input sequences, and hence increase the code free hamming distance or reduce the number of code words with small distances in the code sequence. The size and structure of interleavers play a key function in the performance of turbo codes. There are a number of interleavers, which can be implemented.
3.1 Random InterleaversRandom interleavers scramble the data word of various users with different pattern (Figure 2). Patterns of scrambling the data of users are generated randomly. Because of the scrambling of data, burst error of the channel is randomized at the receiver section. The user specific Random Interleaver rearranges the elements of its input vector using a random permutation25. The incoming data is rearranged using a series of generated permuter indices. A per-muter is a device that generates pseudo-random permutation of given memory addresses. The data is set according to the pseudo-random order of memory addresses. If random interleavers are employed for the purpose of user separation, then lot of memory will be required at the transmitter and receiver end for the purpose of their storage. Also, significant amount of bandwidth will be consumed for transmission of all these interleaver. After randomi-zation of the burst error it will be easily to detect and correct errors. Spreading is the important attribute of random interleavers15.
3.2 Master-Random InterleaversIn this user interleaver is defined as: user Interleaver = (master inter-leaver)n , where n is the user number in the transmitter side. Assume if this interleaver have P number of master interleaver. Then we can generate the K interleavers using interleavers = P
K. Where, P
K is defined as P1 = P, P2 = P (P) etc. User specific Interleaver is orthogonal to interleaver related to other user15. This method of generation improves the performance in the terms of information that has to be send by the base station to the mobile station.
3.3 Prime InterleaversPrime Interleaver is very simple to generate and is superior than the random and any other interleavers in terms of bandwidth
utilization. The Prime interleaver is better than master random interleaver in terms of computational complexity. With tree based interleaver, the proposed interleaver seems to be having little bit more complexity. However entertaining the other issues including BER, memory and bandwidth requirements, and the proposed interleavers can take the place of any other interleaver techniques without performance loss. In generation of prime interleaver the prime numbers are used as seed of interleaver11,13. Here, user-specific seeds are assigned to different users. For understanding the generation mechanism of prime interleaver, consider a case of interleaving n bits with seed p. First, we con-sider a gallois field GF(n). Now, the bits are interleaved with a distance of seed over GF(n).
( )( )1 1 modn n p n⇒ + - (20)
The bandwidth required by the Prime Interleaver (PI) is smaller than other available interleavers as only seed is to be transmitted11.
3.4 Tree Based InterleaversThe Tree Based Interleavers (TBI) is basically proposed to opti-mize the problems of computational complexity and memory requirement which occurs in MRI and RI respectively. In TBI generation mechanism, two randomly generated master inter-leavers 1P and 2P are taken initially6.
Figure 3. Interleaving strategy for Tree Based Interleaving scheme.Figure 2. Random interleaving of data sequence.

65
Somendra Shukla, Shikha Pandey, Vipul Dixit and M. Shukla Empirical Article
Vol 6 | Issue 2 | April–June 2014 | www.gjeis.org GJEIS | Print ISSN: 0975–153X | Online ISSN: 0975–1432
The allocations of the interleaving masks follow the tree format as shown in Figure 3 representing tree based interleaver mechanism6. The interleaver masking diagram is shown upon fourteen users only for the simplicity. For obtaining the inter-leaving sequence of the 14th user, the TBI mechanism needs only 2 cycles of clock, as compared to several more cycles needed in case of master random interleaver method.
( )( )14 2 2 2P = P P P (21)
4 Comparison of InterleaversThe Table 1 below show comparison between different interleavers used in wireless optical IDMA system on the basis of memory requirement, bandwidth, complexity, bite error rate and also on the basis of user cross correlation for RI, MRI, PI and TBI.
5 Simulation ResultsThe simulation of optical IDMA for indoor wireless channel model presented in this section has been performed using MATLAB software.
Figure 4 shows BER performance of various Interleavers on Wireless Optical IDMA with different numbers of simultaneous users. During the simulation, the spreading length is chosen to be 16, and the iterative number is set to be 10. The variation in user count has been selected as parameter for performance comparison of various interleavers over uncoded Wireless Optical IDMA sys-tem. For simulation purpose, the input data length for each user is
assumed to be same i.e. 2048 bits. The laser has been operated with 155nm wavelength with maximum bit rate of 1Gbps capability. The transmitted power is chosen to be 1mW, while the nature of channel is selected to be AWGN. The responsivity and efficiency is 0.65, 0.80 has been taken respectively. The transmitted signal is a Gaussian waveform and ON-OFF Keying (OOK) is used for pulse transmission. The simulations have been performed using random interleavers, master random interleavers and prime interleavers. Simulation results shown in Figure 5 demonstrates
10 20 30 40 50 60 7010
-5
10-4
10-3
10-2
NO. OF SIMULTANEOUS USER
BE
R
Performance Comparison of Various Interleavers on the Wireless Optical IDMA with a data length of 2048
Random Interleaver
Master Random Interleaver
Prime Interleaver
Tree Based Interleaver
Figure 4. Comparison of BER performance of Various Interleavers On Uncoded Wireless Optical IDMA for various users with data length 2048.
Table 1. Comparison between RI, MRI, PI and Tree Based InterleaverParameters RI MRI PI TBIMemory requirement
High Low Lowest Low
Bandwidth requirement of Interleaver (30 users)
1.5×10⁶ 0.01×10⁶ 0.0001×10⁶ 0.02×10⁶
Complexity High Very high Low LowBite error rate for Eb/No= 9 (20 users) with Datalength–2048
6.1890 ×10⁻⁴
3.0762 ×10⁻⁴
6.5186 ×10⁻⁴
4.2969 ×10⁻⁴
Bite error rate for Eb/No = 9 (20 users) with Datalength–1024
8.1787 ×10⁻⁴
0.0009 0.0011 0.0013
Specific user cross correlation
Low Low High High
10 20 30 40 50 60 7010
-5
10-4
10-3
10-2
NO. OF SIMULTANEOUS USER
BE
R
Performance Comparison of Various Interleavers on the Wireless Optical IDMA with a data length of 1024
Prime Interleaver
Master Random Interleaver
Random Interleaver
Tree Based Interleaver
Figure 5. Comparison of BER performance of Various Interleavers On Uncoded Wireless Optical IDMA for various users with data length 1024.

66
Analysis and Design of Optimum Interleaver for Iterative Receivers in Indoor Wireless Optical IDMA Scheme
Vol 6 | Issue 2 | April–June 2014 | www.gjeis.org GJEIS | Print ISSN: 0975–153X | Online ISSN: 0975–1432
the performance of various interleavers over uncoded wireless optical IDMA for different number of users with a data length of 1024. The BER degrades with the increasing number of users.
6 ConclusionIn this paper, comparison between various Interleavers have been made on the basis of parameters like complexity, Bit Error Rate (BER), memory requirement etc. Among all the comparisons dis-cussed so far, the features of Master random interleavers shows their precision for the Wireless Optical IDMA technology for fourth generation wireless communication. On the basis of above compar-isons shown in table 1, we can see that Master random interleavers and Tree based interleavers perform better than other interleavers. But if we consider 32 users and calculate the bit error rate then we find that these all interleavers have almost identical performance as shown in Figures 3 and 4. Tree based interleaver has low complexity than other interleavers in consideration.
Further, it has to be noted that the performance of the system can be observed employing tree based interleavers with con-volutional coding6. Further the performance of Optical IDMA systems can also be observed with diversity schemes14.
7 References1. Salehi JA. Code division multiple-access techniques in optical fiber
networks-part I: Fundamental principles. IEEE Trans Communication. 1989 Aug; 37:824–33.
2. Al-Bazzaz SSH. Simulation of single mode fiber optics and optical communication components using VC++. International Journal of Computer Science and Network Security. 2008 Feb; 8(2).
3. Huang W, Nizam MHM. Coherent optical CDMA (OCDMA) systems used for high-capacity optical fiber networks-system descrip-tion, OTDMA Comparison, and OCDMA/WDMA Networking. J Lightwave Tech. 2000 Jun; 18(6).
4. Rusch LA, Poor HV. Effects of laser phase drift on coherent optical CDMA. IEEE J Select Areas Communication. 1995 Apr; 13:577–91.
5. Mahadevappa H, Proakis JG. Mitigating multiple access interference and intersymbol Interference in uncoded CDMA Systems with chip level interleaving. IEEE Trans. Wireless Commun. 2002 Oct. 1:781–92.
6. Shukla M, Srivastava VK, Tiwari S. Analysis and design of tree based interleaver for multiuser receivers in idma scheme. 16th IEEE International Conference on Networks “ICON 2008”; 2008 Dec 13–14; Delhi, India. pp. 1–4.
7. Shukla M, Shukla A, Srivastava VK, Tiwari S. Different designing factors for IDMA systems. 1ST International Conference on Computer,
Communication, and Control and Information Technology “C3 IT 2009”; 2009 Feb 6–7; Academy of Technology, Calcutta, India. p. 748–56.
8. Wisely D. A 1Gbit/s optical wireless tracked architecture for atm delivery. IEE colloquium on Optical Free Space Communication Links. 1996; 14/1–14/7.
9. Ghassemlooy Z, Popoola WO, Rajbhandari S, Amiri M, Hashemi S. A synopsis of modulation techniques for wireless Infrared com-munication. International Conference on Transparent Optical Networks; 2007; Rome, Italy. IEEE. p. 1–6.
10. Gambling WA. Possibilities of optical communications. Engineering. 1964; 198:776.
11. Gupta R, Kanauji BK, Chauhan RCS, Shukla M. Prime number based interleaver for multiuser iterative IDMA systems. International Conference on Computational Intelligence and Communication Networks. Doi 10.1109/CICN.2010.119.
12. Chen L-J, Sun T, Sanadidi MY, Gerla M. Improving wireless link throughput via interleaved FEC.
13. Bie Z, Wu W. PEG algorithm based interleavers design for IDMA system. Proc 41st IEEE Annual Conference on Information Sciences and Systems, CISS'07; 2007. p. 480–83.
14. Djahani P, Kahn JM. Analysis of Infrared wireless links employing multibeam transmitters and imaging diversity receivers. IEEE Transactions on Communications. 2000; 48:2077–88.
15. Wu H, Ping L, Perotti A. User-specific chip-level interleaver design for IDMA System. IEEE Electronics Letters. 2006 Feb; 42(4).
16. Basharat A, Khokhar IA, Murtaza S. CDMA versus IDMA for Subscriber Cell Density. IEEE. 2008.
17. Liu L, Leung WK, Ping L. Simple chip-by-chip multi user detec-tion for CDMA systems. Proc IEEE VTC-Spring; 2003 Apr; Korea. p. 2157–61.
18. Berrou C, Glavieux A. Near Shannon limit error correcting coding and decoding: Turbo-codes. IEEE Trans Commun. 1996 Oct. 44:1261–71.
19. Barry JR. Wireless infrared communications. Boston, Mass; London: Kluwer Academic; 1994.
20. Kahn JM, Krause WJ, Carruthers JB. Experimental characterization of non-directed indoor infrared channels. IEEE Transactions on Communications. 1995; 43:1613–23.
21. Omrani R, Kumar PV. Spreading sequences for asynchronous spectrally phase encoded optical CDMA. Proceeding of ISIT 2006. Seattle, USA; 2006.
22. Kahn JM, Barry JR. Wireless infrared communications. Proc IEEE. 1997; 85:265–98.
23. Kolimbiris H. Fiber Optics Communications. Pearson Education; 2004.
24. John M Sr. Optical Fiber Communication. Pearson Education; 2008.
25. Ping L, Liu L, Wu KY, Leung WK. On interleave-division multiple-Access. Proceeding 2004 of ICC'2004; Paris, France.
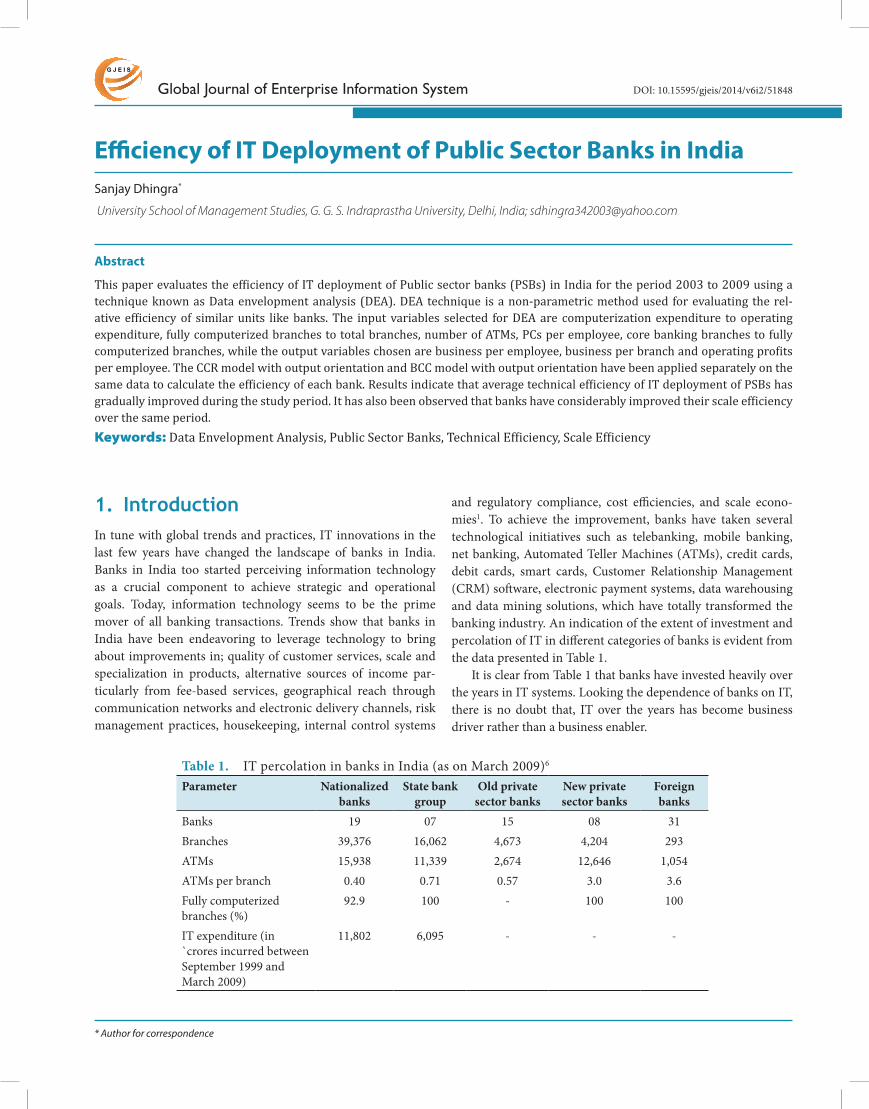
Global Journal of Enterprise Information SystemG J E I S
Efficiency of IT Deployment of Public Sector Banks in IndiaSanjay Dhingra*
University School of Management Studies, G. G. S. Indraprastha University, Delhi, India; [email protected]
Abstract
This paper evaluates the efficiency of IT deployment of Public sector banks (PSBs) in India for the period 2003 to 2009 using a technique known as Data envelopment analysis (DEA). DEA technique is a non-parametric method used for evaluating the rel-ative efficiency of similar units like banks. The input variables selected for DEA are computerization expenditure to operating expenditure, fully computerized branches to total branches, number of ATMs, PCs per employee, core banking branches to fully computerized branches, while the output variables chosen are business per employee, business per branch and operating profits per employee. The CCR model with output orientation and BCC model with output orientation have been applied separately on the same data to calculate the efficiency of each bank. Results indicate that average technical efficiency of IT deployment of PSBs has gradually improved during the study period. It has also been observed that banks have considerably improved their scale efficiency over the same period. Keywords: Data Envelopment Analysis, Public Sector Banks, Technical Efficiency, Scale Efficiency
1. IntroductionIn tune with global trends and practices, IT innovations in the last few years have changed the landscape of banks in India. Banks in India too started perceiving information technology as a crucial component to achieve strategic and operational goals. Today, information technology seems to be the prime mover of all banking transactions. Trends show that banks in India have been endeavoring to leverage technology to bring about improvements in; quality of customer services, scale and specialization in products, alternative sources of income par-ticularly from fee-based services, geographical reach through communication networks and electronic delivery channels, risk management practices, housekeeping, internal control systems
* Author for correspondence
and regulatory compliance, cost efficiencies, and scale econo-mies1. To achieve the improvement, banks have taken several technological initiatives such as telebanking, mobile banking, net banking, Automated Teller Machines (ATMs), credit cards, debit cards, smart cards, Customer Relationship Management (CRM) software, electronic payment systems, data warehousing and data mining solutions, which have totally transformed the banking industry. An indication of the extent of investment and percolation of IT in different categories of banks is evident from the data presented in Table 1.
It is clear from Table 1 that banks have invested heavily over the years in IT systems. Looking the dependence of banks on IT, there is no doubt that, IT over the years has become business driver rather than a business enabler.
Table 1. IT percolation in banks in India (as on March 2009)6
Parameter Nationalized banks
State bank group
Old private sector banks
New private sector banks
Foreign banks
Banks 19 07 15 08 31Branches 39,376 16,062 4,673 4,204 293ATMs 15,938 11,339 2,674 12,646 1,054ATMs per branch 0.40 0.71 0.57 3.0 3.6Fully computerized branches (%)
92.9 100 - 100 100
IT expenditure (in `crores incurred between September 1999 and March 2009)
11,802 6,095 - - -
DOI: 10.15595/gjeis/2014/v6i2/51848

68
Efficiency of IT Deployment of Public Sector Banks in India
Vol 6 | Issue 2 | April-June 2014 | www.gjeis.org GJEIS | Print ISSN: 0975-153X | Online ISSN: 0975-1432
IT is considered to be an important tool in improving the effi-ciency of banks, therefore this paper evaluates the efficiency of IT deployment of Public Sector Banks (PSBs) in India for the period 2003 to 2009. The period 2003 to 2009 is selected as most of com-puterization of the banks has happened in this period only. The public sector banks have been selected for the study due to the dominant position enjoyed by these banks and their contribu-tion towards socio-economic development of the country. The efficiency of banks has been calculated using the CCR and BCC models of DEA technique.
2. Data Envelopment AnalysisCharnes et al.2 first proposed DEA as an evaluation tool to meas-ure and compare the DMU’s productivity. After that this tool has been extensively used in banking and other areas to measure the DMU’s relative productivity. Data Envelopment Analysis is an approach of comparing the efficiency of organizational units such as bank branches, schools, hospitals and other similar instances where there is a relatively homogenous set of units. The analysis will measure output(s) achieved from the input(s) provided and will compare the group of DMUs by their strength in turning input into output. At the end of analysis, the DEA will be able to say which units are (relatively) efficient and which are (relatively) inefficient.
It is a method for mathematically comparing different Decision-Making Units’ (DMUs) productivity based on multiple inputs and outputs. The ratio of weighted inputs and outputs pro-duces a single measure of productivity called relative efficiency. DMUs that have a ratio of 1 are referred to as efficient, given the required inputs and produced outputs. The units that have a ratio less then 1 are less-efficient relative to the more efficient unit(s). Because the weights for input and output variables of DMU are computed to maximize the ratio and are compared with similar ratios of best performing DMUs hence the measured productiv-ity is referred as relative efficiency.
2.1 DEA Model SelectionOne of the basic choices in selecting a DEA model is to decide, whether to use an input-orientation or an output-orientation. The difference is subtle but important and can typically be best understood by considering whether a DMU emphasize on reduc-ing inputs while achieving the same level of output or emphasize on producing more output given the same level of input.
DEA offers three possible orientations in efficiency analysis3:
(a) Input-oriented models are models, where DMUs are deemed to produce a given amount of output with the smallest pos-sible amount of input.
(b) Output-oriented models are models, where DMUs are deemed to produce the highest possible amount of output with the given amount of input.
(c) Base-oriented models are models, where DMUs are deemed to produce the optimal mix of input and output.
2.1.1 Return to ScaleReturn to scale refers to increasing or decreasing efficiency based on size. For example, a manufacturer can achieve certain econo-mies of scale by producing thousand integrated circuits at a time rather than one at a time. It might be only 100 times as hard as producing one at a time. This is an example of Increasing Returns to Scale (IRS).
On the other hand, the manufacturer might find it more than trillion times difficult to produce a trillion integrated cir-cuits at a time because of storage problems and limitations on the worldwide silicon supply. This range of production illustrates Decreasing Returns to Scale (DRS). Combining the extreme two ranges would necessitate Variable Returns to Scale (VRS).
Constant Return to Scale (CRS) means that the producers are able to linearly scale the inputs and outputs without increas-ing or decreasing efficiency. This is a significant assumption. The assumption of CRS may be valid over limited ranges but its use must be justified. But, CRS efficiency scores will never be higher than that of VRS efficiency scores. In a CRS model, the input-oriented efficiency score is exactly equal to the inverse of the output-oriented efficiency score. This is not necessarily true for inefficient DMUs in the case of Variable Return to Scale (VRS) assumption. The CRS version is more restrictive than the VRS and yields usually a fewer number of efficient units and also lower efficient score among all DMUs. In DEA literature, the CRS model is typically referred to as the CCR model after the seminal publication, by Charnes et al.2
2.1.2 The CCR Model of DEADEA is a linear programming based technique for measuring relative performance of DMUs. CCR model, which was initially proposed by Charnes et al.2, can be represented as a fractional linear programming problem:
Eo
=
u1y1o + u2y2o + …… + usyso
v1x1o+v2x2o+………+vmxmo
Subject to u1y1j + u2y2j + …… + usysj ≤ 1 (j = 1, …, n)v1x1j+v2x2j+………+vmxmj
v1,v2,…….,vm ≥ 0 u1,u2, …….,us ≥ 0where Eo= the efficiency of the oth DMU, yso = sth output of oth DMU,

69
Sanjay Dhingra Empirical Article
Vol 6 | Issue 2 | April-June 2014 | www.gjeis.org GJEIS | Print ISSN: 0975-153X | Online ISSN: 0975-1432
us = weight of sth output xmo = mth input of the oth DMU vm = weight of mth input
Here the DMUj to be evaluated on any trial be designed as DMUo where o ranges over 1,2,…,n.
The constraints meant that the ratio of “virtual output” to “virtual input” should not exceed 1 for every DMU. The above fractional program can be replaced by the following linear pro-gram:
Maximize Eo = u1y1o + v2y2o +….+usyso
Subject to v1x1o + v2x2o +….+vmxmo =1u1y1j + u2y2j + …… + usysj ≤ v1x1j + v2x2j +….+vmxmj (j = 1,….,n)v1,v2,….vm ≥ 0u1,u2,….us ≥ 0
The DEA model is a fractional linear program but may be converted into linear form in a straight forward manner by normalizing either the numerator or the denominator of the fractional program objective function, so that the methods of linear programming can be applied. The weighted sum of the inputs is constrained to be unity in the linear program. As the objective function is the weighted sum of outputs that has to be maximized, this formulation is referred to as the output maximi-zation DEA program.
In the model the weights are treated as unknown. They can be obtained by solving the fractional programming problem to obtain values for the input weights (vi) (i=1,…,m) and the output weights (ur)(r=1,….,s). The value obtained of these weights will maximize the efficiency of the oth target unit.
2.1.3 The BCC Model of DEABanker et al.4 published the BCC model whose production pos-sibility set PB is defined by:
PB = {(x, y) | x ≥ X λ, y ≤ Y λ, e λ=1, λ ≥ 0}
where, X = (xj) Є Rm*n and Y = (yj) Є Rs*n are a given data set, λ Є Rn and e is a row vector with all elements equal to 1. The BCC model differs from the CCR model only in the adjunction of the condition e λ = ∑n
j=1 λj = 1. Together with the condition λj ≥ 0, for all j, this imposes a convexity condition on allowable ways in which the n DMUs may be combined.
The output-oriented BCC model can be written as
Max. ηB
Subject to Xλ ≤ xo
ηB yo - Yλ ≤ 0 eλ = 1 λ ≥ 0This is the envelopment form of the output-oriented BCC
model.
3. Research Methodology In order to find the efficiency of IT deployment, the required data for the study period on input variables i.e. computeriza-tion expenditure to operating expenditure, fully computerized branches to total branches, number of ATMs, PCs per employee, core banking branches to fully computerized branches and out-put variables i.e. business per employee, business per branch and operating profits per employee required for applying DEA technique has been compiled from secondary sources such as RBI trend and progress reports from 2003 to 2009 and Prowess database, a corporate database developed by Center for Monitoring of Indian Economy (CMIE). The Punjab and Sind Bank has been excluded from the study on account of very low investment in information technology. Expenditure made by the bank on computerization between September 1999 and March 2009 is just `69 crores, which is the minimum expendi-ture incurred by any of the public sector bank. IDBI has been excluded because it became public sector bank in the year 2004-05 and hence its data was not comparable with other public sector banks. Production approach is being used for choosing the input and output variables. The production approach con-siders the efficiency, with which inputs (physical variables such as manpower, ATMs, IT expenditure etc) are converted into outputs. DEA-Solver software has been used to solve linear pro-gramming model.
In the application of DEA, inadequacy of data or sample size may impair results. The DEA is said to be computationally more convenient when the number of DMUs are larger than the total number of inputs and outputs by at least three times5. In the present study, 26 PSBs have been selected which are more than three times that of number of inputs and outputs. The data for the period 2003 to 2009 is being considered for the study, as this was the transformation phase for the public sector banks in terms of IT deployment. Most of the comput-erization like full computerization of branches, core banking, and ATMs deployment has happened during this period only. On each year of data, CCR output-oriented model (out-put maximization) and BCC output-oriented model (output maximization) have been applied. Efficiency scores between 0 and 1 have been obtained for every bank, for the each year. The average efficiency of all the banks for each year has been computed.
4. ResultsThe technical efficiency, management efficiency and scale effi-ciency obtained by applying CCR model and BCC model of DEA technique are summarized in Table 2, Table 3 and Table 4 respectively.

70
Efficiency of IT Deployment of Public Sector Banks in India
Vol 6 | Issue 2 | April-June 2014 | www.gjeis.org GJEIS | Print ISSN: 0975-153X | Online ISSN: 0975-1432
4.1 Outcome of CCR Output Orientation Model
CCR model works on CRS assumption. It assumes that all the DMUs are operating at optimal scale. CCR model output results in measure of efficiency, called Technical Efficiency (TE), which is affected by Scale Efficiencies (SE). Therefore results of CCR model reflect the overall efficiency of banks. The BCC model assumes VRS specification, permits the calculation of TE, with-out the SE effects. TE obtained from BCC model, without the SE effect is known as pure technical efficiency.
CCR output oriented model is applied on each year of data for the period between 2003 and 2009 using the selected input
Table 2. DEA efficiency score of banks with CCR output orientation modelDMU Eff03 Eff04 Eff05 Eff06 Eff07 Eff08 Eff09Allahabad Bank 1.00 1.00 1.00 1.00 1.00 1.00 1.00Andhra Bank 0.55 0.56 0.63 0.57 0.75 0.81 0.71Bank of Baroda 1.00 1.00 0.82 1.00 1.00 1.00 1.00Bank of India 1.00 1.00 1.00 1.00 1.00 1.00 1.00Bank of Maharashtra 0.73 0.93 1.00 0.54 0.58 0.68 0.75Canara Bank 0.77 0.89 1.00 1.00 1.00 1.00 1.00Central Bank of India 0.89 1.00 1.00 0.80 0.81 0.71 1.00Corporation Bank 0.46 0.46 0.71 0.73 0.85 1.00 1.00Dena Bank 0.54 0.56 0.52 0.83 1.00 1.00 0.85Indian Bank 0.56 0.60 0.56 0.61 0.80 0.82 0.82Indian Overseas Bank 0.92 1.00 1.00 1.00 1.00 1.00 1.00Oriental Bank of Commerce 1.00 1.00 1.00 1.00 1.00 1.00 1.00State Bank of India 1.00 0.99 1.00 0.78 0.79 0.84 0.92State Bank of Bikaner & Jaipur 0.60 0.50 0.50 0.55 0.72 0.66 0.68State Bank of Hyderabad 0.80 0.85 0.75 0.79 1.00 0.87 0.93State Bank of Indore 1.00 1.00 0.83 0.82 1.00 1.00 1.00State Bank of Mysore 1.00 0.62 0.63 0.70 0.83 0.91 0.88State Bank of Patiala 0.69 0.77 0.74 0.92 1.00 1.00 1.00State Bank of Saurashtra 1.00 0.84 0.89 0.75 0.89 0.97 *
State Bank of Travancore 0.85 0.75 0.94 0.95 1.00 1.00 1.00Punjab National Bank 1.00 0.99 1.00 0.74 0.90 0.78 0.79Syndicate Bank 1.00 1.00 1.00 1.00 0.59 0.78 0.71UCO Bank 1.00 1.00 1.00 1.00 1.00 1.00 1.00Union Bank of India 1.00 1.00 1.00 1.00 1.00 0.97 0.83United Bank of India 1.00 0.99 1.00 1.00 1.00 1.00 0.91Vijaya Bank 0.74 1.00 1.00 1.00 1.00 0.91 0.88Average 0.85 0.86 0.87 0.85 0.90 0.91 0.91Notes: * State Bank of Saurashtra was merged with State Bank of India in year 2008-091. Eff03 to Eff09 represents the technical efficiency for each year for the period 2003 to 2009.
and output variables. The results of the model are presented in the Table 2.
From the Table 2, which represents output of CCR model with output orientation, it is clear that average IT efficiency of the banks has improved from 0.85 in year 2003 to 0.91 in the year 2009. This means, that average inefficiency of the public sec-tor banks have decreased from 15 percent to 9 percent during the period. Also lowest relative efficiency score of 0.46, which has been achieved by a bank in year 2003 improved to 0.68 in the year 2009. This shows that technical efficiency of PSBs has improved with the deployment of IT over a period of time. This also suggests that, by adopting best practices, PSBs can, on an average further increase their output of business per employee,

71
Sanjay Dhingra Empirical Article
Vol 6 | Issue 2 | April-June 2014 | www.gjeis.org GJEIS | Print ISSN: 0975-153X | Online ISSN: 0975-1432
Table 3. DEA efficiency score of banks with BCC output orientation modelDMU Eff03 Eff04 Eff05 Eff06 Eff07 Eff08 Eff09Allahabad Bank 1.00 1.00 1.00 1.00 1.00 1.00 1.00Andhra Bank 0.67 0.75 1.00 0.83 0.92 0.83 0.72Bank of Baroda 1.00 1.00 1.00 1.00 1.00 1.00 1.00Bank of India 1.00 1.00 1.00 1.00 1.00 1.00 1.00Bank of Maharashtra 0.74 0.94 1.00 0.79 0.81 0.79 0.80Canara Bank 1.00 1.00 1.00 1.00 1.00 1.00 1.00Central Bank of India 0.98 1.00 1.00 1.00 1.00 1.00 1.00Corporation Bank 1.00 0.96 1.00 1.00 1.00 1.00 1.00Dena Bank 0.71 0.72 0.97 1.00 1.00 1.00 0.96Indian Bank 0.63 0.73 0.84 0.74 0.90 0.85 0.82Indian Overseas Bank 0.92 1.00 1.00 1.00 1.00 1.00 1.00Oriental Bank of Commerce 1.00 1.00 1.00 1.00 1.00 1.00 1.00State Bank of India 1.00 1.00 1.00 0.90 0.83 0.85 0.96State Bank of Bikaner & Jaipur 0.69 0.50 0.84 0.59 0.82 0.68 0.69State Bank of Hyderabad 0.81 0.85 0.96 0.84 1.00 0.87 0.93State Bank of Indore 1.00 1.00 0.92 0.98 1.00 1.00 1.00State Bank of Mysore 1.00 0.62 0.79 0.80 0.85 0.91 0.88State Bank of Patiala 0.83 0.85 1.00 1.00 1.00 1.00 1.00State Bank of Saurashtra 1.00 0.84 0.93 0.84 0.89 0.98 *
State Bank of Travancore 0.91 0.94 1.00 0.99 1.00 1.00 1.00Punjab National Bank 1.00 1.00 1.00 0.74 0.90 0.78 0.79Syndicate Bank 1.00 1.00 1.00 1.00 0.76 0.78 0.74UCO Bank 1.00 1.00 1.00 1.00 1.00 1.00 1.00Union Bank of India 1.00 1.00 1.00 1.00 1.00 1.00 0.83United Bank of India 1.00 1.00 1.00 1.00 1.00 1.00 1.00Vijaya Bank 0.99 1.00 1.00 1.00 1.00 0.96 0.93Average 0.92 0.91 0.97 0.92 0.95 0.93 0.92Notes: * State Bank of Saurashtra was merged with State Bank of India in year 2008-091. Eff03 to Eff09 represents the pure technical efficiency for each year for the period 2003 to 2009.
business per branch and operating profits per employee by at least 9 percent keeping the same level of inputs.
4.2 Outcome of BCC Output Orientation Model
In order to find scale inefficiency, management inefficiency or pure technical inefficiency the BCC model has been applied. Pure technical inefficiency (obtained from BCC model) i.e. technical inefficiency devoid of scale effects, is totally under the control of management and results directly due to management errors. Thus it is also called management inefficiency. It occurs when more of each input is used, than is required to produce a
given level of output. BCC output oriented model is applied on each year of data for the period between 2003 and 2009 using the selected input and output variables. The performance of DMUs is summarized in Table 3.
From the Table 3, which represents output of BCC model with output orientation, it is clear that average IT efficiency of the banks remained more or less same during the period 2003 to 2009 i.e. 0.92. This implies an inefficiency of 8 percent in handing the IT inputs. Allahabad Bank, Bank of Baroda, Bank of India, Canara Bank, Indian Overseas Bank, Oriental Bank of Commerce, UCO Bank and United Bank of India are found to be efficient through out the study period. This indicates that these banks have used their IT resources optimally through out

72
Efficiency of IT Deployment of Public Sector Banks in India
Vol 6 | Issue 2 | April-June 2014 | www.gjeis.org GJEIS | Print ISSN: 0975-153X | Online ISSN: 0975-1432
Table 4. Scale inefficiency in percentageDMU Ineff03 Ineff04 Ineff05 Ineff06 Ineff07 Ineff08 Ineff09Allahabad Bank 0.00 0.00 0.00 0.00 0.00 0.00 0.00Andhra Bank 18.45 25.63 37.13 30.51 18.54 2.50 0.97Bank of Baroda 0.00 0.00 18.19 0.00 0.00 0.00 0.00Bank of India 0.00 0.00 0.00 0.00 0.00 0.00 0.00Bank of Maharashtra 0.49 0.89 0.00 31.45 27.79 14.32 5.85Canara Bank 23.15 11.00 0.50 0.00 0.00 0.00 0.00Central Bank of India 8.40 0.00 0.00 20.10 19.00 28.99 0.00Corporation Bank 54.03 51.96 29.34 27.27 14.73 0.00 0.00Dena Bank 23.44 21.87 47.12 17.04 0.00 0.00 11.14Indian Bank 11.37 17.95 32.90 18.13 10.62 3.47 0.00Indian Overseas Bank 0.02 0.00 0.00 0.00 0.00 0.00 0.00Oriental Bank of Commerce 0.00 0.00 0.00 0.00 0.00 0.00 0.00State Bank of India 0.00 1.12 0.00 13.51 5.18 0.26 4.22State Bank of Bikaner & Jaipur 13.60 0.66 39.73 7.69 12.34 2.38 0.86State Bank of Hyderabad 1.20 0.31 22.26 6.51 0.00 0.12 0.70State Bank of Indore 0.00 0.00 9.33 16.02 0.00 0.00 0.00State Bank of Mysore 0.00 0.67 20.75 12.79 2.32 0.37 0.17State Bank of Patiala 16.71 9.48 26.49 8.49 0.00 0.00 0.00State Bank of Saurashtra 0.00 0.25 4.54 10.01 0.17 0.64 *
State Bank of Travancore 6.81 20.42 5.88 3.86 0.00 0.00 0.00Punjab National Bank 0.00 1.20 0.00 1.04 0.02 0.31 0.08Syndicate Bank 0.00 0.00 0.00 0.00 22.44 0.01 4.43UCO Bank 0.00 0.00 0.00 0.00 0.00 0.00 0.00Union Bank of India 0.00 0.00 0.00 0.00 0.00 2.75 0.00United Bank of India 0.00 1.08 0.00 0.00 0.00 0.00 8.53Vijaya Bank 24.43 0.00 0.00 0.00 0.00 4.96 5.64Average 7.77 6.33 11.31 8.63 5.12 2.35 1.70Notes: * State Bank of Saurashtra was merged with State Bank of India in year 2008-091. Ineff03 to Ineff09 represents the scale inefficiency for each year for the period 2003 to 2009.
the study period. The results of CCR model reported above, shows an improvement in average IT efficiency (technical effi-ciency) from 0.85 to 0.91 during the study period, while BCC model results reported that average IT efficiency (management efficiency) of the banks remained more or less same during the study period i.e. 0.92. This implies that an improvement in technical efficiency has been due to improvement in scale efficiency rather than due to management efficiency or pure technical efficiency.
4.3 Scale InefficienciesScale efficiency is obtained by dividing the efficiency score obtained from CCR model with the efficiency score of BCC
model. The percentage inefficiency is obtained by subtracting the score of scale efficiency from unity and multiplying the result with 100. The scale inefficiency calculated for the period 2003 to 2009 is shown in Table 4.
Results show that overall average scale inefficiency of PSBs has reduced from 7.77 percent in the year 2003 to 1.7 percent in the year 2009. This shows that scale inefficiency of PSBs has decreased with the deployment of IT over a period of time. The exceptionally high inefficiency of 11.31 percent, obtained in the year 2005, may be due to heavy investment in core banking by banks. Results clearly show that banks have used the IT successfully to reduce the scale inefficiency by properly deploying ATMs and bringing the branches under core banking.

73
Sanjay Dhingra Empirical Article
Vol 6 | Issue 2 | April-June 2014 | www.gjeis.org GJEIS | Print ISSN: 0975-153X | Online ISSN: 0975-1432
5. ConclusionResults of the study show that the average efficiency (techni-cal efficiency obtained by applying CCR model) of the banks’ with respect to IT has improved gradually from 0.85 in year 2003 to 0.91 in the year 2009 (Table 2). From the result of BCC model with output orientation, it is clear that average IT efficiency(management efficiency) of the banks remained more or less same during the period 2003 to 2009 i.e. 0.92 (Table 3). This suggests that improvement in average efficiency (technical) for the period 2003 to 2009 is due to improvement in scale effi-ciency rather than of management efficiency. This calls for proper utilization of IT resources such as finding proper locations of ATMs where they can be maximally utilized and ensuring the minimum downtime of the IT systems. It is also observed that overall average scale inefficiency of PSBs has been reduced from 7.77 percent in the year 2003 to 1.7 percent in the year 2009 (Table 4). This suggests that computerization particularly deploy-ment of ATMs and core banking solution has helped the banks to become scale efficient. Overall it can be concluded that banks have used the IT successfully to reduce the scale inefficiency by properly deploying ATMs and bringing the branches under core banking. However the almost stagnancy of pure technical effi-ciency or management efficiency observed in banks is still an area of concern to the bankers.
6. AcknowledgementThis work has been carried out as part of my Ph.D. work.
7. References1. Dhingra S. Measuring IT effectiveness in banks of India for sustain-
able development.2. BVICAM’s International Journal of Information Technology.2011;
3(2):19–22.3. Charnes A, Cooper W, Rhodes E. Measuring the efficiency of deci-
sion making units. Eur J Oper Res. 1978; 3:429–44. 4. Charnes A, Cooper W, Lewin, YA, Seiford M L. Data envelopment
analysis: Theory, methodology and application. Boston: Kluwer Academic Publishers; 1994.
5. Banker RD, Charnes A, Cooper W. Some models for estimating technical and scale inefficiencies in data envelopment analysis. Manag Sci.1984; 30:1078–92
6. Dyson RG, Allen R, Camanho AS, Podinosky VV, Sarrico CS, Shale EA. Pitfalls and protocols in data envelopment analysis. Eur J Oper Res.2001; 132(2): 245–59.
7. India. Report on trend and progress of banking in India. Mumbai: Reserve Bank of India; 2009.

Global Journal of Enterprise Information SystemG J E I S
Turnaround Strategies in Indian Industries: A Few CasesJ. R. Dikshit1*, P. C. Basak2 and Kamal Vagrecha3
1*Vishveshwarya Group of Institutions, Near Dadri, G. T. Road, Greater Noida phase-II Gautam Budh Nagar (U.P.), India; [email protected]’s University, Faridabad (Haryana), India; [email protected] Gandhi National Open University (IGNOU), Maidan Garhi, New Delhi, India; [email protected]
Abstract
Turnaround strategy is the action of reversing a negative trend and turning around the organisation into profitability. Turnaround strategy derives its name from the action of reversing a negative trend and turning around the organisation into profitability. The turning around company aims at steady state and growth. The case studies on turnaround of five companies belonging to different industries are discussed and analyzed. In all most all the cases there is a change in management. The management in all the cases has acted in similar manner and after drawing up revival plan presented the same before various stakeholders. In serious situations, top priority is given to stop the outflow of cash i.e. stop the bleeding. To identify and divest those segments of business which are not contributing to cash flow. The emphasis shifts from ensuring cost reduction for survival to profit improvement with stability. The emphasis of growth strategy has been on revenue growth coupled with profit margin in long run. Planning for growth should be balanced with resources available and other constraints of the company. The possible turnaround strategies relating to finance, marketing, products and human resource which have been initiated are discussed. The communication strategies aimed at the vari-ous groups represent a key element for the successful turnaround of companies in critical conditions. The selected strategy needed to be pursued relentlessly and with all out effort to make it work. The set of actions overlapped to some extent but each also had its unique features, which tended to reflect and attempt to remedy the cause of sickness.Keywords: Downsizing Strategy, Evaluation, Marketing and Product Mix Strategy, Organisational and Financial Restructuring, Situational Analysis, Steady State
1. Introduction Turnaround strategy derives its name from the action involved i.e. reversing a negative trend and turning around the organisa-tion to profitability.
1.1 ObjectiveThe objective of turnaround strategy, in the face of declin-ing trend in business performance, should obviously be to halt declining trend while improving long run efficiency of perfor-mance, stabilization, and return to growth1
1.2 Turnaround ManagementAll businesses grow in cycles and routinely experience periods of change. The first three stages of Start up, Growth, and Maturity requires entrepreneurial management.
The company when reaches peak position will go into the decline phase if it continues to follow the same strategy. Because
environmental conditions always change, there are bound to be some competitors who will come out with improved products at most competitive cost, which will ultimately phase out the com-pany’s product (Figure 1).
Warning signals are clearly visible in the form of declining figures of financial performance. The declining trend continues if not taken care of from non crisis (positive profit) to crisis (nega-tive profit or loss) area.
The company may go into liquidation if turnaround plan is not successfully implemented.
If a revival plan is carried out there may be renewal of the company (Figure 2).
There may be three possible outcome of the revival process.
1. Short term survival but eventual failure,2. Mere recovery, neither further growth nor further decline,3. Steady state and growth.
It is the third stage which is desirable and aimed at. The com-pany reaches the growth stage of a fresh life cycle Figure 1.
* Author for correspondence
DOI: 10.15595/gjeis/2014/v6i2/51849

75
J. R. Dikshit, P. C. Basak and Kamal Vagrecha Case Study
Vol 6 | Issue 2 | April-June 2014 | www.gjeis.org GJEIS | Print ISSN: 0975-153X | Online ISSN: 0975-1432
We have taken up case studies of five companies from pub-lic as well as private sector belonging to different industries like Automobiles, Mining, Engineering and Food processing.
1. Scooters India Ltd. (SIL)2,3
2. Bharat Coking Coal Ltd. (BCCL)4 3. Kamani Tubes Ltd. (KTL)5
4. Tata Refractories Ltd. (TRL)6
5. Tasty Bite Eatables Ltd. (TBEL)7
This paper aims to analyze the circumstances under which these companies have become sick. It examines the steps that have been taken by the management to affect a turnaround. It also observes the outcome of the turnaround actions and the pre-sent position of these companies. Whether the management has learnt its lesson well and is facing the challenges posed by the ever changing business environment.
2. Literature Review
2.1 Conditions for TurnaroundAccording to Dholakia8 term lending institutions identify sick-ness on the following criteria:
• Continuous defaults in meeting four consecutive half-yearly installments of interest or principal of institutional loans.
• Continuous cash losses for a period of two years or continued erosion in the net worth by 50 per cent or more.
• Mounting arrears on account of statutory or other liabilities for a period of one or two years.
Suresh9 has described that the following are some of the uni-versally accepted danger signals, which a company should watch out for:
• Decreasing market share / decreasing constant rupee sales• Decreasing profitability• Increased dependence on debt / restricted dividend polices• Failure to plough back the profits into business / Wrong
diversification at the expense of the core business.• Lack of planning• Inflexible CEO / Management succession problems /
Unquestioning Board of Directors• A management team unwilling to learn from competitors.
2.2 Phases of Turnaround Breiter10 has observed that there are three ways in which turna-rounds can be handled:
1. The existing chief executive and management team handle the entire turnaround strategy, with the advisory support of a specialist external consultant.
2. In another situation, the existing team withdraws temporar-ily and an executive consultant or turnaround specialist is employed to do the job. This person is usually deputed by the bank and financial institutions and, after the job is over, reverts to the original position.
3. The last method-and most difficult to attempt but that is most often used-involves replacement of the existing team, espe-cially chief executive, or merging the sick organisation with a healthy one.
Suresh9 has said thatThere are three phases in any Turnaround Management.
1. The diagnosis of the impending trouble or the danger signals2. Choosing appropriate Turnaround Strategy3. Implementation of the change process and its monitoring.
2.3 Types of Operating Turnaround StrategiesYadav11, Breiter10, and Ghosh1 have all observed that there may be three types of operating turnaround strategies:
1. Cost reduction strategies,2. Revenue generating strategies, 3. Disposal of assets.
Figure 1. Different stages of Company’s Life Cycle
Figure 2. Decline and turnaround stages

76
Turnaround Strategies in Indian Industries: A Few Cases
Vol 6 | Issue 2 | April-June 2014 | www.gjeis.org GJEIS | Print ISSN: 0975-153X | Online ISSN: 0975-1432
3. Discussion
3.1 Early Identification Helps“Prevention of sickness is always better than cure”
According to Hegde6 although turnarounds can be effected, it is certainly much better to prevent sickness than to cure it. The choice of technology may also be important. The more versatile, adaptable, and updated the technology, the better its mainte-nance, and the lesser the probability of sickness. The better the rapport of management with the various stakeholders of the cor-poration (customers, employees, government, suppliers, etc.), the lesser the chance of sickness.
Timely action to help sick units requires early identification of sickness and for this purpose, it is necessary to identify other symptoms. The relevant criterion to identify sickness is the rela-tive performance of a unit vis-à-vis other firms in the industry.
In favourable conditions, even marginal or inefficient firms with relatively high cost of production also make profits. When the boom is over, marginal or relatively inefficient firms are the first ones to show a sharp decline in profitability.
According to Yadav11 early detection of sickness possibly may enable the management to take timely action to avert the crisis of such an occurrence. If there exist a forewarning system which helps in predicting corporate sickness, the attention can be focused on those concerns which are trudging towards sickness.
The early detection of sickness can be made by monitoring the financial parameters of a unit in respect of working capital, cash losses and erosion of net worth.
Out of all the case studies under consideration, only Tata Refractories could identify the sickness early and acted timely to turnaround.
3.2 Turnaround Strategies and Causes of Sickness
According to Yadav11
The choice of turnaround strategy would depend on various factors such as
- Stages of sickness i.e. tending towards sickness, incipient sick-ness and the gravely sick,
- Causes of sickness i.e. external or internal or both, - Operational performance gap, strategic gap etc.
Sick units generally suffer from the performance gap. It may be operational performance gap or strategic performance or both.
Yadav11 and Suresh9 both are of the view that,
• If the company’s financial position is critical, assets reduction strategy would be more appropriate.
• If the firm is operating substantially but not extremely below its breakeven level, then the appropriate turnaround strategy is to generate extra revenues.
• Operating closer but below breakeven levels calls for appli-cation of combination strategies. Under this method all the three namely cost reducing, revenue generating and asset reduction actions are pursued simultaneously in an inte-grated and balanced manner. Combination strategies have a direct favourable impact on cash flows as well as on profits.
• If the firm is operating around or above the breakeven level, cost reduction strategies are preferable as they are easy to carry out and the firms’ profits rise once the unnecessary costs are cut down.
3.3 Stages of Turnarounds Strategic turnarounds concentrate on divesting of the business which is not operationally viable and diverting the fund realized to finance the turnover of viable unit.
The turnover programme may commence at various stages of the company decline, it would vary depending upon the situation. If turnaround activity starts when the company has reached the stage of grave sickness, one is to go through all the stages of turnaround described below. If the symptoms of sick-ness have been detected in the early stages one may skip over some of the stages or at least move very rapidly through one stage to another.
Five stages of a turnaround are:
1. The Management Changes Stage.2. The Evaluation Stage.3. The Emergency Stage.4. The Stabilisation Stage.5. The Return of Normal Growth Stage.
3.3.1 Taking ChargeManagement change means either replacing the existing top management or change in approach. In all most all the cases there is a change in management.
3.3.2 EvaluationEfforts should be made to identify the thrust areas requiring urgent attention to revive the unit. Getting commitments from the parties concerned is the key for successful implementation of turnaround action plan.
The management in all the cases have acted in a similar manner and after drawing up the revival plan presented the same before various stakeholders, be it banks financial institutions, debtors, suppliers, workers , officers and staff etc.

77
J. R. Dikshit, P. C. Basak and Kamal Vagrecha Case Study
Vol 6 | Issue 2 | April-June 2014 | www.gjeis.org GJEIS | Print ISSN: 0975-153X | Online ISSN: 0975-1432
3.3.3 SurvivalThe priority of activities to be implemented depends on the seri-ousness of the problem. In serious situations, top priority is given to stop the outflow of cash i.e. stop the bleeding. To identify and divest those segments of business which are not contributing to cash flow.
The Scooters India Ltd., have discontinued manufacturing of two wheelers.
Similarly Tasty Bites India ltd. has also withdrawn from fro-zen food business.
It is just like an emergency medical surgery to human body. Critical problems are identified and steps initiated to ensure survival and positive cash flow since it ensures the company’s immediate survival and provides a foundation for profitable growth.
3.3.4 Profit StabilityThe emphasis shifts from ensuring cost reduction for survival to profit improvement with stability having a reasonable rate of return on assets employed.
Strategies are to be formulated and implemented emphasiz-ing the following aspects:
a. Profitability coupled with positive cash flow, since only sus-tained profitability can make the long-term cash required for growth of the unit. One time cost reduction and disposal of fixed assets can solve only short term cash flow problems.
b. Profit margin improvement along with sales volume growth. SIL has increased the volume of sales and production. Increase
in volume by increase in market share as well as entering new markets.
BCCL has outsourced machinery to increase the capacity and has also taken over abandoned line to commence mining activity.
c. Increasing of efficiency through effective systems of control. SIL could get tenfold rise in output with staff strength reduced
to approximately 2/3. KTL could manage with less (600) number of workers,
thereby increasing the efficiency. Tata Refractories also enhanced efficiency by implementing
use of Information Technology; As a result it has resorted to smart sizing.
d. Looking for the business areas which are more attractive from growth point of view.
• SIL resorted to three wheelers.• BCCL has taken over Dhanbad-Patherdih line to commence
production.• KTL developed new products i.e. brass wire for ball pen
industry, fining quality copper tubes for air conditioning and refrigeration industry.
• Tata Refractories has set up new units and also diversified into new business ventures
3.3.5 GrowthIt requires concentration on long-term planning leading to
sustained growth in the long run. The emphasis of growth stra-tegic should be on revenue growth coupled with profit margin in long run. Planning for growth should be balanced with resources available and other constraints of the company
Scooters India Ltd. (SIL) did not make any substantial invest-ment in plant and machinery. The company undertook a serious exercise of Business Process Re- engineering (BPR).
Bharat Coking Coal Ltd. (BCCL), to overcome shrinkage in mine capacity and under investment in mining equipment hired productive machines and taken over Dhanbad- Patherdih rail-way line to commence mining.
Kamani Tubes Ltd. laid emphasis on marketing strategy and development of new Product.
Tata Refractories has drawn up growth plan of business expansion for products with potential demand supply gaps.
Tasty Bite Eatables Ltd. (TBEL), realizing the importance of quality as per US standard, got both the product and communi-cation redesigned as per US customer.
4. Observations The possible turnaround strategies relating to finance, market-ing, products and human resource which may be initiated, are explained below:
4.1 Organizational Restructuring KTL restructured its Board of Directors to incorporate workers representatives. It also constituted Plant level committee.
TBEL also reconstituted its management to come closer and be available for greater interaction with the plant people.
4.2 Financial Restructuring 1. Rescheduling of Debts of Financial Institutions (FIs) and
Banks SIL requested FIs to waive off interest and allow one time set-
tlement. Tata Refractories has adopted growth strategy to facilitate
recapitalization. 2. Cost Reduction SIL did not increase the cost specially man power cost.
4.3 Marketing and Product-mix StrategyMarket strategies regarding pricing, product line and promo-tional efforts should concentrate on generating cash and reducing marketing cost.
SIL concentrated mainly on three wheeler market.

78
Turnaround Strategies in Indian Industries: A Few Cases
Vol 6 | Issue 2 | April-June 2014 | www.gjeis.org GJEIS | Print ISSN: 0975-153X | Online ISSN: 0975-1432
KTL developed products for ball pen industry as well as for refrigeration and air conditioning industry.
TBEL redesigned its product to suite needs of US customer. The decision regarding dropping of poorly performing prod-
ucts should be made after proper analysis of the various aspects such as whether the sales volume of the product or product line is rising, stagnating or falling; whether the product is of high mar-gin of low margin.
SIL withdrew from two wheeler market; TBEL has with-drawn from frozen foods.
4.4 Human Resource DevelopmentBCCL has adopted various welfare measures for the workers.
KTL, Tata Refractories, TBEL organized training pro-grammes for their employees.
4.5 Down SizingOverstaffing has been found one of the major problems in the case of sick units. An important aspect of this strategy is the retrenchment of surplus manpower and its management. It calls for evolving fair and acceptable separation, adequate compensation.
All the cases have witnessed downsizing; even in KTL which was managed by workers.
4.6 Communication StrategyThe communication strategies aimed at various stakeholders like shareholders, bankers, employees, customers and suppliers rep-resent key element for the successful turnaround of companies. In almost all the cases the management maintained good com-munication with various stakeholders.
4.7 Present Position 4.7.1 Scooters India Ltd.Scooters India Ltd. became sick and was referred to BIFR in 1992. Consequent upon the revival plan sanctioned in 1996, the company achieved a turnaround in its performance and posted profits consecutively till 2005–06. The performance of the com-pany is not commensurate with the growth trends in the auto sector (Table 1, Figure 3). SIL started incurring losses again from 2006–07 onwards. The revival proposal based on the recommen-dation of Board for Reconstruction of Public Sector Enterprises (BRPSE) is under consideration.
4.7.2 Bharat Coking Coal Ltd.Bharat Coking Coal Ltd. (BCCL) was a terminally sick company having suffered losses consistently since inception. A revival plan
Table 1. Scooters India Ltd. profit and loss statement for various years13
Year Profit/ Loss Rs. (In Crores)2001-02 2.262002-03 2.652003-04 3.162004-05 1.392005-06 1.902006-07 -22.502007-08 -22.472008-09 -27.652009-10 -28.01
was formulated to reverse the trend and implemented on a fast track in 2003-04. The company turned around from a near bank-ruptcy situation in less than two years. Thus the company is on steady state of growth
4.7.3 Kamani Tubes Ltd. The unit, closed since September 1985 was reopened in 1988 when, at the behest of the Hon’ble Supreme Court of India, a workers’ co-operative society took over the company after the sanction of rehabilitation scheme by BIFR in September 1988. To implement the scheme IDBI Bank was appointed the MA (Monitoring Agency). However, as the company could not imple-ment the sanctioned scheme, BIFR at a hearing held on May 26, 1995 declared the scheme as failed. Subsequent attempts to revive the Company failed to materialise and a scheme agreeable to all parties to generate funds & settle dues could not be formulated.
KTL was a sick company that was taken over by Mrs. Kalpana Saroj in 2006. The new management has paid off existing debt & liabilities and has installed state-of-the-art technology at the plant in Wada.
Figure 3. Profit/loss for Scooters India Ltd.13

79
J. R. Dikshit, P. C. Basak and Kamal Vagrecha Case Study
Vol 6 | Issue 2 | April-June 2014 | www.gjeis.org GJEIS | Print ISSN: 0975-153X | Online ISSN: 0975-1432
The new management of KTL led by Mrs. Kalpana Saroj has shown serious intent in reviving the company and turning its for-tunes around. KTL has started its operations in its new premises at Wada and now is no longer a Sick Company.
4.7.4 Tata Refractories Ltd.After acquisition of 51% shares of Tata Refractories Limited
by Krosaki Harima Corporation (KHC), Japan (a leading refrac-tory player with global presence and advanced technology) from Tata Steel, Tata Refractories Ltd. has changed its name to TRL Krosaki Refractories Limited in June 2011. Tata Steel continues to hold 26.46% equity stake in TRL Krosaki.
The company is on a steady state of growth, looking into the profit and loss statement of last six years.
4.7.5 Tasty Bite Eatables Ltd.The company was deregistered as sick company by BIFR in
1999. The figures for Profit and Loss Statement for last seven years are given in Table 4.
We find that company has successfully turned around and on a steady growth.
5. ConclusionSome of the companies were born sick like Scooters India Ltd. and Bharat Coking Coal Ltd.
The companies like Scooters India Ltd. Tasty Bites Eatables could not foresee the changing environment.
In the case of Scooters India Ltd. (SIL), the main reason of sickness was old plant and machinery, poor product quality and stiff competition from competitor. The opportunity lied in three wheelers product which it exploited and withdrew from two wheelers market.
In Bharat Coking Coal Ltd. (BCCL), the main reason for sickness was shrinkage in mining area. It took over abandoned railway line and started production with hired machinery.
Figure 4. Profit/loss for Bharat Coking Coal Ltd.14
Table 2. Bharat Coking Coal Ltd. profit and loss statement for various years14
Year Profit/ Loss Rs. (In Crores)1997-98 -140.911998-99 -442.34
1999-2000 -692.322000-01 -1276.702001-02 -755.02002-03 -507.132003-04 -569.852004-05 -959.432005-06 205.082006-07 52.302007-08 97.052008-09 -1376.992009-10 793.932010-11 1093.692011-12 822.36
Table 3. Profit and loss statement TRL Krosaki Refractories Ltd. (Tata Refractories Ltd.)15
Year Profit/Loss Rs. (In Million)
2005-06 3542006-07 189.82007-08 216.62008-09 344.42009-10 384.72010-11 426.9
Figure 5. Profit/loss for Tata Refractories Ltd.15

80
Turnaround Strategies in Indian Industries: A Few Cases
Vol 6 | Issue 2 | April-June 2014 | www.gjeis.org GJEIS | Print ISSN: 0975-153X | Online ISSN: 0975-1432
The Kamani Tubes Limited (KTL) identified two new prod-ucts for development i.e. brass wires in ball pen industry and fine quality copper tubes for air conditioning and refrigeration.
Tata Refractories embarked upon, modernisation of facilities, business expansion for products with potential demand supply gap, setting up new units through strategic analysis.
Tasty Bite Eatables Ltd. was having problems due to difference in perception about the quality in the US and India. It embarked upon training and development programme on quality amongst the employees, and ensuring that the suppliers also follow the quality programme to get quality supplies.
The selected strategy needs to be pursued relentlessly and with all out effort to make it work. Success will crown the efforts of those who will accomplish the interest of the various stake holders. For each cause of sickness, a number of turnaround actions, some organisations in character, some strategic, and some operational were executed. The set of actions overlapped to some extent but each also had its unique features, which tended to reflect and attempt to remedy the cause of sickness.
6. References 1. Ghosh PK. Strategic Planning and Management. New Delhi: Sultan
Chand & Sons; 2008. 2. Kumar K, Srivastava R, Scooters India Ltd. Vikalpa. 2001 Apr–Jun;
26(2):59–72. 3. Maheshwari SK, Ahlstrom D. Turning around a state owned enter-
prise: the case of scooters India Limited. Asia Pac J Manag. 2004; 21:75–101.
4. Prakash A. Summer training report on BCCL: achieving new heights in sales vis-à-vis carrying corporate social responsibil-ity. Institute of Productivity and Management, Meerut; 2009 Nov. Available from: http://www.scribd.com/doc/39465601/Summer-Training-Report
5. Mookherjee S. Workers’ cooperative and turnaround of a sick enter-prise: the KTL experience. Vikalpa. 1993 Jan–Mar; 18(1):15–24.
6. Kamath CD. A Case Study in Intrapreneurship: The Turnaround at Tata Refractories. Vikalpa. 2006 Jan–Mar; 31(1):117–21.
7. Bajaj G. Tasty Bite Eatables Ltd. (TBEL). Vikalpa. 2008 Jul–Sep; 33(3):99–109.
8. Dholakia BH. Industrial sickness in India: need for comprehensive identification criteria. Vikalpa. 1989; 14(2):19–24.
9. Suresh UV. Turnaround management. Available from: http://www. astralconsultants.com/pdf/turnaroundgs.pdf
10. Breiter AE. Dynamics of a successful turnaround strategy; 1993. Available from: http://www.systemdynamics.org/confer-ences/1993/ proceed/breit031.pdf
11. Yadav RA. Managing Corporate Turnaround. New Delhi: Concept Publishing Company; 1992.
12. Hegde M. Western and Indian Models of Turnaround Management. Vikalpa. 1982 Oct–Dec; 7(4):289–304.
13. Annual Reports. Ministry of Heavy Industries, Government of India, years 2001–02 to 2010–11.
14. Annual Reports. Ministry of Coal, Government of India, years 1997– 98 to 2010–11.
15. Annual Reports of Tata Refractories Ltd. and TRL Krosaki Refractories Ltd. from 2005–06 to 2010–11.
16. Annual Reports, Tasty Bite Eatables Ltd. from 2005–06 to 2011–12.
Table 4. Profit and Loss Statement for Tasty Bites Eatables Ltd.10, 16
Year Profit/ Loss Rs. (In Million)
2000-01 13.432001-02 22.912002-03 11.752003-04 -24.332004-05 -2.682005-06 5.582006-07 8.662007-08 11.702008-09 14.102009-10 69.692010-11 18.882011-12 16.62
Figure 6. Profit/Loss for Tasty Bites Eatables Ltd.16

81
J. R. Dikshit, P. C. Basak and Kamal Vagrecha Case Study
Vol 6 | Issue 2 | April-June 2014 | www.gjeis.org GJEIS | Print ISSN: 0975-153X | Online ISSN: 0975-1432
Annexure-A
Highlights of “SCOOTERS INDIA LTD.: The Case of an Extraordinary Turnaround”2 by Krishna Kumar, R. SrivastavaThe key aspects in the context of change in this case are:
1. The company had been making losses ever since its inception, and had accumulated losses to the tune of over Rs.656 million (as at 3.3.96) funded through loans.
2. The company became a BIFR case, BIFR initially felt that company should be wound up.3. The financial institutions and the Government too were disinterested and not keen to help.4. The company had old plant and machinery, some being 30-40 years old.5. There was a market for 3W, but the company never realized it,
The company has prepared an action plan having following main features
1. The company increased the revenue and reduced the cost. 2. To increase the revenue, the company has increased the price and volume by expanding the market. 3. The company banked on increasing productivity by increasing production with 2/3 staff strength. 4. The company undertook a serious exercise of Business Process Re-Engineering (BPR). The areas in which actions were taken, both
for bought out items and for in- house manufacturing. 5. The management did not allow the cost to increase, especially the manpower costs,
The Chief Executive impressed upon the Financial Institution to waive off interest and agree for one time settlement. The company gave an extra-ordinary performance during the period.
1. The 3Wheeler production went up from 1435 to 15618 i.e., 10.9 times.2. The sales went up from Rs.10.3 million to Rs.119.1 million (11.3 times).3. The company earned a net profit 109 million in 1996-97 as compared to a net loss of Rs.404 million on a sale of 103 million in
1989-90.4. At the back of it all, there was also a factor of leadership, who fought and also negotiated well with all the key stakeholders (sup-
pliers, workers, officers, customers, financial institutions including the government); and convinced them to make SIL a success.

82
Turnaround Strategies in Indian Industries: A Few Cases
Vol 6 | Issue 2 | April-June 2014 | www.gjeis.org GJEIS | Print ISSN: 0975-153X | Online ISSN: 0975-1432
Annexure-B
Highlights of “BHARAT COKING COAL LTD. THE TURNAROUND STORY”4 A Report by A. PrakashBharat Coking Coal ltd. was incorporated in 1972 to operate coking coal fields, of Jharia and Raniganj taken over by the Government of India. BCCL was a terminally sick company having suffered losses consistently since inception.
Scenario Prevailing Till 2003-04• Cash losses of Rs. 300 Crores p.a. resulted in accumulation of huge liabilities to PF authorities, Employees, CISF, and Suppliers.
Salary payments were delayed by 3-4 weeks.• Old Machinery, Ageing equipment leading to declining production. • Raw Coking Coal production declined from 8.44 mill t to 4.31 mill t between 1999-00 to 2003-04.• Washeries continued to incur substantial losses.
Measures Initiated for Turn AroundA revival plan was formulated to reverse the trend and implement on a fast track,
1. Securing support of Rs. 300 Crores and initiating action for procurement of equipment. 2. Initiative was taken to introduce hired productive machines in isolated open cast patches.3. Dismantling Dhanbad-Patherdih railway line to commence coal production by digging out the fire with hired HEMM (Heavy
Earth Moving Machine).4. To achieve focus on quality of coal production rather than quantity.5. Introduction of internet based e-marketing to establish free, fair and transparent access to coal for all consumers.6. Initiatives taken to improve work culture by introducing faster decision making, streamlining backup services, procurement of
material in time, minimizing stock out of production, introduction of 100% payment to workers through banks.
Results Achieved1. Coal production is registering positive growth in 2005-06.2. Reversing the trend of losses till 2003-04, washeries have earned profit.3. The company could discharge entire dues of around Rs. 360 crores towards pension fund, interest and penalties thereon. Time lag
in payment of salaries has been eliminated.4. In effect the company turned around from a near bankruptcy situation in less than two years.
83
J. R. Dikshit, P. C. Basak and Kamal Vagrecha Case Study
Vol 6 | Issue 2 | April-June 2014 | www.gjeis.org GJEIS | Print ISSN: 0975-153X | Online ISSN: 0975-1432
Annexure-C
Highlights of “Workers’ Cooperative and Turnaround of a Sick Enterprise: The KTL Experience” Background of the Kamani Tubes Limited5 by S. MookherjeeKamani Tubes Ltd. came into existence in 1959. It produced non ferrous tubes and rods, copper and copper based alloys; brass sugar tubes, and admiralty aluminum tubes.
However the premium position of the company started eroding from the beginning of 1970s. It slowly started incurring losses due to mismanagement and legal feud. In September 1985, the closure took place due to accumulated losses.
Kamani Employees Union (KEU) decided to form a producer’s cooperative of the employees of KTL and run the organisation.
Action plan for TurnaroundManagement Structure: The board of directors was reconstituted to include representatives of workers’ cooperative of KTL and experts.
A plant level committee was constituted to monitor day to day working of the plant.
Streamlining Personnel: KTL also engaged the services professionals for functional requirements such as Income Tax, Sales Tax, and Excise Duty etc. KTL was able to rationalize the manpower at the lowest level and improve the morale of the employees.
Marketing and Product Development: KTL laid emphasis on the formulation of a marketing strategy and development of new products.
Training and Orientation: A series of training programmes for the workers were organized, to make the workmen understand and comprehend managing the manufacturing organisation.
KEU laid special emphasis on educating the workers about the adverse effect of absenteeism, restrictive work practices, indisci-pline, improper conduct and behavior at work place.
Operational Highlights: The company made a net profit of Rs. 34.00 Crores in 1990-91.
Learning from the Turnaround ExperienceThe process of turnaround at KTL corresponds to the democratic mode of decision making At every stage of decision making with regard to commercial, operational, and personnel matters workers involvement was adequately ensured.
Some important features under workers’ management were: conformity to ethical management practices, product development, diversification of new product lines etc.

84
Turnaround Strategies in Indian Industries: A Few Cases
Vol 6 | Issue 2 | April-June 2014 | www.gjeis.org GJEIS | Print ISSN: 0975-153X | Online ISSN: 0975-1432
Annexure-D
Highlights of “A Case Study in Intrapreneurship: The Turnaround at Tata Refractories”6 by C. D. KamathThis is an account of a 40 year old company- The Tata Refractories Ltd. (TRL) - with a record of uninterrupted profitability turning sick for a variety of reasons and thereafter ‘turning around’ through a series of initiatives.
The Liquidity CrisisThe cash flow crisis came about principally because of the following factors:
• Capital investments which failed to yield returns as projected.• Poor finance management.• Poor Competitive position in the market because of obsolete technology and high costs.
All this led to a steep fall in profitability.
The Turnaround ProcessSome of the initiatives taken by the management on various fronts were as follows:
Improving and Strengthening Business Systems: To go in for an ERP system, and to have a re-look at the existing processes that enabled many of the inefficient ones to be re-engineered. The management drew up an investment plan to eliminate obsolescence in the company.
Intensification of HRD Programme: The management embarked upon the programme of human resource development for both executives and workmen to enhance skills.
Initiatives for Smart Sizing: There has been a significant reduction in overall numbers of employment and increase in the efficiency of business processes.
Recapitalizing the Company: The growth strategy that Tata Refractories outlined provided a cogent case for recapitalization.
Outlining an Aggressive Growth StrategyTata Refractories had drawn up an ambitious growth plan involving, inter alia,
a. Modernization of facilities; b. Business expansion for products; and c. Setting up new units.d. Diversification into new business ventures.
Business Excellence as a Holistic InitiativeIn house business excellence programme aptly termed Tata Business Excellence Model (TBEM) made easier the task of achieving the turnaround.
85
J. R. Dikshit, P. C. Basak and Kamal Vagrecha Case Study
Vol 6 | Issue 2 | April-June 2014 | www.gjeis.org GJEIS | Print ISSN: 0975-153X | Online ISSN: 0975-1432
Annexure-E
Highlights of “The Tasty Bite Story: The Turnaround”7 by G. BajajTasty Bite Eatables (TBEL) was incorporated in 1986. It set up a state-of-the art Ready to Serve (RTS) food and frozen vegetables production facility in India. Its attempt to sell in the Indian Markets failed, even in Middle East, Russia, and the US the sales failed to pick up.
TBEL had accumulated losses. In 1997, HLL converted its unsecured loans to preference capital. However, HLL had decided against venturing into frozen foods business.
In 1999, TBEL registered profit for the first time in 13 years. BIFR deregistered TBEL in 1999.
Unraveling the Turnaround Issues: Salaries and statutory dues such as PF were delayed. The workers morale was low.
Turnaround JourneyInternal communication at TBELA core value that the top management decided and resolved to ensure in TBEL was to be honest and transparent.
The second objective the management set for itself was to work closely with workers at the factory, enable extensive interaction with them to understand the problems and help in resolving them.
1. Grievance Redressal to Unions: New team ensured timely payment and job security for all. In return they asked that production is not stalled for even a single day.
2. Enhancing Day- to- Day Interaction: The management worked very closely with the workers to resolve day- to- day issues. 3. Bringing about social change: Explaining and listening over and over again and no dictates. Several other initiatives such as reducing power usage, improving electro conductivity or PH level of the soil, and many such pro-
grammes were taken up by the community. Training was made an ongoing process.4. Investing in Communication Technology for Future Returns: In 1999, after the implementation of Move-Ex ERP software the
work culture transformed. 5. External Communication Strategy: TBEL got both the product and its communications redesigned to suit the US customer. TBEL continuously educated the suppliers to help them develop the quality of the raw material (pulse, cardamom and spices etc.).

Global Journal of Enterprise Information SystemG J E I S
Innovative Qualities of Education Sector that Kills Quality and Employability in IT sectorNeelam G. Tikkha*
Università di RTM NU, India; [email protected]
Abstract
The higher education sector in India is in turmoil, struck harsh by a tornado. It is being repeated over and over again and publicized highly that hardly a fourth of graduating engineers, and an even smaller percentage of other graduates, are of employable quality for IT -BPO jobs. This had created a whirlpool situation where people started introspecting and similar opinion was echoed by other sectors which initiated a widespread debate. Increased industry academic interaction, “finishing schools”, and other efforts were initiated as immediate measures to conduit skill deficits. These, however, have not worked as some feel that these are merely band-aid solutions; instead, radical systemic reform is necessary.The present study examines the causes of failure in imparting quality education by the teachers and the policies that kill the re-search and Innovation and highlights possible solution to overcome the drawbacks of the present education system. It is important to provide facilities and infrastructure to teachers, give them dignity so that talent pool is attracted towards teach-ing profession. Autonomy to educational institutes should be given. Corporate houses should be invited for running competitive International institutes.Keywords: Band-aid Solutions, Employability, Finishing Schools, Flexibility at Workplace
1. PreambleThe higher education sector in India is in turmoil, struck harsh by a tornado. It is being repeated over and over again and publi-cized highly that only one third of graduating technical students and an even smaller percentage of graduates from other streams are of employable quality for IT jobs. This initiated tremendous run for improving the condition. Technical Institutes started giv-ing additional courses in communication and soft skills. A kind of “finishing school” concept was built up. This was a band aid solution and could not develop a tower on a weak foundation. The present need is of a strong foundation.
The present study examines the causes of failure in impart-ing quality education by the teachers and the policies that kill the research and Innovation and highlights possible solution to overcome the drawbacks of the present education system.
Quality teaching in higher education is very important so that number of employable youth increase. But, higher education sector is facing dynamic and tremendous challenges. The various challenges are the students that enroll are very poor in communi-cative skills. The quality of English is so poor that it hampers the performance in other subjects as well. The pedagogy should be such that it should be able to take care of the students need and
at the same time should be able to meet the employers demand as well.
Dr. Babsaheb Ambedkar, a great visionary had a great con-cern about the quality of education. He firmly believed that only good quality education and research can lead to the progress of the society and the country at large. He expressed his grief stat-ing that the “Universities have been founded for just conducting exams”1. He expressed concern in the year 1927 but, in so many years time there has been no growth in the standards of educa-tion and still we find a steady decline and students’ preference to go abroad for education.
The major cause that Dr. Babasaheb Ambedkar had found out was that the teachers are heavily burdened with work and hence are not capable to give required performance. The teachers have to rely on guide books and notes for teaching because of lack of time. According to him, “it was the biggest blunder… and the major reason for no improvement in the research standards in Higher education…” He also mentioned to professor Hamilton and Munshi “in such an environment, new knowledge and curi-osity would be stifled… which would lead to a loss for the society. Teachers teach for 13 hours a week so they do not prepare due to lack of time and read notes and guides to somehow complete the course. Teachers should be given time to do research work and
* Author for correspondence
DOI: 10.15595/gjeis/2014/v6i2/51850

87
Neelam G. Tikkha Case Study
Vol 6 | Issue 2 | April-June 2014 | www.gjeis.org GJEIS | Print ISSN: 0975-153X | Online ISSN: 0975-1432
other good work1. With this technique teachers will be able to support quality education and the differences would be seen in the quality of graduate and Ph. D education. They will teach the best way and will be able to bring innovation in teaching and will amount to saving money”1.
There has been a tremendous effort by UGC to improve the quality of higher education in the country. It has come out with various rules and regulations like the one under discussion where the timings for teachers have been increased to 6 hours 40 min-utes instead of 5 hours per day. All these policies sound very good in an AC room where policies are framed over sumptuous lunch-eons by people who are actually unaware of the ground realities.
The foremost problem is that college timings are very long that is six hours and forty minutes every day and there is no research facility within the premises. Teachers sit outside and bask in the sun and chat while the staffroom gets swept (Figure 2). West and a few corporate are promoting flexibility in time to get the best of talent (Figure 1). University wants to drive away talents. Newton got an idea bathing in the water tub he cried ‘Eureka’. Teachers have to cry within prison walls of colleges. Universities still have an advantage that they have departmental library and central library. They also have an edge that they have online journals like JSTOR and SAGE a treasure house for research which can be accessed anywhere with wi fi facility for free. But college teachers do not have any facility even after using their own dongal. Some colleges have converted balcony into a library, where teachers and children both study (Figure 3). This creates an unfair com-petition and is the very reason that college teachers can never compete with university teachers, since they do not have good research facilities and good reading space. Reading space for faculty is just one table, where there is a good fish market. A research cannot be conducted in such an environment. How can one focus or get new ideas. The teachers have becomes a prisoner of time. The world is moving ahead with the idea of flexibility of time. Furthermore, UGC also gives a step treatment to teachers from college. JNU teachers get a lot of travel funds for attending conferences abroad, but teachers from colleges do not get and so again they are trapped in their stagnated well. UGC does not even reply or assign reason for rejecting travel proposal or minor research projects of the teachers from the colleges. The regula-tory bodies and administrative bodies need lessons and training themselves for competency management.
Another, reason why the teachers of the colleges cannot com-pete with teachers from the Universities and world at large, is that Google scholar does not acknowledge the work of teachers, who do not have email id of the university. Hence, the teachers from the colleges lag behind and the knowledge they create does not get disseminated to the world. There is always a lurking fear of their intellectual property being stolen.
Figure 1. Flexibility in corporate.
Figure 2. Teachers basking in sun chatting and reading newspaper while rooms are getting cleaned.
Figure 3. Balcony being used as college library for teachers and students (open air).
The teachers working in colleges are considered to be infe-rior, since they are considered to be the personal employees of the management and are not treated any more than the employee that works in a grocery shop. The teachers are employed for menial work like distributing pamphlets in front of the cinema thea-tre to collect students for admission to the college. Sometimes, the teachers are also accused of drawing fat salary, but working for fewer hours. Srilanka which is much smaller than India and lags behind in economy, the start salary of Assistant professor is 130000 Srilankan rupees plus ever year he is allowed to buy a duty free imported car. Moreover, the infrastructure and the library

88
Innovative Qualities of Education Sector that Kills Quality and Employability in IT sector
Vol 6 | Issue 2 | April-June 2014 | www.gjeis.org GJEIS | Print ISSN: 0975-153X | Online ISSN: 0975-1432
are excellent. This clearly shows that government has got great respect for teachers. A teacher’s work is teaching and research. If the teacher does not keep herself updated or upgraded continu-ously, then she will be unable to give results. This would result in students, who would not be able to compete with world at large. In global era there would be a great loss incurred to the nation.
Neither, NAAC nor UGC is bothered to see if the colleges are providing infrastructure or research facilities to the faculty. The college managements are busy collecting record by keeping teachers in jail quoting ridiculous documents. NAAC committee and UGC are also just focusing on collecting papers. It is wast-age of human resource and paper. In small countries they make poo paper out of elephant dung and in India government and management creates dung out of paper. This would soon lead to a deluge of competitive foreign universities entering the market. Time has already come to raise public voice like that of Anna Hazare.
Many people advocate free or subsidized education. If you offer peanuts you will surely catch monkeys. Regulations stipulate that educational institute should be not- for – profit but people find devious ways to make money by taking bribes from teachers for getting jobs, asking teachers and students to water the plants and the ground and do other menial jobs of peon cleaning the benches, computers or asking them to maintain the institute by contributing money to save their jobs (Figure 4). This is not being read from a blank slate. It is high time government should drop this veil of farce of “not- for- profit” and let corporate enter this field for profit. This would increase competition and good
education will be available at low cost. Many management, tech-nical and college for medicine run by politicians for example Jawaharlal Nehru College of Medicine Sawangi has an excellent library which can compete with any library in the world. There are excellent labs and provision of quality education, but since there are few such institutes education is expensive. The issue of high cost of education can be tackled by bank loans and easy installments.
The UGC should decide whether to continue the colleges and provide them with all facilities or should try to close all of them down. Gurucharan Das rightly says that India suffers from poor governance. Much cannot be expected from the government that sleeps and is not able to give justice even after a year to Nirbhaya. The impotent old haggish government is hardly competent enough to provide any relief or dignity to college teachers. It is time for the government to bite the bullet.
I had a discussion in 2013 at OPJIT Raigarh with Dr. Ramgopal, retired Director, DRDO who had worked with APJ Abdul Kalam feels that, ‘the teachers have no accountability. They come at any time and they go at any time, but they are think tanks’. I feel that accountability should be tested not by the physi-cal presence of the teacher in the campus but, by regularity in conducting given classes. Soon college teachers would become empty tanks. There is no time for research or facility for teachers of the colleges. Research and innovation are very important for the growth of any country, but unfortunately we will lose more Kalpana Chawlas and Sunita Williams to US because of the drag-ging Government and Management.
Figure 4. Senior and Junior college teachers watering the ground and arranging benches for college gathering.

89
Neelam G. Tikkha Case Study
Vol 6 | Issue 2 | April-June 2014 | www.gjeis.org GJEIS | Print ISSN: 0975-153X | Online ISSN: 0975-1432
Saari umar hum Mar mar ke jee liye Ek pal to ab humein jeene do Jeene do Na na na….Na na na….Na na na….Na na nana na…. Give me some sunshine Give me some rain Give me another chance I wanna grow up once again2
2. ConclusionIt is a hyper competitive market and hence, it is important to pro-vide facilities, infrastructure and facilities to teachers, give them dignity so that talent pool is attracted towards teaching profes-sion. Autonomy to educational institutes should be given to design the course curriculum and faculty fee. Corporate houses
should be invited for running competitive International insti-tutes. If these steps are taken only then IT sector of India will be able to employ graduates without initial training.
3. AknowledgementI would like to acknowledge the management of colleges where teachers are synonym to labor, UGC for such defective policies and my daughter Ishita who compared the teachers with a labor that gave me a clue to write this article.
4. References 1. Nimbalkar W. Babasahebanche Rajyaghatnetil Yogdan. Nagpur:
Prabodhan Prakashan; 2013. 2. Shantanu Moitra. 3 Idiots. Give Me Some Sunshine. Lyrics from
http://www.elyrics.net/read/0-9/3-idiots-lyrics/give-me-some-sun-shine-lyrics.html; 2009.

Global Journal of Enterprise Information SystemG J E I S
DCT based Fuzzy Image WatermarkingDurgansh Sharma1*, Manish Prateek2 and Tanushyam Chattopadhyay3
1Jaipuria Institute of Management, Noida, India; [email protected] 2Centre for Information Technology, College of Engineering Studies, UPES, Dehradun, India; [email protected] 3R&D, Innovation Lab, Tata Consultancy Services, Kolkata, India; [email protected]
Abstract
Image watermarking implants an ownership parameter in a digital image or video. This paper works on authentication of the image file. Robust image watermarking technique is used to model the Human Visual System (HVS) using Fuzzy Logic. The proposed Fuzzy Logic System is trained using inference rules considering three sensitivities of HVS as Brightness, Contrast and Edge Sensitivity. The Fuzzy network uses the image captured in realtime and computes block wise for producing a single output weighting factor used to embed unique identification numbers generated from the confidential data as watermark, which is for authorization and verifica-tion of the original image. The robustness of the watermark embedded is checked by Stirmark image processing attacks. Recovered watermark’s computed value using SIM(X, X*) parameter for the image verified it as good watermark recovery process.Keywords: Fuzzy Logic, Fuzzy Inference System, Human Visual System (HVS), Robust Image Watermarking,
1. IntroductionCurrent trends are about posting and sharing the captured images almost instantly, it has raised the amount of data reposi-tory in web-servers saved in the form of images, photos and videos. Across the globe it has been observed a trend of expo-nential growth in the generation of images and video due to the provision of handy mobile devices with a built-in camera. The current way of distributing data, is leading towards unauthor-ized distribution in terms of copying the digital content. This technology offers advantage intelligently as compared to the old analog counterpart. Some of these advantages are data transmis-sion, easy data editing of digital content, improved capability of lossless copying of the digital content. Digitization of image enhances its prospects almost in every domain from medical imaging to architecture, satellite imaging, and space explora-tion etc. at the same time the protection of the originality is most important. The digitization of the content has reduced the efforts to connect and collaborate amongst various users across the globe. But, at the other hand it has also increased the scope of vulnerable attacks on these contents specially images and videos.
Digital image watermarking is a method to authenticate the content through its ownership.
Many optimization algorithms based on Transform-ations (DCT-DWT)1, Encryption Techniques2, Neuro-Fuzzy (Fuzzy-BP)3, Fuzzy Logic4, Artificial Neural Network5, Genetic Algorithm7 are used to embed and extract the authorization code for validation from the given image and is perceived as the key application area of image processing. The objective is to develop a Optimized Robust Image Watermarking algorithm for embedding and extracting the unique ownership key as watermark in an image.
Motwani et al.4 has implemented a MAMDANI type FIS, its input parameters are derived from HVS like sensitivity towards brightness, edge and texture or contrast of the image. Charu et al.3 extended the work further by including the three layered Fuzzy-BPN with a 3-3-1 layer configuration for learning mechanism system using 50 iterations.
Charu et al.3 have also implemented the HVS model using Fuzzy-BP in the context of digital image watermarking. They divided the image into blocks and compute its sensitivity, on the basis of the variance computed using Fuzzy-BP, they fil-tered the blocks and embed the random sequence of numbers as watermark. The adopted procedure generated a good quality watermarked image which is imperceptible in its property.
In the paper, we propose to embed a robust label of text strings of ownership identification in the image for its validation.
* Author for correspondence
DOI: 10.15595/gjeis/2014/v6i2/51851

91
Durgansh Sharma, Manish Prateek, and Tanushyam Chattopadhyay Theme Based Paper
Vol 6 | Issue 2 | April-June 2014 | www.gjeis.org GJEIS | Print ISSN: 0975-153X | Online ISSN: 0975-1432
We consider a 256x256 pixel image of ‘Lena’ for this presented work. The characteristics are modeled using Zhao and Koch10,11 emphasized that the multimedia data must contain a label or code, which identifies it uniquely as property of the copyright holder. He described the technique of embedding robust labels in the images for copyright protection.
The watermark extracted from the signed image using algorithm proposed by Cox et al.9. It will be compared for the similarity correlation using SIM(X,X*), this parameter is deter-mined for recovered watermark. Computed values show a good significance level of optimization in the process of embedding and extraction of watermark.
The output of proposed inference system in this paper is used to embed the watermark in the host image in the DCT domain. This FIS uses a set of 27 inference rules based on SIGMOID way of interpreting the logical inputs, which are primarily based on the facts of HVS behavior of sensitive to noise in the image with respect to brightness, texture or contrast, edges. All the men-tioned ways are better inferred in a SIGMOID format as there are overlaps of brightness, contrast and edge sensitivity in HVS.
2. Experimental DetailsThe classification of present experimental work is as follows:
(i) Preprocessing of Host Image, Computing its HVS Characteristics and Evolving Fuzzy Inference System (FIS)
The host image of ‘Lena’ in spatial domain having the size of 256x256 pixel is divided into the 1024 blocks of 8x8 pixel each. Discrete Cosine Transformation (DCT) is used for the transfor-mation of these blocks in the frequency domain. All the three HVS characteristics mentioned formerly are computed over these blocks as follows:
The Luminance Sensitivity: It is derived from the DC coef-ficients from the DCT blocks of the host image according to following formula3:
where, XDC,i denotes the DC coefficient of the ith block and XDCM is the mean value of the DC coefficients of all the blocks put together.
The Contrast Sensitivity: The contrast sensitivity is derived from the texture content of a region of 8x8 blocks in an image. The value of variance computed of an image block is provided to the direct metric for the quantification of the texture as a param-eter. A routine proposed by Gonzalez et al.6 is used through MATLAB. The execution of this routine is given by (2).
t = statxture(f) (2)
LiXX
DC i
DCM=
, (1)
where, f is the input image or the sub-image (block) and t is the 7 – element row vector, one of which is the variance of the block in question.
The Edge Sensitivity: The edge could be detected in an image using the threshold operation; edge sensitivity can be quantified as a natural effect to the calculation of the block threshold T. The Matlab image processing toolbox implements graythresh( ) rou-tine which computes the block threshold using histogram – based Otsu’s method9. The implementation of this routine is given by (3)
T = graythresh(f) (3)
where, f is the host sub-image (block) in question and T is the computed threshold value.
These three parameters are fed into the proposed FIS as shown in Figure 1.
Fuzzy Input Variables for Luminance sensitivity of the eye: The brightness can be categorized as dark, medium or bright. The Figure 2 below plots the fuzzy input variable with less, moderate and high brightness values.
Contrast or Texture sensitivity of the eye: The eye’s response to texture is classified into 3 categories - low, medium, and high. Figure 3, illustrate smooth, medium and rough texture values for this fuzzy input variable.
Figure 1. Fuzzy Model for HVS.
Figure 2. Fuzzy Values for Luminance Sensitivity.
Figure 3. Fuzzy Values for Contrast Sensitivity.

92
DCT based Fuzzy Image Watermarking
Vol 6 | Issue 2 | April-June 2014 | www.gjeis.org GJEIS | Print ISSN: 0975-153X | Online ISSN: 0975-1432
Edge Sensitivity: The Edge Sensitivity can be small, medium, or large as shown in the plots below in Figure 4.
Fuzzy output variable is Weighting factor (W) that can take the following values - least, less, average, higher, and highest. Plots for the values are shown in Figure 5.
Sharma et al.13 proposed Fuzzy Rules: The fuzzy rules are derived are based on the following facts:
a) Human Eye is highly sensitive to noise in those areas of the image where brightness is average.
b) Human Eye is highly sensitive to noise in low textured areas and towards the edges in high textured area as well
c) Human Eye is highly sensitive in the regions with low bright-ness and changes in less dark regions.
A total of 27 such rules are developed and are listed in Table 1.A set of most frequently fired rules in the fuzzy rule engine
are shown in the Figure 6.
Figure 4. Fuzzy values for edge sensitivity.
Figure 5. Fuzzy values for Weighting Factor (W).
Table 1. HVS based 27 rules for fuzzy inference systemRule No. Luminance
SensitivityContrast
SensitivityEdge
SensitivityWeighting
Factor1 DARK LOW SMALL LEAST2 DARK MEDIUM SMALL LEAST3 DARK HIGH SMALL LEAST4 MEDIUM LOW SMALL LEAST5 MEDIUM MEDIUM SMALL LEAST6 MEDIUM HIGH SMALL LEAST7 BRIGHT LOW SMALL LEAST8 BRIGHT MEDIUM SMALL LEAST9 BRIGHT HIGH SMALL LEAST
10 DARK LOW MEDIUM LESS11 DARK MEDIUM MEDIUM HIGH12 DARK HIGH MEDIUM HIGHER13 MEDIUM LOW MEDIUM LESS14 MEDIUM MEDIUM MEDIUM AVERAGE15 MEDIUM HIGH MEDIUM AVERAGE16 BRIGHT LOW MEDIUM LESS17 BRIGHT MEDIUM MEDIUM AVERAGE18 BRIGHT HIGH MEDIUM HIGHER19 DARK LOW LARGE LESS20 DARK MEDIUM LARGE HIGHER21 DARK HIGH LARGE HIGHEST22 MEDIUM LOW LARGE LESS23 MEDIUM MEDIUM LARGE AVERAGE24 MEDIUM HIGH LARGE HIGHER25 BRIGHT LOW LARGE LESS26 BRIGHT MEDIUM LARGE HIGHER27 BRIGHT HIGH LARGE HIGHEST
Figure 6. Most frequently fired rules in the fuzzy rule engine.
(ii) Embedding the Watermark for ValidationAny computational device has certain identification numbers
like MAC address for a computer, IMEI no. of a mobile phone. Once the FIS is trained with given set of 27 inference rules.
We propose the following process for embedding unique identi-fication numbers as watermark for authorization and verification of the original image
Jian et al.10 suggested the following algorithm which could be further extended for the usage in current computational devices. The first step generates a pseudo random position sequence using the outcome of FIS for selecting the 8x8 sub-blocks, where the code is embedded. This step is denoted as a function Ts(y, UK) where y is the image data to be labelled,

93
Durgansh Sharma, Manish Prateek, and Tanushyam Chattopadhyay Theme Based Paper
Vol 6 | Issue 2 | April-June 2014 | www.gjeis.org GJEIS | Print ISSN: 0975-153X | Online ISSN: 0975-1432
and UK is the user-supplied secret key. The second step simply embeds or retrieves the code into or from the blocks specified in the position sequence.
The function Ts(y, UK) initially extracts the required features from the image data, for its further usage with the unique iden-tification numbers provided by user as secret key to be used as seeds for position sequence generation12. The featured must be robust against simple image processing that does not affect the visual quality of the image, and they must be image-dependent, i.e. the image can be recognized, distinctively in an ideal case, by these features extracted from the data provided by image under consideration14.
Let D be the embedded code generated from the unique secret key, represented by binary bit stream {d0,d1,..,dn}. Let, i be the index of current bit in this stream. Let B be the block set in which each block can be randomly selected. Initialize i to 0 and B to {}. The framework for writing and reading robust labels is described below:
In Figures (7,8) following legends will be used:Image Data as (y), User defined Key (UK), Label Code and
Embedded Code as (D), Position Sequence as (PS), Labeled image as (y’), Position Sequence Generator as [Ts(y, Uk)], Label Embedding System as (LES), Label Retrieval System (LRS).
Algorithm 1(a): Framework (write)
(1) If i ≥ n, return.(2) Randomly select a block b, using the position sequence gen-
eration function Ts(UK, y) in Figure 7.(3) If b exists already in B, goto (2), otherwise add b to B.(4) Call check_write(b, di) to check wether b is a valid block:
if this function returns False (i.e. the block b is an invalid block), go to (2).
(5) Call write(b, di) to embed a bit di to the block b.(6) Increment i, go to (1).
Figure 8. Read Label.
Figure 7. Write Label.
Algorithm 1(b): Framework (read)
(1) If i ≥ n, return.(2) Randomly select a distributed or a contiguous 8x8 block b,
using the position sequence generation function Ts(UK, y) in Figure 8.
(3) If b exists already in B, then go to (2), otherwise add b to B.(4) Call check_read(b,di) to check whether b is a valid block:
if this function returns False (i.e. the block b is an invalid block), go to (2).
(5) Call read(b) to retrieve a bit from the block b.(6) Increment i, and go to (1).
Once the label is embedded then Quality assessment of the signed image is done by computing Mean Square Error (MSE) and Peak Signal to Noise Ratio (PSNR).
Executing StirMark Attacks: The watermarked image is fur-ther subjected to seven image processing attacks as prescribed by StirMark standard proposed by Petitcolas8.
(1) Counterclockwise rotation of 90°.(2) Dithering of color levels from 256 to 16-color(3) Gaussian Blur (Radius = 1.0 units)(4) Brightness and Contrast operation (each 15%)(5) Median Filtering (Filtering aperture = 3 units)(6) 10% Gaussian Noise addition(7) Jpeg compression (QF=90).
Quality assessment is done using Mean Square Error (MSE) and Peak Signal to Noise Ratio (PSNR) before and after execu-tion of attacks on the signed image.
Extracting Watermark from Signed Image and Computing SIM(X, X*) Parameter: Firstly, the DCT of both host and signed images are computed block wise. Thereafter, the computed coef-ficients are subtracted from each other and the watermark is recovered. Let the original and recovered watermarks be denoted as X and X* respectively. A comparison check is performed between X and X* using the similarity correlation parameter given by eq. (5).
3. ResultsFigure 9 depicts both the host and signed images. The detectable quality of the signed image is very good as indicated by the com-puted MSE and PSNR values mentioned above it.
Figure 9(a-g) represent attacked images obtained after exe-cuting StirMark prescribed image processing attacks over the
SIM(X X(X X
(X Xi=1
n
i=1
n, ), )
, )*
*
*
=∑
∑
(5)

94
DCT based Fuzzy Image Watermarking
Vol 6 | Issue 2 | April-June 2014 | www.gjeis.org GJEIS | Print ISSN: 0975-153X | Online ISSN: 0975-1432
image shown in Figure 9 (Signed image). The respective MSE and PSNR values are mentioned above these images. These computed values are within the expected range for these attacks.
4. ConclusionsComputed value of SIM(X, X*) parameter for the image depicted in Figure 9 (Singed Image) is 18.6348 which indicates a good watermark recovery process.
5. AcknowledgementThe author Durgansh Sharma is a student of Ph.D. under the guid-ance of Dr. Manish Prateek and Dr. Tanushyam Chattopadhyay wish to thank his guides for providing their valuable support in pursuing his research work.
Figure 9. MSE and PSNR calculation of attacked images.
6. References 1. Idrissi N, Roukh A, Masmoudi L, Radouane M, Messoussi R. A
robust digital watermarking technique using DWT-DCT and Statics blocks. International Journal of Computer Science Issues (IJCSI). 2013; 10(2).
2. Jawad LM, Sulong GB. A review of color image encryption tech-niques. International Journal of Computer Science Issues (IJCSI). 2013; 10(6).
3. Agarwal C, Mishra A. A Novel Image Watermarking Technique using Fuzzy-BP Network. 2010 Sixth International Conference on Intelligent Information Hiding and Multimedia Signal Processing (IIH-MSP); 2010; IEEE. p. 102–5.
4. Motwani MC, Harris FC Jr. Fuzzy perceptual watermarking for ownership verification. 2009; IPCV. p. 321–25.
5. Lou, D-C, Hu M-C, Liu J-L. Healthcare image watermarking scheme based on human visual model and back-propagation network. Journal of CCIT. 2008; 37(1):151-62.

95
Durgansh Sharma, Manish Prateek, and Tanushyam Chattopadhyay Theme Based Paper
Vol 6 | Issue 2 | April-June 2014 | www.gjeis.org GJEIS | Print ISSN: 0975-153X | Online ISSN: 0975-1432
6. Gonzalez RC, Woods RE, Eddins SL. Digital image processing using MATLAB; 2005; Pearson Education. p. 406 and 467.
7. Shieh, C-S, Huang H-C, Wang F-H, Pan J-S. Genetic watermark-ing based on transform-domain techniques. Pattern Recogn. 2004; 37(3):555–65.
8. Petitcolas FAP. Watermarking schemes evaluation. IEEE Signal Process Mag. 2000 Sep; 58–64.
9. Cox IJ, Kilian J, Leighton FT, Shamoon T. Secure spread spectrum watermarking for multimedia. IEEE Trans Image Process.1997; 6(12):1673–87.
10. Zhao J, Koch E. Embedding robust labels into images for copyright protection. KnowRight. 1995; 242–51.
11. Koch E, Zhao J. Towards robust and hidden image copyright labe-ling. IEEE Workshop on Nonlinear Signal and Image Processing; 1995; Neos Marmaras, Greece. p. 452–55.
12. Diffie W, Hellman M. New directions in cryptography. IEEE Transactions on Information Theory. 1976; IT-22:644–54.
13. Sharma D, Prateek M, Chattopadhyay T. Optimized robust image watermarking. Proceedings of 4th International Conference on Emerging Trends in Engineering & Technology; 2013 Oct 25–27. p. 99–106.

Global Journal of Enterprise Information SystemG J E I S
A Critical Appraisal of Organic Food Market in IndiaTanushree Roy*
S. S. Khanna Girls’ Degree College, University of Allahabad, Allahabad, India; [email protected]
Abstract
Organic foods are outcome of organic farming which does not involve chemical fertilizers, pesticides, etc. By preserving the regen-erative capacity of soil and sound soil management, such foods are produced which are naturally pure, safe, healthy, environment friendly and protects against diseases. With the rising awareness about the adverse effects of usage of preservatives, chemical ferti-lizers, etc. people have started to prefer organic food and many companies such as Fabindia, Organc India, etc. are actively involved in marketing of organic food items. Government has also realized the importance of organic farming for social welfare and preservation of environment and that is why the Government is promoting organic farming through various schemes like National Project on Organic Farming (NPOF), National Horticulture Mission (NHM), Horticulture Mission for North East & Himalayan States (HMNEH), National Project on Management of Soil Health and Fertility (NPMSH&F), Rashtriya Krishi Vikas Yojana (RKVY) and also Network Project on Organic Farming of Indian Council of Agricultural Research (ICAR). Government has also implemented the National Programme for Organic Production (NPOP). Currently, India’s rank is 10th among the top ten countries in terms of cultivable land under organic certification. For the expansion of organic food market, attention should be given to many factors such as low availability, high price, complexity of certification, lack of information, publicity of health benefits, freshness, taste packaging, etc. Although, in the recent past, there has been a huge increase in the turnover of organic food items but even though the percentage of organic food customers is very low. Hence, promotional and awareness programmes are needed to motivate people for purchas-ing such items and besides ensuring the easy and regular supply of organic food products, financial support from government and private enterprises is also required. Keywords: Organic Farming, Organic Food
1. IntroductionIf a person wants to live a healthier life then he should be com-mitted to healthy eating habits. Healthy eating doesn’t mean only eating more fruits, vegetables, whole grains and good fats. Food safety, nutrition and its sustainability is very important. Human health and environment both are affected by the way in which foods are grown or raised. Health benefits and safety for environ-ment motivates the usage of organic food.
“The term organic refers to an ecological method of agricul-tural production that respects the natural environment. Organics focuses on enhancing the health and vitality of the soil, preserv-ing biodiversity, promoting animal welfare and preserving the ecological integrity of our environment. No synthetic fertiliz-ers, synthetic pesticides or genetically modified organisms are
permitted in organics.” Organic foods are produced using meth-ods of organic farming. For growing organic products; such a system of agriculture is used which is not based on fertilizers and pesticides so that an environmentally and socially responsible approach can be adopted in the field of agriculture. In this kind of farming, efforts are made at grass root level so that regenera-tive and reproductive capacity of soil can be preserved and at the same time it will help in sound soil management and good plant nutrition which will lead to production of nutritious food. Such food will have more resistance power against diseases.
According to nutritionist Naini Setalvad, “An organic diet is not just about nutrition, it is the Art of Eating – it reflects your attitude to life and to the world, because good food sustains life-bad food kills. For healthy growth, we need PURE food. Organic food is safe, pure, more nutritious, environment friendly,
* Author for correspondence
DOI: 10.15595/gjeis/2014/v6i2/51852

97
Tanushree Roy View Point
Vol 6 | Issue 2 | April-June 2014 | www.gjeis.org GJEIS | Print ISSN: 0975-153X | Online ISSN: 0975-1432
protects against diseases and maintains peace of mind. A pure diet fosters purity of mind, body and soul”1.
For signifying healthy food items, a term ‘natural’ is also used instead of ‘organic’. There is a difference between the two terms. The term ‘natural’ can be applied on packaged food by any person or company as it is an unregulated term but the term ‘organic’ can be used only after meeting some specified production standards. These production standards vary from country to country.
2. Organic Food Market in IndiaFor making fruits, vegetables, pulses, larger and plumper, growth hormones are injected in them and preservatives are used for showing them fresh; thus humans are unknowingly compelled to consume these chemicals. Consumption of these chemicals cause many types of diseases and psychological disorder like depres-sion, mood swing, hypertension, obesity, infertility in men, problems in conceiving, etc. Now, people have started to realize the adverse effects of usage of chemicals, fertilizers and preserva-tives. This realization is enhancing the demand for organic food. Organic food market is the biggest opportunity for green mar-keters. In India, organic food market is growing very rapidly. In the recent past, level of awareness about organic farming and benefits of organic food among people has increased to a great extent and to take advantage of this situation, many big corpo-rate and retailers have opened a lot of shops for selling organic food items. These shops are mainly in metropolitan and big cit-ies. Some of the examples are given:
• Fabindia is one such chain which has several stores across the country from where organic food can be purchased and online orders can also be made.
• Organic India is another brand which sells organic pro-duce. Its revenue has increased from ` 25 crore in 2008 to ` 175 crore in 2013. Best known for its Tulsi Tea, it makes a range of organic products and has grown so confident of the market’s potential that it is setting up its own standalone stores. It has opened two stores in Lucknow and aim to have 20 stores across the country by the end of 2015. It has also launched new products such as organic ghee (using milk from cows fed only organic grass and fodder) and organic chyawanprash.
• “Conscious Food, perhaps the oldest in the business, launched almost 25 years ago by eco-nutritionist Kavita Mukhi, has grown at a compound annual growth rate of nearly 35 per cent in the last four years to reach revenues of ` 120 crore. It sells organic sweeteners - honey, raw sugar, jaggery - along with cereals and pulses”2.
• Many organic product manufacturers, who earlier were mainly into exports, have realized the increasing interest in
such products within the country. For instance, Bangalore-based Mother India Farms, used to export the organic fruit pulp, dehydrated fruit and vegetables and a variety of spices it produced to France, Germany and Netherlands. But now it has a growing Indian market as well. Sensing the market gap in organic fruit juices in India, they launched a mango-fla-voured organic fruit beverage in 2012, under the brand name Organa. They are now selling organic guava juice, organic apple juice and organic mango pulp here as well.
• AMWAY is also an active retailer in the field of organic food in India. Their product NUTRILITE is a vitamin and mineral brand in the entire world which is grown, harvested and pro-cessed in their own certified organic farms.
“India produced around 1.34 million MT of certified organic products which includes all varieties of food products namely Sugarcane, Cotton, Basmati rice, Pulses, Tea, Spices, Coffee, Oil Seeds, Fruits and their value added products. The production is not limited to the edible sector but also produces organic cotton fiber, functional food products etc. India exported 135 products last year (2012-13) with the total volume of 165262 MT includ-ing 4985 MT organic textiles. The organic agri export realization was around 374 million US $ including 160 US $ organic textiles registering a 4.38% growth over the previous year. Organic prod-ucts are exported to EU, US, Switzerland, Canada, South East Asian countries and South Africa. Soybean (41%) lead among the products exported followed by Cane Sugar (26%), Processed food products (14%), Basmati Rice (5%), Other cereals & millets (4%), Tea (2%), Spices (1%), Dry fruits (1%) and others”3.
Due to the nutritional value of organic food items, customers are ready to purchase them at a costlier price than its non organic substitute. Growth of Indian organic food market at a compound annual growth rate of 20 to 22 percent is the biggest evidence for reflecting acceptance of organic food items by Indian customers.
3. National Programme for Organic Production
A scheme known as National Programme for Organic Production (NPOP) has been started by the Government of India for enhancement of organic farming. The national pro-gramme involves the accreditation programme for Certification Bodies, standards for organic production, promotion of organic farming etc. The “NPOP standards for production and accredi-tation system have been recognized by European Commission and Switzerland as equivalent to their country standards. Similarly, USDA has recognized NPOP conformity assessment procedures of accreditation as equivalent to that of US. With these recognitions, Indian organic products duly certified by the accredited certification bodies of India are accepted by the

98
A Critical Appraisal of Organic Food Market in India
Vol 6 | Issue 2 | April-June 2014 | www.gjeis.org GJEIS | Print ISSN: 0975-153X | Online ISSN: 0975-1432
importing countries. Among all the states, Madhya Pradesh has covered largest area under organic certification followed by Rajasthan and Uttar Pradesh. Currently, India ranks 10th among the top ten countries in terms of cultivable land under organic certification. The certified area includes 10% cultivable area with 0.50 million Hectare and rest 90% (4.71 million Hectare) is for-est and wild area for collection of minor forest produces. The total area under organic certification is 5.21 million Hectare (2012–13)”4.
4. Initiatives of Government towards Organic Farming
Social welfare and protection of environment is the prime respon-sibility of Government and organic farming can play an important role in this context. Outcome of organic farming reflects in the form of organic food. Government has also realized the signifi-cance of organic farming and this is the reason behind promoting organic farming through various schemes like National Project on Organic Farming (NPOF), National Horticulture Mission (NHM), Horticulture Mission for North East & Himalayan States (HMNEH), National Project on Management of Soil Health and Fertility (NPMSH&F), Rashtriya Krishi Vikas Yojana (RKVY) and also Network Project on Organic Farming of Indian Council of Agricultural Research (ICAR).
4.1 National Project on Organic Farming (NPOF)
“National Project on Organic Farming (NPOF) is a continu-ing central sector scheme since 10th Five Year Plan. National Project on Organic Farming is being operated by the Integrated Nutrient Management Division of Department of Agriculture and Cooperation, Government of India, and is headed by Joint Secretary (INM). The project objectives are being implemented and monitored through National Centre of Organic Farming (NCOF) at Ghaziabad as Head quarter with its six Regional Centers of Organic Farming (RCOF) located at Bangalore, Bhubaneswar, Hisar, Imphal, Jabalpur and Nagpur”5.
The main objectives of this project are promotion of organic farming in the country through technical capacity building of all the stakeholders including human resource development, transfer of technology, promotion and production of quality organic and biological inputs, awareness creation and publicity through print and electronic media. It also aims at capacity building for soil health assessment, organic input resource management, technology devel-opment through support to research and market development.
Financial Assistance upto 25% and 33% of total outlay upto a ceiling of ̀ 40 lakhs and ̀ 60 lakhs respectively is provided as back ended subsidy through NABARD in this scheme. This financial
assistance is provided for establishment of bio-pesticides/bio-fertilizers production units and agro waste compost production units respectively.
4.2 National Horticulture Mission (NHM)Presently, India is the 2nd largest producer of fruits & vegeta-bles in the world. “A National Horticulture Mission has been launched as a Centrally Sponsored Scheme to promote holistic growth of the horticulture sector through an area based region-ally differentiated strategies. The scheme is fully funded by the Government and different components proposed for imple-mentation financially supported on the scales laid down. It was launched under the 10th five-year plan in the year 2005-06. The NHM’s key objective is to develop horticulture to the maximum potential available in the state and to augment production of all horticultural products (fruits, vegetables, flowers, plantation crops, spices, medicinal aromatic plants) in the state”6.
Under National Horticulture Mission (NHM), financial assistance is provided for setting up vermi-compost production units @ 50% of the cost subject to a maximum of ` 30,000/- per beneficiary, for adoption of organic farming @ `10,000/- per hectare for maximum area of 4 hectare per beneficiary and for organic farming certification @ ` 5.00 lakh for a group of farmers covering an area of 50 hectares.
4.3 Horticulture Mission for North East & Himalayan States (HMNEH)
For overall development of horticulture, a centrally spon-sored scheme known as Horticulture Mission for North East and Himalayan States (HMNEH) has been implemented by the Department of Agriculture & Cooperation, Ministry of Agriculture. Sikkim, Jammu & Kashmir, Himachal Pradesh and Uttarakhand are covered under this scheme. With the help of forward and backward linkages, entire range of horticulture starting from production to consumption is included in this scheme. The programmes under HMNEH have been designed after considering local interests and it also includes viewpoint of state governments. It covers plantation works, area expansion, post harvest management, processing, value addition including that of aromatic plants, marketing and exports. In this mission, special emphasis is placed on “Low Volume, High Value, Less Perishable Horticulture Crops”.
The main purpose of this scheme is to enhance quantity and quality, i.e. production and productivity of horticulture crops by utilizing the regional potential. Under this mission, efforts are being made for development of a horticulture based faming system so that viable and ample opportunities for employment, especially for women can be provided besides improving the pro-ductivity of land.

99
Tanushree Roy View Point
Vol 6 | Issue 2 | April-June 2014 | www.gjeis.org GJEIS | Print ISSN: 0975-153X | Online ISSN: 0975-1432
By the end of 2015, Sikkim wants to become an organic agri-cultural state but it is not easy to achieve this target. For achieving this goal, many challenges have to be faced. To meet the challenges of change in climate, organic agriculture can prove to be a revised and improved version of traditional farming but there is doubt about its acceptance and sustainability. The biggest challenge lies in acceptance by farmers because usually farmers are reluctant to adopt this new technique as they are habitual with the use of fertiliz-ers and techniques of traditional farming. The financial investment is also huge, especially for the certification process, which is costly and complex. Also in terms of sustainability, financial support will be required even 10 years after the implementation,
4.4 Rashtriya Krishi Vikas Yojana (RKVY)“To spur growth in the Agriculture and allied sectors, National Development Council (NDC), in its meeting held on 29th May, 2007 observed that a special Additional Central Assistance (ACA) Scheme be introduced to incentivize States to draw up comprehensive agriculture development plans taking into account agro-climatic conditions, natural resources and tech-nology for ensuring more inclusive and integrated development of agriculture and allied sector. In pursuance to aforesaid obser-vation and in consultation with the Planning Commission, Department of Agriculture & Cooperation (DAC), Ministry of Agriculture, Govt. of India launched Rashtriya Krishi Vikas Yojana (RKVY) from 2007-2008, which has been operational since then”7. The main objectives of the scheme are to incentivize the States so as to increase public investment in Agriculture and allied sectors and to provide flexibility and autonomy to States in the process of planning and executing Agriculture and allied sector schemes.
Assistance for promotion of organic farming on different components is available under RKVY with the approval of State Level Sanctioning Committee.
4.5 Network Project on Organic FarmingA network project on organic farming has been implemented by Indian Council of Agricultural Research (ICAR) in different agro-ecological regions of the country for developing package of practices of different crops and cropping system under organic farming. It involves a budget of ` 5.34 crore. Organic farming package of practices for 14 crops namely basmati rice, rainfed wheat, maize, redgram, chickpea, soyabean, groundnut, mustard, isabgol, black pepper, ginger, tomato, cabbage and cauliflower have been developed.
For maintaining quality of soils, ICAR emphasizes on inte-grated nutrient management. For this purpose, it recommends conjunctive use of both organic and inorganic source of plant nutrient which should be based on soil test. ICAR has developed
technologies to prepare various types of organic manures such as Phospho-compost, Vermi-compost, Municipal Solid Waste Compost etc. from various organic wastes.
Besides these schemes, Government is promoting organic/chemical free fertilizers under Capital Investment Subsidy Scheme of National Project on Organic Farming (NPOF) through NABARD by setting up of Fruit & Vegetable Waste/Agro Waste Compost Units under Municipalities, Agricultural Produce marketing Committees (APMCs), Public Sector/Private Sector Companies, individual entrepreneurs and Bio-fertilizer/Bio-pesticide Production Units through Public Sector, Co-operative/Private Sector Companies, NGOs and individual entrepreneurs. For example, for promoting usage of organic manure; financial assistance of ` 500 per hectare is provided under National Project on Management of Soil Health and Fertility.
It is the result of these efforts that currently, India is the 2nd
largest producer of fruits & vegetables in the world. The result of Government’s initiatives towards promoting organic farming is very positive and it is evident from the fact that India exported agri-organic products of total volume of 160276.95 MT and reali-zation was around ` 1155.81 crore in the year 2012-13.
5. Factors Affecting Buyers’ Decisions in Organic Food Market
At the time of taking decision of purchasing organic food, a buyer considers many factors in this regard. Importance of these factors for consumers is responsible for the growth of market of organic food. For the expansion of organic food market, attention should be given to following factors:
5.1 AvailabilityA product is successful only when it is purchased repeatedly or frequently by the buyers. For frequent purchases, regular and adequate availability is essential. Low and irregular availability of organic products especially fruits and dairy products often com-pel buyers to switch back to non-organic varieties. It also reduces possibility of trials by non users which acts as a hurdle in expan-sion of customer base.
5.2 High PriceA major portion of Indian customers is price conscious. Usually organic items are costlier than non organic variety. For exam-ple, a liter of ‘Ghee’ approximately costs around ` 400 but if it is purchased from organic stores it costs around ` 900. Although a certain percentage of customers are ready to pay this extra price on account of associated health benefits but price matters more than health benefits for a major portion of customers.

100
A Critical Appraisal of Organic Food Market in India
Vol 6 | Issue 2 | April-June 2014 | www.gjeis.org GJEIS | Print ISSN: 0975-153X | Online ISSN: 0975-1432
5.3 Certification and InformationIn case of organic food items, level of standardization and authenticity is not so high yet and people are also not much aware about the benefits of organic products. Standardization of quality parameters and certification will help consumers to take decision regarding purchase of organic items. Certification of prod-uct authenticity creates a sense of assurance among customers which induces consumers for trial of organic items. Thus, proper standardization and its publicity can help a lot in increasing the number of customers for organic food items.
5.4 Health BenefitsThe biggest advantage of organic food items is its health benefits. Existing customers understand the positive impact of organic food on their health and are ready to purchase more quantity but there is lack of clarity on the exact benefits offered by replacing non-organic products with organic ones. Promotional offers and recommendations from existing customers can encourage non buyers to switch to organic products on the ground of health benefits.
5.5 FreshnessLimited stocks of organic food at retail stores create doubt about their freshness. Since non-organic varieties are more readily available; thus, freshness is not a motivating factor for the usage of organic food.
5.6 TasteNon users of organic food cannot make their decision on the basis of taste because they have not experienced it. Existing customers do not give much weightage to taste because their decision is pri-marily based on health benefits not on taste.
5.7 PackagingIf organic food products are available in small sized packs then it will be possible for more people to try them inspite of high prices. With the growth of organic food market, visual appeal will become an important factor in future. Currently, there is very limited competition in the field of organic food market. When competition will increase among retail brands of organic food
then packaging especially visual appeal will definitely play an important role in attracting customers.
6. ConclusionIn India, organic food is such a field which has immense growth opportunities for the marketers. Real development is not only associated with quantity but also with quality. Now, people have started to realize the importance of organic food for quality living and safe environment but in comparison to total popula-tion, their percentage is not so high. Thus, there is a great need of such type of awareness and promotional programmes which will motivate people to buy organic food items. Besides this, for the expansion of organic food market; regular, easy and adequate availability must be ensured. From the point of view of finan-cial support, Government is running many schemes and projects for enhancing organic farming. But in a vast country like India only government efforts will not be able to provide the adequate support. Since organic production needs a huge financial outlay, thus, public private partnership can be proved to be a viable solu-tion for this problem.
7. References 1. Available from: http://articles.economictimes.indiatimes.com 2. Available from: http://businesstoday.intoday.in 3. Available from: www.apeda.gov.in/ 4. Available from: http://ncof.dacnet.nic.in/AnnualReport2012-13.pdf 5. Yadav AK. Organic agriculture; (Concept, Scenario, Principals
and Practices); National Centre of Organic Farming, Department of Agriculture and Cooperation, Ministry of Agriculture, Govt of India.
6. Available from: http://nhm.nic.in/ 7. Available from: http://rkvy.nic.in/ 8. Charyulu DK, Biswas S. Organic input production and marketing in
India – efficiency, issues and policies. CMA Publication No – 239. 9. Chandrashekar HM. Changing scenario of organic farming in India:
An overview. International NGO Journal. 2010 Feb; 5(1):34–39.10. Dubey RK. Green growth and organic agriculture as livelihood
strategy in sustainable rural development. International Journal of Scientific and Research Publications. 2013 Nov. 3(11).
11. Available from: http://organicaalberta.org/about organics/organic-definitions

101
BOOK REVIEWSarad Kumar Yadav
Research Scholar
Department of Political Science
University of Delhi
Crafting Cooperation: Regional International Institutions in Comparative Perspectives.
Amitav Acharya and Alastair Iain Johnston
Citation
http://www.cambridge.org/us/academic/subjects/politics-international-relations/international-relations-and-international-organisations/crafting-cooperation-regional- international-institutions-comparative-perspective
ReviewThis book provides the comparative study of regional interna-tional organization in terms of institutional design and the nature of cooperation. The book highlights the similarities and differ-ences in the efficacy across regional institution and relationship between institutional design and the nature of cooperation. The book starts with the central question, “Why does it appear that different forms of institutions develop in different regions of the world, where States generally face similar kind of difficulties in cooperation?” In this regard, the authors of the book found two puzzles, the first one being how to describe and explain any vari-ation in the design of regional security and economic institutions across world. The second one being is the design of institution leads to the variation in nature of cooperation? Acharya and Johnston in their very introductory chapter provided an over-view of literature on regional institution and argued that with the exception of European institution, regional institution have occupied a small and insignificant part of the overall theoreti-cal literature on international institution. The Authors criticized the RDII (Rational Design of International Institution) project of the study of design features of international institution. The theory does not ask why the institution looks and acts differently. In designing an institution, the Actors are mainly concerned with maximizing the material gain, rather than legitimacy, but it’s not the case, actors choose their specific design features with utility and efficacy in mind, but they are also influenced by their moral consideration. This project neglects the study of non-western regional institutions. Therefore, the authors suggested that the
effectiveness of third world regional institution must be judged by employing different yardsticks, given the differences in their political, social and economic conditions. Thus, this book goes beyond the RDII framework and provides the comparative study of regional institutions.
According to Acharya and Johnston, Institutional design includes the formal and informal rules and organizational fea-tures that constitute the institution and that function as either the constraint on actor choice or the bare bones of the social envi-ronment within which agents interact or both. Author examined that the institutional design affected by the different type of the independent variables like type of cooperation problem, num-ber of actors, ideology and identity, systemic and sub systemic power distribution, domestic politics, extra-regional institu-tion and non-state actors and history. The Author identified five major features of institutional design; membership refers mainly to the number of actors allowed to participate. Scope refers to the range of issues that the institution is designed to handle .the scope could be narrow, broad, intrusive, or non intrusive. Formal rules refer to the explicit and legalized regulations governing how decisions are made? Norms refer to formal and informal ideol-ogy of institution. Finally a mandate refers to overall purpose of the institution.
Yuen Foong Khong and Helen Nesadurai in their chapter on Southeast Asia, said that a group of small and middle power played a role in the creation and maintenance of many of these institutions, in particular the ARF, AFTA, and the APT. they Argued that Institutional design in ASEAN remains devoted to state sovereignty as initial preferences, which result in a high
Global Journal of Enterprise Information SystemG J E I S
GJEIS | Print ISSN: 0975-153X | Online ISSN: 0975-1432Vol 6 | Issue 2 | April-June 2014 | www.gjeis.org
DOI: 10.15595/gjeis/2014/v6i2/51853

102
BOOK REVIEW
Vol 6 | Issue 2 | April-June 2014 | www.gjeis.org GJEIS | Print ISSN: 0975-153X | Online ISSN: 0975-1432
degree of autonomy for national governments in determin-ing domestic policy. In the case of AFTA/ASEAN, The need for collective clout to “hang together ‘’plays an important role in maintaining the regional organization and in the case of ARF identity uncertainty is the important factor behind the emergence of institution. ‘ASEAN Way’ has remained a constant feature of ASEAN institutions. ASEAN Way derives from Southeast Asian cultural practices and sustains the domestic autonomy of ruling regimes. The principle of non-interference and search for accom-modation and consensus that has traditionally guided decision –making and the behavior in the association-ASEAN way has remained a constant feature of the institution.
Dominguez, in his chapter international cooperation in Latin America, argued that the international regional institution in Americas did not have a crafting moment or a master architect. The idea of international regionalism was a response to secu-rity problems in the immediate aftermath of Spanish American independence in the 1820s. He said that the Ideational legacy, differentiated subsystem within the Americas and the relative autonomy of the continent from the global international sys-tem is the key source of institution building in Latin America. In 1980sregion wide economic depression, the breakdown of authoritarian regimes and effects of the end of the cold war made changes in the international institution of the Americas and explain their characteristics. Dominguez also discussed his-torical rules of Inter-American institutions and said that Latin America‘s first key innovation in international law was uti possi-detis juris which turned existing administrative boundaries into international frontier after the departure of colonials powers. This rule addressed the security dilemma. The second rule, the defense of state sovereignty and international non-intervention in the domestic affairs of state. This rule became part of a Latin American crusade to contain the United States. Third rule was a commitment to activist intermediation preceding the formal establishment of the OAS. This ruled evolved in South America since the 1880s as one means to sustain the peace. The fourth intuitionalist rule was the laxity in implementation, signifying a gap between formal pledges and behavior. Laxity gave way to automaticity. The likelihood of regional and sub regional institu-tional effectiveness responds strongly to prior and independent structural and normative changes in the inter national system. INGO played significant role in assisting Latin America‘s democ-ratization. Changes in the preferences of actors affected how they used the institution and how they complied with their decisions. The presence of distributional problems affects the likelihood of success of international economic institution. Dominguez argued that Latin Americans have been international rule inno-vators. They are not just price taker. They develop the doctrine of uti possidetis juris a century before its spread throughout Africa,
Asia, and the former Soviet Union. They pioneered the defense of ‘’hard shell’’ notion of sovereign and the non-intervention.
Jeffrey Herbst discussed the crafting regional cooperation in Africa. He argued that Regional cooperation is largely initiated in Africa to promote the security and interest of rulers, rather than the more generally assumed goals of increasing the size of economic markets, ensuring the right of citizens. African lead-ers have always looked to the international system as a source of domestic power. Type of cooperation is fail in Africa actually does challenge the sovereignty. African leaders cooperate when it is in interest. African leaders are extremely enthusiastic about particular type of regional cooperation, especially those that highlight sovereignty, help secure national leaders and ask lit-tle in return. These desired lead to a particular style of regional cooperation that is effective in promoting domestic interest but not necessarily a normative improvement over other paths.
In the case of NATO, Schimmelfenning explored the vari-ation in institutional design and cooperation in post-cold war NATO. He described and categorized the elements of insti-tutional design in NATO partnership and the new NATO in comparison to the old, cold war NATO. The fact that post cold war NATO has changed and differentiated its institutional design and exhibited highly different degrees of members state cooperation. He argued that the constant features of NATO’s institutional design (liberal ideology, high member state control, and low agent autonomy) can be attributed to the liberal identity of the transatlantic community and the hegemonic structure of its membership. He explained, these three NATOs are differ in terms of membership, scope, formal rules: control and flexibility, norms, mandate, agent autonomy,. In the post-COLD war era, NATO has become more flexible and developed an open-ended and process-oriented partnership with the countries of central and Eastern Europe. The more flexible design institutional design of POST–COLD war NATO, which allows for varying degrees of cooperation NATO members and partners. thus variation and changes in the institutional design of POST-COLD WAR NATO, the more open diffuse, and process oriented partnership and more flexible. The new NATO can be plausibly understood as functional responses to the challenges of the POST-COLD war era. In the case of institutional design and international coop-eration in NATO, the identity of euro-Atlantic community that shapes both the norms of NATO(institutional design) and the extent of policy convergence(cooperation).
Barnett and Solingen’s chapter dealt with Arab League; they argued that Arab league has achieved a relatively low level of cooperation. They suggested several reasons for the relatively cooperation. First, the league of Arab states was the first regional organization established after 1945. Second, its members share a common language, identity and culture. Third, and there is

103
Sarad Kumar Yadav
Vol 6 | Issue 2 | April-June 2014 | www.gjeis.org GJEIS | Print ISSN: 0975-153X | Online ISSN: 0975-1432
arguable shared threat in Israel and continuing suspicions of the west. Fourth, there have been expectations of joint gains from trade and commerce. They identified Identity and domestic poli-tics is important factor for weak cooperation among Arab states and an institutional design. The domestic survival of ruling coa-lition is always a critical consideration in the design of the Arab league. They identified the two key variables Arabism and stat-ist interests are critical to explain the design of the Arab league and its low level of cooperation. During the 1980s the decline of identity and the rise of international market forces, international institution pressures, new domestic coalition reflecting among other demand for foreign investment and financial assistance, and growing interest in regional cooperation outside of the Arab league as key determinants of regional institution. These changes gave the new possibilities of regional cooperation in Arab.
Jeffrey Checkel discussed the European Union experience. The author’s central focus is that how institutional design affects the degree of cooperation in European regional organizations. In this regard Checkel discussed the three generic mechanism, strategic calculation, role playing and normative suasion that
can provide casual micro-foundation to arguments connecting regional institution and cooperation. Persuasion. domestic vari-ables, the embeddedness of agents in pre-existing national norms and values play a central role in determining the degree of coop-eration in European institution. European institutions in many ways –their design, effectiveness, domestic impact are different from their counterparts in other world region.
So we saw that the book dealt with different individual regional organization. Each author tried to explain that how institutional designing of organization affect the nature of cooperation and how independent variables plays an important role to determin-ing the institutional design and nature of cooperation. This book is very useful for international organization students. The book suggested many important questions for future research like why do different features of institutions satisfy leaders with the same concerns with domestic politics. Furthermore, why do countries with different domestic political environments want the same features of regional institutions? The book represents a major contribution to theories of international institutions.

104
BOOK REVIEWNancy Rao
Research Scholar
Department of Commerce, Delhi School of Economics
New Delhi, India
Governance, Ethics and Social Responsibility of Business
J P. Sharma
Citation
Sharma, J P (2014). Governance, Business Ethics and Social Responsibility of Business, Ane Publishing House Pvt. Ltd.
ReviewCorporate governance, ethics and corporate social responsibil-ity have become topics of worldwide importance in the present times. In the globalised business environment a host of compli-cated issues are being raised and business cannot be unethical due to a lot of environmental pressures and market forces. A number of corrective measures and interventions form government and regulatory authorities have been introduced as measure good governance.
The author has come up with the special edition of this book on Governance, Business Ethics and Social Responsibility of Business as per the new syllabus of B.Com (Hons.) of the University of Delhi. This book has been written specifically for the students of semester mode of University of Delhi in accord-ance with the prescribed syllabus.
The book provides an introduction to business ethics, CSR and important issues and reforms in the area of corporate gov-ernance. Governance is a subject that is constantly evolving under the influence of new legislations, reforms and the impact of global codes and practices on good governance. The book
has been divided into eight chapters. The chapters in the book includes politics and ethics, principles and theories of business ethics, corporate governance, major corporate scandals, codes and standards on corporate governance, corporate social respon-sibility. Each concept has been explained in a detailed manner.
There are many pedagogical features of the book worth mentioning. The book has been written in simple and easy to understand language. The subject matter has been presented in student-friendly, systematic and intelligible manner. Simple and reader-friendly style has been used by the author while writing this book. Each lesson has a list of carefully selected questions that will help the students revisit and apply the learning in criti-cal fashion. So the book authored by Prof. J.P Sharma, completely serves the purpose of providing reading material for the students who want to acquaint themselves with the particular subject. This book attempts to present the complicated subject of Corporate Governance, Ethics and corporate social responsibility in an eas-ily comprehensible manner.
The book is ideal for self study and makes the learning a pain-less exercise. The book is completely students friendly, interesting and worth reading.
Global Journal of Enterprise Information SystemG J E I S
GJEIS | Print ISSN: 0975-153X | Online ISSN: 0975-1432Vol 6 | Issue 1 | January-March 2014 | www.gjeis.org
DOI: 10.15595/gjeis/2014/v6i2/51854

105
Biographical Note of the Luminary in an Area of IS
Arun Kumar , Authority on Dr. Stephen Covey’s “The 7 Habits of Highly Effective People”
Dr. Arun KumarSr. Faculty of IT at University of Allahabad
Website: http://arunk.com Address: 25/19 L.I.C. Colony,Tagore Town, Allahabad, India
Mobile :+91-9415217841 +91-9415217841 E-mail : [email protected]
Dr. Arun Kumar is an acclaimed academician with his excel-lent academic credentials. He is Associate Professor in the Department of Commerce and Business Administration, University of Allahabad and an Accredited Management Teacher (AMT) from AIMA. He is Corporate Trainer, Information Systems Auditor (CISA), and Quality Auditor (ISO 9001:2000) and is continuously researching, writing and lecturing for more than two decades. He has authored many books for CA, CS and CMA Examinations and has invented the wheel of professional examinations in the form of “Scanner”. Behooving his area of specialization, he has authored nine books and twenty one papers.
He has array of experience of organizing and steering occa-sions like workshops, seminars, meets, training programs, talks,
presentations at the university and corporate level, both. He has distinguished and consequential contribution in this area. He is an authority on Dr. Stephen Covey’s “The 7 Habits of Highly Effective People”.
Dr. Kumar believes in structured thinking with areas of spe-cialization of Application of Information and Communication Technologies in Business, Organizational and Personal Effectiveness, and Quality Management Systems. He has a differ-entiable knack of learning and teaching the vast line of subjects. Very popular and very much esteemed amid the students. He is member of many a prestigious institutions of India. People who have the occasion to interact with him claim to have enriched and effective lives. The more he has contributed, the more he is solicitous for.
Global Journal of Enterprise Information SystemG J E I S
GJEIS | Print ISSN: 0975-153X | Online ISSN: 0975-1432Vol 6 | Issue 2 | April-June 2014 | www.gjeis.org
DOI: 10.15595/gjeis/2014/v6i2/51855
Great Enterprise Contribution to Society in Information System Perspectives
Experiential Learning through Simulation Games
www.mantis.co.in
+91 98186 31280
Global Journal of Enterprise Information SystemG J E I S
GJEIS | Print ISSN: 0975-153X | Online ISSN: 0975-1432Vol 6 | Issue 2 | April-June 2014 | www.gjeis.org
About MantisMantis is the country’s only organisation devoted solely to simu-lation games for management and other areas of education. It has developed the widest range in games in India in terms of complexity, objectives, and range of scenarios. Such games are powerful interactive and exciting exercises whose participants get to understand complex, abstract and multidisciplinary issues with ease and great speed.
Learning and Competiting through Simulation GamesA simulation is a replica or a narration of either, a portion or the entire human or other activity, process or event. That event could have happened in the past or would be an imagined out-put of its creator. A photo, a story, a stage play, a feature film, a role play, a toy car, and a case study are all examples of a simula-tion. A simulation is always smaller than the original situation it replicates. The learning objective is to build more awareness and understanding about the processes in that activity.
A game is a contest between humans or other living creatures, or teams of such individuals, in an effort to acquire something rare under a set of rules clearly understood by the game players. Every game uses a unique set of instruments and scoring system. Cricket, kho-kho, bridge, and carom are games. The objec-tive of the game players is to win by scoring more than other competitor/s in the game.
A simulation game has characteristics of both the simula-tion and the game. Chess simulates war, and Monopoly simulates business. Therefore, both are simulation games. The objective of such players is to build their understanding about its processes and to build their abilities (into skills) such as analysis, forecast-ing, planning and decision making by measuring both situational and competitive conditions in the game.
A business simulation game focuses on learning about busi-ness issues such as technology and product manufacturing, while
a management simulation game focuses on learning about man-agement issues such as making decisions, resources, planning, analysis, review, customer behaviour, and managing perfor-mance, irrespective of the nature of business.
Variety and Track RecordMANTIS is named after the six-limbed insect known for its inexhaustible patience, lightning speed of response, and extreme daring: traits that are vital for learning by any human being in any domain. Its games are conducted in two forms: competi-tions and learning programmes. It has made and conducted such games for over 13,000 career managers and students of manage-ment and engineering.
Its games have served big and small firms, management schools, engineering institutes, and universities across India and Dubai. IceBreaker, BRANDISH, HeadStart, Business Insight, MyFirm, TAPI, MINT, Mastery, and InGenius are some of its most popular games. It has produced games in marketing man-agement (BRANDISH, 2005), project management (TAPI, 2009), banking (MINT, 2010), and PowerStation (2011) for NTPC.
Ownership and ManagementMANTIS was founded in 2003, and is managed by Dr. Vinod Dumblekar with inputs from other professionals, academics, and game masters in India and abroad. He is a trainer, researcher, multi-disciplinary consultant, and management teacher. He holds a post-graduate degree in business administration (MBA) and a doctorate (Ph D) in management psychology. He teaches strategy and related courses for post-graduate management stu-dents. He serves as a mentor to his students in their start-ups, and has been a regular panellist judge for business plans at man-agement schools and IITs.
Vinod Dumblekar has over three decades of extensive managerial and entrepreneurial experience in commercial and
106
DOI: 10.15595/gjeis/2014/v6i2/51856

107
Vinod Dumblekar
Vol 6 | Issue 1 | January-June 2014 | www.gjeis.org GJEIS | Print ISSN: 0975-153X | Online ISSN: 0975-1432
merchant banking, finance and financial services, information technology and management education. He has held a variety of senior positions as the manager of a commercial bank, profes-sor, president, and director in different organisations. He advises business enterprises, K-12 schools, and educational institutes. He has written a book, and has published papers on simulation games, marketing, finance, learning, and management psychol-ogy. His papers on simulation games were presented at and
published for conferences at Munich, Atlanta, Singapore, and Thailand.
Vinod Dumblekar is the only Indian on the Advisory Council of the International Simulation and Gaming Association (http://www.isaga.info/sc-full.htm). He is the General Secretary of the Indian Simulation and Gaming Association. He is India’s most experienced authority and only researcher in learning in soft-ware-based simulation games.

108
Global Journal of Enterprise Information SystemG J E I S
‘BEST DIRECTOR AWARD’ to Dr. Jitendra K. Das, Director, FORE School of Management
Dr. Jitendra K. Das, Director of FORE School of Management, New Delhi has bagged the Best Director Award at the Asian Education Leadership Awards. The awards ceremony was held on 24th September 2013 at Movenpick Hotel, Jumeirah Beach, Dubai and attracted the best in the field of management from all over Asia. It’s a feather in the cap, not only for the prolific academician, but for one of the most renowned B schools in the country as well.
Dr. Das is quick to give credit to his institution, as he says, “I am privileged to be part of FORE School of Management, New Delhi, which continuously strives to make a niche for itself. This award is recognition for all the work the institute has been doing. I am elated to receive the award on the behalf of the institute and the entire FORE family that works towards the goal of creating a unique space for itself in the management school environment.”
The Asian Leadership Awards are all about super achievers and future leaders in the world of business. The event attracts and acknowledges high profile business leaders from all over the continent who have made a difference to the economic development of their countries. It also brings together leaders whose qualities have given a whole new meaning to nation building, especially in the post-recession period.
The Best Director Award falls under the Asian Education Leadership Awards, a category that holds huge importance considering it is all about contributions towards shaping careers of future management professionals. Recipients of awards in this category are those who make a difference to management students of today and prospective leaders of tomorrow.
Dr. Das concurs with the notion that awards for educationists directly relate to grooming of students at respective institutes. “It is generally believed that faculty makes a good B-school, thereby resulting in the overall development of the students so as to prepare them for the corporate world. The faculty at FORE School of Management, New Delhi has been trying tirelessly to prove this point,” he says.
Dr. Jitendra K. Das, Director, FORE School of Management, New Delhi wins the Best Director Award at the Asian Education Leadership Awards 2013
GJEIS | Print ISSN: 0975-153X | Online ISSN: 0975-1432Vol 6 | Issue 2 | April-June 2014 | www.gjeis.org
DOI: 10.15595/gjeis/2014/v6i2/51857

109
‘BEST DIRECTOR AWARD’ to Dr. Jitendra K. Das
Vol 6 | Issue 2 | April-June 2014 | www.gjeis.org GJEIS | Print ISSN: 0975-153X | Online ISSN: 0975-1432
It is a known fact that the faculty members at FORE School of Management, New Delhi come from premier educational institu-tions and reputed business organisations. Many of them have published numerous research papers and have spearheaded several initiatives in various areas of management. Moreover, according to Dr. Das, “Faculty members are sent to national and international conferences. Faculty Development Programmes at international locations, with local academic partners, are organised to sharpen their skills.”
Together with a healthy student faculty ratio of 8:1, FORE ensures that best learning environment is created for future managers. The institute prides itself on the fact that it takes students on board when it comes to initiatives and activities related to their studies and future. Student concerns are also taken up on a priority basis, according to Dr. Das.
The award is an acknowledgement of these efforts taken by FORE School Of Management, New Delhi and its Director. But it has also served as encouragement for the institute to keep up the quality work it has been doing for student development. Dr. Das explains his institute’s vision for the future as he says, “We are taking new initiatives to involve students in various corporate assignments with the objective of them getting a valuable ‘on-the-job live experience’. We are encouraging students to work on new idea projects and plan to provide the initial funding. Later, the successful initiatives can be funded by external investors, for which we have initiated discussions.”
Clearly, the prestigious award is just the beginning for the institute and it’s Director. And that is definitely good news for present and future students of FORE School of Management, New Delhi.

110
Global Journal of Enterprise Information SystemG J E I S
A Brief Write Up of Rashtriya Shiksha Gaurav Puraskar – 2014 by CEGR to Dr. Urvashi Makkar
IMS Ghaziabad is proud to inform3that our Director – Dr. Urvashi Makkar has been conferred with Rashtriya Shiksha Gaurav Puraskar – 2014 by CEGR in recognition of her contribution in improving the quality of education, innovation, research and devel-opment.
Centre for Education Growth and Research (CEGR) – a premier organization in Education sodality dedicated towards qualitative, innovative and employability - enhancing education.
During the glittering Award ceremony which witnessed the delegates from Senior Government Officials, Leading Industrialists, Eminent Academicians, Researchers, Civil Societies and Top Corporate Houses, Chief Guest - Mr. Arif Mohammed Khan, Former Union Cabinet Minister conferred the award. Mr. Pawan Agarwal, Adviser (Higher Education) Planning Commission of India and Dr. K. P. Isaac, Member Secretary-AICTE were also the invited delegates.
GJEIS | Print ISSN: 0975-153X | Online ISSN: 0975-1432Vol 6 | Issue 2 | April-June 2014 | www.gjeis.org
DOI: 10.15595/gjeis/2014/v6i2/51858

111
Global Journal of Enterprise Information SystemG J E I S
International Innovation, Sustainability and Entrepreneurship Summit 201426th September, 2014 at IIT Delhiwww.i2ses.org
GJEIS | Print ISSN: 0975-153X | Online ISSN: 0975-1432Vol 6 | Issue 2 | April-June 2014 | www.gjeis.org
In today’s global economy, countries aim for economic competitiveness and technological advancement to accelerate social and economic transformation. Developed and developing countries increasingly recognize the value of technology and innovation as drivers of change in agriculture, land administration, education, ICT, health, energy and environment, water, transport and other sec-tors. The challenge for many is how to transform ideas to solutions that promote sustainable and inclusive growth. The international Summit on “Innovation, Sustainability & Entrepreneurship” aims to cover the whole spectrum of innovation and entrepreneurship from knowledge development, transfer to commercialization and utilization. It will deliberate on building public, private and social sector capacity to invest in innovative initiatives and technological advancements to maximize the growth potential. The Summit will also address the issue of promoting and diffusing Grass root innovations. Also, Innovation & Entrepreneur of the year Awards 2014 will be conferred on individuals, teams and organisations that have made significant contribution to economic, environmental, and social well-being through innovations and practical application of technological solutions.
International Innovation, Sustainability, and Entrepreneurship Summit (I2SES) is a joint initiative of Foundation for Innovation and Technology Transfer (FITT), the industrial interface of IIT Delhi, IIT Delhi Alumni Association (IITDAA), an organization engaged in enhancement of social utility of IIT Delhi, and Knowledge Resource Development & Welfare Group (KRDWG), a social benefit organization promoting inclusive economic growth and sustainable development.
EVENT VENUE CONTACT US PUBLICATION OF ARTICLE
Indian Institute of Technology, Delhi, Hauz Khas,
New Delhi-110016, INDIAwww.iitd.ac.in
KRDWGI2SES Secretariat Secular House ,
Ist Floor, 9/1,Aruna Asaf Ali Marg, OPP. JNU-East Gate, Qutub Institutional Area,
New Delhi-110067Email: [email protected]
www.krdwg.org
GJEIS Editorial OfficeBlock-C Room-18, SOMS
IGNOU, New Delhi-110068, IndiaEmail: [email protected]
www.gjeis.org

112
International Innovation, Sustainability and Entrepreneurship Summit 2014 (I2SES 2014)
Vol 6 | Issue 2 | April-June 2014 | www.gjeis.org GJEIS | Print ISSN: 0975-153X | Online ISSN: 0975-1432
Board of the Summit - (Chairperson)Prof. R. K. Shevgaonkar - Chairman Director of IIT Delhi
Mr. Ashok Kumar - Co-ChairmanInspector General of Police (IGP)President, IIT Delhi Alumni Association
Dr. Anil Wali, Co-Chairman Managing Director, Foundation for Innovation & Technology Transfer, IIT Delhi, India
Prof. Anuradha Sharma, Ex- Professor Emeritus, Indian Institute of Technology, New Delhi.
Board of the Summit - (Executive Board)Mr. P. SomarajanExecutive Consultant (Business Development), FITT, IIT Delhi
Ms. Aparna Saroagi, Vice President and Head, Market Risk Reporting and Controls, Global Investment Bank
Mr. Jagdeep Singh Dr. Subodh K. Kesharwani, Founder Editor, GJEISMr. Ajay AroraIndependent Distributer, Forever Living Product, Executive Member, KRDWG
Mr. Prateek Jain, Management Professional, Delhi
Board of the Summit - (Organizing Secretary - I2SES )Dr. Naresh Gill, Secretary, KRDWG
www.krdwg.org
Time Program08:30 am – 09:00 am Registration/morning coffee09:00 am – 09:10 am Inauguration09:10 am – 10: 45 am Session 1: Kick off
- Innovation & Entrepreneurship for sustainable and inclusive growth - Inclusive Innovation - Presentation of Summit Paper
10:45 am – 11: 00 am Coffee Break11: 00 am – 01: 00 pm Session 2: Innovation & Technology
- Technologies for sustainable economy with future-oriented innovations and developments- Transferring Knowledge for Innovation and Technology - Managing Innovations & Technology
01:00 pm – 02:00 pm Networking Lunch02:00 pm – 04:00 pm Session 3: Innovators Session
- Business Model Innovation - Systems, Services and Design Innovation - Grass root Innovators
04:00 pm – 04:15 pm Coffee Break04:15 pm – 06:15 pm Session 4: Entrepreneurs Session
- Building an entrepreneurial ecosystem - Creating tomorrow’s game changers - Trends Today: the success stories
06:15 pm Vote of thanks followed by High Tea

Global Journal of Enterprise Information SystemSubscription Order Form 2014
Subscribe today and receive your copy of Global Journal of Enterprise Information System!
Subcription Rates for the year 2014
Version Subscription Price Online Rs. 2247 Print + Online Rs. 3747 Print only (Please check the box for subscription)
1. Online Access is rolling year based2. Perpetual access to subscribed year content3. Print subscription is calendar year based4. Orders will be accepted against advance payment only
To start your subscriptions please fill out and return the form below and send the payment to:
Terms & Conditions:

Journal of Tourism:A Contemporary Perspective
ANVESHAK-International Journal of Management
IBMRD’sJournal of Management & Research
MetamorphosisA Journal of Management Research
SDMIMDJournal of Management
Journal of Management Research Global Journal of Enterprise Information System