
university of turkish aeronautical association
85
UNIVERSITY OF TURKISH AERONAUTICAL ASSOCIATION INSTITUTE OF SCIENCE AND TECHNOLOGY IMPLEMENTATION AND PERFORMANCE EVALUATION OF DISTRIBUTED POWER FLOW CONTROLLER (DPFC) TO IMPROVE POWER QUALITY IN POWER TRANSMISSION SYSTEM MASTER THESIS Ali Mohammed Ibrahim AL-HARDANEE ELECTRICAL AND ELECTRONICS ENGINEERING DEPARTMENT MASTER THESIS PROGRAM NOVEMBER, 2017
-
Upload
khangminh22 -
Category
Documents
-
view
1 -
download
0
Transcript of university of turkish aeronautical association

UNIVERSITY OF TURKISH AERONAUTICAL ASSOCIATION INSTITUTE OF SCIENCE AND TECHNOLOGY
IMPLEMENTATION AND PERFORMANCE EVALUATION OF DISTRIBUTED POWER FLOW CONTROLLER (DPFC) TO IMPROVE
POWER QUALITY IN POWER TRANSMISSION SYSTEM
MASTER THESIS
Ali Mohammed Ibrahim AL-HARDANEE
ELECTRICAL AND ELECTRONICS ENGINEERING DEPARTMENT
MASTER THESIS PROGRAM
NOVEMBER, 2017

UNIVERSITY OF TURKISH AERONAUTICAL ASSOCIATION INSTITUTE OF SCIENCE AND TECHNOLOGY
IMPLEMENTATION AND PERFORMANCE EVALUATION OF DISTRIBUTED POWER FLOW CONTROLLER (DPFC) TO IMPROVE
POWER QUALITY IN POWER TRANSMISSION SYSTEM
MASTER THESIS
Ali AL-HARDANEE
1406030017
IN PARTIAL FULFILLMENT OF THE REQUIREMENT FOR THE DEGREE OF MASTER OF SCIENCE IN ELECTRICAL AND
ELECTRONIC ENGINEERING
Thesis Supervisor: Prof. Dr. Doğan ÇALIKOĞLU


iv
ACKNOWLEDGEMENTS
In the name of ALLAH, the most Gracious, the Most Merciful for giving me the strength to complete this work in its final form. My Lord mercy and peace be upon our leader MOHAMMED peace be upon on him, who invites us to science and wisdom, and members of his family and his followers.
I would like to express gratitude to my supervisor, Prof. Dr. Doğan ÇALIKOĞLU for his patience, encouragement, useful advice, discussion, comments and understanding my situation. He gave me opportunities to present my work in front of experts in the field.
I would like to thank all my colleagues and the M.Sc. Studies staff members of the Department of Electrical and Electronics Engineering, University of Turkish Aeronautical Association.
I would like to thank my parents supporting me throughout my academic career. Without their moral support, interest, and encouragement for my academic work, the completion of this effort would not have been possible. Thanks to my brothers, sisters, family and friends.
I would like to express my profound gratitude to my sons Yousif, Tuqa, Rzan and Rwan, for every time they needed me but I wasn’t there. For missing me throughout my study.
The most of all my sincere love and infinite appreciation goes to my wife, for being everything in my life, for his patience, supporting and invaluable assistance.
Last, but not least my thanks go to all people who have supported this research directly or indirectly.
November 2017 Ali, Al-HARDANEE

v
LIST OF CONTENTS
ACKNOWLEDGEMENTS ....................................................................................... iv LIST OF CONTENTS ................................................................................................ v LIST OF TABLES .................................................................................................... vii LIST OF FIGURES ................................................................................................. viii LIST OF ABBREVIATIONS ..................................................................................... x ABSTRACT .............................................................................................................. xii ÖZET ....................................................................................................................... xiv CHAPTER ONE ....................................................................................................... 1 1. INTRODUCTION ................................................................................................ 1
1.1 Presentation of Work ...................................................................................... 1 1.2 Literature Survey ............................................................................................ 2 1.3 Problem Formulation ...................................................................................... 4 1.4 Objective of Thesis ......................................................................................... 5 1.5 Organization of Thesis ................................................................................... 6
CHAPTER TWO ...................................................................................................... 7 2. POWER FLOW CONTROLLING DEVICES.................................................. 7
2.1 Introduction .................................................................................................... 7 2.2 Power Flow Theory ........................................................................................ 8 2.3 Definition of Facts ........................................................................................ 10 2.4 Possible Benefits of FACTS Technology .................................................... 10 2.5 Technological Features ................................................................................ 10
2.5.1 First Generation ................................................................................. 11 2.5.2 Second Generation ............................................................................. 11
2.6 Configurations of Facts-Devices .................................................................. 11 2.6.1 Model of Shunt devices controllers/Static Synchronous
Compensator STATCOM .................................................................. 11 2.6.2 Model of Series Devices Controllers SSSC ...................................... 13 2.6.3 Model of Combined Shunt and Series Devices/ Unified Power
Flow Controller UPFC ...................................................................... 14 CHAPTER THREE ................................................................................................ 16 3. DISTRIBUTED POWER FLOW CONTROLLER DPFC ............................ 16
3.1 Distributed Power Flow Controller DPFC ................................................... 16 3.2 Working Principle of DPFC ......................................................................... 17
3.2.1 Power Exchange and DC Link Elimination ...................................... 18 3.2.2 The DPFC Advantages ...................................................................... 20
3.3 DPFC Explanation and Equivalent Circuit .................................................. 21 3.4 Steady – State Analysis of DPFC ................................................................. 22 3.5 DPFC Control Circuit ................................................................................... 24
3.5.1 Central Control .................................................................................. 24 3.5.2 Shunt Control ..................................................................................... 25 3.5.3 Series Control .................................................................................... 25

vi
CHAPTER FOUR ................................................................................................... 27 4. DPFC MODELING AND CONTROL DESIGN ............................................ 27
4.1 Introduction .................................................................................................. 27 4.2 Modeling of DPFC ....................................................................................... 27
4.2.1 Network Modeling ............................................................................. 28 4.2.1.1 Fundamental frequency network modeling ......................... 28 4.2.1.2 Third harmonic frequency network modeling ..................... 29
4.2.2 Shunt Converter Modeling ................................................................ 30 4.2.2.1 AC side modeling ................................................................ 31 4.2.2.2 DC side modeling ................................................................ 31
4.2.3 Series Converter Modeling ................................................................ 32 4.2.3.1 AC side modeling ................................................................ 33 4.2.3.2 DC side modeling ................................................................ 33
4.3 DPFC Control ............................................................................................... 34 4.3.1 Shunt Control ..................................................................................... 35 4.3.2 Series Control .................................................................................... 36
CHAPTER FIVE ..................................................................................................... 38 5. SIMULATION AND RESULTS ....................................................................... 38
5.1 Introduction .................................................................................................. 38 5.2 Steady-State Analysis ................................................................................... 38 5.3 Network Simulation Model Without DPFC ................................................. 39 5.4 Network Simulation Model with DPFC ....................................................... 42
5.4.1 Power Flow Control by Using DPFC with Two Series Converters Per Phase ......................................................................... 42 5.4.1.1 DPFC converter specifications ............................................ 43 5.4.1.2 Shunt converter and shunt control ....................................... 45 5.4.1.3 Series Converter and Series Control .................................... 47
5.4.2 Steady-State Analysis Results ........................................................... 48 5.4.3 Power Flow Controllability By Using DPFC With Two Series
Converters Per Phase ......................................................................... 50 5.4.4 Power Flow Controllability by Using DPFC With Three Series
Converters Per Phase ......................................................................... 52 5.5 Step Response Results .................................................................................. 56 5.6 Dynamic Performance of DPFC .................................................................. 59
CHAPTER SIX ....................................................................................................... 64 6. CONCLUSION ................................................................................................... 64
6.1 Conclusion .................................................................................................... 64 6.2 Future Scope ................................................................................................. 65
REFERENCES ........................................................................................................ 66 CURRICULUM VITAE ......................................................................................... 69
vii
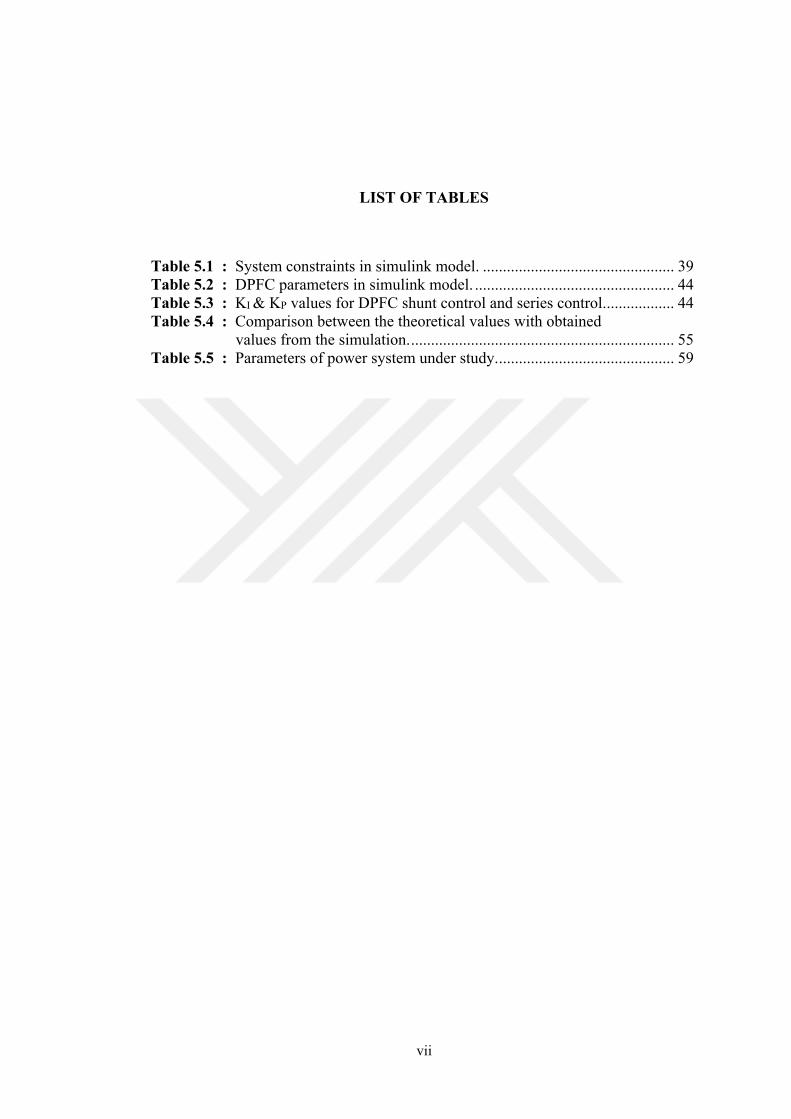
LIST OF TABLES
Table 5.1 : System constraints in simulink model. ................................................ 39 Table 5.2 : DPFC parameters in simulink model. .................................................. 44 Table 5.3 : KI & KP values for DPFC shunt control and series control. ................. 44 Table 5.4 : Comparison between the theoretical values with obtained
values from the simulation. .................................................................. 55 Table 5.5 : Parameters of power system under study. ............................................ 59
viii
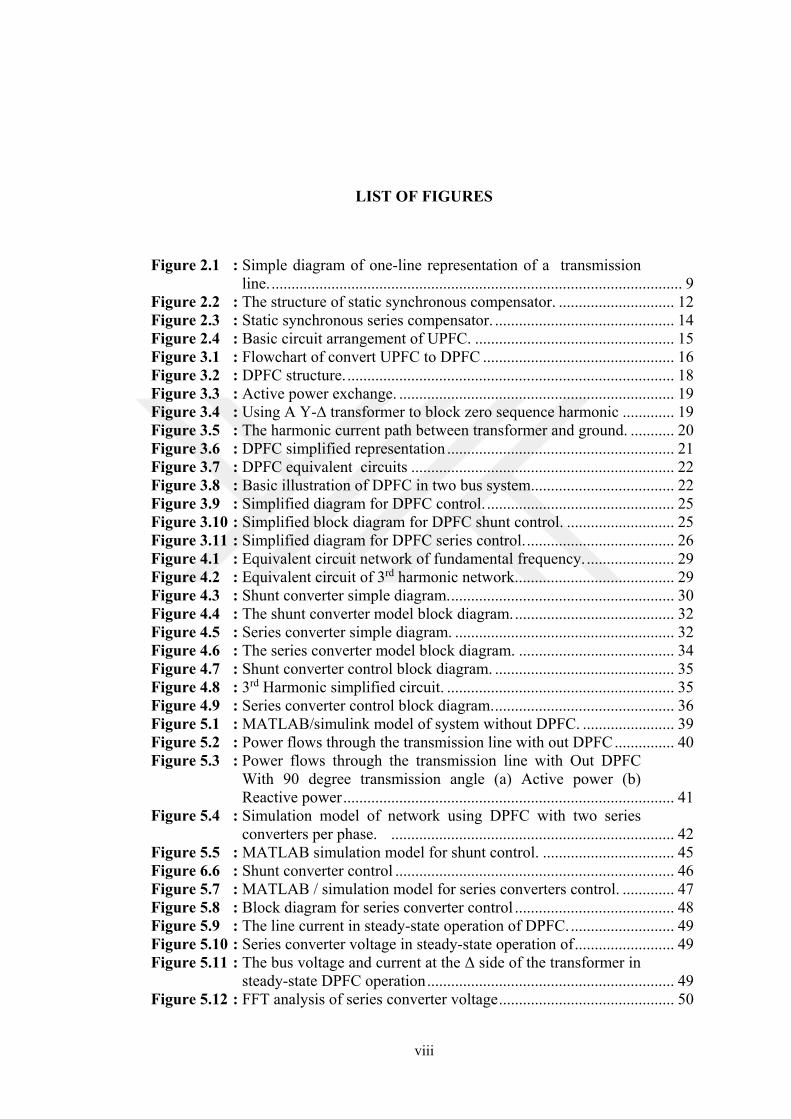
LIST OF FIGURES
Figure 2.1 : Simple diagram of one-line representation of a transmission line. ....................................................................................................... 9
Figure 2.2 : The structure of static synchronous compensator. ............................. 12 Figure 2.3 : Static synchronous series compensator. ............................................. 14 Figure 2.4 : Basic circuit arrangement of UPFC. .................................................. 15 Figure 3.1 : Flowchart of convert UPFC to DPFC ................................................ 16 Figure 3.2 : DPFC structure. .................................................................................. 18 Figure 3.3 : Active power exchange. ..................................................................... 19 Figure 3.4 : Using A Y-∆ transformer to block zero sequence harmonic ............. 19 Figure 3.5 : The harmonic current path between transformer and ground. ........... 20 Figure 3.6 : DPFC simplified representation ......................................................... 21 Figure 3.7 : DPFC equivalent circuits .................................................................. 22 Figure 3.8 : Basic illustration of DPFC in two bus system .................................... 22 Figure 3.9 : Simplified diagram for DPFC control. ............................................... 25 Figure 3.10 : Simplified block diagram for DPFC shunt control. ........................... 25 Figure 3.11 : Simplified diagram for DPFC series control. ..................................... 26 Figure 4.1 : Equivalent circuit network of fundamental frequency. ...................... 29 Figure 4.2 : Equivalent circuit of 3rd harmonic network. ....................................... 29 Figure 4.3 : Shunt converter simple diagram. ........................................................ 30 Figure 4.4 : The shunt converter model block diagram. ........................................ 32 Figure 4.5 : Series converter simple diagram. ....................................................... 32 Figure 4.6 : The series converter model block diagram. ....................................... 34 Figure 4.7 : Shunt converter control block diagram. ............................................. 35 Figure 4.8 : 3rd Harmonic simplified circuit. ......................................................... 35 Figure 4.9 : Series converter control block diagram. ............................................. 36 Figure 5.1 : MATLAB/simulink model of system without DPFC. ....................... 39 Figure 5.2 : Power flows through the transmission line with out DPFC ............... 40 Figure 5.3 : Power flows through the transmission line with Out DPFC
With 90 degree transmission angle (a) Active power (b) Reactive power ................................................................................... 41
Figure 5.4 : Simulation model of network using DPFC with two series converters per phase. ....................................................................... 42
Figure 5.5 : MATLAB simulation model for shunt control. ................................. 45 Figure 6.6 : Shunt converter control ...................................................................... 46 Figure 5.7 : MATLAB / simulation model for series converters control. ............. 47 Figure 5.8 : Block diagram for series converter control ........................................ 48 Figure 5.9 : The line current in steady-state operation of DPFC. .......................... 49 Figure 5.10 : Series converter voltage in steady-state operation of ......................... 49 Figure 5.11 : The bus voltage and current at the Δ side of the transformer in
steady-state DPFC operation .............................................................. 49 Figure 5.12 : FFT analysis of series converter voltage ............................................ 50
ix
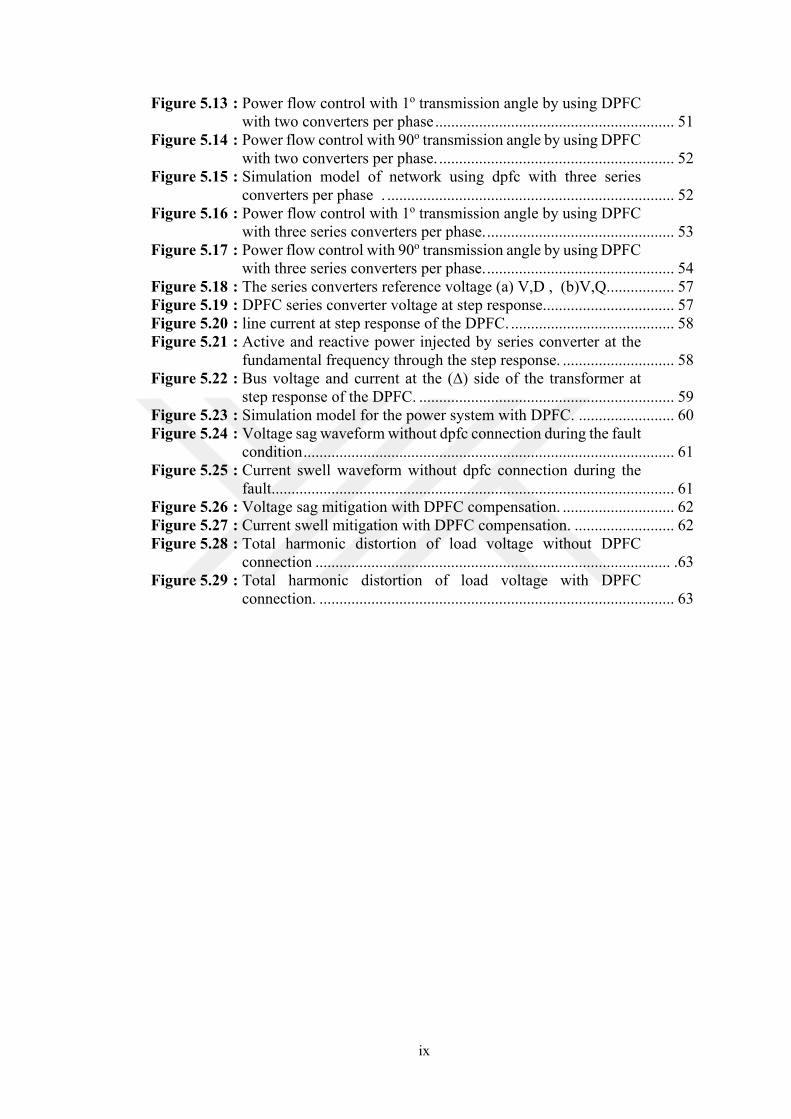
Figure 5.13 : Power flow control with 1o transmission angle by using DPFC with two converters per phase ............................................................ 51
Figure 5.14 : Power flow control with 90o transmission angle by using DPFC with two converters per phase. ........................................................... 52
Figure 5.15 : Simulation model of network using dpfc with three series converters per phase . ........................................................................ 52
Figure 5.16 : Power flow control with 1o transmission angle by using DPFC with three series converters per phase. ............................................... 53
Figure 5.17 : Power flow control with 90o transmission angle by using DPFC with three series converters per phase. ............................................... 54
Figure 5.18 : The series converters reference voltage (a) V,D , (b)V,Q. ................ 57 Figure 5.19 : DPFC series converter voltage at step response. ................................ 57 Figure 5.20 : line current at step response of the DPFC. ......................................... 58 Figure 5.21 : Active and reactive power injected by series converter at the
fundamental frequency through the step response. ............................ 58 Figure 5.22 : Bus voltage and current at the (∆) side of the transformer at
step response of the DPFC. ................................................................ 59 Figure 5.23 : Simulation model for the power system with DPFC. ........................ 60 Figure 5.24 : Voltage sag waveform without dpfc connection during the fault
condition ............................................................................................. 61 Figure 5.25 : Current swell waveform without dpfc connection during the
fault ..................................................................................................... 61 Figure 5.26 : Voltage sag mitigation with DPFC compensation. ............................ 62 Figure 5.27 : Current swell mitigation with DPFC compensation. ......................... 62 Figure 5.28 : Total harmonic distortion of load voltage without DPFC
connection ......................................................................................... .63 Figure 5.29 : Total harmonic distortion of load voltage with DPFC
connection. ......................................................................................... 63

x
LIST OF ABBREVIATIONS
Pq : Power quality Facts : Flexible alternating current transmission system Dpfc : Distributed power flow controller Upfc : Unified power flow controller Svc : Static var compensator Thd : Total harmonic distortion Statcom : Static synchronous compensator Sssc : Synchronous Series Compensator Controller Cse : Capacitor connected to series converter Csh : Capacitor connected to shunt converter I : Line Current I* : Conjugate of line current Ir : Receiving end current Ish : Shunt current IA : Current through phase A IB : Current through phase B IC : Current through phase C Ii : ith harmonic current L : Inductance of the transmission line per phase L3 : Equivalent Inductance of the transmission line per phase 3rd harmonic
frequency Pr : Active power at the receiving end of compensated line Pro : Active power at the receiving end Pse,1 : Active power exchanged by series converter at fundamental frequency Pse,3 : Active power exchanged by series converter at 3rd harmonic frequency Psh,1 : Active power exchanged by shunt converter at fundamental frequency Psh,3 : Active power exchanged by shunt converter at 3rd harmonic frequency Pr,c : Active power control range of DPFC Qr : Reactive power at the receiving end of compensated line Qro : Reactive power at the receiving end Qse,1 : Reactive power exchanged at fundamental harmonic frequency Qse,3 : Reactive power exchanged by series converter at 3rd harmonic frequency Qr,c : Reactive power control range of DPFC R : Resistance of the transmission line per phase R3 : Equivalent resistance of the transmission line per phase at 3rd harmonic
frequency refv,se : Reference input to series converter refv,se,1 : Reference input to series converter at fundamental frequency refv,se,3 : Reference input to series converter at 3rd harmonic frequency refv,se,1,d : d-axis component of reference input to series converter at fundamental
frequency

xi
refv,se,1,q : q-axis component of reference input to series converter at fundamental frequency
refv,se,3,d : d-axis component of reference input to series converter at 3rd harmonic frequency
refv,se,3,q : q-axis component of reference input to series converter at 3rd harmonic frequency
refv,sh : Reference input to shunt converter refv,sh,1 : Reference input to shunt converter at fundamental frequency refv,sh,3 : Reference input to shunt converter at 3rd harmonic frequency refv,sh,1,d : d-axis component of reference input to shunt converter at fundamental
frequency refv,sh,1,q : q-axis component of reference input to shunt converter at fundamental
frequency refv,sh,3,d : d-axis component of reference input to shunt converter at 3rd harmonic
frequency refv,sh,3,q : q-axis component of reference input to shunt converter at 3rd harmonic
frequency Sr : Apparent power in compensated network Sro : Apparent power in uncompensated network Sr,c : Control range of DPFC Vs : Sending end bus voltage Vr : Receiving end bus voltage VDC : DC voltage of the converter Vse : Series converter voltage Vi : ith harmonic voltage Vsh,1 : Shunt voltage at fundamental frequency Vsh,3 : Shunt voltage at 3rd harmonic voltage Vse,1,ref : Fundamental reference voltage of series converter Vsh,i : Shunt voltage at ith harmonic frequency Vse,i : Series voltage at ith harmonic frequency ω : Angular velocity X : Inductive impedance XC : Capacitive reactance Xi : Reactance at ith harmonic voltage Xsh,1 : Shunt converter reactance at fundamental frequency Xsh,3 : Shunt converter reactance at 3rd harmonic frequency Z : Impedance of the transmission line Z3 : Impedance of the transmission line at 3rd harmonic frequency θ : Transmission angle δ : Phase angle of the impedance Øi : Phase angle between Vi and Ii
θ3 : Phase angle difference between the voltages Vsh,3 and Vse,3
αd : Bandwidth of d-compoment αq : Bandwidth of q-compoment

xii
ABSTRACT
IMPLEMENTATION AND PERFORMANCE EVALUATION OF DISTRIBUTED POWER FLOW CONTROLLER (DPFC) TO IMPROVE
POWER QUALITY IN POWER TRANSMISSION SYSTEM
AL-HARDANEE, Ali Mohammed
Master, Department of Electrical and Electronics Engineering
Thesis Supervisor: Prof. Dr. Doğan ÇALIKOĞLU
NOVEMBER 2017, 69 pages
The basic function of the electrical power system is to deliver electricity to the
consumer efficiently. This system deals with the electric power from generation to
consumption passing through transmission and distribution. The rate of the electrical
energy that is transferred within the transmission lines of the power system is known
as ‘Power Flow’. For more clarity, it is the amount of active and reactive power that
flows in the power transmission lines. When there is a problem with the power flow it
causes a problem in the electrical power quality. For this reason, there is a great need
to control the power flow in the transmission lines in order to avoid overloading.
The main objective of this study is to evaluate the performance for one of flexible
AC transmission system (FACTS) devices which is used to control power flow through
transmission system and to solve the power quality problems. This device called
Distributed Power Flow Controller (DPFC). It is one of the best devices which is used
to control power flow and to improve electrical power quality.
This device is developed and introduced recently as a power flow controller
instrument inside the FACTS family devices. The use of DPFC offers higher reliability
and lower cost than the others facts devices. DPFC is derived from UPFC and it has
the capability at the same time to regulate all power system parameters such as
transmission angle, the line impedances and the bus voltage magnitude. The
performance evaluation of DPFC to control power system flow and to improve power

xiii
quality is demonstrated in MATLAB/ SIMULINK through simulation at different
operating conditions.
Keywords: Distributed Power Flow Controller, Power Quality, Power Flow Control,
Facts Devices, Voltage Sag, Current Swell.

xiv
ÖZET
GÜÇ İLETİM SİSTEMİNDE GÜÇ KALİTESİNİ GELİŞTİRMEK İÇİN DAĞITIM GÜCÜ AKIMI KONTROLÖRÜNÜN (DPFC) UYGULAMA VE
PERFORMANS DEĞERLENDİRMESİ
AL-HARDANEE, Ali Mohammed
Yüksek Lisans, Elektrik ve Elektronik Mühendisliği Bölümü
Tez Danışmanı: Prof. Dr. Doğan ÇALIKOĞLU
KASIM 2017, 69 sayfa
Elektrik güç sisteminin temel işlevi, tüketiciye verimli bir şekilde elektrik
iletmektir. Bu sistem, jeneratörden, tüketime, iletim ve dağıtım yoluyla geçen elektrik
enerjisini ele alıyor. Güç sisteminin iletim hatlarında iletilen elektrik enerjisine oranı
'Güç Akışı' olarak bilinir. Bunun açıklaması; güç aktarma hatlarında akan aktif ve
reaktif güç miktarıdır. Güç akışı ile ilgili bir problem olduğunda, elektriksel güç
kalitesinde bir probleme neden olur. Bu nedenle aşırı yüklenmeyi önlemek için iletim
hatlarındaki güç akışını kontrol etmek büyük bir ihtiyaçtır.
Bu çalışmanın temel amacı; iletim sisteminde güç akışını kontrol etmek ve güç
kalitesi problemlerini çözmek için kullanılan, esnek AC iletim sistemi (FACTS)
cihazlarından birinin performansını değerlendirmektir. Bu cihaz Güç Dağıtımı Akış
Kontrol Cihazı (DPFC) olarak adlandırılır. Güç akışını kontrol etmek ve elektrik güç
kalitesini artırmak için kullanılan en iyi cihazlardan biridir.
Bu cihaz son zamanlarda geliştirilmiş ve FACTS ailesi cihazları içinde bir güç
akışı kontrol cihazı olarak yakın zamanda piyasaya sürülmüştür. DPFC'nin kullanımı
diğer cihazların gerçek cihazlarından daha yüksek güvenilirlik ve daha düşük maliyet
sunar. DPFC, UPFC'den türetilmiştir ve iletim açısı, hat direnci ve bara voltajı
(gerilim) büyüklüğü gibi tüm güç sistemi parametrelerini düzenlemek için aynı anda
kapasiteye sahiptir. Güç sisteminin akışını control etmek ve güç kalitesini artırmak

xv
için DPFC'nin performans değerlendirmesi, MATLAB / SIMULINK'de farklı çalışma
koşullarında simülasyon yoluyla gösterilir.
Anahtar kelimeler: Güç Dağıtımı Akış Kontrol Cihazı, Güç Kalitesi, Güç Akışı
Kontrolü, Gerçek Cihazlar, Gerilim Sarkması, Akım Şişmesi.

1
CHAPTER ONE
INTRODUCTION
1.1 Presentation of Work
The growth in the consumption of the electrical energy requires more
transmission lines and more generation plants to support this growth. Sometimes, the
transmission lines operate at higher rating than their design capacity and subjected to
conditions cause disturbance of work. As a matter of fact, traditional solutions such as
new transmission lines construction sometimes cannot be used for different reasons,
such as the high cost and the lack of routes to these new transmission lines. However,
within a power transmission network, many of parallel routes may exist from the
electrical source to the loads. As the electrical power tends to flow through the route
with the lowest impedance, this leads to overloaded transmission lines. Overloaded
transmission lines make it difficult to exploit of full transmission capacity for
transmission lines in the network. Consequently, to increase the transmission line
capacity of the whole network, there is a need to shift the power from the overloaded
line to other parallel paths. Also, when the transmission lines operate at higher rating
than their design capacity, it will be subjected to conditions cause disturbance of work,
this leads to major problems in the electrical power quality.
In the recent period, scientists and engineers have developed alternative
solutions that are highly efficient and cost less. One of these solutions is the using of
flexible AC transmission systems FACTS techniques which are characterized by their
high efficiency to control the power system parameters and to improve the power
quality of the electrical grid.
Custom power devices and FACTS devices are used in the electrical power
system in transmission stage and distribution stage to control the power flow and to

2
improve the electrical power quality. DVR, STATCOM/DSTATCOM, ACTIVE
FILTERS, UPFC, UPQC, are some of the devices belong to the FACTS which used
to improve the power quality of the voltage and the current. With the help of these
devices, there capability to reduce the problems related to power quality [1].
To some extent, passive filters were used to mitigate reactive power disturbances
and Harmonics, but there are many problems with them like size (they are large in
size), the impact of source impedance on the efficiency and the problem of resonance.
Active Power Filters APF are used for the power quality enhancement and for the
power flow controlling. These filters can be classified according to the connecting
configuration in the system. There are two types of Active power filters, series and
shunt. Uniting both series APF& shunt APF we get a device identified as DPFC.
DPFC can eliminate the voltage and current based distortions together. A shunt
APF eliminates all kinds of problems in current such as reactive power compensation,
current harmonic compensation, power factor improvement. A series APF
compensates voltage dip/rise so that the voltage at load side is perfectly regulated. The
DPFC is a modern and sophisticated device, it is similar to the unified power flow
controller UPFC in the structure. There are two main differences between UPFC and
DPFC. The first one, is that in UPFC there is a common DC-link between the shunt
and series converters, but in DPFC, this DC link is eliminated and in place of this DC
link the transmission line is used to exchange the power between the series and the
shunt converters and the second difference, is that UPFC has one three-phase series
converter but the series converters in DPFC are single-phase and distributed through
the line as a separated series converter [1].
1.2 Literature Survey
As the size, the load and the complexity of the power system networks increase,
its performance will decrease. These factors lead to problems associated with power
flow, power oscillations and voltage quality. Various studies have proposed
resolutions for these problems, by means of the optimal place of FACTS and
appropriate organization between FACTS controllers to amendment performance of
the power systems. There is a massive amount of work reported in the literature in this
area to improve power system performance. The FACTS technology has a group of
controllers, that can be used individually or synchronized with other controllers

3
connected to the network, thus allowing to gain better characteristics of the network’s
control.
Between the several facts devices presented for power system balance, the most
comprehensive prominent device with very striking working features that stemmed
from the facts family technology is the DPFC, which has ability to control
independently and simultaneously both of active and reactive power flow in the
transmission line systems, increase the power transfer capability of transmission lines
and supply the most effective action in damping of low oscillations in frequency in
multimachine power systems [2].
There are many studies that examine the problems and solutions to improve the
quality of electrical power by using different techniques. The focus here will be on the
studies that used the DPFC and proved excellent results.
Zhihui Yuan et al [3]. This study presented a new concept for power flow
controller. This system is called the DPFC, this study presented the basic idea that
proved to derive the DPFC from UPFC, the idea based mainly on using transmission
line as the connection path between the AC port of shunt converter and series
converters instead of joint DC link. This study improved that DPFC can do the same
tasks as the UPFC at a lesser cost and higher efficiency.
Ahmad Jamshidi et al [4]. In this study, the device was applied to an electrical
network with values similar to real values using the MATLAB environment at (230
kV, 100 MW, 60 Hz) system parameters. The Synchronous Reference Frame Method
SRF is used as a way to calculate and get results. The results obtained proved the
efficiency of the DPFC device in compensation of voltage sag and current swell.
P. RAMESH1 et al [5]. In this study, the steady-state response and control of
power in the transmission line equipped with FACTS devices was presented.
Simulations model for DPFC are carried out on two- machine systems with multi-
series converters to display the control features of this device and their impact to
increase power transfer capability and improve system reliability.
Mr. N. Peddaiah et al [6]. The system under study in this research paper was a
single machine infinite-bus system. The result of this study discussed the performance
of the system under fault effect without and with DPFC. It is shown that the DPFC can
give a satisfactory performance in power quality mitigation and power flow controller.

4
Amin Safari et al [7]. This study present the modeling of current injection model
for one of FACTS device based on distributed power flow controller in addition to
current injection model of the DPFC for studying on the low-frequency oscillations is
suggested to use for the first time and the design problem of the DPFC damping
controller parameters are changed into an optimization problem which is resolved by
a PSO technique that has a solid ability to find the most positive results.
Akhib Khan Bahamani et al [8]. In this study the model and Simulink of DPFC
system were presented. Circuit models are advanced for two bus system without and
with DPFC. The DPFC employs a shunt based Static Compensator STATCOM and
multiple series converters to improve the power quality. DPFC has benefits like
enhanced voltage shape and reduced power cost. The simulation results of two bus
system with and without DPFC are presented in this study.
P.nirmala et al [9]. In this study SRF (synchronous reference frame method) is
proposed to mitigate the voltage sags and find out the three single-phase reference
voltages of DPFC. Submission of DPFC in power quality enrichment is simulated in
MATLAB/Simulink program which displays the efficiency of the projected structure
the gotten simulation results display the achievement of DPFC in power quality
improvement, expressly in sag and swell mitigation.
1.3 Problem Formulation
To mitigate the problems and improve power flows in the power system we need
to use an effective way with high performance and low cost. Between many devices
that can be used in to give superior results, FACTS device DPFC has superior control
capabilities and proved significantly raise in the transfer capacity and the utilization of
the power system. DPFC is derived from UPFC by using transmission line to exchange
active power instead of DC link between converters. The commercial success for
UPFC has been limited due to following reasons [10]:
1. High Cost: Converter complexity and high semiconductor ratings make
UPFC an expensive solution. Moreover, the series and shunt converters voltage
isolation need three-phase high-voltage transformers. Lastly, it involves a big zone for
implementation and calls for expert work for the problem fixing in UPFC parts, which
added more cost.
5
2. Low Reliability: A single component failure can prove to be fatal in the
overall performance of the module. If any failure occurs at the shunt converter, the
consequences will be as device disconnection from the network. For a series device
failure, it doesn't affect the device only, but as well disengages the transmission lines
from the power grid as it is directly inserted into transmission lines.
All the disadvantages mentioned for the UPFC can be discarded by using DPFC.
The limitations listed above for UPFC can be attributed to the designing construction
of UPFC. The reliability of the device can be increased and the cost can be decreased
if the same control capability is served by replacing a lumped controller into smaller
controllers and distributing them over the grid. By using DPFC, low cost and high
performance can be realized.
1.4 Objective of Thesis
This thesis mainly focuses on demonstrating the efficiency of DPFC device by
evaluating its performance to control power flows for power system through
comparison between the theoretical and practical results and then verify its efficiency
in improving electrical power quality through studying the dynamic effect of it to
mitigate sag in voltage and swell in the current.
This study enhances the concept of minimizing the limitations of UPFC.
Distributed Power Flow Controller is established by removing the common DC link
present between the shunt and series converters in UPFC and distributing the series
converters over the transmission line. The DPFC is a modern and developing device,
it is similar to UPFC in structure. There are two main differences between UPFC and
DPFC the first one, is that in UPFC there is a common DC-link between the shunt and
series converters but in DPFC this DC link is eliminated and in place of this DC link
the transmission line is used to exchange power between series and shunt converters
and the second difference is that UPFC has one three-phase series converter but the
series converters in DPFC are single-phase and distributed through the line as a
separated series converter.
The steady state, step response and dynamic performance analysis are obtained
to verify the principle of DPFC using MATLAB/SIMULINK software.

6
1.5 Organization of Thesis
The work carried out in this thesis is divided into six chapters and its
organization is given as below:
Chapter 2: In this chapter, the principles of power flow control and power quality
improvement by using various FACTS controllers are discussed. Also, the
configuration and connecting ways for facts devices with power system are explained.
Chapter 3: In this chapter, the principle of DPFC is explained. Also, the concept
of deriving DPFC from UPFC and the Distributed FACTS concept is employed to the
series converters. Also, the steady-state performance of DPFC is studied in this
chapter. The mathematical model of the DPFC has studied in this chapter also and
based on these mathematical calculations the performance is evaluated.
Chapter 4: In this chapter, the modeling, design and basic control for DPFC are
realized. By using Park’s DQ transformation the AC components of DPFC are
transformed into DC components and components of DPFC are controlled by the
traditional PI controller. This control is answerable for controlling and fixing DC
voltage of the DPFC converters and generating the AC voltage by series converters.
Chapter 5: In this chapter, the performance evaluation of DPFC is demonstrated
in SIMULINK/MATLAB through simulation of DPFC at different operating
conditions. Firstly, the model of DPFC is simulated under steady-state condition.
Simple two bus system is applied with two voltage source block interconnected
through an RLC series branch blocks representing transmission line. The device and
its controls are also developed in SIMULINK. Secondly, the power quality
improvement by using DPFC controller is developed and verified dynamically by
connecting this device to RLC load through two transmission lines connected in
parallel.
Chapter 6: This chapter gives the conclusion of the work carried out and
addresses the issues that can be considered for future work.

7
CHAPTER TWO
POWER FLOW CONTROLLING DEVICES
2.1 Introduction
The demand for the electrical energy rises continuously, this rising in demand
day by day leading to more stress of the transmission lines, also electric power utility
industry is suffering constantly changes due to privatization and competition in
electricity markets in many leading countries. All this makes it necessary for electric
power utility industry to competitive structures, which means that the secure and
economic operation of power systems is opposite a new challenge along with the more
competitive market environment [11].
The pressure related with the reasonable cost effect and environmental
limitations has obligatory the power utilities to try to meet the growing demand for the
future request for energy completely by utilizing the standing resources of
transmission facilities without any construction for newlines.
In the last two decades of the nineteenth century, electronic devices developed
rapidly, with this fast development of power electronics devices and the possibility of
exchange the electrical energy by export/import this energy and moving transactions
between the utilities, it has become necessary to think in new ways to organize the
work of electrical networks. The electric power research institute EPRI presented a
novel method to find right and appropriate solutions for problems of the power system,
the offered concept is identified as flexible AC transmission systems FACTS devices
were originally launched to solve the emerging problems [12].
The increasing of power electronic components capabilities made expansion of
FACTS -devices faster. FACTS devices became available for high and even highest
voltage levels with high power levels. The general initial points are network parts

8
which have an effect on the impedance or the reactive power for any element in the
electric power system network. For the FACTS concept, there are two basic terms used
under this concept known as 'DYNAMIC' and 'STATIC' these two terms used as a
classification for facts devices.
These two terms need some explanation. When the power electronics of FACTS
devices provide fast and reliable control ability, the expression 'DYNAMIC' is used to
express the quality of control ability. This term is the important and it’s the main
difference from the conventional devices that used in power quality improvement field.
Because there are no moving parts in these devices like mechanical switches that used
to perform the dynamic controllability, the second term 'static' is used as a description
of these devices. So, at the same time most of the FACTS -devices can be classified as
static and dynamic.
The FACTS controllers give real possibility and great chances to regulate the
alternating current parameters in the transmission system and power flow control by
increasing or reducing the flow in specific transmission lines.
The FACTS technology extension is based on the controlling ability of the
power flow route and the capability of joining networks that are cannot interconnect
for technical reasons and it gives the possibility of energy trading among distant agents
[13].
2.2 Power Flow Theory
At any power system, the transmission line can be characterized by four
parameters: resistance, capacitance, inductance and conductance. Where conductance
is a measure for the current that leaks at the insulators of the overhead transmission
lines. However, in the short and medium length transmission lines that have a length
(less than 240 km), the magnitude of capacitance and conductance are very small, so
that it can be ignored with little loss of accurateness [14]. According to that a
transmission line can be represented as Figure 2.1, where Vs and Vr are line-to-ground
phasor voltages at sending and receiving end, I is the phasor current through the line,
R is the value of series resistance and L are the value of the inductance of the line.

9
Figure 2.1: Simple Diagram of one-line representation of a transmission line.
From Figure 2.1, the power flow Sr that flows at the transmission line at the
receiving end is given by[15]:
S P jQ V ∙ I ∗ V ∙V VR jwL
∗
2.1
Where the symbol (∗) means the conjugation of a complex number, and ω is the
angular frequency of the power system[14]. The transmission line impedance can be
substituted by Z and it is equal to R + jωL. In a typical high-voltage or medium voltage
transmission line, the reactance is usually much larger than the resistance [16].
Therefore, the resistance can be ignored during the power flow calculation with little
loss of accurateness, and the active and reactive power flow through a lossless line can
be simplified to the following [15]:
P| || |
sin
(2.2)
Q| || |
cos| |
Where X = ωL is the inductive impedance of the line. Equation (2.2) shows that
three system parameters can be utilized to vary the power flow; transmission angle θ,
line impedance X and bus voltage magnitudes |Vr| and |Vs|. Because power systems
are operated in a unified voltage mode (voltages are close to 1 per unit)[14]. Power
flows can only be adjusted in a small range by varying the bus voltage magnitude.
Therefore, the bus voltage magnitude is not suitable for controlling the power flow
over a large range. By assuming that the bus voltages at the sending and receiving ends
have the same magnitude |V |, the power flow equations can be further simplified to:

10
P| |
sin and Q| |
cos 1 2.3
As shown, the active and reactive power flows are coupled. By varying one
parameter, both active and reactive power flow will change accordingly.
2.3 Definition of Facts
FACTS is the shortening of Flexible Ac Transmission Systems. According to
IEEE, is defined as follows, “alternating current transmission systems incorporating
power electronics based and other static controllers to enhance controllability and
power transfer capability” [12].[17].
2.4 Possible Benefits of FACTS Technology
FACTS-devices offer an improved harmony to varying operation circumstances
and increase the usage of current installations by giving the possibility to the
transmission and distribution systems to get one or more of the following benefits[18]:
1. Power quality improvement. Thus, letting the lines to carry more active
power, lower system losses, better stability of the network.
2. The ability of controlling Power flow.
3. Reactive power enhancement.
4. Stability enhancement, through dynamic transient and steady state stability
enhancement, power oscillation damping and control voltage stability.
5. Increasing of transmission capability.
6. Voltage control.
a. The interconnection possibility between the renewable energy source and
distributed generation to the power grid.
b. Offer safe tie-line joining to neighboring utilities and areas which decrease
overall generation reserve requirements on both sides.
2.5 Technological Features
FACTS devices can be classified according to technological structures into two
generations:

11
2.5.1 First Generation
The principle work of the first-generation of FACTS devices rely on impedance
or tap changer transformers controlled by thyristors to control power system flow. The
thyristors with ignition controlled by a gate SCR is used in this generation. This group
has produced in many types like Thyristor-Controlled Series Compensation, Static Var
Compensation, and Thyristor Controlled Phase Shifting.
2.5.2 Second Generation
in this generation, the GTO semiconductors with ignition and extinction
controlled by Gate Turn-Of Thyristor are used, the second-generation depend on using
converters, using electronic tension sources such as (3-phase inverters, synchronous
voltage sources, auto-switched voltage sources, voltage source controller) [16]. This
generation types are Insulated Gate Bipolar Transistor, Integrated Gate Commutated
Thyristor, Metal-oxide semiconductor Controlled Thyristor, etc. It has produced in
UPFC, UPQC, DPFC, STATCOM, SSSC and the IPFC.
2.6 Configurations of Facts-Devices
FACTS devices can be coupled with an electric transmission line in three main
ways [17]:
1- Series Connection with the power system (series compensation) like SSSC
and TCSC.
2- Shunt Connection with the power system (shunt compensation) like SVC and
STATCOM.
3- Both in Shunt and Series connection like TCPST and UPFC.
2.6.1 Model of Shunt devices controllers/Static Synchronous Compensator STATCOM
Shunt fact devices inject current at a common point between the device and the
system. They might be convertible impedance, convertible source, or a combination
of convertible impedance and convertible source. There are diverse shunt-connected
FACTS devices, the most famous among them in terms of the applications is the static

12
VAR compensator SVC or the type which known as STATCOM that come with
Voltage Source Converter. Shunt controller is to a certain extent similar to a current
source, which draws current from the line or injects it into the line. Therefore, at the
point of connection between shunt device and grid a leading or lagging reactive current
is injected, Shunt controller, is an effective way to control and damp oscillations of
voltage. These shunt devices can work as reactive power enhancement devices [13].
The disadvantage of using SVC, besides their slower response, is the fact that their
ability to provide VAR support is voltage dependent. Shunt VAR is normally required
when the system voltage is depressed and during these periods the ability of SVC to
provide VAR support is also seen to decrease [13].
STATCOM can be operated in inductive or capacitive regions by making a
change in the output voltage magnitude with respect to bus voltage. It is the static
sample of the rotating synchronous condenser but because there are no moving parts
inside it, it can inject or draw reactive power quickly. In principle, it achieves the same
voltage regulation purpose as the SVC but in a stronger way because of the difference
from the SVC, its work is not affected by the attendance of low voltages. Figure 2.2
shows the structure of static synchronous Compensator [19]. STATCOM is seen to be
more robust in providing reactive support to the network as their level of injection is
independent of the variations in system voltage.
Figure 2.2: The structure of static synchronous Compensator.

13
Today while the application of the VSC became more practical in the distributed
energy area especially for the combination old sources with a new one and with the
development of distributed energy storages (large storage capacitor, battery,
superconducting magnet) the power quality improvement and balanced network
operation can be achieved by the STATCOM [20].
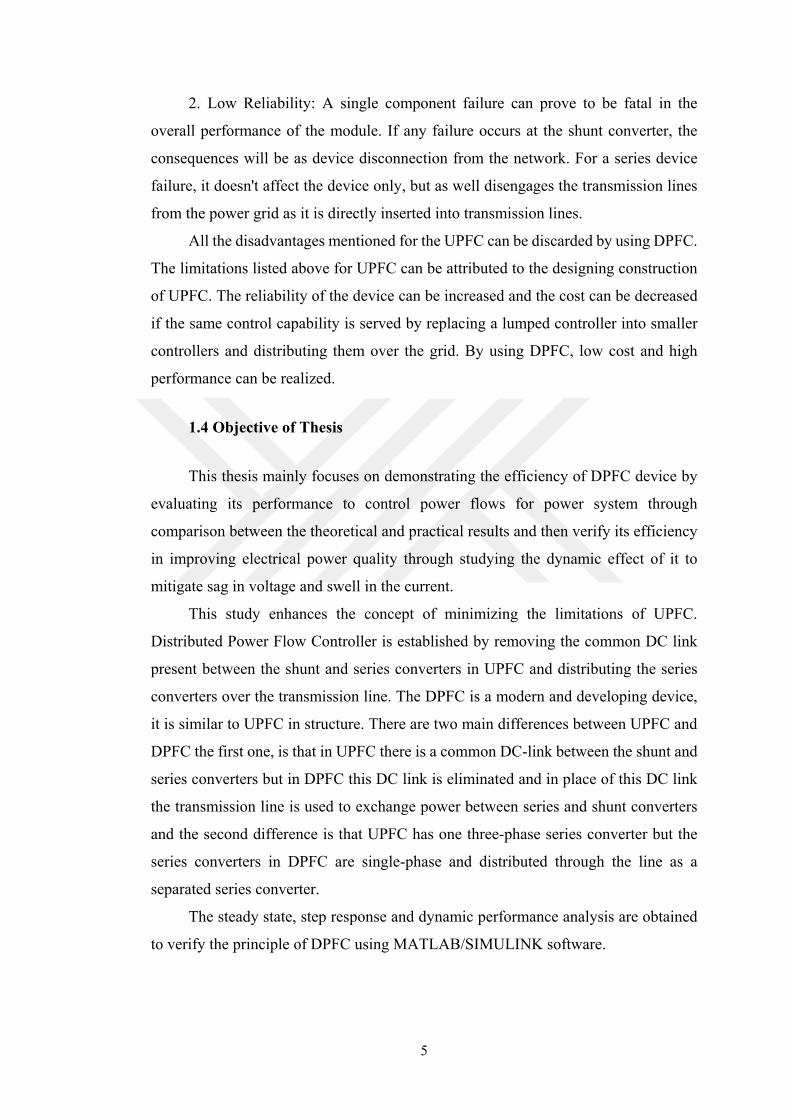
2.6.2 Model of Series Devices Controllers SSSC
Series FACTS devices are the devices that depend on power electronics as
working principle and it has the ability to inject a voltage in series to the electrical
transmission line.
A Static Synchronous Series Compensator SSSC is one of the series devices that
coupled in series to the transmission power system. It can be shown as one of an
advanced facts device which takes place on the set of series-connected FACTS
devices.
The working principle of this device is similar to the STATCOM. It coupled to
the transmission line by coupling transformer and uses a VSC interfaced, which
generates a controllable alternating voltage at the fundamental frequency. A large
energy source is required to provide and maintaining the DC voltage over a condenser
(DC capacitor) and to restore the losses of the VSC by injecting voltage which
controlled in phase and magnitude, but if the aim of using SSSC is only reactive power
balancing, the energy source might be pretty small. Even though the main purpose of
using an SSSC is power flow controlling at power system steady-state operation, it
also has the ability to enhance power system transient stability. One of the SSSC
versions that practically applied in power systems at distribution stage is the Dynamic
Voltage Regulator DVR that essentially contains a three-phase converter coupled with
a transformer. The main aims of using DVR is to keep the voltage at a constant level
[21]. Figure 2.3 shows the SSSC configuration [22].
14
Figure 2.3: Static synchronous series compensator.
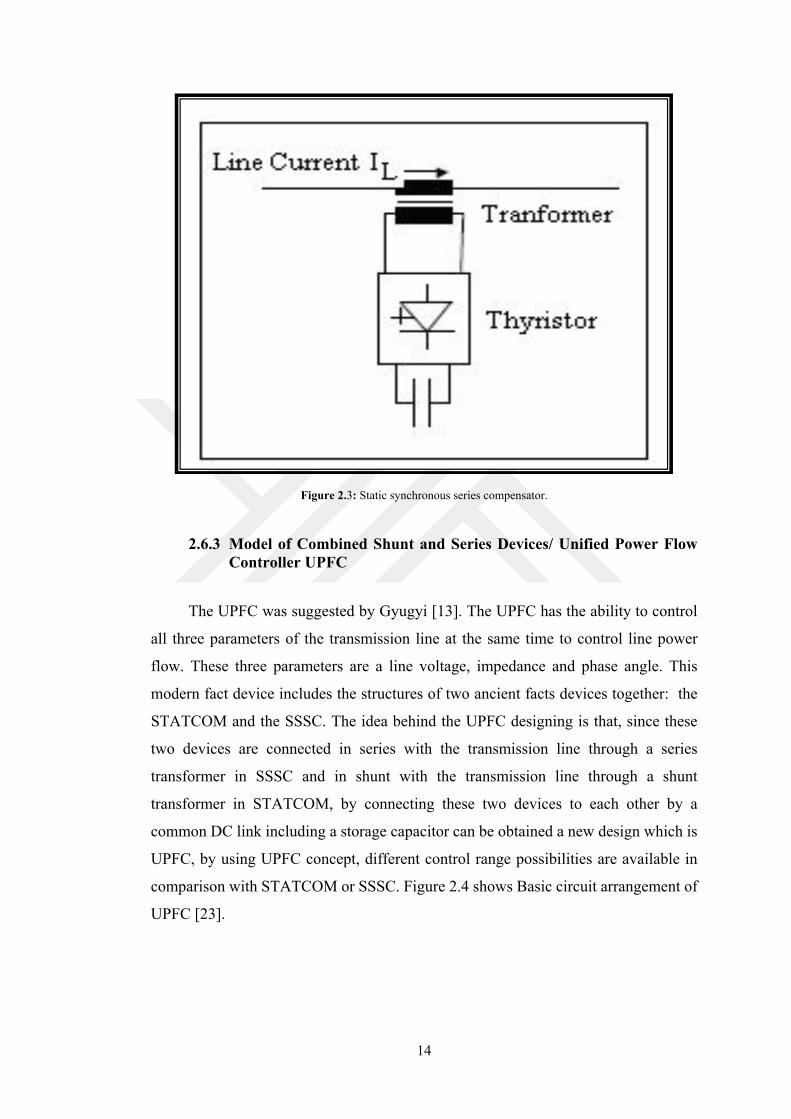
2.6.3 Model of Combined Shunt and Series Devices/ Unified Power Flow Controller UPFC
The UPFC was suggested by Gyugyi [13]. The UPFC has the ability to control
all three parameters of the transmission line at the same time to control line power
flow. These three parameters are a line voltage, impedance and phase angle. This
modern fact device includes the structures of two ancient facts devices together: the
STATCOM and the SSSC. The idea behind the UPFC designing is that, since these
two devices are connected in series with the transmission line through a series
transformer in SSSC and in shunt with the transmission line through a shunt
transformer in STATCOM, by connecting these two devices to each other by a
common DC link including a storage capacitor can be obtained a new design which is
UPFC, by using UPFC concept, different control range possibilities are available in
comparison with STATCOM or SSSC. Figure 2.4 shows Basic circuit arrangement of
UPFC [23].

15
Figure 2.4: Basic circuit arrangement of UPFC.
Between the existing FACTS devices, UPFC is recognized as the most
multipurpose, sophisticated, multifunction and powerful device using to control power
flow, at the other side, the optimal control problem for UPFC is most complex.
Probably it's the most expensive one of the other FACTS devices. Uniting the
structures of the static compensator STATCOM and the static series compensation
SSSC, gives an another way to alleviate power system fluctuations [13]. It is of
attention to know that impact of UPFC in mitigation the troubles in voltages, currents
and maintaining power flows under fault situations, not only in the transmission line
where it is connected but likewise in the nearby parallel transmission line. Further,
how the importance of UPFC contribution to a quicker recapture of the system as
before-fault situations.
During steady-state circumstances, the demand of real power that series
converter need is provided by the shunt converter. Under transient circumstances, the
demand of real power for the series converter is provided by the DC link capacitor.

16
CHAPTER THREE
DISTRIBUTED POWER FLOW CONTROLLER DPFC
3.1 Distributed Power Flow Controller DPFC
The distributed power flow controller can be viewed as a modern type of (shunt
– series) facts device controller that has the ability to improve the power quality of the
electrical power system. The DPFC operating technique is same as the UPFC. It gives
results similar to UPFC when it used to compensate power system disturbances such
as the voltage sag and the current swell which considered a task problems of power
quality problems but in high reliability and low cost. As compared to UPFC the
common DC link that connects shunt and series converter together is eliminated and
instead of this DC link the transmission line is used as connection between the shunt
and the series converters and three separate single-phase converters are used in place
of a three-phase series converter as shown in figure 3.1[24].
Figure 3.1: Flowchart of convert UPFC to DPFC.

17
3.2 Working Principle of DPFC
DPFC is derived from UPFC. When we compare DPFC with UPFC, the most
important benefit presented by DPFC is the elimination of the huge DC-link between
series converters and shunt converter and instead of that DC-link, the transmission line
and 3rd-harmonic current are used as ways to exchange the power between shunt and
series converter. The shunt converter injects 3rd harmonic current to the transmission
line and through the transmission line this current arrive to the series converters. This
elimination making DPFC much less expensive from UPFC. Theoretically, the other
harmonics can work for the same purpose as the third harmonic to exchange active
power in the DPFC like, sixth harmonic, and ninth harmonic frequency. All of these
harmonics are zero sequence frequencies. The 3rd harmonic is the preferred frequency
to exchange active power in DPFC because of the transmission line impedance is
inductive and related to the magnitude of frequency, so when a high degree of
transmission frequencies are used this will leads to high impedance. For this cause, the
third harmonic frequency is chosen because the third harmonic is the lowest zero
sequences harmonic frequency[10]. In the next sections; the DPFC basic principle is
described.
The DPFC comprises of one shunt and several separated converters coupled in
series with the power transmission line. The arrangement of the DPFC is given in
Figure 3.2.
In addition to the main components, there are essential equipment that must be
available in order for the DPFC function properly, the DPFC involves a high-pass filter
connected between the transformer and ground at the next side of the transmission line,
and two transformers the first one is a Δ-Y connection and the second transformer
connection is Y-Δ [25].

18
Figure 3.2: Dpfc structure.
3.2.1 Power Exchange and DC Link Elimination
In the DPFC, the connection tool between the series converters terminals and
DC terminal of shunt converter is transmission line that can use to exchange active
power and provide connection path in place of common DC link [25]. To exchange
power in DPFC, the concept of non-sinusoidal component theory of power is used.
According to Fourier series [2]. A non-sinusoidal element of voltage or current
can be presented as the sum of sinusoidal components at different frequencies. The
active power can be obtained from the multiplication of the voltage and current
components, according to that the active power equation is given as:
P ∑ ViIi cos ∅i∞i 0 3.1
Where,V isthevoltageat harmonic,I isthecurrentat harmonic, and
COS∅ Is the angle between the voltage and current at the same frequency. Equation
3.1 defines that the active powers at different frequencies are separated from each other
and the voltage or current in one frequency has no impact on the active power at other
frequencies [26]. So, according to this principle the shunt converter in DPFC has
ability to absorb active power from the network at the fundamental frequency and
inject the current back into the network at a harmonic frequency. Also, the series
converter in DPFC can generate the voltage at the harmonic frequency this achieved
by absorbing the active power from harmonic components [27].
19
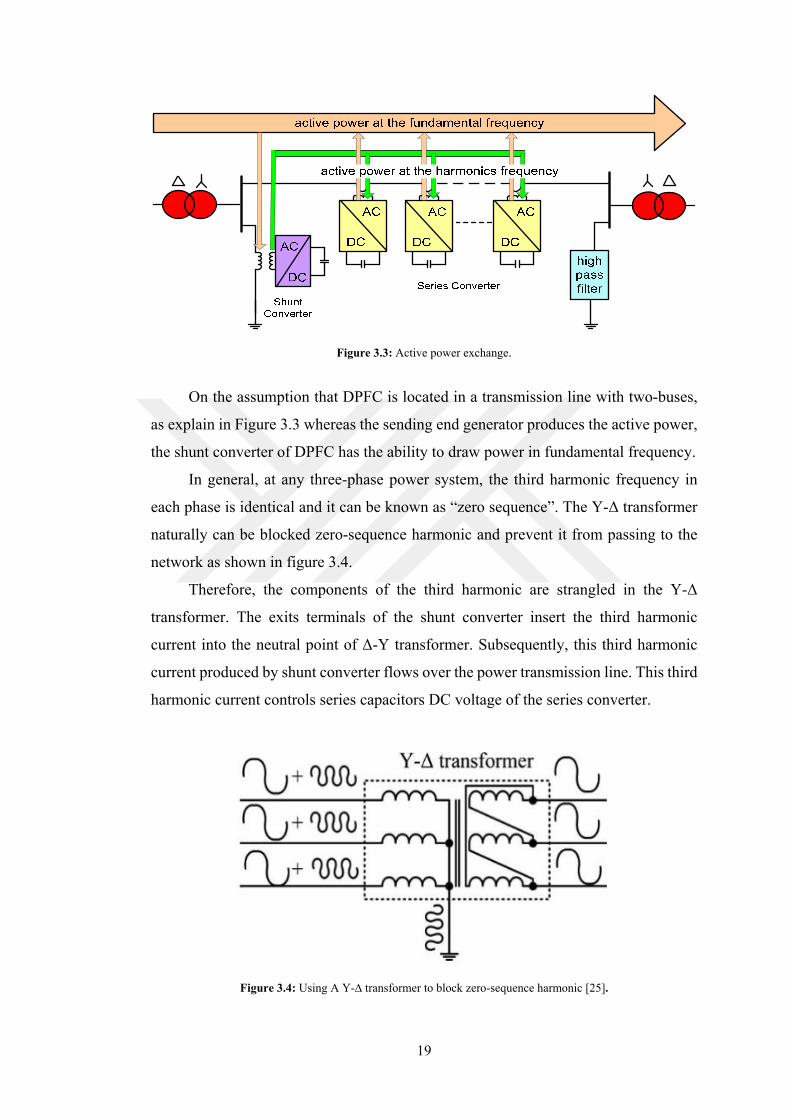
Figure 3.3: Active power exchange.
On the assumption that DPFC is located in a transmission line with two-buses,
as explain in Figure 3.3 whereas the sending end generator produces the active power,
the shunt converter of DPFC has the ability to draw power in fundamental frequency.
In general, at any three-phase power system, the third harmonic frequency in
each phase is identical and it can be known as “zero sequence”. The Y-Δ transformer
naturally can be blocked zero-sequence harmonic and prevent it from passing to the
network as shown in figure 3.4.
Therefore, the components of the third harmonic are strangled in the Y-Δ
transformer. The exits terminals of the shunt converter insert the third harmonic
current into the neutral point of Δ-Y transformer. Subsequently, this third harmonic
current produced by shunt converter flows over the power transmission line. This third
harmonic current controls series capacitors DC voltage of the series converter.
Figure 3.4: Using A Y-∆ transformer to block zero-sequence harmonic [25].

20
One of the basics of the working principle of DPFC is that third-harmonic is used
as a means to exchange the active power so that the existence of a high-pass filter is
necessary to produce a closed loop path for this harmonic current. The high-pass filter
can be substituted with a cable. This cable connects star winding of the transformer to
the ground [28].
This cable will be as a path to the harmonic current to the ground as shown in
figure 3.5 So that, there is no necessity to use the high-pass filter in the system
receiving-end.
Figure 3.5: The harmonic current path between transformer and ground.
3.2.2 The DPFC Advantages
Compared to other FACTS devices, DPFC has economic and practical
advantages that can be summed up in the following points [2]:
1) High Control Capability: The DPFC is derived from UPFC, and has same
control capability as UPFC it can control all basic power system network parameters
such as line impedance, transmission angle degree and bus voltage scale.
2) More Reliability: The separation of series converters to many groups that
distributed through a transmission line rises the DPFC reliability through converters
working. This means that if one of series converters be faced with any problem that
causes fails, the others can continue to work.
3) Lower Cost: The cost of using DPFC is lower than UPFC for two main
causes:
The first: is no needing to DC link between converters like UPFC.
21
The second: the cost of using many single-phase converters in series with
transmission line is lower than using one three-phase converter. That's because the
connection of series converters to the transmission line does not require any high
voltage isolation. Instead of the high voltage isolation, a single-turn transformer can
be used to hang the series converters through the transmission line.
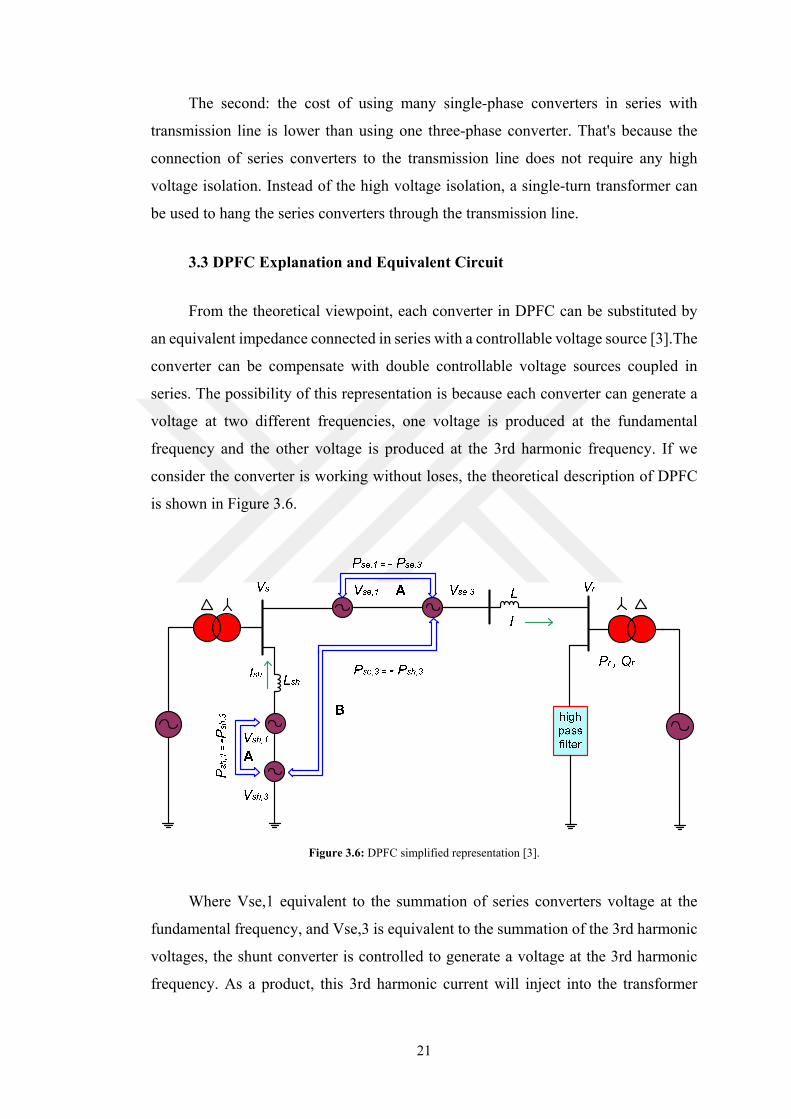
3.3 DPFC Explanation and Equivalent Circuit
From the theoretical viewpoint, each converter in DPFC can be substituted by
an equivalent impedance connected in series with a controllable voltage source [3].The
converter can be compensate with double controllable voltage sources coupled in
series. The possibility of this representation is because each converter can generate a
voltage at two different frequencies, one voltage is produced at the fundamental
frequency and the other voltage is produced at the 3rd harmonic frequency. If we
consider the converter is working without loses, the theoretical description of DPFC
is shown in Figure 3.6.
Figure 3.6: DPFC simplified representation [3].
Where Vse,1 equivalent to the summation of series converters voltage at the
fundamental frequency, and Vse,3 is equivalent to the summation of the 3rd harmonic
voltages, the shunt converter is controlled to generate a voltage at the 3rd harmonic
frequency. As a product, this 3rd harmonic current will inject into the transformer

22
neutral point at star side and flow over the transmission line to supply the active power
to series converters. The series converters absorb the active power from third-harmonic
frequency to equilibrium and regulate their DC voltages. Based on the superposition
theorem, the two circuits for two frequencies can separate from each other, the circuit
can be divided into two circuits at two frequencies[2]. And the active power will be as
a link between two circuits to provide stability for each converter, see figure 3.7.
Figure 3.7: DPFC equivalent circuits in(a) fundamental and (b) 3rd harmonic frequency.
3.4 Steady – State Analysis of DPFC
To study the DPFC steady- state performance, the DPFC can be expressed by
replacing each converter in DPFC by an impedance connected in series with a
controllable voltage source to produce the voltages at two different frequencies [26].
On this assumption, the DPFC is located through two-bus system, the sending end
voltage is Vs and the receiving end voltage is Vr as given in Figure 3.8.
Figure 3.8: Basic illustration of DPFC in two bus system [26].

23
For steady-state analysis, the transmission line is analytically represented by a
line current I with an inductance L. Where Vse1 represent the voltage injected by series
converters at the fundamental frequency and Vse3 is the voltage injected by series
converters at the third harmonic frequency. The shunt converter is linked to the sending
end bus by an inductor L,sh and generates the voltage Vsh1 and Vsh3. Pr and Qr are
the active and reactive power flows at the receiving end, respectively.
The capability of the DPFC to control power flow can be shown by the active
power Pr and reactive power Qr at the receiving end. The reference for power flow
capability illustration is figure 3.7. According to this figure, the flow of active and
reactive power can be stated as follows [29].
P JQ V I∗ V . ∗ 3.2
Where X1 = ωL1 is the impedance of the transmission line at the fundamental
frequency. The power flow Pr, Qr contains two parts: Pr0, Qr0 which refer to the power
flow without DPFC connection and Pr,c,Qr,c that is the part that is mixed by the DPFC
compensation. The power flow lacking to DPFC attendances Pr0,Qr0 is given by[3]:
P jQ ∗ 3.3
DPFC power flow control range can be stated as follows [26]:
P . jQ . ∗ 3.4
Where Pr,c is the active power flow control range of DPFC, and Qr,c is reactive
power flow control range of DPFC.
As the line impedance and the voltage at the receiving end are fixed, the power
flow control range of the DPFC is related to the series converter maximum voltage,
the way of controlling the active and reactive power flow over the transmission line
obtained from the phase angle of voltage V*se1 that can be rotated over 360◦,From
Eqn. (3.2) and Eqn. (3.3), the control ability of the DPFC is given by [3], [2]:
P P . Q Q .| || . | (3.5)
The magnitude of the injected voltage that injects by the series converter Vse1
at fundamental frequency can be obtained from the following equation [2]:
V (3.6)

24
Where Sr0 is the apparent power in transmission network without DPFC
connection and Sr is the apparent power in transmission network with DPFC
compensation. For the possibility of a 360◦ rotatable voltage injection, series converter
should feed with an active and reactive power at the fundamental frequency, although
the required magnitude of active power to compensate disturbances is provided by the
shunt converter at the third harmonic frequency and this active power that flows
through the transmission line, given as [2]:
P| |
|S ||S | Sin Φ Φ (3.7)
Where the symbol φr0 reffers to value of power angle at the receiving end of the
uncompensated power system and it is equal to tan-1 Pr0/Qr0 and φr is the receiving
end power angle with DPFC compensation [26].
3.5 DPFC Control Circuit
To regulate the work of several converters in DPFC, there are three kinds of
controllers, central control, shunt control and series control.
3.5.1 Central Control
To adjust the work of series control and shunt control to regulate shunt and series
converters of the DPFC, reference signals are produced by central control. It is dealing
with keeping DPFC tasks near the power-system level to keep it within the required
work limits, such as power-flow control, balancing of asymmetrical components and
low-frequency power oscillation damping. The central control gives equivalent
reference voltage signals for the series converters and reactive current signal for the
shunt converter according to the system requirement. All the reference signals made
by the central control are at the fundamental frequency. A simplified diagram for
DPFC control is shown in figure 3.9 [4].

25
Figure 3.9: Simplified diagram for DPFC control.
3.5.2 Shunt Control
The shunt part of DPFC comprises two converters. The steady 3rd harmonic
current injected into the network by the single- phase converter. Another converter is
three-phase converter and its task is to keep the DC voltage at a fixed value. Each
converter has its own control independently. A simplified block diagram of the shunt
converter controller is given in figure 3.10.
Figure 3.10: Simplified block diagram for DPFC shunt control.
3.5.3 Series Control
The series converters in DPFC separated from each other and they are single
phase converters connecting in series with the transmission line, each converter is
controlled locally by its own controller, and the control structures for each series

26
converters are similar. For series converter control, isolated control loops are designed
for the two frequencies components. To control DC voltage, the 3rd harmonic control
loop is used. The DPFC series converter control simplified block diagram is shown in
figure 3.11.
Figure 3.11: Simplified diagram for DPFC series control.

27
CHAPTER FOUR
DPFC MODELING AND CONTROL DESIGN
4.1 Introduction
This chapter presents modeling, design and basic control for DPFC. By using
Park’s dq transformation the AC components of DPFC are transformed into DC
components and components of DPFC are controlled by the traditional PI controller.
This control is answerable for controlling and fixing DC voltage of the DPFC
converters and generating the AC voltage by series converters.
4.2 Modeling of DPFC
The DPFC principle of work depends on using transmission line as a link to
connect the shunt and the series converters. The main parts of the DPFC are:
1. Shunt converter.
2. Series converters.
3. Power system transmission line.
The model of DPFC describes the performance of DPFC at the system level. The
series converters at DPFC are single phase converters and these converters are
designed as single-phase system. The network is designed as three single-phase
networks with a 120-degree phase shift. There are two essential tools used for DPFC
modeling design, the superposition theorem and Park’s transformation.
Because of DPFC signal comprises two frequencies, at first superposition
theorem is used to isolate the components of the signal and then Park’s transformation
is used for signal analysis at a single frequency. To implement the DPFC the following
models must be implemented:

28
1. Network model which consists of (fundamental frequency and third harmonic
frequency).
2. Series converter models.
3. Shunt converter models.
4.2.1 Network Modeling
The network circuits at the two frequencies are isolated by the superposition
theorem, then the mathematical illustration of a network with a DPFC at two
frequencies is presented.
4.2.1.1 Fundamental frequency network modeling
For network modeling, the transmission line is considered to be as symmetrical
with lines transposed along their lengths and the converters of DPFC are assumed to
be as controllable voltage sources. With these considerations, at the fundamental
frequency, the network with the series converters of DPFC can be simplified as shown
in Figure 4.1.
In the equivalent circuit, Vse,1 represent the magnitude of the voltage that injected
by the series converters at the fundamental frequency, Z1 is the line impedance, Vs and
Vr are the sending and receiving ends voltages, respectively. Vse,1, Vs, Vr and the
current I1 are column vectors, which contain the information for the three phases. The
network is designed as three single-phase networks with a 120-degree phase shift. The
relationship between series voltage and the line current I1 according to the equivalent
circuit is given by:
V ,
V ,
V ,
V ,
V ,
V ,
V , ,
V , ,
V , ,
Z000Z000Z
I ,
I ,
I ,
4.1

29
Figure 4.1: Equivalent circuit network of fundamental frequency.
The fundamental frequency model of DPFC illustrates how DPFC series
converters have the ability to affect the current through the transmission line by
changing the injected voltages.
4.2.1.2 Third harmonic frequency network modeling
The shunt converter in DPFC is modeled to inject 3rd harmonic current to the
network at the neutral point of the Y-Δ transformer. This current is evenly divided over
the three phases of the transmission line and flow by a closed loop through the
grounded neutral point of the other Δ-Y transformer.by compensation for converters
with voltage source the 3rd harmonic frequency equivalent circuit network can be
clarified as shown in Figure 4.2.
Figure 4.2: Equivalent circuit of 3rd harmonic network.
30
The transmission line impedance and the two transformer windings with zero
sequence reactance can be combined. The overall impedance at the third harmonic
frequency can be denoted by Z3. The impedance of neutral is considered to be zero.
So, the relationship between the voltages and the currents at the 3rd harmonic frequency
is given by:
V ,
V ,
V ,
V , ,
V , ,
V , ,
Z000Z000Z
I ,
I ,
I ,
4.2
The network model of third-harmonic represents the third-harmonic current in
each phase, the input elements of this model are the voltages Vsh,3 and Vse,3 and the
output of the model is the 3rd harmonic I3 current of each phase.
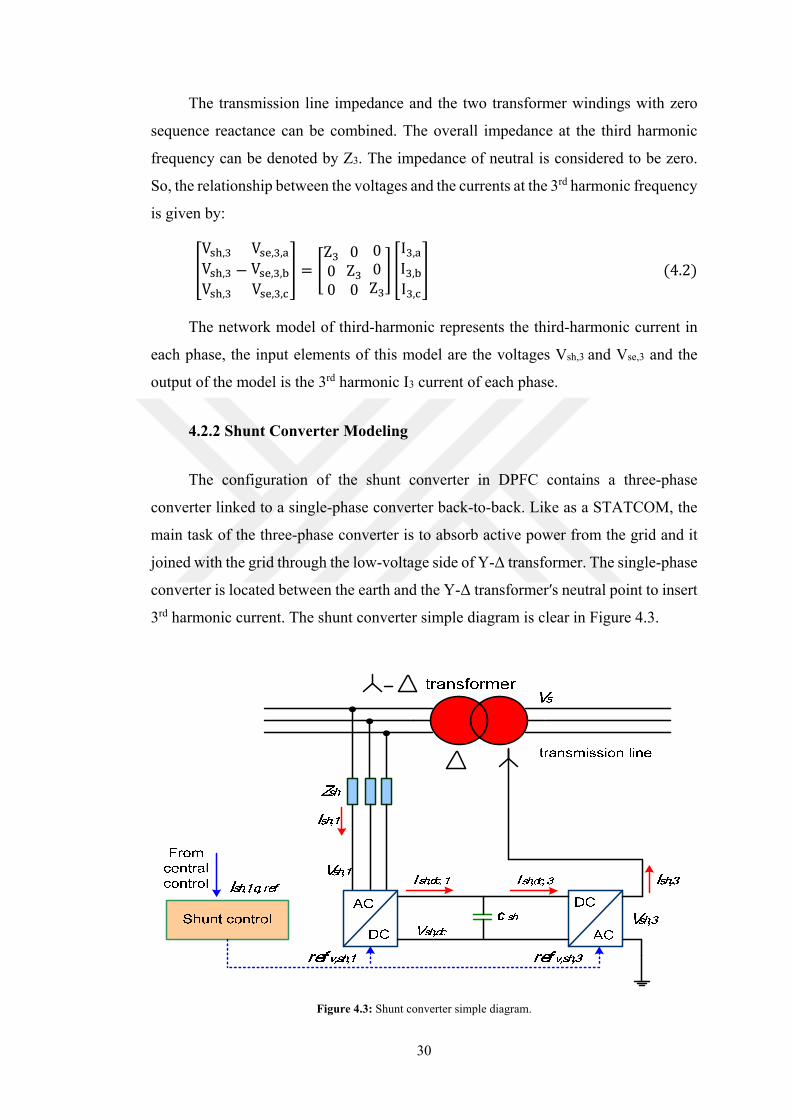
4.2.2 Shunt Converter Modeling
The configuration of the shunt converter in DPFC contains a three-phase
converter linked to a single-phase converter back-to-back. Like as a STATCOM, the
main task of the three-phase converter is to absorb active power from the grid and it
joined with the grid through the low-voltage side of Y-Δ transformer. The single-phase
converter is located between the earth and the Y-Δ transformerʹs neutral point to insert
3rd harmonic current. The shunt converter simple diagram is clear in Figure 4.3.
Figure 4.3: Shunt converter simple diagram.

31
The component of voltage Vsh,3 and current Ish,3 at the 3rd harmonic frequency
are single-phase. The DPFC converter on the left side include only the components at
the fundamental frequency which contain voltage Vsh,1 and the current Ish,1.
4.2.2.1 AC side modeling
In shunt converter the AC voltage can be write in a similar way as to the series
converter modeling, approximately written as:
V , ref , , . V ,
V , ref , , . V , 4.3
where the amplitudes of refV,sh,1 and refV,sh,3 in modulation are PU values and their
range are between -1 to 1.
4.2.2.2 DC side modeling
The shunt converter capacitor DC voltage is given as:
CdV ,
dtI , , I , , 4.4
By applying Park’s transformation to components of the fundamental frequency
at the three-phase side the DC current is given as:
I , ,32ref , , , I , , ref , , , I , , 4.5
The DC current Ish,DC,1 can be constant with no ripple, If the three-phase
components are symmetrical. The 3rd DC current can get it by substituting single-phase
Park’s transformation by the 3rd harmonic components, it is given as:
I , , ref , , , sin 3θ ref , , , cos 3θ . I , , sin 3θ I , , cos 3θ 4.6
The relations with zero-average values will not donate to the capacitor DC
voltage while seeming as ripples of the DC voltage. By ignoring these relations, the
shunt converter DC voltage is given by:
CdV ,
dt32ref , , , I , , ref , , , I , ,
12ref , , , I , , ref , , , I , , 4.7

32
The final shape of shunt converter model, shaped by joining the AC and DC
sides of the shunt converter model is shown in Figure 4.4.
Figure 4.4: The shunt converter model block diagram.
The reference current and voltage signals at both frequencies represent input
signals for the model, while the outputs are the generated voltages by the shunt
converter at fundamental and 3rd harmonic frequency.
4.2.3 Series Converter Modeling
The DPFC series converters are identical PWM control single-phase converters.
The simple diagram for the series converter is shown in Figure 4.5. The converter
losses are ignored for analysis simplifying.
Figure 4.5: Series converter simple diagram.
Vse and V,se,DC are the series converter AC side and the DC side voltages,
respectively. and refV,se is the series control reference AC signal in PU, which is
generated by the series controller. As shown in Figure 4.5 the AC voltages and currents
comprise of two components at different frequencies, in another meaning the

33
fundamental and the 3rd harmonic frequency components are denoted by subscripts Vse
and their relationship is given as:
V V , V , 4.8
4.2.3.1 AC side modeling
The DPFC series converter is (PWM) control single-phase converter. The
converter AC side voltage (Vse) can be rounded to the product of AC reference signal
and the DC voltage multiplication process as given below:
V ref , . V , 4.9
The refV,se is pu value with the range between -1 to 1. By applying the
superposition theorem, can rewrite Eqn. (4.9) as:
V ,
V ,
ref , ,
ref , ,. V , 4.10
The series converter AC side model input signals are refV,se and Vse,DC and the
output is the AC voltage Vse.
4.2.3.2 DC side modeling
The series converter DC voltage VDC,se is associated with the DC current IDC,se
and is given by:
CdV ,
dtI , 4.11
In the reference voltage and the AC current there are two frequency components.
The series converter DC side voltage is written as:
CdV ,
dtref , , ref , , . I I 4.12
and the DC current can be approximated to:
I , ref , . I ref , , ref , , . I I 4.13
When the inverse single-phase Park’s transformation is applying to Eqn. (4.12)
we get:

34
CdV ,
dtref , , , sin θ ref , , , cos θ ref , , , sin 3θ
ref , , , cos 3θ . , , , 3
, 3 4.14
Where θ is the rotation reference frame angle for Park’s transformation. The
cross relations components of different frequency on the right side of Eqn.4.14, seem
as zero-average ripples compose with the DC voltage. This ripple has no influence on
the DC voltage magnitude, so during the modeling, the relations that cause the ripple
are ignored. Thus, the DC voltage can be approximated to:
C , ref , , , I , ref , , , I , ref , , , I ,
ref , , , I , (4.15)
For DC side model the input signals are refV,se,1, refV,se,3, I1 and I3, and the output
is the DC voltage Vse,DC. The overall design of the series converter model is as shown
in Figure 5.6.
Figure 4.6: The series converter model block diagram.
4.3 DPFC Control
DPFC involves three types of controllers which are central controller, shunt
controller and series controller. In this section, the shunt control and series control
design is presented based on the mathematical model of DPFC.

35
4.3.1 Shunt Control
The shunt controller consists of two control circuits. The first one is fundamental
frequency control circuit that be responsible of keeping DC voltage of the converter at
a constant magnitude. The other one is 3rd harmonic frequency control circuit that is
responsible of keeping shunt converter 3rd harmonic current injected to the grid
regularly. The simple block diagram of shunt control model is shown in Figure 4.7.
1 3
1
Figure 4.7: Shunt converter control block diagram.
The current control circuit is the more complex loop within the shunt converter’s
3rd harmonic control and it is major loop. On the assumption that the DC voltage of
the converter is fixed at a constant magnitude, the shunt and series converters can be
characterized by voltage sources. From Figure 4.2, the 3rd harmonic circuit can be more
shortened into two voltage sources coupled in series to a resistor and an inductor, as
shown in Figure 4.8.
Figure 4.8: 3rd Harmonic simplified circuit.

36
At the 3rd harmonic frequency R3 and L3 are the network equivalent resistance
and inductance. In the circuit the relation between voltage and current is:
V , LdI ,
dtR I , V , 4.16
By using Park’s transformation and applying it to Eqn.(4.16), in the dq-frame
the relationship between the voltage and the current is given as:
V , , R I , , LdI , ,
dtω L I , , V , , 4.17
V , , R I , , LdI , ,
dtω L I , , V , , 4.18
4.3.2 Series Control
Two isolated control circuits are executed for two frequency components
controlling in series converter. The first one is 3rd harmonic control loop that used for
DC voltage control. The DPFC control diagram of series converter is shown in Figure
4.9. The central control generates reference voltage for the series converters at the
fundamental frequency to inject voltage in to the transmission line and the other
reference voltage is used at 3rd harmonic frequency to keep the DC capacitor voltage
of series converter.
3
Figure 4.9: Series converter control block diagram.
The 3rd harmonic current that flows through the transmission line is captured by
3rd band pass filter. From the 3rd harmonic current the single-phase Phase Locked Loop

37
PLL produces a rotation reference frame. The DC voltage control loop generate control
signal. The DC voltage controlled by d-component for 3rd harmonic voltage. As the q-
component will cause reactive power injection into the network, it is kept at zero
during the operation. As the current is taken for rotating reference frame for Park’s
transformation, by projecting the current to itself, the q-components I1,q and I3,q that
are perpendicular to the current will be zero and Eqn.(4.15) can be written as:
CdV ,
dt12ref , , , I , ref , , , I , 4.19

38
CHAPTER FIVE
SIMULATION AND RESULTS
5.1 Introduction
In this chapter, the performance evaluation of DPFC is verified in
SIMULINK/MATLAB through implementation of DPFC and simulation it at different
operating conditions. Firstly, the model of DPFC is simulated under a steady-state
analysis. Simple two bus system is implemented with two voltage source blocks
interconnected through L series branch blocks representing transmission line. The
device and its controls are also developed in SIMULINK. It is observed from steady-
state simulation results that shunt and series converters exchange power and the device
is able to control power flow through the line. Secondly, the power quality
improvement by using DPFC controller is developed and verified dynamically by
connecting this device to RLC load through two transmission lines connecting in
parallel and it observed that voltage sag and current swell can be mitigated effectively
by using DPFC controller.
5.2 Steady-State Analysis
Distributed Power Flow Controller model of the simple two-bus system is
designed by using MATLAB/Simulink software and the simulation results are
discussed and presented. The model comprises a shunt converter and multi-series
converters which are of a single phase. The shunt converter is placed in between the
neutral point of the ∆-Y transformer and the ground, and it is power is supplied by the
constant DC source. The results show the steady-state behavior with and without
DPFC. The phase difference between buses is provided to obtain the power flow
between them.

39
5.3 Network Simulation Model Without DPFC
Figure 5.1 depicts the simulation model without DPFC, the system consists of
two three-phase sources interconnected via a ∆-Y transformer and a transmission line.
The three inductors that coupled between buses B2 and B3 represent the transmission
line. These two three-phase sources represent different distribution networks of two
different areas connected together by the transmission line. The power flows from
sending end to receiving end can get by ensuring the phase difference between buses.
The active power and the reactive power are measured by the power measurement
block based on the Equation 4.1.
The measurement block is shown in Figure 5.1 and Table 5.1 presents the
parameter values that are substituted in the equation to obtain theoretical values.
Figure 5.1: MATLAB/simulink model of system without DPFC.
The network values are given in Table 5.1.
Table 5.1: System constraints in simulink model.
Abbreviation Explanation Value Vs End bus Sending voltage 380 Volt Vr End bus Receiving voltage 380 Volt
Θ Transmission angle between sending end bus voltages and receiving end bus voltages
1o and90o
L Line inductance 6 mh

40
Figure 5.2 displays the simulation results obtained for the active and reactive
power flows for 1 degree transmission angle. The theoretical values are calculated for
1-degree transmission angle using equation 4.2 and the resulting waveforms are
depicted in Figures: 5.2 (a) and 5.2 (b).
In mathematical calculations the value of XL=(2π fl)=(2 ∗ π ∗ 50 ∗ 6 ∗ 10 0.6π
P jQ V ∙V VJX
∗
3 ∗ 380 ∗380∠1 380∠0
J ∗ 0.6π
∗
4011 j35.02 VA 5.1
(a)
(b)
Figure 5.2: Power flows through the transmission line with out dpfc with 1 degree transmission angle (a) Active
power (b) Reactive power.

41
The resulting wave for simulation shows the values of active and reactive power
flows that observed from Figure 5.2 are (P= 4012 W and Q=35.02 VAR) for the
system under study without DPFC for constraints with 1-degree transmission angle.
Similarly, for the transmission angle of 90o the theoretical values and simulated
waveforms are shown in Eqn. (5.2) and Figures 5.3 (a) and 5.3 (b).
P jQ V ∙V VJX
∗
3 ∗ 380 ∗380∠90 380∠0
J ∗ 0.6π
∗
2.29819 ∗ 10 j2.2981910 VA 5.2
(a)
(b)
Figure 5.3: Power flows through the transmission line with Out DPFC With 90 degree transmission angle (a)
Active power (b) Reactive power.

42
The resulting wave for simulation shows the values of active and reactive power
flows that observed from Figure 5.3 are (P = 2.299 ∗ 10 W and Q = 2.297 ∗
10 VAR) for the system under study without DPFC for constraints with 90 degree
transmission angle.
5.4 Network Simulation Model with DPFC
The DPFC model with itˊs control circuits will be added to the previous model
of the network without DPFC which was shown in Figure 5.1. To control power flow
in this system and to study the performance of this device, two cases of analysis will
be used firstly by using two series converters per phase and then by using three series
converters per phase. The goal of using a different number of series converters each
time is to prove control ability by using multi-single-phase converters instead of using
one large three phase converter as in UPFC.
5.4.1 Power Flow Control by Using DPFC with Two Series Converters Per Phase
The system model with DPFC controller is given in Figure 5.4 in which DPFC
comprises a single phase shunt converter placed between ∆-Y transformer’s neutral
point and the ground and six single phase serial converters.
Figure 5.4: Simulation model of network using DPFC with two series converters per phase.

43
In this design there are six serial converters, each two converters are coupled in
series with the transmission line in each phase on two sides of the inductor.In Figure
5.4 the series and shunt controls are shown as subsystems and the system specifications
are tabulated in Table 5.1. From Figure 5.4 it is clear that the DC voltage source is
coupled to the DC side of the inverter and the AC side is coupled via a coupling
transformer to the system.
5.4.1.1 DPFC converter specifications
In DPFC the shunt and the series converters voltage and current ratings are
depend on the control range of the DPFC. According to Eq 5.1 the minimum power
flow with out DPFC connection is:
|Sr0| = |Pr0 + jQr0| =4011 j35.02 VA ≅ 4011 (5.3)
After DPFC connection the power flow according to Eq 5.12
|Src| = |Pr0 + jQr0| =1805.84 j35.0026 ≅ 1805VA (5.4)
the DPFC control range is given as:
|S,range| = |Src - Sr0| = |4011 - 1805| = 2206 VA (5.5)
When the DPFC control range is known, the total voltage at fundamental
frequency injected by series converters can be calculated as following:
V ,
∗
=∗ ∗ ∗ . ∗
≅11 v (5.6)
The current that flows through the series converters is:
I ,| | | |
√
∗=
√ ∗
∗≅10 A (5.7)
To find the specifications of the converters at the 3rd harmonic frequency, the
maximum active power that is exchanged between the converters is given by:
P ,| |
| |S ∗ ∗ . ∗ ∗| |
| ||2206| ≅ 116 (5.8)
The 3rd harmonic current is chosen to be one third of the nominal line current at
the fundamental frequency, which gives a constant value of I3 = 3 A per phase,
consequently. The maximum voltage of the series converter at the 3rd harmonic will
be:

44
V , ,
∗ ∗12.8 ≅ 13 (5.9)
The 3rd harmonic current though the shunt converter is:
|Ish, 3| 3|I3| 9A (5.10)
and the voltage of the shunt converter is given by:
|Vsh, 3| |Vse, 3 jX3|ise, 3| |13 j2*150*0.006*π*|9|| 51.6V≅ 52 (5.11)
Table 5.2: DPFC parameters in simulink model.
Parameter Name Parameter
Symbol unit
Parameter
Value
Maximum ac voltage of shunt converter Vsh, max volt 52
Maximum ac current of shunt converter Ish, max ampere 9
DC source supply of shunt converter Vsh, DC volt 17.7
Reference current with 3rd harmonic that
injected by the shunt converter Ish, ref,3 ampere 3
Maximum ac voltage of the series converter at
line side Vse, max volt 11
Maximum ac current of the series converter at
line side Ise, max ampere 10
Table 5.3: KI & KP values for DPFC shunt control and series control.
Current shunt control:
Symbol Parameter Value
KI 0.01
KP 0.9
Series converters DC control:
Symbol Parameter Value
KI 95
KP 0.22
R 0.22

45
5.4.1.2 Shunt converter and shunt control
Figure 5.5: MATLAB simulation model for shunt control.
The simulation model of shunt control is shown in Figure 5.5. only 3rd harmonic
frequency control is shown because the shunt converter DC voltage is maintained
constant by DC source. A PLL-Phase Locked Loop is used to captures, three-phase
frequency of bus voltage then the output signal is multiplied by 3 with gain block, thus
creating a virtual rotation reference frame for third harmonic frequency. The control
system is consisted of the current controller, park’s and inverse park’s transformer
subsystem. Figure 5.6 shows the simulation model of each subsystem. PI-Proportion
Integral controller is used to realize the current control gains which are tabulated in
table 5.3.

46
(a)
(b)
(c)
Figure 6.6: Shunt converter control: (a) Park’s transformation (b) Current control (C) Inverse dq-transformation.

47
5.4.1.3 Series Converter and Series Control
Figure 5.7: MATLAB / Simulation Model for Series Converters Control.
The single-phase series converter is a full bridge converter coupled with a
capacitor that connected on DC side of the converter. It is coupled with transmission
line by a single-phase transformer as shown in figure 5.7. Each one of series converters
has its isolated control from others as own control whose simulation model is shown
in Fig 5.8 (a). The DC control is depicted in 5.8 (b). The 3rd harmonic current is filtered
from the line current by the second order filter block. The DC control gains calculated
are tabulated in table 5.3. Figure 5.8 (c) shows the fundamental frequency control. The
fundamental rotating reference frame is generated by filtering fundamental current
with second-order filter.

48
(a)
(b)
(c)
Figure 5.8: Block diagram for series converter control: (a) DC control (b) 3rd Harmonic frequency control (c)
Fundamental frequency control.
5.4.2 Steady-State Analysis Results
To analyze steady state behavior of DPFC, the series converter is regulated to
inject 2V of fundamental voltage. The results of the injected line current are given in
Figure 5.9 and the injected voltage shown in Figure 5.10. Figure 5.11 shows the
voltage and current waveforms of the transformer at ∆ side. The shunt converter injects

49
third harmonic constant current which is equally distributed over the three phases and
overlaid on the fundamental current as shown in Figure 5.9. The voltage waveforms
of the series converter injected are shown in Figure 5.10, which are shaped as a Pulse
Width Modulation PWM waveform with two frequency components. The amplitude
indicates the DC-capacitor voltage of the transformer at the line side.
Figure 5.9: The line current in steady-state operation of DPFC.
Figure 5.10: Series converter voltage in steady-state operation of DPFC.
Figure 5.11: The bus voltage and current at the Δ side of the transformer in steady-state DPFC operation.

50
Figure 5.11 depicts waveforms of voltage and current without 3rd harmonic
component. Thus, the property of 3rd harmonic filtering is observed. The FFT analysis
of converter voltage is shown in Figure 5.12.
Figure 5.12: FFT analysis of series converter voltage.
5.4.3 Power Flow Controllability By Using DPFC With Two Series Converters Per Phase
The mathematical values of the power flow for 1 degree and 90 degree
transmission angles with six series converters are measured using equations (5.12) and
(5.13) respectively, the theoretical calculations for 1 degree are:
S P jQ V ∙ I ∗ V ∙V V V
JX
∗
3 ∗ 380 ∗380∠1 380∠0 3.646∠90
J ∗ 0.6 ∗ π∗
1805.84 j35.0026 VA 5.12

51
The waveforms with simulation values of active power and reactive power with
DPFC compensation for 1 degree angles are shown in Figure 5.13.
(a)
(b)
Figure 5.13: Power flow control with 1o transmission angle by using DPFC with two converters per phase (a)
The transmission line active power (b) The transmission line reactive power.
The theoretical calculations for 90 degree are:
S P jQ V ∙ I ∗ V ∙V V V
JX
∗
S 3 ∗ 380 ∗380∠90 380∠0 3.646∠90
J ∗ 0.6 ∗ π
∗
2.27614 ∗ 10 j2.29819 ∗ 10 VA 5.13
The waveforms with simulation values of active power and reactive power with
DPFC compensation for 90 degree angle is shown in Figure 5.14.

52
(a)
(b)
Figure 5.14: Power flow control with 90o transmission angle by using DPFC with two converters per phase (a)
The transmission line active power (b) The transmission line reactive power.
5.4.4 Power Flow Controllability by Using DPFC With Three Series Converters Per Phase
In this design there are nine serial converters, each three converters are coupled
in series with the transmission line in each phase on two sides of the inductor as shown
in figure 5.15.
Figure 5.15: Simulation model of network using DPFC with three series converters per phase.

53
The mathematical values of the power flow for 1 degree and 90 degree
transmission angles with nine series converters are measured using Equations 5.14 and
5.15 respectively, the theoretical calculations for 1 degree are:
S P jQ V ∙ I ∗ V ∙∗
3 ∗ 380 ∗380∠1 380∠0 5.47∠90
J ∗ 0.6 ∗ π
∗
702.712 j35 VA 5.14
The waveforms with simulation values of active power and reactive power with
DPFC compensation for 1 degree angles are shown in Figure 5.16
(a)
(b)
Figure 5.16: Power flow control with 1o transmission angle by using DPFC with three series converters per phase
(a) The transmission line active power (b) The transmission line reactive power.

54
The theoretical calculations for 90 degree are:
S P jQ V ∙ I ∗ V ∙V V V
JX
∗
S 3 ∗ 380 ∗380∠90 380∠0 5.47∠90
J ∗ 0.6 ∗ π
∗
226511 j229819.7 VA(5.15)
The waveforms with simulation values of active power and reactive power with
DPFC compensation for 90 degree angle are shown in Figure 5.17.
(a)
(b)
Figure 5.17: Power Flow Control With 90o Transmission Angle By Using DPFC With Three series Converters
Per Phase (a) The Transmission Line Active Power (b) The Transmission Line Reactive Power.

55
Table 5.4 compares the theoretical values that are calculated and the values that
obtained from simulation of active and reactive power flow for (1) degree and (90)
degree transmission angles with and without DPFC compensation.
Table 5.4: Comparison between the theoretical values with obtained values from the simulation.
Power Flows Without DPFC Compensation
Calculated Value Measured Value
With 1-degree transmission angle
Active power (Pro)(watt) 4011 4012
Reactive power (Qro)(var) -35.02 -34.99
With 90-degree transmission angle
Active power (Pro)(watt) 229819 229900
Reactive power (Qro)(var) -229819 -227900
Power Flows with DPFC Compensation by Using Six Series Converters
Calculated Value Measured Value
With 1 degree transmission angle
Active power (Pr)(watt) 1805,84 1803
Reactive power (Qr)(var) -35.002 -34.99
With 90 degree transmission angle
Active power (Pr)(watt) 227614,7 227500
Reactive power (Qr)(var) -229819.737 -229400
Power Flows with DPFC Compensation by Using Nine Series Converters
Calculated Value Measured Value
With 1 degree transmission angle
Active power (Pr)(watt) 702.712 701
Reactive power (Qr)(var) -35 -34.9
With 90 degree transmission angle
Active power (Pr)(watt) 226511 226400
Reactive power (Qr)(var) -229819.7 -229700
The resulting from the values obtained in the previous table shows that the DPFC
has the ability to control power flow in transmission system effectively and this ability
is increased by increasing the number of series converters per phase.

56
When comparing the values of the real power before DPFC connecting and its
values after DPFC connection, it is noted that the DPFC is able to reduce the minimum
power flow obtained by using 1-degree transmission angle from 4.012 kW without
DPFC connection to 1.803 kW by using DPFC with two series converters Per Phase
and to 0.701 kW by using DPFC with three series converters per phase.
For 90-degree transmission angle, the DPFC is able to reduce maximum power
flow from 229.9 kw without DPFC connection to 227.5 kW by using DPFC with two
series converters Per Phase and to 226.4 kW by using DPFC with three series
converters per phase. The results obtained depend on the DPFC control range in the
power system.
As shown in the Table 5.4, the measured values of active and reactive power
flow are approximately equal to the calculated values according to equations.
5.5 Step Response Results
To control the transmission line power flow and to prove the ability of DPFC to
control power flow a step change is made at the reference voltage of the serial
converters Figure 5.18 explain the step response of the Simulink model. The step
change contains both active and reactive change as shown in figure 5.18. The result
shows that the DC voltage of the series converter is stabilized before and after the step
change as shown in Figure 5.19. The current through the line is shown in Figure 5.20.
Figure 5.21 shows the ability of series converter to absorb and inject active and
reactive power before and after step change at fundamental frequency to the grid. The
results show that the series converters have ability to absorb and inject both active and
reactive power to the grid at the fundamental frequency. As shown in Figure 5.20. It
is observed that the change in the voltage injected by the series converter changes the
current flowing through the line.

57
(a)
(b)
Figure 5.18: The series converters reference voltage (a) V,D , (b)V,Q.
Figure 5.19: DPFC series converter voltage at step response.

58
Figure 5.20: line current at step response of the DPFC.
Figure 5.21: Active and reactive power injected by series converter at the fundamental frequency through the step response.
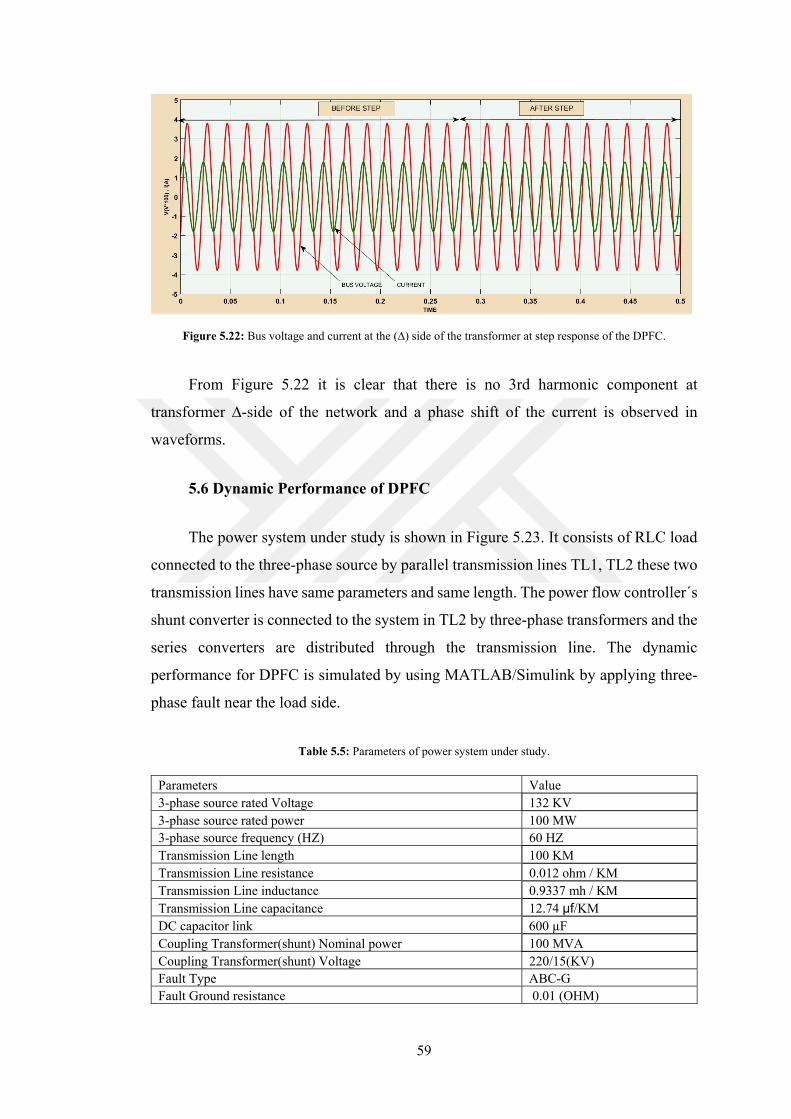
59
Figure 5.22: Bus voltage and current at the (∆) side of the transformer at step response of the DPFC.
From Figure 5.22 it is clear that there is no 3rd harmonic component at
transformer ∆-side of the network and a phase shift of the current is observed in
waveforms.
5.6 Dynamic Performance of DPFC
The power system under study is shown in Figure 5.23. It consists of RLC load
connected to the three-phase source by parallel transmission lines TL1, TL2 these two
transmission lines have same parameters and same length. The power flow controllerˊs
shunt converter is connected to the system in TL2 by three-phase transformers and the
series converters are distributed through the transmission line. The dynamic
performance for DPFC is simulated by using MATLAB/Simulink by applying three-
phase fault near the load side.
Table 5.5: Parameters of power system under study.
Parameters Value 3-phase source rated Voltage 132 KV 3-phase source rated power 100 MW 3-phase source frequency (HZ) 60 HZ Transmission Line length 100 KM Transmission Line resistance 0.012 ohm / KM Transmission Line inductance 0.9337 mh / KM Transmission Line capacitance 12.74 µf/KM DC capacitor link 600 µF Coupling Transformer(shunt) Nominal power 100 MVA Coupling Transformer(shunt) Voltage 220/15(KV) Fault Type ABC-G Fault Ground resistance 0.01 (OHM)

60
Figure 5.23: Simulation model for the power system with DPFC.
The fault takes time duration between (0.1 and 0.2) second. During the fault
occurrence, there is sag occurs in load voltage and causes the voltage to reduce from
(0.83 % to 0.53%) this difference magnitude is about 0.3% from normal pu value as
shown in Figure 5.24. And as a reaction to this fault, there is a swell in a current wave,
this swell causes current to raise from (0.28% to 0.57%) per unit. This difference
magnitude is about (0.29%) pu from normal value of current.

61
Figure 5.24: Voltage sag waveform without DPFC connection during the fault condition.
Figure 5.25: Current swell waveform without dpfc connection during the fault condition.
After DPFC connection, the voltage sag and current swell can be mitigated to
values near from normal values for voltage and current before fault happening as
shown in Figure 5.26 and Figure 5.27.

62
Figure 5.26: Voltage sag mitigation with DPFC compensation.
Figure 5.27: Current swell mitigation with DPFC compensation.
The load voltage harmonic analysis without DPFC connection can be seen in
Figure 5.28 which is having a value equal to (3.23%) of THD.

63
Figure 5.28: Total harmonic distortion of load voltage without DPFC connection.
Figure 5.29: Total harmonic distortion of load voltage with DPFC connection.
After DPFC connection and disturbances mitigation, the THD is reduced to
(0.61%). It is clear from these results that harmonic is eliminated to acceptable value
with DPFC connection to the power system.

64
CHAPTER SIX
CONCLUSION
6.1 Conclusion
The DPFC is one of the FACTS devices which has been recently developed. In
this study, the performance evaluation of DPFC device to control the power flow in
the transmission system and to improve the power quality in the transmission system
has been studied. The performance evaluation of DPFC is verified in SIMULINK by
using MATLAB software through simulation of this device at different operating
conditions.
Firstly, the model of DPFC is simulated under steady-state and step-response
analysis. Simple two bus system is implemented with two voltage source blocks
interconnected through RLC series branch blocks representing transmission line. The
device and its control are also implemented in SIMULINK. The shunt and series
converters in Simulink are realized using universal bridge block available in Simulink
library and also the controllers are realized with blocks available in Simulink library.
The shunt and series controls are implemented according to the DPFC modeling. The
results show that voltage injected by series converter contains both fundamental and
third harmonic frequency components. It is observed from the results that the series
control steadies the level of the capacitor DC voltage of each converter and is also
shown that the series converter can exchanges active and reactive power to the test
system.
The results proved the device's ability to control power flow through the
transmission line by connecting six converters and then nine series converters in the
network. From the results can be observed that the control property increases with the
increasing number of converters.

65
It is observed from step-response simulation results that shunt and series
converters exchange power and the device is able to control power flow through the
transmission line. Secondly, the power quality improvement by using DPFC controller
is developed and verified dynamically by connecting this device to RLC load through
two transmission lines connecting in parallel and it observed that voltage sag and
current swell can be mitigated effectively by using DPFC controller. The results
obtained from the simulation for this device proved that the performance of this device
in the stage of transmission of electricity is excellent. Finally, the results proved that
this device has the ability to control the flow of electrical energy with the difference
in transmission angle. It has the ability to mitigate problems that cause disturbances to
the electrical system with high efficiency.
6.2 Future Scope
Because of the principle of work for DPFC is based on using the third harmonic
frequency to exchange power between shunt and series converters, the third harmonic
current will cause extra losses in the transmission line and the transformers. In this
thesis the third harmonic current is set as constant value by right adjusting of the
amount of this current according to the amount of power that system requires the losses
can be reduced. Also, using advanced soft computing control techniques to control
DPFC converters is important to develop the performance of DPFC and the optimal
location of DPFC in the power system network can be one of the future scopes for this
device to give more enhance to the device working.

66
REFERENCES
1. Ghosh, A. and G. Ledwich, Power quality enhancement using custom power devices. 2012: Springer Science & Business Media.
2. Yuan, Z., et al., A FACTS device: Distributed power-flow controller (DPFC). IEEE transactions on power electronics, 2010. 25(10): p. 2564-2572.
3. Yuan, Z., S.W. de Haan, and B. Ferreira. A New FACTS component—Distributed Power Flow Controller (DPFC). in Power Electronics and Applications, 2007 European Conference on. 2007. IEEE.
4. Jamshidi, A., S.M. Barakati, and M.M. Ghahderijani, Impact of Distributed Power Flow Controller to Improve Power Quality Based on Synchronous Reference Frame Method. International Journal of Engineering and Technology, 2012. 4(5): p. 581.
5. RAMESH, P. and M.D. REDDY, Modeling and Analysis of Distributed Power-Flow Controller (DPFC).
6. Peddaiah, M.N., M.K.V. Sekhar, and M.J.L.M.G. Rajashekhar, A Revolutionary Idea to Improve Power Quality by Using Distributed Power Flow Controller [DPFC].
7. Safari, A., B. Soulat, and A. Ajami, Modeling and unified tuning of distributed power flow controller for damping of power system oscillations. Ain Shams Engineering Journal, 2013. 4(4): p. 775-782.
8. Bahamani, A.K., et al., Modeling and Digital Simulation of DPFC System using Matlab Simulink. International Journal of Emerging Trends in Electrical and Electronics (IJETEE-ISSN: 2320-9569), 2013. 6(1): p. 1-5.
9. NIRMALA, P., S. SAJIDA, and S. BHASHA, Power Quality Improvement And Mitigation Of Voltage Sag And Current Swell Using Distributed Power Flow Controller.

67
10. Yuan, Z., S.W. de Haan, and B. Ferreira. DPFC design Procedure-a Case Study Using the KEPCO UPFC as an Example. in Power Electronics Conference (IPEC), 2010 International. 2010. IEEE.
11. Glanzmann, G. and G. Andersson. Using FACTS devices to resolve congestions in transmission grids. in CIGRE/IEEE PES, 2005. International Symposium. 2005. IEEE.
12. Kalyani, S.T. and G.T. Das, Simulation of real and reactive power flow control with UPFC connected to a transmission line. Journal of Theoretical & Applied Information Technology, 2008. 4(1).
13. Zhang, X.-P., C. Rehtanz, and B. Pal, Flexible AC transmission systems: modelling and control. 2012: Springer Science & Business Media.
14. Grainger, J.J.S., W.D.J.J. Grainger, and W.D. Stevenson, Power system analysis. 1994.
15. Saadat, H., Power system analysis. 1999: McGraw-Hill.
16. Kundur, P., N.J. Balu, and M.G. Lauby, Power system stability and control. Vol. 7. 1994: McGraw-hill New York.
17. Ibrahim Oumarou, P., D. Jiang, and C. Yijia. Optimal Placement of shunt connected Facts device in a series compensated long transmission line. in Proceedings of the World Congress on Engineering. 2009.
18. Akter, S. and P. Das, Comparison of the Performance of IPFC (series-series) and UPFC (series-shunt) FACTS Controller in Power System. International Journal of Computer Applications, 2013. 67(2).
19. Singh, B., et al., Introduction of FACTS controllers, a critical review. International Journal of reviews in computing, 2011. 8.
20. Othman, A.M., Enhancing the performance of flexible AC transmission systems (FACTS) by computational intelligence. 2011.
21. Murali, D., M. Rajaram, and N. Reka, Comparison of FACTS devices for power system stability enhancement. International Journal of Computer Applications, 2010. 8(4): p. 30-35.
22. Eslami, M., et al., A survey on flexible AC transmission systems (FACTS). Organ, 2012. 1: p. 12.

68
23. Bhowmik, A.R. and N. Champa, Implementation of unified power flow controller (UPFC) for power quality improvement in IEEE 14-Bus System. 2011.
24. Martins, I.M., et al. Control of distributed power flow controllers using active power from homopolar line currents. in Optimization of Electrical and Electronic Equipment (OPTIM), 2012 13th International Conference on. 2012. IEEE.
25. Rajasekhar, A.N. and M.N. Babu. Harmonics reduction and power quality improvement by using DPFC. in Electrical, Electronics, and Optimization Techniques (ICEEOT), International Conference on. 2016. IEEE.
26. Saini, K., A. Saxena, and M. Farooqi, Analysis of Distributed Power Flow Controller in Power System Network for Improving Power Flow Control. Indonesian Journal of Electrical Engineering and Computer Science, 2016. 2(3): p. 510-521.
27. Ramya, K. and C.C.A. Rajan. Analysis and regulation of system parameters using DPFC. in Advances in Engineering, Science and Management (ICAESM), 2012 International Conference on. 2012. IEEE.
28. Renduchintala, U.K., et al. Smooth shunt control of a fuzzy based distributed power flow controller to improve power quality. in Information and Automation for Sustainability (ICIAfS), 2016 IEEE International Conference on. 2016. IEEE.
29. Ramesh, P. and M.D. Reddy, Power Transfer Capability & Reliability Improvement in a Transmission Line using Distributed Power-Flow Controller. International Journal of Electrical and Computer Engineering, 2012. 2(4): p. 553.

69
CURRICULUM VITAE
PERSONAL INFORMATION
Name, Surname : Ali Mohammed Ibrahim AL-HARDANEE
Date and place of Birth : Iraq – 10.10.1985
Marital Status : Married
Phone : 00905384903515
Email : [email protected]
Occupation : Employee in the Iraqi Ministry of Electricity
EDUCATION
Undergraduate: Northern Technical University, Iraq -Technical College of Mosul-
Department of Electrical Power Engineering.
LANGUAGE
Arabic, English