University of Reading The effects of taste sensitivity and ...
257
University of Reading The effects of taste sensitivity and repeated taste exposure on children’s intake and liking of turnip (Brassica rapa subsp. rapa); a bitter Brassica vegetable Nurfarhana Diana Mohd Nor Thesis submitted for the Degree of Doctor of Philosophy (PhD) Department of Food and Nutritional Sciences February 2018
-
Upload
khangminh22 -
Category
Documents
-
view
0 -
download
0
Transcript of University of Reading The effects of taste sensitivity and ...
University of Reading
The effects of taste sensitivity and repeated taste exposure on children’s intake and liking of turnip (Brassica rapa subsp. rapa); a bitter
Brassica vegetable
Nurfarhana Diana Mohd Nor
Thesis submitted for the Degree of Doctor of Philosophy (PhD)
Department of Food and Nutritional Sciences
February 2018

Declaration
I confirm that this is my own work and the use of all material from other sources has been
properly and fully acknowledged.
Nurfarhana Diana Mohd Nor

Acknowledgements
First and foremost, I would like to express my sincere gratitude to my supervisors, Dr Lisa
Methven, Professor Carmel Houston-Price and Dr Kate Harvey for their guidance and support
throughout my PhD journey. I truly appreciate their patience and sacrifice for spending hours
reading and editing my work, sharing knowledge and giving ideas. They have also helped me
to be an independent researcher by allowing me to do my project in my own way, and indirectly
increases my self-confidence. Working with them has been my greatest pleasure and I could
not ask for a better supervisor.
I am indebted to all participants who take part in my studies. I wish to thank all the head
teachers for allowing me to do my research at their schools, teachers, school staffs and parents
for their cooperation.
Special thanks go to numerous people that have helped me especially my research group
members (Sherrie, Bola, Ayo, Stephanie, Amber and Sarah), my project students (Sahadev,
Megan, Harshita and Vicky), my colleagues and staffs of the Department of Food and
Nutritional Sciences, University of Reading, UK.
Finally, I would like to thank my husband (Hazrol), my parents (Mohd Nor and Halijah)
and my siblings (Hasanah, Fadhli and Haniff) for their endless support, belief and for always
be there for me. I would not be who I am today and none of this would have been possible
without them. They mean the world to me.

Abstract
Taste sensitivity plays an important role in influencing food preferences and thus nutritional
status. It has been reported that children have low vegetable consumption. Differences in bitter
taste sensitivity between individuals may influence vegetable consumption, especially Brassica
vegetables. Glucosinolates (GSLs) are present in high amount in Brassica vegetables, and these
compounds contain a thiourea group, which is partly responsible for the bitter taste of Brassica
vegetables. The thiourea group also exists in 6-propylthiouracil (PROP), and the ability to taste
it is genetically determined. Variations in the bitter taste receptor of TAS2R38 predominantly
explain the differences in response of PROP perception. Additionally, phenotypic measure of
fungiform papillae density (FPD) has been shown to contribute to taste sensitivity, and gustin
(CA6) gene has been proposed to be involved in the development of papillae. Existing literature
has shown that repeated taste exposure can modify the acceptance of initially disliked/novel
foods. However, no previous study has considered taste sensitivity within a repeated taste
exposure study design.
The main objective of this thesis was to investigate the effects of taste genotypes
(TAS2R38 and CA6) and phenotypes (PROP taster status and FPD) on the effectiveness of
repeated taste exposure of an unfamiliar Brassica vegetable (turnip) on intake and liking in
children aged 3 to 5 years. To support this main objective, we also determined the effects of
cooking method on the sensory profile and consumer liking of turnip, and identified and
quantified GSLs in turnip. Using parental reported questionnaires about children’s preferences,
this thesis also explored whether taste sensitivity would have effects on overall vegetable intake
and liking in children.
Our findings revealed that turnip liking is dependent on cooking method, where we
found that roasted-turnip was the most preferred, and boiled-pureed turnip was the least
preferred. Sweetness in turnip increased liking, while bitterness decreased liking. Although
TAS2R38 genotype had a significant impact on bitter perception in turnip, where the PAV/PAV
consumers tended to score higher bitter intensity than the PAV/AVI and AVI/AVI consumers,
it did not influence taste liking. Our chemical analysis showed that there were 12 individual
GSLs found across our turnip samples. Gluconasturtiin was the most abundant GSL, and we
found significant differences in individual GSL content (except glucoalyssin) between samples.
As expected, GSLs were positively correlated with bitter taste, and negatively correlated
(except glucobrassicanapin) with sweet taste.
In our main study, intake and liking of steamed-pureed turnip significantly increased
after exposure, but there were no significant effects of taste genotypes and phenotypes.
Furthermore, we found significant increases in intake and liking of the vegetable at follow-up,
compared to pre-intervention. From the parent-reported questionnaires, we found no significant
effects of taste genotypes and phenotypes on intake of vegetables collectively (Brassica, non-
Brassica and total vegetables). However, there were some significant effects of these genotypes
and phenotypes on intake of certain vegetables. For liking, FPD was found to have had a
significant impact on Brassica and total vegetables where the low and high FPD groups had
higher liking than the medium FPD group. From the questionnaire results, we concluded that
vegetable intake and liking were positively correlated, suggesting that as intake increases, liking
increases and vice versa.
In conclusion, cooking method predicts turnip liking, and 12 GSLs in turnip were
positively correlated with bitterness. Repeated taste exposure is effective in increasing the
acceptance of an unfamiliar bitter vegetable in children, and has long-term positive effects.
Taste sensitivity did not have a significant impact on the effectiveness of repeated taste
exposure. However, there were significant effects of taste genotype (TAS2R38) and phenotypes
(PROP taster status and FPD) on intake of specific vegetables, and only FPD influenced parent-
reported liking of vegetables from the 3 to 5 year-old children.

i
Table of Contents List of figures .............................................................................................................................. v
List of tables ............................................................................................................................. vii Glossary of terms ...................................................................................................................... ix
Chapter 1: Literature review ................................................................................................... 1
1.1 Health benefits of fruit and vegetable consumption .................................................... 1
1.2 Food neophobia ............................................................................................................ 3
1.3 Development of food preferences in children .............................................................. 4
1.4 PROP taster status ........................................................................................................ 9
1.5 Fungiform papillae density (FPD) ............................................................................. 10
1.6 TAS2R38 ..................................................................................................................... 11
1.7 Gustin (CA6) .............................................................................................................. 14
1.8 Glucosinolates in Brassica vegetables ....................................................................... 16
1.9 Effects of taste sensitivity on food preferences .......................................................... 19
Chapter 2: Sensory characteristics and consumer liking of turnip cooked by different methods ............................................................................................................................ 25
2.1 Abstract ...................................................................................................................... 25
2.2 Introduction ................................................................................................................ 26
2.3 Materials and methods ............................................................................................... 28
2.3.1 Turnip samples and preparation .......................................................................... 28
2.3.2 Processing ........................................................................................................... 29
2.3.3 Boiled-pureed ...................................................................................................... 29
2.3.4 Roasted ................................................................................................................ 29
2.3.5 Steamed-pureed .................................................................................................. 29
2.3.6 Stir-fried .............................................................................................................. 29
2.3.7 Sample storage .................................................................................................... 30
2.3.8 Sample serving .................................................................................................... 30
2.3.9 Sensory analysis .................................................................................................. 30
2.3.10 Consumer recruitment and acceptability test ...................................................... 33
2.3.11 DNA extraction and genotyping ......................................................................... 34
2.3.12 PROP taster status ............................................................................................... 34
2.3.13 Statistical analysis ............................................................................................... 35
2.4 Results ........................................................................................................................ 36
2.4.1 Sensory characteristics of cooked turnip ............................................................ 36
2.4.2 Consumer demographics, taste genotype and phenotype characteristics ........... 39
2.4.3 Consumer liking of cooked turnip ...................................................................... 41

ii
2.4.4 Consumption intent ............................................................................................. 42
2.4.5 Effects of taste genotype and phenotype on taste liking and perceptions .......... 42
2.4.6 Hierarchical cluster analysis of consumer liking data ........................................ 48
2.4.7 Internal preference map ...................................................................................... 48
2.5 Discussion .................................................................................................................. 51
2.6 Conclusion.................................................................................................................. 54
Chapter 3: Evaluation of glucosinolates and sensory characteristics of steamed-pureed turnip (Brassica rapa subsp. rapa) ...................................................................................................... 56
3.1 Abstract ...................................................................................................................... 56
3.2 Introduction ................................................................................................................ 57
3.3 Materials and methods ............................................................................................... 59
3.3.1 Turnip sample and preparation ........................................................................... 59
3.3.2 Reagents and chemicals ...................................................................................... 60
3.3.3 Glucosinolates extraction .................................................................................... 60
3.3.4 LC-MS analysis .................................................................................................. 61
3.3.5 Sensory analysis .................................................................................................. 62
3.3.6 Statistical analysis ............................................................................................... 63
3.4 Results ........................................................................................................................ 65
3.4.1 Identification and quantification of glucosinolates ............................................. 65
3.4.2 Sensory characteristics ........................................................................................ 67
3.4.3 Principal component analysis (PCA) .................................................................. 70
3.5 Discussion .................................................................................................................. 72
3.6 Conclusion.................................................................................................................. 75
Chapter 4: The effects of repeated taste exposure on vegetable acceptance in children varying in bitter taste sensitivity ............................................................................................................ 77
4.1 Abstract ...................................................................................................................... 77
4.2 Introduction ................................................................................................................ 78
4.3 Materials and methods ............................................................................................... 80
4.3.1 Study design ........................................................................................................ 80
4.3.2 Power calculation ................................................................................................ 81
4.3.3 Recruitment ......................................................................................................... 82
4.3.4 Participants .......................................................................................................... 82
4.3.5 Selection of target vegetable ............................................................................... 82
4.3.6 Vegetable preparation ......................................................................................... 83
4.3.7 Vegetable serving ............................................................................................... 83
4.3.8 Repeated taste exposure test ............................................................................... 84
4.3.9 DNA extraction and genotyping ......................................................................... 84
iii
4.3.10 PROP taster status ............................................................................................... 85
4.3.11 Fungiform papillae counts .................................................................................. 85
4.3.12 Statistical analysis ............................................................................................... 86
4.4 Results ........................................................................................................................ 87
4.4.1 Taste genotype and phenotype characteristics .................................................... 87
4.4.2 Relationship between taste genotypes and phenotypes ...................................... 89
4.4.3 Comparison between intervention and control groups ....................................... 91
4.4.4 Effects of repeated taste exposure on intake and liking of steamed-pureed turnip ............................................................................................................................ 94
4.4.5 Effects of taste genotypes and phenotypes on repeated taste exposure .............. 96
4.4.6 Vegetable acceptance over time ....................................................................... 103
4.4.7 Vegetable acceptance over time according to taste genotypes and phenotypes ..... .......................................................................................................................... 104
4.4.8 Effects of repeated taste exposure at follow-up ................................................ 112
4.4.9 Effects of repeated taste exposure at follow-up according to taste genotypes and phenotypes ...................................................................................................................... 113
4.5 Discussion ................................................................................................................ 121
4.6 Conclusion................................................................................................................ 125
Chapter 5: The effects of bitter taste sensitivity on parent-reported vegetable intake and liking in children ..................................................................................................................... 126
5.1 Abstract .................................................................................................................... 126
5.2 Introduction .............................................................................................................. 127
5.3 Materials and methods ............................................................................................. 129
5.3.1 Participants ........................................................................................................ 129
5.3.2 Assessment of vegetable intake and liking ....................................................... 129
5.3.3 Statistical analysis ............................................................................................. 131
5.4 Results ...................................................................................................................... 131
5.4.1 Taste genotype and phenotype characteristics .................................................. 131
5.4.2 Relationship between taste genotypes and phenotypes .................................... 133
5.4.3 Estimated yearly intake of vegetables .............................................................. 134
5.4.4 Effects of taste genotypes and phenotypes on vegetable intake ....................... 137
5.4.5 Effects of taste genotypes and phenotypes on individual vegetables ............... 139
5.4.6 Vegetable liking ................................................................................................ 141
5.4.7 Effects of taste genotype and phenotype on vegetable liking ........................... 144
5.5 Discussion ................................................................................................................ 146
5.6 Conclusion................................................................................................................ 150
Chapter 6: General discussion ............................................................................................ 151
6.1 Introduction .............................................................................................................. 151

iv
6.2 Key findings ............................................................................................................. 152
6.2.1 Does cooking method predict turnip liking? ..................................................... 152
6.2.2 Which glucosinolate is responsible for the bitterness in turnip? ...................... 154
6.2.3 Repeated taste exposure is a good strategy to increase the acceptance of an unfamiliar bitter vegetable. Does taste sensitivity have an impact on it? ....................... 155
6.2.4 Do taste genotypes and phenotypes influence vegetable intake and liking? .... 156
6.2.5 Is PROP sensitivity dependent on taste genotype or phenotype? ..................... 157
6.3 Limitations ............................................................................................................... 158
6.3.1 Classification method of PROP taster status .................................................... 158
6.3.2 Unequal group sizes .......................................................................................... 159
6.3.3 Sample size ....................................................................................................... 159
6.3.4 Hedonic scale .................................................................................................... 160
6.3.5 Food frequency questionnaire (FFQ) ................................................................ 161
6.4 Recommendations .................................................................................................... 162
6.5 Conclusion................................................................................................................ 165
References ............................................................................................................................... 166
Appendix 1: Titles of oral and poster presentations in conferences ....................................... 184
Appendix 2: University of Reading research ethics ............................................................... 185
Appendix 3: Shapiro-Wilk normality tests for Chapter 2 ....................................................... 222
Appendix 4: Shapiro-Wilk normality tests for Chapter 3 ....................................................... 226
Appendix 5: Vegetable preference and familiarity questionnaire .......................................... 230
Appendix 6: 3-point hedonic scale ......................................................................................... 239
Appendix 7: Shapiro-Wilk normality tests for Chapter 4 ....................................................... 240
Appendix 8: Comparison mean intake between schools for group A and B .......................... 241
Appendix 9: Sample size calculation for future study ............................................................ 242
Appendix 10: Shapiro-Wilk normality tests for Chapter 5 ..................................................... 243

v
List of figures Figure 2-1: Mean scores for consumption intent of turnip cooked by 4 different methods. .... 42 Figure 2-2: Consumer scores for taste liking for turnip cooked by 4 different methods according to TAS2R38 genotype and PROP taster status .......................................................................... 44 Figure 2-3: Consumer scores for bitter perception for turnip cooked by 4 different methods according to TAS2R38 genotype and PROP taster status ......................................................... 46 Figure 2-4: Consumer scores for sweet perception for turnip cooked by 4 different methods according to TAS2R38 genotype and PROP taster status ......................................................... 47 Figure 2-5: Internal preference map of consumer overall liking scores for 4 cooking methods of turnip with sensory characteristics ....................................................................................... 50 Figure 3-1: PCA plot of glucosinolate compounds in 7 batches of steamed-pureed turnip with sensory characteristics .............................................................................................................. 70 Figure 4-1: Study design for repeated taste exposure to increase vegetable acceptance in children ..................................................................................................................................... 80 Figure 4-2: Power calculation ................................................................................................... 82 Figure 4-3: Intake for group A (intervention group) and group B (control group) at pre- and post-intervention ....................................................................................................................... 91 Figure 4-4: Change in intake for group A and B from T1, T2 and T3 ..................................... 93 Figure 4-5: Liking scores for group A (intervention group) and group B (control group) at pre- and post-intervention ................................................................................................................ 94 Figure 4-6: Overall intake and liking scores for steamed-pureed turnip across group A and B at pre- and post-intervention ......................................................................................................... 95 Figure 4-7: Intake and liking scores for steamed-pureed turnip across group A and B at pre- and post-intervention according to TAS2R38 .................................................................................. 97 Figure 4-8: Intake and liking scores for steamed-pureed turnip across group A and B at pre- and post-intervention according to gustin (CA6) ............................................................................. 99 Figure 4-9: Intake and liking scores for steamed-pureed turnip across group A and B at pre- and post-intervention according to PROP taster status ................................................................. 101 Figure 4-10: Intake and liking scores for steamed-pureed turnip across group A and B at pre- and post-intervention according to fungiform papillae density (FPD) ................................... 102 Figure 4-11: Change in intake and liking score across group A and B from pre-intervention, Day 5 and 8 of exposure to post-intervention ......................................................................... 103

vi
Figure 4-12: Change in intake and liking score across group A and B from pre-intervention, Day 5 and 8 of exposure to post-intervention according to TAS2R38 .................................... 105 Figure 4-13: Changes in intake across group A and B from pre-intervention, Day 5 and 8 of exposure to post-intervention according to TAS2R38 (combined genotype groups) .............. 106 Figure 4-14: Change in intake and liking score across group A and B from pre-intervention, Day 5 and 8 of exposure to post-intervention according to gustin (CA6) .............................. 108 Figure 4-15: Change in intake and liking score across group A and B from pre-intervention, Day 5 and 8 of exposure to post-intervention according to PROP taster status ..................... 110 Figure 4-16: Change in intake and liking score across group A and B from pre-intervention, Day 5 and 8 of exposure to post-intervention according to fungiform papillae density (FPD) ................................................................................................................................................ 111 Figure 4-17: Intake and liking scores for steamed-pureed turnip across group A and B at pre-, post-intervention and follow-up.............................................................................................. 113 Figure 4-18: Intake and liking scores for steamed-pureed turnip across group A and B at pre-, post-intervention and follow-up according to TAS2R38 ......................................................... 114 Figure 4-19: Intake and liking scores for steamed-pureed turnip across group A and B at pre-, post-intervention and follow-up according to gustin (CA6) ................................................... 116 Figure 4-20: Intake and liking scores for steamed-pureed turnip across group A and B at pre-, post-intervention and follow-up according to PROP taster status .......................................... 118 Figure 4-21: Intake and liking scores for steamed-pureed turnip across group A and B at pre-, post-intervention and follow-up according to fungiform papillae density (FPD) .................. 120 Figure 5-1: Mean yearly portions for 15 Brassica vegetables ................................................ 135 Figure 5-2: Mean yearly portions for 30 non-Brassica vegetables ........................................ 136 Figure 5-3: Mean liking scores for 15 Brassica vegetables .................................................... 142 Figure 5-4: Mean liking scores for 30 non-Brassica vegetables ............................................ 143 Figure 5-5: Mean liking scores for Brassica, non-Brassica and total vegetables between FPD groups ...................................................................................................................................... 146

vii
List of tables
Table 1-1: Distribution of TAS2R38 genotypes by ethnicity .................................................... 13 Table 2-1: Definition of sensory characteristics associated with samples of turnips cooked by 4 different methods and references used during vocabulary development. ................................. 32 Table 2-2: Mean scores of sensory characteristics for turnips cooked by 4 different methods 37 Table 2-3: Demographics characteristics, taste genotype and phenotype of consumers .......... 40 Table 2-4: Mean liking scores for overall, taste, texture and appearance liking of turnip cooked by 4 different methods .............................................................................................................. 41 Table 2-5: Correlation between taste liking and either bitter perception or sweet perception . 43 Table 2-6: Mean overall liking scores for 3 clusters following hierarchical cluster analysis .. 48 Table 3-1: Purchase date of turnips for each batch. .................................................................. 59 Table 3-2: Definition of sensory characteristics associated with 7 batches of steamed-pureed turnip and references used during vocabulary development. ................................................... 63 Table 3-3: Mean concentration of glucosinolates in 7 batches of steamed-pureed turnip ....... 66 Table 3-4: Chemical structures of individual glucosinolates. ................................................... 67 Table 3-5: Mean scores for sensory characteristics for 7 batches of steamed-pureed turnip ... 69 Table 4-1: Taste genotype and phenotype characteristics of participants ................................ 88 Table 4-2: Relationship between taste genotypes and phenotypes ........................................... 90 Table 5-1: Frequency of vegetable intake and calculation of yearly vegetable portion ......... 130 Table 5-2: Taste genotype and phenotype characteristics of participants .............................. 132 Table 5-3: Relationship between taste genotypes and phenotypes ......................................... 133 Table 5-4: Mean portions for total vegetable per year and per day using minimum, median and maximum calculation .............................................................................................................. 134 Table 5-5: Mean yearly intake of vegetable portions (Brassica, non-Brassica and total) and proportion (%) of vegetables consumed as Brassica per year, according to TAS2R38, gustin (CA6) genotypes, PROP taster status and FPD. ...................................................................... 137 Table 5-6: Yearly intake of vegetable portions (Brassica, non-Brassica and total) for children with rare genotypes. ................................................................................................................ 138
viii
Table 5-7: Mean liking scores for Brassica, non-Brassica and total vegetables according to taste genotypes and phenotypes ...................................................................................................... 144

ix
Glossary of terms AHC: Agglomerative hierarchical cluster
ANOVA: Analysis of variance
API-ES: Atmospheric pressure ionization-electrospray
AVI: Alanine-Valine-Isoleucine
CA6: Gustin
CVD: Cardiovascular disease
DNA: Deoxyribonucleic acid
DW: Dry weight
FAO: Food and Agriculture Organisation
FFQ: Food frequency questionnaire
FPD: Fungiform papillae density
gLMS: General labelled magnitude scale
GSL: Glucosinolate
HPLC: High-performance liquid chromatography
ITC: Isothiocyanate
KCL: Potassium chloride
LC-MS: Liquid chromatography mass spectrometry
NaCl: sodium chloride
NDNS: National Diet and Nutrition Survey
NHS: National Health Service
PAV: Proline-Alanine-Valine
PCA: Principal component analysis
PROP: 6-n-propylthiouracil
PTC: Phenylthiocarbamide
QDA: Quantitative Descriptive Analysis
RRF: Relative response factor
SD: Standard deviation
SEM: Standard error of the mean
SNP: Single nucleotide polymorphism
T2R: Taste type 2 receptors
WHO: World Health Organisation

Chapter 1
1
CHAPTER 1: Literature review
1.1 Health benefits of fruit and vegetable consumption
A diet high in fruit and vegetables is promoted globally (Slavin & Lloyd, 2012) and studies
show that their consumption is associated with decreased risk of chronic diseases. Slavin and
Lloyd's (2012) review demonstrates that dietary fibre in fruit and vegetables has a role in
cardiovascular disease (CVD) prevention and may help prevent obesity. A meta-analysis of
case-controlled studies shows vegetables have protective effects against cancers of the
oesophagus, lung, stomach, colorectum and breast (Riboli & Norat, 2003). The World Health
Organisation (WHO) has listed ‘low fruit and vegetable consumption’ as one of the risk factors
for total burden of disease (World Health Organisation, 2002) and Lock, Pomerleau, Causer,
Altmann and McKee (2005) suggest that an intake of 600 g of fruit and vegetables per day in
adults has the potential to reduce the total burden of disease by 1.8% and ischaemic heart
disease and ischaemic stroke by 31% and 19% respectively. The authors conclude that increased
fruit and vegetable intake in the daily diet may reduce the risk of lung, stomach, oesophageal
and colorectal cancer by 12%, 19%, 20% and 2% respectively.
Studies have reported that risk of CVD starts to develop from childhood. A study that
involved 2204 subjects showed that CVD risk factors (BMI, serum lipid levels and blood
pressure) in childhood are correlated with values measured in adulthood; concluded from a 27-
year follow up (Juhola et al., 2011). Another study showed similar results, concluding that
cardiovascular risk in childhood persists through adulthood (Joshi et al., 2014).
Maynard, Gunnell, Emmett, Frankel and Davey Smith (2003) suggested that early diet
intervention has an impact on adult health, as their study showed that fruit consumption in
childhood has a protective effect on cancer risk in later life.

Chapter 1
2
In addition to reducing risk of disease, evidence indicates a diet high in fruit and
vegetables can reduce obesity. In a prospective dietary study of 206 adults, a 10-year follow up
revealed an average weight gain of 3.41 kg/person. However, with an intake of 249 to 386 g
fruit/day, the risk of gaining ≥3.41 kg over 10 years reduces by 69% and with an intake of >333
g vegetables/day, this risk reduces by 82% (Vioque, Weinbrenner, Castelló, Asensio, & Garcia
de la Hera, 2008).
The World Health Organisation (WHO)/Food and Agriculture Organisation (FAO)
recommend a minimum intake of 400 g of fruit and vegetables per day (excluding potatoes and
other starchy tubers) to prevent chronic diseases such as diabetes, obesity and heart disease
(WHO, 2004). The recommendation is the same as UK guidelines that recommend 5 portions
of fruit and vegetables per day (at 80 g per portion) (Bates et al., 2014). The guideline is
recommended for those aged 11 years and over (Bates et al., 2016). According to National
Health Service (NHS), younger children should also consume at least 5 portions of fruit and
vegetables a day, where one portion is equal to the amount they can fit in their hand (National
Health Service, 2015).
Despite the health benefits of vegetables being heavily promoted, vegetable intake is
often reported to be low among children. The National Diet and Nutrition Survey (NDNS) in
the UK from 2008 to 2012 showed that the mean intake of vegetables was 72 g per day for
children aged 1.5 to 3 years, 97 g per day for children aged 4 to 10 years and 112 g per day for
children aged 11 to 18 years. Only 9% of 11 to 18 years old children consumed 5 portions of
fruit and vegetables as recommended by the UK guidelines (Bates et al., 2014). Low vegetable
intake occurs not only in the UK; Reinaerts, Nooijer, Candel and Vries (2007) reported that
children aged 4 to 12 years old in the Netherlands only consume an average of 60 g of
vegetables per day. In addition, Magarey, Daniels and Smith (2001) showed that the mean
intake of vegetables in Australian children aged 2 to 7 years is between 60 to 98 g per day.

Chapter 1
3
In summary, children must be encouraged to eat vegetables as it has been established
that a diet rich in vegetables provides health benefits as it may help prevent or reduce many
chronic diseases.
1.2 Food neophobia
Many researchers have suggested that low consumption or avoidance of certain foods is due to
food neophobia. Pelchat and Pliner (1995) defined food neophobia as “the reluctance to try
unfamiliar foods or dislike for the flavour of unfamiliar foods” (p.153). Cooke, Wardle and
Gibson (2003) found that greater food neophobia in 2 to 6 year-old children was related to lower
consumption of vegetables, fruits and meat. These data were based on a questionnaire which
included a measure of child food neophobia and a food frequency questionnaire completed by
564 mothers. They suggested that these foods are being avoided because they may contain
toxins especially in vegetables and food neophobia serves to protect humans from ingesting
these potentially dangerous foods. Similar results were found in a study by Russell and Worsley
(2008) that revealed food neophobia in 2 to 5 year-old children has the strongest effects on
intake of vegetables followed by meat and fruits. These studies suggest that food neophobia is
crucial in determining children’s dietary intake and food preferences. In addition, Knaapila et
al. (2015) reported that food neophobia is associated with low consumption of vegetables, poor
quality of diet and high body mass index (BMI) in Finnish adults. Moreover, the same research
group argued that food neophobia limited familiarity with spices (Knaapila et al., 2017).
Food neophobia is associated with age and tends to decrease as age increases. Cashdan
(1994) found that food neophobia is low in children under 2 years old, substantially increases
between 2 to 3 years, and slowly decreases thereafter. Pelchat and Pliner (1995) also argued
that food neophobia is more pronounced in younger children than older children given their
findings that children aged 6 to 8 years were more willing to try novel foods than children aged
Chapter 1
4
3 to 5 years. McFarlane and Pliner (1997) in a study on 10 to 79 year-old participants reported
that food neophobia continues to decrease from childhood, through adolescence to adulthood.
Cooke and Wardle (2005) suggested that as age increases, children are more exposed to a
variety of foods, and thus neophobia decreases. Ton Nu, Macleod and Barthelemy (1996)
argued that older children (10 to 15 years) tend to have greater autonomy about the foods they
eat at home and eating away from home becomes common. Eating away from home provides
children with more opportunities to exert their autonomy as well as increased exposure to
previously novel foods and different norms, for example peers’ food preferences.
1.3 Development of food preferences in children
As discussed above, the rejection of unfamiliar foods due to food neophobia is common in
younger children but it becomes a less prominent feature as children get older. Other factors
also influence the development of food preferences, including innate preferences and exposure
to foods. Humans are born with an innate preference for sweet tastes and a tendency to reject
bitter tastes (Galindo, Schneider, Stähler, Töle, & Meyerhof, 2012). Desor, Maller and Turner
(1973) demonstrated infants’ (1 to 3 days of age) innate preference for sweet tastes by recording
their greater ingestion of a sugar solution versus water. Moreover, the findings demonstrated
that infants showed greater preferences for sugar solutions at higher concentrations. Newborns
exhibited negative hedonic responses when given bitter solutions (urea and quinine) but
exhibited positive hedonic responses when given a sweet solution (sucrose) (Ganchrow,
Steiner, & Daher, 1983). Bitter tastes are innately disliked and avoided because bitter tasting
foods potentially contain toxic compounds (Glendinning, 1994). According to Drewnowski and
Gomez-Carneros (2000), humans have a low bitter taste threshold but a high sweet taste
threshold; the bitter taste of quinine can be detected at 25 μmol/L while the sweet taste of
sucrose is detected at 10000 μmol/L.

Chapter 1
5
Such innate preferences may influence food choice in later life as a study in the UK
found that among the top favourite foods of 4 to 5 year-old children were sweet foods which
included cream, cakes, pastries, fruit pie, sponge pudding, custard and dairy desserts, and the
least liked foods were vegetables (Wardle, Sanderson, Gibson, & Rapoport, 2001). Among the
lowest rated vegetables by children aged from 4 to 16 years in the UK were bitter tasting
vegetables (swede, sprouts and turnip) (Cooke & Wardle, 2005). Similar results were shown in
a study among children aged 2 to 8 years in the USA (Skinner, Carruth, Bounds, & Ziegler,
2002). Consistent across many studies around the world is the result that vegetables are reported
to be the least favoured foods, which are associated with bitter tastes. Ton Nu, Macleod and
Barthelemy (1996) determined food preferences among 222 French participants aged between
10 to 20 years old and found green vegetables, for example endives, spinach, sprouts and
cabbage were among the 10 most disliked foods. Pérez-Rodrigo, Ribas, Serra-Majem and
Aranceta (2003) found that 47% of a Spanish population of 3534 individuals aged 2 to 24 years-
old reported dislike for vegetables (artichokes, cauliflower, spinach, asparagus, carrot, lettuce
and tomato). The study also reported that individuals with low consumption of vegetables were
among those who reported dislike for vegetables. Yngve et al. (2005) argued that there are
similar patterns in vegetable intake in children aged 11 years across 9 European countries (the
Netherlands, Belgium, Portugal, Denmark, Sweden, Austria, Norway, Iceland and Spain) and
they are all below the national and international guidelines. In addition, the study argued that
vegetable preparation is determined by culture where they found that northern countries
consumed more raw vegetables, while Portugal and Spain consumers had vegetables
predominantly as soup. Besides, parents tend to offer foods that are readily accepted by their
children (Wardle et al., 2001), providing more exposures to the foods, which then may
contribute to higher food liking, and parents typically stop offering foods that their children
reject or dislike (Carruth, Ziegler, Gordon, & Barr, 2004).

Chapter 1
6
Familiarisation of foods starts as early as in the uterus and continues throughout life.
Before the introduction to solid foods, foetus and breast-fed babies have already experienced
flavours from their mother’s diet. Flavours are transmitted from foods to amniotic fluid and
later to breast-milk (Birch, 1999). Schaal, Marlier and Soussignan (2000) reported that infants
develop odour preferences related to mothers’ diet during pregnancy. The study found that
infants who had been exposed to anise flavour prenatally (ingested by mothers during
pregnancy) showed positive responses when anise odour was presented, whereas infants in a
control group showed negative or neutral responses. Similarly, in another study, Mennella,
Jagnow and Beauchamp (2001) revealed that exposure to flavours that occur during the
pregnancy and breastfeeding periods can modify infants’ acceptance of similar flavours during
weaning. Their study found that infants showed less negative facial expressions while eating
carrot-flavoured cereal relative to plain cereal if they had been exposed to the carrot flavour
either prenatally (mothers drank carrot juice during the last trimester of pregnancy) or
postnatally (mothers drank carrot juice during the first 2 months of lactation).
Breastfeeding not only facilitates infants’ acceptance of specific flavours during
weaning, but it also facilitates acceptance of novel flavours compared to formula-fed infants.
Maier, Chabanet, Schaal, Leathwood and Issanchou's (2008) findings supported this statement
with breast-fed infants (5 to 6 months) in their study consuming and liking (as rated by mothers
and observers) novel vegetables (zucchini, tomato and peas) more than formula-fed infants. In
a recent paper describing follow-up at 6 years old, results revealed that the breast-fed infants
continued to have higher consumption of vegetables compared to the formula-fed infants
(Maier-Nöth, Schaal, Leathwood, & Issanchou, 2016).
Children’s food preferences can be influenced by their family members’ preferences as
they have been exposed to similar foods. A meta-analysis of 5 studies concluded that there is a
similarity in food preferences between children and their mothers and fathers (Borah-Giddens
Chapter 1
7
& Falciglia, 1993). In a study to determine food preferences among children, Skinner et al.
(1998) found a strong concordance between children and their fathers, mothers and siblings.
The study assessed food preferences of 118 children aged 28 to 36 months by using
questionnaires comprising a list of 196 foods commonly eaten in the USA. In a child/mother
pair longitudinal study where children were recruited at 2 months of age and followed until they
were 8 years old, results demonstrated a strong correlation between mothers and children for
liked, disliked and never tasted foods and the concordance only decreased by 2% at the end of
the study when the children reached 8 years old (Skinner et al., 2002). The study concluded that
the mothers’ influences on food preferences remain strong even though children are exposed to
other influences outside the family.
In addition to incidental exposure through experiences, familiarity with foods has also
been explored through intentional repeated exposure regimes. Many intervention studies have
been done to determine the effectiveness of repeated taste exposure on unfamiliar and disliked
foods. A study conducted by Wardle, Herrera, Cooke and Gibson (2003) that involved 5 to 7
year-old children tasting a novel and disliked vegetable (sweet red pepper) for 8 days, showed
that intake of this vegetable increased significantly from just over 1 piece of sweet red pepper
before exposure to more than 9 pieces after exposure, furthermore the liking score also
increased. In addition, the study reported that intake and liking of the vegetable in the exposure
group were higher compared to both a reward group (in which children received stickers if they
ate vegetable) and the control group.
In another repeated exposure study with 49 seven-month old infants, they were fed
disliked and liked vegetable purees on alternate days over a period of 16 days (Maier, Chabanet,
Schaal, Issanchou, & Leathwood, 2007). Initially, the mean intake of the disliked vegetable was
substantially lower than the liked vegetable (39 ± 29 g versus 164 ± 73 g (mean ± SD)), however
at day 8 of exposure, the mean intake of the disliked vegetable increased substantially to 174 ±

Chapter 1
8
54 g, which was comparable to the mean intake of the liked vegetable, 186 ± 68 g. Furthermore,
infants’ liking (rated by mothers using a 9-point scale) also showed a similar pattern.
Another study involving 3 to 6 year-old children compared 2 strategies to encourage
vegetable consumption in children; the two strategies were mere exposure and flavour-flavour
learning using a liked dip. Each child was asked to taste 2 disliked vegetables, one without a
dip (mere exposure) and the other one with a liked dip (flavour-flavour learning), twice weekly
over a period of 4 weeks. The results showed that liking increased after 6 exposures for both
strategies and remained higher until the end of 8 tasting trials; with liking from mere exposure
being higher than flavour-flavour learning (Anzman-Frasca, Savage, Marini, Fisher, & Birch,
2012). In a similar study, Bouhlal, Issanchou, Chabanet and Nicklaus (2014) compared repeated
taste exposure with 2 flavour-flavour learning tests (in which salt and spice (nutmeg) were used
separately) of an unfamiliar vegetable (salsify) puree in toddlers aged 2 to 3 years. The results
demonstrated that children in the repeated taste exposure group had the highest increase in
intake (64 ± 11 g (mean ± SE)) compared to flavour-flavour learning with nutmeg (36 ± 11 g)
and flavour-flavour learning with salt (23 ± 11 g). The increase in intake remained high in all
groups after 6 months. These results revealed that repeated taste exposure is a simpler and better
strategy to increase vegetable acceptance than flavour-flavour learning.
Repeated exposure increases familiarity of a stimulus which then increases liking of it.
There are a few theories explaining how exposure works in increasing liking of a stimulus.
Zajonc (1968) suggested that repeated exposure to a particular stimulus would enhance positive
attitude to that stimulus. On the other hand, Kalat and Rozin (1973) proposed a ‘learned safety
theory’ as a mechanism of food acceptance. The theory explains that a food is safe to eat if it
does not cause any negative effect after repeated taste exposure to the food.

Chapter 1
9
1.4 PROP taster status
Although innate preferences and familiarity to foods are partially responsible for the
development of food preferences, individuals may perceive foods differently due to variability
in taste sensitivity. For example, some individuals have higher sensitivity to bitter tastes than
others, therefore they may not accept bitter foods as readily as the less sensitive individuals.
There are a number of methods to test taste sensitivity, and one of them is to test sensitivity to
6-n-propylthiouracil (PROP), which is a bitter compound. Tepper, Christensen and Cao (2001)
classified super-, medium- and non-tasters using a suprathreshold (above threshold) method.
Participants were asked to rate bitterness and saltiness from 3 levels of PROP solutions (0.032,
0.32 and 3.2 mmol/l) and sodium chloride solutions (NaCl) (0.01, 0.1 and 1.0 mmol/l) on a
labelled magnitude scale (LMS). Non-tasters were classified as those who rated PROP intensity
lower than NaCl, medium-tasters rated the intensity of both PROP and NaCl as similar, and
super-tasters rated PROP intensity higher than NaCl. Meanwhile, Zhao, Kirkmeyer and Tepper
(2003) determined PROP taster status by placing PROP and NaCl paper disks on the tip of the
tongue. The PROP paper disks were prepared by impregnating filter paper disks in a 50 mmol/l
PROP solution while NaCl disks were impregnated in a 1.0 mol/l NaCl solution, then dried in
an oven at 121°C for 1 hour. Participants who rated the PROP disk below ≤15 mm (over 100-
mm on a LMS; labelled from ‘barely detectable’ to ‘strongest imaginable’) were classified as
non-tasters, those who rated ≥67 mm were classified as super-tasters, and medium-tasters were
in between these limits. The NaCl rating was to help determine those participants who give a
borderline rating to PROP. For example, participants who gave a rating of PROP at 15 mm and
gave a higher rating of NaCl, were categorised as non-tasters. When these 2 methods were
tested together, Zhao et al. (2003) found that the classification of PROP taster status was similar
for both tests, thus concluding both suprathreshold and PROP paper disk tests are reliable in
classifying PROP taster status.
Chapter 1
10
However, measuring PROP taster status in children is not as straightforward as in adults
as the methods used in adults (as discussed above) requires participants to rate the bitter
intensity of PROP on a complex scale, which may be difficult for children to use. Instead of
using a complex scale, a simple forced-choice method is normally used to determine children’s
PROP taster status, however this method only categorises children into either tasters or non-
tasters (Keller, Steinmann, Nurse, & Tepper, 2002; Mennella et al., 2005). This difference in
PROP classification method between adults and children may lead to discrepant findings in
studies of taste sensitivity and food preferences. Therefore, bitter taste sensitivity measurements
other than PROP taster status should be considered in order to increase confidence in study
results.
1.5 Fungiform papillae density (FPD)
FPD is also used as a phenotypical measure of taste sensitivity. According to Prescott (2012),
when a food enters the mouth, chemical compounds from the food are released which stimulate
taste receptors to perceive sourness, sweetness, saltiness or bitterness. People with a high
density of taste buds on their tongue will perceive all tastes as more intense compared to those
with a low density of taste buds. It is said that the human tongue has between 3000 and 8000
taste buds (Prescott, 2012). A high number of fungiform papillae (FP) can be found at the dorsal
anterior tongue in humans (Segovia, Hutchinson, Laing, & Jinks, 2002) and the measurement
of FPD can act as a tool to retrieve information about taste functions (Shahbake, Hutchinson,
Laing, & Jinks, 2005). FP are mushroom-liked shapes that are embedded with taste buds which
contain taste receptor cells and trigeminal (touch) fibres (Feeney, O’Brien, Scannell, Markey,
& Gibney, 2014).
A large study that involved 2371 adults aged 21 to 84 years concluded that FPD tends
to decrease with age (Fischer et al., 2013). Segovia et al. (2002) found that children aged 8 to 9
Chapter 1
11
years have higher FPD (91/cm2) than adults aged 18 to 30 years (68/cm2), similarly, children
had higher taste bud density (571/cm2) than adults (359/cm2). This study also reported that the
papillae diameters in children are smaller and more symmetrical in shape than adults. With
children having more FPD and taste buds, they might have higher sensitivity to tastes than
adults.
Individuals with higher FPD often rate the intensity of PROP bitterness to be stronger
than those with lower FPD (Duffy et al., 2010; Yackinous & Guinard, 2002). Moreover, Essick,
Chopra, Guest and McGlone (2003) reported that in 83 adult females (52 Asians and 31
Caucasians) between the ages of 18 to 35 years, super-tasters of PROP have the highest number
of papillae (143.7/cm2), compared to medium- (106.5/cm2) and non-tasters (54.4/cm2). Other
than bitter tastes, Hayes and Duffy (2008) found that creaminess and sweetness ratings for
milk/sugar mixtures to be higher in those with high FPD. Higher FPD is also associated with
low liking for both high fat and high sodium foods as well as greater saltiness in salt solutions
(Hayes, Sullivan, & Duffy, 2010). In Spence, Hobkinson, Gallace and Fiszman's (2013) review,
the predominant attributes recognised in fatty foods result from mouthfeel, tactile sensations in
the mouth, rather than true taste sensations. As mentioned previously, FP contain trigeminal
fibres which explains those with higher FPD perceive fatty foods as more intense than
individuals with lower FPD.
1.6 TAS2R38
Variations in individual PROP sensitivity are genetically predisposed. Bitter tastes are detected
by taste type 2 receptors (T2R) located mainly in taste buds (cells) within the papillae on the
surface of the tongue. These receptors also can be found in the palate and epiglottis (Garcia-
Bailo, Toguri, Eny, & El-Sohemy, 2009). Up until now, 25 T2R bitter receptors have been
discovered in humans and each one of these receptors reacts differently to various bitter

Chapter 1
12
compounds (Meyerhof et al., 2010). TAS2R38 gene encodes for a bitter receptor which
specifically detects bitter compounds with thiourea (N-C=S) group, such as the synthetic
compounds phenylthiocarbamide (PTC) and 6-n-propylthiouracil (PROP) (Bufe et al., 2005).
Such thiourea group can also be found within glucosinolates which occur in bitter-tasting
Brassica vegetables such as broccoli, Brussels sprouts, cabbage, turnip and kale (Tepper, 1998).
Genetic differences can occur in the genes that encode for the taste receptors and the
most well defined of these are the genetic differences within TAS2R38. There are 3 common
single nucleotide polymorphisms (SNPs) that can be found in TAS2R38 which are rs713598,
rs1726866 and rs10246939 (Kim, Wooding, Ricci, Jorde, & Drayna, 2005), which form 2
common haplotypes, Proline-Alanine-Valine (PAV) and Alanine-Valine-Isoleucine (AVI).
These polymorphisms occur at amino acid position 49, 262 and 296, where either proline or
alanine, alanine or valine, valine or isoleucine are encoded respectively (Bufe et al. 2005). The
PAV haplotype is associated with the ability to taste the thiourea group of PROP while the AVI
haplotype is associated with non-tasting (Hayes, Feeney, & Allen, 2013). These haplotypes
result in 3 main genotypes across the population; PAV/PAV, PAV/AVI and AVI/AVI (Bufe et
al. 2005) and the distribution of these varies between ethnic groups (Table 1-1). Kim et al.
(2003) and Mennella, Pepino, Duke and Reed (2010) reported that rare haplotypes such as
AAV, AAI, PAI and PVI also can be found within population.

Chapter 1
13
Table 1-1: Distribution of TAS2R38 genotypes by ethnicity. Abbreviation: n/a: not available.
Paper n Ethnicity
PAV/PAV n (%)
PAV/AVI n (%)
AVI/AVI n (%)
Rare n (%)
Calò et al. (2011)
76 Caucasian 14 (18) 37 (49) 21 (28) 4 (5) (AAV, AAI)
Duffy et al. (2004)
84 Caucasian (86%) Asian (5%) African- American (1%) Hispanics (7%) Asian- Indian (1%)
21 (25) 37 (44) 26 (31) n/a
Khataan, Stewart, Brenner, Cornelis and El-Sohemy (2009)
442 Caucasian (European, Hispanic, Middle-Eastern)
93 (21) 208 (47) 141 (32) n/a
302 Asian (Chinese, Japanese, Korean, Vietnam, Filipino)
157 (52) 123 (41) 22 (7) n/a
94 South Asian (Indian, Pakistani, Sri Lankan)
15 (16) 46 (49) 33 (35) n/a
73 Others (First Nations, African, mixed ethinicities)
17 (23) 30 (41) 26 (36) n/a
Mennella, Pepino, Duke and Reed (2010)
282 Caucasian 49 (18) 126 (45) 71 (25) 36 (12) AAI, AAV
548 African-American
88 (16) 181 (33) 74 (14) 205 (37) AAI, AAV, PAI, PVI
150 Mixed ancestry, Asian, Hispanic
33 (22) 51 (34) 27 (18) 39 (26) AAI, AAV
Sandell et al. (2014)
2557 Finnish 289 (11) 1115 (44) 1010 (40) 141 (6) AAV
Ooi, Lee, Law and Say (2010)
215 Asian 81 (38) 110 (51) 24 (11) n/a
Shen, Kennedy and Methven (2016)
136 Caucasian (75%) African & Asian (25%)
28 (20) 62 (46) 46 (34) n/a
Total 2402 596 (25) 1011 (42) 511 (21) 284 (12)
Individuals with PAV/PAV often perceive PROP as intensely bitter while those with
AVI/AVI perceive low intensity from PROP, and PAV/AVI are in between (Bufe et al., 2005).
However, this is not always the case, as studies reported that PROP intensity ratings overlap
across genotype groups. A few rare cases reported that PAV/PAV individuals to be PROP non-

Chapter 1
14
tasters, and PAV/AVI and AVI/AVI individuals to be super-tasters (Calò et al., 2011; Fischer
et al., 2014; Shen, Kennedy, & Methven, 2016). The reason for such discrepancies may be
connected to differences in number of taste cells in addition to genotype for TAS2R38.
Bartoshuk (2000) showed that PROP super-, medium- and non-tasters are distributed in
the population with proportions of 25%, 50% and 25% respectively in the USA. In addition,
Duffy et al. (2004) found that among participants that were mostly Caucasians, 25% were PROP
super-tasters, 50% were medium-tasters and 25% were non-tasters, which is similar to the
genotype data they found; PAV/PAV, PAV/AVI and AVI/AVI genotypes were distributed
25%, 44% and 31% respectively. Similar distributions were found in another study with 198
participants in the USA from European ancestry, where it was reported that 22% of subjects
were classified as PROP super-tasters, 54% as medium-tasters and 24% as non-tasters and the
distribution was comparable to the genotype data; PAV/PAV, PAV/AVI and AVI/AVI with
25%, 38% and 26% respectively (Hayes, Bartoshuk, Kidd, & Duffy, 2008).
1.7 Gustin (CA6)
In addition to TAS2R38 gene, gustin (CA6) is another gene that has been shown to influence
taste sensitivity. Gustin, also known as carbonic anhydrase V1 (CA6), is a salivary protein that
plays an important role in gustatory function (Melis et al., 2013). Henkin, Martin and Agarwal
(1999) found that patients with distorted and/or loss of smell and taste function had a low
secretion level of CA6 which was associated with impaired taste bud anatomy compared to
healthy volunteers, suggesting that CA6 is a trophic factor in the growth and development of
taste buds on the tongue.
Padiglia et al. (2010) reported that CA6 contributes to differences in taste sensitivity as
the study found an association between PROP taster status and CA6 gene polymorphism
rs2274333 (A/G) in 75 white participants aged 20 to 29 years, where super-tasters were more
Chapter 1
15
likely to carry genotype A/A and allele A, whereas non-tasters were more likely to carry
genotype G/G and allele G, the less functional form of the CA6 gene. While in medium-tasters,
allele A was more frequent than allele G. Similarly, Melis et al. (2013) reported that PROP
bitterness was perceived as higher in subjects with genotype A/A compared to the other
genotypes among 63 young Caucasian adults (mean age: 25 years). Furthermore, individuals
with G/G genotype had a lower papillae density, larger papillae, greater variation in shape and
a high percentage of distorted fungiform papillae than those with A/A and A/G genotypes.
These studies suggest that the rs2274333 (A/G) polymorphism of CA6 gene is associated with
the development and maintenance of taste papillae. Consistent with these findings, Barbarossa
et al. (2015) revealed in a multi-ethnicity study (Caucasian, Asian, Black and Hispanic) that
high FPD was associated with the presence of allele A whereas low FPD was associated with
allele G. However, there was no association between ratings of PROP bitterness and the CA6
gene. In another study of participants with North American mixed ancestry, Feeney and Hayes
(2014a) found no associations between 12 single-nucleotide polymorphisms (SNPs) within
CA6, including rs2274333, and FP. Other SNPs that were examined in the study included
rs12748400, rs17032907, rs2274327, rs2274328, rs2274334, rs3737665, rs3765964,
rs3765965, rs3765967, rs3765968 and rs7545200. None of the SNPs were associated with
PROP intensity, however 2 SNPs (rs3737665 and rs3765964) were associated with perception
of NaCl saltiness and 2 SNPs (rs3737665 and rs2274327) were associated with perception of
KCl saltiness. Melis et al. (2013) argued that the distribution of allele frequencies of CA6 within
population are not known and the variations in the CA6 gene across population may contribute
to discrepant findings between studies. To date, the study of the relationship between CA6 and
taste sensitivity is limited, therefore more research needs to be done in order to fully understand
the influence of CA6 on taste sensitivity.

Chapter 1
16
In summary, genotypic (TAS2R38 and CA6) and phenotypic (PROP taster status and
FPD) variations have been shown to account for variations in taste sensitivity between
individuals. Understanding these variations may provide some explanation on differential
preferences of foods, and ultimately nutrient intake.
1.8 Glucosinolates in Brassica vegetables
Chemical compounds are responsible for the sensory characteristics of foods especially aroma,
taste and flavour of foods. Taste happens on the tongue; when foods enter the mouth, the five
basic tastes (salty, sweet, sour, bitter and umami) are perceived from signals resulting from taste
receptor responses. Meanwhile, flavour is a combination of taste, aroma (through retronasal
olfaction) and chemesthesis. These characteristics can be important to the overall eating
experience and drive food choice and liking. One example of the chemical compounds in foods
is glucosinolate (GSL) which is responsible for the bitter taste in Brassica vegetables (for
examples, broccoli, Brussels sprouts, turnip, cauliflower and cabbage) due to thiourea group
(N-C=S) (Keller & Adise, 2016). GSLs are sulfur-containing compounds and they have been
studied extensively for their anticarcinogenic properties. Over 100 GSLs have been identified
and they are classified into aliphatic, aromatic and indole (Mithen, Dekker, Verkerk, Rabot, &
Johnson, 2000). A prospective cohort study showed a negative association between
consumption of Brassica vegetables and colon and lung cancers in men and women (Voorrips
et al., 2000a; Voorrips et al., 2000b). Herr and Büchler (2010) summarised in a review that
Brassica vegetables have a tendency to lower risks of lung, colorectal, breast, prostate and
pancreatic cancers.
GSLs and myrosinase enzyme remain intact in separate compartments in plant tissues.
Upon plant tissue disruption, GSLs are hydrolysed to produce several breakdown products
(including isothiocyanates (ITCs), thiocyanates, nitriles, glucose and sulfate) by myrosinase
Chapter 1
17
enzyme (van Doorn et al., 1998). These products contribute to the flavour of Brassica
vegetables. ITCs are said to be responsible for the hot and bitter taste perception along with an
acrid smell (Mithen et al., 2000) and sulfate contributes to a sulfurous aroma (Engel, Baty, Le
Corre, Souchon, & Martin, 2002). Some intact GSLs such as sinigrin and progotrin are
responsible for bitter tastes (van Doorn et al., 1998).
Considerable research has been done to identify and quantify individual GSLs in
vegetables. Fenwick, Griffiths and Heaney (1983) and van Doorn et al. (1998) found that GSL
sinigrin and progoitrin were linked to bitterness in Brussels sprouts (Brassica oleracea var.
gemmifera). These studies concluded that progroitrin is a non-bitter GSL, however its
breakdown product, goitrin is responsible for bitter tastes. Meanwhile 16 GSLs were found in
113 varieties of turnip greens (Brassica rapa L.), of which 3 individual GSLs
(glucobrassicanapin, glucobrassicin and gluconasturtiin) were detected in all varieties and 4
other GSLs (gluconapin, progoitrin, glucoiberin and neoglucobrassicin) were detected in
approximately 90% of the varieties (Padilla, Cartea, Velasco, de Haro, & Ordás, 2007). The
study further analysed sensory characteristics of the varieties and found that total GSL and
gluconapin contents were high in the most bitter varieties compared to the less bitter varieties.
However, gluconapin alone was not associated with bitterness as the results showed that
varieties with high levels of gluconapin were as bitter as varieties with low levels of gluconapin,
suggesting that other phytochemicals may be responsible for the bitterness. In another study,
progoitrin and dimeric glucosativin were positively correlated with the bitter taste in rocket
salad (Diplotaxis and Eruca spp.), while pungency was associated with total GSL (Pasini,
Verardo, Cerretani, Caboni, & D’Antuono, 2011).
There are many factors which contribute to differences in GSL concentration in
Brassica vegetables. Kushad et al. (1999) found significant differences in GSL content between
cultivars of broccoli, Brussel sprouts, cabbage, cauliflower and kale. Meanwhile, Rangkadilok

Chapter 1
18
et al. (2002) reported that GSL content is dependent on plant development, where they found
that glucoraphanin in broccoli (Brassica oleracea var. italica) decreased from seedling stage to
flowering stage. Furthermore, there was a fluctuation pattern in sinigrin concentration in black
mustard (Brassica nigra) and brown mustard (Brassica juncea) from seedling to early
flowering, to late flowering and to maturation stage. In a review by Ruud Verkerk et al. (2009),
total and individual GSL concentrations in vegetables were concluded to vary greatly between
seasons, and climate factors such as temperature also had impacts on GSL content. They further
added that limited water supply could either increase or decrease GSL content in vegetables.
Moreover, GSL content in Brassica vegetables is dependent on household preparations
(Dekker, Verkerk, & Jongen, 2000). Cooking processes decrease GSLs by approximately 36%
on average (McNaughton & Marks, 2003). Nugrahedi, Verkerk, Widianarko and Dekker (2015)
argued that boiling and blanching can reduce GSL content due to cell lysis, diffusion, thermal
degradation and leaching, while stir-frying, steaming and microwave processing can retain or
minimise the GSL content loss, and increase extractability of GSL in plant tissues. Furthermore,
cooking processes can also affect sensory characteristics of vegetables, for example the flavour
of cauliflower was rated more bland after boiling compared to other cooking methods
(microwave steaming, microwave boiling and steaming), while steaming resulted in the
strongest flavour (Schnepf & Driskell, 1994). Consistent with these findings, Bongoni,
Verkerk, Steenbekkers, Dekker and Stieger (2014) and Nunn, Giraud, Parkhurst, Hamouz and
Driskell (2006) demonstrated that steamed broccoli had more intense flavour than boiled
broccoli. When vegetables are cooked in water, soluble compounds in vegetables are lost by
leaching (Bongoni et al., 2014; Petersen, 1993), which may reduce the palatability (Borowski,
Narwojsz, Borowska, & Majewska, 2015). However, such losses could also increase
palatability, especially in Brassica vegetables where GSL loss would reduce bitterness.
Armesto, Gómez-Limia, Carballo and Martínez (2016) confirmed that cooking method has a

Chapter 1
19
strong effect on the sensory characteristics of Galega kale (Brassica oleracea L. var. acephala),
where they found that kale had the highest bitter taste intensity after steaming compared to other
cooking methods (boiling, pressure cooking and microwaving). The authors further explained
that sensory characteristics of vegetables were associated with changes in chemical compounds
during the cooking process.
1.9 Effects of taste sensitivity on food preferences
Although taste is an important determinant of food choice and liking, it is also can be a cause
of food rejection (Drewnowski & Gomez-Carneros, 2000). The relationship between taste
sensitivity and food preferences has been widely investigated. A study by Barajas-Ramírez,
Quintana-Castro, Oliart-Ros and Angulo-Guerrero (2016) found that adults’ vegetable
consumption was lower in those who perceived PROP as more bitter, based on 2 sets of 7-day
diet-dairies. In contrast, Baranowski et al. (2011) reported that there was no significant
association between PROP taster status and consumption of Brassica vegetables in 9 to 10 year-
old and 17 to 18 year-old participants. In addition, another previous study involving college
students aged 17 to 36 years, reported that PROP sensitivity did not influence the intake of
bitter tasting fruits and vegetables except green salad; with super-tasters having higher intake
(Yackinous & Guinard, 2002).
Researchers have examined the effects of taste genotype TAS2R38 on food preferences.
In one study, PAV/PAV individuals (n=14) were more sensitive to glucosinolate-containing
vegetables (watercress, mustard greens, turnip, broccoli, rutabaga and horseradish) as they rated
the vegetables 60% more bitter than AVI/AVI individuals (n=11) while PAV/AVI individuals
(n=10) gave intermediate results. The study further found that those with PAV/PAV genotype
did not rate non-glucosinolate vegetables more bitter than those with AVI/AVI genotype
(Sandell & Breslin, 2006). A recent study found that those with PAV/AVI genotype had the

Chapter 1
20
lowest yearly vegetable intake compared to 2 other TAS2R38 genotype groups, the same
findings were also found when comparing genotypes on the basis of Brassica vegetable intake
specifically (Shen et al., 2016). Suomela et al. (2012) argued that PAV/AVI children consumed
more vegetables than the AVI/AVI children. The influence of TAS2R38 was also explored on
the consumption of bitter tasting lingonberries in Finnish adults where it was found that
PAV/PAV individuals consumed less lingonberries than the AVI/AVI group (Sandell et al.,
2015). However, in contrast, Timpson et al. (2005) showed that there was no influence of
TAS2R38 on green vegetable intake among 3383 British women. This study contradicts the
previous ones, probably because the green vegetables that were measured were non-
glucosinolates, thus no difference in intake between genotypes was found. Moreover a study
by Hoppu, Laitinen, Jaakkola and Sandell (2015) also reported that TAS2R38 did not affect fruit
and vegetable consumption among 2 to 6 year-old preschool boys. The inconsistency in findings
suggests that vegetable intake is not only dependent on taste sensitivity, suggesting other factors
are involved. For example, PROP tasters or individuals with PAV/PAV TAS2R38 genotype
may learn to like bitter foods following repeated tasting, which increases familiarity and
acceptance of the foods.
Furthermore, previous studies have also examined the relationship between FPD and
food preferences where Duffy and Bartoshuk (2000) did not find a significant correlation
between FPD and liking/disliking of bitter beverages or Brassica vegetables in adults. In
another study which examined the effects of genotypic and phenotypic taste measures on
vegetable intake and liking in 525 children aged between 7 to 13 years old, FPD was not found
to correlate with vegetable intake and liking across TAS2R38 genotype groups or PROP groups
except that there was a small, positive correlation between FPD and vegetable intake in the non-
taster groups (AVI/AVI and PROP non-taster) (Feeney et al., 2014).
Chapter 1
21
Even though FPD has an influence on perception of PROP bitterness (as discussed in
section 1.5), it is independent of TAS2R38 and it may have a different effect on sensitivity to
bitterness across the genotypes (Hayes et al., 2008). A study involving 59 college students with
mean age of 26 years (primarily European ancestry) found that PROP non-tasters with more
fungiform papillae had a higher vegetable intake than non-tasters with fewer papillae (Duffy et
al., 2010). Greater density of fungiform papillae in non-tasters may cause them to perceive
higher intensity of other tastes, for example sweetness. They may therefore perceive a different
profile of taste from PAV/PAV individuals or PROP super-tasters who would perceive perhaps
more bitterness and less sweetness from the same vegetable. The study also found that vegetable
intake in PROP super-tasters was less influenced by the number of fungiform papillae than for
non-tasters. Also in the same study, AVI/AVI individuals consumed significantly more
vegetables than PAV/PAV and PAV/AVI individuals, based on the information from their food
records and food frequency questionnaire but this was not limited to glucosinolate-containing
vegetables.
Moreover, a recent study reported that total vegetable intake was greater in participants
with AVI/AVI TAS2R38 genotype with high FPD in comparison to the same TAS2R38
genotype group with low FPD (Shen et al., 2016). The study further investigated an interaction
between FPD and CA6, where it was found that G/G CA6 genotype participants with medium
FPD had a higher total vegetable intake compared to the same FPD group with A/A CA6
genotype. When comparing CA6 with TAS2R38, participants with G/G-PAV/AVI had a higher
total vegetable intake than G/G-PAV/PAV participants. The authors suggested that taste
genotype or phenotype alone could not precisely predict one’s food acceptance. The
relationship between taste sensitivity and fungiform papillae is complex and some authors have
reasoned that fungiform papillae provide a separate taste sensitivity measurement that makes a

Chapter 1
22
distinctive contribution to the prediction of one’s dietary regimen (Hayes & Duffy, 2008;
Hayes, Sullivan, & Duffy, 2010).
High sensitivity to bitter compounds is a plausible explanation for why some people
reject certain vegetables and why their consumption is consistently reported to be low. Although
repeated taste exposure has been found to be successful at increasing vegetable acceptance, it
is still not known whether exposure works similarly in all individuals, regardless of their
sensitivity to bitter tastes, as this has not previously been measured in repeated taste exposure
studies. The objective of this study (described in detail in Chapter 4) was to determine the
effects of repeated taste exposure on the acceptance of an unfamiliar Brassica vegetable in
children varying in bitter taste sensitivity, assessed using taste genotypes (TAS2R38 and CA6)
and phenotypes (PROP taster status and FPD). If this study finds that repeated taste exposure
successfully increases vegetable acceptance in children with high bitter taste sensitivity, it
would mean that bitter taste is not a barrier to vegetable liking as disliking could change with
exposure. Therefore, it could be a good recommendation for parents who seek advice and
guidance on child feeding practice, and it is crucial to advise them to be persistent in offering
disliked/unfamiliar vegetables to their child in order to overcome vegetable refusal.
Main Research Question (Primary Objective; Chapter 4):
Does repeated taste exposure increase vegetable (steamed-pureed turnip) intake and liking in
children regardless of different levels of taste sensitivity?
Hypothesis:
Repeated taste exposure will increase vegetable (steamed-pureed turnip) intake and liking in
children regardless of different levels of taste sensitivity.

Chapter 1
23
In order to achieve and support the primary objective, this study has 3 secondary
objectives. In support the use of steamed and pureed turnip in the main study (Chapter 4);
chapters 2 and 3 evaluate the cooking methods for turnip and ensure the cooked turnip samples
taste bitter and contain glucosinolates (GSLs). The experimental work in chapters 2 and 3 was
carried out during and after the experimental work in Chapter 4, however it has been reported
before Chapter 4 as it underpins the main study. The questionnaire in Chapter 5 was used to
screen children for the main study (Chapter 4) however the detailed analysis of this
questionnaire occurred after the main study was complete.
Secondary Objective 1 (Chapter 2):
To determine sensory characteristics and consumer acceptance of turnip cooked by different
methods.
Research questions:
Which cooking method produces the highest level of bitterness? Is turnip liking influenced by
cooking method?
Hypotheses:
Steamed-pureed turnip would produce the highest level of bitterness compared to other cooking
methods. Turnip liking is influenced by cooking method with steamed-pureed turnip having the
lowest liking as it was hypothesised to be the most bitter.
Secondary Objective 2 (Chapter 3):
To identify and quantify glucosinolates in different batches of steamed-pureed turnip.

Chapter 1
24
Research question:
Does each batch of steamed-pureed turnip contain glucosinolates?
Hypothesis:
Each batch of steamed-pureed turnip would contain substantial amounts of GSL, regardless of
any differences between batches.
Secondary Objective 3 (Chapter 5):
To investigate the effects of taste sensitivity on vegetable intake and liking in children.
Research question:
Does taste sensitivity has effect on parent-reported intake and liking of Brassica and non-
Brassica vegetables in children?
Hypothesis:
Taste sensitivity would have effects on parent-reported intake and liking of Brassica and non-
Brassica vegetables in children, where the less sensitive children would consume more
vegetables (both Brassica and non-Brassica) than the more sensitive children.

Chapter 2
25
CHAPTER 2: Sensory characteristics and consumer liking of turnip cooked by different
methods
2.1 Abstract
Brassica vegetables are bitter, predominantly because they contain bitter-tasting glucosinolates.
Individuals with high sensitivity to bitter tastes are reported to have lower consumption of
vegetables. Studies have shown that cooking methods can alter sensory characteristics of
vegetables, making the vegetables more acceptable. This study investigated consumer liking of
turnip cooked by 4 methods (boiled-pureed, roasted, steamed-pureed and stir-fried), and related
this to sensory characteristics. The study also determined the effects of taste genotype and
phenotype on taste perceptions and liking of turnip by an adult consumer group. The findings
of this study were used to determine the most suitable cooking method to use in the main study
(Chapter 4). 74 participants were recruited, taste genotype (TAS2R38) and phenotype (PROP
taster status) were measured. Liking, consumption intent, perception of bitterness and
sweetness of turnip were evaluated. Sensory profiling of turnip was also determined. There
were significant differences in overall (p=0.01) and taste (p=0.008) liking between cooking
methods. Turnip liking was increased when preparation led to high sweet and low bitter tastes.
TAS2R38 genotype had a significant effect on bitter perception (p=0.02). However, there was
no significant effect of either taste genotype or phenotype on taste liking. Sensory profiling
showed that there was no significant difference in bitterness but there was a significant
difference in sweetness (p<0.001) between cooking methods. In conclusion, cooking method
appeared to affect liking of turnip, and bitter perception in turnip was influenced by TAS2R38
genotype. However, taste sensitivity did not predict turnip liking in this UK adult cohort.
Keywords: turnip, TAS2R38, PROP, Brassica vegetable, bitter

Chapter 2
26
2.2 Introduction
Consumption of Brassica vegetables has been consistently shown to be beneficial to human
health as they contain health-promoting compounds, including glucosinolates (GSLs) and
phenolic compounds such as flavonoids and hydroxycinnamic acids (Francisco, Velasco,
Romero, Vázquez, & Cartea, 2009; Traka & Mithen, 2009). GSLs are associated with the risk
reduction of many kinds of cancer such as colorectal, lung and prostate cancer (Hayes, Kelleher,
& Eggleston, 2008). As Brassica vegetables contain high levels of antioxidants, it has been
claimed that they could additionally prevent other chronic diseases such as diabetes and
cardiovascular disease (Podsedek, 2007).
Despite much evidence to support the role of vegetables on health benefits, it was
recently reported in the UK that vegetable intake falls short of recommendations in both
children and adults (Bates et al. 2014). Sensory characteristics of vegetables are said to be
predictors of consumer liking and consumption (Cox, Melo, Zabaras, & Delahunty, 2012).
Bitterness in vegetables, especially Brassica vegetables, has been shown to be a reason for
consumer rejection, while sweetness is a key influence on preference (Donadini, Fumi, &
Porretta, 2012). As discussed in Chapter 1 (section 1.8), GSLs and their breakdown products
contribute to sensory characteristics. Rosa (1997) reported that isothiocyanates (hydrolysis
products of GSLs), are associated with pungency and bitterness, and that intact GSLs have bitter
tastes (Schonhof, Krumbein, & Brückner, 2004). Additionally, flavonoids are also reported to
be related with bitter and astringent tastes (Drewnowski & Gomez-Carneros, 2000). Many
interventions have been suggested to increase vegetable liking and consumption, in particular
cooking processes can alter the sensory characteristics of vegetables (Drewnowski & Gomez-
Carneros, 2000). As reported by Zeinstra, Koelen, Kok and de Graaf (2010), cooking method
has an impact on vegetable liking which is highly influenced by appearance, texture and taste.
Cooking temperature causes softening of the texture; Chiang and Luo (2007) reported that

Chapter 2
27
reducing cooking temperature and duration can maintain good appearance and texture. Baxter,
Jack and Schröder (1998) found that children’s vegetable liking depends on crunchiness and
hard textures such as stir-fried vegetables and disliking is associated with soft and mushy
textures.
Other than that, Verkerk, van der Gaag, Dekker and Jongen (1997) found that boiling
could significantly reduce bitterness caused by GSLs, while Francisco, Velasco, Moreno,
García-Viguera and Cartea (2010) reported that steaming maintained the bitterness. Poelman,
Delahunty and de Graaf (2013) also demonstrated that boiling reduced flavour in vegetables in
comparison to steaming. The major factor of GSL loss is due to leaching into cooking water
(Nugrahedi et al., 2015). Besides, boiling can also cause leaching of other taste compounds
such as sugars, which then results in tasteless vegetables (Xu et al., 2014). Meanwhile, the
roasting process causes the Maillard reaction due to heat; where amino acids react with sugars
which contribute to formation of favourable flavours (Jousse, Jongen, Agterof, Russell, &
Braat, 2002).
The ability to taste bitterness varies in humans and is related to genotype. TAS2R38 is
the gene for the T2R38 bitter receptor that is responsible for perceiving bitterness from the
thiourea group in GSLs and 6-n-propylthiouracil (PROP) (Bufe et al., 2005; Tepper, 2008).
Three common genotypes in TAS2R38 that have been observed within the population are;
PAV/PAV, PAV/AVI and AVI/AVI. Individuals that carry PAV/PAV genotype are able to
detect thiourea-containing compounds at a low level, followed by PAV/AVI genotype, while
AVI/AVI individuals have the highest detection threshold (Barajas-Ramírez et al., 2016)
(discussed in detail in Chapter 1 (section 1.6)).
In summary, cooking methods are important determinants of vegetable liking as they
can alter the sensory characteristics of vegetables; for example, different cooking methods can
result in different bitter perception of the same vegetable. This study sought to determine a
Chapter 2
28
suitable cooking method of turnip that would be used in the main study (described in Chapter
4). In the main study, it was hypothesised that repeated taste exposure would increase
acceptance of turnip regardless of children’s bitter taste sensitivity. Therefore, the chosen
cooking method must be suitable for its purpose where it must retain the bitterness of turnip
and have low consumer liking. In addition, the influence of taste sensitivity on bitterness in
turnip was explored. In this current study, the objectives were to a) investigate consumer liking
of turnip cooked using 4 different methods (boiled-pureed, roasted, steamed-pureed and stir-
fried) b) relate consumer liking of cooked turnips with sensory characteristics and c) determine
consumers’ taste perceptions of cooked turnips, related with TAS2R38 genotype and PROP
sensitivity. The hypothesis was turnip liking is influenced by cooking method, and that taste
genotype and phenotype would have an impact on taste perception where PAV/PAV
individuals would score higher intensity of bitterness compared to PAV/AVI and AVI/AVI
individuals, and also the same results for PROP taster status where tasters would score higher
taste intensity than non-tasters.
2.3 Materials and methods
2.3.1 Turnip samples and preparation
Fresh turnips (Brassica rapa subsp. rapa) were bought from 2 different local grocery stores in
Reading. For sensory profiling, turnips were bought from one source whereas for the consumer
test, turnips were bought from another source. Samples were prepared in the sensory kitchen of
the Department of Food and Nutritional Sciences at the University of Reading, UK. Prior to
cooking, turnips were peeled, stems and tails were removed and then washed. Turnips were
sliced to a thickness of approximately 0.5 cm.

Chapter 2
29
2.3.2 Processing
Turnips were prepared by 4 different cooking methods: boiled-pureed, roasted, steamed-pureed
and stir-fried.
2.3.3 Boiled-pureed
1.2 L of water was added into a saucepan and heated until boiling. 750 g of sliced turnips were
then added into the saucepan and boiled for 10 min. The turnips were then drained and blended
using a hand blender (Russell Hobbs) for approximately 5 min until the texture was smooth.
2.3.4 Roasted
The oven was pre-heated to 200°C. Sliced turnips (260 g) was placed on a baking tray and
drizzled with vegetable oil (3 ml). The baking trays were then placed into the oven (2 at the
front and 2 at the back of the oven) and roasted for 15 min. At 7.5 min, the 2 trays at the back
were swapped to the front and vice versa. After 15 min, turnips were turned to the other side
and roasted for 5 more min. Turnips that were excessively burnt were discarded.
2.3.5 Steamed-pureed
750 g of sliced turnips were placed into an electric steamer (Tefal) with 1 L water added to the
base of the steamer and steamed for 15 min. Turnips were then blended using a hand blender
(Russell Hobbs) for approximately 5 min until the texture was smooth.
2.3.6 Stir-fried
3 ml of vegetable oil was poured into a cooking pan and heated up. 260 g of sliced turnips were
added to the pan and heated whilst stirring occasionally for 7 min, until they were soft and
slightly brown.

Chapter 2
30
2.3.7 Sample storage
All cooked samples were placed into plastic containers, labelled and stored frozen at -18°C
prior to testing (storage time approximately 2 to 3 weeks).
2.3.8 Sample serving
Prior to serving, all sample types were defrosted, reheated in a microwave (800W) and stirred
every 1 min until the temperature reached >75°C. Roasted and stir-fried turnips were served on
a petri-dish while both boiled-pureed and steamed-pureed turnips were served in a 30 ml
transparent polystyrene cup. All samples were labelled with 3 digit random codes. Each serving
consisted of either 2 slices of each roasted or stir-fried turnips or approximately 15 g of boiled-
or steamed-pureed turnips. Samples were placed on heat-resistant trays and placed on a hot
plate to keep them warm while serving (40-45°C). Water and plain cracker (Carr’s table water
crackers, UK) were given for palate cleansing.
2.3.9 Sensory analysis
Sensory analysis was carried out by 10 trained panellists, each with a minimum of 6 months
experience, using sensory profiling. The panel developed a consensus vocabulary for the 4
turnip samples concerning aroma, flavour and taste over 3 training sessions. During the
sessions, the panel were asked to sniff and taste the samples, reference standards (spinach,
mashed potato, sucrose and quinine solutions) were used to help the panel to standardise the
vocabulary development. With the help of the panel leader, the terms produced were discussed
and led to the consensus sensory vocabulary described in (Table 2-1). During duplicate
evaluations, samples were presented monadically in a balanced sequential order and each
characteristic was scored on an unstructured line (scaled 0-100), using Compusense Software
(Ontario, Canada). Evaluation sessions were conducted in a sensory room within the Sensory

Chapter 2
31
Science Centre at the Department of Food and Nutritional Sciences, Reading, UK. Each
panellist sat in an individual booth equipped with artificial daylight and with room temperature
controlled (approximately 22°C).

Chapter 2
32
Table 2-1: Definition of sensory characteristics associated with samples of turnips cooked by 4 different methods and references used during vocabulary development.
Sensory characteristic Definition
Aroma
Apple Aroma associated with apple
Cooked swede Aroma associated with cooked swede
Green vegetable Aroma associated with green vegetable (spinach)
Sweetcorn Aroma associated with sweetcorn
Savoury Aroma associated with savoury food
Sweet Aroma associated with sweet food
Caramelised Aroma associated with burnt sugar
Earthy Aroma associated with earth or soil
Starchy Aroma associated with starchy food (mashed potato)
Tannin Aroma associated with tea
Burnt Aroma associated with burnt food
Wet Aroma associated with musty
Oily Aroma associated with cooking oil
Taste
Salty Taste associated with sodium chloride
Umami Taste associated with monosodium glutamate
Sweet Taste associated with sucrose solution (0.5%, 1.0%, 2.0%
and 2.6%)
Bitter Taste associated with quinine solution (0.00005%, 0.0001%,
0.0002%, 0.0004% and 0.0006%)
Flavour
Earthy Flavour associated with earth or soil
Tannin Flavour associated with tea
Burnt Flavour associated with burnt food
Green vegetable Flavour associated with green vegetable (spinach)
Cooked onion Flavour associated with cooked onion
Apple Flavour associated with apple
Chapter 2
33
2.3.10 Consumer recruitment and acceptability test
This study was given a favourable opinion to proceed by the University of Reading School of
Chemistry, Food and Pharmacy Research Ethics Committee (study number 14_40) (Appendix
2). Consumers were recruited by email circulation across University departments, via social
media and via posters around the University campus. The aim was to recruit 100 consumers,
however due to time constraint, only 74 consumers were recruited. Consumers gave written
informed consent upon arrival and sat in an individual booth. DNA buccal swab samples were
taken prior to sample tasting (described in section 2.3.11). Consumers were asked to taste all
samples and rate their liking (overall, taste, texture and appearance) using a 9-point hedonic
scale (1: dislike extremely, 2: dislike very much, 3: dislike moderately, 4: dislike slightly, 5:
neither like nor dislike, 6: like slightly, 7: like moderately, 8: like very much and 9: like
extremely). Consumption intent was rated using a 5-point scale (1: definitely would not eat, 2:
probably would not eat, 3: may or may not eat, 4: probably would eat and 5: definitely would
eat). Individual perception of bitterness and sweetness of each sample were collected using a
general labelled magnitude scale (gLMS). Consumers first practiced using the scale by rating
their remembered perception of sweetness in honey, bitterness in espresso, sourness of lemon
and saltiness in crisps before sample tasting and scoring. The gLMS non-linear scales have
descriptive anchors at a point of ‘no sensation’, ‘barely detectable’, ‘weak’, ‘moderate’,
‘strong’, ‘very strong’ to ‘strongest imaginable sensation of any kind’. Geometric data from
gLMS were then converted into antilog values and normalised for analyses to reduce scale bias
effects. A normalisation factor for each consumer was derived by dividing the mean scores
across all taste perceptions (sweetness, bitterness, sourness and saltiness) of all consumers by
the mean scores for the same taste perceptions for each consumer. The antilogged values of
gLMS scores were then multiplied with the normalisation factor. Individual PROP taster status
was determined at the end of the tasting session (described in section 2.3.12).

Chapter 2
34
2.3.11 DNA extraction and genotyping
Consumers were asked to swab the inside of their cheeks for approximately 1 min on each
cheek using Isohelix DNA buccal swabs. These were then stored until DNA extraction at room
temperature and kept dry through the use of Isohelix Dri-Capsules (Cell Projects Ltd, Kent,
UK). The swabs were sent to IDna Genetics Ltd. (Norwich, UK) for extraction and genotyping,
with 10% of the swabs sent as blinded replicates to ensure accuracy. DNA were extracted using
Isohelix Buccalyse DNA Extraction Kit (Cell Projects, Kent, UK) according to the
manufacturer’s instructions, then diluted 1:8 with water prior to analysis. TAS2R38
polymorphisms (rs713598, rs1726866 and rs10246939) were analysed using the KASP
genotyping chemistry (LGC Group, Middlesex, UK). Diluted DNA was dried into 384-well
PCR plates (Life Technologies, UK) then 5 μL of KASP Master mix (LGC Group, Middlesex,
UK) and primers were added. PCR amplification were performed as follows: 94°C for 15 min,
94°C for 15 s, 65°C for 20 s, 94°C for 15 s, 57°C for 20 s (Life Technologies, UK). The
fluorescent products were detected in Applied Biosystems machine (Life Technologies, UK).
2.3.12 PROP taster status
PROP taster status was determined by using filter papers impregnated with 6-n-propylthiouracil
(PROP) and this was prepared in the laboratory at the Department of Food and Nutritional
Sciences, University of Reading, UK. As described in Zhao, Kirkmeyer and Tepper (2003),
approximately 10 g of PROP (HPLC grade) (Sigma-Aldrich) was dissolved in 1000 mL boiled
spring water (Harrogate Spring water, UK) on a stirring hotplate to prepare a 50 mmol/L PROP
solution. Filter paper disks (Whatman Grade 1, 30 mm in diameter, Sigma-Aldrich Cat No:
1001-030) were then placed into the PROP solution for 30 s then taken out. The filter paper
disks were then placed on a tray wrapped with aluminium foil and then dried in an oven for 1
h at 121°C. To determine PROP taster status, consumers were asked to put the PROP paper on

Chapter 2
35
the tip of their tongue, then asked ‘Did you taste anything?’ Those who answered ‘yes’ were
categorised as PROP tasters, and those answered ‘no’ were non-tasters.
2.3.13 Statistical analysis
Normality tests showed that for sensory profile data, 23/92 data were normally distributed
(Appendix 3). Parametric tests were performed if all samples were normally distributed within
each characteristic, and these included sweet aroma, starchy aroma and sweet taste, while the
rest of the data were analysed using non-parametric tests. For consumer data, all data were not
normally distributed except appearance liking for boiled-pureed turnip. Therefore all analyses
were performed using non-parametric tests. Friedman tests and one-way repeated measure
ANOVA were used (where appropriate) to compare means (sensory characteristics, liking
scores, consumption intent and taste perceptions) between cooking methods. Sensory profile
data that were normally distributed were carried out using two-way ANOVA using a mixed
model where assessors were fitted as random effects and main effects (samples) were tested
against the assessor by sample interaction. These assessor by sample interactions could not be
tested when Friedman tests were used, however when the interaction plots were examined,
sensory characteristics were rated uniformly by the panel, giving confidence that the data were
sufficiently robust to be analysed by Friedman tests without concern of panel performance. Post
hoc tests were done using Nemenyi’s tests and Tukey HSD (post Friedman and ANOVA
respectively) at a significance level of 5%. Mixed ANOVAs were used to determine the
interactions between cooking method and TAS2R38 or PROP taster status.
Spearman’s correlation was used to determine associations between taste perception and
consumer liking. Moreover, agglomerative hierarchical cluster (AHC) analysis was used to
identify groups of consumers with different liking patterns. Dissimilarity was determined by
Euclidean distance, agglomeration using Ward’s method (automatic truncation). To relate

Chapter 2
36
consumer liking of cooked turnips with sensory characteristics, an internal preference map was
carried out using principal component analysis (PCA). Sensory characteristics and cluster
means were projected onto the PCA of consumer liking, as supplementary data. PCA was
chosen instead of PLS (partial-least squares) regression because PCA is suitable to handle small
data sets (as in our study), and in the PCA, a correlation matrix was used in order to remove
scaling issues when using different types of data (in this case consumer liking and sensory
profiling data). All sensory profile data (for non-parametric tests) and consumer data were
analysed using XL Stat (Addinsoft, Paris, France). Parametric tests for sensory profile data were
carried out in SENPAQ (Qi Statistics Ltd., Reading, UK).
2.4 Results
2.4.1 Sensory characteristics of cooked turnip
Twenty-three characteristics associated with aroma, taste and flavour were identified. Table 2-2
shows the mean sensory characteristic scores for turnip cooked by 4 different methods.
Significant differences were found for all aroma characteristics except for apple, sweetcorn,
earthy and tannin aroma. Savoury, caramelisation and burnt aroma in roasted turnip were scored
significantly higher than in boiled- and steamed-pureed turnip. In addition, roasted turnip had
a higher score for sweet aroma than boiled-pureed turnip. Both puree samples had a
significantly higher score for starchy aroma than roasted and stir-fried turnip.

Chapter 2
37
Table 2-2: Mean scores (0-100; ± standard deviation) of sensory characteristics for turnips cooked by 4 different methods. Different superscript letters indicate significant differences of mean scores between cooking methods.
Sensory
characteristic
Cooking method Significance of
difference
between
cooking
methods
Boiled-
pureed
Roasted Steamed-
pureed
Stir-fried
Aroma
Apple 2.6 ± 5.4 9.2 ± 8.9 1.3 ± 4.0 5.2 ± 7.4 χ2(3)=7.13,
p=0.07
Cooked
Swede
17.4 ± 19.9a 8.5 ± 9.3b 19.0 ± 17.0a 14.1 ± 17.1ab χ2(3)=13.13,
p=0.004
Green
vegetable
14.7 ± 11.7ab 6.7 ± 9.2b 19.9 ± 15.9a 11.6 ± 16.5b χ2(3)=14.45,
p=0.002
Sweetcorn 4.5 ± 7.8 4.0 ± 5.1 1.8 ± 5.6 3.7 ± 5.6 χ2(3)=5.77,
p=0.12
Savoury 18.7 ± 11.9b 27.8 ± 16.4a 19.4 ± 12.9b 26.2 ± 20.2ab χ2(3)=9.72,
p=0.02
Sweet 14.9 ± 5.9b 22.4 ± 8.2a 17.7 ± 10.2ab 19.8 ± 8.1ab F(3,40)=3.13,
p=0.04*
Caramelised 0.0 ± 0.1b 17.4 ± 8.7a 0.0 ± 0.1b 5.8 ± 9.2ab χ2(3)=24.18,
p<0.001
Earthy 12.6 ± 13.3 9.8 ± 11.5 14.3 ± 15.8 7.8 ± 8.7 χ2(3)=5.07,
p=0.17
Starchy 21.9 ± 16.4a 6.0 ± 7.0b 23.3 ± 19.3a 6.7 ± 6.3b F(3,40)=11.62,
p<0.001*
Tannin 0.7 ± 2.6 5.6 ± 14.0 0.6 ± 2.1 2.1 ± 4.8 χ2(3)=3.55,
p=0.32
Burnt 0.0 ± 0.0b 14.1 ± 18.2a 0.0 ± 0.0b 1.8 ± 6.2ab χ2(3)=15.21,
p=0.002
Wet 20.9 ± 16.0a 0.4 ± 1.2c 16.6 ± 15.7ab 2.5 ± 4.0bc χ2(3)=24.36,
p<0.001
Oily 0.7 ± 1.8ab 6.0 ± 8.4ab 0.0 ± 0.0b 6.8 ± 9.1a χ2(3)=11.59,
p=0.009
(*) indicates that the data were normally distributed, therefore ANOVA were used for analyses.
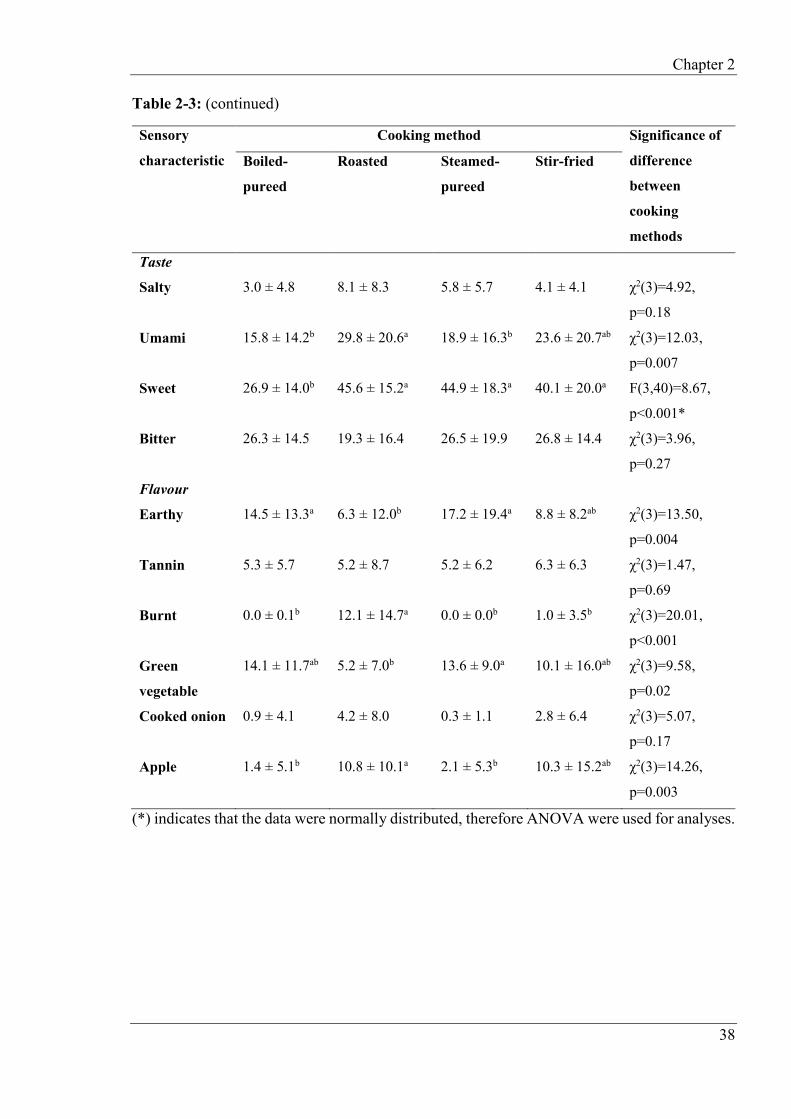
Chapter 2
38
Table 2-3: (continued)
Sensory
characteristic
Cooking method Significance of
difference
between
cooking
methods
Boiled-
pureed
Roasted Steamed-
pureed
Stir-fried
Taste
Salty 3.0 ± 4.8 8.1 ± 8.3 5.8 ± 5.7 4.1 ± 4.1 χ2(3)=4.92,
p=0.18
Umami 15.8 ± 14.2b 29.8 ± 20.6a 18.9 ± 16.3b 23.6 ± 20.7ab χ2(3)=12.03,
p=0.007
Sweet 26.9 ± 14.0b 45.6 ± 15.2a 44.9 ± 18.3a 40.1 ± 20.0a F(3,40)=8.67,
p<0.001*
Bitter 26.3 ± 14.5 19.3 ± 16.4 26.5 ± 19.9 26.8 ± 14.4 χ2(3)=3.96,
p=0.27
Flavour
Earthy 14.5 ± 13.3a 6.3 ± 12.0b 17.2 ± 19.4a 8.8 ± 8.2ab χ2(3)=13.50,
p=0.004
Tannin 5.3 ± 5.7 5.2 ± 8.7 5.2 ± 6.2 6.3 ± 6.3 χ2(3)=1.47,
p=0.69
Burnt 0.0 ± 0.1b 12.1 ± 14.7a 0.0 ± 0.0b 1.0 ± 3.5b χ2(3)=20.01,
p<0.001
Green
vegetable
14.1 ± 11.7ab 5.2 ± 7.0b 13.6 ± 9.0a 10.1 ± 16.0ab χ2(3)=9.58,
p=0.02
Cooked onion 0.9 ± 4.1 4.2 ± 8.0 0.3 ± 1.1 2.8 ± 6.4 χ2(3)=5.07,
p=0.17
Apple 1.4 ± 5.1b 10.8 ± 10.1a 2.1 ± 5.3b 10.3 ± 15.2ab χ2(3)=14.26,
p=0.003
(*) indicates that the data were normally distributed, therefore ANOVA were used for analyses.
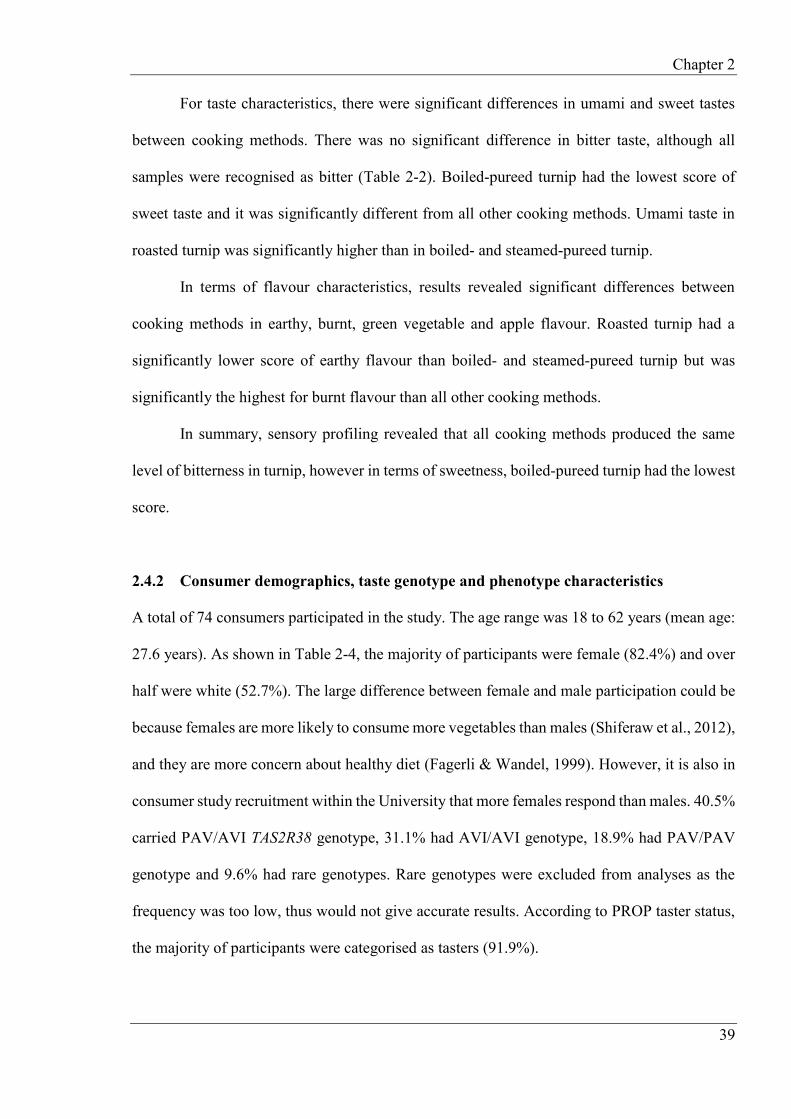
Chapter 2
39
For taste characteristics, there were significant differences in umami and sweet tastes
between cooking methods. There was no significant difference in bitter taste, although all
samples were recognised as bitter (Table 2-2). Boiled-pureed turnip had the lowest score of
sweet taste and it was significantly different from all other cooking methods. Umami taste in
roasted turnip was significantly higher than in boiled- and steamed-pureed turnip.
In terms of flavour characteristics, results revealed significant differences between
cooking methods in earthy, burnt, green vegetable and apple flavour. Roasted turnip had a
significantly lower score of earthy flavour than boiled- and steamed-pureed turnip but was
significantly the highest for burnt flavour than all other cooking methods.
In summary, sensory profiling revealed that all cooking methods produced the same
level of bitterness in turnip, however in terms of sweetness, boiled-pureed turnip had the lowest
score.
2.4.2 Consumer demographics, taste genotype and phenotype characteristics
A total of 74 consumers participated in the study. The age range was 18 to 62 years (mean age:
27.6 years). As shown in Table 2-4, the majority of participants were female (82.4%) and over
half were white (52.7%). The large difference between female and male participation could be
because females are more likely to consume more vegetables than males (Shiferaw et al., 2012),
and they are more concern about healthy diet (Fagerli & Wandel, 1999). However, it is also in
consumer study recruitment within the University that more females respond than males. 40.5%
carried PAV/AVI TAS2R38 genotype, 31.1% had AVI/AVI genotype, 18.9% had PAV/PAV
genotype and 9.6% had rare genotypes. Rare genotypes were excluded from analyses as the
frequency was too low, thus would not give accurate results. According to PROP taster status,
the majority of participants were categorised as tasters (91.9%).

Chapter 2
40
Table 2-4: Demographics characteristics, taste genotype and phenotype of consumers (n=74).
Characteristic n (%)
Gender
Male 13 (17.6)
Female 61 (82.4)
Ethnic group
White 39 (52.7)
Asian British 12 (16.3)
Black 5 (6.8)
Arab 3 (4.1)
Others 13 (17.6)
Refused to disclose 2 (2.7)
TAS2R38
PAV/PAV 14 (18.9)
PAV/AVI 30 (40.5)
AVI/AVI 23 (31.1)
PAV/AAV 4 (5.4)
PAV/AAI 1 (1.4)
AAI/AVI 1 (1.4)
AAV/AVI 1 (1.4)
PROP taster status
Tasters 68 (91.9)
Non-tasters 6 (8.1)

Chapter 2
41
2.4.3 Consumer liking of cooked turnip
As shown in Table 2-5, there were significant differences in overall and taste liking between
cooking methods where roasted turnip was significantly more liked than boiled-pureed turnip
(both overall and taste liking, p=0.02). There were no significant differences in texture and
appearance likings between cooking methods.
Table 2-5: Mean liking scores (1-9; ± standard deviation) for overall, taste, texture and appearance liking of turnip cooked by 4 different methods. Differences in superscript letters indicate significant differences between cooking methods.
Samples Boiled-
pureed
Roasted
Steamed-
pureed
Stir-fried Significance of
difference between
cooking methods
Overall
liking
4.6 ± 1.8b 5.5 ± 1.9a 4.9 ± 1.7ab 5.3 ± 1.9ab χ2(3)=11.33,
p=0.01
Taste
liking
4.7 ± 2.0b 5.6 ± 1.9a 4.9 ± 1.9ab 5.4 ± 2.0ab χ2(3)=11.94,
p=0.008
Texture
liking
4.7 ± 1.9 5.3 ± 2.0 4.7 ± 2.0 5.4 ± 1.9 χ2(3)=5.50,
p=0.14
Appearance
liking
4.8 ± 1.8 4.9 ± 1.8 4.6 ± 1.7 4.8 ± 1.9 χ2(3)=0.81,
p=0.85
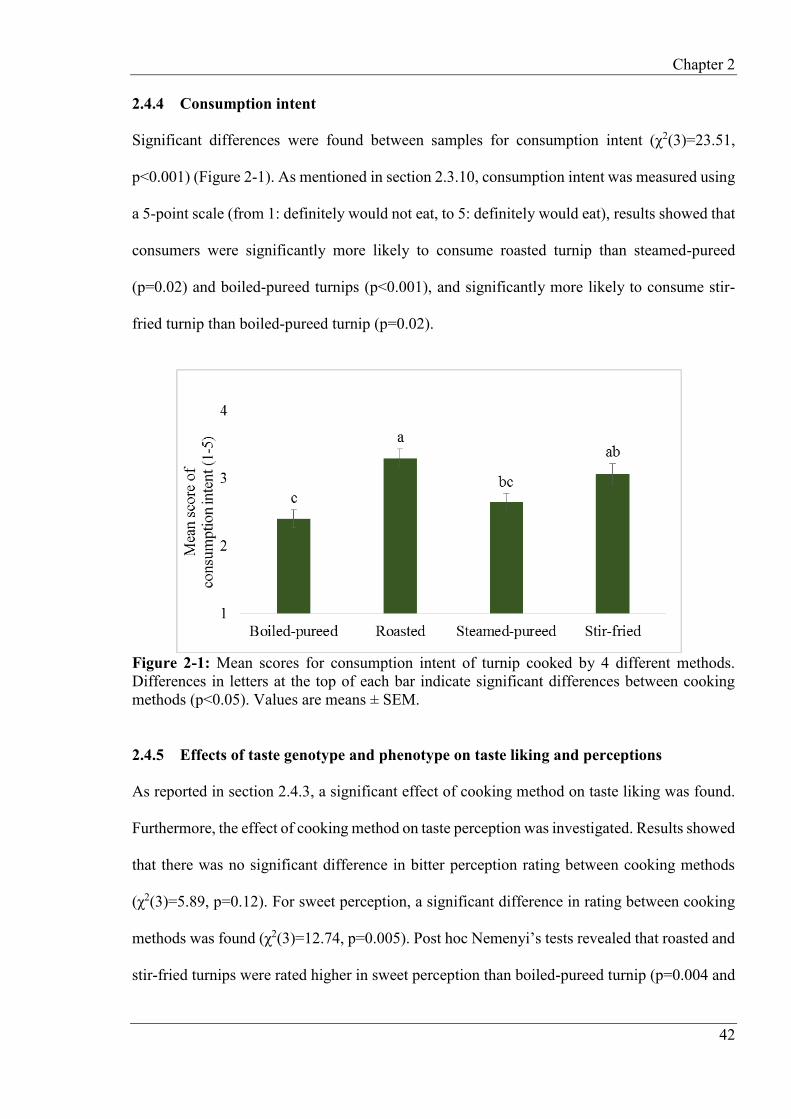
Chapter 2
42
2.4.4 Consumption intent
Significant differences were found between samples for consumption intent (χ2(3)=23.51,
p<0.001) (Figure 2-1). As mentioned in section 2.3.10, consumption intent was measured using
a 5-point scale (from 1: definitely would not eat, to 5: definitely would eat), results showed that
consumers were significantly more likely to consume roasted turnip than steamed-pureed
(p=0.02) and boiled-pureed turnips (p<0.001), and significantly more likely to consume stir-
fried turnip than boiled-pureed turnip (p=0.02).
Figure 2-1: Mean scores for consumption intent of turnip cooked by 4 different methods. Differences in letters at the top of each bar indicate significant differences between cooking methods (p<0.05). Values are means ± SEM.
2.4.5 Effects of taste genotype and phenotype on taste liking and perceptions
As reported in section 2.4.3, a significant effect of cooking method on taste liking was found.
Furthermore, the effect of cooking method on taste perception was investigated. Results showed
that there was no significant difference in bitter perception rating between cooking methods
(χ2(3)=5.89, p=0.12). For sweet perception, a significant difference in rating between cooking
methods was found (χ2(3)=12.74, p=0.005). Post hoc Nemenyi’s tests revealed that roasted and
stir-fried turnips were rated higher in sweet perception than boiled-pureed turnip (p=0.004 and
Chapter 2
43
p=0.049 respectively). As shown in Table 2-6, taste liking was negatively correlated with bitter
perception but positively correlated with sweet perception.
Table 2-6: Correlation between taste liking and either bitter perception or sweet perception (n=74).
Cooking method Correlation between taste
liking and bitter perception
Correlation between taste
liking and sweet perception
Spearman’s
correlation (rs)
p value Spearman’s
correlation (rs)
p value
Boiled-pureed -0.14 0.23 0.25 0.04
Roasted -0.49 <0.001 0.20 0.09
Steamed-pureed -0.41 <0.001 0.29 0.01
Stir-fried -0.39 0.001 0.11 0.37
To investigate the relationships between cooking method and either genotype or
phenotype on taste liking, mixed ANOVAs were performed. Previously non-parametric tests
(Friedman test) were used to compare mean scores of taste liking between cooking methods as
these data were not normally distributed, therefore a repeated measure ANOVA was also
performed to compare the results and establish a mixed ANOVA could be reliably used given
the data were not normally distributed. Results from the ANOVA showed that there was a
significant difference in taste liking between cooking methods (F(3,219)=5.02, p=0.002),
similarly found from Friedman test (χ2(3)=11.94, p=0.008), which gave us a strong justification
to proceed with mixed ANOVA.
Results revealed that there was a significant effect of cooking method on taste liking
(F(3,256)=3.92, p=0.009), but no significant main effect of TAS2R38 genotype (F(2,256)=0.99,
p=0.37). No significant interaction was found between cooking method and TAS2R38
(F(6,256)=0.77, p=0.59) (Figure 2-2a). There was a significant effect of cooking method on
taste liking (F(3,288)=4.99, p=0.002) but no significant effect of PROP taster status
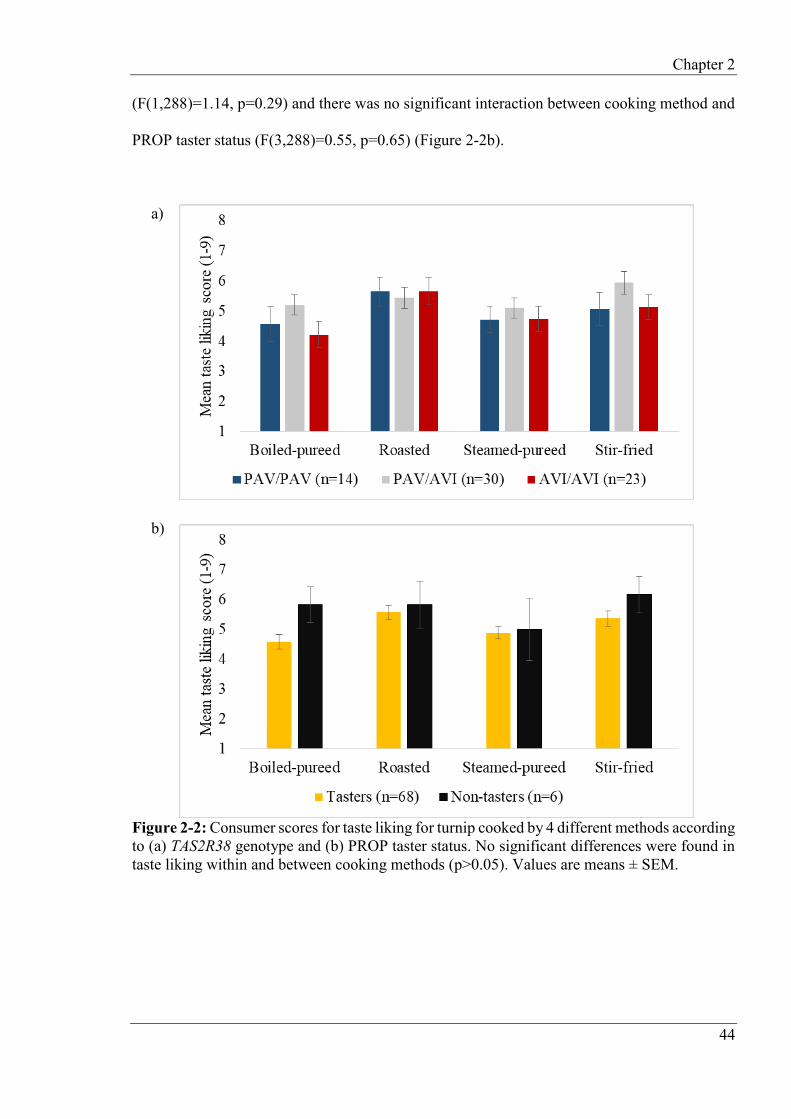
Chapter 2
44
(F(1,288)=1.14, p=0.29) and there was no significant interaction between cooking method and
PROP taster status (F(3,288)=0.55, p=0.65) (Figure 2-2b).
a)
b)
Figure 2-2: Consumer scores for taste liking for turnip cooked by 4 different methods according to (a) TAS2R38 genotype and (b) PROP taster status. No significant differences were found in taste liking within and between cooking methods (p>0.05). Values are means ± SEM.
Chapter 2
45
For bitter perception, there was no significant effect of cooking method (F(3,256)=1.89,
p=0.13), however TAS2R38 genotype had a significant effect on bitter perception
(F(2,256)=4.14, p=0.02); PAV/PAV consumers tended to score higher for bitter intensity than
PAV/AVI (p=0.07) and AVI/AVI consumers (p=0.05) across all samples (Figure 2-3a). There
was no significant difference in bitter intensity score between PAV/AVI and AVI/AVI
consumers (p=0.99). No significant interaction was found between cooking method and
TAS2R38 (F(6,256)=1.96, p=0.07). PAV/PAV consumers generally scored bitter intensity
higher for all samples; however, only in stir-fried turnip, the PAV/PAV consumers significantly
perceived higher bitter intensity than PAV/AVI (p=0.02) and AVI/AVI (p=0.001). Between
rare genotypes, a consumer with PAV/AAI scored higher bitterness (34.3) followed by a
consumer with AAV/AVI (21.8), AAI/AVI (12.1) and 4 consumers with PAV/AAV (11.6).
Other than that, no significant main effect of cooking method on bitter perception was found
(F(3,288)=2.37, p=0.07) and there was no significant main effect of PROP taster status
(F(1,288)=1.68, p=0.20). No significant interaction was found between cooking method and
PROP taster status (F(3,288)=0.54, p=0.66) (Figure 2-3b).

Chapter 2
46
a)
b)
Figure 2-3: Consumer scores for bitter perception for turnip cooked by 4 different methods according to (a) TAS2R38 genotype and (b) PROP taster status. Differences in letters at the top of each bar indicate significant differences (p<0.05) between genotypes within each cooking method, and between genotypes between the 4 cooking methods, whereas absence of letters indicate no significant differences (p>0.05). Values are means ± SEM.
For sweet perception, ANOVA revealed that there was a significant effect of cooking
method (F(3,256)=3.26, p=0.02) but TAS2R38 genotype had no significant effect on sweet
perception (F(2,256)=2.56, p=0.08). No significant interaction between cooking method and
TAS2R38 was found (F(6,256)=1.07, p=0.38) (Figure 2-4a). Moreover, there was a significant
effect of cooking method on sweet perception (F(3,288)=3.55, p=0.02), however there was no

Chapter 2
47
significant effect of PROP taster status (F(1,288)=0.57, p=0.45) and there was no significant
interaction between cooking method and PROP (F(3,288)=0.14, p=0.93) (Figure 2-4b).
a)
b)
Figure 2-4: Consumer scores for sweet perception for turnip cooked by 4 different methods according to (a) TAS2R38 genotype and (b) PROP taster status. No significant differences were found in sweet perception within and between cooking methods (p>0.05). Values are means ± SEM.
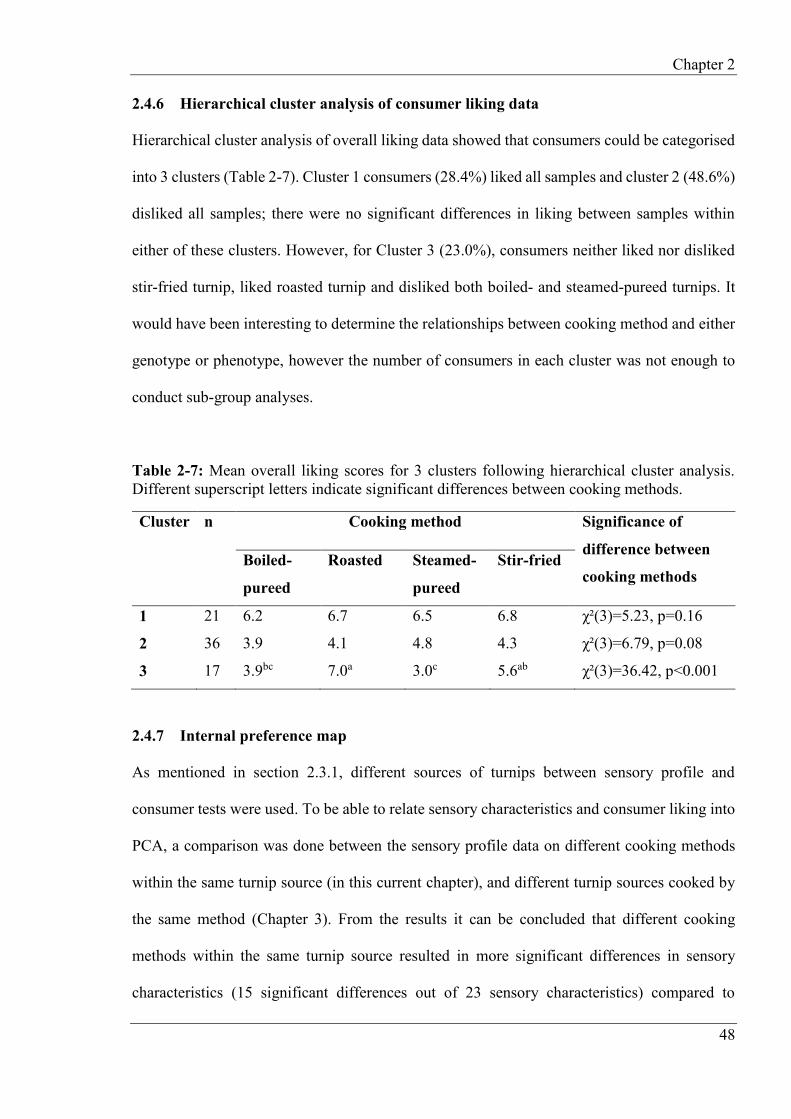
Chapter 2
48
2.4.6 Hierarchical cluster analysis of consumer liking data
Hierarchical cluster analysis of overall liking data showed that consumers could be categorised
into 3 clusters (Table 2-7). Cluster 1 consumers (28.4%) liked all samples and cluster 2 (48.6%)
disliked all samples; there were no significant differences in liking between samples within
either of these clusters. However, for Cluster 3 (23.0%), consumers neither liked nor disliked
stir-fried turnip, liked roasted turnip and disliked both boiled- and steamed-pureed turnips. It
would have been interesting to determine the relationships between cooking method and either
genotype or phenotype, however the number of consumers in each cluster was not enough to
conduct sub-group analyses.
Table 2-7: Mean overall liking scores for 3 clusters following hierarchical cluster analysis. Different superscript letters indicate significant differences between cooking methods.
Cluster n Cooking method Significance of
difference between
cooking methods Boiled-
pureed
Roasted Steamed-
pureed
Stir-fried
1 21 6.2 6.7 6.5 6.8 χ²(3)=5.23, p=0.16
2 36 3.9 4.1 4.8 4.3 χ²(3)=6.79, p=0.08
3 17 3.9bc 7.0a 3.0c 5.6ab χ²(3)=36.42, p<0.001
2.4.7 Internal preference map
As mentioned in section 2.3.1, different sources of turnips between sensory profile and
consumer tests were used. To be able to relate sensory characteristics and consumer liking into
PCA, a comparison was done between the sensory profile data on different cooking methods
within the same turnip source (in this current chapter), and different turnip sources cooked by
the same method (Chapter 3). From the results it can be concluded that different cooking
methods within the same turnip source resulted in more significant differences in sensory
characteristics (15 significant differences out of 23 sensory characteristics) compared to

Chapter 2
49
differences due to turnip sources (3 significant differences out of 18 sensory characteristics).
Therefore, with the assumption that the differences between different turnip sources were small,
this enables us to relate sensory characteristics and consumer liking in this chapter.
Sensory characteristics and cluster data were regressed onto a principal component
analysis (PCA) of the consumer liking data to produce an internal preference map (Figure 2-5).
The first dimension (PC1) explained 44.8% of variation within overall liking data, while the
second dimension (PC2) explained 34.5% of the variation. The first dimension was highly
correlated with overall liking of cooked turnip of consumers in cluster 1 (r=0.90) and cluster 3
(r=0.86). These consumers from both clusters liked samples that had a sweet taste (r=0.44),
caramelised aroma (r=0.72), sweet aroma (r=0.82), burnt aroma (r=0.56) and burnt flavour
(r=0.52) but disliked bitter taste (r= -0.40), earthy aroma (r= -0.96) and earthy flavour (r= -
0.91). The third dimension explained 20.7% of the variation, highly correlated with consumers
in cluster 2 (r= -0.96), which disliked all samples; however the PCA was not shown here as
there was no significant difference in overall liking between cooking methods. Sweet (aroma
and taste) and caramelised aroma were positioned along with roasted turnip in the top right of
the plot and were negatively correlated with bitter taste which was positioned in the bottom left
of the plot along with steamed- and boiled-pureed turnip.

Chapter 2
50
Figure 2-5: Internal preference map showing consumer overall liking scores (red circles) for 4 cooking methods of turnip (boiled-pureed, roasted, steamed-pureed and stir-fried) with sensory characteristics (blue squares) as supplement variables. Abbreviation: A: aroma, C: cluster, F: flavour and T: taste.
Boiled-pureed
Roasted
Steamed-pureed
Stir-fried
AppleA
Cooked Swede A
Green vegetable A
Savoury A
Sweet A
Caramelised A
Earthy A
Starchy A
Burnt A
Wet A
Oily A
Salty T
Umami T
Sweet T
Bitter T
Earthy F
Burnt F
Apple F
C1
C2
C3
-8
-6
-4
-2
0
2
4
6
8
-10 -8 -6 -4 -2 0 2 4 6 8 10 12
PC2
(34.
47 %
)
PC1 (44.79 %)
Biplot (axes PC1 and PC2: 79.26 %)
Active Active variables Supplementary variables

Chapter 2
51
2.5 Discussion
In this study, it was found that turnip acceptability is influenced by cooking method. Roasted
turnip had a significantly higher overall and taste liking compared to boiled-pureed turnip.
Consumers were significantly more likely to consume roasted turnip than boiled-pureed turnip.
It was noted that the mean liking scores of the cooked turnips were relatively low, this may be
due to samples were pre-prepared, frozen, defrosted and then reheated upon serving. However,
low liking is not a main concern, given that in the main study (Chapter 4), the aim was to change
consumption and liking of turnip through repeated taste exposure, therefore low liking would
leave room for increases of the turnip acceptance.
A negative correlation between taste liking and bitter perception, and a positive
correlation between taste liking and sweet perception were found. These suggest that as
bitterness increases in cooked turnip, liking decreases; but as sweetness increases, liking
increases. Similar findings were reported in previous studies where consumers preference of
vegetables were influenced by lower bitterness and higher sweetness (Dinehart, Hayes,
Bartoshuk, Lanier, & Duffy, 2006; Schonhof et al., 2004). This is particularly true for
consumers in cluster 3, as they significantly liked roasted turnip more than boiled- and steamed-
pureed turnip, which was positively associated with sweet taste and negatively associated with
bitter taste. It may also explain why these consumers rated lower overall liking scores for
boiled- and steamed-pureed turnips as these cooking methods were positively associated with
bitterness. In addition, boiled-pureed turnip was significantly less liked than roasted turnip and
indeed the sensory profiling concluded that it had significantly the lowest mean sweet taste
score. Schwartz, Issanchou and Nicklaus (2009) and Steiner, Glaser, Hawilo and Berridge
(2001) explained that humans are born with a preference to sweet tastes and dislike bitter tastes,
therefore this might explain the correlations between taste liking and taste perception in this
study. Appearance and texture characteristics were not tested for sensory profiling, thus the

Chapter 2
52
associations of these 2 characteristics with cooked turnip could not be determined. However,
there were no significant differences in appearance and texture liking between cooking
methods. The low liking scores for appearance and texture were not surprising as samples were
reheated prior to testing, therefore stir-fried and roasted turnips would not have had a crisp
texture.
TAS2R38 gene and PROP sensitivity are taste genotype and phenotype, respectively for
the perception of bitterness from the thiourea group, therefore their effects on taste perception
were analysed. Results revealed that there was a significant effect of TAS2R38 genotype on
bitter perception. PAV/PAV consumers tended to perceive higher bitterness of turnip than
PAV/AVI and AVI/AVI consumers, across all samples. A similar result was reported by Bell,
Methven and Wagstaff (2017) for bitter perception in rocket, where it was found that generally
PAV/PAV individuals perceived higher bitter intensity than the other two TAS2R38 genotype
groups in 7 cultivars of rocket. Consistent with Sandell and Breslin's (2006) findings, the
PAV/PAV individuals rated Brassica vegetables more bitter than the AVI/AVI individuals.
Rare genotypes were not included in any statistical analysis. From observation, those with
PAV/AAI scored the highest for bitterness, followed by AAV/AVI, AAI/AVI and PAV/AAV.
Bufe et al. (2005) suggested that the AAI and AAV haplotypes perceived intermediate PROP
intensity. However, the number of consumers whom carried these rare genotypes in this study
were too low to make any interpretation from the results.
On the other hand, this study found that there was no effect of either TAS2R38 genotype
or PROP taster status on taste liking across all samples, and also no significant interaction
between cooking method and either TAS2R38 genotype or PROP taster status. This indicates
that genetic predisposition does not affect consumers to like particular cooking methods.
Although sensory profiling found no significant differences in mean scores of bitter
taste between cooking methods, the PAV/PAV consumers did rate the stir-fried turnip to be

Chapter 2
53
significantly more bitter than the PAV/AVI and AVI/AVI consumers. Nugrahedi, Verkerk,
Widianarko and Dekker (2015) reported that stir-frying is one of the best cooking methods to
retain GSLs in Brassica vegetables, which might explain the PAV/PAV consumers’ response.
A possible reason for this finding might be because the sweetness in stir-fried turnip has not
masked the bitterness for the bitter sensitive consumers compared to other consumers.
Significant differences between groups of PROP taster status were not seen which could
be because of the large imbalance in number of consumers in each group (68 tasters versus 6
non-tasters). In this current study, a simplified method to determine PROP taster status was
used where consumers only tasted one high concentration of PROP in order to be categorised
into either tasters or non-tasters. This simplified method was used as it was a suitable simple
method to use with children in the main study (Chapter 4). This method limitation could be
overcome by using a more accurate method (a suprathreshold test) of determining PROP taster
status, which can distinguish medium-tasters from super-tasters (Tepper, Christensen, & Cao,
2001). Participants are given 3 PROP solutions (0.032, 0.32 and 3.2 mmol/l) and sodium
chloride (NaCl) solutions (0.01, 0.1 and 1.0 mol/l) then asked to rate the intensity on a labelled
magnitude scale (LMS). Those who rate NaCl higher in intensity than PROP are non-tasters,
those who give similar ratings for both PROP and NaCl are medium-tasters, while those who
rate PROP higher in intensity than NaCl are super-tasters.
As the focus of this current study was to determine a suitable cooking method for turnip
to be used in the main study described in Chapter 4, it was important that the cooked turnip was
bitter and had low liking. Overall liking demonstrated that the boiled-pureed turnip was
significantly different from roasted turnip and had the lowest liking score. Sensory profiling
showed that steamed-pureed turnip had a slightly higher bitter intensity than boiled-pureed
turnip, although this was not significant and both cooking methods were similarly disliked.
Although GSL content (to confirm that bitterness comes from GSLs) of the turnip samples
Chapter 2
54
cooked by varying methods was not quantifies, previous studies have established that boiling
causes leaching of a substantial amount of GSLs into cooking water (Song & Thornalley, 2007).
Giallourou, Oruna-Concha and Harbourne (2016) demonstrated that this cooking method
reduced up to 63% of total GSL in watercress. Similar observations were found in other studies
confirming significant GSL reduction in broccoli, Brussels sprouts, cauliflower and green
cabbage with 77%, 58%, 75% and 65% of GSL loss, respectively (Song & Thornalley, 2007),
and also 64% of GSL losses in turnip after boiling (Francisco et al., 2010). On the other hand,
steaming is thought to be a good cooking method to retain GSL content in Brassica vegetables.
Song and Thornalley (2007) reported that steaming of broccoli, Brussels sprouts, cauliflower
and green cabbage had no significant loss of GSL content. Moreover, Giallourou et al. (2016)
found a small increase of an individual GSL in watercress after steaming, and Francisco et al.
(2010) concluded it is the best cooking method to preserve GSLs as indicated by minimal losses
of GSLs in turnip compared to other methods (boiling, microwaving and high pressure
cooking). These findings suggest that steaming is a better cooking method to preserve bitter-
tasting GSL compared to boiling. Therefore steamed-pureed turnip was the most suitable
cooking method to be used in the main study (Chapter 4). In addition, pureed turnip is suitable
to be prepared in a large batch and more consistent in terms of taste, texture and appearance
compared to roasted and stir-fried turnips.
2.6 Conclusion
Consumer liking of turnip is dependent on cooking methods, with roasted turnip being the most
liked and boiled-pureed turnip the least liked. TAS2R38 genotype had an impact on bitter
perception but not on taste liking of turnip. There was a tendency that PAV/PAV consumers
perceived higher bitterness compared to PAV/AVI and AVI/AVI consumers. Sweetness was
found to be a driver of turnip liking, however bitterness decreased liking of the vegetable.

Chapter 2
55
Limitations of this study should be noted. The samples were served in a form that may not be
eaten normally as they were pre-prepared and reheated upon serving. A higher overall liking
may be achieved if samples were freshly cooked. Furthermore, sensory characteristics of
appearance and texture are required to determine their associations with each cooking method.
Moreover, to clearly understand the influence of taste genotype and phenotype on taste
perceptions, other measures such as gustin (CA6) gene and fungiform papillae density should
be measured.
This chapter has confirmed that our turnip samples were bitter; the next chapter
examines the GSL content of turnip samples, and associated this with sensory characteristics.
Chapter 3
56
CHAPTER 3: Evaluation of glucosinolates and sensory characteristics of steamed-pureed
turnip (Brassica rapa subsp. rapa)
3.1 Abstract
Glucosinolates (GSLs) are phytochemical compounds that can be found in Brassica vegetables.
Seven separate batches of steamed-pureed turnip were assessed for GSL content using liquid
chromatography mass spectrometry (LC-MS) and sensory profiling (carried out by a trained
sensory panel). Twelve individual GSLs which included 7 aliphatic, 4 indole and 1 aromatic
GSL, were identified across all batches. There were significant differences in individual GSL
content (except glucoalyssin) between batches, with gluconasturtiin as the most abundant GSL.
The total GSL content ranged from 16.07 to 44.74 μmol/g dry weight (DW). PCA showed
positive correlations between GSLs and bitter taste, and negative correlations between GSLs
(except glucobrassicanapin) and sweet taste.
Keywords: glucosinolates, turnip, Brassica, bitter taste

Chapter 3
57
3.2 Introduction
Brassica vegetables such as turnip, cabbage, broccoli and cauliflower are rich with sulfur-
containing glucosinolate compounds, (GSLs) (Mithen et al., 2000). These compounds are
water-soluble and have a role in plant defence against pests and diseases (Vieites-Outes, López-
Hernández, & Lage-Yusty, 2016). As discussed in Chapter 1, GSLs can be structurally
classified into aliphatic, aromatic and indole types (Mithen et al., 2000). Wang et al. (2011)
discussed that the degradation products of GSLs possess anticarcinogenic properties; reducing
risks of certain cancers in humans. Glucoraphanin, glucobrassicin and gluconasturtiin are
among the GSLs that have been shown to have anti-cancer properties, and these are all found
in turnip (Lee et al., 2013).
GSLs are, amongst other compounds, partly responsible for the taste characteristics of
Brassica vegetables. Individual GSLs such as sinigrin, gluconapin, progoitrin and
neoglucobrassicin have been associated with bitter taste (Engel, Baty, Le Corre, Souchon, &
Martin, 2002; Fenwick, Griffiths, & Heaney, 1983; Francisco, Velasco, Romero, Vázquez, &
Cartea, 2009). Furthermore, Bell, Methven, Signore, Oruna-Concha and Wagstaff (2017)
reported that GSLs were also correlated with earthy, pepper, mustard flavour and pungency in
rocket varieties (Eruca sativa). GSL content in Brassica vegetables are influenced by many
factors, such as environmental factors and cultivars. The abundance of GSLs in plants is varied,
depending on the type of plant species, developmental stage and plant part (root, shoot, seeds
and leaves) (Brown, Tokuhisa, Reichelt, & Gershenzon, 2003; Kabouw, Biere, Van Der Putten,
& Van Dam, 2010). Pereira et al. (2002) found that development stage of broccoli sprouts
(Brassica oleracea var. italica) contribute to variation of GSL content and concluded that the
GSL content decreases with the age of sprouts. In contrast, the GSL content in leaves of kale
(Brassica oleracea acephala) increased as the plant developed (Velasco, Cartea, Gonzäles,
Vilar, & Ordäs, 2007). Another environmental factor is seasonal changes, for example it has
Chapter 3
58
been reported that GSL content in Brussels sprout and white mustard were higher when they
were grown in August and November compared to July (Gols et al., 2007). Concerning
cultivars, Kabouw et al. (2010) showed that there was a significant difference in GSL content
between white cabbage cultivars (Brassica oleracea var. capitata) and Zhu, Yang and Zhu
(2013) reported significant differences in GSL content between pak choi cultivars.
In addition, nutrient supply contributes to the concentration of GSL in plants where a
previous study showed that GSL content increased with an adequate supply of sulfur. In
contrast, a supply of nitrogen in the absence of sulfur resulted in a decrease of GSL content,
however a supply of nitrogen with a sufficient sulfur supply increased GSL content, concluding
that nitrogen can change the GSL content depending on the amount of sulfur (Zhao, Evans,
Bilsborrow, & Syers, 1993). This variation leads to distinctive sensory characteristics (Traka &
Mithen, 2009) of Brassica vegetables, which are thought to influence their consumption (Cox,
Melo, Zabaras, & Delahunty, 2012).
Previously discussed in Chapter 1, GSL content in Brassica vegetables could change
depending on how they are handled and prepared before consumption. GSLs undergo
hydrolysis to produce breakdown products when the plant cells are wounded (Jia et al., 2009).
Preparation processes, including cooking and cutting, can trigger myrosinase enzyme in plant
cells to hydrolyse GSLs and produce isothiocyanates plus other breakdown products, including
nitriles, thiocyanates, epithionitriles, oxazolidine-2-thiones and epithioalkanes (Grubb & Abel,
2006; Traka & Mithen, 2009). A review by Nugrahedi, Verkerk, Widianarko and Dekker (2015)
concluded that boiling and blanching could significantly reduce GSL content due to leaching
of compounds. On the other hand, steaming, microwaving and stir-frying could limit the amount
of GSL loss. Because GSL content in commercial turnip can vary between cultivars, growth
conditions, seasons and cooking batches, the objective of this study was to evaluate 7 batches
of steamed-pureed turnip for GSL identification and quantification using liquid
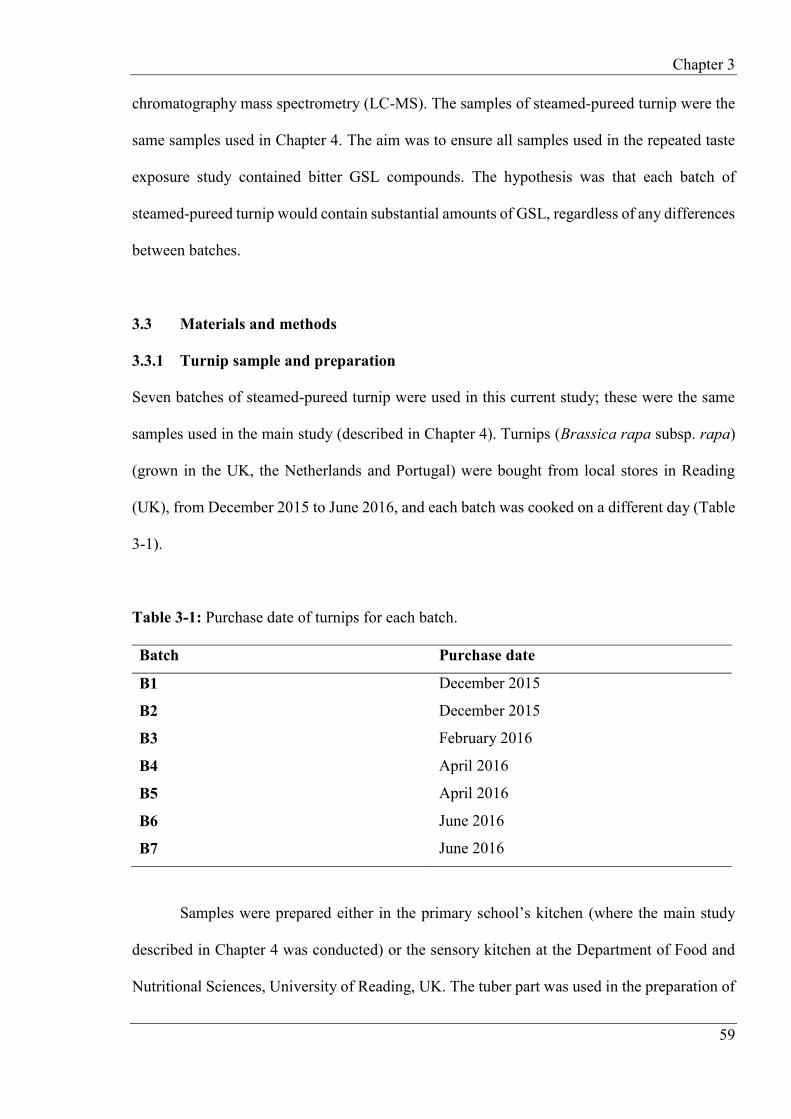
Chapter 3
59
chromatography mass spectrometry (LC-MS). The samples of steamed-pureed turnip were the
same samples used in Chapter 4. The aim was to ensure all samples used in the repeated taste
exposure study contained bitter GSL compounds. The hypothesis was that each batch of
steamed-pureed turnip would contain substantial amounts of GSL, regardless of any differences
between batches.
3.3 Materials and methods
3.3.1 Turnip sample and preparation
Seven batches of steamed-pureed turnip were used in this current study; these were the same
samples used in the main study (described in Chapter 4). Turnips (Brassica rapa subsp. rapa)
(grown in the UK, the Netherlands and Portugal) were bought from local stores in Reading
(UK), from December 2015 to June 2016, and each batch was cooked on a different day (Table
3-1).
Table 3-1: Purchase date of turnips for each batch.
Batch Purchase date
B1 December 2015
B2 December 2015
B3 February 2016
B4 April 2016
B5 April 2016
B6 June 2016
B7 June 2016
Samples were prepared either in the primary school’s kitchen (where the main study
described in Chapter 4 was conducted) or the sensory kitchen at the Department of Food and
Nutritional Sciences, University of Reading, UK. The tuber part was used in the preparation of

Chapter 3
60
the samples; prior to cooking, turnips were peeled and stems and tails removed, then washed
and sliced to a thickness of approximately 0.5 cm. Approximately 2.4 kg of sliced turnips were
placed into an electric 3-tier steamer (Tefal) (800 g in each tier), with 1 L of water added to the
base of the steamer and steamed for 25 min. Sliced turnips from tier 1 were transferred to tier
3 and vice versa (to ensure equal heat circulation), water was added again up to 1 L and then
steamed for another 25 min. Turnips were then blended using a hand blender (Russell Hobbs)
for approximately 5 min until the texture was smooth. All cooked turnips were then placed into
plastic containers, labelled and stored in a freezer at -18ºC. Prior to GSL extraction, samples
were frozen (-80°C) then freeze-dried for 5 days (Stokes freeze dryer, F.J Stokes Corporation,
Philadelphia, USA). The dried samples were ground (pestle and mortar) and then sieved (20
mesh) to ensure a fine powder.
3.3.2 Reagents and chemicals
All chemicals used were of LC-MS grade and purchased from Sigma-Aldrich (Poole, UK),
unless otherwise stated.
3.3.3 Glucosinolates extraction
The extraction method was adapted from Bell, Oruna-Concha and Wagstaff (2015). Three
replicates of each batch were prepared as follows: 40 mg of ground steamed-pureed turnip
powder was heated in a dry-block at 75°C for 2 min to inactivate myrosinase enzyme (Pasini,
Verardo, Caboni, & D’Antuono, 2012). 1.2 ml of preheated 70% (v/v) methanol (70°C) was
added and the sample placed in a water bath for 20 min at 70°C. Samples were then centrifuged
for 10 min (10000 rpm, 18°C) to collect loose material into a pellet. The supernatant was then
filtered through 0.22 m Arcrodisc syringe filters with Supor membrane (hydrophilic
Chapter 3
61
polyethersulfone; VWR, Lutterworth, UK) and frozen (-80°C) in an Eppendorf tubes until
analysis by LC-MS.
3.3.4 LC-MS analysis
LC-MS analysis was adapted from Bell (unpublished). Sinigrin hydrate was used as an external
reference standard for quantification of GSL compounds. Preparation was as follows; a 12 mM
sinigrin solution was prepared in 70% methanol. A dilution series of concentrations was
prepared as an external calibration curve with HPLC-grade water (5.6, 14, 28, 42, 56 and 112
ng/l sinigrin; calibration curve y = 26.7x + 52.6; correlation coefficient r2 = 0.99). Relative
response factors (RRFs) were used in the calculation of GSL concentrations where available
(Clarke, 2010). RRFs were assumed to be 1.00 if such data was not available in the literature
(Lewis & Fenwick, 1987) or from our laboratory for intact GSL. LC-MS analysis was
performed in the negative ion mode on an Agilent 1260 Infinity Series LC system (Stockport,
UK) equipped with a binary pump, degasser, autosampler, column heater, diode array detector,
coupled to an Agilent 6120 Series single quadrupole mass spectrometer. Separation of
compounds was achieved on a Gemini 3 m C18 110 Å (150 x 4.6 mm) column (with Security
Guard column, C18; 4mm x 3mm; Phenomenex, Macclesfield, UK), as recommended by Ares,
Nozal, Bernal and Bernal (2014). GSLs were separated during a 40 min chromatographic run,
with 5 min post-run sequence. Mobile phases consisted of ammonium formate (0.1%; A) and
acetonitrile (B) with the following gradient timetable: (i) 0 min (A-B, 95:5, v/v); (ii) 0-13 min
(A-B, 95:5, v/v); (iii) 13-18 min (A-B, 40:60, v/v); (iv) 18-26 min (A-B, 40:60, v/v); 26-30 min
(A-B, 95:5, v/v); (v) 30-40 min (A-B, 95:5, v/v). The flow rate was optimised for the system at
0.4 ml/min, with a column temperature of 30C, with 25 l of sample injected into the system.
Quantification was conducted at a wavelength of 229 nm.

Chapter 3
62
MS analysis settings were as follows: API-ES was carried out at atmospheric pressure
in negative ion mode (scan range m/z 100–1500 Da). Nebulizer pressure was set at 50 psi, gas-
drying temperature at 350C, and capillary voltage at 2000 V. Compounds were identified using
their primary ion mass and by comparing relative retention times with those published in the
literature (Cataldi, Rubino, Lelario, & Bufo, 2007) and some authentic standards run in our
laboratory. All data were analysed using Agilent OpenLAB CDS ChemStation Edition for LC-
MS (Agilent, version A.02.10).
3.3.5 Sensory analysis
Sensory analysis was carried out by 9 sensory trained panellists, each with a minimum of 6
months experience, using sensory profiling. The panel developed a consensus vocabulary for
the 7 batches of steamed-pureed turnip concerning aroma, taste and flavour (Table 3-2).
Spinach, mashed potato, sucrose and quinine solutions were used as references to help the panel
to standardise the vocabulary development. During duplicate sample evaluations, samples were
presented in a balanced sequential order and each characteristic was scored on an unstructured
line (scaled 0-100), using Compusense Software (Ontario, Canada) (detailed explanation in
Chapter 2 (section 2.3.9).

Chapter 3
63
Table 3-2: Definition of sensory characteristics associated with 7 batches of steamed-pureed turnip and references used during vocabulary development.
Sensory characteristic Definition
Aroma
Apple Aroma associated with apple
Cooked swede Aroma associated with cooked swede
Green vegetable Aroma associated with green vegetable (spinach)
Sweetcorn Aroma associated with sweetcorn
Savoury Aroma associated with savoury food
Sweet Aroma associated with sweet food
Earthy Aroma associated with earth or soil
Starchy Aroma associated with starchy food (mashed potato)
Tannin Aroma associated with tea
Wet Aroma associated with musty
Taste
Salty Taste associated with sodium chloride
Umami Taste associated with monosodium glutamate
Sweet Taste associated with sucrose solution (0.5%, 1.0%, 2.0%
and 2.6%)
Bitter Taste associated with quinine solution (0.00005%,
0.0001%, 0.0002%, 0.0004% and 0.0006%)
Flavour
Earthy Flavour associated with earth or soil
Tannin Flavour associated with tea
Apple Flavour associated with apple
Starchy Flavour associated with starchy food (mashed potato)
3.3.6 Statistical analysis
The GSL results presented are the means of three replicates (n=3) for each batch. Normality
tests showed that progoitrin, gluconapoleiferin, 4-hydroxyglucobrassicin, glucobrassicin, 4-
methoxyglucobrassicin and neoglucobrassicin were normally distributed (Appendix 4). One-
way ANOVAs were used for normally distributed data while Kruskal-Wallis tests were used

Chapter 3
64
for non-normally distributed data (glucoalyssin, gluconapin, glucobrassicanapin, glucoerucin,
gluconasturtiin, glucoberteroin and total GSL) for comparisons of GSL content between
batches of steamed-pureed turnip.
Normality tests showed that 88/126 of sensory profile data were normally distributed
(Appendix 4). Parametric tests were used if all 7 batches were normally distributed within each
sensory characteristic. Two-way ANOVAs were used to analyse data that were normally
distributed (green vegetable aroma, savoury aroma, earthy aroma, sweet taste, bitter taste,
tannin flavour and starchy flavour) where the main effects of samples were tested against the
assessor by sample interaction. Meanwhile, Friedman tests were used for data that were not
normally distributed (apple aroma, cooked swede aroma, sweetcorn aroma, sweet aroma,
starchy aroma, tannin aroma, wet aroma, salty taste, umami taste, earthy flavour and apple
flavour) to compare mean scores of sensory characteristics between batches. Using Friedman
tests, the assessor by sample interactions were not tested, however from ANOVA results, all
samples were rated uniformly by the panel. Post hoc tests were assessed using Dunn’s tests (for
Kruskal-Wallis tests), Nemenyi’s tests (for Friedman tests) and Tukey’s HSD (for ANOVA) at
a significance level of 5%.
A principal component analysis (PCA) was carried out to relate GSLs to sensory
characteristics. GSL data were projected onto the PCA with the sensory data as supplementary
variables. Similarly to Chapter 2, PCA was used instead of PLS because PCA is suitable to
handle our small data sets and, where used with correlation rather covariance, can be used for
to relate 2 variables from different data sets. GSL and sensory profile data (non-parametric
tests) were performed using XL Stat (Addinsoft, Paris, France), while parametric tests for
sensory profile data were carried out in SENPAQ (Qi Statistics Ltd., Reading, UK).

Chapter 3
65
3.4 Results
3.4.1 Identification and quantification of glucosinolates
Twelve individual GSLs were detected across all batches of steamed-pureed turnip (Table 3-3)
and the concentration of each of GSL varied significantly between batches. Although Kruskal-
Wallis test showed that there was a significant difference in glucoalyssin, post hoc Dunn’s tests
did not reveal any significant difference between batches. There were 7 aliphatic GSLs
(progoitrin, glucoalyssin, gluconapin, glucobrassicanapin, gluconapoleiferin, glucoerucin and
glucoberteroin), 4 indole GSLs (4-hydroxyglucobrassicin, glucobrassicin, 4-
methoxyglucobrassicin and neoglucobrassicin) and 1 aromatic GSL (gluconasturtiin).
Glucoalyssin was only detected in batches B1 and B2, while no glucoerucin was detected in
B5. Gluconasturtiin was the most abundant GSL across all batches. Total GSL concentration
ranged from 16.07 to 44.74 μmol/g DW. Chemical structure of each individual GSL is shown
in Table 3-4.

Chapter 3
66
Table 3-3: Mean concentration of glucosinolates in 7 batches of steamed-pureed turnip (B1 to B7). Results are expressed as μmol/g DW ± standard deviation. Different superscript letters indicate significant differences in mean concentration between batches. Abbreviation: ND: not detected.
(*) indicates that data were normally distributed, therefore ANOVA were used for analyses.
Glucosinolate Group Side chain Mass ion
Batch Significance of difference between batches
B1 B2 B3 B4 B5 B6 B7
Progoitrin Aliphatic (2R)-2-hydroxy- 3-butenyl
388 1.68 ± 0.03ab
1.94 ± 0.2a
1.73 ± 0.2ab
1.76 ± 0.04ab
1.34 ± 0.05b
1.37 ± 0.14b
1.69 ± 0.26ab
F(6,14)=5.53, p=0.004*
Glucoalyssin Aliphatic 5-methylsulfinylpentyl
450 0.10 ± 0.09a
0.14 ± 0.1a
NDa NDa NDa NDa NDa H(6)=19.29, p=0.004
Gluconapin Aliphatic 3-butenyl 372 1.15 ± 0.34ab
2.03 ± 0.95ab
1.22 ± 0.12ab
0.80 ± 0.25ab
0.43 ± 0.25b
9.49 ± 0.68ab
11.21 ± 1.4a
H(6)=17.78, p=0.007
4-hydroxy-glucobrassicin
Indole 4-hydroxy-3- indolylmethyl
463 0.32 ± 0.01bc
0.30 ± 0.02c
0.18 ± 0.03d
0.27 ± 0.01c
0.14 ± 0.01d
0.37 ± 0.03ab
0.39 ± 0.03a
F(6,14)=50.51, p<0.001*
Glucobrassicanapin Aliphatic 4-pentenyl 386 3.77 ± 0.26ab
5.06 ± 0.97ab
4.76 ± 0.95a
3.70 ± 0.04ab
1.92 ± 0.13ab
1.29 ± 0.1b
1.33 ± 0.1ab
H(6)=18.41, p=0.005
Gluconapoleiferin Aliphatic 2-hydroxy-4- pentenyl
402 0.72 ± 0.01e
1.10 ± 0.02cd
1.00 ± 0.21cd
0.97 ± 0.04d
1.23 ± 0.01bc
1.38 ± 0.07ab
1.58 ± 0.06a
F(6,14)=30.42, p<0.001*
Glucoerucin Aliphatic 4-methylthiobutyl 420 0.48 ± 0.07ab
0.84 ± 0.24ab
1.46 ± 0.14ab
1.15 ± 0.55ab
NDb 7.15 ± 0.32a
6.27 ± 0.39ab
H(6)=18.61, p=0.005
Glucobrassicin Indole 3-indolylmethyl 447 0.87 ± 0.02c
1.08 ± 0.06ab
0.65 ± 0.06d
0.70 ± 0.08cd
0.90 ± 0.15bc
1.13 ± 0.04a
1.19 ± 0.07a
F(6,14)=22.58, p<0.001*
Gluconasturtiin Aromatic 2-phenethyl 422 9.72 ± 0.27ab
10.94 ± 0.59ab
8.96 ± 0.2b
9.20 ± 0.57ab
9.43 ± 0.1ab
19.81 ± 1.5a
19.32 ± 0.6ab
H(6)=17.96, p=0.006
Glucoberteroin Aliphatic 5-methylthiopentyl 434 1.37 ± 0.12ab
1.56 ± 0.03a
0.95 ± 0.1ab
1.08 ± 0.07ab
0.21 ± 0.06b
1.30 ± 0.09ab
1.38 ± 0.16ab
H(6)=18.32, p=0.005
4-methoxy-glucobrassicin
Indole 4-methoxy-3- indolylmethyl
477 0.05 ± 0.01b
0.07 ± <0.01a
0.03 ± <0.01b
0.04 ± <0.01b
0.05 ± <0.01b
0.07 ± 0.02a
0.05 ± <0.01ab
F(6,14)=10.28, p<0.001*
Neoglucobrassicin Indole N-methoxy-3- indolylmethyl
477 0.26 ± 0.03b
0.41 ± 0.03a
0.31 ± 0.06b
0.30 ± 0.01b
0.41 ± 0.03a
0.28 ± 0.02b
0.34 ± 0.02ab
F(6,14)=10.93, p<0.001*
Total glucosinolates 20.48 ± 0.67ab
25.46 ± 2.47ab
21.25 ± 1.97ab
19.97 ± 1.47ab
16.07 ± 0.46b
43.64 ± 2.66a
44.74 ± 3.0a
H(6)=17.91, p=0.006
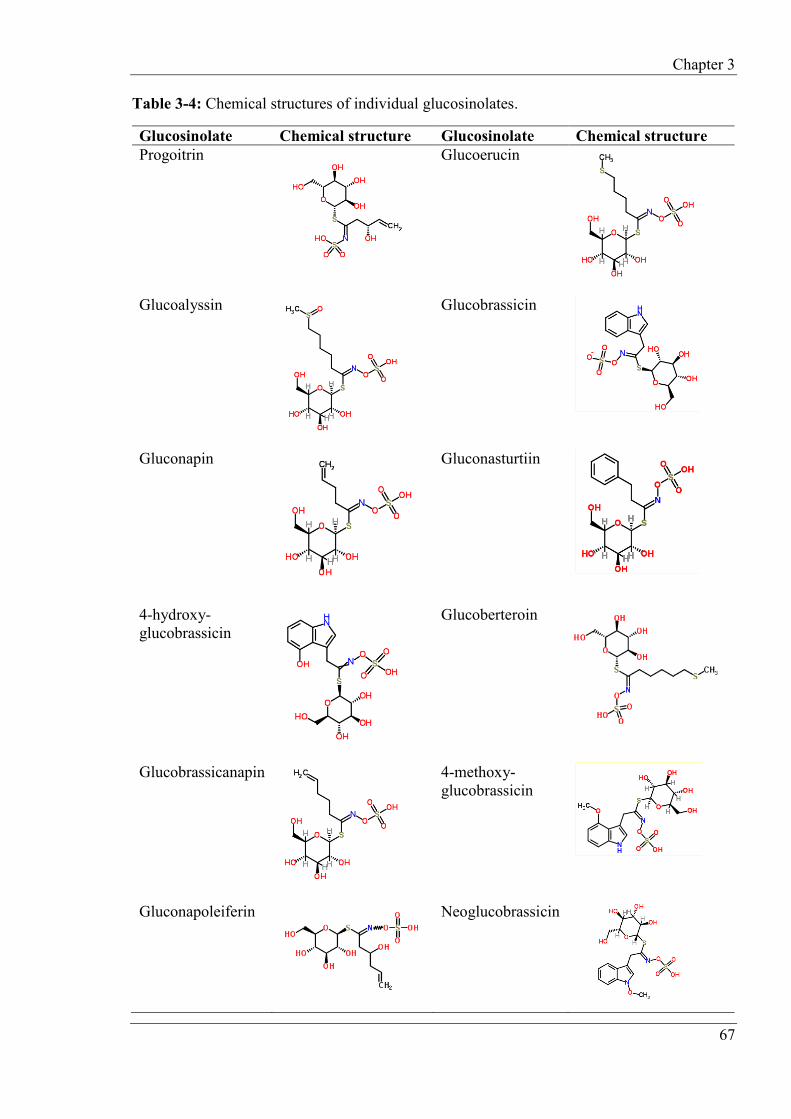
Chapter 3
67
Table 3-4: Chemical structures of individual glucosinolates.
Glucosinolate Chemical structure Glucosinolate Chemical structure Progoitrin
Glucoerucin
Glucoalyssin
Glucobrassicin
Gluconapin
Gluconasturtiin
4-hydroxy-glucobrassicin
Glucoberteroin
Glucobrassicanapin
4-methoxy-glucobrassicin
Gluconapoleiferin
Neoglucobrassicin

Chapter 3
68
3.4.2 Sensory characteristics
Table 3-5 summarises the mean sensory characteristic scores for the 7 batches of steamed-
pureed turnip. No significant differences were found between batches for any of the aroma
characteristics.
For taste characteristics, there was a significant difference in bitter taste between
batches, where batch B2 had the highest intensity for bitter taste, whereas B1 and B4 were
significantly less intense.
Significant differences between batches can be found for tannin and apple flavour. B2
was significantly higher than B1, B3, B4 and B5 for tannin flavour. B3, B4 and B5 were
significantly higher than B7 in terms of apple flavour. There were no significant differences
between batches for other characteristics.

Chapter 3
69
Table 3-5: Mean scores for sensory characteristics for 7 batches of steamed-pureed turnip. Different superscript letters indicate significant differences between batches. Sensory
characteristic
Batch Significance of
difference between
batches
B1 B2 B3 B4 B5 B6 B7
Aroma
Apple 2.8 4.3 8.0 4.0 9.1 3.8 2.8 χ²(6)=4.78, p=0.57
Cooked
Swede
15.7 17.6 13.4 20.8 15.4 21.9 22.3 χ²(6)=10.00, p=0.12
Green
vegetable
12.8 17.9 12.7 12.5 14.3 14.6 18.2 F(6,63)=0.69,
p=0.66*
Sweetcorn 3.5 5.3 1.4 3.7 1.8 3.2 2.1 χ²(6)=7.39, p=0.29
Savoury 18.0 24.0 19.8 21.6 22.8 24.9 26.3 F(6,63)=2.17,
p=0.06*
Sweet 15.1 13.7 16.6 14.7 17.2 15.5 15.2 χ²(6)=7.81, p=0.25
Earthy 11.0 12.5 9.7 11.2 9.5 16.6 20.1 F(6,63)=2.23),
p=0.06*
Starchy 18.4 16.7 15.5 14.2 12.9 13.2 12.3 χ²(6)=3.17, p=0.79
Tannin 2.1 1.8 2.0 2.4 2.4 1.3 2.9 χ²(6)=0.81, p=0.99
Wet 12.2 14.7 9.7 8.9 9.4 10.4 8.0 χ²(6)=11.36, p=0.08
Taste
Salty 6.4 7.1 5.5 10.2 13.6 6.4 7.8 χ²(6)=10.17, p=0.12
Umami 14.3 19.6 17.2 19.5 23.3 23.0 15.3 χ²(6)=10.51, p=0.11
Sweet 33.1 30.3 31.2 35.3 30.5 34.5 26.3 F(6,63)=1.38,
p=0.24*
Bitter 30.8c 53.2a 33.1bc 30.2c 34.5bc 40.3bc 43.3ab F(6,63)=9.61,
p<0.001*
Flavour
Earthy 11.8 18.9 11.0 16.2 15.1 18.9 19.9 χ²(6)=6.30, p=0.39
Tannin 9.8b 20.1a 8.3b 7.9b 9.4b 12.3ab 15.9ab F(6,63)=5.37,
p<0.001*
Apple 4.3ab 3.3ab 8.7a 12.0a 12.6a 2.6ab 1.9b χ²(6)=23.97,
p=0.001
Starchy 13.5 14.5 12.3 15.3 14.3 12.6 12.0 F(6,63)=0.53,
p=0.78*
(*) indicates that data were normally distributed, therefore ANOVA were used for analyses.

Chapter 3
70
3.4.3 Principal component analysis (PCA)
A principal component analysis (PCA) of the GSL data was carried out to demonstrate the batch
separation according to GSLs, and onto this map the sensory data was fitted in order to
investigate any correlation of the GSLs with the sensory characteristics (Figure 3-1). The first
dimension (PC1) represents 54.9% of the variation in the data, while second dimension (PC2)
represents 23.5% of the variation. Total GSL and many of the individual GSLs tend to correlate
with the right side of PC1, located alongside turnip batches B6 and B7. While PC2 highly
correlated with gluoberteroin (r=0.88) and glucoalyssin (r=0.84).
Figure 3-1: PCA plot of glucosinolate compounds in 7 batches of steamed-pureed turnip (B1 to B7), with sensory characteristics fitted onto the lot as supplementary variables. Abbreviations: A: aroma, T: taste and F: flavour.
B1
B2
B3B4
B5
B6
B7
ProgoitrinGlucoalyssin
Gluconapoleiferin
Gluconapin
4-hydroxyglucobrassicinGlucobrassicanapin
Glucoerucin
Glucobrassicin
Gluconasturtiin
Glucoberteroin
4-methoxyglucobrassicin
Neoglucobrassicin
Total GSL
Apple A
Cooked Swede A
Green_vegetable A
Sweetcorn A
Savoury A
Earthy A
Starchy A
Tannin A
Wet A
Salty T
Umami T
Sweet T
Bitter T
Earthy F
Tannin F
Apple F
Starchy F
-4
-3
-2
-1
0
1
2
3
4
5
-6 -5 -4 -3 -2 -1 0 1 2 3 4 5 6 7PC2
(23.
47 %
)
PC1 (54.93 %)
Biplot (axes PC1 and PC2: 78.40 %)
Active Active variables Supplementary variables

Chapter 3
71
The position for the total GSL content strongly correlated with PC1 (r=0.98) and also
to many of the individual GSLs: gluconapin (r=0.99, p<0.001), gluconasturtiin (r=0.98,
p<0.001), glucoerucin (r=0.97, p<0.001), 4-hydroxyglucobrassicin (r=0.82, p=0.03),
glucobrassicin (r=0.78, p=0.04) and gluconapoleiferin (r=0.77, p=0.04). However, 4 other
GSLs strongly correlated with each other were positioned at the top of PC2: glucoberteroin
(r=0.88), glucoalyssin (r=0.84), progoitrin (r=0.80) and glucobrassicanapin (r=0.59).
There was a clear separation of groups of sensory characteristics on the PC plot. Earthy
(aroma and flavour), cooked swede aroma and savoury aroma were positioned to the right of
PC1 and negatively correlated with sweet taste. Bitter taste and tannin flavour were positioned
in the top right quadrant of the plot and negatively correlated with apple (aroma and flavour).
As expected, many of the GSLs correlated with bitter taste: 4-methoxyglucobrassicin
(r=0.82, p=0.02), glucobrassicin (r=0.75, p=0.05) and neoglucobrassicin (r=0.55, p=0.20).
Although this does not indicate which of these GSLs as the greatest contribution to bitter taste,
it does support the hypothesis that the GSLs in turnip contribute to bitter taste. Bitter taste will
supress sweet taste, so it was as expected that all GSLs (except glucobrassicanapin) were
negatively correlated with sweet taste (r= -0.55 to r= -0.01).
B1 and B2 were negatively correlated with B6 and B7; B1 and B2 were separated from
B3, B4 and B5 along PC2. Moreover, B6 and B7 were separated from the other batches along
PC1 and this was driven by the higher level of total GSL and particularly 4-
hydroxyglucobrassicin, 4-methoxyglucobrassicin, glucobrassicin, gluconasturtiin, gluconapin
and glucoerucin. These 2 batches were indeed the most bitter tasting, along with B2 which
although not as high in total GSL, was highest in glucobrassicanapin. PC2 particularly separated
B5 from B2, where B5 was particularly low in all GSLs and higher in apple (aroma and flavour).

Chapter 3
72
3.5 Discussion
Twelve individual GSLs were detected across all batches. The total GSL content ranged from
16.07 to 44.74 μmol/g DW with mean value of 27.37 μmol/g DW. The content is comparable
to findings reported by Zhang et al. (2008), (16.4 to 31.4 μmol/g DW) but lower than those
reported by Lee et al. (2013), (117.05 μmol/g DW). This large difference in GSL content from
Lee et al. (2013) is perhaps because of the different method that they used, quantifying for
desulfo GSL. Aliphatic GSLs were the most abundant, representing 48.6% of total GSL content,
followed by 45.6% of aromatic GSL and 5.8% of indole GSL. The identified aliphatic GSLs in
this study were progoitrin, glucoalyssin, gluconapin, glucobrassicanapin, gluconapoleiferin,
glucoerucin and glucoberteroin; the indole GSLs were 4-hydroxyglucobrassicin,
glucobrassicin, 4-methoxyglucobrassicin and neoglucobrassicin and only one aromatic GSL,
which is gluconasturtiin. These results are in agreement with other studies which confirm that
these compounds are common GSLs in turnip varieties (Justen et al., 2012; Lee et al., 2013;
Padilla, Cartea, Velasco, de Haro, & Ordás, 2007; Zhang et al., 2008). Gluconasturtiin was the
most predominant GSL (45.6%), ranging from 8.96 to 19.81 μmol/g DW, with a mean value of
12.48 μmol/g DW. This GSL compound was also found as the most abundant in turnip greens
(Padilla et al., 2007) and turnip roots (Zhang et al., 2008).
There were significant differences in each individual GSL between batches (although
post hoc tests did not reveal any significant difference between batches for glucoalyssin) and
this could be because turnips were bought on different days, across different seasons, and from
a variety of suppliers, and although they were all purple top turnips, they were potentially of
different cultivars. There are many factors that could cause this variability. Kim, Ishida, Matsuo,
Watanabe and Watanabe (2001) reported that GSL content in turnip is dependent on harvest
times. The results of their study showed that the GSL content changed drastically at 21-day
intervals between harvesting times. Rosa, Heaney, Portas and Fenwick (1996) and Zhang et al.

Chapter 3
73
(2008) added that, in addition to harvest time, growth season could also result in the GSL
variation. Our PCA plot showed that batches B1 and B2 were similar, as were B4 and B5, and
B6 and B7. These similarities can be explained by the month the turnips were purchased.
Turnips for batches B1 and B2 were purchased in autumn/winter season, and they were
negatively correlated in terms of GSL content and sensory characteristics, with B6 and B7
which were bought in spring/summer season. Although turnips for batch B3 were purchased in
a different season from B4 and B5, these three batches were correlated with each other, in terms
of GSL content and sensory characteristics. It could be speculated that these 3 batches may be
from the same cultivar of turnip, and the cultivar effect is greater than season effect, however
this cannot be concluded as the turnip cultivar was not controlled for in this study.
It is known that type of cultivar also plays an important role in GSL content where Kim,
Kawaguchi and Watanabe (2003) reported that the GSL content of turnip seeds varied
significantly between 12 cultivars. Similar findings were reported by Kabouw et al. (2010)
where considerable variations in GSL content were found in 12 cultivars of cabbage shoot.
Other than that, GSL analysis of Brussels sprouts from 5 different sites showed
significant differences in the content (Heaney & Fenwick, 1980). Shelp, Liu and McLellan
(1993) reported that the GSL differences between growing sites were greater compared to
between cultivars of broccoli. The differences might be caused by soil type as Josefsson (1970)
demonstrated that rapeseed grown on clay soil had higher GSL content compared to the plants
grown on sandy soil.
A previous study demonstrated that sulfur and nitrogen fertilization also influenced
plant GSL content. Li et al. (2007) reported that an increase in sulfur supply increased GSL
content regardless of the nitrogen supply, however, increasing nitrogen supply at high sulfur
supply did not affect the total GSL content. The significant differences in GSL content that
were found in this study might also be caused by these growth conditions. Turnips sold in the

Chapter 3
74
UK come from many different countries with different growth conditions. Therefore, variation
in GSL content at the point of consumption might be expected from turnips purchased in the
UK supermarkets at different times of year.
GSLs are among the compounds that are responsible for the sensory characteristics of
Brassica vegetables (Drewnowski & Gomez-Carneros, 2000). In this study, 4-
methoxyglucobrassicin was highly correlated with bitter taste. Helland et al. (2016) also found
that this compound was related to the bitterness of swede and turnip. Glucobrassicin also
correlated with bitter taste, and batches B2, B6 and B7 which had the highest content of
glucobrassicin, were rated as the most bitter. Bitter taste was positively correlated with tannin
flavour and 2 individual GSLs were highly correlated with tannin flavour; 4-
methoxyglucobrassicin and glucobrassicin. In our sensory profile data, batches B2, B6 and B7
were rated the highest in tannin flavour and bitter taste. The tannin flavour is likely to originate
from tannin (phenolic compounds) rather than from the GSLs. Such phenolic compounds have
been found in turnip (Şengül, Yildiz, & Kavaz, 2014) and are associated with bitter taste
(Drewnowski & Gomez-Carneros, 2000). However, phenolic compounds were not measured
in the current study, hence the relationship between bitter taste and phenolic compounds could
not be determined. Other GSLs that have been reported to cause bitter taste (in turnip, swede,
rocket, broccoli and cauliflower) include 4-hydroxyglucobrassicin, glucobrassicin, progoitrin,
gluconapin and neoglucobrassicin (Helland et al., 2016; Pasini, Verardo, Cerretani, Caboni, &
D’Antuono, 2011; Schonhof, Krumbein, & Brückner, 2004) which is consistent with this
current study showing these compounds were positively correlated with the bitter taste in turnip
(r=0.33 to r=0.75). A high content of gluconasturtiin was found in all batches which was also
positively correlated with bitter taste (r=0.43). Batches B6 and B7 had the highest content of
gluconasturtiin and had high ratings of bitter taste. The findings suggest that gluconasturtiin
might contribute to bitterness; according to Bladh, Olsson and Yndgaard (2013), the breakdown

Chapter 3
75
product of gluconasturtiin has a strong bitter taste. In addition, our results showed that all
individual GSLs (except glucobrassicanapin) were negatively correlated with sweet taste,
similarly found by Francisco, Velasco, Romero, Vázquez and Cartea (2009), which suggests
that bitter taste supresses sweet taste.
It was also observed that gluconapoleiferin, gluconapin, 4-hydroxyglucobrassicin,
glucoerucin, glucobrassicin and gluconasturtiin and total GSL were highly correlated with
earthy aroma and gluconapoleiferin, glucobrassicin and 4-methoxyglucobrassicin were highly
correlated with earthy flavour. In comparison, Helland et al. (2016) observed that gluconapin,
glucoerucin, glucobrassicanapin were positively correlated with earthy aroma. However, there
are possible chemical compounds other than GSLs that contribute to aroma and flavour of
vegetables (Cartea & Velasco, 2008), such as the breakdown products of GSLs, which were not
measured.
3.6 Conclusion
The results obtained in this study showed that individual and total GSL varied between the
different batches of steamed-pureed turnip. The variation could be due to different plant
cultivars as this was not controlled for in this study (although all samples were purple top
cultivars). Other factors such as harvest time, growing site, season change, soil and fertilization
type could have contributed to the variation in the GSL content, as shown in previous studies
of Brassica vegetables.
The GSL compounds contributed to aroma, taste and flavour characteristic of turnip. As
shown in this study, many GSLs contributed to bitter taste with the strongest correlation being
with 4-methoxyglucobrassicin.
Overall, all batches of steamed-pureed turnip demonstrated both bitter and sweet taste,
and these two taste characteristics were negatively correlated. There were differences in bitter

Chapter 3
76
taste between batches and this was partially accounted for by differences in GSLs. It was also
evident that the bitter taste suppressed the sweet taste of the turnip as the batches containing the
least GSL were the sweetest.
In summary, the cooking method chosen in this study (steam and puree) was able to
retain GSLs and bitterness in turnip. All 7 batches tested contained GSLs and were rated as
bitter, despite differences between batches as discussed above. Therefore steamed-pureed
turnip was suitable to be used in the repeated exposure study (Chapter 4), and different batches
were considered sufficiently uniform to proceed.

Chapter 4
77
CHAPTER 4: The effects of repeated taste exposure on vegetable acceptance in children
varying in bitter taste sensitivity
4.1 Abstract
Low consumption of vegetables in children is a concern around the world, hence approaches
aimed at increasing intake are highly relevant. Previous studies have shown that repeated taste
exposure is an effective strategy to increase vegetable acceptance. However, to date no study
has examined the effect of repeated taste exposure on children varying in bitter taste sensitivity.
This study investigated the influence of taste genotypes and phenotypes on the effects of
repeated taste exposure to a Brassica vegetable. Preschool children aged 3 to 5 years were
recruited into this study. Turnip was selected as the target vegetable and parents completed a
questionnaire to ensure unfamiliarity. During the intervention, children were exposed to
steamed-pureed turnip for 10 days (once/day). Intake and liking were measured before, during
and after the intervention, and a follow-up was done 3 months post-intervention. Taste
genotypes (TAS2R38 and gustin (CA6) genotypes) and taste phenotypes (PROP taster status
and fungiform papillae density) were determined. There were significant increases in intake
(p<0.001) and liking (p=0.008) post-intervention. However, no significant effects of taste
genotypes and phenotypes were found. Repeated taste exposure is confirmed to be a good
strategy to increase vegetable acceptance in children, regardless of bitter taste sensitivity;
although children who were less bitter taste sensitive tended to consume more steamed-pureed
turnip than those who were more bitter taste sensitive.
Keywords: repeated taste exposure, bitter taste sensitivity, Brassica, turnip, children
Chapter 4
78
4.2 Introduction
Adequate daily consumption of vegetables has been shown to be associated with positive health
outcomes and may provide protection against chronic diseases such as heart diseases, stroke,
diabetes and cancers (Dias, 2012). Phytochemicals such as carotenoids, flavonoids,
glucosinolates, vitamins and minerals are potential anticarcinogenic compounds that can be
found in vegetables (Van Duyn & Pivonka, 2000). Despite these health benefits, vegetable
intake in both children and adults is reported to be below recommendation in the UK (Bates et
al., 2014; Bates et al., 2016). One serious concern for children being that eating habits in
childhood are a determinant of adult diet (Mikkilä, Räsänen, Raitakari, Pietinen, & Viikari,
2004).
Encouraging children to eat vegetables can be challenging as children are often reluctant
to try unfamiliar foods, a condition referred as food neophobia (Pliner & Hobden, 1992).
According to Wardle, Carnell and Cooke (2005), food neophobia is a predictor of vegetable
consumption in children, where those with high food neophobia consume fewer vegetables
compared to those with low food neophobia. Another challenge to promoting vegetable
consumption is innate preference; children are born to like foods that are sweet and tend to
dislike bitter foods (Birch, 1999). This predisposition often leads to children eating sweet foods
but avoiding vegetables, particularly the bitter ones (Wardle, Sanderson, Gibson, & Rapoport,
2001). Furthermore, taste sensitivity could also be a possible barrier, as studies show that
individuals who are more sensitive to bitter taste consume fewer vegetables than less sensitive
individuals (Duffy et al., 2010; Sacerdote et al., 2007).
Studies of bitter taste sensitivity often use 6-n-propylthiouracil (PROP) or
phenylthiocarbamide (PTC), bitter compounds that have a thiourea group. Although PROP and
PTC are synthetic compounds, the thiourea moiety is found within glucosinolate compounds
present in Brassica vegetables (Keller & Adise, 2016). The ability to taste PROP/PTC is

Chapter 4
79
genetically determined (Barajas-Ramírez et al., 2016) where TAS2R38 gene which encodes a
bitter taste receptor is predominantly responsible for the taste detection of the thiourea group
(Bufe et al., 2005). As discussed in detail in Chapter 1, there are 3 common single nucleotide
polymorphisms (SNPs) (rs713598, rs1726866 and rs10246939) that can be found within
TAS2R38 genotype which give rise to 3 common haplotypes (PAV/PAV, PAV/AVI and
AVI/AVI) (Kim, Wooding, Ricci, Jorde, & Drayna, 2005). Kim et al. (2003) discovered that
individuals with PAV/PAV genotype are PTC super-tasters, while those that carry PAV/AVI
and AVI/AVI are categorised as medium-tasters and non-tasters, respectively. In addition,
Duffy et al., (2010) reported that the AVI/AVI individuals had a lower consumption of
vegetables compared to 2 other genotypes and that the effect of TAS2R38 was not limited to
only Brassica vegetables.
Other than that, sensitivity to all tastes is often associated with fungiform papillae
density (FPD) (Hayes, Sullivan, & Duffy, 2010; Yackinous & Guinard, 2002). Duffy et al.
(2010) found that individuals with high FPD perceived PROP as more bitter than low FPD
individuals which then might be a factor for the high FPD individuals to consume fewer bitter
tasting vegetables. Henkin, Martin and Agarwal (1999) suggested that gustin (CA6) genotype
plays an important role in taste bud development and Padiglia et al. (2010) reported that
individuals who are PROP tasters carry A/A genotype more frequently while non-tasters carry
G/G genotype on gustin (CA6) SNP rs2274333.
Many strategies have been tested with the intention of encouraging children to eat more
vegetables; one of them is repeated taste exposure. Repeated tastings contribute to food
familiarity, which is an important determinant of food liking in children (Birch, 1999).
Therefore, exposure can become a platform to modify children’s acceptance of initially disliked
vegetables. Repeated taste exposure has been proposed to be effective for various age ranges;
from infants and preschoolers to schoolchildren (Wardle et al., 2003a). Anzman-Frasca,
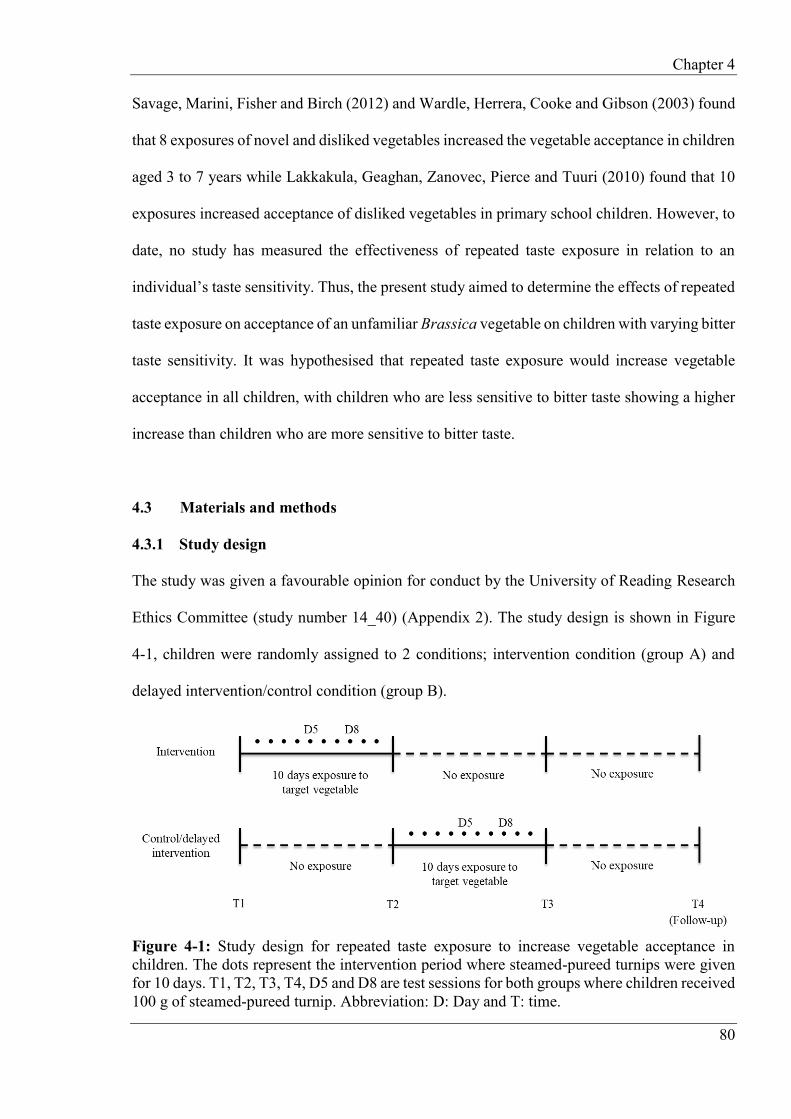
Chapter 4
80
Savage, Marini, Fisher and Birch (2012) and Wardle, Herrera, Cooke and Gibson (2003) found
that 8 exposures of novel and disliked vegetables increased the vegetable acceptance in children
aged 3 to 7 years while Lakkakula, Geaghan, Zanovec, Pierce and Tuuri (2010) found that 10
exposures increased acceptance of disliked vegetables in primary school children. However, to
date, no study has measured the effectiveness of repeated taste exposure in relation to an
individual’s taste sensitivity. Thus, the present study aimed to determine the effects of repeated
taste exposure on acceptance of an unfamiliar Brassica vegetable on children with varying bitter
taste sensitivity. It was hypothesised that repeated taste exposure would increase vegetable
acceptance in all children, with children who are less sensitive to bitter taste showing a higher
increase than children who are more sensitive to bitter taste.
4.3 Materials and methods
4.3.1 Study design
The study was given a favourable opinion for conduct by the University of Reading Research
Ethics Committee (study number 14_40) (Appendix 2). The study design is shown in Figure
4-1, children were randomly assigned to 2 conditions; intervention condition (group A) and
delayed intervention/control condition (group B).
Figure 4-1: Study design for repeated taste exposure to increase vegetable acceptance in children. The dots represent the intervention period where steamed-pureed turnips were given for 10 days. T1, T2, T3, T4, D5 and D8 are test sessions for both groups where children received 100 g of steamed-pureed turnip. Abbreviation: D: Day and T: time.
Chapter 4
81
Following the pre-intervention test (T1), children in group A received 10 exposures
(once/attended school day) of steamed-pureed turnip, while group B received no exposure.
After the second common measurement day (T2), the 2 groups switched conditions. In between
T1 and T2, group A were the intervention group and group B the control group. Between T2
and T3, group B received the intervention. This study design enabled 2 types of analysis; a
single group within-subject design (combining group A T2 versus T1 data with group B T3
versus T2 data) as well as a between-subject design where group A the intervention group and
group B were the control group (both T2 versus T1).
The primary outcome measure was intake of steamed-pureed turnip and rated liking was
the secondary outcome. A follow-up was done 3 months after the end of the intervention to
assess the durability of the effects of repeated taste exposure.
4.3.2 Power calculation
Data from a previous study was used to estimate the minimum number of children required in
this study; assuming a mean difference in intake of 4.9 g before and after an exposure period
with a standard deviation of 8.16 g (Wardle et al., 2003a) and a significance level of p=0.05
(one sided) and a power of 80%. A sufficient number of children was needed in each TAS2R38
PAV/PAV, PAV/AVI and AVI/AVI group to allow comparisons between genotypes. This
power calculation indicated that 44 children (Figure 4-2) were needed for each genotype group.
Taking into account an expected dropout rate of 10%, the target number of children was 48 per
group. The proportion of the population with the 3 common TAS2R38 genotype groups is
approximately 25% of PAV/PAV, 50% of PAV/AVI and 25% of AVI/AVI (Duffy et al., 2004),
therefore to ensure the required number of 48 in each group, the aim was to recruit 200 children.

Chapter 4
82
Figure 4-2: Power calculation to determine number of participants in this study.
4.3.3 Recruitment
A letter explaining the purpose and protocol of the study was sent to primary schools in
Reading. Once permission was granted from the head teacher, parents were given an
information sheet explaining the details of the study as well a consent form for them to sign if
they agreed to their child to participating.
4.3.4 Participants
172 children (82 males and 90 females) aged between 3 years 1 month to 5 years 7 months
(mean age: 4 years 9 months) were recruited from 6 schools. The inclusion criteria was children
were reported by their parents to be unfamiliar with turnip. The exclusion criteria was children
who were familiar with turnip and had a high liking of the steamed-pureed turnip given at T1.
There was no child that met the exclusion criteria.
4.3.5 Selection of target vegetable
An unfamiliar Brassica vegetable was used in this study as Brassica contain bitter tasting
glucosinolate compounds containing a thiourea group, thus suiting the purpose of the study
which was to measure vegetable intake and liking across individual’s bitter taste sensitivity. To
determine the target vegetable for this study, potential vegetables that would be unfamiliar to
children in the UK was obtained from a previous study that used a “Food Familiarity and Liking
Questionnaire” which included fruits and vegetables (Heath, 2012). Turnip and watercress were
n > 2F (σ/d)2
n > 2(7.85) x (8.16/4.9)2
n > 15.7 x 2.77
n > 44

Chapter 4
83
reported to be among the most unfamiliar Brassica vegetables and these vegetables were tested
under several different cooking methods to determine the method most reproducible which
retained bitter taste in the vegetables. Each vegetable type was cooked using various methods,
such as roasting, steaming, boiling and stir-frying; blending into puree or soup where
appropriate. Informal evaluation of the taste and texture of both vegetables resulted in the
selection of turnip as the target vegetable. Whereas watercress was both pungent and bitter,
turnip was consistently bitter and had the most consistent and attractive appearance after
cooking. Furthermore, turnip is white in colour, unlike most Brassica vegetables, which are
green, which would avoid confounding factor of some children not liking green foods (Zeinstra
et al., 2010). Steamed-puree was chosen as the most suitable cooking method for turnip for this
study based on the work described in detail in Chapter 2.
4.3.6 Vegetable preparation
Detailed vegetable preparation is described in Chapter 3 (section 3.3.1).
4.3.7 Vegetable serving
Prior to serving, the steamed-pureed turnip was defrosted, reheated in a microwave (800W) and
stirred every 2 min until the temperature reached >75ºC. At all test sessions, on Day 5 and 8 of
exposure and at follow-up, 100 g of steamed-pureed turnip was served in a 230 ml transparent
plastic serving dish and labelled with participant’s code; a plastic teaspoon was provided. On
Day 1, 2, 3, 4, 6, 7, 9 and 10 of exposure, approximately 5 g of steamed-pureed turnip was
given to the children on a plastic teaspoon. The puree was served warm (approximately 40 to
45ºC); in rooms varying in temperature between approximately 20ºC and 24ºC.

Chapter 4
84
4.3.8 Repeated taste exposure test
Before the study began, researchers attended 2 sessions (minimum 2 hours per session) at each
school, so that they were familiar to the children. Parents completed a ‘Vegetable preference
and familiarity’ questionnaire that comprised a list of 46 Brassica and non-Brassica vegetables
(Appendix 5) to determine children’s familiarity with and liking of turnip.
At Time 1 (T1), Time 2 (T2), Time 3 (T3), as well as on Day 5 (D5), Day 8 (D8) of the
exposure period and follow-up, children were given 100 g of steamed-pureed turnip. Children
were taken out of their classes to a separate room and this was done individually. They were
asked to eat as much as or as little as they wanted. No persuasion or force was used. Intake and
liking of the puree were measured at these times. For the rest of the exposure days (Day 1, 2, 3,
4, 6, 7, 9 and 10), children were only given 1 teaspoon (approximately 5 g) of the puree, intake
and liking were not measured, and refusal to eat was monitored. At these times, children were
taken out of their classes in groups of between 2 and 5 children.
Intake was measured in grams (g) using a digital weighing scale (3 decimal places)
(Salter) while liking was assessed using a 3-point hedonic scale (Appendix 6). As demonstrated
by Chen, Resurreccion and Paguio (1996), this scale is best for young children. It comprised 3
cartoon faces with a deep frown, a neutral face and a broad smile which represent ‘yucky’, ‘just
okay’ and ‘yummy’. These were coded as 1, 2 and 3 respectively for analysis.
4.3.9 DNA extraction and genotyping
Buccal swab samples collection, DNA extraction and analysis were done as described
previously in Chapter 2 (section 2.3.11). However, for the buccal swab samples collection, it
was done by the researcher with the children individually after the end of the intervention. In
addition to the genotyping of TAS2R38 gene, polymorphism of gustin (CA6) gene (rs2274333)
was also analysed.

Chapter 4
85
4.3.10 PROP taster status
PROP taster status was determined by using filter papers impregnated with a 50 mmol/L PROP
solution. The preparation of the PROP filter papers was done as described in Chapter 2 (2.3.12).
After the intervention, children were asked to take a sip of water and then the PROP
impregnated filter paper was placed on the tip of their tongue for a few seconds until the paper
was wet, and removed. A simple forced-choice method was adapted from Keller, Steinmann,
Nurse and Tepper (2002) where children were asked a question ‘Did you taste anything?’ Those
who answered ‘no’, were categorised as non-tasters. Those who reported the filter paper has a
taste were then questioned as to what it tasted like. Responses of ‘bad’, ‘bitter’ and ‘yucky’
were recorded as tasters. Those who did not verbally state the filter paper had a taste but
exhibited rejection signs such as grimacing or frowning, were also categorised as tasters.
4.3.11 Fungiform papillae counts
Two different methods were used to count FPD where the first method was used for the first 2
schools, and the second method was used in the remaining 4 schools. The reasons to change to
the second method were because it enabled clearer images of the papillae and allowed for more
than one area on the tongue to be counted. For the first method, the anterior tongue was dried
using a filter paper (Whatman Grade 1, 55 mm in diameter, Sigma-Aldrich, Dorset, UK) then
a blue food colouring (Sainsbury’s, UK) was used to colour the tongue area. Another filter
paper disk with a 1 cm2 cut out was placed on the tip of the tongue in the middle area.
Photographic images of the stained tongue area were taken using a digital camera (Canon EOS
700D) on close-up setting. Approximately 3 to 10 images were taken for each child and the best
image was used to count the papillae; the fungiform papillae identify as pink circles against a
blue background.

Chapter 4
86
The second method was adapted from Feeney and Hayes (2014b). The tongue was dried
and coloured using the same method as mentioned above. A 1 cm2 paper was cut and paste on
a ruler as a marker, then the ruler was placed next to the tongue, and images (tongue including
the square on the ruler) were taken using the same method as above. Images were viewed in
Microsoft Office Power Point 2013 where the outer square on the ruler was drawn to enable the
square to be moved to middle, left and right areas of the tip of the tongue. The left and right
areas have been shown to be reliable measures of FPD (Shahbake et al., 2005). There was a
high correlation between mean FPD of left and right area and mean FPD of middle area of the
tongue (rs=0.91, p<0.001), hence the middle area was used in this analysis in order to include
data from the first 2 schools where the single “middle” count was taken. All fungiform papillae
in a 1 cm2 stained area were counted by 2 researchers to ensure accuracy and this was done
after the data collection at each school was completed. Quartile calculation was used to
categorise children into 3 groups (low, medium and high FPD); the upper quartile as the high
FPD, the lower quartile as the low FPD and the remaining 50% quartile as the medium FPD
group.
4.3.12 Statistical analysis
Shapiro-Wilk tests showed that no data were normally distributed (Appendix 7). Wilcoxon
signed-rank tests were used to compare means of intake and rated liking between 2 time points.
Friedman tests were used to compare means of intake and liking between 3 or 4 time points.
However, parametric tests were also used to compare the results. In analyses comparing
multiple time-points or more than one factor, parametric tests were used on the assumption that
ANOVA is sufficiently robust to handle non-normality for a big sample size (n=134) (Norman,
2010). Mixed ANOVAs were used to determine interactions between group and either intake
or liking at 2 different time points. Time was set as a within-subjects factor and group (group

Chapter 4
87
A and B, taste genotype group or taste phenotype group) as a between-subjects factor. Wilcoxon
or Bonferroni tests were used for post hoc tests where appropriate. Significance value of p<0.05
was used, Bonferroni correction was applied for testing pairwise comparisons. Associations
between groups of categorical data were analysed using Chi-square tests. All analyses were
performed using SPSS (version 21, New York, USA).
4.4 Results
Previously in Chapter 3, glucosinolate (GSL) content and sensory characteristics of 7 batches
of steamed-pureed turnip that were used in this current study were determined. From the results,
there were significant differences in GSL content and bitterness between batches. In order to
determine whether the differences in GSL content and bitterness would affect the intake of
steamed-pureed turnip, mean intake between schools were compared. Results revealed no
significant differences in intake between schools which indicates that the differences in GSL
content and bitterness did not affect the intake of steamed-pureed turnip and that the data from
all 6 schools were combined for analyses (Appendix 8).
4.4.1 Taste genotype and phenotype characteristics
Of the 172 children that participated in this study, only 134 children had complete data sets
which included data for intake and liking (at pre-intervention and post-intervention), and all
taste sensitivity measurements (TAS2R38, CA6, PROP taster status and FPD). These data were
then used for the main analyses. Data analyses by excluding missing data according to
individual taste sensitivity measurement were also done to maximise number of children.
However results were consistent with the analyses using complete data sets. Hence, only results
of complete data sets are reported. Taste genotype and phenotype characteristics of children are
described in Table 4-1.

Chapter 4
88
Table 4-1: Taste genotype and phenotype characteristics of participants (full data set, n=134).
Characteristic n (%)
TAS2R38 PAV/PAV 22 (16.4)
PAV/AVI 67 (50.0)
AVI/AVI 33 (24.6)
PAV/AAI 3 (2.2)
PAV/AAV 2 (1.5)
AAI/AAI 1 (0.7)
AAV/AAI 1 (0.7)
AAV/AVI 1 (0.7)
AAI/AVI 4 (3.0)
Gustin (CA6) A/A 62 (46.3)
A/G 56 (41.8)
G/G 16 (11.9)
PROP taster status Taster 108 (80.6)
Non-taster 26 (19.4)
FPD High (57 to 113 papillae/cm2) 33 (24.6)
Medium (36 to 56 papillae/cm2) 63 (47.0)
Low (17 to 35 papillae/cm2) 38 (28.4)
16.4% had PAV/PAV TAS2R38 genotype, 50.0% were PAV/AVI, 24.6% were
AVI/AVI and 8.8% had a rare genotype (PAV/AAV, PAV/AAI, AAI/AVI, AAV/AAI,
AAI/AAI and AAV/AVI). 46.3% carried A/A CA6 genotype, 41.8% carried A/G genotype and
11.9% had G/G genotype. For taste phenotype, the majority of participants (80.6%) were
categorised as PROP tasters and 19.4% were non-tasters. In addition, quartile calculation
showed that 24.6% had high FPD (57 to 113 papillae/cm2), 47.0% had medium FPD (36 to 56
papillae/cm2) and 28.4% had low FPD (17 to 35 papillae/cm2). Ethnicity was known only for
91 children; based on the Office for National Statistics's (2015) ethnicity classification in
England, 40 children were white, 27 children were Asian/Asian British, 11 children were
Chapter 4
89
Black/African/Carribean/Black British, 10 children were mixed/multiple ethnic and 3 children
were in ‘other’ ethnic group.
4.4.2 Relationship between taste genotypes and phenotypes
Distribution of TAS2R38, CA6 genes and FPD according to PROP taster status are shown in
Table 4-2. The majority of the children that carried PAV/PAV TAS2R38 (n=20/22), A/A CA6
genotypes (n=52/62) and had high FPD (n=26/33) were PROP tasters. Unexpectedly, 2
PAV/PAV children were categorised as non-tasters and 27 AVI/AVI children were tasters, 10
non-tasters had A/A and 9 tasters had G/G CA6 genotypes. Additionally, 7 children with high
FPD were unexpectedly categorised as non-tasters and 33 children with low FPD were tasters.
Other than that, it was found that 8 AVI/AVI TAS2R38 children with low FPD were PROP
tasters, 1 child with high FPD and had A/A CA6 genotype was non-taster, and 2 children with
low FPD and G/G CA6 genotype were tasters (data not shown).

Chapter 4
90
Table 4-2: Relationship between taste genotypes and phenotypes (full data set, n=134).
Chi-square tests were used to determine associations between genotypes and
phenotypes. To avoid expected counts below 5, 2 genotype groups within TAS2R38 and CA6
were combined. The PAV/PAV TAS2R38 genotype was combined with the PAV/AVI genotype
into one group as both groups have the sensitive PAV haplotype. The PAV/PAV-PAV/AVI
group would be expected to have more tasters than the AVI/AVI group. For CA6, the A/G and
G/G genotype were combined together as both groups have the recessive allele G, where it
would be expected that children in the A/G-G/G group have less FPD compared to the A/A
group (dominant allele). Results showed that there were no significant associations between
TAS2R38 and PROP taster status (χ²(1)=0.001, p=0.98); between FPD and PROP taster status
(χ²(2)=1.34, p=0.51) and between CA6 genotype and PROP taster status (χ²(1)=0.79, p=0.37).
There were no other associations found; CA6 and FPD (χ²(2)=1.18, p=0.55), TAS2R38 and CA6
Genotypes and phenotypes PROP taster status
Taster Non-taster
TAS2R38 PAV/PAV 20 2
PAV/AVI 53 14
AVI/AVI 27 6
PAV/AAI 3 0
PAV/AAV 2 0
AAI/AAI 1 0
AAV/AAI 0 1
AAV/AVI 0 1
AAI/AVI 2 2
Gustin (CA6) A/A 52 10
A/G 47 9
G/G 9 7
FPD High (57 to 113 papillae/cm2) 26 7
Medium (36 to 56 papillae/cm2) 49 14
Low (17 to 35 papillae/cm2) 33 5
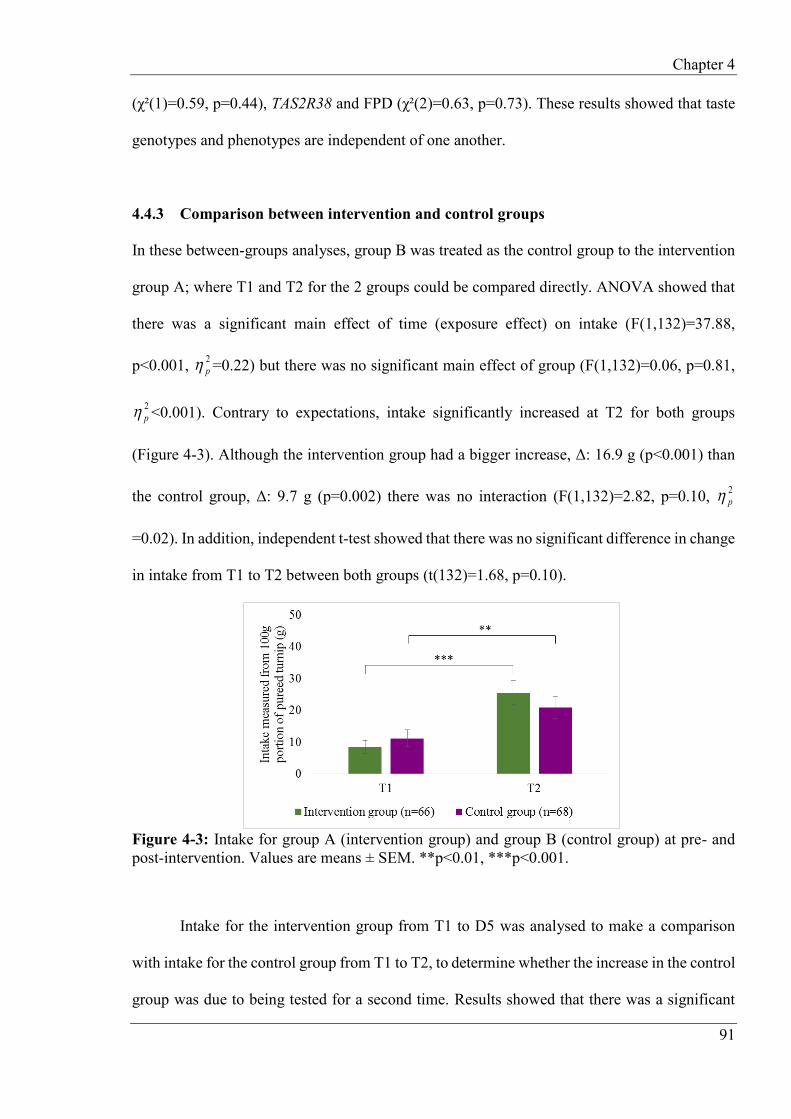
Chapter 4
91
(χ²(1)=0.59, p=0.44), TAS2R38 and FPD (χ²(2)=0.63, p=0.73). These results showed that taste
genotypes and phenotypes are independent of one another.
4.4.3 Comparison between intervention and control groups
In these between-groups analyses, group B was treated as the control group to the intervention
group A; where T1 and T2 for the 2 groups could be compared directly. ANOVA showed that
there was a significant main effect of time (exposure effect) on intake (F(1,132)=37.88,
p<0.001, 2p =0.22) but there was no significant main effect of group (F(1,132)=0.06, p=0.81,
2p <0.001). Contrary to expectations, intake significantly increased at T2 for both groups
(Figure 4-3). Although the intervention group had a bigger increase, Δ: 16.9 g (p<0.001) than
the control group, Δ: 9.7 g (p=0.002) there was no interaction (F(1,132)=2.82, p=0.10, 2p
=0.02). In addition, independent t-test showed that there was no significant difference in change
in intake from T1 to T2 between both groups (t(132)=1.68, p=0.10).
Figure 4-3: Intake for group A (intervention group) and group B (control group) at pre- and post-intervention. Values are means ± SEM. **p<0.01, ***p<0.001.
Intake for the intervention group from T1 to D5 was analysed to make a comparison
with intake for the control group from T1 to T2, to determine whether the increase in the control
group was due to being tested for a second time. Results showed that there was a significant

Chapter 4
92
increase in intake at D5, Δ: 4.3 g (Wilcoxon Z= -3.00, p=0.003; paired t-test t(65)= -2.20,
p=0.03) (data not shown), however the increase was bigger in the control group (from T1 to
T2) which suggests that the increase for the control group is likely due to familiarity with the
researcher or the study.
Intake at T1, T2 and T3 were compared for group A and B to investigate the increase
pattern. For these analyses, out of 66 children from group A with complete data sets, only 50
children had intake data at T3. Figure 4-4 shows that intake continuously increased significantly
for both groups from T1 to T3. Moreover, intake at T1, T2 (pre-intervention) and T3 (post-
intervention) for group B were compared (Figure 4-4b); results showed that there was a
significant main effect of time in intake (Friedman test: χ2(2)=16.35, p<0.001; one-way
repeated measure ANOVA: F(1.7, 112.8)=19.08, p<0.001, 2p =0.22). Intake significantly
increased from T1 (11.2 ± 21.9 g) to T2 (20.9 ± 28.2 g, Wilcoxon Z= -2.68, p=0.007;
Bonferroni, p=0.005), and continued to increase significantly at T3 (34.1 ± 38.1 g), from T2
(Wilcoxon Z= -3.64, p<0.001; Bonferroni, p=0.002), suggesting that the effect of repeated taste
exposure is larger than the effect of familiarity with researcher/study.

Chapter 4
93
a)
Figure 4-4: Change in intake for group A (a) and B (b) from T1, T2 and T3. Values are means ± SEM. Differences in letters indicate significant differences between time points.
As shown in Figure 4-5, there was a significant main effect of time on liking
(F(1,132)=13.86, p<0.001, 2p =0.10) and a significant main effect of group (F(1,132)=6.55,
p=0.01, 2p =0.05). However, there was no significant interaction between time and group
(F(1,132)=1.05, p=0.31, 2p =0.01). Both groups rated liking higher at T2, and the intervention
group liked steamed-pureed turnip more than the control group. These results reveal intake
significantly increased after exposure for the intervention and control groups, and liking
significantly increased after exposure for the control group, although there was a tendency for
liking to increase in the intervention group.
b)

Chapter 4
94
Figure 4-5: Liking scores for group A (intervention group) and group B (control group) at pre- and post-intervention. Values are means ± SEM. *p<0.05, **p<0.01.
4.4.4 Effects of repeated taste exposure on intake and liking of steamed-pureed turnip
Considering the within-subjects design, data from group A and B were combined; where data
at T1 (group A) and T2 (group B) served as pre-intervention data, and data at T2 (group A) and
T3 (group B) served as post-intervention data. Wilcoxon and paired t-tests revealed that overall
intake significantly increased post-intervention from 14.8 ± 24.0 g (mean ± SD) to 29.8 ± 34.9
g (Wilcoxon Z= -6.27, p<0.001; t-test, t(133)= -6.17, p<0.001) (Figure 4-6a). Figure 4-6b
shows that overall liking increased significantly from 2.3 ± 0.9 to 2.5 ± 0.8 post-intervention
(Wilcoxon Z= - 2.65, p=0.008; t- test t(133)= -2.35, p=0.02).

Chapter 4
95
a)
Figure 4-6: Overall intake (a) and liking scores (b) for steamed-pureed turnip across group A and B at pre- and post-intervention. Values are means ± SEM. **p<0.01, ***p<0.001.
Since group B received the first exposure at T1, data at T1 were used for both groups as
pre-intervention data for analyses to make comparisons with the analyses above. Consistent
results were found where intake significantly increased from 9.9 ± 19.5 g to 29.8 ± 34.9 g
(Wilcoxon Z= -6.81, p<0.001; t-test t(133)= -7.35, p<0.001). For liking, there was a significant
increase from 2.0 ± 0.9 to 2.5 ± 0.8 (Wilcoxon Z= -4.33, p<0.001; t-test t(133)= -4.58, p<0.001).
The within-subjects analyses concludes that intake and liking significantly increased
post-intervention.
b)

Chapter 4
96
4.4.5 Effects of taste genotypes and phenotypes on repeated taste exposure
Results confirmed that intake and liking of steamed-pureed turnip significantly increased post-
intervention. Further investigations were done to determine whether taste genotypes and
phenotypes have impacts on the size of the increase in intake and liking post-intervention.
TAS2R38
To investigate the effect of time (pre- or post-intervention) and TAS2R38 genotype (PAV/PAV,
PAV/AVI or AVI/AVI), a 2 x 3 mixed ANOVA was conducted. Results showed that there was
a significant main effect of time on intake (F(1,119)=31.19, p<0.001, 2p =0.21) however there
was no significant main effect of TAS2R38 (F(2,119)=0.08, p=0.93, 2p =0.001). No significant
interaction was found between time and TAS2R38 (F(2,119)=0.68, p=0.51, 2p =0.01). Both
PAV/AVI and AVI/AVI genotypes had significant increases in intake post-intervention, from
15.7 ± 26.6 g to 31.3 ± 36 g (p<0.001) and from 11.9 ± 17.8 g to 32.6 ± 36.3 g (p<0.001),
respectively (Figure 4-7a). No significant increase in intake was found for the PAV/PAV
genotype, although there was an indication that the intake of this group increased post-
intervention (p=0.06).
Results revealed a significant main effect of time on liking (F(1,119)=6.12, p=0.02, 2p
=0.05). No significant main effect of TAS2R38 was found (F(2,119)=1.75, p=0.18, 2p =0.03)
and there was no significant interaction between time and TAS2R38 (F(2,119)=0.37, p=0.69,
2p =0.01). Although liking tended to increase post-intervention for all genotypes, these
increases were not significant (PAV/PAV, p=0.08; PAV/AVI, p=0.06; AVI/AVI, p=0.43)
(Figure 4-7b).

Chapter 4
97
a)
Figure 4-7: Intake (a) and liking scores (b) for steamed-pureed turnip across group A and B at pre- and post-intervention according to TAS2R38. Values are means ± SEM. ***p<0.001 (significant differences from pre- to post-intervention within genotype).
When the PAV/PAV and PAV/AVI genotypes were combined for analyses, results
showed a significant main effect of time on intake (F(1,120)=37.00, p<0.001, 2p =0.24); intake
increased significantly post-intervention but there was no significant main effect of TAS2R38
(F(1,120)=0.01, p=0.91, 2p <0.001). There was no significant interaction (F(1,120)=1.08,
p=0.30, 2p =0.01). Similarly for liking, there was a significant main effect of time
(F(1,120)=3.99, p=0.048, 2p =0.03) where liking increased post-intervention, but there was no
significant main effect of TAS2R38 (F(1,120)=1.39, p=0.24, 2p =0.01). No interaction between
time and TAS2R38 was found (F(1,120)=0.40, p=0.53, 2p =0.003).
b)

Chapter 4
98
Rare genotypes were excluded from analyses as there were too few children to make
meaningful comparisons between rare genotype groups. However, it was observed that there
was a tendency for the rare TAS2R38 genotypes comprising AAI on one allele (n=9) to consume
very little steamed-pureed turnip; indeed the intake for the AAV/AAI child and the PAV/AAI
children (n=3) decreased post-intervention; from 16.4 g to 7.5 g and from 20.7 g to 8.7 g,
respectively. Those with AAI/AVI genotype (n=4) had similar intake at pre- (10.3 g) and post-
intervention (11.7 g). Although the one AAI/AAI child did increase intake post-intervention,
this was from merely 4.6 g to 13.3 g. The two PAV/AAV children did consume more steam-
pureed turnip post-intervention; from a mean of 5.1 g to 32.0 g. The one AAV/AVI child had
exceptionally high intake at both pre- (80.1 g) and post-intervention (81.4 g), but clearly no
conclusions can be drawn from a single participant (data not shown).
Gustin (CA6)
Results confirmed that there was a significant main effect of time on intake (F(1,131)=32.55,
p<0.001, 2p =0.20) but there was no significant main effect of CA6 (F(2,131)=0.11, p=0.90, 2
p
=0.002) and no interaction between time and CA6 was found (F(2,131)=0.89, p=0.42, 2p
=0.01). As demonstrated in Figure 4-8a, there were significant increases in intake for all CA6
genotypes post-intervention. The intake for the A/A genotype increased from 15.3 ± 22.3 g to
27.2 ± 34.1 g (p=0.001), while intake for the A/G genotype and G/G genotype increased from
14.6 ± 26.3 g to 31.2 ± 35.5 g (p<0.001) and from 13.6 ± 23.4 g to 35.2 ± 37.5 g (p=0.003),
respectively.

Chapter 4
99
a)
Figure 4-8: Intake (a) and liking scores (b) for steamed-pureed turnip across group A and B at pre- and post-intervention according to gustin (CA6). Values are means ± SEM. *p<0.05, **p<0.01, ***p<0.001 (significant differences from pre- to post-intervention within genotype).
For liking, results showed no significant main effect of time (F(1,131)=3.65, p=0.06,
2p =0.03) and no significant effect of CA6 (F(2,131)=0.32, p=0.73, 2
p =0.01). There was also
no interaction between time and CA6 (F(2,131)=0.54, p=0.58, 2p =0.01). Overall liking tended
to increase post-intervention; only the A/G genotype significantly increased in liking post-
intervention (from 2.2 ± 0.9 to 2.5 ± 0.7, p=0.02) and, there were no significant differences in
liking for the A/A (p=0.36) and G/G genotype (p=0.50) post-intervention (Figure 4-8b).
When A/G and G/G genotypes were combined, results revealed a significant main effect
of time on intake (F(1,132)=36.84, p<0.001, 2p =0.22) (intake significantly increased post-
b)

Chapter 4
100
intervention), but no significant main effect of CA6 was found (F(1,132)=0.18, p=0.67, 2p
=0.001). There was no significant interaction between time and CA6 (F(1,132)=1.40, p=0.24,
2p =0.01). For liking, results showed a significant effect of time (F(1,132)=5.18, p=0.02, 2
p
=0.04) where children rated higher liking post-intervention, but there was no significant main
effect of CA6 (F(1,132)=0.003, p=0.95, 2p <0.001) and there was no interaction between time
and CA6 (F(1,132)=0.86, p=0.36, 2p =0.01).
PROP taster status
ANOVA showed a significant main effect of time on intake (F(1,132)=29.19, p<0.001, 2p
=0.18) but no significant main effect of PROP taster status (F(1,132)=1.47, p=0.23, 2p =0.01)
and no significant interaction between time and PROP taster status (F(1,132)=0.75, p=0.39, 2p
=0.01). As shown in Figure 4-9a, intake significantly increased from 14.0 ± 23.0 g to 28.0 ±
34.4 g (p<0.001) and from 18.3 ± 28.1 g to 37.6 ± 36.7 g (p=0.001), for PROP tasters and non-
tasters, respectively.
For liking, there was a significant main effect of time (F(1,132)=4.49, p=0.04, 2p =0.03)
but there was no significant main effect of PROP taster status (F(1,132)=0.92, p=0.34, 2p
=0.01). There was no significant interaction between time and PROP taster status
(F(1,132)=0.19, p=0.67, 2p =0.001). For both PROP tasters and non-tasters, there were no
significant increases in liking post-intervention (p=0.06 and p=0.16, respectively) (Figure
4-9b).

Chapter 4
101
a)
Figure 4-9: Intake (a) and liking scores (b) for steamed-pureed turnip across group A and B at pre- and post-intervention according to PROP taster status. Values are means ± SEM. **p<0.01, ***p<0.001 (significant differences from pre- to post-intervention within genotype).
Fungiform papillae density (FPD)
Results revealed a significant main effect of time on intake (F(1,131)=35.51, p<0.001, 2p
=0.21) however there was no significant main effect of FPD (F(2,131)=1.18, p=0.31, 2p =0.02)
and there was no significant interaction between time and FPD (F(2,131)=2.40, p=0.10, 2p
=0.04). Intake significantly increased from 16.6 ± 25.1 g to 30.7 ± 35.3 g (p<0.001) for the
medium FPD group while, for the low FPD group, intake increased from 14.1 ± 25.0 g to 36.7
± 38.7 g (p<0.001) post-intervention (Figure 4-10a). There was no significant increase in intake
for high FPD group (p=0.10) post-intervention.
b)

Chapter 4
102
a)
Figure 4-10: Intake (a) and liking scores (b) for steamed-pureed turnip across group A and B at pre- and post-intervention according to fungiform papillae density (FPD). Values are means ± SEM. ***p<0.001 (significant differences from pre- to post-intervention within genotype).
For liking, there was a significant main effect of time (F(1,131)=4.84, p=0.03, 2p =0.04)
but there was no significant main effect of FPD (F(2,131)=0.54, p=0.59, 2p =0.01) and no
significant interaction was found between time and FPD (F(2,131)=0.03, p=0.97, 2p <0.001).
Overall liking significantly increased post-intervention, however as shown in Figure 4-10b,
there were no significant increases in liking post-intervention for any FPD groups (high FPD,
p=0.35; medium FPD, p=0.09; low FPD, p=0.19).
In this section, it can be summarised that there were significant increases in intake and
liking of steamed-pureed turnip from pre- to post-intervention, irrespective of taste genotypes
and phenotypes.
b)

Chapter 4
103
4.4.6 Vegetable acceptance over time
In these analyses, data at Day 5 and Day 8 of exposure were included to compare mean intake
and liking at 4 different time points. Out of 134 children used for previous analyses, only 132
children had intake and liking data at pre-intervention, Day 5, Day 8 and post-intervention. A
Friedman test and one-way repeated-measures ANOVA demonstrated a significant main effect
of time on intake (χ2(3)=42.91, p<0.001; F(2.4, 319.3)=20.37, p<0.001, 2p =0.14) respectively.
Post hoc Wilcoxon and Bonferroni tests showed that intake significantly increased from pre-
intervention (15.0 ± 24.1 g) to Day 5 (21.6 ± 28.9 g, Wilcoxon Z= -4.39, p<0.001; Bonferroni,
p=0.002), remained constant at Day 8 (22.7 ± 30.6 g, Wilcoxon Z= -0.25, p=0.80; Bonferroni,
p=1.00) and increased again at post-intervention (30.3 ± 35.0 g, Wilcoxon Z= -4.25, p<0.001;
Bonferroni, p<0.001) (Figure 4-11a).
a)
Figure 4-11: Change in intake (a) and liking score (b) across group A and B from pre-intervention, Day 5 and 8 of exposure to post-intervention. Values are means ± SEM. Differences in letters indicate significant differences between time points.
b)
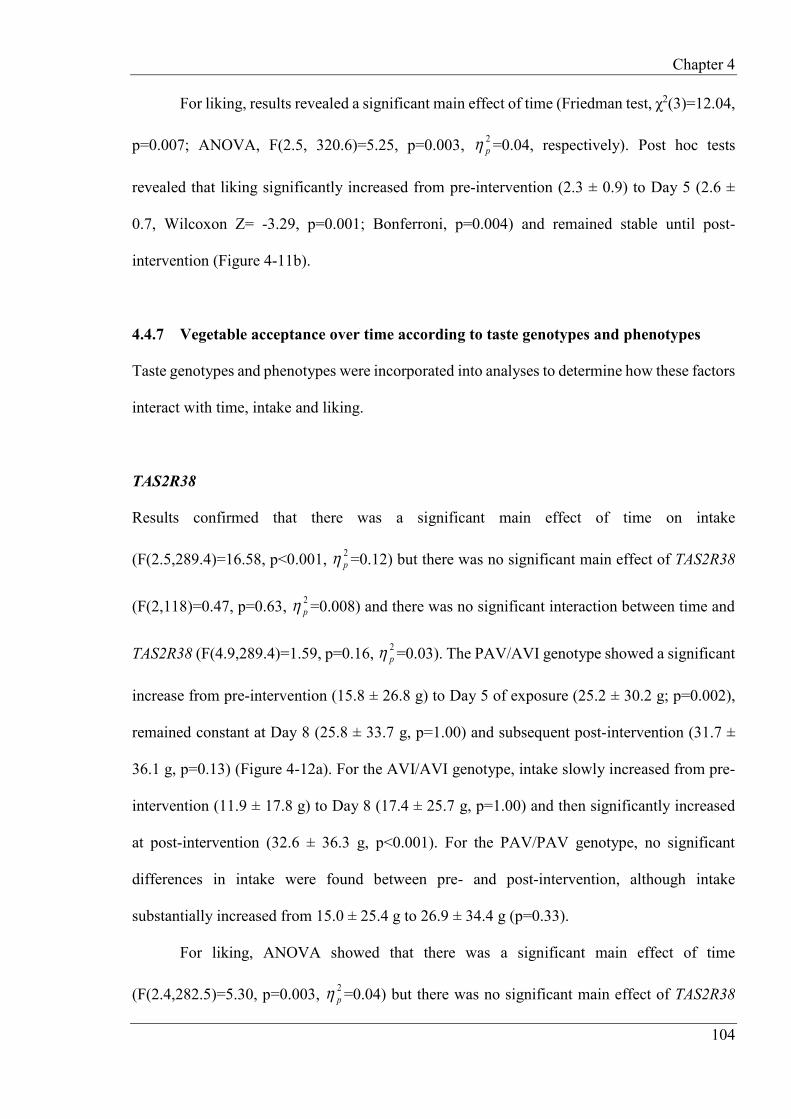
Chapter 4
104
For liking, results revealed a significant main effect of time (Friedman test, χ2(3)=12.04,
p=0.007; ANOVA, F(2.5, 320.6)=5.25, p=0.003, 2p =0.04, respectively). Post hoc tests
revealed that liking significantly increased from pre-intervention (2.3 ± 0.9) to Day 5 (2.6 ±
0.7, Wilcoxon Z= -3.29, p=0.001; Bonferroni, p=0.004) and remained stable until post-
intervention (Figure 4-11b).
4.4.7 Vegetable acceptance over time according to taste genotypes and phenotypes
Taste genotypes and phenotypes were incorporated into analyses to determine how these factors
interact with time, intake and liking.
TAS2R38
Results confirmed that there was a significant main effect of time on intake
(F(2.5,289.4)=16.58, p<0.001, 2p =0.12) but there was no significant main effect of TAS2R38
(F(2,118)=0.47, p=0.63, 2p =0.008) and there was no significant interaction between time and
TAS2R38 (F(4.9,289.4)=1.59, p=0.16, 2p =0.03). The PAV/AVI genotype showed a significant
increase from pre-intervention (15.8 ± 26.8 g) to Day 5 of exposure (25.2 ± 30.2 g; p=0.002),
remained constant at Day 8 (25.8 ± 33.7 g, p=1.00) and subsequent post-intervention (31.7 ±
36.1 g, p=0.13) (Figure 4-12a). For the AVI/AVI genotype, intake slowly increased from pre-
intervention (11.9 ± 17.8 g) to Day 8 (17.4 ± 25.7 g, p=1.00) and then significantly increased
at post-intervention (32.6 ± 36.3 g, p<0.001). For the PAV/PAV genotype, no significant
differences in intake were found between pre- and post-intervention, although intake
substantially increased from 15.0 ± 25.4 g to 26.9 ± 34.4 g (p=0.33).
For liking, ANOVA showed that there was a significant main effect of time
(F(2.4,282.5)=5.30, p=0.003, 2p =0.04) but there was no significant main effect of TAS2R38
Chapter 4
105
(F(2,118)=1.24, p=0.30, 2p =0.02) and no significant interaction was found between time and
TAS2R38 (F(4.8,282.5)=1.38, p=0.23, 2p =0.02). As shown in Figure 4-12b, there was a
significant increase in liking for the PAV/AVI genotype from pre-intervention (2.2 ± 0.9) to
Day 5 (2.6 ± 0.7, p=0.02) and remained constant afterwards. There was no significant difference
in liking between pre- and post-intervention (p=1.00) for the AVI/AVI genotype and also no
significant increase in liking was found for the PAV/PAV genotype from pre- to post-
intervention (p=0.49).
a)
Figure 4-12: Change in intake (a) and liking score (b) across group A and B from pre-intervention, Day 5 and 8 of exposure to post-intervention according to TAS2R38. Values are means ± SEM.
When the PAV/PAV and PAV/AVI genotypes were combined, results revealed a
significant main effect of time on intake (F(2.5,291.7)=20.24, p<0.001, 2p =0.15) where intake
significantly increased over time. However there was no significant main effect of TAS2R38
b)

Chapter 4
106
(F(1,119)=0.87, p=0.35, 2p =0.007). There was a significant interaction between time and
TAS2R38 (F(2.5,291.7)=2.93, p=0.04, 2p =0.02). The interaction is caused by a different
increase pattern in intake between these 2 groups where the PAV/PAV-PAV/AVI group (n=88)
had a significant increase in intake from pre-intervention (15.6 ± 26.3 g) to Day 5 (25.1 ± 31.2
g, p<0.001), Day 8 (25.5 ± 32.7 g, p=0.001) and post-intervention (30.5 ± 35.5 g, p<0.001)
(Figure 4-13). However, the AVI/AVI group (n=33) had a stable intake from pre-intervention
(11.9 ± 17.8 g) to Day 5 (14.4 ± 22.7 g, p=1.00) and Day 8 (17.4 ± 25.7 g, p=1.00) then a
substantial increase in intake at post-intervention (32.6 ± 36.3 g, p<0.001). There were no
significant differences in intake between these 2 groups at any time point. For liking, results
showed a significant main effect of time (F(2.4,288.0)=4.16, p=0.01, 2p =0.03); liking
increased over time, but there was no significant effect of TAS2R38 (F(1,119)=1.52, p=0.22,
2p =0.01). There was no significant interaction between time and TAS2R38 (F(2.4,288.0)=1.5,
p=0.23, 2p =0.01).
Figure 4-13: Changes in intake across group A and B from pre-intervention, Day 5 and 8 of exposure to post-intervention according to TAS2R38 (combined genotype groups). Values are means ± SEM.

Chapter 4
107
Gustin (CA6)
There was a significant main effect of time on intake (F(2.4,312.7)=18.13, p<0.001, 2p =0.12)
but no significant main effect of CA6 (F(2,129)=0.36, p=0.70, 2p =0.006) and there was no
significant interaction between time and CA6 (F(4.8,312.7)=1.39, p=0.23, 2p =0.02). The G/G
genotype group (n=16) had the highest intake across exposures, however this was a small group
of subjects and no significant differences were found in intake between the CA6 genotypes at
any time point (Figure 4-14a). Intake for the G/G genotype increased significantly from pre-
intervention (13.6 ± 23.4 g) to at Day 8 (35.0 ± 39.3 g, p=0.002) and remained stable afterwards
(35.2 ± 37.5 g, p=1.00). For the A/G genotype, the intake slowly increased from pre-
intervention (14.6 ± 26.3 g) to Day 8 (22.6 ± 29.4 g, p=0.06) then significantly increased at
post-intervention (31.2 ± 35.5 g, p=0.01). The A/A genotype showed a similar pattern where
intake slowly increased from pre-intervention (15.7 ± 22.5 g) to Day 8 (19.5 ± 28.8 g, p=1.00)
then significantly increased at post-intervention (28.0 ± 34.4 g, p=0.008).
For liking, results revealed that there was a significant main effect of time
(F(2.5,316.4)=3.89, p=0.02, 2p =0.03). There was no significant main effect of CA6
(F(2,129)=0.61, p=0.54, 2p =0.01) and there was no significant interaction between time and
CA6 (F(4.9,316.4)=0.43, p=0.82, 2p =0.01). Liking significantly increased for the A/G
genotype from pre-intervention (2.2 ± 0.9) to Day 5 (2.6 ± 0.7, p=0.02) and remained stable
afterwards. (Figure 4-14b). There were no significant differences in liking between pre- and
post-intervention for the A/A and G/G genotype (p=1.00 and p=1.00, respectively).

Chapter 4
108
a)
Figure 4-14: Change in intake (a) and liking score (b) across group A and B from pre-intervention, Day 5 and 8 of exposure to post-intervention according to gustin (CA6). Values are means ± SEM.
When combining the A/G and G/G genotypes into one group, results revealed a
significant main effect of time on intake (F(2.4,317.3)=19.59, p<0.001, 2p =0.13); intake
increased over time but there was no significant main effect of CA6 (F(1,130)=0.35, p=0.56,
2p =0.003). There was no significant interaction between time and CA6 (F(2.4,317.3)=1.21,
p=0.34, 2p =0.01). For liking, there was a significant main effect of time (F(2.5,319.2)=4.88,
p=0.005, 2p =0.04), where liking increased over time, but there was no significant effect of CA6
(F(1,130)=0.06, p=0.81, 2p <0.001). There was no significant interaction between time and
CA6 (F(2.5,319.2)=0.63, p=0.56, 2p =0.005).
b)

Chapter 4
109
PROP taster status
There was a significant main effect of time on intake (F(2.4,316.7)=16.03, p<0.001, 2p =0.11),
however there was no significant main effect of PROP taster status (F(1,130)=2.83, p=0.10, 2p
=0.02) and there was no significant interaction between time and PROP taster status
(F(2.4,316.7)=1.23, p=0.30, 2p =0.01). The intake for PROP tasters was smaller compared to
non-tasters across the exposures, however there were no significant differences in intake
between these 2 groups at any time point except at Day 8 of exposure where the tasters
consumed significantly less (19.9 ± 28.7 g compared to the non-tasters whom consumed 34.3
± 36.0 g; p=0.03) (Figure 4-15a). Tasters showed a significant increase at Day 5 of exposure
(19.9 ± 28.1 g; p=0.03) compared to pre-intervention (14.1 ± 23.1 g), and this group continued
to increase their intake significantly at post-intervention (28.2 ± 34.5 g; p=0.002). The non-
tasters group significantly increased their intake from pre-intervention (19.0 ± 28.4 g) to Day 8
(34.3 ± 36.0 g; p=0.007) and remained stable at post-intervention.
For liking, there was a significant main effect of time (F(2.4,318.0)=2.94, p=0.04, 2p
=0.02) but there was no significant main effect of PROP taster status (F(1,130)=0.89, p=0.35,
2p =0.01). No significant interaction was found between time and PROP taster status
(F(2.4,318.0)=0.08, p=0.95, 2p =0.001). For tasters, liking significantly increased from pre-
intervention (2.2 ± 0.9) to Day 5 (2.5 ± 0.7; p=0.007) and remained stable subsequently (Figure
4-15b). For non-tasters, there was no significant difference in liking between pre- and post-
intervention (p=1.00).

Chapter 4
110
a)
Figure 4-15: Change in intake (a) and liking score (b) across group A and B from pre-intervention, Day 5 and 8 of exposure to post-intervention according to PROP taster status. Values are means ± SEM.
Fungiform papillae density (FPD)
When FPD was tested as a between-subjects factor, the results showed that there was a
significant main effect of time on intake (F(2.4,316.0)=19.15, p<0.001, 2p =0.13) however
there was no significant main effect of FPD (F(2,129)=1.46, p=0.24, 2p =0.02) and there was
no significant interaction between time and FPD (F(4.9,316.0)=1.82, p=0.11, 2p =0.03). As
demonstrated in Figure 4-16a, the low FPD group had a significant increase in intake from pre-
intervention (14.7 ± 25.6 g) to Day 5 (28.0 ± 33.5 g; p=0.001) and continued to increase their
intake significantly from Day 8 (26.2 ± 33.8 g) to post-intervention (38.5 ± 39.0 g; p=0.002).
The medium FPD group had a significant increase in intake from pre-intervention (16.6 ± 25.1
b)
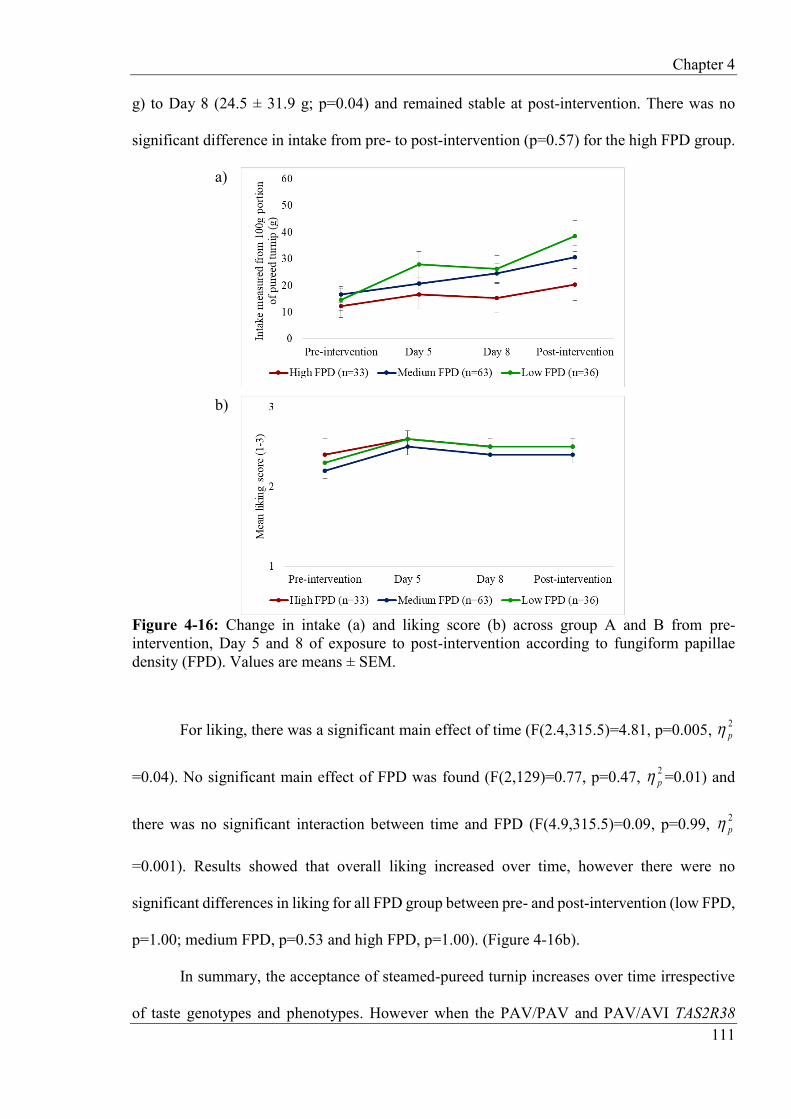
Chapter 4
111
g) to Day 8 (24.5 ± 31.9 g; p=0.04) and remained stable at post-intervention. There was no
significant difference in intake from pre- to post-intervention (p=0.57) for the high FPD group.
a)
Figure 4-16: Change in intake (a) and liking score (b) across group A and B from pre-intervention, Day 5 and 8 of exposure to post-intervention according to fungiform papillae density (FPD). Values are means ± SEM.
For liking, there was a significant main effect of time (F(2.4,315.5)=4.81, p=0.005, 2p
=0.04). No significant main effect of FPD was found (F(2,129)=0.77, p=0.47, 2p =0.01) and
there was no significant interaction between time and FPD (F(4.9,315.5)=0.09, p=0.99, 2p
=0.001). Results showed that overall liking increased over time, however there were no
significant differences in liking for all FPD group between pre- and post-intervention (low FPD,
p=1.00; medium FPD, p=0.53 and high FPD, p=1.00). (Figure 4-16b).
In summary, the acceptance of steamed-pureed turnip increases over time irrespective
of taste genotypes and phenotypes. However when the PAV/PAV and PAV/AVI TAS2R38
b)

Chapter 4
112
genotypes were combined, the PAV/PAV-PAV/AVI group showed a more rapid increase in
intake compared to the AVI/AVI group.
4.4.8 Effects of repeated taste exposure at follow-up
Of 134 children, 121 children participated at 3 month follow-up. Friedman and one-way
repeated-measures ANOVA tests were carried out to determine any lasting effect of repeated
taste exposure. The results revealed a significant effect of time on intake (Friedman test,
χ²(2)=61.31, p<0.001; ANOVA, F(1.7, 206.1)=42.13, p<0.001, 2p =0.26). Post hoc Wilcoxon
and Bonferroni tests showed that intake significantly increased at follow-up (38.3 ± 37.7 g)
from pre-intervention (15.5 ± 25.1 g, Wilcoxon Z= -7.47, p<0.001; Bonferroni p<0.001) and
post-intervention (31.4 ± 35.9 g, Wilcoxon Z= -3.17, p=0.002; Bonferroni p=0.002) (Figure
4-17a).
For liking, there was a significant main effect of time (Friedman test, χ²(2)=10.78,
p=0.005; ANOVA, F(1.9, 222.8)=7.54, p=0.001, 2p =0.06). Liking significantly increased from
pre-intervention (2.2 ± 0.9) to follow-up (2.5 ± 0.8, Wilcoxon Z= -3.43, p=0.001; Bonferroni
p=0.001). There was no difference in liking from post-intervention to follow-up (Wilcoxon Z=
-0.67, p=0.50, Bonferroni p=1.00) (Figure 4-17b).

Chapter 4
113
a)
Figure 4-17: Intake (a) and liking scores (b) for steamed-pureed turnip across group A and B at pre-, post-intervention and follow-up. Values are means ± SEM. Differences in letters at the top of each bar indicate significant differences (p<0.05).
4.4.9 Effects of repeated taste exposure at follow-up according to taste genotypes and
phenotypes
The results from mixed ANOVAs when either taste genotype or phenotype was tested together
with time on intake and liking are as follows:
TAS2R38
Results showed a significant main effect of time on intake (F(1.7,187.6)=34.32, p<0.001, 2p
=0.24) but no significant main effect of TAS2R38 (F(2,110)=0.04, p=0.96, 2p =0.001) and no
b)

Chapter 4
114
significant interaction between time and TAS2R38 (F(3.4,187.6)=0.87, p=0.47, 2p =0.02).
Intake for the PAV/AVI genotype significantly increased from both pre-intervention (16.1 ±
27.2 g) and post-intervention (32.0 ± 36.5 g) to follow-up (41.4 ± 39.1 g) (p<0.001, p=0.003
respectively). The AVI/AVI and PAV/PAV genotypes had significant increases in intake from
pre-intervention to follow-up (AVI/AVI: from 12.6 ± 18.8 g to 35.4 ± 34.4 g, p=0.001;
PAV/PAV: from 16.3 ± 26.3 g to 40.4 ± 39.7 g, p=0.004). However, there were no significant
differences in intake from post-intervention to follow-up for either AVI/AVI (p=1.00) or
PAV/PAV genotypes (p=0.07) (Figure 4-18a).
Figure 4-18: Intake (a) and liking scores (b) for steamed-pureed turnip across group A and B at pre-, post-intervention and follow-up according to TAS2R38. Values are means ± SEM. Differences in letters at the top of each bar indicate significant differences between time points within genotype (p<0.05).
b)

Chapter 4
115
For liking, there was a significant main effect of time (F(1.8,200.3)=6.48, p=0.003, 2p
=0.06) but there was no significant main effect of TAS2R38 (F(2,110)=1.51, p=0.23, 2p =0.03)
and there was no significant interaction between time and TAS2R38 (F(3.6,200.3)=0.44,
p=0.76, 2p =0.01). The PAV/AVI genotype showed a significant increase in liking from pre-
intervention (2.2 ± 0.9) to follow-up (2.6 ± 0.7, p=0.006), however there was no significant
difference in liking from post-intervention to follow-up (p=0.37). There were no significant
differences in liking from either pre- or post-intervention to follow-up for the AVI/AVI (p=0.12
and p=0.75 respectively) and the PAV/PAV genotype (p=0.77 and p=1.00 respectively) (Figure
4-18b).
When the PAV/PAV and PAV/AVI genotypes were combined, results revealed a
significant main effect of time on intake (F(1.7,189.4)=34.62, p<0.001, 2p =0.24) where intake
increased at follow-up but there was no significant main effect of TAS2R38 (F(1,111)=0.06,
p=0.81, 2p =0.001). There was no significant interaction between time and TAS2R38
(F(1.7,189.4)=1.65, p=0.20, 2p =0.02). For liking, a significant main effect of time was found
(F(1.8,203.1)=6.60, p=0.002, 2p =0.06) where liking increased at follow-up but there was no
significant main effect of TAS2R38 (F(1,111)=1.30, p=0.26, 2p =0.01). There was no
significant interaction between time and TAS2R38 (F(1.8,203.1)=0.10, p=0.89, 2p =0.001).
Gustin (CA6)
There was a significant main effect of time on intake (F(1.7,202.9)=32.31, p<0.001, 2p =0.22)
but there was no significant main effect of CA6 (F(2,118)=0.16, p=0.85, 2p =0.003) and there
was no significant interaction between time and CA6 (F(3.4,202.9)=0.32, p=0.84, 2p =0.01). In

Chapter 4
116
Figure 4-19a, intake for the A/A genotype significantly increased from pre-intervention (15.6
± 23.3 g) and from post-intervention (29.3 ± 35.2 g) to follow-up (36.6 ± 38.5 g) (p<0.001,
p=0.046, respectively). For the A/G genotype, intake significantly increased from pre-
intervention (15.5 ± 27.4 g) to follow-up (38.8 ± 37.1 g, p<0.001), however there was no
significant increase from post-intervention to follow-up (p=0.09). Similarly for the G/G
genotype, there was a significant increase in intake from pre-intervention (15.2 ± 24.7 g) to
follow-up (43.0 ± 38.9 g, p=0.005) but there was no significant increase in intake from post-
intervention to follow-up (p=1.00).
a)
Figure 4-19: Intake (a) and liking scores (b) for steamed-pureed turnip across group A and B at pre-, post-intervention and follow-up according to gustin (CA6). Values are means ± SEM. Differences in letters at the top of each bar indicate significant differences between time points within genotype (p<0.05).
b)

Chapter 4
117
For liking, ANOVA showed a significant main effect of time (F(1.8,217.4)=8.16,
p=0.001, 2p =0.07). However, there was no significant main effect of CA6 (F(2,118)=0.82,
p=0.44, 2p =0.01) and no significant interaction was found between time and CA6
(F(3.7,217.4)=1.76, p=0.14, 2p =0.03). The G/G genotype had a significant increase in liking
from pre-intervention (2.3 ± 0.9) to follow-up (3.0 ± 0.0, p=0.02), but not from post-
intervention to follow-up (p=0.08) (Figure 4-19b). For the A/G genotype, liking significantly
increased from pre-intervention (2.1 ± 0.9) to follow-up (2.6 ± 0.8, p=0.005) but no significant
difference in liking was found from post-intervention to follow-up (p=1.00). There were no
significant differences in liking from either pre- or post-intervention to follow-up for the A/A
genotype (both p=1.00).
When the A/G and G/G genotype were combined, results revealed a significant main
effect of time on intake (F(1.7,204.6)=41.15, p<0.001, 2p =0.26); where intake increased at
follow-up but there was no significant main effect of CA6 (F(1,119)=0.18, p=0.67, 2p =0.002).
There was no significant interaction between time and CA6 (F(1.7,204.6)=0.38, p=0.65, 2p
=0.003). For liking, a significant main effect of time was found (F(1.9,220.8)=6.99, p=0.002,
2p =0.06); where children rated higher liking at follow-up but there was no significant main
effect of CA6 (F(1,119)=0.33, p=0.57, 2p =0.003). There was no significant interaction between
time and CA6 (F(1.9,220.8)=2.22, p=0.12, 2p =0.02).
PROP taster status
There was a significant main effect of time on intake (F(1.7,203.9)=28.03, p<0.001, 2p =0.19).
No significant main effect of PROP taster status was found (F(1,119)=1.32, p=0.25, 2p =0.01)

Chapter 4
118
and there was no significant interaction between time and PROP taster status
(F(1.7,203.9)=0.50, p=0.58, 2p =0.004). PROP tasters had significant increases in intake from
pre-intervention (14.5 ± 24.0 g) and from post-intervention (29.2 ± 35.4 g) to follow-up (37.0
± 38.2 g) (p<0.001, p=0.002, respectively) (Figure 4-20a). While for PROP non-tasters, intake
increased from pre-intervention (19.7 ± 29.5 g) to follow-up (43.7 ± 35.8 g, p=0.001) but there
was no significant difference in intake from post-intervention to follow-up (p=1.00).
a)
Figure 4-20: Intake (a) and liking scores (b) for steamed-pureed turnip across group A and B at pre-, post-intervention and follow-up according to PROP taster status. Values are means ± SEM. Differences in letters at the top of each bar indicate significant differences between time points within phenotype (p<0.05).
For liking, there was a significant main effect of time (F(1.9,221.5)=7.43, p=0.001, 2p
=0.06) but there was no significant main effect of PROP taster status (F(1,119)=1.71, p=0.19,
b)
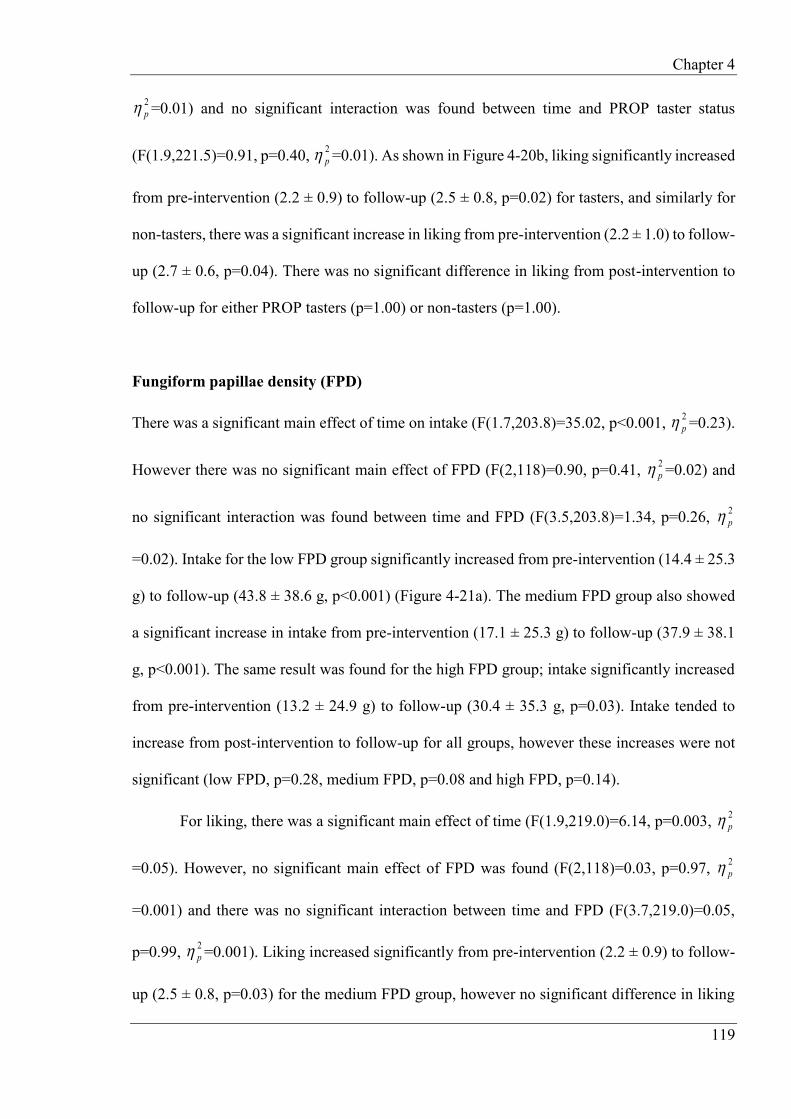
Chapter 4
119
2p =0.01) and no significant interaction was found between time and PROP taster status
(F(1.9,221.5)=0.91, p=0.40, 2p =0.01). As shown in Figure 4-20b, liking significantly increased
from pre-intervention (2.2 ± 0.9) to follow-up (2.5 ± 0.8, p=0.02) for tasters, and similarly for
non-tasters, there was a significant increase in liking from pre-intervention (2.2 ± 1.0) to follow-
up (2.7 ± 0.6, p=0.04). There was no significant difference in liking from post-intervention to
follow-up for either PROP tasters (p=1.00) or non-tasters (p=1.00).
Fungiform papillae density (FPD)
There was a significant main effect of time on intake (F(1.7,203.8)=35.02, p<0.001, 2p =0.23).
However there was no significant main effect of FPD (F(2,118)=0.90, p=0.41, 2p =0.02) and
no significant interaction was found between time and FPD (F(3.5,203.8)=1.34, p=0.26, 2p
=0.02). Intake for the low FPD group significantly increased from pre-intervention (14.4 ± 25.3
g) to follow-up (43.8 ± 38.6 g, p<0.001) (Figure 4-21a). The medium FPD group also showed
a significant increase in intake from pre-intervention (17.1 ± 25.3 g) to follow-up (37.9 ± 38.1
g, p<0.001). The same result was found for the high FPD group; intake significantly increased
from pre-intervention (13.2 ± 24.9 g) to follow-up (30.4 ± 35.3 g, p=0.03). Intake tended to
increase from post-intervention to follow-up for all groups, however these increases were not
significant (low FPD, p=0.28, medium FPD, p=0.08 and high FPD, p=0.14).
For liking, there was a significant main effect of time (F(1.9,219.0)=6.14, p=0.003, 2p
=0.05). However, no significant main effect of FPD was found (F(2,118)=0.03, p=0.97, 2p
=0.001) and there was no significant interaction between time and FPD (F(3.7,219.0)=0.05,
p=0.99, 2p =0.001). Liking increased significantly from pre-intervention (2.2 ± 0.9) to follow-
up (2.5 ± 0.8, p=0.03) for the medium FPD group, however no significant difference in liking

Chapter 4
120
was found from post-intervention (p=1.00) (Figure 4-21b). No significant differences in liking
were found at either pre- or post-intervention to follow-up for either the low FPD (p=0.10 and
p=1.00 respectively) or the high FPD groups (p=0.62 and p=1.00 respectively).
Results in this section indicate that intake and liking increased from pre-intervention to
follow-up, regardless of taste genotypes and phenotypes.
a)
Figure 4-21: Intake (a) and liking scores (b) for steamed-pureed turnip across group A and B at pre-, post-intervention and follow-up according to fungiform papillae density (FPD). Values are means ± SEM. Differences in letters at the top of each bar indicate significant differences between time points within phenotype (p<0.05).
b)
Chapter 4
121
4.5 Discussion
Our findings show that there was a significant increase in overall intake and liking of steamed-
pureed turnip over exposures (when both group A and B were combined). Other studies have
also found the same effects of repeated taste exposure, for example Ahern, Caton, Blundell and
Hetherington (2014) reported that intake of novel vegetables (swede, turnip and celeriac)
increased after repeated exposure in preschool children (15 to 56 months). Hausner, Olsen, et
al. (2012) described that repeated taste exposure is a powerful strategy to enhance vegetable
acceptance as it was found that intake of a novel vegetable (artichoke) increased after 10
exposures in 2 to 3 year-old children. Similarly, repeated taste exposure increased the
acceptance of initially disliked vegetables (red bell pepper and yellow squash) in 3 to 6 year-
old children (Anzman-Frasca et al., 2012).
It was observed that overall intake and liking significantly increased after 5 exposures
and continued to increase significantly (intake) or remain stable (liking) post-intervention. In
agreement with previous studies, results indicate 5 exposures might be sufficient to increase
acceptance of a novel vegetable (Caton et al., 2013; Hausner, Olsen, et al., 2012). It was also
found that intake and liking increased significantly from pre-intervention to follow-up, which
indicates a long-term effect of repeated taste exposure. This result is supported by Caton et al.
(2013) and Hausner, Olsen, et al. (2012) who report that repeated taste exposure could increase
vegetable acceptance up to 5 weeks and 6 months, respectively.
Surprisingly, when comparing the intake between the intervention and control groups
in the current study, both groups showed significant increases from T1 to T2, despite the control
group receiving no exposures in between these time points. To determine what caused intake
to increase significantly in the control group, a comparison with intake (from T1 to Day 5) for
the intervention group was made. Results showed that intake increased significantly for the
intervention group from T1 to Day 5, however the increase in intake for the control group from
Chapter 4
122
T1 to T2 was higher. Researchers were present during the intervention period for the both
groups. It is possible that children in the control group were aware of the presence of the
researchers, and this increased familiarity to the researchers as well as the study. This increased
familiarity with researchers/study may have resulted in greater intake by the control group at
T2. Alternatively, it may be that one exposure is sufficient to increase vegetable acceptance in
children. However, it would be expected that the increase in intake for the intervention group
would be greater or similar to the control group in order to accept the theory of one exposure.
Since this is not the case, it is more likely that increased intake in the control group is resulted
from the familiarity with the researchers/study. To establish whether increased intake among
the control group is explained by familiarity to turnip or familiarity with the researchers/study,
a future study could present a different unfamiliar vegetable together with turnip at T2. If the
intake of both vegetables are comparable, it can be hypothesised that it is due to familiarity to
researchers/study. Although it is suspected that familiarity with researchers/study would may
have caused intake of steamed-pureed turnip to increase between first and second visit, our
study does still conclude that repeated taste exposure led to increased intake of steamed-pureed
turnip because intake increased significantly after 5 exposures and continued to increase at post-
intervention (after 10 exposures). Furthermore it was found that intake continued to increase
significantly from T2 to T3 (after repeated taste exposure) for group B. In addition, results
showed that the intervention group had a tendency to have a higher increase in intake from T1
to T2 compared to the increase for the control group between the same time points.
When intake is evaluated according to taste genotypes (TAS2R38 and gustin (CA6)) and
phenotypes (PROP taster status and FPD) it was found that it significantly increased post-
intervention for PAV/AVI and AVI/AVI TAS2R38 genotypes; all CA6 genotypes (A/A, A/G
and G/G); both PROP tasters and non-tasters; medium and low FPD groups. Several trends in
the predicted direction were observed, with less sensitive groups typically showing greater
Chapter 4
123
increases in intake than more sensitive groups, however none of these group differences were
found to be statistically significant, except that there was a significant interaction between time
and TAS2R38 (when PAV/PAV and PAV/AVI genotypes were combined), where the
PAV/PAV-PAV/AVI genotype had a more rapid increase in intake than the AVI/AVI genotype.
Moreover, as shown in section 4.4.5, the effect sizes of time are larger than the effect sizes of
TAS2R38, CA6, PROP taster status and FPD, suggesting that the effects of exposure are greater
than the effects of taste genotypes and phenotypes. This current study is underpowered to
conclude a null effect of taste sensitivity on repeated taste exposure as, using the data from our
study, a sample size calculation of a 90% power shows that 770 children are needed in future
study in order to determine whether the effect sizes of taste genotypes and phenotypes are
significant (Appendix 9).
To our knowledge, this is the first repeated taste exposure study that examines the role
of bitter taste sensitivity although several studies have investigated the effects of both taste
genotype and phenotype on vegetable intake. Bell and Tepper (2006) found that PROP non-
taster children consumed more vegetables than tasters. This is also supported by Dinehart,
Hayes, Bartoshuk, Lanier and Duffy (2006) where it was reported that individuals who were
PROP sensitive consumed less vegetables and the same research group found that adults with
AVI/AVI TAS2R38 genotype consumed more vegetables (Duffy et al., 2010).
Although liking increased across the whole sample post-intervention, there were no
significant differences according to genotype or phenotype group, except for the A/G CA6
genotype. It is possible that the 3-point hedonic scale that was used in this study may be
insufficiently sensitive to detect differences in children’s liking and a scale with more than 3-
points would have been better. However, it was selected because young children (below 6 years)
might have difficulty interpreting wider hedonic scales (for example 5 or 7-point scales) (Stone
& Sidel, 2004). Moreover, Chen, Resurreccion and Paguio (1996) have demonstrated that a 9-

Chapter 4
124
point hedonic scale is not suitable for 3 to 5 year-old children, but 3-, 5- and 7-point scales work
best on 3, 4 and 5 year-old children, respectively. During the intervention, some children did
not use the scale properly, as they rated high liking when they showed disliking of the steamed-
pureed turnip. Given the evidence indicating wider scales are not ideal for young children,
future researcher may consider training children on how to use the scale before data collection
begins.
Considering the relationship between taste genotypes and phenotypes, our results did
not find associations between TAS2R38, FPD, CA6 and PROP taster status. It was expected that
children with high FPD, PAV/PAV TAS2R38 and A/A CA6 would be PROP tasters, and those
with low FPD, AVI/AVI TAS2R38 and G/G CA6 would be non-tasters, but there were
anomalies. It was found that the number of children categorised as PROP tasters was not always
consistent with the expected PAV/PAV TAS2R38 or PAV/AVI genotype. These unexpected
results are thought to be due to the simplified method used to identify PROP taster status in this
study. Children were categorised into either PROP tasters or non-tasters by tasting just one
concentrated level of PROP impregnated into a filter paper, whilst other studies have used a
more complex method to separate adult participants into 3 categories (PROP super-, medium-
or non-tasters). Similarly discussed in Chapter 2 (section 2.5), this requires participants to taste
different concentration of PROP solutions and sodium chloride (NaCl) solutions then rate the
intensity of the solutions by using a labelled magnitude scale (LMS) (Tepper, Christensen, &
Cao, 2001; Shen, Kennedy, & Methven, 2016). However, Keller and Adise (2016) argued that
young children (under 7 years old) would struggle to use more complex scales, and most studies
in children have used a simple forced-choice screening method to categorise them into either
tasters or non-tasters, therefore this method was selected for the current study. Turnbull and
Matisoo-Smith (2002) determined PROP taster status in 3 to 6 year-old children using a more
sensitive procedure; by which PROP thresholds and suprathreshold of the children were

Chapter 4
125
measured on simple categorical scales. Despite its sensitivity, the method is not practical to be
used for our large field-based study as it involves tasting multiple solutions. The relationship
between taste genotype and phenotype is complex as Hayes, Bartoshuk, Kidd and Duffy (2008)
explained that PROP sensitivity is not entirely dependent on taste genotypes and phenotypes
and they suggested that there might be more than just one receptor (ie: TAS2R38) or mechanism
that explains PROP bitter taste sensitivity. It may be possible that the interactions between
genotype and phenotype have an impact on vegetable intake and liking rather than taste
genotype or phenotype alone, and it would be interesting to investigate the interactions in this
study, however the number of participants was insufficient to sub-divide groups further.
4.6 Conclusion
This study confirms previous literature that repeated taste exposure is a good method to enhance
the acceptance of an unfamiliar vegetable in children. The intake of steamed-pureed turnip
significantly increased after exposures for PAV/AVI and AVI/AVI TAS2R38 genotype; A/A,
A/G and G/G CA6 genotype; for both PROP tasters and non-tasters, and for children with
medium and low FPD. Moreover, intake tended to increase for PAV/PAV TAS2R38 and high
FPD groups. Repeated taste exposure is simple and easy for parents to implement in a home-
setting environment to encourage children to eat bitter-tasting vegetables. This study also
demonstrates that repeated taste exposure is not only effective in the short-term, but remains
effective 3 months after exposure.
This current study has not found significant effects of taste sensitivity on a Brassica
vegetable intake and liking either before or after a repeated taste exposure intervention. Our
next study (Chapter 5) explores whether taste sensitivity is a predictor of both Brassica and
non-Brassica vegetable intake and liking in children at home.

Chapter 5
126
CHAPTER 5: The effects of bitter taste sensitivity on parent-reported vegetable intake
and liking in children
5.1 Abstract
Variation in sensitivity to bitter taste can be explained by taste genotypes and phenotypes.
TAS2R38 gene codes for the T2R38 taste receptor which specifically detects bitter taste from
the thiourea moiety that is within the structure of glucosinolate (GSL) compounds, which can
be found in Brassica vegetables. Studies have shown that vegetable consumption and liking are
influenced by bitter taste sensitivity, thus the present study aimed to investigate the effects of
taste genotypes and phenotypes on parent-reported vegetable intake and liking in children. A
parent-completed questionnaire was used to assess vegetable intake frequency and vegetable
liking in 132 children aged 3 to 5 years old. TAS2R38 and gustin (CA6) genes were genotyped
from saliva. Fungiform papillae density (FPD) were counted from tongue images and 6-n-
propylthiouracil (PROP) taster status was determined. Results showed that although there were
no significant effects of TAS2R38, CA6, PROP taster status and FPD on intake of vegetables
collectively (Brassica, non-Brassica and total vegetables), there were some significant effects
of these genotypes and phenotypes on intake of specific vegetables. In addition, FPD had
significant effects on liking of Brassica and total vegetables. Vegetable intake and liking were
positively correlated demonstrating, as expected, that as intake increases, liking increases and
vice versa.
Keywords: Brassica vegetable, bitter taste sensitivity, children, vegetable intake, TAS2R38

Chapter 5
127
5.2 Introduction
Development of food preferences is determined by various intrinsic and extrinsic factors (Birch,
1999; Shepherd, 1999). Taste is one of the factors reported to influence food preferences and
intake (Grimm & Steinle, 2011). Genetic variations can cause differences in taste perception
which subsequently have an impact on food choice (Garcia-Bailo et al., 2009). For example,
individuals who perceive a high intensity of bitter taste may avoid certain vegetables, such as
Brassica vegetables (Drewnowski & Gomez-Carneros, 2000) and they tend to have lower
consumption of vegetables (Barajas-Ramírez, Quintana-Castro, Oliart-Ros, & Angulo-
Guerrero, 2016; Sandell et al., 2014).
The bitter taste in Brassica vegetables is caused by a thiourea group within GSL, which
may be a primary cause of their rejection (Keller & Adise, 2016). As discussed in Chapter 1,
the ability to taste the bitter thiourea group is determined by TAS2R38 gene (Prodi et al., 2004).
The PAV/PAV genotype is highly responsive to 6-n-propylthiouracil (PROP) (a synthetic bitter
compound containing a thiourea group), on the other hand, the AVI/AVI genotype is
unresponsive while the PAV/AVI has an intermediate response to bitter taste (Bufe et al., 2005).
Additionally, as the density of fungiform papillae increases, the PROP intensity perception
increases (Yackinous & Guinard, 2002). Previous studies demonstrated that CA6 gene is
responsible for the differences in FPD counts, where individuals with high FPD tend to carry
A/A genotype while those with low FPD tend to carry G/G genotype (Melis et al., 2013).
Moreover, it is reported that PROP super-tasters more frequently carry A/A genotype and non-
tasters carry G/G genotype (Padiglia et al., 2010).
Many studies have been done to determine an association between bitter taste sensitivity
and food preferences, however findings from some of these studies are contradictory. Sacerdote
et al. (2007) found that AVI/AVI TAS2R38 individuals had the highest Brassica vegetable
intake, assessed from a 24-h diet recall, in an Italian population (n=634). Bell and Tepper (2006)

Chapter 5
128
demonstrated that children aged between 3 to 5 years who were PROP non-tasters (n=41) had
a greater intake of vegetables compared to tasters (n=24) during a free-choice intake test where
they were presented with 5 types of vegetables. In contrast, Kaminski, Henderson and
Drewnowski (2000) reported that PROP taster status did not associate with intake of 22 bitter
foods and beverages, listed in a food frequency questionnaire, in 36 adult women aged 20 to 40
years. In addition, Lumeng, Cardinal, Sitto and Kannan (2008) similarly found no association
between PROP taster status and parent-reported vegetable intake using a food frequency
questionnaire in 81 children aged 3 to 6 years. These inconsistent findings indicate that further
research should be done to fully understand the relationships between taste sensitivity and food
preferences. In our study, more than one bitter taste sensitivity measurement were used. In
particular, TAS2R38 genotype was used, which is less subjective than the PROP phenotype
measure, which may therefore have increased the possibility of finding significant effects of
taste sensitivity in vegetable intake and liking. Additionally, young children were used as our
sample population, who might have had less influence of exposure than older children and
adults, which might minimise the potential source of noise in the study. Moreover, very few
studies have used a parental recall method to obtain children’s vegetable intake; no studies to
date have incorporated this with TAS2R38, CA6, PROP taster status and FPD, and these findings
would be beneficial in the field of food preferences and taste sensitivity.
In Chapter 4, there were no significant effects of taste genotypes and phenotypes on the
acceptance of a Brassica vegetable before and after a repeated taste exposure intervention. We
wanted to determine whether the same taste genotypes and phenotypes would have an impact
on parent-reported intake and liking of both Brassica and non-Brassica vegetables in children
at home. Therefore, this current study aimed to investigate the effects of taste genotypes
(TAS2R38 and gustin (CA6) genes) and phenotypes (PROP taster status and FPD) on parent-
reported intake and liking of Brassica and non-Brassica vegetables in children. The hypotheses

Chapter 5
129
were the AVI/AVI TAS2R38, G/G CA6 genotype, PROP non-tasters and low FPD groups would
consume more vegetables (both Brassica and non-Brassica) than the PAV/PAV TAS2R38, A/A
CA6 genotype, PROP tasters and high FPD groups.
5.3 Materials and methods
5.3.1 Participants
Participants in this study were the same 172 children that were recruited for the study described
in Chapter 4 (ranged in age from 3 years 1 month to 5 years 7 months, with a mean of 4 years
9 months). Males and females were equally represented (82 males, 90 females). The processes
followed to determine children’s bitter taste sensitivity by using 4 measurements (TAS2R38,
gustin (CA6), PROP taster status and FPD) were as described in Chapter 2 (section 2.3.11 and
2.3.12) and Chapter 4 (section 4.3.9, 4.3.10 and 4.3.11).
5.3.2 Assessment of vegetable intake and liking
In order to assess children’s vegetable intake and liking, parents were asked to complete a food
frequency questionnaire (FFQ) that consisted of 46 vegetables, adapted from Heath (2012)
(Appendix 5). Of the 46 vegetables, 15 were Brassica vegetables (broccoli, Brussels sprouts,
green cabbage, red cabbage, white cabbage, cauliflower, kale, kohlrabi, pak choi, radishes,
rocket, spring greens, swede, turnip and watercress). The remaining 31 vegetables were non-
Brassica vegetables. Two questions were asked in the questionnaire: 1)‘How often is your child
offered this vegetable?’ where responses were collected on a 5-point scale: ‘never, occasionally,
at least once a month, at least once a week and several times a week’, 2)‘How much does your
child like this vegetable?’ where responses were collected on a 6-point scale: ‘don’t know,
dislike extremely, dislike, neutral, like and like extremely’.

Chapter 5
130
By referring to a calculation by Beck, Nicklaus, Jensen, Issanchou and Kidmose (2013),
frequency options in the questionnaire were converted into a yearly portion, and from that
range, minimum, median and maximum yearly portion were determined (Table 5-1). For liking
data, each response was coded for analyses: don’t know (0) (which was excluded from
analyses), dislike extremely (1), dislike (2), neutral (3), like (4) and like extremely (5).
Vegetable intake and liking were categorised into Brassica vegetables, non-Brassica vegetables
and total vegetables.
Table 5-1: Frequency of vegetable intake and calculation of yearly vegetable portion. Taken from Beck et al. (2013).
Frequency in
questionnaire
Range of
yearly
portion
Minimum yearly
portion
Median yearly
portion*
Maximum
yearly
portion
Never 0 0 0 0
Occasionally 1-12 1 7 12
At least once a
month
12-52 12 32 52
At least once a
week
52-156 52 104 156
Several times a
week
156-365 156 261 365
*Median yearly portion (for example, occasionally = median of 7 portions per year (range 1 to 12).
Chapter 5
131
5.3.3 Statistical analysis
Normality tests were performed using Shapiro-Wilk tests, no data were normally distributed
(Appendix 10), therefore non-parametric tests were used. Spearman’s correlation was used to
examine the correlation between vegetable intake and liking. Chi-square tests were used to
determine associations between categorical data. Mann-Whitney tests were used to investigate
the effect of 2 categorical variables (PROP taster status) on vegetable intake and liking.
Kruskal-Wallis tests were used for 3 categorical variables (TAS2R38, gustin (CA6) and FPD)
and Mann-Whitney tests were used for post hoc comparisons. A significance value of p<0.05
was used, however Bonferroni correction was applied for testing pairwise comparisons. All
analyses were performed using SPSS (version 21, New York, USA).
5.4 Results
5.4.1 Taste genotype and phenotype characteristics
Of 172 children recruited, only 132 had a complete data set that included intake and liking of
all vegetables in the questionnaire, and 4 bitter taste sensitivity measurements (TAS2R38, CA6,
PROP taster status and FPD). As in Chapter 4, analyses using complete data sets with analyses
that excluded missing data according to individual taste sensitivity measurement were
compared; both analyses gave consistent results, therefore results with complete data sets are
reported in this chapter. Taste genotype and phenotype characteristics of children are shown in
Table 5-2. 16.7% had PAV/PAV TAS2R38 genotype, 49.2% had PAV/AVI, 25.8% carried
AVI/AVI and 8.4% had rare genotypes (PAV/AAI, PAV/AAV, AAI/AAI, AAV/AAI and
AAI/AVI). Only 11.4% carried G/G gustin (CA6) genotype, while 47.0% had A/A genotype
and the remaining 41.7% had A/G genotype. Children were grouped into 3 categories for
fungiform papillae density (FPD); the majority of them had medium FPD (36 to 56
papillae/cm2) (47.7%), 26.5% had high FPD (57 to 113 papillae/cm2), and the other 25.8% had

Chapter 5
132
low FPD (17 to 35 papillae/cm2). According to PROP sensitivity, 81.1% were categorised as
tasters while only 18.9% were non-tasters. Of 132 children with a complete data set, ethnicity
was known for only 96 children. Based on the Office for National Statistics's (2015) ethnicity
classification in England, 40 children were white, 31 were Asian/Asian British, 11 were
mixed/multiple ethnic, 11 were Black/African/Carribean/Black British and 3 children were in
‘other’ ethnic group.
Table 5-2: Taste genotype and phenotype characteristics of participants (full data set, n=132).
Characteristic n (%)
TAS2R38 PAV/PAV 22 (16.7)
PAV/AVI 65 (49.2)
AVI/AVI 34 (25.8)
PAV/AAI 3 (2.3)
PAV/AAV 2 (1.5)
AAI/AAI 1 (0.8)
AAV/AAI 1 (0.8)
AAI/AVI 4 (3.0)
Gustin (CA6) A/A 62 (47.0)
A/G 55 (41.7)
G/G 15 (11.4)
FPD High (57 to 113 papillae/cm2) 35 (26.5)
Medium (36 to 56 papillae/cm2) 63 (47.7)
Low (17 to 35 papillae/cm2) 34 (25.8)
PROP taster status Taster 107 (81.1)
Non-taster 25 (18.9)

Chapter 5
133
5.4.2 Relationship between taste genotypes and phenotypes
As shown in Table 5-3, the majority of children carrying PAV/PAV TAS2R38 (n=19/22), A/A
CA6 (n=52/62) and had high FPD (n=28/35) were categorised as PROP tasters Similarly in
Chapter 4 (section 4.4.2), there were anomalies in categorisation of PROP taster status
according to taste genotype and phenotype, where PROP tasters were unexpectedly had
insensitive taste genotype and phenotype, and vice versa.
Table 5-3: Relationship between taste genotypes and phenotypes (full data set, n=132).
PROP taster status
Taster Non-taster
TAS2R38 PAV/PAV 19 3
PAV/AVI 51 14
AVI/AVI 28 6
PAV/AAI 3 0
PAV/AAV 2 0
AAI/AAI 1 0
AAV/AAI 0 1
AAI/AVI 3 1
Gustin (CA6) A/A 52 10
A/G 45 10
G/G 10 5
FPD High (57 to 113 papillae/cm2) 28 7
Medium (36 to 56 papillae/cm2) 49 14
Low (17 to 35 papillae/cm2) 30 4
Chi-square tests were carried out to determine associations between genotypes and
phenotypes. As explained in Chapter 4 (section 4.4.2), to avoid expected counts below 5,
PAV/PAV and PAV/AVI TAS2R38 genotypes were combined into one group as both groups
have the sensitive PAV haplotype, and for CA6, G/G and A/G genotypes were combined

Chapter 5
134
together as both groups have a recessive allele G. Consistent with the results in Chapter 4, there
were no significant associations between TAS2R38 and PROP taster status (χ²(1)=0.06, p=0.81);
between CA6 and PROP taster status (χ²(1)=0.60, p=0.44); between FPD and PROP taster status
(χ²(2)=1.61, p=0.45). No other associations were found; CA6 and FPD (χ²(2)=0.26, p=0.88),
TAS2R38 and CA6 (χ²(1)=0.03, p=0.86), TAS2R38 and FPD (χ²(2)=0.81, p=0.67). Rare
genotypes were not included in analyses as there were too few children in each of the rare
genotype group. Chi-square results in this section concluded that taste genotypes and
phenotypes are independent of each other.
5.4.3 Estimated yearly intake of vegetables
The mean portions of total vegetables (Brassica and non-Brassica vegetables combined) per
day using the minimum, median and maximum for this current study were 3.8, 6.9 and 10.0,
respectively (Table 5-4). These values are considerably higher than data reported in Health
Survey for England 2011 (Joint Health Surveys Unit, 2012) where boys aged 5 years had 3.3
portions of vegetables per day, while girls the same age had 3.6 portions per day. Our results
suggest that perhaps parents were over reporting their children’s vegetable intake. Therefore,
the minimum value was used to convert the frequency from the questionnaire into yearly portion
of vegetable in this study as it is the closest value to the report.
Table 5-4: Mean portions for total vegetable per year and per day using minimum, median and maximum calculation.
Minimum Median Maximum
Mean portions for total
vegetables per year
1372.8
2527.5
3665.6
Mean portions for total
vegetables per day
3.8 6.9 10.0

Chapter 5
135
The estimated mean yearly portions for Brassica, non-Brassica and total vegetables per
child were 258.9 ± 258.9 (mean ± SD), 1113.9 ± 651.0 and 1372.8 ± 857.2, respectively. Potato
was not included in the estimation of intake for non-Brassica vegetables nor total vegetables,
as it does not contribute to the 5-a-day recommendation (Bates et al., 2014).
Among 15 Brassica vegetables in the questionnaire, broccoli was the most consumed
with a mean portion intake of 69.1 ± 62.7 per year (Figure 5-1). Kohlrabi, turnip and pak choi
were among the least consumed vegetables at only 2.9 ± 19.6, 3.6 ± 10.4 and 4.9 ± 17.8 portions
per year, respectively.
Figure 5-1: Mean yearly portions for 15 Brassica vegetables. Values are means ± SEM.
For non-Brassica vegetables, cucumber, tomato, carrot and onion were the most
consumed vegetables (101.6 ± 63.6, 104.3 ± 63.1, 109.4 ± 56.6 and 110.3 ± 64.2 portions per
year, respectively), while artichoke, fennel and chard were among the least consumed (1.7 ±
14.3, 2.6 ± 15.1 and 4.3 ± 20.6 portions per year, respectively) (Figure 5-2). Onion is commonly
used in cooking, which might be the reason why onion is the most consumed non-Brassica
vegetable.
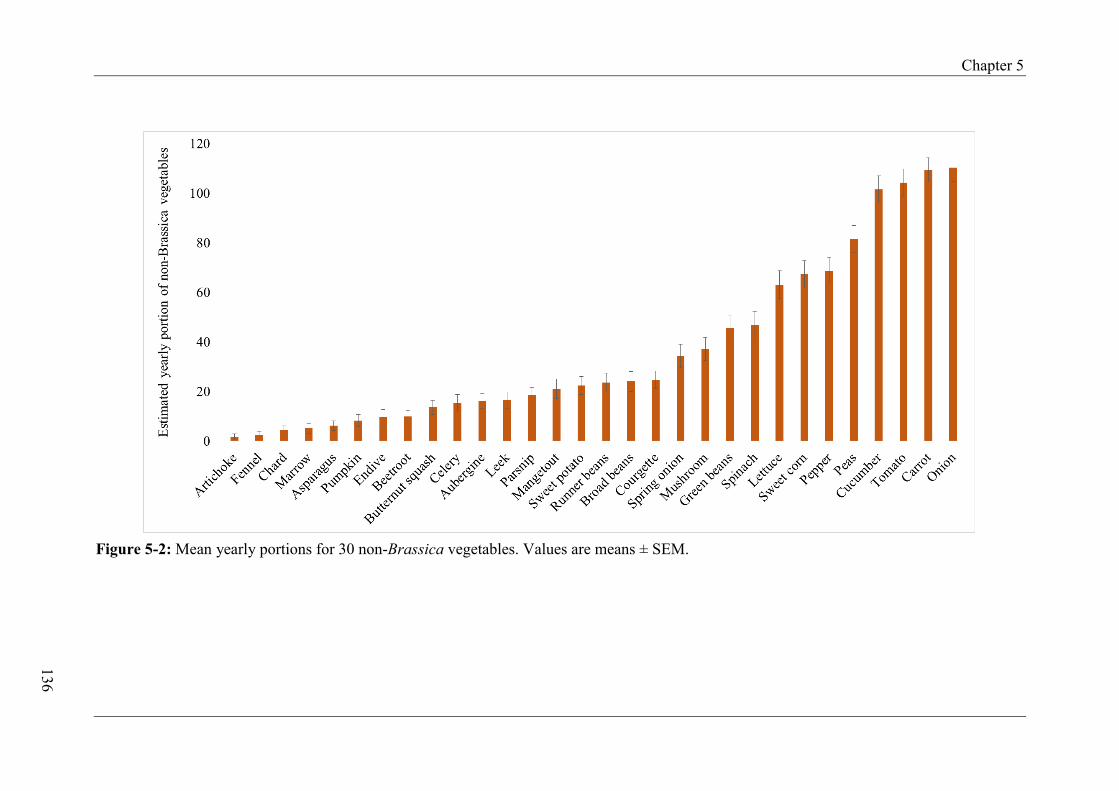
Chapter 5
136
Figure 5-2: Mean yearly portions for 30 non-Brassica vegetables. Values are means ± SEM.

Chapter 5
137
5.4.4 Effects of taste genotypes and phenotypes on vegetable intake
Table 5-5 shows mean yearly vegetable intake (expressed as portions) according to taste
genotypes and phenotypes. Kruskal-Wallis tests were conducted to determine the effects of
TAS2R38 (3 genotype groups (PAV/PAV, PAV/AVI and AVI/AVI)) on vegetable intake. The
results showed that there was no significant effect of TAS2R38 on reported Brassica vegetable
intake (H(2)=0.79, p=0.67), non-Brassica vegetable intake (H(2)=3.18, p=0.20) and total
vegetable intake (H(2)=2.07, p=0.36). TAS2R38 (2 genotype groups (PAV/PAV-PAV/AVI and
AVI/AVI)) was also tested and the same results were found, where there was no significant
effect of TAS2R38 on each of the vegetable categories (data not shown).
Table 5-5: Mean yearly intake of vegetable portions (Brassica, non-Brassica and total) and proportion (%) of vegetables consumed as Brassica per year, according to TAS2R38, gustin (CA6) genotypes, PROP taster status and FPD.
Genotype/phenotype n Brassica
vegetable
intake
(mean ± SD)
Non-
Brassica
vegetable
intake
(mean ± SD)
Total
vegetable
intake
(mean ± SD)
Brassica
intake as a
percentage of
total
vegetable
intake (%)
TAS2R38 PAV/PAV 22 332 ± 329 1263 ± 687 1595 ± 984 20.8
PAV/AVI 65 256 ± 248 1035 ± 630 1290 ± 824 19.8
AVI/AVI 34 252 ± 258 1140 ± 606 1392 ± 825 18.1
Gustin (CA6) A/A 62 255 ± 255 1148 ± 747 1403 ± 961 18.2
A/G 55 251 ± 252 1065 ± 518 1315 ± 718 19.1
G/G 15 305 ± 311 1155 ± 695 1459 ± 915 20.9
PROP taster
status
Taster 107 260 ± 247 1133 ± 651 1393 ± 846 18.7
Non-taster 25 254 ± 310 1032 ± 658 1286 ± 917 19.8
FPD High 35 230 ± 249 1109 ± 645 1339 ± 818 17.2
Medium 63 217 ± 199 1024 ± 558 1240 ± 694 17.5
Low 34 366 ± 335 1286 ± 789 1653 ± 1098 22.1

Chapter 5
138
For rare genotypes, a child with AAI/AAI genotype had the highest vegetable intake in
each vegetable category (Table 5-6), children with PAV/AAV genotype had the lowest intake
of Brassica vegetable, while a child with AAV/AAI genotype had the lowest intake of non-
Brassica vegetables. However, the number of children in each genotype was too low to draw
any firm conclusions.
Table 5-6: Yearly intake of vegetable portions (Brassica, non-Brassica and total) for children with rare genotypes.
Genotype Brassica
vegetables
Non-Brassica
vegetables
Total
vegetables
AAI/AVI (n=4) 181.8 1217.8 1399.5
AAV/AAI (n=1) 56.0 659.0 715.0
AAI/AAI (n=1) 273.0 2478.0 2751.0
PAV/AAV (n=2) 48.0 1021.0 1069.0
PAV/AAI (n=3) 174.7 1067.0 1241.7
Results showed that there was no significant main effect of CA6 (3 genotype groups
(A/A, A/G and G/G)) on Brassica vegetable intake (H(2)=0.46, p=0.79), non-Brassica
vegetable intake (H(2)=0.38, p=0.83) and total vegetable intake (H(2)=0.68, p=0.71). There
were also no significant effects of CA6 when 2 genotypes were combined (A/G-G/G) on
vegetable intake (data not shown).
Mann-Whitney tests revealed no significant effects of PROP taster status on Brassica
vegetable intake (U=1211.50, p=0.46), non-Brassica vegetable intake (U=1161.50, p=0.31)
and total vegetable intake (U=1183.50, p=0.37).
Other than that, Kruskal-Wallis tests showed that there was no significant effect of FPD
on Brassica vegetable intake (H(2)=5.65, p=0.06), non-Brassica vegetable intake (H(2)=2.19,
p=0.34) and total vegetable intake (H(2)=2.56, p=0.28). The low FPD group tended to have a
higher Brassica vegetables intake than the medium and high FPD groups.

Chapter 5
139
From this section, it can be summarised that taste genotypes and phenotypes have no
influence on intake of Brassica, non-Brassica and total vegetables in children.
5.4.5 Effects of taste genotypes and phenotypes on individual vegetables
As broccoli and cauliflower were the most consumed (at least 40 portions per year) Brassica
vegetables, analyses were done to determine whether taste genotypes and phenotypes had
effects on these 2 vegetables. Results showed there was a significant main effect of FPD on
intake of broccoli (H(2)=13.08, p=0.001) where the low FPD group consumed more broccoli
than the high FPD group (96.2 ± 62.6 portions versus 43.1 ± 55.9 portions; U=310.50; p<0.001).
There was no difference in intake between the low and medium FPD group (U=818.00, p=0.04
(Bonferroni correction, p<0.02)) nor between the medium and high FPD group (U=821.50,
p=0.03). Results showed that there was no effect of TAS2R38 (H(2)=2.89, p=0.24); CA6
(H(2)=0.54, p=0.76) and PROP taster status (U=1323.00, p=0.93) on intake of broccoli. The
same results were found when 2 genotypes groups of TAS2R38 (PAV/PAV-PAV/AVI versus
AVI/AVI) and CA6 (A/A versus A/G-G/G) were used for analyses (data not shown).
For cauliflower, there was no effect of any genotype or phenotype (TAS2R38
(H(2)=1.29, p=0.53); CA6 (H(2)=0.45, p=0.80); PROP taster status (U=1329.00, p=0.96) and
FPD (H(2)=4.78, p=0.09)). When the PAV/PAV TAS2R38 genotype was combined with
PAV/AVI genotype, and A/G CA6 genotype was combined with G/G genotype, the same
results were found where there were no effects of TAS2R38 and CA6 on intake of cauliflower
(data not shown).
For non-Brassica vegetables, the effects of genotypes and phenotypes on intake of the
10 most consumed vegetables (green beans, spinach, lettuce, sweet corn, peppers, peas,
cucumber, tomato, carrot and onions) were assessed. It was found that TAS2R38 had an effect
only on intake of lettuce (H(2)=7.13, p=0.03). Post hoc Mann-Whitney tests showed that the
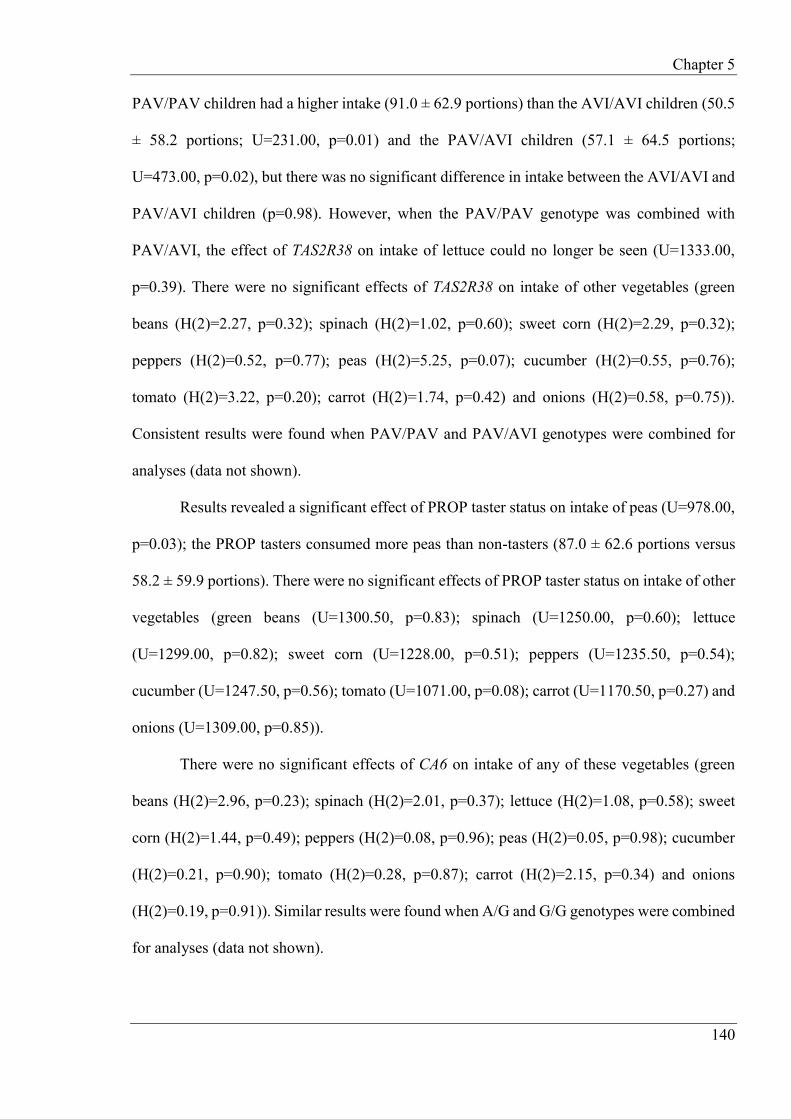
Chapter 5
140
PAV/PAV children had a higher intake (91.0 ± 62.9 portions) than the AVI/AVI children (50.5
± 58.2 portions; U=231.00, p=0.01) and the PAV/AVI children (57.1 ± 64.5 portions;
U=473.00, p=0.02), but there was no significant difference in intake between the AVI/AVI and
PAV/AVI children (p=0.98). However, when the PAV/PAV genotype was combined with
PAV/AVI, the effect of TAS2R38 on intake of lettuce could no longer be seen (U=1333.00,
p=0.39). There were no significant effects of TAS2R38 on intake of other vegetables (green
beans (H(2)=2.27, p=0.32); spinach (H(2)=1.02, p=0.60); sweet corn (H(2)=2.29, p=0.32);
peppers (H(2)=0.52, p=0.77); peas (H(2)=5.25, p=0.07); cucumber (H(2)=0.55, p=0.76);
tomato (H(2)=3.22, p=0.20); carrot (H(2)=1.74, p=0.42) and onions (H(2)=0.58, p=0.75)).
Consistent results were found when PAV/PAV and PAV/AVI genotypes were combined for
analyses (data not shown).
Results revealed a significant effect of PROP taster status on intake of peas (U=978.00,
p=0.03); the PROP tasters consumed more peas than non-tasters (87.0 ± 62.6 portions versus
58.2 ± 59.9 portions). There were no significant effects of PROP taster status on intake of other
vegetables (green beans (U=1300.50, p=0.83); spinach (U=1250.00, p=0.60); lettuce
(U=1299.00, p=0.82); sweet corn (U=1228.00, p=0.51); peppers (U=1235.50, p=0.54);
cucumber (U=1247.50, p=0.56); tomato (U=1071.00, p=0.08); carrot (U=1170.50, p=0.27) and
onions (U=1309.00, p=0.85)).
There were no significant effects of CA6 on intake of any of these vegetables (green
beans (H(2)=2.96, p=0.23); spinach (H(2)=2.01, p=0.37); lettuce (H(2)=1.08, p=0.58); sweet
corn (H(2)=1.44, p=0.49); peppers (H(2)=0.08, p=0.96); peas (H(2)=0.05, p=0.98); cucumber
(H(2)=0.21, p=0.90); tomato (H(2)=0.28, p=0.87); carrot (H(2)=2.15, p=0.34) and onions
(H(2)=0.19, p=0.91)). Similar results were found when A/G and G/G genotypes were combined
for analyses (data not shown).

Chapter 5
141
Results showed there were no significant effects of FPD on intake of any of these
vegetables (green beans (H(2)=5.10, p=0.08); spinach (H(2)=2.85, p=0.24); lettuce (H(2)=1.30,
p=0.52); sweet corn (H(2)=0.21, p=0.90); peppers (H(2)=3.06, p=0.22); peas (H(2)=4.72,
p=0.09); cucumber (H(2)=0.21, p=0.90); tomato (H(2)=0.96, p=0.62); carrot (H(2)=1.80,
p=0.41) and onions (H(2)=2.74, p=0.26)).
In summary, when the 12 most consumed vegetables were analysed individually, there
were significant effects of TAS2R38, PROP taster status and FPD only on selected vegetables.
However, CA6 had no impact on intake of any of the vegetables.
5.4.6 Vegetable liking
Brassica vegetable intake and liking were positively correlated (rs=0.32; p<0.001), as were non-
Brassica vegetable intake and liking (rs=0.34; p<0.001), and total vegetable intake and liking
(rs=0.32; p<0.001). The mean liking scores for Brassica vegetables, non-Brassica vegetables
and total vegetables were 3.1 ± 0.8, 3.4 ± 0.7 and 3.3 ± 0.6, respectively (1-5 scale).
As shown in Figure 5-3:, broccoli was reported as the most liked Brassica vegetable,
followed by cauliflower and white cabbage. On the other hand, rocket, pak choi and radish were
among the least liked. For non-Brassica vegetable, artichoke, celery and fennel were among
the least liked vegetables. Cucumber, sweet corn and carrot were the most liked non-Brassica
vegetables (Figure 5-4).

Chapter 5
142
Figure 5-3: Mean liking scores for 15 Brassica vegetables. Values are means ± SEM.
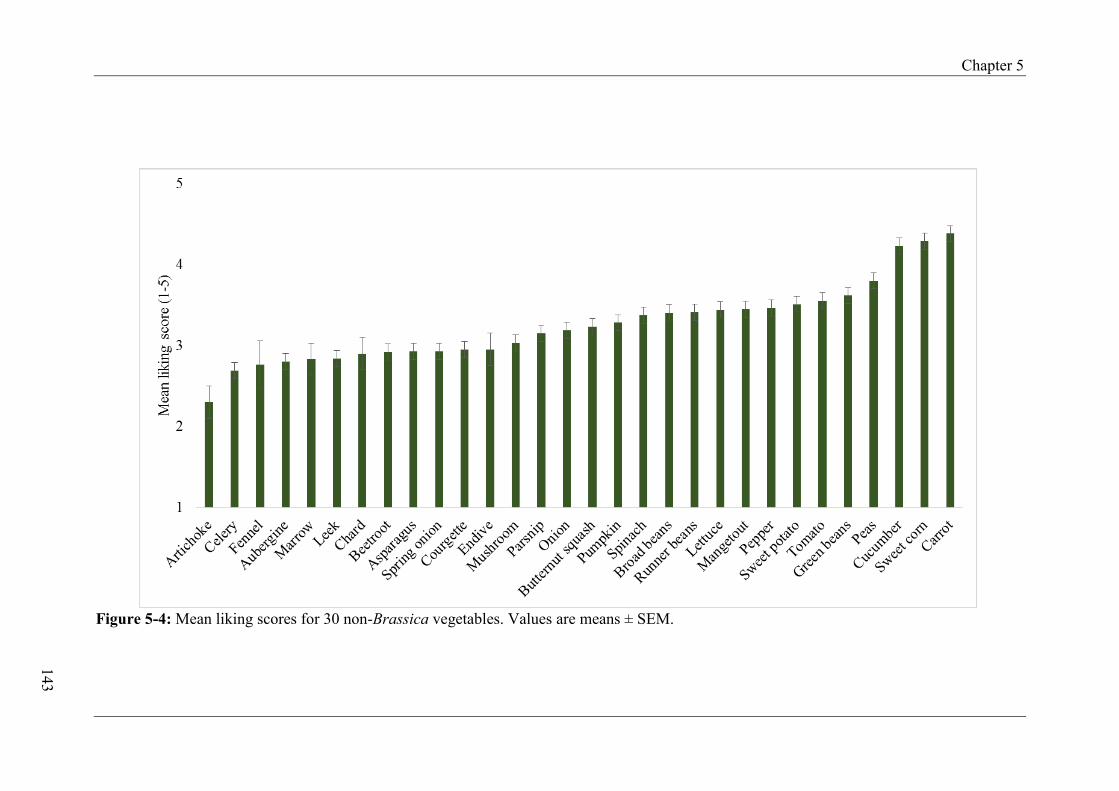
Chapter 5
143
Figure 5-4: Mean liking scores for 30 non-Brassica vegetables. Values are means ± SEM.

Chapter 5
144
5.4.7 Effects of taste genotype and phenotype on vegetable liking
Table 5-7 shows the mean liking scores for Brassica, non-Brassica and total vegetables
according to genotypes and phenotypes. Kruskal-Wallis tests showed no significant main
effects of TAS2R38 on liking of Brassica vegetables (H(2)=1.78, p=0.41), non-Brassica
vegetables (H(2)=0.78, p=0.68) and total vegetables (H(2)=1.12, p=0.57). When PAV/PAV and
PAV/AVI genotypes were combined, the same results were found where there were no
significant effects of TAS2R38 on vegetable liking (data not shown).
Table 5-7: Mean liking scores (1-5 scale) for Brassica, non-Brassica and total vegetables according to taste genotypes and phenotypes
Genotype/phenotype n Brassica
vegetable liking
(mean ± SD)
Non-Brassica
vegetable liking
(mean ± SD)
Total vegetable
liking
(mean ± SD)
TAS2R38 PAV/PAV 22 3.1 ± 0.7 3.4 ± 0.7 3.3 ± 0.7
PAV/AVI 65 3.0 ± 0.9 3.3 ± 0.7 3.2 ± 0.7
AVI/AVI 34 3.3 ± 0.6 3.5 ± 0.5 3.4 ± 0.5
Gustin
(CA6)
A/A 62 3.2 ± 0.6 3.5 ± 0.6 3.4 ± 0.5
A/G 55 3.0 ± 0.8 3.3 ± 0.7 3.2 ± 0.7
G/G 15 2.9 ± 0.8 3.3 ± 0.8 3.2 ± 0.8
PROP
taster status
Taster 107 3.1 ± 0.8 3.4 ± 0.7 3.3 ± 0.7
Non-taster 25 3.1 ± 0.8 3.4 ± 0.6 3.3 ± 0.6
FPD High 35 3.3 ± 0.7 3.6 ± 0.6 3.5 ± 0.6
Medium 63 2.9 ± 0.8 3.2 ± 0.7 3.1 ± 0.7
Low 34 3.4 ± 0.7 3.5 ± 0.5 3.5 ± 0.6
There were no significant main effects of CA6 on liking of Brassica vegetables
(H(2)=4.11, p=0.13), non-Brassica vegetables (H(2)=2.48, p=0.29) and total vegetables
(H(2)=2.20, p=0.33). The same results were found when A/G and G/G genotypes were
combined (data not shown).
Chapter 5
145
Mann-Whitney tests revealed that there were no significant main effects of PROP taster
status on liking of Brassica vegetables (U=1265.00, p=0.67), non-Brassica vegetables
(U=1332.50, p=0.98) and total vegetables (U=1312.50, p=0.89).
FPD was observed to have significant effects on liking of Brassica vegetables
(H(2)=13.62, p=0.001), non-Brassica vegetables (H(2)=7.27, p=0.03) and total vegetables
(H(2)=11.14, p=0.004). Post hoc Mann-Whitney tests showed that the low FPD group rated
higher liking for Brassica vegetables (3.4 ± 0.7) and total vegetables (3.5 ± 0.6) than the
medium FPD group (2.9 ± 0.8, U=665.00, p=0.002; 3.1 ± 0.7, U=712.50, p=0.007 respectively).
However, the high FPD group also rated higher liking for Brassica vegetables (3.3 ± 0.7) and
total vegetables (3.5 ± 0.6) than the medium FPD group (2.9 ± 0.8, U=702.50, p=0.003; 3.1 ±
0.7, U=728.50, p=0.006 respectively). There were no significant differences in liking between
the low FPD and high FPD groups for Brassica vegetables (U=551.00, p=0.60) and total
vegetables (U=591.00, p=0.96). For non-Brassica vegetables, post hoc tests did not reveal any
significant difference in liking between groups (low FPD versus medium FPD, p=0.04
(Bonferroni correction, p<0.017); low FPD versus high FPD, p=0.78; medium FPD versus high
FPD, p=0.02) (Figure 5-5).
Results in this section reveal that vegetable liking is not influenced by TAS2R38, CA6
and PROP taster status. However, there were significant main effects of FPD on vegetable
liking.

Chapter 5
146
Figure 5-5: Mean liking scores for Brassica, non-Brassica and total vegetables between FPD groups. Values are means ± SEM. **p<0.01.
5.5 Discussion
In this study, no associations between taste genotype and phenotype were found, and there were
anomalies between taste genotype and phenotype. The possible cause of these anomalies has
been discussed in detail in Chapter 4 (section 4.5).
The estimated mean portion of total vegetables in this study was 3.8 portions per day,
using the minimum estimate from each point on the scale, as discussed in section 5.4.3. This
result is similar to that reported by the Joint Health Surveys Unit (2012), where the mean portion
of fruit and vegetable consumption in 5 year-old boys in England between 2001 to 2011 was
2.4 to 3.4 portions per day and between 2.4 to 3.9 portions per day for girls. Rutherford et al.
(2012) also reported that 2 to 4 year-old Scottish children consumed 3.2 portions of fruit and
vegetables per day. In comparison, the UK National Diet and Nutrition Survey (2008 to 2012),
reported that children aged 1.5 to 3 years had 0.9 portion of vegetable per day and children aged
4 to 10 years had 1.2 portion of vegetable per day (Bates et al., 2014). ‘5-a-day’ is recommended
for those aged 11 years and over (Bates et al., 2016), while children below that age should also

Chapter 5
147
consume 5 portions of fruit and vegetables, where one portion size is equal to the amount that
fit in their hand (National Health Service, 2015).
As mentioned in section 5.4.3, Beck et al.'s (2013) conversion table was used to convert
parents’ reports on food frequency into daily and yearly portions. If median or maximum values
were used for the range for these calculations, parents’ estimates of intake (6.9 and 10.0 portions
per day, respectively) would have been very high compared to previous reports by Bates et al.
(2014), Joint Health Surveys Unit (2012) and Rutherford et al. (2012), suggesting parents were
over reporting. However, these reports did not specifically group their samples according to
region and only considered the general population of England, Scotland or the whole UK. In
our study, the samples came from one population (Southern England), and it is possible that
children from this population have high vegetable consumption. Since we were unable to
compare our samples’ vegetable intake with children’s vegetable intake in the Southern
England, and we only had information from the reports above, therefore the minimum
calculation of vegetable intake was selected as it is the closest values to the reports.
It has been suggested that vegetable intake may be influenced by taste genotypes and
phenotypes. Individuals who are sensitive to PROP often perceive strong bitterness in Brassica
vegetables (Shen et al., 2016), therefore they may consume fewer vegetables. Our results did
not find significant effects of TAS2R38, CA6 and PROP taster status on parent-reported intake
or liking of Brassica, non-Brassica and total vegetables. However, when the 12 most consumed
vegetables were analysed separately, results revealed a significant effect of TAS2R38 on intake
of lettuce, and an effect of PROP taster status on intake of peas. Unexpectedly, children with
PAV/PAV genotype and PROP tasters had a higher intake of lettuce and peas, respectively.
Using a FFQ, Lumeng, Cardinal, Sitto and Kannan (2008) found that PROP sensitivity did not
influence vegetable intake (mean intake: 0.9 portion/day) among 3 to 6 years old children
(n=81) in the US. Similarly, using a 3-day diet diary approach, Feeney, O’Brien, Scannell,
Chapter 5
148
Markey and Gibney (2014) found no significant differences in vegetable intake (mean intake:
0.8 portion/day) between TAS2R38 genotype groups and PROP taster status in 7 to 13 year-old
Irish children (n=451). In contrast, a smaller study of young adults in the US (n=59), which
used a FFQ, revealed that PROP tasters and those with PAV/PAV TAS2R38 genotype had a
lower consumption of vegetables (mean intake: 3.2 portions/day) (Duffy et al., 2010). The same
research group had also previously found that PROP tasters consumed fewer vegetables (mean
intake: 4 portions/day; reported by FFQ) among 110 adults (18 to 60 years) (Dinehart et al.,
2006). These conflicting results may be due to the large difference in vegetable intake between
children and adults in these respective studies. It is perhaps that the vegetable intake in children
was too low for the effects of taste genotypes and phenotypes to be detected, unlike in adult
studies where the intake is generally much higher. Another possibility is that children have less
control over their food choice compared to adults. If an adult does not like a particular
vegetable, he/she would probably choose not to eat it, but a child might not have that choice as
he/she is fed by parents.
It was hypothesised that children with low FPD might have higher vegetable intake and
liking due to their lower taste sensitivity compared to children with high FPD. Although our
results showed that there were no significant effects of FPD on intake of any of the vegetable
categories, the low FPD children tended to have a higher intake of vegetables. For liking, the
low FPD and high FPD groups had significant higher liking for Brassica and total vegetables
than the medium FPD group. When vegetables are tested separately, it was found that the low
FPD group had a significantly higher intake of broccoli than the high FPD group. Although
FPD is often associated with taste sensitivity and vegetable intake, results are inconsistent.
Duffy et al. (2010) and Feeney, O’Brien, Scannell, Markey and Gibney (2014) reported that the
effect of FPD was only prominent in non-tasters where non-tasters with high FPD consumed
more vegetables, and concluded that FPD is not a significant predictor of vegetable intake and

Chapter 5
149
liking on its own. A possible explanation for this discrepancy is that FPD is not a direct measure
of bitter taste as Duffy et al. (2010) explained and that individuals with high FPD may better
perceive other tastes such as sweetness and this results in vegetable liking. This interpretation
is supported by our finding that the high FPD group had a higher liking than the medium FPD
group for all categories of vegetables.
In summary, studies of vegetable intake and bitter taste sensitivity have discrepant
findings. One possible explanation may be the difference in method used to identify PROP
taster status. As discussed previously in Chapter 2 (section 2.5) and Chapter 4 (section 4.5), our
method only categorised children into either PROP tasters or non-tasters, unlike other studies
that further categorise adults into 3 categories (super-, medium- and non-tasters) (Barbarossa et
al., 2015; Calò et al., 2011). It would be expected that our PROP tasters group comprised of
PROP super- and medium-tasters, and this combination may affect the overall intake, hence
resulting in inaccurate estimation of vegetable intake. Additionally, since the simplified PROP
categorisation method was used, there were more children in the tasters group (n=107)
compared to non-tasters (n=25), and this resulted in imbalance group sizes. Similarly, only 15
children were categorised into G/G CA6 genotype. Moreover, the differences in sample size
between studies might contribute to the conflicting results as sample size would influence
detection of differences (effect size). Different methods in retrieving vegetable intake and liking
between studies could also contribute to different findings. In this study, intake was recorded
using a FFQ where it takes into account general patterns of consumption but is limited by recall
and tends to lead to under- or over-reporting (Schaefer et al., 2000). Our FFQ was completed
by parents, so there is a possibility that parents might not fully aware of their child’s vegetable
intake especially when they eat at school or in day care. Moreover, there are other limitations
of the FFQ where it did not specifically mention the timescale for vegetable intake, hence
parents might use different timescales for their recalls (for example, vegetable intake for the

Chapter 5
150
past 6 months). Other than that, the FFQ is a non-quantitative, which might lead to parents
interpreting the responses in the FFQ differently, therefore it might contribute to under or over
estimation of vegetable intake.
Although taste sensitivity may influence vegetable intake, an external factor such as
familiarity to vegetables may also have an important part. Our study found that vegetable intake
was positively correlated with vegetable liking. Among Brassica vegetables, broccoli was the
most consumed and also the most liked. This result suggests that as vegetable intake increases,
vegetable liking also increases. As supported by Wardle, Herrera, Cooke and Gibson (2003),
exposure to vegetables is a good method of promoting vegetable intake and liking. Other
environmental factors that might influence vegetable intake include social economic status,
household education level and lifestyle (Cockroft, Durkin, Masding, & Cade, 2005; Feeney et
al., 2014). Furthermore, role modelling could also be a factor to children’s vegetable
consumption (Draxten, Fulkerson, Friend, Flattum, & Schow, 2014). However, this study did
not look at the role of environmental factors, other than in terms of how often foods were
provided to children, and it is possible that these factors had a stronger influence on children’s
eating and liking of vegetables than their taste sensitivity.
5.6 Conclusion
Taste genotype (TAS2R38) and phenotypes (FPD and PROP taster status) had influences on
intake of only selected vegetables as obtained by a parent-completed FFQ. These effects could
no longer be seen when Brassica vegetables and non-Brassica vegetables were analysed
collectively. For liking, only FPD showed significant effects on Brassica vegetables and total
vegetables where the low and high FPD groups had higher liking than the medium FPD group.
Vegetable intake was positively correlated with vegetable liking which indicates that vegetable
intake could increase vegetable liking, and vice versa.

Chapter 6
151
CHAPTER 6: General discussion
6.1 Introduction
This thesis has explored whether taste sensitivity has influences on the effects of repeated taste
exposure of an unfamiliar Brassica vegetable (turnip) in children aged 3 to 5 years, and whether
taste sensitivity contributes to vegetable intake and liking at home. In addition, this thesis
investigated whether cooking methods have influences on turnip liking, and determined
glucosinolate (GSL) content in turnip.
Vegetables are good sources of vitamins, minerals, antioxidants and dietary fibre
(Slavin & Lloyd, 2012). It has been shown that a diet high in fruits and vegetables could reduce
risks of chronic diseases such as cardiovascular diseases (CVD) (Hung et al., 2004) and cancers
(Riboli & Norat, 2003). A study has found that eating pattern that starts at the early age may
influence diet in adulthood (Kelder, Perry, Klepp, & Lytle, 1994). Furthermore, Law (2000)
reported that diet in childhood is a determinant of chronic diseases in adult life.
A dietary guideline has been established to ensure adequate daily vegetable intake.
However, vegetable consumption is still reported to be below recommendation (Bates et al.,
2014). Taste plays an important role in developing food preferences (Galindo et al., 2012) and
Drewnowski and Gomez-Carneros (2000) reported that bitter taste is one of the reasons
individuals reject vegetables especially Brassica vegetables. It is suggested that rejection of
bitter tastes is instinctive as to avoid ingestion of potentially toxic foods (Slavin & Lloyd, 2012),
however people learn to like these aversive tastes with time (Beauchamp & Mennella, 2011).
Studies found that individuals that are more sensitive to bitter taste (by using 6-propylthiouracil
(PROP) as a marker) had lower vegetable intake (Barajas-Ramírez, Quintana-Castro, Oliart-
Ros, & Angulo-Guerrero, 2016; Bell & Tepper, 2006). Individuals perceive bitterness
differently and it is genetically related (Barajas-Ramírez et al., 2016). TAS2R38 is a gene that
encodes a specific bitter receptor that detects the bitterness of the thiourea group within both
Chapter 6
152
the synthetic PROP compounds, and within naturally occurring glucosinolates (GSLs) in
Brassica vegetables (Bufe et al., 2005). Meanwhile, Duffy et al. (2010) reported that a greater
density of fungiform papillae would contribute to a heightened sensitivity to all tastes, including
bitterness, and it has since been found that papillae density is related to the functionality of the
gustin (CA6) gene (Padiglia et al., 2010).
Repeated taste exposure has been shown to be effective to increase vegetable acceptance
in children (Wardle et al., 2003b). In our main study, the effects of taste genotypes (TAS2R38
and CA6) and phenotypes (PROP taster status and fungiform papillae density (FPD)) on the
effectiveness of repeated taste exposure were examined. As mentioned above, individuals who
are more bitter sensitive might reject vegetables, therefore investigations were done to
determine whether repeated taste exposure would also work effectively for them. In order to
establish the main objective, it was necessary to explore these 3 objectives:
1. To determine sensory characteristics and consumer acceptance of cooked turnip.
2. To identify and quantify glucosinolates in different batches of steamed-pureed turnip.
3. To investigate the effects of taste genotypes and phenotypes on vegetable intake and
liking in children.
6.2 Key findings
6.2.1 Does cooking method predict turnip liking?
Brassica vegetables are known for their bitterness. Preparations and cooking processes of
Brassica vegetables could change the sensory characteristics, hence increasing acceptance. Our
results showed that, among adults, roasted turnip was the most liked, while boiled-pureed turnip
was the least liked (Chapter 2). Sensory profile data revealed that roasted turnip had the highest
score of sweet taste, and the lowest score for bitter taste compared to other cooking methods.
Moreover, there was a negative correlation between taste liking and bitter perception, and a

Chapter 6
153
positive correlation between taste liking and sweet perception. These findings suggest that
vegetable liking is influenced by low bitterness and high sweetness, similarly found by
Dinehart, Hayes, Bartoshuk, Lanier and Duffy (2006) and Schonhof, Krumbein and Brückner
(2004). It could be a good recommendation for the public to roast Brassica vegetables, as it
would enhance their sweetness and reduce the bitterness in order to increase acceptance.
Moreover, it was found that taste genotype (TAS2R38) and phenotype (PROP taster
status) had no influences on taste liking of turnip, although individuals with PAV/PAV
TAS2R38 genotype tended to perceive higher bitterness than PAV/AVI and AVI/AVI
individuals.
The main objective in Chapter 2 was to determine the most bitter and the least liked
cooking method to be used in our main study (Chapter 4), in order to see increases in intake
and liking of turnip over exposure. Although it was found that boiled-pureed turnip was the
least liked, it was not the most bitter. Therefore, steamed-pureed turnip was chosen as it was
similarly disliked as boiled-pureed turnip but had a relatively higher bitterness than boiled-
pureed turnip. Although steamed-pureed turnip had a low liking, it was hypothesised that this
could be modified through repeated taste exposure (discussed in section 6.2.3).
In Chapter 2, adults were recruited to determine turnip liking using 4 cooking methods,
and steamed-pureed turnip was chosen to be used in our repeated taste exposure study in
children (Chapter 4). Studies show that the level of taste sensitivity in children is different from
adults. Guinard (2001) argued that taste thresholds are developing throughout childhood, while
Segovia, Hutchinson, Laing and Jinks (2002) showed that children have more taste buds than
adults. Studies reported that children are more PROP/PTC sensitive than adults (Harris &
Kalmus, 1949; Mennella, Pepino, Duke, & Reed, 2010; Mennella, Pepino, & Reed, 2005).
Similarly, Mojet, Christ-Hazelhof and Heidema (2001) found that taste sensitivity decreases
with age. These findings suggest that taste sensitivity changes across lifespan, and Schiffman,

Chapter 6
154
Orlandi and Erickson (1979) suggested that this change is caused by many factors such as
reduced functions of taste receptors and hormonal changes in gustatory system. In contrast,
James, Laing and Oram (1997) reported that children had a high bitter threshold, and De Graaf
and Zandstra (1999) reported that adults had higher sweet taste sensitivity than children. This
discrepancy might arise from different methods used in these studies, and Guinard (2001)
argued that children might have difficulties in understanding experimental procedures
accurately.
Given these previous findings that children are more taste sensitive than adults,
therefore it would be expected that our sample of children in Chapter 4 would have perceived
a higher bitterness in turnip and led to a lower liking than our adult participants in Chapter 2,
but low liking would change by repeated taste exposure.
6.2.2 Which glucosinolate is responsible for the bitterness in turnip?
A chemical analysis confirmed that 7 batches of steamed-pureed turnip contained 12 individual
GSLs, across all batches (progoitrin, glucoalyssin, gluconapin, glucobrassicanapin,
gluconapoleiferin, glucoerucin, glucoberteroin, 4-hydroxyglucobrassicin, glucobrassicin, 4-
methoxyglucobrassicin, neoglucobrassicin and gluconasturtiin) (Chapter 3). Of all GSLs,
gluconasturtiin was the most abundant GSL in our turnip samples, comprising 45.6% of the
total GSL. Our results showed that many GSLs were correlated to bitter taste (4-
methoxyglucobrassicin, 4-hydroxyglucobrassicin, glucobrassicin, progoitrin, gluconapin and
neoglucobrassicin), which is supported by Helland et al. (2016); Pasini, Verardo, Cerretani,
Caboni and D’Antuono (2011) and Schonhof et al. (2004). As bitter taste would suppress sweet
taste, it was found as expected that all individual GSLs (except glucobrassicanapin) were
negatively correlated with sweet taste.

Chapter 6
155
Although there were significant differences in GSL content and bitterness between
turnip batches, and these batches were used in different schools, the mean intake of steamed-
pureed turnip was not significantly different between schools (Chapter 4). This suggests that
the differences in bitterness between batches was not sufficiently large to affect overall intake.
6.2.3 Repeated taste exposure is a good strategy to increase the acceptance of an
unfamiliar bitter vegetable. Does taste sensitivity have an impact on it?
It was reported in our findings in Chapter 4 that the acceptance of an unfamiliar bitter vegetable
(turnip) in children increased after 10 days of taste exposure. Our results further revealed that
overall intake and liking of steamed-pureed turnip increased after 5 exposures, which indicates
that 5 exposures are sufficient to increase vegetable acceptance in children, as supported by
Caton et al. (2013) and Hausner, Olsen and Møller (2012). These findings imply that repeated
taste exposure is a powerful tool to increase vegetable acceptance in children. Moreover,
repeated taste exposure has long-term positive effects, where it was found that intake and liking
increased at 3 months follow-up from pre-intervention.
It was also found that taste genotypes and phenotypes had no significant effects on
repeated taste exposure, although results showed that there were trends that the less bitter
sensitive children had higher increases in intake compared to bitter sensitive children. Our
results revealed that the effect sizes of exposure are larger than the effect sizes of TAS2R38,
CA6, PROP taster status and FPD, suggesting that the effects of repeated taste exposure are
greater than the effects of taste genotypes and phenotypes.
Encouraging children to eat vegetables is a challenge for many parents. It can be
frustrating because acceptance may take longer time than parents would expect. Unfortunately,
parents tend to give up easily before the exposure could show the positive effects (Wardle et
al., 2003b). Therefore, it is crucial to give the right advice to parents on how to tackle problems
Chapter 6
156
with food rejection. Additionally, a school setting is a good place to encourage children to eat
vegetables as normally foods are served repeatedly during school lunch. Parents and schools
should be advised to include vegetables during meal times, and most importantly to serve
vegetables repeatedly.
6.2.4 Do taste genotypes and phenotypes influence vegetable intake and liking?
In chapter 5, consumption and liking of Brassica and non-Brassica vegetables in children were
compared. The estimated yearly intake of Brassica and non-Brassica vegetables were
calculated from a parent-reported food frequency questionnaire (FFQ). Overall, intake of non-
Brassica vegetables was higher compared to Brassica vegetables.
There were no significant effects of taste genotypes and phenotypes on intake of
Brassica, non-Brassica and total vegetables. However, when the 12 most consumed vegetables
(2 Brassica and 10 non-Brassica vegetables) were analysed individually, a significant effect of
TAS2R38 was found on intake of lettuce, and a significant effect of PROP taster status on intake
of peas where the PAV/PAV children and PROP tasters consumed more of these vegetables.
Tepper (1998) reported that, other than bitter tastes, PROP tasters are highly sensitive to other
tastes too. These unexpected results from our findings might be explained due to PROP tasters
and PAV/PAV children being more familiar with these vegetables, hence having higher
consumption. In addition, as expected, the low FPD group had a higher intake of broccoli. On
the other hand, there was no effect of CA6 on intake of any of the vegetables.
For liking, a significant effect of FPD was found on Brassica and total vegetables; where
the low FPD and high FPD groups had higher liking than the medium FPD group. Individuals
with greater density of fungiform papillae may perceive all tastes as more intense. We speculate
that high FPD children in our study might perceive other tastes such as sweetness in vegetables,
which might explain why they have a higher liking than the medium FPD group, while children

Chapter 6
157
with low FPD had a higher liking, probably because they perceived low bitterness in vegetables.
However, TAS2R38, CA6 and PROP taster status had no effects on vegetable liking.
In summary, the effects of taste sensitivity could be seen on only selected vegetables.
Surprisingly there were no effects of TAS2R38 and PROP taster status on intake of individual
Brassica vegetables, although the intake of most of the Brassica vegetables were very low. It
is suspected that there are other factors that influence vegetable intake and liking such as
environmental factors. For example, familiarity to vegetables helps to increase acceptance
(Heath, Houston-Price, & Kennedy, 2011). Although bitter sensitive individuals may perceive
the bitterness in vegetables, they may like it due to long-term exposure. From our results, this
is particularly true for broccoli, where it was found that broccoli was the most consumed, and
the most liked among Brassica vegetables.
6.2.5 Is PROP sensitivity dependent on taste genotype or phenotype?
Children’s bitter taste sensitivity were measured using taste genotypes (TAS2R38 and CA6) and
phenotypes (PROP taster status and FPD) as discussed in Chapter 4 and 5. Studies reported that
individuals that are sensitive to PROP, carry the PAV/PAV TAS2R38 genotype (Bufe et al.,
2005), and have a greater density of fungiform papillae (Duffy et al., 2010); while CA6 is a
contributing factor in the growth and development of taste buds (Henkin et al., 1999).
Unexpectedly, there was no significant association between PROP sensitivity and any taste
genotype or phenotype. Furthermore, there were anomalies found where PROP tasters had the
non-sensitive genotype/phenotype and vice versa. As discussed in those chapters, the anomalies
might be caused by the simplified PROP classification method that was used where children
were categorised into either tasters or non-tasters. Tepper, Banni, Melis, Crnjar and Barbarossa
(2014) reviewed that there are other possible factors that contribute in the expression of PROP

Chapter 6
158
sensitivity. These factors include chemical composition of saliva, other bitter receptors and
TAS2R38 expression.
6.3 Limitations
6.3.1 Classification method of PROP taster status
Our participants were categorised into either PROP tasters or non-tasters by using a simplified
categorisation method, unlike other studies where participants can be categorised into either
super-, medium- or non-tasters (Tepper, Christensen, & Cao, 2001; Shen, Kennedy, &
Methven, 2016). Using this method, participants are required to taste multiple solutions of
PROP and sodium chloride (NaCl) and rate the intensity on a labelled magnitude scale (LMS).
This method is widely used in taste sensitivity study, however it is unsuitable to be used in
children as it involves rating a complex scale.
Turnbull and Matisoo-Smith (2002) had developed a sensitive method to assess
children’s PROP threshold and suprathreshold where children were required to taste 15 PROP
solutions (for threshold test) and 10 solutions (4 PROP solutions, 4 NaCl solutions and 2 water;
for suprathreshold), then a simple game was used to allow children to rate the intensity of the
solutions (intensity ratings: ‘taste like water’, ‘quite strong’ and ‘very strong’). However, as our
study is a large field study, this method is not convenient to be used as it involves preparing
and tasting multiple solutions. If this method was used in our study, children would be
distributed into 3 groups, which would reduce the possibility of having unequal group sizes
(discussed in section 6.3.2). Hence, increasing the chance of finding a significant difference of
PROP taster status in Chapter 2, 4 and 5. In future research, it would be worthwhile to consider
using this method.

Chapter 6
159
6.3.2 Unequal group sizes
As discussed above, a simplified method to classify PROP taster status was used in our study.
As reported in Chapter 2, 4 and 5, participants were unequally grouped into PROP tasters and
non-tasters. Similarly for CA6 gene, the number of children between 3 groups was unbalanced,
which may cause bias when comparing mean values between genotype/phenotype groups.
Moreover, the interactions between taste genotype and phenotype could not be explored as the
number of participants in each taste genotype/phenotype group was not enough to sub-divide
groups.
Although there were participants with rare TAS2R38 genotype, the number of
participants was too small to do data analyses, however it would be worth investigating the
distribution and functions of these rare genotypes in the future. To date, the functions of the
rare genotypes are unknown. Although Bufe et al. (2005) reported that the AAI, PVI and AAV
haplotypes had intermediate sensitivity of PROP/PTC perception, while AVV haplotype is
unresponsive to PROP/PTC perception, and PAI is very responsive to these compounds, these
are not conclusive. If the distribution and functions of these rare genotypes have been
established, it would also be of interest how these genotypes influence food perception and food
choice.
6.3.3 Sample size
In Chapter 4, there were 134 children with full data sets. Although this number was enough to
show significant effects of repeated taste exposure, no significant effect of taste genotype or
phenotype was found. Results showed that there were trends that the less bitter sensitive
children (measured by TAS2R38, CA6, PROP taster status and FPD) had greater increases in
intake of steamed-pureed turnip than the more bitter sensitive children. Although these trends
were in predicted directions, the number of children in the study was underpowered. In our

Chapter 6
160
sample size calculation, a mean difference in intake of vegetable in children (regardless of their
bitter taste sensitivity) after repeated taste exposure was used, which would explain the small
effects of taste genotypes and phenotypes in our study. A new sample size calculation revealed
that 770 children would be needed in a future study to determine whether there are indeed
significant effects of taste genotypes and phenotypes on the effectiveness of repeated taste
exposure at power of 90%.
6.3.4 Hedonic scale
A 3-point facial hedonic scale was used in Chapter 4 to measure liking of steamed-pureed turnip
in children. Although there was a significant increase in overall liking post-intervention, no
significant increase in each genotype or phenotype group was found, except for the A/G CA6
genotype. The scale has very few response categories, which might prevent children to fully
express their liking. A wider scale such as 9-point hedonic scale is commonly used to assess
liking (Lim, 2011). In Chen et al.'s (1996) study, they used facial hedonic scales with descriptors
ranged from super-bad to super-good; results showed that children as young as 36 months until
47 months were able to use a 3-point hedonic scale; a 5-point scale was suitable for children
aged 47 to 59 months, and a 7-point scale was suitable for 60 to 71 months children. Moreover,
Kimmel, Sigman-Grant and Guinard (1994) reported that a 7-point scale could be used in
children as young as 4 years old. However, Chen et al. (1996) argued that young children (3 to
5 years) are unable to use a 9-point scale, and Stone & Sidel (2004) reported that 5- or 7-point
scales are not suitable for children below 6 years old, hence a 3-point scale was selected in our
study. A future research should consider wider scales to be able to find significant differences
in liking between genotype/phenotype groups, but given the evidence that children might have
difficulty interpreting wider scales, it is recommended for researchers in a future research to do
several practices with children before the actual test, to ensure understanding of the scales.

Chapter 6
161
6.3.5 Food frequency questionnaire (FFQ)
Vegetable intake and liking in children were reported by parents, based on a recalled food
frequency questionnaire. The FFQ is a non-quantitative, therefore this might cause parents to
interpret the response options in the FFQ differently. Moreover, parents might use different
timescales during recalls as the FFQ did not specify a timescale. These limitations could lead
to under- or over-reporting of vegetable intake.
There are many dietary assessment methods offer to estimate dietary intake. Each one
of the methods has advantages and disadvantages. Day, McKeown, Wong, Welch and Bingham
(2001) argued that none of these methods can provide a complete accuracy. FFQ has become
popular because of its convenience as it is normally self-administered. As reported in Shim, Oh
and Kim's (2014) review, this method allows researchers to assess a long-term dietary intake,
and it can focus on specific nutrient intake. Moreover, it is suitable to be used in a large study
as it is a simple, cost-effective and time-saving method, which drove us to select this method.
However, this method could lead to a recall bias and thus to inaccurate estimation of dietary
intake.
A food diary, such as 3- or 7-day food diary has been reported to be more accurate than
FFQ (Day et al., 2001; Schaefer et al., 2000). This method allows real-time data collection
which provides a more precise dietary intake, and minimises the dependency on memory recall
(Shim et al., 2014). However, a food diary only assesses dietary intake for a short period of
time that may not represent participants’ typical diet. In addition, it is time consuming, it
requires training for the participants, and has a large respondent burden (Shim et al., 2014).
Another commonly used dietary assessment method is a 24-hour diet recall. This
method has a lower respondent burden if compared to food diary. Similarly to food diary, it
collects detailed dietary data, however it depends on memory recall, therefore it could lead to
recall bias (Shim et al., 2014). Normally, the 24-hour diet recall is done by a trained interviewer,

Chapter 6
162
which makes this method expensive and time consuming. Moreover, a day measurement of
dietary intake does not represent the actual dietary pattern as dietary intake varies from day to
day. In addition, these 3 self-reported dietary measures are prone to social desirability bias
(Klesges et al., 2004); a tendency to report favourable traits to avoid criticism (Hebert et al.,
1997), hence increasing the probability of over- or under estimation of dietary intake.
With evidence showing each dietary assessment method has advantages and
disadvantages, and none can provide a complete accuracy, a future large field study could use
a FFQ as it is convenient and enables a long-term assessment of dietary intake. To get more
accurate dietary data, the FFQ should be quantitative, specify timescale during recall and could
also include portion size.
6.4 Recommendations
As Hayes, Bartoshuk, Kidd and Duffy (2008) reported that bitter taste sensitivity depends more
than just TAS2R38, relationships between bitter taste genotype and phenotype should be
considered. Although 4 different taste sensitivity measurements were examined, the
interactions between taste genotype and phenotype could not be explored as the number of
participants was not enough in each genotype and phenotype group to sub-divide groups.
Therefore a large number of participants should be recruited in future research to be able to
determine the interactions between taste genotype and phenotype, and to investigate how these
interactions affect food acceptance.
Studies of food preference are complex as they involve many factors. Taste is often said
to be a reason for either food acceptance or rejection. However, Prescott (2015) explained that
food perception is a multisensory phenomena as it is an integration of taste, odour and tactile
sensation, rather than just one sensory characteristic alone. For example, texture of foods is
found to contribute to acceptance of vegetables (Baxter, Jack, & Schröder, 1998; Zeinstra,

Chapter 6
163
Koelen, Kok, & de Graaf, 2010). A crunchy texture of vegetables is often preferred by children,
while soft and mushy textures are disliked (Baxter et al., 1998). Similarly, Zeinstra et al. (2010)
reported that children like crunchy vegetables but dislike granular texture. Prescott, Lee and
Kim (2011) reported that overall liking of a lemon drink which focused only on one sensory
characteristic differed from the overall liking of the same drink which focused on multiple
sensory characteristics. It is possible that if children were asked to rate liking of steamed-pureed
turnip based on multiple sensory characteristics, liking would either decrease or increase. These
sensory characteristics and their relationships are worth investigated in future research, and
relate them with the influence of taste sensitivity on food perception.
Although no influence of taste sensitivity was found on vegetable intake and liking in
children, other factors should be explored. As an example, socioeconomic status has found to
be a predictor of vegetable acceptance in children, where children with higher educated parents
had higher intake of fruit and vegetables compared to lower educated parents (Hilsen, van
Stralen, Klepp, & Bere, 2011). In addition, household income could also contribute to fruit and
vegetable intake (Kamphuis et al., 2006; Othman et al., 2012). Moreover, Pollard, Kirk and
Cade (2002) argued that culture plays an important role in determining one’s food choice, as
they further explained that some cultures may have dietary restrictions to be followed. These
environmental factors were not measured in our study, hence, it is important to investigate these
factors to determine the key predictors of vegetable intake and liking in children.
In a wider perspective, encouraging children to eat vegetables is not only a parental
responsibility; school is a good platform to provide nutrition education. It can be introduced to
children as early as in the preschool age and provide further knowledge about healthy eating as
they grow. Exposure to vegetables is important to increase children’s familiarity with
vegetables. To achieve this objective in a school-setting, schools could organise fun and hands-
on activities such as making a vegetable garden so that children can plant and eat their own

Chapter 6
164
vegetables, at the same time, gaining knowledge about healthy foods. Bell and Dyment (2008)
reported that such activity has a positive influence on children’s food preferences, similarly
reported in a review by Dazeley, Houston-Price and Hill (2012); garden-based interventions
promote willingness to taste vegetables and increase liking of vegetables that they grow, in
addition these interventions encourage children to consume more vegetables in the school
canteen. In addition, schools could provide vegetables at snack times and lunch times, and serve
the same vegetable over a 5-school-day cycle, given our findings that 5 exposures are enough
to increase vegetable acceptance. Some children may refuse to taste vegetables, especially the
unfamiliar ones at the beginning; to encourage children to taste vegetables, teachers could create
snack time as a fun learning experience. For example, they could tell stories or create games
relating to benefits of eating vegetables. Furthermore, after-school clubs are another
opportunity for creativity; children can participate in the preparation of vegetables they are then
offered. To increase children’s engagement in school activities, schools should encourage
parents to participate in the activities. In addition, the SAPERE method has been widely used
in Finland and other countries (Norway, Denmark, the Netherlands, Switzerland and France) to
educate children about the 5 basic tastes (sour, sweet, salty, bitter and umami) and flavour,
using 5 senses (smell, taste, touch, vision and hearing), to allow them to understand the
importance of healthy eating (Flavour School, 2017). Some of the activities offered by this
method include fruit and vegetables picking, preparing salad and visits to food markets. A study
by Hoppu, Prinz, Ojansivu, Laaksonen and Sandell (2015) showed that this type of sensory-
based food education increased willingness to eat vegetables in 3 to 6 year-old children. These
activities should be proposed, in hopes of making children familiar with vegetables, and at the
same time encouraging them to eat vegetables.

Chapter 6
165
6.5 Conclusion
The findings of our study add to the current literature that repeated taste exposure drives
vegetable acceptance of an initially unfamiliar vegetable in children. Additionally, to our
knowledge, this is the first study of repeated taste exposure that have considered 4 different
bitter taste sensitivity measurements (TAS2R38, CA6, PROP taster status and FPD). Our results
suggest that the effect of repeated taste exposure is larger than the effect of taste sensitivity,
where it was found that bitter taste sensitivity had no influences on the effectiveness of repeated
taste exposure, although there were consistent trends that the less bitter sensitive children had
greater increase in intake of steamed-pureed turnip than the more bitter sensitive children.
Other than that, taste sensitivity plays a role on intake of certain vegetables. However,
only FPD had an impact on intake of a Brassica vegetable, while TAS2R38 and PROP taster
status had influences on non-Brassica vegetables. For liking, only FPD had significant effects
on Brassica and total vegetables. There are possibilities that other factors contribute to
vegetable intake in children such as environmental factors and that these factors might have
stronger impacts than taste sensitivity.
It is also worth noting that cooking method is a predictor of vegetable liking where a
cooking method that produces high sweetness and low bitterness is the most preferred. Cooking
processes can change the sensory characteristics of vegetables, therefore it would be a good
suggestion for parents to cook vegetables for their children in ways that it would enhance the
taste in order to increase acceptance.

References
166
References Ahern, S. M., Caton, S. J., Blundell, P., & Hetherington, M. M. (2014). The root of the problem:
increasing root vegetable intake in preschool children by repeated exposure and flavour flavour learning. Appetite, 80, 154–160. http://doi.org/10.1016/j.appet.2014.04.016
Anzman-Frasca, S., Savage, J. S., Marini, M. E., Fisher, J. O., & Birch, L. L. (2012). Repeated exposure and associative conditioning promote preschool children’s liking of vegetables. Appetite, 58, 543–553. http://doi.org/10.1016/j.appet.2011.11.012
Ares, A. M., Nozal, M. J., Bernal, J. L., & Bernal, J. (2014). Optimized extraction, separation and quantification of twelve intact glucosinolates in broccoli leaves. Food Chemistry, 152, 66–74. http://doi.org/10.1016/j.foodchem.2013.11.125
Armesto, J., Gómez-Limia, L., Carballo, J., & Martínez, S. (2016). Effects of different cooking methods on some chemical and sensory properties of Galega kale. International Journal of Food Science and Technology, 51, 2071–2080. http://doi.org/10.1111/ijfs.13181
Barajas-Ramírez, J. A., Quintana-Castro, R., Oliart-Ros, R. M., & Angulo-Guerrero, O. (2016). Bitter taste perception and TAS2R38 genotype: effects on taste sensitivity, food consumption and anthropometry in Mexican adults. Flavour and Fragrance Journal, 31, 310–318. http://doi.org/10.1002/ffj.3319
Baranowski, T., Baranowski, J. C., Watson, K. B., Jago, R., Islam, N., Beltran, A., Martin, S.J., Nguyen, N., & Tepper, B. J. (2011). 6-n-Propylthiouracil taster status not related to reported cruciferous vegetable intake among ethnically diverse children. Nutrition Research, 31, 594–600. http://doi.org/10.1016/j.nutres.2011.07.004
Barbarossa, I. T., Melis, M., Mattes, M. Z., Calò, C., Muroni, P., Crnjar, R., & Tepper, B. J. (2015). The gustin (CA6) gene polymorphism, rs2274333 (A/G), is associated with fungiform papilla density, whereas PROP bitterness is mostly due to TAS2R38 in an ethnically-mixed population. Physiology & Behavior, 138, 6–12. http://doi.org/10.1016/j.physbeh.2014.09.011
Bartoshuk, L. M. (2000). Comparing sensory experiences across individuals: Recent psychophysical advances illuminate genetic variation in taste perception. Chemical Senses, 25, 447–460. http://doi.org/10.1093/chemse/25.4.447
Bates, B., Cox, L., Page, S. N. P., Prentice, A., Steer, T., & Swan, G. (2016). National Diet and Nutrition Survey : Results from Years 5 and 6 ( combined ) of the Rolling Programme (2012/2013-2013/2014). Public Health England, London, UK. London, UK.
Bates, B., Lennox, A., Prentice, A., Bates, C., Page, P., Nicholson, S., & Swan, G. (2014). National Diet and Nutrition Survey Results from Years 1 , 2 , 3 and 4 (combined) of the Rolling Programme (2008/2009-2011/2012). London, UK.
Baxter, I. A., Jack, F. R., & Schröder, M. J. A. (1998). The use of repertory grid method to elicit perceptual data from primary school children. Food Quality and Preference, 9(1–2), 73–80. http://doi.org/10.1016/S0950-3293(97)00031-1
Beauchamp, G. K., & Mennella, J. A. (2011). Flavor perception in human infants: Development and functional significance. Digestion, 83(SUPPL.1), 1–6. http://doi.org/10.1159/000323397

References
167
Beck, T. K., Nicklaus, S., Jensen, S., Issanchou, S., & Kidmose, U. (2013). Comparisons of individual bitterness perception and vegetable liking and consumption among Danish consumers: A pilot study for a cross-cultural sensory study between Denmark and France. MENU: Journal of Food & Hospitality Research, 2, 7–14.
Bell, A. C., & Dyment, J. E. (2008). Grounds for health: the intersection of green school grounds and health‐promoting schools. Environmental Education Research, 14(1), 77–90. http://doi.org/10.1080/13504620701843426
Bell, K. I., & Tepper, B. J. (2006). Short-term vegetable intake by young children classified by 6-n-propylthoiuracil bitter-taste phenotype. American Journal of Clinical Nutrition, 84, 245–251.
Bell, L. (2017). University of Reading standard operating procedure for glucosinolate analysis by LCMS, unpublished.
Bell, L., Methven, L., Signore, A., Oruna-Concha, M. J., & Wagstaff, C. (2017). Analysis of seven salad rocket (Eruca sativa) accessions: The relationships between sensory attributes and volatile and non-volatile compounds. Food Chemistry, 218, 181–191. http://doi.org/10.1016/j.foodchem.2016.09.076
Bell, L., Methven, L., & Wagstaff, C. (2017). The influence of phytochemical composition and resulting sensory attributes on preference for salad rocket (Eruca sativa) accessions by consumers of varying TAS2R38 diplotype. Food Chemistry, 222, 6–17. http://doi.org/10.1016/j.foodchem.2016.11.153
Bell, L., Oruna-Concha, M. J., & Wagstaff, C. (2015). Identification and quantification of glucosinolate and flavonol compounds in rocket salad (Eruca sativa, Eruca vesicaria and Diplotaxis tenuifolia) by LC-MS: Highlighting the potential for improving nutritional value of rocket crops. Food Chemistry, 172, 852–861. http://doi.org/10.1016/j.foodchem.2014.09.116
Birch, L. L. (1999). Development of food preferences. Annual Review of Nutrition, 19, 41–62.
Bladh, K. T., Olsson, K. M., & Yndgaard, F. (2013). Evaluation of glucosinolates in Nordic horseradish (Armoracia Rusticana). Botanica Lithuanica, 19(1), 48–56.
Bongoni, R., Verkerk, R., Steenbekkers, B., Dekker, M., & Stieger, M. (2014). Evaluation of Different Cooking Conditions on Broccoli (Brassica oleracea var. italica) to Improve the Nutritional Value and Consumer Acceptance. Plant Foods for Human Nutrition, 69(3), 228–234. http://doi.org/10.1007/s11130-014-0420-2
Borah-Giddens, J., & Falciglia, G. A. (1993). A meta-analysis of the relationship in food preferences between parents and children. Journal of Nutrition Education, 25(3), 102–107. http://doi.org/10.1016/S0022-3182(12)80565-6
Borowski, J., Narwojsz, A., Borowska, E. J., & Majewska, K. (2015). The effect of thermal processing on sensory properties, texture attributes and pectic changes in broccoli. Czech Journal of Food Sciences, 33(3), 254–260. http://doi.org/10.17221/207/2014-CJFS
Bouhlal, S., Issanchou, S., Chabanet, C., & Nicklaus, S. (2014). “Just a pinch of salt”. An experimental comparison of the effect of repeated exposure and flavor-flavor learning with salt or spice on vegetable acceptance in toddlers. Appetite, 83, 209–217. http://doi.org/10.1016/j.appet.2014.07.032

References
168
Brown, P. D., Tokuhisa, J. G., Reichelt, M., & Gershenzon, J. (2003). Variation of glucosinolate accumulation among different organs and developmental stages of Arabidopsis thaliana. Phytochemistry, 62, 471–481. http://doi.org/10.1016/S0031-9422(02)00549-6
Bufe, B., Breslin, P. A. S., Kuhn, C., Reed, D. R., Tharp, C. D., Slack, J. P., Kim, U.-K., Drayna, D., & Meyerhof, W. (2005). The molecular basis of individual differences in phenylthiocarbamide and propylthiouracil bitterness perception. Current Biology, 15, 322–327.
Calò, C., Padiglia, A., Zonza, A., Corrias, L., Contu, P., Tepper, B. J., & Barbarossa, I. T. (2011). Polymorphisms in TAS2R38 and the taste bud trophic factor, gustin gene co-operate in modulating PROP taste phenotype. Physiology and Behavior, 104, 1065–1071. http://doi.org/10.1016/j.physbeh.2011.06.013
Carruth, B. R., Ziegler, P. J., Gordon, A., & Barr, S. I. (2004). Prevalence of picky eaters among infants and toddlers and their caregivers’ decisions about offering a new food. Journal of the American Dietetic Association, 104, S57–S64. http://doi.org/10.1016/j.jada.2003.10.024
Cartea, M. E., & Velasco, P. (2008). Glucosinolates in Brassica foods: bioavailability in food and significance for human health. Phytochemistry Reviews, 7, 213–229. http://doi.org/10.1007/s11101-007-9072-2
Cataldi, T. R. I., Rubino, A., Lelario, F., & Bufo, S. A. (2007). Naturally occurring glucosinolates in plant extracts of rocket salad (Eruca sativa L.) identified by liquid chromatography coupled with negative ion electrospray ionization and quadrupole ion-trap mass spectrometry. Rapid Communications in Mass Spectrometry, 21, 2374–2388. http://doi.org/10.1002/rcm
Caton, S. J., Ahern, S. M., Remy, E., Nicklaus, S., Blundell, P., & Hetherington, M. M. (2013). Repetition counts: repeated exposure increases intake of a novel vegetable in UK pre-school children compared to flavour–flavour and flavour–nutrient learning. British Journal of Nutrition, 109, 2089–2097. http://doi.org/10.1017/S0007114512004126
Chen, A. W., Resurreccion, A. V. A., & Paguio, L. P. (1996). Age appropriate hedonic scales to measure food preferences of young children. Journal of Sensory Studies, 11, 141–163. http://doi.org/10.1111/j.1745-459X.1996.tb00038.x
Chiang, P.-Y., & Luo, Y.-Y. (2007). Effects of pressurized cooking on the relationship between the chemical compositions and texture changes of lotus root (Nelumbo nucifera Gaertn.). Food Chemistry, 105, 480–484. http://doi.org/10.1016/j.foodchem.2007.04.003
Clarke, D. B. (2010). Glucosinolates, structures and analysis in food. Analytical Methods, 2, 310–325. http://doi.org/10.1039/b9ay00280d
Cockroft, J. E., Durkin, M., Masding, C., & Cade, J. E. (2005). Fruit and vegetable intakes in a sample of pre-school children participating in the “Five for All” project in Bradford. Public Health Nutrition, 8(7), 861–869. http://doi.org/10.1079/PHN2005734
Cooke, L. J., & Wardle, J. (2005). Age and gender differences in children’s food preferences. British Journal of Nutrition, 93, 741–746. http://doi.org/10.1079/bjn20051389
Cooke, L., Wardle, J., & Gibson, E. L. (2003). Relationship between parental report of food neophobia and everyday food consumption in 2-6-year-old children. Appetite, 41, 205–206. http://doi.org/10.1016/S0195-6663(03)00048-5

References
169
Cox, D. N., Melo, L., Zabaras, D., & Delahunty, C. M. (2012). Acceptance of health-promoting Brassica vegetables: The influence of taste perception, information and attitudes. Public Health Nutrition, 15(8), 1474–1482. http://doi.org/10.1017/S1368980011003442
Day, N. E., McKeown, N., Wong, M. Y., Welch, A., & Bingham, S. (2001). Epidemiological assessment of diet: a comparison of a 7-day diary with a food frequency questionnaire using urinary markers of nitrogen, potassium and sodium. International Journal of Epidemiology, 30, 309–317. http://doi.org/10.1093/ije/30.2.309
Dazeley, P., Houston-Price, C., & Hill, C. (2012). Should healthy eating programmes incorporate interaction with foods in different sensory modalities? A review of the evidence. British Journal of Nutrition, 108, 769–777. http://doi.org/10.1017/S0007114511007343
De Graaf, C., & Zandstra, E. H. (1999). Sweetness intensity and pleasantness in children, adolescents, and adults. Physiology and Behavior, 67(4), 513–520. http://doi.org/10.1016/S0031-9384(99)00090-6
Dekker, M., Verkerk, R., & Jongen, W. M. . (2000). Predictive modelling of health aspects in the food production chain: a case study on glucosinolates in cabbage. Trends in Food Science & Technology, 11, 174–181. Retrieved from http://www.sciencedirect.com/science/article/pii/S0924224400000625
Desor, J. A., Maller, O., & Turner, R. E. (1973). Taste in acceptance of sugars by human infants. Journal of Comparative and Physiological Psychology, 84(3), 496–501. Retrieved from http://www.ncbi.nlm.nih.gov/pubmed/4745817
Dias, J. S. (2012). Nutritional quality and health benefits of vegetables: A review. Food and Nutrition Sciences, 3, 1354–1374. http://doi.org/10.4236/fns.2012.310179
Dinehart, M. E., Hayes, J. E., Bartoshuk, L. M., Lanier, S. L., & Duffy, V. B. (2006). Bitter taste markers explain variability in vegetable sweetness, bitterness, and intake. Physiology and Behavior, 87, 304–313. http://doi.org/10.1016/j.physbeh.2005.10.018
Donadini, G., Fumi, M. D., & Porretta, S. (2012). Influence of preparation method on the hedonic response of preschoolers to raw, boiled or oven-baked vegetables. LWT - Food Science and Technology, 49(2), 282–292. http://doi.org/10.1016/j.lwt.2012.07.019
Draxten, M., Fulkerson, J. A., Friend, S., Flattum, C. F., & Schow, R. (2014). Parental role modeling of fruits and vegetables at meals and snacks is associated with children’s adequate consumption. Appetite, 78C, 1–7. http://doi.org/10.1016/j.appet.2014.02.017
Drewnowski, A., & Gomez-Carneros, C. (2000). Bitter taste, phyonutrients, and the consumer: a review. American Journal of Clinical Nutrition, 72, 1424–1435.
Duffy, V. B., & Bartoshuk, L. M. (2000). Food acceptance and genetic variation in taste. Journal of the American Dietetic Association, 100, 647–655. http://doi.org/10.1016/S0002-8223(00)00191-7
Duffy, V. B., Davidson, A. C., Kidd, J. R., Kidd, K. K., Speed, W. C., Pakstis, A. J., Reed, D. R., Snyder, D. J., & Bartoshuk, L. M. (2004). Bitter receptor gene (TAS2R38), 6-n-propylthiouracil (PROP) bitterness and alcohol intake. Alcoholism, Clinical and Experimental Research, 28(11), 1629–1637. http://doi.org/Doi 10.1097/01.Alc.0000145789.55183.D4

References
170
Duffy, V. B., Hayes, J. E., Davidson, A. C., Kidd, J. R., Kidd, K. K., & Bartoshuk, L. M. (2010). Vegetable intake in college-aged adults is explained by oral sensory phenotypes and TAS2R38 genotype. Chemosensory Perception, 3(3–4), 137–148. http://doi.org/10.1007/s12078-010-9079-8
Engel, E., Baty, C., Le Corre, D., Souchon, I., & Martin, N. (2002). Flavor-active compounds potentially implicated in cooked cauliflower acceptance. Journal of Agricultural and Food Chemistry, 50, 6459–6467. http://doi.org/10.1021/jf025579u
Essick, G. K., Chopra, A., Guest, S., & McGlone, F. (2003). Lingual tactile acuity, taste perception, and the density and diameter of fungiform papillae in female subjects. Physiology and Behavior, 80, 289–302. http://doi.org/10.1016/j.physbeh.2003.08.007
Fagerli, R. A., & Wandel, M. (1999). Gender differences in opinions and practices with regard to a “Healthy Diet.” Appetite, 32, 171–190. http://doi.org/10.1006/appe.1998.0188
Feeney, E. L., & Hayes, J. E. (2014a). Exploring associations between taste perception, oral anatomy and polymorphisms in the carbonic anhydrase (gustin) gene CA6. Physiology and Behavior, 128, 148–154. http://doi.org/10.1016/j.physbeh.2014.02.013
Feeney, E. L., & Hayes, J. E. (2014b). Regional differences in suprathreshold intensity for bitter and umami stimuli. Chemosensory Perception, 7(3–4), 147–157. http://doi.org/10.1007/s12078-014-9166-3
Feeney, E. L., O’Brien, S. A., Scannell, A. G. M., Markey, A., & Gibney, E. R. (2014). Genetic and environmental influences on liking and reported intakes of vegetables in Irish children. Food Quality and Preference, 32, 253–263. http://doi.org/10.1016/j.foodqual.2013.09.009
Fenwick, G. R., Griffiths, N. M., & Heaney, R. K. (1983). Bitterness in brussels sprouts (Brassica oleracea L. var. gemmifera): The role of glucosinolates and their breakdown products. Journal of the Science of Food and Agriculture, 34, 73–80. http://doi.org/10.1002/jsfa.2740340111
Fischer, M. E., Cruickshanks, K. J., Pankow, J. S., Pankratz, N., Schubert, C. R., Huang, G.-H., Klein, B. E. K., Klein, R., & Pinto, A. (2014). The associations between 6-n-propylthiouracil (PROP) intensity and taste intensities differ by TAS2R38 haplotype. Journal of Nutrigenetics and Nutrigenomics, 7, 143–152. http://doi.org/10.1159/000371552
Fischer, M. E., Cruickshanks, K. J., Schubert, C. R., Pinto, A., Klein, R., Pankratz, N., Pankow, J. S., & Huang, G.-H. (2013). Factors related to fungiform papillae density: The Beaver Dam Offspring Study. Chemical Senses, 38, 669–677. http://doi.org/10.1093/chemse/bjt033
Flavour School. (2017). Making sense of food with the SAPERE method. Retrieved April 10, 2018, from https://www.flavourschool.org.uk/
Fox, A. L. (1932). The relationship between chemical constitution and taste. Proceedings of the National Academy of Sciences of the United States of America, 18, 115–20.
Francisco, M., Velasco, P., Moreno, D. A., García-Viguera, C., & Cartea, M. E. (2010). Cooking methods of Brassica rapa affect the preservation of glucosinolates, phenolics and vitamin C. Food Research International, 43, 1455–1463. http://doi.org/10.1016/j.foodres.2010.04.024

References
171
Francisco, M., Velasco, P., Romero, Á., Vázquez, L., & Cartea, M. E. (2009). Sensory quality of turnip greens and turnip tops grown in northwestern Spain. European Food Research and Technology, 230, 281–290. http://doi.org/10.1007/s00217-009-1163-4
Galindo, M. M., Schneider, N. Y., Stähler, F., Töle, J., & Meyerhof, W. (2012). Taste preferences. Progress in Molecular Biology and Translational Science, 108, 383–426. http://doi.org/10.1016/B978-0-12-398397-8.00015-0
Ganchrow, J. R., Steiner, J. E., & Daher, M. (1983). Neonatal facial expressions in response to different qualities and intensities of gustatory stimuli. Infant Behavior and Development, 6, 473–484. http://doi.org/10.1016/S0163-6383(83)90301-6
Garcia-Bailo, B., Toguri, C., Eny, K. M., & El-Sohemy, A. (2009). Genetic variation in taste and its influence on food selection. Omics : A Journal of Integrative Biology, 13(1), 69–80. http://doi.org/10.1089/omi.2008.0031
Giallourou, N., Oruna-Concha, M. J., & Harbourne, N. (2016). Effects of domestic processing methods on the phytochemical content of watercress (Nasturtium officinale). Food Chemistry, 212, 411–419. http://doi.org/10.1016/j.foodchem.2016.05.190
Glendinning, J. I. (1994). Is the bitter rejection response always adaptive? Physiology and Behavior, 56(6), 1217–1227. http://doi.org/10.1016/0031-9384(94)90369-7
Gols, R., Raaijmakers, C. E., van Dam, N. M., Dicke, M., Bukovinszky, T., & Harvey, J. A. (2007). Temporal changes affect plant chemistry and tritrophic interactions. Basic and Applied Ecology, 8, 421–433. http://doi.org/10.1016/j.baae.2006.09.005
Grimm, E. R., & Steinle, N. I. (2011). Genetics of eating behavior: established and emerging concepts. Nutrition Reviews, 69(1), 52–60. http://doi.org/10.1111/j.1753-4887.2010.00361.x
Grubb, C. D., & Abel, S. (2006). Glucosinolate metabolism and its control. Trends in Plant Science, 11(2), 89–100. http://doi.org/10.1016/j.tplants.2005.12.006
Guinard, J.-X. (2001). Sensory and consumer testing with children. Trends in Food Science & Technology, 11, 273–283.
Hausner, H., Olsen, A., & Møller, P. (2012). Mere exposure and flavour-flavour learning increase 2-3year-old children’s acceptance of a novel vegetable. Appetite, 58, 1152–1159. http://doi.org/10.1016/j.appet.2012.03.009
Hayes, J. D., Kelleher, M. O., & Eggleston, I. M. (2008). The cancer chemopreventive actions of phytochemicals derived from glucosinolates. European Journal of Nutrition, 47(SUPPL. 2), 73–88. http://doi.org/10.1007/s00394-008-2009-8
Hayes, J. E., Bartoshuk, L. M., Kidd, J. R., & Duffy, V. B. (2008). Supertasting and PROP bitterness depends on more than the TAS2R38 gene. Chemical Senses, 33, 255–265. http://doi.org/10.1093/chemse/bjm084
Hayes, J. E., & Duffy, V. B. (2008). Oral sensory phenotype identifies level of sugar and fat required for maximal liking. Physiology & Behavior, 95(1–2), 77–87. http://doi.org/10.1016/j.physbeh.2008.04.023.
Hayes, J. E., Feeney, E. L., & Allen, A. L. (2013). Do polymorphisms in chemosensory genes matter for human ingestive behavior? Food Quality and Preference, 30(2), 202–216. http://doi.org/10.1016/j.biotechadv.2011.08.021.Secreted

References
172
Hayes, J. E., Sullivan, B. S., & Duffy, V. B. (2010). Explaining variability in sodium intake through oral sensory phenotype, salt sensation and liking. Physiology & Behavior, 100(4), 369–380. http://doi.org/10.1016/j.biotechadv.2011.08.021.
Heaney, R. K., & Fenwick, G. R. (1980). Glucosinolates in Brassica vegetables. Analysis of 22 varieties of Brussels sprout (Brassica oleracea var. gemmifera). Journal of the Science of Food and Agriculture, 31, 785–793. http://doi.org/10.1002/jsfa.2740310808
Heath, P. (2012). Improving children’s responses to fruit and vegetables: Picture-book exposure and the impact of food familiarity and liking. University of Reading.
Heath, P., Houston-Price, C., & Kennedy, O. B. (2011). Increasing food familiarity without the tears. A role for visual exposure? Appetite, 57, 832–838. http://doi.org/10.1016/j.appet.2011.05.315
Hebert, J. R., Ma, Y., Clemow, L., Ockene, I. S., Saperia, G., Stanek III, E. J., Merriam, P. A., & Ockene, J. K. (1997). Gender differences in social desirability and social approval bias in dietary self-report. American Journal of Epidemiology, 146(12), 1046–1055.
Helland, H. S., Leufvén, A., Bengtsson, G. B., Pettersen, M. K., Lea, P., & Wold, A.-B. (2016). Storage of fresh-cut swede and turnip: Effect of temperature, including sub-zero temperature, and packaging material on sensory attributes, sugars and glucosinolates. Postharvest Biology and Technology, 111, 370–379. http://doi.org/10.1016/j.postharvbio.2015.09.011
Henkin, R. I., Martin, B. M., & Agarwal, R. P. (1999). Decreased parotid saliva gustin/carbonic anhydrase VI secretion: An enzyme disorder manifested by gustatory and olfactory dysfunction. The American Journal of the Medical Sciences, 318(6), 380–391. http://doi.org/10.1016/S0002-9629(15)40663-9
Herr, I., & Büchler, M. W. (2010). Dietary constituents of broccoli and other cruciferous vegetables: Implications for prevention and therapy of cancer. Cancer Treatment Reviews, 36, 377–383. http://doi.org/10.1016/j.ctrv.2010.01.002
Hilsen, M., van Stralen, M. M., Klepp, K.-I., & Bere, E. (2011). Changes in 10-12 year old’s fruit and vegetable intake in Norway from 2001 to 2008 in relation to gender and socioeconomic status - a comparison of two cross-sectional groups. International Journal of Behavioral Nutrition and Physical Activity, 8(108), 1–8. http://doi.org/10.1186/1479-5868-8-108
Hoppu, U., Laitinen, K., Jaakkola, J., & Sandell, M. (2015). The hTAS2R38 genotype is associated with sugar and candy consumption in preschool boys. Journal of Human Nutrition and Dietetics, 28(Suppl. 1), 45–51. http://doi.org/10.1111/jhn.12249
Hoppu, U., Prinz, M., Ojansivu, P., Laaksonen, O., & Sandell, M. A. (2015). Impact of sensory-based food education in kindergarten on willingness to eat vegetables and berries. Food and Nutrition Research, 59, 28795.
Hung, H.-C., Joshipura, K. J., Jiang, R., Hu, F. B., Hunter, D., Smith-Warner, S. A., Colditz, G. A., Rosner, B., Spiegelman, D., & Willett, W. C. (2004). Fruit and vegetable intake and risk of major chronic disease. Journal of the National Cancer Institute, 96(21), 1577–1584. http://doi.org/10.1093/jnci/djh296
James, C. E., Laing, D. G., & Oram, N. (1997). A comparison of the ability of 8-9-Year-old children and adults to detect taste stimuli. Physiology and Behavior, 62(1), 193–197. http://doi.org/10.1016/S0031-9384(97)00030-9

References
173
Jia, C.-G., Xu, C.-J., Wei, J., Yuan, J., Yuan, G.-F., Wang, B.-L., & Wang, Q.-M. (2009). Effect of modified atmosphere packaging on visual quality and glucosinolates of broccoli florets. Food Chemistry, 114, 28–37. http://doi.org/10.1016/j.foodchem.2008.09.009
Joint Health Surveys Unit. (2012). Health Survey for England 2011: Trend tables.
Josefsson, E. (1970). Glucosinolate content and amino acid composition of rapeseed (Brassica napus) meal as affected by sulphur and nitrogen nutrition. Journal of the Science of Food and Agriculture, 21, 98–103. http://doi.org/10.1002/jsfa.2740210211
Joshi, S. M., Katre, P. A., Kumaran, K., Joglekar, C., Osmond, C., Bhat, D. S., Lubree, H., Pandit, A., Yajnik, C. S., & Fall, C. H. D. (2014). Tracking of cardiovascular risk factors from childhood to young adulthood - The Pune Children’s Study. International Journal of Cardiology, 175(1), 176–178. http://doi.org/10.1016/j.ijcard.2014.04.105
Jousse, F., Jongen, T., Agterof, W., Russell, S., & Braat, P. (2002). Simplified kinetic scheme of flavor formation by the Maillard reaction. Journal of Food Science, 67(7), 2534–2542. http://doi.org/10.1111/j.1365-2621.2002.tb08772.x
Juhola, J., Magnussen, C. G., Viikari, J. S. ., Kähönen, M., Hutri-Kähönen, N., Jula, A., Lehtimäki, T., Åkerblom, H. K., Pietikäinen, M., Laitinen, T., Jokinen, E., Taittonen, L., Raitikari, O. T., & Juonala, M. (2011). Tracking of serum lipid levels, blood pressure, and body mass index from childhood to adulthood: the cardiovascular risk in young Finns study. Journal of Pediatrics, 159(4), 584–590.
Justen, V. L., Fritz, V. A., & Cohen, J. D. (2012). Seasonal variation in glucosinolate accumulation in turnips grown under photoselective nettings. Horticulture Environment and Biotechnology, 53(2), 108–115. http://doi.org/10.1007/s13580-012-0106-3
Kabouw, P., Biere, A., Van Der Putten, W. H., & Van Dam, N. M. (2010). Intra-specific differences in root and shoot glucosinolate profiles among white cabbage (Brassica oleracea var. capitata) Cultivars. Journal of Agricultural and Food Chemistry, 58, 411–417. http://doi.org/10.1021/jf902835k
Kalat, J. W., & Rozin, P. (1973). “Learned safety” as a mechanism in long-delay taste-aversion learning in rats. Journal of Comparative and Physiological Psychology, 83(2), 198–207. http://doi.org/10.1037/h0034424
Kaminski, L. C., Henderson, S. A., & Drewnowski, A. (2000). Young women’s food preferences and taste responsiveness to 6-n-propylthiouracil (PROP). Physiology and Behavior, 68, 691–697. http://doi.org/10.1016/S0031-9384(99)00240-1
Kamphuis, C. B. M., Giskes, K., Bruijn, G. De, Wendel-Vos, W., Brug, J., & van Lenthe, F. J. (2006). Environmental determinants of fruit and vegetable consumption among adults : a systematic review. British Journal of Nutrition, 96(4), 620–635. http://doi.org/10.1079/BJN20061896
Kelder, S. H., Perry, C. L., Klepp, K.-I., & Lytle, L. L. (1994). Longitudinal tracking of adolescent smoking, physical activity, and food choice behaviors. American Journal of Public Health, 84, 1121–1126. http://doi.org/10.2105/AJPH.84.7.1121
Keller, K. L., & Adise, S. (2016). Variation in the Ability to Taste Bitter Thiourea Compounds: Implications for Food Acceptance, Dietary Intake, and Obesity Risk in Children. Annual Review of Nutrition, 36, 157–182. http://doi.org/10.1146/annurev-nutr-071715-050916

References
174
Keller, K. L., Steinmann, L., Nurse, R. J., & Tepper, B. J. (2002). Genetic taste sensitivity to 6-n-propylthiouracil influences food preference and reported intake in preschool children. Appetite, 38, 3–12. http://doi.org/10.1006/appe.2001.0441
Khataan, N. H., Stewart, L., Brenner, D. M., Cornelis, M. C., & El-Sohemy, A. (2009). TAS2R38 genotypes and phenylthiocarbamide bitter taste perception in a population of young adults. Journal of Nutrigenetics and Nutrigenomics, 2, 251–256. http://doi.org/10.1159/000297217
Kim, S.-J., Ishida, M., Matsuo, T., Watanabe, M., & Watanabe, Y. (2001). Separation and identification of glucosinolates of vegetable turnip rape by LC / APCI-MS and comparison of their contents in ten cultivars of vegetable turnip rape ( Brassica rapa L .). Soil Science and Plant Nutrition, 47(1), 167–177.
Kim, S.-J., Kawaguchi, S., & Watanabe, Y. (2003). Glucosinolates in vegetative tissues and seeds of twelve cultivars of vegetable turnip rape (Brassica rapa L.). Soil Science And Plant Nutrition, 49(3), 337–346. http://doi.org/10.1080/00380768.2003.10410018
Kim, U., Jorgenson, E., Coon, H., Leppert, M., Risch, N., & Drayna, D. (2003). Positional cloning of the human quantitative trait locus underlying taste sensitivity to phenylthiocarbamide. Science, 299, 1221–1225.
Kim, U., Wooding, S., Ricci, D., Jorde, L. B., & Drayna, D. (2005). Worldwide haplotype diversity and coding sequence variation at human bitter taste receptor loci. Human Mutation, 26(3), 199–204. http://doi.org/10.1002/humu.20203
Kimmel, S. ., Sigman-Grant, M., & Guinard, J. . (1994). Sensory testing with young children. Food Technology, 48(3), 92–99.
Klesges, L. M., Baranowski, T., Beech, B., Cullen, K., Murray, D. M., Rochon, J., & Pratt, C. (2004). Social desirability bias in self-reported dietary, physical activity and weight concerns measures in 8- to 10-year-old African-American girls: Results from the Girls health Enrichment Multisite Studies (GEMS). Preventive Medicine, 38, S78–S87. http://doi.org/10.1016/j.ypmed.2003.07.003
Knaapila, A. J., Sandell, M. A., Vaarno, J., Hoppu, U., Puolimatka, T., Kaljonen, A., & Lagström, H. (2015). Food neophobia associates with lower dietary quality and higher BMI in Finnish adults. Public Health Nutrition, 18(12), 2161–2171. http://doi.org/10.1017/S1368980014003024
Knaapila, A., Laaksonen, O., Virtanen, M., Yang, B., Lagström, H., & Sandell, M. (2017). Pleasantness, familiarity, and identification of spice odors are interrelated and enhanced by consumption of herbs and food neophilia. Appetite, 109, 190–200. http://doi.org/10.1016/j.appet.2016.11.025
Kushad, M. M., Brown, A. F., Kurilich, A. C., Juvik, J. A., Klein, B. P., Wallig, M. A., & Jeffery, E. H. (1999). Variation of glucosinolates in vegetable crops of Brassica oleracea. Journal of Agricultural and Food Chemistry, 47(4), 1541–1548. http://doi.org/10.1021/jf980985s
Lakkakula, A., Geaghan, J., Zanovec, M., Pierce, S., & Tuuri, G. (2010). Repeated taste exposure increases liking for vegetables by low-income elementary school children. Appetite, 55, 226–231. http://doi.org/10.1016/j.appet.2010.06.003
Law, M. (2000). Dietary fat and adult diseases and the implications for childhood nutrition: An epidemiologic approach. American Journal of Clinical Nutrition, 72, 1291S–1296S.

References
175
Lee, J. G., Bonnema, G., Zhang, N., Kwak, J. H., de Vos, R. C. H., & Beekwilder, J. (2013). Evaluation of glucosinolate variation in a collection of turnip (Brassica rapa) germplasm by the analysis of intact and desulfo glucosinolates. Journal of Agricultural and Food Chemistry, 61, 3984–3993. http://doi.org/10.1021/jf400890p
Lewis, J., & Fenwick, G. R. (1987). Glucosinolate content of Brassica vegetables: Analysis of twenty-four cultivars of Calabrese (green sprouting broccoli, Brassica oleracea L. var. botrytis subvar. cymosa Lam.). Food Chemistry, 25, 259–268. http://doi.org/10.1016/0308-8146(87)90012-4
Li, S., Schonhof, I., Krumbein, A., Li, L., Stützel, H., & Schreiner, M. (2007). Glucosinolate concentration in turnip ( Brassica rapa ssp. rapifera L.) roots as affected by nitrogen and sulfur supply. Journal of Agricultural and Food Chemistry, 55, 8452–8457. http://doi.org/10.1021/jf070816k
Lim, J. (2011). Hedonic scaling: A review of methods and theory. Food Quality and Preference, 22, 733–747. http://doi.org/10.1016/j.foodqual.2011.05.008
Lock, K., Pomerleau, J., Causer, L., Altmann, D. R., & McKee, M. (2005). The global burden of disease attributable to low consumption of fruit and vegetables: Implications for the global strategy on diet. Bulletin of the World Health Organization, 83(2), 100–108. http://doi.org//S0042-96862005000200010
Lumeng, J. C., Cardinal, T. M., Sitto, J. R., & Kannan, S. (2008). Ability to taste 6-n-propylthiouracil and BMI in low-income preschool-aged children. Obesity, 16(7), 1522–1528. http://doi.org/10.1038/oby.2008.227
Magarey, A., Daniels, L. A., & Smith, A. (2001). Fruit and vegetable intakes of Australians aged 2-18 years: An evaluation of the 1995 National Nutrition Survey data. Australian and New Zealand Journal of Public Health, 25(2), 155–161. http://doi.org/10.1111/j.1753-6405.2001.tb01839.x
Maier-Nöth, A., Schaal, B., Leathwood, P., & Issanchou, S. (2016). The lasting influences of early food-related variety experience: A longitudinal study of vegetable acceptance from 5 months to 6 years in two populations. PLoS ONE, 11(3), e0151356. http://doi.org/10.1371/journal.pone.0151356
Maier, A., Chabanet, C., Schaal, B., Issanchou, S., & Leathwood, P. (2007). Effects of repeated exposure on acceptance of initially disliked vegetables in 7-month old infants. Food Quality and Preference, 18, 1023–1032. http://doi.org/10.1016/j.foodqual.2007.04.005
Maier, A. S., Chabanet, C., Schaal, B., Leathwood, P. D., & Issanchou, S. N. (2008). Breastfeeding and experience with variety early in weaning increase infants’ acceptance of new foods for up to two months. Clinical Nutrition, 27, 849–857. http://doi.org/10.1016/j.clnu.2008.08.002
Maynard, M., Gunnell, D., Emmett, P., Frankel, S., & Davey Smith, G. (2003). Fruit, vegetables, and antioxidants in childhood and risk of adult cancer: the Boyd Orr cohort. Journal of Epidemiology and Community Health, 57, 218–225. http://doi.org/10.1136/jech.57.3.218
McFarlane, T., & Pliner, P. (1997). Increasing willingness to taste novel foods: effects of nutrition and taste information. Appetite, 28, 227–238. http://doi.org/10.1006/appe.1996.0075

References
176
McNaughton, S. A., & Marks, G. C. (2003). Development of a food composition database for the estimation of dietary intakes of glucosinolates, the biologically active constituents of cruciferous vegetables. The British Journal of Nutrition, 90, 687–697. http://doi.org/10.1079/BJN2003917
Melis, M., Atzori, E., Cabras, S., Zonza, A., Calò, C., Muroni, P., Nieddu, M., Padiglia, A., Sogos, V., Tepper, B. J., & Barbarossa, I. T. (2013). The Gustin (CA6) Gene Polymorphism, rs2274333 (A/G), as a Mechanistic Link between PROP Tasting and Fungiform Taste Papilla Density and Maintenance. PLoS ONE, 8(9), e74151. http://doi.org/10.1371/journal.pone.0074151
Mennella, J. A., Jagnow, C. P., & Beauchamp, G. K. (2001). Prenatal and postnatal flavor learning by human infants. Pediatrics, 107(6), e88–e88. http://doi.org/10.1542/peds.107.6.e88
Mennella, J. A., Pepino, M. Y., Duke, F. F., & Reed, D. R. (2010). Age modifies the genotype-phenotype relationship for the bitter receptor TAS2R38. BMC Genetics, 11, 60. http://doi.org/10.1186/1471-2156-11-60
Mennella, J. A., Pepino, M. Y., & Reed, D. R. (2005). Genetic and environmental determinants of bitter perception and sweet preferences. Pediatrics, 115(2), e216–e222. http://doi.org/10.1542/peds.2004-1582
Meyerhof, W., Batram, C., Kuhn, C., Brockhoff, A., Chudoba, E., Bufe, B., Appendino, G., & Behrens, M. (2010). The molecular receptive ranges of human TAS2R bitter taste receptors. Chemical Senses, 35, 157–170. http://doi.org/10.1093/chemse/bjp092
Mikkilä, V., Räsänen, L., Raitakari, O. T., Pietinen, P., & Viikari, J. (2004). Longitudinal changes in diet from childhood into adulthood with respect to risk of cardiovascular diseases: The Cardiovascular Risk in Young Finns Study. European Journal of Clinical Nutrition, 58, 1038–1045. http://doi.org/10.1038/sj.ejcn.1601929
Mithen, R. F., Dekker, M., Verkerk, R., Rabot, S., & Johnson, I. T. (2000). The nutritional significance, biosynthesis and bioavailability of glucosinolates in human foods. Journal of the Science of Food and Agriculture, 80, 967–984.
Mojet, J., Christ-Hazelhof, E., & Heidema, J. (2001). Taste perception with age: generic or specific losses in threshold sensitivity to the five basic tastes? Chemical Senses, 26, 845–860. http://doi.org/10.1093/chemse/28.5.397
National Health Service. (2015). 5 A Day portion sizes. Retrieved January 30, 2018, from https://www.nhs.uk/Livewell/5ADAY/Pages/Portionsizes.aspx
Norman, G. (2010). Likert scales, levels of measurement and the “laws” of statistics. Advances in Health Sciences Education, 15, 625–632. http://doi.org/10.1007/s10459-010-9222-y
Nugrahedi, P. Y., Verkerk, R., Widianarko, B., & Dekker, M. (2015). A mechanistic perspective on process-induced changes in glucosinolate content in Brassica vegetables: A review. Critical Reviews in Food Science and Nutrition, 55, 823–838. http://doi.org/10.1080/10408398.2012.688076
Nunn, M. D., Giraud, D. W., Parkhurst, A. M., Hamouz, F. L., & Driskell, J. A. (2006). Effects of cooking methods on sensory qualities and carotenoid retention in selected vegetables. Journal of Food Quality, 29, 445–457.

References
177
Office for National Statistics. (2015). Harmonised concepts and questions for social data sources. Retrieved May 1, 2015, from https://www.ons.gov.uk/ons/guide-method/harmonisation/primary-set-of-harmonised-concepts-and-questions/ethnic-group.pdf
Ooi, S.-X., Lee, P.-L., Law, H.-Y., & Say, Y.-H. (2010). Bitter receptor gene (TAS2R38) P49A genotypes and their associations with aversion to vegetables and sweet/fat foods in Malaysian subjects. Asia Pacific Journal of Clinical Nutrition, 19(4), 491–498.
Othman, K. I., Ab Karim, M. S., Karim, R., Adzhan, N., Abdul Halim, N., & Osman, S. (2012). Factors influencing fruits and vegetables consumption behaviour among adults in Malaysia. Journal of Agribusiness Marketing, 5, 29–46.
Padiglia, A., Zonza, A., Atzori, E., Chillotti, C., Calò, C., Tepper, B. J., & Barbarossa, I. T. (2010). Sensitivity to 6-n-propylthiouracil is associated with gustin (carbonic anhydrase VI) gene polymorphism, salivary zinc, and body mass index in humans. American Journal of Clinical Nutrition, 92, 539–545. http://doi.org/10.3945/ajcn.2010.29418
Padilla, G., Cartea, M. E., Velasco, P., de Haro, A., & Ordás, A. (2007). Variation of glucosinolates in vegetable crops of Brassica rapa. Phytochemistry, 68, 536–545. http://doi.org/10.1016/j.phytochem.2006.11.017
Pasini, F., Verardo, V., Caboni, M. F., & D’Antuono, L. F. (2012). Determination of glucosinolates and phenolic compounds in rocket salad by HPLC-DAD-MS: Evaluation of Eruca sativa Mill. and Diplotaxis tenuifolia L. genetic resources. Food Chemistry, 133, 1025–1033. http://doi.org/10.1016/j.foodchem.2012.01.021
Pasini, F., Verardo, V., Cerretani, L., Caboni, M. F., & D’Antuono, L. F. (2011). Rocket salad (Diplotaxis and Eruca spp.) sensory analysis and relation with glucosinolate and phenolic content. Journal of the Science of Food and Agriculture, 91, 2858–2864. http://doi.org/10.1002/jsfa.4535
Pelchat, M. L., & Pliner, P. (1995). “ Try it . You’ll like it.” Effects of information on willingness to try novel foods. Appetite, 24, 153–166. http://doi.org/10.1016/S0195-6663(95)99373-8
Pereira, F. M. V., Rosa, E., Fahey, J. W., Stephenson, K. K., Carvalho, R., & Aires, A. (2002). Influence of temperature and ontogeny on the levels of glucosinolates in broccoli (Brassica oleracea var. italica) sprouts and their effect on the induction of mammalian phase 2 enzymes. Journal of Agricultural and Food Chemistry, 50, 6239–6244. http://doi.org/10.1021/jf020309x
Pérez-Rodrigo, C., Ribas, L., Serra-Majem, L., & Aranceta, J. (2003). Food preferences of Spanish children and young people: the enKid study. European Journal of Clinical Nutrition, 57 Suppl 1, S45-8. http://doi.org/10.1038/sj.ejcn.1601814
Petersen, M. A. (1993). Influence of sous vide processing, steaming and boiling on vitamin retention and sensory quality in broccoli florets. Zeitschrift Für Lebensmittel-Untersuchung Und -Forschung, 197, 375–380. http://doi.org/10.1007/BF01242064
Pliner, P., & Hobden, K. (1992). Development of a scale to measure the trait of food neophobia in humans. Appetite, 19, 105–120. http://doi.org/10.1016/0195-6663(92)90014-W
Podsedek, A. (2007). Natural antioxidants and antioxidant capacity of Brassica vegetables: A review. LWT - Food Science and Technology, 40, 1–11. http://doi.org/10.1016/j.lwt.2005.07.023

References
178
Poelman, A. A. M., Delahunty, C. M., & de Graaf, C. (2013). Cooking time but not cooking method affects children’s acceptance of Brassica vegetables. Food Quality and Preference, 28, 441–448. http://doi.org/10.1016/j.foodqual.2012.12.003
Pollard, J., Kirk, S. F. L., & Cade, J. E. (2002). Factors affecting food choice in relation to fruit and vegetable intake: a review. Nutrition Research Reviews, 15, 373–387. http://doi.org/10.1079/NRR200244
Prescott, J. (2012). Taste matters. London, UK: Reaktion Books Ltd.
Prescott, J. (2015). Multisensory processes in flavour perception and their influence on food choice. Current Opinion in Food Science, 3, 47–52. http://doi.org/10.1016/j.cofs.2015.02.007
Prescott, J., Lee, S. M., & Kim, K.-O. (2011). Analytic approaches to evaluation modify hedonic responses. Food Quality and Preference, 22, 391–393. http://doi.org/10.1016/j.foodqual.2011.01.007
Prodi, D. A., Drayna, D., Forabosco, P., Palmas, M. A., Maestrale, G. B., Piras, D., Pirastu, M., & Angius, A. (2004). Bitter taste study in a Sardinian genetic isolate supports the association of phenylthiocarbamide sensitivity to the TAS2R38 bitter receptor gene. Chemical Senses, 29, 697–702. http://doi.org/10.1093/chemse/bjh074
Rangkadilok, N., Nicolas, M. E., Bennett, R. N., Premier, R. R., Eagling, D. R., & Taylor, P. W. J. (2002). Developmental changes of sinigrin and glucoraphanin in three Brassica species (Brassica nigra, Brassica juncea and Brassica oleracea var. italica). Scientia Horticulturae, 96, 11–26. http://doi.org/10.1016/S0304-4238(02)00118-8
Reinaerts, E., Nooijer, J. De, Candel, M., & Vries, N. De. (2007). Explaining school children’s fruit and vegetable consumption : The contributions of availability , accessibility , exposure , parental consumption and habit in addition to psychosocial factors. Appetite, 48, 248–258. http://doi.org/10.1016/j.appet.2006.09.007
Riboli, E., & Norat, T. (2003). Epidemiologic evidence of the protective effect of fruit and vegetables on cancer risk. American Journal of Clinical Nutrition, 78(suppl), 559S–569S.
Rosa, E. A. S. (1997). Glucosinolates from flower buds of Portuguese Brassica Crops. Phytochemistry, 44(8), 1415–1419.
Rosa, E. A. S., Heaney, R. K., Portas, C. A. M., & Fenwick, G. R. (1996). Changes in glucosinolate concentrations in Brassica crops (B. oleracea and B. napus) throughout growing seasons. Journal of the Science of Food and Agriculture, 71, 237–244. http://doi.org/10.1002/(SICI)1097-0010(199606)71:2<237::AID-JSFA574>3.0.CO;2-P
Russell, C. G., & Worsley, A. (2008). A population-based study of preschoolers’ food neophobia and its associations with food preferences. Journal of Nutrition Education and Behavior, 40, 11–19. http://doi.org/10.1016/j.jneb.2007.03.007
Rutherford, L., Sharp, C., Bromley, C., Bradshaw, P., Corbett, J., Day, J., Doig, M., Dowling, S., Gharib, W., Gray, L., Hill, T., Leyland, A., McManus, S., Mindell, J., Pickering, K., Reid, S., Roth, M., & Whalley, R. (2012). The Scottish Health Survey 2011: Volume 2: Children. The Scottish Government (Vol. 2). Edinburgh.
References
179
Sacerdote, C., Guarrera, S., Smith, G. D., Grioni, S., Krogh, V., Masala, G., Mattiello, A., Palli, D., Panico, S., Tumino, R., Veglia, F., Matullo, G., & Vineis, P. (2007). Lactase persistence and bitter taste response: Instrumental variables and Mendelian randomization in epidemiologic studies of dietary factors and cancer risk. American Journal of Epidemiology, 166(5), 576–581. http://doi.org/10.1093/aje/kwm113
Sandell, M. A., & Breslin, P. A. S. (2006). Variability in a taste-receptor gene determines whether we taste toxins in food. Current Biology, 16(18), R792–R794. http://doi.org/10.1016/j.cub.2006.08.049
Sandell, M., Hoppu, U., Lundén, S., Salminen, M., Puolimatka, T., Laaksonen, O., Laitinen, K., & Hopia, A. (2015). Consumption of lingonberries by TAS2R38 genotype and sensory quality of texture-designed lingonberry samples. Food Quality and Preference, 45, 166–170. http://doi.org/10.1016/j.foodqual.2015.06.015
Sandell, M., Hoppu, U., Mikkilä, V., Mononen, N., Kähönen, M., Männistö, S., Rönnemaa, T., Viikari, J., Lehtimäki, T., & Raitakari, O. T. (2014). Genetic variation in the hTAS2R38 taste receptor and food consumption among Finnish adults. Genes and Nutrition, 9(433), 1–8. http://doi.org/10.1007/s12263-014-0433-3
Schaal, B., Marlier, L., & Soussignan, R. (2000). Human foetuses learn odours from their pregnant mother’s diet. Chemical Senses, 25, 729–737. http://doi.org/10.1093/chemse/25.6.729
Schaefer, E. J., Augustin, J. L., Schaefer, M. M., Rasmussen, H., Ordovas, J. M., Dallal, G. E., & Dwyer, J. T. (2000). Lack of efficacy of a food-frequency questionnaire in assessing dietary macronutrient intakes in subjects consuming diets of known composition. American Journal of Clinical Nutrition, 71, 746–751.
Schiffman, S., Orlandi, M., & Erickson, R. (1979). Changes in taste and smell with age: biological aspects. Sensory Systems and Communication in the Elderly, 10, 247–268.
Schnepf, M., & Driskell, J. (1994). Sensory attributes and nutrient retention in selected vegetables prepared by conventional and microwave methods. Journal of Food Quality, 17, 87–99. http://doi.org/10.1111/j.1745-4557.1994.tb00135.x
Schonhof, I., Krumbein, A., & Brückner, B. (2004). Genotypic effects on glucosinolates and sensory properties of broccoli and cauliflower. Nahrung/Food, 48(1), 25–33. http://doi.org/10.1002/food.200300329
Schwartz, C., Issanchou, S., & Nicklaus, S. (2009). Developmental changes in the acceptance of the five basic tastes in the first year of life. British Journal of Nutrition, 102, 1375–1385. http://doi.org/10.1017/S0007114509990286
Segovia, C., Hutchinson, I., Laing, D. G., & Jinks, A. L. (2002). A quantitative study of fungiform papillae and taste pore density in adults and children. Developmental Brain Research, 138, 135–146. http://doi.org/10.1016/S0165-3806(02)00463-7
Şengül, M., Yildiz, H., & Kavaz, A. (2014). The effect of cooking on total polyphenolic content and antioxidant activity of selected vegetables. International Journal of Food Properties, 17(3), 481–490. http://doi.org/10.1080/10942912.2011.619292
Shahbake, M., Hutchinson, I., Laing, D. G., & Jinks, A. L. (2005). Rapid quantitative assessment of fungiform papillae density in the human tongue. Brain Research, 1052, 196–201. http://doi.org/10.1016/j.brainres.2005.06.031
References
180
Shelp, B. J., Liu, L., & McLellan, D. (1993). Glucosinolate composition of broccoli (Brassica oleacea var. italica ) grown under various boron treatments at three Ontario sites. Canadian Journal of Plant Science, 73, 885–888. http://doi.org/10.4141/cjps93-115
Shen, Y., Kennedy, O. B., & Methven, L. (2016). Exploring the effects of genotypical and phenotypical variations in bitter taste sensitivity on perception, liking and intake of brassica vegetables in the UK. Food Quality and Preference, 50, 71–81. http://doi.org/10.1016/j.foodqual.2016.01.005
Shepherd, R. (1999). Social determinants of food choice. Proceedings of the Nutrition Society, 58, 807–812. http://doi.org/doi:10.1017/S0029665199001093
Shiferaw, B., Verrill, L., Booth, H., Zansky, S. M., Norton, D. M., Crim, S., & Henao, O. L. (2012). Sex-based differences in food consumption: Foodborne diseases active surveillance network (FoodNet) population survey, 2006-2007. Clinical Infectious Diseases, 54(S5), S453–S457. http://doi.org/10.1093/cid/cis247
Shim, J.-S., Oh, K., & Kim, H. C. (2014). Dietary assessment methods in epidemiologic studies. Epidemiology and Health, 36, e2014009. http://doi.org/10.4178/epih/e2014009
Skinner, J., Carruth, B. R., Moran III, J., Houck, K., Schmidhammer, J., Reed, A., Coletta, F., Cotter, R., & Ott, D. (1998). Toddlers’ food preferences : Concordance with family members’ preferences. Journal of Nutrition Education, 30, 17–22.
Skinner, J. D., Carruth, B. R., Bounds, W., & Ziegler, P. J. (2002). Children’s food preferences: A longitudinal analysis. Journal of the American Dietetic Association, 102, 1638–1647.
Slavin, J. L., & Lloyd, B. (2012). Health benefits of fruits and vegetables. Advances in Nutrition, 3, 506–516. http://doi.org/10.3945/an.112.002154.506
Song, L., & Thornalley, P. J. (2007). Effect of storage, processing and cooking on glucosinolate content of Brassica vegetables. Food and Chemical Toxicology, 45, 216–224. http://doi.org/10.1016/j.fct.2006.07.021
Spence, C., Hobkinson, C., Gallace, A., & Fiszman, B. P. (2013). A touch of gastronomy. Flavour, 2, 14. http://doi.org/10.1186/2044-7248-2-14
Steiner, J. E., Glaser, D., Hawilo, M. E., & Berridge, K. C. (2001). Comparative expression of hedonic impact: affective reactions to taste by human infants and other primates. Neuroscience and Biobehavioral Reviews, 25, 53–74. http://doi.org/10.1016/S0149-7634(00)00051-8
Stone, H., & Sidel, J. L. (2004). Sensory evaluation practices (3rd ed.). San Diego, CA: Academic Press.
Suomela, J.-P., Vaarno, J., Sandell, M., Lehtonen, H.-M., Tahvonen, R., Viikari, J., & Kallio, H. (2012). Children’s hedonic response to berry products : Effect of chemical composition of berries and hTAS2R38 genotype on liking. Food Chemistry, 135, 1210–1219. http://doi.org/10.1016/j.foodchem.2012.05.079
Tepper, B. J. (1998). 6-n-propylthiouracil : A genetic marker for taste, with implications for food preference and dietary habits. The American Journal of Human Genetics, 63, 1271–1276. http://doi.org/10.1086/302124
Tepper, B. J. (2008). Nutritional implications of genetic taste variation: The role of PROP sensitivity and other taste phenotypes. Annual Review of Nutrition, 28, 367–388. http://doi.org/10.1146/annurev.nutr.28.061807.155458
References
181
Tepper, B. J., Banni, S., Melis, M., Crnjar, R., & Barbarossa, I. T. (2014). Genetic sensitivity to the bitter taste of 6-n-propylthiouracil (PROP) and its association with physiological mechanisms controlling Body Mass Index (BMI). Nutrients, 6, 3363–3381. http://doi.org/10.3390/nu6093363
Tepper, B. J., Christensen, C. M., & Cao, J. (2001). Development of brief methods to classify individuals by PROP taster status. Physiology and Behavior, 73, 571–577. http://doi.org/10.1016/S0031-9384(01)00500-5
Timpson, N. J., Christensen, M., Lawlor, D. A., Gaunt, T. R., Day, I. N., Ebrahim, S., & Smith, G. D. (2005). TAS2R38 (phenylthiocarbamide) haplotypes, coronary heart disease traits , and eating behavior in the British Women’s Heart and Health Study. The American Journal of Clinical Nutrition, 81, 1005–1011.
Ton Nu, C., Macleod, P., & Barthelemy, J. (1996). Effects of age and gender on adolescents’ food habits and preferences. Food Quality and Preference, 7(3), 251–262.
Traka, M., & Mithen, R. (2009). Glucosinolates, isothiocyanates and human health. Phytochemistry Reviews, 8, 269–282. http://doi.org/10.1007/s11101-008-9103-7
Turnbull, B., & Matisoo-Smith, E. (2002). Taste sensitivity to 6- n -propylthiouracil predicts acceptance of bitter-tasting spinach in 3-6-7-old children. The American Journal of Clinical Nutrition, 76, 1101–1105.
van Doorn, H. E., van Der Kruk, G. C., van Holst, G.-J., Raaijmakers-Ruijs, N. C. M. E., Postma, E., Groeneweg, B., & Jongen, W. H. F. (1998). The glucosinolates sinigrin and progoitrin are important determinants for taste preference and bitterness of brussels sprouts. Journal of the Science of Food and Agriculture, 78, 30–38.
Van Duyn, M. A. S., & Pivonka, E. (2000). Overview of the health benefits of fruit and vegetable consumption for the dietetics professional: Selected literature. Journal of the American Dietetic Association. http://doi.org/10.1016/S0002-8223(00)00420-X
Velasco, P., Cartea, M. E., Gonzäles, C., Vilar, M., & Ordäs, A. (2007). Factors affecting the glucosinolate content of kale (Brassica oleracea acephala Group). Journal of Agricultural and Food Chemistry, 55, 955–962. http://doi.org/10.1021/jf0624897
Verkerk, R., Schreiner, M., Krumbein, A., Ciska, E., Holst, B., Rowland, I., De Schrijver, R., Hansen, M., Gerhäuser, C., Mithen, R., & Dekker, M. (2009). Glucosinolates in Brassica vegetables: The influence of the food supply chain on intake, bioavailability and human health. Molecular Nutrition and Food Research, 53, S219–S265. http://doi.org/10.1002/mnfr.200800065
Verkerk, R., van der Gaag, M. S., Dekker, M., & Jongen, W. M. F. (1997). Effects of processing conditions on glucosinolates in cruciferous vegetables. Cancer Letters, 114, 193–194. http://doi.org/10.1016/S0304-3835(97)04661-2
Vieites-Outes, C., López-Hernández, J., & Lage-Yusty, M. A. (2016). Modification of glucosinolates in turnip greens (Brassica rapa subsp. rapa L.) subjected to culinary heat processes. CYTA - Journal of Food, 14(4), 536–540. http://doi.org/10.1080/19476337.2016.1154609
Vioque, J., Weinbrenner, T., Castelló, A., Asensio, L., & Garcia de la Hera, M. (2008). Intake of fruits and vegetables in relation to 10-year weight gain among Spanish adults. Obesity, 16, 664–670. http://doi.org/10.1038/oby.2007.121
References
182
Voorrips, L. E., Goldbohm, R. A., van Poppel, G., Sturmans, F., Hermus, R. J. J., & van den Brandt, P. A. (2000a). Vegetable and fruit consumption and risks of colon and rectal cancer in a prospective cohort study. American Journal of Epidemiology, 152(11), 1081–1092.
Voorrips, L. E., Goldbohm, R. A., Verhoeven, D. T. H., van Poppel, G. A. F. C., Sturmans, F., Hermus, R. J. J., & van den Brandt, P. A. (2000b). Vegetable and fruit consumption and lung cancer risk in the Netherlands Cohort Study on Diet and Cancer. Cancer Causes and Control, 11(2), 101–115.
Wang, H., Wu, J., Sun, S., Liu, B., Cheng, F., Sun, R., & Wang, X. (2011). Glucosinolate biosynthetic genes in Brassica rapa. Gene, 487, 135–142. http://doi.org/10.1016/j.gene.2011.07.021
Wardle, J., Carnell, S., & Cooke, L. (2005). Parental control over feeding and children’s fruit and vegetable intake: How are they related? Journal of the American Dietetic Association, 105(2), 227–232. http://doi.org/10.1016/j.jada.2004.11.006
Wardle, J., Cooke, L. J., Gibson, E. L., Sapochnik, M., Sheiham, A., & Lawson, M. (2003a). Increasing children’s acceptance of vegetables; a randomized trial of parent-led exposure. Appetite, 40(2), 155–162. http://doi.org/10.1016/S0195-6663(02)00135-6
Wardle, J., Herrera, M.-L., Cooke, L., & Gibson, E. L. (2003b). Modifying children’s food preferences: the effects of exposure and reward on acceptance of an unfamiliar vegetable. European Journal of Clinical Nutrition, 57(2), 341–348.
Wardle, J., Sanderson, S., Gibson, E. L., & Rapoport, L. (2001). Factor-analytic structure of food preferences in four-year-old children in the UK. Appetite, 37, 217–223. http://doi.org/10.1006/appe.2001.0423
World Health Organisation. (2002). The world health report 2002 - reducing risks, promoting healthy life. Geneva: WHO.
Xu, F., Zheng, Y., Yang, Z., Cao, S., Shao, X., & Wang, H. (2014). Domestic cooking methods affect the nutritional quality of red cabbage. Food Chemistry, 161, 162–167. http://doi.org/10.1016/j.foodchem.2014.04.025
Yackinous, C. A., & Guinard, J.-X. (2002). Relation between PROP (6-n-propylthiouracil) taster status, taste anatomy and dietary intake measures for young men and women. Appetite, 38, 201–209. http://doi.org/10.1006/appe.2001.0481
Yngve, A., Wolf, A., Poortvliet, E., Elmadfa, I., Brug, J., Ehrenblad, B., Franchini, B., Haraldsdóttir, J., Krølner, R., Maes, L., Pérez-Rodrigo, C., Sjöström, M., Thórsdóttir, I., & Klepp, K.-I. (2005). Fruit and vegetable intake in a sample of 11-year-old children in 9 European countries: The pro children cross-sectional survey. Annals of Nutrition and Metabolism, 49, 236–245. http://doi.org/10.1159/000087247
Zajonc, R. B. (1968). Attitudinal effects of mere exposure. Journal of Personality and Social Psychology, 9, 1–27.
Zeinstra, G. G., Koelen, M. A., Kok, F. J., & de Graaf, C. (2010). The influence of preparation method on children’s liking for vegetables. Food Quality and Preference, 21(8), 906–914. http://doi.org/10.1016/j.foodqual.2009.12.006

References
183
Zhang, H., Schonhof, I., Krumbein, A., Gutezeit, B., Li, L., Stützel, H., & Schreiner, M. (2008). Water supply and growing season influence glucosinolate concentration and composition in turnip root (Brassica rapa ssp. rapifera L.). Journal of Plant Nutrition and Soil Science, 171, 255–265. http://doi.org/10.1002/jpln.200700079
Zhao, F., Evans, E. J., Bilsborrow, P. E., & Syers, J. K. (1993). Influence of sulphur and nitrogen on seed yield and quality of low glucosinolate oilseed rape (Brassica napus L). Journal of the Science of Food and Agriculture, 63, 29–37. http://doi.org/10.1002/jsfa.2740630106
Zhao, L., Kirkmeyer, S. V., & Tepper, B. J. (2003). A paper screening test to assess genetic taste sensitivity to 6-n-propylthiouracil. Physiology and Behavior, 78, 625–633. http://doi.org/10.1016/S0031-9384(03)00057-X
Zhu, B., Yang, J., & Zhu, Z. (2013). Variation in glucosinolates in pak choi cultivars and various organs at different stages of vegetative growth during the harvest period. Journal of Zhejiang University. Science. B, 14(4), 309–317. http://doi.org/10.1631/jzus.B1200213

Appendix 1
184
Appendix 1: Titles of oral and poster presentations in conferences
Mohd Nor, N.D., Harvey, K., Houston-Price, C. & Methven, L. (2015). The impact of taste sensitivity and repeated taste exposure on vegetable acceptance in children. In EGEA VII Conference, Milan, Italy (Poster presentation). Mohd Nor, N.D., Harvey, K., Houston-Price, C. & Methven, L. (2016). The impact of taste sensitivity and repeated taste exposure on vegetable acceptance in children. In Food Behaviours in Young Children Symposium, Lyon, France (Poster presentation).
Mohd Nor, N.D., Harvey, K., Houston-Price, C. & Methven, L. (2016). The impact of taste sensitivity and repeated taste exposure on vegetable acceptance in children. In 4th Nursten Postgraduate Flavour Symposium, Reading, UK (Oral presentation).
Mohd Nor, N.D., Harvey, K., Houston-Price, C. & Methven, L. (2016). The impact of taste sensitivity and repeated taste exposure on vegetable acceptance in children. In UK Institute of Food Science and Technology (IFST) Sensory Science Group (SSG) Conference, London, UK (Poster presentation). Mohd Nor, N.D., Harvey, K., Houston-Price, C. & Methven, L. (2016). The impact of taste sensitivity and repeated taste exposure on vegetable acceptance in children. In Doctoral Research Conference, Reading, UK (Poster presentation). Mohd Nor, N.D., Harvey, K., Houston-Price, C. & Methven, L. (2016). The impact of taste sensitivity and repeated taste exposure on vegetable acceptance in children. In 7th European Conference on Sensory and Consumer Research (Eurosense), Dijon, France (Poster presentation). Mohd Nor, N.D., Harvey, K., Houston-Price, C. & Methven, L. (2017). The effect of repeated taste exposure to bitter tasting vegetable in children varying in bitter taste sensitivity. In British Feeding and Drinking Group (BFDG) Annual Meeting, Reading, UK (Oral presentation). Mohd Nor, N.D., Harvey, K., Houston-Price, C. & Methven, L. (2017). The effect of repeated taste exposure to bitter tasting vegetables in children varying in bitter taste sensitivity. In 5th Nursten Postgraduate Flavour Symposium, Belfast, UK (Oral presentation). Mohd Nor, N.D., Harvey, K., Houston-Price, C. & Methven, L. (2017). Assessing the effect of taste genotype and phenotype on repeated taste exposure of a Brassica vegetable. In 12th Pangborn Sensory Science Symposium, Rhode Island, USA (Poster and data snapshot presentation). Mohd Nor, N.D., Harvey, K., Houston-Price, C. & Methven, L. (2017). Assessing the effect of taste genotype and phenotype on repeated taste exposure of a Brassica vegetable. In The Nutrition Society Student Conference, Reading, UK (Flash presentation).

Appendix 2
185
Appendix 2: University of Reading research ethics
SECTION 1: APPLICATION DETAILS 1.1
Project Title: The impact of genetic taste sensitivity and repeated taste exposure on vegetable acceptance in children. Date of Submission: Sept 2014 Proposed start date: November 2014 Proposed End Date: December 2016
1.2
Principal Investigator: Dr Lisa Methven Office room number: FNS Room 2.65b Internal telephone: 8714 Email address: [email protected] Alternative contact telephone: N/A Other applicants: Name: Dr Carmel Houston-Price (Staff) Institution/Department: Psychology Email: [email protected] Name: Dr Kate Harvey (Staff) Institution/Department: Psychology Email: [email protected] Name: Nurfarhana Diana Mohd Nor (Student) Institution/Department: Food and Email: [email protected] Nutritional Sciences Name: Motunrayo Ayomipo Usikalu (Student) Institution/Department: Food and Email: [email protected] Nutritional Sciences Name: Omobolanle Oluwadamilola Oloyede (Student) Institution/Department: Food and Email: [email protected] Nutritional Sciences Name: Stephanie Paige Bull (Student) Institution/Department: Food and Email: [email protected] Nutritional Sciences Name: Sarah Smith (Student) Institution/Department: Food and Email: [email protected] Nutritional Sciences Name: Sahadev Joshi (Student) Institution/Department: Food and Email: [email protected] Nutritional Sciences Name: Megan Rose Downey Institution/Department: Psychology Email: [email protected]
School of Chemistry, Food and Nutritional Sciences and Pharmacy Research Ethics Committee Application Form

Appendix 2
186
Name: Victoria Frances Gerrard Institution/Department: Food and Email: [email protected] Nutritional Sciences Name: Harshita Mullick Institution/Department: Food and Email: [email protected] Nutritional Sciences
1.3 Project Submission Declaration
I confirm that to the best of my knowledge I have made known all information relevant to the Research Ethics Committee and I undertake to inform the Committee of any such information which subsequently becomes available whether before or after the research has begun.
I understand that it is a legal requirement that both staff and students undergo Criminal Records Checks when in a position of trust (i.e. when working with children or vulnerable adults).
I confirm that a list of the names and addresses of the subjects in this project will be compiled and that this, together with a copy of the Consent Form, will be retained within the School for a minimum of five years after the date that the project is completed.
Signed…………………………… (Principal Investigator) Date:…………
…………………………… (Student) Date:………… …………………………… (Other named investigators) Date:………… 1.4
University Research Ethics Committee Applications Projects expected to require review by the University Research Ethics Committee must be reviewed by a member of the School research ethics committee and the Head of School before submission.
Signed……………… (Chair/Deputy Chair of School Committee) Date:…………………… Signed……………… (Head of Department) Date:…………………… Signed……………… (SCFP Ethics Administrator) Date:…………………… SECTION 2: PROJECT DETAILS 2.1
Lay summary Vegetables are a main source of fibre and provide many important micronutrients. Previous studies reported that high consumption of vegetables and fruits reduce the risk of oesophagus, lungs and colorectal cancer (Ribioli & Norat 2003), ischemic heart disease, stroke (Lock et al. 2005) and obesity (Vioque et al. 2008). Even though vegetables give many health benefits, the consumption among children is still low. The National Diet and Nutrition Survey in the United Kingdom from 2008 to 2012 showed that the mean intake of vegetable was 72 g per day for children aged 1.5 to 3 years, 97 g per day for children aged 4 to 10 years and 112 g per day for children aged 11 to 18 years (Bates et al. 2014). It is far from the UK recommended intake, which is similar to WHO recommendations of 400 g per day (Cockroft et al. 2005).

Appendix 2
187
Duffy (2007) suggested that the bitter taste in vegetables is the main cause of low levels of consumption. Humans’ perception of bitter tastes varies between individuals, according to genetic variation (Hayes et al. 2013). PROP (6-n-propylthiouracil) is commonly used in taste phenotype studies (Bartoshuk et al. 1994) as a surrogate for the glucosinolates (bitter compound) found in vegetables (Bell & Tepper 2006). Most vegetables contain this compound especially green (Brassica) vegetables, for example broccoli, brussel sprouts and cabbage as well as turnip and cauliflower. Studies suggest that children who are sensitive to PROP eat less vegetables compared to those who are less sensitive. Perception of PROP bitterness is known to be related to bitter taste receptor gene, TAS2R38. Within the gene, the PAV haplotype is associated with high sensitivity to bitter taste of PROP while AVI haplotype is more common in PROP non-taster. Humans can be classified as super-tasters, medium-tasters and non-tasters based on these 2 haplotypes (Duffy et al. 2010) and they are distributed in the general population with proportions of approximately 25%, 50% and 25% (Bartoshuk et al. 1994). Perception of PROP is also associated with levels of the salivary protein, gustin. It is responsible in promoting and developing taste buds on tongue (Henkin et al. 1999). A study of gustin showed that PROP super-tasters more frequently carried the genotype AA and allele A whereas PROP non-tasters more frequently carried the genotype GG and allele G. In medium tasters, they found allele A was more frequent than allele G (Calo et al. 2011). A third factor associated with PROP tasting ability is the number of fungiform papillae on the tongue. Fungiform papillae are mushroom shaped protrusions embedded with taste buds which contain taste receptor cells and touch fibres (Feeney et al. 2014). Bartoshuk et al. (1994) and Miller & Reedy (1990) reported that super-tasters of the bitter substance of PROP had a larger number of fungiform papillae on the anterior dorsal surface of the tongue compared to medium- and non-tasters. While fungiform papillae density is independent of TAS2R38 genotype status, the effects of papillae density on sensitivity to bitterness vary across the genotype (Hayes et al. 2008). Given the complex relationship between taste genotype and density of fungiform papillae, both types of measure should be collected when assessing PROP sensitivity. Dietary patterns that are adopted in early childhood tend to remain until adolescence (Mannino et al. 2004; Nicklaus et al. 2004). Thus, it is important to know the best strategy to encourage vegetable consumption among children to prevent health problems. Birch (1989) and Pliner (1982) explained that repeated exposure to the taste of a food would increase the acceptance of the food. Numerous previous studies have reported that repeated taste exposure to a particular food or flavor contributes to an increase in consumption of the food among infants, preschoolers and children (Wardle et al. 2003). For example, 49 infants aged 7 month-old showed an increase of intake of disliked vegetable puree after 8 exposures (Maier et al. 2007). A study in the US showed that 10 exposures to carrots, peas, tomatoes and bell peppers increased low-income fourth and fifth graders’ liking scores for all foods except bell peppers (Lakkakula et al. 2010). Although repeated taste exposure has been found to be successful at increasing vegetable acceptance, it is still not known whether exposure works similarly in all individuals, regardless of their sensitivity to bitter tastes, as this has not previously been measured in repeated taste exposure studies. The objective of this study is to determine the effects of repeated taste exposure on the acceptance of vegetable in children with different levels of bitter taste sensitivity, assessed using four type of different measurements (PROP taster status, TAS2R38 genotype, gustin genotype and density of fungiform papillae). If this study finds that repeated taste exposure finds the same positive results in children with high levels of bitter taste sensitivity, this can be used to encourage parents to not give up when offering disliked vegetables to their child.

Appendix 2
188
2.2 Procedure Screening Information Sheet (Appendix A) will be distributed. Consent form to be signed (Appendix B) by parents who agree to allow their child to participate in the study. Study design:
This study involves healthy 2 to 5 year-old children. Four type of bitter taste measurements; TAS2R38 gene, gustin gene, PROP taster status and density of fungiform papillae will be done. A Vegetable Preference and Familiarity Questionnaire (Appendix C) will be distributed to the parents. There will be 2 groups in this study, group A is randomly assigned to the intervention first condition and group B to the control/delayed intervention condition. 10 exposures to the unfamiliar vegetable will be given to the children during intervention over a 3-week period.
Genotypic categorization:
Genotype analyses for alleles of the TAS2R38 and gustin will be performed via collection of buccal cell samples. Samples will be collected by rubbing a sterile cotton swab on the inside of children’s cheeks. Genomic DNA will be extracted following the directions of the manufacturer. Three common single nucleotide polymorphisms (SNPs) within TAS2R38 will be chosen (Kim et al. 2005) which include rs713598 (Ala49Pro), rs1726866 (Val262Ala) and rs10246939 (Val296Ile). Haplotype combinations of PAV and AVI at TAS2R38 will be used to categorise children into the three main TAS2R38 genotype groups; PAV/PAV, PAV/AVI and AVI/AVI. Polymorphisms of gustin include allele A and G. PCR techniques will be used to amplify TAS2R38 and gustin gene. The buccal cell samples collected during this study will be stored under the authority of the School’s Human Tissue Act research licence (currently held by Professor Glen Gibson).
PROP taster status:
PROP taster status will be determined using a method adapted from Keller et al. (2002). Instead of using PROP (6-propyl-2-thiouracil) solution in spring water, impregnated filter paper will be used. The filter paper is impregnated with 50 mmol/L PROP solution. The children will be asked to rinse their mouth with bottled water first and then the filter paper will be placed on the tip of their tongue. Children will be asked the question ‘Do you taste anything?’ If the child responds ‘no’, they will be categorised as a non-taster. Those who report that the filter paper has a taste will be further questioned as to what it tastes like. Responses of ‘bad’, ‘bitter’, ‘sour’ and ‘yucky’ will be recorded as tasters. If a child does not verbally state the filter paper has a taste but exhibits classic rejection signs such as grimacing or frowning, this child will be recorded as a taster.
Fungiform papillae counts: The tip of the anterior surface of tongue will be dried with a filter paper and then stained with blue food colouring using a cotton-tipped applicator. Photographic images of the stained tongue area will be taken using a digital camera. Approximately 3 to 10 images will be taken for each child and the best image will be analysed. All papillae in a 1 cm2 stained area will be counted for each child (Delwiche et al. 2001; Melis et al. 2013). Selection of target vegetable: The target vegetable will be a Brassica vegetable that is least familiar and least consumed by the children. A Brassica vegetable will be used as the target vegetable because this group contains glucosinolate-derived bitter compounds; as the purpose of this study is to measure vegetable intake and liking across individual taste sensitivity, this group of vegetables is best suited to our purpose. Turnip will be used as a target vegetable because based on a previous study, it was likely to be unfamiliar to children in England. A questionnaire will be distributed
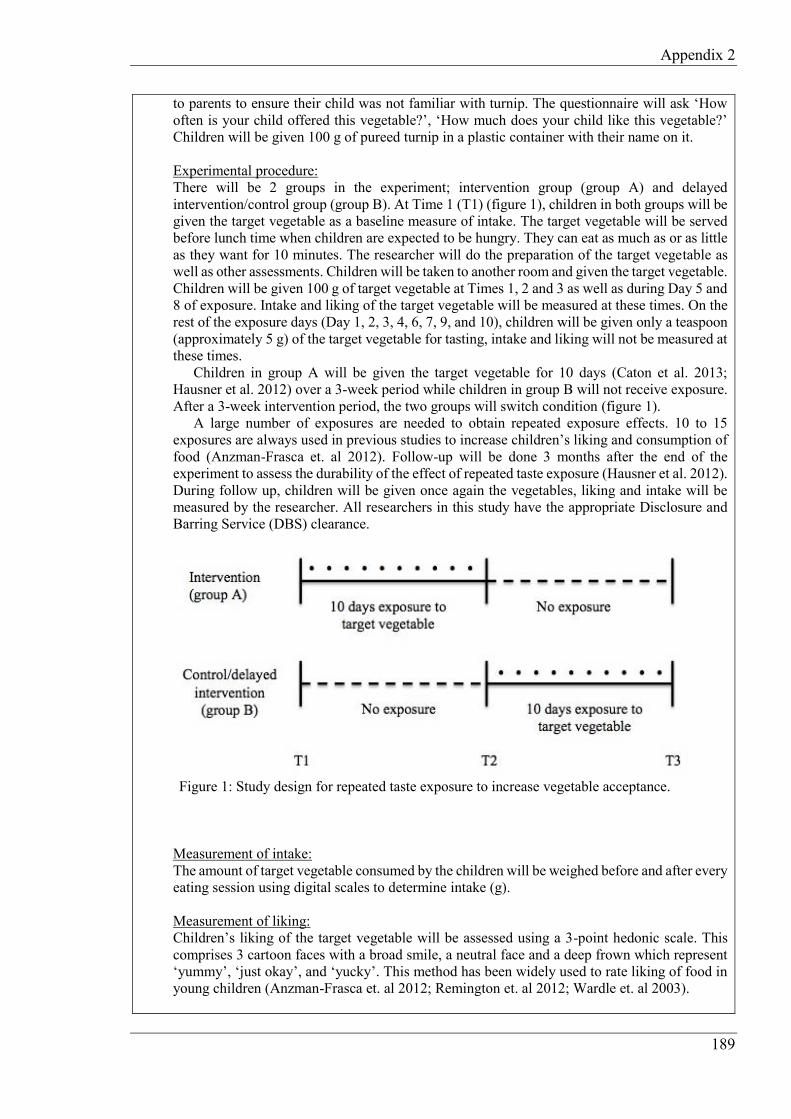
Appendix 2
189
to parents to ensure their child was not familiar with turnip. The questionnaire will ask ‘How often is your child offered this vegetable?’, ‘How much does your child like this vegetable?’ Children will be given 100 g of pureed turnip in a plastic container with their name on it.
Experimental procedure: There will be 2 groups in the experiment; intervention group (group A) and delayed intervention/control group (group B). At Time 1 (T1) (figure 1), children in both groups will be given the target vegetable as a baseline measure of intake. The target vegetable will be served before lunch time when children are expected to be hungry. They can eat as much as or as little as they want for 10 minutes. The researcher will do the preparation of the target vegetable as well as other assessments. Children will be taken to another room and given the target vegetable. Children will be given 100 g of target vegetable at Times 1, 2 and 3 as well as during Day 5 and 8 of exposure. Intake and liking of the target vegetable will be measured at these times. On the rest of the exposure days (Day 1, 2, 3, 4, 6, 7, 9, and 10), children will be given only a teaspoon (approximately 5 g) of the target vegetable for tasting, intake and liking will not be measured at these times. Children in group A will be given the target vegetable for 10 days (Caton et al. 2013; Hausner et al. 2012) over a 3-week period while children in group B will not receive exposure. After a 3-week intervention period, the two groups will switch condition (figure 1). A large number of exposures are needed to obtain repeated exposure effects. 10 to 15 exposures are always used in previous studies to increase children’s liking and consumption of food (Anzman-Frasca et. al 2012). Follow-up will be done 3 months after the end of the experiment to assess the durability of the effect of repeated taste exposure (Hausner et al. 2012). During follow up, children will be given once again the vegetables, liking and intake will be measured by the researcher. All researchers in this study have the appropriate Disclosure and Barring Service (DBS) clearance.
Figure 1: Study design for repeated taste exposure to increase vegetable acceptance.
Measurement of intake: The amount of target vegetable consumed by the children will be weighed before and after every eating session using digital scales to determine intake (g).
Measurement of liking: Children’s liking of the target vegetable will be assessed using a 3-point hedonic scale. This comprises 3 cartoon faces with a broad smile, a neutral face and a deep frown which represent ‘yummy’, ‘just okay’, and ‘yucky’. This method has been widely used to rate liking of food in young children (Anzman-Frasca et. al 2012; Remington et. al 2012; Wardle et. al 2003).
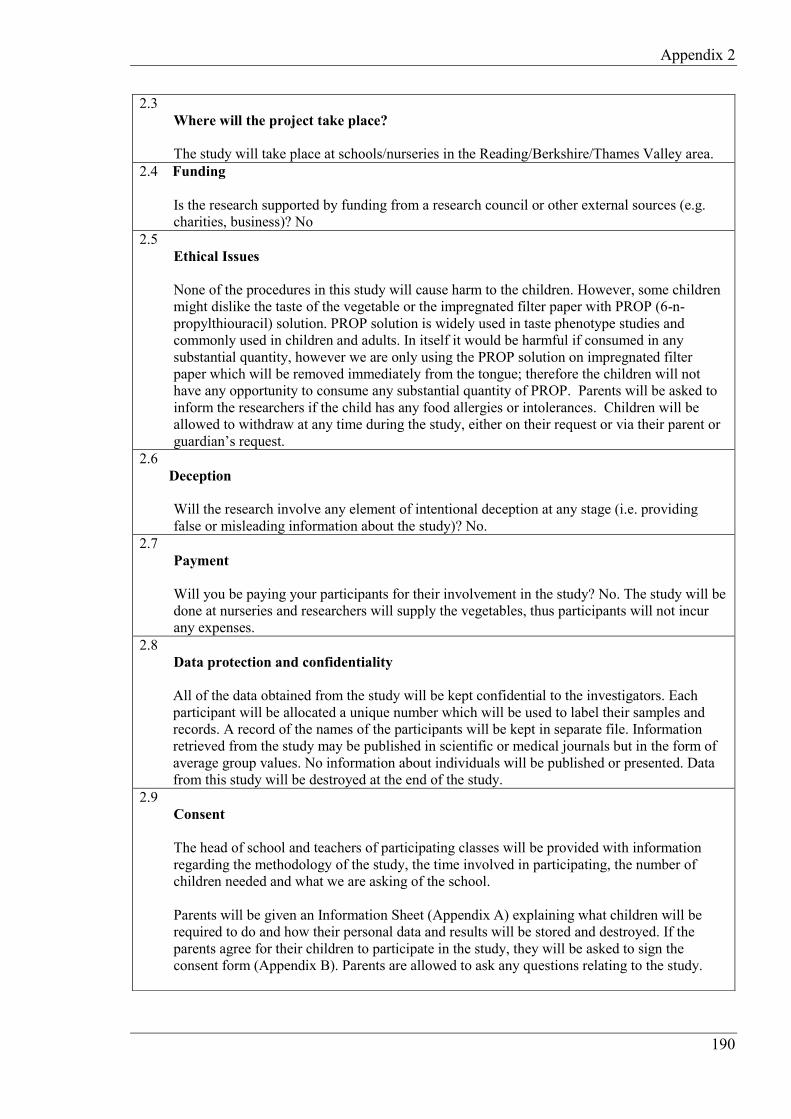
Appendix 2
190
2.3 Where will the project take place?
The study will take place at schools/nurseries in the Reading/Berkshire/Thames Valley area.
2.4 Funding Is the research supported by funding from a research council or other external sources (e.g. charities, business)? No
2.5 Ethical Issues None of the procedures in this study will cause harm to the children. However, some children might dislike the taste of the vegetable or the impregnated filter paper with PROP (6-n-propylthiouracil) solution. PROP solution is widely used in taste phenotype studies and commonly used in children and adults. In itself it would be harmful if consumed in any substantial quantity, however we are only using the PROP solution on impregnated filter paper which will be removed immediately from the tongue; therefore the children will not have any opportunity to consume any substantial quantity of PROP. Parents will be asked to inform the researchers if the child has any food allergies or intolerances. Children will be allowed to withdraw at any time during the study, either on their request or via their parent or guardian’s request.
2.6 Deception
Will the research involve any element of intentional deception at any stage (i.e. providing false or misleading information about the study)? No.
2.7 Payment Will you be paying your participants for their involvement in the study? No. The study will be done at nurseries and researchers will supply the vegetables, thus participants will not incur any expenses.
2.8 Data protection and confidentiality All of the data obtained from the study will be kept confidential to the investigators. Each participant will be allocated a unique number which will be used to label their samples and records. A record of the names of the participants will be kept in separate file. Information retrieved from the study may be published in scientific or medical journals but in the form of average group values. No information about individuals will be published or presented. Data from this study will be destroyed at the end of the study.
2.9 Consent The head of school and teachers of participating classes will be provided with information regarding the methodology of the study, the time involved in participating, the number of children needed and what we are asking of the school. Parents will be given an Information Sheet (Appendix A) explaining what children will be required to do and how their personal data and results will be stored and destroyed. If the parents agree for their children to participate in the study, they will be asked to sign the consent form (Appendix B). Parents are allowed to ask any questions relating to the study.

Appendix 2
191
Once consent forms have been signed and returned, children will be informed on the experiment day of what they will be asked to do and that their parents have allowed them to take part. However, children are allowed to withdraw at any time of the study without giving any reason.
2.10 Genotyping Are you intending to genotype the participants? Which genotypes will be determined? Yes. Genotypic categorization will be done in bitter taste receptor TAS2R38 and gustin gene. SECTION 3: PARTICIPANT DETAILS 3.1 Sample Size Children were divided into 2 groups. In order to estimate the minimum number of participants required in the study, the following assumptions were made with 4.9 g of difference in mean
intake before and after an exposure period with a standard deviation of 8.16 g (Wardle et al., 2003a) and a significance level of p = 0.05 one sided and a power of 80%. Power calculation indicates that 44 children were needed for each group. Taking into account an expected dropout rate of 10%, the total number of children were 48 per group (Group A and B).
In each group, we need enough PAV/PAV and AVI/AVI TAS2R38 genotype to compare the effects of repeated taste exposure between these 2 groups. Assuming that the population to be 25% PAV/PAV, 50% PAV/AVI and 25% AVI/AVI, thus we need twice as many participants which is ~100 participants per group.
3.2 Will the research involve children or vulnerable adults (e.g. adults with mental health problems or neurological conditions)? Yes, children.
Before the test begins, children will be briefed by the school/nursery staff what they are going to do. Children will be asked verbally to ensure they understand what will they do. They and their parents will be told that they are free to withdraw if they do not want to take part.
All investigators on this project have the appropriate Disclosure and Barring Service (DBS)
clearance and will be approved by the university to work with children. 3.3
Will your research involve children under the age of 18 years? Yes Will your research involve children under the age of 5 years? Yes
Children aged 2 to 5 year will be recruiting in this study. 3.4
Will your research involve NHS patients, Clients of Social Services or will GP or NHS databases be used for recruitment purposes? No
n > 2F (σ/d)2
n > 2(7.85) x (8.16/4.9)2
n > 15.7 x 2.77 n > 44

Appendix 2
192
3.5 Recruitment Schools/nurseries will be contacted via letter or email and informed about the study. They will subsequently be contacted by telephone and invited to take part. Information sheets and consent forms will be distributed to all parents. Parents who are interested to let their child to participate in the study will return signed consent forms to the school/nursery.
Appendix 2
193
Information Sheet for Parents Study Title: The impact of genetic taste sensitivity and repeated taste exposure on vegetable acceptance in children. We are inviting children aged between 2 and 5 years to take part in a study aiming to increase their acceptance of vegetables. We know that by tasting vegetables over and over again can help children to like their taste and eat more of them. What we don’t know is whether children who are highly sensitive to bitter tastes benefit from repeatedly tasting vegetables in the same way. This study will examine the effects of repeatedly tasting vegetables in children with high and low levels of bitter taste sensitivity. If you agree to your child taking part, first you need to complete the consent form and questionnaire attached with this information sheet. Your child will be given a small portion of one vegetable type for 10 days over a 3-week period whilst at school/nursery. We will not force your child to eat the vegetables if he/she does not want to. There will be 2 groups of children where one group will start the eating session first and the other one will start a couple of weeks later, your child will be assigned to one of the groups. We will ask your child how much he/she likes the vegetables and weigh how much he/she eats. The nursery staffs will prepare the vegetables according to standard cooking procedures. After your child has completed the 10 taster days, we will measure your child’s bitter taste sensitivity. We do it by 3 simple ways: 1) by gently wiping a cotton swab on the inside of your child’s cheeks. We will use your child’s saliva and look for 2 genes that are linked to bitter taste (TAS2R38 and gustin) 2) by placing a filter paper containing a small amount of bitter compound known as PROP (6-n-propylthiouracil) on the tip of your child’s tongue, this will then be quickly removed. We will measure you child’s ability to taste this bitter compound; and 3) by placing a tiny drop of blue food colouring on the tip of your child’s tongue and take a photograph of the tongue. This allows us to count the number of “bumps” (papillae) on the tongue. None of the procedures in this study will cause harm to your child. PROP solution is widely used in taste phenotype studies and commonly used in children and adults. The PROP solution used in this study is dilute and only a very small amount will be used. We will do a follow-up 3 months after the tastings, where your child will be given the same vegetable to taste and once again we will measure how much your child likes it as well as how much he/she eats of the vegetable. The results will be strictly confidential to the investigators and each child will only be identified by means of a random number allocated at the beginning of the study. Information obtained from the study may be published in scientific journals but only in the form of average values for the group; no results for the individual subjects will be published or presented in scientific meetings. Data from this study will be destroyed at the end of the study. You/your child are free to withdraw from the study at any time and without giving a reason. This will not affect the support your child receives at school/nursery. Please feel free to ask us anything relating the study.
Appendix A
Dr Lisa Methven
+44 (0)118 378 8714
Department of Food and
Nutritional Sciences,
Food Biosciences Building
Whiteknights, PO Box 226
Reading RG6 6AP
phone +44 (0)118 378 8714
Appendix 2
194
The study application has been reviewed by the University Research Ethics Committee and has been given a favourable ethical opinion for conduct. The researchers on this project have been through the formal DBS Disclosure procedure approved by the university to work with children. If you are happy for your child to take part, please complete and sign the consent form as well as the questionnaire attached and return to your child’s class teacher as soon as possible. You must inform the researcher if your child has any food allergies by writing it down on the consent form. Thank you very much for your help. Contact details : Supervisors : Dr Lisa Methven (Department of Food & Nutritional Sciences) [email protected]
0118 378 8714
Dr Carmel Houston-Price (Department of Psychology) [email protected]
Dr Kate Harvey (Department of Psychology) [email protected]
0118 378 7524 Researcher: Nurfarhana Diana

Appendix 2
195
Consent Form
I have read the accompanying Information Sheet relating to the project entitled “The
impact of genetic taste sensitivity and repeated taste exposure on vegetable acceptance in children”, being conducted by Dr Lisa Methven, Dr Carmel Houston-Price, Dr Kate Harvey and Nurfarhana Diana at the University of Reading. This project has been subject to ethical review, according to the procedures specified by the University Research Ethics Committee, and has been given a favourable ethical opinion for conduct.
I have had explained to me the purposes of the project and what will be required of me, and
any questions I had, have been answered to my satisfaction. I agree to the arrangements described in the Information Sheet in so far as they relate to my
child’s participation. I understand that participation is entirely voluntary and that my child may withdraw at any
time he/she wants to and that I also have the right to withdraw my child from the project at any time without giving reason, and that this will be without detriment to any care or services I may be receiving or may receive in the future.
I understand that all personal information will remain confidential to the researchers and
arrangements for the storage and eventual disposal of any identifiable material have been made clear to me.
I confirm that my child has no known food allergies or intolerances other than those listed
below: ______________________ ______________________ ______________________ ______________________ ______________________ I am happy for my child to participate. I have received a copy of this Consent Form and of the accompanying Information Sheet.
Appendix B
Dr Lisa Methven
+44 (0)118 378 8714
Department of Food and
Nutritional Sciences,
Food Biosciences Building
Whiteknights, PO Box 226
Reading RG6 6AP
phone +44 (0)118 378 8714

Appendix 2
196
Name ………………………………… Child’s name ………………………………… Signature ………………………………… Date …………………………………

Appendix 2
197
1 November 2014 Dear …... (Nursery manager), I am a lecturer in Food and Sensory Sciences at the Department of Food and Nutritional Sciences at the University of Reading. I am writing to you to ask for your permission for my PhD student, Nurfarhana Diana to carry out a study involving the children in your school/nursery. The objective of the study is to determine the effects of repeated taste exposure to increase vegetable acceptance in children with different levels of sensitivity to bitter tastes. To complete the project, Farhana will need to recruit children from aged 2 to 5 years. Parents who agree to participate in this study will need to complete a questionnaire. After that, children will be given vegetables to be consumed prior to lunch time for 10 days over a 3-week period. However, there will be 2 groups of children where one group will start the eating session first and the other one will start a bit later. Farhana will measure how much the children like the vegetables by using a simple rating scale and also weight the amount of vegetables consumed. After the 10 eating session have ended, Farhana will need to take measurements of each child’s taste sensitivity and this is done by 3 simple ways: 1) by gently wiping a cotton swab on the inside of children’s cheeks. We will use the saliva and look for 2 genes that are linked to bitter taste (TAS2R38 and gustin) 2) by placing a filter paper containing a small amount of bitter compound known as PROP (6-n-propylthiouracil) on the tip of the children’s tongues, this will then be quickly removed. We will measure the children’s ability to taste this bitter compound; and 3) by placing a tiny drop of blue food colouring on the tip of the children’s tongues and take a photograph of the tongues. This allows us to count the number of “bumps” (papillae) on the tongues. None of the procedures in this study will cause harm to the children. PROP solution is widely used in taste phenotype studies and commonly used in children and adults. The PROP solution used in this study is dilute and only a very small amount will be used. A follow-up will be done 3 months after the tastings, where the children will be given the same vegetable to taste and once again Farhana will measure how much the children like it as well as how much they eat of the vegetable. Farhana is familiar working with children as she is a tutor at Department of Early Childhood Education in a University in Malaysia (Sultan Idris Education University). This study has been reviewed by the University of Reading Research Committee and has been given a favourable ethical opinion for conduct. Farhana has been through the formal DBS Disclosure and approved by the university to work with children. If you agree to let us do the study in your nursery, we would like to ask for your prior assistance. We would be happy if you can distribute letters to all parents, inviting them to participate in the study. The letter asks the parents to inform the researchers if their child has any food allergies. As a thank you, we would like to offer a workshop for parents where Dr Kate Harvey and Dr Lisa Methven, experts in children’s eating behavior and in food science respectively, can talk
Appendix D:
Dr Lisa Methven
+44 (0)118 378 8714
Department of Food and
Nutritional Sciences,
Food Biosciences Building
Whiteknights, PO Box 226
Reading RG6 6AP
phone +44 (0)118 378 8714
Appendix 2
198
about effective strategies for encouraging healthy eating in children. They are happy to run this workshop at the school for all parents. If you have any questions regarding the study, you can always contact me at [email protected] or 0118 378 8714. Farhana will follow up this letter with a phone call in the next few days. Thank you very much for your time. We would be grateful for your help. Yours sincerely, Dr. Lisa Methven Lecturer in Food and Sensory Science, Department of Food and Nutritional Sciences, University of Reading
Appendix 2
199
15 November 2014 Dear Parent, Are you interested in why some children eat vegetables more readily than others? At the University of Reading, we are looking at the effects of a repeated taste exposure to vegetable acceptance in children with different levels of bitter taste sensitivity. Your child’s school/nursery has agreed to participate in this study and therefore we are asking if you would like for your child to take part. We have attached an information sheet that describes our study. If you are happy to let your child participate, please complete the attached consent form and return to your child’s class teacher as soon as possible. Please inform us if your child has any food allergies. As a thank you, we would like to offer a workshop for parents where Dr Kate Harvey and Dr Lisa Methven, experts in children’s eating behavior and in food science respectively, can talk about effective strategies for encouraging healthy eating in children. They are happy to run this workshop at the school/nursery for all parents. If you have any questions regarding the study, you are free to contact me at [email protected] or 0118 378 8714. Thank you for your support, Dr. Lisa Methven Lecturer in Food and Sensory Science, Department of Food and Nutritional Sciences, University of Reading
Appendix E:
Dr Lisa Methven
+44 (0)118 378 8714
Department of Food and
Nutritional Sciences,
Food Biosciences Building
Whiteknights, PO Box 226
Reading RG6 6AP
phone +44 (0)118 378 8714

Appendix 2
200
REMINDER:
Dear Parent, You may recall receiving a letter about our study. I have included the letter below in case you no longer have it. This research is important because we want to know the effects of repeated taste exposure on the vegetable acceptance in children with different level of bitter taste sensitivity and hopefully the findings of the study would give an idea to parents on how to encourage their child to eat more vegetables. If you would be willing to let your child participate in our study, please return the completed consent form to your child’s class teacher. Thank you for your time and support. Sincerely, Nurfarhana Diana, PhD student, Food and Nutritional Sciences, University of Reading
Appendix F:
Dr Lisa Methven
+44 (0)118 378 8714
Department of Food and
Nutritional Sciences,
Food Biosciences Building
Whiteknights, PO Box 226
Reading RG6 6AP
phone +44 (0)118 378 8714

Appendix 2
201
Prize draw to win a £25 groceries VOUCHER!!
(open to families participating in our study)
Prize draw to win a £25 groceries VOUCHER!!
(open to families participating in our study)
Prize draw to win a £25 groceries VOUCHER!!
(open to families participating in our study)
Prize draw to win a £25 groceries VOUCHER!!
(open to families participating in our study)
Prize draw to win a £25 groceries VOUCHER!!
(open to families participating in our study)
Prize draw to win a £25 groceries VOUCHER!!
(open to families participating in our study)
Prize draw to win a £25 groceries VOUCHER!!
(open to families participating in our study)
Prize draw to win a £25 groceries VOUCHER!!
(open to families participating in our study)
Prize draw to win a £25 groceries VOUCHER!!
(open to families participating in our study)
Prize draw to win a £25 groceries VOUCHER!!
(open to families participating in our study)
Appendix G:

Appendix 2
202
Newsletter Is your child in Nursery or Reception? The University of Reading is conducting a study here at (name of the school/nursery) to see if children's liking for a vegetable is affected by repeatedly tasting it. Participating children will be given a teaspoon of a vegetable to taste over 10 school days and have their taste sensitivity measured. We hope the findings of the study will be useful to help parents encourage children to eat more vegetables. Don’t miss this chance to let your child to participate in the study!
Appendix H:

Appendix 2
203
School of Chemistry, Food and Pharmacy Research Ethics Committee
Application Form for Internal Approval
SECTION 1: APPLICATION DETAILS 1.1
Project Title: Exploring the Drivers of liking of different preparation methods of turnip. Date of Submission: 21/11/16 Proposed start date: 5/12/16 Proposed End Date: 31/3/17
1.2
Principal Investigator: Dr Lisa Methven Office room number: FNS Room 2.65b Internal telephone: 8714 Email address: [email protected] Alternative contact telephone: N/A Other applicants: Name: Harshita Mullick (Student) Institution/Department: Food and Email: [email protected] Nutritional Sciences
Name: Nurfarhana Diana Mohd Nor (Student) Institution/Department: Food and Email: [email protected] Nutritional Sciences
…. 1.3
Project Submission Declaration
I confirm that to the best of my knowledge I have made known all information relevant to the SCFP Research Ethics Committee and I undertake to inform the Committee of any such information which subsequently becomes available whether before or after the research has begun.
I understand that it is a legal requirement that both staff and students undergo Criminal Records Checks when in a position of trust (i.e. when working with children or vulnerable adults).
I confirm that a list of the names and addresses of the subjects in this project will be compiled and that this, together with a copy of the Consent Form, will be retained within the School for a minimum of five years after the date that the project is completed.
Signed…………………………… (Principal Investigator) Date:…………
…………………………… (Student) Date:………… …………………………… (Other named investigators) Date:…………
…………………………… (Other named investigators) Date:…………
Appendix 2
204
1.4 SCFP (Internal Approval) Ethics Committee Applications Projects expected to require review by the SCFP Ethics Committee must be reviewed by a member of the School research ethics committee and the Head of School before submission.
Signed……………… (Chair/Deputy Chair of School Committee) Date:…………………… Signed……………… (Head of Department) Date:…………………… Signed……………… (SCFP Ethics Administrator) Date:…………………… SECTION 2: PROJECT DETAILS 2.1
Please provide a summary of the project in non-specialist terms that could be understood by non-scientist members of the public, which includes a description of the scientific background to the study (existing knowledge), the scientific questions the project will address and a justification of these. Please note that the description must be sufficient for the committee to take a reasonable view on the likely scientific rigour and value of the project
An on-going study in our research group (UREC 14_40) is investigating the impact of
taste sensitivity and repeated taste exposure of vegetable acceptance in children (Researcher: Nurfarhana Nor), focusing specifically on Turnip, a brassica vegetable that is bitter due to its glucosinolate content. Existing literature reports sensory properties to be a main factor limiting vegetable intake in youth (Dinnella et al.2016). It has been suggested that the vegetable preparation method has a large impact on children’s overall liking; influenced by appearance, texture and taste (Zeinstra et al., 2010). Donadini et al., (2012) found vegetable acceptance was significantly related to sensory characteristics; sweetness and colour intensity affected acceptance positively while bitterness, brown colouring and tough texture lowered acceptance.
The characteristic bitter taste of Brassica vegetables is largely due to their glucosinolate content, and sensitivity to such bitterness is directly influenced by genotype for the bitter receptor T2R38 as well as indirectly by gustin genotype which relates to taste cell proliferation (Shen et al., 2016). However the bitterness of brassica is also effected by cooking time and method. In addition, the cooking method will also alter the other properties of the brassica vegetable, for example appearance and texture, as well as other taste and flavour characteristics. The hypothesis of the main study (UREC14_40) is that bitter taste sensitivity may influence children’s liking for brassica vegetables (specifically Turnip) and that this may modify the successfulness of repeated exposure. However, we do not know that bitter taster is a main driver of acceptance or rejection of turnip. Therefore, this additional study investigates possible drivers of liking of turnips, although with adult consumers rather than children.
References: Dinnella, C., Morizet, D., Masi, C. & Cliceri, D. (2016). Sensory determinants of stated liking
for vegetable names and actual liking for canned vegetables: A cross-country study among European adolescents. Appetite, 107, 339-347.
Donadini, G., Fumi, M. D. & Porretta, S. (2012). Influence of preparation method on the
hedonic response of preschoolers to raw, boiled or oven-baked vegetables. Lwt-Food Science and Technology, 49 (2), 282-292.
Shen, Y., Kennedy, O. B. & Methven, L. (2016) Exploring the effects of genotypical and
phenotypical variations in bitter taste sensitivity on perception, liking and intake of brassica vegetables in the UK. Food quality and preference, 50, 71-81.

Appendix 2
205
Zeinstra, G. G., Koelen, M., Kok, F. J. & Graaf, d. (2010). The influence of preparation method on children's liking for vegetables. Food quality and preference, 21 (8), 906-914
(This box may be expanded as required – Word Limit Maximum 250)
2.2 Procedure Please describe concisely what the study will involve for your participants and the procedures and methodology to be undertaken (you may expand this box as required). Study design: This study involves adult participants who will be tested for one bitter phenotype (PROP taster status) and two bitter genotype measures (TAS2R38 gene (rs713598, rs1726866, rs10246939), gustin (CA6) gene (rs2274333)). Each participant will take part in a consumer test where they will taste turnip samples prepared by four different cooking methods ((i) steamed and pureed, (ii) roasted, (iii) Boiled and pureed, (iv) stir-fried) and asked to rate their liking and provide comments. Bitter Taste Phenotype (PROP taster status): PROP taster status will be determined using a method adapted from Keller et al. (2002). Instead of using PROP (6-propyl-2-thiouracil) solution in spring water, impregnated filter paper will be used. The filter paper is impregnated with 50 mmol/L PROP solution. The participants will be asked to rinse their mouth with bottled water first and then the filter paper will be placed on the tip of their tongue. Participants will be asked the question ‘Do you taste anything?’ If the participant responds ‘no’, they will be categorised as a non-taster. Those who report that the filter paper has a taste will be further questioned as to what it tastes like, individuals who detect bitterness will be recorded as tasters. (This is the same methods as used in UREC 14_40). Genotypic categorization: Genotype analyses for alleles of the TAS2R38 and gustin (CA6) will be performed via collection of buccal cell samples. Samples will be collected by rubbing a sterile cotton swab on the inside of the participant’s cheeks. Genomic DNA will be extracted following the directions of the manufacturer. Three common single nucleotide polymorphisms (SNPs) within TAS2R38 will be chosen (Kim et al. 2005) which include rs713598 (Ala49Pro), rs1726866 (Val262Ala) and rs10246939 (Val296Ile). Haplotype combinations of PAV and AVI at TAS2R38 will be used to categorise participants into the three main TAS2R38 genotype groups; PAV/PAV, PAV/AVI and AVI/AVI. Polymorphisms of gustin at SNP rs2274333 include allele A and G. PCR techniques will be used to amplify TAS2R38 and gustin gene. The buccal cell samples collected during this study will be stored under the authority of the School’s Human Tissue Act research licence (currently held by Professor Glen Gibson).
Liking and perception of Turnip samples: The different turnips will be presented to participants in a balanced order. Participants will be asked to first rate their liking of the sample appearance and then to taste the sample. They will be then asked to rate their overall liking of the sample, followed by questions related to the modalities of taste and texture. For taste they will be asked to first rate their perception of the bitter and sweet taste using LMS (labelled magnitude scales).Finally they will be asked how much they like the texture of the sample. All liking ratings will be taken on 9 point hedonic scales (from dislike extremely to like extremely). They will also be asked for free comments regarding their like and dislike of the samples. Additional Measures: The consumers will be asked standard demographic questions relating to socio-economic group, age, sex and ethnicity. They will also be asked how many times per week they consume a range of brassica and non-brassica vegetables.
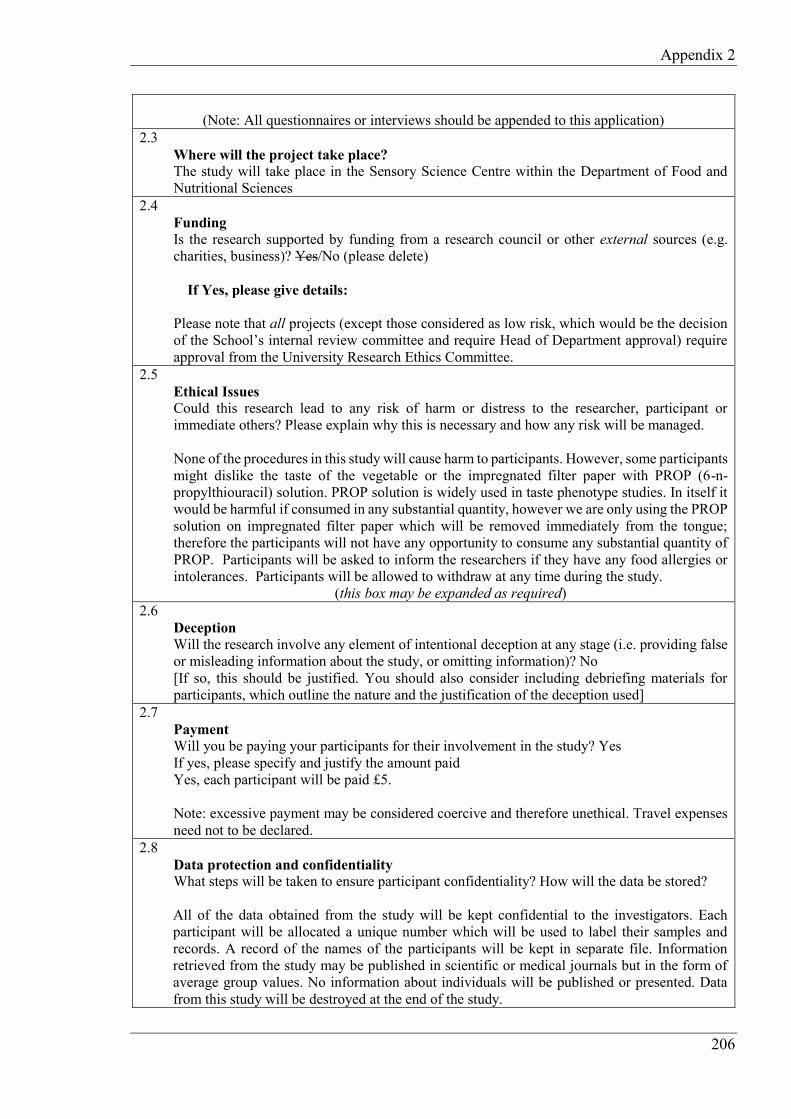
Appendix 2
206
(Note: All questionnaires or interviews should be appended to this application)
2.3 Where will the project take place? The study will take place in the Sensory Science Centre within the Department of Food and Nutritional Sciences
2.4 Funding Is the research supported by funding from a research council or other external sources (e.g. charities, business)? Yes/No (please delete)
If Yes, please give details:
Please note that all projects (except those considered as low risk, which would be the decision of the School’s internal review committee and require Head of Department approval) require approval from the University Research Ethics Committee.
2.5 Ethical Issues Could this research lead to any risk of harm or distress to the researcher, participant or immediate others? Please explain why this is necessary and how any risk will be managed. None of the procedures in this study will cause harm to participants. However, some participants might dislike the taste of the vegetable or the impregnated filter paper with PROP (6-n-propylthiouracil) solution. PROP solution is widely used in taste phenotype studies. In itself it would be harmful if consumed in any substantial quantity, however we are only using the PROP solution on impregnated filter paper which will be removed immediately from the tongue; therefore the participants will not have any opportunity to consume any substantial quantity of PROP. Participants will be asked to inform the researchers if they have any food allergies or intolerances. Participants will be allowed to withdraw at any time during the study.
(this box may be expanded as required) 2.6
Deception Will the research involve any element of intentional deception at any stage (i.e. providing false or misleading information about the study, or omitting information)? No [If so, this should be justified. You should also consider including debriefing materials for participants, which outline the nature and the justification of the deception used]
2.7 Payment Will you be paying your participants for their involvement in the study? Yes If yes, please specify and justify the amount paid Yes, each participant will be paid £5.
Note: excessive payment may be considered coercive and therefore unethical. Travel expenses need not to be declared.
2.8 Data protection and confidentiality What steps will be taken to ensure participant confidentiality? How will the data be stored? All of the data obtained from the study will be kept confidential to the investigators. Each participant will be allocated a unique number which will be used to label their samples and records. A record of the names of the participants will be kept in separate file. Information retrieved from the study may be published in scientific or medical journals but in the form of average group values. No information about individuals will be published or presented. Data from this study will be destroyed at the end of the study.

Appendix 2
207
2.9 Consent Please describe the process by which participants will be informed about the nature of the study and the process by which you will obtain consent
Potential volunteers will be contacted by email or phone. They will be given an information sheet about the study. Informed consent will be taken by a trained researcher prior to study entry (Appendix C). The signed consent forms will be stored in a locked cabinet for a 5-year period. Please note that a copy of consent forms and information letters for all participants must be appended to this application.
2.10 Genotyping Are you intending to genotype the participants? Which genotypes will be determined?
Yes. Genotypic categorization will be done in bitter taste receptor TAS2R38 and gustin (CA6) gene. Please note that a copy of all information sheets on the implications of determining the specific genotype(s) to be undertaken must be appended to this application.
SECTION 3: PARTICIPANT DETAILS 3.1
Sample Size How many participants do you plan to recruit? Please provide a suitable power calculation demonstrating how the sample size has been arrived at or a suitable justification explaining why this is not possible/appropriate for the study.
100 Participants will be recruited in total, which should ensure approximately 25 participants of PAV/PAV and AVI/AVI TAS2R38 genotype and 50 of PAV/AVI. Using power calculations there is 80 % chance of detecting a difference of size 1.0 (on a 9 point hedonic scale) between two means at the 95 % confidence interval with 23 participants, allowing a standard deviation of 1.5. Therefore approximately 25 people in each group should be sufficient to detect meaningful differences in liking.
3.2 Will the research involve children or vulnerable adults (e.g. adults with mental health problems or neurological conditions)? Yes/No (delete) If yes, how will you ensure these participants fully understand the study and the nature of their involvement in it and freely consent to participate?
(Please append letters and, if relevant, consent forms, for parents, guardians or carers). Please note: information letters must be supplied for all participants wherever possible, including children. Written consent should be obtained from children wherever possible in addition to that required from parents.
3.3 Will your research involve children under the age of 18 years? Yes/No (delete) Will your research involve children under the age of 5 years? Yes/No (delete)
3.4 Will your research involve NHS patients, Clients of Social Services or will GP or NHS databases be used for recruitment purposes? Yes/No (delete)

Appendix 2
208
Please note that if your research involves NHS patients or Clients of Social Services your application will have to be reviewed by the University Research Ethics Committee and by an NHS research ethics committee.
3.5 Recruitment Please describe the recruitment process and append all advertising and letters of recruitment.
Adults will be recruited via posters (Appendix G) around Reading town centre and the University of Reading, and through social media sites. Volunteers may also be recruited using our existing volunteer databases and through the use of an outside company, Sensory Dimensions who are based on the University site and have experience in recruitment for consumer studies. Recruitment will be done by researchers during daytime and early evening hours, not late at night.
Important Notes
1. The Principal Investigator must complete the Checklist in Appendix A to ensure that all the relevant steps and have been taken and all the appropriate documentation has been appended.
2. If you expect that your application will need to be reviewed by the University Research Ethics
Committee you must also complete the correct Application form including the Form Appendix B.
3. For template consent forms, please see Appendices C.

Appendix 2
209
Appendix C
Effect of Vegetable Preparation Method on overall liking
Please initial boxes
1. I confirm that I have read and understand the Participant Information Sheet dated ______________for the above study, which was explained by _________________________. I have had the opportunity to consider the information, ask questions and have had these answered satisfactorily.
2. I understand that my participation is voluntary and that I am free to withdraw at any
time without giving any reason.
3. I have received a copy of this Consent Form and of the accompanying Participant Information Sheet.
4. I consent to the use of my samples for genetic testing in ethically approved research. 5. I have had explained to me that consent for my contact details and personal
information to be added to the Hugh Sinclair Unit of Human Nutrition Volunteer Database is entirely voluntary. Accordingly I consent as indicated below:
I consent to my contact details being stored on the Nutrition Unit
Volunteer Database.
Participant details Name of Participant: _______________________________ Date of Birth: _____________ Signature: ________________ Date: _____________
LISA METHVEN
Internal Telephone: 8714
School of Chemistry, Food & Nutritional Sciences and Pharmacy Whiteknights PO Box 266, Reading RG6 6AP, UK phone +44 (0)118 378 8453 fax +44 (0)118 378 6331
Yes No

Appendix 2
210
Screening Questions: In order to ensure the food and / or beverage products you will be presented with are safe for you to consume, please answer the following questions :
1. Do you have any food allergies or intolerances? (For examples nuts, wheat etc). If YES, please specify (eg Wheat, Gluten, Nuts, Milk etc).
YES / NO
Type of allergy / intolerance.............................................................................
2. Are there any foods / food types / ingredients that you do not consume for other reasons (personal, cultural, religious etc) ? If YES, please specify (eg Pork, All Meat, Alcohol etc).
YES / NO
Foods / Drinks NOT consumed.......................................................................
3. Do you have any medical condition(s) which may affect your food intake? (For example, on a salt/sodium controlled diet etc)
YES / NO
If YES, please specify…………………………………………………………….. Thank you very much for your time. All information and data will be handled in a confidential manner.

Appendix 2
211
Appendix D1
Subject Information Sheet
Study title: Effect of Vegetable Preparation method on overall liking
We would be very grateful for your participation in this study as we believe it may help us to understand how preparation method of vegetables affect consumers’ preference and liking
Who would we like to participate in the study?
We are looking to recruit healthy and non-smoking volunteers from the Reading area.
What will happen if I take part?
You will be invited to come to the Department of Food and Nutritional Sciences, University of Reading, Whiteknights, Reading RG6 6AP.
You will be asked to taste a vegetable prepared in different ways and rate how much you like them
Participation will involve one visit, taking approximately 30 minutes.
You will be asked some basic demographic questions
Can anyone take part in the study?
We want to study 100 healthy adults, non-smoking male and female consumers, who are happy to eat vegetable samples.
Do I have to take part?
It is up to you to decide whether you wish to participate in the study. We will describe the study and then ask you to sign a consent form to show you have agreed to take part. You are free to withdraw at any time, without giving a reason.
Are there any adverse consequences to your health as a result of being a volunteer on this study?
There are no health risks associated with taking part in this study; all samples that will be tested are allergen free and will be manufactured in line with current good manufacturing practice.

Appendix 2
212
What are the potential benefits of the study?
This study would help gain an understanding of the effect of preparation method on vegetable liking.
Will any expenses be incurred during the study?
You will be remunerated for your time and travel with £5 on completion of the study.
Who has reviewed the study?
The School of Chemistry, Food and Pharmacy School Research Ethics Committee have reviewed the study and given a favourable ethical opinion for conduct.
Data protection and confidentiality
Your records and personal data will remain confidential and will be identified by a number code. The information linking your name with the code will be known only to the investigators. All data and samples will be stored in Food and Nutritional Sciences building at the University of Reading for a maximum of 5 years.
If you have any concerns or complaints about the research, we will do our best to resolve them. Please contact:
Contact details:
Harshita Mullick, E-mail: [email protected]
Nurfarhana Diana Mohd Nor, E-mail: [email protected]
Dr Lisa Methven Tel: 0118 378 8714, E-mail: [email protected]

Appendix 2
213
Appendix E
Advertisement We are looking for healthy, non-smoking, adult men and women to taste Brassica type vegetables (turnip). The study involves attending the Sensory Science Centre at the University of Reading for a 30-30 minute visit on one occasion. You will be asked to 4 samples of turnip prepared differently nd rate the products for overall liking and acceptability. You will be remunerated for your participation. If you would like more information, please contact: Harshita Mullick E-mail: [email protected]

Appendix 2
214
Appendix F
Study information email/letter
Dear _________________, Would you like try a range of vegetable samples and find out if you are a supertaster? A new study is taking place at the Sensory Science Centre, Food and Nutritional Sciences, The University of Reading that may be of interest to you. We are looking for healthy, non-smoking, men and women to taste vegetable samples. You will attend the Sensory Science Centre at the University of Reading for a 30-minute visit. You will be asked to taste and rate your liking of a small number of vegetable samples and your test sensitivity will be determined. If you would like to take part in the study please call or email: Harshita Mullick E-mail: [email protected] We will give you more information about the study and ask you a number of questions about your medical history including any food allergies to make sure that you are suitable for the study. After consenting to the study you will invited to a tasting session on one of the following dates: Dates will be provided when letters /emails are sent out. You will be reimbursed for your time. Kind regards, Harshita Mullick
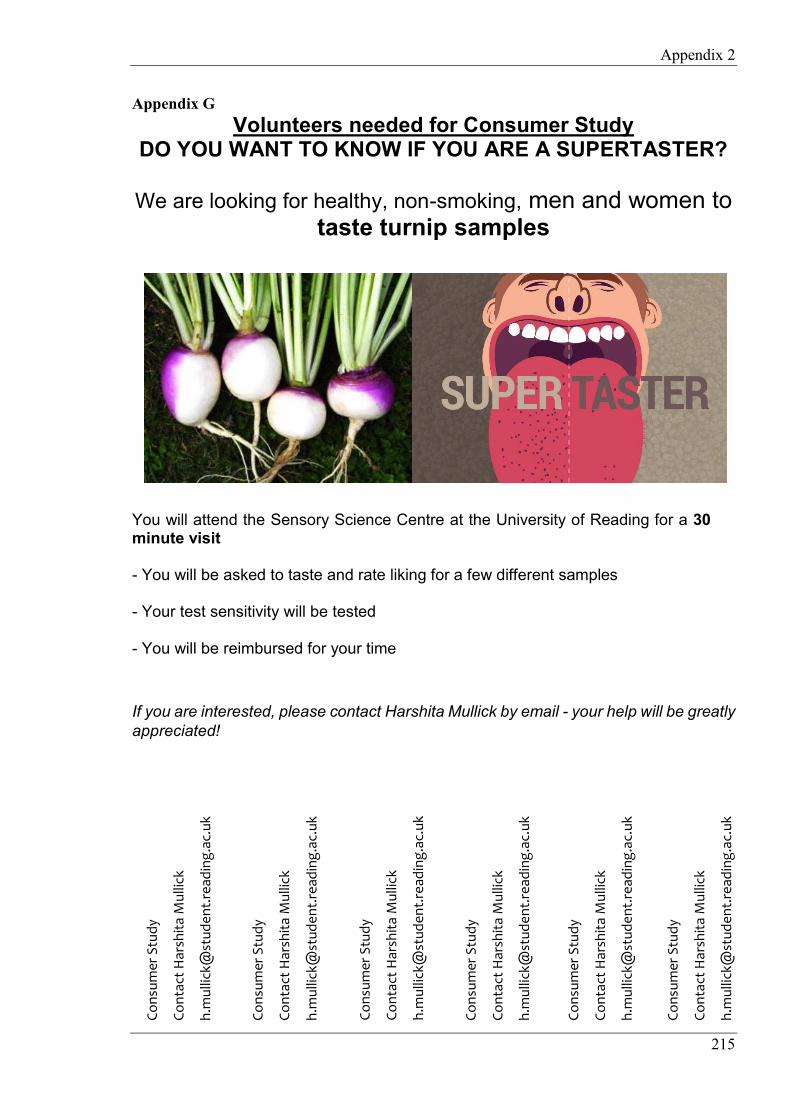
Appendix 2
215
Appendix G Volunteers needed for Consumer Study
DO YOU WANT TO KNOW IF YOU ARE A SUPERTASTER?
We are looking for healthy, non-smoking, men and women to taste turnip samples
You will attend the Sensory Science Centre at the University of Reading for a 30 minute visit - You will be asked to taste and rate liking for a few different samples - Your test sensitivity will be tested - You will be reimbursed for your time
If you are interested, please contact Harshita Mullick by email - your help will be greatly appreciated!
Co
nsu
mer
Stu
dy
Co
nta
ct H
arsh
ita
Mu
llick
h.m
ulli
ck@
stu
de
nt.
read
ing
.ac.
uk
Co
nsu
mer
Stu
dy
Co
nta
ct H
arsh
ita
Mu
llick
h.m
ulli
ck@
stu
de
nt.
read
ing
.ac.
uk
Co
nsu
mer
Stu
dy
Co
nta
ct H
arsh
ita
Mu
llick
h.m
ulli
ck@
stu
de
nt.
read
ing
.ac.
uk
Co
nsu
mer
Stu
dy
Co
nta
ct H
arsh
ita
Mu
llick
h.m
ulli
ck@
stu
de
nt.
read
ing
.ac.
uk
Co
nsu
mer
Stu
dy
Co
nta
ct H
arsh
ita
Mu
llick
h.m
ulli
ck@
stu
de
nt.
read
ing
.ac.
uk
Co
nsu
mer
Stu
dy
Co
nta
ct H
arsh
ita
Mu
llick
h.m
ulli
ck@
stu
de
nt.
read
ing
.ac.
uk

Appendix 2
216
Questions in consumer test
1: How sweet would you rate a typical sample of honey? Please mark on the scale below. Please
use the scale relative to any sensation you have ever experienced, not just sweetness. So, the
top of the scale is the strongest imaginable sensation you have experienced, including pain.
2: How bitter would you rate a typical sample of espresso coffee? Please mark on the scale
below. Please use the scale relative to any sensation you have ever experienced, not just
bitterness. So, the top of the scale is the strongest imaginable sensation you have experienced,
including pain.

Appendix 2
217
3: How sour would you rate a typical piece of lemon? Please mark on the scale below. Please
use the scale relative to any sensation you have ever experienced, not just sourness. So, the top
of the scale is the strongest imaginable sensation you have experienced, including pain.
4: How salty would you rate a typical sample of ready salted crisps? Please mark on the scale
below. Please use the scale relative to any sensation you have ever experienced, not just
saltiness. So, the top of the scale is the strongest imaginable sensation you have experienced,
including pain.

Appendix 2
218
5: Please ensure that you have 2 buccal swab kits in front of you before you proceed to the next
screen. If you do, please proceed to the next screen where you will watch a video that will
demonstrate how to take the swab sample.
6: Please taste the turnip sample (random code for sample 1, 2, 3 or 4). How do you rate your
overall liking of this sample?
1 Dislike extremely 2 Dislike very much 3 Dislike moderately 4 Dislike slightly 5 Neither like nor dislike 6 Like slightly 7 Like moderately 8 Like very much 9 Like extremely
7: How do you rate your liking of the taste of this sample?
1 Dislike extremely 2 Dislike very much 3 Dislike moderately 4 Dislike slightly 5 Neither like nor dislike 6 Like slightly 7 Like moderately 8 Like very much 9 Like extremely
8: How do you rate your liking of the texture of this sample?
1 Dislike extremely 2 Dislike very much 3 Dislike moderately 4 Dislike slightly 5 Neither like nor dislike 6 Like slightly 7 Like moderately 8 Like very much 9 Like extremely

Appendix 2
219
9: How do you rate your liking of the appearance of this sample?
1 Dislike extremely 2 Dislike very much 3 Dislike moderately 4 Dislike slightly 5 Neither like nor dislike 6 Like slightly 7 Like moderately 8 Like very much 9 Like extremely
10: Please taste the turnip sample (random code for sample 1, 2, 3 or 4) and mark the bitter
intensity on the scale.
11: Please taste the turnip (random code for sample 1, 2, 3 or 4) and mark the sweetness intensity
on the scale.

Appendix 2
220
12: Would you want to eat this sample (random code for sample 1, 2, 3 or 4) as part of a meal?
1 Definitely would not eat 2 Probably would not eat 3 May or may not eat 4 Probably would eat 5 Definitely would eat
13: You have been provided with a filter paper. Hold the filter paper and place the paper on the
tip of your tongue for a few seconds. Please do not ingest the paper. Do you taste anything?
1 Yes 2 No
What did you taste? _________________________
14: How old are you? _________________________
15: Please indicate your gender.
1 Male 2 Female
16: How would you describe your ethnic background?
1 White (English/Welsh/Scottish/Northern Irish/British) 2 White (Irish) 3 White (Other) 4 Mixed/Multiple ethnic group (White and Black Caribbean) 5 Mixed/Multiple ethnic group (White and Black African) 6 Mixed/Multiple ethnic group (White and Black Asian) 7 Asian/Asian British (Indian) 8 Asian/Asian British (Pakistani) 9 Asian/Asian British (Bangladeshi) 10 Asian/Asian British (Chinese) 11 Black/African/Caribbean/Black British (African) 12 Black/African/Caribbean/Black British (Caribbean) 13 Other ethnic group (Arab) 14 Other ethnic group (Any other) 15 Prefer not to declare

Appendix 2
221
17: Are you currently working/unemployed/student/other?
1 Working 2 Unemployed 3 Student 4 Other
18: Do you study and/or work in food & nutrition sciences or sensory sector?
1 Yes 2 No
19: Please provide us with the occupation of the chief wage earner in your household?
_________________________
20: What is the typical wage of the chief wage earner of your household?
1 Less than £15000 per annum 2 Approximately £15000 per annum 3 More than £15000 per annum 4 Does not want to say
21: What is your highest level of completed qualification?
1 Did not graduate from secondary school 2 Secondary school graduate 3 Apprenticeship/trade 4 Diploma 5 Bachelor’s degree 6 Master’s degree 7 Doctorate (PhD)
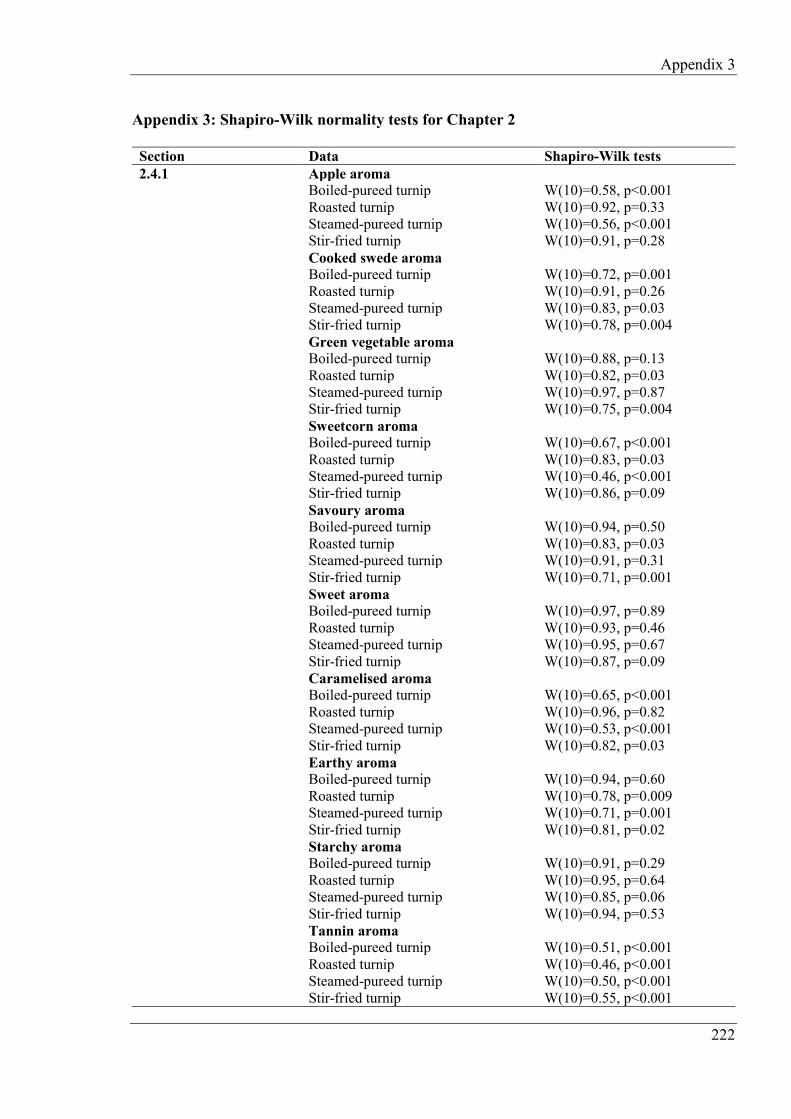
Appendix 3
222
Appendix 3: Shapiro-Wilk normality tests for Chapter 2 Section Data Shapiro-Wilk tests 2.4.1 Apple aroma
Boiled-pureed turnip W(10)=0.58, p<0.001 Roasted turnip W(10)=0.92, p=0.33 Steamed-pureed turnip W(10)=0.56, p<0.001 Stir-fried turnip W(10)=0.91, p=0.28 Cooked swede aroma Boiled-pureed turnip W(10)=0.72, p=0.001 Roasted turnip W(10)=0.91, p=0.26 Steamed-pureed turnip W(10)=0.83, p=0.03 Stir-fried turnip W(10)=0.78, p=0.004 Green vegetable aroma Boiled-pureed turnip W(10)=0.88, p=0.13 Roasted turnip W(10)=0.82, p=0.03 Steamed-pureed turnip W(10)=0.97, p=0.87 Stir-fried turnip W(10)=0.75, p=0.004 Sweetcorn aroma Boiled-pureed turnip W(10)=0.67, p<0.001 Roasted turnip W(10)=0.83, p=0.03 Steamed-pureed turnip W(10)=0.46, p<0.001 Stir-fried turnip W(10)=0.86, p=0.09 Savoury aroma Boiled-pureed turnip W(10)=0.94, p=0.50 Roasted turnip W(10)=0.83, p=0.03 Steamed-pureed turnip W(10)=0.91, p=0.31 Stir-fried turnip W(10)=0.71, p=0.001 Sweet aroma Boiled-pureed turnip W(10)=0.97, p=0.89 Roasted turnip W(10)=0.93, p=0.46 Steamed-pureed turnip W(10)=0.95, p=0.67 Stir-fried turnip W(10)=0.87, p=0.09 Caramelised aroma Boiled-pureed turnip W(10)=0.65, p<0.001 Roasted turnip W(10)=0.96, p=0.82 Steamed-pureed turnip W(10)=0.53, p<0.001 Stir-fried turnip W(10)=0.82, p=0.03 Earthy aroma Boiled-pureed turnip W(10)=0.94, p=0.60 Roasted turnip W(10)=0.78, p=0.009 Steamed-pureed turnip W(10)=0.71, p=0.001 Stir-fried turnip W(10)=0.81, p=0.02 Starchy aroma Boiled-pureed turnip W(10)=0.91, p=0.29 Roasted turnip W(10)=0.95, p=0.64 Steamed-pureed turnip W(10)=0.85, p=0.06 Stir-fried turnip W(10)=0.94, p=0.53 Tannin aroma Boiled-pureed turnip W(10)=0.51, p<0.001 Roasted turnip W(10)=0.46, p<0.001 Steamed-pureed turnip W(10)=0.50, p<0.001 Stir-fried turnip W(10)=0.55, p<0.001
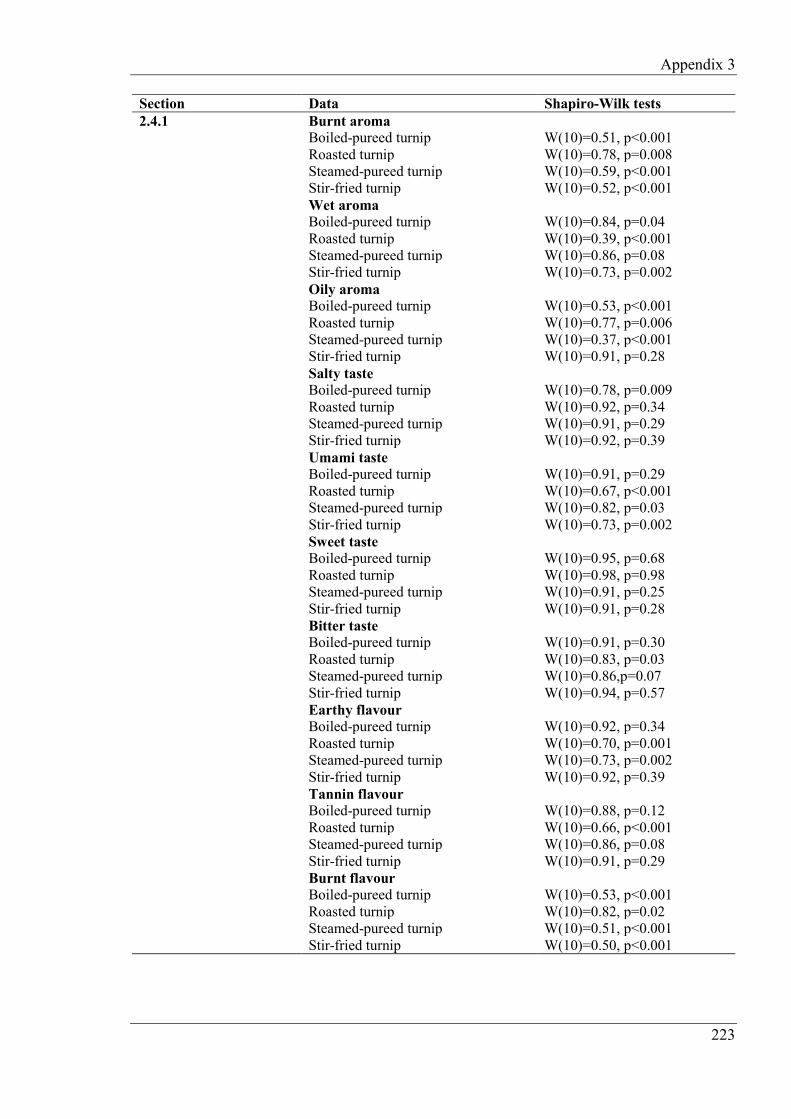
Appendix 3
223
Section Data Shapiro-Wilk tests 2.4.1 Burnt aroma
Boiled-pureed turnip W(10)=0.51, p<0.001 Roasted turnip W(10)=0.78, p=0.008 Steamed-pureed turnip W(10)=0.59, p<0.001 Stir-fried turnip W(10)=0.52, p<0.001 Wet aroma Boiled-pureed turnip W(10)=0.84, p=0.04 Roasted turnip W(10)=0.39, p<0.001 Steamed-pureed turnip W(10)=0.86, p=0.08 Stir-fried turnip W(10)=0.73, p=0.002 Oily aroma Boiled-pureed turnip W(10)=0.53, p<0.001 Roasted turnip W(10)=0.77, p=0.006 Steamed-pureed turnip W(10)=0.37, p<0.001 Stir-fried turnip W(10)=0.91, p=0.28 Salty taste Boiled-pureed turnip W(10)=0.78, p=0.009 Roasted turnip W(10)=0.92, p=0.34 Steamed-pureed turnip W(10)=0.91, p=0.29 Stir-fried turnip W(10)=0.92, p=0.39 Umami taste Boiled-pureed turnip W(10)=0.91, p=0.29 Roasted turnip W(10)=0.67, p<0.001 Steamed-pureed turnip W(10)=0.82, p=0.03 Stir-fried turnip W(10)=0.73, p=0.002 Sweet taste Boiled-pureed turnip W(10)=0.95, p=0.68 Roasted turnip W(10)=0.98, p=0.98 Steamed-pureed turnip W(10)=0.91, p=0.25 Stir-fried turnip W(10)=0.91, p=0.28 Bitter taste Boiled-pureed turnip W(10)=0.91, p=0.30 Roasted turnip W(10)=0.83, p=0.03 Steamed-pureed turnip W(10)=0.86,p=0.07 Stir-fried turnip W(10)=0.94, p=0.57 Earthy flavour Boiled-pureed turnip W(10)=0.92, p=0.34 Roasted turnip W(10)=0.70, p=0.001 Steamed-pureed turnip W(10)=0.73, p=0.002 Stir-fried turnip W(10)=0.92, p=0.39 Tannin flavour Boiled-pureed turnip W(10)=0.88, p=0.12 Roasted turnip W(10)=0.66, p<0.001 Steamed-pureed turnip W(10)=0.86, p=0.08 Stir-fried turnip W(10)=0.91, p=0.29 Burnt flavour Boiled-pureed turnip W(10)=0.53, p<0.001 Roasted turnip W(10)=0.82, p=0.02 Steamed-pureed turnip W(10)=0.51, p<0.001 Stir-fried turnip W(10)=0.50, p<0.001

Appendix 3
224
Section Data Shapiro-Wilk tests 2.4.1 Green vegetable flavour
Boiled-pureed turnip W(10)=0.96, p=0.76 Roasted turnip W(10)=0.77, p=0.006 Steamed-pureed turnip W(10)=0.85, p=0.06 Stir-fried turnip W(10)=0.73, p=0.002 Cooked onion flavour Boiled-pureed turnip W(10)=0.38, p<0.001 Roasted turnip W(10)=0.61, p<0.001 Steamed-pureed turnip W(10)=0.41, p<0.001 Stir-fried turnip W(10)=0.53, p<0.001 Apple flavour Boiled-pureed turnip W(10)=0.49, p<0.001 Roasted turnip W(10)=0.91, p=0.26 Steamed-pureed turnip W(10)=0.55, p<0.001 Stir-fried turnip W(10)=0.74, p=0.003
2.4.3 Overall liking Boiled-pureed turnip W(74)=0.95,p=0.008 Roasted turnip W(74)=0.93, p<0.001 Steamed-pureed turnip W(74)=0.93, p<0.001 Stir-fried turnip W(74)=0.95, p=0.003 Taste liking Boiled-pureed turnip W(74)=0.95, p=0.004 Roasted turnip W(74)=0.92, p<0.001 Steamed-pureed turnip W(74)=0.91, p<0.0001 Stir-fried turnip W(74)=0.95, p=0.003 Texture liking Boiled-pureed turnip W(74)=0.96, p=0.01 Roasted turnip W(74)=0.95, p=0.005 Steamed-pureed turnip W(74)=0.96, p=0.03 Stir-fried turnip W(74)=0.94, p=0.002 Appearance liking Boiled-pureed turnip W(74)=0.97, p=0.07 Roasted turnip W(74)=0.93, p=0.001 Steamed-pureed turnip W(74)=0.96, p=0.02 Stir-fried turnip W(74)=0.95, p=0.005
2.4.4 Consumption intent Boiled-pureed turnip W(74)=0.89, p<0.001 Roasted turnip W(74)=0.88, p<0.001 Steamed-pureed turnip W(74)=0.90, p<0.001 Stir-fried turnip W(74)=0.90, p<0.001
2.4.5 Bitter perception Boiled-pureed turnip W(74)=0.87, p<0.001 Roasted turnip W(74)=0.80, p<0.001 Steamed-pureed turnip W(74)=0.88, p<0.001 Stir-fried turnip W(74)=0.85, p<0.001 Sweet perception Boiled-pureed turnip W(74)=0.85, p<0.001 Roasted turnip W(74)=0.92, p<0.001 Steamed-pureed turnip W(74)=0.90, p<0.001 Stir-fried turnip W(74)=0.92, p<0.001

Appendix 3
225
Section Data Shapiro-Wilk tests 2.4.6 Cluster 1
Boiled-pureed turnip W(21)=0.91, p=0.05 Roasted turnip W(21)=0.86, p=0.006 Steamed-pureed turnip W(21)=0.85, p=0.004 Stir-fried turnip W(21)=0.80, p=0.001 Cluster 2 Boiled-pureed turnip W(36)=0.92, p=0.01 Roasted turnip W(36)=0.94, p=0.04 Steamed-pureed turnip W(36)=0.90, p=0.003 Stir-fried turnip W(36)=0.95, p=0.09 Cluster 3 Boiled-pureed turnip W(17)=0.92, p=0.16 Roasted turnip W(17)=0.86, p=0.01 Steamed-pureed turnip W(17)=0.86, p=0.01 Stir-fried turnip W(17)=0.93, p=0.20

Appendix 4
226
Appendix 4: Shapiro-Wilk normality tests for Chapter 3
Section Data Shapiro-Wilk tests 3.4.1 Progoitrin W(21)=0.96, p=0.53
Glucoalyssin W(21)=0.56, p<0.001 Gluconapoleiferin W(21)=0.96, p=0.58 Gluconapin W(21)=0.72, p<0.001 4-hydroxyglucobrassicin W(21)=0.92, p=0.11 Glucobrassicanapin W(21)=0.89, p=0.02 Glucoerucin W(21)=0.74, p<0.001 Glucobrassicin W(21)=0.92, p=0.08 Gluconasturtiin W(21)=0.72, p<0.001 Glucoberteroin W(21)=0.84, p=0.003 4-methoxy-glucobrassicin W(21)=0.93, p=0.11 Neoglucobrassicin W(21)=0.93, p=0.15 Total GSL W(21)=0.79, p<0.001
3.4.2 Apple aroma B1 W(9)=0.71, p=0.002 B2 W(9)=0.77, p=0.008 B3 W(9)=0.63, p<0.001 B4 W(9)=0.78, p=0.01 B5 W(9)=0.90, p=0.23 B6 W(9)=0.65, p<0.001 B7 W(9)=0.57, p<0.001 Cooked swede aroma B1 W(9)=0.96, p=0.76 B2 W(9)=0.94, p=0.61 B3 W(9)=0.83, p=0.04 B4 W(9)=0.98, p=0.94 B5 W(9)=0.91, p=0.35 B6 W(9)=0.99, p=0.99 B7 W(9)=0.94, p=0.62 Green vegetable aroma B1 W(9)=0.89, p=0.18 B2 W(9)=0.93, p=0.45 B3 W(9)=0.94, p=0.59 B4 W(9)=0.87, p=0.11 B5 W(9)=0.84, p=0.05 B6 W(9)=0.88, p=0.17 B7 W(9)=0.86, p=0.10 Sweetcorn aroma B1 W(9)=0.61, p<0.001 B2 W(9)=0.78, p=0.01 B3 W(9)=0.57, p<0.001 B4 W(9)=0.74, p=0.004 B5 W(9)=0.70, p=0.001 B6 W(9)=0.75, p=0.005 B7 W(9)=0.64, p<0.001

Appendix 4
227
Section Data Shapiro-Wilk tests 3.4.2 Savoury aroma
B1 W(9)=0.92, p=0.36 B2 W(9)=0.89, p=0.19 B3 W(9)=0.89, p=0.18 B4 W(9)=0.91, p=0.35 B5 W(9)=0.96, p=0.80 B6 W(9)=0.93, p=0.44 B7 W(9)=0.94, p=0.57 Sweet aroma B1 W(9)=0.95, p=0.73 B2 W(9)=0.96, p=0.77 B3 W(9)=0.93, p=0.52 B4 W(9)=0.90, p=0.24 B5 W(9)=0.97, p=0.86 B6 W(9)=0.98, p=0.98 B7 W(9)=0.81, p=0.03 Earthy aroma B1 W(9)=0.85, p=0.08 B2 W(9)=0.85, p=0.07 B3 W(9)=0.91, p=0.35 B4 W(9)=0.88, p=0.16 B5 W(9)=0.90, p=0.26 B6 W(9)=0.88, p=0.14 B7 W(9)=0.84, p=0.06 Starchy aroma B1 W(9)=0.89, p=0.22 B2 W(9)=0.98, p=0.94 B3 W(9)=0.73, p=0.003 B4 W(9)=0.95, p=0.67 B5 W(9)=0.89, p=0.19 B6 W(9)=0.95, p=0.65 B7 W(9)=0.94, p=0.57 Tannin aroma B1 W(9)=0.77, p=0.01 B2 W(9)=0.77, p=0.01 B3 W(9)=0.81, p=0.03 B4 W(9)=0.90, p=0.24 B5 W(9)=0.79, p=0.02 B6 W(9)=0.77, p=0.008 B7 W(9)=0.72, p=0.003

Appendix 4
228
Section Data Shapiro-Wilk tests 3.4.2 Wet aroma
B1 W(9)=0.82, p=0.03 B2 W(9)=0.95, p=0.67 B3 W(9)=0.90, p=0.24 B4 W(9)=0.81, p=0.02 B5 W(9)=0.88, p=0.15 B6 W(9)=0.86, p=0.10 B7 W(9)=0.87, p=0.13 Salty taste B1 W(9)=0.97, p=0.89 B2 W(9)=0.93, p=0.51 B3 W(9)=0.98, p=0.95 B4 W(9)=0.90, p=0.23 B5 W(9)=0.81, p=0.03 B6 W(9)=0.94, p=0.55 B7 W(9)=0.96, p=0.77 Umami taste B1 W(9)=0.93, p=0.48 B2 W(9)=0.73, p=0.003 B3 W(9)=0.71, p=0.002 B4 W(9)=0.77, p=0.01 B5 W(9)=0.77, p=0.01 B6 W(9)=0.82, p=0.03 B7 W(9)=0.85, p=0.08 Sweet taste B1 W(9)=0.93, p=0.44 B2 W(9)=0.96, p=0.82 B3 W(9)=0.95, p=0.64 B4 W(9)=0.96, p=0.81 B5 W(9)=0.86, p=0.09 B6 W(9)=0.92, p=0.41 B7 W(9)=0.92, p=0.38 Bitter taste B1 W(9)=0.91, p=0.33 B2 W(9)=0.96, p=0.78 B3 W(9)=0.89, p=0.22 B4 W(9)=0.96, p=0.81 B5 W(9)=0.95, p=0.73 B6 W(9)=0.92, p=0.41 B7 W(9)=0.94, p=0.57

Appendix 4
229
Section Data Shapiro-Wilk tests 3.4.2 Earthy flavour
B1 W(9)=0.84, p=0.06 B2 W(9)=0.88, p=0.16 B3 W(9)=0.87, p=0.12 B4 W(9)=0.86, p=0.08 B5 W(9)=0.85, p=0.07 B6 W(9)=0.81, p=0.03 B7 W(9)=0.83, p=0.04 Tannin flavour B1 W(9)=0.97, p=0.86 B2 W(9)=0.99, p=0.99 B3 W(9)=0.89, p=0.21 B4 W(9)=0.94, p=0.53 B5 W(9)=0.96, p=0.75 B6 W(9)=0.87, p=0.13 B7 W(9)=0.95, p=0.66 Apple flavour B1 W(9)=0.76, p=0.007 B2 W(9)=0.74, p=0.004 B3 W(9)=0.90, p=0.24 B4 W(9)=0.83, p=0.04 B5 W(9)=0.77, p=0.01 B6 W(9)=0.54, p<0.001 B7 W(9)=0.52, p<0.001 Starchy flavour B1 W(9)=0.95, p=0.72 B2 W(9)=0.98, p=0.97 B3 W(9)=0.94, p=0.60 B4 W(9)=0.96, p=0.81 B5 W(9)=0.90, p=0.25 B6 W(9)=0.94, p=0.59 B7 W(9)=0.95, p=0.73

Appendix 5
230
Appendix 5: Vegetable preference and familiarity questionnaire
Name of parent/guardian:
Relationship to child:
Address:
Parent/guardian’s contact number:
Parent/guardian’s email:
Child’s name:
Child’s gender: Male Female
Child’s age:
Child’s DOB:
Does your child have any special diet/ eating habit that you want to tell us?
Does your child ever have school lunch? Yes Sometimes No Only on special days (eg: Fish and Chip on Fridays)
Dr Lisa Methven
+44 (0)118 378 8714
Department of Food and
Nutritional Sciences,
Food Biosciences Building
Whiteknights, PO Box 226
Reading RG6 6AP
phone +44 (0)118 378 8714

Appendix 5
231
Child’s ethnic group, please tick as appropriate:
White: Black/African/Caribbean/Black British:
English/Welsh/Scottish/Northern Irish/British African
Irish Caribbean
Gypsy or Irish Traveller Any other Black/African/Caribbean background,
Any other White background, please describe: _______________
please describe: _______________
Other ethnic group:
Mixed/Multiple ethnic groups: Arab
White and Black Caribbean Any other ethnic group, please describe: _______________
White and Black African
White and Asian
Any other Mixed/Multiple ethnic background,
please describe: _______________
Asian/Asian British:
Indian
Pakistani
Bangladeshi
Chinese
Any other Asian background, please describe: _______________
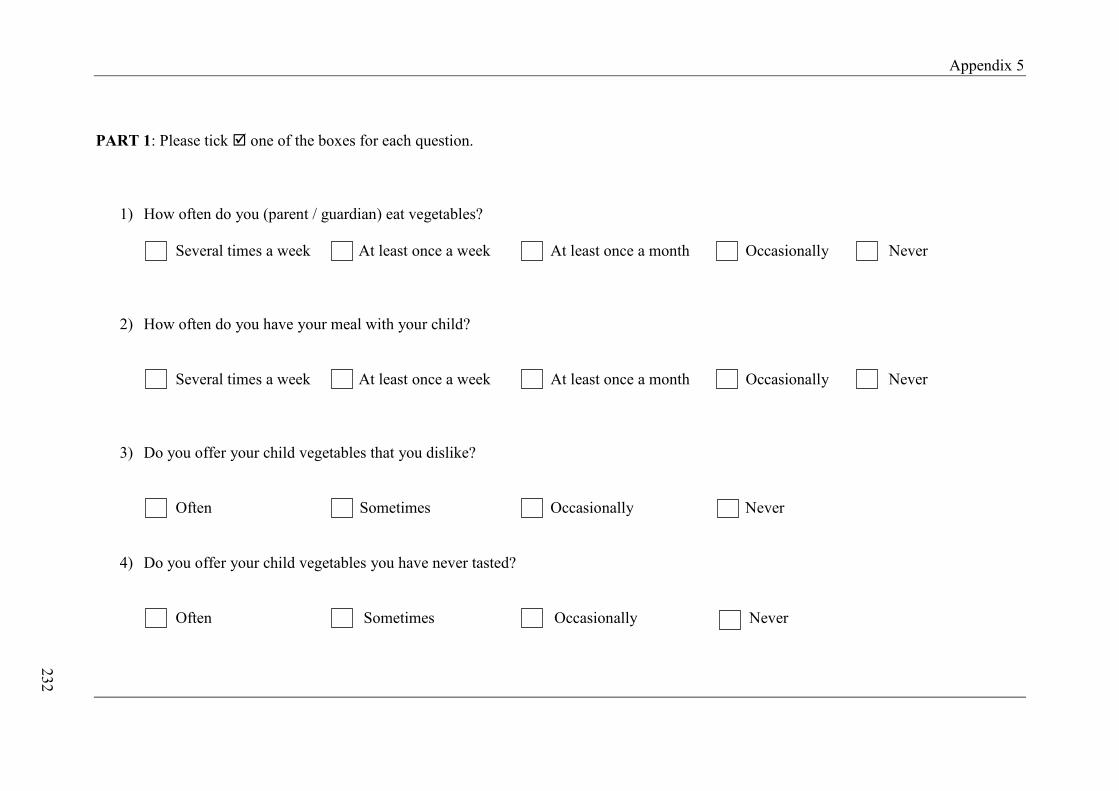
Appendix 5
232
PART 1: Please tick one of the boxes for each question.
1) How often do you (parent / guardian) eat vegetables? Several times a week At least once a week At least once a month Occasionally Never
2) How often do you have your meal with your child?
Several times a week At least once a week At least once a month Occasionally Never
3) Do you offer your child vegetables that you dislike?
Often Sometimes Occasionally Never
4) Do you offer your child vegetables you have never tasted?
Often Sometimes Occasionally Never

Appendix 5
233
PART 2: Please tick one of the boxes for each question.
Q1: How often is your child offered this vegetable? Q2: How much does your child like this vegetable? Several times a week
At least once a week
At least once a month
Occasionally Never Like extremely
Like
Neutral
Dislike
Dislike extremely
Don’t know
Artichoke
Asparagus
Aubergine
Beetroot
Broad beans
Broccoli
Brussel sprouts

Appendix 5
234
Q1: How often is your child offered this vegetable? Q2: How much does your child like this vegetable? Several times a week
At least once a week
At least once a month
Occasionally Never Like extremely
Like
Neutral
Dislike
Dislike extremely
Don’t know
Butternut squash
Green cabbage (eg: Savoy or Sweetheart)
Red cabbage
White cabbage
Carrot
Cauliflower
Chard
Celery

Appendix 5
235
Q1: How often is your child offered this vegetable? Q2: How much does your child like this vegetable? Several times a week
At least once a week
At least once a month
Occasionally Never Like extremely
Like
Neutral
Dislike
Dislike extremely
Don’t know
Courgette
Cucumber
Endive (chicory)
Fennel
Green beans
Kale
Leeks
Kohlrabi

Appendix 5
236
Q1: How often is your child offered this vegetable? Q2: How much does your child like this vegetable? Several times a week
At least once a week
At least once a month
Occasionally Never Like extremely
Like
Neutral
Dislike
Dislike extremely
Don’t know
Lettuce
Mangetout
Marrow
Mushrooms
Onions
Parsnip
Pak choi
Peas
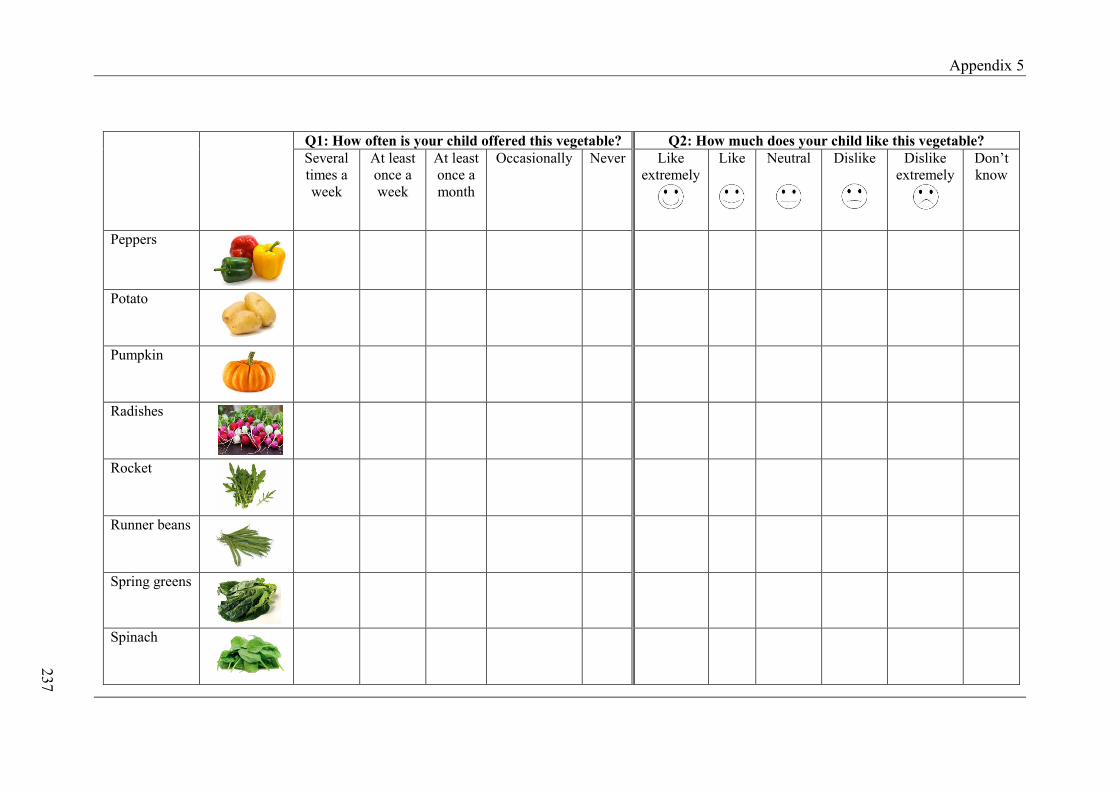
Appendix 5
237
Q1: How often is your child offered this vegetable? Q2: How much does your child like this vegetable? Several times a week
At least once a week
At least once a month
Occasionally Never Like extremely
Like
Neutral
Dislike
Dislike extremely
Don’t know
Peppers
Potato
Pumpkin
Radishes
Rocket
Runner beans
Spring greens
Spinach

Appendix 5
238
Q1: How often is your child offered this vegetable? Q2: How much does your child like this vegetable? Several times a week
At least once a week
At least once a month
Occasionally Never Like extremely
Like
Neutral
Dislike
Dislike extremely
Don’t know
Spring onions
Swede
Sweet corn
Sweet potato
Tomatoes
Turnips
Watercress
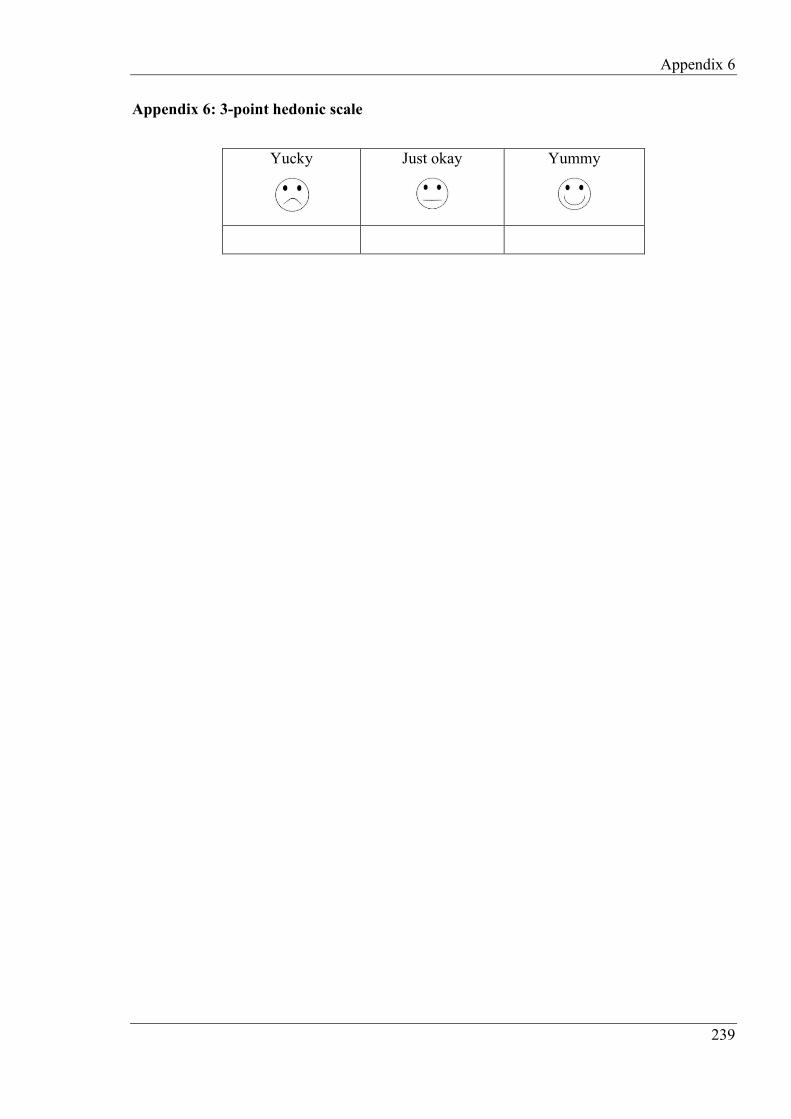
Appendix 6
239
Appendix 6: 3-point hedonic scale
Yucky
Just okay
Yummy

Appendix 7
240
Appendix 7: Shapiro-Wilk normality tests for Chapter 4 Section Data Shapiro-Wilk test
4.4.3 T1 intake W(134)=0.5, p<0.001
T2 intake W(134)=0.8, p<0.001
T1 liking W(134)=0.7, p<0.001
T2 liking W(134)=0.7, p<0.001
4.4.4 and 4.4.5 Pre-intervention intake W(134)=0.6, p<0.001
Post-intervention intake W(134)=0.8, p<0.001
Pre-intervention liking W(134)=0.7, p<0.001
Post-intervention liking W(134)=0.7, p<0.001
4.4.6 and 4.4.7 Pre-intervention intake W(132)=0.6, p<0.001
Day 5 intake W(132)=0.7, p<0.001
Day 8 intake W(132)=0.7, p<0.001
Post-intervention intake W(132)=0.8, p<0.001
Pre-intervention liking W(132)=0.7, p<0.001
Day 5 liking W(132)=0.6, p<0.001
Day 8 liking W(132)=0.7, p<0.001
Post-intervention liking W(132)=0.7, p<0.001
4.4.8 and 4.4.9 Pre-intervention intake W(121)=0.6, p<0.001
Post-intervention intake W(121)=0.8, p<0.001
Follow-up intake W(121)=0.8, p<0.001
Pre-intervention liking W(121)=0.7, p<0.001
Post-intervention liking W(121)=0.7, p<0.001
Follow-up liking W(121)=0.6, p<0.001

Appendix 8
241
Appendix 8: Comparison mean intake between schools for group A and B
Group A
Intake Kruskal-Wallis tests (Bonferroni correction, p<0.003)
Time 1 H(5)=15.70, p=0.008
Day 5 H(5)=10.38, p=0.07
Day 8 H(5)=7.70, p=0.17
Time 2 H(5)=13.70, p=0.02
Time 3 H(5)=15.33, p=0.009
Group B
Intake Kruskal-Wallis tests (Bonferroni correction, p<0.005)
Time 1 H(4)=7.23, p=0.12
Time 2 H(4)=12.11, p=0.02
Day 5 H(4)=10.52, p=0.03
Day 8 H(4)=10.17, p=0.04
Time 3 H(4)=10.43, p=0.03

Appendix 9
242
Appendix 9: Sample size calculation for future study
Difference in intake between the PAV/PAV and AVI/AVI genotypes at post-intervention (d) =
5.7 g
Standard deviation of the PAV/PAV genotype at post-intervention (σ) = 34.4 g
From the sample size calculation of 90% power, the target number of children to be recruited
in future study to detect the significant effect at 0.05 of taste genotype in intake, based on
TAS2R38 is approximately 770.
n > 2F (σ/d)2
n > 2(10.51) x (34.4/5.7)2
n > 21.02 x 36.4
n > 765

Appendix 10
243
Appendix 10: Shapiro-Wilk normality tests for Chapter 5 Section Data Shapiro-Wilk tests
5.4.4 Brassica vegetables intake W(132)=0.8, p<0.001
Non-Brassica vegetables intake W(132)=0.9, p<0.001
Total vegetables intake W(132)=0.9, p<0.001
5.4.5 Broccoli intake W(132)=0.8, p<0.001
Cauliflower intake W(132)=0.7, p<0.001
Carrot intake W(132)=0.7, p<0.001
Cucumber intake W(132)=0.7, p<0.001
Green beans intake W(132)=0.7, p<0.001
Lettuce intake W(132)=0.8, p<0.001
Onion intake W(132)=0.7, p<0.001
Peas intake W(132)=0.8, p<0.001
Peppers intake W(132)=0.8, p<0.001
Spinach intake W(132)=0.7, p<0.001
Sweet corn intake W(132)=0.8, p<0.001
Tomato intake W(132)=0.7, p<0.001
5.4.7 Brassica vegetables liking W(132)=1.0, p=0.02
Non-Brassica vegetables liking W(132)=1.0, p<0.001
Total vegetables liking W(132)=0.9, p<0.001