Universidade Federal do Rio Grande do Sul Programa de Pós ...
71
Universidade Federal do Rio Grande do Sul Programa de Pós-Graduação em Ciências Médicas: Endocrinologia POLIMORFISMO -3826A/G NO GENE UCP1: INVESTIGAÇÃO DE SUA POSSÍVEL ASSOCIAÇÃO COM RETINOPATIA DIABÉTICA EM PACIENTES COM DIABETES MELLITUS TIPO 1 E DE SEU EFEITO NA EXPRESSÃO DA UCP1 NA RETINA Dissertação de Mestrado Letícia de Almeida Brondani Porto Alegre, Setembro de 2011
-
Upload
khangminh22 -
Category
Documents
-
view
2 -
download
0
Transcript of Universidade Federal do Rio Grande do Sul Programa de Pós ...

Universidade Federal do Rio Grande do Sul
Programa de Pós-Graduação em Ciências Médicas: Endocrinologia
POLIMORFISMO -3826A/G NO GENE UCP1: INVESTIGAÇÃO DE SUA
POSSÍVEL ASSOCIAÇÃO COM RETINOPATIA DIABÉTICA EM
PACIENTES COM DIABETES MELLITUS TIPO 1 E DE SEU EFEITO NA
EXPRESSÃO DA UCP1 NA RETINA
Dissertação de Mestrado
Letícia de Almeida Brondani
Porto Alegre, Setembro de 2011
2
Universidade Federal do Rio Grande do Sul
Programa de Pós-Graduação em Ciências Médicas: Endocrinologia
POLIMORFISMO -3826A/G NO GENE UCP1: INVESTIGAÇÃO DE SUA
POSSÍVEL ASSOCIAÇÃO COM RETINOPATIA DIABÉTICA EM
PACIENTES COM DIABETES MELLITUS TIPO 1 E DE SEU EFEITO NA
EXPRESSÃO DA UCP1 NA RETINA
Letícia de Almeida Brondani
Orientadora: Profa. Dra. Daisy Crispim Moreira
Dissertação de mestrado apresentada ao
Programa de Pós-Graduação em Ciências
Médicas: Endocrinologia, da Universidade
Federal do Rio Grande do Sul (UFRGS)
como requisito parcial para obtenção do
título de Mestre em Endocrinologia.
Porto Alegre, setembro de 2011.
3
Dedico essa dissertação aos meus pais, meus
exemplos de vida.
“Chegou a tua vez, oh! Natureza!
Eu desafio agora essa grandeza,
Perante a qual meus olhos se extasiam...
Eu desafio, desta cova escura,
No histerismo danado da tortura
Todos os monstros que os teus peitos
criam!”
Augusto dos Anjos

4
AGRADECIMENTOS
A minha orientadora, Dra. Daisy Crispim, por acreditar em mim e me dar
oportunidade desde a época de iniciação científica, por me apresentar à ciência e por
todos os ensinamentos, pela impecável orientação e por ser um exemplo de profissional.
Ao Dr. Luís Henrique Canani, Dr. Jorge Luiz Gross, Dra. Lúcia M. Kliemann,
Dr. Alexandre S. Marcon, Bianca de Souza, Taís Assmann e Guilherme Duarte pelas
fundamentais colaborações que enriqueceram este trabalho.
Aos colegas e amigos do laboratório do Serviço de Endocrinologia pelo
incentivo, troca de conhecimentos e valiosas conversas propiciando um ótimo ambiente
de trabalho.
Aos meus pais Enio e Jussara por sempre me incentivarem a buscar e acreditar
nos meus sonhos e pelas sábias lições de amor, honestidade e perseverança.
Ao meu irmão Leonardo pelo cuidado e proteção dedicados a mim.
Ao Gustavo, pelo amor, paciência e companheirismo dedicados a mim.
A todos os meus amigos que me apoiaram em minhas decisões e participaram
indiretamente na realização desse trabalho, especialmente à Vanessa, pela amizade,
pelos momentos divertidos e pelas palavras de incentivo e ao Ramon pela amizade em
todos os momentos desde a graduação.
Por fim, agradeço a todos que de alguma forma também contribuíram para a
realização deste trabalho.

5
Esta dissertação de mestrado segue o formato proposto pelo Programa de Pós-
Graduação em Ciências Médicas: Endocrinologia, Metabolismo e Nutrição, Faculdade
de Medicina, Universidade Federal do Rio Grande do Sul, sendo apresentada na forma
de um artigo de revisão e um artigo original sobre o tema da dissertação.
- Artigo de revisão: “The role of the uncoupling protein 1 (UCP1) on the
development of obesity and type 2 diabetes mellitus” (submetido a Diabetology
& Metabolic Syndrome).
- Artigo original: “Association between the -3826A/G polymorphism in the
uncoupling protein 1 (UCP1) gene and diabetic retinopathy and UCP1 gene
expression in human retina” (a ser submetido à revista Diabetes).

6
SUMÁRIO
LISTA DE ABREVIATURAS...................................................................................................................7
RESUMO ....................................................................................................................................................9
ABSTRACT ..............................................................................................................................................11
PARTE I - ARTIGO DE REVISÃO: “THE ROLE OF THE UNCOUPLING PROTEIN 1 (UCP1) ON
THE DEVELOPMENT OF OBESITY AND TYPE 2 DIABETES MELLITUS” ....................................13
PARTE II - ARTIGO ORIGINAL: “ASSOCIATION BETWEEN THE -3826A/G POLYMORPHISM
IN THE UNCOUPLING PROTEIN 1 (UCP1) GENE AND DIABETIC RETINOPATHY AND UCP1
GENE EXPRESSION IN HUMAN RETINA”..........................................................................................44
7
LISTA DE ABREVIATURA
3'UTR 3' untranslated region
ADP Adenine diphosphatase
ANT Adenine nucleotide translocase
ATF Activating transcription factors
ATP Adenine triphosphatase
BAT Brown adipose tissue
β3-AR β3-adrenergic receptor
BMI Body mass index
CoQ Coenzyme Q
CREB cAMP-response element binding
DM Diabetes mellitus
DM1 Type 1 diabetes mellitus
DM2 Type 2 diabetes mellitus
DR Diabetic retinopathy
FADH2 Flavin adenine dinucleotide reduced
FFA Free fatty acid
GDP Guanosine diphosphate
GSH Glutathione
H2O2 Hydrogen peroxide
HNE 4-hydroxy-2-nonenal
HWE Hardy-Weinberg equilibrium
IR Insulin resistance
MAPK Mitogen-activated protein kinase

8
MnSOD2 Manganese superoxide dismutase 2
MRC Mitochondrial respiratory chain
mRNA Messenger RNA
NADH Nicotinamide adenine dinucleotide reduced
O2-
Superoxide anion
OR Odds ratio
OH Hydroxyl radical
OXPHOS Oxidative phosphorylation
PDR Proliferative diabetic retinopathy
PGC-1α PPAR-gama coactivator-1α
Pi Inorganic phosphate
PKA Protein kinase A
PPAR Peroxisome proliferator-activated receptor
RMR Resting metabolic rate
ROS Reactive oxygen species
RT-PCR Reverse transcription-polymerase chain reaction
SD Standard deviation
SE Standard error
UCP1 Uncoupling protein 1
UCPs Uncoupling proteins
WAT White adipose tissue

9
RESUMO
Está bem definido que fatores genéticos têm um papel importante no
desenvolvimento do diabetes mellitus (DM) e de suas complicações crônicas. Sendo
assim, grandes esforços têm sido feitos para se identificar os genes associados com estas
doenças. A proteína desacopladora 1 (UCP1), principalmente expressa no tecido
adiposo marrom, desacopla a oxidação dos substratos da síntese de ATP pela ATP-
sintase, dessa forma, dissipando o potencial de membrana e, consequentemente,
diminuindo a produção de ATP pela cadeia respiratória mitocondrial. Esse
desacoplamento então leva à regulação do gasto energético, à termogênese e à proteção
contra o estresse oxidativo. Um dos principais mecanismos pelo qual a hiperglicemia
leva ao aparecimento das complicações crônicas do DM, como a retinopatia diabética
(RD), é através do aumento da produção de espécies reativas de oxigênio pela
mitocôndria. Portanto, é biologicamente plausível que o polimorfismo -3826A/G
localizado na região promotora do gene UCP1 possa estar associado com a RD em
pacientes com DM.
No presente estudo, através de um delineamento de caso-controle, investigamos
se o polimorfismo -3826A/G no gene UCP1 está associado à RD em pacientes com
diabetes mellitus tipo 1 (DM1). Além disso, em um estudo transversal realizado em
doadores de córnea, avaliamos se a UCP1 está expressa na retina humana e se o
polimorfismo -3826A/G modifica a sua expressão nesse tecido. Também avaliamos a
expressão do gene MnSOD2, o qual codifica uma importante enzima antioxidante, de
acordo com os diferentes genótipos do polimorfismo -3826A/G.
No estudo de caso-controle, as frequências do polimorfismo -3826A/G foram
avaliadas em 257 pacientes com DM1 diferenciados de acordo com a presença de RD

10
(154 casos com RD e 103 controles sem RD). O estudo transversal incluiu 166 doadores
cadavéricos de córneas. Em um subgrupo de 107 amostras de retina diferenciadas de
acordo com a presença do alelo de risco do polimorfismo estudado, as concentrações
dos mRNAs de UCP1 e MnSOD2 foram avaliadas pela técnica de PCR em tempo real.
O alelo G do polimorfismo -3826A/G foi mais frequente em pacientes com RD
do que em pacientes sem esta complicação (41,0% vs. 31,0%; P = 0,029). O genótipo
G/G foi associado a um risco aumentado para RD, após o ajuste para idade, presença de
hipertensão arterial e níveis de creatinina sérica (Razão de Chances = 3,503, IC 95%
1,04 – 11,80; P = 0,043). Nossos dados mostram pela primeira vez a expressão do
mRNA de UCP1 na retina humana (0,93 ± 1,35 n fold). Além disso, os portadores do
alelo G apresentaram uma maior expressão gênica de UCP1 do que os portadores do
genótipo A/A (1,10 ± 1,50 vs. 0,51 ± 0,99 n fold; P = 0,034). Interessantemente, os
portadores do alelo G também apresentaram uma expressão gênica aumentada de
MnSOD2 (P = 0,031). Adicionalmente, as concentrações de UCP1 e de MnSOD2 na
retina se correlacionaram positivamente (r = 0,29, P = 0,015).
Em conclusão, nossos resultados mostram uma associação independente do
polimorfismo -3826A/G com a RD em pacientes com DM1. Esse estudo é o primeiro a
relatar que a UCP1 está expressa na retina humana e que o polimorfismo -3826A/G
influencia a sua expressão nesse tecido. Possivelmente, a expressão de MnSOD2
influencia o efeito da UCP1 na proteção contra o estresse oxidativo. Estudos funcionais
adicionais serão necessários para avaliar qual o efeito da UCP1 na retina humana e
confirmar se mudanças na expressão do gene UCP1 também ocasionam mudanças nos
níveis de proteína.

11
ABSTRACT
It is well established that genetic factors play an important role in the
development of diabetes mellitus (DM) and its chronic complications. Therefore, great
efforts have been made to identify genes associated with these diseases. The uncoupling
protein 1 (UCP1), mainly expressed in brown adipose tissue, acts uncoupling the
oxidation of substrates from ATP synthesis by ATP-synthase, thereby dissipating the
membrane potential and, consequently, decreasing the ATP production by the
mitochondrial respiratory chain. This uncoupling then leads to the regulation of energy
expenditure, thermogenesis, and protection against oxidative stress. One of the main
mechanisms by which hyperglycemia leads to the development of chronic diabetic
complications, such as diabetic retinopathy (DR), is through the increased production of
reactive oxygen species by mitochondria. Thus, it is biological plausible that the -
3826A/G polymorphism located at the promoter region of the UCP1 gene might be
associated with DR in patients with DM.
In this study, through a case-control design, we investigated whether the -
3826A/G polymorphism in the UCP1 gene is associated with DR in patients with type 1
diabetes mellitus (DM1). In addition, in a cross-sectional study performed in cornea
donors, we evaluated whether the UCP1 gene is expressed in human retina, and whether
the -3826A/G polymorphism modifies its expression in this tissue. We also evaluated
the MnSOD2 gene expression (which is a gene that codifies an important antioxidant
enzyme) according to the different genotypes of the -3826A/G polymorphism.
In the case-control study, the frequencies of the -3826A/G polymorphism were
evaluated in 257 patients with DM1 differentiated according to the presence of DR (154
cases with DR and 103 controls without DR). The cross-sectional study included 166

12
cadaveric donor corneas. In a subgroup of 107 retinal samples differentiated according
to the presence of the risk allele of the analyzed polymorphism, UCP1 and MnSOD2
mRNA concentrations were evaluated by real time-PCR technique.
The G allele of the -3826A/G polymorphism was more frequent in patients with
DR compared to patients without this complication (41.0% vs. 31.0%; P = 0.029). The
G/G genotype was associated with an increased risk to DR, after adjusting for age,
arterial hypertension and serum creatinine levels (Odds Ratio = 3.503; 95% 1.04 -
11.80; P = 0.043). Our data show for the first time the UCP1 mRNA expression in
human retina (1.35 ± 0.93 n fold). Moreover, G allele carriers had a higher UCP1
mRNA expression than A/A genotype carriers (1.10 ± 1.50 vs. 0.51 ± 0.99 n fold, P =
0.034). Interestingly, G allele carriers also showed an increased MnSOD2 gene
expression (P = 0.031). Additionally, UCP1 and MnSOD2 concentrations in retina were
positively correlated (r = 0.29, P = 0.015).
In conclusion, our results show an independent association between the -3826
A/G polymorphism and DR in DM1 patients. This is the first report showing that UCP1
is expressed in human retina, and that the -3826A/G polymorphism influences its
expression in this tissue. Possibly, MnSOD2 expression might influence the UCP1
effect in the protection against oxidative stress. Further functional studies will be
needed to evaluate the effect of UCP1 in human retina, and to confirm that changes in
the UCP1 gene expression also cause changes in protein levels.

13
PARTE I
Artigo de revisão
THE ROLE OF THE UNCOUPLING PROTEIN 1 (UCP1) ON THE
DEVELOPMENT OF OBESITY AND TYPE 2 DIABETES MELLITUS
O PAPEL DA PROTEÍNA DESACOPLADORA 1 (UCP1) NO
DESENVOLVIMENTO DA OBESIDADE E DIABETES MELLITUS TIPO 2

14
The role of the uncoupling protein 1 (UCP1) on the development of obesity and
type 2 diabetes mellitus
Letícia de Almeida Brondani, Taís Silveira Assmann, Guilherme Coutinho Kullmann
Duarte, Luís Henrique Canani, Daisy Crispim*
Endocrinology Division, Hospital de Clínicas de Porto Alegre, Universidade Federal do
Rio Grande do Sul. Porto Alegre, RS, Brazil. Emails: [email protected] (LAB);
[email protected] (TSA); [email protected] (GCKD);
[email protected] (LHC); [email protected] (DC).
* Correspondence: Dr. Daisy Crispim. Rua Ramiro Barcelos 2350; prédio 12; 4°
andar. CEP 90035-003, Porto Alegre, RS, Brazil.
15
ABSTRACT
It is well established that genetic factors play an important role in the development of
both type 2 diabetes mellitus (DM2) and obesity, and that genetically susceptible
subjects can develop these metabolic diseases after being exposed to environmental risk
factors. Therefore, great efforts have been made to identify genes associated with DM2
and/or obesity. Uncoupling protein 1 (UCP1) is mainly expressed in brown adipose
tissue, and acts in thermogenesis, regulation of energy expenditure, and protection
against oxidative stress. All these mechanisms are associated with the pathogenesis of
DM2 and obesity. Hence, UCP1 is a candidate gene for the development of these
disorders. Indeed, several studies have reported that polymorphisms -3826A/G, -
1766A/G and -112A/C in the promoter region, Ala64Thr in exon 2 and Met299Leu in
exon 5 of UCP1 gene are possibly associated with obesity and/or DM2. However, the
results are still controversial in different populations. Thus, the aim of this study was to
review the role of UCP1 in the development of these metabolic diseases.
Keywords: UCP1, obesity, type 2 diabetes mellitus, DNA polymorphisms, brown
adipose tissue.

16
Introduction
Type 2 diabetes mellitus (DM2) and obesity are common, multifactorial conditions for
which susceptibility is determined by the joint actions of genetic and environmental
factors [1-3]. The prevalence of obesity and DM2 is increasing worldwide at an
alarming rate, and both traits are associated with increased morbidity and mortality [4-
6]. The dramatic increase in the prevalence of these disorders over the past two decades
is mostly likely due to changes in diet and physical activity [7]. However, it is believed
that these environmental changes would only lead to DM2 and/or obesity under a
permissible genetic background [2]. Therefore, great efforts have been made to identify
genes associated with these disorders, and a number of studies have been focused on the
genes related to energy expenditure, such as those encoding adrenergic receptors and
mitochondrial uncoupling proteins (UCPs) [8-10].
Uncoupling protein 1 (UCP1) plays important roles in metabolic and energy
balance and regulation, cold- and diet-induced thermogenesis, and in decreasing
reactive oxygen species (ROS) production by mitochondria, which are mechanisms
associated with the pathogenesis of obesity and/or DM2 [8, 9]. Thus, the aim of the
present study was to review the role of UCP1 in relation to the development of these
conditions.
Mitochondrial Respiratory Chain
Mitochondria are organelles in all eukaryotic cells and are involved in many processes
essential for cell survival and function, including energy production, redox control,
calcium homeostasis, and certain metabolic and biosynthetic pathways. In addition,
mitochondria are the main sources of ROS and often play a key role in physiological
cell death mechanisms [11].

17
The main source of cell energy is the synthesis of ATP from ADP and inorganic
phosphate (Pi) by oxidative phosphorylation (OXPHOS) carried out in the
mitochondrial respiratory chain (MRC) [12]. MRC is located in the inner mitochondrial
membrane, and is constituted by four multienzymatic complexes, an oligomeric protein
complex (ATP-synthase), and two proteins responsible for electron transport, coenzyme
Q (CoQ) and cytochrome c (Figure 1). OXPHOS involves the coupling of electron
transport, through the complexes I-IV of the MRC, to the active pumping of protons
across the inner mitochondrial membrane and ATP formation by ATP-synthase [11,
13].
Oxidation of reduced nutrient molecules through cellular metabolism yields
electrons in the form of reduced hydrogen carriers (NADH and FADH2), which donate
electrons to the MRC. The movement of electrons through MRC is driven by a redox
potential that is present across the chain. Complexes I, III and IV pump protons across
the inner membrane as electrons pass down the MRC. This produces an electrochemical
potential difference across the inner membrane, known as proton-motive force,
consisting mostly of an electrochemical gradient (membrane potential) and a chemical
gradient (pH difference). The energy that is conserved in the proton gradient across the
inner membrane is used by ATP-synthase to synthesize ATP as protons are transported
back from the intermembrane space into the mitochondrial matrix. The final destination
for the electrons is the generation of molecular oxygen, which is reduced to water by
complex IV, in the last step of the MRC. Therefore, the process of substrate oxidation
and oxygen reduction is also called respiration [11, 13-15].
The coupling of respiration to ATP synthesis is not 100% efficient and some of
the energy is dissipated as heat. Partial uncoupling of respiration from ATP synthesis,
also known as proton-leak, can be mediated by UCPs and by other mitochondrial inner

18
membrane proteins as for example the adenine nucleotide translocase (ANT); thus,
preventing the inhibition of MRC by exaggerated ATP levels [16-18].
Although OXPHOS constitutes a vital part of cellular metabolism, the MRC is
probably the most important site of ROS production [19]. ROS correspond to a variety
of molecules and free radicals (chemical species with one unpaired electron) derived
from the metabolism of molecular oxygen. Superoxide anion (O2-) is the precursor of
most ROS and a mediator in oxidative chain reactions [19, 20]. Dismutation of O2-
(either spontaneously or through a reaction catalyzed by superoxide dismutases)
produces hydrogen peroxide (H2O2), which in turn may be fully reduced to water or, in
the presence of ferrous or cuprous ions, may form the highly reactive hydroxyl radical (
OH) [11]. ROS normally exist in all aerobic cells in balance with biochemical
antioxidants. Oxidative stress occurs when this critical balance is disrupted because of
excess ROS, antioxidants depletion, or both. This stress causes damage to cellular
macromolecules, such as nucleic acids, proteins, lipids and structural carbohydrates
[21]. Moreover, oxidative stress can also lead to cell death by necrosis or apoptosis,
mechanisms involved in the pathogenesis of ageing and some disorders such as DM2
and its chronic complications [22, 23].
Uncoupling of the Mitochondrial Respiratory Chain, Changes in Energy
Expenditure, and Adaptive Thermogenesis
Total body energy expenditure represents the conversion of oxygen and food (or
storable forms of energy) to carbon dioxide, water, heat and “work” on the environment
[24]. Energy expenditure in humans can be subdivided into: 1) basal energy expenditure
or resting metabolic rate (RMR), measured under resting conditions and required for

19
normal functioning of cells; 2) energy expenditure resulting from physical activity; and
3) energy expenditure attributed to adaptive thermogenesis (Figure 2) [24, 25].
Uncoupling (proton-leak) of MRC constitutes a considerable part of the RMR
[25]. Approximately 20-50% of total energy expenditure is due to proton-leaks, with the
skeletal muscle as the main contributor [26]. Variations in the RMR are due to several
determinants, including body composition (fat vs. fat free mass), concentrations of
steroid and thyroid hormones, genetic factors, and the activity of the sympathetic
nervous system [25]. It is known that a low energy expenditure could predict future
weight gain [27], and that only a slight imbalance between energy intake and energy
expenditure is necessary for a weight gain if it persists over several years [28]. Thus,
increasing the energy expenditure by increasing the proton-leak in mitochondria has
been recognized as an effective way to achieve weight loss [25].
Brown adipose tissue (BAT) is found in newborns, rodents and hibernating
mammals, and is the main site of adaptive thermogenesis, which is defined as non-
shivering heat production in response to environmental temperature or diet [9, 17, 29].
As a result, thermogenesis in BAT has important roles in thermal and energetic balance
and, when deficient, can lead to obesity [30]. BAT is a metabolically active tissue,
which consists of adipocytes rich in mitochondria and numerous small lipid droplets,
and is heavily innervated by sympathetic nerves [25]. This tissue differs from the white
adipose tissue (WAT), which contains large lipid droplets and few mitochondria [17,
25].
In fetuses and newborn infants, BAT has traditionally been regarded as
occurring in specific depots, such as axillary, interscapular, perirenal and periadrenal
[31]. At birth, human newborns have considerable amount of BAT, corresponding to 1-
5% of the total body weight. This amount is able to take care of the heat generation for

20
the body when the skeletal muscles are yet not able to make any controlled movements
and thus, produce heat. Children have highly active functional BAT until 13-15 years of
age; but, until a few years ago, it was thought that the quantity of BAT declines after
puberty, being rare in adults [30]. Nevertheless, nowadays it is known that BAT can be
found in adults in the presence of catecholamine-secreting tumors, such as
pheochromocytomas and paragangliomas [32]. Besides, some recent studies have
shown that BAT in adults is functionally and metabolically highly active, especially
after chronic exposure to cold [33, 34].
In 1978, Himms-Hagen and Desautels [35] showed that BAT metabolism played
a role in obesity development, and that obese mice had a defect in the mechanisms
necessary for the activation of BAT thermogenesis. After this pioneering work, many
studies have also shown that defective BAT thermogenesis is involved in the
development of obesity in most rodent models, and activation of BAT thermogenesis
reduces weight gain in these animals [36, 37]. Studies in humans show that although the
amount of BAT is reported to be decreased in healthy adults, it is still responsible for 1-
2% of the energy expenditure, preventing a weight gain of 1-2 kg per year [38-40].
Interestingly, healthy men that has BAT when exposed to cold (19°C) have a 30%
increase in energy expenditure when compared to thermoneutrality (27°C), in contrast
to those men with almost no BAT that did not show any increase in cold-induced energy
expenditure [41].
It has been suggested that development of ectopic BAT within the WAT may
play an important role in preventing obesity [16]. In agreement with this hypothesis,
transgenic mice overexpressing UCP1 in their skeletal muscle or WAT develop a
resistance to diet-induced obesity and DM2, and also have a marked stimulation of fatty
acid oxidation in muscles [29, 42]. In addition, Tiraby et al. [43] reported that the

21
adenovirus-mediated expression of human PGC-1α (PPARγ-coactivator-1α) increased
the expression of UCP1, respiratory chain proteins, and fatty acid oxidation enzymes in
human subcutaneous white adipocytes. Changes in the expression of other genes were
also consistent with brown adipocyte mRNA expression profile. The authors concluded
that human white adipocytes can therefore acquire typical features of brown fat cells
following proper stimulation [43]. These data indicate that a moderate induction of
UCP1 in WAT may be used to increase metabolic energy expenditure in obese subjects.
Thus, specific uncoupling of adipocyte mitochondria remains an attractive target for the
development of anti-obesity drugs [16].
Mitochondrial Uncoupling Proteins (UCPs)
UCPs 1, 2, 3, 4 and 5 are members of an anion-carrier protein family and are located in
the inner mitochondrial membrane [44]. These proteins have similarities in their
structures, but different tissue expression in mammals. The original UCP, UCP1, is
mainly expressed in BAT [45]. UCP2 is widely distributed, whereas UCP3 is mainly
restricted to the skeletal muscle and UCP4 and 5 are mainly expressed in the brain [44,
45].
Over the last few years, several studies have shown that UCPs decrease
metabolic efficiency by uncoupling substrate oxidation in mitochondria from ATP
synthesis by MRC. This is thought to be accomplished by promoting net translocation
of protons from the intermembrane space, across the inner mitochondrial membrane, to
the mitochondrial matrix, thereby dissipating the potential energy available for ATP
synthesis, and consequently, decreasing ATP production [44, 46]. This uncoupling
effect then leads to homologue- and tissue-specific functions, such as thermogenesis
and energy expenditure (UCP1), regulation of free-fatty acids (FFAs) metabolism

22
(UCP2 and UCP3), reduction in ROS formation (UCP1-3 and UCP5), and regulation of
ATP-dependent processes (UCP2) [45, 47].
Uncoupling Protein 1 (UCP1)
Thermogenesis in BAT is due to UCP1, also called thermogenin or SLC25A7 [25,
48]. In 1985, Aquila et al. [49] cloned the UCP1 coding DNA sequence, and also
determined its amino acid sequence. UCP1 gene covers a 9 kb region on
chromosome 4 (region 4q28-q31) and contains 6 exons and 5 introns (Figure 3)
[50]. UCP1 is a 33-kDa dimeric protein that dissipates the pH-gradient generated by
OXPHOS (Figure 1), releasing chemical energy as heat [18, 25].
UCP1 gene expression is increased by cold, adrenergic stimulation, β3-
agonists, retinoid and thyroid hormones and cAMP [25, 51, 52]. Its expression is
activated by non-sterified fatty acids and inhibited by purine nucleotides (GDP, ATP
and ADP) [11, 25, 44]. Many studies based on the use of drugs activating β3-
adrenergic receptor (β3-AR) confirmed that the sympathetic nervous system was the
main trigger of UCP1 activation and induction [53]. Moreover, uncoupling of MRC
through UCP1 action is only observed when the cells are properly stimulated, for
example, by norepinephrine [46]. Norepinephrine stimulation of β3-AR results in
three concerted processes: 1) activation of p38 mitogen-activated protein kinase
(MAPK) pathways that upregulate UCP1 synthesis; 2) activation of protein kinase A
(PKA)-mediated pathways that initiate lipolysis and release of acute regulators of
UCP1, such as FFAs; and 3) inhibition of lysosomal pathways that degrade UCP1
[17, 18]. In addition, it is well known that PGC-1α plays a pivotal role in the
regulation of UCP1 gene expression, following adrenergic stimulation, through a

23
MAPK pathway that is associated with the JNK-interacting protein (JIP) family of
scaffold proteins [46].
The uncoupling activity of UCP1 is explained by its ability to transport protons
across the inner mitochondrial membrane, in particular when FFAs bind to the protein.
However, although CoQ has been described as a cofactor essential for its activity, the
precise mechanism by which FFAs regulate transport through UCP1 is still a matter of
intense debate [54, 55]. The main proposed mechanisms include the fatty acids
protonophore (or flip-flop) model and the channel (or proton buffering) model. In the
flip-flop model, UCP1 is a carrier of fatty acid anions, which are transported by this
protein from the matrix side to the intermembrane space. In this model, each fatty acid
anion combines with a proton, becomes electrically neutral and flips back through the
membrane, releasing the proton in the matrix [56]. The channel model predicts a two-
domain structure of UCP1 with a pore domain and a gating domain, which allows
protons to pass through the UCP1. In this model, fatty acid carboxy groups are involved
in the proton transport by providing H+-buffering capacity [57]. The arguments for and
against each model were reviewed by Brand et al. [26] in 1999.
Transgenic and knockout rodent models are common approaches for
investigating the impact of overexpression or the absence of a particular gene on the
mouse phenotype. The UCP1 knockout mice did not become obese, and merely showed
an increased sensitivity to cold exposure [58]. On the other hand, transgenic mice with
increased UCP1 expression in WAT were obesity-resistant after being fed with a diet
rich in saturated fat [59]. UCP1 has also been ectopically expressed in skeletal muscle
of mice, which showed an improved glucose tolerance when compared with wild-type
mice, after a high-fat diet [60]. In humans, UCP1 expression in the intraperitoneal fat of
obese subjects is 50% lower than in normal weight subjects, in spite of the amount of
24
BAT interspersed in WAT depots in adult individuals is relatively low (approximately
1 brown adipocyte / 200 white adipocytes) [38, 61].
Until a few years ago, it was believed that UCP1 was expressed exclusively
in BAT; but it was recently reported that UCP1 mRNA expression and/or protein
were also observed in the WAT of mouse and humans, in mammalian pancreatic
islets, in human skeletal muscle, in bovine retina, in human longitudinal smooth
muscle layers, and in rat and mouse thymocytes [62-66]. However, the physiological
role of UCP1 in these tissues is still a matter of debate [25]. As already mentioned,
uncoupling of MRC due to UCP1 activity allows a more rapid flux of electrons
through the inner mitochondrial membrane, reducing membrane potential and,
consequently, decreasing ROS production [44]. Therefore, the main role of UCP1 in
these other tissues seems to be a protection against oxidative stress [67, 68].
Superoxide anions could activate UCPs through lipid peroxidation products, such as
4-hydroxy-2-nonenal (HNE), which is a marker of oxidative stress and a direct
activator of UCP1 [68-70]. On the other hand, superoxide dismutase enzymes inhibit
the UCP1 activity [68]. Interestingly, Cui et al. [65] reported that endothelial cells
from bovine retina incubated with high glucose levels increased UCP1 and UCP2
expression, which protected them from ROS damage derived from glucotoxicity,
suggesting a protective role of these UCPs in the pathogenesis of diabetic
retinopathy, a chronic diabetic complication.
UCP1 Gene Polymorphisms Associated with Obesity and/or Type 2 Diabetes
Mellitus
Because UCP1 has been found to decrease membrane potential and increase energy
expenditure, UCP1 gene is regarded as a candidate gene for obesity, DM2 or

25
related-traits [25]. For that reason, in a number of genetic studies, the relationship
between UCP1 locus and susceptibility to these disorders has been investigated,
with particular attention being paid to -3826A/G, -1766A/G and -112A/C
polymorphisms in the promoter region, Ala64Thr polymorphism in exon 2, and
Met299Leu polymorphism in exon 5 of the UCP1 gene (Figure 3). Results of these
studies have been variable (Table 1): while some studies showed an association of
one or more of these polymorphisms with obesity, DM2, body fat accumulation,
body mass index (BMI) or other characteristics of metabolic syndrome [40, 62, 71-
91], other studies were unable to find any association between these polymorphisms
and these characteristics [92-102].
Most association studies about the effects of UCP1 gene polymorphisms
were focused on the -3826A/G (rs1800592) polymorphism. The -3826G allele has
been associated with reduced UCP1 mRNA expression in intraperitonial adipose
tissue of obese subjects, indicating that this polymorphism has functional
importance [103]. Several independent studies support the association between the -
3826G allele and obesity, BMI or other obesity-related parameters [75-77, 81-84,
87, 90]. Additionally, other studies indicate that the -3826G allele might be
associated with reduced HDL-cholesterol levels [62, 74, 78, 85], increased
triglycerides [78, 84] or LDL-cholesterol levels [80, 85], and increased systolic
and/or diastolic blood pressure [76, 85].
Conversely, studies on the association of the effects of UCP1 gene
polymorphisms on DM2 have shown controversial results: a few studies reported an
association between the -3826G allele and DM2, insulin resistance (IR) or increased
insulin or glucose levels [78, 82]; whereas other studies indicated that this
polymorphism is not associated with these characteristics [73, 77, 81, 82, 93, 95-97,

26
100, 101]. A number of studies analyzed the association between other UCP1 gene
polymorphisms and DM2. Mori et al. [79] reported that the C allele of -112A/C
polymorphism and Leu allele of Met299Leu polymorphism were associated with
susceptibility to DM2 in Japanese subjects. A recent study showed that the -3826A/-
112A/Met229 UCP1 haplotype was associated with increased risk for DM2 in
Indian subjects [91]. In addition, the study of Fukuyama et al. [73] indicated that the -
112A/C polymorphism was associated with both increased insulin resistance and
hepatic lipid content in Japanese subjects with DM2.
Like UCP1, β3-AR is expressed in BAT and WAT and plays an important role
in the induction of lipolysis and in the regulation of energy homeostasis [10]. In
addition, it is the main adrenoreceptor that stimulates UCP1 expression [52]. The
Trp64Arg polymorphism in the β3-AR gene has been associated with weight gain and
other obesity-related indexes as well as with insulin resistance in different populations
(reviewed in [10]). Interestingly, some studies have shown that a synergistic effect
between the -3826A/G polymorphism (UCP1 gene) and the Trp64Arg polymorphism
(β3-AR gene) is associated with an increased tendency to weight gain [87], lower RMR
[99], resistance to weight loss [98, 104] or subsequent weight-maintenance after a low-
calorie diet [98]. In contrast, other studies did not found any influence of the interaction
between these two polymorphisms on the resistance to a low-calorie diet [105], BMI
and triglyceride levels [81, 84] or several metabolic parameters related to obesity and
DM2 [101]. The ethnical difference, the age and environmental factors as well as
synergetic effect with other genes might explain the controversial results among
different investigations [10].
In brief, studies on these associations cited here indicated that the -3826A/G
polymorphism contributes to the susceptibility of obesity. On the other hand, results

27
reported by other studies related to the effects of -3826A/G polymorphism and other
UCP1 gene polymorphisms on lipid profile, blood pressure or DM2 are still
inconclusive.
Conclusion
Several studies have contributed to the understanding of the mechanisms underlying
BAT function and UCP1 activity in this tissue. Interestingly, recent studies have
shown that UCP1 can also be detected in pancreatic islets, WAT, skeletal muscle,
longitudinal smooth muscle layers, retina and thymus. However, the physiological
functions of UCP1 in these tissues are not established as well as in BAT, and future
studies will determine the role of UCP1 in these tissues.
Obesity and DM2 are multifactorial diseases associated with both genetic and
environmental factors. Knowledge on factors associated with these disorders will
allow us to better understand them, and may provide us with more effective
approaches to treatment and prevention. UCP1 plays important roles in
thermogenesis, regulation of energy expenditure, and in decreasing oxidative stress,
which are mechanisms associated with the pathogenesis of obesity and DM2. Thus,
UCP1 gene is an excellent candidate for these disorders. Indeed, numerous studies
strongly suggest that the UCP1 -3826A/G polymorphism is associated with obesity.
Further studies are needed to investigate UCP1 gene polymorphism in different
populations in order to confirm the association between these polymorphisms and
DM2, and also to elucidate the molecular mechanisms of association between UCP1
polymorphisms and obesity, DM2, and related-phenotypes.

28
Acknowledgments
This study was partially supported by grants from the Conselho Nacional de
Desenvolvimento Científico e Tecnólogico (CNPq), Coordenação de Aperfeiçoamento
de Pessoal de Nível Superior (CAPES) and Fundo de Incentivo à Pesquisa e Eventos
(FIFE) at Hospital de Clínicas de Porto Alegre.
Authors’ Contributions
All authors have contributed equally to the concept of the review, the literature search,
and the writing. All authors have read and approved the final manuscript.
Conflict of Interests
The authors declare that they have no competing interests.

29
References
1. American Diabetes Association: Diagnosis and classification of diabetes mellitus. Diabetes Care 2010, 33 Suppl 1:S62-69.
2. Vimaleswaran KS, Loos RJ: Progress in the genetics of common obesity and type 2 diabetes. Expert Rev Mol Med 2010, 12:e7.
3. Kopelman PG: Obesity as a medical problem. Nature 2000, 404(6778):635-
643.
4. Flegal KM, Graubard BI, Williamson DF, Gail MH: Excess deaths associated with underweight, overweight, and obesity. JAMA 2005, 293(15):1861-1867.
5. Ogden CL, Carroll MD, Curtin LR, McDowell MA, Tabak CJ, Flegal KM:
Prevalence of overweight and obesity in the United States, 1999-2004. JAMA
2006, 295(13):1549-1555.
6. Narayan KM, Boyle JP, Thompson TJ, Sorensen SW, Williamson DF: Lifetime risk for diabetes mellitus in the United States. JAMA 2003, 290(14):1884-
1890.
7. Hill JO, Wyatt HR, Reed GW, Peters JC: Obesity and the environment: where do we go from here? Science 2003, 299(5608):853-855.
8. Lowell BB, Flier JS: Brown adipose tissue, beta 3-adrenergic receptors, and obesity. Annu Rev Med 1997, 48:307-316.
9. Argyropoulos G, Harper ME: Uncoupling proteins and thermoregulation. J Appl Physiol 2002, 92(5):2187-2198.
10. Jia JJ, Tian YB, Cao ZH, Tao LL, Zhang X, Gao SZ, Ge CR, Lin QY, Jois M:
The polymorphisms of UCP1 genes associated with fat metabolism, obesity and diabetes. Mol Biol Rep 2010, 37(3):1513-1522.
11. Echtay KS: Mitochondrial uncoupling proteins--what is their physiological role? Free Radic Biol Med 2007, 43(10):1351-1371.
12. Dalgaard LT, Pedersen O: Uncoupling proteins: functional characteristics and role in the pathogenesis of obesity and Type II diabetes. Diabetologia 2001, 44(8):946-965.
13. Souza BM, Assmann TS, Kliemann LM, Gross JL, Canani LH, Crispim D: The role of uncoupling protein 2 (UCP2) on the development of type 2 diabetes mellitus and its chronic complications. Arq Bras Endocrinol Metabol 2011,
55(4):239-248.
14. Munnich A, Rustin P: Clinical spectrum and diagnosis of mitochondrial disorders. Am J Med Genet 2001, 106(1):4-17.
15. Enns GM: The contribution of mitochondria to common disorders. Mol
Genet Metab 2003, 80(1-2):11-26.
16. Ricquier D: Respiration uncoupling and metabolism in the control of energy expenditure. Proc Nutr Soc 2005, 64(1):47-52.
17. Cannon B, Nedergaard J: Brown adipose tissue: function and physiological significance. Physiol Rev 2004, 84(1):277-359.
18. Azzu V, Brand MD: The on-off switches of the mitochondrial uncoupling proteins. Trends Biochem Sci 2010, 35(5):298-307.
19. Nubel T, Ricquier D: Respiration under control of uncoupling proteins: Clinical perspective. Hormone Research 2006, 65(6):300-310.
20. Miwa S, Brand MD: Mitochondrial matrix reactive oxygen species production is very sensitive to mild uncoupling. Biochem Soc Trans 2003,
31(Pt 6):1300-1301.

30
21. Dröge W: Free radicals in the physiological control of cell function. Physiol Rev 2002, 82(1):47-95.
22. Fatehi-Hassanabad Z, Chan CB, Furman BL: Reactive oxygen species and endothelial function in diabetes. Eur J Pharmacol 2010, 636(1-3):8-17.
23. Papa S, Skulachev V: Reactive oxygen species, mitochondria, apoptosis and aging. Mol Cell Biochem 1997, 174(1-2):305-319.
24. Lowell BB, Spiegelman BM: Towards a molecular understanding of adaptive thermogenesis. Nature 2000, 404(6778):652-660.
25. Dalgaard L, Pedersen O: Uncoupling proteins: functional characteristics and role in the pathogenesis of obesity and Type II diabetes. Diabetologia 2001,
44(8):946-965.
26. Brand MD, Brindle KM, Buckingham JA, Harper JA, Rolfe DF, Stuart JA: The significance and mechanism of mitochondrial proton conductance. Int J Obes Relat Metab Disord 1999, 23 Suppl 6:S4-11.
27. Griffiths M, Payne PR, Stunkard AJ, Rivers JP, Cox M: Metabolic rate and physical development in children at risk of obesity. Lancet 1990,
336(8707):76-78.
28. Rosenbaum M, Leibel RL, Hirsch J: Obesity. N Engl J Med 1997, 337(6):396-
407.
29. Kozak LP, Harper ME: Mitochondrial uncoupling proteins in energy expenditure. Annu Rev Nutr 2000, 20:339-363.
30. Himms-Hagen J: Brown adipose tissue thermogenesis: interdisciplinary studies. FASEB J 1990, 4(11):2890-2898.
31. Lean ME, James WP, Jennings G, Trayhurn P: Brown adipose tissue uncoupling protein content in human infants, children and adults. Clin Sci (Lond) 1986, 71(3):291-297.
32. Fukuchi K, Tatsumi M, Ishida Y, Oku N, Hatazawa J, Wahl RL: Radionuclide imaging metabolic activity of brown adipose tissue in a patient with pheochromocytoma. Exp Clin Endocrinol Diabetes 2004, 112(10):601-603.
33. Virtanen KA, Lidell ME, Orava J, Heglind M, Westergren R, Niemi T,
Taittonen M, Laine J, Savisto NJ, Enerbäck S et al: Functional brown adipose tissue in healthy adults. N Engl J Med 2009, 360(15):1518-1525.
34. Virtanen KA, Nuutila P: Brown adipose tissue in humans. Curr Opin Lipidol 2011, 22(1):49-54.
35. Himms-Hagen J, Desautels M: A mitochondrial defect in brown adipose tissue of the obese (ob/ob) mouse: reduced binding of purine nucleotides and a failure to respond to cold by an increase in binding. Biochem Biophys Res Commun 1978, 83(2):628-634.
36. Trayhurn P: Energy expenditure and thermogenesis: animal studies on brown adipose tissue. Int J Obes 1990, 14 Suppl 1:17-26; discussion 26-19.
37. Trayhurn P, Jones PM, McGuckin MM, Goodbody AE: Effects of overfeeding on energy balance and brown fat thermogenesis in obese (ob/ob) mice. Nature 1982, 295(5847):323-325.
38. Bouillaud F, Villarroya F, Hentz E, Raimbault S, Cassard AM, Ricquier D:
Detection of brown adipose tissue uncoupling protein mRNA in adult patients by a human genomic probe. Clin Sci (Lond) 1988, 75(1):21-27.
39. Klaus S, Casteilla L, Bouillaud F, Ricquier D: The uncoupling protein UCP: a membraneous mitochondrial ion carrier exclusively expressed in brown adipose tissue. Int J Biochem 1991, 23(9):791-801.

31
40. Hamann A, Tafel J, Büsing B, Münzberg H, Hinney A, Mayer H, Siegfried W,
Ricquier D, Greten H, Hebebrand J et al: Analysis of the uncoupling protein-1 (UCP1) gene in obese and lean subjects: identification of four amino acid variants. Int J Obes Relat Metab Disord 1998, 22(9):939-941.
41. Yoneshiro T, Aita S, Matsushita M, Kameya T, Nakada K, Kawai Y, Saito M:
Brown adipose tissue, whole-body energy expenditure, and thermogenesis in healthy adult men. Obesity (Silver Spring) 2011, 19(1):13-16.
42. Kopecky J, Clarke G, Enerback S, Spiegelman B, Kozak LP: Expression of the mitochondrial uncoupling protein gene from the aP2 gene promoter prevents genetic obesity. J Clin Invest 1995, 96(6):2914-2923.
43. Tiraby C, Tavernier G, Lefort C, Larrouy D, Bouillaud F, Ricquier D, Langin D:
Acquirement of brown fat cell features by human white adipocytes. J Biol Chem 2003, 278(35):33370-33376.
44. Fisler J, Warden C: Uncoupling proteins, dietary fat and the metabolic syndrome. Nutrition & Metabolism 2006, 3(1):38.
45. Erlanson-Albertsson C: Uncoupling proteins--a new family of proteins with unknown function. Nutr Neurosci 2002, 5(1):1-11.
46. Nedergaard J, Ricquier D, Kozak LP: Uncoupling proteins: current status and therapeutic prospects - Meeting on Uncoupling Proteins. Embo Reports 2005, 6(10):917-921.
47. Jezek P: Possible physiological roles of mitochondrial uncoupling proteins--UCPn. Int J Biochem Cell Biol 2002, 34(10):1190-1206.
48. Ricquier D, Bouillaud F: Mitochondrial uncoupling proteins: from mitochondria to the regulation of energy balance. J Physiol 2000, 529 Pt 1:3-
10.
49. Aquila H, Link TA, Klingenberg M: The uncoupling protein from brown fat mitochondria is related to the mitochondrial ADP/ATP carrier. Analysis of sequence homologies and of folding of the protein in the membrane. EMBO
J 1985, 4(9):2369-2376.
50. Cassard AM, Bouillaud F, Mattei MG, Hentz E, Raimbault S, Thomas M,
Ricquier D: Human uncoupling protein gene: structure, comparison with rat gene, and assignment to the long arm of chromosome 4. J Cell Biochem 1990, 43(3):255-264.
51. Hall JA, Ribich S, Christoffolete MA, Simovic G, Correa-Medina M, Patti ME,
Bianco AC: Absence of thyroid hormone activation during development underlies a permanent defect in adaptive thermogenesis. Endocrinology 2010, 151(9):4573-4582.
52. Rousset S, Alves-Guerra M, Mozo J, Miroux B, Cassard-Doulcier A, Bouillaud
F, Ricquier D: The biology of mitochondrial uncoupling proteins. Diabetes 2004, 53 Suppl 1:S130-135.
53. Collins S, Yehuda-Shnaidman E, Wang H: Positive and negative control of Ucp1 gene transcription and the role of β-adrenergic signaling networks. Int J Obes (Lond) 2010, 34 Suppl 1:S28-33.
54. Echtay KS, Winkler E, Klingenberg M: Coenzyme Q is an obligatory cofactor for uncoupling protein function. Nature 2000, 408(6812):609-613.
55. Ledesma A, de Lacoba M, Rial E: The mitochondrial uncoupling proteins. Genome Biology 2002, 3(12):reviews3015.3011 - reviews3015.3019.
56. Garlid KD, Jaburek M, Jezek P: The mechanism of proton transport mediated by mitochondrial uncoupling proteins. FEBS Lett 1998, 438(1-
2):10-14.

32
57. Klingenberg M, Huang SG: Structure and function of the uncoupling protein from brown adipose tissue. Biochim Biophys Acta 1999, 1415(2):271-296.
58. Enerbäck S, Jacobsson A, Simpson EM, Guerra C, Yamashita H, Harper ME,
Kozak LP: Mice lacking mitochondrial uncoupling protein are cold-sensitive but not obese. Nature 1997, 387(6628):90-94.
59. Baumruk F, Flachs P, Horakova M, Floryk D, Kopecky J: Transgenic UCP1 in white adipocytes modulates mitochondrial membrane potential. FEBS Lett 1999, 444(2-3):206-210.
60. Li B, Nolte LA, Ju J-S, Han DH, Coleman T, Holloszy JO, Semenkovich CF:
Skeletal muscle respiratory uncoupling prevents diet-induced obesity and insulin resistance in mice. Nature Medicine 2000, 6(10):1115-1120.
61. Himms-Hagen J, Melnyk A, Zingaretti MC, Ceresi E, Barbatelli G, Cinti S:
Multilocular fat cells in WAT of CL-316243-treated rats derive directly from white adipocytes. Am J Physiol Cell Physiol 2000, 279(3):C670-681.
62. Sale M, Hsu F, Palmer N, Gordon C, Keene K, Borgerink H, Sharma A,
Bergman R, Taylor K, Saad M et al: The uncoupling protein 1 gene, UCP1, is expressed in mammalian islet cells and associated with acute insulin response to glucose in African American families from the IRAS Family Study. BMC Endocr Disord 2007, 7:1.
63. Nagase I, Yoshida T, Kumamoto K, Umekawa T, Sakane N, Nikami H, Kawada
T, Saito M: Expression of uncoupling protein in skeletal muscle and white fat of obese mice treated with thermogenic beta 3-adrenergic agonist. J Clin Invest 1996, 97(12):2898-2904.
64. Nibbelink M, Moulin K, Arnaud E, Duval C, Pénicaud L, Casteilla L: Brown fat UCP1 is specifically expressed in uterine longitudinal smooth muscle cells. J Biol Chem 2001, 276(50):47291-47295.
65. Cui Y, Xu X, Bi H, Zhu Q, Wu J, Xia X, Qiushi R, Ho PC: Expression modification of uncoupling proteins and MnSOD in retinal endothelial cells and pericytes induced by high glucose: the role of reactive oxygen species in diabetic retinopathy. Exp Eye Res 2006, 83(4):807-816.
66. Carroll AM, Haines LR, Pearson TW, Fallon PG, Walsh CM, Brennan CM,
Breen EP, Porter RK: Identification of a functioning mitochondrial uncoupling protein 1 in thymus. J Biol Chem 2005, 280(16):15534-15543.
67. Sluse F, Jarmuszkiewicz W, Navet R, Douette P, Mathy G, Sluse-Goffart C:
Mitochondrial UCPs: new insights into regulation and impact. Biochim Biophys Acta 2006, 1757(5-6):480-485.
68. Echtay KS, Roussel D, St-Pierre J, Jekabsons MB, Cadenas S, Stuart JA, Harper
JA, Roebuck SJ, Morrison A, Pickering S et al: Superoxide activates mitochondrial uncoupling proteins. Nature 2002, 415(6867):96-99.
69. Brand M, Affourtit C, Esteves T, Green K, Lambert A, Miwa S, Pakay J, Parker
N: Mitochondrial superoxide: production, biological effects, and activation of uncoupling proteins. Free Radic Biol Med 2004, 37(6):755-767.
70. Echtay KS, Esteves TC, Pakay JL, Jekabsons MB, Lambert AJ, Portero-Otín M,
Pamplona R, Vidal-Puig AJ, Wang S, Roebuck SJ et al: A signalling role for 4-hydroxy-2-nonenal in regulation of mitochondrial uncoupling. EMBO J
2003, 22(16):4103-4110.
71. Herrmann SM, Wang JG, Staessen JA, Kertmen E, Schmidt-Petersen K, Zidek
W, Paul M, Brand E: Uncoupling protein 1 and 3 polymorphisms are associated with waist-to-hip ratio. J Mol Med 2003, 81(5):327-332.

33
72. Kim KS, Cho DY, Kim YJ, Choi SM, Kim JY, Shin SU, Yoon YS: The finding of new genetic polymorphism of UCP-1 A-1766G and its effects on body fat accumulation. Biochim Biophys Acta 2005, 1741(1-2):149-155.
73. Fukuyama K, Ohara T, Hirota Y, Maeda K, Kuno S, Zenibayashi M, Teranishi
T, Kouyama K, Maeda E, Sakamoto N et al: Association of the -112A>C polymorphism of the uncoupling protein 1 gene with insulin resistance in Japanese individuals with type 2 diabetes. Biochem Biophys Res Commun 2006, 339(4):1212-1216.
74. Hamada T, Kotani K, Nagai N, Tsuzaki K, Matsuoka Y, Sano Y, Fujibayashi M,
Kiyohara N, Tanaka S, Yoshimura M et al: Low-calorie diet-induced reduction in serum HDL cholesterol is ameliorated in obese women with the -3826 G allele in the uncoupling protein-1 gene. Tohoku J Exp Med 2009,
219(4):337-342.
75. Sramkova D, Krejbichova S, Vcelak J, Vankova M, Samalikova P, Hill M,
Kvasnickova H, Dvorakova K, Vondra K, Hainer V et al: The UCP1 gene polymorphism A-3826G in relation to DM2 and body composition in Czech population. Exp Clin Endocrinol Diabetes 2007, 115(5):303-307.
76. Forga L, Corbalán M, Marti A, Fuentes C, Martínez-González MA, Martínez A:
[Influence of the polymorphism 03826 A --> G in the UCP1 gene on the components of metabolic syndrome]. An Sist Sanit Navar 2003, 26(2):231-
236.
77. Ramis JM, González-Sánchez JL, Proenza AM, Martínez-Larrad MT,
Fernandez-Pérez C, Palou A, Serrano-Ríos M: The Arg64 Allele of the Beta3-Adrenoceptor Gene But Not the -3826G Allele of the Uncoupling Protein 1 Gene Is Associated With Increased Leptin Levels in the Spanish Population.
Metabolism 2004, 53(11):1411-1416.
78. Kieć-Wilk B, Wybrańska I, Malczewska-Malec M, Leszczyńska-Gołabek L,
Partyka L, Niedbał S, Jabrocka A, Dembińska-Kieć A: Correlation of the -3826A >G polymorphism in the promoter of the uncoupling protein 1 gene with obesity and metabolic disorders in obese families from southern Poland. J Physiol Pharmacol 2002, 53(3):477-490.
79. Mori H, Okazawa H, Iwamoto K, Maeda E, Hashiramoto M, Kasuga M: A polymorphism in the 5' untranslated region and a Met229-->Leu variant in exon 5 of the human UCP1 gene are associated with susceptibility to type II diabetes mellitus. Diabetologia 2001, 44(3):373-376.
80. Proenza AM, Poissonnet CM, Ozata M, Ozen S, Guran S, Palou A, Strosberg
AD: Association of sets of alleles of genes encoding beta3-adrenoreceptor, uncoupling protein 1 and lipoprotein lipase with increased risk of metabolic complications in obesity. Int J Obes Relat Metab Disord 2000, 24(1):93-100.
81. Hayakawa T, Nagai Y, Taniguchi M, Yamashita H, Takamura T, Abe T,
Nomura G, Kobayashi K: Phenotypic characterization of the beta3-adrenergic receptor mutation and the uncoupling protein 1 polymorphism in Japanese men. Metabolism 1999, 48(5):636-640.
82. Heilbronn LK, Kind KL, Pancewicz E, Morris AM, Noakes M, Clifton PM:
Association of -3826 G variant in uncoupling protein-1 with increased BMI in overweight Australian women. Diabetologia 2000, 43(2):242-244.
83. Nakano T, Shinka T, Sei M, Sato Y, Umeno M, Sakamoto K, Nomura I,
Nakahori Y: A/G heterozygote of the A-3826G polymorphism in the UCP-1 gene has higher BMI than A/A and G/G homozygote in young Japanese males. The Journal of Medical Investigation 2006, 53(3,4):218-222.

34
84. Matsushita H, Kurabayashi T, Tomita M, Kato N, Tanaka K: Effects of uncoupling protein 1 and [beta]3-adrenergic receptor gene polymorphisms on body size and serum lipid concentrations in Japanese women. Maturitas
2003, 45(1):39-45.
85. Oh HH, Kim KS, Choi SM, Yang HS, Yoon Y: The Effects of Uncoupling Protein-1 Genotype on Lipoprotein Cholesterol Level in Korean Obese Subjects. Metabolism 2004, 53(8):1054-1059.
86. Shin HD, Kim KS, Cha MH, Yoon Y: The effects of UCP-1 polymorphisms on obesity phenotypes among Korean female subjects. Biochemical and Biophysical Research Communications 2005, 335:624-630.
87. Clément K, Ruiz J, Cassard-Doulcier AM, Bouillaud F, Ricquier D, Basdevant
A, Guy-Grand B, Froguel P: Additive effect of A-->G (-3826) variant of the uncoupling protein gene and the Trp64Arg mutation of the beta 3-adrenergic receptor gene on weight gain in morbid obesity. Int J Obes Relat Metab Disord 1996, 20(12):1062-1066.
88. Franco-Hincapie L, Duque CE, Parra MV, Gallego N, Villegas A, Ruiz-Linares
A, Bedoya G: [Association between polymorphism in uncoupling proteins and type 2 diabetes in a northwestern Colombian population]. Biomedica 2009, 29(1):108-118.
89. Kim JY, Lee SS: The effects of uncoupling protein 1 and beta3-adrenergic receptor gene polymorphisms on weight loss and lipid profiles in obese women. Int J Vitam Nutr Res 2010, 80(2):87-96.
90. Cha MH, Kim KS, Suh D, Chung SI, Yoon Y: A UCP1-412A>C polymorphism is associated with abdominal fat area in Korean women. Hereditas 2008, 145(5):231-237.
91. Vimaleswaran KS, Radha V, Ghosh S, Majumder PP, Rao MR, Mohan V: A haplotype at the UCP1 gene locus contributes to genetic risk for type 2 diabetes in Asian Indians (CURES-72). Metab Syndr Relat Disord 2010,
8(1):63-68.
92. Shen ZN, Wang XS, Bai H, Fan P, Liu R, Liu Y, Liu BW: [Analysis of -3826A/G polymorphism in the promoter of the uncoupling protein-1 gene in Chinese non-obese and obese populations]. Zhonghua Yi Xue Yi Chuan Xue Za Zhi 2009, 26(5):555-561.
93. Mottagui-Tabar S, Hoffstedt J, Brookes AJ, Jiao H, Arner P, Dahlman I:
Association of ADRB1 and UCP3 gene polymorphisms with insulin sensitivity but not obesity. Horm Res 2008, 69(1):31-36.
94. Nieters A, Becker N, Linseisen J: Polymorphisms in candidate obesity genes and their interaction with dietary intake of n-6 polyunsaturated fatty acids affect obesity risk in a sub-sample of the EPIC-Heidelberg cohort. Eur J Nutr 2002, 41(5):210-221.
95. Urhammer SA, Hansen T, Borch-Johnsen K, Pedersen O: Studies of the Synergistic Effect of the Trp/Arg64 Polymorphism of the {beta}3-Adrenergic Receptor Gene and the -3826 A->G Variant of the Uncoupling Protein-1 Gene on Features of Obesity and Insulin Resistance in a Population-Based Sample of 379 Young Danish Subjects. J Clin Endocrinol Metab 2000, 85(9):3151-3154.
96. Sivenius K, Valve R, Lindi V, Niskanen L, Laakso M, Uusitupa M: Synergistic effect of polymorphisms in uncoupling protein 1 and beta3-adrenergic receptor genes on long-term body weight change in Finnish type 2 diabetic

35
and non-diabetic control subjects. Int J Obes Relat Metab Disord 2000,
24(4):514-519.
97. Boullu-Sanchis S, Leprêtre F, Hedelin G, Donnet JP, Schaffer P, Froguel P,
Pinget M: Type 2 diabetes mellitus: association study of five candidate genes in an Indian population of Guadeloupe, genetic contribution of FABP2 polymorphism. Diabetes Metab 1999, 25(2):150-156.
98. Fogelholm M, Valve R, Kukkonen-Harjula K, Nenonen A, Hakkarainen V,
Laakso M, Uusitupa M: Additive effects of the mutations in the beta3-adrenergic receptor and uncoupling protein-1 genes on weight loss and weight maintenance in Finnish women. J Clin Endocrinol Metab 1998,
83(12):4246-4250.
99. Valve R, Heikkinen S, Rissanen A, Laakso M, Uusitupa M: Synergistic effect of polymorphisms in uncoupling protein 1 and beta3-adrenergic receptor genes on basal metabolic rate in obese Finns. Diabetologia 1998, 41(3):357-
361.
100. Evans D, Minouchehr S, Hagemann G, Mann WA, Wendt D, Wolf A, Beisiegel
U: Frequency of and interaction between polymorphisms in the beta3-adrenergic receptor and in uncoupling proteins 1 and 2 and obesity in Germans. Int J Obes Relat Metab Disord 2000, 24(10):1239-1245.
101. Schaffler A, Palitzsch KD, Watzlawek E, Drobnik W, Schwer H, Scholmerich J,
Schmitz G: Frequency and significance of the A-->G (-3826) polymorphism in the promoter of the gene for uncoupling protein-1 with regard to metabolic parameters and adipocyte transcription factor binding in a large population-based Caucasian cohort. Eur J Clin Invest 1999, 29(9):770-779.
102. Gagnon J, Lago F, Chagnon YC, Pérusse L, Näslund I, Lissner L, Sjöström L,
Bouchard C: DNA polymorphism in the uncoupling protein 1 (UCP1) gene has no effect on obesity related phenotypes in the Swedish Obese Subjects cohorts. Int J Obes Relat Metab Disord 1998, 22(6):500-505.
103. Esterbauer H, Oberkofler H, Liu YM, Breban D, Hell E, Krempler F, Patsch W:
Uncoupling protein-1 mRNA expression in obese human subjects: the role of sequence variations at the uncoupling protein-1 gene locus. J Lipid Res 1998, 39(4):834-844.
104. Kogure A, Yoshida T, Sakane N, Umekawa T, Takakura Y, Kondo M: Synergic effect of polymorphisms in uncoupling protein 1 and beta3-adrenergic receptor genes on weight loss in obese Japanese. Diabetologia 1998,
41(11):1399.
105. Fumeron F, Durack-Bown I, Betoulle D, Cassard-Doulcier AM, Tuzet S,
Bouillaud F, Melchior JC, Ricquier D, Apfelbaum M: Polymorphisms of uncoupling protein (UCP) and beta 3 adrenoreceptor genes in obese people submitted to a low calorie diet. Int J Obes Relat Metab Disord 1996,
20(12):1051-1054.

36
Table 1 Studies of the association between UCP1 gene polymorphisms and obesity, type 2 diabetes mellitus or related-traits
Polymorphism Population and Design Characteristics Results Ref.
-3826A/G Colombian (455 patients with DM2 and 449 non-
diabetic controls).
DM2. Association between the A allele and DM2 (OR =
0.78, P = 0.02).
[88]
-3826A/G Korean (40 obese women). Randomized clinical
trial of low-calorie meals (white vs. mixed rice), in
a 6-week follow-up.
Weight, BMI, lipid profile,
and blood glucose.
A/A genotype was associated with significant weight
loss in the mixed rice group.
[89]
-3826A/G Japanese (32 obese women). Low-calorie diet
intervention in a 2-month follow-up.
Obesity- and lipid-related
parameters.
The degree of reduction in the HDL levels was
significantly smaller in G allele carriers than in A/A
carriers.
[74]
-3826A/G 239 African-Americans and 583 Hispanics. BMI, WHR, lipid profile,
blood glucose, IR, and AIRg.
A/A genotype was associated with AIRg in African-
Americans and HDL levels in Hispanics.
[62]
-3826A/G Chinese (127 obese and 257 non-obese subjects). Obesity. No association. [92]
-3826A/G Swedish (292 obese and 481 non-obese women). IR and obesity. No association. [93]
-3826A/G Czech (295 DM2 patients, 113 offspring of DM2
patients, and 120 healthy adults).
Anthropometric parameters,
lipid profile, and blood
glucose.
No association with DM2. In the offspring of DM2
patients, the A/G genotype was associated with
higher BMI and subcutaneous fat mass compared
with A/A carriers.
[75]

37
-3826A/G Spanish (159 obese and 154 non-obese subjects). MetS related-traits. Within the obese group, the G allele was associated
with greater BMI, greater percentage of body fat and
higher DBP and SBP values than A/A carriers.
[76]
-3826A/G Spanish (160 men and 172 women with and
without obesity).
BMI, WHR, insulin, blood
glucose, leptin, and lipid
profile.
The G allele was more frequent in obese than in non-
obese women (0.31 vs. 0.17, P = 0.008).
[77]
-3826A/G Polish (118 obese subjects). Lipid profile, blood glucose,
insulin, and leptin.
G/G genotype carriers had higher triglyceride levels
and decreased HDL and insulin levels than A allele
carriers.
[78]
-3826A/G German (154 obese and 154 non-obese subjects). Obesity. No association. [94]
-3826 A/G 379 Danish subjects. Obesity, WHR, IR, blood
glucose, and lipid profile.
No association. [95]
-3826A/G Finnish (70 DM2 patients and 123 non-diabetic
subjects), in a 10-year follow-up.
BMI, blood glucose, insulin,
and BP.
No association. [96]
-3826A/G Turkish (271 obese and non-obese subjects). BMI, BP, blood glucose, and
lipid profile.
G/G genotype carriers showed BMI-associated
increases of cholesterol levels which were more
marked than in A allele carriers.
[80]
-3826A/G 214 Japanese men. BMI and IR. BMI was higher in subjects with the G allele vs. [81]

38
those without it.
-3826A/G Indian (89 DM2 patients and 100 non-diabetic
controls).
DM2. No association. [97]
-3826A/G 251 Japanese men. BMI, blood glucose, and lipid
profile.
Men with the A/G genotype had higher BMI than
those with the A/A genotype.
[83]
-3826A/G Japanese (182 postmenopausal and 99
premenopausal women), in a 4-year follow-up.
BMI and lipid profile.
In the premenopausal women, G allele carriers had
higher BMI than A/A genotype carriers. In the
postmenopausal women, the 4-year change in
triglyceride levels was higher in G allele carriers
than in non-carriers.
[84]
-3826A/G Korean (190 obese subjects). Lipid, blood glucose, and BP. The G allele was associated with higher DBP and
LDL levels and with lower HDL levels compared
with A/A genotype carriers.
[85]
-3826A/G Swedish (674 obese and 311 non-obese subjects). Obesity. No association. [102]
-3826A/G Finish (170 obese women). Treatment with low-
calorie diet, in a 12-week follow-up.
Weight loss and RMR. No association. [98]
-3826A/G Australian (526 obese or overweight women). BMI, DM2, blood glucose,
lipid profile, insulin.
The G allele was associated with higher BMI and
glucose levels than A/A genotype carriers.
[82]

39
-3826A/G French (238 morbidly obese and 91 non-obese
subjects).
Obesity and weight gain.
The G allele was associated with high weight gain
during adult life (OR = 1.4, P = 0.02).
[87]
-3826 A/G Finish (170 obese subjects). RMR. No association. [99]
-3826 A/G German (236 morbidly obese and 198 non-obese
subjects).
Obesity and DM2. No association. [100]
-3826 A/G 1020 German subjects. BMI, DM2, blood glucose,
and lipid profile.
No association. [101]
-3826A/G
-412A/C
367 Korean women. Body fat distribution.
-3826G and -412C alleles were individually
associated with larger areas of abdominal
subcutaneous fat. The [GC] haplotype enhanced the
significance of this association.
[90]
-3826A/G
Ala64Thr
162 German subjects. BMI and WHR.
The 64Thr allele was significantly associated with
higher WHR.
[71]
-3826A/G
-112A/C
Japanese (93 DM2 patients). DM2-related clinical
characteristics.
IR and hepatic lipid content were significantly
greater in -112C allele carriers than in non-carriers.
[73]
Met229Leu
-112A/C
Japanese (320 DM2 patients and 250 non-diabetic
controls).
DM2.
Leu229 and -112C allele frequencies were higher in
DM2 patients than in the control group.
[79]
-1176A/G 387 Korean women. BMI, WHR, percentage of WHR, body fat mass and percentage of body fat [72]

40
body fat.
were significantly higher in G allele carriers
compared to A/A genotype carriers.
Met229Leu
Ala64Thr
German (293 obese and 134 non-obese children) Obesity. Thr/Thr genotype was associated with risk for
obesity.
[40]
-3826A/G
-1776A/G
Ala64Thr
Korean (453 overweight women). Body fat distribution. The [GAA] haplotype was associated with decreased
abdominal fat tissue area, body fat mass and WHR.
[86]
-3826A/G
-112A/C
Met229Leu
Indian (812 DM2 patients and 990 non-diabetic
subjects).
DM2. Association between the -3826A/-112A /Met229
haplotype and risk for DM2 (OR = 1.82, P = 0.009).
[91]
AIRg = acute insulin response to glucose; BMI = body mass index; DBP = diastolic blood pressure; SBP = systolic blood pressure; DM2 = type 2 diabetes mellitus;
IR = insulin resistance; MetS = metabolic syndrome; WHR = waist-to-hip ratio.
41
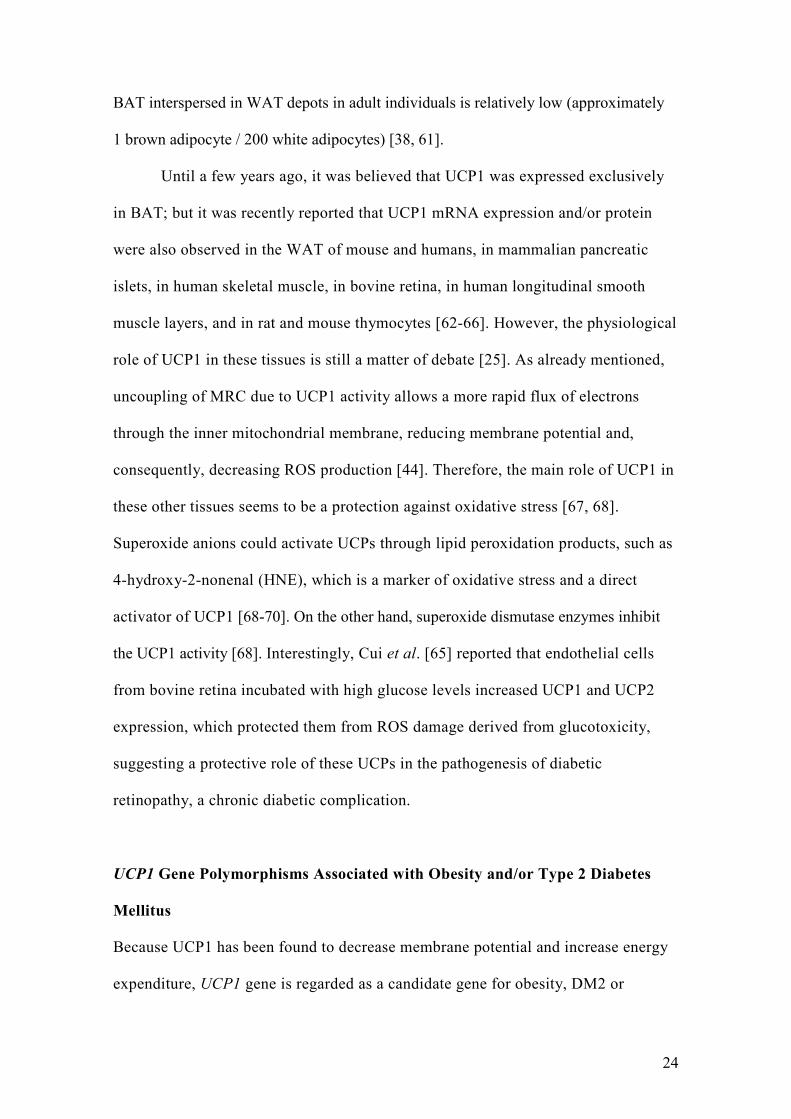
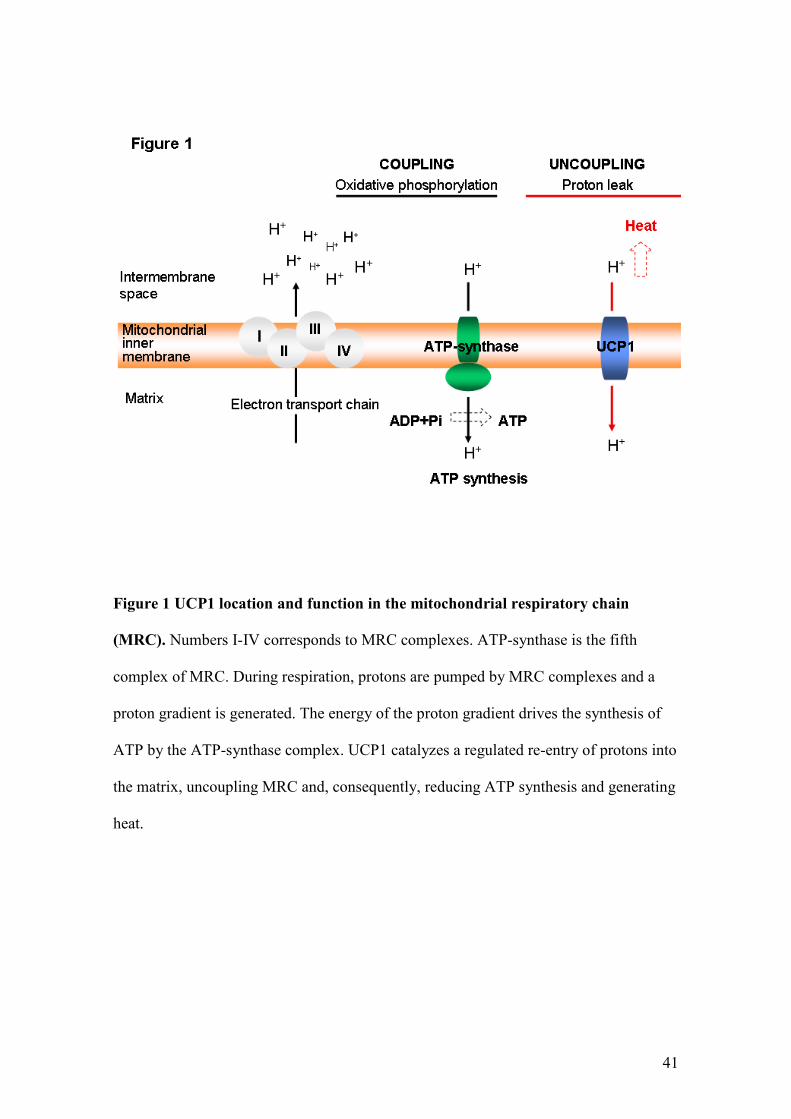
Figure 1 UCP1 location and function in the mitochondrial respiratory chain
(MRC). Numbers I-IV corresponds to MRC complexes. ATP-synthase is the fifth
complex of MRC. During respiration, protons are pumped by MRC complexes and a
proton gradient is generated. The energy of the proton gradient drives the synthesis of
ATP by the ATP-synthase complex. UCP1 catalyzes a regulated re-entry of protons into
the matrix, uncoupling MRC and, consequently, reducing ATP synthesis and generating
heat.

42
Figure 2 A thermodynamic perspective of energy expenditure. Energy enters into a
body as food and leaves it as heat and "work". Energy can also be obtained from
adipose stores. Total energy expenditure can be divided into: obligatory energy
expenditure or resting metabolic rate, measured under resting conditions and required
for functioning of cells; energy expenditure resulting from physical activity (variable);
and energy expenditure attributed to adaptive thermogenesis (variable, regulated by the
brain), which is defined as non-shivering heat production in response to environmental
temperature or diet. Adaptive thermogenesis mainly occurs in brown adipocytes
mitochondria and skeletal muscles. Adapted from Lowell and Spiegelman [24].

43
Figure 3 Map of UCP1 locus on chromosome 4 (region 4q28-q31). The six exons (boxes)
are numbered from left to right according to the transcriptional region. The vertical arrows
show the main common polymorphisms associated with obesity or type 2 diabetes mellitus.
Adapted from Jia et al. [10].

44
PARTE II
Artigo Original
ASSOCIATION BETWEEN THE -3826A/G POLYMORPHISM IN THE
UNCOUPLING PROTEIN 1 (UCP1) GENE ON DIABETIC RETINOPATHY AND
UCP1 GENE EXPRESSION IN HUMAN RETINA
ASSOCIAÇÃO ENTRE O POLIMORFISMO -3826A/G NO GENE DA PROTEÍNA
DESACOPLADORA 1 (UCP1) E A RETINOPATIA DIABÉTICA E A EXPRESSÃO
GÊNICA DA UCP1 NA RETINA HUMANA

45
Association between the -3826A/G polymorphism in the uncoupling protein 1 (UCP1)
gene and diabetic retinopathy and UCP1 gene expression in human retina
Short title: UCP1 gene expression in human retina.
Letícia A. Brondani1,3
, Bianca M. de Souza1,3
, Guilherme C. K. Duarte
1, Lúcia M. Kliemann
2,
Alexandre S. Marcon4, Jorge L. Gross
1,3, Luís H. Canani
1,3, Daisy Crispim
1,3
1 - Endocrinology Division, 2 - Pathology Service, Hospital de Clínicas de Porto Alegre; 3 –
Post-Graduation Program in Medical Sciences: Endocrinology, Universidade Federal do Rio
Grande do Sul; 4 - Cornea Bank, Hospital Santa Casa de Misericórdia de Porto Alegre. Porto
Alegre, RS, Brazil.
Corresponding author:
Dr. Daisy Crispim. Rua Ramiro Barcelos 2350; prédio 12; 4° andar. CEP 90035-003
Porto Alegre, RS, Brazil. Phone number: +55 51 33598318. Fax number: +55 51
33598777. E-mail: [email protected]
Word count: 3.850
Number of tables and figures: 3 tables and 2 figures
46
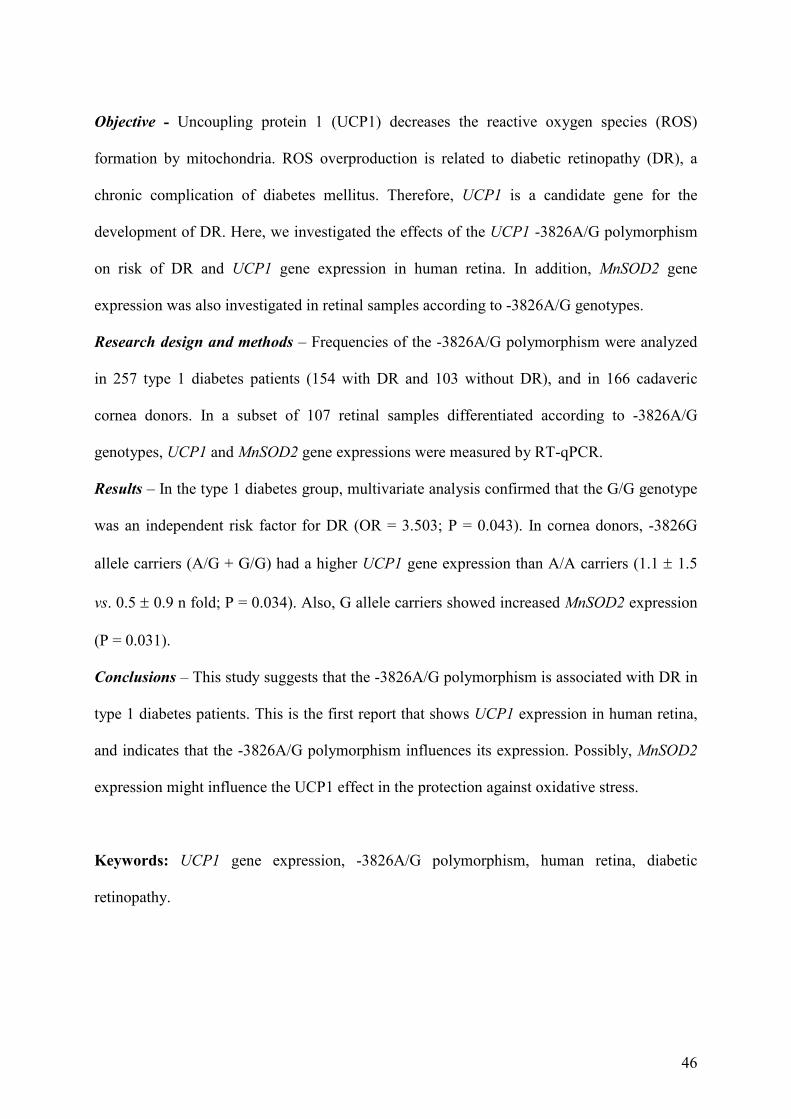
Objective - Uncoupling protein 1 (UCP1) decreases the reactive oxygen species (ROS)
formation by mitochondria. ROS overproduction is related to diabetic retinopathy (DR), a
chronic complication of diabetes mellitus. Therefore, UCP1 is a candidate gene for the
development of DR. Here, we investigated the effects of the UCP1 -3826A/G polymorphism
on risk of DR and UCP1 gene expression in human retina. In addition, MnSOD2 gene
expression was also investigated in retinal samples according to -3826A/G genotypes.
Research design and methods – Frequencies of the -3826A/G polymorphism were analyzed
in 257 type 1 diabetes patients (154 with DR and 103 without DR), and in 166 cadaveric
cornea donors. In a subset of 107 retinal samples differentiated according to -3826A/G
genotypes, UCP1 and MnSOD2 gene expressions were measured by RT-qPCR.
Results – In the type 1 diabetes group, multivariate analysis confirmed that the G/G genotype
was an independent risk factor for DR (OR = 3.503; P = 0.043). In cornea donors, -3826G
allele carriers (A/G + G/G) had a higher UCP1 gene expression than A/A carriers (1.1 ± 1.5
vs. 0.5 ± 0.9 n fold; P = 0.034). Also, G allele carriers showed increased MnSOD2 expression
(P = 0.031).
Conclusions – This study suggests that the -3826A/G polymorphism is associated with DR in
type 1 diabetes patients. This is the first report that shows UCP1 expression in human retina,
and indicates that the -3826A/G polymorphism influences its expression. Possibly, MnSOD2
expression might influence the UCP1 effect in the protection against oxidative stress.
Keywords: UCP1 gene expression, -3826A/G polymorphism, human retina, diabetic
retinopathy.

47
Diabetic retinopathy (DR) is a common sight-threatening microvascular complication
affecting patients with diabetes mellitus and it represents a major cause of new cases of
blindness in adults (1). Although the risk of developing this complication increases with poor
glycemic control, arterial hypertension and long-term duration of diabetes, its occurrence is
also influenced by genetic factors (2). Several studies show that the overproduction of
reactive oxygen species (ROS) is a causal link between hyperglycemia and other important
abnormalities involved in the development of DR (3, 5).
Uncoupling protein (UCP) 1 is a member of an anion-carrier protein family and is
located in the inner mitochondrial membrane (6). UCP1 uncouples substrate oxidation from
ATP synthesis, thereby dissipating the membrane potential energy and consequently
decreasing ATP production by mitochondrial respiratory chain (7, 8). This uncoupling then
leads to important roles in energy expenditure regulation, cold- and diet-induced
thermogenesis, and in decreasing ROS formation by mitochondria (9, 10).
Mitochondria are the main source of superoxide production and this makes them the
target of direct attack of ROS (11, 12). There is a positive correlation between inner
mitochondrial membrane potential and ROS production. At high membrane potentials, even a
small increase in membrane potential causes a large stimulation of hydrogen peroxide (H2O2)
production. Therefore, uncoupling of the mitochondrial proton gradient by UCP1 has been
suggested to have a natural antioxidant effect (13). Manganese superoxide dismutase
(MnSOD) catalyzes the breakdown of superoxide into H2O2 scavenging superoxide, and,
because of its mitochondrial localization, this enzyme is considered as the first line of defense
against oxidative stress (4).
Until a few years ago, it was believed that UCP1 was expressed exclusively in
brown adipose tissue; but it was recently reported that UCP1 expression was also

48
observed in other tissues and organs, such as white adipose tissue, pancreatic islets,
skeletal muscle, thymus, and bovine retina (14-19). Interestingly, Cui et al. (19) reported
that endothelial cells from bovine retina incubated with high glucose levels increased UCP1
expression, which protected them from ROS damage derived from glucotoxicity, suggesting a
protective role of UCP1 in the pathogenesis of DR. Therefore, UCP1 is a candidate gene for
the development of DR.
The -3826A/G polymorphism is located in the promoter region of the UCP1 gene, and
it seems to be associated with type 2 diabetes, body mass index (BMI), obesity or other
obesity-related parameters (20-25). However, only two studies evaluated the association
between this polymorphism and DR, showing inconclusive results (26, 27). Therefore, in
the present study we investigated whether the UCP1 -3826A/G polymorphism is associated
with DR in type 1 diabetes patients, and if this polymorphism has an effect in the UCP1 gene
expression in human retina isolated from cadaveric cornea donors. In addition, MnSOD2 gene
expression was also investigated in retinal samples according to different -3826A/G
genotypes.
RESEARCH DESIGN AND METHODS
Type 1 diabetes samples and phenotype measurements
The case-control study designed to investigate whether the UCP1 -3826A/G polymorphism is
associated with DR was carried out in 257 unrelated type 1 diabetes patients from the out-
patient clinic of Hospital de Clínicas de Porto Alegre (Rio Grande do Sul, Brazil). Patients
were considered to have type 1 diabetes if hyperglycemia was diagnosed before the age of 40
years, its control required insulin treatment within 1 year of diagnosis, and this treatment

49
could not be interrupted thereafter (28). Cases were defined by the presence of DR (n = 154).
Patients without any degree of DR and with known type 1 diabetes duration of at least 10
years were considered as controls (n = 103).
All patients were of European ancestry (mostly descendants of Portuguese, Spanish,
Italians and Germans). The ethnic group was defined on the basis of self-classification and
subjective classification (skin color, nose and lip shapes, hair texture, and family ancestry). A
standard questionnaire was used to collect information about age, age at diabetes diagnosis
and drug treatment, and all patients underwent physical and laboratory evaluations. They were
weighed without shoes and in light outdoor clothes and had their height measured. BMI was
calculated as weight (kg)/height2 (meters). Blood pressure (BP) was measured twice after a 5-
min rest in the sitting position using a mercury sphygmomanometer (Korotkoff phases I and
V). The mean value of two measurements was used to calculate systolic and diastolic BP.
Hypertension was defined as BP levels ≥ 140/90 mmHg, or if the patient was taking
antihypertensive drugs.
Assessment of DR was performed in all patients by an experienced ophthalmologist
using fundoscopy through dilated pupils. DR was classified as ‘absent DR’ (no fundus
abnormalities), ‘nonproliferative DR’ (microaneurysms, haemorrhage, and hard exudates) or
presence of ‘proliferative DR’ (newly formed blood vessels and/or growth of fibrous tissue
into the vitreous cavity) (29). The DR classification was based on the most severe degree of
retinopathy in the worst affected eye. We have previously described an excellent agreement of
DR classification (95.3%) carried out by different trained ophthalmologists from our group
(30). In this study, a single ophthalmologist, unaware of the patients’ clinical data, classified
all the subjects. The diagnosis of diabetic nephropathy (DN) was based on the albumin
excretion rate (AER) in at least two out of three consecutive 24-h timed or random spot sterile

50
urine collections in a 6-month period. Patients were classified as having normoalbuminuria
(AER < 20 µg/min or <17 mg/L), microalbuminuria (AER 20–200 µg/min or 17–174 mg/L)
or macroalbuminuria (AER > 200 µg/min or >174 mg/L).
A serum sample was collected after a 12-h fast for laboratory analyses. Creatinine
levels were determined using the Jaffe´ reaction, glycated haemoglobin (GHb) by an ion-
exchange HPLC procedure (Merck-Hitachi L-9100 GhB Analyser, Merck, Darmstadt,
Germany; reference range: 4.7–6.0%), total plasma cholesterol and triglycerides by enzymatic
methods, and albuminuria by immunoturbidimetry (Sera-Pak immuno microalbuminuria,
Bayer, Tarrytown, NY, USA; mean intra and interassay coefficients of variance of 4.5% and
7.6% respectively).
The protocol was approved by the Hospital ethical committees, and all patients gave
their written informed consent.
Cornea donor’s samples and phenotype measurements
For evaluating the UCP1 and MnSOD2 gene expression according to different -3826A/G
genotypes, 332 eyes were obtained from 166 cadaveric cornea donors identified through the
Central de Transplantes do Rio Grande do Sul (a Brazilian organization that regulates organ
donations in Rio Grande do Sul [RS], Brazil), and collected at two Porto Alegre (RS)
hospitals, namely Hospital de Clínicas de Porto Alegre and Hospital Santa Casa de
Misericórdia. A standard questionnaire was used to collect information from medical records
about age, gender, presence of arterial hypertension and diabetes, occurrence of other diseases
and cause of death.
After enucleation and separation of corneas for donation, retinas were visually
separated from the remaining intraocular structures, snap-frozen in liquid nitrogen and stored

51
at -80°C until analysis. Blood samples were also collected from each subject for DNA
extraction and genotyping of the -3826A/G polymorphism. Following genotyping, subjects
were divided into groups according to different genotypes of the analyzed polymorphism.
The protocol of this study was also approved by the Hospital Ethics committees, and
relatives of all donors gave their written informed consent authorizing the use of the retinas.
Genotyping
DNA was extracted from peripheral blood leukocytes using a standardized salting-out
procedure. The -3826A/G polymorphism (rs1800592) in the promoter region of the UCP1
gene was determined by digesting polymerase chain reaction (PCR) products with the enzyme
BclI (Invitrogen Life Technologies, CA, USA), as previously described (31) and using
primers depicted in Table 1. Digestion fragments were resolved on 2% agarose gels
containing GelRedTM
Nucleic Acid Gel Stain (Biotium Inc., CA, USA) and visualized under
ultraviolet illuminations.
RNA isolation
Retinal tissues (250 mg) were homogenized in phenol-guanidine isothiocyanate (Invitrogen
Life Technologies, CA, USA). RNA was extracted with chloroform and precipitated with
isopropanol by centrifugation (12,000 x g) at 4°C. RNA pellet was washed twice with 75%
ethanol and ressuspended in 10-50 µL of diethylpyrocarbonate treated water. Concentrations
of isolated RNAs were assessed using NANODROP 2000 spectrophotometer (Thermo
Scientific Inc., DE, USA).

52
Quantification of UCP1 and MnSOD2 gene expressions by real-time PCR
Reverse transcription real time-PCR was performed in two separate reactions: first, RNA was
reverse transcribed into cDNA, then cDNA was amplified by real-time PCR. Reverse
transcription of 1 µg of RNA into cDNA was carried out using the SuperScript™ III First-
Strand Synthesis System for RT-PCR (Invitrogen Life Technologies), following the
manufacturer’s protocol for oligo (dT)12-18 method.
Real-time PCR experiments were done in a 7500 Fast Real-Time PCR System thermal
cycler (Applied Biosystems) using SYBER® Green dye [32]. Primers and probes for UCP1,
MnSOD2 and β-actin were designed using Primer Express 3.0 Software (Applied Biosytems)
and are depicted in Table 1. PCR reactions were performed using 10 µL of 2x Fast SYBER®
Green Master Mix (Applied Biosystems), 1 µL (1 ng/µL) of forward and reverse primers for
UCP1, MnSOD2 or β-actin and 1 µL of cDNA template (0.25 µg/µL), in a total volume of 20
µL. Each sample was assayed in triplicate and a negative control was included in each
experiment. The thermocycling conditions for these genes were as follows: an initial cycle of
95°C for 20s, followed by 50 cycles of 95°C for 30s and 60°C for 30s. The specificity of the
RT-PCR was determined using melting curve analyses.
Quantification of the UCP1 and MnSOD2 mRNA were performed by relative
quantification using the comparative CT method (33), and human β-actin as an endogenous
control. Validation assays were done by amplification of the target (MnSOD2 or UCP1) and
control (β-actin) genes, separately, using serial dilutions of a cDNA sample. Both target and
control genes presented equal efficiencies of amplification. The comparative CT method
calculates changes in gene expression as relative fold difference (n fold) between an
experimental and an external calibrator sample (33).

53
Statistical analyses
Allele frequencies were determined by gene counting, and departures from the Hardy-
Weinberg equilibrium (HWE) were verified using χ2 tests. Comparisons of allelic and
genotypic frequencies among groups of subjects were evaluated using χ2 test. Clinical and
laboratory characteristics and mRNA abundance were compared between groups by using
unpaired Student’s t-test, One-way ANOVA or χ2, as appropriate. Variables with normal
distribution are presented as mean ± 2 standard deviations (SD) or percentage. Variables with
skewed distribution were logarithmically transformed before analyses and are presented as
median (minimum – maximum values) or median ± standard error (SE).
The magnitude of association between UCP1 -3826A/G genotypes and DR was
estimated using odds ratio (OR) test with 95% CI. Multivariate logistic regression analysis
was performed to assess the independent association between the UCP1 -3826A/G
polymorphism and DR (dependent variable) as well as to control for possible confounding
factors whenever a statistically significant association was found in the univariate analyses.
DM duration was not included as an independent variable in this analysis because the control
group (without DR) was selected based on this characteristic.
Pearson’s correlation tests were used to assess the correlation between UCP1 and
MnSOD2 expression or between UCP1 or MnSOD2 expression and age. Multiple linear
regression analysis was performed with UCP1 or MnSOD2 mRNAs (logarithmic) as
dependent variables and age, gender, diabetes diagnosis and presence of UCP1 -3826G allele
as independent variables. P < 0.05 was considered statistically significant. These statistical
analyses were done with SPSS 18.0 (Chicago, IL, USA).

54
RESULTS
Association study between the UCP1 -3826A/G polymorphism and diabetic retinopathy
The main clinical features of type 1 diabetes patients stratified according to the presence or
absence of DR are depicted in Table 2. Type 1 diabetes patients with DR differed from
control patients for diabetes duration, age, serum total cholesterol, triglycerides, creatinine,
systolic and diastolic BP levels and occurrence of DN.
Table 3 shows the distribution of the UCP1 -3826A/G polymorphism in type 1
diabetes patients grouped according to the presence of DR. Genotypic frequencies of this
polymorphism were in agreement with those predicted by the HWE in both case and control
groups (P = 0.230 and P = 0.126, respectively). Interestingly, type 1 diabetes patients with DR
presented a higher frequency of the -3826G allele than type 1 diabetes patients without DR (P
= 0.029). Likewise, the percentage of type 1 diabetes patients that presented the G allele in
homozygosis was significantly higher in the case group than in the control group (P = 0.009).
Moreover, multivariate analysis, adjusting for age, presence of arterial hypertension and
serum creatinine, confirmed that the -3826 G/G genotype is an independent risk factor for DR
(Table 3). It is worth mentioning that the magnitude of this association was similar in patients
with proliferative DR or nonproliferative DR (data not shown).
UCP1 and MnSOD2 gene expression in human retina from cornea donors according to
different UCP1 -3826A/G genotypes
One hundred and sixty-six cornea donors were genotyped for the UCP1 -3826A/G
polymorphism. The main clinical characteristics of these subjects were as follows. The mean

55
age was 56.5 ± 15.3 years, males comprised 58.4% (n = 97) of the sample, and 39.8% (n =
66) of all patients had arterial hypertension. Diabetes was diagnosed in 9,0% (n = 15) of all
patients. Diabetic patients differed from non-diabetic subjects regarding age (66.6 ± 6.8 vs.
55.5 ± 14.4 years; P = 0.005) and presence of arterial hypertension (71.4% vs. 24.2%; P =
0.015). Both diabetic patients and non-diabetic subjects were similar regarding gender (data
not shown). The genotypic frequencies of the UCP1 -3826A/G polymorphism in cornea
donor samples were 48.2% A/A, 42.2% A/G and 9.6% G/G, and all frequencies were in
agreement with those predicted by the HWE (P = 0.772).
The mean ± SD UCP1 mRNA concentration in the whole retinal tissue group was
0.926 ± 1.35 n fold. No significant difference was observed when UCP1 gene expression was
analyzed by gender (men: 1.07 ± 1.41 vs. women: 0.84 ± 1.29 n fold; P = 0.381) or
hypertension status (normotensives: 1.0 ± 1.23 vs. hypertensives: 0.74 ± 1.24 n fold; P =
0.423). UCP1 gene expression did not correlate with age (r = 0.067, P = 0.462), and it was not
statistically different between cornea donors with or without diabetes (1.02 ± 1.42 vs. 0.96 ±
1.15 n fold; P = 0.740).
UCP1 gene expressions in retinal samples stratified according to different genotypes
or alleles of the -3826A/G polymorphism are depicted in Figure 1. UCP1 gene expression did
not differ statistically among different genotypes of this polymorphism (P = 0.068; Figure
1A). Nevertheless, we observed that G allele carriers (A/G + G/G) presented a higher UCP1
gene expression than A/A genotype carriers (1.10 ± 1.5 vs. 0.51 ± 0.99 n fold; P = 0.018). In
the linear regression analysis, the presence of the G allele remained significantly associated
with UCP1 gene expression after controlling for age, gender and diabetes diagnosis
(standardized coefficient β for the presence of the G allele = 0.22; P = 0.034).

56
The mean ± SD MnSOD2 gene expression in the whole retinal tissue sample was -0.82
± 1.04 n fold. No significant difference was observed when MnSOD2 gene expression was
analyzed by gender (men: -1.0 ± 1.2 vs. women: -0.8 ± 1.2 n fold; P = 0.393), hypertension
status (normotensives: -0.7 ± 1.4 vs. hypertensives: -1.0 ± 1.1 n fold; P = 0.652) or diabetes
diagnosis (non-diabetic: -0.6 ± 0.9 vs. diabetic subjects: -0.9 ± 1.0 n fold; P = 0.594).
MnSOD2 gene expression did not correlate with age (r = -0.152, P = 0.142), but it correlated
weakly with UCP1 mRNA concentrations (r = 0.29, P = 0.015).
MnSOD2 gene expression in retinal samples stratified according to different genotypes
and alleles of the -3826A/G polymorphism are depicted in Figure 2. MnSOD2 gene
expression seemed to be higher in both A/G and G/G genotype carriers when compared with
A/A genotype subjects (P = 0.004; Figure 2A); however, after Tukey’s post-hoc test, only the
A/G genotype group reached conventional statistical significance (P = 0.006). Furthermore, G
allele carriers (A/G + G/G) showed higher MnSOD2 gene expression than A/A genotype
carriers (P = 0.001; Figure 2B). In the linear regression analysis, the G allele remained
independently associated with increased MnSOD2 gene expression after controlling for age,
sex and diabetes diagnosis (standardized coefficient β for the presence of G allele = 0.215; P
= 0.031).
DISCUSSION
In this study, we investigated the frequencies of the -3826A/G polymorphism in the promoter
region of the UCP1 gene in type 1 diabetes patients divided according to the presence of DR.
The G/G genotype was significantly associated with an increased risk for DR after adjusting
for age, presence of arterial hypertension and serum creatinine. Notwithstanding the
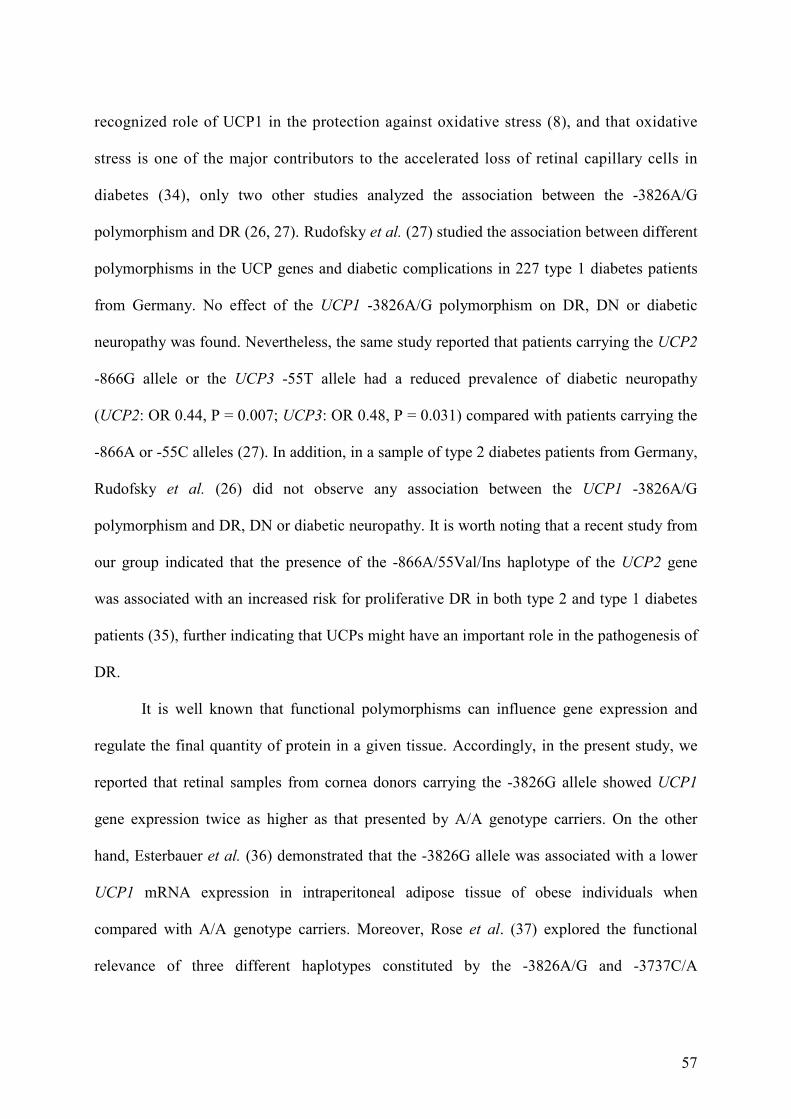
57
recognized role of UCP1 in the protection against oxidative stress (8), and that oxidative
stress is one of the major contributors to the accelerated loss of retinal capillary cells in
diabetes (34), only two other studies analyzed the association between the -3826A/G
polymorphism and DR (26, 27). Rudofsky et al. (27) studied the association between different
polymorphisms in the UCP genes and diabetic complications in 227 type 1 diabetes patients
from Germany. No effect of the UCP1 -3826A/G polymorphism on DR, DN or diabetic
neuropathy was found. Nevertheless, the same study reported that patients carrying the UCP2
-866G allele or the UCP3 -55T allele had a reduced prevalence of diabetic neuropathy
(UCP2: OR 0.44, P = 0.007; UCP3: OR 0.48, P = 0.031) compared with patients carrying the
-866A or -55C alleles (27). In addition, in a sample of type 2 diabetes patients from Germany,
Rudofsky et al. (26) did not observe any association between the UCP1 -3826A/G
polymorphism and DR, DN or diabetic neuropathy. It is worth noting that a recent study from
our group indicated that the presence of the -866A/55Val/Ins haplotype of the UCP2 gene
was associated with an increased risk for proliferative DR in both type 2 and type 1 diabetes
patients (35), further indicating that UCPs might have an important role in the pathogenesis of
DR.
It is well known that functional polymorphisms can influence gene expression and
regulate the final quantity of protein in a given tissue. Accordingly, in the present study, we
reported that retinal samples from cornea donors carrying the -3826G allele showed UCP1
gene expression twice as higher as that presented by A/A genotype carriers. On the other
hand, Esterbauer et al. (36) demonstrated that the -3826G allele was associated with a lower
UCP1 mRNA expression in intraperitoneal adipose tissue of obese individuals when
compared with A/A genotype carriers. Moreover, Rose et al. (37) explored the functional
relevance of three different haplotypes constituted by the -3826A/G and -3737C/A

58
polymorphisms of the UCP1 gene, which are in strong linkage disequilibrium. Their
transfection experiments in MCF-7 and T47D cell lines showed that the luciferase activity of
the plasmidial construct containing the -3826A/-3737C haplotype was significantly higher
than that containing the -3826G/-3737A haplotype. No activity was observed for the -3826G/-
3737C haplotype in basal conditions (37).
A possible explanation for the contrasting results mentioned above is that the -
3826A/G polymorphism might be involved in putative binding sites for specific transcription
factors, and that the preferential binding of some transcription factors to the A or G allele in
the UCP1 promoter sequence could confer tissue-specific advantages to either allele, as
already demonstrated for the -866G/A polymorphism in the UCP2 promoter sequence (38).
This hypothesis is reinforced by the knowledge that the -3826A/G polymorphism is located in
proximity of a complex enhancer region (from positions -3820 to -3470, upstream of the
UCP1 transcription start site), which contains multiple and distinct cis-acting elements that
seem to mediate strong drug-dependent transcriptional activation of the UCP1 gene (39).
Accordingly, Rose et al. (37), using the MatInspector Online Software, found a putative
retinoic acid response element (from positions -3842 to -3826), which included the -3826A/G
polymorphism, in the UCP1 promoter region. Furthermore, an ATF/CREB binding element
(from -3738 to -3733), a progesterone responsive element (PRE)-like sequence (from -3817 to
-3804), and an estrogen responsive element (ERE)-like sequence (from -3713 to -3701) were
also predicted in the vicinity of the -3826A/G and -3737C/A variants (37). Interestingly,
different UCP1 haplotypes constituted by the -3826A/G and -3737C/A polymorphisms
responded differently after stimuli with progesterone or estradiol (37). The authors concluded
that it is likely that the real in vivo effect of the -3826A/G polymorphism is mediated by the

59
intricacy of different cellular and physiological stimuli, and influenced by interactions with
other UCP1 polymorphisms or other genes (37).
Echtay et al. (40) have proposed a simple feedback cycle in which mitochondrial ROS
overproduction acutely and chronically increases proton conductance through effects on
UCP1-3, which consequently decrease superoxide production by the mitochondrial
respiratory chain. Besides, it is well known that retinal mitochondria become dysfunctional in
diabetes and the production of superoxide radicals is increased (41, 42). In this context, the
inhibition of oxidative stress through overexpression of MnSOD2 gene also prevents retinal
cells from undergoing the accelerated apoptosis that precedes the onset of DR in diabetic mice
(42). Thus, the protection of mitochondrial DNA from glucose-induced oxidative damage is
one of the plausible mechanisms by which MnSOD2 ameliorates the development of DR (42).
Cui et al. (19) showed that increased mitochondrial ROS production could be induced by high
glucose concentrations. At high levels of glucose, endothelial cells from bovine retina
increase UCP1, UCP2 and MnSOD2 expression to accommodate ROS production
compensatively. Nevertheless, this compensative mechanism disappeared when glucose
concentration was too high (30 mM), suggesting that UCPs and MnSOD could exert
compensative actions against oxidative stress only to a certain extent (19). In the present
study, MnSOD2 mRNA concentrations positively correlated with UCP1 mRNA
concentrations in human retina from cornea donors, and those subjects carrying the UCP1 -
3826G allele showed higher MnSOD2 gene expression compared to A/A genotype carriers.
Thus, our findings suggest that MnSOD levels could influence UCP1 gene expression,
possibly because MnSOD is the major scavenger of mitochondrial superoxide and, as already
mentioned, this free radical directly activates UCP1 gene expression (40, 43).

60
In conclusion, the data presented here indicated that the UCP1 -3826G/G genotype is
associated with an increased risk to DR in type 1 diabetes patients. Furthermore, the mutated
G allele was associated with increased UCP1 and MnSOD2 mRNA concentrations in human
retina from cornea donors. To our knowledge, these are the first data showing UCP1 gene
expression in human retina. So, based on these results and in the study of Cui et al. (19) on
bovine retina, we therefore hypothesized that the increased UCP1 and MnSOD2 gene
expression observed in G allele carriers might be a compensatory mechanism in response to a
possible elevated ROS production in retina. However, in a glucotoxicity context, such as
occurring in some type 1 diabetes patients, the G/G genotype might no longer be able to
compensating ROS overproduction and, consequently, could predispose their carriers to the
development of DR. Likely, interactions between UCP1 and MnSOD2 proteins in retinal cells
as well as different hormonal stimuli on tissue-specific transcription factors may influence the
UCP1 effect in the protection against ROS and the risk of DR development. However, further
functional studies will be necessary to confirm the association between the -3826A/G
polymorphism and DR, and also to elucidate how these interactions occur. In addition,
therapeutic strategies to counteract ROS through reinforcing complementary action of UCPs
and MnSOD2 should be explored.

61
ACKNOWLEDGMENTS
This study was partially supported by grants from Fundação de Amparo à Pesquisa do Estado
do Rio Grande do Sul (FAPERGS), Conselho Nacional de Desenvolvimento Científico e
Tecnológico (CNPq), and Fundo de Incentivo à Pesquisa e Eventos (FIPE) at Hospital de
Clínicas de Porto Alegre. The authors thank Dr. Rosana R. Nothen and Fernando Pagnussato
(Hospital de Clínicas de Porto Alegre) for their support with sample collection and
preparation.
Competing interests / financial disclosure: Nothing to declare.

62
REFERENCES
1. Fong DS, Aiello LP, Ferris FL, Klein R: Diabetic retinopathy. Diabetes Care 2004,
27(10):2540-2553.
2. Warpeha KM, Chakravarthy U: Molecular genetics of microvascular disease in
diabetic retinopathy. Eye (Lond) 2003, 17(3):305-311.
3. Brownlee M: Biochemistry and molecular cell biology of diabetic complications.
Nature 2001, 414(6865):813-820.
4. Kowluru RA, Chan PS: Oxidative stress and diabetic retinopathy. Exp Diabetes Res
2007, 2007:43603.
5. Ejaz S, Chekarova I, Ejaz A, Sohail A, Lim CW: Importance of pericytes and
mechanisms of pericyte loss during diabetes retinopathy. Diabetes Obes Metab 2008,
10(1):53-63.
6. Dalgaard LT, Pedersen O: Uncoupling proteins: functional characteristics and role in
the pathogenesis of obesity and Type II diabetes. Diabetologia 2001, 44(8):946-965.
7. Jezek P: Possible physiological roles of mitochondrial uncoupling proteins--UCPn. Int
J Biochem Cell Biol 2002, 34(10):1190-1206.
8. Azzu V, Brand MD: The on-off switches of the mitochondrial uncoupling proteins.
Trends Biochem Sci 2010, 35(5):298-307.
9. Cannon B, Shabalina IG, Kramarova TV, Petrovic N, Nedergaard J: Uncoupling
proteins: a role in protection against reactive oxygen species--or not? Biochim Biophys
Acta 2006, 1757(5-6):449-458.
10. Rousset S, Alves-Guerra MC, Mozo J, Miroux B, Cassard-Doulcier AM, Bouillaud F,
Ricquier D: The biology of mitochondrial uncoupling proteins. Diabetes 2004, 53
Suppl 1:S130-135.
11. Mailloux RJ, Harper ME: Uncoupling proteins and the control of mitochondrial
reactive oxygen species production. Free Radic Biol Med 2011, 51(6):1106-1115.
12. Liang FQ, Godley BF: Oxidative stress-induced mitochondrial DNA damage in
human retinal pigment epithelial cells: a possible mechanism for RPE aging and age-
related macular degeneration. Exp Eye Res 2003, 76(4):397-403.
13. Papa S, Skulachev VP: Reactive oxygen species, mitochondria, apoptosis and aging.
Mol Cell Biochem 1997, 174(1-2):305-319.
14. Himms-Hagen J: Brown adipose tissue thermogenesis: interdisciplinary studies.
FASEB J 1990, 4(11):2890-2898.
15. Himms-Hagen J, Desautels M: A mitochondrial defect in brown adipose tissue of the
obese (ob/ob) mouse: reduced binding of purine nucleotides and a failure to respond to
cold by an increase in binding. Biochem Biophys Res Commun 1978, 83(2):628-634.
16. Li B, Nolte LA, Ju JS, Han DH, Coleman T, Holloszy JO, Semenkovich CF: Skeletal
muscle respiratory uncoupling prevents diet-induced obesity and insulin resistance in
mice. Nat Med 2000, 6(10):1115-1120.
17. Nagase I, Yoshida T, Kumamoto K, Umekawa T, Sakane N, Nikami H, Kawada T,
Saito M: Expression of uncoupling protein in skeletal muscle and white fat of obese
mice treated with thermogenic beta 3-adrenergic agonist. J Clin Invest 1996,
97(12):2898-2904.
63
18. Carroll AM, Haines LR, Pearson TW, Fallon PG, Walsh CM, Brennan CM, Breen EP,
Porter RK: Identification of a functioning mitochondrial uncoupling protein 1 in
thymus. J Biol Chem 2005, 280(16):15534-15543.
19. Cui Y, Xu X, Bi H, Zhu Q, Wu J, Xia X, Qiushi R, Ho PC: Expression modification
of uncoupling proteins and MnSOD in retinal endothelial cells and pericytes induced
by high glucose: the role of reactive oxygen species in diabetic retinopathy. Exp Eye
Res 2006, 83(4):807-816.
20. Shin HD, Kim KS, Cha MH, Yoon Y: The effects of UCP-1 polymorphisms on
obesity phenotypes among Korean female subjects. Biochem Biophys Res Commun
2005, 335(2):624-630.
21. Oh HH, Kim KS, Choi SM, Yang HS, Yoon Y: The effects of uncoupling protein-1
genotype on lipoprotein cholesterol level in Korean obese subjects. Metabolism 2004,
53(8):1054-1059.
22. Sramkova D, Krejbichova S, Vcelak J, Vankova M, Samalikova P, Hill M,
Kvasnickova H, Dvorakova K, Vondra K, Hainer V et al: The UCP1 gene
polymorphism A-3826G in relation to DM2 and body composition in Czech
population. Exp Clin Endocrinol Diabetes 2007, 115(5):303-307.
23. Kotani K, Sakane N, Saiga K, Adachi S, Shimohiro H, Mu H, Kurozawa Y:
Relationship between A-3826G polymorphism in the promoter of the uncoupling
protein-1 gene and high-density lipoprotein cholesterol in Japanese individuals: a
cross-sectional study. Arch Med Res 2008, 39(1):142-146.
24. Nakano T, Shinka T, Sei M, Sato Y, Umeno M, Sakamoto K, Nomura I, Nakahori Y:
A/G heterozygote of the A-3826G polymorphism in the UCP-1 gene has higher BMI
than A/A and G/G homozygote in young Japanese males. J Med Invest 2006, 53(3-
4):218-222.
25. Jia JJ, Tian YB, Cao ZH, Tao LL, Zhang X, Gao SZ, Ge CR, Lin QY, Jois M: The
polymorphisms of UCP1 genes associated with fat metabolism, obesity and diabetes.
Mol Biol Rep 2010, 37(3):1513-1522.
26. Rudofsky G, Schrödter A, Voron'ko OE, Schlotterer A, Humpert PM, Tafel J,
Nawroth PP, Bierhaus A, Hamann A: Promoter polymorphisms of UCP1, UCP2, and
UCP3 are not associated with diabetic microvascular complications in type 2 diabetes.
Horm Metab Res 2007, 39(4):306-309.
27. Rudofsky G, Schroedter A, Schlotterer A, Voron'ko OE, Schlimme M, Tafel J,
Isermann BH, Humpert PM, Morcos M, Bierhaus A et al: Functional polymorphisms
of UCP2 and UCP3 are associated with a reduced prevalence of diabetic neuropathy in
patients with type 1 diabetes. Diabetes Care 2006, 29(1):89-94.
28. Association AD: Diagnosis and classification of diabetes mellitus. Diabetes Care
2011, 34 Suppl 1:S62-69.
29. Wilkinson CP, Ferris FL, Klein RE, Lee PP, Agardh CD, Davis M, Dills D, Kampik
A, Pararajasegaram R, Verdaguer JT et al: Proposed international clinical diabetic
retinopathy and diabetic macular edema disease severity scales. Ophthalmology 2003,
110(9):1677-1682.
30. Boelter MC, Gross JL, Canani LH, Costa LA, Lisboa HR, Três GS, Lavinsky J,
Azevedo MJ: Proliferative diabetic retinopathy is associated with microalbuminuria in
patients with type 2 diabetes. Braz J Med Biol Res 2006, 39(8):1033-1039.
31. Ramis JM, González-Sánchez JL, Proenza AM, Martínez-Larrad MT, Fernández-
Pérez C, Palou A, Serrano-Ríos M: The Arg64 allele of the beta 3-adrenoceptor gene

64
but not the -3826G allele of the uncoupling protein 1 gene is associated with increased
leptin levels in the Spanish population. Metabolism 2004, 53(11):1411-1416.
32. Higuchi R, Fockler C, Dollinger G, Watson R: Kinetic PCR analysis: real-time
monitoring of DNA amplification reactions. Biotechnology (N Y) 1993, 11(9):1026-
1030.
33. Livak KJ, Schmittgen TD: Analysis of relative gene expression data using real-time
quantitative PCR and the 2(-Delta Delta C(T)) Method. Methods 2001, 25(4):402-408.
34. Kowluru RA, Abbas SN: Diabetes-induced mitochondrial dysfunction in the retina.
Invest Ophthalmol Vis Sci 2003, 44(12):5327-5334.
35. Crispim D, Fagundes N, dos Santos K, Rheinheimer J, Bouças A, de Souza B, Macedo
G, Leiria L, Gross J, Canani L: Polymorphisms of the UCP2 gene are associated with
proliferative diabetic retinopathy in patients with diabetes mellitus. Clin Endocrinol
(Oxf) 2010, 72(5):612-619.
36. Esterbauer H, Oberkofler H, Liu YM, Breban D, Hell E, Krempler F, Patsch W:
Uncoupling protein-1 mRNA expression in obese human subjects: the role of
sequence variations at the uncoupling protein-1 gene locus. J Lipid Res 1998,
39(4):834-844.
37. Rose G, Crocco P, D'Aquila P, Montesanto A, Bellizzi D, Passarino G: Two variants
located in the upstream enhancer region of human UCP1 gene affect gene expression
and are correlated with human longevity. Exp Gerontol 2011.
38. Esterbauer H, Schneitler C, Oberkofler H, Ebenbichler C, Paulweber B, Sandhofer F,
Ladurner G, Hell E, Strosberg AD, Patsch JR et al: A common polymorphism in the
promoter of UCP2 is associated with decreased risk of obesity in middle-aged
humans. Nat Genet 2001, 28(2):178-183.
39. del Mar Gonzalez-Barroso M, Pecqueur C, Gelly C, Sanchis D, Alves-Guerra MC,
Bouillaud F, Ricquier D, Cassard-Doulcier AM: Transcriptional activation of the
human ucp1 gene in a rodent cell line. Synergism of retinoids, isoproterenol, and
thiazolidinedione is mediated by a multipartite response element. J Biol Chem 2000,
275(41):31722-31732.
40. Echtay KS, Roussel D, St-Pierre J, Jekabsons MB, Cadenas S, Stuart JA, Harper JA,
Roebuck SJ, Morrison A, Pickering S et al: Superoxide activates mitochondrial
uncoupling proteins. Nature 2002, 415(6867):96-99.
41. Kanwar M, Chan PS, Kern TS, Kowluru RA: Oxidative damage in the retinal
mitochondria of diabetic mice: possible protection by superoxide dismutase. Invest
Ophthalmol Vis Sci 2007, 48(8):3805-3811.
42. Madsen-Bouterse SA, Mohammad G, Kanwar M, Kowluru RA: Role of mitochondrial
DNA damage in the development of diabetic retinopathy, and the metabolic memory
phenomenon associated with its progression. Antioxid Redox Signal 2010, 13(6):797-
805.
43. Esteves, Brand MD: The reactions catalysed by the mitochondrial uncoupling proteins
UCP2 and UCP3. Biochimica et Biophysica Acta 2005, 1709:35-44.

65
TABLE 1
Primer and probe sequences used for genotyping of UCP1 gene polymorphisms or expression
analyses
Sequences
- 3826A/G polymorphism F 5’ - CTTGGGTAGTGACAAAGTAT - 3’
R 5’ - CCAAAGGGTCAGATTTCTAC - 3’
UCP1 gene* F 5’ - GCCATCTCCACGGAATCAAA - 3’
R 5’ - CCTTTCCAAAGACCCGTCAAG - 3’
MnSOD2 gene* F 5’ - AAATTGCTGCTTGTCCAAATCAG - 3’
R 5’ - ATCAATCCCCAGCAGTGGAAT - 3’
β-actin gene* F 5’ - GCGCGGCTACAGCTTCA - 3’
R 5’ - CTTAATGTCACGCACGATTTCC - 3’
F = forward primer and R = reverse primer. * Primers were designed using published human
gene sequences and the Primer Express 3.0 Software (Applied Biosystems), and they were
projected to target two consecutive exons of a gene in order to prevent the amplification of
any contaminating genomic DNA.

66
TABLE 2
Clinical and laboratory characteristics of patients with type 1 diabetes according to the
presence of diabetic retinopathy (cases) or absence of diabetic retinopathy (controls)
Data are presented as mean ± SD or %. The control group is constituted by patients without
any degree of diabetic retinopathy and with at least 10 years of DM. The case group is
composed of patients with DR. * P values were computed by χ2 or Student´s t-test, as
appropriate. n = sample number; BMI = body mass index. GHb = glycated haemoglobin.
Cases Controls P*
n 153 104
Gender (% male) 42.3 51.0 0.203
Duration of diabetes (years) 20.3 ± 7.1 18.1 ± 8.5 0.036
Age (years) 33.8 ± 14.7 38.9 ± 12.4 0.025
BMI (kg/m2) 23.6 ± 4.9 22.9 ± 5.1 0.362
HDL cholesterol (mmol/l) 1.49 ± 0.49 1.56 ± 0.46 0.339
Cholesterol (mmol/l) 5.0 ± 1.44 4.58 ± 1.04 0.015
Triglycerides (mmol/l) 1.0 (0.35 – 6.27) 0.71 (0.33 – 7.44) 0.006
Creatinine (µmol/l) 88.4 (44.2 – 981.2) 83.9 (35.4 – 707.2) <0.001
GHb (%) 8.92 ± 2.07 9.13 ± 7.09 0.749
Systolic blood pressure (mmHg) 129.6 ± 21.6 116.9 ± 17.8 < 0.001
Diastolic blood pressure (mmHg) 81.0 ± 13.2 75.3 ± 10.7 < 0.001
Hypertension (%) 25 44.4 0,003
Diabetic nephropathy (%) 82.9 17.1 < 0.001
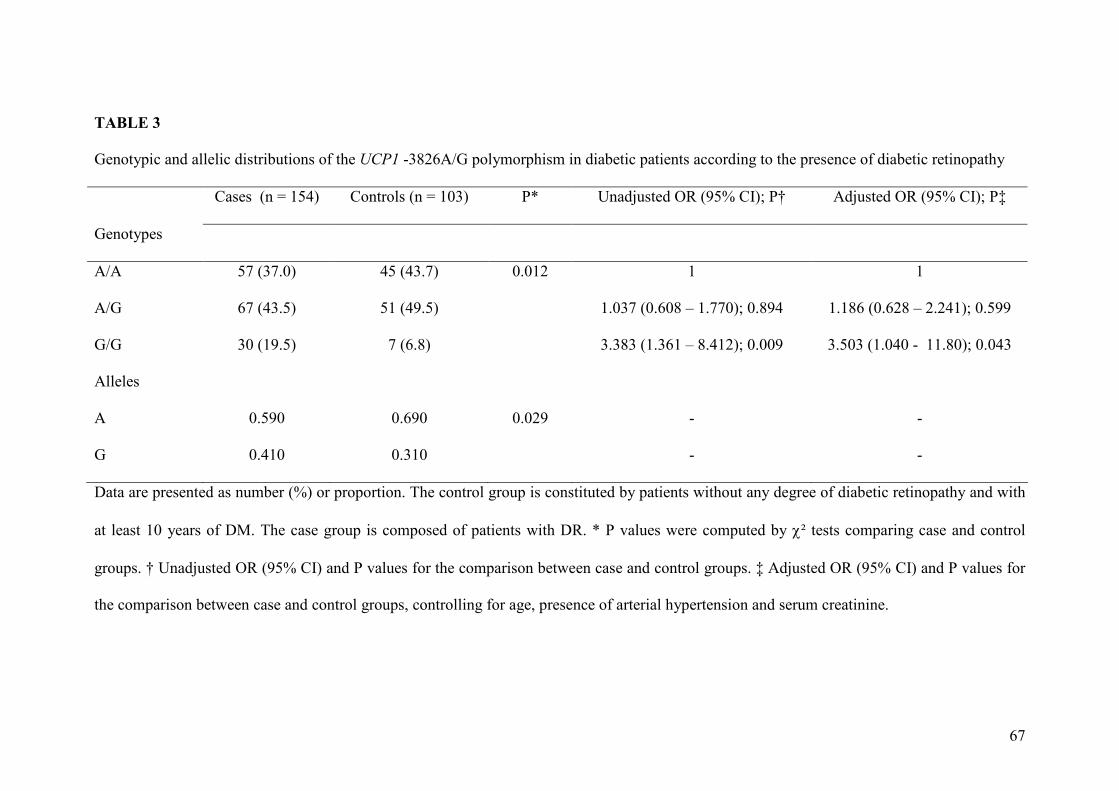
67
TABLE 3
Genotypic and allelic distributions of the UCP1 -3826A/G polymorphism in diabetic patients according to the presence of diabetic retinopathy
Cases (n = 154) Controls (n = 103) P* Unadjusted OR (95% CI); P† Adjusted OR (95% CI); P‡
Genotypes
A/A 57 (37.0) 45 (43.7) 0.012 1 1
A/G 67 (43.5) 51 (49.5) 1.037 (0.608 – 1.770); 0.894 1.186 (0.628 – 2.241); 0.599
G/G 30 (19.5) 7 (6.8) 3.383 (1.361 – 8.412); 0.009 3.503 (1.040 - 11.80); 0.043
Alleles
A 0.590 0.690 0.029 - -
G 0.410 0.310 - -
Data are presented as number (%) or proportion. The control group is constituted by patients without any degree of diabetic retinopathy and with
at least 10 years of DM. The case group is composed of patients with DR. * P values were computed by χ² tests comparing case and control
groups. † Unadjusted OR (95% CI) and P values for the comparison between case and control groups. ‡ Adjusted OR (95% CI) and P values for
the comparison between case and control groups, controlling for age, presence of arterial hypertension and serum creatinine.

68
FIG. 1 UCP1 mRNA expression in human retinal samples. A) UCP1 gene expression in
samples stratified according to different -3826A/G genotypes. P = 0.068 (One-way ANOVA
test). * P = 0.057 in relation to the A/A genotype group (Tukey post-hoc test). B) UCP1 gene
expression in samples stratified according to the presence of the G allele (AA vs. A/G+G/G).
P = 0.018 (Student’s t-test). Data are represented as n fold differences to the calibrator sample
(∆∆CT method), and are presented as mean ± 2 SE.

69
FIG. 2 MnSOD2 mRNA expression in human retinal samples. A) MnSOD2 gene expression
in samples stratified according to different -3826A/G genotypes. P = 0.004 (One-way
ANOVA test). * P = 0.006 in relation to the A/A genotype group (Tukey post-hoc test). B)
MnSOD2 gene expression in samples stratified according to the presence of the G allele (AA
vs. A/G+G/G). P = 0.001 (Student’s t-test). Values are represented as n fold differences to the
calibrator sample (∆∆CT method), and are presented as mean ± 2 SE.

70

71