understanding the sadiola hill oxide zone (mali), its geochemical
171
1 UNDERSTANDING THE SADIOLA HILL OXIDE ZONE (MALI), ITS GEOCHEMICAL COMPLEXITIES, AND ALTERATION SIGNATURES Mr TRAORE Daouda A Dissertation submitted to the Faculty of Science, University of the Witwatersrand, Johannesburg in fulfilment of the requirements for the degree of Master of Science November 2019
-
Upload
khangminh22 -
Category
Documents
-
view
0 -
download
0
Transcript of understanding the sadiola hill oxide zone (mali), its geochemical

1
UNDERSTANDING THE SADIOLA HILL OXIDE ZONE (MALI), ITS GEOCHEMICAL
COMPLEXITIES, AND ALTERATION SIGNATURES
Mr TRAORE Daouda
A Dissertation submitted to the Faculty of Science, University of the Witwatersrand,
Johannesburg in fulfilment of the requirements for the degree of Master of Science
November 2019

2
Declaration
I declare that this dissertation is my own, unaided work. It is being submitted for the Degree of
Master of Science at the University of Witwatersrand, Johannesburg. It has not been submitted before
for any degree or examination at any other University.
…………………………….
13th day of November 2019 in Johannesburg

3
Abstract
The Sadiola goldfield is located in the eastern Kédougou Kéniéba Inlier of the West African
Craton. The study area is located in the western region of the Republic of Mali close to the
international border between Mali and Senegal, and approximately 75 km south of the regional capital
of Kayes in the sub-Sahelian region of West Africa.
The goals of this research are to study the different geological relationships: oxide and
unaltered rock (calc-silicate, siltstone-shale-greywacke); oxide and structure; oxide and
mineralisation; supergene alteration and mineralisation; supergene alteration and structure.
To achieve the Sadiola Hill oxide zone geochemical complexities and alteration signatures
study, many research studies were conducted such as lithological and oxide 2D mapping, lithological
and oxide 3D modelling. The oxide profiles were sampled for gold analysis, XRF, and XRD analysis.
The found minerals were separated into light and heavy.
The key minerals identified by XRD are alunite (K2Al6 (SO4)4(OH)12) and jarosite (K2Fe63+
(SO4)4(OH)12). The mineral association suggests a highly acidic environment and acidic supergene
conditions. The examination of oxides also allowed distinguishing the different ferricrete horizons in
the Sadiola goldfield. Significant gold mineralisation is hosted in the oxide profile (weathered calc-
silicate) in the Sadiola Hill opencast pit.
Sadiola gold plant at Sadiola gold mine is fed oxide ore mined from the oxidation profile in the
weathered rock. The oxide ore fed into the Sadiola gold plant includes laterite, transitional oxide and
saprolitic oxide. The age of oxide saprolite and oxide transitional zones is assumed to have formed
during recent weathering by deeply penetrating meteoric waters. In general, the geology of the oxide
feed is assumed to be derived from weathering and decomposition of rocks of the Birimian
Supergroup. The need of oxide-feed to sustain Life of Mine of the Sadiola goldfield mean that
exploration for oxide ore is critical but understanding the geology and geochemistry of the oxide is
also vital, particularly in terms of ore optimization.
Five main lithologies are identified from mapping the Sadiola Hill area and these include calc-
silicate, siltstone-shale-greywacke, metasandstone, diorite and quartz-feldspar porphyry. Furthermore,
six calc-silicate sub-facies are identified as (1) thick-bedded (more than 0.5-1 cm) marble with an
alternation of white and black layers, (2) thin-bedded (3-5 mm), (3) massive marble, (4) slump-folded
marble, (5) carbonaceous siltstone and (6) pure marble. Oxide mapping in the Sadiola Hill opencast pit
identified three oxide profiles and three distinct alteration types as follows (Type 1) decarbonated
calc-silicate alteration, (Type 2) Fe alteration (oxide-jarosite-siderite), and (Type 3) potassic clay
alteration. The Fe-oxide and potassic clay alteration profile are related to the gold mineralisation at the
Sadiola goldfield.
3D lithological modelling conducted in the Sadiola goldfield has established a significant
relationship between gold mineralisation and the calc-silicate unit. The 3D oxide profiles and hard

4
rock modelling defined three types of gold mineralisation according to the age of the host. Young gold
is found in the ferricrete of Eocene-Miocene age, the second type of gold is found in the oxide profile
(oxide saprolite and transitional) of unknown age and the third type is found in the hard rocks of
Birimian age. Gold mineralisation is associated with the (1) lithological contacts, (2) north-south
trending structure (Sadiola Fracture Zone), (3) northeast trending faults, while it is proportionally with
iron (Fe) and potassium (K) alteration.
The three-oxide development has been sampled individually to characterise the oxide
geochemistry and alteration signature. The geochemistry study of the oxide zone of the opencast mine
identified the following minerals (1) Silica or quartz (SiO2), (2) Goethite (Fe+ 3O.OH), (3) Muscovite
(KAl3Si3O10 (OH) 2), (4) Siderite (FeCO3), (5) Biotite KFeMg2 (AlSi3O10) (OH) 2, (6) Bernalite (Fe
(OH) 3), (7) Orthoclase (KAlSi3O8), (8) Alunite (K2Al6 (SO4)4(OH)12) and (9) Jarosite (K2Fe63+
(SO4)4(OH)12). The presence of jarosite and alunite are an indicator of an acidic pH condition. The
XRF analysis results established the relationship between the gold grade and silica, potassium, and
iron.
The presence of alunite and jarosite highlight a highly acidic environment and acid supergene
conditions. The oxidation of the calc-silicate rock caused the diminution of volume and subsequent
concentration of the gold mineralisation in the decarbonated calc-silicate mainly along the structures.
This diminution of volume also caused the collapse of the contact between the siltstone-shale-
greywacke in the west of the Sadiola Hill opencast pit and the decarbonated calc-silicate rock in the
east. This contact is known as Sadiola Fracture Zone. The collapses of the decarbonated calc-silicate is
associated with the flexure of the Sadiola Fracture Zone, a number of discontinuous bodies of diorites
and quartz-feldspar porphyry units, and possibly produced the soft sediment deformation in the Sadiola
Hill opencast pit.
Sadiola goldfield can be classified as an oxide gold enrichment deposit.

5
Acknowledgments
All my thanks to the Société d’Exploitation des Mines d’Or de Sadiola S.A. (SEMOS),
AngloGold Ashanti and IAMGOLD for their financial support to make my MSc dream a reality.
Special thanks to Exploration Manager, Geology Manager and the SEMOS SA General Manager for
believing in me and all the staff of SEMOS.
Special thanks to my supervisors, Dr Asinne Tshibubudze and Professor Robert Bolhar for their
support and Professor Kim Hein who gave me the self-confidence. I just want to say, ‘God bless you’.
In the same way, I thank the University of the Witwatersrand, Johannesburg and all the staff of
Geosciences, Professor Roger Gibson, Dr Musa Manzi, and Kgothatso Nhlengetwa, Joe Aphane,
Marlin Patchappa, Professor Dave Billing and Aarif Ellemdeen from School of Chemistry.
I thank, Eybers Heinrich, Hlabangana Sitshengiso, Samuel Tessougué, Siguia Traoré, Eric
Imbeah, Geoffrey Gushee, Tom Gell, and Andre Strydom (SEMOS SA. Management Director) for
their support.
I thank Mamadou Sidibé, Cheick Omar Sissoko, Sekou Samaké and all the Human Resources
staff.
I thank Kaiba Keita, Sory I Goita, Mamadou A Traore, Adama Diombana, Zoumana Traoré,
Soumaila Doulla, Bakary Ballo, Kefa Traoré and all Mining staff.
I would like to thank all my colleagues, Yaya Singaré, Fousseyni Samaké, Yacouba S Koné,
Fousseini Magassouba, Monzon Traoré, Cheick O Baby, Baguiya Boulkadre, Cheickna Cissé and
grade control staff, Amadou Traoré and Hydrogeology staff, Daouda Fofana, Wadiou Traoré, and
Bassirou Traoré.
I would like to thank all the sampler staff for their collaborations in each field work with me.
Thanks to Mamadou Yossi and all our promotion of Ecole Nationale d’Ingénieurs, Abderhamane
Baba Touré de Bamako (ENI-ABT) promotion 2007.
I thank the Malian community present in South Africa especially in Johannesburg and Free
State through Moussa Dagnoko.
Special thanks to my family; my wife Mariam Diarra, my dad Mamadou Traoré, my mom
Kadidia Sacko, my aunties Nana Touré, Nana Sacko, and all my uncles and children Bany, Mohamed,
Mariétou and Kadidia. Nephew Binké, Basidiki, Bamoye, nieces Fatoumata Nandy Keita, Mamy, and
Awa are also thanked for their support. Also, all my friends Moustapha, Nouhoum, Moussa, Adama
and brothers and sisters Moulaye, Fatoumata, Oumou and Tanti, for their support and encouragement.

6
Table of Contents
Page
Abstract 3
Acknowledgements 5
Table of Contents 6
List of Figures 8
List of Tables 17
List of Appendices 18
Chapter 1 - Introduction 1.1. Preamble 19
1.2. Location and physiography 23
1.3. Exploration and Mining History 26
1.4. Aims and Program 27
1.5. Acronyms and Abbreviations 28
1.6. Thesis Organisation 28
Chapter 2 – Literature Review 2.1. Introduction 30
2.2. Geology of the Kédougou-Kéniéba Inlier (KKI) 30
2.3. Magmatism 35
2.4. Metamorphism 36
2.5. Structure and Tectonics 36
2.6. Mineralisation 37
2.7. Sadiola 3D gold mineralisation model 37
2.8. Alteration in the Sadiola goldfield 38
2.8.1. Hydrothermal alteration 38
2.8.2. Supergene alteration 38
Chapter 3 – Methodology 3.1. Introduction 40
3.2. Mapping 40
3.3. Modelling 40
3.4. Sampling 41
3.5. XRF analysis 58
3.6. XRD analysis 58
3.7. Minerals separation 59
3.8. Geophysical character of the Sadiola goldfield 59
3.8.1. Sadiola gravity data 59
3.8.2. Sadiola magnetic data 61
3.8.3. Sadiola radiometric data 63
Chapter 4 - Results
4.1. Sadiola mine scale and regional 2D mapping 65
4.1.1. Introduction 65
4.1.2. Lithologies 67
4.1.3. Alteration mapping 77
4.1.4. Structural mapping 85
4.1.5. Reverse Circulation (RC) and diamond borehole results 88
4.1.5.1. Sadiola Hill opencast pit 88
4.1.5.2. FN3 RC Results 89

7
4.1.5.3. Tambali diamond drillhole results 90
4.1.6. Sadiola regolith mapping results 91
4.1.7. Sadiola termite mounts sampling results 92
4.1.8. Gold mineralisation distribution 94
4.1.8.1. Gold mineralisation distribution 94
4.1.8.2. Relationship between gold mineralisation and oxide phases 95
4.1.8.3. Relationship between gold mineralisation and calc-silicate sub-facies 99
4.1.8.4. Relationship between structures and lithologies 99
4.1.9. Summary 102
4.2. 3D modelling of Sadiola goldfield lithologies and oxide profiles 106 4.2.1. Introduction 106
4.2.2. Lithology modelling 106
4.2.3. Oxide modelling 107
4.2.4. Summary 112
4.3. Geochemical analysis Results 113 4.3.1. Introduction 113
4.3.2. Gold assays 114
4.3.3. XRF results 116
4.3.4. XRD results 126
4.3.5. Minerals Separation 157
4.3.6. Summary 157
Chapter 5 - Discussion 5.1. Oxide profile development 159
5.2. Genetic model hypothesis 163
Chapter 6 – Conclusions and Recommendation 165
Reference List 166
Appendices 172 Appendix A: University of Witwatersrand XRF laboratory procedure 172
Appendix B: University of the Witwatersrand minerals separation laboratory procedure 173
Appendix C: Field Mapping data and station point descriptions 174
Appendix D: Field notebook copy 204
Appendix E: Sadiola Hill opencast pit northwest RC drilling data 301

8
List of Figures
Figure 1: Location of the Kédougou Kéniéba Inlier (KKI) in the West Africa Craton (WAC).
Modified after Hein et al. (2012).
Figure 2: Sadiola goldfield with ancillary opencast pits. Each pit is indicated by its name. The pits
shapes were plotted in the ArcGIS to represent their position in the Sadiola district.
Figure 3: The laterite road in blue linking Kayes, Sadiola and Kéniéba while the red line is a tar road
linking Bamako-Kayes-Dakar.
Figure 4: Position and name of artisanal mining in the Sadiola goldfield. The names of artisanal mines
indicate their location, while the light blue colour represents the waste dump and the dark
yellow colour represent the opencast pits. Each artisanal mine was contoured with a GPS.
Figure 5: The inserted map shows the position of the WAC in Africa. A- Presentation of the study
area in Sadiola goldfield. B- Location of the different goldfield in the Kédougou-Kénieba
Inlier. In the KKI the SMSZ (Sénégalo-Malian Shear Zone) is located in the east and the MTZ
(Main Transcurrent Zone) at the west (after Hein et al., 2012).
Figure 6: Sadiola goldfield local geological map, this map is established by a compilation of the field
mapping and drilling data.
Figure 7: Photograph of the samples according to the alteration profile.
a. Photograph of the sample DTMS-012, showing very fine-grained sand with strong oxidized
profile and Fe alteration red colour (quartz 35%, clay 55% sericite 10%).
b. Photograph of the sample DTMS-013 showing fine-grained decarbonated calc-silicate alteration
(quartz 35%, clay 60%, sericite 5%).
c. Photograph of the sample DTMS-014 presents potassic and decarbonated alteration. The rock is
bedded with slump folds (Hein and Tshibubudze, 2007).
d. Sample DTMS-015 comprises Fe alteration with red-brown colour (quartz 45%, clay 45% sericite
10%).
e. Sample DTMS-016 fine grain clayey sand (quartz 40% clay 50% sericite 10%. Fe alteration.
f. Sample DTMS-017 of quartz 30%, clay 55%, sericite 10%, and biotite 5%.
Figure 8: Photograph of the samples according to the alteration profile.
a. Sample DTMS-018 quartz 30% clay 55% sericite 5% biotite 5% Potassic alteration fine grain,
clayey sand.
b. Sample DTMS-019 quartz 40% clay 55% sericite 5% Fe alteration fine grain, clayey sand.
c. Sample DTMS-021 quartz 35% clay 55% sericite 5% biotite 5% fine grain potassic alteration,
name clayey sand.
d. Sample DTMS-022 quartz 45% clay 55% fine grain potassic alteration bedded, clayey sand
e. Sample DTMS-023 quartz 45% clay 55% fine grain Fe alteration, clayey sand

9
f. Sample DTMS-024 quartz 30% clay 65% sericite 5% fine grain decarbonated calc-silicate
massive, clayey sand
Figure 9: Photograph of the samples according to the alteration profile.
a. Sample DTMS-025 quartz 45% clay 50% sericite 5% fine grain, bedded to massive with weak Fe
alteration, clayey sand.
b. Show the sample DTMS-026 with quartz 40% clay 55% sericite 5% fine grain with decarbonated
calc-silicate alteration and the sample DTMS-027 quartz 45% clay 50% sericite 5% fine grain
with Fe alteration, clayey sand.
c. Sample DTMS-028 quartz 40% clay 55% sericite 5% fine grain Fe alteration, clayey sand.
d. Sample DTMS-029 quartz 35% clay 55% sericite 5% biotite 5% fine grain strong potassic
alteration, clayey sand.
e. Sample DTMS-030/031 duplicated sample as composition there are quartz 45% clay 55% fine
grain with strong Fe alteration brown colour, clayey sand.
f. Sample DTMS-032 quartz 45% clay 55% fine grain, Fe alteration, clayey sand.
Figure 10: Photograph of the samples according to the alteration profile.
a. Sample DTMS-033 quartz 40% clay 55% biotite 5% fine grain strong Fe alteration, clayey sand.
b. This photograph the following three sample DTMS-034 mineral composition is quartz 45% clay
50% sericite 5% decarbonated calc-silicate alteration; DTMS-036 presents quartz 40% clay 50%
biotite 10% fine grain potassic alteration; DTMS-037 quartz 45% clay 55% fine grain Fe
alteration, clayey sand.
c. This photograph shows the following sample: sample DTMS-038 presents quartz 40% clay 50%
biotite 10% fine grain with strong potassic alteration, clayey sand; DTMS-039 presents quartz
40% clay 50% biotite 10% fine grain decarbonated calc-silicate alteration; DTMS-041 quartz
45% clay 55% fine grain Fe alteration, clayey sand.
Figure 11: Photograph of the samples according to the alteration profile.
a. Photograph of the sample DTMS-046, showing fine-grained sand decarbonated calc-silicate
alteration, sandy clay (quartz 50%, clay 35% sericite 5% biotite 10%).
b. Photograph of the sample DTMS-047 showing fine-grained, Fe alteration clayey sand (quartz
45%, clay 50%, and sericite 5%).
c. Photograph of the sample DTMS-048, fine grain, presents Fe alteration, clayey sand (quartz
40%, clay 50%, biotite 5% and sericite 5%).
d. Photograph of the sample DTMS-049 comprises Fe alteration, fine grain with red colour
clayey sand (quartz 40%, clay 55% sericite 5%).
e. Photograph of the sample DTMS-050/051 duplicated sample, fine grain with Fe alteration
clayey sand (quartz 45% clay 55%).
f. Photograph of the sample DTMS-052 presents quartz 30%, clay 70%, and fine grain with Fe
alteration, clayey sand.

10
Figure 12: Photograph of the samples according to the alteration profile.
a. Sample DTMS-053 presents quartz 40% clay 45% sericite 10% biotite 5% Fe alteration fine
grain, clayey sand.
b. Sample DTMS-054 presents quartz 40% clay 60% decarbonated calc-silicate, Fe alteration
fine grain, and clayey sand.
c. Sample DTMS-055 presents quartz 45% clay 55% decarbonated calc-silicate alteration,
clayey sand.
d. Sample DTMS-056 presents quartz 40% clay 55% biotite 5%, fine grain strong Fe alteration,
and clayey sand
e. Sample DTMS-057 presents quartz 35% clay 65% fine grain K alteration, clayey sand
f. Sample DTMS-058 presents quartz 45% clay 55% fine grain Fe alteration, clayey sand
Figure 13: Photograph of the samples according to the alteration profile.
a. Sample DTMS-059 presents quartz 55% clay 45% fine grain, Fe alteration, clayey sand.
b. Sample DTMS-061 shows quartz 45% clay 55% fine grain with decarbonated calc-silicate
alteration clayey sand.
c. Sample DTMS-062 quartz 30% clay 70% fine grain K alteration, clayey sand.
d. Sample DTMS-063 quartz 45% clay 55% fine grain Fe alteration, clayey sand.
e. Sample DTMS-064 as composition there are quartz 45% clay 55% fine grain with strong Fe
alteration brown colour, clayey sand.
f. Sample DTMS-066 quartz 45% clay 55% fine grain, K alteration, clayey sand.
Figure 14: Photograph of the samples according to the alteration profile.
a. Photograph of the sample DTMS-067, showing fine-grained clayey sand with Fe alteration
(quartz 40%, clay 60%).
b. Photograph of the sample DTMS-068 showing fine-grained, clayey sand, with a decarbonated
calc-silicate alteration (quartz 30%, clay 70%).
c. Photograph of the sample DTMS-069, showing fine-grained, clayey sand with K alteration
(quartz 35%, clay 65%).
d. Photograph of the sample DTMS-070/DTMS-071 showing fine-grained, decarbonated calc-
silicate alteration (quartz 30%, clay 70%).
e. Photograph of the sample DTMS-072, showing fine-grained sand, Fe alteration (quartz 35%,
clay 65%) clayey sand.
f. Photograph of the sample DTMS-073 showing fine-grained, clayey sand, K alteration (quartz
30%, clay 70%).
Figure 15: Photograph of the samples according to the alteration profile.
a. Photograph of the sample DTMS-074, showing fine-grained clayey sand K alteration (quartz
35%, clay 65%).

11
b. Photograph of the sample DTMS-075 showing fine-grained decarbonated calc-silicate
alteration (quartz 40%, clay 60%). Photograph of the sample DTMS-076, showing fine-
grained clayey sand with Fe alteration (quartz 35%, clay 65%).
c. Photograph of the sample DTMS-077 showing fine-grained, K alteration, clayey sand (quartz
30%, clay 70%).
d. Photograph of the sample DTMS-078, showing fine-grained clayey sand Fe alteration (quartz
35%, clay 65%).
e. Photograph of the sample DTMS-079 showing fine-grained, with K alteration (quartz 35%,
clay 65%).
f. Photograph of the sample DTMS-081 showing fine-grained, with a decarbonated calc-silicate
alteration (quartz 30%, clay 70%).
Figure 16: Photograph of the samples according to the alteration profile.
a. Photograph of the sample DTMS-082, showing fine-grained clayey sand Fe alteration (quartz
30%, clay 70%).
b. Photograph of the sample DTMS-083 showing fine-grained, Fe alteration (quartz 35%, clay
65%).
c. Photograph showing a massive calc-silicate rock with micro fault.
d. Photograph showing unconformity between oxidized profile and fresh calc-silicate rock.
e. Photograph showing bedded calc-silicate rock.
f. Photograph showing the folded calc-silicate.
Figure 17: Sadiola goldfield regional gravity map. The blue colour represents low gravity, while the
red the high gravity. Each open cast pit is located on area of low gravity, where oxides are
mined for gold. Sadiola goldfield gravity data has been plotted in the Arc GIS. The black line
on the map represents the SMSZ.
Figure 18: Regional Magnetic data and interpretation map on the Sadiola goldfield shows the shape
and width of the SMSZ. The SMSZ is located on the western side of the map. This Sadiola total
field is GradEnh_0p05_NEW_RTPLL_UC50_1VD.ecw.
Figure 19: The regional radiometric data across the Sadiola goldfield. The blue light colour shows the
ferricrete which cover most parts of the goldfield. The red colour represents some outcrop
through the goldfield.
Figure 20: Position of the forty-four RC holes drilled in the Sadiola Hill NW, the holes were logged
for stratigraphic definition purposes.
Figure 21: Lithological map of the FN3 south and north pits. The pits are dominated by altered and
unaltered calc-silicate rock and crosscut by quartz-feldspar porphyry.
Figure 22: Sadiola Hill opencast pit geological map. The eastern part of the pit is the altered and
unaltered calc-silicate, while the western part is the siltstone-shale greywacke. The contact is

12
structurally defined by the SFZ. The sedimentary rocks are cross cut by a dyke and sill of
diorite and quartz-feldspar porphyry dyke.
Figure 23: Lithological map of the Tambali opencast pits. The pits are composed mainly of sandstone
and greywacke. The dyke of diorite and quartz-feldspar porphyry across the sedimentary rock.
Figure 24: The red sandstone mapped at the southwest of the Sadiola Hill. (A) present the photograph
of the sandstone and (B) the position of the map.
Figure 25(a): Photography of the three different layers of the ferricrete on the decarbonated calc-
silicate, the aeolian sand separates them. Looking east of the Sadiola Hill opencast pit. (b)
Photography of layers of ferricrete on the decarbonated calc-silicate, the aeolian sand separates
them. Image taken looking east, north of the Sadiola Hill opencast pit.
Figure 26: The hydrothermal alteration presents in the SFZ from the middle of the Sadiola Hill
opencast pit.
Figure 27: West-east vertical cross section along a 1537775 Nm latitude line showing the Sadiola Hill
opencast oxide profile. All the four domains are well depicted from the hard rock to the
ferricrete horizon.
Figure 28: Photograph of ferricrete in the Sadiola Hill opencast showing the coarse pisolitic gravel
and quartz which indicates weathering of transported materials.
Figure 29: A plan view of oxide map for Tambali north and south pits, composed of ferricrete in red
colour, the oxide saprolite, the oxide transitional zone is the light blue colour and the hard rock
is represented by the grey colour.
Figure 30: The oxide map of the Sadiola Hill opencast pit, composed of ferricrete in red colour, the
oxide saprolite, the oxide transitional zone is the light blue colour and the hard rock in grey
colour.
Figure 31: The oxide map for FN3 north and south pits, composed of ferricrete in red colour, the
oxide saprolite, the oxide transitional zone is the light blue colour and the hard rock in grey
colour.
Figure 32: Photograph of the weathering profile on the southern wall of the Sadiola Hill opencast pit.
The shape is presented as a funnel of the meteoric water penetration.
Figure 33: West-east cross-sectional sketch of the Sadiola Hill genetic model for the supergene
enrichment phase. The D2 deformation related to northwest-southeast compression, probably
associated with the Eburnean orogeny, produced an effect on the SFZ, and north-northeast
trending faults. The SFZ and north-northeast trending faults seem to be syn-genetic. The source
of the gold in the Sadiola Hill opencast pit was concluded by Hein (2007) as hydrothermal.
Figure 34: Sadiola Hill opencast stratigraphic column. The column was established by the compilation
of the pit mapping data and RC and diamond drilling data.
Figure 35: Tambali opencast pit stratigraphic column. The column was established by the compilation
of the pit mapping data and RC and diamond) drilling data.

13
Figure 36: Map of termite mounds sample result in the Sadiola exploration permit. The red (high
value), (2) yellow (medium), (3) green (Low) and (4) blue (zero) of gold. This value is
overprinted on each open cast pit in the Sadiola goldfield.
Figure 37: The 3D Sadiola goldfield gold mineralisation model across the Tambali, Sadiola Hill open
cast and FN3 pits. Compiled by SEMOS resources evaluation team.
Figure 38: The 3D laterite model plotted with the 3D gold mineralisation model for Sadiola goldfield
(FN3 in the northern, Sadiola Hill open cast in the middle, and the Tambali pits in the
southern).
Figure 39: The 3D oxide saprolite model plotted with the 3D gold mineralisation model for Sadiola
goldfield (FN3 in the northern, Sadiola Hill open cast in the middle, and the Tambali pits in the
southern part).
Figure 40: The 3D oxide transitional zone plotted with the 3D gold mineralisation model for Sadiola
goldfield (FN3 in the northern, Sadiola Hill open cast in the middle, and the Tambali pits in the
southern part).
Figure 41: The SFZ, northeast trending faults and west east trending faults plotted on the Sadiola Hill
opencast pit geological map. The SFZ is located along the contact between the siltstone-shale-
greywacke in the west and the calc-silicate in the east.
Figure 42: West-east cross-sectional sketch of the Sadiola Hill genetic model for the supergene
enrichment phase. The surface water penetrated the calc-silicate rock through the SFZ and
northeast trending structures. The pyrite in the presence of H2O and O2 can active some
reactions and cause the oxidation of calc-silicate.
Figure 43: West-east cross-sectional sketch of the Sadiola Hill genetic model for the supergene
enrichment phase. The decrease in the volume of the decarbonated calc-silicate caused the
collapse of oxide. Then SFZ which is a lithological contact between siltstone-shale-greywacke
and calc-silicate collapsed. Subsequently, aeolian sand was deposited on the ferricrete and on
the decarbonated calc-silicate.
Figure 44: West-east cross-sectional sketch of the Sadiola Hill showing the results of oxidation and
collapse of the oxide profile.
Figure 45: The 3D Sadiola goldfield lithology model. The green at the west represents the siltstone-
shale-greywacke, while the calc-silicate is located mostly in the east with the blue colour.
Figure 46: The 3D laterite model for Sadiola goldfield (FN3 in the northern, Sadiola Hill open cast in
the middle, and the Tambali pits in the southern part).
Figure 47: The 3D oxide saprolite model for Sadiola goldfield (FN3 in the northern, Sadiola Hill open
cast in the middle, and the Tambali pits in the southern).
Figure 48: The 3D oxide transitional zone for Sadiola goldfield (FN3 in the northern, Sadiola Hill
open cast in the middle, and the Tambali pits in the southern part).

14
Figure 49: The 3D hard rock model for Sadiola goldfield (FN3 in the northern, Sadiola Hill open cast
in the middle, and the Tambali pits in the south).
Figure 50: The supergene alteration presents in the calc-silicate rock from the southern area to north
of the Sadiola Hill opencast pit.
Figure 51: The three-oxide facies developed in the Sadiola Hill opencast pit. The blue colour is
decarbonated calc-silicate rocks, crosscut by the red Fe-oxide alteration zones, which are in turn
crosscut by zones of pink colour potassic clay alteration.
Figure 52: Diagram of SEMOS XRF “Mining Plus” showing silica (Si), potassium (K), calcium (Ca),
and the iron (Fe) with gold result. There is a strong correlation, between gold and iron alteration
and a second correlation with Au and potassium K, while no correlation with calcium (Ca) was
examined due to the absence or weakness of Ca due to the oxidation.
Figure 53: Diagram of the XRF result analysed in the Earth laboratory of the University of the
Witwatersrand, Johannesburg. On the chart, concentrations in ppm are shown on the vertical
axis, while the samples are given along the horizontal axis.
Figure 54: The result of sample DTMS-012 contains silica, goethite, muscovite, siderite and biotite
minerals.
Figure 55: The result of sample DTMS-013 contains silica, goethite, muscovite, siderite and biotite
minerals.
Figure 56: The result of sample DTMS-014 contains silica, goethite, muscovite, siderite and biotite
minerals.
Figure 57: The result of sample DTMS-015 contains silica, goethite, muscovite, siderite, bernalite and
biotite minerals.
Figure 58: The result of sample DTMS-016 contains silica, goethite, muscovite, siderite and biotite
minerals.
Figure 59: The result of sample DTMS-017 indicates the presents of silica, goethite, muscovite,
siderite and biotite minerals.
Figure 60: The result of sample DTMS-018 indicates the presents of silica, goethite, muscovite,
siderite and biotite minerals.
Figure 61: The result of sample DTMS-019 indicates the presents of silica, goethite, muscovite,
siderite and biotite minerals.
Figure 62: The result of sample DTMS-021 indicates the presents of silica, goethite, muscovite,
siderite and biotite minerals.
Figure 63: The result of sample DTMS-025 indicates the presents of silica, goethite, muscovite,
siderite and biotite minerals.
Figure 64: The result of sample DTMS-026 indicates the presents of silica, goethite, muscovite,
siderite and biotite minerals.

15
Figure 65: The result of sample DTMS-027 indicates the presents of silica, goethite, muscovite,
siderite and biotite minerals.
Figure 66: The result of sample DTMS-028 indicates the presents of silica, goethite, muscovite,
siderite and biotite minerals.
Figure 67: The result of sample DTMS-029 indicates the presents of silica, goethite, muscovite,
siderite and biotite minerals.
Figure 68: The result of sample DTMS-030 indicates the presents of silica, goethite, muscovite,
siderite and biotite minerals.
Figure 69: The result of sample DTMS-033 indicates the presents of silica, goethite, muscovite,
siderite and biotite minerals.
Figure 70: The result of sample DTMS-034 indicates the presents of silica, goethite, muscovite,
siderite and biotite minerals.
Figure 71: The result of sample DTMS-036 indicates the presents of silica, goethite, muscovite,
siderite and biotite minerals.
Figure 72: The result of sample DTMS-037 indicates the presents of silica, goethite, muscovite,
siderite and biotite minerals.
Figure 73: The result of sample DTMS-038 indicates the presents of silica, goethite, muscovite,
siderite and biotite minerals.
Figure 74: The result of sample DTMS-039 indicates the presents of silica, goethite, muscovite,
siderite and biotite minerals.
Figure 75: The result of sample DTMS-041 indicates the presents of silica, goethite, muscovite,
siderite and biotite minerals.
Figure 76: The result of sample DTMS-048 indicates the presents of silica, goethite, muscovite,
siderite and biotite minerals.
Figure 77: The result of sample DTMS-050 indicates the presents of silica, goethite, muscovite,
siderite and biotite minerals.
Figure 78: The result of sample DTMS-053 indicates the presents of silica, goethite, muscovite,
siderite and biotite minerals.
Figure 79: The result of sample DTMS-056 indicates the presents of silica, goethite, muscovite,
siderite and biotite minerals.
Figure 80: The result of sample DTMS-062 indicates the presents of silica, goethite, muscovite,
siderite and biotite minerals.
Figure 81: The result of sample DTMS-074 indicates the presents of silica, goethite, muscovite,
siderite and biotite minerals.
Figure 82: The result of sample DTMS-077 indicates the presents of silica, goethite, muscovite,
siderite and biotite minerals.

16
Figure 83: The result of sample DTMS-082 indicates the presents of silica, goethite, muscovite,
siderite and biotite minerals.

17
List of Tables
Table 1 - Samples descriptions and related gold grades
Table 2 - Orientation, Assay and composition results of samples from Sadiola Hill opencast pit
southwest sample data
Table 3 - Gold assay results in grams per tonne
Table 4 - SEMOS portable handheld XRF result in Soil Mode
Table 5 - SEMOS portable handheld XRF analysis in Mining Plus Mode
Table 6 - University of the Witwatersrand XRF analysis results

18
List of Appendices
Appendix A University of the Witwatersrand XRF laboratory procedure.
Appendix B University of the Witwatersrand mineral separation laboratory procedure
Appendix C Field Mapping data and station point descriptions
Appendix D Field notebook copy
Appendix E Sadiola Hill opencast pit northwest RC drilling data

19
Chapter 1
Introduction
1.1. Preamble
The Sadiola goldfield is located in the eastern Kédougou Kéniéba Inlier (KKI) of the West
African Craton (WAC) (Figure 1). The Sadiola gold deposit is mined in several opencast pits
including the Sadiola Hill opencast pit, Tambali, FE3, FE4, Timbougouni, FND, Farabakouta North
BC (FNBC), FNA, FN3 and FN2 pits (Figure 2). The Sadiola gold mine is operated and mined by the
Société d’Exploitation des Mines d’Or de Sadiola SA (SEMOS) through a joint venture partnership
between AngloGold Ashanti (AGA), IAMGOLD and the Malian government. Since December 1996,
SEMOS has mined oxide gold (saprolite, transitional) from the Sadiola Hill opencast pit, but the
resource is almost exhausted and the Sadiola Hill deposit has reached its Life of Mine. The Sadiola
Deep Sulphide Project now known as the Sadiola Sulphide Project (SSP), which is focused on hard
rock sulphide ore below the oxide zone, is a focus of exploration for future development. The
challenge for SEMOS is to develop or discover new oxide gold deposits, while developing the hard
rock Sadiola Sulphide ore. There is a need to further understand the distribution of gold in the oxide
zone, while exploring the relationship between hard rock sulphide ore and the dispersion of gold in
the oxide. The oxide zone is gradational from transition zone rocks to saprolitic oxide; the saprolitic
oxide is associated with alteration sub-facies of decarbonation, sulphidation, kaolinisation and
lateritization, as observed during field studies early in 2015.
The aims of this research are to study the different geological relationships: oxide and unaltered
rock (calc-silicate, siltstone-shale-greywacke); oxide and structure; oxide and mineralisation;
supergene alteration and mineralisation; supergene alteration and structure.
The lithologies in the Sadiola goldfield are dominated by rocks of the Birimian Supergroup of
the Dialé-Kofi Formation. Hein and Tshibubudze (2007) classified the lithologies of the Sadiola
goldfield into greywacke, volcaniclastic, volcaniclastic-greywacke, carbonaceous siltstone, marble,
carbonaceous greywacke, BIF, shale and graphitic shale. The sedimentary textures observed indicate
that shallow marine deltaic processes and turbidite activity were operating conjointly during
deposition. The units have been metamorphosed to at least upper greenschist facies and locally, to
amphibolite facies adjacent to diorite and granodiorite dykes. The rock units are thus altered to
quartzite, calc-silicate, and metapelitic rocks.
The Sadiola Fracture Zone (SFZ) is exposed in the Sadiola Hill opencast pit. It forms the
tectonic boundary between hanging-wall greywacke on the western high-wall of the opencast and
footwall calc-silicates on the eastern high wall. The SFZ generally trends north-south and dips steeply
west to vertical. Gold mineralisation is hosted in and along the SFZ and along northeast trending

20
faults. The SFZ is brittle-ductile in character and ranges in thickness from 10 m to over 60 m
(Cameron, 2010).
In the Sadiola goldfield there are two reported gold mineralisation styles: 1) Placer gold in
palaeochannels and screes; 2) gold in breccia and stockwork veins (Hein and Tshibubudze, 2007).
Masurel et al. (2017) established that gold mineralisation can be correlated to the disseminated
sulphides along hydrothermal-tectonic shear zone hosted in breccia and biotite-calcite-tourmaline-
quartz vein. Around 50% of the ore minerals are comparatively different, but their volumetric
proportions are typically low in each rock type, ranging from approximately 0.5 to 3% sulphides.
Gold can also be found in reworked laterite above the saprolitic oxide that is locally interpreted
as Tertiary in age; in saprolite and transitional oxide facies, and unweathered Birimian host rock. The
oxide ore fed into the Sadiola gold plant includes laterite, transitional oxide and saprolitic oxide.
The age of oxide formation in the Sadiola goldfield is assumed to be modern and related to
deep weathering of the host Birimian rocks. However, at the Yatela gold mine, north of Sadiola, oxide
formation is associated with the development of karst residuum that formed over a considerable
period of time, perhaps 2.0 Ga ago, but principally during the Neoproterozoic and Cretaceous (Hein et
al., 2015), which may mean that the oxide at Sadiola formed over a long period of time.
This research project used mapping and characterisation of the various phases of oxide in the
oxide zone that is exposed in the opencast pit of the Sadiola goldfield. The temporal relationship of
gold in the oxide zone, with respect to the age of oxide formation, was investigated. Another research
focus was to establish the relationship between oxide formation and gold dispersion in the oxide zone
and sulphide ore in calc-silicate rocks.

21
Figure 1: Location of the Kédougou Kéniéba Inlier (KKI) in the West Africa Craton (WAC).
Modified after Hein et al. (2012).

22
Figure 2: Sadiola goldfield with ancillary opencast pits. Each pit is indicated by its name. The
pits shapes were plotted in the ArcGIS to represent their position in the Sadiola district.

23
1.2. Location and physiography
The study area is located in the Kayes region around 600 km from Bamako capital of Mali and
740 km from Dakar (Senegal). The Sadiola goldfield is located in the western region of the Republic
of Mali close to the international border between Mali and Senegal, and approximately 75 km south of
the regional capital of Kayes (Figure 3) in the sub-Sahelian region of West Africa. Sadiola is a rural
commune in the municipality of the Kayes region. Covering an area of 3,050 km2, it encompasses 46
villages and 50 hamlets. It has about 23,000 inhabitants. The city of Kayes is accessible by railway
(Bamako-Kayes-Dakar), a paved road (Bamako-Kayes) as well as using an international airport.
Figure 3: The laterite road in blue linking Kayes, Sadiola and Kéniéba while the red line is a tar
road linking Bamako-Kayes-Dakar.
The Sadiola commune can be accessed by a domestic flight via Bamako airport linking
Bamako-Kayes-Sadiola-Dakar. There is also a laterite road linking Kayes, Sadiola and Kéniéba. The
mine is named after the place where it was discovered. Its geographical coordinates are 13◦53’00”
north, 11◦42’0” west and east by the Souroukoto cliff. The region is characterized by a Sudano-
Sahelian climate with three (3) seasons: (1) dry season (March to May); (2) rainy season (June to

24
October); (3) cold season (December to January). The climate is sub-humid in the south with rainfall
of about 1000mm / year, and increasingly more arid towards the north with rainfall of about 600mm /
year. The minimum and maximum temperatures during the year vary from 10◦ to 27
◦ and from 25
◦ to
45◦C respectively. The vegetation, north of the Senegal River (semi-arid to sub-desert), is sparse and
monotonous with fairly common baobabs and thorny trees. To the south, it is much denser and varied
and is of the shrub or forest savannah type. The human population consists of Malinké, Sarakolé of
Fulani and Moors. In addition, there are persons of other nationalities employed at the Sadiola gold
mine. The main activities are agriculture (millet, groundnuts and sometimes maize), livestock (cattle,
sheep, goats) and gold panning. Hydrography consists of temporary streams that flow only in the
rainy season and dry up after the rainy season. Written records of mining at Sadiola reportedly date
back 250 years and the extent of the old workings suggests that the mining could have occurred over
1,000 years ago (http://www.iamgold.com, 2015). Artisanal mining for gold was practised for
centuries and especially at Farabakouta and Timbabougouni; artisanal mining continues today at
Diagounté and Kantéla. Evidence for ancient and recent artisanal mining is widespread in western
Mali; this is also the case at Sadiola goldfield (Figure 4). In the 7th to 14th century, the trade in gold
across the Trans-Saharan trade routes was important for the Mediterranean economies. The gold
together with iron and slaves was traded for salt (AAOA, 2000).

25
Figure 4: Position and name of artisanal mining in the Sadiola goldfield. The names of artisanal
mines indicate their location, while the light blue colour represents the waste dump and the dark
yellow colour represent the opencast pits. Each artisanal mine was contoured with a GPS.

26
1.3. Exploration and Mining History
The first major studies in the Sadiola goldfield began in the early twentieth century, mainly
including the work of Hubert in 1909 to 1919 who presented the first geological map of the Afrique
Occidentale Française (AOF) at 1:5,000,000. Skawych in 1913 established a first geological map at
1:500,000.
From 1979 to 1985, the Unions Gold Diamond company, COGEMA Uranium and other
companies conducted regional research work. In 1987, Mali-West I, which was financed by the
European Development Fund (EDF), undertook a study of the geology and geochemistry (1000m x
250 m grid) of the Kayes Inlier and KKI. In 1989, under the direction of Klöckner Industrie, the Mali-
West I project investigated soil geochemistry of the Sadiola anomaly, as confirmed in 1987-1988 by
Mali-West I project at its first reconnaissance campaign of Sadiola Hill, discovering high 5 g/t gold at
the surface.
From 1990 to 1992, Klöckner Industrie and IAMGOLD (AGEM) conducted the first evaluation
surveys of the Sadiola goldfield. In 1992, IAMGOLD and Anglo-American signed an agreement to
undertake exploration, which included a systematic core drilling program and feasibility study of the
Sadiola goldfield. Commercial mine development of the Sadiola goldfield began in 1992 and was
based on proven and probable reserves amounting to 49.2 Mt of oxide and partly oxidized ore with an
average grade of 2.86 g/t Au, representing some 4.5 Moz of contained gold at an average depth of 140
m (Boshoff et al., 1998).
During 1994 to 1998, the Australian company ELTINE (ELTINE Mali) discovered the Yatela
gold deposit north of the Sadiola Hill deposits; the Yatela gold deposit was transferred to SADEX-SA
(Sadiola Mining) and ANSER (Anglo Services, now known as SEMOS SA) undertook feasibility
studies of the deposit. During 1998-1999, a 200 m x 50 m regolith and soil geochemistry campaign
was completed on the exploration permit. From 1999 to 2009, ANSER discovered gold anomalies
using detailed soil geochemistry, which additionally resulted in the discovery of several satellite
deposits. From 2009 to 2015, SEMOS SA Exploration explored and mined the gold resources in both
the Sadiola and Yatela goldfields, including satellite deposits at Alamoutala (Masurel et al., 2014),
FE3, FE4 and Yatela.
Several Sadiola deposit genesis models have been proposed by a number of consultants, which
has complicated a full understanding of the deposits in the goldfield. The Sadiola deposit has been
variously classified as:
1) Carlin-style (Voet, 1996)
2) Intrusion-related style (Anonymous, 1994; Voet, 1996; Theron 1997)
3) Mesothermal Lode style
4) Greisen style
5) Skarn (distal to proximal deposit) (Sillitoe, 1994; Boshoff et al., 1998)

27
6) Thermal Aureole Gold Deposit or TAGD (Hein et al., 2007)
7) Carbonate-hosted Au-As-Sb mineralisation (Masurel et al., 2014; 2016).
According to Masurel et al. (2017), the structural setting and fluid flux were critical factors
dictating gold mineralisation processes, although the source of fluid and metals for the Sadiola Hill
hydrothermal system remains uncertain.
1.4. Aims and program
At Sadiola goldfield there are several forms of gold mineralisation, including detrital gold in
Tertiary sediments, gold in oxidized rock and gold as calc-silicate hard-rock sulphide ore. The Sadiola
operation currently mines detrital and oxide gold, but the future development of the goldfield may
focus on hard-rock sulphide potential that exists at depth beneath the Sadiola Hill opencast pit. The
hard-rock sulphide ore has been extensively studied and reported by Cameron (2010) and Masurel et
al. (2017), but the character of gold ore in the oxide zone has not been systematically studied.
The aims of this project are to study the relationships between the oxides and calc-silicate;
oxides and structures; oxides and mineralisation; alteration and structures as well as structure and
mineralisation. Therefore, this research can be subdivided into three themes:
Theme 1: Modelling – To build a 3D Datamine model of the various oxide/hard rock phases in
Sadiola and Tambali opencast pits and cross-correlate these with the gold grade.
a) The Sadiola goldfield geology, including weathering and supergene profile and the structure,
was mapped. The pits forming the subject of this study are the Sadiola Hill opencast, FN3
north and south and Tambali north and south pits. The Reverse Circulation (RC) and
Diamond Drill (DD) boreholes in the northwest of the Sadiola Hill opencast pit, and to the
north of the Tambali northern pits were logged to establish the stratigraphic column. The
calc-silicate sub-facies and Tertiary stratigraphy of the Sadiola goldfield were also mapped.
b) This work was correlated with borehole data across the opencast pits; validation included
field studies.
c) Any sub-facies in the calc-silicate (marble) were established.
d) The distribution of gold grade from grade control drilling with respect to sub-facies
variations and/or oxide phases was examined.
Theme 2 Extension into regional studies of gold grade distribution using ArcGIS:
a) This included regolith, termite and other regional map datasets in ArcGIS to build a
comprehensive oxide database for the Sadiola goldfield.
b) Queries were undertaken to examine the relationship between gold grade, oxide phases;
marble sub-facies, structures and lithologies.

28
c) A comprehensive rationale for gold grade distribution across the goldfield in the oxide zone
was developed.
Theme 3 Oxide geochemistry:
a) XRD, XRF and minerals separation process of selected samples in the oxide zone were
studied.
b) The character and nature of auriferous oxide were established using the software packages
Excel 2013, Datamine CAE Studio 3 and Leapfrog Geo 3.1 for 3D modelling, CorelDraw
v9, Arc Map® 10.2 for 2D mapping. Samples were collected as needed.
1.5. Acronyms and Abbreviations
SEMOS. S. A Société d’Exploitation des Mines d’Or de Sadiola. Société Annonyme
WAC West African Craton
KKI Kédougou Kéniéba Inlier
SMSZ Sénégal-Malian Shear zone
SFZ Sadiola Fracture Zone
XRF X- Ray Fluorescence
XRD X-Ray Diffraction
CAE Computer-Aided Engineering (Datamine)
FN3 Farabakouta North 3
Mt Million ton
Moz Million once
GPS Global Positioning System
AOF Afrique Occidentale Française
EDF European Development Fund
SSP Sadiola Sulphide Project.
1.6. Thesis Organisation
This thesis is organised as follow. The first sections present abstract, acknowledgements, list of
Figures, list of Tables, and list of Appendices.
Chapter 1 introduces the research thesis by a preamble, then the study location and
physiography, followed by exploration and mining history, the aims and program, the acronyms and
abbreviation and the thesis organisation.
Chapter 2 gives a detailed review of the regional geology, including a summary of the regional
geology of the West African Craton (WAC), and detailed regional geology of the Kédougou Kéniéba

29
Inlier (KKI) and geophysical datasets. The local geology of the Sadiola goldfield is also detailed in
this chapter.
Chapter 3 describes the methodology that relates to the aims and objective of the research.
These include mapping, sampling techniques, XRF and XRD analysis, and modelling using Datamine
studio 3 CAE software and leapfrog Geo 3.1.
Chapter 4 presents the results of this MSc research: Section 4.1 presents the results of Sadiola
mine scale and regional 2D mapping that include lithologies, alteration and structures. Mine-scale 2D
mapping included FN3 south and north pits, Sadiola Hill opencast pit, and Tambali south and north
pits as well as regolith data, Sadiola termite results. RC and Diamond drilling datasets were combined
with the mapping datasets to establish a stratigraphic column and establish the relationship between
gold grade and the marble sub-facies, oxide profile for every opencast working. Section 4.2 presents
the Sadiola goldfield lithologies and oxide 3D modelling to establish the relationship between gold
grade and different lithologies, oxide profiles. Section 4.3 presents the result of studies of the oxide
geochemistry to establish the character of oxide in the goldfield.
Chapter 5 presents the discussion.
Chapter 6 presents the conclusions and Recommendation.

30
Chapter 2
Literature Review
2.1. Introduction
The WAC is composed of Réguibat Shield, Leo-Man Shield, Kayes Inlier and KKI on the
western margin of the craton, and the Ansongo Inlier on the eastern margin of the craton. The WAC
presents two major basement highs, the Réguibat Shield in the north of the craton and the Leo-Man
Shield in the south. The geology of the craton is mainly composed of Archaean and Palaeoproterozoic
rocks. The Neoproterozoic to Palaeozoic Taoudeni sedimentary basin separates the shields (Figure 1);
they are surrounded by Pan African and Hercynian belts (Bassot, 1965; Pons et al., 1991, 1992, 1995;
Ndiaye et al., 1997; Hirdes and Davis, 2002; Dioh et al., 2006; Diene et al., 2012).
The Palaeoproterozoic rocks of the WAC are generally composed of belts with tholeiitic and
calc-alkaline lavas, and felsic volcaniclastics, wackes, argillites and chemical sediments (Hirdes and
Davis, 2002). According to Hirdes and Davis (2002), these rocks can be grouped together as the
Birimian Supergroup, excluding the conglomerates and sandstones of the Tarkwaian Group, which
represent erosion products of the Birimian Supergroup.
2.2. Geology of the Kédougou-Kéniéba Inlier (KKI)
The KKI is situated on the western margin of the WAC and is crossed by the international
border of Senegal and Mali. The Sadiola goldfield is situated in the eastern part of the KKI and
straddles countries such as Senegal and Mali (Figure 5). In the Sadiola goldfield, two stratigraphic
subdivisions have been identified including the Kofi Formation and the Saboussiré Formation by
Klöckner Industrie (1989). They are generally assigned to the Birimian Supergroup but have not been
dated. The Kofi Formation is made up of metasedimentary rocks, while the Saboussiré Formation is
volcano-sedimentary and composed of interlayered mafic volcanic, fine-grained greywacke and
clastic sediments.

31
Figure 5: The inserted map shows the position of the WAC in Africa. A- Presentation of the
study area in Sadiola goldfield. B- Location of the different goldfield in the Kédougou-Kénieba Inlier.
In the KKI the SMSZ (Sénégalo-Malian Shear Zone) is located in the east and the MTZ (Main
Transcurrent Zone) at the west (after Hein et al., 2012).
The KKI represents the western-most exposure of the Birimian in the WAC. It comprises two
greenstone belts, known as the Mako Series and Falémé Series, and adjacent sedimentary basins
referred to as the Dialé-Daléma Series and the Kofi Series (Hirdes and Davis, 2002).
According to Villeneuve (2008), the Hercynian Mauritanides form the western margin of the
KKI. The KKI is overlain by all side by flat-lying Taoudeni basin (Masurel et al., 2014). According to

32
Debat et al. (1984), Bassot (1987), Ngom (1989), Pons et al. (1992), Dia (1993a, b) and Dia et al.
(1993, 1997), the geology of the KKI can be divided into four (4) groups from west to east: the Mako
volcanic belt, the Dialé-Daléma Series, the Falémé Belt and the Kofi Series (Figure 5B). There is no
consensus as to the stratigraphic and/or paleogeographic relationship between these Series (Hirdes
and Davis, 2002).
The KKI can be divided into three strato-structural domains based on the location of two
regional-scale shear zones, respectively, the Main Transcurrent Zone and the Sénégalo-Malian Shear
Zone. Bassot (1987) defined the Mako Series to the western domain as mainly composed of tholeiitic
pillowed basalt and calc-alkaline andesite.
In the WAC, the major granitoids are divided into two groups: the “belt type”, now interpreted
as pre/syn-orogenic intrusive bodies (2190-2108 Ma) and the “basin-type”, which is younger, with
ages ranging from 2110-2080 Ma (Hirdes et al., 1992; Davis et al., 1994; Hirdes and Davis, 2002).
Gueye et al. (2007) classified KKI granitoids into four generations GI-GIV. The first generation (GI)
represents the oldest rocks in KKI and includes the Badon granite (2198 ± 2 Ma) and tonalitic
gneisses from Tonkouto (2200-2198 Ma). The G1 generation could be correlated with an early
Birimian magmatic event. The second manifestation of magmatism (GII) includes intrusion of mafic
diorite, the gabbroic Sandikounda Layered Igneous Complex (SLIC), and development of the Laminia
Kaourou Pluton Complex (LKPC) (2160-2130 Ma). The third major peak of magmatic activity (GIII)
includes the development of the oval-shaped Diombalou and Bouroumbourou plutons. Finally,
magmatism was terminated in the Mako Belt following the Eburnean Orogeny, with the emplacement
of the Tinkoto and Mamakono plutons (GIV) in the east of the LKPC and continued in the Dialé-
Daléma Supergroup with the syn-tectonic emplacement of the Saraya batholith. Lompo (2010)
established three tholeiitic suites (PTH1, PTH2, PTH3) and two granite suites (PAG, PBG) based on
the geochemical, geochronological and structural studies of Paleoproterozoic magmatic rocks in the
Man-Leo Shield. The three principal events recognized by Lompo (2009) for the ca. 2.25–2.00 Ga
tectonic period of evolution of the West African Craton are: Event I (ca. 2250–2200 Ma) as
characterized by widespread tholeiitic volcanism in an oceanic basin setting (PTH1) to mantle plume
activity, Event II (ca. 2200–2150 Ma) as characterized by a second (PTH2) and third (PTH3)
generation of tholeiites in a calc-alkaline magmatic setting. The event was concomitant to widespread
emplacement of amphibole-bearing (PAG) granitoids, and greenstone belt deformation. The event
was facilitated by the formation of a subsiding mega-synclinorium and vertical tectonics and finally
Event III (ca. 2150–2000 Ma) as characterized by the emplacement of dominant biotite ± muscovite-
bearing (without amphibole) granitoids (PBG) during transcurrent tectonics illustrated in Lompo
(2009).
Hirdes et al. (2002) and Dioh et al. (2006) defined the metavolcanic rocks as intercalated with
immature metamorphosed sedimentary and volcaniclastic rocks. Pawlig et al. (2006) described the
Dialé-Daléma Series as meta-sedimentary sequences intercalated with calc-alkaline volcanic between

33
the Main Transcurrent Zone (MTZ) and SMSZ in the KKI. The Dialé-Daléma Series is composed of
sedimentary and volcano-sedimentary rocks (quartzite, carbonate, sandstone, conglomerate, epiclastic
tuff) that were isoclinally folded and attained a schistosity during a deformation accompanying a
phase of regional greenschist metamorphism (Hirdes and Davis, 2002). According to Ledru et al.
(1991), the clastic rocks of the Dialé-Daléma Series were deposited in an intra-cratonic basin. The
Dialé-Daléma Series lies beneath and are older than, the Mako Series; the former has been affected by
two tectonic phases and the latter by only one phase (Ledru et al. 1991).
The Mako volcanic belt is located in the western domain of the MTZ and consists largely of
basaltic, frequently carbonate-altered flow rocks intercalated with minor volcaniclastics. They are
intruded by ultramafic (pyroxenitic) subvolcanic sills and numerous relatively small, massive biotite
and amphibole-bearing TTG granitoids that resemble syn-volcanic, co-magmatic belt-type granitoids
of Ghana and eastern Cote d’Ivoire (Hirdes and Davis 2002). The boundary of the Mako belt with the
adjacent Dialé-Daléma sedimentary basin is partly transitional. Therefore, the Mako and Falémé belts
volcanic, volcaniclastics and sediments of the Dialé-Daléma basin, are understood as lateral facies
equivalents of almost similar relative age.
Hirdes and Davis (2002) and Schwartz et al. (2004) define the meta-sedimentary sequences of
the Dialé-Daléma series as being composed of intercalations of carbonate, volcaniclastic and turbiditic
units. Quartz-rich wacke from the series has been dated at 2164.7 ± 0.9 Ma (207
Pb/206
Pb) on the
detrital zircon by Hirdes and Davis (2002) constraining the maximum age of deposition.
In contrast, the Falémé Series in the central domain is recognized as a distinct entity from the
Dialé-Daléma Series. Hirdes et al. (2002) concluded that andesite and felsic lava dominant the
Baoulé-Mossi domain, but volcaniclastic units, chemical sediments (e.g., chert and manganiferous
shale) and metagreywacke also occur throughout the Falémé volcanic belt. They interpreted these
sequences as proximal volcanic rocks. The Falémé volcanic belt is associated with major skarn type
iron deposits (Schwartz et al., 2004).
The Kofi Series occurs in the eastern domain of the KKI. The Kofi Series, as first defined by
Klöckner Industries (1989), crops out east of the SMSZ and is displaced sinistrally (Hirdes et al.,
2002). The Kofi Series is composed of Birimian metasedimentary rocks and volcaniclastic sequences.
The Kofi Series at Loulo has been dated between 2093 ± 7 and 2125 ± 27 Ma (Boher et al., 1992
quoted in Lawrence et al., 2013).
The Sadiola goldfield is situated in the Kofi Series. The Kofi Series comprises sandstones;
argillites and platform carbonates; and syn-tectonic, S-type, peraluminous biotite-bearing granites
(with similar compositions to the Saraya batholith) (Lawrence et al., 2013). In the KKI, the Sadiola
goldfield local geology is presented in Figure 6.

34
Figure 6: Sadiola goldfield local geological map, this map is established by a compilation of the
field mapping and drilling data.

35
The KKI differs from other Palaeoproterozoic terranes in the WAC by having an abundance of
carbonates, with thick sequences (>250 m) in both the Dialé-Daléma and Kofi Series, representing the
most extensive carbonate exposure in the Birimian of the West Africa (Masurel et al., 2016). Sarr et
al. (2012) identified four facies in sandstone, the red sandstone, white sandstone, purplish sandstone
and sandstone intercalated pelites in the basin of Segou-Madina Kouta. Sarr et al. (2012) classified the
Segou-Madina Kouta basin as a fragment of lower Proterozoic formations between Senegal and
Guinea. The limit of this basin is on the north side by the volcanic formation of KKI, the Man ridge
on the south side, on the west side by the Bassarides and the Rockellides and finally the Taoudeni
basin on its eastern side. In Sadiola goldfield, the metasandstone was identified in Tambali pits, FE4
and in the southwest of Sadiola Hill opencast pit.
2.3. Magmatism
The KKI sedimentary rocks have been intruded by numerous granitoids. The granitoids of
Dialé-Daléma are calc-alkaline affinity. They have been intruded with andesitic lavas that have
geochemical similarities of arc magmas (Ndiaye, 1994).
The Dialé-Daléma granitoids, dated at 2008 Ma, appears to have been emplaced earlier than the
Trondhjemite granitoids of the Kakadian batholith dated at 2190 Ma (Dia, 1988), and they are
intrusive in the tholeiitic volcanic rocks of the Mako Supergroup.
The age of the Mako Supergroup has been dated to be 2063 ± 41 Ma (Sm-Nd on zircons;
Abouchami et al., 1990) and that of the volcanic-plutonic complex has been dated at 2195 ± 118 Ma
by Dia (1988).
Various intrusions were emplaced into the sedimentary rocks of the Kofi Series. According to
Pons et al. (1992), biotite-muscovite and adamellite-granite make up almost 90% of the Saraya
batholith (Figure 5B). Its central part, in the vicinity of the town of Saraya, contains a U-bearing
episyenite. According to Hein et al. (2015), quartz-feldspar wacke was dated at 2146.6 ± 6.4 Ma, or
2106 ± 10, (207
Pb/206
Pb) at Yatela and intruded by diorite (dated at 2106 ± 10, 207
Pb/206
Pb). The
Alamoutala granodiorite north of the Sadiola Hill deposit has been dated at 2081 ± 6 Ma (U-Pb zircon
age; Masurel et al., 2013). Masurel et al. (2013) defined many types age of diorite in the Sadiola-
Yatela goldfield, namely, (1) 2116 ± 7.5 Ma for the Yatela diorite and possibly Sadiola diorite, (2)
2082 ± 8 Ma for the Alamoutala rhyodacite and (3) 2108 ± 10 Ma for the Sadiola rhyolite (Quartz
Feldspar Porphyry).
According to Masurel et al. (2017), the metasedimentary rocks mapped in the Sadiola Hill
opencast pit are intruded by two generations of diorite and one generation of quartz-feldspar
porphyry. According to Theron (1997), in the Sadiola Hill opencast pit, the intrusions are
trondhjemitic diorite-quartz dioritic to granodioritic in composition. He also reported the presence of
lamprophyre dykes in the region, especially in the Dinnguilou prospect.

36
2.4. Metamorphism
In the KKI, the volcanic and the volcano-sedimentary rocks were subjected to greenschist-
facies conditions during regional metamorphism (Taylor et al., 1992; Debat et al., 2003). In the
Sadiola goldfield, metamorphic grade attained greenschist facies and hornblende-hornfels facies along
contacts to tonalite-granodiorite plutons and tonalite dykes (Boshoff et al., 1998; Hein and
Tshibubudze, 2007).
2.5. Structure and Tectonics
In Senegal and Mali, the geodynamic evolution of the Birimian Supergroup is characterized by
several tectonic events (Ledru et al., 1991):
(1) An extensional E1 phase associated with sedimentary deposits and fissure-rupture tholeiitic
volcanics;
(2) A tangential compressive deformation D1, with the tendency towards thrusting, affecting
the lower Birimian successions;
(3) An extensional E2 phase associated with deposition of fluvio-deltaic deposits and calc-
alkaline volcanic eruptions;
(4) A compressional D2 transcurrent tectonic phase, localized on the large north-south to
southwest-northeast trending shear zones and associated with emplacement of granitoids (Dabo et al.,
2010).
The two main shear zones identified in this domain are the Senegalo-Malian Shear Zone
(Bassot and Dommanget, 1986) and the Main Transcurrent Zone. D1 compression in the eastern
domain of the KKI is characterized by NNE to NE trending recumbent and overturned folds (F1),
NW-verging thrusts, and axial planar schistosity (Milési et al., 1989; 1992; Ledru et al., 1991; Dabo et
al., 2010). F1 folds are refolded by younger upright folds (F2) associated with D2 deformation. The
north-south brittle-ductile SMSZ was initiated as a sinistral transpressional shear zone during the
onset of D2 deformation.
According to Lawrence et al. (2013), east of the Falémé River, a third deformation (D3) is
associated with transtensional displacement along D2 structures, and the development of sinistral
north and north-west trending Riedel shears (third and fourth-order). Masurel et al. (2017) linked the
formation of high-angle reverse shear zones and upright folds with vergence towards the west-
northwest.

37
2.6. Mineralisation
The KKI hosts important goldfields such as the ~10 Moz Sadiola and ~2 Moz Yatela deposits,
and the Loulo goldfield that includes Yalea, Gara, Gounkoto, Segala (operated and owned by
Randgold Resources now known as Barrick Gold) and Tabakoto deposits (Figure 5B). The goldfields
are located in different tectonic settings and show different gold mineralisation styles, including
shear-hosted, disseminated sulphides, stratabound tourmaline-altered, auriferous veins-stock work,
greisen style, turbidite hosted, and intrusion-related gold style (Voet, 1997; Hanssen et al., 1998; Hein
and Tshibubudze, 2007; Cameron, 2010; Lawrence et al., 2013). They are close to crustal-scale shear
zones, but generally occur along second-order or even lower order splay shears (Voet, 1996; Boshoff
et al., 1998).
At the Sadiola Hill deposit, gold mineralisation is strongly bound to the upper part of a
carbonate sequence and more particularly to the boundary between carbonate sequences and overlying
greywackes. This boundary is generally interpreted as representing the SFZ. Masurel et al. (2017)
linked ore minerals texturally with silicate mineral precipitation during a potassic alteration phase.
Two stages of mineralisation were defined; the early As-rich sulphide (stage I), followed by an Au-Sb
(stage II). Both ore stages overlap the potassic alteration event.
Robertson and Peter (2002) identified supergene or oxidised gold deposits in the WAC, e.g. at
Yatela and Siguiri. This range of gold deposit types has expanded the opportunities for discovery in
the WAC. Robertson and Peter (2002) identified several examples of orogenic mineralisation in the
West Africa Craton including:
* Shear Zone-Hosted Vein deposits: Ashanti (Obuasi), Prestea, Poura, Belahouro
* Disseminated, Shear-Zone Hosted deposits: Bogosu, Konongo
* Breccia Disseminated: Syama, Sabodala
* Intrusive Disseminated: Ayenfuri
* Porphyry copper-gold: Diénémera; Gaoua
* Tourmaline: Loulo
* Intrusive Contact: Ity, Morila, Sadiola
* Stockwork: Bouda, Guida, Essakane, Djambaye II in the Tabakoto camp
* Extension Vein Stockwork: Kalana
* Skarn: Ity
* Paleoplacer deposits: Tarkwa (Robertson and Peter, 2002).
2.7. Sadiola 3D gold mineralisation model
A Sadiola goldfield mineralisation model has been completed by AGA evaluation team. The 3D
model was used in this study to establish the relationship between gold mineralisation and the 3D oxide

38
phases and 3D lithological model in the Sadiola goldfield. The relationship is presented in Section 4.2.
The 3D models were plotted together to show the relationship between them.
2.8. Alteration in the Sadiola goldfield
The Sadiola goldfield presents two types of alteration, namely hydrothermal and supergene.
Both are visible in pits, in Reverse Circulation samples, and in the diamond core.
2.8.1. Hydrothermal alteration
Masurel et al. (2017) described a poly-phase hydrothermal alteration history at Sadiola Hill. In
summary, biotite marks the fabric in host rocks within the SFZ and along the NNE-trending shear
zone. The potassic alteration halo in the country rocks occurs in form of pervasive biotite and extends
beyond the extent of the current Sadiola Hill open pit. The type of mica in the alteration assemblages
is, at least in part, lithological controlled. Tourmaline is structurally controlled and occurs as a
euhedral, rod- and heart-shaped accessory mineral (up to 2%). The reactivation of ore-hosting
structures and the formation of several chlorite-calcite-pyrite veins were related to the last stage of
hydrothermal alteration. According to Masurel et al. (2017), these veins postdate the potassic
alteration stage and, by inference, the main mineralisation phase.
Hydrothermal gold mineralisation is generally associated with silicification in the hanging-wall
(siltstone-shale-greywacke), but also closely related to a potassic alteration in the footwall (calc-
silicate) called Spotty Chert Alteration (SCA) (Cameron, 2010). Boshoff et al. (1998) and Masurel et
al. (2014) related the presence of gold mineralisation to potassic clay alteration. Primary calc-silicate
alteration consists of a Fe-poor mineral association, including tremolite-actinolite, scapolite and
vesuvianite, minor diopside, a trace of wollastonite and garnet as well as pyrrhotite. Potassic alteration
consists dominantly of biotite as well as K-feldspar and sericite. Scapolite and to a lesser extent
feldspar may alter to sericite (Boshoff et al., 1998).
2.8.2. Supergene alteration
At Sadiola Hill, Anonymous (1994) directly linked gold grade in the oxidized main zone to the
degree of kaolinisation. Weathering /alteration are most intense along the SFZ and at depth, but
otherwise follows diorite and quartz-feldspar porphyry dykes.
Decarbonation and argillisation, described as a hypogene alteration in reports dealing with the
early history of the Sadiola Hill orebody, are now recognised as supergene processes, and first
identified by Sillitoe (1994) and Boshoff et al. (1998). According to Voet (1996), the effects of
hypogene alteration extend to 220 m in depth.
In addition to the three (3) types of alteration described, there are also other types of alteration
namely biotitisation, chloritisation, sericitisation, albitisation, hematitisation, limonitisation,

39
kaolinitisation, scapolitisation and tourmalinisation. Jordaan et al. (1994) identified exotic weathering
minerals in the saprolite profile including;
1. Alunite (K2Al6 (SO4)4(OH)12), stable in a highly acid environment.
2. Zunyite (Al3Si5O20 (OH, F)18 Cl).
3. Melanterite (FeSO4.7H2O), derived from weathering pyrite.
4. Jarosite (K2Fe63+
(SO4)4(OH)12), formed in acid supergene conditions.
5. Stibiconite (Sb3O6 (OH)), a yellow oxide derived from weathering stibnite.
6. Ilsemannite (Mo3O8.nH2O), a blue weathering product of molybdenite.
7. Azurite (Cu3 (CO3)2(OH)2 ), derived from weathering copper sulphide.
Fe alteration as oxide-jarosite-siderite is linked to the gold mineralisation. Sillitoe (1994)
noticed that jarosite rather than hematite is the dominant component resulting from complete sulphide
oxidation.

40
Chapter 3
Methodology
3.1. Introduction
To understand the Sadiola Hill oxide zone, its geochemical complexities and alteration
signatures, many research studies were conducted such as lithological and oxide 2D mapping,
lithological and oxide 3D modelling. The oxide profiles were sampled for gold analysis, XRF, and
XRD analysis. The minerals found in the samples were separated into light and heavy constituencies.
3.2. Mapping
The Sadiola goldfields pits were mapped systematically from May 2015 to February 2017
according to the mining schedule, with reference to the geology, oxidation phases, alteration profiles,
and structures. Mapping took place in the FN3 south and north opencast pits, Sadiola Hill opencast
pit, Tambali south and north opencast pits. The mapping was achieved only in the accessible and safe
areas of the pits. The geological and oxide profiles map were achieved for each opencast pit in 2D. 2D
geological and oxide profile maps were done using ArcGIS 10.3
A GPS and camera were used to georeference and take photographs of each station point across
the goldfield. In the field, the data was recorded in the field notebook and then in Excel for data
validation and analysis.
The results of the field mapping are presented in Section 4.1 and tabulated in Appendix A.
Pit mapping was carried out with special emphasis on the relationship between saprolite,
transitional oxide, hard rock, and their structural interplay. The different kinds of alteration facies
were logged and sampled, assayed for gold, analysed using XRF and XRD. Mineral separation was
done to examine the different minerals from the samples.
The software packages used include Excel 2013, Datamine CAE Studio 3, Leapfrog Geo 3.1,
for the 3D model, CorelDraw v9, Arc Map® 10.2 for 2D map.
3.3. Modelling
In the Sadiola goldfield, the geology and the oxide phases were modelled in 3D. The 3D
geological model was achieved using Leapfrog Geo 3.1 3D software, while the oxide profiles were
modelled in 3D using CAE Studio 3 3D (Datamine). The modelling were done using field mapping and
drill core logged data sets. The results of the modelling are presented in Section 4.2.

41
In order for the 3D model to be completed, the various lithologies identified were wireframed
using the Datamine software.
1. The objective of the 3D geological modelling was to investigate and establish a relationship
between gold grade, lithology and lithological contacts.
2. The objectives of the oxide modelling were to investigate and establish a relationship between
each oxide profile and the gold grade, to make a link with oxide phases and structure.
3.4. Sampling
The oxide phases were sampled successively in the Sadiola Hill, FN3 and Tambali opencast
pits. The sampling process was conducted perpendicular to the bedding as a channel in the oxide
profile. The samples were assayed for gold at Sadiola in the SEMOS laboratory.
A total of ninety-seven samples were collected. All those samples were assayed for gold
mineralisation and analysed by XRF at the exploration office of Sadiola gold mine. Sixty-three
samples out of the ninety-seven were selected from the three oxide profiles (Table 1). The SEMOS
laboratory used fire assay as the method for gold analysis. Sample collection followed a procedure, in
which the samples were split into 3 parts. To check the results of the laboratory the standard, duplicate
and blank samples were inserted as quality control and quality assurance.
(1) The first part was split into two; one was sent to the SEMOS SA laboratory at Sadiola mine
for gold analysis, and the second was used for XRF at the exploration office at the Sadiola Mine.
(2) The second part was crushed and sieved to obtain a fraction of < 500 µm at the University
of the Witwatersrand, Johannesburg. The sieved portion was divided into three equal parts; the first
powder was used for XRF analysis; the second powder was used for XRD analysis and the third
sample powder was used for mineral separation.
(3) The third part sample was archived at the University of the Witwatersrand. All the samples
were photographed.
According to the gold assay result, the best samples were selected and re-sampled for selecting
the three identified oxide phases. Then, the sampling was also done on each identified profile, namely
(1) decarbonated calc-silicate rocks unit, (2) Fe-oxide alteration zones and (3) potassic clay alteration.
The second phase of sampling in the oxide profiles was used for systematical analysis of gold and
subjected to XRF, and XRD for oxide geochemistry and alteration signature. Afterwards, the samples
were submitted for mineral separation processing. The last process was conducted to identify and also
for detrital zircon dating.
The results of XRF and XRD permitted the study of the oxide complexities and alteration
signatures. The goal of sampling was to establish the relationship between gold mineralisation and
oxide profiles and then establish the oxide geochemistry.

42
Three types of oxide alteration are observed in the field, namely the decarbonated calc-silicate
rocks crosscut by Fe-oxide alteration zones, which are in turn crosscut by zones of potassic clay
alteration (Figure 7 to 16).

43
Figure 7: Photograph of the samples according to the alteration profile.
a. Photograph of the sample DTMS-012, showing very fine-grained sand with strong oxidized
profile and Fe alteration red colour (quartz 35%, clay 55% sericite 10%).
b. Photograph of the sample DTMS-013 showing fine-grained decarbonated calc-silicate
alteration (quartz 35%, clay 60%, sericite 5%).
c. Photograph of the sample DTMS-014 presents potassic and decarbonated alteration. The rock
is bedded with slump folds (Hein and Tshibubudze, 2007).
d. Sample DTMS-015 comprises Fe alteration with red-brown colour (quartz 45%, clay 45%
sericite 10%).
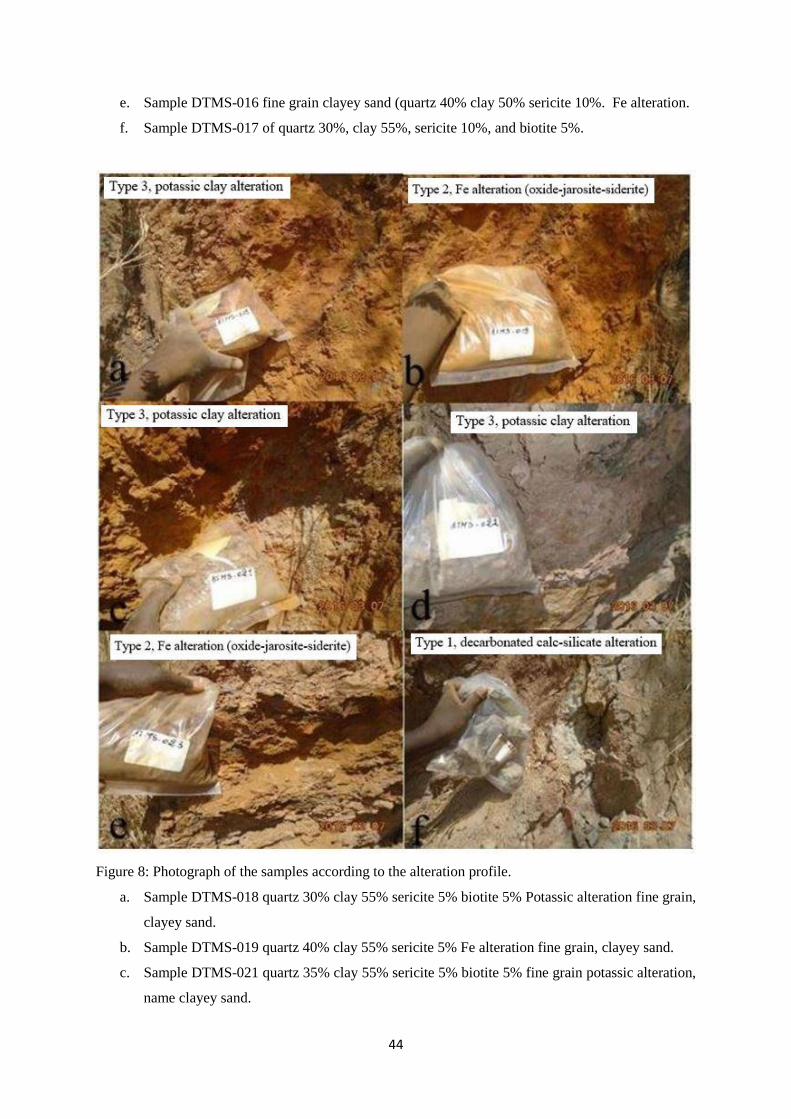
44
e. Sample DTMS-016 fine grain clayey sand (quartz 40% clay 50% sericite 10%. Fe alteration.
f. Sample DTMS-017 of quartz 30%, clay 55%, sericite 10%, and biotite 5%.
Figure 8: Photograph of the samples according to the alteration profile.
a. Sample DTMS-018 quartz 30% clay 55% sericite 5% biotite 5% Potassic alteration fine grain,
clayey sand.
b. Sample DTMS-019 quartz 40% clay 55% sericite 5% Fe alteration fine grain, clayey sand.
c. Sample DTMS-021 quartz 35% clay 55% sericite 5% biotite 5% fine grain potassic alteration,
name clayey sand.

45
d. Sample DTMS-022 quartz 45% clay 55% fine grain potassic alteration bedded, clayey sand
e. Sample DTMS-023 quartz 45% clay 55% fine grain Fe alteration, clayey sand
f. Sample DTMS-024 quartz 30% clay 65% sericite 5% fine grain decarbonated calc-silicate
massive, clayey sand
Figure 9: Photograph of the samples according to the alteration profile.
a. Sample DTMS-025 quartz 45% clay 50% sericite 5% fine grain, bedded to massive with
weak Fe alteration, clayey sand.

46
b. Show the sample DTMS-026 with quartz 40% clay 55% sericite 5% fine grain with
decarbonated calc-silicate alteration and the sample DTMS-027 quartz 45% clay 50% sericite
5% fine grain with Fe alteration, clayey sand.
c. Sample DTMS-028 quartz 40% clay 55% sericite 5% fine grain Fe alteration, clayey sand.
d. Sample DTMS-029 quartz 35% clay 55% sericite 5% biotite 5% fine grain strong potassic
alteration, clayey sand.
e. Sample DTMS-030/031 duplicated sample as composition there are quartz 45% clay 55%
fine grain with strong Fe alteration brown colour, clayey sand.
f. Sample DTMS-032 quartz 45% clay 55% fine grain, Fe alteration, clayey sand.
Figure 10: Photograph of the samples according to the alteration profile.
a. Sample DTMS-033 quartz 40% clay 55% biotite 5% fine grain strong Fe alteration, clayey
sand.
b. This photograph shows the following three sample DTMS-034 mineral composition is quartz
45% clay 50% sericite 5% decarbonated calc-silicate alteration; DTMS-036 presents quartz
40% clay 50% biotite 10% fine grain potassic alteration; DTMS-037 quartz 45% clay 55%
fine grain Fe alteration, clayey sand.

47
c. This photograph shows the following sample: sample DTMS-038 presents quartz 40% clay
50% biotite 10% fine grain with strong potassic alteration, clayey sand; DTMS-039 presents
quartz 40% clay 50% biotite 10% fine grain decarbonated calc-silicate alteration; DTMS-041
quartz 45% clay 55% fine grain Fe alteration, clayey sand.
Figure 11: Photograph of the samples according to the alteration profile.
a. Photograph of the sample DTMS-046, showing fine-grained sand decarbonated calc-silicate
alteration, sandy clay (quartz 50%, clay 35% sericite 5% biotite 10%).

48
b. Photograph of the sample DTMS-047 showing fine-grained, Fe alteration clayey sand (quartz
45%, clay 50%, and sericite 5%).
c. Photograph of the sample DTMS-048, fine grain, presents Fe alteration, clayey sand (quartz
40%, clay 50%, biotite 5% and sericite 5%).
d. Photograph of the sample DTMS-049 comprises Fe alteration, fine grain with red colour
clayey sand (quartz 40%, clay 55% sericite 5%).
e. Photograph of the sample DTMS-050/051 duplicated sample, fine grain with Fe alteration
clayey sand (quartz 45% clay 55%).
f. Photograph of the sample DTMS-052 contains quartz 30%, clay 70%, and fine grain with Fe
alteration, clayey sand.

49
Figure 12: Photograph of the samples according to the alteration profile.
a. Sample DTMS-053 contains quartz 40% clay 45% sericite 10% biotite 5% Fe alteration fine
grain, clayey sand.
b. Sample DTMS-054 comprises of quartz 40% clay 60% decarbonated calc-silicate, Fe
alteration fine grain, and clayey sand.
c. Sample DTMS-055 comprises of quartz 45% clay 55% decarbonated calc-silicate alteration,
clayey sand.
d. Sample DTMS-056 comprises of quartz 40% clay 55% biotite 5%, fine grain strong Fe
alteration, and clayey sand

50
e. Sample DTMS-057 comprises of quartz 35% clay 65% fine grain K alteration, clayey sand
f. Sample DTMS-058 comprises of quartz 45% clay 55% fine grain Fe alteration, clayey sand
Figure 13: Photograph of the samples according to the alteration profile.
a. Sample DTMS-059 presents quartz 55% clay 45% fine grain, Fe alteration, clayey sand.
b. Sample DTMS-061 shows quartz 45% clay 55% fine grain with decarbonated calc-silicate
alteration clayey sand.
c. Sample DTMS-062 quartz 30% clay 70% fine grain K alteration, clayey sand.
d. Sample DTMS-063 quartz 45% clay 55% fine grain Fe alteration, clayey sand.

51
e. Sample DTMS-064 as composition there are quartz 45% clay 55% fine grain with strong Fe
alteration brown colour, clayey sand.
f. Sample DTMS-066 quartz 45% clay 55% fine grain, K alteration, clayey sand.
Figure 14: Photograph of the samples according to the alteration profile.
a. Photograph of the sample DTMS-067, showing fine-grained clayey sand with Fe alteration
(quartz 40%, clay 60%).
b. Photograph of the sample DTMS-068 showing fine-grained, clayey sand, with a decarbonated
calc-silicate alteration (quartz 30%, clay 70%).

52
c. Photograph of the sample DTMS-069, showing fine-grained, clayey sand with K alteration
(quartz 35%, clay 65%).
d. Photograph of the sample DTMS-070/DTMS-071 showing fine-grained, decarbonated calc-
silicate alteration (quartz 30%, clay 70%).
e. Photograph of the sample DTMS-072, showing fine-grained sand, Fe alteration (quartz 35%,
clay 65%) clayey sand.
f. Photograph of the sample DTMS-073 showing fine-grained, clayey sand, K alteration (quartz
30%, clay 70%).
Figure 15: Photograph of the samples according to the alteration profile.

53
a. Photograph of the sample DTMS-074, showing fine-grained clayey sand K alteration (quartz
35%, clay 65%).
b. Photograph of the sample DTMS-075 showing fine-grained decarbonated calc-silicate
alteration (quartz 40%, clay 60%). Photograph of the sample DTMS-076, showing fine-
grained clayey sand with Fe alteration (quartz 35%, clay 65%).
c. Photograph of the sample DTMS-077 showing fine-grained, K alteration, clayey sand (quartz
30%, clay 70%).
d. Photograph of the sample DTMS-078, showing fine-grained clayey sand Fe alteration (quartz
35%, clay 65%).
e. Photograph of the sample DTMS-079 showing fine-grained, with K alteration (quartz 35%,
clay 65%).
f. Photograph of the sample DTMS-081 showing fine-grained, with a decarbonated calc-silicate
alteration (quartz 30%, clay 70%).

54
Figure 16: Photograph of the samples according to the alteration profile.
a. Photograph of the sample DTMS-082, showing fine-grained clayey sand Fe alteration (quartz
30%, clay 70%).
b. Photograph of the sample DTMS-083 showing fine-grained, Fe alteration (quartz 35%, clay
65%).
c. Photograph showing a massive calc-silicate rock with micro fault.
d. Photograph showing unconformity between oxidized profile and fresh calc-silicate rock.
e. Photograph showing bedded calc-silicate rock.
f. Photograph showing the folded calc-silicate.

55
Table 1: Sample description and related gold grades.
Sample ID X Easting
Y
Northing Au g/t Rock field description
DTMS-012 210074 1539445 0.46 quartz 25%, clay 45% sericite 10% very fine grain, Fe alteration
DTMS-013 210078 1539451 0.48 quartz 35%, clay 40% sericite 10% fine grain
DTMS-014 210079 1539452 0.49 quartz 35%, clay 45% sericite 5% fine grain strong potassic alteration
DTMS-015 210084 1539456 14.65 quartz 35%, clay 45% sericite 10% fine grain strong potassic/Fe alteration
DTMS-016 210110 1539466 1.02 quartz 30%, clay 50% sericite 10% fine grain strong Fe alteration
DTMS-017 210110 1539464 0.85 quartz 30%, clay 50% sericite 10% fine grain strong potassic alteration
DTMS-018 210125 1539471 2.15 quartz 35%, clay 50% sericite 5% fine grain strong potassic alteration
DTMS-019 210125 1539471 1.75 quartz 35%, clay 50% sericite 5% fine grain strong potassic alteration
DTMS-020 Standard
DTMS-021 210125 1539471 0.39 quartz 35%, clay 50% sericite 5% fine grain strong potassic alteration
DTMS-022 210148 1539470 0.11 quartz 35%, clay 55% fine grain strong potassic alteration bedded
DTMS-023 210148 1539470 0.17 quartz 35%, clay 50% fine grain strong Fe alteration
DTMS-024 210146 1539471 0.17 quartz 30%, clay 55% sericite 5% fine grain calc-silicate alteration, massive
DTMS-025 210207 1539447 0.67 quartz 45%, clay 50% biotite 5% fine grain bedded to massive strong Fe alteration
DTMS-026 210208 1539457 0.73 quartz 45%, clay 50% sericite 5% fine grain calc silicate alteration
DTMS-027 210208 1539457 0.87 quartz 45%, clay 50% sericite 5% fine grain Fe alteration
DTMS-028 210207 1539451 0.86 quartz 40%, clay 55% sericite 5% fine grain Fe alteration
DTMS-029 210207 1539449 3.09 quartz 40%, clay 55% fine grain strong potassic alteration
DTMS-030 210207 1539446 2.56 quartz 40%, clay 55% fine grain Fe alteration
DTMS-031
Field
Duplicate 2.43 Field Duplicate
DTMS-032 210206 1539440 0.08 quartz 45%, clay 55% fine grain strong Fe alteration
DTMS-033 210186 1539431 0.69 quartz 40%, clay 50% fine grain strong potassic alteration
DTMS-034 210156 1539377 1.64 quartz 45%, clay 50% sericite 5% fine grain calc silicate alteration
DTMS-035 Coarse blank

56
DTMS-036 210156 1539377 1.03 quartz 40%, clay 50% fine grain strong potassic alteration
DTMS-037 210156 1539377 1.31 quartz 45%, clay 55% fine grain strong Fe alteration
DTMS-038 210152 1539403 0.89 quartz 40%, clay 50% fine grain strong potassic alteration
DTMS-039 210152 1539403 2.2 quartz 45%, clay 50% sericite 5% fine grain decarbonated calc silicate alteration
DTMS-040 Standard
DTMS-041 210152 1539403 0.58 quartz 45%, clay 55% fine grain strong Fe alteration
DTMS-045 Pulp Blank
DTMS-046 210711 1539267 0.12 quartz 45%, clay 35% sericite 5% biotite 5% fine grain decarbonated calc silicate
DTMS-047 210711 1539267 0.23 quartz 45%, clay 45% sericite 5% fine grain Fe alteration
DTMS-048 210711 1539267 1.03 quartz 40%, clay 55% sericite 5% biotite 5% fine grain Fe/K alteration
DTMS-049 210476 1539694 0.02 quartz 40%, clay 45% sericite 5% fine grain Fe alteration
DTMS-050 210482 1539681 0.61 quartz 45%, clay 55% fine grain Fe alteration
DTMS-051 210482 1539681 0.46 Field Duplicate
DTMS-052 210482 1539681 0.11 quartz 30%, clay 70% fine grain Fe alteration
DTMS-053 210482 1539681 0.26 quartz 40%, clay 45% sericite 10% Biotite 5% fine grain Fe alteration
DTMS-054 210497 1539686 0.08 quartz 40%, clay 60% fine grain decarbonated calc silicate/K/Fe alteration
DTMS-055 210497 1539686 0.02 quartz 45%, clay 55% fine grain decarbonated calc silicate alteration
DTMS-056 210497 1539686 0.36 quartz 40%, clay 55% Biotite 5% fine grain Fe alteration
DTMS-057 210527 1539717 0.02 quartz 30%, clay 65% fine grain K alteration
DTMS-058 210550 1539742 0.09 quartz 45%, clay 55% fine grain Fe alteration
DTMS-059 210550 1539742 0.11 quartz 55%, clay 45% fine grain Fe alteration
DTMS-060 Standard
DTMS-061 210550 1539742 0.15 quartz 45%, clay 50% fine grain decarbonated calc silicate alteration
DTMS-062 210607 1539807 0.82 quartz 30%, clay 70% fine grain K alteration
DTMS-063 210613 1539812 0.04 quartz 45%, clay 55% fine grain Fe alteration
DTMS-064 210630 1539823 0.02 quartz 45%, clay 55% fine grain Fe alteration
DTMS-065 Coarse blank
DTMS-066 210603 1539799 0.15 quartz 45%, clay 55% fine grain K alteration
DTMS-067 210545 1539778 0.02 quartz 40%, clay 60% fine grain K/Fe alteration
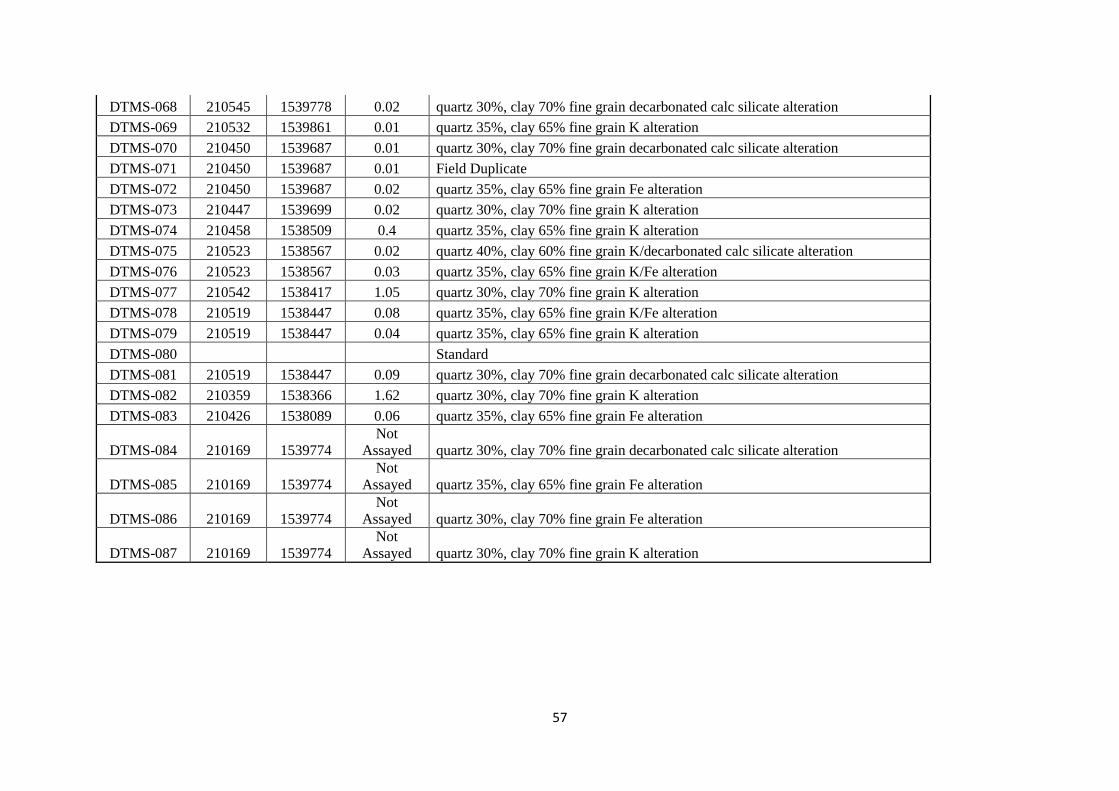
57
DTMS-068 210545 1539778 0.02 quartz 30%, clay 70% fine grain decarbonated calc silicate alteration
DTMS-069 210532 1539861 0.01 quartz 35%, clay 65% fine grain K alteration
DTMS-070 210450 1539687 0.01 quartz 30%, clay 70% fine grain decarbonated calc silicate alteration
DTMS-071 210450 1539687 0.01 Field Duplicate
DTMS-072 210450 1539687 0.02 quartz 35%, clay 65% fine grain Fe alteration
DTMS-073 210447 1539699 0.02 quartz 30%, clay 70% fine grain K alteration
DTMS-074 210458 1538509 0.4 quartz 35%, clay 65% fine grain K alteration
DTMS-075 210523 1538567 0.02 quartz 40%, clay 60% fine grain K/decarbonated calc silicate alteration
DTMS-076 210523 1538567 0.03 quartz 35%, clay 65% fine grain K/Fe alteration
DTMS-077 210542 1538417 1.05 quartz 30%, clay 70% fine grain K alteration
DTMS-078 210519 1538447 0.08 quartz 35%, clay 65% fine grain K/Fe alteration
DTMS-079 210519 1538447 0.04 quartz 35%, clay 65% fine grain K alteration
DTMS-080 Standard
DTMS-081 210519 1538447 0.09 quartz 30%, clay 70% fine grain decarbonated calc silicate alteration
DTMS-082 210359 1538366 1.62 quartz 30%, clay 70% fine grain K alteration
DTMS-083 210426 1538089 0.06 quartz 35%, clay 65% fine grain Fe alteration
DTMS-084 210169 1539774
Not
Assayed quartz 30%, clay 70% fine grain decarbonated calc silicate alteration
DTMS-085 210169 1539774
Not
Assayed quartz 35%, clay 65% fine grain Fe alteration
DTMS-086 210169 1539774
Not
Assayed quartz 30%, clay 70% fine grain Fe alteration
DTMS-087 210169 1539774
Not
Assayed quartz 30%, clay 70% fine grain K alteration

58
Each profile was precisely sampled and analysed for gold, and for oxide geochemistry using
XRF, XRD, and minerals separation.
The samples with the significant gold result were selected for the second part of the XRF
analysis and then XRD and minerals separation processing. All these analyses were conducted in the
University of the Witwatersrand, Johannesburg. The results of XRF, XRD and minerals separation
analysis are presented in Section 4.3.
This sampling has allowed the establishment of the relationship between gold mineralisation
and oxide profile and the geochemistry of the oxide profile.
3.5. XRF analysis
The XRF analysis was done in two stages. The first stage used a portable handheld XRF model
X-500 at SEMOS Sadiola mine, using “soil” and “mining plus”. The soil mode is used to analyse the
termite mound samples, while the mining plus mode is used to analyse the RC, diamond samples. Soil
mode detect the element such as K, Ca, Ti, Cr, Mn, Fe, Ni, while mining plus mode detect Mg, Al, Si,
P, K, Ca, Ti, Cr, Mn, Fe, and Ni. The program analyses the major element and the detection limit can
be 0 wt %.
The second stage of XRF analysis was done at the University of the Witwatersrand,
Johannesburg using Axios Max from Panalytical. For this program, the major elements were analysed
using the fused method with a Li-tetraborate flux, and data reduction was carried out using SuperQ. In
the result, dl (detection limits) can be taken as 0 wt %. The two stages of XRF analysis were to
establish quality assurance/quality control. At the University of the Witwatersrand, XRF analytic
work was done by Mr Marlin Patchappa.
The pulps of the samples for gold assay were also analysed using XRF at the SEMOS
exploration office. The powder was sieved to < 500µm. The SEMOS XRF machine used 4.5 g of
pulp, while the University of the Witwatersrand XRF machine used 2 g of pulp. The results of
analysis of the SEMOS XRF are presented as elements, while those of the University of the
Witwatersrand XRF are presented as a compound element. Both results were presented and
interpreted in this research. The procedure for XRF analysis at the University of the Witwatersrand is
presented in Appendix A.
3.6. XRD analysis
The sieved powders of thirty (30) selected samples were used for XRD analysis at the
University of the Witwatersrand, Johannesburg in the School of Chemistry. Ten (10 g) grams of
powder were sent for XRD analysis. The analysis was done by using the Bruker D2 Phaser, using a
cobalt emission source, Bragg-Brantano geometry. For this program, the setting was 50-120◦ step size

59
0.26 with a total time 15 min. The results were interpreted using Diffrac Plus Eva. The XRD analysis
was completed by Professor Billing. The identified minerals are presented in Section 4.3.4.
The XRD (X-ray Diffraction) is a physical process which produces an X-ray on the atoms of a
crystal, an interference effect called the diffraction pattern gives information on the structure of the
crystal or the identity of a crystalline substance. It is used to study the structure, composition and
physical properties of materials.
3.7. Minerals Separation
Minerals separation was conducted at the University of the Witwatersrand, Johannesburg Earth
Laboratory to separate light from heavy minerals. The minerals identified petrographically were used
for XRD interpretation. Different minerals were used to define the alteration signature. Minerals
separated were obtained using the procedure outlined in Appendix B.
To separate the light to heavy mineral, the crushed and sieved to < 500µm powder of the
mineral is washed in the glass beaker with water (remove of the clay material). The acetone liquid is
added to eliminate the water on the first heavy mineral obtained from water cleaning. Then the sample
is dried in the oven and put it in the separator machine and bromoform liquid is added. The density of
the bromoform liquid is 2.83 g/cm3, it is very heavy. After mixing the melange the light minerals will
float while the heavy will sink.
The mine-scale and the regional 2D mapping were used to interpret the geology and the oxide
profile, and establish the relationship between gold mineralisation, the geology and the oxide profiles.
The results are presented in Section 4.1.
3.8. Geophysical character of the Sadiola goldfield
The geophysical methods helped to identify the oxide and alteration signatures present in the
goldfield are presented below. The geophysical data were done by SEMOS geophysical team, the
shapefiles were loaded in ArcGIS for interpreting in this research.
3.8.1. Sadiola regional gravity data
In order to investigate the oxide profile in the goldfield, gravity data was used to identify the
gravel cover, hidden fault displacements, karst features and deep weathering profile.
The weathering profile in Sadiola can be attributed to many factors. Thus, the low gravity
response to surface water penetration or hydrothermal fluid reaction on the ground. Alteration
associated with surface water penetration is clearly visible on the southern wall of the Sadiola Hill,
this is well illustrated in chapter 4. The evidence of this on the gravity data is showing by the low
gravity present in the south of the opencast pit. The low gravity signature has been noticed along the

60
SMSZ (Figure 17). The low gravity signature follows the structures as SMSZ or northeast trending
faults.
Figure 17: Sadiola goldfield regional gravity map. The blue colour represents low gravity,
while the red the high gravity. Each open cast pit is located on area of low gravity, where oxides are

61
mined for gold. Sadiola goldfield gravity data has been plotted in the ArcGIS. The black line on the
map represents the SMSZ.
3.8.2. Sadiola magnetic data
The magnetic data detects features such as igneous rocks and structures. It allows the
identification and mapping of these features.
The total field magnetic image for the Sadiola goldfield is presented in Figure 18. The image
shows the high magnetic response in red colour and the blue is the low magnetic response. The
igneous rocks (diorite and dolerite) are visible on the image. The structures are oriented north-
northeast, and the regional SMSZ is oriented north-west to north-south on the image. On the Sadiola
total field magnetic image the dolerite dykes trend north-northeast and transect the SMSZ near
Lakanfla prospect.

62
Figure 18: Regional Magnetic data and interpretation map on the Sadiola goldfield shows the
shape and width of the SMSZ. The SMSZ is located on the western side of the map. This Sadiola total
field is GradEnh_0p05_NEW_RTPLL_UC50_1VD.ecw.

63
Baratoux et al. (2016) dated the dolerite dyke in Burkina Faso as 1575 Ma, using U-Pb. The
magnetic data allows us to identify the two important factors of gold mineralisation in the Sadiola
goldfield, namely, the regional structures and the intrusions. The SFZ contact is a local structure and
not visible in the geophysical datasets.
3.8.3. Sadiola radiometric data
The radiometric method estimates concentrations of potassium, uranium and thorium by
measuring the gamma-rays (Figure 19). It was used to understand the regional geology of Sadiola
goldfield. Boshoff et al. (1998), Cameron (2010) and Masurel et al. (2015) established a relationship
between gold mineralisation and potassium (K) alteration. Therefore, potassium can be used as a
geological mapping tool. The changes in lithology, or soil type, are often accompanied by changes in
the concentration of the radiometric elements. The red shows outcropping rocks, the ferricrete is
shown by the blue colour. The radiometry data provides insights into the weathering profile,
palaeochannels and the ferricrete. The radiometry data contributes to geological mapping. The
radiometry surveys of directly detect mineral deposits.
On the map (Figure 19) the potassium is represented by the red colour, the green colour shows
the thorium, while the uranium is represented by the blue colour. A high concentration of potassium
can be observed on the map in Sadiola Hill opencast pit.

64
Figure 19: The regional radiometric data across the Sadiola goldfield. The blue light colour
shows the ferricrete which cover most parts of the goldfield. The red colour represents some outcrop
through the goldfield.

65
Chapter 4
Results
4.1. Sadiola mine scale and regional 2D mapping
4.1.1. Introduction
Mapping is a 2D graphical presentation of field and drill core observation and interpretation. For
this purpose, the Sadiola mine scale and regional 2D mapping represent a summary of geological
(lithological, oxidation, alteration and structural) observations within and also outside the exploitation
pit. This chapter presents different interpreted maps created for each pit. The different types of maps
produced are lithological 2D map and alteration or oxide profile 2D maps. The lithological mapping
has been conducted in the three opencasts, which are Tambali, Sadiola Hill and FN3. The processes
were to identify each lithology and the different lithological contacts. The description of each lithology
has been conducted and presented in Table 1.
To do this lithological mapping, station point of lithological contact, structure, oxidation and
alteration were recorded in a field notebook. Appendix C presents the station points descriptions and
Appendix D is a copy of the field notebook. Forty-four (44) RC holes (Appendix E) and two (2)
diamond holes were logged to confirm the stratigraphy of Sadiola Hill and Tambali deposits (Figure
20).
The datasets collected from pits and field mapping were imported into ArcGIS software to
digitize every single lithology and oxide profile in 2D map, the examples of the lithological maps are
in Figure 21, 22, and 23. The Sadiola goldfield includes Sadiola Hill opencast pit, Tambali pits south
and north, and FN3 north and south opencast pits. In the oxide zone, ferricrete horizon, oxide saprolite,
oxide transitional phase and hard rock phases were individually mapped. The relationship between
gold mineralisation and geology, oxidation and lateritization were clarified. Gold mineralisation was
correlated with each phase of alteration and oxide profile. Oxide profile mapping, 3D oxide modelling
and mapping of the different types of alterations were completed for the Sadiola Hill, FN3 and Tambali
opencasts pits. The objectives of those mapping study were to establish the relationship between (1)
gold mineralisation distribution and the oxide phases; (2) gold mineralisation and calc-silicate sub-
facies, and (3) structures and the lithologies. The stratigraphic column was established for each
opencast pit across the Sadiola goldfield. The correlation between gold mineralisation and geology,
oxidation and lateritization were established.

66
Figure 20: Position of the forty-four RC holes drilled in the Sadiola Hill NW, the holes were logged for stratigraphic definition purposes.

67
4.1.2. Lithologies
Lithological mapping conducted in the Sadiola goldfield allowed to establish a 2D lithological
and oxide profile for Sadiola FN3 opencast, Sadiola Hill opencast and Tambali opencast pits. The
FN3 opencast pits are mainly composed of weathered and unweathered calc-silicate rock and cut by
quartz-feldspar porphyry. Both lithologies, calc-silicate and quartz-feldspar porphyry are covered by
ferricrete. The gold mineralisation has been found in all these lithologies.

68
Figure 21: Lithological map of the FN3 south and north pits. The pits are dominated by altered
and unaltered calc-silicate rock and crosscut by quartz-feldspar porphyry.
Lithological map of Sadiola Hill opencast is illustrated in Figure 22. Different lithologies were
identified, which are mostly steeply dipping, and these are Palaeoproterozoic in age and form part of
the Birimian Supergroup (Kofi Formation). However, three distinct ferricrete horizons separated by

69
mottled clay beds unconformably overlie the steeply dipping units. Siltstone-shale-greywacke
sequence is localized on the western highwall of the Sadiola opencast pit, while calc-silicate rocks are
localized on the eastern side of the pit. Diorite and quartz-feldspar porphyry crosscut all sedimentary
rock units. The quartz-feldspar porphyry is crosscut by a diorite in the Tambali south pit giving a
relative age for the formation of the intrusions. Diorite intrusions are present as dykes and sills. The
diorite and calc-silicate are both brecciated in the northwest of FNBC pit north of the Sadiola Hill
opencast pit.

70
Figure 22: Sadiola Hill opencast pit geological map. The eastern part of the pit is the altered
and unaltered calc-silicate, while the western part is the siltstone-shale greywacke. The contact is
structurally defined by the SFZ. The sedimentary rocks are cross cut by a dyke and sill of diorite and
quartz-feldspar porphyry dyke.

71
At Sadiola Hill opencast pit, gold mineralisation is associated with every lithology but mostly
hosted in both the altered and unaltered calc-silicate units.
In the Sadiola Hill opencast pit and FN3 pits, different sub-facies of calc-silicate were
observed, including (1) very thick (more than 1cm) to thick-bedded (0.5-1 cm) calc-silicate (with
alternate of white and black layers, (2) thin (3-5 mm) to very thin-bedded (1-3 mm), (3) massive
marble, (4) slump-folded marble, (5) carbonaceous siltstone and (6) pure marble (Figure 16 c, d, and f).
In addition to these marble sub-facies Hein (2008) identified (1) massive greywacke facies, (2)
carbonate greywacke-siltstone facies, (3) massive carbonate facies, (4) bedded carbonate and (5) slump
to massive carbonate facies. The different intrusions present in the pit include diorite dykes and/or sills
and quartz-feldspar porphyry.
The Tambali lithological map is presented in Figure 23. Tambali opencast pit lithologies
include meta-sandstone, greywacke, quartz-feldspar porphyry, and diorite and these are
unconformably overlain by ferricrete. In the Tambali opencast pit, diorite cuts quartz-feldspar
porphyry, thus, the diorite is younger than the quartz-feldspar porphyry. The gold mineralisation is
hosted in quartz-feldspar porphyry and meta-sandstones. White NE-trending quartz veins that crosscut
the quartz-feldspar porphyry are mineralised.

72
Figure 23: Lithological map of the Tambali opencast pits. The pits are composed mainly of
sandstone and greywacke. The dyke of diorite and quartz-feldspar porphyry across the sedimentary
rock.

73
A ferruginous sandstone unit exposed in the southwest of the Sadiola Hill opencast pit is
folded. The sandstone trends northeast and dips steeply southeast. It is crosscut by white quartz vein.
These were sampled and assayed, and the results are presented in Table 2.
Regional mapping was conducted in the south of Tambali at Lakanfla prospects and south-west
of the Sadiola Hill opencast pit. Sandstone was mapped in the southwest of Sadiola Hill opencast pit
(Figure 24), and also in Tambali opencast pit; the sandstones at both locations have some similarity in
colour and the grain size composition but is not mineralised (Table 2).
Figure 24: The red sandstone mapped at the southwest of the Sadiola Hill. (A) present the
photograph of the sandstone and (B) the position of the map.

74
Table 2: Orientation, Assay and composition results data of samples from southwest of Sadiola Hill opencast pit.
Sample ID XCOLLA
R
YCOLLA
R
ZCOLLA
R Rock type
STRUCTUR
E DIP
DIP
AZ Au COMMENT
SMAP17-
001 208952 1537872 108
Meta-
sandstone Bedding 35 50 0.02
Clay 20%, quartz 80% reddish colour fine
grain
SMAP17-
002 208956 1537876 108
Meta-
sandstone Bedding 30 95 0.01
Clay 20%, quartz 80% reddish colour fine
grain
SMAP17-
003 208961 1537881 108
Meta-
sandstone Bedding 38 92 0.01
Clay 20%, quartz 80% reddish colour fine
grain
SMAP17-
004 209034 1537847 114
Meta-
sandstone Bedding 41 100 0.06
Clay 20%, quartz 80% reddish colour fine
grain
SMAP17-
005 209036 1537992 115
Meta-
sandstone Quartz Vein 60 160 0.02 White quartz vein in W-E trench 5cm width
SMAP17-
006 209070 1537847 115
Meta-
sandstone Bedding 65 112 0.01
Clay 20%, quartz 80% reddish colour fine
grain
SMAP17-
007 209054 1537836 112
Meta-
sandstone Bedding 42 100 0.04
Clay 20%, quartz 80% reddish colour fine
grain
SMAP17-
008 209100 1537822 111
Meta-
sandstone Bedding 45 114 0.01
Clay 20%, quartz 80% reddish colour fine
grain
SMAP17-
009 209100 1537790 111
Meta-
sandstone Quartz Vein 55 160 0.01 White quartz vein 15cm width S0 50@120
SMAP17-
010 209123 1537792 113
Meta-
sandstone Bedding 55 125 0.1
Clay 20%, quartz 80% reddish colour fine
grain
SMAP17-
011 209123 1537792 113
Meta-
sandstone Bedding 55 125 0.02
Clay 20%, quartz 80% reddish colour fine
grain

75
Lithological mapping in the three opencast pits, FN3, Sadiola Hill opencast pit and Tambali pits
identified lithologies as calc-silicate, siltstone-shale-greywacke, meta-sandstone, diorite and quartz-
feldspar porphyry. Six (6) different sub-facies of calc-silicate or marble were recognised in the
goldfield. The number of layers of ferricrete presents in the Sadiola Hill opencast pit has been
established. Three (3) distinct ferricrete horizons were recognised overlying the calc-silicate (Figure
25a, b), while one thin horizon was observed to overlie the siltstone-shale-greywacke. The gold
mineralisation was detected in every single lithology, but it is mainly hosted by altered and unaltered
calc-silicate in the Sadiola Hill opencast pit. The gold mineralisation is also found in the ferricrete
horizons in the Sadiola goldfield.

76
Figure 25(a): Photography of the three different layers of the ferricrete on the decarbonated calc-silicate, the aeolian sand separates them. Looking east
of the Sadiola Hill opencast pit. (b) Photography of layers of ferricrete on the decarbonated calc-silicate, the aeolian sand separates them. Image taken looking
east, north of the Sadiola Hill opencast pit.

77
4.1.3. Alteration Mapping
Alteration is the change in mineralogic composition through physical or chemical processes
facilitated by hydrothermal and/ or supergene solutions. It results in two classes of alteration, namely
hydrothermal and supergene (Sillitoe, 2005). Both classes of alteration were identified in the Sadiola
goldfield. The hydrothermal and supergene alterations are visible along the SFZ in the Sadiola Hill
opencast pit.
The supergene alteration occurred down to a depth of 220 m in the Sadiola Hill opencast pit.
Supergene alteration types consist of hematitisation, kaolinitisation and limonitisation. Hematitisation
is more visible in the ferricrete, while limonitisation, hematitisation and kaolinitisation are all visible in
the oxide profile (saprolite and transitional). Hydrothermal alteration is associated with chloritisation,
silicification, feldspathic, biotitisation, and sulfidation of calc-silicate rocks (Figure 26). The biotite
alteration is spotty and follows the bedding in the calc-silicate rocks. The biotite is disseminated in the
dark layer (Mg) in the calc-silicate.
Figure 26: The hydrothermal alteration presents in the SFZ from the middle of the Sadiola Hill
opencast pit.
The objective of the oxide phase mapping was to identify and describe the different oxide
phases and to make a link between each phase and gold mineralisation. Four domains were defined
during the oxide phases mapping, namely (1) a ferricrete horizon, (2) oxide saprolite zone, (3) oxide
transition zone, and (4) calc-silicate, siltstone-shale-greywacke (unweathered rock). Figure 27 is a

78
cross-sectional view of the Sadiola Hill opencast pit showing all four oxide domains mapped. In this
supergene alteration, three-oxide development profiles are identified as decarbonated calc-silicate
alteration; Fe alteration (oxide-jarosite-siderite); and the potassic clay alteration, and are related to gold
mineralisation.
Figure 27: West-east vertical cross section along a 1537775 Nm latitude line showing the
Sadiola Hill opencast oxide profile. All the four domains are well depicted from the hard rock to the
ferricrete horizon.
The ferricrete horizon is interpreted as Tertiary in age (Grimaud, 2014) and overlies the oxide
saprolite zone. In the oxide saprolite zone, the rock has lost its primary elements and is, by and large,
replaced by secondary minerals, while in the oxide transitional zone it is possible to map primary
sedimentary features and some minerals. The age of oxide saprolite and oxide transitional zones is
unknown but assumed to be recent, when weathering occurred by deeply penetrating surface waters.
The ferricrete represents materials which are not in-situ, but transported, as indicated by the presence
of coarse pisolitic gravel and quartz (Figure 28).

79
Figure 28: Photograph of ferricrete in the Sadiola Hill opencast showing the coarse pisolitic
gravel and quartz which indicates weathering of transported materials.
The different oxide profiles mapped in the Tambali south and north opencast pits are shown in
Figure 29, which range from ferricrete to hard rock.

80
Figure 29: A plan view of oxide map for Tambali north and south pits, composed of ferricrete
in red colour, the oxide saprolite, the oxide transitional zone is the light blue colour and the hard rock
is represented by the grey colour.

81
Considering the oxide mapping results, gold mineralisation is found in the ferricrete horizon,
oxide saprolite and the oxide transitional zones. In the Sadiola goldfield, the ore fed to the plant is only
from the ferricrete, oxide saprolite and the oxide transitional zone ores. However, some gold in oxides
and siltstone-shale-greywacke and quartz-feldspar porphyry remains in the pit as unmined due to safety
or cost management issues.
The Sadiola Hill opencast pit oxide profiles mapping results are presented in Figure 30. In the
Sadiola Hill opencast pit, gold mineralisation is found in the ferricrete horizon and also, hosted in the
oxide saprolite and the oxide transitional zones. The gold mineralisation hosted in the hard rock should
be mined in the second phase of the Sadiola Hill life, Sadiola Sulphide Project. In the Sadiola Hill
opencast pit, exposures of hard rock consist of calc-silicate and siltstone-shale-greywacke.

82
Figure 30: The oxide map of the Sadiola Hill opencast pit, composed of ferricrete in red colour,
the oxide saprolite, the oxide transitional zone is the light blue colour and the hard rock in grey
colour.
Based on field studies conducted in May 2015, three stages of development of the oxide profile
in the Sadiola Hill opencast pit were identified. Decarbonated calc-silicate rocks are crosscut by Fe-
oxide alteration zones, which are in turn crosscut by zones of potassic clay alteration. In the pit
mapping process, the Fe oxide alteration has been a pathfinder for a Fe oxide-jarosite-siderite
assemblage, while the decarbonation may be associated with the formation of bauxitic clay. The three
stages of oxide were sampled systematically for gold, XRF, XRD analysis, and mineral separation for
oxide geochemistry characterisation.

83
The different oxide profiles mapped in the FN3 opencast pits are shown in Figure 31. In the FN3
opencast pit, gold mineralisation is found in the ferricrete, the oxide saprolite, the oxide transitional
zone, the calc-silicate, and unweathered siltstone-shale-greywacke. The thickness of the ferricrete
horizon measures between 0 to 10 m; the oxide saprolite is around 10 to 20 m thick; and the oxide
transitional zone extends to the base of the opencast pits and is the most important in term of volume.
Gold is mined in the oxide saprolite zone, which is approximately 20 m thick, below which the oxide
transitional zone is around 30 m thick. Exposures of siltstone-shale-greywacke occur at the bottom of
the pits. Exposures of calc-silicates are present only at the bottom of the FN3 south pit. In the FN3
opencast pits, there are more ferricrete exposed in the northern pit than the southern pit due to the
presence of the significant weathering profile in the north than south of FN3 opencast pits.
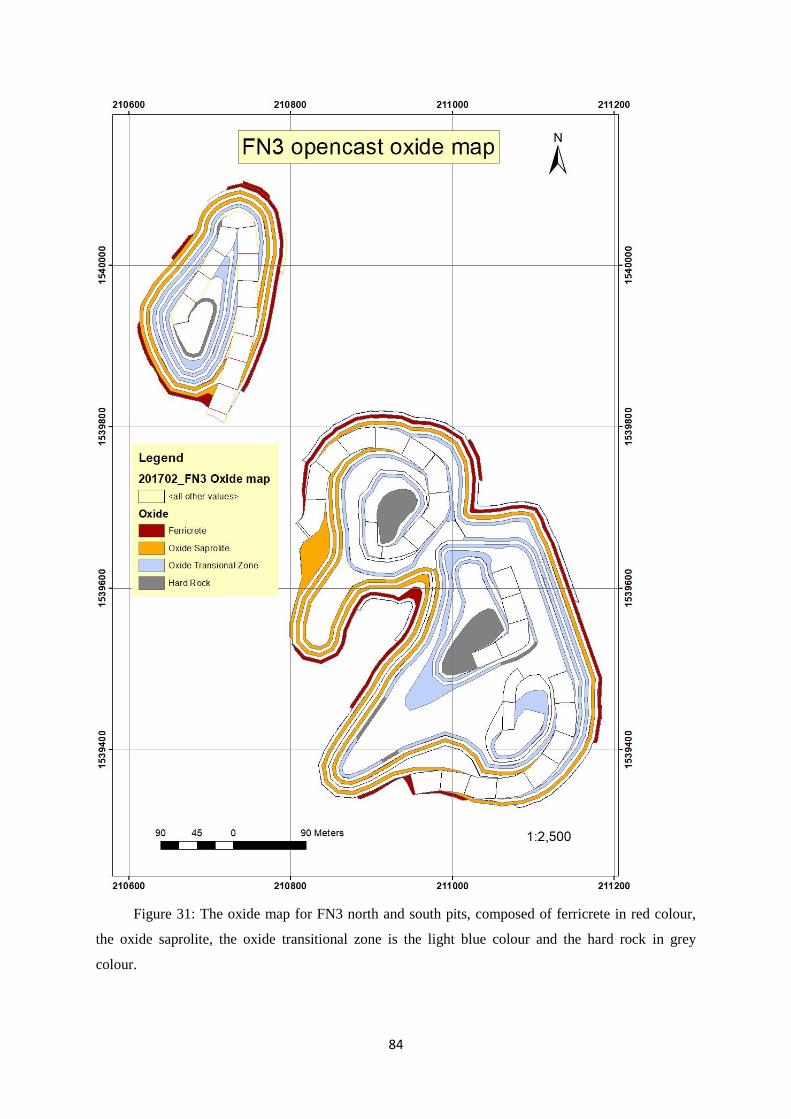
84
Figure 31: The oxide map for FN3 north and south pits, composed of ferricrete in red colour,
the oxide saprolite, the oxide transitional zone is the light blue colour and the hard rock in grey
colour.

85
Based on the oxide mapping completed in this study, there is more oxide by volume in the south
than the north of the Sadiola goldfield (Tambali in the south, Sadiola Hill opencast pit in the middle,
and FN3 pits to the north). The oxide profile is much deeper at Tambali to the south of Sadiola Hill
opencast pit than FN3 opencast pits to the north. The oxide profiles are very shallow in the FN3
opencast pits. This can be explained by the fact that the SFZ was the main conduit for the circulation of
meteoric water and hydrothermal fluids at Sadiola Hill, and that the structure extends to greater depths
in the SSW, but terminates towards the north. In the Sadiola goldfield, the oxide profile extends to
deeper levels where faults are present in the opencast pits.
In contrast, in the Sadiola Hill opencast pit, supergene alteration is largely hosted in the calc-
silicate rock as karst decomposition. There is evidence of a significant surface water penetration zone
on the southern highwall of the opencast pit (Figure 32). The meteoric water penetration caused the
oxidation of the hard rock, then the diminution of the volume and density, after concentration of the
gold in the oxide occurred.
The supergene alteration is associated with limonitisation, hematitisation, and kaolinitisation, as
well as deflation of the calc-silicate leaving a brown calcium silica-sand residuum or soil. In the
Sadiola goldfield, the weathered profile covers most of the structures and consists of a residuum or
soil along the structure. This residuum or soil is often enriched in minerals which are not leached such
as gold. Hematite, limonite and biotite alteration are related to gold mineralisation in the Sadiola
goldfield.
Figure 32: Photograph of the weathering profile on the southern wall of the Sadiola Hill
opencast pit. The shape is presented as a funnel of the meteoric water penetration.

86
4.1.4. Structural mapping
Field mapping in the Sadiola goldfield indicates that syn-sedimentary structure and tectonic
structures are dominant in the region. The syn-sedimentary structures are formed during the
sedimentation process. They can also be related to the oxide profiles collapse. Figure 16 c, e, and f
show some example of syn-sedimentary structures, all the structures were identified in the opencast pit.
The pencil in figure 16 shows the sedimentary layer cut by a fault. In the calc-silicate, the bedding is
generally oriented northeast and dips toward the west. Small-scale folds and intra bedding folds are
present everywhere in the opencast pit.
SFZ is oriented north-south and dip west to sub-vertical. The SFZ also lies at the contact
between siltstone-shale-greywacke and calc-silicate effectively making it a bedding-parallel structure
(Figure 33).
The grade control data indicates that the southern part of the SFZ is gold mineralised, and the
opencast workings in the northern extent show it cannot be barren - possibly just not as well
mineralised. Masurel et al. (2017) indicates that the SFZ propagated and formed during D2 but
experienced sinistral reactivation during D3. According to the oxide distribution established during
the pit mapping, the SFZ and the northeast faults could be syn-genetic and seem to have served as the
passageway/conduit of hydrothermal fluid and meteoric fluids, at least in the southern part of the pit.
The SFZ is parallel to the SMSZ, without a visible relationship between them. The SFZ has exploited
a lithological boundary between the siltstone-shale-greywacke (hanging wall) and the calc-silicate
(footwall). The characteristic of the SFZ is due firstly to the D2 deformation and subsequently to the
oxidation of the footwall (calc-silicate).

87
Figure 33: West-east cross-sectional sketch of the Sadiola Hill genetic model for the supergene
enrichment phase. The D2 deformation related to northwest-southeast compression, probably
associated with the Eburnean orogeny, produced an effect on the SFZ, and north-northeast trending
faults. The SFZ and north-northeast trending faults seem to be syn-genetic. The source of the gold in
the Sadiola Hill opencast pit was concluded by Hein (2007) as hydrothermal.
In contrast, the supergene alteration has penetrated the entire SFZ along its entire length
creating a fault-hosted residuum or soil. As stated above, this is in part, enriched in gold, which is
similar to what has been observed at the Yatela mine (Hein et al., 2015) in that pre-existing
hydrothermal gold is enriched during karstification and formation of karst residuum. This seems to be
the case at the Sadiola Hill gold deposit as well.

88
A series of west-east normal fault crosscuts the Sadiola Hill opencast and displace the SFZ and
the trend of gold mineralisation.
The infiltration of the surface water into the calc-silicate through the structures has caused the
oxidation of the hard calc-silicate (discordance between the oxide and hard rock). Blocks of hard rock
are sporadically distributed in the oxide phases.
The oxide phases are observed to follow the structures in a north-south and north-northeast
direction. The oxide phases are overprinted on the structures. To study their character, geochemistry
and the alteration signatures, sampling was conducted mainly along these structures in the oxide
phases. The geochemistry and the alteration signatures are presented in Section 4.3.
4.1.5. Reverse Circulation (RC) and diamond drill hole Results
Information from drill core logging was used to establish the stratigraphy and identify the
oxidation profile. Stratigraphic columns were established to show the lithological sequence in every
opencast pit. The oxidation profile shows the oxidation history.
4.1.5.1. Sadiola Hill opencast pit,
Sadiola Hill pit stratigraphy column is established using the pit mapping of oxide and
lithologies. The different profiles from top to bottom that are well defined from pit mapping included:
1. A soil cover that is brown in colour with the significant organic material.
2. A ferricrete horizon that is red in colour with coarse pisolitic gravel and sometimes clasts of
quartz. It is noted that ferricrete is present in two or three distinct levels that are separated by aeolian
sand or bauxite clay.
3. Aeolian sand horizon that is very fine-grained and yellow to red in colour. The aeolian sand is
yellow in colour and encrusted with kaolinite to limonite.
4. Weathered calc-silicate (decarbonated) composed of very fine-grained sandy clay. This is
mixed in colour.
5. Hard calc-silicate rock that is massive to bedded and bedded siltstone-shale-greywacke that is
moderately silicified (Figure 34). Calcite is present in all rock types as an alteration product. These
rock types are crosscut by quartz-feldspar porphyry dykes and diorite dykes. The rock presents a strong
to weak weathering profile in appearance. A diorite dyke is situated at the contact between siltstone-
shale-greywacke and calc-silicate rock in the Sadiola Hill opencast pit. These dykes were emplaced
after deposition of the metasedimentary rocks because they crosscut these units. Masurel et al. (2017)
distinguished two dykes of diorite, one early oriented north-south and another later oriented north
north-east. The brecciation associated with the SFZ affected all the lithologies.

89
Biotite, calcite, muscovite, sericite, quartz, and alkali feldspar and potassic feldspar minerals
where identified in the calc-silicates samples or rocks cuttings derived from the RC borehole.
Alteration assemblages found throughout the RC boreholes included chloritisation, skarnification,
biotitisation, silicification, limonitisation, hematitisation, kaolinitisation, and calcification. The
sulphides identified are pyrite, pyrrhotite, and arsenopyrite. A significant relationship has been
established between biotite, pyrite and bedding.
Figure 34: Sadiola Hill opencast stratigraphic column. The column was established by the
compilation of the pit mapping data and RC and diamond drilling data.
4.1.5.2. FN3 RC Results
Forty-four RC boreholes drilled in the north-west of the Sadiola Hill and FN3 opencast pits were
logged as part of this study to understand the oxide profile outside the pit (Appendix E). The objective
of the logging is to establish a stratigraphic column for Sadiola Hill opencast pit. The pit mapping and
borehole logging show a comprehensive stratigraphic column. The different lithologies downhole from
top to bottom include:
1. A soil profile that is brown in colour with the significant organic material that includes tree
roots.
2. A ferricrete horizon that is red in colour with coarse pisolitic gravel and sometimes clasts of
quartz. It is noted that ferricrete is present in two or three distinct levels that are separated by aeolian
sand or bauxite clay.

90
3. Aeolian sand horizon that is very fine grained and yellow to red in colour. The aeolian sand is
yellow in colour and encrusted with kaolinite to limonite.
4. Weathered and decarbonated calc-silicate composed of very fine-grained sandy clay. This is
mixed in colour due to the presence of the three type of oxide development.
5. Hard calc-silicate rock that is massive to bedded, and bedded siltstone-shale-greywacke that is
moderately silicified. Sadiola Hill opencast pit northwest RC drilling data presented in Appendix E.
4.1.5.3 Tambali diamond drillhole results
The objective of the diamond drilling in the Sadiola goldfield was first to test the north-south
mineralisation trend at Tambali, and the north to northeast mineralisation trend at Sadiola Hill
opencast pit. A total of 2 diamond holes were logged. One hole at Tambali, and one at the west of
Sadiola Hill opencast pit. The two were logged to confirm the stratigraphy column established during
pits mapping. The detailed loggings were focused on the rock type, structures, alteration, and
mineralisation.
The different lithologies downhole from top to bottom in Tambali pits (Figure 35) include the
following:
1. A soil profile that is brown in colour with the significant organic material.
2. A ferricrete horizon that is red in colour with coarse pisolitic gravel and sometimes clasts of
quartz.
3. Red to yellow sandstone horizon that is very fine to medium grained. This sandstone is friable
and encrusted with kaolinite, limonite to hematite alteration.
4. Siltstone-shale-greywacke that is moderate to strong silicified, it is a turbidite sequence.
5. Calc-silicate rock that is massive.
6. Quartz-feldspar porphyry dykes oriented north-northeast crosscut all the sediments.
7. Diorite dykes intruded the quartz-feldspar porphyry and the sediments.

91
Figure 35: Tambali opencast pit stratigraphic column. The column was established by the
compilation of the pit mapping data and RC and diamond). drilling data.
4.1.6. Sadiola regolith mapping results
Outcrops are limited in the Sadiola goldfield, the Sadiola area is mainly covered by ferricrete.
In the KKI, the soil geochemistry is not an appropriate technique for gold exploration due to the
character and profile of the ferricrete according to Chardon (2015). The Sadiola goldfield plant is fed
with oxide ore material, therefore knowledge of the regolith regime related to deposition and
transportation is an important factor in the exploration strategy. Gold mineralisation is found from the
surface in the ferricrete to hard calc-silicate sequences and/or siltstone-shale-metagreywacke
sequences of Birimian age. Hein and Tshibubudze (2007) identified two styles of gold mineralisation
in Sadiola goldfield: placer gold in palaeochannels and screes, and gold in breccia and stockwork
veins. Most of the goldfield is covered by ferricrete (laterite). According to Grimaud (2014), the
ferricrete formation began in the Eocene-Miocene with the development of three (3) distinct
glaciations across West Africa Craton. The oldest glaciation event generally caused an infill of deep
palaeochannels as this can be seen in the southeast of the Sadiola Hill opencast also in the highwall
adjacent to the ramp in the FE4 opencast pit.
The regolith data assisted in field mapping to indicate where there is rock outcrop and reconstitute the
palaeochannels (palaeo-environment). Schwarnecki (2014) conducted regional regolith mapping in
the Sadiola district. According to his compilation, there are palaeochannels, sedimentary units,

92
cuirasses developed in transported material, pediplain, sand and clays, and ferruginous and or lithic
lag.
4.1.7. Sadiola termite mounds sampling results
In the Sadiola goldfield, the termite mounds sampling data covers all the exploration permit.
The termite mounds data correspond mainly to the low gravity terrain with deep oxidation profile.
The termite mounts sampling is one of the exploration strategies for gold mineralisation in the Sadiola
goldfield. The entire Sadiola goldfield is covered by laterite and soil geochemistry is not an
appropriate technique.
Several criteria were applied for sampling, including (1) type, (2) age and (3) colour of the
termite mount. A characteristic of a good sample selection is the large mounds, with a recent age, with
colour defining the type of alteration. There are three types of termite mounts (small, medium and
large) in the goldfield according to the height above the surface. The colour of termite mount is an
indicator of the type of alteration, the age is classified as recent (wet) or ancient (dry). The termite
mound type is defined as small (0.2-0.5 m height), medium (0.5-1 m height) and large (1-2 m height).
In an area of 50 m2, a good termite mound is selected. On this large mound, the recent is sampled to
avoid contamination. The last Sadiola termite mound sampling campaign was carried out in
September 2012 by SEMOS exploration geologists in collaboration with AGA geochemists from
Johannesburg office. The interpretation map presents four data grouping from high to low value; (1)
red (high value), (2) yellow (medium), (3) green (Low) and (4) blue (zero) (Figure 36). The red
represents very high value and subsequently blue represents very low assay result. Basically, the
termite mounds data is the first regional data used by Sadiola exploration team. The soil geochemistry
is not used to a large extent in the Sadiola exploration strategy.

93
Figure 36: Map of termite mounds sample result in the Sadiola exploration permit. The red
(high value), (2) yellow (medium), (3) green (Low) and (4) blue (zero) of gold. This value is
overprinted on each open cast pit in the Sadiola goldfield.

94
4.1.8. Gold mineralisation distribution
4.1.8.1. Gold mineralisation distribution
Gold is found in three different units in the Sadiola Hill opencast. The first units are the
ferricrete layers, second is the oxide units (oxide saprolite and transitional) and the third units are hard
(calc-silicate, siltstone-shale-greywacke, diorite and quartz-feldspar porphyry) rock. The oxidation
process was a controlling factor in the concentration of gold in the decarbonated calc-silicate rock.
The shape of gold grains suggests that the source of gold mineralisation could be variable: (1)
transported hosted in ferricrete, (2) hydrothermal mineralisation. Masurel et al. (2017) classified the
origin of fluid and metal as unknown. At Sadiola goldfield, three types of gold have been identified
and were found in unique conditions and uniquely distinguished. This has allowed the examination of
the relationship between the gold mineralisation and the following factors such as (1) lithological
contact, (2) SFZ, (3) northeast trending faults, (4) iron (Fe) and (5) potassium (K) alteration. The gold
mineralisation has been concentrated after oxidation process into lithological contact, SFZ, and
northeast trending faults, while it is proportionally associated with iron (Fe) and potassium (K)
alteration. At the Sadiola goldfield, the gold mineralisation is present in all lithologies, but the
significant quantity is hosted in the decarbonated calc-silicate and the calc-silicate unit. Figure 37
shows gold mineralisation distribution through the Sadiola goldfield.

95
Figure 37: The 3D Sadiola goldfield gold mineralisation model across the Tambali, Sadiola Hill
open cast and FN3 pits. Compiled by SEMOS resources evaluation team.
4.1.8.2. Relationship between gold mineralisation and oxide phases
Gold mineralisation in the Sadiola goldfield has been modelled in 3D model by AGA (Figure
37), while the 3D model for ferricrete, oxide saprolite and oxide transitional zone were completed in
this study. To examine and establish the relationship between, gold mineralisation and the oxide
phases, 3D gold mineralisation has been plotted with the following oxide profiles: ferricrete, oxide
saprolite and oxide transitional. Gold mineralisation is found in the ferricrete (Figure 38), as the
ferricrete has developed in transported material, it implies that the hosted gold is also transported.
This can be confirmed by sub-rounded to rounded and oval shape of observed gold under the
binocular microscope (Section 4.3). There is a relationship between gold mineralisation and ferricrete
unit across Sadiola goldfield.

96
Figure 38: The 3D laterite model plotted with the 3D gold mineralisation model for Sadiola
goldfield (FN3 in the northern, Sadiola Hill open cast in the middle, and the Tambali pits in the
southern).
The gold mineralisation found in the ferricrete constitutes type 1 of the three-types established.
Gold mineralisation is distinguished across the oxide saprolite throughout the goldfield (Figure 39).
There is a strong correlation between the gold mineralisation and the oxide saprolite zone.

97
Figure 39: The 3D oxide saprolite model plotted with the 3D gold mineralisation model for
Sadiola goldfield (FN3 in the northern, Sadiola Hill open cast in the middle, and the Tambali pits in
the southern part).
Figure 40 shows that the Sadiola mineralisation is also hosted in the oxide transitional zones. In
the oxide transitional profile, the primary features of the rocks are still distinguishable.

98
Figure 40: The 3D oxide transitional zone plotted with the 3D gold mineralisation model for
Sadiola goldfield (FN3 in the northern, Sadiola Hill open cast in the middle, and the Tambali pits in
the southern part).
The significant presence of the gold mineralisation in the weathered calc-silicate (oxide
saprolite and oxide transitional) is the consequence of the calc-silicate weathering. The oxidation of
the calc-silicate led to the diminution of volume and density with leading to concentration of the gold
mineralisation. The three shapes of the gold are found in the oxide zone. The sub-rounded to oval
shapes of gold (transported gold) found in the oxide phases probably comes from the ferricrete. The
meteoric fluid circulation has probably facilitated the migration down in the oxide phases. At the
Sadiola goldfield, gold mineralisation is hosted by the ferricrete, the oxide phases (oxide saprolite,
oxide transitional zone), hard calc-silicate, and siltstone-shale-greywacke.

99
This relationship between gold and oxide phases study highlighted a significant correlation
between them. The oxidation caused the loss of volume and diminution of the density resulting in the
concentration of the gold grade in the oxide phases. This gold is the type 2 of gold mineralisation
identified in the opencast. It has been proved that the oxide transitional is significantly more important
than oxide saprolite in term of volume, and mineable gold quantity.
Type 3 gold mineralisation is found in hard rock. The gold mineralisation hosted in the hard
rock is still present in the Sadiola opencast pit as sulphide mineralisation.
4.1.8.3. Relationship between gold mineralisation and calc-silicate sub-facies
All the six identified calc-silicate sub-facies host gold mineralisation, but a significant gold
grade was found in the very thick to thick-bedded marble with alternating white and black layers, the
biotite alteration related to the dark layers, the thin to very thin-bedded calc-silicate, the slump-folded
marble, and the carbonaceous siltstone. It is important to note that the marble sub-facies without
significant structural feature or alteration signature are not consequently mineralised. Gold
mineralisation in the Sadiola goldfield is mainly located in the calc-silicate rock unit due to its
chemical composition. All the lithologies are mineralised as well as the different sub-facies identified
in the goldfield. The oxide profiles are significantly related to the gold mineralisation. The DD and
RC drilling data from Sadiola Hill and FN3 opencast pits indicate that gold grade are mainly located
in the different calc-silicate sub-facies, while the gold mineralisation is essentially in the meta-
sandstone to greywacke sequence in the Tambali opencast pits. Some occurances of high grade
mineralisation have been seen in siltstone-shale-greywacke in the Sadiola Hill opencast pit.
4.1.8.4. Relationship between structures and lithologies
At Sadiola goldfield there are three main faults orientations which are visible in the Sadiola Hill
opencast pit: the main north-south trending structure, the northeast trending structures, and the east-
west trending structures. The SFZ is oriented north-south. The SFZ is located on the lithological
contact between the calc-silicate unit to the east and the siltstone-shale-greywacke unit in the west of
the Sadiola Hill opencast pit (Figure 41). In general, the lithological contact corresponds to the
structure. This presents a moderate to strong oxidized zone. The northeast trending faults and the SFZ
are interpreted to have formed synchronously, with the northeast trending faults splaying off from the
SFZ. The mineralisation is concentrated along the SFZ and northeast trending faults, while the west-
east trending faults are younger than the mineralisation as they crosscut the mineralisation. All these
structures are more visible in the calc-silicate rock than the siltstone-shale-greywacke due to
differences in the competency of the rock. The oxidation process of the calc-silicate occurred along
the north-south and northeast trending faults. The meteoric water penetrated the calc-silicate rock
through the structures and caused oxidation due to the calc-silicate chemical composition. Traoré and
Samaké (2010) noted that the Sadiola Hill ore body is displaced by this west-east trending faults.

100
According to this study, the displacement of the Sadiola Hill ore body is largely due to the collapses
of the oxide unit after oxidation of the calc-silicate unit. The collapse of the oxide zone can be
explained by the diminution of the volume of material. Sadiola Hill opencast pit mapping data reveals
the presence of several blocks of diorite, and quartz-feldspar porphyry which can be explained by the
oxide profile collapse. The loss of volume and density resulted in the concentration of the gold
mineralisation in the oxide profile. The progressive collapse of decarbonated calc-silicate caused the
collapse of the contact between siltstone-shale-greywacke and the calc-silicate along the SFZ.

101
Figure 41: The SFZ, northeast trending faults and west east trending faults plotted on the
Sadiola Hill opencast pit geological map. The SFZ is located along the contact between the siltstone-
shale-greywacke in the west and the calc-silicate in the east.

102
4.1.9. Summary
Based on mapping of the Sadiola goldfield within the opencast pits and the logging of drill core
(RC and DD), several lithologies can be identified, namely calc-silicate, siltstone-shale-greywacke,
meta-sandstone, quartz-feldspar porphyry, and diorite. Gold mineralisation is significantly hosted in
the calc-silicate sub-facies in the Sadiola Hill opencast pit, while it is hosted in the meta-sandstone to
greywacke sequence in the Tambali opencast pits. There is sporadic gold mineralisation in siltstone-
shale-greywacke in the Sadiola Hill opencast pit. In the Sadiola goldfield, the termite mound
anomalies are an excellent indicator of gold mineralisation. There is a strong relationship between the
termite mound anomaly and the oxide profile. In the goldfield, many opencast pits are located along
trends of the gold anomalies in termite mounds. The regolith data assisted in field mapping and to
reconstitute the palaeochannels. The meteoric water penetrated in the hard rock through the structures
and caused the oxidation of the hard rock (Figure 42).

103
Figure 42: West-east cross-sectional sketch of the Sadiola Hill genetic model for the supergene
enrichment phase. The surface water penetrated the calc-silicate rock through the SFZ and northeast
trending structures. The pyrite in the presence of H2O and O2 can active some reactions and cause the
oxidation of calc-silicate.
Note that this refers to supergene enrichment, and is not the genetic model for the primary gold
mineralising event.
An increase in gold concentration is linked to a diminution of volume and density due to the
formation of the oxide zone. Supergene alteration minerals are limonite, hematite, and kaolinite.
Deflation of the calc-silicate has resulted in a brown calcium silica-sand residuum or soil which is
often enriched in minerals that are not leached, such as gold. Hematite, limonite and biotite alteration
are related to the gold mineralisation in the Sadiola goldfield. Three distinct ferricrete horizons were

104
identified on the calc-silicate, with one thin horizon on the siltstone-shale-greywacke. In the goldfield,
every single lithology hosted the gold mineralisation. A significant part of the ore body is hosted by
the weathered and unweathered calc-silicate unit in the Sadiola Hill opencast pit. At Sadiola goldfield,
three units host gold mineralisation: (1) ferricrete, (2) oxide phases and (3) hard rocks (calc-silicate
and/or siltstone-shale-greywacke). In the Sadiola goldfield, gold values of the oxide phase showed a
significant link between the gold mineralisation and the oxide profile. The collapse of the oxide unit
caused the following events (1) break down of diorite into multiple pieces in the oxide zone observed
through the Sadiola Hill opencast pit, (2) break down of the quartz-feldspar porphyry in multiple
pieces observed in the south-east of the Sadiola Hill opencast pit, and (3) The brittle and ductile
deformations have been observed on the core drilled through the SFZ.

105
Figure 43: West-east cross-sectional sketch of the Sadiola Hill genetic model for the supergene
enrichment phase. The decrease in the volume of the decarbonated calc-silicate caused the collapse of
oxide. Then SFZ which is a lithological contact between siltstone-shale-greywacke and calc-silicate
collapsed. Subsequently, aeolian sand was deposited on the ferricrete and on the decarbonated calc-
silicate.
The Sadiola Hill opencast pit after oxidation process and collapse of the oxide profile is
illustrated in Figure 44.
The Sadiola mine-scale geology and regional mapping study facilitated the building of the 3D
geological model for Sadiola goldfield. The 3D lithological and oxide models are presented in Section
4.2.
Figure 44: West-east cross-sectional sketch of the Sadiola Hill showing the results of oxidation
and collapse of the oxide profile.

106
4.2. 3D modelling of Sadiola goldfield lithologies and oxide profiles
4.2.1. Introduction
3D modelling is a spatial representation of an object in three-dimensions (3D). The lithology and
oxide profile 3D models were completed to build geometry and a stratigraphic sequence for each
lithology and oxide profiles in every opencast pit, and to establish the relationship between each 3D
model and gold mineralisation. 3D modelling was conducted using the 2D lithological and oxide
mapping results. The mapping of the lithologies, oxide profiles and the drilling data were used to build
the 3D oxide model using the CAE Studio 3 (Datamine). 3D lithological model was completed using
Leapfrog Geo 3.1. To do this 3D lithological modelling, the different 2D maps were taken as
reference. The west-east vertical sections were taken and then a string for each grouped lithology and
oxide profile was drawn. The different grouped lithologies strings were linked as wireframe to build a
3D model. This chapter presents the building of a 3D lithological and oxide model for Sadiola
goldfield, the 3D model results and interpretation. To achieve these objectives, AGA 3D gold
mineralisation model was used to examine the relationship between gold mineralisation and every
oxide profile, and different lithologies.
4.2.2. Lithology modelling
The models include the Tambali, the Sadiola Hill and FN3 opencast pits. The relationship
between the lithologies has helped to elaborate the stratigraphic sequence for each opencast pit. The
model covers the areas between the topographic surface at the top and -500 m RL depth. The
geological model involves all the single lithologies present in the pit. Some lithologies were grouped to
facilitate the modelling. Five units were modelled: (1) Ferricrete; (2) calc-silicate; (3) siltstone-shale-
greywacke, (4) diorite and (5) quartz-feldspar porphyry. Ferricrete, laterite and overburden were
grouped into a ferricrete unit; sandstone and siltstone-shale-greywacke were grouped into a siltstone-
shale-greywacke unit, calc-silicate, marble, and breccia were grouped into a calc-silicate unit, diorite
and granodiorite were grouped into diorite unit, and quartz-feldspar porphyry as the final unit. Figure
45 shows that a significant area in the goldfield is covered by meta-sediment (calc-silicate and
siltstone-shale-greywacke). Diorite and quartz-feldspar porphyry are present in the goldfield as several
discontinuous intrusions with general orientation of north-south to the northeast trend.

107
Figure 45: The 3D Sadiola goldfield lithology model. The green at the west represents the
siltstone-shale-greywacke, while the calc-silicate is located mostly in the east with the blue colour.
4.2.3. Oxide modelling
The modelling was done for the four weathering profiles, i.e., (1) the ferricrete, (2) oxide
saprolite, (3) oxide transitional zone, and (4) unweathered hard rocks. Each profile was modelled
separately. Oxide modelling has allowed the relationship of weathered and unweathered material and
the gold mineralisation to be established. It has also allowed the weathering sources and causes to be
investigated and the link between oxide phases and structure. The Sadiola Hill models include
structures mapped by Cameron (2010) that trend northerly and north-easterly. West-east trending
structures did not resolve well in the models and are therefore not reported here (documented in
Masurel et al. 2017). Sadiola Hill gold mine has produced gold since 1996 from the three oxide
profiles. In the Sadiola Hill opencast pit, many supergene alterations phases are present such as
limonitisation, hematitisation and kaolinisation. The 3D ferricrete model for Sadiola goldfield is
presented in Figure 46. The drill hole information was used to create a ferricrete domain, section by

108
section from south to north. The ferricrete string domain was linked to create a ferricrete wireframe.
The spacing between the sections was 25 m. There was some aeolian sand between the ferricrete layers
cover the calc-silicate, as noted from pit wall mapping.
Figure 46: The 3D laterite model for Sadiola goldfield (FN3 in the northern, Sadiola Hill open
cast in the middle, and the Tambali pits in the southern part).
The Sadiola goldfield 3D oxide saprolite model is presented in Figure 47. The oxide saprolite is
situated between the ferricrete and oxide transitional zone. According to the pit mapping data, the
oxide saprolite is significantly present in the calc-silicate than siltstone-shale-greywacke due to its
chemical composition.

109
Figure 47: The 3D oxide saprolite model for Sadiola goldfield (FN3 in the northern, Sadiola
Hill open cast in the middle, and the Tambali pits in the southern).
The Sadiola goldfield 3D oxide transitional model is presented in Figure 48. The oxide
transitional profile is situated between the oxide saprolite profile and hard rock. The pit mapping data,
and the oxide saprolite profile is more important than the oxide transitional profile.

110
Figure 48: The 3D oxide transitional zone for Sadiola goldfield (FN3 in the northern, Sadiola
Hill open cast in the middle, and the Tambali pits in the southern part).
3D modelling of the oxide saprolite and transitional zone indicates that the oxide saprolite zone
is significantly more important than oxide transitional zone in terms of volume, and gold quantity.
The hard rock has been modelled in 3D (Figure 49). The hard rock profile is situated below the
oxide transitional profile. The hard rock is mainly composed of calc-silicate and siltstone-shale-
greywacke. The hard rock is exposed in the Sadiola Hill opencast pit (Figure 50). Hein et al. (2015)
established that the Birimian supracrustal rocks are comprised of metamorphosed calcitic and
dolomite marbles, which were intruded by a diorite (2106 ± 10 Ma, 207
Pb/206
Pb, zircon), and
sandstone-siltstone shale sequences (youngest detrital zircon population dated at 2139 ± 6 Ma). This
implies that the hard rock calc-silicate and siltstone-shale-greywacke in the Sadiola goldfield are of
Birimian age.

111
Figure 49: The 3D hard rock model for Sadiola goldfield (FN3 in the northern, Sadiola Hill
open cast in the middle, and the Tambali pits in the south).

112
Figure 50: The supergene alteration presents in the calc-silicate rock from the southern area to
north of the Sadiola Hill opencast pit.
The 3D oxide and hard rock modelling have defined three types of gold mineralisation according
to the age of the host rock. The gold type 1 is found in the ferricrete of Eocene-Miocene age, the type 2
gold, in the oxide profile (oxide saprolite and transitional zone) age unknown and the type 3 gold in the
hard rock, of Birimian age.
The structures include, the SFZ oriented north-south and the northeast trending fault secondary
structures that splay from the SFZ. The structures allowed the circulation of meteoric and hydrothermal
fluids, which caused the oxidation of the hard rock.
4.2.4. Summary
The lithological 3D model for Sadiola goldfield shows that the calc-silicate unit is significantly
dominant in the goldfield followed by siltstone-shale-greywacke. Diorite and quartz-feldspar
porphyry form several discontinuous pieces with a general orientation of north-south to the northeast.
Three-oxide development profiles were identified. The main structures present include, the SFZ and

113
the northeast trending faults (Figure 50). The 3D modelling conducted in the Sadiola goldfield has
allowed an examination of the relationship between the oxidation profile to the structures as SFZ and
northeast trending faults. As relationship, the structures facilitated the circulation of the meteoric and
hydrothermal fluids. The ferricrete hosts the coarse pisolitic gravel and quartz. The presence of the
quartz in the ferricrete is an indicator of transport. To study, the oxide profile character, geochemistry
and alteration signatures, sampling was conducted along these structures. The geochemistry and
alteration signatures are presented in Section 4.3.
4.3. Geochemical analysis Results
4.3.1. Introduction
Geochemical data are used to study, describe and establish the alteration signature of the
Sadiola oxide profiles. To achieve these objectives samples were collected during mapping and
analysed for gold and by XRF and XRD. To understand the composition of the oxide facies and to
establish a relationship between gold mineralisation and elemental distribution, sixty-three samples
were analysed at SEMOS SA exploration office, using a portable model X-5000 XRF machine, while
thirty-three samples were sent for analysis at the University of Witwatersrand, however, only thirty
samples were analysed.
Additionally, minerals were separated. The separated minerals were observed under a
microscope to confirm the XRD result. Geochemical data are used to determine the relationship of
the gold mineralisation and the minerals, oxide profiles and alteration signature. Three-oxide zones
have been recognized (Figure 51); Type 1: decarbonated calc-silicate alteration; Type 2: Fe alteration
(oxide-jarosite-siderite); Type 3: potassic clay alteration was separately sampled.
Sixty-three samples were collected in the oxide zone of the various deposits to develop a fuller
understanding of the geology and geochemistry, as well as gold deportment and distribution.

114
Figure 51: The three-oxide facies developed in the Sadiola Hill opencast pit. The blue colour is
decarbonated calc-silicate rocks, crosscut by the red Fe-oxide alteration zones, which are in turn
crosscut by zones of pink colour potassic clay alteration.
4.3.2. Gold Assays
The sixty-three oxide samples were assayed for gold at the SEMOS laboratory using the fire
assay method and 30 g of sample material. The fire assay method is an analytical method of choice for
gold evaluation. The method is composed of four steps as (1) fusion, (2) cupellation, (3) parting and
(4) weighing the gold. The object of the fire assay fusion is to concentrate the precious metals in a
button of lead, while the whole of the remainder of the ore forms a fusible slag with suitable fluxes
lead sinks (Keith, 2004). The most significant gold results were found in type 2: Fe alteration (oxide-
jarosite-siderite); and type 3: potassic clay alteration of the three-oxide development. The gold results
are presented in Table 3 and range from 0.01 to 14.65 g/t Au. The cut-off gold grade for exploration is
0.4 g/t Au, while the mine cut-off gold grade is 0.6 g/t Au, but cut-off gold grade varies from one pit
to another.
For each sample, a photo has been taken and illustrated from Figure 7 to 16.

115
Table 3: Gold results in grams per tonne
Sample ID X Easting Y Northing Au Comment
DTMS-012 210074 1539445 0.46 Sample
DTMS-013 210078 1539451 0.48 Sample
DTMS-014 210079 1539452 0.49 Sample
DTMS-015 210084 1539456 14.65 Sample
DTMS-016 210110 1539466 1.02 Sample
DTMS-017 210110 1539464 0.85 Sample
DTMS-018 210125 1539471 2.15 Sample
DTMS-019 210125 1539471 1.75 Sample
DTMS-020 0.93 Standard
DTMS-021 210125 1539471 0.39 Sample
DTMS-022 210148 1539470 0.11 Sample
DTMS-023 210148 1539470 0.17 Sample
DTMS-024 210146 1539471 0.17 Sample
DTMS-025 210207 1539447 0.67 Sample
DTMS-026 210208 1539457 0.73 Sample
DTMS-027 210208 1539457 0.87 Sample
DTMS-028 210207 1539451 0.86 Sample
DTMS-029 210207 1539449 3.09 Sample
DTMS-030 210207 1539446 2.56 Sample
DTMS-031 210207 1539446 2.43 Field duplicate
DTMS-032 210206 1539440 0.08 Sample
DTMS-033 210186 1539431 0.69 Sample
DTMS-034 210156 1539377 1.64 Sample
DTMS-035 0.01 Blank
DTMS-036 210156 1539377 1.03 Sample
DTMS-037 210156 1539377 1.31 Sample
DTMS-038 210152 1539403 0.89 Sample
DTMS-039 210152 1539403 2.2 Sample
DTMS-040 0.94 Standard
DTMS-041 210152 1539403 0.58 Sample
DTMS-045 0.01 Blank
DTMS-046 210711 1539267 0.12 Sample
DTMS-047 210711 1539267 0.23 Sample
DTMS-048 210711 1539267 1.03 Sample
DTMS-049 210476 1539694 0.02 Sample
DTMS-050 210482 1539681 0.61 Sample
DTMS-051 210482 1539681 0.46 Field duplicate
DTMS-052 210482 1539681 0.11 Sample
DTMS-053 210482 1539681 0.26 Sample
DTMS-054 210497 1539686 0.08 Sample
DTMS-055 210497 1539686 0.02 Sample
DTMS-056 210497 1539686 0.36 Sample
DTMS-057 210527 1539717 0.02 Sample
DTMS-058 210550 1539742 0.09 Sample

116
DTMS-059 210550 1539742 0.11 Sample
DTMS-060 0.9 Standard
DTMS-061 210550 1539742 0.15 Sample
DTMS-062 210607 1539807 0.82 Sample
DTMS-063 210613 1539812 0.04 Sample
DTMS-064 210630 1539823 0.02 Sample
DTMS-065 0.01 Blank
DTMS-066 210603 1539799 0.15 Sample
DTMS-067 210545 1539778 0.02 Sample
DTMS-068 210545 1539778 0.02 Sample
DTMS-069 210532 1539861 0.01 Sample
DTMS-070 210450 1539687 0.01 Sample
DTMS-071 210450 1539687 0.01 Field duplicate
DTMS-072 210450 1539687 0.02 Sample
DTMS-073 210447 1539699 0.02 Sample
DTMS-074 210458 1538509 0.4 Sample
DTMS-075 210523 1538567 0.02 Sample
DTMS-076 210523 1538567 0.03 Sample
DTMS-077 210542 1538417 1.05 Sample
DTMS-078 210519 1538447 0.08 Sample
DTMS-079 210519 1538447 0.04 Sample
DTMS-080 0.89 Standard
DTMS-081 210519 1538447 0.09 Sample
DTMS-082 210359 1538366 1.62 Sample
DTMS-083 210426 1538089 0.06 Sample
4.3.3. XRF results
The collected samples were analysed in two stages by XRF. The first has been conducted with
a portable handheld XRF model X-500 at SEMOS Sadiola gold mine (Table 4 and Table 5). “Soil”
and “mining plus” were the modes of analysis present in this handheld XRF. The soil mode is used to
analyse the termite mound samples and soil samples, while the mining plus mode is used to analyse
the RC, and diamond drill samples (Figure 52). The second analysis has been conducted at the
University of the Witwatersrand, Johannesburg using Axios Max from Panalytical (Table 6) and
illustrated in Figure 53. Major elements were analysed using the fused method with a Li-tetraborate
flux, using the data reduction software SuperQ. In the result, dl (detection limits) can be taken as 0.
The two stages of XRF analysis were to establish quality assurance/quality control. The results of
XRF analysed at SEMOS are presented as elements, while those of the University of the
Witwatersrand XRF are presented as oxides. The procedure for XRF analysis at the University of the
Witwatersrand is presented in Appendix A.

117
Figure 52: Diagram of SEMOS XRF “Mining Plus” showing silica (Si), potassium (K), calcium
(Ca), and the iron (Fe) with gold result. There is a strong correlation, between gold and iron alteration
and a second correlation with Au and potassium K, while no correlation with calcium (Ca) was
examined due to the absence or weakness of Ca due to the oxidation.

118
Figure 53: Diagram of the XRF result analysed in the Earth laboratory of the University of the
Witwatersrand, Johannesburg. On the chart, concentrations in ppm are shown on the vertical axis,
while the samples are given along the horizontal axis.
The results of the XRF analysis from SEMOS Lab are presented in Table 4 for soil mode with
measurements in ppm and Table 5 for mining plus mode in % wt.
0 5 10 15 20 25 30 35
0
2
4
6
8
10
12
14
16
0
10
20
30
40
50
60
70
80
DTM
S-0
12
DTM
S-0
13
DTM
S-0
14
DTM
S-0
15
DTM
S-0
16
DTM
S-0
17
DTM
S-0
18
DTM
S-0
19
DTM
S-0
21
DTM
S-0
25
DTM
S-0
26
DTM
S-0
27
DTM
S-0
28
DTM
S-0
29
DTM
S-0
30
DTM
S-0
33
DTM
S-0
34
DTM
S-0
36
DTM
S-0
37
DTM
S-0
38
DTM
S-0
39
DTM
S-0
41
DTM
S-0
48
DTM
S-0
50
DTM
S-0
53
DTM
S-0
56
DTM
S-0
62
DTM
S-0
74
DTM
S-0
77
DTM
S-0
82
WITS XRF RESULTS WITH GOLD ASSAY RESULT
SiO2 Al2O3 Fe2O3 FeO MnO MgO CaO
Na2O K2O TiO2 P2O5 Cr2O3 NiO Au

119
Table 4: SEMOS portable handheld XRF results in Soil Mode.
Sample ID Mode P K Ca Ti Cr Mn Fe Ni Unit
DTMS-
012 Soil -9711 97782 2524 3722 298 2273 67736 20 PPM
DTMS-
013 Soil -7849 25858 3709 4242 136 373 33283 -22 PPM
DTMS-
014 Soil -10058 25946 4465 4265 135 152 46612 -2 PPM
DTMS-
015 Soil -14229 29795 6425 1030 22 1577 339027 -243 PPM
DTMS-
016 Soil -5250 99243 1690 3681 103 1598 92326 7 PPM
DTMS-
017 Soil -9478 81830 1980 4061 95 231 53527 4 PPM
DTMS-
018 Soil -6213 90088 2036 4046 149 175 52159 20 PPM
DTMS-
019 Soil -10145 105214 1714 3164 77 543 118350 -10 PPM
DTMS-
021 Soil -7591 99607 965 3688 142 56 17602 1 PPM
DTMS-
022 Soil -7762 57457 1906 3337 106 1626 28588 16 PPM
DTMS-
023 Soil -12367 76838 2868 3437 124 3410 69905 7 PPM
DTMS-
024 Soil -15735 27172 9319 3818 93 641 33013 -7 PPM
DTMS-
025 Soil -8226 21809 7602 2533 86 214 40175 -14 PPM
DTMS-
026 Soil -8627 37217 5330 3261 37 375 19488 -28 PPM
DTMS-
027 Soil -9756 40379 7105 2733 70 590 60452 -59 PPM
DTMS-
028 Soil -6370 90626 3116 3343 97 201 79026 6 PPM
DTMS-
029 Soil -7917 90865 2943 4514 138 317 23252 10 PPM

120
DTMS-
030 Soil -7913 89047 2707 4172 101 3606 44645 -3 PPM
DTMS-
031 Soil -7480 83657 2741 4350 116 3570 47619 24 PPM
DTMS-
032 Soil -6590 80396 2728 4713 125 4300 29594 34 PPM
DTMS-
033 Soil -10425 23616 6669 4136 95 946 40160 4 PPM
DTMS-
034 Soil -23460 25468 18762 3806 113 189 40683 -25 PPM
DTMS-
035 Soil -886 4909 -195 251 139 31 2980 -7 PPM
DTMS-
036 Soil -17037 20145 9996 4625 91 333 49880 -12 PPM
DTMS-
037 Soil -17878 29786 14663 3758 393 242 41524 -13 PPM
DTMS-
038 Soil -9181 20740 9179 4635 106 520 53070 -2 PPM
DTMS-
039 Soil -22156 30645 16206 3956 119 304 36556 -14 PPM
DTMS-
041 Soil -25412 21064 24841 3677 139 199 41141 -10 PPM
DTMS-
046 Soil -9924 44352 4290 3690 201 435 25394 50 PPM
DTMS-
047 Soil -9468 80264 3612 2970 134 921 78414 56 PPM
DTMS-
048 Soil -7357 88246 4621 3165 135 534 76458 6 PPM
DTMS-
049 Soil -8562 110707 3191 3690 147 1605 37386 35 PPM
DTMS-
050 Soil -5407 90793 4487 3659 158 2952 74359 107 PPM
DTMS-
051 Soil -8077 92495 4320 3622 154 3181 90720 110 PPM
DTMS-
052 Soil -8489 76032 3991 1982 68 148 12758 47 PPM
DTMS-
053 Soil -11734 90564 3731 5011 97 481 33224 36 PPM

121
DTMS-
054 Soil -14135 28124 13442 3471 99 254 59054 69 PPM
DTMS-
055 Soil -16728 21558 11617 3657 197 505 32227 -1 PPM
DTMS-
056 Soil -13418 4824 16716 3809 388 1087 63138 -51 PPM
DTMS-
057 Soil -4164 10321 800 5134 186 101 30848 -8 PPM
DTMS-
058 Soil -5302 110823 786 3973 152 439 42748 58 PPM
DTMS-
059 Soil -6441 114669 475 4375 180 220 12349 67 PPM
DTMS-
061 Soil -5920 99943 952 3973 180 99 15667 45 PPM
DTMS-
062 Soil -10511 34860 6298 2128 59 89 24098 10 PPM
DTMS-
063 Soil -13583 121497 4917 4419 168 2600 49643 32 PPM
DTMS-
064 Soil -6802 122890 1245 4328 185 1006 50077 53 PPM
DTMS-
065 Soil -775 3926 -78 218 234 32 2950 -11 PPM
DTMS-
066 Soil -12406 65768 7446 1680 57 88 25674 28 PPM
DTMS-
067 Soil -17545 30467 13734 4188 209 546 46615 4 PPM
DTMS-
068 Soil -13987 60287 8456 5678 177 208 34230 68 PPM
DTMS-
069 Soil -1304 7469 626 2917 150 258 17738 23 PPM
DTMS-
070 Soil -9359 37390 5420 4383 168 352 26698 17 PPM
DTMS-
071 Soil -8681 38685 5119 4323 152 403 25375 20 PPM
DTMS-
072 Soil -12296 97706 3371 3408 132 2251 61950 15 PPM
DTMS-
073 Soil -8028 68825 3289 3315 120 740 20907 25 PPM

122
DTMS-
074 Soil -8123 84875 2168 3195 97 186 62671 71 PPM
DTMS-
075 Soil -15794 34266 14653 4769 181 138 23262 38 PPM
DTMS-
076 Soil -18932 29897 14475 4258 126 690 54662 7 PPM
DTMS-
077 Soil -6848 31606 4000 3556 197 90 37963 31 PPM
DTMS-
078 Soil -9349 57592 2929 3869 156 79 53686 53 PPM
DTMS-
079 Soil -8186 62339 2332 4034 177 82 29667 5 PPM
DTMS-
081 Soil -8873 62402 3402 3854 139 50 20047 1 PPM
DTMS-
082 Soil -5946 92986 4599 3799 250 150 47641 -15 PPM
DTMS-
083 Soil -8040 128451 6653 4086 134 1273 57272 22 PPM

123
Table 5: SEMOS portable handheld XRF analysis in Mining Plus Mode.
Sample ID Mode Mg Al Si P K Ca Ti Cr Mn Fe Ni Unit
DTMS-012 Mining Plus 0 4.89 19.4 0 7.91 0.0797 0.309 0.0095 0.2787 6.91 0.0045 %
DTMS-013 Mining Plus 0 8.57 24.46 0 3.083 0.2788 0.3117 0 0.0375 4.3265 0 %
DTMS-014 Mining Plus 0 8.6 21.37 0 2.7458 0.335 0.3182 0 0 5.5119 0.002 %
DTMS-015 Mining Plus 0 4.19 18.62 0 2.0917 0.2726 0.1561 0 0.1661 19.54 0 %
DTMS-016 Mining Plus 0 3.07 19.28 0 8.04 0 0.3043 0 0.1985 8.48 0.0034 %
DTMS-017 Mining Plus 0 7.76 19.5 0 7.0308 0 0.3088 0 0.0253 6.0059 0 %
DTMS-018 Mining Plus 0 5.38 21.19 0 7.81 0 0.3113 0 0 5.6477 0 %
DTMS-019 Mining Plus 0 3.1 17.55 0 7.97 0 0.2657 0 0.0572 9.99 0.0039 %
DTMS-021 Mining Plus 0 5.36 25.35 0 10.84 0 0.3432 0 0 2.6015 0 %
DTMS-022 Mining Plus 0 8.51 22.71 0 6.1012 0 0.338 0 0.2407 3.7213 0.0016 %
DTMS-023 Mining Plus 0 5.19 20.94 0 6.6245 0.1273 0.2705 0 0.4147 7.13 0.0019 %
DTMS-024 Mining Plus 0 7.25 23.9 0 2.8266 0.8858 0.2609 0 0.0751 3.8398 0 %
DTMS-025 Mining Plus 0 6.22 24.57 0 2.3788 0.7137 0.1997 0 0.0231 4.7482 0 %
DTMS-026 Mining Plus 0 9.05 23.87 0 4.3167 0.5151 0.2832 0 0.0405 2.6991 0 %
DTMS-027 Mining Plus 0 6.52 20.67 0.0616 3.6494 0.5632 0.2206 0 0.0626 6.2609 0 %
DTMS-028 Mining Plus 0 6.49 20.27 0 7.77 0.1258 0.2926 0 0.0264 7.9 0.0026 %
DTMS-029 Mining Plus 0 7.78 22.82 0 9.49 0.1772 0.4465 0 0.0601 3.1857 0 %
DTMS-030 Mining Plus 0 6.58 20.3 0 7.79 0.1157 0.3785 0 0.4572 4.9756 0.0019 %
DTMS-031 Mining Plus 0 6.69 20.32 0 7.1789 0.1328 0.3692 0 0.4684 5.188 0.0018 %
DTMS-032 Mining Plus 0 6.91 22.48 0 7.77 0.1674 0.4356 0.0061 0.6068 3.5313 0.0036 %
DTMS-033 Mining Plus 0 7.5 23.54 0 2.481 0.5864 0.3524 0 0.1163 4.6232 0 %
DTMS-034 Mining Plus 0 5.92 23.67 0 2.699 1.9276 0.3291 0 0.0301 4.8035 0.0017 %
DTMS-035 Mining Plus 0 0 39.23 0 0.9067 0 0 0 0 0.5327 0 %
DTMS-036 Mining Plus 0 7.9 22.89 0 2.1169 0.9061 0.3596 0.0046 0.0298 5.6394 0 %
DTMS-037 Mining Plus 0 4.9 23.89 0 3.0767 1.5567 0.291 0.0087 0.0293 4.6512 0.0018 %
DTMS-038 Mining Plus 0 6.45 23.31 0 2.0811 0.8571 0.3323 0 0.0563 5.8845 0 %
DTMS-039 Mining Plus 0 6.46 23.54 0 3.3027 1.7215 0.3655 0 0.0325 4.5241 0.0022 %
DTMS-041 Mining Plus 0 4.93 22.97 0.0972 2.1341 2.5623 0.3143 0.0048 0.0194 4.6461 0.002 %

124
DTMS-046 Mining Plus 0 6.25 22.07 0 4.8891 0.5092 0.2912 0.0057 0.0502 3.1392 0.0017 %
DTMS-047 Mining Plus 0 3.94 17.47 0 6.0453 0.3363 0.2499 0.0053 0.094 7.25 0.0042 %
DTMS-048 Mining Plus 0 4.11 17.56 0 6.87 0.4777 0.2688 0.0062 0.0481 7.24 0.0034 %
DTMS-049 Mining Plus 0 5.83 20.32 0.0883 9.84 0.3423 0.358 0.0086 0.2084 4.3928 0.0027 %
DTMS-050 Mining Plus 0 4.31 19.24 0.1131 7.42 0.4156 0.3323 0.0093 0.3649 7.36 0.0062 %
DTMS-051 Mining Plus 0 4.28 18.47 0.0931 7.21 0.2912 0.3494 0.0067 0.3694 8.26 0.0057 %
DTMS-052 Mining Plus 0 10.19 22.11 0.0693 8.46 0.326 0.166 0 0 1.9304 0 %
DTMS-053 Mining Plus 0 7.47 18.23 0.069 8.12 0.3178 0.4216 0.0053 0.0584 3.9841 0.002 %
DTMS-054 Mining Plus 0 3.18 19.73 0.123 2.4273 1.1688 0.3068 0.0052 0.0231 5.7015 0.005 %
DTMS-055 Mining Plus 0 5.3 21.13 0 2.3642 1.2436 0.2644 0 0.0682 3.9177 0 %
DTMS-056 Mining Plus 0 3.89 21.26 0.3851 0.4588 1.4129 0.2551 0.0128 0.1224 6.0044 0 %
DTMS-057 Mining Plus 0 10.89 23.2 0 1.2912 0 0.3888 0 0.0167 3.8069 0 %
DTMS-058 Mining Plus 0 4.7 20.98 0 9.57 0 0.3744 0.0056 0.059 5.1858 0.0035 %
DTMS-059 Mining Plus 0 5.79 23.87 0 11.97 0 0.4434 0.01 0.0358 1.8922 0.0033 %
DTMS-061 Mining Plus 0 6.67 24.11 0 10.41 0 0.3523 0.0072 0.0222 2.1012 0 %
DTMS-062 Mining Plus 0 8.5 20.72 0.0968 3.7984 0.6097 0.1366 0 0 3.1316 0 %
DTMS-063 Mining Plus 0 4.45 19.08 0.0996 9.83 0.3603 0.3938 0.005 0.3368 5.4337 0.003 %
DTMS-064 Mining Plus 0 6.41 20.53 0.0933 10.63 0 0.3841 0.0077 0.1464 5.7675 0.0032 %
DTMS-074 Mining Plus 0 5.02 19.03 0 7.14 0.0734 0.2422 0 0.0202 6.3327 0.0035 %
DTMS-075 Mining Plus 0 6.26 23.26 0.1176 3.8809 1.6898 0.4512 0.007 0.0255 3.0445 0.0038 %
DTMS-076 Mining Plus 0 4.26 20.64 0.1128 2.8031 1.3168 0.3531 0.0057 0.0828 5.5434 0.0029 %
DTMS-077 Mining Plus 0 5.91 22.61 0 3.4339 0.3493 0.3252 0 0 4.6001 0.0024 %
DTMS-078 Mining Plus 0 5.87 20.31 0 5.345 0.2043 0.2564 0 0 5.792 0.0027 %
DTMS-079 Mining Plus 0 6.03 21.24 0 6.1759 0.1417 0.3421 0 0 3.7135 0 %
DTMS-081 Mining Plus 0 6.48 22.59 0 6.6975 0.3114 0.2825 0 0 2.7558 0 %
DTMS-082 Mining Plus 0 5.47 22.94 0 8.82 0.4015 0.2971 0.0071 0.0148 5.4911 0 %
DTMS-083 Mining Plus 0 5.05 20.12 0 10.57 0.6024 0.3605 0 0.1767 5.9383 0.0034 %
Thirty pulp samples were analysed in the XRF laboratory of the University of the Witwatersrand. The results are shown in Table 6. The XRF analysis
was done according to the major oxides, which are SiO2, AlO3, FeO3, FeO, MnO, MgO, Cao, Na2O, K2O, TiO2, P2O5, Cr2O3, NiO, and LOl. The result shows
a value of SiO2 around 60%, followed by around 6% of FeO, Fe2O3 then 6% of K2O.

125
Table 6: University of the Witwatersrand XRF analysis results.
SID SiO2 Al2O3 Fe2O3 FeO MnO MgO CaO Na2O K2O TiO2 P2O5 Cr2O3 NiO LOI
DTMS12 58.14 15.88 0.86 7.01 0.24 2.75 0.35 0.1 9.89 0.61 0.1 0.05 0.01 4.02
DTMS13 63.65 16.91 0.49 3.98 0.05 2.51 0.5 0.04 2.8 0.72 0.03 0.02 0.01 7.74
DTMS14 58.82 19.13 0.64 5.18 0.02 2.38 0.58 0.07 2.79 0.69 0.07 0.02 0.01 9.32
DTMS15 53.2 9.72 2.77 22.48 0.19 1.5 0.61 0.06 2.37 0.35 0.1 0.02 0.01 6.29
DTMS16 57.14 15.73 1.11 8.95 0.2 2.16 0.25 0.11 9.74 0.61 0.1 0.03 0.01 3.89
DTMS17 58.2 18.7 0.75 6.05 0.03 1.45 0.3 0.09 8.85 0.63 0.09 0.02 0.01 5.47
DTMS18 60.77 16.31 0.72 5.81 0.03 1.83 0.32 0.16 9.48 0.67 0.05 0.03 0.01 4.11
DTMS19 55.74 15.38 1.32 10.68 0.07 1.22 0.29 0.28 10.35 0.57 0.12 0.02 0.01 4.01
DTMS21 65.86 15.9 0.28 2.25 0.01 1.32 0.21 0.07 11.03 0.6 0.03 0.03 0 2.61
DTMS25 67.79 13.85 0.55 4.42 0.03 1.87 0.95 0.65 2.47 0.41 0.14 0.01 0 7.02
DTMS26 59.88 19.44 0.3 2.47 0.06 3.12 0.77 0.55 4.6 0.54 0.17 0.01 0 8.21
DTMS27 57.84 16.53 0.81 6.52 0.07 3.31 0.91 0.07 4.29 0.45 0.31 0.02 0 8.09
DTMS28 57.78 16.82 0.96 7.84 0.03 0.99 0.42 0.07 9.61 0.61 0.16 0.03 0.01 4.62
DTMS29 61.32 18.74 0.35 2.78 0.04 0.69 0.49 0.16 10.89 0.78 0.23 0.03 0.01 3.48
DTMS30 60.55 17.48 0.59 4.81 0.4 0.99 0.36 0.09 9.69 0.65 0.07 0.02 0.01 4.16
DTMS33 63.83 16.55 0.54 4.36 0.12 1.62 0.9 1.54 2.67 0.69 0.16 0.02 0.01 7.15
DTMS34 62.35 15.92 0.55 4.46 0.02 2.11 2.54 3.24 2.88 0.62 0.24 0.02 0.01 4.63
DTMS36 60.21 18.1 0.65 5.28 0.04 1.74 1.33 1.52 2.29 0.75 0.17 0.02 0.01 7.96
DTMS37 63.56 15.81 0.56 4.52 0.03 2.03 2.07 3.22 3.29 0.62 0.23 0.07 0 3.68
DTMS38 63.89 14.91 0.69 5.6 0.06 1.88 1.16 0.3 2.35 0.73 0.22 0.02 0.01 8.23
DTMS39 62.25 16.08 0.51 4.16 0.04 2.31 2.19 1.48 3.6 0.65 0.24 0.02 0.01 6.63
DTMS41 62.79 16.22 0.54 4.38 0.03 1.59 3.37 3.67 2.33 0.64 0.26 0.03 0.01 4
DTMS48 58.51 15.03 0.92 7.41 0.06 2.73 0.53 0.17 8.9 0.53 0.11 0.03 0.01 4.49
DTMS50 59.58 15.25 0.97 7.88 0.32 1.26 0.56 0.21 9.35 0.55 0.29 0.03 0.02 3.53
DTMS53 55.54 20.36 0.49 3.92 0.05 3.32 0.57 0.26 10.03 0.72 0.24 0.02 0.01 4.62
DTMS56 58.91 16.84 0.8 6.51 0.11 4.66 1.61 1.09 0.24 0.65 0.6 0.06 0.01 3.42
DTMS62 57.3 22.1 0.38 3.04 0.01 1.15 1.16 2.7 4.02 0.48 0.48 0.01 0.01 7.51
DTMS74 60.55 15.62 0.82 6.67 0.03 1.67 0.29 0.04 9.32 0.55 0.11 0.02 0.02 4.64
DTMS77 65.4 15.09 0.51 4.15 0.02 1.65 0.58 0.09 3.58 0.61 0.1 0.03 0.01 8.35
DTMS82 61.28 16.45 0.64 5.2 0.02 1.28 0.71 0.09 9.46 0.64 0.25 0.04 0.01 3.38
Average 60.421 16.561667 0.73567 5.959 0.081 1.96967 0.896 0.73967 6.10533 0.61067 0.18233 0.02667 0.009 5.50867

126
XRF results indicate a significant relationship between the gold mineralisation and potassium
and iron alteration. All the samples are totally or partially decarbonated. The XRF analytical results
for Ca, K, and Fe are higher ~ 1000 %wt. The result of the XRF analysis at the Earth laboratory of the
University of the Witwatersrand, Johannesburg, has been used for the interpretation of the XRD
result. The XRF and XRD analysis results have facilitated the determination of the geochemistry of
the oxide.
Figure 52 shows a correlation, between gold and iron alteration and a second correlation with
Au and potassium K, while no correlation with calcium (Ca) was examined due to the absence or
weakness of Ca due to the oxidation. Masurel et al. (2017) and Cameron (2010) established the
relationship between gold mineralisation and potassium (K) in the Sadiola goldfield.
4.3.4. XRD results
XRD analysis was completed to identify the different minerals present in the types of oxides.
The different minerals identified in the field by rock description have been compared to the detected
minerals in the XRD results. According to Skwarnecki (2017), the XRD data has two main
limitations: (i) There is a lower detection limit (even for well-crystallised minerals), generally ~5%
for wavelength-dispersive systems and perhaps (10%) for energy-dispersive systems. So XRD will
not detect minerals present in small quantities (Jarosite); (ii) Minerals formed during weathering are
generally poorly crystalline, which means they give poor XRD patterns, so that even minerals such as
goethite and hematite may be difficult to detect unequivocally.
The different minerals detected in XRD analysis are: (1) Silica or quartz (SiO2), (2) Goethite
(Fe+ 3O.OH), (3) Muscovite (KAl3Si3O10 (OH)2), (4) Siderite (FeCO3), (5) Biotite KFeMg2
(AlSi3O10)(OH)2, (6) Bernalite (Fe (OH) 3), (7) Orthoclase (KAlSi3O8). Figure 54 to 83 presents the
XRD analysis results.
The alunite and jarosite alteration indicate an acidic pH condition of the formation (Hein et al.,
2008). The calc-silicate skarnification produced variable minerals as diopside, actinolite, chlorite,
epidote, dravitic tourmaline (Sillitoe, 1994) scapolite, vesuvianite and fluorite (Boshoff et al., 1998).
According to Theron (1997), the skarnification in the Sadiola region is related to flushing of
metasomatic hydrothermal fluids during contact metamorphism and emplacement of a suite of diorite
intrusions. The different minerals identified helped to elucidate the condition of the oxide formation.
The presence of alunite (K2Al6 (SO4)4(OH)12) and jarosite (K2Fe63+ (SO4)4(OH)12) highlight a highly
acidic environment and acidic supergene conditions (Hein et al., 2008).
The mineral bernalite has been identified in the sample DTMS-0015. The bernalite mineral can
be found in the surface oxidation zone. The different minerals found are all indicators of a deep
oxidation zone.

127
Figure 54: The result of sample DTMS-012 contains silica, goethite, muscovite, siderite and biotite minerals.
DTMS-012
01-076-0629 (C) - Jarosite - K(Fe3(SO4)2(OH)6) - Y: 6.12 % - d x by: 1. - WL: 1.78897 - Rhombo.H.axes - a 7.
00-031-0966 (*) - Orthoclase - KAlSi3O8 - Y: 16.06 % - d x by: 1. - WL: 1.78897 - Monoclinic - a 8.55600 - b 12
01-080-1110 (C) - Biotite - KFeMg2(AlSi3O10)(OH)2 - Y: 23.34 % - d x by: 1. - WL: 1.78897 - Monoclinic - a 5.
00-029-0696 (*) - Siderite - FeCO3 - Y: 3.22 % - d x by: 1. - WL: 1.78897 - Rhombo.H.axes - a 4.69350 - b 4.69
01-084-1306 (C) - Muscovite 2M1 - KAl3Si3O10(OH)2 - Y: 7.30 % - d x by: 1. - WL: 1.78897 - Monoclinic - a 5.
00-029-0713 (I) - Goethite - Fe+3O(OH) - Y: 6.10 % - d x by: 1. - WL: 1.78897 - Orthorhombic - a 4.60800 - b 9.
01-089-8934 (C) - Quartz alpha - SiO2 - Y: 109.97 % - d x by: 1. - WL: 1.78897 - Hexagonal - a 4.91370 - b 4.9
Operations: Strip kAlpha2 0.000 | Background 0.000,1.000 | Import
DTMS-012 - File: d2_2016_2269.raw - Type: Locked Coupled - Start: 5.002 ° - End: 120.006 ° - Step: 0.026 ° -
Lin
(C
ounts
)
0
1000
2000
3000
4000
5000
6000
7000
2-Theta - Scale
5 10 20 30 40 50 60 70 80 90

128
Figure 55: The result of sample DTMS-013 contains silica, goethite, muscovite, siderite and biotite minerals.
DTMS-013
01-076-0629 (C) - Jarosite - K(Fe3(SO4)2(OH)6) - Y: 6.12 % - d x by: 1. - WL: 1.78897 - Rhombo.H.axes - a 7.
00-031-0966 (*) - Orthoclase - KAlSi3O8 - Y: 16.06 % - d x by: 1. - WL: 1.78897 - Monoclinic - a 8.55600 - b 12
01-080-1110 (C) - Biotite - KFeMg2(AlSi3O10)(OH)2 - Y: 23.34 % - d x by: 1. - WL: 1.78897 - Monoclinic - a 5.
00-029-0696 (*) - Siderite - FeCO3 - Y: 3.22 % - d x by: 1. - WL: 1.78897 - Rhombo.H.axes - a 4.69350 - b 4.69
01-084-1306 (C) - Muscovite 2M1 - KAl3Si3O10(OH)2 - Y: 7.30 % - d x by: 1. - WL: 1.78897 - Monoclinic - a 5.
00-029-0713 (I) - Goethite - Fe+3O(OH) - Y: 6.10 % - d x by: 1. - WL: 1.78897 - Orthorhombic - a 4.60800 - b 9.
01-089-8934 (C) - Quartz alpha - SiO2 - Y: 109.97 % - d x by: 1. - WL: 1.78897 - Hexagonal - a 4.91370 - b 4.9
Operations: Fourier 10.888 x 1 | Smooth 0.026 | Strip kAlpha2 0.000 | Background 0.031,1.000 | Import
DTMS-013 - File: d2_2016_2267.raw - Type: Locked Coupled - Start: 5.002 ° - End: 120.006 ° - Step: 0.026 ° -
Lin
(Cou
nts)
0
1000
2000
3000
4000
5000
6000
7000
2-Theta - Scale
5 10 20 30 40 50 60 70 80 90

129
Figure 56: The result of sample DTMS-014 contains silica, goethite, muscovite, siderite and biotite minerals.
DTMS-014
01-076-0629 (C) - Jarosite - K(Fe3(SO4)2(OH)6) - Y: 6.12 % - d x by: 1. - WL: 1.78897 - Rhombo.H.axes - a 7.
00-031-0966 (*) - Orthoclase - KAlSi3O8 - Y: 16.06 % - d x by: 1. - WL: 1.78897 - Monoclinic - a 8.55600 - b 12
01-080-1110 (C) - Biotite - KFeMg2(AlSi3O10)(OH)2 - Y: 23.34 % - d x by: 1. - WL: 1.78897 - Monoclinic - a 5.
00-029-0696 (*) - Siderite - FeCO3 - Y: 3.22 % - d x by: 1. - WL: 1.78897 - Rhombo.H.axes - a 4.69350 - b 4.69
01-084-1306 (C) - Muscovite 2M1 - KAl3Si3O10(OH)2 - Y: 7.30 % - d x by: 1. - WL: 1.78897 - Monoclinic - a 5.
00-029-0713 (I) - Goethite - Fe+3O(OH) - Y: 6.10 % - d x by: 1. - WL: 1.78897 - Orthorhombic - a 4.60800 - b 9.
01-089-8934 (C) - Quartz alpha - SiO2 - Y: 109.97 % - d x by: 1. - WL: 1.78897 - Hexagonal - a 4.91370 - b 4.9
Operations: Strip kAlpha2 0.000 | Background 0.046,1.000 | Import
DTMS-014 - File: d2_2016_2268.raw - Type: Locked Coupled - Start: 5.002 ° - End: 120.006 ° - Step: 0.026 ° -
Lin
(C
ounts
)
0
1000
2000
3000
4000
5000
6000
7000
2-Theta - Scale
5 10 20 30 40 50 60 70 80 90

130
Figure 57: The result of sample DTMS-015 contains silica, goethite, muscovite, siderite, bernalite and biotite minerals.
DTMS-015
01-076-0629 (C) - Jarosite - K(Fe3(SO4)2(OH)6) - Y: 6.12 % - d x by: 1. - WL: 1.78897 - Rhombo.H.axes - a 7.
00-031-0966 (*) - Orthoclase - KAlSi3O8 - Y: 16.06 % - d x by: 1. - WL: 1.78897 - Monoclinic - a 8.55600 - b 12
01-080-1110 (C) - Biotite - KFeMg2(AlSi3O10)(OH)2 - Y: 23.34 % - d x by: 1. - WL: 1.78897 - Monoclinic - a 5.
00-029-0696 (*) - Siderite - FeCO3 - Y: 3.22 % - d x by: 1. - WL: 1.78897 - Rhombo.H.axes - a 4.69350 - b 4.69
01-084-1306 (C) - Muscovite 2M1 - KAl3Si3O10(OH)2 - Y: 7.30 % - d x by: 1. - WL: 1.78897 - Monoclinic - a 5.
00-029-0713 (I) - Goethite - Fe+3O(OH) - Y: 6.10 % - d x by: 1. - WL: 1.78897 - Orthorhombic - a 4.60800 - b 9.
01-089-8934 (C) - Quartz alpha - SiO2 - Y: 109.97 % - d x by: 1. - WL: 1.78897 - Hexagonal - a 4.91370 - b 4.9
Operations: Background 0.081,1.000 | Import
DTMS-015 - File: d2_2016_2265.raw - Type: Locked Coupled - Start: 5.002 ° - End: 120.006 ° - Step: 0.026 ° -
Lin
(C
ounts
)
0
1000
2000
3000
4000
5000
6000
7000
2-Theta - Scale
5 10 20 30 40 50 60 70 80 90

131
Figure 58: The result of sample DTMS-016 contains silica, goethite, muscovite, siderite and biotite minerals.
DTMS-016
01-076-0629 (C) - Jarosite - K(Fe3(SO4)2(OH)6) - Y: 6.12 % - d x by: 1. - WL: 1.78897 - Rhombo.H.axes - a 7.
00-031-0966 (*) - Orthoclase - KAlSi3O8 - Y: 16.06 % - d x by: 1. - WL: 1.78897 - Monoclinic - a 8.55600 - b 12
01-080-1110 (C) - Biotite - KFeMg2(AlSi3O10)(OH)2 - Y: 23.34 % - d x by: 1. - WL: 1.78897 - Monoclinic - a 5.
00-029-0696 (*) - Siderite - FeCO3 - Y: 3.22 % - d x by: 1. - WL: 1.78897 - Rhombo.H.axes - a 4.69350 - b 4.69
01-084-1306 (C) - Muscovite 2M1 - KAl3Si3O10(OH)2 - Y: 7.30 % - d x by: 1. - WL: 1.78897 - Monoclinic - a 5.
00-029-0713 (I) - Goethite - Fe+3O(OH) - Y: 6.10 % - d x by: 1. - WL: 1.78897 - Orthorhombic - a 4.60800 - b 9.
01-089-8934 (C) - Quartz alpha - SiO2 - Y: 109.97 % - d x by: 1. - WL: 1.78897 - Hexagonal - a 4.91370 - b 4.9
Operations: Strip kAlpha2 0.000 | Background 0.037,1.000 | Import
DTMS-016 - File: d2_2016_2270.raw - Type: Locked Coupled - Start: 5.002 ° - End: 120.006 ° - Step: 0.026 ° -
Lin
(Cou
nts)
0
1000
2000
3000
4000
5000
6000
7000
2-Theta - Scale
5 10 20 30 40 50 60 70 80 90

132
Figure 59: The result of sample DTMS-017 indicates the presents of silica, goethite, muscovite, siderite and biotite minerals.
DTMS-017
01-076-0629 (C) - Jarosite - K(Fe3(SO4)2(OH)6) - Y: 9.67 % - d x by: 1. - WL: 1.78897 - Rhombo.H.axes - a 7.
00-031-0966 (*) - Orthoclase - KAlSi3O8 - Y: 13.14 % - d x by: 1. - WL: 1.78897 - Monoclinic - a 8.55600 - b 12
01-080-1110 (C) - Biotite - KFeMg2(AlSi3O10)(OH)2 - Y: 23.48 % - d x by: 1.0042 - WL: 1.78897 - Monoclinic -
00-029-0696 (*) - Siderite - FeCO3 - Y: 3.24 % - d x by: 1. - WL: 1.78897 - Rhombo.H.axes - a 4.69350 - b 4.69
01-084-1306 (C) - Muscovite 2M1 - KAl3Si3O10(OH)2 - Y: 7.34 % - d x by: 1. - WL: 1.78897 - Monoclinic - a 5.
00-029-0713 (I) - Goethite - Fe+3O(OH) - Y: 6.14 % - d x by: 1. - WL: 1.78897 - Orthorhombic - a 4.60800 - b 9.
01-089-8934 (C) - Quartz alpha - SiO2 - Y: 115.22 % - d x by: 1.0021 - WL: 1.78897 - Hexagonal - a 4.91370 -
Operations: Background 0.000,1.000 | Import
DTMS-017 - File: d2_2016_2271.raw - Type: Locked Coupled - Start: 5.002 ° - End: 120.006 ° - Step: 0.026 ° -
Lin
(C
ounts
)
0
1000
2000
3000
4000
5000
6000
7000
2-Theta - Scale
5 10 20 30 40 50 60 70 80 90

133
Figure 60: The result of sample DTMS-018 indicates the presents of silica, goethite, muscovite, siderite and biotite minerals.
DTMS-018
01-076-0629 (C) - Jarosite - K(Fe3(SO4)2(OH)6) - Y: 9.67 % - d x by: 1. - WL: 1.78897 - Rhombo.H.axes - a 7.
00-031-0966 (*) - Orthoclase - KAlSi3O8 - Y: 13.14 % - d x by: 1. - WL: 1.78897 - Monoclinic - a 8.55600 - b 12
01-080-1110 (C) - Biotite - KFeMg2(AlSi3O10)(OH)2 - Y: 23.48 % - d x by: 1.0042 - WL: 1.78897 - Monoclinic -
00-029-0696 (*) - Siderite - FeCO3 - Y: 3.24 % - d x by: 1. - WL: 1.78897 - Rhombo.H.axes - a 4.69350 - b 4.69
01-084-1306 (C) - Muscovite 2M1 - KAl3Si3O10(OH)2 - Y: 7.34 % - d x by: 1. - WL: 1.78897 - Monoclinic - a 5.
00-029-0713 (I) - Goethite - Fe+3O(OH) - Y: 6.14 % - d x by: 1. - WL: 1.78897 - Orthorhombic - a 4.60800 - b 9.
01-089-8934 (C) - Quartz alpha - SiO2 - Y: 115.22 % - d x by: 1.0021 - WL: 1.78897 - Hexagonal - a 4.91370 -
Operations: Background 0.000,1.000 | Import
DTMS-018 - File: d2_2016_2272.raw - Type: Locked Coupled - Start: 5.002 ° - End: 120.006 ° - Step: 0.026 ° -
Lin
(Cou
nts)
0
1000
2000
3000
4000
5000
6000
7000
2-Theta - Scale
5 10 20 30 40 50 60 70 80 90

134
Figure 61: The result of sample DTMS-019 indicates the presents of silica, goethite, muscovite, siderite and biotite minerals.
DTMS-019
01-076-0629 (C) - Jarosite - K(Fe3(SO4)2(OH)6) - Y: 9.67 % - d x by: 1. - WL: 1.78897 - Rhombo.H.axes - a 7.
00-031-0966 (*) - Orthoclase - KAlSi3O8 - Y: 13.14 % - d x by: 1. - WL: 1.78897 - Monoclinic - a 8.55600 - b 12
01-080-1110 (C) - Biotite - KFeMg2(AlSi3O10)(OH)2 - Y: 23.48 % - d x by: 1.0042 - WL: 1.78897 - Monoclinic -
00-029-0696 (*) - Siderite - FeCO3 - Y: 3.24 % - d x by: 1. - WL: 1.78897 - Rhombo.H.axes - a 4.69350 - b 4.69
01-084-1306 (C) - Muscovite 2M1 - KAl3Si3O10(OH)2 - Y: 7.34 % - d x by: 1. - WL: 1.78897 - Monoclinic - a 5.
00-029-0713 (I) - Goethite - Fe+3O(OH) - Y: 6.14 % - d x by: 1. - WL: 1.78897 - Orthorhombic - a 4.60800 - b 9.
01-089-8934 (C) - Quartz alpha - SiO2 - Y: 115.22 % - d x by: 1.0021 - WL: 1.78897 - Hexagonal - a 4.91370 -
Operations: Background 0.014,1.000 | Import
DTMS-019 - File: d2_2016_2273.raw - Type: Locked Coupled - Start: 5.002 ° - End: 120.006 ° - Step: 0.026 ° -
Lin
(C
ounts
)
0
1000
2000
3000
4000
5000
6000
7000
2-Theta - Scale
5 10 20 30 40 50 60 70 80 90

135
Figure 62: The result of sample DTMS-021 indicates the presents of silica, goethite, muscovite, siderite and biotite minerals.
DTMS-021
01-076-0629 (C) - Jarosite - K(Fe3(SO4)2(OH)6) - Y: 9.67 % - d x by: 1. - WL: 1.78897 - Rhombo.H.axes - a 7.
00-031-0966 (*) - Orthoclase - KAlSi3O8 - Y: 13.14 % - d x by: 1. - WL: 1.78897 - Monoclinic - a 8.55600 - b 12
01-080-1110 (C) - Biotite - KFeMg2(AlSi3O10)(OH)2 - Y: 23.48 % - d x by: 1.0042 - WL: 1.78897 - Monoclinic -
00-029-0696 (*) - Siderite - FeCO3 - Y: 3.24 % - d x by: 1. - WL: 1.78897 - Rhombo.H.axes - a 4.69350 - b 4.69
01-084-1306 (C) - Muscovite 2M1 - KAl3Si3O10(OH)2 - Y: 7.34 % - d x by: 1. - WL: 1.78897 - Monoclinic - a 5.
00-029-0713 (I) - Goethite - Fe+3O(OH) - Y: 6.14 % - d x by: 1. - WL: 1.78897 - Orthorhombic - a 4.60800 - b 9.
01-089-8934 (C) - Quartz alpha - SiO2 - Y: 115.22 % - d x by: 1.0021 - WL: 1.78897 - Hexagonal - a 4.91370 -
Operations: Background 0.000,1.000 | Import
DTMS-021 - File: d2_2016_2274.raw - Type: Locked Coupled - Start: 5.002 ° - End: 120.006 ° - Step: 0.026 ° -
Lin
(Cou
nts)
0
1000
2000
3000
4000
5000
6000
7000
2-Theta - Scale
5 10 20 30 40 50 60 70 80 90

136
Figure 63: The result of sample DTMS-025 indicates the presents of silica, goethite, muscovite, siderite and biotite minerals.
DTMS-025
01-076-0629 (C) - Jarosite - K(Fe3(SO4)2(OH)6) - Y: 9.67 % - d x by: 1. - WL: 1.78897 - Rhombo.H.axes - a 7.
00-031-0966 (*) - Orthoclase - KAlSi3O8 - Y: 13.14 % - d x by: 1. - WL: 1.78897 - Monoclinic - a 8.55600 - b 12
01-080-1110 (C) - Biotite - KFeMg2(AlSi3O10)(OH)2 - Y: 23.48 % - d x by: 1.0042 - WL: 1.78897 - Monoclinic -
00-029-0696 (*) - Siderite - FeCO3 - Y: 3.24 % - d x by: 1. - WL: 1.78897 - Rhombo.H.axes - a 4.69350 - b 4.69
01-084-1306 (C) - Muscovite 2M1 - KAl3Si3O10(OH)2 - Y: 7.34 % - d x by: 1. - WL: 1.78897 - Monoclinic - a 5.
00-029-0713 (I) - Goethite - Fe+3O(OH) - Y: 6.14 % - d x by: 1. - WL: 1.78897 - Orthorhombic - a 4.60800 - b 9.
01-089-8934 (C) - Quartz alpha - SiO2 - Y: 115.22 % - d x by: 1.0021 - WL: 1.78897 - Hexagonal - a 4.91370 -
Operations: Background 0.021,1.000 | Import
DTMS-025 - File: d2_2016_2276.raw - Type: Locked Coupled - Start: 5.002 ° - End: 120.006 ° - Step: 0.026 ° -
Lin
(Cou
nts)
0
1000
2000
3000
4000
5000
6000
7000
2-Theta - Scale
5 10 20 30 40 50 60 70 80 90

137
Figure 64: The result of sample DTMS-026 indicates the presents of silica, goethite, muscovite, siderite and biotite minerals.
DTMS-026
01-076-0629 (C) - Jarosite - K(Fe3(SO4)2(OH)6) - Y: 5.30 % - d x by: 1. - WL: 1.78897 - Rhombo.H.axes - a 7.
00-031-0966 (*) - Orthoclase - KAlSi3O8 - Y: 12.28 % - d x by: 1. - WL: 1.78897 - Monoclinic - a 8.55600 - b 12
01-080-1110 (C) - Biotite - KFeMg2(AlSi3O10)(OH)2 - Y: 21.95 % - d x by: 1.0042 - WL: 1.78897 - Monoclinic -
00-029-0696 (*) - Siderite - FeCO3 - Y: 3.03 % - d x by: 1. - WL: 1.78897 - Rhombo.H.axes - a 4.69350 - b 4.69
01-084-1306 (C) - Muscovite 2M1 - KAl3Si3O10(OH)2 - Y: 6.86 % - d x by: 1. - WL: 1.78897 - Monoclinic - a 5.
00-029-0713 (I) - Goethite - Fe+3O(OH) - Y: 5.74 % - d x by: 1. - WL: 1.78897 - Orthorhombic - a 4.60800 - b 9.
01-089-8934 (C) - Quartz alpha - SiO2 - Y: 103.23 % - d x by: 1. - WL: 1.78897 - Hexagonal - a 4.91370 - b 4.9
Operations: Background 0.055,1.000 | Import
DTMS-026 - File: d2_2016_2277.raw - Type: Locked Coupled - Start: 5.002 ° - End: 120.006 ° - Step: 0.026 ° -
Lin
(Cou
nts)
0
1000
2000
3000
4000
5000
6000
7000
2-Theta - Scale
5 10 20 30 40 50 60 70 80 90

138
Figure 65: The result of sample DTMS-027 indicates the presents of silica, goethite, muscovite, siderite and biotite minerals.
DTMS-027
01-076-0629 (C) - Jarosite - K(Fe3(SO4)2(OH)6) - Y: 5.30 % - d x by: 1. - WL: 1.78897 - Rhombo.H.axes - a 7.
00-031-0966 (*) - Orthoclase - KAlSi3O8 - Y: 12.28 % - d x by: 1. - WL: 1.78897 - Monoclinic - a 8.55600 - b 12
01-080-1110 (C) - Biotite - KFeMg2(AlSi3O10)(OH)2 - Y: 21.95 % - d x by: 1.0042 - WL: 1.78897 - Monoclinic -
00-029-0696 (*) - Siderite - FeCO3 - Y: 3.03 % - d x by: 1. - WL: 1.78897 - Rhombo.H.axes - a 4.69350 - b 4.69
01-084-1306 (C) - Muscovite 2M1 - KAl3Si3O10(OH)2 - Y: 6.86 % - d x by: 1. - WL: 1.78897 - Monoclinic - a 5.
00-029-0713 (I) - Goethite - Fe+3O(OH) - Y: 5.74 % - d x by: 1. - WL: 1.78897 - Orthorhombic - a 4.60800 - b 9.
01-089-8934 (C) - Quartz alpha - SiO2 - Y: 103.23 % - d x by: 1. - WL: 1.78897 - Hexagonal - a 4.91370 - b 4.9
Operations: Background 0.081,1.000 | Import
DTMS-027 - File: d2_2016_2278.raw - Type: Locked Coupled - Start: 5.002 ° - End: 120.006 ° - Step: 0.026 ° -
Lin
(Cou
nts)
0
1000
2000
3000
4000
5000
6000
7000
2-Theta - Scale
5 10 20 30 40 50 60 70 80 90

139
Figure 66: The result of sample DTMS-028 indicates the presents of silica, goethite, muscovite, siderite and biotite minerals.
DTMS-028
01-076-0629 (C) - Jarosite - K(Fe3(SO4)2(OH)6) - Y: 5.30 % - d x by: 1. - WL: 1.78897 - Rhombo.H.axes - a 7.
00-031-0966 (*) - Orthoclase - KAlSi3O8 - Y: 12.28 % - d x by: 1. - WL: 1.78897 - Monoclinic - a 8.55600 - b 12
01-080-1110 (C) - Biotite - KFeMg2(AlSi3O10)(OH)2 - Y: 21.95 % - d x by: 1.0042 - WL: 1.78897 - Monoclinic -
00-029-0696 (*) - Siderite - FeCO3 - Y: 3.03 % - d x by: 1. - WL: 1.78897 - Rhombo.H.axes - a 4.69350 - b 4.69
01-084-1306 (C) - Muscovite 2M1 - KAl3Si3O10(OH)2 - Y: 6.86 % - d x by: 1. - WL: 1.78897 - Monoclinic - a 5.
00-029-0713 (I) - Goethite - Fe+3O(OH) - Y: 5.74 % - d x by: 1. - WL: 1.78897 - Orthorhombic - a 4.60800 - b 9.
01-089-8934 (C) - Quartz alpha - SiO2 - Y: 103.23 % - d x by: 1. - WL: 1.78897 - Hexagonal - a 4.91370 - b 4.9
Operations: Background 0.081,1.000 | Import
DTMS-028 - File: d2_2016_2279.raw - Type: Locked Coupled - Start: 5.002 ° - End: 120.006 ° - Step: 0.026 ° -
Lin
(C
ounts
)
0
1000
2000
3000
4000
5000
6000
7000
2-Theta - Scale
5 10 20 30 40 50 60 70 80 90

140
Figure 67: The result of sample DTMS-029 indicates the presents of silica, goethite, muscovite, siderite and biotite minerals.
DTMS-029
01-076-0629 (C) - Jarosite - K(Fe3(SO4)2(OH)6) - Y: 5.30 % - d x by: 1. - WL: 1.78897 - Rhombo.H.axes - a 7.
00-031-0966 (*) - Orthoclase - KAlSi3O8 - Y: 12.28 % - d x by: 1. - WL: 1.78897 - Monoclinic - a 8.55600 - b 12
01-080-1110 (C) - Biotite - KFeMg2(AlSi3O10)(OH)2 - Y: 21.95 % - d x by: 1.0042 - WL: 1.78897 - Monoclinic -
00-029-0696 (*) - Siderite - FeCO3 - Y: 3.03 % - d x by: 1. - WL: 1.78897 - Rhombo.H.axes - a 4.69350 - b 4.69
01-084-1306 (C) - Muscovite 2M1 - KAl3Si3O10(OH)2 - Y: 6.86 % - d x by: 1. - WL: 1.78897 - Monoclinic - a 5.
00-029-0713 (I) - Goethite - Fe+3O(OH) - Y: 5.74 % - d x by: 1. - WL: 1.78897 - Orthorhombic - a 4.60800 - b 9.
01-089-8934 (C) - Quartz alpha - SiO2 - Y: 103.23 % - d x by: 1. - WL: 1.78897 - Hexagonal - a 4.91370 - b 4.9
Operations: Background 0.120,1.000 | Import
DTMS-029 - File: d2_2016_2280.raw - Type: Locked Coupled - Start: 5.002 ° - End: 120.006 ° - Step: 0.026 ° -
Lin
(Cou
nts)
0
1000
2000
3000
4000
5000
6000
7000
2-Theta - Scale
5 10 20 30 40 50 60 70 80 90

141
Figure 68: The result of sample DTMS-030 indicates the presents of silica, goethite, muscovite, siderite and biotite minerals.
DTMS-030
01-076-0629 (C) - Jarosite - K(Fe3(SO4)2(OH)6) - Y: 5.30 % - d x by: 1. - WL: 1.78897 - Rhombo.H.axes - a 7.
00-031-0966 (*) - Orthoclase - KAlSi3O8 - Y: 12.28 % - d x by: 1. - WL: 1.78897 - Monoclinic - a 8.55600 - b 12
01-080-1110 (C) - Biotite - KFeMg2(AlSi3O10)(OH)2 - Y: 21.95 % - d x by: 1.0042 - WL: 1.78897 - Monoclinic -
00-029-0696 (*) - Siderite - FeCO3 - Y: 3.03 % - d x by: 1. - WL: 1.78897 - Rhombo.H.axes - a 4.69350 - b 4.69
01-084-1306 (C) - Muscovite 2M1 - KAl3Si3O10(OH)2 - Y: 6.86 % - d x by: 1. - WL: 1.78897 - Monoclinic - a 5.
00-029-0713 (I) - Goethite - Fe+3O(OH) - Y: 5.74 % - d x by: 1. - WL: 1.78897 - Orthorhombic - a 4.60800 - b 9.
01-089-8934 (C) - Quartz alpha - SiO2 - Y: 103.23 % - d x by: 1. - WL: 1.78897 - Hexagonal - a 4.91370 - b 4.9
Operations: Background 0.120,1.000 | Import
DTMS-030 - File: d2_2016_2281.raw - Type: Locked Coupled - Start: 5.002 ° - End: 120.006 ° - Step: 0.026 ° -
Lin
(Cou
nts)
0
1000
2000
3000
4000
5000
6000
7000
2-Theta - Scale
5 10 20 30 40 50 60 70 80 90

142
Figure 69: The result of sample DTMS-033 indicates the presents of silica, goethite, muscovite, siderite and biotite minerals.
DTMS-033
01-076-0629 (C) - Jarosite - K(Fe3(SO4)2(OH)6) - Y: 6.90 % - d x by: 1. - WL: 1.78897 - Rhombo.H.axes - a 7.
00-031-0966 (*) - Orthoclase - KAlSi3O8 - Y: 10.23 % - d x by: 1. - WL: 1.78897 - Monoclinic - a 8.55600 - b 12
01-080-1110 (C) - Biotite - KFeMg2(AlSi3O10)(OH)2 - Y: 18.28 % - d x by: 1.0042 - WL: 1.78897 - Monoclinic -
00-029-0696 (*) - Siderite - FeCO3 - Y: 2.52 % - d x by: 1. - WL: 1.78897 - Rhombo.H.axes - a 4.69350 - b 4.69
01-084-1306 (C) - Muscovite 2M1 - KAl3Si3O10(OH)2 - Y: 5.71 % - d x by: 1. - WL: 1.78897 - Monoclinic - a 5.
00-029-0713 (I) - Goethite - Fe+3O(OH) - Y: 4.78 % - d x by: 1. - WL: 1.78897 - Orthorhombic - a 4.60800 - b 9.
01-089-8934 (C) - Quartz alpha - SiO2 - Y: 85.99 % - d x by: 1. - WL: 1.78897 - Hexagonal - a 4.91370 - b 4.91
Operations: Background 0.120,1.000 | Import
DTMS-033 - File: d2_2016_2282.raw - Type: Locked Coupled - Start: 5.002 ° - End: 120.006 ° - Step: 0.026 ° -
Lin
(Cou
nts)
0
1000
2000
3000
4000
5000
6000
7000
2-Theta - Scale
5 10 20 30 40 50 60 70 80 90

143
Figure 70: The result of sample DTMS-034 indicates the presents of silica, goethite, muscovite, siderite and biotite minerals.
DTMS-034
01-076-0629 (C) - Jarosite - K(Fe3(SO4)2(OH)6) - Y: 6.90 % - d x by: 1. - WL: 1.78897 - Rhombo.H.axes - a 7.
00-031-0966 (*) - Orthoclase - KAlSi3O8 - Y: 10.23 % - d x by: 1. - WL: 1.78897 - Monoclinic - a 8.55600 - b 12
01-080-1110 (C) - Biotite - KFeMg2(AlSi3O10)(OH)2 - Y: 18.28 % - d x by: 1.0042 - WL: 1.78897 - Monoclinic -
00-029-0696 (*) - Siderite - FeCO3 - Y: 2.52 % - d x by: 1. - WL: 1.78897 - Rhombo.H.axes - a 4.69350 - b 4.69
01-084-1306 (C) - Muscovite 2M1 - KAl3Si3O10(OH)2 - Y: 5.71 % - d x by: 1. - WL: 1.78897 - Monoclinic - a 5.
00-029-0713 (I) - Goethite - Fe+3O(OH) - Y: 4.78 % - d x by: 1. - WL: 1.78897 - Orthorhombic - a 4.60800 - b 9.
01-089-8934 (C) - Quartz alpha - SiO2 - Y: 85.99 % - d x by: 1. - WL: 1.78897 - Hexagonal - a 4.91370 - b 4.91
Operations: Background 0.120,1.000 | Import
DTMS-034 - File: d2_2016_2283.raw - Type: Locked Coupled - Start: 5.002 ° - End: 120.006 ° - Step: 0.026 ° -
Lin
(Cou
nts)
0
1000
2000
3000
4000
5000
6000
7000
2-Theta - Scale
5 10 20 30 40 50 60 70 80 90

144
Figure 71: The result of sample DTMS-036 indicates the presents of silica, goethite, muscovite, siderite and biotite minerals.
DTMS-036
01-076-0629 (C) - Jarosite - K(Fe3(SO4)2(OH)6) - Y: 6.90 % - d x by: 1. - WL: 1.78897 - Rhombo.H.axes - a 7.
00-031-0966 (*) - Orthoclase - KAlSi3O8 - Y: 10.23 % - d x by: 1. - WL: 1.78897 - Monoclinic - a 8.55600 - b 12
01-080-1110 (C) - Biotite - KFeMg2(AlSi3O10)(OH)2 - Y: 18.28 % - d x by: 1.0042 - WL: 1.78897 - Monoclinic -
00-029-0696 (*) - Siderite - FeCO3 - Y: 2.52 % - d x by: 1. - WL: 1.78897 - Rhombo.H.axes - a 4.69350 - b 4.69
01-084-1306 (C) - Muscovite 2M1 - KAl3Si3O10(OH)2 - Y: 5.71 % - d x by: 1. - WL: 1.78897 - Monoclinic - a 5.
00-029-0713 (I) - Goethite - Fe+3O(OH) - Y: 4.78 % - d x by: 1. - WL: 1.78897 - Orthorhombic - a 4.60800 - b 9.
01-089-8934 (C) - Quartz alpha - SiO2 - Y: 85.99 % - d x by: 1. - WL: 1.78897 - Hexagonal - a 4.91370 - b 4.91
Operations: Background 0.120,1.000 | Import
DTMS-036 - File: d2_2016_2287.raw - Type: Locked Coupled - Start: 5.002 ° - End: 120.006 ° - Step: 0.026 ° -
Lin
(Cou
nts)
0
1000
2000
3000
4000
5000
6000
7000
2-Theta - Scale
5 10 20 30 40 50 60 70 80 90
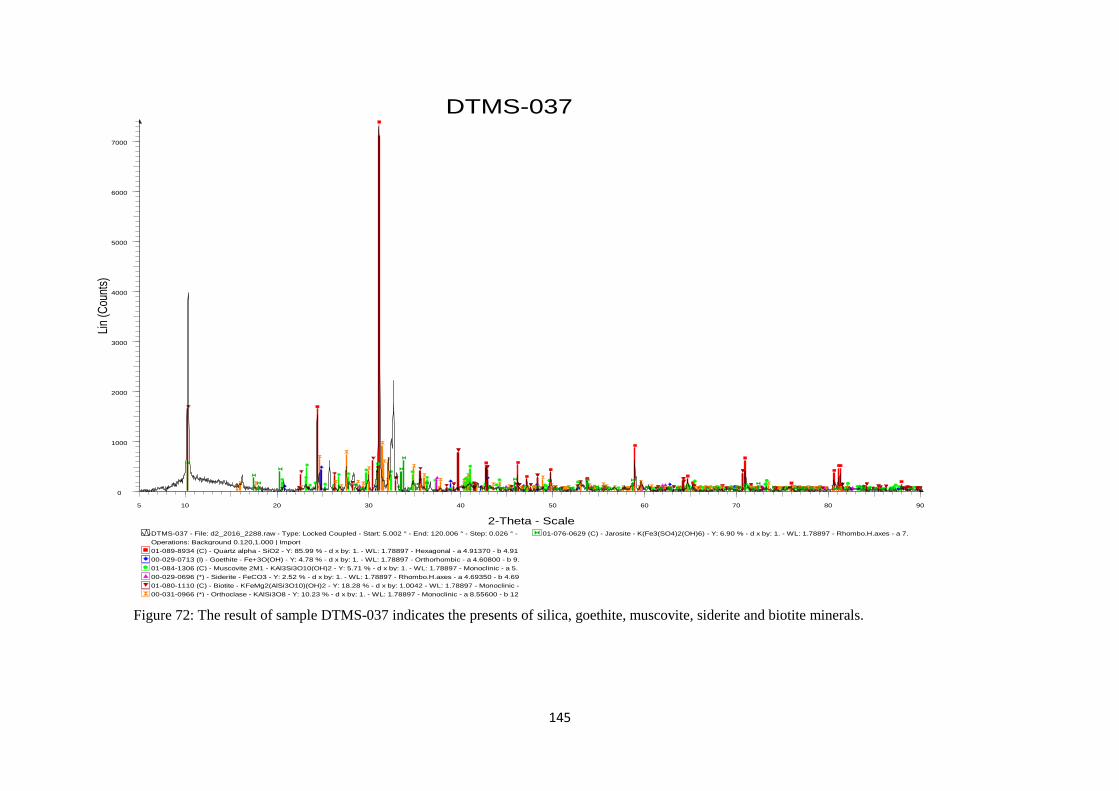
145
Figure 72: The result of sample DTMS-037 indicates the presents of silica, goethite, muscovite, siderite and biotite minerals.
DTMS-037
01-076-0629 (C) - Jarosite - K(Fe3(SO4)2(OH)6) - Y: 6.90 % - d x by: 1. - WL: 1.78897 - Rhombo.H.axes - a 7.
00-031-0966 (*) - Orthoclase - KAlSi3O8 - Y: 10.23 % - d x by: 1. - WL: 1.78897 - Monoclinic - a 8.55600 - b 12
01-080-1110 (C) - Biotite - KFeMg2(AlSi3O10)(OH)2 - Y: 18.28 % - d x by: 1.0042 - WL: 1.78897 - Monoclinic -
00-029-0696 (*) - Siderite - FeCO3 - Y: 2.52 % - d x by: 1. - WL: 1.78897 - Rhombo.H.axes - a 4.69350 - b 4.69
01-084-1306 (C) - Muscovite 2M1 - KAl3Si3O10(OH)2 - Y: 5.71 % - d x by: 1. - WL: 1.78897 - Monoclinic - a 5.
00-029-0713 (I) - Goethite - Fe+3O(OH) - Y: 4.78 % - d x by: 1. - WL: 1.78897 - Orthorhombic - a 4.60800 - b 9.
01-089-8934 (C) - Quartz alpha - SiO2 - Y: 85.99 % - d x by: 1. - WL: 1.78897 - Hexagonal - a 4.91370 - b 4.91
Operations: Background 0.120,1.000 | Import
DTMS-037 - File: d2_2016_2288.raw - Type: Locked Coupled - Start: 5.002 ° - End: 120.006 ° - Step: 0.026 ° -
Lin
(Cou
nts)
0
1000
2000
3000
4000
5000
6000
7000
2-Theta - Scale
5 10 20 30 40 50 60 70 80 90

146
Figure 73: The result of sample DTMS-038 indicates the presents of silica, goethite, muscovite, siderite and biotite minerals.
DTMS-038
01-076-0629 (C) - Jarosite - K(Fe3(SO4)2(OH)6) - Y: 6.90 % - d x by: 1. - WL: 1.78897 - Rhombo.H.axes - a 7.
00-031-0966 (*) - Orthoclase - KAlSi3O8 - Y: 10.23 % - d x by: 1. - WL: 1.78897 - Monoclinic - a 8.55600 - b 12
01-080-1110 (C) - Biotite - KFeMg2(AlSi3O10)(OH)2 - Y: 18.28 % - d x by: 1.0042 - WL: 1.78897 - Monoclinic -
00-029-0696 (*) - Siderite - FeCO3 - Y: 2.52 % - d x by: 1. - WL: 1.78897 - Rhombo.H.axes - a 4.69350 - b 4.69
01-084-1306 (C) - Muscovite 2M1 - KAl3Si3O10(OH)2 - Y: 5.71 % - d x by: 1. - WL: 1.78897 - Monoclinic - a 5.
00-029-0713 (I) - Goethite - Fe+3O(OH) - Y: 4.78 % - d x by: 1. - WL: 1.78897 - Orthorhombic - a 4.60800 - b 9.
01-089-8934 (C) - Quartz alpha - SiO2 - Y: 85.99 % - d x by: 1. - WL: 1.78897 - Hexagonal - a 4.91370 - b 4.91
Operations: Background 0.120,1.000 | Import
DTMS-038 - File: d2_2016_2289.raw - Type: Locked Coupled - Start: 5.002 ° - End: 120.006 ° - Step: 0.026 ° -
Lin
(Cou
nts)
0
1000
2000
3000
4000
5000
6000
7000
2-Theta - Scale
5 10 20 30 40 50 60 70 80 90

147
Figure 74: The result of sample DTMS-039 indicates the presents of silica, goethite, muscovite, siderite and biotite minerals.
DTMS-039
01-076-0629 (C) - Jarosite - K(Fe3(SO4)2(OH)6) - Y: 3.98 % - d x by: 1. - WL: 1.78897 - Rhombo.H.axes - a 7.
00-031-0966 (*) - Orthoclase - KAlSi3O8 - Y: 8.24 % - d x by: 1. - WL: 1.78897 - Monoclinic - a 8.55600 - b 12.
01-080-1110 (C) - Biotite - KFeMg2(AlSi3O10)(OH)2 - Y: 14.72 % - d x by: 1.0042 - WL: 1.78897 - Monoclinic -
00-029-0696 (*) - Siderite - FeCO3 - Y: 2.03 % - d x by: 1. - WL: 1.78897 - Rhombo.H.axes - a 4.69350 - b 4.69
01-084-1306 (C) - Muscovite 2M1 - KAl3Si3O10(OH)2 - Y: 4.60 % - d x by: 1. - WL: 1.78897 - Monoclinic - a 5.
00-029-0713 (I) - Goethite - Fe+3O(OH) - Y: 3.85 % - d x by: 1. - WL: 1.78897 - Orthorhombic - a 4.60800 - b 9.
01-089-8934 (C) - Quartz alpha - SiO2 - Y: 69.23 % - d x by: 1. - WL: 1.78897 - Hexagonal - a 4.91370 - b 4.91
Operations: Background 0.120,1.000 | Import
DTMS-039 - File: d2_2016_2290.raw - Type: Locked Coupled - Start: 5.002 ° - End: 120.006 ° - Step: 0.026 ° -
Lin
(Cou
nts)
0
1000
2000
3000
4000
5000
6000
7000
2-Theta - Scale
5 10 20 30 40 50 60 70 80 90

148
Figure 75: The result of sample DTMS-041 indicates the presents of silica, goethite, muscovite, siderite and biotite minerals.
DTMS-041
01-076-0629 (C) - Jarosite - K(Fe3(SO4)2(OH)6) - Y: 3.98 % - d x by: 1. - WL: 1.78897 - Rhombo.H.axes - a 7.
00-031-0966 (*) - Orthoclase - KAlSi3O8 - Y: 8.24 % - d x by: 1. - WL: 1.78897 - Monoclinic - a 8.55600 - b 12.
01-080-1110 (C) - Biotite - KFeMg2(AlSi3O10)(OH)2 - Y: 14.72 % - d x by: 1.0042 - WL: 1.78897 - Monoclinic -
00-029-0696 (*) - Siderite - FeCO3 - Y: 2.03 % - d x by: 1. - WL: 1.78897 - Rhombo.H.axes - a 4.69350 - b 4.69
01-084-1306 (C) - Muscovite 2M1 - KAl3Si3O10(OH)2 - Y: 4.60 % - d x by: 1. - WL: 1.78897 - Monoclinic - a 5.
00-029-0713 (I) - Goethite - Fe+3O(OH) - Y: 3.85 % - d x by: 1. - WL: 1.78897 - Orthorhombic - a 4.60800 - b 9.
01-089-8934 (C) - Quartz alpha - SiO2 - Y: 69.23 % - d x by: 1. - WL: 1.78897 - Hexagonal - a 4.91370 - b 4.91
Operations: Background 0.120,1.000 | Import
DTMS-041 - File: d2_2016_2291.raw - Type: Locked Coupled - Start: 5.002 ° - End: 120.006 ° - Step: 0.026 ° -
Lin
(Cou
nts)
0
1000
2000
3000
4000
5000
6000
7000
2-Theta - Scale
5 10 20 30 40 50 60 70 80 90

149
Figure 76: The result of sample DTMS-048 indicates the presents of silica, goethite, muscovite, siderite and biotite minerals.
DTMS-048
01-076-0629 (C) - Jarosite - K(Fe3(SO4)2(OH)6) - Y: 3.98 % - d x by: 1. - WL: 1.78897 - Rhombo.H.axes - a 7.
00-031-0966 (*) - Orthoclase - KAlSi3O8 - Y: 8.24 % - d x by: 1. - WL: 1.78897 - Monoclinic - a 8.55600 - b 12.
01-080-1110 (C) - Biotite - KFeMg2(AlSi3O10)(OH)2 - Y: 14.72 % - d x by: 1.0042 - WL: 1.78897 - Monoclinic -
00-029-0696 (*) - Siderite - FeCO3 - Y: 2.03 % - d x by: 1. - WL: 1.78897 - Rhombo.H.axes - a 4.69350 - b 4.69
01-084-1306 (C) - Muscovite 2M1 - KAl3Si3O10(OH)2 - Y: 4.60 % - d x by: 1. - WL: 1.78897 - Monoclinic - a 5.
00-029-0713 (I) - Goethite - Fe+3O(OH) - Y: 3.85 % - d x by: 1. - WL: 1.78897 - Orthorhombic - a 4.60800 - b 9.
01-089-8934 (C) - Quartz alpha - SiO2 - Y: 69.23 % - d x by: 1. - WL: 1.78897 - Hexagonal - a 4.91370 - b 4.91
Operations: Background 0.120,1.000 | Import
DTMS-048 - File: d2_2016_2292.raw - Type: Locked Coupled - Start: 5.002 ° - End: 120.006 ° - Step: 0.026 ° -
Lin
(Cou
nts)
0
1000
2000
3000
4000
5000
6000
7000
2-Theta - Scale
5 10 20 30 40 50 60 70 80 90

150
Figure 77: The result of sample DTMS-050 indicates the presents of silica, goethite, muscovite, siderite and biotite minerals.
DTMS-050
01-076-0629 (C) - Jarosite - K(Fe3(SO4)2(OH)6) - Y: 3.98 % - d x by: 1. - WL: 1.78897 - Rhombo.H.axes - a 7.
00-031-0966 (*) - Orthoclase - KAlSi3O8 - Y: 8.24 % - d x by: 1. - WL: 1.78897 - Monoclinic - a 8.55600 - b 12.
01-080-1110 (C) - Biotite - KFeMg2(AlSi3O10)(OH)2 - Y: 14.72 % - d x by: 1.0042 - WL: 1.78897 - Monoclinic -
00-029-0696 (*) - Siderite - FeCO3 - Y: 2.03 % - d x by: 1. - WL: 1.78897 - Rhombo.H.axes - a 4.69350 - b 4.69
01-084-1306 (C) - Muscovite 2M1 - KAl3Si3O10(OH)2 - Y: 4.60 % - d x by: 1. - WL: 1.78897 - Monoclinic - a 5.
00-029-0713 (I) - Goethite - Fe+3O(OH) - Y: 3.85 % - d x by: 1. - WL: 1.78897 - Orthorhombic - a 4.60800 - b 9.
01-089-8934 (C) - Quartz alpha - SiO2 - Y: 69.23 % - d x by: 1. - WL: 1.78897 - Hexagonal - a 4.91370 - b 4.91
Operations: Background 0.120,1.000 | Import
DTMS-050 - File: d2_2016_2293.raw - Type: Locked Coupled - Start: 5.002 ° - End: 120.006 ° - Step: 0.026 ° -
Lin
(Cou
nts)
0
1000
2000
3000
4000
5000
6000
7000
2-Theta - Scale
5 10 20 30 40 50 60 70 80 90

151
Figure 78: The result of sample DTMS-053 indicates the presents of silica, goethite, muscovite, siderite and biotite minerals.
DTMS-053
01-076-0629 (C) - Jarosite - K(Fe3(SO4)2(OH)6) - Y: 3.98 % - d x by: 1. - WL: 1.78897 - Rhombo.H.axes - a 7.
00-031-0966 (*) - Orthoclase - KAlSi3O8 - Y: 8.24 % - d x by: 1. - WL: 1.78897 - Monoclinic - a 8.55600 - b 12.
01-080-1110 (C) - Biotite - KFeMg2(AlSi3O10)(OH)2 - Y: 14.72 % - d x by: 1.0042 - WL: 1.78897 - Monoclinic -
00-029-0696 (*) - Siderite - FeCO3 - Y: 2.03 % - d x by: 1. - WL: 1.78897 - Rhombo.H.axes - a 4.69350 - b 4.69
01-084-1306 (C) - Muscovite 2M1 - KAl3Si3O10(OH)2 - Y: 4.60 % - d x by: 1. - WL: 1.78897 - Monoclinic - a 5.
00-029-0713 (I) - Goethite - Fe+3O(OH) - Y: 3.85 % - d x by: 1. - WL: 1.78897 - Orthorhombic - a 4.60800 - b 9.
01-089-8934 (C) - Quartz alpha - SiO2 - Y: 69.23 % - d x by: 1. - WL: 1.78897 - Hexagonal - a 4.91370 - b 4.91
Operations: Background 0.120,1.000 | Import
DTMS-053 - File: d2_2016_2294.raw - Type: Locked Coupled - Start: 5.002 ° - End: 120.006 ° - Step: 0.026 ° -
Lin
(Cou
nts)
0
1000
2000
3000
4000
5000
6000
7000
2-Theta - Scale
5 10 20 30 40 50 60 70 80 90

152
Figure 79: The result of sample DTMS-056 indicates the presents of silica, goethite, muscovite, siderite and biotite minerals.
DTMS-056
01-076-0629 (C) - Jarosite - K(Fe3(SO4)2(OH)6) - Y: 2.90 % - d x by: 1. - WL: 1.78897 - Rhombo.H.axes - a 7.30400 - b 7.30400 - c 17.26800 - alpha 90.000 - beta 90.000 - gamma 120.000 - Primitive - R-3m (166) - 3 - 797.800 -
01-080-1110 (C) - Biotite - KFeMg2(AlSi3O10)(OH)2 - Y: 14.63 % - d x by: 1.0042 - WL: 1.78897 - Monoclinic - a 5.33700 - b 9.24200 - c 10.21100 - alpha 90.000 - beta 100.150 - gamma 90.000 - Base-centered - C2/m (12) - 2 -
00-029-0696 (*) - Siderite - FeCO3 - Y: 2.02 % - d x by: 1. - WL: 1.78897 - Rhombo.H.axes - a 4.69350 - b 4.69350 - c 15.38600 - alpha 90.000 - beta 90.000 - gamma 120.000 - Primitive - R-3c (167) - 6 - 293.528 - F30= 75(0.01
01-084-1306 (C) - Muscovite 2M1 - KAl3Si3O10(OH)2 - Y: 4.58 % - d x by: 1. - WL: 1.78897 - Monoclinic - a 5.18900 - b 9.00400 - c 20.25600 - alpha 90.000 - beta 95.740 - gamma 90.000 - Base-centered - C2/c (15) - 4 - 941.65
00-029-0713 (I) - Goethite - Fe+3O(OH) - Y: 3.83 % - d x by: 1. - WL: 1.78897 - Orthorhombic - a 4.60800 - b 9.95600 - c 3.02150 - alpha 90.000 - beta 90.000 - gamma 90.000 - Primitive - Pbnm (62) - 4 - 138.618 - F30= 47(0.01
01-089-8934 (C) - Quartz alpha - SiO2 - Y: 68.81 % - d x by: 1. - WL: 1.78897 - Hexagonal - a 4.91370 - b 4.91370 - c 5.40470 - alpha 90.000 - beta 90.000 - gamma 120.000 - Primitive - P3221 (154) - 3 - 113.011 - I/Ic PDF 3. - F
Operations: Background 1.000,1.000 | Import
DTMS-056 - File: d2_2016_2295.raw - Type: Locked Coupled - Start: 5.002 ° - End: 120.006 ° - Step: 0.026 ° - Step time: 37. s - Temp.: 25 °C (Room) - Time Started: 0 s - 2-Theta: 5.002 ° - Theta: 2.501 ° - Chi: 0.00 ° - Phi: 0.00 °
Lin
(Cou
nts)
0
1000
2000
3000
4000
5000
6000
7000
2-Theta - Scale
5 10 20 30 40 50 60 70 80 90

153
Figure 80: The result of sample DTMS-062 indicates the presents of silica, goethite, muscovite, siderite and biotite minerals.
DTMS-062
01-076-0629 (C) - Jarosite - K(Fe3(SO4)2(OH)6) - Y: 2.90 % - d x by: 1. - WL: 1.78897 - Rhombo.H.axes - a 7.
00-031-0966 (*) - Orthoclase - KAlSi3O8 - Y: 8.19 % - d x by: 1. - WL: 1.78897 - Monoclinic - a 8.55600 - b 12.
01-080-1110 (C) - Biotite - KFeMg2(AlSi3O10)(OH)2 - Y: 14.63 % - d x by: 1.0042 - WL: 1.78897 - Monoclinic -
00-029-0696 (*) - Siderite - FeCO3 - Y: 2.02 % - d x by: 1. - WL: 1.78897 - Rhombo.H.axes - a 4.69350 - b 4.69
01-084-1306 (C) - Muscovite 2M1 - KAl3Si3O10(OH)2 - Y: 4.58 % - d x by: 1. - WL: 1.78897 - Monoclinic - a 5.
00-029-0713 (I) - Goethite - Fe+3O(OH) - Y: 3.83 % - d x by: 1. - WL: 1.78897 - Orthorhombic - a 4.60800 - b 9.
01-089-8934 (C) - Quartz alpha - SiO2 - Y: 68.81 % - d x by: 1. - WL: 1.78897 - Hexagonal - a 4.91370 - b 4.91
Operations: Background 1.000,1.000 | Import
DTMS-062 - File: d2_2016_2296.raw - Type: Locked Coupled - Start: 5.002 ° - End: 120.006 ° - Step: 0.026 ° -
Lin
(Cou
nts)
0
1000
2000
3000
4000
5000
6000
7000
2-Theta - Scale
5 10 20 30 40 50 60 70 80 90

154
Figure 81: The result of sample DTMS-074 indicates the presents of silica, goethite, muscovite, siderite and biotite minerals.
DTMS-074
01-076-0629 (C) - Jarosite - K(Fe3(SO4)2(OH)6) - Y: 2.90 % - d x by: 1. - WL: 1.78897 - Rhombo.H.axes - a 7.
00-031-0966 (*) - Orthoclase - KAlSi3O8 - Y: 8.19 % - d x by: 1. - WL: 1.78897 - Monoclinic - a 8.55600 - b 12.
01-080-1110 (C) - Biotite - KFeMg2(AlSi3O10)(OH)2 - Y: 14.63 % - d x by: 1.0042 - WL: 1.78897 - Monoclinic -
00-029-0696 (*) - Siderite - FeCO3 - Y: 2.02 % - d x by: 1. - WL: 1.78897 - Rhombo.H.axes - a 4.69350 - b 4.69
01-084-1306 (C) - Muscovite 2M1 - KAl3Si3O10(OH)2 - Y: 4.58 % - d x by: 1. - WL: 1.78897 - Monoclinic - a 5.
00-029-0713 (I) - Goethite - Fe+3O(OH) - Y: 3.83 % - d x by: 1. - WL: 1.78897 - Orthorhombic - a 4.60800 - b 9.
01-089-8934 (C) - Quartz alpha - SiO2 - Y: 68.81 % - d x by: 1. - WL: 1.78897 - Hexagonal - a 4.91370 - b 4.91
Operations: Background 1.000,1.000 | Import
DTMS-074 - File: d2_2016_2297.raw - Type: Locked Coupled - Start: 5.002 ° - End: 120.006 ° - Step: 0.026 ° -
Lin
(Cou
nts)
0
1000
2000
3000
4000
5000
6000
7000
2-Theta - Scale
5 10 20 30 40 50 60 70 80 90

155
Figure 82: The result of sample DTMS-077 indicates the presents of silica, goethite, muscovite, siderite and biotite minerals.
DTMS-077
01-076-0629 (C) - Jarosite - K(Fe3(SO4)2(OH)6) - Y: 2.90 % - d x by: 1. - WL: 1.78897 - Rhombo.H.axes - a 7.
00-031-0966 (*) - Orthoclase - KAlSi3O8 - Y: 8.19 % - d x by: 1. - WL: 1.78897 - Monoclinic - a 8.55600 - b 12.
01-080-1110 (C) - Biotite - KFeMg2(AlSi3O10)(OH)2 - Y: 14.63 % - d x by: 1.0042 - WL: 1.78897 - Monoclinic -
00-029-0696 (*) - Siderite - FeCO3 - Y: 2.02 % - d x by: 1. - WL: 1.78897 - Rhombo.H.axes - a 4.69350 - b 4.69
01-084-1306 (C) - Muscovite 2M1 - KAl3Si3O10(OH)2 - Y: 4.58 % - d x by: 1. - WL: 1.78897 - Monoclinic - a 5.
00-029-0713 (I) - Goethite - Fe+3O(OH) - Y: 3.83 % - d x by: 1. - WL: 1.78897 - Orthorhombic - a 4.60800 - b 9.
01-089-8934 (C) - Quartz alpha - SiO2 - Y: 68.81 % - d x by: 1. - WL: 1.78897 - Hexagonal - a 4.91370 - b 4.91
Operations: Background 1.000,1.000 | Import
DTMS-077 - File: d2_2016_2298.raw - Type: Locked Coupled - Start: 5.002 ° - End: 120.006 ° - Step: 0.026 ° -
Lin
(Cou
nts)
0
1000
2000
3000
4000
5000
6000
7000
2-Theta - Scale
5 10 20 30 40 50 60 70 80 90

156
Figure 83: The result of sample DTMS-082 indicates the presents of silica, goethite, muscovite, siderite and biotite minerals.
DTMS-082
01-076-0629 (C) - Jarosite - K(Fe3(SO4)2(OH)6) - Y: 2.90 % - d x by: 1. - WL: 1.78897 - Rhombo.H.axes - a 7.
00-031-0966 (*) - Orthoclase - KAlSi3O8 - Y: 8.19 % - d x by: 1. - WL: 1.78897 - Monoclinic - a 8.55600 - b 12.
01-080-1110 (C) - Biotite - KFeMg2(AlSi3O10)(OH)2 - Y: 14.63 % - d x by: 1.0042 - WL: 1.78897 - Monoclinic -
00-029-0696 (*) - Siderite - FeCO3 - Y: 2.02 % - d x by: 1. - WL: 1.78897 - Rhombo.H.axes - a 4.69350 - b 4.69
01-084-1306 (C) - Muscovite 2M1 - KAl3Si3O10(OH)2 - Y: 4.58 % - d x by: 1. - WL: 1.78897 - Monoclinic - a 5.
00-029-0713 (I) - Goethite - Fe+3O(OH) - Y: 3.83 % - d x by: 1. - WL: 1.78897 - Orthorhombic - a 4.60800 - b 9.
01-089-8934 (C) - Quartz alpha - SiO2 - Y: 68.81 % - d x by: 1. - WL: 1.78897 - Hexagonal - a 4.91370 - b 4.91
Operations: Background 1.000,1.000 | Import
DTMS-082 - File: d2_2016_2299.raw - Type: Locked Coupled - Start: 5.002 ° - End: 120.006 ° - Step: 0.026 ° -
Lin
(Cou
nts)
0
1000
2000
3000
4000
5000
6000
7000
2-Theta - Scale
5 10 20 30 40 50 60 70 80 90

157
4.3.5. Mineral separation
Minerals separation is a technique to separate heavy from light and magnetic minerals. The
separation was conducted to identify each mineral content in the three-oxide development profile as
well as to establish the relationship with gold mineralisation. The first mineral description was done in
the field. The different minerals identified in the field are quartz, biotite, muscovite, sericite, and
chlorite. Thirty samples were crushed, sieved to a fraction of < 500µm and separated into heavy and
light minerals.
Two types of quartz were observed: type (1) showing dissolution holes, and another type (2)
Sub-rounded to angular, which is less abundant. The colour of the quartz is white, yellow and red. The
minerals observed under the binocular microscope are quartz, biotite, muscovite, chlorite, tourmaline,
feldspar potassic, tourmaline, and jarosite. Some of those minerals were confirmed by the XRD
analysis presented in Section 4.3.4.
From the gold shape, three types of gold mineralisation can be established that is; in situ gold,
transported and hydrothermal.
4.3.6. Summary
The highest gold grades are associated with iron (Fe) and potassic (K) alteration. The XRF
analysis conducted on the pulp samples, which were analysed for gold by fire assay confirm the
relationship between gold mineralisation and potassic alteration, which has been previously established
by Cameron (2010) and Masurel et al. (2014).
The silica is a product of calc-silicate weathering, the presence of 60% of silica (quartz) in the
results analysed by XRF indicates that there is a relationship between calc-silicate alteration and gold
mineralisation.
The relationship of the oxide jarosite alteration with gold mineralisation has been proved by the
gold analysis results from SEMOS laboratory. The result of XRF and XRD analysis and the
description of mineral separates were useful to determine the shape of gold and quartz. The shape of
gold and quartz are an indicator of their origin. The presence of the minerals, such as alunite (K2Al6
(SO4)4(OH)12) and jarosite (K2Fe63+ (SO4)4(OH)12) highlight a highly acidic environment and acid
supergene conditions (Hein, 2008). The bernalite mineral can be found from the surface oxidation
zone. Alunite and jarosite formed deeper in the oxidation zone.
The significant presence of the gold grade in the unweathered calc-silicate can be explained by
one or both hypothesis: (1) As Thermal Aureole Gold Deposit (TAGD) as proposed by Hein (2007),
and (2) as hydrothermal mineralisation proposed by Masurel et al. (2017), although in the latter study

158
the origin of fluid and metals are unspecified. The concentration of the gold in the weathered calc-
silicate can be due to the loss of volume and density as a consequence of the oxidation.

159
Chapter 5
Discussion
The combination of mapping and drilling data in the building of the 3D model and analysing
gold XRF and XRD bring a new understanding of Sadiola goldfield model. According to the project,
three oxide profiles were found, and three types of gold mineralisation were established in the Sadiola
goldfield. Two types of quartz were observed in the study area, and seven minerals detected in XRF
and XRD. The similarity between the stratigraphy in the Sadiola Hill opencast and FN3 opencast pits
has been established and five profiles were identified from top to bottom, while seven profiles were
identified in Tambali opencast pit. Three layers of ferricrete were observed. Oxidation resulting in the
collapses of the oxide profile caused several events in the goldfield. Five lithologies and six sub-facies
of the calc-silicate were established. The oxide profiles were found along the SFZ and the northeast
trending faults.
5.1. Oxide profile development
The Sadiola gold mine in western Mali develops different profiles, which are different from
other mines in the region. In the Sadiola goldfield, the oxide profile developed includes saprolite and
transitional zones. These profiles are composed of three-oxide facies developed namely: Type 1,
decarbonated calc-silicate alteration; Type 2, Fe alteration (oxide-jarosite-siderite); and Type 3,
potassic clay alteration. This study established a relationship between the gold mineralisation and type
2 and 3 of oxides developed. The colour of type 2 is red and, defined as oxide-jarosite-siderite, while
the type 3, colour is pink and, defined as potassic clay alteration. However, Strydom and Rompel
(1997) defined their type (ii) like yellowish stained marble as limonite mineralised, and type (iii) like
brown to red stained as goethite and hematite mineralised. The three-oxide facies described in this
study correspond to those defined by Strydom and Rompel (1997).
The Sadiola goldfield opencast pits mapping allowed the identification of five main lithologies:
meta-sandstone, calc-silicate, siltstone-shale-greywacke, diorite and quartz-feldspar porphyry, while
Hein and Tshibubudze (2007) classified the lithologies of the Sadiola goldfield into greywacke,
volcaniclastic, volcaniclastic-greywacke, carbonaceous siltstone, marble, carbonaceous greywacke,
BIF, shale and graphitic shale. The difference appears in the presence of intrusion, grouping of the
siltstone-shale-greywacke in the present study. Hein and Tshibubudze (2007) present a more detailed
classification with less grouping.
The calc-silicate study conducted in the Sadiola goldfield establish the following sub-facies of
the calc-silicate (1) very thick (more than 1 cm) to thick-bedded (0.5-1 cm) marble (with alternate of
white and black layers), (2) thin (3-5 mm) to very thin-bedded (1-3 mm) marble, (3) massive marble,

160
(4) slump-folded marble, (5) carbonaceous siltstone and (6) pure marble, while Hein (2008) identified
five calc-silicate sub-facies (1) massive greywacke facies, (2) carbonate greywacke-siltstone facies, (3)
massive carbonate facies, (4) bedded carbonate, and (5) slump facies to massive carbonate facies. The
similarity could be found in the massive to bedded and slump-folded sub-facies. Much of those calc-
silicate sub-facies are probably formed because of the oxide profiles collapsing.
The weathering process of the calc-silicate resulted in a concentration of the quartz in the oxide
profile. Two types of quartz were observed: quartz type (1) with dissolution holes, a lot of the quartz
is presented like that, this quantity is probably due to the sulfidation of the calc-silicate rock. (2) Sub-
rounded to angular quartz. This type of quartz can be explained by transport.
The colour of the quartz is white, yellow and red. The different colours could relate to the
different style of oxidation, like white related to (Type 1) decarbonated calc-silicate alteration, then
the red could be related to the (Type 2) Fe alteration (oxide-jarosite-siderite), and finally, the yellow
can be related to the (Type 3) potassic clay alteration.
There is two types of gold mineralisation in the oxide phase, and one in the sulphides. The gold
mineralisation in the oxide phase is composed of gold in ferricrete (Eocene-Miocene age), and the gold
mineralisation in the oxide profile (oxide saprolite and transitional) with unknown age. The gold
mineralisation found in the hard rock is from Birimian age, probably related to the Eburnean Orogeny
at 2.1 Ga. At Sadiola goldfield opencast pits the study of oxide profiles allowed to identify different
types of gold shape, suggesting that the source of the gold mineralisation could be variable: (1)
transported gold hosted in ferricrete, (2) as Thermal Aureole Gold Deposit defined by Hein (2007),
and (3) as hydrothermal gold proposed by Masurel et al. (2017), although in the latter study the origin
of fluids and metals as remain unspecified. Sadiola gold mineralisation is mined in the oxide phases
and the ferricrete units. The three units which host gold mineralisation are as following: (1) ferricrete,
(2) oxide phases and (3) hard rocks (calc-silicate and/or siltstone-shale-greywacke). It appears that the
oxide profile gold has not been mentioned by Hein 2007), and Masurel et al. (2017).
The different minerals detected by XRD are: (1) Silica or quartz (SiO2), (2) Goethite (Fe+
3O.OH), (3) Muscovite (KAl3Si3O10 (OH)2), (4) Siderite (FeCO3), (5) Biotite KFeMg2
(AlSi3O10)(OH)2, (6) Bernalite (Fe (OH) 3), (7) Orthoclase (KAlSi3O8). The calc-silicate skarnification
was conducive to the formation of variable minerals such as diopside, actinolite, chlorite, epidote,
dravitic tourmaline (Sillitoe, 1994) scapolite, vesuvianite and fluorite (Boshoff et al., 1998). The
minerals observed under the binocular microscope are quartz, biotite, muscovite, chlorite, tourmaline,
feldspar potassic, jarosite, limonite and hematite. Some of those minerals were confirmed by the XRD
analysis result. The condition of formation of the different minerals identified helped to understand
the condition of the oxide formation. The presence of alunite (K2Al6 (SO4)4(OH)12) and jarosite
(K2Fe63+ (SO4)4(OH)12) highlight a highly acidic environment and acid supergene conditions.

161
Gold is observed in some samples under the binocular microscope. The shapes are
variable: (1) sub-rounded to rounded, (2) oval and (3) sub-angular to angular. The gold shape
can explain the different type of gold mineralisation within the goldfield. These different
types of gold shapes could be related to the units, which host the gold mineralisation. Hein et
al. (2015) established the following gold grain shapes: rounded to oval, curved, irregular
(abundant), rod-shaped, tabular gold, wire to tangled wire type gold, broken hexagonal and
rare pseudo-crystalline gold.
The stratigraphic columns for Sadiola Hill opencast, and FN3 opencast pits are similar, based on
the mapping of the lithologies, and comprise the following, from top to bottom: (1) soil profile that is
brown in colour with a significant amount of organic material, (2) a ferricrete horizon that is red in
colour with coarse pisolitic gravel and sometimes clasts of quartz. The ferricrete is present in two or
three distinct levels that are separated by aeolian sand or bauxite clay. (3) Aeolian sand horizon, very
fine grained and yellow to red in colour, encrusted with kaolinite and limonite; (4) weathered calc-
silicate (decarbonated) composed of very fine-grained sandy clay. (5) Massive to bedded hard calc-
silicate rocks, and moderately silicified, bedded siltstone-shale-greywacke that is moderately silicified.
The Tambali opencast pit stratigraphic column comprises of (1) a soil layer that is brown in colour with
the significant organic material, (2) a ferricrete horizon that is red in colour with coarse pisolitic gravel
and sometimes clasts of quartz, (3) red to yellow sandstone horizon that is very fine to medium
grained. This sandstone is friable and encrusted with kaolinite, limonite to hematite alteration. (4)
Siltstone-shale-greywacke that is moderate to strongly silicified. (5) Calc-silicate rock that is massive.
(6) Quartz-feldspar porphyry dykes oriented north-northeast crosscut all the sediments and (7) diorite
dykes intruded the quartz-feldspar porphyry and the sediments. While Hein (2008) established a
stratigraphic column for Sadiola Hill opencast and FE3 opencast pits such as (1) laterite, (2) sand, and
brown clay soil in paleochannels, (3) granodiorite, (3) siltstone-shale ± greywacke sequence, (4)
slump-turbidite sequence, (5) mass-wasting sequence (MWS), (6) paleo regolith, (7) marble sequence.
According to Masurel et al. (2017), the metasedimentary rocks mapped in the Sadiola Hill
opencast pit are intruded by two generations of diorite and one generation of quartz-feldspar
porphyry. According to Theron (1997), in the Sadiola Hill opencast pit, the intrusions are
trondhjemitic diorite-quartz dioritic to granodioritic in composition. Calcite is present in all rock types
as an alteration product. The sedimentary rock displays a strong to weak weathering profile in
appearance. A diorite dyke is situated at the contact between siltstone-shale-greywacke and calc-
silicate rock in the Sadiola Hill opencast pit. These dykes were emplaced after deposition of the
metasedimentary rocks based on crosscutting relationships.
XRF results allowed establishing the proportionality between the gold mineralisation and silica,
potassium, and iron. There is a strong correlation between the gold mineralisation, potassium (K), and
iron (Fe) alteration. In the Sadiola goldfield, the potassium and iron alteration are hosted in the

162
decarbonated calc-silicate and are related to the three-oxide developed in the oxide profiles. Cameron
(2010) and Masurel et al. (2017) have also shown the relationship between gold and potassium and
iron (Fe).
The more important consequence of the calc-silicate oxidation in terms of mine benefit is the
concentration of gold mineralisation in the altered calc-silicate (oxide saprolite and oxide transitional).
The circulation of cool and hydrothermal fluids allowed mobilization of all the types of gold in the
oxide phases. The significant gold mineralisation is found and mined from the oxide profile, which is
not carbonated, but represents a calc-silicate alteration product. The Sadiola Hill oxide gold
mineralisation can’t be classified as carbonate-hosted due to the absence of the carbonate in the oxide
profile. In the light of this work, the Sadiola gold mineralisation can be classified as an oxide gold
enrichment deposit, similar to the Siguiri Gold deposit proposed by Robertson and Peter (2002) in
Guinee Conakry and Carlin-style in Nevada (Maroun et al, 2017). Gold mineralisation in the Yatela
Main gold mine is hosted in a saprolitic residuum situated above Birimian supracrustal rocks (Hein et
al, 2015). Robertson and Peter (2002) identified supergene or oxidised gold deposits in the West
African Craton, e.g. at Yatela and Siguiri.
Traoré and Samaké (2010) reported that the Sadiola ore body displacement was only due to this
west-east trending faults. According to this research, the displacement of the Sadiola ore body is
significantly due to the collapses of the oxide profile. The oxide profiles collapses can be explained by
the diminution of the volume of oxide. The pit mapping data interpretation can explain that these
collapses caused the displacement of the orebody in the oxide phases. The loss of volume and density
resulted in the concentration of the gold mineralisation in the oxide profile. SFZ attributed to collapse
of a contact in this study, while Masurel et al. (2017) and other previous workers relate this structure
to local and regional deformation.
Three ferricrete layers were observed on the decarbonated calc-silicate, while it is one (1) on the
siltstone-shale-greywacke. The differences in the number of the ferricrete layers above the
decarbonated calc-silicate can be explained by the collapses of the oxide profiles because of its
diminution of the volume. This difference of ferricrete layers can be explained by the collapses of
decarbonated calc-silicate because of oxidation of the calc-silicate. When the decarbonated calc-
silicate collapsed, aeolian sand was deposited and the ferricrete layer formed. According to Grimaud
(2014), the ferricrete formation began in the Eocene-Miocene, with the development of three distinct
glaciations across West Africa Craton. The lower glaciation is generally an infill of deep
palaeochannels as this can be seen in the highwall adjacent to the ramp in the FE4 opencast pit.
This study established three types of gold, with two types of gold mineralisation in the oxide
phase, and one in the sulphides. The different types of gold were established according to the age of the
host rock, while Strydom and Rompel (1997) established four types of mineralisation (1) pelites layer,
(2) cross pelites and folded, (3) extension vein of quartz and calcite vein, and (4) yellow and red Fe-
hydroxide mineralisation.

163
5.2. Genetic Model hypothesis
The Sadiola Hill oxide zone study conducted to establish a genetic model as follows. The
genetic model has been modified from Hein (2007; 2008) as follows:
1) Deposition of metasedimentary sequences in shallow marine deltaic to the pro-deltaic
environment (horizontal contact between siltstone-shale-greywacke on top and calc-silicate in the
bottom).
2) Deformation with an oriented NW-SE compression, probably associated, with the Eburnean
orogeny, produced an effect on the SFZ, and northeast trending faults. The SFZ and north-northeast
faults seem to be syn-genetic because of the NE faults always start from the SFZ outward.
3) The meteoric fluids penetrated the calc-silicate rock through the SFZ and northeast trending
faults. The fluids circulation in calc-silicates facilitated its oxidation. According to Keita (2003)
oxidation and hydrolysis reactions occurred. The most important reaction was oxidation and change in
pH towards acidic conditions. At Sadiola Hill opencast pit, pyrite is the most important sulphide in
terms of quantity. Pyrite in the presence of H2O and O2 was involved in the following reactions.
Oxidation, the formation of acid, referring to Blanchard (1966)
(1) 2FeS2 + 7O2 + 2H2O 2FeSO4 +2H2SO4
(2) 12FeSO4 + 3O2 + 6H2O 4Fe2 (SO4)3 + 4Fe (OH) 3
Or
(2) 4FeSO4 + O2 + 2H2SO4 2Fe2 (SO4)3 +2H2O
(3) Fe2 (SO4)3 +6H2O + 6H2O 2 Fe (OH) 3 + 3H2SO4 (sulphuric acid)
Limonite could be formed as a result of the oxidation reaction. Limonite composition is
2Fe2O3.nH2O and composed of goethite (FeO. OH), hematite (Fe2O3) and scarce magnetite, jarosite
and siderite and impurity as silica, and different types of carbonate. The first process of the formation
of limonite is that of the dilution of solutions resulting from the oxidation of pyrite Blanchard (1966).
The second process of precipitation of limonite is the one demonstrated by reactions (3) and (4).
The sulphates oxidize other sulphide as follows:
(4) M++
S + 4Fe2 (SO4)3 + 4H2O M++
SO4 + 8FeSO4 + 4H2SO4
Hydrolysis and hydroxide formation (OH-) and bases.
a) FeSiO4 + 4H2O 2Fe2+
+ 4OH- +H2SiO4
(Fayalite)
b) 2KAlSi3O8 + 3H2O Al2Si2O5 (OH) 4 + 4Si2O5 (OH)4 +4SiO2 +2 KOH

164
(Orthoclase) (Kaolinite)
c) MgCO3 +H2O Mg2+
+OH- +HCO
-3
(Anklesite)
In the Sadiola goldfield, the gold mineralisation is associated with the major sulphides, namely
arsenopyrite, pyrrhotite, and pyrite (Masurel et al. 2017). The water in contact with the sulphide under
appropriate temperature and pressure conditions could activate reactions which can create minerals
like siderite, and jarosite.
4) The calc-silicate, which was oxidized, led to formation of decarbonated calc-silicate,
resulting in a decrease in volume of the decarbonated calc-silicate and concentration of gold content
in the decarbonated calc-silicate.
5) Formation of the first layer of ferricrete above the meta-siltstone shale greywacke and
decarbonated calc-silicate rock.
6) The decrease in the volume of the decarbonated calc-silicate caused a collapse of oxide.
Then, SFZ collapsed. The sudden and slow collapse of the SFZ can be explained by the diminution of
the volume of the oxide profile added to the charge of above lithologies, like the siltstone-shale-
greywacke and ferricrete. Subsequently, the aeolian sand was progressively deposited on the ferricrete
unit, which resides on top of the decarbonated calc-silicate unit.
7) Formation of the second layer of the ferricrete on the decarbonated calc-silicate on the
aeolian sand.
8) The second collapse of decarbonated calc-silicate resulted in another collapse of SFZ, then
another period of filling by aeolian sand occurred on the second layer of ferricrete.
9) Formation of the third layer of ferricrete on the decarbonated calc-silicate. These different
stages of collapsing occurred globally within the decarbonated calc-silicate.
10) Formation of regolith profile, with the final position of Sadiola Hill opencast pit.
The oxidation is the source of the concentration of the gold grade. The oxidation profile follows
the SFZ and the north-northeast structures, which explain the reason why many researchers relate the
gold mineralisation to the structures. In the Sadiola goldfield, the gold mineralisation is hosted in each
lithology, but the gold concentration varies in the various rock units. Many factors could be the source
of gold concentration: (1) the chemistry of the calc-silicate, (2) the density of the gold in a
relationship with the meteoric fluid circulation. The Sadiola gold mineralisation can be classified as
oxide gold enrichment deposit.

165
Chapter 6
Conclusions and Recommendation
This research study on the Sadiola goldfield was aimed at improving current understanding of
the Sadiola Hill oxide zone, in particular, the geochemical complexities and alteration signatures.
Examination of the oxide saprolite and transitional profile allowed establishing three-oxide facies:
(Type 1) decarbonated calc-silicate alteration, (Type 2) Fe-alteration (oxide-jarosite-siderite) and
(Type 3) potassic clay alteration. The lithological mapping established the following: calc-silicate or
marble sub-facies as (1) very thick (more than 1cm) to thick-bedded marble (0.5-1 cm) (with alternate
of white and black layers), (2) thin (3-5 mm) to very thin-bedded (1-3 mm) marble, (3) massive marble,
(4) slump-folded marble, (5) carbonaceous siltstone and (6) pure marble.
All these marble sub-facies hosts gold mineralisation, but significant gold mineralisation was
found in thick-bedded marble with an alternating of white and black layers associated with biotite
alteration within the dark layers. The carbonaceous siltstone marble sub-facies, without significant
structural features or alteration signatures are not mineralised.
The key minerals identified by XRD are alunite (K2Al6 (SO4)4(OH)12) and jarosite (K2Fe63+
(SO4)4(OH)12). The mineral association suggests a highly acidic environment and acidic supergene
conditions. The examination of oxides also allowed distinguishing the different ferricrete horizons in
the Sadiola goldfield. Significant gold mineralisation is hosted in the oxide profile (weathered calc-
silicate) in the Sadiola Hill opencast pit.
The relative age of the Sadiola oxide profile could be established between the ferricrete unit,
Miocene-Eocene age and the hard rock which is Birimian age (2200-2100 Ma). The consequences of
the oxidation are variable: (1) diminution of the volume of the decarbonated calc-silicate, (2)
concentration of gold mineralisation, (3) collapse of the lithological contact between calc-silicate and
the siltstone-shale-greywacke, (4) formation of several discontinuous pieces of diorite units in the
oxide unit, (5) formation of several discontinuous pieces of the quartz-feldspar porphyry observed in
the south-east of the Sadiola Hill opencast pit, and (6) brittle and ductile deformation observed
through the SFZ.
The 3D oxide and hard rock modelling defined three types of gold mineralisation according to
the age of the host rock. The young gold is found in the ferricrete (Eocene-Miocene age), the second
gold type is found in the oxide profile (oxide saprolite and transitional), with unknown age and the
third gold is found in the hard rock that is Birimian age.
Formation of the three layers of ferricrete occurred on the decarbonated calc-silicate.
Combining all above observations, the Sadiola Hill opencast pit can be classified as an oxide
gold enrichment deposit.

166
References
AAOA, 2000. The trans-Saharan Gold Trade (7th-14
th century). In Heilbrunn Timeline of Art History.
New York: The Metropolitan Museum of Art, Department of Arts of Africa, Oceania, and the
Americas. 2000-. http://www.metmuseum.org/toah/hd/gold/hd_gold.htm (October 2000).
Abouchami, W., Boher, M., Michard, A. and Albarede, F. 1990. A major 2.1 Ga old event of mafic
magmatism in West Africa: An Early stage of crustal accretion. Geophysical Research 95,
17605-I 7629.
Anonymous, 1994. Geology of the Sadiola Hill orebody near Kayes, Mali - some preliminary
observations. Unpublished, Field workshop for ANMERCOSA Exploration (Mali) Limited,
17p.
Bassot, J.P., 1966. Etudes géologique du Sénégal Oriental et de ses confins guinéo-maliens. Mémoires
BRGM 40, 322p.
Bassot, J.P., 1987. Le complexe volcano-plutonique calco-alcalin de la rivière Daléma (Est Sénégal):
discussion de sa signification géodynamique dans le cadre de l’orogène éburnéenne
(Protérozoïque inférieur). Journal of African Earth Sciences 6 (4): 505-519.
Bassot, J.P., and Dommanget, A., 1986, Mise en évidence d’un accident majeur affectant le
Protérozoïque inférieur des confins sénégalo-maliens: Comptes Rendus Géosciences, v. 302, p.
1101–1106.
Baratoux, L., Ouiya, P., Siebenaller, L., Salvi, S., Béziat, D., Naba, S., Naré, A., Franceschi, G., 2016.
The Nassara gold prospect, Gaoua District, southwestern Burkina Faso. Ore Geology
Reviews. Doi: 10.1016/j.oregeorev.2015.11.026
Blanchard, R., 1966. Interpretation of leached outcrops. Nevada Bureau of Mines. Bulletin 66: 196
Boher, M., Abouchami, W., Michard, A., Albarede, F., Arndt, N.T., 1992. Crustal Growth in West
Africa at 2.1 Ga. Journal of Geophysical Research 97 (B1); 345-369.
Boshoff, F., Hanssen, E., Hill, J.V., Jones, D., Kaisin, J., Traore, S., Voet, H.W., 1998. The Sadiola
Hill Mine: A lower Proterozoic gold deposit in the Kéniéba window - Mali, West Africa. In:
Pathways 98, Exploration Symposium, and Vancouver, Canada, 6p.
Cameron, G.H., 2010. A review and investigation into the controls of deep sulphide mineralisation at
the Sadiola and Gold Deposit Mali - West Africa. Unpublished report prepared for SEMOS
S.A., 33p.
Charbon, D., Grimaud, J.L., Metelka., V, Beauvais., A, Bamba, O., 2015. Neogene cratonic erosion
fluxes and landform evolution processes from regional regolith mapping (Burkina Faso, West
Africa). Geomorphology, 241, 315-330.
Dabo, M., Aïfa, T., 2010. Structural styles and tectonic evolution of the Kolia-Boboti sedimentary
basin, Kédougou-Kéniéba Inlier, eastern Sénégal. Comptes Rendus Geosciences 342, 796-805.

167
Debat, P., Diallo, D.P., Ngom, P.M., Rollet, M., and Seyler, M., 1984, La série de Mako dans ses
parties centrale et méridionale (Sénégal Oriental, Afrique de l’ouest). Précisions sur l’évolution
de la série volcanosédimentaire et données géochimiques préliminaires sur les formations
magmatiques posttectoniques: Journal of African Earth Sciences v. 2, p. 71–79.
Debat, P., Nikie´ma, S., Mercier, A., Lompo, M., Be´ziat, D., Bourges, F., Roddaz, M., Salvi, S.,
Tollon, F., Wenmenga, U., 2003. A new metamorphic constraint for the Eburnean orogeny
from Palaeoproterozoic formations of the Man shield (Aribinda and Tampelga countries,
Burkina Faso). Precambrian Res. 123, 47–65.
Dia, A., 1988, Caractéres et signification des complexes magmatiques et métamorphiques du secteur
de Sandikounda-Laminia (Nord de la boutonnière de Kédougou, Est du Sénégal) : un modèle
géodynamique du Birimien de l’Afrique de l’Ouest: Ph.D. thesis, Sénégal, Université de Dakar,
350 p.
Dia, A., 1993a. Nd and Pb isotopic constraints on the evolution of the Early Proterozoic magmatism
episod in the Kedougou Inlier, East Senegal: implications for the timing of the Early
Proterozoic crustal growth event. In: Dia, A. (Ed.), Early Proterozoic: Geochemical and
Structural Constraints- Metallogeny-Atmosphere. International Symposium, January 1993, vol.
23. CIFEG Occas. Publ., Dakar/Senegal, pp. 16-19.
Dia, A.,1993b. Geochemical constraints and tectonic significance of amphibolite-gneiss xenoliths in
an Early Proterozoic arc complex (2.1 Ga) in the Mako area, Kedougou Inlier, eastern Senegal.
In: Dia, A. (Ed.), Early Proterozoic: Geochemical and Structural Constraints-Metallogeny-
Atmosphere. International Symposium, January 1993, vol. 23. CIFEG Occas. Publ.,
Dakar/Senegal, pp. 20-23.
Dia, A., Rocci, G., Bassot, J.P., Albarede. F., Dioh, E., Diallo, D.P., Ngom, P.M. and Sylla, M., 1993.
The Early Proterozoic magmatism of the Mako Supergroup area, eastern Senegal-
characteristics of new crust. In: Dia, A. (Ed.), Early Proterozoic: Geochemical and Structural
Constraints-Metallogeny- Atmosphere. International Symposium, January 1993, vol. 23.
CIFEG Occas. Publ., Dakar/Senegal, pp. A19-A22.
Dia, A., Van Schmus, W.R., Kroner, A., 1997. Isotopic constraints on the age and formation of a
Paleoproterozoic volcanic arc complex in the Kédougou Inlier, eastern Senegal, West Africa.
Journal of African Earth Sciences 24 (3), 19-213.
Diene, M., Gueye, M., Diallo, D.P., Dia, A., 2012. Structural evolution of a Precambrian segment:
example of the Palaeoproterozoic formations of the Mako belt (eastern Senegal, West Africa).
International Journal of Geosciences 3, 153-165.
Dioh, E., Béziat, D., Debat, P., Grégoire, M., Ngom, P.M., 2006. Diversity of the Palaeoproterozoic
granitoids of the Kédougou inlier (eastern Senegal): Petrographical and geochemical
constraints. Journal of African Earth Sciences 44, 351-371.

168
Grimaud, J. L., 2014. Dynamique long-terme de l'érosion en contexte cratonique : l'Afrique de
l'Ouest depuis l'Eocène. Earth Sciences. Université Paul Sabatier - Toulouse III, 2014. French.
<tel-00982077>
Hanssen, E., Kaisin, J., Mounkoro, B., Hill, J., 1998. Sadiola sulphide drilling project. Unpublished,
report to IAMGOLD Corporation on behalf of SEMOS, November 1998, 87p.
Hein, K.A.A., 2007. Sadiola & Yatela opencasts and satellite pits, Alamoutala opencast pit & the
Dinnguilou prospect, Mali: notes on the geology, palaeogeography and gold metallogenesis.
Report to Société D'Exploitation des Mines d'Or de Sadiola S.A, Sept 2007, 19p.
Hein, K.A.A., Tshibubudze, A., 2007. Sadiola Ore Genesis Model, Sadiola Mine and satellite pits,
Mali. Unpublished report to Société Exploitation des Mines d‘Or de Sadiola S.A. (SEMOS),
16p.
Hein, K.A.A., 2008. Geology of the Sadiola opencast pit and ancillary pits, Mali. (Draft) final report
to SEMOS SA, Jan 2008, 18p.
Hein, K.A.A., Matsheka, I.R., Bruguier, O., Masurel, Q., Bosch, D., Caby, R.; Monié, P., 2015. The
Yatela gold deposit: 2 Billion years in the making. Journal of African Earth Sciences Special
Volume, 29p.
Hirdes, W., Davis D.W., 2002. U-Pb Geochronology of Palaeoproterozoic Rocks in the Southern Part
of the Kédougou-Kéniéba Inlier, Senegal, West Africa: Evidence for Diachronous Accretionary
Development of the Eburnean Province. Precambrian Research 118, 83-99.
Keita, M., 2003. Etude de la distribution qualitative et quantitative des sulfures et leur rapport lith-
stuctural avec la minéralisation aurifère dans la mine d’or de Sadiola.
Keith, S. M., 2004. The systems engineering of automated fire assay laboratories for the analysis of
the precious metals. Dissertation presented for the Degree of DOCTOR OF PHILOSOPHY
(Extractive Metallurgical Engineering Science), 295p.
Klöckner Industries (1989) Notice explicative de la carte géologique du Mali occidental, Direction
Nationale de la Géologie et des Mines, Ministère de l'industrie, République du Mali.
Lawrence, D.M., Treloar, P.J., Rankin, A.H., Harbidge, P., Holliday, J., 2013. The Geology and
Mineralogy of the Loulo Mining District, Mali, West Africa: Evidence for Two Distinct Styles
of Orogeny Gold Mineralisation. Economic Geology 108, 199–227.
Ledru, P., Pons, J., Milési, J.P., Feybesse, J. L, Johan, V., 1991. Transcurrent tectonics and polycyclic
evolution in the lower Proterozoic of Senegal- Mali. Precambrian Research 50, 337-354.
Lompo, M., 2010. Paleoproterozoic structural evolution of the Man-Leo Shield (West Africa). Key
structures for vertical to transcurrent tectonics, Feb 2010, 18p.
Milesi, J. P., Ledru, P., Dommanget, A., Johan, V. and Diallo, M. 1989. Lower Proterozoic succession
in Senegal and Mali (West Africa): posrtion of sediment-hosted Au and Fe deposits of Loulo
area and significance in terms of crustal evolution. Abstracts, 28th international Geological
Congress Washington. July, 2-3, ~~353-357. Washington DC, USA.

169
Milési, J.P., Ledru, P., Feybesse, J.L., Dommanget, A., and Marcoux, E., 1992, Early Proterozoic ore
deposits and tectonics of the Birimian orogenic belt, West Africa: Precambrian Research, v. 58,
p. 305–344.
Maroun, J. S., Lindsey R. C., Cline, A. S., Page A., John M., 2017. High-Grade Gold Deposition and
Collapse Breccia Formation, Cortez Hills Carlin-Type Gold Deposit, Nevada, USA. Bulletin of
the society of economic geologists. June 2017, Vol. 112, 707-740. 34p
Masurel, Q., Thébaud, N., Miller, J., 2013. Controls on the genesis, geometry and location of the
Sadiola gold system in Mali, West Africa. Quarterly Report October 2013. Unpublished report
to SEMOS, Mali, 22p.
Masurel, Q., Thébaud, N., Miller, J., 2014. Controls on the genesis and location of the Sadiola gold
system. Annual Report 2014, 1-41.
Masurel, Q., Miller, J., Hein, K.A.A., Hanssen, E., Thébaud, N., Ulrich, S., Kaisin, J., Tessougue, S.,
2016, The Yatela gold deposit in Mali, West Africa: The final product of a long-lived history of
hydrothermal alteration and weathering: Journal of African Earth Sciences, v. 113, p. 73–87.
Masurel, Q., Thébaud, N., Miller, J., Ulrich, S., Hein, K., Cameron, G., Davis, J., 2017. Sadiola Hill:
A world-class carbonate hosted gold deposit in Mali, West Africa. Economic Geology Special
Volume 112, 23-47.
Masurel, Q., Thébaud, N., Miller, J., Ulrich, S., Roberts, M.P., Béziet, D., 2017. The Alamoutala
carbonate-hosted gold deposit, Kédougou-Kénieba Inlier, West Africa. Economic Geology 112,
49-72.
Ndiaye, P. M. 1994. Evolution au Protérozoïque inferieur de la région Est Saraya, Supergroupe de
Dialé-Daléma, Sénégal oriental: tourmalinisation, altérations hydrothermales et minéralisations
associées. Unpubl. Ph. D. thésis 372~. Université de Dakar, Sénégal.
Ndiaye, P.M., Dia, A., Vialette, Y., Diallo, D.P., Ngom, P.M., Sylla, M., Wade, S., Dioh, E., 1997.
Données pétrographiques, géochimiques et géochronologiques nouvelles sur les granitoïdes du
Paléoprotérozoïque du Supergroupe de Dialé Daléma (Sénégal Oriental) : implications
pétrogénétiques et géodynamiques. Journal African Earth Sciences 25, 193–208.
Ngom, P.M., 1989. Caractères géochimiques des formations Birrimiennes du Supergroupe de Mako.
(Sabadola et ses environs). J. Afr. Earth Sci. 8 (1), 91–97.
Pons, J., P. Debat, C. Oudin and J. Valero, 1991. Emplacement and evolution of a synkinematic
Pluton (Saraya granite, Senegal, West Africa). Bull. Soc. Géol. Fr., 162: 1075-1082.
Pons, J., Pons, C., Oudin, J., Valero, 1992. Kinematics of large syn-orogenic intrusions: example of
the Lower Proterozoic Saraya batholith (Eastern Senegal). Geologische Rundschau 81, 473-
486.
Pons, J., Barbey, P., Dupuis, D., Leger, J.M., 1995. Mechanisms of pluton emplacement and structural
evolution of a 2.1 Ga juvenile continental crust: the Birimian of southwestern Niger.
Precambrian Research 70, 281-301.

170
Pawlig, S., Gueye, M., Klischies, R., Schwarz, S., Wemmer, K., and Siegesmund, S., 2006,
Geochemical and Sr-Nd isotopic data on the Birimian of the Kedougou-Kenieba inlier (eastern
Senegal): Implications on the Palaeoproterozoic evolution of the West African craton: South
African Journal of Geology, v. 109, p. 411–427.
Robertson, M., Peter, L., 2016. West African goldfields. The MSA Group. 20B Rothesay Avenue,
Craighall Park, 2196, South Africa. DOI 10.18814/epiiugs/2016/v39i2/95773, June 2016,
Episodes Vol. 39 n0. 2:155-176.
Sarr, D., Fall, M., Ngom, P. M., Ndiaye, M., Kane, C.H., Ba, M., 2012. Geomechanical
Characterization of Sandstones Cliffs of Segou (Senegal, West Africa) in the Madina Kouta
Basin, February 2012, 9p.
Schwartz, M.O., and Melcher, F., 2004, The Falémé iron district, Senegal: ECONOMIC GEOLOGY,
v. 99. p. 917–939.
Schwarnecki, M., 2014. Sadiola report. Sadiola goldfield regolith mapping, Mali. Unpublished report
to Société Exploitation des Mines d‘Or de Sadiola S.A. (SEMOS), 8p.
Sillitoe, R.H., 1994. Comments on mineralisation style and exploration approach at the gold prospects
of Sadiola in Mali, Bambadji in Sénégal and Yako-Arbole in Burkina Faso, West Africa.
Unpublished report to Anglo America Corporation S.A. Limited, July 1994, 17p.
Sillitoe, R. H., 2005, Supergene Oxidized and Enriched Porphyry Copper and Related Deposits:
Economic Geology, 100th Anniversary Volume, p. 723-768.
Strydom, D., Rompel, A.K.K., 1997. Structural investigation of the Sadiola exploitation and
exploration area in the Kéniéba Kédougou window, western Mali. Anglo American
Corporation of South Africa Limited, Vol1, 4p.
Taylor, P.N., Moorbath, S., Leube, A., Hirdes, W., 1992. Early Proterozoic crustal evolution in the
Birimian of Ghana: constraints from geochronology and isotope geochemistry. Precambrian
Res. 56, 97–111.
Theron, S.J., 1997. Possible genetic model for gold mineralisation within the greater Sadiola
Concession Area. Unpublished Memorandum to AARL Geology, Sadiola, 3p.
Traoré, S., Samaké, M., 2010. Sadiola monthly report. Sadiola Mine and satellite pits, Mali.
Unpublished report to Société Exploitation des Mines d‘Or de Sadiola S.A. (SEMOS), 12p.
Voet, H.W., 1996. The Sadiola Hill orebody in western Mali - A giant diorite gold porphyry deposit
with Carlin-like characteristics. Unpublished report to Anglo American Corporation of South
Africa Limited, 15p.
Voet, H.W., 1997. Cross folding at Sadiola Hill mine and the possible extent of the orebody to the
south. Unpublished, report to Anglo American Corporation of South Africa Limited, File 13-
147-500(a), 19 November 1997, 3p.

171
Villeneuve, M., 2008, Review of the orogenic belts on the western side of the West African craton:
the Bassarides, Rokelides and Mauritanides: Geological Society of London Special Publication
297, p. 169–201.