
Understanding the Path of Labour Supply Adjustment - EconStor
41
econstor Make Your Publications Visible. A Service of zbw Leibniz-Informationszentrum Wirtschaft Leibniz Information Centre for Economics Blundell, Richard W.; Brewer, Mike; Francesconi, Marco Working Paper Job changes and hours changes: Understanding the path of labour supply adjustment IZA Discussion Papers, No. 3044 Provided in Cooperation with: IZA – Institute of Labor Economics Suggested Citation: Blundell, Richard W.; Brewer, Mike; Francesconi, Marco (2007) : Job changes and hours changes: Understanding the path of labour supply adjustment, IZA Discussion Papers, No. 3044, Institute for the Study of Labor (IZA), Bonn This Version is available at: http://hdl.handle.net/10419/34749 Standard-Nutzungsbedingungen: Die Dokumente auf EconStor dürfen zu eigenen wissenschaftlichen Zwecken und zum Privatgebrauch gespeichert und kopiert werden. Sie dürfen die Dokumente nicht für öffentliche oder kommerzielle Zwecke vervielfältigen, öffentlich ausstellen, öffentlich zugänglich machen, vertreiben oder anderweitig nutzen. Sofern die Verfasser die Dokumente unter Open-Content-Lizenzen (insbesondere CC-Lizenzen) zur Verfügung gestellt haben sollten, gelten abweichend von diesen Nutzungsbedingungen die in der dort genannten Lizenz gewährten Nutzungsrechte. Terms of use: Documents in EconStor may be saved and copied for your personal and scholarly purposes. You are not to copy documents for public or commercial purposes, to exhibit the documents publicly, to make them publicly available on the internet, or to distribute or otherwise use the documents in public. If the documents have been made available under an Open Content Licence (especially Creative Commons Licences), you may exercise further usage rights as specified in the indicated licence. www.econstor.eu
-
Upload
khangminh22 -
Category
Documents
-
view
5 -
download
0
Transcript of Understanding the Path of Labour Supply Adjustment - EconStor

econstorMake Your Publications Visible.
A Service of
zbwLeibniz-InformationszentrumWirtschaftLeibniz Information Centrefor Economics
Blundell, Richard W.; Brewer, Mike; Francesconi, Marco
Working Paper
Job changes and hours changes: Understanding thepath of labour supply adjustment
IZA Discussion Papers, No. 3044
Provided in Cooperation with:IZA – Institute of Labor Economics
Suggested Citation: Blundell, Richard W.; Brewer, Mike; Francesconi, Marco (2007) : Jobchanges and hours changes: Understanding the path of labour supply adjustment, IZADiscussion Papers, No. 3044, Institute for the Study of Labor (IZA), Bonn
This Version is available at:http://hdl.handle.net/10419/34749
Standard-Nutzungsbedingungen:
Die Dokumente auf EconStor dürfen zu eigenen wissenschaftlichenZwecken und zum Privatgebrauch gespeichert und kopiert werden.
Sie dürfen die Dokumente nicht für öffentliche oder kommerzielleZwecke vervielfältigen, öffentlich ausstellen, öffentlich zugänglichmachen, vertreiben oder anderweitig nutzen.
Sofern die Verfasser die Dokumente unter Open-Content-Lizenzen(insbesondere CC-Lizenzen) zur Verfügung gestellt haben sollten,gelten abweichend von diesen Nutzungsbedingungen die in der dortgenannten Lizenz gewährten Nutzungsrechte.
Terms of use:
Documents in EconStor may be saved and copied for yourpersonal and scholarly purposes.
You are not to copy documents for public or commercialpurposes, to exhibit the documents publicly, to make thempublicly available on the internet, or to distribute or otherwiseuse the documents in public.
If the documents have been made available under an OpenContent Licence (especially Creative Commons Licences), youmay exercise further usage rights as specified in the indicatedlicence.
www.econstor.eu
IZA DP No. 3044
Job Changes and Hours Changes:Understanding the Path of Labour Supply Adjustment
Richard BlundellMike BrewerMarco Francesconi
DI
SC
US
SI
ON
PA
PE
R S
ER
IE
S
Forschungsinstitutzur Zukunft der ArbeitInstitute for the Studyof Labor
September 2007
Job Changes and Hours Changes:
Understanding the Path of Labour Supply Adjustment
Richard Blundell University College London,
Institute for Fiscal Studies and IZA
Mike Brewer Institute for Fiscal Studies
Marco Francesconi
University of Essex, Institute for Fiscal Studies and IZA
Discussion Paper No. 3044 September 2007
IZA
P.O. Box 7240 53072 Bonn
Germany
Phone: +49-228-3894-0 Fax: +49-228-3894-180
E-mail: [email protected]
Any opinions expressed here are those of the author(s) and not those of the institute. Research disseminated by IZA may include views on policy, but the institute itself takes no institutional policy positions. The Institute for the Study of Labor (IZA) in Bonn is a local and virtual international research center and a place of communication between science, politics and business. IZA is an independent nonprofit company supported by Deutsche Post World Net. The center is associated with the University of Bonn and offers a stimulating research environment through its research networks, research support, and visitors and doctoral programs. IZA engages in (i) original and internationally competitive research in all fields of labor economics, (ii) development of policy concepts, and (iii) dissemination of research results and concepts to the interested public. IZA Discussion Papers often represent preliminary work and are circulated to encourage discussion. Citation of such a paper should account for its provisional character. A revised version may be available directly from the author.

IZA Discussion Paper No. 3044 September 2007
ABSTRACT
Job Changes and Hours Changes: Understanding the Path of Labour Supply Adjustment*
This paper uses British panel data to investigate single women’s labour supply changes in response to three tax and benefit policy reforms that occurred in the 1990s. These reforms changed individuals’ work incentives and we use them to identify changes in labour supply. We find evidence of small hours of work effects for two of such reforms. A third reform in 1999 instead led to a significant increase in single mothers’ hours of work. The mechanism by which the labour supply adjustments were made occurred largely through job changes rather than hours changes with the same employer. These results are confirmed when we look at hours changes by stated labour supply preferences. Finally, we find little overall effect of the reforms on wages. JEL Classification: C23, H31, I38, J12, J13, J22 Keywords: job mobility, hours flexibility, labour supply preferences, hours-wage trade-off,
monopsony Corresponding author: Marco Francesconi Department of Economics University of Essex Colchester CO4 3SQ United Kingdom E-mail: [email protected]
* Financial supports from the Department of Trade and Industry ‘Labour Market Flexibility Small Grant Fund 2004’ and from the ESRC Centre for the Microeconomic Analysis of Public Policy (CPP) at the IFS are gratefully acknowledged. We thank Alison Booth, Mark Bryan, Jan van Ours, Jeff Smith, Arthur van Soest, and seminar participants at the Universities of Essex and Tilburg, Institute for Fiscal Studies, Bank of England, Bank of Spain, UK Department for Education and Skills (London), the 2005 European Society for Population Economics (Paris) and the Econometric Society World Congress 2005 (London) for helpful suggestions. We are responsible for all remaining errors and shortcomings of the paper.
I. Introduction
The use of the canonical model of labour supply for policy analysis is pervasive. A central tenet of
this model is that workers have flexible choices over hours of work, selecting their desired utility-
maximising level at any given wage. A number of studies have cast some doubt on this model by
arguing that there is not free choice of hours within a job and limited choice across jobs, and
providing evidence of job “packages” whereby wage and hours are tied together.1 Most of the
contributions in this literature however identify hours constraints by relying on observed individual
characteristics (e.g., number and age of children, or job mobility) or stated labour supply
preferences (Ham, 1982; Moffitt, 1984; Lundberg, 1985; Altonji and Paxson, 1988; Stewart and
Swaffield, 1997; Euwals, 2001). These two strategies are problematic because changes in labour
supply preferences or other individual variables may not be exogenous to hours levels or changes.
Our strategy is to use a sequence of policy reforms that directly affected the labour supply
incentives of specific groups of individuals while leaving the incentives faced by others unchanged.
Our objective is to use these reforms to assess the degree of flexibility of hours changes within and
across jobs. The emphasis is more on the extent of within- and between-job flexibility ⎯ whether it
is large or small and for which type of workers it is larger or smaller ⎯ rather than on the question
of whether hours flexibility is complete or not. Specifically, we analyse transitions from positive
hours of work to positive hours of work made by single women in response to (exogenous) tax and
benefit policy changes that occurred in Britain in the 1990s. We use three different reforms to
highlight likely actual movements along the labour supply curve, and combine these with
information on stated preferences and job mobility to assess whether and how women adjust their
labour supply in response to changes in the incentives to work a given number of hours.
Many of the tax and benefit reforms in the United Kingdom, Canada, and the United States
has been directed at increasing the labour market attachment of the lower skilled workers, in
particular those facing high fixed costs of work such as childcare (Blundell, 2002). A significant
1 See Blundell and MaCurdy (1999) for an overview.
1

part of the rise in employment among single mothers in the US over the late 1980s and 1990s has
been attributed to the expansion of the Earned Income Tax Credit (Eissa and Liebman, 1996; Meyer
and Rosenbaum, 2001). Similarly, it has been argued that much of the rise in the participation of
single mothers in the UK has been due to increases in the generosity of the tax credit policies,
namely Family Credit (FC) and Working Families’ Tax Credit (WFTC).2 The self-sufficiency
experiment in Canada provided further experimental evidence on the effectiveness of financial
incentives on the working decisions of low income single parents (Card and Robins, 1998). An
interesting feature of the UK reforms has been the changing incentive structure towards part-time
and full-time work engendered by these reforms. Not only has employment responded to these
reforms but so has the distribution of weekly hours of work (Blundell et al., 2000; Brewer, 2001).
However, the mechanism for these adjustments in labour supply has not been studied. Are
adjustments to hours made by moving jobs or do workers adjust their hours of work over time with
the same employer? This mechanism of adjustment is the focus of this paper.
For such an analysis panel data are essential, as it is necessary to know the employment
position and hours worked of each specific individual before and after adjustment takes place. Since
1991 a high-quality panel data survey, the British Household Panel Survey (BHPS), has been
collected annually for Britain, and that is the data source we use in our analysis covering the period
1991-2002. The BHPS also has the attraction of recording individuals’ stated preferences toward
hours of work, so that actual movements can be examined alongside changes in stated preferences.
Even if hours were completely fixed within jobs but mobility between jobs was costless, we
would still expect workers to be located on their labour supply curve, i.e., at their most preferred
level of hours given the market wage. But if there are individual costs to moving between jobs or
firms collectively require a given number of hours due to facing fixed costs or technology-related
coordination requirements,3 then workers will face immobility (at least in the short run) on the
2 Blundell and Hoynes (2004) and Brewer et al. (2006) present a comprehensive review of the evidence. 3 Card (1990) argues that constraints are the result of nonconvexities in the relationship between output and individual hours due to start-up costs or other aspects of the technology used.
2

hours they can work. This has implications for the interpretation of data on actual and preferred
hours of work, rates of mobility between jobs, and for estimating models of labour supply. Various
strands of research have suggested models of hours choice where hours are fixed within jobs. One
strand, which dates back to Barzel (1973) and Rosen (1976), grounds its analysis in models where
jobs are packages of fixed hours-wage combinations (Ham, 1982; Moffitt, 1984; Lundberg, 1985;
Biddle and Zarkin, 1989; Kahn and Lang, 1991; Altonji and Paxson, 1988, 1992; Dickens and
Lundberg, 1993). Another more recent strand is developed within a monopsonistic environment,
where employer preferences play a key role in determining hours of work in a given job (Manning,
2003).
In this study we are interested in examining if and how employed single mothers vary their
hours in response to exogenous changes in the incentives to work a given level of hours. For this
purpose, we use reforms to the tax and benefit system that changed the hours conditions for FC in
1992 and 1995 and the attractiveness of work through WFTC in 1999 to assess the ‘canonical’
model of hours flexibility. We also look at how changes in hourly wages both within and between
jobs relate to the introduction of the reforms. Although this analysis can be biased by the usual
endogeneity problems, it is likely to give us a more exhaustive picture of the British labour market
and an indication of the possible presence of imperfections or technological rigidities.
Besides providing us with relatively “clean” experiments to test hours constraints, these
three tax/benefit reforms (especially the WFTC programme) have also been widely analysed in
previous studies (Bingley and Walker, 1997; Blundell et al., 2000; Blundell and Hoynes, 2004;
Gregg and Harkness, 2003; Brewer et al., 2006; Francesconi and Van der Klaauw, 2007). These
studies have come up with broadly consensual evaluations of the reforms’ effects on a number of
outcomes, including employment and wages. None of these studies, however, focuses on changes in
worked hours. Stewart and Swaffield (2004) examine the working hours of low-wage employees in
the UK, but analyse the impact of the introduction of the National Minimum Wage in April 1999
rather than the impact induced by reforms that potentially changed the incentive to work a given
3

number of hours per week. Their results indicate that the minimum wage had a negative effect on
hours worked by low-wage women, although they do not show how single women with and without
children have been differentially affected. In addition, neither these studies nor the earlier research
on wage-hours packages analyse job changing behaviour as a mechanism to adjust hours of work or
address the broader issue of labour supply adjustment.4
We find that the introduction of the WFTC reform in 1999 led to a substantial increase in
single mothers’ hours of work. The primary mechanism for this adjustment was through job
changes rather than labour supply adjustments within a job. There is a good deal of heterogeneity in
the effects of the WFTC reform, with evidence of even less adjustment within jobs emerging among
single mothers whose youngest child was aged 0-4, and who worked in larger firms, service
industries, and the public sector. The presence of some hours inflexibility within jobs is confirmed
when we look at hours changes by stated labour supply preferences. Women who stated that they
were unconstrained in their job showed the largest upward adjustments after the WFTC reform if
they changed job. Similarly, and again in line with their stated preferences, overemployed women
showed the largest downward adjustments after the 1992 FC reform (which reduced the minimum
work requirement to receive FC from 24 to 16 hours a week) only if they changed job. Finally, we
find relatively little effect on wages. However, there is some weak evidence that certain groups of
women (especially single mothers who lived in London and the South East) operated under
monopsonistic conditions, whereby changing job led to significantly lower wages after the
introduction of WFTC.
Our research is likely to be relevant for many aspects of labour market policy, especially for
the design of tax credit and benefit policies which specify a minimum number of hours of work per
week as a precondition for entitlement to a given payment (e.g., the Working Tax Credit, and the
4 There has been relatively little analysis of hours constraints in Britain. Two studies that have investigated the extent of constrains on desired hours are Stewart and Swaffield (1997) and Bryan (2007). Using data from the British Household Panel Survey, they both find that a substantial proportion of male workers (Stewart-Swaffield) and male and female workers (Bryan) are not putting in the hours they would like, with most of the dissatisfied workers wishing to work fewer hours per week. Both studies, however, abstract from the way in which job changes are related to hours changes, and, more broadly, from the issue of the path of labour supply adjustment.
4

current demonstration project for the Employment Retention and Advancement Scheme in the UK).
From the result that hours are not very flexible within jobs, we can infer that changes to the
tax/benefit incentives to work a given number of minimum hours are likely to influence rates of job-
to-job transitions for the affected groups of workers.
The next section briefly explains the rules and structure of the FC/WFTC programs, and
discusses our estimation approach and identification strategy. Section III introduces the data, and
describes the variables used in the analysis. Section IV presents the empirical results, and Section V
summarizes our main results.
II. ‘In Work’ Benefit Reforms in the United Kingdom
A. Institutional Background
Programmes to support low-income working families with children (hereafter called “in-work
benefits”, even though the more recent programmes are officially designated tax credits) have a
long history in the United Kingdom. A peculiar feature of the UK’s in-work benefits is that awards
depend not just on the earned and unearned income and family characteristics, but also directly on
(weekly) hours of work: since their inception, in-work benefits have only been available to families
with children who usually work some minimum number of hours a week.5
Two in-work benefits were in operation during our sample period: Family Credit (FC),
which existed from April 1988 until September 1999, and the Working Families’ Tax Credit
(WFTC), which existed from October 1999 until March 2003.6 In April 1992, the minimum work
requirement in FC fell from 24 to 16 hours a week. This occurred between the first two waves of the
BHPS. The impact of this reform on single parents’ labour supply is ambiguous: those working
5 Hours rules are an important feature of the UK’s welfare system more generally. Receipt of the basic safety-net welfare benefit (Income Support or income-related Jobseekers’ Allowance) is conditional on both working less than a certain number of hours and having a sufficiently low income. For parents, the hours rules for welfare benefits and in-work benefits are aligned so that families can never be entitled to both. 6 Since 1998, the transfer system affecting lone parents has undergone nearly continuous reform. However, the most important change, in terms of both government expenditure and potential labour supply effects, was the introduction of WFTC. We do not want to claim however that there has been a stable post-reform period since October 1999. On this and other related and concurrent policy initiatives, see the discussion in the next subsection.
5

more than 16 hours had an incentive to cut hours to (no less than) 16, while those previously
working fewer than 16 hours had an incentive to increase their labour supply to (at least) the new
cut-off. In 1995, there was another reform to Family Credit, in the form of an additional (small)
credit for those adults working full time (i.e., 30 or more hours a week). This reform affected the
labour supply decisions of lone parents in obvious ways: there was an increased incentive for those
working less than 30 hours to increase their hours to 30, but an income effect meant that those
already working at least 30 hours had an incentive to cut their hours worked to no less than 30.
The 1999 WFTC reform has a more complicated impact on labour supply. WFTC was more
generous than FC in three ways: it had higher credits, particularly those for young children, families
could earn more before the benefit began to be withdrawn, and it had a lower withdrawal/taper rate.
Overall, the reform increased the attractiveness of working 16 or more hours a week compared to
working fewer hours. But the last of the three aspects of the reform meant that the biggest income
gains were experienced by families just at the end of the FC taper (i.e., families whose earnings had
reduced their entitlement to FC just to zero), who tended to be working full time (Blundell et al.,
2000). The expected impact of the WFTC reform on lone parents’ labour supply, conditional on
working 16 or more hours, is as follows: (i) people receiving the maximum FC award will face an
income effect away from work, but not below 16 hours a week; (ii) people working more than 16
hours and not on maximum FC will face an income effect away from work (but not below 16 hours
a week), and a substitution effect towards work; (iii) people working more than 16 hours and
earning too much to be entitled to FC but not WFTC (“windfall beneficiaries”) will face income and
substitution effects away from work if they claim WFTC (see Blundell and Hoynes, 2004; Brewer
et al., 2006).7
7 It is worthwhile noticing that, for all three reforms, work incentives were likely to be dampened for single mothers living in areas with high childcare costs or high house rents (e.g., London and the South East of England). The availability of a more generous childcare tax credit component under WFTC might reduce this problem (Francesconi and Van der Klaauw, 2007), although high and increasing rents had to be weighed within the trade-off between additional tax credit gains and lower Housing Benefit entitlements (Gregg and Harkness, 2003). In Section IV.B we will present and discuss estimation results obtained after stratifying the sample by child’s age, housing tenure, and region of residence.
6

The occurrence of such reforms (i.e., the 1992 fall in hours requirement for FC, the 1995
additional credit for working full time, and the introduction of the WFTC programme in 1999)
means that we can divide our sample into three periods: (a) Autumn 1991 to (March) 1995, with the
post-reform period (which in our analysis we label FC, i.e., under the in-work benefit regime of FC)
covering the years 1992-94; (b) April 1995 to September 1999, with the post-reform period
(labelled FC+) being defined over the years 1995-97; and (c) October 1999 to the end of the
sample, with the post-reform period (labelled WFTC) being between 1999 and 2002.8 In our
empirical analysis we take advantage of each of these separate reforms: not only did they have the
potential to affect single mothers’ hours of work, but they also could have done so in opposite
directions. However, although we use this three-group categorization, most of our analysis will only
isolate the 1992 and 1999 reforms (as the additional credit under FC+ was small), and focus on the
few years immediately following the introduction of each policy change.
B. Analytical Framework and Identification Issues
To assess whether female labour supply adjustments operate through job changes in response to
exogenous changes in the incentives to work a given number of hours, we estimate four different
specifications of a simple model of hours changes. We perform this assessment using a difference-
in-difference method (Ashenfelter, 1978; Heckman and Robb, 1985): that is, we identify the FC and
WFTC effects on single mothers’ behaviour through the differential tax and benefit treatment that
they receive as compared to a control group, which is given by single women without children.9
8 In Section IV.A we shall return to the definition of the post-reform periods. Brewer (2001) has a detailed time-line of reforms to in-work benefits between 1971 and 2000. This does not reflect the reforms in April 2003 which lie outside our sample, and which are described in Brewer (2003). 9 The choice of single women without children as control group in our analysis is somewhat arbitrary. Albeit not eligible to receive FC or WFTC because they do not have children, these women are different from single mothers along a number of observable characteristics (see Section III). Most of the existing studies on the effect of in-work benefits on lone mothers use the same control group as used here, whether they look at the UK (Blundell et al., 2000; Blundell and Hoynes, 2004; Francesconi and Van der Klaauw, 2007; Gregg and Harkness, 2003) or the US experience (Eissa and Liebman, 1996; Meyer and Rosenbaum, 2001). Blundell and MaCurdy (1999) lay out the identification conditions for such an analysis. Their credibility in the context of the analysis of tax reform is further discussed in Heckman’s (1996) comment on Eissa (1996). In Section IV, however, we perform some sensitivity analysis in which the control group is restricted to single childless women with lower educational attainment.
7

The main identification condition underlying this approach is that, other than the introduction of the
changes in in-work benefits, there are no contemporaneous shocks that affect the relative outcomes
of the treatment and control groups. Therefore, identification relies on the assumption that variation
in labour supply preferences of single parents be independent of the reforms conditional on the
observed covariates and time effects.10
At the time of the introduction of the 1999 reform, however, there were other shocks that
might have influenced single mothers’ and childless women’s labour supply differently. Three
policy changes in particular could have interacted with the WFTC effects. First, there was an
increase in basic child benefits under Income Support (the main welfare benefit, similar to the Aid
to Families with Dependent Children or Temporary Aid to Needy Families in the United States)
between 1998 and 1999. In terms of labour supply, however, this increase implies a negative
income effect that could lead to a downward bias in our effect estimates. Our estimates may then
represent a lower bound of the true effect. Second, the National Minimum Wage (NMW) was
introduced in April 1999 (Dickens and Manning, 2004; Stewart, 2004). The NMW might have
affected both the extensive margin of labour supply (inducing inactive women to get a job) and the
intensive margin (increasing the incentives for working women to work more hours). But such
incentives presumably had the same impact on single mothers’ behaviour as they did on single
childless women’s. The NMW-related shock, therefore, is not likely to have changed the
employment outcomes of the treatment group differently from those of the control group.
Third, between July 1997 and October 1998, the British government launched a series of
New Deal programmes intended to help different groups of low-income people move from welfare
into work using a combination of intensive job-search assistance and small basic skills courses
(Blundell et al. 2004; Van Reenen, 2004). One of such initiatives, the New Deal for Lone Parents
(NDLP), was aimed at all lone parents in receipt of Income Support with children under 16 and
whose youngest child was over five years and three months (from April 2000 this lower age cut-off
10 In general, conditioning can be accomplished nonparametrically by combining matching and difference-in-differences. We find that this makes very little difference to our estimates, which condition linearly on covariates.
8

was dropped to three).11 Under NDLP, lone parents were assigned to a personal advisor, whom they
were supposed to meet once every two weeks to receive advice on job vacancies, in-work benefits,
childcare arrangements, training, and job search techniques. One interesting aspect of NDLP, which
was shared with some (but not all) other New Deal programmes, was that involvement in the
scheme and searching for work were entirely voluntary, and benefit entitlements did not depend on
whether people decided to enter the scheme or not.12 Single women without children were not
involved in a similar initiative, unless they too were longer-term unemployed and had low income.
Therefore, NDLP and any of the other New Deal schemes were likely to affect women – whether
single mothers or not – only to the extent that they were unemployed. But since unemployed and
out-of-the-labour-force women are excluded from our analysis (in fact, women must be employed
for at least two consecutive years to be included in our sample; see Section III), the influence of
NDLP on hours changes is likely to be limited. In any case, as single mothers, on average, have less
education and are more likely to be unemployed, we performed sensitivity checks that will be
discussed in Section IV.A by replicating our analysis using a more restricted control group,
consisting of single childless women with low educational attainment.
Turning to the model specifications, let ithΔ denote the change in total (usual and overtime)
weekly hours of work between year t-1 and year t; let be a dummy variable that is equal to 1 if
woman i is a lone mother at time t-1, and 0 otherwise; and let be equal to 1 if woman i changes
a job between year t-1 and t, and zero otherwise. The four specifications are as follows:
1−itd
itQ
=Δ ith )2002 I(1999 )19941992(I 112110 ≤≤+≤≤+++ −−− tQdtQdQd ititWFTCititFCitit ββααα + itit εγ +′X (1)
11 Eligibility to and provisions of the various New Deal schemes have slightly changed over time. In relation to NDLP, since 2002 lone parents are eligible to NDLP not only if they are in receipt of Income Support (as they were in previous years) but also if they receive other benefits (such as Housing Benefit and Council Tax Benefit) and, importantly, WFTC (as well as maternity allowance and statutory maternity pay). Also eligible are lone parents working under 16 hours per week (and thus ineligible to WFTC) who are not claiming any benefits, except child benefit. All these changes, however, were implemented outside our sample period. 12 Compulsory Work Focused Interviews (CWFI) for lone parents claiming Income Support were introduced in April 2001. Under CWFI people of working age seeking to claim Income Support are obliged to participate in a work-focused interview with an advisor at the start of their claim as a condition of receiving the benefit. Kirby and Riley (2004) find little evidence that CWFI increase labour market participation amongst inactive benefit claiming lone mothers.
9

=Δ ith )19941992(I)()( 1132312110 ≤≤+++++ −−− tQdtdQd ititFCititit βδααααα )20021999(I1 ≤≤+ − tQd ititWFTCβ + itit εγ +′X
(2)
=Δ ith )20021999(I)()19941992(I)( 14132110 ≤≤++≤≤++++ −−− tdbtdbQd itWFTCitFCitit ααααα )2002 I(1999 )1994 I(1992 11 ≤≤+≤≤+ −− tQdtQd ititWFTCititFC ββ itit εγ +′+ X (3)
=Δ ith )2002 I(1999 )19941992(I 22212110 ≤≤+≤≤+++ − tQtQQd itititit ααααα
)2002 I(1999)( )19941992(I)( 1413 ≤≤++≤≤++ −− tdbtdb itWFTCitFC αα )2002 I(1999)1994 I(1992 11 ≤≤+≤≤+ −− tQdtQd ititWFTCititFC ββ + itit εγ +′X , (4)
where I(w) is a function indicating that the event w occurs; )(tδ in equation (2) is a linear time
trend; is a vector of individual characteristics measured either at t-1 or between t-1 and t; and itX
itε is an i.i.d. error term. The variables in described in detail in the next section, are a cubic
polynomial in total work experience, dummy variables for race, educational qualification, firm size,
public sector, region of residence, housing tenure, union coverage, and industry, the number and
changes in the number of children by age group, and changes in health status and local
unemployment rate.
,X
13 The treatment effects for movers are captured by FCβ and WFTCβ , while
and respectively capture the FC and WFTC treatment effects for workers who did not change
job (stayers).
FCb
WFTCb
14
The key differences across equations (1)-(4) involve the specification of time trends. In
equation (1), time trends are not modelled, except those operating through FCβ and .WFTCβ
Equation (2) instead allows for group-specific linear time trends (captured by 31α and ),32α while
in equation (3), we have a more flexible specification with group-specific discrete jumps for stayers
after both the 1992 and 1999 reforms and Finally, equation (4) introduces even greater
flexibility by allowing different trends in job changing behaviour after each reform (through
FCb( ).WFTCb
21α
and ).22α If (with we cannot statistically reject the hypothesis of within-jjb β̂ˆ = ),,WFTCFCj =
13 The levels of time-varying variables are all measured at t-1. 14 It is worth noting at this point that were firms to adjust their overall shift lengths in response to these changes in desired labour supply, there could be important spill-over effects on other workers in our control group. We have not
10

job flexibility in hours choice, while if is statistically smaller than ˆjb ˆ
jβ there is evidence of hours
constraints within jobs.
Estimation of (1)-(4) is performed using ordinary least squares (OLS). However, because
our regressions are in changes,15 all individual time-invariant permanent unobservables that enter
additively in the determination of hours levels are eliminated from the estimation. In computing the
standard errors we take advantage of the fact that we have multiple observations over time, and thus
we allow for arbitrary serial correlation.
III. Data
The data we use come from the first twelve waves of the British Household Panel Survey (BHPS)
collected over the period 1991-2002. Since Autumn 1991, the BHPS has annually interviewed a
representative random stratified sample of the population of Great Britain with about 5,500
households covering more than 10,000 individuals. All adults and children in the first wave are
designated as original sample members. On-going representativeness of the non-immigrant
population has been maintained by using a ‘following rule’ typical of household panel surveys: at
the second and subsequent waves, all original sample members are followed (even if they moved
house or if their households split up), and there are interviews, at approximately one-year intervals,
with all adult members of all households containing either an original sample member, or an
individual born to an original sample member whether or not they were members of the original
sample. The sample therefore remains broadly representative of the population of Britain as it
changes over time.16
been able to locate any evidence either way on changes in shift length (or, more generally, in labour demand) at the time of these reforms in Britain, but it would clearly be useful to document evidence on this. 15 Women with zero hours at the time of any of the twelve interviews are excluded from the analysis. For further discussion on this point, see Section III. 16 Of the individuals interviewed in 1991, 88 percent were re-interviewed in wave 2 (1992). The wave-on-wave response rates from the third wave onwards have been consistently above 95 percent (that is, 95 percent of the previous-wave respondents get interviewed). Detailed information on the BHPS is presented in Lynn et al. (2006) and can be obtained at ⟨http://www.iser.essex.ac.uk/ulsc/bhps/doc/⟩. The households from the European Community Household Panel subsample (followed since the seventh wave in 1997), those from the Scotland and Wales booster subsamples (added to the BHPS in the ninth wave) and those from the Northern Ireland booster subsample (which started in wave 11) are excluded from our analysis.
11
Our estimation sample includes employed unmarried non-cohabiting females (separated,
divorced, widowed and never married) who are at least 16 years old and were born after 1941 (thus
aged at most 60 in 2002). Because equations (1)-(4) refer to changes in hours worked, we measure
hours changes conditional on being in work in period t-1 and remaining in work in period t. We
exclude any female who was long-term ill or disabled, and in school full time or self-employed or
out of the labour force in a given year. The sample includes 2,284 women who have been observed
working at least two consecutive times over the sample period and at some point were living alone,
of whom 1,122 are lone mothers and the remaining 1,162 are childless. In line with the Inland
Revenue’s definition, a child must be aged 16 or less (or be under the age of 19 and in full-time
education) to count as a dependent child for whom the single mother is responsible. Although only
16 percent of the women are observed in the same marital state for all the 12 years of the panel,
about 60 percent of them are observed for at least 7 years in the same state. The resulting sample
size, after pooling all available years for both groups of women, is 12,359 observations (4,585 on
lone mothers and 7,774 on childless women). Of the 1,280 single women in the 1999 wave of
interviews, 25 lone mothers and 32 childless women (about 4.5 percent of the sample in that year)
were interviewed just before the day in which the 1999 reform was implemented (October 5th). To
limit problems of interpretation, they were dropped from the estimating sample. Their inclusion
however does not alter any of our main results.
Table 1 presents summary statistics of the outcomes and characteristics of the two groups of
women, which we use as covariates in the empirical analysis below. There are some noticeable
differences between the two groups.17 Lone mothers are younger (30 versus 38 years), less educated
(56 percent have qualifications short of A level versus 48 percent among childless women, and only
6 percent of lone mothers have a university degree versus 14.4 percent),18 more likely to be
17 Restricting our analysis to women who work for at least two consecutive periods leads to a sample of women who are more educated and less poor than those who are observed out of the labour market more frequently. But crucially the differences between treatment and control groups in this larger sample (containing also women who are out of the labour market) are very similar to those found in the more restricted sample used in the paper. 18 For non-British readers, “A(Advanced)-level” corresponds to education beyond high school, but short of a university degree.
12

nonwhite (9 versus 4.3 percent) and in social housing (38 versus 23 percent), less likely to be
employed in the public sector (17 percent versus 25 percent), and have fewer years of work
experience. The two groups of women are instead relatively similar in terms of job changing
behaviour with 17 percent of childless women and 18 percent of single mothers moving across
employers in any two given years.19 Systematic differences emerge again in the case of labour
market outcomes. Compared to unmarried women without children, lone mothers work about 9
fewer hours per week, earn £1.20 less per hour, and nearly £420 less per month, and report a larger
change in worked hours from one year to the next (an increase of 2 hours and a quarter per week
versus less than 25 minutes).20
To gain a greater insight into how the reforms might have changed the distribution of hours
worked among all single women, Figure 1 plots histograms of total weekly hours of work for all
women in the sample by survey year (with the vertical line in each panel indicating the eligibility
hours cutoff).21 Women can be found working any number of hours from 1 to 60 per week in any
given year. In most years, we observe a great deal of variability with bunching at about 20, 30, and
35-40 hours and, depending on the year, at some hours between 40 and 50 (see also Blundell,
Duncan, and Meghir, 1998; Blundell and Hoynes, 2004). A striking feature is that, in every year up
to 1996 (perhaps with the exclusion of 1991), there was only a small fraction of workers below the
eligibility cutoff (accounting for about 15-20 percent of the single women in the sample), while in
the two years prior to the 1999 reform there was clear evidence of bunching just below the 16-hour
cutoff. From 1999 onwards, the fraction of female workers with total weekly hours between 16 and
19 Our measure of job change does not include internal promotions or job changes within the same firm or establishment, but includes all moves from one firm to another (either through quits or layoffs). Alternative definitions of job change (e.g., dropping laid-off workers from the pool of movers, or dropping promoted workers from the group of the stayers) produce similar results to those reported in this paper. See also Section IV.C. 20 To account for potential differential attrition over the panel and individual/item nonresponse in each specific wave, we recomputed group-specific means using weighted data (with either cross-sectional or longitudinal enumerated individual weights). The results (not shown) are very similar to those obtained with unweighted data and presented in Table 1, suggesting that the problems induced by panel attrition and changing sample composition are likely to be relatively small in our data. We shall return to some of these issues while performing sensitivity analysis (see Section IV.C). 21 For the sake of visual clarity, Figure 1 does not show the observations with more than 60 weekly hours. These, however, represent less than one percent of the subsamples in each survey period, and are included in the regression analysis reported below.
13
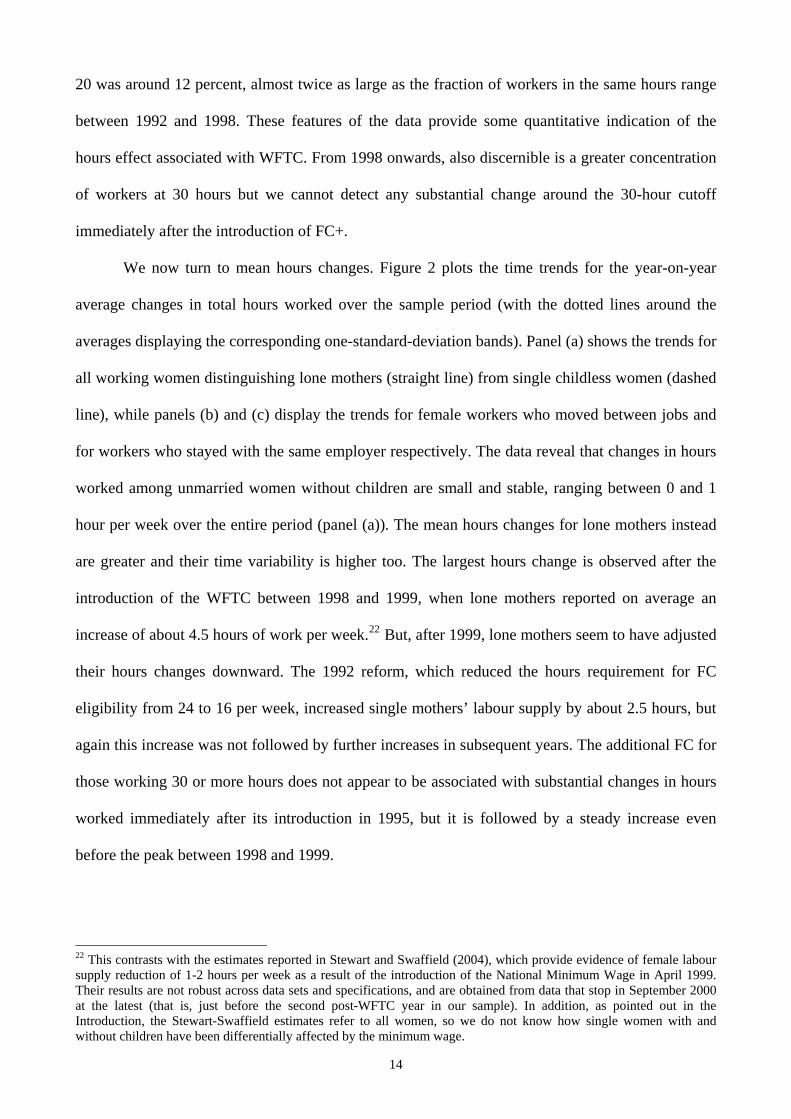
20 was around 12 percent, almost twice as large as the fraction of workers in the same hours range
between 1992 and 1998. These features of the data provide some quantitative indication of the
hours effect associated with WFTC. From 1998 onwards, also discernible is a greater concentration
of workers at 30 hours but we cannot detect any substantial change around the 30-hour cutoff
immediately after the introduction of FC+.
We now turn to mean hours changes. Figure 2 plots the time trends for the year-on-year
average changes in total hours worked over the sample period (with the dotted lines around the
averages displaying the corresponding one-standard-deviation bands). Panel (a) shows the trends for
all working women distinguishing lone mothers (straight line) from single childless women (dashed
line), while panels (b) and (c) display the trends for female workers who moved between jobs and
for workers who stayed with the same employer respectively. The data reveal that changes in hours
worked among unmarried women without children are small and stable, ranging between 0 and 1
hour per week over the entire period (panel (a)). The mean hours changes for lone mothers instead
are greater and their time variability is higher too. The largest hours change is observed after the
introduction of the WFTC between 1998 and 1999, when lone mothers reported on average an
increase of about 4.5 hours of work per week.22 But, after 1999, lone mothers seem to have adjusted
their hours changes downward. The 1992 reform, which reduced the hours requirement for FC
eligibility from 24 to 16 per week, increased single mothers’ labour supply by about 2.5 hours, but
again this increase was not followed by further increases in subsequent years. The additional FC for
those working 30 or more hours does not appear to be associated with substantial changes in hours
worked immediately after its introduction in 1995, but it is followed by a steady increase even
before the peak between 1998 and 1999.
22 This contrasts with the estimates reported in Stewart and Swaffield (2004), which provide evidence of female labour supply reduction of 1-2 hours per week as a result of the introduction of the National Minimum Wage in April 1999. Their results are not robust across data sets and specifications, and are obtained from data that stop in September 2000 at the latest (that is, just before the second post-WFTC year in our sample). In addition, as pointed out in the Introduction, the Stewart-Swaffield estimates refer to all women, so we do not know how single women with and without children have been differentially affected by the minimum wage.
14

Panel (b) shows that the largest changes are experienced by women who moved between
jobs, with lone mothers reporting an average change in hours of about 4 per week over the whole
sample period and unmarried women without children of 1 per week. The time patterns for lone
mothers are similar to those reported in the previous panel, although the peak in 1998-99 is
followed by a further increase over the subsequent year. Lone mothers’ increase in hours between
1991 and 1992 is also sizable, with an average close to 4 hours per week. Hours changes among
those who stayed with the same employer instead are much smaller for both groups of women,
especially for women without children (panel (c)).
IV. Results
A. Benchmark estimates
The estimates of the impact of job changing behaviour on hours changes are shown in Table 2.
These are presented for the four specifications described in Section II.B, and separately for the
cases in which the variables in are excluded or included.X 23
The regressions without controls indicate that changing job is associated with increases in
women’s labour supply by less than one hour per week ),( 2α although this effect is only significant
at the 10 percent level in the first three specifications, while single mothers experience significantly
larger changes of about 1.5 hours per week ).( 1α The treatment effects for stayers and
are small and never statistically significant, and so are the average treatment effects for job movers
after the 1992 reduction in hours requirement under FC
FCb( )WFTCb
).( FCβ But the introduction of WFTC had a
strong impact on job movers with a significant increase of their labour supply by 2.5-3 hours per
week on average. Importantly, from specification (4) we can reject the hypothesis that
at the 5 percent level (the p-value of the t-test of equality is 0.024), which provides WFTCWFTCb β̂ˆ =
23 In parentheses, this and the subsequent tables report the absolute value of t-ratios obtained from standard errors that are adjusted to reflect multiple observations per person (and are robust to arbitrary forms of serial correlation and misspecification). For the sake of brevity, the estimates on the control variables are not reported but are available from the authors.
15

evidence of hours inflexibility within jobs. Most of these results are robust to the inclusion of the
control variables with the only exception of ,X 1α which now becomes statistically insignificant.24
With 16 and 20 percent of women changing job after the 1992 and 1999 reforms respectively, we
can derive their overall effects on hours changes conditional on working: FC had virtually no
overall impact, while WFTC increased single mothers’ weekly hours of work by about 1.1 hours
(specification (4)).
Because Figure 2 reveals that stayers also increased their worked hours immediately after
the 1999 reform, the previous analysis was repeated after excluding the last two years of the sample.
Indeed, the WFTC effect for stayers is now larger and close to one extra hour per week, but its p-
value is never below 0.11. In any case, even after this selection, all other results are confirmed,
including the rejection of the hypothesis of flexibility in hours within jobs.25 Thus, in response to
the exogenous change in work incentives given by the WFTC programme, changing job seemed to
have been the strongest mechanism of labour supply adjustment among single mothers after 1999.
We repeated the previous analysis with a different subsample, in which the control group of
single childless women is limited to those with educational qualifications below A level. In the
spirit of the discussion in Section II.B, this allows us to see whether our results are concentrated in
specific subgroups of the population who might have been affected by other policy initiatives (such
as the New Deal for Lone Parents) that were introduced at approximately the same time as the
WFTC reform. It also provides us with an important sensitivity check. Restricting our analysis to
this different control group reduces only slightly the treatment effect for movers under WFTC
)( WFTCβ to 3.28 (t-ratio= 2.86), changing neither the estimated effect for movers under FC nor the
treatment effects for stayers in any significant way. The results illustrated so far, therefore, are
robust to this change in the definition of the control group.
24 To understand this lack of effect, we estimated variants of equations (1)-(4) with Q interacted with marital status (not shown). Regardless of whether we control for group-specific time trends, changing job is associated with increases of about 1.2 hours per week for single mothers and with reductions of 0.8 hours per week for single childless women. 25 We reach the same conclusion if we keep the entire sample as in Table 2 but redefine the post-reform period as either 1999-2000 or 1999-2001. Similarly, redefining the FC period over 1992-93 (rather than 1992-94) does not alter our baseline results.
16

B. Heterogeneous responses
It is possible that the labour supply responses to the policy reforms vary by observable
characteristics of the women in the treatment and control groups. To allow for this, we look for
heterogeneous responses by estimating models that distinguish women separately by individual
attributes (such as education and number and age of children), work related attributes (such as firm
size and industry), and stated labour supply preferences. The results from these regressions (based
on specification (4) only) are reported in Table 3.
The estimates in the first panel of the table reveal that the increase in hours worked after the
1999 reform was predominantly observed among single mothers who changed job and used to work
fewer than 16 hours per week. Women in this group experienced a labour supply increase in excess
of 6 hours per week while women who already worked 16 or more hours experienced a more
modest growth of about 2 additional hours.26 Both effects are significantly different from zero, and
they are statistically different from each other at conventional levels (p-value=0.006). These results
suggest that an important part of the overall treatment effect of the 1999 reform was driven by
greater entry into WFTC eligible employment of already working single mothers. As the differences
between and document, there is evidence of a greater degree of hours inflexibility within jobs
after the WFTC reform for both groups of women and, for women who worked fewer than 16 hours
per week, also after the 1992 FC reform (but this effect is significant only at the 6 percent level).
b̂ β̂
The treatment effects for stayers do not differ between more educated women and less
educated women (panel B). There are however asymmetric responses among movers. Less educated
single mothers increased their labour supply by 3-4 hours per week after the 1992 reform, while
more educated single mothers’ supply increased by 4-5 hours after the 1999 reform.27 Equality tests
26 These estimates are also accompanied by a significantly different impact of changing job on hours changes for the two groups of women (α2). When moving from one job to another, women in the bottom part of the hours distribution faced an average increase of nearly 2 hours per week, while women in the top part of the distribution reduced their labour supply by about 1 hour per week. 27 If a large proportion of better-educated single mothers had not been eligible to WFTC, the effects reported in Table 2 should be attributed to shocks other than WFTC. However, using data from the Family Resources Survey, we find that
17

of the estimated b and β coefficients can be rejected at the 5 percent level during the WFTC
regime among the more educated, and at the 10 percent during the FC regime among the less
educated.
The next two panels demonstrate that the post-WFTC upward adjustment in single mothers’
labour supply is primarily experienced by mothers of one child aged 0-4. Albeit smaller, the effect
observed for mothers of children aged 5 or more is still sizeable and significant (panel D). If we
pool all women as we did in Table 2 and interact the variable on with the indicator of the
youngest child being aged 0-4, this interaction term is negative and statistically significant
and s.e. while the interaction with the indicator of the youngest child being
older is never significant. This provides evidence that the 1992 reform induced some groups of
workers (in this case, single mothers of young children who did not change job) to reduce their
hours worked over the 1992-94 period.
FCb
35.1( −=FCb ),48.0=
The UK in-work benefit system interacts with other welfare benefits (Blundell and Hoynes,
2004). One of these is Housing Benefit, which works as a rent subsidy. If a single mother receives
Housing Benefit, she would benefit less from a given amount of tax credit because this is treated as
income in other means-tested programmes. Rents in some parts of the country (in particular,
London and the South East) are high and have rapidly increased over the 1990s, while owner-
occupiers are not eligible to Housing Benefit. To capture part of the relationship between Housing
Benefit and the tax credits of interest here, we stratified our sample by region of residence (London
and the South East in one group and the rest of the country in the other) and by housing tenure
(owner-occupier or not), both measured at t-1. For the sake of brevity, the results are not shown but
are available from the authors. From this analysis it emerges that labour supply adjustments
observed after the 1999 reform were greater for single mothers who lived outside the
tax credit eligibility has increased proportionally more for more educated lone mothers than for the less educated after the introduction of WFTC (albeit a greater fraction of the less educated are eligible). In particular, between 1995 and 1998, about 26 percent of better educated lone mothers who work 16 or more hours per week were eligible to FC. Between 2000 and 2002, 49 percent were eligible to WFTC (an increase in eligibility rate by 88 percent). For the less educated, the increase in eligibility rate was only 28 percent (from 65 to 83 percent).
18
London/South-East region (where house rents are lower and the interaction with Housing Benefit is
likely to be more modest), and who were not owner-occupiers.28
Job specific characteristics provide other important sources of heterogeneity for the impact
of job changes on hours changes after the 1999 reform. The strongest treatment effects are found for
single mothers employed in relatively larger establishments (of the order of 4 additional hours per
week, panel E), in service industries (about 3 extra hours, panel F),29 and equally for those
employed in the private sector or the public sector (between 3 and 4 additional hours per week,
panel G). Strong evidence of hours inflexibility emerges among lone mothers who work in larger
firms, service industries, and the public sector.30
Another important dimension along which we expect to see heterogeneous responses is
given by stated labour supply preferences. At each interview, the BHPS asks respondents whether
they would like to work fewer hours, or more hours, or continue to work the same number of hours
“assuming that they would be paid the same amount per hour”. We use this information to construct
three labour supply preference variables for any given year of the sample period, labelled OVER
(=1 if a worker would like to work fewer hours, and zero otherwise), UNDER (=1 if a worker
would like to work more hours, and zero otherwise) and SAME (=1 if a worker would like to
28 Stratifying the sample jointly by region and house tenure leads to small subsamples. But when we performed the analysis on the entire sample and included an interaction term between these two variables, the largest increases in worked hours occurred in association with changing job after the introduction of WFTC for single mothers who lived in rented accommodations outside the London/South-East region. 29 Single mothers who were employed in manufacturing industries also showed a significant increase of 3 hours of work per week if they changed job after the introduction of WFTC (panel F). For the same group of women there is also evidence (significant only at the 10 percent level) of positive labour supply adjustments of about 1.6 hours per week if they changed job between 1992 and 1994 (i.e., during the FC regime). This effect involves only 25 percent of the whole sample, and this may be why it does not show up in the baseline estimates of Table 2 for the whole sample. Manufacturing production is based on technologies that are traditionally less flexible than those used in services, such as batch methods and robotized assembly lines (Goldin and Katz, 1998), which may be reflected in a greater rigidity in (downward) adjustments in hours. 30 To capture occupation specific human capital we examined some further interaction terms constructed using the Standard Occupation Classification (SOC) measure. In particular, we partitioned the sample into two occupation groups, that is, “white collar” occupations (i.e., managerial, professional, and technical occupations, corresponding to major groups 1-3 in the 1-digit SOC system) and “blue collar” occupations (i.e., clerical/secretarial occupations, craft, personal service, sales, semi-skilled and unskilled, SOC groups 4-9). The results were similar to those for education and industry, with women in white-collar occupations showing a greater positive response after the 1999 reform (significant) and a negative response after the 1992 reform (not significant). All other estimates remain broadly similar to those already reported. These additional results are available from the authors on request.
19

continue to work the same number of hours, and zero otherwise).31 We expect that workers who are
overemployed/underemployed at one point in time reduce/increase their worked hours over time,
and those who want to continue working the same number of hours do not change their labour
supply. The estimates on 2α reported in panel H of Table 3 confirm such expectations, with
overemployed workers reducing their labour supply by 3 hours per week on average,
underemployed workers increasing it by about 4 hours, and the remaining group of workers
showing no significant change. The 1992 and 1999 in-work benefits reforms did not affect hours
worked by women who would have liked to keep working the same number of hours and did not
change job. But single mothers who wanted to continue working the same number of hours showed
large upward labour supply adjustments of about 4 hours per week if they changed job after the
WFTC reform.32 Thus, initially “unconstrained” (i.e., neither over- nor under-employed) lone
mothers did respond to the greater work incentives of the WFTC programme but only through a
change of job.33 This upholds our previous finding that there is evidence of hours inflexibility
within jobs.
The 1999 reform also led to increases of 1-3 hours per week among both overemployed and
underemployed workers who changed job, although none of such increases is statistically
significant at conventional levels. After the 1992 reform, instead, we observe large (and significant
at the 10 percent level) reductions of about 7 hours per week among overemployed single mothers
who changed job. This lines up very well with the 8-hour fall in the minimum work requirement to
receive FC (from 24 to 16 hours a week). Again, this labour supply adjustment occurs through
movements across (rather than within) jobs, although equality tests of the estimated b and β
coefficients can be rejected only at the 10 percent level, irrespective of the specification.
31 Over the whole sample period, about 19 percent of lone mothers report being overemployed, 18 percent underemployed, and the remaining 62 percent report being satisfied with their hours of work. The corresponding proportions for single women without children are 28, 11, and 61 percent. Considering all women in the sample, the most mobile are the underemployed (with 27 percent of them changing job in any two consecutive years), while the job changing rates for the overemployed and the other group of workers are lower (19 and 15 percent respectively). 32 The hypothesis that the estimated b and β coefficients are equal can be rejected at the 5 percent level (p-value=0.027).
20
Underemployed workers seem to be unable to adjust their labour supply upward if they did not
change job. But those who moved did manage to increase their worked hours even after the 1992
reform by about 3 hours per week (although this increase is not statistically significant).34
We re-estimated variants of equations (1)-(4) over the whole sample of women which
included interaction terms between the variables on and jb jβ ),( WFTCFCj = and stated labour
supply preferences. The results from this analysis (not shown) confirm those previously discussed.
In particular (from specification (4)), unconstrained single mothers who changed job after the 1999
reform increased labour supply by about 4 hours (t-value=4.61), and overemployed single mothers
who moved across jobs after the 1992 reform reduced their hours by about 7 a week (t-value=2.41).
Further interactions with indicators of the age of the youngest child reveal that mothers of younger
children (aged 0-4) who moved jobs experienced the greatest changes in hours conditional on
working. In particular, after the introduction of WFTC, unconstrained mothers whose youngest
child was aged 0-4 and who changed job worked nearly 5.5 extra hours (t-value=3.27) as opposed
to 3 among unconstrained mothers whose youngest child was aged 5-18. Similarly, after the FC
reform, overemployed single mothers with younger children reduced their labour supply by 9 hours
a week as compared to 5.6 among mothers of older children.
C. Sensitivity Analysis
We performed a number of sensitivity analyses to demonstrate the robustness of the results. For the
sake of brevity Table 4 presents the results only from three exercises using specification (4). The
results obtained from the other specifications are qualitatively similar to those discussed here.35
33 Notice that “unconstrained” are defined to be those workers who would like to continue to work the same number of hours. This definition may not precisely reflect their entire preference ordering, since they may be constrained in other dimension (e.g., job location and family responsibilities). 34 Following Altonji and Paxson (1992) and Euwals (2001), we also checked whether the hours adjustments estimated in conjunction with the WFTC reform are in line with women’s stated preferences. The results (which are not reported for convenience) show that this is the case, especially for underemployed lone mothers. Almost 80 percent of single mothers who wanted to work more did adjust their hours upward by changing job after the 1999 reform as opposed to only 30 percent among those who did not change job. The corresponding downward adjustments for women who wanted to work fewer hours were instead 55 and 18 percent for movers and stayers respectively.
21

First, we performed our analysis accounting for the 1995 FC reform that provided extra
credit for full-time work. The estimates in column (i) confirm our previous findings, and document
that the 1995 reform was followed by no sizeable change in worked hours irrespective of whether
women changed employer or stayed in the same job.
As mentioned in Section III, there may be concerns with changing sample composition over
time, differential attrition, and missing data. Besides using weighted data, which provided similar
results to those presented so far, we addressed these concerns by reestimating our models only on
women who have been successfully interviewed for a given number of times (for example, six or
more waves). If attrition or changing sample composition are important, the results from such
selected subsamples are expected to differ from those discussed earlier. Columns (ii) and (iii) of
Table 4 report the estimates found from two subsamples, one in which we include only women who
have been observed for six or more years (i.e., at least half of the time between 1991 and 2002) and
the other in which women have to be observed for at least 9 consecutive times. In general, the
estimates from both subsamples are relatively close to the corresponding figures reported in Table
2. For example, ,WFTCβ one of the key parameters in our study, is estimated to be 32 percent greater
(column (ii)) and 13 percent smaller (column (iii)) than its counterpart of Table 2. Despite such
differences in magnitude, therefore, these estimates tend to support our previous results, suggesting
that missing data problems are likely to have only minor consequences for our analysis.
Finally, we estimated the effects using propensity score matching (biweight kernel and local
linear regression matching). Although, like standard OLS regressions, matching methods rely on a
selection-on-observables assumption (Angrist and Krueger, 1999), they limit the potential bias due
to differences in the support of between single mothers and women without children and the bias
due to the difference between the two groups of women in the distribution of over its common
X
X
35 We also reestimated the models eliminating laid-off workers from Q, or dropping promoted workers from the group of the stayers. Both these exercises produced results that were virtually identical to those shown in Table 2, and are thus not reported.
22

support (Heckman et al., 1998). The estimates in the last two columns of Table 4 display patterns
that are very similar to those illustrated above in this section.
D. Wage Estimates
The evidence so far indicates that British single mothers responded to the greater work incentives of
the 1999 in-work benefits reform by substantially increasing their hours of paid work, whereas the
two previous reforms to FC seemed to have induced only minor labour supply effects. The strong
labour supply adjustment in conjunction with the introduction of WFTC was primarily achieved
through a change of employer rather than changes in hours within the same job. This finding
suggests that single mothers face some form of hours inflexibility within jobs. Against this
background, we analyse wage responses. Of course, in-work benefits reforms were directly
designed to change the incentive to work specific hours leaving wages unaltered, while wage
determination was affected more explicitly by the introduction of the National Minimum Wage, and
both hours and wages were (and still are) under employers’ control, and so our partial-equilibrium
analysis is likely to provide biased estimates. Nonetheless, gauging wage responses is important
because it gives us a more complete picture of the British labour market and some indication of the
possible presence of labour market imperfections or rigidities in the matching technology. We
therefore estimated equations (1)-(4) with log hourly wages (expressed in 2002 prices) as dependent
variable and the same set of explanatory variables used before. A number of checks, which were
performed to test the robustness of such specifications, led to results that have the same qualitative
implications as those reported here.
For both job movers and stayers and both the 1992 and 1999 reforms, we find no significant
wage effect. There is also relatively little effect heterogeneity across different groups of women.
Two important exceptions however are single mothers who lived in London and the South East and
those who worked in small establishments. Among the former group of women, changing job after
the introduction of WFTC implied not only a labour supply increase of almost 3 hours per week (t-
23

ratio=3.11), but also a wage reduction of 2.7 percent (t-value=2.23). Among the latter, changing job
after the 1999 reform led to 1.5 percent lower wages (t-value=1.51) and modest positive hours
changes (see Table 5). Thus, despite the presence of hours inflexibility, the labour market generally
operates quite competitively, although there is an indication of monopsony among some groups of
single mothers.
V. Conclusions
By using three in-work benefits reforms during the 1990s in the UK, which either changed hours
requirements to be eligible for the benefits or increased the attractiveness of working a given
number of hours, we are able to assess the mechanism of labour supply adjustment among single
women with children ⎯ the main target of these in-work benefit reforms. We find that the 1992 and
1995 FC reforms had modest impacts on single mothers’ hours of work, but the introduction of the
WFTC reform in 1999 had large positive effects on their number of hours of work. This increase is
largely driven by women who changed job, suggesting that the mechanism of labour supply
adjustments is between rather than within jobs. This lines up well with the estimates we get when
we look at hours changes by stated labour supply preferences: unconstrained women who changed
job showed the largest hours increases after the 1999 reform, and overemployed women
substantially reduced their hours worked after the 1992 reform (which did reduce the minimum
work requirement to receive FC from 24 to 16 hours a week) only if they moved across jobs. There
is evidence of considerable heterogeneity in the effects of the WFTC reform for different groups of
women. The strongest evidence of hours inflexibility within jobs emerged among single mothers
whose youngest child was aged 0-4. This was especially the case for those who worked in larger
firms, service industries, and the public sector. Although there is little in the way of overall wage
effects, we do find that after the introduction of WFTC hourly wages decreased significantly for
single women who lived in London and the South East and moved jobs and, to a lesser extent, for
movers who worked in small firms.
24

So what remains of the canonical labour supply model? We have shown that adjustments in
hours of work are made primarily by movements between jobs and there is little evidence of
systematic labour supply induced hours movements within jobs. Our analysis of stated preferences
confirms this further, showing that responses are greater among those who say they are
unconstrained as well as among those who are constrained but state that they would like to move in
the direction suggested by the incentives. Thus, a labour supply model emerges in which hours
adjustments are largely made by moving between workplaces. This could be achieved within an
“adapted” canonical model in which establishments are organised around hours requirements and
individuals move jobs to achieve hours flexibility. Of course, it could also be supported by theories
that emphasise the importance of labour market frictions and imperfections, such as job search,
wage-job packages, and/or dynamic monopsony. However, if there were such ‘imperfections’ we
would expect these to be displayed in wage responses. The evidence is that such responses are not
large and overall not statistically significant. Consequently, at least to a first approximation, an
adapted canonical labour supply model with hours flexibility across jobs cannot be rejected.
Nonetheless, our results by region and firm size suggest that production technology or employer
preferences may not only reduce labour supply flexibility within firms but may also place
constraints on hours mobility across firms.
25
References
Altonji, Joseph G. and Paxson, Christina H. “Labor Supply Preferences, Hours Constraints, and Hours-Wage Tradeoffs.” Journal of Labor Economics, 1988, 6(2), pp. 254-76.
Altonji, Joseph G. and Paxson, Christina H. “Labor Supply, Hours Constraints, and Job Mobility.”
Journal of Human Resource, 1992, 27(2), pp. 256-78. Angrist, Joshua D. and Krueger, Alan B. “Empirical Strategies in Labor Economics,” in Orley
Ashenfelter and David Card, eds., Handbook of Labor Economics, Vol. 3A. Amsterdam: Elsevier Science, 1999, pp. 1277-1366.
Ashenfelter, Orley C. “Estimating the Effect of Training Programs on Earnings.” Review of
Economics and Statistics, 1978, 60(1), pp. 47-57. Barzel, Yoram. “The Determination of Daily Hours and Wages.” Quarterly Journal of Economics,
1973, 87(2), pp. 220-38. Biddle, Jeff E. and Zarkin, Gary A. “Choice Among Wage-Hours Packages: An Empirical
Investigation of Male Labor Supply.” Journal of Labor Economics, 1989, 7(4), pp. 415-37. Bingley, Paul and Walker, Ian. “The Labour Supply, Unemployment and Participation of Lone
Mothers in In-Work Transfer Programs.” Economic Journal, 1997, 107(444), pp. 1375-90. Blundell, Richard. (2002) ‘Welfare-to-Work: Which Policies Work and Why?’ Keynes Lecture in
Economics, Proceedings of The British Academy, 117, pp. 477-524. Blundell, Richard; Costa Dias, Monica; Meghir, Costas and Van Reenen, John. “Evaluating the
Employment Impact of a Mandatory Job Search Program.” Journal of the European Economic Association, 2004, 2(4), pp. 569-606.
Blundell, Richard; Duncan, Alan; McCrae, Julian and Meghir, Costas. “The Labour Market Impact
of the Working Families’ Tax Credit.” Fiscal Studies, 2000, 21(1), pp. 75-103. Blundell, Richard; Duncan, Alan and Meghir, Costas. “Estimating Labor Supply Responses Using
Tax Reforms.” Econometrica, 1998, 66(4), pp. 827-61. Blundell, Richard and Hoynes, Hilary. “Has ‘In-Work’ Benefit Reform Helped the Labor Market?”
in David Card, Richard Blundell, and Richard B. Freeman, eds., Seeking a Premier Economy: The Economic Effects of British Economic Reforms, 1980-2000. Chicago: University of Chicago Press, 2004, pp. 411-59.
Blundell, Richard and MaCurdy, Thomas E. “Labor Supply: A Review of Alternative Approaches,”
in Orley Ashenfelter and David Card, eds., Handbook of labor economics, Vol. 3A. Amsterdam: Elsevier Science, 1999, pp. 1559-1695.
Brewer, Mike. “Comparing In-work Benefits and the Reward to Work for Low-Income Families
with Children in the US and UK.” Fiscal Studies, 2001, 22(1), pp. 41-77. Brewer, Mike. “The New Tax Credits.” Institute for Fiscal Studies, IFS Briefing Note: No. 35,
2003.
26

Brewer, Mike; Duncan, Alan; Shepard, Andrew and Suárez, María José. “Did Working Families’ Tax Credit Work? The Impact of In-Work Support on Labour Supply in Great Britain.” Labour Economics, 2006, 13(6), pp. 699-720.
Bryan, Mark L. “Free to choose? Differences in the hours determination of constrained and
unconstrained workers.” Oxford Economic Papers, 2007, 59(2), pp. 226-52. Card, David. “Labour Supply with a Minimum Hours Threshold.” Carnegie-Rochester Conference
Series on Public Policy, 1990, 33, pp. 137-68. Card, David and Robins, Philip K. “Do Financial Incentives Encourage Welfare Recipients To
Work?” Research in Labor Economics, 1998, 17, pp. 1-56. Dickens, William T. and Lundberg, Shelly J. “Hours Restrictions and Labor Supply.” International
Economic Review, 1993, 34(1), 169-92. Dickens, Richard and Manning, Alan. “Has the national minimum wage reduced UK wage
inequality?” Journal of the Royal Statistical Society, Series A, 2004, 167(4), pp. 613-26. Eissa, Nada. “Labor Supply and the Economic Recovery Tax Act of 1981.” In Martin Feldstein and
James Poterba, eds., Empirical Foundations of Household Taxation. Chicago: University of Chicago Press, 1996, pp. 5-32.
Eissa, Nada and Liebman, Jeffrey B. “Labor Supply Response to the Earned Income Tax Credit.”
Quarterly Journal of Economics, 1996, 111(2), pp. 605-37. Euwals, Rob. “Female Labour Supply, Flexibility of Working Hours, and Job Mobility.” Economic
Journal, 2001, 111(471), pp. C120-C134. Francesconi, Marco and Van der Klaauw, Wilbert. “The Socioeconomic Consequences of ‘In-
Work’ Benefit Reform for British Lone Mothers.” Journal of Human Resources, 2007, 42(1), pp. 1-31.
Goldin, Claudia and Katz, Lawrence F. “The Origins of Technology Skills Complementarity.”
Quarterly Journal of Economics, 1998, 113(3), pp. 693-732. Gregg, Paul and Harkness, Susan. “Welfare Reform and Lone Parents Employment in the UK.”
Mimeo, University of Bristol, 2003. Ham, John C. “Estimation of a Labour Supply Model with Censoring Due to Unemployment and
Underemployment.” Review of Economic Studies, 1982, 49(3), pp. 335-54. Heckman, James. “Comment.” In Martin Feldstein and James Poterba, eds., Empirical Foundations
of Household Taxation. Chicago: University of Chicago Press, 1996, pp. 32-38. Heckman, James, Hidehiko Ichimura, Jeffrey Smith, and Petra Todd. “Characterizing Selection
Bias Using Experimental Data.” Econometrica, 1998, 66(5), pp. 1017-98. Heckman, James J. and Robb, Richard, Jr. “Alternative Methods for Evaluating the Impact of
Interventions,” in James J. Heckman and Burton Singer, eds., Longitudinal Analysis of Labor Market Data. Econometric Society Monographs Series, No. 10, Cambridge: Cambridge University Press, 1985, pp. 156-245.
27

Kahn, Shulamit and Lang, Kevin. “The Effect of Hours Constraints on Labor Supply Estimates.”
Review of Economics and Statistics, 1991, 73(4), pp. 605-11. Kirby, Simon and Riley, Rebecca. “Compulsory Work-Focused Interviews for Inactive Benefit
Claimants: An Evaluation of the British ONE Pilots.” Labour Economics, 2004, 11(4), pp. 415-29.
Lundberg, Shelly. “Tied Wage-Hours Offers and the Endogeneity of Wages.” Review of Economics
and Statistics, 1985, 67(3), pp. 405-10. Lynn, Peter; Buck, Nicholas; Burton, Jonathan; Laurie, Heather and Urhig, S.C. Noah. “Quality
Profile: British Household Panel Survey.” Discussion Paper, Institute for Social and Economic Research, University of Essex, 2006. Available at: ⟨http://www.iser.essex.ac.uk/ ulsc/bhps/quality-profiles/BHPS-QP-01-03-06-v2.pdf⟩.
Manning, Alan. (2003) Monopsony in Motion: Imperfect Competition in Labor Markets. Princeton,
NJ: Princeton University Press. Meyer, Bruce D. and Rosenbaum, Dan T. “Welfare, the Earned Income Tax Credit, and the Labor
Supply of Single Mothers.” Quarterly Journal of Economics, 2001, 117(3), pp. 1063-1114. Moffitt, Robert. “The Estimation of a Joint Wage-Hours Labor Supply Model.” Journal of Labor
Economics, 1984, 2(4), pp. 550-66. Rosen, Harvey S. “Taxes in a Labor Supply Model with Joint Wage-Hours Determination.”
Econometrica, 1976, 44(3), pp. 485-507. Stewart, Mark. “The Employment Effects of the National Minimum Wage.” Economic Journal,
March 2004, 114(494), C110-C116. Stewart, Mark B. and Swaffield, Joanna K. “Constraints on the Desired Hours of Work of British
Men.” Economic Journal, 1997, 107(441), pp. 520-35. Stewart, Mark B. and Swaffield, Joanna K. “The Other Margin: Do Minimum Wages Cause
Working Hours Adjustments for Low-Wage Workers?” Mimeo, University of Warwick, 2004.
Van Reenen, John. “Active labor market policies and the British New Deal for the Young
Unemployed in context,” in David Card, Richard Blundell, and Richard B. Freeman, eds., Seeking a Premier Economy: The Economic Effects of British Economic Reforms, 1980-2000. Chicago: University of Chicago Press, 2004, pp. 461-496.
28

Figure 1 Female weekly hours of work by survey year
0
.05
.1
Den
sity
24
0 10 20 30 40 50 60
1991
0
.05
.1
Den
sity
16
0 10 20 30 40 50 60
1992
0
.05
.1
Den
sity
16
0 10 20 30 40 50 60
1993
0
.05
.1
Den
sity
16
0 10 20 30 40 50 60
1994
0
.05
.1
Den
sity
16
0 10 20 30 40 50 60
1995
Weekly hours of work
0
.05
.1
Den
sity
16
0 10 20 30 40 50 60
1996
Weekly hours of work
29

0
.05
.1
Den
sity
16
0 10 20 30 40 50 60
1997
0
.05
.1
Den
sity
16
0 10 20 30 40 50 60
1998
0
.05
.1
Den
sity
16
0 10 20 30 40 50 60
1999
0
.05
.1
Den
sity
16
0 10 20 30 40 50 60
2000
0
.05
.1
Den
sity
16
0 10 20 30 40 50 60
2001
Weekly hours of work
0
.05
.1
Den
sity
16
0 10 20 30 40 50 60
2002
Weekly hours of work
Note: The vertical line indicates hours eligibility cutoff.
30

Figure 2 Average changes in total weekly hours of work
Single childless women and lone mothers by job changing status
.39
2.25
-1
0
1
2
3
4
5
6
7
1992 1995 1999
1992 1994 1996 1998 2000 2002Year
Single childless Lone mothersMean +/- standard deviation
wee
kly
hour
s of
wor
kA
vera
ge c
hang
e in
A. All workers
1.03
3.97
-101234567
1992 1995 1999
1992 1994 1996 1998 2000 2002Year
Single childless Lone mothersMean +/- standard deviation
wee
kly
hour
s of
wor
kA
vera
ge c
hang
e in
B. Job movers
31

.18
1.84
-1
0
1
2
3
4
5
6
7
1992 1995 1999
1992 1994 1996 1998 2000 2002Year
Single childless Lone mothersMean +/- standard deviation
wee
kly
hour
s of
wor
kA
vera
ge c
hang
e in
C. Stayers
32

Table 1. Summary Statistics Variable
Unpartnered women without children
Lone mothers
Total weekly hours of work 34.74 (13.25)
25.61 (14.20)
Change in worked weekly hoursa 0.39 (11.40)
2.25 (12.31)
Absolute change in worked weekly hoursa 6.00 (9.62)
6.91 (10.28)
Hourly pay 7.06 (6.01)
5.85 (5.19)
Monthly labour income conditional on working positive hours (in 2002 pounds)
1,110 (911)
694 (629)
Age (years) 38.1 (15.0)
30.00 (11.36)
Nonwhite 0.043 0.090 Registered disabled 0.049 0.023 Number of children by age group:b
0-4 0.231 (0.510)
5-10 0.588 (0.755)
11-18 0.798 (0.771)
House owner 0.578 0.541 In social housing 0.229 0.377 A level or higher educational qualification 0.520 0.438 No qualification 0.152 0.144 University degree or more 0.144 0.060 Total work experience (years) 14.33
(11.47) 8.67
(7.88) Employed in a firm with fewer than 50 workers 0.660 0.746 Employed in service industriesc 0.838 0.820 Employed in the public sector 0.247 0.171 Union covered 0.514 0.530 Changed job during previous year 0.167 0.179 Local unemployment rated 0.065
(0.032) 0.063
(0.031)
Number of person-wave observations 7,774 4,585 Number of women 1,162 1,122
Notes: The figures are means (standard deviations in parentheses) computed over all person-wave observations for which two consecutive years of data are available. a The change is measured over two consecutive years. b Averages are computed over the entire subsample of lone mothers. If computed over the three specific subsamples of lone mothers with children in each child group, the means (standard deviations) are 1.172 (0.448), 1.318 (0.582), and 1.321 (0.548), respectively. c ‘Service industries’ refer to banking, finance and insurance, distribution, hotels and catering, transport and communication, and other services (which include education and sanitary services). d Computed over 306 travel to work areas.
33

Table 2. The Impact of the In-Work Benefit Reforms and Job Changes on Hours Changes Without controls With controls (1) (2) (3) (4) (1) (2) (3) (4)
1α 1.58 (7.94)
1.27 (2.68)
1.54 (3.51)
1.36 (2.98)
0.34 (1.08)
0.44 (0.85)
0.24 (0.59)
0.19 (0.32)
2α 0.77 (1.86)
0.74 (1.78)
0.73 (1.76)
-0.19 (0.28)
-0.30 (0.64)
-0.32 (0.70)
-0.31 (0.71)
-0.45 (0.82)
FCb -0.25 (0.40)
0.03 (0.07)
-0.03 (0.01)
-0.21 (0.44)
WFTCb 0.16 (0.33)
0.45 (0.89)
0.20 (0.42)
0.56 (0.94)
FCβ 0.11 (0.08)
0.72 (0.51)
0.95 (0.67)
0.48 (0.29)
0.21 (0.15)
0.83 (0.59)
0.89 (0.62)
0.44 (0.28)
WFTCβ 2.56 (2.46)
2.66 (2.56)
2.48 (2.29)
3.39 (2.82)
2.54 (2.51)
2.65 (2.63)
2.60 (2.47)
3.42 (2.92)
Number of observations 12,359 12,359
Source: British Household Panel Survey 1991-2002. Notes: Absolute values of t-statistics (obtained from standard errors that are adjusted to reflect multiple observations per person) are in parentheses. The labelling of columns (1)-(4) corresponds to equations (1)-(4) described in the text. Controls include a cubic polynomial in total work experience, dummy variables for race, educational attainment, firm size, public sector, region of residence, housing tenure, union coverage, and industry, the number and changes in the number of children by age group, and changes in health status and local unemployment rate.
34

Table 3. Heterogeneous Responses by Selected Observed Groups – Specification (4)
1α 2α FCb WFTCb FCβ WFTCβ Obs.
A. Previous hours worked Fewer than 16 per week -0.17
(0.14) 1.88
(3.54) -0.19 (0.31)
0.26 (0.18)
2.84 (1.92)
6.39 (2.52)
3,117
16 per week or more 0.32 (1.25)
-1.24 (2.89)
-0.23 (0.34)
0.68 (1.47)
-0.57 (1.55)
2.27 (2.51)
9,242
B. Educationa
Less educated -0.31 (0.61)
-0.64 (0.82)
0.51 (0.85)
0.53 (0.88)
3.61 (2.15)
1.92 (1.26)
6,297
More educated 0.56 (0.83)
-0.25 (0.39)
-0.45 (0.23)
0.58 (0.77)
-2.65 (1.52)
4.89 (2.88)
6,062
C. Number of childrenb One child 0.60
(1.07) -0.97 (1.49)
0.47 (0.78)
0.39 (0.64)
-0.47 (0.44)
4.15 (2.95)
6,427
Two or more children -0.29 (0.66)
-0.16 (0.27)
-0.57 (0.88)
0.53 (0.84)
1.98 (0.92)
1.37 (1.31)
5,932
D. Age of youngest childc 0-4 years -0.33
(0.37) -0.27 (0.36)
-0.59 (0.78)
0.30 (0.19)
-0.51 (0.45)
3.82 (2.84)
5,438
5 years or more 0.62 (1.09)
-0.76 (1.45)
0.03 (0.82)
0.64 (1.05)
0.97 (0.56)
2.80 (2.63)
6,921
E. Firm size Fewer than 50 employees -0.01
(0.02) -0.38 (0.61)
0.47 (0.84)
0.61 (1.08)
0.37 (0.25)
2.18 (1.84)
8,553
50 employees or more 0.74 (1.03)
-0.93 (1.52)
-0.38 (0.38)
-0.16 (0.13)
0.72 (0.41)
4.20 (2.64)
3,806
F. Industryd Services 0.72
(1.12) -0.84 (0.97)
-0.48 (0.28)
0.33 (0.51)
-0.82 (0.88)
3.74 (3.15)
9,262
Manufacturing -0.40 (0.74)
0.23 (0.15)
0.30 (0.48)
0.86 (1.27)
1.57 (1.91)
2.95 (2.77)
3,097
G. Sectore Private -0.08
(0.19) -0.26 (0.27)
0.09 (0.16)
0.55 (0.91)
1.08 (0.54)
3.09 (2.43)
9,659
Public 0.94 (1.14)
-0.88 (1.52)
0.43 (0.68)
-0.18 (0.15)
-0.52 (0.76)
4.10 (2.71)
2,700
H. Labour supply preferencesf SAME=1 0.07
(0.17) -1.21 (1.58)
0.61 (0.90)
0.84 (1.52)
0.43 (0.74)
4.20 (2.97)
7,539
OVER=1 1.65 (1.19)
-3.92 (2.86)
-0.53 (0.86)
-0.35 (0.66)
-6.74 (1.84)
1.09 (0.31)
3,090
UNDER=1 0.31 (0.42)
4.37 (2.73)
-0.24 (0.15)
-0.50 (0.27)
2.97 (1.44)
2.87 (1.64)
1,730
Notes: Absolute values of t-statistics (obtained from standard errors that are adjusted to reflect multiple observations per person) are in parentheses. All regressions include the control variables used in Table 2, except for: education (panel B); number and change in the number of children by age group (panels C and D); firm size (panel E); industry (panel F); sector (panel G). The variables defining each of the observed groups are measured at time t-1. For other definitions see the notes to Table 2. a ‘Less educated’ is defined as having less than A level qualifications; ‘More educated’ is defined as having A-level or higher qualifications. b ‘One child’ and ‘Two or more children’ pertain to lone mothers. c ‘Youngest child aged 0-4’ and ‘Youngest child aged 5 or more’ refer to lone mothers.
35

d ‘Services’ includes banking, finance and insurance, distribution, hotels and catering, transport and communication, and other services (which include education and sanitary services). ‘Manufacturing’ includes energy, extraction, metal goods, other manufacturing industries, construction, and primary industries. e ‘Public sector’ includes civil service, central and local government, National Health Service, education, and non-profit organizations. f OVER = 1 if the respondent indicated that she would like to work fewer hours “assuming that [she] would be paid the same amount per hour”, and equals 0 otherwise; UNDER = 1 if the respondent indicated that she would like to work more hours “assuming that [she] would be paid the same amount per hour”, and equals 0 otherwise; SAME = 1 if the respondent indicated that she would like to continue to work the same number of hours “assuming that [she] would be paid the same amount per hour”, and equals 0 otherwise.
36

Table 4. Robustness checks – Specification (4) Length of time
in the panela Propensity score
matching modelsb
Accounting for 1995
reform that provided extra credit for full-
time work (FC+)
(i)
6 years or more
(ii)
9 years or more
(iii)
Biweight kernel
matching
(iv)
Local linear regression matching
(v)
1α 0.30 (0.69)
0.57 (1.20)
0.66 (1.13)
0.97 (0.89)
1.05 (1.36)
2α -0.56 (0.88)
-0.81 (1.56)
-0.60 (0.88)
-1.12 (1.53)
-0.20 (0.51)
FCb 0.12 (0.11)
-0.45 (0.80)
-0.27 (0.40)
-0.13 (0.11)
-0.38 (0.75)
+FCb (extra credit for FT work) -0.22 (0.44)
WFTCb 0.24 (0.48)
0.81 (1.54)
0.75 (1.02)
-0.49 (0.90)
0.97 (1.13)
FCβ 0.81 (0.52)
0.65 (0.50)
0.17 (0.23)
0.36 (0.48)
0.53 (0.62)
+FCβ (extra credit for FT work) 1.18 (1.32)
WFTCβ 3.48 (3.13)
4.52 (3.34)
2.99 (2.39)
3.12 (3.07)
3.07 (2.74)
Number of observations 12,359 8,314 5,153 12,359 12,359
Notes: Absolute values of t-statistics (obtained from standard errors that are adjusted to reflect multiple observations per person) are in parentheses. All regressions include the control variables used in Table 2. For other definitions, see the note to Table 2. a The categories ‘6 years or more’ and ‘9 years or more’ include only women who have been observed for at least 6 years and 9 years consecutively in the panel respectively. b Absolute values of t-statistics (with standard errors obtained from 500 bootstrapped replications) are in parentheses. For the local linear regression matching regression, the estimates are obtained after imposing a tricube kernel.
37


