Understanding Lithologic Significance of Amplitude Envelope and Acoustic Impedance within Oligocene...
35
Understanding Lithologic Significance of Amplitude Envelope and Acoustic Impedance within Oligocene and Miocene Strata, South Texas Gulf Coast* Osareni Ogiesoba 1 and Ursula Hammes 1 Search and Discovery Article #40577 (2010) Posted July 30, 2010 *Adapted from oral presentation at AAPG Annual Convention and Exhibition, New Orleans, Louisiana, April 11-14, 2010 1 Bureau of Economic Geology, The University of Texas at Austin, Austin, TX ([email protected] ) Abstract Distinguishing between sand‐ and shale‐rich sediments is key to delineating economically viable prospects within a sedimentary basin. Researchers have noted that high seismic amplitudes indicate sand‐prone sediments, and, as such, could be used to search for sand‐rich zones. Whereas this observation may be correct to some extent, amplitude anomalies depend on a variety of geologic variables such as depositional environments, geopressure, fluid content, source of sediment supply, burial depth, age, diagenesis, etc. In this study, we integrated seismic attribute, acoustic impedance, sequence stratigraphic and wireline‐log analyses to investigate the significance of high amplitudes within selected Oligocene and Miocene intervals along the South Texas Gulf Coast. We calibrated gamma‐ray and resistivity logs to 3‐D seismic data using synthetic seismograms to associate lithology with seismic data and then generate acoustic impedance (AI) logs and instantaneous amplitude envelope (amplitude) volume. We identified and tied different depositional systems tracts to the seismic data. By cross‐plotting logs and amplitude traces, we attempted to establish a relationship between amplitudes and lithology, as well as a relationship between amplitude and AI that could be used to predict lithology in each of the different systems tracts. Our seismic analysis of various systems tracts from two different subbasins show that correlation between high amplitudes and lithology depends on individual systems tracts and basin location. High amplitudes and high AI in a transgressive systems tract in one subbasin were indicative of sand‐prone zones, whereas the same attributes were indicative of shales in the transgressive systems tract of another subbasin. Similar observations were recorded in the highstand and lowstand systems tracts. However, if several systems tracts are combined into one zone for seismic analyses no direct correlation is observed between amplitude and lithology. Therefore, seismic analyses of amplitudes should be performed within individual systems tracts when relating amplitudes to lithology. Reference Bracewell, R.N., 1965, The Fourier Transform and Its Applications: McGraw-Hill, New York, 386 p.
Transcript of Understanding Lithologic Significance of Amplitude Envelope and Acoustic Impedance within Oligocene...
Understanding Lithologic Significance of Amplitude Envelope and Acoustic Impedance within Oligocene and Miocene Strata, South Texas Gulf Coast*
Osareni Ogiesoba1 and Ursula Hammes1
Search and Discovery Article #40577 (2010)
Posted July 30, 2010 *Adapted from oral presentation at AAPG Annual Convention and Exhibition, New Orleans, Louisiana, April 11-14, 2010 1Bureau of Economic Geology, The University of Texas at Austin, Austin, TX ([email protected])
Abstract Distinguishing between sand‐ and shale‐rich sediments is key to delineating economically viable prospects within a sedimentary basin. Researchers have noted that high seismic amplitudes indicate sand‐prone sediments, and, as such, could be used to search for sand‐rich zones. Whereas this observation may be correct to some extent, amplitude anomalies depend on a variety of geologic variables such as depositional environments, geopressure, fluid content, source of sediment supply, burial depth, age, diagenesis, etc. In this study, we integrated seismic attribute, acoustic impedance, sequence stratigraphic and wireline‐log analyses to investigate the significance of high amplitudes within selected Oligocene and Miocene intervals along the South Texas Gulf Coast. We calibrated gamma‐ray and resistivity logs to 3‐D seismic data using synthetic seismograms to associate lithology with seismic data and then generate acoustic impedance (AI) logs and instantaneous amplitude envelope (amplitude) volume. We identified and tied different depositional systems tracts to the seismic data. By cross‐plotting logs and amplitude traces, we attempted to establish a relationship between amplitudes and lithology, as well as a relationship between amplitude and AI that could be used to predict lithology in each of the different systems tracts. Our seismic analysis of various systems tracts from two different subbasins show that correlation between high amplitudes and lithology depends on individual systems tracts and basin location. High amplitudes and high AI in a transgressive systems tract in one subbasin were indicative of sand‐prone zones, whereas the same attributes were indicative of shales in the transgressive systems tract of another subbasin. Similar observations were recorded in the highstand and lowstand systems tracts. However, if several systems tracts are combined into one zone for seismic analyses no direct correlation is observed between amplitude and lithology. Therefore, seismic analyses of amplitudes should be performed within individual systems tracts when relating amplitudes to lithology.
Reference Bracewell, R.N., 1965, The Fourier Transform and Its Applications: McGraw-Hill, New York, 386 p.

Understanding Lithologic Significance ofUnderstanding Lithologic Significance of Amplitude Envelope and Acoustic Impedance within Oligocene and Miocene Strata, Southwithin Oligocene and Miocene Strata, South
Texas Gulf Coast
Osareni Ogiesoba and Ursula HammesB f E i G lBureau of Economic Geology
Jackson School of Geosciences, The University of Texas
OverviewOverview• Introduction
• Objectives
• Brief description of amplitude envelopep p p
• Brief explanation of S5 log
• Relationship between amplitude envelope acoustic impedance and• Relationship between amplitude envelope, acoustic impedance and gamma‐ray within the Miocene and Oligocene from two subbasins:
(1) Redfish Bay( ) d(2) Laguna Madre
• Conclusions
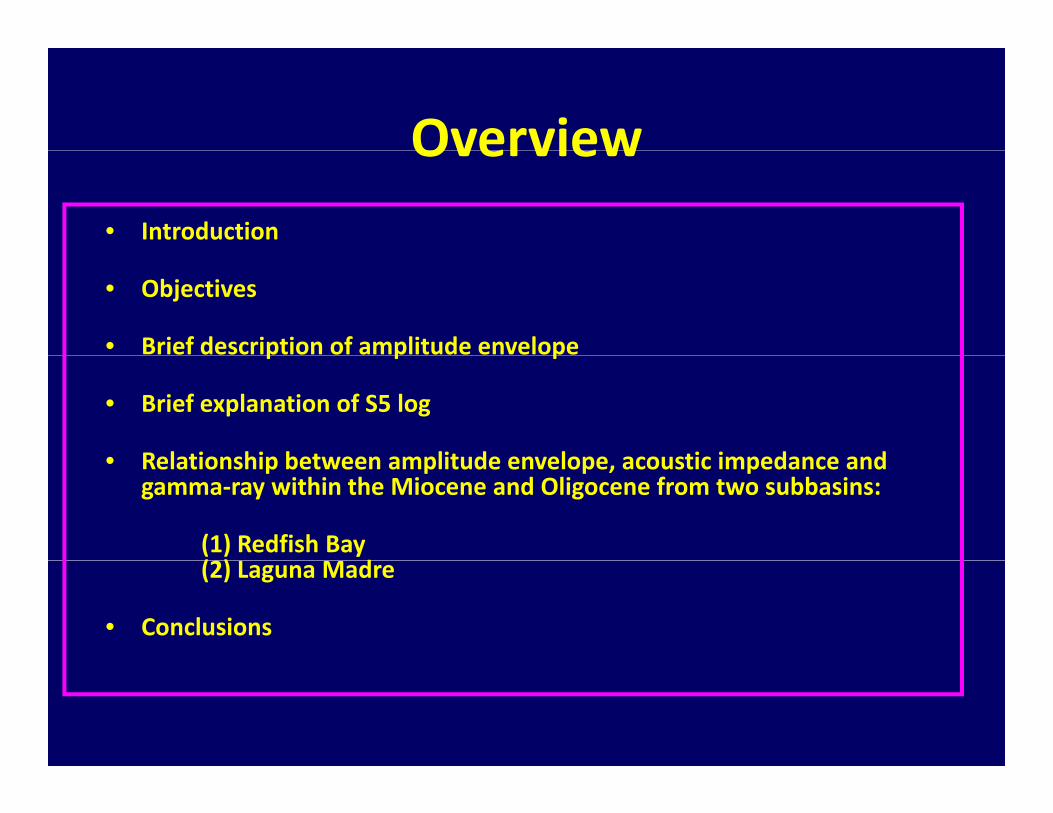
Introduction: Location
N
STUDY AREA
0
0
50 100 mi
150 km

ObjectivesObjectives
• Obtain linear relationship between lithologyObtain linear relationship between lithology and amplitude envelope (AE) and also between acoustic impedance (AI) andbetween acoustic impedance (AI) and lithology that could be used to infer lithology within individual systems tracts in the surveywithin individual systems tracts in the survey area.

Amplitude envelope (AE)Amplitude envelope (AE)
The modulus (amplitude envelope) is given asThe modulus (amplitude envelope) is given as
A(t) = (f2(t) + h2(t))1/2, (1)
where f(t) is the amplitude of the real seismic trace,and h(t) is the quadrature expressed by Bracewell (1965) as:
h(t) = 1/t * f(t), (2)where * denotes convolution.
Amplitude envelope is always positive and does not depend on phase.
It is used for fault delineation and lithology differentiation.

An example of typical S5 log from South Texas Gulf Coast
SP/Gamma‐ray log
Resistivity log
Legend
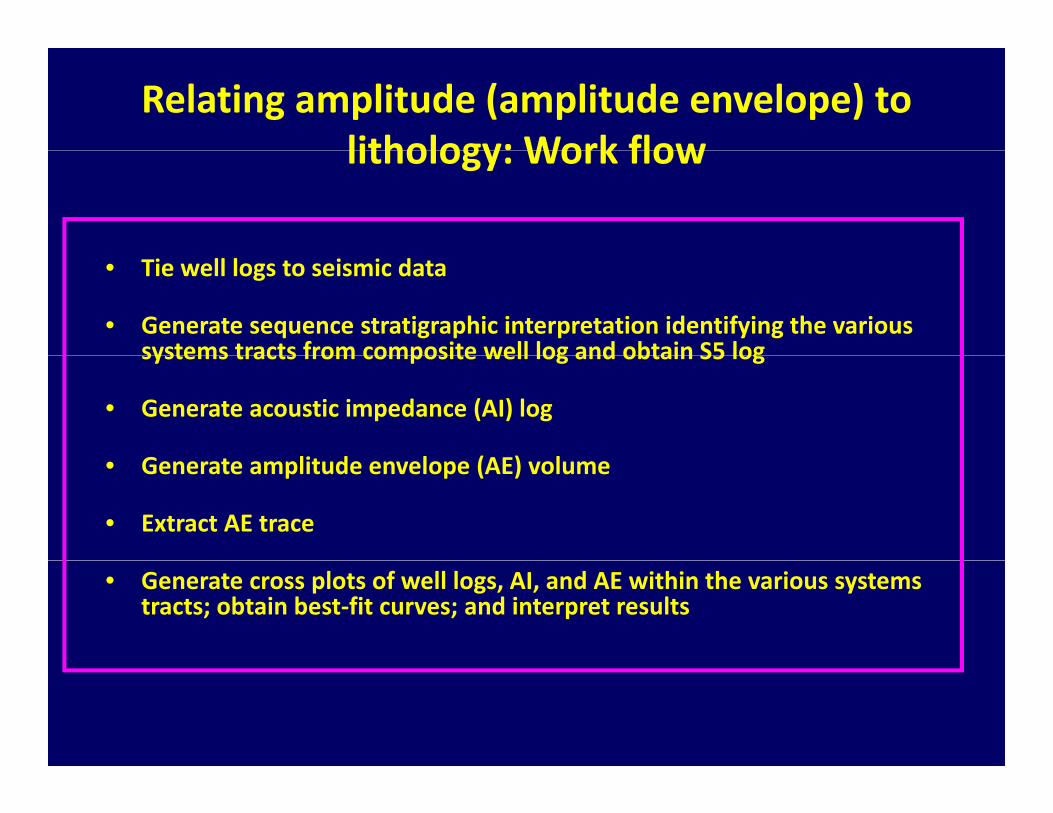
Relating amplitude (amplitude envelope) to lithology: Work flowlithology: Work flow
• Tie well logs to seismic data
• Generate sequence stratigraphic interpretation identifying the various systems tracts from composite well log and obtain S5 logsystems tracts from composite well log and obtain S5 log
• Generate acoustic impedance (AI) log
G li d l (AE) l• Generate amplitude envelope (AE) volume
• Extract AE trace
• Generate cross plots of well logs, AI, and AE within the various systems tracts; obtain best‐fit curves; and interpret results

Results from Redfish Bay
Cross plots within various systems p ytracts and interpretation—Miocene
analysisanalysis

Redfish Bay Miocene lowstand systems tractWell A
E
LowstandSynthetic seismogram
MIO
CEN
E
WT)
Gamma‐ray
M
00 m
s (T
W
Impedance
1,00
Envelope
Gamma‐ray
FRIO5170’

Redfish Bay Miocene lowstand systems tract
The three curvesshow linearshow linear relationships.AI vs. gamma‐ray and AI vs. AE have similar trends(negative gradients).

Redfish Bay Miocene lowstand systems tract:3D cross plots of AI, AE, and Gamma‐ray3D cross plots of AI, AE, and Gamma ray
3D plots of gamma‐f iray as a function
of AI and AE.Results show that sand‐rich zones increase as AE’sdecrease and AI’sincrease.

Redfish Bay Miocene highstand/transgressive systems tractsWell A
E
Synthetic seismogram Highstand/
Transgressive
MIO
CEN
E
Gamma‐ray
WT) M
Impedance
00 m
s (T
W
Envelope
1,00
Gamma‐ray
FRIO5170’

Redfish Bay Miocene highstand/transgressive systems tracts
2D cross plots
These curves areapproximately linear.AI vs. gamma-ray g yand AI vs. AE have opposite trends(positive and negativegradients) suggestinggradients), suggestingmixed environments.
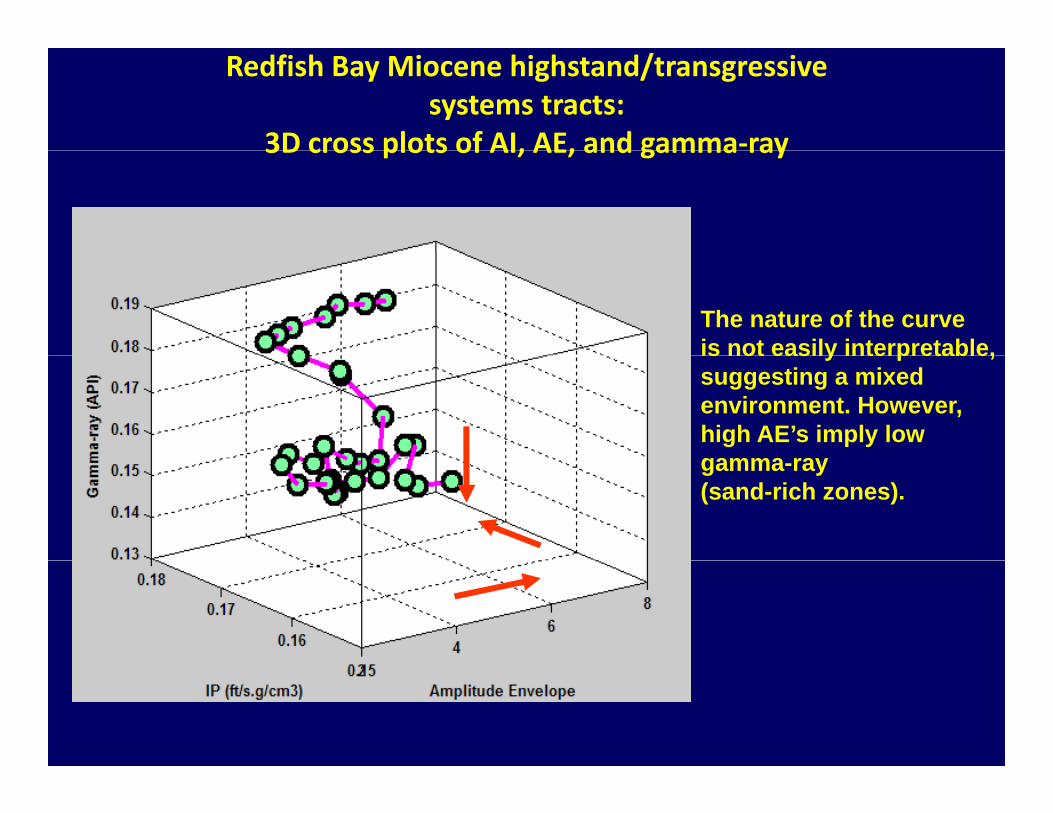
Redfish Bay Miocene highstand/transgressive systems tracts:
3D cross plots of AI, AE, and gamma‐ray3D cross plots of AI, AE, and gamma ray
The nature of the curveis not easily interpretable,is not easily interpretable,suggesting a mixed environment. However,high AE’s imply low gamma-ray (sand-rich zones).

Well A
Redfish Bay Miocene Transgressive—Anahuac
Synthetic seismogram
MIO
CEN
E
Gamma‐ray
Gamma‐ray
WT) My
Impedance
00 m
s (T
W1,
00
Transgressive
Envelope
FRIO5170’

Redfish Bay Miocene Transgressive—Anahuac
Both AI vs. gamma-d AI AE hray and AI vs. AE have
different equations (positive and negativegradients).g )
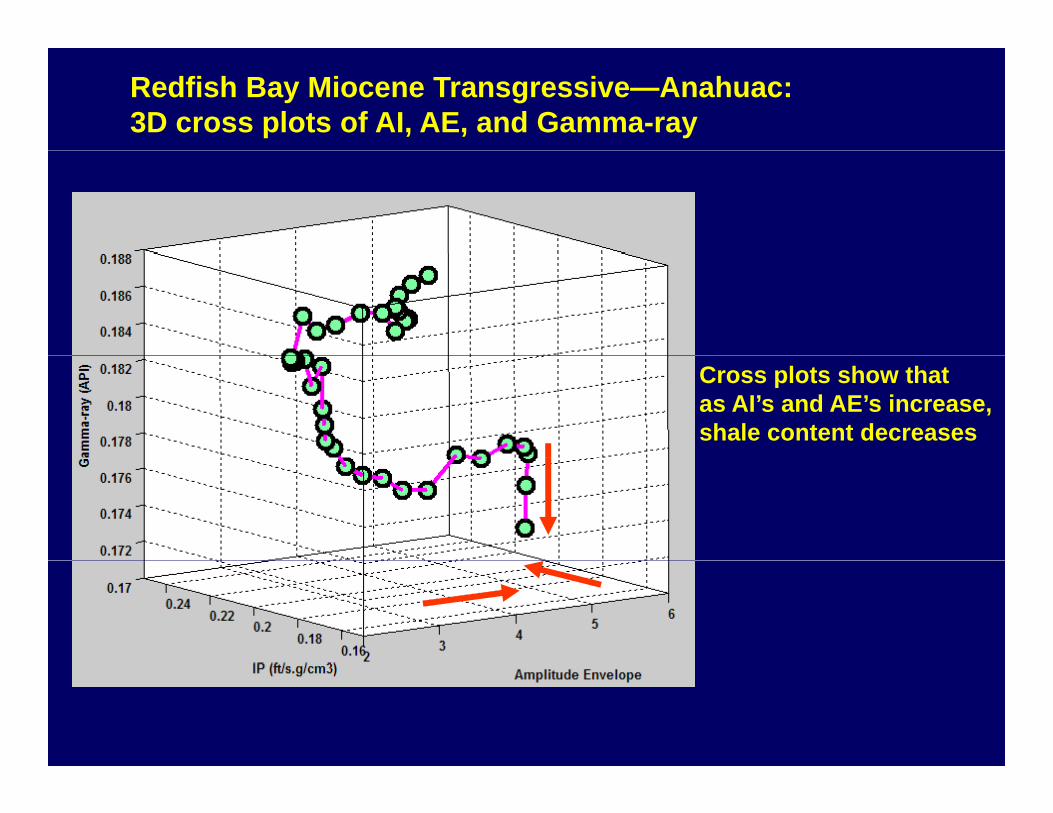
Redfish Bay Miocene Transgressive—Anahuac:3D cross plots of AI, AE, and Gamma-ray
Cross plots show thatas AI’s and AE’s increase,shale content decreases

Results from Redfish Bay
Cross plots within various system p ytracts and interpretation—Oligocene
Frio analysisFrio analysis

Redfish Bay Oligocene Frio highstand systems tract Well A
Synthetic seismogram
MIO
CEN
E
Gamma‐ray
Gamma‐ray
WT) My
Impedance
00 m
s (T
W
Envelope
1,00
Highstand
FRIO5170’

Redfish Bay Oligocene Frio highstand systems tract
2D cross plots
AI vs. gamma‐rayd AI AEand AI vs. AE curves
have similar equations.As AE’s decrease, gamma‐ray decreases, suggestingy , gg gsand‐rich zones.

Redfish Bay Oligocene Frio highstand systems tract: 3D cross plotsp
of AI, AE, and Gamma‐ray
Cross plots show thatas AI’s increase and AE’sdecreases, sand contentincrease suggesting thatincrease suggesting that sand‐rich zones are of low energy.

Results from Laguna Madre basin:Results from Laguna Madre basin:
Cross plots within various systems tracts and interpretationtracts and interpretation

Laguna Madre Miocene highstand systems tractWell B
ImpedanceSynthetic seismogram
ned
Gamma‐ray
Gamma‐ray
Mioce
Hig
hsta
nd
TWT)
Envelope
1,500 ms (T
e Frio
1
Oligocen
e
5170’

Laguna Madre Miocene highstand systems tract
2D cross plots
Increasing AI’s and AE’ssuggest high gamma‐ray (shale‐rich zones).(shale rich zones).
AI vs. gamma‐ ray and AI vs. AE plots have i il i i hsimilar equations withpositive gradients.
The interval does notcontain any significantlowstand.
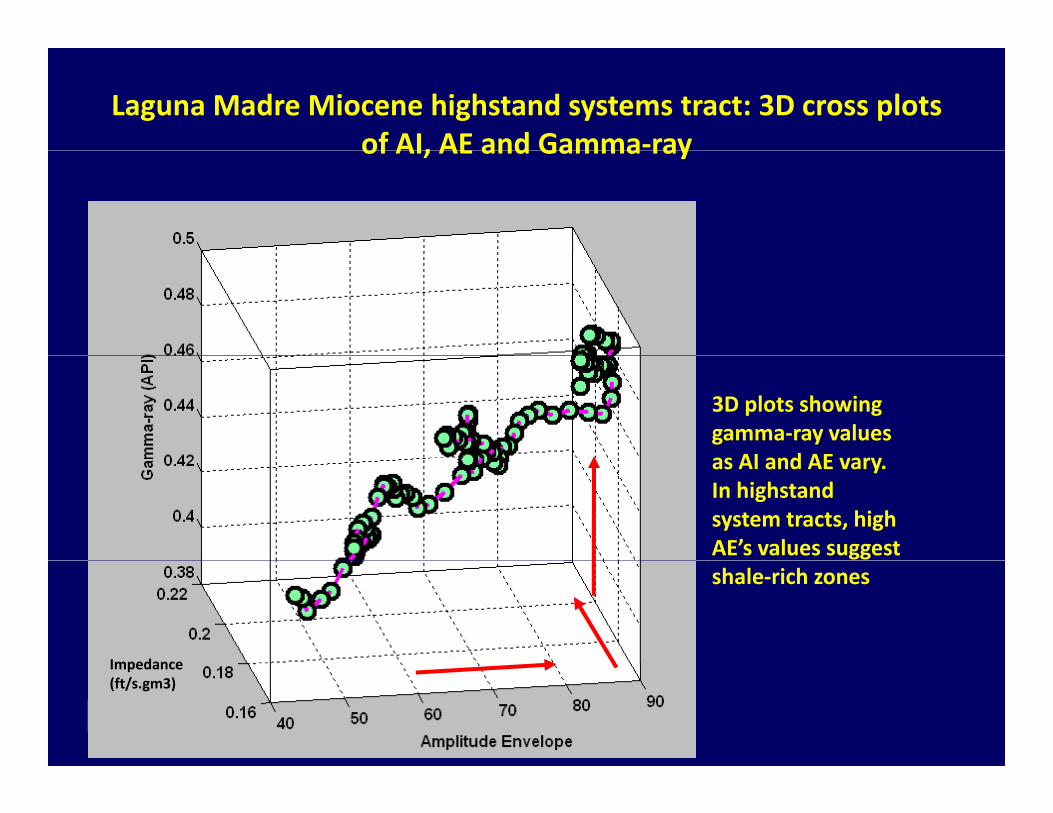
Laguna Madre Miocene highstand systems tract: 3D cross plotsof AI, AE and Gamma‐rayof AI, AE and Gamma ray
3D plots showinggamma‐ray values as AI and AE varyas AI and AE vary. In highstand system tracts, high AE’s values suggest
Impedance
shale‐rich zones
Impedance(ft/s.gm3)
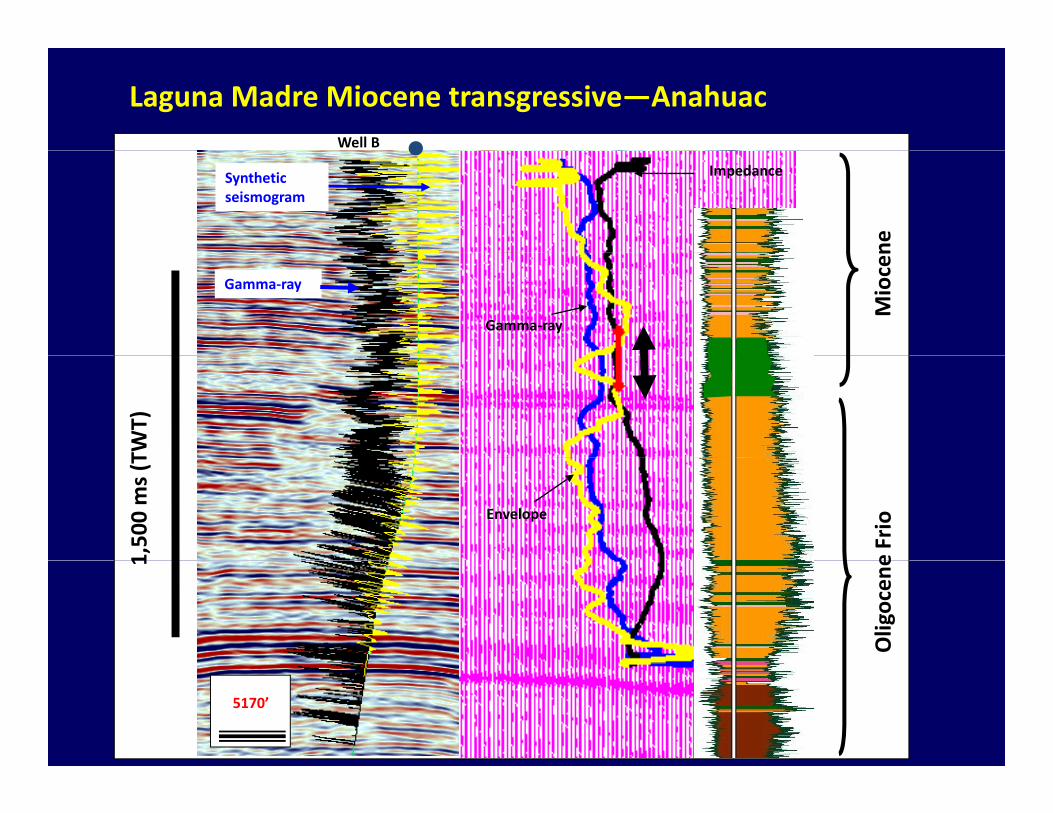
Laguna Madre Miocene transgressive—Anahuac Well B
ne
ImpedanceSynthetic seismogram
Miocen
Gamma‐ray
Gamma‐ray
TWT)
1,500 ms (T
e FrioEnvelope
1
Oligocen
e
5170’
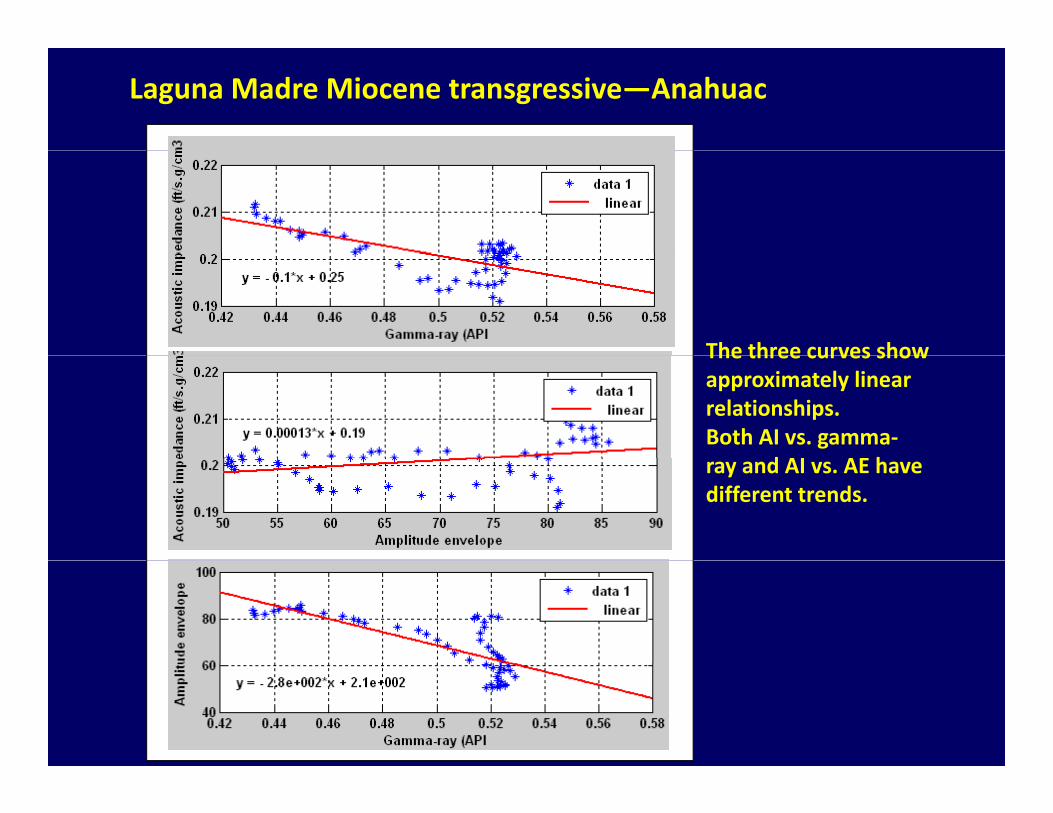
Laguna Madre Miocene transgressive—Anahuac
The three curves showThe three curves showapproximately linearrelationships.Both AI vs. gamma‐
d AI AE hray and AI vs. AE have different trends.

Laguna Madre Miocene transgressive—Anahuac:3D cross plots of AI, AE, and Gamma‐ray
In transgressivesystem tracts, low AE’s and highAI’s imply shale‐rich zones; i.e.,high AE’s and low AI’s imply sand‐AI s, imply sand‐rich zones suchas turbidites.
Trend is similarto the Anahuac in Redfish Bay.
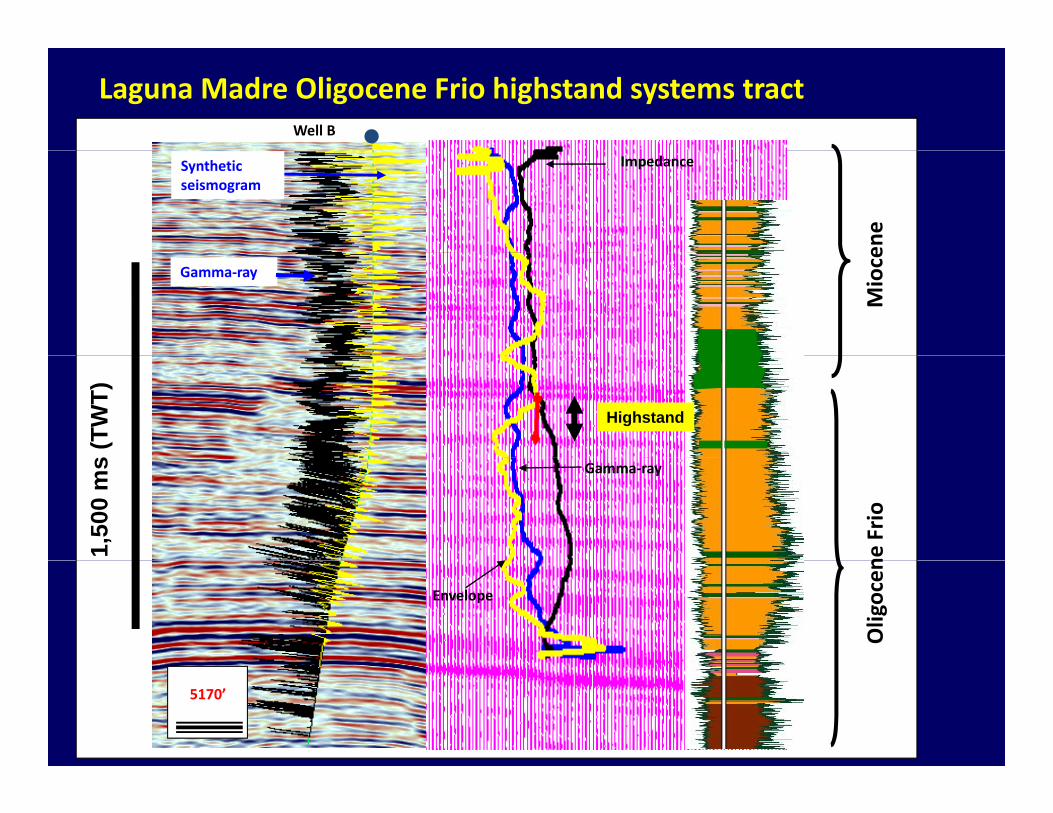
Laguna Madre Oligocene Frio highstand systems tract Well B
ene
ImpedanceSynthetic seismogram
MioceGamma‐ray
s (T
WT)
Highstand
1,50
0 m
s
ne Frio
Gamma‐ray
Oligocen
Envelope
5170’

Laguna Madre Oligocene Frio highstand systems tract
2D cross plots
Graphs show thathigh AE’s low AI’ssuggest sand-rich zones. Results arecontrary to what iscontrary to what isobserved in RedfishBay. Plot of AI vs gamma-ray shows adifferent trend (positive gradient)–Impedance increasesas shale contentas shale contentincreases.

Laguna Madre Oligocene Frio highstand systems tract: 3D cross plots
of AI, AE and Gamma‐ray
Cross plots show thathigh AE’s and low AI’ssuggest sand-richsuggest sand rich zones. Results arecontrary to what is observed in RedfishBBay.

CONCLUSIONS• Miocene highstand:g
In Redfish Bay, high acoustic impedance and high amplitude envelope suggest sand‐rich zone, whereas in Laguna Madre, high acoustic impedance and high amplitude envelope suggest shale, implying different local sediment supply, diagenesis, etc, in the two subbasins.
• Miocene transgressive Anahuac:In both Redfish Bay and Laguna Madre, high impedance and high amplitude envelope suggest sand‐rich zones (turbidites), implying a widespread event common to both subbasins
In Redfish Bay lowstand incised‐valley‐fills, sand‐rich zones are characterized by high impedance and low amplitude envelope.
• Oligocene highstand:In Redfish Bay high impedance but low amplitude envelope suggest sand richIn Redfish Bay, high impedance but low amplitude envelope suggest sand‐rich zones, whereas in Laguna Madre, high impedance but low envelope suggest shales, implying different local sediment supply, diagenesis, etc. in the two subbasins.
I d i i li l ti hi b t lit d l d d• In deriving linear relationships between amplitude envelope and gamma‐ray and between impedance and amplitude envelope, analysis should be performed within each systems tract to avoid ambiguous interpretation.
• Linear relationships between these variables in the various systems tracts can f bb bb h l h bl h d
p yvary from subbasin to subbasin. As such, relationships established in one subbasin may not apply in another subbasin.

ACKNOWLEDGMENTSACKNOWLEDGMENTS
• LANDMARK GRAPHICSLANDMARK GRAPHICS• WESTERN GECO
j S• Project STARR

THANK YOUTHANK YOU