UNDERSTANDING HOW HARVEST INFLUENCES THE LIFE HISTORY AND DEMOGRAPHICS OF SHOVELNOSE STURGEON IN THE...
62
UNDERSTANDING HOW HARVEST INFLUENCES THE LIFE HISTORY AND DEMOGRAPHICS OF SHOVELNOSE STURGEON IN THE MIDDLE MISSISSIPPI RIVER by Sara Joy Tripp B.A., Southern Illinois University, 2004 A Thesis Submitted in Partial Fulfillment of the Requirements for the Master of Science Degree Department of Zoology in the Graduate School Southern Illinois University Carbondale December 2007
Transcript of UNDERSTANDING HOW HARVEST INFLUENCES THE LIFE HISTORY AND DEMOGRAPHICS OF SHOVELNOSE STURGEON IN THE...
UNDERSTANDING HOW HARVEST INFLUENCES THE LIFE HISTORY
AND DEMOGRAPHICS OF SHOVELNOSE STURGEON IN THE MIDDLE
MISSISSIPPI RIVER
by
Sara Joy Tripp
B.A., Southern Illinois University, 2004
A Thesis Submitted in Partial Fulfillment of the Requirements for the
Master of Science Degree
Department of Zoology in the Graduate School
Southern Illinois University Carbondale
December 2007
THESIS APPROVAL
UNDERSTANDING HOW HARVEST INFLUENCES THE LIFE HISTORY
AND DEMOGRAPHICS OF SHOVELNOSE STURGEON IN THE MIDDLE
MISSISSIPPI RIVER
By
Sara Joy Tripp
A Thesis Submitted in Partial
Fulfillment of the Requirements
for the Degree of
Master of Science
in the field of Zoology
Approved by:
Dr. James E. Garvey, Co-Chair
Dr. Brooks M. Burr, Co-Chair
Dr. Anita M. Kelly
Graduate School Southern Illinois University Carbondale
December 2007

AN ABSTRACT OF THE THESIS OF
SARA J. TRIPP, for the Master of Science Degree in Zoology, presented on July 11, 2007 at Southern Illinois University Carbondale TITLE: Understanding How Harvest Influences the Life History and Demographics of Shovelnose Sturgeon in the Middle Mississippi River MAJOR PROFESSORS: James E. Garvey and Brooks M. Burr
Shovelnose sturgeon Scaphirhynchus platorynchus in the Middle
Mississippi River is one of the last commercially viable sturgeon populations in
the world. To determine whether commercial harvest of the black-egg (sexually
mature) females is impacting this population, information regarding sex-specific
demographics and the reproductive life history is required. Adult shovelnose
sturgeon were sampled using gill nets (5-cm bar mesh) monthly during February
2005 through July 2006 at three sites on the Middle Mississippi River between
Cairo, IL and St. Louis, MO; (RKM: 201-198; 191-188, and RKM 127-124). Of
all shovelnose sturgeon sampled, 363 were females and 416 were males, deviating
from 1:1 (p=0.06). Sex-specific length frequency distributions differed (p=0.03)
with females having a larger median fork length (614 mm). Compared to
historical data, the population shifted towards longer fish, and somatic growth
declined. The population also shifted towards older fish with reduced
recruitment. Age at maturity was later than previously reported, with females
maturing at a mean age of 10.5 years and males at 9 years of age. Total egg count
was slightly lower than previously reported with a mean of 29,573/female.
However, the spawning cycle had not changed with most males and females
i

spawning every 2 and 3 years, respectively. Larval sturgeon were also sampled to
link age at maturation, timing and periodicity of spawning, and larval growth
rates. Larval sturgeon occurred during June and July of 2005 and May and June
of 2006, confirming successful spawning. Larval sturgeon grew between 0.69 to
1.69 mm total length per day among four distinct cohorts produced each year. For
the first time for this population, sturgeon were found to spawn during the fall.
Fall sturgeon contained ripe eggs with polarization indexes (PIs) <0.05; larval
sturgeon were collected thereafter. The population structure is changing likely
due to increased commercial harvest perhaps coupled with poor habitat
conditions. The life history strategy, which is similar to other sturgeon, likely
places this species at risk of overharvest.
ii

ACKNOWLEDGEMENTS
I would like to thank my major advisors Dr. James Garvey and Dr. Brooks
Burr for all their guidance, support, and patience during my education at Southern
Illinois University. I would also like to thank Dr. Anita Kelly for serving on my
graduate committee and providing her valuable expertise and suggestions.
I am grateful to the many graduate and undergraduate students for their
field and lab assistance, especially Pat Beck, Kelly DeGrandchamp, Rick Echols,
Dave Knuth, Adam Lohmeyer, Quinton Phelps, Andy Plauck, Doug Schultz,
Diane Shasteen, and John Ziegler. In addition, I would sincerely like to thank
researcher Mike Hill for all his assistance in the field and lab, contributing
countless hours into completing this project. I would also like to thank Rob
Colombo for his valuable assistance with design, data analysis, writing, and
manuscript preparation.
iii

TABLE OF CONTENTS
ABSTRACT......................................................................................................................... i
ACKNOWLEDGEMENTS............................................................................................... iii
LIST OF TABLES.............................................................................................................. v
LIST OF FIGURES ........................................................................................................... vi
CHAPTER ONE ................................................................................................................. 1
Abstract........................................................................................................................... 1 Introduction..................................................................................................................... 1 Methods .......................................................................................................................... 3 Results............................................................................................................................. 8 Discussion..................................................................................................................... 11
CHAPTER TWO .............................................................................................................. 25
Abstract......................................................................................................................... 25 Introduction................................................................................................................... 25 Methods ........................................................................................................................ 28 Results........................................................................................................................... 32 Discussion..................................................................................................................... 34
LITERATURE CITED ..................................................................................................... 48
VITA................................................................................................................................. 53
iv

LIST OF TABLES
Table 1. Von Bertalanffy parameters estimated for the Middle
Mississippi River shovelnose sturgeon population in 2002-2003 and 2005-2006, and also sex-specific parameters for the 2005-2006 sample ....................................................................16
Table 2. Stages of gonadal development of the shovelnose sturgeon
(modified from Colombo et al. 2007b) ..........................................38 Table 3. Sex and stage specific fork length and age ranges for
shovelnose sturgeon collected from February 2005 through June 2006 .......................................................................................39
v

LIST OF FIGURES
Figure 1. Length-frequency distributions of the shovelnose sturgeon population in the Middle Mississippi River by year and commercially harvested shovelnose sturgeon from one sample in 2004. ..............................................................................17
Figure 2. Sex-specific length-frequency distributions of shovelnose
sturgeon in the Middle Mississippi River during 2005 through 2006. .................................................................................18
Figure 3. Length-weight relationship of shovelnose sturgeon in the
Middle Mississippi River during 2005 through 2006. Solid line representing females (R2 = 0.92) and dashed line representing males (R2 = 0.90) ......................................................19
Figure 4. Age-frequency distributions for the shovelnose sturgeon
population in the Middle Mississippi River from 2002 to 2006................................................................................................20
Figure 5. Sex-specific age-frequency distributions for shovelnose
sturgeon in the Middle Mississippi River during 2005 through 2006. Black portion of bars showing immature individuals and white portion of bars representing the mature individuals..........................................................................21
Figure 6. Linear regression analysis of age bias between independent
readers. Age estimates are plotted as the mean age estimate by ager 2 for the age classes of ager 1 for shovelnose sturgeon collected in the Middle Mississippi River during 2005 through 2006. Error bars represent 95% confidence intervals. The slope of the regression line did differ from one due to minimal variation in the data .......................................22
Figure 7. Mean fork length with error bars (standard error) of each
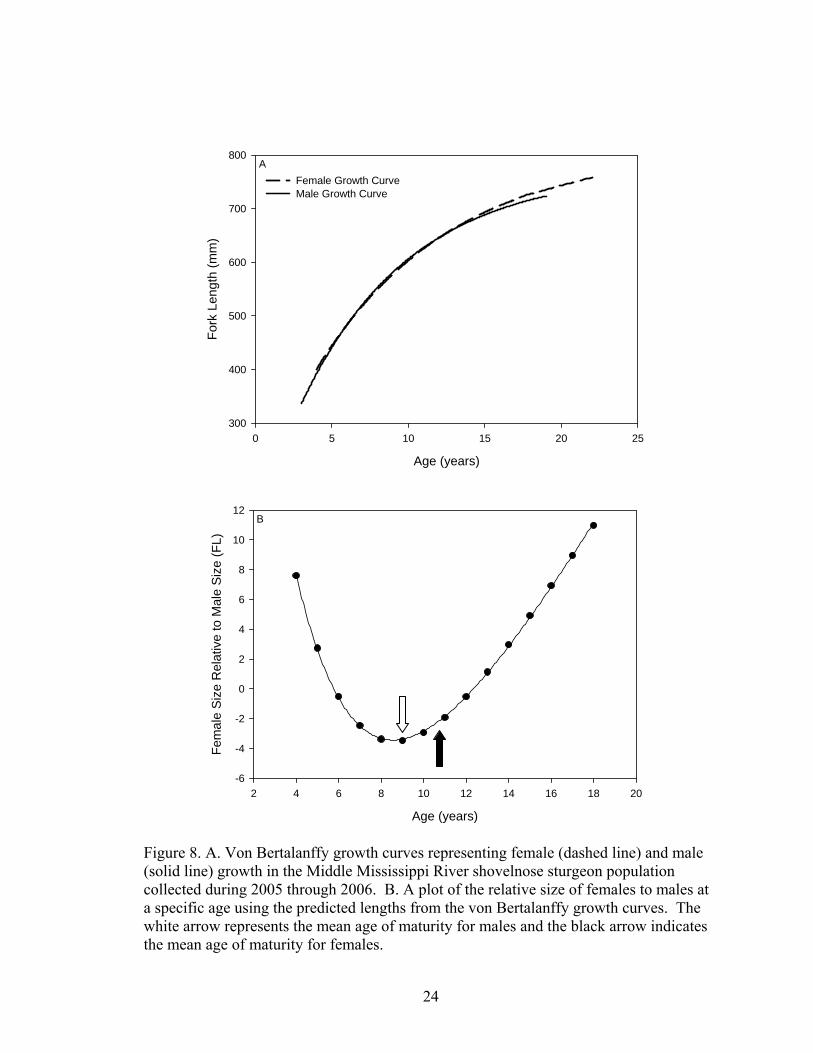
age class by year. Note different scales on the y-axis...................23 Figure 8. Von Bertalanffy growth curves representing female (dashed
line) and male (solid line) growth in the Middle Mississippi River shovelnose sturgeon population collected during 2005 through 2006. B. A plot of the relative size of females to males at a specific age using the predicted lengths from the von Bertalanffy growth curves. The white arrow represents the mean age of maturity for males and
vi

the black arrow indicates the mean age of maturity for females ...........................................................................................24
Figure 9. Mean GSI for each stage of the male shovelnose sturgeon
gonadal development in the Middle Mississippi River during 2005 through 2006 with standard error and sample size above each error bar. (Different letters represent significantly different means at p<0.05) ........................................40
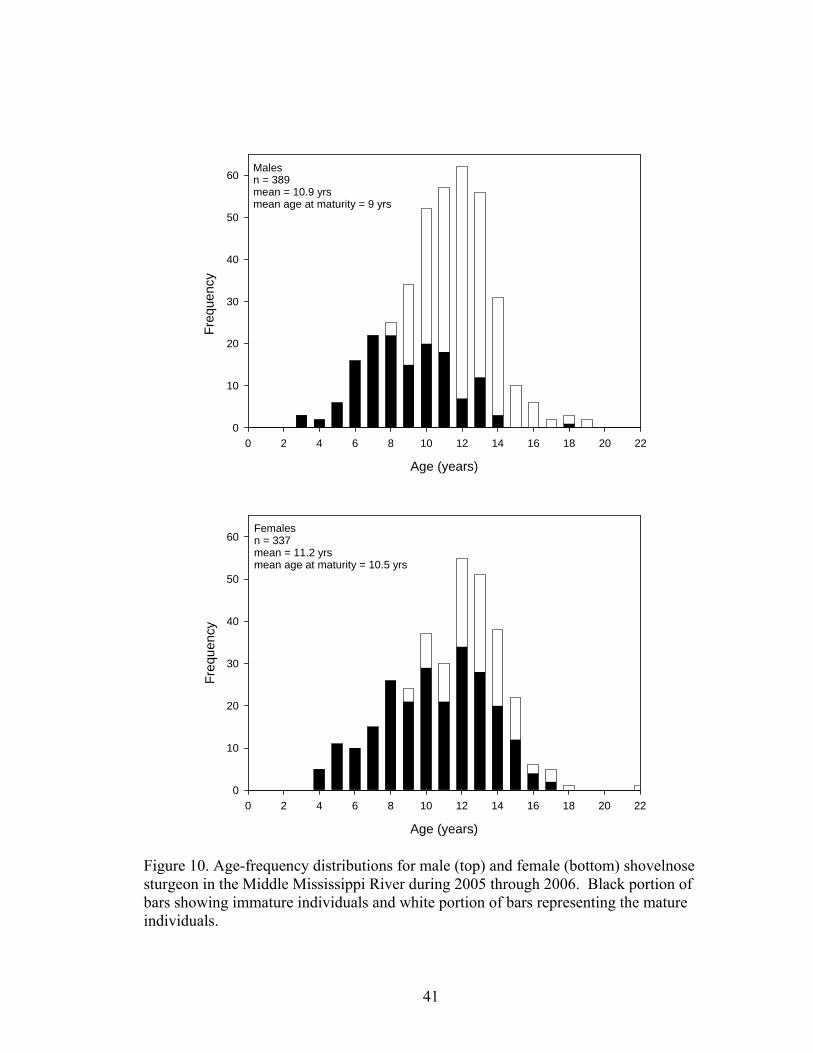
Figure 10. Age-frequency distributions for male (top) and female
(bottom) shovelnose sturgeon in the Middle Mississippi River during 2005 through 2006. Black portion of bars showing immature individuals and white portion of bars representing the mature individuals ...............................................41
Figure 11. Mean GSI for each stage of the female shovelnose sturgeon
gonadal development in the Middle Mississippi River during 2005 and 2006 with standard error and sample size above each error bar. (Different letters represent significantly different means at p<0.05) ........................................42
Figure 12. Total egg count –wet weight relationship of female black
egg shovelnose sturgeon in the Middle Mississippi River during 2005 and 2006 (R2 = 0.48)..................................................43
Figure 13. Proportion of mature (top) and spent (bottom) males (left)
and females (right) plotted against river stage (gray solid) and water temperature (black dash). The black box includes the optimal spawning temperatures for shovelnose sturgeon..........................................................................................44
Figure 14. Proportion of mature female shovelnose sturgeon (circles)
with larval abundance (triangles) during 2005 and 2006 in the Middle Mississippi River .........................................................45
Figure 15. Linear relationship of length (mm) and day of the year for
cohorts of larval and young of the year shovelnose sturgeon in the Middle Mississippi River during 2005 (top) and 2006 (bottom)..........................................................................................46
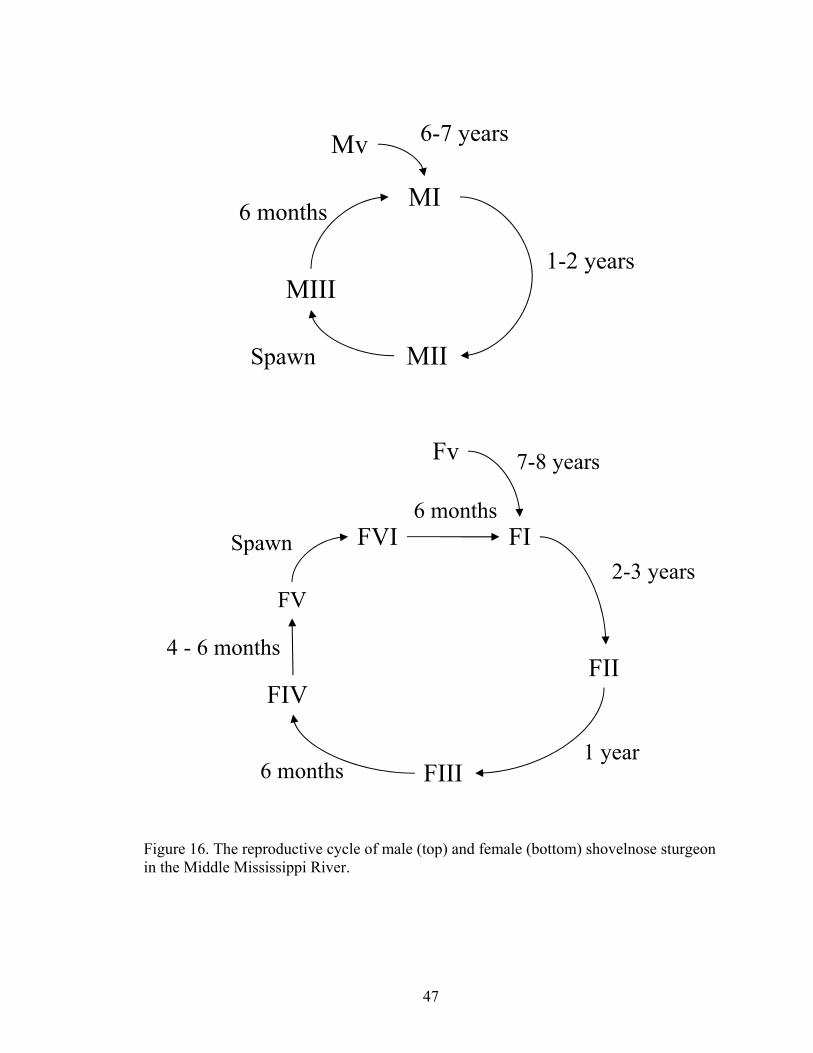
Figure 16. The reproductive cycle of male (top) and female (bottom)
shovelnose sturgeon in the Middle Mississippi River ...................47
vii

CHAPTER ONE
CHANGING DEMOGRAPHICS OF STURGEON IN THE MIDDLE MISSISSIPPI
RIVER: POTENTIAL HARVEST RESPONSES
ABSTRACT
To determine whether shovelnose sturgeon Scaphirhynchus platorynchus
populations are changing due to commercial overharvest of black-egg (sexually mature)
females, I require seasonal information regarding sex-specific population demographics.
I sampled shovelnose sturgeon using gill nets (5-cm bar mesh) monthly during February
2005 through June 2006 at three sites on the Middle Mississippi River between Cairo, IL
and St. Louis, MO; (RKM: 201-198; 191-188; and RKM 127-124). Of all shovelnose
sturgeon sampled, 363 were females and 416 males, deviating from 1:1 (p=0.06). Annual
mortality was 44%. Sex-specific length-frequency distributions differed (p=0.03) with
females having a larger median fork length (614 mm). Compared to historical data, the
population shifted towards longer fish, and somatic growth declined. The population
shifted towards older fish with reduced recruitment. Age at maturity was later than
previously reported, with females maturing at a mean age of 10.5 years and males at 9
years of age. Population structure is changing, likely due to increased commercial
harvest perhaps coupled with poor habitat conditions.
INTRODUCTION
Globally, the status of most sturgeon populations is either imperiled or unknown.
Of the 27 extant sturgeon species, all are characterized by limited adult abundance and
1

most are threatened (Pikitch et al. 2005). The order Acipenseriformes includes some of
the most economically valuable freshwater species due to their ability to produce black
caviar. However, this value also leaves these species susceptible to overharvest of
females. These long-lived late maturing species are unable to compensate for intense
harvest and when coinciding with habitat degradation, the fishery collapses (Billard and
Lecointre 2001, Ludwig et al. 2002, Secor et al. 2002). World catch of sturgeon is
currently at its lowest level in recent decades (Billard and Lecointre 2001). With the
recent collapse of the Caspian Sea fisheries (Birstein 1993, Billard and Lecointre 2001,
Pikitch et al. 2005), fishing pressure has shifted toward North American species such as
the shovelnose sturgeon (Scaphirhynchus platorynchus), which is one of the few species
that can be legally harvested in the world.
Shovelnose sturgeon appear to be more resilient to harvest than other sturgeon
species, being relatively small and perhaps less commercially valuable (Carlander 1954).
Shovelnose sturgeon are thought to mature at a relatively early age of 5-7 years (Helms
1974, Farbee 1979), which may enable them to better withstand fishing pressure (Morrow
et al. 1998). Although shovelnose sturgeon populations appear more stable than their
European and Asian counterparts, its distribution and abundance have been reduced over
the last century due to habitat alteration, water pollution, and overharvest (Bailey and
Cross 1954, Hurley and Nickum 1984, Keenlyne 1997, Morrow et al. 1998).
Commercial fishing is currently legal in both Missouri and Illinois, and occurs in
the Middle Mississippi River (MMR) which extends from river kilometer (RKM) 309, St.
Louis, MO to RKM 0, Cairo, IL. In 2001 commercial harvest of shovelnose sturgeon
flesh in the MMR reached a historical high (Colombo et al. 2007a). By 2000, this
2
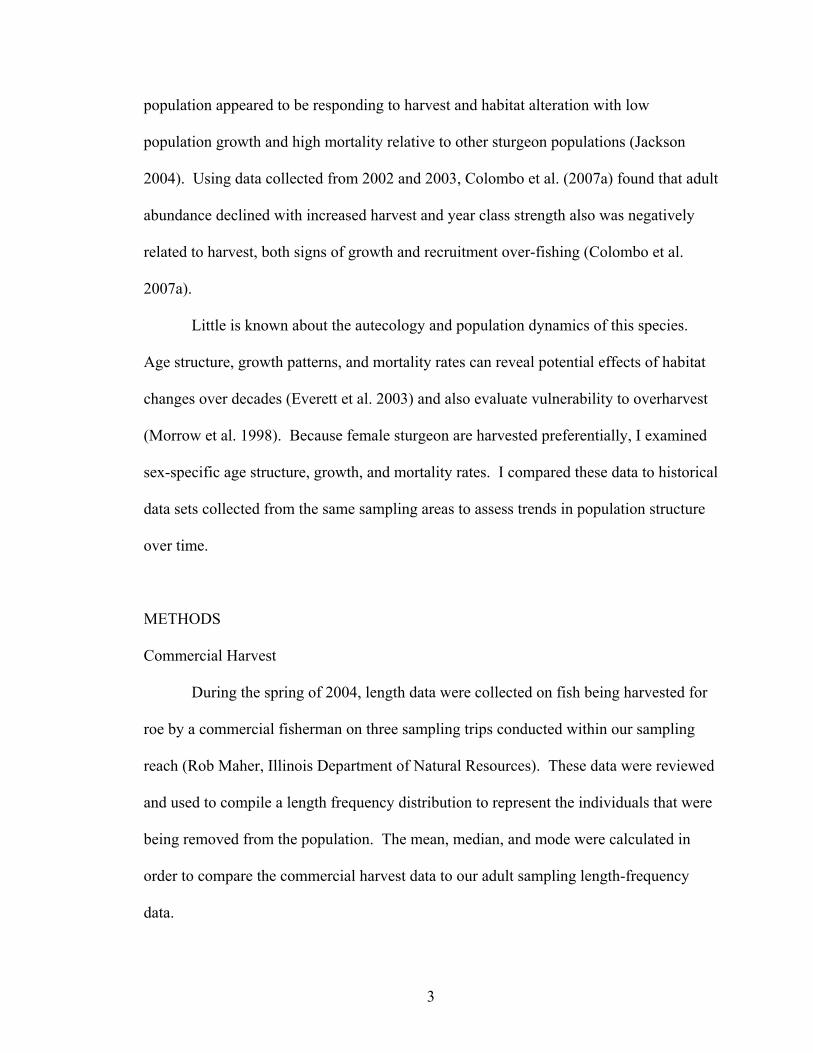
population appeared to be responding to harvest and habitat alteration with low
population growth and high mortality relative to other sturgeon populations (Jackson
2004). Using data collected from 2002 and 2003, Colombo et al. (2007a) found that adult
abundance declined with increased harvest and year class strength also was negatively
related to harvest, both signs of growth and recruitment over-fishing (Colombo et al.
2007a).
Little is known about the autecology and population dynamics of this species.
Age structure, growth patterns, and mortality rates can reveal potential effects of habitat
changes over decades (Everett et al. 2003) and also evaluate vulnerability to overharvest
(Morrow et al. 1998). Because female sturgeon are harvested preferentially, I examined
sex-specific age structure, growth, and mortality rates. I compared these data to historical
data sets collected from the same sampling areas to assess trends in population structure
over time.
METHODS
Commercial Harvest
During the spring of 2004, length data were collected on fish being harvested for
roe by a commercial fisherman on three sampling trips conducted within our sampling
reach (Rob Maher, Illinois Department of Natural Resources). These data were reviewed
and used to compile a length frequency distribution to represent the individuals that were
being removed from the population. The mean, median, and mode were calculated in
order to compare the commercial harvest data to our adult sampling length-frequency
data.
3

Stratified Random Adult Sampling
Standardized sampling of shovelnose sturgeon occurred during November
through April, 2002 through 2005. Stationary bottom set gill nets [5.08 centimeter bar
mesh, 45.7 meters long, 3.05 meters deep] were set at randomly selected sites, stratified
by habitat type in the MMR. Fork length (FL, 1 mm) and wet weight (0.1 g) were
quantified for each fish. The left pectoral ray was removed from all fish and later used to
determine the age of each specimen. These data were used to compare yearly length and
age-frequency distributions across years, with mean and mode reported for each year.
Directed Repeated Adult Sampling
In addition to the annual random sampling, directed monthly collection of
shovelnose sturgeon occurred during February 2005 through June 2006, using the same
stationary bottom set gill nets. Six nets were set for 24 hours on the seam of wingdikes at
Modoc, IL (RKM 201-198), Chester, IL (RKM 191-188), and Grand Tower, IL (RKM
127-124) due to known high densities of shovelnose sturgeon in these areas. Lengths,
weights, and rays were collected as before. Water temperature, conductivity, dissolved
oxygen, and pH were collected at the surface for each sampling trip with a Quanta
Hydrolab water quality meter. Daily river stage height was determined from the United
States Geological Services (USGS) gauging station at Chester, IL.
Each month, a subsample of the first 20 sturgeon collected at each site was
preserved on wet ice and taken back to the lab. A mid-ventral incision was made from
the anus through the pelvic girdle, exposing the gonads. The gonads from each sturgeon
were photographed and the digital images were later used to categorize the samples into
stages of development based on the index from Colombo et al. (2007b).
4

Catch was quantified as fish per net night and was compared to season using an
ANOVA and river stage and water temperature using Pearson’s Correlation and
significance was determined using and alpha (α) value of 0.05 for all statistical
comparisons. Length-frequency graphs were constructed for both sexes with mean,
median and mode reported. Kolmogorov-Smirnov test was used to determine if
distributions were sex-specific. Sex-specific length-weight regressions and relative
weight calculations were compiled to determine the condition of the population. Relative
weight can also be used to monitor influences of environmental change or human
manipulations over time (Ney 1999) and was defined as:
100W ×=s
r WW
where W is the observed weight and Ws is the length-specific standard weight values for
the species. Relative weight values were calculated using the length specific standard
weight (Ws) equation determined by Quist et al. (1998):
FLlog330.3287.6Wlog 1010 +−=s .
Age and Growth
Pectoral fins rays were placed in coin envelopes and dried. Three sections were
cut from the basal portion of each fin ray using a Buhler Isomet® low speed saw. Each
section, increasing in width (0.635mm, 0.6858mm, and 0.7366mm) was secured to a slide
using cyanoacrylate. Cross sections were examined independently by two readers using a
stereomicroscope under 7-45x magnification. Under transmitted light, a pair of opaque
(growth) and translucent bands was considered an annulus (Everett et al. 2003). The
annuli were counted from the nucleus to the apex of each section. This method has been
5

validated for Atlantic sturgeon (Secor et al. 1997), lake sturgeon (Rossiter et al. 1995),
and white sturgeon (Brennan and Cailliet 1989) and is the most precise method for aging
the shovelnose sturgeon (Jackson et al. 2007). When readers disagreed, they examined
the cross sections together to reach an agreement.
Precision between independent readers was assessed using average percent error
(Beamish and Fournier 1981) and coefficient of variation (Chang 1982) for the
shovelnose sturgeon collected in the directed repeated sampling in 2005 and 2006.
Average percent error (APE) was defined as:
∑=
−=
R
i j
jijj
X
XX
RxAPE
1
1100
where Xij was the ith age determination of the jth fish, Xj was the mean age of the jth fish,
and R was the number of times each fish was aged. When APEj was averaged across
many fish, it became an index of average percent error (Campana et al. 1995). The
coefficient of variation (CV):
j
R
i
jij
jX
RXX
xCV∑= −
−
= 1
2
1)(
100
was expressed as the ratio of the standard deviation of age estimates to the mean, where
Xij was the ith age determination of the jth fish, Xj was the mean estimated age of the jth
fish, and R was the number of times each fish was aged (Chang 1982). This formula
yielded a single index value for each ray; when the individual values were averaged a
mean coefficient of variation was generated giving an estimate of precision. Age bias
plots were constructed to visualize reader precision, in which the mean estimated age of
one reader was plotted against the second reader’s set of estimated ages for each age class
6

(Campana et al. 1995). Using linear regression, precision could be tested. If the
agreement was perfect the slope of the line would equal one.
Growth curves for the population and also sex specific growth curves were
calculated using FAST (Fishery Analysis and Simulation Tools) software (Slipke and
Maceina 2000). Growth in length was assessed using a von Bertalanffy model:
[ ]))((t
01LL ttKe −−∞ −=
where L∞ is the theoretic maximum length, K is the Brody growth coefficient, t0 is the
predicted age at which length is zero (Ricker 1975). Differences in sex-specific growth
curves were evaluated using the residual sums of squares method (Chen et al. 2002).
Mortality
A catch curve analysis was used to quantify mortality rates for the population as a
whole and sex-specific. The catch curve analysis equation:
)()N(log)(Nlog te tZoe −=
where Nt is the number alive at time t, No is the number alive initially (at time to), Z is
total mortality or instantaneous total mortality rate, and t is the time elapsed since to, is
used to calculate the total instantaneous mortality rate (Ricker 1975). The equation is
simply a linear regression in which the natural log of abundance of fish at age (y) is
regressed against age (x) (Ricker 1975). A weighted regression was used to reduce any
bias that may occur due to reduced relative abundance of older individuals in the
population (Slipke and Maceina 2000). The declining slope of this regression equation
represents the instantaneous mortality estimate (Z), which is used to determine total
annual mortality (A) using this equation:
7

Ze−−=1A
for the population and sex specific mortality rates. Sex-specific catch curve slopes were
tested for homogeneity (test for interaction in ANCOVA) to determine if annual mortality
differed among sexes.
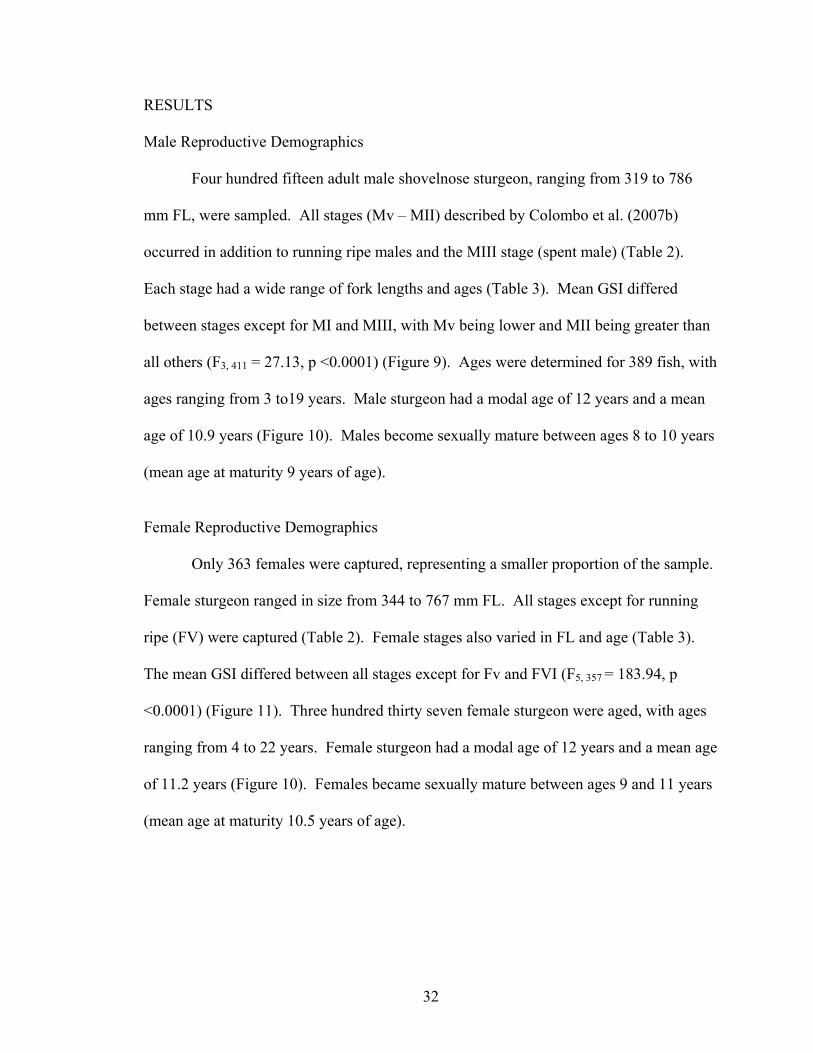
RESULTS
Of the 557 shovelnose sturgeon captured by the commercial fisherman in 2004,
139 were harvested for eggs. The harvested shovelnose sturgeon FL ranged from 400
mm to 760 mm, with a median FL of 654 mm. A total of 3518 shovelnose sturgeon were
captured during the stratified random sampling in 2002 through 2005, with the median
FL ranging from 591 mm in 2002 to 616 mm in 2005. During the 18 month directed
sampling completed during 2005 through 2006, a total of 1725 shovelnose sturgeon were
collected, with a median FL of 621 mm. The length-frequency distributions of
shovelnose sturgeon collected during 2002 through 2006 shifted in median FL towards
larger fish and the distribution transformed from normally distributed to negatively
skewed and truncated toward fish in the 600-700 mm range (Figure 1). The length
distribution of the commercial harvest shovelnose sturgeon illustrated that larger mature
females were targeted with the modal FL being 690 mm (Figure 1).
Of the 1725 shovelnose sturgeon collected in 2005 through 2006, 792 were
brought back to the lab for analysis. The subsample contained 415 males, 363 females,
and 14 that were either intersexuals or unidentifiable. Thus, the sex ratio was 1.14 males:
1 female (χ2 = 3.48, df = 1, p = 0.06). Catch declined by year, with the mean catch in
2005 being 9.06 fish per net night, which decreased to 3.05 fish per net night in 2006 (T
8

= 4.21, df = 253, p <0.0001). Catch was related to season (ANOVA F = 3.92, df = 45, p
= 0.014) and weakly, positively correlated with river stage (r = 0.34, df = 45, p = 0.02),
but unrelated to water temperature (r = 0.025, df = 45, p = 0.87).
The mean FL and weight of females captured during the 2005 through 2006
sampling (mean ± SE) was 615 ± 4 mm (Figure 2) and 998 ± 9 g, respectively. Male
sturgeon had a mean fork length of 609 ± 3 mm (Figure 2) and a mean weight of 936 ±
15 g. Sex-specific length-frequency distributions differed (KS = 0.06, df = 769, p = 0.02)
with females having a greater median fork length. Weight-length regressions were [log 10
weight = 3.4497(log 10 length) – 6.6457] (R2 = 0.92) for females and [log 10 weight =
3.3205 (log 10 length) – 6.2953] (R2 = 0.90) for males (Figure 3). Mean relative weight
values were for females 96, and 94 for males.
Age and Growth
Two hundred and eighty-three shovelnose sturgeon collected during 2002 through
2003 were aged and compared to the age-frequency distributions of the 740 that were
aged from the 2005 through 2006 sampling. The comparison of the age-frequency
distributions showed a shift towards older fish with mean age in 2002 being 7.6 years and
in 2006 11.3 years in age (Figure 4). The age-frequency distributions also converted
from a positively skewed distribution to being normally distributed.
Of the 740 shovelnose sturgeon aged from the 2005 through 2006 sampling; 337
were females and 389 were males with the remaining 14 being intersexuals. Female
shovelnose sturgeon ages ranged between 4 and 22 years of age with a mean age of 11.2,
while males ranged between 3 and 19 years of age with a mean age of 10.9. Females
became sexually mature within the range of 9 to 12 years of age (mean age of maturity
9

10.5) and males matured at 8 to 10 years of age (mean age of maturity 9) (Figure 5).
Between reader percent agreement was high with 88% exact agreement, 10% agreement
within 1 annulus, and 2% within 2 annuli. Precision was high with an APE of 0.7% and a
CV of 1.1 for the entire sample. Bias was not apparent in age estimates according to the
age bias plot; however the slope (0.982) did slightly differ from one (Figure 6).
The von Bertalanffy growth equations for the MMR shovelnose sturgeon
population were estimated and compared among years and sexes (Table 1). In 2002-2003
the population reached a larger L∞ and the Brody growth coefficient was greater than in
2005-2006 (F = 6.72, df = 27, p = 0.0016). When somatic growth was broken down by
age class for each year of data, a decrease in mean fork length at age was observed
between 2002-2003 and 2005-2006 over all age classes (Figure 7). The sex-specific von
Bertalanffy growth curves differed (F = 5.72, df = 27, p = 0.0036) with males reaching
the L∞ at a slightly quicker rate, but females having the larger L∞ (Figure 8 A). During
the years in which the females were becoming sexually mature, the males attained a
larger size; however after maturity was reached, females became larger (Figure 8 B).
Mortality
The catch curve analyses for instantaneous mortality rates were based on fish age
12 and older for both males and females. The pooled instantaneous mortality rate for
both years and sexes was 0.60 (r2 = 96, df = 8, p= <0.0001) or 45% annual mortality.
The instantaneous mortality rate for females in the population was 0.58 (r2 = 0.86, df = 7,
p = .0005; 44.3% annual) and 0.59 for males (r2 = 0.93, df = 7, p = 0.0001; 44.8%
annual). Catch curve regressions were tested for homogeneity of slopes, but did not
differ.
10

DISCUSSION
In the MMR, the shovelnose sturgeon population is changing demographically
over time. I suggest that these changes are due to increased harvest and habitat change.
All of the observed changes are characteristic of exploited fisheries experiencing a lack
of spawning activity and poor recruitment. Habitat alterations can further reduce
reproductive success, by reducing available spawning habitat, impeding access to
required habitat, and reducing environmental cues that prompt spawning.
The sex ratio for the shovelnose sturgeon population in the MMR was 1:1 in
2002-2003 (Colombo et al. 2007b); however increased harvest in recent years may be
responsible for the shift to a skewed sex ratio with more males. The sex ratio of a
sturgeon population at equilibrium should be 1:1 (Trencia et al. 2002, Apperson and
Wakkinen 1993, Alberta Sustainable Resource Development 2002), but the ratio may
deviate on a local level due to differential distributions, activities, or movements of males
and females. These natural effects on sex ratios were likely not important given our
unbiased, standardized sampling effort, which was identical to that of Colombo et al.
(2007b). More likely, sex ratio changed at the population scale due to changes in sex-
specific growth, mortality, and longevity through selective harvest (Sandovy 1996). In
many fisheries the sex ratio shifts toward predominately males due to high fishing
pressure directed towards mature females or large-sized individuals which are typically
females (Bruch 1999, Kamukuru and Mgaya 2004). The preferential harvest of females
not only affects the sex ratio of the population, but also can negatively affect the
reproductive success of the population, which reduces recruitment.
11

Evidence of reduced reproductive success and recruitment in the MMR can be
seen in shifting length and age-frequencies. Sex-specific length distributions showed a
pattern that is common among sturgeon species, with females growing larger (Everett et
al. 2003). This pattern was not previously seen in the MMR population; Colombo et al.
(2007b) reported no sex-specific differences in length-frequencies. However, as the
removal of females likely has increased through harvest, it makes sense that the surviving
females would enhance growth to compensate. Comparing length and age distributions
at the population level between 2002 through 2006, it appears that fewer recruits are
being produced. Thus, the removal of mature females by commercial harvest is likely
leading to decreased reproductive success, which indirectly has a negative impact on
recruitment leading to reduced abundance of smaller fish. Colombo et al. (2007a) found
a similar pattern in that year class strength was negatively related to harvest. This
increased tipping of the length and age structure towards older individuals has been
reported in other sturgeon populations as an effect of substantial loss in reproduction due
to increased exploitation and habitat degradation blocking migrations to spawning
grounds (Khodorevskaya et al. 1997).
Increased harvest appears to be contributing to increased mortality. Colombo et
al. (2007a) concluded that the pooled annual mortality rate for years 2000 through 2003
was 37%. With just a few years passing, the pooled mortality rate for 2005 and 2006 has
risen to 45%. In this same time period standardized catch rates have declined relative to
historical levels (Colombo et al. 2007a).
Changes in growth and maturation of commercial fish stocks over time have been
well documented (Law 2000); specifically size-selective harvest causes adaptive changes
12

in life history traits related to body size such as modified length and age at maturity
(Conover and Munch 2002). These changes can often be immediate consequences of
shifts in the physical environment, the biotic environment, the prevailing patterns of
fishing, or any combination of these (Law 2000). The most common response is earlier
maturation and increased growth due to reduced intraspecific competition (Weatherly
1972, Beacham 1983, Law 2000), which allows fish to reproduce before being harvested
(Gardmark et al. 2003). The converse appears to be happening in the MMR. Shovelnose
sturgeon are thought to reach maturity at age 5 for males and age 7 for females (Helms
1974, Hurley and Nickum 1984) while MMR sturgeon matured later. A possible
explanation is that sturgeon that are maturing early are being selected for by commercial
fishers (Law 2000). In sturgeon populations, females do not recruit to the fishery until
they become sexually mature. It is advantageous for fish to mature at a later age and
larger size in populations that are mainly harvested for mature adults (Ernande et al.
2003) and when fishing primarily takes place on spawning grounds (Law 2000). In both
cases, increased mortality due to fishing makes it beneficial to grow larger and older
before maturing.
The sex-specific growth curves strategically make sense, with males attaining the
theoretical maximum length quicker than females, but females reaching a larger
maximum length. However, all year classes have experienced a similar deceleration in
somatic growth through time, with a consistent shift in length at age. Similar trends have
been previously seen in populations in which harvest was selective for larger-sized
individuals, the growth rate of the surviving individuals declines and smaller sizes occur
(Walsh et al. 2006). In addition, 2005 and 2006 were atypically low water years in the
13

MMR and this may have reduced growth rates across all ages through some climatic
mechanism (e.g., high temperatures or reduced food).
One of the major factors impeding the understanding of what is truly occurring
within the shovelnose sturgeon population in the MMR is the difficulty of teasing apart
the actual contribution of each possible factor such as harvest, habitat degradation, and
climate. Habitat has not been greatly altered in the past decade, with the exception of low
water levels in 2005 and 2006, which likely affected growth but probably not longer-term
population characters such as survival and recruitment. Thus, on the basis of these data, I
suggest that the current harvest of mature females is negatively affecting the reproductive
capacity of the shovelnose sturgeon population. It appears that the population is aging,
recruitment is not sufficient to replace those being removed, and the majority of those
fish remaining are male due to females being harvested after maturation.
A major goal of fisheries science is to conserve the available resources, and in the
case of sturgeon populations, this means that recruitment must be successful and
spawning stocks must be preserved. However if current harvest and habitat degradation
persist, spawning and recruitment success will only continue to decline. One possible
strategy to conserve the population is to impose conservative length limits, such as a
minimum harvestable size of 685 mm FL, which was suggested by Colombo et al.
(2007a) to allow the population to withstand harvest. Limits on length, gear, and catch
can be very effective when coupled with strict enforcement and close monitoring
(Williamson 2003), but such regulations are difficult to enforce, particularly on such a
large system, and may not be the best option. Although specific spawning areas have not
been located in the MMR, aggregations occur at specific locations during the spawning
14

season. If these types of areas could be protected at the appropriate times, a majority of
the mature females may be allowed to spawn. A temporary ban on harvest may also be
successful as it has in other sturgeon populations (Pikitch et al. 2005), but the signs of
recovery may not be seen for many years. The best management plan for sturgeon
population recovery will probably be a combination of regulations and restrictive harvest
with strict enforcement and monitoring.
15

Table 1. Von Bertalanffy parameters estimated for the Middle Mississippi River shovelnose sturgeon population in 2002-2003 and 2005-2006, and also sex-specific parameters for the 2005-2006 sample.
Year Level L ∞ K t0 N
2002-2003 Population 792.31 0.16 -1.54 283
2005-2006 Population 781.31 0.13 -1.23 726
Male Only 770.78 0.14 -1.13 389
Female Only 811.52 0.11 -1.99 337
16

0.00
0.02
0.04
0.06
0.08
0.10
0.12
Pro
porti
on
0.00
0.02
0.04
0.06
0.08
0.10
0.12
2002n = 355mean = 587 mmmedian = 591 mmmode = 600 mm
2003n = 786mean = 609 mmmedian = 616 mmmode = 610 mm
Fork Length (mm)
200 300 400 500 600 700 800 9000.00
0.02
0.04
0.06
0.08
0.10
0.122004n = 1384mean = 602 mmmedian = 613.5 mmmode = 620 mm
2005n = 993mean = 610 mmmedian = 616 mm mode = 610 mm
2005-2006n = 784mean = 612 mmmedian = 621 mmmode = 620
200 300 400 500 600 700 800 900
Commerical Harvest 2004n = 139mean = 653 mmmedian = 654 mmmode = 690 mm
Figure 1. Length-frequency distributions of the shovelnose sturgeon population in the Middle Mississippi River by year and commercially harvested shovelnose sturgeon from one sample in 2004.
17

Fork Length (mm)
300 400 500 600 700 800
Freq
uenc
y
0
10
20
30
40
Malesn = 410mean = 609 mm
0
10
20
30
40
50Femalesn = 360mean =615 mm
Figure 2. Sex-specific length-frequency distributions of shovelnose sturgeon in the Middle Mississippi River during 2005 through 2006.
18

Log10 Length
2.5 2.6 2.7 2.8 2.9 3.0
Log 10
Wei
ght
2.0
2.2
2.4
2.6
2.8
3.0
3.2
3.4
3.6
Females
Males
Figure 3. Length-weight relationship of shovelnose sturgeon in the Middle Mississippi River during 2005 through 2006. Solid line representing females (R2 = 0.92) and dashed line representing males (R2 = 0.90).
19

0.00
0.05
0.10
0.15
0.20
0 5 10 15 20 25
Pro
porti
on
0.00
0.05
0.10
0.15
0.20
Age (yrs)
0 5 10 15 20 25
2002n = 127mean = 7.6 yrsmodal age = 7 yrs
2003n = 156mean = 8.7 yrsmodal age = 9 yrs
2005n = 528mean = 10.9 yrsmodal age = 12 yrs
2006n = 212mean = 11.3 yrsmodal age = 13 yrs
Figure 4. Age-frequency distributions for the shovelnose sturgeon population in the Middle Mississippi River from 2002 to 2006.
20

Age (years)
0 2 4 6 8 10 12 14 16 18 20 22
Freq
uenc
y
0
10
20
30
40
50
60
0
10
20
30
40
50
60Femalesn = 337mean = 11.2 yrs
Malesn = 389mean = 10.9 yrs
Figure 5. Sex-specific age-frequency distributions for shovelnose sturgeon in the Middle Mississippi River during 2005 through 2006. Black portion of bars showing immature individuals and white portion of bars representing the mature individuals.
21

Ager 1
0 5 10 15 20 25
Age
r 2
0
5
10
15
20
25y = 0.982x + 0.2051R2 = 0.9994
Figure 6. Linear regression analysis of age bias between independent readers. Age estimates are plotted as the mean age estimate by ager 2 for the age classes of ager 1 for shovelnose sturgeon collected in the Middle Mississippi River during 2005 through 2006. Error bars represent 95% confidence intervals. The slope of the regression line did differ from one due to minimal variation in the data.
22

300
350
400
450
500
550 Age 4y = -34.09x + 68750R2 = 0.74
Mea
n Fo
rk L
engt
h (m
m)
300
350
400
450
500
550 Age 5y = -19.932x + 40430R2 = 0.877
2001 2002 2003 2004 2005 2006 2007300
350
400
450
500
550 Age 6y = -20.629x + 41854R2 = 0.9433
500
550
600
650
700Age 7y = -18.178x + 36983R2 = 0.9406
500
550
600
650
700Age 8y = -16.079x + 32801R2 = 0.8549
500
550
600
650
700Age 9y = -19.976x + 40642R2
= 0.9844
Year
2001 2002 2003 2004 2005 2006 2007500
550
600
650
700Age 10y = -17.176x + 35047
R2 = 0.8745
2001 2002 2003 2004 2005 2006 2007600
650
700
750 Age 14y = -27.983x + 56787R2 = 0.9553
600
650
700
750 Age 11y = -19.392x + 39514R2
= 0.8657
600
650
700
750 Age 13y = -16.61x + 33966R2 = 0.4757
600
650
700
750 Age 12y = -10.65x + 22000R2 = 0.2566
300
350
400
450
500
550 Age 3y = -19.15x + 38748R2= 0.4772
Figure 7. Mean fork length with error bars (standard error) of each age class by year. Note different scales on the y-axis.
23
Age (years)
2 4 6 8 10 12 14 16 18 20
Fem
ale
Size
Rel
ativ
e to
Mal
e Si
ze (F
L)
-6
-4
-2
0
2
4
6
8
10
12
Age (years)
0 5 10 15 20 25
Fork
Len
gth
(mm
)
300
400
500
600
700
800
Female Growth Curve Male Growth Curve
A
B
Figure 8. A. Von Bertalanffy growth curves representing female (dashed line) and male (solid line) growth in the Middle Mississippi River shovelnose sturgeon population collected during 2005 through 2006. B. A plot of the relative size of females to males at a specific age using the predicted lengths from the von Bertalanffy growth curves. The white arrow represents the mean age of maturity for males and the black arrow indicates the mean age of maturity for females.
24

CHAPTER TWO
DEFINING A LIFE HISTORY STRATEGY FOR SHOVELNOSE STURGEON IN
THE MIDDLE MISSISSIPPI RIVER
ABSTRACT
Shovelnose sturgeon Scaphirhynchus platorynchus in the Middle Mississippi
River is one of the last commercially viable sturgeon populations in the world, yet its
basic life history strategy is unknown. I sampled adult and larval shovelnose sturgeon to
link age at maturation, timing and periodicity of spawning, and larval growth rates. Age
at maturity was later than shown previously, with males becoming sexually mature at age
9 and females at 10.5 years. Total egg count was slightly lower than previously reported
with a mean of 29,573/female. Similar to previous reports, most males and females
spawned every 2 and 3 years, respectively. Larval shovelnose sturgeon occurred during
June and July of 2005 and May and June of 2006, confirming successful spawning.
Larval sturgeon grew between 0.69 to 1.69 mm total length per day among four distinct
cohorts produced each year. For the first time for this population, sturgeon were found to
spawn during the fall. Fall sturgeon contained ripe eggs with polarization indexes (PIs)
<0.05; larval sturgeon was collected thereafter. This life history strategy is similar to
those of other sturgeon and likely places this species at risk to overharvest.
INTRODUCTION
Life history theory attempts to predict population responses to changes in
reproduction, growth, and mortality, thus providing insight into vulnerability to
25

disturbances in the environment, mortality rates due to harvest, and recruitment
variability. Winemiller and Rose (1992) proposed a triangular continuum of life history
strategies for fishes with three endpoints: (1) opportunistic - small, rapidly maturing,
short-lived fish with high reproductive effort, low batch fecundity, and low investment
per offspring, (2) equilibrium - intermediate size fish that often exhibit parental care with
moderate to long generation time, low reproductive effort, low batch fecundity, and high
investment per offspring, and (3) periodic - large, late-maturing, long-lived fish with
moderate reproductive effort, high batch fecundity, and low investment per offspring.
Models such as those proposed by Winemiller and Rose (1992) increase our ability to
develop management and conservation practices.
The high intrinsic rate (r) of population growth of opportunistic fishes
(Winemiller and Rose 1992, Rochet et al. 2000, Winemiller 2005), allows them to resist
frequent habitat disturbances and high adult mortality (Winemiller and Rose 1992).
Because equilibrium strategists depend on density-dependent factors to control
population size, they are less vulnerable to environmental variability and harvest (Rochet
et al. 2000, Winemiller 2005). Species with a periodic life history are vulnerable to
exploitation because they rely on predictable environmental cues and must have long life
spans to allow reproductive effort to be spread over multiple years (Winemiller and Rose
1992, Rochet et al. 2000). These traits not only cause populations to be adversely
affected by increased adult mortality (Rochet et al. 2000), but also small differences in
mortality of early life stages have potential to greatly influence the stock abundance
(Winemiller 2005). Because a majority of our commercially and economically important
species are periodic strategists (Winemiller and Rose 1992, Winemiller 2005), it is
26

important to gain information on their reproductive biology so that I can better
understand their population dynamics.
Some of the most valuable commercial species are sturgeon and paddlefish in the
order Acipenseriformes, which typically fall in the periodic endpoint. Given the
susceptibility of this group, it is also considered to be among the most endangered and
threatened (Ludwig et al. 2002, Pikitch et al. 2005). Of the 27 extant species, all are
characterized by limited adult abundance and most are threatened with only a few
exceptions (Billard and Lecointre 2001, Pikitch et al. 2005). The Caspian Sea sturgeon
fishery has long produced the majority of the caviar traded internationally, but with the
collapse of these European and Asian sturgeon fisheries appearing imminent, increased
pressure has shifted towards the smaller North American species, such as the shovelnose
sturgeon (Scaphirhynchus platorynchus) (Quist et al. 2002, Pikitch et al. 2005, Colombo
et al. 2007a). The Winemiller and Rose life history model may provide some guidance as
to how shovelnose sturgeon populations will respond to increased harvest and how to
better manage these populations before they reach the imperiled status. However,
sturgeon population demographics and reproductive characteristics vary greatly between
geographical ranges and among species, so guidelines for one species may not benefit
another. For example, the Winemiller and Rose model used large sturgeon, but it is
possible that small sturgeon such as the shovelnose sturgeon may have a different suite of
tactics.
Most sturgeon show some basic spawning characteristics such as environmental
cues triggering spawning during the spring over gravel or rock substrates, with multiple
years between spawning intervals (Billard and Lecointre 2001, Williamson 2003).
27

However the small size of shovelnose sturgeon leads to earlier age at maturation, higher
growth rates, shorter life spans, and lower fecundity than other sturgeon (Keenlyne 1997,
Billard and Lecointre 2001, Williamson 2003). These traits that deviate from most other
sturgeon may place shovelnose sturgeon farther from the periodic endpoint and closer to
the opportunistic end of the continuum, perhaps requiring different management tactics.
The objective of this study was to quantify the duration and timing of life stages
of the shovelnose sturgeon in the Middle Mississippi River (MMR). Adult shovelnose
sturgeon were sampled to determine age at maturation and periodicity of spawning.
Larval shovelnose sturgeon were collected to determine the timing of spawning and to
quantify larval growth rates in the MMR. Collecting data on the reproductive biology of
the shovelnose sturgeon will provide the parameters that are required for stock
assessment and population models.
METHODS
Directed Repeated Adult Sampling To quantify reproductive status of adults, shovelnose sturgeon were sampled
monthly during February 2005 through June 2006, using stationary bottom set gill nets
[5.08 centimeter bar mesh, 45.7 meters long, 3.05 meters deep]. During each month, six
nets were set for 24 hours off the tips of wingdikes, parallel to the flow in an area of
converging water velocities at Modoc, IL (RKM 201-198), Chester, IL (RKM 191-188),
and Grand Tower, IL (RKM 127-124) due to known high densities of shovelnose
sturgeon in these areas. Fork length (FL, 1 mm) and wet mass (0.1 g) were quantified for
each fish. The left pectoral ray was removed from all fish and later used to determine
28

age. Water temperature, conductivity, dissolved oxygen, and pH were collected at the
surface for each sampling trip with a Quanta Hydrolab water quality meter. Daily river
stage height was determined from the United States Geological Services (USGS) gauging
station at Chester, IL.
Each month, a subsample of the first 20 sturgeon collected at each site was
preserved on wet ice and taken back to the lab. A mid-ventral incision was made from
the anus through the pelvic girdle, exposing the gonads. The gonads from each sturgeon
were photographed, removed, and weighed to calculate gonadosomatic index (GSI),
which is defined as the gonad and gonadal fat wet weight divided by the total body wet
weight and then multiplied by 100. All gonads were fixed in 10% neutral buffered
formalin. The digital images of the gonads were later used to categorize the samples into
the stages of development based on the index from Colombo et al. (2007b). Egg quantity
within black egg (Stage FIV) females was quantified by removing five, 1-gram samples
per ovary and counting eggs in each subsample. The mean egg count for each ovary was
multiplied by the weight of both ovaries to estimate total egg quantity (Crim and Glebe
1990). Linear regression was used to determine whether relationships among fork length,
weight, GSI, egg count, and relative egg size were present for FIV sturgeon.
Aging
Pectoral fins rays were placed in coin envelopes and dried to determine age, so
that age at maturation could be established. Three sections were cut from the basal
portion of each fin ray using a Buhler Isomet® low speed saw. Each section, increasing
in width (0.635mm, 0.6858mm, and 0.7366mm) was secured to a slide using
cyanoacrylate. Cross sections were examined independently by two readers using a
29

stereomicroscope under 7-45x magnification. Under transmitted light, a pair of opaque
(growth) and translucent bands was considered an annulus (Everett et al. 2003). The
annuli were counted from the nucleus to the apex of each section. This method has been
validated for Atlantic sturgeon (Secor et al. 1997), lake sturgeon (Rossiter et al. 1995),
and white sturgeon (Brennan and Cailliet 1989) and is the most precise method for aging
the shovelnose sturgeon (Jackson et al. 2007). When readers disagreed, they examined
the cross sections together to reach an agreement.
Larval and Juvenile Sampling
In order to determine the timing and duration of successful spawning, sturgeon
larvae and juveniles were collected at sites within the MMR reach using a mini-Missouri
trawl during June and July of 2005 as well as May through August of 2006. The mini-
Missouri trawl is a two-layer, balloon trawl with a cover of 4.76 mm delta style mesh and
an inner trawl body of 17.46 mm bar mesh. The trawl narrows from 2.44 meters at the
head rope to 0.46 meters at the mid-section and the cod end (Herzog et al. 2005). The
head rope with floats and a chained foot rope are tied to otter boards [40.6 cm x 22.86
cm, weighing 8.2 kg]. The trawl is towed (in reverse) along the bottom contours of the
river with 22.86 m tow lines tied to each side of the bow of the boat. Three minute trawls
were made around islands and in side channels, with the majority of the effort being
concentrated at island tips at about 3 m depth. Larvae were kept in an ice slurry and
brought back to the lab.
The total length (mm, TL) of each larval sturgeon was measured and a digital
image was captured. Growth rates for each year were estimated, using similar methods to
Braaten and Fuller (2007). Length-frequency histograms for each sampling week were
30

generated and cohorts were assigned to groups of fish with similar length modes
progressing throughout the sampling period. For each sampling week, the mean length of
each weekly cohort was calculated. Regression was used to estimate relative growth
rates for each weekly cohort (Braaten and Fuller 2007). The slopes were tested for
homogeneity (test for interaction in ANCOVA) to determine whether growth rates
differed among cohorts.
Additional Fall Sampling
The increased proportion of both mature male and female sturgeon in October
2005 followed by an increased proportion of spent male and female sturgeon in January
of 2006, prompted additional fall sampling in 2006. Although standard sampling ceased
in June 2006, shovelnose sturgeon adults also were collected during September, October
and November in 2006. The first twenty fish were brought back to the lab and data were
collected as before. Egg samples also were collected from the FIV females and stored in
balanced salt solution. The eggs were then boiled for 10 minutes allowing the yolk to
harden and fixing the position of the germinal vesicle. After boiling, the eggs were
stored in buffered formalin. Eggs were then bisected with a razor blade along the animal-
vegetal axis and examined under a dissecting microscope. The distance of the germinal
vesicle from the inner border of the oocyte chorion and oocyte diameter was used to
calculate the polarization index (PI) for each sample. The PI (an indicator of oocyte
ripeness) is the distance of the germinal vesicle from the chorion divided by the egg
diameter (Dettlaff et al. 1993). Trawling for larval fish also was conducted during
October and November of 2006.
31
RESULTS
Male Reproductive Demographics
Four hundred fifteen adult male shovelnose sturgeon, ranging from 319 to 786
mm FL, were sampled. All stages (Mv – MII) described by Colombo et al. (2007b)
occurred in addition to running ripe males and the MIII stage (spent male) (Table 2).
Each stage had a wide range of fork lengths and ages (Table 3). Mean GSI differed
between stages except for MI and MIII, with Mv being lower and MII being greater than
all others (F3, 411 = 27.13, p <0.0001) (Figure 9). Ages were determined for 389 fish, with
ages ranging from 3 to19 years. Male sturgeon had a modal age of 12 years and a mean
age of 10.9 years (Figure 10). Males become sexually mature between ages 8 to 10 years
(mean age at maturity 9 years of age).
Female Reproductive Demographics
Only 363 females were captured, representing a smaller proportion of the sample.
Female sturgeon ranged in size from 344 to 767 mm FL. All stages except for running
ripe (FV) were captured (Table 2). Female stages also varied in FL and age (Table 3).
The mean GSI differed between all stages except for Fv and FVI (F5, 357 = 183.94, p
<0.0001) (Figure 11). Three hundred thirty seven female sturgeon were aged, with ages
ranging from 4 to 22 years. Female sturgeon had a modal age of 12 years and a mean age
of 11.2 years (Figure 10). Females became sexually mature between ages 9 and 11 years
(mean age at maturity 10.5 years of age).
32

Total Egg Count
The mean (± SE) total egg count of FIV shovelnose sturgeon was 29573 ± 2472
eggs (n = 40), or 21.7 ± 1.29 eggs per gram of fish wet weight. The total number of eggs
was positively related to wet weight (p < 0.001, r2 = 0.48) (Figure 12). No other
relationships occurred among fecundity, fork length, GSI, and relative egg size.
Timing and Periodicity of Spawning
Mature (FIV and MII) shovelnose sturgeon, peaked during March and April 2005,
October 2005, and April 2006 (Figure 13). These peaks coincided with conditions
believed necessary for successful spawning. The peak in the proportion of mature
sturgeon was followed by peaks in proportion of spent (FVI and MIII) shovelnose
sturgeon with a lag time of about one or two months during May through June 2005,
January 2006, and June 2006 (Figure 13).
Mature ovaries comprised 13% of the total body weight with a mean GSI of
13.11%, while the mature testes only accounted for 3% of the body weight with a mean
GSI of 3.09%. All stages for both males and females were present during all seasons.
However, only 61% of males and 27% of females were mature.
Larval and Juvenile Sampling
Larval and juvenile sturgeon were collected in June and July of 2005 and May
and June of 2006 (Figure 14). A total of 130 and 39 larval and juvenile shovelnose
sturgeon were collected during 2005 and 2006, respectively. In 2005, individuals were
collected on eleven sampling days during June 8th through July 7th. In 2006, individuals
were collected on eleven sampling days during May 8th through June 22nd.
33

Relative growth rates were estimated for the larval sturgeon in 2005 and 2006.
The relative growth rates were based on four weekly cohorts each year. In 2005 the
growth rates (± 95% confidence intervals) of weekly cohort 1 (1.28 mm per day, 0.86 –
1.69), weekly cohort 2 (1.34 mm per day, 1.22 – 1.44), weekly cohort 3 (1.38 mm per
day, 1.3 – 1.46), and weekly cohort 4 (1.28 mm per day, 1.17 – 1.38) did not differ (p =
0.594) (Figure 15). For 2006, again the growth rates for each weekly cohort were not
different (p = 0.699) (weekly cohort 1: 1.27 mm per day, 1.12 – 1.42), (weekly cohort 2:
1.14 mm per day, 0.98 – 1.32), (weekly cohort 3: 1.21 mm per day, 1.01 – 1.42), and
(weekly cohort 4: 1.35 mm per day, 0.69 – 2.01) (Figure 15).
Evidence of Fall Spawning
Eggs of three fall sturgeon collected in September and October had PIs < 0.05,
meaning the eggs were ripe and good candidates for spawning. During September, a
milting male occurred. Additional trawling was inhibited by low water, but in November
2006 I collected a 55-mm TL larval sturgeon.
DISCUSSION
While shovelnose sturgeon may be smaller and mature earlier than some other
sturgeon species, their reproductive biology appears to fall into the periodic life history
strategy. Shovelnose sturgeon gonadal development was similar to that of other sturgeon
species. All stages described by Colombo et al. (2007b) were collected and identified
with the exception of FV (running ripe females) and I additionally found spent males
(MIII). Similar to other sturgeon species, shovelnose sturgeon do not spawn annually,
having multiple years between spawning intervals. Using the proportion of each stage by
34

season in combination with age data, models for the periodicity of spawning intervals
were developed. The male reproductive cycle is completed in one to two years. The
abundance of each stage in a given year indicates that the two-year cycle is more
common. Male sturgeon spend about 6 to 7 years in the Mv stage before they become an
MI, then they spend 1 to 2 years developing into a mature male (MII) and spawn (Figure
16). Female shovelnose spawn every three to four years. The three-year cycle is most
common. Female sturgeon transform from the Fv to the FI stage after about 7 to 8 years,
spend about 2 or 3 years in stage FI, then progress through FII and FIII within the next
year and a half. From the FIV stage, which can last 4 to 6 months, which then becomes
running ripe (FV) during the spawning season (Figure 16).
Previous research in the Mississippi and Missouri Rivers suggested that
shovelnose sturgeon matured at age 5 (males) and 7 (females) (Helms 1974, Moos 1978,
Hurley and Nickum 1984). However, our results (males: 9 and females: 10.5) coupled
with a recent study in the Wabash River (females: 9) (Kennedy et al. 2005), show
evidence that these populations are now reaching maturity at later ages. A possible
explanation for this could be the increased harvest seen in recent years (Colombo et al.
2007a). Because sex and size-specific harvest can increase age at maturity (Law 2000,
Conover and Munch 2002, Ernande et al. 2003) these changes may be due to the recent
increase in shovelnose sturgeon harvest. Size selective harvest also can reduce fecundity
(Conover and Munch 2002), which is supported by a decline in mean fecundity estimates
from 32,562 in 1974 (Helms 1974) to 29,573 in 2005 and 2006. Shovelnose sturgeon
were once assumed to be more resilient to harvest than other sturgeon species due to
smaller size, earlier maturation, and shorter life spans (Carlander 1954, Morrow et al.
35

1998). However the MMR shovelnose sturgeon population may now be showing
negative impacts of harvest similar to other exploited sturgeon populations.
As seen in other periodic species, shovelnose sturgeon spawning seems to be cued
by annual or seasonal variations in environmental conditions. Three major peaks
occurred in the proportions of mature fish, two in the spring of each year and one in the
fall of 2005. However all peaks coincided with rising river stages and water temperatures
that approached or included the 16.9 to 20.5 °C range at which shovelnose sturgeon are
believed to spawn. These peaks were then followed by peaks in spent adults and larval
shovelnose sturgeon, suggesting that successful spawning occurred. With a periodic
strategy, fish can delay maturation so that they are more likely to reproduce when
environmental conditions are optimal for the growth and survival of larval and juvenile
fish (Winemiller and Rose 1992). Based on the reproductive demographics for
shovelnose sturgeon in the MMR it appears that females have a longer reproductive cycle
than male sturgeon, similar to other sturgeon. With the ovaries on average comprising a
larger percentage of the total body weight, this prolonged reproductive cycle in females
may be expected. Female shovelnose sturgeon appear to favor a three year cycle that
allows a third of the mature females to reproduce any given year, similar to many other
sturgeon species in the same geographical range (Williamson 2003). With only a fraction
of the fish reproducing each year, this allows reproductive output to be allocated across
multiple years and some individuals to reproduce successfully despite long periods of
unfavorable conditions (Winemiller 2005). This tactic of “bet-hedging” enhances adult
survivorship in suboptimal conditions and allows the reproductive effort to be spread
over many years, so that increased recruitment during a year of optimal conditions will
36

compensate for years with reduced juvenile survivorship (Winemiller and Rose 1992).
However if the environmental conditions are suboptimal for many years or adult
mortality increases, reproductive success will be reduced.
Based on all the evidence, I believe that harvest may be selecting individuals that
spawn in the fall when conditions are similar to those that occur during the spring. This
phenomenon has been observed in other exploited sturgeon populations, such as the
Atlantic sturgeon (Acipenser oxyrinchus oxyrinchus) (Collins et al. 2000), Gulf sturgeon
(Acipenser oxyrinchus desotoi) (Sulak and Clugston 1998), and a number of Eurasian
species (Berg 1959). Indeed additional sampling in fall 2005 produced milting males as
well as females with eggs in spawning condition. If I apply the growth rates found in
2005 and 2006, the one larval shovelnose sturgeon collected during November 2006 was
spawned in September.
This study has provided current information on the reproductive biology of
shovelnose sturgeon in the Middle Mississippi River as well as some evidence of possible
fall spawning; however, gaps still remain. The best possible management for periodic
species, such as the shovelnose sturgeon, is to maintain some critical density of adult
stock and to protect spawners and spawning habitat during the reproductive period. In
order to implement this type of management, spawning areas in the MMR must be
identified and possibly more effort should be focused on determining whether both spring
and fall spawning cohorts exist. If these information gaps could be filled, maintaining
this crucial density of adult stocks by protecting the spawning habitat during the
spawning periods, conservation of the MMR shovelnose sturgeon population is not only
possible, but may also allow commercial harvest to persist.
37

Table 2 Stages of gonadal development of the shovelnose sturgeon (modified from Colombo et al. 2007b).
Sex Stage Description Male Mv Virgin male, pink ribbon like testis embedded
in small amount of testicular fat
MI Yellow tubular testis in large amount of fat
MII Large pink testis in reduced amount of fat
MIII Spent male, compressed red/pink testis
Female Fv Virgin female, small well ordered ovarian folds
with small amount of fat
FI Ovarian folds with large amount of fat
FII Small white to yellow oocytes
FIII Yellow to green eggs
FIV Black eggs
FV Spawning female
FVI
Spent female or recovering, translucent ovary
with atretic oocytes
38

Table 3. Sex and stage specific fork length and age ranges for shovelnose sturgeon collected from February 2005 through June 2006. Fork Length (mm) Age (years) Sex/Stage Minimum Maximum Mean Minimum Maximum Mean
Mv 319 598 480 3 13 6.4 MI 457 786 595 6 18 9.7 MII 531 762 635 8 19 12 MIII 549 743 632 8 18 12 Fv 344 599 492 4 12 6.5 FI 506 738 607 7 17 10.8 FII 574 761 641 9 16 12.2 FIII 592 760 655 10 16 12.9 FIV 559 767 665 9 22 13.3 FVI 549 723 641 10 17 12.5
39

Stage
Mv MI MII MIII
Mea
n G
SI
0
1
2
3
4
n = 119
n = 165
n = 41
n = 90
a
b
c
b
Figure 9. Mean GSI for each stage of the male shovelnose sturgeon gonadal development in the Middle Mississippi River during 2005 through 2006 with standard error and sample size above each error bar. (Different letters represent significantly different means, at p<0.05).
40
Age (years)
0 2 4 6 8 10 12 14 16 18 20 22
Freq
uenc
y
0
10
20
30
40
50
60Malesn = 389mean = 10.9 yrsmean age at maturity = 9 yrs
Age (years)
0 2 4 6 8 10 12 14 16 18 20 22
Freq
uenc
y
0
10
20
30
40
50
60Femalesn = 337mean = 11.2 yrsmean age at maturity = 10.5 yrs
Figure 10. Age-frequency distributions for male (top) and female (bottom) shovelnose sturgeon in the Middle Mississippi River during 2005 through 2006. Black portion of bars showing immature individuals and white portion of bars representing the mature individuals.
41

Stage
Fv FI FII FIII FIV FVI
Mea
n G
SI
0
2
4
6
8
10
12
14
16
n = 54
n = 115
n = 56
n = 38
n = 56
n = 44a
b
c
d
e
a
Figure 11. Mean GSI for each stage of the female shovelnose sturgeon gonadal development in the Middle Mississippi River during 2005 and 2006 with standard error and sample size above each error bar. (Different letters represent significantly different means at p<0.05)
42

Wet weight (g)
800 1000 1200 1400 1600 1800 2000 2200 2400
Tota
l egg
cou
nt
0
20000
40000
60000
80000
100000
Total egg count = 38.64(wet weight) -21954R2 = 0.479n = 40
Figure 12. Total egg count –wet weight relationship of female black egg shovelnose sturgeon in the Middle Mississippi River during 2005 and 2006 (R2 = 0.48).
43

Males
MII (Mature)
1/1/2005 5/1/2005 9/1/2005 1/1/2006 5/1/2006
Tem
pera
ture
(°C
)
0
5
10
15
20
25
30
35
Riv
er S
tage
(ft)
Females
FIV (Mature)
1/1/2005 5/1/2005 9/1/2005 1/1/2006 5/1/2006
Prop
ortio
n
0.0
0.2
0.4
0.6
0.8
1.0
FVI (Spent)
1/1/2005 5/1/2005 9/1/2005 1/1/2006 5/1/2006
Pro
porti
on0.0
0.1
0.2
0.3
0.4
0.5
0.6
MIII (Spent)
1/1/2005 5/1/2005 9/1/2005 1/1/2006 5/1/2006
Tem
pera
ture
(°C
)
0
5
10
15
20
25
30
35
Riv
er S
tage
(ft)
Figure 13. Proportion of mature (top) and spent (bottom) males (left) and females (right) plotted against river stage (gray solid) and water temperature (black dash). The black box includes the optimal spawning temperatures for shovelnose sturgeon.
44

1/1/2005 5/1/2005 9/1/2005 1/1/2006 5/1/2006
Larv
al A
bund
ance
0
5
10
15
20
25
30Pr
opor
tion
of M
atur
e Fe
mal
es
0.0
0.1
0.2
0.3
0.4
0.5
0.6
0.7
Figure 14. Proportion of mature female shovelnose sturgeon (circles) with larval abundance (triangles) during 2005 and 2006 in the Middle Mississippi River.
45

Day of year 2005
155 160 165 170 175 180 185 190 195150 200
Leng
th (m
m)
10
20
30
40
50
60
70
80
Cohort 1Y = 1.28(Days) - 163.08
R2 = 0.84
n = 11
Cohort 2Y = 1.34(Days) - 187.21
R2 = 0.96
n = 29 Cohort 3 Y = 1.38(Days) - 202.79
R2 = 0.96
n = 57
Cohort 4Y = 1.28(Days) - 192.13
R2 = 0.98
n = 16
Day of year 2006
120 125 130 135 140 145 150 155 160 165 170 175
Leng
th (m
m)
10
20
30
40
50
60
Cohort 1Y = 1.3(Days) - 143.6
R2 = 0.95
n = 5
Cohort 2Y = 1.14(Days) - 139.29
R2 = 0.98
n = 8
Cohort 3Y = 1.21(Days) - 158.44
R2 = 0.92
n = 16
Cohort 4Y = 1.34(Days) - 191.43
R2
= 0.85n = 7
Figure 15. Linear relationship of length (mm) and day of the year for cohorts of larval and young of the year shovelnose sturgeon in the Middle Mississippi River during 2005 (top) and 2006 (bottom).
46
Mv
MI
MII
MIII
6-7 years
1-2 years
6 months
Spawn
FI
1 year
Fv
FII
FIII
FIV
FVI2-3 years
6 months
6 months
FV
Spawn
4 - 6 months
7-8 years
Figure 16. The reproductive cycle of male (top) and female (bottom) shovelnose sturgeon in the Middle Mississippi River.
47

LITERATURE CITED
Alberta Sustainable Resource Development. 2002. Status of the Lake Sturgeon (Acipenser fulvescens) in Alberta. Alberta Sustainable Resource Development, Fish and Wildlife Division, and Alberta Conservation Association, Wildlife Status Report No. 46, Edmonton, Alberta.
Apperson, K.A., and V.D. Wakkinen. 1993. Kootenai River white sturgeon investigations
and experimental culture. Idaho Department of Fish and Game, Annual Report 1992, Project Number 88-65.
Bailey, R.M., and F.B. Cross. 1954. River sturgeons of the American genus
Scaphirhynchus: characters, distribution, and synonymy. Papers of the Michigan Academy of Science, Arts, and Letters 39: 169-208.
Beacham, T.D. 1983. Variability in median size and age at sexual maturity of Atlantic
cod (Gadus morhua) on Scotian Shelf in the Northwest Atlantic Ocean. Fisheries Bulletin U.S. 81: 303-321.
Beamish, R.J., and D.A. Fournier. 1981. A method for comparing the precision of a set of
age determinations. Canadian Journal of Fisheries and Aquatic Sciences 38: 982-983.
Berg, L.S. 1959. Vernal and hiemal races among anadromous fishes. Journal of the
Fisheries Research Board of Canada 16: 515-537. Billard, R., and G. Lecointre. 2001. Biology and conservation of sturgeon and paddlefish.
Reviews in Fish Biology and Fisheries 10: 355-392. Birstein, V.J. 1993. Sturgeons and Paddlefish: Threatened fishes in need of conservation.
Conservation Biology 7: 773-787. Braaten, P.J. and D.B. Fuller. 2007. Growth rates of young-of-year shovelnose sturgeon
in the Upper Missouri River. Journal of Applied Ichthyology 23: 506-515. Brennan, J.S., and G.M. Cailliet. 1989. Comparative age-determination techniques for
white sturgeon in California. Transactions of the American Fisheries Society 118: 296-310.
Bruch, R.M. 1999. Management of lake sturgeon on the Winnebago System: long-term
impacts of harvest and regulations on population structure. Journal of Applied Ichthyology 18: 142-152.
48

Campana, S.E., M.C. Annand, and J.I. McMillan. 1995. Graphical and statistical methods for determining the consistency of age determinations. Transactions of the American Fisheries Society 124: 131-138.
Carlander, H.B. 1954. History of fish and fishing in the upper Mississippi River. Upper
Mississippi River Conservation Commission, Rock Island, Illinois. Chang, W.Y.B. 1982. A statistical method for evaluating the reproducibility of age
determination. Canadian Journal of Fisheries and Aquatic Sciences 39: 1208-1210.
Chen, Y., D.A. Jackson, and H.H. Harvey. 1992. A comparison of von Bertalanffy and
polynomial functions in modeling fish growth data. Canadian Journal of Fisheries and Aquatic Sciences 49: 1228-1235.
Collins, M.R., T.I.J. Smith, W.C. Post, and O. Pashuk. 2000. Habitat utilization and
biological characteristics of adult Atlantic sturgeon in two South Carolina Rivers. Transactions of the American Fisheries Society 129: 982-988.
Colombo, R.E., J.E. Garvey, N.D. Jackson, B.T. Koch, R. Brooks, D.P. Herzog, R.A.
Hrabik, and T.W. Spier. 2007a. Harvest of Mississippi River sturgeon drives abundance and reproductive success: a harbinger of collapse? Journal of Applied Ichthyology 23: 444-451.
Colombo, R.E., J.E. Garvey, and P.S. Wills. 2007b. Gonadal development and sex-
specific demographics of the shovelnose sturgeon (Scaphirhynchus platorynchus) in the Middle Mississippi River. Journal of Applied Ichthyology 23: 420-427.
Conover, D.O. and S.B. Munch. 2002. Sustaining fisheries yields over evolutionary time
scales. Science 297: 94-96. Crim, L. W., and B. D. Glebe. 1990. Reproduction. Pages 529-554 in C. B. Schreck and
P. B. Moyle, editors. Methods for fish biology. American Fisheries Society, Bethesda, Maryland.
Dettlaff, T.A., A.S. Ginsburg, and O.I. Schmalhausen. 1993. Sturgeon fishes:
Developmental biology and aquaculture. Springer-Verlag, New York, New York. Ernande, B., U. Dieckmann, and M. Heino. 2004. Adaptive changes in harvested
populations: plasticity and evolution of age and size at maturation. Proceedings of the Royal Society London 271: 415-423.
Everett, S.R., D.L. Scarnecchia, G.J. Power, and C.J. Williams. 2003. Comparison of age
and growth of shovelnose sturgeon in the Missouri and Yellowstone Rivers. North American Journal of Fisheries Management 23: 230-240.
49
Farbee, G.B. 1979. Life histories of important sport and commercial fishes of the upper Mississippi River, shovelnose sturgeon. Pages 41-68 in J. L. Rasussen, editor. A compendium of fishery information on the upper Mississippi River, 2nd edition. Upper Mississippi River Conservation Committee, Rock Island, Illinois.
Gardmark, A., U. Dieckmann, and P. Lundberg. 2003. Life-history evolution in harvested
populations: the role of natural predation. Evolutionary Ecology Research 5: 239-257.
Helms, D.R. 1974. Shovelnose sturgeon in the Mississippi River, Iowa. Iowa
Conservation Commission, Iowa Fisheries Research Technical Series 74-3, Des Moines, Iowa.
Herzog, D. V.A. Barko, J.S. Scheibe, R.A. Hrabik, and D.E. Ostendorf. 2005. Efficacy of
a benthic trawl for sampling small-bodied fishes in large river systems. North American Journal of Fisheries Management 25: 594-603.
Hurley, S.T., and J.G. Nickum. 1984. Spawning and early life history of shovelnose
sturgeon. Iowa Cooperative Fish and Wildlife Research Unit, Iowa State University, Project Segment 2-399-R-1, Completion Report, Ames, Iowa.
Jackson, N.D., J.E. Garvey, and R.E. Colombo 2007. Comparing aging precision of
calcified structures in shovelnose sturgeon. Journal of Applied Ichthyology 23: 525-528.
Jackson, N.D. 2004. Age, growth, and mortality of shovelnose sturgeon, Scaphirhynchus
platorynchus, in the middle Mississippi River and lower Wabash River, Illinois. Masters Thesis. University of Southern Illinois, Carbondale, Illinois.
Kamukuru, A.T. and Y.D. Mgaya. 2004. Effects of exploitation on reproductive capacity
of black-spot snapper, Lutjanus fulviflamma (Pisces: Lutjanidae) in Mafia Island, Tanzania. African Journal of Ecology 42: 270-280.
Keenlyne, K.D. 1997. Life history and status of the shovelnose sturgeon, Scaphirhynchus
platorynchus. Environmental Biology of Fishes 48: 291-298. Kennedy, A.J., T.M. Sutton, and B.E. Fisher. 2005. Reproductive biology of female
shovelnose sturgeon in the upper Wabash River, Indiana. Journal of Applied Ichthyology 22: 177-182.
Khodorevskaya, R.P., G.F. Dovgopol, O.L. Zhuravleva, and A.D. Vlasenko. 1997.
Present status of commercial stocks of sturgeons in the Caspian Sea basin. Environmental Biology of Fishes 48: 209-219.
Law, R. 2000. Fishing, selection, and phenotypic evolution. ICES Journal of Marine
Science 57: 659-689.
50

Ludwig, A., L. Dubus, and I. Jenneckens. 2002. A molecular approach to control the international trade in black caviar. International Review of Hydrobiology 87: 661-674.
Morrow, J.V., J.P. Kirk, K.J. Killgore, and S.G. George. 1998. Age, growth, and
mortality of shovelnose sturgeon in the lower Mississippi River. North American Journal of Fisheries Management 18: 725-730.
Moos, R.E. 1978. Movement and reproduction of the shovelnose sturgeon,
Scaphirhynchus platorynchus, in the Missouri River, South Dakota. Ph.D. Dissertation. University of South Dakota, Vermillion, South Dakota.
Ney, J.J. 1999. Practical use of biological statistics. Pages 197-199. in C.C. Kohler and
W.A. Hubert, editors (2nd edition). Inland Fisheries Management in North America, American Fisheries Society. Bethesda, Maryland.
Pikitch, E.K., P. Doukakis, L. Lauck, P. Charkrabarty, and D.L. Erickson. 2005. Status,
trends and management of sturgeon and paddlefish fisheries. Fish and Fisheries 6: 233-265.
Quist, M.C., C.S. Guy, M.A. Pegg, P.J. Braaten, C.L. Pierce and V.H. Travnichek. 2002.
Potential influence of harvest on shovelnose sturgeon in the Missouri River System. North American Journal of Fisheries Management 22: 537-549.
Quist, M.C., C.S. Guy, and P.J. Braaten. 1998, Standard weight (Ws) equation and length
categories for shovelnose sturgeon. North American Journal of Fish Management 18: 992-997.
Ricker, W.E. 1975. Computation and interpretation of biological statistics of fish
populations. Bulletin of Fisheries Research Board of Canada 191, 382 pp. Rochet, M.J., P.A. Cornillion, R. Sabatier, and D. Pontier. 2000. Comparative analysis of
phylogenetic and fishing effects in life history patterns of teleost fishes. OIKOS 91: 255-270.
Rossiter, A., D.G.L. Noakes, and F.W.H. Beamish. 1995. Validation of age estimation for
the lake sturgeon. Transactions of the American Fisheries Society 124: 777-781. Sandovy, Y.J. 1996. Reproduction of reef fishery species. Pages 15-59 in N.V.C. Polunin
and C.M. Roberts, editors. Reef Fisheries. Chapman & Hall, London. Secor, D.H., P.J. Anders, W. Van Winkle, and D.A. Dixon. 2002. Can we study sturgeon
to extinction? What we know and don’t know about the conservation of North American sturgeon. Pages 183-189 in W. Van Winkle, P.J. Anders, D.H. Secor and D.A. Dixon editors. Biology, Management and Protection of North American Sturgeon. American Fisheries Society, Bethesda, Maryland.
51

Secor, D.H., J.T. Stevenson, and E.D. Houde. 1997. Age structure and life history attributes of Atlantic sturgeon (Aciperser oxyrinchus) in the Hudson River. University of Maryland System, Center for Environmental and Estuarine Studies, Chesapeake Biological Laboratory, Hudson River Foundation Grant 006/93A, Final Report, Solomons, Maryland.
Slipke, J.W., and M.J. Maceina. 2000. Fisheries analysis and simulation tools (FAST)
user’s guide. Auburn University, Auburn, Alabama. Sulak, K.J. and J.P. Clugston . 1998. Early life history stages of Gulf sturgeon in the
Suwannee River, Florida. Transactions of the American Fisheries Society 127: 758-771.
Trencia, G., G. Verreault, S. Georges, and P. Pettigrew. 2002. Atlantic sturgeon
(Acipenser oxyrinchus oxyrinchus) fishery management in Quebec, Canada, between 1994 and 2000. Journal of Applied Ichthyology 18: 455-462.
Walsh, M.R., S.B. Munch, S. Chiba, and D.O. Conover. 2006. Maladaptive changes in
multiple traits caused by fishing: impediments to population recovery. Ecology Letters 9: 142-148.
Weatherly, A.H. 1972. Growth and ecology of fish populations. Academic Press,
London. Williamson, D.F. 2003. Caviar and conservation: status, management and trade of North
American sturgeon and paddlefish. TRAFFIC North America. Washington, DC. Winemiller, K.O. and K.A. Rose. 1992. Patterns of life-history diversification in North
American fishes: Implications for population regulation. Canadian Journal of Fisheries and Aquatic Science. 49: 2196-2219.
Winemiller, K.O. 2005. Life history strategies, population regulation, and implications
for fisheries management. Canadian Journal of Fisheries and Aquatic Science. 62: 872-885.
52

VITA
Graduate School Southern Illinois University
Sara J. Tripp Date of Birth: March 26, 1981 7477 Holly Lane Carbondale, IL 62902 Southern Illinois University Bachelor of Arts, Administration of Justice, May 2004 Thesis Title: Understanding How Harvest Influences the Life History and Demographics of
Shovelnose Sturgeon in the Middle Mississippi River Major Professors: James E. Garvey and Brooks M. Burr
53