Understanding cities through city brands: City branding as a social and semantic network
10
Understanding cities through city brands: City branding as a social and semantic network H. Efe Sevin ⇑ American University, School of International Service, 4400 Massachusetts Ave. NW, Washington, DC 20016, USA article info Article history: Received 28 May 2013 Received in revised form 5 January 2014 Accepted 7 January 2014 Keywords: City branding Place branding Measurement Social network analysis Semantic network analysis abstract More and more towns, cities, regions, and countries are investing in branding campaigns in order to establish a reputation for themselves, and to have a competitive edge in today’s global market. In their essence, branding campaigns are places’ attempts to define themselves to target audiences. However, the literature and practice of place branding have focused on the competition of brands at the expense of exploring the relations between people, symbols, meanings, and physical characteristics of cities. Therefore, current branding measurement scales and indices used to understand the defining character- istics of places are problematic. This article first analyzes three of the prominent place branding indices: Anholt-GfK Roper City Brands Index, FutureBrand Country Brand Index, and East–West Nation Brand Perception Index. Subsequently, it proposes an analytical framework combining two network analysis methods – social and semantic – to evaluate place brands, called ‘‘Define–Measure–Visualize’’ (DMV). In order to argue for the feasibility of the proposed method, a sample dataset is created based on tweets about Boston and New York City. By introducing a consumer-centric and communications-based approach and exploring the connection between cities, people, and messages, the findings of this research can be used in understanding cities/places, measuring the success of branding campaigns, and managing future campaigns. Ó 2014 Elsevier Ltd. All rights reserved. Introduction This research aims to present a place branding measurement model that is capable of capturing the complexity of cities, regions, and nations, 1 and of their brands, with the ultimate objective of a better understanding of how places are perceived by different audi- ences. This is indeed a complicated task as places are intricate phe- nomena, involving geographic, economic, social, cultural, and many other components (Landry, 2006). Additionally more and more places are investing in branding campaigns in order to have a com- petitive edge in today’s global market, and to establish a reputation for themselves (Anholt, 2010). In other words, these places attempt to define and communicate what they believe to be their distinctive and defining characteristics to target audiences (Chen, 2012). Such strategies and communication campaigns add a second layer of com- plexity to the already complicated nature of places because places do not have concrete uniformed identities and are seen differently by different audiences. There is still a need to make sense of and draw meaning from this complex nature of places. It is important to know where a place stands and how it is perceived as without sound measure- ment, branding cannot go beyond being ‘‘just talk’’ (Aaker & Joach- imsthaler, 1999, p. 141). There are several measurement practices and studies using various methods such as quantitative perception surveys (Anholt, 2006a), interviews gathering qualitative data (Laaksonen, Laaksonen, Borisov, & Halkoaho, 2006), concept maps (Brandt & de Mortanges, 2011), repertory grid analysis (Hankinson, 2004a), and importance satisfaction analysis (Insch, 2010). Even though several of these models have shown various levels of suc- cess, it is not possible to argue that they present a comprehensive model in which we can measure place brands. This article presents a more exclusive model in the following four sections. Firstly, a literature review on place brands, place branding, and measurement is introduced. The second section describes and examines three prominent models [Anholt-Gfk Roper City Brand In- dex (ACBI), FutureBrand Country Brand Index (FCBI), and East–West Nation Brand Perception Index (NBPI)]. Thirdly, ‘‘Define–Measure– Visualize’’ (DMV) model is introduced which is influenced by earlier work on relational branding (Hankinson, 2004b), and perception and network analysis (Zenker & Beckman, 2013). Subsequently, the feasibility of DMV is demonstrated through an example case, fol- lowed by limitations of this study and conclusion. 0264-2751/$ - see front matter Ó 2014 Elsevier Ltd. All rights reserved. http://dx.doi.org/10.1016/j.cities.2014.01.003 ⇑ Tel.: +1 202 885 1000. E-mail address: [email protected] 1 This article assumes that city, region, and nation branding refer to similar processes taking place at different bureaucratic levels (Lucarelli & Berg, 2011). Therefore, ‘‘place branding’’ and ‘‘place’’ are used as umbrella terms to refer to all these processes and levels – including cities – throughout the paper. Cities 38 (2014) 47–56 Contents lists available at ScienceDirect Cities journal homepage: www.elsevier.com/locate/cities
Transcript of Understanding cities through city brands: City branding as a social and semantic network

Cities 38 (2014) 47–56
Contents lists available at ScienceDirect
Cities
journal homepage: www.elsevier .com/locate /c i t ies
Understanding cities through city brands: City branding as a socialand semantic network
0264-2751/$ - see front matter � 2014 Elsevier Ltd. All rights reserved.http://dx.doi.org/10.1016/j.cities.2014.01.003
⇑ Tel.: +1 202 885 1000.E-mail address: [email protected]
1 This article assumes that city, region, and nation branding refer to similarprocesses taking place at different bureaucratic levels (Lucarelli & Berg, 2011).Therefore, ‘‘place branding’’ and ‘‘place’’ are used as umbrella terms to refer to allthese processes and levels – including cities – throughout the paper.
H. Efe Sevin ⇑American University, School of International Service, 4400 Massachusetts Ave. NW, Washington, DC 20016, USA
a r t i c l e i n f o
Article history:Received 28 May 2013Received in revised form 5 January 2014Accepted 7 January 2014
Keywords:City brandingPlace brandingMeasurementSocial network analysisSemantic network analysis
a b s t r a c t
More and more towns, cities, regions, and countries are investing in branding campaigns in order toestablish a reputation for themselves, and to have a competitive edge in today’s global market. In theiressence, branding campaigns are places’ attempts to define themselves to target audiences. However,the literature and practice of place branding have focused on the competition of brands at the expenseof exploring the relations between people, symbols, meanings, and physical characteristics of cities.Therefore, current branding measurement scales and indices used to understand the defining character-istics of places are problematic. This article first analyzes three of the prominent place branding indices:Anholt-GfK Roper City Brands Index, FutureBrand Country Brand Index, and East–West Nation BrandPerception Index. Subsequently, it proposes an analytical framework combining two network analysismethods – social and semantic – to evaluate place brands, called ‘‘Define–Measure–Visualize’’ (DMV). Inorder to argue for the feasibility of the proposed method, a sample dataset is created based on tweetsabout Boston and New York City. By introducing a consumer-centric and communications-basedapproach and exploring the connection between cities, people, and messages, the findings of this researchcan be used in understanding cities/places, measuring the success of branding campaigns, and managingfuture campaigns.
� 2014 Elsevier Ltd. All rights reserved.
Introduction
This research aims to present a place branding measurementmodel that is capable of capturing the complexity of cities, regions,and nations,1 and of their brands, with the ultimate objective of abetter understanding of how places are perceived by different audi-ences. This is indeed a complicated task as places are intricate phe-nomena, involving geographic, economic, social, cultural, and manyother components (Landry, 2006). Additionally more and moreplaces are investing in branding campaigns in order to have a com-petitive edge in today’s global market, and to establish a reputationfor themselves (Anholt, 2010). In other words, these places attemptto define and communicate what they believe to be their distinctiveand defining characteristics to target audiences (Chen, 2012). Suchstrategies and communication campaigns add a second layer of com-plexity to the already complicated nature of places because places donot have concrete uniformed identities and are seen differently bydifferent audiences.
There is still a need to make sense of and draw meaning fromthis complex nature of places. It is important to know where aplace stands and how it is perceived as without sound measure-ment, branding cannot go beyond being ‘‘just talk’’ (Aaker & Joach-imsthaler, 1999, p. 141). There are several measurement practicesand studies using various methods such as quantitative perceptionsurveys (Anholt, 2006a), interviews gathering qualitative data(Laaksonen, Laaksonen, Borisov, & Halkoaho, 2006), concept maps(Brandt & de Mortanges, 2011), repertory grid analysis (Hankinson,2004a), and importance satisfaction analysis (Insch, 2010). Eventhough several of these models have shown various levels of suc-cess, it is not possible to argue that they present a comprehensivemodel in which we can measure place brands.
This article presents a more exclusive model in the following foursections. Firstly, a literature review on place brands, place branding,and measurement is introduced. The second section describes andexamines three prominent models [Anholt-Gfk Roper City Brand In-dex (ACBI), FutureBrand Country Brand Index (FCBI), and East–WestNation Brand Perception Index (NBPI)]. Thirdly, ‘‘Define–Measure–Visualize’’ (DMV) model is introduced which is influenced by earlierwork on relational branding (Hankinson, 2004b), and perceptionand network analysis (Zenker & Beckman, 2013). Subsequently,the feasibility of DMV is demonstrated through an example case, fol-lowed by limitations of this study and conclusion.
48 H.E. Sevin / Cities 38 (2014) 47–56
Literature review
Definitions
‘Place brands’ and ‘place branding’ have been defined with thehelp of several disciplines such as marketing theories (cf. Kavarat-zis, 2005), public relations (Szondi, 2010), international relations(Potter, 2009; van Ham, 2001), public administration (Eshuis,Braun, & Klijn, 2013) public diplomacy (Gilboa, 2008; Szondi,2008), communication (Kaneva, 2011; Sevin, 2010), and geography(Boisen, Terlouw, & van Gorp, 2011). Thus, it is not surprising tofind that the consensus within the literature is on what placebranding is not, rather than what it is (Kavaratzis & Ashworth,2006). Indeed, as Lucarelli and Berg (2011) argue, there seems tobe different approaches even in the nature of the activity itself –let it be marketing, promotion or branding.
The main premises behind place branding are that when a placeis named, several associated concepts are invoked in individuals’minds (Kavaratzis, 2004) and these associations can be manipu-lated to create a better brand for a place. Therefore, place brandingconcentrates on creating a brand management system focused onthe identity (Freire, 2005), and distinctive and definitive character-istics (Zhang & Zhao, 2009) of a particular place. Parallel to thesedefinitions of branding, Zenker and Braun (2010) provide a com-prehensive definition of a place brand and argue that a brand is a‘‘network of associations in the consumer’s mind based on the visual,verbal, and behavio[u]ral expression of a place, which is embodiedthrough the aims, communication, values, and the general culture ofthe place’s stakeholders and the overall place design’’ (p. 5). This isto say, as a social phenomenon, a place brand is based on the per-ceptions of target audiences – which might or might not be influ-enced by the physical and communicative aspects of a given city.
Place branding and measurement
Scholars have introduced various measurement models in placebranding employing various theories and methods. Zenker, Knub-ben, and Beckman (2010, p. 5) categorize these attempts underthree headings based on their research methods: qualitative meth-ods using free brand associations, quantitative methods measuringattributes through standardized questionnaires, and mixed meth-ods combining qualitative and quantitative data through networkanalysis. Given the fact that the theoretical background of placebranding is based on several disciplines (Ashworth & Kavaratzis,2010), a categorization based on how these studies interact withdisciplinary boundaries is also helpful in understanding the currentstate of the literature. Within this approach, there are three possi-ble alternatives: (i) employing corporate marketing and brandingmeasures, (ii) adapting corporate marketing and branding mea-sures to place branding context, and (iii) devising models specificto place branding.
Kaplan, Yurt, Guneri, and Kurtulus (2010) employ alreadyestablished branding methods to cities. These scholars bring theconcept of brand personality from marketing discipline to defineand measure city brands. The research extracts six dimensions –namely excitement, malignancy, peacefulness, competence,conservatism, and ruggedness – to evaluate the brands of threeTurkish cities. Their study is based on the argument that ‘‘brandpersonality dimensions are applicable to place brands’’ (Kaplanet al., 2010, p. 1298).
Insch and Florek (2008) attempt to adapt different customersatisfaction indices to create a model of place satisfaction thatdetermines ‘‘the interrelationships between objective and subjec-tive place qualities and the individual assessments of residents’’(p. 142). Arguing that residents are the main stakeholders of cities,
the authors direct their research question and model at this spe-cific group. The results of such a satisfaction analysis can be usedin place management and resource allocation (Insch & Florek,2008). Instead of directly using customer satisfaction analysis,the authors adapt the concepts to the context of places.
Baxter and Kerr (2010) devise a model specific to place imagesand place identities by using semantic-differential scale. In theirmodel, they initially identify a list of concepts that can be usedto describe a place. Subsequently, they put these concepts on afive-point differential scale and gather data through a survey re-search from different target groups including the residents. Theresearchers argue that their model helps place marketers to iden-tify the gaps ‘‘between place identity and place images’’ (Baxter& Kerr, 2010, p. 15). Zenker, Eggers, and Farsky (2013) propose amodel by using choice-based conjoint analysis and network analy-sis. The researchers aim to examine the nature of competitionbetween German cities and demonstrate the importance of cityimages in this competitive environment. Their model is based onthe argument that decisions regarding places – in this case thedecision to move to a new city – are highly complex thus requirea more elaborate inspection of a city’s perception by target audi-ences (Zenker et al., 2013, p. 137).
At this moment, it is important to clarify the difference betweenadapting outside methods to place branding and devising specificmodels. In both approaches, scholars use data gathering and anal-ysis methods available in virtually all social science disciplines. Yet,in the former approach scholars tend to fine-tune existing mea-surement scales – such as satisfaction analysis in the exampleexplained above – whereas in the latter approach, proposed mea-surement models are novel and are designed specifically for places.Given the unique and complicated nature of places, the DMV mod-el argues the need for using place branding specific models andbuilds one using available methods – namely social network anal-ysis and semantic network analysis.
Contemporary practices
This section focuses on three place branding measurementpractices (ACBI, FCBI, NBPI) with the objective of identifying theirstrengths and weaknesses. There are several branding scales usedby practitioners such as Anholt-GfK Nation Brands Index, SaffronEuropean City Brand Barometer, and Creative Cities Interna-tional—The Vitality Index. The practices included in this studyare chosen through a purposeful sampling understanding to cap-ture the variation among prominent practices. All three indicesare widely used and discussed in the literature (as seen in Goand Govers (2011)) and employ different data gathering and anal-ysis processes.
In order to provide a succinct analysis of these indices, acomparative framework is created. The framework borrows funda-mental social science concepts in order to assess these indices.Basically, three questions are raised about their (i) operationaliza-tion of the place brand concepts, (ii) instruments used to measurethe brands, and (iii) lastly reporting styles of the results.
Given the fact that city brands are not material phenomena thatcan be directly measured, a measurement scale first needs to de-fine what it seeks out to measure: A valid measurement scaleshould be able to accurately represent the social phenomenon thatit seeks to measure. Each measurement scale should include animplicit or explicit definition of ‘place brand’. By asking whetherthe scales define place branding adequately and include all the rel-evant dimensions, construct validity of their city branding defini-tion is evaluated.
Secondly, the instruments of measurement – namely data gath-ering and analysis processes – are discussed. In other words,

Table 1Comparative framework.
Concepts assessed Index part analyzed
Operationalization Construct validity Definition of ‘‘PlaceBrands’’
Instruments Content validity andreliability
Tools of measurement
Reporting Consistency and usability Reports
H.E. Sevin / Cities 38 (2014) 47–56 49
content validity – the ability of the instruments to capture allrelevant aspects of place brands – is questioned. Additionally, thereliability – the ability of these instruments to yield consistentmeasures over repeated attempts – is assessed.
Reporting is an important part of measurement. The resultsneed to be shared with various stakeholders – in the case of placebranding, including bureaucratic authorities and decision-makers.More often than not, it is difficult to share the entire research pro-cess with all the stakeholders. This is why measurement scales areexpected to summarize and report their results. The comparativeframework assesses whether these reports are comprehensibleand usable by decision-makers. A supplementary question is askedto understand whether the reporting methods convey their find-ings without losing any aspects of their place brand definition.The table below shows a summary of the comparative framework(see Table 1).
The Anholt-GfK Roper City Brands Index (ACBI)
Simon Anholt, a practitioner who is often credited in coining theterm ‘nation branding’,2 started the Nation Brands Index in 2005and partnered up with GfK in 2008 (Anholt, 2011). Following thecommercial success of Nation Brands Index, Anholt started the An-holt-Global Marketing Institute (GMI) City Brands Index. The currentACBI is surveyed by GfK Roper Public Affairs & Corporate Communi-cations (GfK America, 2013).3
The survey asks around 40 questions to 20,000 people from 20countries about 50 cities, and is administered online (Anholt,2009). ACBI has six separate measures for the characteristics of cit-ies (Anholt, 2009):
Presence [. . .] measures the city’s global contribution in science,culture and governance. Place [explores] people’s perceptionsabout the physical aspect of each city in terms of pleasantnessof climate, cleanliness of environment and how attractive itsbuildings and parks are. Pre-requisites determines how peopleperceive the basic qualities of the city [. . .] such as schools, hos-pitals, transportation and sports facilities. People [reveals]whether the inhabitants of the city are perceived as warm andwelcoming, whether respondents think it would be easy forthem to find and fit into a community that shares their languageand culture and whether they would feel safe. Pulse [measures]the perception that there are interesting things to fill free timewith and how exciting the city is perceived to be in regard tonew things to discover. Potential [measures] the perception ofeconomic and educational opportunities within the city (GfKAmerica, 2013, italics added)
The ranking is based on the average of these six measures(Anholt, 2006a, 2009). Anholt (2007), in his book, Competitive Iden-tity, explicitly argues that in today’s global economy each country,region, and city should be ready to compete for limited resourcessuch as investors, tourists, and consumers. Competitive identityis ‘‘the synthesis of brand management with public diplomacyand with trade, investment, tourism, and export promotion’’ (An-holt, 2007, p. 3) and brand is ‘‘a word that captures the idea of rep-
utation observed, reputation valued and reputation managed’’(Anholt, 2010, p. 20). Both terms Anholt uses refer to establishinga system that controls the policy, strategy, and communication as-pects of how a given place is seen by target audiences. He arguesthat cities and countries with better reputations are in a moreadvantageous position than those with poor reputations by sayingthat the ‘‘brand images of places are indeed central to their pro-gress and prosperity’’ (Anholt, 2010, p. 3, emphasis in the original).
ACBI’s definition of brands, which is dominantly based on rep-utation and brand image, is widely accepted and echoed in the lit-erature (Dinnie, 2008; Hankinson, 2009; Kavaratzis, 2005). Yet,problematically, ACBI does not provide details about how theaforementioned six categories are derived from reputation, brandor competitive identity concepts. ACBI argues cities are differentfrom nations, therefore requires a different hexagon than the oneused for The Anholt-GfK Roper Nation Brands Index (Anholt,2007, pp. 55–62). However, it is not possible to argue that thesesix categories entirely capture city brand as a social phenomenon.For instance, history, an aspect that is deemed vital by certainscholars (cf. Zenker, 2011), is ignored in ACBI by keeping the ques-tions focused solely to the most recent three decades (Anholt,2006b). Thus, the construct validity is questionable as it is not pos-sible to argue that the hexagon can exhaustively capture the socialreality.
ACBI gathers data through an online survey and uses statisticalmeasures; therefore it is likely to have a high reliability. However,the results of online surveys might not be generalizable to the pop-ulation as this method might reflect the skewed attributes of theInternet population or as online sampling might not follow randomsampling strategies (Evans & Mathur, 2005). ACBI is a commercialproduct, therefore its methods and surveys are not transparent.However, Anholt (2006b) and other GfK employees (Feinberg &Zhao, 2011) have shared limited information about the contentof these surveys that include questions about various aspects ofthe hexagon. Respondents are given hypothetical questions (i.e.‘‘If you had a week of free time in the city, how easy do you thinkit would be to find interesting things to fill that time?’’), and areasked about their perceptions of the cities (i.e. ‘‘How clean or dirtydo you think the city is?’’) included in the survey. The non-trans-parent nature of the survey makes it difficult to argue for or againstthe content validity of the index. But it is important to note thatwithout construct validity, content validity is virtually impossibleto reach.
ACBI publishes its results in terms of scores and rankings. Thecities are ranked separately in six categories. The average of thesescores is assigned to the cities as an overall brand score. Based onthe ranking of the cities, it is possible to provide policy recommen-dations to decision makers. Especially the changes in the rankingsover time can be used to identify potential areas for intervention orto assess the effectiveness of certain campaigns and projects. Bethat as it may, there seems to be an inconsistency between thebrand definition and reporting style in ACBI. Despite the fact thatAnholt argues the governments should promote distinct character-istics of ‘‘their people and landscapes, their history and heritage,their products and their resources: to prevent them from becomingmere brands,’’ (Anholt, 2010, p. 4), the results are produced interms of rankings and scores for all cities included in the study.
FutureBrand Country Brand Index (FCBI)
FCBI is a global study conducted by FutureBrand. Over 110countries are included in the study (FutureBrand, 2012, 2013). InFutureBrand’s conceptualization, country branding is the attemptto capture a country’s narrative and assets for internal and externalaudiences (FutureBrand, 2012). A country’s brand is ‘‘an asset thatrepresents the sum total of the associations that influence prefer-
50 H.E. Sevin / Cities 38 (2014) 47–56
ence’’ (FutureBrand, 2012, p. 3). In order to entirely capture theseassociations, FutureBrand uses a survey to gather quantitative datafrom frequent travellers, organizes focus groups with tourism,investment, export, and public policy experts, and crowd-sourcesinformation from online discussions (FutureBrand, 2012).
The focus on ‘associations’ in country brand concept providesFCBI the opportunity to present a more inclusive understandingof place brands compared to other contemporary practices, andthe inclusion of qualitative data in addition to the quantitative datafacilitates the measurement of distinct brand characteristics.Therefore, the construct validity is high.
FutureBrand has been developing its methodology through theyears. In 2013, the company claimed that the 2012–2013 report is‘‘based on more research and data than ever before’’ (FutureBrand,2013, p. 5). FCBI follows a ‘‘hierarchical decision model (HDM)’’that tries to understand how key audiences perceive brands by fol-lowing seven steps: awareness, familiarity, associations, prefer-ence, consideration, visitation, and advocacy (FutureBrand, 2012).Similar to ACBI, the commercial nature of the product limits itstransparency. Apart from FutureBrand reports (Futurebrand,2012, 2013) and publication by its employees (Adams, 2011), theinformation about FutureBrand’s methodology is limited. FCBIgathers data through surveys with different groups of respondents,such as travelers, businessmen, and global experts, which presentthem with rich data, however, creates problems about generaliza-tion as their sample is not representative of the population. Surveyincludes questions that directly assesses respondents’ awarenessof a given country (awareness), their familiarity with what thecountry has to offer (familiarity), whether they resonate with thecountry (preference), whether they plan to interact with the coun-try (consideration), whether they follow up on their intentions tointeract with the country (visitation), and whether they recom-mend this country to others (advocacy) (Adams, 2011; Future-Brand, 2012, 2013). Associations are broken into furtherdimensions, such as value system, quality of life, and heritageand culture (Futurebrand, 2013). Indeed, this detailed system islikely to be helpful in establishing content validity of survey ques-tions and other measurement instruments. Robust data-gatheringand analysis procedures also ensure reliability of themeasurement.
FCBI’s reporting system is very similar to ACBI in the sense thatreports include ranking in different categories and an overall rank-ing for each country included in the index. Such overall rankingstend to disregard associations, one of FCBI’s strengths. Moreover,associations are also underlined in FCBI’s definition of brand, whichmakes its reporting system inconsistent with its definition.
East–West Communications Nation Brands Perception Index (NBPI)
NBPI was ‘‘developed as [a] tool[. . .] to quantify internationalperceptions of nations’’ (Cromwell, 2011, p. 102) by East–WestCommunications. Basically, NBPI employs a proprietary system toevaluate news articles that are connected to a given country as po-sitive or negative (East-West Communications, 2012). Based on thevolume and tone of coverage, countries are given a perception in-dex score and ranked accordingly.
NBPI claims that every country ‘‘makes a unique contribution tothe world and has a compelling story to tell’’ (East-West Commu-nications, 2012). Behind this generic explanation and infrequentreferences to reputation in company documents (East-West Com-munications, 2012) and works published by its employees (Crom-well, 2011), there is no definition of brands or branding. Theconcept is vaguely constructed.
The measurement process of NBPI solely focuses on the percep-tion portrayed by the English language mass media (Cromwell,2011). East–West Communications argue that ‘‘most of the infor-
mation we get about places, and the images produced in our mindsby that information, comes to us through one form of mass mediaor another’’ (Cromwell, 2011, p. 107). Even though it is possible toclaim the presence of a link between media frames and publicopinion formation, in the case of nation branding and individualbehavior this link is not precise as various other media outlets –including social media – and personal experiences/interactions in-deed influence people’s perceptions of cities. The proprietary sys-tem’s ability to do language processing is not certain due to lackof transparency. The same system, on the other hand, establishesreliability in their measurement as the same automated systemis used across countries and years.
Reporting is again limited by rankings and scores based on thenews media portrayal. Country specific reports are used to ‘‘iden-tify which words improve perceptions, and which are damaging,enabling countries to design messaging that builds on theirstrengths and addresses their weaknesses. . .[and] the relative im-pact, positive or negative, of sectors on the overall perception ofa country’’ (Cromwell, 2011, p. 103). But, encapsulating a nation’sreputation as positive or negative is neither possible nor desirable.Moreover, NBPI’s reporting deduces the unique stories of countriesinto scores and rankings thus is inconsistent with its definition.
The summary of this comparative analysis is presented in Ta-ble 5 under the ‘‘Discussion and Implications outside Social Media’’section of this paper. It is important to note these indices tend toprepare more detailed reports to their clients. Yet, the details ofthe reports do not change any of the assessments made in thisanalysis as the conceptualization of brands, measurement tools,and the reporting of aggregate results stay the same across theboard.
Define–Measure–Visualize
DMV aims to provide guidance on the three areas discussedduring the comparative analysis, namely operationalization,instruments, and reporting. Define prepares an operational defini-tion of place brands which is important in terms of establishingconstruct validity. Measure explains data gathering and analysismethods to establish content validity and reliability. Visualize pro-poses a new reporting method that is easy to interpret and is con-sistent with the definition – instead of ranking places, DMVintroduces semantic network and social network visualizations.
DMV is influenced by earlier work on relational branding (Han-kinson, 2004b, 2009), and perception and network analysis (Zen-ker, 2011; Zenker & Beckman, 2013) in the field of placebranding. Hankinson (2004b) sets out to create specific modelsfor place branding through a comparison with corporate brandingliterature. Based on relational and network paradigms of branding,he redefines place brand as a relational network brand. Basically,Hankinson argues that ‘‘a place branding strategy relies on theeffective extension of the core brand through effective relation-ships with stakeholders, each of which extends and reinforcesthe reality of the core brand’’ (2004b, p. 116). Therefore a placebrand is not solely about the perception of audiences but is also re-lated to how relevant stakeholders interact with each other. DMVmodel incorporates a social network understanding which can beused to capture, analyze, and visualize such relations.
Zenker and Beckman (2013) start their discussion within thefields of place branding and marketing. The authors define brandsas networks of associations and make use of network analyses toinclude ‘‘the complexity of the place marketing target audienceas well as the different perceptions of the brand among the varioustarget groups’’ (Zenker & Beckman, 2013, p. 13) in their research.Their proposed model makes it possible to identify various associ-ations attached by different target audiences for a given place.

H.E. Sevin / Cities 38 (2014) 47–56 51
DMV accepts this possibility of multiple brand images and makes itpossible to analyze the relations between different associationsthrough semantic network analysis and between different targetaudiences through social network analysis.
Define
When a country or a place is named, several associated conceptsare invoked in individuals’ minds (Anholt, 2007). If one is to mea-sure a given place’s brand, one has to analyze who thinks whatabout the place. In other words, different groups (Zenker et al.,2013) and stakeholders (Insch & Florek, 2008), and their percep-tions should be identified. Thus, a place brand is the sum of every-one’s perceptions and their interactions within their informationresource network.
Measure
Based on the definition, the brand of a place could be measuredwith social and semantic network analyses. Social network analy-sis, as the name suggests, studies the relationship between actorswithin a social network by conceptualizing such actors as nodesand their relations as edges (Wasserman & Faust, 1998). In the caseof places, the nodes will be used to signify members of target audi-ences and edges will show their interactions with each other abouta given place. Semantic network analysis studies the relationshipbetween themes and concepts by identifying how closely differentconcepts are used. In the case of places, the themes and conceptswill show the associations people have in their minds. The rela-tions between these associations will be used to aggregate individ-ual data to undercover place brands.
Visualize
Data needs to be reported to decision-makers, stakeholders, andother interested parties. This is why data should be summarized ina concise manner while making sure all the relevant aspects are in-cluded. The brand indices discussed in this research summarize thedata in ranking terms. This reporting method fails to capture theunique characteristics of places, deduces them to numbers and fig-ures, and assumes that all places have the same characteristics thatcan be ranked. DMV proposes social and semantic network visual-ization to take the place of these figures by summarizing how mes-sages travel and what concepts are associated with a given place.These maps make it possible to identify the influential actors in so-cial networks and relevant themes and associations in semanticnetworks.
Example case
To exemplify DMV, this research uses data collected from Twit-ter about Boston and New York City. It is important to note thatthis example study should not be seen as an attempt to accuratelymeasure the brands of Boston and New York City. In order to makesuch an argument, one must assume that Twitter is a perfect rep-lica of the entire population. Given the fact that Twitter users donot represent the entire population, the discussions about Bostonand New York City are partial and are made to demonstrate howDMV might be used. Twitter is chosen for testing because of logis-tical reasons as the platforms makes it possible for users to freelyexpress their ideas, and ‘‘mention/retweet’’ capabilities enableusers to interact with each other. In other words, data coming fromTwitter can be analyzed both through social and semantic networkanalyses.
A total of 70,691 tweets for New York and 35,513 tweets forBoston were collected between April 1st and June 27th, 2012.Tweets are scrapped with a python-based scrapper code, and arebased on three keywords (Boston, New York, and NYC). The con-tent of tweets are used to find out the associations about given cit-ies through semantic network analysis. A retweet-mentionnetwork is created for each city to analyze the social network.
Social network
The first part of measurement in DMV is to analyze the socialrelations within target audiences. In the case of a Twitter analysis,it is possible to analyze such relations through retweet/mentionnetworks. The relations between Twitter users were analyzed sep-arately for each city. Each tweet that contained a reference to an-other user (by including the other user’s twitter handle with an‘‘@’’ sign) was extracted, and a dyadic list of relations was created.These dyads showed the interactions between users. Each refer-ence to a user was counted as a degree for both the user makingthe reference, and the user that was referred.
An analysis of degree frequencies in Boston revealed that only3% of the users had a frequency of 10 or more. This shows thatmost of the users were not active part of the network. The userswith highest frequencies were usually sports teams/players, localnewspapers/TV stations, and technology companies. The messagesthat are sent by these users are likely to reach a higher number ofpeople. In Boston, 2702 unique users build up 3400 connections,with 2610 of these connections being unique. We can then see thatwithin this network, connections are not strong. Users prefer tobuild up new relations with new users, rather than conversing withthe users they already know. Only 23% of the relations are usedmore than once. Moreover, it is not possible to talk about a singlenetwork for Boston. There are 99 different networks that are notconnected to each other. The largest network includes nearly 37%of the users, whereas the rest belongs to 98 different networks(see Table 2).
New York’s network structure showed similar characteristics interms of activity level. Only 1% of the users has a degree frequencyhigher than 10. Out of all the users, 92% of the users have a degreefrequency of less than five. These users were included in the anal-ysis stages, however they were excluded from network visualiza-tions due to their low level of influence. The users with the sevenhighest degree frequencies are celebrities (including three mem-bers of the Kardashian family), TV shows, and online deals. NewYork network has 13,476 unique users that build up 19,353 con-nections, with 12,896 of these connections being unique. Similarto Boston’s network, this network does not have strong, repeatedconnections among their users, as 33% of the relations are repeatedover time. The overall network is composed of 2365 connectedsub-networks, with nearly 29% of the connections belonging tothe largest component.
This network analysis reveals three important findings withpolicy implications. First, there is low level of interaction amongusers which show that users do not get their information fromeach other about Boston or New York on Twitter, but rather followa small number of users. Secondly, there is a low level of activityabout the cities. In other words, these places are not likely to bepriorities for the audience. And lastly, there are multiple networkssurrounding the cities. Therefore, it is possible to argue – at leaston Twitter – there are independent groups of target audiences thatdo not interact with each other. If a place branding campaign aimsto change the perception of the entire target audience, it is of utter-most importance to use several nodes as starting points for themessages within this disconnected network (see Table 3).

Table 2Overall usage statistics.
Boston New York City
Vertices 2702 13,476
Unique edges 2610 12,896Edges with duplicates 790 6457Total edges 3400 19,353
Connected components 99 2365Maximum vertices in a connected component 1005 2981Maximum edges in a connected component 1194 5671
Degree frequencies (df)Users with df < 10 2632 13,301Users with df < 20 20 142Users with df < 30 23 17Users with df < 40 10 5Users with df 40 and above 17 11
52 H.E. Sevin / Cities 38 (2014) 47–56
Semantic network
Second step of measurement in DMV is identifying the associa-tions. The content of tweets were analyzed, and a keyword and aphrase frequency analyses were conducted by using WordStat soft-ware. The analysis returned 150 words and phrases for both cities.Table 4 shows the top ten keywords and phrases for Boston. Thehighest frequencies belong to sports and local media relatedwords. This is caused by both the repetition of these names in ret-weets, as well as the overall interest in local news and sports in thecity.
Wordstat’s thesaurus was used to cluster the keywords into tencategories based on co-occurrence and similarity (the visualizationfor Boston and New York clusters can be seen in Figs. 3 and 4respectively). Subsequently, these ten clusters were manually ana-lyzed and re-categorized into five categories labeled as: ‘night life’,‘sports’, ‘culture’, ‘economy’, and ‘media/local news’.
The same process was repeated for New York City. Table 5shows the top 10 keywords and phrases. It is seen that TV showsand live concerts attract the attention of Twitter users. Based onthe similarity of the keywords, Computer-generated ten clusterswere re-categorized into three categories labeled as: ‘music’, ‘localnews’, and ‘business’.
The analysis of the content presents three findings. Firstly, usingfrequency analysis makes it possible to capture more associationsabout a place. A certain tweet might include references to morethan one category. By counting keywords and phrases, the analysisincludes all these references in the results. Secondly there are rela-tions between different associations. Different brand aspects (suchas ACBI’s hexagon categories) should not be seen separately. Forinstance, Boston’s sports teams are observed under the culture cat-egory. In New York, business and music are very closely related.Within the framework of Twitter, interest in sports is embedded
Table 3Top 10 phrases and keywords for Boston.
Frequency %Cases
Frequency %Cases
BOSTON RED 942 2.50 CELTICS 1657 4.30BOSTON CELTICS 939 2.60 RED 1541 3.90BOSTON MARATHON 722 2.00 GAME 1416 3.60BOSTON HERALD 695 1.90 WIN 1299 3.50BOSTON GLOBE 517 1.40 JOB 1263 2.70BOSTON BRUIN 389 1.00 DAY 1199 3.10BOSTON FAN 331 0.90 TIME 1121 3.00TIME TO MESS WITH
TEXAS315 0.90 HEAT 1014 2.60
BOSTON COLLEGE 262 0.70 FAN 1014 2.50
into the culture in Boston, and business and music go hand-in-hand. Lastly, combining social network analysis and semantic net-work analysis enable the researcher to show the differencesbetween target audiences (such as residents and non-residents)in terms of associations about a given place and the interaction be-tween these associations. However given the low densities of thenetworks, it was not possible to demonstrate this functionality ofDMV with the test dataset.
Visualize
In the last step of DMV, networks maps are used to report thefindings. As opposed to rankings and scores, networks maps pro-tect the unique characteristics of places and their brands in thereporting stage. The social network maps below are created by No-deXL (Smith et al., 2010), and enhanced by Gephi (Bastian,Heymann, & Jacomy, 2009). 2-D concept maps are created byWordStat and finished by manual manipulation.
Fig. 1 shows Boston’s network. The sizes of the bubbles arebased on degree frequencies. The thickness of the edges (linesbetween bubbles) shows the strength of relations between two ac-tors. At a first glance, this visualization reports the most influentialactors: bostondotcom, yankees, celtics (Boston-based basketballteam), and espnchrispalmer (Chris Palmer, a sports writer).
It is also possible to identify different sub-networks throughthis visualization. Bostondotcom, the Twitter account of Boston’s lo-cal news site boston.com has a community of users around it,whereas there is another smaller network around Yankees, theNew York-based baseball club’s official Twitter account. Moreover,accounts belonging to individuals, such as boston_mikem andfrienshlp.
Similarly Fig. 2 shows New York’s network – however includessolely actors with a degree frequency of 8 or higher. Given the largesize of New York’s network (a total of 13,476 unique nodes), onlymore influential actors are included in the map to avoid unneces-sary visual cluttering. The Kardashian sisters, Nicki Minaj, JustinBieber, and the Today Show are easily identifiable as influential ac-tors on the map.
These influential actors lead their own sub-networks with littleor no interaction between them. There are also smaller groups ofpeople in between these larger actors. Succinctly stated, social net-work visualizations report the characteristics about individual ac-tors (i.e. their level of influence) as well as interactions andgroupings within target audiences.
Fig. 3 shows the top keywords about Boston with the added 5categories, and Fig. 4 shows New York’s top keywords with theadded 3 categories. This reporting style makes it possible to visu-ally summarize all the relevant concepts and associations about acity. Moreover, semantic network maps also display the relationsof these concepts and associations with each other.
It is important to underline that these maps offer more than vi-sual aesthetic to the research. The DMV model argues that it is notpossible to summarize a place’s brand with figures or rankings. Asa place’s brand is about the audiences and their perceptions, it isimportant to use social and semantic network maps that displaythe structure of these audiences and perceptions in the datasummary.
The discussions included here should be seen only as an exem-plification of the DMV method, as the results do not necessarily re-flect the structure of entire audience and relevant stakeholders. Ananalysis on Twitter cannot present the whole picture of an audi-ence network. In this test case, it was assumed that tweets withcity names were sent for information exchange purposes. More-over, co-occurrence and proximity of terms within tweets weretaken as associations. These assumptions are not necessarily

Table 4Top 10 phrases and keywords for New York.
Frequency % Cases Frequency % Cases
YORK DAILY NEWS 489 0.70 TIME 4847 6.60YORK SUE SPRINT 422 0.40 DAY 3557 4.30INSTAGRAM BE WORTH 405 0.60 LOVE 2809 3.80REMEMBER THIS DAY 363 0.50 JOB 2557 2.80CONCERT IN NYC 327 0.50 LIVE 2111 2.90NYC IN THE MORNING 295 0.40 TODAY 2091 2.90ALL AROUND THE WORLD ON THE NBA FINAL 286 0.40 GREAT 1833 2.30GOTTA GET SOME REST 286 0.40 NEWS 1711 2.30TODAY SHOW CONCERT IN NYC 286 0.40 SHOW 1581 2.20LIVE IN NEW YORK 280 0.40 YEAR 1535 2.10
Table 5Comparing DMV to contemporary practice.
ACBI FCBI NBPI DMV
Operationalization Constructvalidity
Problematic High Vague construct High, includes allassociations
Instruments Contentvalidity
Transparency and construct validityproblem
Transparencyproblem
Transparency and choiceproblem
Depends on the application
Reliability High but sampling issues High but samplingissues
High High
Reporting Usability Easy to understand Easy to understand Easy to understand Easy to understand,informative
Consistency Inconsistent Inconsistent Inconsistent Consistent
Fig. 1. Boston network map.
H.E. Sevin / Cities 38 (2014) 47–56 53
correct but are made solely to demonstrate the capabilities of DMVmodel through an example.
Discussion and implications outside social media
The example case study challenges two assumptions made bycontemporary practices. Firstly, a deductive approach tomeasurement is not effective. The three place branding indices
mentioned earlier employ a deductive approach. However, a placebrand is a network of associations in people’s minds, therefore twoplaces might have distinct associations that can be neither com-pared nor ranked. In their attempt to evaluate the brands of Cata-lonia and Wales, Roig et al. (2010) come up with semantic groupssuch as country of contrasts, quality, and national identity for Cata-lonia; and golf, nature, and scenery for Wales. In other words, theirresearch also shows that places do not necessarily have same or

Fig. 2. New York Network visualization, df > 3.
Fig. 3. Boston 2D dendogram (category representation is approximate on the figure).
54 H.E. Sevin / Cities 38 (2014) 47–56
similar associations in people’s minds. In DMV, an inductiveapproach was used to come up with brand categories.
Secondly, DMV does not rank or compare places. Places cannotbe compared unless the audience have similar perceptions, andcannot be ranked unless these perceptions are the same. Similarperceptions can be grouped at a higher level of abstraction (Sartori,1970) to compare places. In other words, if the associations aboutdifferent places can be combined under same categories, it is pos-sible to compare their brands. In the case of Boston and New YorkCity, it is possible to compare them based on economy/business,
and night life/music. However, it is not possible to rank theseplaces in the aforementioned categories as Boston’s economy-re-lated associations are usually about state/local government andjob offers, whereas New York City’s business-related associationsare stock market related. Similarly, night life and music categoriesare predominantly composed of local events, which are not neces-sarily comparable. In the case of New York City, over 70% ofmusic-related tweets mentioned Justin Bieber’s concert on TheToday Show, whereas Boston’s tweets deal with a variety of con-certs and night life-related advertisements.
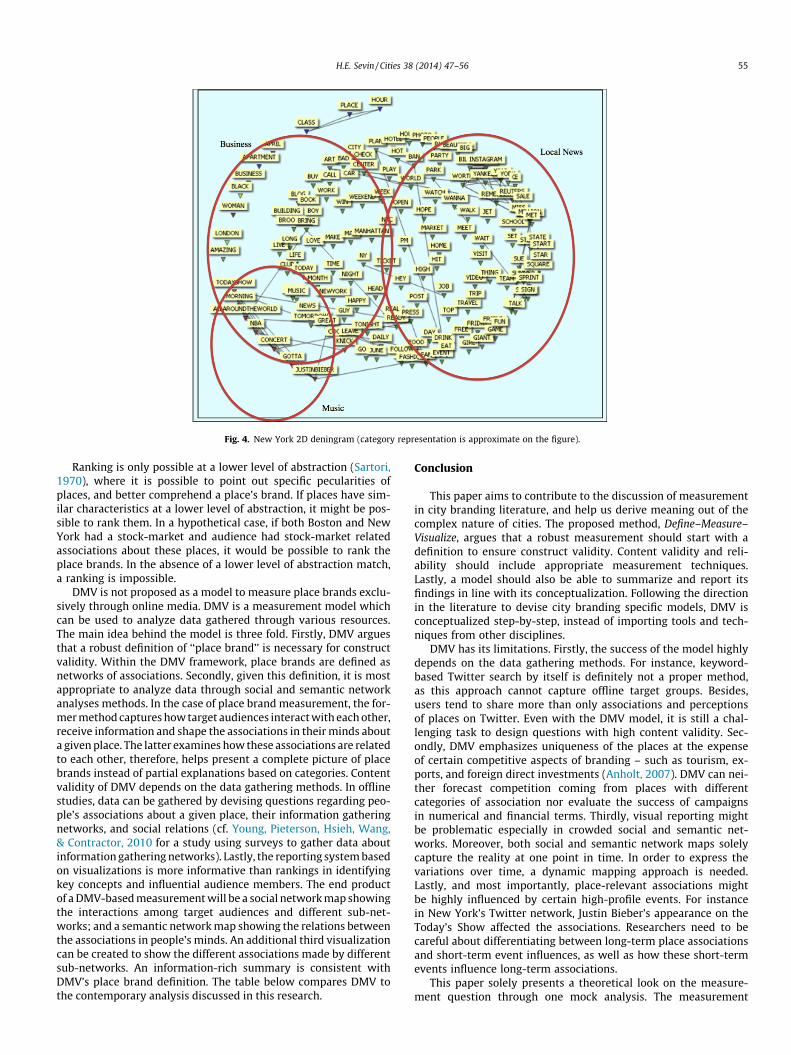
Fig. 4. New York 2D deningram (category representation is approximate on the figure).
H.E. Sevin / Cities 38 (2014) 47–56 55
Ranking is only possible at a lower level of abstraction (Sartori,1970), where it is possible to point out specific pecularities ofplaces, and better comprehend a place’s brand. If places have sim-ilar characteristics at a lower level of abstraction, it might be pos-sible to rank them. In a hypothetical case, if both Boston and NewYork had a stock-market and audience had stock-market relatedassociations about these places, it would be possible to rank theplace brands. In the absence of a lower level of abstraction match,a ranking is impossible.
DMV is not proposed as a model to measure place brands exclu-sively through online media. DMV is a measurement model whichcan be used to analyze data gathered through various resources.The main idea behind the model is three fold. Firstly, DMV arguesthat a robust definition of ‘‘place brand’’ is necessary for constructvalidity. Within the DMV framework, place brands are defined asnetworks of associations. Secondly, given this definition, it is mostappropriate to analyze data through social and semantic networkanalyses methods. In the case of place brand measurement, the for-mer method captures how target audiences interact with each other,receive information and shape the associations in their minds abouta given place. The latter examines how these associations are relatedto each other, therefore, helps present a complete picture of placebrands instead of partial explanations based on categories. Contentvalidity of DMV depends on the data gathering methods. In offlinestudies, data can be gathered by devising questions regarding peo-ple’s associations about a given place, their information gatheringnetworks, and social relations (cf. Young, Pieterson, Hsieh, Wang,& Contractor, 2010 for a study using surveys to gather data aboutinformation gathering networks). Lastly, the reporting system basedon visualizations is more informative than rankings in identifyingkey concepts and influential audience members. The end productof a DMV-based measurement will be a social network map showingthe interactions among target audiences and different sub-net-works; and a semantic network map showing the relations betweenthe associations in people’s minds. An additional third visualizationcan be created to show the different associations made by differentsub-networks. An information-rich summary is consistent withDMV’s place brand definition. The table below compares DMV tothe contemporary analysis discussed in this research.
Conclusion
This paper aims to contribute to the discussion of measurementin city branding literature, and help us derive meaning out of thecomplex nature of cities. The proposed method, Define–Measure–Visualize, argues that a robust measurement should start with adefinition to ensure construct validity. Content validity and reli-ability should include appropriate measurement techniques.Lastly, a model should also be able to summarize and report itsfindings in line with its conceptualization. Following the directionin the literature to devise city branding specific models, DMV isconceptualized step-by-step, instead of importing tools and tech-niques from other disciplines.
DMV has its limitations. Firstly, the success of the model highlydepends on the data gathering methods. For instance, keyword-based Twitter search by itself is definitely not a proper method,as this approach cannot capture offline target groups. Besides,users tend to share more than only associations and perceptionsof places on Twitter. Even with the DMV model, it is still a chal-lenging task to design questions with high content validity. Sec-ondly, DMV emphasizes uniqueness of the places at the expenseof certain competitive aspects of branding – such as tourism, ex-ports, and foreign direct investments (Anholt, 2007). DMV can nei-ther forecast competition coming from places with differentcategories of association nor evaluate the success of campaignsin numerical and financial terms. Thirdly, visual reporting mightbe problematic especially in crowded social and semantic net-works. Moreover, both social and semantic network maps solelycapture the reality at one point in time. In order to express thevariations over time, a dynamic mapping approach is needed.Lastly, and most importantly, place-relevant associations mightbe highly influenced by certain high-profile events. For instancein New York’s Twitter network, Justin Bieber’s appearance on theToday’s Show affected the associations. Researchers need to becareful about differentiating between long-term place associationsand short-term event influences, as well as how these short-termevents influence long-term associations.
This paper solely presents a theoretical look on the measure-ment question through one mock analysis. The measurement

56 H.E. Sevin / Cities 38 (2014) 47–56
processes and visualizations introduced here are the parts of arudimentary analysis. Future research projects could and shouldintroduce new data gathering methods that have high contentvalidity. Moreover, the visualization aspect should be developedto reflect variation over time and different sub-networks.
Acknowledgments
The author would like to express his gratitude to Namalie Jaya-singhe of American University, and two anonymous reviewers fortheir feedback.
References
Aaker, D., & Joachimsthaler, E. (1999). The lure of global branding. Harvard BusinessReview, 77(6), 137–144.
Adams, T. (2011). The FutureBrand country brand index. In F. Go & R. Govers (Eds.),International place branding yearbook 2011: Managing reputational risk(pp. 92–101). Basingstoke: Palgrave Macmillan.
Anholt, S. (2006a). The Anholt-GMI city brands index: How the world sees theworld’s cities. Place Branding, 2(1), 18–31.
Anholt, S. (2006b). The Anholt-GMI city brands index: How the world sees theworld’s cities, report, GMI. <http://www.futuremelbourne.com.au/wiki/pub/FMPlan/S3Resources/Anholt_City_Brands_Index_cbi2006-q4-free.pdf>Retrieved 18.10.13.
Anholt, S. (2007). Competitive identity: The new brand management for nations, citiesand regions. Basingstoke: Palgrave Macmillan.
Anholt, S. (2008). Place branding: Is it marketing, or isn’t it? Place Branding andPublic Diplomacy, 4(1), 1–6.
Anholt, S. (2009). The Anholt-GfK Roper City Brands Index. <http://www.simonanholt.com/Research/research-city-brand-index.aspx> Retrieved03.03.13.
Anholt, S. (2010). Places: Identity, image and reputation. Houndmills: PalgraveMacMillan.
Anholt, S. (2011). Beyond the nation brand: The role of image and identity ininternational relations. In A. Pike (Ed.), Brands and branding geographies(pp. 289–304). Northampton, MA: Edward Elgar Publishing.
Ashworth, G., & Kavaratzis, M. (2010). Conclusion. In G. Ashworth & M. Kavaratzis(Eds.), Towards effective place brand management branding European cities andregions (pp. 234–239). Cheltenham, UK: Edward Elgar.
Bastian, M., Heymann, S., & Jacomy, M. (2009). Gephi: An open source software forexploring and manipulating networks. Presented at the international AAAIconference on weblogs and social media, San Jose, CA. <http://www.aaai.org/ocs/index.php/ICWSM/09/paper/view/154> Retrieved on 07.10.13 .
Baxter, J., & Kerr, G. (2010). The meaning and measurement of place identity andplace image. Paper presented at the 50th European regional science associationcongress, 19–23 August, Jönköping, Sweden. <http://ideas.repec.org/p/wiw/wiwrsa/ersa10p223.html> Retrieved 15.10.13.
Boisen, M., Terlouw, K., & van Gorp, B. (2011). The selective nature of place brandingand the layering of spatial identities. Journal of Place Management andDevelopment, 4(2), 135–147.
Brandt, C., & de Mortanges, C. P. (2011). City branding: A brand concept mapanalysis of a university town. Place Branding and Public Diplomacy, 7(1), 50–63.
Chen, N. (2012). Branding national images: The 2008 Beijing Summer Olympics,2010 Shanghai World Expo, and 2010 Guangzhou Asian Games. Public RelationsReview, 38(5), 731–745.
Cromwell, T. (2011). The East–West Nation Brand Perception Indexes and reports:Perception measurement and nation branding. In F. Go & R. Govers (Eds.),International place branding yearbook 2011: Managing reputational risk(pp. 92–101). Basingstoke: Palgrave Macmillan.
Dinnie, K. (2008). Nation branding: Concepts, issues, practice (1st ed.). Oxford:Butterworth-Heinemann.
East-West Communications (2012). Nation branding indexes. <http://www.eastwestcoms.com/global.htm> Retrieved 14.12.12.
Eshuis, J., Braun, E., & Klijn, E.-H. (2013). Place marketing as governance strategy: Anassessment of obstacles in place marketing and their effects on attracting targetgroups. Public Administration Review, 73(3), 507–516.
Evans, J. R., & Mathur, A. (2005). The value of online surveys. Internet Research, 15(2),195–219.
Feinberg, Z., & Zhao, X. (2011). The Anholt–GfK Roper Nation Brands IndexSM:Navigating the changing world. In F. Go & R. Govers (Eds.), International placebranding yearbook 2011: Managing reputational risk (pp. 63–76). Basingstoke:Palgrave Macmillan.
Freire, J. R. (2005). Geo-branding, are we talking nonsense? A theoretical reflectionon brands applied to places. Place Branding, 1(4), 347–362.
FutureBrand (2012). 2011–2012 Country brand index. <http://www.futurebrand.com/images/uploads/studies/cbi/2011-2012_FutureBrand_CBI_ENG.pdf> Retrieved 10.02.13.
FutureBrand (2013). 2012–2013 Country brand index. <http://www.futurebrand.com/images/uploads/studies/cbi/CBI_2012-Final.pdf>Retrieved 01.22.14.
GfK America (2013). The Anholt-GfK Roper city brands index. <http://marketing.gfkamerica.com/093013-1694/093013-1694.html> Retrieved03.01.13.
Gilboa, E. (2008). Searching for a theory of public diplomacy. The ANNALS of theAmerican Academy of Political and Social Science, 616(1), 55–77.
Go, F., & Govers, R. (Eds.). (2011). International place branding yearbook 2011:Managing reputational risk. Basingstoke: Palgrave Macmillan.
Hankinson, G. (2004a). Repertory grid analysis: An application to the measurementof destination images. International Journal of Nonprofit and Voluntary SectorMarketing, 9(2), 145–153.
Hankinson, G. (2004b). Relational network brands: Towards a conceptual model ofplace brands. Journal of Vacation Marketing, 10(2), 109–121.
Hankinson, G. (2009). Managing destination brands: Establishing a theoreticalfoundation. Journal of Marketing Management, 25(1), 97–115.
Insch, A. (2010). Managing residents’ satisfaction with city life: Application ofimportance—satisfaction analysis. Journal of Town and City Management, 1(2),164–174.
Insch, A., & Florek, M. (2008). A great place to live, work and play: Conceptualisingplace satisfaction in the case of a city’s residents. Journal of Place Managementand Development, 1(2), 138–149.
Kaneva, N. (2011). Nation branding: Toward an agenda for critical research.International Journal of Communication, 5, 117–141.
Kaplan, M. D., Yurt, O., Guneri, B., & Kurtulus, K. (2010). Branding places: Applyingbrand personality concept to cities. European Journal of Marketing, 44(9/10),1286–1304.
Kavaratzis, M. (2004). From city marketing to city branding: Towards a theoreticalframework for developing city brands. Place Branding, 1(1), 58–73.
Kavaratzis, M. (2005). Place branding: A review of trends and conceptual models.The Marketing Review, 5(4), 329–342.
Kavaratzis, M., & Ashworth, G. (2006). City branding: An effective assertion ofidentity or a transitory marketing trick? Place Branding, 2(3), 183–194.
Laaksonen, P., Laaksonen, M., Borisov, P., & Halkoaho, J. (2006). Measuring image ofa city: A qualitative approach with case example. Place Branding, 2(3), 210–219.
Landry, C. (2006). The art of city-making. Sterling, VA: Earthscan.Lucarelli, A., & Berg, P. O. (2011). City branding: A state-of-the-art review of the
research domain. Journal of Place Management and Development, 4(1), 9–27.Potter, E. (2009). Branding Canada projecting Canada’s soft power through public
diplomacy. Montreal: McGill-Queen’s University Press.Roig, A. H., Pritchard, A., & Morgan, N. (2010). Placemaking or place branding? Case
studies of Catalonia and Wales. In G. J. Ashworth & M. Kavaratzis (Eds.), Towardseffective place brand management branding European cities and regions(pp. 116–135). Cheltenham, UK: Edward Elgar.
Sartori, G. (1970). Concept misformation in comparative politics. The AmericanPolitical Science Review, 64(4), 1033–1053.
Sevin, E. (2010). Controlling the message: A strategic approach to nation branding.Saarbrucken: LAP Lambert Academic Pub.
Smith, M., Milic-Frayling, N., Shneiderman, B., Mendes Rodrigues, E., Leskovec, J., &Dunne, C. (2010). NodeXL: A free and open network overview, discovery andexploration add-in for Excel 2007/2010.
Szondi, G. (2008). Public diplomacy and nation branding: Conceptual similaritiesand differences. Discussion papers in diplomacy.
Szondi, G. (2010). From image management to relationship building: A publicrelations approach to nation branding. Place Branding and Public Diplomacy, 6(4),333–343.
Van Ham, P. (2001). The rise of the brand state. Foreign Affairs, 80(5), 2–8.Wasserman, S., & Faust, K. (1998). Social network analysis: Methods and applications.
Cambridge: Cambridge University Press.Young, L., Pieterson, W., Hsieh, Y. P., Wang, H., & Contractor, N. (2010). Mapping
community-based information networks to enable the Chicago climate action plan:A case study of the North Kenwood/Oakland community. Chicago, IL:Northwestern University. <http://sonic.northwestern.edu/wp-content/uploads/2011/01/CCAP_NorthKenwoodOakland-Analysis-Report.pdf>Retrieved 17.10.13.
Zenker, S. (2011). How to catch a city? The concept and measurement of placebrands. Journal of Place Management and Development, 4(1), 40–52.
Zenker, S., & Braun, E. (2010). Towards an integrated approach for place brandmanagement. Presented at the 50th European regional science associationcongress, Jönköping, Sweden. <http://www.ekf.vsb.cz/export/sites/ekf/projekty/cs/weby/esf-0116/databaze-prispevku/clanky_ERSA_2010/ERSA2010finalpaper181.pdf> Retrieved 05.02.13.
Zenker, S., & Beckman, S. C. (2013). My place is not your place – Different placebrand knowledge by different target groups. Journal of Place Management andDevelopment, 6(1), 6–17.
Zenker, S., Eggers, F., & Farsky, M. (2013). Putting a price tag on cities: Insights intothe competitive environment of places. Cities, 30, 133–139.
Zenker, S., Knubben, E., & Beckman, S. C. (2010). Your city, my city, their city, ourcity – Different perceptions of place brands by diverse target groups. Presentedat the 6th international conference thought leaders in brand management, 18–20April, Lugano, Switzerland. <http://openarchive.cbs.dk/bitstream/handle/10398/8266/Zenker_KnubbenBeckmann%202010%20Place%20Brand%20 Perception.pdf?sequence=1> Retrieved 05.02.13.
Zhang, L., & Zhao, S. X. (2009). City branding and the Olympic effect: A case study ofBeijing. Cities, 26(5), 245–254.