Understanding and modeling the effect of temperature and daylength on soybean phenology under...
16
Agronomy and Horticulture Department Agronomy – Faculty Publications University of Nebraska - Lincoln Year Understanding and modeling the effect of temperature and daylength on soybean phenology under high-yield conditions T. D. Setiyono * Albert Weiss † James E. Specht ‡ A. M. Bastidas ** Kenneth G. Cassman †† A. Dobermann ‡‡ * University of Nebraska - Lincoln, [email protected] † University of Nebraska - Lincoln, [email protected] ‡ University of Nebraska - Lincoln, [email protected] ** University of Nebraska - Lincoln †† University of Nebraska - Lincoln, [email protected] ‡‡ University of Nebraska - Lincoln This paper is posted at DigitalCommons@University of Nebraska - Lincoln. http://digitalcommons.unl.edu/agronomyfacpub/112
-
Upload
un-lincoln -
Category
Documents
-
view
1 -
download
0
Transcript of Understanding and modeling the effect of temperature and daylength on soybean phenology under...

Agronomy and Horticulture Department
Agronomy – Faculty Publications
University of Nebraska - Lincoln Year
Understanding and modeling the effect of
temperature and daylength on soybean
phenology under high-yield conditions
T. D. Setiyono∗ Albert Weiss† James E. Specht‡
A. M. Bastidas∗∗ Kenneth G. Cassman†† A. Dobermann‡‡
∗University of Nebraska - Lincoln, [email protected]†University of Nebraska - Lincoln, [email protected]‡University of Nebraska - Lincoln, [email protected]∗∗University of Nebraska - Lincoln††University of Nebraska - Lincoln, [email protected]‡‡University of Nebraska - Lincoln
This paper is posted at DigitalCommons@University of Nebraska - Lincoln.
http://digitalcommons.unl.edu/agronomyfacpub/112

1. Introduction
Simulating crop phenology at the whole plant level is con-sidered more effective than alternative approaches that focus on plant organ or cellular levels (Trewavas, 1986, Wallace et al., 1993 and Zobel, 1992). The most commonly used whole plant phenology staging system for soybean (Glycine max [L.] Merr) was developed by Fehr and Caviness (1977). In this sys-tem, vegetative development begins at emergence when coty-ledons appear above the soil surface. Stages following emer-gence include cotyledon, unifoliate, and trifoliolate nodes. The newest node is assigned a number on the basis of the sta-tus of the leaf at a node above it; if unrolled (leaf edges are not touching), then the node below is assigned a number. The beginning flower stage (R1) indicates the initiation of the re-productive phase and is marked by the first open flower on the main stem. The beginning pod (R3) occurs when a pod of at
least 5 mm length is found at one of the four uppermost nodes on the main stem. The mid-pod elongation stage (R3.5) occurs when a pod 10–12 mm long is found at one of the four up-permost nodes on the main stem the mid-pod elongation stage and can be used as a key indicator for irrigation. R3.5 is also when vegetative stem and leaf development ceases in most in-determinate cultivars. The beginning seed stage (R5) indicates the beginning of the linear seed filling and is marked by the presence of seeds of at least 3 mm in any of the four upper-most nodes. Physiological maturity (R7) indicates the end of the reproductive phase and is marked by the presence of one mature pod of brown or tan color at any node on the main stem.
In cereals, the transition from vegetative to reproductive development is distinct, whereas in soybean, and other crops exhibiting indeterminate habit, reproductive and vegetative development co-exist for some proportion of the crop life cy-
Published in Field Crops Research 100:2–3 (February 1, 2007), pp. 257–271; doi 10.1016/j.fcr.2006.07.011 Copyright © 2006 Elsevier B.V. Used by permission. http://www.sciencedirect.com/science/journal/03784290
Submitted April 24, 2006; revised July 28, 2006; accepted July 28, 2006; published online September 8, 2006.
Understanding and modeling the effect of temperature and daylength on soybean phenology under high-yield conditions
T. D. Setiyono1, A. Weiss2, J. Specht1, A. M. Bastidas1, K. G. Cassman1, and A. Dobermann1
1 Department of Agronomy and Horticulture, University of Nebraska–Lincoln, P.O. Box 830915, Lincoln, NE 68583-0915, USA2 School of Natural Resources, University of Nebraska–Lincoln, P.O. Box 830728, Lincoln, NE 68583-0728, USA
Corresponding author: A. Dobermann, tel 402 472-1501, fax 402 472-7904, email [email protected]
AbstractTemperature and photoperiod can be used to simulate soybean (Glycine max [L.] Merr) phenology because they serve as surrogates for complex biochemical pathways leading to the appearance of certain developmental stages at the whole plant level. We developed a soybean phenology model (SOYDEV) which utilizes non-linear temperature and photoperiod func-tions and separates floral induction and post-induction for simulating time of flowering. This model accurately simulated the dynamics of vegetative development, final node number and the occurrence of major reproductive stages such as flow-ering (R1), beginning pod (R3), mid-pod elongation (R3.5), beginning seed (R5), and physiological maturity (R7) in a long-term field experiment (6 years) with the semi-determinate soybean cv. NE3001, as well as in a 2-year cultivar × sowing date experiment with 12 (2004) and 8 (2005) cultivars. With cultivar-specific model calibration, root mean square errors (RMSE) of major phenological stages simulated with SOYDEV averaged 1.8 days in the long-term experiment and 3.3 days in the cultivar × sowing date experiment. Data from the cultivar × sowing date experiment were used to develop em-pirical relationships for estimating key cultivar-specific model parameters from published soybean maturity group ratings (0.8–4.2). Compared to using nine cultivar-specific parameters derived from the full calibration, estimation of model pa-rameters from readily available cultivar information such as maturity group rating only slightly decreased simulation ac-curacy, resulting in RMSE (across stages and cultivars) values of 3.6–3.8 days. The proposed SOYDEV model may be particularly suitable for practical model applications because of its reduced need for cultivar-specific calibration. Further evaluation of the model is required under a wider range of variety maturity group ratings and environments.
Keywords: soybean, Glycine max, phenology, temperature, photoperiod, flowering, maturity, beta function, simulation, modeling
257

258 Setiyono et al. in Field Crops researCh 100 (2007)
cle. New inflorescences appear at the auxiliary meristem of soybean while new nodes bearing trifoliolates are being ini-tiated at the apical meristem. In determinate and semi-deter-minate soybean genotypes, the apical meristem eventually becomes a raceme, thus ending the vegetative activity at the stem apex. In indeterminate types, this transition is less abrupt and is influenced by competition for assimilates by the grow-ing seeds at existing nodes. Therefore, a functional definition of the vegetative phase in soybean is duration from emergence to the end of node appearance, and we rely on this definition hereafter.
The two dominant abiotic factors influencing soybean phe-nology are temperature and photoperiod (Cregan and Hartwig, 1984, Hesketh et al., 1973, and Summerfield and Wilcox, 1978). Temperature generally has a positive influence on the rate of crop development. Photoperiod, modifies the temper-ature response in soybean, a short-day plant, in that long day-length slows the development rate. The maturity group classi-fication for soybean cultivars in the U.S. is based on soybean development response to photoperiod (Heatherly and Elmore, 2004). Simulating phenology under optimum growth and de-velopment conditions requires quantification of temperature and photoperiod responses. However, since water and nutri-ent stress also influence development rate in soybean (Breve-dan and Egli, 2003, Brown and Chapman, 1960, Robins and Domingo, 1956, Sinclair and deWit, 1975, and Sinclair and deWit, 1976), evaluating temperature and photoperiod effects per se on phenology requires non-limiting water and nutrient conditions under field conditions.
When only temperature and photoperiod are consid-ered for simulating phenology, options for an overall algo-rithm include multiplicative (Grimm et al., 1993, Hodges and French, 1985, Jones et al., 2000, Major et al., 1975, Streck et al., 2003, and Wang and Engel, 1998), additive (Sinclair et al., 1991, Steward et al., 2003, and Summerfield et al., 1991), subtractive (Steward et al., 2003), or a mixture of additive and multiplicative approaches (Cober et al., 2001). The multipli-cative approach is widely used in crop models such as WO-FOST, STICS, or CROPGRO (Boogard et al., 1998, Brisson et al., 1998, and Jones et al., 2000). In these algorithms, the development rate is assumed to increase linearly with temper-ature above a certain critical base temperature, with or with-out a plateau representing maximum growth rate at an optimal temperature. Models with a plateau above the optimal temper-ature are analogues to an accumulated thermal time (°C d) ap-proach (Wilhelm and McMaster, 1995). The development rate may also decrease at high temperature (Hesketh et al., 1973) and thus a spline function is sometimes used to model this de-crease in development rate. CROPGRO uses a linear spline function to reflect the response of development rate to a high temperature (Jones et al., 2000). In rice, the use of a non-lin-ear temperature function was found to offer better accuracy in phenology simulation than an accumulated thermal time ap-proach (Yin et al., 1995).
Photoperiod is typically treated as a modifier to the ef-fect of temperature, and in the case of soybean, a quantitative
short-day plant, longer daylength decreases the development rate by delaying reproductive development. Experiments in-volving manipulation of light by red and far red wavelengths led to the acceptance of the phytochrome-mediated regulation of flowering in response to photoperiod in short- and long-day plants (Leopold and Kriedemann, 1975 and Naylor, 1953). Leaves are the receptor of photoperiod signals leading to reg-ulation of flowering in soybean and other plants (Thomas and Vince-Prue, 1997). Considering the well-known photoperiod flower induction response in soybean, the use of a photope-riod function in soybean phenology modeling is reasonable. Most soybean phenology research on photoperiod response has focused on developing a photoperiod function for flow-ering (Grimm et al., 1993, Grimm et al., 1994, Major et al., 1975, and Steward et al., 2003). However, the empirical ev-idence of responsiveness of soybean post-flowering develop-ment to daylength (Johnson et al., 1960, Shibles, 1978, and Summerfield et al., 1998), the proposed involvement phyto-chromes as receptors for photoperiod signal during post-flow-ering phase (Han et al., 2006), and the existent of genes con-trolling time of maturity (independent of flowering time) in soybean (McBlain et al., 1987) suggest that photoperiod re-sponse function should also be considered in modeling post-flowering soybean development.
The objectives of this study were to gain a better under-standing of the governing processes of soybean phenology as-sociated with its responses to temperature and/or photoperiod and to develop a robust soybean phenology model for a high-yield environment. The successful application of crop simu-lation models in practice often hinges on the availability of cultivar-specific input parameters, which are usually obtained from carefully conducted field experiments. If these data are not available, a simulation model can be run with generic, de-fault parameters, but the practical use of such a model may then be limited by the potential decrease in simulation accu-racy. We hypothesized that key model parameters required for simulating soybean phenology can be estimated from readily available cultivar-specific information such as maturity group (MG) rating and stem termination habit, and that this simplifi-cation would lead to only a small loss of simulation accuracy.
2. Materials and methods
2.1. Field experiments
Data for the SOYDEV model development and evaluation were obtained from a long-term high-yield experiment (1999–2005) and a cultivar × sowing date experiment (2004–2005) conducted at the University of Nebraska–Lincoln (40°49″N, 96°39″W, 357 m above sea level), where soybean was grown with full irrigation in rotation with maize. The soil type was Kennebec silt loam (fine-silty, mixed, superactive, mesic Cu-mulic Hapludolls), initially containing 2.7% organic mat-ter, 67 mg kg−1 Bray P1, and 350 mg kg−1 extractable K in 0–0.2 m depth. Weeds were controlled by pre-plant application of 0.23 kg ha−1 flufenacet [N-(4-fluorophenyl)-N-(1-methyle-thyl)-2-[[5-(trifluoromethyl)-1,3,4-thiadiazol-2-yl]oxy] acet-

Modeling the effect of teMperature and daylength on Soybean phenology under high-yield conditionS 259
amide] and 0.06 kg ha−1 metribuzin [4-amino-6-tert-butyl-4,5-dihydro-3-methylthio-1,2,4-triazin-5-one] and in-season manual hoeing. Pests and diseases were managed to avoid yield loss, with particular emphasis on avoiding outbreaks of white mold (Sclerotinia sclerotiorum), soybean aphids (Aphis glycines), and been leaf beetles (Ceratoma trifurcate) with the associated bean pod mottle virus (genus Comovirus, family Comoviridae).
The long-term, high-yield experiment (1999–2005) was designed to evaluate year to year differences in soybean de-velopment and yield potential. The cultivar used in this study was NE3001, a semi-determinate cultivar with a relative ma-turity group rating of 3.0. Row spacing in the treatments used here was 0.76 m (1999–2002, and 2005) and 0.385 m (2004). Sowing density ranged from 247,000 to 494,000 vi-able seeds ha−1. Sowing depth was approximately 2.5 cm and sowing dates varied from 26 April to 15 May among the dif-ferent years. Tillage consisted of fall plowing followed by field cultivation in spring for seedbed preparation. Irrigation was applied with a surface drip tape system (1999 and 2000), a sub-surface drip tape system (2001 and 2002), or a solid-set sprinkler system (2004–2005). Irrigation generally com-menced at the R3–R3.5 stage and was scheduled to replenish the estimated daily evapotranspiration obtained from an auto-mated weather station located within 500 m of the experimen-tal site. Such an irrigation regime is optimal for soybean in the Western Corn Belt (Kadhem et al., 1985a, Kadhem et al., 1985b, Korte et al., 1983a, Korte et al., 1983b, and Specht et al., 1989). An automated weather station (maintained by the High Plains Regional Climate Center, http://www.hprcc.unl.edu) estimated daily evapotranspiration based on reference evapotranspiration (Penman method) and a crop coefficient derived from accumulated thermal time (°C d) from sowing to maturity. Nutrient applications included 80 kg N ha−1 (at R3.5 stage), 45 kg P ha−1 and 85 kg K ha−1 (pre-plant). The exper-imental plots were 15.2 m × 6.1 m (eight rows in 1999–2002 and 2005, and 15 rows in 2004) with four replicates. The har-vested area was 9.14 m × 1.52 m (two non-border rows) for the 0.76 m row spacing and 9.14 m × 1.15 m (three non-bor-der rows) for the 0.385 m row spacing. Plants were manually harvested and machine threshed. Soybean yields (adjusted to 13% moisture) obtained in the high-yield experiment ranged from 4.3 to 5.9 Mg ha−1.
In the cultivar × sowing date experiment, several soybean cultivars (Table 1) ranging in MG rating from 3.0 to 3.9 in 2004 and from 0.8 to 4.2 in 2005 were grown at 0.76 m row spacing and a sowing density of 370,000 viable seeds ha−1. The sowing date treatments were 28 April, 16 May, 2 June, and 17 June in 2004; 15 April, 5 May, and 24 May in 2005. Tillage included plowing in fall and field cultivation in spring for seedbed preparation. Irrigation was applied with a solid-set sprinkler system and scheduled to replenish the estimated daily evapotranspiration (obtained from an automated weather station located within 500 m distance of the experimental site) for cv. NE3001 in the first sowing date treatment. No nutrients were applied to soybean in the cultivar × sowing date experi-ment because soil testing indicated that available P and K were
far above recommended critical levels of 12 mg P kg−1 or 124 mg K kg−1 (Ferguson et al., 2003). The experimental plots were 4.57 m × 3.05 m (four rows) and consists of four repli-cations. The harvested area was 4.27 m × 1.52 m (two mid-dle rows) and a small plot combine was used for harvesting. Soybean yields (adjusted to 13% seed moisture) ranged from 2.4 to 5.5 Mg ha−1 in 2004 and 3.0 to 5.9 Mg ha−1 in 2005. In both years, yield generally declined with later sowing (Basti-das, 2005).
2.2. Phenology and climate measurements
In both experiments, emergence date was determined when at least 50% of the cotyledons of the seedlings were above the soil surface. The subsequent phenology data were collected by non-destructive random sampling of 10 plants, to determine main stem node appearance from unifoliate (V1) to the final main stem node (Vn), first open flower (R1), first pod (R3), mid-pod elongation (R3.5), beginning seed (R5), and physio-logical maturity (R7) (Fehr and Caviness, 1977). Phenological sampling was conducted at 3–4 days intervals.
Daily weather data were obtained from the automatic weather station located within 500 m distance of the field exper-iment. Mean daily temperature (average of maximum and mini-mum) was used as the temperature input in the SOYDEV. Day-length was calculated using the algorithm described in Keisling (1982). Data from the literature and field experiments were used to estimate model parameters (Table 1). Maximum develop-ment rates and cardinal temperatures, in several cases, were es-timated using SAS NLIN procedure (SAS Institute, 1999). Phe-nological sampling was conducted in more detail in 2004 than
Table 1. Cultivars used in the cultivar × sowing date experiment in 2004 and 2005 at Lincoln, NE
Year Cultivar Maturity group Stem termination type
2004 NE3001 3.0 Semi-determinate Dekalb 3152 3.1 Indeterminate Latham 1067RR 3.1 Indeterminate NEX8903 3.1 Indeterminate Krueger 323RR 3.2 Indeterminate NE3201 3.2 Indeterminate KAUP 335 3.3 Indeterminate Pioneer 93B63 3.3 Indeterminate Asgrow 3401 3.4 Indeterminate Pioneer 93B47 3.4 Indeterminate Stine 3632 3.4 Indeterminate U98 307917 3.4 Indeterminate U98 307162 3.6 Indeterminate U98 311442 3.9 Indeterminate
2005 Asgrow 0801 0.8 Indeterminate Dekalb 1552 1.5 Indeterminate U01-290401 1.6 Semi-determinate U01-390224 2.5 Semi-determinate Dekalb 2653 2.6 Indeterminate NE3001 3.0 Semi-determinate Pioneer 93B63 3.1 Indeterminate Dekalb 4251 4.2 Indeterminate

260 Setiyono et al. in Field Crops researCh 100 (2007)
in other years and therefore these data were used for model cali-bration, particularly for estimating some of the cardinal temper-ature and the maximum development rates as noted previously. For the cultivar × sowing date experiment, sowing dates repre-senting the highest yields in each year (28 April in 2004 and 5 May in 2005) were used for cultivar-specific calibrations.
2.3. Model development
SOYDEV simulates soybean phenology based on five main phases, Figure 1. The first phase, from sowing to emergence, is based on accumulated thermal time during radicle develop-ment (sowing—radicle appearance, RA) and hypocotyl elon-gation (RA—emergence, Figure 1a). The next main phase is from emergence to final main stem node (Vn) and is a function of temperature and a chronology function describing reduction of main stem node appearance rate (Figure 1b). Since soybean development is not sequential, as in cereals, the beginning of reproductive phase overlaps with continuing vegetative phase. Therefore, the next main phase, which ends at the first open flower (R1), commences at the cotyledon stage (V0, Figure 1c), and is a function of photoperiod during the floral induc-tion phase (V0–R0) and temperature during the post-induction phase (R0–R1). The subsequent main phase, which ends at be-ginning seed (R5) was a function of temperature and photope-riod (Figure 1d). Just prior to R5, the chronology function (Fig-ure 2) was employed to decrease main stem node appearance in the vegetative phase (Figure 1b). The onset of reduction in main stem node appearance rate (VΔ) was simulated based on mid-phase R1–VΔ. The maturity main phase (R1–R7) was also a function of temperature and photoperiod (Figure 1e).
Emergence was simulated in SOYDEV using a similar ap-proach as in STICS (Brisson et al., 2003), where the radicle appearance (RA) and hypocotyl elongation were simulated se-quentially. Radicle appearance was simulated when the accu-
mulated thermal time (base temperature of 5 °C) was at 40 °C days. Afterwards, hypocotyl length (HL) was calculated using the accumulated thermal time from radicle appearance until emergence:
HL = Hmax [1 – e(–aATTbra)] (1)
where a and b are constants, Hmax is the maximum hypocotyl length (cm), Tb the base temperature (°C), and ATTra is the ac-cumulated thermal time since radicle appearance (°C d). The values of a, b, Hmax, and Tb used in SOYDEV were 0.0128, 4.57, 5 cm, and 5 °C, respectively. The value a, was derived from observed data in 2004, while b, Hmax, and Tb were pa-rameters given for soybean in STICS (Brisson et al., 2003). Emergence is defined as when the hypocotyl length exceeds sowing depth plus 0.6 cm. This latter value was added to en-sure that emergence represents the cotyledon being above the soil surface.
Figure 1. Phenological sequence simulated in SOYDEV. Phases were organized into main-phases (a–e), sub-phases (sub-division within each main phase), and mid-phases (segment within a main or sub-phase for simulating a stage of interest within that main or sub-phase). Type of function(s) used in simulating each of the main phases and sub-phases were schematically shown. Sow, sowing; RA, radicle appearance; Emg, emergence; V0, cotyledon stage; V1, unifoliate stage; R0, end of floral induction; R1, first flower; R3.5, mid-pod elongation; Vn, end of main stem node appearance; f *(T ), accumulated thermal time; Equation (1) [ f *(T )], Equation (1) as a function of accumulated thermal time; f (T ), temperature function; f (P), photoperiod function; dashed arrow, information flow across two main phases; VΔ, beginning of reduction in main stem node appearance rate; CF, chronological function describing reduction in main stem node appearance rate.
Figure 2. Chronological function (CF) used in simulation of soybean V-stages (Equation (6)). x, day after VΔ.
Modeling the effect of teMperature and daylength on Soybean phenology under high-yield conditionS 261
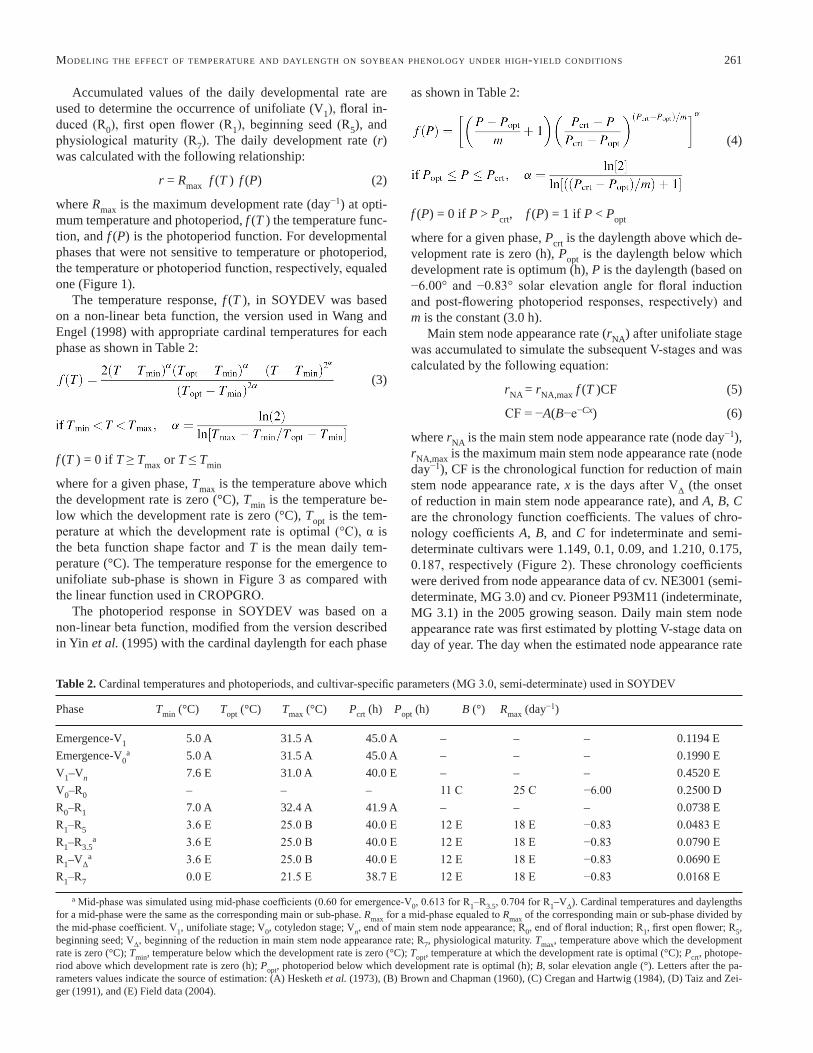
Accumulated values of the daily developmental rate are used to determine the occurrence of unifoliate (V1), floral in-duced (R0), first open flower (R1), beginning seed (R5), and physiological maturity (R7). The daily development rate (r) was calculated with the following relationship:
r = Rmax f (T ) f (P) (2)
where Rmax is the maximum development rate (day−1) at opti-mum temperature and photoperiod, f (T ) the temperature func-tion, and f (P) is the photoperiod function. For developmental phases that were not sensitive to temperature or photoperiod, the temperature or photoperiod function, respectively, equaled one (Figure 1).
The temperature response, f (T ), in SOYDEV was based on a non-linear beta function, the version used in Wang and Engel (1998) with appropriate cardinal temperatures for each phase as shown in Table 2:
(3)
f (T ) = 0 if T ≥ Tmax or T ≤ Tmin
where for a given phase, Tmax is the temperature above which the development rate is zero (°C), Tmin is the temperature be-low which the development rate is zero (°C), Topt is the tem-perature at which the development rate is optimal (°C), α is the beta function shape factor and T is the mean daily tem-perature (°C). The temperature response for the emergence to unifoliate sub-phase is shown in Figure 3 as compared with the linear function used in CROPGRO.
The photoperiod response in SOYDEV was based on a non-linear beta function, modified from the version described in Yin et al. (1995) with the cardinal daylength for each phase
as shown in Table 2:
(4)
f (P) = 0 if P > Pcrt, f (P) = 1 if P < Popt
where for a given phase, Pcrt is the daylength above which de-velopment rate is zero (h), Popt is the daylength below which development rate is optimum (h), P is the daylength (based on −6.00° and −0.83° solar elevation angle for floral induction and post-flowering photoperiod responses, respectively) and m is the constant (3.0 h).
Main stem node appearance rate (rNA) after unifoliate stage was accumulated to simulate the subsequent V-stages and was calculated by the following equation:
rNA = rNA,max f (T )CF (5)
CF = −A(B−e−Cx) (6)
where rNA is the main stem node appearance rate (node day−1), rNA,max is the maximum main stem node appearance rate (node day−1), CF is the chronological function for reduction of main stem node appearance rate, x is the days after VΔ (the onset of reduction in main stem node appearance rate), and A, B, C are the chronology function coefficients. The values of chro-nology coefficients A, B, and C for indeterminate and semi-determinate cultivars were 1.149, 0.1, 0.09, and 1.210, 0.175, 0.187, respectively (Figure 2). These chronology coefficients were derived from node appearance data of cv. NE3001 (semi-determinate, MG 3.0) and cv. Pioneer P93M11 (indeterminate, MG 3.1) in the 2005 growing season. Daily main stem node appearance rate was first estimated by plotting V-stage data on day of year. The day when the estimated node appearance rate
Table 2. Cardinal temperatures and photoperiods, and cultivar-specific parameters (MG 3.0, semi-determinate) used in SOYDEV
Phase Tmin (°C) Topt (°C) Tmax (°C) Pcrt (h) Popt (h) B (°) Rmax (day−1)
Emergence-V1 5.0 A 31.5 A 45.0 A – – – 0.1194 EEmergence-V0
a 5.0 A 31.5 A 45.0 A – – – 0.1990 EV1–Vn 7.6 E 31.0 A 40.0 E – – – 0.4520 EV0–R0 – – – 11 C 25 C −6.00 0.2500 DR0–R1 7.0 A 32.4 A 41.9 A – – – 0.0738 ER1–R5 3.6 E 25.0 B 40.0 E 12 E 18 E −0.83 0.0483 ER1–R3.5
a 3.6 E 25.0 B 40.0 E 12 E 18 E −0.83 0.0790 ER1–VΔ
a 3.6 E 25.0 B 40.0 E 12 E 18 E −0.83 0.0690 ER1–R7 0.0 E 21.5 E 38.7 E 12 E 18 E −0.83 0.0168 E
a Mid-phase was simulated using mid-phase coefficients (0.60 for emergence-V0, 0.613 for R1–R3.5, 0.704 for R1–VΔ). Cardinal temperatures and daylengths for a mid-phase were the same as the corresponding main or sub-phase. Rmax for a mid-phase equaled to Rmax of the corresponding main or sub-phase divided by the mid-phase coefficient. V1, unifoliate stage; V0, cotyledon stage; Vn, end of main stem node appearance; R0, end of floral induction; R1, first open flower; R5, beginning seed; VΔ, beginning of the reduction in main stem node appearance rate; R7, physiological maturity. Tmax, temperature above which the development rate is zero (°C); Tmin, temperature below which the development rate is zero (°C); Topt, temperature at which the development rate is optimal (°C); Pcrt, photope-riod above which development rate is zero (h); Popt, photoperiod below which development rate is optimal (h); B, solar elevation angle (°). Letters after the pa-rameters values indicate the source of estimation: (A) Hesketh et al. (1973), (B) Brown and Chapman (1960), (C) Cregan and Hartwig (1984), (D) Taiz and Zei-ger (1991), and (E) Field data (2004).

262 Setiyono et al. in Field Crops researCh 100 (2007)
was reduced from its optimal value was noted as VΔ. CF was calculated as ratio of the current day main stem node appear-ance rate and the optimal node appearance rate. VΔ was asso-ciated with the reproductive phase R1–R5 (Figure 1d).
2.4. Model evaluation
For model evaluation, simulated occurrences of phenologi-cal stages (day of year) and cumulative number of main stem nodes above the cotyledon node (V0) were compared with the observed values. The statistics used to evaluate model per-formance were the root mean square error (RMSE) and the normalized root mean square error (NRMSE), calculated as (Janssen and Heuberger, 1995):
(7)
(8)
where s is the simulated data on the ith day, o is the observed data on the ith day, and n is the number of pairs of simulated and observed data. The smaller the RMSE and NRMSE, the better the simulation. SOYDEV performance will be com-pared to a widely used soybean model, CROPGRO (Jones et al., 2000). The CROPGRO model was chosen because it shares overall similarity with SOYDEV in the use of a mul-tiplicative approach. This approach allows different tempera-ture and photoperiod functions and steps in the simulation of flowering between the two models to be compared.
To evaluate model sensitivity to the availability of culti-var-specific input parameters, simulations of phenological stages with SOYDEV were made for all 14 cultivars × 4 sow-ing dates in 2004 and 8 cultivars × 3 sowing dates in 2005. These data sets include the calibration data set from each year, the first sowing date in 2004 and the second sowing date in 2005. The reason the calibration data set were included was to include the optimum conditions, otherwise the results would be biased to non-optimum conditions associated sowing dates.
Four simulation options were evaluated: (a) cultivar-specific parameters derived from full calibration wherein each culti-var had a set of unique coefficients, (b) no cultivar-specific parameters, one set of coefficients for all cultivars, (c) Rmax-cultivar-specific parameters derived from maturity group and stem termination type, and (d) photoperiod-cultivar-specific model parameters derived from maturity group and stem ter-mination type. In options (c) and (d), selected model parame-ters were derived based on their relationships with published maturity group ratings, which is the only widely available cul-tivar information associated with phenology provided by seed producers in North America.
When two soybean genotypes are exposed to the same temperature and photoperiod, differences in development rates can be simulated by using either different Rmax or dif-ferent photoperiod response parameters. Correlation analyses were conducted evaluating Rmax in (c) or photoperiod response
Figure 3. Temperature functions describing soybean development rate towards the appearance of the unifoliate stage (V1). (a) Linear spline function (Jones et al., 2000) used in CROPGRO (Tmin = 7 °C, Topt,1 = 28 °C, Topt,2 = 35 °C, and Tmax = 45 °C). (b) Beta function (Wang and Engel, 1998) used in SOYDEV (Tmin = 5 °C, Topt = 31.5 °C, and Tmax = 45 °C).
Figure 4. Simulated and observed photoperiod response of the development rate toward flowering: (□), (◊), (∆), (○), and (Ñ), indicate observed data from Cregan and Hartwig (1984) for MG 0, 3, 5, 6, and 8, respectively. Lines in-dicate simulated rate toward flowering for each of the maturity group rat-ings (MG) using beta function derived from Yin et al. (1995). Simulation is based on generalized parameters shown in the insert, where Popt (opti-mum daylength) = 12.759 − 0.388 MG − 0.058 MG2, and Pcrt (critical day-length) = 27.275 − 0.493 MG − 0.066 MG2.

Modeling the effect of teMperature and daylength on Soybean phenology under high-yield conditionS 263
parameters in (d) against maturity group ratings, holding pho-toperiod response parameters in (c) or Rmax in (d) constant for all cultivars for all cultivars in the first sowing date in 2004 and the second sowing date in 2005. The effect of stem ter-mination types (semi-determinate and indeterminate) on Rmax or photoperiod response parameters was also evaluated. Equa-tions relating Pcrt and Popt for the floral induction phase (V0–R0) with maturity group rating were derived from our evalua-tion of data published by Cregan and Hartwig (1984) (Figure 4) and were used in option (c).
Cultivar-specific parameters were used in SOYDEV to simulate phenology for the year × sowing date combinations that were not included in the calibration (the second to the fourth sowing dates in 2004 and the first and the third sow-ing dates in 2005). This approach represents the most detailed of the model simulations, but it requires observed data for cal-ibrating each of the cultivars of interest. In practical applica-tions, such data are often not available and commercial soy-bean cultivars change frequently. Therefore, options (b)–(d) were tested as possible alternatives for simulating soybean phenology without the need for cultivar-specific calibration. In the non-calibrated option (b), the model was run using the same default parameters (Table 2) for each of the cultivars shown in Table 1.
3. Results
3.1. Simulation of soybean phenology in the high-yield long-term experiment
Soybean yields, occurrences and duration of reproductive stages of cv. NE3001 (MG 3.0, semi-determinate) grown in the long-term experiment at Lincoln, NE are shown in Ta-ble 3. The highest yield (5.9 Mg ha−1) was achieved in the 2001 growing season when both flowering (emergence-R1) and post-flowering (R1–R7) durations were the longest. The flowering duration (emergence-R1) was negatively corre-lated with mean temperature (r = −0.83, p < 0.1) and mini-mum daylength (r = −0.85, p < 0.1), but no correlation was evident between post-flowering duration and mean temper-ature, maximum daylength, or minimum daylength (data not shown).
An example of the relationship between observed phenol-ogy and growth (LAI and total above ground dry mater) of soybean cv. NE3001 in 2005 growing season is illustrated in Figure 5. Leaf area index reached a maximum (6.2 ± 0.42) between R3.5 and R5 when vegetative growth was approach-ing its peak value, while total above ground dry matter was at maximum as the plant approached R7. SOYDEV, calibrated with data from the 2004 growing season, accurately simulated the pattern of vegetative development, final main stem node number, and the occurrence of key R-stages for the 2005 inde-pendent data set (Figure 5b).
A summary of 6 years of phenology simulation in the long-term high-yield experiment comparing results from SOYDEV with CROPGRO is shown in Figure 6. Overall RMSE of sim-ulating unifoliate, R1, R3/3.5, R5, and R7 stages was 1.8 days with SOYDEV as compared to 2.9 days with CROPGRO. The improvement in simulating V1 between the simulation mod-els was smallest (0.2 day), indicating that the choice of lin-ear versus nonlinear temperature functions may not be crucial for simulating very early soybean development. The ability to simulate R1 is particularly important because this stage serves as the starting point for simulation of subsequent reproductive stages and simulation of pod set and seed filling (Figure 1). SOYDEV simulated R1 in cv. NE3001 with an across years RMSE of 1.8 days, as compared to 2.6 days in CROPGRO. Across years and stages, improvements in simulation of the different R-stages ranged from 0.2 to 1.6 days (Figure 6).
Table 3. Overview of phenological occurrence, duration, and seed yield of soybean cv. NE3001 (MG 3.0, semi-determinate) in the long-term high-yield experiment at Lincoln, NE
Year Occurrence (day of year) Duration (days) Yield (13% m.c.) Emergence R1 R7 Emergence-R1 R1–R7 (Mg ha−1)
1999 136 175 252 39 77 5.02 ± 0.182000 134 170 248 36 78 4.28 ± 0.182001 125 169 255 44 86 5.90 ± 0.052002 140 176 252 36 76 5.26 ± 0.142004 131 174 250 43 76 4.99 ± 0.142005 130 171 249 41 78 4.51 ± 0.20
Figure 5. Growth and development of the semi-determinate soybean cv. NE3001 in the high-yield experiment in 2005. (a) Total above ground dry matter and leaf area index (LAI). (b) Vegetative and reproductive stages (Fehr and Caviness, 1977) as observed and simulated with SOYDEV. Bars indicate standard errors associated with dry matter, leaf area index, and V-stages measurements.

264 Setiyono et al. in Field Crops researCh 100 (2007)
Figure 6. Observed and simulated soybean phenology with CROPGRO (A) and SOYDEV (B) for NE3001 in the high-yield experiment in Lincoln, Nebraska (1999–2002, 2004, and 2005). The simulation for both models utilized cultivar-specific parameters calibrated against phenology in the 2004 growing season for cv. NE3001 (MG 3.0, semi-determinate). Different symbols indicate phenology for different developmental stages as indicated in the legend. Shown in the leg-end are also root mean square error (RMSE) and its normalized value (NRMSE) associated with simulation of each of the developmental stages.
Figure 7. Pre- (emergence-R1) and post-flowering (R1–R7) duration and seed yield of soybean cultivars with different maturity group rating in the cultivar × sowing date experiment in 2004 and 2005 at Lincoln, NE. Numbers in the legend indicate emergence (day of year). See Table 1 for cultivar names and their maturity group ratings.

Modeling the effect of teMperature and daylength on Soybean phenology under high-yield conditionS 265
3.2. Simulation of soybean phenology in the cultivar × sowing date experiment
In the cultivar × sowing date experiment, the duration of pre-flowering (emergence-R1) and post-flowering (R1–R7) phases, as well as seed yields generally decreased with later sowing in both years within maturity groups (Figure 7). Soybean culti-vars from higher maturity groups tended to have longer post-flowering phase, but only slightly longer pre-flowering dura-tion (Figure 7). The increase in duration with later maturity group was greatest for earlier planting date for the post-flow-ering phase. In contrast, the increase in duration with later ma-turity group was greatest for the later planting date for the pre-flowering phase.
SOYDEV provided accurate simulation of the patterns of vegetative development and the final number of main stem
nodes for all cultivars in the planting date study (Figure 8). Late planted soybeans developed less main stem nodes than early planted soybeans. Final main stem node number was positively correlated with duration of R1–R5 as indicated from the 2004 cultivar × sowing date study based on the actual measured values (Figure 9a). This correlation between final node number and duration of R1–R5 was simulated relatively well by SOYDEV (Figure 9b). Across all cultivars tested, the RMSE of V-stages simulation was 0.7 nodes in 2004 and 0.5 nodes in 2005 (Table 4). Across cultivar and sowing date, the RMSE of V-stages simulation was 1.0 days and 0.8 days in 2004 and 2005, respectively (data not shown).
RMSE values with respect to simulation of unifoliate (V1) and key reproductive stages (R1, R3.5, R5, and R7) with SOY-DEV in the cultivar × sowing date experiment for the fully calibrated option are shown in Figure 10a. Across stages and
Figure 8. Observed (symbols) and simulated (lines) soybean V-stages in the cultivar × sowing date experiment in 2004 at Lincoln, NE. Different symbols and lines indicate V-stages of soybean emerged on days 131 (●), 144 (▲), 159(■), and 176(♦). Simulation was based on calibrated V-stage parameters (Figure 13) and Rmax-cultivar-specific parameters derived from maturity group rating (Figure 11). See Table 1 for maturity group ratings of the above cultivars.

266 Setiyono et al. in Field Crops researCh 100 (2007)
years, the RMSE was 3.3 days (3.2 days and 3.6 days in 2004 and 2005, respectively) (Figure 10a). In both years RMSE val-ues were relatively higher for mid-pod (R3.5) and beginning seed (R5) stages (4.3 and 4.0 days, respectively) and smallest for V1 and R1 (1.7 and 2.7 days, respectively, Figure 10a).
3.3. Simulation of soybean phenology without cultivar-specific model calibration
Phenology simulation shown in Figure 10a was based on full-calibration of cultivar-specific parameters for all 21 cultivars used in the cultivar × sowing date experiment. A considerable decrease in RMSE was evident when the least input-demand-ing option (non-calibrated option) was used (Figure 10b), in which the generic set of model parameters (Table 2) was ap-plied to all 21 cultivars. The overall RMSE of the simulated phenological stages were 5.8 days and 9.3 days in 2004 and 2005, respectively. The RMSE value was greater in 2005 than in 2004 due to a wider range of cultivars used (MG 0.8–4.2) in 2005.
Significant correlations were found between maturity group rating and Rmax during the floral induction phase (R0–R1, Fig-ure 11a), pod and seed set duration (R1–R5, Figure 11c), and post-flowering duration (R1–R7, Figure 11d). Similarly, empir-ical relationships allowed estimating Rmax associated with pho-toperiod response in the floral induction process (V0–R0) and Pcrt and Popt for the R1–R5 and R1–R7 periods from published
MG ratings (Figure 12). No significant correlation was ob-served between maturity group rating and the R3.5 stage indi-cator and thus an average value of 0.6123 was assumed (Fig-ure 11b). No significant effect of stem termination type on Rmax or photoperiod response parameters was observed in re-productive phases. Unlike reproductive phases, no relationship was observed between maturity group rating and the parame-ters for simulating main stem node appearance. The parame-ters rNA,max and VΔ were instead influenced by the stem ter-mination types and sowing date treatments. To account for the effect of sowing date and thus time of emergence, rNA,max and VΔ values (obtained by calibration against observed data in 2004 and 2005) were plotted against daylength at the time of emergence (Figure 13). With the exception of semi-determi-nate type, the effect of late sowing (early June or later) was associated with reduction in rNA,max and VΔ. In general, using the above simplification approach for deriving cultivar-spe-cific parameters from maturity group rating resulted in only a small loss of simulation accuracy in term of RMSE values
Figure 9. Final number of main stem nodes and R1–R5 duration in the cultivar × sowing date experiment in 2004 as observed (a) and simulated (b). n is the number of observation.
Table 4. Root mean square error (RMSE) of V-stage simulation with SOYDEV in the cultivar × sowing date experiment at Lincoln, NE, in 2004 and 2005
Cultivar Emergence (day of year)a
131 144 159 176 All dates
Year 2004Asgrow AG3401 0.8 1.2 0.9 0.4 0.9Dekalb DKB 31-52 0.4 0.8 0.5 0.5 0.6KAUP 335 0.7 1.0 0.4 0.5 0.7Kruger KR323+ RR 0.5 1.2 0.5 0.5 0.8Latham 1067RR 1.5 1.0 0.4 0.7 1.0Nebraska NE3001 0.5 0.8 0.6 0.9 0.8Nebraska NE3201 1.0 1.0 0.5 0.4 0.8Nebraska NEX8903 0.7 0.9 0.5 0.4 0.7Nebraska U98-307162 0.8 1.2 0.3 0.4 0.7Nebraska U98-307917 0.6 1.2 0.5 0.5 0.6Nebraska U98-311442 1.0 0.9 0.4 0.5 0.8Pioneer 93B36 0.7 0.8 0.6 0.4 0.7Pioneer 93B47 0.5 1.0 0.4 0.2 0.6Stine 3632-4 0.6 0.8 0.4 0.4 0.6Across cultivars 0.8 1.0 0.5 0.5 0.7Range 1.1 0.5 0.5 0.7 0.4
Cultivar Emergence (day of year)a 123 132 152 All dates
Year 2005 Asgrow AG0801 0.6 0.5 0.4 0.5 Dekalb DKB 1552 0.4 0.3 0.4 0.4 Nebraska U01-290401 0.5 0.4 0.4 0.4 Nebraska U01-390224 0.3 0.4 0.6 0.4 Dekalb DKB 2653 0.9 0.6 1.0 0.8 Nebraska NE3001 0.4 0.4 0.5 0.4 Pioneer 93M11 0.4 0.7 0.8 0.6 Dekalb DKB 4251 0.4 0.6 0.6 0.5 Across cultivars 0.5 0.5 0.6 0.5 Range 0.5 0.3 0.6 0.5 a RMSE (nodes).

Modeling the effect of teMperature and daylength on Soybean phenology under high-yield conditionS 267
Figure 10. Observed and simulated soybean phenology with SOYDEV in the cultivar × sowing date experiment in 2004 and 2005 using full calibrated (a), non-calibrated (b), Rmax-based generalized (c), and photoperiod-response-based generalized (d) modes. Symbols indicate phenological stages: V1 (▼), R1 (●), R3.5(▲), R5 (●), and R7(♦). Shown in the insets are plots of residuals (simulated − observed) versus observed phenology.
Figure 11. SOYDEV parameter generalization for R0–R1 (a), R1–R3.5 (b), R1–R5 (c), and R1–R7 (d). Rmax or mid-phase coefficients calibrated against observed phenology of soybeans planted on 5 May 2005 and 28 April 2004 were plotted against maturity group rating (MG) while photoperiod response parameters, Pcrt and Popt, were held constant.

268 Setiyono et al. in Field Crops researCh 100 (2007)
(Figure 10). Compared to the fully calibrated option, RMSE across stages and years increased by only 0.3 day in the Rmax-based (Figure 10c) or 0.5 day in the photoperiod-based gener-alized modes (Figure 10d).
4. Discussion
Floral induction (V0–R0) and post-induction (R0–R1) are cru-cial determinants of flowering time in soybean and other pho-toperiod-inducible plants. While floral induction is affected by daylength (Garner and Allard, 1920), post-induction appears to be solely dependent on temperature in a sequential man-ner (Heatherly and Elmore, 2004). Three phases describing flowering progress were used in SOYDEV: (1) pre-induction (emergence to V0), (2) induction (V0–R0), and (3) post-induc-tion (R0–R1). This three phases concept of progress toward flowering was suggested by Shanmugasundaram and Tsou (1978), Ellis et al. (1992), Collinson et al. (1993), and Upad-hyay et al. (1994), and is also used in another soybean phenol-ogy model (Hodges and French, 1985). Further studies across a wider range of conditions are needed to confirm the post-in-duction insensitive to photoperiod and to identify the appro-priate phases of floral induction. The assumption of V0 as the beginning of floral induction phase was based on the hypothe-
sis that at the cotyledon stage, unifoliate leaves are starting to unroll and they can serve as the initial receptors for photope-riod induction (Bastidas, 2005). As for the optimal duration, it was assumed that four short-day cycles are required to com-plete floral induction (Blaney and Hamner, 1957).
Empirical evidence supporting that the hypothesis that pho-toperiod may control any or all stages of reproductive develop-ment was established as early as 1960 (Johnson et al., 1960). Shibles (1978) hypothesized that the photoperiod responsive-ness at the late stages of reproductive growth allows some de-gree of seasonal adaptation independent of time of flowering that can be useful in fine-tuning vegetative growth, even when early flowering is promoted by late sowing. Results from this study confirm the need for including photoperiod response in modeling post-flowering stages (R5 and R7). Photoperiod re-sponse was also accounted for in simulation of post-flowering stages in CROPGRO. The ability of SOYDEV to simulate pre-viously documented effects of sowing date on the number of main stem nodes in soybean (Bastidas, 2005) relies on the in-teraction between vegetative and reproductive development and the effect of sowing dates on V-stage parameters, namely the VΔ and the maximum node appearance rate. Shorter R1–R5 duration, lower maximum node appearance rate, and shorter R1–VΔ duration cause late planted soybeans to have fewer fi-nal main stem nodes than earlier planted ones. The relationship between R5 and the cessation of leaf emergence was suggested by Sinclair (1984). The effect of sowing date on V-stage pa-rameters may be linked to the interaction between phenology and growth and is of interest for future investigation.
An interesting observation from this study was the different nature of soybean node appearance and flowering in response to temperature and daylength. The delay in floral induction at later sowing dates, due to longer daylength, was not discern-able in terms of duration from emergence to R1 phase (Figure 7) because higher temperatures later in the growing season apparently shorten the duration of the post-induction phase. Both flowering (post-induction) and node appearance respond to temperature, but only flowering (induction) responds to daylength. Therefore, comparing R1 occurrence with respect to the V-stage allows the daylength effect on flowering (induc-tion) to be compared between the different sowing dates with-out the confounding effect of temperature. The effect of day-length on floral induction was evident when R1 occurrences on different sowing dates were compared with respect to the V-stage. Plants that were sown on 15 April, 4 May, and 17 June (15.3, 15.7, and 16.2 h of daylength at V0) reached R1 at V5.7, V7.5 and V8.4, respectively.
In evaluating the performance of any soybean phenology model, it is necessary to consider the level of accuracy of the observed data. Uncertainties associated with observed data in-clude the nature of the staging system and plant-to-plant vari-ability. While spatial error is introduced by field variability, temporal error exists because the staging system used here (Fehr and Caviness, 1977) is not measurably continuous. In other words, the visually observable phenological stage as-signed in the field may suggest no change from 1 day to the next although the plant continues its phenological develop-
Figure 12. SOYDEV parameter generalization for V0–R0 (a), R1–R5 (b), and R1–R7 (c). Rmax for V0–R0, Popt, and Pcrt calibrated against observed phe-nology of soybeans planted on 5 May 2005 and 28 April 2004 were plotted against maturity group rating (MG) while Rmax for R0–R1, R1–R5, and R1–R7 phases were held constant.

Modeling the effect of teMperature and daylength on Soybean phenology under high-yield conditionS 269
Figure 13. V-stage parameters, VΔ and maximum main stem node appearance rate, rLA,max for the indeterminate (left) and semi-determinate (right) as affected by daylength at emergence. Symbols and bars indicate mean and standard errors of the parameters obtained from calibration using data from all cultivars of the same stem termination type in the cultivar × sowing date experiment in 2004 and 2005. Daylength was defined as daylight duration when solar elevation was above −0.83°.
ment. Considering the uncertainties in observed data, both SOYDEV and CROPGRO provided acceptable simulation of soybean phenology in the long-term high-yield study (Fig-ure 9), with a small, but consistently superior performance of SOYDEV. Both models attempt to mechanistically describe soybean development, but in different ways and with differ-ent empirical parameters. SOYDEV simulates floral induction and post-induction and uses non-linear temperature and pho-toperiod functions. In contrast, CROPGRO calculates the rate of development in an hourly time step using generated hourly temperature (from daily maximum and minimum tempera-tures) (Parton and Logan, 1981) and a linear spline function (Jones et al., 2000).
Methods for defining and calculating daylength differ be-tween SOYDEV and CROPGRO. In CROPGRO, daylength was calculated with the Spitters et al. (1986) method in which daylength is defined as the daylight duration when solar ele-vation ≥0°. In SOYDEV daylength was calculated using the algorithm described in Keisling (1982) which allows a more flexible definition of daylength depending on solar elevation. Daylength influencing floral induction in SOYDEV was day-light duration when solar elevation ≥−6.00°, while daylength influencing post-flowering development was based on solar
elevation ≥−0.83°. Solar elevation of −6.00° is known as civil twilight while solar elevation of −0.83° is when the upper edge of the disk of the sun is on the horizon (Seidelmann, 1992). The different daylength definition used in SOYDEV for post-flowering versus floral induction phases suggests that the pre-sumed post-flowering developmental response to daylength may involve a distinct underlying mechanism other than that of floral induction. The use of civil twilight to describe the ef-fect of daylength on floral induction was suggested by Downs and Thomas (1990) and was used in an experiment investi-gating photoperiod sensitivity in soybean (Ellis et al., 1992). Daylength based on solar elevation of −0.83° was used for the post-R1 phase as results from this series of experiments indi-cated a more accurate phenology simulation was achieved us-ing this daylength definition (data not shown). We speculate that post-R1 phenology was associated with the daily photo-synthetic duration, which most likely does not respond to civil twilight illumination levels.
Further research is needed to evaluate cardinal daylengths (Popt and Pcrt) describing the effect of daylength on post-flow-ering development (R1–R5 and R1–R7). A clear understanding of the molecular mechanism of the presumed development re-sponse to daylength in late reproductive stages and its incor-

270 Setiyono et al. in Field Crops researCh 100 (2007)
poration into mathematical models remain critical toward a more mechanistic option in simulating soybean phenology.
Our results provide first indications that key model param-eters needed to simulate soybean phenology on a cultivar-specific basic can be estimated from readily available culti-var information such as stem termination type and maturity group rating. This is a potential advantage of the new SOY-DEV model, particularly with regard to practical applications in which it is not possible to conduct extensive cultivar-spe-cific model calibrations, which are required for utilizing mod-els such as CROPGRO.
In this study, only two types of stem termination were con-sidered (indeterminate and semi-determinate). Stem termina-tion types in soybean germplasm collections, however range qualitatively from very determinate to very indeterminate (Ber-nard et al., 1998). Quantification of the effect of genes such as Dt1/dt1 and Dt2/dt2 (Bernard, 1972) and dt1-t (Thompson et al., 1997) on the stem termination habit in soybean will be of fu-ture interest as it may lead to a more detailed parameterization of node appearance simulation in order to extend application of SOYDEV to a wider selection of stem termination types.
Maturity group ratings are by themselves of a more qualita-tive nature and they may vary depending on the experimental procedures used to assign a MG to a commercially available soybean variety. It remains to be seen whether the empiri-cal relationships established for estimating Rmax, Pcrt and Popt (Figure 11 and Figure 12) hold for an even wider range of ma-turity group ratings grown under widely differing conditions and whether the relationships can be linked to the genes con-trolling flowering and maturity in soybean such as E1/e1 and E2/e2 (Bernard, 1971 and McBlain et al., 1987), E3/e3 (Buzell, 1971 and McBlain et al., 1987), E4/e4 (Buzell and Voldeng, 1980), E5/e5 (McBlain and Bernard, 1987), E6/e6 (Bonato and Vello, 1999), and E7/e7 (Cober et al., 2001). Likewise, the pro-posed SOYDEV model has only been tested under near-opti-mal conditions. Its performance needs to be further evaluated under abiotic stress, such as water and nutrient stresses.
5. Conclusions
Soybean phenology can be successfully simulated across a range of cultivars and sowing dates by the use of: (1) appro-priate flowering phases based on an understanding of soybean flowering physiology, and (2) biologically reasonable, non-lin-ear temperature and photoperiod response functions. This study also highlighted the interaction between vegetative and repro-ductive developments with respect to temperature and daylength in that: (1) longer daylength during the floral inductive phase at later planting dates caused R1 to occur at later V-stage, and (2) the earlier occurrence of R5 limited the total number of nodes at later planting dates due to the earlier cessation of node ap-pearance. SOYDEV holds promise for practical model applica-tions because data input requirements can be kept to a minimum (sowing date, sowing depth, daily temperature, cultivar stem ter-mination type, and cultivar maturity group rating) and key culti-var-specific parameters can be estimated from the published ma-turity group rating with little loss of prediction accuracy.
Acknowledgements
We thank the Nebraska Soybean Board, the Fluid Fertilizer Founda-tion (FFF), and the Foundation for Agronomic Research (FAR) for providing the funding for this research. We also thank Joe Mitch-ell, Travis Wegner, Darren Binder, and student workers for their help with field operations, phenology staging, sampling, and sample pro-cessing. Contribution of the University of Nebraska Agric. Res. Div., Lincoln, NE. Journal Ser. no. 15205.
References
Bastidas, 2005: A. M. Bastidas, 2005. Soybean growth, development, and yield. The effect of planting date. M. S. Thesis. Univ. of Nebraska–Lin-coln, Lincoln, NE.
Bernard, 1971: R. L. Bernard, Two major genes for time of flowering and maturity in soybeans, Crop Sci. 11 (1971), pp. 242–244.
Bernard, 1972: R. L. Bernard, Two genes affecting stem termination in soy-beans, Crop Sci. 12 (1972), pp. 235–239.
Bernard et al., 1998: R. L. Bernard, C. R. Cremeens, R. L. Cooper, F. I. Col-lins, K. L. Krober, K. L. Athow, F. A. Laviolette, C. J. Coble, and R. L. Nelson, 1998. Evaluation of the USDA soybean germplasm collection: maturity group 000-IV (FC 01. 547-PI 266. 807). USDA-ARS Technical Bulletin 1844. Washington, DC, U. S. Government Printing Office.
Blaney and Hamner, 1957: L. T. Blaney and K. C. Hamner, Interrelations among effects of temperature, photoperiod, and dark period on floral ini-tiation of Biloxi soybean, Bot. Gaz. 119 (1957), pp. 10–24.
Bonato and Vello, 1999: E. R. Bonato and N. A. Vello, E6, a dominant gene conditioning early flowering and maturity in soybeans, Genet. Mol. Biol. 22 (1999), pp. 229–232.
Boogard et al., 1998: H. L. Boogard, C. A. van Diepen, R. P. Rötter, J. M. C. A. Cabrera, and H. H. van Laar, 1998. User’s guide for the WOFOST 7. 1 crop growth simulation model and WOFOST Control Center 1. 5. Technical Document 52. DLO Winand Staring Centre, Wageningen, The Netherlands.
Brevedan and Egli, 2003: R. E. Brevedan and D. B. Egli, Short periods of water stress during seed filling, leaf senescence, and yield of soybean, Crop Sci. 43 (2003), pp. 2083–2088.
Brisson et al., 1998: N. Brisson, B. Mary, D. Ripoche, M. H. Jeuffroy, F. Ru-get, B. Nicoullaud, P. Gate, F. Devienne-Barret, R. Antonioletti, C. Durr, G. Richard, N. Beaudoin, S. Recous, X. Tayot, D. Plenet, P. Cellier, J. M. Machet, J. M. Meynard and R. Delécolle, STICS: a generic model for the simulation of crops and their water and nitrogen balances. I. Theory and parameterization applied to wheat and corn, Agronomie 18 (1998), pp. 311–346.
Brisson et al., 2003: N. Brisson, C. Gary, E. Justes, R. Roche, B. Mary, D. Ripoche, D. Zimmer, J. Sierra, P. Bertuzzi, P. Burger, F. Bussière, Y. M. Cabidoche, P. Cellier, P. Debaeke, J. P. Gaudillère, C. Hénault, F. Ma-raux, B. Seguin and H. Sinoquet, An overview of the crop model STICS, Eur. J. Agron. 18 (2003), pp. 309–332.
Brown and Chapman, 1960: D. M. Brown and L. J. Chapman, Soybean ecology. II. Development-temperature-moisture relationship from field studies, Agron. J. 52 (1960), pp. 496–499.
Buzell, 1971: R. I. Buzell, Inheritance of a soybean flowering response to fluorescent-daylength conditions, Can. J. Genet. Cytol. 13 (1971), pp. 703–707.
Buzell and Voldeng, 1980: R. I. Buzell and H. D. Voldeng, Inheritance of sen-sitivity to long daylength, Soybean Genet. Newsl. 7 (1980), pp. 26–29.
Cober et al., 2001: E. R. Cober, D. W. Steward, and H. D. Voldeng, Photope-riod and temperature response in early-maturing, near isogenic soybean lines, Crop Sci. 41 (2001), pp. 721–727.
Collinson et al., 1993: S. T. Collinson, R. J. Summerfield, R. H. Ellis and E. H. Roberts, Durations of the photoperiod-sensitive and photoperiod-in-sensitive phases of development to flowering in four cultivars of soybean [Glycine max (L) Merrill], Ann. Bot. 71 (1993), pp. 389–394.
Cregan and Hartwig, 1984: P. B. Cregan and E. E. Hartwig, Characteriza-tion of flowering response to photoperiod in diverse soybean genotypes, Crop Sci. 24 (1984), pp. 659–662.
Downs and Thomas, 1990: J. R. Downs and J. F. Thomas, Morphology and reproductive development of soybean under artificial conditions, Biotron-ics 19 (1990), pp. 19–32.
Ellis et al., 1992: R. H. Ellis, S. T. Collinson, D. Hudson and W. M. Patefield, The analysis of reciprocal transfer experiments to estimate the durations

Modeling the effect of teMperature and daylength on Soybean phenology under high-yield conditionS 271
of the photoperiod-sensitive and photoperiod-insensitive phases of plant development: an example in soya bean, Ann. Bot. 70 (1992), pp. 87–92.
Fehr and Caviness, 1977: W. R. Fehr and C. E. Caviness, Stages of Soy-bean Development, Cooperative Extension Service, Agriculture and Home Economics Experiment Station Iowa State University, Ames, Iowa (1977).
Ferguson et al., 2003: R. B. Ferguson, C. A. Shapiro, A. Dobermann and C. S. Wortmann, Fertilizer Recommendations for Soybean. NebGuide G87-859-A, Cooperate Extension, Institute of Agriculture and Natural Re-sources, University of Nebraska-Lincoln, Lincoln, NE (2003).
Garner and Allard, 1920: W. W. Garner and H. A. Allard, Effect of the rel-ative length of the day and night and other factors of the environment on growth and reproduction in plants, J. Agric. Res. 18 (1920), pp. 553–605.
Grimm et al., 1993: S. S. Grimm, J. W. Jones, K. J. Boote and J. D. Hesketh, Parameter estimation for predicting flowering date of soybean cultivars, Crop Sci. 33 (1993), pp. 137–144.
Grimm et al., 1994: S. S. Grimm, J. W. Jones, K. J. Boote and D. C. Herzog, Modeling the occurrence of reproductive stages after flowering for four soybean cultivars, Agron. J. 86 (1994), pp. 31–38.
Han et al., 2006: T. Han, C. Wu, Z. Tong, R. S. Mentreddy, K. Tan and J. Gai, Postflowering photoperiod regulates vegetative growth and reproductive development of soybean, Environ. Exp. Bot. 55 (2006), pp. 120–129.
Heatherly and Elmore, 2004: L. G. Heatherly and R. W. Elmore, Managing inputs for peak production. In: H. R. Boerma and J. E. Specht, Editors, Soybean: Improvement, Production, and Uses, ASA-CSSA-SSSA, Madi-son, WI (2004), pp. 451–536.
Hesketh et al., 1973: J. D. Hesketh, D. L. Myhre and C. R. Willey, Tempera-ture control of time intervals between vegetative and reproductive events in soybeans, Crop Sci. 13 (1973), pp. 250–254.
Hodges and French, 1985: T. Hodges and V. French, Soyphen: soybean growth stages modeled from temperature, daylength, and water availabil-ity, Agron. J. 77 (1985), pp. 500–505.
Janssen and Heuberger, 1995: P. H. M. Janssen and P. S. C. Heuberger, Cal-ibration of process-oriented models, Ecol. Model. 83 (1995), pp. 55–66.
Johnson et al., 1960: H. W. Johnson, H. A. Borthwick and R. C. Leffel, Ef-fects of photoperiod and time of planting on rates of development of the soybean in various stages of the life cycle, Bot. Gaz. 122 (1960), pp. 77–95.
Jones et al., 2000: J. W. Jones, J. White, K. Boote, G. Hoogenboom and C. H. Porter, Phenology Module in DSSAT v 4. 0. Documentation and Source Code Listing, Agricultural and Biological Engineering Department, Uni-versity of Florida, Gainesville, FL (2000).
Kadhem et al., 1985a: F. A. Kadhem, J. E. Specht and J. H. Williams, Soy-bean irrigation serially timed during stages R1 to R6. II. Yield component responses, Agron. J. 77 (1985), pp. 299–304.
Kadhem et al., 1985b: F. A. Kadhem, J. E. Specht and J. H. Williams, Soy-bean irrigation serially timed during stages R1 to R6. I. Agronomic re-sponses, Agron. J. 77 (1985), pp. 291–298.
Keisling, 1982: T. C. Keisling, Calculation of the length of day, Agron. J. 74 (1982), pp. 758–759.
Korte et al., 1983a: L. L. Korte, J. E. Specht, J. H. Williams and R. C. So-rensen, Irrigation of soybean genotypes during reproductive ontogeny. II. Yield component responses, Crop Sci. 23 (1983), pp. 528–533.
Korte et al., 1983b: L. L. Korte, J. E. Specht, J. H. Williams and R. C. So-rensen, Irrigation of soybean genotypes during reproductive ontogeny. I. Agronomic responses, Crop Sci. 23 (1983), pp. 521–527.
Leopold and Kriedemann, 1975: A. C. Leopold and P. E. Kriedemann, Plant growth and Development, McGraw-Hill Book Company, New York (1975).
Major et al., 1975: D. J. Major, D. R. Johnson, J. W. Tanner and I. C. Ander-son, Effects of daylength and temperature on soybean development, Crop Sci. 15 (1975), pp. 174–179.
McBlain and Bernard, 1987: B. A. McBlain and R. L. Bernard, A new gene affecting the time of flowering and maturity in soybeans, J. Hered. 78 (1987), pp. 160–162.
McBlain et al., 1987: B. A. McBlain, J. D. Hesketh and R. L. Bernard, Ge-netic effects on reproductive phenology in soybean isolines differing in maturity genes, Can. J. Plant Sci. 67 (1987), pp. 105–116.
Naylor, 1953: A. W. Naylor, Reactions of plants to photoperiod. In: W. E Loo-mis, Editor, Growth and Differentiation in Plants. A Monograph of the American Society of Plant Physiologist, The Iowa State College Press, Ames, IA (1953), pp. 149–178.
Parton and Logan, 1981: W. J. Parton and J. A. Logan, A model for diurnal vari-ation in soil and air temperature, Agric. Meteorol. 23 (1981), pp. 205–216.
Robins and Domingo, 1956: J. S. Robins and C. E. Domingo, Moisture def-icit in relation to growth and development of dry beans, Agron. J. 48 (1956), pp. 67–70.
SAS Institute, 1999: SAS Institute, The SAS System for Windows. Release 8. 02, SAS Institute, Cary, NC (1999).
Seidelmann, 1992: P. K. Seidelmann, Explanatory Supplement to the Astro-nomical Almanac, University Science Books, Herndon, VA (1992).
Shanmugasundaram and Tsou, 1978: S. Shanmugasundaram and S. C. S. Tsou, Photoperiod and critical duration for flower induction in soybean, Crop Sci. 18 (1978), pp. 598–601.
Shibles, 1978: R. Shibles, Adaptation of soyabeans to different seasonal du-rations. In: R. J. Summerfield and A. H. Bunting, Editors, Advances in Legume Sciences, Royal Botanic Gardens, Kew, England (1978), pp. 279–285.
Sinclair, 1984: T. R. Sinclair, Cessation of leaf emergence in indeterminate soybeans, Crop Sci. 24 (1984), pp. 483–486.
Sinclair and deWit, 1975: T. R. Sinclair and C. T. deWit, Comparative anal-ysis of photosynthate and nitrogen requirement in the production of seed by various crops, Science 189 (1975), pp. 565–567.
Sinclair and deWit, 1976: T. R. Sinclair and C. T. deWit, Analysis of the car-bon and nitrogen limitation to soybean yield, Agron. J. 68 (1976), pp. 319–324.
Sinclair et al., 1991: T. R. Sinclair, S. Kitani, K. Hinson, J. Bruniard and T. Horie, Soybean flowering date: linear and logistic models based on tem-perature and photoperiod, Crop Sci. 31 (1991), pp. 786–790.
Specht et al., 1989: J. E. Specht, R. W. Elmore, D. E. Eisenhauer and N. W. Klocke, Growth stage scheduling criteria for soybeans, Irrigation Sci. 10 (1989), pp. 99–111.
Spitters et al., 1986: C. J. T. Spitters, H. A. J. M. Toussaint and J. Goudriaan, Separating the diffuse and direct component of global radiation and its implications for modeling canopy photosynthesis. Part 1. Components of incoming radiation, Agric. For. Meteorol. 38 (1986), pp. 217–229.
Steward et al., 2003: D. W. Steward, E. R. Cober and R. L. Bernard, Model-ing genetic effects on the photothermal response of soybean phenological development, Agron. J. 95 (2003), pp. 65–70.
Streck et al., 2003: N. A. Streck, A. Weiss, Q. Xue and P. S. Baenziger, Im-proving predictions of developmental stages in winter wheat, Agric. For. Meteorol. 115 (2003), pp. 139–150.
Summerfield and Wilcox, 1978: R. J. Summerfield and J. R. Wilcox, Effects of photoperiod and air temperature on growth and yield of economic le-gumes. In: R. J. Summerfield and A. H. Bunting, Editors, Advances in Legume Sciences, Royal Botanic Gardens, Kew, England (1978), pp. 17–36.
Summerfield et al., 1991: R. J. Summerfield, E. H. Roberts, R. H. Ellis and R. J. Lawn, Towards the reliable prediction of time to flowering in seven annual crops. I. The development of simple models for fluctuating field environments, Exp. Agric. 27 (1991), pp. 11–31.
Summerfield et al., 1998: R. J. Summerfield, H. Asumadu, R. H. Ellis and A. Qi, Characterization of the photoperiodic response of post-flowering development in maturity isolines of soyabean [Glycine max (L) Merrill] ‘Clark’, Ann. Bot. 82 (1998), pp. 765–771.
Taiz and Zeiger, 1991: L. Taiz and E. Zeiger, Plant Physiology, The Benja-min/Cummings Publishing Company Inc., Redwood City, CA (1991).
Thomas and Vince-Prue, 1997: B. Thomas and D. Vince-Prue, Photoperiod-ism in Plants, Academic Press, San Diego, CA, USA (1997) pp. 63–84.
Thompson et al., 1997: J. A. Thompson, R. L. Bernard and R. L. Nelson, A third allele at the soybean dt1 locus, Crop Sci. 37 (1997), pp. 757–762.
Trewavas, 1986: A. Trewavas, Understanding the control of plant devel-opment and the role of growth substances, Aust. J. Plant. Physiol. 13 (1986), pp. 447–457.
Upadhyay et al., 1994: A. P. Upadhyay, R. J. Summerfield, R. H. Ellis, E. H. Roberts and A. Qi, Variation in the duration of the photoperiod-sensitive and photoperiod-insensitive phase of development to flowering among eight maturity isolines of soyabean [Glycine max (L) Merrill], Ann. Bot. 74 (1994), pp. 87–96.
Wallace et al., 1993: D. H. Wallace, R. W. Zobel and K. S. Yourstone, A whole-system reconsideration of paradigms about photoperiod and tem-perature control of crop yield, Theor. Appl. Genet. 86 (1993), pp. 17–26.
Wang and Engel, 1998: E. Wang and T. Engel, Simulation of phenological development of wheat crops, Agric. Syst. 58 (1998), pp. 1–24.
Wilhelm and McMaster, 1995: W. W. Wilhelm and G. S. McMaster, The importance of the phyllochron in studying development and growth of grasses, Crop Sci. 35 (1995), pp. 1–3.
Yin et al., 1995: X. Yin, M. J. Kropff, G. McLaren and R. M. Visperas, A nonlinear model for crop development as a function of temperature, Ag-ric. For. Meteorol. 77 (1995), pp. 1–16.
Zobel, 1992: R. W. Zobel, Soil environment constraints to root growth, Adv. Soil Sci. 19 (1992), pp. 27–51.