Underlying Event measurements in pp collisions at $\sqrt{s}$ = 0.9 and 7 TeV with the ALICE...
37
EUROPEAN ORGANIZATION FOR NUCLEAR RESEARCH CERN-PH-EP-2011-204 09.12.2011 Underlying Event measurements in pp collisions at √ s = 0.9 and 7 TeV with the ALICE experiment at the LHC The ALICE Collaboration * Abstract We present measurements of Underlying Event observables in pp collisions at √ s = 0.9 and 7TeV. The analysis is performed as a function of the highest charged-particle transverse momentum p T,LT in the event. Different regions are defined with respect to the azimuthal direction of the leading (highest transverse momentum) track: Toward, Transverse and Away. The Toward and Away regions collect the fragmentation products of the hardest partonic interaction. The Transverse region is expected to be most sensitive to the Underlying Event activity. The study is performed with charged particles above three different p T thresholds: 0.15, 0.5 and 1.0 GeV/c. In the Transverse region we observe an increase in the multiplicity of a factor 2-3 between the lower and higher collision energies, depending on the track p T threshold considered. Data are compared to PYTHIA 6.4, PYTHIA 8.1 and PHOJET. On average, all models considered underestimate the multiplicity and summed p T in the Transverse region by about 10-30%. * See Appendix A for the list of collaboration members arXiv:1112.2082v3 [hep-ex] 16 Aug 2012
Transcript of Underlying Event measurements in pp collisions at $\sqrt{s}$ = 0.9 and 7 TeV with the ALICE...

EUROPEAN ORGANIZATION FOR NUCLEAR RESEARCH
CERN-PH-EP-2011-20409.12.2011
Underlying Event measurements in pp collisions at√
s = 0.9 and 7 TeVwith the ALICE experiment at the LHC
The ALICE Collaboration∗
Abstract
We present measurements of Underlying Event observables in pp collisions at√
s = 0.9 and 7 TeV.The analysis is performed as a function of the highest charged-particle transverse momentum pT,LT inthe event. Different regions are defined with respect to the azimuthal direction of the leading (highesttransverse momentum) track: Toward, Transverse and Away. The Toward and Away regions collectthe fragmentation products of the hardest partonic interaction. The Transverse region is expectedto be most sensitive to the Underlying Event activity. The study is performed with charged particlesabove three different pT thresholds: 0.15, 0.5 and 1.0 GeV/c. In the Transverse region we observe anincrease in the multiplicity of a factor 2-3 between the lower and higher collision energies, dependingon the track pT threshold considered. Data are compared to PYTHIA 6.4, PYTHIA 8.1 and PHOJET.On average, all models considered underestimate the multiplicity and summed pT in the Transverseregion by about 10-30%.
∗See Appendix A for the list of collaboration members
arX
iv:1
112.
2082
v3 [
hep-
ex]
16
Aug
201
2


Underlying Event measurements with ALICE 3
1 Introduction
The detailed characterization of hadronic collisions is of great interest for the understanding of the under-lying physics. The production of particles can be classified according to the energy scale of the processinvolved. At high transverse momentum transfers (pT & 2GeV/c) perturbative Quantum Chromodynam-ics (pQCD) is the appropriate theoretical framework to describe partonic interactions. This approach canbe used to quantify parton yields and correlations, whereas the transition from partons to hadrons is anon-perturbative process that has to be treated using phenomenological approaches. Moreover, the bulkof particles produced in high-energy hadronic collisions originate from low-momentum transfer pro-cesses. For momenta of the order of the QCD scale, O(100 MeV), a perturbative treatment is no longerfeasible. Furthermore, at the center-of-mass energies of the Large Hadron Collider (LHC), at momentumtransfers of a few GeV/c, the calculated QCD cross-sections for 2-to-2 parton scatterings exceed the totalhadronic cross-section [1]. This result indicates that Multiple Partonic Interactions (MPI) occur in thisregime. The overall event dynamics cannot be derived fully from first principles and must be modeledusing phenomenological calculations. Measurements at different center-of-mass energies are required totest and constrain these models.
In this paper, we present an analysis of the bulk particle production in pp collisions at the LHC bymeasuring the so-called Underlying Event (UE) activity [2]. The UE is defined as the sum of all theprocesses that build up the final hadronic state in a collision excluding the hardest leading order partonicinteraction. This includes fragmentation of beam remnants, multiple parton interactions and initial-and final-state radiation (ISR/FSR) associated to each interaction. Ideally, we would like to study thecorrelation between the UE and perturbative QCD interactions by isolating the two leading partons withtopological cuts and measuring the remaining event activity as a function of the transferred momentumscale (Q2). Experimentally, one can identify the products of the hard scattering, usually the leading jet,and study the region azimuthally perpendicular to it as a function of the jet energy. Results of suchan analysis have been published by the CDF [2, 3, 4, 5] and STAR [6] collaborations for pp collisionsat√
s = 1.8 and 0.2 TeV, respectively. Alternatively, the energy scale is given by the leading charged-particle transverse momentum, circumventing uncertainties related to the jet reconstruction procedure atlow pT. It is clear that this is only an approximation to the original outgoing parton momentum, the exactrelation depends on the details of the fragmentation mechanism. The same strategy based on the leadingcharged particle has recently been applied by the ATLAS [7] and CMS [8] collaborations.
In the present paper we consider only charged primary particles1, due to the limited calorimetric accep-tance of the ALICE detector systems in azimuth. Distributions are measured for particles in the pseudo-rapidity range |η |< 0.8 with pT > pT,min, where pT,min = 0.15, 0.5 and 1.0 GeV/c, and are studied as afunction of the leading particle transverse momentum.
Many Monte Carlo (MC) generators for the simulation of pp collisions are available; see [9] for a recentreview discussing for example PYTHIA [10], PHOJET [11], SHERPA [9] and HERWIG [12]. These pro-vide different descriptions of the UE associated with high energy hadron collisions. A general strategyis to combine a perturbative QCD treatment of the hard scattering with a phenomenological approachto soft processes. This is the case for the two models used in our analysis: PYTHIA and PHOJET. InPYTHIA the simulation starts with a hard LO QCD process of the type 2→ 2. Multi-jet topologies aregenerated with the parton shower formalism and hadronization is implemented through the Lund stringfragmentation model [13]. Each collision is characterized by a different impact parameter b. Small bvalues correspond to a large overlap of the two incoming hadrons and to an increased probability forMPIs. At small pT values color screening effects need to be taken into account. Therefore a cut-off pT,0is introduced, which damps the QCD cross-section for pT� pT,0. This cut-off is one of the main tunablemodel parameters.
1Primary particles are defined as prompt particles produced in the collision and their decay products (strong and electro-magnetic decays), except products of weak decays of strange particles such as K0
S and Λ.

4 The ALICE Collaboration
In PYTHIA version 6.4 [10] MPI and ISR have a common transverse momentum evolution scale (calledinterleaved evolution [14]). Version 8.1 [15] is a natural extension of version 6.4, where the FSR evolu-tion is interleaved with MPI and ISR and parton rescatterings [16] are considered. In addition initial-statepartonic fluctuations are introduced, leading to a different amount of color-screening in each event.PHOJET is a two-component event generator, where the soft regime is described by the Dual PartonModel (DPM) [17] and the high-pT particle production by perturbative QCD. The transition between thetwo regimes happens at a pT cut-off value of 3 GeV/c. A high-energy hadronic collision is described bythe exchange of effective Pomerons. Multiple-Pomeron exchanges, required by unitarization, naturallyintroduce MPI in the model.
UE observables allow one to study the interplay of the soft part of the event with particles produced inthe hard scattering and are therefore good candidates for Monte Carlo tuning. A better understanding ofthe processes contributing to the global event activity will help to improve the predictive power of suchmodels. Further, a good description of the UE is needed to understand backgrounds to other observables,e.g., in the reconstruction of high-pT jets.
The paper is organized in the following way: the ALICE sub-systems used in the analysis are describedin Section 2 and the data samples in Section 3. Section 4 is dedicated to the event and track selection.Section 5 introduces the analysis strategy. In Sections 6 and 7 we focus on the data correction procedureand systematic uncertainties, respectively. Final results are presented in Section 8 and in Section 9 wedraw conclusions.
2 ALICE detector
Optimized for the high particle densities encountered in heavy-ion collisions, the ALICE detector is alsowell suited for the study of pp interactions. Its high granularity and particle identification capabilitiescan be exploited for precise measurements of global event properties [18, 19, 20, 21, 22, 23, 24]. Thecentral barrel covers the polar angle range 45◦−135◦ (|η |< 1) and full azimuth. It is contained in the L3solenoidal magnet which provides a nominal uniform magnetic field of 0.5T. In this section we describeonly the trigger and tracking detectors used in the analysis, while a detailed discussion of all ALICEsub-systems can be found in [25].
The V0A and V0C counters consist of scintillators with a pseudorapidity coverage of −3.7 < η <−1.7and 2.8 < η < 5.1, respectively. They are used as trigger detectors and to reject beam–gas interactions.
Tracks are reconstructed combining information from the two main tracking detectors in the ALICEcentral barrel: the Inner Tracking System (ITS) and the Time Projection Chamber (TPC). The ITS is theinnermost detector of the central barrel and consists of six layers of silicon sensors. The first two layers,closely surrounding the beam pipe, are equipped with high granularity Silicon Pixel Detectors (SPD).They cover the pseudorapidity ranges |η | < 2.0 and |η | < 1.4 respectively. The position resolutionis 12 µm in rφ and about 100 µm along the beam direction. The next two layers are composed ofSilicon Drift Detectors (SDD). The SDD is an intrinsically 2-dimensional sensor. The position alongthe beam direction is measured via collection anodes and the associated resolution is about 50 µm. Therφ coordinate is given by a drift time measurement with a spatial resolution of about 60 µm. Due todrift field non-uniformities, which were not corrected for in the 2010 data, a systematic uncertainty of300 µm is assigned to the SDD points. Finally, the two outer layers are made of double-sided Siliconmicro-Strip Detectors (SSD) with a position resolution of 20 µm in rφ and about 800 µm along the beamdirection. The material budget of all six layers including support and services amounts to 7.7% of aradiation length.
The main tracking device of ALICE is the Time Projection Chamber that covers the pseudorapidity rangeof about |η |< 0.9 for tracks traversing the maximum radius. In order to avoid border effects, the fiducial

Underlying Event measurements with ALICE 5
Collision energy: 0.9 TeVEvents % of all
Offline trigger 5,515,184 100.0Reconstructed vertex 4,482,976 81.3
Leading track pT > 0.15 GeV/c 4,043,580 73.3Leading track pT > 0.5 GeV/c 3,013,612 54.6Leading track pT > 1.0 GeV/c 1,281,269 23.2
Collision energy: 7 TeVEvents % of all
Offline trigger 25,137,512 100.0Reconstructed vertex 22,698,200 90.3
Leading track pT > 0.15 GeV/c 21,002,568 83.6Leading track pT > 0.5 GeV/c 17,159,249 68.3Leading track pT > 1.0 GeV/c 9,873,085 39.3
Table 1: Events remaining after each event selection step.
region has been restricted in this analysis to |η | < 0.8. The position resolution along the rφ coordinatevaries from 1100 µm at the inner radius to 800 µm at the outer. The resolution along the beam axis rangesfrom 1250 µm to 1100 µm.
For the evaluation of the detector performance we use events generated with the PYTHIA 6.4 [10] MonteCarlo with tune Perugia-0 [26] passed through a full detector simulation based on GEANT3 [27]. Thesame reconstruction algorithms are used for simulated and real data.
3 Data samples
The analysis uses two data sets which were taken at the center-of-mass energies of√
s = 0.9 and 7 TeV.In May 2010, ALICE recorded about 6 million good quality minimum-bias events at
√s = 0.9 TeV. The
luminosity was of the order of 1026 cm−2 s−1 and, thus, the probability for pile-up events in the samebunch crossing was negligible. The
√s = 7 TeV sample of about 25 million events was collected in
April 2010 with a luminosity of 1027 cm−2 s−1. In this case the mean number of interactions per bunchcrossing µ ranges from 0.005 to 0.04. A set of high pile-up probability runs (µ = 0.2−2) was analysedin order to study our pile-up rejection procedure and determine its related uncertainty. Those runs areexcluded from the analysis.
Corrected data are compared to three Monte Carlo models: PYTHIA 6.4 (tune Perugia-0), PYTHIA 8.1(tune 1 [15]) and PHOJET 1.12.
4 Event and track selection
4.1 Trigger and offline event selection
Events are recorded if either of the three triggering systems, V0A, V0C or SPD, has a signal. The arrivaltime of particles in the V0A and V0C are used to reject beam–gas interactions that occur outside thenominal interaction region. A more detailed description of the online trigger can be found in [20]. Anadditional offline selection is made following the same criteria but considering reconstructed informationinstead of online trigger signals.
For each event a reconstructed vertex is required. The vertex reconstruction procedure is based on tracksas well as signals in the SPD. Only vertices within ±10 cm of the nominal interaction point along the

6 The ALICE Collaboration
Selection criteria ValueDetectors required ITS,TPC
Minimum number of TPC clusters 70Maximum χ2 per TPC cluster 4
Minimum number of ITS clusters 3Minimum number of SPD or 1st layer SDD clusters 1
Maximum DCAZ 2 cmMaximum DCAXY (pT) 7σ
Table 2: Track selection criteria.
beam axis are considered. Moreover, we require at least one track with pT > pT,min = 0.15, 0.5 or1.0 GeV/c in the acceptance |η |< 0.8.
A pile-up rejection procedure is applied to the set of data taken at√
s = 7 TeV: events with more than onedistinct reconstructed primary vertex are rejected. This cut has a negligible effect on simulated eventswithout pile-up: only 0.06% of the events are removed. We have compared a selection of high pile-upprobability runs (see Section 3) with a sample of low pile-up probability runs. The UE distributions differby 20-25% between the two samples. After the above mentioned rejection procedure, the differenceis reduced to less than 2%. Therefore, in the runs considered in the analysis, the effect of pile-up isnegligible.
No explicit rejection of cosmic-ray events is applied since cosmic particles are efficiently suppressed byour track selection cuts [23]. This is further confirmed by the absence of a sharp enhanced correlationat ∆φ = π from the leading track which would be caused by almost straight high-pT tracks crossing thedetector.
Table 1 summarizes the percentage of events remaining after each event selection step. We do not explic-itly select non-diffractive events, although the above mentioned event selection significantly reduces theamount of diffraction in the sample. Simulated events show that the event selections reduce the fractionof diffractive events from 18-33% to 11-16% (PYTHIA 6.4 and PHOJET at 0.9 and 7 TeV). We do notcorrect for this contribution.
4.2 Track cuts
The track cuts are optimized to minimize the contamination from secondary tracks. For this purpose atrack must have at least 3 ITS clusters, one of which has to be in the first 3 layers. Moreover, we requireat least 70 (out of a maximum of 159) clusters in the TPC drift volume. The quality of the track fittingmeasured in terms of the χ2 per space point is required to be lower than 4 (each space point having 2degrees of freedom). We require the distance of closest approach of the track to the primary vertex alongthe beam axis (DCAZ) to be smaller than 2 cm. In the transverse direction we apply a pT dependentDCAXY cut, corresponding to 7 standard deviations of its inclusive probability distribution. These cutsare summarized in Table 2.
5 Analysis strategy
The Underlying Event activity is characterized by the following observables [2]:
– average charged particle density vs. leading track transverse momentum pT,LT:
1∆η ·∆Φ
1Nev(pT,LT)
Nch(pT,LT) (1)

Underlying Event measurements with ALICE 7
!"
Fig. 1: Definition of the regions Toward, Transverse and Away w.r.t. leading track direction.
– average summed pT density vs. leading track pT,LT:
1∆η ·∆Φ
1Nev(pT,LT)
∑ pT(pT,LT) (2)
– ∆φ -correlation between tracks and the leading track:
1∆η
1Nev(pT,LT)
dNch
d∆φ(3)
(in bins of leading track pT,LT).
Nev is the total number of events selected and Nev(pT,LT) is the number of events in a given leading-tracktransverse-momentum bin. The first two variables are evaluated in three distinct regions. These regions,illustrated in Fig. 1, are defined with respect to the leading track azimuthal angle:
– Toward: |∆φ |< 1/3 π
– Transverse: 1/3 π < |∆φ |< 2/3 π
– Away: |∆φ |> 2/3 π
where ∆φ = φLT −φ is defined in±π . In Eq. (1)-(3) the normalization factor ∆Φ is equal to 2/3π , whichis the size of each region. ∆η = 1.6 corresponds to the acceptance in pseudorapidity. The leading trackis not included in the final distributions.
6 Corrections
We correct for the following detector effects: vertex reconstruction efficiency, tracking efficiency, con-tamination from secondary particles and leading-track misidentification bias. The various correctionsare explained in more detail in the following subsections. We do not correct for the trigger efficiencysince its value is basically 100% for events which have at least one particle with pT > 0.15 GeV/c in therange |η |< 0.8. In Table 3 we summarize the maximum effect of each correction on the measured finalobservables at the two collision energies for pT,min = 0.5GeV/c.

8 The ALICE Collaboration
Correction√
s = 0.9 TeV√
s = 7 TeVLeading track misidentification < 5% < 8%
Contamination < 3% < 3%Efficiency < 19% < 19%
Vertex reconstruction < 0.7% < 0.3%
Table 3: Maximum effect of corrections on final observables for pT,min = 0.5GeV/c.
Vertex reconstruction The correction for finite vertex reconstruction efficiency is performed as a func-tion of the measured multiplicity. Its value is smaller than 0.7% and 0.3% at
√s = 0.9 and
√s = 7TeV,
respectively.
Tracking efficiency The tracking efficiency depends on the track level observables η and pT. Theprojections of the tracking efficiency on the pT and η axes are shown in Fig. 2. In the pseudorapidityprojection we observe a dip of about 1% at η = 0 due to the central TPC cathode. The slight asymmetrybetween positive and negative η is due to a different number of active SPD and SDD modules in the twohalves of the detector. The number of active modules also differs between the data-taking periods at thetwo collision energies. Moreover, the efficiency decreases by 5% in the range 1-3 GeV/c. This is dueto the fact that above about 1 GeV/c tracks are almost straight and can be contained completely in thedead areas between TPC sectors. Therefore, at high pT the efficiency is dominated by geometry and hasa constant value of about 80% at both collision energies. To avoid statistical fluctuations, the estimatedefficiency is fitted with a constant for pT > 5GeV/c (not shown in the figure).
Contamination from secondaries We correct for secondary tracks that pass the track selection cuts.Secondary tracks are predominantly produced by weak decays of strange particles (e.g. K0
S and Λ),photon conversions or hadronic interactions in the detector material, and decays of charged pions. Therelevant track level observables for the contamination correction are transverse momentum and pseudo-rapidity. The correction is determined from detector simulations and is found to be 15-20% for trackswith pT < 0.5 GeV/c and saturates at about 2% for higher transverse momenta (see Fig. 3).
We multiply the contamination estimate by a data-driven coefficient to take into account the low strangenessyield in the Monte Carlo compared to data [24]. The coefficient is derived from a fit of the discrepancybetween data and Monte Carlo strangeness yields in the tails of the DCAXY distribution which are pre-dominantly populated by secondaries. The factor has a maximum value of 1.07 for tracks with pT <0.5 GeV/c and is equal to 1 for pT > 1.5 GeV/c. This factor is included in the Contamination entry inTable 3.
Leading-track misidentification Experimentally, the real leading track can escape detection becauseof tracking inefficiency and the detector’s finite acceptance. In these cases another track (i.e. the sub-leading or sub-sub-leading etc.) will be selected as the leading one, thus biasing the analysis in twopossible ways. Firstly, the sub-leading track will have a different transverse momentum than the leadingone. We refer to this as leading-track pT bin migration. It has been verified with Monte Carlo thatthis effect is negligible due to the weak dependence of the final distributions on pT,LT. Secondly, thereconstructed leading track might have a significantly different orientation with respect to the real one,resulting in a rotation of the overall event topology. The largest bias occurs when the misidentifiedleading track falls in the Transverse region defined by the real leading track.
We correct for leading-track misidentification with a data-driven procedure. Starting from the measureddistributions, for each event the track loss due to inefficiency is applied a second time to the data (havingbeen applied the first time naturally by the detector) by rejecting tracks randomly. If the leading track isconsidered reconstructed it is used as before to define the different regions. Otherwise the sub-leading

Underlying Event measurements with ALICE 9
(GeV/c)T
p0 1 2 3 4 5 6 7 8 9 10
Tra
ckin
g E
ffici
ency
0.65
0.7
0.75
0.8
0.85
= 0.9 TeVs
= 7 TeVs
η-1 -0.8 -0.6 -0.4 -0.2 0 0.2 0.4 0.6 0.8 1
Tra
ckin
g ef
ficie
ncy
0.65
0.7
0.75
0.8
0.85
= 0.9 TeVs
= 7 TeVs
Fig. 2: Tracking efficiency vs. track pT (left, |η | < 0.8) and η (right, pT > 0.5GeV/c) from a PYTHIA 6.4 andGEANT3 simulation.
track is used. Since the tracking inefficiency is quite small (about 20%) applying it on the reconstructeddata a second time does not alter the results significantly. To verify this statement we compared ourresults with a two step procedure. In this case the inefficiency is applied two times on measured data, halfof its value at a time. The correction factor obtained in this way is compatible with the one step procedure.Furthermore, the data-driven procedure has been tested on simulated data where the true leading particleis known. We observed a discrepancy between the two methods, especially at low leading-track pTvalues, which is taken into account in the systematic error. The maximum leading-track misidentificationcorrection is 8% on the final distributions.
Two-track effects By comparing simulated events corrected for single-particle efficiencies with theinput Monte Carlo, we observe a 0.5% discrepancy around ∆φ = 0. This effect is called non-closurein Monte Carlo (it will be discussed further in Section 7) and in this case is related to small two-trackresolution effects. Data are corrected for this discrepancy.
7 Systematic uncertainties
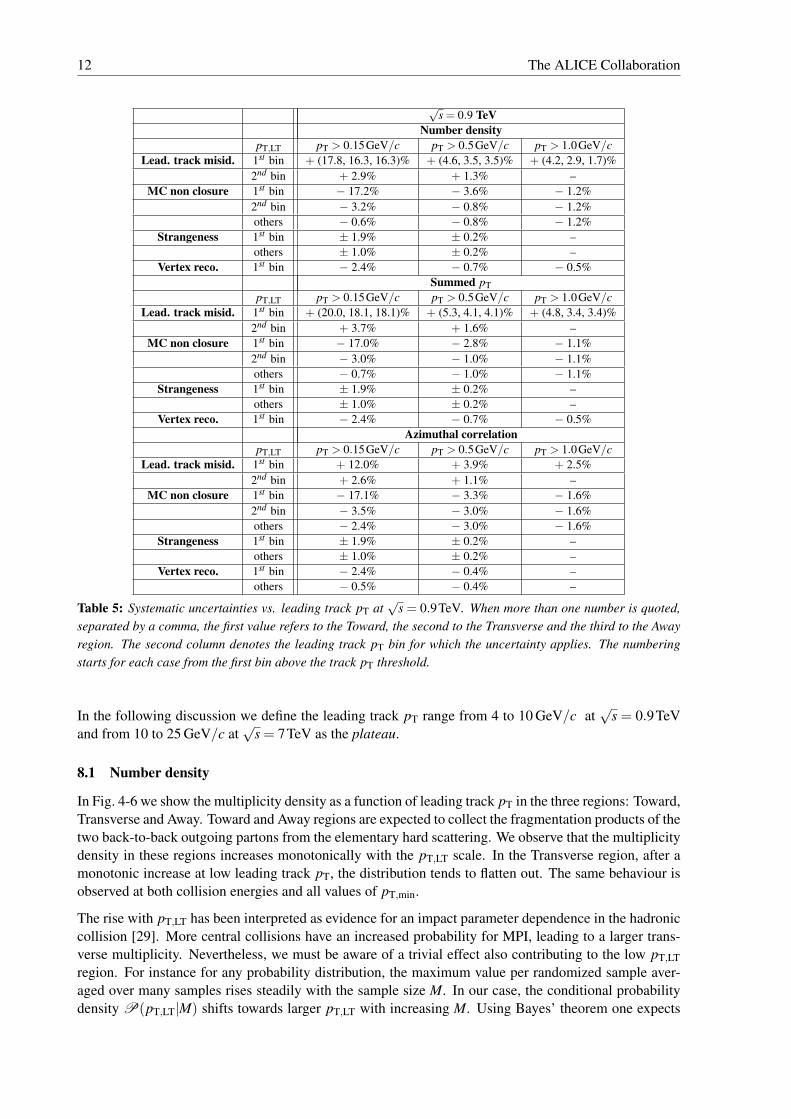
In Tables 4, 5 and 6 we summarize the systematic uncertainties evaluated in the analysis for the three trackthresholds: pT > 0.15, 0.5 and 1.0 GeV/c. Each uncertainty is explained in more detail in the followingsubsections. Uncertainties which are constant as a function of leading-track pT are listed in Table 4.Leading-track pT dependent uncertainties are summarized in Tables 5 and 6 for
√s = 0.9TeV and 7TeV,
respectively. Positive and negative uncertainties are propagated separately, resulting in asymmetric finaluncertainties.
Particle composition The tracking efficiency and contamination corrections depend slightly on theparticle species mainly due to their decay length and absorption in the material. To assess the effect ofan incorrect description of the particle abundances in the Monte Carlo, we varied the relative yields ofpions, protons, kaons, and other particles by 30% relative to the default Monte Carlo predictions. Themaximum variation of the final values is 0.9% and represents the systematic uncertainty related to theparticle composition (see Table 4).
Moreover, we have compared our assessment of the underestimation of strangeness yields with a directmeasurement from the ALICE collaboration [24]. Based on the discrepancy between the two estimates,we assign a systematic uncertainty of 0-2.3% depending on the pT threshold and collision energy, seeTables 5 and 6.

10 The ALICE Collaboration
(GeV/c)T
p0 1 2 3 4 5 6 7 8 9 10
Cor
rect
ion
Fac
tor
0.84
0.86
0.88
0.9
0.92
0.94
0.96
0.98
1
= 0.9 TeVs
= 7 TeVs
η-1 -0.8 -0.6 -0.4 -0.2 0 0.2 0.4 0.6 0.8 1
Cor
rect
ion
Fac
tor
0.97
0.972
0.974
0.976
0.978
0.98
0.982
0.984
= 0.9 TeVs
= 7 TeVs
Fig. 3: Contamination correction: correction factor vs. track pT (left, |η | < 0.8) and η (right, pT > 0.5GeV/c)from a PYTHIA 6.4 and GEANT3 simulation.
√s = 0.9 TeV
pT > 0.15GeV/c pT > 0.5GeV/c pT > 1.0GeV/cParticle composition ± 0.9% ± 0.7% ± 0.4%
ITS efficiency ± 0.6% – –TPC efficiency ± 1.9% ± 0.8% ± 0.4%
Track cuts + 3.0%− 1.1%
+ 2.0%− 1.1%
+ 0.9%− 1.5%
ITS/TPC matching ± 1.0% ± 1.0% ± 1.0%MC dependence + 1.1% , + 1.1% , + 1.6% + 0.9% + 0.9% , + 0.9% , + 1.3%Material budget ± 0.6% ± 0.2% ± 0.2%
√s = 7 TeV
pT > 0.15GeV/c pT > 0.5GeV/c pT > 1.0GeV/cParticle composition ± 0.9% ± 0.7% ± 0.5%
ITS efficiency ± 0.5% – –TPC efficiency ± 1.8% ± 0.8% ± 0.5%
Track cuts + 2.1%− 2.3%
+ 1.6%− 3.2%
+ 2.5%− 3.5%
ITS/TPC matching ± 1.0% ± 1.0% ± 1.0%MC dependence + 0.8% , + 0.8% , + 1.2% + 0.8% + 1.0%Material budget ± 0.6% ± 0.2% ± 0.2%
Table 4: Constant systematic uncertainties at both collision energies. When more than one number is quoted,separated by a comma, the first value refers to the number density distribution, the second to the summed pT andthe third to the azimuthal correlation. Some of the uncertainties are quoted asymmetrically.
ITS and TPC efficiency The tracking efficiency depends on the level of precision of the description ofthe ITS and TPC detectors in the simulation and the modeling of their response. After detector alignmentwith survey methods, cosmic-ray events and pp collision events [28], the uncertainty on the efficiencydue to the ITS description is estimated to be below 2% and affects only tracks with pT < 0.3 GeV/c. Theuncertainty due to the TPC reaches 4.5% at very low pT and is smaller than 1.2% for tracks with pT >0.5 GeV/c. The resulting maximum uncertainty on the final distributions is below 1.9%. Moreover, anuncertainty of 1% is included to account for uncertainties in the MC description of the matching betweenTPC and ITS tracks (see Table 4).
Track cuts By applying the efficiency and contamination corrections we correct for those particleswhich are lost due to detector effects and for secondary tracks which have not been removed by theselection cuts. These corrections rely on detector simulations and therefore, one needs to estimate thesystematic uncertainty introduced in the correction procedure by one particular choice of track cuts. Todo so, we repeat the analysis with different values of the track cuts, both for simulated and real data. The

Underlying Event measurements with ALICE 11
variation of the final distributions with different track cuts is a measure of the systematic uncertainty.The overall effect, considering all final distributions, is smaller than 3.5% at both collision energies (seeTable 4).
Misidentification bias The uncertainty on the leading-track misidentification correction is estimatedfrom the discrepancy between the data-driven correction used in the analysis and that based on simula-tions. The effect influences only the first two leading-track pT bins at both collision energies. The max-imum uncertainty (∼ 18%) affects the first leading-track pT bin for the track pT cut-off of 0.15 GeV/c.In all other bins this uncertainty is of the order of few percent. As summarized in Tables 5 and 6, theuncertainty has slightly different values for the various UE distributions.
Vertex-reconstruction efficiency The analysis accepts reconstructed vertices with at least one con-tributing track. We repeat the analysis requiring at least two contributing tracks. The systematic uncer-tainty related to the vertex reconstruction efficiency is given by the maximum variation in the final distri-butions between the cases of one and two contributing tracks. Its value is 2.4% for pT,min = 0.15 GeV/cand below 1% for the other cut-off values (see Tables 5 and 6). The effect is only visible in the firstleading-track pT bin.
Non-closure in Monte Carlo By correcting a Monte Carlo prediction after full detector simulationwith corrections extracted from the same generator, we expect to obtain the input Monte Carlo predic-tion within the statistical uncertainty. This consideration holds true only if each correction is evaluatedwith respect to all the variables to which the given correction is sensitive. Any statistically significantdifference between input and corrected distributions is referred to as non-closure in Monte Carlo.
The overall non-closure effect is sizable (∼ 17%) in the first leading-track pT bin and is 0.6-5.3% in allother bins at both collision energies.
Monte-Carlo dependence The difference in final distributions when correcting the data with PYTHIA 6.4or PHOJET generators is of the order of 1% and equally affects all the leading-track pT bins.
Material budget The material budget has been measured by reconstructing photon conversions whichallows a precise γ-ray tomography of the ALICE detector. For the detector regions important for thisanalysis the remaining uncertainty on the extracted material budget is less than 7%. Varying the materialdensity in the detector simulation, the effect on the observables presented is determined to be 0.2-0.6%depending on the pT threshold considered.
8 Results
In this section we present and discuss the corrected results for the three UE distributions in all regions atthe two collision energies. The upper part of each plot shows the relevant measured distribution (blackpoints) compared to a set of Monte Carlo predictions (coloured curves). Shaded bands represent thesystematic uncertainty only. Error bars along the x axis indicate the bin width. The lower part shows theratio between Monte Carlo and data. In this case the shaded band is the sum in quadrature of statisticaland systematic uncertainties.
The overall agreement of data and simulations is of the order of 10-30% and we were not able to identifya preferred model that can reproduce all measured observables. In general, all three generators under-estimate the event activity in the Transverse region. Nevertheless, an agreement of the order of 20%has to be considered a success, considering the complexity of the system under study. Even though anexhaustive comparison of data with the latest models available is beyond the scope of this paper, in thenext sections we will indicate some general trends observed in the comparison with the chosen models.
12 The ALICE Collaboration
√s = 0.9 TeV
Number densitypT,LT pT > 0.15GeV/c pT > 0.5GeV/c pT > 1.0GeV/c
Lead. track misid. 1st bin + (17.8, 16.3, 16.3)% + (4.6, 3.5, 3.5)% + (4.2, 2.9, 1.7)%2nd bin + 2.9% + 1.3% –
MC non closure 1st bin − 17.2% − 3.6% − 1.2%2nd bin − 3.2% − 0.8% − 1.2%others − 0.6% − 0.8% − 1.2%
Strangeness 1st bin ± 1.9% ± 0.2% –others ± 1.0% ± 0.2% –
Vertex reco. 1st bin − 2.4% − 0.7% − 0.5%Summed pT
pT,LT pT > 0.15GeV/c pT > 0.5GeV/c pT > 1.0GeV/cLead. track misid. 1st bin + (20.0, 18.1, 18.1)% + (5.3, 4.1, 4.1)% + (4.8, 3.4, 3.4)%
2nd bin + 3.7% + 1.6% –MC non closure 1st bin − 17.0% − 2.8% − 1.1%
2nd bin − 3.0% − 1.0% − 1.1%others − 0.7% − 1.0% − 1.1%
Strangeness 1st bin ± 1.9% ± 0.2% –others ± 1.0% ± 0.2% –
Vertex reco. 1st bin − 2.4% − 0.7% − 0.5%Azimuthal correlation
pT,LT pT > 0.15GeV/c pT > 0.5GeV/c pT > 1.0GeV/cLead. track misid. 1st bin + 12.0% + 3.9% + 2.5%
2nd bin + 2.6% + 1.1% –MC non closure 1st bin − 17.1% − 3.3% − 1.6%
2nd bin − 3.5% − 3.0% − 1.6%others − 2.4% − 3.0% − 1.6%
Strangeness 1st bin ± 1.9% ± 0.2% –others ± 1.0% ± 0.2% –
Vertex reco. 1st bin − 2.4% − 0.4% –others − 0.5% − 0.4% –
Table 5: Systematic uncertainties vs. leading track pT at√
s = 0.9TeV. When more than one number is quoted,separated by a comma, the first value refers to the Toward, the second to the Transverse and the third to the Awayregion. The second column denotes the leading track pT bin for which the uncertainty applies. The numberingstarts for each case from the first bin above the track pT threshold.
In the following discussion we define the leading track pT range from 4 to 10 GeV/c at√
s = 0.9TeVand from 10 to 25 GeV/c at
√s = 7TeV as the plateau.
8.1 Number density
In Fig. 4-6 we show the multiplicity density as a function of leading track pT in the three regions: Toward,Transverse and Away. Toward and Away regions are expected to collect the fragmentation products of thetwo back-to-back outgoing partons from the elementary hard scattering. We observe that the multiplicitydensity in these regions increases monotonically with the pT,LT scale. In the Transverse region, after amonotonic increase at low leading track pT, the distribution tends to flatten out. The same behaviour isobserved at both collision energies and all values of pT,min.
The rise with pT,LT has been interpreted as evidence for an impact parameter dependence in the hadroniccollision [29]. More central collisions have an increased probability for MPI, leading to a larger trans-verse multiplicity. Nevertheless, we must be aware of a trivial effect also contributing to the low pT,LTregion. For instance for any probability distribution, the maximum value per randomized sample aver-aged over many samples rises steadily with the sample size M. In our case, the conditional probabilitydensity P(pT,LT|M) shifts towards larger pT,LT with increasing M. Using Bayes’ theorem one expects

Underlying Event measurements with ALICE 13
√s = 7 TeV
Number densitypT,LT pT > 0.15GeV/c pT > 0.5GeV/c pT > 1.0GeV/c
Lead. track misid. 1st bin + (17.9, 16.3, 16.3)% + (4.0, 3.2, 3.2)% + (2.5, 1.2, 1.2)%2nd bin + 2.7% – + 0.7%
MC non closure 1st bin − 16.8% − 2.6% − 1.9%2nd bin − 2.9% − 1.4% − 1.9%others − 0.6% − 1.0% − 1.9%
Strangeness 1st bin ± 1.8% ± 2.3% –others ± 1.0% ± 2.3% –
Vertex reco. 1st bin − 2.4% − 0.7% − 0.5%Summed pT
pT,LT pT > 0.15GeV/c pT > 0.5GeV/c pT > 1.0GeV/cLead. track misid. 1st bin + (20.0, 17.9, 17.9)% + (4.9, 3.8, 3.8)% + (3.4, 1.9, 1.9)%
2nd bin + 3.4% + 0.8% + 1.1%MC non closure 1st bin − 16.7% − 2.7% − 1.5%
2nd bin − 2.6% − 1.2% − 1.5%others − 0.8% − 1.0% − 1.5%
Strangeness 1st bin ± 1.8% ± 2.3% –others ± 1.0% ± 2.3% –
Vertex reco. 1st bin − 2.4% − 0.7% − 0.5%Azimuthal correlation
pT,LT pT > 0.15GeV/c pT > 0.5GeV/c pT > 1.0GeV/cLead. track misid. 1st bin + 16.8% + 3.4% + 0.9%
2nd bin + 2.5% – –MC non closure 1st bin − 25.3% − 4.3% − 1.2%
2nd bin − 5.3% − 2.1% − 1.2%others − 2.1% − 2.1% − 1.2%
Strangeness 1st bin ± 1.8% ± 2.3% –others ± 1.0% ± 2.3% –
Vertex reco. 1st bin − 2.4% − 0.4% –others − 0.5% − 0.4% –
Table 6: Systematic uncertainties vs. leading track pT at√
s = 7TeV. When more than one number is quoted,separated by a comma, the first value refers to the Toward, the second to the Transverse and the third to the Awayregion. The second column denotes the leading track pT bin for which the uncertainty applies. The numberingstarts for each case from the first bin above the track pT threshold.
the conditional probability density P(M|pT,LT) to shift towards larger M with rising pT,LT:
P(M|pT,LT)∼P(pT,LT|M)P(M). (4)
The saturation of the distribution at higher values of pT,LT indicates the onset of the event-by-eventpartitioning into azimuthal regions containing the particles from the hard scattering and the UE region.The bulk particle production becomes independent of the hard scale.
The plateau range is fitted with a line. The fit slopes, consistent with zero, and mean values for the threepT thresholds are reported in Table 7. In the fit, potential correlations of the systematic uncertainties indifferent pT bins are neglected.
ATLAS has published a UE measurement where the hard scale is given by the leading track pT, with a pTthreshold for particles of 0.5 GeV/c and an acceptance of |η | < 2.5 [7]. Given the different acceptancewith respect to our measurement, the results in the Toward and Away regions are not comparable. On theother hand the mean values of the Transverse plateaus from the two measurements are in good agreement,indicating an independence of the UE activity on the pseudorapidity range. The CDF collaborationmeasured the UE as a function of charged particle jet pT at a collision energy of 1.8 TeV[2]. The particle

14 The ALICE Collaboration
√s = 0.9 TeV
Number density Summed pT
Slope (GeV/c)−1 Mean Slope Mean (GeV/c)pT > 0.15 GeV/c 0.00 ± 0.02 1.00 ± 0.04 0.00 ± 0.01 0.62 ± 0.02pT > 0.5 GeV/c 0.00 ± 0.01 0.45 ± 0.02 0.01 ± 0.01 0.45 ± 0.02pT > 1.0 GeV/c 0.003 ± 0.003 0.16 ± 0.01 0.006 ± 0.005 0.24 ± 0.01
√s = 7 TeV
Number density Summed pT
Slope (GeV/c)−1 Mean Slope Mean (GeV/c)pT > 0.15 GeV/c 0.00 ± 0.01 1.82 ± 0.06 0.01 ± 0.01 1.43 ± 0.05pT > 0.5 GeV/c 0.005 ± 0.007 0.95 ± 0.03 0.01 ± 0.01 1.15 ± 0.04pT > 1.0 GeV/c 0.001 ± 0.003 0.41 ± 0.01 0.008 ± 0.006 0.76 ± 0.03
√s = 1.8 TeV (CDF)
Number density (at leading charged jet pT = 20GeV/c)pT > 0.5 GeV/c 0.60
Table 7: Saturation values in the Transverse region for the two collision energies. The result from CDF is alsogiven, for details see text.
pT threshold is 0.5 GeV/c and the acceptance |η | < 1. In the Transverse region CDF measures 3.8charged particles per unit pseudorapidity above the pT threshold at leading-jet pT = 20GeV/c. Thisnumber needs to be divided by 2π in order to be compared with the average number of particles in theplateau from Table 7 at the same threshold value. The scaled CDF result is 0.60, also shown in Table 7for comparison. As expected it falls between our two measurements at
√s = 0.9TeV and
√s = 7TeV.
The values do not scale linearly with the collision energy, in particular the increase is higher from 0.9to 1.8 TeV than from 1.8 to 7 TeV. Interpolating between our measurements assuming a logarithmicdependence on
√s results in 0.62 charged particles per unit area at 1.8 TeV, consistent with the CDF
result.
For illustration, Figure 7 presents the number density in the plateau of the Transverse region for pT >0.5GeV/c (our measurement as well as the value measured by CDF at 1.8 TeV) compared withdNch/dη |η=0 of charged particles with pT > 0.5 GeV/c in minimum-bias events [30] (scaled by 1/2π).2
The UE activity in the plateau region is more than a factor 2 larger than the dNch/dη . Both can be fittedwith a logarithmic dependence on s (a+ b lns). The relative increase from 0.9 to 7 TeV for the UE islarger than that for the dNch/dη : about 110% compared to about 80%, respectively.
In Fig. 8 (left) we show the ratio between the number density distribution at√
s = 7TeV and√
s =0.9TeV. Most of the systematic uncertainties are expected to be correlated between the two energies,therefore we consider only statistical uncertainties. The ratio saturates for leading track pT > 4GeV/c.The results of a constant fit in the range 4 < pT,LT < 10GeV/c are reported in Table 8. The measuredscaling factor for a pT threshold of 0.5 GeV/c is in agreement with the observations of ATLAS [7, 31]and CMS [32].
For the track threshold pT > 0.15GeV/c all models underestimate the charged multiplicity in the Trans-verse and Away regions. In particular at
√s = 7TeV PHOJET predictions largely underestimate the
measurement in the Transverse region (up to ∼ 50%), the discrepancy being more pronounced with in-creasing pT cut-off value. PYTHIA 8 correctly describes the Toward region at both collision energiesand PHOJET only at
√s = 0.9TeV. For track pT > 1 GeV/c, PYTHIA 8 systematically overestimates the
event activity in the jet fragmentation regions (Toward and Away).
2These data are for events that have at least one charged particle in |η |< 2.5.

Underlying Event measurements with ALICE 15
Number density Summed pT
pT > 0.15GeV/c 1.76 ± 0.02 2.00 ± 0.03pT > 0.5GeV/c 1.97 ± 0.03 2.16 ± 0.03pT > 1.0GeV/c 2.32 ± 0.04 2.48 ± 0.05
Table 8: Constant fit in 4 < pT,LT < 10GeV/c to the ratio between√
s = 0.9TeV and√
s = 7TeV for numberdensity (left) and summed pT (right) distributions in the Transverse region. The shown uncertainties are based onstatistical and systematic uncertainties summed in quadrature.
8.2 Summed pT
In Fig. 9-11 we show the summed pT density as a function of leading track pT in the three topologicalregions. The shape of the distributions follows a trend similar to that discussed above for the numberdensity.
The general trend of PYTHIA 8 is to overestimate the fragmentation in the Toward region at all pT cut-off values. Also in this case at
√s = 7TeV PHOJET largely underestimates the measurement in the
Transverse region (up to ∼ 50%), especially at higher values of pT cut-off. Other systematic trends arenot very pronounced.
In Table 7 we report the mean value of a linear fit in the plateau range. Our results agree with the ATLASmeasurement in the Transverse plateau.
In Fig. 8 (right) we show the ratio between the distribution at√
s = 7TeV and√
s = 0.9TeV, consideringas before only statistical errors. The results of a constant fit in the range 4 < pT,LT < 10GeV/c arereported in Table 8. Also in this case the scaling factor is in agreement with ATLAS and CMS results.
The summed pT density in the Transverse region can be interpreted as a measurement of the UE activityin a given leading track pT bin. Therefore, its value in the plateau can be used, for example, to correctjet spectra.
8.3 Azimuthal correlation
In Fig. 12-22 azimuthal correlations between tracks and the leading track are shown in different rangesof leading track pT. The range 1/3π < |∆φ |< 2/3π corresponds to the Transverse region. The regions−1/3π < ∆φ < 1/3π (Toward) and 2/3π < |∆φ |< π (Away) collect the fragmentation products of theleading and sub-leading jets. In general, all Monte Carlo simulations considered fail to reproduce theshape of the measured distributions. PYTHIA 8 provides the best prediction for the Transverse activity inall leading track pT ranges considered. Unfortunately the same model significantly overestimates the jetfragmentation regions.
9 Conclusions
We have characterized the Underlying Event in pp collisions at√
s = 0.9 and 7 TeV by measuring thenumber density, the summed pT distribution and the azimuthal correlation of charged particles withrespect to the leading particle. The analysis is based on about 6 · 106 minimum bias events at
√s =
0.9 TeV and 25 · 106 events at√
s = 7 TeV collected during the data taking periods from April to July2010. Measured data have been corrected for detector related effects; in particular we applied a data-driven correction to account for the misidentification of the leading track. The fully corrected finaldistributions are compared with PYTHIA 6.4, PYTHIA 8 and PHOJET, showing that pre-LHC tunes havedifficulties describing the data. These results are an important ingredient in the required retuning of thosegenerators.

16 The ALICE Collaboration
Among the presented distributions, the Transverse region is particularly sensitive to the UnderlyingEvent. We find that the ratio between the distributions at
√s = 0.9 and 7 TeV in this region saturates at a
value of about 2 for track pT > 0.5 GeV/c. The summed pT distribution rises slightly faster as a functionof√
s than the number density distribution, indicating that the available energy tends to increase theparticle’s transverse momentum in addition to the multiplicity. This is in qualitative agreement with anincreased relative contribution of hard processes to the Underlying Event with increasing
√s. Moreover,
the average number of particles at large pT,LT in the Transverse region seems to scale logarithmicallywith the collision energy. In general our results are in good qualitative and quantitative agreement withmeasurements from other LHC experiments (ATLAS and CMS) and show similar trends to that of theTevatron (CDF).
Our results show that the activity in the Transverse region increases logarithmically and faster thandNch/dη in minimum-bias events. Models aiming to correctly reproduce these minimum-bias and un-derlying event distributions need a precise description of the interplay of the hard process, the associatedinitial and final-state radiation and multiple parton interactions.

Underlying Event measurements with ALICE 17
Number Density - track pT > 0.15GeV/c
(GeV/c)T
leading p1 2 3 4 5 6 7 8 9 10
RA
TIO
0.8
1
1.2
(GeV/c)T
leading p1 2 3 4 5 6 7 8 9 10
)Φ∆η∆
ev 1
/(N
chN
0
0.5
1
1.5
2Toward Region /3π| < φ∆| | <0.8η > 0.15 GeV/c |
T p
= 0.9 TeVsALICE pp at Data (corrected)Pythia 6 - Perugia 0 Pythia 8 - Tune 1
Phojet
(GeV/c)T
leading p5 10 15 20 25
RA
TIO
0.8
1
1.2
(GeV/c)T
leading p5 10 15 20 25
)Φ∆η∆
ev 1
/(N
chN
0
0.5
1
1.5
2
2.5
3
3.5
4
4.5Toward Region /3π| < φ∆| | <0.8η > 0.15 GeV/c |
T p
= 7 TeVsALICE pp at Data (corrected)Pythia 6 - Perugia 0 Pythia 8 - Tune 1
Phojet
(GeV/c)T
leading p1 2 3 4 5 6 7 8 9 10
RA
TIO
0.8
1
1.2
(GeV/c)T
leading p1 2 3 4 5 6 7 8 9 10
)Φ∆η∆
ev 1
/(N
chN
0
0.2
0.4
0.6
0.8
1
1.2
1.4 Transverse Region /3π| < 2φ∆/3 < |π | <0.8η > 0.15 GeV/c |T
p
= 0.9 TeVsALICE pp at Data (corrected)Pythia 6 - Perugia 0 Pythia 8 - Tune 1
Phojet
(GeV/c)T
leading p5 10 15 20 25
RA
TIO
0.8
1
1.2
(GeV/c)T
leading p5 10 15 20 25
)Φ∆η∆
ev 1
/(N
chN
0
0.5
1
1.5
2
2.5
3Transverse Region /3π| < 2φ∆/3 < |π | <0.8η > 0.15 GeV/c |
T p
= 7 TeVsALICE pp at Data (corrected)Pythia 6 - Perugia 0 Pythia 8 - Tune 1
Phojet
(GeV/c)T
leading p1 2 3 4 5 6 7 8 9 10
RA
TIO
0.8
1
1.2
(GeV/c)T
leading p1 2 3 4 5 6 7 8 9 10
)Φ∆η∆
ev 1
/(N
chN
0
0.5
1
1.5
2 Away Region /3π| > 2φ∆| | <0.8η > 0.15 GeV/c |T
p
= 0.9 TeVsALICE pp at Data (corrected)Pythia 6 - Perugia 0 Pythia 8 - Tune 1
Phojet
(GeV/c)T
leading p5 10 15 20 25
RA
TIO
0.8
1
1.2
(GeV/c)T
leading p5 10 15 20 25
)Φ∆η∆
ev 1
/(N
chN
0
0.5
1
1.5
2
2.5
3
3.5
4 Away Region /3π| > 2φ∆| | <0.8η > 0.15 GeV/c |T
p
= 7 TeVsALICE pp at Data (corrected)Pythia 6 - Perugia 0 Pythia 8 - Tune 1
Phojet
Fig. 4: Number density in Toward (top), Transverse (middle) and Away (bottom) regions at√
s = 0.9 TeV (left)and√
s = 7 TeV (right). Right and left vertical scales differ by a factor 2. Shaded area in upper plots: system-atic uncertainties. Shaded areas in bottom plots: sum in quadrature of statistical and systematic uncertainties.Horizontal error bars: bin width.

18 The ALICE Collaboration
Number Density - track pT > 0.5GeV/c
(GeV/c)T
leading p1 2 3 4 5 6 7 8 9 10
RA
TIO
0.8
1
1.2
(GeV/c)T
leading p1 2 3 4 5 6 7 8 9 10
)Φ∆η∆
ev 1
/(N
chN
0
0.2
0.4
0.6
0.8
1
1.2
1.4Toward Region /3π| < φ∆| | <0.8η > 0.5 GeV/c |
T p
= 0.9 TeVsALICE pp at Data (corrected)Pythia 6 - Perugia 0 Pythia 8 - Tune 1
Phojet
(GeV/c)T
leading p5 10 15 20 25
RA
TIO
0.8
1
1.2
(GeV/c)T
leading p5 10 15 20 25
)Φ∆η∆
ev 1
/(N
chN
0
0.5
1
1.5
2
2.5Toward Region /3π| < φ∆| | <0.8η > 0.5 GeV/c |
T p
= 7 TeVsALICE pp at Data (corrected)Pythia 6 - Perugia 0 Pythia 8 - Tune 1
Phojet
(GeV/c)T
leading p1 2 3 4 5 6 7 8 9 10
RA
TIO
0.8
1
1.2
(GeV/c)T
leading p1 2 3 4 5 6 7 8 9 10
)Φ∆η∆
ev 1
/(N
chN
0
0.1
0.2
0.3
0.4
0.5
0.6
0.7Transverse Region /3π| < 2φ∆/3 < |π | <0.8η > 0.5 GeV/c |
T p
= 0.9 TeVsALICE pp at Data (corrected)Pythia 6 - Perugia 0 Pythia 8 - Tune 1
Phojet
(GeV/c)T
leading p5 10 15 20 25
RA
TIO
0.8
1
1.2
(GeV/c)T
leading p5 10 15 20 25
)Φ∆η∆
ev 1
/(N
chN
0
0.2
0.4
0.6
0.8
1
1.2
1.4Transverse Region /3π| < 2φ∆/3 < |π | <0.8η > 0.5 GeV/c |
T p
= 7 TeVsALICE pp at Data (corrected)Pythia 6 - Perugia 0 Pythia 8 - Tune 1
Phojet
(GeV/c)T
leading p1 2 3 4 5 6 7 8 9 10
RA
TIO
0.8
1
1.2
(GeV/c)T
leading p1 2 3 4 5 6 7 8 9 10
)Φ∆η∆
ev 1
/(N
chN
0
0.2
0.4
0.6
0.8
1
1.2Away Region /3π| > 2φ∆| | <0.8η > 0.5 GeV/c |
T p
= 0.9 TeVsALICE pp at Data (corrected)Pythia 6 - Perugia 0 Pythia 8 - Tune 1
Phojet
(GeV/c)T
leading p5 10 15 20 25
RA
TIO
0.8
1
1.2
(GeV/c)T
leading p5 10 15 20 25
)Φ∆η∆
ev 1
/(N
chN
0
0.5
1
1.5
2
Away Region /3π| > 2φ∆| | <0.8η > 0.5 GeV/c |T
p
= 7 TeVsALICE pp at Data (corrected)Pythia 6 - Perugia 0 Pythia 8 - Tune 1
Phojet
Fig. 5: Number density in Toward (top), Transverse (middle) and Away (bottom) regions at√
s = 0.9 TeV (left)and√
s = 7 TeV (right). Right and left vertical scales differ by a factor 2. Shaded area in upper plots: system-atic uncertainties. Shaded areas in bottom plots: sum in quadrature of statistical and systematic uncertainties.Horizontal error bars: bin width.

Underlying Event measurements with ALICE 19
Number Density - track pT > 1.0GeV/c
(GeV/c)T
leading p1 2 3 4 5 6 7 8 9 10
RA
TIO
0.8
1
1.2
(GeV/c)T
leading p1 2 3 4 5 6 7 8 9 10
)Φ∆η∆
ev 1
/(N
chN
0
0.1
0.2
0.3
0.4
0.5
0.6
0.7
0.8 Toward Region /3π| < φ∆| | <0.8η > 1.0 GeV/c |T
p
= 0.9 TeVsALICE pp at Data (corrected)Pythia 6 - Perugia 0 Pythia 8 - Tune 1
Phojet
(GeV/c)T
leading p5 10 15 20 25
RA
TIO
0.8
1
1.2
(GeV/c)T
leading p5 10 15 20 25
)Φ∆η∆
ev 1
/(N
chN
0
0.2
0.4
0.6
0.8
1
1.2
1.4
1.6 Toward Region /3π| < φ∆| | <0.8η > 1.0 GeV/c |T
p
= 7 TeVsALICE pp at Data (corrected)Pythia 6 - Perugia 0 Pythia 8 - Tune 1
Phojet
(GeV/c)T
leading p1 2 3 4 5 6 7 8 9 10
RA
TIO
0.8
1
1.2
(GeV/c)T
leading p1 2 3 4 5 6 7 8 9 10
)Φ∆η∆
ev 1
/(N
chN
-0.05
0
0.05
0.1
0.15
0.2
0.25
0.3Transverse Region /3π| < 2φ∆/3 < |π | <0.8η > 1.0 GeV/c |
T p
= 0.9 TeVsALICE pp at Data (corrected)Pythia 6 - Perugia 0 Pythia 8 - Tune 1
Phojet
(GeV/c)T
leading p5 10 15 20 25
RA
TIO
0.8
1
1.2
(GeV/c)T
leading p5 10 15 20 25
)Φ∆η∆
ev 1
/(N
chN
0
0.1
0.2
0.3
0.4
0.5
0.6Transverse Region /3π| < 2φ∆/3 < |π | <0.8η > 1.0 GeV/c |
T p
= 7 TeVsALICE pp at Data (corrected)Pythia 6 - Perugia 0 Pythia 8 - Tune 1
Phojet
(GeV/c)T
leading p1 2 3 4 5 6 7 8 9 10
RA
TIO
0.8
1
1.2
(GeV/c)T
leading p1 2 3 4 5 6 7 8 9 10
)Φ∆η∆
ev 1
/(N
chN
0
0.1
0.2
0.3
0.4
0.5
0.6 Away Region /3π| > 2φ∆| | <0.8η > 1.0 GeV/c |T
p
= 0.9 TeVsALICE pp at Data (corrected)Pythia 6 - Perugia 0 Pythia 8 - Tune 1
Phojet
(GeV/c)T
leading p5 10 15 20 25
RA
TIO
0.8
1
1.2
(GeV/c)T
leading p5 10 15 20 25
)Φ∆η∆
ev 1
/(N
chN
0
0.2
0.4
0.6
0.8
1
1.2 Away Region /3π| > 2φ∆| | <0.8η > 1.0 GeV/c |T
p
= 7 TeVsALICE pp at Data (corrected)Pythia 6 - Perugia 0 Pythia 8 - Tune 1
Phojet
Fig. 6: Number density in Toward (top), Transverse (middle) and Away (bottom) regions at√
s = 0.9 TeV (left)and√
s = 7 TeV (right). Right and left vertical scales differ by a factor 2. Shaded area in upper plots: system-atic uncertainties. Shaded areas in bottom plots: sum in quadrature of statistical and systematic uncertainties.Horizontal error bars: bin width.

20 The ALICE Collaboration
(TeV)s
-110×8 1 2 3 4 5 6 7 8 9 10
Mul
tiplic
ity
0.1
0.2
0.3
0.4
0.5
0.6
0.7
0.8
0.9
1.0 )π (scaled by 1/2η/dch MB dN
Underlying Event
Fig. 7: Comparison of number density in the plateau of the Transverse region (see Table 8) and dNch/dη inminimum-bias events (scaled by 1/2π) [30]. Both are for charged particles with pT > 0.5GeV/c. For this plot,statistical and systematic uncertainties have been summed in quadrature. The lines show fits with the functionalform a+b lns.
(GeV/c)T
Leading p0 1 2 3 4 5 6 7 8 9 10
RA
TIO
0.5
1
1.5
2
2.5
3
3.5
thresholdT
Track p > 0.15 GeV/c
Tp
> 0.5 GeV/cT
p > 1.0 GeV/c
Tp
Number density ratio between 7 and 0.9 TeV in Transverse region
(GeV/c)T
Leading p0 1 2 3 4 5 6 7 8 9 10
RA
TIO
0.5
1
1.5
2
2.5
3
3.5
thresholdT
Track p > 0.15 GeV/c
Tp
> 0.5 GeV/cT
p > 1.0 GeV/c
Tp
ratio between 7 and 0.9 TeV in Transverse regionT
Summed p
Fig. 8: Ratio between√
s = 0.9TeV and√
s = 7TeV for number density (left) and summed pT (right) distributionsin the Transverse region. Statistical uncertainties only.

Underlying Event measurements with ALICE 21
Summed pT - track pT > 0.15GeV/c
(GeV/c)T
leading p1 2 3 4 5 6 7 8 9 10
RA
TIO
0.8
1
1.2
(GeV/c)T
leading p1 2 3 4 5 6 7 8 9 10
) (G
eV/c
)Φ∆η∆
ev 1
/(N
T pΣ
0
0.5
1
1.5
2 Toward Region /3π| < φ∆| | <0.8η > 0.15 GeV/c |T
p
= 0.9 TeVsALICE pp at Data (corrected)Pythia 6 - Perugia 0 Pythia 8 - Tune 1
Phojet
(GeV/c)T
leading p5 10 15 20 25
RA
TIO
0.8
1
1.2
(GeV/c)T
leading p5 10 15 20 25
) (G
eV/c
)Φ∆η∆
ev 1
/(N
T pΣ
0
1
2
3
4
5
6
7
8 Toward Region /3π| < φ∆| | <0.8η > 0.15 GeV/c |T
p
= 7 TeVsALICE pp at Data (corrected)Pythia 6 - Perugia 0 Pythia 8 - Tune 1
Phojet
(GeV/c)T
leading p1 2 3 4 5 6 7 8 9 10
RA
TIO
0.8
1
1.2
(GeV/c)T
leading p1 2 3 4 5 6 7 8 9 10
) (G
eV/c
)Φ∆η∆
ev 1
/(N
T pΣ
0
0.2
0.4
0.6
0.8
1Transverse Region /3π| < 2φ∆/3 < |π | <0.8η > 0.15 GeV/c |
T p
= 0.9 TeVsALICE pp at Data (corrected)Pythia 6 - Perugia 0 Pythia 8 - Tune 1
Phojet
(GeV/c)T
leading p5 10 15 20 25
RA
TIO
0.8
1
1.2
(GeV/c)T
leading p5 10 15 20 25
) (G
eV/c
)Φ∆η∆
ev 1
/(N
T pΣ
0
0.5
1
1.5
2Transverse Region /3π| < 2φ∆/3 < |π | <0.8η > 0.15 GeV/c |
T p
= 7 TeVsALICE pp at Data (corrected)Pythia 6 - Perugia 0 Pythia 8 - Tune 1
Phojet
(GeV/c)T
leading p1 2 3 4 5 6 7 8 9 10
RA
TIO
0.8
1
1.2
(GeV/c)T
leading p1 2 3 4 5 6 7 8 9 10
) (G
eV/c
)Φ∆η∆
ev 1
/(N
T pΣ
0
0.5
1
1.5
2Away Region /3π| > 2φ∆| | <0.8η > 0.15 GeV/c |
T p
= 0.9 TeVsALICE pp at Data (corrected)Pythia 6 - Perugia 0 Pythia 8 - Tune 1
Phojet
(GeV/c)T
leading p5 10 15 20 25
RA
TIO
0.8
1
1.2
(GeV/c)T
leading p5 10 15 20 25
) (G
eV/c
)Φ∆η∆
ev 1
/(N
T pΣ
0
0.5
1
1.5
2
2.5
3
3.5
4
4.5Away Region /3π| > 2φ∆| | <0.8η > 0.15 GeV/c |
T p
= 7 TeVsALICE pp at Data (corrected)Pythia 6 - Perugia 0 Pythia 8 - Tune 1
Phojet
Fig. 9: Summed pT in Toward (top), Transverse (middle) and Away (bottom) regions at√
s = 0.9 TeV (left) and√s = 7 TeV (right). Right and left vertical scales differ by a factor 4 (2) in the top (middle and bottom) panel.
Shaded area in upper plots: systematic uncertainties. Shaded areas in bottom plots: sum in quadrature of statisti-cal and systematic uncertainties. Horizontal error bars: bin width.

22 The ALICE Collaboration
Summed pT - track pT > 0.5GeV/c
(GeV/c)T
leading p1 2 3 4 5 6 7 8 9 10
RA
TIO
0.8
1
1.2
(GeV/c)T
leading p1 2 3 4 5 6 7 8 9 10
) (G
eV/c
)Φ∆η∆
ev 1
/(N
T pΣ
0
0.5
1
1.5
2Toward Region /3π| < φ∆| | <0.8η > 0.5 GeV/c |
T p
= 0.9 TeVsALICE pp at Data (corrected)Pythia 6 - Perugia 0 Pythia 8 - Tune 1
Phojet
(GeV/c)T
leading p5 10 15 20 25
RA
TIO
0.8
1
1.2
(GeV/c)T
leading p5 10 15 20 25
) (G
eV/c
)Φ∆η∆
ev 1
/(N
T pΣ
0
1
2
3
4
5
6
7
8Toward Region /3π| < φ∆| | <0.8η > 0.5 GeV/c |
T p
= 7 TeVsALICE pp at Data (corrected)Pythia 6 - Perugia 0 Pythia 8 - Tune 1
Phojet
(GeV/c)T
leading p1 2 3 4 5 6 7 8 9 10
RA
TIO
0.8
1
1.2
(GeV/c)T
leading p1 2 3 4 5 6 7 8 9 10
) (G
eV/c
)Φ∆η∆
ev 1
/(N
T pΣ
-0.1
0
0.1
0.2
0.3
0.4
0.5
0.6
0.7
0.8 Transverse Region /3π| < 2φ∆/3 < |π | <0.8η > 0.5 GeV/c |T
p
= 0.9 TeVsALICE pp at Data (corrected)Pythia 6 - Perugia 0 Pythia 8 - Tune 1
Phojet
(GeV/c)T
leading p5 10 15 20 25
RA
TIO
0.8
1
1.2
(GeV/c)T
leading p5 10 15 20 25
) (G
eV/c
)Φ∆η∆
ev 1
/(N
T pΣ
0
0.2
0.4
0.6
0.8
1
1.2
1.4
1.6 Transverse Region /3π| < 2φ∆/3 < |π | <0.8η > 0.5 GeV/c |T
p
= 7 TeVsALICE pp at Data (corrected)Pythia 6 - Perugia 0 Pythia 8 - Tune 1
Phojet
(GeV/c)T
leading p1 2 3 4 5 6 7 8 9 10
RA
TIO
0.8
1
1.2
(GeV/c)T
leading p1 2 3 4 5 6 7 8 9 10
) (G
eV/c
)Φ∆η∆
ev 1
/(N
T pΣ
0
0.5
1
1.5
2Away Region /3π| > 2φ∆| | <0.8η > 0.5 GeV/c |
T p
= 0.9 TeVsALICE pp at Data (corrected)Pythia 6 - Perugia 0 Pythia 8 - Tune 1
Phojet
(GeV/c)T
leading p5 10 15 20 25
RA
TIO
0.8
1
1.2
(GeV/c)T
leading p5 10 15 20 25
) (G
eV/c
)Φ∆η∆
ev 1
/(N
T pΣ
0
0.5
1
1.5
2
2.5
3
3.5
4 Away Region /3π| > 2φ∆| | <0.8η > 0.5 GeV/c |T
p
= 7 TeVsALICE pp at Data (corrected)Pythia 6 - Perugia 0 Pythia 8 - Tune 1
Phojet
Fig. 10: Summed pT in Toward (top), Transverse (middle) and Away (bottom) regions at√
s = 0.9 TeV (left)and√
s = 7 TeV (right). Right and left vertical scales differ by a factor 4 (2) in the top (middle and bottom)panel. Shaded area in upper plots: systematic uncertainties. Shaded areas in bottom plots: sum in quadrature ofstatistical and systematic uncertainties. Horizontal error bars: bin width.

Underlying Event measurements with ALICE 23
Summed pT - track pT > 1.0GeV/c
(GeV/c)T
leading p1 2 3 4 5 6 7 8 9 10
RA
TIO
0.8
1
1.2
(GeV/c)T
leading p1 2 3 4 5 6 7 8 9 10
) (G
eV/c
)Φ∆η∆
ev 1
/(N
T pΣ
0
0.2
0.4
0.6
0.8
1
1.2
1.4
1.6Toward Region /3π| < φ∆| | <0.8η > 1.0 GeV/c |
T p
= 0.9 TeVsALICE pp at Data (corrected)Pythia 6 - Perugia 0 Pythia 8 - Tune 1
Phojet
(GeV/c)T
leading p5 10 15 20 25
RA
TIO
0.8
1
1.2
(GeV/c)T
leading p5 10 15 20 25
) (G
eV/c
)Φ∆η∆
ev 1
/(N
T pΣ
0
1
2
3
4
5
6 Toward Region /3π| < φ∆| | <0.8η > 1.0 GeV/c |T
p
= 7 TeVsALICE pp at Data (corrected)Pythia 6 - Perugia 0 Pythia 8 - Tune 1
Phojet
(GeV/c)T
leading p1 2 3 4 5 6 7 8 9 10
RA
TIO
0.8
1
1.2
(GeV/c)T
leading p1 2 3 4 5 6 7 8 9 10
) (G
eV/c
)Φ∆η∆
ev 1
/(N
T pΣ
-0.2
-0.1
0
0.1
0.2
0.3
0.4Transverse Region /3π| < 2φ∆/3 < |π | <0.8η > 1.0 GeV/c |
T p
= 0.9 TeVsALICE pp at Data (corrected)Pythia 6 - Perugia 0 Pythia 8 - Tune 1
Phojet
(GeV/c)T
leading p5 10 15 20 25
RA
TIO
0.8
1
1.2
(GeV/c)T
leading p5 10 15 20 25
) (G
eV/c
)Φ∆η∆
ev 1
/(N
T pΣ
-0.2
0
0.2
0.4
0.6
0.8
1
1.2 Transverse Region /3π| < 2φ∆/3 < |π | <0.8η > 1.0 GeV/c |T
p
= 7 TeVsALICE pp at Data (corrected)Pythia 6 - Perugia 0 Pythia 8 - Tune 1
Phojet
(GeV/c)T
leading p1 2 3 4 5 6 7 8 9 10
RA
TIO
0.8
1
1.2
(GeV/c)T
leading p1 2 3 4 5 6 7 8 9 10
) (G
eV/c
)Φ∆η∆
ev 1
/(N
T pΣ
0
0.2
0.4
0.6
0.8
1
1.2Away Region /3π| > 2φ∆| | <0.8η > 1.0 GeV/c |
T p
= 0.9 TeVsALICE pp at Data (corrected)Pythia 6 - Perugia 0 Pythia 8 - Tune 1
Phojet
(GeV/c)T
leading p5 10 15 20 25
RA
TIO
0.8
1
1.2
(GeV/c)T
leading p5 10 15 20 25
) (G
eV/c
)Φ∆η∆
ev 1
/(N
T pΣ
0
0.5
1
1.5
2
2.5
3
3.5Away Region /3π| > 2φ∆| | <0.8η > 1.0 GeV/c |
T p
= 7 TeVsALICE pp at Data (corrected)Pythia 6 - Perugia 0 Pythia 8 - Tune 1
Phojet
Fig. 11: Summed pT in Toward (top), Transverse (middle) and Away (bottom) regions at√
s = 0.9 TeV (left)and√
s = 7 TeV (right). Right and left vertical scales differ by a factor 4 (3) in the top (middle and bottom)panel. Shaded area in upper plots: systematic uncertainties. Shaded areas in bottom plots: sum in quadrature ofstatistical and systematic uncertainties. Horizontal error bars: bin width.

24 The ALICE Collaboration
Azimuthal correlations - track pT > 0.15GeV/c
w.r.t. leading track (rad)φ∆-1 0 1 2 3 4
RA
TIO
0.8
0.9
1
1.1
w.r.t. leading trackφ ∆-1 0 1 2 3 4
)η∆ ev
) 1/
(Nφ∆
/d(
chdN
0.4
0.45
0.5
0.55
0.6
0.65
| <0.8η < 1.5 (GeV/c) and |T
Leading track: 0.5 < p| <0.8η > 0.15 GeV/c and |
TAssociated: p
= 0.9 TeVsALICE pp at Data (corrected)Pythia 6 - Perugia 0 Pythia 8 - Tune 1 Phojet
w.r.t. leading track (rad)φ∆-1 0 1 2 3 4
RA
TIO
0.8
0.9
1
1.1
w.r.t. leading trackφ ∆-1 0 1 2 3 4
)η∆ ev
) 1/
(Nφ∆
/d(
chdN
0.5
0.55
0.6
0.65
0.7
0.75
0.8
0.85
0.9
| <0.8η < 1.5 (GeV/c) and |T
Leading track: 0.5 < p| <0.8η > 0.15 GeV/c and |
TAssociated: p
= 7 TeVsALICE pp at Data (corrected)Pythia 6 - Perugia 0 Pythia 8 - Tune 1 Phojet
Fig. 12: Azimuthal correlation at√
s = 0.9 TeV (left) and√
s = 7 TeV (right). Leading-track: 0.5 < pT,LT <
1.5 GeV/c. For visualization purposes the ∆φ axis is not centered around 0. Shaded area in upper plots: system-atic uncertainties. Shaded areas in bottom plots: sum in quadrature of statistical and systematic uncertainties.Horizontal error bars: bin width.
w.r.t. leading track (rad)φ∆-1 0 1 2 3 4
RA
TIO
0.8
0.9
1
1.1
w.r.t. leading trackφ ∆-1 0 1 2 3 4
)η∆ ev
) 1/
(Nφ∆
/d(
chdN
0.7
0.8
0.9
1
1.1
1.2
1.3
1.4
| <0.8η < 4.0 (GeV/c) and |T
Leading track: 2.0 < p| <0.8η > 0.15 GeV/c and |
TAssociated: p
= 0.9 TeVsALICE pp at Data (corrected)Pythia 6 - Perugia 0 Pythia 8 - Tune 1 Phojet
w.r.t. leading track (rad)φ∆-1 0 1 2 3 4
RA
TIO
0.8
0.9
1
1.1
w.r.t. leading trackφ ∆-1 0 1 2 3 4
)η∆ ev
) 1/
(Nφ∆
/d(
chdN
1
1.2
1.4
1.6
1.8
2
2.2
2.4
| <0.8η < 4.0 (GeV/c) and |T
Leading track: 2.0 < p| <0.8η > 0.15 GeV/c and |
TAssociated: p
= 7 TeVsALICE pp at Data (corrected)Pythia 6 - Perugia 0 Pythia 8 - Tune 1 Phojet
Fig. 13: Azimuthal correlation at√
s = 0.9 TeV (left) and√
s = 7 TeV (right). Leading-track: 2.0 < pT,LT <
4.0 GeV/c. For visualization purposes the ∆φ axis is not centered around 0. Shaded area in upper plots: system-atic uncertainties. Shaded areas in bottom plots: sum in quadrature of statistical and systematic uncertainties.Horizontal error bars: bin width.

Underlying Event measurements with ALICE 25
w.r.t. leading track (rad)φ∆-1 0 1 2 3 4
RA
TIO
0.8
0.9
1
1.1
w.r.t. leading trackφ ∆-1 0 1 2 3 4
)η∆ ev
) 1/
(Nφ∆
/d(
chdN
0.6
0.8
1
1.2
1.4
1.6
1.8
2
| <0.8η < 6.0 (GeV/c) and |T
Leading track: 4.0 < p| <0.8η > 0.15 GeV/c and |
TAssociated: p
= 0.9 TeVsALICE pp at Data (corrected)Pythia 6 - Perugia 0 Pythia 8 - Tune 1 Phojet
w.r.t. leading track (rad)φ∆-1 0 1 2 3 4
RA
TIO
0.8
0.9
1
1.1
w.r.t. leading trackφ ∆-1 0 1 2 3 4
)η∆ ev
) 1/
(Nφ∆
/d(
chdN
1
1.5
2
2.5
3
| <0.8η < 6.0 (GeV/c) and |T
Leading track: 4.0 < p| <0.8η > 0.15 GeV/c and |
TAssociated: p
= 7 TeVsALICE pp at Data (corrected)Pythia 6 - Perugia 0 Pythia 8 - Tune 1 Phojet
Fig. 14: Azimuthal correlation at√
s = 0.9 TeV (left) and√
s = 7 TeV (right). Leading-track: 4.0 < pT,LT <
6.0 GeV/c. For visualization purposes the ∆φ axis is not centered around 0. Shaded area in upper plots: system-atic uncertainties. Shaded areas in bottom plots: sum in quadrature of statistical and systematic uncertainties.Horizontal error bars: bin width.
w.r.t. leading track (rad)φ∆-1 0 1 2 3 4
RA
TIO
0.8
1
1.2
w.r.t. leading trackφ ∆-1 0 1 2 3 4
)η∆ ev
) 1/
(Nφ∆
/d(
chdN
0.5
1
1.5
2
2.5
| <0.8η < 10.0 (GeV/c) and |T
Leading track: 6.0 < p| <0.8η > 0.15 GeV/c and |
TAssociated: p
= 0.9 TeVsALICE pp at Data (corrected)Pythia 6 - Perugia 0 Pythia 8 - Tune 1 Phojet
w.r.t. leading track (rad)φ∆-1 0 1 2 3 4
RA
TIO
0.8
1
1.2
w.r.t. leading trackφ ∆-1 0 1 2 3 4
)η∆ ev
) 1/
(Nφ∆
/d(
chdN
1
1.5
2
2.5
3
3.5
4
| <0.8η < 10.0 (GeV/c) and |T
Leading track: 6.0 < p| <0.8η > 0.15 GeV/c and |
TAssociated: p
= 7 TeVsALICE pp at Data (corrected)Pythia 6 - Perugia 0 Pythia 8 - Tune 1 Phojet
Fig. 15: Azimuthal correlation at√
s = 0.9 TeV (left) and√
s = 7 TeV (right). Leading-track: 6.0 < pT,LT <
10.0 GeV/c. For visualization purposes the ∆φ axis is not centered around 0. Shaded area in upper plots: sys-tematic uncertainties. Shaded areas in bottom plots: sum in quadrature of statistical and systematic uncertainties.Horizontal error bars: bin width.

26 The ALICE Collaboration
Azimuthal correlations - track pT > 0.5GeV/c
w.r.t. leading track (rad)φ∆-1 0 1 2 3 4
RA
TIO
0.8
0.9
1
1.1
w.r.t. leading trackφ ∆-1 0 1 2 3 4
)η∆ ev
) 1/
(Nφ∆
/d(
chdN
0.1
0.12
0.14
0.16
0.18
0.2
0.22
| <0.8η < 1.5 (GeV/c) and |T
Leading track: 0.5 < p| <0.8η > 0.50 GeV/c and |
TAssociated: p
= 0.9 TeVsALICE pp at Data (corrected)Pythia 6 - Perugia 0 Pythia 8 - Tune 1 Phojet
w.r.t. leading track (rad)φ∆-1 0 1 2 3 4
RA
TIO
0.8
0.9
1
1.1
w.r.t. leading trackφ ∆-1 0 1 2 3 4
)η∆ ev
) 1/
(Nφ∆
/d(
chdN
0.15
0.2
0.25
0.3
0.35
| <0.8η < 1.5 (GeV/c) and |T
Leading track: 0.5 < p| <0.8η > 0.50 GeV/c and |
TAssociated: p
= 7 TeVsALICE pp at Data (corrected)Pythia 6 - Perugia 0 Pythia 8 - Tune 1 Phojet
Fig. 16: Azimuthal correlation at√
s = 0.9 TeV (left) and√
s = 7 TeV (right). Leading-track: 0.5 < pT,LT <
1.5 GeV/c. For visualization purposes the ∆φ axis is not centered around 0. Shaded area in upper plots: system-atic uncertainties. Shaded areas in bottom plots: sum in quadrature of statistical and systematic uncertainties.Horizontal error bars: bin width.
w.r.t. leading track (rad)φ∆-1 0 1 2 3 4
RA
TIO
0.8
0.9
1
1.1
w.r.t. leading trackφ ∆-1 0 1 2 3 4
)η∆ ev
) 1/
(Nφ∆
/d(
chdN
0.3
0.4
0.5
0.6
0.7
0.8
| <0.8η < 4.0 (GeV/c) and |T
Leading track: 2.0 < p| <0.8η > 0.50 GeV/c and |
TAssociated: p
= 0.9 TeVsALICE pp at Data (corrected)Pythia 6 - Perugia 0 Pythia 8 - Tune 1 Phojet
w.r.t. leading track (rad)φ∆-1 0 1 2 3 4
RA
TIO
0.8
0.9
1
1.1
w.r.t. leading trackφ ∆-1 0 1 2 3 4
)η∆ ev
) 1/
(Nφ∆
/d(
chdN
0.4
0.6
0.8
1
1.2
| <0.8η < 4.0 (GeV/c) and |T
Leading track: 2.0 < p| <0.8η > 0.50 GeV/c and |
TAssociated: p
= 7 TeVsALICE pp at Data (corrected)Pythia 6 - Perugia 0 Pythia 8 - Tune 1 Phojet
Fig. 17: Azimuthal correlation at√
s = 0.9 TeV (left) and√
s = 7 TeV (right). Leading-track: 2.0 < pT,LT <
4.0 GeV/c. For visualization purposes the ∆φ axis is not centered around 0. Shaded area in upper plots: system-atic uncertainties. Shaded areas in bottom plots: sum in quadrature of statistical and systematic uncertainties.Horizontal error bars: bin width.

Underlying Event measurements with ALICE 27
w.r.t. leading track (rad)φ∆-1 0 1 2 3 4
RA
TIO
0.8
0.9
1
1.1
w.r.t. leading trackφ ∆-1 0 1 2 3 4
)η∆ ev
) 1/
(Nφ∆
/d(
chdN
0.2
0.4
0.6
0.8
1
1.2
1.4
| <0.8η < 6.0 (GeV/c) and |T
Leading track: 4.0 < p| <0.8η > 0.50 GeV/c and |
TAssociated: p
= 0.9 TeVsALICE pp at Data (corrected)Pythia 6 - Perugia 0 Pythia 8 - Tune 1 Phojet
w.r.t. leading track (rad)φ∆-1 0 1 2 3 4
RA
TIO
0.8
0.9
1
1.1
w.r.t. leading trackφ ∆-1 0 1 2 3 4
)η∆ ev
) 1/
(Nφ∆
/d(
chdN
0.4
0.6
0.8
1
1.2
1.4
1.6
1.8
2
2.2
| <0.8η < 6.0 (GeV/c) and |T
Leading track: 4.0 < p| <0.8η > 0.50 GeV/c and |
TAssociated: p
= 7 TeVsALICE pp at Data (corrected)Pythia 6 - Perugia 0 Pythia 8 - Tune 1 Phojet
Fig. 18: Azimuthal correlation at√
s = 0.9 TeV (left) and√
s = 7 TeV (right). Leading-track: 4.0 < pT,LT <
6.0 GeV/c. For visualization purposes the ∆φ axis is not centered around 0. Shaded area in upper plots: system-atic uncertainties. Shaded areas in bottom plots: sum in quadrature of statistical and systematic uncertainties.Horizontal error bars: bin width.
w.r.t. leading track (rad)φ∆-1 0 1 2 3 4
RA
TIO
0.8
1
1.2
w.r.t. leading trackφ ∆-1 0 1 2 3 4
)η∆ ev
) 1/
(Nφ∆
/d(
chdN
0.2
0.4
0.6
0.8
1
1.2
1.4
1.6
1.8
2
| <0.8η < 10.0 (GeV/c) and |T
Leading track: 6.0 < p| <0.8η > 0.50 GeV/c and |
TAssociated: p
= 0.9 TeVsALICE pp at Data (corrected)Pythia 6 - Perugia 0 Pythia 8 - Tune 1 Phojet
w.r.t. leading track (rad)φ∆-1 0 1 2 3 4
RA
TIO
0.8
1
1.2
w.r.t. leading trackφ ∆-1 0 1 2 3 4
)η∆ ev
) 1/
(Nφ∆
/d(
chdN
0.5
1
1.5
2
2.5
3
| <0.8η < 10.0 (GeV/c) and |T
Leading track: 6.0 < p| <0.8η > 0.50 GeV/c and |
TAssociated: p
= 7 TeVsALICE pp at Data (corrected)Pythia 6 - Perugia 0 Pythia 8 - Tune 1 Phojet
Fig. 19: Azimuthal correlation at√
s = 0.9 TeV (left) and√
s = 7 TeV (right). Leading-track: 6.0 < pT,LT <
10.0 GeV/c. For visualization purposes the ∆φ axis is not centered around 0. Shaded area in upper plots: sys-tematic uncertainties. Shaded areas in bottom plots: sum in quadrature of statistical and systematic uncertainties.Horizontal error bars: bin width.

28 The ALICE Collaboration
Azimuthal correlations - track pT > 1.0GeV/c
w.r.t. leading track (rad)φ∆-1 0 1 2 3 4
RA
TIO
0.8
0.9
1
1.1
w.r.t. leading trackφ ∆-1 0 1 2 3 4
)η∆ ev
) 1/
(Nφ∆
/d(
chdN
0.05
0.1
0.15
0.2
0.25
0.3
0.35
| <0.8η < 4.0 (GeV/c) and |T
Leading track: 2.0 < p| <0.8η > 1.00 GeV/c and |
TAssociated: p
= 0.9 TeVsALICE pp at Data (corrected)Pythia 6 - Perugia 0 Pythia 8 - Tune 1 Phojet
w.r.t. leading track (rad)φ∆-1 0 1 2 3 4
RA
TIO
0.8
0.9
1
1.1
w.r.t. leading trackφ ∆-1 0 1 2 3 4
)η∆ ev
) 1/
(Nφ∆
/d(
chdN
0.1
0.2
0.3
0.4
0.5
0.6
| <0.8η < 4.0 (GeV/c) and |T
Leading track: 2.0 < p| <0.8η > 1.00 GeV/c and |
TAssociated: p
= 7 TeVsALICE pp at Data (corrected)Pythia 6 - Perugia 0 Pythia 8 - Tune 1 Phojet
Fig. 20: Azimuthal correlation at√
s = 0.9 TeV (left) and√
s = 7 TeV (right). Leading-track: 2.0 < pT,LT <
4.0 GeV/c. For visualization purposes the ∆φ axis is not centered around 0. Shaded area in upper plots: system-atic uncertainties. Shaded areas in bottom plots: sum in quadrature of statistical and systematic uncertainties.Horizontal error bars: bin width.
w.r.t. leading track (rad)φ∆-1 0 1 2 3 4
RA
TIO
0.8
0.9
1
1.1
w.r.t. leading trackφ ∆-1 0 1 2 3 4
)η∆ ev
) 1/
(Nφ∆
/d(
chdN
0
0.1
0.2
0.3
0.4
0.5
0.6
0.7
0.8
| <0.8η < 6.0 (GeV/c) and |T
Leading track: 4.0 < p| <0.8η > 1.00 GeV/c and |
TAssociated: p
= 0.9 TeVsALICE pp at Data (corrected)Pythia 6 - Perugia 0 Pythia 8 - Tune 1 Phojet
w.r.t. leading track (rad)φ∆-1 0 1 2 3 4
RA
TIO
0.8
0.9
1
1.1
w.r.t. leading trackφ ∆-1 0 1 2 3 4
)η∆ ev
) 1/
(Nφ∆
/d(
chdN
0
0.2
0.4
0.6
0.8
1
1.2
1.4
| <0.8η < 6.0 (GeV/c) and |T
Leading track: 4.0 < p| <0.8η > 1.00 GeV/c and |
TAssociated: p
= 7 TeVsALICE pp at Data (corrected)Pythia 6 - Perugia 0 Pythia 8 - Tune 1 Phojet
Fig. 21: Azimuthal correlation at√
s = 0.9 TeV (left) and√
s = 7 TeV (right). Leading-track: 4.0 < pT,LT <
6.0 GeV/c. For visualization purposes the ∆φ axis is not centered around 0. Shaded area in upper plots: system-atic uncertainties. Shaded areas in bottom plots: sum in quadrature of statistical and systematic uncertainties.Horizontal error bars: bin width.

Underlying Event measurements with ALICE 29
w.r.t. leading track (rad)φ∆-1 0 1 2 3 4
RA
TIO
0.8
1
1.2
w.r.t. leading trackφ ∆-1 0 1 2 3 4
)η∆ ev
) 1/
(Nφ∆
/d(
chdN
0
0.2
0.4
0.6
0.8
1
1.2
1.4
| <0.8η < 10.0 (GeV/c) and |T
Leading track: 6.0 < p| <0.8η > 1.00 GeV/c and |
TAssociated: p
= 0.9 TeVsALICE pp at Data (corrected)Pythia 6 - Perugia 0 Pythia 8 - Tune 1 Phojet
w.r.t. leading track (rad)φ∆-1 0 1 2 3 4
RA
TIO
0.8
1
1.2
w.r.t. leading trackφ ∆-1 0 1 2 3 4
)η∆ ev
) 1/
(Nφ∆
/d(
chdN
0
0.5
1
1.5
2
| <0.8η < 10.0 (GeV/c) and |T
Leading track: 6.0 < p| <0.8η > 1.00 GeV/c and |
TAssociated: p
= 7 TeVsALICE pp at Data (corrected)Pythia 6 - Perugia 0 Pythia 8 - Tune 1 Phojet
Fig. 22: Azimuthal correlation at√
s = 0.9 TeV (left) and√
s = 7 TeV (right). Leading-track: 6.0 < pT,LT <
10.0 GeV/c. For visualization purposes the ∆φ axis is not centered around 0. Shaded area in upper plots: sys-tematic uncertainties. Shaded areas in bottom plots: sum in quadrature of statistical and systematic uncertainties.Horizontal error bars: bin width.
10 Acknowledgements
The ALICE collaboration would like to thank all its engineers and technicians for their invaluable con-tributions to the construction of the experiment and the CERN accelerator teams for the outstandingperformance of the LHC complex.The ALICE collaboration acknowledges the following funding agencies for their support in building andrunning the ALICE detector:Calouste Gulbenkian Foundation from Lisbon and Swiss Fonds Kidagan, Armenia;Conselho Nacional de Desenvolvimento Cientıfico e Tecnologico (CNPq), Financiadora de Estudos eProjetos (FINEP), Fundacao de Amparo a Pesquisa do Estado de Sao Paulo (FAPESP);National Natural Science Foundation of China (NSFC), the Chinese Ministry of Education (CMOE) andthe Ministry of Science and Technology of China (MSTC);Ministry of Education and Youth of the Czech Republic;Danish Natural Science Research Council, the Carlsberg Foundation and the Danish National ResearchFoundation;The European Research Council under the European Community’s Seventh Framework Programme;Helsinki Institute of Physics and the Academy of Finland;French CNRS-IN2P3, the ‘Region Pays de Loire’, ‘Region Alsace’, ‘Region Auvergne’ and CEA,France;German BMBF and the Helmholtz Association;General Secretariat for Research and Technology, Ministry of Development, Greece;Hungarian OTKA and National Office for Research and Technology (NKTH);Department of Atomic Energy and Department of Science and Technology of the Government of India;Istituto Nazionale di Fisica Nucleare (INFN) of Italy;MEXT Grant-in-Aid for Specially Promoted Research, Japan;Joint Institute for Nuclear Research, Dubna;National Research Foundation of Korea (NRF);CONACYT, DGAPA, Mexico, ALFA-EC and the HELEN Program (High-Energy physics Latin-American–European Network);Stichting voor Fundamenteel Onderzoek der Materie (FOM) and the Nederlandse Organisatie voorWetenschappelijk Onderzoek (NWO), Netherlands;Research Council of Norway (NFR);

30 The ALICE Collaboration
Polish Ministry of Science and Higher Education;National Authority for Scientific Research - NASR (Autoritatea Nationala pentru Cercetare Stiintifica -ANCS);Federal Agency of Science of the Ministry of Education and Science of Russian Federation, InternationalScience and Technology Center, Russian Academy of Sciences, Russian Federal Agency of Atomic En-ergy, Russian Federal Agency for Science and Innovations and CERN-INTAS;Ministry of Education of Slovakia;Department of Science and Technology, South Africa;CIEMAT, EELA, Ministerio de Educacion y Ciencia of Spain, Xunta de Galicia (Consellerıa de Edu-cacion), CEADEN, Cubaenergıa, Cuba, and IAEA (International Atomic Energy Agency);Swedish Reseach Council (VR) and Knut & Alice Wallenberg Foundation (KAW);Ukraine Ministry of Education and Science;United Kingdom Science and Technology Facilities Council (STFC);The United States Department of Energy, the United States National Science Foundation, the State ofTexas, and the State of Ohio.
References
[1] T. Sjostrand and P. Z. Skands, Multiple interactions and the structure of beam remnants, JHEP 03(2004) 053, [hep-ph/0402078].
[2] CDF Collaboration, A. A. Affolder et. al., Charged jet evolution and the underlying event in ppcollisions at 1.8 TeV, Phys. Rev. D65 (2002) 092002.
[3] CDF Collaboration, D. E. Acosta et. al., The underlying event in hard interactions at the Tevatronpp collider, Phys. Rev. D70 (2004) 072002, [hep-ex/0404004].
[4] CDF Collaboration, R. Field, Min-bias and the underlying event in Run 2 at CDF, Acta Phys.Polon. B36 (2005) 167–178.
[5] CDF Collaboration, T. Aaltonen et. al., Studying the Underlying Event in Drell-Yan and HighTransverse Momentum Jet Production at the Tevatron, Phys. Rev. D82 (2010) 034001,[hep-ex/1003.3146].
[6] H. Caines, Underlying Event Studies at RHIC, nucl-ex/0910.5203. eConf C090726.[7] ATLAS Collaboration, G. Aad et. al., Measurement of underlying event characteristics using
charged particles in pp collisions at√
s = 900GeV and 7 TeV with the ATLAS detector, Phys. Rev.D 83 (2011) 112001, [hep-ex/1012.0791].
[8] CMS Collaboration, V. Khachatryan et. al., First Measurement of the Underlying Event Activity atthe LHC with
√s = 0.9 TeV, Eur. Phys. J. C70 (2010) 555–572, [hep-ex/1006.2083].
[9] A. Buckley et. al., General-purpose event generators for LHC physics, Phys. Rept. 504 (2011)145–233, [hep-ph/1101.2599].
[10] T. Sjostrand, S. Mrenna, and P. Z. Skands, PYTHIA 6.4 Physics and Manual, JHEP 05 (2006) 026,[hep-ph/0603175].
[11] S. Roesler, R. Engel, and J. Ranft, The Monte Carlo event generator DPMJET-III, Lisbon 2000 -Advanced Monte Carlo (2000) 1033–1038, [hep-ph/0012252].
[12] M. Bahr et. al., Herwig++ Physics and Manual, Eur. Phys. J. C58 (2008) 639–707,[hep-ph/0803.0883].
[13] B. Andersson, G. Gustafson, G. Ingelman, and T. Sjostrand, Parton fragmentation and stringdynamics, Physics Reports 97 (1983), no. 2-3 31 – 145.
[14] T. Sjostrand and P. Z. Skands, Transverse-momentum-ordered showers and interleaved multipleinteractions, Eur. Phys. J. C39 (2005) 129–154, [hep-ph/0408302].

Underlying Event measurements with ALICE 31
[15] T. Sjostrand, S. Mrenna, and P. Z. Skands, A Brief Introduction to PYTHIA 8.1, Comput. Phys.Commun. 178 (2008) 852–867, [hep-ph/0710.3820].
[16] R. Corke and T. Sjostrand, Multiparton Interactions and Rescattering, JHEP 01 (2010) 035,[hep-ph/0911.1909].
[17] A. Capella, U. Sukhatme, C.-I. Tan, and J. Tran Thanh Van, Dual parton model, Phys. Rept. 236(1994) 225–329.
[18] ALICE Collaboration, K. Aamodt et. al., First proton-proton collisions at the LHC as observedwith the ALICE detector: Measurement of the charged particle pseudorapidity density at s**(1/2)= 900-GeV, Eur. Phys. J. C65 (2010) 111–125, [hep-ex/0911.5430].
[19] ALICE Collaboration, K. Aamodt et. al., Charged-particle multiplicity measurement inproton-proton collisions at sqrt(s) = 0.9 and 2.36 TeV with ALICE at LHC, Eur. Phys. J. C68(2010) 89–108, [hep-ex/1004.3034].
[20] ALICE Collaboration, K. Aamodt et. al., Charged-particle multiplicity measurement inproton-proton collisions at sqrt(s) = 7 TeV with ALICE at LHC, Eur. Phys. J. C68 (2010) 345–354,[hep-ex/1004.3514].
[21] ALICE Collaboration, A. K. Aamodt et. al., Midrapidity antiproton-to-proton ratio in ppcollisions at
√s = 0.9 and 7 TeV measured by the ALICE experiment, Phys. Rev. Lett. 105 (2010)
072002, [hep-ex/1006.5432].[22] ALICE Collaboration, K. Aamodt et. al., Two-pion Bose-Einstein correlations in central Pb-Pb
collisions at sqrt(sNN) = 2.76 TeV, Phys. Lett. B696 (2011) 328–337, [nucl-ex/1012.4035].[23] ALICE Collaboration, K. Aamodt et. al., Transverse momentum spectra of charged particles in
proton-proton collisions at√
s = 900 GeV with ALICE at the LHC, Phys. Lett. B693 (2010)53–68, [hep-ex/1007.0719].
[24] ALICE Collaboration, K. Aamodt et. al., Strange particle production in proton-proton collisionsat sqrt(s) = 0.9 TeV with ALICE at the LHC, Eur.Phys.J. C71 (2011) 1594, [hep-ex/1012.3257].
[25] ALICE Collaboration, K. Aamodt et. al., The ALICE experiment at the CERN LHC, JINST 3(2008) S08002.
[26] P. Z. Skands, Tuning Monte Carlo Generators: The Perugia Tunes, Phys. Rev. D82 (2010)074018, [hep-ph/1005.3457].
[27] R. Brun, F. Bruyant, M. Maire, A. C. McPherson, and P. Zanarini, GEANT3, .CERN-DD-EE-84-1.
[28] ALICE Collaboration, K. Aamodt et. al., Alignment of the ALICE Inner Tracking System withcosmic-ray tracks, JINST 5 (2010) P03003.
[29] T. Sjostrand and M. van Zijl, A multiple-interaction model for the event structure in hadroncollisions, Phys. Rev. D 36 (Oct, 1987) 2019–2041.
[30] ATLAS Collaboration Collaboration, G. Aad et. al., Charged-particle multiplicities in ppinteractions measured with the ATLAS detector at the LHC, New J.Phys. 13 (2011) 053033,[arXiv:1012.5104]. Long author list - awaiting processing.
[31] ATLAS Collaboration, G. Aad et. al., Measurement of underlying event characteristics usingcharged particles in pp collisions at sqrts =900 gev and 7 tev with the atlas detector in a limitedphase space, ATLAS-CONF-2011-009 (Feb, 2011).
[32] CMS Collaboration, S. Chatrchyan et. al., Measurement of the Underlying Event Activity at theLHC with sqrt(s)= 7 TeV and Comparison with sqrt(s) = 0.9 TeV, hep-ex/1107.0330.CERN-PH-EP-2011-059.

32 The ALICE Collaboration
A The ALICE Collaboration
B. Abelev69 , A. Abrahantes Quintana6 , D. Adamova74 , A.M. Adare120 , M.M. Aggarwal78 ,G. Aglieri Rinella30 , A.G. Agocs60 , A. Agostinelli19 , S. Aguilar Salazar56 , Z. Ahammed116 , N. Ahmad14 ,A. Ahmad Masoodi14 , S.U. Ahn64 ,37 , A. Akindinov46 , D. Aleksandrov89 , B. Alessandro95 ,R. Alfaro Molina56 , A. Alici96 ,30 ,9 , A. Alkin2 , E. Almaraz Avina56 , T. Alt36 , V. Altini28 ,30 , S. Altinpinar15 ,I. Altsybeev117 , C. Andrei71 , A. Andronic86 , V. Anguelov83 , C. Anson16 , T. Anticic87 , F. Antinori100 ,P. Antonioli96 , L. Aphecetche102 , H. Appelshauser52 , N. Arbor65 , S. Arcelli19 , A. Arend52 , N. Armesto13 ,R. Arnaldi95 , T. Aronsson120 , I.C. Arsene86 , M. Arslandok52 , A. Asryan117 , A. Augustinus30 , R. Averbeck86 ,T.C. Awes75 , J. Aysto38 , M.D. Azmi14 , M. Bach36 , A. Badala97 , Y.W. Baek64 ,37 , R. Bailhache52 , R. Bala95 ,R. Baldini Ferroli9 , A. Baldisseri12 , A. Baldit64 , F. Baltasar Dos Santos Pedrosa30 , J. Ban47 , R.C. Baral48 ,R. Barbera24 , F. Barile28 , G.G. Barnafoldi60 , L.S. Barnby91 , V. Barret64 , J. Bartke104 , M. Basile19 , N. Bastid64 ,B. Bathen54 , G. Batigne102 , B. Batyunya59 , C. Baumann52 , I.G. Bearden72 , H. Beck52 , I. Belikov58 ,F. Bellini19 , R. Bellwied110 , E. Belmont-Moreno56 , S. Beole26 , I. Berceanu71 , A. Bercuci71 , Y. Berdnikov76 ,D. Berenyi60 , C. Bergmann54 , D. Berzano95 , L. Betev30 , A. Bhasin81 , A.K. Bhati78 , N. Bianchi66 ,L. Bianchi26 , C. Bianchin22 , J. Bielcık34 , J. Bielcıkova74 , A. Bilandzic73 , F. Blanco7 , F. Blanco110 , D. Blau89 ,C. Blume52 , M. Boccioli30 , N. Bock16 , A. Bogdanov70 , H. Bøggild72 , M. Bogolyubsky43 , L. Boldizsar60 ,M. Bombara35 , J. Book52 , H. Borel12 , A. Borissov119 , C. Bortolin22 ,,ii, S. Bose90 , F. Bossu30 ,26 , M. Botje73 ,S. Bottger51 , B. Boyer42 , P. Braun-Munzinger86 , M. Bregant102 , T. Breitner51 , M. Broz33 , R. Brun30 ,E. Bruna120 ,26 ,95 , G.E. Bruno28 , D. Budnikov88 , H. Buesching52 , S. Bufalino26 ,95 , K. Bugaiev2 , O. Busch83 ,Z. Buthelezi80 , D. Caffarri22 , X. Cai40 , H. Caines120 , E. Calvo Villar92 , P. Camerini20 , V. Canoa Roman8 ,1 ,G. Cara Romeo96 , F. Carena30 , W. Carena30 , N. Carlin Filho107 , F. Carminati30 , C.A. Carrillo Montoya30 ,A. Casanova Dıaz66 , M. Caselle30 , J. Castillo Castellanos12 , J.F. Castillo Hernandez86 , E.A.R. Casula21 ,V. Catanescu71 , C. Cavicchioli30 , J. Cepila34 , P. Cerello95 , B. Chang38 ,123 , S. Chapeland30 , J.L. Charvet12 ,S. Chattopadhyay90 , S. Chattopadhyay116 , M. Cherney77 , C. Cheshkov30 ,109 , B. Cheynis109 , E. Chiavassa95 ,V. Chibante Barroso30 , D.D. Chinellato108 , P. Chochula30 , M. Chojnacki45 , P. Christakoglou73 ,45 ,C.H. Christensen72 , P. Christiansen29 , T. Chujo114 , S.U. Chung85 , C. Cicalo93 , L. Cifarelli19 ,30 , F. Cindolo96 ,J. Cleymans80 , F. Coccetti9 , J.-P. Coffin58 , F. Colamaria28 , D. Colella28 , G. Conesa Balbastre65 ,Z. Conesa del Valle30 ,58 , P. Constantin83 , G. Contin20 , J.G. Contreras8 , T.M. Cormier119 ,Y. Corrales Morales26 , P. Cortese27 , I. Cortes Maldonado1 , M.R. Cosentino68 ,108 , F. Costa30 , M.E. Cotallo7 ,E. Crescio8 , P. Crochet64 , E. Cruz Alaniz56 , E. Cuautle55 , L. Cunqueiro66 , A. Dainese22 ,100 ,H.H. Dalsgaard72 , A. Danu50 , I. Das90 ,42 , K. Das90 , D. Das90 , A. Dash48 ,108 , S. Dash41 ,95 , S. De116 ,A. De Azevedo Moregula66 , G.O.V. de Barros107 , A. De Caro25 ,9 , G. de Cataldo94 , J. de Cuveland36 ,A. De Falco21 , D. De Gruttola25 , H. Delagrange102 , E. Del Castillo Sanchez30 , A. Deloff101 , V. Demanov88 ,N. De Marco95 , E. Denes60 , S. De Pasquale25 , A. Deppman107 , G. D Erasmo28 , R. de Rooij45 , D. Di Bari28 ,T. Dietel54 , C. Di Giglio28 , S. Di Liberto99 , A. Di Mauro30 , P. Di Nezza66 , R. Divia30 , Ø. Djuvsland15 ,A. Dobrin119 ,29 , T. Dobrowolski101 , I. Domınguez55 , B. Donigus86 , O. Dordic18 , O. Driga102 , A.K. Dubey116 ,L. Ducroux109 , P. Dupieux64 , M.R. Dutta Majumdar116 , A.K. Dutta Majumdar90 , D. Elia94 ,D. Emschermann54 , H. Engel51 , H.A. Erdal32 , B. Espagnon42 , M. Estienne102 , S. Esumi114 , D. Evans91 ,G. Eyyubova18 , D. Fabris22 ,100 , J. Faivre65 , D. Falchieri19 , A. Fantoni66 , M. Fasel86 , R. Fearick80 ,A. Fedunov59 , D. Fehlker15 , L. Feldkamp54 , D. Felea50 , G. Feofilov117 , A. Fernandez Tellez1 , A. Ferretti26 ,R. Ferretti27 , J. Figiel104 , M.A.S. Figueredo107 , S. Filchagin88 , R. Fini94 , D. Finogeev44 , F.M. Fionda28 ,E.M. Fiore28 , M. Floris30 , S. Foertsch80 , P. Foka86 , S. Fokin89 , E. Fragiacomo98 , M. Fragkiadakis79 ,U. Frankenfeld86 , U. Fuchs30 , C. Furget65 , M. Fusco Girard25 , J.J. Gaardhøje72 , M. Gagliardi26 , A. Gago92 ,M. Gallio26 , D.R. Gangadharan16 , P. Ganoti75 , C. Garabatos86 , E. Garcia-Solis10 , I. Garishvili69 , J. Gerhard36 ,M. Germain102 , C. Geuna12 , A. Gheata30 , M. Gheata30 , B. Ghidini28 , P. Ghosh116 , P. Gianotti66 ,M.R. Girard118 , P. Giubellino30 , E. Gladysz-Dziadus104 , P. Glassel83 , R. Gomez106 , E.G. Ferreiro13 ,L.H. Gonzalez-Trueba56 , P. Gonzalez-Zamora7 , S. Gorbunov36 , A. Goswami82 , S. Gotovac103 , V. Grabski56 ,L.K. Graczykowski118 , R. Grajcarek83 , A. Grelli45 , C. Grigoras30 , A. Grigoras30 , V. Grigoriev70 ,A. Grigoryan121 , S. Grigoryan59 , B. Grinyov2 , N. Grion98 , P. Gros29 , J.F. Grosse-Oetringhaus30 ,J.-Y. Grossiord109 , R. Grosso30 , F. Guber44 , R. Guernane65 , C. Guerra Gutierrez92 , B. Guerzoni19 , M.Guilbaud109 , K. Gulbrandsen72 , T. Gunji113 , A. Gupta81 , R. Gupta81 , H. Gutbrod86 , Ø. Haaland15 ,C. Hadjidakis42 , M. Haiduc50 , H. Hamagaki113 , G. Hamar60 , B.H. Han17 , L.D. Hanratty91 , A. Hansen72 ,Z. Harmanova35 , J.W. Harris120 , M. Hartig52 , D. Hasegan50 , D. Hatzifotiadou96 , A. Hayrapetyan30 ,121 ,S.T. Heckel52 , M. Heide54 , H. Helstrup32 , A. Herghelegiu71 , G. Herrera Corral8 , N. Herrmann83 ,K.F. Hetland32 , B. Hicks120 , P.T. Hille120 , B. Hippolyte58 , T. Horaguchi114 , Y. Hori113 , P. Hristov30 ,I. Hrivnacova42 , M. Huang15 , S. Huber86 , T.J. Humanic16 , D.S. Hwang17 , R. Ichou64 , R. Ilkaev88 , I. Ilkiv101 ,

Underlying Event measurements with ALICE 33
M. Inaba114 , E. Incani21 , P.G. Innocenti30 , G.M. Innocenti26 , M. Ippolitov89 , M. Irfan14 , C. Ivan86 ,M. Ivanov86 , V. Ivanov76 , A. Ivanov117 , O. Ivanytskyi2 , A. Jachołkowski30 , P. M. Jacobs68 , L. Jancurova59 ,H.J. Jang63 , S. Jangal58 , R. Janik33 , M.A. Janik118 , P.H.S.Y. Jayarathna110 , S. Jena41 ,R.T. Jimenez Bustamante55 , L. Jirden30 , P.G. Jones91 , W. Jung37 , H. Jung37 , A. Jusko91 , A.B. Kaidalov46 ,V. Kakoyan121 , S. Kalcher36 , P. Kalinak47 , M. Kalisky54 , T. Kalliokoski38 , A. Kalweit53 , K. Kanaki15 ,J.H. Kang123 , V. Kaplin70 , A. Karasu Uysal30 ,122 , O. Karavichev44 , T. Karavicheva44 , E. Karpechev44 ,A. Kazantsev89 , U. Kebschull62 ,51 , R. Keidel124 , P. Khan90 , M.M. Khan14 , S.A. Khan116 , A. Khanzadeev76 ,Y. Kharlov43 , B. Kileng32 , J.H. Kim17 , D.J. Kim38 , D.W. Kim37 , J.S. Kim37 , M. Kim123 , S.H. Kim37 ,S. Kim17 , B. Kim123 , T. Kim123 , S. Kirsch36 ,30 , I. Kisel36 , S. Kiselev46 , A. Kisiel30 ,118 , J.L. Klay4 ,J. Klein83 , C. Klein-Bosing54 , M. Kliemant52 , A. Kluge30 , M.L. Knichel86 , K. Koch83 , M.K. Kohler86 ,A. Kolojvari117 , V. Kondratiev117 , N. Kondratyeva70 , A. Konevskikh44 , A. Korneev88 ,C. Kottachchi Kankanamge Don119 , R. Kour91 , M. Kowalski104 , S. Kox65 , G. Koyithatta Meethaleveedu41 ,J. Kral38 , I. Kralik47 , F. Kramer52 , I. Kraus86 , T. Krawutschke83 ,31 , M. Kretz36 , M. Krivda91 ,47 , F. Krizek38 ,M. Krus34 , E. Kryshen76 , M. Krzewicki73 ,86 , Y. Kucheriaev89 , C. Kuhn58 , P.G. Kuijer73 , P. Kurashvili101 ,A.B. Kurepin44 , A. Kurepin44 , A. Kuryakin88 , S. Kushpil74 , V. Kushpil74 , H. Kvaerno18 , M.J. Kweon83 ,Y. Kwon123 , P. Ladron de Guevara55 , I. Lakomov42 ,117 , R. Langoy15 , C. Lara51 , A. Lardeux102 ,P. La Rocca24 , C. Lazzeroni91 , R. Lea20 , Y. Le Bornec42 , S.C. Lee37 , K.S. Lee37 , F. Lefevre102 , J. Lehnert52 ,L. Leistam30 , M. Lenhardt102 , V. Lenti94 , H. Leon56 , I. Leon Monzon106 , H. Leon Vargas52 , P. Levai60 ,X. Li11 , J. Lien15 , R. Lietava91 , S. Lindal18 , V. Lindenstruth36 , C. Lippmann86 ,30 , M.A. Lisa16 , L. Liu15 ,P.I. Loenne15 , V.R. Loggins119 , V. Loginov70 , S. Lohn30 , D. Lohner83 , C. Loizides68 , K.K. Loo38 , X. Lopez64 ,E. Lopez Torres6 , G. Løvhøiden18 , X.-G. Lu83 , P. Luettig52 , M. Lunardon22 , J. Luo40 , G. Luparello45 ,L. Luquin102 , C. Luzzi30 , R. Ma120 , K. Ma40 , D.M. Madagodahettige-Don110 , A. Maevskaya44 ,M. Mager53 ,30 , D.P. Mahapatra48 , A. Maire58 , M. Malaev76 , I. Maldonado Cervantes55 , L. Malinina59 ,,iii,D. Mal’Kevich46 , P. Malzacher86 , A. Mamonov88 , L. Manceau95 , L. Mangotra81 , V. Manko89 , F. Manso64 ,V. Manzari94 , Y. Mao65 ,40 , M. Marchisone64 ,26 , J. Mares49 , G.V. Margagliotti20 ,98 , A. Margotti96 ,A. Marın86 , C. Markert105 , I. Martashvili112 , P. Martinengo30 , M.I. Martınez1 , A. Martınez Davalos56 ,G. Martınez Garcıa102 , Y. Martynov2 , A. Mas102 , S. Masciocchi86 , M. Masera26 , A. Masoni93 ,L. Massacrier109 , M. Mastromarco94 , A. Mastroserio28 ,30 , Z.L. Matthews91 , A. Matyja102 , D. Mayani55 ,C. Mayer104 , J. Mazer112 , M.A. Mazzoni99 , F. Meddi23 , A. Menchaca-Rocha56 , J. Mercado Perez83 ,M. Meres33 , Y. Miake114 , A. Michalon58 , J. Midori39 , L. Milano26 , J. Milosevic18 ,,iv, A. Mischke45 ,A.N. Mishra82 , D. Miskowiec86 ,30 , C. Mitu50 , J. Mlynarz119 , A.K. Mohanty30 , B. Mohanty116 , L. Molnar30 ,L. Montano Zetina8 , M. Monteno95 , E. Montes7 , T. Moon123 , M. Morando22 , D.A. Moreira De Godoy107 ,S. Moretto22 , A. Morsch30 , V. Muccifora66 , E. Mudnic103 , S. Muhuri116 , H. Muller30 , M.G. Munhoz107 ,L. Musa30 , A. Musso95 , B.K. Nandi41 , R. Nania96 , E. Nappi94 , C. Nattrass112 , N.P. Naumov88 , S. Navin91 ,T.K. Nayak116 , S. Nazarenko88 , G. Nazarov88 , A. Nedosekin46 , M. Nicassio28 , B.S. Nielsen72 , T. Niida114 ,S. Nikolaev89 , V. Nikolic87 , V. Nikulin76 , S. Nikulin89 , B.S. Nilsen77 , M.S. Nilsson18 , F. Noferini96 ,9 ,P. Nomokonov59 , G. Nooren45 , N. Novitzky38 , A. Nyanin89 , A. Nyatha41 , C. Nygaard72 , J. Nystrand15 ,H. Obayashi39 , A. Ochirov117 , H. Oeschler53 ,30 , S.K. Oh37 , S. Oh120 , J. Oleniacz118 , C. Oppedisano95 ,A. Ortiz Velasquez55 , G. Ortona30 ,26 , A. Oskarsson29 , P. Ostrowski118 , I. Otterlund29 , J. Otwinowski86 ,K. Oyama83 , K. Ozawa113 , Y. Pachmayer83 , M. Pachr34 , F. Padilla26 , P. Pagano25 , G. Paic55 , F. Painke36 ,C. Pajares13 , S. Pal12 , S.K. Pal116 , A. Palaha91 , A. Palmeri97 , V. Papikyan121 , G.S. Pappalardo97 , W.J. Park86 ,A. Passfeld54 , B. Pastircak47 , D.I. Patalakha43 , V. Paticchio94 , A. Pavlinov119 , T. Pawlak118 , T. Peitzmann45 ,M. Perales10 , E. Pereira De Oliveira Filho107 , D. Peresunko89 , C.E. Perez Lara73 , E. Perez Lezama55 ,D. Perini30 , D. Perrino28 , W. Peryt118 , A. Pesci96 , V. Peskov30 ,55 , Y. Pestov3 , V. Petracek34 , M. Petran34 ,M. Petris71 , P. Petrov91 , M. Petrovici71 , C. Petta24 , S. Piano98 , A. Piccotti95 , M. Pikna33 , P. Pillot102 ,O. Pinazza30 , L. Pinsky110 , N. Pitz52 , F. Piuz30 , D.B. Piyarathna110 , M. Płoskon68 , J. Pluta118 ,T. Pocheptsov59 ,18 , S. Pochybova60 , P.L.M. Podesta-Lerma106 , M.G. Poghosyan30 ,26 , K. Polak49 ,B. Polichtchouk43 , A. Pop71 , S. Porteboeuf-Houssais64 , V. Pospısil34 , B. Potukuchi81 , S.K. Prasad119 ,R. Preghenella96 ,9 , F. Prino95 , C.A. Pruneau119 , I. Pshenichnov44 , S. Puchagin88 , G. Puddu21 ,A. Pulvirenti24 ,30 , V. Punin88 , M. Putis35 , J. Putschke119 ,120 , E. Quercigh30 , H. Qvigstad18 , A. Rachevski98 ,A. Rademakers30 , S. Radomski83 , T.S. Raiha38 , J. Rak38 , A. Rakotozafindrabe12 , L. Ramello27 ,A. Ramırez Reyes8 , S. Raniwala82 , R. Raniwala82 , S.S. Rasanen38 , B.T. Rascanu52 , D. Rathee78 ,K.F. Read112 , J.S. Real65 , K. Redlich101 ,57 , P. Reichelt52 , M. Reicher45 , R. Renfordt52 , A.R. Reolon66 ,A. Reshetin44 , F. Rettig36 , J.-P. Revol30 , K. Reygers83 , L. Riccati95 , R.A. Ricci67 , M. Richter18 , P. Riedler30 ,W. Riegler30 , F. Riggi24 ,97 , M. Rodrıguez Cahuantzi1 , D. Rohr36 , D. Rohrich15 , R. Romita86 , F. Ronchetti66 ,P. Rosnet64 , S. Rossegger30 , A. Rossi22 , F. Roukoutakis79 , P. Roy90 , C. Roy58 , A.J. Rubio Montero7 , R. Rui20 ,

34 The ALICE Collaboration
E. Ryabinkin89 , A. Rybicki104 , S. Sadovsky43 , K. Safarık30 , P.K. Sahu48 , J. Saini116 , H. Sakaguchi39 ,S. Sakai68 , D. Sakata114 , C.A. Salgado13 , S. Sambyal81 , V. Samsonov76 , X. Sanchez Castro55 ,58 , L. Sandor47 ,A. Sandoval56 , M. Sano114 , S. Sano113 , R. Santo54 , R. Santoro94 ,30 , J. Sarkamo38 , E. Scapparone96 ,F. Scarlassara22 , R.P. Scharenberg84 , C. Schiaua71 , R. Schicker83 , C. Schmidt86 , H.R. Schmidt86 ,115 ,S. Schreiner30 , S. Schuchmann52 , J. Schukraft30 , Y. Schutz30 ,102 , K. Schwarz86 , K. Schweda86 ,83 , G. Scioli19 ,E. Scomparin95 , R. Scott112 , P.A. Scott91 , G. Segato22 , I. Selyuzhenkov86 , S. Senyukov27 ,58 , J. Seo85 ,S. Serci21 , E. Serradilla7 ,56 , A. Sevcenco50 , I. Sgura94 , A. Shabetai102 , G. Shabratova59 , R. Shahoyan30 ,N. Sharma78 , S. Sharma81 , K. Shigaki39 , M. Shimomura114 , K. Shtejer6 , Y. Sibiriak89 , M. Siciliano26 ,E. Sicking30 , S. Siddhanta93 , T. Siemiarczuk101 , D. Silvermyr75 , G. Simonetti28 ,30 , R. Singaraju116 ,R. Singh81 , S. Singha116 , B.C. Sinha116 , T. Sinha90 , B. Sitar33 , M. Sitta27 , T.B. Skaali18 , K. Skjerdal15 ,R. Smakal34 , N. Smirnov120 , R. Snellings45 , C. Søgaard72 , R. Soltz69 , H. Son17 , J. Song85 , M. Song123 ,C. Soos30 , F. Soramel22 , I. Sputowska104 , M. Spyropoulou-Stassinaki79 , B.K. Srivastava84 , J. Stachel83 ,I. Stan50 , I. Stan50 , G. Stefanek101 , G. Stefanini30 , T. Steinbeck36 , M. Steinpreis16 , E. Stenlund29 , G. Steyn80 ,D. Stocco102 , M. Stolpovskiy43 , K. Strabykin88 , P. Strmen33 , A.A.P. Suaide107 , M.A. Subieta Vasquez26 ,T. Sugitate39 , C. Suire42 , M. Sukhorukov88 , R. Sultanov46 , M. Sumbera74 , T. Susa87 , A. Szanto de Toledo107 ,I. Szarka33 , A. Szostak15 , C. Tagridis79 , J. Takahashi108 , J.D. Tapia Takaki42 , A. Tauro30 , G. Tejeda Munoz1 ,A. Telesca30 , C. Terrevoli28 , J. Thader86 , J.H. Thomas86 , D. Thomas45 , R. Tieulent109 , A.R. Timmins110 ,D. Tlusty34 , A. Toia36 ,30 , H. Torii39 ,113 , L. Toscano95 , F. Tosello95 , T. Traczyk118 , D. Truesdale16 ,W.H. Trzaska38 , T. Tsuji113 , A. Tumkin88 , R. Turrisi100 , T.S. Tveter18 , J. Ulery52 , K. Ullaland15 ,J. Ulrich62 ,51 , A. Uras109 , J. Urban35 , G.M. Urciuoli99 , G.L. Usai21 , M. Vajzer34 ,74 , M. Vala59 ,47 ,L. Valencia Palomo42 , S. Vallero83 , N. van der Kolk73 , P. Vande Vyvre30 , M. van Leeuwen45 , L. Vannucci67 ,A. Vargas1 , R. Varma41 , M. Vasileiou79 , A. Vasiliev89 , V. Vechernin117 , M. Veldhoen45 , M. Venaruzzo20 ,E. Vercellin26 , S. Vergara1 , D.C. Vernekohl54 , R. Vernet5 , M. Verweij45 , L. Vickovic103 , G. Viesti22 ,O. Vikhlyantsev88 , Z. Vilakazi80 , O. Villalobos Baillie91 , L. Vinogradov117 , Y. Vinogradov88 ,A. Vinogradov89 , T. Virgili25 , Y.P. Viyogi116 , A. Vodopyanov59 , S. Voloshin119 , K. Voloshin46 , G. Volpe28 ,30 ,B. von Haller30 , D. Vranic86 , G. Øvrebekk15 , J. Vrlakova35 , B. Vulpescu64 , A. Vyushin88 , B. Wagner15 ,V. Wagner34 , R. Wan58 ,40 , Y. Wang83 , M. Wang40 , D. Wang40 , Y. Wang40 , K. Watanabe114 , J.P. Wessels30 ,54 ,U. Westerhoff54 , J. Wiechula83 ,115 , J. Wikne18 , M. Wilde54 , G. Wilk101 , A. Wilk54 , M.C.S. Williams96 ,B. Windelband83 , L. Xaplanteris Karampatsos105 , H. Yang12 , S. Yang15 , S. Yano39 , S. Yasnopolskiy89 , J. Yi85 ,Z. Yin40 , H. Yokoyama114 , I.-K. Yoo85 , J. Yoon123 , W. Yu52 , X. Yuan40 , I. Yushmanov89 , C. Zach34 ,C. Zampolli96 ,30 , S. Zaporozhets59 , A. Zarochentsev117 , P. Zavada49 , N. Zaviyalov88 , H. Zbroszczyk118 ,P. Zelnicek30 ,51 , I.S. Zgura50 , M. Zhalov76 , X. Zhang64 ,40 , F. Zhou40 , Y. Zhou45 , D. Zhou40 , X. Zhu40 ,A. Zichichi19 ,9 , A. Zimmermann83 , G. Zinovjev2 , Y. Zoccarato109 , M. Zynovyev2
Affiliation notesi Deceased
ii Also at: Dipartimento di Fisica dell’Universita, Udine, Italyiii Also at: M.V.Lomonosov Moscow State University, D.V.Skobeltsyn Institute of Nuclear Physics, Moscow,
Russiaiv Also at: ”Vinca” Institute of Nuclear Sciences, Belgrade, Serbia
Collaboration Institutes1 Benemerita Universidad Autonoma de Puebla, Puebla, Mexico2 Bogolyubov Institute for Theoretical Physics, Kiev, Ukraine3 Budker Institute for Nuclear Physics, Novosibirsk, Russia4 California Polytechnic State University, San Luis Obispo, California, United States5 Centre de Calcul de l’IN2P3, Villeurbanne, France6 Centro de Aplicaciones Tecnologicas y Desarrollo Nuclear (CEADEN), Havana, Cuba7 Centro de Investigaciones Energeticas Medioambientales y Tecnologicas (CIEMAT), Madrid, Spain8 Centro de Investigacion y de Estudios Avanzados (CINVESTAV), Mexico City and Merida, Mexico9 Centro Fermi – Centro Studi e Ricerche e Museo Storico della Fisica “Enrico Fermi”, Rome, Italy
10 Chicago State University, Chicago, United States11 China Institute of Atomic Energy, Beijing, China12 Commissariat a l’Energie Atomique, IRFU, Saclay, France

Underlying Event measurements with ALICE 35
13 Departamento de Fısica de Partıculas and IGFAE, Universidad de Santiago de Compostela, Santiago deCompostela, Spain
14 Department of Physics Aligarh Muslim University, Aligarh, India15 Department of Physics and Technology, University of Bergen, Bergen, Norway16 Department of Physics, Ohio State University, Columbus, Ohio, United States17 Department of Physics, Sejong University, Seoul, South Korea18 Department of Physics, University of Oslo, Oslo, Norway19 Dipartimento di Fisica dell’Universita and Sezione INFN, Bologna, Italy20 Dipartimento di Fisica dell’Universita and Sezione INFN, Trieste, Italy21 Dipartimento di Fisica dell’Universita and Sezione INFN, Cagliari, Italy22 Dipartimento di Fisica dell’Universita and Sezione INFN, Padova, Italy23 Dipartimento di Fisica dell’Universita ‘La Sapienza’ and Sezione INFN, Rome, Italy24 Dipartimento di Fisica e Astronomia dell’Universita and Sezione INFN, Catania, Italy25 Dipartimento di Fisica ‘E.R. Caianiello’ dell’Universita and Gruppo Collegato INFN, Salerno, Italy26 Dipartimento di Fisica Sperimentale dell’Universita and Sezione INFN, Turin, Italy27 Dipartimento di Scienze e Tecnologie Avanzate dell’Universita del Piemonte Orientale and Gruppo
Collegato INFN, Alessandria, Italy28 Dipartimento Interateneo di Fisica ‘M. Merlin’ and Sezione INFN, Bari, Italy29 Division of Experimental High Energy Physics, University of Lund, Lund, Sweden30 European Organization for Nuclear Research (CERN), Geneva, Switzerland31 Fachhochschule Koln, Koln, Germany32 Faculty of Engineering, Bergen University College, Bergen, Norway33 Faculty of Mathematics, Physics and Informatics, Comenius University, Bratislava, Slovakia34 Faculty of Nuclear Sciences and Physical Engineering, Czech Technical University in Prague, Prague,
Czech Republic35 Faculty of Science, P.J. Safarik University, Kosice, Slovakia36 Frankfurt Institute for Advanced Studies, Johann Wolfgang Goethe-Universitat Frankfurt, Frankfurt,
Germany37 Gangneung-Wonju National University, Gangneung, South Korea38 Helsinki Institute of Physics (HIP) and University of Jyvaskyla, Jyvaskyla, Finland39 Hiroshima University, Hiroshima, Japan40 Hua-Zhong Normal University, Wuhan, China41 Indian Institute of Technology, Mumbai, India42 Institut de Physique Nucleaire d’Orsay (IPNO), Universite Paris-Sud, CNRS-IN2P3, Orsay, France43 Institute for High Energy Physics, Protvino, Russia44 Institute for Nuclear Research, Academy of Sciences, Moscow, Russia45 Nikhef, National Institute for Subatomic Physics and Institute for Subatomic Physics of Utrecht University,
Utrecht, Netherlands46 Institute for Theoretical and Experimental Physics, Moscow, Russia47 Institute of Experimental Physics, Slovak Academy of Sciences, Kosice, Slovakia48 Institute of Physics, Bhubaneswar, India49 Institute of Physics, Academy of Sciences of the Czech Republic, Prague, Czech Republic50 Institute of Space Sciences (ISS), Bucharest, Romania51 Institut fur Informatik, Johann Wolfgang Goethe-Universitat Frankfurt, Frankfurt, Germany52 Institut fur Kernphysik, Johann Wolfgang Goethe-Universitat Frankfurt, Frankfurt, Germany53 Institut fur Kernphysik, Technische Universitat Darmstadt, Darmstadt, Germany54 Institut fur Kernphysik, Westfalische Wilhelms-Universitat Munster, Munster, Germany55 Instituto de Ciencias Nucleares, Universidad Nacional Autonoma de Mexico, Mexico City, Mexico56 Instituto de Fısica, Universidad Nacional Autonoma de Mexico, Mexico City, Mexico57 Institut of Theoretical Physics, University of Wroclaw58 Institut Pluridisciplinaire Hubert Curien (IPHC), Universite de Strasbourg, CNRS-IN2P3, Strasbourg,
France59 Joint Institute for Nuclear Research (JINR), Dubna, Russia60 KFKI Research Institute for Particle and Nuclear Physics, Hungarian Academy of Sciences, Budapest,
Hungary61 Kharkiv Institute of Physics and Technology (KIPT), National Academy of Sciences of Ukraine (NASU),

36 The ALICE Collaboration
Kharkov, Ukraine62 Kirchhoff-Institut fur Physik, Ruprecht-Karls-Universitat Heidelberg, Heidelberg, Germany63 Korea Institute of Science and Technology Information64 Laboratoire de Physique Corpusculaire (LPC), Clermont Universite, Universite Blaise Pascal,
CNRS–IN2P3, Clermont-Ferrand, France65 Laboratoire de Physique Subatomique et de Cosmologie (LPSC), Universite Joseph Fourier, CNRS-IN2P3,
Institut Polytechnique de Grenoble, Grenoble, France66 Laboratori Nazionali di Frascati, INFN, Frascati, Italy67 Laboratori Nazionali di Legnaro, INFN, Legnaro, Italy68 Lawrence Berkeley National Laboratory, Berkeley, California, United States69 Lawrence Livermore National Laboratory, Livermore, California, United States70 Moscow Engineering Physics Institute, Moscow, Russia71 National Institute for Physics and Nuclear Engineering, Bucharest, Romania72 Niels Bohr Institute, University of Copenhagen, Copenhagen, Denmark73 Nikhef, National Institute for Subatomic Physics, Amsterdam, Netherlands74 Nuclear Physics Institute, Academy of Sciences of the Czech Republic, Rez u Prahy, Czech Republic75 Oak Ridge National Laboratory, Oak Ridge, Tennessee, United States76 Petersburg Nuclear Physics Institute, Gatchina, Russia77 Physics Department, Creighton University, Omaha, Nebraska, United States78 Physics Department, Panjab University, Chandigarh, India79 Physics Department, University of Athens, Athens, Greece80 Physics Department, University of Cape Town, iThemba LABS, Cape Town, South Africa81 Physics Department, University of Jammu, Jammu, India82 Physics Department, University of Rajasthan, Jaipur, India83 Physikalisches Institut, Ruprecht-Karls-Universitat Heidelberg, Heidelberg, Germany84 Purdue University, West Lafayette, Indiana, United States85 Pusan National University, Pusan, South Korea86 Research Division and ExtreMe Matter Institute EMMI, GSI Helmholtzzentrum fur
Schwerionenforschung, Darmstadt, Germany87 Rudjer Boskovic Institute, Zagreb, Croatia88 Russian Federal Nuclear Center (VNIIEF), Sarov, Russia89 Russian Research Centre Kurchatov Institute, Moscow, Russia90 Saha Institute of Nuclear Physics, Kolkata, India91 School of Physics and Astronomy, University of Birmingham, Birmingham, United Kingdom92 Seccion Fısica, Departamento de Ciencias, Pontificia Universidad Catolica del Peru, Lima, Peru93 Sezione INFN, Cagliari, Italy94 Sezione INFN, Bari, Italy95 Sezione INFN, Turin, Italy96 Sezione INFN, Bologna, Italy97 Sezione INFN, Catania, Italy98 Sezione INFN, Trieste, Italy99 Sezione INFN, Rome, Italy
100 Sezione INFN, Padova, Italy101 Soltan Institute for Nuclear Studies, Warsaw, Poland102 SUBATECH, Ecole des Mines de Nantes, Universite de Nantes, CNRS-IN2P3, Nantes, France103 Technical University of Split FESB, Split, Croatia104 The Henryk Niewodniczanski Institute of Nuclear Physics, Polish Academy of Sciences, Cracow, Poland105 The University of Texas at Austin, Physics Department, Austin, TX, United States106 Universidad Autonoma de Sinaloa, Culiacan, Mexico107 Universidade de Sao Paulo (USP), Sao Paulo, Brazil108 Universidade Estadual de Campinas (UNICAMP), Campinas, Brazil109 Universite de Lyon, Universite Lyon 1, CNRS/IN2P3, IPN-Lyon, Villeurbanne, France110 University of Houston, Houston, Texas, United States111 University of Technology and Austrian Academy of Sciences, Vienna, Austria112 University of Tennessee, Knoxville, Tennessee, United States113 University of Tokyo, Tokyo, Japan

Underlying Event measurements with ALICE 37
114 University of Tsukuba, Tsukuba, Japan115 Eberhard Karls Universitat Tubingen, Tubingen, Germany116 Variable Energy Cyclotron Centre, Kolkata, India117 V. Fock Institute for Physics, St. Petersburg State University, St. Petersburg, Russia118 Warsaw University of Technology, Warsaw, Poland119 Wayne State University, Detroit, Michigan, United States120 Yale University, New Haven, Connecticut, United States121 Yerevan Physics Institute, Yerevan, Armenia122 Yildiz Technical University, Istanbul, Turkey123 Yonsei University, Seoul, South Korea124 Zentrum fur Technologietransfer und Telekommunikation (ZTT), Fachhochschule Worms, Worms,
Germany


![Midrapidity Antiproton-to-Proton Ratio in pp Collisons at sqrt[s]=0.9 and 7 TeV Measured by the ALICE Experiment](https://static.fdokumen.com/doc/165x107/6323fc973c19cb2bd106c631/midrapidity-antiproton-to-proton-ratio-in-pp-collisons-at-sqrts09-and-7tev.jpg)