Uncovering the U.S. Term Premium: An Alternative Route
13
Uncovering the US term premium: An alternative route Luis A. Gil-Alana a , Antonio Moreno b,⇑ a Economics Department and ICS, University of Navarra, Pamplona 31080, Spain b Economics Department, University of Navarra, Pamplona 31080, Spain article info Article history: Received 26 February 2010 Accepted 12 November 2011 Available online 20 November 2011 JEL classification: E4 G1 C5 Keywords: Interest rates Term premium Fractional integration abstract The estimates of the US term premium crucially depend upon the ex-ante decision on whether the short- term rate is either an I(0) or an I(1) process. In this paper we estimate a fractionally integrated (I(d)) model which simultaneously determines both the order of integration of the short-term rate and the associated term premium. We show that the term premium experienced a sharp increase from essen- tially zero in mid-2007 to almost 3% in 2009. We also show that unemployment and term premium dynamics exhibit a very significant positive co-movement. Ó 2011 Elsevier B.V. All rights reserved. 1. Introduction What is the current term premium on US long-term securities? What is the impact of the 2008 financial meltdown on the term pre- mium? In a recent article, Cochrane and Piazzesi (2008) show that the estimates of the expected short-term interest rate – and the term premium on long-term treasury bonds – crucially depend upon the order of integration assumed for short-term interest rates. So, for instance, during the early 2000s the term premium implied by an I(1) model for the short-rates was more than 2% points above that implied by an I(0) model, thus giving rise to very different implications for public policy (see Bernanke, 2006), government fi- nances and long-term savers and investors. This contrasting result is known as the ‘‘discontinuity’’ problem. In this paper we estimate a stylized univariate fractionally inte- grated model which simultaneously determines the order of integra- tion of the short-rate and the term premium. This approach avoids the controversial ex-ante choice between an I(0) and an I(1) model for the short-rate order of integration by construction. It directly estimates the order of integration from the data and it permits the order of integration to be of a fractional value, allowing for alterna- tive dynamics to those offered by standard I(0)/I(1) models. The estimated order of integration of the short-term rate at the monthly frequency is 0.847. As a result, the short-rate exhibits long-memory and is mean-reverting. An important difference be- tween the dynamics of this process and those implied by a stan- dard stationary I(0) process is that the mean reversion of our estimated model takes place at a much slower rate so that the long-distance expectations of the short-rate display a great deal of volatility, comparable to those of an I(1) process. In this way, the expectations of the short-rate implied by the fractionally inte- grated process are able to better fit the dynamics of both long-term yields and forward rates. We find that the term premium remains positive for most of our sample period (1971–2009). In the early 2000s, the term premium increased and hovered above 2.5% until the beginning of 2004, when it began a steady and steep decline. At the end of 2006, the term premium was essentially zero. This decline is thus the main reason behind the decrease of the long-rates during this period, even if, as we show below, the expectations (at all horizons) of the short-rate were rapidly increasing following the interest rate hikes engineered by the Fed from 2004 to the end of 2006. Since mid-2007, however, the term premium experienced a rapid in- crease to reach almost 3% in August of 2009. Our economic analysis shows that the term premium is significantly and positively related with unemployment especially at medium frequencies. We show that the term premium follows a protracted dynamic increase fol- lowing a negative shock to the labor market conditions. We also show that our results are robust to alternative multivariate frame- works, subsamples and short-memory stochastic dynamics. The discussion on the order of integration of the short-term nominal interest rates is not a new one. The interest rate model 0378-4266/$ - see front matter Ó 2011 Elsevier B.V. All rights reserved. doi:10.1016/j.jbankfin.2011.11.013 ⇑ Corresponding author. Tel.: +34 948 425625; fax: +34 948 425626. E-mail addresses: [email protected] (L.A. Gil-Alana), [email protected] (A. Moreno). Journal of Banking & Finance 36 (2012) 1181–1193 Contents lists available at SciVerse ScienceDirect Journal of Banking & Finance journal homepage: www.elsevier.com/locate/jbf
-
Upload
independent -
Category
Documents
-
view
0 -
download
0
Transcript of Uncovering the U.S. Term Premium: An Alternative Route

Journal of Banking & Finance 36 (2012) 1181–1193
Contents lists available at SciVerse ScienceDirect
Journal of Banking & Finance
journal homepage: www.elsevier .com/locate / jbf
Uncovering the US term premium: An alternative route
Luis A. Gil-Alana a, Antonio Moreno b,⇑a Economics Department and ICS, University of Navarra, Pamplona 31080, Spainb Economics Department, University of Navarra, Pamplona 31080, Spain
a r t i c l e i n f o
Article history:Received 26 February 2010Accepted 12 November 2011Available online 20 November 2011
JEL classification:E4G1C5
Keywords:Interest ratesTerm premiumFractional integration
0378-4266/$ - see front matter � 2011 Elsevier B.V. Adoi:10.1016/j.jbankfin.2011.11.013
⇑ Corresponding author. Tel.: +34 948 425625; fax:E-mail addresses: [email protected] (L.A. Gil-A
(A. Moreno).
a b s t r a c t
The estimates of the US term premium crucially depend upon the ex-ante decision on whether the short-term rate is either an I(0) or an I(1) process. In this paper we estimate a fractionally integrated (I(d))model which simultaneously determines both the order of integration of the short-term rate and theassociated term premium. We show that the term premium experienced a sharp increase from essen-tially zero in mid-2007 to almost 3% in 2009. We also show that unemployment and term premiumdynamics exhibit a very significant positive co-movement.
� 2011 Elsevier B.V. All rights reserved.
1. Introduction long-memory and is mean-reverting. An important difference be-
What is the current term premium on US long-term securities?What is the impact of the 2008 financial meltdown on the term pre-mium? In a recent article, Cochrane and Piazzesi (2008) show thatthe estimates of the expected short-term interest rate – and theterm premium on long-term treasury bonds – crucially dependupon the order of integration assumed for short-term interest rates.So, for instance, during the early 2000s the term premium impliedby an I(1) model for the short-rates was more than 2% points abovethat implied by an I(0) model, thus giving rise to very differentimplications for public policy (see Bernanke, 2006), government fi-nances and long-term savers and investors. This contrasting resultis known as the ‘‘discontinuity’’ problem.
In this paper we estimate a stylized univariate fractionally inte-grated model which simultaneously determines the order of integra-tion of the short-rate and the term premium. This approach avoidsthe controversial ex-ante choice between an I(0) and an I(1) modelfor the short-rate order of integration by construction. It directlyestimates the order of integration from the data and it permits theorder of integration to be of a fractional value, allowing for alterna-tive dynamics to those offered by standard I(0)/I(1) models.
The estimated order of integration of the short-term rate at themonthly frequency is 0.847. As a result, the short-rate exhibits
ll rights reserved.
+34 948 425626.lana), [email protected]
tween the dynamics of this process and those implied by a stan-dard stationary I(0) process is that the mean reversion of ourestimated model takes place at a much slower rate so that thelong-distance expectations of the short-rate display a great dealof volatility, comparable to those of an I(1) process. In this way,the expectations of the short-rate implied by the fractionally inte-grated process are able to better fit the dynamics of both long-termyields and forward rates.
We find that the term premium remains positive for most of oursample period (1971–2009). In the early 2000s, the term premiumincreased and hovered above 2.5% until the beginning of 2004,when it began a steady and steep decline. At the end of 2006, theterm premium was essentially zero. This decline is thus the mainreason behind the decrease of the long-rates during this period,even if, as we show below, the expectations (at all horizons) ofthe short-rate were rapidly increasing following the interest ratehikes engineered by the Fed from 2004 to the end of 2006. Sincemid-2007, however, the term premium experienced a rapid in-crease to reach almost 3% in August of 2009. Our economic analysisshows that the term premium is significantly and positively relatedwith unemployment especially at medium frequencies. We showthat the term premium follows a protracted dynamic increase fol-lowing a negative shock to the labor market conditions. We alsoshow that our results are robust to alternative multivariate frame-works, subsamples and short-memory stochastic dynamics.
The discussion on the order of integration of the short-termnominal interest rates is not a new one. The interest rate model
1182 L.A. Gil-Alana, A. Moreno / Journal of Banking & Finance 36 (2012) 1181–1193
employed, for instance, by Cox et al. (1985), is stationary andmean-reverting I(0), whereas Campbell et al. (1987) assume aunit-root. The drawback of I(0) models is that they imply long-rates which are not volatile enough (see Shiller, 1979) whereasthe problem with I(1) models is that they imply that the term pre-mium necessarily increases (or decreases) forever as the bondmaturity rises (see Campbell et al., 1997). In alternative richerframeworks, Kozicki and Tinsley (2001) propose a model withshifting endpoints for the short-rate which is able to fit the termstructure, whereas Ang and Bekaert (2002) propose regime-switching models for the short-rates.
Our paper is also related to a growing body of literature aimingat identifying the term premium in US long-term securities. Kimand Wright (2005), Bernanke et al. (2005) and Backus and Wright(2007) also identify a significant decline of the term premium inrich reduced-form contexts as the culprit of the low long-termrates in the mid-2000s. They however assume an I(0) frameworkin their models, and their implied estimates of the historical termpremiums are quite different to ours. Other papers which back outthe term premium in a structural macro-finance model context areRavenna and Seppala (2006) and Rudebusch et al. (2006). Whilethese works have the goal of determining the mechanics behindterm premium dynamics, our approach directly focuses on identi-fying the empirical term premium. Once we identify the term pre-mium with our stylized model, we relate it to macro, financial andmonetary policy variables.
In a related article, Jardet et al. (2011) apply the ‘‘averaging esti-mators’’ technique devised by Hansen (2007) to identify the termpremium. This method, based on local-to-unity asymptotics, in-volves performing weighted averages of an I(0) VAR and a cointe-grated I(1) VAR model based on the prediction performance of eachmodel. Therefore, this approach is also based on the I(0)/I(1)dichotomy, not taking into account fractional alternatives. Ratherthan focusing on what is the most accurate predictor of theshort-rate expectation at each point in time, our fractional integra-tion model nests both I(0) and I(1) models and lets the data decideamong both them – plus all the fractional options – for the fullsample. Thus, the two approaches can be seen as alternative andcomplementary, as they are both potential solutions to the ‘‘dis-continuity’’ problem. As we comment below, our term premiumturns out to be qualitatively and quantitatively similar to that de-rived by Jardet et al. (2011).1
There is a number of papers which use fractional integrationtechniques to estimate interest rates. Backus and Zin (1993) ob-served that the volatility of bond yields does not decline exponen-tially when the maturity of the bond increases. In fact, they noticedthat the decline was hyperbolic and consistent with the fraction-ally integrated specification. Diebold and Lindner (1996) andGil-Alana and Robinson (1997) are two examples of applicationsinvolving interest rates and using long-memory. Phillips (2005)provided evidence based on semi-parametric methods that bothex-ante and ex-post US real interest rates are fractionally inte-grated. Diebold and Inoue (2001) show that it may be difficult todistinguish between long-memory and regime-switching dynam-ics. In a recent article, Connolly et al. (2007) find that long-memorypersists even after controlling for regime switches in the mean ofinterest rates. None of these papers however examines the termpremium implications of a fractionally integrated process for theshort-term interest rate.
This article is structured as follows. Section 2 illustrates our ap-proach to identify the term premium in a fractionally integrated
1 Robinson (1978) and Granger (1980) show that the aggregation of heterogeneousstationary AR models can yield a fractionally integrated process. The relation betweenthe method by Hansen (2007) and our fractional integration approach is howeveroutside the scope of this paper.
framework. It shows the estimates of the term premium identifiedwith the fractionally integrated model for the short-rate and dis-cusses the implications of this model from economic and financialperspectives. Section 3 provides economic intuition for the sourcesof term premium dynamics in our fractionally integrated frame-work. Section 4 concludes.
2. Identifying the term premium: an alternative approach
We start this section by describing our statistical approach toidentify the term premium without taking an ex-ante decision onthe order of integration of the short-rate. We then estimate thefractional integration model and compare the resulting term pre-mium with those implied by standard I(0) and I(1) processes. Afterthat, we examine the recent behavior of long interest rates in thecontext of our I(d) model for the short-rate. Finally we show thatour results are robust to the use of multivariate specifications,alternative interest rate decompositions or short-memorydynamics.
2.1. A fractional integration approach
As Backus and Wright (2007) point out, there is an identity rela-tion between the long-term rate and the sum of current and ex-pected short-term rates plus a time-varying term premium. Wecharacterize this relation with monthly data and short-term ratesof annual maturity as follows2:
ið120Þt ¼ 1
10Et
X9
j¼0
ið12Þtþ12j þ tpð120Þ
t ; ð1Þ
where ið120Þt is the 10-year rate in month t, ið12Þ
tþ12j is the 1-year short-
rate in month t + 12j (j = 0, 1, 2, . . . , 9) and tpð120Þt is the term pre-
mium on a 10-year bond with respect to the 1-year bond in montht. Therefore, the key element for the identification of the term pre-mium are the expectations of the short-term rate. Researchers haveemployed a wide variety of models to characterize the short-rate.Among the two simplest models are the standard I(0) and I(1) timeseries processes:
ð1� LÞkðið12Þt � lÞ ¼ �t; ð2Þ
�t ¼ q�t�1 þ nt; ð3Þ
where L is the lag operator, i.e. Lit = it�1, jqj < 1 and nt is assumed tobe i.i.d. If k = 0, this model is a stationary AR(1) process, whereas ifk = 1, we have an ARIMA(1, 1, 0) process. We estimated these twomodels with the zero-coupon bond 1-year rates retrieved fromthe updated Gürkaynak et al. (2007) database.3 The sample periodgoes from August 1971 to August 2009 and the frequency ismonthly. As it turns out, the implied term premiums by these twomodels are significantly different. Fig. 1 shows that there are impor-tant divergences across term premiums in the last four decades. Forinstance, in the early 1980s the I(0) model predicts a term premiummore than four percentage points above the I(1) model. Importantly,the I(0)-implied premium is more than one percentage point aboveits I(1) counterpart between 2001 and 2004 and also in 2009. Thereare thus potentially very large bond pricing model specificationerrors.
The main contribution of this article is to use a simple fractionalintegration model to endogenously determine both the order of
2 We use the 1-year as short-rate, as in Cochrane and Piazzesi (2008) andLudvigson and Ng (2009). Using the 1-month as the short-rate does not change thesubsequent analysis or implied results.
3 Results with the Fama and Bliss (1987) database did not reveal any significantdifferences.

Fig. 1. Term premium across orders of integration. Note: This figure compares the term premiums implied by the AR(1)/I(0) model (dashed line), the I(d) model (d = 0.847,solid line) and the ARIMA(1, 1, 0)/I(1) model (dotted line), for the short-term rate. The sample period is August 1971–August 2009. Recession periods appear in shaded bars.
Table 1Short and long-term interest rates: fractional integration estimates.
iðshortÞt iðlongÞ
t
Param. 95% C.I. Param. 95% C.I.
d 0.847 [0.766, 0.944] 0.878 [0.806, 0.968]q 0.470 [0.388, 0.544] 0.391 [0.311, 0.463]l 5.617 [5.589, 5.672] 6.306 [6.290, 6.318]
This table shows the estimates and 95% confidence intervals of the ARFIMA(1, d, 0)model for both the short-term (1-year) and long-term interest (10-year) rates:ð1� qLÞð1� LÞd iðjÞt � l
� �¼ nt ,
where (j) can be the short (1-year) or long-term (10-year) interest rate. The modelwas estimated through the parametric technique derived in Robinson (1994).
Table 2Short and long-term interest rates: fractional integration estimates (robustness).
iðshortÞt iðlongÞ
t
Param. 95% C.I. Param. 95% C.I.
d(m = 1) 0.804 [0.731, 0.902] 0.828 [0.761, 0.913]d(m = 2) 0.885 [0.787, 1.045] 0.952 [0.884, 1.147]
This table shows the estimates and 95% confidence intervals of the fractionalintegration model for the short-rate (1-year) and long-rate (10-year) employing (inthe context of Robinson’s (1994) testing procedure) the method of Bloomfield(1973), which approximates non-parametrically the ARMA part of the interest rateprocess. Two models (m = 1, 2) which imply alternative ARMA structures for theshort-run dynamics are estimated.
4 This is a standard assumption in the empirical work with fractional integration.For further details, see Gil-Alana and Hualde (2009), dealing with the Type I and TypeII I(d) processes.
5 If d = 0 and et follows an AR process, the decay in the autocorrelations isexponentially rapid compared with the I(d,d > 0) case, where the decay is hyperbolic.
L.A. Gil-Alana, A. Moreno / Journal of Banking & Finance 36 (2012) 1181–1193 1183
integration of the short-term process and the associated term pre-mium. In this alternative way, we avoid the controversial ex-antedecision on the order of integration of the short-rate process. Wesimply let the data speak and estimate the following ARF-IMA(1, d, 0) process for the short-rate:
ð1� LÞdðið12Þt � lÞ ¼ �t ; ð4Þ
�t ¼ q�t�1 þ nt ; ð5Þ
where d is the (possibly fractional) order of integration of the short-rate. This process can also be expressed in a single equation as:
ð1� qLÞð1� LÞdðið12Þt � lÞ ¼ nt: ð6Þ
The above expression can be represented in terms of an infiniteautoregressive (AR) process of the form:
wðL;q; dÞðið12Þt � lÞ ¼ nt ; ð7Þ
where wðL;q;dÞ ¼P1
j¼0wjLj, and ðið12Þ
t � lÞ ¼ 0, for t 6 0.4 As it iswell-known, the dynamics of this process depend on the values ofd and q, being crucial the value of d. If d = 0, the series is a covariancestationary process and possesses ‘short memory’, with the autocor-relations decaying fairly rapid. If d belongs to the interval (0, 0.50),ið12Þt is still covariance stationary, but both the autocorrelations and
the response of a variable to a shock take much longer to disappearthan in a standard (d = 0) stationary case.5 If d 2 [0.50, 1), the series

Fig. 2. Recursive estimates of the short-term rate fractional integration order. Note: This figure plots the recursive estimates of the fractional integration order of the short-term (1-year) interest rate and the associated 95% confidence bands. The order of integration was estimated through the parametric technique derived in Robinson (1994).The first estimation is conducted with the first 100 observations and then we recursively add one more observation (slide window) to estimate the following fractionalintegration orders.
Table 3Order of integration of the term premiums.
d 95% C.I. q
I(0) 0.830 [0.644, 0.961] 0.351I(d) 0.716 [0.619, 0.813] 0.061I(1) 0.724 [0.612, 0.832] 0.239
This table shows the estimates and 95% confidence intervals of the ARFIMA(1, d, 0)model for the term premiums implied by the three short-rate models:ð1� qLÞð1� LÞdðtpð120Þ
t ðIðjÞÞ � lÞ ¼ nt ,where j can be 0, d or 1. The model was estimated through the parametric tech-
nique derived in Robinson (1994).
1184 L.A. Gil-Alana, A. Moreno / Journal of Banking & Finance 36 (2012) 1181–1193
is no longer covariance stationary, but is still mean-reverting, withthe effect of the shocks dying away in the long-run. If d = 1 the seriesis a non-stationary, non-mean-reverting I(1) process.
Our method presents some differences with respect to previousapproaches. First, the fractional integration approach allows us todiscern the order of integration of a given variable without restrict-ing the econometrician to choose a priori between zero and one. Infact, the order of integration could be zero, a fraction of one, or itcould even be above one. Thus, our approach is agnostic with re-spect to the order of integration of the short-rate. As a result, pre-tests of the orders of integration of the variables – which often donot provide conclusive evidence – are not required. As a related po-sitive byproduct, our method simultaneously determines the orderof integration of the short-rate and the term premium. Comparingthe fractional integration methodology with the ‘‘local-to-unity’’asymptotic approach, employed in the ‘‘average estimators’’ meth-od of Jardet et al. (2011), it is important to note that both encom-pass the unit root model through from a very different perspective.Thus, in the local-to-unity approach the model is nested in a
classical AR framework, whilst ours is based on an I(d) structure.To draw some intuition, the former approach can be illustratedwith this process:
ð1� qðTÞLÞyt ¼ et t ¼ 1;2; . . . ð8Þ
with qðTÞ ¼ ð1� aTÞ. Clearly, as T ?1 we get closer to the unit root
case. On the other hand, the fractional integrated or I(d) approachadopts the model,
ð1� LÞdyt ¼ et t ¼ 1;2; . . . ð9Þ
and the unit root corresponds to the null of d = 1. In the latter case,as d increases beyond 0.5 and through 1, yt can be viewed as becom-ing ‘‘more non-stationary’’ (in the sense that the variance of the par-tial sums increases in magnitude with d) but it does so gradually,unlike in the AR case. Moreover, the I(d) class comprises many sta-tionary, non-stationary, invertible and non-invertible processes andthere is a smooth change around the unit root case. In contrast, inthe asymptotic theory for statistics directed against AR alternativesthere is an abrupt change around the unit root where differentasymptotics are obtained for jqj < 1, jqj = 1, and jqj > 1. Anotheradvantage of the I(d) approach is that d can be any real value,encompassing then the stationary I(0) and the non-stationary I(1)models. A drawback compared with the local-to-unity approach isthat the results for long-run dynamics rely on a single parameterd. The two approaches lead to a quite different decay of the impulseresponses; the local-to-unity being exponential, the I(d) beinghyperbolically slower.
Fractional integration and regime-switching models are also re-lated. Diebold and Inoue (2001) show that it is difficult to distin-guish fractional integration and regime-switching processes from

Fig. 3. Term spread and term premiums across decompositions. Note: This figure plots the term spread (dashed line, 10 year minus 1 year rate) and compares the termpremiums across decompositions. Recession periods appear in shaded bars. The sample period is August 1971–August 2009. Decomposition 1 (f(108,12), in dotted line) is:f ð108;12Þt ¼ Eti
ð12Þ108 þ t̂pð120Þ
t : Decomposition 2 (i(120), in dark continuous line) is: ið120Þt ¼ 1
10 EtP9
j¼0ið12Þtþ12j þ tpð120Þ
t .
L.A. Gil-Alana, A. Moreno / Journal of Banking & Finance 36 (2012) 1181–1193 1185
time series data. Nevertheless, these two processes are very differ-ently motivated. Regime switching models are designed to identifyshifts in parameters (means, autocorrelations or shock variances).The fractional integration structure does not provide this economicinterpretation, but captures empirical long-memory time seriesdependence and can accommodate standard short-run depen-dence. Alternatively, Kozicki and Tinsley (2001) use a shifting end-points approach to fit the term structure of interest rates. Thistechnique is related to the fractional integration approach in thatit combines interest rate non-stationarity with mean reversion.In contrast to fractional integration, the shifting endpoints ap-proach involves shifts in the long-run parameters for inflation,and thus a time-varying interest rate mean.
2.2. Empirical results
We employ the econometric method devised by Robinson(1994) which allows for testing (possibly) fractionally integratedprocesses. This method, based on the Lagrange Multiplier (LM)principle, uses the Whittle function – which is an approximationto the likelihood function – in the frequency domain and is speci-fied in a parametric framework. We should note here that eventhough Robinson’s (1994) method is a testing procedure, we canapproximate the estimation of d by choosing the value that pro-duces the lowest statistic in absolute value. An advantage of thismethod is that it is valid for any real value of d, therefore encom-passing stationary (d < 0.5) and non-stationary (d P 0.5) hypothe-ses, unlike other methods that require first differencing to render
the series stationary prior to the estimation of d. Nevertheless,we also employed the maximum likelihood approach in the timedomain of Sowell (1992) and the results were almost exactly thesame as those reported in the paper.
The estimates for the same data, frequency and period than theI(0)/I(1) models illustrated above, are reported in Table 1. It showsthat d̂ ¼ 0:847 (and significantly different from 1 and 0), q̂ ¼ 0:470and l̂ ¼ 5:617 (and significantly different from 0). Therefore, theinterest rate exhibits long-memory, is non-stationary but mean-reverting. Table 1 also shows that the long-rate exhibits similardynamics, with d̂ ¼ 0:878.
In order to gauge the robustness of this parameter estimate tothe short-run dynamics of the series, we employ the technique de-vised by Bloomfield (1973). This method essentially approximatesARMA structures with a reduced number of parameters. Moreover,this model can be flexibly accommodated in the context ofRobinson’s (1994) tests, and the researcher does not have to spec-ify parametrically the process for the short-rate dynamics, as theprocedure approximates the dynamics of alternative ARMA(p, q)processes. We employ the model of Bloomfield (1973) with oneand two parameters, which differ on the persistence degree ofthe I(0) dynamics of the interest rate. As Table 2 shows, the esti-mates of the order of integration of the short-rate are 0.804 and0.885, very close and statistically insignificantly different fromthe value originally estimated (0.847) with the AR(1) structure. Ta-ble 2 also shows that the estimates of the long-rate order of inte-gration (0.828 and 0.952) are also quite similar to those of theoriginal model (0.878).
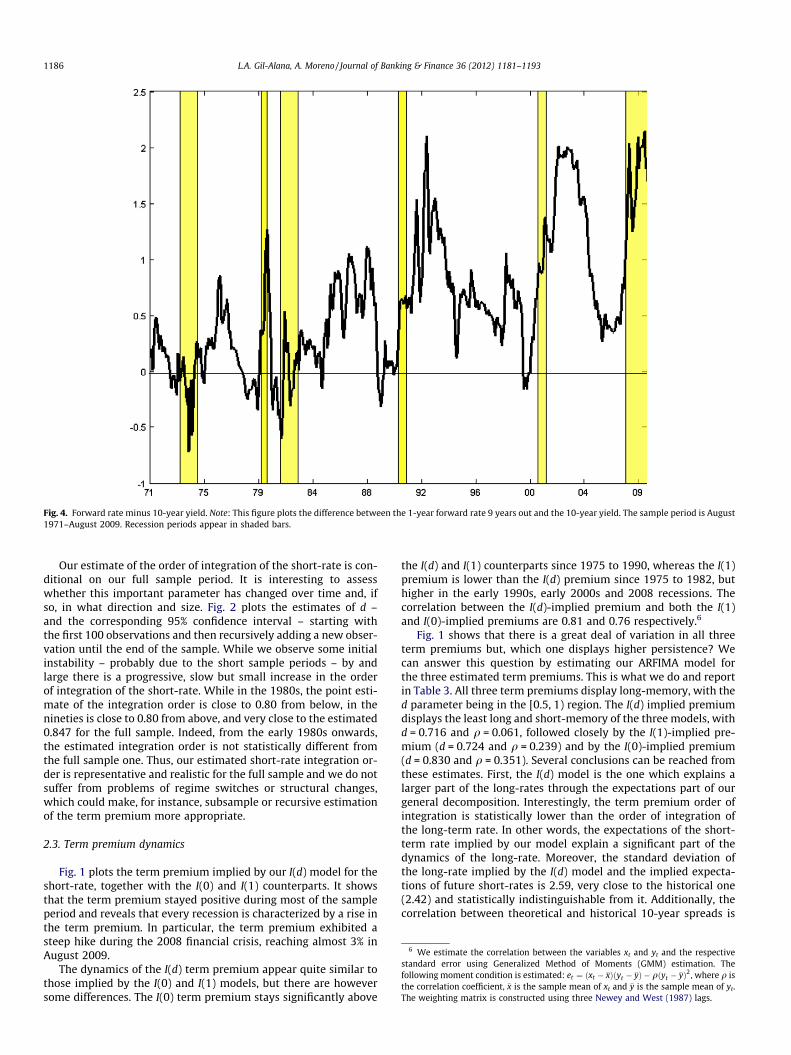
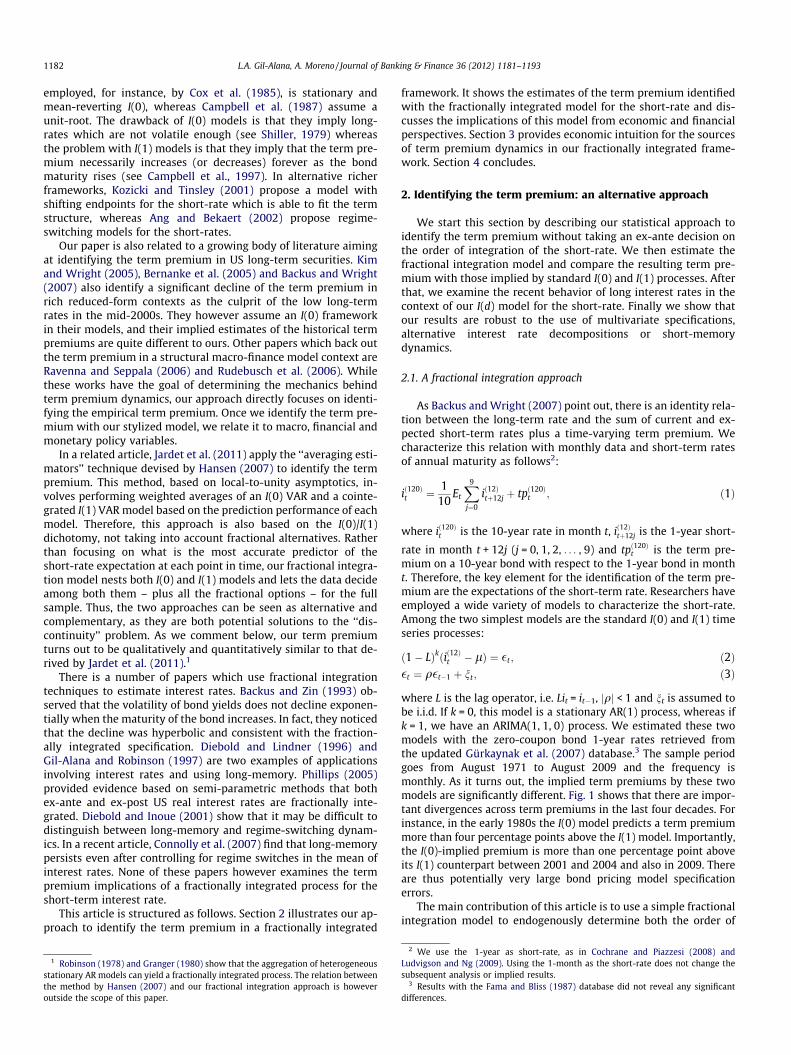
Fig. 4. Forward rate minus 10-year yield. Note: This figure plots the difference between the 1-year forward rate 9 years out and the 10-year yield. The sample period is August1971–August 2009. Recession periods appear in shaded bars.
6 We estimate the correlation between the variables xt and yt and the respectivestandard error using Generalized Method of Moments (GMM) estimation. Thefollowing moment condition is estimated: et ¼ ðxt � �xÞðyt � �yÞ � qðyt � �yÞ2, where q isthe correlation coefficient, �x is the sample mean of xt and �y is the sample mean of yt.The weighting matrix is constructed using three Newey and West (1987) lags.
1186 L.A. Gil-Alana, A. Moreno / Journal of Banking & Finance 36 (2012) 1181–1193
Our estimate of the order of integration of the short-rate is con-ditional on our full sample period. It is interesting to assesswhether this important parameter has changed over time and, ifso, in what direction and size. Fig. 2 plots the estimates of d –and the corresponding 95% confidence interval – starting withthe first 100 observations and then recursively adding a new obser-vation until the end of the sample. While we observe some initialinstability – probably due to the short sample periods – by andlarge there is a progressive, slow but small increase in the orderof integration of the short-rate. While in the 1980s, the point esti-mate of the integration order is close to 0.80 from below, in thenineties is close to 0.80 from above, and very close to the estimated0.847 for the full sample. Indeed, from the early 1980s onwards,the estimated integration order is not statistically different fromthe full sample one. Thus, our estimated short-rate integration or-der is representative and realistic for the full sample and we do notsuffer from problems of regime switches or structural changes,which could make, for instance, subsample or recursive estimationof the term premium more appropriate.
2.3. Term premium dynamics
Fig. 1 plots the term premium implied by our I(d) model for theshort-rate, together with the I(0) and I(1) counterparts. It showsthat the term premium stayed positive during most of the sampleperiod and reveals that every recession is characterized by a rise inthe term premium. In particular, the term premium exhibited asteep hike during the 2008 financial crisis, reaching almost 3% inAugust 2009.
The dynamics of the I(d) term premium appear quite similar tothose implied by the I(0) and I(1) models, but there are howeversome differences. The I(0) term premium stays significantly above
the I(d) and I(1) counterparts since 1975 to 1990, whereas the I(1)premium is lower than the I(d) premium since 1975 to 1982, buthigher in the early 1990s, early 2000s and 2008 recessions. Thecorrelation between the I(d)-implied premium and both the I(1)and I(0)-implied premiums are 0.81 and 0.76 respectively.6
Fig. 1 shows that there is a great deal of variation in all threeterm premiums but, which one displays higher persistence? Wecan answer this question by estimating our ARFIMA model forthe three estimated term premiums. This is what we do and reportin Table 3. All three term premiums display long-memory, with thed parameter being in the [0.5, 1) region. The I(d) implied premiumdisplays the least long and short-memory of the three models, withd = 0.716 and q = 0.061, followed closely by the I(1)-implied pre-mium (d = 0.724 and q = 0.239) and by the I(0)-implied premium(d = 0.830 and q = 0.351). Several conclusions can be reached fromthese estimates. First, the I(d) model is the one which explains alarger part of the long-rates through the expectations part of ourgeneral decomposition. Interestingly, the term premium order ofintegration is statistically lower than the order of integration ofthe long-term rate. In other words, the expectations of the short-term rate implied by our model explain a significant part of thedynamics of the long-rate. Moreover, the standard deviation ofthe long-rate implied by the I(d) model and the implied expecta-tions of future short-rates is 2.59, very close to the historical one(2.42) and statistically indistinguishable from it. Additionally, thecorrelation between theoretical and historical 10-year spreads is

Fig. 5. I(0)/I(1) term premiums: univariate versus multivariate models. Note: The top figure compares the term premiums implied by the univariate AR(1) (thick line) andmultivariate vector autoregressive (VAR(1), thin line) models. The bottom figure compares the term premiums implied by the univariate ARIMA(1, 1, 0) (thick line) andmultivariate Vector Error Correction (VECM, thin line) models. The VAR and VECM models are computed with 1-, 2-, 3-, 4- and 5-year yields. The sample period is August1971–August 2009. Recession periods appear in shaded bars.
L.A. Gil-Alana, A. Moreno / Journal of Banking & Finance 36 (2012) 1181–1193 1187
79%, and statistically significant. Second, the I(1)-implied premiumhas a very similar order of integration to the I(d)-premium and itsassociated expectations also help to explain the variations of thelong rate. The opposite is true for the I(0) model, whose impliedterm premium has a significantly higher order of integration, veryclose to that of the long-term rate. Third, there is still substantialtime-variation in the term premium. Therefore, the expectationshypothesis is clearly rejected by the data in our stylized setting.
Our I(d)-implied term premium is very similar to one financialvariable observable in real time, the term spread. Fig. 3 shows thatthe two variables display a very similar co-movement. Theirunconditional correlation is 0.87 and statistically significant. Thereason is very simple. Since the expectations of the short-rate dis-play long-memory, long-distance expectations are very similar tothe current short-rate. As a result, the weighted sum of expecta-tions of the short-rate is very similar to the short-rate itself, so thatthe term premium is very close to the 10-year term spread. Thus,the term premium is also an indicator of the investors’ preferencesof long-term relative to short-term bonds. Jardet et al. (2011) alsoreport a strong positive relation between the spread and the termpremium both in levels and as a response of the term premium to aspread shock.
We now show that our implied I(d) term premium dynamics arerobust to two alternative term premium modeling specifications.Firstly, we compute the term premium with the standard formulafor forward interest rates:
f ð108;12Þt ¼ Eti
ð12Þtþ108 þ t̂pð120Þ
t : ð10Þ
That is, we compute the expectations of the 1-year rate 9 years
out (Etið12Þtþ108) and subtract it from the 1-year forward rate 9 years
out (f ð108;12Þt ) to obtain the term premium. Fig. 3 also compares the
term premiums obtained with this forward identity and thoseobtained with the decomposition of Eq. (1), both with our I(d) modelfor the short-rate. They display essentially the same dynamics, witha significant correlation well above 95%. One slight differencebetween the two term premiums is that the one computed withthe forward formula is typically above the one computed with ourinitial identity. This is especially the case in the second part of thesample. But this occurs because the forward rate remains regularlyhigher than the 10-year yield since the mid-1980s, as Fig. 4 shows.
Secondly, our short-rate forecast model is univariate, whereasmany authors employ multivariate specifications. While we agreethat there is predictability of future short-term rates based on cur-rent macroeconomic and financial variables, it is also true thatmuch of that information is contained in the current value of theshort-rate itself, for instance through monetary policy actions(see Taylor (1993) and Clarida et al. (1999) among others). Thus,the short-term interest rate contains a great deal of informationregarding past, current and expected values of macro and financialvariables. Moreover, since macro and financial variables often dis-play autocorrelation, this is in effect captured by the infinite auto-regressive dynamic structure of our fractionally integrated model.

Fig. 6. Expectations of the short-rate 10 years out across models. Note: This figure compares the expectations of the short-rate 10 years out across univariate models. Thesample period is August 1971–August 2009. Recession periods appear in shaded bars.
1188 L.A. Gil-Alana, A. Moreno / Journal of Banking & Finance 36 (2012) 1181–1193
We also directly assess whether the results of univariate modelshold in the multivariate set-up employed by Cochrane and Piazzesi(2008) and other authors.7 To this end, we compare the term premi-ums implied by univariate models (AR(1) and ARIMA(1, 1, 0)) andthose implied by their multivariate counterparts (I(0) Vector Autore-gressive (VAR(1)) in levels and I(1) Vector Error Correction (VECM) inspreads), respectively. The VAR and VECM models are computedwith 1-, 2-, 3-, 4- and 5-year yields. Fig. 5 indeed shows that the uni-variate and multivariate term premiums are essentially the sameacross integration orders, with significant correlations above 93%.In other words, there is not significant additional information inthe 2–5-year yields in order to identify the 10-year premium.
2.4. Long-distance expectations of the short-rate
Fig. 6 plots the expectations of the 1-year rate 10 years out forthe I(d), I(0) and I(1) models. While the expectations of the I(0)model are close to the sample mean throughout the sample span,those implied by the I(1) model are very close to the currentshort-rate dynamics, as should be expected from a unit root model.The I(d) model yields quite volatile expectations which exhibit veryslow mean-reversion and indeed move closer to the I(1) than to theI(0) expectations. As Backus and Wright (2007) point out, this is adesirable feature of realistic term structure models.8 We would liketo emphasize that even though the expectations of the I(d) model are
7 Working with yields and forwards results in almost identical implications.8 Gürkaynak et al. (2005) and Bekaert et al. (2010) manage to produce volatile long-
distance short-rate expectations through the introduction of very persistent unob-servable macro variables – such as the inflation target or the natural rate of output –which in their structural models are filtered through the term structure. These works,in turn, provide a macroeconomic interpretation to the important level factordiscussed in the affine term structure models of the finance literature, such as Dai andSingleton (2000).
quite close to those of the I(1) model, the nature of the two models isvery different. The first is mean-reverting, the second is not.
Fig. 7 plots the expectations of the short-rate at different hori-zons across models. There are six graphs which correspond to fiveimportant macroeconomic episodes occurred over the last 35 years(the beginning of the 1973 oil crisis, the 1980, 1981, 2001 and2008–2009 recessions) and January 2005, coinciding with theconundrum episode. As expected, the predictions of the I(1) modelare very similar to the current short-rate across horizons andtimes. In contrast, the I(0) model always predicts a fast conver-gence towards the implied mean so that the predictions of theshort-rate 10 years out are very similar to this mean. The I(d) mod-el exhibits very slow mean-reversion. For instance, in January 1980and June 1981, at historically high interest rates, the prediction ofthe 1-year rate 1-year ahead is very close to the high rates presentat those times, whereas 10 years ahead is between two and threepoints below. Similar dynamics are found in December 2001 andAugust 2009, but then the interest rates were at historically lowlevels, so that the predictions of the short-rate 10 years out were3.5% and 2%, respectively. Interestingly, the January 2005 episodeshows that the reversion of the I(d) expectations can be non-mono-tonic, with the expectations path exhibiting an alternative hump-shape. This is due to the fact that the expectations of the I(d) model– unlike the other two models considered here – depend on all pastobserved short-rate dynamics.
3. Macro-finance analysis
In this section we develop some economic intuition on thesources of the I(d)-implied term premium dynamics. We firstexamine the impact of some important macro-finance variableson the I(d) term premium in a linear multivariate regression con-text. Then, we examine the I(d) term premium dynamic response

Fig. 7. Prediction of the short-rate across models at different times. Note: This figure plots the predictions of the short-rate at different horizons (1-month to 10-year) andtimes across interest rate models.
Table 4Multivariate analysis coefficients.
pt ut Dyt Dmt ccit eq � rett tpt
pt�1 0.5839 � 0.0115 0.2170 � 0.2137 �0.0546 � 0.0193 � 0.0240(0.0434) (0.0062) (0.0515) (0.0472) (0.0160) (0.0559) (0.0269)
ut�1 0.0484 0.9745 0.1555 0.2356 � 0.0285 0.1105 0.0737(0.0511) (0.0073) (0.0606) (0.0556) (0.0188) (0.0658) (0.0317)
Dyt�1 0.0824 � 0.0210 0.0910 � 0.0462 0.0425 0.1218 � 0.0563(0.0426) (0.0061) (0.0505) (0.0463) (0.0157) (0.0548) (0.0264)
Dmt�1 � 0.0146 0.0044 � 0.0126 0.3746 0.0265 � 0.0242 0.0045(0.0409) (0.0059) (0.0485) (0.0445) (0.0150) (0.0526) (0.0253)
ccit�1 � 0.0923 � 0.0533 0.4708 � 0.0031 0.9126 � 0.0076 � 0.0015(0.0508) (0.0073) (0.0602) (0.0553) (0.0187) (0.0654) (0.0315)
eq � rett�1 0.0106 � 0.0028 � 0.0057 � 0.1575 0.1123 0.2514 � 0.0030(0.0393) (0.0056) (0.0465) (0.0427) (0.0145) (0.0505) (0.0243)
tpt�1 � 0.1424 � 0.0044 0.1509 � 0.3620 0.0310 � 0.0961 0.8590(0.0067) (0.0553) (0.0508) (0.0172) (0.0601) (0.0289) (0.0467)
Note: This table shows the coefficients of the VAR(1) estimated for inflation, unemployment, industrial production growth, money supply (M2) growth, the consumerconfidence index, equity returns and the term premium identified with the I(d) model for the short-rates. The associated standard errors appear in parentheses. Variables arestandardized (in mean deviation and divided by their standard deviation). The sample period is January 1978–August 2009.
L.A. Gil-Alana, A. Moreno / Journal of Banking & Finance 36 (2012) 1181–1193 1189
to shocks in relevant macro-finance variables, as well as the re-sponses of these variables to a term premium shock.
3.1. Multivariate regression analysis
Which are the factors behind the variations in the term pre-mium? What is the term premium influence on macro-finance
dynamics? A straightforward approach to address this question isto set up a joint multivariate system with both the I(d)-impliedterm premium and the one obtained with a set of macroeconomicand financial variables. As macro variables, we choose monthly CPIinflation, the unemployment rate, the money supply (M2) growth,and the output (industrial production) growth. We also select theconsumer confidence index and the monthly stock return of the

Fig. 8. The term premium and the unemployment rate. Note: The figure compares the term premium implied by the I(d) model for short-rates with the unemployment rate.Variables are demeaned. The sample period is August 1971–August 2009.
Fig. 9. Term premium dynamics: response to macro-finance shocks. Note: The figure shows the impulse response functions – and the associated two-standard errorconfidence intervals – of the I(d) term premium in response to a set of macro-finance shocks in the context of a VAR(1) model including the term premium, CPI inflation, theunemployment rate, industrial production growth, money supply (M2) growth, the consumer confidence index and equity returns. Variables are standardized (in meandeviation and divided by their standard deviation) before the estimation. The sample period is January 1978–August 2009.
1190 L.A. Gil-Alana, A. Moreno / Journal of Banking & Finance 36 (2012) 1181–1193

Fig. 10. Macro-finance dynamics: responses to the term premium shock. Note: The figure shows the impulse response functions – and the associated two-standard errorconfidence intervals – of the macro-finance variables (CPI inflation, the unemployment rate, industrial production growth, money supply (M2) growth, the consumerconfidence index and equity returns) to the I(d) term premium shock. Variables are standardized (in mean deviation and divided by their standard deviation) before theestimation. The sample period is January 1978–August 2009.
9 Backus and Wright (2007) also find a positive relation between their I(0) termpremium and unemployment in a regression including only disagreement of inflationexpectations and a constant as additional explanatory variables.
L.A. Gil-Alana, A. Moreno / Journal of Banking & Finance 36 (2012) 1181–1193 1191
S&P 500 index as explanatory variables. All macro-finance serieswere retrieved from the Federal Reserve Bank of St. Louis EconomicResearch Database.
Table 4 shows the slope coefficients of the Vector Auto-Regres-sive (VAR) system of order one. The VAR order was selected on thebasis of the Schwarz Bayesian information criterion. Variables arestandardized prior to estimation to facilitate interpretation. Westart the sample in January 1978, the first available date for con-sumer confidence index data. Results are robust if we start theregressions in August 1971 – with the available data – or in1984, when the monetary authority started to be more effectivein stabilizing inflation.
Table 4 shows that higher unemployment significantly predictsa future increase in the term premium. A potential explanation isthat higher unemployment signals uncertainty about the state ofthe economy, thus making long-term bonds relatively less attrac-tive. Below, we further elaborate on this relation. A higher outputgrowth, in turn, lowers the expected future term premium. Thiscan be due to the fact that as the real economy performance im-proves, the monetary authority increases the current and expectedshort-rate increase, thus implying a decrease in the term premium.The table also shows that a higher term premium predicts signifi-cant declines of future inflation, money growth and equity returnsand a significant increase in output growth.
The unemployment rate appears as a strong predictor of termpremium dynamics. This is interesting because the unemploymentrate is a real variable and no other variables apart from nominalinterest rates are used in identifying the term premium. To develop
more intuition about the positive relation between the termpremium and the unemployment rate, we plot the demeaned ser-ies of the unemployment rate and the term premiums in Fig. 8. Therelation among the term premium and the unemployment rate ap-pears striking, especially since the late 1980s and at medium andlong frequencies, when the dynamics of the unemployment ratealmost mimic those of the term premiums. Indeed, the correlationbetween the term premium and the unemployment rate since1988 is 74% and statistically significant. Our stylized analysis thussuggests to closely follow the unemployment rate as a driver ofterm premium dynamics.9 So, for instance, the recent term pre-mium increase appears clearly related with the unemployment hikeof 2009. Even if monetary policy had become persistently expansivesince 2008, investors perceived an increased risk in the US economy– as reflected in labor market conditions – pricing down long-termdebt relative to its current and expected short-term counterpart.
3.2. Impulse response functions
In this section, we examine the impulse response functions ofour identified term premium to macro-finance shocks. While inthe previous regression setting we identified conditional correla-tions, it is interesting to analyze the dynamics of the term pre-mium following meaningful empirical shocks. To this end, we

1192 L.A. Gil-Alana, A. Moreno / Journal of Banking & Finance 36 (2012) 1181–1193
perform impulse response function analysis based on the VAR(1)system estimated in the previous subsection. We follow the‘‘Generalized Impulse Response’’ strategy designed by Pesaranand Shin (1998), which does not require a specific ordering ofthe variables nor constraints on the impact responses of some vari-ables to specific shocks. Nevertheless, results are robust to struc-tural shock identification based on alternative ordering schemes,as in Christiano et al. (1999).
Fig. 9 shows the impulse responses of the term premium to themacro-finance shocks. All responses are statistically significant –some periods after the shock – except those to the inflation andmoney growth shocks. An unemployment shock (an increase inunemployment) generates a hump-shaped positive response ofthe term premium, which is consistent with the graphical andregression evidence shown in the earlier section. The term pre-mium also declines in a hump-shaped fashion after positive indus-trial production. Our results are thus consistent with those in thestructural macro-finance model of Rudebusch and Swanson,(accepted for publication), who find that a technology shock im-plies a dynamic reduction of the term premium. They also find thatan expansionary monetary policy shock increases the term pre-mium, as we do – although in our case the effect is not statisticallysignificant. They finally find that an expansionary governmentshock increases the term premium. Notice however that the Ricar-dian equivalence holds in their setting so that this positive fiscalshock does not expand production or consumption.
Our results also show that the term premium declines severalperiods after a consumer confidence shock while it exhibits a per-manent decline after a shock increase in equity returns, typicallyassociated with eased financial conditions. All in all, our results im-ply that ‘‘positive’’ shocks for the economy and financial marketsimply dynamic reductions in the term premium.
Fig. 10 shows the responses of the macro-finance variables to apositive shock (increase) in the term premium. Industrial produc-tion growth first declines on impact but then persistently increases– and significantly during several months. While regression resultsin Ang et al. (2006) show an insignificant response of output growthto the term premium, impulse responses in Joslin et al. (2010) show asignificant initial decline of economic activity during some periodsonce they take into account that GDP is unspanned by the yieldcurve. In turn, Jardet et al. (2011) show that GDP first declines afterthe positive term premium shock, but then significantly increasesafter three quarters. This could be due to the fact that an increasein the term premium may come accompanied by an increase in gov-ernment debt which can eventually induce expansion in GDP. Ourresults are thus consistent with this hypothesis.
Inflation persistently declines after a positive shock to the termpremium. Joslin et al. (2010) also show a significant initial declineof inflation when considering inflation unspanned by the yieldcurve. Our results also show the monetary policy authority pursueda contractionary monetary policy stance following a term premiumshock during the full sample. Consumer confidence increases in ahump-shaped form following the term premium shock – signifi-cantly during the first periods. The remaining responses are not sta-tistically significant but show that the unemployment rate andequity returns decline after the term premium shock.
4. Conclusions
A clear advantage of our fractional integration approach is thatit introduces a route to avoid the specification error present inmany models of the term structure of interest rates. Our frame-work allows for the endogenous determination of both the orderof integration of the interest rates and the associated term pre-mium. According to our econometric tests, the short-rate possesses
long-memory and is very slowly mean-reverting, so that the pre-dictions of the I(1) model are indeed closer to our model.
While our approach can be a solution to the model specifica-tion errors, the sampling error of both forecast and term premiumcalculations continues to be a concern for researchers (seeRudebusch, 2007). In this paper, we show that the asymptoticconfidence interval for the short-rate order of integration param-eter is quite tight. Nevertheless, treating the order of integrationas a parameter estimate adds another source of uncertaintywhich could be translated into uncertain forecasts. We intendto measure these errors in future research. The advantage of thefractional integration framework is that researchers can focusonly on one source of uncertainty instead of two sources.
In future work we also intend to distinguish between nominaland real term premiums. In this respect, articles by Kim and Wright(2005) and Ang et al. (2008) are significant contributions. In a frac-tional integration framework, it would be interesting to elucidatewhere the long-memory for short-rates is coming from. At a theoret-ical level, an argument employed to justify fractional integration isthe aggregation of heterogeneous AR processes (see, for instance,Robinson, 1978; Granger, 1980). It could be that an important com-ponent of interest rate dynamics is coming from the diverse forma-tion of inflation expectations. In Section 3 we identified significantrelations between the term premium and macro variables. In thiscontext, the application of the emerging fractional cointegrationtechniques (see Robinson and Hualde (2003) and Johansen (2008)among others) should be of great interest. Finally, we intend to intro-duce fractional integration specifications in a fully fledged affineterm structure model (Dai and Singleton, 2000). As the work inSchotman et al. (2008) shows, the combination of long and shortmemory may prove to be a fruitful avenue to generate richer andmore realistic term structure dynamics.
Acknowledgement
Luis A. Gil-Alana acknowledges financial support from MICINNGrant SEJ2008-03035. Antonio Moreno acknowledges financialsupport from MICINN Grant ECO2009-11151 and from the Jerón-imo de Ayanz research program. We thank an anonymous referee,David Backus, Geert Bekaert, Javier Hualde, Ching-Chih Lu, GabrielPérez Quirós and seminar participants in the Bank of Spain, Bank ofSweden, Universidad Autónoma de Madrid, Yonsei University,University of Navarra, the 2009 Foro de Finanzas in Madrid, the2009 Simposio de Análisis Económico in Valencia and the 2009Meeting of the Methods in International Finance Network in Lux-embourg for their comments.
References
Ang, A., Bekaert, G., 2002. Regime switches in interest rates. Journal of Business andEconomic Statistics 20, 163–182.
Ang, A., Piazzesi, M., Wei, M., 2006. What does the yield curve tell us about GDPgrowth? Journal of Econometrics 131 (3), 359–403.
Ang, A., Bekaert, G., Wei, M., 2008. The term structure of real rates and expectedinflation. Journal of Finance 63 (2), 797–849.
Backus, D.K., Wright, J.H., 2007. Cracking the conundrum. Brooking Papers onEconomic Activity 1, 293–316.
Backus, D.K., Zin, S.E., 1993. Long-memory inflation uncertainty. Evidence from theterm structure of interest rates. Journal of Money, Credit and Banking 25, 681–700.
Bekaert, G., Cho, S., Moreno, A., 2010. New-Keynesian macroeconomics and theterm structure. Journal of Money, Credit and Banking 42 (1), 33–62.
Bernanke, B.S., 2006. Remarks before the Economic Club of New York, New YorkMarch 20, 2006.
Bernanke, B.S., Reinhart, V., Sack, B., 2005. Monetary policy alternatives at the zerobound: an empirical assessment. Brooking Papers on Economic Activity 2, 1–78.
Bloomfield, P., 1973. An exponential model in the spectrum of a scalar time series.Biometrika 60, 217–226.
Campbell, J.Y., Shiller, R.J., 1987. Cointegration and tests of present value models.Journal of Political Economy 95 (5), 1062–1088.

L.A. Gil-Alana, A. Moreno / Journal of Banking & Finance 36 (2012) 1181–1193 1193
Campbell, J.Y., Law, A.W., MacKinlay, A.C., 1997. The Econometrics of the FinancialMarkets. Princeton University Press, Princeton, NJ.
Christiano, L., Eichenbaum, M., Evans, C.L., 1999. Monetary policy shocks: what havewe learned and to what end? In: Taylor, John B., Woodford, Michael (Eds.),Handbook of Macroeconomics, vol. 1. North Holland, Amsterdam.
Clarida, R.H., Galí, J., Gertler, M., 1999. The science of monetary policy: a NewKeynesian perspective. Journal of Economic Literature 37 (4), 1661–1707.
Cochrane, J., Piazzesi, M., 2008. Decomposing the Yield Curve. Mimeo, University ofChicago.
Connolly, R.A., Gner, Z.N., Hightower, K.N., 2007. Evidence on the extent andpotential sources of long memory in US treasury security returns and yields.Journal of Money, Credit and Banking 39 (2-3), 689–702.
Cox, J., Ingersoll, J., Ross, S., 1985. A theory of term structure of interest rates.Econometrica 53, 385–408.
Dai, Q., Singleton, K., 2000. Specification analysis of affine term structure models.Journal of Finance 55 (4), 531–552.
Diebold, F.X., Inoue, A., 2001. Long memory and regime switching. Journal ofEconometrics 105, 131–159.
Diebold, F.X., Lindner, P., 1996. Fractional integration and interval prediction.Economics Letters 50, 305–313.
Fama, E.F., Bliss, R.R., 1987. The information in long-maturity forward rates.American Economic Review 77, 680–692.
Gil-Alana, L.A., Hualde, J., 2009. Fractional integration and cointegration. Anoverview and an empirical application. Palgrave Handbook of AppliedEconometrics, Part III 2, 1190–1219.
Gil-Alana, L.A., Robinson, P.M., 1997. Testing of unit roots and other nonstationaryhypotheses in macroeconomic time series. Journal of Econometrics 80, 241–268.
Granger, C.W.J., 1980. Long memory relationships and the aggregation of dynamicmodels. Journal of Econometrics 14, 227–238.
Gürkaynak, R.T., Sack, B., Swanson, E., 2005. The sensitivity of long-term interestrates to economic news: evidence and implications for macroeconomic models.American Economic Review 95 (1), 425–436.
Gürkaynak, R.S., Sack, B., Wright, J.H., 2007. The US treasury yield curve: 1961 to thepresent. Journal of Monetary Economics 54 (8), 2291–2304.
Hansen, B., 2007. Least square model averaging. Econometrica 75 (4), 1175–1189.Jardet, C., Monfort, A., Pegoraro, F., 2011. No-Arbitrage Near-cointegrated VAR(p)
Term Structure Models, Term Premia and GDP Growth. Mimeo, Banque deFrance.
Johansen, S., 2008. A representation theory for a class of vector autoregressivemodels for fractional processes. Econometric Theory 24, 651–676.
Joslin, S., Priebsch, M., Singleton, K.J., 2010. Risk Premiums in Dynamic TermStructure Models with Unspanned Macro Risks. Mimeo, Stanford University.
Kim, D.H., Wright, J.H., 2005. An Arbitrage-free Three-factor Term Structure Modeland the Recent Behavior of Long-term Yields and Distant-horizon ForwardRates. Finance and Economics Discussion Series No 2005-33. Board ofGovernors of the Federal Reserve System.
Kozicki, S., Tinsley, P.A., 2001. Shifting endpoints in the term structure of interestrates. Journal of Monetary Economics 47, 613–652.
Ludvigson, S.C., Ng, S., 2009. Macro factors in bond risk premia. The Review ofFinancial Studies 22 (12), 5027–5067.
Newey, W.K., West, K.D., 1987. A simple, positive semi-definite, heteroskedasticityand autocorrelation consistent covariance matrix. Econometrica 55, 703–708.
Pesaran, H.H., Shin, Y., 1998. Generalized impulse response analysis in linearmultivariate models. Economics Letters 58 (1), 17–29.
Phillips, P.C., 2005. Econometric analysis of Fisher’s equation. The American Journalof Economics and Sociology 64 (1), 125–168.
Ravenna, F., Seppala, J., 2006. Monetary Policy and Rejections of the ExpectationsHypothesis. Bank of Finland Research Discussion Papers 25.
Robinson, P.M., 1978. Statistical inference for a random coefficient autoregressivemodel. Scandinavian Journal of Statistics 5, 163–168.
Robinson, P.M., 1994. Efficient tests of nonstationary hypotheses. Journal of theAmerican Statistical Association 89, 1420–1437.
Robinson, P.M., Hualde, J., 2003. Cointegration in fractional systems with unknownintegration orders. Econometrica 71 (6), 1727–1766.
Rudebusch, G.D., 2007. Comment to ‘‘Cracking the conundrum’’ by David K. Backusand Jonathan H. Wright. Brooking Papers on Economic Activity 1, 317–335.
Rudebusch, G.D., Swanson, E., accepted for publication. The bond premium in aDSGE model with long-run real and nominal risks. American Economic Journal:Macroeconomics.
Rudebusch, G.D., Swanson, E.T., Wu, T., 2006. The bond yield ‘‘conundrum’’ from amacro-finance perspective. Monetary and Economic Studies 24 (1), 83–128.
Schotman, P.C., Tschernig, R., Budek, J., 2008. Long memory and the term structureof risk. Journal of Financial Econometrics 6 (4), 459–495.
Shiller, R.J., 1979. The volatility of long-term interest rates and expectations modelsof the term structure. Journal of Political Economy 87, 1190–1219.
Sowell, F., 1992. Maximum likelihood estimation of stationary univariatefractionally integrated time series models. Journal of Econometrics 53, 165–188.
Taylor, J.B., 1993. Discretion versus policy rules in practice. Carnegie–RochesterConference Series on Public Policy 39, 195–214.