Uncovering the Plight of Low-Income Malaysia - REFSA
15
Uncovering the Plight of Low-Income Malaysia Uncovering the Plight of Low-Income Malaysia REFSA BRIEF Issue 6 June 2020 Darshan Joshi, Lead Researcher [email protected]
-
Upload
khangminh22 -
Category
Documents
-
view
2 -
download
0
Transcript of Uncovering the Plight of Low-Income Malaysia - REFSA

Uncovering the Plight of Low-Income Malaysia
Uncovering the Plight ofLow-Income Malaysia
REFSA BRIEFIssue 6 June 2020
Darshan Joshi, Lead Researcher [email protected]

Uncovering the Plight of Low-Income Malaysia
Executive Summary
• The need for stronger social protections for Malaysia’s low-income households existed well before the current, coronavirus-driven economic slowdown.
• Malaysia’s existing system of direct financial assistance, Bantuan Sara Hidup (BSH), is flawed in two ways:
o It is geographically-uniform and does not take into consideration differences in the cost of living across states or across the rural-urban divide within each state.
o The level of support it provides low-income households is far from sufficient to act as an effective safety net.
• To prove this, living wages are first estimated for households of varying size in rural and urban
areas of each state. These highlight significant disparities in the monthly income required for households to enjoy the ‘minimum acceptable standard of living’ across Malaysia, from as low as RM3,895 for a four-person household in rural Kelantan to a peak of RM6,500 for the same household in the federal territories of Kuala Lumpur and Putrajaya.
• Due to the absence of raw household- or individual-level data, as well as limitations in the data that is available, this paper contrasts living wage requirements against median household income and median wages, as reported by the Department of Statistics in its Household Income and Expenditure Survey, and Salaries and Wages Survey, respectively. This exercise indicates that in many states, even the median household earns significantly less than the living wage – households below the median of Malaysia’s income distribution would have a much larger income shortage.
o In conjunction with other evidence of the prevalence of both absolute and relative poverty across the country, this analysis issues a strong argument for the need for the provision of a stronger system of social protections in Malaysia.
• The Malaysian government should embark on the twin strategies of revamping its existing welfare
policies and putting forward policies that stimulate job and wage growth in strategic and forward-looking sectors.
o Possible solutions include the provision of a targeted and tiered monthly basic income which varies by spatial costs of living, increases in the minimum wage and general wage levels, and public investment which culminates in the creation of jobs in the education and healthcare sectors, as well as in industries that comprise the green economy.

Uncovering the Plight of Low-Income Malaysia
3
Introduction Recent events have exposed and exacerbated the need for strong systems of social protection. With the global economy slowing, governments have been forced to take steps to cushion blows faced by households and businesses. In Malaysia, direct household aid has come in the form of a litany of measures, including cash handouts (to some 80% of households), electricity bill discounts, and rental waivers for some residents of public housing, amongst others. A number of business support measures, particularly those aimed at preserving jobs, are also likely to also have indirect, positive effects on household welfare. While these measures are primarily intended to tide households over throughout the current economic slowdown, this paper shows that the need for stronger social protections – and higher wages – for Malaysia’s lower-income households existed well before the pandemic struck. The pandemic and ensuing economic lockdown are also likely to have reinforced another, already growing concern: inequality1. Upper- and middle-income earners are far likelier to have maintained employment and wages than low-income earners, including hourly workers and those in the informal economy. With unemployment at a thirty-year record, it is imperative that the Malaysian government provides a strong social safety net for its low-income households and takes steps which limit the potential effects of the pandemic on economic inequities within the country. Malaysia’s existing welfare system manifests itself in many forms, including subsidies, price controls for essential goods, public education, healthcare, and housing, unemployment insurance, pensions, and direct financial assistance. Most relevant to the context of this paper is the latter, which was introduced in Malaysia in 2012 as Bantuan Rakyat 1Malaysia (BR1M). Since rebranded Bantuan Sara Hidup (BSH), this tiered, progressive system provides direct cash transfers to roughly 3.8 million households who comprise the bottom 40% (B40) of the income distribution. These transfers vary in quantity by household income and are listed in Table 1.
Table 1: Annual BSH Aid, 2019 and 20202
Monthly Household Income Annual Baseline BSH Allocation Additional Notes
RM0 to RM2,000 RM1,000 RM120 per child, up to four children RM2,001 to RM3,000 RM750
RM3,001 to RM4,000 RM500 The rest of this paper progresses as follows. First, weaknesses are highlighted in the existing BSH policy. Second, living wages requirements are estimated across the rural-urban divide of each state, which expose further BSH’s weaknesses as a method to improving the welfare of low-income households. Finally, attempts are made to contrast living wages with actual income, a process made tricky by severe data limitations. This process nonetheless uncovers sufficient evidence that even in the pre-pandemic world, many households earned less than their required living wage – a situation only likely to have since worsened. The Shortcomings of BSH While a progressive system, there are two crucial shortcomings to BSH in its current form. First, it does not take into account spatial differences in the cost of living3. These vary widely across Malaysia’s thirteen
1 For extensive discussions on the prevalence of inequality in Malaysia in recent decades, refer to Buell (2019), Khazanah Research Institute (2016), Lee & Khalid (2016), Ragayah (2008), and Tey et al (2019). While the reduction of inequality is an important and related policy outcome, it is beyond the immediate scope of this paper. 2 Inland Revenue Board of Malaysia (2019) 3 Neither does the minimum wage policy, of RM1,200 per month in urban and RM1,100 in rural areas.

Uncovering the Plight of Low-Income Malaysia
4
states and three administrative regions. The cost of a basic consumption basket varies by up to 70% across Malaysia4, with the lowest costs found in rural Kelantan and highest in the federal territories of Kuala Lumpur (KL) and Putrajaya. An overview of these spatial price disparities is presented in Table 2. With clear and significant disparities in the cost of living both across states and the rural-urban divide, a geographically-uniform approach to financial assistance is likely to be inefficient, since it ignores the higher costs in more expensive regions of the country. If wages in these areas are not high enough to compensate for the higher costs of living, households living in expensive areas are likely to be underserved by BSH.
Table 2: Spatial Price Index (SPI), PLI Consumption Basket
State Urban Rural
Johor 78.97% 68.30% Kedah 73.40% 66.27% Kelantan 68.06% 59.92% Malacca 77.95% 69.08% N Sembilan 74.90% 73.10% Pahang 76.69% 69.32% Penang 84.30% 75.13% Perak 73.40% 66.75% Perlis 70.34% 66.03% Sabah 89.10% 85.80% Sarawak 83.76% 77.95% Selangor 85.80% 73.10% Terengganu 74.42% 70.04% WP Kuala Lumpur and Putrajaya 100% - WP Labuan 89.10% 85.80% Source: World Bank (2019) PLI: Poverty Line Income
A second drawback of the existing BSH system is that the quantity of aid currently provided, as will be shown later in this paper, is insufficient to assist households in reaching the levels of income required to achieve ‘decent’ living standards, as defined by the living wage metric. This situation will only worsen given the current economic slowdown. It is consequently important to determine the levels of aid required for welfare policies to play a better role improving the livelihoods of lower-income households. Being mindful of spatial differences in the cost of living across the country would allow these policies to be more efficient and less wasteful. A useful target would be to bring households closer to achieving a ‘living wage’ income. A study conducted by Bank Negara Malaysia focuses on developing estimates of living wages in KL. It aims to determine the ‘minimum acceptable standard of living’ which in addition to allowing Malaysians to afford necessities should also allow for ‘the ability to meaningfully participate in society, the opportunity for personal and family development, and freedom from severe financial stress’5. These estimates, covering households of varying size, are provided in Table 3.
4 World Bank (2019) 5 Bank Negara Malaysia (2018)

Uncovering the Plight of Low-Income Malaysia
5
Table 3: Monthly Living Wage Estimates for KL
Household Type Monthly Living Wage Estimates
BNM (2018)
1 Single RM 2,700 2 Couple RM 4,500 4 Couple with two children6 RM 6,500
Establishing Living Wages Across Malaysia In order to estimate living wages in other states and territories across Malaysia, the spatial price index is applied to BNM’s living wage estimates for KL. Calculations are provided for single, two-, and four-person households, and the results of this exercise, segregated into rural and urban monthly living wages across each state, are presented in Table 4.
Table 4: Monthly Living Wages Across Malaysia for Household Sizes of 1, 2, and 4
State
Living Wage (RM)
Single Couple Couple with two
children
Urban Rural Urban Rural Urban Rural
WP Kuala Lumpur 2,700 N/A 4,500 N/A 6,500 N/A
WP Putrajaya 2,700 N/A 4,500 N/A 6,500 N/A
Sabah 2,406 2,317 4,009 3,861 5,791 5,577 WP Labuan 2,406 2,317 4,009 3,861 5,791 5,577 Selangor 2,317 1,974 3,861 3,289 5,577 4,751 Penang 2,276 2,029 3,794 3,381 5,480 4,884 Sarawak 2,262 2,105 3,769 3,508 5,445 5,067 Johor 2,132 1,844 3,554 3,074 5,133 4,440 Malacca 2,105 1,865 3,508 3,109 5,067 4,490 Pahang 2,071 1,872 3,451 3,120 4,985 4,506 N Sembilan 2,022 1,974 3,370 3,289 4,868 4,751 Terengganu 2,009 1,891 3,349 3,152 4,837 4,553 Perak 1,982 1,802 3,303 2,982 4,771 4,307 Kedah 1,982 1,789 3,303 3,004 4,771 4,339 Perlis 1,899 1,783 3,165 2,971 4,572 4,292 Kelantan 1,838 1,618 3,063 2,696 4,424 3,895 Note: These living wage estimates should be treated as approximations: using the SPI to infer living wages across states and strata is an imperfect process since the reference baskets of goods and services across the two metrics vary. Further, the SPI compares a single reference basket across state and strata, whereas the reference baskets used to estimate the living wage vary by household size and composition. In the absence of the data that would be required to make more accurate estimations of the living wage, however, this is amongst the set of next-best approximations.
For urban singles, monthly living wages range from RM1,838 in Kelantan (153% of the minimum wage) to RM2,700 (225%) in the federal territories of KL and Putrajaya, while for singles in rural areas the range is smaller: from RM1,618 (147%) in Kelantan to RM2,317 (210%) in Labuan and Sabah. Living wage requirements are generally higher in East Malaysia partly due to additional logistical and supply-chain costs, even for goods ultimately produced there. As a result, both Sabah and Sarawak (as well as Labuan) appear high in this list despite having amongst the lowest rates of urbanisation in the country.
6 For the remainder of the paper, emphasis is placed primarily on households of size four, since this is most reflective of the average household size in many states across the country.

Uncovering the Plight of Low-Income Malaysia
6
As household sizes increase, the absolute disparities in living wages across the country are much larger. For four-person households, loosely reflective of the size of the average household in Malaysia, urban living wages range from RM4,424 (Kelantan) to RM6,500 in KL and Putrajaya. In rural areas this disparity is only slightly smaller, at almost RM1,700 per month. These gaps are a reminder of the significant differences in income requirements across the country, lending support to the argument that, should they be required, welfare policies (and the minimum wage, for that matter) would do well to address the differing underlying conditions faced by households.
Aside: The Challenges of Data Limitations in Malaysia Drawing evidence-based conclusions about on-ground realities in Malaysia using these living wage estimates is tricky, only because of severe data limitations. Malaysia’s Department of Statistics (DOSM) does not provide even a sample of the raw household or individual income data that would be required to produce a consistent comparison between actual income and these living wage estimates. As a result, it is almost impossible to measure with a significant degree of certainty the share of households in Malaysia who, for example, earn less than their required living wage. Other examples of data not publicly available that would have been of use in this and similar studies – and which can inform public policy discussions more broadly – include mean and median household and individual income data by strata across states, and the number of households of varying size by strata across states. More generally, Malaysia’s restrictive data access regime poses a major threat to the development of evidence-based policy. For a general overview of Malaysia’s open data ecosystem and recommendations for reform, see Yap (2019). Contrasting Living Wage Estimates with the Malaysian Reality A key question that now remains is how these living wages estimates contrast with reality, and in this section attempts are made to compare living wages with actual household-level income. Due to data limitations, this is tricky. Raw individual- or household-level income data is not publicly available. The best available data to conduct such a comparison come from the summary statistics provided by DOSM in its biennial Household Income and Expenditure Survey (HIES), as well as the Salaries and Wages Survey Report (SWS), the last of which was conducted in 2018. These data, however, are still imperfect for two reasons. First, household income data provided in the HIES is inclusive of non-wage income, such as capital income and transfers (e.g. BSH), whereas the living ‘wage’ is strictly concerned with the monetary requirement for a specific household to attain BNM’s definition of an ‘acceptable’ standard of living, regardless of the sources of such income. There is clearly a discrepancy between what these two metrics encompass, but analysing household income through the lens of the living wage does still offer some insights. Should total household income fall short of the living wage, it is almost certain that salaries will too, which is something that can be confirmed or refuted by the SWS data. And if the assumption is made that lower-income households earn most (or all) of their income from wages, any discrepancy between the two metrics would be insignificant. Second, while the salary data provided in the SWS does offer breakdowns of the mean and median salary by state and strata, it does not go as far as to provide them together (i.e. the data does not allow a comparison between mean and median salaries across rural and urban areas of any one given state). Steps therefore must be taken in this study to allow for a rough approximation of the salary differential across strata within the same state; these steps will be described later. Taken together with other analyses of income, poverty, and inequality across the country, the ultimate aim of this section is to re-establish support for the idea that low-income Malaysia is indeed struggling, and in order to raise the standards of living enjoyed by low-income Malaysian households, welfare transfers and wages both need to increase.

Uncovering the Plight of Low-Income Malaysia
7
To start with, Table 5 reports urban household income distributions by state; Table 6 does the same for rural households. These data reveal the stark disparities in income levels across states, with median urban household income ranging from a low of RM3,000–3,999 in Kelantan to RM9,000-9,999 in KL, while in rural areas these range from a low of RM2,000–2,999 in Kelantan and Sarawak to a high of RM5,000–5,999 in Selangor and Labuan.
Table 5: Monthly Urban Household Incomes for the 15th to 50th Percentile of Each State
State Income Range, in RM, for each Percentile Rank
15th 20th 25th 30th 35th 40th 50th (Median)
Johor 3,000 to 3,999 4,000 to 4,999 5,000 to 5,999 6,000 to 6,999
Kedah 2,000 to 2,999 3,000 to 3,999 4,000 to 4,999
Kelantan 2,000 to 2,999 3,000 to 3,999
Malacca 3,000 to 3,999 4,000 to 4,999 5,000 to 5,999
N Sembilan 2,000 to 2,999 3,000 to 3,999 4,000 to 4,999
Pahang 2,000 to 2,999 3,000 to 3,999 4,000 to 4,999
Penang 3,000 to 3,999 4,000 to 4,999 5,000 to 5,999
Perak 2,000 to 2,999 3,000 to 3,999 4,000 to 4,999
Perlis 2,000 to 2,999 3,000 to 3,999 4,000 to 4,999
Sabah 2,000 to 2,999 3,000 to 3,999 4,000 to 4,999
Sarawak 2,000 to 2,999 3,000 to 3,999 4,000 to 4,999 5,000 to 5,999
Selangor 4,000 to 4,999 5,000 to 5,999 6,000 to 6,999 7,000 to 7,999
Terengganu 3,000 to 3,999 4,000 to 4,999 5,000 to 5,999
WP KL 4,000 to 4,999 5,000 to 5,999 6,000 to 6,999 7,000 to 7,999 9,000 to 9,999
WP Labuan 3,000 to 3,999 4,000 to 4,999 5,000 to 5,999
WP Putrajaya 5,000 to 5,999 6,000 to 6,999 7,000 to 7,999 8,000 to 8,999 Source: DOSM (2017)
Table 6: Monthly Rural Household Incomes for the 15th to 50th Percentile of Each State
State Income Range, in RM, for each Percentile Rank
15th 20th 25th 30th 35th 40th 50th (Median)
Johor 2,000 to 2,999 3,000 to 3,999 4,000 to 4,999
Kedah 0 to 1,999 2,000 to 2,999 3,000 to 3,999
Kelantan 0 to 1,999 2,000 to 2,999
Malacca 2,000 to 2,999 3,000 to 3,999 4,000 to 4,999
N Sembilan 0 to 1999 2,000 to 2,999 3,000 to 3,999
Pahang 2,000 to 2,999 3,000 to 3,999
Penang 2,000 to 2,999 3,000 to 3,999 4,000 to 4,999
Perak 0 to 1,999 2,000 to 2,999 3,000 to 3,999
Perlis 2,000 to 2,999 3,000 to 3,999 4,000 to 4,999
Sabah 0 to 1,999 2,000 to 2,999 3,000 to 3,999
Sarawak 0 to 1,999 2,000 to 2,999
Selangor 2,000 to 2,999 3,000 to 3,999 4,000 to 4,999 5,000 to 5,999
Terengganu 2,000 to 2,999 3,000 to 3,999 3,000 to 3,999 4,000 to 4,999
WP Labuan 2,000 to 2,999 3,000 to 3,999 4,000 to 4,999 5,000 to 5,999 Source: DOSM (2017)
Due to the absence of raw, individual unit-level data, however, it is impossible to contrast actual household income with the estimated living wage for households of any given size without making numerous, potentially contentious assumptions. To circumvent this, the approach taken in this study involves
Uncovering the Plight of Low-Income Malaysia
8
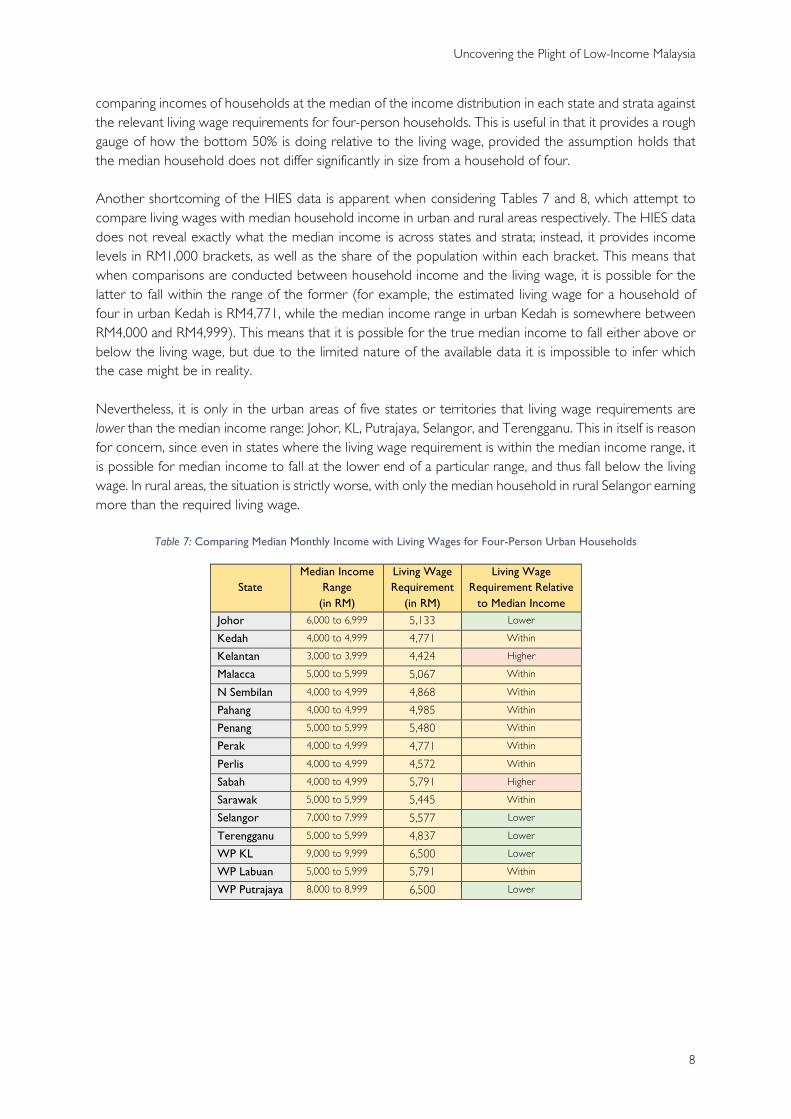
comparing incomes of households at the median of the income distribution in each state and strata against the relevant living wage requirements for four-person households. This is useful in that it provides a rough gauge of how the bottom 50% is doing relative to the living wage, provided the assumption holds that the median household does not differ significantly in size from a household of four. Another shortcoming of the HIES data is apparent when considering Tables 7 and 8, which attempt to compare living wages with median household income in urban and rural areas respectively. The HIES data does not reveal exactly what the median income is across states and strata; instead, it provides income levels in RM1,000 brackets, as well as the share of the population within each bracket. This means that when comparisons are conducted between household income and the living wage, it is possible for the latter to fall within the range of the former (for example, the estimated living wage for a household of four in urban Kedah is RM4,771, while the median income range in urban Kedah is somewhere between RM4,000 and RM4,999). This means that it is possible for the true median income to fall either above or below the living wage, but due to the limited nature of the available data it is impossible to infer which the case might be in reality. Nevertheless, it is only in the urban areas of five states or territories that living wage requirements are lower than the median income range: Johor, KL, Putrajaya, Selangor, and Terengganu. This in itself is reason for concern, since even in states where the living wage requirement is within the median income range, it is possible for median income to fall at the lower end of a particular range, and thus fall below the living wage. In rural areas, the situation is strictly worse, with only the median household in rural Selangor earning more than the required living wage.
Table 7: Comparing Median Monthly Income with Living Wages for Four-Person Urban Households
State Median Income
Range (in RM)
Living Wage Requirement
(in RM)
Living Wage Requirement Relative
to Median Income
Johor 6,000 to 6,999 5,133 Lower
Kedah 4,000 to 4,999 4,771 Within
Kelantan 3,000 to 3,999 4,424 Higher
Malacca 5,000 to 5,999 5,067 Within
N Sembilan 4,000 to 4,999 4,868 Within Pahang 4,000 to 4,999 4,985 Within Penang 5,000 to 5,999 5,480 Within
Perak 4,000 to 4,999 4,771 Within Perlis 4,000 to 4,999 4,572 Within Sabah 4,000 to 4,999 5,791 Higher Sarawak 5,000 to 5,999 5,445 Within Selangor 7,000 to 7,999 5,577 Lower Terengganu 5,000 to 5,999 4,837 Lower WP KL 9,000 to 9,999 6,500 Lower WP Labuan 5,000 to 5,999 5,791 Within WP Putrajaya 8,000 to 8,999 6,500 Lower

Uncovering the Plight of Low-Income Malaysia
9
Table 8: Comparing Median Monthly Income with Living Wages for Four-Person Rural Households
State Median Income
(in RM) Living Wage
(in RM) Living Wage Relative to Median Income
Johor 4,000 to 4,999 4,440 Within
Kedah 3,000 to 3,999 4,339 Higher
Kelantan 2,000 to 2,999 3,895 Higher
Malacca 4,000 to 4,999 4,490 Within
N Sembilan 3,000 to 3,999 4,751 Higher Pahang 3,000 to 3,999 4,506 Higher Penang 4,000 to 4,999 4,884 Within
Perak 3,000 to 3,999 4,307 Higher Perlis 4,000 to 4,999 4,292 Within Sabah 3,000 to 3,999 5,577 Higher Sarawak 2,000 to 2,999 5,067 Higher Selangor 5,000 to 5,999 4,751 Lower Terengganu 4,000 to 4,999 4,553 Within WP Labuan 5,000 to 5,999 5,577 Within
Next, the same comparison is conducted using data from the SWS. This allows for a more straightforward, apples-to-apples comparison between two strictly wage-based measures: the living wage requirement, and actual wages. As mentioned earlier, however, the available data has one major shortcoming in the context of this study: it does not provide an explicit distinction between the median salary earned in rural and urban areas of any one state. It does, however, provide data for the median salary, by gender, in rural and urban areas across the country as a whole, and the median salary, by gender, across states (though not across strata). This data is reproduced in Table 9.
Table 9: Median Monthly Wages by State and Strata, 2017
Location Median Wage (in RM)
Male Female
Rural 1,527 1,339
Urban 2,464 2,316
National Average 2,342 2,227
Johor 2,556 2,104
Kedah 1,760 1,533
Kelantan 1,604 1,605
Melaka 2,382 2,154
N Sembilan 2,442 2,137
Pahang 2,140 1,967
Penang 2,241 2,082
Perak 1,935 1,640
Perlis 2,011 1,959
Selangor 2,888 2,549
Terengganu 1,860 1,903
Sabah 1,947 1,964
Sarawak 2,063 1,952
WP KL 2,963 2,930
WP Labuan 2,513 2,024
WP Putrajaya 3,849 3,563 Source: DOSM (2019)

Uncovering the Plight of Low-Income Malaysia
10
Across the country as a whole, urban wages are significantly higher than those in rural areas, and because of the disproportionate share of individuals residing in urban areas7, median wages track closely to those in cities. On average, urban males earn 61.4% more than their rural counterparts, and urban females 73% more than theirs; the average male (across both strata) earns 53.4% more than a rural male, while the average female earns 66.3% more than the average female. In order to make up for the aforementioned limitations in this data as well as account for the fact that salaries in rural areas are necessarily lower than in cities, in Table 10 efforts are made to estimate rural and urban wages across each state based on the median wage differentials observed across strata in the country as a whole. Two scenarios are put forward. The first assumes that median urban wages are 1.05x that of each state’s median wage (across gender) while median rural wages are 0.65x that of the median (again, across gender). This is representative of the differential between strata across the country as a whole. The second of these scenarios is more optimistic, and assumes median urban wages are 1.1x that of each state’s median wage, while median rural wages are 0.7x the median. While the actual rural-urban wage disparities might vary in scale across states, in the absence of more detailed data it is impossible to predict exactly what the differentials are across states.
Table 10: Adjusted Median Monthly Wages by State, Strata, and Gender
State
Adjusted Wages, Scenario 1 (1.05x; 0.65x) Adjusted Wages, Scenario 2 (1.1x; 0.7x) Urban Rural Urban Rural
Male Female Male Female Male Female Male Female
Johor 2,684 2,209 1,661 1,368 2,812 2,314 1,789 1,368
Kedah 1,848 1,610 1,144 996 1,936 1,686 1,232 996
Kelantan 1,684 1,685 1,043 1,043 1,764 1,766 1,123 1,043
Malacca 2,501 2,262 1,548 1,400 2,620 2,369 1,667 1,400
N Sembilan 2,564 2,244 1,587 1,389 2,686 2,351 1,709 1,389
Pahang 2,247 2,065 1,391 1,279 2,354 2,164 1,498 1,279
Penang 2,353 2,186 1,457 1,353 2,465 2,290 1,569 1,353
Perak 2,032 1,722 1,258 1,066 2,129 1,804 1,355 1,066
Perlis 2,112 2,057 1,307 1,273 2,212 2,155 1,408 1,273
Selangor 3,032 2,676 1,877 1,657 3,177 2,804 2,022 1,657
Terengganu 1,953 1,998 1,209 1,237 2,046 2,093 1,302 1,237
Sabah 2,044 2,062 1,266 1,277 2,142 2,160 1,363 1,277
Sarawak 2,166 2,050 1,341 1,269 2,269 2,147 1,444 1,269
WP KL 3,111 3,077 - - 3,259 3,223 - -
WP Labuan 2,639 2,125 1,633 1,316 2,764 2,226 1,759 1,316
WP Putrajaya 4,041 3,741 - - 4,234 3,919 - -
The results presented in Table 10 are then used to build models of income for households of size four (i.e. a male and female couple with two children) as well as two (a couple) across strata in each state, and compared against living wages. The results of this exercise are presented in Tables 10 and 11 respectively. Given the assumption that four-person households are comprised of a couple with two children, their median wage is derived by simply combining the wages of the male and female income earners, depending on their respective state and strata of occupation. For couples, household income is assumed to be the same, since this household is assumed to comprise of a working male and a working female (without children). Naturally, then, one would expect two-person households to be more likely to earn a living
7 As of 2019, close to 80% of the Malaysian population lived in cities.

Uncovering the Plight of Low-Income Malaysia
11
wage than four-person households. This is borne out in Tables 11 and 12, where median household wages are contrasted with living wage requirements.
Table 11: Comparing Median Monthly Household Wages with Living Wages for Four-Person Households
State
Median Household Salary (RM) Living Wage – Median Household Salary (RM)
Scenario 1 Scenario 2 Scenario 1 Scenario 2
Urban Rural Urban Rural Urban Rural Urban Rural
Johor 4,893 3,029 5,126 3,157 (240) (1,411) (7) (1,283)
Kedah 3,458 2,140 3,622 2,228 (1,313) (2,199) (1,149) (2,111)
Kelantan 3,369 2,086 3,530 2,166 (1,055) (1,809) (894) (1,729)
Malacca 4,763 2,948 4,990 3,068 (304) (1,542) (77) (1,423)
N Sembilan 4,808 2,976 5,037 3,098 (60) (1,775) 169 (1,653)
Pahang 4,312 2,670 4,518 2,777 (673) (1,836) (467) (1,729)
Penang 4,539 2,810 4,755 2,922 (941) (2,074) (725) (1,962)
Perak 3,754 2,324 3,933 2,421 (1,017) (1,983) (839) (1,887)
Perlis 4,169 2,581 4,367 2,681 (404) (1,712) (205) (1,611)
Selangor 5,709 3,534 5,981 3,678 (82) (2,043) 190 (1,899)
Terengganu 3,951 2,446 4,139 2,539 (1,494) (2,621) (1,306) (2,528)
Sabah 4,107 2,542 4,302 2,640 (1,470) (2,209) (1,275) (2,112)
Sarawak 4,216 2,610 4,417 2,713 (621) (1,943) (421) (1,840) WP KL 6,188 - 6,482 - (312) - (18) - WP Labuan 4,764 2,949 4,991 3,075 (1,027) (2,628) (800) (2,502) WP Putrajaya 7,783 - 8,153 - 1,283 - 1,653 -
Average Monthly Shortage/Surplus (608) (1,985) (386) (1,642)
Average Annual Shortage/Surplus (7,298) (23,815) (4,627) (19,700)
Table 12: Comparing Median Monthly Household Wages with Living Wages for Two-Person Households
State
Median Household Salary Living Wage – Median Household Salary
Scenario 1 Scenario 2 Scenario 1 Scenario 2
Urban Rural Urban Rural Urban Rural Urban Rural
Johor 4,893 3,029 5,126 3,157 1,339 (45) 1,572 83 Kedah 3,458 2,140 3,622 2,228 155 (863) 319 (775) Kelantan 3,369 2,086 3,530 2,166 307 (610) 467 (530) Malacca 4,763 2,948 4,990 3,068 1,255 (160) 1,482 (41) N Sembilan 4,808 2,976 5,037 3,098 1,438 (313) 1,667 (191)
Pahang 4,312 2,670 4,518 2,777 861 (450) 1,067 (343)
Penang 4,539 2,810 4,755 2,922 746 (571) 962 (459)
Perak 3,754 2,324 3,933 2,421 451 (658) 630 (562)
Perlis 4,169 2,581 4,367 2,681 1,003 (391) 1,202 (290)
Selangor 5,709 3,534 5,981 3,678 1,848 245 2,120 389
Terengganu 3,951 2,446 4,139 2,539 602 (706) 791 (613)
Sabah 4,107 2,542 4,302 2,640 97 (1,319) 293 (1,221)
Sarawak 4,216 2,610 4,417 2,713 446 (898) 647 (795)
WP KL 6,188 - 6,482 - 1,688 - 1,982 -
WP Labuan 4,764 2,949 4,991 3,075 755 (912) 981 (786)
WP Putrajaya 7,783 - 8,153 - 3,283 - 3,653 -
Average Monthly Shortage/Surplus 1,017 (547) 1,240 (383)
Average Annual Shortage/Surplus 12,205 (6,559) 14,875 (4,601)

Uncovering the Plight of Low-Income Malaysia
12
The results paint a concerning picture, even under the more optimistic second scenario. For four-person households, median household wages fall short of the living wage requirement in almost every location analysed, with the exceptions of the urban areas Negeri Sembilan and Selangor (where households earn no more than RM190 more than the living wage each month, but only under Scenario 2), as well as Putrajaya. In fact, the results indicate that it is only in Putrajaya that median household wages are comfortably higher than the living wage requirement. In rural areas, the situation is worse still, just as it was when the HIES data was considered. In all states, median household wages are lower than the living wage requirement. All this is confirmed by the average shortages seen across state and strata; even under Scenario 2, the median urban household is almost RM400 short of attaining the living wage each month (or over RM4,600 annualised), while the median rural household is over RM1,600 short of reaching its living wage requirement every month (or RM19,700 annualised). For two-person urban households, the situation is better. Even under Scenario 1, the median household earns more than their living wage requirement – although in some states, such as Sabah, Kedah, and Kelantan, the ‘surplus’ isn’t significant. This positive outlook isn’t shared by households in rural areas, however. In all states, except Johor and Selangor under Scenario 2, the median household earns less than the living wage. On average, these households have a monthly shortage of over RM500 under Scenario 1 and just under RM400 under Scenario 2. This, combined with the analysis of four-person households, indicates that rural wages are significantly lower than they should be. An important point to note at this stage is that these analyses are contrasting living wage requirements with the median household income or wage. Even then, many households are postulated to be struggling. For households lower down in the income distribution8, estimated income shortages will be larger still. Recalling that BSH offers a maximum transfer of RM1,240 per year to the lowest-income four-person households9 in the country, the income shortages estimated in Tables 11 and 12 offer evidence that these transfers are both insignificant and insufficient, since the median four-person household living in an urban area is itself between RM4,600 and RM7,300 short of attaining a living wage on an annual basis. BSH does little, then, to bring a family in the B20 of Malaysia’s income distribution closer to attaining the acceptable standard of living defined by BNM’s living wage metric. In order to build a strong and robust social safety net for low-income Malaysians, more impactful and generous measures will be required. Concluding Thoughts and Policy Recommendations This paper had two major objectives: to highlight the inefficiency and insufficiency of the existing BSH framework, and provide evidence that low-income households earn less than their required living wages. Estimating living wages across the rural-urban divide across each state and contrasting these with data on median household income as well as wages provides irrefutable evidence of a significant number of households – even at the median of Malaysia’s income distribution – who do not meet the ‘minimum acceptable standard of living’ implied by the living wage metric. Policymakers must step in to address this issue, and play a more substantial role improving the standards of living faced by lower-income households. It should do this through both welfare policies and labour market interventions. Transfers under the BSH mechanism should be increased dramatically; repurposing the program as a targeted monthly basic income would be a good first step. It should also be designed in a manner which reflects the sizeable differences in the spatial costs of living across the country. Labour market interventions, meanwhile, are necessary in order to elevate the general level of wages. The minimum wage, currently no more than RM1,200 per month in Peninsular Malaysia, should be increased 8 See Joshi (2020) for an overview of Malaysia’s income distribution. 9 Again, assuming that the four-person household is comprised of two working adults and two children.

Uncovering the Plight of Low-Income Malaysia
13
and also vary by location. The government should also invest heavily in creating jobs across the skills spectrum in strategic sectors, such as education, healthcare, and the green economy. In addition to boosting employment and wages, such action can serve to future-proof the Malaysian workforce. List of References and Recommended Reading Bank Negara Malaysia. 2018. “The Living Wage: Beyond Making Ends Meet”. Kuala Lumpur: BNM. Retrieved from http://bnm.gov.my Barrientos, A. 2019. “The Role of Social Assistance in Reducing Poverty and Inequality in Asia and the Pacific”. Asian Development Bank. Manila: ADB. Available at https://www.adb.org/sites/default/files/publication/525401/sdwp-062-social-assistance-asia-pacific.pdf Buell, EE. 2019. "Income Inequality in Malaysia: The Dichotomy of Government Perception and Malaysians' Lived Experiences". Perspectives, 37: The New Malaysia. Available at https://preserve.lehigh.edu/perspectives-v37/4 Department of Statistics Malaysia. 2010. “Average Household Size by State, 1980-2010”. Putrajaya: DOSM. Available at https://www.dosm.gov.my/v1/images/stories/files/LatestReleases/banci/jadual3.pdf Department of Statistics Malaysia. 2017. “Household Income and Basic Amenities Survey 2016”. Putrajaya: DOSM. Retrieved from http://www.dosm.gov.my/ Department of Statistics Malaysia. 2018. “Towards Population & Housing Census of Malaysia, 2020”. Putrajaya: DOSM. Available at https://www.unescap.org/sites/default/files/Session5_Towards_Population_Housing_Census_of_Malaysia_2020_Cambodia_Census_WS_24-27Jan2018_0.pdf Department of Statistics Malaysia. 2019. “Salaries and Wages Survey Report, Malaysia, 2018”. Putrajaya: DOSM. Retrieved from http://www.dosm.gov.my/ Employees’ Provident Fund. 2019. “Belanjawanku: Expenditure Guide for Malaysian Individuals and Families, Klang Valley 2019”. Kuala Lumpur: EPF. Retrieved from https://www.kwsp.gov.my/ Inland Revenue Board of Malaysia. 2019. “BSH 2020”. Putrajaya: IRB. Retrieved from https://bsh.hasil.gov.my/ Joshi, D. 2020. “Rethinking Malaysia’s Income Classifications: Not B40, but B20”. Research for Social Advancement. Available at https://refsa.org/wp-content/uploads/2020/03/Final_Income-Reclassification_B20.pdf Kenworthy, L. 1999. “Do Social-Welfare Policies Reduce Poverty? A Cross-National Assessment”. Social Forces, 77(3): 1119-1139. Available at https://academic.oup.com/sf/article/77/3/1119/2233857 Khazanah Research Institute. 2018. “The State of Households 2018: Different Realities”. Kuala Lumpur: Khazanah Research Institute. Retrieved from http://www.krinstitute.org/ Lee, HA & Khalid, MA. 2014. “Is Inequality in Malaysia Really Going Down? A Puzzle Explored”. Faculty of Economic Administration, University of Malaysia. Kuala Lumpur: UM. Available at http://pubdocs.worldbank.org/en/285151475547874083/Is-Inequality-in-Malaysia-Really-Going-Down.pdf Nelson, JA. 1988. “Household Economies of Scale in Consumption: Theory and Evidence”. Econometrica, 56(6): 1301-1314. Available at https://www.jstor.org/stable/1913099 OHCHR. 2019. “Statement by Professor Philip Alston, UN Special Rapporteur on Extreme Poverty and Human Rights, on his Visit to Malaysia, 13–23 August 2019”. Available at https://www.ohchr.org/EN/NewsEvents/Pages/ DisplayNews.aspx?NewsID=24912&LangID=E Ragayah, HMZ. 2008. “Income Inequality in Malaysia”. Asian Economic Policy Review, 3(1): 114-132. Available at https://onlinelibrary.wiley.com/doi/abs/10.1111/j.1748-3131.2008.00096.x Redmond, G; Praino, R & Siddiquee, N. 2016. “Child Deprivation in Malaysia: Final Report for UNICEF”. Available at https://www.unicef.org/malaysia/media/621/file/Child%20deprivation%20in%20Malaysia.pdf

Uncovering the Plight of Low-Income Malaysia
14
Tey, NP; Lai, SL; Ng, ST; Goh, KL; & Osman, AF. 2019. “Income Inequality Across States in Malaysia”. Journal of the Malaysian Institute of Planners, 17(2): 12-26. Available at http://planningmalaysia.org/index.php/pmj/article/view/625 UN. 2019. “Database on Household Size and Composition 2019”. UN: United Nations, Department of Economic and Social Affairs, Population Division. Available at https://population.un.org/Household/index.html#/countries/840 UNDP. 2013. “Malaysia Human Development Report: Redesigning an Inclusive Future”. UNDP: United Nations Development Programme. Available at http://hdr.undp.org/sites/default/files/mhdr_2013.pdf Wagle, UR. 2016. “How much do social protections matter to poverty and inequality? An insight from Asian experiences”. Global Social Policy, 17(2): 1-31. Available at https://journals.sagepub.com/doi/abs/10.1177/1468018116675496 World Bank. 2014. “Malaysia Economic Monitor, December 2014: Towards a Middle-Class Society”. Kuala Lumpur: World Bank. Available at https://documents.worldbank.org/en/publication/documents-reports/documentdetail/524381468046492426/malaysia-economic-monitor-towards-a-middle-class-society World Bank. 2019. “Malaysia Economic Monitor, December 2019: Making Ends Meet”. Kuala Lumpur: World Bank. Available at https://openknowledge.worldbank.org/handle/10986/32810 Yap, LS. 2020. “Strengthening Malaysia’s Open Data Ecosystem: Notes for Reform”. Kuala Lumpur: Research for Social Advancement. Available at https://refsa.org/wp-content/uploads/2020/04/Strengthening-Malaysia%E2%80%99s-Open-Data-Ecosystem.pdf

Uncovering the Plight of Low-Income Malaysia
15
About REFSA Research for Social Advancement (REFSA) is a progressive, non-profit think tank that promotes social advancement in Malaysia. Since its inception, REFSA has been at the forefront of policy discussions and debates in the important political and socio- economic issues of the nation. Today, our aspiration hasn’t changed – we want to power the movement for a just, inclusive and multi-ethnic society. About REFSA Brief REFSA Brief is a series of briefs and opinion pieces that aim to analyse pertinent socioeconomic issues and encourage discussions about policy issues across the public, private and the third sector. Connect with us
Copyright is held by the author(s) of each article. All rights reserved. Cover Photo Attribution: Babak Fakhamzadeh on Flickr, Creative Commons The findings, interpretations, and conclusions expressed in this Policy Brief do not necessarily reflect the views of the Management or Board of Trustees of Research for Social Advancement (REFSA). REFSA does not guarantee the accuracy of the data included in this work. The responsibility for the interpretation and use of the material lies with the reader. In no event shall REFSA be liable for damages arising from its use.
refsa.org
twitter.com/inforefsa
linkedin.com/company/research-for-social-advancement
facebook.com/refsa