Coexistence of Fermi arcs and Fermi pockets in a high-Tc copper oxide superconductor

1
Uncovering the hidden order in URu2Si2:
Identification of Fermi surface instability and gapping
S. Elgazzar1, J. Rusz
1, M. Amft
1, P. M. Oppeneer
1*, J.A. Mydosh
2
1 Department of Physics and Materials Science, Uppsala University,
Box 530, S-751 21 Uppsala, Sweden
2 II. Physikalisches Institut, Universität zu Köln, Zülpicher Strasse 77, D-50937 Köln, Germany
Spontaneous, collective ordering of electronic degrees of freedom leads to second-order
phase transitions that are characterized by an order parameter. The notion “hidden
order”(HO) has recently been used for a variety of materials where a clear phase transition
occurs to a phase without a known order parameter. The prototype example is the heavy-
fermion compound URu2Si2 where a mysterious HO transition occurs at 17.5K. For more
than twenty years this system has been studied theoretically and experimentally without a
firm grasp of the underlying physics. Using state-of-the-art density-functional theory
calculations, we provide here a microscopic explanation for the HO. We identify the Fermi
surface “hot spots” where degeneracy induces a Fermi surface instability and quantify how
symmetry breaking lifts the degeneracy, causing a surprisingly large Fermi surface
gapping. As mechanism for the HO we propose spontaneous symmetry breaking through
collective antiferromagnetic moment excitations.
*E-mail: [email protected]

2
The hidden order (HO) state in the uranium compound URu2Si2 has had a mystifying attraction
since its discovery 20 years ago [1-3]. As temperature is reduced below 100K, lattice coherence
between local uranium f-moments in URu2Si2 develops and a heavy-fermion liquid starts to form as
the uranium moments are dissolved into the Fermi surface (FS). At T0=17.5K the HO transition
takes place, evidenced by dramatic effects in the thermodynamic and transport properties [1-3].
While the latter properties unambiguously exhibit sharp anomalies, typical of a magnetic phase
transition, microscopic measurements, such as neutron diffraction, μSR and nuclear magnetic
resonance (NMR), do not indicate a transition to a well-ordered magnetic phase. Very small
antiferromagnetic (AF) moments of ~0.03μB have been detected in the HO [4], which by far are too
small to explain the large entropy loss and sharp anomalies in the thermodynamic quantities [5,6].
However, with pressure the U-moments are resurrected (~0.4μB) and an ordered, large moment
antiferromagnetic (LMAF) state develops. The bulk properties between HO and LMAF are very
much alike with similar, continuous changes in the thermodynamic quantities. Due to this
equivalence, the term “adiabatic continuity” was adopted to describe the pressure transformation
from HO to LMAF and its corresponding physics [7]. Other recent measurements indicate a mild
change in slope of pressure-dependent quantities at the HO to LMAF crossover [8,9]. Below 1.5K
and only out of the HO an exotic superconducting state appears, which is the subject of recent
interest [10,11].
A variety of theories have been proposed to explain the mysterious order parameter of the HO state
[12-18]. Some of these theories assume localized uranium f-states, others itinerant f-states. Yet,
there is no general agreement as to a model to fully describe the HO. Neutron scattering
measurements [19,20] showed that time-reversal symmetry must be broken in both the HO and
LMAF phase. Experimental investigations such as conductivity measurements [3,8], Hall effect
[21], infrared spectroscopy [22] and thermal transport [23] are consistent with the opening of a gap
at the Fermi surface in both the HO and LMAF phases. Compatibly, recent inelastic neutron
scattering experiments revealed gapped spin excitations in the HO phase [24]. Since the high-
temperature paramagnetic (PM) phase possesses a non-gapped FS, the anticipated marked changes
in FS topology at the HO/AF transition, though occurring at a small energy scale of about 10meV,
should be traceable by band-structure calculations. A few such calculations have been performed
for URu2Si2 [25,26]. However, these earlier investigations were not yet accurate enough to provide

3
a clear picture neither of the energy dispersions nor the Fermi surface, and in particular did not
attempt to compare the FS for the different phases. A materials-specific, microscopic model of how
and where the FS gapping occurs is consequently lacking.
We have performed density-functional theory (DFT) investigations of the energy band dispersions
and Fermi surface of URu2Si2, using two state-of-the-art electronic structure methods (see Methods
section for details). We tested that these two independent full-potential relativistic codes provide
precisely the same energy dispersions and FS. Our calculations have been done for both the PM and
the LMAF state; our aim is to explain these two phases first and subsequently converge on the HO
phase. The large-moment (type-I) AF phase has a computed uranium magnetic moment of 0.39μB (-
0.36μB spin and 0.75μB orbital moment, along the c-axis of the ThCr2Si2 unit cell), which compares
very well to the experimental moment of 0.40μB [9]. Also, we have investigated the development of
a continuous transition from the PM to LMAF phase by varying the exchange interaction,
responsible for the formation of the magnetic moment. In this manner we can gradually transform
from a small-moment antiferromagnetic (SMAF) state with total moment of ~0.03μB to the LMAF
state. We emphasize that while the SMAF and HO phases do have similarities, we do not state that
they are identical, but rather use the SMAF phase to study the consequences of the small moment.
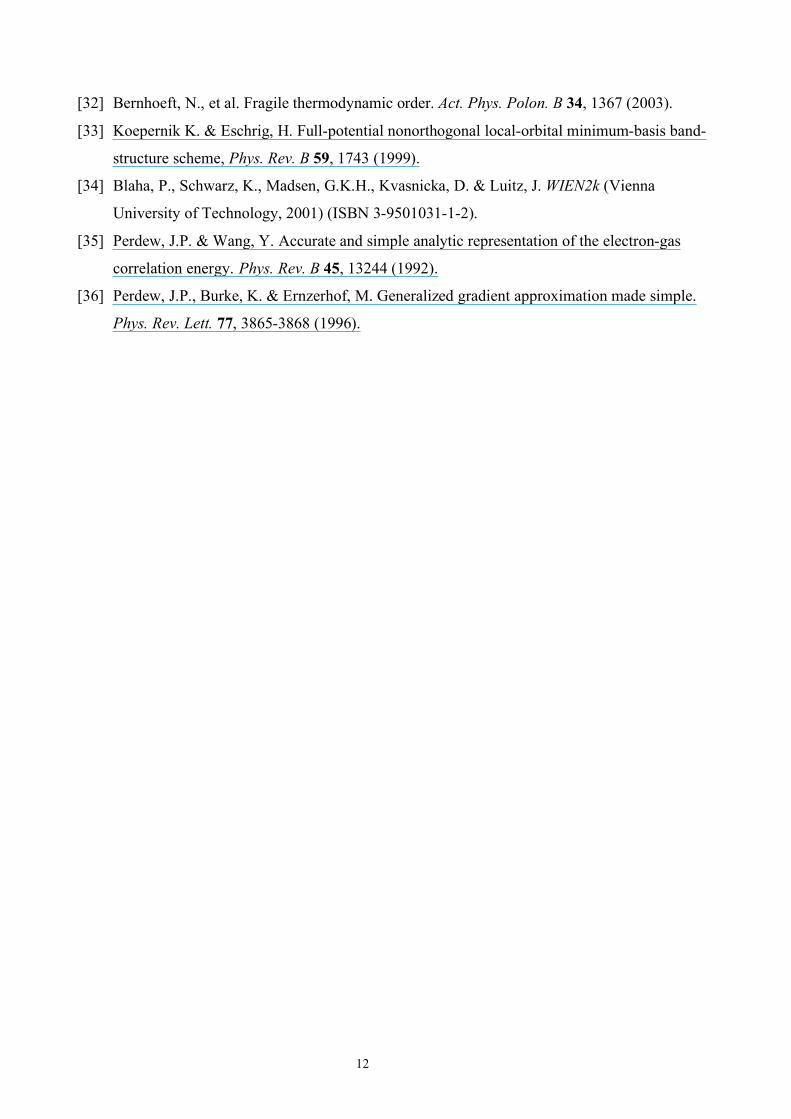
Figure 1 shows the computed electronic bands for URu2Si2 in both the PM and LMAF phases. For
a convenient comparison, both sets of energy dispersions are shown in the tetragonal Brillouin zone
(BZ) of the LMAF phase. Figure 1 evidences that the difference between the electronic structures of
the two phases is quite small: the energy dispersions of the two phases are practically
superimposed. Some bands, which are degenerate in the PM phase, become split in the LMAF
phase, due to its exchange interaction (e.g., along the Z-A and R-Z high-symmetry directions). At
the Fermi energy (EF), which is at 0 eV, the PM and AF dispersions are mainly coinciding
throughout the whole BZ, except for one conspicuous point along the -M ( ) high-symmetry line
and at the Z point. The Z-point modification is insignificant, as will become clear below. However,
the modification along the -M direction is indeed significant: a crossing of two energy bands
occurs, causing a band degeneracy in the PM phase which osculates the Fermi level. For clarity this
reciprocal space section is highlighted by the green box and shown enlarged in the inset of Fig. 1.
AF ordering provides a symmetry breaking that removes the band degeneracy and causes the
opening of a gap at the Fermi level. The same two PM band dispersions also cross close to EF at
other, non high-symmetry points in the BZ. They additionally cross along the X- ( ) high-
symmetry line but there AF ordering does not lift the degeneracy.

4
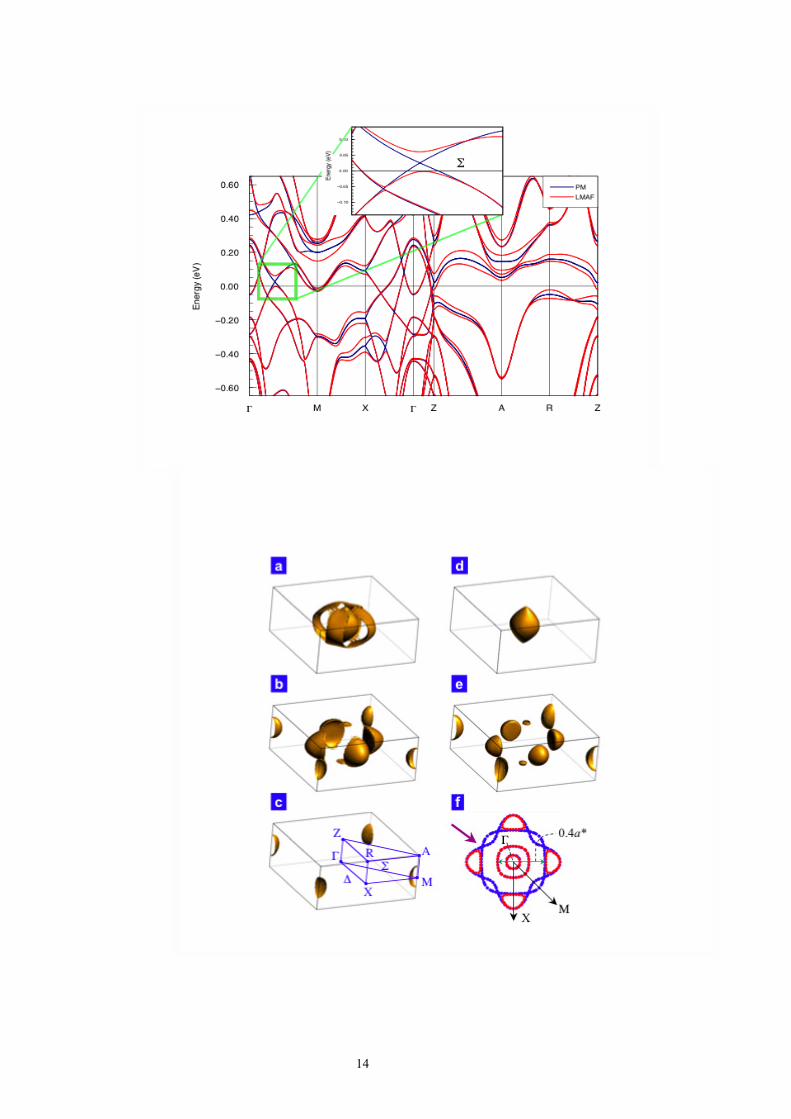
Figure 2 shows the computed FSs for the PM and LMAF phases. The FSs we have computed are
significantly different from the earlier ones [25,26]. We obtain for both phases three (Kramers
doubly-degenerate) bands that cross the Fermi level. Panels a-c display the resulting three FS sheets
in the PM phase while panels d, e, and c show the corresponding sheets for the LMAF phase. The
third FS sheet (panel c) is the same in both phases and therefore displayed only once. A comparison
of the FS sheets in a and d, and b and e, respectively, exemplifies how dramatic the modification of
the FS due to the removal of the degeneracy is. In Fig. 2a there is a rugged, four-armed FS sheet
that becomes completely gapped in the LMAF phase (Fig. 2d). The same band gives rise to a -
centered rugby-ball shaped sheet, which however is identical in both phases. Panels b and e show
that the second FS sheet is also modified: there are four cup-like FS parts in the PM phase which
shrink substantially in the LMAF phase (Fig. 2e). The above-mentioned difference between the PM
and LMAF energy bands at the Z point leads to an insignificant FS change, as can be recognized
from panels b and e. Panel f shows a cross-section of the two crucial FS sheets in the kz=0 plane.
Blue symbols depict the computed FS contours for the PM, red symbols for the LMAF phase. The
rugged, arm-shaped FS sheets in Fig. 2a correspond to the blue ellipses centered on the -M high-
symmetry lines whereas the half-sphere FS sheets of LMAF URu2Si2 shown in Fig. 2e relate to the
red contours centered on the -X lines. Note that the PM FS consists, in fact, of two intersecting
sheets. A degenerate crossing point of the PM bands occurs precisely at EF at the intersection lines
of these two sheets, i.e., forming Dirac-like crossings between the -M and -X directions in the
kz=0 plane (indicated by the purple arrow in Fig. 2f). Degenerate crossings occur in the whole BZ
on eight intersection lines of the two PM FS sheets, which extend almost from the Z to –Z points.
We have investigated how the gapping commences at the degenerate crossing points by performing
calculations for a range of AF phases, from the SMAF phase up to the LMAF phase, through the
gradual variation of the exchange interaction. Our calculations for the SMAF phase reveal that
already for tiny moments of 0.03μB, the entangled FS sheets break-up at the intersection lines and
form disconnected, smaller FS sheets. The induced FS gap is then smaller than that occurring for
the LMAF phase. As shown below, the gapping increases (nonlinearly) with increasing moment
and, accordingly, the arm-like FS sheets shrink until these become completely gapped when the
full-moment of 0.39μB is nearly reached. While these calculations have been performed for various
AF phases, we conjecture that we have identified the FS “hot spots” for the HO transition. Such

5
critical regions on the FS are where the gapping takes place and the size of which is related to the
order parameter of the HO.
Figure 3 quantifies how the FS gap progresses with the total moment per uranium atom. The total
U-moment along the c-axis is orbitally-dominated, with the orbital moment being twice larger than
the spin moment. The FS gap value depends on the position in k-space. For small U total moments
(0.04μB) a gap of about 7meV first occurs at the FS hot spots. When the moment increases, the gap
increases and the position of the maximal gap in k-space shifts from the hot spot to the center of the
ellipse at the -M line. The maximum gap is reached along the -M direction for the LMAF phase.
Next, we show that our calculations are fully consistent with the known experimental properties of
URu2Si2. All our calculations demonstrate that the differences between the PM and LMAF phases
are extremely small. The LMAF total energy is computed to be only 7K per formula unit deeper
than the PM total energy. We have computed the theoretical equilibrium volume, which is only
1.6% smaller than the experimental volume. A recent experimental work [10] classified HO
URu2Si2 to be a low-carrier density, electron-hole compensated metal, which is indeed the case for
the computed electronic structure as a closer inspection of the band dispersions in Fig. 1
demonstrates. From the computed plasma frequency we obtain for the number of holes per uranium
atom nh=0.0185 in the LMAF phase, which compares favorable with the recent values
0.017<nh<0.021 [10]. The number of holes of the PM phase is calculated to be four times larger
(0.08 per U-atom). Hall effect measurements estimated 0.1 holes per U-atom [10,21] for the PM
phase, in reasonable agreement. An analysis of the character of the energy dispersions crossing at
EF reveals that these consist dominantly of itinerant f-states, i.e., the gapping occurs as a
rearrangement of itinerant f-electrons. The itinerant character of the f-states involved in the FS
transition is consistent with recent neutron scattering experiments [24] that detected itinerant
excitations above T0. Dispersive variations of the 5f-spectral weight have, furthermore, been
observed with angular resolved photoemission [27,28]. The FS cross-sections shown in Fig. 2f
contain several quasi-parallel FS sections, stipulating significant nesting. The dominant nesting
occurs between the flat side of the cup-like sheet and the opposite-side of the -centered squarish
FS sheet, with nesting wavevector of 0.4a* (a* = 2 a) . Neutron scattering experiments [24,29]
identified nesting at wavevectors Q = (1 0.4, 0, 0) and (1+ 0.4, 0, 0) in perfect agreement.

6
Maple et al. [3] originally proposed a gapping of the FS at the transition to the HO/AF from
transport measurements; the BZ-averaged gap was approximated to be ~11meV [3]. Somewhat
smaller gaps ~5–7meV were obtained by Mentink et al. [30] and Jeffries et al. [8]. The gap we
have identified here varies from maximally 65meV along the -direction to 0meV along the -
direction for the LMAF state. For the SMAF phase the gap opening at the intersection lines is about
7meV. Our computed gaps are larger than the experimental (transport) one because they are k-
dependent and derived for the coherent (T=0K) phases, whereas the experimental analysis assumes
a T-independent gap from 0K to T0. We have furthermore determined the effect of the FS gapping
on the resistivity by computing the conductivities in the Kubo formalism. The theoretical resistivity
change due to the removal of the FS instability is large and anisotropic,
[ AF PM ]/ PM (J ||c) = 620% and [ AF PM ]/ PM (J || a) =160% , for the LMAF phase. These
values are larger than the experimental values of 56% and 14% at the HO transition; however, the
experimental resistivity is superimposed on a large T2-dependent background (due to incoherent and
phonon scattering), which is not included in our (T=0K) calculations. With background subtracted,
the experimental values would be about 400% and 100%, respectively. A considerable anisotropy
of [ HO PM ]/ PM has been observed experimentally [31] in agreement with our theoretical ratio
of 4:1.
Bonn et al. [22] performed infrared optical spectroscopy on URu2Si2 and observed a reduction of its
optical conductivity ( ) when temperature was lowered below T0, evidencing the opening of a gap
in the a-a plane. We have calculated the optical conductivity for a range of magnetic moments,
from the PM phase up to the LMAF phase. Figure 4 shows the computed conductivity spectra
Re[ a ( )] (i.e., E || a) and Re[ c ( )] ( E ||c ). For small photon energies (below 50meV) the
optical conductivity, being maximal for the PM phase, becomes clearly reduced for the SMAF and
LMAF phases, due to the gapping occurring in the vicinity of EF. The largest drop in ( ) is
obtained for the LMAF phase, where the FS gapping is the largest. The computed behavior agrees
with experiment: Bonn et al. [22], who only measured in the a-a plane ( E || a), observed a
reduction of the reflectivity in the HO phase for energies below 30meV. Our calculation predicts a
drop in a ( ) for the small-moment state below 40meV (red and blue curves in Fig. 4). Bonn et al.
did not measure c ( ) (i.e., E ||c ), but our theory predicts that a larger reduction of c ( ) should
occur at small energies below 50meV as well as an inverted behavior, i.e., an increase, at energies
of 50meV up to 600meV.

7
Our calculations are fully consistent with the known experimental properties of URu2Si2 and
provide a natural explanation for the reported “adiabatic continuity” [7], i.e., the similarity as well
as continuous transition in the bulk physical properties of HO/SMAF and LMAF URu2Si2, which
can be understood as an increase in the FS gapping. When we compare the symmetry operations of
the body-centered tetragonal PM phase to those of the SMAF and LMAF phases, we evidently
obtain that in the latter phases time-reversal symmetry is broken, as there exist small spin and (two-
times larger) orbital moments on U. The crystal symmetry remains tetragonal, but, as the two U
atoms in the cell are not equivalent, the body-centering is also broken. Both symmetry reductions
agree with experimental observations [4,19,20]. According to our band-structure model the amount
of FS gapping is related to the exchange splitting (that drives the net longitudinal U magnetic
moment along c). In most materials a small moment will normally not induce a considerable FS
gapping. However, URu2Si2 is a special material, as there exist degenerate band crossings located
precisely at EF, the identified FS hot spots. Yet, this does not imply that the HO and SMAF phases
are identical. As the observed magnetic moment of the HO phase is tiny [4] or even extrinsic (e.g.,
due to stress inhomogeneity) [9], we emphasize that the dominant mechanism leading to FS
gapping is the combined time-reversal and translational symmetry breaking. When temperature is
lowered towards T0 and the f-electrons become incorporated in the FS, the degenerate band
crossings at EF emerge, but now the system can effectively remove these degenerate crossings by
spontaneous symmetry breaking. As our calculations showed, this could be achieved by a small
dipolar moment along the c-axis, which would already be sufficient to lift the degeneracy at the FS
hot spots and cause a sizable gapping. Nonetheless, in the limit of vanishing spin and orbital
moments the FS gapping will vanish as well, whereas experiment indicates that the gapping in the
HO phase is only about 20% smaller than in the LMAF [8]. Consequently, spurious AF moments
alone are not sufficient to explain the HO and another mechanism that breaks time-reversal and
translational symmetry must be responsible for the more robust gapping appearing in the HO.
Since the spontaneous symmetry breaking happens on a very small energy scale (~7K) we must
search for a novel mechanism causing the HO transition. An intriguing possibility here would be
spontaneous symmetry breaking through a collective mode of long-lived antiferromagnetic moment
excitations. If such a mode would be lattice coherent and involve sufficiently large longitudinal AF
moments, then our calculations evidence the induced FS gapping to be larger than that of static
SMAF order. We note that, since the FS gap is an even function of the longitudinal AF moment, the
macroscopic gap value, which is obtained through averaging over many lattice sites, does not
8
average out to zero, whereas the macroscopic net moment does average to zero. Given that URu2Si2
is exceptional, in which a substantial FS gapping of 750K occurs through symmetry breaking on a
scale less than 7K, such a lattice coherent dynamic AF mode–which otherwise would only be a soft
perturbation–can now alter the electronic structure sufficiently, so that the material’s bulk properties
become modified. The existence of a dynamic AF mode is in accord with several recent
experiments. Inelastic neutron scattering studies discovered long-lived modes of longitudinal spin
excitations in the HO phase [4,24]. Other inelastic neutron studies observed a sharp excitation at the
AF wavevector in the HO phase. Under pressure this dynamic AF mode “freezes” into the static AF
order of the LMAF phase [29], i.e., it becomes the static magnetic Bragg peak of the LMAF phase.
Also, resonant X-ray scattering revealed an anomalous Bragg peak at the AF wavevector that was
associated with a dynamic AF state in the HO phase [32]. The occurrence of the dynamic AF mode
additionally provides a scenario for why exotic superconductivity emerges only in the HO and not
in the LMAF phase [11]. The coherent AF mode appears as the ideal candidate for mediating the
unconventional superconductivity in URu2Si2.
Our calculations provide a microscopic picture for where the Fermi surface instability occurs and
how the FS gapping evolves. The order parameter, which follows from our band-structure model, is
the instantaneous longitudinal AF moment that determines the magnitude of the FS gap. Any future
complete theory of the HO must take this FS instability and gapping into account. The identified FS
hot spots could be probed by future high-resolution angular resolved photoemission experiments,
and neutron experiments or X-ray magnetic circular dichroism could be exploited to detect the
orbitally-dominated magnetism. The mechanism that we propose for the HO is dynamic symmetry
breaking through lattice coherent modes of longitudinal AF moment excitations.

9
METHODS
The density-functional theory (DFT) calculations presented here for URu2Si2 were performed
using two state-of-the-art relativistic electronic structure codes, the full-potential local orbitals
(FPLO) method [33] as well as the full-potential linearized augmented plane wave (FPLAPW)
method in the WIEN2k implementation [34]. We employed for the exchange-correlation functional
both the local spin-density approximation (LSDA) in the Perdew-Wang parameterization [35] and
the generalized gradient approximation (GGA) in the parameterization of Perdew et al. [36]. The f -
electrons were treated as itinerant valence states and allowed to hybridize with other valence states.
Specifically, we used in the FPLO calculations the following sets of basis orbitals: 5f;6s6p6d;7s7p
for U, 4s4p4d;5s5p, and 3s3p3d, for Ru and Si, respectively. For the FPLAPW calculations we have
included relativistic local orbitals in the basis. The computational parameter determining the basis
size, RKmax, was equal to 7.5 in our calculations. We have verified that both electronic structure
codes provide the same electronic structure. 20x20x20 k-points in the whole BZ were used to
resolve the band dispersions close to EF.
Acknowledgements
The authors would like to acknowledge helpful discussions with R. Caciuffo, M. Biasini, G.H.
Lander, and N. Bernhoeft.
This work was supported by the Swedish Research Council (VR), the Swedish National
Infrastructure for Computing (SNIC), STINT, and the European Commission, JRC-ITU.
Competing financial interests
The authors declare that they have no competing financial interests.

10
REFERENCES
[1] Palstra, T.T.M., et al. Superconducting and magnetic transitions in the heavy-fermion system
URu2Si2. Phys. Rev. Lett. 55, 2727-2730 (1985).
[2] Schlabitz, W., et al. Superconductivity and magnetic order in a strongly interacting Fermi-
system: URu2Si2. Z. Phys. B 62, 171-177 (1986).
[3] Maple, M.B., et al. Partially gapped Fermi surface in the heavy-fermion superconductor
URu2Si2. Phys. Rev. Lett. 56, 185-188 (1986).
[4] Broholm, C., et al. Magnetic excitations and ordering in the heavy-electron superconductor
URu2Si2. Phys. Rev. Lett. 58, 1467-1470 (1987).
[5] Kim, J.S., Hall, D., Kumar, P. & Steward, G.R. Specific heat of URu2Si2 in fields up 42T:
Clues to the hidden order. Phys. Rev. B 67, 014404 (2003).
[6] Buyers, W.J.L. Low moments in heavy-fermion systems. Physica B 223&224, 9-14 (1996).
[7] Jo, Y.J., et al. Field-induced Fermi surface reconstruction and adiabatic continuity between
antiferromagnetism and the hidden-order state in URu2Si2. Phys. Rev. Lett. 98, 166404
(2007).
[8] Jeffries, J.R., Butch, N.P., Yukich, B.T. & Maple, M.B. Competing ordered phases in
URu2Si2: Hydrostatic pressure and rhenium substitution. Phys. Rev. Lett. 99, 217207 (2007).
[9] Amitsuka, H., et al. Pressure-temperature phase diagram of the heavy-electron superconductor
URu2Si2. J. Magn. Magn. Mater. 310, 214-220 (2007).
[10] Kasahara, Y., et al. Exotic superconducting properties in the electron-hole-compensated
heavy-fermion “semimetal” URu2Si2. Phys. Rev. Lett. 99, 116402 (2007).
[11] Yano, K., et al. Field-angle-dependent specific heat measurements and gap determination of a
heavy fermion superconductor URu2Si2. Phys. Rev. Lett. 100, 017004 (2008).
[12] Santini, P. & Amoretti, G. Crystal field model of the magnetic properties of URu2Si2. Phys.
Rev. Lett. 73, 1027-1030 (1994).
[13] Okuno, Y. & Miyake, K. Induced-moment weak antiferromagnetism and orbital order on the
itinerant-localized duality model with nested Fermi surface: A possible origin of exotic
magnetism in URu2Si2. J. Phys. Soc. Jpn. 67, 2469-2476 (1998).
[14] Ikeda, H. & Ohashi, Y. Theory of unconventional spin density wave: A possible mechanism
of the micromagnetism in U-based heavy fermion compounds. Phys. Rev. Lett. 81, 3723-3726
(1998).
[15] Chandra, P., Coleman, P., Mydosh, J.A. & Tripathi, V. Hidden orbital order in the heavy
fermion metal URu2Si2. Nature 417, 831-834 (2002).

11
[16] Mineev, V.P. & Zhitomirsky, M.E. Interplay between spin-density wave and induced local
moments in URu2Si2. Phys. Rev. B 72, 014432 (2005).
[17] Kiss, A. & Fazekas, P. Group theory and octupolar order in URu2Si2. Phys. Rev. B 71, 054415
(2005).
[18] Varma, C.M. & Zhu, L. Helicity order: Hiden order parameter in URu2Si2. Phys. Rev. Lett.
96, 036405 (2006).
[19] Walker, M.B., et al. Nature of the order parameter in the heavy-fermion system URu2Si2.
Phys. Rev. Lett. 71, 2630-2633 (1993).
[20] Bourdarot, F., et al. Inflection point in the magnetic field dependence of the ordered moment
of URu2Si2 observed by neutron scattering in fields up to 17T. Phys. Rev. Lett. 90, 067203
(2003).
[21] Oh, Y.S., et al. Interplay between Fermi surface topology and ordering in URu2Si2 revealed
through abrupt Hall coefficient changes in strong magnetic field. Phys. Rev. Lett. 98, 016401
(2007).
[22] Bonn, D.A., Garrett, J.D. & Timusk, T. Far-infrared properties of URu2Si2. Phys. Rev. Lett.
61, 1305-1308 (1988).
[23] Behnia, K., et al. Thermal transport in the hidden-order state of URu2Si2. Phys. Rev. Lett. 94,
156405 (2005).
[24] Wiebe, C.R., et al. Gapped itinerant spin excitations account for missing entropy in the hidden
order state of URu2Si2. Nature Phys. 3, 96-100 (2007).
[25] Ohkuni, H., et al. Fermi surface properties and de Haas-van Alphen oscillation in both normal
and superconducting mixed states of URu2Si2. Phil. Mag. B 79, 1045-1077 (1999).
[26] Yamagami, H. & Hamada, N. Relativistic electronic structure and Fermi surface of URu2Si2
in antiferromagnetic state. Physica B 284-288, 1295-1296 (2000).
[27] Ito, T., et al. Band structure and Fermi surface of URu2Si2 studied by high resolution angular-
resolved photoemission spectroscopy. Phys. Rev. B 60, 13390 (1999).
[28] Denlinger, J.D., et al. Comparative study of the electronic structure of XRu2Si2: probing the
Anderson lattice. J. Electron Spectrosc. Relat. Phenom. 117-118, 347-369 (2001).
[29] Villaume, A., et al. A signature of hidden order in URu2Si2: the excitation at the wavevector
Q0=(100). arXiv:0805.0672v1.
[30] Mentink, S.A.M., et al. Gap formation and magnetic ordering in URu2Si2 probed by high-field
magnetoresistance. Phys. Rev. B 53, R6014-6017 (1996).
[31] Palstra, T.T.M., Menovsky, A.A. & Mydosh, J.A. Anisotropic electrical resistivity of the
magnetic heavy-fermion superconductor URu2Si2. Phys. Rev. B 33, 6527 (1986).
12
[32] Bernhoeft, N., et al. Fragile thermodynamic order. Act. Phys. Polon. B 34, 1367 (2003).
[33] Koepernik K. & Eschrig, H. Full-potential nonorthogonal local-orbital minimum-basis band-
structure scheme, Phys. Rev. B 59, 1743 (1999).
[34] Blaha, P., Schwarz, K., Madsen, G.K.H., Kvasnicka, D. & Luitz, J. WIEN2k (Vienna
University of Technology, 2001) (ISBN 3-9501031-1-2).
[35] Perdew, J.P. & Wang, Y. Accurate and simple analytic representation of the electron-gas
correlation energy. Phys. Rev. B 45, 13244 (1992).
[36] Perdew, J.P., Burke, K. & Ernzerhof, M. Generalized gradient approximation made simple.
Phys. Rev. Lett. 77, 3865-3868 (1996).

13
Figure 1 The theoretical energy dispersions of URu2Si2. Energy dispersions of paramagnetic
(PM) URu2Si2 are shown in blue, those of large-moment antiferromagnetic (LMAF) URu2Si2 in
red. For comparison both set of energy bands are shown for high-symmetry directions in the
tetragonal Brillouin zone. Close to the Fermi energy (at 0 eV) the energy dispersions of the two
phases are nearly indistinguishable, except for the bands crossing the Fermi level between the and
M points along the high-symmetry direction. The green rectangle highlights the lifting of a
degeneracy, which is shown enlarged in the inset: the crossing of two bands close to the Fermi
energy in the PM phase is removed in the LMAF phase.
Figure 2 The Fermi surface of URu2Si2 in the paramagnetic (PM) and large-moment
antiferromagnetic (LMAF) phase. Panels a and b show the PM Fermi surface sheets, while
panels d and e show the corresponding LMAF sheets. The FS sheet shown in panel c is identical for
both phases. The high-symmetry points and directions in reciprocal space are given in this panel.
The lifting of the degeneracy in the PM bands crossing at EF causes the removal of a sizable FS
parts: the rugged, four-armed FS bands in a are completely gapped in the symmetry-broken phase
(panel d). The cup-like FS sheets in b furthermore shrink substantially (cf. panel e). Panel f shows a
cross-section of the two main FSs in the kz=0 plane; the FS contour of URu2Si2 in the PM phase is
given by the blue symbols and that of the LMAF phase by the red symbols. The difference between
these two FS contours exemplifies the surprisingly large FS part that is removed by lifting of the
degeneracy. The purple arrow indicates the position of one of the FS hot spots, while the green
arrow specifies the nesting vector of length 0.4a*.
Figure 3 Fermi surface gap of URu2Si2 versus the uranium total moment along the c-axis. The
gap depends on the position in reciprocal space. Shown are the gap values at the FS hot spots
(squares) in the kz=0 plane and the maximal gap values for all k-points in the kz=0 plane (circles).
Figure 4 Calculated optical conductivity Re[ a] (full lines) and Re[ c] (dashed lines) of
URu2Si2. The spectra have been computed for different uranium total magnetic moments, from the
PM phase (0.0 μB), relatively small moment AF (0.09 μB), to the LMAF phase (0.39 μB). The effect
of the increased gapping in the vicinity of the Fermi energy causes the progressive reduction of a
and c below 50 meV photon energy. The inset shows the computed spectra on a larger energy
interval, exemplifying that the influence of the gapping is restricted to small photon energies (up to
600 meV for c). For sake of visibility the Re[ c] spectra have been shifted upward by 3 1015
s-1
.
14

15
Copyright © 2022 FDOKUMEN