Uncovering Meaningful Correlation between Student Academic Performance and Library Material Usage
11
361 Uncovering Meaningful Correlation between Student Academic Performance and Library Material Usage Shun Han Rebekah Wong and T.D. Webb Shun Han Rebekah Wong is Assistant Librarian in the Multimedia Services Section and T.D. Webb is previous University Librarian, both at Hong Kong Baptist University Library; e-mail: rebekahw@hkbu. edu.hk, [email protected]. Sincere thanks go to Dr. Tong Chong Sze (previous Academic Registrar, HKBU) and Mr. Manson Yiu (Executive Officer, Academic Registry, HKBU). Without their cooperation, this project could not have been successfully completed and accomplished in a timely fashion. Academic libraries must demonstrate empirically that library usage does contribute positively to student academic performance and, thereby, to the university’s effectiveness. While customary academic library assessment practices may not be sufficient for this purpose, the Hong Kong Baptist University (HKBU) Library undertook an experimental project, which intended to establish a mathematical correlation between student library material usage and their cumulative grade point average (GPA). Taking 2007 to 2009 graduates as samples, with 8,701 pairs of data, the HKBU Library was able to demonstrate its impact on student learning outcomes. Objective The ways in which universities assess the value and performance of their member libraries have changed dramatically, especially in these difficult budgetary times. Merely reporting collection size, circulation data, usage of reference and instructional services, and other facets may not be sufficient for the university administration. Academic libraries must demonstrate their value and impact on their universities’ teaching mission to remain in a competitive and viable posi- tion within the institution. Being able to show empirically that library usage does contribute positively to student academic performance became one of our pressing tasks. We started with one variable that we were most confident had a positive impact on student learning: library mate- rial usage. The Hong Kong Baptist University (HKBU) Library initiated a highly experi- mental project, making use of 2007 to 2009 graduates as the sample, to investigate if a mathematical correlation exists between student cumulative grade point average (GPA) and their loans of books and au- diovisual materials. A total of 8,701 cases were involved. We understand that book and multimedia checkouts alone cannot present a full picture of library material use, as monographs and media may be important to some disciplines but not others. To provide a more comprehensive view, a brief discussion about the use of electronic resources will be supplemented in the later part of this paper. crl-129
Transcript of Uncovering Meaningful Correlation between Student Academic Performance and Library Material Usage

361
Uncovering Meaningful Correlation between Student Academic Performance and Library Material Usage
Shun Han Rebekah Wong and T.D. Webb
Shun Han Rebekah Wong is Assistant Librarian in the Multimedia Services Section and T.D. Webb is previous University Librarian, both at Hong Kong Baptist University Library; e-mail: [email protected], [email protected]. Sincere thanks go to Dr. Tong Chong Sze (previous Academic Registrar, HKBU) and Mr. Manson Yiu (Executive Officer, Academic Registry, HKBU). Without their cooperation, this project could not have been successfully completed and accomplished in a timely fashion.
Academic libraries must demonstrate empirically that library usage does contribute positively to student academic performance and, thereby, to the university’s effectiveness. While customary academic library assessment practices may not be sufficient for this purpose, the Hong Kong Baptist University (HKBU) Library undertook an experimental project, which intended to establish a mathematical correlation between student library material usage and their cumulative grade point average (GPA). Taking 2007 to 2009 graduates as samples, with 8,701 pairs of data, the HKBU Library was able to demonstrate its impact on student learning outcomes.
ObjectiveThe ways in which universities assess the value and performance of their member libraries have changed dramatically, especially in these difficult budgetary times. Merely reporting collection size, circulation data, usage of reference and instructional services, and other facets may not be sufficient for the university administration. Academic libraries must demonstrate their value and impact on their universities’ teaching mission to remain in a competitive and viable posi-tion within the institution. Being able to show empirically that library usage does contribute positively to student academic performance became one of our pressing tasks. We started with one variable that we were most confident had a positive
impact on student learning: library mate-rial usage.
The Hong Kong Baptist University (HKBU) Library initiated a highly experi-mental project, making use of 2007 to 2009 graduates as the sample, to investigate if a mathematical correlation exists between student cumulative grade point average (GPA) and their loans of books and au-diovisual materials. A total of 8,701 cases were involved. We understand that book and multimedia checkouts alone cannot present a full picture of library material use, as monographs and media may be important to some disciplines but not others. To provide a more comprehensive view, a brief discussion about the use of electronic resources will be supplemented in the later part of this paper.
crl-129
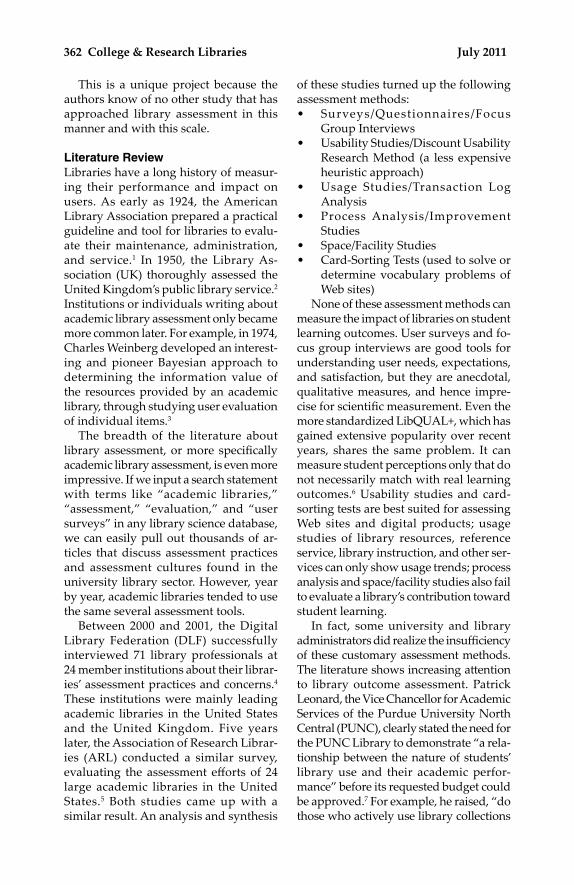
362 College & Research Libraries July 2011
This is a unique project because the authors know of no other study that has approached library assessment in this manner and with this scale.
Literature ReviewLibraries have a long history of measur-ing their performance and impact on users. As early as 1924, the American Library Association prepared a practical guideline and tool for libraries to evalu-ate their maintenance, administration, and service.1 In 1950, the Library As-sociation (UK) thoroughly assessed the United Kingdom’s public library service.2 Institutions or individuals writing about academic library assessment only became more common later. For example, in 1974, Charles Weinberg developed an interest-ing and pioneer Bayesian approach to determining the information value of the resources provided by an academic library, through studying user evaluation of individual items.3
The breadth of the literature about library assessment, or more specifically academic library assessment, is even more impressive. If we input a search statement with terms like “academic libraries,” “assessment,” “evaluation,” and “user surveys” in any library science database, we can easily pull out thousands of ar-ticles that discuss assessment practices and assessment cultures found in the university library sector. However, year by year, academic libraries tended to use the same several assessment tools.
Between 2000 and 2001, the Digital Library Federation (DLF) successfully interviewed 71 library professionals at 24 member institutions about their librar-ies’ assessment practices and concerns.4 These institutions were mainly leading academic libraries in the United States and the United Kingdom. Five years later, the Association of Research Librar-ies (ARL) conducted a similar survey, evaluating the assessment efforts of 24 large academic libraries in the United States.5 Both studies came up with a similar result. An analysis and synthesis
of these studies turned up the following assessment methods:• Surveys/Questionnaires/Focus
Group Interviews• Usability Studies/Discount Usability
Research Method (a less expensive heuristic approach)
• Usage Studies/Transaction Log Analysis
• Process Analysis/Improvement Studies
• Space/Facility Studies• Card-Sorting Tests (used to solve or
determine vocabulary problems of Web sites)
None of these assessment methods can measure the impact of libraries on student learning outcomes. User surveys and fo-cus group interviews are good tools for understanding user needs, expectations, and satisfaction, but they are anecdotal, qualitative measures, and hence impre-cise for scientific measurement. Even the more standardized LibQUAL+, which has gained extensive popularity over recent years, shares the same problem. It can measure student perceptions only that do not necessarily match with real learning outcomes.6 Usability studies and card-sorting tests are best suited for assessing Web sites and digital products; usage studies of library resources, reference service, library instruction, and other ser-vices can only show usage trends; process analysis and space/facility studies also fail to evaluate a library’s contribution toward student learning.
In fact, some university and library administrators did realize the insufficiency of these customary assessment methods. The literature shows increasing attention to library outcome assessment. Patrick Leonard, the Vice Chancellor for Academic Services of the Purdue University North Central (PUNC), clearly stated the need for the PUNC Library to demonstrate “a rela-tionship between the nature of students’ library use and their academic perfor-mance” before its requested budget could be approved.7 For example, he raised, “do those who actively use library collections

Uncovering Meaningful Correlation 363
and services perform better than their non-using peers?” Ronald Powell also sug-gested that “in an era in which academic libraries are more and more in competition for financial support with other important enterprises on their campuses, it is becom-ing increasingly important for them to be able to justify their costs, if not their existence.” 8 He further stressed that “we need to know how students’ use of libraries affect their academic performance.”9
Although the literature shows the importance of measuring the relation-ship between student library usage and their academic performance, only few studies have actually been undertaken. One of the most famous studies was conducted by Knapp in 1966. He found that students who attended more library skills programs acquired higher grades and GRE scores.10 Robinson and Schegl (2004) found a statistically significant correlation between citation behavior and assignment grade but suggested that the correlation might have been based more on quantity of citations than on quality.11
In accessing the relationship between book loans and academic success, Barkey (1965) found that students who checked out books got higher GPAs than others.12 However, due to the technological limita-tion in those days, Barkey showed in the same paper that this result was “not very reliable.” In a more recent study, De Jager (1997) was able to demonstrate a posi-tive relationship between student course grades and their book loans. However, his study involved only 240 students and two courses.13 The authors could not find any other published research findings discuss-ing the measurement of the relationship between student academic performance and their book checkouts.
Experimental DesignAn essential prerequisite for this study was the approval and support from the HKBU’s administration for the exchange of information between the library that keeps historic circulation data and the Academic Registry (AR) that manages
student academic information. The Uni-versity Librarian conducted meetings with the Academic Vice-President, Academic Registrar, Vice President (Administra-tion), and Director of General Admin-istration for this purpose. After getting the university’s support, in November 2009 the authors started to meet with the Academic Registrar and his colleagues to discuss the details of the cooperation. To protect the privacy of the graduates, li-brary colleagues were not allowed to have the GPA data with the student’s identifica-tion, which included the student number and student name in this case. Eventually, we agreed to adopt these procedures:1. For each sample group (we will
define “sample group” later), the library prepared an Excel table with student numbers, student names, graduation years, the program of study, and checkout data, and sent it to AR;
2. AR prepared a list of student num-bers that were missing in the previ-ous files for the library (we found the library’s system had some errors in the data of graduation year);
3. The library added the information of the missing graduates in the files and sent them again to AR; and
4. AR replaced student numbers and student names with corresponding GPA data and shuffled the order of rows before sending them to the library.
Samples & PopulationsThe subjects of this study were all HKBU students who had graduated within the last three years (from 2007 to 2009) with cumulative GPA given. A total of 8,701 students were identified. The two selected independent variables in this analysis were:1. Graduation GPA of the students
(denoted as “GPA”), ranging from 1.82 to 4.00.
2. The number of times these students had checked out books and AV mate-rials during their study at HKBU, not

364 College & Research Libraries July 2011
taking the number of renewals into account (denoted as “CHKOUT”). This data ranged from 0 to 1,054.
Cases (pairs of data) were first divided into 53 sample groups, according to their study major (a couple of examples: Trans-lation, Biology) and level of study (under-graduate or graduate level). (Please refer
to table 1.) This arrangement was based on the belief that different subject disci-plines had different criteria or internal guidelines to assign GPA values, so cases across programs of study were not com-parable. Moreover, students’ information behaviors are strongly associated with their subject interests and academic level.14
TABLE 1Sample Groups with Corresponding Sample Sizes
Uncovering Meaningful Correlation
20
TABLE 1
Sample Group Sample Size (n)
Discipline Level* 30 31–200 201
FACULTY OF ARTS
Chi Lang & Lit UGS Y
GS Y
Eng Lang & Lit UGS Y
GS Y
Humanities UGS Y
Language Std GS Y
Music UGS Y
GS Y
Religion & Phil UGS Y
GS Y
Translation UGS Y
GS Y
SCHOOL OF BUSINESS
Accountancy UGS Y
GS Y
Economics UGS Y
GS Y
Finance UGS Y
Human Res Mgt UGS Y
GS Y
Marketing UGS Y
China Business UGS Y
Business Mgt GS Y
SCHOOL OF COMMUNICATION
Film UGS Y
GS Y
Communication
Std
UGS Y
GS Y
Journalism UGS Y
GS Y
Sample Group Sample Size (n)
Discipline Level* 30 31–200 201
FACULTY OF SCIENCE
Biology UGS Y
GS Y
Chemistry UGS Y
GS Y
Computer Sc UGS Y
GS Y
Mathematics UGS Y
GS Y
Physics UGS Y
FACULTY OF SOCIAL SCIENCES
Education GS Y
Geography UGS Y
GS Y
Gov’t & Int’l Std UGS Y
History UGS Y
GS Y
Physical Ed UGS Y
GS Y
Sociology UGS Y
GS Y
Social Work UGS Y
GS Y
OTHER
Chi Medicine UGS Y
GS Y
Visual Arts UGS Y
GS Y
* UGS denotes undergraduate students and GS denotes graduate students. *UGS denotes undergraduate students and GS denotes graduate students.

Uncovering Meaningful Correlation 365
According to Corder & Foreman, “the minimum sample size for using a para-metric statistical test varies among texts… [M]ost researchers suggest n>30.”15 Among the 53 sample groups that we identified, 5 of them had sample size not greater than 30 and thus were invalid. (They are shaded in grey in table 1.) We used the remaining 48 groups as our fi-nal samples. The sample size of these 48 groups ranged from 31 to 1,223.
The corresponding population of each sample group is all HKBU current students and graduates who share the same study major and level of study. For example, the sample group <Journalism – UGS> is intended to provide inferences, whenever possible, to all HKBU students/graduates who take/took journalism as their major in their undergraduate study.
Statistical Methods UsedFor each valid sample group, we used the Pearson’s Correlation for the analy-sis. This method is the most common method used to determine the degree of linear dependence between two variables (which were GPA and CHKOUT in this study). The classic interpretation of the correlation coefficients (r) in behavioral sciences was established by Cohen first in 1983. (Please see table 2 for his approach.) In behavioral sciences, an r value of 0.8
is already very high and infrequently oc-curs. Correlation coefficients (r) are also not based on a linear scale. For example, r=0.6 is not twice as strong as r=0.3.
A two-tailed significance test was then carried out on the sample correlation coefficient (r) to examine if we could provide valid inferences from the sample to the corresponding population. As the common practice, our null hypothesis was that the two variables in question have a zero correlation in the population (H0:r=0), where r represents the correla-tion coefficient of the population. The alternative hypothesis was that the two variables are related (HA:r≠0). We set the significance criterion (a) as 0.05, which is a widely used standard in behavioral sciences.17 By using this value, there was
TABLE 2Interpretation of Correlation
Coefficients in Behavioral Sciences16
r for a Positive
Relationship
r for a Negative
Relationship
Relationship Strength
1.0 –1.0 Perfect0.5 –0.5 Large0.3 –0.3 Medium0.1 –0.1 Small0.0 0.0 None
FIGurE 1Correlation result of a Sample Group
Chi Lang & Lit – uGS
r : 0.375p : ≈0.000
The correlation coefficient was significant (r = 0.375, p<0.05). There is a positive relationship between GPA and checkout in the corresponding population.
Note: p = Two-tailed significance

366 College & Research Libraries July 2011
a 95 percent chance that any observed statistical differences were real and not due to chance.
There are a number of factors affecting the result of a significance test, which does not solely depend on the correlation coef-ficient (r). For example, the r value of 0.119 in the sample group <Education – GS> was significant, most probably due to its large sample size of 1,223. In comparison to <Physical Ed – UGS>, although its r=0.154, it failed to pass the significance test. In other words, the correspond-ing population of <Physical Ed – UGS> was statistically proven to have no clear relationship between the two testing vari-ables, even though a positive correlation existed in the sample.
To further explain our methodologies, the correlation result of a sample group is presented as an illustrative example. (See figure 1.) Due to privacy reasons, this graph does not have labels (values of scales) displayed. We also transformed the scales, so that all dots appeared in the centre of the graph. This kind of ar-rangement does not affect the relationship between the variables.
FindingsAmong the 48 valid sample groups, 31 sample groups (65 percent) were statisti-cally proven to have a positive relation-ship between GPA and CHKOUT in the corresponding population (see figure 2). These sample groups are listed in table 3. No sample groups were found to have a negative correlation between the two variables. The remaining 35 percent had no clear relationship.
The correlation coefficients (r) of the above 31 sample groups ranged from 0.119 (<Education – GS)>) to 0.494 (<Mathematics – GS>). There were a number of sample groups having cor-relation strength very close to “large.” They included: <Humanities – UGS> with r=0.472, <Translation – GS> with r=0.471, and <Mathematics – GS> with r=0.494.
Within each Faculty/School, the per-centage of sample groups that were
proven to have a positive correlation in the corresponding population is illus-trated in figure 3.
Discussion & Further InvestigationsFrom the results, we can make two con-clusions for the students of Academy of Visual Arts, Faculty of Social Sciences, Faculty of Arts, School of Communica-tion, and Faculty of Science. Either or both of these two conclusions were statistically proven to be valid.
Conclusion One: Most students follow the inference that the more library books and audiovisual materials they use, the higher GPAs they acquire.
Conclusion Two: Most students fol-low the inference that the higher GPAs they have, the more library books and audiovisual materials they use.
No matter which factor (monograph and multimedia usage or students with higher GPA) is the cause or determinant
FIGurE 2Percentage of Sample Groups
That Have a Positive Correlation in the Corresponding Population
(university Based)
Posi�veRela�onship
65%
No ClearRela�onship
35%

Uncovering Meaningful Correlation 367
TABLE 3The 31 Sample Groups That Have a Positive Correlation in the
Corresponding PopulationSample Groups That Passed the Significance Test
Sample r Affiliated Faculty/School
Chi Lang & Lit UGS 0.375 Faculty of Arts
Chi Lang & Lit GS 0.245
Eng Lang & Lit UGS 0.236
Humanities UGS 0.472
Language Std GS 0.228
Music UGS 0.270
Translation UGS 0.318
Translation GS 0.471
Accountancy UGS 0.147 School of Business
Economics UGS 0.146
Human Res Mgt GS 0.199
China Business UGS 0.211
Film UGS 0.274 School of Communication
Communication Std GS 0.131
Journalism UGS 0.258
Journalism GS 0.274
Chi Medicine UGS 0.176 School of Chinese Medicine
Biology GS 0.195 Faculty of Science
Chemistry GS 0.228
Mathematics UGS 0.163
Mathematics GS 0.494
Physics UGS 0.424
Education GS 0.119 Faculty of Social Sciences
Geography UGS 0.210
Gov’t & Int’l Std UGS 0.244
History UGS 0.265
History GS 0.357
Physical Ed GS 0.331
Sociology UGS 0.304
Social Work UGS 0.253
Visual Arts UGS 0.207 Academy of Visual Arts

368 College & Research Libraries July 2011
of the relationship, we proved that these two factors are positively correlated for all or most departments of these five Facul-ties/Schools.
This result brings us (and, one hopes, also other libraries) meaningful impli-cations. First, this study can serve as strong evidence to show the university administration that the library plays an important role in student learning and their academic success for these five Fac-ulties/Schools. Even though some people may choose not to accept Conclusion One, they cannot deny the proven fact that students who have higher GPAs use (or like to use) more monographs and mul-timedia resources that are provided by the library. The importance of the library is still soundly proven.
We can also make use of this study as a helpful method to justify a strengthened monograph and audiovisual material budget to the university. Even though we are in the Internet era, the results demonstrate that some students (espe-cially those studying Visual Arts, Social Sciences, Arts, and Communication) are still heavily reliant on monographs and audiovisual materials for their study. This confirmed idea can also help collections librarians have a better understanding on how much emphasis to give to mono-graph and multimedia purchases for different disciplines.
For HKBU, this result had attracted considerable discussions among the uni-versity administrators, who then became more interested in the work the library is doing. They decided to give us a small amount of extra funding to investigate if a similar relationship exists between student GPAs and their attendance of library instruction workshops.
Further InvestigationsHowever, one may quickly come to a conclusion that the library has not made significant (or enough) contribution to student learning for the students of School of Chinese Medicine and School of Business. In response to this possible comment, we thought that a usage study of electronic resources might be useful.
We made use of 2004–2009 usage data of the library’s subscribed electronic re-sources for analysis, covering both online books and online journals. We selected this range of data for analysis, since more than 90 percent of students who graduated be-tween 2007 and 2009 (our subjects) carried out their study within the period from 2004 to 2009. We first classified all electronic resources into Faculty/School –based cat-egories, according to the content of their collections. Then, through assuming the electronic resources used were related to the students’ programs of study, we came up with an interesting result. It showed
FIGurE 3Percentage of Sample Groups That Have a Positive Correlation in the
Corresponding Population (Faculty/School Based)
44%50%56%
67%73%80%
100%
0%
20%
40%
60%
80%
100%
Academy ofVisual Arts
Faculty of Social Sciences
Faculty of Arts School ofCommunica�on
Faculty ofScience
School ofChinese
Medicine
School ofBusiness
Note: Academy of Visual Arts has only one valid sample group.

Uncovering Meaningful Correlation 369
the average number of searches made per student per year. (Please refer to figure 4.)
Due to the complication of this task and the fact that this further study was beyond the scope and primary research of this paper, we admit that the exact calculated figures were not very accurate. For example, we could not include any multidisciplinary electronic resources in this analysis, as it was impossible to clas-sify any of them into one single Faculty/School category. However, the distribu-tion, which is far more important in this case, can serve as a good reference for us.
The scales of the horizontal axes (x-axes) of figures 3 and 4 are the same; Faculty/School names are listed in the same order for both figures. By comparing these two figures, we can easily notice that they are the opposite of each other. Figure 3 is a downward curve, whereas figure 4 goes upward. In other words, the Facul-ties/Schools whose student GPAs were less correlated with book and AV material loans, their students used more electronic resources. To better understand the actual impact of library material usage on the students of School of Chinese Medicine and School of Business, we believe an-other relationship analysis for the use of electronic resources and GPA is needed.
Limitations of the Primary StudyTo yield a correlation result that could provide the best inference to the popula-
tion, the ideal sampling method is to se-lect graduates randomly from each year, starting from when the Departments (subject disciplines) were first estab-lished till now. However, not all this data, especially the circulation data of earlier years, is stored. It was already our best attempt to take 2007 to 2009 graduates as samples that required us to retrieve circulation transactions starting from 1998. More important, we believe this arrangement cannot have any negative impact on the conclusions we derived from the results.
Another major limitation relates to the statistical method itself. Correlation anal-ysis can only reflect the relationship be-tween two sets of data, including (1) if an association exists, (2) if the association is a positive or a negative relationship, and (3) the strength of the association. Correla-tion tests cannot tell the cause-and-effect relationship. Therefore, through this study, we cannot simply make a conclu-sion that the use of books and audiovisual materials is statistically proven to be one of the determinant factors of a higher GPA for the graduate students of Mathematics, undergraduate students of Humanities, and so on. Another possible scenario could be that the students who have higher GPAs tend to use more books and multimedia materials. Yet, as mentioned before, this study and the results are still meaningful in various aspects.
FIGurE 4usage of Electronic resources (Faculty/School Based)
Ave
rage
No.
of S
earc
hes
Mad
e Pe
r Stu
dent
, Per
Yea
r
0
100
200
300
400
500
600
700
Academy ofVisual Arts
Faculty ofSocial Sciences
Faculty of Arts School ofCommunicaon
Faculty ofScience
School ofChinese
Medicine
School ofBusiness

370 College & Research Libraries July 2011
ConclusionThis is a highly experimental project for the HKBU Library and the academic library sector as a whole. We were very glad to be able to establish a positive cor-relation between book and multimedia loans and students’ academic perfor-mance for most Faculties/Schools, by using 8,701 sets of data. We believe we have demonstrated our value on student
learning outcomes. Nevertheless, books and audiovisual materials are just two of the three major types of resources libraries are providing today. To gener-ate a more comprehensive picture, we would like to see us or other libraries to be able to establish a mathematical relationship between student usage of electronic resources and their GPAs in the near future.
Notes
1. American Library Association, The Library Survey Questionnaire (Chicago, American Library Association, 1924).
2. Library Association, A Century of Public Library Service: Where Do We Stand To-day? Centenary Assessment (London: Library Association, 1950).
3. Charles B. Weinberg, “The University Library: Analysis and Proposals,” Management Sci-ence 21, no. 2 (1974): 130–40.
4. Denise Troll Covey, Usage and Usability Assessment: Library Practices and Concerns (Jan. 2002). Available online at www.diglib.org/pubs/dlf096/. [Accessed 9 April 2010].
5. Steve Hiller, Martha Kyrillidou, and Jim Self, “When the Evidence Is Not Enough: Or-ganizational Factors That Influence Effective and Successful Library Assessment,” Performance Measurement and Metrics 9, no. 3 (2008): 223–30.
6. William H. Walters, “Expertise and Evidence in the Assessment of Library Service Quality,” Performance Measurement and Metrics 4, no. 3 (2003): 98–102.
7. W. Patrick Leonard, “On My Mind: This Year Is Different: Facing Outcome Assessment,” The Journal of Academic Librarianship 18, no. 4 (1992), 228, 231.
8. Ronald R. Powell, “Impact Assessment of University Libraries: A Consideration of Issues and Research Methodologies,” Library & Information Science Research 14, no. 3 (1992), 245–57.
9. Ibid. 10. Patricia B. Knapp, The Monteith College Library Experiment (New York: Scarecrow Press,
1966). 11. Andrew M. Robinson and Karen Schlegl, “Student Bibliographies Improve When Profes-
sors Provide Enforceable Guidelines for Citations,” Portal-Libraries and the Academy 4, no. 2 (2004): 275–90.
12. P. Barkey, “Patterns of Student Use of a College Library,” College & Research Libraries 20, no. 2 (1965), 115–18.
13. K. De Jager, “Library Use and Academic Achievement,” South African Journal of Library & Information Science 65, no. 1 (1997), 26–30.
14. I. Rowlands and D. Nicholas, “Understanding Information Behavior: How Do Students and Faculty Find Books?” The Journal of Academic Librarianship 34, no. 1 (2008), 3–15. doi:10.1016/j.acalib.2007.11.005.
15. G.W. Corder and D.I. Foreman, Nonparametric Statistics for Non-Statisticians: A Step-by-Step Approach (Hoboken, N.J.: John Wiley & Sons, 2009).
16. J. Cohen, Applied Multiple Regression/Correlation Analysis for the Behavioral Sciences (Hillsdale, N.J.: L. Erlbaum Associates, 1983).
17. Ibid.

The #1 source for jobs in Library and Information Science and Technology
WHERE JOB SEEKERS AND EMPLOYERS GET RESULTS
HRDR
joblist.ala.org
JOB SEEKERSSearch and sort hundreds of job ads by position type, employer, location, and morePost your résumé for employersSave your search as an RSS feed to alert you when new jobs matching your requirements are posted
EMPLOYERSStrengthen your candidate pool—ALA reaches the most engaged professionals and studentsSimplify recruitment—one-stop advertising for online and printReview posted résumésConnect with candidates
New job postings added daily!