uasin gishu district environment action plan 2009-2013
162
1 REPUBLIC OF KENYA MINISTRY OF ENVIRONMENT AND MINERAL RESOURCES UASIN GISHU DISTRICT ENVIRONMENT ACTION PLAN 2009-2013
-
Upload
khangminh22 -
Category
Documents
-
view
1 -
download
0
Transcript of uasin gishu district environment action plan 2009-2013
1
REPUBLIC OF KENYAMINISTRY OF ENVIRONMENT AND MINERAL RESOURCES
UASIN GISHU DISTRICTENVIRONMENT ACTION PLAN
2009-2013

i
EXECUTIVE SUMMARYEconomic growth and environment are closely intertwined in Kenya’s development.
Environmental Action Planning is a tool that aims at enhancing the integration of
environment into development planning. UasinGishu District faces many environmental
challenges with some being unique to the District.
Poverty has lead to the over-use and destruction of environment. Continued reliance on
trees for fuel and wetlands for farming and its resources has lead to deforestation and
wetland encroachment. Annual flooding continues to destroy property and frustrate
farming.
The DEAP highlights priority themes and activities for the District towards achieving
sustainable development. The report is divided into eight chapters. Chapter one gives the
challenges of sustainable development and also describes the rationale for and
preparatory process of the DEAP. The chapter introduces the district’s main profile
covering the physical features, demographic, agro-ecological zones, and main
environmental issues.
Chapter two describes the District’s Environment and Natural resources of Land, Water,
Biodiversity (forest, wildlife, and Dry lands biodiversity), wetlands and agriculture,
livestock and fisheries. For each resource, major environmental issues, challenges and
proposed interventions are identified.
Chapter three discusses the Human settlements and infrastructure in UasinGishu District
covering situation analysis, challenges and proposed interventions. Environmental
challenges addressed include; waste management, sanitation, pollution, diseases, land use,
demand for water, energy, materials for construction, land and wetlands degradation,
policy and legislation, biodiversity loss and land tenure.
Chapter four addresses environmental aspects in tourism, trade, industry and services
sectors. The key issues under this chapter are high pollution levels from industrial
activities and weak enforcement of relevant legislations.
Chapter five discusses environmental hazards and disasters. The major hazards covered
include; drought and floods.

ii
Environmental information, networking and technology are discussed in chapter six. It
emerges that environmental information and networking technology have continued to
receive scanty attention.
Governance, Policy and Legal Framework as well as Institutional arrangements are set in
chapter Seven. The key issues addressed include; harmonization of environmental
legislations and institutional mandates, incorporation of indigenous knowledge in
environmental management. Chapter eight is the implementation Matrix.

iii
FOREWORDThe 1992 Earth Summit held in Rio de Janeiro came up with various recommendations,
among them Agenda 21, a Global Environmental Action Plan. The theme of the
Summit focused on how nations could attain sustainable development. The Government
of Kenya embraced this idea by developing the first National Environment Action Plan
(NEAP) in 1994.
Since independence, Kenya has continued to demonstrate her commitment to
environmental management through various initiatives, among them the National
Development Plans of 1974 and the National Environment Action Plan of 1994.
Further, there have been a number of sectoral policies on environment in fields such as
Agriculture, Livestock, Water, Energy, Food, Land, Wildlife, Forest, Industry, Trade,
Arid Lands, Disaster Management and the Draft Sessional Paper No. 6 of 1999 on
Environment and Development.
The Environmental Management and Coordination Act (EMCA, 1999) provides for the
integration of environmental concerns in national policies, plans, programmes and
projects. In this regard, EMCA 1999 provides for the formulation of National, Provincial
and District Environment Action Plans every five years.
Environmental Action Planning is a tool that aims at integrating environmental concerns
into development planning. The process followed in preparing this DEAP was
participatory, involving various stakeholders from institutions and sectors, including the
public, private, NGOs and local communities at District and Divisional levels. These
consultative meetings provided the basis also for formulation of the PEAP and finally
the National Environment Action Plan.
The DEAP addresses environmental issues from various sectors in an integrated manner
and discusses their significance in development planning. It proposes a strategy for
achieving sustainable development in line with Kenya’s quest to meet the Millennium
Development Goals (MDGs) Vision 2030 and Medium Term Plan (MTP2008-2012).
The Plan has brought out a number of proposed interventions, legal and institutional
framework to be incorporated into sectoral development plans and programmes. Its
implementation will be monitored by the DEC and will be reflected in the State of the
Environment Reports.

iv
The preparation of the DEAPs for UasinGishu owes much to the technical and financial
assistance provided by the NEMA This support, which included innovative community
and civil society consultations, facilitation of DEC meetings, as well as final publication
costs, is gratefully acknowledged
I wish to underscore that the 2009-2013 DEAP report is a broad-based strategy that will
enable the District attain sustainable development as envisaged in Vision 2030
Dr. Ayub Macharia (PhD),DIRECTOR GENERAL (Ag),NATIONAL ENVIRONMENT MANAGEMENT AUTHORITY
v
ACKNOWLEDGEMENTEnvironment Action Planning is a multi disciplinary, multi stakeholder and multi-sectoral
participatory process. In this connection, many institutions and individuals have
contributed immensely to the preparation of this District Environment Action Plan. I
take this opportunity therefore, to acknowledge all those who contributed to its
preparation.
I particularly acknowledge with appreciation the participation of the District technical
Committee charged with the responsibility formulating this action plan for their valuable
input, participation and tireless effort to accomplish this task. I further thank the
different departments NGOs, CBOs, Research institutions and individual who provided
information and data that was the building blocks for this plan.
I also acknowledge the support of NEMA headquarters and the board for facilitating the
entire process through provision of appropriate guidance and finances respectively to
complete the exercise. Together I am grateful to the Provincial Director of Environment
- Eastern Province and the District Environment Officer UasinGishu for the inputs and
commitment to the entire process of preparation of this document.
It is my belief that this plan will be implemented for the betterment of our environment
in UasinGishu District, the province and the country at large.
Dr. Kennedy I. Ondimu
DIRECTOR, ENVIRONMENTAL PLANNING
& RESEARCH CO-ORDINATION

vi
TABLE OF CONTENTSEXECUTIVE SUMMARY ........................................................................................................................I
FOREWORD ......................................................................................................................................... III
ACKNOWLEDGEMENT ......................................................................................................................V
CONTENTS ........................................................................ ERROR! BOOKMARK NOT DEFINED.
LIST OF ACRONYMS ......................................................................................................................... XII
CHAPTER ONE.......................................................................................................................................1
1.0 INTRODUCTION ...............................................................................................................................1
1.1 PREAMBLE........................................................................................................................................1
1.2 CHALLENGES OF ENVIRONMENTAL MANAGEMENT ................................................................2
1.3 PROVISIONS OF EMCA ON ENVIRONMENTAL PLANNING ........................................................4
1.4 OBJECTIVES OF DISTRICT ENVIRONMENT ACTION PLAN .......................................................4
1.5 THE ENVIRONMENTAL ACTION PLANNING PROCESS ..............................................................4
1.6 DISTRICT PROFILE.........................................................................................................................5
1.6.1 GEOGRAPHICAL LOCATION, SIZE AND ADMINISTRATIVE UNITS .................................5
1.7 CLIMATE AND PHYSICAL FEATURES .......................................................................................6
1.7.1 GEOLOGY AND SOILS ................................................................................................................6
1.7.2 AGRO ECOLOGICAL ZONES .....................................................................................................6
1.7.3 VEGETATION................................................................................................................................6
1.7.4 DRAINAGE ....................................................................................................................................7
1.7.4 CLIMATE .......................................................................................................................................7
1.8 POPULATION SIZE AND DISTRIBUTION ...................................................................................7
1.9 SOCIAL, CULTURAL AND ECONOMIC CHARACTERISTICS ...............................................10
CHAPTER TWO....................................................................................................................................12
2.0 ENVIRONMENT AND NATURAL RESOURCES .......................................................................12
2.1 LAND USE AND SOILS.................................................................................................................12
2.2 LAND AND LAND USE CHANGES .............................................................................................14
2.2.1 IMPACTS OF LAND USE CHANGES .......................................................................................14
2.2.2 REGULATORY AND INSTITUTIONAL ARRANGEMENTS GOVERNING LAND
ADMINISTRATION .............................................................................................................................14
vii
2.2.3 PRIORITIZATION OF KEY ENVIRONMENTAL ISSUES; ...................................................15
2.3 AGRICULTURE..............................................................................................................................15
2.3.1 REGULATORY AND MANAGEMENT ARRANGEMENTS ...................................................16
2.3.3 PROPOSED INTERVENTIONS ..................................................................................................18
2.4 LIVESTOCK PRODUCTION .........................................................................................................19
2.4.1 TYPES OF PRODUCTION SYSTEMS .......................................................................................19
2.4.2 AREA COVERAGE (HA) ............................................................................................................19
2.4.3 PRODUCTION PATTERNS, STATUS AND TRENDS .............................................................20
2.4.4 REGULATORY AND INSTITUTIONAL ARRANGEMENTS..................................................25
2.4.5 POLLUTION AND WASTES IN LIVESTOCK PRODUCTION ...............................................29
2.5 FISHERIES RESOURCES................................................................................................................29
2.5.1 STATUS OF FISHERIES DEVELOPMENT AND TRENDS IN PONDS..................................30
2.5.2 REGULATORY AND INSTITUTIONAL ARRANGEMENT....................................................30
2.6 WATER RESOURCES....................................................................................................................32
2. 6.1 WATER SOURCES.....................................................................................................................32
2.6.2 MAIN WATER USES...................................................................................................................33
2. 6.3 STATUS AND TRENDS OF WATER RESOURCES................................................................33
2.6.4 ACCESS TO SAFE DRINKING/PORTABLE WATER..............................................................33
2.6.5 IMPACT OF WATER USE AND DEMAND ON THE ENVIRONMENT AND NATURAL
RESOURCES.........................................................................................................................................33
2.6.8 REGULATORY AND MANAGEMENT ARRANGEMENTS ...................................................34
2.7 FORESTRY......................................................................................................................................34
2. 7.1 TYPES OF FORESTS..................................................................................................................34
2.7.2 STATUS AND TRENDS OF FOREST RESOURCES ................................................................35
STATUS:................................................................................................................................................35
2.7.3 REGULATORY AND MANAGEMENT ARRANGEMENTS..............................................35
2.7.4 EXPLOITATION OF FOREST RESOURCES FOR TIMBER AND NON TIMBER
PRODUCTS ...........................................................................................................................................36
2.7.5 FOREST USES .............................................................................................................................36
2.8 BIODIVERSITY CONSERVATION ..............................................................................................37
viii
CHAPTER THREE................................................................................................................................45
3.0 HUMAN SETTLEMENT AND INFRASTRUCTURE...................................................................45
3.1 HUMAN SETTLEMENT AND PLANNING .................................................................................45
3.1.1 URBAN SETTLEMENTS ............................................................................................................45
3.1.2 PROBLEMS OF URBAN SETTLEMENTS ................................................................................46
3.1.3 RURAL SETTLEMENT...............................................................................................................47
3.1.4 PROBLEMS OF RURAL SETTLEMENTS.................................................................................47
3.3 HUMAN AND ENVIRONMENTAL HEALTH .............................................................................48
3.3.1 INTERVENTION MEASURES TO ADDRESS THE PREVALENCE OF DISEASES.............48
3.3.2 POLLUTION AND WASTE GENERATED FROM HUMAN SETTLEMENT.........................49
3.4 SOCIAL ECONOMIC SERVICES AND INFRASTRUCTURE ....................................................49
3.5 ENERGY SECTOR..........................................................................................................................50
3.5.1 TYPES AND STATUS OF ENERGY SERVICES ......................................................................51
3.5.2 TRENDS IN ENERGY PRODUCTION, CONSUMPTION, COSTS AND PROJECTIONS .....52
3.5.3 GEOTHERMAL............................................................................................................................52
3.5.4 FACTORS INFLUENCING TRENDS.........................................................................................53
CHAPTER FOUR ..................................................................................................................................54
4.0 INDUSTRY, TRADE AND SERVICES .........................................................................................54
4.1 INDUSTRIAL SECTOR..................................................................................................................54
4.1.1 INDUSTRIAL WASTES AND POLLUTION .............................................................................56
4.1.2 ENERGY RELATED POLLUTION AND WASTE GENERATION..........................................57
4.1.3 WASTE AND POLLUTION FROM MINING AND QUARRYING ..........................................57
4.1.4 EMISSIONS AND NOISE POLLUTION ..................................................................................58
4.1.5 SERVICE INDUSTRY WASTE AND POLLUTION..................................................................58
4.1.5 HAZARDOUS WASTE................................................................................................................59
4.2 TRADE SECTOR ............................................................................................................................61
4.2.1 RELATIONSHIP BETWEEN CONSUMPTION PATTERNS AND THE ENVIRONMENT ...61
4.3 SERVICES SECTOR.......................................................................................................................63
4.3.1 TELEPHONE, ELECTRICITY ....................................................................................................63
4.3.2 AIR TRANSPORT........................................................................................................................64

ix
4.3.3 BUILDINGS .................................................................................................................................64
4.3.4 TOURISM .....................................................................................................................................66
4.4 MINING ...........................................................................................................................................71
4.4.1 QUARRYING ...............................................................................................................................71
4.4.2 REGULATORY AND INSTITUTIONAL ARRANGEMENT....................................................72
4.4.3 SAND HARVESTING..................................................................................................................74
CHAPTER FIVE....................................................................................................................................75
5.0 ENVIROMENTAL HARZARDS AND DISASTERS ....................................................................75
5.1 EXTENT AND TRENDS OF ENVIRONMENTAL HAZARDS AND DISASTERS ...................75
5.1.1 ENVIRONMENTAL HAZARDS AND DISASTERS .................................................................75
5.1.2 EXTENT AND TRENDS OF ENVIRONMENTAL HAZARDS AND DISASTERS ................75
5.1.3. TRADITIONAL COPING MECHANISMS................................................................................77
5.1.4 DISTRICT ENVIRONMENTAL RESPONSE MECHANISMS .................................................77
5.1.5 STATUS OF EARLY WARNING AND PREPAREDNESS.......................................................78
CHAPTER SIX ......................................................................................................................................80
6.0 ENVIRONMENTAL EDUCATION AND TECHNOLOGY..........................................................80
6.1 STATUS OF ENVIRONMENTAL EDUCATION .........................................................................80
6.2 PUBLIC AWARENESS AND PARTICIPATION..........................................................................81
6.2.1 CHALLENGES IN CREATING ENVIRONMENTAL AWARENESS ......................................83
6.3 TECHNOLOGIES............................................................................................................................83
6.5 ENVIRONMENTAL INFORMATION SYSTEMS........................................................................84
6.5.1 TYPES AND SOURCES OF ENVIRONMENTAL INFORMATION ........................................84
6.5.2 STATUS OF ENVIRONMENTAL INFORMATION MANAGEMENT SYSTEMS ...................4
15.2 STATUS OF ENVIRONMENTAL INFORMATION MANAGEMENT SYSTEMS ....................5
6.6 INDIGENOUS KNOWLEDGE .........................................................................................................6
6.6.1 CONSTRAINTS/CHALLENGES IN THE UTILIZATION, DOCUMENTATION AND
DISSEMINATION OF INDIGENOUS KNOWLEDGE (IK) .................................................................8
CHAPTER SEVEN................................................................................................................................10
7.0: ENVIRONMENTAL GOVERNACE AND INSTITUTIONAL ARRANGEMENTS ..................10
7.1 OVERVIEW.....................................................................................................................................10

x
7.2 EMCA STRUCTURES FOR ENVIRONMENTAL MANAGEMENT ..........................................10
7.3. STATUS OF ENVIRONMENTAL GOVERNANCE & INSTITUTIONAL ARRANGEMENTS11
CHAPTER EIGHT.................................................................................................................................16
8.0 IMPLEMENTATION STRATEGY.................................................................................................16
8.1 STAKEHOLDERS INVOLVEMENT.............................................................................................16
APPENDIX I..........................................................................................................................................61
APPENDIX II.........................................................................................................................................62

xi
LIST OF TABLESTable 1 : Administrative Units by area and number.........................................................5Table 2: Population Distribution in terms of male, Female and Density per Division ....7Table 3: Urban Population of major towns/centres in Uasin Gishu................................7Table 4: Population distribution by Gender for Uasin Gishu District .............................8Table 5: No. of Urban Centres by actual Population – 1999 Census ...............................9Table 6: Crop Production Statistics .............................................................................17Table 7: Types of pollutants emanating from agricultural activities ...........................18Table 8: Fodder and Pasture development ....................................................................19Table 9: Dairy cattle production trends .......................................................................20Table2-5: Table 10: Breeding: Artificial Insemination Trends ........................................20Table 11: Hive population and production trends........................................................20Table 12: sheep population trends ...............................................................................21Table 13: Population trends of Goats...........................................................................22Table 14: Poultry population trends.............................................................................23Table 15: Pig population trends ...................................................................................24Table 16: Donkeys population .....................................................................................25Table 17: Types and status of livestock production systems.......................................26Table 18: Summary: Estimated animal population Figures per division.....................28Table 19: Livestock Population trends ........................................................................29Table 20: Sources of Pollutants ...................................................................................29Table 21: Fisheries Production Patterns ......................................................................30Table 22: Types and Status of Fisheries Production Systems .....................................31Table 23: Area under Forest Cover (gazetted).............................................................34Table 24: Types & Status of Biological Resources .....................................................41Table 25: Key Environmental Issues and Proposed Interventions ..............................43Table 26: FACTORS INFLUENCING ENERGY GENERATION ...........................52Table 27: The main Industries .....................................................................................54Table 28: Trends in Industrial Development ...............................................................55Table 29: Type and Impact of Industries on Environment ..........................................55Table 30: Type and Sources of Wastes........................................................................56Table 31: Table 4-5: Types and sources of wastes ......................................................58Table 32: Types and Sources of hazardous Waste.......................................................60Table 33: Type and impact of trade on Environment ..................................................62Table 34: Service sector Linkages to environmental Degradation .............................64Table 35: Type of Tourism, Attraction and Potential ..................................................66Table 36: Tourist Attraction Areas in the North Rift Region ......................................68Table 37: Table 4-11: Types of rock and method of extraction ..................................71Table 38: Table 4-12: Unrehabilitated Quarries ..........................................................72Table 39: Status of early warning and preparedness ...................................................76Table 40: Sector Capacities for Disaster Preparedness and Response ........................78Table 41: Table 6-1 Status of Environmental Programmes in Schools .......................80Table 42: Status of Environmental Awareness and Participation in the District.........81Table 43: Information and data types in the district ......................................................2Table 44: Types of Information by different sectors .....................................................4Table 45: Policies that Impact on Environment............................................................12Table 46: Legislation that Impact on Human Health & Environmental Quality ............13Table 47: Implementation Matrix for Uasin Gishu/Wareng District .............................18
xii
Table 48: Monitoring and Evaluation Matrix ................................................................36
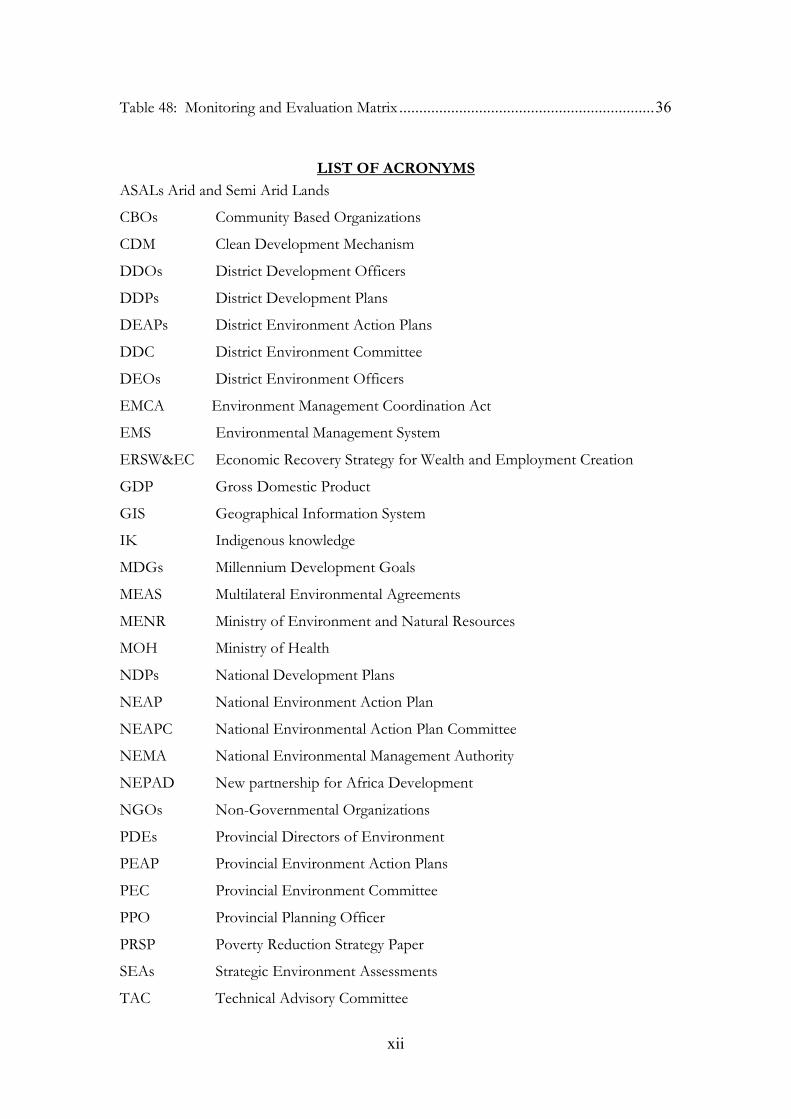
LIST OF ACRONYMSASALs Arid and Semi Arid Lands
CBOs Community Based Organizations
CDM Clean Development Mechanism
DDOs District Development Officers
DDPs District Development Plans
DEAPs District Environment Action Plans
DDC District Environment Committee
DEOs District Environment Officers
EMCA Environment Management Coordination Act
EMS Environmental Management System
ERSW&EC Economic Recovery Strategy for Wealth and Employment Creation
GDP Gross Domestic Product
GIS Geographical Information System
IK Indigenous knowledge
MDGs Millennium Development Goals
MEAS Multilateral Environmental Agreements
MENR Ministry of Environment and Natural Resources
MOH Ministry of Health
NDPs National Development Plans
NEAP National Environment Action Plan
NEAPC National Environmental Action Plan Committee
NEMA National Environmental Management Authority
NEPAD New partnership for Africa Development
NGOs Non-Governmental Organizations
PDEs Provincial Directors of Environment
PEAP Provincial Environment Action Plans
PEC Provincial Environment Committee
PPO Provincial Planning Officer
PRSP Poverty Reduction Strategy Paper
SEAs Strategic Environment Assessments
TAC Technical Advisory Committee

xiii
UNCED United Nations Conference on Environment and Development
UNEP United Nations Development Programme
WC Water Closet
WHO World Health Organization
WSSD World Summit on Sustainable Development
1
CHAPTER ONE1.0 INTRODUCTION
1.1 PreambleThe United Nations Conference on Environment and Development (UNCED) held in
Rio de Janeiro in 1992 had a double mandate of finding ways to protect the global
environment while ensuring that economic and social concerns are integrated into
development planning. The Conference underscored the need to developing modalities
for integrating environmental concerns into development policies, plans, programmes
and 'projects. It agreed on the guiding principles and a global plan of action for
sustainable development commonly called Agenda 21
The World Summit on Sustainable Development (WSSD) held in Johannesburg in 2002,
reaffirmed the commitments of the international community to the principles of
sustainable development contained in Agenda 21 and the Millennium Development
Goals (MDGs) of 2000.
Sustainable development is commonly defined as "development that meets the needs of the
present generation without compromising the ability of future generations to meet their own needs".
Development is also sustainable if it meets ecological, economic and social needs. This
calls for the integration of environmental considerations at all levels of decision making
in development planning and implementation of programmes and projects.
The Government of Kenya is committed to the achievement of sustainable development
stated in Agenda 21, the Millennium Development Goals, Vision 2030 and the
Johannesburg Plan of Implementation. This commitment to environmental protection
and sustainable use of natural resources is well articulated in various Government policy
documents including the Sessional Paper No.6 of 1999 on Environment and
Development, the Economic Recovery Strategy for Wealth and Employment Creation
(2003-2007) and the National Development Plan (2002-2008). These policies and plans
recognize integration of environmental concerns into national planning and management
processes and provide guidelines for achieving sustainable national development.
The 9th National Development Plan (2002-2008) states that "The full integration of
environmental concerns in development planning process at all levels of decision making remains a
challenge to the country, the need to integrate environmental concerns in development activities should be
given high priority". The Environmental Management and Coordination Act (EMCA) of

2
1999 provides for the integration of environmental concerns into the national
development process. The National Environment Management Authority (NEMA) is
mandated to implement the Act and in particular coordinate the preparation of
Environmental Action Plans (EAPs) at the District, Provincial and National level.
Poverty is a major challenge to the Goals of the sustainable development Sound
environmental and natural resources management should contribute to poverty
reduction, food security and sustainable livelihoods, enhanced environmental quality and
health, promotion of sustainable energy production, minimization of pollution and waste,
improvement of shelter and habitats, promotion of eco-tourism and improved standards
of living.
1.2 Challenges of Environmental ManagementKenya's economy primarily depends on natural resources where over 68% of the
population live in rural areas and derive their livelihoods mainly from these resources.
Economic activities derived from, the natural resources include agriculture, industry,
tourism, energy, water, trade, and mining. The environment and natural resources have
in the recent years been under, threat due to increased dependence on natural resources
to meet basic needs. The situation is aggravated by the rising poverty levels from 42% in
1994 to 56% in 2002 and is currently estimated to be over 62%. The situation is even
worse within the rural population. The population growth rate has over time become
higher than the economic growth rate hence the pressure on these resources. This has
also led to increased in-migration and over-utilization of fragile ecosystems. The
immigration into marginal areas from high potential areas has contributed to
unsustainable land use practices often resulting in resource use conflicts especially water
and pasture.
Poverty often leads to over-use and destruction of the environment where short-term
development goals and practices are pursued at the expense of long-term environmental
sustainability. Once the resource base is degraded, poverty is aggravated because the
capacity of the resource base to support the same population even with unchanged
demand will have diminished. Therefore, there exist a close link between poverty and
environment.
Rapid urbanization coupled with increased slum settlements due to rural-urban

3
migration have resulted in urban decay, loss of environmental quality and health
deterioration, water pollution, loss of biodiversity and encroachment of fragile
ecosystems. In both rural and urban areas, access to safe drinking water and basic
sanitation is a critical environmental and health concern. The widespread accumulation
of solid wastes and poor disposal of effluents in urban areas is also an environmental
hazard culminating in air and water pollution and increased incidences of respiratory and
water borne diseases.
About 88% of Kenya's land areas are classified as arid and semi arid lands (ASALs)
which supports over 50% of livestock, about 30% of the population and most wildlife.
Climatic variability has reduced the capacity of ASALs to support existing and emerging
livelihoods thus further aggravating environmental degradation. This is evidenced by
increased soil erosion, reduction in pasture and vegetation cover, food insecurity,
increased conflicts and insecurity - all contributing to increased poverty
Prior to the enactment of EMCA 1999, environment management in Kenya mainly
focused on administrative boundaries with little regard to trans-boundary and shared
resource issues. Consequently, management of these resources has not been adequately
addressed, including watersheds, wildlife and mountain ecosystems among others. The
challenge is to develop integrated management plans for inter- and intra-districts,
provinces, regional, national and international boundaries.
Indigenous management systems that are sustainable have largely been disregarded in t4e
recent past leading to environmental deterioration. Sectoral regulatory instruments,
which have been used to manage the environment before enactment of EMCA 1999, did
not achieve the desired outcomes. This is largely attributed to lack of linkages, sectoral
conflicts/overlaps, resource limitations, inadequate stakeholder involvement hence weak
compliance and enforcement.
The challenge of managing environmental resources sustainably calls for the
development of integrated management plans and, their implementation. Integrated
planning enables harmonization of sectoral priorities, stakeholder involvement and
participation, proper programming and budgeting system.
Section 38 of EMCA provides for the preparation of District, Provincial and National
Environment Action plans every five years.

4
1.3 Provisions of EMCA on Environmental PlanningPart IV of the Environmental Management and Coordination Act (EMCA), 1999 deals
with environmental planning at the national, Provincial and district level. Section 40
specifically deals with environmental planning at the district level and states in part:
Every District Environmental committee, shall every five, years prepare a district
environment action plan in respect of the district for which it is appointed and shall
submit such plan to the chairman of the provincial environment action plan committee
for incorporation into the provincial environment action plan proposed under section
39.
1.4 Objectives of District Environment Action Plan To determine the major environmental issues and challenges facing the country;
To identify environmental management opportunities;
To create synergy and harmony in environmental planning;
To integrate environmental concerns into social, economic planning and
development; and
To formulate appropriate environmental management strategies.
1.5 The environmental action planning processDEAP METHODOLOGY
The process started by holding regional workshops, which the DEAP Secretariat was
appointed by the Director General in 2004. That comprised of a District Water
Officer, District Development Officer (DDO) and District Environment Officer
(DEO) to attend an induction course on the DEAP methodology. The District
Environment Committee (DEC) members gazetted in 2003 were further requested to
form a District Environment Action Planning Committee (Technical Committee
comprising lead agencies and representatives from other stakeholders), chaired by the
DDO and the DEO is the secretary. Once the draft DEAP is prepared, the DEC
approves and submits to the Provincial Environment Committee for inclusion in the
Provincial Environment Action Plan.
The District Environment Action Planning Committee spearheaded the preparation of
the UasinGishu DEAP. The committee requested for sectoral environment reports
from the lead agencies and compiled the DEAP. The UasinGishu District
Environment Action Plan was further enriched through participatory planning
5
approach in which consultation workshops at the district
The preparation of the UasinGishu DEAP has been realigned with Vision 2030, Mid-
Term Plan 2008-2012 as directed by the government. The current DEAP covers the
period of 2009-2013 and as per EMCA shall be revised after every five years. The
DEAP will be monitored by the annual preparation of the State of Environment
Reports. The environmental indicators that have been developed in the implementation
matrix will be monitored by the respective lead agencies on an annual basis and
incorporated in the annual State of Environment Report. The National Steering
Committee and the National Environment Action Planning Committee have approved
the indicators.
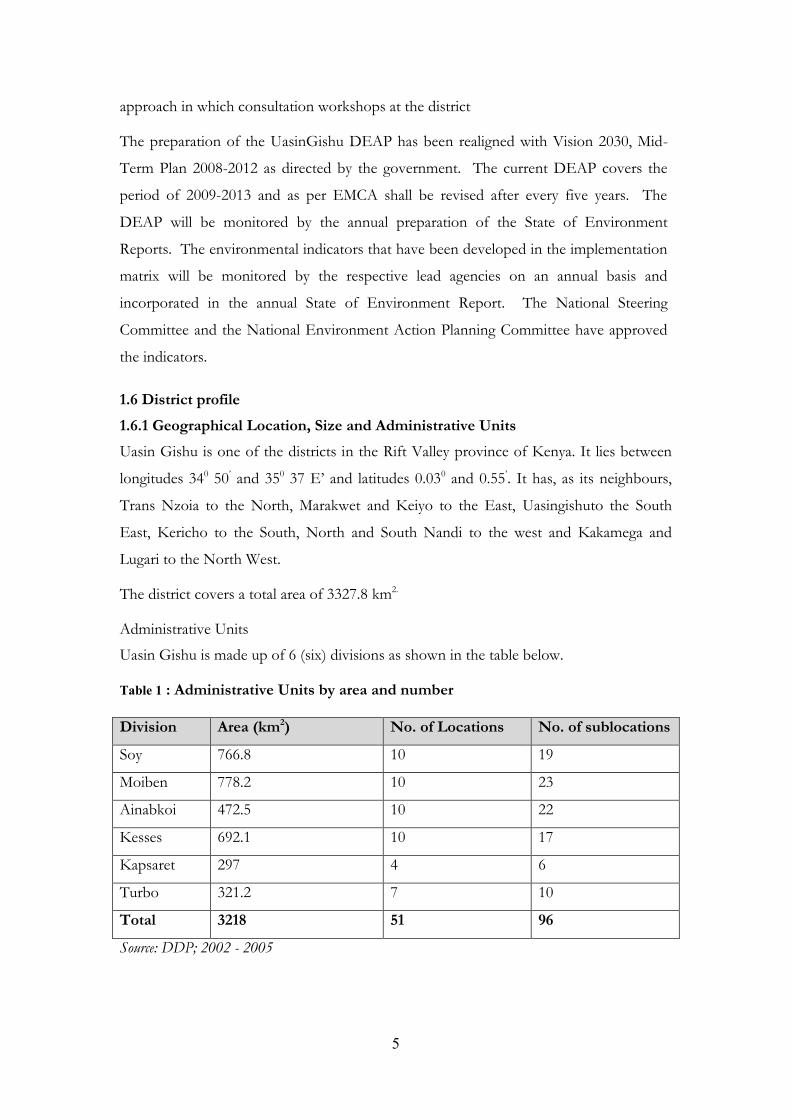
1.6 District profile1.6.1 Geographical Location, Size and Administrative UnitsUasin Gishu is one of the districts in the Rift Valley province of Kenya. It lies between
longitudes 340 50’ and 350 37 E’ and latitudes 0.030 and 0.55’. It has, as its neighbours,
Trans Nzoia to the North, Marakwet and Keiyo to the East, Uasingishuto the South
East, Kericho to the South, North and South Nandi to the west and Kakamega and
Lugari to the North West.
The district covers a total area of 3327.8 km2.
Administrative Units
Uasin Gishu is made up of 6 (six) divisions as shown in the table below.
Table 1 : Administrative Units by area and number
Division Area (km2) No. of Locations No. of sublocations
Soy 766.8 10 19
Moiben 778.2 10 23
Ainabkoi 472.5 10 22
Kesses 692.1 10 17
Kapsaret 297 4 6
Turbo 321.2 7 10
Total 3218 51 96
Source: DDP; 2002 - 2005
6
The district has three constituencies namely Eldoret East, Eldoret North and Eldoret
South. There are three local Authorities namely Wareng County Council, covering the
widest area with 21 wards, Eldoret Municipal council with 15 wards and Burnt Forest
Town Council with 6 wards.
1.7 Climate and physical featuresThe district is a highland plateau ranging from 2700m above sea level at Timboroa and
1500m above sea level at Kipkaren. Eldoret lies at an altitude of 2085m above sea level.
The rivers in the district drain into Lake Victoria. These rivers are dotted with many
dams and wetlands which help regulate river flows. The higher forested areas in the
south act as part of the catchment for the rivers. The forests are Timboroa, Cengalo,
Nabkoi, Lorenge, Kipkurere and Kapsaret.
1.7.1 Geology and SoilsThe Geology is mainly composed of basalt rock outcrops of Pre-Cambrian formations.
The top layer of soil is mainly red loam soils and underlying is a layer of murram. The
rocks are hard and their extraction requires blasting and heavy machinery. The main soil
types are red loam, red clay brown clay and brown loam soils.
1.7.2 Agro ecological zonesLH3 – Low highland which occupies the largest part of the district and covers Moiben,
Kesses, Soy and Kapsaret. Maize and wheat are the major crops.
UH4 – Upper midland covering Turbo (Tapsangoi and Sugoi areas) and is a maize zone.
UH2 – Upper midland covering Timboroa. Wheat and pyrethrum are the main crops.
Much forest is found here.
LH4 – Lower highland covering Moiben, Soy, Kesses, and Kapsaret. Cattle, sheep are
reared, and crops grown include wheat and barely.
1.7.3 VegetationUasin Gishu is mainly agricultural. The common vegetation is grassland with scattered
bushes and trees. Forests cover an area of about 29801.92ha with 56% being indigenous
and the rest being exotic plantations.
7
1.7.4 DrainageUasin Gishu is well drained with many perennial rivers, streams and springs and
numerous wetlands. The permanent rivers include Moiben, Little Nzoia, Sergoit,
Ellengerine, Endorota, Sosiani and Kipkaren rivers. The district drains its waters into
Lake Victoria.
1.7.4 ClimateUasin Gishu has high, reliable rainfall averaging between 900mm and 1200 mm. The
rainfall is experienced in March to September, with two peaks in May and August. The
wettest areas are Ainabkoi, Kesses and Kapsaret divisions. Turbo receives average rainfall
while Moiben and Soy relatively low rainfall. November to March is dry months.
The mean temperature is 180C, with an average maximum of 23.40C and a minimum of
9.80C. and 26.1 degrees centigrade.
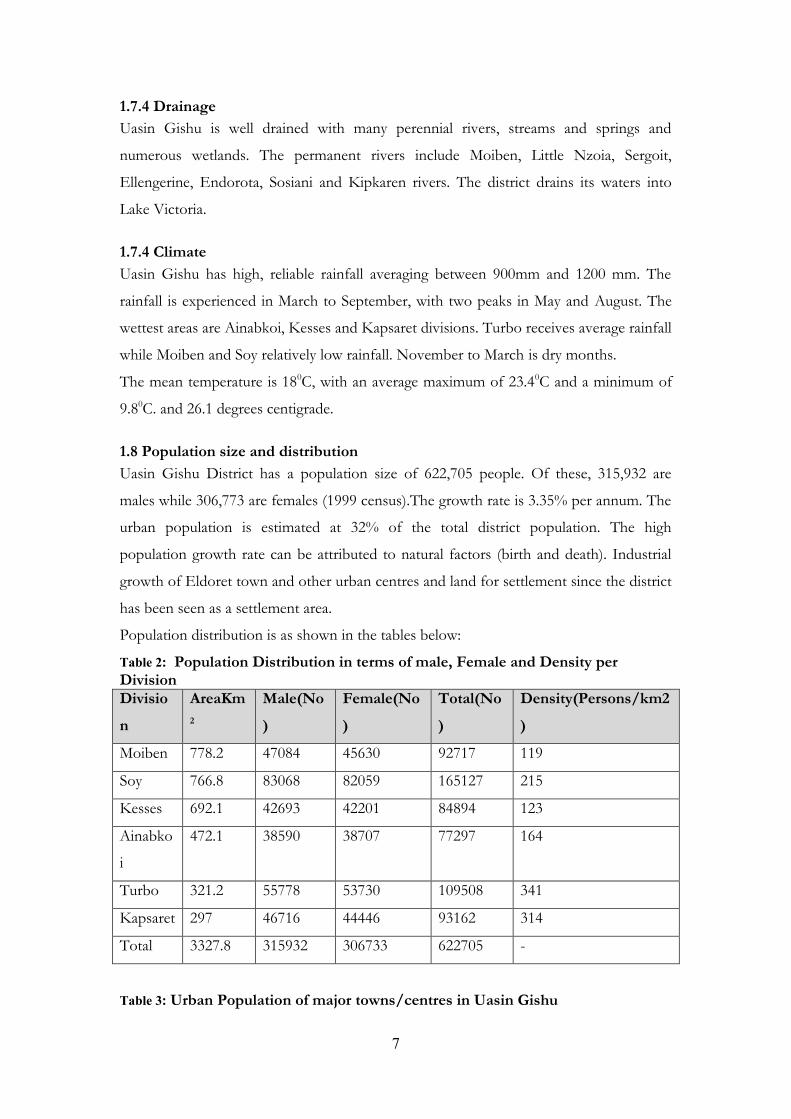
1.8 Population size and distributionUasin Gishu District has a population size of 622,705 people. Of these, 315,932 are
males while 306,773 are females (1999 census).The growth rate is 3.35% per annum. The
urban population is estimated at 32% of the total district population. The high
population growth rate can be attributed to natural factors (birth and death). Industrial
growth of Eldoret town and other urban centres and land for settlement since the district
has been seen as a settlement area.
Population distribution is as shown in the tables below:
Table 2: Population Distribution in terms of male, Female and Density perDivisionDivision
AreaKm2
Male(No)
Female(No)
Total(No)
Density(Persons/km2)
Moiben 778.2 47084 45630 92717 119
Soy 766.8 83068 82059 165127 215
Kesses 692.1 42693 42201 84894 123
Ainabko
i
472.1 38590 38707 77297 164
Turbo 321.2 55778 53730 109508 341
Kapsaret 297 46716 44446 93162 314
Total 3327.8 315932 306733 622705 -
Table 3: Urban Population of major towns/centres in Uasin Gishu
8
Town/centre Population(No)
Eldoret 197449
Burnt Forest 30166
Moi’s Bridge 21844
Matunda 11214
Kipkaren 145
Turbo 2701
Timboroa 3038
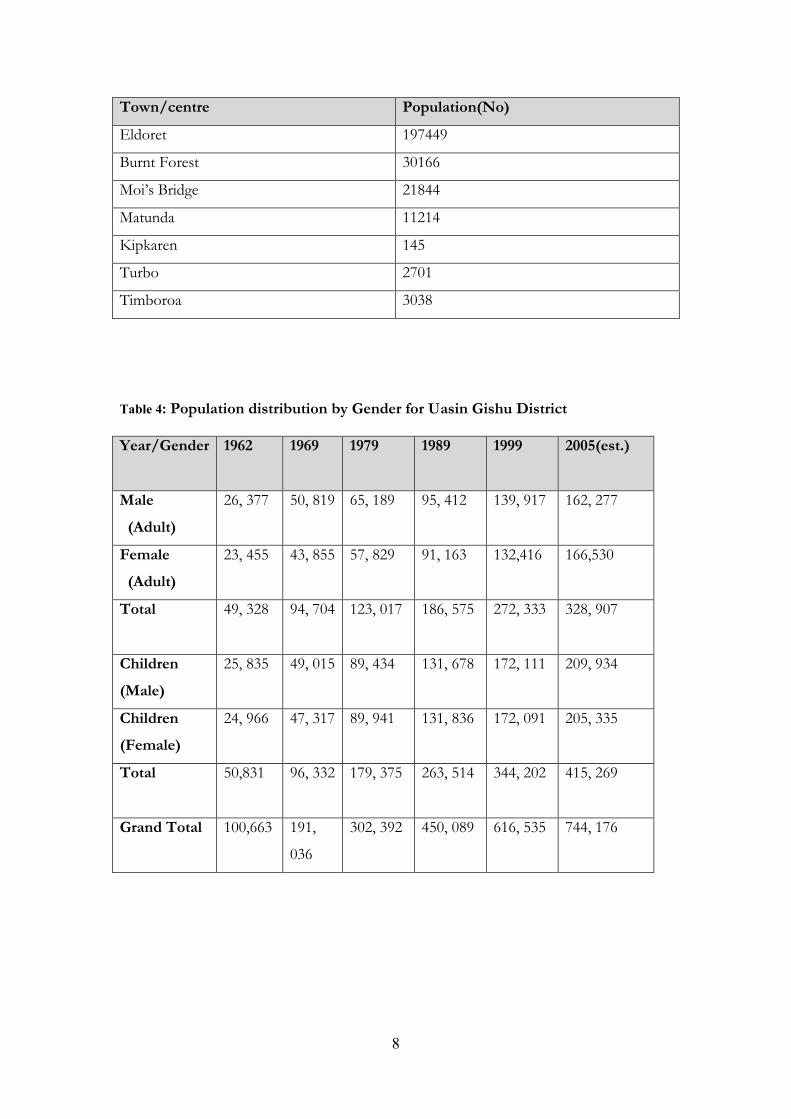
Table 4: Population distribution by Gender for Uasin Gishu District
Year/Gender 1962 1969 1979 1989 1999 2005(est.)
Male(Adult)
26, 377 50, 819 65, 189 95, 412 139, 917 162, 277
Female(Adult)
23, 455 43, 855 57, 829 91, 163 132,416 166,530
Total 49, 328 94, 704 123, 017 186, 575 272, 333 328, 907
Children(Male)
25, 835 49, 015 89, 434 131, 678 172, 111 209, 934
Children(Female)
24, 966 47, 317 89, 941 131, 836 172, 091 205, 335
Total 50,831 96, 332 179, 375 263, 514 344, 202 415, 269
Grand Total 100,663 191,
036
302, 392 450, 089 616, 535 744, 176
9
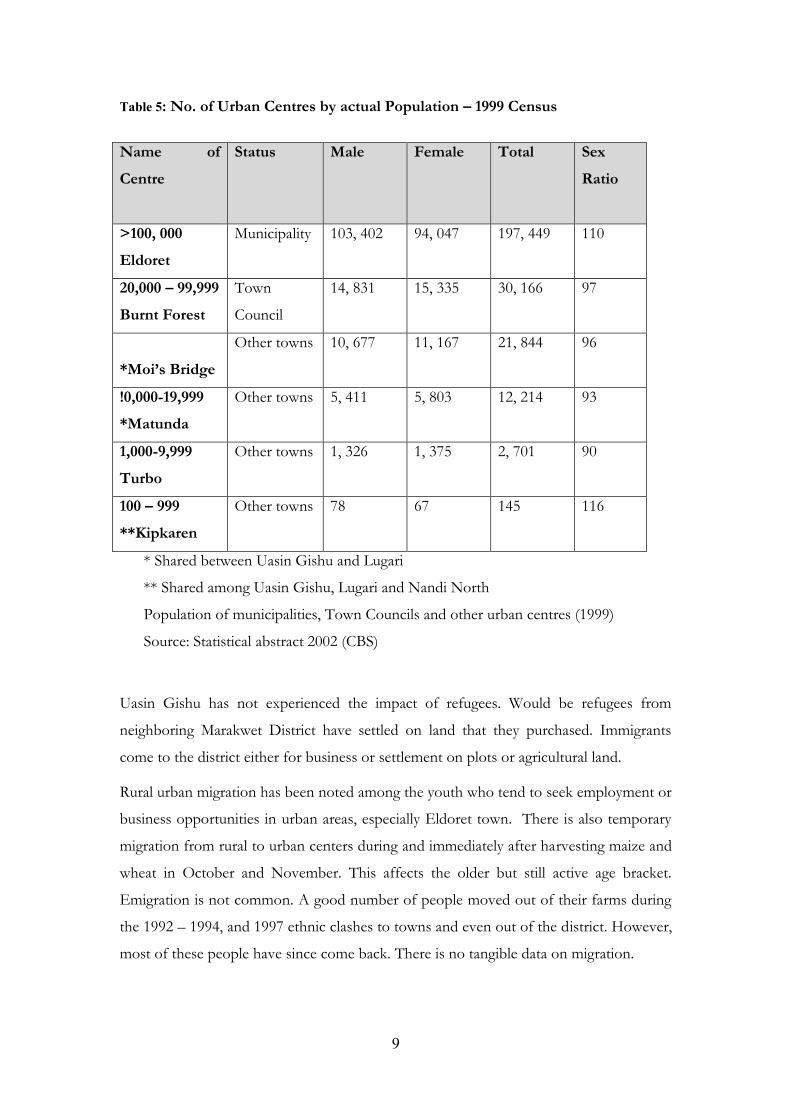
Table 5: No. of Urban Centres by actual Population – 1999 Census
Name ofCentre
Status Male Female Total SexRatio
>100, 000Eldoret
Municipality 103, 402 94, 047 197, 449 110
20,000 – 99,999Burnt Forest
Town
Council
14, 831 15, 335 30, 166 97
*Moi’s BridgeOther towns 10, 677 11, 167 21, 844 96
!0,000-19,999*Matunda
Other towns 5, 411 5, 803 12, 214 93
1,000-9,999Turbo
Other towns 1, 326 1, 375 2, 701 90
100 – 999**Kipkaren
Other towns 78 67 145 116
* Shared between Uasin Gishu and Lugari
** Shared among Uasin Gishu, Lugari and Nandi North
Population of municipalities, Town Councils and other urban centres (1999)
Source: Statistical abstract 2002 (CBS)
Uasin Gishu has not experienced the impact of refugees. Would be refugees from
neighboring Marakwet District have settled on land that they purchased. Immigrants
come to the district either for business or settlement on plots or agricultural land.
Rural urban migration has been noted among the youth who tend to seek employment or
business opportunities in urban areas, especially Eldoret town. There is also temporary
migration from rural to urban centers during and immediately after harvesting maize and
wheat in October and November. This affects the older but still active age bracket.
Emigration is not common. A good number of people moved out of their farms during
the 1992 – 1994, and 1997 ethnic clashes to towns and even out of the district. However,
most of these people have since come back. There is no tangible data on migration.

10
1.9 Social, cultural and economic characteristicsA good number of people in the district can be termed as poor. The poor are defined as
those members of society that are unable to afford minimum basic needs – food, shelter
and clothing. Poverty can be classified as:
i. Material poverty
ii. Relative poverty
It can also be classified as:
i. Food poverty
ii. Overall poverty
Classification of the poor includes lack of land and education. Categories of the poor
include small-scale farmers, agricultural laborers, unskilled and semi skilled workers,
female-headed households, physically handicapped, HIV/AIDs orphans and street
children.
The overall poverty in Uasin Gishu is estimated at 42.22%, poverty gap (depth of
poverty) at 12.4% and severity of poverty at 5.04 %(1994 welfare Monitoring Survey,
WMS). Food poverty was estimated at 46.62%.
Levels of Income are dependent upon economic activities undertaken, and this in turn
determines the poverty levels. As income levels decline, people tend to undertake any
form of economic activities regardless of their impact on the environment. In Uasin
Gishu, high levels of unemployment, high living costs and low incomes have resulted to
such activities as deforestation, cultivation along river banks, encroachment into wetlands
and cultivation of steep slopes, of which are land degrading activities. Low incomes are
also resulting to more slum dwellers in Eldoret town. These are areas with low cost
housing facilities like Langas, Kamukunji and some parts of Huruma estates. These
estates are poorly served with infrastructure due to poor planning and inaccessibility. The
areas experience poor waste disposal, use poor quality construction materials like
polythene, mud, wood and wetland products. These areas experience high insecurity.
Generally, poor people use cheap sources of energy like fuel wood, and in turn they
deplete forest resources.
On the other hand, the large-scale farms offer high income, either from direct sale of
farm produce or from employment, both direct and indirect. Good income has a positive
impact on the environment, enabling people live in well planned housing estates with

11
good infrastructure including proper sewage disposal. High-income people also tend to
use energy sources that are less harmful to the environment, like electricity and gas.
High income classes also have their negative impacts. Refrigerators may use Ozone
depleting methyl bromide, while motor vehicles contribute to air pollution, especially the
poorly maintained. High vehicle population demands more fuel, hence more petrol
stations with their potential negative impacts if not well maintained. Car wash cause a lot
of water pollution. Eldoret town is a victim of this negative impact by high income
earners. River Sosiani receives much of the car wash effluent. Most petrol stations do not
have proper waste disposal systems, especially for used oil and car wash. These pollutants
end up in the river.

12
CHAPTER TWO2.0 ENVIRONMENT AND NATURAL RESOURCES
2.1 Land use and soilsThis chapter gives a description of the soils and land use patterns in Uasin Gishu
District. It focuses on the types, extent, status and trends of soils and land use. The
district is well endowed with a fairly flat land and fertile soils, which support agriculture,
livestock and forestry. An accurate understanding of the soil types and land use
situations calls for the need to examine the geology of the area because the soils are
formed from the parent rocks.
GeologyThe geology of Uasin Gishu district is dominated by Tertiary volcanic’s consisting mainly
of alkalines, basalts, and phonolites among others. The district has no commercially
exploitable minerals.
SoilsThere are four main soil types in the district.
1. Red loam soils – Occur mainly in the northern part of the district in Turbo,
Moi’s Bridge and Lower Moiben areas. The soils are derived from the basement
complex rocks e.g. granites and laterites, and mainly support maize sunflower and
cattle. Vegetation comprises of scattered tree grassland (low tree – high grass).
2. Red clay soils occur around Soy Upper Moiben and Nandi border areas. These
are derived from phonolites. In some cases murram is of good depth. They
support wheat and maize growing. Vegetation is similar to (1) above.
3. Brown clay soils – These are centered mainly around Plateau station and cover
most of the Upper Lessos/plateau Location. These are mainly shallow with
murram close to the surface and poorly drained. The soils are good for rearing
beef livestock.
4. Brown Loam Soils – Occur in high altitude areas of the district, mainly in
Ainabkoi and Kaptagat locations. They are derived from both volcanic and
basement complex rocks. They are deep soils. Vegetation is natural highland
forest and derived grassland (mainly kikuyu grass) and bush land. The soils are
good for forestry, dairying and wheat, pyrethrum, potatoes, oats and barley
farming.
13
Regulatory and institutional arrangements Governing soil AdministrationUnder Chapter 318 of the Laws of Kenya, The Ministry of Agriculture is
mandated to provide technical advice on the use of soils as a resource. The
extension officers at the divisional level sensitize farmers on the best practices
for soil conservation.
Key environmental issuesThe key environmental concerns in the soils sector in Uasin Gishu District include;
Poor soils/low fertility
Soil erosion
Water logging
Soil excavations for brick making and sand harvesting
Pollution of soils arising from dumping of wastes and agro-chemicals
Proposed InterventionsIt is suggested that the soil-based environmental issues be isolated and addressed as
follows;-
1. Poor soils/low fertility of soils can be improved by use of the environmentally
friendly fertilizers such as compost manure. Crop rotation will be encouraged as
a strategy for improving the fertility of soils.
2. Soils erosion can be curbed through enforcement of the existing agricultural
regulations requiring that terraces be created and contour farming be adhered to
in areas with hilly topography.
3. Water-logging is a common problem in areas covered by clay soils. This situation
can be improved by provision of open drains to re-direct the water to the
primary drainage systems.
4. The problem of excavation of soils for brick making and sand harvesting is
rapidly expanding in Uasin Gishu District. This leaves the land surface bare and
disfigured. The excavation of soils activities should be regulated and the derelict
land be rehabilitated and be planted with trees to enhance the aesthetic qualities
of the affected areas.
5. On soil pollution occasioned by dumping of wastes in the urban areas and use of
agro-chemicals in the farms, proper methods of waste disposal should be
encouraged whereas the use of environmentally friendly agro-chemicals should
be used in the farming sector.

14
2.2 Land and land use changesThe entire 3,784 sq. Km. of Uasin Gishu is arable land. It is estimated that about 2,354
Km2 of the land area is considered to be high potential whereas about 1430 Km2 is
medium potential. There is neither marginal nor irrigated land in the district.
In terms of the Land Area and category of land use, it is estimated that out of the
235,400 hectares of high potential land in Uasin Gishu nearly three fourths of it is in
Timboroa, Kaptagat and Turbo locations. Most of the medium – potential land is to be
found in Moiben and Lessos/Plateau locations.
Forest reserves occupy around 6100 hectares. Some 37,260 hectares had been parceled
into conventional settlement schemes by 1983. The existing forests in the district are
mainly the Kapsaret and Timboroa forests.
The main farming characteristic in Uasin Gishu is mixed type; maize, dairying, wheat and
beef cattle rearing form the dominant enterprises. The production combinations are
generally cattle/maize/wheat in any sequence. In the warmer parts of the district in areas
around Turbo Division, sunflower and beans feature prominently in the basic pattern,
while in the southern parts of the district bordering the forest zone, pyrethrum and
potatoes are grown.
2.2.1 Impacts of land use changesThe impacts of land use changes include: -
Over utilization of land
Intense subdivision of land
Encroachment of fragile environments e.g. rivers, wetlands and forest
Competing land uses e.g. wheat verses maize farming
Encroachment of fertile agricultural land by expansion of towns
Environmental degradation
2.2.2 Regulatory and institutional arrangements governing land administrationThere are many land laws and institutions governing land use, ownership and land
transactions in Kenya. Land in Uasin Gishu District is held under freehold, trust and the
leasehold. The local authorities are agents of the Commissioner of Lands and are
responsible for all land transactions relating to leasehold land. Some leases in the district
were granted for a term of 999 years and the same are being converted through purchase

15
of freehold instruments from the Commissioner of Lands. The Departments of Survey,
Physical Planning, Lands and Settlement are responsible for implementation of land use
policies and transactions on the ground in consultation with other Government
Departments and stakeholders.
Other collaborative institutions that play some roles in processing and approving land
transactions include land disputes tribunal, land control Boards, Physical Planning
Liaison Committees and land Adjudication and Settlement Committees. They are
responsible for ensuring that land is managed in the accustomed ways and means.
2.2.3 Prioritization of key Environmental issues;The environmental issues can be ranked as follows;
Over utilization/infertility of soils
Intensive land subdivision
Encroachment of wetlands, river riparian
Excavation of soils for brick making and sand harvesting
Pollution, dumping of wastes on soils
Soil erosion.
2.3 AgricultureAgriculture still remains one of the most important sectors in the Kenyan economy. It
directly contributes 26% of the Gross Domestic Product (GDP) and a further 27%
indirectly through linkages with manufacturing, distribution, and the service related
sector. In addition, about 80% of the population lives in the rural areas and depend
mainly on agriculture for livelihood. 87% of all poor households live in rural areas where
their main economic activity is agriculture.
In Uasin Gishu, the main agricultural production system is small-scale mixed farming
where farmers grow various crops and keep livestock, mainly cattle on the same land
parcel. However, there are a few large scale farmers. Over the years, most farmers have
been involved mainly in three commercial enterprises i.e. wheat and maize production,
and dairy farming, with the other crops being grown only for domestic use. However, in
the last few years, farmers have been involved in diversification of their commercial
agricultural enterprises, mainly in the area of horticulture. Many farmers continue to take

16
up production of various vegetables and fruits for both local and export market. A few
farmers in the district have also taken up sun flower production.
Maize production is the main crop enterprise in the district. The area under this crop has
increased in the recent years, reaching 65,758ha in the year 2005. Total production has
equally increased over the same period and reached about 2.8million bags in 2005, valued
at slightly over 3.4 billion. It is important to mention here that this crop is not only a
food crop but an important cash crop in the district.
The increase in production can be attributed to improving producer prices, which
reached Kshs. 1300.00 per 90 kg bag in 2005, good weather conditions, timely field
operations and adoption of new high yielding varieties such as H6210, H6213, H628,
H629, and Pan 699. There was also opening up of new land from former EATEC owned
land.
2.3.1 Regulatory and Management ArrangementsThe Ministry of Agriculture is charged with the responsibility of regulating and managing
agricultural production in this country and its current vision is ‘To be the leading agent of
agricultural transformation in Kenya.’
To enable the ministry achieve its objectives, the sector is governed by about 130 pieces
of legislation. There are various statutory boards, institutions and farmer organizations all
charged with the responsibility of regulating this sector. However, according to the
Strategy for Revitalizing Agriculture (SRA), currently in the implementation phase, many
of the pieces of legislation have been found to be obsolete, unenforceable, or
inconsistent with the changes taking place in the sector. The Laws will be reviewed with
the objective of:
i. Amalgamation of existing legislation to have fewer and broad based acts to suit
prevailing circumstances.
ii. Encourage self-regulation by facilitating capacity building for stakeholder
organizations.
iii. Encourage collaboration and private sector participation.
Institutions such as research organizations, extension services, supply of inputs and
animal health and plant protection services are also in the process of being reformed.

17
Table 6: Crop Production Statistics
2.3.2 Key Environmental Issues
i. Encroachment into water resources and forests
ii. Soil degradation and loss of fertility
iii. Pollution through fertilizers, chemicals, agricultural wastes
iv. Destruction of natural habitats
v. Pesticide residues in agricultural products
vi. Food safety
vii. Workers safety
The farmer/organization should identify environmental aspects that emanate from the
activities at every stage of agricultural production. The following are types of pollutants
and wastes that emanate from agricultural production activities.
Crop Extent (Ha) CurrentProduction Levelkg/ha
PotentialProductionLevel kg/ha
Maize 65758 43 60
Wheat 37500 33 40
Millet 1080 9 15
Sorghum 183 9 15
Beans 27842 5 15
I/potatoes 2960 90 120
Kales 460 70000 100000
Cabbages 450 40000 80000
Tomatoes 355 50000 100000
Passion fruits 295 15000 20000
Carrots 400 20000 30000
Bananas 4400 20000 30000
Avocadoes 1050
Onions 170 17000 20000

18
Table 7: Types of pollutants emanating from agricultural activities
Process/Activity Environmental Aspects
Transport Old machines, oil, tubes, old tyres
Personnel Human wastes, clothes, effluent water, food remnants,
Seed Seed packaging
Land preparation Smoke from tractor, dust, soil erosion, soil compaction, plant
materials
Spraying Expired chemicals, chemical containers, chemical spillage,
chemical left over, excess spray mixtures
Weeding Weeds
Irrigation Excess irrigation, use of salty water
Fertilizer use Excess fertilizer, plastic containers, inappropriate application/use
Harvesting Harvesting containers, harvesting wastes
Park house Rejected wastes, washing effluents, used preservatives, package
rejects
Cooling Compresser gas
Storage wastes Fertilizer spillage, chemical spillage, contaminated water
Testing laboratory Contaminated water
2.3.3 Proposed Interventionsi. Training of farmers and other stake holders on all environmental aspects of their
activities
ii. Carry out environmental impact assessment s
iii. Set rules and regulations for the organizations/farmers to comply with, to ensure
environmentally safe agricultural activities e.g. EUREPGAP, K-GAP, e.t.c.
iv. Auditing farmers activities against set standards
v. Training farmers/organizations on sustainable agriculture which minimizes
environmental pollution
vi. Train farmers on good agricultural practices and use of appropriate technology;
e.g. soil and water conservation, soil fertility management, use of organic matter,
integrated pest/disease managements as opposed to indiscriminate use of
chemical pesticides
vii. Partnership, collaboration, and participation of all the stakeholders to ensure safe
environment

19
viii. Awareness creation to the farming community.
2.4 Livestock production
2.4.1 Types of Production SystemsMost farmers in the District practice free range grazing whereby livestock is subjected to
mixing up. Some farmers have their own bulls reserved for breeding purposes and
mating may occur indiscriminately. AI services are offered but farmers in remote areas
may not have adequate access to the service. Indigenous herds of cattle are almost
phased out.
Zero grazing is rare and where found, it is for dairy cows. Sheep and goats are herded
together with cattle. Livestock feed is used to supplement the diet. Fodder crops are
grown on limited farms.Bee keeping is coming up and the use of modern hives like
langstroth and Kenya Top Bar Hives is on the rise.
Poultry in the real sense is not practiced by many farmers. Pig raring is practiced in urban
areas where they are left to wander. Farmers Choice has one breeding and raring farm in
the former EATEC farm along Nairobi road.
2.4.2 Area Coverage (Ha)Livestock keeping is done throughout the district with a higher concentration in the drier
areas of Moiben Division and cooler areas of Ainabkoi Division. It is normally integrated
with crop production. Trends in fodder and pasture development are as follows:
Table 8: Fodder and Pasture development
Type (ha) 2003 2004 2005 Remarks
Fodders 8189 8859 9350 All fodder types included
Legumes 87.5 89.5 113 Seeds readily available at Kenya Seed and KARI
Fodder
Trees
41155 40938 42435
Improved
Pasture
41026 43665 46832
Natural
Pastures
47852 47069 49793 Most common forage

20
2.4.3 Production Patterns, Status and Trendsa) Dairy cattle
Table 9: Dairy cattle production trends
Year 2003 2004 2005
Population 345219 325200 345672
Dairy cattle population trends
Table2-5: Table 10: Breeding: Artificial Insemination Trends
Year 1st Insemination Repeat Total
2003 148 51 199
2004 99 32 131
2005 117 58 175
Breeding is constrained by poor timing of heat detection which causes repeat, breeding
diseases, poor road network, lack of roadside AI crushes, nutritional disorders and poor
feeding which causes poor conception rates.
b) Bees
Table 11: Hive population and production trends
Year KTBH Log Hive Langstroth Honey (kg) Wax (kg)
2001 8347 11392 107 238068 23806
2002 8380 11315 345 172292 14070
2003 8401 11452 448 219806 20810
2004 8330 11312 654 232900 21742
2005 8580 12820 1238 218599 23753
Bee keeping is coming up. It is constrained by the following:
i. Inadequate staff trained on bee keeping
ii. Inadequate funding to carry out bee keeping
iii. Expensive bee keeping equipment
iv. Lack of organized market for honey and wax.

21
Bee keeping is normally done by groups of farmers.
c) Sheep
Sheep production is second to dairy production. There is high potential for hair and wool
production. Hair sheep are widespread and supply red meat. Wool sheep are confined to
Kesses and Ainabkoi Divisions. The sheep population trends are shown below.
Table 12: sheep population trends
Type of sheep 2003 2004 2005
Wool sheep 17821 22391 22492
Hair sheep 23179 23228 27843
Crosses 76250 84796 91205
Total 118248 130415 141540
Wool sheep are likely to increase due to current ready market at RUPA mills.
Constraints in sheep production include:
i. Inferior breeds with light body weights and slow growth rates
ii. Poor breeding programs that encourage inbreeding
iii. Poor husbandry practices of lack of worm control hoof trimming, and proper
feeding.
iv. Poor housing resulting to diseases e.g. foot rot and pneumonia.
v. Expensive and scarce superior breeding stock.
Possible Solutions
i. Encourage farmers to upgrade their local stock using superior breeds e.g. Dorper
ii. Train farmers on good husbandry practices
iii. Educate farmers to develop good breeding programs, procure superior rams and
exchange amongst themselves.
iv. Train farmers on the importance of good housing for sheep. Construct improved
houses as demonstration models using standard plans.
v. The DLPO office to assist farmers source breeding stock and encourage local
multiplication of high quality sheep within farms.
22
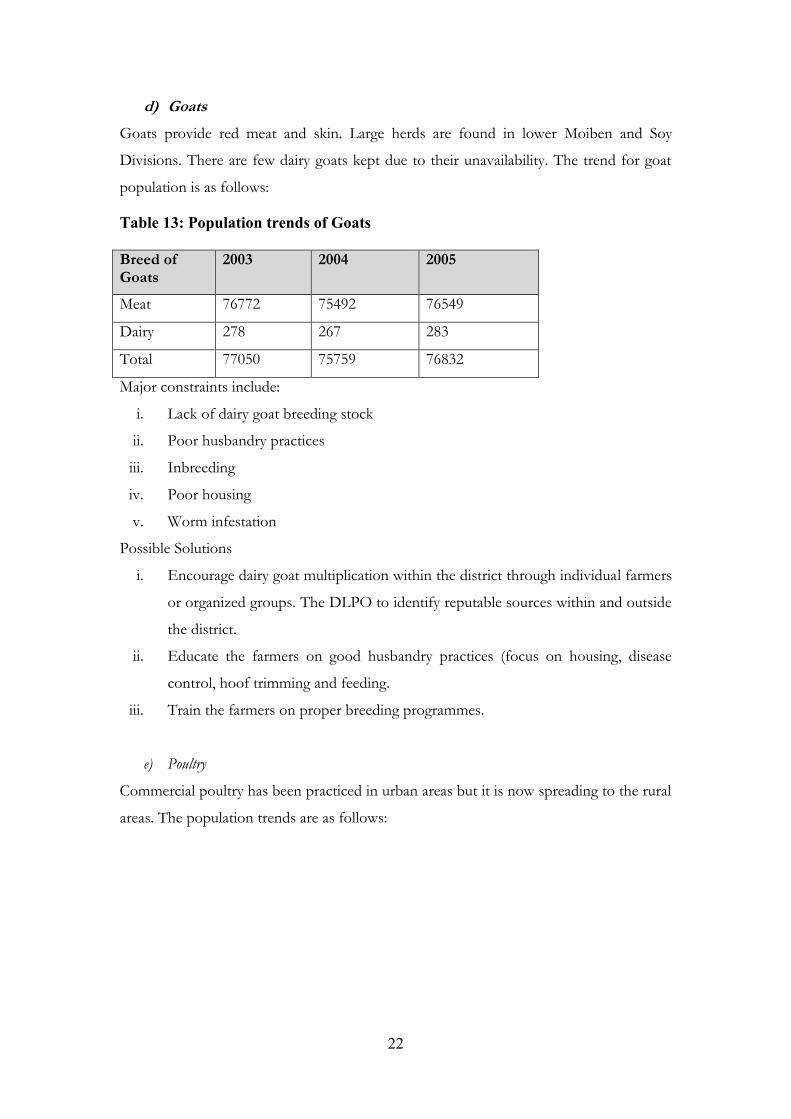
d) GoatsGoats provide red meat and skin. Large herds are found in lower Moiben and Soy
Divisions. There are few dairy goats kept due to their unavailability. The trend for goat
population is as follows:
Table 13: Population trends of Goats
Breed ofGoats
2003 2004 2005
Meat 76772 75492 76549
Dairy 278 267 283
Total 77050 75759 76832
Major constraints include:
i. Lack of dairy goat breeding stock
ii. Poor husbandry practices
iii. Inbreeding
iv. Poor housing
v. Worm infestation
Possible Solutions
i. Encourage dairy goat multiplication within the district through individual farmers
or organized groups. The DLPO to identify reputable sources within and outside
the district.
ii. Educate the farmers on good husbandry practices (focus on housing, disease
control, hoof trimming and feeding.
iii. Train the farmers on proper breeding programmes.
e) Poultry
Commercial poultry has been practiced in urban areas but it is now spreading to the rural
areas. The population trends are as follows:

23
Table 14: Poultry population trends
Type ofpoultry
2003 2004 2005
Indigenous 512326 449346 494281
Layers 33789 30695 55768
Broilers 21175 48075 52883
Turkeys 2430 1720 1892
Geese 919 2026 2229
Ducks 4008 2219 2441
Challenges/Constraints
i. High input cost
ii. Unpredictable and disorganized market
iii. Disease and outbreaks
iv. Inadequate adoption of technologies leading to poor management practices
v. Acute shortage of day old chicks
Recommendations and opportunities
i. Continuous touring and demonstrations on proper husbandry
ii. Formation of poultry lobby groups
iii. Strengthen collaboration among all relevant stakeholders
iv. Train farmers to formulate feeds
v. Encourage investors to establish a hatchery locally.
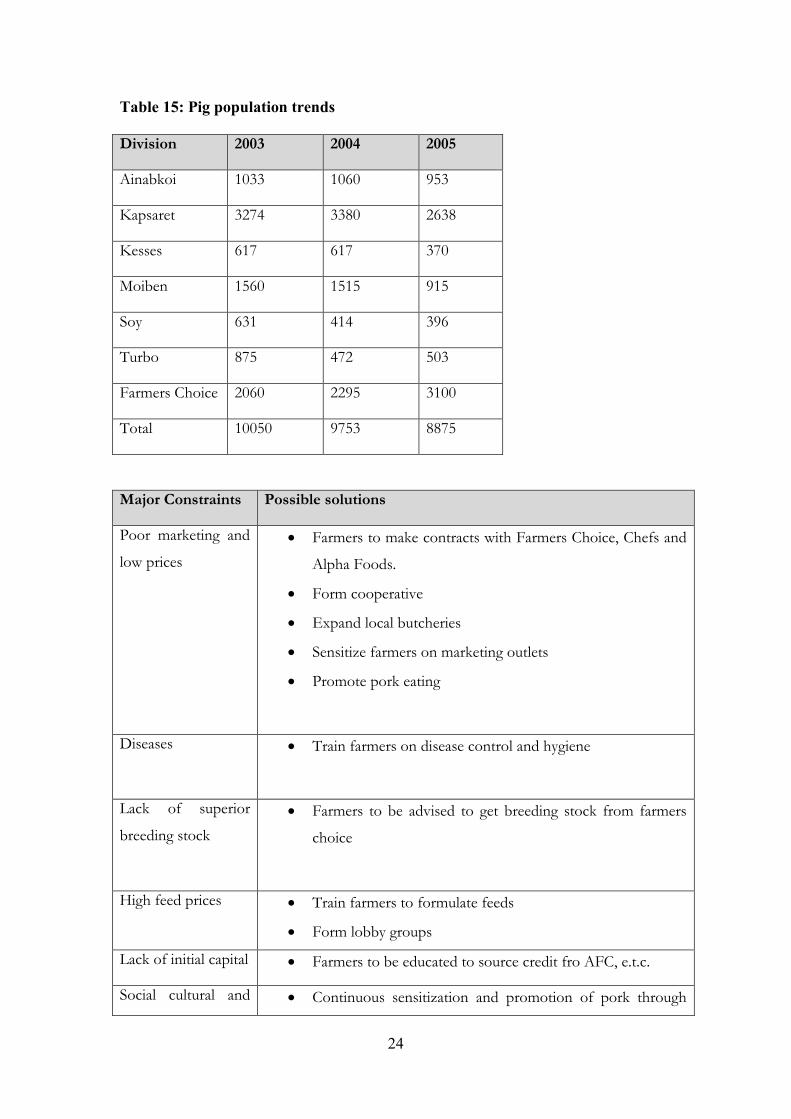
f) Pigs
Breeds include large white, landrace and their crosses. Free range is practiced within the
municipality despite efforts by the municipal council to control it. There is better
management in the rural areas. The pig population trends are as follows:
24
Table 15: Pig population trends
Division 2003 2004 2005
Ainabkoi 1033 1060 953
Kapsaret 3274 3380 2638
Kesses 617 617 370
Moiben 1560 1515 915
Soy 631 414 396
Turbo 875 472 503
Farmers Choice 2060 2295 3100
Total 10050 9753 8875
Major Constraints Possible solutions
Poor marketing and
low prices Farmers to make contracts with Farmers Choice, Chefs and
Alpha Foods.
Form cooperative
Expand local butcheries
Sensitize farmers on marketing outlets
Promote pork eating
Diseases Train farmers on disease control and hygiene
Lack of superior
breeding stock Farmers to be advised to get breeding stock from farmers
choice
High feed prices Train farmers to formulate feeds
Form lobby groups
Lack of initial capital Farmers to be educated to source credit fro AFC, e.t.c.
Social cultural and Continuous sensitization and promotion of pork through

25
Major Constraints Possible solutions
religious beliefs demonstrations in collaboration with the home economics
division.
Expose farmers through tours and field days.
g) Donkeys
These are kept as beasts of burden for farm produce and water mainly in Kesses,
Moiben, Soy and Ainabkoi divisions. The trends are as follows:
Table 16: Donkeys population
Year 2003 2004 2005
Total 2312 2735 3007
Constraints
i. Lack of proper handling equipment
ii. Inadequate feeding
iii. Poor breeding programs
iv. Poor husbandry practices
Possible Solutions
i. Educate farmers on the recommended equipment
ii. Encourage farmers on proper feeding
iii. Educate farmers on breeding programs
2.4.4 Regulatory and Institutional ArrangementsLivestock rearing is governed by the Agriculture Act this part of the law is implemented
by the livestock production and training department. Extension officers man the location
and sublocations who bring services down to the communities. There are many
stakeholders and supporters of this sector including KARI, Etang Kenya, LVEMP,
World Vision, ACK, KENFAP, Empowering Live International, Farming Systems of
Kenya/Action Aid, poverty reduction projects and NALEP.
26
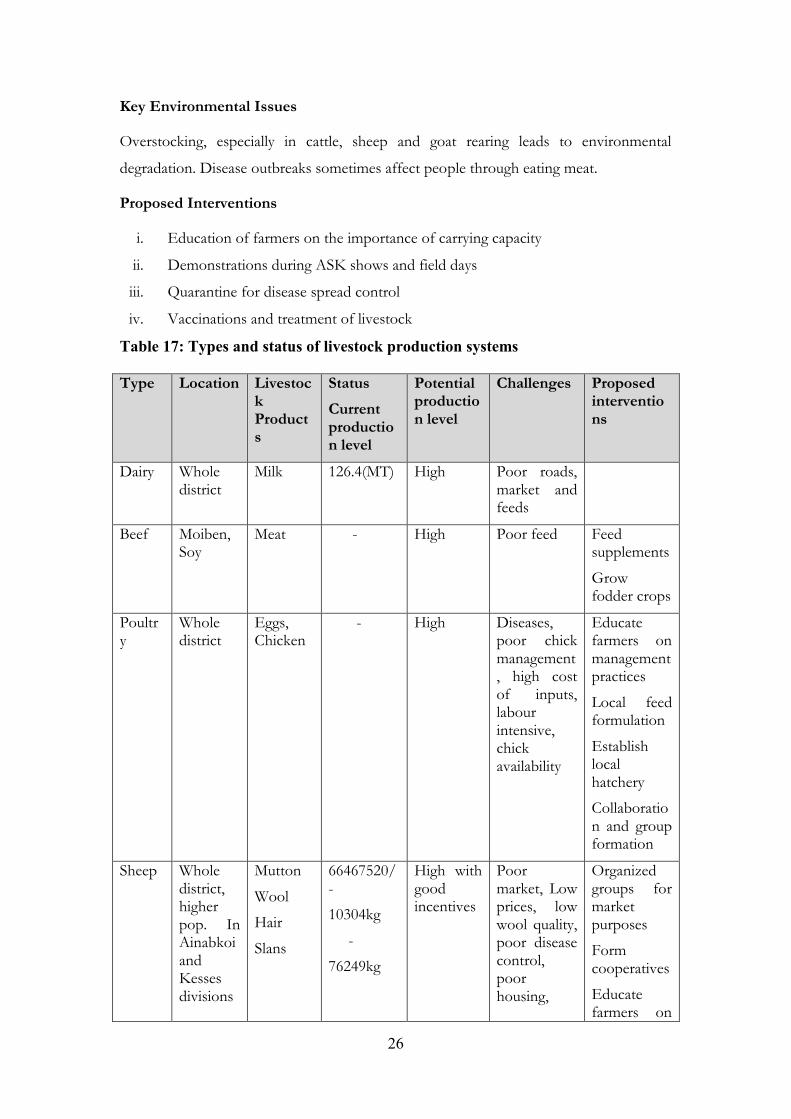
Key Environmental Issues
Overstocking, especially in cattle, sheep and goat rearing leads to environmental
degradation. Disease outbreaks sometimes affect people through eating meat.
Proposed Interventions
i. Education of farmers on the importance of carrying capacity
ii. Demonstrations during ASK shows and field days
iii. Quarantine for disease spread control
iv. Vaccinations and treatment of livestock
Table 17: Types and status of livestock production systems
Type Location LivestockProducts
StatusCurrentproduction level
Potentialproduction level
Challenges Proposedinterventions
Dairy Wholedistrict
Milk 126.4(MT) High Poor roads,market andfeeds
Beef Moiben,Soy
Meat - High Poor feed Feedsupplements
Growfodder crops
Poultry
Wholedistrict
Eggs,Chicken
- High Diseases,poor chickmanagement, high costof inputs,labourintensive,chickavailability
Educatefarmers onmanagementpractices
Local feedformulation
Establishlocalhatchery
Collaboration and groupformation
Sheep Wholedistrict,higherpop. InAinabkoiandKessesdivisions
Mutton
Wool
Hair
Slans
66467520/-
10304kg
-
76249kg
High withgoodincentives
Poormarket, Lowprices, lowwool quality,poor diseasecontrol,poorhousing,
Organizedgroups formarketpurposes
Formcooperatives
Educatefarmers on

27
Type Location LivestockProducts
StatusCurrentproduction level
Potentialproduction level
Challenges Proposedinterventions
inbreeding, management
Introducehigh qualitybreedingstock
Re-openstalled textileindustry
Goats “ Meat
Milk
Slans
22842000/=
-
45321kg
High poorbreedingstock,diseases, poormanagement
Improvebreedingstocks
Educationonmanagementpractices
Donkey
Mainly inMoiben,Ainabkoiand SoyDivisions
Labour - - Managementhandlingequipment
Education
Bees Scatterred in thedisstrict
Honey
Wax
218599kg
23753kg
High Adverseweather,high demand
Extractionandprocessing
Supplementfeed e.gwater withsugar
Plant moreflower treesand otherplants
Educationonextractionandprocessing
Pigs Wholedistrict,highestpopulation inKapsaret
Pork 18381600 High Breedingstock, fullrangegrazing
Getbreedingstock fromfarmerschoice,
Educationonmanagement

28
Type Location LivestockProducts
StatusCurrentproduction level
Potentialproduction level
Challenges Proposedinterventions
,
Lawenforcement
Table 18: Summary: Estimated animal population Figures per division
Division
DairyCattle
BeefCattle
Hairsheep
Woolsheep
Meatgoat
Dairygoat
Local
chicks
Exotic
chicks
Pigs
rabbits
Donkeys
Loghives
KTBH
Langstroth
Aina
bkoi
119
525
119
52
465
0
504
0
340
7
230 411
56
175
26
95
3
244
7
643 200
0
268
0
40
Kaps
aret
289
95
289
6
282
8
161
3
304
3
15 663
24
331
19
57
38
623 36 159
0
162
0
40
Kess
es
427
81
427
8
264
0
147
60
340
0
0 852
63
154
75
37
0
- 707 258
0
126
0
32
Moib
en
723
99
724
0
394
8
144
8
459
42
18 102
31
122
86
91
5
538 1020 204
0
159
0
70
Soy 447
11
446
8
347
2
181
7
166
76
0 883
20
148
60
39
6
392 567 304
0
960 726
Turb
o
373
00
373
3
630
5
814 436
4
20 110
897
153
88
50
3
409 34 158
0
670 330
Total 345
677
345
67
238
43
254
92
768
32
283 494
281
108
65
88
75
481
5
3007 128
30
858
0
1238
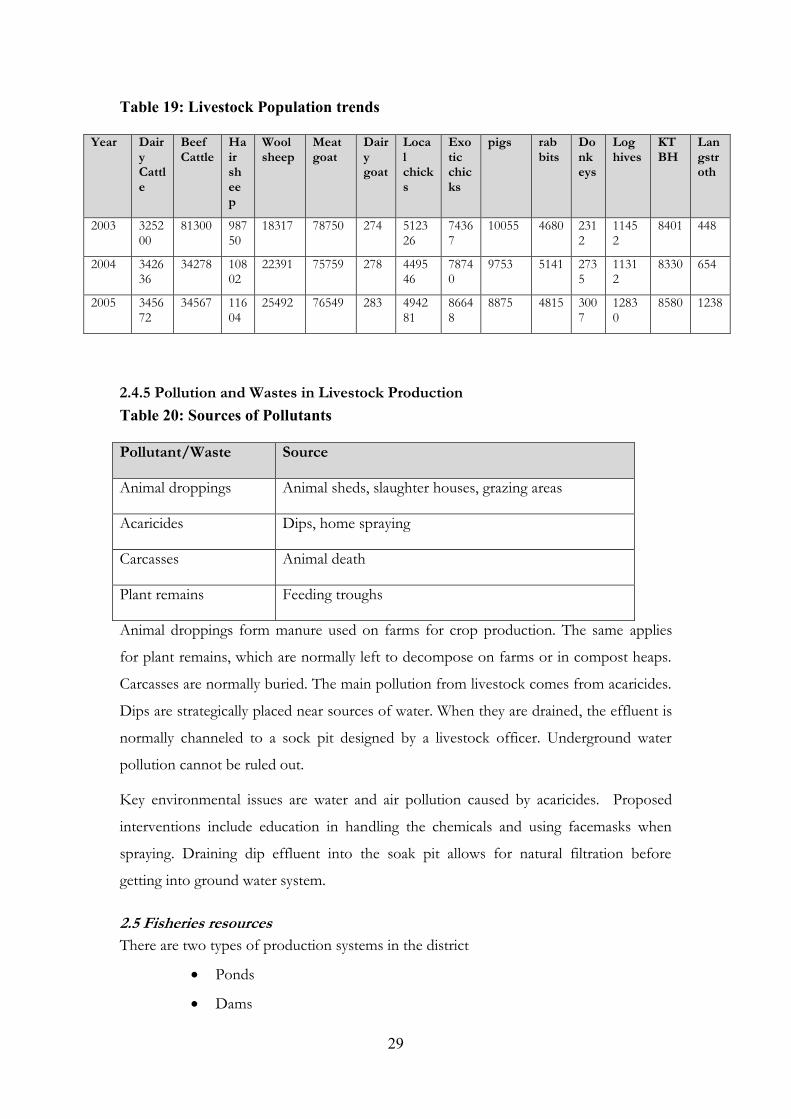
29
Table 19: Livestock Population trends
Year DairyCattle
BeefCattle
Hairsheep
Woolsheep
Meatgoat
Dairygoat
Localchicks
Exoticchicks
pigs rabbits
Donkeys
Loghives
KTBH
Langstroth
2003 325200
81300 98750
18317 78750 274 512326
74367
10055 4680 2312
11452
8401 448
2004 342636
34278 10802
22391 75759 278 449546
78740
9753 5141 2735
11312
8330 654
2005 345672
34567 11604
25492 76549 283 494281
86648
8875 4815 3007
12830
8580 1238
2.4.5 Pollution and Wastes in Livestock ProductionTable 20: Sources of Pollutants
Pollutant/Waste Source
Animal droppings Animal sheds, slaughter houses, grazing areas
Acaricides Dips, home spraying
Carcasses Animal death
Plant remains Feeding troughs
Animal droppings form manure used on farms for crop production. The same applies
for plant remains, which are normally left to decompose on farms or in compost heaps.
Carcasses are normally buried. The main pollution from livestock comes from acaricides.
Dips are strategically placed near sources of water. When they are drained, the effluent is
normally channeled to a sock pit designed by a livestock officer. Underground water
pollution cannot be ruled out.
Key environmental issues are water and air pollution caused by acaricides. Proposed
interventions include education in handling the chemicals and using facemasks when
spraying. Draining dip effluent into the soak pit allows for natural filtration before
getting into ground water system.
2.5 Fisheries resourcesThere are two types of production systems in the district
Ponds
Dams

30
2.5.1 Status of Fisheries Development and Trends in PondsNo. of fish farmers – 143
No. of fish ponds - 277
Area of operational ponds – 5170m2
Annual average production – 8000kg/year
DamsNo. of dams – 100
Average annual production-3000kg/yr
Table 21: Fisheries Production Patterns
YEAR PRODUCTIONSYSTEM
TOTALPRODUCTION(KG)
2001 Ponds 2000
Dams 500
2002 Ponds 3500
Dams 1500
2003 Ponds 3100
Dams 1500
2004 Ponds 4600
Dams 2200
2005 Ponds 8000
Dams 3000
2.5.2 Regulatory and Institutional ArrangementFisheries resources are regulated by the Department of Fisheries.

31
Table 22: Types and Status of Fisheries Production Systems
Type OfProduction System
Location Status-CurrentProduction
PotentialProductionLevel
Challenges ProposedInterventions
POND Throughout thedistrict
8000kg/yr 20,000kg/yr Low level ofmanagement
Training of fish farmerson intensive level ofmanagement
Intensive extensionservices
DAMS Throughout thedistrict
2300kg/yr 2000tons Lack ofawareness
Need forstocking
Stocking of dams
Key Environmental Issues and Interventions
PrioritizedIssues/Challenges
CurrentIntervention
ProposedInterventionIn The PlanPeriod
ResponsibleInstitution
Remarks
Development of
aquaculture
Extension
services
Training of fish
farmers
Recruitment of
new fish farmers
Development
of seed
production
center
Development
of model fish
farm for
training
purposes
Fisheries
Department
Subject to
availability
of funds
Optimum Training of the Re Fisheries
32
PrioritizedIssues/Challenges
CurrentIntervention
ProposedInterventionIn The PlanPeriod
ResponsibleInstitution
Remarks
exploitation of dams community connaissance
survey
Stocking of
dams
Management of
Dams
Department
Development of
ornamental fish
culture for export
Training of fish
farmers
Establishing a
marketing
system
Fisheries
Department
2.6 Water resources
2. 6.1 Water Sources1. There are about 250 boreholes in the district, of which 170 are registered.
2. There are eight (8) permanent rivers with numerous streams and springs.
3. The no. of shallow wells is equaled to no. of homes in the district because in
every home there is a shallow well.
4. There is only one (1) wetland which is on trust land but numerous wetlands are
found on private lands.
5. The main water towers in the district are kaptagat, Timboroa and Kapchemutwa
forests.
6. The district is drained by rivers Moiben, Sosiani, and |Sergoit river all of which
drain to river Nzoia and lastly to Lake Victoria.
7. The water resources of the district are highly depleted due to deforestation and
over abstraction.
8. WRMA is in the process of restoring catchment areas by afforestation and also it
is the process of regulating usage of water to avoid abuse.

33
2.6.2 Main Water Uses
1. A bigger percentage of water use in Uasin Gishu is for domestic purposes.
Floriculture and horticulture are picking up and use a significant amount of water
because they are mainly grown in green houses.
2. Various industries are found in Eldoret or are coming up due to its abundant
supply of water.
2. 6.3 Status and Trends of Water ResourcesDue to increase in population growth, there is a great demand for fertile agricultural land.
This has led to encroachment of river banks causing depletion and pollution of the water
resources.
2.6.4 Access to safe Drinking/Portable WaterPercentage of population in this area who have access to pure drinking/portable water is
42%but about 90% of the population have access to water resource within a 2km radius.
2.6.5 Impact of Water Use and Demand on the Environment and NaturalResourcesDue to unreliable rainfall pattern, the population have encroached on rivers banks,
wetlands, catchment areas, e.t.c. which has degraded the environment and natural
resources. These have resulted to siltation of our dams (reservoirs), the depletion of our
water resources and hence pollution of the same.
Environmental Isues in Management and Utilization of Water Resources
There are conflicts over sourcing and use of water from the following sources.
1. Moiben catchment – Chebara dam
2. Usalama dam
3. Kipkaren Dam
4. Osorongai dam
5. Kerita dam between school and community.
Proposed Interventions
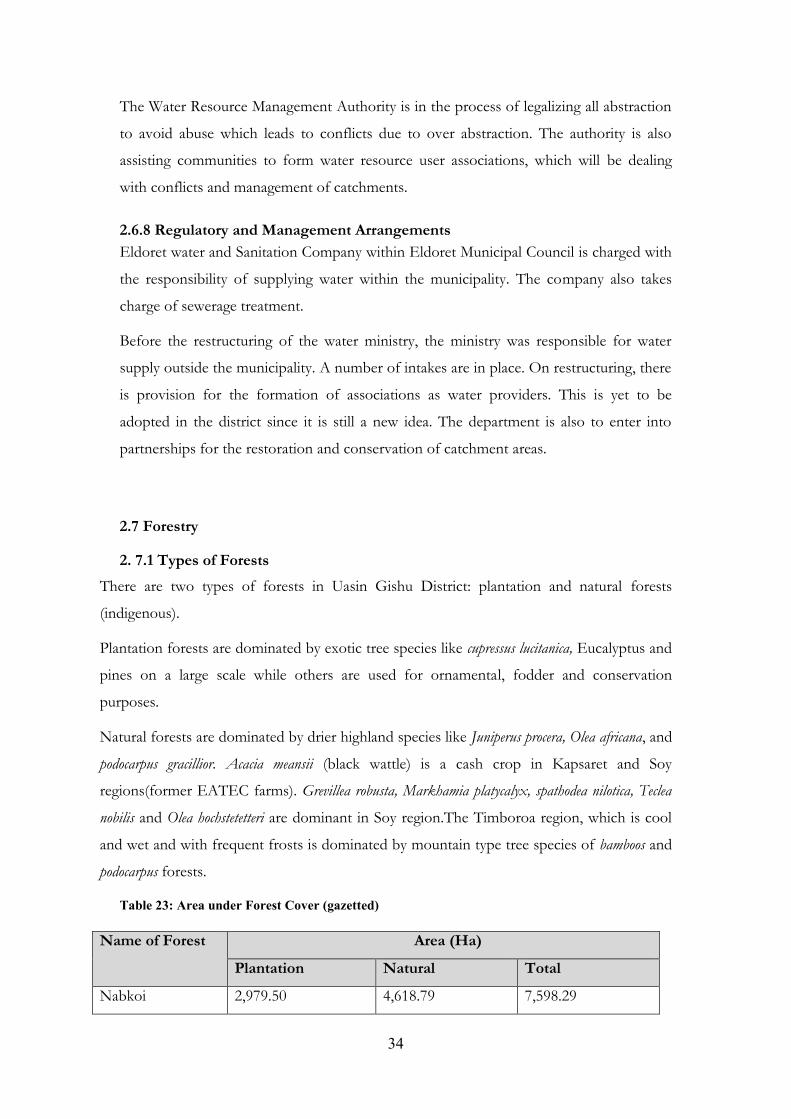
34
The Water Resource Management Authority is in the process of legalizing all abstraction
to avoid abuse which leads to conflicts due to over abstraction. The authority is also
assisting communities to form water resource user associations, which will be dealing
with conflicts and management of catchments.
2.6.8 Regulatory and Management ArrangementsEldoret water and Sanitation Company within Eldoret Municipal Council is charged with
the responsibility of supplying water within the municipality. The company also takes
charge of sewerage treatment.
Before the restructuring of the water ministry, the ministry was responsible for water
supply outside the municipality. A number of intakes are in place. On restructuring, there
is provision for the formation of associations as water providers. This is yet to be
adopted in the district since it is still a new idea. The department is also to enter into
partnerships for the restoration and conservation of catchment areas.
2.7 Forestry
2. 7.1 Types of ForestsThere are two types of forests in Uasin Gishu District: plantation and natural forests
(indigenous).
Plantation forests are dominated by exotic tree species like cupressus lucitanica, Eucalyptus and
pines on a large scale while others are used for ornamental, fodder and conservation
purposes.
Natural forests are dominated by drier highland species like Juniperus procera, Olea africana, and
podocarpus gracillior. Acacia meansii (black wattle) is a cash crop in Kapsaret and Soy
regions(former EATEC farms). Grevillea robusta, Markhamia platycalyx, spathodea nilotica, Teclea
nobilis and Olea hochstetetteri are dominant in Soy region.The Timboroa region, which is cool
and wet and with frequent frosts is dominated by mountain type tree species of bamboos and
podocarpus forests.
Table 23: Area under Forest Cover (gazetted)
Name of Forest Area (Ha)
Plantation Natural Total
Nabkoi 2,979.50 4,618.79 7,598.29
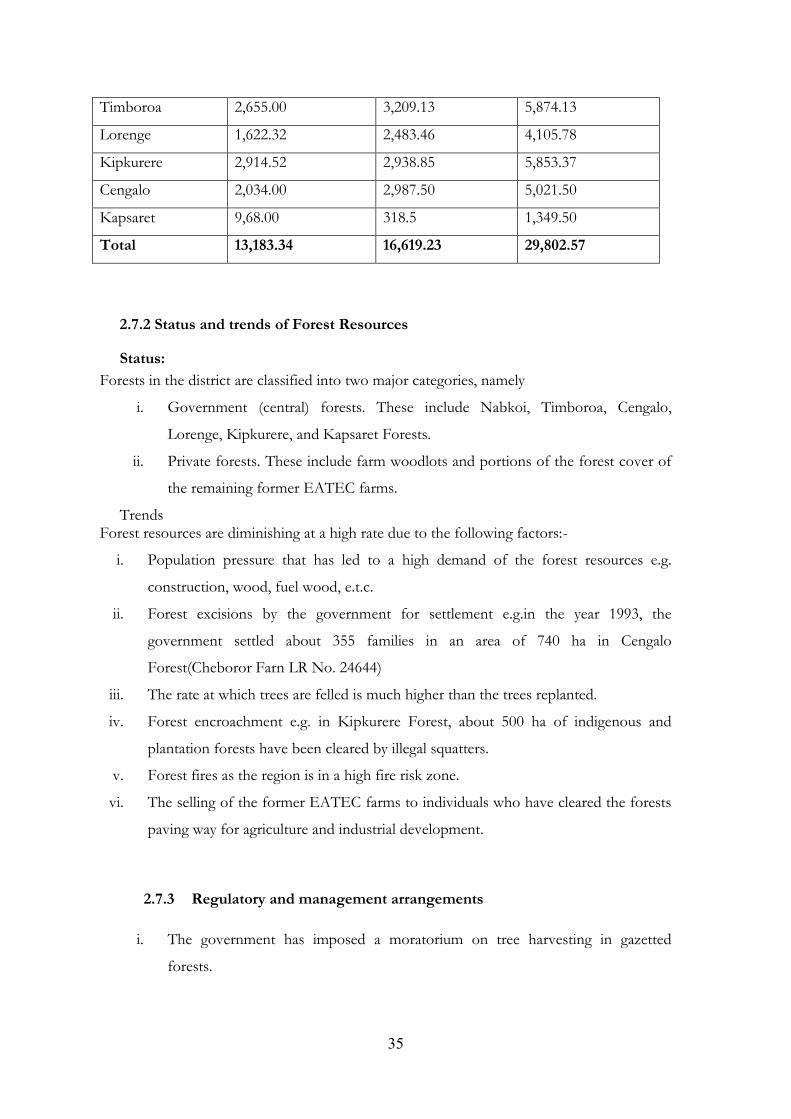
35
Timboroa 2,655.00 3,209.13 5,874.13
Lorenge 1,622.32 2,483.46 4,105.78
Kipkurere 2,914.52 2,938.85 5,853.37
Cengalo 2,034.00 2,987.50 5,021.50
Kapsaret 9,68.00 318.5 1,349.50
Total 13,183.34 16,619.23 29,802.57
2.7.2 Status and trends of Forest Resources
Status:Forests in the district are classified into two major categories, namely
i. Government (central) forests. These include Nabkoi, Timboroa, Cengalo,
Lorenge, Kipkurere, and Kapsaret Forests.
ii. Private forests. These include farm woodlots and portions of the forest cover of
the remaining former EATEC farms.
TrendsForest resources are diminishing at a high rate due to the following factors:-
i. Population pressure that has led to a high demand of the forest resources e.g.
construction, wood, fuel wood, e.t.c.
ii. Forest excisions by the government for settlement e.g.in the year 1993, the
government settled about 355 families in an area of 740 ha in Cengalo
Forest(Cheboror Farn LR No. 24644)
iii. The rate at which trees are felled is much higher than the trees replanted.
iv. Forest encroachment e.g. in Kipkurere Forest, about 500 ha of indigenous and
plantation forests have been cleared by illegal squatters.
v. Forest fires as the region is in a high fire risk zone.
vi. The selling of the former EATEC farms to individuals who have cleared the forests
paving way for agriculture and industrial development.
2.7.3 Regulatory and management arrangements
i. The government has imposed a moratorium on tree harvesting in gazetted
forests.

36
ii. Issuance of forest produce permits to regulate tree felling both in private and
government forests.
iii. Awareness campaigns on forest conservation and inclusion of all stakeholders in
the management of forests.
iv. Drawing and implementing forest management plans.
v. Regular forest patrols and policing
vi. Legislation (forest act) to control the management
vii. Forest policy that guides the management.
2.7.4 Exploitation of Forest Resources for Timber and Non Timber Productsi. Exploitation in gazetted forests is done by only two companies, which were
exempted from the ban, these are PPM (EA) Ltd for pulp and paper production
and Rai Plywoods for plywood production.
ii. Exploitation of timber products which are used locally is done on private farms,
while non timber products such as honey, fruits, forage, and medicinal plants are
obtained from both private and government forests.
Key Environmental Issuesi. Soil erosion due to deforestation
ii. Change in micro-climate
iii. Loss of habitat for flora and fauna
iv. Strong winds
Proposed Interventionsi. To develop, conserve and protect forests, trees, and forestry resources
sustainably for socio-economic development.
ii. Managing the wood production areas for maximum yields so that the different
needs for wood can be met using the smallest possible area of forest land.
iii. Introduction of fast growing species e.g. improved species of Eucalyptus
iv. Forest extension services to rural communities
2.7.5 Forest usesi. Soil and water conservation
ii. Herbal medicine
iii. Paper, pulp and plywood production
iv. Climate amelioration
v. Construction wood
vi. Energy (wood fuel)
37
vii. Bio diversity conservation
viii. Education and training
ix. Forage
2.8 Biodiversity conservationResearch on 39 wetlands recorded a diversity of organisms, varying in size, type and
abundance. The orgarnisms were classified as follows:
a) Macrophytes
b) Planktons
c) Mammals
d) Birds
e) Reptiles
f) Amphibians
g) Fish
h) Aquatic invertebrates
a) MacrophytesA variety of these have been recorded wetland and non wetland species as well as
emergent wetland species. Examples include
Species Name Category
Apium leptophylum non wetland
Bidens pilosa non wetland
Cyperus spp. wetland emergent
Typhae latipha wetland emergent
Indisigia leptocarpa wetland emergent
Nympae nonchali wetland floating leaved
Food crops include maize, wheat, potatoes, peas, beans, and a variety of vegetables.
Forest vegetation includes both indigenous and exotic species and these can also be
planted on farms. A variety of grasses can also be found.
b) BirdsAbout 6000 bird species have been recorded. Birds act as bio-indicators and could be
used to monitor aspects of environment like water quality and devegetation. Common
birds are:

38
Name Habitat Activity
Anas hottenpta dam edge perching
Alopochan open shallow water wading
Scopus umbrella muddy shore feeding
Rodica senegalensis open water wading
Columba guinea shrubs around dam perching
Bubucus ibis short grass around dam feeding
Quelea quelea farm fields nesting/feeding
Crested crane expansive swamps feeding
Other birds include chicken, ducks, geese, turkey, doves, crows and guinea fowls.
c) AmphibiansIn the 39 wetlands, about 322 amphibians were recorded. Common ones include:
Name Habitat
Hylambates Shallow water ponds
Rana Witter Shallow Pond
Ptydiadena mascamusis wet soil
Xenophus laenis water edge
Hyperolrus viridiflanus grass straws
d) Planktons25 species were recorded in the 39 wetlands. These include:
i)PhytoplanktonsName Habitat
Centronella spp. Regular
Asterionella spp. Common
Aphanocopsa spp. Extremely common
Synedro spp. Occasional
Protococcus spp. Occasional

39
Microsterias spp. Extremely rare
ii) Zoo planktonsLepidocaris spp. Extremely rare
Cyclops spp. Regular
Filina longsita Occasional
e) Mammals and ReptilesMammalsThese are not confined to any one particular habitat. They include cattle, sheep, goats
and rabbits. Others are Rothschild giraffe, antelopes, elephants (at the border with Nandi
South and uncommon), rodents like rats and squirrels. Mongooses are also found as well
as the domestic cats and dogs.
In the district, there are some rare and threatened species like the Rothschild giraffe
which is currently being conserved at Krugger Ranch, Sergoit area. The elephant is also
threatened and only confined to the border with Nandi in Lorenge and Kipkurere
forests. Most wild species are threatened because they are either dangerous to human
beings (like snakes) or a threat to cops and livestock.
The district being agricultural, most animal and plant species have lost their habitats to
cultivation. There is not much in terms of conservation efforts. Remarkable, however, is
the establishment of the private Krugger Ranch in Sergoit which is now home to the rare
Roterchild giraffe a number of reptiles and antelopes intended for tourism . Moi
University is establishing a conservation site at Chepkoilel campus for plants and animals.
Tree species are conserved in gazetted forests and through establishment of woodlots,
tree nurseries and on farm planting. Wild vegetables have been domesticated e.g. Suja,
sagaa. Little effort is put towards food crops conservation of indigenous variety.
f) Reptiles and FishVarious species of snakes, lizards and tortoise and turtles. Fish is mainly in man made
ponds and dams. They are getting extinct in rivers due to pollution. The most commonly
found is tilapia.
Key Environmental IssuesThese include:
1. Low awareness on bio diversity conservation
2. Deforestation as a result of rampant logging, cultivation, settlement and charcoal
burning.

40
3. Agriculture – Indigenous species are eliminated through cultivation and farm
clearing through burning.
4. Annual wetland burning by local communities
5. Introduction of exotic species mainly in Forestry and agriculture in preference to
indigenous.
6. Pollution in water affecting aquatic life.
7. Poverty
Proposed intervention measures include1. Setting up arboretums for species conservation
2. Education of the public
3. Encourage domestication and propagation of wild vegetables and fruits
4. Preservation of water catchment areas and enriched by planting more indigenous
species
5. Domestication of biodiversity conservation plans.
6. Creation of recreation sites
7. Encourage tourism in the district
8. Support ongoing conservation efforts like the Krugger ranch and Naiberi
campsite.

41
Table 24: Types & Status of Biological Resources
Ecosystem Location andsize
Keyspecies
Threats Status Proposedinterventions
Rare
Thre
aten
ed
Vul
nera
ble
GazettedForests
Indigenous
Nabkoi–4618.79Timboroa –3209.13Lorenge –2483.46Kipkurere –2938.85Cengalo–2987.53Kapsaret - 318.5Total –16619.23
J.proceraOleaafricanaBamboo
ExcisionOverexploitationFiresOvergrazingSlowregenerationPoorsilviculturalmanagement
Threatened
Vulnerable
IntegratedforestmanagementAlternativeenergysources(cheaper)ImplementPRSPLawenforcement
Plantation
Nabkoi–2979.50Timboroa -2665.00Lorenge –1622.32Kipkurere –2914.52Cengalo–2034.00Kapsaret –918.00Total –13,183.34
EucalyptusCypressPine
Insects/pestsOverharvestingPlantingbacklogsFirePoorsilviculturalmanagement
Threatened
Improveextensionservices

42
Ecosystem Location andsize
Keyspecies
Threats Status Proposedinterventions
PrivateForests
BlackwattleTecleanobilisGrevillearobustaSpathodea niloticaMakhamiaOleahochsteteriiEucalyptus
Overexploitationfor timberandcharcoal
wattle IncentivesTechnicaladviceespecially intreemanagement
Agricultural 204,000ha
MaizeWheatBeansSorghumPyrethrumPotatoesPeasVegetablesCattleSheepGoatspoultry
Maize stockborerWeevilsDroughtMonocultureDiseasesTheftdrought
Beans
Sorghum
Pyrethrum
Cattle
Potatoes
Cattle,poultry
ImprovefarmingmethodsIntegratedpestmanagementUse ofcertifiedseedsImprovedmarket,(especiallyforpyrethrum)Cropdiversification
Wildlife areas KruggerRanch,Sergoit
MoiUniversityrecreation site
Eldoretculturalsite
RheedbuckGiraffesOribiJackalPorcupineBirdsRodentsSnakes
TortoiseFish
SnakesOstrichCrocodiles
Rotschid
girraffe
Privateandprotected
Privateandprotected
CommunityandgovernmentSupport
Inland waters andwetlands
Scattered
PapyrusreedsFrogsBirdsSyzigium
EncroachmentCatchmentdestructionSiltationPollution
Crested crane
Allwetlandspecies
Allwetlandspecies
WetlandpolicyEnforcementof existinglawsEducation
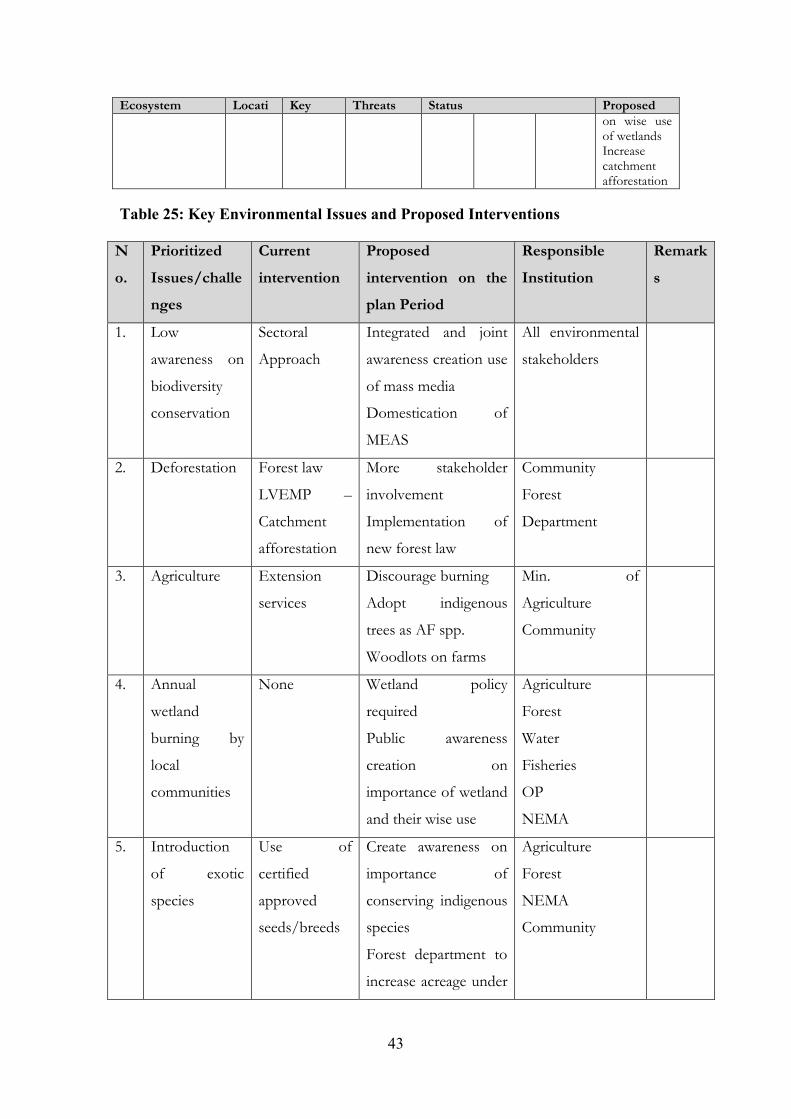
43
Ecosystem Location andsize
Keyspecies
Threats Status Proposedinterventionson wise useof wetlandsIncreasecatchmentafforestation
Table 25: Key Environmental Issues and Proposed Interventions
No.
PrioritizedIssues/challenges
Currentintervention
Proposedintervention on theplan Period
ResponsibleInstitution
Remarks
1. Low
awareness on
biodiversity
conservation
Sectoral
Approach
Integrated and joint
awareness creation use
of mass media
Domestication of
MEAS
All environmental
stakeholders
2. Deforestation Forest law
LVEMP –
Catchment
afforestation
More stakeholder
involvement
Implementation of
new forest law
Community
Forest
Department
3. Agriculture Extension
services
Discourage burning
Adopt indigenous
trees as AF spp.
Woodlots on farms
Min. of
Agriculture
Community
4. Annual
wetland
burning by
local
communities
None Wetland policy
required
Public awareness
creation on
importance of wetland
and their wise use
Agriculture
Forest
Water
Fisheries
OP
NEMA
5. Introduction
of exotic
species
Use of
certified
approved
seeds/breeds
Create awareness on
importance of
conserving indigenous
species
Forest department to
increase acreage under
Agriculture
Forest
NEMA
Community

44
No.
PrioritizedIssues/challenges
Currentintervention
Proposedintervention on theplan Period
ResponsibleInstitution
Remarks
conservation
area(indigenous forest)
6. Pollution Awareness
creation
Lawenforcement,
Constant monitoring
of water quality and
proper documentation
Increase awareness
creation
Water
Department,
ELDOWAS
7. Poverty PRSP
strategies for
economic
recovery
Support micro
projects for
communities
Encourage more
CBOs
Lead agencies
NGOs
CBOs
National policy
makers
45
CHAPTER THREE
3.0 HUMAN SETTLEMENT AND INFRASTRUCTUREHuman Settlements are viewed as human habitats and the linkages with areas where man
derives his livelihood. Human settlements do not exist in isolation they are linked to
activity areas and functions such as education, commercial, industrial, recreational,
residential among other users together with infrastructural units. The Government
Policy on human settlement is viewed in terms of shelter and housing which is to ensure
adequate shelter that provides protection from the elements of weather as well as
security, privacy and space for socio-economic activities for the advancement of the
quality of life. There are two types of human settlements, the urban and rural settlements.
3.1 Human settlement and planning
3.1.1 Urban SettlementsAccording to the 1999 population and Housing censes, the population of Uasin
Gishu District was 665,000 persons with an annual growth rate of 3.5% per annum. The
population was projected to 690,037 persons in 2002 and is expected to grow to 1.4
million people by the year 2022.
In terms of urban settlements, Eldoret town is the principle urban centre in the district
with an estimated population of 216,356 as per the National Population census. Other
major towns and corresponding urban population are Burnt Forest, Moi’s Bridge and
Matunda with residential population of 33,055, 23,936; 12,288 people respectively.
Eldoret town exerts a lot of influence as far as urbanization in Uasin Gishu District is
concerned. It accounts for about 22.25% of the total population in the district. Burnt
Forest has 26.12% of the population, Moi’s Bridge 17.59% Matunda 6.05%, and Turbo
2.3% the district’s total urban population is 27.73% meaning that the vast majority of the
people reside in the rural area.
The areas within which the major towns and small centres occupy fall within land which
is held on leasehold tenure of which many of them have been planned. Table 3.1
indicates the number of towns and centres and Physical Planning status (see appendix).

46
3.1.2 Problems of urban settlementsThe major problems confronting the growth and development of towns and small
centres in the Uasin Gishu district include;
Lack of infrastructure e.g. water, electricity, sewer and good roads
Poor housing/mushrooming up of unplanned structures
Pollution arising from dumping of wastes
Encroachment of riparian reserves and wetland areas
Traffic congestion especially in Eldoret town
Poor drainage
Uncertanity of land tenure
Squatter settlement problems e.g. on Langas
Inadequate provision of public utilities
Expansion of urban centres into prime agricultural land
Key Environmental Issuers and Proposed interventionsThe strategies and mitigation measures to address the negative environmental impacts of
urban human settlements are outlined as follows:-
Issue Causes Solution Actors
Pollution Dumping of wastes Adoption of an
effective waste
disposal system
Local Authorities
Government
Departments
Encroachment of
riparian reserves
and wetland areas
Allocation of plots
near riparian
reserves
Revoking of plots
within riparian
reserves
Protection of rivers
and wetlands
Ministry of
Environment
Local Authorities
Government
Departments
NGOs
CBOs
Poor Drainage Interference of
natural drains
Blockage of drains
Opening of drains Local Authorities
Government
Departments
Urban plight shanty
eyesore character
Poor planning
lack of development
Zoning upgrading Local Authorities
Physical Planning

47
Issue Causes Solution Actors
control NEMA
NGOs
CBOs
3.1.3 Rural SettlementSettlement patterns in Uasin Gishu District are dominated by rural homesteads which
dot the country side. Settlements in Moiben Division are sparsely distributed due to the
effect of the dry spell and harsh climate conditions. The cluster types of settlements are
mainly found in Turbo and Kapsaret Divisions. The factors that have influence
settlement factors include;
1. climate
2. infrastructure availability e.g. good roads, water sources
3. large scale farms
4. land potentiality
Unlike urban settlements, rural settlements fall in areas with security of tenure. The
housing typologies in the rural areas of Uasin Gishu are mainly permanent, and semi-
permanent housing with many houses being made of grass thatched and mud-walled
materials. A common feature of rural settlements is the presence of stores which are
used to store farm produce.
3.1.4 Problems of Rural SettlementsEnvironmental problem in rural areas are not so critical as compared with urban
agglomerations. The issues under consideration include:-
Poor housing
Encroachment of rural settlements on forest areas e.g. Turbo Forest
Devegetation due to demand for wood fuel.
The proposed intervention measures for the problems associated with rural settlement
patterns include:-
Sensitization of rural inhabitants on the need to adopt modern housing designs.
Encouragement of the land owners to practice agroforestry farming and to set
aside part of the farms for tree planting.

48
Sensitization of the rural people to adopt the use of other alternative sources of
energy such as solar energy, biogas and electricity among others.
3.3 Human and Environmental HealthThe common diseases influenced by environmental factors in the urban and rural
landscapes can be categorized as follows:-
1. Water borne infectionsThis is a group of infections which the disease causative agents are transmitted
through water or food and the same include enteric fever salmonellosis E. coli
2. Water based infectionsAre infections which the causative agents live and breed in water e.g. Bilhazia
guinea worms.
3. Water related infectionsAre infections which its vectors breed at a water body and infects man away
from the water body e.g. malaria and river blindness.
4. Water washed infectionsThese are an infection which affect man due to lack of water or contamination of
water and includes scabies, trachoma, and leishmaniaisis.
5. Diseases that come about due to pollution of drinking water e.g. cholera and
amoebiasis.
6. Diseases that arise due to poor post harvesting and storage of food stuffs thus
leading to food poisoning e.g. aflatoxicosis.
7. Diseases that are caused due to poor housing and sanitation e.g. tuberculosis.
8. Diseases that are caused due to poor disposal of water hence leads to breeding of
diseases vectors e.g. house flies hence transmissions of diarhoeal diseases.
9. Diseases that are caused due to poor disposal of animal products and wastes e.g.
anthrax and tetanus
3.3.1 Intervention measures to address the prevalence of diseasesAs a strategy for addressing the prevalence of diseases in Uasin Gishu district, the
following measures are recommended:-
Provide access for safe drinking water for all
Zoning of urban areas to curb the problem of mushrooming up of slums in
towns
Regulate use of agro-chemicals and green houses

49
Promotion of afforestation programmes to check on the problem of land
degradation and disasters such as flooding and extreme weather conditions.
Stepping up measures for environmental improvement in order to curb the
problem of massive breeding of diseases vectors
Carrying out Environmental Impacts Assesments and Environmental Audits
for installations which are likely to cause chemical pollution and radiation
hazards
Routine inspection of buildings to ascertain habitability and to address the issue
of indoor air pollution i.e. poisonous gases
Monitoring and eradication of emerging and re-emerging of diseases
Sanitization of members of the public on the importance of primary health
care
3.3.2 Pollution and waste generated from human settlementPollution is an important environmental concern in Uasin Gishu District. The district
experiences air and water pollution, fires, charcoal burning, dust particles and emissions
from agro-based industries which cause air pollution.
The sources of water pollution include silting due to soil erosion and industrial chemical
deposits into water bodies. Increased use of plastics today has a severe effect on the
scenery of urban environment.
3.4 Social economic services and infrastructureIn Uasin Gishu District, urban areas are adequately served with all manner of
infrastructure facilities and services. These include water supply, power supply and
sanitation services.
In terms of access to water and sanitation services, it is estimated that only 40,926
households have piped water supply while 103,064 households have access to potable
water. To aleviate the problems of inadequate water supply over 5,488 families use roof
catchments. It is also estimated that VIP sanitary facilities are used by 5,785 families as
means of waste disposal (DDO 2002).
Other sources of water and their corresponding quantities in Uasin Gishu are indicated
as follows:-
50
Source of Water Number
(i) Wells 67,804
(ii) Rivers 7
(iii) Protected Springs 450
(iv) Dams 75
(v) Ponds 450
(vi) Boreholes 13,039
Proposed intervention measuresIt is recommended that all activities that contribute to air pollution should be regulated
and be subjected to Environmental Impact Assessments and audits. On the issue of
charcoal burning, alternative sources of energy should be encouraged e.g. the use of solar
energy, biogas and windmill among others.
Other strategies to environmental pollution include:-
Desilting of damps
Recycling of garbage
Use of biodegradable materials
Acquisition of appropriate sites for waste disposal
Provision of sewered sanitation for urban settlement
The district has several types of water facilities ranging from boreholes, furrow,
rivers, wells and
3.5 Energy sectorThe Ministry of Energy is the key Government Agency charged with responsibility of
facilitating development geared towards supply of adequate and reliable energy sources to
support socio-economic development. To serve this mandate, the ministry is currently
pursuing activities to ensure adequate supply of energy in the country this includes
promoting conservation of all forms of energy, intensify exploration and development of
fossil fuels, Geothermal and hydro-electric power, increasing on – farm wood fuel
production efficiency in wood utilization and promoting the development of alternative
energy sources.
The ministry plays a highly facilitative role in energy supply. It plays a leadership role in
development of policy, legal and regulatory framework, overseeing and ensuring
provision of reliable and adequate energy and distribution through supervision of
services providers, specifically State Corporation

51
3.5.1 Types and Status of Energy ServicesThe types of energy available in the district include: -
1. Wood fuel:Wood fuel has remained the most important source of energy accounting for
over 70% of the total energy demand in Kenya. 80% of the population depend
on it for domestic energy needs, providing over 90% of rural households’ energy
requirements. Sources of wood fuel are declining because of destruction of
vegetative cover.
(i) Charcoal: Charcoal is a semi-refined wood fuel made from the carbonization
of wood in the limited air. This form of energy is used in the district mostly by
low- income urban residents and in the rural by mainly high-income groups and
people with employment in addition to farm income. The resource is declining
as some of the producers of the commodity have closed down e.g. EATEC
2. Farm residueFarm residue comprises of a broad range of vegetative materials generated from
diverse agricultural operations and process. Dung and crop residue are dominant
by products from primary agricultural production, which are occasionally used as
domestic fuel in the district. The resource is abundant especially during
harvesting season.
3. Wood wasteWood waste includes sawdust, timber rejects, off- cuts and others. This has declined
with the closure of sawmills.
4. KeroseneKerosene is used by almost all households in the rural for lighting. The resource
is available with high costs with the government exempting it from taxation to
lower its price.
5. LPG (Liquefied Petroleum Gas)This resource is used in the district by urban residence. The resource is available
with high cost.
6. Electricity.Electricity is the most modern and convenient fuel and ranks highest in the
energy ladder. However, electricity is expensive for the majority of households.
Urban households have easy access to electricity unlike the rural where few
households have access to it due to the distance from the National grid.
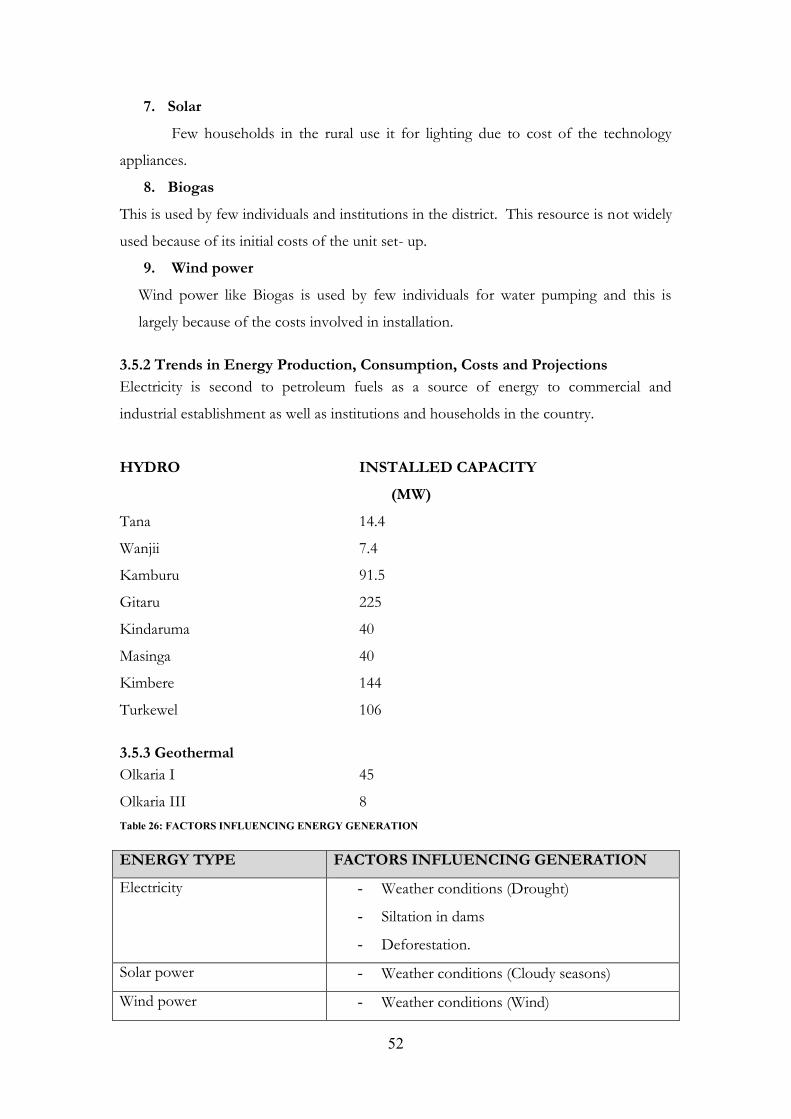
52
7. SolarFew households in the rural use it for lighting due to cost of the technology
appliances.
8. BiogasThis is used by few individuals and institutions in the district. This resource is not widely
used because of its initial costs of the unit set- up.
9. Wind powerWind power like Biogas is used by few individuals for water pumping and this is
largely because of the costs involved in installation.
3.5.2 Trends in Energy Production, Consumption, Costs and ProjectionsElectricity is second to petroleum fuels as a source of energy to commercial and
industrial establishment as well as institutions and households in the country.
HYDRO INSTALLED CAPACITY(MW)
Tana 14.4
Wanjii 7.4
Kamburu 91.5
Gitaru 225
Kindaruma 40
Masinga 40
Kimbere 144
Turkewel 106
3.5.3 GeothermalOlkaria I 45
Olkaria III 8Table 26: FACTORS INFLUENCING ENERGY GENERATION
ENERGY TYPE FACTORS INFLUENCING GENERATION
Electricity - Weather conditions (Drought)
- Siltation in dams
- Deforestation.
Solar power - Weather conditions (Cloudy seasons)
Wind power - Weather conditions (Wind)

53
ENERGY TYPE FACTORS INFLUENCING GENERATION
Petroleum - Importation pricing
- Refinery for lead fuels
- Exploration.
3.5.4 Factors influencing trendsa) Population growth
b) Over grazing
c) Deforestation
d) Out dated technology
Key Environmental Issues Use of firewood and charcoal leads to increased destruction of the district forest
cover.
The need for firewood to fire boilers in tea factories has lead to encroachment
of wetlands for planting of eucalyptus species.
Oil spillages from service stations, automobile garages, vehicles, factories pollute
soil and water.
Petrol and other fossil fuels contain heavy metals which are armful to man.
Use of kerosene, charcoal-making results in harmful gases such as carbon
monoxide emission, which contribute to depletion of the ozone.
Widespread use of polythenes and plastics in the packaging of charcoal,
kerosene and other fuels result in increased environmental pollution when
plastics/polythenes are not properly disposed.
Proposed Interventions Increase public awareness on good environment practices.
Intensify tree planting campaigns
Encourage use of unleaded fuel
Increase security patrols to ensure no encroachment on public/gazetted forest
Timely collection and proper disposal of wastes-polythenes and plastics.
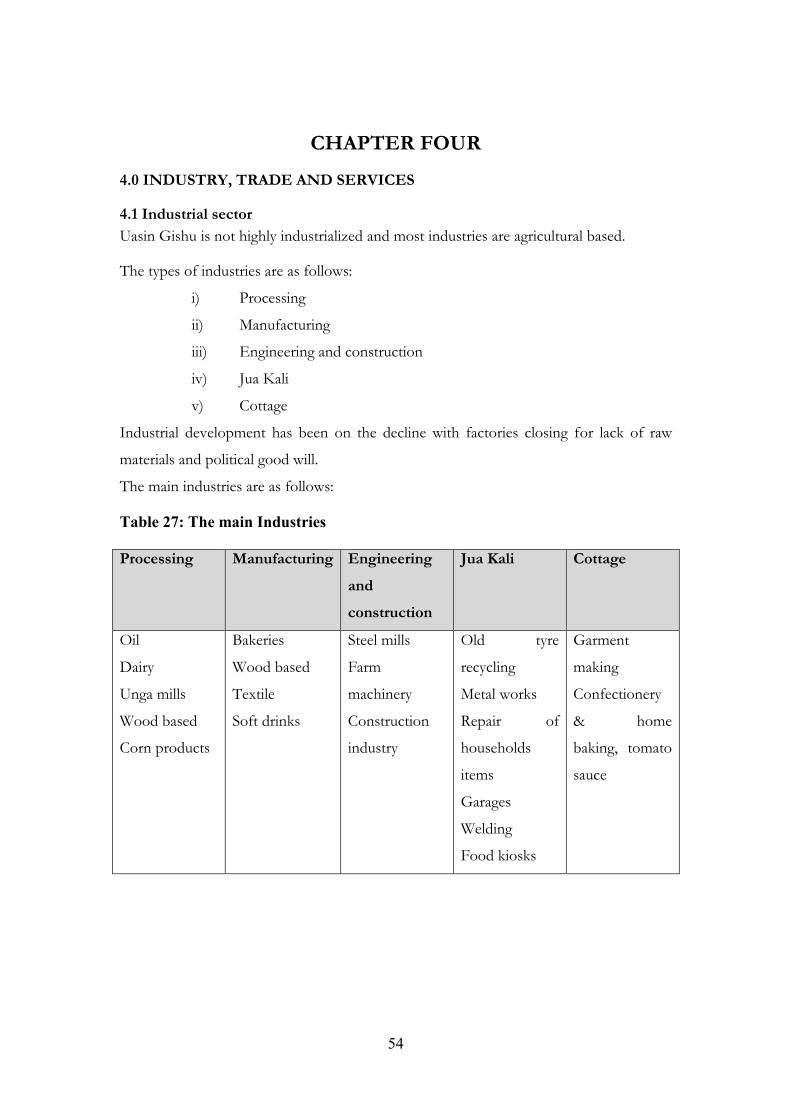
54
CHAPTER FOUR4.0 INDUSTRY, TRADE AND SERVICES
4.1 Industrial sectorUasin Gishu is not highly industrialized and most industries are agricultural based.
The types of industries are as follows:
i) Processing
ii) Manufacturing
iii) Engineering and construction
iv) Jua Kali
v) Cottage
Industrial development has been on the decline with factories closing for lack of raw
materials and political good will.
The main industries are as follows:
Table 27: The main Industries
Processing Manufacturing Engineeringandconstruction
Jua Kali Cottage
Oil
Dairy
Unga mills
Wood based
Corn products
Bakeries
Wood based
Textile
Soft drinks
Steel mills
Farm
machinery
Construction
industry
Old tyre
recycling
Metal works
Repair of
households
items
Garages
Welding
Food kiosks
Garment
making
Confectionery
& home
baking, tomato
sauce
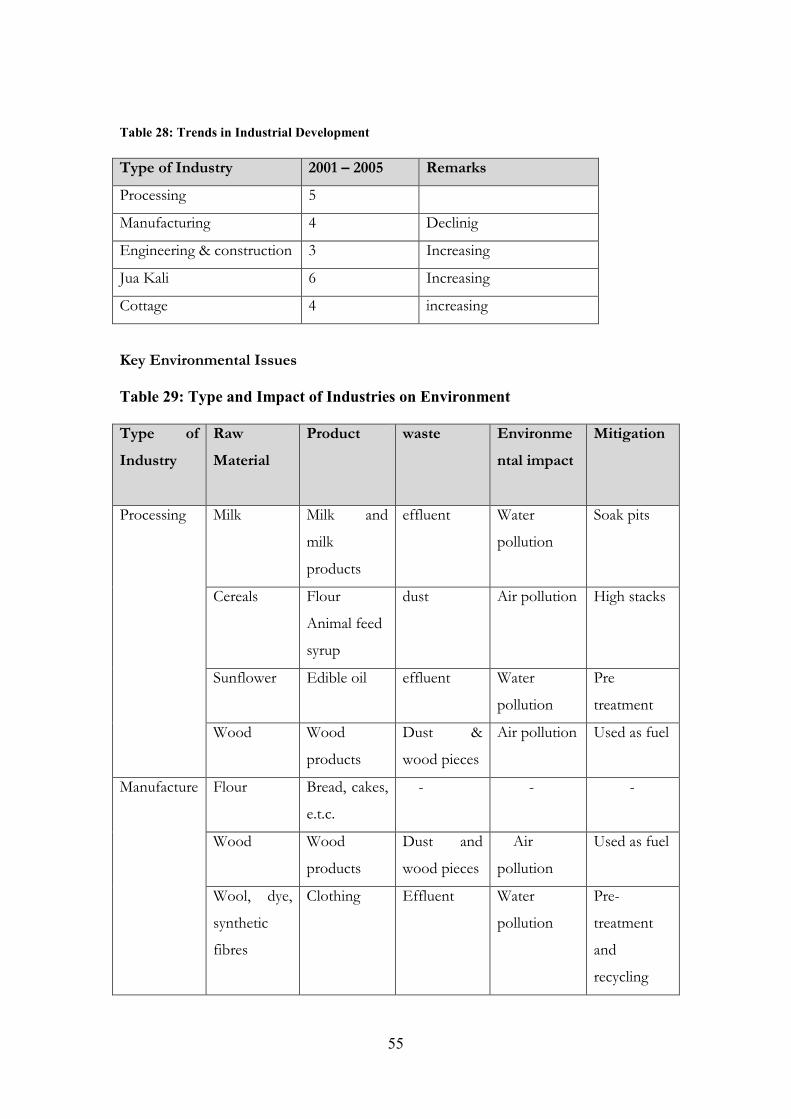
55
Table 28: Trends in Industrial Development
Type of Industry 2001 – 2005 Remarks
Processing 5
Manufacturing 4 Declinig
Engineering & construction 3 Increasing
Jua Kali 6 Increasing
Cottage 4 increasing
Key Environmental Issues
Table 29: Type and Impact of Industries on Environment
Type ofIndustry
RawMaterial
Product waste Environmental impact
Mitigation
Processing Milk Milk and
milk
products
effluent Water
pollution
Soak pits
Cereals Flour
Animal feed
syrup
dust Air pollution High stacks
Sunflower Edible oil effluent Water
pollution
Pre
treatment
Wood Wood
products
Dust &
wood pieces
Air pollution Used as fuel
Manufacture Flour Bread, cakes,
e.t.c.
- - -
Wood Wood
products
Dust and
wood pieces
Air
pollution
Used as fuel
Wool, dye,
synthetic
fibres
Clothing Effluent Water
pollution
Pre-
treatment
and
recycling

56
Type ofIndustry
RawMaterial
Product waste Environmental impact
Mitigation
Water,
formula
Soft drinks - - -
Engineering
and
construction
Metal,
wood, glass,
stones,
cement,
sand
Metal bars,
wooden
frames,
buildings
Iron filings,
wood and
metal pieces,
stone
chippings,
dust
Soil and air
pollution,
noise
Protective
gear
Jua Kali Assorted Assorted Unusable
pieces of
assorted raw
materials
Soil and
noise
pollution
Mostly
recycled,
burnt
Cottage Clothing
materials
garments Unused
pieces
littering Burnt and
dumped in
the
municipal
dumping
site
Starch +
formula
Tomato
sauce
Sugar ,
flour, food
colours
Confectioner
y
4.1.1 Industrial Wastes and PollutionTable 30: Type and Sources of Wastes
TYPE SOURCE STATUS1. Saw Dust Saw mills, saw bench, Pit Minimum waste mostly recovered and

57
TYPE SOURCE STATUSsawing, Power saws,Raiplywood, carpentry shops
used as fuel and production of boardsin Raiplywood. Used as fuel in somehouseholds
2. Chemicals Manufacturing/processing/service Industries – KCC,Doinyo Lessos, Arkay OilFactory, Rupa/KenKnittextile factory
Manufacturing/processing releaseeffluents which is at times not welltreated/protected. Dyes in textileindustries are normally recycled.
3. Effluent Rupa/KenKnit, Raiplywood,Arkay Highlands paper Mills,slaughter Houses and cateringindustry
Recycled pre-treatment done beforerelease into municipal sewercontrolled through municipal sewer.
4. Emissions(gaseous)
Raiplywood, Eldoret steelmills, Corn products, UngaMills, vehicles
Concentration controlled through tallstacks and improved boilers.Emissions from Eldoret Steel Millsremain heavy.
5. Noise Vehicles Nuisance near residential estates andprominent at Picking points alongUganda road (main highway)
6. Scrubbings Jua kali Iron fillings normally scattered on theground, they are usually swept in therunoff.
7. Odour Slaughter houses Effluent from washing released inopen drains. Dung dried for manure
8. Cut hair Salons and Kinyozis Disposed off in rubbish bins and endin municipal dumping ground or isburnt.Sometimes can be seen scatteredalong the roadside where rubbish binsare not provided.
4.1.2 Energy related pollution and waste generationMost of the industries use electricity as a source of energy. Waste is therefore in terms of
used bulbs and tubes and occasionally wires. Some use fuel wood or wood products.
Examples are Corn products and Raiplywood. Ash is an inevitable waste. Gaseous
emissions from the wood add excess heat; are wastes.Generators that use petrol or diesel
are also used in few cases or during electricity failure. These are sources of oil spills and
used oil.Currently, there is insignificant pollution generated from this source.
4.1.3 Waste and pollution from Mining and QuarryingThere are no mining activities in the district. Large commercial quarries in the district e.g.
Sirikwa and Kipluge, whereas other commercial quarries in the municipality like Gituro
quarry are out of operation.
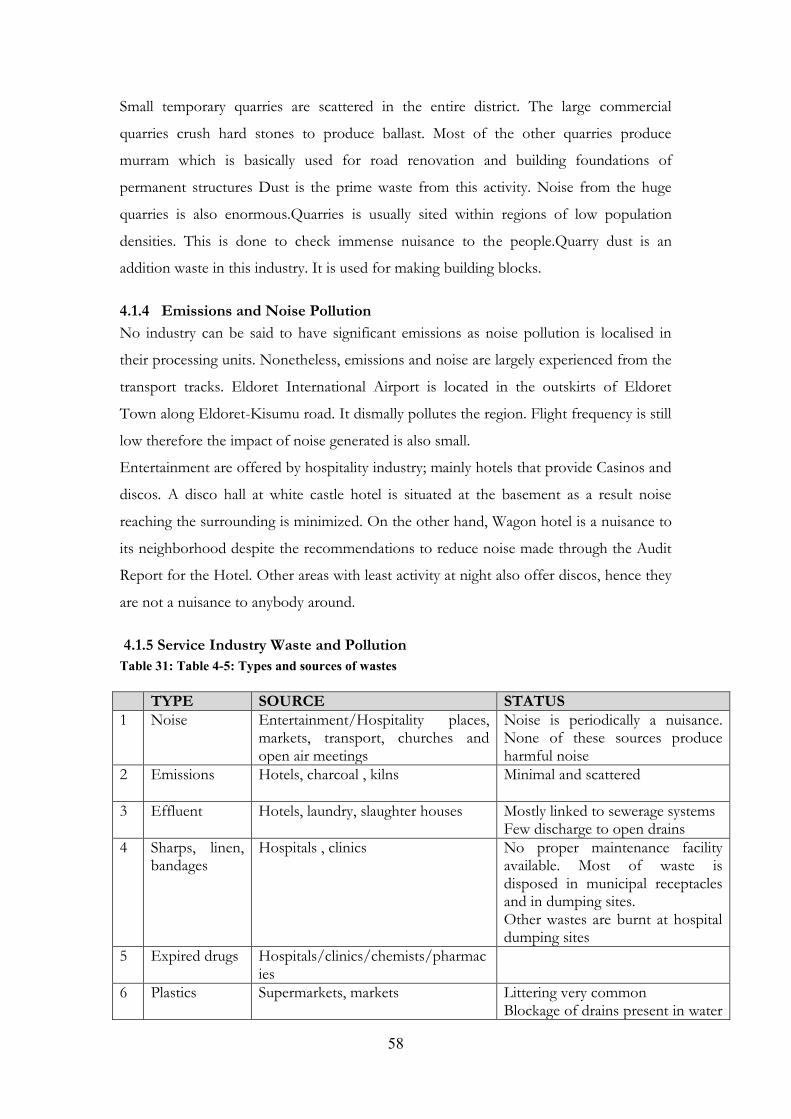
58
Small temporary quarries are scattered in the entire district. The large commercial
quarries crush hard stones to produce ballast. Most of the other quarries produce
murram which is basically used for road renovation and building foundations of
permanent structures Dust is the prime waste from this activity. Noise from the huge
quarries is also enormous.Quarries is usually sited within regions of low population
densities. This is done to check immense nuisance to the people.Quarry dust is an
addition waste in this industry. It is used for making building blocks.
4.1.4 Emissions and Noise PollutionNo industry can be said to have significant emissions as noise pollution is localised in
their processing units. Nonetheless, emissions and noise are largely experienced from the
transport tracks. Eldoret International Airport is located in the outskirts of Eldoret
Town along Eldoret-Kisumu road. It dismally pollutes the region. Flight frequency is still
low therefore the impact of noise generated is also small.
Entertainment are offered by hospitality industry; mainly hotels that provide Casinos and
discos. A disco hall at white castle hotel is situated at the basement as a result noise
reaching the surrounding is minimized. On the other hand, Wagon hotel is a nuisance to
its neighborhood despite the recommendations to reduce noise made through the Audit
Report for the Hotel. Other areas with least activity at night also offer discos, hence they
are not a nuisance to anybody around.
4.1.5 Service Industry Waste and PollutionTable 31: Table 4-5: Types and sources of wastes
TYPE SOURCE STATUS1 Noise Entertainment/Hospitality places,
markets, transport, churches andopen air meetings
Noise is periodically a nuisance.None of these sources produceharmful noise
2 Emissions Hotels, charcoal , kilns Minimal and scattered
3 Effluent Hotels, laundry, slaughter houses Mostly linked to sewerage systemsFew discharge to open drains
4 Sharps, linen,bandages
Hospitals , clinics No proper maintenance facilityavailable. Most of waste isdisposed in municipal receptaclesand in dumping sites.Other wastes are burnt at hospitaldumping sites
5 Expired drugs Hospitals/clinics/chemists/pharmacies
6 Plastics Supermarkets, markets Littering very commonBlockage of drains present in water

59
TYPE SOURCE STATUSbodies.
7 Used oils Garages, Petrol stations Used oil in petrol stations normallytrapped and stored for sale.Garages have no proper disposalmechanism and oil is normally spilton the ground.
8 Exhaust gases Transport , kilns Concentrated in main town andurban centres as well as along mainhighway.
Kilns for charcoal scattered onfarms.
9 Chemicals/labwaste
Laboratories , laundry Released as effluent to municipalsewer. Sometimes released in opendrains
10 Detergentsand soaps
Laundry Released into municipal sewer oropen drains
11 Garage wastes Garages Metallic waste recycled. Rubberwaste disposed into municipalreceptacles.
Used oil disposed intoenvironment or stored for sale
12 Worn outtyres
Garages Used in jua kali industry formaking sandals, ropes etcWires are used to make rat trapsand bird cages
13 Food waste Hotels, markets Disposed off into municipalreceptacles, dumping sitesoccasionally found dumped alongroads/road sides and open drains
14 Used batteries Transport, lighting sources Dry cells normally discarded intoenvironment
15 Packagingmaterial
Supermarkets/ retail shops, markets Polythene is a main problem.Plastics are normally collected forrecycling.Mostly reused and finally disposedof by burning.
4.1.5 Hazardous WasteHazardous waste is waste that poses substantial or potential threats to public or
environmental health and safety and generally exhibits one or more of these
characteristics: Ignitability, corrosivity, reactivity (Explosive) and/or toxicity. While waste
is unwanted or undesired solid, liquid or gaseous material left over after the completion
of a process and is likely to cause attention in the environment.
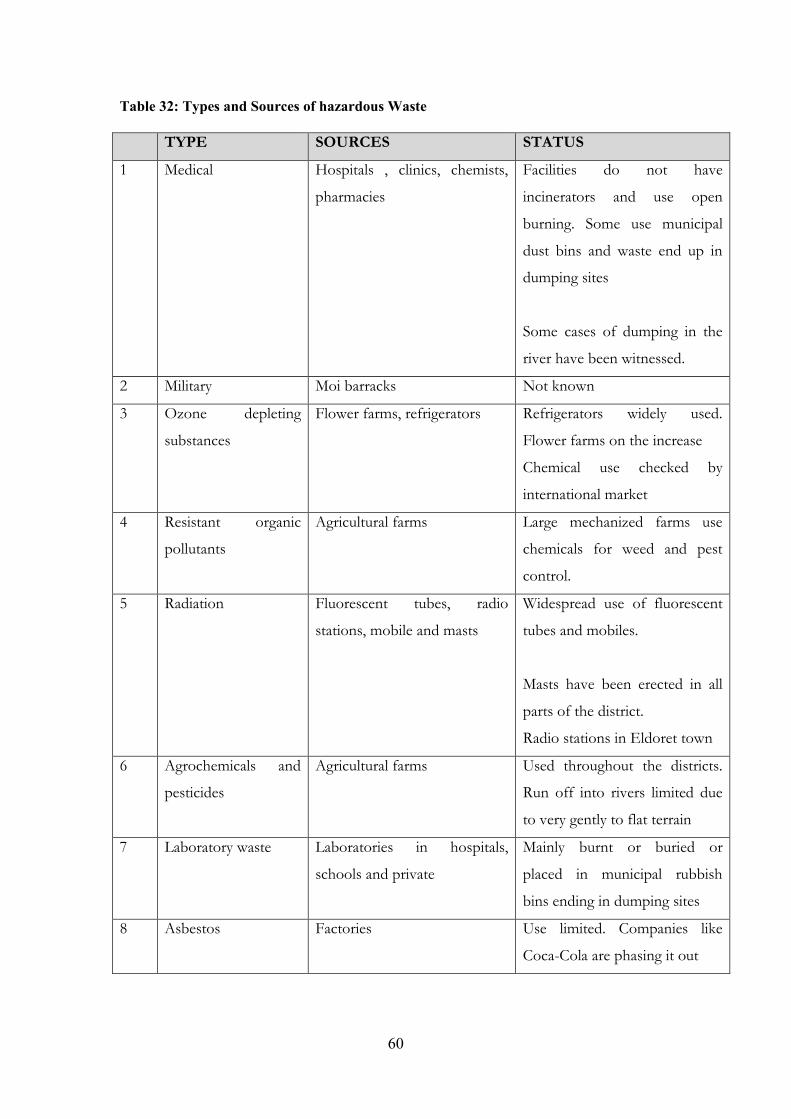
60
Table 32: Types and Sources of hazardous Waste
TYPE SOURCES STATUS
1 Medical Hospitals , clinics, chemists,
pharmacies
Facilities do not have
incinerators and use open
burning. Some use municipal
dust bins and waste end up in
dumping sites
Some cases of dumping in the
river have been witnessed.
2 Military Moi barracks Not known
3 Ozone depleting
substances
Flower farms, refrigerators Refrigerators widely used.
Flower farms on the increase
Chemical use checked by
international market
4 Resistant organic
pollutants
Agricultural farms Large mechanized farms use
chemicals for weed and pest
control.
5 Radiation Fluorescent tubes, radio
stations, mobile and masts
Widespread use of fluorescent
tubes and mobiles.
Masts have been erected in all
parts of the district.
Radio stations in Eldoret town
6 Agrochemicals and
pesticides
Agricultural farms Used throughout the districts.
Run off into rivers limited due
to very gently to flat terrain
7 Laboratory waste Laboratories in hospitals,
schools and private
Mainly burnt or buried or
placed in municipal rubbish
bins ending in dumping sites
8 Asbestos Factories Use limited. Companies like
Coca-Cola are phasing it out
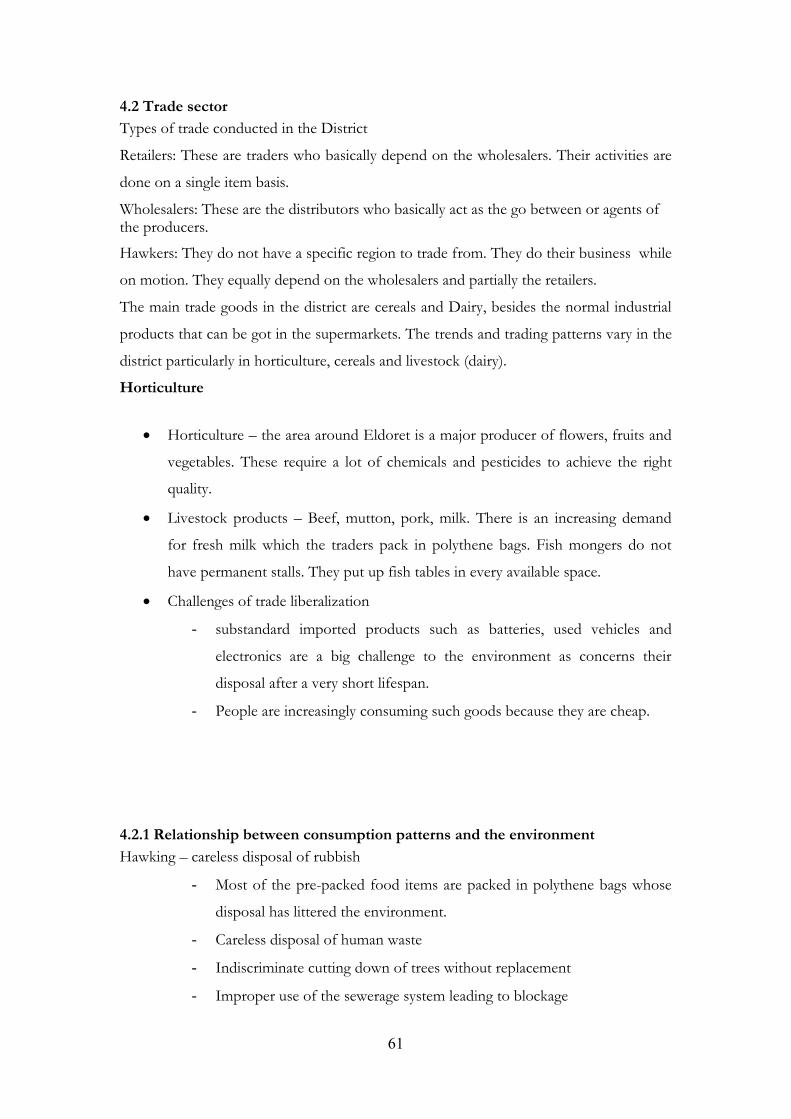
61
4.2 Trade sectorTypes of trade conducted in the District
Retailers: These are traders who basically depend on the wholesalers. Their activities are
done on a single item basis.
Wholesalers: These are the distributors who basically act as the go between or agents ofthe producers.
Hawkers: They do not have a specific region to trade from. They do their business while
on motion. They equally depend on the wholesalers and partially the retailers.
The main trade goods in the district are cereals and Dairy, besides the normal industrial
products that can be got in the supermarkets. The trends and trading patterns vary in the
district particularly in horticulture, cereals and livestock (dairy).
Horticulture
Horticulture – the area around Eldoret is a major producer of flowers, fruits and
vegetables. These require a lot of chemicals and pesticides to achieve the right
quality.
Livestock products – Beef, mutton, pork, milk. There is an increasing demand
for fresh milk which the traders pack in polythene bags. Fish mongers do not
have permanent stalls. They put up fish tables in every available space.
Challenges of trade liberalization
- substandard imported products such as batteries, used vehicles and
electronics are a big challenge to the environment as concerns their
disposal after a very short lifespan.
- People are increasingly consuming such goods because they are cheap.
4.2.1 Relationship between consumption patterns and the environmentHawking – careless disposal of rubbish
- Most of the pre-packed food items are packed in polythene bags whose
disposal has littered the environment.
- Careless disposal of human waste
- Indiscriminate cutting down of trees without replacement
- Improper use of the sewerage system leading to blockage

62
- Careless disposal of solid waste including metals
- Wasteful use of water
- Poor farming methods
- Charcoal burning
- Non recycling of used plastics
- Unplanned structures in urban centres which interfere with drainage flow
and both human and vehicle traffic.
- Air pollution due to smog from the increase in the number of vehicles
and burning of waste products such as tyres and foam
- Flow of used oil, grease from garages and car washing yards into water
systems and also contaminating land.Table 33: Type and impact of trade on Environment
No.
Tradetype
Rawmaterials
Product No. ofPeopleemployed
WasteSolid/gaseous
Environmental impacts
Mitigationmeasures
1. Hawking various Fruits,
electronics,
confectioneri
es
About
1000
Fruit
peelings,
plastics
and
polythene
Littered
environment
Provide waste
bins
2. Retail and
wholesale
Various Electronics,
sugar, oil&
fats, etc
15000 Polythene
and plastic
wrapping
materials
Littered
environment
Should adopt
use of
biodegradable
materials
3. Caterers
(Hotels)
Potatoes,
vegetables
etc
Such foods
as Chips,
posho, meat
stew
1000 Solid
waste
Blocking of
drains etc
Provide
disposal bins
4. Motor
vehicle
repairers
Paints, oil
and
petroleum
Painting,
panel
beating, oil
changes, etc
1800 Solid and
liquid
Land and
water
pollution
Each garage
should have a
disposal pit
5. Woodwor
ks, poles
and posts
Trees Furniture,
building
poles,
electric
power and
- Climatic
change,
soil
erosion,
etc
Forest
depletion
Replace the
trees felled
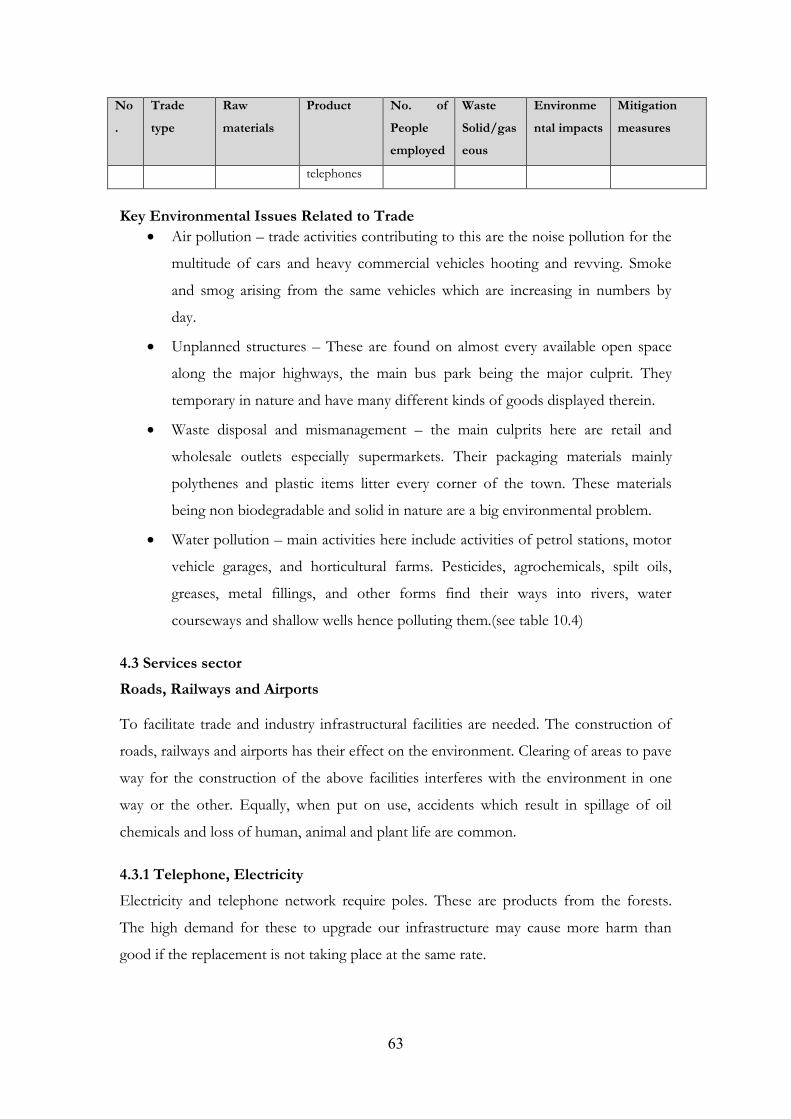
63
No.
Tradetype
Rawmaterials
Product No. ofPeopleemployed
WasteSolid/gaseous
Environmental impacts
Mitigationmeasures
telephones
Key Environmental Issues Related to Trade Air pollution – trade activities contributing to this are the noise pollution for the
multitude of cars and heavy commercial vehicles hooting and revving. Smoke
and smog arising from the same vehicles which are increasing in numbers by
day.
Unplanned structures – These are found on almost every available open space
along the major highways, the main bus park being the major culprit. They
temporary in nature and have many different kinds of goods displayed therein.
Waste disposal and mismanagement – the main culprits here are retail and
wholesale outlets especially supermarkets. Their packaging materials mainly
polythenes and plastic items litter every corner of the town. These materials
being non biodegradable and solid in nature are a big environmental problem.
Water pollution – main activities here include activities of petrol stations, motor
vehicle garages, and horticultural farms. Pesticides, agrochemicals, spilt oils,
greases, metal fillings, and other forms find their ways into rivers, water
courseways and shallow wells hence polluting them.(see table 10.4)
4.3 Services sectorRoads, Railways and Airports
To facilitate trade and industry infrastructural facilities are needed. The construction of
roads, railways and airports has their effect on the environment. Clearing of areas to pave
way for the construction of the above facilities interferes with the environment in one
way or the other. Equally, when put on use, accidents which result in spillage of oil
chemicals and loss of human, animal and plant life are common.
4.3.1 Telephone, ElectricityElectricity and telephone network require poles. These are products from the forests.
The high demand for these to upgrade our infrastructure may cause more harm than
good if the replacement is not taking place at the same rate.

64
4.3.2 Air TransportAirline is a growing industry for both cargo and passenger travel. It facilitates trade in
goods and services. The recent plane accidents result into fire mangled wreckages
littering the ground and loss of human life.
4.3.3 BuildingsThe construction of buildings may start with clearing the ground to create room for
construction. This at times may be through felling trees. Poorly constructed or
maintained buildings may equally be a danger to the occupants and the surrounding
environment. Protruding live electric wires on the walls of buildings may pose danger to
the user. Poorly constructed sewerage systems to discharge wastes from the buildings
may equally be dangerous to the environment. When the sewerage system blocks and the
wastes flow onto the land surface or finds its way to the water sources, it becomes a
potential health hazard.
Table 34: Service sector Linkages to environmental Degradation
No. Services Linkages(Impact) to environmentaldegradation
Proposed interventions
1. Telephone,Electricity
Land lines use wooden poles, extensive useof poles to carry power transmission cables.The two lead to forest depletion.Mobile telephone kiosks porpularly knownas simu ya jamii have caused congestioneven blocking walkways.
Examine the possibility of usingconcrete postsReplant forests with faster maturingspeciesRegulate the growth of these units
2. Railways andRoads
Roads – construction of all weather roadsuse bitumen and ballast. The ease of wearand tear of these roads means more ofthese raw materials are needed.
Railways – though no new lines have beenlaid, the old lines need replacement ofwood slippers leading to forest depletion.
Construct roads using cement blockswhich are believed to be more durable.
Examine the possibility of using othermaterials instead of wood slippers
3. Buildings Poorly planned structures put up usingsubstandard materials.
All buildings should adhere to the laiddown building regulationsAll building developers should beasked to comply with EIA
Key Environmental Issues and Proposed InterventionsPriorityIssues/Challenges
CurrentIntervention
ProposedIntervention
ResponsibleInstitution
Remarks
Emission of toxicwastes into the
- Formulate a law andpolicy setting the
GOKNEMA
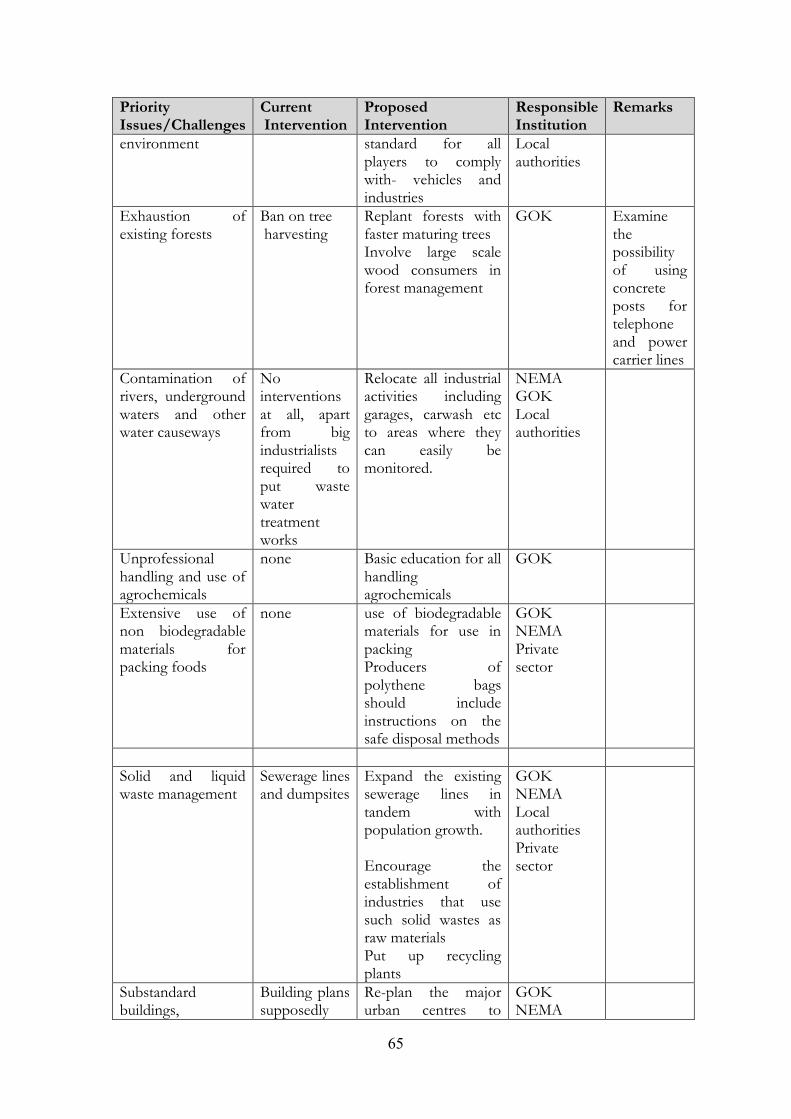
65
PriorityIssues/Challenges
CurrentIntervention
ProposedIntervention
ResponsibleInstitution
Remarks
environment standard for allplayers to complywith- vehicles andindustries
Localauthorities
Exhaustion ofexisting forests
Ban on treeharvesting
Replant forests withfaster maturing treesInvolve large scalewood consumers inforest management
GOK Examinethepossibilityof usingconcreteposts fortelephoneand powercarrier lines
Contamination ofrivers, undergroundwaters and otherwater causeways
Nointerventionsat all, apartfrom bigindustrialistsrequired toput wastewatertreatmentworks
Relocate all industrialactivities includinggarages, carwash etcto areas where theycan easily bemonitored.
NEMAGOKLocalauthorities
Unprofessionalhandling and use ofagrochemicals
none Basic education for allhandlingagrochemicals
GOK
Extensive use ofnon biodegradablematerials forpacking foods
none use of biodegradablematerials for use inpackingProducers ofpolythene bagsshould includeinstructions on thesafe disposal methods
GOKNEMAPrivatesector
Solid and liquidwaste management
Sewerage linesand dumpsites
Expand the existingsewerage lines intandem withpopulation growth.
Encourage theestablishment ofindustries that usesuch solid wastes asraw materialsPut up recyclingplants
GOKNEMALocalauthoritiesPrivatesector
Substandardbuildings,
Building planssupposedly
Re-plan the majorurban centres to
GOKNEMA

66
PriorityIssues/Challenges
CurrentIntervention
ProposedIntervention
ResponsibleInstitution
Remarks
encroachment onurban open spaces.
approved bythe localauthorities
allow for easymovement, decongestwalkways and have inplace an urban masterplan.
Localauthorities
4.3.4 TourismThe District has a lot of potential in tourism resources but most of which are still
untapped. The natural and cultural resources in this region are unique and diverse hence
the need to control the degree and manner in which they are exploited and to anticipate
the effect of the sustainability of tourism by different methods of exploitation in order to
contribute to the conservation and management of the environment.
Tourism and the Environment
Most natural resources such as forests have been depleted by other sectors as
human settlements; construction and agriculture have adversely affected tourism.
There has been a limited impact on our cultures but with the increase in number
of tourists in the area there will be various effects.
Tourism facilities are not up to standard which thus affects the number of
tourists visiting the area. The roads are not badly off.
The Tourism office is regional, hence regional data is as shown below.Table 35: Type of Tourism, Attraction and Potential
No.
Type ofTourism
Attraction No. ofFacilities
Geographical Location Environmentalimpacts
1. Cultural
Tourism
Diverse peoples
cultures, e.g.
Nandis, Keiyos
Dances
Cultural artefacts
Nandi
cultural
center
and
museum
11 km from Eldoret town
along Eldoret - Kapsabet
Road.
Cultural erosion
Promotion of local
economic benefits
Rise in crime rate
Infringement of local
privacy
Spread of
environmental disease
e.g. STI
2. Sport Tourism Athletics training
camps
Origin of the
Infrustructural
development
Promotion of GDP

67
No.
Type ofTourism
Attraction No. ofFacilities
Geographical Location Environmentalimpacts
worlds renowned
athletes and also for
training
Inward and outward
Migration
3. Biological
attractions
Kruger Farm
Lt(game ranch with
giraffes and
heedbucks, Oribi,
Serval Cats, Jackal
Porcupine, ant bear,
birds, e.t.c)
Nandi rock
Bonjoge National
Reserve
Naiberi
Camp
site
Tindiny
o falls
resort
17Km from Eldoret off
Eldoret – Iten Road (Uasin
Gishu)
Nandi South
Habituation of
animals
Littering and soil
erosion
Night game drives and
hiking safaris together
with associated
impacts
Off road driving
4. Geological
attractions
Keben Soda Water
springs(Urugine
water springs
surrounded by very
beautiful scenery)
Chepktit falls
Kormosho water
fall
Nandi South, 120 Km off
Kapenguria Lodwar road
Nandi North
4 Km from Eldoret
International Airport
Uasin Gishu
Eldoret – Webuye Road
Collection of
souvenirs
Pollution
5. Agro tourism Wheat, maize,
horticultural farms
Profile of North Rift Tourism ActivitiesThe North Rift region includes the following districts:-
Uasin Gishu
Trans Nzoia
Keiyo
Marakwet
Nandi North
Nandi South
West Pokot
Turkana
Registered Establishments

68
The following are the registered establishments under the various categories in this
region.
Category NO.
Hotels 77
Restaurants 61
Travel Agents and Tour Operators 8
Tourism Attraction Areas
North Rift region has a lot of areas of tourist potential many of them still unexploited.
There is potential here to optimise the promotion of unique forms of tourism like agro
tourism, sports tourism and cultural based tourism.
Various areas are highlighted in the table below.Table 36: Tourist Attraction Areas in the North Rift Region
Attraction Area LocationDistrict
Access
1. Mt Elgon National ParkTrans Nzoia
28 Km. from Kitale town via Endebes
2. Saiwa swamp National Park (has the rare andendangered Sitatunga antelopes)
Trans Nzoia 20 Km from Kitale off Kitale - Kapenguria road
3. Kitale Nature Reserve(Botanical Garden andGame Sanctuary)
Trans Nzoia 7 Km from Kitale off Kitale - Kapenguria road
4. Delta Crescent Wildlife Sanctuary(GameSanctuary, Lodge and camp site)
Trans Nzoia 7 Km. from Kitale town via Endebes
5. Sirikwa Safaris and Lodge(Lodge, Camping Site,Historical Site and Tour Operator)
Trans Nzoia 30 Km from Kitale off Kitale - Kapenguria road
6. Kitale MuseumTrans Nzoia Kitale town
7. Treasures of Africa MuseumTrans Nzoia Kitale town
8. Kruger Farm Ltd.(Game Ranch with Girraffes,Rheedbuck, Oribi, Serval cats,Jackal, porcupine,ant bear, and birds e.t.c)
Uasin Gishu 17 Km from Eldoret off Eldoret – Iten Road
9. Naiberi River Camp Site Uasin Gishu 25 Km from Eldoret off Eldoret – Eldoret Road
10. Kormosho Water Falls Uasin Gishu 10 Km from Eldoret off Eldoret – Webuye Road
11. Great Nandi Cultural Centre– upcoming cultural centre along Kaptagat road
Uasin Gishu 11 Km from Eldoret along Eldoret – Kapsabet Road
12. Chepkit fallsNandi North 4 Km from Eldoret International Airport off Eldoret
– Kapsabet Road13. Tindinyo falls resort (Campsite, Picnic site and
Lodge along Yala River)Nandi North 20 Km from Kapsabet off Kapsabet Chavakali Road

69
Attraction Area LocationDistrict
Access
14. Nandi Rock and Bonjoge National Reserve Nandi South
15. Keben Soda Water Springs( unique water springssurrounded by very beautiful scenery)
Nandi South 10 Km from Lessos
16. Nasolot National Reserve West Pokot 120 Km from Kapenguria off Kapenguria LodwarRoad
17. Kapenguria Museum West Pokot Kapenguria Town
18. Turkwel Gorge and Power Plant West Pokot 120 Km from Kapenguria off Kapenguria LodwarRoad
19. Kerio Valley Escarpment(Stretching across Keiyoand Marakwet Districts with Various view points)
Keiyo andMarakwetDistricts
20. Cherangani Hills Marakwet, WestPokot, TransNzoia
21. Rimoi National Reserve Keiyo 54 Km from Iten off Iten Kabarnet Road
22. Chebloch Gorge Keiyo andBaringo Boarder
28 Km Kabarnet across Iten Kabarnet Road
23. Tugen Hills(with forest, hills and someagricultural areas)
Baringo Distric
24. Lake Baringo, , Baringo 64 KM from Kabarnet Via Marigat
25. Lake Bogoria Baringo andKoibatek
60 Km from Kabarnet off Kabarnet Nakuru Road
26. Kampi ya Samaki Snake Park Baringo 64 KM from Kabarnet Via Marigat
27. Kapsaraman Museum Baringo 38 KM from Kabarnet Via Kabartonjo
28. Kabarnet Museum Kabarnet Kabarnet town
29. Lake Kamnarok Baringo 50 Km from Kabarnet off Iten Kabarnet Road
30. Lake Turkana Turkana 120 Km from Kapenguria off Kapenguria LodwarRoad
31. Lake TurkanaTurkana Across large parts of Turkana District
32. Central IslandTurkana Within Lake Turkana
There are numerous athletics training camps that are meant to utilise the advantage of
high altitude training. Majority of Kenya’s leading athletes come from this region and the
training camps are owned or associated with some of them. These camps attract
international tourists coming to train and some coming to see this land that produces
such world renowned athletes.
Agro tourism takes place in the expansive tea plantations of Nandi and in the wheat and
maize farms of Uasin Gishu and Trans Nzoia as well as in some flower farms. The
cultures of the people of this region are rich, authentic and diverse and this is a major
selling point here. Establishment of cultural centres and museums could further harness
this potential.

70
The North Rift offers numerous other topographical features which include hills, rivers,
waterfalls and dams. More lodges, camps and picnic sites could be developed in such
places. Water sports facilities could also be developed in the existing water bodies. Kerio
Valley area is also ideal for paragliding.
Way Forwarda) As seen before, this area offers resources for development of unique forms of
tourism like agro tourism, sports tourism and cultural based tourism. The North
Rift has done well in agriculture over the years and its sportsmen have excelled at
the international level. The cultures of the people here are rich and their artefacts
still well preserved. The realization by the local people that the same activities
they have excelled in can attract tourism and earn them more wealth is already
serving as an encouragement to them and all players have to continue building on
this.
b) Investors, both local and foreign need to be encouraged to set up better quality
accommodation facilities. This should include some of the leading companies
investing in chains of hotels and lodges in various other parts of the country to
invest here. There will be benefits from their established marketing networks as
well as the high standards they have set.
c) Facilities such as cultural centres and museums need to be set up to optimise
utilization of the existing potential. Local authorities need to be involved in this.
d) The existing resources that have not been exploited need to be harnessed to
ensure that hey are utilized. This includes water bodies like rivers and dams that
can be used for water sports.
e) The sport of paragliding is of special importance and its development needs to be
pursued vigorously. A group of German Paragliders who visited Iten recently
indicated that Kerio Valley has one of the most ideal conditions worldwide for
this sport.
It is evident that the current situation in this region does present immense opportunity
for investment both in exploiting the untapped resources as well as in hospitality
services. Implementing the measures mentioned above will be a major breakthrough that
will lead to tremendous improvement in visitation by foreign and domestic tourists.
It is evident that the north rift region has a lot of potential most of which is still
untapped. It presents an opportunity to achieving diversification of the country’s tourism
industry with its scenery and other unique forms of tourism like agro tourism, sports

71
tourism and cultural tourism. What is now needed is an all out effort both by
government and private sector stakeholders to optimise the use of existing resources.
4.4 MiningUasin Gishu has no known minerals.
4.4.1 QuarryingThe basement rock in Uasin Gishu is of the metamorphic Precambrian type. The land
surface is of phonolite weathering products formed insitu.
The phonolites are hard and excavation requires blasting and heavy machinery. The
material is normally used for road construction and concrete aggregates. Below the top
soil is a layer of advanced weathering product of phonolite called murram. It is excavated
by hand or machinery and used for road construction and other purposes.
Table 37: Table 4-11: Types of rock and method of extraction
Type of
Quarry
Method
of
Quarryin
g
Ecosyste
m
Geographical
location/Nam
e of Quarry
Size of
Quarr
y
Quantity
extracted
Regulator
y agency
Environmenta
l Impacts
Stone Manual Forest Nabkoi - Currently
not
licenced,
thus not
operationa
l
Forest
Dept.
Devegetation
Land
degradation
Aggregat
e
Manual Farmland
s
Scattered Small
scale
- Not
regulated
No significant
destruction,
rocks
normally on
ground
surface;
improves
agricultural
land
Machiner
y
Farmland
s
Sirikwa - - Local
authority
Landscape
destruction,
land
degradation,
dust,
vibrations

72
Type of
Quarry
Method
of
Quarryin
g
Ecosyste
m
Geographical
location/Nam
e of Quarry
Size of
Quarr
y
Quantity
extracted
Regulator
y agency
Environmenta
l Impacts
Murrum Manual Farmland
s and
roadsides
Scattered Small
scale
- Not
regulated
Land
degradation
Table 38: Table 4-12: Unrehabilitated Quarries
Type of Quarry Status Name/Size Mitigationmeasures
Stone Operationtemporarilysuspended
Revegatation
Aggregate Operations stopped Gituro (private)Approx. 2 acres
Order issued forrehabilitation
Operationstemporarilysuspended
Airport (private)Approx. ½ acres
Currently used forlivestock wateringFenced
Non-operational.Pose danger tohumans andlivestock
Kamukunji(ownershipunknown) approx. 1acre
Partially fenced;needs urgentrehabilitation.
Murram Operations on andoff as need arises
Small scale There is need to monitorand advice refilling andrevegetation
Quarries are not under any one lead agency. Mines and Geology Department comes in
when there is use of explosives to license and supervise their use. Local authority licenses
trade. Therefore it is very difficult to obtain specific data. In addition, there is no
quarrying organization or association.
Key Environmental IssuesTypes of pollutants and wastes in quarries include noise and vibrations where blasting is
applied, and dust. Quarrying involves excavation of rocks and murram. This results in
devegetation and pit formation. There is therefore loss of aesthetic beauty of the
landscape and creation of hazard sites.
4.4.2 Regulatory and Institutional ArrangementNoise, vibration and dust pollution are likely to decrease because of application of
environmental tools specifically EIA and EA. Normally, all products of quarrying and

73
processing are utilized. The top layer soil is used for refilling excavated sites while the
aggregates are used for their intended purpose. Accidental spills and uncollectable
aggregates however may be treated as waste. The resulting dust from aggregates is used
for building block making.
Impacts of pollutants and wastes include respiratory and eye problems, injury and
property loss, due to flying rocks during blasting, cracking structures due to vibrations,
death or injury of humans and livestock as a result of accidental falling into quarry pits.
Mitigation measures include:
i. Environmental Auditing and application of EMP
ii. Fencing of quarry areas
iii. Siting quarries in low population areas
Management challenges include:
i. Lack of documentation
ii. Lack of lead agency directly in charge of quarrying
iii. Lack of legislation to govern quarrying
iv. Small scale quarry operators are not organized
v. Lack of environmental inspectors
Key Environmental Issues and Proposed Interventions
PriorityIssues/Challenges
CurrentIntervention
Proposedintervention
ResponsibleInstitution
Remarks
Lack of lead agencydirectly in charge ofquarrying
Mines andGeology Dept.regulate use ofexplosivesLocal authorityregulate trade
Placequarryingunder Minesand GeologyDept.
NEMA tolobbyParliament toeffect
Neededurgently
Lack of legislation As aboveUse of EMCA
Formulate lawand include inMines andGeologyNEMA toprovideguidelines andstandards
As above “
Lack ofenvironmentalinspectors
DEOs acting Gazette DEOsas inspectorsamong others
NEMA “
Lack ofdocumentation
Site analysis Suggested leadagency todocument
ProposedMines andGeology Dept.
Lack of - Educate As above Once the
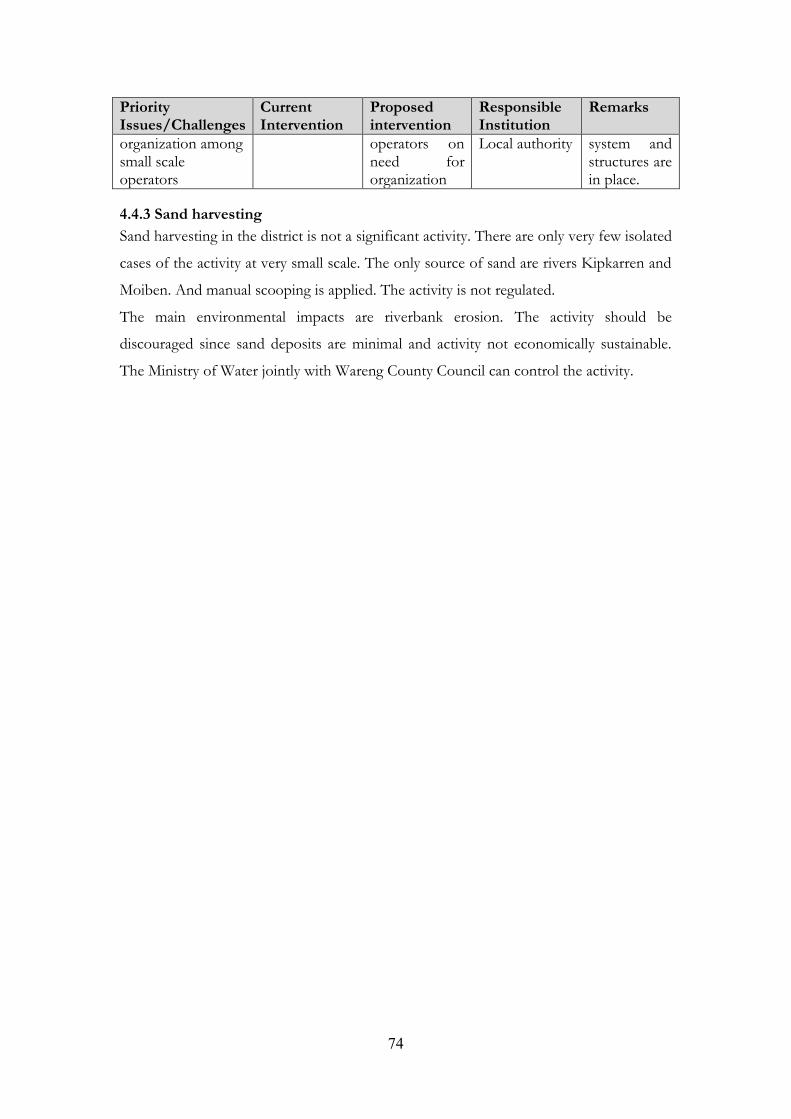
74
PriorityIssues/Challenges
CurrentIntervention
Proposedintervention
ResponsibleInstitution
Remarks
organization amongsmall scaleoperators
operators onneed fororganization
Local authority system andstructures arein place.
4.4.3 Sand harvestingSand harvesting in the district is not a significant activity. There are only very few isolated
cases of the activity at very small scale. The only source of sand are rivers Kipkarren and
Moiben. And manual scooping is applied. The activity is not regulated.
The main environmental impacts are riverbank erosion. The activity should be
discouraged since sand deposits are minimal and activity not economically sustainable.
The Ministry of Water jointly with Wareng County Council can control the activity.

75
CHAPTER FIVE5.0 ENVIROMENTAL HARZARDS AND DISASTERSMost environmental disasters are climate/weather and tectonic movements related.
Environmental disasters have a tendency to retard and erode gains made in building
meaningful livelihood and economic development
Hazard: A potentially damaging physical event, human activity or phenomenon with a
potential to cause loss of life or injury, property damage, social and economic disruption
of life, environmental degradation among other effects. And few cases of Environmental
disasters have been reported in the district.
Disaster: A disaster can be defined as a serious disruption of the functioning of the
society causing widespread human, material or environmental damage and losses which
exceed the ability of the affected community to cope using their own resources
5.1 Extent and trends of environmental hazards and disastersThis section describes environmental hazards and disasters, their extent and trend
including geological, climatic, biological, and technological hazards as well as existing
mitigation measures, physical, indigenous knowledge.
5.1.1 Environmental Hazards and DisastersLike all other districts, Uasin Gishu is vulnerable to disasters and hazards that pose
challenges to achieving the development objectives including poverty alleviation. The
common types of environmental hazards and disasters in the District include floods,fires and (road) accidents. The results of the above have been destruction of the
environment particularly along the riverbanks as well as property and lose of life.
5.1.2 Extent and trends of environmental hazards and disastersFloods:
A total of 67 floods were recorded between the years 1997-2001. Major causes of floods
were overflowing riverbanks and poor drainage, especially at Uhuru Estate.

76
Fires:
Between the years 1997-2001, the district experienced a total of 428 fire episodes. The
Eldoret Municipal Council (EMC) Fire Brigade attended to 152 calls between 2001 and
2003 which left private and government entities with a loss of about Kshs. 8.4 million.
Major causes of fires reported in the district were drought and electrical faults.
Accidents:
A total of 1,107 accidents occurred out of which 268 were fatal, 494 were serious and
345 caused slight injuries to the victims during the 1997-2001 period. Major causes of
accidents were man-made i.e. drivers, pedal cyclists, pedestrians and passengers. When
combined, they accounted for over 80% of the accidents that occurred during that
period.
Mitigation measures
In order to reduce the frequency and extent of damage of the above hazards and
disasters, a number of measures have been put in place. The traffic department has
intensified road safety public awareness campaign through public lectures to all learning
institutions and through public barazas as well as through radio broadcasts to sensitize all
road users on road safety. In addition, the Ministry of Roads and Public Works and EMC
have combined efforts to erect bumps where required and painting road edges. Further,
road signs have been restored to warn and regulate traffic.
Table 39: Status of early warning and preparedness
Sector Type ofdisaster
Humanresource
Technical(equipment)
Financial
Coordinatingmechanism(logistics)
Leadagency
Forest Fires Staff AmbulanceFireengines,First AidKits
DisasterManagement Committee
Forest deptand EMC
Transport
Accidents
Policeandcommunity
“ “ Police,PublicWorks
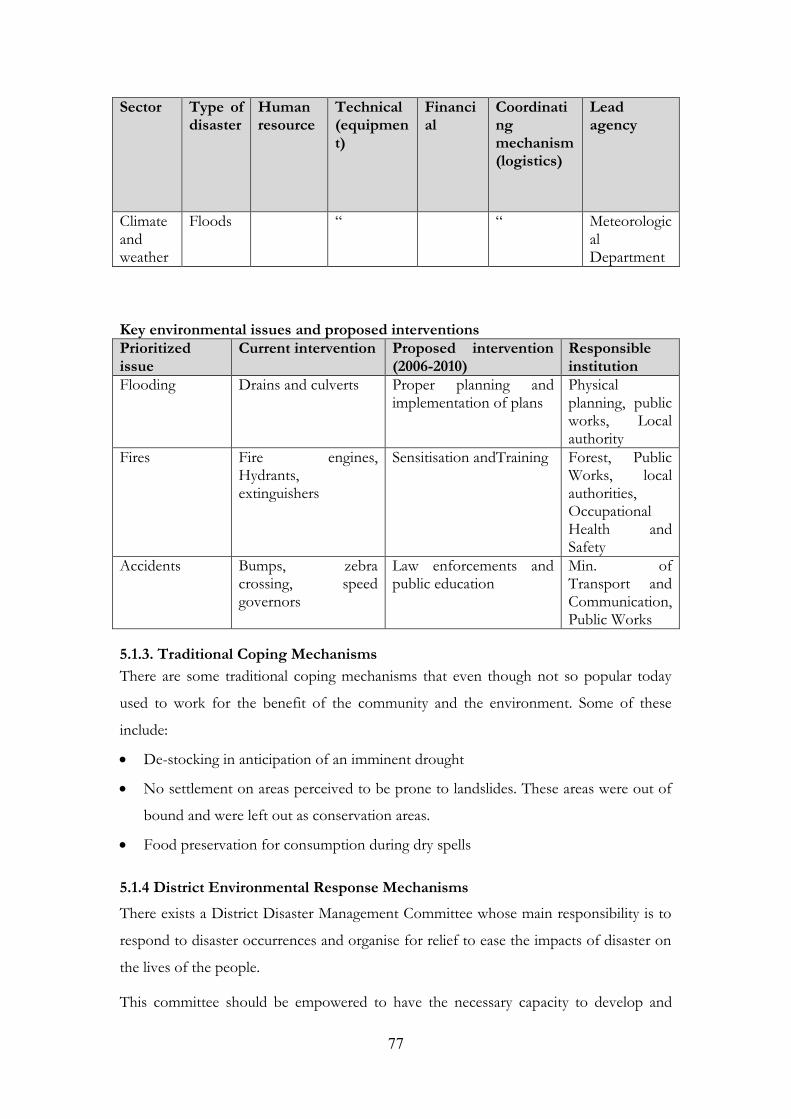
77
Sector Type ofdisaster
Humanresource
Technical(equipment)
Financial
Coordinatingmechanism(logistics)
Leadagency
Climateandweather
Floods “ “ MeteorologicalDepartment
Key environmental issues and proposed interventionsPrioritizedissue
Current intervention Proposed intervention(2006-2010)
Responsibleinstitution
Flooding Drains and culverts Proper planning andimplementation of plans
Physicalplanning, publicworks, Localauthority
Fires Fire engines,Hydrants,extinguishers
Sensitisation andTraining Forest, PublicWorks, localauthorities,OccupationalHealth andSafety
Accidents Bumps, zebracrossing, speedgovernors
Law enforcements andpublic education
Min. ofTransport andCommunication,Public Works
5.1.3. Traditional Coping MechanismsThere are some traditional coping mechanisms that even though not so popular today
used to work for the benefit of the community and the environment. Some of these
include:
De-stocking in anticipation of an imminent drought
No settlement on areas perceived to be prone to landslides. These areas were out of
bound and were left out as conservation areas.
Food preservation for consumption during dry spells
5.1.4 District Environmental Response MechanismsThere exists a District Disaster Management Committee whose main responsibility is to
respond to disaster occurrences and organise for relief to ease the impacts of disaster on
the lives of the people.
This committee should be empowered to have the necessary capacity to develop and

78
implement systems and mechanism not only to react to disaster situation but also to
proactively act on the causative factors of the most occurring disaster situation.
5.1.5 Status of Early Warning and PreparednessCapacities to mitigate and recover from disasters are often constrained by lack of early
warning systems and preparedness, keeping in minds the social dimensions and
livelihood options that hamper the building of resilience from external shocks. Table 41
shows the capacities for disaster preparedness and response in the district.
Table 40: Sector Capacities for Disaster Preparedness and Response
Sector Type ofDisaster
Human Resource Lead agency
Agriculture Drought Extension workers
Health Epidemics Social workers, doctors and
public health officers
Public health
Security Conflicts Security agencies Provincial
Administration
Wildlife Drought
/ Conflict
/ Fire
Warders KWS
Forestry Fire Forest guards Forest Dept
Water Drought Hydrologists WRMA
Source: District Environment Office2007 - UasinGishu District
Key Environmental Issues Lack of Disaster preparedness
Lack of appropriate early warning systems and technologies
Inadequate capacity and resources to handle disasters
Proposed Interventions Adoption of environmental early warning systems and preparedness strategy
Development of response plans
Establishment of food reserves
Plan and stock up and be ready for any disaster

79
Develop appropriate warning systems for each disaster
Ad hoc arrangements and response
Allocate more resource for disaster response
Acquire skill in disaster management

80
CHAPTER SIX6.0 ENVIRONMENTAL EDUCATION AND TECHNOLOGYAs Kenya aspires to achieve sustainable development, there is need to educate the public
on the importance to participate in environmental conservation and application of
appropriate technology while addressing their socio-economic development concerns.
6.1 Status of Environmental EducationIn the endeavour to participate in conservation efforts, there are a number of initiatives
started by various groups to promote environmental educational programmes in the
district. An environmental group called Itinerant Group for Environmental Amelioration
(IGEA) has been involved with about 10 schools in Ntonyiri and Igembe in nursery
establishment and tree planting programmes
Various schools, both secondary and primary have initiated clubs like Wildlife Clubs of
Kenya, 4K clubs and Environmental clubs to promote conservation of the environment
in and around their schools. There are over 50 schools with such initiatives and the
District Environment Officer is co-ordinating their activities.
Moi University which is based in the district offers a full course in Environmental studies
at masters’ level, as well as other aspects of the environment namely forestry, wildlife
management, agriculture, environmental health.
Table 42 documents the environmental programmes and challenges in the district
Table 41: Table 6-1 Status of Environmental Programmes in Schools
No. No. of Schools Types ofEnvironmentalProgrammes
RemarksPrimary Secondary Tertiary
1. Approx. 20 Young farmersclub, wildlifeclub
Most notactive forlack ofleadershipandemphasis
Approx. 40 Young farmersclub, Wildlifeclub,environmentalclub
-ditto-
1 (MoiUniversity)
Forest, wildlife,environmentalclub
Studentinitiativeandvoluntary

81
Source: District Education Office, Eldoret.
Key Environmental issues Lack of awareness creation materials (resource / documentation centre)
Poverty and ignorance and lack of awareness
Poor infrastructure.
Proposed Interventions Develop materials for awareness creation
Collect and gather materials that are appropriate to priority environmental issues
Share and disseminate pertinent information among the stakeholders
Improve infrastructure.
6.2 Public awareness and participationWhen information on the environment is made available to the public it enhances
internalization of values that support sustainable environmental management.
Key PlayersSome of the key players in environmental awareness and public participation in the
district include:
Community self help groups
Provincial administration – organise public meetings
Forest department – collaboration with farmers and stakeholders
Ministry of Agriculture – provision of extension services
NEMA – environmental awareness and sensitisation
Table 42: Status of Environmental Awareness and Participation in the DistrictPrograms
KeyPlayers
Sector EnvironmentalBenefits
Opportunities
Challenges
Interventions
LVEMP
Forest,NEMA,CBOs,community
MENR Afforestation,wetlandconservation,water sourceprotection
Increasedtree cover,provision ofclean water,
Wise use ofwetlands
Financialconstraints
Trainingof trainers
NALEP
Agric.
Community
Agric. Soil and Waterconservation,Agroforestry
Betterfarmingactivities,hunger/povertyeradication
weather Irrigation

82
Programs
KeyPlayers
Sector EnvironmentalBenefits
Opportunities
Challenges
Interventions
Road2000
Publicworks
PublicWorks
Road androadsidemaintainance,Flood control
All yearroundmotorableroads, feweraccidents,lessflooding
- -
Churchbased
Community
Church Afforestation,water sourceprotection/harvesting
Widecoverage
Limitedskilledworkers
Use focalpoints
Massmedia
SAYARE
Information
Information Widecoverage
Follow -up
-
Key Environmental Issues and Proposed interventionsNo. Issue Proposed
Intervention inthe PlanPeriod 2006 -2010
ResponsibleInstitution
Remarks
1. Slowimplementationbecause of initialcost implication
Reduce taxEnforce EMCA
Policy makers, NEMAand Lead Agencies
2. Inadequateinformation onbettertechnologies
CreateawarenessSensitisationMoreinformationcenters
NEMALine ministriesLearning institutions(Moi University,Eldoret Polytechnic,Rift Valley Institute ofTechnology)
ASK showsgood forexhibitions butcost becomingprohibitive.Encouragescience subjectsin schools
3. Laxity in lawenforcement
Motivation;facilitation andadequatepersonnel
GOK Commitmentand selfmotivation veryimportant
4. Use of electricityand other energyforms is expensivehence preferencefor wood fuel
Reduce cost ofelectricity andother forms ofenergy
Policy makersKPLCKENGEN
Use of locallyavailablesources shouldbe encouragede.g. tidal waves,biogas
5. Low selling rates –products moreexpensivetherefore lessaffordable
Reduce taxation Policy makers,Manufactures
Importation analternative

83
No. Issue ProposedIntervention inthe PlanPeriod 2006 -2010
ResponsibleInstitution
Remarks
6. Resistance tochange
Education,awarenesscampaigns, lawenforcement
GOK, CBOs, NGOs,schools/Institutionalcurriculum
Training ofyouth key tochange
7. Lack ofenvironmentalmanagers invariousestablishment
Make it lawrequirement
ResponsibleestablishmentLicensing authoritiesNEMA
6.2.1 Challenges in Creating Environmental Awareness Lack of awareness creation materials (resource / documentation centre)
Incomplete adjudication process and land disputes creating conflict zones
Poverty and high levels of illiteracy
Community apathy
Transport and accessibility
Politicisation of some key environmental resources
6.3 TechnologiesTechnologies can contribute to economic development and environmental conservation
when used appropriately. The level of application of modern technology in the
management of the environment is limited, and includes construction of gabions and
other modern structures. People still largely depend on indigenous technologies,
innovations and practices which include that are diverse and include soil and water
conservation structures like trenches, benches and lining up crop residue, rotational
cropping, preservation technologies and others.
Key Environmental Issues Lack of awareness creation materials (resource / documentation centre)
Poverty and high levels of illiteracy
Community apathy
Poor infrastructure
Low adoption of appropriate technology

84
Proposed Interventions Development of relevant materials
Development of a resource centre
Poverty alleviation programmes and education
Community sensitisation and awareness
Reach out to people in accessible area
Infrastructure rehabilitation
Community training and education
Enhance technology transfer through demonstration
Provision if extension services
6.5 Environmental Information SystemsThe broad challenge in harnessing environmental information and communication
technology include inadequate resources and capacity for information collection,
analysis, storage and dissemination; inadequate awareness among environmental
managers and the public; and lack of knowledge sharing networks at grass root level.
6.5.1 Types and Sources of Environmental InformationMost of the information available in the district is scattered among the different
organisations and institutions and in different forms and types and is available mostly as:
Research and surveys reports
Departmental progress reports
Population Census data and household surveys results
Maps and drawings
Books
Some information is not documented at all, especially that which relates to indigenous
conservation knowledge and natural resources utilisation among others.
Institutions where the data is available
GOK departments on sector specific information and data
Institutions like schools and hospitals
Among the civil society organisations and community groups
All documented data and information is freely accessible to the public, the only
hindrance being the level of literacy among the population. Access to digitalised

2
information is limited.Table 43: Information and data types in the district
Sector Type ofInformation
Form ofInformation
Institutions
Accessconditions/ policy
Users SystemOfupdating
Agriculture
Cropdevelopment andhusbandryAgro-chemicalsAgroindustriesSoil andwaterconservationMarketing
ReportsPostersMapsLeaflets
Dept ofAgriculture
Free CBOFarmersExtensionworkersStaff
Annual
Land LandadjudicationLandregistrationprocessLand sizesParcelnumbersConservation areas
MapsReportsPlans anddrawings
LandAdjudication
Consultation
FarmersPlannersSurveyorsStaffBusinesspeople
Periodical
Health Prevalenceof diseases
Hospitalreports
HospitalsHealthcentresDispensaries andclinics
Restricted Health workers Manualandperiodical
Forestry ForesttypesGazettedforestNon –gazettedforestsPlantationsExoticspeciesBiodiversityCatchment
MapsReports
ForestDept
Free andaccessible
CommunityStaffOtherdepartmentsIndustriesCBOsNGOs
Periodical

3
Sector Type ofInformation
Form ofInformation
Institutions
Accessconditions/ policy
Users SystemOfupdating
sIndustry Types
ProcessingRawmaterialsProductsWaste andby-products
ReportsDiagrams
Industries Free StaffInterestedpersonsGovernmentofficialsFarmers
Wildlife Conservation areasWildlifedispersalareasCases ofconflictsAnimalnumbers,status,behaviour
Maps,Reports,
KWS Free StaffTouristsConservationistsPlannersEnvironmentalistsCommunity
Periodical
Quarrying
QuarrysitesRehabilitated quarriesAbandoned quarriesMaterialsquarried
NEMA Free LocalAuthoritiesContractorsQuarry owners
Fisheries Types offishFishingareasMarketingof fishRivers withfishFish pondsFishfarmers
MapsMagazinesreports
FisheriesDept.
Free Fish farmersStaff
Water RiversWateraccessibilityBoreholesDrainagepatternsWater
MapsReportsDiagrams
WaterDept
Free Water usersassociationWater projectsCommunityStaffOther deptIndustriesFarmers

4
Sector Type ofInformation
Form ofInformation
Institutions
Accessconditions/ policy
Users SystemOfupdating
availabilityIrrigationschemesWater usesAbstraction levels
Climateandweather
Rainfalland temp
TablesReports
Free StaffFarmersCommunity
Regular
Source: District Respective Departments 2007 - UasinGishu District
6.5.2 Status of Environmental Information Management SystemsNewsletters, magazines, books, posters, reports, electronic media, photographs, maps
Institutions where data is availableUniversities- Moi University
NGOs- Etang Kenya, Catholic Dioceses of Eldoret, SMU Kenya, World Vision,
Anglican Church of Kenya,
Regional Authorities – Kerio Valley Development Authority, Eldoret airport
Government – Line ministries, local authorities, LVEMP, NEMA, Moi Teaching and
Referral Hospital,
Information Centres – Kenya National Library, DIDC
Format of Data and accessibility by the Community
The communities may get photocopies of required portions, or have own questionnaires
which they fill. They may also just conduct oral interviews and take short notes. Data is
normally free except in cases where copies have to be made. The Airport Authority
charges a fee to avail data.Table 44: Types of Information by different sectors
Sector Types of Inf. Form Institution Accessconditions
Users UpdatingSystem
Learning Assortment Electronic,books,reports,journals
MoiUniversity,MoiTeachingandRefferalHospital
Students,public

5
Sector Types of Inf. Form Institution Accessconditions
Users UpdatingSystem
Government
Assortment Books,Reports, Maps
Lineministries
Free Public,students
Policies,regulations
NGOs/CBOs
Forestry,water,sanitation,energy,agricultural
Reports, Oral,electronic,maps,magazines
SNVKenya,EtangKenya,WorldVision,Catholic/ACKdiocese,CBOs
Free Students,public
e-machines,newpublications
Authorities Weather,water, forest,agriculture
Electronic,maps
KenyaAirportsAuthority,Eldoret;KVDA
Fee
Free
Students,public
Public
e-media,daily release
Research
Information Centres
Assorted Maps,books,journals,magazines e.t.c
KenyaNationalLibrary,DistrictInformation Centre
Free Students,Public,governmentministries
15.2 Status of Environmental Information Management Systems
Information sharing/ communication mechanism between institutions / lead agencies,
committees, task forces
Correspondences
Publications
Meetings
Workshops/seminars
National Celebrations – WED, WWD, Tourism Day, Tree planting day, e.t.c.
Adequacy of Institutional skills in information management- inadequate or lacking
No. of documentation centres – 2; DIDC, NEMA
Libraries – Moi University (in every campus)
- Kenya National Library
Circulating NewspapersNation
Standard

6
People
Times
MagazinesNEMA
FAN
Local PublicationsConstraints and Challenges in environmental Information /do the collection and
dissemination coordination networking and collaboration among various institutions
Inadequate materials
Limited information centres
Inadequate manpower
Limited funding
Key Environmental Issues The high level of illiteracy
Limited skills in environmental information management
Inadequate ICT infrastructure
Low level of adoption of IT
Lack of central information dissemination centre
Proposed interventions Enhance training in ICT
Construct and equip the DIDC
Facilitate access to internet services for schools, hospitals, institutions and
government departments
Create an environmental information database
Increase funding to cater for environmental information material production,
dissemination and use of mass media(local channels)
Every line ministry to have an accessible information centre
Use of e-media
6.6 Indigenous knowledgeKenya has over 42 different ethnic communities with a very rich indigenous knowledge
(IK) base unique to each community. This cultural diversity offers potential information
that can be exploited to contribute positively to national development and environmental
sustainability. Information on IK has not been well documented and properly packaged
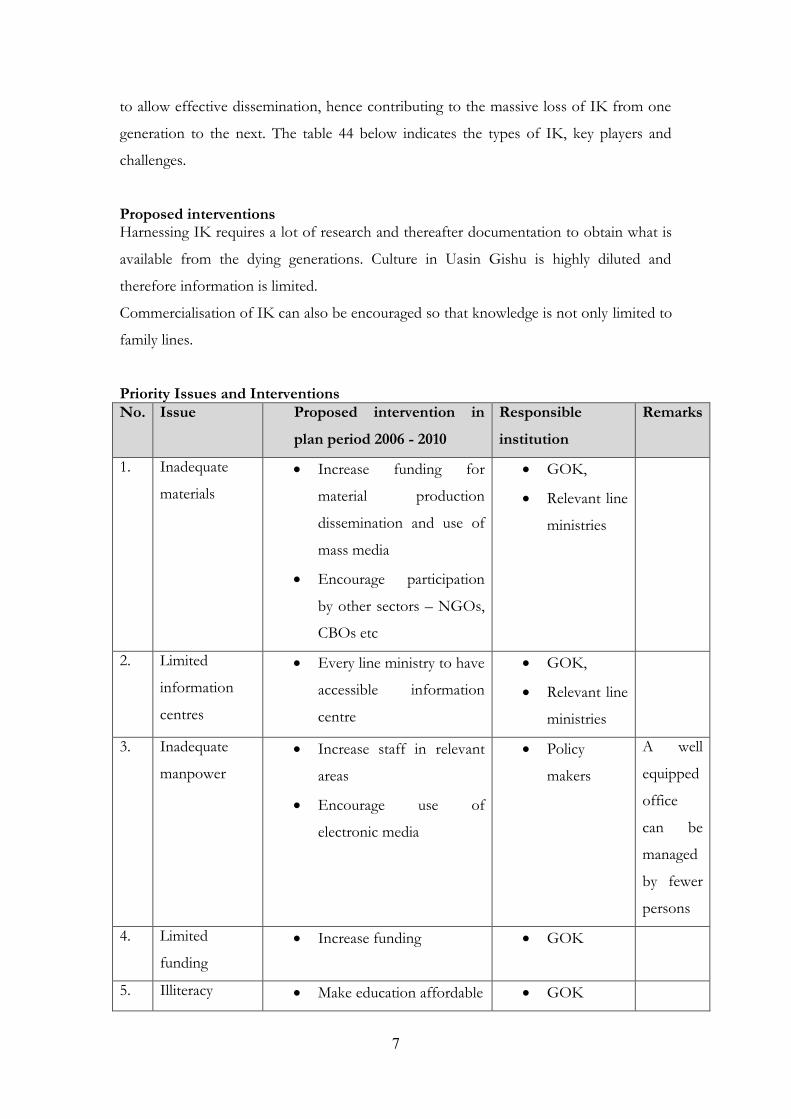
7
to allow effective dissemination, hence contributing to the massive loss of IK from one
generation to the next. The table 44 below indicates the types of IK, key players and
challenges.
Proposed interventionsHarnessing IK requires a lot of research and thereafter documentation to obtain what is
available from the dying generations. Culture in Uasin Gishu is highly diluted and
therefore information is limited.
Commercialisation of IK can also be encouraged so that knowledge is not only limited to
family lines.
Priority Issues and InterventionsNo. Issue Proposed intervention in
plan period 2006 - 2010Responsibleinstitution
Remarks
1. Inadequate
materials Increase funding for
material production
dissemination and use of
mass media
Encourage participation
by other sectors – NGOs,
CBOs etc
GOK,
Relevant line
ministries
2. Limited
information
centres
Every line ministry to have
accessible information
centre
GOK,
Relevant line
ministries
3. Inadequate
manpower Increase staff in relevant
areas
Encourage use of
electronic media
Policy
makers
A well
equipped
office
can be
managed
by fewer
persons
4. Limited
funding Increase funding GOK
5. Illiteracy Make education affordable GOK
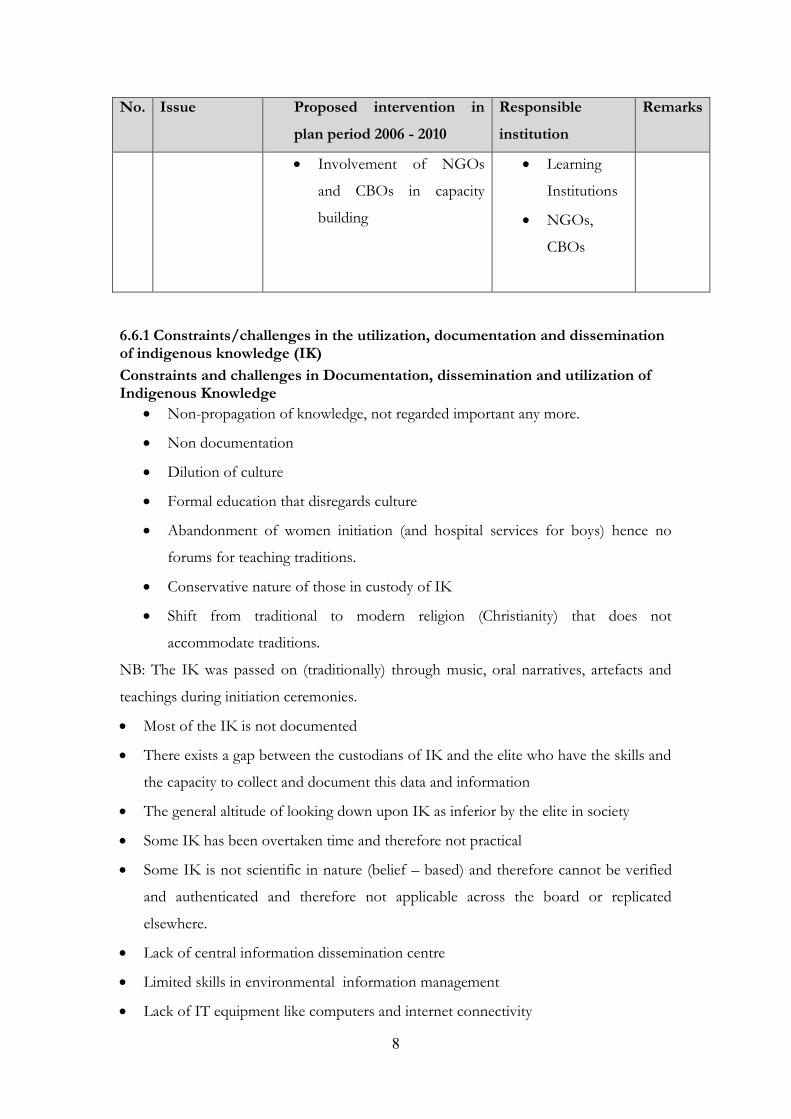
8
No. Issue Proposed intervention inplan period 2006 - 2010
Responsibleinstitution
Remarks
Involvement of NGOs
and CBOs in capacity
building
Learning
Institutions
NGOs,
CBOs
6.6.1 Constraints/challenges in the utilization, documentation and disseminationof indigenous knowledge (IK)Constraints and challenges in Documentation, dissemination and utilization ofIndigenous Knowledge Non-propagation of knowledge, not regarded important any more.
Non documentation
Dilution of culture
Formal education that disregards culture
Abandonment of women initiation (and hospital services for boys) hence no
forums for teaching traditions.
Conservative nature of those in custody of IK
Shift from traditional to modern religion (Christianity) that does not
accommodate traditions.
NB: The IK was passed on (traditionally) through music, oral narratives, artefacts and
teachings during initiation ceremonies.
Most of the IK is not documented
There exists a gap between the custodians of IK and the elite who have the skills and
the capacity to collect and document this data and information
The general altitude of looking down upon IK as inferior by the elite in society
Some IK has been overtaken time and therefore not practical
Some IK is not scientific in nature (belief – based) and therefore cannot be verified
and authenticated and therefore not applicable across the board or replicated
elsewhere.
Lack of central information dissemination centre
Limited skills in environmental information management
Lack of IT equipment like computers and internet connectivity
9
Low level of adoption of IT
The high level of illiteracy
Proposed interventions Construct and equip the DIDC
Enhance training and create opportunities for people to gain IT skills
Facilitate access to internet services for schools, hospitals, institutions and
government departments
Emphasize on the importance of generating, sharing and disseminating relevant
information
Offer training and education opportunities
Inter-sectoral sharing of information
Enhance training and create opportunities for people to gain IT skills
Facilitate access to internet services for schools, hospitals, institutions and
government departments
Emphasize on the importance of generating, sharing and disseminating relevant
information
Offer training and education opportunities

10
CHAPTER SEVEN7.0: ENVIRONMENTAL GOVERNACE AND INSTITUTIONALARRANGEMENTS
7.1 OverviewThere are many institutions involved in the management of the environment in the
district. They range from government departments, Non-governmental organizations,
private sector, associations community based organization and others. With that range of
institutions there is bound to be operational conflicts and duplication of roles and
responsibilities. The problem is compounded by poor co-ordination, inappropriate and
incoherent legislation, lack of adequate institutional frameworks for dealing with
governance issues and a lack of understanding of the importance of these ecosystems for
human health, well-being and prosperity1.
Promotion of awareness among the public and policy-makers of the importance of
proper management of resources and the integration of environmental issues in the
development agenda remains a key priority. Other important priorities include promoting
legislation to take up and implement relevant multilateral environmental agreements,
harmonizing legal frameworks that address these issues, developing appropriate
guidelines, standards and procedures for strategic environmental assessments (SEA) and
environmental impact assessments (EIA), developing model legislation for sectors such
as local councils, tourism, agriculture, and engaging with relevant organizations to
promote sustainable business practices.
7.2 EMCA structures for environmental managementEnvironmental governance in Kenya involves major players who are coordinated by
National Environment Management Authority. There are also sectors of the
government who have aspects of environmental management in their programmes and
are referred to as lead agencies in the EMCA. Environmental Impact Assessment and
Environmental Audit are tools used for planning for upcoming and existing projects
respectively
Some of the Lead Agencies in the district Ministry of Water and Irrigation
1This upholds the Principle of Sustainable development; the development that meets the needs of thepresent without compromising the ability of future generations to meet their own needs.
11
The Kenya Forest Service
Water Resources Management Authority and related Companies and Boards
Ministry of Works
Ministry of Housing
Ministry of Labour and Human Development
Mines and Geology Department
Ministry of Education, Science and Technology Development
Ministry of Medical Services
Ministry of Public Health and Sanitation
Ministry of Energy
Ministry of Agriculture
Ministry of Local Government
Kenya Wildlife Services
Ministry of Livestock Development
Ministry of Fisheries development
EMCA Committees Public Complaints Committee
National Environment Tribunal
District and Provincial Environment Committees
7.3. Status of Environmental Governance & Institutional ArrangementsKey issues on governance, legal framework and institutional arrangements and policies
are: inadequate capacity to interpret and enforce environmental legislations; conflict of
environmental legislations and institutional mandates; undefined pre-existing ownership
rights and utilization of natural resources; use of incentives to strengthen compliance for
environmental management; introduction and acceptance to pay for ecosystem services
and goods; over reliance on elaborate and lengthy court systems and formal institution in
deliberating environmental cases. The government departments that collaborate with
NEMA (District Environment Office) are Forest, Agriculture, Fisheries, Livestock,
Health, Education, Development Office, Water Resources and Management Authority,
Local Authorities as indicated in the table this also includes International organizations
NGOs and CBOs.
Active Environmental NGOs / CBOs / Private Sector OrganizationThere is no fully fledged environmental NGO in the district, but there are a number

12
of active Community Self Help Groups mainly dealing with environmental
conservation through efforts to establish tree nurseries and planting trees. A few are
involved in mobilising people to undertake environmental conservation through
public education and community participation.
The tables 44 and 45 below indicate the policies and legislations that impact on
environment in the district.
Table 45: Policies that Impact on Environment
Title ofpolicy
Year offormulation
Aspects ofenvironmentaddressed bypolicy
Implementingagency(ies)
Coordinatingmechanisms
Challenges inenforcement
Areas onoverlaps&conflictswithEMCA
Forestpolicy
2005 Tree planting,povertyreduction,soil, water &biodiversityconservation,conservationof catchmentareas, forestresearch,training
ForestDept
Participatorycommunity forestprotection,participatory treeplanting,reportingforest pest& diseasesto KEFRI,researchanddissemination offindingsbyKEFRI,
-Inadequate funds.-Poorcoordination-politicalinterferences-inadequate lawenforcement
Overlaps-Research-Training-Publicparticipation
Diagnosis,treatment &prevention ofmalaria
2003 Prevention/control ofvectors
Ministry ofHealth
SeasonalcalendarDatacompiledat MedicalDept
-Inadequate funds
Source; District Forest Office, 2006 & District Public Health Office,
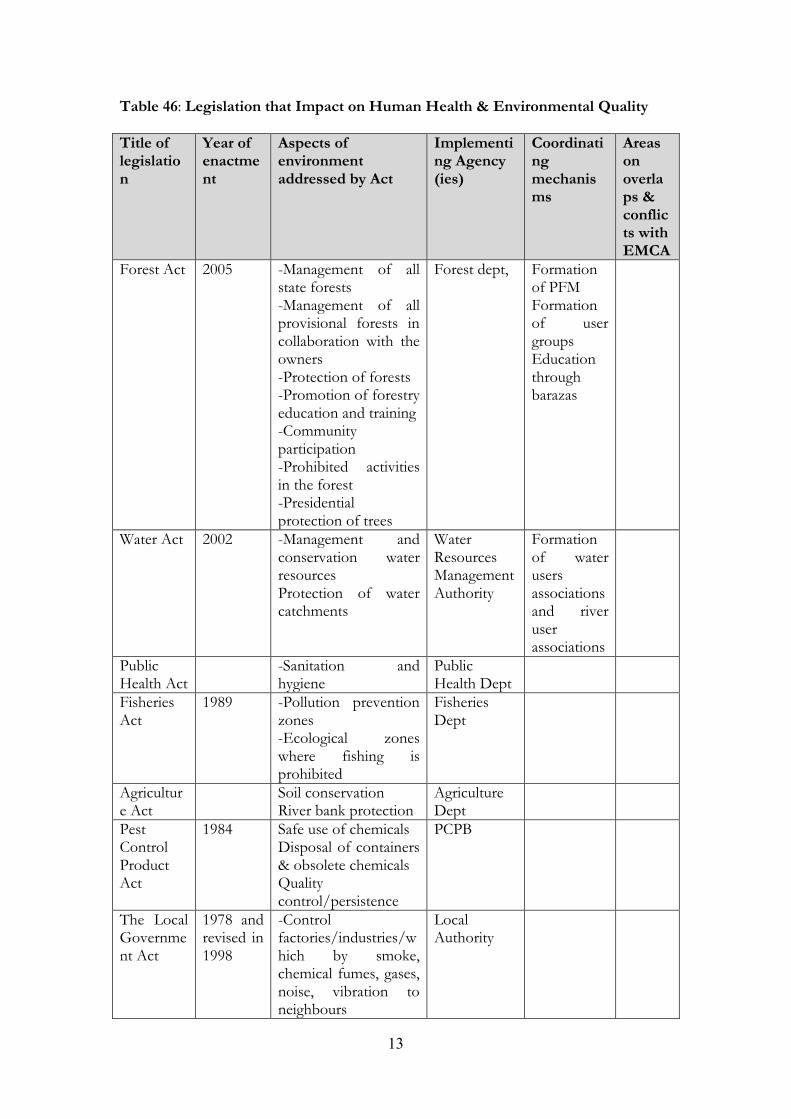
13
Table 46: Legislation that Impact on Human Health & Environmental Quality
Title oflegislation
Year ofenactment
Aspects ofenvironmentaddressed by Act
Implementing Agency(ies)
Coordinatingmechanisms
Areasonoverlaps &conflicts withEMCA
Forest Act 2005 -Management of allstate forests-Management of allprovisional forests incollaboration with theowners-Protection of forests-Promotion of forestryeducation and training-Communityparticipation-Prohibited activitiesin the forest-Presidentialprotection of trees
Forest dept, Formationof PFMFormationof usergroupsEducationthroughbarazas
Water Act 2002 -Management andconservation waterresourcesProtection of watercatchments
WaterResourcesManagementAuthority
Formationof waterusersassociationsand riveruserassociations
PublicHealth Act
-Sanitation andhygiene
PublicHealth Dept
FisheriesAct
1989 -Pollution preventionzones-Ecological zoneswhere fishing isprohibited
FisheriesDept
Agriculture Act
Soil conservationRiver bank protection
AgricultureDept
PestControlProductAct
1984 Safe use of chemicalsDisposal of containers& obsolete chemicalsQualitycontrol/persistence
PCPB
The LocalGovernment Act
1978 andrevised in1998
-Controlfactories/industries/which by smoke,chemical fumes, gases,noise, vibration toneighbours
LocalAuthority

14
Title oflegislation
Year ofenactment
Aspects ofenvironmentaddressed by Act
Implementing Agency(ies)
Coordinatingmechanisms
Areasonoverlaps &conflicts withEMCA
-Control planning ofspecific areas
Source, District Forest, Agriculture, Public Health, Fisheries & Water Offices, 2006
Environmental Impact Assessment (EIA) and Environmental Audit (EA)These are the regulatory tools applied in the districts for activities listed in the first
schedule of EMCA. . Other facilities such as the agro based processing industry; filling
stations also undertake annual EA to ensure compliance. Due to the complicated nature
of Land use activities as well as sensitivity of wetland management, the District
Environment Committee through the District Environment Officer keeps itself
informed of the on going activities.
There are various mechanisms in place in the district that ensure that the environment is
conserved.
EMCA 1999 provided for the establishment of the District Environmental Committees.
The DEC is already constituted and gazette. The Local Authority (Town Council) has an
Environment Division to ensure that the environment’s integrity is maintained. The level
of domestication of MEAs is very low. There is an urgent need for the public to be
informed on the contents of these MEAs.
Key Environmental Issues Overlaps in enforcement
Inadequate research on local Environmental issues
Inadequate capacity for enforcement
Inadequate public participation
Lack of established environmental standards
Lack of mechanisms to establish and measure the extent of environmental
damage
Conflicting legislation
Weak institutional linkages
Low level of domestication and implementation of MEAs
15
Proposed Interventions Harmonization of regulations
Enhanced research on environment al issues
Enforcement of EMCA and other relevant regulations and guidelines
Enhance public participation thorough Barazas and field days
Domesticate and create awareness on MEAs locally
Increase co-operation and strengthen institutional linkages
Enforcement of EMCA (1999) regulations

16
CHAPTER EIGHT8.0 IMPLEMENTATION STRATEGYEnvironmental issues are cross cutting and their incorporation in development plans is
important if sustainable development is to be realized.
Implementation of DEAP will very much depend on the District Development Plans
and the National Policies.
8.1 Stakeholders InvolvementPreparation of the DEAP involved consultations with the Lead agencies, NGOs, private
sector. The stakeholders were identified based on their mandate and the role played in
society. Members of the DDC were key stakeholders in this exercise. The diversity of
DEC is a strength that was realized. However, localised interest or biased opinions are
weaknesses that cannot be overlooked. Limited resources, limited data collection mainly
to secondary data. In most cases, it was not possible to get first hand information. In
addition, compiling the data was limited to limited workforce, there being no resources
for meetings. The report is therefore not exhaustive.
Stakeholder sharing fora are very resourceful. These include meetings, seminars, and
workshops. One such forum introduced within Eldoret Municipality through the district
Environment office and SNV Kenya has been very useful. More such avenues need to be
created for a wider coverage.
Key ways of integrating implementation of DEAP in stakeholders’ policies, plans,
programmes and projects include use of environmental tools especially EIAs and EAs.
The use of these tools is already bearing fruit.
District Development Plans should be formulated in such a way that environmental
issues take centre stage in every sector followed by the implementation of the same.
There is need to review the existing legislation to ensure harmony with the EMCA and
by extension DEAP.

17
Monitoring and Evaluation (M&E)
DEC members will be involved in monitoring and evaluation. It will be a continuous
exercise and discussions will be undertaken at the quarterly DEC meetings. Field visits
will be very necessary to complete the excersise. There is therefore need for sufficient
funds to be set aside for M&E.
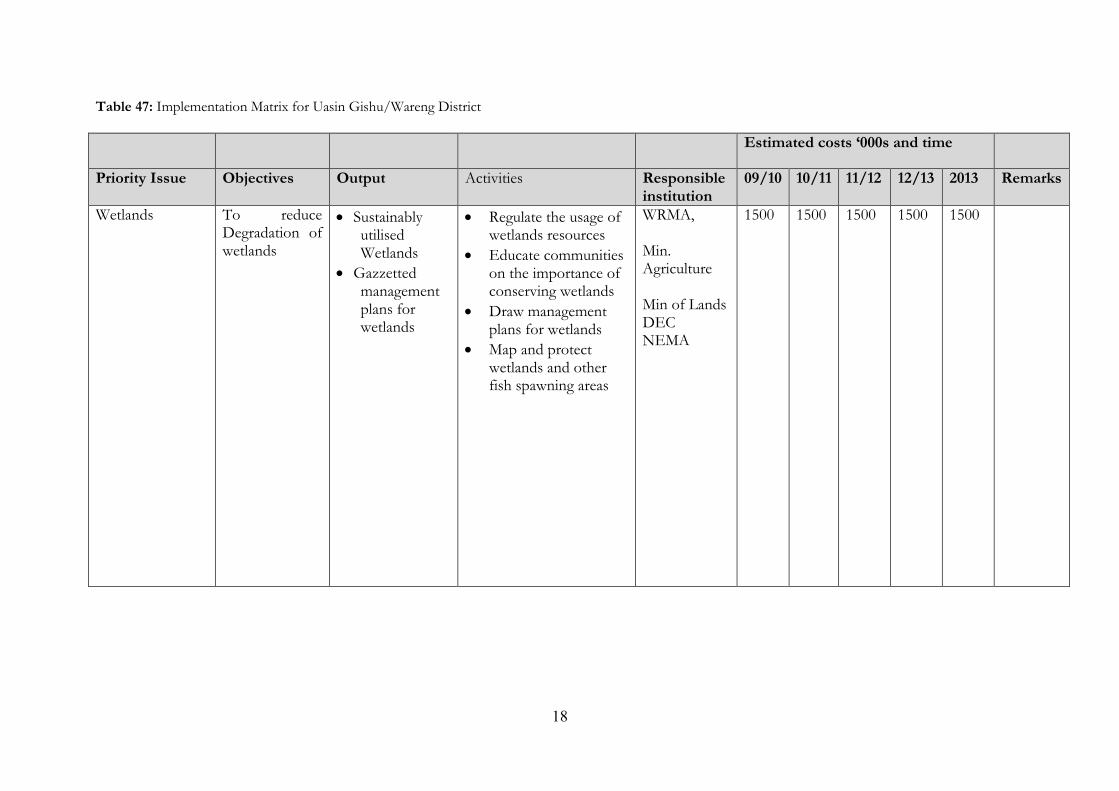
18
Table 47: Implementation Matrix for Uasin Gishu/Wareng District
Estimated costs ‘000s and time
Priority Issue Objectives Output Activities Responsibleinstitution
09/10 10/11 11/12 12/13 2013 Remarks
Wetlands To reduceDegradation ofwetlands
SustainablyutilisedWetlands
Gazzettedmanagementplans forwetlands
Regulate the usage ofwetlands resources
Educate communitieson the importance ofconserving wetlands
Draw managementplans for wetlands
Map and protectwetlands and otherfish spawning areas
WRMA,
Min.Agriculture
Min of LandsDECNEMA
1500 1500 1500 1500 1500

19
Estimated costs ‘000s and time
Priority Issue Objectives Output Activities Responsibleinstitution
09/10 10/11 11/12 12/13 2013 Remarks
Livestock &Grazing
To reduce landdegradation
To reduceOverstockingTo increaselivestockProductivity
Train farmers toformulate feeds
Encourage investorsto establish a hatcherylocally.
Improved pasture/seedstock breeds
Improved livestock breeds Hold livestock marketing
stakeholders meeting Streamline livestock
marketing Activate all sale yard
committees Controlled / deferred
grazing Support establishment of
grazing committees Enact policy on proper
livestock stocking rates Support to livestock off
take programmesReducethe stocking rate
Undertake research ontsetse fly control Controltsetse throughsuppression, spraying andtraps
Control animal diseases Train the communities on
tsetse fly control Train farmers on good
animal husbandry
Min. ofLivestockDLPO
SCC
MTC
ALRMPII
KVDA
DLMC
R.P.K
3000 3000 3000 3000 3000 “

20
Estimated costs ‘000s and time
Priority Issue Objectives Output Activities Responsibleinstitution
09/10 10/11 11/12 12/13 2013 Remarks
Plant fodder crops/trees Construct cattle drinking
water points Make hay for use during
the dry season

21
Estimated costs ‘000s and time
Priority Issue Objectives Output Activities Responsibleinstitution
09/10 10/11 11/12 12/13 2013 Remarks
Air pollution To reduce airpollution
Control burninggarbage
Promote recycling ofwaste
Apply and enforcePublic Health andSanitation Act ondisposal of deadanimals
Designate an area fordumpsite in urbanareas
Min. ofPublic HealthandSanitation,LocalAuthoritiesLocalAuthoritiesMin. ofPublic HealthandSanitation,LocalAuthoritiesDEC
1500 1500 1500 1500 1500 “”

22
Estimated costs ‘000s and time
Priority Issue Objectives Output Activities Responsibleinstitution
09/10 10/11 11/12 12/13 2013 Remarks
Energy To reduceOverdepedenceon wood fuel
To reduceShortage ofwood fuelTo increasesupply ofEnergy
Enhancement ofRural electrificationPromote planting ofquick maturing trees
Introduction of solartechnology
Promote use ofenergy saving devices
Promote use ofalternative sources ofenergy eg
biogas, solar Energy conservation
awareness Promote Agroforestry Establishment of On-
farm woodlots
Min. ofEnergy KFSDEC,DevelopmentOfficersDEC
EnvironmentalEducation &Awareness
To increaselevels ofawareness onenvironmentaleducation
To integrateIndigenousknowledge in
Enhance technologytransfer throughdemonstrations
Prepare andDisseminate relevantenvironmentalinformation Promotepublic participation in
NEMAMin ofEducationLocalAuthoritiesOOPSocial
2000 2000 2000 2000 2000 “”
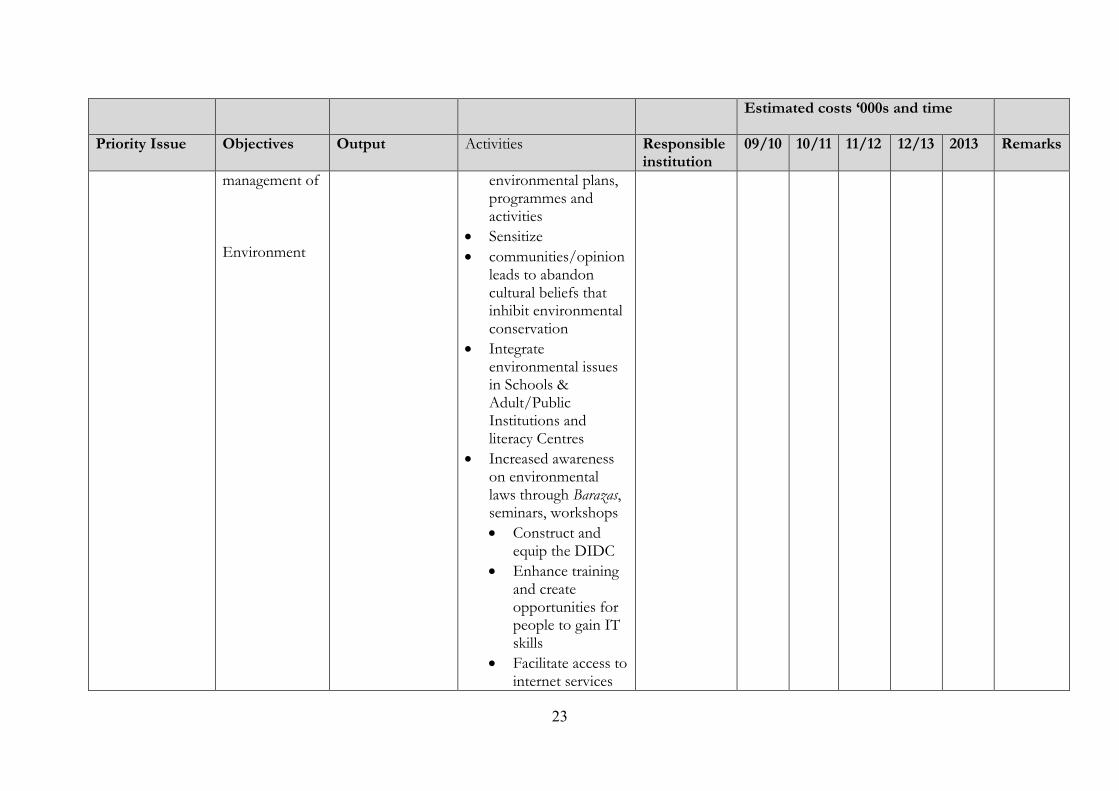
23
Estimated costs ‘000s and time
Priority Issue Objectives Output Activities Responsibleinstitution
09/10 10/11 11/12 12/13 2013 Remarks
management of
Environment
environmental plans,programmes andactivities
Sensitize communities/opinion
leads to abandoncultural beliefs thatinhibit environmentalconservation
Integrateenvironmental issuesin Schools &Adult/PublicInstitutions andliteracy Centres
Increased awarenesson environmentallaws through Barazas,seminars, workshops Construct and
equip the DIDC Enhance training
and createopportunities forpeople to gain ITskills
Facilitate access tointernet services

24
Estimated costs ‘000s and time
Priority Issue Objectives Output Activities Responsibleinstitution
09/10 10/11 11/12 12/13 2013 Remarks
for schools,hospitals,institutions andgovernmentdepartments
Emphasize on theimportance ofgenerating,sharing anddisseminatingrelevantinformation
Offer training andeducationopportunities
Forestry - To havesustainableutilization offorest resources-To conserveand protect theexistingvegetation ingazetted areas,rangelands andcultivated areas
Increasedforest cover
Sustainableuse of forestresources
Communitiesorganized intoconservationgroups andcommittees /users group
CFAs
Replanting/Enrichmentplanting ingazetted areas
Tree nurserydevelopment
Identify and mapdegraded/deforested areas/ sites
Tree planting indegraded sites
Promotion of
KFS
MOA
UasinGishucountyCouncil
WarengTownCouncil
3000 3000 3000 3000 3000 Budgetfiguresare aguide

25
Estimated costs ‘000s and time
Priority Issue Objectives Output Activities Responsibleinstitution
09/10 10/11 11/12 12/13 2013 Remarks
-To re-afforestdegraded areaswith suitabletree
species
-To buildcapacity ofcommunitieson conservationforestry
To regulate useof forestresources
Protection
committees Reduced
charcoalburning
Sustainableutilisation offorestresources
Farm forestry /agroforestry
Awarenesscreation Trainings
Formation offorest /environmentprotectioncommittees andgroups / usersassociation
Enactment of bylaws restrictinguse of cedar inconstruction
Policy on charcoalburning
Stakeholdersmeeting
Regulation ofherbalists
KVDANEMA
OOP
DEC
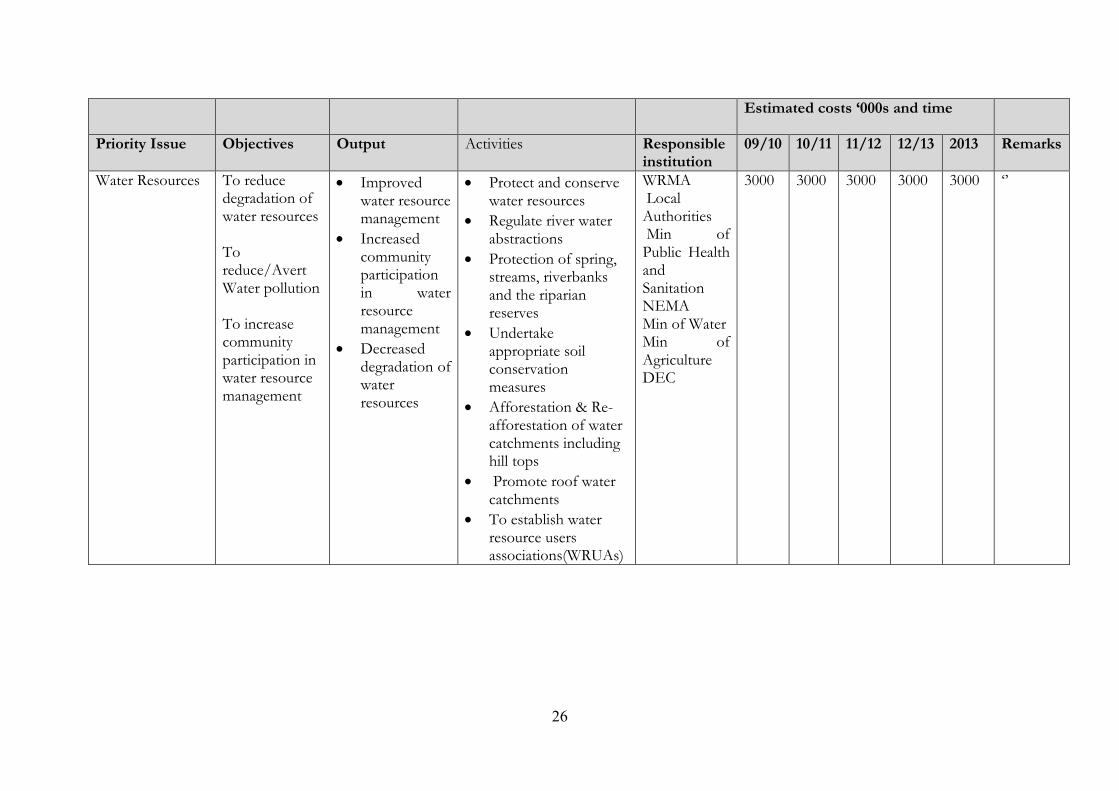
26
Estimated costs ‘000s and time
Priority Issue Objectives Output Activities Responsibleinstitution
09/10 10/11 11/12 12/13 2013 Remarks
Water Resources To reducedegradation ofwater resources
Toreduce/AvertWater pollution
To increasecommunityparticipation inwater resourcemanagement
Improvedwater resourcemanagement
Increasedcommunityparticipationin waterresourcemanagement
Decreaseddegradation ofwaterresources
Protect and conservewater resources
Regulate river waterabstractions
Protection of spring,streams, riverbanksand the riparianreserves
Undertakeappropriate soilconservationmeasures
Afforestation & Re-afforestation of watercatchments includinghill tops
Promote roof watercatchments
To establish waterresource usersassociations(WRUAs)
WRMALocal
AuthoritiesMin of
Public HealthandSanitationNEMAMin of WaterMin ofAgricultureDEC
3000 3000 3000 3000 3000 ‘’

27
Estimated costs ‘000s and time
Priority Issue Objectives Output Activities Responsibleinstitution
09/10 10/11 11/12 12/13 2013 Remarks
Land: Agriculture& Soils
To reduceHigh rate ofsoil erosion andlow crop yields
Reduced soilerosion/Landdegradation
Increasedcropproductivity/food security
Initiate appropriatesoil conservationmeasures
Promote use ofmulching
Build gabions Afforestation and Re-
afforestation Plant cover crops Promote roof water
catchment Plant drought tolerant crops Promote use of
certified seeds promote timely land
preparation andplanting
Initiate appropriatesoil conservationmeasures
Promote indigenouscrops
Promote use of farmyard manures
PromoteAgroforestry
Min. ofAgricultureKFSDEC
1000 2000 2500 3000 2000
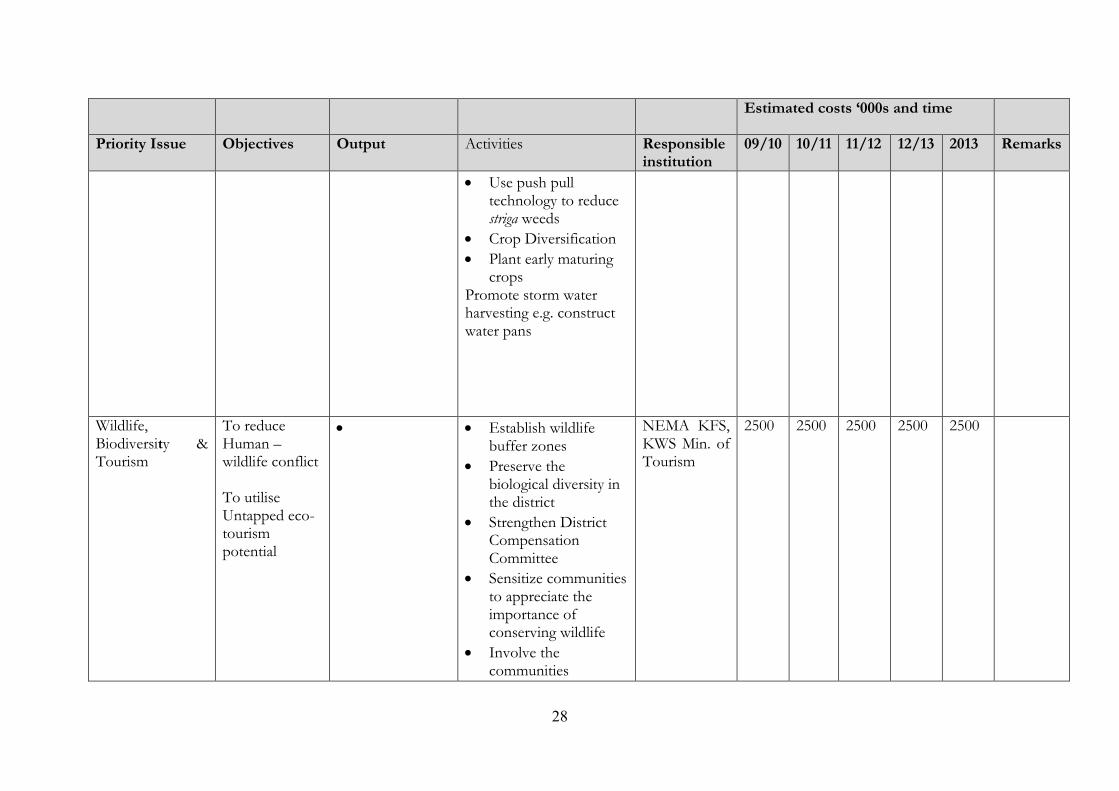
28
Estimated costs ‘000s and time
Priority Issue Objectives Output Activities Responsibleinstitution
09/10 10/11 11/12 12/13 2013 Remarks
Use push pulltechnology to reducestriga weeds
Crop Diversification Plant early maturing
cropsPromote storm waterharvesting e.g. constructwater pans
Wildlife,Biodiversity &Tourism
To reduceHuman –wildlife conflict
To utiliseUntapped eco-tourismpotential
Establish wildlifebuffer zones
Preserve thebiological diversity inthe district
Strengthen DistrictCompensationCommittee
Sensitize communitiesto appreciate theimportance ofconserving wildlife
Involve thecommunities
NEMA KFS,KWS Min. ofTourism
2500 2500 2500 2500 2500

29
Estimated costs ‘000s and time
Priority Issue Objectives Output Activities Responsibleinstitution
09/10 10/11 11/12 12/13 2013 Remarks
in wildlifemanagement
Carry out aninventory ofexisting/potentialtourism sites

30
Estimated costs ‘000s and time
Priority Issue Objectives Output Activities Responsibleinstitution
09/10 10/11 11/12 12/13 2013 Remarks
Biodiversity To avert Lossof biodiversity
Conserve biodiversity- significant areas
Regulate activities ofherbal doctors withregards to access togenetic resources
OperationaliseBiodiversityregulations at theDistrict Level
Plant indigenous trees
Stop illegal logging Preserve indigenous
tree species Protect natural
ecosystems Apply and enforce
EMCA
KFS, KWSMin. ofTourism
500 500 500 500 500

31
Estimated costs ‘000s and time
Priority Issue Objectives Output Activities Responsibleinstitution
09/10 10/11 11/12 12/13 2013 Remarks
Climate &environmentalhazards/Disasters
To reduceFrequentDrought/Famine
To mitigateFlooding
To manageForest Fires
Establish an activeDistrict Disastercommittee
Delineate Riparian Afforestation and Re-
afforestation Initiate appropriate
soil conservationmeasures
Improve farmingmethods
Peg river banks Construct drainage
channels Promote drought
tolerant crops Forest patrols
OOPNEMAMin ofSpecialProgrammesMin. ofFisheriesWRMA KFSMin. ofAgricultureDEC
1000 1000 1000 1000 1000 “”

32
Estimated costs ‘000s and time
Priority Issue Objectives Output Activities Responsibleinstitution
09/10 10/11 11/12 12/13 2013 Remarks
EnvironmentalHealth
To reducePrevalence ofwaterbornediseases
Construct a properdrainage andsanitation facilities
Apply and enforcePublic Health andSanitation Act
Promote treatment ofdrinking water
Protect water sources Apply and enforce
waste managementand Water
quality regulations Construct latrines
/sewer treatmentfacilities
Create awareness onproper hygiene
Promote use oftreated mosquito nets
Min. ofPublic HealthandSanitation,LocalAuthoritiesWRMAWRMA, Min.AgricultureDEC
4000 4000 20000 4000 4000 “”
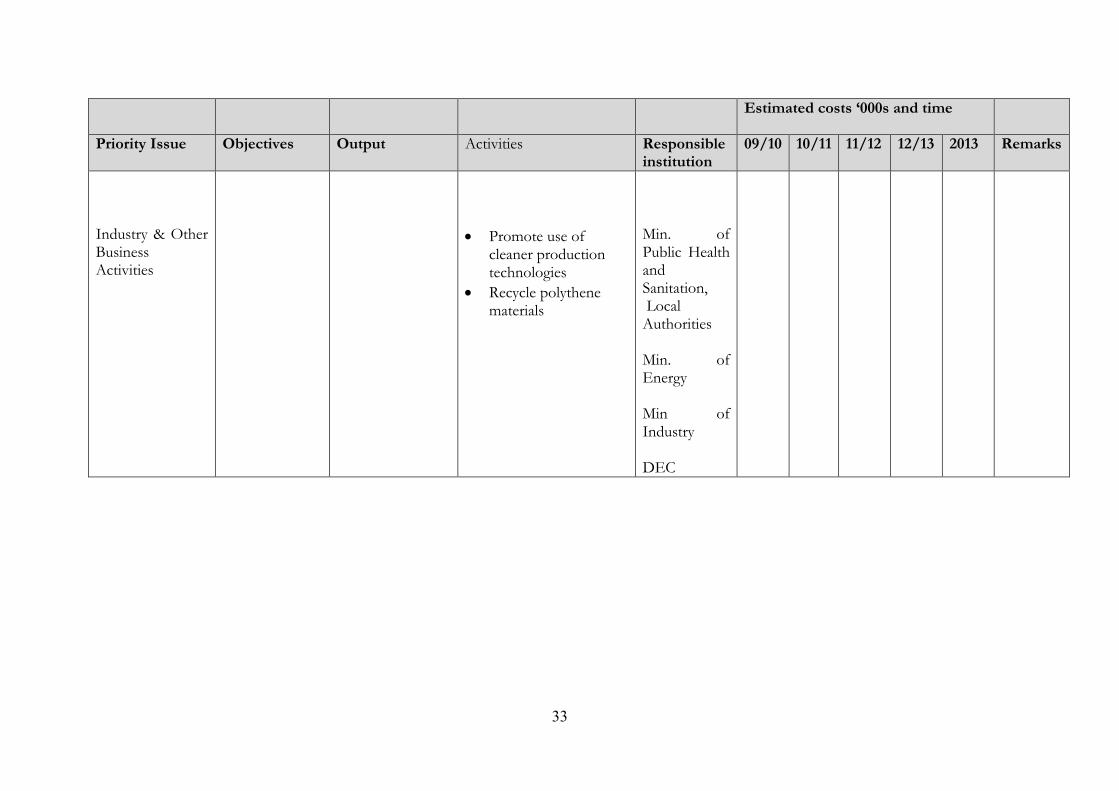
33
Estimated costs ‘000s and time
Priority Issue Objectives Output Activities Responsibleinstitution
09/10 10/11 11/12 12/13 2013 Remarks
Industry & OtherBusinessActivities
Promote use ofcleaner productiontechnologies
Recycle polythenematerials
Min. ofPublic HealthandSanitation,Local
Authorities
Min. ofEnergy
Min ofIndustry
DEC
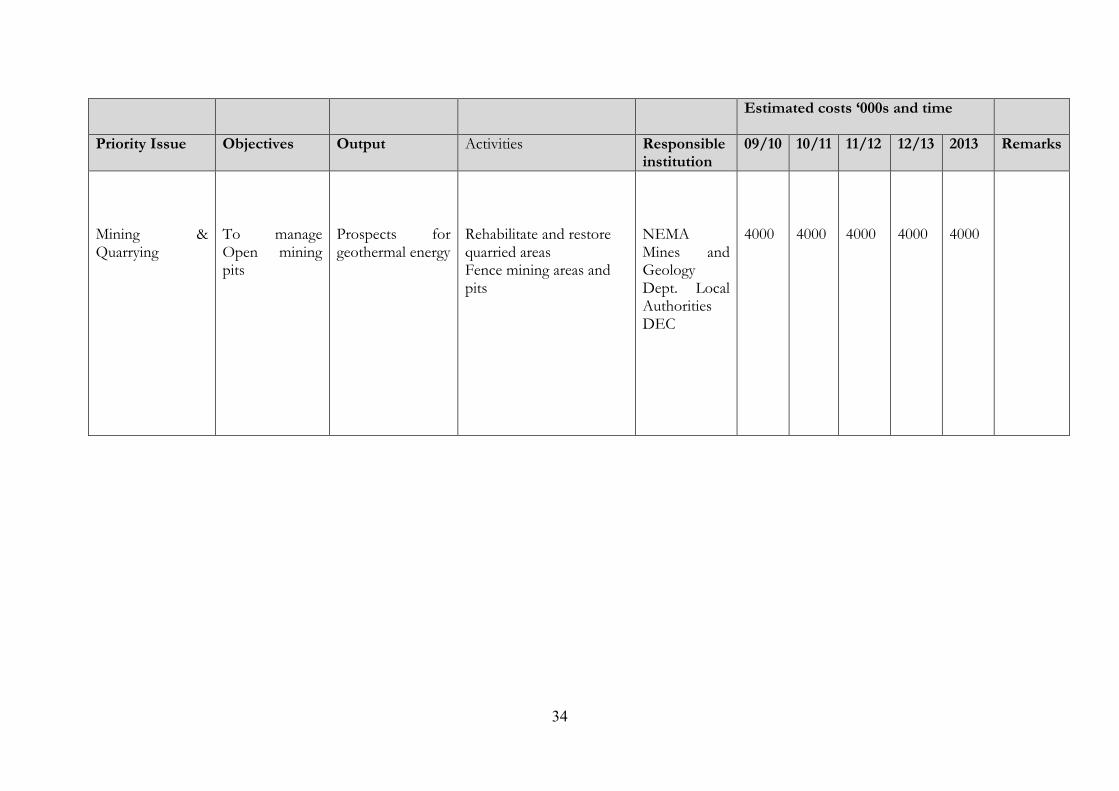
34
Estimated costs ‘000s and time
Priority Issue Objectives Output Activities Responsibleinstitution
09/10 10/11 11/12 12/13 2013 Remarks
Mining &Quarrying
To manageOpen miningpits
Prospects forgeothermal energy
Rehabilitate and restorequarried areasFence mining areas andpits
NEMAMines andGeologyDept. LocalAuthoritiesDEC
4000 4000 4000 4000 4000

35
Estimated costs ‘000s and time
Priority Issue Objectives Output Activities Responsibleinstitution
09/10 10/11 11/12 12/13 2013 Remarks
Settlements &Infrastructure
To reduceUnplannedsettlements
To managePoor sanitationTo reduceprevalence ofDiseases
Prepare urbandevelopment plans
Construct latrines Promote community
education on goodhygiene and sanitation
Apply and enforcePublic Health andSanitation Act
Apply and enforcewaste managementregulations
Apply and enforcePhysical Planning Actand Council Bylaws
Improve existingroads
Promote land useplanning
Construction ofsewerage system
Designate wastedisposal sites
Min. ofPublic HealthandSanitation,LocalAuthoritiesMin of landsDEC
5000 5000 10000 10000 10000
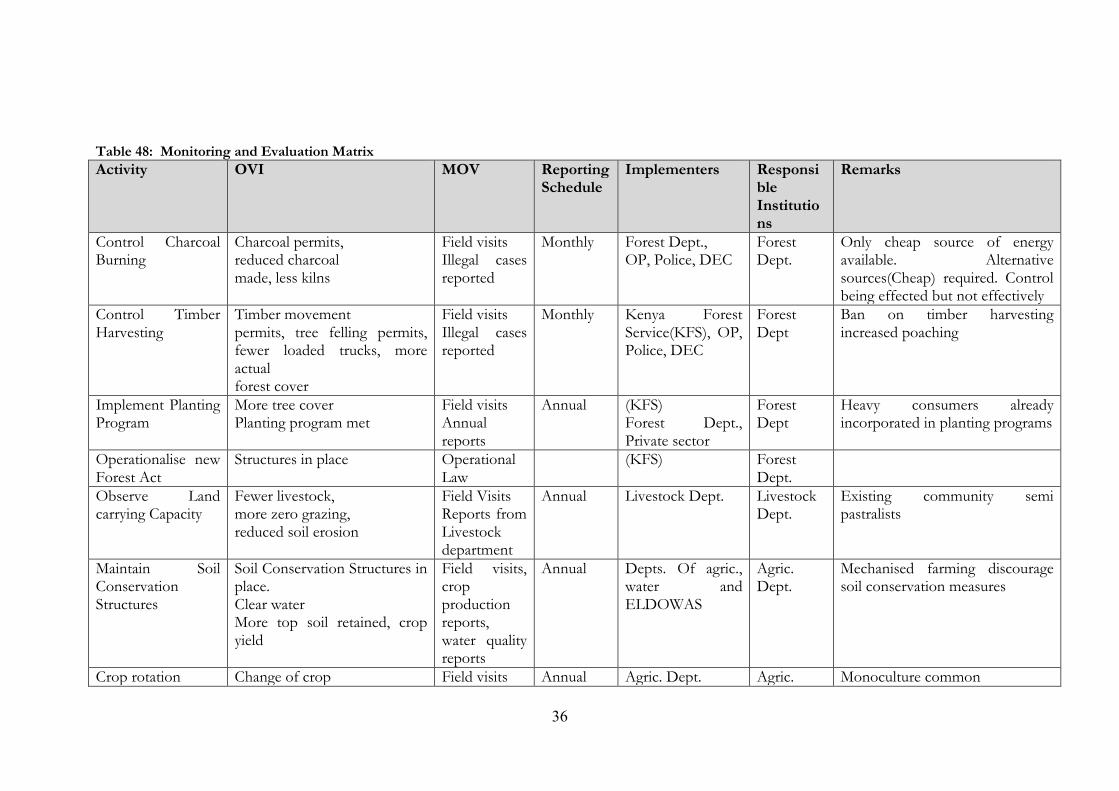
36
Table 48: Monitoring and Evaluation MatrixActivity OVI MOV Reporting
ScheduleImplementers Responsi
bleInstitutions
Remarks
Control CharcoalBurning
Charcoal permits,reduced charcoalmade, less kilns
Field visitsIllegal casesreported
Monthly Forest Dept.,OP, Police, DEC
ForestDept.
Only cheap source of energyavailable. Alternativesources(Cheap) required. Controlbeing effected but not effectively
Control TimberHarvesting
Timber movementpermits, tree felling permits,fewer loaded trucks, moreactualforest cover
Field visitsIllegal casesreported
Monthly Kenya ForestService(KFS), OP,Police, DEC
ForestDept
Ban on timber harvestingincreased poaching
Implement PlantingProgram
More tree coverPlanting program met
Field visitsAnnualreports
Annual (KFS)Forest Dept.,Private sector
ForestDept
Heavy consumers alreadyincorporated in planting programs
Operationalise newForest Act
Structures in place OperationalLaw
(KFS) ForestDept.
Observe Landcarrying Capacity
Fewer livestock,more zero grazing,reduced soil erosion
Field VisitsReports fromLivestockdepartment
Annual Livestock Dept. LivestockDept.
Existing community semipastralists
Maintain SoilConservationStructures
Soil Conservation Structures inplace.Clear waterMore top soil retained, cropyield
Field visits,cropproductionreports,water qualityreports
Annual Depts. Of agric.,water andELDOWAS
Agric.Dept.
Mechanised farming discouragesoil conservation measures
Crop rotation Change of crop Field visits Annual Agric. Dept. Agric. Monoculture common

37
Activity OVI MOV ReportingSchedule
Implementers ResponsibleInstitutions
Remarks
Agriculturalreports
Dept.
Agroforestry AF trees on farmlandsPrivate tree nurseries
Field visitsAgriculturalreportsForestreports
Annual Forest dept.Agric. Dept.Community,CBOs, NGOs
Forestdept.Agric.Dept.
Picking up large mechanizedfarms lack trees
Application oforganic manure
Compost pitsLess inorganicFertilizerpurchased/applied
Field visitsDatacollection,farm fertilizeroutlets
Annual Agric. Dept.Community
Agric.Dept.
Crop diversification Varied crops produced Field visitsAgriculturalreports
Annual Agric. Dept.Community
Agric.Dept.
Limited to small scale producers
Reduce soilpollution
Cleaner environment,higher water quality,higher soil fertility
Field visitsLab tests
Annual Water dept., Agric.Dept, anduniversity
Agric.Dept.Waterdept.
Control riparianreserveencroachment
Reserves not cultivatedReserves planted withfodder crops astree cover
Field visits Annual Agric. Dept, OP,Water dept.
Agric.Dept.Waterdept.
Problem chronic
Control quarryingand sand harvesting
Activities controlled Field visits Annual Local authority Localauthority
Currently no dept. is in charge.Local authorities collect revenuefor trade.
Proper wastemanagement
Sanitary landfillsin place
Field visitsReports from
Annual Local authority Localauthority
Open dumping practiced and notcontrolled

38
Activity OVI MOV ReportingSchedule
Implementers ResponsibleInstitutions
Remarks
Dumping sitesfenced and manned
Littering reducedOpen dumping inundesignated areasstopped
localauthorities
Enforce polluterpays principle
Revenue raised ReportedcasesReturns fromKRA
quarterly NEMA, KRA,Police, OP
NEMA,Police
No guidelines to its application
Education onchemical handling
Informed communityTrainings held
InterviewsReturns fromagriculture&Min. ofTrade andIndustry
Annual Agric., Trade andIndustry,community
Agric.Dept,Trade andIndustry
Chemical handlers on farms areignorant and therefore exposed
Mandatory effluentpre-treatment forfactories
Treatment worksin place
Effluent qualityat entry point tosewer system
Site visitsLab. Tests
quarterly Trade andIndustry, localauthority, Water
Trade andindustry,LocalAuthority
Some industries skip pre-treatment
Recycle/re-usepolythene
Collection pointsestablishedRecycle plants set up
Site visits Annual Trade andIndustry, KNCCI,local authority,NEMA, KAM
NEMA,KNCCI,trade andIndustry,KAM
National policy needed
Create Informationcentres
Centres in place Site visits Annual NEMA, DDO,Local authorities,
NEMA,DDO,
Limited access to Moi UniversityLibrary, District information
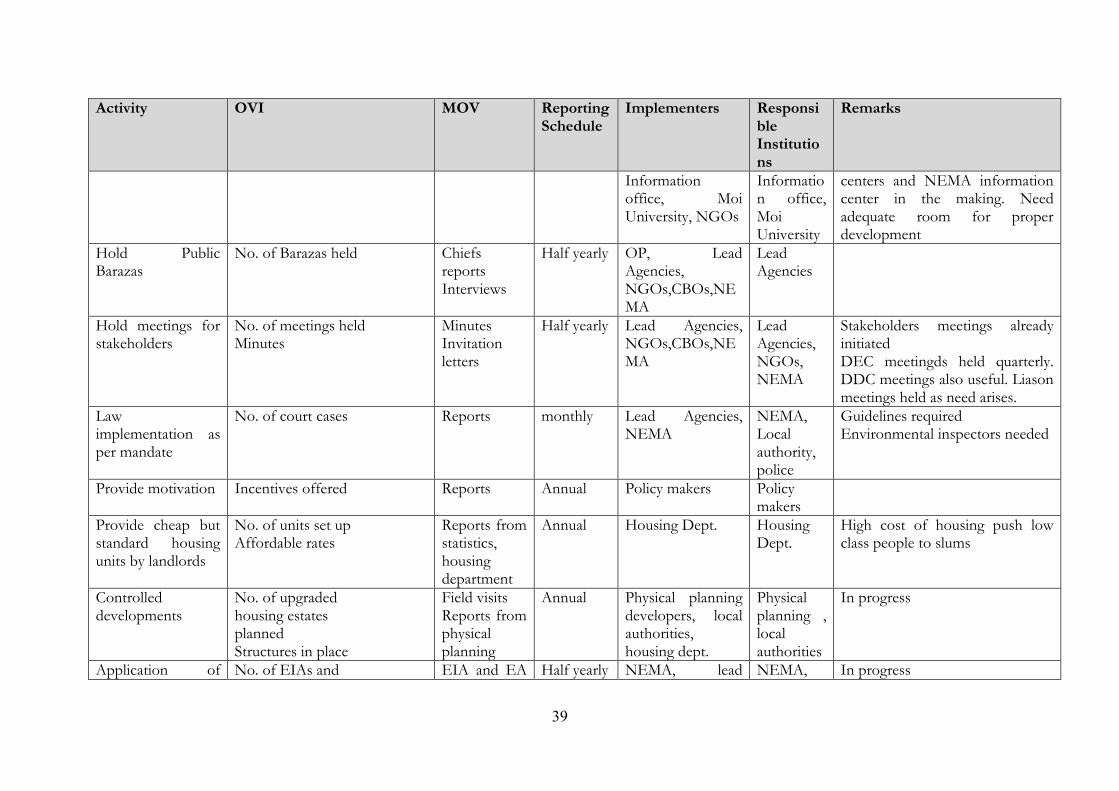
39
Activity OVI MOV ReportingSchedule
Implementers ResponsibleInstitutions
Remarks
Informationoffice, MoiUniversity, NGOs
Information office,MoiUniversity
centers and NEMA informationcenter in the making. Needadequate room for properdevelopment
Hold PublicBarazas
No. of Barazas held ChiefsreportsInterviews
Half yearly OP, LeadAgencies,NGOs,CBOs,NEMA
LeadAgencies
Hold meetings forstakeholders
No. of meetings heldMinutes
MinutesInvitationletters
Half yearly Lead Agencies,NGOs,CBOs,NEMA
LeadAgencies,NGOs,NEMA
Stakeholders meetings alreadyinitiatedDEC meetingds held quarterly.DDC meetings also useful. Liasonmeetings held as need arises.
Lawimplementation asper mandate
No. of court cases Reports monthly Lead Agencies,NEMA
NEMA,Localauthority,police
Guidelines requiredEnvironmental inspectors needed
Provide motivation Incentives offered Reports Annual Policy makers Policymakers
Provide cheap butstandard housingunits by landlords
No. of units set upAffordable rates
Reports fromstatistics,housingdepartment
Annual Housing Dept. HousingDept.
High cost of housing push lowclass people to slums
Controlleddevelopments
No. of upgradedhousing estatesplannedStructures in place
Field visitsReports fromphysicalplanning
Annual Physical planningdevelopers, localauthorities,housing dept.
Physicalplanning ,localauthorities
In progress
Application of No. of EIAs and EIA and EA Half yearly NEMA, lead NEMA, In progress
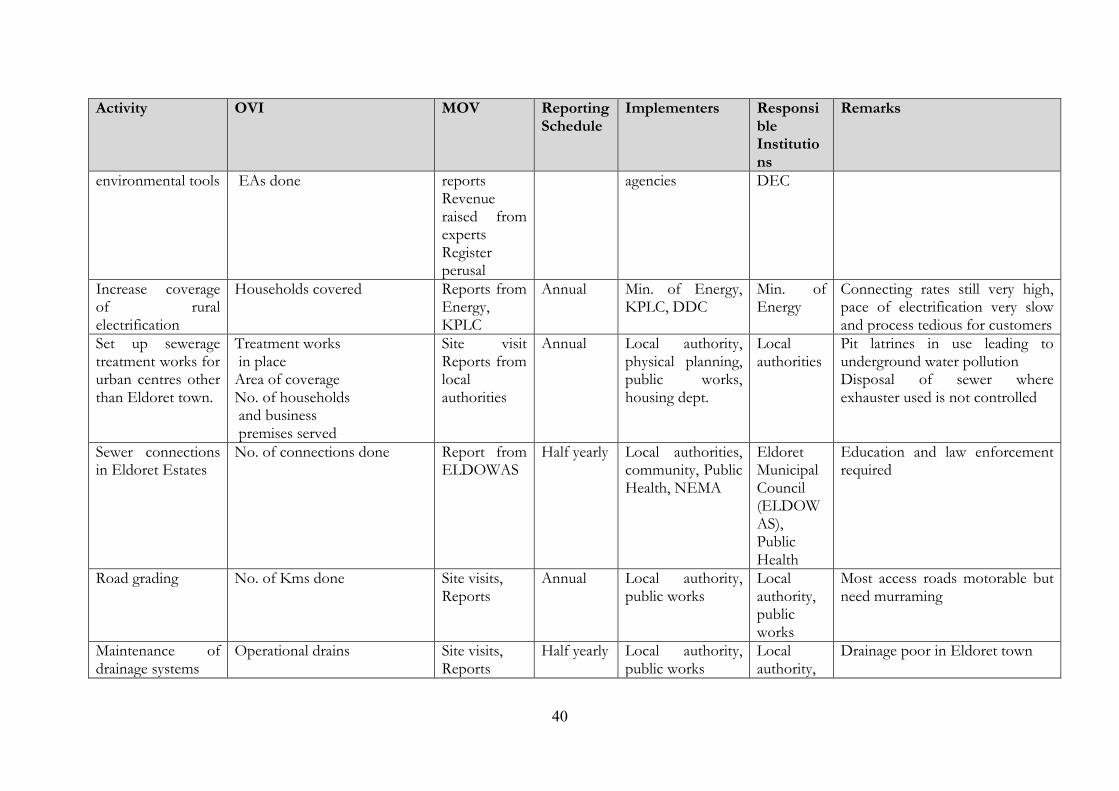
40
Activity OVI MOV ReportingSchedule
Implementers ResponsibleInstitutions
Remarks
environmental tools EAs done reportsRevenueraised fromexpertsRegisterperusal
agencies DEC
Increase coverageof ruralelectrification
Households covered Reports fromEnergy,KPLC
Annual Min. of Energy,KPLC, DDC
Min. ofEnergy
Connecting rates still very high,pace of electrification very slowand process tedious for customers
Set up seweragetreatment works forurban centres otherthan Eldoret town.
Treatment worksin place
Area of coverageNo. of householdsand businesspremises served
Site visitReports fromlocalauthorities
Annual Local authority,physical planning,public works,housing dept.
Localauthorities
Pit latrines in use leading tounderground water pollutionDisposal of sewer whereexhauster used is not controlled
Sewer connectionsin Eldoret Estates
No. of connections done Report fromELDOWAS
Half yearly Local authorities,community, PublicHealth, NEMA
EldoretMunicipalCouncil(ELDOWAS),PublicHealth
Education and law enforcementrequired
Road grading No. of Kms done Site visits,Reports
Annual Local authority,public works
Localauthority,publicworks
Most access roads motorable butneed murraming
Maintenance ofdrainage systems
Operational drains Site visits,Reports
Half yearly Local authority,public works
Localauthority,
Drainage poor in Eldoret town
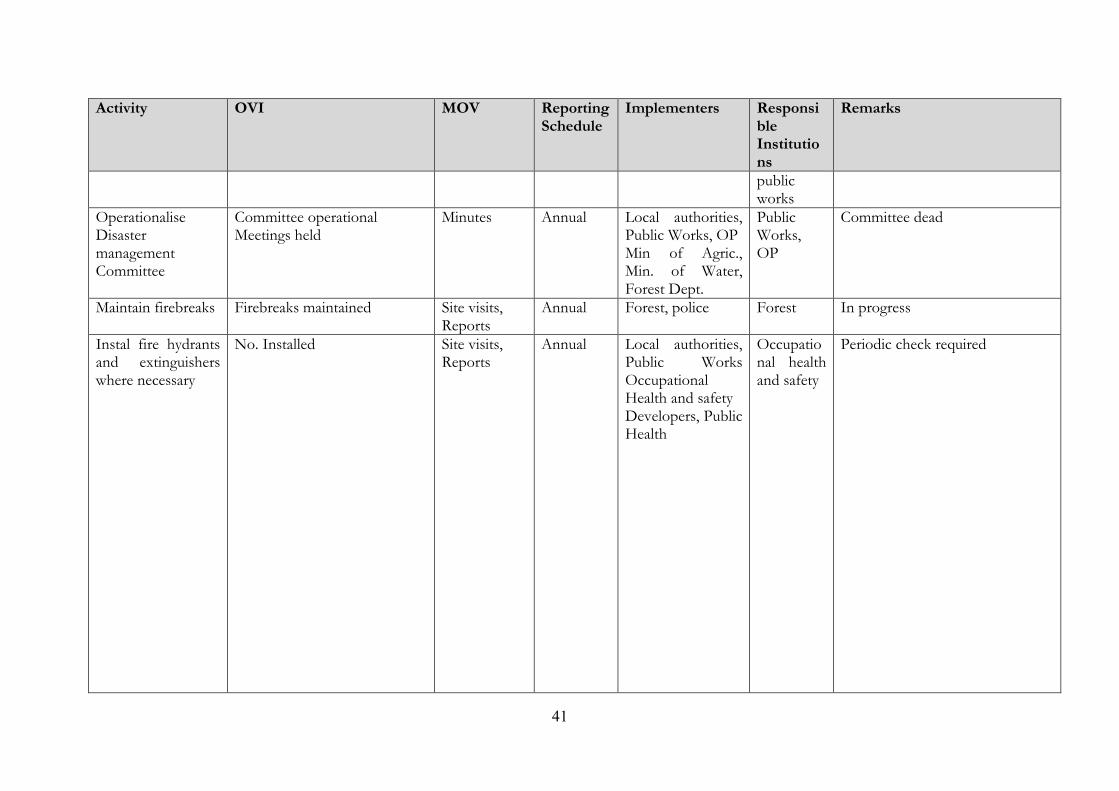
41
Activity OVI MOV ReportingSchedule
Implementers ResponsibleInstitutions
Remarks
publicworks
OperationaliseDisastermanagementCommittee
Committee operationalMeetings held
Minutes Annual Local authorities,Public Works, OPMin of Agric.,Min. of Water,Forest Dept.
PublicWorks,OP
Committee dead
Maintain firebreaks Firebreaks maintained Site visits,Reports
Annual Forest, police Forest In progress
Instal fire hydrantsand extinguisherswhere necessary
No. Installed Site visits,Reports
Annual Local authorities,Public WorksOccupationalHealth and safetyDevelopers, PublicHealth
Occupational healthand safety
Periodic check required
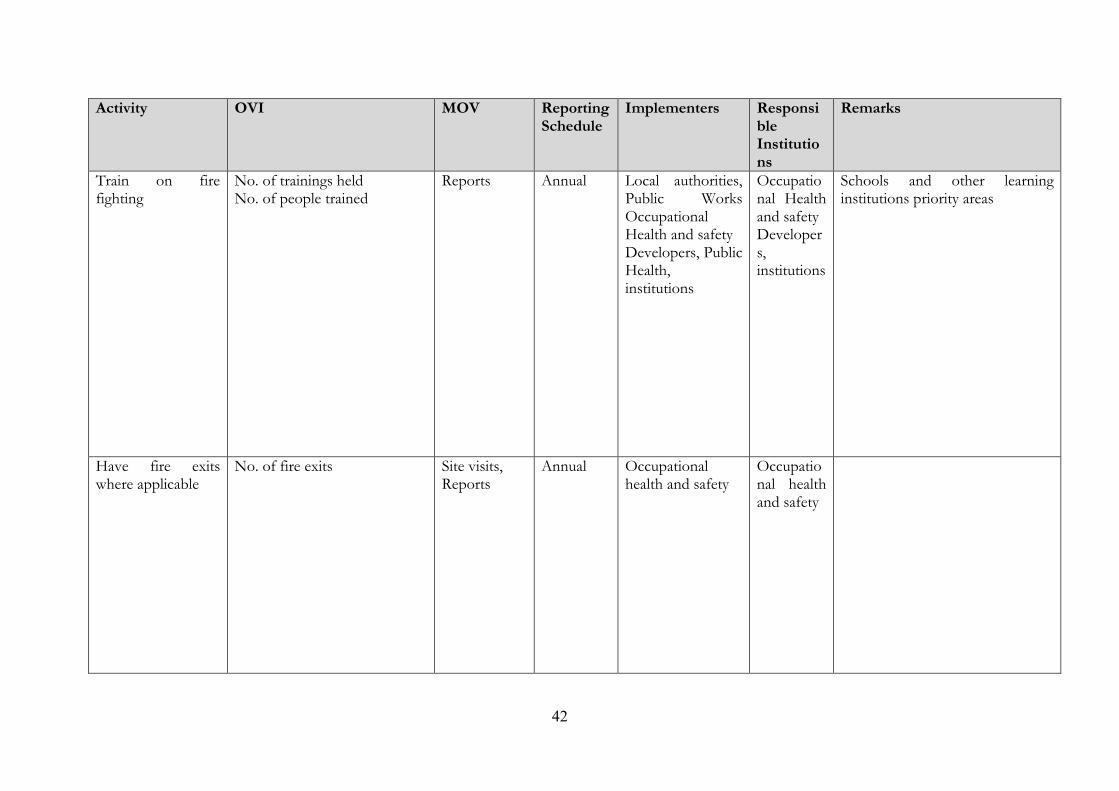
42
Activity OVI MOV ReportingSchedule
Implementers ResponsibleInstitutions
Remarks
Train on firefighting
No. of trainings heldNo. of people trained
Reports Annual Local authorities,Public WorksOccupationalHealth and safetyDevelopers, PublicHealth,institutions
Occupational Healthand safetyDevelopers,institutions
Schools and other learninginstitutions priority areas
Have fire exitswhere applicable
No. of fire exits Site visits,Reports
Annual Occupationalhealth and safety
Occupational healthand safety

43
Activity OVI MOV ReportingSchedule
Implementers ResponsibleInstitutions
Remarks
Activity OVIs (objectively verifiableindicators)
MoVs(MeansofVerification)
Reportingschedule
Implementers Responsibleinstitutionsfor M&E
Remarks
Forest patrols Increased vegetation coverReduced cases of logging
No of patrolsIllegal casesof loggingreportedReports
Quarterly KFS KFSK.W.S
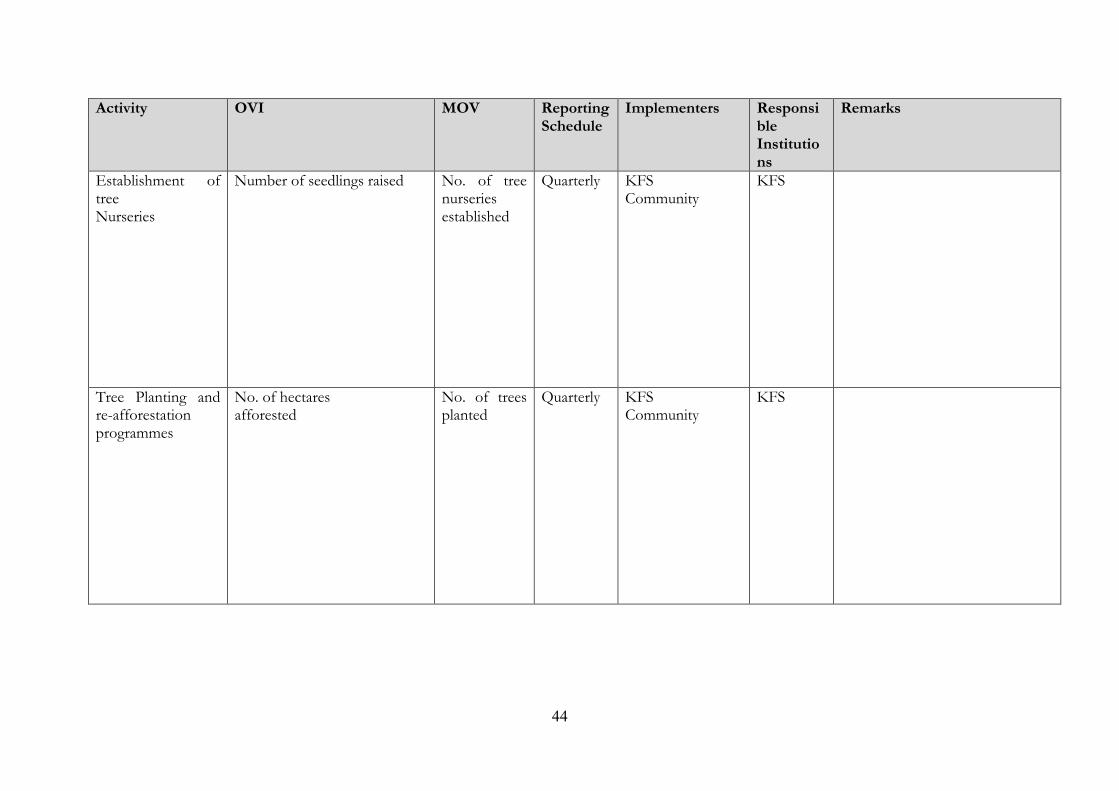
44
Activity OVI MOV ReportingSchedule
Implementers ResponsibleInstitutions
Remarks
Establishment oftreeNurseries
Number of seedlings raised No. of treenurseriesestablished
Quarterly KFSCommunity
KFS
Tree Planting andre-afforestationprogrammes
No. of hectaresafforested
No. of treesplanted
Quarterly KFSCommunity
KFS

45
Activity OVI MOV ReportingSchedule
Implementers ResponsibleInstitutions
Remarks
Communitysensitisation andawareness onwetlandconservation
No of people sensitised No. oftrainingsconductedReports
Quarterly Water BoardWRMA
DECWaterBoardWRMA
Curb charcoalburning andtransportation
Reduced cases of charcoalburning
No. of casesreported
Quarterly Forest DeptKWSPoliceProvincialAdministration
KFSKWS

46
Activity OVI MOV ReportingSchedule
Implementers ResponsibleInstitutions
Remarks
Identify andinventorise theexisting Wetlands
No. of wetlands identified No. ofinventories(entry)
Quarterly D.E.CWater BoardWRMAMinistry of landand settlement
Reclamation andrehabilitation ofwetlands
No. of wetlands reclaimed &rehabilitated
No of wetlands covered withtrees
No. ofwetlandsidentified andsurveyed(functional)
No ofseedlingsplanted
Quarterly Forest Dept ForestDeptD.E.CCountycouncilWaterboards

47
Activity OVI MOV ReportingSchedule
Implementers ResponsibleInstitutions
Remarks
Gazettement ofwetlands
No. of wetlandsgazetted
No. ofgazettenotices
Quarterly D.E.CWater BoardWRMAMinistry of landand settlement
D.E.C
Inventory ofwetlands
No of inventories Reports Quarterly D.E.C N.E.M.A
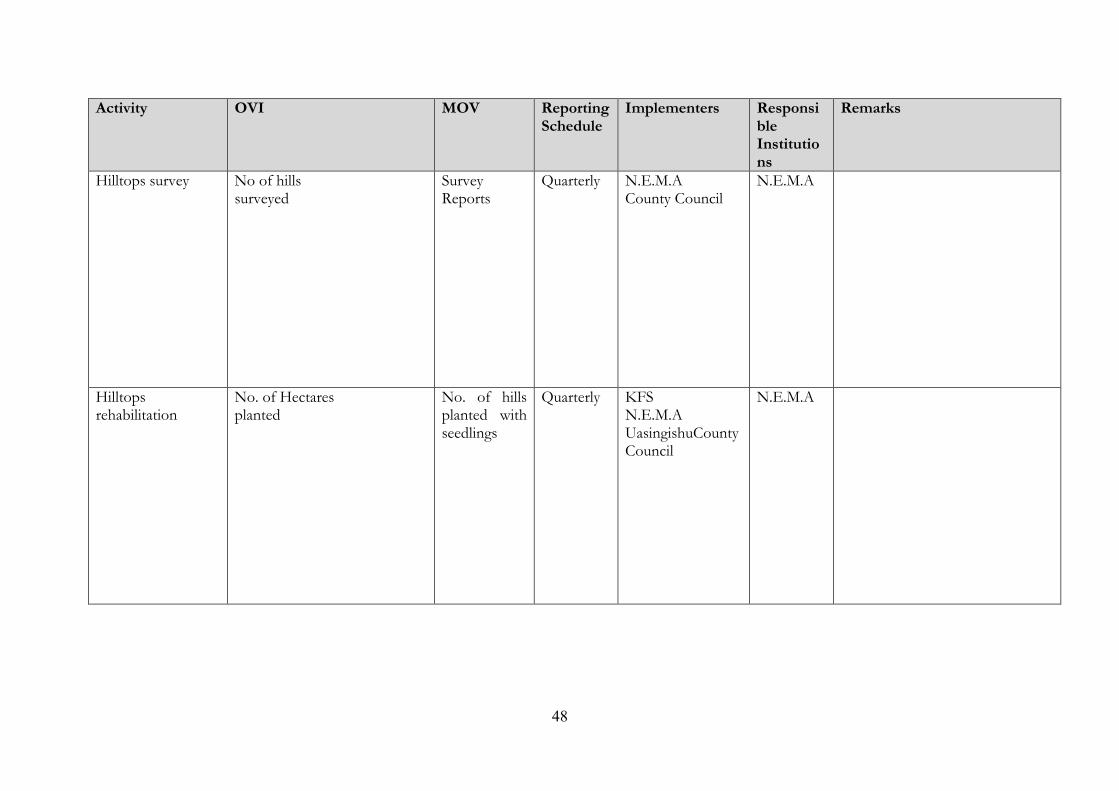
48
Activity OVI MOV ReportingSchedule
Implementers ResponsibleInstitutions
Remarks
Hilltops survey No of hillssurveyed
SurveyReports
Quarterly N.E.M.ACounty Council
N.E.M.A
Hilltopsrehabilitation
No. of Hectaresplanted
No. of hillsplanted withseedlings
Quarterly KFSN.E.M.AUasingishuCountyCouncil
N.E.M.A
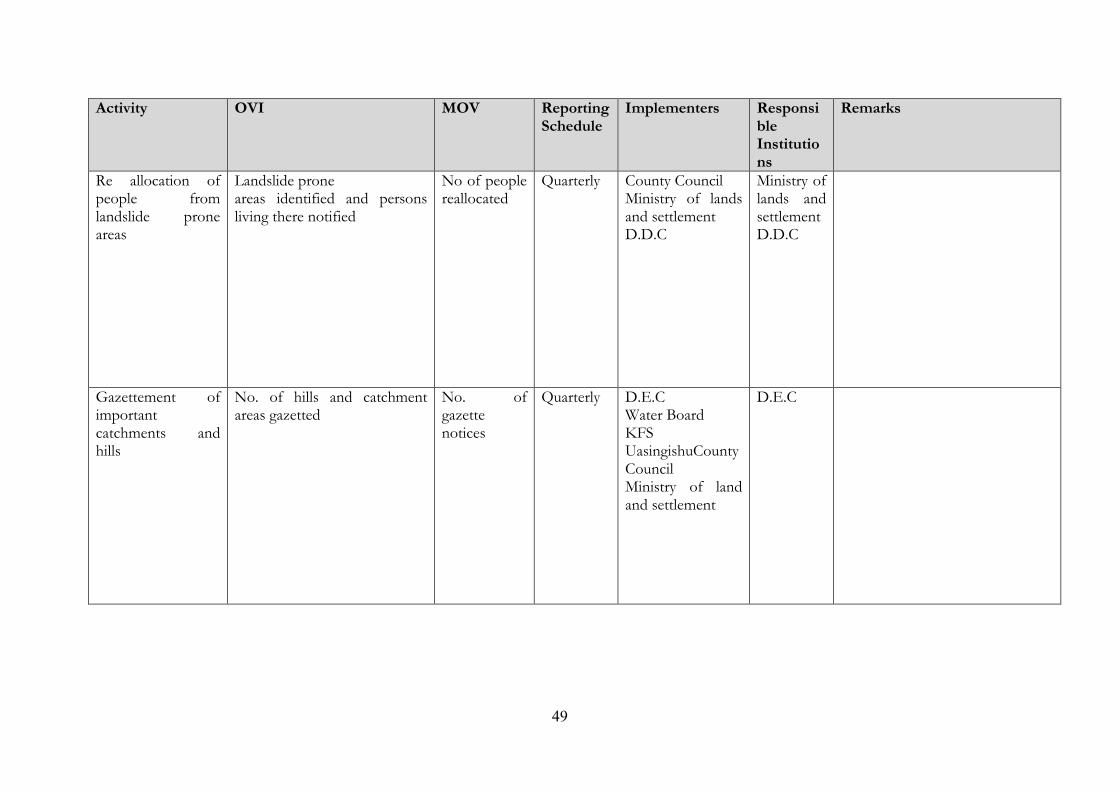
49
Activity OVI MOV ReportingSchedule
Implementers ResponsibleInstitutions
Remarks
Re allocation ofpeople fromlandslide proneareas
Landslide proneareas identified and personsliving there notified
No of peoplereallocated
Quarterly County CouncilMinistry of landsand settlementD.D.C
Ministry oflands andsettlementD.D.C
Gazettement ofimportantcatchments andhills
No. of hills and catchmentareas gazetted
No. ofgazettenotices
Quarterly D.E.CWater BoardKFSUasingishuCountyCouncilMinistry of landand settlement
D.E.C
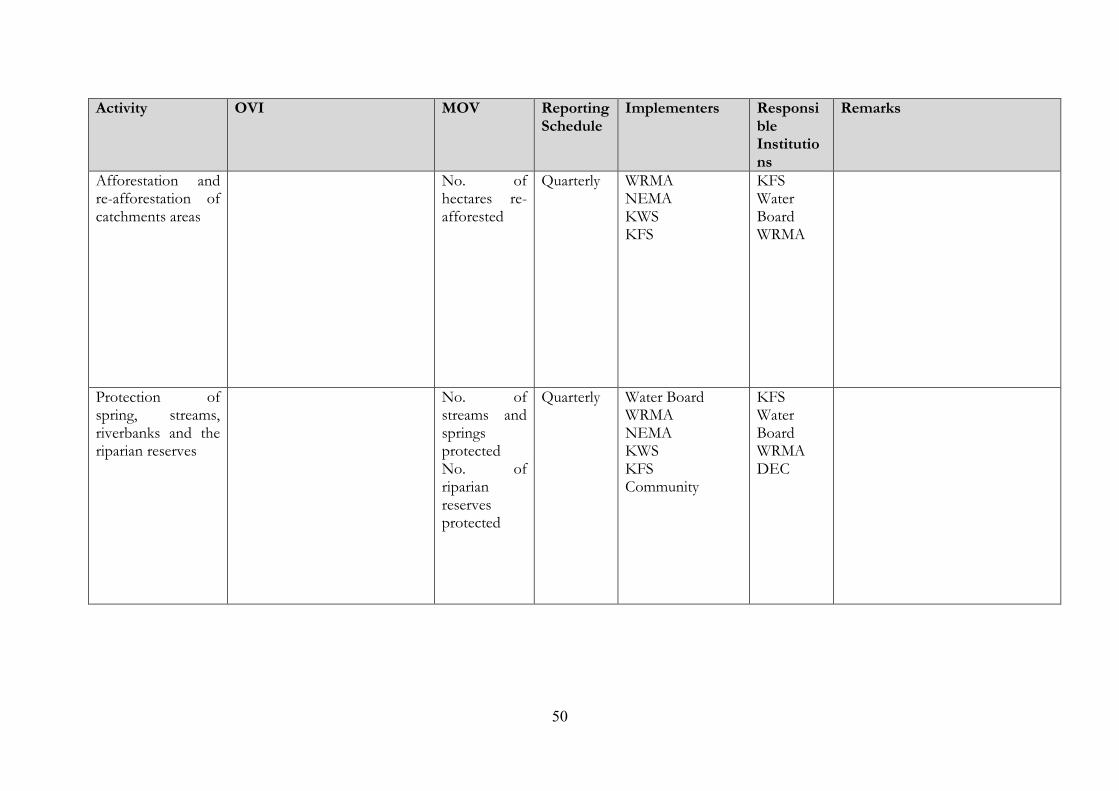
50
Activity OVI MOV ReportingSchedule
Implementers ResponsibleInstitutions
Remarks
Afforestation andre-afforestation ofcatchments areas
No. ofhectares re-afforested
Quarterly WRMANEMAKWSKFS
KFSWaterBoardWRMA
Protection ofspring, streams,riverbanks and theriparian reserves
No. ofstreams andspringsprotectedNo. ofriparianreservesprotected
Quarterly Water BoardWRMANEMAKWSKFSCommunity
KFSWaterBoardWRMADEC
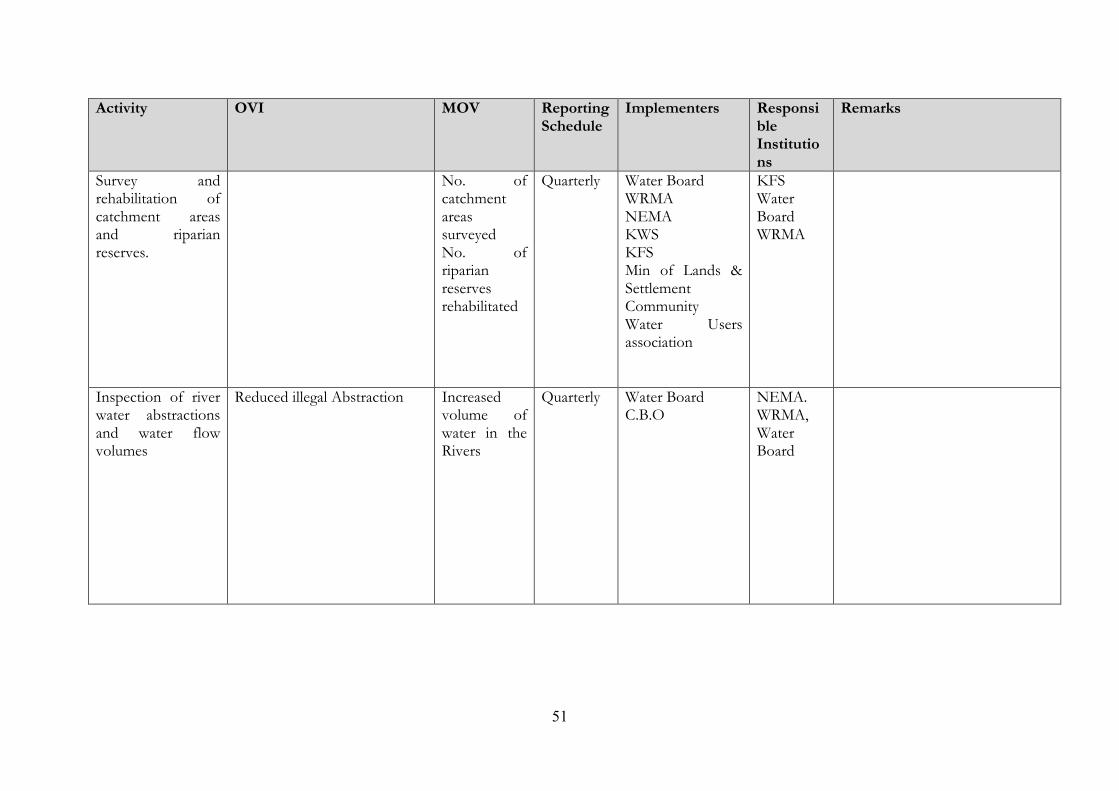
51
Activity OVI MOV ReportingSchedule
Implementers ResponsibleInstitutions
Remarks
Survey andrehabilitation ofcatchment areasand riparianreserves.
No. ofcatchmentareassurveyedNo. ofriparianreservesrehabilitated
Quarterly Water BoardWRMANEMAKWSKFSMin of Lands &SettlementCommunityWater Usersassociation
KFSWaterBoardWRMA
Inspection of riverwater abstractionsand water flowvolumes
Reduced illegal Abstraction Increasedvolume ofwater in theRivers
Quarterly Water BoardC.B.O
NEMA.WRMA,WaterBoard
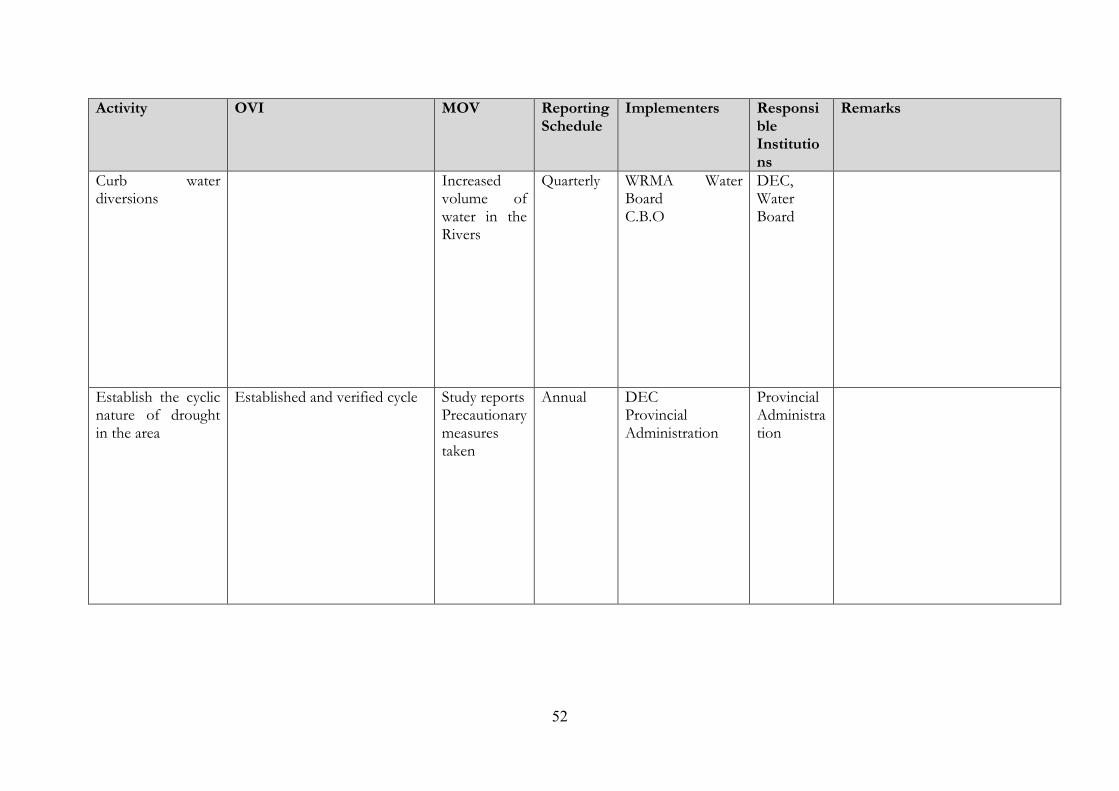
52
Activity OVI MOV ReportingSchedule
Implementers ResponsibleInstitutions
Remarks
Curb waterdiversions
Increasedvolume ofwater in theRivers
Quarterly WRMA WaterBoardC.B.O
DEC,WaterBoard
Establish the cyclicnature of droughtin the area
Established and verified cycle Study reportsPrecautionarymeasurestaken
Annual DECProvincialAdministration
ProvincialAdministration

53
Activity OVI MOV ReportingSchedule
Implementers ResponsibleInstitutions
Remarks
Identify areas thatsuffer most fromthe effects ofdrought
Areas identified and defined No. of areasidentifiedExtentdefined
Quarterly DECProvincialAdministration
DECProvincialadministrationMin. ofAgriculture
Identify landslideprone areas
Areas identified and defined No. of areasidentifiedExtentdefined
Quarterly DECProvincialAdministration

54
Activity OVI MOV ReportingSchedule
Implementers ResponsibleInstitutions
Remarks
Re-allocate peoplefrom landslideprone areas
Precautionary measures takento avert landslides disaster
No. offamilies re-located
Annual DDCProvincialAdministration
DDCLocalAuthoritiesProvincialadministration
Making ofconservationStructures (e.g.gabions)
Reduced soilerosion
No. ofconservationstructuresconstructed
Quarterly Min of AgriculturePublic Works
Min ofAgriculture

55
Activity OVI MOV ReportingSchedule
Implementers ResponsibleInstitutions
Remarks
Refilling ofabandonedand exhaustedquarries
RehabilitatedQuarries
No. ofQueriesRefilled
Quarterly C.B.ONEMAEldoret MunicipalCouncilUasingishuCountyCouncil
N.E.M.A
Electric fetchingaround wildlifeconservation areas
Reduced human/wildlifeConflicts cases
Kms ofelectric fenceelected
Annual K.W.SCommunity
K.W.S
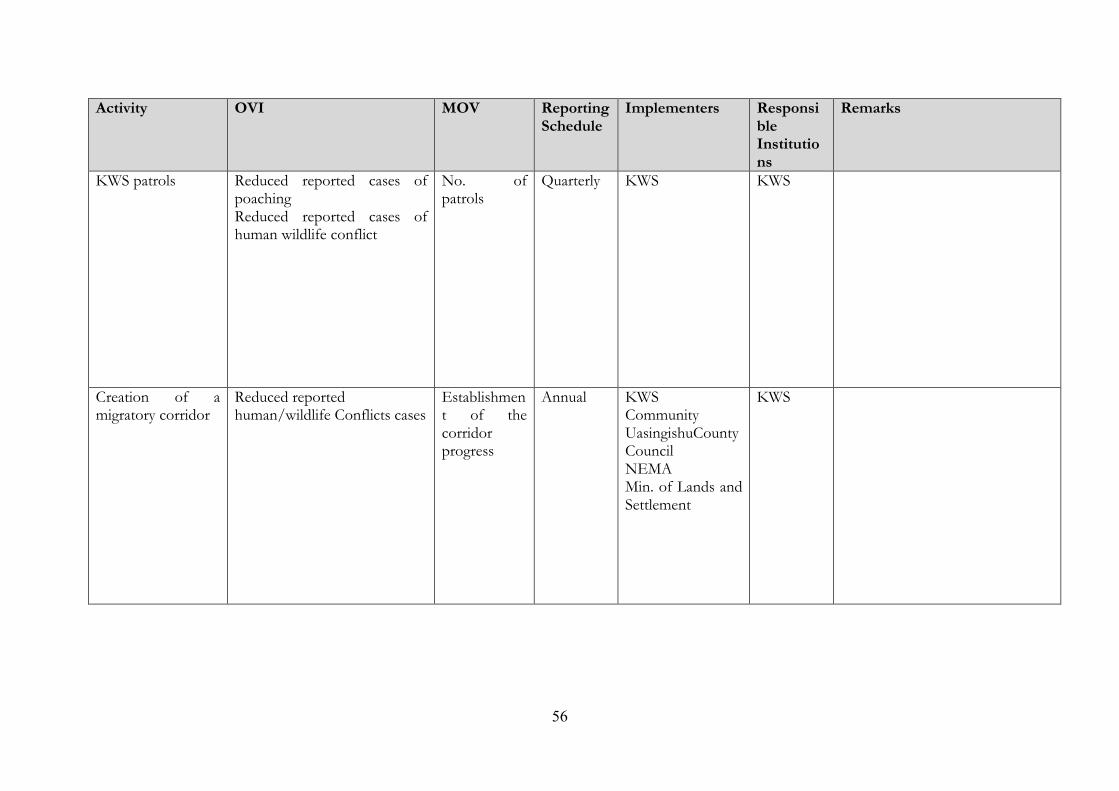
56
Activity OVI MOV ReportingSchedule
Implementers ResponsibleInstitutions
Remarks
KWS patrols Reduced reported cases ofpoachingReduced reported cases ofhuman wildlife conflict
No. ofpatrols
Quarterly KWS KWS
Creation of amigratory corridor
Reduced reportedhuman/wildlife Conflicts cases
Establishment of thecorridorprogress
Annual KWSCommunityUasingishuCountyCouncilNEMAMin. of Lands andSettlement
KWS

57
Activity OVI MOV ReportingSchedule
Implementers ResponsibleInstitutions
Remarks
Introduction ofdustbins in towns
Reduced solid waste loadgarbage in towns
No ofdustbinsinstalledCollectiontrucksavailable
Quarterly Eldoret Municipalcouncil
EldoretMunicipalCouncilD.E.C
Construct standardseptic tanks inresidential andcommercial estates
Reduced over flow ofsewerage into the open
No. ofstandardseptic tanksand soak pitsconstructed
Annual Eldoret Municipalcouncil
EldoretMunicipalcouncilD.E.C
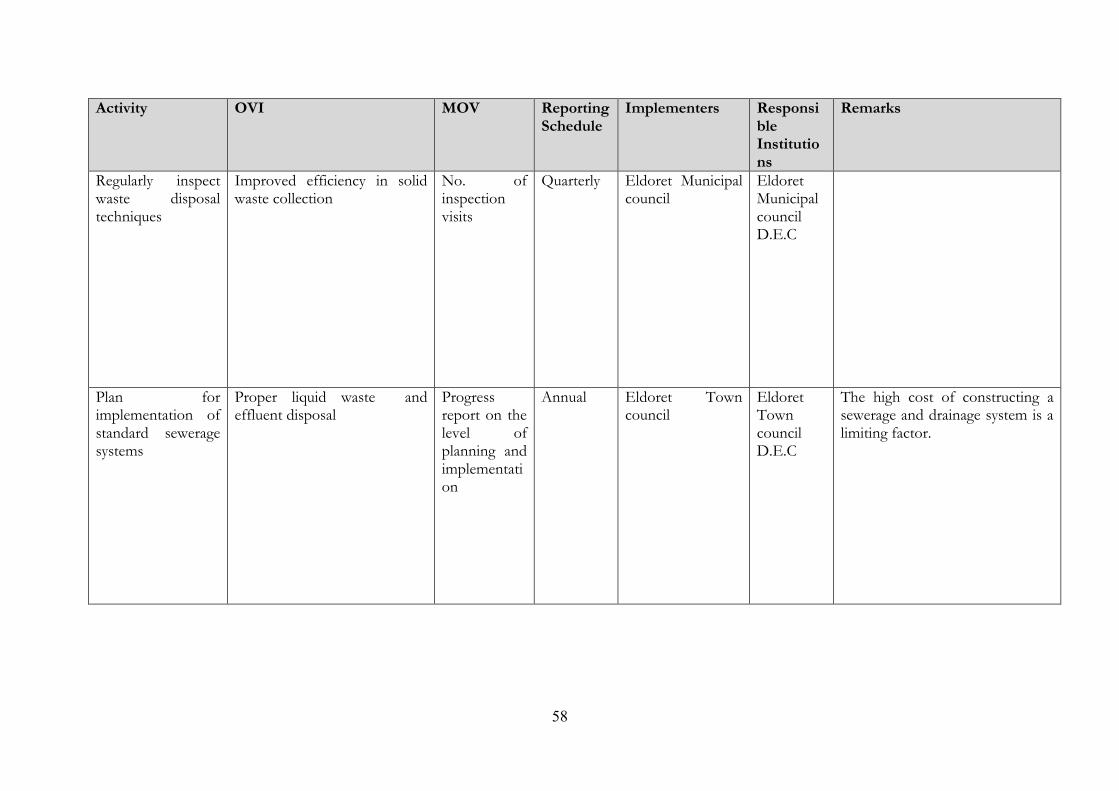
58
Activity OVI MOV ReportingSchedule
Implementers ResponsibleInstitutions
Remarks
Regularly inspectwaste disposaltechniques
Improved efficiency in solidwaste collection
No. ofinspectionvisits
Quarterly Eldoret Municipalcouncil
EldoretMunicipalcouncilD.E.C
Plan forimplementation ofstandard seweragesystems
Proper liquid waste andeffluent disposal
Progressreport on thelevel ofplanning andimplementation
Annual Eldoret Towncouncil
EldoretTowncouncilD.E.C
The high cost of constructing asewerage and drainage system is alimiting factor.

59
Activity OVI MOV ReportingSchedule
Implementers ResponsibleInstitutions
Remarks
Slaughter houses &other effluentsource pointssurveillance
Reduced and well disposedeffluent
No. ofsurveillanceandinspectionvisits
Quarterly Eldoret TowncouncilPublic Health
EldoretTowncouncilD.E.C
Construction ofsanitary landfills
No. of landfills constructedProperly disposed solid waste
No. oflandfillsproperly used
Annual Eldoret Towncouncil
EldoretTowncouncilD.E.C
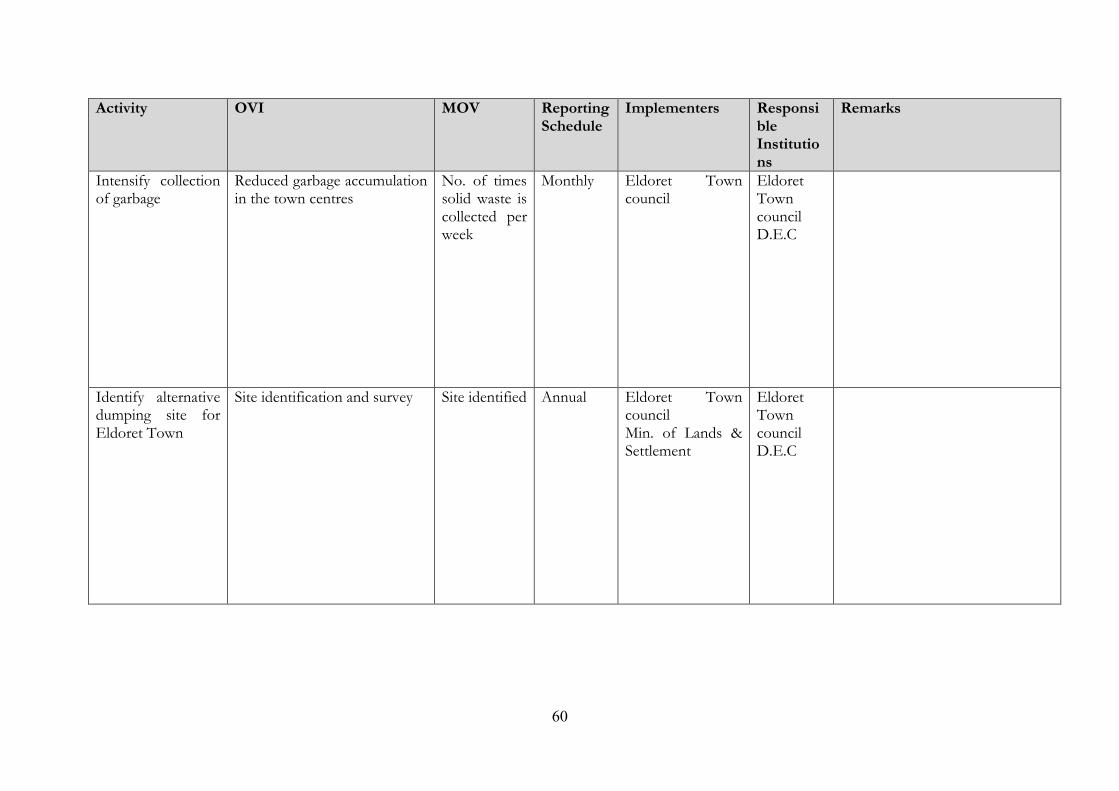
60
Activity OVI MOV ReportingSchedule
Implementers ResponsibleInstitutions
Remarks
Intensify collectionof garbage
Reduced garbage accumulationin the town centres
No. of timessolid waste iscollected perweek
Monthly Eldoret Towncouncil
EldoretTowncouncilD.E.C
Identify alternativedumping site forEldoret Town
Site identification and survey Site identified Annual Eldoret TowncouncilMin. of Lands &Settlement
EldoretTowncouncilD.E.C
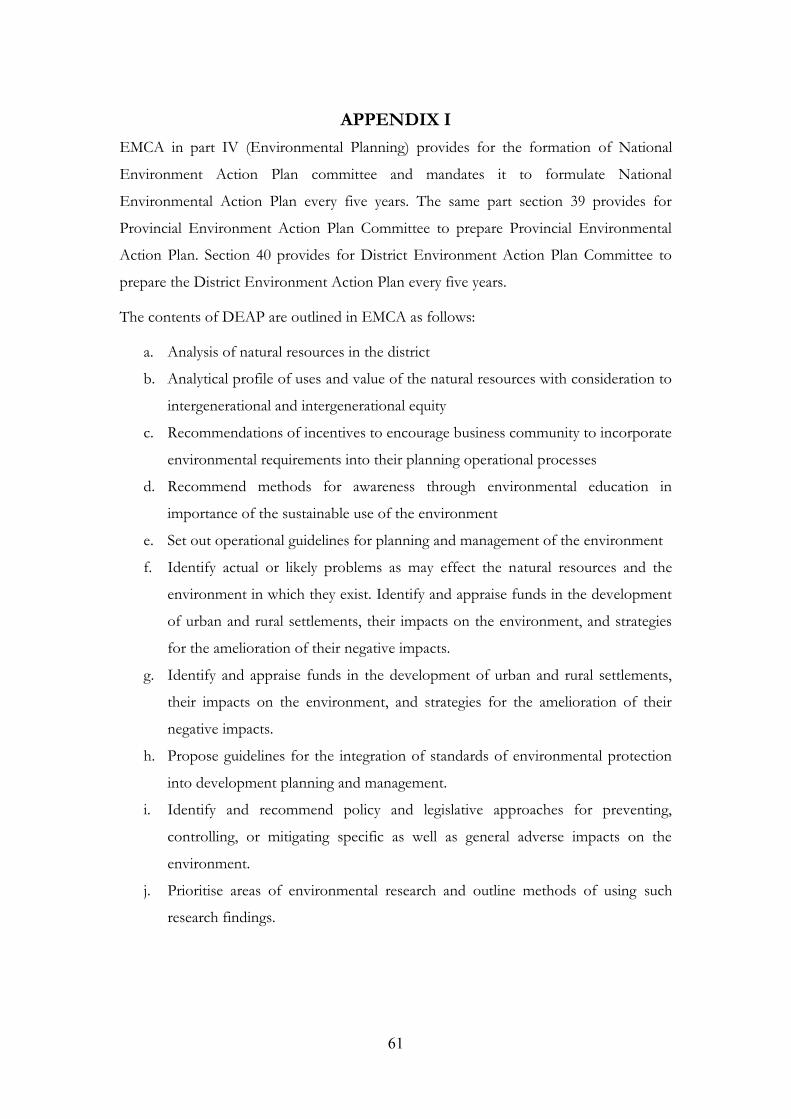
61
APPENDIX IEMCA in part IV (Environmental Planning) provides for the formation of National
Environment Action Plan committee and mandates it to formulate National
Environmental Action Plan every five years. The same part section 39 provides for
Provincial Environment Action Plan Committee to prepare Provincial Environmental
Action Plan. Section 40 provides for District Environment Action Plan Committee to
prepare the District Environment Action Plan every five years.
The contents of DEAP are outlined in EMCA as follows:
a. Analysis of natural resources in the district
b. Analytical profile of uses and value of the natural resources with consideration to
intergenerational and intergenerational equity
c. Recommendations of incentives to encourage business community to incorporate
environmental requirements into their planning operational processes
d. Recommend methods for awareness through environmental education in
importance of the sustainable use of the environment
e. Set out operational guidelines for planning and management of the environment
f. Identify actual or likely problems as may effect the natural resources and the
environment in which they exist. Identify and appraise funds in the development
of urban and rural settlements, their impacts on the environment, and strategies
for the amelioration of their negative impacts.
g. Identify and appraise funds in the development of urban and rural settlements,
their impacts on the environment, and strategies for the amelioration of their
negative impacts.
h. Propose guidelines for the integration of standards of environmental protection
into development planning and management.
i. Identify and recommend policy and legislative approaches for preventing,
controlling, or mitigating specific as well as general adverse impacts on the
environment.
j. Prioritise areas of environmental research and outline methods of using such
research findings.

62
APPENDIX IITrading Centres Reference No. Date
PreparedRemarks
1.
2.
3.
4.
5.
6.
7.
8.
9.
10.
11.
12.
13.
14.
15.
16.
17.
18.
19.
20.
21.
22.
23.
24.
25.
26.
27.
28.
29.
30.
Kongnyalil
Uswo
Kapsaret
Simbi
Momoniat
Chepkatet
Elgon View S.C.
Outspan Centre
Ngasra Falls
Boderlands
Kosaji
Chegaya
Kamuyu B.
Ainabkoi East
Ainabkoi West
Aibabngetik
Burnt Forest
Baharini
Burnt Forest Revised
Bindura S.F.
Chegaya
(Revision)
Chepkigen
Chepsaita Township
Cheptiret
Chepkongoni
Cheukta
Cheptambach
Chirchir
Chebyemit
Cheplaskei
ELD.1997/99/1
ELD.1998/99/1
ELD.2172/2001/1
ELD.2170/2001/1
ELD.2175/2001/1
ELD.2174/2001/1
ELD./2001/1
ELD.2173/2001/1
ELD./2179/1
ELD./2274/2002/1
ELD.1214/2002/1
ELD.50/84/1
ELD.1595/97/1
ELD.50/70/3
ELD.2171/2001/1A
ELD.075/87/1A
ELD.1211/88/1
ELD.1214/2002/1
ELD.1600/93/1
ELD.50/70/1
ELD.1533/93/1
ELD.1590/92/1
ELD.1587/92/1
ELD./735/80/2
25/03/1999
25/03/1999
25/05/2001
25/05/2001
18/06/2001
25/06/2001
26/07/2001
06/08/2001
03/09/2001
17/09/2001
25/07/2002
26/07/2002
10/09/2002
14/06/1984
13/06/1989
07/03/1997
06/01/1970
20/07/2001
27/11/1987
29/01/1988
26/7/2002
27/05/93
05/10/1970
27/08/1986
31/03/1993
20/11/1992
23/10/1992
13/08/1991
28/11/1980
17/09/1990
5/12/1979
Submitted for approval
Submitted for approval
Not Approved
Not Approved
Not Approved
Not Approved
Not Approved
Not Approved
Not Approved
Not Approved
Not Approved
Not Approved
Not Approved
Not Approved
Not Approved
Not Approved
Approved (12/10/1970)
Not Approved
Not Approved
Not Approved
Approved(23/12/1970)
Not Approved
Not Approved
Not Approved
Not Approved
Not Approved
Approved (05/02/1982)
Not Approved
Approved (25/02/1980)

63
Trading Centres Reference No. DatePrepared
Remarks
31.
32.
33.
34.
35.
36.
37.
38.
39.
40.
41.
42.
43.
44.
45.
46.
47.
48.
49.
50.
51.
52.
53.
54.
55.
56.
57.
58.
59.
Elgeyo Border
Longnet
Simat
Ngelel-Tarit
Chemgoror Revised
Koilel
Shawood
Flax Centre
Gachau S.C. (Timboroa)
Field centre(Losirwa
Farm)
Imani(Subukia Famers
Coop Society)
Growel L.C.
Kesses
Kipsangui
Koromiat
Kahuruko
Kerita
Kuinet
Kapsundei
Kimilili
Kipkaren
Kapkeno (Revision)
Kamuyu
Kipkoriony
Kapsiliot
Kelji
Katani
Komblokoyet
Keses
Karandili
ELD.50/79/20
ELD.1870/97/1
ELD.2320/2003/1
ELD.1804/2004/1
ELD.2276/2004/1
ELD.2324/2004/1
ELD.1004/84/1A
ELD./832/1
ELD./1865/97/1
ELD./1203/88/1
ELD./1459/91/1
ELD./92/1532/1
ELD./571/82/1
ELD./1216/90/1
ELD./1003/84/1
ELD./1670/93/1
ELD./2328/203/1
ELD./1585/1
ELD.1233/89/1
ELD./1534/92/1
ELD./1531/92/1
ELD./1984/98/1
ELD./1256/88/1
24/07/2003
20/1/2003
15/04/2003
08/10/2004
29/07/2004
29/1/2004
14/11/1984
14/11/1984
7/7/1996
30/9/1996
10/5/1997
7/5/1988
16/01/1991
20/06/1996
01/09/1992
14/04/1982
14/06/1990
31/10/1984
20/12/1993
11/10/1979
02/02/1989
01/12/1992
12/04/1989
03/08/1992
01/04/1992
12/10/1998
06/07/1984
06/07/1984
Not Approved
Not Approved
Not Approved
Not Approved
Not Approved
Not Approved
Not Approved
Not Approved
Not Approved
Not Approved
Not Approved
Not Approved
Not Approved
Not Approved
Not Approved
Not Approved
Not Approved
Not Approved
Approved (10/11/1986)
Not Approved
Not Approved
Submitted for approval
Not Approved
Not Approved
Not Approved
Not Approved
Not Approved
Not Approved
Not Approved

64
Trading Centres Reference No. DatePrepared
Remarks
60.
61.
62.
63.
64.
65.
66.
67.
68.
69.
70.
71.
72.
73.
74.
75.
76.
77.
78.
79.
80
81.
82.
83.
84.
85.
86.
87.
88.
89.
90.
91.
Kaptait
Kesses (Revised)
Naiberi
Mile 13
Kamukunji (Eldoret)
Mafuta
Menerwet
Moiben
Wareng S.C
Ngoisa
New Nyaru
Plateau (Revised)
Rock centre
Rock Centre (revised)
Segero
Subukia(Muchorwe)
Sogich S.C.
Senetwet
Sugutek S.F.T.
Sugutek
Soy Navillus
Soy
Turbo
Tapsangoi
Turbo
Ziwa Machine
Waunifour S.F.T.
Yamumbi
Kipsomba T.C.
Kipkarren T.C.
Koilunget
Kapkoiga
ELD./1255/93/1A
ELD./1457/05/01
ELD./1785/96/1
ELD./950/83/1
ELD./50/83/1
ELD./59/83/1
ELD./25/83/1
ELD./1506/82/1
ELD./285/SET/1
/523/74/1
ELD./1695/1
ELD./1695/99/1
ELD./1367/90/1
ELD.1248/1
ELD./2277/2001/1
ELD./1639/93/1
ELD./50/85/1
981/86/1
ELD./1693/94/1
ELD./250/82/1
ELD./34/90/1
50/69/1
ELD./3484/1
ELD./1282/89/1
ELD./1212/88/1
ELD./1584/92/1
ELD./2278/2002/1
ELD.1359/90/1
ELD./1588/92/1
29/02/1998
12/10/1990
15/07/1988
07/07/1996
26/04/1983
07/06/1993
14/12/1983
01/03/1988
28/3/1978
22/04/1987
25/05/1992
16/06/1989
07/01/1974
02/03/1995
25/03/1999
15/06/1990
11/06/1986
24/08/2001
19/11/1993
22/02/1984
31/10/1986
19/04/1994
03/03/1982
02/1990
26/06/1969
29/2/1984
31/07/1989
04/02/1988
24/08/92
19/07/2002
05/06/1990
16/10/1992
Not Approved
Not Approved
Not Approved
Not Approved
Not Approved
Not Approved
Not Approved
Not Approved
Not Approved
Not Approved
Not Approved
Not Approved
Approved (09/09/1975)
Not Approved
Not Approved
Not Approved
Not Approved
Not Approved
Not Approved
Not approved
Approved (20/09/1989)
Approved
Approved
Approved
Approved(25/08/1969)
Not approved
Not Approved
“
“
“
“
“
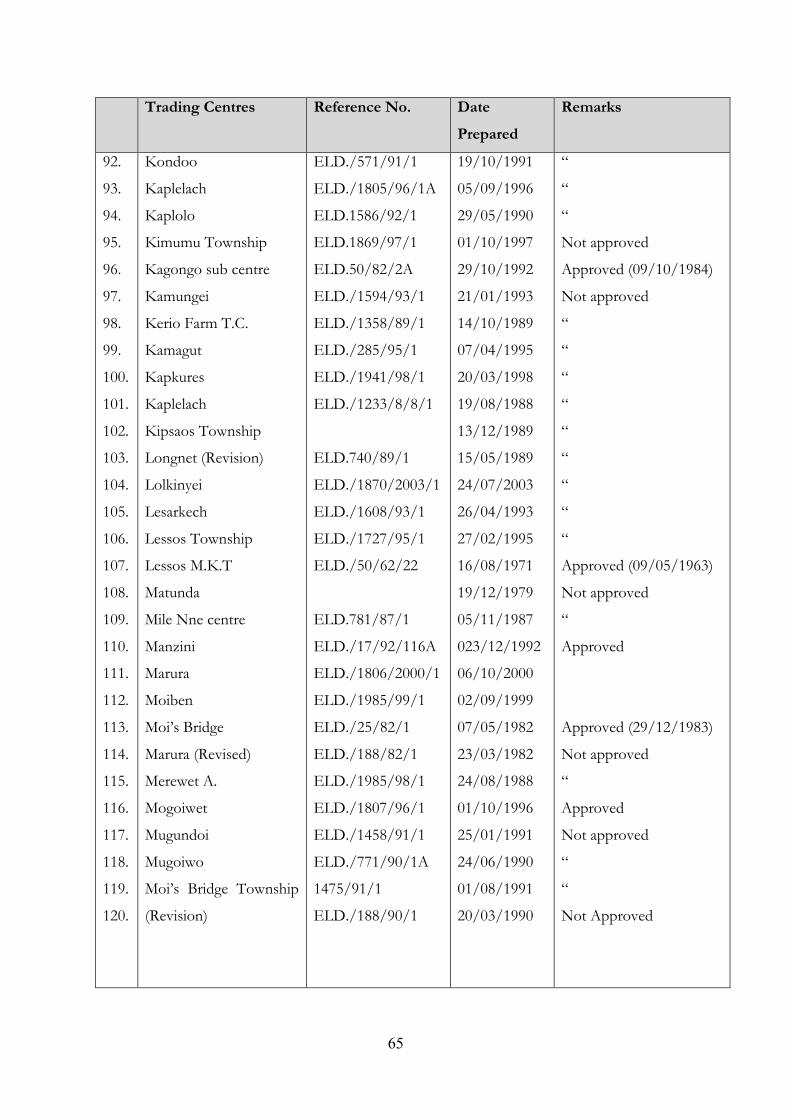
65
Trading Centres Reference No. DatePrepared
Remarks
92.
93.
94.
95.
96.
97.
98.
99.
100.
101.
102.
103.
104.
105.
106.
107.
108.
109.
110.
111.
112.
113.
114.
115.
116.
117.
118.
119.
120.
Kondoo
Kaplelach
Kaplolo
Kimumu Township
Kagongo sub centre
Kamungei
Kerio Farm T.C.
Kamagut
Kapkures
Kaplelach
Kipsaos Township
Longnet (Revision)
Lolkinyei
Lesarkech
Lessos Township
Lessos M.K.T
Matunda
Mile Nne centre
Manzini
Marura
Moiben
Moi’s Bridge
Marura (Revised)
Merewet A.
Mogoiwet
Mugundoi
Mugoiwo
Moi’s Bridge Township
(Revision)
ELD./571/91/1
ELD./1805/96/1A
ELD.1586/92/1
ELD.1869/97/1
ELD.50/82/2A
ELD./1594/93/1
ELD./1358/89/1
ELD./285/95/1
ELD./1941/98/1
ELD./1233/8/8/1
ELD.740/89/1
ELD./1870/2003/1
ELD./1608/93/1
ELD./1727/95/1
ELD./50/62/22
ELD.781/87/1
ELD./17/92/116A
ELD./1806/2000/1
ELD./1985/99/1
ELD./25/82/1
ELD./188/82/1
ELD./1985/98/1
ELD./1807/96/1
ELD./1458/91/1
ELD./771/90/1A
1475/91/1
ELD./188/90/1
19/10/1991
05/09/1996
29/05/1990
01/10/1997
29/10/1992
21/01/1993
14/10/1989
07/04/1995
20/03/1998
19/08/1988
13/12/1989
15/05/1989
24/07/2003
26/04/1993
27/02/1995
16/08/1971
19/12/1979
05/11/1987
023/12/1992
06/10/2000
02/09/1999
07/05/1982
23/03/1982
24/08/1988
01/10/1996
25/01/1991
24/06/1990
01/08/1991
20/03/1990
“
“
“
Not approved
Approved (09/10/1984)
Not approved
“
“
“
“
“
“
“
“
“
Approved (09/05/1963)
Not approved
“
Approved
Approved (29/12/1983)
Not approved
“
Approved
Not approved
“
“
Not Approved