Two Rate-Constant Kinetic Model for the Chromium(III)
48
1 Manuscript Ref.: KIN-16-0118 (Revised) Two Rate-Constant Kinetic Model for the Chromium(III)- EDTA Complexation Reaction by Numerical Simulations JOAQUIN F. PEREZ-BENITO Departamento de Ciencia de Materiales y Quimica Fisica, Sección de Quimica Fisica, Facultad de Quimica, Universidad de Barcelona, Marti i Franques, 1, 08028 Barcelona, Spain ___________________________________________________________________________ Correspondence to: J. F. Perez-Benito; e-mail: [email protected]. Supporting Information is available in the online issue at www.wileyonlinelibrary.com.
-
Upload
khangminh22 -
Category
Documents
-
view
1 -
download
0
Transcript of Two Rate-Constant Kinetic Model for the Chromium(III)
1
Manuscript Ref.: KIN-16-0118 (Revised)
Two Rate-Constant Kinetic Model for the Chromium(III)-
EDTA Complexation Reaction by Numerical Simulations
JOAQUIN F. PEREZ-BENITO
Departamento de Ciencia de Materiales y Quimica Fisica, Sección de Quimica Fisica,
Facultad de Quimica, Universidad de Barcelona, Marti i Franques, 1, 08028 Barcelona,
Spain
___________________________________________________________________________
Correspondence to: J. F. Perez-Benito; e-mail: [email protected].
Supporting Information is available in the online issue at www.wileyonlinelibrary.com.

2
ABSTRACT: The complexation reaction of Cr(III) ion in the presence of a large excess of
EDTA does not follow a pseudo-first-order kinetics as sometimes suggested. There are two
causes for the deviation from this simple behavior: the involvement of a long-lived
intermediate, precluding the application of the steady-state approximation, and the
autoinhibition provoked by the release of hydrogen ions from the organic ligand to the
medium as the final Cr(III)-EDTA violet complex is formed. Numerical simulations have
allowed obtaining for each kinetic experiment the values of two rate constants, k1
(corresponding to the formation of the long-lived intermediate from the reactants) and k2
(corresponding to the formation of the final complex product from the long-lived
intermediate), as well as the number of hydrogens liberated per molecule of final complex
product formed (Hkin). The results indicate that k1 is associated to a fast step (Ea = 87 ± 4 kJ
mol-1) and k2 to a slow step (Ea = 120 ± 2 kJ mol-1), whereas the number of hydrogen ions
lies within the range 0 < Hkin < 2 in all the kinetic runs. A mechanism in accordance with the
experimental data has been proposed.
3
INTRODUCTION
In most kinetic studies found in the chemical literature the reactions are reported to be of
pseudo-first-order (after application of the isolation method). However, it should be
emphasized that the concept of kinetic order can be applied only in particular cases in which
the kinetic behavior is simple enough to be described by the use of a single pseudo-rate
constant. When fitting of the concentration-time plots requires the use of two or more pseudo-
rate constants, the classification of the reaction according to its presumed kinetic order might
lead to erroneous conclusions. It is described here an important example where this has
occurred: the complexation reaction of chromium(III) by ethylenediaminetetraacetic acid
(EDTA).
Chromium(III) is an important species both in the chemistry laboratory and in biology. In
the first case, it is the final product from nearly all chromium(VI) oxidations of different
reducing agents [1,2]. In the second, it is a trace element required in the formation of the
glucose tolerance factor (GTF) by coordination with a peptide molecule and playing a central
role in the cellular carbohydrate metabolism [3,4]. In addition, Cr(III) complexes with several
biological ligands showing GTF-like activity have been prepared [5]. Although Cr(III)
supplementation has been proposed as a potential therapy to improve insulin sensitivity in
diabetic patients [6], intoxication by this element has been described [7]. An interesting result
reported in the scientific literature is that Cr(III) leads to notable increases in both median and
maximum lifespan in rodents [8]. The effects of supplemental Cr(III) are similar to those
observed in animals on calorie-restricted diets: decreased glucose levels, enhanced insulin
sensitivity, and longer lifespan [9].
On the other hand, EDTA is a useful chemical substance exhibiting both reducing [10,11]
and complexing [12 14] reactivities. Among the latter, its ability to complex divalent [15,16]
4
and trivalent [17 19] metal ions as a polydentate ligand is noteworthy. For instance, it can be
used to complex Fe(II) and Fe(III) ions in kinetic studies of the Fenton reaction [20,21], as
well as a food additive to trap metal impurities [22]. The metal-chelating character of EDTA
makes it helpful as a therapy in intoxications by metal ions [23]. In particular, it has been used
for the treatment of Wilson’s disease (copper overload) [24] and thalassemia (iron overload)
[25] patients. Actually, EDTA-chelating therapy for the treatment of metal-induced diseases
has already been applied in millions of patients [26]. In addition, its applications have recently
been extended to the nanomedicine field [27].
The chemical structure of the Cr(III)-EDTA complex has been the objective of some
spectroscopic research [28 30] and quantitative determinations of its acid-base properties
have also been reported [31]. This complexation has been applied to the elimination of toxic
and carcinogenic Cr(VI) by ultrafiltration techniques [32]. The kinetics of the reactions of
Cr(III) with EDTA and similar ligands [33,34] have been studied both in the absence and in
the presence of hydrogen peroxide [35,36]. Although the Cr(III)-EDTA reaction under
conditions of a large ligand/metal excess has so far been classified as a pseudo-first-order
reaction [37 39], some experimental results showing compelling evidence of deviations from
this simple kinetic behavior have been found and will be presented here forth.
EXPERIMENTAL
Materials and Methods
5
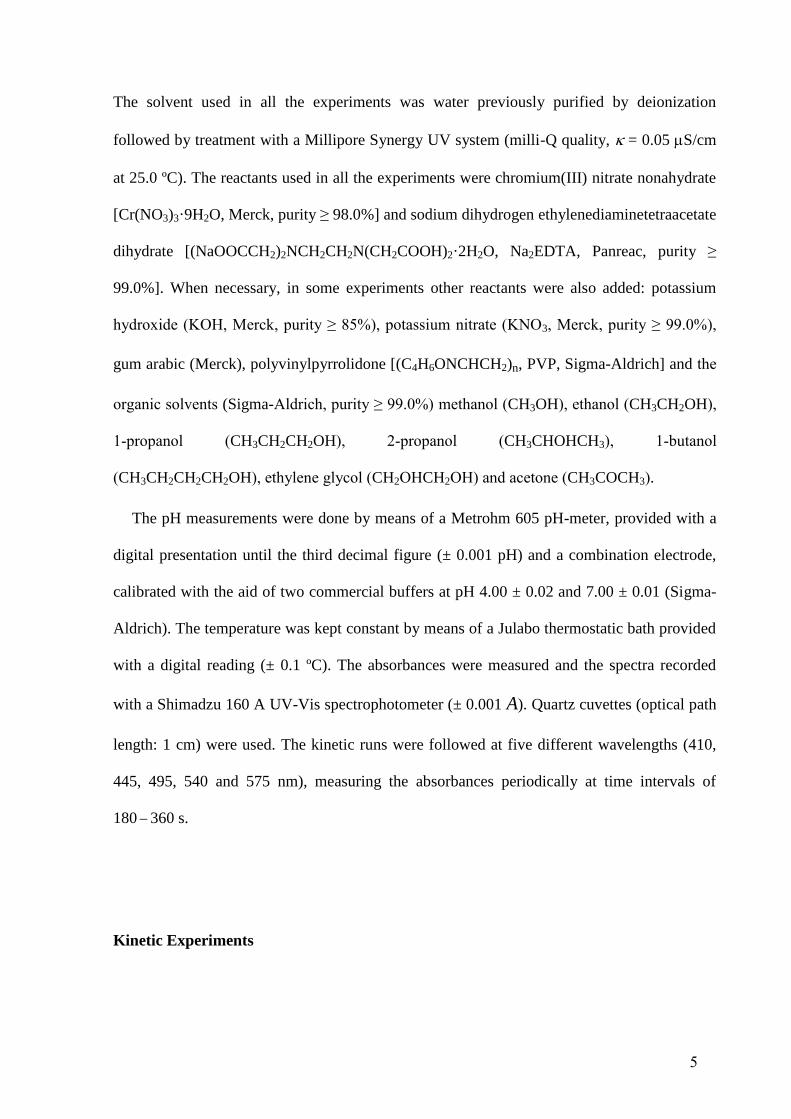
The solvent used in all the experiments was water previously purified by deionization
followed by treatment with a Millipore Synergy UV system (milli-Q quality, = 0.05 S/cm
at 25.0 ºC). The reactants used in all the experiments were chromium(III) nitrate nonahydrate
[Cr(NO3)3·9H2O, Merck, purity ≥ 98.0%] and sodium dihydrogen ethylenediaminetetraacetate
dihydrate [(NaOOCCH2)2NCH2CH2N(CH2COOH)2·2H2O, Na2EDTA, Panreac, purity ≥
99.0%]. When necessary, in some experiments other reactants were also added: potassium
hydroxide (KOH, Merck, purity ≥ 85%), potassium nitrate (KNO3, Merck, purity ≥ 99.0%),
gum arabic (Merck), polyvinylpyrrolidone [(C4H6ONCHCH2)n, PVP, Sigma-Aldrich] and the
organic solvents (Sigma-Aldrich, purity ≥ 99.0%) methanol (CH3OH), ethanol (CH3CH2OH),
1-propanol (CH3CH2CH2OH), 2-propanol (CH3CHOHCH3), 1-butanol
(CH3CH2CH2CH2OH), ethylene glycol (CH2OHCH2OH) and acetone (CH3COCH3).
The pH measurements were done by means of a Metrohm 605 pH-meter, provided with a
digital presentation until the third decimal figure (± 0.001 pH) and a combination electrode,
calibrated with the aid of two commercial buffers at pH 4.00 ± 0.02 and 7.00 ± 0.01 (Sigma-
Aldrich). The temperature was kept constant by means of a Julabo thermostatic bath provided
with a digital reading (± 0.1 ºC). The absorbances were measured and the spectra recorded
with a Shimadzu 160 A UV-Vis spectrophotometer (± 0.001 A). Quartz cuvettes (optical path
length: 1 cm) were used. The kinetic runs were followed at five different wavelengths (410,
445, 495, 540 and 575 nm), measuring the absorbances periodically at time intervals of
180 360 s.
Kinetic Experiments
6
In most of the runs the initial concentration of the complexing agent, Na2EDTA, was much
higher than that of the metallic ion, Cr(III), in order to attain an approximately constant
concentration of the organic reactant (isolation method). The total solution volume was kept
the same in all the experiments (51 mL). Among the five wavelengths chosen to monitor the
process, 540 nm corresponded to the maximum increase of the solution absorbance during the
course of the reaction and, to minimize the experimental errors, was chosen to obtain the
kinetic data. In order to assess reproducibility, all the runs were duplicated.
Kinetic Calculations
A program was written in BASIC language for the treatment of the absorbance-time
experimental data. Four fitting parameters were required: the initial absorbance (Ao), the
number of hydrogen ions released per Cr(III)-EDTA complex molecule formed (Hkin) and
two pseudo-rate constants (k1 and k2). Pseudo-rate constant k1 was associated to the
conversion of the reactant Cr(III) into a long-lived intermediate, whereas k2 was associated to
the base-catalyzed decay of that intermediate to yield the final complex product. The
calculations were implemented on a Sony Vaio personal computer.
RESULTS AND DISCUSSION
7
The reaction was studied in the absence of an added buffer in order to avoid any perturbation
caused by the competition of its anionic form with EDTA as a Cr(III) potential ligand.
Although EDTA actually exercised some self-buffering action, the retarding effect caused by
the decrease in pH as the reaction advanced allowed obtaining some valuable information on
the number of hydrogen ions released to the medium during the formation of different Cr(III)-
EDTA complexes.
Electronic Spectra
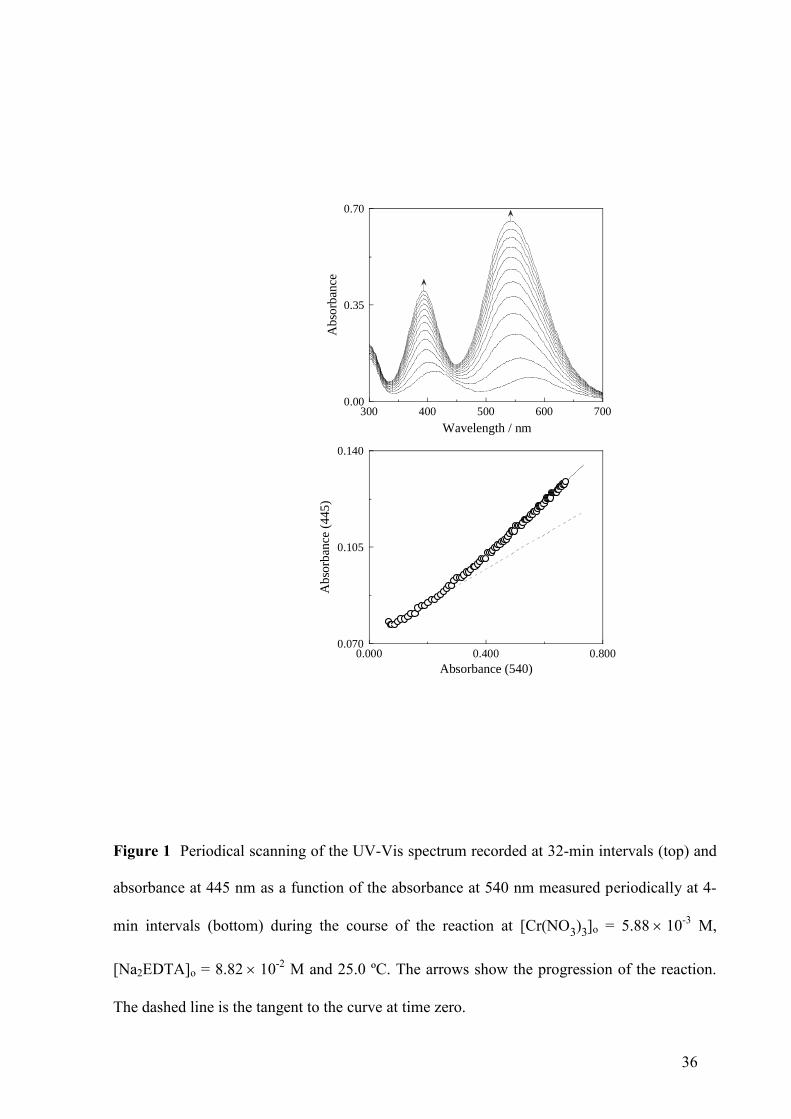
A periodical scanning of the UV-Vis spectrum of the solution during the course of the
reaction is shown in Fig. 1 (top). It can be seen that the absorbance increased with time over
the whole wavelength range, and that the peaks corresponding to the violet complex product
(392 and 540 nm) were shifted toward the left with respect to those corresponding to the blue-
gray complex reactant (412 and 576 nm). Moreover, whereas for the reactant [Cr(H2O)6]3+
the
low-wavelength band was more pronounced than the high-wavelength band, for the product
Cr(III)-EDTA happened the opposite. No isosbestic point was observed.
Involvement of a Long-Lived Intermediate
In the present case, there are at least two chemical species absorbing light in the visible region
of the spectrum: the reactant [Cr(H2O)6]3+
and the product Cr(III)-EDTA. When a reaction is
followed spectrophotometrically at two different wavelengths (1 and 2) at which both the
8
reactant (R) and the product (P) absorb light, assuming that the Lambert-Beer law is fulfilled
and that all the intermediates involved in the mechanism are short lived (in steady state), it is
easy to demonstrate that the relationship between the corresponding absorbances A(1)t and
A(2)t at time t should be:
P,1 R,1
1 1 2 2
P,2 R,2
t o t o
( ) = ( ) + ( ) ( )
A A A A
(1)
where A(1)o and A(2)o are the initial absorbances at the two wavelengths, whereas the
subscripts of the molar absorption coefficients indicate the corresponding species and
wavelength. Hence, provided that the above mentioned hypotheses are fulfilled, an A(1) vs
A(2) plot is expected to be linear. A representation of the absorbance at 445 nm versus the
absorbance at 540 nm during the course of the reaction for a typical kinetic experiment is
shown in Fig. 1 (bottom). These wavelengths were selected because the visible spectrum of
the final Cr(III)-EDTA complex had a minimum at the first (445 nm) and maximum at the
second (540 nm). Thus, the existence of an absorption minimum for the product at 445 nm
offered a chance to look for any absorption caused by a potential long-lived intermediate. The
plot shows a definite upward-concave curvature instead of the expected linearity. Since, of the
conditions required for fulfilment of Eq. (1), the validity of the steady-state approximation for
all the intermediates is the one with a higher probability of not being reached, the curvature of
the A(445) vs A(540) plot suggests that a long-lived intermediate is involved in the reaction
mechanism. This hypothesis was confirmed later by the excellent agreement between the
absorbance-time experimental data and the numerical simulations based on it.
9
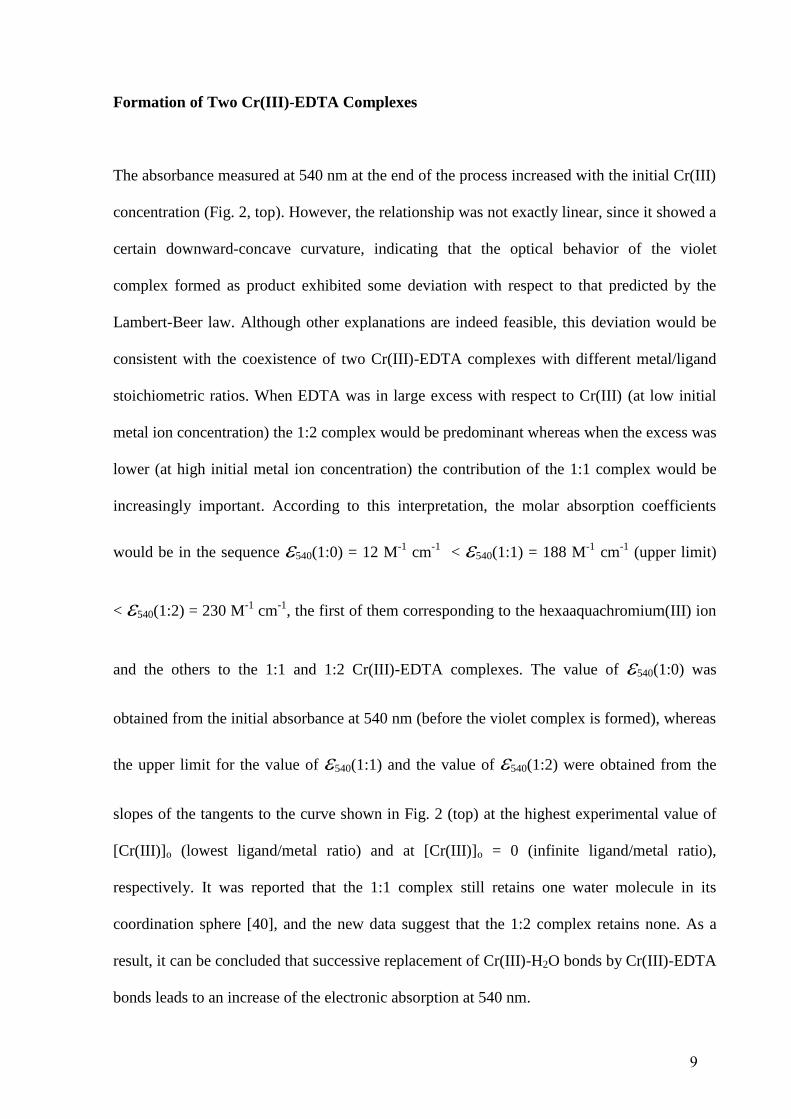
Formation of Two Cr(III)-EDTA Complexes
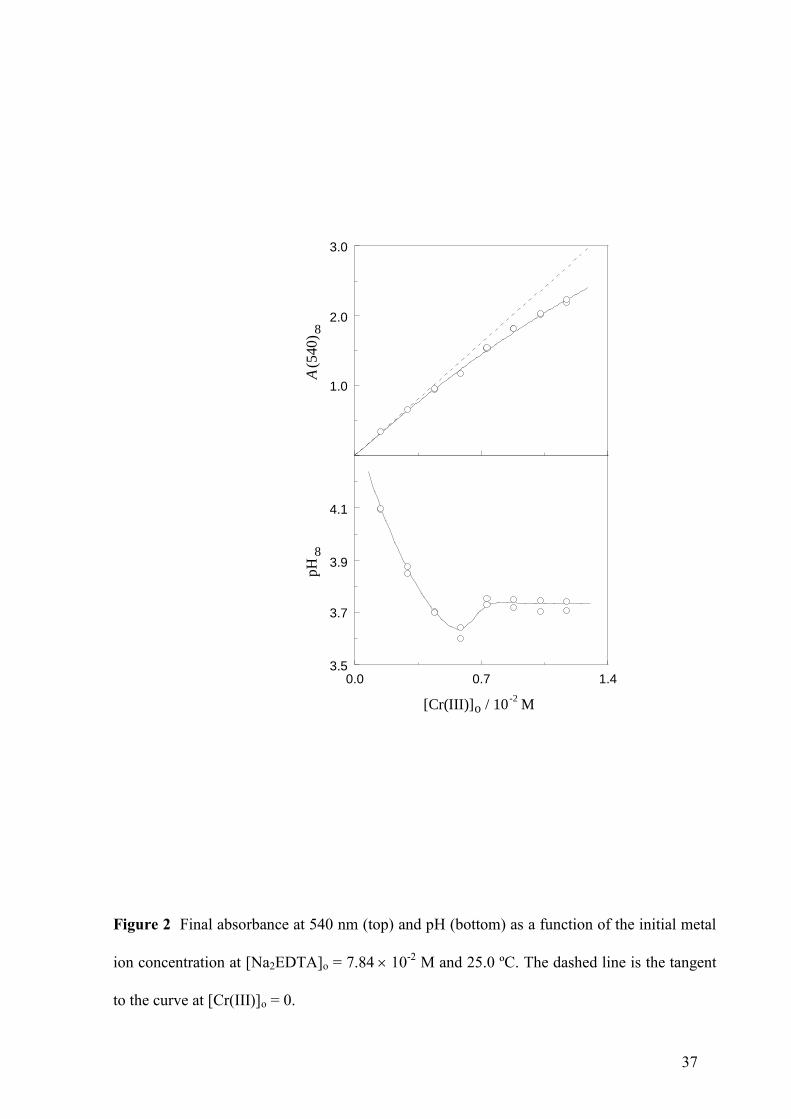
The absorbance measured at 540 nm at the end of the process increased with the initial Cr(III)
concentration (Fig. 2, top). However, the relationship was not exactly linear, since it showed a
certain downward-concave curvature, indicating that the optical behavior of the violet
complex formed as product exhibited some deviation with respect to that predicted by the
Lambert-Beer law. Although other explanations are indeed feasible, this deviation would be
consistent with the coexistence of two Cr(III)-EDTA complexes with different metal/ligand
stoichiometric ratios. When EDTA was in large excess with respect to Cr(III) (at low initial
metal ion concentration) the 1:2 complex would be predominant whereas when the excess was
lower (at high initial metal ion concentration) the contribution of the 1:1 complex would be
increasingly important. According to this interpretation, the molar absorption coefficients
would be in the sequence 540(1:0) = 12 M-1
cm-1
< 540(1:1) = 188 M-1
cm-1
(upper limit)
<540(1:2) = 230 M-1
cm-1
, the first of them corresponding to the hexaaquachromium(III) ion
and the others to the 1:1 and 1:2 Cr(III)-EDTA complexes. The value of 540(1:0) was
obtained from the initial absorbance at 540 nm (before the violet complex is formed), whereas
the upper limit for the value of 540(1:1) and the value of 540(1:2) were obtained from the
slopes of the tangents to the curve shown in Fig. 2 (top) at the highest experimental value of
[Cr(III)]o (lowest ligand/metal ratio) and at [Cr(III)]o = 0 (infinite ligand/metal ratio),
respectively. It was reported that the 1:1 complex still retains one water molecule in its
coordination sphere [40], and the new data suggest that the 1:2 complex retains none. As a
result, it can be concluded that successive replacement of Cr(III)-H2O bonds by Cr(III)-EDTA
bonds leads to an increase of the electronic absorption at 540 nm.
10
The final pH showed a singular profile when represented as a function of the initial Cr(III)
concentration, showing first a definite decrease, passing through a minimum, increasing later
and reaching a plateau at the end (Fig. 2, bottom). This plot suggests that the organic divalent
ion (H2Y2-
) used as initial reactant suffers a partial deprotonation during the formation of the
complex and that the number of hydrogen ions released to the medium is higher for the 1:2
complex than for the 1:1 counterpart. In this way, the initial decrease of the pH
vs [Cr(III)]o
plot would correspond to the conditions for which the 1:2 complex predominates (high
[ligand]/[metal] ratio), whereas the posterior increase and final plateau would correspond to
the range for which the contribution of the 1:1 complex starts to be high enough (low
[ligand]/[metal] ratio). Thus, we can conclude that the plots shown in Fig. 2 cannot be
explained by the formation of just one Cr(III)-EDTA complex with a unique metal-ligand
stoichiometric ratio, strongly suggesting that at least two complexes were formed.
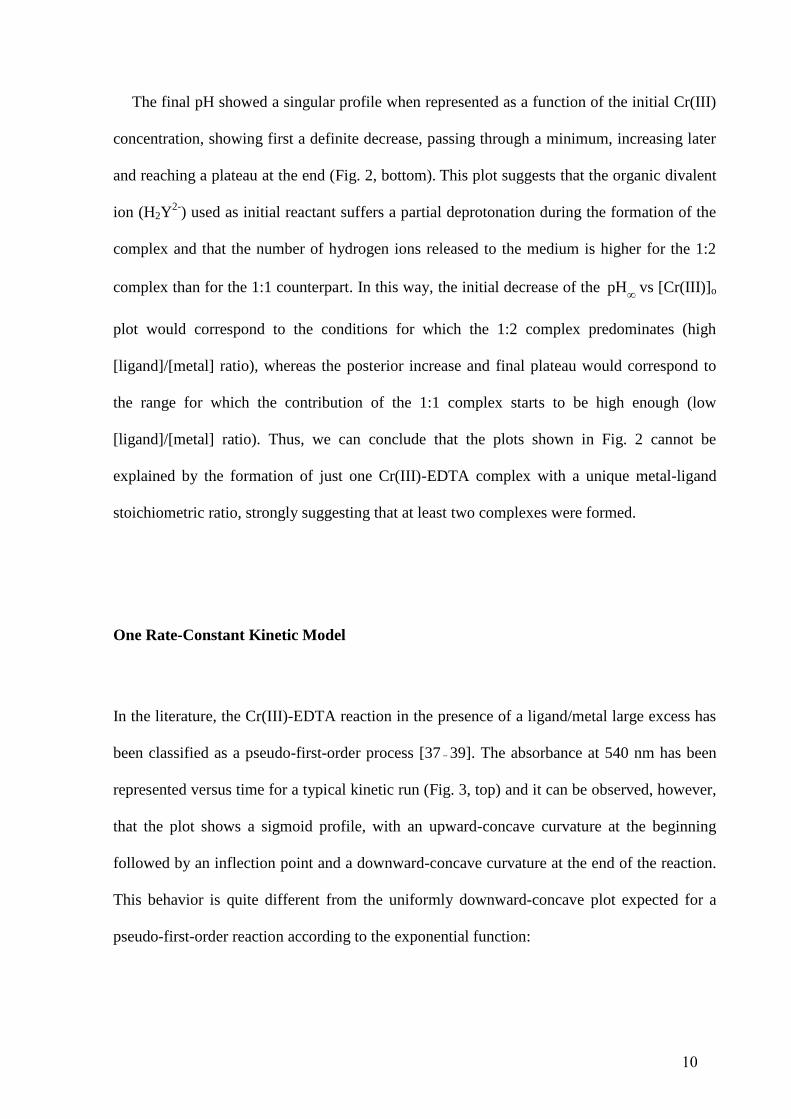
One Rate-Constant Kinetic Model
In the literature, the Cr(III)-EDTA reaction in the presence of a ligand/metal large excess has
been classified as a pseudo-first-order process [37 39]. The absorbance at 540 nm has been
represented versus time for a typical kinetic run (Fig. 3, top) and it can be observed, however,
that the plot shows a sigmoid profile, with an upward-concave curvature at the beginning
followed by an inflection point and a downward-concave curvature at the end of the reaction.
This behavior is quite different from the uniformly downward-concave plot expected for a
pseudo-first-order reaction according to the exponential function:
11
t o = ( ) k tA A A A e
(2)
where oA ,
tA and
A are the absorbances at the beginning, at time t and at the end of the
reaction, respectively, whereas k is the pseudo-first-order rate constant.
Linearization of Eq. (2) yields:
t o ln ( ) = ln ( ) A A A A k t (3)
However, systematic deviations of the experimental data from the straight line were observed
in the attempted pseudo-first-order plots for all the kinetic runs, presenting a downward-
concave curvature at the beginning of the reaction and an upward-concave curvature at the
end (Fig. 3, bottom).
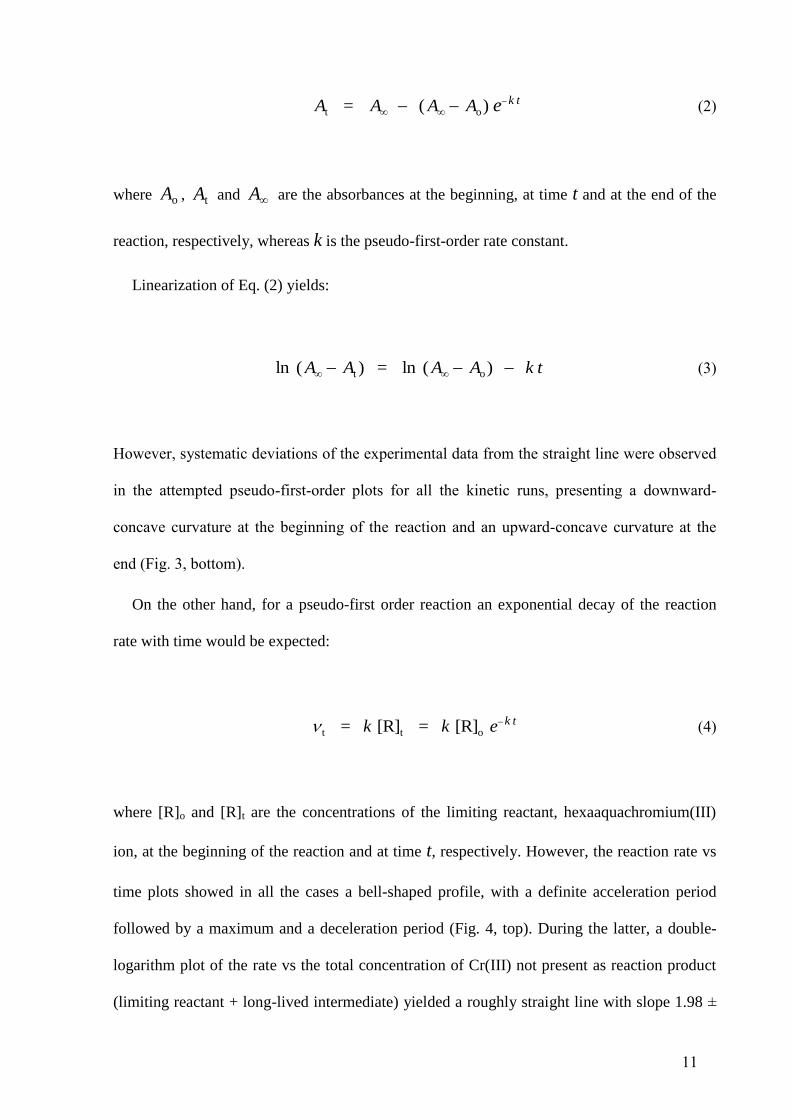
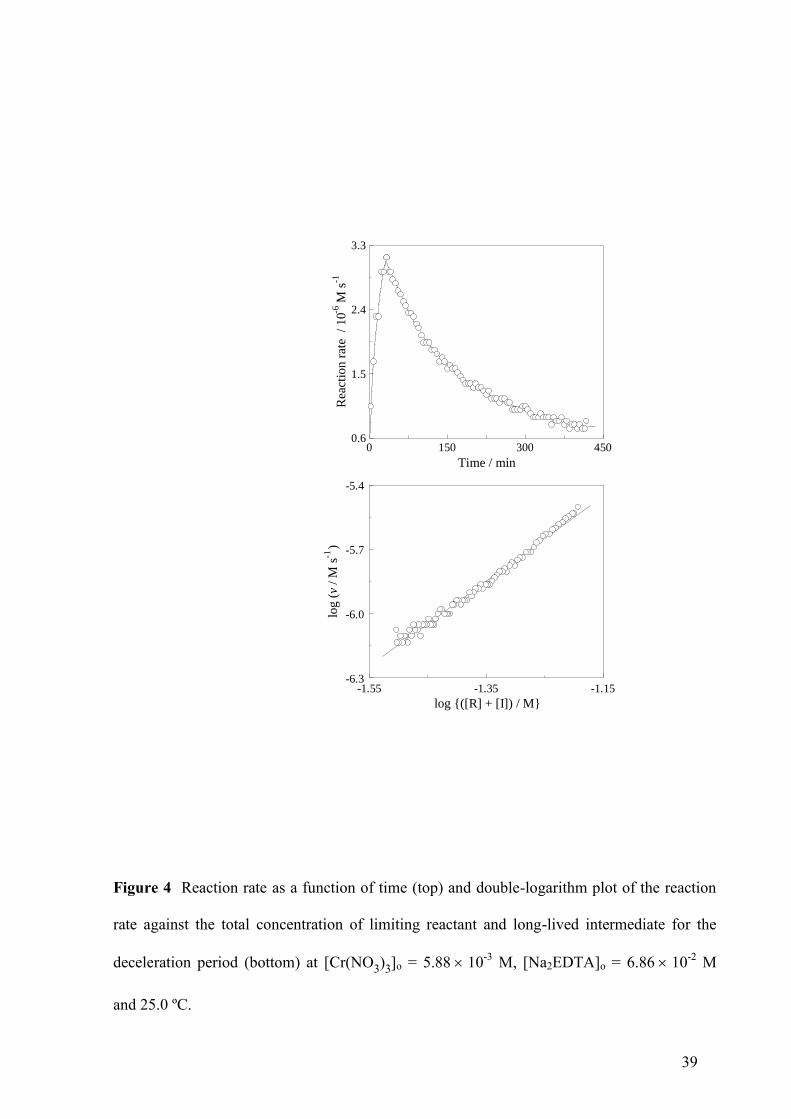
On the other hand, for a pseudo-first order reaction an exponential decay of the reaction
rate with time would be expected:
t t o = [R] = [R] k tk k e (4)
where [R]o and [R]t are the concentrations of the limiting reactant, hexaaquachromium(III)
ion, at the beginning of the reaction and at time t, respectively. However, the reaction rate vs
time plots showed in all the cases a bell-shaped profile, with a definite acceleration period
followed by a maximum and a deceleration period (Fig. 4, top). During the latter, a double-
logarithm plot of the rate vs the total concentration of Cr(III) not present as reaction product
(limiting reactant + long-lived intermediate) yielded a roughly straight line with slope 1.98 ±
12
0.03 (Fig. 4, bottom). The reaction rate values were obtained from the absorbance at 545 nm
vs time kinetic data by means of a combination of the finite-difference method of derivation
and the formula of physical additive properties as t+ t/2 =
t ot+ t o( )[Cr(III)] /[( ) ]tA A A A for small values of t.
Thus, the experimental behavior revealed two distinct deviations from the simple pseudo-
first-order kinetic model: an initial acceleration period, as well as a posterior deceleration
period where the reaction rate decreased much faster than expected for a pseudo-first-order
reaction. These deviations were probably originated by two independent causes, and led to the
conclusion that a new and more elaborated kinetic model was required.
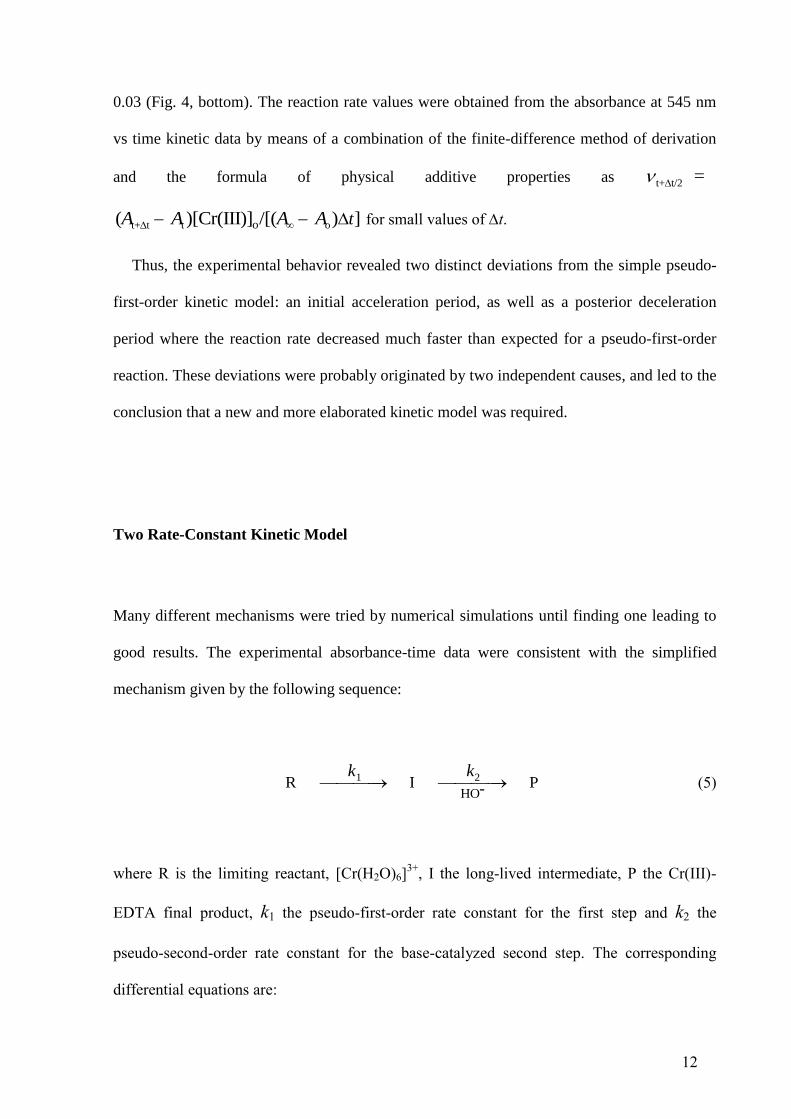
Two Rate-Constant Kinetic Model
Many different mechanisms were tried by numerical simulations until finding one leading to
good results. The experimental absorbance-time data were consistent with the simplified
mechanism given by the following sequence:
1 2
HOR I P-
k k (5)
where R is the limiting reactant, [Cr(H2O)6]3+
, I the long-lived intermediate, P the Cr(III)-
EDTA final product, k1 the pseudo-first-order rate constant for the first step and k2 the
pseudo-second-order rate constant for the base-catalyzed second step. The corresponding
differential equations are:
13
1 d[R]
[R]d
kt
(6)
1 2-
d[I]
[R] [I] [HO ]d
k kt
(7)
2-
d[P]
[I] [HO ]d
kt
(8)
Equations (6)-(8) have been integrated for each kinetic experiment by means of a numerical
approximate procedure, the fourth order Runge-Kutta method [41]. In this way, once known
the initial concentration of R, as well as those of I and P (both equal to 0), the concentrations
of the three species at different instants during the course of the reaction could be obtained,
using to that end short time intervals (t = 180360 s, depending on the experimental
conditions). The concentration of hydroxide ion during the course of the reaction was
obtained from a combination of the EDTA dissociation equilibrium constants and the number
of hydrogen ions released per Cr(III)-EDTA complex formed. As a starting point, a BASIC
computer program (KIN SIM, Supporting Information) was developed for the optimization of
the values of the 5 fitting parameters involved: the initial absorbance (Ao), the number of
hydrogen ions released during the reaction (Hkin), the two pseudo-rate constants (k1 and k2)
and the ratio between the molar absorption coefficients of the inorganic reactant and the long-
lived intermediate at 540 nm (Q). Different combinations of those parameters were
systematically tried for each kinetic run until reaching a minimum of the average error
defined as:
i,cal i,exp
i 1
N
N
A A
E
(9)
14
where i,cal
A and i,exp
A are the calculated and experimental absorbances, respectively, and N
is the number of time-absorbance datum couples for each kinetic run. The average value
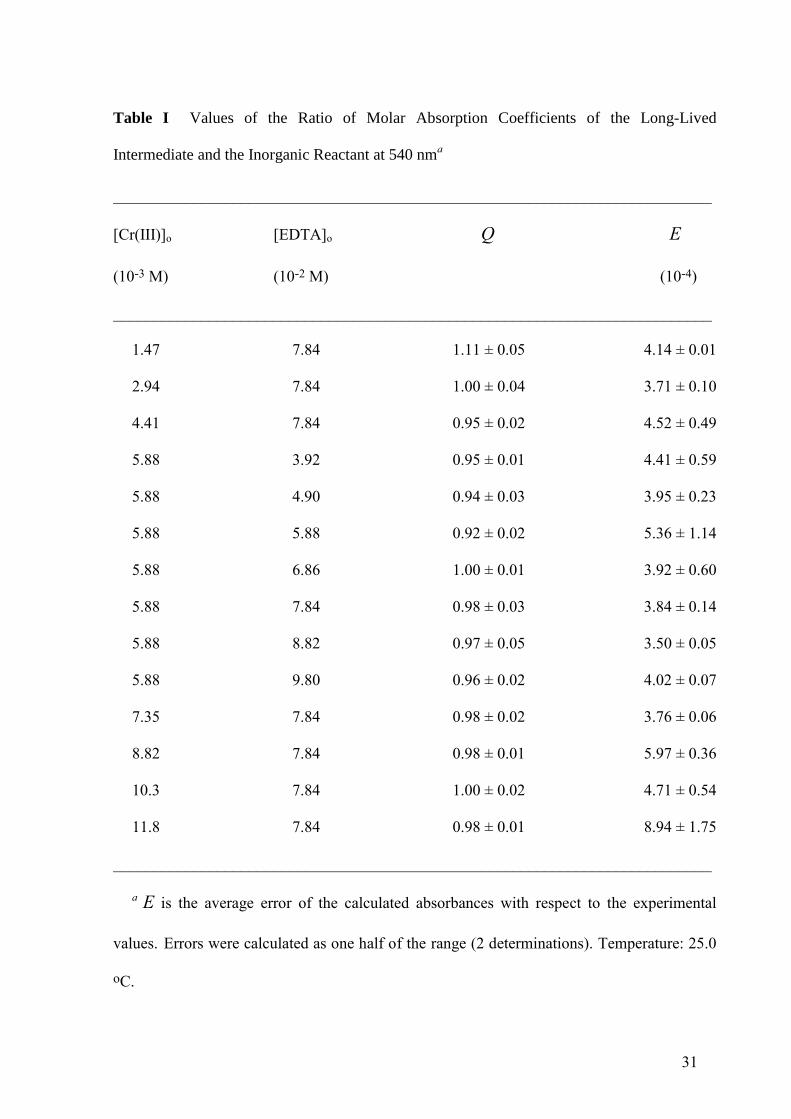
found for the ratio of molar absorption coefficients corresponding to 28 kinetic runs with
different initial concentrations of metal ion and organic ligand was Q = 0.98 ± 0.04 (Table I).
The fact that this value is so close to unity suggests that the number of Cr(III)-EDTA
chemical bonds in the long-lived intermediate is much lower than in the final complex
product, probably just one bond. In order to decrease the accidental errors associated to the
kinetic parameters, the numerical simulations were performed for all the kinetic experiments
with 4 fitting parameters, taking Q = 1 (the same molar absorption coefficients for the
inorganic reactant and the long-lived intermediate). The values of Ao obtained from the fits
were consistent within the experimental errors with the ones measured for the same
concentrations of Cr(III) in the absence of EDTA.
Comparison between Kinetic Models
The values of the average error were within the ranges E = 3.4610-33.6710
-2 for the
one rate-constant model and E = 2.9010-41.4010
-3 for the two rate-constant model,
indicating that the errors between calculated and experimental absorbances were one order of
magnitude smaller in the second case. This was confirmed by representing the ratio between
the calculated (according to the two kinetic models) and experimental absorbances at 540 nm
as a function of time for a typical kinetic run (Fig. 5). The values were within the ranges
A(540)cal/A(540)exp = 0.9531.640 for the one rate-constant model and A(540)cal/A(540)exp
= 0.9891.007 for the two rate-constant model. Moreover, the plot showed only 2 crossing
15
points with the horizontal line of A(540)cal/A(540)exp = 1 (corresponding to a perfect fit) for
the one rate-constant model and 52 crossing points for the two rate-constant model, indicating
that the errors were essentially of systematic nature in the first case and of accidental nature in
the second. It can then be concluded that the two rate-constant model is a better choice to
describe the kinetic behavior of the Cr(III)-EDTA complexation reaction than the one rate-
constant model.
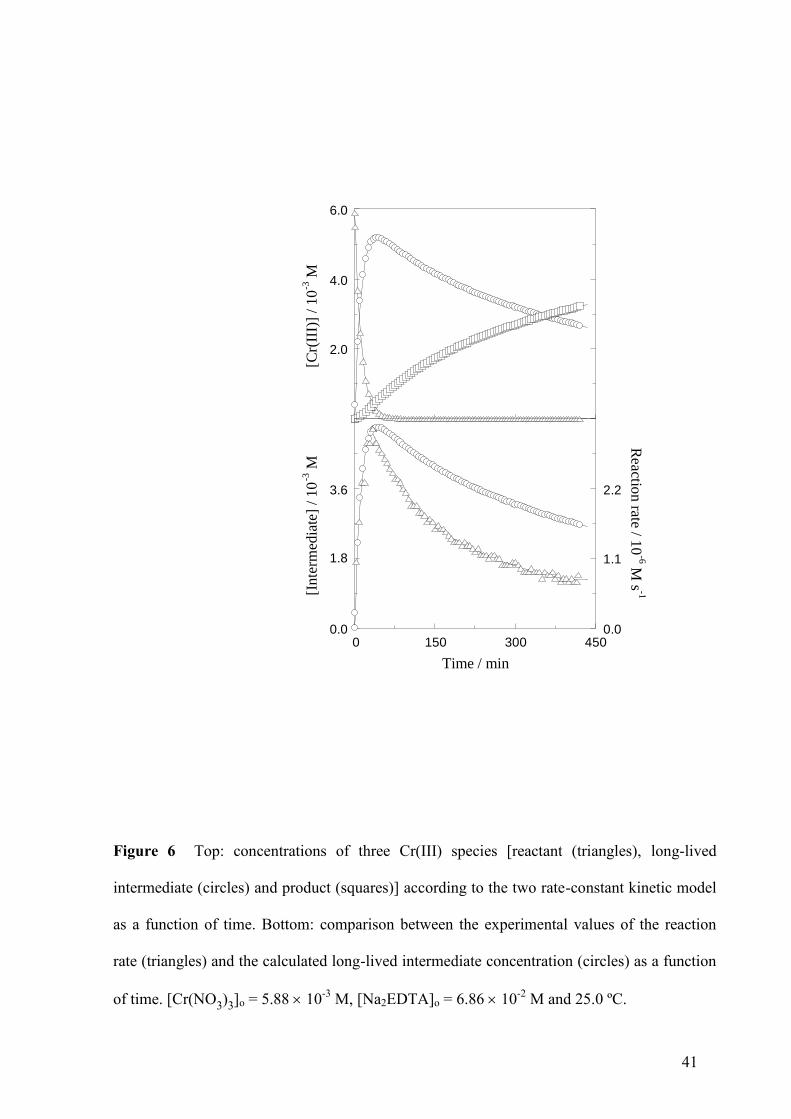
Time Evolution of the Cr(III) Complexes
The concentration vs time profiles for the limiting reactant, the long-lived intermediate and
the final product, calculated according to the two rate-constant model, have been plotted for a
typical kinetic run in Fig. 6 (top). It can be seen that the formation of the intermediate from
the reactant was rather fast, whereas the formation of the product from the intermediate was
much slower. A comparison of the experimental reaction rate with the calculated long-lived
intermediate concentration (Fig. 6, bottom) revealed that the initial increase of the rate almost
exactly matched the increase of the intermediate concentration. However, the maximum in the
rate took place slightly before than the maximum in the intermediate concentration, and the
rate decreased much faster than the concentration. This fast deceleration was caused
(according to the proposed kinetic model) by the decrease in the solution pH due to the
release of hydrogen ions during the reaction.
Number of Hydrogen Ions Released
16
In order to form its complex with Cr(III), the dianionic form of EDTA must lose at least part
of its acidic hydrogen atoms. The number of hydrogen ions released per Cr(III)-EDTA
complex molecule formed has been denoted as H. The value of this parameter corresponding
to each experiment was obtained in two different ways: from the fitting of the absorbance-
time data (kinetic value, Hkin) and from the measurements of the pH values at the end of the
reaction combined with the acidity equilibrium constants reported in the literature [42] for the
dissociations of H3Y- and H2Y
2- (thermodynamic value, Hth). Both Hkin and Hth decreased as
the metal ion initial concentration increased, and their respective values converged at high
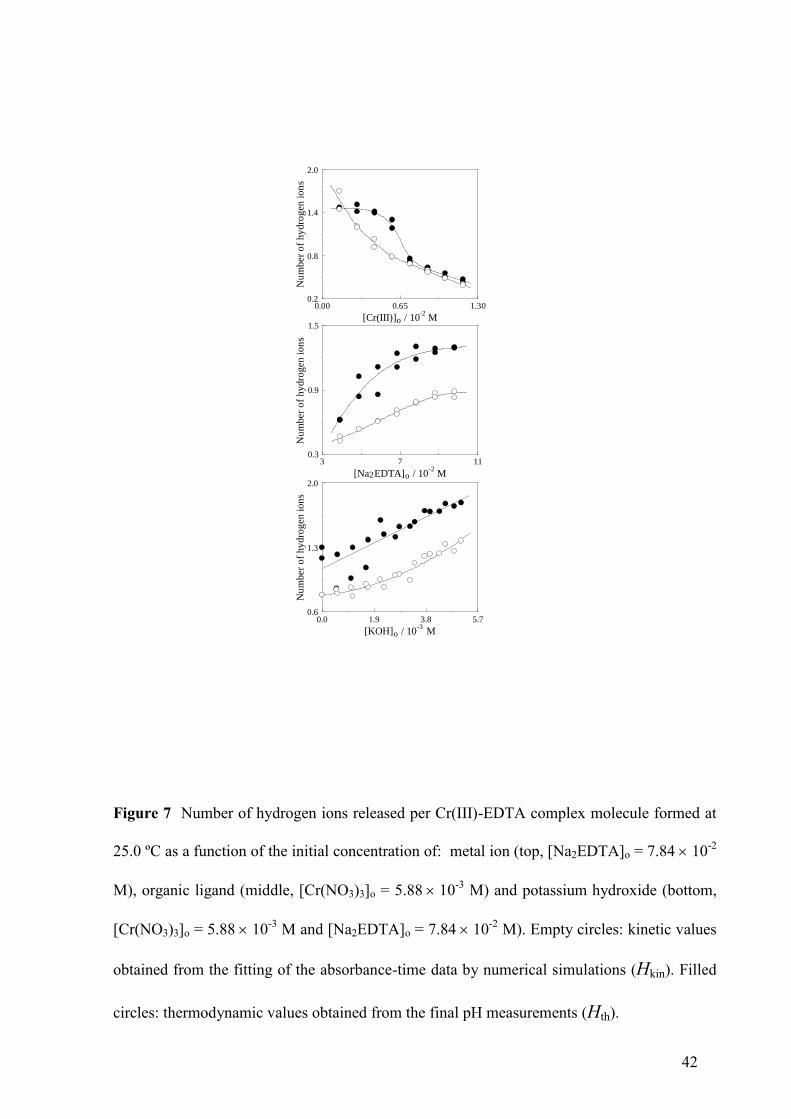
[Cr(III)]o (Fig. 7, top). On the contrary, an increase in the initial ligand concentration led to an
increase of both Hkin and Hth, and their respective values converged at low [Na2EDTA]o (Fig.
7, middle). Addition of KOH resulted in an increase of both Hkin and Hth (Fig. 7, bottom).
The values found for these parameters were in the range 0 < H < 2 in all the experiments,
with a trend to Hth > Hkin.
Kinetic Data
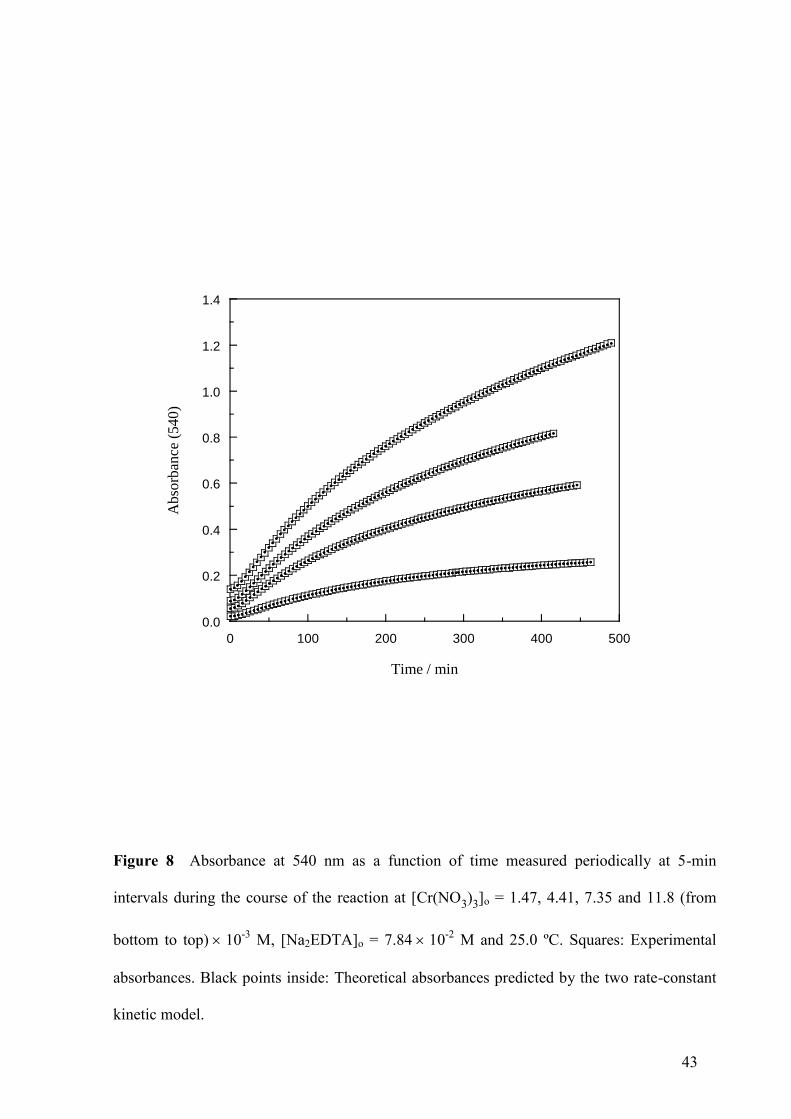
Excellent accordance between the experimental absorbances and those predicted by the two
rate-constant kinetic model was observed in all the kinetic runs (see Fig. 8).
After application of the isolation method, the pseudo-rate constants should be independent
of the initial concentration of the limiting reactant. Thus, this independence can be adopted as
a criterion to check the validity of the kinetic model used to fit the experimental data. In the
present case, pseudo-rate constant k1 was independent of the initial concentration of metal

17
ion, whereas k2 decreased as that concentration increased (Table II). A double-logarithm plot
of k1 vs [Cr(III)]o yielded the slope 0.04 ± 0.03, whereas that of k2 yielded the slope – 0.27 ±
0.03. The small absolute values of those slopes indicated that the two rate-constant model,
although not perfect (especially as concerning the determination of k2), was a rather faithful
description of the kinetics followed by the Cr(III)-EDTA complexation reaction.
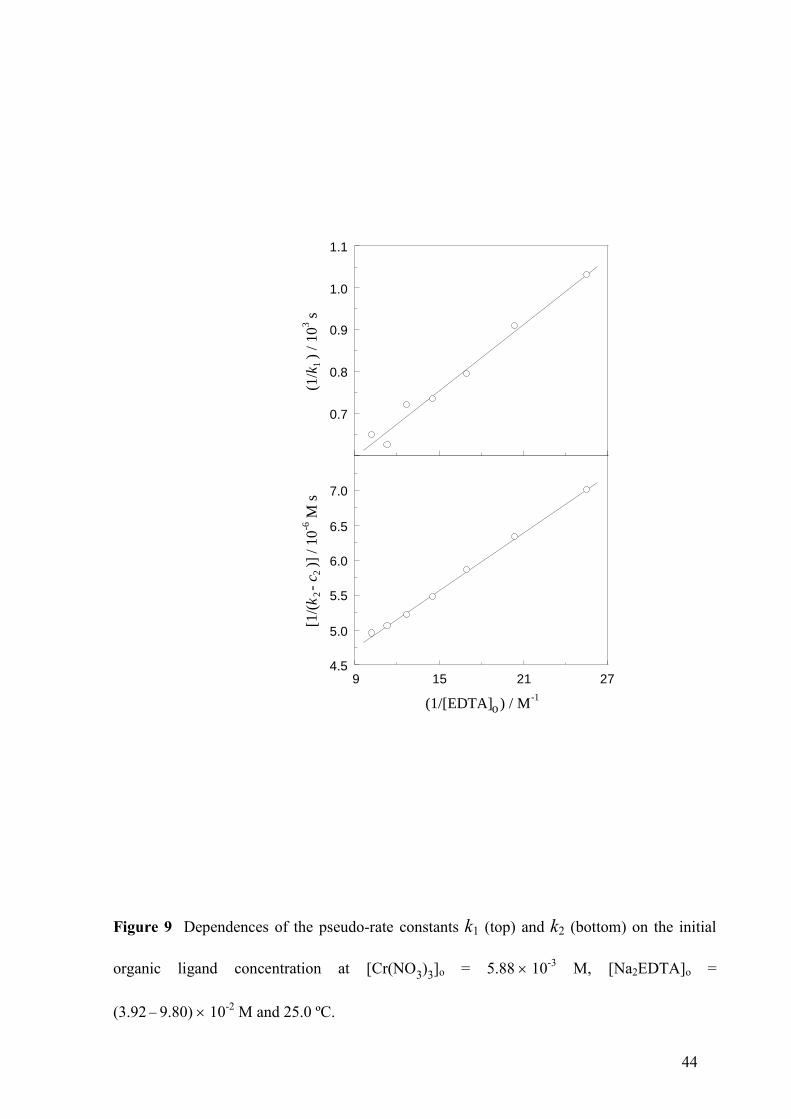
Both pseudo-rate constants increased with increasing initial ligand concentration, although
the dependence of k1 on [EDTA]o (Fig. 9, top) was stronger than that of k2 (Fig. 9, bottom).
The experimental data could be fitted to the functions:
o11
o1
[EDTA] =
1 [EDTA]
ak
b (10)
o22 2
o2
[EDTA] = +
1 [EDTA]
ak c
b (11)
with a1 = (3.8 ± 0.2)10-2
M-1
s-1
, b1 = 14 ± 2 M-1
, a2 = (7.4 ± 0.2)106 M
-2 s
-1, b2 = 26.0 ±
1.2 M-1
and c2 = (4.02 ± 0.12)104 M
-1 s
-1. Thus, it can be concluded that, although EDTA is
a reactant essential in the part of the mechanism associated to pseudo-rate constant k1, in that
associated to pseudo-rate constant k2 there are at least two reaction pathways involved, one
including EDTA as a reactant and the other not (see that, for [EDTA]o = 0, k1 = 0 and k2 =
c2).
The reaction showed base catalysis. Pseudo-rate constant k1 increased linearly with
increasing [KOH]o (Fig. 10, top), whereas k2 decreased at first and reached soon a plateau
18
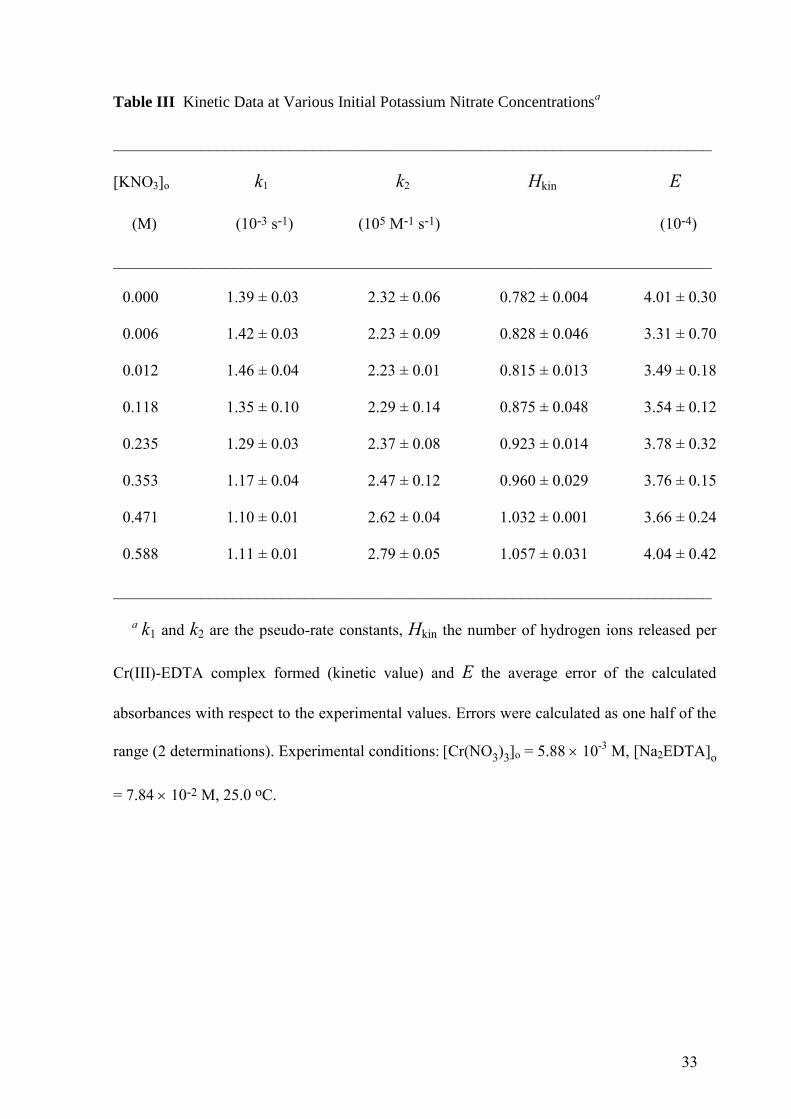
(Fig. 10, bottom). Addition of KNO3 resulted in slight changes of the pseudo-rate constants, a
decrease of k1 and an increase of k2, whereas the value of Hkin increased (Table III).
Addition of the water-soluble polymer polyvinylpyrrolidone (PVP) did not appreciably
change the values of either k1, k2 or Hkin (Table S1, Supporting Information). Since PVP was
expected to act as a protective colloid, hindering the approach of EDTA to a potential Cr(III)
intermediate species of colloidal nature, its lack of noticeable effect on the rate of the Cr(III)–
EDTA reaction allows to exclude colloidal Cr(OH)3 as a possible intermediate in the
mechanism of this complexation process. However, when the water-soluble polymer gum
arabic (GA) was added, a net decrease in all k1, k2 and Hkin was observed (Table S2,
Supporting Information). This suggests the possible formation of a complex between Cr(III)
and the polysaccharide GA in competition with the Cr(III)-EDTA complexation reaction.
Actually, the monosaccharide D-ribose is known to form long-lived intermediate complexes
in its reaction with Cr(VI) [43,44].
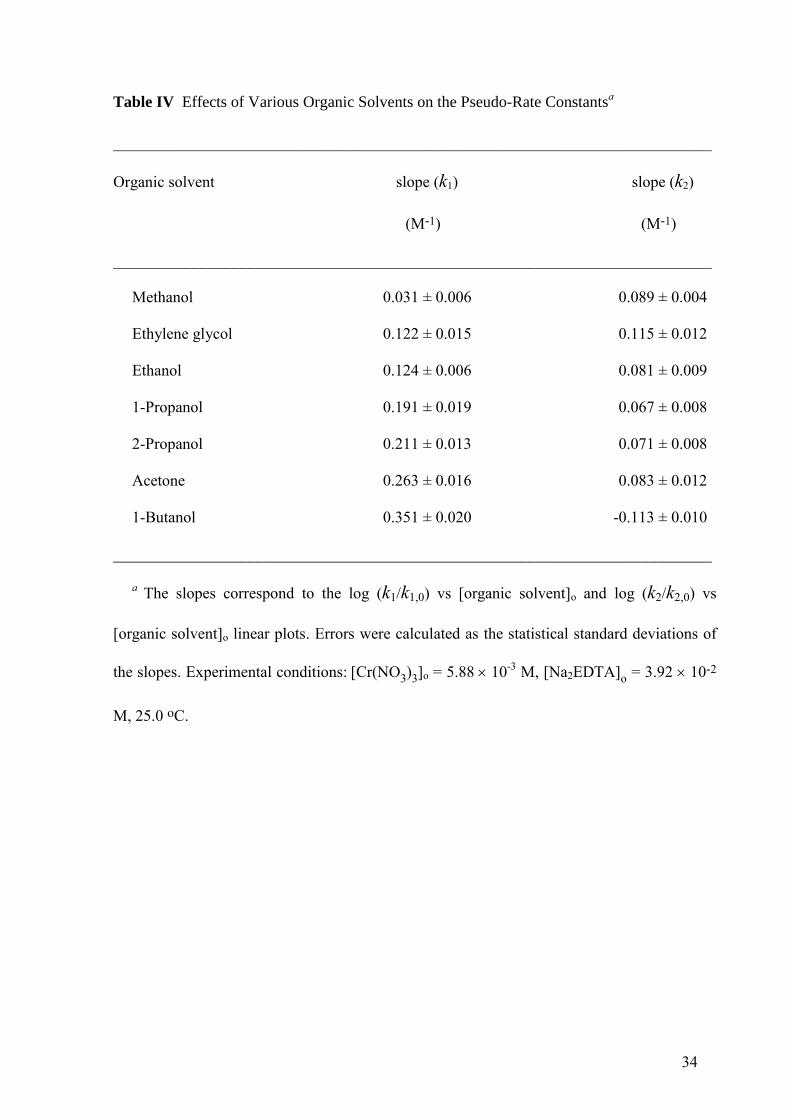
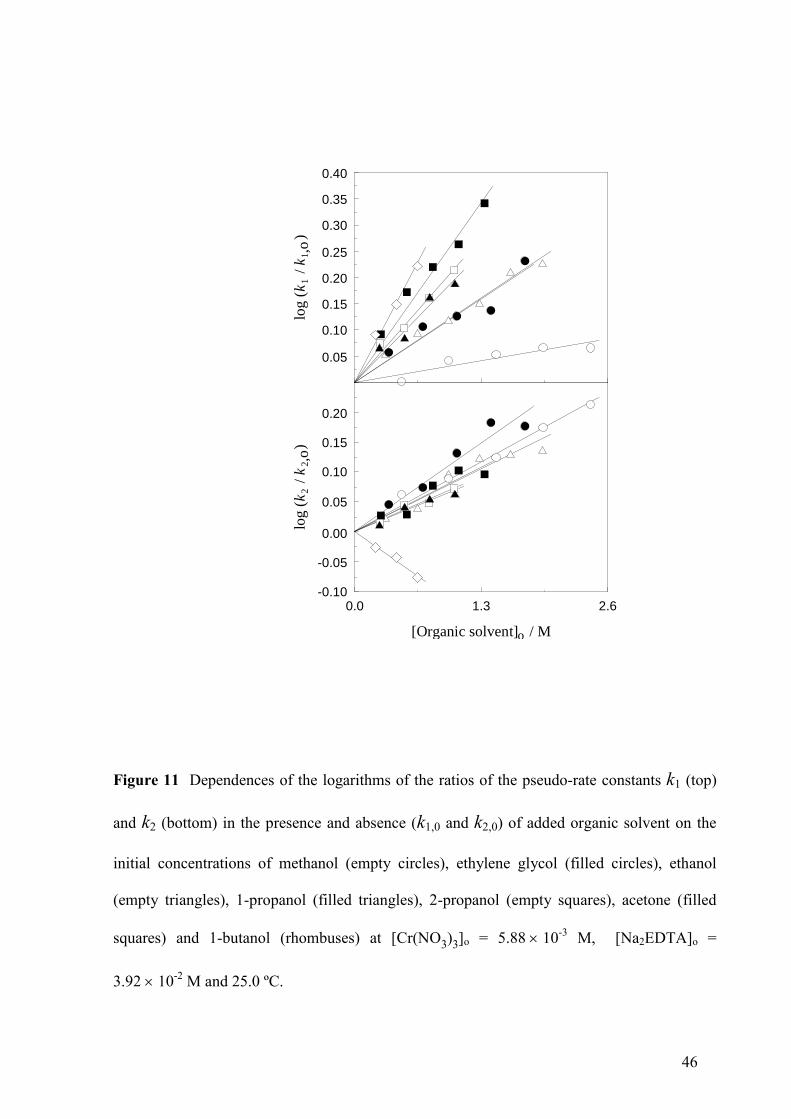
Addition of an organic solvent (several alcohols or acetone) resulted in an increase of both
pseudo-rate constants k1 (Fig. 11, top) and k2 (Fig. 11, bottom), with the only exception of 1-
butanol (which led to a decrease of k2). The results shown in Table IV for the slopes of the
log (k1/k1,0) vs [organic solvent]o and log (k2/k2,0) vs [organic solvent]o linear plots (k1,0 and
k2,0 being the pseudo-rate constants in the absence of organic solvent) indicate that in the
homologous series of primary alcohols the rate-increasing effect followed the sequence of
increasing non-polar hydrocarbon chain length (methanol < ethanol < 1-propanol < 1-butanol)
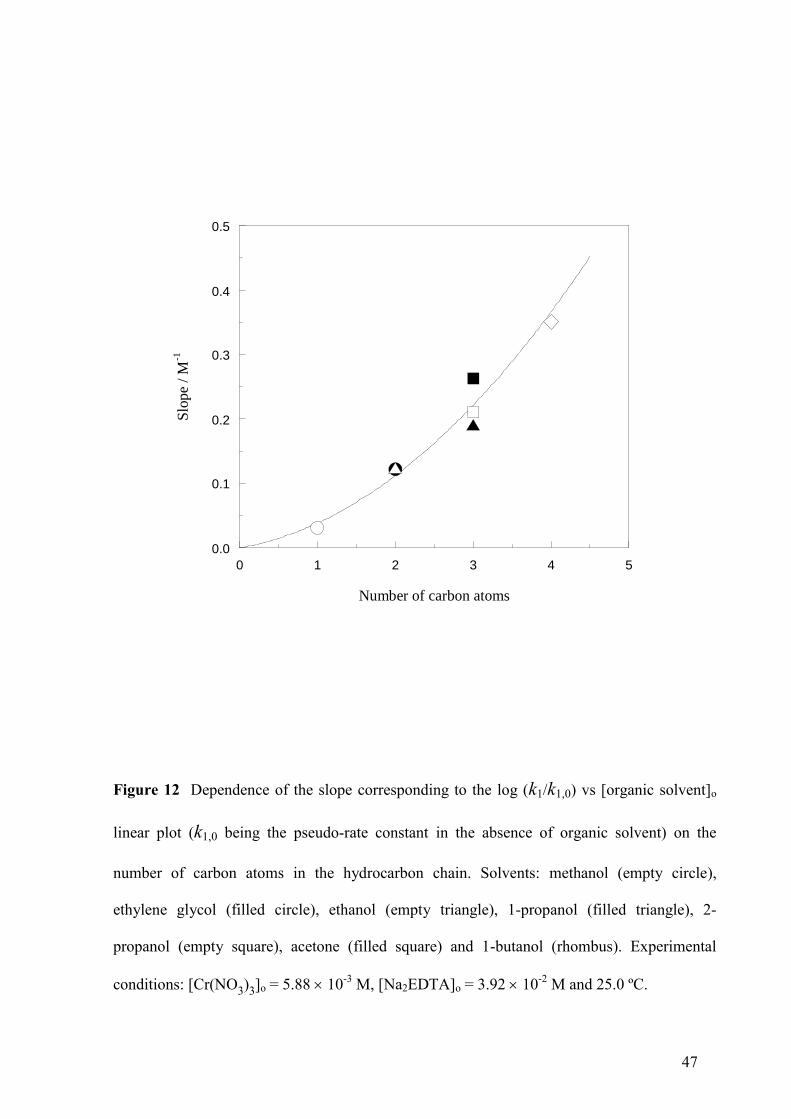
as far as k1 was concerned. Moreover, the slopes of the log (k1/k1,0) vs [organic solvent]o
linear plots were strongly correlated with the number of carbon atoms in the hydrocarbon
chain for all the 7 organic solvents studied (Fig. 12). However, the effect on k2 was rather
similar for the different solvents (1-butanol excepted). A comparison of the data shown in
19
Tables IV and S3 (Supporting Information) reveals that an increase of the initial EDTA
concentration resulted in a net decrease of the ethanol effect on k1 (duplication of that
concentration led to a decrease of the slope from 0.124 ± 0.006 M-1
to 0.048 ± 0.005 M-1)
whereas the effect on k2 remained unchanged (0.081 ± 0.009 M-1 vs 0.078 ± 0.010 M-1,
respectively).
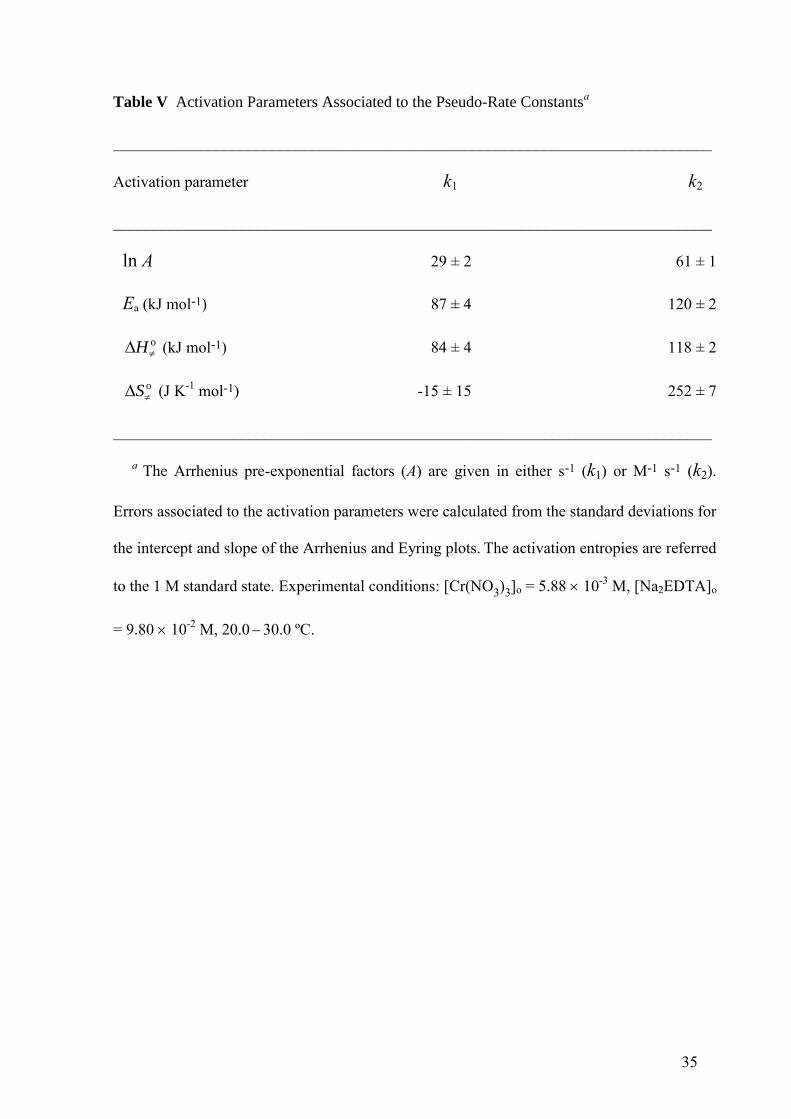
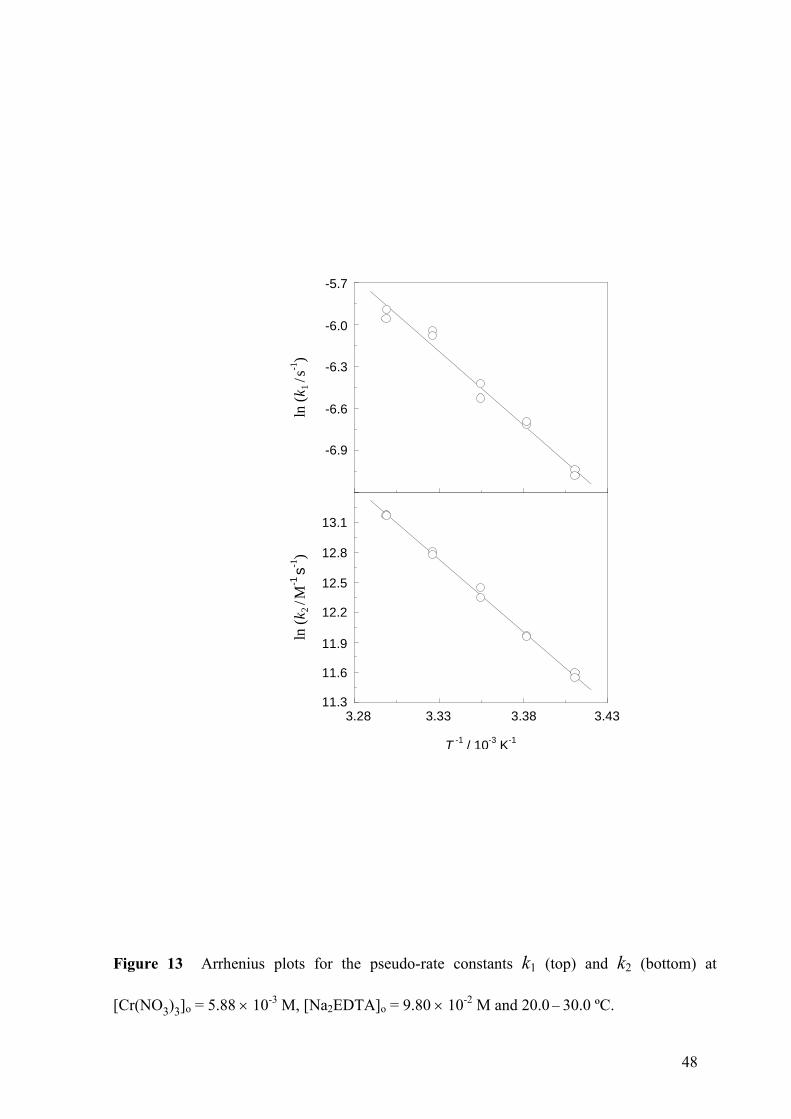
The fulfilment of the Arrhenius equation was reasonably good for k1 (Fig. 13, top) and
excellent for k2 (Fig. 13, bottom). The activation energy associated to the second pseudo-rate
constant was much higher than that associated to the first (Table V). Although the activation
entropy corresponding to k1 was slightly negative and that corresponding to k2 largely
positive, caution should be exercised when interpreting these results, for it has to be reminded
that activation entropies associated to pseudo-rate constants with different units cannot be
compared, since they present a different dependence on the arbitrary choice of the standard
state [45].
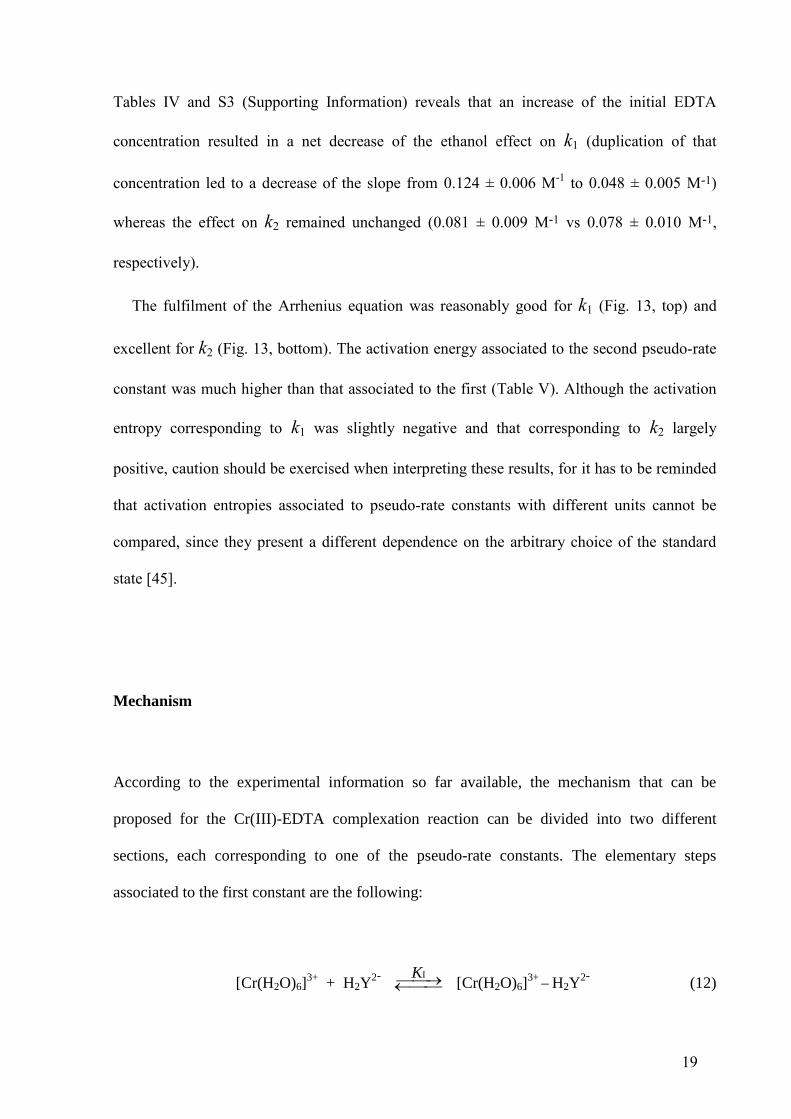
Mechanism
According to the experimental information so far available, the mechanism that can be
proposed for the Cr(III)-EDTA complexation reaction can be divided into two different
sections, each corresponding to one of the pseudo-rate constants. The elementary steps
associated to the first constant are the following:
[Cr(H2O)6]3+
+ H2Y2-
IK [Cr(H2O)6]
3+H2Y
2- (12)
20
[Cr(H2O)6]3+H2Y
2- + HO
-
IIK [Cr(HO)(H2O)5]2+H2Y
2- + H2O
(13)
[Cr(H2O)6]3+H2Y
2- III
slowk [Cr(H2Y)(H2O)5]
+ + H2O
(14)
[Cr(HO)(H2O)5]2+H2Y
2- IV
slowk [Cr(H2Y)(H2O)5]
+ + HO
- (15)
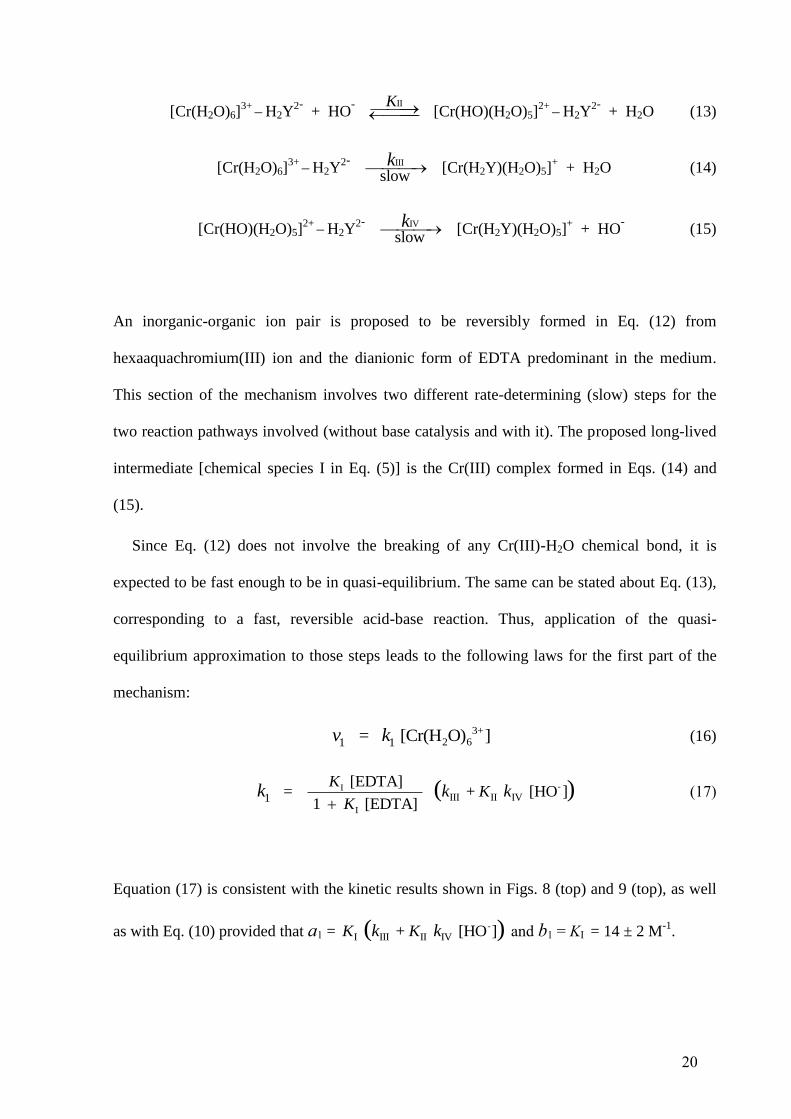
An inorganic-organic ion pair is proposed to be reversibly formed in Eq. (12) from
hexaaquachromium(III) ion and the dianionic form of EDTA predominant in the medium.
This section of the mechanism involves two different rate-determining (slow) steps for the
two reaction pathways involved (without base catalysis and with it). The proposed long-lived
intermediate [chemical species I in Eq. (5)] is the Cr(III) complex formed in Eqs. (14) and
(15).
Since Eq. (12) does not involve the breaking of any Cr(III)-H2O chemical bond, it is
expected to be fast enough to be in quasi-equilibrium. The same can be stated about Eq. (13),
corresponding to a fast, reversible acid-base reaction. Thus, application of the quasi-
equilibrium approximation to those steps leads to the following laws for the first part of the
mechanism:
3+2 61 1 = [Cr(H O) ]v k (16)
-I
I
III II IV1
[EDTA] = + [HO ]
1 [EDTA] ( )K
KK
k kk
(17)
Equation (17) is consistent with the kinetic results shown in Figs. 8 (top) and 9 (top), as well
as with Eq. (10) provided that a1 = -
I III II IV + [HO ]( )K Kk k and b1 = KI = 14 ± 2 M-1
.
21
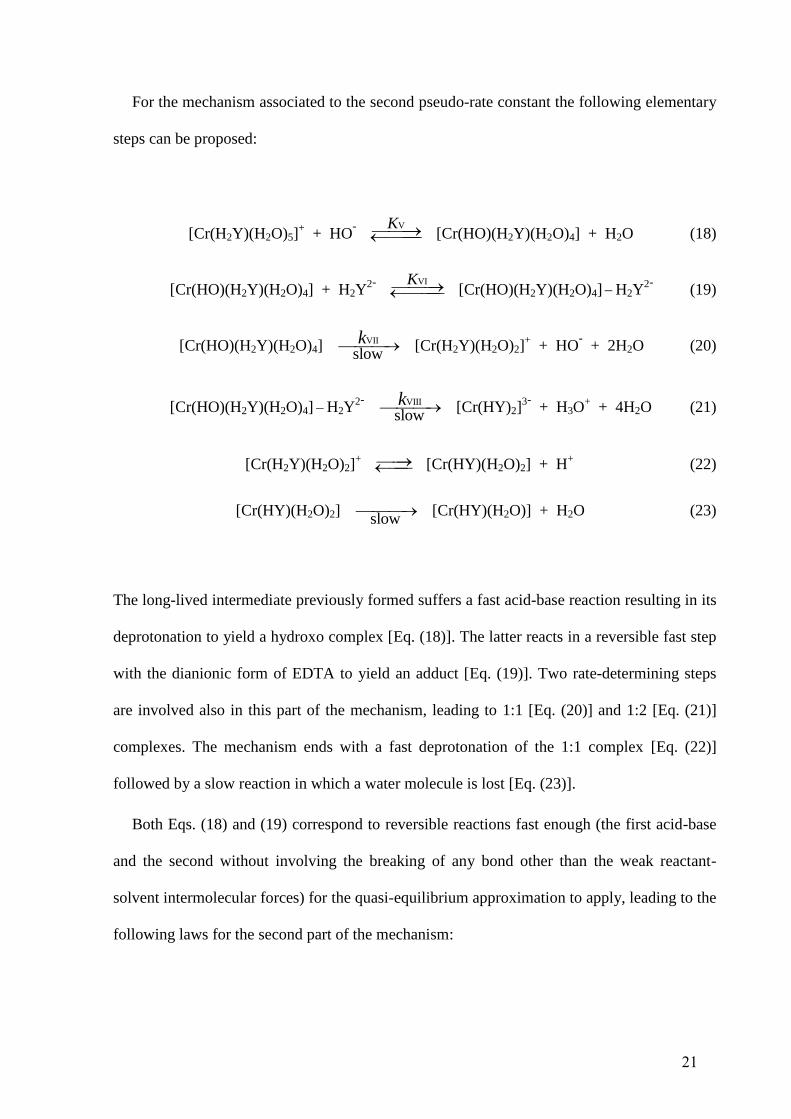
For the mechanism associated to the second pseudo-rate constant the following elementary
steps can be proposed:
[Cr(H2Y)(H2O)5]+ + HO
-
VK [Cr(HO)(H2Y)(H2O)4] + H2O
(18)
[Cr(HO)(H2Y)(H2O)4] + H2Y2-
VIK [Cr(HO)(H2Y)(H2O)4]H2Y
2- (19)
[Cr(HO)(H2Y)(H2O)4] VII
slowk [Cr(H2Y)(H2O)2]
+ + HO
- + 2H2O
(20)
[Cr(HO)(H2Y)(H2O)4] H2Y2-
VIII
slowk [Cr(HY)2]
3- + H3O
+ + 4H2O (21)
[Cr(H2Y)(H2O)2]+ [Cr(HY)(H2O)2] + H
+ (22)
[Cr(HY)(H2O)2] slow [Cr(HY)(H2O)] + H2O (23)
The long-lived intermediate previously formed suffers a fast acid-base reaction resulting in its
deprotonation to yield a hydroxo complex [Eq. (18)]. The latter reacts in a reversible fast step
with the dianionic form of EDTA to yield an adduct [Eq. (19)]. Two rate-determining steps
are involved also in this part of the mechanism, leading to 1:1 [Eq. (20)] and 1:2 [Eq. (21)]
complexes. The mechanism ends with a fast deprotonation of the 1:1 complex [Eq. (22)]
followed by a slow reaction in which a water molecule is lost [Eq. (23)].
Both Eqs. (18) and (19) correspond to reversible reactions fast enough (the first acid-base
and the second without involving the breaking of any bond other than the weak reactant-
solvent intermolecular forces) for the quasi-equilibrium approximation to apply, leading to the
following laws for the second part of the mechanism:
22
-
2 2 = [I] [HO ]v k (24)
VIV2 -
V VI
VIIIVII
[EDTA] = +
1+ [HO ] 1 [EDTA] ( )KK
kK K
kk
(25)
where [Cr(H2Y)(H2O)5]+ is the long-lived intermediate. Equation (25) is consistent with
the kinetic results shown in Figs. 8 (bottom) and 9 (bottom), as well as with Eq. (11) provided
that -
2 V VI VVIII = /(1+ [HO ])K K Kka , b2 = KVI = 26.0 ± 1.2 M-1
and 2 =c
-
V VVII /(1+ [HO ])K Kk .
The decrease of rate constant k1 with increasing ionic strength (Table III) can be explained
by the effect on equilibrium constant KI, expected to decrease because the corresponding
reaction, Eq. (12), involves the encounter of two strongly charged anion-cation reactants.
However, this decreasing effect failed to show up in the case of rate constant k2, probably
because the reaction associated to equilibrium constant KV, Eq. (18), involves two ionic
reactants with a much lower electrostatic charge, and the combined effects on the different
elementary reactions should then be taken into account.
The number of hydrogen ions released to the medium during the reaction per Cr(III)-
EDTA complex formed can be calculated as:
3-
2 2
+ 3-
2 2 2 2 2
kin
[Cr(HY)(H O)] + 2 [Cr(HY) ] =
[Cr(H Y)(H O) ] + [Cr(HY)(H O)] + [Cr(HY) ] H (26)
where the concentration of [Cr(HY)(H2O)2] has been neglected. It has been considered that
per each [Cr(H2Y)(H2O)2]+, [Cr(HY)(H2O)] or [Cr(HY)2]
3- formed 0, 1 or 2 hydrogen ions are
released to the medium, respectively. Equation (26) predicts that 0 < Hkin < 2, in agreement
23
with the results shown in Tables II and III, as well as in Fig. 7. Moreover, an increase of
[Cr(III)]o should result in an increase of the ratio of the 1:1 complexes (releasing either 0 or 1
hydrogen ions) versus the 1:2 complex (releasing 2 hydrogen ions), thus decreasing Hkin,
what agrees with the results shown in Fig. 7 (top). On the contrary, an increase of [EDTA]o
should result in an increase of the ratio of the 1:2 complex versus the 1:1 complexes, thus
increasing Hkin, what agrees with the results shown in Fig. 7 (middle). Addition of KOH
shifts the quasi-equilibrium defined by Eq. (22) toward the right side, thus increasing Hkin, in
agreement with Fig. 7 (bottom). Furthermore, the trend observed for the value of the number
of hydrogen ions liberated per Cr(III)-EDTA complex formed as calculated from the final
experimental pH being higher than that calculated from the numerical simulations performed
on the absorbance-time data (Hth > Hkin) can be explained by the combination of Eqs. (22)
and (23) as long as the latter reaction is slow enough to have a negligible effect during the
kinetic runs but a measurable effect on the final pH.
The effect of addition to the medium of low-polarity organic solvents is also consistent
with the proposed mechanism. Given that Eq. (12) involves the participation as reactants of a
strongly charged anion-cation pair, a decrease of the medium polarity is expected to result in
an increase of equilibrium constant KI and, hence, also of pseudo-rate constant k1 [see Eq.
(17)], because an enhancement of the anion-cation electrostatic attraction would produce an
increase of the forward rate constant, the backward rate constant remaining essentially
unchanged. However, since Eq. (18) involves as reactants a less strongly charged anion-cation
pair, the effect of addition of an organic solvent on equilibrium constant KV and, hence, also
on pseudo-rate constant k2 [see Eq. (25)], is expected to be of a lesser magnitude. In fact,
whereas in the case of k1 the effect is so notable (see Fig. 11, top) that it has been possible to
correlate it with the number of carbon atoms in the hydrocarbon chain (see Fig. 12), in the
24
case of k2 a clear-cut difference between the various organic solvents with an acceleration
effect could not be established (see Fig. 11, bottom). The finding that 1-butanol had a
decreasing effect on k2, quite different from the effects produced by the other organic
solvents, might be connected with its ability to aggregate in the form of micelles, thus
introducing a big change in the medium structure.
The fact that the activation energy associated to the experimental rate constant k1 is much
lower than that associated to k2 (87 ± 4 versus 120 ± 2 kJ mol-1
) is coherent with the fact that
the intermediate [Cr(H2Y)(H2O)5]+ is long lived, since it must be formed in a fast step (low
activation energy) and consumed in a slow step (high activation energy). In the opposite case,
if it would have been formed in a slow step and consumed in a fast one, that species would
behave as a short-lived intermediate in steady state, leading to continuously decreasing rate vs
time plots, instead of the bell-shaped curves experimentally observed, as shown in Figs. 4
(top) and 6 (bottom). Moreover, the notable high values of the activation energies associated
to both pseudo-rate constants is consistent with the well-known inherent kinetic inertness to
substitution of the d2sp
3 octahedral complexes of Cr(III) [46 48].
It should be noticed that, in the lack of any direct independent proof, the proposal of the
formation of the 1:2 Cr(III)-EDTA complex in Eq. (21) should be considered as only a
working hypothesis. Several indirect evidences of its existence, however, can be extracted
from the present kinetic study: (i) The downward-concave curvature of the A(540)∞ vs
[Cr(III)]o plot (Fig. 2, top), suggesting that at high [EDTA]/[Cr(III)] ratios a complex with a
high molar absorption coefficient is predominantly formed (presumably, the 1:2 complex),
whereas at low [EDTA]/[Cr(III)] ratios a complex with a low molar absorption coefficient is
predominantly formed (the 1:1 complex). (ii) The finding that the final pH did not decrease
monotonously as the metal ion initial concentration increased (situation expected if only 1:1
25
complexes were formed), since at high [Cr(III)]o values the plot showed a slight increase
followed by a plateau (Fig. 2, bottom), suggesting that additional increases of [Cr(III)]o did
not result in a further increase of the number of hydrogen ions released by EDTA to form the
violet complex. (iii) The decrease of both Hkin and Hth as [Cr(III)]o increased (Fig. 7, top).
(iv) The increase of both Hkin and Hth as [EDTA]o increased (Fig. 7, middle). (v) The
increase of rate constant k2 as [EDTA]o increased (Fig. 9, bottom), suggesting that the long-
lived intermediate actually reacts with a second ligand molecule. Although the tendency of
EDTA as a chelating ligand to wrap itself around a single metal center (thus leading to 1:1
complexes) is indeed well known, the rather prolonged lifetime of the long-lived intermediate
(Fig. 6) might offer a chance for a second ligand molecule to become attached to Cr(III)
before the first ligand molecule wraps itself around the metal center. This would be certainly
consistent with the high activation energy associated to rate constant k2, indicating that the
conversion of the long-lived intermediate into the reaction product is notoriously slow.
Structures of the Cr(III)-EDTA Complexes
Given that Cr(III) forms hexacoordinated complexes and EDTA can behave as a hexadentate
ligand (including two amine nitrogen atoms and four carboxylate oxygen atoms as electron
donors), it might seem logic at first view that in the final violet complex six Cr(III)-EDTA
bonds be involved. However, EDTA complexes with the organic ligand fully coordinated to
the metal are known to present a considerable structural stress [28]. Consequently, there has
been some discussion in the chemical literature on the actual number of Cr(III)-EDTA bonds
involved in the violet complex, both in aqueous solution and in the solid state. Spectroscopic
26
studies have yielded apparently conflicting results. Some reports favor a structure with five
bonds and the sixth metal position occupied by a water molecule, as proposed in the product
[Cr(HY)(H2O)] formed in Eq. (23) [49 53]. Certainly, this structure agrees with the well-
known fact that the Cr(III)-EDTA complex presents two distinct acidity equilibrium
constants, corresponding to the loss of hydrogen ions from the unbounded carboxyl group of
the organic ligand HY3-
and from the metal-bonded water molecule [29,54]. On the contrary,
other reports favor a structure with six Cr(III)-EDTA bonds [28,29,55 57].
Since the sodium salt of the dianionic form of EDTA was used as organic reactant in the
present study, if the predominant form of the final Cr(III)-EDTA complex was
hexacoordinated, [Cr(Y)]-, one would expect values of Hth 2. However the experimental
values were in most cases considerably lower. This finding suggests that the loss of the sixth
water molecule from the coordination sphere of Cr(III) is very slow, probably involving a
notably high activation energy:
[Cr(HY)(H2O)] [Cr(Y)(H2O)]- + H
+ (27)
[Cr(Y)(H2O)]-
very slow [Cr(Y)]
- + H2O (28)
Eq. (27) suggests that an increase in the pH should result in a higher contribution of the
hexacoordinated complex. This prediction agrees with the results shown in Fig. 7 (bottom),
showing that at high [KOH]o the value of Hth approaches the theoretical limit of 2.
Applicability of the Kinetic Model
27
The procedure developed in this work for the treatment of the kinetic experimental data
corresponding to the Cr(III)-EDTA reaction might prove useful for other complexation
reactions involving as reactants aqua complexes of transition metal ions kinetically inert to
substitution and different polydentate ligands.
BIBLIOGRAPHY
1. Perez-Benito, J. F.; Arias, C.; Rodriguez, R. M. J Phys Chem A 2001, 105,
1150 1157.
2. Bertoni, F. A.; Bellu, S. E.; Gonzalez, J. C.; Sala, L. F. Carbohydr Polym 2014, 114,
1 11.
3. Schwarz, K.; Mertz, W. Arch Biochem Biophys 1959, 85, 292 295.
4. Barrett, J.; O’Brien, P.; Pedrosa de Jesus, J. Polyhedron 1985, 4, 1 14.
5. Cooper, J. A.; Blackwell, L. F.; Buckley, P. D. Inorg Chim Acta 1984, 92, 23 31.
6. Kim, D. S.; Kim, T. W.; Kang, J. S. J. Trace Elem Med Biol 2004, 17, 243 247.
7. Dubois, F.; Belleville, F. Path Biol 1991, 39, 801 808.
8. McCarty, M. F. Med Hypotheses 1994, 43, 253 265.
9. Anderson, R. A. In Chromium and the Aging Process; Cser, M. A.; Laszlo, I. S.;
Etienne, J. C.; Maymard, Y.; Centeno, J. A.; Khassanova, L.; Collery, P. Eds.; John
Libbey Eurotext: Paris, France, 2004; Vol. 8.
10. El-Aila, H. J. Y. J Dispers Sci Technol 2012, 33, 1688 1694.
11. Liu, X.; Fan, J. H.; Ma, L. M. Water Air Soil Pollut 2013, 224, 1583.
12. Nash, K. L.; Brigham, D.; Shehee, T. C.; Martin, A. Dalton Trans 2012, 41,
14547 14556.
28
13. Evans, N.; Hallam, R. Mineral Mag 2012, 76, 3435 3438.
14. Broggs, M. A.; Islam, M.; Dong, W.; Wall, N. A. Radiochim Acta 2013, 101, 13 18.
15. Riha, M.; Karlickova, J.; Filipsky, T.; Macakova, K.; Hrdina, R.; Mladenka, P. J Inorg
Biochem 2013, 123, 80 87.
16. Zhan, Y.; Chen, Y. W.; Lin, Z. X.; Li, Q.; Chen, Y. C.; Peng, L.; Han, M. Clin Lab
2014, 60, 543 551.
17. Choppin, G. R.; Thakur, P.; Mathur, J. N. Inorg Chim Acta 2017, 360, 1859 1869.
18. Garcia-Reyes, R. B.; Rangel-Mendez, J. R.; Alfaro-De la Torre, M. C. J Haz Mater
2009, 170, 845 854.
19. Thakur, P.; Xiong, Y. L.; Borkowski, M.; Choppin, G. R. Geochim Cosmochim Acta
2014, 133, 299 312.
20. Rush, J. D.; Koppenol, W. H. J Biol Chem 1986, 261, 6730 6733.
21. Rahhal, S.; Richter, H. W. J Am Chem Soc 1988, 110, 3126 3133.
22. Storkey, C.; Pattison, D. I.; Koehler, J. A.; Gaspard, D. S.; Evans, J. C.; Hagestuen, E.
D.; Davies, M. J Food Chem 2015, 173, 645 651.
23. Armstrong, C.; Leong, W.; Less, G. J Brain Res 2001, 892, 51 62.
24. Stillhart, H.; Richterich, R.; Jeandet, J. Rev Int Hepat 1962, 12, 1125 1133.
25. Kontoghiorghes, G. J. Toxicol Mech Methods 2013, 23, 1 4.
26. Born, T.; Kontoghiorghe, C. N.; Spyrou, A.; Kolnagou, A.; Kontoghiorghes, G. J.
Toxicol Mech Methods 2013, 23, 11 17.
27. Song, Y. Z.; Huang, Z. J.; Song, Y.; Tian, Q. J.; Liu, X. R.; She, Z. N.; Jiao, J.; Lu, E.;
Deng, Y. H. Int J Nanomed 2014, 9, 3611 3621.
28. Wheeler, W. D.; Legg, J. I. Inorg Chem 1984, 23, 3798 3802.
29. Kanamori, K.; Kawai, K. Inorg Chem 1986, 25, 3711 3713.
30. Liu, B.; Chai, J.; Feng, S.; Yang, B. Spectrochim Acta A 2015, 140, 437 443.
29
31. Leupin, P.; Sykes, A. G.; Wieghardt, K. Inorg Chem 1983, 22, 1253 1254.
32. Balaska, F.; Bencheikh-Lehocine, M.; Chikhi, M.; Meniai, A. H. Energy Proc 2012,
19, 249 258.
33. Ogino, H.; Watanabe, T.; Tanaka, N. Inorg Chem 1975, 14, 2093 2097.
34. Ogino, H.; Shimura, M; Tanaka, N. Inorg Chem 1979, 18, 2497 2501.
35. Yamamoto, K.; Ohashi, K. Bull Chem Soc Jpn 1976, 9, 2433 2436.
36. Luo, Z.; Chatterjee, N. Chem Spec Bioavailab 2010, 22, 25 34.
37. Hamm, R. E. J Am Chem Soc 1953, 75, 5670 5672.
38. Hedrick, C. E. J Chem Educ 1965, 42, 479 480.
39. Barreto, J. C.; Brown, D.; Dubetz, T.; Kakareka, J.; Alberte, R. S. Chem Educator
2005, 10, 196 199.
40. Hecht, M.; Schultz, F. A.; Speiser, B. Inorg Chem 1996, 35, 5555 5563.
41. Espenson, J. H. Chemical Kinetics and Reaction Mechanisms; McGraw-Hill: New
York, 1995.
42. Coetzee, J. F.; Ritchie, C. D. Solute-Solvent Interactions; Dekker: New York, 1969.
43. Perez-Benito, J. F.; Arias, C.; Rodriguez, R. M.; Ros, M. New J Chem 1998, 22,
1445 1451.
44. Perez-Benito, J. F. New J Chem 2001, 25, 268 274.
45. Robinson, P. J. J Chem Educ 1978, 55, 509510.
46. Bakac, A.; Espenson, J. H. Acc Chem Res 1993, 26, 519 523.
47. Kornev, V. I.; Mikryukova, G. A. Russ J Coord Chem 2004, 30, 895 899.
48. Perez-Benito, J. F. J Trace Elem Med Biol 2006, 20, 161 170.
49. Brintzinger, H.; Thiele, H.; Muller, U. Z Anorg Allg Chem 1943, 251, 285 294.
50. Dwyer, F. P.; Garvan, F. L. J Am Chem Soc 1960, 82, 4823 4826.
51. Hoard, J. L.; Kenneard, C. H. L.; Smith, G. S. Inorg Chem 1963, 2, 1316 1317.

30
52. Thorneley, R. N. F.; Sykes, A. G. Chem Commun 1968, 340 341.
53. Gerdom, L. E.; Baenziger, N. A.; Goff, H. M. Inorg Chem 1981, 20, 1606 1609.
54. Knox, J. H.; Shibukawa, M. J Chromatogr 1991, 545, 123 134.
55. Sawyer, D. T.; McKinnie, J. M. J Am Chem Soc 1960, 82, 4191 4196.
56. Hoard, J. L.; Smith, G. S.; Lind, M. D. In Advances in the Chemistry of the
Coordination Compounds; Kirschner, S. Ed.; Macmillan: New York, 1961.
57. Tsuchiya, R.; Uehara, A.; Kyuno, E. Bull Chem Soc Jpn 1969, 42, 1886 1891.
31
Table I Values of the Ratio of Molar Absorption Coefficients of the Long-Lived
Intermediate and the Inorganic Reactant at 540 nma
___________________________________________________________________________
[Cr(III)]o [EDTA]o Q E
(10-3 M) (10-2 M) (10-4)
___________________________________________________________________________
1.47 7.84 1.11 ± 0.05 4.14 ± 0.01
2.94 7.84 1.00 ± 0.04 3.71 ± 0.10
4.41 7.84 0.95 ± 0.02 4.52 ± 0.49
5.88 3.92 0.95 ± 0.01 4.41 ± 0.59
5.88 4.90 0.94 ± 0.03 3.95 ± 0.23
5.88 5.88 0.92 ± 0.02 5.36 ± 1.14
5.88 6.86 1.00 ± 0.01 3.92 ± 0.60
5.88 7.84 0.98 ± 0.03 3.84 ± 0.14
5.88 8.82 0.97 ± 0.05 3.50 ± 0.05
5.88 9.80 0.96 ± 0.02 4.02 ± 0.07
7.35 7.84 0.98 ± 0.02 3.76 ± 0.06
8.82 7.84 0.98 ± 0.01 5.97 ± 0.36
10.3 7.84 1.00 ± 0.02 4.71 ± 0.54
11.8 7.84 0.98 ± 0.01 8.94 ± 1.75
___________________________________________________________________________
a E is the average error of the calculated absorbances with respect to the experimental
values. Errors were calculated as one half of the range (2 determinations). Temperature: 25.0
oC.

32
Table II Kinetic Data at Various Initial Metal Ion Concentrationsa
___________________________________________________________________________
[Cr(III)]o k1 k2 Hkin E
(10-3 M) (10-3 s-1) (105 M-1 s-1) (10-4)
___________________________________________________________________________
1.47 1.45 ± 0.10 2.95 ± 0.05 1.572 ± 0.126 4.27 ± 0.13
2.94 1.43 ± 0.03 2.67 ± 0.01 1.201 ± 0.007 3.76 ± 0.09
4.41 1.53 ± 0.02 2.43 ± 0.04 0.975 ± 0.058 4.61 ± 0.57
5.88 1.39 ± 0.03 2.32 ± 0.06 0.782 ± 0.004 4.01 ± 0.30
7.35 1.49 ± 0.02 2.00 ± 0.03 0.686 ± 0.003 3.88 ± 0.06
8.82 1.54 ± 0.01 1.85 ± 0.03 0.583 ± 0.014 6.04 ± 0.31
10.3 1.46 ± 0.02 1.79 ± 0.01 0.484 ± 0.002 4.72 ± 0.54
11.8 1.63 ± 0.03 1.74 ± 0.05 0.393 ± 0.011 9.10 ± 1.73
___________________________________________________________________________
a k1 and k2 are the pseudo-rate constants, Hkin the number of hydrogen ions released per
Cr(III)-EDTA complex formed (kinetic value) and E the average error of the calculated
absorbances with respect to the experimental values. Errors were calculated as one half of the
range (2 determinations). Experimental conditions: [Na2EDTA]o = 7.84 10-2 M, 25.0 oC.
33
Table III Kinetic Data at Various Initial Potassium Nitrate Concentrationsa
___________________________________________________________________________
[KNO3]o k1 k2 Hkin E
(M) (10-3 s-1) (105 M-1 s-1) (10-4)
___________________________________________________________________________
0.000 1.39 ± 0.03 2.32 ± 0.06 0.782 ± 0.004 4.01 ± 0.30
0.006 1.42 ± 0.03 2.23 ± 0.09 0.828 ± 0.046 3.31 ± 0.70
0.012 1.46 ± 0.04 2.23 ± 0.01 0.815 ± 0.013 3.49 ± 0.18
0.118 1.35 ± 0.10 2.29 ± 0.14 0.875 ± 0.048 3.54 ± 0.12
0.235 1.29 ± 0.03 2.37 ± 0.08 0.923 ± 0.014 3.78 ± 0.32
0.353 1.17 ± 0.04 2.47 ± 0.12 0.960 ± 0.029 3.76 ± 0.15
0.471 1.10 ± 0.01 2.62 ± 0.04 1.032 ± 0.001 3.66 ± 0.24
0.588 1.11 ± 0.01 2.79 ± 0.05 1.057 ± 0.031 4.04 ± 0.42
___________________________________________________________________________
a k1 and k2 are the pseudo-rate constants, Hkin the number of hydrogen ions released per
Cr(III)-EDTA complex formed (kinetic value) and E the average error of the calculated
absorbances with respect to the experimental values. Errors were calculated as one half of the
range (2 determinations). Experimental conditions: [Cr(NO3)3]o = 5.8810
-3 M, [Na2EDTA]o
= 7.84 10-2 M, 25.0 oC.
34
Table IV Effects of Various Organic Solvents on the Pseudo-Rate Constantsa
___________________________________________________________________________
Organic solvent slope (k1) slope (k2)
(M-1) (M-1)
___________________________________________________________________________
Methanol 0.031 ± 0.006 0.089 ± 0.004
Ethylene glycol 0.122 ± 0.015 0.115 ± 0.012
Ethanol 0.124 ± 0.006 0.081 ± 0.009
1-Propanol 0.191 ± 0.019 0.067 ± 0.008
2-Propanol 0.211 ± 0.013 0.071 ± 0.008
Acetone 0.263 ± 0.016 0.083 ± 0.012
1-Butanol 0.351 ± 0.020 -0.113 ± 0.010
___________________________________________________________________________
a
The slopes correspond to the log (k1/k1,0) vs [organic solvent]o and log (k2/k2,0) vs
[organic solvent]o linear plots. Errors were calculated as the statistical standard deviations of
the slopes. Experimental conditions: [Cr(NO3)3]o = 5.8810
-3 M, [Na2EDTA]o = 3.92 10-2
M, 25.0 oC.
35
Table V Activation Parameters Associated to the Pseudo-Rate Constantsa
___________________________________________________________________________
Activation parameter k1 k2
___________________________________________________________________________
ln A 29 ± 2 61 ± 1
Ea (kJ mol-1) 87 ± 4 120 ± 2
oH (kJ mol-1) 84 ± 4 118 ± 2
oS (J K-1
mol-1) -15 ± 15 252 ± 7
___________________________________________________________________________
a
The Arrhenius pre-exponential factors (A) are given in either s-1 (k1) or M-1 s-1 (k2).
Errors associated to the activation parameters were calculated from the standard deviations for
the intercept and slope of the Arrhenius and Eyring plots. The activation entropies are referred
to the 1 M standard state. Experimental conditions: [Cr(NO3)3]o = 5.8810-3
M, [Na2EDTA]o
= 9.8010-2
M, 20.0 30.0 ºC.
36
0.00
0.35
0.70
300 400 500 600 700
Ab
sorb
ance
Wavelength / nm
0.070
0.105
0.140
0.000 0.400 0.800
Ab
sorb
ance
(4
45
)
Absorbance (540)
Figure 1 Periodical scanning of the UV-Vis spectrum recorded at 32-min intervals (top) and
absorbance at 445 nm as a function of the absorbance at 540 nm measured periodically at 4-
min intervals (bottom) during the course of the reaction at [Cr(NO3)3]o = 5.8810-3
M,
[Na2EDTA]o = 8.8210-2
M and 25.0 ºC. The arrows show the progression of the reaction.
The dashed line is the tangent to the curve at time zero.
37
0.0 1.43.5
3.9
3.7
0.7
4.1
1.0
2.0
3.0
[Cr(III)] / 10-2
Mo
A (540)
8
pH
8
Figure 2 Final absorbance at 540 nm (top) and pH (bottom) as a function of the initial metal
ion concentration at [Na2EDTA]o = 7.8410-2
M and 25.0 ºC. The dashed line is the tangent
to the curve at [Cr(III)]o = 0.

38
0 450-1.0
-0.4
-0.7
300
-0.1
0.4
0.6
0.8
Time / min
Ab
sorb
ance
(5
40
)ln
(A
-
A )
8
0.2
150
t
Figure 3 Absorbance at 540 nm as a function of time measured periodically at 4-min
intervals during the course of the reaction (top) and attempted pseudo-first-order plot (bottom)
at [Cr(NO3)3]o = 5.8810-3
M, [Na2EDTA]o = 9.8010-2
M and 25.0 ºC.
39
0.6
1.5
2.4
3.3
0 150 300 450
Rea
ctio
n r
ate
/ 1
0-6 M
s-1
Time / min
-6.3
-6.0
-5.7
-5.4
-1.55 -1.35 -1.15
log
(v
/ M
s-1
)
log {([R] + [I]) / M}
Figure 4 Reaction rate as a function of time (top) and double-logarithm plot of the reaction
rate against the total concentration of limiting reactant and long-lived intermediate for the
deceleration period (bottom) at [Cr(NO3)3]o = 5.8810-3
M, [Na2EDTA]o = 6.8610-2
M
and 25.0 ºC.

40
0 4000.900
1.100
200
1.300
Time / min
cal
A(5
40)
/ A
(540) 1.500ex
p
1.003
0.993
0.998
1.008
A(5
40)
/ A
(540)
cal
exp
Figure 5 Ratio between the calculated and experimental values of the absorbance at 540 nm
as a function of time at 4-min intervals for the one rate-constant (bottom, E = 1.4310-2
) and
two rate-constant (top, E = 3.4510-4
) kinetic models with [Cr(NO3)3]o = 5.8810-3
M,
[Na2EDTA]o = 8.8210-2
M and 25.0 ºC.
41
0 4500.0
3.6
1.8
300
4.0
6.0
Time / min
[Inte
rmed
iate
] /
10
-3 M
2.0
150
2.2
1.1
0.0
Rea
ction rate / 1
0-6 M
s-1
[Cr(
III)
] /
10
-3 M
Figure 6 Top: concentrations of three Cr(III) species [reactant (triangles), long-lived
intermediate (circles) and product (squares)] according to the two rate-constant kinetic model
as a function of time. Bottom: comparison between the experimental values of the reaction
rate (triangles) and the calculated long-lived intermediate concentration (circles) as a function
of time. [Cr(NO3)3]o = 5.8810-3
M, [Na2EDTA]o = 6.8610-2
M and 25.0 ºC.
42
0.2
0.8
1.4
2.0
0.00 0.65 1.30N
um
ber
of
hy
dro
gen
io
ns
[Cr(III)] / 10-2
Mo
0.6
1.3
2.0
0.0 1.9 3.8 5.7
[KOH] / 10-3
M
Nu
mber
of
hy
dro
gen
io
ns
o
0.3
0.9
1.5
3 7 11
[Na EDTA] / 10-2
M
Nu
mber
of
hy
dro
gen
io
ns
2 o
Figure 7 Number of hydrogen ions released per Cr(III)-EDTA complex molecule formed at
25.0 ºC as a function of the initial concentration of: metal ion (top, [Na2EDTA]o = 7.8410-2
M), organic ligand (middle, [Cr(NO3)3]o = 5.8810-3
M) and potassium hydroxide (bottom,
[Cr(NO3)3]o = 5.8810-3
M and [Na2EDTA]o = 7.8410-2
M). Empty circles: kinetic values
obtained from the fitting of the absorbance-time data by numerical simulations (Hkin). Filled
circles: thermodynamic values obtained from the final pH measurements (Hth).
43
0.0
0.2
0.4
0.6
0.8
1.0
1.2
1.4
0 100 200 300 400 500
Ab
sorb
ance
(5
40
)
Time / min
Figure 8 Absorbance at 540 nm as a function of time measured periodically at 5-min
intervals during the course of the reaction at [Cr(NO3)3]o = 1.47, 4.41, 7.35 and 11.8 (from
bottom to top)10-3
M, [Na2EDTA]o = 7.8410-2
M and 25.0 ºC. Squares: Experimental
absorbances. Black points inside: Theoretical absorbances predicted by the two rate-constant
kinetic model.
44
9 274.5
6.5
5.5
15
0.7
0.9
1.1
(1/[EDTA] ) / M-1
o
(1/k
)
/ 10
3 s
[1/(
k -
c
)] /
10
-6 M
s2
1.0
0.8
21
12
5.0
6.0
7.0
Figure 9 Dependences of the pseudo-rate constants k1 (top) and k2 (bottom) on the initial
organic ligand concentration at [Cr(NO3)3]o = 5.8810-3
M, [Na2EDTA]o =
(3.92 9.80)10-2
M and 25.0 ºC.

45
0.0 5.41.0
1.9
1.3
1.8
1.7
3.1
4.5
[KOH] / 10-3
Mo
k /
10
-3 s
-1k
/
10
5 M
-1 s
-1
3.8
2.4
3.6
12
1.6
2.2
Figure 10 Dependences of the pseudo-rate constants k1 (top) and k2 (bottom) on the initial
potassium hydroxide concentration at [Cr(NO3)3]o = 5.8810-3
M, [Na2EDTA]o = 7.8410-2
M and 25.0 ºC.
46
0.0 2.6-0.10
0.05
-0.05
0.05
0.15
0.40
[Organic solvent] / Mo
log
(k
/
k
)
0.20
0.10
1.3
1
0.00
0.10
0.30
0.25
0.15
0.20
1,o
log
(k
/
k
)
22,o
0.35
Figure 11 Dependences of the logarithms of the ratios of the pseudo-rate constants k1 (top)
and k2 (bottom) in the presence and absence (k1,0 and k2,0) of added organic solvent on the
initial concentrations of methanol (empty circles), ethylene glycol (filled circles), ethanol
(empty triangles), 1-propanol (filled triangles), 2-propanol (empty squares), acetone (filled
squares) and 1-butanol (rhombuses) at [Cr(NO3)3]o = 5.8810-3
M, [Na2EDTA]o =
3.9210-2
M and 25.0 ºC.
47
0.0
0.1
0.2
0.3
0.4
0.5
0 1 2 3 4 5
Slo
pe
/ M
-1
Number of carbon atoms
Figure 12 Dependence of the slope corresponding to the log (k1/k1,0) vs [organic solvent]o
linear plot (k1,0 being the pseudo-rate constant in the absence of organic solvent) on the
number of carbon atoms in the hydrocarbon chain. Solvents: methanol (empty circle),
ethylene glycol (filled circle), ethanol (empty triangle), 1-propanol (filled triangle), 2-
propanol (empty square), acetone (filled square) and 1-butanol (rhombus). Experimental
conditions: [Cr(NO3)3]o = 5.8810-3
M, [Na2EDTA]o = 3.9210-2
M and 25.0 ºC.
48
3.28 3.4311.3
12.2
11.6
-6.6
-5.7ln
(k
/ s
-1)
-6.9
3.33
1
11.9
12.5
-6.3
12.8
13.1
-6.0
T -1
/ 10-3
K-1
3.38
ln (
k /
M-1
s-1
)2
Figure 13 Arrhenius plots for the pseudo-rate constants k1 (top) and k2 (bottom) at
[Cr(NO3)3]o = 5.8810-3
M, [Na2EDTA]o = 9.8010-2
M and 20.0 30.0 ºC.