Two-dimensional (2D) Functional Molecular Networks - CORE
266
Two-dimensional (2D) Functional Molecular Networks By Ya Hu Thesis submitted to University College London for the degree of Doctor of Philosophy Supervised by Dr. Matthew Blunt Department of Chemistry University College London (UCL) August 2016
-
Upload
khangminh22 -
Category
Documents
-
view
0 -
download
0
Transcript of Two-dimensional (2D) Functional Molecular Networks - CORE

Two-dimensional (2D) Functional
Molecular Networks
By
Ya Hu
Thesis submitted to University College London
for the degree of
Doctor of Philosophy
Supervised by
Dr. Matthew Blunt
Department of Chemistry
University College London (UCL)
August 2016

i
Declaration
I, Ya Hu confirm that the work presented in this thesis is my own. Where
information has been derived from other sources, I confirm that this has been indicated
in the thesis.
Ya Hu
August 2016

ii
Abstract
This thesis aims to investigate the formation of complex two-dimensional (2D) on
solid surfaces. Investigations have been carried out to synthesise and characterise novel
2D functional molecular networks with controllable morphologies and properties on
highly oriented pyrolytic graphite (HOPG) surfaces. Two molecular systems that
undergo non-covalent 2D self-assembly and one molecular system that demonstrates the
formation of 2D covalent-organic frameworks (2D-COFs) have been studied.
Following an introduction in chapter 1, chapter 2 provides a background to the
doctoral research. Chapter 3 presents the experimental and theoretical methodology
used during the thesis.
Chapter 4 details scanning tunnelling microscopy (STM) investigations of the
interfacial self-assembly of a tetra-carboxylic acid derivative, 5, 5'-(anthracene-2,6-diyl)
diisophthalic acid (ATC). This prochiral molecule forms chiral domains when it
self-assembles into 2D molecular network at a liquid-solid interface. The morphology of
the ATC networks is tuneable by changing the concentration of ATC in solution. Three
distinct structural arrangements of ATC have been observed within the same 2D
self-assembled network.
Chapter 5 describes STM investigations of self-assembled porphyrin networks
organised by selective hydrogen bonding between DNA nucleobases at a liquid-solid
interface. Driven by homo-molecular thymine-thymine and hetero-molecular
thymine-adenine interactions, both mono-component and bi-component self-assembled
structures have been formed using freebase and metal containing thymine functionalised
porphyrins.
Finally, in chapter 6, a Schiff-base condensation reaction has been utilised to grow
highly ordered 2D-COFs using tetra-amine functionalised porphyrin and
benzene-1,4-dicarboxaldehyde (BDA) at a vapour-solid interface. These structures have
been investigated experimentally using STM, atomic force microscopy (AFM) and
X-ray photoelectron spectroscopy (XPS). The chemical composition of the 2D-COFs

iii
was found to be closely related to the environmental conditions during growth. Our
results demonstrate that complementary experimental techniques that probe both the
structure and the chemical composition of 2D materials are necessary when
investigating 2D-COF materials.

iv
List of publications
G.. Slater#, Y. Hu#, L. Yang, S. P. Argent, W. Lewis, M. O. Blunt and N. R.
Champness, Thymine functionalised porphyrins, synthesis and heteromolecular
surface-based self-assembly, Chem. Sci., 2015,6, 1562-1569
# These authors contributed equally to this work.
Y. Hu, N. Goodeal, Y. Chen, A. M. Ganose, R. G. Palgrave, H. Bronstein and M. O.
Blunt, Probing the chemical structure of monolayer covalent-organic frameworks
grown via Schiff-base condensation reactions, Chem. Commun., 2016, 52, 9941-9944

v
Acknowledgement
Looking back on the past three and a half years, I would like to express my sincere
gratitude to those who offered me help, advice and encouragement throughout my PhD.
First of all, I would like to thank my PhD supervisor, Dr. Matthew Blunt. His
helpful guidance, curiosity for knowledge, in-depth expertise, enthusiasm for science,
and insight to scientific questions have always impressed me and made my PhD
enjoyable. As we came to UCL almost at the same time, I have witnessed how Matt
established the lab from zero. His devotion to the research career has inspired me to be
brave to take on new challenges. I think my ability to interpret experimental results and
provide novel research ideas has improved a lot – thanks to Matt’s supervision. Matt, as
an excellent scientist and approachable PhD supervisor, is really an invaluable asset to
my PhD study at UCL Chemistry Department. Thank you, Matt.
Many thanks should go to those who participated in research projects with me,
particularly my team members - Niall Goodeal and Yin Chen, and our collaborators in
synthetic chemistry – Prof. Neil Champness (University of Nottingham) and Dr. Hugo
Bronstein (UCL). Dr. Giovanni Costantini and Dr. Luís Perdigão should be
acknowledged for their warm welcome to my visit to the University of Warwick. I also
thank Martin Rosillo-Lopez and Dr. Sanjay Sathasivam for friendship and technical
assistance.
I would like to thank my officemates and friends in London –Jane Yates, Yi Shi,
Oliver Yim, Yu Zhang, George Harrison, Daniel Paynes, Qiang Gang, Jin Si, Lixun Liu,
Xi Ji, Xingwei Zhao and Bao-luen Chang. The experience of fighting for the PhD
together with you seemed to be daunting, but finally turned out to be unforgettable and
precious.
My six-year higher education in Europe was financially supported by an Erasmus
Mundus Scholarship awarded by the European Commission and a UCL Overseas
Research Scholarship. All these would never have been possible without support from
Prof. Nora de Leeuw (UCL), Prof. Richard Palmer (University of Birmingham), Dr.

vi
Brigitte Prevel (University Lyon 1), Prof. Alfonso San-Miguel (University Lyon 1), and
Prof. Xiaofang Bi (Beijing University of Aeronautics and Astronautics).
A special and big thank you must go to my parents, Chengguo Hu and Xiaoxia Han.
Their love and support helped me go through this “luxury” PhD in the UK. I will try to
pay back my parents by being a better person. Although being so far away from home, I
highly cherish the memory of staying in London with my cousins Yan Liu and Dr. Ning
Guo. I would like also to say thank you to my boyfriend, Yunlong Meng, for helping me
through the long thesis writing. I love you.

vii
Table of contents
Declaration i
Abstract ii
List of publications iv
Acknowledgement v
Table of contents vii
Chapter 1 Introduction 1
1.1 From non-covalent supramolecular self-assembly to covalent on-surface synthesis
1
1.2 Thesis outline 6
Chapter 2 2D self-assembly and on-surface synthesis 8
2.1 Thermodynamics and kinetics of 2D self-assembly 8
2.2 Factors controlling interfacial 2D self-assembly 11
2.2.1 Molecule-molecule and molecule-surface interactions 12
2.2.2 External experimental conditions 19
2.3 Inclusion of guest molecules 23
2.4 Chirality in 2D self-assembled systems 26
2.5 On-surface synthesis of 2D covalent molecular networks 29
2.6 Conclusions 38
Chapter 3 Methodology 39
3.1 Introduction 39
3.2 Scanning Tunnelling Microscopy (STM) 41
3.2.1 Basic principles of STM 41
3.2.2 Understanding the tunnelling current 42
3.2.3 Applications of STM in studying molecules on solid surfaces 49
3.2.4 Data acquisition and processing in ambient STM 52
3.2.5 Advantages and drawbacks of STM 56
3.3 Atomic Force Microscopy (AFM) 57

viii
3.3.1 Basic principles of AFM 57
3.3.2 Tip-surface interactions and conventional AFM imaging modes 58
3.3.3 Applications of AFM in molecules on solid surfaces 61
3.3.4 Setup of high-resolution AFMs at ambient conditions 62
3.3.5 Advantages and drawbacks of AFM 63
3.4 X-ray Photoelectron Spectroscopy (XPS) 64
3.4.1Basic mechanism of XPS 64
3.4.2 XPS setup and peak fitting 69
3.4.3 Applications of XPS 72
3.5 Molecular Mechanics (MM) simulation 73
Chapter 4 2D supramolecular self-assembly of a tetra-carboxylic acid derivative 75
4.1 Introduction 75
4.2 Experimental details 79
4.3 Results and analysis 82
4.3.1 Choice of solvent 82
4.3.2 Concentration-dependent self-assembly 87
4.3.3 Inclusion of coronene 95
4.4 Conclusions 98
4.5 Future work 98
Chapter 5 Surface-based self-assembly of thymine functionalised porphyrins 100
5.1 Introduction 100
5.2 Details of experiments and simulations 107
5.3 Self-assembly of freebase thymine-functionalised porphyrins 109
5.3.1 Tetra-TP on its own 109
5.3.2 Tetra-TP and PA 114
5.3.3 Tetra-TP and melamine 121
5.4 Self-assembly of Zn-tetra-TP 128
5.4.1 Zn-tetra-TP on its own 128
5.4.2 Zn-tetra-TP and freebase tetra-TP 130
5.4.3 Zn-tetra-TP and PA 132

ix
5.5 Conclusions 134
5.6 Future work 135
Chapter 6 On-surface synthesis and characterisation of mono-layer
covalent-organic frameworks 137
6.1 Introduction 137
6.2 Experimental methods 138
6.2.1 Synthetic route 138
6.2.2 Morphology characterisation 141
6.2.3 Chemical structure characterisation 141
6.3 TAPP COFs 143
6.3.1 Morphology studies 143
6.3.2 Chemical structure of TAPP/BDA 2D-COFs 170
6.4 ZnTAPP COFs 188
6.4.1 Morphology studies of ZnTAPP/BDA 2D-COFs 189
6.4.2 Chemical structure of ZnTAPP/BDA 2D-COFs 197
6.5 Conclusions 203
6.6 Future work 204
Chapter 7 206
Summary and future work 206
Bibliography 213
List of abbreviations 241
List of figures 244
List of tables 256

1
Chapter 1
Introduction
1.1 From non-covalent supramolecular self-assembly to
covalent on-surface synthesis
Supramolecular self-assembly is the spontaneous process by which simple molecular
components organise themselves into complex structures through non-covalent
intermolecular interactions. As an equilibrium process, self-assembly occurs via
nucleation and growth, and proceeds towards the minimization of free energy. During
the formation of a self-assembled structure, the molecular components of a system have
the possibility to adopt a large number of different configurations. When the interactions
between the components are weak and reversible, the individual molecules can easily
attach and detach from a growing molecular structure. Consequently, the molecular
system can adjust the packing arrangement of the molecules until reaching the
configuration with the lowest free energy.
Self-assembly has attracted huge research interest for several reasons. Because of
the ability to sample numerous different structural configurations as mentioned above,
self-assembly of molecular components can lead to the formation of nanostructures with
high levels of spatial order. Due to the abundance of biological and synthetic molecular
components, self-assembly is a versatile bottom-up method that can be used to fabricate
complex, functional structures. Moreover, the self-assembly of molecules can be carried
out in a wide array of different environments such as in solution, on solid surface or at
the liquid-solid interface. Despite these advantages, applications of supramolecular
self-assembly are still often limited by the inherent weakness of the individual
non-covalent bonds that are used to stabilise these structures.
Examples of supramolecular self-assembly are commonplace in biological systems,

Chapter 1. Introduction
2
including: the assembly of lipids to form membranes, the formation of multiple folded
proteins and the double helical structure of deoxyribonucleic acid (DNA). Based on the
recognition and highly selective binding found in these biological structures, researchers
have explored similar methods to design synthetic nanostructures. In one example based
on this approach, Y. He et al. proposed a method to assemble large three-dimensional
structures by copying basic DNA units as demonstrated in Figure 1.1 [1]. For this
strategy, three different types of DNA single strands (S, M and L/L’) are first assembled
into three-point-star motifs which can act as unit building blocks for the further
assembly of DNA polyhedra.
Figure 1.1 Schematic representation of the self-assembly of DNA polyhedral [1].
An important sub-division of research into supramolecular self-assembly is the
formation of two-dimensional (2D) molecular networks on solid surfaces.
Surface-based self-assembly has been shown to occur under various different
environmental conditions including ultra-high vacuum (UHV) and liquid-solid
interfaces. One important example of 2D self-assembly under UHV conditions is that of
perylene tetra-carboxylic di-imide (PTCDI) and melamine. The self-assembly of PTCDI
and melamine forms a 2D hexagonal network (see Figure 1.2) stabilised by a triple
hydrogen bond between adjacent PTCDI and melamine molecules [2]. The PTCDI and
melamine molecules form a porous hexagonal network when these molecules are

Chapter 1. Introduction
3
deposited on a Ag/Si(111)- surface under UHV conditions. The
molecular network formed by PTCDI and melamine has well-defined pores that can act
as ‘nanoscale containers’. These pores offer space to accommodate fullerene guest
molecules that are deposited on-top of the pre-formed self-assembled network.
Figure 1.2 (a) Chemical structures of PTCDI and melamine. Schematic diagram of a
PTCDI-melamine hydrogen bonded junction. (b). Schematic of a C60 heptamer trapped within a
pore of the PTCDI-melamine open hexagonal network. [2]
Supramolecular 2D self-assembly allows the quick and easy formation of highly
ordered structures over large surface areas. In contrast to some top-down methods of
nanostructure formation, e.g., lithographic processes, which have limited spatial
resolution and strict requirements for instrumentation and surface preparation,
supramolecular self-assembly provides an economical and rapid bottom-up approach to
the fabrication of ordered structures with nanometre precision.
One promising future research trend in supramolecular self-assembly is the
application of molecular networks as templates which can accurately direct the
assembly of other nano-sized components. For example, the formation of the previously
described PTCDI-melamine network has also been reported on a gold surface using a
solution-based fabrication strategy [3]. The utilisation of solution-based deposition
allows a wider range of molecular components to be used than would be possible under
UHV and opens the possibility of more complex modification of the self-assembled
structures. The results on the PTCDI-melamine self-assembly on gold demonstrate that
the network exhibits sufficient stability to be used as a template to assemble three types
(a)
(b)

Chapter 1. Introduction
4
of thiol molecules. Moreover, a more recent study has shown that gold nanoparticles
which exhibit useful electronic and optical properties can also be incorporated into
self-assembled mono-layers at the phenyloctane-graphite interface [4].These types of
hybrid molecular-nanoparticle systems not only open up novel possibilities to increase
network functionality for technological applications, but also help enhance scientific
understanding of the unique properties of these materials at the nanometre scale.
Figure 1.3. Schematic diagram showing the different possible arrangements of sodium dodecyl
sulphate molecules physisorbed onto a CNT surface [5].
The development of 2D supramolecular self-assembly is of considerable
importance to a number of other relevant disciplines as well. Firstly, in the field of
surface functionalisation, the assembly of surfactants and synthetic lipids has been
employed to decorate the surface of carbon nanotubes (CNTs) for the purpose of
developing new bio-sensor and bioelectronic nanomaterials (Figure 1.3) [5]. In contrast
to other covalent chemistry strategies, supramolecular self-assembly is more attractive
as it functionalises the surface without altering the inherent physical properties of the
CNTs. Detailed investigations have been carried out on the acquisition of stable
supramolecular assemblies at the CNT-liquid interface. Secondly, supramolecular
self-assembly plays an important part in the design of optical sensor devices. Due to the
ability to combine the properties of organic and inorganic components, supramolecular
metal-organic assemblies can potentially be applied for the sensing of molecules and
ions. A supramolecular chromatic sensor, which is able to rapidly detect Ni2+
, Cd2+
and

Chapter 1. Introduction
5
Cr2+
at micro-molar concentrations has been constructed via self-assembly [6].
Lanthanide ions, which exhibit particularly desirable photo-physical properties, have
been reported to be used in supramolecular luminescent sensors in various ways [7].
Thirdly, self-assembled structures have been found to have an impact on the
development of molecular electronics. A key example includes the application of
self-assembled guanosine derivatives in the fabrication of electronic nano-devices [8].
Self-assembly enables the realisation of these devices in a cheap and easy to implement
approach. However, self-assembled structures do lack control over the material
orientation between electrodes.
The sample preparation methods used for the majority of self-assembled molecular
networks can be classified into two main sub-groups: sublimation and solution-based
deposition [9]. In sublimation processes, molecular materials are thermally evaporated
onto solid surfaces under UHV conditions. Sublimation achieves high versatility at the
expense of time, effort and applicability for large molecular species. In solution-based
deposition approaches, a drop of solution containing the target molecules is deposited
directly onto a substrate. Self-assembled networks can then form either directly at the
liquid-solid interface, or at the air-solid interface following solvent evaporation. When
using volatile solvents, the final surface coverage can vary between sub-monolayer and
multi-layer films. In contrast, solution-based deposition techniques using non-volatile
solvents offer more intriguing possibilities for the investigation of self-assembled
systems: the structure of solvent molecules and the concentration of solutions can have
an important influence on the morphology of self-assembled structures.
One obstacle to the application of 2D supramolecular networks in real-world
applications is their poor chemical and thermal stability. A promising solution to help
overcome this weakness of 2D self-assembled structures is to link together molecular
building blocks using covalent bonds. The idea of covalently bonded molecular
networks has opened up a multidisciplinary area of research, known as two-dimensional
covalent-organic frameworks (2D-COFs). 2D-COFs have attracted significant interest
from diverse research communities including: supramolecular chemistry, nanoscience,
organic synthesis and materials science. The covalent interlinking of molecular

Chapter 1. Introduction
6
components within 2D-COFs provides these materials with enhanced stability and the
potential to form new, fully conjugated 2D structures. The wide variety of molecular
building blocks made available by organic synthesis means that the properties of
2D-COFs can be tuned by careful selection of the component molecules. The ability to
design and control the physical properties of 2D-COFs means that 2D-COFs are
emerging as novel 2D materials for applications in areas such as sensing, molecular
electronics and catalysis.
1.2 Thesis outline
This PhD thesis addresses some of the research questions at the forefront of the field of
2D organic molecular networks, including self-assembled structures organised by
hydrogen bonding between carboxylic acid groups, and porphyrin arrays linked by
non-covalent and covalent bonds. Both 2D molecular self-assembly and on-surface
synthesis are studied using a combination of scanning probe microscopy, spectroscopic
experimental techniques, and theoretical simulations. The results presented in this thesis
focus on three molecular systems and help to provide a deeper understanding of the
driving forces behind the self-assembly of 2D molecular networks and the growth
routes and properties of high-quality 2D-COFs. The doctoral research has contributed to
advances in the design, and growth of novel 2D functional molecular networks with
controllable morphologies and chemical properties.
Chapter 2:
This chapter gives a background to the doctoral research by presenting an outline
of the current state-of-the-art in research into 2D supramolecular self-assembly and
on-surface synthesis of 2D-COFs. The discussions will be mainly focused on 2D
self-assembled networks at liquid-solid interfaces and single-layered 2D-COFs formed
under ambient conditions.
Chapter 3:
All the significant experimental techniques and simulation methods employed in
the thesis are described, including scanning tunnelling microscopy (STM), atomic force

Chapter 1. Introduction
7
microscopy (AFM), X-ray photoelectron spectroscopy (XPS) and molecular mechanics
(MM) simulations.
Chapter 4:
The interfacial self-assembly behaviour of a tetra-carboxylic acid derivative,
5,5 -́(anthracene-2,6-diyl) diisophthalic acid (ATC) is studied using STM operating at a
liquid-solid interface between a graphite surface and an organic solvent. This work
includes a study of the dependence of the morphology of the self-assembled network on
the concentration of molecules in solution, and the co-adsorption of ATC with guest
molecules.
Chapter 5:
This chapter focuses on the 2D self-assembly of thymine-functionalised porphyrin
molecules, including freebase and Zn-containing tetra-(phenyl-thymine) porphyrin. This
research investigates the possibility of forming hetero-molecular structures driven by
the hydrogen bonding interactions between thymine and adenine functional groups. In
addition, multi-component self-assembly of thymine-functionalised porphyrins with
melamine molecules is also discussed.
Chapter 6:
This chapter presents a systematic investigation of the formation of porphyrin
2D-COFs on graphite surfaces via Schiff-base condensation reaction between
benzene-1,4-dicarboxaldehyde and freebase or zinc-containing tetra-amine
functionalised porphyrins. Both the morphology and chemical structure of the porphyrin
2D-COFs was studied using a combination of scanning probe microscopy (SPM) and
X-ray photoelectron spectroscopy (XPS).
Chapter 7:
In the last chapter, all the findings and conclusions of the research carried out in
the chapters 4, 5 and 6 will be summarised. Based on these results, future directions for
this work will be suggested.

8
Chapter 2
2D self-assembly and on-surface synthesis
This chapter is a review of the state of current research into 2D functional molecular
networks formed either via non-covalent self-assembly or via on-surface chemical
reactions. Relevant work in the literature will be discussed to give an overview of the
background knowledge, important research questions and possible future trends in the
area of 2D organic molecular nano-architectures. A particular focus will be given to 2D
molecular networks fabricated under ambient temperature and pressure conditions.
2.1 Thermodynamics and kinetics of 2D self-assembly
Numerous different 2D self-assembled structures have been formed under
environmental conditions ranging from UHV to liquid-solid interfaces. The growth
processes of 2D self-assembled structures are influenced by both thermodynamic and
kinetic effects.
Figure 2.1 illustrates how molecules or atoms that are deposited from the vapour
phase grow into nanostructures on a surface [10]. The atoms or molecules are assumed
to be deposited onto the surface at a constant deposition rate F. Activated by thermal
energy, these adsorbed species can overcome surface diffusion barriers and move
laterally on the surface. This lateral motion continues until adsorbates are trapped by
fixed nucleation sites, such as surface defects or steps edges, or until sufficient binding
to other adsorbates occurs to allow the formation of a stable nucleus. At low diffusivity
to deposition rate ratio (D/F), the adsorbates do not have enough time to find the lowest
energy configuration on the surface before meeting other adsorbed molecules or atoms.
Thus the system is not at a minimum energy configuration and the growth process is
controlled by kinetics. In comparison, structure growth at large D/F, where adsorbates
are highly mobile and can sample many different configurations on the surface before

Chapter 2. 2D self-assembly and on-surface synthesis
9
forming a nucleus, can be termed as thermodynamically controlled. For supramolecular
self-assembly at liquid-solid interfaces, adsorbed molecules have the possibility to
desorb back to solution and solvent molecules may also adsorb back onto the surface,
rendering the growth mechanism more complicated.
Figure 2.1. Schematic diagram showing growth processes for atoms or molecules deposited at
surfaces. D = diffusivity, the mean square distance by which an adsorbate travels per unit time;
F = deposition rate. The ratio D/F characterises the growth regime: kinetically or
thermodynamically controlled. [10]
In order to rationalise the experimentally observed formation of different 2D
self-assembled structures, the respective roles played by kinetics and thermodynamics
in controlling 2D self-assembly processes have been investigated extensively [11].
As an equilibrium process, self-assembly in 2D leads to a minimisation of the free
energy of a molecular system. The free energy of the system can be represented by the
Gibbs free energy as written below:
(2.1)
where is the change in Gibbs free energy, is the change in enthalpy, is the
change in entropy and T is the absolute temperature of the molecular system.
During the self-assembly of extended ordered structures on a solid surface, the
entropy of the molecular system decreases. This decrease in entropy should be

Chapter 2. 2D self-assembly and on-surface synthesis
10
compensated by an increase in enthalpy so that is negative. The increase in
enthalpy can be achieved by the formation of intermolecular interactions between
molecular components. In the case of 2D self-assembly at a liquid-solid interface, the
morphology of self-assembled molecular networks is related to several factors,
including molecular structure; solvent type; surface structure; concentration; and
temperature.
Similar to other self-assembly processes, individual molecules in 2D can also
attach or detach from a growing structure until an arrangement with the lowest free
energy is reached. In addition to this equilibrium aspect, non-equilibrium processes are
also involved in the growth of 2D self-assembled structures. Therefore, kinetic effects
play an important role in determining the morphology of the resulting 2D molecular
networks. At a liquid-solid interface, enthalpy gains for a molecular systems are
associated with both the adsorption of solute and solvent molecules and the formation of
intermolecular interactions.
As described previously for Figure 2.1, the self-assembly process for extended,
ordered 2D molecular networks occurs via two steps: nucleation and growth. During a
nucleation process, a region of stable self-assembled network with a size larger than the
critical nucleus size is formed. After the nucleation, the network continues to grow by
the addition of individual molecules at the periphery. Non-equilibrium arrangements can
form because they have a faster nucleation or growth rate than the equilibrium structure.
If the system does not have sufficient energy to overcome the energy barrier for the
transition from the as grown arrangement to the free energy minimum structure, the
non-equilibrium arrangements will persist on the surface. In this case, the molecular
system is kinetically trapped. The formation of defects and disordered molecular
arrangements also results from kinetic trapping. When the concentration of target
molecules is high or the temperature is low, individual molecules will add to the
growing nucleus at a rapid rate. Under this condition, a molecule that attaches to the
periphery of the nucleus into a defective arrangement may be trapped by further
molecules adding to the structure. Consequently, the configuration of the molecule
cannot be adjusted to reach the minimum free energy arrangement.

Chapter 2. 2D self-assembly and on-surface synthesis
11
The formation of domains and domain boundaries in surface-based 2D
self-assembled networks also results from kinetic effects. When molecules are deposited
on a surface multiple nucleation points occur across the surface. Growth of each
nucleation point leads to the formation of an individual domains. Domain boundaries
are formed when domains with different orientations or alignment meet each other. The
domain boundaries consist of molecules in energetically unfavourable packing
arrangements. If sufficient energy is provided to the molecular system, the domain
boundaries can be eliminated via a process known as Ostwald ripening [12]. In Ostwald
ripening, larger domains grow at the expense of smaller domains, reducing the amount
of domain boundaries..
At a liquid-solid interface, the formation of stable and highly ordered
self-assembled monolayers with structures that do not evolve with time can be
thermodynamically controlled. In this case, the adsorbed molecules are in equilibrium
with molecules in solution and the entire system which includes surface, solution and
self-assembled monolayer, is at a minimum Gibbs free energy state. However, currently
there is no generalised thermodynamic model that describes 2D supramolecular
self-assembly at liquid-solid interfaces [13]. Effects of thermodynamic factors such as
solute concentration, solvent type and temperature have been explored in numerous
different publications. However, to determine the exact roles of these parameters in the
thermodynamics and kinetics of interfacial self-assembly and to develop a general
thermodynamic model that is applicable across a range of different molecular systems,
further investigations are still required.
2.2 Factors controlling interfacial 2D self-assembly
As mentioned previously, the morphology of 2D molecular networks self-assembled at
liquid-solid interfaces can be influenced by a range of factors, such as molecular
structure, surface structure, solvent type, concentration and temperature. In this section,
our current understanding of these factors will be introduced. Firstly, we will present the
role that molecule-molecule and molecule-substrate interactions play in 2D

Chapter 2. 2D self-assembly and on-surface synthesis
12
self-assembly. Secondly, the influence of solvent structure, concentration and
temperature on the morphology of 2D self-assembled networks will be discussed.
Gaining a deeper understanding of these factors will help to realise the prediction and
systematic design of self-assembled networks either through tailoring the functional
groups of component molecules, or by controlling experimental conditions.
2.2.1 Molecule-molecule and molecule-surface interactions
In the field of surface-confined molecular self-assembly, molecule-molecule and
molecule-substrate interactions play a combined role in the stabilisation of molecular
networks. The morphology and dimensionality of self-assembled structures can be
tuned by adding functionalising molecular building blocks with suitable chemical
groups at different positions [14]. These functional groups can be chosen to promote
specific types of directional, non-covalent interactions.
Non-covalent interactions between molecular building blocks have an important
impact on the creation of self-assembled structures. The formation of complex,
functional supramolecular systems is often a result of more than one type of
non-covalent interactions working in a cooperative way [15].
Among various non-covalent interactions, hydrogen bonding, van der Waals
interactions and π-π stacking are non-covalent interactions that are closely related to the
molecular self-assembly systems studied in this PhD thesis.
Figure 2.2. Hydrogen bond donor and acceptor atoms.
Figure 2.2 is the standard expression of a hydrogen bond which is an
electromagnetic attractive interaction between the hydrogen bond donor and acceptor
atoms. The hydrogen bond donor consists of a hydrogen atom attached to an

Chapter 2. 2D self-assembly and on-surface synthesis
13
electronegative atom (D), thus forming a dipole in which the hydrogen atom is slightly
positively charged. The hydrogen bond acceptor is a highly electron-withdrawing atom
(A), for example, oxygen, fluorine or nitrogen.
In terms of strength, hydrogen bonds can be categorized as very strong, strong and
weak. Among these hydrogen bonds, strong hydrogen bonds, which are much stronger
than van der Waals interactions, are able to control and direct supramolecular structures
because the interactions are highly directional and sufficiently strong. Typical examples
of strong hydrogen bonds include O-H···O=C (7.4 kcal/mol) [16], N-H···O=C (5.19 –
5.73 kcal/mol ) [17] and O-H···O-H (5.0 kcal/mol) [18, 19].
An extensively reported example of hydrogen bonding stabilised 2D self-assembly
are molecular networks formed using carboxylic acid functionalised molecules. The
reason that carboxylic acid groups readily facilitate the self-assembly of ordered and
stable structures is that each group contains both a hydrogen bond donor (the hydroxyl)
and acceptor (the carbonyl). This allows for the formation of a hydrogen bond dimer
between two carboxylic acid groups. Figure 2.3 shows three different hydrogen bonding
arrangements common to carboxylic acid functionalised molecules in 2D
self-assembled network structures [9].
Figure 2.3. Modes of interlinking carboxylic acid groups via hydrogen bonds (marked as red
dots) in molecular crystals. (a) Cyclic hydrogen-bonded dimer, the most commonly observed
hydrogen bonding arrangement in 2D self-assembled networks. (b) Catemer motif. (c) cyclic
trimer [9, 20].
The self-assembly of trimesic acid (TMA), which is a benzene derivative with
three symmetrically positioned carboxyl groups, is a typical example of the formation of
molecular mono-layers directed by hydrogen bonding. M. Lackinger et al. have reported
two different crystallographic phases of self-assembled TMA mono-layers: a “chicken
(a) (b) (c)

Chapter 2. 2D self-assembly and on-surface synthesis
14
wire” structure formed at the saturated heptanoic acid-HOPG interface and a “flower”
structure at the saturated pentanoic acid-HOPG interface [21]. As can be seen in Figure
2.4, these two arrangements are stabilised by two different hydrogen bonding schemes
between the carboxylic acid groups.
Figure 2.4. Two 15×15 nm2 constant current STM images of TMA monolayers formed at fatty
acid-HOPG interfaces. (a)-(b) STM image of the “chicken wire” structure and its corresponding
molecular model; (c)-(d) STM image of the “flower” structure and its corresponding molecular
model. [21]
Apart from the extensively studied carboxylic acids, researchers have also been
exploring other hydrogen bonding schemes that would yield more interesting 2D
functional networks. Examples include hydrogen bonding between amide groups for
photosensitive self-assembled networks at liquid-solid interfaces [22], and selective
hydrogen interactions between natural and artificial nucleobases [23].
In addition to hydrogen bonding, van der Waals interactions can also drive the
formation of highly ordered 2D self-assembled structures. Van der Waals interactions
are defined as the forces between molecules or atoms excluding covalent bonding and
electrostatic interactions of ionic groups. Arising from the polarizability of atoms or
molecules, van der Waals interactions exist between two instantaneous induced dipoles,
(a) (b)
(d) (c)

Chapter 2. 2D self-assembly and on-surface synthesis
15
two permanent dipoles, or a permanent and an induced dipole.
Van der Waals interactions differ from hydrogen bonding in several ways.
Hydrogen bonds are discrete entities associated with a specific group of atoms. A
strength can be assigned to a hydrogen bond based on the energy required to break this
interaction. In contrast, van der Waals interactions are cumulative and act between all
the atoms of two interacting molecules. As with all non-covalent interactions, the
strength of van der Waals interactions is distance dependent. The strength of the overall
van der Waals interactions between two molecules depends on the contact surface areas
between the atoms of the two molecules. Moreover, hydrogen bonding interactions are
directional, which means the strength of a hydrogen bond can be changed significantly
by changing the angle between the two hydrogen bonding groups. Unlike hydrogen
bonding, the strength of van der Waals interactions does not depend on the angle
between atoms. However, a specific orientation that leads to a maximum area of
interaction between two molecules will be favoured by van der Waals interactions. This
is caused by the fact van der Waals interactions are very short range, only operating
effectively over a few Angstroms: essentially when the molecules are in direct contact.
In practice, this means that the strength of van der Waals interactions between two
molecules is governed by the surface area of contact between two molecules. Therefore,
van der Waals interactions can drive the formation of highly ordered self-assembled
structures with a specific orientation of molecules that helps achieve the maximum area
of interaction.
Despite their weakness in comparison to other non-covalent interactions, van der
Waals interactions have the advantage that they act cumulatively between all the atoms
of two interacting molecules. For example, a combination of lateral van der Waals
interactions between alkyl chains and the registry of the chains to an underlying
graphite lattice makes alkyl chain interdigitation an extensively employed arrangement
for network stabilisation on HOPG surfaces. As shown in Figure 2.5, the alkyl chains
attached to the π-conjugated molecules are oriented along the C3 axis of the (001) plane
of the underlying HOPG lattice resulting in the formation of close-packed lamellar
structures [24]. The distance between two neighbouring methylene (-CH2-) groups is

Chapter 2. 2D self-assembly and on-surface synthesis
16
0.251 nm. This value is in good agreement with the lattice parameter of the underlying
HOPG surface (0.246 nm). The registry of the alkyl chains with the HOPG surface leads
to an increase in the adsorption energy of the methylene groups [25]. Additionally, the
lateral interactions between the adsorbed alkyl chains also contribute to the stabilisation
of the 2D self-assembled structure [26].
Figure 2.5. Schematic illustration showing packing interactions between interdigitated alkyl
chains on a HOPG surface. [24]
π-π stacking is another non-covalent attractive interaction that plays an important
role in the 2D self-assembly of molecular components containing aromatic rings. The
nature of this interaction is still under investigation [27], but it has been found to be
important in large aromatic molecular systems [28]. In a π system, the formation of π
bonds involves the overlap of p atomic orbitals. An electron-rich π system can interact
with a metal, a polar molecule or another aromatic π system. The interaction between a
π electron-rich system and a π electron-deficient system is called π-π stacking [29]. As
illustrated in Figure 2.6, two aromatic rings can interact with each other in a face-to-face,
face-to-edge or displaced face-to-face orientation.
Figure 2.6. Schematic representations of benzene dimers interacting in different orientations.
Face-to-face Face-to-edge Face-to-face with a displacement

Chapter 2. 2D self-assembly and on-surface synthesis
17
Zhu et al. has reported the molecular arrangement of an aromatic helical polymer
self-assembled both in solution and at the liquid-solid interface, as shown in Figure 2.7
[30]. From direct STM observation (Figure 2.7 (d)), the spacing distance between two
adjacent double helix polymers is in good agreement with the value measured from
XRD experiments (Figure 2.7 (b)). The columnar π-π stacking of the conjugated
backbones leads to the formation of the helical polymers observed by STM.
Figure 2.7. (a) Chemical structure of polymer 1. (b) Molecular model showing the distance
between two adjacent polymers. (c) Molecular model presenting the columnar stacking of the
inner aromatic backbone. (d) STM image of polymer 1 (scale bar: 5 nm). (e) Schematic
illustration of the corresponding molecular structure in (d). [30]
In addition to intermolecular interactions, interfacial interactions also play a crucial
role in 2D supramolecular self-assembly at surfaces. For studies carried out at
liquid-solid interfaces, commonly used conductive substrates including highly oriented
pyrolytic graphite (HOPG); Au (111); and substrate-supported graphene. These surfaces
are used because they do not promote chemisorption of molecules. HOPG and Au (111)
are chemically inert, thus, most organic molecules do not form covalent bonds with
them: i.e. molecules adsorb onto these surfaces via physisorption. As physisorption is
relatively weak compared with chemisorption, the adsorbed molecules can freely
(a) (b)
(c)
(d) (e)

Chapter 2. 2D self-assembly and on-surface synthesis
18
diffuse across the surface. In the case of liquid-solid interfaces, adsorbed molecules can
also desorb back into overlying solution. This free movement of molecules allows them
to attach and detach from a growing self-assembled structure, and then to find the
minimum free energy arrangement. Due to differences in their electronic and
crystallographic structures, these surfaces interact with molecular building blocks in
different ways. The predominant interactions between an organic molecule and one of
the surfaces are van der Waals and electrostatic forces.
Upon the deposition of a target solution onto a surface, some of the molecules
dissolved in the solution may be physisorbed on the surface driven by van der Waals
interactions. Depending on factors such as the strength of the molecule-substrate
adsorption interaction, solvent, concentration and temperature, these molecules may
also desorb back into the solution or diffuse across the surface. Balandina et al. have
systematically investigated the self-assembly of a multi-component system composed of
alkylated dehydrobenzo[12]annulene (DBA), isophthalic acid (ISA) and coronene
molecules at the liquid-Au(111) interface [31] (Figure 2.8). By comparison with the
results obtained from an identical molecular system formed on HOPG, they pointed out
that the substrate material affects the adsorption energy and diffusion barrier of the
molecules and their ability to act as nucleation sites for further 2D crystal growth. On
Au(111), the molecules experience higher diffusion barrier in comparison to HOPG.
Thus, guest molecules can act as nucleation sites on Au(111) leading to the formation of
achiral pores.
Figure 2.8. (a) Chemical formulae of DBA, ISA and coronene molecules. (b) Schematic
illustrations of the formation of both chiral and achiral pores at the liquid-Au(111) interface. (c)
Display of only chiral pores at the liquid-HOPG interface.[31]
(a) (b) (c)
Liquid-Au(111) interface Liquid-HOPG interface

Chapter 2. 2D self-assembly and on-surface synthesis
19
2.2.2 External experimental conditions
In 2D self-assembled systems, the same molecular components have the ability to adopt
different packing arrangements. This phenomenon has been observed in many
molecular systems that self-assemble from a solution onto a solid surface. The
self-assembly of 2D molecular networks is influenced by a combination of
molecule-molecule, molecule-substrate, molecule-solvent and solvent-substrate
interactions. Therefore, the morphological structures formed by 2D self-assembled
networks are closely related to the formation conditions, such as temperature, the type
of solvent and the concentration of target molecules.
Figure 2.9. (a) Molecular structure of an alkylated isophthalic acid derivative (ISA-OC14). The
term n indicates the number of the repeating –CH2– units (n = 13). (b)-(c) STM image and
corresponding molecular model of the linear structure formed by ISA-OC14 at the interface
between HOPG and 1-phenyloctane. (d)-(e) STM image and corresponding molecular model of
the porous structure formed by the same molecule.[32]
(a)
(b)
(c)
(b)
(d)
(b)
(e)
(b)

Chapter 2. 2D self-assembly and on-surface synthesis
20
The dependence of interfacial 2D self-assembly on the concentration of target
molecules has been demonstrated for a number of molecular systems. The
intermolecular interactions that drive the formation of concentration-dependent
molecular networks include: hydrogen bonding between pyridyl containing molecules
[33] and carboxylic acid groups [32]; and van der Waals interactions between
interdigitated alkyl chains [34, 35]. Concentration-dependent molecular systems often
consist of molecular building blocks that can have more than one packing arrangement
with distinct adsorption energy, intermolecular interaction, or packing density. An
example of this is the 2D self-assembly of an alkylated isophthalic acid (ISA-OC14),
the molecular structure of which is shown in Figure 2.9 (a) [32]. At high concentrations,
ISA-OC14 self-assembles into a mixture of a close-packed, linear structure (0.69
molecules/nm2) and a porous structure (0.33 molecules/nm
2) in separate domains as
shown in Figure 2.9 (b)-(e). In contrast, less ISA-OC14 molecules adsorb at the
interface at low concentrations. This decreased presence of ISA-OC14 leads to the
formation of only the porous structure. The co-adsorption of solvent molecules within
the hexagonal pores and between the interdigitated alkyl chains helps compensate the
energy loss raised by the formation of less densely packed structures. In a more recent
study, the concentration-dependent self-assembly of a pyridyl containing molecule at
the liquid-solid interface has been investigated using density functional theory (DFT)
simulations [33]. This theoretical method calculates the packing density, the adsorption
energy and the energy of intermolecular interactions for each of the self-assembled
structures the target molecule can form. The calculation results reveal that the number
of the target molecules per surface area plays an important role in determining the
morphology of self-assembled structures. The number of molecules present on the
surface is tuneable by changing the concentration of the solutions deposited onto the
surface [36]. Thereby, the respective dominance of porous and densely packed
structures at low and high concentrations can be predicted.
Solvent molecules may play a dual role in 2D molecular self-assembly. The
universal function of solvent molecules is to dissolve target molecules and act as a
medium for interfacial 2D self-assembly. However, in some cases, especially for porous

Chapter 2. 2D self-assembly and on-surface synthesis
21
2D molecular networks, solvent molecules may also participate in self-assembly as a
second molecular component. Solvent molecules with favourable functional groups for
self-assembly, for example, carboxylic acid groups and alkyl chains, are particularly
likely to co-assemble with target molecules through hydrogen bonding or van der Waals
interactions [37]. Solvent co-adsorption effects lead to difficulty in determining whether
the observed network structure is the most thermodynamically stable one or not. An
effective method for determining if an observed structure is metastable is simply heating
the network [38]. When given enough energy, metastable network structures, caused
either by solvent co-adsorption or other kinetic trapping effects will re-arrange into the
equilibrium structures. True phase transitions between different equilibrium structures
are indicated by reversible transition between structures.
Figure 2.10. Reversible temperature-induced phase transition observed for
1,3,5-tris(4-carboxyphenyl) benzene (BTB) networks self-assembled at the nonanoic
acid-HOPG interface. (a) STM image of the nanoporous phase acquired at 25°C. (b) Chemical
structure of BTB. (c) STM image of the densely packed structure obtained at 55 °C.[39]
Substrate temperature has a significant influence on the thermodynamics and
kinetics of 2D self-assembly processes. Firstly, an elevated temperature is favourable
for the removal of kinetic effects and can lead to the formation of thermodynamically
stable structures [40]. Structural transitions from metastable to thermodynamically
stable phases are irreversible. This means if a sample is cooled back to the initial low
temperature, the structure at the equilibrium state will not change back. Secondly,
changes in substrate temperature can also result in reversible transitions between two
(a) (b) (c)

Chapter 2. 2D self-assembly and on-surface synthesis
22
equilibrium states. R. Gutzler et al. presented a system that displayed a reversible phase
transition from a nanoporous low-temperature phase to a more densely packed
high-temperature phase [39]. The molecular system in question was
1,3,5-tris(4-carboxyphenyl) benzene (BTB) at a fatty acid-HOPG interface as shown in
Figure 2.10. The transition temperatures were found to be related to the type of solvent
and the solute concentration. A thermodynamic model was employed to interpret the
experimental results by means of analysing the entropic cost and enthalpy gain upon
monolayer self-assembly. This study suggested that elevation of the temperature
favoured desorption of weakly bound solvent molecules from the nano-porous phase.
Removal of these solvent molecules from the surface led to the thermodynamic
stabilisation of the densely packed polymorph over the nano-porous polymorph and
resulted in the phase transition.
Figure 2.11. (a)-(c) STM images showing the self-assembled molecular networks formed by
CoOEP, NiOFP and a mixture of CoOEP and NiOEP. (d) Molecular structure of CoOEP
(NiOEP).[41]
In addition to the formation of thermodynamically stable phases, temperature is a
factor that can induce adsorption and desorption of target molecules at a liquid-solid
interface. The temperature-dependent kinetics of self-assembled metal porphyrin
networks at the interface between Au (111) and phenyloctane has been investigated by
K.W. Hipps et al. [41]. Figure 2.11 (a) and (b) show the STM images of the
mono-component self-assembled networks formed by cobalt(II) octaethylporphyrin
(CoOEP) and nickel(II) octaethylporphyrin (NiOEP), respectively. These two
(a) (b) (c) CoOEP NiOEP CoOEP:NiOEP (1:3.7)
(d)
M:
Co or Ni

Chapter 2. 2D self-assembly and on-surface synthesis
23
porphyrin species exhibit different apparent heights in the STM images collected using
the same scanning parameters. Since CoOEP appears higher NiOEP, these two
porphyrin species are clearly resolved in the STM image of the bi-component molecular
network formed by a mixture of porphyrins (Figure 2.11 (c)). Consequently, desorption
of either CoOEP or NiOEP can be traced using STM operating at the liquid-solid
interface. In order to study the desorption of CoOEP, a mono-component CoOEP
network was prepared and then exposed to a solution containing both NiOEP and
CoOEP. The sample was heated at a range of temperatures for different time lengths.
Any exchange in composition between the molecular network and the upper solution
can be observed and analysed quantitatively. The results show that a temperature as high
as 135 °C is needed to overcome the desorption barrier for CoOEP at the interface
between Au(111) and the mixture of both NiOEP and CoOEP.
2.3 Inclusion of guest molecules
Using porous molecular networks as adsorption sites for guest molecules is one
potential approach to add functionality to 2D self-assembled molecular networks. In
addition to adding functionality, the inclusion of guest molecules within molecular
networks also provides the ability to arrange individual molecules in 2D with nanometre
accuracy. A range of guest molecules have been reported to be accommodated within
surface-confined nano-porous structures. The ability of various molecules to act as
effective guests depends on their size and geometry and the complementarity between
guest molecule and the pores of the host network.
Simple examples of guest molecules include coronene, which has been shown to
fill the pores of hexagonal networks formed from trimesic acid at the liquid-solid
interface [42]. As research into host-guest molecular systems has advanced, more
complex and varied guest species have been investigated along with novel strategies to
understand and apply host-guest self-assembly. Coronene and its derivative
hexabenzocoronene (HBC) have been reported to act as guest molecules in
1,3,5-tris[(E)-2-(3,5-didecyloxyphenyl)-ethenyl]- benzene (TSB35) host matrix as

Chapter 2. 2D self-assembly and on-surface synthesis
24
illustrated in Figure 2.12 [43], where the dynamics of these guest molecules were
probed in situ using STM. When exposing the TSB35 self-assembled network to a
mixture of coronene and HBC solutions, a simultaneous adsorption of the two guest
molecules within the pores of the host network was observed. Compared with HBC,
coronene exhibits a higher diffusion ability within the pores. Therefore, coronene
appears as a striped feature in STM images while HBC appears as a solid circular shape.
The results demonstrate that the trapping and diffusion of individual guest molecules
can be selectively controlled by a host self-assembled molecular network with well
designed pore sizes.
Figure 2.12. (a) Molecular structures of the host molecule TSB35 and the two guest molecules
coronene and HBC. (b) A model of the porous TSB35 molecular network stabilized by van der
Waals interactions arising from alkyl chain interdigitation. (c)-(e) Constant current STM images
of (c) TSB35 host network on HOPG; (d) the network after the addition of coronene; and (e) the
network after the addition of HBC.[43]
Studies of more complex multi-component host-guest structures have been
extended to four-component molecular systems based on a DBA molecular network
investigated by De Feyter et al. [34, 44, 45]. A DBA1 derivative with four short alkoxy
chains and two longer alkoxy chains (Figure 2.13 (b)) was synthesised and used to form
(a) (b)
(c) (d) (e)

Chapter 2. 2D self-assembly and on-surface synthesis
25
a self-assembled molecular network. By changing the environmental conditions during
self-assembly, such as solvent, temperature and concentration, two distinct porous
structures (p6 and p2) were obtained selectively (Figure 2.13 (a)).
Figure 2.13. (a) Schematic diagram of the two porous structures (p6 and p2) obtained using
DBA1 building block. (b) Chemical structure of the DBA1 building block with four short
alkoxy chains (C10H21) on two sides of the triangular DBA core and two longer alkoxy chains
(C20H41) on the third side.[34]
Both coronene-isophthalic acid (COR1-ISA6) heteroclusters and triangular
nano-graphene (NG) species (Figure 2.14 (a)) were added into the p6 porous network.
The COR1-ISA6 and NG acted as guest molecules and were observed to preferentially
fill different shaped pores within the network. This selective interaction of particular
guest molecules with specific pores based on shape complementarity led to the
formation of a four-component self-assembled network at the interface between
HOPG and 1-phenyloctane (Figure 2.14 (b)-(d)).
Figure 2.14. (a) Molecular structure of nano-graphene and schematic diagram of COR1-ISA6
hetero-cluster. (b), (c) STM images of a mono-layer of DBA1, coronene, ISA, and
nano-graphene at the 1-phenyloctane-HOPG interface. (d) Molecular model showing the
structure of the four-component network.[34]
(a) (b)
(a) (b) (c) (d)

Chapter 2. 2D self-assembly and on-surface synthesis
26
Non-planar molecules, such as C60 and C70, are another group of guest molecules
that have attracted interests from the 2D self-assembly research community. Ordered
C60 arrays have potential technological applications in electronic devices as electron
acceptors [46], and can be fabricated using 2D self-assembled networks as templates.
Under UHV conditions, C60, C70, and their derivatives have been observed to organise
into ordered 2D arrays on metal or semiconductor substrates, either by employing
porous host networks [2, 47], or by using low temperatures to immobilise C60 [48]. At
room temperature and pressure, the formation of ordered C60 arrays can be directed
using porous self-assembled molecular networks at liquid-solid interfaces. Li et al.
studied the self-assembly of a tetra-carboxylic acid functionalised molecule that forms a
Kagomé pattern [49]. The 2D network self-assembled at the interface between HOPG
and heptanoic acid consists of two types of pores within distinct shapes. Each of these
pore types can act as adsorption sites for guest molecules: C60, C80, and Sc3N@C80.
Selective adsorption of these non-planar guest molecules leads to the self-assembly of
highly ordered host-guest networks. In some molecular systems, the boundaries
between different domains of nano-porous networks can also act as adsorption sites for
C60 molecules [50].
It is also worthwhile noting that the role of guest molecules is not limited to
passively filling pores within self-assembled nano-porous networks. The inclusion of
guest molecules can actively induce phase transitions between different structural
arrangements [51] or even promote the growth of supramolecular bi-layers [52]. These
results open intriguing possibilities for the control of 2D supramolecular architectures
and the extension of self-assembled networks from 2D to 3D systems.
2.4 Chirality in 2D self-assembled systems
A chiral object is one that is not superimposable on its mirror image by in-plane
translational or rotational motion. At the molecular level, chiral molecules demonstrate
right- and left-handed appearances. The right- and left-handed mirror images of a chiral
molecule are called enantiomers. Achiral molecules that can be changed into chiral

Chapter 2. 2D self-assembly and on-surface synthesis
27
through additional interactions, e.g., adsorption on a surface, are defined as prochiral.
In 2D molecular systems, target molecules self-assembled into ordered molecular
networks on a solid surface directed by molecule-molecule and molecule-surface
interactions. The chiral characteristic of the resulting molecular networks is closely
related to the chirality of the target molecules and the underlying surface. The
interactions between chiral molecules and chiral inorganic surfaces have shown an
enantio-selectivity [53]. The chiral surfaces used to study the adsorption of chiral
molecules are often kink sites of single crystal metal surfaces. Examples include Pt(643)
and space-inverted enantiomer surfaces created by cutting a single Pt crystal [54]. To
date, the flat solid surfaces commonly used for STM investigations of 2D
self-assembled molecular networks are all achiral. The achiral substrates include:
HOPG and Au(111) for STM operating at ambient conditions; and Cu(100), Cu (100)
and other noble metal surfaces for STM operating in ultra-high vacuum (UHV).
Figure 2.15. (a) and (c) STM images showing the left-handed and right-handed pinwheel
structures formed by pentacene on Bi(111). (b) Molecular models of the molecular assemblies
and pentacene. [55]
At achiral surfaces, chiral 2D self-assembled networks have been observed to form
from molecular components that are intrinsically achiral, chiral and prochiral [56]. For
achiral molecules, the chirality of the resulting self-assembled molecular networks are
usually caused by molecule-surface interactions. Although no chiral feature is exhibited
for the individual molecular components, the chirality of the 2D self-assembled
networks may result from the oblique alignment of the molecules with respect to the
underlying surface. In addition to oblique alignment, the chirality of the 2D
(a) (b) (c)

Chapter 2. 2D self-assembly and on-surface synthesis
28
self-assembled networks may also arise from the interdigitation and close packing of the
molecules. Figure 2.15 shows the left- and right-handed pinwheel-shaped molecular
structures formed by symmetric pentacene molecules on a Bi(111) surface [55]. The
chirality of the pinwheel structures is induced by the 2D self-assembly of pentacene. All
of the individual pentacene molecules adsorb on the surface in a planar fashion. Each of
the single pinwheel structures consists of six hexamers. In a single hexamer, six
pentacene molecules are aligned parallel with each other. The close packing
arrangement of the six hexamers gives rise to the chirality of the single pinwheel
structure.
Figure 2.16. (a) Molecular structures of 1,5-bis-(3′-thia-tetradecyl) anthracene (1) and
1,5-bis-(3′-thia-pentadecyl) anthracene (2). (b) STM image showing the self-assembled network
formed by the opposite enantiomers of 1 on HOPG. (c) STM image showing the self-assembled
network formed by the same enantiomers of 2. [57]
In addition to 2D self-assembly induced chirality, chiral molecular networks can
also result from the adsorption of prochiral molecular components. This adsorption
induced chirality has been frequently observed for asymmetric planar molecules when
adsorbing onto achiral solid surfaces [58]. When the opposite enantiomers of a prochiral
molecule are both present on a surface, they can either form separate chiral domains or
co-crystallise into a mixed domain. If the interactions between the same enantiomers are
more favourable than those between the opposite enantiomers, then they form chiral
domains. If the interactions between the opposite enantiomers are more favourable, they
will co-assemble into mixed domains. The chain length dependent self-assembly of
(a) (b) (C) 1
2 3
4 5 6 7
8 9
10

Chapter 2. 2D self-assembly and on-surface synthesis
29
alkylated anthracene derivatives is a good example showing the 2D self-assembly
behaviour of a prochiral molecule on an achiral surface [57]. As illustrated in Figure
2.16 (a), the two target molecules are anthracene derivatives with alkyl chains
connected to the anthracene 1 and 5 positions via sulphur atoms. For anthracene
derivative 1, each of the side chains consists of ten methylene groups. Compared with
anthracene derivative 1, each of the side chains of anthracene derivative 2 contains
eleven methylene groups. This difference in chain length leads to the different packing
arrangements of the two target molecules on HOPG surfaces as shown in Figure 2.16 (b)
and (c). Both of the molecular networks self-assembled by 1 and 2 are composed of
closely packed rows of a single enantiomer. For the molecular network of 1, two
adjacent rows adopt a mirror-image configuration where the opposite enantiomers of 1
are present. In contrast, the energy of the molecular network formed by 2 reaches a
minimum when all the molecules adopt the same enantiomer in all of the rows.
2.5 On-surface synthesis of 2D covalent molecular networks
Covalent organic frameworks (COFs) consist of extended materials, where molecular
building blocks are linked by strong covalent bonds. COFs have elicited interest from a
wide array of research areas including: organic synthesis; molecular nanoscience;
surface science; and 2D materials. COFs can be synthesised in various forms, such as
3D-COFs, bulk 2D-COFs and mono-layer 2D-COFs. 3D-COFs consist of a single
interlinked molecular crystal. In bulk 2D-COFs, 2D covalent molecular layers are
stacked on top of each other driven by van der Waals interactions. Discussions in this
chapter will focus on mono-layer 2D-COFs that have been grown directly onto
supporting surfaces.
The structure of mono-layer 2D-COFs is analogous to that of other 2D layered
materials: e.g. graphene and hexagonal boron nitride. If the periodically distributed
carbon atoms in a graphene sheet were replaced with organic molecular building blocks,
then a 2D molecular network is created. In this 2D layered structure, the target
functional molecules are linked together via covalent bonds.

Chapter 2. 2D self-assembly and on-surface synthesis
30
The formation of a variety of mono-layer 2D-COFs structures with potential
applications in nanotechnology have been explored under UHV conditions as well as at
solid-liquid and solid-vapour interfaces. One example is 1,3,5-tris(4-bromophenyl)
benzene (TBPB) (Figure 2.17 (a)). TBPB assembles into ordered, close-packed
mono-layers on Au(111) at room temperature under UHV. On annealing to 110 °C, the
TBPB molecules were observed to form porous 2D networks (Figure 2.17 (b)) by
undergoing a surface-mediated Ullmann coupling reaction between the Br functional
groups [59]. The TBPB covalently linked network was further applied as a template to
direct the adsorption of thermally evaporated C60 molecules on the surface.
Figure 2.17. (a) Molecular structure of the TBPB molecule. (b) Schematics of different pore
types formed in the TBPB 2D-COF.[59]
Since Grill et al. made the first mono-layer covalently linked network via an
Ullmann coupling reactions [60], a large number of 2D-COF structures have been
created and characterised by various innovative approaches. 2D covalently bonded
polymer networks have attracted attention from experimental chemists and raised
interest in the study of their electronic structures through theoretical methods [61, 62].
Figure 2.18. Scheme showing the method of constructing 2D-COFs proposed by Grill et. al.
[60], in which molecular components bear chemical groups for radical addition reactions.
(a) (b)

Chapter 2. 2D self-assembly and on-surface synthesis
31
Strategies to synthesise mono-layer 2D-COFs include top-down exfoliation of bulk
2D-COFs [63] and direct formation of mono-layer 2D-COFs from molecular building
blocks via on-surface synthesis. The on-surface synthesis approach is currently the most
widely used method for the synthesis of mono-layer 2D-COF materials. The chemical
structure of molecular components plays a key role in controlling the final morphology
of 2D-COFs. As can be seen from Figure 2.18, Grill et al. employed molecular building
blocks functionalised with chemical groups that can undergo radical addition reactions
to form ordered covalently bonded nano-architectures [60]. The work is a good example
of building up extended 2D-COFs without the need for the addition of other external
molecules as linkages to connect the target functional components.
Connecting target molecular components using additional linker molecules is
another effective design strategy used for the growth of 2D-COF materials. Figure 2.19
shows a schematic illustration of this construction method. The precursor molecules A
with a three-fold symmetry (marked in red) are connected by the linker molecule B with
a two-fold symmetry (marked in blue). Connecting A and B together allows the
formation of an extended porous network with hexagonal morphology. The formation of
the molecular network is driven by a chemical reaction between functional groups at the
reactions sites of the two molecular species.
Figure 2.19. Representative 2D-COFs construction scheme using additional molecules as
linkers [64].
The morphology and dimensions of the resulting 2D-COFs built from the coupling
reactions shown in Figure 2.19 are highly tuneable and can be controlled by varying the
size, shape and chemical structure of the molecular building blocks used. The shape of
the molecular building blocks, and the properties of the chemical reaction sites also
Precursor A Precursor B
Reaction site on A
Reaction site on B

Chapter 2. 2D self-assembly and on-surface synthesis
32
have a significant influence on the physical and chemical properties of the final
2D-COFs mono-layers.
In order to grow high-quality mono-layer 2D-COFs with pre-designed structure
and function, a better understanding of the chemical reactions used to form these
systems is required. Under different reaction conditions, distinct experimental
parameters are adjusted carefully to help elucidate their influence on the resulting
2D-COF structure. Performing 2D-COFs growth outside UHV conditions has proven to
be an effective and easy to implement approach. A range of growth environments from
ambient to high pressures have been investigated to synthesise mono-layer 2D-COFs.
The applicability of these different growth environments depends on the activation
conditions of the chosen reaction scheme for 2D-COF formations.
On-surface synthesis approaches to the formation of ordered mono-layer 2D-COFs
involve the formation of covalent bonds between molecular building blocks via suitable
chemical reactions schemes. The suitability of a reaction scheme is based on several
factors. Firstly, the reaction must be selective so that covalent bonds are formed only at
desired locations on the molecular building blocks and undesired side reactions are
avoided. Secondly, the reaction must maintain the symmetry of the original molecular
building blocks. This requirement is based on the concept of reticular synthesis [65]. In
this synthesis approach, the final morphology of the 2D-COF can be tuned by
controlling the structure of the individual molecular components. Thirdly, the reaction
should be reversible under suitable growth conditions. This requirement allows the
formation of highly ordered 2D-COF structures. To date, Ullmann coupling, boronic
acid condensation and Schiff-base condensation reactions have been the most widely
employed chemical reactions used to grow mono-layer 2D-COFs outside of UHV.
Figure 2.20. Ullmann couple reaction assisted by a noble metal surface.
The Ullmann reaction is a radical addition coupling reaction that takes place
Noble metal
Annealing X = Br, I. Cl
R = alkyl or aryl groups

Chapter 2. 2D self-assembly and on-surface synthesis
33
between aryl halides in the presence of a metal catalyst, such as Cu, Ag or Au (Figure
2.20). Noble metals are widely believed to participate in the reaction by forming an
intermediate metal-organic complex with C radicals following the breaking of C-X
bonds.
Typical surface-assisted Ullmann coupling reactions start with the pre-organisation
of target molecules on a metal surface via 2D self-assembly. Subsequently, the sample is
annealed at elevated temperatures to activate covalent crosslinking. Most on-surface
Ullmann coupling reactions are performed under UHV conditions. However, this
reaction scheme has also been demonstrated to be applicable under ambient conditions
[66, 67]. Most early work on on-surface Ullmann reactions adopted active metal
surfaces which act as catalysts for the coupling reactions. The application of this
reaction scheme in on-surface synthesis of 2D-COFs is limited by the irreversibility of
the coupling reactions. Additionally, the activation conditions of the coupling reactions
requires high temperatures and the presence of a metal substrate. This also leads to a
narrow range of growth conditions that are suitable for the connection of molecular
building blocks directed by Ullmann reactions.
Figure 2.21. Boronic acid condensation reactions. (a) Boroxine ring formation via
poly-condensation reaction between three boronic acid derivatives. (b) Boronic ester formed by
the condensation reaction between a boronic acid and a diol group.
Heating
R = alkyl or aryl group
(a)
(b) Heating

Chapter 2. 2D self-assembly and on-surface synthesis
34
The formation of hexagonal boroxine rings and boronic esters results from
condensation reactions between boronic acids and diol groups (Figure 2.21). The
self-condensation of boronic derivatives was first introduced by Yaghi and co-workers
in the synthesis of 3D bulk COFs using solvothermal methods [68]. Zwaneveld et al.
later applied this synthetic scheme to form 2D networks via the co-deposition of ditopic
and tritopic boronic acid derivatives onto Ag (111) in UHV [69]. Unlike radical addition
reactions, boronic acid condensation reactions can be activated with no requirement for
the presence of catalytic noble metals. On chemically inert surfaces, such as HOPG,
boronic acid condensation has been employed to obtain extended highly ordered
2D-COFs [70]. The flexible activation conditions allow for boronic acid condensation
reactions to be performed outside of UHV conditions.
Another key advantage of boronic acid condensation, and other condensation
reactions, is that the equilibrium position of the reaction can be controlled via the
presence of water in a closed reaction vessel. Control over the equilibrium position of
the reaction allows control over the reversibility of the reaction during the growth phase.
As discussed previously, having a reversible reaction favours defect eliminations during
growth and leads to the formation of highly ordered 2D-COF structures with large
domain sizes. Studies have shown that the thermodynamic equilibrium of the boronic
acid condensation reaction can be successfully tuned by the addition of a small amount
of CuSO4·5H2O as an equilibrium regulator [71]. Despite these advantages, the intrinsic
reversibility of the boronic acid condensation reactions lowers the chemical stability of
the covalent bonds in presence of water. The 2D-COFs formed using boronic acid
condensation reactions are susceptible to decomposition of the boroxine or boronic ester
groups by hydrolysis.
Figure 2.22. Addition and elimination steps in a Schiff base condensation reaction.
R = alkyl or aryl group

Chapter 2. 2D self-assembly and on-surface synthesis
35
Schiff-base condensation reactions, which lead to the formation of polyimide
networks, are one of the most effective reactions for the fabrication of mono-layer
2D-COFs. As shown in Figure 2.22, Schiff-base condensation involves two linked
reaction steps. In the first step, an aldehyde reacts with an amine forming an unstable,
intermediate product, known as a hemiaminal. In the second step, the hemiaminal group
undergoes dehydration producing an imine. The reaction is reversible and can also be
shifted to favour either reactants or products via the presence of water. The imine can be
converted back into amine and aldehyde via a hydrolysis process.
Schiff-base condensation reactions are generally induced either by annealing or
with the assistance of an acid catalyst. Amine-aldehyde covalent crosslinking has been
demonstrated on an Au(111) surface under UHV conditions [72]; in aqueous solutions
[73]; and at the interface between an octanoic acid solvent and a copper-supported
graphene substrate [74]. Compared with the other chemical reaction schemes discussed
above, Schiff-base condensation reactions exhibit the ideal combination of moderate
synthesis conditions, flexibility in design of molecular building blocks and good
stability of the final covalent bonds. Moreover, Schiff-base condensation reactions have
the advantage over boronic acid condensation that they produce conjugated imine
linkages between molecules, something that is vital for the fabrication of new fully
conjugated 2D-COF materials.
The Schiff-base condensation reaction scheme has been utilised for the growth of
mono-layer 2D-COFs under different conditions, including liquid-solid and
vapour-solid interfaces. Liquid-solid interfaces provide a unique environment, where
molecules adsorbed on a surface can be in a state of dynamic equilibrium with those in
the overlying solution. The ability of molecules to easily adsorb and desorb from the
surface helps to minimise kinetic effects for self-assembly at liquid-solid interfaces. In
turn, this facilitates the assembly of thermodynamically stable 2D molecular structures.
The dynamic environment offered by liquid-solid interfaces has been used to produce
highly ordered 2D self-assembled networks and 2D-COFs. The presence of a solution
layer above the growing 2D-COF is especially favourable for covalent reaction schemes
where the reversibility of the reaction can be tuned by control over the solution pH.

Chapter 2. 2D self-assembly and on-surface synthesis
36
To date, the growth of mono-layer 2D-COFs at liquid-solid interfaces has been
applied for both Schiff-base condensation and boronic acid condensation reactions [70,
75]. Tanoue et al. [73] introduced a general surface-based solution approach for the
fabrication of extended 2D porphyrin networks (Figure 2.23). In this fabrication scheme
solution pH and the substrate material were carefully selected for the purpose of
achieving spontaneous and selective polymerization reactions. Later, Xu et al. reported
an in-situ STM study of an imine-based 2D-COF formed at the interface between
octanoic acid and HOPG [75]. In the resulting 2D-COF molecular arrangements
resulting from incomplete condensation were frequently observed.
Figure 2.23. Schematic diagram showing the formation mechanism for a mono-layer
Schiff-base 2D-COF, consisting of porphyrin units connected by smaller linker molecules,
formed at a liquid-solid interface. [73]
Synthetic approaches to the growth of mono-layer 2D-COFs at vapour-solid
interfaces are applicable to both mono-component and bi-component 2D-COFs. In
mono-component systems, molecular building blocks are usually deposited on a surface
followed by a reaction activation process, normally annealing. If two types of precursor
molecule are used for the growth of a 2D-COF, then two distinct approaches can be
adopted. Firstly, the two molecular species can be co-deposited onto the surface prior to
activation [76]. Secondly, one of the precursor molecules can be deposited onto the
surface while the second molecule is present in the vapour phase above the surface (see
Figure 2.24) [64, 77]. In comparison, the second approach is more favourable for the
growth of highly ordered mono-layer 2D-COFs. This is because the precursor molecules

Chapter 2. 2D self-assembly and on-surface synthesis
37
deposited on the surface have more space to diffuse on the surface, thus are more likely
to avoid being trapped by kinetic effects. The molecular species present in the vapour
phase is able to adsorb and desorb from the interface. The increased mobility of the
vapour phase component results in smaller kinetic barriers for the free energy
minimisation of the molecular system. The minimisation of these barriers means that the
systems can easily reorganise and defect elimination within the mono-layer 2D-COFs
can proceed more quickly. Despite these advantages, a growth mode where one
precursor is on the surface and the other precursor is in the vapour phase, is not suitable
for linker molecules with a high boiling point.
Figure 2.24. Schematic illustration of 2D-COFs synthesis between a tritopic precursor (red) that
has been deposited onto a surface and a ditopic precursor (blue) that is present in the vapour
phase above the surface. Growth of the 2D-COF occurs at the vapour-solid interface. [64]
For condensation reactions, during which water is released, extra water added to
the vapour phase enhances the reversibility of the reactions. As a result, the
reorganisation of molecules and defect elimination are promoted leading to the growth
of highly ordered 2D-COFs. The concept of equilibrium manipulation has been applied
to improve the synthesis of 2D COFs via boronic acid and Schiff-base condensation
reactions [64, 71]. Additional water can be introduced to the reaction schemes by adding
a suitable amount of CuSO4·5H2O as an agent to regulate the dehydration processes.
Many interesting aspects of 2D-COFs grown at vapour-solid interfaces have been
investigated, such as synthesis on copper supported graphene surfaces [74], growth of
2D-COF bi-layers [78], network structures with non-aromatic linkages [79], and side
functionalisation of 2D-COFs [80]. Moreover, 2D-COFs formed at vapour-solid
interfaces are accessible to further tests of their capability in technological applications,
due to the absence of an overlaying solution layer. For example, both boroxine- and
Precursor A Precursor B
Substrate

Chapter 2. 2D self-assembly and on-surface synthesis
38
imine-based 2D-COFs have been used as host templates for the adsorption of guest
molecules [81, 82]. In order to study the performance of 2D-COFs as components in
electrodes, electrochemical measurements have been carried out to test a porous,
imine-based 2D-COFs grown on graphene layers [83].
2.6 Conclusions
In this chapter, non-covalent and covalent interactions that have been used in the
formation of 2D self-assembled molecular networks and 2D-COFs have been
summarised. The control over 2D self-assembled structures has been discussed with a
focus on thermodynamics and kinetic effects for molecular systems formed at
liquid-solid interfaces. Examples reported in the literature demonstrate how the
functionality of interfacial 2D self-assembled architectures has been explored via the
addition of guest molecules. 2D-COFs have been introduced as a class of novel 2D
materials that are able to overcome the chemical and thermal weakness suffered by 2D
self-assembled networks. The increased stability of 2D-COFs in comparison to 2D
self-assembled molecular networks makes them ideal candidates for a range of
technological applications. To deepen the understanding of the physical and chemical
properties of 2D-COFs, further investigations into the formation of highly ordered
2D-COF mono-layers with complex multi-component structures and desired chemical
functionality are required [64]. A key advance related to the fabrication of
highly-ordered 2D-COFs over extended scales would be a method to pre-organise
molecular precursors in a controlled manner prior to covalent bond formation.

39
Chapter 3
Methodology
Discussions in this chapter are focused on the main experimental techniques and
simulation tools used to investigate 2D molecular networks in this thesis. The
experimental techniques include scanning tunnelling microscopy (STM), atomic force
microscopy (AFM), and X-ray photoelectron spectroscopy (XPS). The simulation
method employed in this work was molecular mechanics (MM) simulation. Firstly, a
description of the physical principles that form the basis of these experimental and
theoretical methods will be given. Secondly, the specific equipment (and software
packages) used for the research presented in this thesis and the current state-of-the-art
for the respective techniques will be discussed. Finally, examples of the application of
these techniques in the study of molecular nano-architectures on solid surfaces will be
briefly described.
3.1 Introduction
Scanning probe microscopy (SPM) encompasses a large collection of different
microscopy techniques that are used in surface characterisation. The thing that all SPM
techniques have in common is that a sharp probe, commonly referred to as the tip, is
used to map features on a surface. The tip is brought into close proximity with a surface,
normally within a few nm or less, and scanned across the surface using a piezo-electric
scanner. Interactions between the tip and the surface means that the tip can record a
signal that is related to a certain property of the surface: e.g. height, charge, or
temperature. The particular property of the surface being measured is specific to each
different type of SPM. The sharpness of the tip and the distance dependence of the
interactions between the tip and the surface means that the property is only measured for
the local region of the surface directly underneath the tip. By scanning the tip

Chapter 3. Methodology
40
back-and-forth across the surface while measuring the signal in question, a map of the
surface can be built up, often with a lateral resolution ranging from a few nm down to
Angstroms. Among the variety of existing SPM techniques, STM and AFM are the most
widely adopted imaging and manipulation tools used for the real space investigation of
2D self-assembled or covalently bonded molecular networks on solid surfaces.
Despite the high levels of spatial resolution, standard SPM techniques such as
STM and AFM often only provide information on the morphology and structure of a
surface molecular layer. Information such as the height, lateral size of molecular
features and unit cell dimensions for ordered 2D molecular crystals are commonly
obtained by these techniques. However, while providing detailed structural information,
STM and AFM provide little or no information about the chemical composition of
surface molecular features. Thus, the experimenter is often left to infer the exact
chemical structure of molecular structures based on a prior knowledge of the molecular
building blocks used. While this approach can be effective for simple systems, when
structures have been formed where a covalent reaction has occurred, it is often
necessary to use a technique that provides additional information on the chemical
structure and composition of surface features. As a complementary approach to SPM,
X-ray photoelectron Spectroscopy (XPS) is a quantitative, surface-sensitive technique
that can be used to analyse the chemical state of adsorbates on a sample surface.
Molecular Mechanics (MM) simulations offer a computationally inexpensive
theoretical approach to the interpretation of molecular structures resolved by STM. MM
allows the easy construction and testing of a wide variety of different surface molecular
structures. The results from MM simulations, most often the 2D unit cell dimensions for
molecular networks, can be directly compared to results obtained from SPM. Therefore,
MM helps elucidate the packing morphologies and non-covalent bonding modes
adopted by molecules in surface-based 2D molecular structures.
The combined utilisation of SPM, XPS and MM simulations provides a
comprehensive set of information concerning the properties of 2D molecular networks
formed either via supramolecular self-assembly or via on-surface covalent synthesis.

Chapter 3. Methodology
41
3.2 Scanning Tunnelling Microscopy (STM)
3.2.1 Basic principles of STM
Figure 3.1. (a) Schematic representation of the basic operational principles of STM. (b) Image
showing the atomic scale depiction of the tip-sample tunnel junction.
STM, invented by G. Binnig and H. Rohrer at IBM Zürich in 1982 [84], was the first
SPM technique to be developed. In STM, a bias voltage is applied between a sharp
metallic tip and a conductive sample as shown in Figure 3.1 (a). When the tip is
positioned within a few nanometres of the sample surface, electrons can tunnel through
the narrow gap between the tip and the surface forming a measurable electrical current
called the tunnelling current.
The direction of the tunnelling current depends on the polarity of the bias voltage.
STM commonly operates in two different imaging modes: constant current mode and
constant height mode. In constant-current mode, which is the first and most widely used
mode in STM operation, the tunnelling current is maintained at a set-point value by
means of adjusting the height of the probe tip using a feedback loop. As the magnitude
of the tunnelling current is small (a few nA or pA), it is amplified by a tunnelling
current amplifier prior to entering the feedback loop. The feedback loop is essentially an
electronic circuit that converts current to voltage. The tunnelling current is constantly
monitored by the feedback loop. In order to maintain the tunnelling current at a constant
value, the feedback loop adjusts the gap between the tip and the sample surface. The
(a)
(b)
STM tip
Sample

Chapter 3. Methodology
42
motion of the STM probe is controlled by stepper motors and the piezo scanner. The
piezo scanners are calibrated during manufacture using samples with known feature size.
When a particular voltage is applied to the scanner, it is known exactly how much it will
move in a particular direction. Thus, the voltage signals that are sent to the Z piezo
scanner in constant current mode can be used to build a height map of the surface. The
probe height recorded at each location is then used to directly reconstruct the scanned
area of the surface as a real space topographic map.
3.2.2 Understanding the tunnelling current
The primary signal detected in STM experiments, the tunnelling current, results from
the tunnelling of electrons between the tip and the surface, a phenomena which can only
be understood from the viewpoint of quantum mechanics. The description of the
dynamic properties of microscopic particles in quantum theory by the use of
wavefunctions leads to several phenomena that are at odds with our classic view of the
macroscale physical world. One such phenomenon is quantum mechanical (QM)
tunnelling. The wave-like nature of electrons means that they are able to “tunnel” from
one electronically conductive region to another through a non-conductive potential
energy barrier. Importantly, this tunnelling occurs even when the height of that barrier is
greater than the electron’s own energy. The rate at which electrons can tunnel through
such a barrier is delicately dependent on a number of factors including: the height and
width of the barrier; the potential energies of the electrons before and after tunnelling;
and the local density of electronic states of the two electrical contacts on either side of
the barrier. In order to build a robust and accurate theory of QM tunnelling all of these
factors need to be taken into account.
Electron tunnelling
The mathematical description of quantum mechanical tunnelling has been
elaborated in a large number of journal papers [85-87] and book chapters [88-90]. These

Chapter 3. Methodology
43
descriptions adopt different levels of complexity and theoretical detail depending on
what aspect of tunnelling they are attempting to explain.
Figure 3.2. Schematic diagram of an electron traversing a 1D rectangular potential barrier which
can be divided into three regions marked as 1 (x < 0), 2 (0 < x < S), and 3 (x > S). E: energy of
the electron. V0: height of the potential barrier.
Among the various theoretical treatments, elastic tunnelling through a
one-dimensional (1D) rectangular potential barrier is a simple but illustrative model
used to understand the electron tunnelling effect (Figure 3.2). By solving the
time-independent Schrödinger equation for the regions 1, 2, and 3, respectively, the
barrier transmission coefficient T, which is defined as the square of the ratio of the
transmitted flux to the incident flux, is derived as:
T
2 2 2
2 2 sinh2 s (3.1)
In equation (3.1) the decay rate is given by K is the
wavenumber of the tunnelling electrons, m is the mass of electrons, s and V0 are
respectively the width and height of the one-dimensional rectangular potential barrier, E
is the energy of the impinging electron, and is the Planck’s constant divided by 2π.
If the energy barrier is strongly attenuating, s >> 1, then:
(3.2)
Typically, the barrier transmission coefficient T is exponentially dependent on the
1 2 3
x

Chapter 3. Methodology
44
barrier width s and the square root of an effective barrier height ,
regardless of the exact shape of the barrier. Inspired by this fact that the barrier
transmission is extremely sensitive to the barrier width, G. Binnig and H. Rohrer and
coworkers developed the idea that a type of microscopy with unprecedented levels of
spatial resolution could be built based on this electron tunnelling effect [88].
Tunnelling between an STM tip and the surface
In STM, electron tunnelling occurs across a tip-surface junction as illustrated in
Figure 3.3. Figure 3.3 (a) shows a simplified representation of the energy levels of an
STM tip and a solid surface when the tip-surface distance is infinitely large. The tip and
surface can be regarded as two isolated objects with their own Fermi levels (EF) and
work functions (фtip or фsurface). If the tip and surface are then brought into very close
proximity (s < 10 Å), their Fermi levels align when reaching an equilibrium, leading to
a shift in vacuum level (Figure 3.3 (b)). This alignment is caused by the tunnelling of
transient electrons. In the case of the diagram shown in Figure 3.3 (a), the electrons
tunnel from the surface to the tip, which lowers the Fermi level of the surface and raises
that of the tip. This tunnelling is instantaneous and only proceeds until the Fermi levels
are aligned at which point no further current flows. When reaching the state shown in
Figure 3.3 (b), no tunnelling current flows between the tip and the surface across the
energy barrier.
As can be seen from Figure 3.3 (c), a tunnelling current occurs if a bias voltage is
applied across the tip-surface junction. When the tip is biased negatively with respect to
the surface, the Fermi level of the tip is raised with respect to that of the surface. The
raising of the tip Fermi level allows electrons to tunnel from filled tip states through the
barrier into empty states in the surface. Similarly, if a positive bias is applied to the tip
with respect to the surface the tunnel current will flow in the opposite direction. From
this qualitative description of electron tunnelling effects in STM, we can clearly see that
the magnitude of the tunnelling current between an STM tip and a surface will depend
on the bias voltage V and the electronic structures of the tip and the surface.

Chapter 3. Methodology
45
Figure 3.3. Schematic diagrams showing energy schemes of a tip-surface junction in STM under
different conditions. (a) The tip and surface have infinite separation, thus can be regarded as
isolated objects. (b) When the tip and surface are brought into close proximity their Fermi levels
align. (c) When the tip is biased negatively with respect to the surface, the Fermi level of the tip
is raised above that of the surface and electrons can tunnel from filled states in the tip to empty
states in the surface. As a result, a tunnelling current is established. eV: increase in the Fermi
level of the tip caused by the bias voltage. Red lines: empty sample states. Blue arrow: tunnel
current flowing from the tip to the surface.
(a)
(c)
ffffff
ffffff
(b)
s
s
фtip фsurface
e-
Bias voltage applied
eV

Chapter 3. Methodology
46
Tersoff-Hamann Theory
Since the invention of STM, several more complete theoretical models have been
developed in an attempt to derive a general formula for elastic tunnelling between an
STM tip and a surface. These description include theories established by Tersoff and
Hamann [91, 92], Lang [93-95], Wentzel-Kramers-Brillouin (WKB) [96] and Chen [97].
The model suggested by Tersoff and Hamann is one of the most widely used to interpret
STM images.
According to Fermi’s golden rule [98], an initial expression of the total tunnel
current flowing between the tip to the sample can be written as shown in equation (3.3):
(3.3)
In equation (3.3), is the Fermi function, is
the Boltzmann constant, is the temperature, is the density of states, is
the matrix element of the perturbation potential between the tip (t) and the sample (s),
and V is the potential applied across the tip-surface junction.
At T = 0 K, the Fermi function can be represented by a step function, and thus the
tunnelling current can be simplified to the form shown in equation (3.4):
(3.4)
While the polarity of the bias voltage applied between tip and surface determines
the direction in which the tunnel current flows, the magnitude of the bias voltage also
plays an important role in the tunnelling process. The magnitude of the bias voltage
defines the energy that tunnelling electrons have with respect to the Fermi levels of the
tip and surface. As the local density of states for a real sample will vary with energy, the
magnitude of the bias voltage can have a significant impact on the magnitude of the
tunnel current.

Chapter 3. Methodology
47
In order to calculate the tunnelling current , the matrix element should be
evaluated. Bardeen first applied time dependent perturbation theory to analyse the
matrix element , which can be expressed using equation (3.5) [99]:
(3.5)
In equation (3.5) the surface integral
is evaluated over any arbitrary surface that
separates the tip and surface regions. and , represent the wave functions of the
tip and surface, respectively.
According to the approximations introduced by Bardeen, knowledge of the wave
functions of the tip and the sample are required in order to evaluate quantitatively.
However, the electronic structure at the very end of the tip is usually unknown. To
address this problem, Tersoff and Hamann proposed the first quantitative model in
which the STM tip is represented by a single s-orbital located at the apex of the STM tip
(see Figure 3.4).
Figure 3.4. Tip-surface model built by Tersoff and Hamann [92]. The tip apex is assumed to be
spherical with a tip radius of curvature R. denotes the vector linking an arbitrary point on the
surface with the centre of spherical tip. The term d is the shortest distance between the tip and
the surface.
In the theory proposed by Tersoff and Hamann, the wave function used to represent
d
R
Surface
Tip

Chapter 3. Methodology
48
the STM tip is assumed to be a spherically symmetric s-wave function. The justification
for this simplification is based on the exponential dependence of the tunnel current on
the tip-sample distance. The exponential decrease in tunnel current with increasing
tip-sample separation means that for a real tip geometry the vast majority of tunnel
current will flow through the atom at the apex of the tip. The tunnelling current between
the tip and the surface is regarded as resulting from an overlap of the s-wave function
with the surface structure.
At low temperature ( 0 K) and low bias voltages, the total tunnelling current can
be simplified to the expression shown in equation (3.6):
(3.6)
In order to calculate the matrix element , the wave functions of the surface and
the tip are analysed. The surface wave function can be written as a 2D Bloch
expansion and inserted to the Schrödinger equation to obtain a new expression. The tip
wave function can be calculated using the form of an s-wave function and then
rewritten as a 2D Fourier sum. If the surface plane separating the surface and tip is
assumed to be parallel with the surface, the matrix element is found to be
proportional to at the tip centre of curvature .
(3.7)
As a result, the total tunnelling current is given by equation (3.8):
(3.8)
As the sum corresponds to the surface local density of
states (LDOS) at the Fermi level evaluated at the position of the point probe, the STM
tunnelling current is then given by equation (3.9):

Chapter 3. Methodology
49
(3.9)
The total tunnelling current is therefore proportional to the LDOS of the surface in
the Tersoff and Hamann’s model. Thus, STM images acquired at low bias voltages and
in constant current mode can be interpreted as a contour map of constant surface LDOS.
3.2.3 Applications of STM in studying molecules on solid
surfaces
STM is a powerful experimental technique for the study of molecular nanostructures
adsorbed on solid surfaces. A wide range of experiments have been performed to both
visualise and manipulate atoms/molecules at surfaces using STM.
As a structural characterisation tool, STM offers the ability to produce real-space
images of molecules with atomic resolution. STM has proven to be particularly
effective for the study of conjugated organic adsorbates. STM images allow us to
understand the morphology, molecular interactions, and quantum phenomena of
low-dimensional molecular structures. In constant-current mode, conjugated moieties,
such as aromatic rings, are observed to have a brighter contrast. This is related to the
high density of states around the Fermi level present in conjugated systems.
When electrons tunnel through an organic molecule physisorbed on a solid surface,
the resulting image is a result of the complex interaction of the surface, molecule and tip
electronic states. A good understanding of all three of these systems is required in order
to arrive at the correct interpretation of an STM image. Because of the involvement of
the electronic density of states of the adsorbate in the tunnelling process, the tunnelling
current through a tip-molecule-substrate junction depends on the energy of the highest
occupied molecular orbital (HOMO) and the lowest unoccupied molecular orbital
(LUMO) of the adsorbed molecule relative to the tip and surface Fermi levels [100].
Moreover, the tunnelling current also depends on the mixing of the molecular orbitals
with the surface electronic states. For molecules that strongly interact with the
underlying surface, the LDOS will be a mixture of the molecule and surface electronic

Chapter 3. Methodology
50
states: the well-defined molecular orbitals of some molecules are broadened by the
interaction with the surface. Under UHV conditions, this broadening effect can be
reduced by depositing a thin insulating layer on the surface prior to adsorption of the
molecule. The insulating layer de-couples the adsorbed molecules from the conducting
surface. Experimental and theoretical investigations of some molecular systems have
been reported showing that STM image contrast is bias-dependent [101, 102]. For
instance, A. J. Fisher and P. E. Blöchl [103] have simulated STM images of benzene on
graphite over a range of bias voltages using electronic structure calculations. They
concluded that the STM image contrast at low voltages results from weak mixing of
benzene and graphite states while the images at higher voltages represent a map of only
the molecular states.
Currently, STM investigations can be carried out under a range of different
environmental conditions, including: ambient and ultra-high vacuum (UHV) conditions.
UHV STM systems enable most of the manipulation experiments of single
atoms/molecules creating artificial nano-architectures [104, 105]. Regarding thermal
drift and the mobility of molecules, low temperature conditions are usually required for
STM manipulation on atomic/molecular scales. At these low temperatures, any gases in
the atmosphere above the surface would quickly adsorb, contaminating the surface and
destroying the experiment. A careful control over the interaction between the atom at the
very end of an STM tip and the single atom/molecule being manipulated is required in
order to move the atom/molecule to a predesignated position [106]. Moreover, STM tips
can even enable activation of on-surface chemical reactions with single-molecule
precision [107].
Compared with UHV STM systems, STM operating at ambient conditions has a
number of advantages and disadvantages. Apparently, STM systems operating under
ambient conditions do not demand expensive UHV chambers and pumping equipment.
This significantly reduces both the price and complexity of these systems. More
importantly, ambient STM allows the experimenter to probe both the formation and the
chemical behaviour of molecular surface structures under technologically relevant
environmental conditions such as at liquid-solid interfaces. Firstly, ambient STM

Chapter 3. Methodology
51
systems enable studies of chemical reactions. For example, Hulsken et al. reported the
first example of real-time single-molecule studies of oxidation catalysis at a liquid-solid
interface [108]. In their work, the individual catalysts self-assembled at the interfaces
were monitored using ambient STM so that the activity and stability of the catalysts
could be measured. Secondly, the less strict requirements concerning the operating
conditions allows adsorption and desorption occurring during physisorption processes to
be revealed [109, 110]. Thirdly, reversible modification of the structural arrangement of
2D molecular networks are achievable through the adjustment of the external
environment [111-113]. Despite these advantages, STM systems operating under
ambient conditions have less imaging stability, higher noise levels, and the potential for
contamination in comparison with UHV STM equipments.
Figure 3.5. STM images showing the results of molecular patterning achieved using a STM
system operating under ambient conditions. (a)-(b) show STM images of C60 molecules sitting
within the pores of a 2D-COF sheet, while (c)-(d) show a bi-layer COF.[114]
Recently, several novel areas of application for STM operating under ambient
conditions have been explored. Nirmalraj et al. have studied the molecular dynamics
and electronic structure of C60 and its derivatives adsorbed at the interface between
silicone oil and a spacer-coated Au(111) surfaces using in situ STM/STS [115]. The
experimental platform designed in this work opens up opportunities to achieve
(a)
(b)
(c)
(d)

Chapter 3. Methodology
52
single-atom/molecule measurements at liquid-solid interfaces without requiring
cumbersome UHV STM systems operating at low temperatures. Moreover, ambient
STM has been used as a SPM lithography facility realising local molecular
manipulation. Plas et al. have reported a successful case of patterning guest-host
covalent organic framework (COF) structures by using ambient STM [114]. Figure 3.5
shows the removal of C60 molecules and bilayers of COF structures caused by carefully
tuned STM scanning conditions.
3.2.4 Data acquisition and processing in ambient STM
Experimental setup
Figure 3.6. (a) Agilent 5500 series SPM microscope including glass environmental chamber for
carrying out experiments under inert gas and low humidity atmospheres. (b) Sample plate
magnetically attached to the microscope body. (c) Schematic illustration of the assembly of a
liquid cell for STM imaging at liquid-solid interfaces [116].
An Agilent 5500 SPM system was employed for all of the STM investigations
presented in this PhD thesis. Figure 3.6 (a) shows the core part of the SPM, the
microscope equipped with a detachable environmental chamber. STM imaging is
extremely sensitive to noise, mechanical vibration and air turbulence. This sensitivity
(a)
(b)
(c)

Chapter 3. Methodology
53
means that the microscope is positioned on the top of an anti-vibration device which is
housed inside an acoustic isolation chamber. The anti-vibration device consists of either
an air table which has a heavy table top floating on four nitrogen pistons, or an active
vibration cancellation system where piezo-electric actuators are used to both sense and
compensate for mechanical vibrations. The sample plate that holds the sample and
makes electrical contact to it is attached to the microscope stand by three magnetic posts.
These magnetic posts are connected to stepper motors that allow the coarse vertical
positioning of the sample stage with respect to the tip. The lateral position of the sample
plate is adjustable within ± 5 mm controlled by X and Y micrometer screws (Figure 3.6
(b)). STM measurements at liquid-solid interfaces can be achieved by fixing a liquid
cell and an O-ring on the sample plate, as presented in Figure 3.6 (c). The liquid cell
allows a small volume of liquid (50 – 100 μl) to be held on the sample surface for
extended STM imaging.
Specimen and tip preparation
Sample surfaces used for STM experiments need to be conductive and flat.
Commonly used substrates for ambient STM systems include highly oriented pyrolytic
graphite (HOPG) and Au (111). HOPG substrates have the dual advantages of chemical
inertness and very simple preparation procedures.
A new HOPG surface with large atomically flat areas can be easily formed by
cleaving off the top layers of a HOPG sample using adhesive tape to expose a fresh
HOPG surface. Commercial HOPG substrates are classified into three levels in terms of
their quality: ZYH (grain size: 30 – 40 nm), ZYB (grain size: up to 1 μm), and ZYA
(grain size: up to 10 μm). Figure 3.7 shows the structure and an example STM image of
the HOPG surface [117, 118]. When imaged using STM, only half the atoms in the
surface layer appearing as bright features because of the ABA stacking of the HOPG
layers.
Gold substrates are normally made by thermal evaporation of a thin layer of gold
film onto a heated mica or silicon substrate. Annealing procedures are necessary to

Chapter 3. Methodology
54
reconstruct the Au(111) surfaces and remove any contamination.
Figure 3.7. (a) Schematic representations of the crystal structure of bulk graphite. The upper
section of the figure shows a top view of the graphite surface. The structure shown in the lower
left corner represents an idealized STM image of the HOPG surface where both the A and B
atoms are visualized. The structure shown in the lower right corner displays how the STM
image would appear if only either A or B atoms are visualized [117]. (b) The most frequently
observed STM contrast for HOPG. Each bright spot corresponds to an individual carbon atom.
The oblique lattice shown in the STM image is in good agreement with the case in the lower
right corner of (a). Image size: 5 nm × 5 nm. STM imaging parameters: Vs = 0.05 V, It = 1 nA.
Due to the exponential dependence of the tunnelling current on the tip-sample
distance, the vast majority of tunnelling current flows through the atom at the very end
of the STM tip, as demonstrated in Figure 3.1. Consequently, the fabrication of an
atomically sharp STM tip is of extreme importance to the acquisition of STM images
with atomic resolution. Under UHV conditions, tungsten tips are widely adopted for
STM studies. However, in air, tungsten oxidises readily forming a nonconductive
tungsten oxide coating on the tip surface. Thus, tungsten probes prepared for UHV STM
systems by chemical etching are not applicable to ambient conditions. In place of
tungsten, platinum-iridium (Pt/Ir) alloy is widely employed for STM tips used in
ambient atmospheres and at liquid-solid interfaces [119]. Etching of Pt/Ir tips is possible
[120], however, for most experiments simple mechanical cutting of Pt/Ir wire will
produce an acceptable STM tip. Beyond these standard STM tips, scientists have
(a)
(b)

Chapter 3. Methodology
55
recently proposed the possibility of collecting STM images with atomic resolution for
Au (111) or graphite surfaces using a variety of carbon-based tips, such as carbon fibre
and diamond tips [121-124].
Drift correction
As the lateral and vertical resolution of STM is able to reach down to the atomic
scale, STM is an effective experimental method for accurately measuring the lattice
parameters of 2D molecular networks physisorbed at the liquid-solid interface. However,
in order to interpret quantitative information from STM images precisely, various
distortions arising during the image acquisition process need to be taken into
consideration: the most prominent of these is image drift.
There are a number of possible reasons for STM image distortion that have been
discussed in previous research [125-127]. The drift of an STM tip with respect to the
scanned sample surface underneath is said to play a dominant role in causing
differences between the structures that are observed in STM images and the real
structure of the sample surface. Drift effects present in STM images may result from a
variety of effects. One of the most common factors to induce drift into STM images is
the differing rates of thermal expansion of STM components due to changes in
temperature [128]. In addition to temperature effects, distortions may arise because the
scanned area on the surface and the STM scanning plane are not parallel, depending on
the sample installation slope [129]. Finally, in addition to the above factors, the
hysteresis and creep of piezo-electric materials employed in the STM scanners can also
contribute to causing distortions during STM scanning. Unlike the variable distortions
associated with temperature and sample orientation, these scanner induced distortions
remain constant for a specific piece of STM equipment [130, 131].
For the work presented in this thesis, a drift correction process has been applied to
some high resolution STM images in order to remove the effects of drift and obtain
accurate unit cell dimensions for 2D molecular layers. Drift correction of STM images
is based on using the known lattice dimensions of the HOPG surface as a calibration

Chapter 3. Methodology
56
lattice. Drift correction is performed by first collecting an STM image of the target
molecular structure. Immediately after acquisition of this image and without altering
any scanning parameters that could influence the level of drift in the image (e.g. scan
direction, scan speed, scan size or scan angle), an image of the underlying HOPG lattice
is obtained. The HOPG surface can be selectively imaged over the molecular layer by
adjusting the set-point and sample bias to values of It = 1 nA and Vs = 0.05 V,
respectively. Changing the set-point and sample bias alters the vertical distance between
the tip and the sample but leaves the lateral drift of the sample with respect to the tip
unaffected. This means that the two images, that of the molecular structure and of the
underlying HOPG lattice, should have the same level of lateral drift and therefore their
structures should be distorted by the same amount.
A software package (SPIP software, Image Metrology, Denmark) is then used to
analyse the unit cell constants of the image of the graphite surface. This process is based
on calculating the two-dimensional Fourier transform of the STM image of the HOPG
surface. A set of correction parameters are then calculated through the comparison of the
distorted HOPG unit cell with the known unit cell values of the graphite lattice as
presented in Figure 3.7. These correction parameters represent the image modification
that is required to make the HOPG lattice in the drift-distorted image match the known
values for the HOPG lattice. As we have assumed that the levels of drift for the image
of HOPG as the same as for the image of the molecular structure, we can then apply the
same correction parameters to the image of the molecular structure in order to obtain a
drift-corrected image.
All large-scan STM images presented in this report have been flattened using
WSxM or SPIP software [132]. All high-resolution STM images have been processed
using SPIP software (Denmark, Image Metrology).
3.2.5 Advantages and drawbacks of STM
Compared with other surface characterisation tools, for example electron microscopy,
STM probes the electronic properties of a sample’s surface by detecting a tunnelling

Chapter 3. Methodology
57
current in the near-field regime. In this case, the resolution of STM is no longer limited
by diffraction and can reach atomic scales. Because no free electrons are involved in the
tunnelling process, STM measurements are not limited by the environmental conditions
and can be conducted in conditions ranging from ultrahigh vacuum (UHV) to
liquid-solid interface. This flexibility makes STM a powerful technique for the
investigation of self-assembled molecular networks in a range of different environments.
Electrons that tunnel between the STM tip and sample surface have a low energy, in the
order of a few electronvolts, which is smaller than the energy of typical chemical bonds.
Because of this, STM is applicable for imaging samples without causing damage to the
chemical structure of the samples being studied. Another significant advantage of STM
is that even non-periodic structures can be directly determined in real-space, leading to
its potential applications in the study of complex systems.
Despite the above advantages, one of the major limitations of STM is that
insulating surfaces cannot be imaged. The requirement for a very small tunnel current
often less than 1 nA to be measured for STM to operate means that only highly
conductive substrates can be used. In order to overcome this drawback, other SPM
techniques have been developed that probe different interactions and do not require an
electrical current to flow between tip and surface. The most widely used of these SPM
techniques is atomic force microscopy (AFM). Another limitation of STM is that
operating under ambient conditions it provides very limited information about the
chemical composition of a sample surface. Thus, complementary spectroscopic
techniques need to be used in conjunction with STM in order to fully understand the
structural and chemical composition of 2D molecular networks.
3.3 Atomic Force Microscopy (AFM)
3.3.1 Basic principles of AFM
In 1986, G. Binnig, C. F. Quate and C. Gerber developed the first AFM which was able
to provide topographic information for both conductive and insulating surfaces [133].

Chapter 3. Methodology
58
The signal measured in AFM is based on the interaction forces between a sharp probe
and a sample surface.
Figure 3.8 (a) presents the basic principle of the AFM technique. In AFM, a sharp
tip, mounted at the free end of a cantilever beam, scans a specimen surface line by line.
The interaction forces between the tip and the surface (see Figure 3.8 (b), (c)) cause the
cantilever to bend. The deflection of the cantilever is detected by a laser beam which is
focused to the back-side of the cantilever and reflected into a photodetector. This
configuration allows the deflection of the cantilever to be monitored by observing the
position change of the laser spot on the photodetector. In the majority of AFM
configurations a feedback loop is then used to keep the tip-surface interaction
maintained at a constant set-point value.
Figure 3.8. (a) Schematic diagram of a typical AFM system. (b) Enlarged image of the AFM
tip-surface region. (c) General long-range and short-range interaction forces that exist during the
approach of an AFM tip towards a sample surface [134].
3.3.2 Tip-surface interactions and conventional AFM imaging
modes
AFM can operate in a variety of modes by means of probing different regions of the
interaction potential between the tip and the surface. Generally, there are three basic
imaging modes performed in AFM measurements: contact (static) mode, intermittent
contact (tapping) mode and non-contact mode.
(a)
(b)
(c)

Chapter 3. Methodology
59
Figure 3.9 illustrates how the interaction force between an AFM tip and a surface
changes as the tip approaches the surface. At large distances between the tip and the
surface there is no interaction between the probe and the surface. As the tip is brought
closer to the surface, long-range attractive van der Waals interactions dominate over
short-range repulsive interactions resulting from the overlap of electronic orbitals. This
results in an initially attractive interaction between the tip and the surface. This region
of the force-distance curve is referred to as the “non-contact” region.
Figure 3.9. Plot showing how the force acting between an AFM tip and a surface varies as a
function of the tip-surface distance. Point A corresponds to the maximum attractive force
between the tip and the surface. Point B corresponds to the tip-surface distance where the
attractive and repulsive forces cancel each other out.
As the tip is brought closer to the surface, the repulsive interactions begin to have a
more dominant role. As the tip is brought closer and closer to the surface, it first goes
through a point where the attractive interaction reaches a maximum. As the tip-surface
distance is further reduced, the tip goes through an equilibrium point where the
attractive and repulsive interactions cancel each other out. This equilibrium point is
normally found at tip-surface separations on the order of a few Angstroms. At
A B
Contact
Intermittent contact
Non-contact

Chapter 3. Methodology
60
tip-surface distances smaller than this, repulsive interactions dominate and the force
between the tip and the surface acts to push the tip sway from the surface. This region of
the force-distance curve is referred to as the “contact” region. Tip-surface distances that
vary around the equilibrium point and cover regions of both attractive and repulsive
interactions are termed the “intermittent contact” region.
In contact mode, a feedback loop is employed to maintain a constant cantilever
deflection and therefore a constant interaction force between the tip and the surface. The
surface topography is measured by measuring how much the sample position is moved
in the vertical direction in order to maintain this set-point value of the cantilever
deflection. The resolution of this mode can reach down to atomic dimensions because of
the extremely short-range nature of the repulsive interactions between the tip and the
surface. However, this sensitivity comes at a risk of the sample or the tip being damaged
by the large forces that result from contact between the tip and the surface.
Non-contact mode AFM, in which the tip is not in physical contact with the surface,
normally achieves good resolution under UHV conditions as opposed to ambient
conditions [135]. This is primarily related to the presence of a water meniscus between
the tip and the surface when imaging under ambient conditions. In non-contact mode, a
piezo-electric resonator connected to the cantilever oscillates the AFM tip as it scans
across the surface. The frequency of oscillation is chosen to match the resonant
frequency of the AFM cantilever. Tip-surface interaction forces are detected by
measuring changes in either the amplitude or the resonant frequency of the cantilever’s
oscillation. To date, non-contact mode AFM operating under UHV conditions has
achieved the highest spatial resolution of any SPM technique, with imaging resolution
that has been able to visualise intramolecular structure including covalent bonds and
even individual hydrogen bonds [136-138].
Intermittent contact (tapping) mode bridges the contact and non-contact regions of
tip-surface interactions. One of the key advantages of tapping mode is that it is able to
obtain high resolution images of delicate sample surface without inflicting the same
level of damage associated with contact mode imaging. In tapping mode a cantilever
with attached tip is oscillated at its resonant frequency while scanning across a surface.

Chapter 3. Methodology
61
Changes in the distance between tip and surface caused by topographic features on the
surface change the force acting on the tip and thereby change the amplitude of the
cantilever’s oscillation. Similar to other SPM techniques, a feedback loop is used to
maintain a constant oscillation amplitude by moving the tip vertically. These vertical
movements of the tip are then used to construct a topographic map of the surface.
3.3.3 Applications of AFM in molecules on solid surfaces
Advanced AFM systems are able to image both atomic and molecular features with no
restriction on the electrical conductivity of sample surface. Under UHV conditions
technical improvements in the mechanism used to oscillate AFM tips and to record their
motion along with advances in tip functionalisation have driven forward non-contact
AFM as a key tool for studying molecules for surfaces. Examples of key milestones in
this research area include: revelation of the chemical structure of individual molecules
[135]; real-space imaging of non-covalent intermolecular interactions [138, 139]; and
the visualisation of covalent bonds formed by on-surface synthesis [140].
Figure 3.10. (a) PeakForce Tapping Mode AFM image of the porous PTCDI-melamine network
self-assembled on a boron nitride surface. (b) Molecular model of the PTCDI-melamine
network [141].
Outside of UHV environments, commercial AFM systems operating at ambient
temperatures and pressures have been employed to image molecules constrained within
(a)
(b)

Chapter 3. Methodology
62
2D self-assembled molecular networks on various non-conductive surfaces. Examples
include molecular networks formed on HOPG, Au(111), hexagonal boron nitride (hBN)
and molybdenum disulphide (MoS2) (Figure 3.10) [141-143]. The technological
advances in ambient AFM have helped to extend research of self-assembled 2D
molecular networks from only STM studies on graphite or gold to a wider range of
insulating or semi-conductive surfaces.
3.3.4 Setup of high-resolution AFMs at ambient conditions
Without the necessity for complex UHV instrumentation, the PeakForce Tapping mode
implemented on the Multimode AFM from Bruker and the CypherTM
AFM from
Asylum Research are both capable of producing molecular resolution images with a
versatile and easily implemented approach. Figure 3.11 shows the microscopy parts of
the Bruker Multimode 8 and the Cypher AFM systems.
Figure 3.11. Ambient environment AFM systems with molecular resolution. (a) Bruker
Multimode 8 AFM. (b) CypherTM
AFM [144].
(a) (b)

Chapter 3. Methodology
63
PeakForce TappingTM
(PFT) is a new imaging technology first introduced by
Bruker to improve the efficiency and controllability of AFM systems operating under
conventional modes. Similar to basic tapping mode, an AFM probe also adopts an
intermittent contact with the sample being measured in PFT mode. Force-distance
curves are periodically obtained during scanning in PFT mode. Each force-distance
curve measures how the cantilever’s deflection changes as it is moved towards the
surface. The exact force applied on the AFM tip can then be calculated from the
cantilever’s deflection if the force constant of the cantilever is known. The PFT mode
uses a feedback loop to maintain the force of interaction between the tip and the surface
at a constant and small value of the order of a few pN. In comparison, tip-surface forces
in standard tapping mode can reach to as high as several nN. The reduced and
controllable tip-surface forces in PFT mode lead to reduced tip and surface damage and
to the acquisition of far more stable AFM images. All main imaging parameters for PFT
can be adjusted automatically by ScanAsyst program (Bruker) rendering the
manipulation acquisition of high quality AFM images significantly easier than with the
ordinary Multimode AFM.
CypherTM
AFM provides fast scanning on atomic scales by utilising the patented
sensor technology developed by Asylum Research. The sensors on the AFM systems are
capable of reaching atomic resolution in all x, y and z axes. A number of standard
scanning modes are available on Cypher, such as contact mode, intermittent contact
mode, force curve mapping and nano-manipulation. In addition to these various AFM
scanning modes, Cypher also supports upgrades to other characterisation tools including:
STM, low-current measurements, band excitation and enhanced imaging ability in
liquid by the blueDrive photothermal excitation [144].
3.3.5 Advantages and drawbacks of AFM
With the limitation to conductive substrates removed, AFM is a more versatile nano
characterisation tool than STM. In addition to being able to operate on non-conductive
surfaces, AFM offers several key advantages over STM. Some of the most notable

Chapter 3. Methodology
64
advantages of AFM are the ability to obtain mechanical information about a surface and
the ability to study substrates with a significantly larger surface roughness than is
possible with STM. Due to the ability to offer topographic information of
non-conductive surfaces and adsorbates with high resolution, AFM has found
application in a vast range of research areas. Some of the most common areas that AFM
is utilised in include: surface science, the semiconductor industry; the cosmetic industry;
and biomedical and life sciences. Under different scanning conditions, a number of
tip-surface interactive forces can be detected by AFM, including: electrostatic;
electromagnetic;and intermolecular interactions.
The invention of UHV non-contact AFM opened up fascinating opportunities to
visualise and manipulate individual atoms and molecules with unprecedented levels of
resolution. UHV non-contact AFM has become one of the most powerful experimental
techniques to help scientists understand fundamental properties of individual molecules,
and is used more commonly in academia.
Technological advances in commercial ambient AFM systems have improved their
scanning performance enormously. AFM imaging can now be carried out at different
temperatures and in diverse environments, including in liquids. By integrating other
techniques with AFM, experimental systems are becoming more and more powerful and
offering new insights into surface molecular systems. A key example of this is the
combination of Raman spectroscopy with SPM in the form of tip-enhanced Raman
spectroscopy (TERS) [145]. The TERS approach combines the high levels of spatial
resolution obtained with SPM with the chemical information available to Raman
spectroscopy. Such techniques offer a wealth of new information for surface scientists.
3.4 X-ray Photoelectron Spectroscopy (XPS)
3.4.1 Basic mechanism of XPS
XPS is a widely used surface analysis tool that provides quantitative information on the
elemental composition and the chemical state of a surface region irradiated with soft

Chapter 3. Methodology
65
X-rays (200 – 2000 eV).
Figure 3.12. Schematic illustration of the basic mechanism of the XPS technique.
The basic mechanism that underlies XPS is illustrated in Figure 3.12. A
monochromatic X-ray source is used to excite an area on the sample surface. X-ray
photons are absorbed by the atoms in the irradiated surface region. The absorption of an
X-ray photon can result in ionization and photoemission of core level electrons from the
surface atoms: these electrons are referred to as photoelectrons. The typical analysis
depth of XPS is less than 10 nm. The reason for the high surface sensitivity of the XPS
signal is that photoelectrons are easily scattered and absorbed by the atoms of the
sample. Thus, only the photoelectrons that originate from the top of the surface can
escape from the material without either being scattered or absorbed by the sample. The
kinetic energy and intensity of the photoelectrons are then measured by a hemispherical
energy analyser. The energy analyser consists of two concentric hemispheres of
different radius dimensions. An electrostatic field is applied across the hemispheres. The
potential at the central line of the two hemispheres is known as the pass energy. When
passing through the analyzer, the photoelectrons are deflected by the electrostatic field
induced by the hemisphere. Photoelectrons with a range of electron energies are able to
pass through the energy analyser. The range of electron energies depend on a few

Chapter 3. Methodology
66
parameters including: the magnitude of the pass energy; the angle with which the
photoelectrons enter the analyser; and the size of the entrance. The information obtained
from XPS experiments allows the elemental composition and the chemical
environments of the surface atoms to be evaluated.
Figure 3.13. Schematic energy level diagram showing the photoemission process from the O1s
oxygen core level in an XPS experiment.
Taking oxygen as an example, Figure 3.13 shows the photoemission process for a
photoelectron emitted from the O1s level of oxygen. The underlying physical principle
used to interpret the XPS experiment is the photoelectric effect [146], which can be
expressed by equation (3.10):
(3.10)
The terms in equation (3.10) are: is the kinetic energy of the emitted
photoelectron; is the energy of the incident X-ray photon; is the binding
energy of the core level involved in the photoemission process measured relative to the

Chapter 3. Methodology
67
material’s Fermi level; and is the work function of the surface material.
Figure 3.14. Energy level diagram showing the calibration of an XPS equipment. The Fermi
levels of the sample and spectrometer are aligned by grounding the sample to the spectrometer.
In real XPS measurements, a conductive sample is grounded to the spectrometer so
that the Fermi levels of the sample and spectrometer are aligned. As can be seen in
Figure 3.14, the binding energy of the core level can be determined by
measuring the work function of the spectrometer and the experimentally measured
kinetic energy. The expression shown in Equation 3.10 is then reduced to that shown in
equation (3.11):
(3.11)
In equation (3.11) represents the kinetic energy of the photoelectron
Sample Spectrometer
Valence bands
Spectrometer sample probe
Vacuum
level
EF EF

Chapter 3. Methodology
68
measured by the XPS energy analyser and is the work function of the
XPS spectrometer. The work function term can be regarded as a constant
that is specific to a particular XPS machine.
Figure 3.15 shows an example XPS spectrum collected from a freshly cleaved
HOPG surface. The resulting XPS spectrum is a plot of the intensity of photoelectrons
versus of core level electrons. The background signal in the XPS spectrum
correspond to emitted photoelectrons that have lost some of their energy due to inelastic
scattering. The well-defined characteristic O1s and C1s peaks in the XPS spectra result
from photoelectrons that have escaped the HOPG surface without undergoing any
inelastic scattering. The lack of any inelastic scattering means that the kinetic energy of
these photoelectrons can be linked directly back to the binding energy of the core
atomic level from which they originated. The likelihood of a photoelectron undergoing
an inelastic scattering process is very dependent on how much material it has to travel
through in order to escape from the surface. Thus, the sharp peaks in XPS spectra are
dominantly composed of photoelectrons from the top few nm of the surface.
Figure 3.15. XPS survey scan of a blank HOPG sample.
The exact value of the binding energy observed for a particular core atomic level is
influenced by the chemical environment of the element in question. If an element forms
C1s
O1s

Chapter 3. Methodology
69
covalent bonds with other elements, the binding energy of electrons in that element will
change based on the electronegativity values of the elements it is bound to. Examples
include C1s binding energies in organic samples. The C1s binding energy for carbon
bound to four fluorine atoms is significantly higher than that of carbon bound to four
hydrogen atoms. This change in binding energy values is known as chemical shift.
Based on this idea of chemical shift, XPS can be used to provide information about the
chemical bonding arrangement of a particular atomic species.
3.4.2 XPS setup and peak fitting
Experimental setup
Figure 3.16 presents the configuration of the Thermo Scientific K-Alpha XPS system
used for XPS experiments presented in this thesis. The XPS system consists of an
analysis chamber that is maintained at UHV conditions with pressures typically of 1 ×
10-7
mbar or lower. The analysis chamber is connected to the outside atmosphere via the
load-lock chamber. Samples for XPS analysis are placed into the load lock chamber and
the chamber is pumped down until it has a pressure less than 1 × 10⁻⁶
mbar before
transferring the samples into the analysis chamber. Samples such as HOPG often require
extended pumping down times in the load lock chamber in order to reach suitable
pressures. This is a result of outgassing by these samples resulting from small adsorbed
molecular species (e.g. O2, N2 and H2O) that can intercalate between the layers of
HOPG. The vacuum environment ensures samples loaded into the system are free from
contamination, and helps prevent losses in electron kinetic energy. The extreme surface
sensitivity of XPS means that it is vitally important to minimise the presence of
unwanted contamination on the sample surface. The Thermo Scientific K-Alpha XPS
system is equipped with a monochomated Al Kα X-ray source (1486.6 eV), generated
by electron bombardment of aluminum target. Spot sizes of the X-ray beam can be
adjusted within the range of 30 to 400 μm. The application of monochromators
improves the spectral resolution of XPS significantly by removing X-ray satellite peaks

Chapter 3. Methodology
70
and lowering background signals. Photoelectrons emitted from an illuminated area are
collected by a lens system and directed into a hemispherical kinetic energy analyser.
The analyser acts as an energy filter allowing electrons with a kinetic energy equal to its
pass energy to reach the detector at the other end. By varying the pass energy in steps,
electrons from a range of kinetic energies are detected. The detector counts the intensity
of photoelectrons at a certain kinetic energy. The collected data is used to produce the
final XPS spectrum.
Figure 3.16. Schematic of theThermo Scientific K-Alpha XPS system [147].
A charge compensation system is implemented on the K-Alpha XPS system to
solve the problem of surface charging when analysing insulating samples. For
conductors, the positive charge induced by photoelectron emission can be rapidly
replaced by electrons via an electrical contact between the sample and gound removing
the need for charge compensation. However, on an insulating surface positive charge
caused by photoelectron emission builds up and cannot be removed by the flow of
electrons through an electrical contact. In this case, a flood gun, which is a beam of low
energy electrons, is used to irradiate the surface and to neutralise the positive charge

Chapter 3. Methodology
71
caused by emitted electrons from the analysis area.
The K-Alpha XPS system can also be used to perform depth profiling experiments
to study the elemental and chemical composition of sub-surface layers. In this appraoch
either a monatomic or a gas cluster ion source is used to etch away material from the
surface. Depth profiling allows XPS experiments to be performed on layers that were
previously buried beneath the surface. Using this approach deeper layer for both organic
and inorganic smaples can be investigated. The most commonly adopted approach is
using an argon ion beam to remove materials from the top of a surface and collect XPS
signals for each new layer sequentially.
XPS peak fitting
Fitting different peaks to a high resolution XPS spectrum is a complex process that
relies on the ability of the experimenter to provide a physically sensible interpretation of
the data and the mathematical model used to fit it. Several key factors should be kept in
mind prior to starting the peak fitting process. These include: the expected elemental
and chemical composition of the surface based on the preparation procedures; the
presence of potential contaminants; the binding energies of atomic species expected on
the surface. As mentioned above, the exact binding energy of a peak in an XPS
spectrum can vary depending on the chemical environment of the atomic species in
question. Therefore, if a sample has a structure which includes an atomic species
present in several different chemical environments, such as different bonding
geometries, the XPS peak shape for an atomic core level of that atomic species will be
complex. For this reason, it is vital that a good knowledge of the chemical system under
invesitgation is employed when analysing XPS data.
A complete peak fitting procedure consists of three main steps: subtraction of a
background function from the XPS data; choosing suitable peak shapes to fit to the data;
and performing a least squares fit of these peaks to the data. Least squares fitting is a
mathematical method used to fit a given set of points to a curve where the sum of the
squares of the offsets of the points reaches a minimum value. Different least squares

Chapter 3. Methodology
72
models are used to fit XPS spectra, depending on the type of data analysis software
employed.
Linear, Tougaard and Shirley are the three most commonly used functions for
background subtraction from XPS data. Each background subtraction function has its
own advantages, drawbacks and preferred application areas. A proper selection of
background function will result in a fitting outcome that is closest to the real situation of
a XPS spectrum. For the CasaXPS software, the Shirley background is the most
generally applicable function for XPS peak fitting.
After subtracting a suitable background function from the XPS spectrum, peaks are
added based on the prior understanding of the physical and chemical properties of the
samples. The number of peaks used to model the data depends on the expected number
of different chemical environments for the element in question. The starting positions of
the peaks are usually decided according to binding energy values reported in literature.
Another factor that needs to be taken into consideration is the peak shape. Peak shapes
commonly used for XPS peak fitting are: Doniach – Sunjic, Gelius, Gaussian –
Lorentzian, and Voigt and pseudo-Voigt line shapes. The choice of which peak shape to
use should be made by considering the composition of the materials being analysed and
the computational ability of the software package used for peak fitting.
To optimise the fitting results, constraints, such as peak position, full width at half
maximum (FWHM) and line shape parameters (Gaussian/Lorentzian ratio and
asymmetry factors), are adjusted in a step-by-step process. In order to obtain an accurate
fit to an XPS peak, the fit needs to be both mathematically valid, and chemically and
physcially meaningful.
3.4.3 Applications of XPS
XPS has a wide range of applications in research areas related to solid surfaces. These
include: catalysis; polymers; and microelectronics. As a complementary tool to other
surface analysis methods, for example, STM and AFM, XPS offers chemically specific
information for molecular surface structures, information that is inaccessible with SPM

Chapter 3. Methodology
73
techniques.
XPS is a powerful technique that allows the quantitative identification of different
elemental and chemical species on surfaces The chemical analysis is achieved by
measuring the binding energy values for core level electrons. Moreover, XPS is also
able to determine quantitatively the relative concentration of each chemical state that an
element has in the surface region.
In addition to detection of core levels, XPS is able to help understand the valence
band (VB) structures of metals and semiconductors. Compared with core atomic levels,
the VB no longer consists of well specified individual energies but rather a region of
closely spaced electronic states close to the Fermi level. This band of densely packed
electronic states arise from the combination of atomic orbitals (AOs) in the material
structure. Thus, VB peak shapes can reflect how AOs overlap and can be used to study
the arrangement of atoms in crystal structures.
3.5 Molecular Mechanics (MM) simulation
Molecular mechanics (MM) simulations, also called force field modeling, is a
theoretical method used to predict molecular structures by classical mechanics treatment
of molecular structure.
In a MM simulation, a molecule is assumed to be made of atoms linked by elastic
bonds. Similar to springs, the chemical bonds can undergo a range of deformation, such
as stretching, compression, bending (bond angles) and torsion (dihedral angles). The
force field of the molecule is defined as the total energy of the deformed “springs” and
interactions between atoms that are not chemically bonded.
A number of molecular mechanics force fields have been developed by
computational chemists. Each of the force fields contains a set of functions and
parameters used to calculate the potential energy of systems made up of different atomic
species combined in different ways. A force field model is verified by comparing the
outcome it produces with a large range of molecules of known atomic arrangements.
Once established, a force field can be used to simulate other molecular structures. In the

Chapter 3. Methodology
74
HyperChem package used for the MM simulations in this thesis, four types of MM
force fields are available, the application areas of which are tabulated in Table 3.1.
To run a MM simulation, a suitable force field should be chosen for the target
molecules and interaction types that are being investigated. After building the starting
geometry of the molecular structure, a geometry optimization process is carried out.
Geometry optimization adjusts the molecular structure in a step-by-step process that
aims to lower the overall strain energy of the molecular structure. Once the strain energy
of the molecular system drops below a pre-defined level chosen prior to starting the
simulation, the MM system is said to be geometry optimized.
One of the main advantages of MM over quantum mechanical simulation
approaches such as density functional theory (DFT) is that MM simulations are much
less computationally intensive. This means that smaller molecular systems can be
simulated much more quickly or larger molecular system that cannot be simulated using
DFT can potentially be investigated. However, the applications of MM simulations are
limited to molecules with known structures due to the restrictions of the force fields
used to model the structures. Moreover, since classical mechanics does not provide any
information on the electronic structures of atoms, MM calculations cannot be used to
simulate electronic properties of molecules, such as molecular orbital (MO) energies or
shapes.
Force fields Preferred molecular systems
MM+ A wide range of molecules [148]
AMBER Proteins and DNA [149]
BIO+(CHARMM) Small molecules and macromolecules [150]
OPLS Molecules in liquids [151]
Table 3.1. The various molecular mechanics (MM) force fields implemented in the HyperChem
software simulation package and their application areas [152].

75
Chapter 4
2D supramolecular self-assembly of a
tetra-carboxylic acid derivative
Carboxylic acid functionalised molecules have attracted extensive research interest as
molecular building blocks for 2D supramolecular self-assembly. The strong and highly
directional hydrogen bonding interaction between carboxylic acid groups provides a
reliable, and to some extent, predictable interaction between molecular building blocks.
In this chapter, the interfacial self-assembly of a tetra-carboxylic acid derivative with an
anthracene backbone, 5, 5'-(anthracene-2,6-diyl) diisophthalic acid (ATC), has been
investigated using STM, combined with MM simulations. Compared with other
tetra-carboxylic acid building blocks, the two interesting properties that this material
exhibits upon adsorption from long chain fatty acids solutions onto HOPG are: (ⅰ) the
ATC molecule is prochiral and following adsorption self-assembles into chiral domains;
(ⅱ) ATC displays 2D polymorphism with three distinct structural arrangements being
resolved within the same 2D self-assembled interfacial layer. Additionally, ATC can also
co-assemble with coronene forming a bi-component network. The self-assembly of ATC
provides another model system to deepen our understanding of the formation of 2D
molecular networks at liquid-solid interfaces.
4.1 Introduction
Directional hydrogen bonding interactions between carboxyl groups are reliable driving
forces for the 2D supramolecular self-assembly of molecular networks [9, 153-156].
Extended 2D self-assembled networks have been realised using organic molecules
functionalised with one [157],two [158, 159], three [160-162] or four [51, 163] carboxyl
groups. As a model molecular building block, the self-assembly of trimesic acid (TMA)

Chapter 4. 2D supramolecular self-assembly of a tetra-carboxylic acid derivative
76
at liquid-HOPG interfaces has shown dependency on the deposition temperature and
solvent used to dissolve the molecule [21, 164]. Analogous to TMA and its derivatives,
tetra-carboxylic acid functionalised molecules are a group of extensively investigated
molecular building blocks that have been used for obtaining predesigned 2D molecular
crystals.
Figure 4.1. Schematic diagram showing three example molecular arrangements of planar
tetra-carboxylic acid molecules. Each tetra-carboxylic acid derivative is represented as a back
bar with the carboxylic acid groups shown as red arrows at either end of the bar. [51]
As discussed in section 2.2.1, carboxyl groups very often form a standard hydrogen
arrangement consisting of a hydrogen bond dimer, but can also form a cyclic trimer of
hydrogen bonds (Figure 2.4 (c) and (d)). Linked by inter-molecular hydrogen bonding
dimers between carboxyl groups, planar tetra-carboxylic acid derivatives form a few
commonly observed molecular patterns as presented in Figure 4.1 [51].
Figure 4.2. Molecular structures of three tetra-carboxylic acid derivatives formed by grafting
isophthalic acid groups to either end of linear connectors. [165].
Wuest and co-workers have studied a series of tetra-acid derivatives, as shown in
Figure 4.2 [165]. For each of the molecules, two isophthalic acid groups are linked
directly or grafted onto either end of a linear conjugated core forming a planar structure.
Their study demonstrated that tecton 1 self-assembles into an open parallel network, and
Close-packed Parallel Kagomé
Tecton 1 Tecton 2 Tecton 3
Backbone
-COOH

Chapter 4. 2D supramolecular self-assembly of a tetra-carboxylic acid derivative
77
tecton 3 forms a Kagomé structure at the HOPG-heptanoic acid interface. In contrast to
tecton 1 and tecton 3, tecton 2, however, fails to produce any large periodic domains.
The frustrated crystallisation of tecton 2 was attributed to the smooth, defect-free
transition between its two packing arrangements. This result shows the conjugated
backbone of a tetra-carboxylic acid derivative plays an important role in determining the
morphology of the resulting self-assembled network structure.
Figure 4.3. Molecular structures of (a) TPTC [51, 52, 163, 166]; (b) QPTC [51, 163]; (c) NTC
[51].
Figure 4.3 presents a range of tetra-carboxylic acid derivatives that have been
investigated by Beton and co-workers [51, 52, 163, 166]. The morphology of 2D
self-assembled networks constructed from these molecules were initially studied
systematically by depositing them from organic solutions onto a HOPG surface.
Terphenyl-3,5,3″,5″-tetra-carboxylic acid (TPTC) molecules have been found to
self-assemble into a hexagonally ordered network with no extended translational
symmetry [166]. By contrast, quaterphenyl 3,5,3‴,5‴-tetra-carboxylic acid (QPTC) or
5,5′-naphthalene- 2,6-diyldibenzene-1,3-dicarboxylic acid (NTC) molecules do not
exhibit such diverse self-assembly properties. As far as previous results have shown,
QPTC and NTC molecules assemble exclusively into parallel and close-packed
networks, respectively, at the liquid-HOPG interfaces [51]. In order to study the
influence of the underlying HOPG surfaces and presence of fatty acids, dried TPTC and
QPTC networks were formed by dipping Au(111) substrates in aqueous solutions
followed by N2 blowing. Instead of forming the standard inter-molecular hydrogen
bonding dimers, TPTC and QPTC in the resulting dried films were packed in a
“head-to-edge” arrangement, as shown in Figure 4.4. The results illustrate that the
(a) (b) (c) TPTC QPTC NTC

Chapter 4. 2D supramolecular self-assembly of a tetra-carboxylic acid derivative
78
combination of solvent and substrates plays an important role in determining the
self-assembled structures formed by the tetra-carboxylic acid derivatives.
Highly ordered 2D self-assembled networks formed by tetra-carboxylic acid
molecules can be used as host structures for the inclusion of guest molecules. Both of
the closely packed QPTC and NTC networks at liquid-HOPG interfaces can be directed
to form stable Kagomé structures by the inclusion of the planar molecule coronene as a
guest [51]. Because of its planar, conjugated core with a six-fold symmetry, coronene
exhibits strong surface adsorption and can fit into the hexagonal pores formed by
carboxyl groups. Thus, coronene is a suitable guest molecule for 2D self-assembled
networks stabilised by hydrogen bonding between carboxylic acid groups [32, 167].
Figure 4.4. STM images and schematic representations showing molecular packing
arrangements of TPTC and QPTC within dried films on Au(111) surfaces, and the liquid-HOPG
interfaces.(a)-(b) STM image and schematic representation of TPTC on Au(111). (c)-(d) TPTC
on HOPG. (e)-(f) QPTC on Au(111). (g)-(h) QPTC on HOPG [51, 163, 166].
Despite the wide range of carboxylic acid functionalised molecular species that
have been investigated as tectons in 2D molecular self-assembly, very few examples of
the self-assembly of prochiral tetra-carboxylic acid derivatives have been reported. In
this chapter, we use an anthracene tetra-carboxylic acid derivative, 5,
(a) (b) (c) (d)
(e) (f) (c) (g) (h)

Chapter 4. 2D supramolecular self-assembly of a tetra-carboxylic acid derivative
79
5'-(anthracene-2,6-diyl) diisophthalic acid (ATC) (Figure 4.5 (a)) as a model building
block to further probe the interfacial self-assembly behaviour of tetra-carboxylic acid
derivatives. The chirality, formation conditions and guest adsorption characterisations of
the ATC self-assembled structures at the liquid-HOPG interfaces will be discussed.
Figure 4.5. Chemical formulae of (a) ATC; (b) coronene.
4.2 Experimental details
Acid Formula Molecular
weight
(g/mol)
Boiling
point
(°C)
Melting
point
(°C)
Density
(g/cm3)
Dielectric
constant
at 20 °C
Viscosity
(mPa•s)
Vapour
pressure
(mmHg
at 410
K)
Heptanoic C7H14O2 130.2 223 -7.5 0.9200 3.04 4.3371
(20 °C)
39.0
Octanoic C8H16O2 144.2 237 16.5 0.9088 2.83 5.105
(25 °C)
17.3
Nonanoic C9H18O2 158.2 254 10 0.9057 2.49 7.25
(24 °C)
9.90
Table 4.1. Physical and chemical properties of the fatty acids used as solvents for the
self-assembly experiments of ATCmolecules [9]
To prepare samples for STM imaging, the target compound, ATC, was dissolved in a
suitable solvent which should be non-conductive, non-volatile and able to dissolve the
molecule of interest. In this work, a series of fatty acids were tested as solvents to
(a) (b)

Chapter 4. 2D supramolecular self-assembly of a tetra-carboxylic acid derivative
80
dissolve ATC molecules: nonanoic acid (GradeⅠ, ≥.97 %, Sigma Aldrich), octanoic
acid (≥.99.0 %, Sigma Aldrich) and heptanoic acid (≥.99.0 % (GC), Sigma Aldrich).
The physical and chemical properties of these solvents are tabulated in Table 4.1 [9].
For each of the solvents, a saturated solution of ATC was first obtained as a stock
solution. After this stock solution had been allowed to settle, the supernatant was taken
and diluted to make up a range of solutions with different concentrations relative to the
saturated solution concentration. A 0 μl droplet of prepared ATC solution was then
deposited onto a freshly cleaved HOPG surface under ambient conditions. The ATC
molecules physisorbed from the solution onto the HOPG surface. The adsorbed
molecules then diffuse across the HOPG surface interacting with each other to nucleate
and grow ordered domains of various self-assembled structures. These self-assembled
interfacial molecular layers are stabilised via hydrogen bonding interactions between the
carboxylic acid groups. In experiments where coronene was also included in the
self-assembly process, coronene was added to heptanoic acid solutions of ATC prior to
the mixture being deposited onto the HOPG surface.
Figure 4.6. Schematic representation of the experimental setup for the acquisition of STM
images at liquid-solid interfaces.
The self-assembled molecular networks were imaged using an Agilent 5500 series
STM system operating at liquid-solid interfaces. As illustrated in Figure 4.6, an STM tip
(Pt/Ir = 8/2) is immersed in the solution and is used to image the self-assembled

Chapter 4. 2D supramolecular self-assembly of a tetra-carboxylic acid derivative
81
network that forms at the interface between the HOPG and the organic solvent. All STM
images were obtained in constant-current mode. The quality of the mechanically cut
Pt/Ir tip can be tested by imaging the bare, dry HOPG surface prior to solution
deposition. All of the STM images presented in this chapter have undergone a flattening
process. The flattening procedure is used to remove image artefacts that arise from the
nature of STM system. The Agilent 5500 system uses a tube piezoelectric scanner
arrangement [116]. The scanner is responsible for moving the tip back and forth across
the surface and building up the STM image. In a tube scanner, the nature of the tip
motion is not perfectly parallel to the sample surface. This can introduce image artefacts
that make STM images appear as if they are bowed. Added to this, the sample surface
and the scanner motion may not be perfectly aligned, leading to the image appearing to
be tilted. Both of these effects can be removed using a flattening process. Flattening
assumes that the overall morphology of the surface is that of a flat plane. Software then
uses a 0, 1st, 2
nd or 3
rd order polynomial equations to model the bowed or tilted surface
and then modifies the image to remove these effects and flatten the image. This process
can massively enhance the contrast of the STM images. However, care must be taken
when applying the flattening procedure to ensure that it does not introduce its own
artefacts into the image. For the high-resolution STM images, the influence of thermal
and mechanical drift was removed by using the atomic lattice of the underlying HOPG
surface as a calibration. All the image processing used on STM images presented in this
thesis was performed using SPIP software (Image Metrology, Denmark).
Geometry optimised molecular models were calculated using MM simulations
employing the HyperChem software package. Starting molecular structures for the MM
simulations were based on unit cell dimensions and angles obtained from high
resolution, drift-corrected STM images. A fixed graphene sheet was added below the
molecular structure to be simulated so that the influence of the underlying HOPG
substrate on the molecular arrangement could be modelled. The distance between the
graphene sheet and the centres of the planar ATC molecules was initially set as 0.35 nm.
The MM+ force field was chosen to apply geometry optimisation to the molecular
structures.

Chapter 4. 2D supramolecular self-assembly of a tetra-carboxylic acid derivative
82
4.3 Results and analysis
Results on three separate aspects of the self-assembly of ATC molecules will be
discussed in the following sections: the choice of solvent; the concentration dependence
of self-assembled patterns; and coronene-ATC bi-component self-assembly.
4.3.1 Choice of solvent
The first step for studying the self-assembly behaviour of ATC at the liquid-solid
interface was to find a suitable solvent. The carboxyl groups of fatty acid readily form
hydrogen bonds with other carboxylic acid functionalised molecules thereby promoting
dissolution. Therefore, fatty acids have previously been widely used as solvents for
carboxylic acid functionalised molecules. In this project, three fatty acid solvents were
studied, including: nonanoic acid, octanoic acid and heptanoic acid. ATC molecules
exhibit good solubility in all of these solvents. The difference in alkyl chain length for
these three solvents will have a significant influence on the solvent’s co-adsorption
ability within porous structures. Consequently, it is interesting to investigate how the
self-assembled structures of ATC are affected by the alkyl chain length of the solvents
used to dissolve the target molecules.
Nonanoic acid
The STM image presented in Figure 4.7 shows the morphology of the ATC
network self-assembled at the interface between HOPG and nonanoic acid. The
concentration of the ATC/nonanoic acid was a 1/20 dilution of stock solution (sat/20).
Each bright unit feature on the STM image corresponds to an individual ATC molecule.
This higher contrast in the STM images results from the higher electronic density of
states around the Fermi level for the central aromatic anthracene section of ATC.
Anthracene represents a class of extended π conjugated systems that contain polycyclic
aromatic hydrocarbons. Among the occupied and empty molecular orbitals of

Chapter 4. 2D supramolecular self-assembly of a tetra-carboxylic acid derivative
83
anthracene, only a few of the highest-energy orbitals occupied by electrons, and a few
of the lowest-energy orbitals unoccupied by electrons (frontier orbitals) are involved in
electron transitions. The Fermi level (EF) of anthracene falls within the gap between the
highest occupied molecular orbital (HOMO) and the lowest unoccupied molecular
orbital (LUMO). Anthracene exhibits a high density of states (DOS) at energies close to
EF and a narrow HOMO-LUMO gap [168]. Given the bias voltages applied in our STM
measurements (sample negative, - 0.8 – - 0.4 V), the STM tunnelling probability is
closely related to the DOS of anthracene with energy levels close to its EF [169].
Therefore, anthracene, and other aromatic groups appear as bright features in STM
images. This is in direct contrast to non-conjugated molecular features, such as alkyl
chains that appear as much darker features.
Figure 4.7. STM image of the ATC network self-assembled at the nonanoic acid-HOPG
interface. Concentration of the ATC/nonanoic acid solution: sat/20. STM imaging parameters:
Vs = - 0.5 V, It = 0.04 nA. Image size: 150 nm. Scale bar: 30 nm.
As can be seen from the STM image presented in Figure 4.7, the ATC network
Close-packed
structure
Parallel
structure

Chapter 4. 2D supramolecular self-assembly of a tetra-carboxylic acid derivative
84
adsorbed from nonanoic acid is a combination of disordered regions and ordered
domains with both close-packed and porous morphologies being observed. In this STM
image, approximately 60.0 % of the surface was covered with an unknown
contamination that formed quasi-ordered stripe-like domains. The percentage coverages
of the close-packed and parallel structures were measured to be about 16.0 % and 9.0%
respectively. The rest of the surface was covered with disordered regions (15.0 %).
Identical contamination patterns were detected when using freshly opened nonanoic
acid. By taking the average and standard deviation of ten measurements, the average
separation of the linear contamination features was measured to be 7.2 ± 1.1 nm. This
value is comparable to the size of a linear contamination observed for the growth of
TAPP 2D-COFs (Section 6.3.1, Figure 6.11). Thus, this stripe-like contamination is
highly likely to arise from polydimethylsiloxane (PDMS) present on the disposable
needles used to make these solutions.
Octanoic acid
Figure 4.8 presents an STM image showing the self-assembled structure resulting
from the deposition of ATC molecules from an octanoic acid solution. The solution
deposited on HOPG was produced by making a 10-fold dilution of the supernatant of a
saturated ATC/octanoic acid (sat/10).
Compared with the case of nonanoic acid, the total coverage of the ATC molecular
network increases and no periodic stripe-like contamination is visible in regions without
ATC network. Measurements taken from the STM image in Figure 4.8 show that the
surface was covered with 4.8 % of the close-packed structure, 19.0 % of the kagomé
structure, 8.9 % of the parallel structure, 45.2 % of disordered regions, and 22.1 % of
bare HOPG with no ATC networks. The domain sizes of the ordered close-packed,
kagomé and parallel structures can also be measured from the STM image. The domain
size of an ordered domain can be determined by taking the square root of the surface
area occupied by the domain. For each of the ordered structures, at least five domain
sizes were collected to calculate their average value and standard deviation. As a result,

Chapter 4. 2D supramolecular self-assembly of a tetra-carboxylic acid derivative
85
the domain sizes of the close-packed, kagomé and parallel structures were measured to
be 8 ± 1 nm, 18 ± 4 nm and 15 ± 4 nm, respectively. Compared with results obtained in
the nonanoic acid system, the increase in molecular coverage may result from the lower
adsorption of the stripe-like contamination.
Figure 4.8. Morphology of the ATC network self-assembled from octanoic acid onto HOPG.
Concentration of the ATC/octanoic acid solution: sat/10. STM imaging parameters: Vs = - 0.6 V,
It = 0.01 nA. Image size: 150 nm. Scale bar: 30 nm.
Heptanoic acid
Further experiments were performed to investigate the effect of depositing ATC
from heptanoic acid. Heptanoic acid has a shorter aliphatic chain length compared with
that of nonanoic acid or octanoic acid. Figure 4.9 presents an STM image showing the
HOPG surface covered by an ATC network self-assembled from heptanoic acid. The
molecular system in heptanoic acid yields ATC networks with extremely high surface
coverage (> 99.9 %). Three types of ordered phases in separate domains were formed
Parallel
structure
Kagomé
structure
Close-packed
structure

Chapter 4. 2D supramolecular self-assembly of a tetra-carboxylic acid derivative
86
when the molecular system reached an equilibrium under ambient conditions. The
surface shown in Figure 4.9 was covered with 7.2 % of the close-packed structure, 12.4 %
of the kagomé structure, 23.9 % of the parallel structure and 56.5 % of disordered and
unoccupied regions.
Figure 4.9. STM image of a good quality ATC network assembled at the heptanoic acid-HOPG
interface. Concentration of the heptanoic/nonanoic acid solution: sat/20. STM imaging
parameters: Vs = - 0.5 V, It = 0.05 nA. Image size: 150 nm. Scale bar: 30 nm.
With an aim to fabricate extended two-dimensional ATC molecular networks,
heptanoic acid was used as a solvent in all the subsequent experiments. The high-quality
ATC network structures are favourable for the acquisition of consistent STM images
over extended scales. The lack of uncovered regions of the surface meant that there
were fewer freely moving ATC molecules on the surface. This restriction of molecular
motion allowed for both higher contrast and more consistent STM imaging.

Chapter 4. 2D supramolecular self-assembly of a tetra-carboxylic acid derivative
87
4.3.2 Concentration-dependent self-assembly
The self-assembly behaviour of ATC at the interface between heptanoic acid and
HOPG was probed using STM. In Figure 4.10, two typical STM images were recorded
for ATC self-assembled networks formed via the deposition of heptanoic acid solutions
with different concentrations. The solution used for the formation of the ATC network
presented in Figure 4.10 (a) was a 1/20 dilution of the saturated ATC/heptanoic acid
solution (sat/20). While the ATC solution corresponding to the STM image in Figure
4.10 (b) was a 1/50 dilution of the saturated ATC/heptanoic acid solution (sat/50).
At the higher concentration, ATC molecules self-assemble into three packing
arrangements that coexist on the surface in separate domains. These packing
arrangements include a porous wheel-like pattern, and two densely packed structures. In
contrast, only the wheel-like pattern is observed in the lower concentration sample. For
the STM image in Figure 4.10 (b), the end of the STM tip changed halfway through the
scanning process. Despite a contrast alternation between the central area, and the lower
and upper parts of the image, it is still reasonable to determine that all of the domains
consist of the porous wheel-like arrangements with defects and domain boundaries.
Using the method introduced in the previous section, quantitative analysis of the
percentage surface coverage and domain size was carried out for the different packing
arrangements observed in Figure 4.10. At the concentration of sat/20, the surface was
approximately covered with: 21 % of the close-packed structure; 11 % of the kagomé
structure; 49 % of the parallel structure; and 19 % of disordered regions. By taking at
least three measurements, the average domain sizes of the close-packed, kagomé and
parallel structures were measured to be 14 ± 5 nm, 27 ± 6 nm, and 28 ± 11 nm,
respectively. At the concentration of sat/50, the surface was covered with around 78 %
of the kagomé structure and 22 % of disordered regions. In contrast to the concentration
of sat/20, the domain size of the kagomé structure increased to approximately 75 ± 3 nm
by taking two measurements from the STM image shown in Figure 4.10 (b).

Chapter 4. 2D supramolecular self-assembly of a tetra-carboxylic acid derivative
88
Figure 4.10. Morphology of self-assembled ATC monolayers at high and low concentrations. (a)
STM image of the ATC network formed at the concentration of sat/20. (b) ATC network formed
at the concentration of sat/50. STM scanning parameters: (a) Vs = - 0.5 V, It = 0.05 nA; (b) Vs = -
0.5 V, It = 0.06 nA. Both image sizes are 150 nm. Both scale bars are 30 nm.
(a)
(b)

Chapter 4. 2D supramolecular self-assembly of a tetra-carboxylic acid derivative
89
These results clearly demonstrate that the ratio of the three coexistent 2D
molecular arrangements is dependent on the concentration of ATC molecules in
heptanoic acid. The parallel structure dominates at the higher concentration (sat/20),
while the porous kagomé structure dominates and grows into larger domains at the
lower concentration (sat/50).
Kagomé network
The term Kagomé lattice was first used in theoretical descriptions of magnetics
phenomena [170]. The original meaning of the term Kagomé is a pattern common in
woven Japanese bamboo baskets consisting of interlaced triangles and hexagons [171].
In a Kagomé lattice, each triangular lattice point has four neighbouring points. Kagomé
structures have previously been observed to form in 2D self-assembled structures
stabilised by hydrogen bonding [172], van der Waals interactions [173] and
metal-organic coordination interactions [174]. The molecular arrangement of Kagomé
lattices formed by tetra-carboxylic acid derivatives has been presented in Figure 4.1.
Figure 4.11 (a) shows a drift-corrected STM image of the ATC Kagomé structure.
Each rod-like feature in the STM image corresponds to an individual ATC molecule
adsorbed on the HOPG surface. The unit cell of the Kagomé structure is composed of
three ATC molecules. Multiple measurements were carried out on two such high
resolution, drift-corrected STM images to obtain unit cell dimensions for the ATC
Kagomé network. At least ten datasets were collected to obtain an average value and its
corresponding standard deviation as an error. The unit cell parameters of the Kagomé
structure was experimentally determined to a = b = (3.2 ± 0.2) nm; and γ = (59 ± 3) °.
In the STM image presented in Figure 4.11 (a), it is even possible to discern the
electronic orbital structure of the anthracene moiety within the ATC molecule. The three
fused benzene rings that makes up the central anthracene group of an ATC molecule
appear as six individual bright features. In striking contrast, the two isophthalic acid
groups at either end of the ATC molecule appear as circular features at the ends of the
fused benzene backbone and are significantly darker.

Chapter 4. 2D supramolecular self-assembly of a tetra-carboxylic acid derivative
90
Figure 4.11. (a) High resolution, drift-corrected STM image of the ATC (sat/50) Kagomé
structure with its unit cell marked in black. STM imaging parameters: Vs = -0.4 V, It = 0.05 nA.
Image size: 8 nm. Scale bar: 1.6 nm. (b) Corresponding MM simulated molecular model with a
unit cell marked in red.
The six-lobe anthracene feature of ATC has previously been observed for other
anthracene derivatives. The alkyl chain functionalised anthracene molecule shown in
Figure 4.12 (a), for example, was imaged as consisting of six lobes at the interface
a
b
γ
(a)
(b)
a
b
γ

Chapter 4. 2D supramolecular self-assembly of a tetra-carboxylic acid derivative
91
between phenyloctane and an HOPG surface [57]. The six lobes shown in this STM
image can be overlaid with the spatial distribution of the HOMO of the anthracene
group. In comparison with the case presented in Figure 4.12, the tunnelling pattern of
the anthracene shown in Figure 4.11 (a) would also be a direct result of the morphology
of the HOMO of anthracene.
Figure 4.12 (a) Chemical structure of 1,5-bis-(3′-thia-tetradecyl) anthracene. (b) STM image of
the self-assembled network of the compound shown in (a) at the interface between HOPG and
phenyloctane (Vs = - 0.8 V, It = 0.28 nA, 12 ×12 nm2). From reference [57].
Based on the high resolution STM image, a molecular model was built for the
wheel-like porous structure using MM simulations (see Figure 4.11 (b)). The model was
then geometry optimised with the influence of a fixed, single layer of underlying HOPG
taken into account. As can been seen from the model, all ATC molecules adsorb on
HOPG in a planar fashion. The entire network is stabilised by hydrogen bonding
interactions between the carboxylic acid moieties on adjacent ATC molecules. The unit
cell dimensions from the MM simulated molecular model were a = b = 3.4 nm; and γ =
60°, in excellent agreement with the STM measurements.
As the conjugated anthracene backbone of ATC is not symmetric, each ATC
molecule is prochiral and can form one of two possible enantiomers upon adsorption
onto the HOPG surface. A mirror-image domain of the porous network displayed in
Figure 4.11 (a) was observed on a different area of the same surface. Figure 4.13 (a)
shows the co-existing chiral domain formed by the opposite-handed enantiomer of ATC,
(a) (b)

Chapter 4. 2D supramolecular self-assembly of a tetra-carboxylic acid derivative
92
the corresponding molecular model of which is presented in Figure 4.13 (b).
Figure 4.13. (a) STM image of the ATC mirror-image domain. This image has not been
drift-corrected. STM imaging conditions: Vs = - 0.6 V, It = 0.04 nA. Image size: 20 nm. Scale
bar: 4 nm. (b) MM molecular model of the chiral, Kagomé porous structure shown in (a).
Parallel network
At the higher concentration (sat/20), the ATC parallel phase is the dominant
(a)
(b)

Chapter 4. 2D supramolecular self-assembly of a tetra-carboxylic acid derivative
93
configuration on the surface (49.2 %). Figure 4.14 (a) shows a high resolution,
drift-corrected STM image of the parallel structure. To determine the unit cell
dimensions, more than ten measurements were recorded from the STM image. The data
were analysed by taking their average and standard deviation as error values. The unit
cell parameters for the parallel structure were, by this way, measured to be a = (1.6 ±
0.1) nm; b = (2.3 ± 0.1) nm; and γ = (50 ± 2)°.
Figure 4.14. (a) Drift-corrected STM image of the ATC (sat/20) parallel structure with its unit
cell marked in black. STM imaging conditions: Vs = - 0.4 V, It = 0.04 nA. Image size: 6.5 nm.
Scale bar: 1.3 nm. (b) MM geometrically optimised molecular model (Unit cell marked in red).
a
b
γ
γ a
b
(a)
(b)

Chapter 4. 2D supramolecular self-assembly of a tetra-carboxylic acid derivative
94
Figure 4.14 (b) presents the molecular model constructed for the parallel phase
using MM simulations. The unit cell dimensions determined from this model following
geometry optimisation were a = 1.8 nm; b = 2.2 nm; and γ = 51°, in good agreement
with the values obtained from STM experiments. As illustrated by the molecular model,
all the four carboxylic acid groups of each ATC molecule are involved in the formation
of intermolecular -COOH···HOOC- double hydrogen bond dimers.
Close-packed network
As can be seen from Figure 4.10 (a), some ATC molecules adopt a closely packed
arrangement within certain areas of the surface. Figure 4.15 (a) shows a drift-corrected,
high resolution STM image of the close-packed structure. Ten line profiles were taken
through this image to give different sets of unit cell dimensions. Then the average
values and associated standard deviations of this data was taken to determine the
experimentally measured unit cell constants: a = (0.9 ± 0.1) nm; b = (2.0 ± 0.1) nm; and
γ = (69 ± 3) °.
A molecular model for the close-packed arrangement observed using STM is
shown in Figure 4.15 (b). In the MM calculation, the stabilisation of the close-packed
structure was assessed with molecule-surface interactions being taken into consideration.
The unit cell constants obtained by the MM theoretical study were a = 1.0 nm; b = 2.2
nm; and γ = 62 °, in good agreement with values measured from STM images. In the
close-packed arrangement, two carboxylic groups on individual ATC molecules adopt
intermolecular -COOH···HOOC- double hydrogen bonding dimers. The other two
carboxylic groups of the ATC molecule form weak =O···HC- or -OH···O= hydrogen
bonding. This type of hydrogen bonding motif is also displayed in the 2D self-assembly
of NTC molecules introduced in section 4.1 (Figure 4.3 (c)) [51].
Similar to the Kagomé network, the two enantiomers of ATC induced by surface
adsorption can lead to the formation of mirror-image chiral domains for the parallel and
close-packed networks. In the cases of the two molecular networks, the enantiomers
should both be present on surfaces within different homochiral domains.

Chapter 4. 2D supramolecular self-assembly of a tetra-carboxylic acid derivative
95
Figure 4.15. ATC (sat/20) close-packed structure. (a) Drift-corrected STM image. STM imaging
conditions: Vs = - 0.4 V, It = 0.05 nA. Image size: 7.5 nm. Scale bar: 1.5 nm. (b) MM geometry
optimised molecular model. Dashed, red lines: different hydrogen bonds involved in the
close-packed structure.
4.3.3 Inclusion of coronene
Figure 4.16 presents the resulting network by depositing a mixture of ATC in heptanoic
acid solutions (sat/20) and coronene 1.0 × 10⁻⁴
mg/ml. Compared with the ATC
a b
γ
a b
γ
(a)
(b)

Chapter 4. 2D supramolecular self-assembly of a tetra-carboxylic acid derivative
96
mono-component network formed using the same concentration of ATC (Figure 4.10
(a)), the existence of the parallel or close-packed structures was not observed following
the inclusion of coronene to the solution. The ATC Kagomé networks, which were not
dominant for the mono-component system at this higher concentration, have been
observed to be stabilised by the inclusion of coronene in the surface structure. Measured
from the STM image shown in Figure 4.16, 75.6 % of the surface was covered with the
ATC-coronene bi-component, and the remaining 24.4 % was not covered by the
molecular network. Thus, the coverage of the bi-component networks was not as high as
the mono-component system without coronene. Following the inclusion of coronene,
the domain sizes of ATC networks reduced with numerous structural defects visible at
domain boundaries.
Figure 4.16. STM image of the bi-component network formed by the mixture of ATC (sat/20)
and coronene 1.0 × 10⁻⁴
mg/ml at the heptanoic acid-HOPG interface. STM imaging conditions:
Vs = - 0.6 V, It = 0.01 nA. Image size: 49.5 nm. Scale bar: 9.9 nm.
High resolution STM images of the Kagomé structure co-assembled with coronene
were collected to resolve detailed features of the bi-component network structure.
Figure 4.17 (a) is a high resolution STM image showing coronene molecules adsorbed

Chapter 4. 2D supramolecular self-assembly of a tetra-carboxylic acid derivative
97
within the hexagonal pores formed by six isophthalic acid groups at the ends of the ATC
molecules. Similar bi-component structures have been observed in the QPTC and NTC
molecular systems following the inclusion of coronene at liquid-HOPG interfaces [51].
The period of this network structure, defined as distance between two adjacent coronene
molecules, were measured to be 3.2 ± 0.1 nm. Ten data sets were collected to calculate
their average and standard deviation as an error value. In the STM image shown in
Figure 4.17 (a), the homo-chiral arrangement of ATC can be resolved from the STM
image. In order to form the ordered Kagomé structure, all the ATC molecules within the
bi-component domain should adopt the same handedness.
Figure 4.17. (a) Drift-corrected STM image of the ATC Kagomé structure stabilised by the
co-adsorption of coronene. STM imaging conditions: Vs = -0.6 V, It = 0.01 nA. Image size: 8.5
nm. Scale bar: 1.7 nm. (b) Tentative molecular model of the ATC-coronene bi-component
structure.
(a)
(b)

Chapter 4. 2D supramolecular self-assembly of a tetra-carboxylic acid derivative
98
A tentative molecular model for the node of six isophthalic acid moieties stabilised
by a coronene molecule was built using MM simulations (see Figure 4.17 (b)). The
orientation of the coronene was placed in the centre of the pore as the starting point for
the simulation. The period of the ATC-coronene network was measured to be 3.4 nm
from this MM geometry optimised molecular model. The MM simulated and STM
experimentally measured period values are in good agreement and remain unchanged in
comparison to the mono-component Kagomé structure discussed in section 4.3.2.
4.4 Conclusions
In conclusion, it has been shown that ATC molecules self-assemble into extended 2D
networks at the interface between heptanoic acid and HOPG. The morphology displayed
by the ATC self-assembled networks depends on the concentration of the heptanoic acid
solutions of ATC. At higher concentrations (sat/20), the parallel and close-packed
structures dominate on the surface. At the lower concentrations (sat/50), the porous
Kagomé structure dominates and grows into larger domains as compared with the
network formed at the higher concentration. The inclusion of coronene in the
self-assembly process significantly enhances the formation of the ATC-coronene
bi-component Kagomé structure.
Compared with other tetra-carboxylic acid derivatives, ATC exhibits two
interesting properties upon adsorption from the heptanoic acid solutions onto HOPG
surfaces. Firstly, the prochiral nature of ATC means that it can adopt two different
enantiomers upon adsorption to the surface, leading to the formation of homo-chiral
self-assembled domains. Secondly, ATC displays 2D polymorphism with three
structurally distinct patterns being resolved within the same two-dimensional
self-assembled interfacial layer.
4.5 Future work
Based on the current results concerning the concentration-dependent self-assembly of
ATC, a more detailed range of concentration experiments are suggested to be performed

Chapter 4. 2D supramolecular self-assembly of a tetra-carboxylic acid derivative
99
to demonstrate how self-assembled structures of ATC vary with changes in
concentration. Kinetic effects most probably play a very important role in determining
the final morphology of the ATC network. The influence of kinetic effects will be
removed or minimised by using an annealing and cooling procedure during network
preparation. More specifically, ATC molecules will be deposited on preheated HOPG
substrates. The heating may provide ATC molecules with enough energy to overcome
any kinetic barriers and hopefully form structures with minimum Gibbs free energy. The
sample will then be allowed to cool down naturally prior to STM imaging at the
liquid-solid interface.
A set of STM experiments studying the temperature dependence of the ATC
networks will also be conducted. In these experiments, ATC will be deposited onto
substrates that are being maintained at elevated temperatures. In-situ STM images will
then be recorded at a range of such elevated temperatures. The substrate will be allowed
to cool back down to room temperature in a controlled fashion.
All of the experiments suggested above would help us gain control over the 2D
self-assembly of prochiral ATC molecules by tuning concentration and temperature.
These experiments would also provide new insights into the thermodynamic and kinetic
factors that influence carboxylic acid drived 2D self-assembly. This would provide
another model molecular system to study guest adsorption, chirality selection and other
interesting phenomena during the formation of 2D self-assembled networks at the
liquid-solid interfaces.

100
Chapter 5
Surface-based self-assembly of thymine
functionalised porphyrins
Hydrogen bonding between DNA nucleobases has been shown to be an effective
intermolecular interaction to drive the formation of two-dimensional (2D) molecular
self-assemblies. This project aims to utilise selective hydrogen bonding between DNA
nucleobases as a driving interaction to help organise more complex molecular
structures. In order to achieve this goal, the 2D self-assembly of thymine functionalised
porphyrins including tetra-(phenylthymine)porphyrin (tetra-TP) and its metal
coordinated derivative, tetra-(phenylthymine)porphyrin-Zn(Ⅱ) (Zn-tetra-TP), was
investigated at the interface between HOPG and organic solvents. The resulting
self-assembled networks were studied using STM and MM simulations. In
mono-component porphyrin systems, hydrogen bonding between the thymine groups of
tetra-TP or Zn-tetra-TP leads to the growth of an extended, highly ordred network that
is part of the p2 plane symmetry group. By careful selection of additional molecular
components that can form complementary hydrogen bonds with thymine, it has been
possible to form bi-component self-assembled networks with the functionalised
porphyrin molecules. Thermodynamic aspects and concentration dependence of the
self-assembly of these diverse molecular networks will also be discussed.
5.1 Introduction
The interaction between carboxylic acid groups is just one of a range of different
hydrogen bonding motifs that have been used to drive the self-assembly of 2D
molecular networks. Taking inspiration from nature, the hydrogen interactions between
DNA nucleobases are potential candidates for the generation of highly ordered 2D

Chapter 5. Surface-based self-assembly of thymine functionalised porphyrins
101
molecular structures.
Figure 5.1. Chemical structures and hydrogen bonding interactions between DNA nucleobase
pairs: (a) Watson-Crick DNA nucleobase pair; (b) Reverse Watson-Crick A-T base pair; (c)
Hoogsteen A-T base pair; (d) Reverse Hoogsteen A-T base pair [175-178]. Red, dashed lines:
hydrogen bonds.
The selective and directional hydrogen bonding between Watson-Crick base pairs
is an important noncovalent interaction that contributes to the formation of the
fascinating DNA double helix structure [175]. Figure 5.1 (a) describes the hydrogen
bonding schemes formed between guanine (G)-cytosine (C) and adenine (A)-thymine (T)
nucleobase pairs in DNA. In addition to the Watson-Crick base pairing, a number of
other possible DNA nucleobase bonding modes exist such as reverse Watson-Crick;
Hoogsteen; and reverse Hoogsteen base pairing (Figure 5.1 (b) - (d)) [176-178]. This
variety of possible hydrogen bonding arrangements makes DNA nucleobases powerful
groups for driving 2D self-assembly.
In addition to DNA nucleobases, other nucleobases that play important roles in
biology have also been used as molecular recognition groups to form 2D
supramolecular structures. Examples include uracil (U) in RNA [179], unnatural
xanthine (X) [180], and isocytosine [181]. The versatile hydrogen bonding interactions
between these natural and unnatural nucleobases have been used to drive the
Watson-Crick: Adenine (A) Thymine (T) Guanine (G) Cytosine (C)
(a)
(b) (c) (d)
Reverse Watson-Crick: A-T Hoogsteen: A-T Reverse Hoogsteen: A-T

Chapter 5. Surface-based self-assembly of thymine functionalised porphyrins
102
self-assembly of a large number of 2D supramolecular structures at solid surfaces and
interfaces [182]. While the recognition process during the self-assembly can be obtained
by visualising adsorbed molecules directly, more experimental and theoretical attempts
are still needed to allow the pre-programmed self-assembly of nucleobase functionalised
molecules [23].
At the liquid-solid interface, highly ordered 2D self-assembled networks formed by
mixing adenine and thymine molecules were first observed by Besenbacher et al. [183].
As the molecules were too small to be clearly resolved by STM under ambient
conditions, orientations of the individual thymine or adenine could not be identified.
Theoretical calculations were carried out to interpret the structures observed using STM.
In order to illustrate the molecular recognition features between DNA nucleobase pairs
at liquid-solid interfaces using STM, efforts can be devoted to functionalising larger
molecular building blocks with DNA nucleobase. Porphyrins make an ideal candidate
for such a molecule because of the ease with which they can be functionalised via
synthetic routes, and the high contrast that their conjugated molecular core displays in
STM images. If the orientation and geometrical size of the resulting self-assembled
porphyrin arrays can be determined exactly, then from this information, the hydrogen
bonding scheme adopted by the nucleobase functional groups can be decuced.
Figure 5.2. Molecular structure of porphyrin and possible positions for functionalisation.
As molecular building blocks for surface-based self-assembly, porphyrins (Figure
5.2) exhibit several advantages: (ⅰ) each meso- / beta-position of a four-fold
symmetric porphyrin core can act as a site for functionalisation with a target chemical
group; (ⅱ) the four nitrogen atoms at the porphyrin core can coordinate a metal atom
which can then act as a reactive site; and (ⅲ) the conjugated nature of the macrocycle
* *
*
* · ·
· · ·
·
· ·
*
:
: meso position
· : beta position

Chapter 5. Surface-based self-assembly of thymine functionalised porphyrins
103
core gives porphyrins favourable optical and electronic properties [184, 185]. The
adsorption of porphyrins on solid surfaces has also been demonstrated to be visualised
clearly by STM. A wide range of porphyrin derivatives have so far been used as
molecular building blocks to grow 2D molecular structures. These include: covalently
linked networks [60, 186]; and self-assembled patterns driven by hydrogen bonding
between carboxylic acid groups [187, 188]; and 2D networks stabilised by metal-ligand
coordination bonds [174, 189, 190]. However very few studies have been conducted on
the self-assembly of porphyrins arrays directed by hetero-molecular hydrogen bonding
interactions [191, 192].
Figure 5.3. Chemical structure of the molecules used to probe thymine-adenine interactions in
solution phases: mono-thymine-tri-(3,5-di-tert-butylphenyl)porphyrin (Mono-TP) and
9-propyladenine (PA).
Prior to studying the intermolecular interactions of DNA nucleobases on surfaces,
our collaborators at the University of Nottingham first probed the property of hydrogen
bonding between thymine functionalised porphyrins and adenine in solution by
investigating a model molecular system consisting of
mono-thymine-tri-(3,5-di-tert-butylphenyl)porphyrin (mono-TP) and 9-propyladenine
(PA) (Figure 5.3) [193]. The bulky tertiary butyl groups of mono-TP act as obstacles to
prevent π–π stacking between porphyrins in solution phase [194]. A phenyl group was
synthetically inserted between the porphyrin core and the thymine to act as a spacer in
order to minimise steric effects between the thymine group and the porphyrin core.
Mono-TP
PA

Chapter 5. Surface-based self-assembly of thymine functionalised porphyrins
104
Planar groups attaching to the meso positions directly may experience steric interactions
with the porphyrin core. The molecular design shown here allows the thymine
functional group and the porphyrin macrocycle to be coplanar, a vital condition for 2D
self-assembly [195].
Our collaborator in synthetic chemistry at the University of Nottingham, Prof. Neil
Champness conducted structural studies on mono-TP and PA [193]. Single crystal X-ray
diffraction was used to characterise the 3D crystal structure formed by mono-TP
molecules. The single crystal was produced by diffusing CH3OH into a mono-TP in
CH2Cl2 solution. A synchrotron X-ray source was then used to collect single crystal
diffraction data for the mono-TP sample [196]. As a result of this diffraction experiment,
the relative arrangement of the thymine group with respect with the porphyrin plane was
determined. Based on the crystal structure of the mono-TP, an R22(8) double hydrogen
bonding interaction [197] as illustrated in Figure 5.4 was identified between thymine
groups of adjacent mono-TPs.
Figure 5.4. Single crystal X-ray structure for mono-TP showing the R22(8) double hydrogen
bonding interaction (see the two black, dashed lines) between two adjacent thymine groups in
3D mono-TP cystals [193].
With the aim to evaluate hetero-molecular adenine-thymine interactions, NMR
measurements were performed for mono-TP in deuterated chloroform solution with
defined amounts of PA added into the solution gradually. Figure 5.5 (a) presents 1H
NMR spectra collected at each increasing concentration of PA in the mixture of
mono-TP and PA.
O
H
N
C

Chapter 5. Surface-based self-assembly of thymine functionalised porphyrins
105
Figure 5.5. (a) 1H NMR spectra of mono-TP in deuterated chloroform solutions with PA being
titrated into the system gradually. Spectrum 1 is recorded in pure PA. Spectra 2-17 correspond to
mixtures with an increasing concentration of PA [193]. (b) Structural illustration of PA with
numbering of positions. (c) Schematic representation of Watson-Crick A-T hydrogen bonding
between PA and Mono-TP. (d) Schematic representation of Hoogsteen A-T hydrogen bonding
between 9-propyladenine and Mono-TP.
In spectrum 1 at the bottom of the graph, the two peaks can be attributed to the H
atoms located at the C2 and C8 positions of the adenine group (Figure 5.5 (b)). The
amine 1H of the adenine group was not detected at this range. In the host Mono-TP
solution with an increasing ratio of PA (Spectra 2-17), the two peaks corresponding to
the C8-H and C2-H of the PA adenine demonstrate chemical shifts. The shifts were
reported to be caused by the change in the electronegativity of the neighbouring
nitrogen species when forming hydrogen bonds with the mono-TP thymine groups. As
two shift directions of the C2-H and C8-H signals were observed, the electronegativity
Spectra 2-17:
Constant mono-TP
concentration
Spectrum 1:
Pure PA
(a)
(b) (c) (d)
Chemical shift in the C2-H and C8-H signals
signals
R: Substituent

Chapter 5. Surface-based self-assembly of thymine functionalised porphyrins
106
of the neighbouring C7-N and C1-N changed in two ways. This suggests that the
binding interactions between the thymine and adenine groups consist of both Hoogsteen
[198] and Watson-Crick [175] hydrogen bonding modes as illustrated in Figure 5.5 (c)
and (d).
Prior to analysing the hetero-molecular adenine-thymine interactions, the
homo-molecular adenine-adenine interactions were also analysed by recording the
chemical shift in adenine NH1H when increasing the concentration of mono-component
PA solutions. The same method was also applied to the measurement of
homo-molecular thymine-thymine interactions for mono-TP. The magnitude of the
increase in NH1H shift for the mono-TP thymine in the mixture of mono-TP and PA was
larger than the shifts observed in the mono-component systems. Thus, the
hetero-molecular interactions between mono-TP and PA were shown to be stronger in
comparison with homo-molecular interactions for mono-TP or PA.
In order to expand the structural studies that had been carried out in the solution
phases to solid surfaces, the self-assembly of tetra thymine functionalised porphyrins,
including freebase tetra-TP and Zn-tetra-TP, have been investigated. As shown in Figure
5.6, the meso-positions of the optically active porphyrin cores were functionalised with
phenylthymine groups. The selective hydrogen bonding formed between the DNA
nucleobases should result in more versatile 2D self-assembled networks compared with
those directed by other less complex hydrogen bonding schemes such as carboxylic acid
hydrogen bonding dimers. Moreover, the Zn metal atoms coordinated at the centre of
Zn-tetra-TP molecular system has the potential to act as a site for forming further ligand
coordination bonds with pyridine derivatives. Due to the axial nature of the coordination
interaction, the on-surface self-assembly of Zn-tetra-TP could then potentially be
extended from 2D to 3D. The extension of porphyrin self-assembled structures from 2D
to 3D has potential applications in catalysis, molecular motors and gas storage [199].
Our experimental results show that both mono-component and multi-component
networks can be formed at liquid-solid interfaces by utilising these thymine
functionalised porphyrins and other small organic molecules with suitable hydrogen
bonding groups as molecular building blocks.

Chapter 5. Surface-based self-assembly of thymine functionalised porphyrins
107
Figure 5.6. Chemical formulae of (a) tetra-(phenylthymine)porphyrin (tetra-TP); and (b)
tetra-(phenylthymine)porphyrin-Zn(Ⅱ) (Zn-tetra-TP).
5.2 Details of experiments and simulations
For investigations of the self-assembly of porphyrin networks, tetra-TP (or
Zn-tetra-TP) were dissolved in a mixture of tetrahydrofuran (THF) (anhydrous, > 99.9%,
Sigma Aldrich) and 1,2,4-trichlorobenzene (TCB) (anhydrous, > 99.9%, Sigma Aldrich)
with a 1:9 volume ratio. Stock solution of tetra-TP (or Zn-tetra-TP) with a concentration
of 0.056 mg/ml (0.059 mg/ml for Zn-tetra-TP) were made and diluted successively to
produce several tetra-TP (or Zn-tetra-TP) solutions with concentrations ranging between
0.0056 mg/ml and 0.056 mg/ml (0.0059 mg/ml to 0.059 mg/ml for Zn-tetra-TP). .
In order to mix PA with tetra-TP (or Zn-tetra-TP) PA was also dissolved in a
mixture of THF and TCB with a 1:9 volume ratio. The nucleobase functionalised
porphyrin molecules exhibit good solubility in THF. However, THF was too volatile for
successful STM measurements, non-volatile TCB was needed to be used to allow STM
experiments to be carried out at the liquid-solid interface. PA solutions with
concentrations ranging between 0.0016 mg/ml and 0.20 mg/ml were prepared by
diluting a stock solution with a concentration of 0.45 mg/ml. This large range of PA
concentrations was used in order to investigate how the bi-component structures formed
by tetra-TP (or Zn-tetra-TP) and PA are modified by the amount of PA. PA solutions
were then mixed with tetra-TP (or Zn-tetra-TP) solutions to produce a range of mixed of
(a) (b)

Chapter 5. Surface-based self-assembly of thymine functionalised porphyrins
108
tetra-TP (or Zn-tetra-TP) and PA solutions with different overall concentrations and
molar ratios.
In the studies of melamine self-assembly, both tetra-TP and melamine were
dissolved in a mixed solvent of dimethyl sulfoxide (DMSO) (anhydrous, > 99.9%,
Sigma Aldrich) and TCB with a 1:9 volume ratio. DMSO was used as a solvent as THF
proved to be unsuitable to dissolve melamine. Since DMSO is a highly polar solvent, a
measurable leakage current was observed during STM experiments. Thus, TCB was
mixed with DMSO to reduce the leakage current of the melamine and tetra-TP solutions.
The STM sample preparation procedures were the same as used for the tetra-TP and
9-propyladenine networks.
Figure 5.7. Illustration of an STM tip scanning at the liquid-HOPG interface mounted inside the
temperature control liquid cell.
Self-assembled networks were prepared by depositing ~ 50 µl of the target solution
onto a freshly cleaved HOPG substrate (Agar Scientific) mounted in a PTFE liquid cell
(Figure 5.7). If no special explanation is provided, HOPG substrates were preheated to
60 ºC, held at this temperature for 5 ~ 10 minutes and then left to cool down to room
temperature (~ 25ºC) naturally prior to STM imaging. All STM images were collected
in constant-current mode using an Agilent 5500 series STM system operating at the
liquid-HOPG interface at ambient conditions. Mechanically cut Pt/Ir (80:20) tips
(Advent Research Materials Ltd) were used for STM imaging. Flattening processes
have been applied to all of the STM images presented in this chapter. For the high
resolution STM images, drift-correction was implemented using the SPIP software

Chapter 5. Surface-based self-assembly of thymine functionalised porphyrins
109
(Image Metrology, Denmark) by using the underlying HOPG lattice as a calibration.
The HyperChem software package was used to produce MM simulations of the
mono-component and bi-component self-assembled porphyrin structures. The MM
simulations were carried out with no repeat boundary conditions. Thus, the calculations
were performed on individual clusters of molecules, instead of systems representing by
a repeating lattice. The influence of the underlying HOPG surfaces was taken into
consideration by including a fixed graphene sheet as a substrate below the molecular
clusters of 2D network structures. Molecular structures derived from high resolution
STM images after drift-correction used to guide the starting morphology of the MM
simulations. The initial positions of the planar porphyrin macrocycles, adenine cores
and melamine centres were set to be 0.35 nm above the underlying graphene sheet. The
MM+ force field was used in order to geometry optimise the starting unit cell of the
network structures. When reaching an energy gradient < 0.01 kcal Å-1
mol-1
, the
geometry optimisation process was deemed complete. The values for the unit cell sizes
and angles from a geometry optimised molecular structure and its underlying HOPG
symmetry axes were compared with those obtained from the corresponding
drift-corrected STM image. This comparison acted as a test of the validity of the
calculation results.
5.3 Self-assembly of freebase thymine-functionalised
porphyrins
In this section, the self-assembly of tetra-TP on its own at the interface between the
TCB/THF solvent mixture and the HOPG substrate will be discussed first. After this,
further investigations that demonstrate the ability of tetra-TP arrays to co-assemble with
either PA or melamine and form bi-component networks will be introduced.
5.3.1 Tetra-TP on its own
Efforts were made to self-assemble mono-TP at the TCB-HOPG interface. However, no

Chapter 5. Surface-based self-assembly of thymine functionalised porphyrins
110
molecular structure was ever captured during STM scans of the mono-TP. The reason
for this lack of observed structure could be related to the smaller number of hydrogen
bonds that a mono-TP molecule is capable of forming in comparison to the tetra-TP
molecule. In addition, the presence of the non-planar tertiary butyl groups on the
mono-TP molecule will lead to it having a far weaker adsorption interaction with the
HOPG surface. In the case of tetra-TP, some undissolved particulate material was
observed in solution even for the diluted tetra-TP solutions used in the project. When
the tetra-TP solution deposited into the liquid cell was heated, it is believed that more of
the tetra-TP was driven into solution increasing the concentration. On cooling, the
additional tetra-TP that had been dissolved by heating then precipitated out of the
solution. These additional tetra-TP molecules would then adsorb on the surface and
form the self-assembled structures.
Morphology of tetra-TP self-assembled networks
Figure 5.8. STM image of a 2D tetra-TP (0.031 mg/ml) mono-component network
self-assembled at the interface between HOPG and TCB/THF mixture (9:1). STM scanning
conditions: Vs = - 0.5 V; It = 0.015 nA. Image size: 100 nm. Scale bar: 20 nm.

Chapter 5. Surface-based self-assembly of thymine functionalised porphyrins
111
Figure 5.8 is a 100 nm × 100 nm STM image showing the formation of an
extended tetra-TP network with domain size larger than 100 nm. When deposited on
HOPG, the mono-component tetra-TP forms a 2D self-assembled network that is part of
the p2 plane symmetry group. Each cross-shaped bright feature in the STM image
corresponds to a tetra-TP molecule. The tetra-TP molecules adsorb in a planar fashion
with the porphyrin cores aligned parallel with the underlying HOPG surface.
Figure 5.9. (a) Drift-corrected STM image of the 2D self-assembly of mono-component tetra-TP
networks, the unit cell marked in white. White arrows at bottom right corner indicate the main
symmetry axes of the underlying HOPG surface. STM imaging conditions: Vs = - 0.53 V; It =
0.012 nA. Image size: 8 nm. Scale bar: 1.6 nm. (b) Molecular model from a geometry optimised
MM simulation of the mono-component tetra-TP network.
Analysis of drift-corrected STM images for the tetra-TP network, for example the
high resolution STM image shown in Figure 5.9 (a), provided a quantitative
measurement of the lattice parameters of the 2D unit cell, and the alignment of the unit
cell with respect to the underlying HOPG lattice. The values were obtained by taking an
average from more than three measurements on different drift-corrected STM images.
Associated error values for the unit cell dimensions and angle were obtained by
calculating the standard deviations of the sets of multiple measurements. By taking
measurements from a series drift-corrected STM images of the tetra-TP
a
b γ
(a) (b)

Chapter 5. Surface-based self-assembly of thymine functionalised porphyrins
112
monocomponent structure, the unit cell lattice parameters were determined to be a =
25.9 ± 0.5 Å, b = 25.2 ± 0.6 Å and γ = 91 ± 1°. The angles that the unit cell structure
makes with respect to its underlying graphite symmetry axes were measured to be α =
(6 ± 3)° and β = (25 ± 3)°.
Figure 5.10. MM simulated tetra-TP structure overlaying a fixed graphene sheet after geometry
optimisation.
MM simulations were employed as a complementary method to STM by
calculating a geometry optimised molecular model for the self-assembled structure. In
the MM simulations a unit cell of the tetra-TP unit structure was placed above a fixed
graphene sheet (Figure 5.10). Figure 5.9 (b) presents the geometry optimised MM
model for a unit cell of the tetra-TP network. The unit cell parameters of the tetra-TP
structure obtained from the MM calculations were a = 26.0 Å, b = 25.9 Å and γ = 91°.
The unit cell vectors made angles of α = 4.7° and β = 24.3° with the underlying HOPG
symmetry axes. These unit cell values were in good agreement with those obtained from
the drift-corrected STM images. Therefore, this molecular model was chosen as a valid
representation of the 2D tetra-TP network. As can be seen from this model, the
a b
γ

Chapter 5. Surface-based self-assembly of thymine functionalised porphyrins
113
formation of the tetra-TP structure is driven by hydrogen bonding between the thymine
groups on adjacent tetra-TP molecules. The thymine-thymine hydrogen bonding mode
is slightly different but still similar to the bonding arrangement observed between
mono-TP molecules in 3D crystals [193] and between thymine molecules
self-assembled in 2D at the interface between HOPG and 1-octanol [183].
Adsorption-induced chirality of tetra-TP
Figure 5.11. Drift-corrected STM images and molecular models showing mirror-image domains
of the tetra-TP network (0.031 mg/ml). Both image sizes: 13.5 nm. Both scale bars: 2.7 nm.
STM imaging parameters: (a) Vs = - 1.3 V, It = 0.02 nA; (b) Vs = - 0.5 V; It = 0.015 nA.
In some of the high resolution STM images, mirror-image domains of the tetra-TP
networks were visible (see Figure 5.11). These two chiral arrangements of the tetra-TP
structure could be observed at different locations on the same surface. The chiral
tetra-TP structures result from the existence of the two possible orientations that the
asymmetric thymine groups can adopt upon adsorption onto a HOPG surface. In each of
the homochiral domains in Figure 5.11, tetra-TP molecules adopt a single handedness.
As the two chiral domains both have a four-fold symmetry, all of the four thymine
groups in individual tetra-TP molecule exhibit the same orientation with respect to the
porphyrin macrocycle. In solution, it is believed that the four thymine groups in a
(a) (b)

Chapter 5. Surface-based self-assembly of thymine functionalised porphyrins
114
tetra-TP are able to rotate freely. Following adsorption onto the HOPG surface, the
prochiral tetra-TP becomes chiral adopting either a right-handed or a left-handed
configuration. The adsorption-induced chirality phenomenon has been observed in
many other supramolecular self-assembled patterns formed by molecules at liquid-solid
interfaces [200, 201].
5.3.2 Tetra-TP and PA
Morphology of tetra-TP and PA bi-component structure
Figure 5.12. STM image of a 2D molecular network formed by the self-assembly of tetra-TP
(0.031 mg/ml) and PA (0.089 mg/ml) at the liquid-solid interface. Scale bar is 14 nm. STM
imaging conditions: Vs = - 0.5 V, It = 0.02 nA.
Figure 5.12 shows an STM image of the self-assembled structure formed by tetra-TP
and PA at the solvent/HOPG interface. In this molecular network tetra-TP and PA
co-crystallise into ordered bi-component structures surrounded by disordered regions

Chapter 5. Surface-based self-assembly of thymine functionalised porphyrins
115
(see Figure 5.12). The domain size of the bi-component structures can be quantified by
taking the square root of the surface area occupied by an ordered domain. In order to
measure the average domain size of the ordered regions, the average value and standard
deviation of five domain sizes collected from different locations on the same surface
were calculated. As a result, the average domain size of the ordered regions formed
under this set of conditions was determined to be 19 ± 7 nm. The ordered regions were
observed in all of the STM images collected on this surface. The percentage of the
surface covered with the disordered regions was analysed from three STM images
collected from different locations of the same surface. The average percentage coverage
of the disordered regions was estimated to be 83.1 % ± 5.5 %. No repeating structural
motif can be seen in the disordered regions.
In order to illustrate the exact bonding mode between tetra-TP and 9-propyladenine
in the ordered co-crystal, drift-corrected high resolution STM images were collected to
determine the unit cell dimensions of the bi-component 2D self-assembled pattern. MM
simulations were then conducted to interpret the molecular morphology observed from
the STM images using a same method as described for the tetra-TP mono-component
system. Unit cell values from the different possible molecular models were compared
with the experimentally measured data for the purpose of validating a calculated
structure.
Figure 5.13 (a) is a high resolution, drift-corrected STM image showing the unit
cell structure of the ordered tetra-TP and PA co-crystal. By analysing more than three
different STM images of this quality, unit cell parameters for the 2D network were
measured to be a = (25.4 ± 0.7) Å, b = (22.2 ± 0.9) Å, and γ = (83.0 ± 2.0)°. The angles
that the unit cell vectors make with respect to the underlying HOPG symmetry axes
were determined to be α = (4.4 ± 1.2)°, and β = (26.9 ± 2.1)°.
MM calculations performed with no repeat boundary conditions were carried out to
optimise the geometry of the ordered tetra-TP and PA structure on an underlying fixed
graphene sheet (Figure 5.14). Figure 5.13 (b) presents the MM calculated unit cell of the
co-crystal which has dimensions that are in good agreement with those measured
directly from the drift-corrected STM images: a = 26.0 Å; b = 21.5 Å; γ = 85.7°. The

Chapter 5. Surface-based self-assembly of thymine functionalised porphyrins
116
angles that the unit cell vectors make with the underlying graphite symmetry axes were
measured to be α = 4.7°, and β = 30.0°. The calculated model can be used to illustrate
the various hydrogen bonding modes that exist in the tetra-TP and PA co-crystal
structure presented in Figure 5.13 (a).
Figure 5.13. (a) Drift-corrected STM image of the tetra-TP and PA co-crystal structure. Scale
bar: 1.6 nm. (b) Geometry optimised molecular model and unit cell (marked in red) for the 2D
network. (c)-(d) A pair of STM images used for drift-correction showing the bi-component
molecular network and the underlying HOPG surface respectively. STM imaging conditions: (a)
Vs = - 0.55 V, It = 0.012 nA; (b) Vs = - 0.5 V, It = 0.02 nA; (c) Vs = - 0.05 V, It = 1 nA.
As can be seen from the molecular model shown in Figure 5.14, the two PA
molecules are linked to each other by a hydrogen bond dimer. Each PA molecule is
(a)
(c) (d)
(b)
γ
a
b

Chapter 5. Surface-based self-assembly of thymine functionalised porphyrins
117
linked to the two adjacent tetra-TP molecules by three hydrogen bonds. The hydrogen
bonding dimer between the two PA molecules is consistent with the bonding scheme
observed in self-assembled adenine structures on a HOPG surface from DFT
calculations [183]. The three hydrogen bonds formed between the PA and two
surrounding tetra-TP molecules consist of a hydrogen bond dimer that adopts a
Watson-Crick adenine-thymine base pair type interaction [175] and a single -NH···N
hydrogen bond.
Figure 5.14. MM simulated molecular model for the tetra-TP and PA co-crystal with the fixed
underlying graphene lattice. Red, dashed lines: hydrogen bonding.
Due to the adsorption-induced chirality of asymmetric thymine groups, the growth
of mirror image domains has also been observed for the tetra-TP and PA bi-component
system. Figure 5.15 presents an STM image showing the formation of two homochiral
domains with opposite chirality for the tetra-TP and PA co-crystal. In each of the highly
ordered domains all four of the thymine groups for each individual tetra-TP molecule
adopt the same orientation with respect to the porphyrin macrocycle either clockwise or
anti-clockwise. The two adsorption-induced enantiomers of the prochiral tetra-TP
molecule lead to the observation of the two mirror-image domains of the tetra-TP and

Chapter 5. Surface-based self-assembly of thymine functionalised porphyrins
118
PA bi-component self-assembled structure.
Figure 5.15. STM image of a bi-component network formed by tetra-TP (0.10 mg/ml) and PA
(0.040 mg/ml) that shows the growth of mirror-image domains. Image size: 50 nm. Scale bar:
10 nm. STM imaging conditions: Vs = - 0.55 V; It = 0.015 nA.
Concentration and molar ratio dependency of the bi-component self-assembly
Efforts have been devoted to understanding the way the bi-component networks
form, and to increasing the areas of the ordered bi-component structures. STM
investigations were carried out to study the influence that the overall concentration and
molar ratio of tetra-TP and PA had on the morphology of the bi-component
self-assembled networks. Networks were formed using a range of mixtures of tetra-TP
and PA with different molar ratio values and concentrations. These structures were then
imaged using STM.
Figure 5.16 demonstrates four example STM images collected for tetra-TP and PA
self-assembled networks prepared under different conditions. By comparing the network
morphology in these STM images, it is observed that the formation and quality of the

Chapter 5. Surface-based self-assembly of thymine functionalised porphyrins
119
ordered tetra-TP and PA co-crystal network is related to the overall concentration and
molar ratio of the two molecular components in solution.
Figure 5.16. STM images showing the morphology of tetra-TP and PA networks formed at
different overall concentrations and molar ratios of the two components. (a) Molar ratio between
tetra-TP (0.015 mg/ml) and PA (0.044 mg/ml) is 1:16. (b) Molar ratio between tetra-TP (0.034
mg/ml) and PA (1.6 × 10⁻³
mg/ml) is 4:1. (c) Molar ratio between tetra-TP (0.020 mg/ml) and PA
(0.22 mg/ml) is 1:64. (d) Molar ratio between tetra-TP (5.6 × 10⁻³
mg/ml) and PA (0.38 mg/ml)
is 1:383. STM imaging conditions: (a) Vs = - 0.5 V, It = 0.02 nA; (b) Vs = - 0.55 V, It = 0.02 nA;
(c) Vs = - 0.5 V, It = 0.02 nA; (d) Vs = - 0.5 V, It = 0.03 nA. Scale bars: (a) 30 nm; (b) 11 nm; (c)
20 nm; (d) 11 nm.
The same quantitative analysis method that was used to analyse the STM image
(a) (b)
(c) (d)

Chapter 5. Surface-based self-assembly of thymine functionalised porphyrins
120
shown in Figure 5,12 was applied to study the structural order of bi-component
networks formed by tetra-TP and PA under different conditions. The results of the
quantitative analysis for the STM images presented in Figure 5.16 are listed in Table
5.1.
STM
image
Mixture of tetra-TP
and PA
(mg/ml)
Molar
ratio of
tetra-TP
to PA
Composition of
ordered areas
% coverage of
ordered areas
Domain size
of ordered
areas (nm)
Figure
5.12
Tetra-TP: 0.031
PA: 0.089
1:16 Bi-component (16.9 ± 5.5) % 19 ± 7
Figure
5.16 (a)
Tetra-TP: 0.015
PA: 0.044
1:16 Bi-component (24.2 ± 16.2) % 39 ± 14
Figure
5.16 (b)
Tetra-TP: 0.034
PA: 1.6 × 10⁻³
4:1 Mono-component (5.3 ± 4.4) % 19 ± 5
Figure
5.16 (c)
Tetra-TP: 0.020
PA: 0.22
1:64 Bi-component (7.4 ± 2.3) % 16 ± 7
Figure
5.16 (d)
Tetra-TP: 5.6 × 10⁻³
PA: 0.38
1:383 Bi-component (1.4 ± 0.8) % 9 ± 1
Table 5.1. Summary of results for the quantitative analysis of the bi-component networks
formed by tetra-TP and PA under different sets of conditions.
In comparison with the network demonstrated in Figure 5.12, Figure 5.16 (a)
maintains the same tetra-TP to PA molar ratio (1:16) but the concentrations of tetra-TP
and PA are both decreased by half. At this molar ratio, the lower overall concentration
leads to the growth of the tetra-TP and PA co-crystal with larger domain sizes, and
lower coverage of disordered regions. This could be related to reduced kinetic trapping
of the adsorbed tetra-TP molecules. As discussed previously, the additional tetra-TP
molecules that are dissolved during the heating stage would precipitate on the HOPG
surface when the sample is cooled. At the lower overall concentration, the kinetic

Chapter 5. Surface-based self-assembly of thymine functionalised porphyrins
121
trapping effect is reduced leading to the growth of larger ordered domains compared
with the network shown in Figure 5.12.
In Figure 5.16 (b), the concentration of tetra-TP is the same is in Figure 5.12.
However, the molar ratio of tetra-TP to PA has been increased to 4:1 by lowering the
concentration of PA. In this case, the highly ordered regions change from the tetra-TP
and PA co-crystal to the tetra-TP mono-component self-assembled network surrounded
by disordered regions.
When the amount of PA is increased to a high level, for example in Figure 5.16 (c),
the ordered bi-component structures interspersed within the disordered regions display
much smaller domain sizes as compared with Figure 5.16 (a).
In Figure 5.16 (d), the molar ratio of PA to tetra-TP is further increased (1:383) by
lowering the concentration of tetra-TP. The large excess of PA molecules in comparison
to tetra-TP results in the favourable growth of disordered regions at the expense of the
ordered bi-component co-crystal.
The above results demonstrate that the formation of the self-assembled tetra-TP
and PA co-crystal is strongly related to the overall concentration and molar ratio of the
molecular species. The concentration and molar ratio dependency suggests the
significance of kinetic effects in the surface-based self-assembly of tetra-TP and PA. the
low solubility of tetra-TP molecules in the mixture of THF and TCB means that it is
difficult for the adsorbed tetra-TP on HOPG to desorb back into the solution. As a result,
the adsorbed tetra-TP and PA molecules are kinetically trapped on the HOPG surface.
Consequently, the re-organisation of the molecular system becomes more difficult and
the formation of ordered structures is reduced.
5.3.3 Tetra-TP and melamine
Molecular recognition between the diimide group of thymine derivatives and the
diaminopyridine group of melamine has previously been explored as a route to build up
a variety of self-assembled 2D nano-architectures. Example molecular systems include:
3D assemblies of melamine and thymine functionalised nanoparticles for the visual

Chapter 5. Surface-based self-assembly of thymine functionalised porphyrins
122
detection of tiny amounts of melamine in raw milk [202]; and 2D porous self-assembled
networks for guest adsorption under either UHV conditions [2] or at liquid-solid
interfaces [203]. Figure 5.17 illustrates the triple hydrogen bonding scheme that can be
observed between melamine and thymine derivatives.
Figure 5.17. Chemical structure of melamine and its non-covalent interaction with thymine via
three hydrogen bonds. Hydrogen bonds are marked by dashed red lines.
Melamine molecules were added to tetra-TP networks as linkers to form
bi-component 2D self-assembled networks driven by the above complementary
hydrogen bonding between melamine and thymine.
Figure 5.18 (a) presents an STM image with a scan size of 150 nm which shows
the formation of a tetra-TP and melamine bi-component network at the interface
between HOPG and DMSO-TCB. Some defects of the network are discernible at this
scale, for example: vacancies corresponding to missing tetra-TP; and dislocations at
domain boundaries (Figure 5.18 (b)). The large bright features visible in the image are
probably due to 3D aggregates of undissolved molecules (Figure 5.18 (c). the leakage
current caused by using DMSO as a solvent rather than THF or TCB meant that STM
tips imaging in DMSO needed to be brought closer to the surface by applying a lower
voltage and selecting a higher set-point tunnel current. Under these imaging conditions,
a larger current flows between the tip and the surface. Thus, the relative influence of the
leakage current resulting from the DMSO in the solvent mxiture can be reduced.
Melamine Thymine (T)

Chapter 5. Surface-based self-assembly of thymine functionalised porphyrins
123
Figure 5.18. (a) STM image of a self-assembled network formed by tetra-TP (5.0 × 10⁻³
mg/ml)
and melamine (0.050 mg/ml) at the liquid-solid interface. STM imaging conditions: Vs = - 0.45
V, It = 0.03 nA. Image size: 150 nm. Scale bar: 30 nm. (b) Magnified STM image of the region
marked by the dashed, white square in (a). (c) Line profile showing the apparent height of one
of the bright features in (a).
(a)
(b)
(c)

Chapter 5. Surface-based self-assembly of thymine functionalised porphyrins
124
Figure 5.19. (a) High resolution, drift-corrected STM images of the tetra-TP (2.4 × 10⁻⁴
mg/ml)
and melamine (0.090 mg/ml) network at the liquid-solid interface between HOPG and
DMSO/TCB. The unit cell for the tetra-TP and melamine structure is marked in white. STM
imaging conditions: Vs = - 0.5 V, It = 0.02 nA. Image size: 15 nm. Scale bar: 3 nm. (b) Geometry
optimised MM simulations of six melamine molecules surrounded by three tetra-TP molecules
with an underlying fixed graphene layer. (c) MM simulated molecular model for an extended
region of the tetra-TP and melamine network. The unit cell of the network is marked in red.
b
a
γ
γ
a
b
(a) (b)
(c)

Chapter 5. Surface-based self-assembly of thymine functionalised porphyrins
125
Higher magnification STM images were collected to determine the exact structure
of the bi-component tetra-TP and melamine self-assembled network and to measure its
unit cell dimensions. Figure 5.19 (a) shows a high resolution, drift-corrected STM
image on a HOPG surface covered with the tetra-TP and melamine network. From this
image we can see that the tetra-TP molecules adopt three orientations with respect to the
underlying surface. Each of the tetra-TP molecules has its central axis making an angle
of 120° with that of adjacent tetra-TP molecules. Using multiple measurements from
different regions of this STM image the lattice parameters of the network were
determined to be a = (4.4 ± 0.4) nm; b = (4.7 ± 0.5) nm; γ = 58 ± 2°. As can be seen
from the STM image, some of the larger pores in the structure are not empty, for
example the red, dashed ring marked in Figure 5.19 (a). In this molecular system, these
pores are highly likely to hold a ring of six melamine molecules leading to an increasing
number of hydrogen bonds. The reason for this STM image interpretation will be
discussed later in this section.
Based on the morphology and dimensions of the tetra-TP and melamine network
illustrated in STM images, tentative molecular models were built for the assembled
structure using MM simulations. Due to the calculation limit of the computer used to
run the HyperChem package, only one unit structure formed by the ring of six melamine
molecules surrounded by three tetra-TP molecules was geometrically optimised with a
fixed underlying graphene sheet taken into consideration (See Figure 5.19 (b). Figure
5.19 (c) is a tentative MM calculated model for the tetra-TP and melamine network with
all of its larger pores filled by the six-melamine rings. The unit cell parameters for the
tetra-TP and melamine network based on these simulations were calculated to be a = 5.0
nm; b = 5.2 nm; γ = 60°, in good agreement with the experimentally measured values.
More high resolution STM images were collected to verify the molecular model
shown in Figure 5.19 (c). Figure 5.20 shows an STM image in which the individual
melamine molecules that act as linkages between tetra-TP molecules can be resolved.
From the molecular model for one of the melamine junctions (Figure 5.20 (c)), each of
the tetra-TP molecules has an achiral arrangement and the four thymine groups of a
single tetra-TP adopt two different orientations.

Chapter 5. Surface-based self-assembly of thymine functionalised porphyrins
126
Figure 5.20. STM image of the tetra-TP (2.4 × 10⁻⁴
mg/ml) and melamine (0.090 mg/ml)
network allowing the identification of the individual melamine linkers. STM imaging conditions:
Vs = - 0.55 V, It = 0.015 nA. Image size: 12.5 nm. Scale bar: 2.5 nm. (b) Magnified STM image
showing a melamine linking its adjacent tetra-TP molecules by three melamine-thymine
hydrogen bond trimers. (c) Corresponding molecular structure of the melamine-linked junction.
Melamine molecules adsorbed in the larger pores of the tetra-TP and melamine
network were visible in some of the STM images, for example, in Figure 5.21 (a).
Details of the melamine assemblies within the pores as guest molecules can be seen
from Figure 5.21 (b). We suggest that six melamine molecules form a hexagonal
arrangement appearing as three bright spots in the STM images for two reasons. Firstly,
the unit cell dimensions of the model match those of the STM images. The stabilisation
and geometrical size of the hexagonal melamine self-assembled structure have also been
verified using DFT simulations [204]. Secondly, the hexagonal arrangement of six
melamine molecules is a commonly observed structural motif in other 2D
self-assembled systems containing melamine [205-207]. Moreover, the three-spot STM
feature for the porous melamine structure self-assembled at the liquid-solid interface is
similar to a previous observation of melamine ad-layers adsorbed at the air-HOPG
interface after solvent evaporation (Figure 5.22) [208]. Figure 5.21 (c) shows a
molecular model built for the melamine assemblies in the pore formed by three tetra-TP
(b) (a)
(c)

Chapter 5. Surface-based self-assembly of thymine functionalised porphyrins
127
molecules with different orientations of their central axis. The guest-host structure is
stabilised by six hydrogen bonding dimers between adjacent melamine molecules taking
opposite directions and six pairs of thymine-melamine hydrogen bonding trimers.
Figure 5.21. (a) STM image of the tetra-TP (2.4 × 10⁻⁴
mg/ml) and melamine (0.090 mg/ml)
network showing the melamine rings. STM scanning parameters: Vs = - 0.55 V, It = 0.015 nA.
Image size: 22 nm. Scale bar: 4.4 nm. (b) Magnified STM image of melamine adsorbed in a
large pore formed by three tetra-TP molecules. (c) Corresponding molecular model of the
nanostructure observed in (b). Dashed, red lines represent individual hydrogen bonds.
(a) (b)
(c)

Chapter 5. Surface-based self-assembly of thymine functionalised porphyrins
128
Figure 5.22. (a) STM image of 2D melamine self-assembly at the air HOPG interface. (b)
Corresponding molecular model. From reference [208].
The concentrations and molar ratios of tetra-TP and melamine were adjusted in an
attempt to explore other possible self-assembled structures and gain control over the
previously described ordered network. However, no other co-assembled structure was
observed to form between tetra-TP and melamine. Interestingly, tetra-TP on its own
cannot adsorb from the mixed solvent of DMSO and TCB onto HOPG to form the
mono-component network. Melamine molecules play an important role in the
adsorption of tetra-TP at the interface between HOPG and the solvent mixture of DMSO
and TCB. Further investigations on intermolecular interactions between tetra-TP,
melamine and solvent molecules are required to determine the reasons why tetra-TP
behaves in a different way at the interface between HOPG and DMSO/TCB.
5.4 Self-assembly of Zn-tetra-TP
The inclusion of zinc within the core of the thymine functionalised porphyrin opens up
several possibilities for building tuneable functional porphyrin assemblies at liquid-solid
interfaces controlled by metal-ligand coordination interactions [209-211]. In this section,
the results of STM investigations into the self-assembly of Zn-tetra-TP related
molecular systems will be discussed.
5.4.1 Zn-tetra-TP on its own
The STM image shown in Figure 5.23 (a) shows a Zn-tetra-TP mono-component
(a) (b)
(b)

Chapter 5. Surface-based self-assembly of thymine functionalised porphyrins
129
network self-assembled at the liquid-solid interface. Compared with the tetra-TP
network formed using a similar molar concentration (Figure 5.8), the Zn-tetra-TP
network has a lower coverage which was determined to be (80.0 ± 6.7 ) % by
calculating the average and standard deviation of four sets of data.
Figure 5.23. (a) STM image of the Zn-tetra-TP (0.028 mg/ml) network self-assembled at the
interface between HOPG and THF/TCB. Image size: 100 nm. Scale bar: 20 nm. STM scanning
conditions: Vs = - 0.5 V, It = 0.02 nA. (b) Magnified STM image showing detailed structure of
the Zn-tetra-TP network. Image size: 45 nm. Scale bar: 9 nm. STM scanning conditions: Vs = -
0.5 V, It = 0.03 nA. (c) Line profile showing the height of different porphyrin species.
(a)
(b)
(c)

Chapter 5. Surface-based self-assembly of thymine functionalised porphyrins
130
The reduced coverage of Zn-tetra-TP mono-component is most probably related to
its higher solubility in the mixture of THF and TCB (1:9). As discussed previously in
section 5.3.1, undissolved tetra-TP particulates were present in THF/TCB solutions at
concentrations as low as 0.03 mg/ml. However, no undissolved particulates were visible
for Zn-tetra-TP at the same concentration. Similar to the tetra-TP network, the
Zn-tetra-TP network is also weakly stabilised and proved difficult to image consistently
using STM.
More details concerning the structure of the Zn-tetra-TP network are revealed by
the higher magnification STM image presented in Figure 5.23 (b). Each Zn-tetra-TP
molecule appears as a bright feature in the image [212, 213]. The symmetrical
cruciform shape of the porphyrin molecules that was previously observed for the
tetra-TP network is not observed. However, the P2 plane symmetry of the porphyrin
lattice is still clearly resolved in the STM images. On first inspection, some Zn-tetra-TP
molecules appear to be missing from the 2D network leaving vacancies in the structure.
However, some of the holes within the network are not empty, but seem to be filled by
another molecular species with a much darker contrast in the STM image corresponding
to a lower topographic height. As illustrated in Figure 5.23 (c), line profiles can be taken
to measure the heights of the different molecular features in the STM image. By
calculating the average and standard deviation of multiple measurements the heights of
the Zn-tetra-TP and darker molecular species were determined to be (0.32 ± 0.04) nm
and (0.14 ± 0.05) nm respectively. This substitution impurity is highly likely to be
freebase tetra-TP which was not converted to Zn-tetra-TP during the synthesis
procedures for the porphyrin raw materials [214, 215]. If this is the case, the hydrogen
bonding scheme between Zn-tetra-TP molecules should be identical as that for tetra-TP.
5.4.2 Zn-tetra-TP and freebase tetra-TP
In order to confirm the hypothesis that the features with different contrasts observed in
Figure 5.23 correspond to freebase and Zn containing porphyrins, mixed solutions of
tetra-TP and Zn-tetra-TP were used to form network structures. A mixed solution with a

Chapter 5. Surface-based self-assembly of thymine functionalised porphyrins
131
1:4 molar ratio of tetra-TP and Zn-tetra-TP was used to form a molecular network at the
interface between HOPG and THF/TCB.
Figure 5.24. (a) STM image of the network formed using a mixture of Zn-tetra-TP (0.040 mg/ml)
and freebase tetra-TP (0.010 mg/ml) at the liquid-solid interface. Image size: 115 nm. Scale bar:
23 nm. STM scanning conditions: Vs = - 0.65 V, It = 0.015 nA. (b) Line profile showing the
heights of bright and dark porphyrin species.
The molecular network formed by the self-assembly of these two porphyrin species
is presented in Figure 5.24 (a). The resulting 2D network shows a mixed composition of
bright and dark contrast porphyrins distributed within a single domain of the tetra-TP
square lattice. Therefore, the adsorption fashion and thymine-thymine hydrogen
bonding recognition of Zn-tetra-TP should be exactly the same as those of tetra-TP. The
result of the mixing experiment suggests an identical unit cell structure of the
Zn-tetra-TP monocomponent network to that of the tetra-TP. By measuring surface
areas covered with the bright and dark porphyrins in Figure 5.24 (a), the percentage of
the bright and dark porphyrins were calculated to be 33.1 % and 66.9 %, respectively.
As shown in Figure 5.24 (b), the heights of the bright and dark porphyrins were
measured by taking line profiles. By calculating the average and standard deviation of
(a)
(b)

Chapter 5. Surface-based self-assembly of thymine functionalised porphyrins
132
multiple measurements, the heights of the bright and dark porphyrins were determined
to be (0.28 ± 0.04) nm and (0.15 ± 0.02) nm, respectively.
5.4.3 Zn-tetra-TP and PA
Figure 5.25 shows an STM image recorded for the self-assembled network formed by
Zn-tetra-TP and 9-propyladenine (PA). In this STM image, the mixture of Zn-tetra-TP
(0.040 mg/ml) and PA (0.043 mg/ml) in THF and TCB (1:9 in volume) was deposited
onto a HOPG surface at room temperature. The two components self-assembled into a
combination of highly ordered bi-component regions and disordered regions occupying
the areas between ordered domains. For the STM image shown in Figure 5.25, the
percentage of porphyrins within disordered regions was estimated to be 35.1 %. By
calculating the average and standard deviation of eight domain size values collected
from this STM image, the average domain size of the ordered areas was measured to be
(23 ± 5) nm.
Figure 5.25. STM images recorded at room temperature for the Zn-tetra-TP (0.040 mg/ml) and
PA (0.043 mg/ml) network deposited from a mixed solution onto a HOPG substrate without
pre-heating. Imaging parameters: Vs = - 0.65 V, It = 0.015 nA. Image size: 150 nm. Scale bar:
30 nm.

Chapter 5. Surface-based self-assembly of thymine functionalised porphyrins
133
Figure 5.26. Typical STM images collected at sequentially elevated temperatures for the
Zn-tetra-TP (0.040 mg/ml) and PA (2.2×10⁻⁴
mg/ml) co-assembled structures. (a) 50 ºC. (b) 60
ºC. STM imaging conditions are both: Vs = - 0.65 V, It = 0.015 nA. Both image sizes are 200 nm.
Both scale bars are 40 nm.
In-situ STM investigations were carried out to study the morphology of the
Zn-tetra-TP and PA co-assembled networks at elevated temperatures. First, an STM
(a)
(b)

Chapter 5. Surface-based self-assembly of thymine functionalised porphyrins
134
sample was prepared using the previously described method used for the bi-component
network. The STM sample was then heated up to 50 ºC, 60 ºC and 70 ºC in a step by
step fashion. STM images were collected after each temperature increase. Less than 30
minutes were spent collecting STM images at each temperature in order to minimise the
influence that solvent evaporation would have on the solution concentration.
Figure 5.26 (a) shows an STM image of the Zn-tetra-TP and PA network taken at
50 ºC. Highly ordered domains of the bi-component co-crystal structure were observed
on the surface. Within the co-crystal domains, the two distinct contrasts for the
porphyrin molecules was still visible. The average domain size of the ordered regions
was measured to be (38 ± 14) nm by calculating the average and standard deviaiton of
eight sets of data. A similar morphology of the Zn-tetra-TP and PA network was formed
at 60 ºC (Figure 5.26 (b)). The average domain size of the ordered bi-component
networks was determined to be (36 ± 14) nm. This value shows no significant change
compared with the network imaged at 50 ºC. When the STM sample was heated up to
70 ºC, no structure was observed in the STM images. Therefore, we assume that the
network had decomposed and potentially the molecules had desorbed back into the
solution. At temperatures above 60 ºC, the bi-component network was destroyed
possibly due to a stronger preference for desorption of the molecular components or the
disruption of the intermolecular hydrogen bonding.
5.5 Conclusions
Highly ordered and extended tetra-TP arrays with a square-shape unit cell have been
prepared at the interface between HOPG and organic solvent mixtures. The formation of
these structures was driven by thymine-thymine hydrogen bonds. The mono-component
tetra-TP network can be disrupted by the addition of 9-propyladenine (PA) molecules
into the molecular system. The addition of PA leads to the formation of a co-crystal of
tetra-TP and PA stabilised by inter-adenine hydrogen bonding and Watson-Crick type
[175] thymine-adenine interactions. The formation of the co-crystal structure depends
strongly on the overall concentration and molar ratio of the two components, indicating

Chapter 5. Surface-based self-assembly of thymine functionalised porphyrins
135
that kinetic effects play an important role in the self-assembly process. More diverse
bi-component tetra-TP nanostructures can be built by including melamine. Directed by
the triple hydrogen bonding interaction between melamine and thymine, tetra-TP and
melamine self-assemble into bi-component nanostructures at the interface between
HOPG and DMSO/TCB. In the tetra-TP-melamine network, melamine molecules not
only link tetra-TP molecules stabilised by the triple melamine-thymine hydrogen
bonding, but also self-assemble within the pores of the bi-component network as guest
molecules.
Similar to the self-assembly behaviour of tetra-TP, Zn-tetra-TP can also form
mono-component networks at the interface between HOPG and THF/TCB. Impurities in
the Zn-tetra-TP raw material that consist of zinc free tetra-TP molecules lead to the
formation of substitutional defects in the Zn-tetra-TP network.
PA can also be used to grow ordered co-crystal structures in combination with
Zn-tetra-TP. Compared with tetra-TP, Zn-tetra-TP has the potential to construct more
complex molecular structures at interfaces driven by the axial coordination interactions
between the central zinc atom and suitable complex forming ligands such as pyridine.
5.6 Future work
The results obtained in this chapter demonstrate a novel strategy for the formation of
highly ordered porphyrin arrays using the selective and directional hydrogen bonding
interactions between DNA nucleobase functional groups. In addition to the
thymine-adenine interactions studied here, other molecular recognition between DNA
bases can be incorporated to prepare more complex surface-based self-assembled
structures. In terms of organic synthesis, a variety of other DNA nucleobase
functionalised molecules could be designed to generate more complex self-assembled
molecular surface structures.
The observation of chiral domains within both the tetra-TP mono-component
network and the tetra-TP and PA network opens the route for using these systems to
study 2D chirality. More efforts can be put into controlling the chirality of these

Chapter 5. Surface-based self-assembly of thymine functionalised porphyrins
136
self-assembled networks. For example, adding a chiral component to see if it leads to a
preferred chiral arrangement.
The coordination of the central Zn atom of Zn-tetra-TP with a pyridine ligand
creates opportunities to extend the self-assembly of mono-layers to bi-layers by binding
other axial ligands leading to more applications for the porphyrin assembles. Since the
Zn-tetra-TP mono-component network can be easily disrupted by STM imaging, more
studies are required to form Zn-tetra-TP arrays with higher stability. A potential solution
would be to attempt self-assembly of Zn-tetra-TP with a similar tetra adenine
functionalised porphyrin species. The selective hydrogen bonding between thymine and
adenine will open up the possibility of forming far more complex 2D arrangements. The
increased structural complexity will result in more new properties of 2D self-assembled
porphyrin structures for potential applications in catalysis, sensors and molecular
electronics.

137
Chapter 6
On-surface synthesis and characterisation of
mono-layer covalent-organic frameworks
The formation of surface-supported two-dimensional covalent organic frameworks
(2D-COFs) via Schiff-base condensation reactions between either
5,10,15,20-meso-tetra(4-aminophenyl) porphyrin (TAPP) or
5,10,15,20-meso-tetra(4-aminophenyl) porphyrin Zn(II) (ZnTAPP) and
benzene-1,4-dicarboxaldehyde (BDA) has been investigated. Through careful control of
environmental conditions during growth, highly ordered 2D-COFs were synthesised on
HOPG with domain sizes larger than 100 nm. The morphology of the porphyrin
2D-COFs was studied using a combination of STM and AFM. Additionally, XPS was
employed as a complementary spectroscopic technique to SPM to reveal the chemical
composition of the 2D-COFs. Our XPS results show the co-existence of conjugated
imine and non-conjugated hemiaminal links between the porphyrins after Schiff-base
condensation reactions. The chemical compositions of the links are closely related to the
electronic properties of the 2D-COF. Our findings highlight the importance of
investigating both the morphological and chemical structure of 2D-COFs utilising
complementary experimental techniques.
6.1 Introduction
Due to the intrinsic weakness of noncovalent interactions in comparison to covalent
bonds, 2D self-assembled molecular networks often have low levels of thermal and
chemical stability. This instability can hinder the use of non-covalently stabilised
molecular networks in technological applications. An effective solution to this problem
is to link molecular components using covalent bonds. The concept of covalent-organic

Chapter 6. On-surface synthesis and characterisation of mono-layer covalent-organic frameworks
138
frameworks (COFs), where molecular building blocks are linked by strong covalent
bonds, was first reported by Côté and Yaghi et al. [68]. Their paper presented the
synthesis of highly robust and thermally stable porous bulk 2D-COFs based on the
dehydration reaction between diboronic acid and hexahydroxy triphenylene. These bulk
2D-COFs consist of 2D covalently stabilised layers stacked on top of each other with
non-covalent interactions between the different layers. With the decrease in material
dimensions from bulk to 2D, surface-based covalently bonded networks have evolved
into an active area of research. The interest in surface-based 2D-COFs has arisen as a
result of the stability of covalent bonds and the diversity of synthetic monomers that are
available [216]. The most commonly used reaction schemes to grow long-range ordered
2D-COFs on solid surfaces are boronic acid and Schiff-base condensation reactions.
These poly-condensation reactions are reversible and thus can be modulated by
thermodynamic equilibrium conditions.
To address the current challenge of growing high-quality 2D-COFs over large
surface areas, the growth of porphyrin 2D-COFs via an amine-aldehyde condensation
reaction on a HOPG surface has been investigated. The morphology and chemical
properties of the resulting 2D-COF materials were then characterised using a
combination of STM, AFM and XPS. In this chapter, experimental results on two
molecular systems are presented. Firstly, 2D-COFs were formed on HOPG via
Schiff-base condensation reactions between freebase TAPP and BDA. Secondly, a
zinc-containing amine functionalised porphyrin, ZnTAPP, was used as a molecular
building block to grow 2D-COFs also using BDA as a linking molecule.
6.2 Experimental methods
6.2.1 Synthetic route
In this section, the reaction scheme designed to activate the Schiff-base condensation
reactions between the amine groups on TAPP (Figure 6.1 (a)) or ZnTAPP (Figure 6.1
(b)), and the aldehyde groups on BDA (Figure 6.1 (c)) is presented.

Chapter 6. On-surface synthesis and characterisation of mono-layer covalent-organic frameworks
139
The porphyrin molecules, TAPP and ZnTAPP, were synthesised as part of a
collaboration with Hugo Bronstein’s group at UCL. In the synthetic scheme for TAPP,
freebase tetra(4-nitrophenyl)porphyrin was initially synthesised via the
cyclotetramerisation of pyrrole and p-nitrobenzaldehyde [217]. The nitro groups were
then reduced to amines by adopting a method previously described in the literature
[218]. Freebase TAPP was metallated with zinc to produce ZnTAPP [219]. Other
chemicals, benzene-1,4-dicarboxaldehyde (BDA), copper sulphate (CuSO4∙5H2O),
toluene (anhydrous, 99.8 %), chloroform (anhydrous, > 99%) and
1,2,4-trichlorobenzene (anhydrous, > 99%), were purchased commercially from
Sigma-Aldrich and used in the experiments directly without any further purification.
The substrates, highly-oriented pyrolytic graphite (HOPG) (12 mm × 12 mm,
grade-ZYB) were purchased from Bruker. The components in the reaction vessel
(Figure 6.2) including the 15 mL glass tube, PTFE screw cap and CAPFE O-ring seal
were ordered from ACE Glass Inc.
Figure 6.1. (a) Molecular structures of TAPP and BDA. Schiff-base condensation reaction
between BDA and TAPP for the synthesis of 2D-COFs. (b) Molecular structure of ZnTAPP.
The glass tube shown in Figure 6.2 was used as a reaction vessel for the fabrication
(a)
(b)
TAPP
ZnTAPP
BDA
-H2O

Chapter 6. On-surface synthesis and characterisation of mono-layer covalent-organic frameworks
140
of porphyrin 2D-COFs. For the purpose of promoting reversibility of the Schiff-base
condensation reaction, a small amount of copper(II) sulphate pentahydrate
(CuSO4∙5H2O) was added in the tube as an equilibrium regulator [64]. One of the
precursor molecules, TAPP (or ZnTAPP), was deposited from toluene solutions onto a
freshly cleaved HOPG surface in small quantities (0.1 –1.0 μg). After evaporation of the
toluene, the HOPG substrate with deposited TAPP (or ZnTAPP) was loaded into the
reaction vessel. The other reactant, BDA, was placed onto the inside wall of the reaction
vessel either as solid or by drop deposition from a solution using a volatile solvent such
as toluene or chloroform. The sealed reaction vessel was then heated slowly to a high
temperature at 120 °C – 150 °C using a laboratory oven. The sample was kept at the
elevated temperature for between 2 and 24 hours. At these high temperatures, the BDA
(melting point: 114 °C – 116 °C) vaporises within the sealed reaction vessel.
Figure 6.2. The glass tube used as the reaction vessel for the formation of porphyrin 2D-COF at
the vapor-solid interface.
As can be seen from Figure 6.3, the BDA molecules present in the vapour phase
react with the porphyrin molecules on the solid surface forming 2D-COF structures.
After the glass tube was removed from the oven, its cap was opened immediately. The
HOPG piece was taken out of the tube promptly to avoid water condensation on the
surface. The sample was then allowed to cool down naturally prior to characterisation
experiments.
BDA deposited in small
quantities.
Porphyrins deposited from
solution to HOPG.
CuSO4∙5H2O added as an
equilibrium regulator.
Reaction vessel sealed and
heated in oven.

Chapter 6. On-surface synthesis and characterisation of mono-layer covalent-organic frameworks
141
Figure 6.3. Schematic diagram showing the growth of highly ordered porphyrin 2D-COFs at the
interface between the BDA vapour and the HOPG surface with deposited TAPP or ZnTAPP.
6.2.2 Morphology characterisation
The molecular scale morphology of the porphyrin 2D-COFs was investigated using
STM operating under ambient conditions. All STM imaging of the 2D-COF structures
was carried out using a PicoSPM (Agilent) system operating in constant-current mode
at ambient conditions. For some of the STM images, a drop of 1-phenyloctane was
deposited on HOPG to improve the resolution of the STM imaging. Several of the
high-resolution STM images were drift-corrected by using the lattice parameters of the
underlying HOPG as a reference.
The morphology of the drop deposited porphyrin films and resulting 2D-COFs was
examined at micrometer scales using Multimode8 (Bruker) and Cypher (Asylum
Research) AFM systems. SCANASYST-AIR AFM cantilevers (Bruker) were used for
all the AFM images collected on Bruker Multimode 8 AFM in PeakForce Tapping mode.
These cantilevers were silicon tips on nitride levers with a force constant of 0.4 N/m
and a resonant frequency of 70 kHz.
Apart from drift-corrected STM images, all STM and AFM images presented in
this Chapter have undergone no further imaging processing other than flattening.
6.2.3 Chemical structure characterisation
In order to study the chemical changes induced by 2D-COF formation, XPS
measurements were first performed on HOPG surfaces with unreacted TAPP (or
TAPP or ZnTAPP
BDA
Covalent bond
Annealing
HOPG
BDA and
water vapour
Deposited
porphyrins

Chapter 6. On-surface synthesis and characterisation of mono-layer covalent-organic frameworks
142
ZnTAPP) films that had not undergone the 2D-COF growth process. These
measurements could then be directly compared to XPS measurements taken from
2D-COF samples in order to study the chemical changes brought about by the covalent
network formation.
A Thermo Scientific K-Alpha instrument equipped with a monochromatic Al Kα
X-ray source (1486.6 eV) was used to perform the XPS characterisation. In order to
avoid charge accumulation on the surfaces, a low-energy argon-ion gun (< 10 eV) was
switched on during the acquisition of all XPS scans presented in the project. The TAPP
2D-COF samples were transferred to UHV following 2D-COF formation. The TAPP
control samples were loaded into UHV directly without undergoing any heating steps.
The samples were made as close to to the date of XPS analysis as possible. If any
waiting between sample fabrication and XPS analysis was required, the samples were
stored inside a lab desicator to avoid exposure to moisture. For each of the TAPP control
and 2D-COFs samples, XPS signals were collected over binding energy regions
associated with the C1s, O1s and N1s core levels. Survey scans were also acquired to
give an overview of possible photoelectron emission from other species present on the
surface. Multiple XPS scans were carried out for several different samples for each type
of sample composition in order to ensure the reproducibility and consistency of the XPS
peak shapes and binding energies. STM was used to confirm the formation of 2D-COF
structures before sending samples for XPS scans. After XPS analysis, STM experiments
on the samples were carried out to confirm that the structures were not destroyed by the
measuring process. Based on results from a large number of STM and XPS experiments
on 2D-COFs, it is found that good quality XPS spectra could be obtained only when
highly ordered 2D-COFs were observed via STM to grow over extended areas on the
HOPG surface.
CasaXPS software was utilised to analyse the XPS data. A Shirley background was
fitted to the area of interest for each XPS spectrum. The XPS peaks identified in the
spectra were fitted with Gaussian-Lorentzian peak shapes. For all the XPS spectra, the
binding energy positions of C1s peaks were consistently at 284.7 ± 0.1 eV which is
often used as a reference when comparing binding energies with values in literature.

Chapter 6. On-surface synthesis and characterisation of mono-layer covalent-organic frameworks
143
This also means that direct comparisons of binding energy values between our samples
without further correction are feasible. Various constraints (position and full width at
half maximum) were applied to the XPS peaks during the fitting process. Detailed
information of the starting positions for the constraints will be discussed in the
experimental results chapter.
6.3 TAPP COFs
6.3.1 Morphology studies
In this section, three aspects on the morphology studies of the formation of the
2D-COFs will be discussed in detail. They include: the morphological structure of the
2D-COFs; experimental conditions during the growth of the 2D-COFs; and the
relationship between the homogeneity of the porphyrin films prepared by drop
deposition and the quality of the resulting TAPP/BDA 2D-COFs.
The STM and AFM results of the morphology studies illustrate the optimum
experimental parameters for the growth of high-quality TAPP/BDA 2D-COFs. These
conditions include: the temperature to activate the amine-aldehyde reactions; the
concentration of the molecular components; the purity of porphyrins deposited on
surfaces and the partial pressure of water released by CuSO4∙5H2O on heating. The
homogeneity of the porphyrin films formed by drop deposition from solution has been
demonstrated to be closely related to the quality of the 2D-COFs after the growth
process.
Morphological structure of the 2D-COFs
STM images of TAPP/BDA 2D-COFs grown using TAPP films that were drop
deposited from toluene solutions display a structure with a p4 symmetry. Figure 6.4 (a)
and (b) present two STM images of TAPP/BDA 2D-COFs with scan sizes of 150 nm
and 250 nm, respectively. The highly ordered TAPP 2D-COF structures display domain

Chapter 6. On-surface synthesis and characterisation of mono-layer covalent-organic frameworks
144
sizes in excess of 100 nm and almost complete coverage of the HOPG surface. Under
ambient conditions, other attempts have been made to grow identical surface-supported
TAPP/BDA 2D-COFs either at solid-liquid interfaces [73] or by depositing both
reactants onto the substrate [76]. Compared with structures previously reported in
literature, the domain sizes observed for the TAPP/BDA 2D-COFs presented here that
have been grown at the vapour-solid interface are larger than 100 nm for the first time.
The detailed structure of the TAPP 2D-COFs is revealed by the high-resolution
STM image shown in Figure 6.4 (c). This STM image has undergone drift-correction by
using the lattice parameters of the underlying HOPG substrate. The cruciform-shaped
bright features in the image, one of which is highlighted using a white, dashed circle in
Figure 6.4 (c), correspond to the conjugated porphyrin cores of TAPP. Ten sets of unit
cell parameters were taken from the dirft-corrected STM image presented in Figure 6.4
(c). The average of the ten measurements were used as the measured values. The
associated errors of the measured values were obtained by calculating the standard
deviations of the ten sets of data. As a result, the unit cell parameters of TAPP/BDA
2D-COF were determined to be a = b = 2.6 ± 0.2 nm and γ = 89 ± 3°.
S. Lei et al. have carried out DFT simulations of TAPP/BDA 2D-COF structures
[76]. In their DFT simulations, a primitive cell with 110 atoms was calculated and the
the surface was included. The distance between TAPP molecules linked together by
BDA via Schiff-base condensation reactions was calculated to be 2.6 ± 0.1 nm. This
DFT calculation acts as a theoretical support for the experimental measurement of
TAPP/BDA 2D-COFs conducted by M. Kunitake et al. using in situ STM scanning at
the liquid-solid interface [73]. In comparison, the unit cell values determined for the
TAPP/BDA 2D-COFs presented here, which were grown at the solid-vapour interface
are in good agreement with those previously reported. The close match between the
dimensions of the DFT simulated 2D-COFs and our experimentally measured structures
is strong evidence supporting the formation of covalent bonds between TAPP and BDA.

Chapter 6. On-surface synthesis and characterisation of mono-layer covalent-organic frameworks
145
Figure 6.4. STM images and schematic representation of TAPP/BDA 2D-COFs. (a)-(b)
Large-scale STM images. Growth conditions: 0.15 g of CuSO4∙5H2O; ~ 1 mg of BDA as solid;
20 µl of 0.2 mg/ml TAPP in toluene (saturated); 2 hours at 150 ºC. Imaging parametres are both
Vs = -0.55 V, It = 20 pA. Image sizes: (a) 150 nm (scale bar: 30 nm); (b) 250 nm (scale bar: 50
nm). (c) Drift-corrected STM image with a porphyrin core marked in a white, dashed circle.
Imaging parameters: Vs = -0.3 V, It = 5 pA. Image size: 10 nm (scale bar: 2 nm). (d) Schematic
diagram of the unit cell of TAPP/BDA 2D-COF structures with a p4 symmetry.
Figure 6.4 (d) shows a schematic diagram of a unit cell of the TAPP/BDA 2D-COF
in which all imine linkages adopt a trans-conformation. Due to the structural flexibility
of the aldehyde groups of BDA, the resulting imine linkages can lie either at the same
side (cis-conformation) or the opposite side (trans-conformation) with respect to the
(a) (b)
(c) (d)
a
b
γ a
b
γ

Chapter 6. On-surface synthesis and characterisation of mono-layer covalent-organic frameworks
146
molecular axis between two adjacent porphyrin cores (see Figure 6.5). The
trans-conformation of imine linkages has been demonstrated to be more energetically
favourable than the cis-conformation [76]. In real experimental systems, the less stable
cis-conformation could exist due to kinetic trapping [220]. Direct observations of trans-
and cis-conformation are achievable from STM images, where the four lobes of a TAPP
molecule are visible. For the STM images collected in this work, the two conformations
of the TAPP/BDA 2D-COFs are not discernible directly. Since highly ordered unit cells
are observed within each domain, the imine linkages could not adopt a mixture of the
two conformations in each unit cell. Under the condition that the TAPP/BDA 2D-COFs
exhibit long-range order, the orientation of the covalent imine linkages shown in Figure
6.4 (d) is proposed.
Figure 6.5. Schematic diagrams of the two possible conformations of the imine linkages
between TAPP and BDA. (a) Trans-conformation. (b) Cis-conformation.
Multi-layered structure of the 2D-COFs
In some areas of the HOPG surfaces covered by TAPP/BDA 2D-COFs,
multi-layered structures of the covalently bonded porphyrin sheets are observed by
STM. Figure 6.5 (a)-(d) are four STM images showing the growth of multi-layers or
bi-layers of TAPP/BDA 2D-COFs on HOPG. The multi-layer 2D-COFs appear as
brighter sheets in the STM images compared with the mono-layer regions. The
multi-layer regions are recorded as areas of higher features, because the STM tip moves
vertically away from the surface to maintain the set-point tunnel current.
(a) (b)
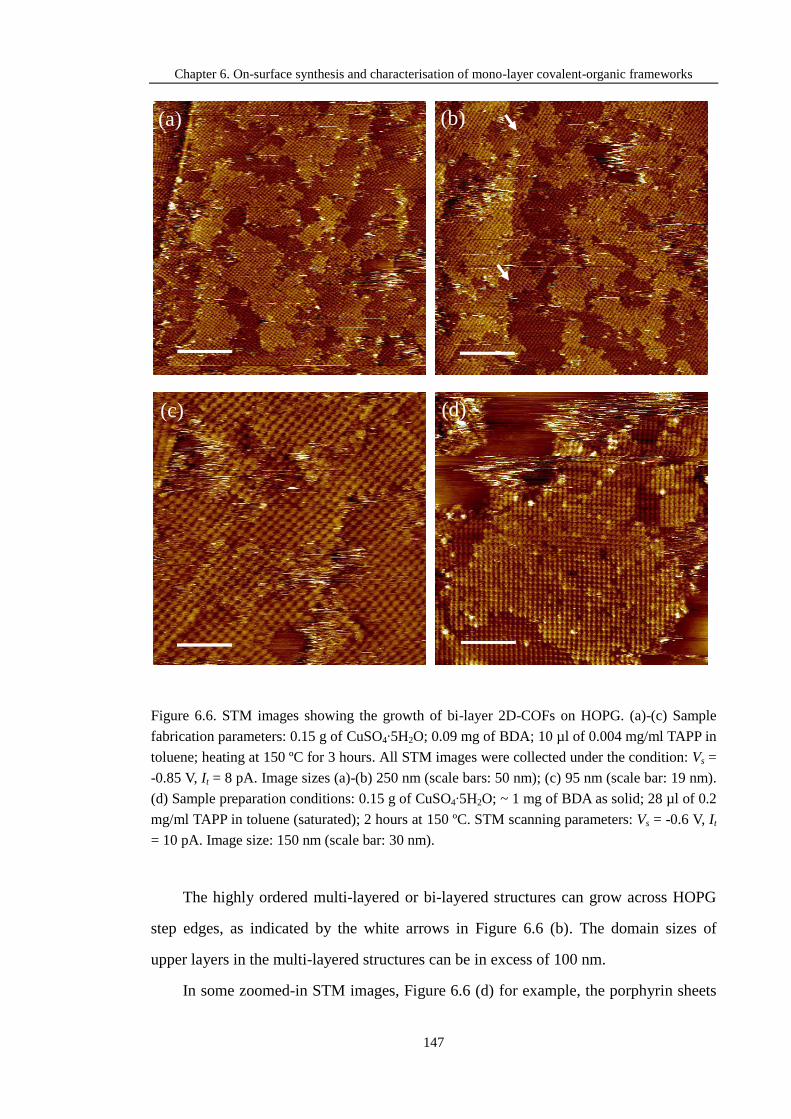
Chapter 6. On-surface synthesis and characterisation of mono-layer covalent-organic frameworks
147
Figure 6.6. STM images showing the growth of bi-layer 2D-COFs on HOPG. (a)-(c) Sample
fabrication parameters: 0.15 g of CuSO4∙5H2O; 0.09 mg of BDA; 10 µl of 0.004 mg/ml TAPP in
toluene; heating at 150 ºC for 3 hours. All STM images were collected under the condition: Vs =
-0.85 V, It = 8 pA. Image sizes (a)-(b) 250 nm (scale bars: 50 nm); (c) 95 nm (scale bar: 19 nm).
(d) Sample preparation conditions: 0.15 g of CuSO4∙5H2O; ~ 1 mg of BDA as solid; 28 µl of 0.2
mg/ml TAPP in toluene (saturated); 2 hours at 150 ºC. STM scanning parameters: Vs = -0.6 V, It
= 10 pA. Image size: 150 nm (scale bar: 30 nm).
The highly ordered multi-layered or bi-layered structures can grow across HOPG
step edges, as indicated by the white arrows in Figure 6.6 (b). The domain sizes of
upper layers in the multi-layered structures can be in excess of 100 nm.
In some zoomed-in STM images, Figure 6.6 (d) for example, the porphyrin sheets
(a) (b)
(c) (d)

Chapter 6. On-surface synthesis and characterisation of mono-layer covalent-organic frameworks
148
in upper layers are observed to be commensurate with the 2D-COF layers underneath.
As illustrated in Figure 6.7, the porphyrin cores in upper layers are sitting directly above
those in layers below. The revelation of accurate structures of multi-layer TAPP
2D-COFs has significant implications for the application of 2D-COFs as templates for
guest adsorption and as components in electronic devices. The varying depth of pores in
multi-layered TAPP/BDA 2D-COFs would change the adsorption energy of guest
molecules on the surface. The electronic structure of the bi-layer 2D-COFs may also be
different from that of the mono-layer due to inter-layer coupling interactions,
Figure 6.7. Schematic illustrations of the multi-layer growth of TAPP/BDA 2D-COFs on a
HOPG surface. (a) Top view. (b) 3D view.
Figure 6.8 shows an example line profile taken across the edge of a bi-layer
structure to determine the apparent thickness of mono-layer and bi-layer TAPP/BDA
2D-COFs in STM images. For the mono-layers or bi-layers, repeated measurements
were taken from 6 different line profiles from 3 different STM images (two line profiles
in each image). In each of the line profiles, 3 - 5 height values for porphyrin cores were
acquired. An average of the height values was taken as the result of the individual line
profile. Using this analysis method, 6 measured heights were collected for the bi-layers
or mono-layers. The final measured height of the bi-layers or mono-layers was the
average value calculated from the 6 measurements. The error associated with the
(c)
HOPG
COF layer underneath
Upper COF layer
Porphyrin core
(a) (b)

Chapter 6. On-surface synthesis and characterisation of mono-layer covalent-organic frameworks
149
measured height was the standard deviations of the 6 measurements. Consequently, the
apparent height of single-layer TAPP/BDA 2D-COFs was measured to be 0.7 ± 0.2 nm.
The apparent height of bilayer TAPP/BDA 2D-COFs was determined to be 1.0 ± 0.4
nm.
Figure 6.8. High-resolution STM image and its height profile (solid, blue line) that demonstrate
the formation of bi-layers on the 2D-COFs. (a) An STM image showing the growth of bi-layers.
Sample preparation conditions: 0.15 g of CuSO4∙5H2O; 0.09 mg of BDA; 10 µl of 0.004 mg/ml
TAPP in toluene; 3 hours at 150 ºC. STM scanning parameters are Vs = -0.85 V, It = 8 pA. Image
size is 65 nm (scale bar: 13 nm). (b) Line profile taken through the edge of the bi-layer
TAPP/BDA COF structure (corresponding to the green, dashed line in (a)).
(b)
(a)

Chapter 6. On-surface synthesis and characterisation of mono-layer covalent-organic frameworks
150
Growth conditions
In this section, three growth factors that have a substantial influence on the
morphology of the porphyrin 2D-COFs will be discussed. These factors include the
amount of CuSO4·5H2O added to regulate the equilibrium of the Schiff-base
condensation reaction and the concentration and purity of TAPP/toluene solutions drop
deposited onto the HOPG surface.
CuSO4·5H2O was added to the glass reaction vessel (Figure 6.2) as an equilibrium
regulator. When heated, CuSO4·5H2O undergoes a dehydration process releasing water
[221]. An increase in the number of water molecules in the vapour above the HOPG
surface shifts the equilibrium of the Schiff-base condensation reaction towards the
reactants. This increase in the reversibility of the Schiff-base condensation reaction
helps to eliminate defects in the growing 2D-COFs and leads to the formation of highly
ordered structures. The amount of CuSO4·5H2O has been found to have an effect on the
morphology of resulting TAPP/BDA 2D-COF structures.
Figure 6.9 (a) - (c) presents three typical STM images of the porphyrin 2D-COFs
synthesised with different amounts of CuSO4·5H2O. When all other growth conditions
were identical, 0.1 g, 0.15 g, 0.25g of CuSO4·5H2O were added into three 15 ml
pressure tubes, respectively. Even though the amount of CuSO4·5H2O was varied over a
relatively small range, the morphology and degree of order of the TAPP 2D-COFs
changed significantly.
With 0.15 g of CuSO4·5H2O, good-quality TAPP/BDA 2D-COFs were formed
with few unreacted TAPP molecules trapped between domain boundaries (see Figure
6.9 (b)).
On increasing the amount of CuSO4·5H2O to 0.25 g, the coverage and domain
sizes of the TAPP 2D-COFs decreases drastically (Figure 6.9 (c)). As all other
fabrication conditions are identical to the cases of 0.1 g and 0.15 g of CuSO4·5H2O, the
change in morphology is likely to be caused by the excessive amount of water released
by the CuSO4·5H2O. The increase in water pressure at the vapour-solid interface drives
the equilibrium of the Schiff-base condensation reactions towards the unreacted

Chapter 6. On-surface synthesis and characterisation of mono-layer covalent-organic frameworks
151
components hindering the synthesis of highly ordered TAPP/BDA 2D-COF structures.
Figure 6.9. STM images of freebase TAPP COF structures fabricated with various amounts of
copper sulphate. (a) 0.1 g of CuSO4·5H2O. Scale bar: 30 nm. (b) 0.15 g of CuSO4·5H2O. Scale
bar: 20 nm. (c) 0.25 g of CuSO4·5H2O. Scale bar: 30 nm. Scanning conditions: (a) Vs = -0.6 V;
It = 0.013 nA. (b) Vs = -0.6 V; It = 0.015 nA. (c) Vs = -0.85 V; It = 0.01 nA.
When decreasing the amount of CuSO4·5H2O from 0.15 g to 0.1 g, a significant
change in the structural order of the porphyrin 2D-COFs occurs. As can be seen in
Figure 6.9 (a), a large amount of disordered structure between domain boundaries is
observed appearing as higher features on the surface. These disordered regions are
(a) (b)
(c)

Chapter 6. On-surface synthesis and characterisation of mono-layer covalent-organic frameworks
152
likely to be unreacted or partially reacted TAPP molecules kinetically trapped between
domains during the formation of the TAPP 2D-COFs. In contrast to the case of 0.25 g of
CuSO4·5H2O, the stacking of porphyrin molecules between domain boundaries
demonstrates an insufficient reversibility of the Schiff-base reaction under the condition
of 0.1 g of CuSO4·5H2O. This lack of reversibility prevents defect removal from the
growing 2D-COF. Another difference between the morphology of the 2D-COFs
synthesised using 0.1 g and 0.25 g of CuSO4·5H2O exists at the edges of the 2D-COFs.
The results of adding 0.1 g of CuSO4·5H2O show less obstacle to the imine growth as
no disordered structure was observed at the edges between the 2D-COFs and bare
HOPG.
From the various different quantities of CuSO4·5H2O tested, the water vapour
pressure released by heating 0.15 g of CuSO4·5H2O at 120 °C - 150 °C (the most
commonly used temperature ranges in this project) has proven to be the optimal
condition for the 15 mL glass reaction vessel in terms of the quality of resulting
TAPP/BDA 2D-COFs.
Careful control over the concentration of TAPP/toluene solutions is required to
grow good-quality mono-layer TAPP/BDA 2D-COFs on HOPG. Deposition of highly
concentrated TAPP/toluene solutions is more likely to lead to the growth of multi-layer
TAPP/BDA 2D-COFs as presented previously. When lowering the concentration of
TAPP/toluene solutions deposited on HOPG, mono-layer porphyrin 2D-COFs can form
on HOPG with large domain sizes in excess of 100 nm over extended areas. In Figure
6.10, two STM images (Figure 6.10 (a) and (b)) are presented as experimental evidence
for the growth of mono-layer TAPP/BDA 2D-COFs when depositing TAPP molecules
from diluted toluene solutions. The average size of the ordered TAPP 2D-COF was
calculated by quantitative analysis. Fifteen ordered domains of the 2D-COF were
selected from three STM images scanned on the surfaces presented in Figure 6.10. The
area of each of the domains was measured directly from the STM image. The square
root of the domain area was then taken to represent the size of the domain. The average
value and standard deviation of the fifteen measurements were calculated. Consequently,
the average domain size of the TAPP 2D-COF was determined to be 70 ± 35 nm. In the

Chapter 6. On-surface synthesis and characterisation of mono-layer covalent-organic frameworks
153
range of 3 - 15 hours, the length of time that the samples are annealed showed no
measurable impact on the domain size or quality of TAPP/BDA 2D-COFs.
Figure 6.10. STM images that show the formation of single-layer TAPP/BDA 2D-COFs by
depositing TAPP from a toluene solution on HOPG. (a) 2D-COFs synthesis conditions: 0.15 g
of CuSO4∙5H2O; 0.05 mg of BDA; 5 µL of 0.0065 mg/ml TAPP in toluene; 14 hours at 120 ºC.
STM scanning parameters: Vs = -0.85 V, It = 3 pA. Image size: 300 nm (scale bar: 60 nm). (b)
2D-COFs fabrication conditions: 0.15 g of CuSO4∙5H2O; 0.05 mg of BDA; 5 µl of 0.002 mg/ml
TAPP in toluene; 3 hours at 120 ºC. STM scanning conditions:Vs = -0.85 V, It = 10 pA. Image
size: 200 nm (scale bar: 40 nm).
In order to maintain the reproducibility and quality of TAPP/BDA 2D-COF growth,
the presence of any contamination on the HOPG surfaces should be minimised at all
times. Possible sources of contamination include: the raw materials provided by our
collaborators in synthetic chemistry; the volatile organic solvents used to dissolve
precursors deposited on HOPG; and the experimental tools employed to make up and
deposit the solutions. In addition to their influence on the structural quality of 2D-COFs
as observed via STM, the presence of contamination can be detected using
complementary methods. For example, XPS and NMR are both commonly used to
identify contaminants in raw materials.
The introduction of contamination to the HOPG surface can lead to the formation
of poor quality 2D-COF structures or even prevent 2D-COF formation altogether. The
(a) (b)

Chapter 6. On-surface synthesis and characterisation of mono-layer covalent-organic frameworks
154
reason for this is probably that the contamination prevents the facile diffusion of the
TAPP molecules across the surface and thereby prevents the 2D-COF layer from
forming.
Figure 6.11. (a) STM image of the network formed fo by contaminants following 2D-COFs
growth. STM scanning parameters: Vs = -0.85 V, It = 10 pA. Image size: 95 nm (scale bar: 19
nm). (b) Enlarged STM image of the contamination with line profiles taken through the periodic
1D network (blue and red dashed lines). Imaging parameters: Vs = -0.65 V, It = 10 pA. Image
size: 19.6 nm (scale bar: 3.9 nm). (c) Height profile corresponding to the blue dashed line in (b)
(d) Height profile corresponding to the red dashed line in (b)..
Figure 6.11 (a) shows a striped feature imaged by STM that was commonly
observed for a contaminated HOPG surface. In Figure 6.11 (b), a line profile marked in
(a)
(b) (c)
(d)

Chapter 6. On-surface synthesis and characterisation of mono-layer covalent-organic frameworks
155
blue is taken through the periodic 1D bright features. Based on five measurements on
this image, the distance between two adjacent bright 1D linear rows was measured to be
5.3 ± 0.1 nm (Figure 6.11 (c)). The associated error was obtained by calculating the
standard deviation of the five measurements.
In addition to measuring the spacing between the bright rows, the much smaller
spacing between the rows at right angles to these was measured as illustrated by the line
profile marked in red in Figure 6.11 (b). Using the same data acquisiton and processing
method, the distance between two adjacent dark rows was determined to be 0.6 ± 0.1
nm (Figure 6.11 (d)).
If the linear structure in Figure 6.11 (a) and (b) was seen to cover the HOPG
surface, the coverage of the porphyrin 2D-COFs was extremely low. In this case,
ordered TAPP/BDA 2D-COF structures were hardly ever imaged during STM scans.
The formation of this linear network appears to prevent the growth of the 2D-COF by
occupying the surface, and preventing the TAPP molecules from diffusing.
Figure 6.12. XPS spectrum showing Si contamination in the unreacted TAPP control sample.
In order to identify the contamination, AFM and XPS investigations were
performed. The chemical composition of the contamination was probed by XPS
Si2s
153.3
Si2p
102.2

Chapter 6. On-surface synthesis and characterisation of mono-layer covalent-organic frameworks
156
characterisation. XPS signals were collected on a dry TAPP film deposited from a
TAPP/toluene solution (10 μl, 0.07 mg/ml) made using disposable needles. Figure 6.12
shows a XPS spectrum extracted from a survey scan of the unreacted TAPP control
sample (C1s peak: 284.7 eV). By referring to literature values, the two binding energy
peaks at 102.2 eV and 153.3 eV are designated to Si2p and Si2s photoemission lines,
respectively [222, 223]. Considering all the materials deposited onto the HOPG surface,
the contamination is most likely to result from polydimethylsiloxane (PDMS) thin
coatings on disposable needles used to make up TAPP/toluene solutions. Such XPS
peaks within this binding energy range were no longer detected when disposable
syringes and hypodermic needles were replaced by glass pipettes in the preparation of
the TAPP solutions. Meanwhile, the formation of highly ordered TAPP/BDA 2D-COFs
could be observed consistently via STM imaging.
Figure 6.13. (a) Plastic syringes and disposable medical needles previously used to make
solutions. (b) Molecular structure of PDMS which is commonly coated as a thin film onto the
surface of disposable hypodermic needles. (C) HyperChem simulation of PDMS on HOPG.
Figure 6.13 (b) shows the chemical formula of PDMS, which is a linear
silicon-based polymer with n repeating monomer units (–SiO(CH3)2-)n and terminated
with trimethylsiloxy units. PDMS, also referred as silicone fluid, has a wide range of
applications in the pharmaceutical industry such as: lubricants for glass cartridges in
disposable syringes [224]; coatings on rubber cap components; and foam or gas
(b)
0.4 nm O
Si
C
(c)
(a)

Chapter 6. On-surface synthesis and characterisation of mono-layer covalent-organic frameworks
157
remover for the reconstitution of powder drugs [225]. Most disposable needles for
medical uses are coated with PDMS thin films outside their stainless steel tubes (Figure
6.13 (a)). The thin PDMS coatings help to increase lubricity of the needles to ensure a
smooth motion of liquids during injection [226]. However, PDMS exhibits a poor
compatibility with the organic solvents used in our project. When in contact with
toluene or TCB, PDMS swells to a substantial degree, and uncross-linked oligomers
PDMS are extracted into the solvent [227]. A HyperChem simulation has been carried
out to calculate the distance between two adjacent PDMS (n = 3) chains (Figure 6.13
(c)). In this simulation, a fixed graphene sheet was added below the PDMS chains. The
initial distance between the graphene sheet and the PDMS chains was set as 0.35 nm.
The MM+ force field was chosen to optimise the geometry of the PDMS chains on the
graphene sheet. The distance between the two PDMS chains was determined to be 0.4
nm, which is in agreement with the value measured from the STM image in Figure 6.11
(b).
Figure 6.14. (a) AFM scan of an unreacted TAPP control sample. The deposited TAPP/toluene
solution was made using disposable needles ( 0 μl, 0.0065 mg/ml). Image size: 7 µm. Scale bar:
1.4 µm. (b) AFM image of TAPP/BDA 2D-COFs grown using a template in (a). Image size: 5
µm. Scale bar: 1 µm. (c) AFM image showing contamination-induced nanobubble-like objects
at the water-HOPG interface [228].
In addition to XPS analysis, AFM analysis of the contaminated samples display
features that are consistent with previously reported PDMS contaminated samples [228].
Figure 6.14 is a comparison between AFM images collected on unreacted TAPP films
(Figure 6.14 (a)) and TAPP/BDA 2D-COFs (Figure 6.14 (b)) and an exemple AFM
(a) (c) (b)

Chapter 6. On-surface synthesis and characterisation of mono-layer covalent-organic frameworks
158
image reported in literature of a PDMS contaminated HOPG sample (Figure 6.14 (c)).
The presence of PDMS as a source of contamination has been raised as an issue by
scientists working in the surface nanobubble community [228]. Figure 6.14 (c) is an
AFM image taken at the interface between HOPG and degassed water. The bright
nanobubble-like objects remained unchanged under the degassing environment
suggesting they cannot be attributed to real gaseous cavities adsorbing on the HOPG
surface. Based on further investigations on all the materials used in their experiments,
R.P. Berkelaar et al. pointed out that the nanobubble-like features were actually caused
by PDMS contamination. The PDMS was introduced to the water when using
disposable syringe needles to drop cast solutions onto graphite surfaces. According to
this finding, it is highly likely the bright bubble-like features observed in Figure 6.14 (a)
and (b) also consist of PDMS contamination from the similar disposable needles that
were initially used in our experimental procedure.
All the findings above indicate that any possible contamination sources should be
carefully controlled throughout the 2D-COF sample preparation process. If possible,
contamination should also be removed from the raw materiasl before the growth stage
in 2D-COF fabrication. Following identification of PDMS as a contamination source,
only glass volumetric flasks and glass pipettes were used in further experiments on
2D-COFs growth.
Homogeneity of porphyrin films prior to 2D-COF growth
The homogeneity of porphyrin films deposited by drop casting has been found to
be closely related to the morphology of the resulting 2D-COFs. This relationship was
investigated in detail using Multimode8 AFM operating in PeakForce Tapping mode.
The morphology of HOPG surfaces after drop deposition of 10 µl of TAPP/toluene
solutions with a range of concentrations were imaged at a micrometer scale.
Subsequently, AFM imaging was performed on TAPP/BDA 2D-COFs grown using
these TAPP control samples as templates. The growth of highly ordered TAPP/BDA
2D-COF structures on HOPG surfaces was confirmed using STM followed by AFM

Chapter 6. On-surface synthesis and characterisation of mono-layer covalent-organic frameworks
159
characterisations. AFM images were collected from samples made using TAPP in
toluene solutions at three concentrations: 0.065 mg/ml, 0.016 mg/ml. and 0.008 mg/ml.
Figure 6.15. (a) AFM image of the HOPG surface with unreacted TAPP film made by drop
deposition of 10 µl of a 0.065 mg/ml toluene solution. (b) AFM image of the HOPG surface
with TAPP/BDA 2D-COF grown using the TAPP template shown in (a). Line profiles are taken
from (a) and (b) respectively to illustrate the height of 3D islands. Sample preparation
conditions: 0.15 g of CuSO4∙5H2O; 0.06 mg of BDA; 10 µl of 0.065 mg/ml TAPP in toluene; 15
hours at 130 ºC. Size of both images are 10 µm with 2 µm scale bars.
When TAPP molecules are deposited from 10 µl of a 0.065 mg/ml toluene solution,
the morphology of porphyrin films formed on HOPG after toluene evaporation is
(a)
(b)

Chapter 6. On-surface synthesis and characterisation of mono-layer covalent-organic frameworks
160
illustrated in Figure 6.15 (a). TAPP molecules exist as 3D aggregates forming an
inhomogeneous film on the surface. As can be seen from Figure 6.15 (a), the
distribution of the TAPP aggregates is driven by the presence of step edges of the
HOPG surface. Step edges provide natural nucleation points for the aggregation of
TAPP molecules during the drying of the TAPP/toluene film. Twenty measurements on
the heights of the 3D aggregates were carried out from the AFM image in Figure 6.15
(a). The average and standard deviation of these measured heights were taken to
represent the height distribution of the 3D aggregates. Using this data collection and
analysis method, the height of the 3D TAPP aggregates was determined to be 8.6 ± 3.0
nm.
As can be seen from Figure 6.15 (b), the morphology of the TAPP 2D-COFs grown
from a template shown in Figure 6.15 (a) is also highly inhomogenous. A line profile
taken through the 3D aggregates in the AFM image shows the height of the bright
features after the 2D-COF growth process at the elevated temperature. The sample after
the 2D-COF growth appear to have two distinct heights of features. Some are lower
features of 4 – 10 nm in height and some are higher features of 30 – 40 nm in height.
Both of these features could be 3D porphyrin aggregates formed during the annealing
process. When heated, some TAPP molecules in the 3D aggregates shown in Figure
6.15 (a) starts to move. If individual TAPP molecules diffuse along the HOPG surface,
they may form mono-layer 2D-COFs by reacting with BDA in the vapour phase. The
coalescence of 3D TAPP aggregates diffusing on the surface may result in even larger
aggregates. In order to increase the degree of chemical conversion for unreacted TAPP
molecules, attempts have been made to re-anneal the surface with 2D-COFs strcutrues
in an atmosphere of BDA vapour at 130 ºC for 3h. Even in this case, the higher bright
features corresponding to the 3D TAPP aggregates were observed again using AFM.
Decreasing the amount of TAPP intitally deposited on HOPG to 10 µl of a 0.016
mg/ml TAPP/toluene solution drastically changes the morphology of the unreacted
porphyrin films. After toluene evaporation the TAPP films consist of more flat areas
with far fewer 3D aggregates as shown in Figure 6.16 (a). Similar to the situation at the
higher concentration of 0.065 mg/ml, the 3D aggregates could not be removed

Chapter 6. On-surface synthesis and characterisation of mono-layer covalent-organic frameworks
161
completely from the surface by initiating the 2D-COF growth. Figure 6.16 (b) shows
part of the HOPG surface after performing 2D-COF growth from the template presented
in Figure 6.16 (a). In this case, a significant aggregation can be observed following
2D-COF growth. In contrast to the few aggregates present prior to 2D-COF growth, a
number of 3D aggregates form on the HOPG surface after annealing.
Figure 6.16. Example AFM images of TAPP films on HOPG before and after the Schiff-base
condensation reaction using 10 µl of a 0.016 mg/ml toluene solution. (a) Unreacted TAPP film
following solvent evaporation. (b) 2D-COFs and 3D TAPP aggregates after 2D-COF growth.
Sample preparation conditions: 0.15 g of CuSO4∙5H2O; 0.06 mg of BDA; 10 µl of 0.016 mg/ml
TAPP in toluene; 15 hours at 130 ºC. Both image sizes: 10 µm; scale bars: 2 µm.
As the concentration of TAPP dissolved in toluene solutions was further lowered to
0.008 mg/ml, the morphology of unreacted TAPP films following toluene evaporation
changes to a more homogeneous morphology with a cellular network structure, as
shown in Figure 6.17 (a). The homogeneous distribution of TAPP molecules when
deposited from the low concentration of 0.008 mg/ml toluene solutions can be
confirmed from the line profile in Figure 6.17 (b). The height of the TAPP films can be
measured from the AFM image by taking line profiles through the TAPP domains. Five
line profiles were taken on the AFM image shown in Figure 6.17 (a) to obtain twenty
height values. The average and standard deviation of these twenty height values were
(a) (b)

Chapter 6. On-surface synthesis and characterisation of mono-layer covalent-organic frameworks
162
calculated to represent the height of the TAPP film. As a result, the height of the
unreacted TAPP film deposited on the HOPG surface was determined to be 0.7 ± 0.1 nm,
identical to the height of the TAPP 2D-COF measured using STM. Similar cellular
network-like morphologies have been observed in other systems formed by deposition
of nano-materials from volatile organic solvents onto solid surfaces, e.g., deposition of
thiol-passivated colloidal Au nanoparticles from toluene onto Si(111) substrates via spin
coating [229]. Cellular networks are an out-of-equilibrium structure that forms because
of rapid solvent evaporation and the subsequent kinetic trapping of the material
following removal of the solvent [230].
The morphology of the initial cellular patterns formed by TAPP following rapid
toluene evaporation plays an important role in determining the morphology of the
2D-COFs grown using the TAPP films as templates. Figure 6.17 (c) is an AFM image of
a HOPG surface on which TAPP/BDA 2D-COF structures were grown following the
formation of unreacted TAPP films presented in Figure 6.17 (a). The majority of the
HOPG surface is covered by TAPP 2D-COFs which appear as the higher features in the
AFM image. In Figure 6.17 (d), a zoomed-in AFM image was taken on the surface
shown in Figure 6.17 (c) to provide more details of the 2D-COF structures. As can be
seen in Figure 6.17 (e), a line profile taken on this area (marked in a blue, dashed line)
is shown to illustrate the height of the flat TAPP/BDA 2D-COFs .
The quality of the TAPP/BDA 2D-COFs shown in Figure 6.17 (c) and (d) was
evaluated by measuring the heights values and surface area of the 2D-COFs. Nine line
profiles were taken from the AFM image in Figure 6.17 (d) to acquire twenty height
values. The average and standard deviation of these twenty height values were
calculated to represent the height of the 2D-COFs on the HOPG surface and its
associated error value. Using this data analysis method, the average height of the
2D-COF films was determined to be 0.4 ± 0.1 nm. Regarding the surface area covered
by the 2D-COF, a quantitative analysis was carried out on the AFM image in Figure
6.17 (d). In this AFM image (area: 9 μm2), the total surface areas covered by the
2D-COF structures were measured to be 7.5 μm2
using the SPIP software. The
percentage of the surface area covered by the 2D-COF structures reaches approximately

Chapter 6. On-surface synthesis and characterisation of mono-layer covalent-organic frameworks
163
83 %.
Figure 6.17. AFM images of HOPG surfaces with unreacted TAPP films and TAPP 2D-COF
layers by depositing 10 µl TAPP/toluene solutions with a concentration of 0.008 mg/ml. (a)
Cellular networks formed by unreacted TAPP following toluene evaporation. (b) Line profile
through the cellular network in (a) (marked in blue, dashed line). (c) HOPG surface after TAPP
2D-COF growth. Sample preparation conditions: 0.15 g of CuSO4∙5H2O; 0.06 mg of BDA; 10
µl of 0.008 mg/ml TAPP in toluene; 15 hours at 130 ºC. (d) Zoomed in AFM image on the
surface shown in (c). (e) Line profile taken through TAPP 2D-COF networks in (d) (marked in
blue, dashed line). Scale bars in (a) and (c): 2 µm. Scale bar in (d): 0.8 µm
(a)
(c)
(b)
(d)
(e)

Chapter 6. On-surface synthesis and characterisation of mono-layer covalent-organic frameworks
164
Ultra-high resolution AFM studies
The Cypher AFM produced by Asylum Research has a proven ability to produce
molecular scale resolution of 2D supramolecular structures [141, 231, 232]. This
technique has been employed to image highly ordered TAPP/BDA 2D-COFs grown on
HOPG surfaces.
Figure 6.18. (a) Cypher AFM image of TAPP/BDA 2D-COFs grown on HOPG. Image size: 100
nm. Scale bar: 20 nm. Sample preparation conditions: 0.15 g of CuSO4∙5H2O; 0.06 mg of BDA;
10 µl of 0.065 mg/ml TAPP in toluene; 3 hours at 130 ºC. (b) Enlarged AFM image of the
ordered area marked in a white, dashed square area in (a). Image size: 10 nm.
All AFM imaging on a Cypher AFM system was carried out by scientists from the
School of Physics and Astronomy at the University of Nottingham. Figure 6.18 - 6.20
present a series of Cypher AFM images collected on a HOPG surface which was
covered by TAPP/BDA 2D-COFs. In Figure 6.18 (a), the molecular structure of
square-shaped porphyrins was resolved by the Cypher AFM. This imaging resolution is
comparable to that of an ambient STM system. As illustrated in Figure 6.18 (b), the unit
cell dimensions of TAPP/BDA 2D-COF can be measured from the high-resolution AFM
(a)
(b)
a
b γ

Chapter 6. On-surface synthesis and characterisation of mono-layer covalent-organic frameworks
165
image. Under the condition of no drift-correction, ten sets of unit cell dimensions were
collected from the AFM image in Figure 6.18 (a). The average values and standard
deviations of these ten sets of data were analysed to determine the unit cell dimensions
of TAPP/BDA 2D-COF. As of result of this data acquisition and analysis, the unit cell
dimensions of TAPP/BDA 2D-COF were determined to be a = b = 2.6 ± 0.2 nm and γ =
87 ± 3°. The results obtained in the Cypher AFM measurement are in excellent
agreement with the values measured from the drift-corrected STM image shown in
Figure 6.4 (c).
In Figure 6.19 (a), 3D aggregates and multi-layered growth of the TAPP 2D-COFs
were both identified. A line profile was taken through one of the 3D aggregates to show
the height of this 3D aggregate feature (Figure 6.19 (b)). As marked in a red, dashed line
in Figure 6.19 (a), the height of the multi-layer TAPP 2D-COFs can also be measured
from the AFM image.
Figure 6.19. (a) Cypher AFM image on a HOPG surface covered with a TAPP/BDA 2D-COF.
Image size: 1µm. Scale bar: 200 nm. (b) Line profile through the 3D aggregate feature in (a)
(marked by a blue, dashed line). (c) Line profile thought the multi-layered structure in (a)
(marked by a red, dashed line).
(a) (b)
(c)

Chapter 6. On-surface synthesis and characterisation of mono-layer covalent-organic frameworks
166
AFM images with larger scan sizes were taken on the surface to obtain more
information about the 3D aggregate features and multi-layer TAPP 2D-COF regions.
Figure 6.20 (a) presents a 5 μm × 5 μm AFM image on the same sample. In order to
measure the average height of the 3D aggregate features, twenty height values were
collected from different parts of the image. The average value and standard deviation of
these twenty measured heights were calculated. As a result, the average height of the 3D
aggregate features was determined to be 3.5 ± 1.0 nm. Compared with the AFM
observation in Figure 6.15 (b), this size is smaller than the higher 3D aggregates, but
similar to the lower features. This difference in morphology may be related to the length
of annealing time. In the previous case, the sample was annealed at 130 ºC for 15 h,
instead of 3 h. The long heating times may enhance the coalescence of 3D aggregates.
The average height and its associated error of the multi-layer regions of 2D-COF
were obtained by measuring twenty height values from Figure 6.20 (a). By calculating
the average and standard deviation of the twenty measurements, the height of the
multi-layer structures was determined to be 0.4 ± 0.1 nm, which is good agreement with
the height of the mono-layer TAPP 2D-COF measured using the Multimode AFM. From
Figure 6.20 (a), the percentage surface coverage of the mono- and bi-layer 2D-COF
regions was measured using the SPIP software. The surface area covered with the
bi-layer 2D-COF was measured to be 5.4 μm2 in total. Thus, approximately 20 % of the
HOPG surface was covered with bi-layer 2D-COF.
From the AFM image shown in Figure 6.20 (a), it can be seen that the bi-layer
2D-COFs regions (highlighted by red overlays) were grown in areas far away from the
3D aggregates instead of being focussed around them. This raises questions about the
structure and composition of the 3D assemblies on the surface. The high coverage of the
TAPP 2D-COFs on HOPG is further demonstrated by the AFM image in Figure 6.20 (b).
The imaging ability of Cypher AFM to resolve both individual molecular structures and
larger scale features of the TAPP 2D-COFs illustrates the possibility to grow porphyrin
2D-COFs on non-conductive surfaces which are not applicable to STM imaging. A
range of insulating or semi-conducting substrates, such as boron nitride, can potentially
be used for supporting 2D-COF growth.

Chapter 6. On-surface synthesis and characterisation of mono-layer covalent-organic frameworks
167
Figure 6.20. Cypher AFM images of a HOPG surface covered with TAPP/BDA 2D-COFs. (a)
Red overlays added to highlight bi-layer regions of 2D-COF. Image size: 5 µm. Scale bar: 1 µm.
(b) Image size: 10 µm. Scale bar: 2 µm.
(a)
(b)
Bi-layer
2D-COF

Chapter 6. On-surface synthesis and characterisation of mono-layer covalent-organic frameworks
168
Deposition of unreacted TAPP films by spin coating
The AFM results above demonstrate that the morphology of TAPP 2D-COFs
depends on the morphology of the drop-cast TAPP films prior to activating the
Schiff-base condensation reaction. With this in mind, some efforts were made to deposit
unreacted TAPP onto the HOPG surface by spin coating. To prepare such samples, a 10
µl droplet of TAPP dissolved in toluene was deposited onto a freshly cleaved 1.2 cm ×
1.2 cm HOPG surface using a glass pipette and spin-coated at 2000 r.p.m. for 1 minute.
AFM images in Figure 6.21, Figure 6.22 and Figure 6.23 present the morphology of
porphyrin films produced by spin coating using 10 μl TAPP/toluene solutions at
concentrations of 0.065 mg/ml, 0.033 mg/ml and 0.016 mg/ml, respectively.
Figure 6.21. PeakForce Tapping mode AFM images of HOPG surfaces spin coated with 10 µl of
0.065 mg/ml TAPP/toluene solutions. (a) Image size: 10 µm. Scale bar: 2µm. (b) Image size: 2
µm. Scale bar: 0.4 µm.
In Figure 6.23 (b), the heights of the 3D bright features can be measured by taking
line profiles. In order to analyse the height of these features, twenty height values were
collected from the AFM image in Figure 6.23 (b). The average and standard deviation of
these twenty measured values were then calculated to determine the average height and
its assciated error. By adopting this data acquisition and analysis method, the average
height of the 3D aggregate features was determined to be 0.7 ± 0.2 nm, which is
(a) (b)

Chapter 6. On-surface synthesis and characterisation of mono-layer covalent-organic frameworks
169
comparable to the thickness of the unreacted TAPP films formed via drop deposition of
10 μl, 0.008 mg/ml of TAPP/toluene solutions onto the HOPG surface (Figure 6.17 (a)).
Figure 6.22. AFM images of HOPG surfaces after the deposition of 10 µl of 0.033 mg/ml
TAPP/toluene solutions by spin coating. (a) Large-scale AFM scan. Image size: 10 µm. Scale
bar: 2µm. (b) Enlarged AFM scan. Image size: 1.5 µm. Scale bar: 0.3 µm.
Figure 6.23. AFM images of HOPG surfaces spin coated with 10 µl of 0.016 mg/ml
TAPP/toluene solutions. (a) Image size: 10 µm. Scale bar: 2 µm. (b) Image size: 5 µm. Scale bar:
1 µm. With a line profile taken throught the higher features.
(a) (b)
(a) (b)
(c)
(c)

Chapter 6. On-surface synthesis and characterisation of mono-layer covalent-organic frameworks
170
In comparison with the quality of TAPP films obtained by drop deposition, spin
coating leads to a much more homogeneous distribution of materials across the HOPG
surface. These AFM studies provide some preliminary results for further research on the
fabrication of high-quality 2D-COFs by adopting novel experimental methods to
deposit unreacted TAPP onto solid surfaces.
6.3.2 Chemical structure of TAPP/BDA 2D-COFs
In addition to morphology studies via STM and AFM, the chemical structure of the
bonds formed between TAPP molecules and BDA linkers via Schiff-base condensation
reactions was investigated using XPS. In comparison with XPS measurements on
unreacted TAPP films, the chemical changes following covalent bonds formation
between TAPP and BDA can be revealed.
Blank HOPG control sample
Figure 6.24. XPS survey scan of the blank HOPG control sample.
C1s
O1s

Chapter 6. On-surface synthesis and characterisation of mono-layer covalent-organic frameworks
171
In order to investigate the influence of the underlying HOPG surface, XPS spectra
were collected on a new, freshly cleaved HOPG sample. Figure 6.24 shows the survey
scan of the blank control HOPG surface. In this XPS spectrum, two distinct peaks can
be observed in the binding energy regions of C1s and O1s.
Figure 6.25. C1s XPS spectrum of the blank HOPG control sample.
Figure 6.25 shows a C1s XPS spectrum collected for the blank HOPG control
sample. Compared with previous XPS studies of HOPG reported in literature [233-235],
this assymetric C1s spectrum is a standard line shape for the C1s region of a HOPG
surface. A Gaussian/Lorentzian peak at 284.6 ± 0.1 eV was fitted for the main peak of
this spectrum. This peak value is in good agreement with the expected binding energy
for the sp2 carbons of HOPG [235]. The associated error value of 0.1 eV was
determined based on the data acquisiton accuracy of the XPS machine. A broad
shake-up peak was fitted at 290.7 ± 0.1 eV, the presence of which is due to the π-π*
transition of the aromatic HOPG surface. The full width at half maximum (FWHM) of
the fitted C1s peak is 1.0 ± 0.1 eV.
In contrast to the C1s spectrum, the presence of oxygen species on the cleaved
Shake-up feature
290.7 eV
C1s
284.6 eV

Chapter 6. On-surface synthesis and characterisation of mono-layer covalent-organic frameworks
172
HOPG surface as demonstrated by the O1s spectrum is less straightforward to interpret.
Despite a large volume of published fitting results, the identification of single oxygen
peaks from an O1s XPS spectrum is controversial [236]. Figure 6.26 presents the O1s
spectrum for the blank control HOPG sample. The oxygen peak in the spectrum
indicates the existence of oxygen species on the HOPG surface. During the cleavage
process, more step edges are introduced to the HOPG surface [237]. The surface defects
may act as reaction sites for carbon and O2/H2O in air. The O1s spectrum was
deconvoluted using a two-component fitting model in literature [238]. The two oxygen
peaks at 533.9 ± 0.1 eV and 532.3 ± 0.1 eV were assigned to oxygens in –COOH and
–C=O/C-OH, respectively [239].
Figure 6.26. O1s XPS spectrum of the blank HOPG control sample.
Unreacted TAPP control sample
The unreacted TAPP control sample for the XPS investigations was made by
depositing 10 µl of a 0.065 mg/ml TAPP/toluene solution onto a freshly cleaved HOPG
surface. The sample was loaded into the UHV chamber of the XPS machine
immediately following toluene evaporation.
O1s
533.9 eV
O1s
532.3 eV

Chapter 6. On-surface synthesis and characterisation of mono-layer covalent-organic frameworks
173
Figure 6.27 is a C1s XPS spectrum collected for the unreacted TAPP films
supported by HOPG underneath. Compared with Figure 6.25, this C1s XPS spectrum is
also a standard line shape for the C1s region of a HOPG surface. A Gaussian/Lorentzian
peak at 284.7 ± 0.1 eV was fitted for the main peak of this spectrum (FWHM: 1.0 ± 0.1
eV). In the XPS data analysis, the the C1s peak position was used as a check to ensure
the other peak positions were consistent. The C1s peaks on all of the samples obtained
for XPS measurements always fall at the same position. Due to the abundant existence
of carbon in the HOPG substrate and TAPP, the C1s peak is not a suitable peak for
studying the chemical structure of the 2D-COFs.
Figure 6.27. C1s XPS spectrum on unreacted TAPP control sample. A Gaussian/Lorentzian peak
has been fitted for the spectrum at 284.7 ± 0.1 eV.
Figure 6.28 (a) shows a comparison between the background-subtracted O1s XPS
spectra of the unreacted TAPP control and the blank HOPG control sample. Compared
with the XPS spectrum of the blank HOPG, the O1s XPS spectrum of the TAPP control
sample exhibited a slight decrease in intensity. Following the deposition of TAPP from
the toluene solution, most step edges on the HOPG surface were covered with 3D TAPP
aggregates (Figure 6.15 (a)). The aggregation of unreacted TAPP along step edges
C1s
284.7 eV
Shake-up feature
290.7 eV

Chapter 6. On-surface synthesis and characterisation of mono-layer covalent-organic frameworks
174
would reduce the amount of reactions sites that were in exposure with O2 and H2O in air.
The decrease in reaction probability for carbon on the HOPG surface and O2/H2O in air
would arise a decrease in the intensity of O1s signals detected by XPS.
Figure 6.28. (a) O1s XPS spectra for unreacted TAPP control and freashly cleaved HOPG
samples after background subtraction. (b) Survey scan for unreacted TAPP control sample.
Insert: XPS spectrum in the binding energy range of 170 – 70 eV (highlighted by blue, dashed
squares).
C1s
N1s
O1s
(a)
(b)
Si2s Si2p

Chapter 6. On-surface synthesis and characterisation of mono-layer covalent-organic frameworks
175
The existence of a very small amount of silicon species present on the TAPP
control sample can be proved from the survey scan in the binding energy range of 70 –
170 eV [222], as presented in the insert of Figure 6.28 (b). The silicon contamination
was likely to be caused by previous PDMS contamination left on the surface. Thus, the
oxygen in PDMS (Binding energy: 532.3 eV [240, 241]) probably had a minor
contribution to the oxygen signal of unreacted TAPP in Figure 6.28 (a).
Nitrogen species Chemical formula Binding energy
in literature (eV)
Amine on phenyl ring
~ 399.4[242, 243]
Protonated nitrogen inside
porphyrin core
~ 399.7[244, 245]
Non-protonated nitrogen
inside porphyrin core
~ 397.7[244, 245]
Satellite peak ---- 401 - 402[244, 246]
Table 6.1. XPS binding energy values of nitrogen species for TAPP according to reports in
literature.
N1s XPS spectra were used to study the chemical composition of the unreacted
TAPP and the chemical nature of the bonds formed between porphyrins via Schiff-base
condensation reactions. For a TAPP molecule, the chemical structure of which is shown
in Figure 6.1 (a), there are three distinct nitrogen species: nitrogens in amine groups on
the outer phenyl rings: protonated nitrogens inside the porphyrin core; and
non-protonated nitrogens inside the porphyrin core. The binding energy positions for
these nitrogen species reported in literature are given in Table 6.1. The C1s peak values
of these reported measurements were used to check the consistency of the measured
peak positions.

Chapter 6. On-surface synthesis and characterisation of mono-layer covalent-organic frameworks
176
In addition to the N1s peaks expected for the unreacted TAPP control sample, an
additional satellite peak was also observed based on the molecular structure of TAPP.
This satellite peak is commonly observed in the binding energy range 401 – 402 eV in
N1s XPS spectra of porphyrins [244, 246]. The satellite feature results from electron
interactions within the aromatic porphyrin core [247].
When performing peak fitting for the N1s peak spectra, the positions of the three
nitrogen peaks listed in Table 6.2 were restrained to be ± 0.3 eV either side of the
positions recorded in literature. A wider set of constraints were adopted for the satellite
peak due to the greater uncertainty associated with the shake-up transition of electrons.
The starting position of the satellite peak was set to be 402 ± 0.5 eV. The FWHM
obtained by fitting to the intense C1s carbon peak was 1.0 eV. This value was used as a
standard for other XPS scans [246]. Therefore, restraints set for the FWHMs of the XPS
peaks were set to be between 0.8 and 1.2 eV excluding the satellite peak. The restraint
for the FWHM of the satellite peak was set to be between 1 and 2 eV.
When fitting peaks to a N1s XPS spectrum, the number of peaks to fit is decided
according to the number of nitrogen species existing in the molecular system. In the
case of fitting the N1s spectrum collected from unreacted TAPP films, three peaks are
expected to be required corresponding to the three nitrogen species as the discussed in
Table 6.2. Additionally, a broad satellite peak should be added at around 402 eV.
For most complex XPS spectra with multiple different species there a large number
of mathematically valid fits that are possible. However, only fits to the data that make
physical sense given the expected molecular structure of the sample should be
considered. For the unreacted TAPP control sample, three criteria were used to assess
the validity of a possible fit to the N1s XPS spectra. Firstly, the percentage of the total
fit area assigned to the area of the satellite peak should be 5% – 15% [244, 246, 248].
Secondly, the combined area of the protonated and non-protonated nitrogens in the
porphyrin cores should make up half of the remaining fit area once the area of the
satellite peak has been subtracted. Thirdly, the area of the peak associated with the
protonated nitrogen in the porphyrin core should be larger than the peak associated with
the non-protonated nitrogen in the porphyrin core. According to previous XPS studies of

Chapter 6. On-surface synthesis and characterisation of mono-layer covalent-organic frameworks
177
porphyrins, the ratio between the areas of these two nitrogen species should be between
1.2 and 1.5 [244, 249]. The difference in areas is related to the higher electronegativity
of the protonated nitrogen compared with the non-protonated nitrogen.
Figure 6.29 shows the N1s XPS spectrum collected for the unreacted TAPP control
sample. This N1s spectrum is an average taken from two identical N1s scans acquired
for the TAPP control sample. Based on the fitting criteria described above, a satellite
peak (marked in green) and three nitrogen peaks were fitted for the N1s XPS spectrum
using Gaussian-Lorentzian functions.
Figure 6.29. N1s XPS spectrum for unreacted TAPP on HOPG substrate. The black curve
represents the raw data collected in the XPS experiments. The four peaks in green, pink, blue
and red (from left to right) are the nitrogen peaks with Gaussian-Lorentzian line-shapes which
were fitted into the raw data based on the fitting criteria set for the TAPP control sample.
The binding energy positions associated with these nitrogen peaks are summarised
in Table 6.3. The percentage contributions of the peak areas corresponding to the three
nitrogen species of TAPP were calculated under the condition that the contribution of
the satellite peak was first removed from the total area of the fitted peaks. The peak

Chapter 6. On-surface synthesis and characterisation of mono-layer covalent-organic frameworks
178
areas of amine nitrogen is 47.2 %, which is nearly half of the total amount of nitrogen
species. The peak separation of the protonated and non-protonated nitrogens is 2.2 ± 0.1
eV, which is in good agreement with the previously published values listed in Table 6.2.
The percentage peak areas for the protonated and non-protonated nitrogens in the
porphyrin cores are 29 % and 23.8 %, respectively. By comparing this data with that
collected from N1s XPS spectra of the TAPP/BDA 2D-COFs, more information about
the formation of covalent bonds between TAPP and BDA can be acquired.
Peaks in
XPS
spectrum
Nitrogen species Chemical
formula
Binding energy
in experiment
(± 0.1 eV)
Percentage
of total fit
area
Amine on phenyl
ring
399.4 47.2 %
Protonated nitrogen
inside porphyrin
core
400.0 29.0 %
Non-protonated
nitrogen inside
porphyrin core
397.8 23.8 %
Satellite peak ---- 401.6 ----
Table 6.2. Experimentally measured binding energy values for the four nitrogen peaks in the
peak fitting of the N1s spectrum of the TAPP control sample shown in Figure 6.29. Percentage
contributions to the total fit area for the peaks associated with the three nitrogen species present
in unreacted TAPP are also given. The area of the satellite peak has been removed from the total
fit area prior to calculating the percentage contributions of the other nitrogen species.
TAPP/BDA 2D-COFs sample
The TAPP/BDA 2D-COFs sample was prepared by adopting the synthetic method
introduced in section 6.2.1. The 2D-COF sample was grown from an unreacted TAPP
sample formed by drop depositing 10 µl of TAPP/toluene solution with a concentration

Chapter 6. On-surface synthesis and characterisation of mono-layer covalent-organic frameworks
179
of 0.065 mg/ml only onto a freshly cleaved HOPG substrate.
Using the CasaXPS software package, Gaussian-Lorentzian line-shape peaks were
used to model all the XPS spectra recorded on the TAPP/BDA 2D-COF sample. Figure
6.30 shows the C1s XPS spectrum which has been fitted with one peak at 284.7 ± 0.1
eV. This is consistent with the C1s binding energy from the TAPP control sample. Thus,
no further correction is needed when comparing N1s binding energies between the
TAPP control sample and the TAPP/BDA 2D-COFs.
Figure 6.30. C1s XPS spectrum on TAPP/BDA 2D-COFs.
Similar to the XPS data recorded for the unreacted TAPP control sample, a strong
O1s signal was detected as can be seen in Figure 6.31 (a). In comparison to the O1s
XPS spectrum acquired for the TAPP control sample, the O1s signal for the TAPP
2D-COF sample exhibits an increase in intensity and higher binding energy components.
The increase in the O1s signals could result from the enhanced reactivity of the HOPG
surface in the reaction vessel at the elevated temperatures used for 2D-COF growth.
The increased O1s signal could also be related to the adsorption of BDA on the HOPG
surface. A number of unknown oxygen components, in particular water and excess BDA,
Shake-up feature
290.7 eV
C1s
284.7 eV

Chapter 6. On-surface synthesis and characterisation of mono-layer covalent-organic frameworks
180
may exist in the system rendering the O1s XPS peak fitting ambiguous [236]. From the
survey scan shown in Figure 6.31 (b), the TAPP/BDA 2D-COFs system was free from
silicon contamination
Figure 6.31. (a) O1s XPS spectra for TAPP 2D-COF and unreacted TAPP control samples
following background subtraction. (b) Survey scan for TAPP 2D-COF sample. Insert: XPS
spectrum in the binding energy range of 170 – 70 eV (highlighted by blue, dashed squares). .
(a)
C1s
O1s
N1s
(b)

Chapter 6. On-surface synthesis and characterisation of mono-layer covalent-organic frameworks
181
When fitting the N1s spectrum for the TAPP/BDA 2D-COF sample, the criteria
associated with the nitrogen species in the porphyrin core that were set for the TAPP
control sample remain unchanged. A proportion of the amine groups on the phenyl rings
will be involved in the Schiff-base condensation reaction between TAPP and BDA.
Thus, the precentage contribution related to the peak areas of the amine groups is
expected to decrease following the formation of TAPP/BDA 2D-COFs. The restraints
set for the starting positions and FWHMs of the 2D-COFs sample were the same as
those for the unreacted TAPP. New peaks are expected to occur due to the covalent
reaction. At least one of these peaks is likely to be associated with imine nitrogens
formed by the standard Schiff-base condensation reaction between TAPP and BDA. The
N1s binding energy of imine groups is observed from literacture to be around 398.5 eV
[243, 250].
Figure 6.32. N1s XPS spectrum for TAPP/BDA 2D-COFs on HOPG. The black curve
represents the raw data collected in the XPS experiments. Six peaks with Gaussian-Lorentzian
shapes were used to model the XPS spectrum including one satallite peak and five N1s peaks.
Figure 6.32 is the N1s XPS spectrum of the TAPP 2D-COFs sample with peaks

Chapter 6. On-surface synthesis and characterisation of mono-layer covalent-organic frameworks
182
modelled using Gaussian-Lorentzian functions. This N1s spectrum is an average taken
from two N1s scans acquired at different locations on the TAPP/BDA 2D-COF sample.
Compared with the N1s spectrum collected for the TAPP control sample (see Figure
6.29), two new peaks associated with the Schiff-base condensation reaction are present:
one at 398.8 ± 0.1 eV; and the other one at 400.7 ± 0.1 eV. The peak at 398.8 eV is
associated with the formation of imine links (Figure 6.33 (a)) via a complete
condensation reaction between the amine groups of TAPP and the aldehyde groups of
BDA. The peak at 400.7 eV is consistent with the binding energy recorded for similar
hemiaminal links as reported by Di Giovannantonio et al. [243]. In their recent XPS
study, the hemiaminal state was identified in a 1D-COF structure formed via a
Schiff-base condensation reaction at the liquid-solid interface. As illustrated in Figure
6.33 (b), the hemiaminal structure is a recognised intermediate state in the Schiff-base
condensation reaction. Apart from the observed formation on a solid surface [243],
intermediate states existing in Schiff-base condensation reactions have only been
detected in solution using other experimental techniques, such as Raman Spectroscopy
[251], mass spectroscopy [252] and nuclear magnetic resonance [253].
Figure 6.33. Schematic diagrams of the covalent bonds formed between TAPP and BDA via the
Schiff-base condensation reactions. (a) Imine links. (b) Hemiaminal links.
The results of peak fitting for the N1s XPS spectrum of the TAPP 2D-COFs is
summarised in Table 6.3. Apart from the contribution from the satellite peak, the
percentage that the unreacted amine groups make up in the total nitrogen species is
18.6 %. This means there still exists a large number of unreacted amine groups present
at the surface after the TAPP/BDA 2D-COF growth. This is despite there being a large
excess of BDA loaded into the glass reaction vessel. While there is a lack of direct
experimental proof, one possibility is that these unreacted amines exist within the 3D
(a) (b)

Chapter 6. On-surface synthesis and characterisation of mono-layer covalent-organic frameworks
183
aggregates imaged by AFM on HOPG, as shown in Figure 6.15 (b). As TAPP molecules
tend to stack into 3D structures, the vapourised BDA molecules may not be able to
reach the amine groups inside the 3D aggregates, preventing the condensation reaction
from occuring.
Peaks in
XPS
spectrum
Nitrogen species Chemical formula Binding energy
in experiment
(± 0.1 eV)
Percentage
of total fit
area
Amine on phenyl
ring
399.5 18.6 %
Protonated
nitrogen inside
porphyrin core
400.0 30 %
Non-protonated
nitrogen inside
porphyrin core
397.8 19.4 %
Nitrogen in
imine links
398.8 18.6 %
Nitrogen in
hemiaminal links
400.7 13.4 %
Satellite peak ---- 401.9 ----
Table 6.3. Summary of the binding energy values measured by XPS experiments corresponding
to the chemical states of different nitrogen species in the TAPP/BDA 2D-COFs. Percentage
contributions of the five N1s peaks to the total fit area. These percentage contributions were
calculated after the area of the satellite peak had been removed from the total fit area.
The percentages of imine and hemiaminal groups in the linkages between TAPP
and BDA are 18.6 % and 13.4 %, respectively. The high proportion of hemiaminal
groups is likely to be related to the presence of significant amount of water vapour

Chapter 6. On-surface synthesis and characterisation of mono-layer covalent-organic frameworks
184
during the 2D-COFs growth. The presence of water in the reaction vessel is favourable
to the formation of hemiaminal groups in terms of the equilibrium position of the
condensation reaction. In the experimental method used, the cap of the reaction vessel
was opened and the sample removed immediately after taking the vessel out of the oven.
My belief is that this rapid quenching of the sample led to the chemical composition of
the 2D-COF being fixed at the composition that was present during the growth process.
Some variation in the percentage contribution of the hemiaminal composition was
observed for TAPP/BDA 2D-COF samples prepared using exactly the same growth
parameters. Thus, the ratio of imine to hemiaminal in the resulting 2D-COFs was not
exactly consistent between different samples grown using the same conditions. This
demonstrates that the chemical structure of the covalent links in the 2D-COFs depends
very delicately on the growth conditions.
The influence that the amount of CuSO4·5H2O added to the reaction vessels has on
the chemical composition of the TAPP 2D-COFs was investigated. Five samples were
parepared using the standard synthetic parameters (10 μl of 0.06 mg/ml TAPP/toluene
solution, 0.064 mg of BDA, and heating at 130 ºC for 15 hours) but with varying
amounts of CuSO4·5H2O (0.00 g, 0.05 g, 0.10 g, 0.15 g, and 0.20 g). Figures 6.34 - 6.38
present the N1s XPS spectra collected for these five TAPP 2D-COF samples. The N1s
spectra were all fitted using the six-component model introduced for the N1s spectrum
shown in Figure 6.32. The percentage contributions of the five nitrogen species existing
in the TAPP 2D-COFs are summarised in Table 6.4.
As can be seen from Table 6.4, the percentage contributions from the protonated
and non-protonated nitrogen species inside the porphyrin cores show no significant
change across the five samples. Given that these nitrogen species play no role in the
Schiff-base condensation reaction this is as expected. However, a drastic increase in the
ratio of imine (36 %) to hemiaminal (3 %) is observed when no CuSO4·5H2O was
added during the 2D-COF growth. With the inclusion of CuSO4·5H2O (0.05 to 0.20 g),
the percentage contributions from the imine nitrogen species decreased to between 12 %
- 25 %. The corresponding contributions from the hemiaminal nitrogen species
increased to between 15 % - 18 %. These results indicate that the water molecules

Chapter 6. On-surface synthesis and characterisation of mono-layer covalent-organic frameworks
185
released by the CuSO4·5H2O has a significant influence on the chemical composition of
the resulting 2D-COF. The presence of water during 2D-COF growth biases the
equilibrium position of the Schiff-base condensation reaction towards the formation of
hemiaminal groups.
Figure 6.34. N1s XPS spectrum for TAPP/BDA 2D-COFs on HOPG. CuSO4·5H2O: 0.00 g.
The chemical nature of the links formed between molecular components plays a
crucial role in determining the electronic properties of 2D-COF materials. To interpret
the precise composition of the links, more complementary techniques are needed to
probe both the chemical structure and the morphology of 2D-COFs. In the future, more
efforts will be focussed on coverting hemiaminal links to imine links by adjusting
growth conditions, particularly by the presence of water. Other more advanced
spectroscopic methods are required to provide more evidence for the existence of
hemiaminal groups, and hopefully to confirm the location of the hemiaminal groups
within the 2D-COF layers.

Chapter 6. On-surface synthesis and characterisation of mono-layer covalent-organic frameworks
186
Figure 6.35. N1s XPS spectrum for TAPP/BDA 2D-COFs on HOPG. CuSO4·5H2O: 0.05 g.
Figure 6.36. N1s XPS spectrum for TAPP/BDA 2D-COFs on HOPG. CuSO4·5H2O: 0.10 g.

Chapter 6. On-surface synthesis and characterisation of mono-layer covalent-organic frameworks
187
Figure 6.37. N1s XPS spectrum for TAPP/BDA 2D-COFs on HOPG. CuSO4·5H2O: 0.15 g.
Figure 6.38. N1s XPS spectrum for TAPP/BDA 2D-COFs on HOPG. CuSO4·5H2O: 0.20 g.

Chapter 6. On-surface synthesis and characterisation of mono-layer covalent-organic frameworks
188
Peaks in
XPS
spectrum
Nitrogen species Amount of CuSO4·5H2O
0.00 g 0.05 g 0.10 g 0.15 g 0.20 g
Amine on
phenyl ring
12 % 13 % 21 % 9 % 15 %
Protonated
nitrogen inside
porphyrin core
28 % 27 % 28 % 30 % 27 %
Non-protonated
nitrogen inside
porphyrin core
22 % 20 % 23 % 19 % 22 %
Nitrogen in
imine links
36 % 25 % 12 % 24 % 21 %
Nitrogen in
hemiaminal
links
3 % 15 % 16 % 18 % 15 %
Table 6.4. Summary of the percentage contributions to the total fit area from the five nitrogen
species present in the TAPP 2D-COF samples grown with different amounts of CuSO4·5H2O.
For each of the samples, the area of the corresponding satellite peak has been removed from the
total fitted area prior to calculating the percentage contributions.
6.4 ZnTAPP COFs
In this section, experimental results on the formation of 2D-COFs via Schiff-base
condensation reactions between BDA and a metal-containing tetra-amine-porphyrin,
5,10,15,20-tetrakis-(4-aminophenyl)porphyrin-Zinc(II) (ZnTAPP) (Figure 6.1), are
discussed. Both STM and AFM were employed to study the morphology of
ZnTAPP/BDA 2D-COFs. The chemical nature of the covalent bonds formed beween
ZnTAPP and BDA were studied using XPS.

Chapter 6. On-surface synthesis and characterisation of mono-layer covalent-organic frameworks
189
6.4.1 Morphology studies of ZnTAPP/BDA 2D-COFs
STM studies
Ordered ZnTAPP/BDA 2D-COF structures can be formed on HOPG by depositing
ZnTAPP from either toluene or 1,2,4-trichlorobenzene (TCB) solutions.
Figure 6.39. STM image of ZnTAPP/BDA 2D-COFs grown by depositing ZnTAPP from TCB.
Sample fabrication conditions: 0.15 g of CuSO4∙5H2O; ~ 1 mg of BDA as solid; 20 µl of 0.1
mg/ml ZnTAPP in TCB; heating at 150 ºC for 2 hours. STM scanning parameters: Vs = -0.55 V,
It = 12 pA. Prior to STM imaging a drop of 1-phenyloctane was deposited on the surface to
improve imaging resolution. Image size: 150 nm. Scale bar: 30 nm.
Figure 6.39 is an STM image showing the growth of the ZnTAPP 2D-COFs. The
ZnTAPP molecules were dissolved in TCB and then deposited onto a freshly cleaved
HOPG surface and the TCB allowed to evaporate. The HOPG substrate covered with an
unreacted ZnTAPP film was then loaded into a reaction vessel. Quantitative analysis
was carried out for this STM image using the same method adopted for the STM image
shown in Figure 6.10. Surface coverages were measured from four STM images

Chapter 6. On-surface synthesis and characterisation of mono-layer covalent-organic frameworks
190
collected at different locations of the ZnTAPP/BDA 2D-COF sample. By taking the
average and standard deviation of the results from these four measurements, the average
surface coverage of the ZnTAPP/BDA 2D-COF on the HOPG surface was determined
to be 83 % ± 4 %. To measure the average domain size of the ZnTAPP 2D-COF, ten
domain size values were collected from the four STM images. From the calculation of
the average and standard deviation of these ten measured values, the average domain
size of the ZnTAPP 2D-COF was determined to be 44 ± 16 nm.
The growth of ZnTAPP/BDA 2D-COFs was also observed by utilising an
unreacted ZnTAPP thin film deposited from toluene solutions. Figure 6.40 shows two
STM images of the ZnTAPP 2D-COFs formed under this condition. The surface
coverage of the ZnTAPP 2D-COF determined from the STM image shown in Figure
6.40 (a) was 87 %. The average domain size of the 2D-COFs in this STM image was
determined by collecting five domain size values and then calculating their average and
standard deviation. As a result, the domain size of the ZnTAPP 2D-COFs shown in
Figure 6.40 (a) was measured to be 35 ± 6 nm. For the growth condition presented in
Figure 6.40 (b), three STM images collected at different locations of the same sample
were used in the 2D-COF quality analysis. By taking the average and standard deviation
of the surface coverage values from these three STM images, the average surface
coverage of the 2D-COFs was determined to be 90 ± 3 %. In order to measure the
average domain size, ten domain size values were collected from the three STM images.
By calculating the average and standard deviation of these ten measured values, the
average domain size of the ZnTAPP 2D-COFs presented in Figure 6.40 (b) was
determined to be 49 ± 18 nm. Compared with the freebase TAPP 2D-COFs, the domain
sizes of the ZnTAPP 2D-COFs are significantly smaller. We suggest that this possibly
results from the lower solubility of ZnTAPP in toluene. ZnTAPP molecules show a
stronger tendency to self-aggregate than freebase TAPP. Thus, newly prepared
ZnTAPP/toluene solutions should be used to ensure a more reproducible ZnTAPP
2D-COFs growth.

Chapter 6. On-surface synthesis and characterisation of mono-layer covalent-organic frameworks
191
Figure 6.40. STM images of ZnTAPP/BDA 2D-COFs prepared by depositing ZnTAPP from
toluene solutions. 2D-COF growth conditions: (a) CuSO4·5H2O: 0.15 g; ZnTAPP: 20 µl, 0.005
mg/ml; BDA: ~ 1 mg in solid; Heating: 120 ºC, 3 h. (b) CuSO4·5H2O: 0.15 g; ZnTAPP: 10 µl,
0.009 mg/ml; BDA: ~ 1 mg in solid; Heating: 120 ºC, 15 h.STM imaging parameters: (a) Vs =
-0.85 V; It = 0.008 nA. Image size: 200 nm. Scale bar: 40 nm. (b) Vs = -1 V; It = 0.01 nA. Image
size: 150 nm. Scale bar: 30 nm.
Unit cell parameters of the ZnTAPP 2D-COFs were determined from high
(a)
(b)

Chapter 6. On-surface synthesis and characterisation of mono-layer covalent-organic frameworks
192
resolution STM images that had been drift-corrected using the underlying HOPG lattice
(see Figure 6.41 (a)). Figure 6.41 (b) shows a pair of drift-corrected STM images for the
measurement of the unit cell dimensions of the ZnTAPP 2D-COFs. The zinc-containing
porphyrin 2D-COFs exhibit indentical unit cell dimensions to that of their freebase
counterparts within the accuracy of the STM measurement. The unit cell lattice values
were measured to be a = b = 2.6 ± 0.2 nm and γ 89 ± 3°. The average and associated
error values were determined by calculating the average and standard deviation of five
sets of data collected from Figure 6.41 (a) and (b).
Figure 6.41. (a) Drift-corrected STM image of ZnTAPP/BDA 2D-COFs. Image size: 10 nm.
Scale bar: 2 nm. STM scanning parameters: Vs = -0.5 V; It = 0.015 nA. (b) A pair of
drift-corrected STM images of the ZnTAPP 2D-COFs stucture (left) and underlying HOPG
lattice (right). STM imaging conditions: left: Vs = -0.55 V; It = 0.015 nA; right Vs = -0.02 V; It =
1 nA.
(a)
(b)
a
b
γ

Chapter 6. On-surface synthesis and characterisation of mono-layer covalent-organic frameworks
193
Figure 6.42. (a) STM image of ZnTAPP/BDA 2D-COFs demonstrating the formation of bi-layer
2D-COF structures. Sample preparation parameters: 0.15 g of CuSO4·5H2O; 20 µl, 0.1 mg/ml.
ZnTAPP in TCB; ~ 1 mg of BDA in solid; heating at 150 ºC for 2h. STM imaging conditions: Vs
= -0.55 V; It = 0.015 nA. (b) Line profile measuring the apparent heights of the bi-layer and
mono-layer 2D-COFs.
In some STM images, for example, Figure 6.42 (a), the growth of bi-layer ZnTAPP
2D-COFs was observed. To measure the apparent heights of the bi-layer and mono-layer
2D-COFs, multiple line profiles (Figure 6.42 (b)) were taken to collect ten height values
for each of the structures from the STM image shown in Figure 6.42 (a). The average
and standard deviation of the ten height values were calculated to determine the average
height and associated error of the bi-layer / mono-layer. As a result, the height of the
bi-layer and mono-layer ZnTAPP/BDA 2D-COFs were measured to be 0.8 ± 0.2 nm and
0.4 ± 0.1 nm, respectively. The percentage of the bi-layer ZnTAPP 2D-COFs was much
lower than that of the bi-layer TAPP 2D-COFs. This probably results from the lower
diffusion ability of the Zn containing porphyrin molecules on the underlying ZnTAPP
2D-COFs.
(a)
(b)

Chapter 6. On-surface synthesis and characterisation of mono-layer covalent-organic frameworks
194
Figure 6.43. NMR spectrum of ZnTAPP run in deuterated DMSO.
The growth processes for the ZnTAPP 2D-COFs have so far not been reproducible.
This is possibly related to the low purity of the ZnTAPP raw materials. Contamination
present in the raw Zn-TAPP material may act as obstacles to the diffusion of ZnTAPP
on the HOPG surface and prevent the formation of high quality 2D-COFs with large
doamin sizes. Even after the use of the disposable syringe needles was stopped,
significant silicon XPS signals could still be detected in the ZnTAPP molecular systems.
From a synthetic point of view, the main source of silicon contamination would be from
vacuum grease used to seal glassware joints. This source of contamination has been
further confirmed by performing NMR analysis on the ZnTAPP powder used for
2D-COFs growth. Figure 6.43 presents the NMR spectrum of the ZnTAPP run in
deuterated DMSO (collected by Niall Goodeal). The peak at – 0.06 corresponds to
silicon grease. Therefore, efforts to synthesis ultra-pure porphyrin raw materials will
play an important role in the future successful growth of ordered 2D-COF structures on
surfaces.

Chapter 6. On-surface synthesis and characterisation of mono-layer covalent-organic frameworks
195
During the synthesis of the ZnTAPP raw materials, more efforts need to be put into
improving the purity of ZnTAPP by removing all silicon related contamination. Then
the 2D-COFs growth conditions, such as temperature and the amounts of precursors,
should be adjusted carefully to increase the coverage and domain sizes of the ZnTAPP
2D-COFs. Other volatile organic solvents in which ZnTAPP has a better solubility than
toluene could also be investigated for the deposition of ZnTAPP.
AFM studies
The morphology of unreacted ZnTAPP films drop deposited onto HOPG from
toluene solutions and the morphology ZnTAPP/BDA 2D-COFs grown from these
deposited films were studied using Bruker Multimode8 AFM. As with TAPP 2D-COF
samples, the homogeneity of the unreacted ZnTAPP films plays a significant role in
determining the quality of the resulting 2D-COFs grown from them. STM and AFM
measurements were performed on the samples after the 2D-COF growth process.
Figure 6.44. PeakForce tapping mode AFM images of HOPG surfaces with: (a) unreacted
ZnTAPP by drop depositing 10 µl of 0.09 mg/ml toluene solutions; and (b) ZnTAPP 2D-COF
grown on a template in (a). ZnTAPP/BDA 2D-COF growth conditions: 0.15 g of CuSO4·5H2O,
0.064 mg of BDA, 10 µl of 0.09 mg/ml ZnTAPP in toluene solutions, heating at 130 ºC for 15
hours. Both image sizes: 10 µm. Both scale bars: 2 µm.
(a) (b)

Chapter 6. On-surface synthesis and characterisation of mono-layer covalent-organic frameworks
196
Figure 6.44 (a) shows the distribution of ZnTAPP on the HOPG surface following
drop deposition of 10 µl of a 0.09 mg/ml ZnTAPP/toluene solution. ZnTAPP molecules
exist as the bright 3D aggregates which locate along the step edges and on the terraces
of the HOPG surface. By taking multiple line profiles through the 3D assemblies, the
average height of the ZnTAPP aggregates was determined to be 5.0 ± 2.0 nm. The AFM
image in Figure 6.44 (b) presents the ZnTAPP 2D-COF structures grown from the
unreacted ZnTAPP film shown in Figure 6.44 (a). The sample was annealed at 130 ºC
for 15 hours with water and BDA in the vapour phase. The 2D-COF exhibits a high
level of homogeneity as can been seen from the AFM scan in Figure 6.44 (b).
Figure 6.45. AFM images of HOPG surfaces with: (a) unreacted ZnTAPP by drop deposition of
5 µl of 0.005 mg/ml toluene solutions; and (b) ZnTAPP 2D-COFs grown using the template
shown in (a). ZnTAPP/BDA 2D-COF growth conditions: 0.15 g of CuSO4·5H2O, 0.053 mg of
BDA, 5 µl of 0.005 mg/ml ZnTAPP in toluene solutions, heating at 120 ºC for 1 h 30 min. Both
image sizes: 10 µm. Both scale bars: 2 µm.
If the amount of ZnTAPP drop deposited on HOPG is decreased to 5µl of 0.005
mg/ml ZnTAPP/toluene solutions, the ZnTAPP molecules still exist as 3D aggregates
with a preference to stack along the step edges as can been seen from the AFM image in
Figure 6.45 (a). ZnTAPP 2D-COFs were grown on this unreacted ZnTAPP film by
heating the substrate at 120 ºC for 1.5 hours. The coverage of the ZnTAPP 2D-COF
(a) (b)

Chapter 6. On-surface synthesis and characterisation of mono-layer covalent-organic frameworks
197
formed via the Schiff-base condensation reaction was smaller compared with the result
presented in Figure 6.44 (b). This difference is probably related to the differences in
annealing temperature and time between the two experiments. The higher annealing
temperature and longer time used in the case presented in Figure 6.44 would be more
favourable for the growth of the ZnTAPP 2D-COFs by increasing the diffusion ability
of ZnTAPP molecules on the HOPG surface. Apart from the annealing conditions, the
decrease in the coverage of 2D-COFs in Figure 6.45 (b) could also be related to a lower
amount of nucleation sites resulting from the decrease in the number of the 3D
aggregates compared with the case shown in Figure 6.44.
6.4.2 Chemical structure of ZnTAPP/BDA 2D-COFs
The chemical nature of the covalent bonds formed between ZnTAPP and BDA via
the Schiff-base condensation reaction was probed using XPS. While two different
nitrogen species are present in a freebase porphyrin core [254], only a single nitrogen
peak is detected in a metalloporphyrin core [255]. Details on the XPS experiments and
criteria for XPS peak fitting can be found in sections 6.2.3 and 6.3.2. In a similar
fashion to TAPP molecular system, nitrogen XPS signals were used to investigate the
covalent bonding beween ZnTAPP and BDA.
Unreacted ZnTAPP control sample
ZnTAPP control samples were made by drop depositing 10µl of a ZnTAPP/toluene
solution with a concentration of 0.027 mg/ml. The sample was loaded into the XPS
machine following complete evaporation of the solvent and without any further heating
steps.
Figure 6.46 presents a series of XPS spectra for the ZnTAPP control sample,
including: C1s, O1s, Zn2p signals and a survey scan of the full binding energy range.
These XPS spectra were not used to analyse the chemical environment of the bonding
formed after the Schiff-base condensation reactions, however, they do provide an

Chapter 6. On-surface synthesis and characterisation of mono-layer covalent-organic frameworks
198
overview of the elemental species present in the system.
Figure 6.46. XPS spectra for the unreacted ZnTAPP control sample. (a) C1s XPS region with a
Gaussian-Lorentzian peak at 284.6 ± 0.1 eV fitted to the spectrum; (b) survey scan; (c) Zn2p; and (d)
O1s.
Figure 6.47 is an N1s XPS spectrum collected from an unreacted ZnTAPP control
sample. This spectrum is an average taken from two areas on the same ZnTAPP control
sample. Three nitrogen peaks are expected from this spectrum, including: one satellite
peak; one nitrogen peak corresponding to the amine groups on the outer phenyl rings;
and one nitrogen peak associated with the nitrogens coordinated to the central zinc atom
in the porphyrin core. According to previous reports in literature, the binding energy of
the nitrogen coordinated to the central zinc atom is 398.5 ± 0.3 eV [244, 247, 249]. The
starting positions for the satellite peak and the nitrogen peak associated with unreacted
amines were set to be 402 ± 0.5 eV and 399.5 ± 0.3 eV. The restraints for the FWHMs
(a) (b)
(c) (d)

Chapter 6. On-surface synthesis and characterisation of mono-layer covalent-organic frameworks
199
of the peaks were the same as those used for fitting the XPS data for the freebase TAPP
molecular system.
Figure 6.47. N1s XPS spectrum for the unreacted ZnTAPP control sample.
Peaks in
XPS
spectrum
Nitrogen species Chemical
formula
Binding energy
in experiment
(± 0.1 eV)
Percentage
of total fit
area
Amine on phenyl
ring
399.8 51.4 %
Nitrogen
coordinated to zinc
inside porphyrin
core
398.4 48.6 %
Satellite peak ---- 401.5 ----
Table 6.5. Summary of binding energies and percentage contributions of N1s peaks from the
N1s spectrum of unreacted ZnTAPP.

Chapter 6. On-surface synthesis and characterisation of mono-layer covalent-organic frameworks
200
Detailed information about the peak fitting to the N1s XPS spectrum in Figure 6.46
is summarised in Table 6.5. The percentage contribution of the two different nitrogen
species in the ZnTAPP control sample to the total fit area was calculated after the area
of the satellite peak was removed from the total fit area. The percentage contributions
associated with the amine and zinc coordinated nitrogen were calculated to be 51.4 %
and 48.6 %, respectively. The percentage contribution of the nitrogen species to the total
fitted area is roughly equal, in good agreement with the expected the molecular structure
of the unreacted ZnTAPP sample.
ZnTAPP /BDA 2D-COFs
Figure 6.48. XPS spectra for the ZnTAPP/BDA 2D-COFs sample. (a) C1s, the binding energy
of the main peak: 284.7 ± 0.1 eV; (b) survey scan; (c) Zn2p; and (d) O1s.
The growth conditions for the ZnTAPP/BDA 2D-COFs used in the XPS
(b) (b)
(c) (d)

Chapter 6. On-surface synthesis and characterisation of mono-layer covalent-organic frameworks
201
investigation were as follows: 0.15 g of CuSO4·5H2O; 10 µL of 0.09 mg/ml
ZnTAPP/toluene solutions; 0.064 mg of BDA; heating at 130 ºC for 15 hours. STM and
AFM imaging was conducted on this sample to ensure the formation of the highly
ordered ZnTAPP 2D-COFs over extended areas prior to XPS analysis.
Figure 6.48 presents C1s, Zn2p, O1s and survey scan XPS spectra on the
ZnTAPP/BDA 2D-COFs sample. As the binding energy of the C1s peak is 284.7 ± 0.1
eV, the XPS spectra collected for the ZnTAPP 2D-COF can be compared with those for
the unreacted ZnTAPP without further correction.
Figure 6.49 is an averaged, fitted N1s spectrum collected for the ZnTAPP/BDA
2D-COFs sample. Apart from the satellite peak, three nitrogen peaks were fitted for this
spectrum. The binding energy of the N1s peaks for nitrogen coordinated to Zn and for
nitrogen in an imine group are so similar that their individual contributions to the XPS
spectrum cannot be separated [243]. The N1s peak located at the binding energy of
400.6 eV corresponds to hemiaminal links formed between ZnTAPP and BDA.
Figure 6.49. N1s XPS spectrum for the ZnTAPP/BDA 2D-COF sample.

Chapter 6. On-surface synthesis and characterisation of mono-layer covalent-organic frameworks
202
The results of peak fitting for the N1s XPS spectrum of the ZnTAPP 2D-COFs are
summarised in Table 6.6. In comparison to the N1s spectrum of unreacted ZnTAPP, the
intensity of the peak associated with unreacted amine groups decreases significantly
from 51.4 % to 17.6 % as the amine groups covert into imine and hemiaminal links. The
percentage contribution of the nitrogen coordinated with zinc is assumed to be
constant before and after 2D-COF growth as these atoms are not involved in the
Schiff-base condensation reaction. The percentage contribution of the imine nitrogens is
expected to be zero prior to the reaction taking place and is therefore estimated to
increase to 12.4 % after the formation of the 2D-COF.
Peaks in
XPS
spectrum
Nitrogen species Chemical formula Binding energy
in experiment
(± 0.1 eV)
Percentage
of total fit
area
Amine on
phenyl ring
399.7 17.6 %
Nitrogen
coordinated to
zinc inside
porphyrin core
&
Nitrogen in
imine links
398.7
61.0 %
Nitrogen in
hemiaminal
links
400.6
21.4 %
Satellite peak ---- 401.8 ----
Table 6.6. Peak fitting and interpretation of N1s XPS spectrum for ZnTAPP/BDA 2D-COF.
Compared with the TAPP/BDA 2D-COF, the covalent bonds formed between
ZnTAPP and BDA exhibit a higher hemiaminal to imine ratio in the XPS N1s spectrum

Chapter 6. On-surface synthesis and characterisation of mono-layer covalent-organic frameworks
203
shown in Figure 6.49. This is possibly related to the influence of the zinc atoms within
porphyrin cores. However, this could also be related simply to statistical fluctuation in
the amount of imine and hemiaminal linkages. Further experiments that investigate a
larger number of samples are required in order to demostrate a clear correlation between
the presence of zinc and the hemiaminal to imine ratio.
6.5 Conclusions
In conclusion, highly ordered 2D-COFs were grown on HOPG substrates using the
Schiff-base condensation reaction between either 5,10,15,20-meso-tetra(4-aminophenyl)
porphyrin (TAPP) or 5,10,15,20-meso-tetra(4-aminophenyl) porphyrin Zn(II) (Zn-TAPP)
and benzene-1,4-dicarboxaldehyde (BDA). Through using the facile synthetic method
described in the thesis, the domain sizes of the TAPP 2D-COFs formed can be larger
than 100 nm by adjusting the experimental parameters. These parameters include: the
amount of porphyrin components deposited on the HOPG surface; the pressure of water
vapour released by copper sulphate; annealing temperature; and annealing time. In order
to ensure the consistency and reproducibility of 2D-COFs growth processes, the
supporting surfaces, solvents and the raw molecular materials should be free from
contamination. Highly purified raw materials and contamination-free solution
preparation schemes are required for a successful 2D-COF preparation process.
The exact morphological structures of the porphyrin/BDA 2D-COFs were
determined using a combination of STM and AFM. The homogeneity of unreacted
porphyrin films drop deposited onto surfaces is closely related to the structural quality
and the domain size of the resulting 2D-COFs. in addition to mono-layer 2D-COFs,
multi-layer porphyrin 2D-COFs grown on HOPG were also identified.
The chemical composition of the covalent bonds formed between the amine
functionalised porphyrins and BDA was demonstrated by XPS to consist of a mixture of
imine and hemiaminal groups. These variations in the chemical composition of the
2D-COFs were not discernible by SPM techniques. The water vapour released by
CuSO4·5H2O influences not only the morphology and structural order of 2D-COFs, but

Chapter 6. On-surface synthesis and characterisation of mono-layer covalent-organic frameworks
204
also modifies the chemical composition of the bonds formed following the Schiff-base
condensation reaction.
The above results relating to the growth, morphology and chemical composition of
2D-COFs will play a key role in advancing studies towards the design, and controllable
growth of novel 2D-COF materials with tuneable stuctures and functional properties.
6.6 Future work
In the future, investigations are suggested in three major aspects: novel growth
schemes for 2D-COF materials; improvements in the morphology of porphyrin
2D-COFs; and deeper insights into the chemical composition of Schiff-base 2D-COFs
and how this is influenced by environmental conditions during growth.
In our study, AFM imaging has been conducted on HOPG surfaces covered with
unreacted porphyrin films and grown 2D-COFs. The initial distribution of porphyrins on
the HOPG surface following deposition has been found to play a major role in
determining the quality of the resulting 2D-COFs. Therefore, it would be interesting to
try and deposit porphyrin molecules onto surfaces using different depsition processes.
These might include: thermal evaporation under UHV; and spin coating. Compared
with drop deposition, spin coating would help produce a more homogeneous unreacted
porphyrin film in preparation for 2D-COF growth. The ability of the Cypher AFM
system to resolve the molecular structure of porphyrins in 2D-COFs also opens the
possibility of using insulating or semi-conducting surfaces to grow 2D-COFs.
Based on previous studies of the morphology of 2D-COFs, more research can be
conducted around the growth of multi-layer 2D-COFs and the composition of the 3D
aggregates left on the surface after the growth process. More specifically, additional
experiments need to be carried out in order to reveal how porphyrins in the upper layers
of multi-layer structures stack on top of those in lower layers. Further experiments are
also needed to discover the exact chemical composition of the 3D aggregates.
In terms of the chemical composition of the 2D-COFs, other complementary
spectroscopic techniques are needed to resolve the formation of imine and hemiaminal

Chapter 6. On-surface synthesis and characterisation of mono-layer covalent-organic frameworks
205
groups. One such technique with the ability to combine the spatial resolution of SPM
with the chemical specificity of optical spectroscopy is tip-enhanced Raman
Spectroscopy (TERS). Some experiments have been performed in an attempt to tune the
ratio between imine and hemiaminal groups. Additionally, several other reaction
conditions to grow the TAPP 2D-COFs have been investigated to convert more of the
hemiaminal linkages into imine linkages. However, no persuasive results have yet been
obtained. The numerous potential applications of porous porphyrin 2D-COFs make
research into guest adsorption, post-synthesis functionalisation and chemical
strengthening of the bonds formed via Schiff-base condensation reactions promising
areas of study. One particular example that merit further study is an attempt to
chemically modify the 2D-COF structure by reducing imine links to secondary amine
links. Such a chemical modification could be attempted by exposing the gwon 2D-COF
to a typical reducing agent such as sodium borohydride. Reduction of the imine linkages
to secondary amine links would produce a 2D-COF structure with a greatly enhaned
resistance to decomposition by hydrolysis, an important step to making the 2D-COF
structures more widely applicable.

206
Chapter 7
Summary and future work
The synthesis and characterisation of two-dimensional (2D) organic molecular networks
are in the interdisciplinary fields of surface physics and chemistry, molecular
nanocience and 2D materials. These 2D molecular networks have potential applications
in molecular electronics, chemical catalysis and sensors. The formation of highly
ordered 2D molecular networks can be realised either by a non-covalent supramolecular
self-assembly approach or by covalent on-surface synthesis of 2D covalent-organic
frameworks (2D-COFs).
This PhD thesis has focused on studies of 2D self-assembled molecular networks
and 2D-COFs grown on HOPG substrates. Three distinct molecular systems have been
investigated using scanning probe microscopy (SPM), X-ray photoelectron
spectroscopy (XPS) and molecular mechanics (MM) simulations. These results
demonstrate the numerous factors that influence the formation of hydrogen bond
stabilised 2D self-assembled molecular networks. Moving from non-covalent molecular
networks to 2D-COFs, the results presented in this thesis demonstrate the pivotal
importance of using coupled chemical and structural analysis to investigate how the
chemical composition of 2D-COFs can be tuned by controlling the growth environment.
In chapter 4, the self-assembly of a tetra-carboxylic acid derivative,
5,5 -́(anthracene-2,6-diyl) diisophthalic acid (ATC) was investigated at a liquid-solid
interface. ATC molecules self-assemble into extended 2D molecular networks at the
interface between heptanoic acid and HOPG. Three distinct self-assembled molecular
arrangements were observed for ATC including: porous Kagomé, parallel and
close-packed structures. Concentration variation experiments showed that the observed
morphology of ATC 2D self-assembled networks exhibit a concentration dependency.
The Kagomé structure dominates at the low concentrations, while the parallel and

Chapter 7. Summary and future work
207
close-packed structures dominate at higher concentrations. The co-assembly of ATC
with a guest molecule, coronene, leads to the formation of a bi-component Kagomé
structure. The chirality of the Kagomé structure was identified using STM images of the
central anthracene backbone of the ATC molecule. This chirality arises from the
prochiral nature of ATC which can adopt one of two different enantiomers upon
adsorption to the HOPG surface. These results illustrate the possibility to utilise the
self-assembly of ATC to gain a systematic understanding of morphology and chirality
control over interfacial self-assembled molecular networks.
In chapter 5, the surface-based self-assembly behaviour of thymine functionalised
porphyrins, including tetra-(phenylthymine)porphyrin (tetra-TP) and its
metallated derivative, tetra-(phenylthymine)porphyrin-Zn(Ⅱ) (Zn-tetra-TP) was
investigated. These molecules formed highly ordered 2D porphyrin arrays stabilised by
thymine-thymine hydrogen bonding when deposited at a liquid-solid interface. In
addition to mono-component porphyrin networks, both thymine functionalised
porphyrins are also observed to co-crystallise with 9-propyladenine (PA) molecules to
form an ordered bi-component molecular network. Freebase tetra-TP has also been
shown to form a bi-component network with melamine. The formation of these
homo-molecular and hetero-molecular networks demonstrate a novel strategy for the
assembly of highly ordered porphyrin arrays on surfaces by utilising selective hydrogen
bonding interactions between DNA nucleobase pairs.
Chapter 6 discussed the synthesis of highly ordered porphyrin 2D-COFs at the
vapour-solid interface. Schiff-base condensation reactions between either
5,10,15,20-meso-tetra(4-aminophenyl) porphyrin (TAPP) or
5,10,15,20-meso-tetra(4-aminophenyl) porphyrin Zn(II) (Zn-TAPP) and
benzene-1,4-dicarboxaldehyde (BDA) were used as a facile synthetic route to 2D-COF
formation. The results presented here demonstrate the importance that the molecular
system is free from any contamination in order to ensure the consistent growth of the
2D-COF layers. According to the results of AFM invesitgations, the morphology of the
resulting 2D-COFs are closely related to the homogeneity of the deposited porphyrin
films on the HOPG surface prior to 2D-COF growth. In addition to these morphological

Chapter 7. Summary and future work
208
studies, the chemical nature of the covalent bonds fromed between the amine
functionalised porphyrins and BDA has been revealed to consist of both conjugated
imine and non-conjugated hemiaminal bonds. This chemical composition is linked to
the environmental conditions under which the 2D-COFs were synthesised. Our results
highlight the importance of utilising complementary experimental tools to study both
the morphology and chemical composition of 2D-COF materials.
In the future, more investigations are needed for each of these molecular systems.
The interfacial self-assembly of ATC shows a dependency on the concentration of
solutions deposited onto HOPG surfaces. In orded to illustrate exactly how
self-assembled structures of ATC change with concentration, a more detailed range of
concentration experiments is required to be carried out. As the ATC solutions were
deposited on HOPG substrates at room temperature, kinetic effects will have a
significant influence on the morpholgy of the resulting ATC network. The role that
kinetic effects play in the self-assembly process of ATC needs to be further investigated
by adding annealing and cooling steps to the network preparation. This temperature
change would remove or minimise kinetic effects, and thus, promote the formation of
self-assembled structures with minimum Gibbs free energy. Therefore, the 2D
self-assembly of prochiral of ATC would be controlled by changing concentration and
temperature. The results from these experiments would reveal new knowledge about the
thermodynamic and kinetic factors that influence carboxylic acid drived 2D
self-assembly. This would contribute to utilising ATC as another model molecular
system to study guest adsorption and chirality selection for 2D self-assembly that occurs
at the liquid-solid interfaces.
In comparison to carboxylic acid groups, the flexible and selective hydrogen
bonding between DNA nucleobases has the potential to drive the self-assembly of 2D
molecular networks with more structural diversity. This increase in complexity of
possible morphological structures would offer a wider range of 2D molecular networks
to explore the functional properties and performance in real applications. The study of
the 2D self-assembly of the thymine functionalised porphyrins is expected to be
expanded to include porphyrin molecules functionalised with other DNA nucleobases

Chapter 7. Summary and future work
209
such as adenine. The observation of chrial domains for the tetra-TP mono-component
network and the tetra-TP and PA bi-component network suggests the possibility of
controlling the chirality of these self-assembled structures. One possibility for achieving
this chiral control would be the inclusion of a small quantity of an additional chiral
component. This approach is similar to the sergeants and soldiers approach utilised by
K.-H. Ernst et al. [256]. The self-assembly of Zn-tetra-TP can be potentially extended
from mono-layers to bi-layers directed by the axial coodination bonding between
pyridine and the central Zn atom. In order to form stable 2D Zn porphyrin arrays, the
self-assembly of Zn-tetra-TP with a similar tetra adenine functionalised porphyrin
species are suggested to be studied.
Of the three different molecular systems investigated in the thesis the porphyrin
2D-COFs offer the most potential for development and future applications. The
additional chemical and environmental stability offered by covalent bonding makes
2D-COFs good candidates for numerous applications ranging from catalysis to
molecular electronics. In relation to the fabrication of 2D-COFs, future work will be
carried out to optimise the growth procedure, with a particular focus on improving the
structural quality and domain size of the 2D-COFs. One of this first steps towards
improving the structural quality of the 2D-COFs is to gain more control over the
homogeneity of the initial porphyrin layer deposited on the surface prior to 2D-COF
growth. Spin coating is a widely used industrial deposition technique that may be used
as an alternative method to produce homogeneous porphyrin films. By increasing the
structural quality and domain size of the 2D-COF materials, it is hoped that new
materials properties inherent to the 2D materials that are linked to the level of structural
order will start to emerge. In particular, the conjugated nature of imine bonds suggests
the possibility of using 2D-COF fabrication methods to form new, fully conjugated 2D
materials. Conjugation over large areas in these 2D materials will open up the
possibility of using the 2D-COF layers as components in electronic devices such as
sensors of field-effect transistors [257, 258].
One aspect that will be of fundamental interest is the formation of an electronic
band structure for these 2D materials. As the size of ordered 2D-COF domains increases

Chapter 7. Summary and future work
210
then fully conjugated 2D-COF layers will start to develop a delocalised valence band
structure that reflects the chemical composition and structural order of the material.
Planned future collaborations include the use of experimental techniques that will allow
us to probe the band structure of 2D materials with nanometre resolution. One such
experimental tool is nanoscale angle resolved photoemission spectroscopy
(Nano-ARPES) at the SOLEIL synchrotron in France [259]. Nano-ARPES
measurements of the porphyrin 2D-COFs would help us to determine if the materials
are conjugated and if so to what extent. Knowledge of the extent of the 2D-COF
conjugation is particularly important for the future application of 2D-COFs. The XPS
results presented in chapter 6 have shown that the Schiff-base condensation reaction
produced a mixture conjugated imine and non-conjugated hemiaminal linkages between
molecules. The ability to study the nanoscale electronic properties of the 2D-COFs may
help to clarify where the imine and hemiaminal links reside within the 2D-COF
structure and what influence this has on the material’s electronic properties.
In addition to observing a mixture imine and hemiaminal linkages in the porphyrin
2D-COFs, the results in chapter 6 also demonstrated that the ratio of these two types of
linkages can be influenced by the environmental conditions used during growth,
particulary by the amount of water vapour present With this in mind, further studies are
required to investigate exactly how different environmental conditions influence the
composition and structural quality of the 2D-COFs: e.g. humidity, pressure, atmospheric
composition and temperature. Developing a reproducible fabrication scheme that allows
a more precise control over the chemical composition of the Schiff-base 2D-COFs is an
important step for investigating how this composition influences the physical properties
of 2D-COFs. This understanding of the link between structural and chemical
composition and physical properties is pivotal for the future development of 2D-COFs
for technological applications.
All of the 2D-COF layers investigated in this thesis were grown on HOPG
substrates. The choice of HOPG as a supporting substrate is largely based on its inert
nature, ease of preparation and high conductivity. These properties make HOPG an
indeal substrate both for growing ordered 2D molecular networks and for investigating

Chapter 7. Summary and future work
211
their structure of these networks with SPM. However, the use of a conductive substrate
leads to several limitations in the properties and further analysis of 2D-COFs. One
major limitation being that a conductive supporting substrate prevents 2D-COFs being
used for electronic device fabrication. Recent developments in high resolution ambient
AFM have made it possible to extend molecular resolution SPM investigations of
2D-COFs to insulator and semiconductor surfaces. In particular, the growth of 2D-COF
layers on transparent substrates would allow the optical properties of 2D-COF layers to
be more easily investigated. There are close structural and chemical similarities between
the porphyrins used in 2D-COF fabrication and the optically active bio-components in
photosynthesis: e.g. chlorophyll [260]. Being able to grow ordered and possibly even
complex porphyrin 2D-COF layers on transparent non-conductive substrates would
make possible a wide array of optical spectroscopy experiments to study light induced
energy transfer and charge separation in 2D molecular layers. Combining such
experiments with the fine control over 2D-COF chemical and structural composition
discussed above could open up new directions of research into optically functional 2D
molecular nanostructures.
In the experiments presented here, multi-layer porphyrin 2D-COFs were observed
to grow. However, the detailed stacking relationship between the top and bottom layers
of the 2F-COFs have not yet been fully revealed. Additional experiments are needed to
be carried out in order to illustrate how porphyrins in the upper layers of multi-layer
structures stack on top of those in lower layers.
Figure 7.1. Schematic illustration showing the irreversible reduction of an imine linkage to a
secondary amine linkage.
Finally, a significant area that warrants further investigation is the post growth
chemical modification of porphyrin 2D-COF layers. One key example of this approach
“H2”
NaBH4, CH3OH

Chapter 7. Summary and future work
212
would be the reduction of imine groups to secondary amines (Figure 7.1). This chemical
conversion would produce covalent linkages between porphyrin molecules that are far
more robust and in particular resilient to decomposition by hydrolysis. Another
important approach to the modification of 2D-COF structures is the use of component
moleucles that produce 2D-COFs decorated with functional groups which could then be
used for further modification. An example of this is the use of dialdehyde linker
molecules with diol functional groups (Figure 7.2). Once incorporated into a porphyin
2D-COF of the same morphology as presented in chapter 6, a suitably chosen molecule
would leave the diol functional groups pointing into the pores of the 2D-COF network.
These functional groups could then be used as reactive sites to attach other molecular
species via the reaction between diol and boronic acid. This approach would provide a
controllable way of adding functionality to the 2D-COF layers. This type of step by step
molecular approach to the growth of complex 2D materials would open up a vast array
of possibilities for the design and application of functional molecular nanostructures.
Figure 7.2 The molecular structure of newly designed dialdehyde linker molecules with diol
functional groups for the synthesis of porphyrin 2D-COFs.

213
Bibliography
1. He, Y., T. Ye, M. Su, C. Zhang, A.E. Ribbe, W. Jiang, and C. Mao, Hierarchical
self-assembly of DNA into symmetric supramolecular polyhedra. Nature, 2008.
452(7184): p. 198-201.
2. Theobald, J.A., N.S. Oxtoby, M.A. Phillips, N.R. Champness, and P.H. Beton,
Controlling molecular deposition and layer structure with supramolecular
surface assemblies. Nature, 2003. 424(6952): p. 1029-1031.
3. Madueno, R., M.T. Räisänen, C. Silien, and M. Buck, Functionalizing
hydrogen-bonded surface networks with self-assembled monolayers. Nature,
2008. 454(7204): p. 618-621.
4. Wei, X., W. Tong, V. Fidler, and M.B. Zimmt, Reactive capture of gold
nanoparticles by strongly physisorbed monolayers on graphite. Journal of
colloid and interface science, 2012. 387(1): p. 221-227.
5. Richard, C., F. Balavoine, P. Schultz, T.W. Ebbesen, and C. Mioskowski,
Supramolecular self-assembly of lipid derivatives on carbon nanotubes. Science,
2003. 300(5620): p. 775-778.
6. Resendiz, M.J., J.C. Noveron, H. Disteldorf, S. Fischer, and P.J. Stang, A
self-assembled supramolecular optical sensor for Ni (II), Cd (II), and Cr (III).
Organic letters, 2004. 6(5): p. 651-653.
7. dos Santos, C.M., A.J. Harte, S.J. Quinn, and T. Gunnlaugsson, Recent
developments in the field of supramolecular lanthanide luminescent sensors and
self-assemblies. Coordination Chemistry Reviews, 2008. 252(23): p. 2512-2527.
8. Davis, J.T. and G.P. Spada, Supramolecular architectures generated by
self-assembly of guanosine derivatives. Chemical Society Reviews, 2007. 36(2):
p. 296-313.
9. Lackinger, M. and W.M. Heckl, Carboxylic acids: Versatile building blocks and
mediators for two-dimensional supramolecular self-assembly. Langmuir, 2009.
25(19): p. 11307-11321.

Bibliography
214
10. Barth, J.V., G. Costantini, and K. Kern, Engineering atomic and molecular
nanostructures at surfaces. Nature, 2005. 437(7059): p. 671-679.
11. Mazur, U. and K.W. Hipps, Kinetic and thermodynamic processes of organic
species at the solution-solid interface: the view through an STM. Chemical
Communications, 2015. 51(23): p. 4737-4749.
12. Voorhees, P.W., The theory of Ostwald ripening. J. Stat. Phys., 1985. 38(1-2): p.
231-252.
13. Gutzler, R., L. Cardenas, and F. Rosei, Kinetics and thermodynamics in
surface-confined molecular self-assembly. Chemical Science, 2011. 2(12): p.
2290-2300.
14. Wang, Y., M. Lingenfelder, S. Fabris, G. Fratesi, R. Ferrando, T. Classen, K.
Kern, and G. Costantini, Programming Hierarchical Supramolecular
Nanostructures by Molecular Design. The Journal of Physical Chemistry C,
2013. 117(7): p. 3440-3445.
15. Rest, C., R. Kandanelli, and G. Fernández, Strategies to create hierarchical
self-assembled structures via cooperative non-covalent interactions. Chemical
Society Reviews, 2015. 44(8): p. 2543-2572.
16. Neuheuser, T., B.A. Hess, C. Reutel, and E. Weber, Ab initio calculations of
supramolecular recognition modes. Cyclic versus noncyclic hydrogen bonding
in the formic acid/formamide system. The Journal of Physical Chemistry, 1994.
98(26): p. 6459-6467.
17. Wang, C.-S., Y. Zhang, K. Gao, and Z.-Z. Yang, A new scheme for determining
the intramolecular seven-membered ring NH... O= C hydrogen-bonding energies
of glycine and alanine peptides. The Journal of chemical physics, 2005. 123(2):
p. 24307-24307.
18. Desiraju, G.R. and T. Steiner, The weak hydrogen bond. 1999, Oxford: Oxford
University Press. 12-13.
19. Feyereisen, M.W., D. Feller, and D.A. Dixon, Hydrogen bond energy of the
water dimer. The Journal of Physical Chemistry, 1996. 100(8): p. 2993-2997.
20. Leiserowitz, L., Molecular packing modes. Carboxylic acids. Acta

Bibliography
215
Crystallographica Section B: Structural Crystallography and Crystal Chemistry,
1976. 32(3): p. 775-802.
21. Lackinger, M., S. Griessl, W.M. Heckl, M. Hietschold, and G.W. Flynn,
Self-Assembly of Trimesic Acid at the Liquid-Solid Interface a Study of
Solvent-Induced Polymorphism. Langmuir, 2005. 21(11): p. 4984-4988.
22. Yokoyama, S., T. Hirose, and K. Matsuda, Phototriggered formation and
disappearance of surface-confined self-assembly composed of photochromic
2-thienyl-type diarylethene: a cooperative model at the liquid/solid interface.
Chemical Communications, 2014. 50(45): p. 5964-5966.
23. Ciesielski, A., M. El Garah, S. Masiero, and P. Samorì, Self‐assembly of
Natural and Unnatural Nucleobases at Surfaces and Interfaces. Small, 2016.
12(1): p. 83-95.
24. Bléger, D., A. Bocheux, D. Kreher, F. Mathevet, A.-J. Attias, G. Metgé, L.
Douillard, C. Fiorini-Debuisschert, and F. Charra, An optimized alkyl
chain-based binding motif for 2D self-assembly: a comprehensive
crystallographic approach. Nanoscale, 2013. 5(4): p. 1452-1455.
25. Gellman, A.J. and K.R. Paserba, Kinetics and Mechanism of Oligomer
Desorption from Surfaces: n-Alkanes on Graphite. The Journal of Physical
Chemistry B, 2002. 106(51): p. 13231-13241.
26. Yin, S., C. Wang, X. Qiu, B. Xu, and C. Bai, Theoretical study of the effects of
intermolecular interactions in self‐assembled long‐chain alkanes adsorbed on
graphite surface. Surf. Interface Anal., 2001. 32(1): p. 248-252.
27. Grimme, S., Do special noncovalent π–π stacking interactions really exist?
Angew. Chem. Int. Ed., 2008. 47(18): p. 3430-3434.
28. Mena‐Osteritz, E. and P. Bäuerle, Complexation of C60 on a cyclothiophene
monolayer template. Advanced Materials, 2006. 18(4): p. 447-451.
29. Claessens, C.G. and J.F. Stoddart, Review commentary–interactions in
self-assembly. J. Phys. Org. Chem., 1997. 10: p. 254-272.
30. Zhu, J., Z. Dong, S. Lei, L. Cao, B. Yang, W. Li, Y. Zhang, J. Liu, and J. Shen,
Design of Aromatic Helical Polymers for STM Visualization: Imaging of Single

Bibliography
216
and Double Helices with a Pattern of π–π Stacking. Angew. Chem., 2015.
127(10): p. 3140-3144.
31. Balandina, T., . Tahara, N. S ndig, M.O. Blunt, J. Adisoejoso, S. Lei, F.
Zerbetto, Y. Tobe, and S. De Feyter, Role of Substrate in Directing the
Self-Assembly of Multicomponent Supramolecular Networks at the
Liquid–Solid Interface. ACS nano, 2012. 6(9): p. 8381-8389.
32. Park, K.-W., J. Adisoejoso, J. Plas, J. Hong, K. Müllen, and S. De Feyter,
Self-Assembly Behavior of Alkylated Isophthalic Acids Revisited:
Concentration in Control and Guest-Induced Phase Transformation. Langmuir,
2014. 30(50): p. 15206-15211.
33. El Garah, M., A. Dianat, A. Cadeddu, R. Gutierrez, M. Cecchini, T.R. Cook, A.
Ciesielski, P.J. Stang, G. Cuniberti, and P. Samorì, Atomically Precise Prediction
of 2D Self‐Assembly of Weakly Bonded Nanostructures: STM Insight into
Concentration‐Dependent Architectures. Small, 2016. 12(3): p. 343-350.
34. Adisoejoso, J., K. Tahara, S. Lei, P. Szabelski, W. Rzysko, K. Inukai, M.O. Blunt,
Y. Tobe, and S. De Feyter, One building block, two different nanoporous
self-assembled monolayers: a combined STM and Monte Carlo study. ACS nano,
2011. 6(1): p. 897-903.
35. Lei, S., K. Tahara, F.C. De Schryver, M. Van der Auweraer, Y. Tobe, and S. De
Feyter, One Building Block, Two Different Supramolecular Surface‐Confined
Patterns: Concentration in Control at the Solid–Liquid Interface. Angew. Chem.,
2008. 120(16): p. 3006-3010.
36. Ikeda, T., M. Asakawa, K. Miyake, M. Goto, and T. Shimizu, Scanning
tunneling microscopy observation of self-assembled monolayers of strapped
porphyrins. Langmuir, 2008. 24(22): p. 12877-12882.
37. Xu, L., X. Miao, B. Zha, and W. Deng, Self-Assembly Polymorphism:
Solvent-Responsive Two-Dimensional Morphologies of
2,7-Ditridecyloxy-9-fluorenone by Scanning Tunneling Microscopy. The
Journal of Physical Chemistry C, 2012. 116(30): p. 16014-16022.
38. Sirtl, T., W. Song, G. Eder, S. Neogi, M. Schmittel, W.M. Heckl, and M.

Bibliography
217
Lackinger, Solvent-Dependent Stabilization of Metastable Monolayer
Polymorphs at the Liquid–Solid Interface. ACS Nano, 2013. 7(8): p. 6711-6718.
39. Gutzler, R., T. Sirtl, J.r.F. Dienstmaier, K. Mahata, W.M. Heckl, M. Schmittel,
and M. Lackinger, Reversible Phase Transitions in Self-Assembled Monolayers
at the Liquid− Solid Interface: Temperature-Controlled Opening and Closing of
Nanopores. Journal of the American Chemical Society, 2010. 132(14): p.
5084-5090.
40. Marie, C., F. Silly, L. Tortech, . M llen, and D. Fichou, Tuning the packing
density of 2D supramolecular self-assemblies at the solid− liquid interface using
variable temperature. ACS nano, 2010. 4(3): p. 1288-1292.
41. Bhattarai, A., U. Mazur, and K. Hipps, A single molecule level study of the
temperature-dependent kinetics for the formation of metal porphyrin monolayers
on Au (111) from solution. Journal of the American Chemical Society, 2014.
136(5): p. 2142-2148.
42. Griessl, S.J., M. Lackinger, F. Jamitzky, T. Markert, M. Hietschold, and W.M.
Heckl, Incorporation and manipulation of coronene in an organic template
structure. Langmuir, 2004. 20(21): p. 9403-9407.
43. Schull, G., L. Douillard, C. Fiorini-Debuisschert, F. Charra, F. Mathevet, D.
Kreher, and A.-J. Attias, Single-molecule dynamics in a self-assembled 2D
molecular sieve. Nano letters, 2006. 6(7): p. 1360-1363.
44. Lei, S., M. Surin, K. Tahara, J. Adisoejoso, R. Lazzaroni, Y. Tobe, and S.D.
Feyter, Programmable hierarchical three-component 2D assembly at a liquid−
solid interface: Recognition, selection, and transformation. Nano letters, 2008.
8(8): p. 2541-2546.
45. Adisoejoso, J., K. Tahara, S. Okuhata, S. Lei, Y. Tobe, and S. De Feyter,
Two‐Dimensional Crystal Engineering: A Four‐Component Architecture at a
Liquid–Solid Interface. Angew. Chem., 2009. 121(40): p. 7489-7493.
46. Xiao, W., P. Ruffieux, K. Aït-Mansour, O. Gröning, K. Palotas, W.A. Hofer, P.
Gröning, and R. Fasel, Formation of a Regular Fullerene Nanochain Lattice. The
Journal of Physical Chemistry B, 2006. 110(43): p. 21394-21398.

Bibliography
218
47. Wei, Y. and J.E. Reutt-Robey, Directed organization of C70 kagome lattice by
titanyl phthalocyanine monolayer template. Journal of the American Chemical
Society, 2011. 133(39): p. 15232-15235.
48. Wang, Y., R. Yamachika, A. Wachowiak, M. Grobis, K. Khoo, D.-H. Lee, S.G.
Louie, and M. Crommie, Novel Orientational Ordering and Reentrant
Metallicity in K x C 60 Monolayers for 3≤ x≤ 5. Physical review letters, 2007.
99(8): p. 086402.
49. Li, M., K. Deng, S.B. Lei, Y.L. Yang, T.S. Wang, Y.T. Shen, C.R. Wang, Q.D.
Zeng, and C. Wang, Site‐Selective Fabrication of Two‐Dimensional
Fullerene Arrays by Using a Supramolecular Template at the Liquid‐Solid
Interface. Angew. Chem., 2008. 120(35): p. 6819-6823.
50. den Boer, D., G.D. Han, and T.M. Swager, Templating Fullerenes by Domain
Boundaries of a Nanoporous Network. Langmuir, 2014. 30(3): p. 762-767.
51. Blunt, M., X. Lin, M. del Carmen Gimenez-Lopez, M. Schröder, N.R.
Champness, and P.H. Beton, Directing two-dimensional molecular
crystallization using guest templates. Chemical Communications, 2008(20): p.
2304-2306.
52. Blunt, M.O., J.C. Russell, M. del Carmen Gimenez-Lopez, N. Taleb, X. Lin, M.
Schröder, N.R. Champness, and P.H. Beton, Guest-induced growth of a
surface-based supramolecular bilayer. Nature chemistry, 2011. 3(1): p. 74-78.
53. McFadden, C.F., P.S. Cremer, and A.J. Gellman, Adsorption of chiral alcohols
on “chiral” metal surfaces. Langmuir, 1996. 12(10): p. 2483-2487.
54. Ahmadi, A., G. Attard, J. Feliu, and A. Rodes, Surface reactivity at “chiral”
platinum surfaces. Langmuir, 1999. 15(7): p. 2420-2424.
55. Sun, K., T.N. Shao, J.L. Xie, M. Lan, H.K. Yuan, Z.H. Xiong, J.Z. Wang, Y. Liu,
and Q.K. Xue, Chiral pinwheel clusters lacking local point chirality. small, 2012.
8(13): p. 2078-2082.
56. Ernst, K.H., Molecular chirality at surfaces. physica status solidi (b), 2012.
249(11): p. 2057-2088.
57. Wei, Y., K. Kannappan, G.W. Flynn, and M.B. Zimmt, Scanning tunneling

Bibliography
219
microscopy of prochiral anthracene derivatives on graphite: chain length effects
on monolayer morphology. Journal of the American Chemical Society, 2004.
126(16): p. 5318-5322.
58. Katsonis, N., E. Lacaze, and B.L. Feringa, Molecular chirality at fluid/solid
interfaces: expression of asymmetry in self-organised monolayers. Journal of
Materials Chemistry, 2008. 18(18): p. 2065-2073.
59. Blunt, M.O., J.C. Russell, N.R. Champness, and P.H. Beton, Templating
molecular adsorption using a covalent organic framework. Chemical
Communications, 2010. 46(38): p. 7157-7159.
60. Grill, L., M. Dyer, L. Lafferentz, M. Persson, M.V. Peters, and S. Hecht,
Nano-architectures by covalent assembly of molecular building blocks. Nature
nanotechnology, 2007. 2(11): p. 687-691.
61. Wen, J., D. Luo, L. Cheng, K. Zhao, and H. Ma, Electronic Structure Properties
of Two-Dimensional π-Conjugated Polymers. Macromolecules, 2016. 49(4): p.
1305-1312.
62. Adjizian, J.-J., P. Briddon, B. Humbert, J.-L. Duvail, P. Wagner, C. Adda, and C.
Ewels, Dirac Cones in two-dimensional conjugated polymer networks. Nature
communications, 2014. 5.
63. Kissel, P., R. Erni, W.B. Schweizer, M.D. Rossell, B.T. King, T. Bauer, S.
Götzinger, A.D. Schlüter, and J. Sakamoto, A two-dimensional polymer prepared
by organic synthesis. Nature chemistry, 2012. 4(4): p. 287-291.
64. Liu, X.-H., C.-Z. Guan, S.-Y. Ding, W. Wang, H.-J. Yan, D. Wang, and L.-J. Wan,
On-surface synthesis of single-layered two-dimensional covalent organic
frameworks via solid–vapor interface reactions. Journal of the American
Chemical Society, 2013. 135(28): p. 10470-10474.
65. Yaghi, O.M., M. O'Keeffe, N.W. Ockwig, H.K. Chae, M. Eddaoudi, and J. Kim,
Reticular synthesis and the design of new materials. Nature, 2003. 423(6941): p.
705-714.
66. Russell, J.C., M.O. Blunt, J.M. Garfitt, D.J. Scurr, M. Alexander, N.R.
Champness, and P.H. Beton, Dimerization of Tri(4-bromophenyl)benzene by

Bibliography
220
Aryl−Aryl Coupling from Solution on a Gold Surface. Journal of the American
Chemical Society, 2011. 133(12): p. 4220-4223.
67. Eder, G., E.F. Smith, I. Cebula, W.M. Heckl, P.H. Beton, and M. Lackinger,
Solution Preparation of Two-Dimensional Covalently Linked Networks by
Polymerization of 1,3,5-Tri(4-iodophenyl)benzene on Au(111). ACS Nano, 2013.
7(4): p. 3014-3021.
68. Cote, A.P., A.I. Benin, N.W. Ockwig, M. O'Keeffe, A.J. Matzger, and O.M.
Yaghi, Porous, crystalline, covalent organic frameworks. Science, 2005.
310(5751): p. 1166-1170.
69. Zwaneveld, N.A.A., R. Pawlak, M. Abel, D. Catalin, D. Gigmes, D. Bertin, and
L. Porte, Organized Formation of 2D Extended Covalent Organic Frameworks at
Surfaces. Journal of the American Chemical Society, 2008. 130(21): p.
6678-6679.
70. Dienstmaier, J.r.F., A.M. Gigler, A.J. Goetz, P. Knochel, T. Bein, A. Lyapin, S.
Reichlmaier, W.M. Heckl, and M. Lackinger, Synthesis of well-ordered COF
monolayers: surface growth of nanocrystalline precursors versus direct
on-surface polycondensation. ACS nano, 2011. 5(12): p. 9737-9745.
71. Guan, C.-Z., D. Wang, and L.-J. Wan, Construction and repair of highly ordered
2D covalent networks by chemical equilibrium regulation. Chemical
Communications, 2012. 48(24): p. 2943-2945.
72. Weigelt, S., C. Busse, C. Bombis, M.M. Knudsen, K.V. Gothelf, T. Strunskus, C.
Wöll, M. Dahlbom, B. Hammer, and E. Lægsgaard, Covalent interlinking of an
aldehyde and an amine on a Au (111) surface in ultrahigh vacuum. Angew.
Chem., 2007. 119(48): p. 9387-9390.
73. Tanoue, R., R. Higuchi, N. Enoki, Y. Miyasato, S. Uemura, N. Kimizuka, A.Z.
Stieg, J.K. Gimzewski, and M. Kunitake, Thermodynamically Controlled
Self-Assembly of Covalent Nanoarchitectures in Aqueous Solution. ACS Nano,
2011. 5(5): p. 3923-3929.
74. Xu, L., X. Zhou, W.Q. Tian, T. Gao, Y.F. Zhang, S. Lei, and Z.F. Liu,
Surface‐Confined Single‐Layer Covalent Organic Framework on

Bibliography
221
Single‐Layer Graphene Grown on Copper Foil. Angew. Chem. Int. Ed., 2014.
53(36): p. 9564-9568.
75. Xu, L., X. Zhou, Y. Yu, W.Q. Tian, J. Ma, and S. Lei, Surface-confined
crystalline two-dimensional covalent organic frameworks via on-surface
schiff-base coupling. ACS nano, 2013. 7(9): p. 8066-8073.
76. Sun, X., L. Fan, X. Zhou, W.Q. Tian, Z. Guo, Z. Li, X. Li, and S. Lei, Surface
confined synthesis of porphyrin containing two-dimensional polymers: the effect
of rigidity and preferential adsorption of building blocks. Chemical
Communications, 2015. 51(27): p. 5864-5867.
77. Hu, Y., N. Goodeal, Y. Chen, A.M. Ganose, R.G. Palgrave, H. Bronstein, and
M.O. Blunt, Probing the chemical structure of monolayer covalent-organic
frameworks grown via Schiff-base condensation reactions. Chemical
Communications, 2016. 52(64): p. 9941-9944.
78. Dong, W.-L., S.-Y. Li, J.-Y. Yue, C. Wang, D. Wang, and L.-J. Wan, Fabrication
of bilayer tetrathiafulvalene integrated surface covalent organic frameworks.
Physical Chemistry Chemical Physics, 2016. 18(26): p. 17356-17359.
79. Yue, J.-Y., X.-H. Liu, B. Sun, and D. Wang, The on-surface synthesis of
imine-based covalent organic frameworks with non-aromatic linkage. Chemical
Communications, 2015. 51(76): p. 14318-14321.
80. Xu, L., L. Cao, Z. Guo, Z. Zha, and S. Lei, Side-functionalized two-dimensional
polymers synthesized via on-surface Schiff-base coupling. Chemical
Communications, 2015. 51(41): p. 8664-8667.
81. Liu, X.-H., J.-Y. Yue, Y.-P. Mo, Y. Yao, C. Zeng, T. Chen, H.-J. Yan, Z.-H. Wang,
D. Wang, and L.-J. Wan, Surface Host–Guest Supramolecular Assemblies on
Porphyrin-Based Covalent Organic Grids. The Journal of Physical Chemistry C,
2016.
82. Cui, D., J. MacLeod, M. Ebrahimi, D. Perepichka, and F. Rosei, Solution and air
stable host/guest architectures from a single layer covalent organic framework.
Chemical Communications, 2015. 51(92): p. 16510-16513.
83. Zha, Z., L. Xu, Z. Wang, X. Li, Q. Pan, P. Hu, and S. Lei, 3D Graphene

Bibliography
222
Functionalized by Covalent Organic Framework Thin Film as Capacitive
Electrode in Alkaline Media. ACS applied materials & interfaces, 2015. 7(32): p.
17837-17843.
84. Binnig, G., H. Rohrer, C. Gerber, and E. Weibel, Surface studies by scanning
tunneling microscopy. Physical review letters, 1982. 49(1): p. 57.
85. Tománek, D., S.G. Louie, H.J. Mamin, D.W. Abraham, R.E. Thomson, E. Ganz,
and J. Clarke, Theory and observation of highly asymmetric atomic structure in
scanning-tunneling-microscopy images of graphite. Physical Review B, 1987.
35(14): p. 7790.
86. Binnig, G. and H. Rohrer, Scanning tunneling microscopy—from birth to
adolescence. Rev. Mod. Phys., 1987. 59(3): p. 615.
87. Salkola, M., A. Balatsky, and D. Scalapino, Theory of scanning tunneling
microscopy probe of impurity states in a d-wave superconductor. Physical
review letters, 1996. 77(9): p. 1841.
88. Wiesendanger, R., Scanning Probe Microscopy and Spectroscopy: Methods and
Applications. 1994, Cambridge: Cambridge University Press.
89. Chen, C.J., Introduction to Scanning Tunneling Microscopy (Second Edition).
2008: Oxford University Press.
90. Bowker, M. and P.R. Davies, Scanning Tunneling Microscopy in Surface Science,
Nanoscience and Catalysis. 2010, Wiley-VCH.
91. Tersoff, J. and D. Hamann, Theory and application for the scanning tunneling
microscope. Physical review letters, 1983. 50(25): p. 1998.
92. Tersoff, J. and D.R. Hamann, Theory of the scanning tunneling microscope.
Physical Review B, 1985. 31(2): p. 805-813.
93. Lang, N.D., Vacuum tunneling current from an adsorbed atom. Physical Review
Letters, 1985. 55(2): p. 230-233.
94. Lang, N.D., Theory of Single-Atom Imaging in the Scanning Tunneling
Microscope. Physical Review Letters, 1986. 56(11): p. 1164-1167.
95. Lang, N.D., Spectroscopy of single atoms in the scanning tunneling microscope.
Physical Review B, 1986. 34(8): p. 5947-5950.

Bibliography
223
96. Scanning Tunneling Microscopy and Spectroscopy: Theory, Techniques, and
Applications, ed. D.A. Bonnell. 1993, New York: VCH Publisher, Inc.
97. Chen, C.J., Origin of atomic resolution on metal surfaces in scanning tunneling
microscopy. Physical Review Letters, 1990. 65(4): p. 448-451.
98. Fermi, E., Golden Rule. Nucl. Phys., 1950.
99. Bardeen, J., Tunnelling from a many-particle point of view. Physical Review
Letters, 1961. 6(2): p. 57.
100. Spong, J., H. Mizes, L. LaComb Jr, M. Dovek, J. Frommer, and J. Foster,
Contrast mechanism for resolving organic molecules with tunnelling microscopy.
Nature, 1989. 338(6211): p. 137-139.
101. Miura, A., Z. Chen, H. Uji-i, S. De Feyter, M. Zdanowska, P. Jonkheijm, A.P.
Schenning, E. Meijer, F. Würthner, and F.C. De Schryver, Bias-dependent
visualization of electron donor (D) and electron acceptor (A) moieties in a chiral
DAD triad molecule. Journal of the American Chemical Society, 2003. 125(49):
p. 14968-14969.
102. Lackinger, M., T. Müller, T. Gopakumar, F. Müller, M. Hietschold, and G.W.
Flynn, Tunneling voltage polarity dependent submolecular contrast of
naphthalocyanine on graphite. A STM study of close-packed monolayers under
ultrahigh-vacuum conditions. The Journal of Physical Chemistry B, 2004.
108(7): p. 2279-2284.
103. Fisher, A. and P. Blöchl, Adsorption and scanning-tunneling-microscope
imaging of benzene on graphite and MoS 2. Physical review letters, 1993.
70(21): p. 3263.
104. Hla, S.-W., Scanning tunneling microscopy single atom/molecule manipulation
and its application to nanoscience and technology. Journal of Vacuum Science &
Technology B, 2005. 23(4): p. 1351-1360.
105. Gimzewski, J.K. and C. Joachim, Nanoscale science of single molecules using
local probes. Science, 1999. 283(5408): p. 1683-1688.
106. Eigler, D.M. and E.K. Schweizer, Positioning single atoms with a scanning
tunnelling microscope. Nature, 1990. 344(6266): p. 524-526.

Bibliography
224
107. Hla, S.-W., L. Bartels, G. Meyer, and K.-H. Rieder, Inducing All Steps of a
Chemical Reaction with the Scanning Tunneling Microscope Tip: Towards
Single Molecule Engineering. Physical Review Letters, 2000. 85(13): p.
2777-2780.
108. Hulsken, B., R. Van Hameren, J.W. Gerritsen, T. Khoury, P. Thordarson, M.J.
Crossley, A.E. Rowan, R.J. Nolte, J.A. Elemans, and S. Speller, Real-time
single-molecule imaging of oxidation catalysis at a liquid–solid interface. Nature
nanotechnology, 2007. 2(5): p. 285-289.
109. Samorí, P., K. Müllen, and J.P. Rabe, Molecular‐Scale Tracking of the
Self‐Healing of Polycrystalline Monolayers at the Solid–Liquid Interface.
Advanced Materials, 2004. 16(19): p. 1761-1765.
110. Griessl, S.J.H., M. Lackinger, F. Jamitzky, T. Markert, M. Hietschold, and W.M.
Heckl, Room-Temperature Scanning Tunneling Microscopy Manipulation of
Single C60 Molecules at the Liquid−Solid Interface: Playing Nanosoccer. The
Journal of Physical Chemistry B, 2004. 108(31): p. 11556-11560.
111. Surin, M., P. Samorì, A. Jouaiti, N. Kyritsakas, and M.W. Hosseini, Molecular
tectonics on surfaces: Bottom‐up fabrication of 1D coordination networks that
form 1D and 2D arrays on graphite. Angew. Chem. Int. Ed., 2007. 46(1‐2): p.
245-249.
112. El Garah, M., A. Ciesielski, N. Marets, V. Bulach, M.W. Hosseini, and P. Samorì,
Molecular tectonics based nanopatterning of interfaces with 2D metal–organic
frameworks (MOFs). Chemical Communications, 2014. 50(82): p. 12250-12253.
113. Piot, L., R.M. Meudtner, T. El Malah, S. Hecht, and P. Samorì, Modulating
Large‐Area Self‐Assembly at the Solid–Liquid Interface by pH‐Mediated
Conformational Switching. Chemistry–A European Journal, 2009. 15(19): p.
4788-4792.
114. Plas, J., O. Ivasenko, N. Martsinovich, M. Lackinger, and S. De Feyter,
Nanopatterning of a covalent organic framework host–guest system. Chemical
Communications, 2016. 52(1): p. 68-71.
115. Nirmalraj, P., D. Thompson, A. Molina-Ontoria, M. Sousa, N. Martín, B.

Bibliography
225
Gotsmann, and H. Riel, Nanoelectrical analysis of single molecules and
atomic-scale materials at the solid/liquid interface. Nature materials, 2014.
13(10): p. 947-953.
116. Agilent Technologies 5500 Scanning Probe Microscope: User's Guide. Agilent
Technologies.
117. HOPG. [cited 2016 7 June ]; Available from:
http://nanoprobes.aist-nt.com/apps/HOPG%20info.htm.
118. Tatar, R. and S. Rabii, Electronic properties of graphite: A unified theoretical
study. Physical Review B, 1982. 25(6): p. 4126.
119. So, A., U. Hvid, M. Mortensen, and K. Mo, Preparation of platinum/iridium
scanning probe microscopy tips. Rev. Sci. Instrum., 1999. 70(7): p. 3059-3067.
120. Rogers, B., J. Shapter, W. Skinner, and K. Gascoigne, A method for production
of cheap, reliable pt–ir tips. Rev. Sci. Instrum., 2000. 71(4): p. 1702-1705.
121. González, C., E. Abad, Y. Dappe, and J. Cuevas, Theoretical study of
carbon-based tips for scanning tunnelling microscopy. Nanotechnology, 2016.
27(10): p. 105201.
122. Grushko, V., O. Lübben, A. Chaika, N. Novikov, E. Mitskevich, A. Chepugov, O.
Lysenko, B. Murphy, S. Krasnikov, and I. Shvets, Atomically resolved STM
imaging with a diamond tip: simulation and experiment. Nanotechnology, 2013.
25(2): p. 025706.
123. Ohmori, T., L. Nagahara, K. Hashimoto, and A. Fujishima, Characterization of
carbon material as a scanning tunneling microscopy tip for insitu
electrochemical studies. Rev. Sci. Instrum., 1994. 65(2): p. 404-406.
124. Castellanos-Gomez, A., N. Agraït, and G. Rubio-Bollinger, Carbon fibre tips for
scanning probe microscopy based on quartz tuning fork force sensors.
Nanotechnology, 2010. 21(14): p. 145702.
125. Van de Walle, G., J. Gerritsen, H. Van Kempen, and P. Wyder, High‐stability
scanning tunneling microscope. Rev. Sci. Instrum., 1985. 56(8): p. 1573-1576.
126. Simpson, A. and W. Wolfs, Thermal expansion and piezoelectric response of
PZT Channel 5800 for use in low‐temperature scanning tunneling microscope

Bibliography
226
designs. Rev. Sci. Instrum., 1987. 58(11): p. 2193-2195.
127. Pohl, D.W., Some design criteria in scanning tunneling microscopy. IBM J. Res.
Dev., 1986. 30(4): p. 417-427.
128. Yurov, V.Y. and A. Klimov, Scanning tunneling microscope calibration and
reconstruction of real image: Drift and slope elimination. Rev. Sci. Instrum.,
1994. 65(5): p. 1551-1557.
129. Kawakatsu, H., Y. Hoshi, T. Higuchi, and H. Kitano, Crystalline lattice for
metrological applications and positioning control by a dual tunneling‐unit
scanning tunneling microscope. Journal of Vacuum Science & Technology B,
1991. 9(2): p. 651-654.
130. Van de Leemput, L., P. Rongen, B. Timmerman, and H. Van Kempen,
Calibration and characterization of piezoelectric elements as used in scanning
tunneling microscopy. Rev. Sci. Instrum., 1991. 62(4): p. 989-992.
131. Libioulle, L., A. Ronda, M. Taborelli, and J. Gilles, Deformations and
nonlinearity in scanning tunneling microscope images. Journal of Vacuum
Science & Technology B, 1991. 9(2): p. 655-658.
132. Horcas, I., R. Fernández, J. Gomez-Rodriguez, J. Colchero, J. Gómez-Herrero,
and A. Baro, WSXM: a software for scanning probe microscopy and a tool for
nanotechnology. Rev. Sci. Instrum., 2007. 78(1): p. 013705.
133. Binnig, G., C.F. Quate, and C. Gerber, Atomic force microscope. Physical
review letters, 1986. 56(9): p. 930.
134. Atomic Force Microscopy. [cited 2016 8 June]; Available from:
http://www.nanoscience.de/HTML/methods/afm.html.
135. Gross, L., F. Mohn, N. Moll, P. Liljeroth, and G. Meyer, The chemical structure
of a molecule resolved by atomic force microscopy. Science, 2009. 325(5944): p.
1110-1114.
136. Albrecht, T., P. Grütter, D. Horne, and D. Rugar, Frequency modulation
detection using high‐Q cantilevers for enhanced force microscope sensitivity. J.
Appl. Phys., 1991. 69(2): p. 668-673.
137. Gross, L., Recent advances in submolecular resolution with scanning probe

Bibliography
227
microscopy. Nature chemistry, 2011. 3(4): p. 273-278.
138. Zhang, J., P. Chen, B. Yuan, W. Ji, Z. Cheng, and X. Qiu, Real-space
identification of intermolecular bonding with atomic force microscopy. Science,
2013. 342(6158): p. 611-614.
139. Kawai, S., A. Sadeghi, F. Xu, L. Peng, A. Orita, J. Otera, S. Goedecker, and E.
Meyer, Extended Halogen Bonding between Fully Fluorinated Aromatic
Molecules. ACS Nano, 2015. 9(3): p. 2574-2583.
140. de Oteyza, D.G., P. Gorman, Y.-C. Chen, S. Wickenburg, A. Riss, D.J. Mowbray,
G. Etkin, Z. Pedramrazi, H.-Z. Tsai, A. Rubio, M.F. Crommie, and F.R. Fischer,
Direct Imaging of Covalent Bond Structure in Single-Molecule Chemical
Reactions. Science, 2013. 340(6139): p. 1434-1437.
141. Korolkov, V.V., S.A. Svatek, S. Allen, C.J. Roberts, S.J. Tendler, T. Taniguchi, K.
Watanabe, N.R. Champness, and P.H. Beton, Bimolecular porous
supramolecular networks deposited from solution on layered materials: graphite,
boron nitride and molybdenum disulphide. Chemical Communications, 2014.
50(64): p. 8882-8885.
142. Korolkov, V.V., S. Allen, C.J. Roberts, and S.J.B. Tendler, Green Chemistry
Approach to Surface Decoration: Trimesic Acid Self-Assembly on HOPG. The
Journal of Physical Chemistry C, 2012. 116(21): p. 11519-11525.
143. Korolkov, V.V., N. Mullin, S. Allen, C.J. Roberts, J.K. Hobbs, and S.J.B. Tendler,
The structure and formation of hydrogen-bonded molecular networks on Au(111)
surfaces revealed by scanning tunnelling and torsional-tapping atomic force
microscopy. Physical Chemistry Chemical Physics, 2012. 14(45): p.
15909-15916.
144. The Cypher™ Atomic Force Microscope. [cited 2016 12 June ]; Available
from:
http://www.asylumresearch.co.uk/Products/Cypher/CypherProduct.shtml#Introd
uction.
145. Stöckle, R.M., Y.D. Suh, V. Deckert, and R. Zenobi, Nanoscale chemical
analysis by tip-enhanced Raman spectroscopy. Chem. Phys. Lett., 2000. 318(1):

Bibliography
228
p. 131-136.
146. Einstein, A., The photoelectric effect. Ann. Phys, 1905. 17(132): p. 4.
147. Key Features and Benefits of the K-Alpha+. [cited 2016 13 June ]; Available
from: http://xpssimplified.com/kalpha_surface_analysis.php.
148. Hocquet, A. and M. Langgård, An evaluation of the MM+ force field. Molecular
modeling annual, 1998. 4(3): p. 94-112.
149. Wang, J., R.M. Wolf, J.W. Caldwell, P.A. Kollman, and D.A. Case,
Development and testing of a general amber force field. J. Comput. Chem., 2004.
25(9): p. 1157-1174.
150. MacKerell, A.D., N. Banavali, and N. Foloppe, Development and current status
of the CHARMM force field for nucleic acids. Biopolymers, 2000. 56(4): p.
257-265.
151. Damm, W., A. Frontera, J. Tirado–Rives, and W.L. Jorgensen, OPLS all‐atom
force field for carbohydrates. J. Comput. Chem., 1997. 18(16): p. 1955-1970.
152. Force field (chemistry) [cited 2016 16 June]; Available from:
https://en.wikipedia.org/wiki/Force_field_(chemistry).
153. Barnard, R.A., A. Dutta, J.K. Schnobrich, C.N. Morrison, S. Ahn, and A.J.
Matzger, Two‐Dimensional Crystals from Reduced Symmetry Analogues of
Trimesic Acid. Chemistry–A European Journal, 2015. 21(15): p. 5954-5961.
154. Ivasenko, O. and D.F. Perepichka, Mastering fundamentals of supramolecular
design with carboxylic acids. Common lessons from X-ray crystallography and
scanning tunneling microscopy. Chemical Society Reviews, 2011. 40(1): p.
191-206.
155. Li, Z., B. Han, L.J. Wan, and T. Wandlowski, Supramolecular Nanostructures of
1,3,5-Benzene-tricarboxylic Acid at Electrified Au(111)/0.05 M H2SO4
Interfaces: An in Situ Scanning Tunneling Microscopy Study. Langmuir, 2005.
21(15): p. 6915-6928.
156. Clair, S., S. Pons, A.P. Seitsonen, H. Brune, K. Kern, and J.V. Barth, STM Study
of Terephthalic Acid Self-Assembly on Au( ): Hydrogen-Bonded Sheets on
an Inhomogeneous Substrate. The Journal of Physical Chemistry B, 2004.

Bibliography
229
108(38): p. 14585-14590.
157. De Marchi, F., D. Cui, J. Lipton-Duffin, C. Santato, J.M. MacLeod, and F. Rosei,
Self-assembly of indole-2-carboxylic acid at graphite and gold surfaces. The
Journal of chemical physics, 2015. 142(10): p. 101923.
158. Lackinger, M., S. Griessl, T. Markert, F. Jamitzky, and W.M. Heckl,
Self-assembly of benzene-dicarboxylic acid isomers at the liquid solid interface:
Steric aspects of hydrogen bonding. The Journal of Physical Chemistry B, 2004.
108(36): p. 13652-13655.
159. Schmitt, T., L. Hammer, and M.A. Schneider, Evidence for On-Site
Carboxylation in the Self-Assembly of , ′-Biphenyl Dicarboxylic Acid on Cu
(111). The Journal of Physical Chemistry C, 2016. 120(2): p. 1043-1048.
160. MacLeod, J.M., J.A. Lipton-Duffin, D. Cui, S. De Feyter, and F. Rosei,
Substrate Effects in the Supramolecular Assembly of 1,3,5-Benzene
Tricarboxylic Acid on Graphite and Graphene. Langmuir, 2015. 31(25): p.
7016-7024.
161. MacLeod, J.M., Z. Ben Chaouch, D.F. Perepichka, and F. Rosei,
Two-Dimensional Self-Assembly of a Symmetry-Reduced Tricarboxylic Acid.
Langmuir, 2013. 29(24): p. 7318-7324.
162. Aitchison, H., H. Lu, M. Zharnikov, and M. Buck, Monolayers of
Biphenyl-3, ′,5-tricarboxylic Acid Formed on Cu and Ag from Solution. The
Journal of Physical Chemistry C, 2015. 119(25): p. 14114-14125.
163. Cebula, I., E.F. Smith, M.d.C. Gimenez-Lopez, S. ang, M. Schr der, N.R.
Champness, and P.H. Beton, Packing of isophthalate tetracarboxylic acids on Au
(111): Rows and disordered herringbone structures. The Journal of Physical
Chemistry C, 2013. 117(36): p. 18381-18385.
164. Nguyen, D.C.Y., L. Smykalla, T.N.H. Nguyen, T. Rüffer, and M. Hietschold,
Deposition Temperature-and Solvent-Dependent 2D Supramolecular Assemblies
of Trimesic Acid at the Liquid-Graphite Interface Revealed by Scanning
Tunneling Microscopy. The Journal of Physical Chemistry C, 2016.
165. Zhou, H., H. Dang, J.-H. Yi, A. Nanci, A. Rochefort, and J.D. Wuest, Frustrated

Bibliography
230
2D Molecular Crystallization. Journal of the American Chemical Society, 2007.
129(45): p. 13774-13775.
166. Blunt, M.O., J.C. Russell, M. del Carmen Giménez-López, J.P. Garrahan, X. Lin,
M. Schröder, N.R. Champness, and P.H. Beton, Random tiling and topological
defects in a two-dimensional molecular network. Science, 2008. 322(5904): p.
1077-1081.
167. Zhang, S., J. Zhang, K. Deng, J. Xie, W. Duan, and Q. Zeng, Solution
concentration controlled self-assembling structure with host-guest recognition at
the liquid-solid interface. Physical Chemistry Chemical Physics, 2015. 17(37): p.
24462-24467.
168. Yan, L., E.J. Bautista, and J.M. Seminario, Ab initio analysis of electron currents
through benzene, naphthalene, and anthracene nanojunctions. Nanotechnology,
2007. 18(48): p. 485701.
169. Cyr, D.M., B. Venkataraman, G.W. Flynn, A. Black, and G.M. Whitesides,
Functional group identification in scanning tunneling microscopy of molecular
adsorbates. The Journal of Physical Chemistry, 1996. 100(32): p. 13747-13759.
170. Syôzi, I., Statistics of kagomé lattice. 理論物理学の進歩, 1951. 6(3): p.
306-308.
171. Mekata, M., Kagome: The story of the basketweave lattice. Phys. Today, 2003.
56(2): p. 12.
172. Schlickum, U., R. Decker, F. Klappenberger, G. Zoppellaro, S. Klyatskaya, W.
Auwarter, S. Neppl, K. Kern, H. Brune, and M. Ruben, Chiral kagomé lattice
from simple ditopic molecular bricks. Journal of the American Chemical Society,
2008. 130(35): p. 11778-11782.
173. Furukawa, S., H. Uji-i, K. Tahara, T. Ichikawa, M. Sonoda, F.C. De Schryver, Y.
Tobe, and S. De Feyter, Molecular geometry directed kagomé and honeycomb
networks: toward two-dimensional crystal engineering. Journal of the American
Chemical Society, 2006. 128(11): p. 3502-3503.
174. Shi, Z. and N. Lin, Porphyrin-based two-dimensional coordination Kagome
lattice self-assembled on a Au (111) surface. Journal of the American Chemical

Bibliography
231
Society, 2009. 131(15): p. 5376-5377.
175. Watson, J.D. and F.H. Crick, Molecular structure of nucleic acids. Nature, 1953.
171(4356): p. 737-738.
176. Hoogsteen, K., The structure of crystals containing a hydrogen-bonded complex
of 1-methylthymine and 9-methyladenine. Acta crystallographica, 1959. 12(10):
p. 822-823.
177. Sessler, J.L., C.M. Lawrence, and J. Jayawickramarajah, Molecular recognition
via base-pairing. Chemical Society Reviews, 2007. 36(2): p. 314-325.
178. Sivakova, S. and S.J. Rowan, Nucleobases as supramolecular motifs. Chemical
Society Reviews, 2005. 34(1): p. 9-21.
179. Papageorgiou, A.C., S. Fischer, J. Reichert, K. Diller, F. Blobner, F.
Klappenberger, F. Allegretti, A.P. Seitsonen, and J.V. Barth, Chemical
Transformations Drive Complex Self-Assembly of Uracil on Close-Packed
Coinage Metal Surfaces. ACS Nano, 2012. 6(3): p. 2477-2486.
180. Ciesielski, A., S. Haar, A. Bényei, G. Paragi, C.F. Guerra, F.M. Bickelhaupt, S.
Masiero, J. Szolomájer, P. Samorì, G.P. Spada, and L. Kovács, Self-Assembly of
N3-Substituted Xanthines in the Solid State and at the Solid–Liquid Interface.
Langmuir, 2013. 29(24): p. 7283-7290.
181. Ciesielski, A., S. Colella, L. Zalewski, B. Bruchmann, and P. Samorì,
Nanopatterning the graphite surface with ordered macrocyclic or ribbon-like
assemblies of isocytosine derivatives: an STM study. CrystEngComm, 2011.
13(18): p. 5535-5537.
182. Liu, L., D. Xia, L.H. Klausen, and M. Dong, The self-assembled behavior of
DNA bases on the interface. International journal of molecular sciences, 2014.
15(2): p. 1901-1914.
183. Mamdouh, W., M. Dong, S. Xu, E. Rauls, and F. Besenbacher, Supramolecular
nanopatterns self-assembled by adenine-thymine quartets at the liquid/solid
interface. Journal of the American Chemical Society, 2006. 128(40): p.
13305-13311.
184. Auwärter, W., D. Écija, F. Klappenberger, and J.V. Barth, Porphyrins at
Bibliography
232
interfaces. Nature chemistry, 2015. 7(2): p. 105-120.
185. Gottfried, J.M., Surface chemistry of porphyrins and phthalocyanines. Surf. Sci.
Rep., 2015. 70(3): p. 259-379.
186. Krasnikov, S.A., C.M. Doyle, N.N. Sergeeva, A.B. Preobrajenski, N.A.
Vinogradov, Y.N. Sergeeva, A.A. Zakharov, M.O. Senge, and A.A. Cafolla,
Formation of extended covalently bonded Ni porphyrin networks on the Au (111)
surface. Nano Research, 2011. 4(4): p. 376-384.
187. Lei, S., C. Wang, S. Yin, H. Wang, F. Xi, H. Liu, B. Xu, L. Wan, and C. Bai,
Surface stabilized porphyrin and phthalocyanine two-dimensional network
connected by hydrogen bonds. The Journal of Physical Chemistry B, 2001.
105(44): p. 10838-10841.
188. Otsuki, J., E. Nagamine, T. Kondo, K. Iwasaki, M. Asakawa, and K. Miyake,
Surface patterning with two-dimensional porphyrin supramolecular arrays.
Journal of the American Chemical Society, 2005. 127(29): p. 10400-10405.
189. Auwärter, W., A. Weber-Bargioni, A. Riemann, A. Schiffrin, O. Gröning, R.
Fasel, and J. Barth, Self-assembly and conformation of tetrapyridyl-porphyrin
molecules on Ag (111). The Journal of chemical physics, 2006. 124(19): p.
194708.
190. Auwärter, W., F. Klappenberger, A. Weber-Bargioni, A. Schiffrin, T. Strunskus,
C. Wöll, Y. Pennec, A. Riemann, and J.V. Barth, Conformational adaptation and
selective adatom capturing of tetrapyridyl-porphyrin molecules on a copper (111)
surface. Journal of the American Chemical Society, 2007. 129(36): p.
11279-11285.
191. Yoshimoto, S., N. Yokoo, T. Fukuda, N. Kobayashi, and K. Itaya, Formation of
highly ordered porphyrin adlayers induced by electrochemical potential
modulation. Chemical Communications, 2006(5): p. 500-502.
192. Yuan, Q., Y. Xing, and E. Borguet, An STM Study of the pH Dependent Redox
Activity of a Two-Dimensional Hydrogen Bonding Porphyrin Network at an
Electrochemical Interface. Journal of the American Chemical Society, 2010.
132(14): p. 5054-5060.

Bibliography
233
193. Slater, A.G., Y. Hu, L. Yang, S.P. Argent, W. Lewis, M.O. Blunt, and N.R.
Champness, Thymine functionalised porphyrins, synthesis and heteromolecular
surface-based self-assembly. Chemical Science, 2015. 6(2): p. 1562-1569.
194. Lai, S.-W., M.C. Chan, K.-K. Cheung, and C.-M. Che, Spectroscopic Properties
of Luminescent Platinum (II) Complexes Containing 4, 4', 4''-Tri-tert-butyl-2, 2':
6', 2''-terpyridine (tBu3tpy). Crystal Structures of [Pt (tBu3tpy) Cl] ClO4 and [Pt
(tBu3tpy){CH2C (O) Me}] ClO4. Inorganic Chemistry, 1999. 38(19): p.
4262-4267.
195. Radivojevic, I., I. Likhtina, X. Shi, S. Singh, and C.M. Drain, Self-organized
nanofibers and nanorods of porphyrins bearing hydrogen bonding motifs.
Chemical Communications, 2010. 46(10): p. 1643-1645.
196. Nowell, H., S.A. Barnett, K.E. Christensen, S.J. Teat, and D.R. Allan, I19, the
small-molecule single-crystal diffraction beamline at Diamond Light Source.
Journal of synchrotron radiation, 2012. 19(3): p. 435-441.
197. Etter, M.C., Encoding and decoding hydrogen-bond patterns of organic
compounds. Accounts of Chemical Research, 1990. 23(4): p. 120-126.
198. Hoogsteen, K.R., The crystal and molecular structure of a hydrogen-bonded
complex between 1-methylthymine and 9-methyladenine. Acta
Crystallographica, 1963. 16(9): p. 907-916.
199. Mohnani, S. and D. Bonifazi, Supramolecular architectures of porphyrins on
surfaces: The structural evolution from 1D to 2D to 3D to devices. Coordination
Chemistry Reviews, 2010. 254(19): p. 2342-2362.
200. Elemans, J.A.A.W., I. De Cat, H. Xu, and S. De Feyter, Two-dimensional
chirality at liquid-solid interfaces. Chemical Society Reviews, 2009. 38(3): p.
722-736.
201. Écija, D., K. Seufert, D. Heim, W. Auwärter, C. Aurisicchio, C. Fabbro, D.
Bonifazi, and J.V. Barth, Hierarchic Self-Assembly of Nanoporous Chiral
Networks with Conformationally Flexible Porphyrins. ACS Nano, 2010. 4(8): p.
4936-4942.
202. Ai, K., Y. Liu, and L. Lu, Hydrogen-bonding recognition-induced color change
Bibliography
234
of gold nanoparticles for visual detection of melamine in raw milk and infant
formula. Journal of the American Chemical Society, 2009. 131(27): p.
9496-9497.
203. Palma, C.-A., J. Bjork, M. Bonini, M.S. Dyer, A. Llanes-Pallas, D. Bonifazi, M.
Persson, and P. Samorì, Tailoring bicomponent supramolecular nanoporous
networks: phase segregation, polymorphism, and glasses at the solid− liquid
interface. Journal of the American Chemical Society, 2009. 131(36): p.
13062-13071.
204. Mura, M., N. Martsinovich, and L. Kantorovich, Theoretical study of melamine
superstructures and their interaction with the Au (111) surface. Nanotechnology,
2008. 19(46): p. 465704.
205. Silly, F., A.Q. Shaw, M.R. Castell, G.A.D. Briggs, M. Mura, N. Martsinovich,
and L. Kantorovich, Melamine Structures on the Au(111) Surface. The Journal
of Physical Chemistry C, 2008. 112(30): p. 11476-11480.
206. Zhang, H.-M., Z.-X. Xie, L.-S. Long, H.-P. Zhong, W. Zhao, B.-W. Mao, X. Xu,
and L.-S. Zheng, One-step preparation of large-scale self-assembled monolayers
of cyanuric acid and melamine supramolecular species on Au (111) surfaces. The
Journal of Physical Chemistry C, 2008. 112(11): p. 4209-4218.
207. Xu, W., M. Dong, H. Gersen, E. Rauls, S. Vázquez‐Campos, M.
Crego‐Calama, D.N. Reinhoudt, I. Stensgaard, E. Laegsgaard, and T.R.
Linderoth, Cyanuric Acid and Melamine on Au (111): Structure and Energetics
of Hydrogen‐Bonded Networks. small, 2007. 3(5): p. 854-858.
208. Zhang, X., T. Chen, Q. Chen, L. Wang, and L.-J. Wan, Self-assembly and
aggregation of melamine and melamine–uric/cyanuric acid investigated by STM
and AFM on solid surfaces. Physical Chemistry chemical physics, 2009. 11(35):
p. 7708-7712.
209. Elemans, J.A., M.C. Lensen, J.W. Gerritsen, H. van Kempen, S. Speller, R.J.
Nolte, and A.E. Rowan, Scanning probe studies of porphyrin assemblies and
their supramolecular manipulation at a solid–liquid interface. Advanced
Materials, 2003. 15(24): p. 2070-2073.

Bibliography
235
210. Lensen, M.C., J.A. Elemans, S.J. van Dingenen, J.W. Gerritsen, S. Speller, A.E.
Rowan, and R.J. Nolte, Giant Porphyrin Disks: Control of Their
Self‐Assembly at Liquid–Solid Interfaces through Metal–Ligand Interactions.
Chemistry–A European Journal, 2007. 13(28): p. 7948-7956.
211. Yoshimoto, S., Y. Honda, O. Ito, and K. Itaya, Supramolecular Pattern of
Fullerene on 2D Bimolecular “Chessboard” Consisting of Bottom-up Assembly
of Porphyrin and Phthalocyanine Molecules. Journal of the American Chemical
Society, 2008. 130(3): p. 1085-1092.
212. Buchner, F., V. Schwald, K. Comanici, H.P. Steinrück, and H. Marbach,
Microscopic Evidence of the Metalation of a Free‐Base Porphyrin Monolayer
with Iron. ChemPhysChem, 2007. 8(2): p. 241-243.
213. Visser, J., N. Katsonis, J. Vicario, and B.L. Feringa, Two-dimensional molecular
patterning by surface-enhanced zn-porphyrin coordination. Langmuir, 2009.
25(10): p. 5980-5985.
214. Lee, C.W., H.P. Lu, C.M. Lan, Y.L. Huang, Y.R. Liang, W.N. Yen, Y.C. Liu, Y.S.
Lin, E.W.G. Diau, and C.Y. Yeh, Novel Zinc Porphyrin Sensitizers for
Dye‐Sensitized Solar Cells: Synthesis and Spectral, Electrochemical, and
Photovoltaic Properties. Chemistry–A European Journal, 2009. 15(6): p.
1403-1412.
215. Wang, Q., W.M. Campbell, E.E. Bonfantani, K.W. Jolley, D.L. Officer, P.J.
Walsh, K. Gordon, R. Humphry-Baker, M.K. Nazeeruddin, and M. Grätzel,
Efficient light harvesting by using green Zn-porphyrin-sensitized nanocrystalline
TiO2 films. The Journal of Physical Chemistry B, 2005. 109(32): p.
15397-15409.
216. Liu, X.-H., C.-Z. Guan, D. Wang, and L.-J. Wan, Graphene-Like Single-Layered
Covalent Organic Frameworks: Synthesis Strategies and Application Prospects.
Advanced Materials, 2014. 26(40): p. 6912-6920.
217. Ormond, A.B. and H.S. Freeman, Effects of substituents on the photophysical
properties of symmetrical porphyrins. Dyes and Pigments, 2013. 96(2): p.
440-448.

Bibliography
236
218. Semeikin, A., O. Koifman, and B. Berezin, Synthesis of tetraphenylporphins
with active groups in the phenyl rings. 1. Preparation of tetrakis (4-aminophenyl)
porphin. Chemistry of Heterocyclic Compounds, 1982. 18(10): p. 1046-1047.
219. Yuasa, M., K. Oyaizu, A. Yamaguchi, and M. Kuwakado, Micellar
Cobaltporphyrin Nanorods in Alcohols. Journal of the American Chemical
Society, 2004. 126(36): p. 11128-11129.
220. Schmitz, C.H., J. Ikonomov, and M. Sokolowski, Two-Dimensional Polyamide
Networks with a Broad Pore Size Distribution on the Ag(111) Surface. The
Journal of Physical Chemistry C, 2011. 115(15): p. 7270-7278.
221. White, R.L., Variable temperature infrared study of copper sulfate pentahydrate
dehydration. Thermochim. Acta, 2012. 528: p. 58-62.
222. Alexander, M.R., R. Short, F. Jones, M. Stollenwerk, J. Zabold, and W. Michaeli,
An X-ray photoelectron spectroscopic investigation into the chemical structure
of deposits formed from hexamethyldisiloxane/oxygen plasmas. Journal of
materials science, 1996. 31(7): p. 1879-1885.
223. Vargo, T.G. and J.A. Gardella Jr, Development of Ti α x radiation for electron
spectroscopy for chemical analysis of polymer surfaces. Journal of Vacuum
Science & Technology A, 1989. 7(3): p. 1733-1741.
224. Hopkins, G.H., Silicone Oil Treatment of Vials. 1980, Phoenixville, PA:
Publication of the West Company.
225. Colas, A., J. Siang, and K. Ulman, Silicones in Pharmaceutical Applications.
Part 5: Siliconization of Parenteral Packaging Components 2006, Midland(MI):
Dow Corning Corporation.
226. Smith, E., M. Henley, E. Adams, A. DeMarco, J. Cronin, D. Wagenknecht, G.
Battes, and M. Musolf, J. of Parenteral Sc. and Tech., 42 (4S). 1988, technical
report 12.
227. Lee, J.N., C. Park, and G.M. Whitesides, Solvent compatibility of poly
(dimethylsiloxane)-based microfluidic devices. Analytical chemistry, 2003.
75(23): p. 6544-6554.
228. Berkelaar, R.P., E. Dietrich, G.A.M. Kip, E.S. Kooij, H.J.W. Zandvliet, and D.

Bibliography
237
Lohse, Exposing nanobubble-like objects to a degassed environment. Soft
Matter, 2014. 10(27): p. 4947-4955.
229. Martin, C.P., M.O. Blunt, and P. Moriarty, Nanoparticle networks on silicon:
Self-organized or disorganized? Nano Letters, 2004. 4(12): p. 2389-2392.
230. Alhummiany, H., S. Jarvis, R.A. Woolley, A. Stannard, M. Blunt, and P.
Moriarty, Dewetting of Au nanoparticle assemblies. Journal of Materials
Chemistry, 2011. 21(42): p. 16983-16989.
231. Page, A.J., A. Elbourne, R. Stefanovic, M.A. Addicoat, G.G. Warr, K.
Voitchovsky, and R. Atkin, 3-Dimensional atomic scale structure of the ionic
liquid-graphite interface elucidated by AM-AFM and quantum chemical
simulations. Nanoscale, 2014. 6(14): p. 8100-8106.
232. Korolkov, V.V., S.A. Svatek, A. Summerfield, J. Kerfoot, L. Yang, T. Taniguchi,
K. Watanabe, N.R. Champness, N.A. Besley, and P.H. Beton, van der
Waals-Induced Chromatic Shifts in Hydrogen-Bonded Two-Dimensional
Porphyrin Arrays on Boron Nitride. ACS Nano, 2015. 9(10): p. 10347-10355.
233. Mezzi, A. and S. Kaciulis, Surface investigation of carbon films: from diamond
to graphite. Surf. Interface Anal., 2010. 42(6‐7): p. 1082-1084.
234. Kaciulis, S., Spectroscopy of carbon: from diamond to nitride films. Surf.
Interface Anal., 2012. 44(8): p. 1155-1161.
235. Yang, D.-Q. and E. Sacher, Carbon 1s X-ray photoemission line shape analysis
of highly oriented pyrolytic graphite: the influence of structural damage on peak
asymmetry. Langmuir, 2006. 22(3): p. 860-862.
236. Li, H., Determination of Oxygen Functionality on Highly Oriented Pyrolytic
Graphite (HOPG). 2012, Freien Universität Berlin: Berlin, Germany.
237. Pong, W.-T. and C. Durkan, A review and outlook for an anomaly of scanning
tunnelling microscopy (STM): superlattices on graphite. J. Phys. D: Appl. Phys.,
2005. 38(21): p. R329.
238. Zhang, G., D. Yang, and E. Sacher, X-ray Photoelectron Spectroscopic Analysis
of Pt Nanoparticles on Highly Oriented Pyrolytic Graphite, Using Symmetric
Component Line Shapes. The Journal of Physical Chemistry C, 2007. 111(2): p.

Bibliography
238
565-570.
239. Yang, D.-Q. and E. Sacher, Platinum nanoparticle interaction with chemically
modified highly oriented pyrolytic graphite surfaces. Chem. Mater., 2006. 18(7):
p. 1811-1816.
240. Louette, P., F. Bodino, and J.-J. Pireaux, Poly (dimethyl siloxane)(PDMS) XPS
reference core level and energy loss spectra. Surf. Sci. Spectra, 2005. 12(1): p.
38-43.
241. Sharma, V., M. Dhayal, S. Shivaprasad, and S. Jain, Surface characterization of
plasma-treated and PEG-grafted PDMS for micro fluidic applications. Vacuum,
2007. 81(9): p. 1094-1100.
242. Gassman, P.G., A. Ghosh, and J. Almlof, Electronic effects of peripheral
substituents in porphyrins: x-ray photoelectron spectroscopy and ab initio
self-consistent field calculations. Journal of the American Chemical Society,
1992. 114(25): p. 9990-10000.
243. Di Giovannantonio, M., T. Kosmala, B. Bonanni, G. Serrano, N. Zema, S.
Turchini, D. Catone, . Wandelt, D. Pasini, and G. Contini, Surface− Enhanced
Polymerization via Schiff-Base Coupling at the Solid–Water Interface under pH
Control. The Journal of Physical Chemistry C, 2015. 119(33): p. 19228-19235.
244. Nemykin, V.N., P. Galloni, B. Floris, C.D. Barrett, R.G. Hadt, R.I. Subbotin,
A.G. Marrani, R. Zanoni, and N.M. Loim, Metal-free and transition-metal
tetraferrocenylporphyrins part 1: synthesis, characterization, electronic structure,
and conformational flexibility of neutral compounds. Dalton Transactions,
2008(32): p. 4233-4246.
245. Macquet, J., M. Millard, and T. Theophanides, X-ray photoelectron spectroscopy
of porphyrins. Journal of the American Chemical Society, 1978. 100(15): p.
4741-4746.
246. Niwa, Y., H. Kobayashi, and T. Tsuchiya, X‐ray photoelectron spectroscopy of
tetraphenylporphin and phthalocyanine. The Journal of Chemical Physics, 1974.
60(3): p. 799-807.
247. Karweik, D. and N. Winograd, Nitrogen charge distributions in free-base

Bibliography
239
porphyrins, metalloporphyrins, and their reduced analogs observed by X-ray
photoelectron spectroscopy. Inorganic Chemistry, 1976. 15(10): p. 2336-2342.
248. Muralidharan, S. and R. Hayes, Intense satellites in the N 1s x-ray photoelectron
spectra of certain metalloporphyrins. Journal of the American Chemical Society,
1980. 102(15): p. 5106-5107.
249. Sarno, D.M., L.J. Matienzo, and W.E. Jones, X-ray Photoelectron Spectroscopy
as a Probe of Intermolecular Interactions in Porphyrin Polymer Thin Films.
Inorganic Chemistry, 2001. 40(24): p. 6308-6315.
250. Sun, X.L., L.X. Fan, Y.J. Yang, Z. Guo, W.Q. Tian, and S. Lei, Synthesis of
One‐Dimensional Schiff Base Polymers that Contain an Oligothiophene
Building Block on the Graphite Surface. Chemistry–A European Journal, 2015.
21(18): p. 6898-6905.
251. Cooper, A., S.F. Dixon, M.A. Nutley, and J.L. Robb, Mechanism of retinal
Schiff base formation and hydrolysis in relation to visual pigment photolysis and
regeneration: resonance Raman spectroscopy of a tetrahedral carbinolamine
intermediate and oxygen-18 labeling of retinal at the metarhodopsin stage in
photoreceptor membranes. Journal of the American Chemical Society, 1987.
109(24): p. 7254-7263.
252. Zhang, T., W. Zhou, W. Jin, Q. Jin, and H. Chen, Direct detection of aromatic
amines and observation of intermediates of Schiff-base reactions by reactive
desorption electrospray ionization mass spectrometry. Microchemical Journal,
2013. 108: p. 18-23.
253. Upthagrove, A.L. and W.L. Nelson, Carbinolamines, imines, and oxazolidines
from fluorinated propranolol analogs. 19F NMR and mass spectral
characterization and evidence for formation as intermediates in cytochrome
P450-catalyzed N-dealkylation. Drug metabolism and disposition, 2001. 29(8):
p. 1114-1122.
254. Zeller, M.V. and R.G. Hayes, X-ray photoelectron spectroscopic studies on the
electronic structures of porphyrin and phthalocyanine compounds. Journal of the
American Chemical Society, 1973. 95(12): p. 3855-3860.

Bibliography
240
255. Karweik, D., N. Winograd, D.G. Davis, and K.M. Kadish, X-ray photoelectron
spectroscopic studies of silver(III) octaethylporphyrin. Journal of the American
Chemical Society, 1974. 96(2): p. 591-592.
256. Parschau, M., S. Romer, and K.-H. Ernst, Induction of Homochirality in Achiral
Enantiomorphous Monolayers. Journal of the American Chemical Society, 2004.
126(47): p. 15398-15399.
257. Meric, I., M.Y. Han, A.F. Young, B. Ozyilmaz, P. Kim, and K.L. Shepard,
Current saturation in zero-bandgap, top-gated graphene field-effect transistors.
Nature nanotechnology, 2008. 3(11): p. 654-659.
258. Xia, F., D.B. Farmer, Y.-m. Lin, and P. Avouris, Graphene field-effect transistors
with high on/off current ratio and large transport band gap at room temperature.
Nano letters, 2010. 10(2): p. 715-718.
259. Avila, J., I. Razado, S. Lorcy, R. Fleurier, E. Pichonat, D. Vignaud, X. Wallart,
and M.C. Asensio, Exploring electronic structure of one-atom thick
polycrystalline graphene films: A nano angle resolved photoemission study.
Scientific reports, 2013. 3.
260. Krause, G. and E. Weis, Chlorophyll fluorescence and photosynthesis: the basics.
Annual review of plant biology, 1991. 42(1): p. 313-349.

241
List of abbreviations
1D One-dimensional
2D Two-dimensional
3D Three-dimensional
A Adenine
AFM Atomic Force Microscopy
AO Atomic orbital
ATC Anthracene tetra-carboxylic acid, 5, 5'-(anthracene-2,6-diyl) diisophthalic acid
BDA Benzene-1,4-dicarboxaldehyde
BDBA 1,4-benzenediboronic acid
BE Binding Energy
BPTC Biphenyl-3,3′,5,5′-tetra-carboxylic acid
BTB 1,3,5-tris(4-carboxyphenyl) benzene
CNT Carbon nanotube
CoOEP Cobalt(II) octaethylporphyrin
COF Covalent Organic Framework
COR Coronene
CPS counts per second
DBA Alkylated dehydrobenzo[12]annulene
DFT Density Functional Theory
DMSO Dimethyl sulfoxide
DNA Deoxyribonucleic acid
DOS Density of states
FWHM Full Width at Half Maximum
HBC Hexabenzocoronene
HOMO Highest occupied molecular orbital
HOPG Highly Oriented Pyrolytic Graphite

List of abbreviations
242
ISA Isophthalic acid
LDOS Local Density of States
LUMO lowest unoccupied molecular orbital
MM Molecular Mechanics
MO molecular orbital
NG Nanographene
NiOEP Nickel(II) octaethylporphyrin
NMR Nuclear Magnetic Resonance
NTC Napthylene tetra-carboxylic acid, 5,5′-naphthalene-
2,6-diyldibenzene-1,3-dicarboxylic acid
PA 9-propyladenine
PDMS Polydimethylsiloxane
PFT PeakForce TappingTM
PTCDI Perylene tetracarboxylic di-imide
PTFE Polytetrafluoroethylene
QPTC quarterphenyl-3,3‴,5,5‴-tetra-carboxylic acid
QM Quantum mechanical
Sat Saturated solution
SEM Scanning Electron Microscopy
SPIP Scanning Probe Image Processor
SPM Scanning Probe Microscopy
STM Scanning Tunnelling Microscopy
STS Scanning Tunnelling Spectroscopy
T Thymine
TAPP 5,10,15,20-meso-tetra(4-aminophenyl) porphyrin
TBPB 1,3,5-tris(4-bromophenyl) benzene
TCB 1,2,4-trichlorobenzene
TEM Transmission electron microscopy
TERS Tip-enhanced Raman spectroscopy
Tetra-TP Tetra-(phenylthymine)porphyrin

List of abbreviations
243
THF Tetrahydrofuran
TMA Trimesic acid
TPTC Terphenyl-3,3″,5,5″-tetra-carboxylic acid
TSB35 1,3,5-tris[(E)-2-(3,5-didecyloxyphenyl)-ethenyl]- benzene
UHV Ultra-high vacuum
VB Valence band
WKB Wentzel-Kramers-Brillouin
XPS X-ray photoelectron Spectroscopy
XRD X-ray Diffraction
ZnTAPP 5,10,15,20-meso-tetra(4-aminophenyl) porphyrin Zn(II)
Zn-tetra-TP Tetra-(phenylthymine)porphyrin-Zn(Ⅱ)

244
List of figures
Figure 1.1 Schematic representation of the self-assembly of DNA polyhedral [1]. ......... 2
Figure 1.2 (a) Chemical structures of PTCDI and melamine. Schematic diagram of a
PTCDI-melamine hydrogen bonded junction. (b). Schematic of a C60 heptamer trapped
within a pore of the PTCDI-melamine open hexagonal network. [2] ............................... 3
Figure 1.3. Schematic diagram showing the different possible arrangements of sodium
dodecyl sulphate molecules physisorbed onto a CNT surface [5]. ................................... 4
Figure 2.1. Schematic diagram showing growth processes for atoms or molecules
deposited at surfaces. [10] ................................................................................................. 9
Figure 2.2. Hydrogen bond donor and acceptor atoms. .................................................. 12
Figure 2.3. Modes of interlinking carboxylic acid groups via hydrogen bonds in
molecular crystals. (a) Cyclic hydrogen-bonded dimer. (b) Catemer motif. (c) cyclic
trimer [9, 20]. .................................................................................................................. 13
Figure 2.4. Two 15×15 nm2 constant current STM images of TMA monolayers formed
at fatty acid-HOPG interfaces. (a)-(b) STM image of the “chicken wire” structure and
its corresponding molecular model; (c)-(d) STM image of the “flower” structure and its
corresponding molecular model. [21] ............................................................................. 14
Figure 2.5. Schematic illustration showing packing interactions between interdigitated
alkyl chains on a HOPG surface. [24] ............................................................................. 16
Figure 2.6. Schematic representations of benzene dimers interacting in different
orientations. ..................................................................................................................... 16
Figure 2.7. (a) Chemical structure of polymer 1. (b) Molecular model showing the
distance between two adjacent polymers. (c) Molecular model presenting the columnar
stacking of the inner aromatic backbone. (d) STM image of polymer 1. (e) Schematic
illustration of the corresponding molecular structure in (d). [30] ................................... 17
Figure 2.8. (a) Chemical formulae of DBA, ISA and coronene molecules. (b) Schematic
illustrations of the formation of both chiral and achiral pores at the liquid-Au(111)

List of figures
245
interface. (c) Display of only chiral pores at the liquid-HOPG interface.[31] ................ 18
Figure 2.9. (a) Molecular structure of an alkylated isophthalic acid derivative
(ISA-OC14). (b)-(c) STM image and corresponding molecular model of the linear
structure formed by ISA-OC14 at the interface between HOPG and 1-phenyloctane.
(d)-(e) STM image and corresponding molecular model of the porous structure formed
by the same molecule.[32] .............................................................................................. 19
Figure 2.10. Reversible temperature-induced phase transition observed for
1,3,5-tris(4-carboxyphenyl) benzene (BTB) networks self-assembled at the nonanoic
acid-HOPG interface. [39] .............................................................................................. 21
Figure 2.11. (a)-(c) STM images showing the self-assembled molecular networks
formed by CoOEP, NiOFP and a mixture of CoOEP and NiOEP. (d) Molecular structure
of CoOEP (NiOEP).[41] ................................................................................................. 22
Figure 2.12. (a) Molecular structures of the host molecule TSB35 and the two guest
molecules coronene and HBC. (b) A model of the porous TSB35 molecular network
stabilized by van der Waals interactions arising from alkyl chain interdigitation. (c)-(e)
Constant current STM images of (c) TSB35 host network on HOPG; (d) the network
after the addition of coronene; and (e) the network after the addition of HBC.[43] ....... 24
Figure 2.13. (a) Schematic diagram of the two porous structures (p6 and p2) obtained
using DBA1 building block. (b) Chemical structure of the DBA1 building block with
four short alkoxy chains (C10H21) on two sides o the triangular DBA core and two
longer alkoxy chains (C20H41) on the third side.[34] ...................................................... 25
Figure 2.14. (a) Molecular structure of nano-graphene and schematic diagram of
COR1-ISA6 hetero-cluster. (b), (c) STM images of a monolayer of DBA1, coronene,
ISA, and nano-graphene at the 1-phenyloctane-HOPG interface. (d) Molecular model
showing the structure of the four-component network.[34] ....................................... 25
Figure 2.15. (a) and (c) STM images showing the left-handed and right-handed
pinwheel structures formed by pentacene on Bi(111). (b) Molecular models of the
molecular assemblies and pentacene. [55] ...................................................................... 27
Figure 2.16. (a) Molecular structures of 1,5-bis-(3′-thia-tetradecyl) anthracene (1) and
1,5-bis-(3′-thia-pentadecyl) anthracene (2). (b) STM image showing the self-assembled

List of figures
246
network formed by the opposite enantiomers of 1 on HOPG. (c) STM image showing
the self-assembled network formed by the same enantiomers of 2. [57] ........................ 28
Figure 2.17. (a) Molecular structure of the TBPB molecule. (b) Schematics of different
pore types formed in the TBPB 2D-COF.[59] ................................................................ 30
Figure 2.18. Scheme showing the method of constructing 2D-COFs proposed by Grill et.
al. [60], in which molecular components bear chemical groups for radical addition
reactions. ......................................................................................................................... 30
Figure 2.19. Representative 2D-COFs construction scheme using additional molecules
as linkers [64]. ................................................................................................................. 31
Figure 2.20. Ullmann couple reaction assisted by a noble metal surface. ...................... 32
Figure 2.21. Boronic acid condensation reactions. ......................................................... 33
Figure 2.22. Addition and elimination steps in a Schiff base condensation reaction. ..... 34
Figure 2.23. Schematic diagram showing the formation mechanism for a mono-layer
Schiff-base 2D-COF, consisting of porphyrin units connected by smaller linker
molecules, formed at a liquid-solid interface. [73] ......................................................... 36
Figure 2.24. Schematic illustration of 2D-COFs synthesis between a tritopic precursor
(red) that has been deposited onto a surface and a ditopic precursor (blue) that is present
in the vapour phase above the surface. Growth of the 2D-COF occurs at the
vapour-solid interface. [64] ............................................................................................. 37
Figure 3.1. (a) Schematic representation of the basic operational principles of STM. (b)
Image showing the atomic scale depiction of the tip-sample tunnel junction. ............... 41
Figure 3.2. Schematic diagram of an electron traversing a 1D rectangular potential
barrier. ............................................................................................................................. 43
Figure 3.3. Schematic diagrams showing energy schemes of a tip-surface junction in
STM under different conditions. ..................................................................................... 45
Figure 3.4. Tip-surface model built by Tersoff and Hamann [92]. ................................. 47
Figure 3.5. STM images showing the results of molecular patterning achieved using a
STM system operating under ambient conditions [114]. ................................................ 51
Figure 3.6. (a) Agilent 5500 series SPM microscope including glass environmental

List of figures
247
chamber for carrying out experiments under inert gas and low humidity atmospheres. (b)
Sample plate magnetically attached to the microscope body. (c) Schematic illustration of
the assembly of a liquid cell for STM imaging at liquid-solid interfaces [116]. ............ 52
Figure 3.7. (a) Schematic representations of the crystal structure of bulk graphite [117].
(b) The most frequently observed STM contrast for HOPG. .......................................... 54
Figure 3.8. (a) Schematic diagram of a typical AFM system. (b) Enlarged image of the
AFM tip-surface region. (c) General long-range and short-range interaction forces that
exist during the approach of an AFM tip towards a sample surface [134]. .................... 58
Figure 3.9. Plot showing how the force acting between an AFM tip and a surface varies
as a function of the tip-surface distance. ......................................................................... 59
Figure 3.10. (a) PeakForce Tapping Mode AFM image of the porous PTCDI-melamine
network self-assembled on a boron nitride surface. (b) Molecular model of the
PTCDI-melamine network [141]. ................................................................................... 61
Figure 3.11. Ambient environment AFM systems with molecular resolution. (a) Bruker
Multimode 8 AFM. (b) CypherTM
AFM [144]. ............................................................... 62
Figure 3.12. Schematic illustration of the basic mechanism of the XPS technique........ 65
Figure 3.13. Schematic energy level diagram showing the photoemission process from
the O1s oxygen core level in an XPS experiment. .......................................................... 66
Figure 3.14. Energy level diagram showing the calibration of an XPS equipment. ....... 67
Figure 3.15. XPS survey scan of a blank HOPG sample. ............................................... 68
Figure 3.16. Schematic of theThermo Scientific K-Alpha XPS system [147]. ............... 70
Figure 4.1. Schematic diagram showing three example molecular arrangements of
planar tetra-carboxylic acid molecules. [51] ................................................................... 76
Figure 4.2. Molecular structures of three tetracarboxylic acid derivatives formed by
grafting isophthalic acid groups to either end of linear connectors. [165]...................... 76
Figure 4.3. Molecular structures of (a) TPTC [51, 52, 163, 166]; (b) QPTC [51, 163]; (c)
NTC [51]. ........................................................................................................................ 77
Figure 4.4. STM images and schematic representations showing molecular packing
arrangements of TPTC and QPTC within dried films on Au(111) surfaces, and the

List of figures
248
liquid-HOPG interfaces. .................................................................................................. 78
Figure 4.5. Chemical formulae of (a) ATC; (b) coronene. .............................................. 79
Figure 4.6. Schematic representation of the experimental setup for the acquisition of
STM images at liquid-solid interfaces. ........................................................................... 80
Figure 4.7. STM image of the ATC network self-assembled at the nonanoic acid-HOPG
interface. .......................................................................................................................... 83
Figure 4.8. Morphology of the ATC network self-assembled from octanoic acid onto
HOPG. ............................................................................................................................. 85
Figure 4.9. STM image of a good quality ATC network assembled at the heptanoic
acid-HOPG interface. ...................................................................................................... 86
Figure 4.10. Morphology of self-assembled ATC monolayers at high and low
concentrations. ................................................................................................................ 88
Figure 4.11. (a) High resolution, drift corrected STM image of the ATC (sat/50)
Kagomé structure with its unit cell marked in black. (b) Corresponding MM simulated
molecular model with a unit cell marked in red. ............................................................. 90
Figure 4.12 (a) Chemical structure of 1,5-bis-(3′-thia-tetradecyl) anthracene. (b) STM
image of the self-assembled network of the compound shown in (a) at the interface
between HOPG and phenyloctane. From reference [57]. ............................................... 91
Figure 4.13. (a) STM image of the ATC mirror-image domain. (b) MM molecular model
of the chiral, Kagomé porous structure shown in (a). ..................................................... 92
Figure 4.14. (a) Drift-corrected STM image of the ATC (sat/20) parallel structure with
its unit cell marked in black. (b) MM geometrically optimised molecular model .......... 93
Figure 4.15. ATC (sat/20) close-packed structure. (a) Drift corrected STM image. (b)
MM geometry optimised molecular model. .................................................................... 95
Figure 4.16. STM image of the bi-component network formed by the mixture of ATC
(sat/20) and coronene 1.0 × 10⁻⁴
mg/ml at the heptanoic acid-HOPG interface. ............ 96
Figure 4.17. (a) Drift corrected STM image of the ATC Kagomé structure stabilised by
the co-adsorption of coronene. (b) Tentative molecular model of the ATC-coronene
binary structure................................................................................................................ 97

List of figures
249
Figure 5.1. Chemical structures and hydrogen bonding interactions between DNA
nucleobase pairs: (a) Watson-Crick DNA nucleobase pair; (b) Reverse Watson-Crick
A-T base pair; (c) Hoogsteen A-T base pair: (d) Reverse Hoogsteen A-T base pair
[175-178].. ..................................................................................................................... 101
Figure 5.2. Molecular structure of porphyrin and possible positions for functionalisation.
....................................................................................................................................... 102
Figure 5.3. Chemical structure of the molecules used to probe thymine-adenine
interactions in solution phases: mono-thymine-tri-(3,5-di-tert-butylphenyl)porphyrin
(Mono-TP) and 9-propyladenine (PA). ......................................................................... 103
Figure 5.4. Single crystal X-ray structure for mono-TP showing the R22(8) double
hydrogen bonding interaction between twadjacent o thymine groups in 3D mono-TP
cystals [193]. ................................................................................................................. 104
Figure 5.5. (a) 1H NMR spectra of mono-TP in deuterated chloroform solutions with PA
being titrated into the system gradually. Spectrum 1 is recorded in pure PA [193]. (b)
Structural illustration of PA with numbering of positions. (c) Schematic representation
of Watson-Crick A-T hydrogen bonding between PA and Mono-TP. (d) Schematic
representation of Hoogsteen A-T hydrogen bonding between 9-propyladenine and
Mono-TP. ....................................................................................................................... 105
Figure 5.6. Chemical formulae of (a) tetra-(phenylthymine)porphyrin (tetra-TP); and
(b) tetra-(phenylthymine)porphyrin-Zn(Ⅱ) (Zn-tetra-TP). .......................................... 107
Figure 5.7. Illustration of an STM tip scanning at the liquid-HOPG interface mounted
inside the temperature control liquid cell. ..................................................................... 108
Figure 5.8. STM image of a 2D tetra-TP (0.031 mg/ml) mono-component network
self-assembled at the interface between HOPG and TCB/THF mixture (9:1). ............. 110
Figure 5.9. (a) Drift-corrected STM image of the 2D self-assembly of mono-component
tetra-TP networks. (b) Molecular model from a geometry optimised MM simulation of
the mono-component tetra-TP network. ........................................................................ 111
Figure 5.10. MM simulated tetra-TP structure overlaying a fixed graphene sheet after
geometry optimisation. .................................................................................................. 112
Figure 5.11. Drift-corrected STM images and molecular models showing mirror-image

List of figures
250
domains of the tetra-TP network (0.031 mg/ml).. ......................................................... 113
Figure 5.12. STM image of a 2D molecular network formed by the self-assembly of
tetra-TP (0.031 mg/ml) and PA (0.089 mg/ml) at the liquid-solid interface. ................ 114
Figure 5.13. (a) Drift-corrected STM image of the tetra-TP and PA co-crystal structure.
(b) Geometry optimised molecular model and unit cell (marked in red) for the 2D
network. (c)-(d) A pair of STM images used for drift-correction showing the
bi-component molecular network and the underlying HOPG surface respectively. ..... 116
Figure 5.14. MM simulated molecular model for the tetra-TP and PA co-crystal with the
fixed underlying graphene lattice. Red, dashed lines: hydrogen bonding. ................... 117
Figure 5.15. STM image of a bi-component network formed by tetra-TP (0.10 mg/ml)
and PA (0.040 mg/ml) that shows the growth of mirror-image domains. ..................... 118
Figure 5.16. STM images showing the morphology of tetra-TP and PA networks formed
at different overall concentrations and molar ratios of the two components. ............... 119
Figure 5.17. Chemical structure of melamine and its non-covalent interaction with
thymine via three hydrogen bonds.. .............................................................................. 122
Figure 5.18. (a) STM image of a self-assembled network formed by tetra-TP (5.0 × 10⁻³
mg/ml) and melamine (0.050 mg/ml) at the liquid-solid interface. (b) Magnified STM
image of the region marked by the dashed, white square in (a). (c) Line profile showing
the apparent height of one of the bright features in (a). ................................................ 123
Figure 5.19. (a) High resolution, drift-corrected STM images of the tetra-TP (2.4 × 10⁻⁴
mg/ml) and melamine (0.090 mg/ml) network at the liquid-solid interface between
HOPG and DMSO/TCB. (b) Geometry optimised MM simulations of six melamine
molecules surrounded by three tetra-TP molecules with an underlying fixed graphene
layer. (c) MM simulated molecular model for an extended regon of the tetra-TP and
melamine network. The unit cell of the network is marked in red. .............................. 124
Figure 5.20. STM image of the tetra-TP (2.4 × 10⁻⁴
mg/ml) and melamine (0.090 mg/ml)
network allowing the identification of the individual melamine linkers. (b) Magnified
STM image showing a melamine linking its adjacent tetra-TP molecules by three
melamine-thymine hydrogen bond trimers. (c) Corresponding molecular structure of the
melamine-linked junction.............................................................................................. 126

List of figures
251
Figure 5.21. (a) STM image of the tetra-TP (2.4 × 10⁻⁴
mg/ml) and melamine (0.090
mg/ml) network showing the melamine rings. (b) Magnified STM image of melamine
adsorbed in a large pore formed by three tetra-TP molecules. (c) Corresponding
molecular model of the nanostructure observed in (b). Dashed, red lines represent
individual hydrogen bonds. ........................................................................................... 127
Figure 5.22. (a) STM image of 2D melamine self-assembly at the air HOPG interface.
(b) Corresponding molecular model. From reference [208]. ........................................ 128
Figure 5.23. (a) STM image of the Zn-tetra-TP (0.028 mg/ml) network self-assembled at
the interface between HOPG and THF/TCB. (b) Magnified STM image showing
detailed structure of the Zn-tetra-TP network. (c) Line profile showing the height of
different porphyrin species. ........................................................................................... 129
Figure 5.24. (a) STM image of the network formed using a mixture of Zn-tetra-TP
(0.040 mg/ml) and freebase tetra-TP (0.010 mg/ml) at the liquid-solid interface. (b) Line
profile showing the heights of bright and dark porphyrin species. ............................... 131
Figure 5.25. STM images recorded at room temperature for the Zn-tetra-TP (0.040
mg/ml) and PA (0.043 mg/ml) network deposited from a mixed solution onto a HOPG
substrate without pre-heating. ....................................................................................... 132
Figure 5.26. Typical STM images collected at sequentially elevated temperatures for the
Zn-tetra-TP (0.040 mg/ml) and PA (2.2×10⁻⁴
mg/ml) co-assembled structures. (a) 50 ºC.
(b) 60 ºC. ....................................................................................................................... 133
Figure 6.1. (a) Molecular structures of TAPP and BDA. Schiff-base condensation
reaction between BDA and TAPP for the synthesis of 2D-COFs. (b) Molecular structure
of ZnTAPP. .................................................................................................................... 139
Figure 6.2. The glass tube used as the reaction vessel for the formation of porphyrin
2D-COF at the vapor-solid interface. ............................................................................ 140
Figure 6.3. Schematic diagram showing the growth of highly ordered porphyrin
2D-COFs at the interface between the BDA vapor and the HOPG surface with deposited
TAPP or ZnTAPP. .......................................................................................................... 141
Figure 6.4. STM images and schematic representation of TAPP/BDA 2D-COFs. (a)-(b)

List of figures
252
Large-scale STM images. (c) Drift-corrected STM image. (d) Schematic diagram of the
unit cell of TAPP/BDA 2D-COF structures with a p4 symmetry.................................. 145
Figure 6.5. Schematic diagrams of the two possible conformations of the imine linkages
between TAPP and BDA. (a) Trans-conformation. (b) Cis-conformation. ................... 146
Figure 6.6. STM images showing the growth of bi-layer 2D-COFs on HOPG. ........... 147
Figure 6.7. Schematic illustrations of the multi-layer growth of TAPP/BDA 2D-COFs
on a HOPG surface. (a) Top view. (b) 3D view. ........................................................... 148
Figure 6.8. High-resolution STM image and its height profile (solid, blue line) that
demonstrate the formation of bi-layers on the 2D-COFs. ............................................. 149
Figure 6.9. STM images of freebase TAPP COF structures fabricated with various
amounts of copper sulphate. .......................................................................................... 151
Figure 6.10. STM images that show the formation of single-layered TAPP/BDA
2D-COFs by depositing TAPP from a toluene solution on HOPG. .............................. 153
Figure 6.11. (a) STM image of the network formed fo by contaminants following
2D-COFs growth. (b) Enlarged STM image of the contamination with line profiles
taken through the periodic 1D network. (c) Height profile corresponding to the blue
dashed line in (b) (d) Height profile corresponding to the red dashed line in (b).. ....... 154
Figure 6.12. XPS spectrum as a proof for the existence of silicon on the surface. ....... 155
Figure 6.13. (a) Plastic syringes and disposable medical needles previously used to
make solutions. (b) Molecular structure of PDMS which is commonly coated as a thin
film onto the surface of disposable hypodermic needles. (C) HyperChem simulation of
PDMS on HOPG. .......................................................................................................... 156
Figure 6.14. (a) AFM scan of an unreacted TAPP control sample. The deposited
TAPP/toluene solution was made using disposable needles ( 0 μl, 0.0065 mg/ml). (b)
AFM image of TAPP/BDA 2D-COFs grown using a template in (a). (c) AFM image
showing contamination-induced nanobubble-like objects at the water-HOPG interface
[228]. ............................................................................................................................. 157
Figure 6.15. (a) AFM image of the HOPG surface with unreacted TAPP film made by
drop deposition of 10 µl of a 0.065 mg/ml toluene solution. (b) AFM image of the
HOPG surface with TAPP/BDA 2D-COF grown using the TAPP template shown in (a).

List of figures
253
....................................................................................................................................... 159
Figure 6.16. Exemple AFM images of TAPP films on HOPG before and after the
Schiff-base condensation reaction using 10 µl of a 0.016 mg/ml toluene solution. ..... 161
Figure 6.17. AFM images of HOPG surfaces with unreacted TAPP films and TAPP
2D-COF layers by depositing 10 µl TAPP/toluene solutions with a concentration of
0.008 mg/ml. ................................................................................................................. 163
Figure 6.18. (a) Cypher AFM image of TAPP/BDA 2D-COFs grown on HOPG. (b)
Enlarged AFM image of the ordered area in (a). .......................................................... 164
Figure 6.19. (a) Cypher AFM image on a HOPG surface covered with a TAPP/BDA
2D-COF. (b) Line profile through the 3D aggregate feature in (a). (c) Line profile
thought the multi-layered structure in (a)...................................................................... 165
Figure 6.20. Cypher AFM images of a HOPG surface covered with TAPP/BDA
2D-COFs. ...................................................................................................................... 167
Figure 6.21. PeakForce Tapping mode AFM images of HOPG surfaces spin coated with
10 µl of 0.065 mg/ml TAPP/toluene solutions. ............................................................. 168
Figure 6.22. AFM images of HOPG surfaces after the deposition of 10 µl of 0.033
mg/ml TAPP/toluene solutions by spin coating. ........................................................... 169
Figure 6.23. AFM images of HOPG surfaces spin coated with 10 µl of 0.016 mg/ml
TAPP/toluene solutions. ................................................................................................ 169
Figure 6.24. XPS survey scan of the blank HOPG control sample. ............................. 170
Figure 6.25. C1s XPS spectrum of the blank HOPG control sample. .......................... 171
Figure 6.26. O1s XPS spectrum of the blank HOPG control sample. .......................... 172
Figure 6.27. C1s XPS spectrum on unreacted TAPP control sample. A
Gaussian/Lorentzian peak has been fitted for the spectrum at 284.7 ± 0.1 eV. ............ 173
Figure 6.28. (a) O1s XPS spectra for unreacted TAPP control and freashly cleaved
HOPG samples after background subtraction. (b) Survey scan for unreacted TAPP
control sample. .............................................................................................................. 174
Figure 6.29. N1s XPS spectrum for unreacted TAPP on HOPG substrate. .................. 177
Figure 6.30. C1s XPS spectrum on TAPP/BDA 2D-COFs. .......................................... 179
Figure 6.31. (a) O1s XPS spectra for TAPP 2D-COF and unreacted TAPP control

List of figures
254
samples following background subtraction. (b) Survey scan for TAPP 2D-COF sample.
Insert: XPS spectrum in the binding energy range of 170 – 70 eV. . ............................ 180
Figure 6.32. N1s XPS spectrum for TAPP/BDA 2D-COFs on HOPG. ........................ 181
Figure 6.33. Schematic diagrams of the covalent bonds formed between TAPP and BDA
via the Schiff-base condensation reactions. (a) Imine links. (b) Hemiaminal links. .... 182
Figure 6.34. N1s XPS spectrum for TAPP/BDA 2D-COFs on HOPG. CuSO4·5H2O:
0.00 g. ............................................................................................................................ 185
Figure 6.35. N1s XPS spectrum for TAPP/BDA 2D-COFs on HOPG. CuSO4·5H2O:
0.05 g. ............................................................................................................................ 186
Figure 6.36. N1s XPS spectrum for TAPP/BDA 2D-COFs on HOPG. CuSO4·5H2O:
0.10 g. ............................................................................................................................ 186
Figure 6.37. N1s XPS spectrum for TAPP/BDA 2D-COFs on HOPG. CuSO4·5H2O:
0.15 g. ............................................................................................................................ 187
Figure 6.38. N1s XPS spectrum for TAPP/BDA 2D-COFs on HOPG. CuSO4·5H2O:
0.20 g. ............................................................................................................................ 187
Figure 6.39. STM image of ZnTAPP/BDA 2D-COFs grown by depositing ZnTAPP
from TCB. ..................................................................................................................... 189
Figure 6.40. STM images of ZnTAPP/BDA 2D-COFs prepared by depositing ZnTAPP
from toluene solutions. ................................................................................................ 191
Figure 6.41. (a) Drift-corrected STM image of ZnTAPP/BDA 2D-COFs. (b) A pair of
drift-corrected STM images of the ZnTAPP 2D-COFs stucture (left) and underlying
HOPG lattice (right). ..................................................................................................... 192
Figure 6.42. (a) STM image of ZnTAPP/BDA 2D-COFs demonstrating the formation of
bi-layer 2D-COF structures. (b) Line profile measuring the apparent heights of the
bi-layer and mono-layer 2D-COFs................................................................................ 193
Figure 6.43. NMR spectrum of ZnTAPP run in deuterated DMSO. ............................. 194
Figure 6.44. PeakForce tapping mode AFM images of HOPG surfaces with: (a)
unreacted ZnTAPP by drop depositing 10 µl of 0.09 mg/ml toluene solutions; and (b)
ZnTAPP 2D-COF grown on a template in (a). ............................................................ 195
Figure 6.45. AFM images of HOPG surfaces with: (a) unreacted ZnTAPP by drop

List of figures
255
deposition of 5 µl of 0.005 mg/ml toluene solutions; and (b) ZnTAPP 2D-COFs grown
using the template shown in (a). ................................................................................... 196
Figure 6.46. XPS spectra for the unreacted ZnTAPP control sample. (a) C1s XPS region
with a Gaussian-Lorentzian peak at 284.6 ± 0.1 eV fitted to the spectrum; (b) survey
scan; (c) Zn2p; and (d) O1s. .......................................................................................... 198
Figure 6.47. N1s XPS spectrum for the unreacted ZnTAPP control sample. ............... 199
Figure 6.48. XPS spectra for the ZnTAPP/BDA 2D-COFs sample. (a) C1s , the binding
energy of the main peak: 284.7 ± 0.1 eV; (b) survey scan; (c) Zn2p; and (d) O1s. ...... 200
Figure 6.49. N1s XPS spectrum for the ZnTAPP/BDA 2D-COF sample. .................... 201
Figure 7.1. Schematic illustration showing the irreversible reduction of an imine linkage
to a secondary amine linkage. ....................................................................................... 211
Figure 7.2 The molecular structure of newly designed dialdehyde linker molecules with
diol functional groups for the synthesis of porphyrin 2D-COFs. ................................. 212

256
List of tables
Table 3.1. The various molecular mechanics (MM) force fields implemented in the
HyperChem software simulation package and their application areas [152]. ................. 74
Table 4.1. Physical and chemical properties of the fatty acids used as solvents for the
self-assembly experiments of ATCmolecules [9] ............................................................ 79
Table 5.1. Summary of results for the quantitative analysis of the bi-component
networks formed by tetra-TP and PA under different sets of conditions. ..................... 120
Table 6.1. XPS binding energy values of nitrogen species for TAPP according to reports
in literature. ................................................................................................................... 175
Table 6.2. Experimentally measured binding energy values for the four nitrogen peaks
in the peak fitting of the N1s spectrum of the TAPP control sample shown in Figure
6.29. ............................................................................................................................... 178
Table 6.3. Summary of the binding energy values measured by XPS experiments
corresponding to the chemical states of different nitrogen species in the TAPP/BDA
2D-COFs. ...................................................................................................................... 183
Table 6.4. Summary of the percentage contributions to the total fit area from the five
nitrogen species present in the TAPP 2D-COF samples grown with different amounts of
CuSO4·5H2O. ................................................................................................................ 188
Table 6.5. Summary of binding energies and percentage contributions of N1s peaks
from the N1s spectrum of unreacted ZnTAPP. .............................................................. 199
Table 6.6. Peak fitting and interpretation of N1s XPS spectrum for ZnTAPP/BDA
2D-COF. ........................................................................................................................ 202