Twenty-One-Year Trends and Correlates of Pressure to Change Drinking
20
Twenty-One Year Trends and Correlates of Pressure to Change Drinking Douglas L. Polcin, Rachael Korcha, Thomas K. Greenfield, Jason Bond, and William Kerr Alcohol Research Group, Public Health Institute, 6475 Christie Avenue, Suite 400, Emeryville, CA 94608-1010 Abstract Background—The vast majority of individuals with alcohol problems in the U.S. and elsewhere do not seek help. One policy response has been to encourage institutions such as criminal justice and social welfare systems to mandate treatment for individuals with alcohol problems (Speiglman, 1997). However, informal pressures to drink less from family and friends are far more common than institutional pressures mandating treatment (Room et al., 1996). The prevalence and correlates of these informal pressures have been minimally studied. Methods—This analysis used data from five Alcohol Research Group National Alcohol Surveys (NAS) collected at approximately five-year intervals over a 21 year period (1984 to 2005, pooled N=16,241) to describe patterns of pressure that drinkers received during the past year from family, friends, physicians, police and the workplace. Results—The overall trend of pressure combining all six sources across all five NAS surveys indicated a decline. Frequent heavy drinking and alcohol related harms also declined and both were strong predictors of receiving pressure. Trends among different sources varied. In multivariate regression models pressure from friends showed an increase. Pressure from spouse and family showed a relatively flat trajectory, with the exception of a spike in pressure from family in 1990. Conclusions—The trajectory of decreasing of pressure over time is most likely the result of decreases in heavy drinking and alcohol related harm. Pressure was generally targeted toward higher risk drinkers, such as heavy drinkers and those reporting alcohol related harm. However, demographic findings suggest that the social context of drinking might also be a determinant of receiving pressure. Additional studies should identify when pressure is associated with decreased drinking and increased help-seeking. Keywords Pressure; Coercion; Social Influence; Confrontation; Alcohol Problems Over the past two decades a growing body of research has substantiated the notion that characteristics of the social environment have a strong impact on alcohol and drug use, help seeking, and treatment outcome (e.g., Beattie,et al., 1993; Kadushin, et al., 1998; Longabaugh, et al., 1993; Matzger et al., 2005; Moos and Finney, 1996; Szalay, et. al., 1996). However, one aspect of social network influence that is common yet understudied is the pressure that many drinkers receive to change their drinking or seek help. Room and colleagues (1996) found that 35% of the general public in Ontario, Canada had commented on a friend’s or relative’s drinking within the past year and 15% had suggested the person Phone (510) 597-3440 extension 277, Fax (510) 985-6459, [email protected]. NIH Public Access Author Manuscript Alcohol Clin Exp Res. Author manuscript; available in PMC 2013 April 1. Published in final edited form as: Alcohol Clin Exp Res. 2012 April ; 36(4): 705–715. doi:10.1111/j.1530-0277.2011.01638.x. NIH-PA Author Manuscript NIH-PA Author Manuscript NIH-PA Author Manuscript
-
Upload
independent -
Category
Documents
-
view
0 -
download
0
Transcript of Twenty-One-Year Trends and Correlates of Pressure to Change Drinking

Twenty-One Year Trends and Correlates of Pressure to ChangeDrinking
Douglas L. Polcin, Rachael Korcha, Thomas K. Greenfield, Jason Bond, and William KerrAlcohol Research Group, Public Health Institute, 6475 Christie Avenue, Suite 400, Emeryville, CA94608-1010
AbstractBackground—The vast majority of individuals with alcohol problems in the U.S. and elsewheredo not seek help. One policy response has been to encourage institutions such as criminal justiceand social welfare systems to mandate treatment for individuals with alcohol problems(Speiglman, 1997). However, informal pressures to drink less from family and friends are far morecommon than institutional pressures mandating treatment (Room et al., 1996). The prevalence andcorrelates of these informal pressures have been minimally studied.
Methods—This analysis used data from five Alcohol Research Group National Alcohol Surveys(NAS) collected at approximately five-year intervals over a 21 year period (1984 to 2005, pooledN=16,241) to describe patterns of pressure that drinkers received during the past year from family,friends, physicians, police and the workplace.
Results—The overall trend of pressure combining all six sources across all five NAS surveysindicated a decline. Frequent heavy drinking and alcohol related harms also declined and bothwere strong predictors of receiving pressure. Trends among different sources varied. Inmultivariate regression models pressure from friends showed an increase. Pressure from spouseand family showed a relatively flat trajectory, with the exception of a spike in pressure fromfamily in 1990.
Conclusions—The trajectory of decreasing of pressure over time is most likely the result ofdecreases in heavy drinking and alcohol related harm. Pressure was generally targeted towardhigher risk drinkers, such as heavy drinkers and those reporting alcohol related harm. However,demographic findings suggest that the social context of drinking might also be a determinant ofreceiving pressure. Additional studies should identify when pressure is associated with decreaseddrinking and increased help-seeking.
KeywordsPressure; Coercion; Social Influence; Confrontation; Alcohol Problems
Over the past two decades a growing body of research has substantiated the notion thatcharacteristics of the social environment have a strong impact on alcohol and drug use, helpseeking, and treatment outcome (e.g., Beattie,et al., 1993; Kadushin, et al., 1998;Longabaugh, et al., 1993; Matzger et al., 2005; Moos and Finney, 1996; Szalay, et. al.,1996). However, one aspect of social network influence that is common yet understudied isthe pressure that many drinkers receive to change their drinking or seek help. Room andcolleagues (1996) found that 35% of the general public in Ontario, Canada had commentedon a friend’s or relative’s drinking within the past year and 15% had suggested the person
Phone (510) 597-3440 extension 277, Fax (510) 985-6459, [email protected].
NIH Public AccessAuthor ManuscriptAlcohol Clin Exp Res. Author manuscript; available in PMC 2013 April 1.
Published in final edited form as:Alcohol Clin Exp Res. 2012 April ; 36(4): 705–715. doi:10.1111/j.1530-0277.2011.01638.x.
NIH
-PA Author Manuscript
NIH
-PA Author Manuscript
NIH
-PA Author Manuscript

get help. In a US population study, Room, et al. (1991) found that 44% of a US populationsample stated they had said something to friends or relatives about their drinking or hadsuggested they cut down.
Studies in the U.S. examining treatment entry have documented that large proportions reportthey received pressure to enter treatment from personal relationships (friends or family) orinstitutions (criminal justice and social welfare) (Polcin and Weisner, 1999). Characteristicsof individuals entering treatment who report receiving pressure from family and friendswere most likely to be those who were white and younger (Polcin and Beattie, 2007; Polcinand Weisner, 1999). A study that looked at pressure from both criminal justice and welfareinstitutions found that minorities were more likely than whites to receive mandates fromthese institutions to enter treatment (Polcin and Beattie, 2007).
Room et al (2004) used a broad definition of pressure that included pressure to changedrinking or enter treatment among a mix of treated (n=926) and untreated (n=672) problemdrinkers in one U.S. county. They found that pressure was most common from one’s spouse;but pressure from other family members was also frequent. Severity of alcohol dependenceand alcohol related problems were strong predictors of receiving pressure.
Few studies have looked at how receiving pressure and its correlates vary at different pointsin time. However, Room et al (1991) used Alcohol Research Group National AlcoholSurveys (NAS’s) in the U.S. between 1979 and 1990 to document that receipt of pressure todrink less or act differently when drinking increased over time. They suggested that theincrease in receipt of pressure may have been due to an increased awareness of alcoholproblems that resulted from more prevention efforts and public education about alcoholduring the 1980’s. Consistent with other studies, men and individuals who were youngerreported more pressure, and spouse was a common source of pressure. However, the authorsalso noted several interesting trends. Between 1979 and 1990 there was an especially highincrease in individuals reporting pressure from family members other than spouse,particularly mothers.
To the best of our knowledge, there have been no reports documenting trends in the U.S. ofpressure to change drinking since the Room et al (1991) paper. In addition, while Room et al(1991) assessed pressure from family and friends, other sources of pressures were notincluded, such as pressure to change drinking received from physicians, police, or theworkplace.
PurposeThis paper describes 21-year trends in the types of pressures that U.S. drinkers received (i.e.,family, friend, workplace, doctor, and police) and how receiving pressure varied by drinkercharacteristics, such as demographics, heavy drinking and alcohol related harm. Using fiveNAS datasets collected over a 21-year time period, the aim is to show how the trajectories ofdifferent types of pressures varied from 1984 to 2005 and whether individuals receivingmore pressure were those for whom reducing their drinking may have been warranted (i.e.,had higher volume of alcohol consumption and more alcohol related harms). Wehypothesized that trends for receipt of pressure over the 5 time points would increase for allsources of pressure. In part, this hypothesis was based on the fact that Room et al (1991)reported increasing pressure from families and friends between 1979 and 1990. We expectedthese trends to continue to the present, particularly because environmental preventionstrategies that emphasize social control over drinking increased during the 1990’s (NIAAA,2000). We also knew from previous analyses using NAS data that heavy drinking hasdeclined over the last 2 decades (Kerr, et al, 2009) and surmised that increasing pressuremay have played a role.
Polcin et al. Page 2
Alcohol Clin Exp Res. Author manuscript; available in PMC 2013 April 1.
NIH
-PA Author Manuscript
NIH
-PA Author Manuscript
NIH
-PA Author Manuscript

Controlling for NAS time points, we hypothesized that the characteristics of individualsreceiving more pressure would be younger, white, and married. We also hypothesized thatheavier drinking and alcohol related harm would be associated with receipt of morepressure. These hypotheses were based on previous research on pressure reported by Roomet al (1991), Polcin and Weisner (1999), and Polcin and Beattie (2007).
MethodsSurvey Data
Scientists at the Alcohol Research Group have used National Alcohol Surveys (NAS) since1979 to document trends in alcohol consumption among U.S. residents age 18 and older.NAS surveys have also tracked related variables, such as the social contexts of drinking andthe prevalence of various types of alcohol related harm. NAS surveys are unique incapturing historical trends in alcohol consumption and problems because most other nationalsurveys have only assessed recent time periods. For example, the National Survey on DrugUse and Health only tracks alcohol use back to 2002. Similarly, the NationalEpidemiological Survey on Alcohol and Related Conditions (NESARC) only goes back to2001. One national survey where there was concordance with the general direction ofdrinking trends reported in the NAS was NIAAA surveillance Report #85, which tracked percapita alcohol consumption between 1970 and 2006 (Latkins, et al., 2008). Like findingsreported on the NAS, they found a decreasing trend in alcohol consumption relative to themid 1980’s. Unfortunately, they did not track alcohol related harm.
The five administrations of the Alcohol Research Group’s National Alcohol Surveys (N7[1984], N8 [1990], N9 [1995], N10 [2000], and N11 [2005]) have a high degree ofcomparability between them, particularly in highly similar item content. Several differencesin the surveys include over-sampling for Latino/Hispanics and African Americans in foursurveys (N7, N9, N10 and 11) and use of random digit dial (RDD) telephone surveymethods for the last two surveys (N10 and N11) while the earlier surveys were multi-stageclustered samples using in-person interviews. All surveys were weighted to the U.S. generalpopulation. Therefore, the over-sampling should not bias the results because they areaccounted for by the weights in the analysis (Kerr et al., 2004). The switch from face-to-faceinterviews with stratified cluster sampling in N7–N9 to RDD telephone interviews in N10and N11 was accompanied by extensive methodological work comparing these two modesduring the same time period, which found prevalence estimates of major drinking behaviorsto be substantively comparable, in spite of the lower response rates for the telephoneinterviews (Greenfield et al., 2000; Midanik, et al., 1999; Midanik et al., 2001a; Midanik etal., 2001b; Midanik et al., 2003a; Midanik et al 2003b).
Two types of evidence indicate that the lower response rate in a telephone survey did notsignificantly bias results related to consumption measures. First, an extensive series ofmethodological studies comparing identical questions in telephone and in-person surveysduring the same time points have found comparable estimations of mean alcoholconsumption (Greenfield et al., 2000; Midanik and Greenfield, 2003a; Midanik andGreenfield, 2003b), with somewhat inconsistent but still modest interview mode effects foralcohol harms (Midanik et al., 2001a; Midanik et al., 2001b). Second, an analysis comparingconsumption estimates in the NAS sample replicates (each a random subsample,successively ‘opened’ during the conduct of the survey, and each with a specific responserate varying around the overall mean of 58%) a finding of no significant correlation betweenreplicate response rate and volume of consumption (Kerr et al., 2004), again suggesting thattelephone estimates of consumption are somewhat insensitive to response rate above andbelow the range typically obtained for telephone surveys (Greenfield et al., 2006). Whilethese studies support the comparability of NAS survey methods (in-person versus
Polcin et al. Page 3
Alcohol Clin Exp Res. Author manuscript; available in PMC 2013 April 1.
NIH
-PA Author Manuscript
NIH
-PA Author Manuscript
NIH
-PA Author Manuscript

telephone), it should be noted that not all NAS variables were included in thesecomparisons, including measures of pressure.
Described below are the six data sets to be used in the study:
N7 SurveyThese data were collected in 1984 (N=5,221) by the Institute for Survey Research at TempleUniversity. A multi-stage stratified sample of 100 primary sampling units (PSUs) was used.African Americans and Latino/Hispanics were over-sampled in 10 PSUs. The response ratewas 77%.
N8 SurveyThese data were collected in 1990 (N=2,058) by the Institute for Survey Research at TempleUniversity using a multi-stage stratified sample of 100 PSUs. The response rate was 70%.
N9 SurveyThese data were collected in 1995 (N=4,925) by the Institute for Survey Research at TempleUniversity using a multi-stage stratified sample of 100 PSUs. The response rate was 77%.
N10 SurveyThe data were collected in 2000 (N=7,612) by the Institute for Survey Research using a listassisted RDD method and Computer Assisted Telephone Interviewing (CATI) methods.African Americans, Latino/Hispanics and low population states were over-sampled. Theresponse rate was 58%. The lower response rate than previous surveys is not unusual fortelephone surveys (Kerr et al., 2004). This method of course has the advantage of collectingdata on a larger number of individuals and lower design effects than for in-person surveys.
N11 SurveyThe data were collected in 2005 (N=6,919) by Data Stat Inc. in Ann Arbor, Michigan. Theyagain used a RDD CATI telephone survey. Again, African Americans, Latino/Hispanics andlow population states were over-sampled. The response rate was 56%.
The NAS data series used here has been successfully used in a number of trend and age-period-cohort analyses, which together have added assurance of the suitability of this seriesof highly comparable surveys for conducting trend analysis (Greenfield and Kerr, 2008;Kerr et al., 2004; Kerr, et al., 2009, Kerr, et al., 2006).
MeasuresItems used in different administrations of the NAS over time were designed to maximizeconsistency so we could compare differences between time periods. Thus, most itemschanged very little over time. The measures described below were all administered in N7-N11, except for a few measures where indicated.
DemographicsThese items consisted of standard characteristics such as gender, age, race, marital status,and education and were used to describe the characteristics of who received pressure overthe past 21 years.
Polcin et al. Page 4
Alcohol Clin Exp Res. Author manuscript; available in PMC 2013 April 1.
NIH
-PA Author Manuscript
NIH
-PA Author Manuscript
NIH
-PA Author Manuscript

PressurePressure consisted of 6 items measuring pressure from spouse/someone lived with, family,friends, physicians, work, and police. Pressure was coded as a dichotomous variableindicating receipt of pressure over the past 12 months versus not receiving pressure. Fouritems directly asked whether the respondent experienced pressure to change drinking fromfour different sources. The wording of each item was geared to how we believed pressurefrom each source may have typically transpired:
1. My spouse or someone I lived with got angry about my drinking or the way Ibehaved while drinking.
2. A physician suggested that I cut down on drinking.
3. People at work indicated I should cut down on drinking.
4. A police officer questioned or warned me about my drinking.
Two additional sources, family and friends, asked whether “other people might have likedyou to drink less or act differently when you drank.” Participants were specifically askedwhether a variety of people ever felt that way including parents, other relatives, girlfriend orboyfriend and other friend. Parents and other relatives were combined into a “family”variable and girlfriend of boyfriend and other friend were combined into a “friend” variable.These questions were asked in terms of past 12 months and they were included in all of theNAS surveys used. This measure of pressure and variations of it have been used at ARG formany years (e.g., Hasin, 1994; Room, 1989, Room et al., 1991, Schmidt et al, 2007).
Table 1 shows the exact wording of pressure items at each time point. As indicated, the vastmajority of questions across NAS administrations were exactly the same. In a few instances,minor word changes are evident. For example, N7 to N9 asked if “A policeman asked orwarned me about my drinking.” N10 to N11 asked if “a police officer asked or warned meabout my drinking.” N7 to N9 ask about pressure from a “mother” and “father,” whereasN10 to N11 ask about pressure from a “parent.”
A more substantive difference was for N7 items on 2 sources, family and friend, where amore conservative threshold was used to identify pressure. In that administration pressurefrom family and friends was only documented if the participant responded yes to a questionasking “Did that break up your relationship with that person or threaten to break it?” Thus,pressure from family and friends in N7 represents a conservative finding.
Another more conservative measure was that of family pressure in the N8 survey, wherethere were questions about pressure from specific relationships that were not used duringother years. These included questions about pressure from a brother, sister, son anddaughter. Because other years did not specify these relationships, we did not include them inthe analysis. Instead, we used a measure that that indicated pressure from mother, father, orany “other relative” for all NAS years. However, in the N8 data the “other relative” categoryis more conservative because it excludes brother, sister, son and daughter.
It should be noted that our assessment of pressure is broader than previous examinations ofpressure using NAS datasets (i.e., Room et al., 1991). For example, Room et al (1991) didnot study pressure from physicians, work, or police. In addition, they used a differentmeasure of pressure from spouse. They asked respondents if their spouse “might have likedyou to drink less or act differently when you drank.” Because our measure of pressure fromone’s spouse measured a reported behavior (i.e. “got angry”) rather than the respondent’sperception about how the spouse might have felt about drinking, we think it is the strongerof the 2 measures. However, on 2 of the sources of pressure Room et al studied (i.e., family
Polcin et al. Page 5
Alcohol Clin Exp Res. Author manuscript; available in PMC 2013 April 1.
NIH
-PA Author Manuscript
NIH
-PA Author Manuscript
NIH
-PA Author Manuscript

and friends) we used the same measure of pressure: “might have liked you to drink less oract differently when you drank.”
Frequent Heavy DrinkingTo assess volume we used procedures similar to those described by Nyaronga et al (2009) .Overall alcohol consumption volume was assessed using the “Knupfer Series” (KS)beverage-specific, graduated-frequencies items (Greenfield, 2000). The KS items first askthe frequencies of drinking wine, beer, and distilled spirits (separately) using a nine-levelcategorical scale, followed in each case by asking the proportion of time the respondentdrinks each beverage in three quantity ranges: one to two, three to four, and five or moredrinks (response categories were the same as for the context of drinking variables). Overallvolume is calculated by summing the responses with an appropriate algorithm (Greenfield,2000) using a log transform to reduce the skew. Respondents reporting 5 or more drinks in asitting on at least a weekly basis in the past 12 months were considered to be frequent heavydrinkers.
Alcohol Related HarmAlcohol related harm was assessed using items that asked, “During the last 12 months, howoften has your drinking had a harmful effect on your: 1) work and employmentopportunities, 2) home life/marriage, 3) friendships and social life, 4) health, and 5) financialposition.” Items were coded yes if the harm occurred during the last 12 months. Previous useof these items yielded a Cronbach’s alpha of 0.73 (Greenfield et al., 2010).
Analysis PlanBecause we were interested in pressure received as a result of drinking behavior, we selectedfor our analysis only those respondents who indicated they were current drinkers (i.e.,consumed alcohol during the past 12 months). This included a majority of individuals takingpart in the NAS surveys, and it ranged from 61% at N10 (year 2000) to 69% at N7 (year1984) and did not differ significantly across the survey years.
The analytic plan began with descriptive statistics documenting demographic and drinkingcharacteristics of the 5 pooled datasets. We then used descriptive statistics to examine trendsof receipt of pressure to change drinking from different sources over the five time points. Toassess the relative influence of demographic factors on receipt of pressure from differentsources at different time points we implemented multivariate logistic regression models.Separate models were conducted for each of the 6 sources of pressure as well as an overallmodel that assessed pressure from any of the 6 sources combined. Pressure wasdichotomized as receiving pressure versus not and predictor variables included survey timepoint (N7 – N11) and demographic characteristics. The logistic regression models assessedhow frequent heavy drinking and alcohol related harms predicted receipt of pressure aftercontrolling for the demographic characteristics and dataset.
ResultsCharacteristics of the Sample
The demographic and drinking characteristics of the sample at each time point are shown inTable 2 along with the pooled sample that combined the datasets together. In the pooledsample, slightly over half were male, and most were white (77%) and married (66%). Over55% had at least some college and those between the ages of 30 and 49 constituted 43% ofthe sample.
Polcin et al. Page 6
Alcohol Clin Exp Res. Author manuscript; available in PMC 2013 April 1.
NIH
-PA Author Manuscript
NIH
-PA Author Manuscript
NIH
-PA Author Manuscript

Proportions for gender and marital status were relatively consistent over NAS time points.However, in 1984 the proportion of the sample that was Hispanic was about half of what itwas in 2005. In contrast, whites constituted 84% of the sample in 1984 and that dropped to76% in 2005. The proportion of the sample that was age 18 to 29 decreased over the fiveNAS administrations and there was a doubling of the proportion reporting completion of acollege degree.
In terms of drinking characteristics, we found a large reduction in alcohol related harms overthe 5 NAS surveys, with 12.1% reporting at least one harm in 1984 and 4.8% in 2005.Frequent heavy drinking also showed a decline over time. During the 1984 survey 13.9%were assessed as frequent heavy drinkers and that proportion declined to 7.2% in 2005.
Receipt of Pressure over NAS Survey Time PeriodsWhen we examined how receipt of pressure to change drinking varied over time weunexpectedly found that overall it decreased. Although the trend was not consistent acrossall time points, Figure 1 shows that the percent reporting pressure during the last 12 monthsfrom at least 1 of the 6 sources decreased significantly, from 12.9% in 1984 to 8.2% in 2005(X2=92.2, p<.001). The trends of receiving pressure varied considerably depending on thesource. Pressure from physicians and friends were relatively consistent over time.Statistically significant differences were found for spouse, family, police officer, and any ofthe 6 sources (all significant at p<.001 using chi square analyses). Some of these trendsshowed significant decreases over time, such as pressure from spouses, which decreased byalmost half from 1984 to 2005. Warning about drinking from police officers was almostthree times as high in 1984 as in 2005.
The other two sources of pressure, family and work, showed more inconsistent patterns.Pressure from family showed a spike in reported pressure at the 1990 time point. Over 10%of the sample reported pressure from relatives in 1990, whereas all other time pointsreported proportions that were under 6%. Relative to other sources, pressure at work wasrarer and the trend was inconsistent. Pressure was highest in 1984 (0.8%) and 2000 (1.1%)and significantly lower in 1990 (0.2%) and 1995 (0.4%).
Frequent Heavy Drinking and Alcohol Related HarmTable 3 shows the proportions of those receiving pressure that were frequent heavy drinkersand had experienced at least one alcohol related harm for each source of pressure. Alcoholrelated harms were broken down into harms related to each source (e.g., drinking impactinghealth for pressure from a physician) and harms that were not related to the source. Eachsource of pressure in the far left column shows the percentage at each NAS time point forheavy drinking, one or more harms related to the source, and one or more harms not relatedto the source. In addition, there is a combined “any source” variable at the bottom. Largeproportions of individuals receiving pressure were frequent heavy drinkers and manyreported experiencing drinking related harm. Among those who reported receiving pressurein the combined analysis (N=1,924) 38.6% were frequent heavy drinkers and 44.9% hadexperienced at least one alcohol related harm during the past 12 months.
Within sources, the proportion of drinkers who received pressure who were heavy frequentdrinkers varied from 63.1% for work to 38.0% for family. Individual harms that wererelevant to specific sources of pressure were lower, varying from 19.9% (work) to 44%(physician). It can be noted that participants with one or more harms not related to a specificsource of pressure represented larger proportions than those with harms related to the sourceof pressure. For example, among those receiving pressure from friends 33.1% reported their
Polcin et al. Page 7
Alcohol Clin Exp Res. Author manuscript; available in PMC 2013 April 1.
NIH
-PA Author Manuscript
NIH
-PA Author Manuscript
NIH
-PA Author Manuscript
drinking had a harmful effect of their friendships. However, a more substantive proportion(48.9%) reported that they experienced one or more harms not related to friendships.
For those who reported pressure from police and physicians, the proportions that werefrequent heavy drinkers and had experienced drinking related harm were consistent acrossNAS time periods. However, those who received pressure from a spouse had largerproportions of frequent heavy drinking in 1984 than other years. Pressure from family hadlarger proportions of frequent heavy drinker s and alcohol related problems in the 1984 and2000 survey years. Pressure from friends showed larger proportions experiencing harmsduring 1990 and 2000 surveys.
Multivariate Analyses of Factors Predicting Receipt of PressureTable 4 shows the relative influence of frequent heavy drinking, alcohol related harms,demographic characteristics and NAS survey time period on receipt of pressure during thepast 12 months. Logistic regression models examined pressure from individual sources aswell as all sources combined.
Drinking Predictors—As hypothesized, frequent heavy drinking and alcohol related harmwere strong, consistent predictors of receiving pressure within and across sources. In thecombined analysis examining all 6 sources together, frequent heavy drinkers were over 5times more likely than those drinking less than that amount to report receiving pressure.Further, frequent heavy drinking predicted receipt of pressure within all sources of pressure,ranging from an odds ratio of 2.7 (CI=2.0 – 3.8) for friends to 5.6 (CI= 2.9 – 10.9( for work.
There were similar findings for alcohol related harms as a predictor of pressure. Somesources of pressure had specific alcohol related harms that were relevant to them. For thesesources we used models that assessed the relative influence of the harm that was relevant tothat source as well an aggregate measure of non-specific harms that were not related to thesource. One source (police) did not have an individual harm associated with it so weassessed the effects of any harm reported. Regardless of how harm was assessed, it was asignificant predictor of receiving pressure within and across sources (Table 4). For harmsthat were relevant to sources, odds ratios ranged from 2.8 (CI= 1.5 – 5.3) for work to 10.3(CI=7.2 – 14.89) for spouse. Harms not related to specific sources of pressure were alsosignificant predictors of receiving pressure in all models. While specific harms related topressure from spouse and physicians had higher odd ratios than non-specific harms, theopposite was the case for pressure from work and family, where non-specific harms werestronger predictors.
Demographic Predictors—Logistic regression models also assessed how demographiccharacteristics were associated with receipt of pressure controlling for frequent heavydrinking, alcohol related harms and NAS time period (see Table 4). In the overall analysisthat assessed predictors of pressure from any of the 6 sources, sex, age, education, andmarital status were all significant predictors. Men were 70% more likely than women toreport pressure. Most of the difference can be attributed to men receiving more pressurefrom spouses (OR= 2.1, CI= 1.6 – 2.7) and police (OR=2.8, CI= 1.9 – 4.2).
Younger age groups also reported receiving more pressure. Those age 18–29 were 2.9 times(CI= 2.3 −3.7) more likely to report receiving pressure than those 50 and older. Those age30 – 49 were 1.7 times (CI= 1.3 – 2.1) more likely to report receiving pressure than those 50and older. Within source models showed that age predicted receipt of pressure from spouse,family, friends, and police.
Polcin et al. Page 8
Alcohol Clin Exp Res. Author manuscript; available in PMC 2013 April 1.
NIH
-PA Author Manuscript
NIH
-PA Author Manuscript
NIH
-PA Author Manuscript

In the combined analyses, race did not predict receipt of pressure. However, significantwithin source differences were noted for family, friends, physician, work and police.Hispanics received more pressure from family, friends, physicians, and work. AfricanAmerican participants received more pressure from physicians but less from police.
Relative to drinkers with a college degree, those with less than a high school education andthose with a high school diploma but no college received more pressure. In the analysispredicting any of the 6 sources, those with less than a high school education were 80% morelikely to report receiving pressure and that those with a high school diploma but no collegewere 30% more likely.
Among those with less than a high school education pressure was more likely for all sourcesexcept physicians. For those with a high school degree pressure was more likely fromfamily, friends and police. As Table 4 indicates, the findings were fairly robust acrosssources, especially for those with less than a high school diploma.
As expected, drinkers who were married reported significantly more pressure from spouses.However, on other sources they tended to report less pressure. Relative to those who weremarried, drinkers who were divorced, widowed, or separated reported higher pressure fromfamily, friends and police. In the analysis considering pressure from any source they wereover 60% more likely than married drinkers to report receiving pressure. Although thosewho were never married did not differ from those who were married in terms of receipt ofpressure from any of the six sources, they did receive significantly more pressure fromfriends (OR= 2.8 CI= 1.8 – 4.1), family (OR= 1.5 CI= 1.1 – 2.1) and police (OR= 2.6 CI=1.6 – 4.2).
NAS Time Periods—One of our primary goals was to document how receipt of pressureto change drinking varied over the past 21 years. Descriptive trends (i.e., percentages) aredescribed above and reported in Figure 1. When we looked as simple percent reportingpressure over time we saw a significant decline across the survey years. However, when wecontrolled for a variety of variables in the logistic regression models (Table 4) we had mixedfindings. The overall model examining the 6 sources pooled together showed that comparedto the most recent time point (2005) pressure was more common in 1990 (OR=1.7, CI= 1.3– 2.1). Higher overall pressure in 1990 appears to have been driven largely by pressure fromfamily, where the odds of receiving pressure were over twice as likely as 2005.
Although not reaching statistical significance, 1995 had a trend of more pressure relative to2005 (OR=1.3, CI= 1.0 – 1.7; p=0.51). Within each source of pressure there wasconsiderable variation in the trends of pressure over time. Again, the findings differed fromthe bivariate trends reported in Figure 1. For example, bivariate comparisons of pressureover time for friends and physicians did not reveal significant differences. However, in ourmultivariate models we found both were about half as likely to report pressure in 1984compared to 2005 and friends was also significantly lower in 2000(OR=0.7, CI = ,0.5 – 0.9,p<.05). While pressure from spouse and police showed overall declines in the bivariateanalyses, neither varied to any significant extent in the regression models.
DiscussionThe overall trend of pressure over the 21-year time period indicated a significant decline.With the exception of an increase in 2000, the trend was consistent across NAS years. Wesaw similar trends for frequent heavy drinking and alcohol related harm. Like pressure,alcohol related harm had a consistent decline over the 21 year period except for an increasein 2000. Frequent heavy drinking had a declining trend except for an increase in 1995.
Polcin et al. Page 9
Alcohol Clin Exp Res. Author manuscript; available in PMC 2013 April 1.
NIH
-PA Author Manuscript
NIH
-PA Author Manuscript
NIH
-PA Author Manuscript
However, when we conducted multivariate analyses of factors predicting pressure, includedNAS dataset, we found the strongest, most consistent predictors were frequent heavydrinking and alcohol related harms.
Frequent Heavy Drinking and HarmsRegardless of the source of pressure or the time period when data were collected, thestrongest and most consistent predictors of receiving pressure to change drinking in ourmultivariate models were frequent heavy drinking and alcohol related harms. For harms, wefound individual harms that were conceptually related to specific sources of pressure (e.g.,medical harm and pressure from physicians) predicted receipt of pressure from that source.However, we also found that aggregate measures of other harms that were not related tosources also predicted receipt of pressure. This was particularly evident when pressure wasreported from a source that could include comments from multiple individuals, such asfriends and family. Some suggestions from these sources appear to reflect concerns aboutproblems unrelated to their relationship with the drinker, such as medical, legal or workproblems the drinker was experiencing. While pressure from sources that reflect oneindividual (e.g., physicians and spouse) were associated with both related and unrelatedharms, the odds ratios were stronger for harms related to sources.
The Social Context of DrinkingAlthough frequent heavy drinking and experiencing alcohol related harms were the strongestpredictors of receiving pressure, other factors were important as well. More pressure wasreported by participants who were male and unmarried, whereas older age individuals andthose with a college degree reported less pressure. Overall, these findings are consistent witha variety of previous studies that examined demographic correlates of pressure to changedrinking and coercion to enter treatment (e.g., Polcin and Weisner, 1999; Room et al., 1991;Room et al., 2004).
Who receives pressure to change their drinking may in part be determined by the socialcontext where drinking takes place. For example, several papers (e.g., Polcin and Weisner,1999; Weisner and Schmidt, 1995) pointed out that younger persons are more likely to havelifestyles where drinking is associated with problem behaviors that are likely to elicitcomments (e.g., drinking in public settings and driving under the influence). Elderlydrinkers are more likely to drink at home and therefore elicit fewer comments aboutdrinking. In addition, if they are retired, pressure from the workplace is eliminated as apotential source.
The finding that men received more pressure than women from spouses is consistent withdata reported by Room et al (1991) and in part a function of men having larger proportionsof frequent heavy drinkers. Although gender roles have become increasingly flexible overthe past several decades in terms of caretaking functions in families, women may still bemore sensitive than men to the destructive effects of drinking on the family, the marriage, orpotential financial consequences that could result from job loss. Thus, they may be morelikely to comment on these concerns. The higher odds of men receiving pressure from policemay be another function of the social context of drinking. Men are more likely than womento drink in contexts where problem behaviors such as driving under the influence come tothe attention of police (Elliot, et al., 2006).
Understanding why those with higher education levels would experience less pressure mayalso be a function of the context where drinking takes place. Drinkers with a higher level ofeducation and income might have access to resources that support drinking in situationswhere there is less risk for problems. These would include things like drinking more often in
Polcin et al. Page 10
Alcohol Clin Exp Res. Author manuscript; available in PMC 2013 April 1.
NIH
-PA Author Manuscript
NIH
-PA Author Manuscript
NIH
-PA Author Manuscript

socially acceptable contexts, such as business and social events. There may also be adynamic that involves others being less likely to pressure these individuals because they areof higher social status.
Having a spouse or live-in partner obviously adds as a potentially important source ofpressure and is only an issue for those who are married or cohabitating. However, ourfindings indicated that, overall, unmarried individuals reported receiving more pressure.Being unmarried was associated with variables that predicted more pressure (i.e., youngerand more heavy drinking). However, when we entered all these variables into multivariatemodels that parsed out their relative effects on pressure we still found marital status was asignificant predictor. Again, the social context of drinking might play a role. It may be thatthose who are married have lifestyles that include drinking in situations where there is lesslikelihood of problem behaviors that are commented on by others. For example, there maybe more drinking at home and less drinking at bars.
Relative Influences of NAS Time PointsWe found pressure from families and friends increased between 1984 and 1990, which isconsistent with the findings reported by Room et al (1991). However, an unexpected findingwas that the overall incidence of receiving pressure, which included three sources notincluded by Room et al (1991) and a different measure of pressure from spouse, decreasedover the 21-year time interval measured. Much of that decline appears to be due to decreasesin frequent heavy drinking and alcohol related harms over the same time period. When wecontrolled for frequent heavy drinking, harms and demographics in the combined analysisexamining pressure from any of the 6 potential sources, the 1984 time period did not differfrom 2005.
We saw similar patterns for some of the individual sources of pressure. While pressure frompolice officers and spouses showed significant declines over time in the bivariate analyses,no declines were noted in the multivariate models. Thus, the changes we observed are likelydue to the changes in frequent heavy drinking and alcohol related harms rather than othersocial or cultural factors unique to those time periods.
Multivariate analyses showed differences from the bivariate analyses in the other directionas well, where previously insignificant bivariate comparisons became significant predictorsin the multivariate analyses. For example, neither friends nor physicians showed significantvariation over NAS time points in the bivariate analyses (Figure 1), yet both were significantin multivariate models illustrated in Table 4. The odds of receiving pressure in 1984 fromeach of these sources were about half that of 2005. It should be noted that increases inpressure from family and physicians occurred even though relative to 1984 there were verylarge reductions heavy drinking and alcohol related harm.
Part of the increase in pressure from friends may be an artifact of the more conservativedefinition of pressure from friends that was used in 1984 relative to 1990 (see the measuressection for a discussion of how the two measures differed). However, other factors may havebeen influential. There may have been increased awareness of alcohol problems resultingfrom prevention efforts and public education. During the 1980’s there was a significant pushto increase prevention efforts in schools (Room et al., 1991). The types of interventionsemphasized were often geared toward affecting peer friendships and creating social normsabout moderate drinking. Thus, they may have played a role in increasing pressure fromfriends between 1984 and 1990. Other social and policy factors that might have beeninfluential include the growth of groups such as Mothers Against Drunk Driving (MADD)and the change in the minimum drinking age to 21 nationwide in 1984.
Polcin et al. Page 11
Alcohol Clin Exp Res. Author manuscript; available in PMC 2013 April 1.
NIH
-PA Author Manuscript
NIH
-PA Author Manuscript
NIH
-PA Author Manuscript

Our multivariate results for pressure from friends suggest that pressure leveled off during1990 to 2000 and then increased in 2005. It could be that the effect of these types ofinterventions on increasing peer pressure had been maximized by 1990 and therefore did notincrease further during the subsequent decade despite the fact that policies and socialinfluences aimed at controlling drinking continued. It is unclear why there was an increasein pressure from friends in 2005, but it could be that the effects of social policy changes,such as increasing prevention efforts, have uneven and sometimes delayed effects. For anexample of delayed policy effects see the work of Greenfield and Kaskutas (1998) on theeffects of warning labels on alcohol beverages.
The relative increase in pressure from physicians in 2005 might be the result of theincreasing emphasis on brief interventions in medical settings (Saitz, et al, 2006). Physicianeducation about the medical effects of alcohol has increase as has education about the needto discuss alcohol with patients. As discussion about alcohol problems in these settings isincreasing, it would presumably include advice about changing destructive drinkingpractices (i.e., pressure).
Implication and Future ResearchResults can be used to inform public health, treatment, and prevention professionals thatformal (police, work and physician) and informal (spouse, family and friends) pressuresover the past 21 years have been targeted toward drinkers for whom decreasing theirdrinking is indicated: frequent heavy drinkers and those experiencing alcohol related harm.The fact that pressure from friends increased in 2005 relative to previous years may be anindication that prevention strategies that aim to increase peer pressure may be working.There may also be some support for efforts to increase assessment and brief interventionamong physicians because pressure from them also increased in 2005 relative to previousyears, although to a lesser extent. Of course receipt of pressure does not necessarily indicatebeneficial impacts on drinking. Important areas for future research include addressing thequestion when pressure results in decreased drinking or increased help seeking. Forexample, when and for who does pressure result in changing drinking practices? Whatdrinker characteristics are associated with an increase in help seeking in response topressure?
Results also suggest there are potential benefits of harm reduction strategies that attempt toinfluence the context where drinking occurs. Demographic findings indicate that controllingfor harms and frequent heavy drinking younger males with less education receive morepressure about their drinking. Problems associated with the context where these groups drinkmight be reduced through harm reduction activities. Examples include strategies to reducedrinking and driving, alcohol related assaults, unprotected sex and binge drinking.
LimitationsThere are a number of limitations that are inherent to our study. First, all of the NAS dataconsists of self-reported information without corroborating sources to validate self-reports.Second, although alcohol related harms assessed a variety of areas, there are other potentialharms not directly assessed, such as legal and emotional problems. Third, although extensiveresearch has documented the equivalence of NAS datasets and the methods used to collectthe data, there is nonetheless some degree of variation resulting from different datacollection methods and wording of items across NAS years. In addition, the studies showingequivalence for data collection methods (in-person versus telephone) did not test forequivalence of pressure items. Fourth, because the measure of pressure from family andfriends in N7 used a screen question, (“did that break up your relationship or threaten tobreak it up”), pressure for those two sources during that year is more conservative. As noted
Polcin et al. Page 12
Alcohol Clin Exp Res. Author manuscript; available in PMC 2013 April 1.
NIH
-PA Author Manuscript
NIH
-PA Author Manuscript
NIH
-PA Author Manuscript

in the Measures section, the measure of family pressure used in N8 was more conservativebecause it did not capture all types of family relationships (i.e., brother, sister, son, anddaughter). Fifth, there are potential factors affecting pressure that we were not able to assessbecause of limited N’s for some subgroups of participants. One example includes underagedrinkers age 18 −21, who might have received increasing pressure when the minimumdrinking age in the U.S. changed from 18 in many states to 21. Other examples includeanalyses of the association between pressure and heavy drinking and alcohol related harmcombined and interactive effects of gender and heavy drinking. Finally, there are analysesthat go beyond the scope of the current paper that we plan to present in future papers. Theseinclude the correlates of pressure and help-seeking and age-period-cohort effects onpressure.
AcknowledgmentsFunded by NIAAA grant R21AA018174.
ReferencesBeattie MC, Longabaugh R, Elliott G, Stout RL, Fava J, Noel NE. Effect of the social environment on
alcohol involvement and subjective well-being prior to alcoholism treatment. J Stud Alcohol. 1993;54(3):283–296. [PubMed: 8387616]
Eliot MR, Shope JT, Raghunathan TE, Waller PF. Gender differences among young drivers in theassociation between high-risk driving and substance use/environmental influences. J Studies onAlcohol. 2006; 67(2):252–260.
Greenfield TK. Ways of measuring drinking patterns and the difference they make: experience withgraduated frequencies. J. Subst. Abuse. 2000; 12(1):33–49. [PubMed: 11288473]
Greenfield, TK.; Bond, J.; Roberts, SCM.; Polcin, DL.; Korcha, R.; Knibbe, R., et al. Alcohol Harms,Pressure to Drink Less, and Considering Seeking Help: A cross-national multilevel GENACISanalysis, in 36th Annual Epidemiological Symposium of the Kettil Bruun Society for Social andEpidemilolgical Study of Alcohol. Lausanne, Switzerland: 2010.
Greenfield TK, Kaskutas LA. Five years’ exposure to alcohol warning label messages and theirimpacts: evidence from diffusion analysis. Applied Behavioral Science Review. 1998; 6(1):39–68.
Greenfield TK, Kerr WC. Alcohol measurement methodology in epidemiology: recent advances andopportunities. Addiction. 2008; 103(7):1082–1099. [PubMed: 18422826]
Greenfield TK, Midanik LT, Rogers JD. Effects of telephone versus face-to-face interview modes onreports of alcohol consumption. Addiction. 2000; 95(2):227–284.
Greenfield TK, Nayak M, Bond J, Ye Y, Midanik LT. Maximum quantity consumed and alcohol-related problems: assessing the most alcohol drunk with two measures. Alcoholism: Clinical &Experimental Research. 2006; 30(9):1576–1582.
Hasin DS. Treatment/self-help for alcohol-related problems: relationship to social pressure and alcoholdependence. J Stud Alcohol. 1994; 55(6):660–666. [PubMed: 7861793]
Kadushin C, Reber E, Saxe L, Livert D. The substance use system: social and neighborhoodenvironments associated with substance use and misuse. Subst Use Misuse. 1998; 33(8):1681–1710. [PubMed: 9680088]
Kerr WC, Greenfield TK, Bond J, Ye Y, Rehm J. Age, period and cohort influences on beer, wine andspirits consumption trends in the US National Surveys. Addiction. 2004; 99(9):1111–1120.[PubMed: 15317631]
Kerr WC, Greenfield TK, Bond J, Ye Y, Rehm J. Age-period-cohort modeling of alcohol volume andheavy drinking days in the US National Alcohol Surveys: divergence in younger and older adulttrends. Addiction. 2009; 104(1):27–37. [PubMed: 19133886]
Kerr WC, Greenfield TK, Midanik LT. How many drinks does it take you to feel drunk? Trends andpredictors for subjective drunkenness. Addiction. 2006; 101(10):1428–1437. [PubMed: 16968344]
Latkins, NE.; LaVallee, RA.; Williams, GD.; Yi, H-y. Surveillance Report # 85[http://pubs.niaaa.nih.gov/publications/surveillance85/CONS06.pdf accessed 10/13/09]. Bethesda,
Polcin et al. Page 13
Alcohol Clin Exp Res. Author manuscript; available in PMC 2013 April 1.
NIH
-PA Author Manuscript
NIH
-PA Author Manuscript
NIH
-PA Author Manuscript
MD: National Institute on Alcohol Abuse and Alcoholism, Division of Epidemiology andPrevention Research, Alcohol Epidemiologic Data System; 2008. Apparent Per Capita AlcoholConsumption: National, State, and Regional Trends, 1970–2006; p. 49
Longabaugh R, Beattie M, Noel N, Stout R, Malloy P. The effect of social investment on treatmentoutcome. J Stud Alcohol. 1993; 54(4):465–478. [PubMed: 8341050]
Matzger H, Kaskutas LA, Weisner C. Reasons for drinking less and their relationship to sustainedremission from problem drinking. Addiction. 2005; 100:1637–1646. [PubMed: 16277625]
Midanik LT, Greenfield TK. Defining “current drinkers” in national surveys: results of the 2000National Alcohol Survey. Addiction. 2003a; 98(4):517–522. [PubMed: 12653821]
Midanik LT, Greenfield TK. Telephone versus in-person interviews for alcohol use: results of the 2000National Alcohol Survey. Drug Alcohol Depend. 2003b; 72(3):209–214. [PubMed: 14643937]
Midanik LT, Greenfield TK, Rogers JD. Reports of alcohol-related harm: telephone versus face-to-face interviews. J Stud Alcohol. 2001a; 62(1):74–78. [PubMed: 11271967]
Midanik LT, Hines AM, Greenfield TK, Rogers JD. Face-to-face versus telephone interviews: usingcognitive methods to assess alcohol survey questions. Contemp Drug Prob. 1999; 26:673–693.
Midanik, LT.; Rogers, JD.; Greenfield, TK. Mode differences in reports of alcohol consumption andalcohol-related harm. In: Cynamon, ML.; Kulka, RA., editors. Seventh Conference on HealthSurvey Research Methods [DHHS Publication No. (PHS) 01-1013]. Hyattsville, MD: NationalCenter for Health Statistics, Centers for Disease Control and Prevention; 2001. p. 129-133.
National Institute on Alcohol Abuse and Alcoholism. Latest approaches to preventing alcohol abuseand alcoholism. Alcohol Research and Health. 2000; 24(1):42–51. [PubMed: 11199273]
Nyaronga D, Greenfield TK, McDaniel PA. Drinking context and drinking problems among black,white and Hispanic men and women in the 1984, 1995 and 2005 U.S. National Alcohol Surveys.Journal of Studies on Alcohol and Drugs. 2009; 70(1):16–26. [PubMed: 19118387]
Polcin DL, Beattie M. Relationship and institutional pressure to enter treatment: differences bydemographics, problem severity, and motivation. Journal of Studies on Alcohol and Drugs. 2007;68(3):428–436. [PubMed: 17446983]
Polcin DL, Weisner C. Factors associated with coercion in entering treatment for alcohol problems.Drug Alcohol Depend. 1999; 54(1):63–68. [PubMed: 10101618]
Room R. The U.S. general population’s experiences of responding to alcohol problems. Br J Addict.1989; 84:1291–1304. [PubMed: 2597806]
Room R, Bondy SJ, Ferris J. Determinants of suggestions for alcohol treatment. Addiction. 1996;91(5):643–655. [PubMed: 8935250]
Room R, Greenfield TK, Weisner C. People who might have liked you to drink less: changingresponses to drinking by U.S. family members and friends, 1979–1990. Contemp Drug Prob.1991; 18(4):573–595.
Room R, Matzger H, Weisner C. Sources of informal pressure on problematic drinkers to cut down orseek treatment. J Subst Use. 2004; 9(6):280–295.
Saitz R, Svikis D, D’Onofrio G, Kraemer K, Perl J. Challenges Applying Alcohol Brief Intervention inDiverse Practice Settings: Populations, Outcomes, and Costs. Alcoholism: Clinical andExperimental Research. 2006; 30(2):332–338.
Schmidt LA, Ye Y, Greenfield TK, Bond J. Ethnic disparities in clinical severity and services foralcohol problems: results from the National Alcohol Survey. Alcohol ClinExp Res. 2007; 31(1):48–56.
Speiglman R. Mandated AA attendance for recidivist drinking drivers: policy issues. Addiction. 1997;92(9):1133–1136. [PubMed: 9374010]
Szalay LB, Inn A, Doherty KT. Social influences: effects of the social environment on the use ofalcohol and other drugs. Subst Use Misuse. 1996; 31(3):343–373. [PubMed: 8834266]
Weisner, C.; Greenfield, TK. Continuing trends in entry to treatment for alcohol treatment in the U.S.general population: 1984–1995. Berkeley, CA: Alcohol Research Group; 1999.
Weisner C, Schmidt L. The Community Epidemiology Laboratory: studying alcohol problems incommunity- and agency-based populations. Addiction. 1995; 90(3):329–342. [PubMed: 7735018]
Polcin et al. Page 14
Alcohol Clin Exp Res. Author manuscript; available in PMC 2013 April 1.
NIH
-PA Author Manuscript
NIH
-PA Author Manuscript
NIH
-PA Author Manuscript
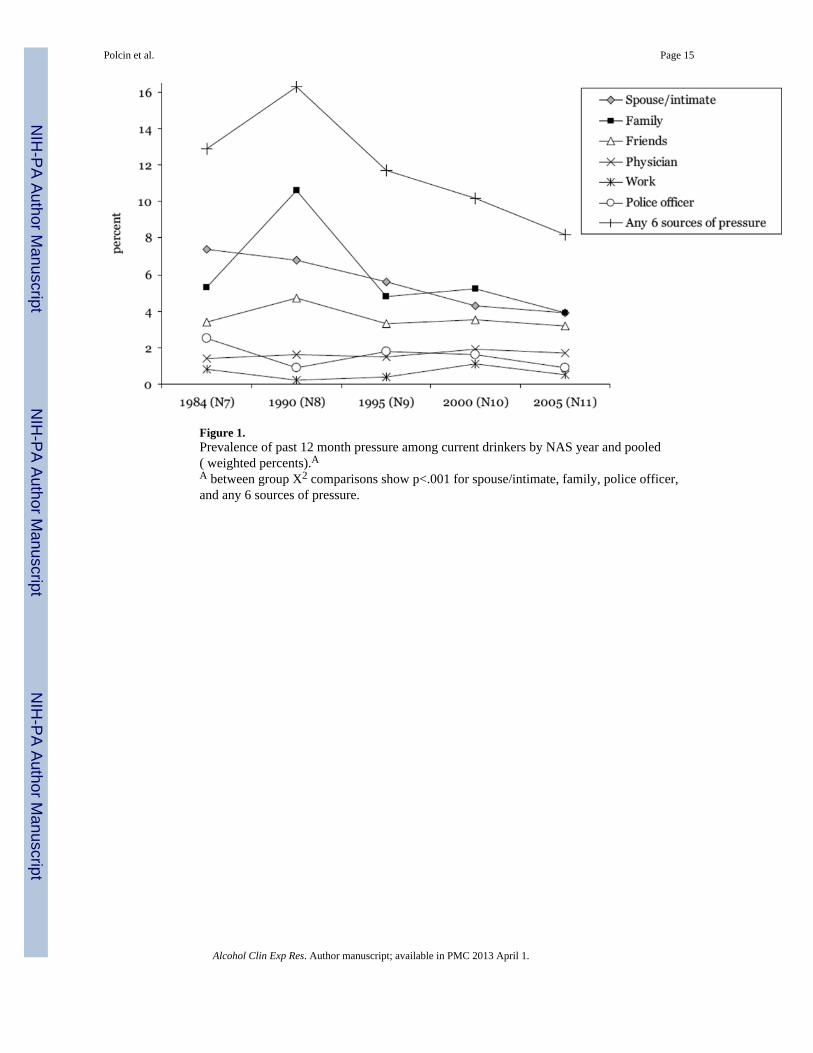
Figure 1.Prevalence of past 12 month pressure among current drinkers by NAS year and pooled( weighted percents).AA between group X2 comparisons show p<.001 for spouse/intimate, family, police officer,and any 6 sources of pressure.
Polcin et al. Page 15
Alcohol Clin Exp Res. Author manuscript; available in PMC 2013 April 1.
NIH
-PA Author Manuscript
NIH
-PA Author Manuscript
NIH
-PA Author Manuscript

NIH
-PA Author Manuscript
NIH
-PA Author Manuscript
NIH
-PA Author Manuscript
Polcin et al. Page 16
Tabl
e 1
Com
para
bilit
y of
pre
ssur
e qu
estio
ns a
cros
s NA
S su
rvey
yea
rs. A
ll qu
estio
ns re
fer t
o th
e pa
st 1
2 m
onth
s.
3N
7+(1
984)
N8
(199
0)N
9(1
995)
N10
(200
0)N
11(2
005)
Pref
ace:
Her
e ar
e so
me
expe
rienc
es th
at m
any
peop
le h
ave
repo
rted
in c
onne
ctio
n w
ith d
rinki
ng. A
s I re
ad e
ach
item
,pl
ease
tell
me
if th
is h
as e
ver
happ
ened
to y
ou?
Did
this
hap
pen
durin
g th
e la
st tw
elve
mon
ths?
xx
xx
x
SPO
USE
A sp
ouse
or s
omeo
ne I
lived
with
got
ang
ry a
bout
my
drin
king
or t
he w
ay I
beha
ved
whi
le d
rinki
ngx
xx
x
Pref
ace:
Now
I’m
goi
ng to
read
a li
st o
f som
e pe
ople
who
mig
ht h
ave
liked
you
to d
rink
less
or a
ct d
iffer
ently
whe
nyo
u dr
ank.
For
eac
h on
e, p
leas
e te
ll m
e if
that
per
son
ever
felt
this
way
. Did
this
hap
pen
in th
e la
st 1
2 m
onth
s?
xx
xx
x
FAM
ILY
^D
id a
par
ent e
ver f
eel t
his w
ay?
xx
You
r mot
her?
xx
x
You
r fat
her?
xx
x
Did
any
oth
er re
lativ
e ev
er fe
el th
is w
ay?
xx
xx
x
FRIE
ND
&D
id a
girl
frie
nd o
r boy
frie
nd e
ver f
eel t
his w
ay?
xx
xx
x
Did
any
oth
er fr
iend
eve
r fee
l thi
s way
?x
xx
xx
Pref
ace:
Her
e ar
e so
me
expe
rienc
es th
at m
any
peop
le h
ave
repo
rted
in c
onne
ctio
n w
ith d
rinki
ng. A
s I re
ad e
ach
item
,pl
ease
tell
me
if th
is h
as e
ver
happ
ened
to y
ou?
Did
this
hap
pen
durin
g th
e la
st tw
elve
mon
ths?
xx
xx
x
PHY
SIC
IAN
A p
hysi
cian
sugg
este
d I c
ut d
own
on d
rinki
ng.
xx
xx
x
WO
RK
Peop
le a
t wor
k in
dica
ted
that
I sh
ould
cut
dow
n on
drin
king
xx
xx
x
POLI
CE
A p
olic
e of
ficer
que
stio
ned
or w
arne
d m
e be
caus
e of
my
drin
king
xx
A p
olic
eman
que
stio
ned
or w
arne
d m
e be
caus
e of
my
drin
king
xx
x
^ Pres
sure
from
fam
ily is
a ‘y
es’ r
espo
nse
to e
ither
‘par
ent’
or ‘o
ther
rela
tive’
.
&Pr
essu
re fr
om fr
iend
s is a
‘yes
’ res
pons
e to
eith
er ‘g
irl/b
oyfr
iend
’ or ‘
othe
r frie
nd’.
+N
7 (1
984)
pre
ssur
e fr
om fa
mily
and
frie
nds i
s ind
icat
ed o
nly
if th
e pr
essu
re b
roke
up
or th
reat
ened
to b
reak
up
the
rela
tions
hip.
Alcohol Clin Exp Res. Author manuscript; available in PMC 2013 April 1.

NIH
-PA Author Manuscript
NIH
-PA Author Manuscript
NIH
-PA Author Manuscript
Polcin et al. Page 17
Tabl
e 2
Dem
ogra
phic
and
drin
king
cha
ract
eris
tics b
y N
AS
year
am
ong
curr
ent d
rinke
rs (w
eigh
ted
perc
ents
).
1984
(N7)
1990
(N8)
1995
(N9)
2000
(N10
)20
05(N
11)
Pool
ed
N=3
,212
N=1
,326
N=2
,817
N=4
,630
N=4
,256
N=1
6,24
1
Dem
ogra
phic
s%
%%
%%
X2P
%
Gen
der
M
ale
51.4
52.5
53.6
51.7
51.0
5.9
0.46
51.8
Age
1
8–29
34.5
29.8
23.1
25.1
20.8
275.
9<0
.00
25.9
3
0–49
37.4
41.8
49.2
45.3
42.6
43.4
5
0+28
.128
.427
.829
.736
.530
.7
Educ
atio
n
L
T hi
gh sc
hool
19.4
18.3
13.2
9.4
7.0
803.
9<0
.00
12.2
H
S gr
adua
te37
.439
.335
.629
.425
.631
.9
so
me
colle
ge22
.920
.826
.528
.827
.326
.1
c
olle
ge g
radu
ate
20.3
21.6
24.7
32.5
40.1
29.8
Mar
ital s
tatu
s
M
arrie
d63
.763
.868
.165
.668
.639
.90.
0166
.4
sep/
wid
/div
15.1
16.0
14.9
14.1
13.9
14.6
n
ever
mar
ried
21.1
20.2
16.9
20.3
17.6
19.1
Ethn
icity
W
hite
83.6
75.4
79.7
77.4
75.8
172.
2<0
.00
77.4
A
fric
an-A
mer
ican
9.2
12.0
9.5
9.2
8.4
9.3
H
ispa
nic
5.2
9.0
7.8
9.5
10.3
8.5
O
ther
2.0
3.6
3.0
3.9
5.5
3.9
Drin
king
cha
ract
eris
tics
5+ w
eekl
y dr
inke
r13
.98.
49.
58.
47.
211
0.6
<0.0
09.
4
1+ a
lcoh
ol-r
elat
ed h
arm
s12
.110
.78.
09.
24.
814
1.7
<0.0
08.
5
Alcohol Clin Exp Res. Author manuscript; available in PMC 2013 April 1.

NIH
-PA Author Manuscript
NIH
-PA Author Manuscript
NIH
-PA Author Manuscript
Polcin et al. Page 18
1984
(N7)
1990
(N8)
1995
(N9)
2000
(N10
)20
05(N
11)
Pool
ed
%%
%%
%X2
P%
Spou
se/in
timat
e
5+ w
eekl
y dr
inke
r54
.527
.840
.142
.741
.639
0.7
0.02
43.9
Har
ms n
ot re
late
d to
hom
e lif
e/m
arria
ge52
.955
.044
.656
.542
.819
0.7
0.16
50.1
Har
mfu
l eff
ect o
n ho
me
life/
mar
riage
40.0
39.5
33.1
35.5
31.1
83.5
0.57
35.8
Fam
ily
5+ w
eekl
y dr
inke
r53
.928
.128
.740
.632
.957
3.2
<0.0
038
.0
Har
ms n
ot re
late
d to
hom
e lif
e/m
arria
ge65
.938
.433
.753
.245
.135
2.8
0.03
47.9
Drin
king
had
har
mfu
l eff
ect o
n ho
me
life/
mar
riage
38.7
23.4
19.2
28.9
25.7
568.
30.
0025
.4
Frie
nds
5+ w
eekl
y dr
inke
r50
.432
.231
.645
.636
.731
5.8
0.18
40.5
Har
ms n
ot re
late
d to
frie
ndsh
ips a
nd so
cial
life
46.5
52.2
42.2
63.1
38.7
536.
20.
0348
.9
Drin
king
had
har
mfu
l eff
ect o
n fr
iend
ship
s and
soci
al li
fe42
.640
.421
.734
.328
.634
3.4
0.19
33.1
Phys
icia
n
5+ w
eekl
y dr
inke
r44
.853
.656
.347
.748
.384
.80.
9049
.4
Har
ms n
ot re
late
d to
hea
lth56
.839
.626
.535
.750
.960
8.1
0.09
42.3
Drin
king
impa
ctin
g he
alth
58.7
50.5
34.4
45.4
37.3
387.
30.
3144
.0
Wor
k
5+ w
eekl
y dr
inke
r80
.610
0.0
66.4
55.0
66.3
n/a
n/a
63.1
Har
ms n
ot re
late
d to
wor
k an
d em
ploy
men
t opp
ortu
nitie
s65
.610
0.0
84.0
71.8
74.0
n/a
n/a
73.2
Har
mfu
l eff
ect o
n w
ork
and
empl
oym
ent o
ppor
tuni
ties
24.6
42.1
16.0
15.8
23.6
219.
70.
7419
.9
Polic
e of
ficer
&
5+ w
eekl
y dr
inke
r61
.838
.234
.845
.243
.457
2.7
0.14
47.6
1+ h
arm
s70
.560
.248
.260
.649
.744
3.6
0.32
59.3
Any
sour
ce o
f pre
ssur
e
5+ w
eekl
y dr
inke
r49
.228
.533
.339
.036
.131
1.8
<0.0
038
.6
1+ h
arm
s54
.142
.538
.148
.337
.728
3.5
<0.0
044
.9
Alcohol Clin Exp Res. Author manuscript; available in PMC 2013 April 1.

NIH
-PA Author Manuscript
NIH
-PA Author Manuscript
NIH
-PA Author Manuscript
Polcin et al. Page 19
Tabl
e 4
Adj
uste
d od
ds ra
tios (
95%
CI)
of d
emog
raph
ic c
hara
cter
istic
sass
ocia
ted
with
rece
ipt o
f pre
ssur
e in
the
past
12
mon
ths f
or c
urre
nt d
rinke
rs, w
eigh
ted.
Spou
seFa
mily
Frie
nds
Phys
icia
nW
ork
Polic
eA
ny 6
pre
ssur
es
AO
R95
% C
IA
OR
95%
CI
AO
R95
% C
IA
OR
95%
CI
AO
R95
% C
IA
OR
95%
CI
AO
R95
% C
I
NA
S ye
ar(r
ef=2
005)
198
4 (N
7)1.
1(0
.7, 1
.5)
0.7
(0.5
, 1.0
)0.
5B(0
.3, 0
.7)
0.5A
(0.3
, 0.9
)0.
7(0
.3, 1
.9)
1.4
(0.8
, 2.5
)0.
9(0
.7, 1
.2)
199
0 (N
8)1.
1(0
.7, 1
.7)
2.1C
(1.5
, 3.0
)0.
8(0
.5, 1
.3)
0.6
(0.3
, 1.1
)0.
2A(0
.1, 0
.8)
0.5
(0.2
, 1.2
)1.
7C(1
.3, 2
.1)
199
5 (N
9)1.
3(0
.9, 1
.8)
1.0
(0.7
, 1.5
)0.
7(0
.4, 1
.1)
0.7
(0.4
, 1.3
)0.
7(0
.3, 1
.6)
1.7
(0.9
, 3.2
)1.
3(1
.0, 1
.7)
200
0 (N
10)
0.8
(0.6
, 1.1
)1.
0(0
.7, 1
.3)
0.7A
(0.5
, 0.9
)0.
9(0
.6, 1
.4)
1.6
(0.8
, 3.1
)1.
3(0
.8, 2
.2)
0.9
(0.7
, 1.1
)
Sex
(ref
=fem
ale)
Mal
e2.
1C(1
.6, 2
.7)
1.3
(1.0
, 1.6
)1.
3(1
.0, 1
.8)
1.4
(1.0
, 2.1
)1.
4(0
.7, 2
.9)
2.8C
(1.9
, 4.2
)1.
7C(1
.4, 2
.0)
Age
(ref
=50+
)
18–
293.
5C(2
.4, 5
.1)
2.6C
(1.8
, 3.6
)4.
7C(3
.1, 7
.1)
0.6
(0.4
, 1.1
)1.
4(0
.7, 3
.0)
9.8C
(4.7
, 20.
5)2.
9C(2
.3, 3
.7)
30–
492.
0C(1
.4, 2
.9)
1.4
(1.0
, 2.0
)2.
0B(1
.3, 3
.0)
0.9
(0.6
, 1.4
)0.
9(0
.5, 1
.8)
5.2C
(2.6
, 10.
8)1.
7C(1
.3, 2
.1)
Rac
e(r
ef=w
hite
)
Bla
ck1.
1(0
.8. 1
.5)
1.2
(0.9
. 1.6
)1.
4(1
.0. 1
.8)
1.7A
(1.1
. 2.5
)1.
5(0
.8. 2
.8)
0.6A
(0.4
. 0.9
)1.
0(0
.8. 1
.2)
His
pani
c0.
9(0
.6, 1
.2)
1.7C
(1.3
, 2.2
)1.
4A(1
.0, 2
.0)
1.7A
(1.1
, 2.7
)2.
2A(1
.1, 4
.1)
0.6
(0.4
, 0.9
)1.
2(1
.0, 1
.5)
Oth
er0.
7(0
.4, 1
.1)
1.0
(0.6
, 1.8
)1.
1(0
.7, 2
.0)
1.8
(0.8
, 4.2
)4.
5A(1
.1, 1
7.7)
0.9
(0.5
, 1.9
)1.
1(0
.7, 1
.6)
Educ
atio
n(r
ef=c
olle
ge+)
LT
HS
1.7B
(1.2
, 2.5
)2.
0C(1
.4, 2
.9)
2.1B
(1.4
, 3.3
)1.
3(0
.8, 2
.3)
2.7A
(1.1
, 6.2
)3.
8C(2
.0, 7
.2)
1.8C
(1.3
, 2.3
)
HS
grad
uate
1.1
(0.8
, 1.6
)1.
7A(1
.2, 2
.3)
1.7A
(1.1
, 2.6
)0.
8(0
.5, 1
.2)
2.0
(0.9
, 4.6
)2.
3B(1
.3, 4
.2)
1.3A
(1.0
, 1.6
)
Som
e co
llege
1.0
(0.7
, 1.5
)1.
4A(1
.0, 2
.0)
1.4
(0.9
, 2.2
)0.
7(0
.4, 1
.2)
0.7
(0.3
, 1.6
)1.
9A(1
.0, 3
.6)
1.1
(0.8
, 1.4
)
Mar
ital S
tatu
s(r
ef=m
arrie
d)
Nev
er m
arrie
d0.
6B(0
.4, 0
.9)
1.5A
(1.1
, 2.1
)2.
8C(1
.8, 4
.1)
1.2
(0.8
, 1.9
)1.
8(0
.9, 3
.4)
2.6C
(1.6
, 4.2
)1.
1(0
.9, 1
.4)
Div
/Wid
/Sep
0.5C
(0.4
, 0.7
)2.
5B(1
.9, 3
.1)
3.4C
(2.5
, 4.6
)1.
3(0
.8, 1
.9)
1.0
(0.5
, 2.0
)2.
0B(1
.3, 3
.1)
1.6C
(1.3
, 1.9
)
Alcohol Clin Exp Res. Author manuscript; available in PMC 2013 April 1.

NIH
-PA Author Manuscript
NIH
-PA Author Manuscript
NIH
-PA Author Manuscript
Polcin et al. Page 20
Spou
seFa
mily
Frie
nds
Phys
icia
nW
ork
Polic
eA
ny 6
pre
ssur
es
AO
R95
% C
IA
OR
95%
CI
AO
R95
% C
IA
OR
95%
CI
AO
R95
% C
IA
OR
95%
CI
AO
R95
% C
I
Drin
king
typo
logy
(ref
=LT
5+ w
eekl
y dr
inke
r)
5+ w
eekl
y dr
inke
r4.
1C(3
.1, 5
.4)
2.9C
(2.2
, 3.7
)2.
7C(2
.0, 3
.8)
5.0C
(3.3
, 7.6
)5.
6C(2
.9, 1
0.9)
2.6C
(1.7
, 3.9
)5.
3C(4
.2, 6
.7)
1+ h
arm
s not
rela
ted
to p
ress
ure
sour
ce4.
5C(3
.4, 6
.1)
5.2C
(3.9
, 6.9
)3.
9C(2
.7, 5
.6)
2.0C
(1.3
, 3.3
)10
.6C
(4.8
, 23.
6)--
----
--
Har
m sp
ecifi
cto
pre
ssur
e so
urce
10.3
C(7
.2, 1
4.8)
3.2C
(2.2
, 4.6
)3.
8C(2
.5, 5
.8)
8.1C
(5.0
, 13.
2)2.
8B(1
.5, 5
.3)
----
----
1+ h
arm
s--
----
----
----
----
--6.
7C(4
.3, 1
0.5)
11.5
C(9
.4, 1
4.1)
A p<.0
5;
B p<.0
1;
Cp<
.001
Alcohol Clin Exp Res. Author manuscript; available in PMC 2013 April 1.