TUROFED TOURİSM REPORT 2015/2
60
2015/2 Turizm raporu
Transcript of TUROFED TOURİSM REPORT 2015/2
2015/2Turizmraporu

İÇİNDEKİLER / TABLE OF CONTENTS1. BÖLÜM: DÜNYADA TURİZM / 1. CHAPTER: TOURISM IN THE WORLD.
1.1. DÜNYA, AVRUPA ve TÜRKİYE TURIZM İSTATISTIKLERI /
1.1. THE TOURISM STATISTICS IN THE WORLD, EUROPE AND TURKEY.
1.1.1. 2014 Yılı Turizm Gelir ve Giderleri / 1.1.1. 2014 Turkish Tourism Income and Expenses
1.1.2. Varış İstikâmetine Göre En Çok Ziyaret Edilen Ülkeler (2014) /
1.1.2. The Most Visited Countries According to the Point of Destination (2014)
1.1.3. 2014’te Ülkelerin Elde Ettikleri Uluslararası Turizm Gelirleri /
1.1.3. The International Tourism Incomes of Countries in 2014
1.1.4. 2014’te Turistlerin Gittikleri Ülkelerdeki Harcamaları /
1.1.4. The Expenses of Tourists in the Visited Countries for 2014
1.1.5. İç Turizmde Geceleme Sayıları ve Harcamaları /
1.1.5. The Number of Overnight Stays and Expenses of Domestic Tourism
1.1.6. Müze İstatistikleri / 1.1.6. Museum Statistics.
1.1.7. Turizm İstatistikleri, I. Çeyrek: Ocak - Mart, 2015 / 1.1.7. Tourism Statistics, 1st Quarter: January - March, 2015
1.1.8. Yurtdışı Seyahatler (Gezi Ve İş Amaçlı Seyahatler) / 1.1.8. Abroad Visits (for Trip and Business Purposes)
1.1.9. Türkiye’de Kruvaziyer Turizm Verileri / 1.1.9. Cruise Tourism Data of Turkey
1.1.10. Türkiye’deki Turizm Teşvik Belgeli Tesisler (2015) /
1.1.10. The Facilities of Turkey with Tourism Incentive Certificate (2015)
1.1.11. 2013-2015 Yılları Turizmde İstihdam Gelişimi / 1.1.11. Development of Employment in Tourism for 2013-2015
2. BÖLÜM: TÜRKİYE TURİZM VERİLERİ / 2. CHAPTER: TOURISM DATA OF TURKEY
2.1. Türkiye’nin Son Çeyrek Asırdaki Turizm İstikrarı / 2.1. Tourism Stability of Turkey for the Last Twenty-Five Years
2.2. Türkiye Ve Dört İlin Ocak-Haziran Verileri / 2.2. January-June Data of Turkey and Four Provinces
2.3. İstanbul 2014- 2015 İlk Altı Aylık Yabancı Ziyaretçi Verilerinin İncelenmesi /
2.3. Analyzing the Foreign Visitor Data of Istanbul for the First Six Months of 2014-2015
2.4. Antalya 2013- 2015 Yıllarının İlk Altı Aylık Yabancı Ziyaretçi Verilerinin İncelenmesi /
2.4. Analyzing the Foreign Visitor Data of Antalya for the First Six Months of 2013-2015
2.5. Muğla İli Turizm Verileri 2013-2014 Karşılaştırmalı Değerlendirmesi /
2.5. The Benchmark of the 2013-2014 Tourism Data of Mugla
2.6. İzmir 2013-2014 Turist Profili İncelemesi / 2.6. 2013-2014 Tourist Profile Analysis of Izmir
3. BÖLÜM: YILLARA GÖRE TURİST GİRİŞ-ÇIKIŞ RAPORLARI /
3. CHAPTER: CHAPTER:CHECK-IN/CHECK-OUT REPORTS OF TOURISTS BY YEARS
3.1. İstanbul’a Gelen Yabancı Ziyaretçilerin Milliyetlere ve Yıllara Göre Dağılımı /
3.1. Distribution of the foreign visitors coming to Istanbul in terms of Nationalities and years
3.2. Antalya’ya Gelen Yabancı Ziyaretçilerin Milliyetlere ve Yıllara Göre Dağılımı /
3.2. Distribution of foreign visitors coming to Antalya in terms of nationalities and years.
3.3. Muğla’ya Gelen Yabancı Ziyaretçilerin Milliyetlere ve Yıllara Göre Dağılımı /
3.3. Distribution of the foreign visitors coming to Muğla in terms of nationalities and years
3.4. İzmir’e Gelen Yabancı Ziyaretçilerin Milliyetlere ve Yıllara Göre Dağılımı /
3.4. Distribution of the foreign visitors coming to İzmir in terms of nationalities and years
3.5. 2013-2015 Yıllarında Türkiye’ye Gelen Yabancıların Ocak-Mayıs Karşılaştırması /
3.5. January-May Comparison of Foreign Visitors of Turkey in between 2013-2015
3.6. Sürdürülebilir Turizm / 3.6. Sustainable Tourism
3.6.1. Sertifikasyon Uygulamaları ve Gerekliliği / 3.6.1. Certification Practices and Their Necessity
3.6.2. Sürdürülebilir Destinasyonlar / 3.6.2. Sustainable Destinations
KAYNAKÇA / BIBLIOGRAPHY
04
04
10
11
12
13
13
14
15
16
17
17
18
19
19
21
21
26
27
29
31
31
32
33
35
36
39
41
4556
TURİZM RAPORU / TOURISM REPORT
2

TÜROFED / TUROFEDTurizm Raporu / Tourism ReportYıl / Year: 5, Sayı / Issue: 10
Sahibi / OwnerTÜROFED AdınaOn behalf of TUROFEDOsman AYIK
Yayın KuruluProf.Dr.A.Akın AksuProf.Dr.Mustafa GülmezDr.Şevket YirikYrd.Doç.Dr. Özlem Güzel
Yayın KoordinatörüEditorial CoordinatorNecip BOZ
Sanat YönetmeniArt DirectorSemih Balseven
Tasarım UygulamaDesign ApplicationYediiletişim
Yazışma AdresiCorrespondence AddressJW Marriott Ankara Otel, Kızılırmak Mah. Muhsin Yazıcıoğlu Cad. No: 1 Ofis 34-35 Söğütözü Çankaya / Ankara
Tel : +90 312 287 70 66Faks : +90 312 287 70 67e-posta : [email protected]
TÜROFED Turizm Raporu, Akdeniz Üniversitesi Turizm Fakültesi Yayın Kurulu tarafından hazırlanmıştır.
TÜROFED Tourism Report has been prepared by the Press Committee of Akdeniz University Tourism Faculty
Katkılarından dolayı HALKBANK’a teşekkür ederiz.Special thanks to HALKBANK for its contributions.
Yeniden merhaba,
Turizm raporumuzun 10. Sayısında yine
birlikteyiz. Bugüne kadar altı ayda bir
yayınladığımız raporumuzun daha gelişkin
olması, akademik yönünün bulunması turizm
sektöründe bulunanlara kabul edilir veri
sağlanması temel hedefimizdi.
Bunun için de Akdeniz Üniversitesi Turizm
Fakültesi ile işbirliğine gittik. Bundan da
güzel sonuç aldık.
Bu konuda bize anlayış gösteren ve katkı
veren akademi yönetimine teşekkür
ediyoruz. Umarım uzun soluklu bir işbirliği
gerçekleştiririz.
Raporumuzun artık akademik ve turizm
çevrelerinde kaynak olarak gösterilmesi,
ülkemizde buna benzer başka bir çalışmanın
olmaması bizi hem gururlandırdı hem de daha
çok özen göstermemiz gerektiği yönünde
bize ek görev verdi. Daha da titizlendik
hazırlarken.
Her bir basımda yeni dosyalarla karşınıza
geleceğiz.
Burada özel bir teşekkürü Halbank hak
ediyor. Değerli Genel Müdürü Ali Fuat
Taşkesinlioğlu’na katkıları ve desteği için
teşekkür ediyoruz.
Osman Ayık
Yönetim Kurulu Başkanı
Türkiye Otelciler Federasyonu
Hello again,
We are again together in 10th issue of our
Tourism report. To date, our essential aim is to
have our report issued semi-annually be more
developed, has an academic aspect and provide
acceptable data for the tourism sector.
Thus we have cooperated with Akdeniz
University Faculty of Tourism. And also
we have achieved good results from this
cooperation.
We thank to the academy management for
their indulgence and contribution. Hope that
we will have a long-termed cooperation.
Having our report to be a resource both in
academic and tourism environment and the
absence of a similar study in our country both
elated us and gave us an additional duty to
show utmost care. We have stickled during the
preparation stage.
We will come with new files in every edition.
Here, Halkbank deserves a special thanks. We
thank to its esteemed General Manager Ali
Fuat Taşkesinlioğlu for his contributions and
support.
Osman Ayık
Chairman of Board
Turkish Hoteliers Federation
TURİZM RAPORU / TOURISM REPORT
3
1. BÖLÜM: DÜNYADA TURİZM
1.CHAPTER: TOURISM IN THE WORLD
1.1. DÜNYA, AVRUPA ve TÜRKİYE TURİZM İSTATİSTİKLERİ1.1. THE TOURISM STATISTICS IN THE WORLD, EUROPE AND TURKEY
Birleşmiş Milletler Dünya Turizm Örgütü rakamlarına göre 2014
yılında uluslararası turizm gelirleri 48 milyar Amerikan Doları
artarak 1245 Milyar ABD Dolarına ulaşmıştır. 2013 yılında
dünya genelinde seyahat edenlerin sayısı 1087 Milyon kişi
iken, bu sayı 2014 yılında 1135 milyon kişiye ulaşmıştır. Dünya
turizm gelirlerinin % 41’ini elde eden Avrupa Kıtası 17 milyar
ABD Doları artışla gelirini 509 milyar ABD Dolarına yükseltmiş,
Asya ve Pasifik Bölgesi 16 milyar Amerikan Doları artış elde
ederek gelirini 377 milyar ABD Dolarına ulaştırmış, Amerika
Kıtası 10 milyar ABD Doları artışla gelirini toplamda 274 milyar
ABD Dolarına çıkarmıştır. Ortadoğu’da ise turizm gelirleri 4
milyar ABD Doları artışla 49 milyar ABD Dolarına ulaşmış ve
Afrika Kıtasında ise 1 milyar ABD Doları artışla turizm geliri 36
milyar ABD Dolarına ulaşmıştır. Turizm gelirleri açısından özetle
% 5 ve üzerinde olmak üzere kıta/bölgelere göre değişen artış
yaşanmıştır. Turizm gelirleri açısından ilk 3 ülke içerisinde 57
milyar ABD Doları ile Çin 5.sıradan 3.sıraya yükselmiş, Amerika
Birleşik Devletleri (177 milyar ABD Doları) ve İspanya (65 milyar
ABD Doları) sırasıyla 1. ve 2.liklerini korumuştur (UNWTO World
Tourism Barometer, volume:13, April 2015: 1-2).2015 yılı için
Birleşmiş Milletler Dünya Turizm Örgütü dünyada seyahat
edecek turist sayısında %3-4 oranında artış beklemekte. En
fazla artışın % 4-5 ile Asya ve Pasifik Bölgesinde, Amerika
Kıtasında % 4-5, Avrupa Kıtasında % 3-4, Afrika Kıtasında % 3-5
ve Ortadoğu’da ise %2-5 arasında olması beklenmektedir (http://
media.unwto.org/press-release/2015-01-27/over-11-billion-
tourists-travelled-abroad-2014:Erişim tarihi:08.06.2015).
2014 yılı itibariyle en çok talep gören şehirler arasında Paris
(18.8 milyon turist), New York (18.5 milyon turist), Londra (16.1
milyon turist), Bangkok (14.6 milyon turist), Barselona (12.4
milyon turist) ve Singapur (10.6 milyon turist) gelmektedir.
Birleşmiş Milletler Dünya Turizm Örgütü tahminlerine göre
2010-2020 yılları arasında % 30.8’lik büyüme beklenmektedir.
Avrupalı turistler seyahate katılma konusunda genel olarak
iyimser görünmekte, daha fazla tatil yapma konusuna sıcak
bakanların oranının % 70’ten (2014) % 72’ye çıkması (2015)
beklenmektedir (ITB World Travel Trends Report 2014/2015:
8,9,13).
According to the figures of the World Tourism Organization of the
United Nations, the international tourism income has increased to
1245 Billions of US Dollars by increasing 48 billions in 2014. While,
the number of tourists travelling around the world in 2013 was
1.087 millions of people, this number has increased up to 1135
millions of people in 2014. The Continental Europe which gains
41% of the world tourism income has increased its income to 509
billions of US Dollars with 17 billions of US Dollars increase, the
Asia and Pacific Region has increased its income to 377 billions
of US Dollars with 16 billions of US Dollars increase and the
Continent of America has increased its income to 274 billions of
US Dollars with 10 billions of US Dollars increase. The Middle East
has increased its income to 49 billions of US Dollars with 4 billions
of US Dollars increase while the Continent of Africa has increased
its income to 36 billions of US Dollars with 1 billions of US Dollars
increase. Briefly, an increase more than 5% has been experienced
in tourism income varying according to the continents/regions.
China has raised up from the 5th row to the 3rd row with 57
billions of US Dollars income and the United States of America
(with 177 billions of US Dollars of tourism income) and Spain (with
65 billions of US Dollars of tourism income) have maintained their
1st and 2nd places in the list (UNWTO World TourismBarometer,
volume:13, April 2015: 1-2). For 2015, the World Tourism Agency
of the United Nations estimates 3-4% of increase in number of
tourist to travel around the world. It is expected that the highest
increase will be experienced for the Asia and Pacific Region with
4-5%, America with 4-5%, the Continental Europe with 3-4%, the
Continent of Africa with 3-5% and the Middle East with 2-5%
(http://media.unwto.org/press-release/2015-01-27/over-11-
billion-tourists-travelled-abroad-2014:Erişim date: 08.06.2015).
The most demanded cities in respect of tourism for 2014 are
respectively Paris (with 18.8 millions of tourists), New York (18.5
millions of tourists), London (16.1 millions of tourists), Bangkok
(14.6 millions of tourists), Barcelona (12.4 millions of tourists)
and Singapore (with 10.6 millions of tourists). According to the
estimations of the World Tourism Agency of the United Nations,
30.8% of growth is expected for the tourism sector in between
2010-2020. The European tourists seem usually pessimistic
about participating in a trip and it is expected that the rate of
the ones positive for more holidays will raise from 70% (2014) to
72% (2015) (ITB World Travel Trends Report 2014/2015: 8,9,13).
TURİZM RAPORU / TOURISM REPORT
4
Uluslararası turizm hareketlerinde 2015 yılının ilk ayları
itibariyle birçok ülke için 2 haneli büyüme gerçekleşmiştir.
Bu bağlamda en fazla büyüme yaşayan ülkeler arasında
İzlanda %31.4, Hırvatistan % 24.6, Karadağ % 23.2,
Romanya %13.1, Macaristan %12.1, Slovenya %11.7
Avusturya %11.4 ve Sırbistan %11 artış yakalamıştır.(www.
eturbonews.com/58838/european-tourism-2015-trends-
prospects:Erişim tarihi:09.06.2015). Zaman zaman bazı
gelişmiş ekonomilerde ekonomik büyümede yavaşlama
yaşansa ve bazı bölgelerde jeopolitik açıdan tansiyon
yükselse de dünya genelinde turizm hareketleri önemli
ölçüde gelişme göstermektedir. Turizm ve seyahat endüstrisi
küresel ekonominin ve istihdamın önemli bir bileşeni (tahmini
olarak küresel gayrisafi hasılanın % 9’u veya 7 trilyon
Amerikan Doları seviyesinde) konumundadır. Çevre, turizm
ve seyahat politikası, altyapı, sosyal ve kültürel kaynaklar
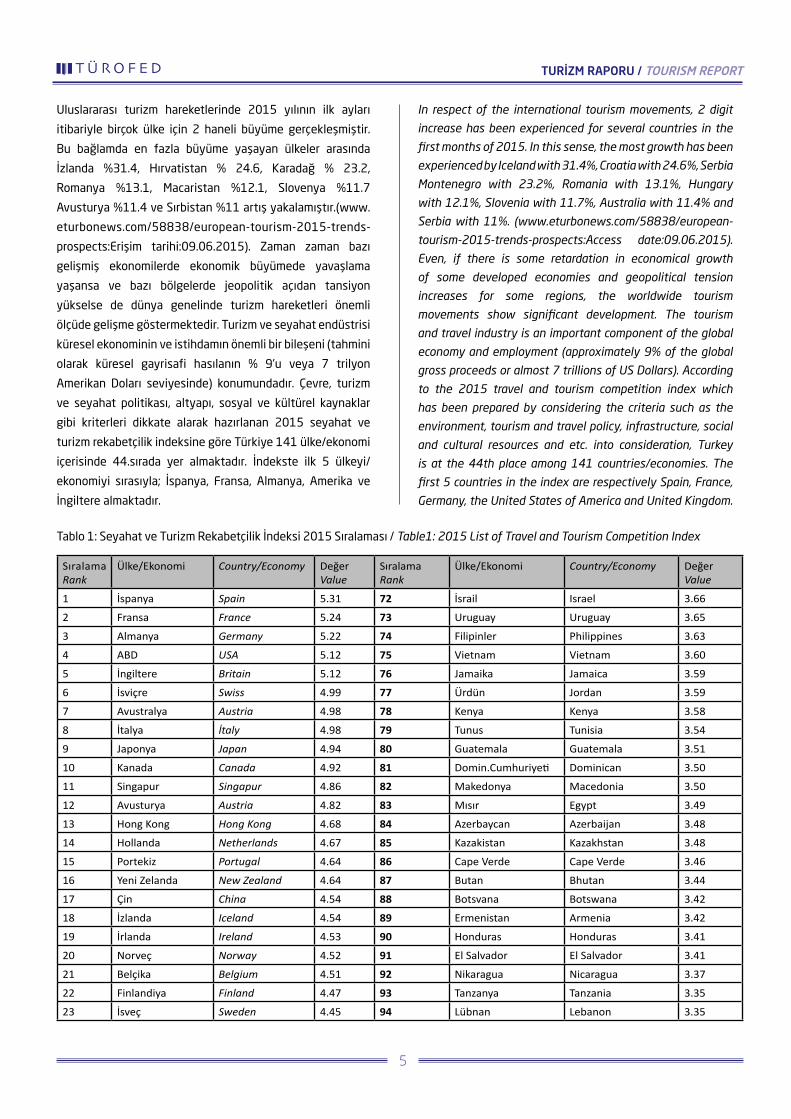
gibi kriterleri dikkate alarak hazırlanan 2015 seyahat ve
turizm rekabetçilik indeksine göre Türkiye 141 ülke/ekonomi
içerisinde 44.sırada yer almaktadır. İndekste ilk 5 ülkeyi/
ekonomiyi sırasıyla; İspanya, Fransa, Almanya, Amerika ve
İngiltere almaktadır.
Tablo 1: Seyahat ve Turizm Rekabetçilik İndeksi 2015 Sıralaması / Table1: 2015 List of Travel and Tourism Competition Index
In respect of the international tourism movements, 2 digit
increase has been experienced for several countries in the
first months of 2015. In this sense, the most growth has been
experienced by Iceland with 31.4%, Croatia with 24.6%, Serbia
Montenegro with 23.2%, Romania with 13.1%, Hungary
with 12.1%, Slovenia with 11.7%, Australia with 11.4% and
Serbia with 11%. (www.eturbonews.com/58838/european-
tourism-2015-trends-prospects:Access date:09.06.2015).
Even, if there is some retardation in economical growth
of some developed economies and geopolitical tension
increases for some regions, the worldwide tourism
movements show significant development. The tourism
and travel industry is an important component of the global
economy and employment (approximately 9% of the global
gross proceeds or almost 7 trillions of US Dollars). According
to the 2015 travel and tourism competition index which
has been prepared by considering the criteria such as the
environment, tourism and travel policy, infrastructure, social
and cultural resources and etc. into consideration, Turkey
is at the 44th place among 141 countries/economies. The
first 5 countries in the index are respectively Spain, France,
Germany, the United States of America and United Kingdom.
Sıralama Rank
Ülke/Ekonomi Country/Economy Değer Value
Sıralama Rank
Ülke/Ekonomi Country/Economy Değer Value
1 İspanya Spain 5.31 72 İsrail Israel 3.66
2 Fransa France 5.24 73 Uruguay Uruguay 3.65
3 Almanya Germany 5.22 74 Filipinler Philippines 3.63
4 ABD USA 5.12 75 Vietnam Vietnam 3.60
5 İngiltere Britain 5.12 76 Jamaika Jamaica 3.59
6 İsviçre Swiss 4.99 77 Ürdün Jordan 3.59
7 Avustralya Austria 4.98 78 Kenya Kenya 3.58
8 İtalya İtaly 4.98 79 Tunus Tunisia 3.54
9 Japonya Japan 4.94 80 Guatemala Guatemala 3.51
10 Kanada Canada 4.92 81 Domin.Cumhuriyeti Dominican 3.50
11 Singapur Singapur 4.86 82 Makedonya Macedonia 3.50
12 Avusturya Austria 4.82 83 Mısır Egypt 3.49
13 Hong Kong Hong Kong 4.68 84 Azerbaycan Azerbaijan 3.48
14 Hollanda Netherlands 4.67 85 Kazakistan Kazakhstan 3.48
15 Portekiz Portugal 4.64 86 Cape Verde Cape Verde 3.46
16 Yeni Zelanda New Zealand 4.64 87 Butan Bhutan 3.44
17 Çin China 4.54 88 Botsvana Botswana 3.42
18 İzlanda Iceland 4.54 89 Ermenistan Armenia 3.42
19 İrlanda Ireland 4.53 90 Honduras Honduras 3.41
20 Norveç Norway 4.52 91 El Salvador El Salvador 3.41
21 Belçika Belgium 4.51 92 Nikaragua Nicaragua 3.37
22 Finlandiya Finland 4.47 93 Tanzanya Tanzania 3.35
23 İsveç Sweden 4.45 94 Lübnan Lebanon 3.35
TURİZM RAPORU / TOURISM REPORT
5
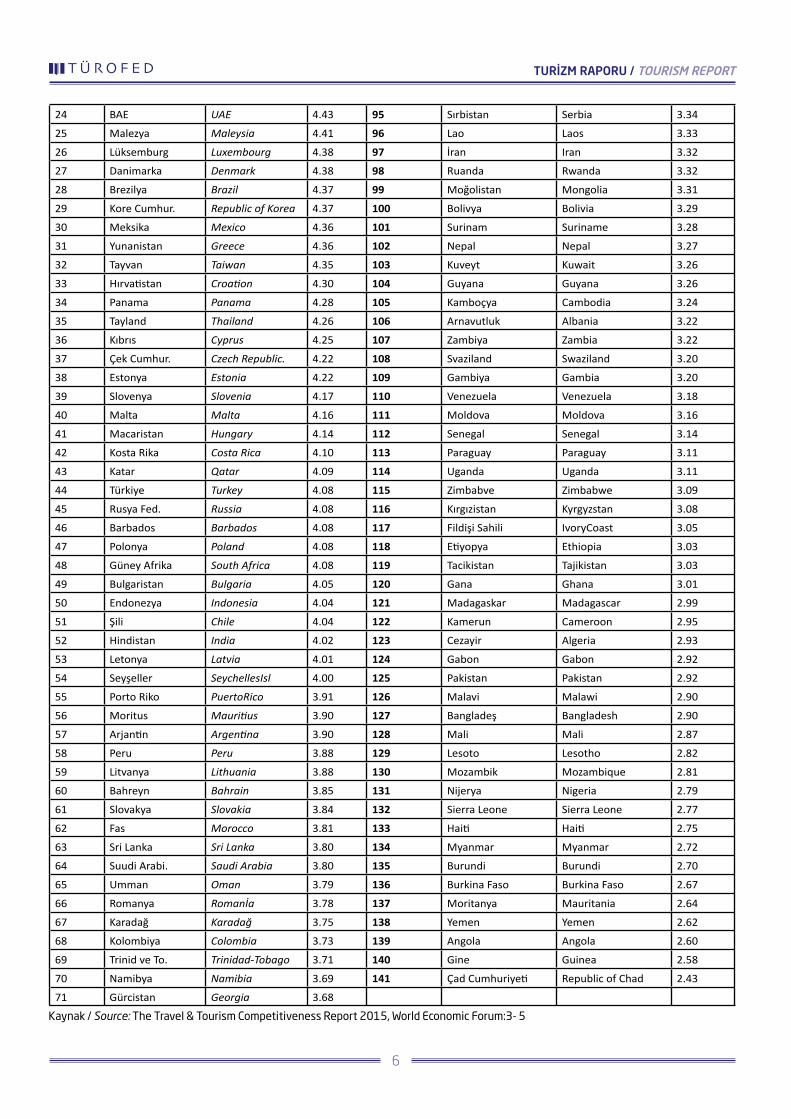
24 BAE UAE 4.43 95 Sırbistan Serbia 3.34
25 Malezya Maleysia 4.41 96 Lao Laos 3.33
26 Lüksemburg Luxembourg 4.38 97 İran Iran 3.32
27 Danimarka Denmark 4.38 98 Ruanda Rwanda 3.32
28 Brezilya Brazil 4.37 99 Moğolistan Mongolia 3.31
29 Kore Cumhur. Republic of Korea 4.37 100 Bolivya Bolivia 3.29
30 Meksika Mexico 4.36 101 Surinam Suriname 3.28
31 Yunanistan Greece 4.36 102 Nepal Nepal 3.27
32 Tayvan Taiwan 4.35 103 Kuveyt Kuwait 3.26
33 Hırvatistan Croation 4.30 104 Guyana Guyana 3.26
34 Panama Panama 4.28 105 Kamboçya Cambodia 3.24
35 Tayland Thailand 4.26 106 Arnavutluk Albania 3.22
36 Kıbrıs Cyprus 4.25 107 Zambiya Zambia 3.22
37 Çek Cumhur. Czech Republic. 4.22 108 Svaziland Swaziland 3.20
38 Estonya Estonia 4.22 109 Gambiya Gambia 3.20
39 Slovenya Slovenia 4.17 110 Venezuela Venezuela 3.18
40 Malta Malta 4.16 111 Moldova Moldova 3.16
41 Macaristan Hungary 4.14 112 Senegal Senegal 3.14
42 Kosta Rika Costa Rica 4.10 113 Paraguay Paraguay 3.11
43 Katar Qatar 4.09 114 Uganda Uganda 3.11
44 Türkiye Turkey 4.08 115 Zimbabve Zimbabwe 3.09
45 Rusya Fed. Russia 4.08 116 Kırgızistan Kyrgyzstan 3.08
46 Barbados Barbados 4.08 117 Fildişi Sahili IvoryCoast 3.05
47 Polonya Poland 4.08 118 Etiyopya Ethiopia 3.03
48 Güney Afrika South Africa 4.08 119 Tacikistan Tajikistan 3.03
49 Bulgaristan Bulgaria 4.05 120 Gana Ghana 3.01
50 Endonezya Indonesia 4.04 121 Madagaskar Madagascar 2.99
51 Şili Chile 4.04 122 Kamerun Cameroon 2.95
52 Hindistan India 4.02 123 Cezayir Algeria 2.93
53 Letonya Latvia 4.01 124 Gabon Gabon 2.92
54 Seyşeller SeychellesIsl 4.00 125 Pakistan Pakistan 2.92
55 Porto Riko PuertoRico 3.91 126 Malavi Malawi 2.90
56 Moritus Mauritius 3.90 127 Bangladeş Bangladesh 2.90
57 Arjantin Argentina 3.90 128 Mali Mali 2.87
58 Peru Peru 3.88 129 Lesoto Lesotho 2.82
59 Litvanya Lithuania 3.88 130 Mozambik Mozambique 2.81
60 Bahreyn Bahrain 3.85 131 Nijerya Nigeria 2.79
61 Slovakya Slovakia 3.84 132 Sierra Leone Sierra Leone 2.77
62 Fas Morocco 3.81 133 Haiti Haiti 2.75
63 Sri Lanka Sri Lanka 3.80 134 Myanmar Myanmar 2.72
64 Suudi Arabi. Saudi Arabia 3.80 135 Burundi Burundi 2.70
65 Umman Oman 3.79 136 Burkina Faso Burkina Faso 2.67
66 Romanya Romanİa 3.78 137 Moritanya Mauritania 2.64
67 Karadağ Karadağ 3.75 138 Yemen Yemen 2.62
68 Kolombiya Colombia 3.73 139 Angola Angola 2.60
69 Trinid ve To. Trinidad-Tobago 3.71 140 Gine Guinea 2.58
70 Namibya Namibia 3.69 141 Çad Cumhuriyeti Republic of Chad 2.43
71 Gürcistan Georgia 3.68
Kaynak / Source: The Travel & Tourism Competitiveness Report 2015, World Economic Forum:3- 5
TURİZM RAPORU / TOURISM REPORT
6
Seyahat ve Turizm Rekabetçilik İndeksi 2015
Raporunda ön plana çıkan ülkelerden İspanya ilk kez bu raporda
1.sırada yer almıştır. İspanya dünyada en çok ziyaret edilen 3.ülke
konumundadır. Yaklaşık olarak 60.6 milyon kişi tarafından ziyaret
edilmektedir. Çin, Brezilya ve Meksika’dan önemli oranda talep
görmektedir. Kültürel kaynakları, iş turizmindeki başarısı,
ev sahipliği yaptığı uluslararası konferanslar, eğlence olanakları,
restoranları, gece yaşamı, seyahat ve turizm endüstrisine verilen
önem, turizme yönelik alt yapısı ön plana çıkmaktadır. Rekabetçilik
raporunda 2.sırada yer alan Fransa yılda 84 milyondan fazla
turist ağırlamaktadır. Zengin tarihi ve çekicilik unsurları, kayak
merkezleri, kıyı turizmi, kültürel zenginlikleri ve doğal kaynakları,
çevresel sürdürülebilirlik uygulamaları vurgulanması gereken
noktalardır (The Travel & Tourism Competitiveness Report
2015, World Economic Forum:9).
Ülkemiz açısından 2 ana pazar konumunda bulunan
ülkelerden Almanya ekonomisiyle Avrupa Birliği içerisinde itici
güç olma özelliğini korumakta, Euro bölgesinde olup, ekonomik
büyümeyi sürdürebilen ve % 6.3’lük gibi düşük işsizlik oranına
sahip ender ülkelerden bir tanesidir. Alman turistler seyahat
tercihlerinde yeni tecrübeler edinmeyi önemsemekte, nereye
gitmekten çok, ne yapılacağı ile daha fazla ilgilenmektedirler.
Daha sık ancak daha az konaklamayı, kısa süreli “kaçışları” tercih
etmektedirler. Kanada halen birçok alman turist için “hayal edilen
destinasyon” olma özelliğini korumaktadır (http://en-corporate.
canada.travel/markets/where-we-market-canada/germany:Erişim
tarihi:09.06.2015).
2015 yılı açısından Türk Lirasının Euro karşısındaki
durumu (TL’nin değer kaybetmesi) Türkiye’ye talebi arttırabilir,
ancak bu esnada Yunanistan ve İspanya’nın da Almanya’dan ciddi
talep alabileceği dikkate alınmalıdır.
Ülkemiz açısından diğer ana pazar konumunda olan
Rusya ise uzun süre turistik açıdan büyüme göstermiş ve Avrupa
açısından önemli bir aktör haline gelmiştir. Rubleyle ilgili yaşanan
sıkıntılar birçok Rus Tur Operatörünün batmasına neden olmuştur.
Haziran ayı göstergelerine göre daha önceden öngörüldüğü üzere
%30’luk küçülme meydana gelmiştir. Rus pazarı açısından genel
bir değerlendirme yapmak gerekirse hammaddeye olan talepteki
azalma ve petrol fiyatlarının düşmesi nedeniyle gayrisafi hasılası
2013 yılı itibariyle % 1.3 büyüme göstermiş, 2014 yılında yaşadığı
uluslararası sıkıntılar, Ukrayna krizi, enflasyondaki artış ve petrol
fiyatlarındaki düşüşün devam etmesi, devamında Rublenin belli
yabancı paralar karşısında değer kaybetmesi söz konusu olmuştur.
Rus turistlerin fiyat açısından daha uygun destinasyonları tercih
etmeleri veya gelecek yılki seyahatleri için para biriktirmeleri,
yurt dışı seyahati yerine kendi ülkelerinde seyahat etmeleri veya
seyahate çıkmamaları olası tercihleri arasında yer almaktadır
(ITB World Travel Trends Report 2014/2015: 15,17). 2015 yılı
itibariyle Mısır ve Yunanistan’ın Rusya’dan giderek artan oranda
talep görme ihtimalleri mevcuttur.
Spain which is one of the prominent countries of the
Travel and Tourism Competition Index 2015 Report is the 1st
place for the first time. Spain is the 3rd most visited country of
the world. This country is visited by approximately 60.6 millions
of people every year. It is demanded significantly by China, Brazil
and Mexico. Its cultural resources, success in business
tourism, international conferences hosted by the country, the
entertainment facilities, restaurants, night life, the importance
attached to the travel and tourism industry and its tourism
focused infrastructure stand out. France which is the 2nd country
in the competition list hosts more than 84 millions of tourists
every year. Its right historical and attractive aspects, ski centers,
coastal tourism, cultural richness and natural resources as well
as its environmental sustainability practices are the issues which
should be emphasized (The Travel &TourismCompetitiveness
Report 2015, World Economic Forum:9).
Germany as one of 2 countries as the main markets of
our country maintains its economical characteristic as being the
driving force of the European Union, is a country in Euro zone
which can sustain its economical growth and have 6.3% of
unemployment rate which is a very low rate for the countries of
Europe. The German tourists considers having new experience for
their travel choices and they are interested in what to do rather
then where to go. They prefer more frequent but shorter visits,
in other words short-term “escapes”. Canada is still a “dream
destination” for several German tourists (http://en-corporate.
canada.travel/markets/where-we-market-canada/germany:Access
date:09.06.2015).
The status of Turkish Lira before Euro for the year 2015
(currency depreciation of TRY) might increase demand for Turkey,
however it should be taken into consideration that Greece and
Spain will also get serious demand from Germans.
Russia as another main market for our country has
shown touristic development for a long-term and has become
an important actor for Europe in this respect. The problems
experienced with Rouble have caused bankruptcy of several
Russian Tour Operators. According to the indicators of June
2015, 30% reduction has happened as previously estimated. If,
the Russian market is evaluated in general basis, the reducing
demand for raw materials and decreasing fuel prices, the gross
national product value of Russia has grown 1.3% compared to
2013 and the international conflicts experienced in 2014, the
Ukraine crisis, increasing inflation and continuing decrease in
fuel prices have caused that the Ruble has decreased in value
compared to particular currencies. The Russian tourists might
prefer more economically affordable hotels or save money for their
journeys for the next year, travel in their own country rather than
preferring trips abroad or might not travel (ITB World Travel Trends
Report 2014/2015: 15,17). As of 2015, it is another possibility
that Egypt and Greece will attract more demand from Russia.
TURİZM RAPORU / TOURISM REPORT
7

*Tahmin Kaynak: Russia Tourism Report Q2, Busines Monitor International Ltd. 2015: 17 *Estimation Source: RussiaTourism Report Q2, Business Monitor International Ltd. 2015: 17
*Tahmin Kaynak: Russia Tourism Report Q2, Bussiness Monitor International Ltd. 2015:20.* Estimation Source: RussiaTourism Report Q2, BussinessMonitor International Ltd. 2015:20.
Tablo 2: Rusya’ya Gelişler Açısından İlk 10 Ülke ‘000 (Rusya 2012-2019)
Tablo 3: Rusya’dan Çıkışlar Açısından İlk 10 Ülke ‘000 (Rusya 2011-2018)
Tablo 4: Rusya’da Faaliyet Gösteren Küresel Otel Grupları (İlk 10 Grup)
Table2:The First 10 Countries Preferring Russia for Tourism ‘000 (Russia 2012 2019)
Table3: The First 10 Countries Preferred by Russian Tourists ‘000 (Russia 2011-2018)
Table4: The Global Hotel Groups Carrying out Their Activities in Russia (the first 10 Groups)
Ülkeler Countries 2012 2013 2014 2015 2016* 2017* 2018* 2019 *
Polonya Poland 1.190.00 1.644.66 1.353.52 1.299.02 1.244.52 1.190.02 1.135.51 1.081.01
Finlandiya Finland 1.375.61 1.388.02 1.155.94 1.040.38 924.82 809.26 763.04 670.59
Çin China 978.99 1.071.52 891.23 842.47 793.70 744.94 696.17 647.41
Almanya Germany 671.68 686.56 471.54 442.41 413.29 384.17 355.04 325.92
Litvanya Lithuania 553.90 539.31 465.63 413.62 361.61 309.60 257.59 205.58
Estonya Estonia 494.28 430.16 383.42 354.06 324.70 295.34 265.98 236.62
Letonya Latvia 461.16 391.30 350.21 288.75 227.29 196.56 196.56 176.07
Moğolistan Mongalia 333.13 356.10 284.88 242.15 217.94 207.04 207.04 207.04
Türkiye Turkey 305.43 385.15 277.99 245.33 212.66 180.00 163.67 136.45
İngiltere UK 231.67 259.68 191.93 183.67 175.41 167.16 158.90 150.64
Ülkeler COUNTRY 2012 2013 2014 2015 2016* 2017* 2018* 2019 *
Ukrayna Ukraİna 9.526.70 10.300.41 2.060.08 1.648.07 1.812.87 1.994.16 2.193.58 2.380.91
Türkiye Turkey 3.599.93 4.269.31 3.190.00 3.459.72 3.729.44 3.999.17 4.268.89 4.538.61
Çin China 2.426.10 2.445.43 1.734.27 1.805.39 1.876.50 1.947.62 2.018.73 2.089.85
Mısır Egypt 2.083.40 2.596.35 1.602.92 1.703.89 1.748.61 1.855.96 1.951.81 2.103.70
Tayland Thailand 1.316.56 1.736.99 722.37 813.37 904.37 995.37 1.086.37 1.177.36
İspanya Spain 1.206.23 1.715.48 736.58 806.50 876.42 946.34 1.016.26 1.086.19
Azerbeycan Azerbaijan 876.01 903.24 840.66 901.61 953.03 1.011.64 1.064.84 1.019.79
İtalya İtaly 1.050.00 1.088.00 566.54 694.72 822.89 951.07 1.079.25 1.207.43
Yunanistan Greece 874.79 1.352.90 772.97 819.73 866.48 913.24 960.00 1.006.76
Almanya Germany 918.23 1.038.83 408.01 446.20 484.38 522.56 560.75 598.93
Küresel Otel Grubu / GLOBAL HOTEL GROUP
Rusya’da Varlığı / PRESENCE IN RUSSIA Rusya’da Bulunan Markaları / BRANDS IN RUSSIA
Accor Otelleri / ACCOR HOTELS Rusya’da halen mevcut olan 24 otelin 9’u başkentte. / 9 0f 24 hotels still present in Russia are located in the capital
Novotel,Mercure,Ibis,Apartotel,Pullman
Carlson Rezidor Otel Grubu CARLSON REZIDOR HOTEL GROUP
Rusya’da halen mevcut olan 30 otelin 6’sı Moskova’da, 6’sı St.Petersburg’ta,yakın zamanda Pulkovo Havaalanında Terminal 3’ün yanına yeni bir Park Inn otelinin yapılması planlanıyor. / 6 of 30 hotels still present in Russia are located in Moscow, 6 of them in St. Petersburg and it is planned to establish a new Park Inn Hotel next to Terminal 3 of Pulkovo Airport in near future.
Park Inn, Radisson, Radisson Blue
Choice Otelleri / CHOICE HOTELS - -
Best Western / BEST WESTERN Her biri farklı şehirlerde olmak üzere toplam 7 oteli mevcut. / The group has 7 hotels as each one is located in different cities. / The groups still has 5 hotels and planning to expand.
Best Western, Best Western Premier
Hilton Halen 5 oteli var, büyüme planlanıyor Hilton, Doubletree
TURİZM RAPORU / TOURISM REPORT
8

Kaynak: Russia Tourism Report Q2, Bussiness Monitor International Ltd. 2015:30,31 Source: RussiaTourism Report Q2, BussinessMonitor International Ltd. 2015:30,31
Hyatt Moskova’da,Soçi’de ve Ekaterinburg’ta olmak üzere toplam 3 oteli mevcut? / The group has 3 hotels in total as in Moscow, Sochi and Yekaterinburg.
Park Hyatt, Hyatt Regency,Hyatt
Intercontinental Otelleri / INTERCONTINENTAL HOTELS
Moskova,St.Petersburg, Chelyabinsk,Ufa,Voronezh ve Samara’da dahil olmak üzere toplam 16 oteli mevcut.2014 yılında 2 yeni otel daha gruba dahil edildi. / The group has 16 hotels in total including Moskova,St.Petersburg, Chelyabinsk,Ufa,Voronezh and Samara. 2 new hotels have been included in the group during 2014.
Holiday Inn, Intercontinental, Crown Plaza, Hotel Indigo,Staybridge Suites
Marriott 16 oteli mevcut / The group has 16 hotels Courtyard,Marriott,Ritz Carlton, Renaissance
Starwood 5 oteli mevcut, 2017 yılına kadar 9 otel daha açmayı planlıyor. / The group has 5 hotels and planning to open 9 new hotels until 2017.
National,Sheraton, W
Wyndham Ekaterinburg, Kazan ve Moskova’da olmak üzere 3 oteli mevcut. / The group has 3 hotels as in Yekaterinburg, Kazan and Moscow.
Ramada
Dünyada yeni trendler olarak; seyahat kararlarında ve rezervasyonlarda internetin artan önemi, kültür turizminin 2020 yılına kadarki dönemde hızla artış göstermesinin beklenmesi, turistlerin seyahat kararlarında çevresel, kültürel, etnik ve tarihi değerleri daha fazla dikkate alacak olmaları, küresel ısınma sonucu iklim değişikliklerinin ülkelerarası rekabete muhtemel etkileri, gençlik turizminin yükselen değeri, Stanford Araştırma Enstitüsü’nün verilerine göre wellness turizminin (mevcut dönem itibariyle dünya genelinde 439 milyar ABD Dolarlık ekonomik etkisi olan ve 2017 yılında 679 milyar dolarlık ekonomik etkiye ulaşması beklenen), yine Stanford Araştırma Enstitüsünün verilerine göre eko turizmin artan önemi (eko turizmin dünya genelindeki ekonomik etkisinin 325 milyar ABD Doları ile 480 milyar ABD Dolar arasında olduğu tahmin ediliyor), çocuklu ailelere yönelinmesi (karar vericiler ebeveynler olsa da çocuklara yönelik su parkları, isteklere yönelik özel hizmetler ve kişiselleştirilmiş ürün sunma) çevre dostu (green meetings) gibi anlayışların gelişmesi sayılabilir. Ayrıca Çin pazarının gelecekteki etkisi de dikkate alınmalıdır (2023 yılında Çinli turist sayısının 220 milyona ulaşması bekleniyor). Ülkemizin rekabetçilik anlamında avantajları; özellikle üçüncü yaş (dünya genelinde 1.3 milyar- 1.6 milyar kişi olduğu tahmin ediliyor) ve gençlik turizmi açısından cazibesinin yüksek olması, Her şey dahil sistemini (fiyat-değer anlamında) en iyi uygulayan ülke konumunda olması, doğal, tarihi ve kültürel değerlerimizin zenginliği (kültür turizminin ekonomik etkisinin dünya genelinde 800 milyar ABD Dolar ile 1.1. trilyon dolar arasında olduğu tahmin ediliyor, Stanford Araştırma Enstitüsünün verileri), ülkelerarası ulaşım kolaylığı sayılabilir, dezavantajlar olarak çevresel kaynakların sürdürülebilirliği, turizm çeşitliliğinin az olması, turistik talebin 3 ilimizde yoğunlaşması (Antalya, İstanbul ve Muğla).
The increasing importance of internet in travel decisions and holiday reservations, estimation for rapid increase of cultural tourism during the term until 2020, increasing preference of tourists for the environmental, cultural, ethnical and historical values for making their travel decisions, potential impacts of climate changes due to global warming in respect of inter-country competition, increasing value of youth tourism, the increasing importance of wellness tourism according to the data of Stanford Research Institute (which currently has 439 billions of US Dollars of economical impact throughout the world and expected to reach an impact of 679 billions of US Dollars in 2017) and the ecological tourism also according to the data of Stanford Research Institute (it is estimated that the economical impact of ecological tourism throughout the world is around 325 billions of US Dollars and 480 billions of US Dollars), inclination towards the families with children (even if the decision makers are the parents of children, the water parks intended for children, special services intended for requests and customized product provisions) and environment-friendly (green meetings) and etc. can be considered as the new trends of the world. Also, the future impact of China market should be taken into consideration (it is expected that the number of Chinese tourists will increase up to 220 millions of people in 2023). The advantages of our country in respect of competitiveness can be considered as; its high appeal especially in respect of the third age (it is estimated that there are 1.3 billions to 1.6 billions of people around the world) and youth tourism, its position which applies the all-inclusive system best in the world (in the sense of price-value), natural, historical and cultural richness (it is estimated that the economical impact of culture tourism is around 800 billions of US Dollars and 1.1 trillions of US Dollars around the world, according to the data of Stanford Research Institute), easy access between countries while the sustainability of environmental resources, less tourism varieties, concentration of touristic demand on 3 provinces of our country (as Antalya, Istanbul and Mugla) can be considered as the disadvantages.
TURİZM RAPORU / TOURISM REPORT
9

Fırsatlar olarak Türk Lirasının turist gönderen ülkeler
açısından cazip olabilecek değeri, Alman ve Rus turistlerin
süregelen talepleri (2015 yılı için Rus turistlerin talebinde
son dakika hareketliliği görülebilir), AB Üyesi ülkelerle olası
işbirliği imkanları ve fon kullanımları, Avrupa’nın en çok yolcu
artışı yakalayan havayolu olan THY’nin (Avrupa’da en büyük
10 havayolu şirketi içinde 4.sırada) tanıtımda daha etkin
kullanılabilmesinin varlığı, güçlü mutfağımız, yeni pazarlar
olarak Güney Amerika, Çin ve Hindistan’ın varlığı belirtilebilir.
Tehditler olarak; mevcut ve yeni rakiplerin varlığı (Mevcutlar
arasında Yunanistan ve Mısır, yeni rakipler olarak Çin, Meksika,
Kore ve Hindistan sayılabilir), rakip ülkelerin daha etkin sosyal
medya ve online tanıtımları, referans ve yorum sitelerine daha
fazla ağırlık verilmesi, ülke genelinde % 7.6’lık fiyat artışları
(TÜİK), otellerdeki maliyet artışları sayılabilir.
Kurum tarafından açıklanan verilere göre, cari işlemler açığı
2013 yılına göre 18 milyar 822 milyon ABD Doları azalarak 45
milyar 836 milyon ABD Doları oldu. Söz konusu gerilemede;
ödemeler dengesi tablosundaki dış ticaret açığının 16 milyar
322 ABD Doları azalarak 63 milyar 585 milyon ABD Dolarına
düşmesi, net hizmet gelirlerinin 2 milyar 509 milyon ABD
Doları artarak 25 milyar 353 milyon ABD Dolara yükselmesi ve
birincil gelir açığının 263 milyon ABD Doları azalarak 8 milyar
723 milyon ABD Dolarına gerilemesi etkili oldu.
Türkiye İstatistik Kurumu’nun turizmle ilgili olarak
gerçekleştirdiği 4. çeyrek anket sonuçlarının yansıtılmasıyla,
seyahat gelirleri 2013 yılına göre 1 milyar 555 milyon ABD
Doları artarak 29 milyar 552 milyon ABD Dolarına, seyahat
giderleri ise 255 milyon ABD Doları artarak 5 milyar 72 milyon
ABD Dolarına ulaştı.
Türkiye İstatistik Kurumu (TÜİK) tarafından açıklanan verilere
göre; 2014 yılında yurt dışına çıkan Türk Vatandaşlarının sayısı
2013 yılına göre %4,4 oranında artarak 8 milyon 363 bin 966
kişiye ulaştı. Bu sayı 2013 yılında ise 8 milyon 11 bin 654 kişi
olarak gerçekleşmişti.
TÜRSAB Ar-Ge Departmanı’nın TÜİK verilerinden derlediği
bilgiye göre; 2014 yılı verilerine göre en fazla seyahat 1 milyon
231 bin 691 kişi ile Gürcistan’a gerçekleşti. Bu ülkeyi sırasıyla
741 bin 37 ile Yunanistan, 620 bin 896 kişi ile Bulgaristan ve
493 bin 592 kişi ile Almanya izledi.
2014 yılında 235 bin 736 vatandaşımızı ağırlayan Azerbaycan
beşinci ülke olurken Azerbaycan’ı Bağımsız Devletler Topluluğu
ülkeleri, İtalya, İran, Rusya Federasyonu ve A.B.D. izledi.
The attractive value of Turkish Lira for the countries sending tourists to our country, continuing demands of German and Russian tourists (for 2015, a last minute movement might be experienced for the demand of Russian tourists), cooperation opportunities and fund uses with the EU member countries, using the Turkish Airlines (the 4th airline company in the biggest 10 airlines of Europe) which is the airline with the highest passenger increase of Europe more effectively in touristic promotions, our rich cuisine and tastes and the presence of the South America, China and India as new markets can be considered as new opportunities. The presence of existing and new competitors (we can consider Greece and Egypt as the existing competitors while China, Mexico, Korea and India as the new competitors), efficient social media and online promotions of the competitor countries, intensive focus on the reference and comment web sites, 7.6% price increases throughout the country (according to the data of the Turkish Statistics Institute) and the cost increases of hotels can be considered as the threats.
According to the data stated by the agency, the current accounts deficit has been 45 billions and 836 millions of US Dollars by decreasing 18 billions and 822 millions of US Dollars compared to 2013. The decrease of foreign trade deficit to 63 billions and 585 millions of US Dollars with 16 billions and 322 US Dollars of reduction in the table of statement of payments, the increase of net service incomes to 25 billions and 353 millions of US Dollars by increasing 2 billions and 509 millions of US Dollars and the decrease of primary income deficit to 8 billions and 723 millions of US Dollars with 263 millions of US Dollars of reduction have impact on that regression. According to the survey results for the 4th quarter of 2013 performed by the Turkish Statistics Institution related with tourism, the tourism income has become 29 billions and 552 million of US Dollars by increasing 1 billions and 555 millions of US Dollars and the travel expenses have increased up to 5 billions and 72 millions of US Dollars by increasing 255 millions of US Dollars.According to the data of the Turkish Statistics Institution (TUIK), the number of Turkish nationals travelling abroad in 2014 have increased 4.4% compared to 2013 and increased up to 8 millions and 363 thousands and 966 people. This number was 8 millions 11 thousands and 654 people in 2013. According to the information compiled by the Research and Development Department of TURSAB from the TUIK data, the most travels in 2014 have been to Georgia with 1 millions and 231 thousands and 691 people. Respectively, Greece with 741 thousands and 37 people, Bulgaria with 620 thousands and 896 people and Germany with 493 thousands and 592 people followed Georgia.While, Azerbaijan which has hosted 235 thousands and 736 citizens of our country is the fifth most preferred destination in 2014, the countries of the Commonwealth of Independent States, Italy, Iran, Russian Federation and the U.S.A. have respectively followed that country.
1.1.1. 2014 Yılı Turizm Gelir ve Giderleri1.1.1. Tourism Income and Costs of 2014
TURİZM RAPORU / TOURISM REPORT
10

Tablo 5: Türkiye’den Yurt Dışına Çıkan T.C. Vatandaşlarımızın Sayıları (Ocak-Aralık) Table 5: The Number of T.R. Citizens who Travelled Abroad in 2014 (January-December)
Tablo 6: Varışlara Göre En Çok Ziyaret Edilen ÜlkelerTable6: The Most Preferred Countries According to Destinations
Varışlara göre en çok ziyaret edilen ülkelerin listesi aşağıdaki
tabloda özetlenmiştir.
The list of the most preferred countries according to destinations is summarized in the following.
1.1.2 Varışlara Göre En Çok Ziyaret Edilen Ülkeler (2014) 1.1.2. The Most Preferred Countries according to the Destinations (2014)
Türkiye’den Yurtdışına Çıkan T.C. Vatandaş Sayısı (Ocak-Aralık) The Number of T.R. Citizens who Travelled Abroad in 2014 (January-December)
Yıllar / Years Yıllık Değişim / Annual Change %
2012 2013 2014 2013/2012 2014/2013
6.273.993 8.011.654 8.363.966 27.7 4.4
No Country
The World Tourism Agency Region
[4]
The Number of Incoming
International Tourists (2014)
The Number of Incoming
International Tourists (2013)
The Change Rate of
2014 compared to
2013 (%)
The Change Rate of
2013 compared to
2012 (%)
1 France Europe 83.7 millions. 83.6 millions. 0.1 2.02 U.S.A. North America 74.8 millions. 70.0 millions. 6.8 5.03 Spain Europe 65.0 millions. 60.7 millions. 7.1 5.6
4 The People’s Republic of China
Asia 55.6 millions. 55.7 millions. 0.1 3.5
5 Italy Europe 48.6 millions. 47.7 millions. 1.8 2.9
6 Turkey Europe 39.8 millions. 37.8 millions. 5.3 5.97 Germany Europe 33.0 millions. 31.5 millions. 4.6 3.7
8 United Kingdom
Europe 32.6 millions. 31.1 millions. 5.0 6.1
9 Russia Europe 29.8 millions. 28.4 millions. 5.3 10.210 Mexico North America 29.1 millions. 24.2 millions. 20.5 3.2
Sıra Ülke
Dünya Turizm Örgütü Bölgesi
[4]
Uluslararası Gelen Turist sayısı (2014)
Uluslararası Gelen Turist sayısı (2013)
2014’ün 2013’e göre
değişim oranı (%)
2013’ün 2012’ye
göre değişim
oranı (%)
1 Fransa Avrupa 83.7 milyon 83.6 milyon 0.1 2.02 ABD Kuzey Amerika 74.8 milyon 70.0 milyon 6.8 5.03 İspanya Avrupa 65.0 milyon 60.7 milyon 7.1 5.6
4 Çin Halk Cumhuriyeti
Asya 55.6 milyon 55.7 milyon 0.1 3.5
5 İtalya Avrupa 48.6 milyon 47.7 milyon 1.8 2.9
6 Türkiye Avrupa 39.8 milyon 37.8 milyon 5.3 5.97 Almanya Avrupa 33.0 milyon 31.5 milyon 4.6 3.78 Birleşik Krallık Avrupa 32.6 milyon 31.1 milyon 5.0 6.19 Rusya Avrupa 29.8 milyon 28.4 milyon 5.3 10.2
10 Meksika Kuzey Amerika 29.1 milyon 24.2 milyon 20.5 3.2
”UNWTO Tourism Highlights 2015 Edition (İngilizce) - Turizm Trendleri 2015 yayını(Türkçe)”. Dünya Turizm Örgütü. 17 Haziran 2015. Erişim tarihi: 25 Haziran 2015. / ”UNWTO TourismHighlights 2015 Edition (English) - Tourism Trendes 2015 publication (Turkish)”. The World Tourism Agency. 17th June 2015. Access date: 25th June 2015.
TURİZM RAPORU / TOURISM REPORT
11

Dünyadaki bazı ülkelerin turizmden elde ettikleri gelirler
aşağıdaki tabloda görülmektedir.
The tourism incomes of some countries are indicated in the following table.
1.1.3 2014’te Ülkelerin Elde Ettikleri Uluslararası Turizm Gelirleri1.1.3. The International Tourism Income of Countries in 2014
Tablo 7: Ülkelerin Uluslararası Turizm GelirleriTable7: The International Tourism Incomes of Countries
Sıra Ülke
Dünya Turizm Örgütü Bölgesi
Uluslararası Turizm
Gelirleri (2014)
($)
Uluslararası Turizm
Gelirleri (2013)
($)
2014’ün 2013’e göre
değişim oranı (%)
2013’ün 2012’ye
göre değişim
oranı (%)
1 ABD Kuzey Amerika 177.2 milyar 172.9 milyar 2.5 7.0
2 İspanya Avrupa 65.2 milyar 62.6 milyar 4.2 7.6
3 Çin Halk Cumhuriyeti
Asya 56.9 milyar 51.7 milyar 10.2 3.3
4 Fransa Avrupa 55.4 milyar 56.7 milyar 2.3 5.6
— Makao Asya 50.8 milyar 51.8 milyar 1.9 18.1
5 İtalya Avrupa 45.5 milyar 43.9 milyar 3.7 6.66 Birleşik Krallık Avrupa 45.3 milyar 41.0 milyar 10.3 12.17 Almanya Avrupa 43.3 milyar 41.3 milyar 5.0 8.2
8 Tayland Asya 38.4 milyar 41.8 milyar 8.0 23.4
— Hong Kong Asya 38.4 milyar 38.9 milyar 1.4 17.7
9 Avustralya Okyanusya 32.0 milyar 31.2 milyar 1.8 0.5
10 Türkiye Avrupa 29.5 milyar 27.9 milyar 3.7 4.1
No Country
The World Tourism Agency Region
International Tourism
Revenues (2014)
($)
International Tourism
Revenues (2013)
($)
The Change Rate of 2014 compared to
2013 (%)
The Change Rate of 2013 compared to
2012 (%)
1 USE North America 177.2 billion 172.9 billion 2.5 7.0
2 Spain Europe 65.2 billions 62.6 billion 4.2 7.6
3 People’s Republic of China
Asia 56.9 billions 51.7 billion 10.2 3.3
4 France Europe 55.4 billions 56.7 billion 2.3 5.6
— Macau Asia 50.8 billions 51.8 billion 1.9 18.1
5 Italy Europe 45.5 billions 43.9 billion 3.7 6.6
6 United Kingdom Europe 45.3 billions 41.0 billion 10.3 12.1
7 Germany Europe 43.3 billions 41.3 billion 5.0 8.2
8 Thailand Asia 38.4 billions 41.8 billion 8.0 23.4
— Hong Kong Asia 38.4 billions 38.9 billion 1.4 17.7
9 Australia Oceania 32.0 billions 31.2 billion 1.8 0.5
10 Turkey Europe 29.5 billions 27.9 billion 3.7 4.1
”UNWTO Tourism Highlights 2015 Edition (İngilizce) - Turizm Trendleri 2015 yayını(Türkçe)”. Dünya Turizm Örgütü. 17 Haziran 2015. Erişim tarihi: 25 Haziran 2015. / “UNWTO TourismHighlights 2015 Edition (English) - Tourism Trendes 2015 publication (Turkish)”. The World Tourism Agency. 17th June 2015. Access date: 25th June 2015.
TURİZM RAPORU / TOURISM REPORT
12
Dünyadaki turistlerin gittikleri ülkelerdeki yaptıkları harcamalar
aşağıdaki tabloda görülmektedir.
The expenses of tourists in the countries they visited are shown in the following table.
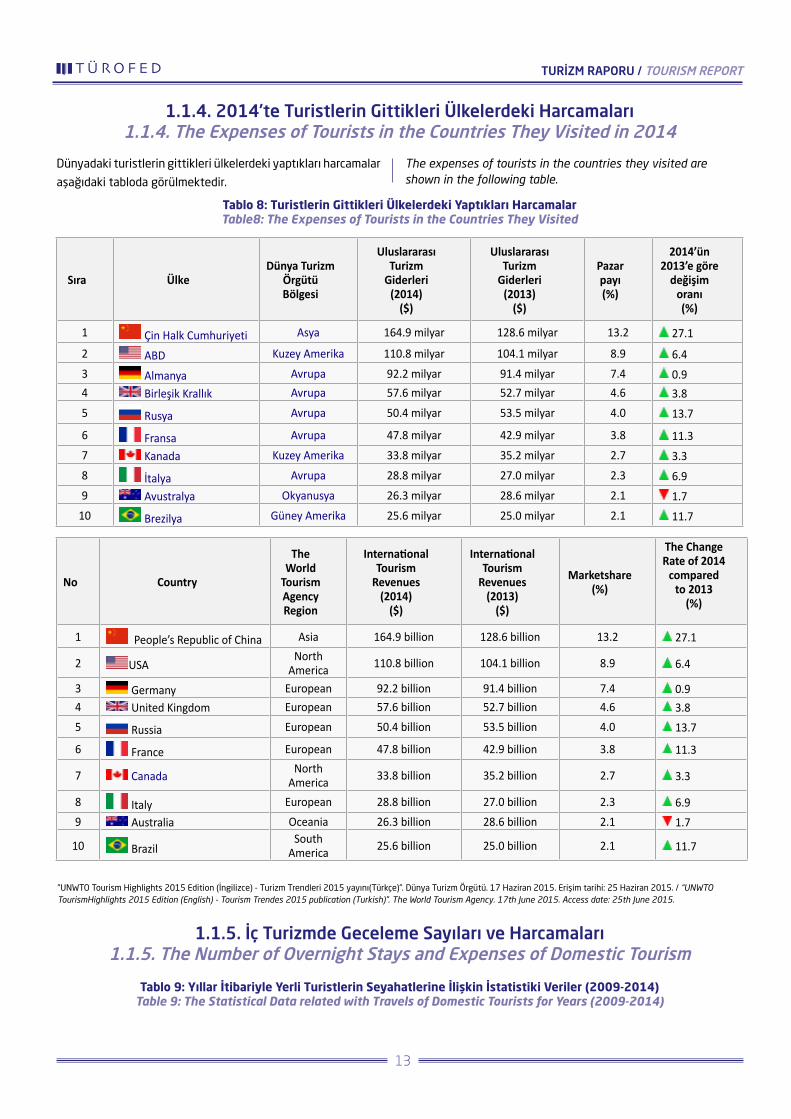
1.1.4. 2014’te Turistlerin Gittikleri Ülkelerdeki Harcamaları1.1.4. The Expenses of Tourists in the Countries They Visited in 2014
1.1.5. İç Turizmde Geceleme Sayıları ve Harcamaları1.1.5. The Number of Overnight Stays and Expenses of Domestic Tourism
Tablo 8: Turistlerin Gittikleri Ülkelerdeki Yaptıkları HarcamalarTable8: The Expenses of Tourists in the Countries They Visited
Tablo 9: Yıllar İtibariyle Yerli Turistlerin Seyahatlerine İlişkin İstatistiki Veriler (2009-2014)Table 9: The Statistical Data related with Travels of Domestic Tourists for Years (2009-2014)
”UNWTO Tourism Highlights 2015 Edition (İngilizce) - Turizm Trendleri 2015 yayını(Türkçe)”. Dünya Turizm Örgütü. 17 Haziran 2015. Erişim tarihi: 25 Haziran 2015. / “UNWTO TourismHighlights 2015 Edition (English) - Tourism Trendes 2015 publication (Turkish)”. The World Tourism Agency. 17th June 2015. Access date: 25th June 2015.
Sıra ÜlkeDünya Turizm
Örgütü Bölgesi
Uluslararası Turizm
Giderleri (2014)
($)
Uluslararası Turizm
Giderleri (2013)
($)
Pazar payı (%)
2014’ün 2013’e göre
değişim oranı (%)
1 Çin Halk Cumhuriyeti Asya 164.9 milyar 128.6 milyar 13.2 27.1
2 ABD Kuzey Amerika 110.8 milyar 104.1 milyar 8.9 6.43 Almanya Avrupa 92.2 milyar 91.4 milyar 7.4 0.94 Birleşik Krallık Avrupa 57.6 milyar 52.7 milyar 4.6 3.85 Rusya Avrupa 50.4 milyar 53.5 milyar 4.0 13.7
6 Fransa Avrupa 47.8 milyar 42.9 milyar 3.8 11.37 Kanada Kuzey Amerika 33.8 milyar 35.2 milyar 2.7 3.38 İtalya Avrupa 28.8 milyar 27.0 milyar 2.3 6.99 Avustralya Okyanusya 26.3 milyar 28.6 milyar 2.1 1.7
10 Brezilya Güney Amerika 25.6 milyar 25.0 milyar 2.1 11.7
No Country
The World
Tourism Agency Region
International Tourism
Revenues (2014)
($)
International Tourism
Revenues (2013)
($)
Marketshare (%)
The Change Rate of 2014
compared to 2013
(%)
1 People’s Republic of China Asia 164.9 billion 128.6 billion 13.2 27.1
2 USA North
America 110.8 billion 104.1 billion 8.9 6.4
3 Germany European 92.2 billion 91.4 billion 7.4 0.94 United Kingdom European 57.6 billion 52.7 billion 4.6 3.85 Russia European 50.4 billion 53.5 billion 4.0 13.7
6 France European 47.8 billion 42.9 billion 3.8 11.3
7 Canada North America 33.8 billion 35.2 billion 2.7 3.3
8 Italy European 28.8 billion 27.0 billion 2.3 6.99 Australia Oceania 26.3 billion 28.6 billion 2.1 1.7
10 BrazilSouth
America 25.6 billion 25.0 billion 2.1 11.7
TURİZM RAPORU / TOURISM REPORT
13
Yıllar Years
Seyahat sayısı (Bin) Number of trips (Thousand)
Geceleme sayısı (Bin) Number of overnights (Thousand)
Ortalama geceleme sayısı Average number of overnights
Seyahat harcaması (Bin TL) Expenditures of trips (Thousand TL)
Ortalama harcama (TL) Average expenditures of trips (TL)
2009 60 888 510 961 8,4 12 216 339 201
2010 68 373 555 145 8,1 13 843 504 202
2011 65 854 558 270 8,5 15 641 262 238
2012 64 922 556 803 8,6 16 725 035 258
2013 68 452 557 459 8,1 18 416 817 269
2014 70 894 575 871 8,1 22 601 201 319
Kaynak: TÜİK Hane halkı Yurt içi Turizm Araştırması / Source: TurkStat Household Domestic Tourism Survey
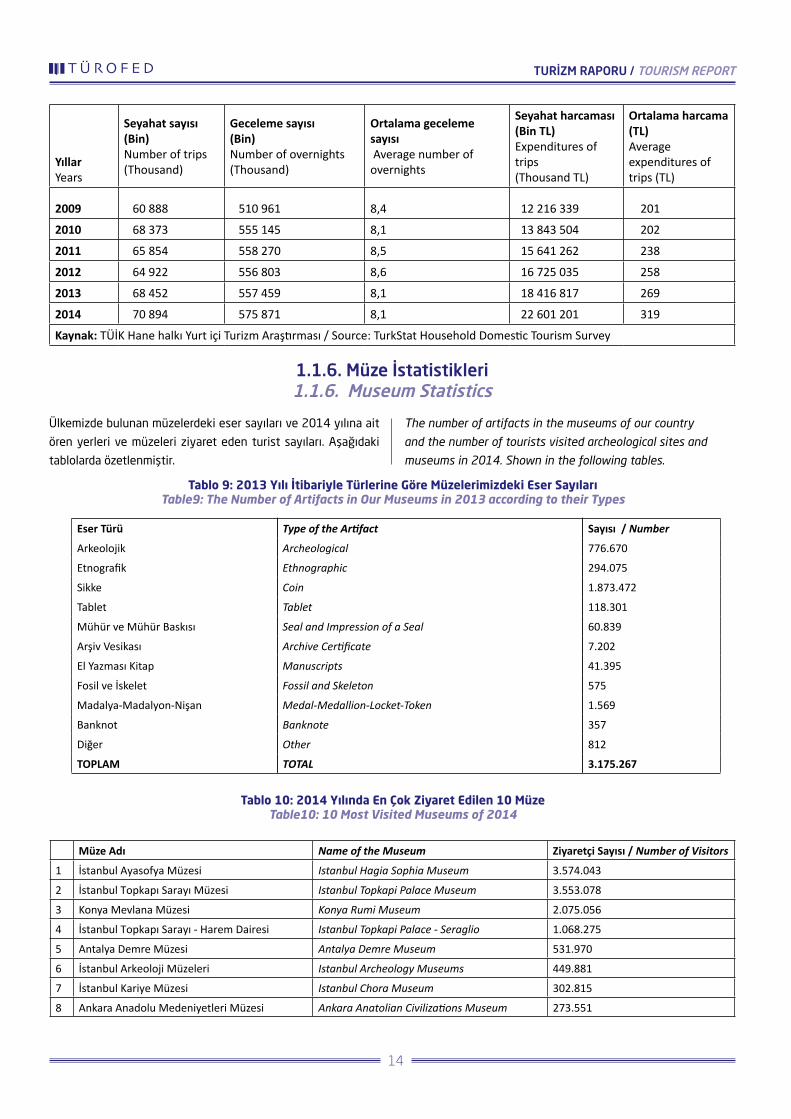
1.1.6. Müze İstatistikleri 1.1.6. Museum Statistics
Ülkemizde bulunan müzelerdeki eser sayıları ve 2014 yılına ait
ören yerleri ve müzeleri ziyaret eden turist sayıları. Aşağıdaki
tablolarda özetlenmiştir.
The number of artifacts in the museums of our country
and the number of tourists visited archeological sites and
museums in 2014. Shown in the following tables.
Tablo 9: 2013 Yılı İtibariyle Türlerine Göre Müzelerimizdeki Eser SayılarıTable9: The Number of Artifacts in Our Museums in 2013 according to their Types
Tablo 10: 2014 Yılında En Çok Ziyaret Edilen 10 MüzeTable10: 10 Most Visited Museums of 2014
Eser Türü Type of the Artifact Sayısı / Number
Arkeolojik Archeological 776.670
Etnografik Ethnographic 294.075
Sikke Coin 1.873.472
Tablet Tablet 118.301
Mühür ve Mühür Baskısı Seal and Impression of a Seal 60.839
Arşiv Vesikası Archive Certificate 7.202
El Yazması Kitap Manuscripts 41.395
Fosil ve İskelet Fossil and Skeleton 575
Madalya-Madalyon-Nişan Medal-Medallion-Locket-Token 1.569
Banknot Banknote 357
Diğer Other 812
TOPLAM TOTAL 3.175.267
Müze Adı Name of the Museum Ziyaretçi Sayısı / Number of Visitors
1 İstanbul Ayasofya Müzesi Istanbul Hagia Sophia Museum 3.574.043
2 İstanbul Topkapı Sarayı Müzesi Istanbul Topkapi Palace Museum 3.553.078
3 Konya Mevlana Müzesi Konya Rumi Museum 2.075.056
4 İstanbul Topkapı Sarayı - Harem Dairesi Istanbul Topkapi Palace - Seraglio 1.068.275
5 Antalya Demre Müzesi Antalya Demre Museum 531.970
6 İstanbul Arkeoloji Müzeleri Istanbul Archeology Museums 449.881
7 İstanbul Kariye Müzesi Istanbul Chora Museum 302.815
8 Ankara Anadolu Medeniyetleri Müzesi Ankara Anatolian Civilizations Museum 273.551
TURİZM RAPORU / TOURISM REPORT
14
1.1.7. Turizm İstatistikleri, I. Çeyrek: Ocak - Mart, 2015 1.1.7. Tourism Statistics, 1st Quarter: January - March, 2015
Turizm geliri ocak, şubat ve mart aylarından oluşan I. çeyrekte
bir önceki yılın aynı çeyreğine göre %1,3 artarak 4 milyar
868 milyon 890 bin ABD Doları oldu. Turizm gelirinin %78,8’i
yabancı ziyaretçilerden, %21,2’si ise yurt dışında ikamet eden
vatandaş ziyaretçilerden elde edildi. Ziyaretçiler, seyahatlerini
kişisel veya paket tur ile organize etmektedirler. Bu çeyrekte
yapılan harcamaların 4 milyar 457 milyon 546 bin ABD Dolarını
kişisel harcamalar, 411 milyon 343 bin ABD Dolarını ise paket
tur harcamaları oluşturdu. Ziyaretçilerin kişi başına ortalama
harcaması 911 ABD Doları oldu. Bu çeyrekte yabancıların
ortalama harcaması 884 ABD Doları, yurt dışında ikamet eden
vatandaşların ortalama harcaması ise 994 ABD Doları oldu.
Ziyaretçi sayısı geçen yılın aynı çeyreğine göre %5,5 arttı.
Ülkemizden çıkış yapan ziyaretçi sayısı 2015 yılı I. çeyreğinde
bir önceki yılın aynı çeyreğine göre %5,5 artarak 5 milyon 344
bin 575 kişi oldu. Bunların %80,7’sini (4 milyon 314 bin 332 kişi)
yabancılar, %19,3’ünü (1 milyon 30 bin 243 kişi) ise yurt dışında
ikamet eden vatandaşlar oluşturdu. Turizm gideri geçen yılın
aynı çeyreğine göre %6,1 azaldı. Yurt içinde ikamet edip başka
ülkeleri ziyaret eden vatandaşlarımızın harcamalarından oluşan
turizm gideri, geçen yılın aynı çeyreğine göre %6,1 azalarak 1
milyar 282 milyon 504 bin ABD Doları oldu. Bunun 1 milyar 27
milyon 542 bin ABD Dolarını kişisel, 254 milyon 962 bin ABD
Dolarını ise paket tur harcamaları oluşturdu. Yurt dışını ziyaret
eden vatandaşlar 2014 yılı I. çeyreğine göre %7,9 arttı. Bu
çeyrekte yurt dışını ziyaret eden vatandaş sayısı bir önceki yılın
aynı çeyreğine göre %7,9 artarak 1 milyon 865 bin 59 kişi oldu.
Bunların kişi başı ortalama harcaması 688 ABD Doları olarak
gerçekleşti. Kaynak: http://www.tuik.gov.tr/PreHaberBultenleri.
do?id=18666:erişim tarihi:01.06.2015
The tourism income has increased 1.3% during the 1st quarter of 2015 consisting of January, February and March compared to the same term of the previous year and become 4 billions and 868 millions of 890 thousands of US Dollars. 78.8% of this tourism income has been obtained from the foreign visitors while the remaining 21.2% has been obtained from the Turkish nationals residing in foreign countries. These visitors organize their journeys personally or by means of package tours. 4 billions and 457 millions and 546 thousands of US Dollars of the expenses made in that quarter consist of personal expenses while, 411 millions and 343 thousands of US Dollars consist of package tour expenses. Average expense of per visitor has been 911 US Dollars. During this term, the average expense of foreign nationals has been 884 US Dollars, while the average expense of Turkish nationals residing abroad has been 994 US Dollars. The number of visitors has increased 5.5% compared to the previous year. The number of visitors checking out from our country has increased 5.5% in the 1st quarter of 2015 compared to the previous year and become 5 millions and 344 thousands and 575 people. 80.7% of them (4 millions and 314 thousands and 332 people) was consisted of foreign nationals and 19.3% (1 millions and 30 thousands and 243 people) was consisted of the Turkish nationals residing abroad. The tourism costs have decreased 6.1% compared to the same quarter of the previous year. The tourism expenses of our nationals who reside in our country have been 1 billions and 282 millions and 504 thousands of US Dollars by decreasing 6.1% compared to the same quarter of the previous year. 1 billions and 27 millions and 542 thousands of US Dollars of the expenses made in that quarter consist of personal expenses while, 254 millions and 962 thousands of US Dollars consist of package tour expenses. The number of Turkish nationals who visited abroad has increased 7.9% compared to the 1st quarter of 2014. The number of citizens visited abroad during this quarter has become 1 millions and 865 thousands and 59 people by increasing 7.9% compared to the same quarter of the previous year. The average expense per visitor has been 688 US Dollars. Source: http://www.tuik.gov.tr/PreHaberBultenleri.do?id=18666:access date:01.06.2015
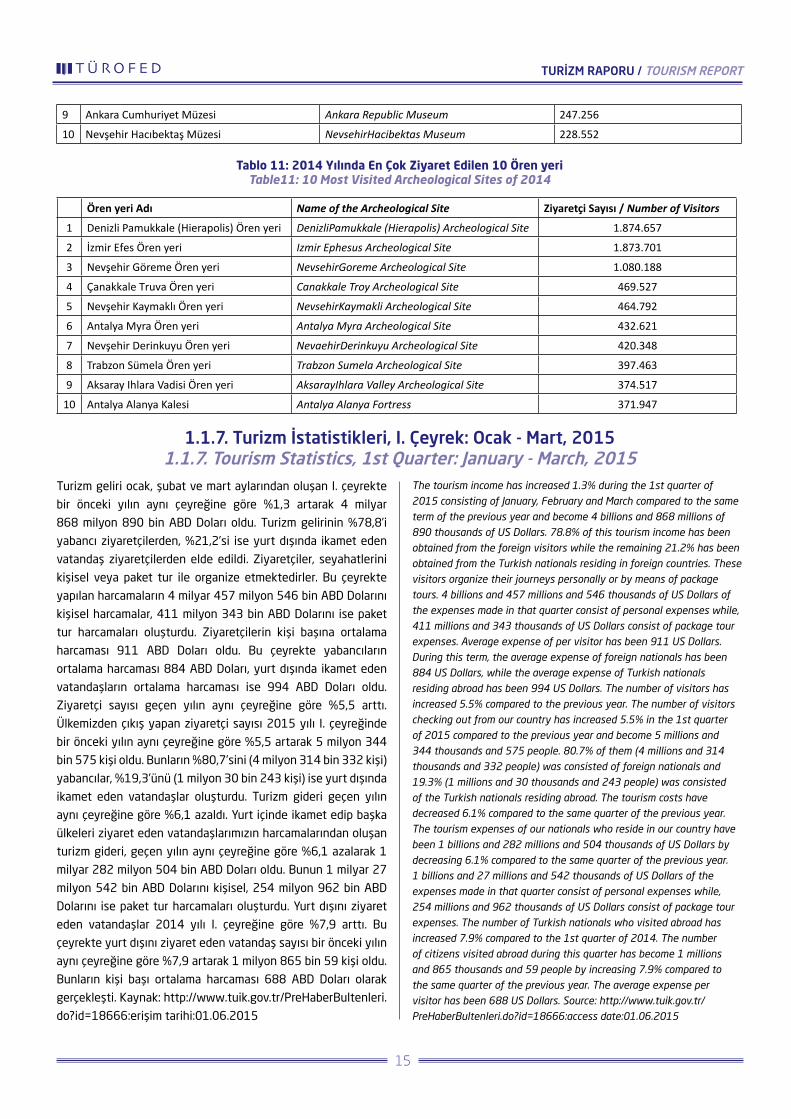
Tablo 11: 2014 Yılında En Çok Ziyaret Edilen 10 Ören yeriTable11: 10 Most Visited Archeological Sites of 2014
9 Ankara Cumhuriyet Müzesi Ankara Republic Museum 247.256
10 Nevşehir Hacıbektaş Müzesi NevsehirHacibektas Museum 228.552
Ören yeri Adı Name of the Archeological Site Ziyaretçi Sayısı / Number of Visitors
1 Denizli Pamukkale (Hierapolis) Ören yeri DenizliPamukkale (Hierapolis) Archeological Site 1.874.657
2 İzmir Efes Ören yeri Izmir Ephesus Archeological Site 1.873.701
3 Nevşehir Göreme Ören yeri NevsehirGoreme Archeological Site 1.080.188
4 Çanakkale Truva Ören yeri Canakkale Troy Archeological Site 469.527
5 Nevşehir Kaymaklı Ören yeri NevsehirKaymakli Archeological Site 464.792
6 Antalya Myra Ören yeri Antalya Myra Archeological Site 432.621
7 Nevşehir Derinkuyu Ören yeri NevaehirDerinkuyu Archeological Site 420.348
8 Trabzon Sümela Ören yeri Trabzon Sumela Archeological Site 397.463
9 Aksaray Ihlara Vadisi Ören yeri AksarayIhlara Valley Archeological Site 374.517
10 Antalya Alanya Kalesi Antalya Alanya Fortress 371.947
TURİZM RAPORU / TOURISM REPORT
15

Çıkış Yapan Ziyaretçiler/ Number of Checking-out Visitors
Giriş Yapan Vatandaşlar / Number of Checking-in Visitors
Yıl / Year Çeyrek /Quarter
Turizm Geliri Bin ($) / Tourism Income in Thousands of ($)
Kişi Sayısı / Number of People
Kişi Başı Ortalama Harcama /Average Expenses per Person ($)
Turizm Gideri Bin ($) / Tourism Expenses in Thousands of ($)
Kişi Sayısı / Number of People
Kişi Başı Ortalama Harcama ($) / Average Expenses per Person ($)
2014
I 4.807.836 5.065.759 949 1.365.770 1.728.284 790
II 8.975.976 10.967.100 818 1.402.783 2.042.086 687
III 12.854.373 17.084.013 752 1.178.170 2.283.278 516
IV 7.667.719 8.298.198 924 1.523.759 1.928.616 790
Annual 34.305.904 41.415.070 828 5.470.481 7.982.264 685
2015
I 4.868.890 5.344.575 911 1.282.504 1.865.059 688
January 1.625.569 1.762.004 923 410.781 605.946 678
February 1.427.246 1.564.925 912 430.687 616.510 699
March 1.816.076 2.017.645 900 441.036 642.603 686
Tablo 12: 2014-2015 Çıkış Yapan Ziyaretçiler/Giriş Yapan VatandaşlarTable12: 2014-2015 Checking Out Visitors/Checking in Citizens
Kaynak: http://www.tuik.gov.tr/PreHaberBultenleri.do?id=18666:erişim tarihi:01.06.2015 Source: http://www.tuik.gov.tr/PreHaberBultenleri.do?id=18666:access date:01.06.2015
1.1.8. Yurt Dışı Seyahatler (Gezi Ve İş Amaçlı Seyahatler) 1.1.8. Foreign Travels (for Holiday and Business Purposes)
TÜİK tarafından açıklanan verilere göre; Türk vatandaşlarının
en önemli yurt dışına çıkış nedenini “gezi, eğlence, sportif ve
kültürel faaliyet” amaçlı çıkışlar oluşturdu. Buna göre, yurtdışına
çıkan 8 milyon 363 bin 966 kişinin yaklaşık yüzde 38,1’i gezi
amaçlı olarak yurt dışına çıkarken iş amaçlı seyahatlerin payı
yaklaşık yüzde 26,9 oldu.
According to the data stated by TUIK, the most important foreign
travel reasons of Turkish nationals are “trip, entertainment,
sportive and cultural activities”. According to this, approximately
38.1% of 8 millions and 363 thousands and 966 people went
abroad visited foreign counties due to trip purposes, the share of
business trips has been 26.9 percent.
T.C. Vatandaşların En Çok Gittiği 10 Ülke (2014)THE TOP 10 COUNTRIES VISITED BY TURKISH NATIONALS
Gürcista
n
Yunan
istan
Bulgarist
an
Alman
ya
Bağım
sız
Devletler
Rusya
Federasyo
nu
Azerb
ayca
nİta
lyaİra
nA.B.D
.
1.231.691
741.037
217.128
620.896
196.359119.206
493.592
161.610235.736
143.448
1.500.000
1.000.000
500.000
0
TURİZM RAPORU / TOURISM REPORT
16
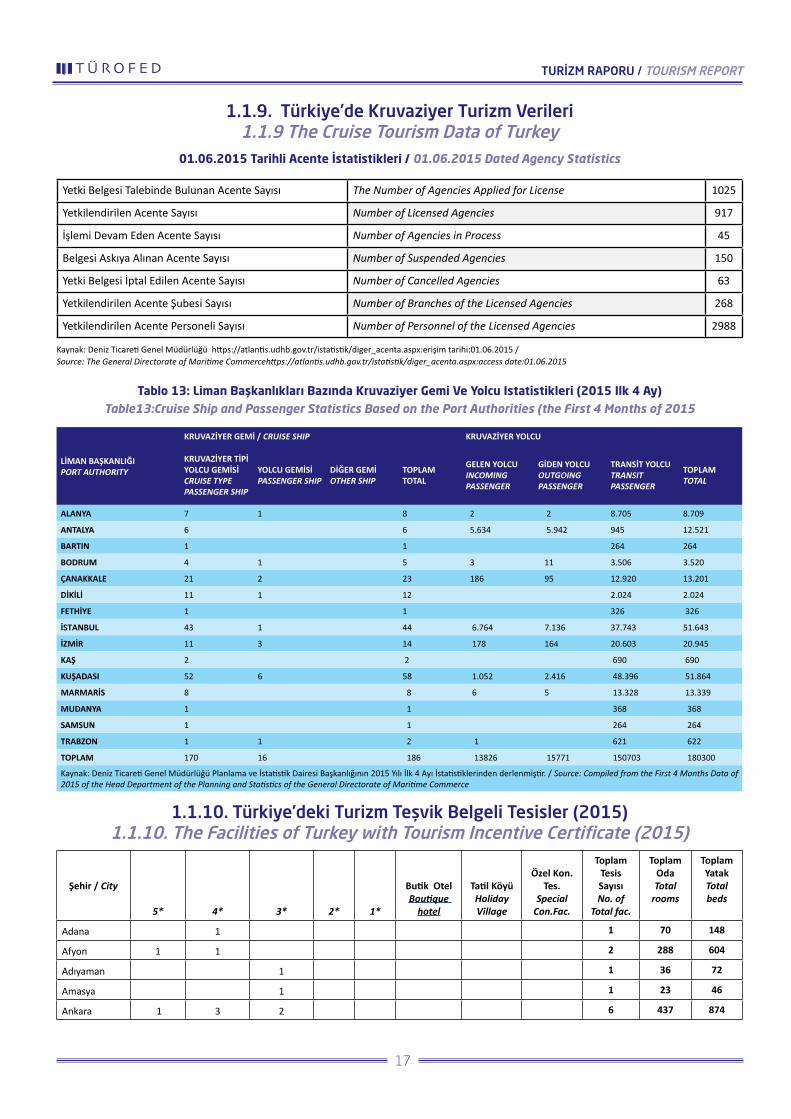
Tablo 13: Liman Başkanlıkları Bazında Kruvaziyer Gemi Ve Yolcu Istatistikleri (2015 Ilk 4 Ay) Table13:Cruise Ship and Passenger Statistics Based on the Port Authorities (the First 4 Months of 2015
1.1.10. Türkiye’deki Turizm Teşvik Belgeli Tesisler (2015)1.1.10. The Facilities of Turkey with Tourism Incentive Certificate (2015)
1.1.9. Türkiye’de Kruvaziyer Turizm Verileri1.1.9 The Cruise Tourism Data of Turkey
01.06.2015 Tarihli Acente İstatistikleri / 01.06.2015 Dated Agency Statistics
Yetki Belgesi Talebinde Bulunan Acente Sayısı The Number of Agencies Applied for License 1025
Yetkilendirilen Acente Sayısı Number of Licensed Agencies 917
İşlemi Devam Eden Acente Sayısı Number of Agencies in Process 45
Belgesi Askıya Alınan Acente Sayısı Number of Suspended Agencies 150
Yetki Belgesi İptal Edilen Acente Sayısı Number of Cancelled Agencies 63
Yetkilendirilen Acente Şubesi Sayısı Number of Branches of the Licensed Agencies 268
Yetkilendirilen Acente Personeli Sayısı Number of Personnel of the Licensed Agencies 2988
Kaynak: Deniz Ticareti Genel Müdürlüğü https://atlantis.udhb.gov.tr/istatistik/diger_acenta.aspx:erişim tarihi:01.06.2015 / Source: The General Directorate of Maritime Commercehttps://atlantis.udhb.gov.tr/istatistik/diger_acenta.aspx:access date:01.06.2015
LİMAN BAŞKANLIĞI PORT AUTHORITY
KRUVAZİYER GEMİ / CRUISE SHIP KRUVAZİYER YOLCU
KRUVAZİYER TİPİ YOLCU GEMİSİ CRUISE TYPE PASSENGER SHIP
YOLCU GEMİSİ PASSENGER SHIP
DİĞER GEMİ OTHER SHIP
TOPLAM TOTAL
GELEN YOLCU INCOMING PASSENGER
GİDEN YOLCU OUTGOING PASSENGER
TRANSİT YOLCU TRANSIT PASSENGER
TOPLAM TOTAL
ALANYA 7 1 8 2 2 8.705 8.709
ANTALYA 6 6 5.634 5.942 945 12.521
BARTIN 1 1 264 264
BODRUM 4 1 5 3 11 3.506 3.520
ÇANAKKALE 21 2 23 186 95 12.920 13.201
DİKİLİ 11 1 12 2.024 2.024
FETHİYE 1 1 326 326
İSTANBUL 43 1 44 6.764 7.136 37.743 51.643
İZMİR 11 3 14 178 164 20.603 20.945
KAŞ 2 2 690 690
KUŞADASI 52 6 58 1.052 2.416 48.396 51.864
MARMARİS 8 8 6 5 13.328 13.339
MUDANYA 1 1 368 368
SAMSUN 1 1 264 264
TRABZON 1 1 2 1 621 622
TOPLAM 170 16 186 13826 15771 150703 180300
Kaynak: Deniz Ticareti Genel Müdürlüğü Planlama ve İstatistik Dairesi Başkanlığının 2015 Yılı İlk 4 Ayı İstatistiklerinden derlenmiştir. / Source: Compiled from the First 4 Months Data of 2015 of the Head Department of the Planning and Statistics of the General Directorate of Maritime Commerce
Şehir / City
5* 4* 3* 2* 1*
Butik Otel Boutique
hotel
Tatil Köyü Holiday Village
Özel Kon.Tes.
Special Con.Fac.
Toplam Tesis Sayısı No. of
Total fac.
Toplam Oda Total
rooms
Toplam Yatak Total beds
Adana 1 1 70 148
Afyon 1 1 2 288 604
Adıyaman 1 1 36 72
Amasya 1 1 23 46
Ankara 1 3 2 6 437 874
TURİZM RAPORU / TOURISM REPORT
17
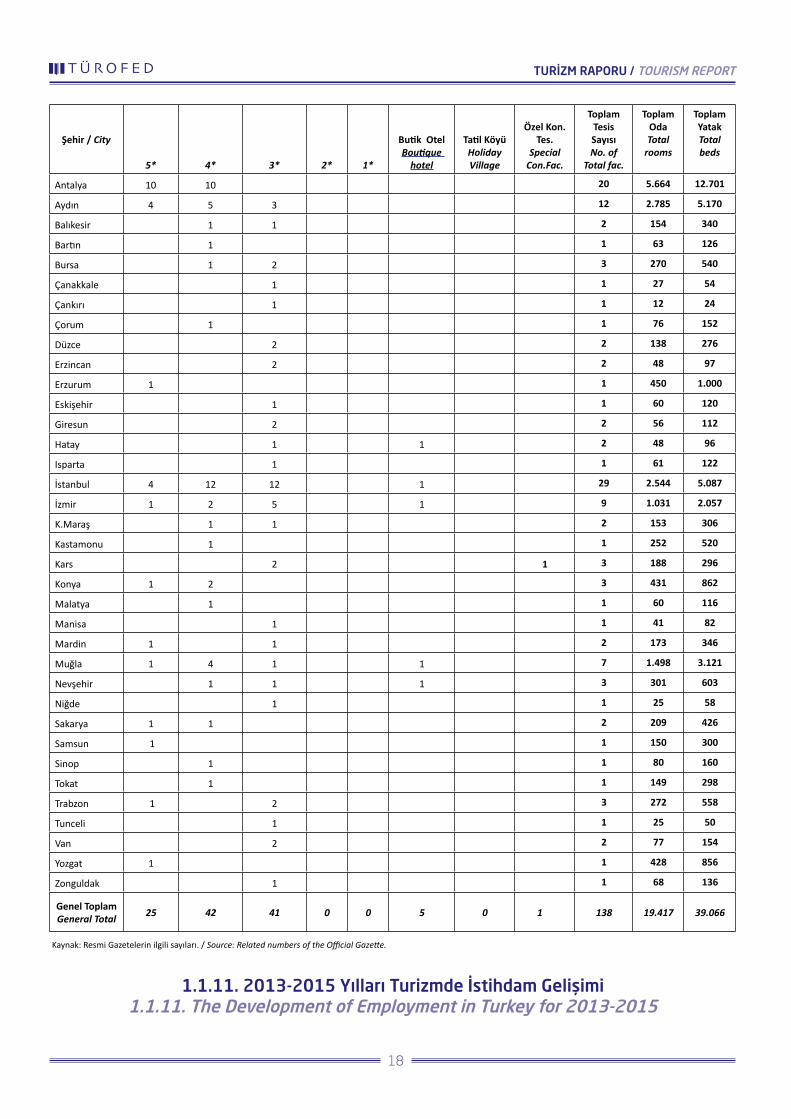
Şehir / City
5* 4* 3* 2* 1*
Butik Otel Boutique
hotel
Tatil Köyü Holiday Village
Özel Kon.Tes.
Special Con.Fac.
Toplam Tesis Sayısı No. of
Total fac.
Toplam Oda Total
rooms
Toplam Yatak Total beds
Antalya 10 10 20 5.664 12.701
Aydın 4 5 3 12 2.785 5.170
Balıkesir 1 1 2 154 340
Bartın 1 1 63 126
Bursa 1 2 3 270 540
Çanakkale 1 1 27 54
Çankırı 1 1 12 24
Çorum 1 1 76 152
Düzce 2 2 138 276
Erzincan 2 2 48 97
Erzurum 1 1 450 1.000
Eskişehir 1 1 60 120
Giresun 2 2 56 112
Hatay 1 1 2 48 96
Isparta 1 1 61 122
İstanbul 4 12 12 1 29 2.544 5.087
İzmir 1 2 5 1 9 1.031 2.057
K.Maraş 1 1 2 153 306
Kastamonu 1 1 252 520
Kars 2 1 3 188 296
Konya 1 2 3 431 862
Malatya 1 1 60 116
Manisa 1 1 41 82
Mardin 1 1 2 173 346
Muğla 1 4 1 1 7 1.498 3.121
Nevşehir 1 1 1 3 301 603
Niğde 1 1 25 58
Sakarya 1 1 2 209 426
Samsun 1 1 150 300
Sinop 1 1 80 160
Tokat 1 1 149 298
Trabzon 1 2 3 272 558
Tunceli 1 1 25 50
Van 2 2 77 154
Yozgat 1 1 428 856
Zonguldak 1 1 68 136
Genel Toplam General Total 25 42 41 0 0 5 0 1 138 19.417 39.066
Kaynak: Resmi Gazetelerin ilgili sayıları. / Source: Related numbers of the Official Gazette.
1.1.11. 2013-2015 Yılları Turizmde İstihdam Gelişimi1.1.11. The Development of Employment in Turkey for 2013-2015
TURİZM RAPORU / TOURISM REPORT
18

Geçen yıl TÜROFED raporunda belirtildiği üzere Rus
pazarında ki yaklaşık %25’lik bir düşüş turizmdeki istihdama da
olumsuz yansıdı.
2015 yılında Rusya pazarında yaşanan yüksek oranlı gerileme
ve Avrupa pazarlarında görülen yavaşlama eğilimi, konaklama
sektöründeki istihdama da olumsuz etki yaptı. Geçen yıllarda
ortalama % 10-12 aralığında büyüyen konaklama sektörü
istihdamı, 2015 yılının ilk yarısında ancak % 3,8 artabildi. 2014
yılındaki gelişme % 12,8 olmuştur. AKTOB Araştırma Birimi’nin
SGK verilerinden derlediği verilere göre, turizmde düşen
yabancı ziyaretçi sayısı, öncelikle turizm istihdamını geriletiyor.
Yılın ilk yarısı geride bırakılırken, yabancı ziyaretçi sayısı %
1 dolayında daralan Türkiye’de, otellerdeki çalışan sayısı da
gerileme içinde olmuştur. Bulgulara göre, otellerde sigortalı
olarak çalışanların sayısı 2014 yılının 4 aylık döneminde % 12,8
gelişme göstermişti. Ancak 2015 yılında bu büyüme eğilimi %
3,8’e düştü. Diğer yandan, her zaman Türkiye ortalamasının
2 katı büyüme kaydeden turizm sektörü istihdamı da 4 aylık
dönemde % 7,3 gelişti. Türkiye istihdamı artışı ise % 6,3 oldu.
(http://www.aktob.org.tr/haber/istihdam-artışı-yavaşladı.)
As indicated in the TUROFED report of the previous year,
approximately 25% regression of the Russian Market has reflected
negatively on the employment of tourism.
The high regression experienced in the Russian market in 2015
and the regression tendency of the European markets, have
negative influence on the accommodation sector. The employment
of accommodation sector which has grown around 10-12% in the
previous year could only increase 3.8% in the first half of 2015.
The development in 2014 has been 12.8%. According to the data
compiled by AKTOP Research Unit from the SGK (Social Security
Agency) date, the number of foreign visitors firstly downgrades
the employment of tourism. While we are leaving the first half of
the year behind us, the number of employees working in hotels
of Turkey has also fallen like the number of visitors which has
regressed 1% compared to the previous year. According to these
findings, the number of insured employees working in hotels has
increased 12.8% in the first 4 months of 2014. However, this
increase has decreased to 3.8% in 2015. On the other hand, the
tourism sector which always achieves 2 times higher growth rate
than the Turkey’s average has developed 7.3% during the 4 month
term. The Turkey’s employment raise has been 6.3%. (http://www.
aktob.org.tr/haber/istihdam-artışı-yavaşladı.)
Tablo 14: Turizm Sektöründe Istihdamın Gelişimi,%* Table14: Development of Employment in Tourism Sector, %*
Tablo 15: Türkiye’nin Son 25 Yıldaki Turizm Seyri Table15:The Course of Tourism in Turkey for the Last 25 Years
Değişim / Change 2013/2014 Değişim / Change 2014/2015
Konaklama Accommodation 12,8 3,8
Yiyecek İçecek Hiz. Food & Beverage Services 12,1 12,7
Spor, Eğl.Dinl.Faal Sports, Entertainment and Recreation Activities 7,8 -24,8
Seyahat Ac.Tur Op.Hiz Travel Agency-Tour Operator Services 2,9 5,9
Havayolu Airlines 13,0 15,1
Turizm Toplamı Total of Tourism 11,5 7,3
*4a kapsamı sigortalı sayıları, 2015 Nisan verileri. Kaynak: http://www.aktob.org.tr: Erişim Tarihi: 03/08/2015 / *Number of insured employees within 4a scope, April 2015 data. Source: http://www.aktob.org.tr: Access date: 03/08/2015
2. BÖLÜM: TÜRKİYE TURİZM VERİLERİ
2. CHAPTER:THE TOURISM DATA OF TURKEY
2.1. Türkiye’nin Son Çeyrek Asırdaki Turizm İstikrarı2.1. The Tourism Stability of Turkey in the Last 25 Years
TURİZM RAPORU / TOURISM REPORT
19

TOPL
AM
Tota
l
4 45
9 15
1
5 38
9 30
8
5 51
7 89
7
7 07
6 09
6
6 50
0 63
8
6 67
0 61
8
7 72
6 88
6
8 61
4 08
5
9 68
9 00
4
9 75
2 69
7
7 48
7 28
5
10 4
28 1
53
11 6
18 9
69
13 2
56 0
28
14 0
29 5
58
17 5
16 9
08
21 1
24 8
86
19 8
19 8
33
23 3
40 9
11
26 3
36 6
77
27 0
77 1
14
28 6
32 2
04
31 4
56 0
76
31 7
82 8
32
34 9
10 0
98
3683
7900
ARAL
IK
Dece
mbe
r
192
160
323
215
366
070
336
072
309
820
341
530
340
467
395
893
417
535
371
057
320
808
423
564
398
005
559
873
643
872
789
367
861
836
926
968
1 01
8 92
3
1 09
1 37
6
1 22
6 14
3
1 16
5 90
3
1 19
4 72
9
1 34
3 22
0
1 44
2 99
5
1580
041
KSAI
M
Nov
embe
r
245
840
367
300
404
267
370
878
382
736
392
040
393
023
452
325
538
368
502
638
435
790
602
396
520
962
662
985
776
181
948
815
1 05
2 56
1
1 02
0 10
6
1 17
7 47
5
1 26
7 99
6
1 40
3 74
0
1 49
1 00
5
1 59
6 29
5
1 63
1 64
7
1 70
9 47
9
1729
803
EKİM
O
ctob
er
462
882
526
115
581
371
697
642
699
415
695
471
836
025
909
397
947
462
1 03
5 23
7
800
513
1 17
8 48
1
1 06
5 82
5
1 42
0 38
6
1 65
7 72
6
1 84
2 27
7
2 10
8 39
8
1 71
3 91
6
2 15
2 90
8
2 46
2 49
7
2 61
7 19
3
2 84
0 09
5
3 03
9 75
4
3 05
0 98
1
3 40
2 46
0
3439
554
EYLÜ
L Se
ptem
ber
605
991
667
359
773
458
861
166
692
967
773
954
1 05
4 87
1
1 11
7 42
9
1 29
7 45
5
1 20
9 25
6
876
261
1 36
8 53
8
1 44
0 36
5
1 77
0 56
6
1 87
4 32
9
2 12
5 02
5
2 50
2 12
3
2 26
7 14
6
2 79
9 27
6
2 98
1 04
4
3 13
6 01
0
3 48
6 31
9
3 92
3 54
6
3 99
1 41
5
4 26
6 13
3
4352
429
AĞU
STO
S Au
gust
633
641
777
793
761
744
992
640
784
532
899
189
1 07
0 23
4
1 15
3 75
5
1 40
4 87
6
1 46
0 07
5
1 07
9 24
9
1 41
9 24
4
1 60
1 33
1
1 90
0 12
0
2 27
5 05
5
2 49
2 79
4
2 86
1 14
1
2 90
5 81
7
3 38
4 06
5
3 76
2 13
6
3 76
0 37
2
3 71
9 18
0
4 07
6 78
3
4 47
0 20
2
4 94
5 99
9
5283
333
TEM
MU
Z Ju
ly
562
218
707
824
635
835
970
394
743
819
820
386
1 00
8 70
9
1 10
6 24
2
1 20
6 22
6
1 28
8 43
9
931
895
1 52
5 71
8
1 77
6 82
1
1 89
7 11
2
2 13
0 94
9
2 59
1 14
0
3 18
0 80
2
3 10
9 72
7
3 62
4 15
6
4 08
4 76
4
4 34
3 02
5
4 35
8 27
5
4 59
7 47
5
4 57
1 38
9
4 59
3 51
1
5214
519
HAZİ
RAN
Ju
ne
443
072
559
266
517
785
727
002
682
401
671
333
810
419
902
015
1 04
5 98
7
1 06
2 96
1
784
642
1 07
9 14
8
1 38
7 95
5
1 45
7 61
5
1 51
0 95
1
1 89
8 43
5
2 40
2 91
2
2 36
8 62
8
2 77
4 07
6
3 30
5 83
2
3 26
3 08
9
3 50
0 02
4
3 78
0 63
7
3 88
2 59
2
4 07
3 90
6
4335
075
4 12
9 10
9
MAY
IS
May
479
623
529
552
502
029
739
918
797
637
644
589
732
394
874
942
1 02
0 89
4
986
237
691
313
986
376
1 23
1 56
2
1 32
5 75
2
1 14
6 30
9
1 79
9 13
0
2 30
2 38
9
1 91
8 80
9
2 28
7 64
5
2 74
8 56
4
2 71
8 78
8
3 14
8 33
7
3 28
3 12
5
3 23
2 92
6
3 81
0 23
6
3 90
0 09
6
3 80
4 15
8
NİS
AN
April
345
332
429
624
376
502
579
022
578
292
468
550
535
462
556
109
639
819
642
332
426
558
721
128
884
805
852
930
669
288
1 10
4 27
0
1 34
8 26
4
1 37
2 92
2
1 52
0 95
4
1 64
7 90
3
1 75
0 28
1
1 74
4 62
8
2 29
0 72
2
2 16
8 71
5
2 45
1 03
1
2 65
2 07
1
2 43
7 26
3
MAR
T M
arch
251
539
242
987
284
039
337
582
343
780
394
107
368
195
537
452
555
204
476
756
409
483
435
158
547
365
675
687
499
663
784
107
1 10
7 34
8
921
892
1 09
9 96
0
1 30
5 29
7
1 20
7 72
9
1 41
4 61
6
1 61
7 78
2
1 46
0 56
3
1 84
1 15
4
1 85
1 98
0
1 89
5 94
0
ŞUBA
T Fe
brua
ry
126
039
143
215
157
123
255
040
273
666
301
811
302
407
324
910
314
306
371
526
371
727
354
487
404
653
426
405
481
252
607
854
696
643
626
565
787
048
896
482
898
927
953
848
1 07
9 50
5
997
571
1 26
8 44
0
1 35
2 18
4
1 39
3 34
3
OCA
K Ja
nuar
y
110
814
115
058
157
674
208
740
211
573
267
658
274
680
283
616
300
872
346
183
359
046
333
915
359
320
306
597
363
983
533
694
700
469
667
337
714
425
782
786
751
817
809
974
975
723
981
611
1 10
4 75
4
1 14
6 81
5
1 25
0 94
1
YILL
AR
YEAR
S
1989
1990
1991
1992
1993
1994
1995
1996
1997
1998
1999
2000
2001
2002
2003
2004
2005
2006
2007
2008
2009
2010
2011
2012
2013
2014
2015
Kaynak: http://www.ktbyatirimisletmeler.gov.tr/TR,9854/sinir-giris-cikis-istatistikleri.html Erişim tarihi: 8/07/2014 http://www.tursab.org.tr/tr/istatistiklerErişim tarihi: 8/07/2014 Source: http://www.ktbyatirimisletmeler.gov.tr/TR,9854/sinir-giris-cikis-istatistikleri.htmlAccess date: 8/07/2014 http://www.tursab.org.tr/tr/istatistiklerAccess date: 8/07/2014
TURİZM RAPORU / TOURISM REPORT
20
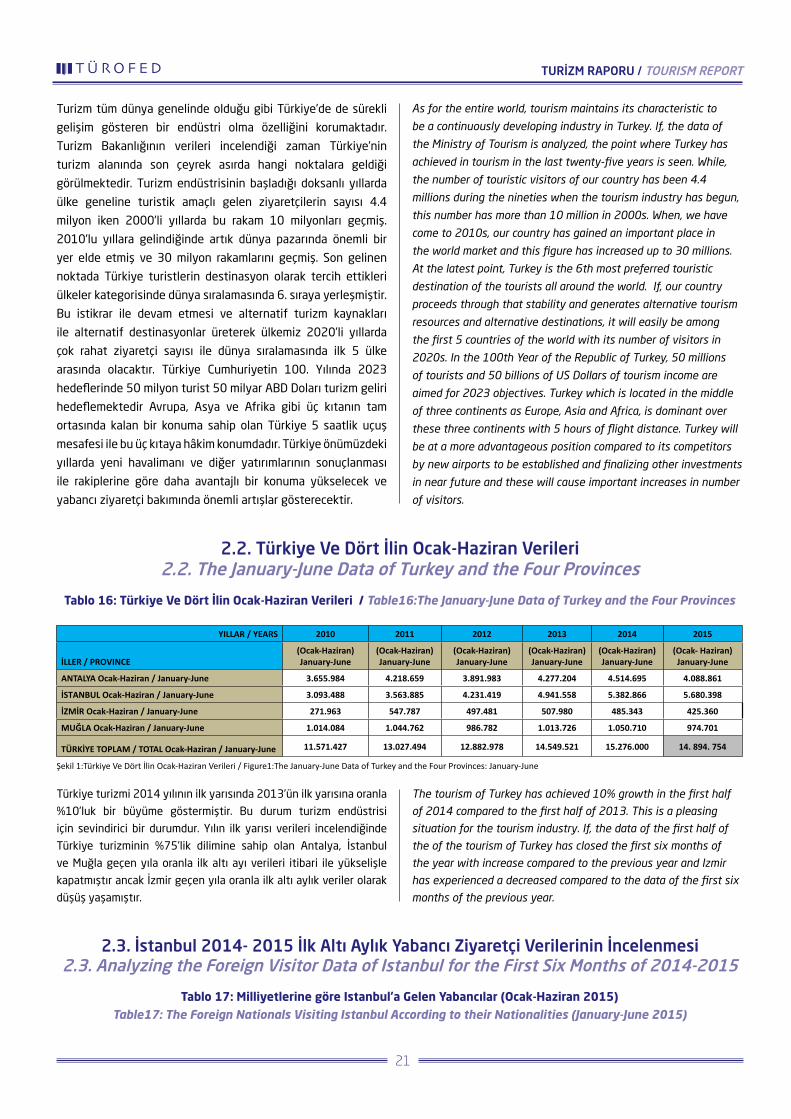
Turizm tüm dünya genelinde olduğu gibi Türkiye’de de sürekli
gelişim gösteren bir endüstri olma özelliğini korumaktadır.
Turizm Bakanlığının verileri incelendiği zaman Türkiye’nin
turizm alanında son çeyrek asırda hangi noktalara geldiği
görülmektedir. Turizm endüstrisinin başladığı doksanlı yıllarda
ülke geneline turistik amaçlı gelen ziyaretçilerin sayısı 4.4
milyon iken 2000’li yıllarda bu rakam 10 milyonları geçmiş.
2010’lu yıllara gelindiğinde artık dünya pazarında önemli bir
yer elde etmiş ve 30 milyon rakamlarını geçmiş. Son gelinen
noktada Türkiye turistlerin destinasyon olarak tercih ettikleri
ülkeler kategorisinde dünya sıralamasında 6. sıraya yerleşmiştir.
Bu istikrar ile devam etmesi ve alternatif turizm kaynakları
ile alternatif destinasyonlar üreterek ülkemiz 2020’li yıllarda
çok rahat ziyaretçi sayısı ile dünya sıralamasında ilk 5 ülke
arasında olacaktır. Türkiye Cumhuriyetin 100. Yılında 2023
hedeflerinde 50 milyon turist 50 milyar ABD Doları turizm geliri
hedeflemektedir Avrupa, Asya ve Afrika gibi üç kıtanın tam
ortasında kalan bir konuma sahip olan Türkiye 5 saatlik uçuş
mesafesi ile bu üç kıtaya hâkim konumdadır. Türkiye önümüzdeki
yıllarda yeni havalimanı ve diğer yatırımlarının sonuçlanması
ile rakiplerine göre daha avantajlı bir konuma yükselecek ve
yabancı ziyaretçi bakımında önemli artışlar gösterecektir.
As for the entire world, tourism maintains its characteristic to
be a continuously developing industry in Turkey. If, the data of
the Ministry of Tourism is analyzed, the point where Turkey has
achieved in tourism in the last twenty-five years is seen. While,
the number of touristic visitors of our country has been 4.4
millions during the nineties when the tourism industry has begun,
this number has more than 10 million in 2000s. When, we have
come to 2010s, our country has gained an important place in
the world market and this figure has increased up to 30 millions.
At the latest point, Turkey is the 6th most preferred touristic
destination of the tourists all around the world. If, our country
proceeds through that stability and generates alternative tourism
resources and alternative destinations, it will easily be among
the first 5 countries of the world with its number of visitors in
2020s. In the 100th Year of the Republic of Turkey, 50 millions
of tourists and 50 billions of US Dollars of tourism income are
aimed for 2023 objectives. Turkey which is located in the middle
of three continents as Europe, Asia and Africa, is dominant over
these three continents with 5 hours of flight distance. Turkey will
be at a more advantageous position compared to its competitors
by new airports to be established and finalizing other investments
in near future and these will cause important increases in number
of visitors.
Türkiye turizmi 2014 yılının ilk yarısında 2013’ün ilk yarısına oranla
%10’luk bir büyüme göstermiştir. Bu durum turizm endüstrisi
için sevindirici bir durumdur. Yılın ilk yarısı verileri incelendiğinde
Türkiye turizminin %75’lik dilimine sahip olan Antalya, İstanbul
ve Muğla geçen yıla oranla ilk altı ayı verileri itibari ile yükselişle
kapatmıştır ancak İzmir geçen yıla oranla ilk altı aylık veriler olarak
düşüş yaşamıştır.
The tourism of Turkey has achieved 10% growth in the first half
of 2014 compared to the first half of 2013. This is a pleasing
situation for the tourism industry. If, the data of the first half of
the of the tourism of Turkey has closed the first six months of
the year with increase compared to the previous year and Izmir
has experienced a decreased compared to the data of the first six
months of the previous year.
2.2. Türkiye Ve Dört İlin Ocak-Haziran Verileri2.2. The January-June Data of Turkey and the Four Provinces
2.3. İstanbul 2014- 2015 İlk Altı Aylık Yabancı Ziyaretçi Verilerinin İncelenmesi2.3. Analyzing the Foreign Visitor Data of Istanbul for the First Six Months of 2014-2015
Tablo 16: Türkiye Ve Dört İlin Ocak-Haziran Verileri / Table16:The January-June Data of Turkey and the Four Provinces
Tablo 17: Milliyetlerine göre Istanbul’a Gelen Yabancılar (Ocak-Haziran 2015) Table17: The Foreign Nationals Visiting Istanbul According to their Nationalities (January-June 2015)
YILLAR / YEARS 2010 2011 2012 2013 2014 2015
İLLER / PROVINCE(Ocak-Haziran) January-June
(Ocak-Haziran) January-June
(Ocak-Haziran) January-June
(Ocak-Haziran) January-June
(Ocak-Haziran) January-June
(Ocak- Haziran) January-June
ANTALYA Ocak-Haziran / January-June 3.655.984 4.218.659 3.891.983 4.277.204 4.514.695 4.088.861
İSTANBUL Ocak-Haziran / January-June 3.093.488 3.563.885 4.231.419 4.941.558 5.382.866 5.680.398
İZMİR Ocak-Haziran / January-June 271.963 547.787 497.481 507.980 485.343 425.360
MUĞLA Ocak-Haziran / January-June 1.014.084 1.044.762 986.782 1.013.726 1.050.710 974.701
TÜRKİYE TOPLAM / TOTAL Ocak-Haziran / January-June 11.571.427 13.027.494 12.882.978 14.549.521 15.276.000 14. 894. 754
Şekil 1:Türkiye Ve Dört İlin Ocak-Haziran Verileri / Figure1:The January-June Data of Turkey and the Four Provinces: January-June
TURİZM RAPORU / TOURISM REPORT
21
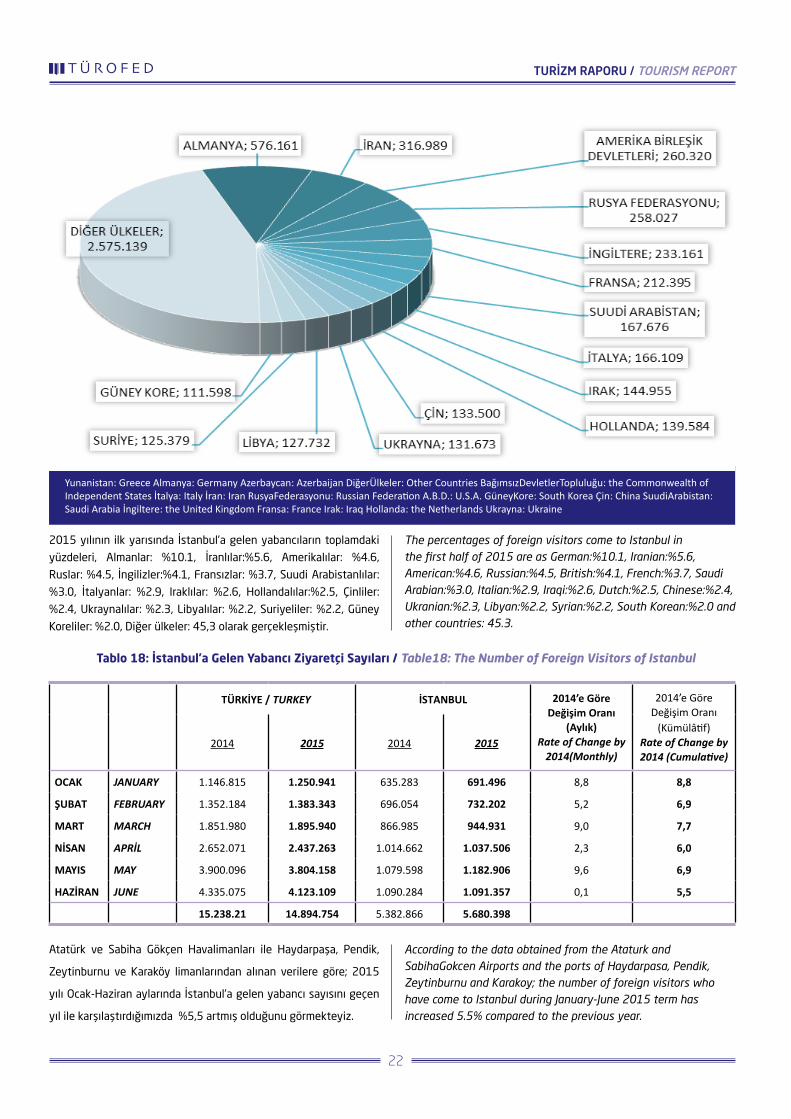
Yunanistan: Greece Almanya: Germany Azerbaycan: Azerbaijan DiğerÜlkeler: Other Countries BağımsızDevletlerTopluluğu: the Commonwealth of Independent States İtalya: Italy İran: Iran RusyaFederasyonu: Russian Federation A.B.D.: U.S.A. GüneyKore: South Korea Çin: China SuudiArabistan: Saudi Arabia İngiltere: the United Kingdom Fransa: France Irak: Iraq Hollanda: the Netherlands Ukrayna: Ukraine
2015 yılının ilk yarısında İstanbul’a gelen yabancıların toplamdaki
yüzdeleri, Almanlar: %10.1, İranlılar:%5.6, Amerikalılar: %4.6,
Ruslar: %4.5, İngilizler:%4.1, Fransızlar: %3.7, Suudi Arabistanlılar:
%3.0, İtalyanlar: %2.9, Iraklılar: %2.6, Hollandalılar:%2.5, Çinliler:
%2.4, Ukraynalılar: %2.3, Libyalılar: %2.2, Suriyeliler: %2.2, Güney
Koreliler: %2.0, Diğer ülkeler: 45,3 olarak gerçekleşmiştir.
The percentages of foreign visitors come to Istanbul in the first half of 2015 are as German:%10.1, Iranian:%5.6, American:%4.6, Russian:%4.5, British:%4.1, French:%3.7, Saudi Arabian:%3.0, Italian:%2.9, Iraqi:%2.6, Dutch:%2.5, Chinese:%2.4, Ukranian:%2.3, Libyan:%2.2, Syrian:%2.2, South Korean:%2.0 and other countries: 45.3.
Atatürk ve Sabiha Gökçen Havalimanları ile Haydarpaşa, Pendik,
Zeytinburnu ve Karaköy limanlarından alınan verilere göre; 2015
yılı Ocak-Haziran aylarında İstanbul’a gelen yabancı sayısını geçen
yıl ile karşılaştırdığımızda %5,5 artmış olduğunu görmekteyiz.
According to the data obtained from the Ataturk and SabihaGokcen Airports and the ports of Haydarpasa, Pendik, Zeytinburnu and Karakoy; the number of foreign visitors who have come to Istanbul during January-June 2015 term has increased 5.5% compared to the previous year.
Tablo 18: İstanbul’a Gelen Yabancı Ziyaretçi Sayıları / Table18: The Number of Foreign Visitors of Istanbul
TÜRKİYE / TURKEY İSTANBUL 2014’e Göre Değişim Oranı
(Aylık) Rate of Change by
2014(Monthly)
2014’e Göre Değişim Oranı
(Kümülâtif) Rate of Change by 2014 (Cumulative)
2014 2015 2014 2015
OCAK JANUARY 1.146.815 1.250.941 635.283 691.496 8,8 8,8
ŞUBAT FEBRUARY 1.352.184 1.383.343 696.054 732.202 5,2 6,9
MART MARCH 1.851.980 1.895.940 866.985 944.931 9,0 7,7
NİSAN APRİL 2.652.071 2.437.263 1.014.662 1.037.506 2,3 6,0
MAYIS MAY 3.900.096 3.804.158 1.079.598 1.182.906 9,6 6,9
HAZİRAN JUNE 4.335.075 4.123.109 1.090.284 1.091.357 0,1 5,5
15.238.21 14.894.754 5.382.866 5.680.398
TURİZM RAPORU / TOURISM REPORT
22

Yılın ilk yarısını değerlendirdiğimizde; her yıl bir önceki yıla göre
artış yaşandığı ve bu artışın giderek azaldığı görülmektedir.
If, we consider the first half of each year, it is observed that there has been an increase every year compared to the previous year while the increase rate has been gradually decreasing.
Geçen yılın ocak-haziran ayına göre havayolu ile geliş %5.4,
denizyolu ile geliş %10.6 artmıştır.
According to the January-June term of the previous year, the arrivals by airlines have increased 5.4% while the arrivals by maritime lines have increased 10.6%.
Şekil 3: Son Beş Yıl Ocak-Haziran Ayı Gelen Yabancı Sayıları Figure3: The Number of Foreign Visitors During January-June Term for the Last Five Years
Şekil 4: Geliş Yollarına Göre Gelen Yabancı Ziyaretçi Sayıları Figure4: The Number of Foreign Visitors According to Means of Transportation
Tablo 19: İstanbul 2013- 2014 İlk Altı Aylık Yabancı Ziyaretçi Verilerinin İncelenmesi Tablo19:Analysis of the Foreign Visitors Data of Istanbul for the First Six Months of 2013-2014
Havayolu Airlines
DenizyoluMaritime Lines
İSTANBUL İSTANBUL
2013 2014 2015 2014 / 2013 YILI KARŞILAŞTIRMASI COMPARİSON OF 2014/2013 YEARS
(Ocak-Haziran) (January-June)
(Ocak-Haziran) (January-June)
(Ocak-Haziran) (January-June)
SAYISAL/ DEĞİŞİM DİJİTAL CHANGE
ORANSAL DEĞİŞİM (%) PROPORTİONAL CHANGE (%)
ALMANYA GERMANY 552.185 531.678 576.161 44.483 8,37
RUSYA FED. RUSSİAN FED. 296.765 301.544 258027 -43517 -14,43
İNGİLTERE UNITED KINGDOM 213.090 221.725 233.161 11.436 5,16
İTALYA İTALY 211.115 198.333 166109 -32224 -16,25
FRANSA FRANCE 224.987 221.374 212395 -8979 -4,06
İRAN IRAN 154.529 235.003 316.989 81.986 34,9
ABD USA 234.183 246.157 260.320 14.163 5,75
TURİZM RAPORU / TOURISM REPORT
23

HOLLANDA NETHERLANDS 134.860 137.946 139.584 1.638 1,19
JAPONYA JAPAN 89.835 72.874 47757 -25.117 -34,47
İSPANYA SPAİN 89.461 94.622 93686 -936 -0,99
UKRAYNA UKRAİNE 121.298 133.190 131673 -1.517 -1,14
AZERBEYCAN AZERBAİJAN 106.616 107.169 109.385 2.216 2,07
GÜNEY KORE KOREA SOUTH 83.058 111.066 111.598 532 0,48
TÜRKMENİSTAN TÜRKMENİSTAN 67.357 75.651 72453 -3198 -4,23
BELÇİKA BELGIUM 62.019 64.670 65.993 1.323 2,05
AVUSTURYA AUSTRIA 77.288 75.760 75684 -76 -0,10
İSVİÇRE SWİTZERLAND 74.279 71.228 72.024 796 1,12
İSRAİL ISRAEL 30.688 43.125 40861 -2.264 -5,25
YUNANİSTAN GREECE 57.108 64.061 64.943 882 1,38
ÇİN CHINA 60.479 83.818 133.500 49.682 59,3
IRAK IRAQ 99.607 121.588 144.955 23.367 19,22
TUNUS TUNISIA 43.019 48.325 49.461 1.136 2,35
LİBYA LİBYA 116.512 142.491 127732 -14.759 -10,36
SUUDI ARABIS. SAUDI ARABIA 110.052 134.548 167.676 33.128 24,62
AVUSTRALYA AUSTRALIA 51.529 52.932 69.605 16.673 31,50
KAZAKISTAN KAZAKHSTAN 72.844 76.462 74600 -1.862 -2,44
CEZAYİR ALGERIA 51.723 66.752 68.073 1.321 1,98
LÜBNAN LEBANON 51.547 55.528 57.900 2.372 4,27
KANADA CANADA 48.651 52.504 55.678 3.174 6,05
ÖZBEKISTAN UZBEKISTAN 54.386 63.283 63.819 536 0,85
SURIYE SYRIA 66.411 104.897 125.379 20.482 19,53
MISIR EGYPT 58.619 49.380 45191 -4.189 -8,48
DİĞER OTHER 1.175.018 1.323.182 1.501.636 178.454 13
GENEL TOPLAM GRAND TOTAL 4.941.118 5.382.866 5.680.398 297.532 6
Kaynak: http://www.istanbulkulturturizm.gov.tr/TR,92428/istanbul-turizm-istatistikleri---2014.html Erişim tarihi: 8/07/2014 http://www.istanbulkulturturizm.gov.tr/TR,92428/istanbul-turizm-istatistikleri---2013.html Erişim tarihi: 8/07/2014 / Source: http://www.istanbulkulturturizm.gov.tr/TR,92428/istanbul-turizm-istatistikleri---2014.html Access date: 8/07/2014 http://www.istanbulkulturturizm.gov.tr/TR,92428/istanbul-turizm-istatistikleri---2013.html Access date: 8/07/2014
Antalya’dan sonra Türkiye’de en fazla turist çeken destinasyonu
İstanbul yılın ilk altı ayında %8.9’luk bir büyüme göstermiştir.
2009’dan itibaren İstanbul’a gelen yabancı ziyaretçi verileri
incelendiğinde, 2010 yılındaki %7’lik düşüş haricinde, artış
gerçekleştiğini görülmektedir. Atatürk ve Sabiha Gökçen
Havalimanları ile Haydarpaşa, Pendik ve Karaköy limanlarından
alınan verilere göre, 2013 yılında İstanbul’a gelen yabancı
ziyaretçi sayısını 2012 yılı ile karşılaştırdığında %12 artış
olduğunu görülmektedir. 2012 yılında 9.381.670 olan yabancı
ziyaretçi sayısı 2013 yılında 10.474.867 kişi olmuştur. 2013
verileri ile 2014 yılının ilk altı ayında gerçekleşen veriler
karşılaştırıldığında 2013 yılında İstanbul’a 4.941.118 turist
gelirken, bu oran 2014 yılında 5.982.866’ya yükselmiş ve 2015
yılınını ilk 6 aylık döneminde 5.680.398’e ulaşmıştır.
Istanbul as the second highest tourist attracting destination
of Turkey after Antalya has shown 8.9% growth in the first
six months of the year. If, the number of foreign visitors of
Istanbul is taken into consideration beginning from 2009,
we see that there has always been an increase instead of
the 7% decrease in 2010. According to the data obtained
from the Ataturk and SabihaGokcen Airports and the ports
of Haydarpasa, Pendik andKarakoy; the number of foreign
visitors who have come to Istanbul during 2013 has increased
12% compared to 2012. The number of foreign visitors which
was 9.381.670 people in 2012 has increased to 10.474.867
people in 2013. If, the 2013 data is compared to the actual
data of the first six months of 2014, it is observed that, while
4.941.118 tourists have visited Istanbul in 2013, this number
has increased to 5.382.866 in 2014 and has reached to
5.680.398 in the first six months of 2015.
TURİZM RAPORU / TOURISM REPORT
24

Yılın ilk yarısını değerlendirdiğimizde; her yıl bir önceki yıla göre
artış yaşandığı ve bu artışın giderek azaldığı görülmektedir.
Kaynak: http://www.istanbulkulturturizm.gov.tr/TR,92428/
istanbul-turizm-istatistikleri---2014.html Erişim Tarihi:
09/07/2014
Gelen yabancı ziyaretçi sayıları milliyet bazında incelediğinde,
2013 yılında İstanbul’a gelen yabancıların milliyetine göre
dağılımları şu şekildedir: Almanlar: %11.3, Ruslar: %5.5,
Amerikalılar: %4.8, Fransızlar: %4.6, İngilizler: %4.4, İtalyanlar:
%4.2, İranlılar: %3.7, Hollandalılar: %2.7, Libyalılar: %2.5,
Ukraynalılar: %2.4, Iraklılar: %2.3, Azerbaycanlılar: %2.2,
Suudi Arabistanlılar: %2.1, İspanyollar: %1.9, Suriyeliler: %1.6,
oranındadır. Ancak Avrupa’daki İngiltere, Hollanda, Belçika,
İspanya ve Yunanistan gibi ülkelerde sayısal olarak ilk altı
aylık dilimde 2013 verilerine göre artış gözlense de Avrupa
pazarındaki durgunluk 2014 yılının ilk altı ayında da devam
etmektedir.
Son yıllarda Orta Doğu’daki gelişmeler kuşkusuz turizm
endüstrisi de etkilemiştir, ancak Arap Baharı sonrası Orta Doğu
ve Arap ülkelerinden gelen turistlerin sayısında sürekli artış
gözlenmiştir. 2015 yılının ilk altı ayının verilerinde de Körfez ve
Arap ülkelerinden gelen ziyaretçilerin bir önceki yıla göre %20
’nin üzerinde bir oranda artış gösterdikleri görülmektedir.
2015 yılı 2014 yılı ile karşılaştırdığında 2015 yılı ilk yarısında
Almanya, İtalya, Fransa, Avusturya, İsviçre gibi Avrupa
ülkelerinden gelenlerde bir miktar azalma görülmektedir. Ayrıca
Japonya ve Mısır‘dan gelen ziyaretçi sayısında da %15-20’lik
bir azalma görülmektedir. Buna karşın İran’dan gelen turistte
%52’lik bir artış gerçekleşmiştir. Güney Kore %33’lük, İsrail
%40, Çin%38, Libya ve Irak %22, Suriye %58, Cezayir %29,
Suudi Arabistan %22 büyüme göstererek bir önceki yıla oranla
gelişme göstermiştir. Böylece Avrupa pazarında görülen
azalmanın etkisi Orta doğu ve Arap pazarının gelişmesi ile
kapanmıştır.
If, we consider the first half of each year, it is observed that there
has been an increase every year compared to the previous year
while the increase rate has been gradually decreasing. Source:
http://www.istanbulkulturturizm.gov.tr/TR,92428/istanbul-turizm-
istatistikleri---2014.html Access Date: 09/07/2014
If, the number of foreign visitors are analyzed according to their
nationalities, the distribution of foreign visitors came to Istanbul
in 2013 are as in the following: German:%11.3, Russian:%5.5,
American:%4.8, French:%4.6, British:%4.4, Italian:%4.2,
Iranian:%3.7, Dutch:%2.7, Libyan:%2.5, Ukranian:%2.4, Iraqi:%2.3,
Azerbaijani:%2.2, Saudi Arabian:%2.1, Spanish:%1.9, Syrian:%1.6.
While, an increase is observed for the first six month term for the
countries of Europe such as the United Kingdom, the Netherlands,
Belgium, Spain, Greece and etc. compared to the data of 2013, the
stagnancy of the European market has been continuing for the
first six months of 2014.
The developments in the Middle East in recent years have
certainly influenced the tourism industry, but an increase has
been observed on the number of tourists coming from the Middle
East and Arab countries after the Arab Spring. According to the
data for the first six months of 2015, it is seen that the number
of visitors from the Coast and Arab countries has increased more
than 20% compared to the previous year.
If, we compare 2015 to 2014, there has been a little decrease in
the number of visitors coming from the European countries such
as Germany, Italy, France, Austria, Switzerland and etc. during the
first half of 2015. Furthermore, there has been 15-20% decrease
in the number of visitors coming from Japan and Egypt. On
contrary, there has been 52% of increase in the number of Iranian
tourists. The number of tourists from South Korea has increased
33%, Israel 40%, China 38%,Libya and Iraq 22%, Syria 58%,
Algeria 29% and Saudi Arabia 22% compared to the previous year.
By this way, the impact of decreasing number of visitors from the
European market has been compensated by the development of
the Middle East and Arab market.
Şekil 5: Son 5 Yıl Ocak-Haziran İstanbul’u Ziyaret Eden Yabancıların Sayısı Figure5:The Number of Foreign Visitors of Istanbul for January-June Term for the Last 5 Years
TURİZM RAPORU / TOURISM REPORT
25

2.4. Antalya 2013- 2015 Yıllarının İlk Altı Aylık Yabancı Ziyaretçi Verilerinin İncelenmesi2.4. Analyzing the Foreign Visitor Data of Antalya for the First Six Months 2013-2015
Tablo 20: Antalya 2013- 2014 Yılının İlk Altı Aylık Yabancı Ziyaretçi Verilerinin İncelenmesi Table20: Analyzing the Foreign Visitor Data of Antalya for the First Six Months 2013-2014
MİLLİYETLER / NATIONALITIES
2013 YILI / January- June Perıod of 2013 YEAR
2014 YILI / January- June Perıod of 2014 YEAR
2015 YILI / January- June Perıod of 2015 YEAR
2015 / 2014 YILI / COMPARISON of 2015 / 2014 YEARS
OCAK - HAZİRAN DÖNEMİ OCAK - HAZİRAN DÖNEMİ OCAK - HAZİRAN
DÖNEMİ KARŞILAŞTIRMASI
ZİYARETÇİ SAYISI NUMBER OF VISITORS
ZİYARETÇİ SAYISI NUMBER OF VISITORS
ZİYARETÇİ SAYISI NUMBER OF VISITORS
SAYISAL DEĞİŞİM DIGITAL CHANGE
ORANSAL DEĞİŞİM (%) PROPORTIONAL CHANGE (%)
ALMANYA GERMANY 1 110 549 1 089 310 1 208 863 119 553 10,98
RUSYA FEDERASYONU RUSSİAN FED 1 268 742 1 479 722 1 077 793 - 401 929 -27,16
HOLLANDA NETHERLANDS 232 349 226 104 210 692 - 15 412 -6,82
İNGİLTERE UNITED KINGDOM 178 209 183 034 184 846 1 812 0,99
İSVEÇ SWEDEN 149 358 153 025 141 865 - 11 160 -7,29
UKRAYNA UKRAINE 155 691 122 771 109 764 - 13 007 -10,59
KAZAKİSTAN KAZAKHSTAN 96 500 98 102 96 820 - 1 282 -1,31
BELÇİKA BELGIUM 105 670 99 188 90 786 - 8 402 -8,47
POLONYA POLAND 64 914 78 104 82 705 4 601 5,89
NORVEÇ NORWAY 133 793 98 395 81 970 - 16 425 -16,69
DANİMARKA DENMARK 83 005 92 564 81 648 - 10 916 -11,79
FİNLANDİYA FİNLAND 62 062 61 739 67 653 5 914 9,58
AVUSTURYA AUSTRIA 86 700 84 579 66 356 - 18 223 -21,55
İRAN IRAN 12 689 64 519 54 822 - 9 697 -15,03
İSVİÇRE SWITZERLAND 53 310 54 985 53 691 - 1 294 -2,35
BELARUS (BEYAZ RUSYA) BELARUS (BEYAZ RUSYA) 45 711 53 694 53 028 - 666 -1,24
ÇEK CUMHURİYETİ CZECH REPUBLIC 45 367 47 202 43 158 - 4 044 -8,57
FRANSA FRANCE 92 330 82 205 38 715 - 43 490 -52,90
SLOVAKYA SLOVAKIA 28 059 27 890 31 138 3 248 11,65
ROMANYA ROMANIA 25 660 27 640 30 435 2 795 10,11
LİTVANYA LITHUANIA 23 358 32 715 29 902 - 2 813 -8,60
İSRAİL ISRAEL 24 054 50 273 28 181 - 22 092 -43,94
MOLDOVA MOLDOVA 18 650 19 601 22 340 2 739 13,97
ESTONYA ESTONIA 13 794 16 844 19 530 2 686 15,95
MACARİSTAN HUNGARY 11 368 12 038 16 356 4 318 35,87
LETONYA LATVIA 13 075 14 843 14 554 - 289 -1,95
SIRBİSTAN SERBIA 11 840 12 406 12 900 494 3,98
İTALYA İTALY 14 298 10 675 11 493 818 7,66
BOSNA - HERSEK BOSNIA-HERZEGOVINA 6 295 6 403 7 697 1 294 20,21
AZERBAYCAN AZERBAIJAN 6 420 8 163 6 945 - 1 218 -14,92
SLOVENYA SLOVENIA 6 034 5 630 5 768 138 2,45
AMERİKA BİRLEŞİK DEVLETLERİ UNITED STATES OF AMERICA 6 982 4 432 5 209 777 17,53
İSPANYA SPAIN 3 381 3 903 2 495 - 1 408 -36,07
YUNANİSTAN GREECE 1 802 2 086 1 857 - 229 -10,98
PORTEKİZ PORTUGAL 1 642 1 643 1 811 168 10,23
SURİYE SYRIA 1 599 1 646 1 736 90 5,47
ERMENİSTAN ARMENIA 1 401 1 909 903 - 1 006 -52,70
LÜBNAN LEBANON 1 404 734 811 77 10,49
CEZAYİR ALGERIA 376 313 216 - 97 -30,99
DİĞER MİLLİYETLER TOPLAMI Other nationalities TOTAL 78 763 83 666 91 409 7 743 9,25
YABANCI ZİYARETÇİLER TOPLAMI TOTAL FOREIGN VISITORS 4 277 204 4 514 695 4 088 861 - 425 834 -9,43
YERLİ ZİYARETÇİLER LOCAL VISITORS 182 237 173 818 189 074 15 256 8,78
GENEL TOPLAM GRAND TOTAL 4 459 441 4 688 513 4 277 935 - 410 578 -8,76
Kaynak: http://www.haberler.gen.al/2014-04-15/vali-ozturk-antalya-18-milyon-turist-agirlama-hedefine-2018de-ulasacaktir/ Erişim tarihi: 8/08/2015 http://www.antalyakulturturizm.gov.tr/TR,67091/kultur-turizm-istatistikleri.html Erişim tarihi: 8/08/2015 / Source: http://www.haberler.gen.al/2014-04-15/vali-ozturk-antalya-18-milyon-turist-agirlama-hedefine-2018de-ulasacaktir/ Access Date: 8/08/2015 http://www.antalyakulturturizm.gov.tr/TR,67091/kultur-turizm-istatistikleri.htmlAccess date: 8/08/2015
TURİZM RAPORU / TOURISM REPORT
26
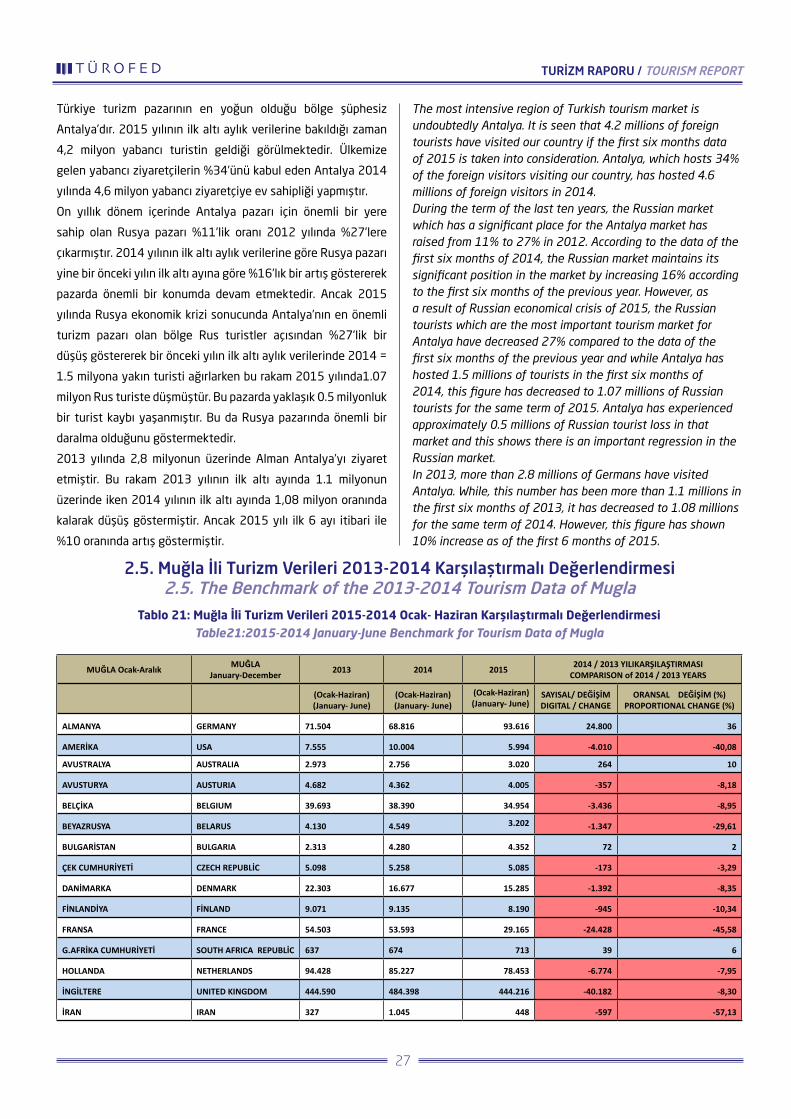
Türkiye turizm pazarının en yoğun olduğu bölge şüphesiz
Antalya’dır. 2015 yılının ilk altı aylık verilerine bakıldığı zaman
4,2 milyon yabancı turistin geldiği görülmektedir. Ülkemize
gelen yabancı ziyaretçilerin %34’ünü kabul eden Antalya 2014
yılında 4,6 milyon yabancı ziyaretçiye ev sahipliği yapmıştır.
On yıllık dönem içerinde Antalya pazarı için önemli bir yere
sahip olan Rusya pazarı %11’lik oranı 2012 yılında %27’lere
çıkarmıştır. 2014 yılının ilk altı aylık verilerine göre Rusya pazarı
yine bir önceki yılın ilk altı ayına göre %16’lık bir artış göstererek
pazarda önemli bir konumda devam etmektedir. Ancak 2015
yılında Rusya ekonomik krizi sonucunda Antalya’nın en önemli
turizm pazarı olan bölge Rus turistler açısından %27’lik bir
düşüş göstererek bir önceki yılın ilk altı aylık verilerinde 2014 =
1.5 milyona yakın turisti ağırlarken bu rakam 2015 yılında1.07
milyon Rus turiste düşmüştür. Bu pazarda yaklaşık 0.5 milyonluk
bir turist kaybı yaşanmıştır. Bu da Rusya pazarında önemli bir
daralma olduğunu göstermektedir.
2013 yılında 2,8 milyonun üzerinde Alman Antalya’yı ziyaret
etmiştir. Bu rakam 2013 yılının ilk altı ayında 1.1 milyonun
üzerinde iken 2014 yılının ilk altı ayında 1,08 milyon oranında
kalarak düşüş göstermiştir. Ancak 2015 yılı ilk 6 ayı itibari ile
%10 oranında artış göstermiştir.
The most intensive region of Turkish tourism market is undoubtedly Antalya. It is seen that 4.2 millions of foreign tourists have visited our country if the first six months data of 2015 is taken into consideration. Antalya, which hosts 34% of the foreign visitors visiting our country, has hosted 4.6 millions of foreign visitors in 2014. During the term of the last ten years, the Russian market which has a significant place for the Antalya market has raised from 11% to 27% in 2012. According to the data of the first six months of 2014, the Russian market maintains its significant position in the market by increasing 16% according to the first six months of the previous year. However, as a result of Russian economical crisis of 2015, the Russian tourists which are the most important tourism market for Antalya have decreased 27% compared to the data of the first six months of the previous year and while Antalya has hosted 1.5 millions of tourists in the first six months of 2014, this figure has decreased to 1.07 millions of Russian tourists for the same term of 2015. Antalya has experienced approximately 0.5 millions of Russian tourist loss in that market and this shows there is an important regression in the Russian market.In 2013, more than 2.8 millions of Germans have visited Antalya. While, this number has been more than 1.1 millions in the first six months of 2013, it has decreased to 1.08 millions for the same term of 2014. However, this figure has shown 10% increase as of the first 6 months of 2015.
2.5. Muğla İli Turizm Verileri 2013-2014 Karşılaştırmalı Değerlendirmesi2.5. The Benchmark of the 2013-2014 Tourism Data of Mugla
Tablo 21: Muğla İli Turizm Verileri 2015-2014 Ocak- Haziran Karşılaştırmalı Değerlendirmesi Table21:2015-2014 January-June Benchmark for Tourism Data of Mugla
MUĞLA Ocak-Aralık MUĞLA January-December 2013 2014 2015 2014 / 2013 YILIKARŞILAŞTIRMASI
COMPARISON of 2014 / 2013 YEARS
(Ocak-Haziran) (January- June)
(Ocak-Haziran) (January- June)
(Ocak-Haziran) (January- June)
SAYISAL/ DEĞİŞİM DIGITAL / CHANGE
ORANSAL DEĞİŞİM (%) PROPORTIONAL CHANGE (%)
ALMANYA GERMANY 71.504 68.816 93.616 24.800 36
AMERİKA USA 7.555 10.004 5.994 -4.010 -40,08
AVUSTRALYA AUSTRALIA 2.973 2.756 3.020 264 10
AVUSTURYA AUSTURIA 4.682 4.362 4.005 -357 -8,18
BELÇİKA BELGIUM 39.693 38.390 34.954 -3.436 -8,95
BEYAZRUSYA BELARUS 4.130 4.549 3.202 -1.347 -29,61
BULGARİSTAN BULGARIA 2.313 4.280 4.352 72 2
ÇEK CUMHURİYETİ CZECH REPUBLİC 5.098 5.258 5.085 -173 -3,29
DANİMARKA DENMARK 22.303 16.677 15.285 -1.392 -8,35
FİNLANDİYA FİNLAND 9.071 9.135 8.190 -945 -10,34
FRANSA FRANCE 54.503 53.593 29.165 -24.428 -45,58
G.AFRİKA CUMHURİYETİ SOUTH AFRICA REPUBLİC 637 674 713 39 6
HOLLANDA NETHERLANDS 94.428 85.227 78.453 -6.774 -7,95
İNGİLTERE UNITED KINGDOM 444.590 484.398 444.216 -40.182 -8,30
İRAN IRAN 327 1.045 448 -597 -57,13
TURİZM RAPORU / TOURISM REPORT
27

İRLANDA IRLAND 8.845 7.669 7.506 -163 -2,13
İSPANYA SPAIN 7.658 1.393 1.721 328 24
İSRAİL ISRAEL 1.524 1.569 1.494 -75 -4,78
İSVEÇ SWEDEN 37.133 24.859 22.496 -2.363 -9,51
İSVİÇRE SWITZERLAND 2.860 2.232 2.896 664 30
İTALYA İTALY 11.059 6.838 6.758 -80 -1,17
JAPONYA JAPAN 199 303 260 -43 -14,19
KANADA KANACA 1.422 1.530 1.611 81 5
KAZAKİSTAN KAZAKHSTAN 2.059 993 1.015 22 2
LETONYA LATVIA 362 944 637 -307 -32,52
LİTVANYA LİTHUANIA 5.148 5.063 4.609 -454 -8,97
LÜBNAN LEBANON 2.259 1.106 953 -153 -13,83
LÜKSEMBURG LUXEMBOURG 275 175 190 15 9
MISIR EGYPT 104 196 82 -114 -58,16
NORVEÇ NORWAY 8.768 6.196 4.848 -1.348 -21,76
POLONYA POLAND 29.768 46.339 48.123 1.784 4
PORTEKİZ PORTUGAL 953 660 708 48 7
ROMANYA ROMANIA 2.574 3.712 3.783 71 2
RUSYA FED. RUSSIA 81.228 99.998 82.177 -17.821 -17,82
SLOVAKYA SLOVAKIA 858 791 1.015 224 28
SLOVENYA SLOVENIA 198 230 198 -32 -13,91
UKRAYNA UKRAINE 18.454 14.880 14.842 -38 -0,26
ÜRDÜN JORDAN 3.997 4.065 3.385 -680 -16,73
YUNANİSTAN GREECE 6.686 8.284 7.287 -997 -12,04
DİĞER OTHER 15.528 21.521 25.409 3.888 18
TOPLAM TOTAL 1.013.726 1.050.710 974.701 -76.009 -7,23
Kaynak:http://www.muglakulturturizm.gov.tr/TR,90760/2014.htmlErişimtarihi:8/07/2014 http://www.muglakulturturizm.gov.tr/TR,90760/2013.html Erişim tarihi: 8/07/2014 / Source:http://www.muglakulturturizm.gov.tr/TR,90760/2014.htmlAccess date:8/07/2014http://www.muglakulturturizm.gov.tr/TR,90760/2013.htmlAccess date: 8/07/2014
Muğla ili Avrupa merkezli turist profiline sahip bir destinasyondur.
Özellikle Türkiye’de İngiltere vatandaşlarının yoğun olarak
tercih ettiği bölgelerin başında gelmektedir. Muğla pazarında
İngiltere’den sonra Hollanda, Almanya ve Fransa gelmektedir..
Ancak son yıllarda İngiltere tek başına Muğla pazarının hakimi
konumuna gelmiş bir pazardır.
Son yıllarda Muğla turist pazarının %43’ünü oluşturan olan
İngiltere, 2010 yılında 1.650.692, 2011 yılında 1.466.096,
2012 yılında 1.352.128 turist göndermiş ancak 2013 yılında
ise 1.337.045 turist göndererek her yıl belli bir oranda bir
düşüş gerçekleştirmiştir. 2013 yılının ilk altı aylık verilerinde
İngiltere’den bölgeyi ziyaret amaçlı gelenlerin sayısı 444,590
iken 2014 yılının ilk ayında bu rakam 484 binin üzerine
çıkarak %8,9’luk bir büyüme gerçekleştirmiş ve tekrar büyüme
eğilimine geçmiştir. Bu durum Muğla için son derece önemlidir.
Ancak 2015 yılı ilk yarısında Muğla’da genel anlamda %7’lik bir
gerileme vardır. Özellikle Fransız ve İngiliz turistlerde önemli
derecede gerileme görülmektedir.
The province of Mugla is a destination with Europe centered tourist profile. Especially, Mugla is one of the regions of Turkey which is intensively preferred by the British nationals. The Netherlands, Germany and France follow the United Kingdom in Mugla market. However, the United Kingdom has recently and solely become dominant on the Mugla market. The United Kingdom which has recently consisted 43% of the tourist market of Mugla, has sent 1.650.692 tourists in 2010, 1.466.096 tourists in 2011, 1.352.128 tourists in 2012 and 1.337.045 tourists in 2013 and there has been a specific decrease in every year. According to the data for the first six months of 2013, the number of British nationals coming to the region for visiting purposes has been 444.590, this number has increased more than 484 thousands in 2014 and there has been a 8.9% growth in the market and the market turns back to growth tendency, again. This issue is extremely important for Mugla. However, there has been a 7% regression for Mugla in general respect for the first half of 2015. Especially, the number of French and British tourists has extremely regressed.
TURİZM RAPORU / TOURISM REPORT
28

Almanya bölgede 2011 yılındaki düşüşünü durdurmuş; 2012
yılında 207 bin ve 2013 yılında 208 binli rakamlar ile durağan
ancak hafif yükselen bir pazar konumuna gelmiştir. Ancak
2013 yılının ilk altı aylık verilerine göre 71.504 turist gelmiştir.
2014 yılının ilk altı aylık verileri incelendiğinde bu rakam 68 bin
seviyelerine düşerek %3,7’lik bir düşüş göstermiştir. Bununla
birlikte Hollanda da bölgeye 2010 yılında 195 bin, 2011 yılında
236 bin, 2012 yılında 275 bin ve 2013 yılında 275 binin
üzerinde ziyaretçi göndermiştir. Ancak 2014 yılı ilk altı aylık
verilerine bakılırsa Hollanda vatandaşları 85 bin sayısında iken
2015 yılı ilk altı aylık diliminde ise 78 bin rakamlarına gerileyerek
%7,9 oranında düşüş göstermiştir
Son yıllarda Muğla’yı tercih eden pazarlar arasında Rusya pazarı
da önemli bir etkiye sahip olarak 2010 yılında 147 bin, 2011
yılında 182 bin, 2013 yılında 195 binlik ve 2013 yılında ise 229
binlik bir turist sayısı ile sürekli artış gösteren pazarlar arasında
yer almaktadır ve 2014 yılı ilk altı ayında Rusya’dan 100 bine
yakın turist gelirken bu sayı 2015 yılının ilk 6 ayında yaklaşık
%20 gerileyerek 82 bin düzeyine inmiştir.
Bölgede artış gösteren pazar olarak Polonya görülmektedir.
2014 yılının ilk altı ayı verilerine bakıldığı zaman 46 bin civarı
turist geldiği görülürken. 2015 yılının aynı döneminde bu
sayının 48 bin civarına ulaştığı görülmektedir.
2000’li yıllardan 2010’lu yıllara kadar bölgede turizm pazarı
açısından en önemli pazar olarak görülen İngiltere pazarı, sayısal
üstünlüğünü hala korusa da 2011 yılından beri sürekli düşüş
gerçekleştirmekte ve pazardaki etkinliğini kaybetmektedir.
Bu durum Muğla için oldukça önemli olup, İngiltere pazarı
için alternatif çözümler geliştirerek pazar kaybının sebepleri
araştırılmalı ve tekrar etkin bir konuma getirilmesi için çalışmalar
yapılmalıdır.
Germany has stopped its regression begun in 2011 and it has become a slightly developing market with 207 thousands of tourists in 2012 and 208 thousands of tourists in 2013. However, according to the data for the first six months of 2013, only 71.504 tourists have visited the region. If, the data for the first six months of 2014 is taken into consideration, this figure decreases down to the level of 68 thousands with 3.7% regression. On the other hand, the region has been visited by 195 thousands of Dutch tourists in 2010, 236 thousands in 2011, 275 thousands in 2012 and more than 275 thousands in 2013. However, if the data for the first six months of 2014 is taken into consideration, while the number of Dutch tourists has been 85 thousands, this number decreases down to 78 thousands for the first six months of 2015 with 7.9% decrase.The Russian market has also a significant impact among the markets recently preferring Mugla; Russia is among the markets which continuously show progress with 147 thousands of Russian tourists in 2010, 182 thousands in 2011, 195 thousands in 2013 and 229 thousands in 2014 and while during the first six months term of 2014, almost 100 thousands of Russian tourists have visited the region, this number has reduced 20% and decrease to 82 thousands level in the first 6 months of 2015. Poland is considered as a growing market for the region. If, the data for the first six months of 2014 is taken into consideration, it is observed that almost 46 thousands of Polish tourists have visited the region, it is observed that this figure has increased around 48 thousands during the same term of 2015.Even, the United Kingdom market which has been taken into consideration as the most important tourism market for the region from 2000s to 2010s, still maintains its numeric precedence, there has been a continuous decrease for that market since 2011 and it has been losing its effectiveness. This issue is extremely important for Mugla and the reasons of this market loss should be analyzed by developing alternative solutions and the studies and activities should be performed for reactivating that market.
2.6. İzmir 2013-2014 Turist Profili İncelemesi2.6. Izmır 2013-2014 Tourist Profile Analysis
Tablo 22: İzmir 2013-2014 Turist Profili İncelemesi Table22: Izmır 2013-2014 Tourist Profile Analysis
İZMİR Ocak-Aralık İZMİR January-December 2013 2014 2015 2014 / 2013 YILI / YEARS
(Ocak-Haziran) (January- June)
(Ocak-Haziran) (January- June)
(Ocak-Haziran) (January- June)
KARŞILAŞTIRMASI COMPARISON
ALMANYA GERMANY 128.417 125.283 121013 -4270 -3,41
İTALYA İTALY 46.407 47.201 24.646 -22.555 -47,79
FRANSA FRANCE 49.196 53.413 34.294 -19.119 -35,79
İNGİLTERE UK 41.192 38.312 34.050 -4.262 -11,12
HOLLANDA NETHERLANDS 33.078 38.902 32.186 -6.716 -17,26
BELÇİKA BELGIUM 22.535 22.969 16.531 -6.438 -28,03
TURİZM RAPORU / TOURISM REPORT
29

A.B.D. U.S.A 20.736 9.444 6.839 -2.605 -27,58
İRLANDA İRLAND 15.377 12.915 12.290 -625 -4,84
YUNANİSTAN GREECE 9.403 11.586 12.407 821 7,09
İSPANYA SPAIN 11.048 3.688 3.493 -195 -5,29
POLONYA POLAND 8.727 8.722 11.168 2446 28,04
AVUSTURYA AUSTRIA 11.114 10.441 7.687 -2.754 -26,38
İSVİÇRE SWITZERLAND 10.295 9.295 8.519 -776 -8,35
İRAN İRAN 6.253 13.380 17.998 4618 34,51
İSVEÇ SWEDEN 4.480 4.849 12.158 7309 150,73
RUSYA FED. RUSSIA 10.708 9.937 5.332 -4.605 -46,34
BELARUS (B. RUSYA) BELARUS (B. RUSYA) 9.589 9.564 8013 -1.551 -16,22
K.K.T.C. K.K.T.C. 6.635 7.722 7039 -683 -8,84
NORVEÇ NORWAY 4.597 3.619 1938 -1.681 -46,45
KANADA KANACA 11.755 2.737 1.592 -1.145 -41,83
DANİMARKA DENMARK 2.529 2.821 5.758 2937 104,11
AVUSTRALYA AUSTRAILA 3.155 2.753 4805 2052 74,54
G. KORE KOREA SOUTH 2.506 4.092 2562 -1.530 -37,39
FİNLANDİYA FİNLAND 2.006 1.690 1834 144 8,52
ÇEK CUM. CZECH REPUBLİC 2.049 1.450 2.633 1183 81,59
BREZİLYA BRAZİL 3.033 1.971 1.615 -356 -18,06
PORTEKİZ PORTUGAL 1.864 1.748 1457 -291 -16,65
JAPONYA JAPAN 1.653 1.111 1291 180 16,20
AZERBAYCAN AZERBAIJAN 919 1.084 951 -133 -12,27
G. KIBRIS RUM YÖN.S. CYPRUS GREEK MANAGEMENT 231 267 224 -43 -16,10
BULGARİSTAN BULGARİA 1.539 1.490 1613 123 8,26
ARJANTİN ARGENTINA 2.377 946 939 -7 -0,74
SLOVAKYA SLOVAKIA 574 1.008 2.033 1025 101,69
UKRAYNA UKRAINE 1.570 1.080 1095 15 1,39
MEKSİKA MEXİCO 1.539 1.277 544 -733 -57,40
ROMANYA ROMANIA 1.189 997 1027 30 3,01
HIRVATİSTAN CROATIA 658 717 735 18 2,51
SLOVENYA SLOVENIA 822 1.072 612 -460 -42,91
MACARİSTAN HUNGARY 737 782 1.346 564 72,12
FİLİPİNLER PHILIPPINES 822 537 1213 676 125,88
GÜNEY AFRİKA CUM. SOUTH AFRICA 1.005 1.106 574 -532 -48,10
LÜBNAN LEBANON 149 186 154 -32 -17,20
ÇİN HALK CUM. PEOPLE’S REPUBLIC OF CHINA 838 1.372 1.579 207 15,09
YENİ ZELLANDA NEW ZEALAND 500 367 291 -76 -20,71
LÜKSEMBURG LUXEMBOURG 1.597 551 334 -217 -39,38
ŞİLİ CHILE 566 346 332 -14 -4,05
DİĞER OTHER 9.303 7.849 8.616 767 9,77
YABANCI TOPLAM FOREIGN TOTAL 507.123 484.463 425.360 -59.103 -12,20
Kaynak: http://www.izmirkulturturizm.gov.tr/TR,95965/izmir-turizm-konseyinin-ilk-toplantisi-vali-mustafa-top-.html Erişim tarihi: 13/07/2015 http://www.izmirkulturturizm.gov.tr/TR,77298/2013-yili-istatistikleri.html Erişim tarihi: 13/07/2015 http://www.izmirkulturturizm.gov.tr/TR,77298/2014-yili-istatistikleri.html Erişim tarihi: 13/07/2015 Source: http://www.izmirkulturturizm.gov.tr/TR,95965/izmir-turizm-konseyinin-ilk-toplantisi-vali-mustafa-top-.html Access date: 13/07/2015 http://www.izmirkulturturizm.gov.tr/TR,77298/2013-yili-istatistikleri.htmlAccess date: 13/07/2015 http://www.izmirkulturturizm.gov.tr/TR,77298/2014-yili-istatistikleri.htmlAccess date: 13/07/2015
TURİZM RAPORU / TOURISM REPORT
30

İzmir son on yılda turizmde önemli bir ivme kazanmıştır. Turist sayısı
500 binli rakamlardan 1.3 milyona ulaşmıştır. Bu oranın artışında
en büyük paya sahip ülkeler genel olarak Avrupa ülkeleri olmuştur.
Ancak 2013-2015 turist giriş verileri incelendiğinde 2013 yılının
ilk altı ayında 507 bin yabancı ziyaretçi geldiği görülmektedir. 2014
yılının ilk altı aylık verilerinde bir önceki yıla ait olan rakamların
gerisinde kaldığı ve 485 binlik yabancı ziyaretçi giriş yapmıştır. Bu
rakam 2015 yılının ilk yarısında %12’lik düşüşle 425 bin olmuştur.
İzmir son on yılda turizmde önemli bir ivme kazanmıştır. Turist sayısı
500 binli rakamlardan 1.3 milyona ulaşmıştır. Bu oranın artışında en
büyük paya sahip ülkeler genel olarak Avrupa ülkeleri olmuştur. Ancak
2013-2015 turist giriş verileri incelendiğinde 2013 yılının ilk altı ayında
507 bin yabancı ziyaretçi geldiği görülmektedir. 2014 yılının ilk altı
aylık verilerinde bir önceki yıla ait olan rakamların gerisinde kaldığı ve
485 binlik yabancı ziyaretçi giriş yapmıştır. Bu rakam 2015 yılının ilk
yarısında %12’lik düşüşle 425 bin olmuştur.
Son yıllarda İzmir’i tercih eden milletler arasında Almanya pazarı da
önemli bir etkiye sahip olarak 2010 yılında 276 bin, 2011 yılında 374
bin, 2012 yılında 359 bin ve 2013 yılında ise 357 binlik turist sayısı ile
önemli bir konuma sahiptir. 2014 yılının ilk altı aylık verilerine bakıldığı
zaman bölgeye Almanya’dan 125 bin turistin geldiği görülürken, 2015
yılı ilk altı ayında ise az bir düşüşle bölgeye Almanya’dan 121 bin turist
gelmiştir.
ABD’den gelen yabacı ziyaretçilerde 2014 yılının ilk altı ayında önemli
oranda düşüş görülmüş olup 2013 yılının ilk altı ayında 20 bin üzerinde
ziyaretçisi olan pazar, 2014 yılının ilk altı ayında 9 binli rakamlarda
kalmış ve pazarda %54 oranında bir azalma görülmüştür. Düşüş devam
ederek 2015 yılı ilk 6 ayında 7 bin civarında olmuştur.
Büyük kayıp yaşanan İspanya pazarında düşüş devam ederek 2013
yılının ilk altı aylık döneminde 11 bin olan rakam, 2014 yılının ilk 6
ayında 3.600 civarında, 2015 yılı ilk 6 ayı ayında ise aynı seviyesini
koruyarak 3.400 civarında olmuştur.
Fransa pazarında da 2013 yılı ilk 6 ayına göre 2014 yılındaki yükseliş,
2015 yılında hızla düşerek 34 bin seviyelerine gelmiştir.
Hollanda pazarında ise 2013 yılına göre 2014 yılında %17’lik bir
büyüme ile 39 bine ulaşan ziyaretçi sayısı 2015 yılı ilk 6 ayında %20’lik
düşüşle 32 bin civarına gelmiştir.
En fazla dikkat çeken pazarlardan birisi de İran pazarıdır. 2013 yılının ilk
altı ayında 6 bin civarında ziyaretçisi bulunan İran, 2014 yılının ilk altı
ayında %113’lük bir artış göstererek 13 bin ziyaretçiyi geçmiştir. Artış
trendi 2015 yılının ilk 6 ayında da devam ederek 19 bin seviyelerine
ulaşmıştır.
Izmir has gained a significant momentum in tourism during the last
ten years. The number of tourists has increased from 500 thousands
to 1.3 millions. The countries with the biggest share in that increase
have generally been the European countries. However, if the check-in
data for 2013-2015 is taken into consideration, it is observed that 507
thousands of foreign visitors have come to the city during the first six
months of 2013.The figures of the first six month of 2014 has fallen
behind the figures of the same term of the previous year and 485
thousands of foreign visitors have checked in. This number has became
425 thousands with 12% decrease for the first half of 2015.
The German market has an important impact among the countries
recently preferring Izmir and it has an important position for the city
with 276 thousands of German tourists in 2010, 374 thousands in
2011, 359 thousands in 2012 and 357 thousands in 2013. If, the
data for the first six months of 2014 is taken into consideration, it is
observed that 125 thousands of German tourists have come to the
region while this number has slightly decreased to 121 thousands in
the first six months of 2015.
For the first six months of 2014, a significant decrease has been
observed on the foreign visitors from the USA and the market with
more than 20 thousands of visitors in the first six months of 2013 has
been decreased down to the figures as 9 thousands and there has been
54% decrease in the market during the first six month of 2014. This
regression has continued and this number has been around 7 thousands
for the first six months of 2015.
The Spanish market which has also shown a great decrease continued
its regression and the number of Spanish visitors which was 11
thousands for the first six months term of 2013 became 3.600 for the
first 6 months of 2014 and preserved the same level and has become
about 3.400 for the first 6 months of 2015.
The increase of the France market which has been experienced in the
first 6 months of 2014 compared to 2013, has decreased down to 34
thousands level by rapidly increasing in 2015.
The number of Dutch visitors which raised up to 39 thousands in
2014 and grown 17% compared to 2013, has decreased down to 32
thousands level with 20% regression in the first 6 months of 2015.
One of the most attractive markets is the Iran market. Iran which has
almost 6 thousands of visitors during the first six months of 2013 has
exceeded 13 thousands of visitors by 113% increase for the first six
months of 2014. This increasing trend has continued for the first 6
months of 2015 and this number has reached up yo 19 thousands level.
Tablo 23: İstanbul’a Gelen Yabancı Ziyaretçilerin Milliyetlere ve Yıllara Göre Dağılımı Table23: The Distribution of Foreign Visitors of Istanbul by Their Nationalities and Years
3. BÖLÜM: YILLARA GÖRE TURİST GİRİŞ-ÇIKIŞ RAPORLARI3. CHAPTER:CHECK-IN/CHECK-OUT REPORTS OF TOURISTS BY YEARS
3.1. İstanbul’a Gelen Yabancı Ziyaretçilerin Milliyetlere ve Yıllara Göre Dağılımı3.1. The Distribution of Foreign Visitors of Istanbul by Their Nationalities and Years
TURİZM RAPORU / TOURISM REPORT
31
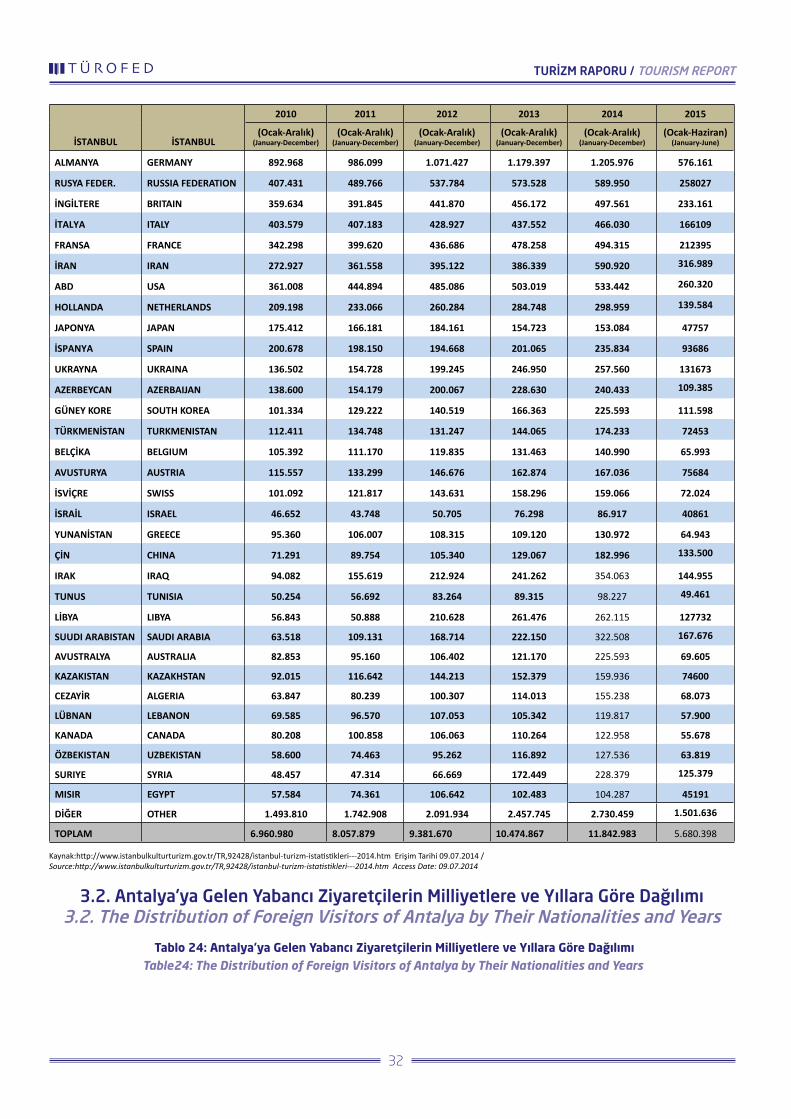
İSTANBUL İSTANBUL
2010 2011 2012 2013 2014 2015
(Ocak-Aralık) (January-December)
(Ocak-Aralık) (January-December)
(Ocak-Aralık) (January-December)
(Ocak-Aralık) (January-December)
(Ocak-Aralık) (January-December)
(Ocak-Haziran) (January-June)
ALMANYA GERMANY 892.968 986.099 1.071.427 1.179.397 1.205.976 576.161
RUSYA FEDER. RUSSIA FEDERATION 407.431 489.766 537.784 573.528 589.950 258027
İNGİLTERE BRITAIN 359.634 391.845 441.870 456.172 497.561 233.161
İTALYA ITALY 403.579 407.183 428.927 437.552 466.030 166109
FRANSA FRANCE 342.298 399.620 436.686 478.258 494.315 212395
İRAN IRAN 272.927 361.558 395.122 386.339 590.920 316.989
ABD USA 361.008 444.894 485.086 503.019 533.442 260.320
HOLLANDA NETHERLANDS 209.198 233.066 260.284 284.748 298.959 139.584
JAPONYA JAPAN 175.412 166.181 184.161 154.723 153.084 47757
İSPANYA SPAIN 200.678 198.150 194.668 201.065 235.834 93686
UKRAYNA UKRAINA 136.502 154.728 199.245 246.950 257.560 131673
AZERBEYCAN AZERBAIJAN 138.600 154.179 200.067 228.630 240.433 109.385
GÜNEY KORE SOUTH KOREA 101.334 129.222 140.519 166.363 225.593 111.598
TÜRKMENİSTAN TURKMENISTAN 112.411 134.748 131.247 144.065 174.233 72453
BELÇİKA BELGIUM 105.392 111.170 119.835 131.463 140.990 65.993
AVUSTURYA AUSTRIA 115.557 133.299 146.676 162.874 167.036 75684
İSVİÇRE SWISS 101.092 121.817 143.631 158.296 159.066 72.024
İSRAİL ISRAEL 46.652 43.748 50.705 76.298 86.917 40861
YUNANİSTAN GREECE 95.360 106.007 108.315 109.120 130.972 64.943
ÇİN CHINA 71.291 89.754 105.340 129.067 182.996 133.500
IRAK IRAQ 94.082 155.619 212.924 241.262 354.063 144.955
TUNUS TUNISIA 50.254 56.692 83.264 89.315 98.227 49.461
LİBYA LIBYA 56.843 50.888 210.628 261.476 262.115 127732
SUUDI ARABISTAN SAUDI ARABIA 63.518 109.131 168.714 222.150 322.508 167.676
AVUSTRALYA AUSTRALIA 82.853 95.160 106.402 121.170 225.593 69.605
KAZAKISTAN KAZAKHSTAN 92.015 116.642 144.213 152.379 159.936 74600
CEZAYİR ALGERIA 63.847 80.239 100.307 114.013 155.238 68.073
LÜBNAN LEBANON 69.585 96.570 107.053 105.342 119.817 57.900
KANADA CANADA 80.208 100.858 106.063 110.264 122.958 55.678
ÖZBEKISTAN UZBEKISTAN 58.600 74.463 95.262 116.892 127.536 63.819
SURIYE SYRIA 48.457 47.314 66.669 172.449 228.379 125.379
MISIR EGYPT 57.584 74.361 106.642 102.483 104.287 45191
DİĞER OTHER 1.493.810 1.742.908 2.091.934 2.457.745 2.730.459 1.501.636
TOPLAM 6.960.980 8.057.879 9.381.670 10.474.867 11.842.983 5.680.398
Kaynak:http://www.istanbulkulturturizm.gov.tr/TR,92428/istanbul-turizm-istatistikleri---2014.htm Erişim Tarihi 09.07.2014 / Source:http://www.istanbulkulturturizm.gov.tr/TR,92428/istanbul-turizm-istatistikleri---2014.htm Access Date: 09.07.2014
3.2. Antalya’ya Gelen Yabancı Ziyaretçilerin Milliyetlere ve Yıllara Göre Dağılımı3.2. The Distribution of Foreign Visitors of Antalya by Their Nationalities and Years
Tablo 24: Antalya’ya Gelen Yabancı Ziyaretçilerin Milliyetlere ve Yıllara Göre Dağılımı Table24: The Distribution of Foreign Visitors of Antalya by Their Nationalities and Years
TURİZM RAPORU / TOURISM REPORT
32
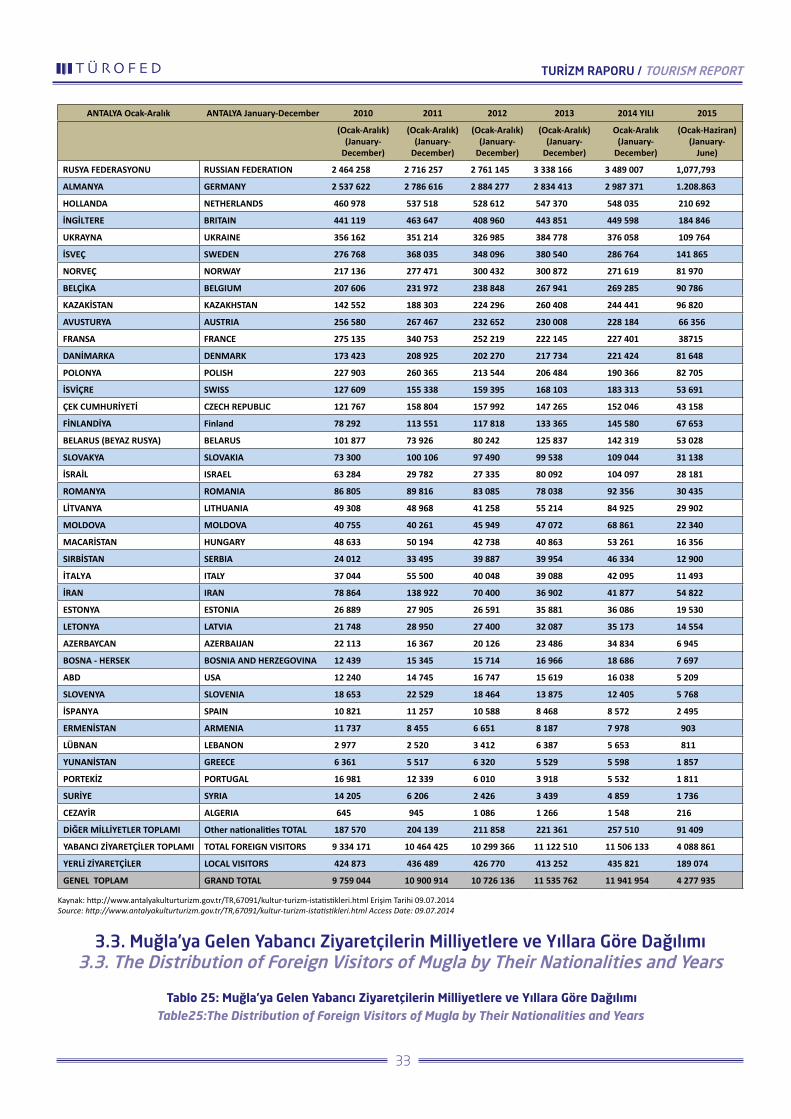
ANTALYA Ocak-Aralık ANTALYA January-December 2010 2011 2012 2013 2014 YILI 2015
(Ocak-Aralık) (January-
December)
(Ocak-Aralık) (January-
December)
(Ocak-Aralık) (January-
December)
(Ocak-Aralık) (January-
December)
Ocak-Aralık (January-
December)
(Ocak-Haziran) (January-
June)
RUSYA FEDERASYONU RUSSIAN FEDERATION 2 464 258 2 716 257 2 761 145 3 338 166 3 489 007 1,077,793
ALMANYA GERMANY 2 537 622 2 786 616 2 884 277 2 834 413 2 987 371 1.208.863
HOLLANDA NETHERLANDS 460 978 537 518 528 612 547 370 548 035 210 692
İNGİLTERE BRITAIN 441 119 463 647 408 960 443 851 449 598 184 846
UKRAYNA UKRAINE 356 162 351 214 326 985 384 778 376 058 109 764
İSVEÇ SWEDEN 276 768 368 035 348 096 380 540 286 764 141 865
NORVEÇ NORWAY 217 136 277 471 300 432 300 872 271 619 81 970
BELÇİKA BELGIUM 207 606 231 972 238 848 267 941 269 285 90 786
KAZAKİSTAN KAZAKHSTAN 142 552 188 303 224 296 260 408 244 441 96 820
AVUSTURYA AUSTRIA 256 580 267 467 232 652 230 008 228 184 66 356
FRANSA FRANCE 275 135 340 753 252 219 222 145 227 401 38715
DANİMARKA DENMARK 173 423 208 925 202 270 217 734 221 424 81 648
POLONYA POLISH 227 903 260 365 213 544 206 484 190 366 82 705
İSVİÇRE SWISS 127 609 155 338 159 395 168 103 183 313 53 691
ÇEK CUMHURİYETİ CZECH REPUBLIC 121 767 158 804 157 992 147 265 152 046 43 158
FİNLANDİYA Finland 78 292 113 551 117 818 133 365 145 580 67 653
BELARUS (BEYAZ RUSYA) BELARUS 101 877 73 926 80 242 125 837 142 319 53 028
SLOVAKYA SLOVAKIA 73 300 100 106 97 490 99 538 109 044 31 138
İSRAİL ISRAEL 63 284 29 782 27 335 80 092 104 097 28 181
ROMANYA ROMANIA 86 805 89 816 83 085 78 038 92 356 30 435
LİTVANYA LITHUANIA 49 308 48 968 41 258 55 214 84 925 29 902
MOLDOVA MOLDOVA 40 755 40 261 45 949 47 072 68 861 22 340
MACARİSTAN HUNGARY 48 633 50 194 42 738 40 863 53 261 16 356
SIRBİSTAN SERBIA 24 012 33 495 39 887 39 954 46 334 12 900
İTALYA ITALY 37 044 55 500 40 048 39 088 42 095 11 493
İRAN IRAN 78 864 138 922 70 400 36 902 41 877 54 822
ESTONYA ESTONIA 26 889 27 905 26 591 35 881 36 086 19 530
LETONYA LATVIA 21 748 28 950 27 400 32 087 35 173 14 554
AZERBAYCAN AZERBAIJAN 22 113 16 367 20 126 23 486 34 834 6 945
BOSNA - HERSEK BOSNIA AND HERZEGOVINA 12 439 15 345 15 714 16 966 18 686 7 697
ABD USA 12 240 14 745 16 747 15 619 16 038 5 209
SLOVENYA SLOVENIA 18 653 22 529 18 464 13 875 12 405 5 768
İSPANYA SPAIN 10 821 11 257 10 588 8 468 8 572 2 495
ERMENİSTAN ARMENIA 11 737 8 455 6 651 8 187 7 978 903
LÜBNAN LEBANON 2 977 2 520 3 412 6 387 5 653 811
YUNANİSTAN GREECE 6 361 5 517 6 320 5 529 5 598 1 857
PORTEKİZ PORTUGAL 16 981 12 339 6 010 3 918 5 532 1 811
SURİYE SYRIA 14 205 6 206 2 426 3 439 4 859 1 736
CEZAYİR ALGERIA 645 945 1 086 1 266 1 548 216
DİĞER MİLLİYETLER TOPLAMI Other nationalities TOTAL 187 570 204 139 211 858 221 361 257 510 91 409
YABANCI ZİYARETÇİLER TOPLAMI TOTAL FOREIGN VISITORS 9 334 171 10 464 425 10 299 366 11 122 510 11 506 133 4 088 861
YERLİ ZİYARETÇİLER LOCAL VISITORS 424 873 436 489 426 770 413 252 435 821 189 074
GENEL TOPLAM GRAND TOTAL 9 759 044 10 900 914 10 726 136 11 535 762 11 941 954 4 277 935
Kaynak: http://www.antalyakulturturizm.gov.tr/TR,67091/kultur-turizm-istatistikleri.html Erişim Tarihi 09.07.2014 Source: http://www.antalyakulturturizm.gov.tr/TR,67091/kultur-turizm-istatistikleri.html Access Date: 09.07.2014
3.3. Muğla’ya Gelen Yabancı Ziyaretçilerin Milliyetlere ve Yıllara Göre Dağılımı3.3. The Distribution of Foreign Visitors of Mugla by Their Nationalities and Years
Tablo 25: Muğla’ya Gelen Yabancı Ziyaretçilerin Milliyetlere ve Yıllara Göre Dağılımı Table25:The Distribution of Foreign Visitors of Mugla by Their Nationalities and Years
TURİZM RAPORU / TOURISM REPORT
33
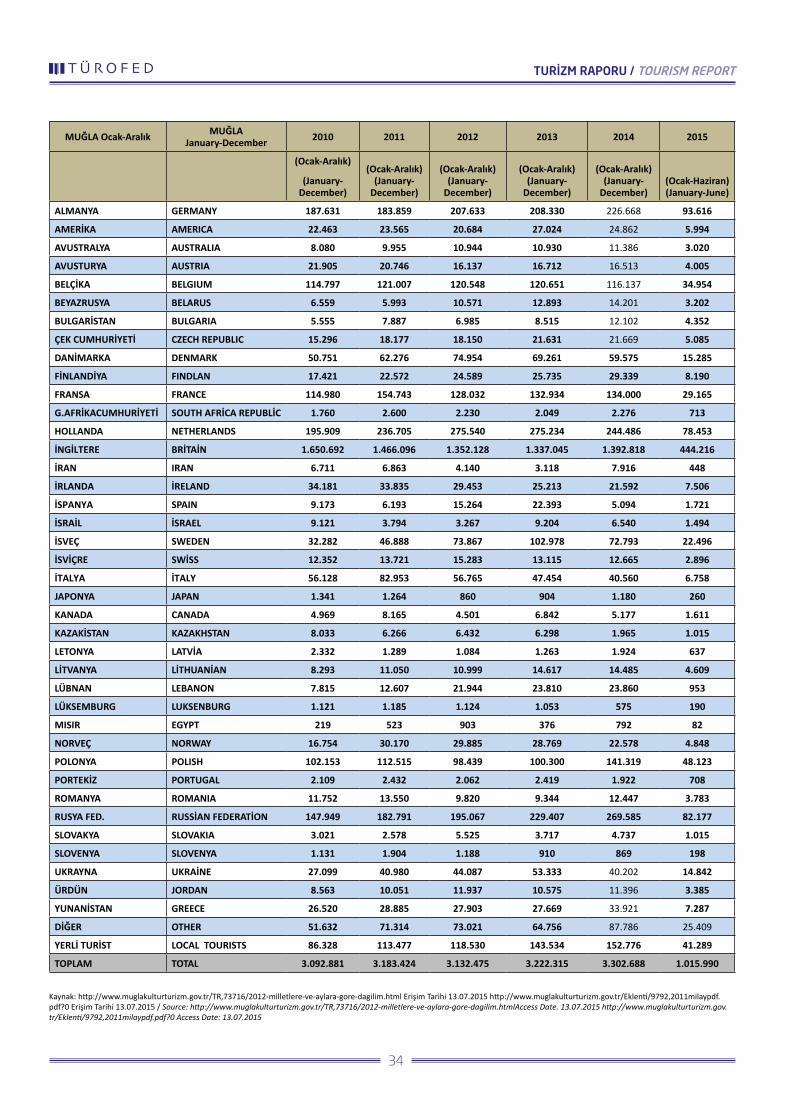
MUĞLA Ocak-Aralık MUĞLA January-December 2010 2011 2012 2013 2014 2015
(Ocak-Aralık)
(January- December)
(Ocak-Aralık) (January-
December)
(Ocak-Aralık) (January-
December)
(Ocak-Aralık) (January-
December)
(Ocak-Aralık) (January-
December)(Ocak-Haziran) (January-June)
ALMANYA GERMANY 187.631 183.859 207.633 208.330 226.668 93.616
AMERİKA AMERICA 22.463 23.565 20.684 27.024 24.862 5.994
AVUSTRALYA AUSTRALIA 8.080 9.955 10.944 10.930 11.386 3.020
AVUSTURYA AUSTRIA 21.905 20.746 16.137 16.712 16.513 4.005
BELÇİKA BELGIUM 114.797 121.007 120.548 120.651 116.137 34.954
BEYAZRUSYA BELARUS 6.559 5.993 10.571 12.893 14.201 3.202
BULGARİSTAN BULGARIA 5.555 7.887 6.985 8.515 12.102 4.352
ÇEK CUMHURİYETİ CZECH REPUBLIC 15.296 18.177 18.150 21.631 21.669 5.085
DANİMARKA DENMARK 50.751 62.276 74.954 69.261 59.575 15.285
FİNLANDİYA FINDLAN 17.421 22.572 24.589 25.735 29.339 8.190
FRANSA FRANCE 114.980 154.743 128.032 132.934 134.000 29.165
G.AFRİKACUMHURİYETİ SOUTH AFRİCA REPUBLİC 1.760 2.600 2.230 2.049 2.276 713
HOLLANDA NETHERLANDS 195.909 236.705 275.540 275.234 244.486 78.453
İNGİLTERE BRİTAİN 1.650.692 1.466.096 1.352.128 1.337.045 1.392.818 444.216
İRAN IRAN 6.711 6.863 4.140 3.118 7.916 448
İRLANDA İRELAND 34.181 33.835 29.453 25.213 21.592 7.506
İSPANYA SPAIN 9.173 6.193 15.264 22.393 5.094 1.721
İSRAİL İSRAEL 9.121 3.794 3.267 9.204 6.540 1.494
İSVEÇ SWEDEN 32.282 46.888 73.867 102.978 72.793 22.496
İSVİÇRE SWİSS 12.352 13.721 15.283 13.115 12.665 2.896
İTALYA İTALY 56.128 82.953 56.765 47.454 40.560 6.758
JAPONYA JAPAN 1.341 1.264 860 904 1.180 260
KANADA CANADA 4.969 8.165 4.501 6.842 5.177 1.611
KAZAKİSTAN KAZAKHSTAN 8.033 6.266 6.432 6.298 1.965 1.015
LETONYA LATVİA 2.332 1.289 1.084 1.263 1.924 637
LİTVANYA LİTHUANİAN 8.293 11.050 10.999 14.617 14.485 4.609
LÜBNAN LEBANON 7.815 12.607 21.944 23.810 23.860 953
LÜKSEMBURG LUKSENBURG 1.121 1.185 1.124 1.053 575 190
MISIR EGYPT 219 523 903 376 792 82
NORVEÇ NORWAY 16.754 30.170 29.885 28.769 22.578 4.848
POLONYA POLISH 102.153 112.515 98.439 100.300 141.319 48.123
PORTEKİZ PORTUGAL 2.109 2.432 2.062 2.419 1.922 708
ROMANYA ROMANIA 11.752 13.550 9.820 9.344 12.447 3.783
RUSYA FED. RUSSİAN FEDERATİON 147.949 182.791 195.067 229.407 269.585 82.177
SLOVAKYA SLOVAKIA 3.021 2.578 5.525 3.717 4.737 1.015
SLOVENYA SLOVENYA 1.131 1.904 1.188 910 869 198
UKRAYNA UKRAİNE 27.099 40.980 44.087 53.333 40.202 14.842
ÜRDÜN JORDAN 8.563 10.051 11.937 10.575 11.396 3.385
YUNANİSTAN GREECE 26.520 28.885 27.903 27.669 33.921 7.287
DİĞER OTHER 51.632 71.314 73.021 64.756 87.786 25.409
YERLİ TURİST LOCAL TOURISTS 86.328 113.477 118.530 143.534 152.776 41.289
TOPLAM TOTAL 3.092.881 3.183.424 3.132.475 3.222.315 3.302.688 1.015.990
Kaynak: http://www.muglakulturturizm.gov.tr/TR,73716/2012-milletlere-ve-aylara-gore-dagilim.html Erişim Tarihi 13.07.2015 http://www.muglakulturturizm.gov.tr/Eklenti/9792,2011milaypdf.pdf?0 Erişim Tarihi 13.07.2015 / Source: http://www.muglakulturturizm.gov.tr/TR,73716/2012-milletlere-ve-aylara-gore-dagilim.htmlAccess Date. 13.07.2015 http://www.muglakulturturizm.gov.tr/Eklenti/9792,2011milaypdf.pdf?0 Access Date: 13.07.2015
TURİZM RAPORU / TOURISM REPORT
34

3.4. İzmir’e Gelen Yabancı Ziyaretçilerin Milliyetlere ve Yıllara Göre Dağılımı 3.4. The Distribution of Foreign Visitors of Izmir by Their Nationalities and Years
Tablo 26: İzmir’e Gelen Yabancı Ziyaretçilerin Milliyetlere ve Yıllara Göre Dağılımı Table26:The Distribution of Foreign Visitors of Izmir by Their Nationalities and Years
İZMİR Ocak-Aralık İZMİR January-December
2010 2011 2012 2013 2014 2015
(Ocak-Aralık) January-
December
(Ocak-Aralık) January-
December
(Ocak-Aralık) January-
December
(Ocak-Aralık) January-
December
(Ocak-Aralık) January-
December(Ocak-Haziran) January-June
ALMANYA GERMANY 264121 361664 348157 357303 338.779 121.013
İTALYA ITALY 136711 159625 135407 152678 128.094 24.646
FRANSA FRANCE 98519 144559 127133 125429 128.124 34.294
İNGİLTERE BRITAIN 116952 105262 113171 114400 103.701 34.050
HOLLANDA NETHERLANDS 75640 81088 84119 82525 90.145 32.186
BELÇİKA BELGIUM 58444 60031 63444 66562 67.365 16.531
A.B.D. USA. 33044 35881 45985 51180 18.864 6.839
İRLANDA IRELAND 32929 40065 37368 36786 31.796 12.290
YUNANİSTAN GREECE 32797 39985 35081 28757 36.280 12.407
İSPANYA SPAIN 35004 45658 31953 33789 13.720 3.493
POLONYA POLISH 18207 26344 31446 26705 28.695 11.168
AVUSTURYA AUSTRIA 20592 28164 28246 28372 24.607 7.687
İSVİÇRE SWISS 18668 23797 24001 28254 28.002 8.519
İRAN IRAN 31688 26338 23483 27930 40.785 17.998
İSVEÇ SWEDEN 14130 16485 22974 12816 18.005 12.158
RUSYA FED. Russian Fed 13728 13994 20975 33724 29.864 5.332
BELARUS (B. RUSYA) BELARUS 19606 18158 17582 25423 27.627 8.013
K.K.T.C. K.K.T.C. 13882 14390 14491 17291 18.641 7.039
NORVEÇ NORWAY 13890 13436 13024 12273 8.527 1.938
KANADA CANADA 8743 9950 12391 20710 5.359 1.592
DANİMARKA DENMARK 11035 11619 12277 8354 11.014 5.758
AVUSTRALYA AUSTRALIA 3728 6288 9066 9148 6.735 4.805
G. KORE S. KOREA 8553 6223 5166 6274 6.428 2.562
FİNLANDİYA FINLAND 4526 4840 4960 5722 4.336 1.834
ÇEK CUMHURİYETİ CZECH REPUBLIC 1650 4701 4868 5390 6.219 2.633
BREZİLYA BRAZIL 1845 4190 4004 7206 3.786 1.615
PORTEKİZ PORTUGAL 3747 3528 3981 4498 3.968 1.457
JAPONYA JAPAN 3117 3566 3679 3827 2.863 1.291
AZERBAYCAN ARGENTINA 293 5569 3509 4367 4.850 951
G. KIBRIS RUM YÖN. G. DIRECTION OF THE GREEK CYPRIOT. 936 1993 3388 2017 2.885 224
BULGARİSTAN BULGARIA 1686 2993 3170 3742 4.112 1.613
ARJANTİN ARGENTINA 1391 2693 2737 4355 1.835 939
SLOVAKYA SLOVAKIA 858 1170 2736 3056 2.984 2.033
UKRAYNA UKRAINE 2598 3166 2247 4540 2.632 1.095
MEKSİKA MEXICO 1491 2088 2222 3514 2.439 544
ROMANYA ROMANIA 1047 2129 2104 2758 2.484 1.027
HIRVATİSTAN CROATIA 1567 1821 1941 1559 1.554 735
SLOVENYA SLOVENIA 1674 1856 1849 2906 2.113 612
MACARİSTAN HUNGARY 1097 1592 1814 2042 1.901 1.346
TURİZM RAPORU / TOURISM REPORT
35
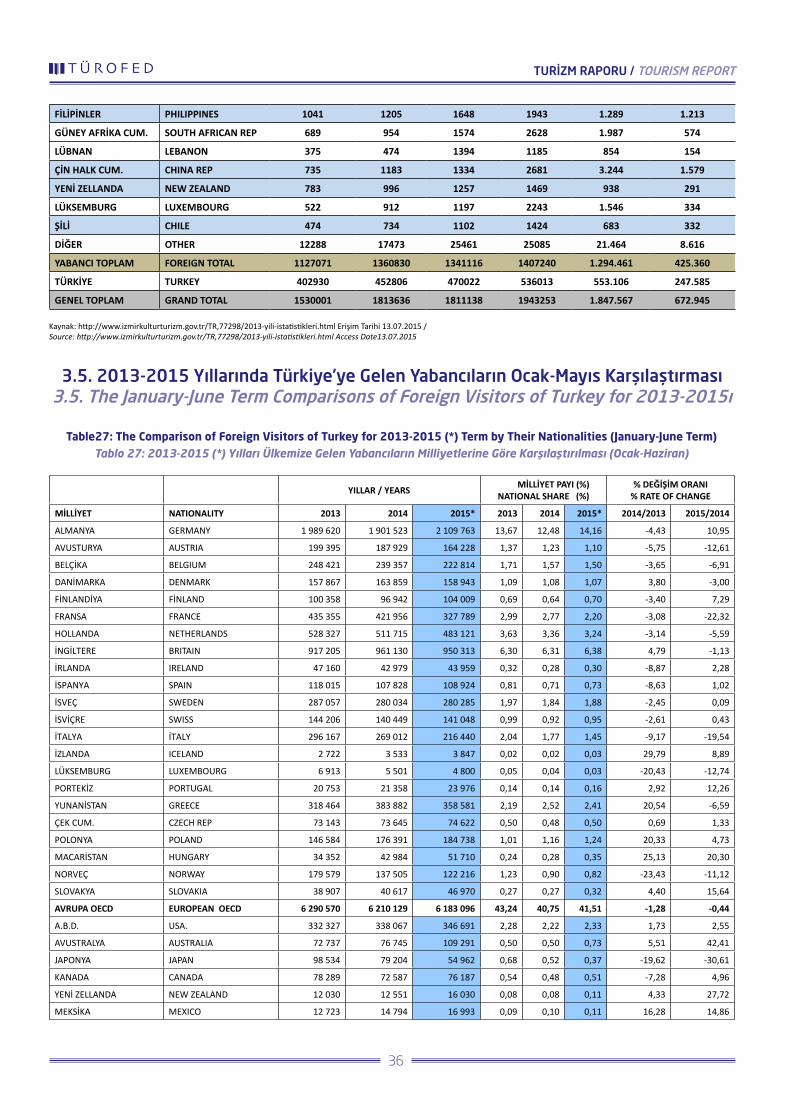
FİLİPİNLER PHILIPPINES 1041 1205 1648 1943 1.289 1.213
GÜNEY AFRİKA CUM. SOUTH AFRICAN REP 689 954 1574 2628 1.987 574
LÜBNAN LEBANON 375 474 1394 1185 854 154
ÇİN HALK CUM. CHINA REP 735 1183 1334 2681 3.244 1.579
YENİ ZELLANDA NEW ZEALAND 783 996 1257 1469 938 291
LÜKSEMBURG LUXEMBOURG 522 912 1197 2243 1.546 334
ŞİLİ CHILE 474 734 1102 1424 683 332
DİĞER OTHER 12288 17473 25461 25085 21.464 8.616
YABANCI TOPLAM FOREIGN TOTAL 1127071 1360830 1341116 1407240 1.294.461 425.360
TÜRKİYE TURKEY 402930 452806 470022 536013 553.106 247.585
GENEL TOPLAM GRAND TOTAL 1530001 1813636 1811138 1943253 1.847.567 672.945
Kaynak: http://www.izmirkulturturizm.gov.tr/TR,77298/2013-yili-istatistikleri.html Erişim Tarihi 13.07.2015 / Source: http://www.izmirkulturturizm.gov.tr/TR,77298/2013-yili-istatistikleri.html Access Date13.07.2015
3.5. 2013-2015 Yıllarında Türkiye’ye Gelen Yabancıların Ocak-Mayıs Karşılaştırması3.5. The January-June Term Comparisons of Foreign Visitors of Turkey for 2013-2015ı
Table27: The Comparison of Foreign Visitors of Turkey for 2013-2015 (*) Term by Their Nationalities (January-June Term) Tablo 27: 2013-2015 (*) Yılları Ülkemize Gelen Yabancıların Milliyetlerine Göre Karşılaştırılması (Ocak-Haziran)
YILLAR / YEARS MİLLİYET PAYI (%) NATIONAL SHARE (%)
% DEĞİŞİM ORANI % RATE OF CHANGE
MİLLİYET NATIONALITY 2013 2014 2015* 2013 2014 2015* 2014/2013 2015/2014
ALMANYA GERMANY 1 989 620 1 901 523 2 109 763 13,67 12,48 14,16 -4,43 10,95
AVUSTURYA AUSTRIA 199 395 187 929 164 228 1,37 1,23 1,10 -5,75 -12,61
BELÇİKA BELGIUM 248 421 239 357 222 814 1,71 1,57 1,50 -3,65 -6,91
DANİMARKA DENMARK 157 867 163 859 158 943 1,09 1,08 1,07 3,80 -3,00
FİNLANDİYA FİNLAND 100 358 96 942 104 009 0,69 0,64 0,70 -3,40 7,29
FRANSA FRANCE 435 355 421 956 327 789 2,99 2,77 2,20 -3,08 -22,32
HOLLANDA NETHERLANDS 528 327 511 715 483 121 3,63 3,36 3,24 -3,14 -5,59
İNGİLTERE BRITAIN 917 205 961 130 950 313 6,30 6,31 6,38 4,79 -1,13
İRLANDA IRELAND 47 160 42 979 43 959 0,32 0,28 0,30 -8,87 2,28
İSPANYA SPAIN 118 015 107 828 108 924 0,81 0,71 0,73 -8,63 1,02
İSVEÇ SWEDEN 287 057 280 034 280 285 1,97 1,84 1,88 -2,45 0,09
İSVİÇRE SWISS 144 206 140 449 141 048 0,99 0,92 0,95 -2,61 0,43
İTALYA İTALY 296 167 269 012 216 440 2,04 1,77 1,45 -9,17 -19,54
İZLANDA ICELAND 2 722 3 533 3 847 0,02 0,02 0,03 29,79 8,89
LÜKSEMBURG LUXEMBOURG 6 913 5 501 4 800 0,05 0,04 0,03 -20,43 -12,74
PORTEKİZ PORTUGAL 20 753 21 358 23 976 0,14 0,14 0,16 2,92 12,26
YUNANİSTAN GREECE 318 464 383 882 358 581 2,19 2,52 2,41 20,54 -6,59
ÇEK CUM. CZECH REP 73 143 73 645 74 622 0,50 0,48 0,50 0,69 1,33
POLONYA POLAND 146 584 176 391 184 738 1,01 1,16 1,24 20,33 4,73
MACARİSTAN HUNGARY 34 352 42 984 51 710 0,24 0,28 0,35 25,13 20,30
NORVEÇ NORWAY 179 579 137 505 122 216 1,23 0,90 0,82 -23,43 -11,12
SLOVAKYA SLOVAKIA 38 907 40 617 46 970 0,27 0,27 0,32 4,40 15,64
AVRUPA OECD EUROPEAN OECD 6 290 570 6 210 129 6 183 096 43,24 40,75 41,51 -1,28 -0,44
A.B.D. USA. 332 327 338 067 346 691 2,28 2,22 2,33 1,73 2,55
AVUSTRALYA AUSTRALIA 72 737 76 745 109 291 0,50 0,50 0,73 5,51 42,41
JAPONYA JAPAN 98 534 79 204 54 962 0,68 0,52 0,37 -19,62 -30,61
KANADA CANADA 78 289 72 587 76 187 0,54 0,48 0,51 -7,28 4,96
YENİ ZELLANDA NEW ZEALAND 12 030 12 551 16 030 0,08 0,08 0,11 4,33 27,72
MEKSİKA MEXICO 12 723 14 794 16 993 0,09 0,10 0,11 16,28 14,86
TURİZM RAPORU / TOURISM REPORT
36
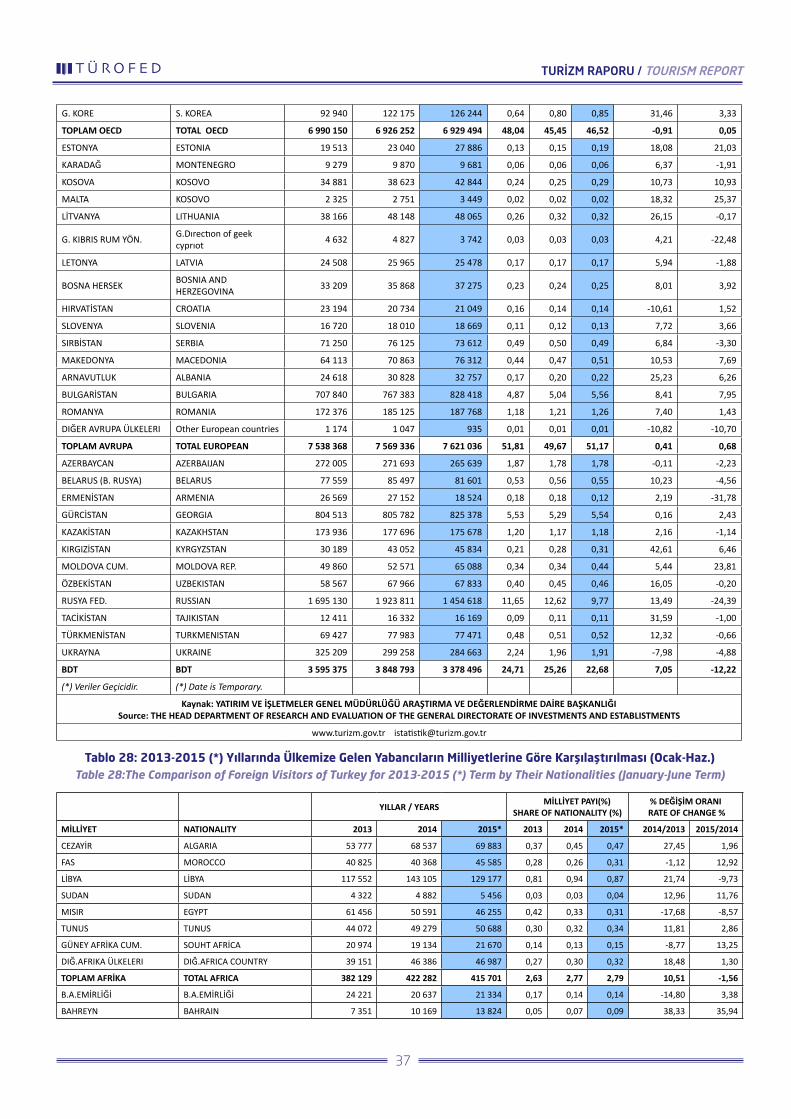
G. KORE S. KOREA 92 940 122 175 126 244 0,64 0,80 0,85 31,46 3,33
TOPLAM OECD TOTAL OECD 6 990 150 6 926 252 6 929 494 48,04 45,45 46,52 -0,91 0,05
ESTONYA ESTONIA 19 513 23 040 27 886 0,13 0,15 0,19 18,08 21,03
KARADAĞ MONTENEGRO 9 279 9 870 9 681 0,06 0,06 0,06 6,37 -1,91
KOSOVA KOSOVO 34 881 38 623 42 844 0,24 0,25 0,29 10,73 10,93
MALTA KOSOVO 2 325 2 751 3 449 0,02 0,02 0,02 18,32 25,37
LİTVANYA LITHUANIA 38 166 48 148 48 065 0,26 0,32 0,32 26,15 -0,17
G. KIBRIS RUM YÖN. G.Dırectıon of geek cyprıot 4 632 4 827 3 742 0,03 0,03 0,03 4,21 -22,48
LETONYA LATVIA 24 508 25 965 25 478 0,17 0,17 0,17 5,94 -1,88
BOSNA HERSEK BOSNIA AND HERZEGOVINA 33 209 35 868 37 275 0,23 0,24 0,25 8,01 3,92
HIRVATİSTAN CROATIA 23 194 20 734 21 049 0,16 0,14 0,14 -10,61 1,52
SLOVENYA SLOVENIA 16 720 18 010 18 669 0,11 0,12 0,13 7,72 3,66
SIRBİSTAN SERBIA 71 250 76 125 73 612 0,49 0,50 0,49 6,84 -3,30
MAKEDONYA MACEDONIA 64 113 70 863 76 312 0,44 0,47 0,51 10,53 7,69
ARNAVUTLUK ALBANIA 24 618 30 828 32 757 0,17 0,20 0,22 25,23 6,26
BULGARİSTAN BULGARIA 707 840 767 383 828 418 4,87 5,04 5,56 8,41 7,95
ROMANYA ROMANIA 172 376 185 125 187 768 1,18 1,21 1,26 7,40 1,43
DIĞER AVRUPA ÜLKELERI Other European countries 1 174 1 047 935 0,01 0,01 0,01 -10,82 -10,70
TOPLAM AVRUPA TOTAL EUROPEAN 7 538 368 7 569 336 7 621 036 51,81 49,67 51,17 0,41 0,68
AZERBAYCAN AZERBAIJAN 272 005 271 693 265 639 1,87 1,78 1,78 -0,11 -2,23
BELARUS (B. RUSYA) BELARUS 77 559 85 497 81 601 0,53 0,56 0,55 10,23 -4,56
ERMENİSTAN ARMENIA 26 569 27 152 18 524 0,18 0,18 0,12 2,19 -31,78
GÜRCİSTAN GEORGIA 804 513 805 782 825 378 5,53 5,29 5,54 0,16 2,43
KAZAKİSTAN KAZAKHSTAN 173 936 177 696 175 678 1,20 1,17 1,18 2,16 -1,14
KIRGIZİSTAN KYRGYZSTAN 30 189 43 052 45 834 0,21 0,28 0,31 42,61 6,46
MOLDOVA CUM. MOLDOVA REP. 49 860 52 571 65 088 0,34 0,34 0,44 5,44 23,81
ÖZBEKİSTAN UZBEKISTAN 58 567 67 966 67 833 0,40 0,45 0,46 16,05 -0,20
RUSYA FED. RUSSIAN 1 695 130 1 923 811 1 454 618 11,65 12,62 9,77 13,49 -24,39
TACİKİSTAN TAJIKISTAN 12 411 16 332 16 169 0,09 0,11 0,11 31,59 -1,00
TÜRKMENİSTAN TURKMENISTAN 69 427 77 983 77 471 0,48 0,51 0,52 12,32 -0,66
UKRAYNA UKRAINE 325 209 299 258 284 663 2,24 1,96 1,91 -7,98 -4,88
BDT BDT 3 595 375 3 848 793 3 378 496 24,71 25,26 22,68 7,05 -12,22
(*) Veriler Geçicidir. (*) Date is Temporary.
Kaynak: YATIRIM VE İŞLETMELER GENEL MÜDÜRLÜĞÜ ARAŞTIRMA VE DEĞERLENDİRME DAİRE BAŞKANLIĞI Source: THE HEAD DEPARTMENT OF RESEARCH AND EVALUATION OF THE GENERAL DIRECTORATE OF INVESTMENTS AND ESTABLISTMENTS
www.turizm.gov.tr [email protected]
Tablo 28: 2013-2015 (*) Yıllarında Ülkemize Gelen Yabancıların Milliyetlerine Göre Karşılaştırılması (Ocak-Haz.) Table 28:The Comparison of Foreign Visitors of Turkey for 2013-2015 (*) Term by Their Nationalities (January-June Term)
YILLAR / YEARS MİLLİYET PAYI(%) SHARE OF NATIONALITY (%)
% DEĞİŞİM ORANI RATE OF CHANGE %
MİLLİYET NATIONALITY 2013 2014 2015* 2013 2014 2015* 2014/2013 2015/2014
CEZAYİR ALGARIA 53 777 68 537 69 883 0,37 0,45 0,47 27,45 1,96
FAS MOROCCO 40 825 40 368 45 585 0,28 0,26 0,31 -1,12 12,92
LİBYA LİBYA 117 552 143 105 129 177 0,81 0,94 0,87 21,74 -9,73
SUDAN SUDAN 4 322 4 882 5 456 0,03 0,03 0,04 12,96 11,76
MISIR EGYPT 61 456 50 591 46 255 0,42 0,33 0,31 -17,68 -8,57
TUNUS TUNUS 44 072 49 279 50 688 0,30 0,32 0,34 11,81 2,86
GÜNEY AFRİKA CUM. SOUHT AFRİCA 20 974 19 134 21 670 0,14 0,13 0,15 -8,77 13,25
DIĞ.AFRIKA ÜLKELERI DIĞ.AFRICA COUNTRY 39 151 46 386 46 987 0,27 0,30 0,32 18,48 1,30
TOPLAM AFRİKA TOTAL AFRICA 382 129 422 282 415 701 2,63 2,77 2,79 10,51 -1,56
B.A.EMİRLİĞİ B.A.EMİRLİĞİ 24 221 20 637 21 334 0,17 0,14 0,14 -14,80 3,38
BAHREYN BAHRAIN 7 351 10 169 13 824 0,05 0,07 0,09 38,33 35,94
TURİZM RAPORU / TOURISM REPORT
37

KATAR QATAR 7 828 11 020 15 577 0,05 0,07 0,10 40,78 41,35
KUVEYT KUWAIT 37 263 51 740 71 766 0,26 0,34 0,48 38,85 38,71
IRAK IRAQ 272 226 393 922 397 802 1,87 2,59 2,67 44,70 0,98
LÜBNAN LEBANON 57 723 59 726 64 148 0,40 0,39 0,43 3,47 7,40
ÜRDÜN JORDAN 43 287 51 000 54 362 0,30 0,33 0,36 17,82 6,59
S.ARABİSTAN S.ARABİSTAN 115 111 140 191 179 377 0,79 0,92 1,20 21,79 27,95
K.K.T.C. K.K.T.C. 95 636 98 287 103 562 0,66 0,65 0,70 2,77 5,37
İSRAİL İSRAEL 57 082 95 664 71 421 0,39 0,63 0,48 67,59 -25,34
YEMEN YEMEN 7 862 11 419 10 795 0,05 0,07 0,07 45,24 -5,46
DIĞ.BATI ASYA ÜLKELERI West asia countries 672 168 535 828 353 635 4,62 3,52 2,37 -20,28 -34,00
TOP. BATI ASYA TOTAL WEST ASİA 1 397 758 1 479 603 1 357 603 9,61 9,71 9,11 5,86 -8,25
BANGLADEŞ BANGLADESH 4 176 6 434 5 736 0,03 0,04 0,04 54,07 -10,85
ÇİN HALK CUM. PEOPLE’S REPUBLİC OF CHİNA 63 742 89 769 144 798 0,44 0,59 0,97 40,83 61,30
ENDONEZYA INDONESİA 30 930 28 868 29 336 0,21 0,19 0,20 -6,67 1,62
FİLİPİNLER FİLİPİNOS 25 529 26 684 35 424 0,18 0,18 0,24 4,52 32,75
HİNDİSTAN İNDİA 49 480 57 990 63 759 0,34 0,38 0,43 17,20 9,95
İRAN İRAN 528 669 749 802 809 790 3,63 4,92 5,44 41,83 8,00
MALEZYA MALAYSİA 29 381 35 236 36 738 0,20 0,23 0,25 19,93 4,26
PAKİSTAN PAKİSTAN 16 260 22 816 25 183 0,11 0,15 0,17 40,32 10,37
SİNGAPUR SİNGAPORE 10 364 12 947 12 525 0,07 0,08 0,08 24,92 -3,26
TAYLAND THAİLAND 11 597 13 057 14 018 0,08 0,09 0,09 12,59 7,36
DIĞ.GÜN.ASYA ÜLK. OTHER SOUTH ASİAN CONTRİES. 40 505 47 215 53 582 0,28 0,31 0,36 16,57 13,49
TOP.GÜN.ASYA TOTAL SOUTH ASİA 810 633 1 090 818 1 230 889 5,57 7,16 8,26 34,56 12,84
TOPLAM ASYA TOTAL ASİA 2 208 391 2 570 421 2 588 492 15,18 16,87 17,38 16,39 0,70
DİĞ. KUZEY AMERİKA ÜLK. OTHER NORTH AMERİCA 4 710 5 610 7 712 0,03 0,04 0,05 19,11 37,47
DİĞ. ORTA AMERİKA ÜLK. OTHER CENTRİAL AMERİCA 3 574 3 319 4 277 0,02 0,02 0,03 -7,13 28,86
ARJANTİN ARGENTİNA 22 874 20 409 35 039 0,16 0,13 0,24 -10,78 71,68
BREZİLYA BRAZİL 52 304 37 217 41 230 0,36 0,24 0,28 -28,84 10,78
KOLOMBİYA COLOMBİA 8 768 9 437 12 395 0,06 0,06 0,08 7,63 31,34
ŞİLİ CHİLE 6 343 7 132 11 226 0,04 0,05 0,08 12,44 57,40
VENEZÜELLA VENEZUELAN 4 121 3 036 2 786 0,03 0,02 0,02 -26,33 -8,23
DİĞ.GÜN.AMERİKA ÜLK. DİĞ.GÜN.AMERİKA ÜLK. 6 889 7 338 9 449 0,05 0,05 0,06 6,52 28,77
TOP.GÜN.AMERİKA TOTAL SOUTH.AMERİCA 101 299 84 569 112 125 0,70 0,55 0,75 -16,52 32,58
TOPLAM AMERİKA TOTAL AMERİCA 109 583 93 498 124 114 0,75 0,61 0,83 -14,68 32,75
OKYANUSYA OCEANİA 177 273 153 0,00 0,00 0,00 54,24 -43,96
MİLLİYETSİZ NATİONALİTY 15 918 17 495 20 364 0,11 0,11 0,14 9,91 16,40
YABANCI TOPLAM FOREİGN TOTAL 14 549 521 15 238 221 14 894 754 100,00 100,00 100,00 4,73 -2,25
(*) Veriler Geçicidir. (*) Date is Temporary.
Kaynak: YATIRIM VE İŞLETMELER GENEL MÜDÜRLÜĞÜ ARAŞTIRMA VE DEĞERLENDİRME DAİRE BAŞKANLIĞI Source: THE HEAD DEPARTMENT OF RESEARCH AND EVALUATION WESTOF THE GENERAL DIRECTORATE OF INVESTMENTS AND ESTABLISTMENTS
www.turizm.gov.tr [email protected]
TURİZM RAPORU / TOURISM REPORT
38

“Dünya Turizm Örgütü (WTO), turizmin insanların yaşamlarına ve
evrene anlamlı bir katkı yapabilir inancı ile yönetilmektedir. Bu inancın
izleri, turizmin gelişimi için yol haritası olarak gösterilen Global Turizm
Etik Kodların merkezinde de yer almaktadır. Herkesi, turistlerin, tur
operatörlerinin, yerel halkın ve çevrenin yararı için kodları benimsemeye
ve yaymaya davet ediyorum”
Taleb Rifai, Dünya Turizm Örgütü (WTO) Genel Sekreteri
Turizm sektöründeki hızlı büyüme; turizmin çevre ve toplum üzerindeki
olumsuz etkisini azaltmak, yararlarını artırmak için sürdürülebilir yaklaşım
ilkelerinin sektöre entegre edilmesini zorunlu hale getirmektedir. Çünkü
turizm sektörü, beslendiği kaynaklara, yani çevreye ve kültürel değerlere
kontrol edilmediği ya da iyi yönetilmediği takdirde zarar verme potansiyeli
yüksek bir sektördür. Yeşil/küresel kapitalist sistemin sıfır noktasına
yaklaşırken yarattığı mahşerin dört atlısından birisi olarak ekolojik
krizin varlığı vurgulanarak, ekolojik krizin beraberinde sürdürülebilir
çevre paradoksunu yarattığını ve turizm faaliyetlerinin kendi geleceğini
tehlikeye attığının fark edilmesiyle beraber ‘doğanın bir tüketim nesnesi
haline dönüştürülmesi’ gerçeğinin sürdürülebilir turizm kavramını ortaya
çıkardığı belirtilmektedir. 1980’li yıllarda Brundtland raporu ile popüler
olan sürdürülebilir turizm yaklaşımı, sektörün gelişimini ve kalıcılığını
sağlamak için bir takım uygulamalara işaret etmektedir. Aynı zamanda
bu yaklaşım uzun vadede destinasyonların çevresel, ekonomik ve
sosyo-kültürel açıdan negatif etkilerini yok etmeyi amaçlamaktadır.
Sürdürülebilirlik ilkeleri, Birleşmiş Milletler Dünya Turizm Örgütü’nün
(UNWTO) yatırım raporlarında “Turizmde Küresel Etik Kodları” içerisinde
vurgulanmaktadır. 2013 yılı verilerine göre, 30 ülkede 200’den fazla
turizm paydaşı etik ve sorumlu işletme uygulamaları ve politikalarını
kamuya duyurarak bu kodların uygulanması kampanyasına katılmıştır.
Turizmde Küresel Etik Kodları içinde seyahat ve turizm hareketlerinin
sosyal, ekonomik, kültürel ve çevresel içeriklerini içeren 10 ilke şu
şekildedir (http://ethics.unwto.org, 27.05.2016);
Madde 1: Turizmin halk ve toplumlar arasında karşılıklı anlayış ve
saygıya katkısı
Madde 2: Turizmin bireysel ve kolektif yönleri
Madde 3: Sürdürülebilir kalkınma unsuru olarak turizm
Madde 4: Kültürel mirası kullanan ve zenginleştiren unsur olarak turizm
Madde 5: Ülke ve toplumların refahını artıran bir faaliyet olarak turizm
Madde 6: Turizmin geliştirilmesinde paydaşların yükümlülükleri
Madde 7: Turizme katılma hakkı
Madde 8: Turizm hareket özgürlüğü
Madde 9: Turizm sektöründe çalışanların ve girişimcilerin hakları
Madde 10: Turizmde global etik ilkelerinin uygulanması
Madde 3’te vurgulandığı üzere, turizm sektörü sürdürülebilir kalkınmanın
temel unsurdur ve bu madde şu içeriklere sahiptir (http://ethics.unwto.
org, 28.05.2016);
“The World Tourism Organization (WTO) is executed on the basis to
make a meaningful contribution to the lives of people and the universe.
The traces of this belief is the center of the Global Tourism Ethic Codes
which are shown as the roadmap for development of tourism. I invite
everyone to adopt and disseminate these codes for the benefit of
tourists, tour operators, local people and the environment”
TalebRifai, The General Secretary of the World Tourism Organization
(WTO)
The rapid development of the tourism sector makes it mandatory to
reduce the negative impact of tourism on the environment and society
and integrate a sustainable approach principles into the sector for
increasing its positive influence. Because, the tourism sector is a sector
which has high damaging potential on its resources in other words
the environment and cultural values if it is not controlled or managed,
well. The presence of the ecological crises is emphasized as one of
the four horsemen of the apocalypse created by the green/capitalist
system while getting closer to the zero point and it is indicated that
the ecological crisis creates a sustainable environmental paradox and
a sustainable tourism concept emerges based on “turning nature a
consumption object” by recognizing that the tourism activities will
endanger its own future. The sustainable tourism approach which
has become popular in 1980s by the Brundtland report, indicates a
particular set of practices in order to ensure the development and
sustainability of sector. In addition, this approach aims to eliminate
the environmental, economical and socio-cultural negative impacts of
destinations in long-term. The Sustainability Principles are emphasized
within the scope of “the Global Ethic Codes of Tourism” in the
investment reports of the World Tourism Organization of the United
Nations (UNWTO). According to 2013 date, more than 200 tourism
stakeholders from 30 countries have participated in implementation
campaign of these codes by means of ethical and responsible operating
activities and announcing their policies to public opinion. 10 principles
including the social, economical, cultural and environmental contents
of travel and tourism movements within the scope of the Tourism
Global Ethic Codes are as in the following: (http://ethics.unwto.org,
27.05.2016);
Article 1: Contribution of tourism in mutual understanding and respect
between public and societies
Article 2: Individual and Collective Aspects of Tourism
Article 3: Tourism as a sustainable development aspect
Article 4: Tourism as an aspect which uses and enriches cultural
inheritance
Article 5: Tourism as an Aspect Improving the Prosperity of Countries
and Societies
Article 6: The Liabilities of Stakeholders in Developing Tourism
Article 7: Right to Participate in Tourism
Article 8: Freedom of Action in Tourism
Article 9: The Rights of Employees and Entrepreneurs in Tourism Sector
Article 10: Implementing Global Ethic principles in Tourism
As indicated in the Article 3, the tourism sector is the primary element
for sustainable development and this article includes the following
contents (http://ethics.unwto.org, 28.05.2016);
3.6. Sürdürülebilir Turizm / 3.6. Sustainable Tourism
3.6.1. Sertifikasyon Uygulamaları ve Gerekliliği 3.6.1. Certification Applications and Necessity
TURİZM RAPORU / TOURISM REPORT
39

1. Turizmin gelişmesinde bütün taraflar, sağlam, sürekli ve sürdürülebilir ekonomik büyüme perspektifinde doğal çevreyi korumakla yükümlüdür ve ihtiyaçların giderilmesinde gelecek nesiller dikkate alınmalıdır. 2. Kaynak tasarrufu, özellikle de su ve enerji tasarrufu sağlayan ve atık azaltan yöntemlere öncelik tanıyan turizm türleri, ulusal/bölgesel/yerel kamu yetkililerince teşvik edilmelidir. 3. Okul tatilleri gibi turist akışının arttığı dönemler, turizmin çevre üzerindeki etkisini azaltacak şekilde düzenlenmelidir. 4. Turizm altyapısı ve faaliyetleri, ekosistem, bio çeşitlilik ve vahşi yaşamın korunmasını sağlayacak şekilde hazırlanmalıdır. 5. Doğa turizmi ve eko turizm, turizmin gelişmesi ve zenginleşmesinde rol oynayan temel unsurlar olarak kabul edilmelidir.
Birleşmiş Milletler Dünya Turizm Örgütü’nün (UNWTO) neden sürdürülebilir turizme önem verdiğine bakıldığında ise, sektörün içinde yer alan turizm işletmelerinin duyarsız uygulamalarının varlığı, yerel halkın ve turistlerin turizmin etkilerine karşı bilinçsiz olmaları gibi durumlara işaret edilebilir. Bu durumun somut örneklerini Birleşmiş Milletler Dünya Turizm Örgütü’nün 2013 yılında yayınladığı sürdürülebilir turizm gelişimi raporunda görmek mümkündür. Raporda gelişimin en önemli gücü olarak gösterilen turizmin negatif yönleri şu şekilde sıralamaktadır; • Turizm, ağırlıklı olarak ulaştırma olanakları ve ulaştırmanın yanında konaklama gibi turizm faaliyetleri ile birlikte mevcut karbon salınımına %5 oranında katkı yaparak iklim değişikliğine yol açmaktadır.• Turizm işletmeleri tarafından katı ve sıvı atıkların doğru şekilde yok edilmemesi yerelde arazi ve su kirliliğine yol açmaktadır. • Turist aktiviteleri, bazı bölgelerde sorunlar oluşturmaktadır. •Konaklama işletmeleri arazi, su ve enerji gibi yenilenebilir olmayan ve değerli kaynakları kullanmaktadır. Bazı bölgelerde, tatil köylerinde yöre halkının kullandığı sudan daha fazla su tüketilmektedir. • Hassas alanlarda turizm gelişiminin yetersiz yönetilmesi ve uygun olmayan aktiviteler bio çeşitliliğe zarar verebilir. •Yetersiz ziyaretçi yönetiminin olduğu yerlerde kültürel miras alanları üzerinde negatif etkiler söz konusu olabilir. • Turizm, sınırlandırılmamış girişlerin olduğu bölgelerde yerel toplumlar üzerinde suç oranı artışı, cinsel sömürü ve sosyo-kültürel geleneklerin ve değerlerin yok olması gibi negatif etkilere neden olabilmektedir.•Turizm, iş olanakları yaratırken kötü çalışma koşullarının oluşmasına neden olabilmektedir.•Sektörün ekonomik performansı, ekonomik durumlar, doğal olaylar ve güvenlik endişeleri gibi durumlar nedeniyle kaynak pazarlara duyarlıdır.
Birçok alanda sıkça kullanılmakta olan sürdürülebilirlik kavramı; toplumun sosyal, kültürel, bilimsel, doğal ve insan kaynaklarının tümünün ihtiyatlı kullanılmasını sağlayan ve buna saygı duyma temelinde sosyal bir bakış oluşturan katılımcı bir süreç olarak tanımlanmaktadır. (Gladwin vd., 1995: 877). Bu doğrultuda Birleşmiş Milletler Çevre Programı (UNEP) ve Birleşmiş Milletler Dünya Turizm Örgütü (UNWTO) bir araya gelerek turizm faaliyetlerinin gelecekte devam edebilmesi, çevreye ve topluma yararlarını sürdürülebilir bir şekilde artırmak için 2005 yılında 12 maddelik “Turizmi Daha Sürdürülebilir Hale Getirme” raporu yayınlamıştır. Tablo 1’de yer alan bu maddelere bakıldığında sürdürülebilir turizmin bütünsel bir yaklaşımla ekonomik, sosyal ve çevresel açıdan değerlendirilmesi gerektiği görülmektedir. Tabloda görüldüğü üzere, 12 maddenin temel çıkış mantığı toplum ve çevre üzerindeki olumsuz etkileri en aza indirmek, yerel ekonomiye yaratıcı katkı sağlamak, doğal ve kültürel kaynakları korunmak, yerel halkın ve turistin yaşam kalitesini korumaktır.
1. All parties are liable to preserve and protect natural environment through a stable, permanent and sustainable economical development perspective for development of tourism and the future generations should be taken into consideration in satisfying these needs. 2. The types of tourism which ensure saving of resources especially water and energy savings and prioritize waste reduction methods should be encourages by the national/regional/local public authorities. 3. The terms when tourist flow increases such as school holidays should be organized in order to decrease the impact of tourism on environment. 4. The infrastructure and activities of tourism should be prepared in order to preserve and protect ecosystem, biodiversity and wild life. 5. Nature tourism and ecotourism should be adopted and accepted as the main elements playing an active role in development and enrichment of tourism.
If, it is considered why the World Tourism Organization of the United Nations (UNWTO) considers sustainable tourism important, the presence of insensitive practices of tourism facilities of the sector and unawareness of the local people and tourists against the impacts of tourism can be indicated. It is possible to see concrete examples of that case in the sustainable tourism development report issued by the World Tourism Organization of the United Nations (UNWTO) in 2013. The negative aspects of tourism which is shown as the most important force of development are listed in that report as in the following; • As well as tourism activities such as accommodation, tourism causes climate change by 5% contribution to current carbon emission mainly through transportation.• Tourism causes local land and water pollution because tourism facilities do not dispose solid and liquid wastes, properly. • The activities of tourists cause problems in some areas. •The accommodation facilities uses non-renewable and valuable resources such as land, water and energy. In some places, the amount of water used by holiday villages is more than the amount consumed by the local people. • Improper management of development of tourism in sensitive areas and inappropriate activities might damage biodiversity. •There might be negative impacts on cultural inheritance areas where the guest management is insufficient. • Where unrestricted entries are allowed, tourism might have negative impacts on the local people such as increasing crime rate, sexual exploitation and destruction of socio-cultural traditions and values.• While creating new job opportunities, tourism might cause creating bad working conditions.• The economical performance of the sector is susceptible to the source markets due to economical circumstances, natural events, security concerns and etc.
The sustainability concept which is widely used in several fields is identified as a participatory process which ensures careful use of all social, cultural, scientific, natural and human resources of society and creates a social perspective based on respecting that. (Gladwin et al., 1995: 877). In this sense, the United Nations Environment Program (UNEP) and the World Tourism Organization of the United Nations (UNWTO) have gotten together in 2005 and issued the report of “Making Tourism More Sustainable” consisting of 12 articles in order to continue tourism activities in the future and increase the advantages of these activities for the environment and society. If, these articles listed in the Table 1 are taken into consideration, it is observed that sustainable tourism should be evaluated in economical, social and environmental holistic approach. As it is seen from the table, the main logic of these 12 articles is to minimize the impacts on the society and environment, provide creative contribution in local economy, preserve and protect natural and cultural resources and preserve the life quality of the local people and tourists.
TURİZM RAPORU / TOURISM REPORT
40

Tablo 29: Sürdürülebilir Turizmin 12 Temel Hedefi / Table29: 12 Basic Goals of Sustainable Tourism
Hedef / Goal İçerik / Content
Ekonomik Süreklilik Economical Sustainability
Turizm destinasyonlarının ve işletmelerinin uzun vadede fayda sağlaması ve başarı elde edebilmesi için sürekliliğini ve rekabetçiliğini sağlamak. / Ensuring the sustainability and competitiveness of the tourism destinations and facilities for providing long term advantage and success.
Yerel Refah Local Prosperity
Turistlerin yörede harcama oranlarını artırarak, ziyaret edilen destinasyonun ekonomik refahına katkı sağlamak. / Providing contribution to the economical prosperity of the visited destination by increasing the local expenses of tourists.
İstihdam Kalitesi Employment Quality
Irk, cinsiyet, engellilik ve benzeri gibi konularda ayrımcılığın yapılmayarak maaş ve çalışma koşullarının iyileştirilmesi, hizmet kalitesinin artırılması dahil olmak üzere yerel istihdam kalitesi ve oranını artırmak. / Without making any discrimination in issues such as the race, gender, disability and etc. and including improving the salary and working conditions and service quality, improving the quality and rate of local employment.
Sosyal Eşitlik Social Equality
Gelirin ve hizmetlerin iyileştirilmesi, turizme gelir bağlamında erişemeyenlere hizmet sunumu sağlama ile birlikte turizmden elde edilen ekonomik ve sosyal faydanın bütüne adil bir şekilde dağılımını sağlamak. / Including improving income and services and providing services to the ones who cannot access these in respect of their income level, providing fair distribution of economical and social benefits obtained from tourism.
Ziyaretçi Memnuniyeti Visitor Satisfaction
Irk, cinsiyet, engellilik gibi hususlarda ayrımcılık yapmadan bütün ziyaretçilere güvenli ve tatmin edici bir deneyim sunmak. / Providing safe and satisfying experience to all guests without making any discrimination in respect of issues such as race, genre, disability and etc.
Yerel Kontrol Local Control
Diğer paydaşlarının katılımını sağlayarak, planlama, yönetim ve turizmin gelişimi konularında yerel yönetimleri sürece dahil etmek ve kendi bölgelerinde yetkilerini artırmak. / Integrating the local managements in planning, managing and developing tourism and increasing their authority in their localities by ensuring participation of other stakeholders.
Toplumsal Refah Social Prosperity
Sosyal yapı ve kaynaklara, imkânlara ve yaşam destek sistemlerine erişimi sağlayarak ve sosyal bozulma/istismarı önleyerek yerel toplulukların yaşam kalitesini korumak ve güçlendirmek. / Preserving and strengthening life quality of local people by providing acces to social facilities, resources, opportunities and life support systems and preventing social deterioration/exploitation.
Kültürel Zenginlik Cultural Wealth
Ev sahibi toplulukların geleneklerine, özgün kültürüne, tarihi alanlarına saygı duymak ve güçlendirmek. / Being respectful and strengthening the traditions, culture and historical places of local societies.
Fiziki Bütünlük Physical Integrity
Kentsel ve kırsal alan kalitesini korumak ve güçlendirmek, çevrenin fiziki ve görsel yapısının bozulmasını önlemek. / Protecting and strengthening urban and rural area quality and preventing damaging physical and visual form of environment.
Biyolojik Çeşitlilik Biological Diversity
Doğal alanların, habitatın ve yaban hayatının korunmasını desteklemek ve olası zararları en aza indirgemek. / Supporting protection of natural areas, habitat and wild life and minimizing potential damages.
Kaynak Verimliliği Source Efficiency
Turizm işletmelerinin hizmetlerinin gelişimi ve uygulanmasında kıt ve yenilenemeyen kaynakların kullanımını en aza indirmek. / Minimizing the use of scarce and non-renewable resources in developing and implementing the services of tourism establishments.
Çevresel Doğallık Environmental Naturality
Turizm işletmelerinin ve ziyaretçilerin neden olduğu hava, su, toprak ve atık kirliliğini en aza indirmek. / Minimizing the air, water, soil and waste pollution caused by the tourism establishments and tourists.
Kaynak: UNEP and UNWTO, Making Tourism More Sustainable, 2005. / Source: UNEP andUNWTO, MakingTourismMoreSustainable, 2005.
3.6.1.1. Sertifikasyon Uygulamalarının Yararları3.6.1.1. Advantages of the Certification Applications
Turizm sektörü sürdürülebilirlik felsefesiyle yönetilmeye
başlandığında farklı ilgili paydaşlar yarar elde edecektir. Bu noktada
yol haritası niteliğinde olan sertifikasyon uygulamaları, turizm
işletmelerine uzun dönemli yarar sağlarken, imajlarına da uluslararası
alanda katkı sağlamaktadır. Yerel toplumlar açısından bakıldığında
ise sertifikasyon uygulamaları, yaşam kalitelerine zarar verilmeden
ve yozlaşmaya maruz kalmadan turizmin gelişimine yardımcı
olmaktadır. Turistler de artık, seyahatlerinin etkilerinden haberdar
olmaya başlamakla birlikte yüksek kaliteli güvenli deneyimler ve
çekiciliği olan destinasyon arayışı içine girmektedirler. Dolayısıyla
sürdürülebilir turizm ilkelerinin uygulanması tüm bu paydaşların
temel motivasyonlarına ve amaçlarına katkıda bulunmaktadır.
If, the tourism sector is managed through sustainability philosophy, various related stakeholders will gain advantage. While, the certification applications which are kind of a roadmap at this point provide long-term advantages for the tourism establishments, they also provide contribution to their international images. If, the issue is considered from the perspective of local socities, the certification applications help development of tourism without damaging life quality and subjecting to corruption. Currently, tourists also become aware of impacts of their travels and they look for high-quality and safe experiences with interesting qualities. Consequently, implementation of sustainable tourism principles provides contribution in basic motivations and goals of these stakeholders.
TURİZM RAPORU / TOURISM REPORT
41

Demir ve Çevirgen (2006), turizm faaliyetlerinin doğal alanların
sürdürülebilir gelişmesine olumsuz etkide bulunmaması ve temel
olumsuzlukların/çevresel etkilerin önlenebilmesi için çevresel
etkilerin değerlendirilmesi gerektiğini ve sistemde sürdürülebilir
gelişimin sağlanabilmesi için bir takım kriterlerin belirlenmesi ve
uygulanması gerektiğini vurgularken, Papatya da (2007) benzer
şekilde, turizm uygulamalarının gerçekleştirilmesi aşamasında tüm
adımların tutarlılığının sürdürülebilirlik ve kaynak tabanlı turizm
açısından test edilmesi gerektiğini belirtmektedir. Bu bağlamda
turizmde sertifikasyon süreci hükümetlerin, endüstrinin ve sivil
toplum örgütlerinin turizm endüstrisinde sürdürülebilir gelişme
ilkelerini uygulamak için aradıkları bir yönetim aracı olma rolünü
üstlenmektedir (Demir ve Çevirgen, 2006).
Sertifikasyon uygulamaları, sürdürülebilirliğin sağlanması ve
çevrenin korunmasında, turizm endüstrisinin standartlarının
belli noktalara getirilmesi bakımından büyük önem taşımaktadır.
Birleşmiş Milletler Çevre Programı (UNEP) ve Birleşmiş Milletler
Dünya Turizm Örgütü’nün (UNWTO) bir araya gelerek 2005 yılında
yayınladıkları raporda turizm işletmelerine turizmi daha sürdürülebilir
hale getirmek için gönüllülük esasına dayalı olarak “rehberlik ve
kodların uygulanması, sürdürülebilir yönetim sisteminin kurulması
ve sertifikasyon uygulaması” olmak üzere üç uygulamadan
bahsedilmektedir. Turizm endüstrisinde sertifikalandırma
ya da etiket şeklinde adlandırılan, farklı isimlerde ve farklı
coğrafyalarda kullanıma sunulan, yeni bir pazar olarak karşımıza
çıkan sertifikalandırma süreci sürdürülebilirlik kavramı içinde
kendine geniş yer bulan bir kavramdır. Sürdürülebilirlik yönetimi
uygulamasının bir çıktısı olarak da görülebilecek olan sertifikasyon
uygulamaları turizmde sadece olumsuz algıları minimize etmeyi ya
da ortadan kaldırmayı amaçlamakla kalmayıp aynı zamanda müşteri
memnuniyeti, iş verimliliği, rekabet avantajları ve motivasyon
açısından da turizm işletmelerine yol göstermektedir. Sürdürülebilir
yönetim sitemini kurmayı başaran işletmeler bu yönetim sisteminin
süreçlerini ve adımlarını benimserken, işletme içinde sürekli
öğrenmeyi de çalışanlarına entegre etmektedirler.
Sürdürülebilir yönetim sisteminin kurulmasıyla birlikte işletmeler,
yönetim çemberi içinde işletme içinde ve dışında uygulamalarının
her aşamasını öz değerlendirmeye tabi tutarak eksik noktaları
keşfedebilmektedir. Bu keşifler de yöneticilere sürekli iyileştirmenin
kapısını açmaktadır. Bilinçlenen tüketicilerin yeşil tatil tercihleri
göz önünde bulundurulduğunda ise, sertifika sahibi işletmeler
rakiplerine karşı rekabetçi bir üstünlük sağlayabileceklerdir.
Sürdürülebilir yönetim sürecinin kurulumunda aktif olarak rol alan
kilit çalışanlarda sürdürülebilir yönetimin her aşamasına dâhil
edilirken, işletme içinde çalışanlarda uygulama yönünde hareket
etme bağlamında bilinçlenmektedir. Bu durumda doğaya ve kültürel
değerlere saygılı işletmelerin çalışanlarının gözünde olumlu bir
işletme imajı yaratırken işletmeye yönelik aidiyet duygusunu da
gelişmektedir. Hedef pazarlar doğrultusunda seçilen sertifikasyon
uygulaması işletmenin tüm uygulama adımlarını bir sertifikasyon
marka çatısı altına toplarken, işletmeye bu çatı altında eğitim,
yönetim, sertifikalandırma ve pazarlama desteği sağlamaktadır.
Demir and Cevirgen (2006) emphasizes that the environmental impacts should be taken into consideration in order the tourism activities not yo have negative impact on sustainable development of natural spaces and prevent basic negative impacts/environmental effects and determine particular criteria and implement them in order to ensure sustainable development through a system while Papatya (2007) similarly indicates that the consistence of all steps at the implementation phase of tourism activities should be tested in respect of sustainability and resource based tourism. In this sense, the certification process of tourism undertakes the role of a management instrument which is needed by the governments, industry and non-governmental organizations in order to implement the sustainable development principles for the tourism industry (Demir and Cevirgen, 2006).
Certification applications have great importance in order to develop the standards of tourism industry to a particular point for ensuring sustainability and protecting environment. The United Nations Environment Program (UNEP) and the World Tourism Organization of the United Nations (UNWTO) have gotten together in 2005 and published a report and indicated three practices as “guidance and implementing the codes, establishing a sustainable management system and certification application” based on voluntariness in order to make tourism more sustainable. The certification concept which we encounter in the certification concept we see as a new market presented through various titles and for use of various geographies which is called as certification or labeling in the tourism industry is a concept which finds a large space in the concept of sustainability. The certification applications which can be considered as an output of the sustainability management practice, do not only aim to minimize or eliminate negative perceptions of tourism but also guide touristic establishments in respect of customer satisfaction, job efficiency, competitive advantages and motivation. While, the establishments achieved to establish a sustainable management system adopt the processes and phases of that management system, they also integrate continuous learning to their employees.
The tourism establishments can discover the missing points by subjecting the internal and external practices within a management circle to self-evaluation through establishing a sustainable management system. These discoveries open the gates of continuous improvement to managers. If, the green preferences of the aware consumers are taken into consideration, the certificate holder establishments will be able to acquire a competitive strength against their competitors. While, the core personnel acting key roles in establishing the sustainable management system are included in any phase of sustainable management, the employees of such establishments become aware in acting accordingly with that practice. By this way, the establishments which are respectful to natural and cultural values create a positive image for their employees, this also improves the loyalty of employees to their establishment. While, the certification practice which is chosen in accordance with the target markets, collects all operational steps of the establishment under a brand, this provides training, management, certification and marketing support for the establishment under that brand.
TURİZM RAPORU / TOURISM REPORT
42
Turizm işletmeleri sürdürülebilir yönetim sistemi gereği tedarikçilerini de kelebek etkisi ile sürdürülebilir uygulamalar ve davranışlar konusunda teşvik edebilir hale gelmektedir. Pazarlama bakış açısıyla sertifika logosunun web sitesinde, promosyon materyalleri üzerinde kullanımı ile birlikte rekabetçi yaklaşımla tüketicilerin gözünde bir farkındalık yaratılmaktadır. Güçlü sertifikasyon uygulamaları aracılığıyla tatil öncesi, anında ve sonrasında tüketiciler yeşil tüketime teşvik edilebilir. En önemlisi de sistemin en önemli aracı olarak destinasyonların turizm faaliyetlerinden göreceği olumsuz etkiler önlenebilir ya da en aza indirilebilir. Turizm işletmeleri, sertifikasyon merkezi aracılığıyla kendilerine uluslararası tedarikçiler bulabilir ve ortaklık kurma imkânı yakalayabilirler. Sertifikasyon denetimleri gereği sürekli öz değerlendirmelerin gerçekleşmesi ve işletmenin uygulamaların her alanında değerlendirme yaparak eksikliklerini keşfetmesini sağlamaktadır. Sertifikasyon merkezi aracılığıyla eğitim olanaklarının işletme içinde sürekli hale gelmektedir. Sürekli iyileştirmeler ile birlikte iş gören ve müşteri memnuniyeti de dolaylı olarak artacaktır. Sürdürülebilirlik yönetimi uygulamaları aracılığıyla operasyonel maliyetlerde azaltma görülmektedir. Küresel sürdürülebilir turizm kriterleri de sertifikasyon programlarını standartlar için rehber olarak önerirken, uluslararası tanınırlık ve gelecekte işletmenin gelişimi için de tavsiye etmektedir.
The tourism establishment encourage their suppliers to sustainable practices and behaviors through butterfly effect due to the sustainable management system they implement. An awareness is created through a competitive approach before the eyes of consumers by publishing the certificate logo on the websites and promotion materials by a marketing perspective. The consumers can be encouraged for green consumption before, during and after their vacations by means of strong certification practices. Most importantly, the negative impacts of tourism activities on destinations as the most important instrument of the system can be prevented or at least minimized. Tourism establishment can find international suppliers and get an opportunity to establish partnerships by means of the certification center. Continuous self-evaluation due to the inspections of certification ensures continuous discovery of deficiencies in any field of practices of establishments. The training opportunities of an establishment become permanent by means of the certification center. Consequently, the satisfaction of employees and customers will increase by means of continuous improvements. The operational costs are decreased by means of the sustainable management practices. While, the glocal sustainable tourism criteria recommend certification programs as a guidance for standards, they are also recommended for international recognition and future development of the establishment.
Dünya’da kurumsal sosyal sorumluluk ve sürdürülebilir turizm konusunda tanınan uluslararası standartlara uymayı arzu eden turizm paydaşları için geliştirilmiş değişik sertifika örnekleri bulunmaktadır. Sertifikasyon uygulamalarından beklenen faydalara ulaşılması için sertifikasyon sisteminin uluslararası alanda tanınması, ulusal/uluslararası çevre yasaları kapsamında desteklenmesi, değerlendirme ve kontrol sürecinin sürekli yapılması önem arz etmektedir. Bu noktada turizm işletmeleri yöneticileri, hedef pazarları veya işbirlikçileriniz doğrultusunda maksimum faydayı sağlayacak sertifika uygulamalarını seçmelidir. Tablo 2’de görüldüğü üzere Avrupa merkezli çeşitli sertifikasyon uygulamaları bulunmaktadır. Tablo’da örnek olarak seçilen konaklama işletmeleri bazında çoğunlukla kullanıldığı düşünülen bazı sertifika uygulamalarının kontrol merkezi, üye sayıları, pazar yerleri ve içerikleri bulunmaktadır.
Yalnızca Avrupa’da ortalama 100 sertifika uygulaması bulunduğu tahmin edilmektedir. Bu sertifikaların bazıları yalnızca işletme odaklı kriterlerden oluşurken, bazıları ise destinasyonlar, rekreasyon merkezleri, ulaştırma firmaları, etkinlikler üzerinde de uygulanabilmektedir. GreenGlobe, Travelife gibi sertifika uygulamaları uluslararası alanda tanınırlığı olan sertifika örneklerindendir. Travelife örneği içerik olarak detaylıca incelendiğinde iç yönetim, müşteri ile iletişim, destinasyon, turlar, ulaştırma işletmeleri, diğer tedarikçiler, rehberler, çalışan hakları, toplumsal konulara da işaret etmektedir. Çok fazla sertifikasyon uygulamasının olduğu sektörde önemli olan ise, işletmeye marka değeri katacak ve uluslararası arenada işletmenin tanınırlığını sağlayacak olan doğru sertifikanın seçilmesi ve uygulanmasıdır. Ayrıca işletmeye entegre edilecek olan sertifikasyon uygulamasının arkasında var olan kuruluşların saygınlığı önemli bir noktadır. Bazı sertifikasyon uygulamaları AB kuruluşları, Birleşmiş Milletler Dünya Turizm Örgütü (UNWTO), Birleşmiş Milletler Çevre Programı (UNEP) gibi önemli kurum ve kuruluşlar tarafından da desteklenmektedir.
There are various certification examples in the world developed for the tourism stakeholders aiming to follow accepted international standards related with corporate social responsibility and sustainable tourism. It is important for achieving the expected advantages from the certification practices that the certification system is recognized in international field, supported within the scope of the national/international environmental laws and subjected to a continuous control process. At this point, the managers of tourism establishments should chose the certification practices which will provide the maximum benefit in accordance with their target markets and stakeholders. As it is seen from the Table 2, there are Europe based various certification practices. In this table, there the control centers, number of members, market locations and contents of some certification practices considered to be used intensively by the exemplary accommodation facilities.
It is estimated that there are almost 100 certification practices only in Europe. While, some of these certificates consist of only establishment-based criteria, some can also be applied on destinations, recreational centers, transportation firms and events. GreenGlobe, Travelife and etc. certification practices are the examples of certificates with international recognition. If, the Travelife example is analyzed in detail in respect of its contents, it indicates internal management, communication with customers, destinations, tours, transportation firms, other suppliers, guides, employee rights and social issues. The important point for the sector where there are lots of certification practices is to chose and implement the correct certificate which will provide brand value and international recognition of the establishment. Furthermore, the prestige of the institutions behind the certification practice to be integrated is another important issue. Some certification practices are also supported by important institutions and organizations such as the EU institutions, the World Tourism Organizationof the United Nations (UNWTO), the United Nations Environment Program (UNEP) and etc.
3.6.1.2. Sertifikasyon Örnekleri / 3.6.1.2. Certification Examples
TURİZM RAPORU / TOURISM REPORT
43

Adı Name
Logo Sertifika Organizasyonu Certification Organization
İşletme Sayısı Number of Enterprises
Pazar Yeri Market Place
İçeriği Contents
Green Holidays
Letonya Ülke Turizm Derneği Latvia National Tourism Agency
75 Kırsal Konaklama İşletmeleri Rural Accommodation Enterprises
Doğal Kaynaklar, Kültürel ve Tarihi Mekânları Koruma, Yerel Gıda Tüketimini Teşviki, Çevre Kalitesi Natural Resources, Protection of Cultural and Historical Places, Supporting Local Food Consumption and Environmental Quality
The Austrian Ecolabel
Avusturya Tarım, Ormancılık, Çevre ve Su Yönetimi Federal Bakanlığı The Federal Ministry of Agriculture, Forestry, Environment and Water Management of Austria
280 Konaklama İşletmeleri, Seyahat Paketler, Kamp Alanları, Restoranlar, Aktiviteler, Konferans Merkezleri Accommodation Enterprises, Travel Packages, Camping Areas, Restaurants, Activities and Conference Centers
Çevre, Yönetim Environment, Management
Green Globe Green Globe, Almanya Green Globe, Germany
458 Kongre Merkezleri Kurvaziyer Gemiler, Golf Sahaları, Restoranlar, Sağlık&Spa Merkezleri, Ulaştırma İşletmeleri, Tur Operatörleri, Destinasyon Yönetim Şirketleri, Konaklama İşletmeleri Congress Centers, Cruise Ships, Golf Courses, Restaurants, Health and Spa Centers, Transportation Enterprises, Tour Operators, Destination Management Companies, Accommodation Enterprises.
Yönetim, Ekonomi ve Sosyal Yapı, Çevre,
Kültürel Miras
Management, Economy and Social Structure, Environment,
Cultural Inheritance
Travelife ECEAT, Hollanda, ECEAT, the Netherlands
220 Seyahat İşletmeleri Travel Enterprises
Çevre, Yönetim, Sosyal Konular, Kültür, Destinasyon, Müşteri Environment, Management Social Issues, Culture, Destination, Customer
Travelife Travelife
ABTA, Birleşik Krallık ABTA, the United Kingdom
1.609 Konaklama İşletmeleri Accommodation Enterprises
Çevre, Yönetim, Sosyal Konular, Kültür, Destinasyon, Müşteri Environment, Management Social Issues, Culture, Destination, Customer
EMAS EMAS
AB Üyesi Ülke Kuruluşları Enterprises of the EU Member Countries
4.500 Tüm İşletme Tipleri All Types of Enterprises
Çevresel Yönetim Environmental Management
The Green Hospitality
Çevre Koruma Ajansı Environment Protection Agency
160 Konaklama İşletmeleri Accommodation Enterprises
Çevresel Yönetim, Ekonomi Environmental Management, Economy
Green Key Eco-Rating
Green Key Global GreenKey Global
2.000 Konaklama İşletmeleri, Etkinlikler Accommodation Enterprises, Events
Çevresel Yönetim, Sosyal Konular, Ekonomi Environmental Management, Social Issues, Economy
The Nordic Swan
SIS Ecolabelling AB, İsveç SIS Ecolabelling EU, Sweden
332 Konaklama İşletmeleri, Restoranlar, Aktiviteler Accommodation Enterprises, Restaurants, Activities
Çevre Environment
Q Certification Tourism
İspanya Sertifikasyon ve Standardizasyon Birliği The Certification and Standardization Union of Spain
2.048 Konaklama İşletmeleri, Restoranlar, Destinasyonlar, Tur Operatörleri, Ulaşım, Etkinlileri Konferans Merkezleri, Aktiviteler Accommodation Enterprises, Restaurants, Destinations, Tour Operators, Transportation, Events and Organizations, Conference Centers, Activities
Kalite Yönetim Sistemleri Quality Management Systems
Tablo 30: Dünyadan Sertifika Örnekleri / Table30: Certification Examples from the World
TURİZM RAPORU / TOURISM REPORT
44
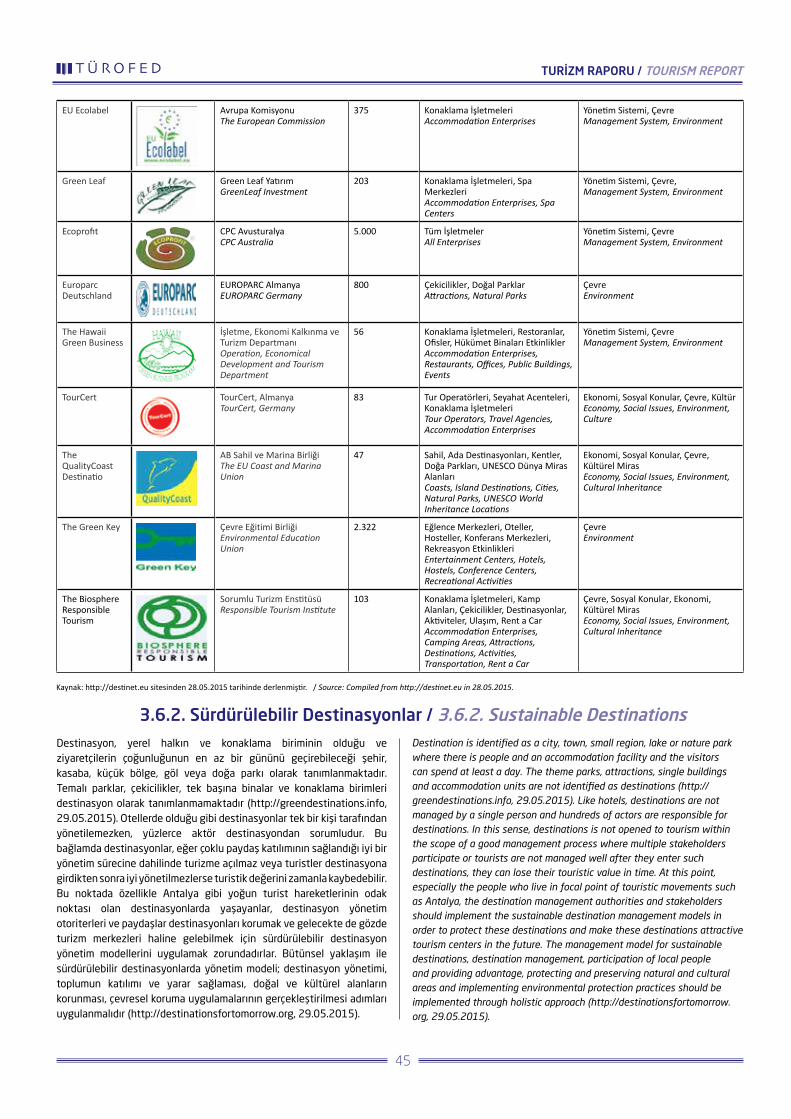
EU Ecolabel Avrupa Komisyonu The European Commission
375 Konaklama İşletmeleri Accommodation Enterprises
Yönetim Sistemi, Çevre Management System, Environment
Green Leaf Green Leaf Yatırım GreenLeaf Investment
203 Konaklama İşletmeleri, Spa Merkezleri Accommodation Enterprises, Spa Centers
Yönetim Sistemi, Çevre, Management System, Environment
Ecoprofıt CPC Avusturalya CPC Australia
5.000 Tüm İşletmeler All Enterprises
Yönetim Sistemi, Çevre Management System, Environment
Europarc Deutschland
EUROPARC Almanya EUROPARC Germany
800 Çekicilikler, Doğal Parklar Attractions, Natural Parks
Çevre Environment
The Hawaii Green Business
İşletme, Ekonomi Kalkınma ve Turizm Departmanı Operation, Economical Development and Tourism Department
56 Konaklama İşletmeleri, Restoranlar, Ofisler, Hükümet Binaları Etkinlikler Accommodation Enterprises, Restaurants, Offices, Public Buildings, Events
Yönetim Sistemi, Çevre Management System, Environment
TourCert TourCert, Almanya TourCert, Germany
83 Tur Operatörleri, Seyahat Acenteleri, Konaklama İşletmeleri Tour Operators, Travel Agencies, Accommodation Enterprises
Ekonomi, Sosyal Konular, Çevre, Kültür Economy, Social Issues, Environment, Culture
The QualityCoast Destinatio
AB Sahil ve Marina Birliği The EU Coast and Marina Union
47 Sahil, Ada Destinasyonları, Kentler, Doğa Parkları, UNESCO Dünya Miras Alanları Coasts, Island Destinations, Cities, Natural Parks, UNESCO World Inheritance Locations
Ekonomi, Sosyal Konular, Çevre, Kültürel Miras Economy, Social Issues, Environment, Cultural Inheritance
The Green Key Çevre Eğitimi Birliği Environmental Education Union
2.322 Eğlence Merkezleri, Oteller, Hosteller, Konferans Merkezleri, Rekreasyon Etkinlikleri Entertainment Centers, Hotels, Hostels, Conference Centers, Recreational Activities
Çevre Environment
The Biosphere Responsible Tourism
Sorumlu Turizm Enstitüsü Responsible Tourism Institute
103 Konaklama İşletmeleri, Kamp Alanları, Çekicilikler, Destinasyonlar, Aktiviteler, Ulaşım, Rent a Car Accommodation Enterprises, Camping Areas, Attractions, Destinations, Activities, Transportation, Rent a Car
Çevre, Sosyal Konular, Ekonomi, Kültürel Miras Economy, Social Issues, Environment, Cultural Inheritance
Kaynak: http://destinet.eu sitesinden 28.05.2015 tarihinde derlenmiştir. / Source: Compiled from http://destinet.eu in 28.05.2015.
3.6.2. Sürdürülebilir Destinasyonlar / 3.6.2. Sustainable DestinationsDestinasyon, yerel halkın ve konaklama biriminin olduğu ve ziyaretçilerin çoğunluğunun en az bir gününü geçirebileceği şehir, kasaba, küçük bölge, göl veya doğa parkı olarak tanımlanmaktadır. Temalı parklar, çekicilikler, tek başına binalar ve konaklama birimleri destinasyon olarak tanımlanmamaktadır (http://greendestinations.info, 29.05.2015). Otellerde olduğu gibi destinasyonlar tek bir kişi tarafından yönetilemezken, yüzlerce aktör destinasyondan sorumludur. Bu bağlamda destinasyonlar, eğer çoklu paydaş katılımının sağlandığı iyi bir yönetim sürecine dahilinde turizme açılmaz veya turistler destinasyona girdikten sonra iyi yönetilmezlerse turistik değerini zamanla kaybedebilir. Bu noktada özellikle Antalya gibi yoğun turist hareketlerinin odak noktası olan destinasyonlarda yaşayanlar, destinasyon yönetim otoriterleri ve paydaşlar destinasyonları korumak ve gelecekte de gözde turizm merkezleri haline gelebilmek için sürdürülebilir destinasyon yönetim modellerini uygulamak zorundadırlar. Bütünsel yaklaşım ile sürdürülebilir destinasyonlarda yönetim modeli; destinasyon yönetimi, toplumun katılımı ve yarar sağlaması, doğal ve kültürel alanların korunması, çevresel koruma uygulamalarının gerçekleştirilmesi adımları uygulanmalıdır (http://destinationsfortomorrow.org, 29.05.2015).
Destination is identified as a city, town, small region, lake or nature park where there is people and an accommodation facility and the visitors can spend at least a day. The theme parks, attractions, single buildings and accommodation units are not identified as destinations (http://greendestinations.info, 29.05.2015). Like hotels, destinations are not managed by a single person and hundreds of actors are responsible for destinations. In this sense, destinations is not opened to tourism within the scope of a good management process where multiple stakeholders participate or tourists are not managed well after they enter such destinations, they can lose their touristic value in time. At this point, especially the people who live in focal point of touristic movements such as Antalya, the destination management authorities and stakeholders should implement the sustainable destination management models in order to protect these destinations and make these destinations attractive tourism centers in the future. The management model for sustainable destinations, destination management, participation of local people and providing advantage, protecting and preserving natural and cultural areas and implementing environmental protection practices should be implemented through holistic approach (http://destinationsfortomorrow.org, 29.05.2015).
TURİZM RAPORU / TOURISM REPORT
45

Küresel Sürdürülebilir Turizm Konsülü (GSTC) tarafından yönetilen
Destinasyon Kriterleri (GSTC-C-D) Birleşmiş Milletler Dünya Turizm
Örgütü destinasyon göstergeleri, Küresel Sürdürülebilir Turizm
Konsülü’nün otel ve tur operatörleri kriterleri, kabul görmüş kültürel
ve jeo-politik sertifikasyon içerikleri baz alınarak hazırlanmıştır ve
Dünyanın çeşitli yerlerinde test edilerek hazırlanmıştır. Bu kriterlerin
hazırlanış amaçları şunlardır (www.gstcouncil.org, 29.05.2015);
Destinasyonların daha sürdürülebilir hale getirilmesi,
Turistlere sürdürülebilir destinasyonlar hakkında ipuçları sunmak,
Hükümet, özel sektör ve kamu kurumlarını sürdürülebilir turizm
gerekliliklerinden haberdar etme ve uygulamaya teşvik etmek,
Turizm eğitimi veren kurumlara yol göstermek.
1 Kasım 2013 yılında yayınlanan Küresel Sürdürülebilir Turizm
Konsülü tarafından hazırlanan ve yayınlanan Küresel Sürdürülebilir
Destinasyon Kriterleri (GSTC C-D) Tablo 3’te yer almaktadır. Tabloda
yer alan sürdürülebilir destinasyon anlayışını ortak hale getirmek
için hazırlanan içerikler incelendiğinde destinasyonların bütüncül
bir yaklaşımla çoklu disiplin uygulamalarını bir araya getirmeye
çalıştığı görülmektedir. Kriterler, fakirliği önlemek, cinsiyet eşitliği,
çevre sürdürülebilirliği gibi Birleşmiş Milletlerin Gelişim amaçlarını
da gerçekleştirmektedir. Destinasyonlara rehberlik eden bir niteliği
olan “Küresel Sürdürülebilir Turizm Konsülü Destinasyon Kriterleri”
destinasyonlarda değişik kamu ve özel sektörden paydaşların bir
araya gelmesiyle yürütülecek olan geniş bir yelpazede uygulama
alanına sahiptir. Destinasyonların sürdürülebilirliğin sağlanması
ve turizmin olumsuz etkilerini en aza indirilmesi için bu kriterlerin
uygulanması sürdürülebilir turizm kalkınmasının gerekliliği haline
gelmektedir. Farklı destinasyonlara uygulanabilecek olan kriterlerin
dört temel amacı bulunmaktadır (www.gstcouncil.org, 29.05.2015);
Sürdürülebilir destinasyon yönetimini göstermek,
Yerli toplum için negatif etkileri en aza indirmek ve sosyal-ekonomik
etkileri artırmak,
Ziyaretçiler, toplum ve kültürel miras için faydaları artırmak ve etkileri
azaltmak,
Çevre için yararları artırmak ve zararları azaltmak.
The Destination Criteria (GSTC-C-D) managed by the Global Sustainable Tourism Commission (GSTC), the destination indicators of the World Tourism Organization of the United Nations, the hotel and tour operator criteria of the Global Sustainable Tourism Commission have been prepared based on the accepted cultural and geo-political certification contents by testing various places of the World. The purposes for preparing these criteria as in the following (www.gstcouncil.org, 29.05.2015);Making destinations more sustainable,Presenting clues to the tourists for sustainable destinations,Raising the awareness of the government, private sector and public institutions related with the requisites of sustainable tourism and encouraging them for implementing these requisites,Guiding the institutions providing tourism education.
The Global Sustainable Destination Criteria (GSTC C-D) which have been prepared by the Global Sustainable Tourism Commission and published in 1st November 2013 are presented in the Table-3. If, the contents prepared for standardizing the sustainable destination approach indicated in the table is taken into consideration, it is seen that the destinations try to combine various disciplines through a holistic approach. The development purposes of the United Nations such as the criteria, preventing poverty, gender equality and environmental sustainability are also implemented by them. “The Destination Criteria of the Global Sustainable Tourism Commission” acting as a guidance for the destinations have a wide range of applications to be executed by collaboration of various stakeholders from the public and private sector. It becomes a requisite for developing sustainable tourism to implement these criteria in order to ensure sustainability of these destinations and minimize the negative impacts of tourism. The criteria which can be applied on various destinations have four main purposes (www.gstcouncil.org, 29.05.2015); Guiding the management of sustainable destinations, Minimizing negative impacts and increasing social and economical effects for the local people, Increasing the advantages for the visitors, society and cultural inheritance and decreasing impacts, Increasing the advantages for environment and decreasing negative impacts,
Tablo 31: Küresel Sürdürülebilir Turizm Konsülü Destinasyon Kriterleri (GSTC C-D) Table31: The Destination Criteria of the Global Sustainable Tourism Commission (GSTC C-D)
BÖLÜM A: Sürdürülebilir Hedef Yönetimi
A1 Sürdürülebilir Destinasyon Stratejisi
Destinasyon, paydaşlarıyla birlikte ölçeğine uygun olarak oluşturdu çevresel, ekonomik, sosyal, kültürel, kalite göstergeleri, sağlık, güvenlik, estetik konularını içeren yıllık destinasyon stratejisini açık olarak kamuya yayınlar.
A2 Hedef Yönetim Organizasyonu
Destinasyon, özel ve kamu sektörünün katılımıyla sürdürülebilir turizm yaklaşımını koordine edecek etkili bir organizasyon, departman, grup ya da komiteye sahiptir. Bu grup destinasyonun büyüklüğüne ve ölçeğine göre sorumlulukları, öngörülerini ve çevresel, sosyal ve kültürel konuların yönetim uygulamalarını tanımlamalıdır. Grubun faaliyetleri uygun bir şekilde finanse edilmelidir.
CHAPTER A: Sustainable Target Management
A1 Sustainable Destination Strategy
Destination declares the annual destination strategy open to public which is established jointly by the stakeholders in accordance with the scale including the environmental, social, cultural issues, quality indicators, health, safety, security and esthetics issues.
A2 Target Management Organization
The destination has an effective organization, department, group of committee which can coordinate the sustainable tourism approach with the participation of public and private sectors. This group should identify the responsibilities, visions and management practices of environmental, social and cultural issues according to the size and scale of the destination. The activities of the group should be funded appropriately.
TURİZM RAPORU / TOURISM REPORT
46

A3 Monitoring
The destination has a reporting and responding system open to public related with the environmental, economical, social, cultural, touristic and human rights issues. The monitoring system is periodically reviewed and evaluated.
A4 Tourism Seasonality Management
Destination assigns the resources to local economy, society, culture and environmental requirements stability activities for decreasing seasonality changes and other appropriate places for identifying year-long tourism opportunities.
A5 Compliance with Climate Change
Destination has a system which determines the climate change and related risks and advantages. This system supports the strategies for compliance with climate change including the development, positioning, design and management activities. The system provides contribution in sustainability of the destination and education of tourists and local people.
A6 Touristic Presence and Attraction Inventory
Destination registers all touristic assets and attractions concurrently and open to public including the natural and cultural places.
A7 Planning Arrangements
Destination implements rules, arrangements and/or policy planning where the area use, design, construction and destructions are integrated and the environmental, economical and social impacts are evaluated. The rules, regulations and/or policies designed for protecting the natural and cultural assets and resources are established by public outputs and declared to the public and implemented by reviewing.
A8 Open Access
Including the handicapped people and people with special access requirements, access of everyone should be provided to the destinations including the places with natural and cultural importance. If, it is not possible to access such places and activities, the destinations should try to implement the required design and application solutions integrated with accommodation facilities for the people with special access needs.
A9 Property Ownership
The laws and rules providing property ownership should provide the right to apply public opinion in accordance with the social and individual rights or no settlement rights should be provided without a fair value or permit.
A10 Visitor Satisfaction
Destination is a system which follows the visitor satisfaction and reports that to the public and if it is considered necessary this system is activated to increase visitor satisfaction.
A11 Sustainability Standards
Destination has a system which supports the sustainability standards for enterprises in accordance with the contents of the Global Sustainable Tourism Commission (GSTC) criteria. Destination declares the enterprises approved or certified for sustainability.
A12 Safety and Security
Destination has a system which notifies any dangerous circumstance related with any crime, safety and health while also reports and prevents them.
A13 Crisis and Emergency Management
The destination has a crisis and emergency intervention plan. The key elements are declared to the local people, visitors and enterprises. Destination presents its plans, procedures, provides resources, training/education services for the employees, visitors and local people and updated regularly.
A14 Promotion
Promotion of destination is done in accordance with the products, services and sustainability criteria. The promotion messages are prepared respectfully and specifically for the local people and tourists.
CHAPTER B: Increasing the Economical Benefits for the Locals and Minimizing Negative Impacts on Them
A3 İzleme
Destinasyon, çevresel, ekonomik, sosyal, kültürel, turizm ve insan hakları konularında kamuya açık raporlama ve cevap verme sistemine sahiptir. İzleme sistemi periyodik olarak gözden geçirilir ve değerlendirilir.
A4 Turizm Mevsimsellik Yönetimi
Destinasyon, mevsimsellik değişimi azaltmak için yerel ekonomi, topluluk, kültür ve çevre ihtiyaçlarını dengeleme çalışmalarına ve yıl boyunca turizm fırsatlarını tanımlamak için uygun olan yerlere kaynakları atar.
A5 İklim Değişikliğine Uyum
Destinasyon, iklim değişikliği ile ilişkili riskleri ve fırsatları belirleyen bir sisteme sahiptir. Bu sistem, gelişim, konumlandırma, tasarım ve yönetim faaliyetlerini içeren iklim değişikliğine uyum stratejileri teşvik eder. Sistem, destinasyonun sürdürülebilirliğine, turistleri ve yerel halkın eğitimine katkıda bulunur.
A6 Turistik Varlık ve Çekicilik Envanteri
Destinasyon, doğal ve kültürel alanlar dahil olmak üzere, tüm turistik varlıkları ve çekicilikleri güncel olarak kamuya açık bir şekilde kaydetmektedir.
A7 Düzenlemelerin Planlaması
Destinasyon, sürdürülebilir arazi kullanımı, tasarım, inşaat ve yıkımın entegre edildiği ve çevresel, ekonomik ve sosyal etkilerin değerlendirildiği kurallar, düzenleme ve/veya politika planlaması yapmaktadır. Doğal ve kültürel kaynaklarını korumak için tasarlanan kurallar, düzenlemeler ve/veya politikalar, kamudan elde edilen çıktılar ile oluşturulmuştur ve gözden geçirilerek kamuya duyurulur ve uygulanır.
A8 Açık Erişim
Destinasyonlarda, doğal ve kültürel öneme sahip olmak üzere tüm uygun alanlara ve faaliyetlere engelli ve özel erişim gereksinimleri olan kişiler dahil olmak üzere herkese erişim sağlanmalıdır. Bu tür alanlar ve aktivitelere erişimin mümkün olmadığı durumlarda, özel erişim ihtiyacı olan kişiler için konaklama imkanlarıyla bütünleştirilmiş gerekli tasarım ve uygulama çözümleri gerçekleştirilmeye çalışılmalıdır.
A9 Mülkiyet Edinme
Mülkiyet edinme hakkını sağlayan yasalar ve kurallar, toplum ve birey hakkına uygun şekilde kamuya danışma hakkını sağlamalı ve makul bir bedel veya izin verilmeden yerleşim hakkı sunmamalıdır.
A10 Ziyaretçi Memnuniyeti
Destinasyon, ziyaretçi memnuniyetini takip eden ve kamuya raporlayan bir sisteme sahiptir ve sistem gerekirse ziyaretçi memnuniyetini artırmak için harekete geçer.
A11 Sürdürülebilirlik Standartları
Destinasyon, Küresel Sürdürülebilir Turizm Konsülü (GSTC) kriterleri içeriklerine uyumlu olarak işletmeler için sürdürülebilirlik standartlarını teşvik eden sisteme sahiptir. Destinasyon, sürdürülebilirlik onaylı veya sertifikalandırılmış işletmeleri kamuya açıklar.
A12 Emniyet ve Güvenlik
Destinasyon, suç, güvenlik ve sağlık ile ilgili tehlikeleri haber veren, kamuya raporlayan ve önleyen bir sisteme sahiptir.
A13 Kriz ve Acil Durum Yönetimi
Destinasyonun kriz ve acil müdahale planı bulunmaktadır. Anahtar elementler yerel halka, ziyaretçilere ve işletmelere iletir. Plan; prosedürlerini ortaya koyar, kaynak sağlar, çalışanlar, ziyaretçiler ve yerel halk için eğitim hizmeti sağlar, düzenli olarak güncellenir.
A14 Tanıtım
Tanıtım, destinasyona ürünlere, hizmetlere ve sürdürülebilirlik kriterlerine uygun olarak yapılır. Tanıtım mesajları, yerel halka ve turistlere saygılı ve özgün olarak oluşturulur.
BÖLÜM B: Yerel Halka Ekonomik Faydaları Çoğaltmak ve Negatif Etkileri Etkilerini En Aza İndirmek
TURİZM RAPORU / TOURISM REPORT
47

B1 Ekonomik İzleme
Destinasyon, ekonomiye doğrudan ve dolaylı katkısı izlenir ve kamuya yıllık olarak rapor edilir. Mümkün olduğu ölçüde, bu rapor mevcut turist harcamalarını, oda gelirleri, istihdam, yatırım bilgilerini de içermelidir.
B2 Yerel İstihdam Olanakları
Destinasyonda yer alan işletmeler, eşit istihdam, eğitim fırsatı, iş güvenliği ve adil ücret sağlamaktadır.
B4 Yerel Toplum Görüşü
Yerel toplulukların destinasyon yönetimi ile ilgili beklentileri, endişeleri ve memnuniyetleri düzenli izlenir, kaydedilir ve kamuya zamanında rapor edilir.
B5 Yerel Erişim
Destinasyon, yerel toplumun doğal ve kültürel alanlara erişimini izler, korur ve gerektiğinde yapılandırır.
B6 Turizm Farkındalığı ve Eğitim
Destinasyon, etkilenen topluluklara turizmin olanaklarını, fırsatlarını ve sürdürülebilirliğin önemini anlamalarını geliştirecek düzenli programlar sağlar.
B7 İstismarın Önlenmesi
Destinasyonun, özellikle çocuk, genç, kadın ve azınlıkların ticari ve cinsel istismarını ve sömürülmesini önleyecek kanunları ve yapılandırılmış uygulamaları vardır. Kanunlar ve yapılandırılmış uygulamalar kamuya iletilir.
B8 Toplum için Destek
Destinasyonun, Hedef etkinleştirmek ve toplum ve sürdürülebilirlik girişimlerine katkıda işletmeler, ziyaretçiler ve kamuoyunu teşvik etmek için bir sisteme sahiptir.
B9 Destekleyici yerel girişimciler ve adil ticaret
Destinasyon, yerel küçük ve orta ölçekli işletmeleri destekleyen bir sisteme sahiptir ve bölgenin doğasını ve kültürünü temel alan yerel sürdürülebilir ürünlerini ve adil ticaret ilkelerini teşvik eder ve geliştirir. Yerel sürdürülebilir ürünler, yiyecek ve içecek, el sanatları, tarım ürünleri gibi ürünleri içerebilir.
BÖLÜM C: Topluluk, Ziyaretçiler ve Kültüre Yönelik Faydaları En Üst Düzeye Çıkarmak; Olumsuz Etkilerini En Aza İndirmek
C1 Çekiciliklerin koruma
Destinasyon, tarihi, kırsal ve kentsel manzarayı da içeren doğal ve kültürel alanları değerlendirecek, rehabilite edecek ve koruyacak politika ve sisteme sahiptir.
C2 Ziyaretçi Yönetimi
Destinasyon, turistik çekicilikler için doğal ve kültürel alanları muhafaza edecek, koruyacak ve geliştirecek ziyaretçi yönetimi sistemine sahiptir.
C3 Ziyaretçi Davranışı
Destinasyon, korunan alanlarda ziyaretçilere yönelik davranış kuralları oluşturur ve yayınlar. Bu tarz kılavuzlar, korunan alanlar üzerindeki ters etkileri azaltmayı ve ziyaretçi davranışlarını güçlendirmek için tasarlanır.
C4 Kültürel Mirası Koruma
Destinasyonun, tarihi ve arkeolojik eserlerin satışın yapılması, ticari amaçlı kullanılması ya da hediye edilmesini önleyici yasaları vardır.
C5 Alan Yorumlama
Doğal ve kültürel alanlar için doğru yorumlanmış bilgiler sağlanmaktadır. Bilgi, toplumun katılımıyla kültüre uygun bir şekilde geliştirilir ve ziyaretçilere istedikleri dilde iletilir.
C6 Fikri Mülkiyet
Destinasyon, toplumun ya da bireylerin entelektüel yatırım haklarını korumaya ve yaşatmaya katkı sağlayacak bir sisteme sahiptir.
B1 Economical Monitoring
The direct and indirect contribution of the destination on economy are monitored and reported to the public on annual basis. In so far as possible, this report should include the current tourist expenses, room incomes, employment data and investment information.
B2 Local Employment Opportunities
The enterprises located in a destination provide equal employment, training opportunities, occupational health and safety and fair wages.
B4 The Opinion of Locals
The expectations, concerns and satisfactions of local societies related with the destination management are monitored and recorded regularly and reported to the public in time.
B5 Local Access
Destination monitors and protects the access of locals to the natural and cultural areas and configures that access if considered necessary.
B6 Tourism Awareness and Training
Destination provides regular programs to the effected societies in order them to understand the facilities and advantages of tourism and the importance of sustainability.
B7 Preventing Exploitation
Destination has the laws and configured/customized regulations and practices especially for preventing commercial and sexual exploitation of children, young people, women and minorities. These laws, regulations and configured practices are declared to the public.
B8 Support for the Society
Destination has a system in order to support the enterprises, visitors and public opinion for providing contribution in the target activation and society and sustainability attempts.
B9 Supporting local entrepreneurs and fair trade
Destination has a system which supports the local small and medium sized enterprises and supports and develops the local sustainable products and fair trade principles based on the nature and culture of the region. Local sustainable products can cover products such as foods and beverages, handcrafts, agricultural products and etc.
CHAPTER C: Maximizing the Benefits for the Society, Visitors and Culture and Minimizing the Negative Influences
C1 Protecting attractions
Destination has a policy and system which will evaluate, utilize, rehabilitate and protect natural and cultural areas with historical, rural and urban view.
C2 Guest Management
Destination has a guest management system which will maintain, protect, preserve and develop the natural and cultural areas for touristic attractions.
C3 Visitor Behavior
Destinations establishes and issues behavior rules for visitors for the protected areas. Such guides are designed in order to reduce the negative influences on protected areas and strengthen visitor behaviors.
C4 Protecting Cultural Inheritance
Destination has laws and regulations for preventing selling historical and archeological artifacts, using them for commercial purposes or presenting them.
C5 Area Interpretation
The properly and correctly interpreted information is provided for the natural and cultural areas. Such information is developed by participation of the locals in accordance with the culture and conveyed to the visitors in their language.
C6 Intellectual Property
Destination has a system which will provide contribution in protecting and maintaining the intellectual property rights of the society or individuals.
TURİZM RAPORU / TOURISM REPORT
48

CHAPTER D: Increasing the Benefits for the Environment and Minimizing its Negative Impacts
D1 Environmental Risks
Destination determines environmental risks and has a system to dispose them.
D2 Protecting Sensitive Areas
Destination has a system for monitoring environmental impacts of tourism, protecting and preserving habitat species and ecosystems and prevent entry of invasive species.
D3 Protecting Wild Life
Destination has a system covering regional, national and international laws, regulations and standards related with harvest, hunting, exhibition and wild life (including plants and animal species).
D4 Greenhouse Gas Emissions
Destination has a system which supports measuring, monitoring, minimizing and decreasing greenhouse gas emissions and declare them to public.
D5 Energy Saving
Destination has a system which supports measuring, monitoring and declaring energy consumption, reporting consumption values to public and decreasing dependency on fossil fuels.
D6 Water Management
Destination has a system which supports measuring, monitoring and decreasing water consumption and reporting consumption values to public.
D7 Water Safety
Destination has a system monitoring the water resources in order to stabilize the water used by enterprises with the water requirements of the society.
D8 Water Quality
Destination has a system which monitors the quality of water used for drinking water and recreational purposes. This monitoring system is declared to the public and destination has a system for instantly responding any water related issue.
D9 Waste Water
Destination has transparent and compelling rules which evaluates waste water positioning, disposal, maintenance and locations of tanks, a waste water refining system and a structure which provides recycling the water in the least harmful manner for the locals and increasing water amount of the region.
D10 Decreasing Solid Wastes
Destination has a system which will dispose, recycle and provide reuse of solid wastes. Any waste which cannot be reused or used after recycling is disposed safely and sustainably.
D11 Light and Noise Pollution
Destination has the rules and regulations to minimize the light and noise pollution. Destination supports enterprises for following these guidelines and regulations.
D12 Transportation with Low Impact
Destination has a mass transportation and active transportation system (such as walking and cycling) which increases transportation with low impact.
BÖLÜM D: Çevreye Faydaları Çoğaltmak ve Olumsuz Etkilerini En Aza İndirmek
D1 Çevre Riskler
Destinasyon, çevresel riskleri tespit eder ve bunları gidermek için bir sisteme sahiptir.
D2 Hassas Ortamları Koruma
Destinasyon, turizmin çevresel etkilerini izlemek, habitatları, türleri ve ekosistemleri korumak ve istilacı türlerin girişini önlemek için bir sisteme sahiptir.
D3 Yaban Hayatı Koruma
Destinasyon, hasat, avlama, sergileme ve yaban hayatının (bitki ve hayvanlar dahil) satışı için bölgesel, ulusal ve uluslar arası kanunlar ve standartları içeren bir sisteme sahiptir.
D4 Sera Gazı Emisyonları
Destinasyon, işletmeleri sera gazı emisyonlarını ölçmeye, izlemeye, minimize etmeye, kamuya duyurmaya ve azaltmaya teşvik eden bir sisteme sahiptir.
D5 Enerji Tasarrufu
Destinasyon, enerji tüketimini ölçmeyi, izlemeyi, azaltmayı, kamuya raporlamayı ve fosil yakıtlara bağımlılığı azaltmayı teşvik eden bir sisteme sahiptir.
D6 Su Yönetimi
Destinasyon, su tüketimini ölçmeyi, izlemeyi, azaltmayı, kamuya raporlamayı teşvik eden için bir sisteme sahiptir.
D7 Su Güvenlik
Destinasyon, işletmeler tarafından kullanılan suyun topluluğun su gereksinimleri ile uyumunu dengelemek için su kaynaklarını izleyen bir sisteme sahiptir.
D8 Su Kalitesi
Destinasyon, içme ve rekreasyon amaçlı kullanılan suyun kalitesini izleyen bir sisteme sahiptir. İzleyici sistem kamuya duyurulur ve destinasyon, su ile ilgili konularda anında cevap vere bir sisteme sahiptir.
D9 Atık Su
Destinasyon, atık su konumlandırma, bakım ve tankların yerleri değerlendiren şeffaf ve zorlayıcı kurallara, atık su arıtıcı sisteme ve atık suyun çevreye ve yerel halka en zarar verecek şekilde geri dönüşümü ve artırılması sağlayan bir yapıya sahiptir.
D10 Katı Atık Azaltma
Destinasyon, katı atığı yok edecek, geri dönüşümünü ve geri kullanımı sağlayacak bir sisteme sahiptir. Yeniden ya da geri dönüşümlü olmayan herhangi bir kalıntı katı atık güvenli ve sürdürülebilir bir şekilde yok edilir.
D11 Işık ve Gürültü Kirliliği
Destinasyon, ışık ve gürültü kirliliğini en aza indirecek kurallara ve düzenlemelere sahiptir. Destinasyon, işletmeleri bu yönergeleri ve düzenlemeleri takip işletmeleri için teşvik eder.
D12 Düşük Etkili Taşımacılık
Destinasyon, toplu taşıma ve aktif taşıma (yürüyüş ve bisiklet gibi) düşük etkili ulaşım kullanımını artırıcı bir sisteme sahiptir.
Kaynak: http://www.gstcouncil.org/gstc-criteria/criteria-for-destinations.html, 29.05.2015. / Source: http://www.gstcouncil.org/gstc-criteria/criteria-for-destinations.html, 29.05.2015.
TURİZM RAPORU / TOURISM REPORT
49

3.6.2.1. İyi Bir Destinasyon Uygulama Örneği: Barselona3.6.2.1. A Good Destination Example: Barcelona
1992 yılında Olimpiyat Yaz Oyunları’na ev sahipliği yaptığı günden beri Barselona, yoğun turist hareketlerini çeken bir turizm destinasyonu haline gelmiştir. Barselona’nın canlı kültürü, zengin yemek kültürü ve Dünya Mirası Listesinde yer alan çekicilikleri Barselona’yı İspanya’nın önemli turizm merkezi haline getirmiştir. Aynı zamanda Barselona Avrupa’nın önemli bir kurvaziyer limanı haline gelirken, bugün yılda 2,6 milyondan fazla kurvaziyer yolcusuna hizmet vererek Avrupa’nın önemli kurvaziyer limanı olarak dikkat çekmektedir. Son altı yılda, Barselona Kent Konseyi ve Barselona Turizm Yönetimi Barselona’nın turizm ürününü pazarlamada sorumlu kuruluş olarak, güçlerini birleştirerek şehrin uzun vadede canlılığı garanti altına alarak turizm faaliyetlerinden negatif yönde etkilenmesini önleyecek bir takım girişimlerde bulunmuşlardır. Barselona’nın sürdürülebilir kalkınma rehberlik politika çerçeveleri 2010-2015 “Barselona Eylem Planı” ve “Barselona Ajandası 21” başlıkları altında hazırlanmıştır. Bu başlıkların odak noktaları destinasyon yönetimi ve pazarlaması kapsamında sürdürülebilir politika ilkeleri ve sürdürülebilir turizm gelişimi ilkelerinden oluşmaktadır. 2012 yılında Barselona Turizm Bürosu 20 önemli paydaşla bir araya gelerek şehre gelen ziyaretçilere şehri unutulmaz bir deneyim sunacak Barselona’nın Sürdürülebilir Turizm Politikasını oluşturmuştur. Bütünsel bir yaklaşımla ele alınan Barselona sürdürülebilir turizm politikasının bir örneğini çevresel, sosyo-kültürel ve ekonomik yönleriyle Barselona mutfağı oluşturmaktadır. “Yavaş yiyecek” (slow food) ve “tarladan tabağa” hareketiyle Barselona mutfağı başlığı restoranları ve yöre tedarikçilerini bir araya getirerek yöre kaynaklı içeriklerin kullanımını teşvik etmektedir. Yenilikçi ve ekonomik bakış açısıyla Barselona kırsal alanlarda su kullanımını azaltma politikasını uygulamaktadır. Aynı zamanda Barselona elektrikli araç kullanan şehirlerin başkenti olmayı hedeflemektedir. Bunun içinde doğaya zarar vermeyen toplu taşıma kullanımını, yaya yürüyüşleri ve bisiklet kullanımını teşvik edici uygulamalar gerçekleştirmektedir. Barselona kirliliğini azaltmak için şehre giriş yolları üzerinde özel hız limiti uygulamasını gerçekleştiren ilk İspanyol kenti olmuştur. Ayrıca, Sürdürülebilir Turizm Politikasını içinde yer alan “Barselona Kültürü” başlığı Barselona geleneklerini, müzelerini ve festivallerini de içeren farklı açılardan Barselona kültürünü destekleyen uygulamaları gerçekleştirmektedir. 2011 yılında Barselona, Sorumlu Turizm Enstitüsü tarafından verilen Biyosfer Dünya Sınıflandırması Destinasyon Sertifikası alan Dünya’daki ilk şehir olmuştur. Bu sertifika destinasyonlara özel çevresel, kültürel ve sosyo-ekonomik yönetim kriterlerini uygulamaları bağlamında verilmektedir.
İyi Bir Destinasyon Uygulama Örneği: Norveç FyorduNational Geographic tarafından 2009’un en ikonik ve bozulmamış destinasyonu olarak seçilen Norveç Fyordları, eşsiz manzarası ve doğal çekicilikleri ile birlikte Dünya’nın en popüler kurvaziyer limanlarındandır. Norveç hükümetinin desteği ile birlikte, Norveç fyordları, turizmin dengeli gelişimi için doğal ve kültürel mirasın korunması içeren ve yerel halkın refahını sağlayan somut adımlar atmıştır. Norveç 2015 yılında sürdürülebilir destinasyon olma hedefi koyarak, 2012 yılında dünyaca tanınan ve kabul görmüş sürdürülebilir uygulama kriterlerini değerlendirmeye almıştır. Bu kapsamda Küresel Sürdürülebilir Turizm Konsülü’nün (GSTC) pilot bölgesi olarak atılan adımların sonuçlarıyla ilgili konsüle geri bildirimlerde bulunmuştur.
Since hosting the Olympic Summer Games of 1992, Barcelona has become a tourism destination which attracts intensive tourist movements. The vivid culture, right food culture and the attractions in the World Inheritance List make Barcelona as the most important tourism center of Spain. Furthermore, while Barcelona becomes an important cruise ship port of Europe, currently the city serves more than 2.6 millions of cruise ship passengers and draws attention as the most important cruise ship port of Europe. In the last six years, the City Council of Barcelona and the Tourism Management of Barcelona as the responsible organizations for marketing tourism product of Barcelona have jointed their forces and made some attempts to prevent that the city would not be negatively influenced from tourism activities by guaranteeing long-term vitality of the city. The sustainable development guidance policy frames of Barcelona have been prepared under the titles of 2010-2015 “Action Plan of Barcelona” and “the Agenda 21 of Barcelona”. The focal points of these titles consist of sustainably policy principles and the principles for developing sustainable tourism within the scope of destination management and marketing. In 2012, the Tourism Office of Barcelona has met with 20 important stakeholders and established the Sustainable Tourism Policy of Barcelona which will present an unforgettable experience for the guests visiting the city. An example of sustainable tourism policy of Barcelona which is taken into consideration through a holistic approach consists of the Barcelona cuisine with its environmental, socio-cultural and economical aspects. Through the “slowfood” and “from farm to your plate” movements, the Barcelona cuisine title supports gathering the restaurants and local suppliers together and using local contents. Through an innovative and economical perspective, Barcelona implements the water saving policy for the rural areas. At the same time, Barcelona aims to become the capital of the cities where electric vehicles are driven. Therefore, the city implements practices for supporting to use mass transportation, pedestrian walks and cycling which do not harm the environment and nature. Barcelona is the first Spanish city which has implemented the special speed limit application at the entranceways of the city in order to decrease pollution. Furthermore, the title of “Barcelona Culture” which is also within the scope of the Sustainable Tourism Policy, implements several practices supporting the culture of Barcelona from various perspectives including its traditions, museums and festivals. In 2011, Barcelona has become the first city to be awarded with the Biosphere World Classification Destination Certificate which is presented by the Responsible Tourism Institute. This certificate is presented to destinations for implementing special environmental, cultural and socio-economical management criteria.
A Good Destination Example: Fiords of NorwayThe Fiords of Norway selected by National Geographic as the most iconic and untouched destination of 2009 is one of the most popular cruise ship ports of the World with its unique view and natural attractions. With the support of Norway Government, the Fiords of Norway has taken concrete steps in order to ensure stabilized development of tourism including protecting the natural and cultural inheritance and prosperity of local people. in 2012, Norway has set a goal to become a sustainable destination in 2015 and taken the most famous and accepted sustainable practice criteria of the world into consideration. Within this scope, the related feedbacks have been provided to the related commission about the results of steps taken as the pilot region of the Global Sustainable Tourism Commission (GSTC).
TURİZM RAPORU / TOURISM REPORT
50
Bu bağlamda Norveç, uygulamaları ile kendi sürdürülebilirlik standart ve belgelendirme programı geliştiren ilk ülke unvanını kazanmıştır. Sürdürülebilir Uluslar Arası Seyahat Birliği de Norveç’in standartlarını izleyerek çıktıları değerlendirmektedir. Norveç’in sürdürülebilir destinasyon standardının amacı sürdürülebilir turizm bilincini ve yeteneklerini artırmak için bir çerçeve çizmektir. Bu bağlamda Norveç, macera seyahati endüstrisi için sürdürülebilir kriterleri içeren “beyaz kitapçık” isimli sürdürülebilir yol haritasını geliştirmiştir. Ayrıca Norveç, destinasyon sürdürülebilirliğinin diğer bir ayrılmaz parçası olarak pazarlamada sürdürülebilir hikaye anlatımı ve sürdürülebilirlikle turizm ürünlerini ve markalarını birleştirmeyi ele almıştır. Norveç, bu bağlamda Sürdürülebilir Seyahat Birliği ile birlikte destinasyonun sürdürülebilirlik temalı pazarlama ve iletişim faaliyetlerini geliştirmek için sürdürülebilirlik amaçlarını raporlayarak dünya çapında seyahat severler ve müşterilerle paylaşmıştır. Norveç, bu sürdürülebilirlik hikâyelerini rekabet gücünü geliştirmek ve yatırımlarının geri dönüşümünü artırmak için kullanmıştır. Røros ve Vega, destinasyon deneyimi ve hikayesinin en güzel örnekleridir.
İyi Bir Destinasyon Uygulama Örneği: Cozumel Cozumel, turkuaz mavisi suları, göz kamaştırıcı mercanları, beyaz kumsalları ve zengin kültürel mirası olan bir adadır. Meksika Karayiplerin’de olan bu destinasyonda, ortalama yıllık 240,000 geceleme yapılırken, Dünya’nın en çok ziyaret edilen kurvaziyer limanı olan bu destinasyon 3 milyona yakın kurvaziyer yolcusu çekmektedir. Sürdürülebilir gelişimin yörüngesinde Cozumel Belediyesi tarafından Mesoamerican Reef Turizm Girişimi (MARTI) ile birlikte son beş yılda turizm sürdürülebilirliği sağlamak adına önemli adımlar atılmıştır. Cozumel, Dünya’da kurvaziyer ziyaretlerinin çevresel etkileriyle ilişkili olan öncelikli konuları tanımlayan ve çok farklı alanlardan paydaşların işbirliğine öncülük eden Eylem Planı geliştiren ilk destinasyonlardandır. 2008 yılında MARTI ve Cozumel Belediyesi, destinasyonun kurvaziyer ziyareti yönetimini daha etkin hale getirmek amacıyla kurvaziyer işletmeleri, hükümet, özel sektör ve sivil toplum kuruluşlarından oluşan kurvaziyer sektörü paydaşlarını bir araya getirmiştir. MARTI partneri olan Cozumel Sektörlerarası Konseyi eylem planının gelişim sürecini oluşturmak ve sektörler arası uygulamaların koordine etmek için kurulmuştur. Cozumel Sektörler Arası Konseyi, Cozumel için kurvaziyer turizm yönetimi konularına işaret eden koruma projelerine ilişkin çok sayıda etkili uygulamayı hayata geçirmiştir. 2012 yılında, MARTI uluslar arası sürdürülebilir seyahat birliği ile ortaklık kurarak sürdürülebilir destinasyon yönetimi için 80 uluslar arası alanda tanınan enerji kullanımı, kültürün turistik ürüne yerleştirilmesi gibi göstergelere odaklanmıştır. Destinasyon paydaşlarının yardımı ile birlikte kısa sürede ölçülebilecek “su koruma ve yeniden kullanma programı, destinasyon kalitesi ve turizm operatörleri için sürdürülebilir standartların oluşturulması, Cozumel’e özgü olan kültürel, tarihi ve doğal çekicilikleri vurgulayan rehber haritaların geliştirilmesi” gibi somut projelere yönelik uygulama takvimi oluşturulmuştur ve başarıyla uygulanmıştır.
Dünyanın En Yeşil Tatil Destinasyonları “100 Küresel Sürdürülebilir Destinasyon” projesi, turistik destinasyonların sürdürülebilir yönetim faaliyetlerini ödüllendirmek ve teşvik etmek için oluşturulmuş bir uygulamadır. Liste sosyal medyada yapılan açık bir çağrı ile alanında 30 uzman kişinin takip ettiği bir seçim sürecinden geçirilmiştir. Uygulama yöneticileri hiç bir destinasyonun % 100 sürdürülebilir olmayacağını belirtirken, destinasyonların sürdürülebilir yönetim performanslarının altı anahtar kriterden oluştuğunu vurgulamaktadır. Bu kriterler; - Doğa kalitesi, vahşi yaşam deneyimi, destinasyonun yüzey şekli,- Çevre kalitesi (hava, su…) ve çevresel uygulamalar,- Kültür ve gelenekler, yerel kimlik ve gelenekler,- Sosyal refah, misafirperverlik, insan hakları, insana saygı,- Yeşil Ekonomi: işletme katılımı, yenilikçilik, yeşil enerji, iklim uyumu, su ve atık yönetimi,- Yeşil turizm politikası, sertifika varlığı ve başarılı yeşil kıyaslamalar.
In this sense, Norway has won the title of being the first country its own sustainability standards and certification program through its own program. The Sustainable International Travel Union monitors the standards of Norway and evaluates outputs. The purpose of sustainable destination standard of Norway is to establish a frame in order to increse tourism awareness and skills. In this respect, Norway has developed its roadmap called as “the white booklet” which includes the sustainable criteria for advanture trip industry. In addition Norway has considered that sustainable storytelling of marketing and integration of tourism products and brands under sustainability as another indispensible part of destination sustainability. In this sense Norway, has reported the sustainability purposes jointly with the Sustainable Travel Union in order to develop the marketing and communication activities of the destination with sustainability theme and shared with these purposes with the worldwide travel lovers and customers. Norway has used these sustainability stories in order to improve its competitiveness and increase return of its investments. Røros and Vega are the most beautiful examples of destination experience and story. A Good Destination Example: CozumelCozumel is an island with turqoise waters, wonderful coral, white beaches and rich cultural inheritance. While, there are approximately 240.000 overnight stays for a year at this destination located at the Mexican Carrabeans, this destination which is the most visited cruise ship port of the World attracts almost 3 millions of cruise passengers every year. In the orbit of the sustainable development, important steps have been taken by the Municipality of Cozumel jointly with the Mesoamerican Reef Tourism Initiative (MARTI) for the last five years in order to ensure sustainability of tourism. Cozumel is one of the first destinations which has implemented the Action Plan identifying prioritized issues related with environmental impacts of cruise journeys of the World and leading cooperation of stakeholders from various fields. In 2008, MARTI and the Municipality of Cozumel have gathered the stakeholders from cruise enterprises, government, private sector and non-governmental organizations in order to make hte cruise visit management of the destination more efficient. The Cozumel Inter-sectoral Council as a partner of MARTI has been founded in order to establish the development process of the action plan and coordinate inter-sectoral practices. Cozumel Inter-Sectoral Council has implemented several efficient practices related with the protection projects indicating cruise tourism management issues of Cozumel In 2012, MARTI has focused on 80 internationally accepted indicators of sustainable destination management such as energy use, integration of culture in a touristic product and etc. by forming an association with the international sustainable travel union. The activity schedule intended for concrete projects such as “the program for protecting and reusing water, establishing sustainability standards for destination quality and tourism operator and developing guiding maps emphasizing the cultural, historical and natural attractions specific to Cozumel” which can be measured in a very short term with the assistance of the destination stakeholders and implemented that schedule, successfully.
The Most Green Holiday Destinations of the World“100 Global Sustainable Destinations” project is a project which has been established in order to reward and support the sustainable management activities of touristic destinations. The list has been subjected to a selection process through an open call in social media which has been followed by 30 experts. While, the project managers indicate that no destination can be 100% sustainable, they indicate that the sustainable management performances of destinations consist of six core criteria. These are; - Natural quality, wildlife experience and surface features of the destination,- Environmental quality (air, water and etc...) and environmental practices,- Culture and traditions, local identity and customs,- Social prosperity, hospitality, human rights and humanism,- Green Economy: participation of enterprises, innovativeness, green energy, acclimation and water and waste management,- Green tourism policy, certification and successful green comparisons.
TURİZM RAPORU / TOURISM REPORT
51

The main purpose for rewarding the destinations with best practices
is to encourage the public and private sector for sustainable
destination policy practices and direct practice managers and
tourists to sustainable behaviors. The project managers recommend
travel lovers to chose the hotels with green certification and low
carbon footprint and chose the destinations with sustainable policy
which implement sustainable management practices. In Table 4,
the destinations selected within the scope of this project are listed.
These destinations are separated as the Africa, America, Asia-
Pacific and Europe. In 2014, 50 destinations have been selected
from Europe, while 10 from Africa, 25 from Asia-Pacific and 15 from
America. It is seen that Spain, the Netherlands, Greece and Portugal
consist the greater part of Europe. From Turkey, Munzur Valley has
been selected as the Nature Park and taken in the list. 42.000
hectares of area from Munzur Valley which is located between
Tunceli-Ovacik has been declared as National Park in 1971. The
data influencing declaration of Munzur Valley Region as a national
park which is one of the biggest national parks of Turkey are its
rich natural assets mainly such as springs and sources, endemic
plant species and animal species specific to the region and rich
habitat and animal presence (www.tuncelikulturturizm.gov.tr,
03.06.2015).
En iyi uygulamalara sahip destinasyonların ödüllendirilmesindeki temel amaç kamu ve özel sektörü sürdürülebilir destinasyon politika uygulamalarına özendirmek, uygulama yöneticileri ve turistleri sürdürülebilir davranışlara sevk etmektir. Proje yöneticileri tatil severlere yeşil sertifikası olan ve düşük karbon ayak izleri olan otelleri seçmelerini, destinasyonlarını da seçerken sürdürülebilir politikası olan ve sürdürülebilir yönetim uygulamalarını gerçekleştiren destinasyonları seçmelerini önermektedir. Tablo 4’de bu proje kapsamında seçilen destinasyonlar bulunmaktadır. Destinasyonlar Afrika kıtası, Amerika kıtası, Asya-Pasifik kıtası ve Avrupa kıtası olarak ayrılmıştır. 2014 yılında Avrupa’dan 50, Afrika kıtasından 10, Asya-Pasifik kıtasından 25 ve Amerika kıtasından 15 destinasyon seçilmiştir. Avrupa kıtasında İspanya, Hollanda, Yunanistan ve Portekiz’in çoğunluğu oluşturduğu görülmektedir. Türkiye’den ise Munzur Vadisi Doğa Parkı seçilerek listede yer almıştır. Tunceli-Ovacık arasında uzanan Munzur Vadisinde, 42.000 Hektarlık bir alan 1971 yılında Milli Park olarak ilan edilmiştir. Türkiye’nin en büyük milli parklarından biri olan Munzur Vadisi Bölgesinin milli park olarak ilan edilmesinde etken olan veriler, başta akarsu kaynakları ve gözeler olmak üzere zengin doğal veriler, endemik bitki türleri ve yöreye özgü hayvan türleri ile zenginleşen bitki örtüsü ve yaban hayvan varlığıdır (www.tuncelikulturturizm.gov.tr, 03.06.2015).
Tablo 32: 100 Küresel Sürdürülebilir Destinasyon (2014) Table32: 100 Global Sustainable Destinations (2014)
TURİZM RAPORU / TOURISM REPORT
52

Avru
pa K
ıtası
/ E
urop
ean
Conti
nent
Ülke Country Destinasyon / Destination
Amer
ika
Kıta
sı /
Am
eric
an c
ontin
ent
Ülke Country Destinasyon / Destination
Portekiz Portugal Azores Hollanda Antilleri Netherlands Antilles Bonaire Saba
Portekiz Portugal Lagos Dominika Dominica Dominika
Portekiz Portugal Oeste –Batı Bölgesi Kitts & Nevis
St. Kitts St. Kitts
Portekiz Portugal Cascais-Estoril Brezilya Brazil Fernando de Noronha
Portekiz Portugal Serra do Socorro Archeira Brezilya Brazil Bonito
Portekiz Portugal Sintra Kanada Canada Jasper Ulusal Parkı
Hollanda Netherlands Westvoorne Kanada Canada Vancouver
Hollanda Netherlands Schouwen-Duiveland Şili Chile Llanquihue Gölü
Hollanda Netherlands Ameland Şili Chile Rapa Nui - Easter Adası
Hollanda Netherlands Katwijk Kolombiya Colombia Otún - Quimbaya Nat. Mabedi
Hollanda Netherlands Noordwijk Costa Rica Costa Rica Los Santos
Hollanda Netherlands Goedereede-Ouddorp Ekvator Equator Challuacocha Gölü - Sani Isla
Hollanda Netherlands Hoek van Holland Meksika Mexican Huatulco
Yunanistan Greece Athos Meksika Mexican Sierra Gorda
Yunanistan Greece Alonissos-Sporades ABD USA Mono Gölü
Yunanistan Greece Lerapetra
Asya
- Pas
ifik
Kıta
sı /
Pas
ifikk
ıta in
Asi
a
Ülke Country Destinasyon / Destination
Yunanistan Greece Naxos Avustralya Australia Kakadu Doğa Parkı
Yunanistan Greece Samothraki Avustralya Australia Rottnest Island
İtalya İtaly Migliarino San Rossore Mass.
Bhutan Bhutan Bhutan Ulusal Parkı
Malta Malta Gozo&Comino Çin China Jinshanling Çin Seddi
Norveç-İsveç Norwegian-Sweden Kosterhavet-Ytre Hvaler Çin China Huangshan Dağı
Norveç Norwegian Svalbard Hindistan India Khangchendzonga - Sikkim
Fransa France Camargue Doğa Parkı Hindistan India Periyar Tiger Reserve
Danimarka Denimark Romo-Fano Endonezya Entonia Flores
Avusturya Austria Werfenweng Japonya Japan Iriomote NP
Litvanya Lithuanian Kursiu Nerija Doğa Parkı Ürdün Jordanian Dana
Almanya Germany Norderney Kazakistan Kazakhstan Shabanbaj bi-Kyzylaray
Almanya Germany Juist Malezya Malaysia Belum-Temenggor Ormanı
Almanya Germany Schwäbisch-Fränkischer Wald
Nepal Nepal Chitwan Doğa Parkı
Belçika Belgian Durbuy Yeni Zelenda New Zealand Kaikoura
Kıbrıs Cypriot Paphos Papua Yeni Gine Papua New Guinea PNG Milli Parkı
İzlanda İceland Snaefellsnes Filipinler Filipinos Vigan
Finlandiya Finland Aland Adaları Rusya Russia Altay Altın Dağları
Letonya Latvia Kuldiga Şeyşeller Seychelles Praslin
Estonya Estonia Võrtsjärv Gölü Güney Kore South Korea Seonheul-ri - Jeju Adası
İrlanda Ireland Kilkee & Loop Head Sri Lanka Sri Lanka Madampa Gölü
Slovenya Slovenia Ljubljana Tacikistan Tajikistan Bartang & Wakhan Vadisi
İsveç Swedish Sigtuna Tayland Thailand Doi Inthanon Doğa Parkı
Polonya Polish Tuchola Ormanı Tonga Tonga Vava’u
Polonya Polish Biebrza Ulusal Ormanı Türkiye Turkey Munzur Vadisi Doğa Parkı
İspanya Spain Galicia Vietnam Vietnamese Can Gio (HCMC)
İspanya Spain Barcelona (Catalunya)
Afrik
a Kı
tası
/ A
fric
an C
ontin
ent
Ülke Country Destinasyon / Destination
İspanya Spain Gijon (Asturias) Fransa France La Reunion & Mayotte
İspanya Spain Lanzarote (Canarias) Botsvana Botswana Okavango Deltası
İspanya Spain La Palma (Canarias) Cape Verde Cape Verde Santo Antão
İspanya Spain Val d’Aran (Catalunya) Kenya Kenya Mara Naboisho
İspanya Spain Noja (Cantabria) Fas Morocco Drâa Vadisi
İngiltere Britain New Forest Ulusal Parkı Namibya Namibia Etosha Ulusal Parkı
İngiltere Britain District Gölü Güney Afrika South Africa Somkhanda Game
Ukrayna Ukraine Carpathian Doğa Parkı Güney Afrika South Africa Cape Whale Sahili
Kaynak: http://greendestinations.info/top100/, 01.06.2015.Gambiya / Source: http://greendestinations.info/top100/, 01.06.2015. Gambia
Güney Afrika South Africa Vahşi Sahil
TURİZM RAPORU / TOURISM REPORT
53

3.6.2.2. Çevreye Duyarlı Konaklama Tesisleri (Yeşil Yıldızlı Tesislerde Son Durum)3.6.2.2. Environment-Friendly Accommodation Facilities
(Final Situation of Green Star Facilities)
3.6.2.3. Türkiye’de Mavi Bayrak Uygulamaları3.6.2.3. Blue Flag Practices of Turkey
Turizm bakanlığından alınan son verilere göre ülkemizdeki yeşil
yıldızlı tesislerin sayısı 230’a yükselmiştir ve her geçen yılda bu
sayı artmaktadır. Grafikte de görüldüğü üzere en fazla yeşil yıldızlı
tesis sayısı geçen yılara olduğu gibi Antalya iline aittir. Antalya ilini
sırasıyla İstanbul, Muğla ve İzmir illeri almaktadır.
According to latest data from the Ministry of Agriculture, the number of green facilities in our country has increased up to 230 and this number gradually increases every year. As it is seen from the following graphic, the most green star facilities are located in Antalya as previously. Istanbul, Mugla and Izmir respectively follow Antalya.
Avrupa Topluluğu, kendi ülkelerinde yüzme amacı ile kullanılacak
göl ve deniz suları için gerekli su kalitelerini belirleyen
mikrobiyolojik parametreleri, yol gösterici ve uyulması zorunlu
hükümler olarak ortaya koymuştur. Bu çalışmalar 1987
yılında Avrupa Çevre Eğitim Vakfı (FEEE) tarafından yürütülen
Mavi Bayrak Kampanyası adı altında birleştirilmiş önce 11
AT ülkesi daha sonra 22 ülkede başarı ile uygulanmıştır.
2001 yılında ise Avrupa’nın dışında yer alan ülkelerden gelen
talepler doğrultusunda kampanyanın kapsamı genişletilmiş
olup Avrupa Çevre Eğitim Vakfı’nın adı Çevre Eğitim Vakfı
olarak değiştirilmiştir. Mavi Bayrak, plaj ve marinalara verilen
uluslararası bir çevre ödülüdür. Bu ödül; deniz suyunun
temizliğini, çevre yönetimine önem verildiğini, çevre bilincinin
oluşturulmasına yönelik etkinliklerin yapıldığını ve plaj veya
marinayı kullananların ihtiyaçlarına cevap verecek donanım
ve güveliğini garanti etmektedir. Bu nedenle Mavi Bayrak, bir
marka veya “Eko-Label” özelliğini taşımaktadır. (http://yigm.
kulturturizm.gov.tr/TR,11569/mavi-bayrak.html http://www.
mavibayrak.org.tr)
The European Union has presented the microbiological parameters
as the guiding and mandatory provisions which determine the
quality of waters for the lakes and seawater to be used for
swimming purposes in the member countries. These activities has
been combined under the Blue Flag Campaign which used to be
executed by the Foundation of Environmental Education of Europe
1987 and then successfully implemented firstly by 11 EU member
countries than other 22 countries. In 2001, due to the demands
from the countries out of Europe, the scope of the campaign has
been expanded and the Foundation of Environmental Education
of Europe has been changed as the Environmental Education
Foundation. Blue Flag is an international environment award
presented to beaches and marinas. This award guarantees the
cleanliness of the seawater and indicates that the environmental
management is considered important and activities intended
for creating an environmental awareness are performed and the
equipment and safety which will address the needs of the ones
using beaches and marinas. Therefore, the Blue Flag has a brand
or “Eco-Label” characteristic. (http://yigm.kulturturizm.gov.tr/
TR,11569/mavi-bayrak.htmlhttp://www.mavibayrak.org.tr)
Grafik 1 Ülkemizdeki Yeşil Yıldızlı Tesislerin İllere Göre Dağılımı Graphic 1. Distribution of Green Star Facilities of Our Country According to Provinces
Kaynak: http://yigm.kulturturizm.gov.tr/Eklenti/41263,cdkt-3006152.xls?0 / Source: http://yigm.kulturturizm.gov.tr/Eklenti/41263,cdkt-3006152.xls?0
TURİZM RAPORU / TOURISM REPORT
54
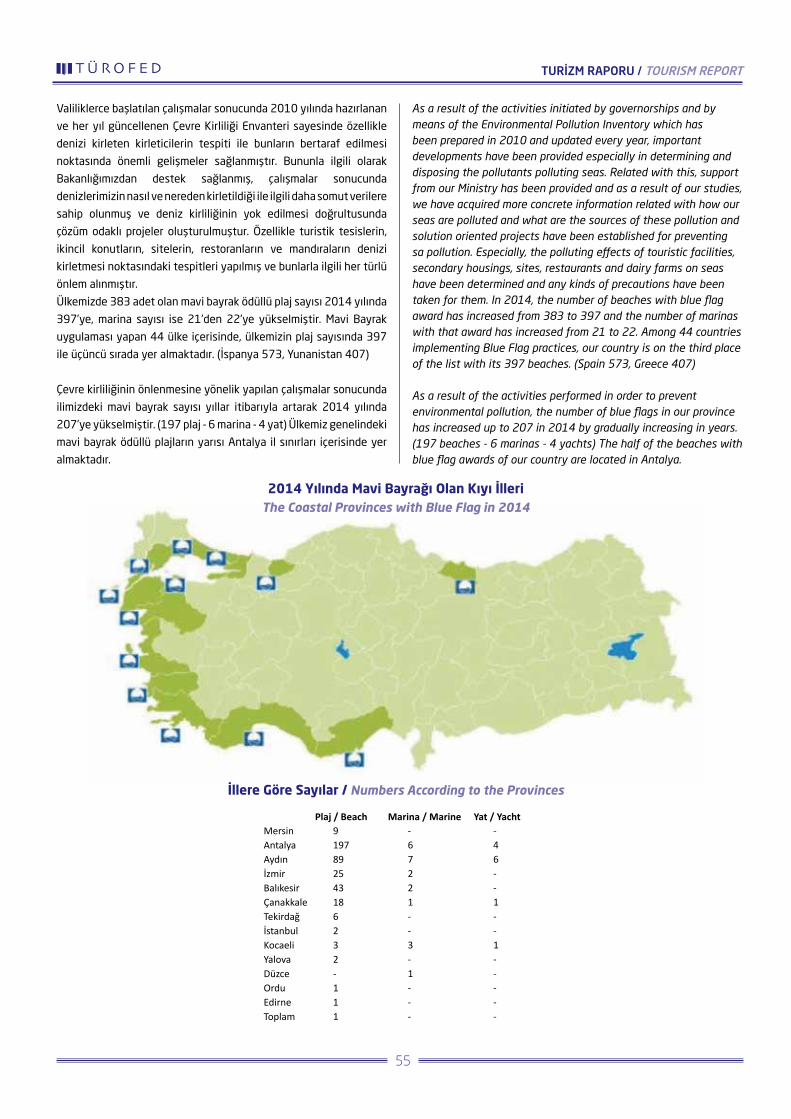
Valiliklerce başlatılan çalışmalar sonucunda 2010 yılında hazırlanan
ve her yıl güncellenen Çevre Kirliliği Envanteri sayesinde özellikle
denizi kirleten kirleticilerin tespiti ile bunların bertaraf edilmesi
noktasında önemli gelişmeler sağlanmıştır. Bununla ilgili olarak
Bakanlığımızdan destek sağlanmış, çalışmalar sonucunda
denizlerimizin nasıl ve nereden kirletildiği ile ilgili daha somut verilere
sahip olunmuş ve deniz kirliliğinin yok edilmesi doğrultusunda
çözüm odaklı projeler oluşturulmuştur. Özellikle turistik tesislerin,
ikincil konutların, sitelerin, restoranların ve mandıraların denizi
kirletmesi noktasındaki tespitleri yapılmış ve bunlarla ilgili her türlü
önlem alınmıştır.
Ülkemizde 383 adet olan mavi bayrak ödüllü plaj sayısı 2014 yılında
397’ye, marina sayısı ise 21’den 22’ye yükselmiştir. Mavi Bayrak
uygulaması yapan 44 ülke içerisinde, ülkemizin plaj sayısında 397
ile üçüncü sırada yer almaktadır. (İspanya 573, Yunanistan 407)
Çevre kirliliğinin önlenmesine yönelik yapılan çalışmalar sonucunda
ilimizdeki mavi bayrak sayısı yıllar itibarıyla artarak 2014 yılında
207’ye yükselmiştir. (197 plaj - 6 marina - 4 yat) Ülkemiz genelindeki
mavi bayrak ödüllü plajların yarısı Antalya il sınırları içerisinde yer
almaktadır.
As a result of the activities initiated by governorships and by means of the Environmental Pollution Inventory which has been prepared in 2010 and updated every year, important developments have been provided especially in determining and disposing the pollutants polluting seas. Related with this, support from our Ministry has been provided and as a result of our studies, we have acquired more concrete information related with how our seas are polluted and what are the sources of these pollution and solution oriented projects have been established for preventing sa pollution. Especially, the polluting effects of touristic facilities, secondary housings, sites, restaurants and dairy farms on seas have been determined and any kinds of precautions have been taken for them. In 2014, the number of beaches with blue flag award has increased from 383 to 397 and the number of marinas with that award has increased from 21 to 22. Among 44 countries implementing Blue Flag practices, our country is on the third place of the list with its 397 beaches. (Spain 573, Greece 407) As a result of the activities performed in order to prevent environmental pollution, the number of blue flags in our province has increased up to 207 in 2014 by gradually increasing in years. (197 beaches - 6 marinas - 4 yachts) The half of the beaches with blue flag awards of our country are located in Antalya.
2014 Yılında Mavi Bayrağı Olan Kıyı İlleri The Coastal Provinces with Blue Flag in 2014
İllere Göre Sayılar / Numbers According to the Provinces
MersinAntalyaAydınİzmirBalıkesirÇanakkaleTekirdağİstanbulKocaeliYalovaDüzceOrduEdirneToplam
Plaj / Beach Marina / Marine Yat / Yacht9197892543186232-111
-67221--3-1---
-46--1--1-----
TURİZM RAPORU / TOURISM REPORT
55

Butler, & G. Wall, Tourismand Sustainable Development: Monitoring, Planning, Managing,
Waterloo, Canada: Department of Geography Publication Series, University of Waterloo,
37, pp.29-43.
Demir, C. ve Çevirgen, A. (2006). Ekoturizm Yönetimi, Nobel Yayın Dağıtım, Ankara.
Papatya, N., Papatya, G. ve Hamşioğlu, B. (2011).“Sürdürülebilir Çevre ve Kaynak Tabanlı
Turizm: Eğirdir Bölgesine İlişkin Bir Değerlendirme Eleştirel/Yapıcı Bir Yaklaşım”, I. Uluslara-
rası IV. Ulusal Eğirdir Turizm Sempozyumu ve Göller Bölgesi Değerleri Çalıştayı, ‘Turizmde
Yeni Ufuklar’ Bildiriler Kitabı, 1-4 Aralık, ss. 221-236.
Papatya, N. (2007). Sürdürülebilir Rekabetçi Üstünlük Sağlamada Stratejik Yönetim ve
Pazarlama Odağı Kaynak Tabanlı Görüş –Kavramsal ve Kuramsal Yaklaşım, Asil Yayıncılık,
Ankara.
Global Code of Ethics for Tourism, http://ethics.unwto.org/en/content/global-code-ethics-
tourism, 27.05.2016 Global Code of Ethics for Tourism - Article 3, http://ethics.unwto.org/
sites/all/files/docpdf/turkey.pdf, 28.05.2016.
Tourism More Sustainable - A Guide for Policy Makers, http://www.e-unwto.org/doi/
pdf/10.18111/9789284411191, 28.05.2016.
Certificates and Standarts, http://destinet.eu/who-who/market-solutions/certificates/
fol442810, 28.05.2016.
UNEP and WTO, (2005), Making Tourism More Sustainable: A Guide for Policy Makers,
World Tourism Organization, WTO, France.
http://destinationsfortomorrow.org/sustainability-solutions/what-is-a-sustainable-
destination, 29.05.2015.
http://greendestinations.info/top100/, 01.06.2015.
http://www.tuncelikulturturizm.gov.tr/TR,57342/munzur-vadisi-milli-parki.html,
03.06.2015.
http://www.gstcouncil.org/gstc-criteria/criteria-for-destinations.html, 29.05.2015.
http://destinationsfortomorrow.org/sustainability-solutions/what-is-a-sustainable-
destination/good-practice-in-action/barcelona, 29.05.2015.
http://destinationsfortomorrow.org/sustainability-solutions/what-is-a-sustainable-
destination, 29.05.2015.
http://destinationsfortomorrow.org/sustainability-solutions/what-is-a-sustainable-
destination/good-practice-in-action/fjord-norway, 29.05.2015.
http://destinationsfortomorrow.org/sustainability-solutions/what-is-a-sustainable-
destination/good-practice-in-action/cozumel, 29.05.2015.
http://www.ktbyatirimisletmeler.gov.tr/TR,9854/sinir-giris-cikis-istatistikleri.html Erişim
tarihi: 8/07/2014
http://www.antalyakulturturizm.gov.tr/TR,67091/kultur-turizm-istatistikleri.html Erişim
tarihi: 8/07/2014
http://www.istanbulkulturturizm.gov.tr/TR,71515/turizm-istatistikleri.html Erişim tarihi:
8/07/2014
http://www.izmirkulturturizm.gov.tr/TR,77255/2011-yili-istatistikleri.html Erişim tarihi:
8/07/2014 http://www.muglakulturturizm.gov.tr/TR,90760/2014.html Erişim tarihi:
8/07/2014
http://www.muglakulturturizm.gov.tr/Eklenti/9796,2010milaypdf.pdf?0 Erişim tarihi:
8/07/2014 http://www.muglakulturturizm.gov.tr/Eklenti/9792,2011milaypdf.pdf?0
Erişim tarihi: 8/07/2014 http://www.muglakulturturizm.gov.tr/TR,73716/2012-milletlere-
ve-aylara-gore-dagilim.html Erişim tarihi: 8/07/2014 http://www.izmirkulturturizm.gov.tr/
TR,77298/2013-yili-istatistikleri.html Erişim tarihi: 8/07/2014
http://yigm.kulturturizm.gov.tr/TR,11569/mavi-bayrak.html
http://yigm.kulturturizm.gov.tr/Eklenti/41263,cdkt-3006152.xls?0
Butler, & G. Wall, TourismandSustainable Development: Monitoring, Planning, Managing,
Waterloo, Canada: Department of GeographyPublication Series, University of Waterloo,
37, pp.29-43.
Demir, C. and Cevirgen, A. (2006). Ecotourism Management, Nobel Publications, Ankara.
Papatya, N., Papatya, G. veHamsioglu, B. (2011).“Sustainable Environment and Source
Based Tourism: An Evaluation for Egridir Region a Critical/Structural Approach”, 1st Inter-
national 4th National Egridir Tourism Symposium and the Values of the Turkish Lakesland
Workshop, ‘New Horizons of Tourism’ Declarations Book, 1-4 December, pp. 221-236.
Papatya, N. (2007). The Strategic Management and Marketing Focus for Getting a Susta-
inable Competitive Edge Source Based Approach-Conceptual and Theoretical Approach,
Asil Publications, Ankara.
Global Code of EthicsforTourism, http://ethics.unwto.org/en/content/global-code-ethics-
tourism, 27.05.2016 Global Code of EthicsforTourism - Article 3, http://ethics.unwto.org/
sites/all/files/docpdf/turkey.pdf, 28.05.2016.
TourismMoreSustainable - A Guide forPolicyMakers, http://www.e-unwto.org/doi/
pdf/10.18111/9789284411191, 28.05.2016.
CertificatesandStandarts, http://destinet.eu/who-who/market-solutions/certificates/
fol442810, 28.05.2016.
UNEP and WTO, (2005), MakingTourismMoreSustainable: A Guide forPolicyMakers, World
TourismOrganization, WTO, France.
http://destinationsfortomorrow.org/sustainability-solutions/what-is-a-sustainable-
destination, 29.05.2015.
http://greendestinations.info/top100/, 01.06.2015.
http://www.tuncelikulturturizm.gov.tr/TR,57342/munzur-vadisi-milli-parki.html,
03.06.2015.
http://www.gstcouncil.org/gstc-criteria/criteria-for-destinations.html, 29.05.2015.
http://destinationsfortomorrow.org/sustainability-solutions/what-is-a-sustainable-
destination/good-practice-in-action/barcelona, 29.05.2015.
http://destinationsfortomorrow.org/sustainability-solutions/what-is-a-sustainable-
destination, 29.05.2015.
http://destinationsfortomorrow.org/sustainability-solutions/what-is-a-sustainable-
destination/good-practice-in-action/fjord-norway, 29.05.2015.
http://destinationsfortomorrow.org/sustainability-solutions/what-is-a-sustainable-
destination/good-practice-in-action/cozumel, 29.05.2015.
http://www.ktbyatirimisletmeler.gov.tr/TR,9854/sinir-giris-cikis-istatistikleri.htmlAccess
date: 8/07/2014
http://www.antalyakulturturizm.gov.tr/TR,67091/kultur-turizm-istatistikleri.htmlAccess
date: 8/07/2014
http://www.istanbulkulturturizm.gov.tr/TR,71515/turizm-istatistikleri.html Access date:
8/07/2014
http://www.izmirkulturturizm.gov.tr/TR,77255/2011-yili-istatistikleri.htmlAccess date:
8/07/2014http://www.muglakulturturizm.gov.tr/TR,90760/2014.html Access date:
8/07/2014
http://www.muglakulturturizm.gov.tr/Eklenti/9796,2010milaypdf.pdf?0Access Date:
8/07/2014http://www.muglakulturturizm.gov.tr/Eklenti/9792,2011milaypdf.pdf?0Access
Date: 8/07/2014 http://www.muglakulturturizm.gov.tr/TR,73716/2012-milletlere-ve-
aylara-gore-dagilim.htmlAccess Date: 8/07/2014 http://www.izmirkulturturizm.gov.tr/
TR,77298/2013-yili-istatistikleri.htmlAccess date: 8/07/2014
http://yigm.kulturturizm.gov.tr/TR,11569/mavi-bayrak.html
http://yigm.kulturturizm.gov.tr/Eklenti/41263,cdkt-3006152.xls?0
KAYNAKLAR RESOURCES
TURİZM RAPORU / TOURISM REPORT
56

AKDENİZ ÜNİVERSİTESİ TURİZM FAKÜLTESİHAZIRLAYANLAR
Prof. Dr. Akın AKSUProf. Dr. Mustafa GÜLMEZ
Dr. Şevket YİRİKYrd. Doç Dr. Özlem GÜZEL
AKDENİZ UNIVERSITY, THE FACULTY OF TOURISMPREPARED BY
Prof. Dr. Akin AKSUProf. Dr. Mustafa GULMEZ
Dr. Sevket YIRIKAss. Prof. Dr. Ozlem GUZEL
TURİZM RAPORU / TOURISM REPORT
57

Notlar:..................................................................................................................................................................................................................................................................
...................................................................................................................................................................................................................................................................................
...................................................................................................................................................................................................................................................................................
...................................................................................................................................................................................................................................................................................
...................................................................................................................................................................................................................................................................................
...................................................................................................................................................................................................................................................................................
...................................................................................................................................................................................................................................................................................
...................................................................................................................................................................................................................................................................................
...................................................................................................................................................................................................................................................................................
...................................................................................................................................................................................................................................................................................
...................................................................................................................................................................................................................................................................................
...................................................................................................................................................................................................................................................................................
...................................................................................................................................................................................................................................................................................
...................................................................................................................................................................................................................................................................................
...................................................................................................................................................................................................................................................................................
...................................................................................................................................................................................................................................................................................
...................................................................................................................................................................................................................................................................................
...................................................................................................................................................................................................................................................................................
...................................................................................................................................................................................................................................................................................
...................................................................................................................................................................................................................................................................................
...................................................................................................................................................................................................................................................................................
...................................................................................................................................................................................................................................................................................
...................................................................................................................................................................................................................................................................................
...................................................................................................................................................................................................................................................................................
...................................................................................................................................................................................................................................................................................
...................................................................................................................................................................................................................................................................................
...................................................................................................................................................................................................................................................................................
...................................................................................................................................................................................................................................................................................
...................................................................................................................................................................................................................................................................................
...................................................................................................................................................................................................................................................................................
...................................................................................................................................................................................................................................................................................
...................................................................................................................................................................................................................................................................................
...................................................................................................................................................................................................................................................................................
...................................................................................................................................................................................................................................................................................
...................................................................................................................................................................................................................................................................................
...................................................................................................................................................................................................................................................................................
...................................................................................................................................................................................................................................................................................
...................................................................................................................................................................................................................................................................................
...................................................................................................................................................................................................................................................................................
...................................................................................................................................................................................................................................................................................
TURİZM RAPORU / TOURISM REPORT
58

Notlar:..................................................................................................................................................................................................................................................................
...................................................................................................................................................................................................................................................................................
...................................................................................................................................................................................................................................................................................
...................................................................................................................................................................................................................................................................................
...................................................................................................................................................................................................................................................................................
...................................................................................................................................................................................................................................................................................
...................................................................................................................................................................................................................................................................................
...................................................................................................................................................................................................................................................................................
...................................................................................................................................................................................................................................................................................
...................................................................................................................................................................................................................................................................................
...................................................................................................................................................................................................................................................................................
...................................................................................................................................................................................................................................................................................
...................................................................................................................................................................................................................................................................................
...................................................................................................................................................................................................................................................................................
...................................................................................................................................................................................................................................................................................
...................................................................................................................................................................................................................................................................................
...................................................................................................................................................................................................................................................................................
...................................................................................................................................................................................................................................................................................
...................................................................................................................................................................................................................................................................................
...................................................................................................................................................................................................................................................................................
...................................................................................................................................................................................................................................................................................
...................................................................................................................................................................................................................................................................................
...................................................................................................................................................................................................................................................................................
...................................................................................................................................................................................................................................................................................
...................................................................................................................................................................................................................................................................................
...................................................................................................................................................................................................................................................................................
...................................................................................................................................................................................................................................................................................
...................................................................................................................................................................................................................................................................................
...................................................................................................................................................................................................................................................................................
...................................................................................................................................................................................................................................................................................
...................................................................................................................................................................................................................................................................................
...................................................................................................................................................................................................................................................................................
...................................................................................................................................................................................................................................................................................
...................................................................................................................................................................................................................................................................................
...................................................................................................................................................................................................................................................................................
...................................................................................................................................................................................................................................................................................
...................................................................................................................................................................................................................................................................................
...................................................................................................................................................................................................................................................................................
...................................................................................................................................................................................................................................................................................
...................................................................................................................................................................................................................................................................................
TURİZM RAPORU / TOURISM REPORT
59