Tsunami mortality and displacement in Aceh province, Indonesia
11
Tsunami mortality and displacement in Aceh province, Indonesia Abdur Rofi, MA Mercy Corps Indonesia, Indonesia, Shannon Doocy, PhD Research Associate, Johns Hopkins Bloomberg School of Public Health, US and Courtland Robinson, PhD Assistant Professor, Johns Hopkins Bloomberg School of Public Health, US A survey of 388 Indonesian households displaced by the December 2004 tsunami was conducted in Aceh province in February 2005. Of tsunami-displaced households in Aceh Barat and Nagan Raya districts, 61.8 per cent reported one or more family members as dead or missing 1 due to the tsunami, with an overall mortality rate of 13.9 per cent (95% confidence interval (CI): 12.4–15.4). Risk of death was greatest in the youngest and oldest age groups, and among females. Overall, 36 per cent of tsunami-displaced households indicated an intention to return to their original community within three months, and displaced households residing in host communities were 2.2 (95% CI: 1.2–2.8) times more likely to state an intention to return to their original villages or another community as those residing in camps. The tsunami recovery effort should focus on strategies that facilitate either prompt return or permanent, voluntary relocation for those displaced. Keywords: displacement, internally displaced persons (IDPs), Indonesia, mortality, tsunami Introduction On the morning of Sunday, 26 December 2004, an earthquake registering 9.0 on the Richter scale struck off the western coast of North Sumatra, triggering massive waves that inundated coastal areas in countries around the Indian Ocean rim. As of July 2005, official figures put the number of dead, missing and displaced in the Indian Ocean region at more than 175,000, nearly 50,000 and over 1.7 million, respectively. Indonesia’s Aceh province, closest to the epicentre of the earthquake, was exception- ally hard hit. According to the Indonesian government’s disaster coordinating agency, BAKORNAS, by the end of March 2005, 128,645 people in Aceh had lost their lives, 37,063 were missing and 532,898 had been displaced (USAID, 2005). The problems that the tsunami-affected population faces are multifaceted and include loss of family members, loss of homes, assets, livelihoods and community infrastructure, displacement and relocation in temporary homes and shelters. Mercy Corps and the Johns Hopkins Bloomberg School of Public Health conducted a survey in Aceh Barat and Nagan Raya districts in early February 2005 to understand some basic demographic impacts of the tsunami and to assess the intentions of displaced households regarding their plans for return and work as a means of informing Mercy Corps’ resettlement and livelihoods recovery programmes. Disasters, 2006, 30(3): 340 − 350. © The Author(s). Journal compilation © Overseas Development Institute, 2006. Published by Blackwell Publishing, 9600 Garsington Road, Oxford, OX4 2DQ, UK and 350 Main Street, Malden, MA 02148, USA
-
Upload
independent -
Category
Documents
-
view
1 -
download
0
Transcript of Tsunami mortality and displacement in Aceh province, Indonesia

Tsunami mortality and displacement in Aceh province, Indonesia 341
Tsunami mortality and displacement in Aceh province, Indonesia
Abdur Rofi, MA Mercy Corps Indonesia, Indonesia, Shannon Doocy, PhD Research Associate, Johns Hopkins Bloomberg School of Public Health, US and Courtland Robinson, PhD Assistant Professor, Johns Hopkins Bloomberg School of Public Health, US
A survey of 388 Indonesian households displaced by the December 2004 tsunami was conducted in Aceh province in February 2005. Of tsunami-displaced households in Aceh Barat and Nagan Raya districts, 61.8 per cent reported one or more family members as dead or missing1 due to the tsunami, with an overall mortality rate of 13.9 per cent (95% confidence interval (CI): 12.4–15.4). Risk of death was greatest in the youngest and oldest age groups, and among females. Overall, 36 per cent of tsunami-displaced households indicated an intention to return to their original community within three months, and displaced households residing in host communities were 2.2 (95% CI: 1.2–2.8) times more likely to state an intention to return to their original villages or another community as those residing in camps. The tsunami recovery effort should focus on strategies that facilitate either prompt return or permanent, voluntary relocation for those displaced.
Keywords: displacement, internally displaced persons (IDPs), Indonesia, mortality, tsunami
IntroductionOn the morning of Sunday, 26 December 2004, an earthquake registering 9.0 on the Richter scale struck off the western coast of North Sumatra, triggering massive waves that inundated coastal areas in countries around the Indian Ocean rim. As of July 2005, official figures put the number of dead, missing and displaced in the Indian Ocean region at more than 175,000, nearly 50,000 and over 1.7 million, respectively. Indonesia’s Aceh province, closest to the epicentre of the earthquake, was exception-ally hard hit. According to the Indonesian government’s disaster coordinating agency, BAKORNAS, by the end of March 2005, 128,645 people in Aceh had lost their lives, 37,063 were missing and 532,898 had been displaced (USAID, 2005). The problems that the tsunami-affected population faces are multifaceted and include loss of family members, loss of homes, assets, livelihoods and community infrastructure, displacement and relocation in temporary homes and shelters. Mercy Corps and the Johns Hopkins Bloomberg School of Public Health conducted a survey in Aceh Barat and Nagan Raya districts in early February 2005 to understand some basic demographic impacts of the tsunami and to assess the intentions of displaced households regarding their plans for return and work as a means of informing Mercy Corps’ resettlement and livelihoods recovery programmes.
Disasters, 2006, 30(3): 340−350. © The Author(s). Journal compilation © Overseas Development Institute, 2006.Published by Blackwell Publishing, 9600 Garsington Road, Oxford, OX4 2DQ, UK and 350 Main Street, Malden, MA 02148, USA

Tsunami mortality and displacement in Aceh province, Indonesia 341
Of a pre-tsunami population estimated by the Indonesian government at 338,985 in Aceh Barat and Nagan Raya districts (WFP, 2005), approximately 1,500 were confirmed dead and more than 13,000 were reported missing as of 23 January 2005 (the time of survey planning). An estimated 30,564 internally displaced per-sons (IDPs) were residing in more than 30 locations in 10 sub-districts of Aceh Barat and three sub-districts of Nagan Raya.2 This number was believed to include some of the IDPs residing in host communities, and thus may be an underestimate of the total IDP population in the two districts. A survey of the displaced population was conducted between 1 and 5 February 2005 (see Figure 1). Affected sub-districts
included Arongan Lambalek, Bubon, Johan Pahlawan, Kaway XVI, Mereubo and Samatiga in Aceh Barat, and Darul Makmur and Kuala in Nagan Raya. Thirty-six villages in four sub-districts of Aceh Barat were completely destroyed; the remaining affected districts absorbed a large number of IDPs and were therefore classified as affected. In Nagan Raya, Kuala sub-district was the most heavily affected by the tsunami, with more than 8,000 people suffering displacement.
MethodsAs of 23 January 2005, an estimated 21,369 and 9,964 IDPs were residing in various locations in Aceh Barat and Nagan Raya districts, respectively.3 No specific information was available on the actual numbers of IDPs residing in camps versus in host commu-nities, although some local sources estimated that the breakdown was approximately 50:50 at the time of the survey design. Due to logistical complexities of accessing some populations farther inland, 4,428 IDPs in the Pante Ceureumin, Woyla, Woyla Barat and Woyla Timur sub-districts of Aceh Barat were excluded from the survey area, result-ing in a reference population of 26,905 IDPs living in camps and host communities. Allowing for some underestimation of IDPs in host communities, the sample size was estimated based on a total reference population of 10,000 IDP households or 50,000 individual IDPs, living in both camps and host communities. The proportion of population members who intended to return to their home village (the primary outcome of interest) was unknown and therefore presumed to be 50 per cent. Based on a 10 per cent margin of error and including a design effect of two for cluster sampling, a total sample of 192 IDP households was identified; this number was in-creased to 200 to allow for non-response and incomplete surveys. A stratified sample
Figure 1Tsunami-affected areas and survey region
Source: Humanitarian Information Center Indonesia

Abdur Rofi, Shannon Doocy and Courtland Robinson342 Tsunami mortality and displacement in Aceh province, Indonesia 343
was employed to allow for comparison of IDPs residing in camps and those in host communities; hence, a total of 400 IDP households were included in the survey: 200 households living in IDP camps and 200 households displaced in host communities. A cluster sample survey design was used, with probability proportional to size. Selec-tion of clusters (n=20) was by camp location; population figures for the sampling frame were provided by the Indonesian military and were the most recent available.4 The sampling interval was determined based on a total reference population of 26,905 IDPs. Of the 20 resulting clusters, 12 were in 10 locations in Aceh Barat and eight in six locations in Nagan Raya. Twenty households were sampled in each cluster; of these, 10 resided in the IDP camp and 10 were being hosted by families living in surround-ing communities. For households residing in IDP camps, within-cluster sampling was conducted systematically using lists of households (when available) or by estimating the total number of households in a camp and then selecting every nth household. Self-settled IDP house-holds that were residing in host communities were identified by randomly selecting a direction from the IDP camp, proceeding to the nearest house, and inquiring if any IDPs were being hosted. Each adjacent house was visited until 10 IDP households had been interviewed. Informed, verbal consent was obtained from each respondent before interviews were carried out. IDP household information was collected using a questionnaire developed by Mercy Corps and Johns Hopkins Bloomberg School of Public Health, which focused on household composition preceding the tsunami and current status of household mem-bers, as well as on resettlement intentions and household livelihoods. The questionnaire was developed in Bahasa Indonesia and English, and Mercy Corps Indonesia performed back translation and field testing. Interviewers were students from the University Student Organization of Aceh Barat; all received three days of training. Data analysis was carried out using STATA Version 8 and SPSS Version 12.0. Paired t-tests were used to compare household size before and after the tsunami; for binary and continuous data, McNemar’s test and marginal homogeneity tests, respectively, were employed. Multivariate regression models were used to adjust risk of death for household size where risk is reported at the household level. Permission to conduct the survey was received from the Indonesian military and from community leaders in each IDP location surveyed. The Committee on Human Research, Johns Hopkins Bloomberg School of Public Health, approved the study.
ResultsA total of 394 IDP households were surveyed in Aceh Barat and Nagan Raya districts. Of the households surveyed, 59.8 per cent were in Aceh Barat and 40.2 per cent were in Nagan Raya. Interviews were completed in 200 IDP households residing in camps and 194 households in host communities. In one cluster in Nagan Raya, it was diffi-cult to find IDPs residing in surrounding host communities because many villages were completely destroyed; consequently, only 14 IDP households in host communities

Abdur Rofi, Shannon Doocy and Courtland Robinson342 Tsunami mortality and displacement in Aceh province, Indonesia 343
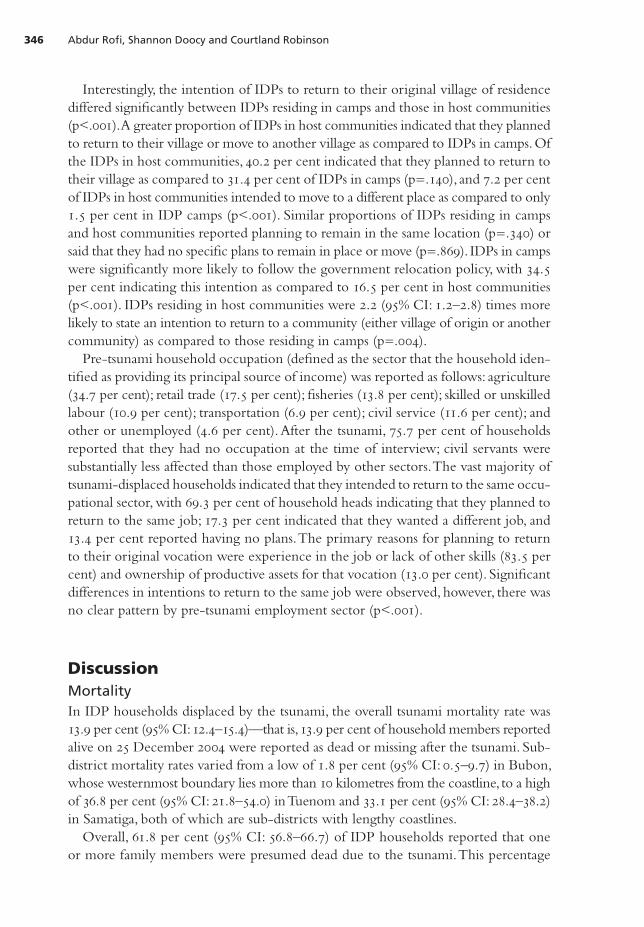
were sampled in that location. To compensate, six interviews with camp IDP house-holds in the same location were randomly discarded, reducing the total number of households in the study from the initial target figure of 400 to a final sample of 388 (n=194 per group). The pre-tsunami population of the 388 households surveyed included 2,128 indi-viduals. Post-tsunami status was reported for 2,121 individuals: 1,672 (78.8 per cent) were alive and living in the household, 154 (7.3 per cent) were alive and living else-where, 190 (9.0 per cent) were dead and 105 (4.9 per cent) were reported as missing/status unknown. For this analysis, it was assumed that those who were still reported as missing/status unknown one month after the tsunami were likely to be dead. The mortality impact of the tsunami is discussed in terms of those presumed dead, which includes both those known to have died and those whose status was reported as still missing/unknown more than one month after the tsunami. Overall, 61.8 per cent (95% confidence interval (CI): 56.8–66.7) of IDP households reported one or more family members as presumed dead due to the tsunami. Of the pre-tsunami population in the households surveyed, 295 of 2,121 or 13.9 per cent (95% CI: 12.4–15.4) perished; the mean number of deaths reported in IDP households was 0.8 (standard deviation (SD)=1.3), with the average number of living household members declining from 5.1 (SD=1.9) to 4.3 (SD=1.8) after the tsunami (p<.001). Table 1 presents the age composition and sex of the pre-tsunami population and tsunami victims. Mortality risk among females was 1.9 (95% CI: 1.5–3.0) times greater
Table 1 Distribution of the pre-tsunami population and tsunami victims
Pre-tsunami population Tsunami victims*
n=2,128 Percentage (95% CI) n=295 Percentage (95% CI)
Sex
Male 1,084 51.1 (48.1–54.2) 104 35.3 (28.8–42.7)
Female 1,037 48.9 (46.0–52.0) 191 64.7 (55.9–74.6)
Age
0–4 156 7.4 (6.3–8.6) 37 12.7 (9.1–17.1)
5–9 204 9.7 (8.5–11.0) 39 13.4 (9.7–17.9)
10–14 225 10.7 (9.4–12.1) 26 8.9 (5.9–12.8)
15–19 234 11.1 (9.8–12.5) 25 8.6 (5.6–12.4)
20–29 424 20.2 (18.4–21.9) 39 13.4 (9.7–17.9)
30–39 352 16.8 (15.1–18.4) 31 10.7 (7.4–14.8)
40–49 249 11.9 (10.5–13.3) 36 12.4 (8.8–16.7)
50–59 123 5.9 (4.9–6.9) 21 7.2 (4.5–10.8)
60–69 86 4.1 (3.3–5.0) 22 7.6 (4.8–11.2)
70+ 46 2.2 (1.6–2.9) 15 5.2 (2.9–8.4)
* Presumed dead; reported as dead or missing/unknown

Abdur Rofi, Shannon Doocy and Courtland Robinson344 Tsunami mortality and displacement in Aceh province, Indonesia 345
than among males, with 18.4 per cent (95% CI: 16.1–20.9) and 9.6 per cent (95% CI: 7.9–11.5) of females and males, respectively, being presumed dead. Tsunami mortality rates by age group also differed considerably, with higher mortality observed in the oldest and youngest age groups (Figure 2). Individuals between 20 and 39 years of age experienced the lowest mortality. Risk of mortality for children under 10 years and adults over 60 years, respectively, was 2.3 (95% CI: 1.6–3.4) and 3.1 (95% CI: 1.9–4.9) times greater as compared to those in the 20–39 year reference category. Tsunami mortality rates among surviving displaced households by pre-tsunami sub-district of residence varied as follows: Darul Makmur 1.7 per cent (95% CI: 0.1–9.6); Bubon 1.8 per cent (95% CI: 0.5–9.7); Mereubo 2.5 per cent (95% CI: 0.5–7.2); Johan Pahlawan 10.4 per cent (95% CI: 7.9–13.2); Kuala 10.9 per cent (95% CI: 8.6–13.5); Kreung Sabee 21.1 per cent (95% CI: 6.1–45.6); Arongan Lambalek 29.4 per cent (95% CI: 15.1–47.5); Samatiga 33.1 per cent (95% CI: 28.4–38.2); and Tuenom 36.8 per cent (95% CI: 21.8–54.0). Households whose livelihoods were based on fisheries experienced significantly greater death rates than those in other sectors. Fifty-three of 263 household members (20.2 per cent; 95% CI: 15.5–25.4) died in households with fisheries-based livelihoods as compared to 214 of 1,682 household members (12.7 per cent; 95% CI: 11.2–14.4) who earned income in other sectors (p=.004). Odds of death were 1.6 (95% CI: 1.1–2.2) times greater among members of households whose livelihood were based in fisheries. Fisheries-based households were 2.2 (95% CI: 1.2–11.4)5 times more likely to have an additional household member die, and reported an average of 1.1 (SD=1.8) deaths as compared to 0.7 (SD=1.2) in households with other livelihoods (p=.089). The majority of IDP households settled close to their original place of residence, with 91.7 per cent (95% CI: 88.6–94.2) remaining in the same district and 72.2 per cent (95% CI: 67.4–77.6) in the same sub-district. Of IDP households residing in
Figure 2 Mortality rates by age group

Abdur Rofi, Shannon Doocy and Courtland Robinson344 Tsunami mortality and displacement in Aceh province, Indonesia 345
host communities, 85.0 per cent reported staying with family, 8.8 per cent reported staying with friends, and 6.2 per cent reported staying with other community members. Significant differences in terms of education and marital status were observed between households residing in camps and those residing in host communities (see Table 2). A greater proportion of IDP household heads with lower educational attainment resided in camps as compared to host communities: 62.4 per cent of household heads in IDP camps had received only an elementary school education or no education as compared to 44.8 per cent of those residing in host communities (p<.001). IDP households with elementary or no education were 1.4 (95% CI: 1.0–2.8) times as likely as more educated households to reside in camps. A large proportion of IDPs indicated a desire to return to their village of original residence. Overall, 35.8 per cent of IDPs indicated that they planned to return to their village within the next three months; 23.7 per cent reported that they would stay in their current location, while an additional 25.5 per cent said that they would follow the government relocation policy. Another 4.4 per cent indicated that they intended to move to another district, while 10.6 per cent reported that they had did not have any plans for the upcoming three-month period. No significant differences in intentions were observed by household and household head characteristics. The proportion of IDP households planning to return to their original village of residence was similar when assessed by household head education category (p=.386), household head marital status (p=.266), household head occupation (p=.548) and tsunami-related mortality in the household (p=.828).
Table 2 Characteristics of IDP households by settlement type (n=388)
Camp Village p-value
Female-headed households 4.6% 10.8% .023
Education level of household head
None 13.9% 8.8% .002
Completed elementary school 48.5% 36.1%
Completed junior high 13.9% 21.1%
Completed high school 23.2% 28.9%
Completed college/university 0.5% 5.2%
Marital status
Unmarried 2.6% 8.2% .046
Married 77.8% 76.3%
Widowed 19.6% 14.9%
Current household size 4.4 (SD=2.0) 4.3 (SD=1.8) .174
Average household members presumed dead
0.9 (SD=1.6) 0.6 (SD=1.0) <.001
Abdur Rofi, Shannon Doocy and Courtland Robinson346 Tsunami mortality and displacement in Aceh province, Indonesia 347
Interestingly, the intention of IDPs to return to their original village of residence differed significantly between IDPs residing in camps and those in host communities (p<.001). A greater proportion of IDPs in host communities indicated that they planned to return to their village or move to another village as compared to IDPs in camps. Of the IDPs in host communities, 40.2 per cent indicated that they planned to return to their village as compared to 31.4 per cent of IDPs in camps (p=.140), and 7.2 per cent of IDPs in host communities intended to move to a different place as compared to only 1.5 per cent in IDP camps (p<.001). Similar proportions of IDPs residing in camps and host communities reported planning to remain in the same location (p=.340) or said that they had no specific plans to remain in place or move (p=.869). IDPs in camps were significantly more likely to follow the government relocation policy, with 34.5 per cent indicating this intention as compared to 16.5 per cent in host communities (p<.001). IDPs residing in host communities were 2.2 (95% CI: 1.2–2.8) times more likely to state an intention to return to a community (either village of origin or another community) as compared to those residing in camps (p=.004). Pre-tsunami household occupation (defined as the sector that the household iden-tified as providing its principal source of income) was reported as follows: agriculture (34.7 per cent); retail trade (17.5 per cent); fisheries (13.8 per cent); skilled or unskilled labour (10.9 per cent); transportation (6.9 per cent); civil service (11.6 per cent); and other or unemployed (4.6 per cent). After the tsunami, 75.7 per cent of households reported that they had no occupation at the time of interview; civil servants were substantially less affected than those employed by other sectors. The vast majority of tsunami-displaced households indicated that they intended to return to the same occu-pational sector, with 69.3 per cent of household heads indicating that they planned to return to the same job; 17.3 per cent indicated that they wanted a different job, and 13.4 per cent reported having no plans. The primary reasons for planning to return to their original vocation were experience in the job or lack of other skills (83.5 per cent) and ownership of productive assets for that vocation (13.0 per cent). Significant differences in intentions to return to the same job were observed, however, there was no clear pattern by pre-tsunami employment sector (p<.001).
DiscussionMortality In IDP households displaced by the tsunami, the overall tsunami mortality rate was 13.9 per cent (95% CI: 12.4–15.4)—that is, 13.9 per cent of household members reported alive on 25 December 2004 were reported as dead or missing after the tsunami. Sub-district mortality rates varied from a low of 1.8 per cent (95% CI: 0.5–9.7) in Bubon, whose westernmost boundary lies more than 10 kilometres from the coastline, to a high of 36.8 per cent (95% CI: 21.8–54.0) in Tuenom and 33.1 per cent (95% CI: 28.4–38.2) in Samatiga, both of which are sub-districts with lengthy coastlines. Overall, 61.8 per cent (95% CI: 56.8–66.7) of IDP households reported that one or more family members were presumed dead due to the tsunami. This percentage

Abdur Rofi, Shannon Doocy and Courtland Robinson346 Tsunami mortality and displacement in Aceh province, Indonesia 347
corresponds closely with a finding by the International Rescue Committee, based on a January 2005 rapid health assessment, that 65.6 per cent (95% CI: 46.8–81.4) of the population of the city of Calang, Aceh Jaya district (just north of Aceh Barat district), reported at least one death of an immediate family member due to the tsunami (Bren-nan, 2005). The youngest and oldest age groups experienced the greatest mortality, with rates of 21.1 per cent (95% CI: 17.0–25.7) and 28.0 per cent (95% CI: 20.6–36.5) for children under 10 years of age and those over 60 years of age, respectively. Mortality rates by age group show a clear trend (see Figure 2) where older children and younger adults had the lowest mortality, while groups near the beginning and end of the life span had the highest mortality. Tsunami mortality among males and females also differed significantly, with nearly two-thirds of those presumed dead being female. Anecdotal impressions reported shortly after the tsunami noted a dearth of women and children among the survivors. One non-governmental organisation, Oxfam, offered this expla-nation, drawn from interviews with survivors:
In rural coastal areas, many men who were fishing far out at sea survived, as the giant waves passed harmlessly under their small boats. When the waves hit the shore, they flattened coastal communities and killed many of the women and children, most of whom were at home on that Sunday morning. In agricultural areas, men were often working out in the fields or doing errands away from the house, or were taking produce to markets. . .The sheer strength needed to stay alive in the torrent was often also decisive in determining who survived. Many women and young children, unable to stay on their feet, or afloat, in the powerful waves, simply tired and drowned. Women clinging to one or more children would have tired even more quickly (Oxfam, 2005, p. 3).
Oxfam reported that, based on surveys in villages in Aceh Besar and North Aceh districts, mortality rates among females may be up to four times higher than among males (Oxfam, 2005). While this study does not offer any explanations for differential survival patterns by age or sex, the data does support the prevailing impression that younger children (and older people) as well as women were less likely to survive (WHO, 2005; ICMH, 2005). One should note that surveys of displaced households rely on finding at least one surviving member of the household. It may be that in areas where the devastation was so total that few survived; the effects of age and sex on mortality outcomes would be less. The study also identified significantly increased risk of mortality among households whose primary income source was fishing. Involvement in the fisheries industry is a likely proxy for distance to coastline, and consequently, increased risk. In assessing the mortality impact of the tsunami in Indonesia, there are several limi-tations to this survey. First, it focuses only on Aceh Barat and Nagan Raya districts on the western coast of Aceh province, which were among the hardest hit areas of Indonesia. Second, it concentrates on displaced households only and may not be generalisable to the broader population. Finally, as noted above, households in which no adult mem-ber survived are not captured in the assessment, creating a survivor bias. Limitations

Abdur Rofi, Shannon Doocy and Courtland Robinson348 Tsunami mortality and displacement in Aceh province, Indonesia 349
in terms of survivor bias and the focus on displaced households restrict application of mortality findings to households in which displacement occurred as a result of the tsunami but at least one adult member survived.
Displacement and returnThe vast majority of displaced households had settled in the sub-district of their orig-inal place of residence, indicating that most displacement was localised. Patterns of displacement, to IDP camps or host communities, suggest important variations. In comparing IDPs settled in camps versus IDPs settled in host communities (85 per cent of whom were staying with family members), it was found that households displaced in communities included a higher proportion of female-headed households than households displaced in camps (p=.023). Furthermore, the heads of camp-based IDP households had lower education levels (p=.002) and a higher average number of members of camp-based IDP households were presumed dead than among community-based IDP households (p<.001). The higher proportion of female-headed households displaced in communities rather than in camps may be evidence that women, many of whom may have been widowed by the tsunami, perceived IDP camps as less safe than private homes and, where possible, avoided them. As for differences in the education level of the house-hold head, it may be that education is a marker in relation to socioeconomic status and that more educated people are more likely to have better social networks, includ-ing friends and relatives who are able to host IDPs. Differential settlement patterns by education level of the household head may also suggest differences in the decision-making process. The higher levels of mortality among camp-based IDP households suggest that greater losses, both in terms of death and destruction of physical property, may be associated with a tendency to settle in camps where services and support are more accessible. As noted previously, IDPs staying in host communities were 2.2 (95% CI: 1.2–2.8) times more likely to state an intention to return to a community (either village of ori-gin or another community) as compared to those residing in camps (p=.004). Moreover, IDPs in camps were significantly more likely to follow the government relocation policy, with 34.5 per cent indicating this intention as compared to 16.5 per cent in host communities (p<.001). The suggestion here is that IDPs settled in communities may remain more connected to those communities, while those settled in camps may be more willing to go elsewhere, including following government relocation schemes. This could have implications for the success of future resettlement plans and policies in Aceh. In addition, it lends weight to the argument that promoting alternatives to camp-based displacement in the short term may reduce the likelihood of long-term encampment of displaced populations. Overall, the significant differences between camp-based and community-based IDP households suggest that, wherever possible, studies of displacement should try to assess the salient characteristics and experiences of both groups.

Abdur Rofi, Shannon Doocy and Courtland Robinson348 Tsunami mortality and displacement in Aceh province, Indonesia 349
ConclusionThe full impact of the Asian tsunami in Aceh province, with respect to lives lost and physical destruction, may never be fully gauged. As Aceh continues the recovery pro-cess, displaced survivors should receive critical attention, most of whom lost valuable assets and many of whom lost family members. The shape of tsunami mortality suggests that among the vulnerable displaced populations in need of special attention are children who have lost their mothers and men who have lost their wives, especially those who are fathers of surviving, minor children. Given the catastrophic loss of life and property in the tsunami, it is crucial that reconstruction proceeds efficiently and that displaced households have an opportunity to return home or resettle permanently in another community in a reasonably short time frame. On 26 March 2005, the Indonesian government unveiled its ‘Master Plan’, a five-year, USD 5.1 billion blueprint for the rebuilding of Aceh province. The docu-ment highlighted the shift from the relief efforts of the first three months after the tsunami to a rehabilitation phase that aims to ‘restore basic social services’ by the end of 2006, followed by a reconstruction phase lasting until the end of 2009 (BRR, 2005). The transition from relief to rehabilitation is a complex process and may necessarily be measured not in months but years; viewed from the perspective of those still living in temporary camps and shelters, it can seem painstakingly slow. Ultimately, however, the success of return or relocation programmes should be determined not in terms of speed but in relation to their capacity to promote community participation in the reconstruction process as well as to restore and improve on pre-existing conditions associated with health, life and livelihood.
AcknowledgementsWe would like to acknowledge the University Student Organization in Aceh Barat for its support for the collection of data for this survey.
CorrespondenceCourtland Robinson, Department of International Health, Johns Hopkins Bloomberg School of Public Health, Suite E8132, 615 N. Wolfe Street, Baltimore, MD 21205, US. Telephone: +410 955 3892; fax: +410 614 1419; e-mail: [email protected].
Endnotes1 For this analysis, it was assumed that those who were still reported as missing/status unknown one month
after the tsunami were likely to be dead.2 Indonesian national army statistics, released on 23 January 2005.3 Indonesian national army statistics, released on 23 January 2005.4 Indonesian national army statistics, released on 23 January 2005.5 Adjusted for household size.

Abdur Rofi, Shannon Doocy and Courtland Robinson350
ReferencesBRR (Badan Rehabilitasi dan Rekonstruksi) NAD-Nias (2005) ‘Master Plan Summary’. 26 March. Brennan, R.J. and K. Rimba (2005) ‘Rapid health assessment in Aceh Jaya District, Indonesia, following
the December 26 tsunami’. Emergency Medicine Australasia. 17. pp. 341–350. ICMH (International Center for Migration and Health) (2005) Interim Report of a Meeting on Public Health
Impact of the Tsunami, Male, Republic of Maldives, April 22–24, 2005. http://www.icmh.ch/WebPDF/2005%20-%20Male%20Meeting%20Interim%20Report%20PDF.pdf.
Oxfam (2005) The Tsunami’s impact on women. Oxfam Briefing Note. 30 March. http://www.oxfam.org. uk/what_we_do/issues/conflict_disasters/downloads/bn_tsunami_women.pdf.
USAID (United States Agency for International Development) (2005) Fact Sheet #39. 7 July. http://www. usaid.gov/our_work/humanitarian_assistance/disaster_assistance/countries/indian_ocean/fy2005/indianocean_et_fs39_07-07-2005.pdf.
WFP (World Food Programme) (2005) WFP Post-Tsunami Emergency Needs Assessment in Aceh Province, Indonesia. 3 January to 1 February 2005. http://www/wfp.org/english/?ModuleID=78&Key=615.
WHO (World Health Organization) (2005) Children are vulnerable because more women died in the Tsunami. Press Release. 5 May. http://w3.whosea.org/en/Section316/Section503/Section1861_9549.htm.