Tropical marine macroalgae as potential sources of nutritionally important PUFAs
10
This article appeared in a journal published by Elsevier. The attached copy is furnished to the author for internal non-commercial research and education use, including for instruction at the authors institution and sharing with colleagues. Other uses, including reproduction and distribution, or selling or licensing copies, or posting to personal, institutional or third party websites are prohibited. In most cases authors are permitted to post their version of the article (e.g. in Word or Tex form) to their personal website or institutional repository. Authors requiring further information regarding Elsevier’s archiving and manuscript policies are encouraged to visit: http://www.elsevier.com/copyright
-
Upload
independent -
Category
Documents
-
view
0 -
download
0
Transcript of Tropical marine macroalgae as potential sources of nutritionally important PUFAs
This article appeared in a journal published by Elsevier. The attachedcopy is furnished to the author for internal non-commercial researchand education use, including for instruction at the authors institution
and sharing with colleagues.
Other uses, including reproduction and distribution, or selling orlicensing copies, or posting to personal, institutional or third party
websites are prohibited.
In most cases authors are permitted to post their version of thearticle (e.g. in Word or Tex form) to their personal website orinstitutional repository. Authors requiring further information
regarding Elsevier’s archiving and manuscript policies areencouraged to visit:
http://www.elsevier.com/copyright

Author's personal copy
Tropical marine macroalgae as potential sources of nutritionally important PUFAs
Puja Kumari, Manoj Kumar, Vishal Gupta, C.R.K. Reddy *, Bhavanath Jha *
Discipline of Marine Biotechnology and Ecology, Central Salt and Marine Chemicals Research Institute, Council of Scientific and Industrial Research (CSIR), Bhavnagar 364021, India
a r t i c l e i n f o
Article history:Received 27 January 2009Received in revised form 25 September2009Accepted 4 November 2009
Keywords:ChlorophytaFatty acidsLipidsn6/n3 ratioPhaeophytaPUFAsRhodophytaTropical macroalgae
a b s t r a c t
The lipid and fatty acid compositions of 27 tropical macroalgae belonging to the three phyla, Chlorophyta,Phaeophyta and Rhodophyta, were studied from a nutritional and chemotaxonomic perspective. The lipidcontent varied widely among the species and ranged from 0.57% to 3.5% on a dry weight basis (p 6 0.01).Chlorophyta members showed higher C18PUFAs contents than did C20 PUFAs while for Rhodophyta thetrend was opposite. The Phaeophyta members displayed a profile of C18PUFAs similar to that of Chloro-phyta and of C20PUFAs to that of Rhodophyta. Both Phaeophyta and Rhodophyta species were rich inarachadonic acid (AA) and eicosopentaenoic acid (EPA) and Ulvales in docosahexaenoic acid (DHA) con-tent. Most of the species studied had a nutritionally beneficial n6/n3 ratio (0.61–5.15:1). Further, theprincipal component analysis clearly segregated the three phyla by their FA composition and hierarchicalcluster analysis altogether classified them into six distinct groups, suggesting that FAs can be used as atool for chemotaxonomic studies.
� 2009 Elsevier Ltd. All rights reserved.
1. Introduction
Benthic marine macroalgae, commonly known as seaweeds,are increasingly viewed as potential sources of bioactive com-pounds with immense pharmaceutical, biomedical and nutraceu-tical importance (Veena, Josephine, Preetha, & Varalakshmi,2006). Many macroalgal species have been used as ingredientsin both medicinal and food preparations, traditionally, in differentregions across the world (Chandini, Ganesan, Suresh, & Bhaskar,2008). In addition, some are common sources of phycocolloids(gelling agents) of commercial value (Cardozo et al., 2007). Thereare 250 macroalgal species which have been listed as commer-cially utilised worldwide, among which 150 are consumed ashuman food (Barrow, 2007). They are also considered as low cal-orie foods with high contents of minerals, vitamins, proteins andcarbohydrates (Chandini et al., 2008). Although macroalgae havebeen reported to have low lipid contents, their polyunsaturatedfatty acid (PUFA) contents are superior to those of the terrestrialvegetables (Darcy-Vrillon, 1993). They are rich in C18 and C20PUFAs with nutritional implications and are thus, studiedextensively for biotechnological, food, feed, cosmetic and pharma-ceutical applications (Chandini et al., 2008). Long-chain n�3 PU-FAs, such as EPA and DHA, have various beneficial clinical and
nutraceutical applications (Ginzberg et al., 2000; Lombardo, Hein,& Chicco, 2007). Their role in growth, development and reproduc-tion of both marine invertebrates and fish has also been welldocumented (Rodriguez et al., 2004). The n � 3 PUFAs cannot besynthesized by humans and are thus obtained through diet. Inview of their promising medical and nutritional applications, theyhave been extensively investigated, However, the studies on effi-cient exploitation of natural sources for these compounds are lim-ited (Colombo et al., 2006). At present, marine fishes and fish oilsare the main commercial sources of PUFAs but their suitability forhuman consumption has been questioned from a biosafetyperspective, raising the need to search for alternative sources ofhigh quality PUFAs (Bhosale, Velankar, & Chaugule, 2008). Conse-quently, marine macroalgae have been studied as alternativepotential sources, as many of them could easily be cultivated inthe sea on a large scale (Critchely, Ohno, & Largo, 2006). Also,the PUFAs present in the fishes enter the food chain from differ-ent trophic levels as a result of consuming primary producers,such as phytoplankton and seaweeds, which synthesize and storethem in good quantities (Visentainer et al., 2007).
Further, FAs have been extensively used as a chemotaxonomictool to classify the species in higher plants (Mongrand et al.,2001) and cyanobacteria (Temina, Rezankovab, Rezankac, &Dembitsky, 2007). Recently, Marsham, Scott, and Tobin (2007)grouped seaweeds by their nutritional composition using multi-variate analysis. To the best of our knowledge, classification ofmacroalgae by FAs remains largely unexplored to date.
0308-8146/$ - see front matter � 2009 Elsevier Ltd. All rights reserved.doi:10.1016/j.foodchem.2009.11.006
* Corresponding authors. Tel.: +91 278 256 7352; fax: +91 278 257 0885/2566970/256 7562.
E-mail address: [email protected] (B. Jha).
Food Chemistry 120 (2010) 749–757
Contents lists available at ScienceDirect
Food Chemistry
journal homepage: www.elsevier .com/locate / foodchem

Author's personal copy
Considering the indispensable importance of PUFAs in healthand nutrition, a systematic study was undertaken to evaluate boththe total lipid and fatty acid (FA) contents in 27 different intertidalmacroalgal species. Further, we sought to differentiate species andclassify them on the basis of their fatty acid composition to assesstheir effectiveness in investigating chemotaxonomic relationshipsin macroalgae.
2. Materials and methods
2.1. Algal samples
A total of 27 different macroalgal species, belonging to the Chlo-rophyta, Phaeophyta and Rhodophyta, were collected during theperiod January to April, 2008, from different locations of Diu andSaurashtra, coast of Gujarat, India. Ulva tubulosa, U. linza, Ulva sp.,and Kappaphycus alverzii were collected from Okha, Hypnea musc-iformis from Mithapur, Grateloupia indica and G. wattii from Diu,Gracilaria debilis from Varvala, Ahnfeltia plicata and U. reticulatafrom Kotuda and U. fasciata, U. rigida, Caulerpa racemosa, C. vera-valnensis, Padina tetrastomatica, Spatoglossum asperii, Stoechosper-mum marginatum, Cystoseira indica, Sargassum tennerrimum, G.dura, G. furgosonii, Amphiora anceps, Hypnea esperii, Sarconema fili-forme, Laurencia cruciata, L. papilosa and U. lactuca from Veraval. Allthe algal samples were harvested manually from their respectivesites and then transported to the laboratory in wet tissue towelsin an ice box. They were then thoroughly cleaned to remove epi-phytes and detritus attached to the fronds. The cleaned frondswere dried at 60 �C, in an oven, to constant weight to determinetheir dry weight. For the lipid extraction and fatty acids analysis,algal subsamples were shade-dried and stored at �40 �C prior toanalysis.
2.2. Lipid extraction and fatty acid methyl esters preparation
Lipids were extracted by following the method of Bligh andDyer (1959). One gram of dried ground algal powder was extractedwith 15 ml of chloroform:methanol (1:2, v/v) and the residue wasextracted thrice with small portions (10 ml) of chloroform: meth-anol (1:1, v/v). All the extracts were pooled, filtered and mixedwith an equal volume of chloroform and water (1:1, v/v) for phaseseparation. The lower organic phase was collected and evaporatedto dryness in a vacuum, and the total lipid content was determinedgravimetrically.
Fatty acids (FA) were converted to their respective methyl es-ters by transmethylation of lipid samples (8–10 mg) using 1 mlof 1% NaOH in MeOH, followed by heating for 15 min at 55 �C, add-ing 2 ml of 5% methanolic HCl and again heating for 15 min at 55 �C(Carreau & Dubacq, 1978), then adding 1 ml of H2O. Fatty acidmethyl esters (FAMEs) were extracted by hexane (3 � 1 ml), andthe organic phase was evaporated to dryness under reduced pres-sure. FAMEs were analyzed by a GC 2010, coupled with a GC–MSQP 2010 (Shimadzu, Japan).
2.3. GC–MS analysis
The GC–MS analysis of FAME samples was carried out on aQP2010 gas chromatography mass spectrometer (GC-2010 coupledwith a GC–MS QP-2010) equipped with an autosampler (AOC-5000) from Shimadzu (Japan), using a RTX-5 fused silica capillarycolumn, 30 m � 0.25 mm � 0.25 lm (Rastek). Helium (99.9% pur-ity) was used as the carrier gas with the column flow rate of1 ml/min and a pre-column pressure of 49.7 kPa. The column tem-perature regime was 40 �C for 3 min, followed by a 5 �C/min rampup to 230 �C, followed by 40 min at 230 �C. The injection volume
and temperature were 0.2 ll and 240 �C and the split ratio was1:30. The mass spectrometer operated in electron compact modewith electron energy of 70 eV. Both the ion source temperatureand the interface temperature were set at 200 �C. FAME peaks wereidentified by comparison of their retention times with those of thestandard mixture (F.A.M.E. Mix C4-C24; Sigma) by GCMS Postrunanalysis and quantified by area normalisation.
2.4. Statistical analysis
All analytical determinations were performed in triplicate andthe mean values were recorded. The percentages of fatty acidswere compared by analysis of variance (ANOVA), and significantvalues at both p 6 0.01 and p 6 0.05. Principal component analysis(PCA) and hierarchical cluster analysis were accomplished usingUnscrambler 9.8 version and data of nine principal components(PCs) were exported to Minitab 15 for construction of a dendro-gram based on FA variables.
3. Results and discussion
3.1. Lipids
The total lipid contents of various algal species analysed arepresented in Table 1. The lipids varied significantly (p 6 0.01)
Table 1Total lipid contents of different tropical macroalgal species.
Algal species Lipid (% dry weight)*
ChlorophytaUlvales
1. Ulva tubulosa 2.13 ± 0.23c
2. Ulva linza 2.10 ± 0.10c
3. Ulva fasciata 1.83 ± 0.20cde
4. Ulva rigida 2.03 ± 0.20c
5. Ulva reticulata 2.00 ± 0.20cd
6. Ulva lactuca 1.27 ± 0.11fgh
7. Ulva sp. 1.77 ± 0.25fgh
Bryopsidales8. Caulerpa racemosa 2.64 ± 0.20b
9. Caulerpa veravalnensis 2.83 ± 0.15b
PhaeophytaDictyotales
10. Padina tetrastromatica 2.07 ± 0.30c
11. Spatoglossum asperum 3.50 ± 0.30a
12. Stoechospermum marginatum 3.36 ± 0.49a
Fucales13. Cystoseira indica 1.23 ± 0.11c
14. Sargassum tenerrimum 2.03 ± 0.35c
RhodophytaAhnfeltiales
15. Ahnfeltia plicata 1.37 ± 0.13efgh
Gracilariales16. Gracilaria debilis 1.23 ± 0.15gh
17. Gracilaria dura 1.10 ± 0.20gh
18. Gracilaria furgosonii 0.57 ± 0.05i
Cryptonemiales19. Grateloupia indica 1.47 ± 0.35efgh
20. Grateloupia wattii 1.43 ± 0.32efgh
Corallinales21. Amphiora anceps 1.23 ± 0.15gh
Gigartinales22. Hypnea musciformis 1.07 ± 0.05gh
23. Hypnea esperi 1.00 ± 0.20h
24. Kappaphycus alverzii 1.50 ± 0.30efg
25. Sarconema filiforme 1.47 ± 0.05efgh
Ceramiales26. Laurencia cruciata 1.53 ± 0.05def
27. Laurencia papillosa 1.73 ± 0.11cdef
* Mean values of triplicate samples ± SD.a–h Values without a common superscript are significantly different (p < 0.01).
750 P. Kumari et al. / Food Chemistry 120 (2010) 749–757
Author's personal copy
within the algal species investigated and ranged from0.57 ± 0.05% to 3.50 ± 0.30% on a dry weight basis (DW). Amongthe various algal species analysed, Dictyotales (Phaeophyta)members, such as Spatoglossum asperum and S. marginatum, regis-tered the highest lipid content with 3.50 ± 0.30% and 3.36 ± 0.49%DW, followed by Bryopsidales (Chlorophyta) members, Caulerpaveravalensis and C. racemosa, with 2.83 ± 0.15% and 2.64 ± 0.20%,respectively. The Rohodophyta members showed relatively mar-ginal variations in lipid content, from 1.00 ± 0.20% to1.73 ± 0.11% as compared to those of Cholorophyta and Pha-eophyta species where the fluctuations ranged from 1.27 ± 0.11%to 2.83 ± 0.15% and 1.23 ± 0.11 to 3.50 ± 0.49%, respectively. Ourdata of total lipid content remained in the range (<4% on DW),as reported earlier for various macroalgal species (Herbreteau,Coiffard, Derrien, & De Roeck-Holtzhauer, 1997). The variationsin lipid contents were attributed to either species types or envi-ronmental factors or a combination of both (Chandini et al.,2008).
3.2. Fatty acid (FA) composition
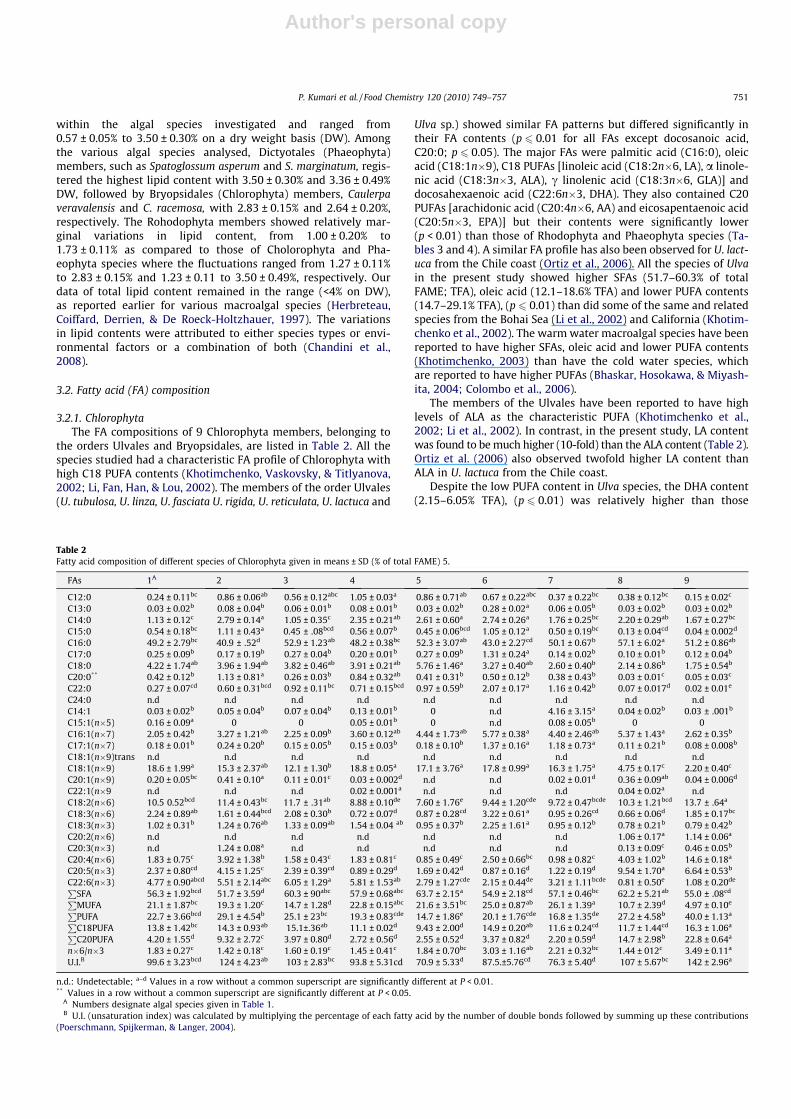
3.2.1. ChlorophytaThe FA compositions of 9 Chlorophyta members, belonging to
the orders Ulvales and Bryopsidales, are listed in Table 2. All thespecies studied had a characteristic FA profile of Chlorophyta withhigh C18 PUFA contents (Khotimchenko, Vaskovsky, & Titlyanova,2002; Li, Fan, Han, & Lou, 2002). The members of the order Ulvales(U. tubulosa, U. linza, U. fasciata U. rigida, U. reticulata, U. lactuca and
Ulva sp.) showed similar FA patterns but differed significantly intheir FA contents (p 6 0.01 for all FAs except docosanoic acid,C20:0; p 6 0.05). The major FAs were palmitic acid (C16:0), oleicacid (C18:1n�9), C18 PUFAs [linoleic acid (C18:2n�6, LA), a linole-nic acid (C18:3n�3, ALA), c linolenic acid (C18:3n�6, GLA)] anddocosahexaenoic acid (C22:6n�3, DHA). They also contained C20PUFAs [arachidonic acid (C20:4n�6, AA) and eicosapentaenoic acid(C20:5n�3, EPA)] but their contents were significantly lower(p < 0.01) than those of Rhodophyta and Phaeophyta species (Ta-bles 3 and 4). A similar FA profile has also been observed for U. lact-uca from the Chile coast (Ortiz et al., 2006). All the species of Ulvain the present study showed higher SFAs (51.7–60.3% of totalFAME; TFA), oleic acid (12.1–18.6% TFA) and lower PUFA contents(14.7–29.1% TFA), (p 6 0.01) than did some of the same and relatedspecies from the Bohai Sea (Li et al., 2002) and California (Khotim-chenko et al., 2002). The warm water macroalgal species have beenreported to have higher SFAs, oleic acid and lower PUFA contents(Khotimchenko, 2003) than have the cold water species, whichare reported to have higher PUFAs (Bhaskar, Hosokawa, & Miyash-ita, 2004; Colombo et al., 2006).
The members of the Ulvales have been reported to have highlevels of ALA as the characteristic PUFA (Khotimchenko et al.,2002; Li et al., 2002). In contrast, in the present study, LA contentwas found to be much higher (10-fold) than the ALA content (Table 2).Ortiz et al. (2006) also observed twofold higher LA content thanALA in U. lactuca from the Chile coast.
Despite the low PUFA content in Ulva species, the DHA content(2.15–6.05% TFA), (p 6 0.01) was relatively higher than those
Table 2Fatty acid composition of different species of Chlorophyta given in means ± SD (% of total FAME) 5.
FAs 1A 2 3 4 5 6 7 8 9
C12:0 0.24 ± 0.11bc 0.86 ± 0.06ab 0.56 ± 0.12abc 1.05 ± 0.03a 0.86 ± 0.71ab 0.67 ± 0.22abc 0.37 ± 0.22bc 0.38 ± 0.12bc 0.15 ± 0.02c
C13:0 0.03 ± 0.02b 0.08 ± 0.04b 0.06 ± 0.01b 0.08 ± 0.01b 0.03 ± 0.02b 0.28 ± 0.02a 0.06 ± 0.05b 0.03 ± 0.02b 0.03 ± 0.02b
C14:0 1.13 ± 0.12c 2.79 ± 0.14a 1.05 ± 0.35c 2.35 ± 0.21ab 2.61 ± 0.60a 2.74 ± 0.26a 1.76 ± 0.25bc 2.20 ± 0.29ab 1.67 ± 0.27bc
C15:0 0.54 ± 0.18bc 1.11 ± 0.43a 0.45 ± .08bcd 0.56 ± 0.07b 0.45 ± 0.06bcd 1.05 ± 0.12a 0.50 ± 0.19bc 0.13 ± 0.04cd 0.04 ± 0.002d
C16:0 49.2 ± 2.79bc 40.9 ± .52d 52.9 ± 1.23ab 48.2 ± 0.38bc 52.3 ± 3.07ab 43.0 ± 2.27cd 50.1 ± 0.67b 57.1 ± 6.02a 51.2 ± 0.86ab
C17:0 0.25 ± 0.09b 0.17 ± 0.19b 0.27 ± 0.04b 0.20 ± 0.01b 0.27 ± 0.09b 1.31 ± 0.24a 0.14 ± 0.02b 0.10 ± 0.01b 0.12 ± 0.04b
C18:0 4.22 ± 1.74ab 3.96 ± 1.94ab 3.82 ± 0.46ab 3.91 ± 0.21ab 5.76 ± 1.46a 3.27 ± 0.40ab 2.60 ± 0.40b 2.14 ± 0.86b 1.75 ± 0.54b
C20:0** 0.42 ± 0.12b 1.13 ± 0.81a 0.26 ± 0.03b 0.84 ± 0.32ab 0.41 ± 0.31b 0.50 ± 0.12b 0.38 ± 0.43b 0.03 ± 0.01c 0.05 ± 0.03c
C22:0 0.27 ± 0.07cd 0.60 ± 0.31bcd 0.92 ± 0.11bc 0.71 ± 0.15bcd 0.97 ± 0.59b 2.07 ± 0.17a 1.16 ± 0.42b 0.07 ± 0.017d 0.02 ± 0.01e
C24:0 n.d n.d n.d n.d n.d n.d n.d n.d n.dC14:1 0.03 ± 0.02b 0.05 ± 0.04b 0.07 ± 0.04b 0.13 ± 0.01b 0 n.d 4.16 ± 3.15a 0.04 ± 0.02b 0.03 ± .001b
C15:1(n�5) 0.16 ± 0.09a 0 0 0.05 ± 0.01b 0 n.d 0.08 ± 0.05b 0 0C16:1(n�7) 2.05 ± 0.42b 3.27 ± 1.21ab 2.25 ± 0.09b 3.60 ± 0.12ab 4.44 ± 1.73ab 5.77 ± 0.38a 4.40 ± 2.46ab 5.37 ± 1.43a 2.62 ± 0.35b
C17:1(n�7) 0.18 ± 0.01b 0.24 ± 0.20b 0.15 ± 0.05b 0.15 ± 0.03b 0.18 ± 0.10b 1.37 ± 0.16a 1.18 ± 0.73a 0.11 ± 0.21b 0.08 ± 0.008b
C18:1(n�9)trans n.d n.d n.d n.d n.d n.d n.d n.d n.dC18:1(n�9) 18.6 ± 1.99a 15.3 ± 2.37ab 12.1 ± 1.30b 18.8 ± 0.05a 17.1 ± 3.76a 17.8 ± 0.99a 16.3 ± 1.75a 4.75 ± 0.17c 2.20 ± 0.40c
C20:1(n�9) 0.20 ± 0.05bc 0.41 ± 0.10a 0.11 ± 0.01c 0.03 ± 0.002d n.d n.d 0.02 ± 0.01d 0.36 ± 0.09ab 0.04 ± 0.006d
C22:1(n�9 n.d n.d n.d 0.02 ± 0.001a n.d n.d n.d 0.04 ± 0.02a n.dC18:2(n�6) 10.5 0.52bcd 11.4 ± 0.43bc 11.7 ± .31ab 8.88 ± 0.10de 7.60 ± 1.76e 9.44 ± 1.20cde 9.72 ± 0.47bcde 10.3 ± 1.21bcd 13.7 ± .64a
C18:3(n�6) 2.24 ± 0.89ab 1.61 ± 0.44bcd 2.08 ± 0.30b 0.72 ± 0.07d 0.87 ± 0.28cd 3.22 ± 0.61a 0.95 ± 0.26cd 0.66 ± 0.06d 1.85 ± 0.17bc
C18:3(n�3) 1.02 ± 0.31b 1.24 ± 0.76ab 1.33 ± 0.09ab 1.54 ± 0.04 ab 0.95 ± 0.37b 2.25 ± 1.61a 0.95 ± 0.12b 0.78 ± 0.21b 0.79 ± 0.42b
C20:2(n�6) n.d n.d n.d n.d n.d n.d n.d 1.06 ± 0.17a 1.14 ± 0.06a
C20:3(n�3) n.d 1.24 ± 0.08a n.d n.d n.d n.d n.d 0.13 ± 0.09c 0.46 ± 0.05b
C20:4(n�6) 1.83 ± 0.75c 3.92 ± 1.38b 1.58 ± 0.43c 1.83 ± 0.81c 0.85 ± 0.49c 2.50 ± 0.66bc 0.98 ± 0.82c 4.03 ± 1.02b 14.6 ± 0.18a
C20:5(n�3) 2.37 ± 0.80cd 4.15 ± 1.25c 2.39 ± 0.39cd 0.89 ± 0.29d 1.69 ± 0.42d 0.87 ± 0.16d 1.22 ± 0.19d 9.54 ± 1.70a 6.64 ± 0.53b
C22:6(n�3) 4.77 ± 0.90abcd 5.51 ± 2.14abc 6.05 ± 1.29a 5.81 ± 1.53ab 2.79 ± 1.27cde 2.15 ± 0.44de 3.21 ± 1.11bcde 0.81 ± 0.50e 1.08 ± 0.20de
PSFA 56.3 ± 1.92bcd 51.7 ± 3.59d 60.3 ± 90abc 57.9 ± 0.68abc 63.7 ± 2.15a 54.9 ± 2.18cd 57.1 ± 0.46bc 62.2 ± 5.21ab 55.0 ± .08cd
PMUFA 21.1 ± 1.87bc 19.3 ± 1.20c 14.7 ± 1.28d 22.8 ± 0.15abc 21.6 ± 3.51bc 25.0 ± 0.87ab 26.1 ± 1.39a 10.7 ± 2.39d 4.97 ± 0.10e
PPUFA 22.7 ± 3.66bcd 29.1 ± 4.54b 25.1 ± 23bc 19.3 ± 0.83cde 14.7 ± 1.86e 20.1 ± 1.76cde 16.8 ± 1.35de 27.2 ± 4.58b 40.0 ± 1.13a
PC18PUFA 13.8 ± 1.42bc 14.3 ± 0.93ab 15.1±.36ab 11.1 ± 0.02d 9.43 ± 2.00d 14.9 ± 0.20ab 11.6 ± 0.24cd 11.7 ± 1.44cd 16.3 ± 1.06a
PC20PUFA 4.20 ± 1.55d 9.32 ± 2.72c 3.97 ± 0.80d 2.72 ± 0.56d 2.55 ± 0.52d 3.37 ± 0.82d 2.20 ± 0.59d 14.7 ± 2.98b 22.8 ± 0.64a
n�6/n�3 1.83 ± 0.27c 1.42 ± 0.18c 1.60 ± 0.19c 1.45 ± 0.41c 1.84 ± 0.70bc 3.03 ± 1.16ab 2.21 ± 0.32bc 1.44 ± 012c 3.49 ± 0.11a
U.I.B 99.6 ± 3.23bcd 124 ± 4.23ab 103 ± 2.83bc 93.8 ± 5.31cd 70.9 ± 5.33d 87.5.±5.76cd 76.3 ± 5.40d 107 ± 5.67bc 142 ± 2.96a
n.d.: Undetectable; a–d Values in a row without a common superscript are significantly different at P < 0.01.** Values in a row without a common superscript are significantly different at P < 0.05.
A Numbers designate algal species given in Table 1.B U.I. (unsaturation index) was calculated by multiplying the percentage of each fatty acid by the number of double bonds followed by summing up these contributions
(Poerschmann, Spijkerman, & Langer, 2004).
P. Kumari et al. / Food Chemistry 120 (2010) 749–757 751
Author's personal copy
values reported earlier for the same species. The U. lactuca from theChile coast also had a DHA content up to 0.8% of TFA while it wasabsent in the same and other members of Ulvales from the BohaiSea (Li et al., 2002) and California (Khotimchenko et al., 2002).
The members of the Bryopsidales, namely C. racemosa and C.veravalensis, also exhibited higher SFA contents (55.0–62.2% TFA),(p 6 0.01) like Ulvales but registered low oleic acid, 2.2–4.75%TFA, and higher PUFA contents, 27.2–40% TFA (p 6 0.01). Khotim-chenko (1995) also described Caulerpa species with low C18 MUFAcontents. The C20 PUFA content in Caulerpa species ranged from14.7% to 22.8% of TFA while Ulva species had a 3–5 times lowercontent of C20 PUFA than C18 PUFA. In keeping with earlier re-ports, Caulerpa spp. in the present study had higher PUFA. How-ever, Matanjun, Mohamed, Mustapha, and Muhammad (2008),while studying C. lentilllifera, reported lower PUFA contents and de-scribed a typical FA profile of Cholorophyta with higher C18 PUFAcontents, oleic acid and low C20 PUFAs. The observed variations inPUFA content in the present study could be attributed to the inter-specific differences.
The n6/n3 ratio in the Cholorophyta members in the presentstudy ranged from 1.42:1 in U. linza to 3.49:1 in C. veravalensis.The unsaturated index varied from 70.9 to 124, indicating a lowerdegree of total unsaturation than in Rhodophyta and Phaeophytamembers (p 6 0.01).
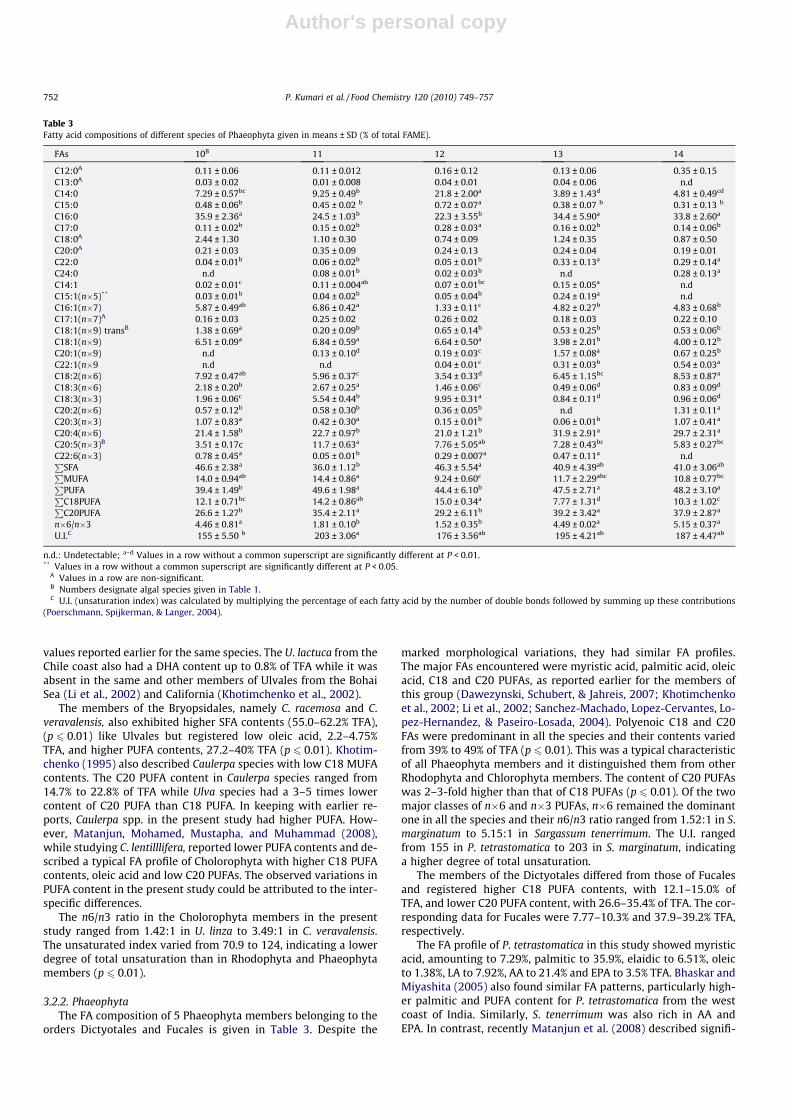
3.2.2. PhaeophytaThe FA composition of 5 Phaeophyta members belonging to the
orders Dictyotales and Fucales is given in Table 3. Despite the
marked morphological variations, they had similar FA profiles.The major FAs encountered were myristic acid, palmitic acid, oleicacid, C18 and C20 PUFAs, as reported earlier for the members ofthis group (Dawezynski, Schubert, & Jahreis, 2007; Khotimchenkoet al., 2002; Li et al., 2002; Sanchez-Machado, Lopez-Cervantes, Lo-pez-Hernandez, & Paseiro-Losada, 2004). Polyenoic C18 and C20FAs were predominant in all the species and their contents variedfrom 39% to 49% of TFA (p 6 0.01). This was a typical characteristicof all Phaeophyta members and it distinguished them from otherRhodophyta and Chlorophyta members. The content of C20 PUFAswas 2–3-fold higher than that of C18 PUFAs (p 6 0.01). Of the twomajor classes of n�6 and n�3 PUFAs, n�6 remained the dominantone in all the species and their n6/n3 ratio ranged from 1.52:1 in S.marginatum to 5.15:1 in Sargassum tenerrimum. The U.I. rangedfrom 155 in P. tetrastomatica to 203 in S. marginatum, indicatinga higher degree of total unsaturation.
The members of the Dictyotales differed from those of Fucalesand registered higher C18 PUFA contents, with 12.1–15.0% ofTFA, and lower C20 PUFA content, with 26.6–35.4% of TFA. The cor-responding data for Fucales were 7.77–10.3% and 37.9–39.2% TFA,respectively.
The FA profile of P. tetrastomatica in this study showed myristicacid, amounting to 7.29%, palmitic to 35.9%, elaidic to 6.51%, oleicto 1.38%, LA to 7.92%, AA to 21.4% and EPA to 3.5% TFA. Bhaskar andMiyashita (2005) also found similar FA patterns, particularly high-er palmitic and PUFA content for P. tetrastomatica from the westcoast of India. Similarly, S. tenerrimum was also rich in AA andEPA. In contrast, recently Matanjun et al. (2008) described signifi-
Table 3Fatty acid compositions of different species of Phaeophyta given in means ± SD (% of total FAME).
FAs 10B 11 12 13 14
C12:0A 0.11 ± 0.06 0.11 ± 0.012 0.16 ± 0.12 0.13 ± 0.06 0.35 ± 0.15C13:0A 0.03 ± 0.02 0.01 ± 0.008 0.04 ± 0.01 0.04 ± 0.06 n.dC14:0 7.29 ± 0.57bc 9.25 ± 0.49b 21.8 ± 2.00a 3.89 ± 1.43d 4.81 ± 0.49cd
C15:0 0.48 ± 0.06b 0.45 ± 0.02 b 0.72 ± 0.07a 0.38 ± 0.07 b 0.31 ± 0.13 b
C16:0 35.9 ± 2.36a 24.5 ± 1.03b 22.3 ± 3.55b 34.4 ± 5.90a 33.8 ± 2.60a
C17:0 0.11 ± 0.02b 0.15 ± 0.02b 0.28 ± 0.03a 0.16 ± 0.02b 0.14 ± 0.06b
C18:0A 2.44 ± 1.30 1.10 ± 0.30 0.74 ± 0.09 1.24 ± 0.35 0.87 ± 0.50C20:0A 0.21 ± 0.03 0.35 ± 0.09 0.24 ± 0.13 0.24 ± 0.04 0.19 ± 0.01C22:0 0.04 ± 0.01b 0.06 ± 0.02b 0.05 ± 0.01b 0.33 ± 0.13a 0.29 ± 0.14a
C24:0 n.d 0.08 ± 0.01b 0.02 ± 0.03b n.d 0.28 ± 0.13a
C14:1 0.02 ± 0.01c 0.11 ± 0.004ab 0.07 ± 0.01bc 0.15 ± 0.05a n.dC15:1(n�5)** 0.03 ± 0.01b 0.04 ± 0.02b 0.05 ± 0.04b 0.24 ± 0.19a n.dC16:1(n�7) 5.87 ± 0.49ab 6.86 ± 0.42a 1.33 ± 0.11c 4.82 ± 0.27b 4.83 ± 0.68b
C17:1(n�7)A 0.16 ± 0.03 0.25 ± 0.02 0.26 ± 0.02 0.18 ± 0.03 0.22 ± 0.10C18:1(n�9) transB 1.38 ± 0.69a 0.20 ± 0.09b 0.65 ± 0.14b 0.53 ± 0.25b 0.53 ± 0.06b
C18:1(n�9) 6.51 ± 0.09a 6.84 ± 0.59a 6.64 ± 0.50a 3.98 ± 2.01b 4.00 ± 0.12b
C20:1(n�9) n.d 0.13 ± 0.10d 0.19 ± 0.03c 1.57 ± 0.08a 0.67 ± 0.25b
C22:1(n�9 n.d n.d 0.04 ± 0.01c 0.31 ± 0.03b 0.54 ± 0.03a
C18:2(n�6) 7.92 ± 0.47ab 5.96 ± 0.37c 3.54 ± 0.33d 6.45 ± 1.15bc 8.53 ± 0.87a
C18:3(n�6) 2.18 ± 0.20b 2.67 ± 0.25a 1.46 ± 0.06c 0.49 ± 0.06d 0.83 ± 0.09d
C18:3(n�3) 1.96 ± 0.06c 5.54 ± 0.44b 9.95 ± 0.31a 0.84 ± 0.11d 0.96 ± 0.06d
C20:2(n�6) 0.57 ± 0.12b 0.58 ± 0.30b 0.36 ± 0.05b n.d 1.31 ± 0.11a
C20:3(n�3) 1.07 ± 0.83a 0.42 ± 0.30a 0.15 ± 0.01b 0.06 ± 0.01b 1.07 ± 0.41a
C20:4(n�6) 21.4 ± 1.58b 22.7 ± 0.97b 21.0 ± 1.21b 31.9 ± 2.91a 29.7 ± 2.31a
C20:5(n�3)B 3.51 ± 0.17c 11.7 ± 0.63a 7.76 ± 5.05ab 7.28 ± 0.43bc 5.83 ± 0.27bc
C22:6(n�3) 0.78 ± 0.45a 0.05 ± 0.01b 0.29 ± 0.007a 0.47 ± 0.11a n.dP
SFA 46.6 ± 2.38a 36.0 ± 1.12b 46.3 ± 5.54a 40.9 ± 4.39ab 41.0 ± 3.06ab
PMUFA 14.0 ± 0.94ab 14.4 ± 0.86a 9.24 ± 0.60c 11.7 ± 2.29abc 10.8 ± 0.77bc
PPUFA 39.4 ± 1.49b 49.6 ± 1.98a 44.4 ± 6.10b 47.5 ± 2.71a 48.2 ± 3.10a
PC18PUFA 12.1 ± 0.71bc 14.2 ± 0.86ab 15.0 ± 0.34a 7.77 ± 1.31d 10.3 ± 1.02c
PC20PUFA 26.6 ± 1.27b 35.4 ± 2.11a 29.2 ± 6.11b 39.2 ± 3.42a 37.9 ± 2.87a
n�6/n�3 4.46 ± 0.81a 1.81 ± 0.10b 1.52 ± 0.35b 4.49 ± 0.02a 5.15 ± 0.37a
U.I.C 155 ± 5.50 b 203 ± 3.06a 176 ± 3.56ab 195 ± 4.21ab 187 ± 4.47ab
n.d.: Undetectable; a–d Values in a row without a common superscript are significantly different at P < 0.01.** Values in a row without a common superscript are significantly different at P < 0.05.
A Values in a row are non-significant.B Numbers designate algal species given in Table 1.C U.I. (unsaturation index) was calculated by multiplying the percentage of each fatty acid by the number of double bonds followed by summing up these contributions
(Poerschmann, Spijkerman, & Langer, 2004).
752 P. Kumari et al. / Food Chemistry 120 (2010) 749–757

Author's personal copy
Table 4Fatty ccid compositions of different species of Rhodophyta given in means ± SD (% of total FAME).
FAs 15B 16 17 18 19 20 21 22 23 24 25 LC 27
C12:0 0.59 ± 0.39ab 1.23 ± 0.82ab 0.10 ± 0.01c 0.16 ± 0.03c 0.85 ± 0.61ab 0.90 ± 0.78ab 0.85 ± 0.43ab 0.92 ± 0.13ab 1.40 ± 0.29a 0.51 ± 0.46ab 0.17 ± 0.13c 0.36 ± 0.16b 0.11 ± 0.01c
C13:0 0.07 ± 0.07c 0.02 ± 0.01d n.d n.d 0.26 ± 0.08a n.d 0.20 ± 0.04abc 0.21 ± 0.15ab 0.17 ± 0.08abc 0.03 ± 0.01d 0.09 ± 0.02bc 0.07 ± 0.04c n.dC14:0 2.67 ± 1.03bcd 3.70 ± 0.46bcd 1.94 ± 0.11cd 2.58 ± 0.30bcd 1.98 ± 1.25cd 4.28 ± 2.01bc 4.83 ± 0.80bc 9.93 ± 3.12a 10.6 ± 1.89a 3.71 ± 0.62bcd 0.98 ± 0.31d 5.33 ± 0.47b 4.87 ± 1.24bc
C15:0 0.63 ± 0.31bc 0.80 ± 0.06abc 0.40 ± 0.21c 0.53 ± 0.07bc 0.37 ± 0.19c 0.51 ± 0.28bc 1.49 ± 0.98a 1.21 ± 0.26ab 1.29 ± 0.39ab 0.68 ± 0.14bc 0.33 ± 0.08c 0.69 ± 0.28bc 0.34 ± 0.03c
C16:0 26.7 ± 2.40f 34.4 ± 1.41def 27.8 ± 1.52f 52.7 ± 2.22a 26.4 ± 2.78f 43.4 ± 6.71bc 48.9 ± 3.59ab 50.4 ± 6.85ab 49.9 ± .79ab 36.3 ± 0.92cde 30.6 ± 4.07ef 38.8 ± 1.89cd 37.8 ± 1.02cde
C17:0 0.32 ± 0.22abcd 0.07 ± 0.02d 0.20 ± 0.02abcd 0.11 ± 0.03cd 0.12 ± 0.01cd 0.25 ± 0.09abcd 0.37 ± 0.14a 0.29 ± 0.01abcd 0.36 ± 0.06a 0.21 ± 0.17abcd 0.07 ± 0.01d 0.13 ± 0.09cd 0.14 ± 0.04bcd
C18:0 2.86 ± 0.99bcd 2.46 ± 0.11bcd 2.57 ± 0.07bcd 2.17 ± 0.13bcd 2.50 ± 0.45bcd 4.29 ± 1.10ab 5.80 ± 0.65a 4.08 ± 1.49abc 4.26 ± 1.23ab 5.41 ± 2.27a 1.61 ± 0.27d 1.11 ± 0.81d 1.86 ± 0.96cd
C20:0A 0.40 ± 0.29 0.76 ± 0.45 0.18 ± 0.18 0.22 ± 0.08 0.36 ± 0.28 0.58 ± 0.88 0.85 ± 0.62 0.63 ± 0.60 0.32 ± 0.31 0.30 ± 0.34 0.07 ± 0.03 0.13 ± 0.01 0.12 ± 0.05C22:0 0.20 ± 0.20b 0.05 ± 0.04 b n.d 0.12 ± 0.03 b 0.21 ± 0.10 b 0.15 ± 0.21b 0.56 ± 0.23a 0.17 ± 0.06 b 0.34 ± 0.29ab 0.05 ± 0.04 b 0.07 ± 0.03 b 0.11 ± 0.04 b 0.10 ± 0.02 b
C24:0 n.d n.d n.d n.d n.d n.d n.d n.d n.d n.d 0.06 ± 0.01 b 0.13 ± 0.05a n.dC14:1 0.15 ± 0.04b n.d n.d n.d 0.11 ± 0.08b n.d 0.48 ± 0.42a 0.15 ± 0.11b 0.19 ± 0.11b 0.14 ± 0.04b n.d 0.22 ± 0.06a n.dC15:1(n�5) 0.07 ± 0.03c n.d n.d n.d n.d n.d 0.43 ± 0.29a 0.23 ± 0.01bc 0.23 ± 0.13bc n.d n.d 0.11 ± 0.02c n.dC16:1(n�7) 6.42 ± 0.42bcd 1.25 ± 0.25e 1.36 ± 0.25e 0.99 ± 0.25e 0.74 ± 0.33e 2.09 ± 0.40e 3.07 ± 0.53cd 3.39 ± 0.84cd 3.22 ± 1.99cd 19.8 ± 6.19a 6.60 ± 0.45bc 10.0 ± 0.69b 2.25 ± 0.41d
C17:1(n�7) 0.36 ± 0.39a 0.06 ± 0.02b n.d 0.21 ± 0.07a 0.14 ± 0.05b n.d 0.29 ± 0.08a 0.59 ± 0.40a 0.55 ± 0.24a 0.10 ± 0.07b 0.10 ± 0.02 b 0.15 ± 0.01b 0.05 ± 0.01b
C18:1(n�9)trans
0.95 ± 0.21fg 1.64 ± 0.01def 1.42 ± 0.12efg 2.49 ± 0.27bc 1.54 ± 0.02def 1.54 ± 0.40def 2.94 ± 0.43ab 3.41 ± 0.52a 2.71 ± 0.20abc 1.31 ± 0.43fg 0.92 ± 0.19g 2.05 ± 0.07cde 2.14 ± 0.48cd
C18:1(n�9) 1.62 ± 0.26cd 2.43 ± 0.002bcd 1.36 ± 0.18d 3.75 ± 0.20ab 2.58 ± 0.95bcd 3.21 ± 0.47bc 1.45 ± 0.35cd 5.38 ± 0.20a 5.55 ± 1.67a 4.23 ± 2.00ab 1.21 ± 0.13d 3.26 ± 0.27bc 3.00 ± 0.23bcd
C20:1(n�n�9)A 0.20 ± 0.23 0.07 ± 0.003 n.d n.d n.d n.d 0.20 ± 0.09 0.15 ± 0.07 0.48 ± 0.60 0.15 ± 0.01 0.05 ± 0.02 0.06 ± 0.02 n.dC22:1(n-9) 0.24 ± 0.20bc 0.06 ± 0.002d n.d n.d n.d n.d 0.55 ± 0.12a 0.31 ± 0.01b n.d 0.11 ± 0.06cd n.d 0.16 ± 0.08cd n.dC18:2(n�6) 1.41 ± 0.46c 1.18 ± 1.06c 2.24 ± 0.47bc 3.23 ± 1.10bc 1.80 ± 0.51bc 1.32 ± 0.97c 10.1 ± 2.23a 2.47 ± 0.71bc 2.05 ± 0.43bc 1.14 ± 0.56c 1.59 ± 0.11c 4.01 ± 0.33b 2.72 ± 1.49bc
C18:3(n�6) 0.29 ± 0.25bc 0.17 ± 0.05c n.d 0.31 ± 0.12abc 0.63 ± 0.08a 0.51 ± 0.26ab n.d 0.39 ± 0.21abc 0.44 ± 0.23abc 0.18 ± 0.01c 0.22 ± 0.04bc 0.32 ± 0.02abc 0.31 ± 0.01abc
C18:3(n�3) 0.94 ± 0.31bc 2.51 ± 0.75a 1.90 ± 0.25ab 1.43 ± 0.34abc 1.79 ± 0.74ab 1.23 ± 0.87abc 0.61 ± 0.62bc 1.29 ± 0.86abc 1.16 ± 1.03bc 1.50 ± 0.37abc 0.62 ± 0.04bc 0.21 ± 0.01c n.dC20:2(n�6) n.d 0.46 ± 0.37a n.d 0.85 ± 0.36a n.d n.d 0.87 ± 0.74a n.d n.d n.d n.d 0.48 ± 0.32a n.dC20:3(n�3) 0.07 ± 0.01b n.d n.d n.d n.d n.d 0.57 ± 0.41a n.d n.d n.d n.d n.d n.dC20:4(n�6) 34.1 ± 5.53c 46.8 ± 1.60b 58.3 ± 0.53a 28.0 ± 1.81cd 21.1 ± 2.03ef 14.8 ± 2.73efg 9.54 ± 0.18ghi 6.70 ± 4.06hi 6.14 ± 1.47i 13.2 ± 4.57gh 42.6 ± 4.38b 14.7 ± 1.31fg 21.4 ± 0.67de
C20:5(n�3) 18.1 ± 2.12bcd 0.21 ± 0.06g 0.32 ± 0.06g 0.39 ± 0.14g 37.0 ± 4.49a 21.4 ± 2.47bc 4.97 ± 0.20f 7.14 ± 3.0ef 8.60 ± 2.31ef 11.1 ± 5.29e 12.1 ± 0.68de 17.2 ± 1.61cd 22.8 ± 0.72b
C22:6(n�3) 1.56 ± 0.90a n.d n.d n.d n.d n.d n.d 0.96 ± 0.57b 0.75 ± 0.47bc n.d n.d 0.27 ± 0.19c n.dP
SFA 34.5 ± 5.17fg 43.5 ± 0.77ef 33.2 ± 1.13g 58.6 ± 2.42bc 33.0 ± 4.54g 54.4 ± 1.99cd 63.9 ± 2.26ab 67.9 ± .46a 68.6 ± 6.24a 47.2 ± 1.96de 34.1 ± 4.81g 46.9 ± 1.24de 45.4 ± 0.39de
PMUFA 9.93 ± 0.91cde 5.51 ± 0.26ef 4.14 ± 0.46f 7.43 ± 0.52def 5.10 ± 1.35ef 6.84 ± 0.69ef 9.41 ± 0.65cdef 13.3 ± 0 .46bc 12.7 ± 1.33bcd 25.8 ± 8.56a 8.85 ± 0.36cdef 16.0 ± 1.04b 7.44 ± 0.08def
PPUFA 55.6 ± 5.79abc 51.0 ± 0.58bc 62.7 ± 1.22a 34.0 ± 0.27ef 61.9 ± 5.87a 38.8 ± 2.14de 26.7 ± 1.63fg 18.9 ± 8.73g 18.7 ± 4.92g 27.0 ± 9.53fg 57.1 ± 5.17abc 37.2 ± 2.27def 47.2 ± 1.37cd
PC18PUFA 2.64 ± 0.92c 3.86 ± 1.76bc 4.13 ± 0.71bc 4.97 ± 1.03b 4.23 ± 0.78bc 3.05 ± 1.97bc 10.8 ± 2.02a 4.16 ± 1.34bc 3.65 ± 1.09bc 2.83 ± 0.26c 2.43 ± 0.11c 4.54 ± 0.33bc 3.02 ± 1.49bc
PC20PUFA 52.3 ± 7.61ab 47.4 ± 1.82b 58.6 ± 0.58a 29.2 ± 1.41de 58.2 ± 5.81a 36.1 ± 0.51cd 16.0 ± 2.12f 13.8 ± 7.00f 14.8 ± 3.78f 24.2 ± 9.47ef 54.7 ± 5.07ab 32.4 ± 2.60de 44.2 ± 1.28bc
n�6/n�3 1.78 ± 0.16c 18.8 ± 5.46b 27.7 ± 3.91a 18.7 ± 5.89b 0.61 ± 0.06c 0.74 ± 0.21c 3.37 ± 0.40c 1.03 ± 0.08c 0.83 ± 0.11c 1.28 ± 048c 3.48 ± 0.15c 1.10 ± 0.05c 1.07 ± 0.09c
U.I.C 250 ± 1.01ab 205 ± 3.07cd 249 ± 3.66abc 135 ± 1.14fgh 286 ± 5.91a 181 ± 3.77de 97.5 ± 2.47gh 91.3 ± 4.11h 93.6 ± 4.63h 141 ± 4.05efg 246 ± 1.27abc 173 ± 5.64def 213 ± 4.89bcd
n.d.: Not detected; a–i Values in a row without a common superscript are significantly different (P < 0.01).A Values in a row are non-significant.B Numbers designate algal species given in Table 1.C U.I. (unsaturation index) was calculated by multiplying the percentage of each fatty acid by the number of double bonds, followed by summing up these contributions (Poerschmann, Spijkerman, & Langer, 2004).
P.Kum
ariet
al./FoodChem
istry120
(2010)749–
757753

Author's personal copy
cantly lower contents of AA (0.63%) and EPA (1.71%) of TFA for Sar-gassum polycystum. A similar lower AA (10–21%) and EPA (1%) ofTFA has also been reported for Sargassum kjellmanianum and Sar-gassum thunbergii collected from Bohai Sea (Li et al., 2002). How-ever, Cystoseira indica had slightly lower PUFA content, with47.5% of TFA, as compared to C. osmundacea, with 54% of TFA fromthe Pacific coast (Khotimchenko et al., 2002). Stoechospermum mar-ginatum was found to have an exceptionally high myristic acid(C14:0) content with 21.8% of TFA (p 6 0.01), which might be acharacteristic of the genus and also such high content was notfound in any other algal species in our study.
3.2.3. RhodophytaTotally, 13 red algal species, belonging to the orders Ahnfelti-
ales, Gracilariales, Cryptonemiales, Corallinales, Gigartinales andCeramiales, were investigated (Table 4). Their overall FA composi-tions had the distinct pattern of Rhodophyta (Jamieson & Reid,1972) with relatively higher levels of palmitic acid, oleic acid, AAand EPA. These FAs together accounted for 65–86.6% of TFA(p 6 0.01) whereas C18 PUFAs were present as minor components,ranging from 2.64% to 4.54% of TFA, except in Amphiora anceps, inwhich C18 PUFA content was 10.8% TFA. The present findings are inaccordance with earlier studies where C20 PUFAs (AA and EPA)were recorded as the dominant fraction of FA in red algae (Daw-ezynski et al., 2007; Khotimchenko et al., 2002; Khotimchenko &Gusarova, 2004; Li et al., 2002; Sanchez-Machado et al., 2004).
From the comparative data analysis of PUFAs, the members ofthe Rhodophyta can be divided into three groups. The first groupincluded A. plicata, G. debilis, G. dura, G. furgosonii, A. anceps andS. filiforme, in which the content of n�6 PUFAs was higher than thatof the n�3 PUFAs, with n6/n3 ratio ranging from 1.77:1 in A. plicatato 27.7:1 in G. dura and AA > EPA. The Grateloupia (G. indica and G.wattii) was included in the second group where n–3 PUFAs werehigher than n�6 PUFAs, with n6/n3 ratio ranging from 0.61:1 to0.74:1 and EPA > AA. The third group included Hypnea sp. (H. musc-iformis and H. esperi), K. alverzii and Laurencia sp. (L. cruciata and L.papillosa) in which the contents of n�6 and n�3 PUFAs were nearlysame with n6/n3 ratio being close to 1 and the contents of AA andEPA were also more or less equal. DHA was absent in most of thered algal species studied, except in A. plicata, H. musciformis, H.
esperi and L. cruciata, in which it ranged from 0.27% of TFA in L. cru-ciata to 1.56% in A. plicata (p 6 0.01). The unsaturation index (U.I.)ranged from 91.3 to 286, indicating a higher degree of unsaturationand in conformity with the fact that U.I. increases with increase inthe content of AA (C20:4, n�6) and EPA (C20:5, n�3) (Colomboet al., 2006).
The overall results of this study showed that the palmitic acid(C16:0) appeared to be the most abundant FA, irrespective of spe-cies. Its content was significantly higher in Chlorophyta (40.9–52.9% TFA), followed by Phaeophyta and Rhodophyta. Palmitoleicacid and oleic acid were the major MUFAs of the three groups stud-ied and ranged from 4.97% to 26.1% of TFA for Chlorophyta, 9.24–14.4% for Phaeophyta and 4.14–13.3% for Rhodophyta members.The contents of PUFAs were noticeably higher within most of the al-gal species examined when compared with earlier studies carriedout with related species. Furthermore, most of the species exam-ined contained approximately 90% TFA as long-chain fatty acids(C15–C24). Surprisingly, the short-chain fatty acids (C4–C10) werenot detected. This may be attributed to such low amounts in theseaweeds that they were beyond the detection limit. The fatty acidswith C11–C14 carbon chains were generally low and varied be-tween 1.87% of TFA in C. veravalnensis and 12.5% of TFA in H. esperi.
3.3. Multivariate analysis
A statistical analysis was performed, using the FA compositionof 27 macroalgal species, in order to establish the relationship be-tween and within different orders and families belonging to thethree phyla. The FA data matrix was subjected to PCA analysis afterruling out seven FAs (variables), namely tridecanoic (C13:0), tetra-cosanoic (C24:0), 9-tetradecenoic (C14:1n�5), 13-docosenoic(C22:1n�9), 11, 14-eicosadienoic (C20:2n�6) and 11,14, 17 eicos-atrienoic acid (C20:3n�3). These FAs were excluded due to theirinsignificant amounts and lack of correlation with the data matrixwhich otherwise led to misclassification of species and increase inthe number of outliers owing to their higher contribution to thescore/loading values.
The nineteen FA variables satisfactorily explained the variabilitypresent in the data, with PC1 accounting for 32% and PC2 15% ofthe total variation (Fig. 1). The most discriminant variables along
Fig. 1. Principal component analysis of 27 macroalgal species, indexed from 1 to 27 according to Table 1; bi-plot (score/loading plot) of 19 fatty acids with first two principalcomponents.
754 P. Kumari et al. / Food Chemistry 120 (2010) 749–757
Author's personal copy
the axis 1 were palmitic, stearic, DHA, LA, oleic, docosanoic, AA andEPA, while, along the axis 2, were ALA, tetradecanoic, myristic,pentadecanoic, elaidic and GLA. Although these percentages werelow, the analysis provided a global statistical distinction betweenthree groups. Axis 1 separated Group 1 from the other two groupsand included the orders Ulvales and Bryopsidales belonging toChlorophyta. All the species of Ulvales showed close similarityand were positively correlated, with palmitic, stearic, DHA, LAand oleic acid, except U. lactuca, due to higher contributions ofGLA, heptadecanoic, 10-heptadecenoic and docosanoic acid. Atthe same time Caulerpa spp. were also distinct, due to higher load-ings of AA and EPA. Group 2 included the two orders of Phaeophyta(Dictyotales and Fucales) but higher contributions of tetradecanoicacid and ALA made S. marginatum an outlier. Group 3, that included
all the Rhodophyta members, was discriminated from the rest byAA and EPA, except Amphiora anceps and Hypnea spp.
Further, the score/loading plot of FA groups (PC1–63%; PC2–17%), including seven variables (SFA, MUFA, PUFA, C18 PUFA, C20PUFA, n�3 and n�6 PUFA) demarcated the Chlorophyta specieswith higher SFA, MUFA and C18 PUFA from Rhodophyta specieswith higher C20 PUFAs. Nonetheless, the central position of Pha-eophyta species on the plot also implied their intermediate posi-tion between the red and green. Exceptionally, Caulerpa spp.showed higher contents of C18 and C20 PUFAs and thus were clo-ser to brown and red macroalgae (data not shown). The oppositepositions of n�6 and n�3 PUFAs on the plot signify their inversecorrelation and thus reflect a distinct metabolic pathway for thesefatty acids.
Fig. 3. Dendrogram obtained by hierarchical cluster analysis of 27 macroalgal species.
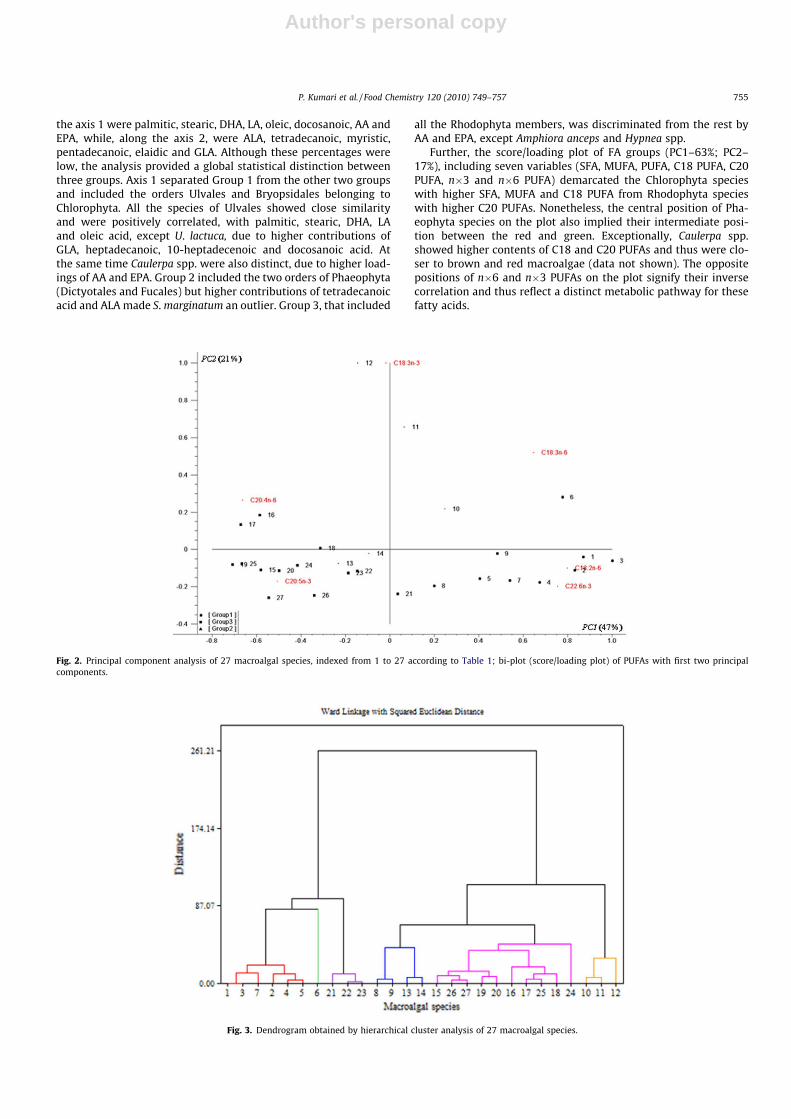
Fig. 2. Principal component analysis of 27 macroalgal species, indexed from 1 to 27 according to Table 1; bi-plot (score/loading plot) of PUFAs with first two principalcomponents.
P. Kumari et al. / Food Chemistry 120 (2010) 749–757 755

Author's personal copy
PCA analysis of the PUFA data matrix (LA, GLA, ALA, AA, EPA andDHA) for evaluating their distribution in macroalgae explained 68%of the variability, PC1–47%; PC2–21% (Fig. 2). The result showedhigher amounts of LA in all the Chlorophyta species while DHAwas exceptionally higher in Ulva spp., which is essential for visualand neurological development of infants. Gracilaria spp. (G. duraand G. debilis) and S. filiforme had higher loadings for AA and Grat-eloupia spp., Laurencia spp. and A. plicata for EPA. Both these FAsare precursors of prostaglandins, thromboxanes and other eicosa-noids, which influence inflammation processes and immune reac-tions (Calder & Grimble, 2002).
A dendrogram was obtained by Ward hierarchical clustering,using squared Euclidean distance (Ward, 1963) for 27 macroalgalspecies described by the first 9 principal components with eigen-values >1 (Kaiser’s rule) (Fig. 3). Ward linkage is an agglomerativeclustering algorithm which starts with n singleton clusters (eachconsisting of one element of the data set) and merges two clusterson the basis of a similarity measure. Six different clusters were ob-tained, whereby all the species of the same family were groupedtogether, except U. lactuca, which formed a separate group. In fact,the present study revealed that FA trends remained conserved upto orders except for Gigartinales whereas Hypneaceae and Solieri-aceae were grouped separately. Similar clustering is also shown ina two dimensional plot where the separation of individual clustersis more illustrative (Fig. 4).
4. Conclusion
Although macroalgae showed low lipid contents (<4 g 100 g�1
DW), their PUFA contents are equivalent or even higher than thoseof terrestrial vegetables. The availability of important PUFAs, suchas LA, ALA, GLA, AA, EPA and DHA, with proven biomedical andnutraceutical applications, indicates their potential utilisation inpreparation of low fat foods. Statistical analysis exhibited that FAsignatures can be used to unravel chemotaxonomic relationshipsamong macroalgal species.
Acknowledgements
The financial support received from CSIR (NWP-018) is grate-fully acknowledged. The first author (PK) gratefully acknowledges
the CSIR, New Delhi for awarding the Junior Research Fellowship(JRF). The second (MK) and third (VG) authors also express theirgratitude to the Department of Biotechnology, New Delhi andDepartment of Science and Technology, New Delhi, for theirfellowships.
References
Barrow, C. J. (2007). Marine by-products as functional food ingredients. FoodTechnology International, 1–5. Available from www.foodtech-international.com.
Bhaskar, N., & Miyashita, K. (2005). Lipid composition of Padina tetrastomatica(Dictyotales, Phaeophyta), brown seaweed of the west coast of India. IndianJournal of Fisheries, 52, 263–268.
Bhaskar, N., Hosokawa, M., & Miyashita, K. (2004). Comparative evaluation of fattyacid composition of different Sargassum (Fucales, Phaeophyta) speciesharvested from temperate and tropical waters. Journal of Aquatic ProductTechnology, 3, 53–70.
Bhosale, R. A., Velankar, D. A., & Chaugule, B. B. (2008). Fatty acid composition of thecold water-inhabiting freshwater red alga Sirodoita kylin. Journal of AppliedPhycology, 21, 99–102.
Bligh, E. G., & Dyer, W. J. (1959). A rapid method of total lipid extraction andpurification. Canadian Journal of Biochemistry and Biophysiology, 37(8), 911–915.
Calder, P. C., & Grimble, R. F. (2002). Polyunsaturated fatty acids, inflammation andimmunity. Journal of Clinical Nutrition, 56(Suppl. 3), 14–19.
Cardozo, K. H. M., Guaratini, T., Barros, M. P., Falcao, V. R., Tonon, A. P., Lopes, N. P.,et al. (2007). Metabolites from algae with economical impact. ComparativeBiochemistry and Physiology, Part C, 146, 60–78.
Carreau, J. P., & Dubacq, J. P. (1978). Adaptation of macroscale method to themicroscale for fatty acid methyl transesterification of biological lipid extracts.Journal of Chromatography, 151, 384–390.
Chandini, S. K., Ganesan, P., Suresh, P. V., & Bhaskar, N. (2008). Seaweeds as source ofnutritionally beneficial compounds – A review. Journal of Food Science andTechnology, 45(1), 1–13.
Colombo, M. L., Rise, P., Giavarini, F., Sngelis, L. De., Galli, C., & Bolis, C. L. (2006).Macroalgae as sources of polyunsaturated fatty acids. Plant Foods for HumanNutrition, 61, 67–72.
Critchely, A. T., Ohno, M., & Largo, D. B. (2006). World seaweed resources: Anauthoritative reference system (in DVD format). Berkshire, UK: ETI InformationServices Ltd.. 25 pp..
Darcy-Vrillon, B. (1993). Nutritional aspects of the developing use of marinemacroalgae for the human food industry. International Journal of Food Scienceand Nutrition, 44, 23–35.
Dawezynski, C., Schubert, R., & Jahreis, G. (2007). Amino acids, fatty acids anddietary fibre in edible seaweed products. Food Chemistry, 103, 891–899.
Ginzberg, A., Cohen, M., Sod-Moriah, U. A., Shany, S., Rosentrauch, A., & Arad, S. M.(2000). Chickens fed with biomass of the red microalga Porphyridium sp. havereduced blood cholesterol level and modified fatty acid composition in egg yolk.Journal of Applied Phycology, 2, 325–330.
Herbreteau, F., Coiffard, L. J. M., Derrien, A., & De Roeck-Holtzhauer, Y. (1997). Thefatty acid composition of five species of macroalgae. Botanica Marina, 40, 25–27.
Jamieson, G. R., & Reid, E. H. (1972). The component fatty acids of some marine algallipids. Phytochemistry, 11(4), 1423–1432.
Fig. 4. Principal component and hierarchic analysis of 27 macroalgae, indexed from 1 to 27 according to Table 1. Six groups were evidenced by the hierarchic analysis.
756 P. Kumari et al. / Food Chemistry 120 (2010) 749–757

Author's personal copy
Khotimchenko, S. V. (1995). Fatty acid composition of green algae of the genusCaulerpa. Botanica Marina, 38, 509–512.
Khotimchenko, S. V. (2003). Fatty acids of species in the genus Codium. BotanicaMarina, 46, 456–460.
Khotimchenko, S. V., & Gusarova, I. S. (2004). Red algae of peter the great bay as asource of arachidonic and eicosapentaenoic acids. Russian Journal of MarineBiology, 30(3), 183–187.
Khotimchenko, S. V., Vaskovsky, V. E., & Titlyanova (2002). Fatty acids from thePacific coast of North California. Botanica Marina, 45, 17–22.
Li, X., Fan, X., Han, L., & Lou, Q. (2002). Fatty acids of some algae from the Bohai Sea.Phytochemistry, 59, 157–161.
Lombardo, B. L., Hein, G., & Chicco, A. (2007). Metabolic syndrome: Effects of n�3PUFA on a model of dyslipidemia, insulin resistance and adiposity. Lipids, 42,427–437.
Marsham, S., Scott, G. W., & Tobin, M. L. (2007). Comparison of nutritive chemistryof a range of temperate seaweeds. Food Chemistry, 100, 1331–1336.
Matanjun, P., Mohamed, S., Mustapha, N. M., & Muhammad, K. (2008). Nutrientcontent of tropical edible seaweeds, Euchema cottonii, Caulerpa lentillifera andSargassum polycystum. Journal of Applied Phycology, 21, 75–80.
Mongrand, S., Badocb, A., Patouillec, B., Lacomblezc, C., Chaventc, M., Cassagnea, C.,et al. (2001). Taxonomy of gymnospermae: Multivariate analyses of leaf fattyacid composition. Phytochemistry, 58, 101–115.
Ortiz, J., Romero, N., Robert, P., Araya, J., Lopez-Hernandez, J., Bozzo, C., et al. (2006).Dietary fiber, amino acid, fatty acid and tocopherol contents of the edibleseaweeds Ulva lactuca and Durvillaea antarctica. Food Chemistry, 99, 98–104.
Poerschmann, J., Spijkerman, E., & Langer, U. (2004). Fatty acid patterns inChlamydomonas sp. as a marker for nutritional regimes and temperatureunder extremely acidic conditions. Microbial Ecology, 48, 78–89.
Rodriguez, C., Acosta, C., Badia, P., Cejas, J. R., Santamaria, F. J., & Lorenzo, A. (2004).Assessment of lipid and essential fatty acids requirements of black seabream(Spondyliosoma cantharus) by comparison of lipid composition in muscle andliver of wild and captive adult fish. Comparative Biochemistry and Physiology,139(B), 619–629.
Sanchez-Machado, D. I., Lopez-Cervantes, J., Lopez-Hernandez, J., & Paseiro-Losada,P. (2004). Fatty acids, total lipid, protein and ash contents of processesd edibleseaweeds. Food Chemistry, 85, 439–444.
Temina, M., Rezankovab, H., Rezankac, T., & Dembitsky, V. M. (2007). Diversity ofthe fatty acids of the Nostoc species and their statistical analysis. MicrobiologicalResearch, 162, 308–321.
Veena, C. K., Josephine, A., Preetha, S. P., & Varalakshmi, P. (2006). Beneficial role ofsulfated polysaccharides from edible seaweed Fucus vesiculosus in experimentalhyperoxaluria. Food Chemistry, 100, 1552–1559.
Visentainer, J. V., Noffs, M. D. A., Carvalho, P. O., de Almeida, V. V., de Oliveira, C. C., &de Souza, N. E. (2007). Lipid content and fatty acid composition of marine fishspecies from the south coast of Brazil. Journal of American Oil Chemist’s Society,84, 543–547.
Ward, J. H. (1963). Hierarchical grouping to optimize an objective function. Journalof the American Statistical Association, 58, 236–244.
P. Kumari et al. / Food Chemistry 120 (2010) 749–757 757