TriFlow: Triaging Android Applications using Speculative ...
13
This is a postprint version of the following published document: Omid Mirzaei, Guillermo Suarez-Tangil, Juan Tapiador, and Jose M. de Fuentes. 2017. TriFlow: Triaging Android Applications using Speculative Information Flows. In Proceedings of the 2017 ACM on Asia Conference on Computer and Communications Security (ASIA CCS '17). ACM, New York, NY, USA, 640-651. DOI: https://doi.org/10.1145/3052973.3053001 ACM New York, NY, USA ©2017 This is the author's version of the work. It is posted here by permission of ACM for your personal use. Not for redistribution. The definitive version was published in ASIA CCS '17 Proceedings of the 2017 ACM on Asia Conference on Computer and Communications Security, 640-651 pp.
-
Upload
khangminh22 -
Category
Documents
-
view
6 -
download
0
Transcript of TriFlow: Triaging Android Applications using Speculative ...
This is a postprint version of the following published document:
Omid Mirzaei, Guillermo Suarez-Tangil, Juan Tapiador, and Jose M. de Fuentes. 2017. TriFlow: Triaging Android Applications using Speculative Information Flows. In Proceedings of the 2017 ACM on Asia Conference on Computer and Communications Security (ASIA CCS '17). ACM, New York, NY, USA, 640-651. DOI: https://doi.org/10.1145/3052973.3053001
ACM New York, NY, USA ©2017 This is the author's version of the work. It is posted here by permission of ACM for your personal use. Not for redistribution. The definitive version was published in ASIA CCS '17 Proceedings of the 2017 ACM on Asia Conference on Computer and Communications Security, 640-651 pp.
TriFlow: Triaging Android Applications using SpeculativeInformation Flows
Omid MirzaeiUniversidad Carlos III de
Guillermo Suarez-TangilUniversity College London
Juan Tapiador,Jose M. de FuentesUniversidad Carlos III de
Madrid{jestevez,
jfuentes}@inf.uc3m.es
ABSTRACTInformation flows in Android can be effectively used to give an in-formative summary of an application’s behavior, showing how andfor what purpose apps use specific pieces of information. This hasbeen shown to be extremely useful to characterize risky behaviorsand, ultimately, to identify unwanted or malicious applications inAndroid. However, identifying information flows in an applica-tion is computationally highly expensive and, with more than onemillion apps in the Google Play market, it is critical to prioritizeapplications that are likely to pose a risk. In this work, we developa triage mechanism to rank applications considering their poten-tial risk. Our approach, called TRIFLOW, relies on static featuresthat are quick to obtain. TRIFLOW combines a probabilistic modelto predict the existence of information flows with a metric of howsignificant a flow is in benign and malicious apps. Based on this,TRIFLOW provides a score for each application that can be used toprioritize analysis. TRIFLOW also provides an explanatory reportof the associated risk. We evaluate our tool with a representativedataset of benign and malicious Android apps. Our results showthat it can predict the presence of information flows very accuratelyand that the overall triage mechanism enables significant resourcesaving.
KeywordsAndroid security; malware analysis; information flow; app triage
1. INTRODUCTIONThe amount and complexity of malware in Android platforms
has rapidly grown in the last years. By early 2016, both Syman-tec and McAfee report more than 300 malware families totalling over 12 million unique samples [26, 40]. Every malware family (and, sometimes, every sample within a family) may pose a differ-ent threat. The sheer number of apps available in current markets, along with the ratio at which new apps are submitted, makes im-possible to manually analyze all of them. Automated analyses also have their limitations and some techniques might require a sub-
stantial amount of time per app [25]. This has motivated the need for a multi-staged analysis pipeline in which apps should be ini-tially triaged to allocate resources intelligently and guarantee that the analysis effort is devoted to those samples that potentially have more security interest.
One of the salient features of Android’s security model is its permission-based access control system. Apps may request access to security- and privacy-sensitive resources in their manifest file. These requests are presented to end users through permission di-alogs at install time or, since Android version 6 (Marshmallow), at runtime for a reduced subset of permissions. Requesting access to protected resources is a clear indicator of risk and most triage systems for Android apps have relied quite heavily on requested permissions (see, e.g., [11, 17, 20, 29, 34]), since they have proven effective to identify apps carrying malicious functionality. The ma-jority of these approaches rely on metrics that combine the preva-lence (or rarity) of each permission in benign and malicious apps with the criticality of the resources protected by the permission.
Using permissions alone to assess risk has important limitations [2]. Permission-based risk metrics might be highly inaccurate for two reasons. First, apps are often overprivileged and many permis-sions requested in the manifest might not be actually used during execution. Second, they assign a risk to a particular permission (e.g., INTERNET) just because it could be used as a vehicle for a malicious purpose, such as leaking out a piece of sensitive data, without considering if sensitive data is actually being sent or not. Determining risk using Information Flows (IFs), as done by the approach introduced in this paper, overcomes this limitation and provides a more accurate assessment of the app’s actual behavior. However, IF analysis presents a number of challenges. Identifying flows in an app involves a non-negligible amount of resources both in time and memory. For instance, according to our experiments, it can take more than 30 minutes per app to extract IFs from at least half of the samples in the Drebin dataset [4] using a relatively powerful computer (40 processors and 200 GB RAM). The situa-tion may even be worse when analyzing apps with sufficiently large call graphs. In those scenarios, the IF extraction might not even be practical [6].
Overview of our system. In this work we describe TRIFLOW, an IF-based triage mechanism for Android apps that attempts to over-come the issues discussed above for permission-based systems and also the limitations of existing IF analysis tools. Since extracting IFs from an app is an unreliable and computationally expensive process, TRIFLOW introduces the notion of speculative informa-tion flows. This means that T RIFLOW extracts some features from apps and then predicts the existence of a flow based on t hem. Pre-
1
dictionisdoneonthebasisofamodelthatispreviouslytrainedusinggroundtruthobtainedwithflowextractiontools.Eachpre-dictedflowisthenscoredbyTRIFLOWintermsofitspotentialrisk,whichdependsontheflow’sobservedprevalenceingoodwareandmalware.Todothiswerelyonthecross-entropybetweentheempiricalprobabilitydistributionsofeachflowingoodwareandmalware.Thisprovidesasimplebutsoundquantificationofthein-tuitionthataninformationflowisriskyifitisfrequentinmalwareandrareinbenignapps.TRIFLOWhasbeenimplementedinPythonandtestedusinga
combineddatasetofmorethan17,000apps. Ourresultssuggestthatitispossibletopredictinformationflowsefficiently,withpre-dictionerrorsremarkablysmallforthemajorityofinformationflows.Theevaluationoftheflowscoringmeasurerevealsthat75%ofinformationflowshavenovalueatallforriskprediction,andonly1%oftheremainingflowsreceivehighweights.Thissug-geststhatmaliciousbehavior(atleastinthesamplescontainedinthedatasetsusedinthiswork)canbemodeledusingarelativelysmallsubsetofallpossibleinformationflows.WeevaluateTRIFLOWbysimulatingatriageprocessinwhich
appsmustbeprioritizedastheyarrive. OurexperimentalresultsdemonstratethatTRIFLOWoutperformsexistingpermission-basedriskmetricsinallconsideredscenarios. Additionally,TRIFLOWprovidesanexplicativereportthatdescribestheflowsthatmostcontributetotheoverallriskassessment.
Contributions.Insummary,inthispaperwemakethreemaincontributions:
•Weintroducetheideaofpredictingtheexistenceofapartic-ularinformationflowusingstaticfeaturesextractedfromanapp’scode.Webelievethisideamighthavepotentialbeyondthescopeofthisworkand,moregenerally,couldbeextendedtopredictthepresenceofotherprogramartifactswhosepre-ciseidentificationrequirescomputationallyexpensivestaticordynamicanalysisprocedures.
•Weextendtoinformationflowsthenotionof“rareequalsrisky”thathasbeenlargelyexploredandtestedinthefieldofpermission-basedriskmetrics.Basedonthis,wedesignaninformation-theoreticriskmeasurerelatedtothecrossen-tropybetweenthedistributionofinformationflowsinbenignandmaliciousapps,thusquantifyinghowinformativeaflowis.
•Finally,wemakeourresultsandourimplementationofTRI-FLOWpubliclyavailableat
https://github.com/OMirzaei/TriFlow
toallowfutureworksinthisareatobenefitfromourresearch.TRIFLOWcanbeeasilyextendedfornewAPImethodsandnewinformationflowsappearinginupcomingversionsofAndroid,anditsmodulararchitecturefacilitatesitsintegra-tioninexistingriskassessmentframeworks.
Organization.Therestofthispaperisorganizedasfollows.Sec-tion2describesindetailourapproachforfasttriageofappsbasedonspeculativeinformationflows.InSection3wepresentanddis-cusstheresultsofourevaluation,includingourprototypeimple-mentationandthedatasetsused(3.1).Additionally,wereport:(i)theaccuracyoftheflowprediction(3.2)andtheflowweighting(3.3)mechanisms;(ii)thetriageresultsandthereportsgeneratedbyTRIFLOW(3.4);and(iii)theefficiencyofthetool(3.5
FeatureExtrac+on
AppDataset
FlowIden+fica+on
ModelEs+ma+on
ScoringApp
FeatureExtrac+on
Predictive model, Flow risk model
Feature vectors
Flows, App label
Feature vectors
score
Training
Triage
).In
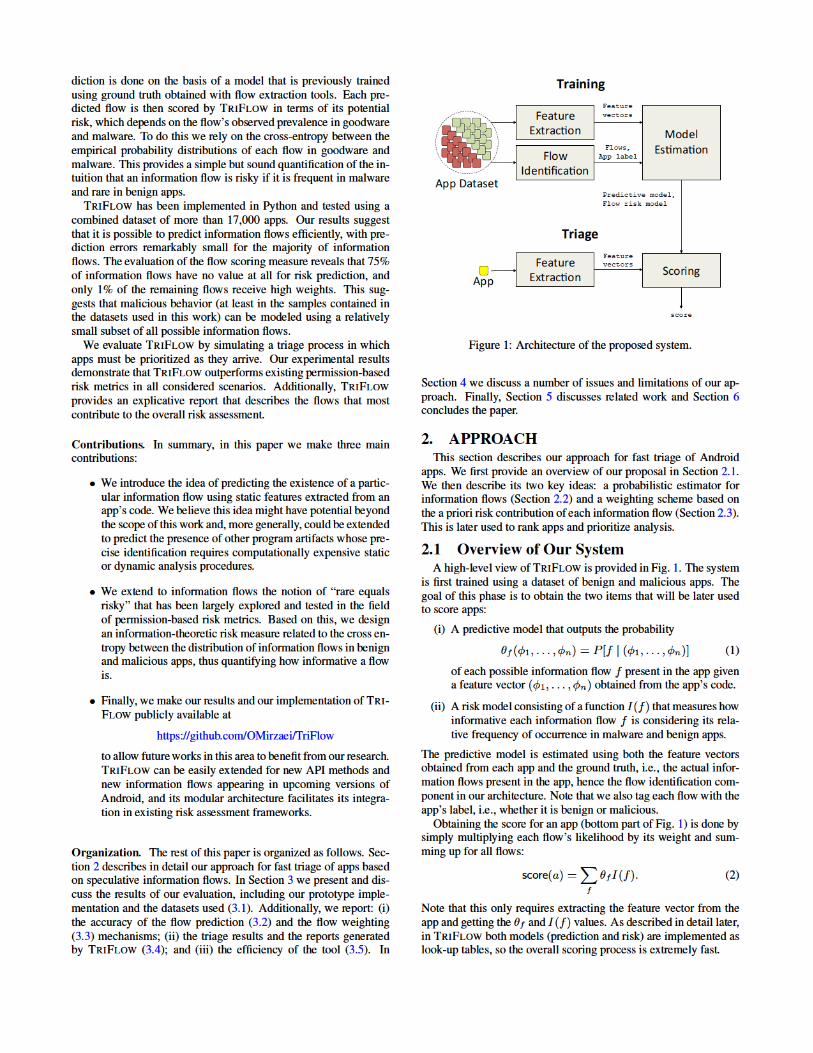
Figure1:Architectureoftheproposedsystem.
Section4wediscussanumberofissuesandlimitationsofourap-proach.Finally,Section5discussesrelatedworkandSection6concludesthepaper.
2. APPROACHThissectiondescribesourapproachforfasttriageofAndroid
apps. WefirstprovideanoverviewofourproposalinSection2.1.Wethendescribeitstwokeyideas:aprobabilisticestimatorforinformationflows(Section2.2)andaweightingschemebasedontheaprioririskcontributionofeachinformationflow(Section2.3).Thisislaterusedtorankappsandprioritizeanalysis.
2.1 OverviewofOurSystemAhigh-levelviewofTRIFLOWisprovidedinFig.1.Thesystem
isfirsttrainedusingadatasetofbenignandmaliciousapps.Thegoalofthisphaseistoobtainthetwoitemsthatwillbelaterusedtoscoreapps:
(i)Apredictivemodelthatoutputstheprobability
θf(φ1,...,φn)=P[f|(φ1,...,φn)] (1)
ofeachpossibleinformationflowfpresentintheappgivenafeaturevector(φ1,...,φn)obtainedfromtheapp’scode.
(ii)AriskmodelconsistingofafunctionI(f)thatmeasureshowinformativeeachinformationflowfisconsideringitsrela-tivefrequencyofoccurrenceinmalwareandbenignapps.
Thepredictivemodelisestimatedusingboththefeaturevectorsobtainedfromeachappandthegroundtruth,i.e.,theactualinfor-mationflowspresentintheapp,hencetheflowidentificationcom-ponentinourarchitecture.Notethatwealsotageachflowwiththeapp’slabel,i.e.,whetheritisbenignormalicious.Obtainingthescoreforanapp(bottompartofFig.1)isdoneby
simplymultiplyingeachflow’slikelihoodbyitsweightandsum-mingupforallflows:
score(a)=f
θfI(f). (2)
NotethatthisonlyrequiresextractingthefeaturevectorfromtheappandgettingtheθfandI(f)values.Asdescribedindetaillater,inTRIFLOWbothmodels(predictionandrisk)areimplementedaslook-uptables,sotheoverallscoringprocessisextremelyfast.
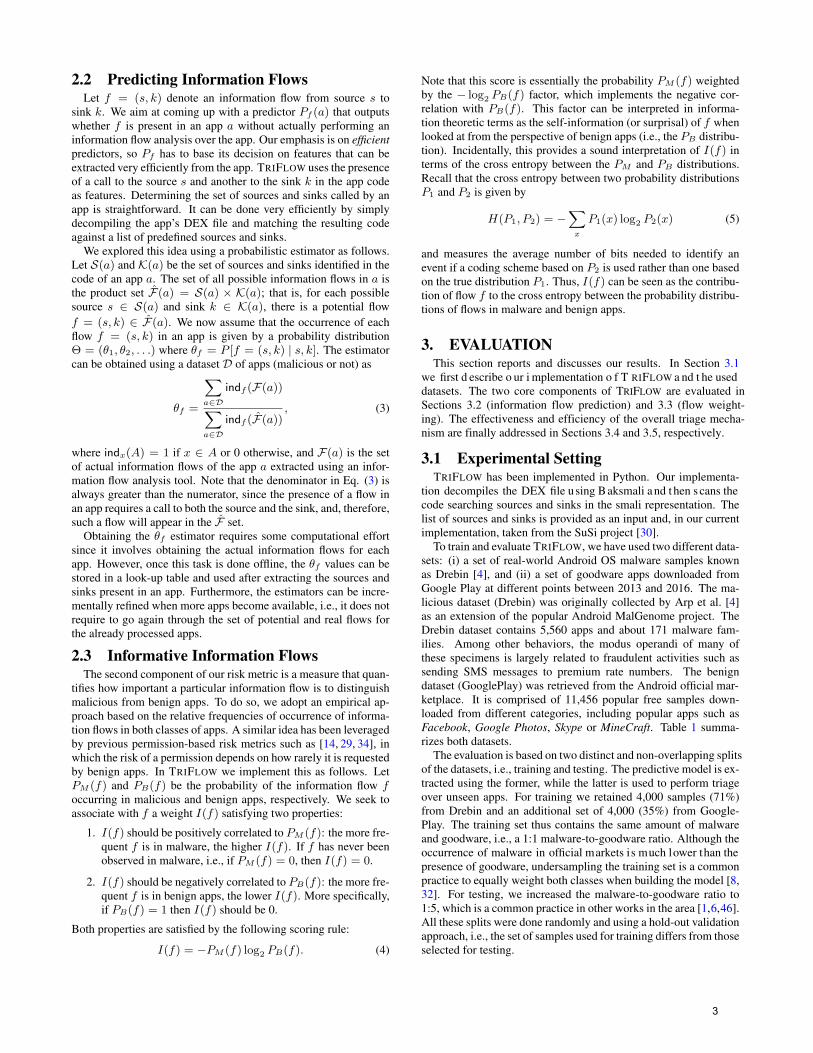
2.2 Predicting Information FlowsLet f = (s, k) denote an information flow from source s to
sink k. We aim at coming up with a predictor Pf (a) that outputswhether f is present in an app a without actually performing aninformation flow analysis over the app. Our emphasis is on efficientpredictors, so Pf has to base its decision on features that can beextracted very efficiently from the app. TRIFLOW uses the presenceof a call to the source s and another to the sink k in the app codeas features. Determining the set of sources and sinks called by anapp is straightforward. It can be done very efficiently by simplydecompiling the app’s DEX file and matching the resulting codeagainst a list of predefined sources and sinks.
We explored this idea using a probabilistic estimator as follows.Let S(a) and K(a) be the set of sources and sinks identified in thecode of an app a. The set of all possible information flows in a isthe product set F̂(a) = S(a) × K(a); that is, for each possiblesource s ∈ S(a) and sink k ∈ K(a), there is a potential flowf = (s, k) ∈ F̂(a). We now assume that the occurrence of eachflow f = (s, k) in an app is given by a probability distributionΘ = (θ1, θ2, . . .) where θf = P [f = (s, k) | s, k]. The estimatorcan be obtained using a dataset D of apps (malicious or not) as
θf =
∑a∈D
indf (F(a))∑a∈D
indf (F̂(a)), (3)
where indx(A) = 1 if x ∈ A or 0 otherwise, and F(a) is the setof actual information flows of the app a extracted using an infor-mation flow analysis tool. Note that the denominator in Eq. (3) isalways greater than the numerator, since the presence of a flow inan app requires a call to both the source and the sink, and, therefore,such a flow will appear in the F̂ set.
Obtaining the θf estimator requires some computational effortsince it involves obtaining the actual information flows for eachapp. However, once this task is done offline, the θf values can bestored in a look-up table and used after extracting the sources andsinks present in an app. Furthermore, the estimators can be incre-mentally refined when more apps become available, i.e., it does notrequire to go again through the set of potential and real flows forthe already processed apps.
2.3 Informative Information FlowsThe second component of our risk metric is a measure that quan-
tifies how important a particular information flow is to distinguishmalicious from benign apps. To do so, we adopt an empirical ap-proach based on the relative frequencies of occurrence of informa-tion flows in both classes of apps. A similar idea has been leveragedby previous permission-based risk metrics such as [14, 29, 34], inwhich the risk of a permission depends on how rarely it is requestedby benign apps. In TRIFLOW we implement this as follows. LetPM (f) and PB(f) be the probability of the information flow foccurring in malicious and benign apps, respectively. We seek toassociate with f a weight I(f) satisfying two properties:
1. I(f) should be positively correlated to PM (f): the more fre-quent f is in malware, the higher I(f). If f has never beenobserved in malware, i.e., if PM (f) = 0, then I(f) = 0.
2. I(f) should be negatively correlated to PB(f): the more fre-quent f is in benign apps, the lower I(f). More specifically,if PB(f) = 1 then I(f) should be 0.
Both properties are satisfied by the following scoring rule:
I(f) = −PM (f) log2 PB(f). (4)
Note that this score is essentially the probability PM (f) weightedby the − log2 PB(f) factor, which implements the negative cor-relation with PB(f). This factor can be interpreted in informa-tion theoretic terms as the self-information (or surprisal) of f whenlooked at from the perspective of benign apps (i.e., the PB distribu-tion). Incidentally, this provides a sound interpretation of I(f) interms of the cross entropy between the PM and PB distributions.Recall that the cross entropy between two probability distributionsP1 and P2 is given by
H(P1, P2) = −∑x
P1(x) log2 P2(x) (5)
and measures the average number of bits needed to identify anevent if a coding scheme based on P2 is used rather than one basedon the true distribution P1. Thus, I(f) can be seen as the contribu-tion of flow f to the cross entropy between the probability distribu-tions of flows in malware and benign apps.
3. EVALUATIONThis section reports and discusses our results. In Section 3.1
we first d escribe o ur i mplementation o f T RIFLOW a nd t he used datasets. The two core components of TRIFLOW are evaluated in Sections 3.2 (information flow prediction) and 3.3 (flow weight-ing). The effectiveness and efficiency of the overall triage mecha-nism are finally addressed in Sections 3.4 and 3.5, respectively.
3.1 Experimental SettingTRIFLOW has been implemented in Python. Our implementa-
tion decompiles the DEX file using Baksmali and t hen scans the code searching sources and sinks in the smali representation. The list of sources and sinks is provided as an input and, in our current implementation, taken from the SuSi project [30].
To train and evaluate TRIFLOW, we have used two different data-sets: (i) a set of real-world Android OS malware samples known as Drebin [4], and (ii) a set of goodware apps downloaded from Google Play at different points between 2013 and 2016. The ma-licious dataset (Drebin) was originally collected by Arp et al. [4] as an extension of the popular Android MalGenome project. The Drebin dataset contains 5,560 apps and about 171 malware fam-ilies. Among other behaviors, the modus operandi of many of these specimens is largely related to fraudulent activities such as sending SMS messages to premium rate numbers. The benign dataset (GooglePlay) was retrieved from the Android official mar-ketplace. It is comprised of 11,456 popular free samples down-loaded from different categories, including popular apps such as Facebook, Google Photos, Skype or MineCraft. Table 1 summa-rizes both datasets.
The evaluation is based on two distinct and non-overlapping splits of the datasets, i.e., training and testing. The predictive model is ex-tracted using the former, while the latter is used to perform triage over unseen apps. For training we retained 4,000 samples (71%) from Drebin and an additional set of 4,000 (35%) from Google-Play. The training set thus contains the same amount of malware and goodware, i.e., a 1:1 malware-to-goodware ratio. Although the occurrence of malware in official markets is much lower than the presence of goodware, undersampling the training set is a common practice to equally weight both classes when building the model [8, 32]. For testing, we increased the malware-to-goodware ratio to 1:5, which is a common practice in other works in the area [1,6,46]. All these splits were done randomly and using a hold-out validation approach, i.e., the set of samples used for training differs from those selected for testing.
3
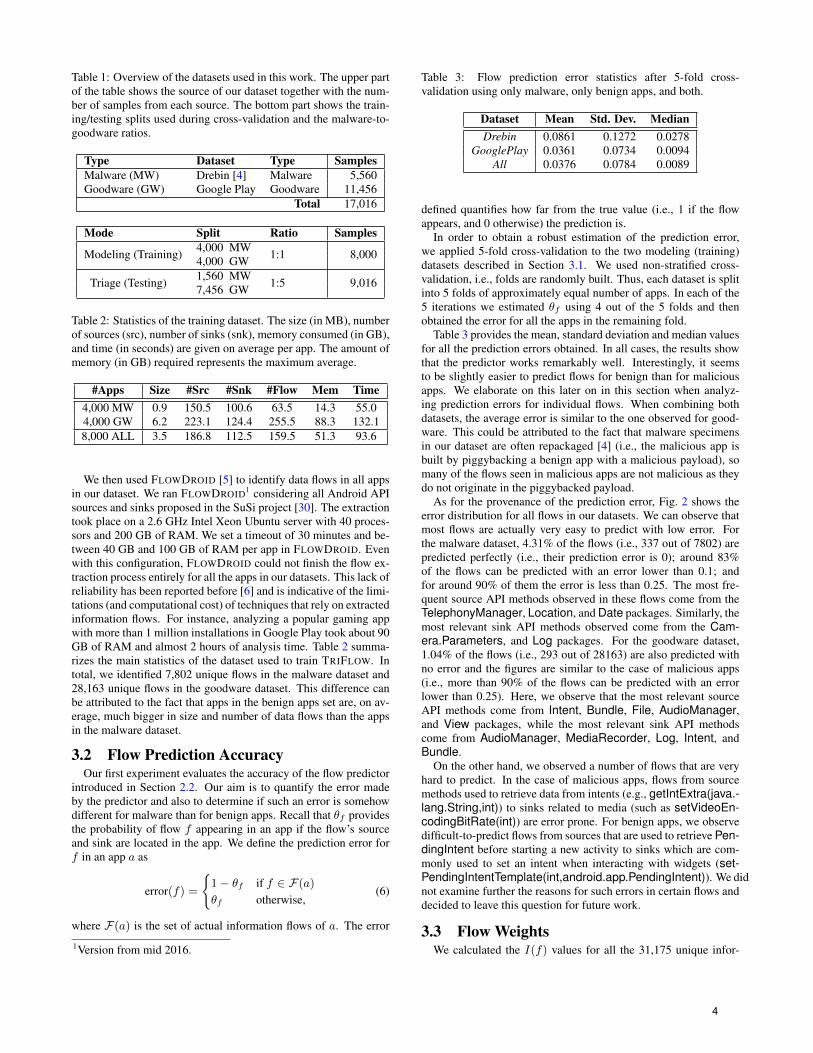
Table 1: Overview of the datasets used in this work. The upper partof the table shows the source of our dataset together with the num-ber of samples from each source. The bottom part shows the train-ing/testing splits used during cross-validation and the malware-to-goodware ratios.
Type Dataset Type SamplesMalware (MW) Drebin [4] Malware 5,560Goodware (GW) Google Play Goodware 11,456
Total 17,016
Mode Split Ratio Samples
Modeling (Training) 4,000 MW 1:1 8,0004,000 GW
Triage (Testing) 1,560 MW 1:5 9,0167,456 GW
Table 2: Statistics of the training dataset. The size (in MB), numberof sources (src), number of sinks (snk), memory consumed (in GB),and time (in seconds) are given on average per app. The amount ofmemory (in GB) required represents the maximum average.
#Apps Size #Src #Snk #Flow Mem Time4,000 MW 0.9 150.5 100.6 63.5 14.3 55.04,000 GW 6.2 223.1 124.4 255.5 88.3 132.18,000 ALL 3.5 186.8 112.5 159.5 51.3 93.6
We then used FLOWDROID [5] to identify data flows in all appsin our dataset. We ran FLOWDROID1 considering all Android APIsources and sinks proposed in the SuSi project [30]. The extractiontook place on a 2.6 GHz Intel Xeon Ubuntu server with 40 proces-sors and 200 GB of RAM. We set a timeout of 30 minutes and be-tween 40 GB and 100 GB of RAM per app in FLOWDROID. Evenwith this configuration, FLOWDROID could not finish the flow ex-traction process entirely for all the apps in our datasets. This lack ofreliability has been reported before [6] and is indicative of the limi-tations (and computational cost) of techniques that rely on extractedinformation flows. For instance, analyzing a popular gaming appwith more than 1 million installations in Google Play took about 90GB of RAM and almost 2 hours of analysis time. Table 2 summa-rizes the main statistics of the dataset used to train TRIFLOW. Intotal, we identified 7,802 unique flows in the malware dataset and28,163 unique flows in the goodware dataset. This difference canbe attributed to the fact that apps in the benign apps set are, on av-erage, much bigger in size and number of data flows than the appsin the malware dataset.
3.2 Flow Prediction AccuracyOur first experiment evaluates the accuracy of the flow predictor
introduced in Section 2.2. Our aim is to quantify the error madeby the predictor and also to determine if such an error is somehowdifferent for malware than for benign apps. Recall that θf providesthe probability of flow f appearing in an app if the flow’s sourceand sink are located in the app. We define the prediction error forf in an app a as
error(f) =
{1− θf if f ∈ F(a)
θf otherwise,(6)
where F(a) is the set of actual information flows of a. The error
1Version from mid 2016.
Table 3: Flow prediction error statistics after 5-fold cross-validation using only malware, only benign apps, and both.
Dataset Mean Std. Dev. MedianDrebin 0.0861 0.1272 0.0278
GooglePlay 0.0361 0.0734 0.0094All 0.0376 0.0784 0.0089
defined quantifies how far from the true value (i.e., 1 if the flowappears, and 0 otherwise) the prediction is.
In order to obtain a robust estimation of the prediction error,we applied 5-fold cross-validation to the two modeling (training)datasets described in Section 3.1. We used non-stratified cross-validation, i.e., folds are randomly built. Thus, each dataset is splitinto 5 folds of approximately equal number of apps. In each of the5 iterations we estimated θf using 4 out of the 5 folds and thenobtained the error for all the apps in the remaining fold.
Table 3 provides the mean, standard deviation and median valuesfor all the prediction errors obtained. In all cases, the results showthat the predictor works remarkably well. Interestingly, it seemsto be slightly easier to predict flows for benign than for maliciousapps. We elaborate on this later on in this section when analyz-ing prediction errors for individual flows. When combining bothdatasets, the average error is similar to the one observed for good-ware. This could be attributed to the fact that malware specimensin our dataset are often repackaged [4] (i.e., the malicious app isbuilt by piggybacking a benign app with a malicious payload), somany of the flows seen in malicious apps are not malicious as theydo not originate in the piggybacked payload.
As for the provenance of the prediction error, Fig. 2 shows theerror distribution for all flows in our datasets. We can observe thatmost flows are actually very easy to predict with low error. Forthe malware dataset, 4.31% of the flows (i.e., 337 out of 7802) arepredicted perfectly (i.e., their prediction error is 0); around 83%of the flows can be predicted with an error lower than 0.1; andfor around 90% of them the error is less than 0.25. The most fre-quent source API methods observed in these flows come from theTelephonyManager, Location, and Date packages. Similarly, themost relevant sink API methods observed come from the Cam-era.Parameters, and Log packages. For the goodware dataset,1.04% of the flows (i.e., 293 out of 28163) are also predicted withno error and the figures are similar to the case of malicious apps(i.e., more than 90% of the flows can be predicted with an errorlower than 0.25). Here, we observe that the most relevant sourceAPI methods come from Intent, Bundle, File, AudioManager,and View packages, while the most relevant sink API methodscome from AudioManager, MediaRecorder, Log, Intent, andBundle.
On the other hand, we observed a number of flows that are veryhard to predict. In the case of malicious apps, flows from sourcemethods used to retrieve data from intents (e.g., getIntExtra(java.-lang.String,int)) to sinks related to media (such as setVideoEn-codingBitRate(int)) are error prone. For benign apps, we observedifficult-to-predict flows from sources that are used to retrieve Pen-dingIntent before starting a new activity to sinks which are com-monly used to set an intent when interacting with widgets (set-PendingIntentTemplate(int,android.app.PendingIntent)). We didnot examine further the reasons for such errors in certain flows anddecided to leave this question for future work.
3.3 Flow WeightsWe calculated the I(f) values for all the 31,175 unique infor-
4
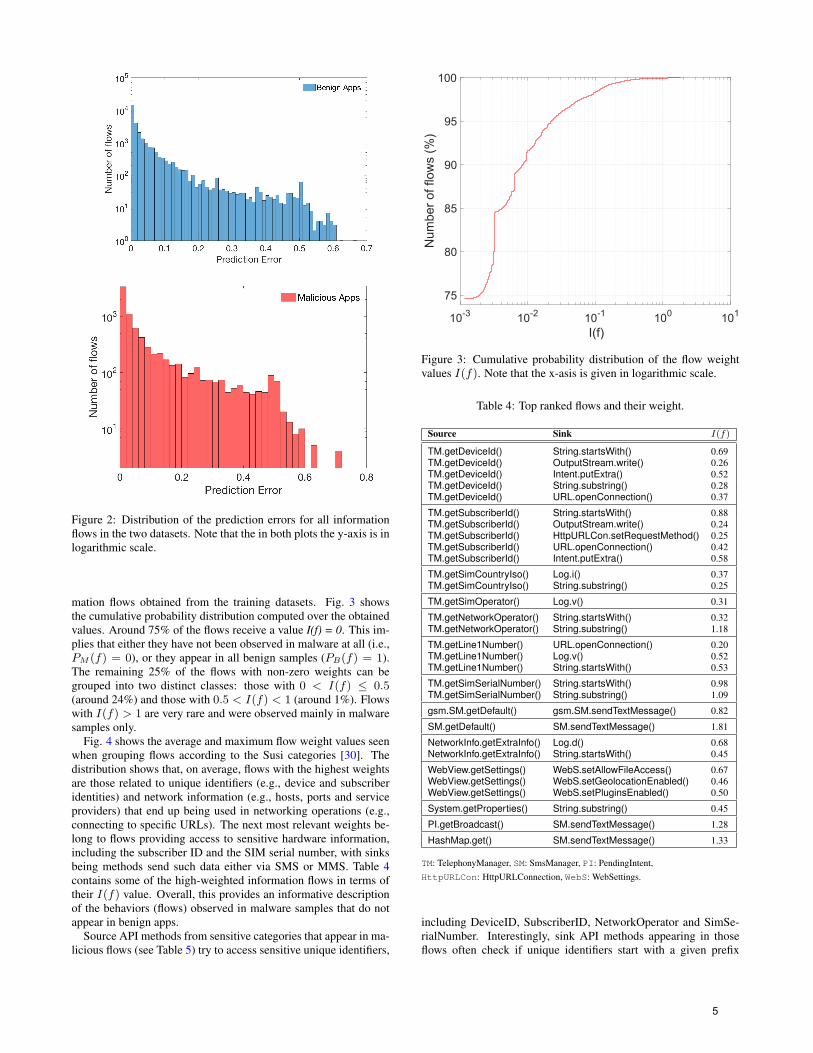
Figure 2: Distribution of the prediction errors for all informationflows in the two datasets. Note that the in both plots the y-axis is inlogarithmic scale.
mation flows obtained from the training datasets. Fig. 3 showsthe cumulative probability distribution computed over the obtainedvalues. Around 75% of the flows receive a value I(f) = 0. This im-plies that either they have not been observed in malware at all (i.e.,PM (f) = 0), or they appear in all benign samples (PB(f) = 1).The remaining 25% of the flows with non-zero weights can begrouped into two distinct classes: those with 0 < I(f) ≤ 0.5(around 24%) and those with 0.5 < I(f) < 1 (around 1%). Flowswith I(f) > 1 are very rare and were observed mainly in malwaresamples only.
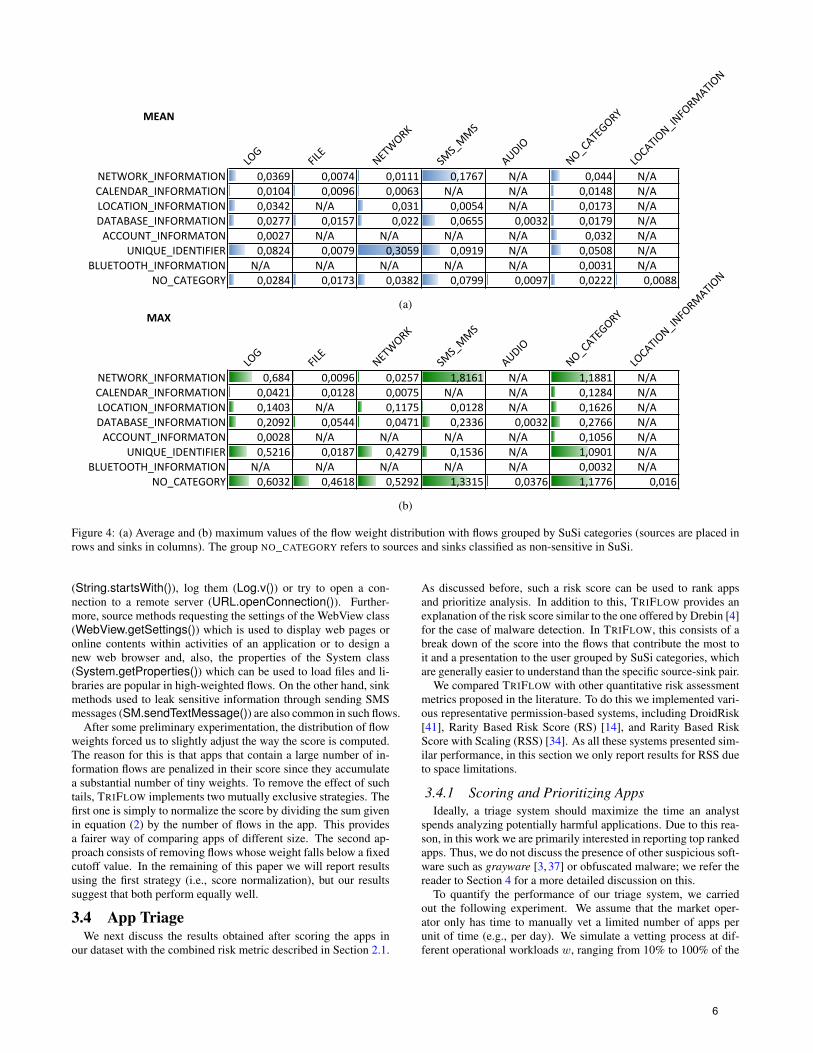
Fig. 4 shows the average and maximum flow weight values seenwhen grouping flows according to the Susi categories [30]. Thedistribution shows that, on average, flows with the highest weightsare those related to unique identifiers (e.g., device and subscriberidentities) and network information (e.g., hosts, ports and serviceproviders) that end up being used in networking operations (e.g.,connecting to specific URLs). The next most relevant weights be-long to flows providing access to sensitive hardware information,including the subscriber ID and the SIM serial number, with sinksbeing methods send such data either via SMS or MMS. Table 4contains some of the high-weighted information flows in terms oftheir I(f) value. Overall, this provides an informative descriptionof the behaviors (flows) observed in malware samples that do notappear in benign apps.
Source API methods from sensitive categories that appear in ma-licious flows (see Table 5) try to access sensitive unique identifiers,
10-3 10-2 10-1 100 101
I(f)
75
80
85
90
95
100
Num
ber o
f flo
ws
(%)
Figure 3: Cumulative probability distribution of the flow weightvalues I(f). Note that the x-asis is given in logarithmic scale.
Table 4: Top ranked flows and their weight.
Source Sink I(f)
TM.getDeviceId() String.startsWith() 0.69TM.getDeviceId() OutputStream.write() 0.26TM.getDeviceId() Intent.putExtra() 0.52TM.getDeviceId() String.substring() 0.28TM.getDeviceId() URL.openConnection() 0.37
TM.getSubscriberId() String.startsWith() 0.88TM.getSubscriberId() OutputStream.write() 0.24TM.getSubscriberId() HttpURLCon.setRequestMethod() 0.25TM.getSubscriberId() URL.openConnection() 0.42TM.getSubscriberId() Intent.putExtra() 0.58
TM.getSimCountryIso() Log.i() 0.37TM.getSimCountryIso() String.substring() 0.25
TM.getSimOperator() Log.v() 0.31
TM.getNetworkOperator() String.startsWith() 0.32TM.getNetworkOperator() String.substring() 1.18
TM.getLine1Number() URL.openConnection() 0.20TM.getLine1Number() Log.v() 0.52TM.getLine1Number() String.startsWith() 0.53
TM.getSimSerialNumber() String.startsWith() 0.98TM.getSimSerialNumber() String.substring() 1.09
gsm.SM.getDefault() gsm.SM.sendTextMessage() 0.82
SM.getDefault() SM.sendTextMessage() 1.81
NetworkInfo.getExtraInfo() Log.d() 0.68NetworkInfo.getExtraInfo() String.startsWith() 0.45
WebView.getSettings() WebS.setAllowFileAccess() 0.67WebView.getSettings() WebS.setGeolocationEnabled() 0.46WebView.getSettings() WebS.setPluginsEnabled() 0.50
System.getProperties() String.substring() 0.45
PI.getBroadcast() SM.sendTextMessage() 1.28
HashMap.get() SM.sendTextMessage() 1.33
TM: TelephonyManager, SM: SmsManager, PI: PendingIntent,HttpURLCon: HttpURLConnection, WebS: WebSettings.
including DeviceID, SubscriberID, NetworkOperator and SimSe-rialNumber. Interestingly, sink API methods appearing in thoseflows often check if unique identifiers start with a given prefix
5
MEAN
LOG
FILE
NETWORK
SMS_MM
S
AUDIO
NO_CATEGORY
LOCATION_INFORMATION
NETWORK_INFORMATION 0,0369 0,0074 0,0111 0,1767 N/A 0,044 N/ACALENDAR_INFORMATION 0,0104 0,0096 0,0063 N/A N/A 0,0148 N/ALOCATION_INFORMATION 0,0342 N/A 0,031 0,0054 N/A 0,0173 N/ADATABASE_INFORMATION 0,0277 0,0157 0,022 0,0655 0,0032 0,0179 N/AACCOUNT_INFORMATON 0,0027 N/A N/A N/A N/A 0,032 N/A
UNIQUE_IDENTIFIER 0,0824 0,0079 0,3059 0,0919 N/A 0,0508 N/ABLUETOOTH_INFORMATION N/A N/A N/A N/A N/A 0,0031 N/A
NO_CATEGORY 0,0284 0,0173 0,0382 0,0799 0,0097 0,0222 0,0088
(a)MAX
LOG
FILE
NETWORK
SMS_MM
S
AUDIO
NO_CATEGORY
LOCATION_INFORMATION
NETWORK_INFORMATION 0,684 0,0096 0,0257 1,8161 N/A 1,1881 N/ACALENDAR_INFORMATION 0,0421 0,0128 0,0075 N/A N/A 0,1284 N/ALOCATION_INFORMATION 0,1403 N/A 0,1175 0,0128 N/A 0,1626 N/ADATABASE_INFORMATION 0,2092 0,0544 0,0471 0,2336 0,0032 0,2766 N/AACCOUNT_INFORMATON 0,0028 N/A N/A N/A N/A 0,1056 N/A
UNIQUE_IDENTIFIER 0,5216 0,0187 0,4279 0,1536 N/A 1,0901 N/ABLUETOOTH_INFORMATION N/A N/A N/A N/A N/A 0,0032 N/A
NO_CATEGORY 0,6032 0,4618 0,5292 1,3315 0,0376 1,1776 0,016
(b)
Figure 4: (a) Average and (b) maximum values of the flow weight distribution with flows grouped by SuSi categories (sources are placed inrows and sinks in columns). The group NO_CATEGORY refers to sources and sinks classified as non-sensitive in SuSi.
(String.startsWith()), log them (Log.v()) or try to open a con-nection to a remote server (URL.openConnection()). Further-more, source methods requesting the settings of the WebView class(WebView.getSettings()) which is used to display web pages oronline contents within activities of an application or to design anew web browser and, also, the properties of the System class(System.getProperties()) which can be used to load files and li-braries are popular in high-weighted flows. On the other hand, sinkmethods used to leak sensitive information through sending SMSmessages (SM.sendTextMessage()) are also common in such flows.
After some preliminary experimentation, the distribution of flowweights forced us to slightly adjust the way the score is computed.The reason for this is that apps that contain a large number of in-formation flows are penalized in their score since they accumulatea substantial number of tiny weights. To remove the effect of suchtails, TRIFLOW implements two mutually exclusive strategies. Thefirst one is simply to normalize the score by dividing the sum givenin equation (2) by the number of flows in the app. This providesa fairer way of comparing apps of different size. The second ap-proach consists of removing flows whose weight falls below a fixedcutoff value. In the remaining of this paper we will report resultsusing the first strategy (i.e., score normalization), but our resultssuggest that both perform equally well.
3.4 App TriageWe next discuss the results obtained after scoring the apps in
our dataset with the combined risk metric described in Section 2.1.
As discussed before, such a risk score can be used to rank appsand prioritize analysis. In addition to this, TRIFLOW provides anexplanation of the risk score similar to the one offered by Drebin [4]for the case of malware detection. In TRIFLOW, this consists of abreak down of the score into the flows that contribute the most toit and a presentation to the user grouped by SuSi categories, whichare generally easier to understand than the specific source-sink pair.
We compared TRIFLOW with other quantitative risk assessmentmetrics proposed in the literature. To do this we implemented vari-ous representative permission-based systems, including DroidRisk[41], Rarity Based Risk Score (RS) [14], and Rarity Based RiskScore with Scaling (RSS) [34]. As all these systems presented sim-ilar performance, in this section we only report results for RSS dueto space limitations.
3.4.1 Scoring and Prioritizing AppsIdeally, a triage system should maximize the time an analyst
spends analyzing potentially harmful applications. Due to this rea-son, in this work we are primarily interested in reporting top rankedapps. Thus, we do not discuss the presence of other suspicious soft-ware such as grayware [3, 37] or obfuscated malware; we refer thereader to Section 4 for a more detailed discussion on this.
To quantify the performance of our triage system, we carriedout the following experiment. We assume that the market oper-ator only has time to manually vet a limited number of apps perunit of time (e.g., per day). We simulate a vetting process at dif-ferent operational workloads w, ranging from 10% to 100% of the
6

Table 5: Most relevant sources and sinks from sensitive categories.
Source Categories Sink CategoriesNETWORK_INFORMATION UNIQUE_IDENTIFIER DATABASE_INFORMATION LOG FILE NETWORK SMS_MMS
getSerialNumber() getDeviceId() getConnectionId() v() write() openConnection() sendTextMessage()getSubscriberId() getSimSerialNumber() query() w() dump() setWifiApEnabled() sendPdu()getSimCountryIso() getLine1Number() getSyncState() e() bind() selectNetwork() recordSound()getNetworkCountryIso() getSubscriberId() getColumnNames() d() setFileInput() disableNetwork() sendData()getNetworkOperator() getNumber() getColumnCount() i() openFileInput() setSerialNumber() sendDataMessage()getAllMessagesFromSim() getIccSerialNumber() getColumnIndex() openFolder() openFileOutput() setCountryCode() setPremiumSmsPermission()getWifiState() getPhoneName() startListening() openDownloadedFile() setNetworkPolicies() dispatchMessage()getHost() getServiceProviderName() storeFile() sendto() setMobileDataEnabled() append()getRemotePort() getVoiceMailNumber() install() readTextFile() setBandwidth() disableCellBroadcast()getRemoteAddress() getAddress() notify() sendfile() setHostname() moveMessageToFolder()getLinkAddress() setUserName() setOption() setDeviceName() setTextVisibility()getNetworkPolicies() checkRead() registerListener()getDefault() checkWrite() setScanMode()getCellIdentity() processMessage()getLatitude() setAuthUserName()getLongitude() writeToParcel()getInstalledApplications()getAllPermissionGroups()
10 20 30 40 50 60 70 80 90 100
020
4060
8010
0
Mal
war
e (%
)
Samples (%)(a) RSS (Sarma et al. [34]).
10 20 30 40 50 60 70 80 90 100
020
4060
8010
0
Mal
war
e (%
)
Samples (%)(b) TRIFLOW.
Figure 5: Results of the triage evaluation. Each plot shows the distribution of the fraction of malware correctly prioritized (y-axis) when amarket operator can only afford to analyze w% of the samples (x-asis) at each time interval (e.g., daily-basis). Results are given for both RSS(left) and TRIFLOW (right). The red arrows within each plot represent the gain achieved by each scoring system with respect to a randomprioritization policy.
analyzed samples. More precisely, we assume that the operatorreceives batches ofN samples per minute and their analysts are ca-pable of processing 10%, 20%, . . ., 100% of them. This constitutesa realistic scenario as some market operators can be more agile thanothers. The same applies to antivirus vendors. For instance, out ofthe 310,000 new samples received every day, Kaspersky Labs onlyprocesses 1% manually (2 per minute)2. For our experiments we setN = 10, though the particular value is irrelevant for our analysisas it only constitutes a scale factor.
For each workload, we prepare a batch of samples containingrandomly chosen samples from the joint goodware and malwaredatasets (recall that the malware-to-goodware ratio for testint is 1:5,so on average there will be 5 times more goodware than malwarein each batch). Each sample in the batch is then scored and the top
2http://apt.securelist.com
w% ranked samples are given to the analyst for a deeper analysis.We measure how many samples (in %) in that final block of samplespassed on to the analyst are malware. We repeated this process 900times, obtaining one percentage each time. For each workload w,the distribution of values is given in the boxplots shown in Fig. 5.We repeated the process for both TRIFLOW and RSS [34]. Wealso compared how both systems behave against a random orderingof the batch of samples. The square (�) symbol in each plot ofFig. 5 denotes the average ratio of malware samples given to thehuman analyst after using a random prioritization policy, while thediamond (�) symbol denotes the value given by the triage system.The red arrow joining them represents the difference between bothnumbers, i.e., the time saved after triaging the batch.
Our results show that in all cases TRIFLOW can prioritize moremalware samples per batch (see upper quartiles in Figure 5b) thanRSS for every single workload value. Although not shown in the
7

App: 4735ba2dfbdbb0f1e9a286da83155760c77dcce1bea9c4032ffd39792b251898.apkScore = 2.78e-05Score contributions:
1 [81.81 %] UNIQUE_IDENTIFIER -> LOG[ 0.03 %] 1.1 TelephonyManager.getDeviceId() -> Log.w()[ 0.05 %] 1.2 TelephonyManager.getSimSerialNumber() -> Log.w()[ 0.04 %] 1.3 TelephonyManager.getSubscriberId() -> Log.w()...
2 [ 6.95 %] UNIQUE_IDENTIFIER -> SMS_MMS[ 6.95 %] 2.1 TelephonyManager.getSimSerialNumber() -> SmsManager.sendTextMessage()
3 [ 2.19 %] NETWORK_INFORMATION -> LOG...
Figure 6: Snippet of a TRIFLOW report for a malware app belonging to the Plankton family.
paper, the results for DroidRisk [41] and RS [14] are similar. Re-markably, our approach performs better than RSS when the op-erators are overwhelmed. For example, TRIFLOW performs un-der a workload of 30% equally than RSS under a workload of 70%. Thus, the absolute number of malware samples analyzed after triage is 83% with RSS and 92% with TRIFLOW. When analyzing the overall improvement reported after a random triage (denotedwith � symbol), we can observe that TRIFLOW not only improves on average with respect to RSS, but also with respect to the mostchallenging cases (note that the distance between � and the lower quartiles is notably larger in TRIFLOW). The same conclusions can be obtained by looking at the lower whiskers (worst cases without considering outliers), where a random triage perform surprisingly better than RSS for workloads from 10% to 60%.
3.4.2 Explaining the ScoreTRIFLOW provides an informative break down of the score of an
app in terms of each contributing information flow. This helps the analyst to understand why an app receives a particular score and how much each potential flow within the app contributes to i t. The report is generated by sorting the flows predicted in the app in de-scending order of their I(f) values and then computing how much (in %) they contribute to the total score. Fig. 6 shows an excerpt of a report describing a malware leaking sensitive information via SMS.
3.5 EfficiencyWe now discuss the efficiency of TRIFLOW measured as the time
required to obtain the score for an app. The scoring process has two main steps: extracting the sources and sinks of the app to con-struct the set F̂ of possible information flows, and then computing the score by adding up the product θf I(f) for each flow f ∈ F̂ . The first s tep r equires i dentifying a ll e xisting s ources a nd sinks, whereas the second depends on the size of F̂ , i.e., the number of sources times the number of sinks in the app. Fig. 7 shows both quantities for all the apps in our datasets (GooglePlay and Drebin). We consistently observe approximately twice the number of sources than sinks in each app, with an average of 290.10 and 176.81, respectively. The average size, measured as the number of potential flows, is 77,187.
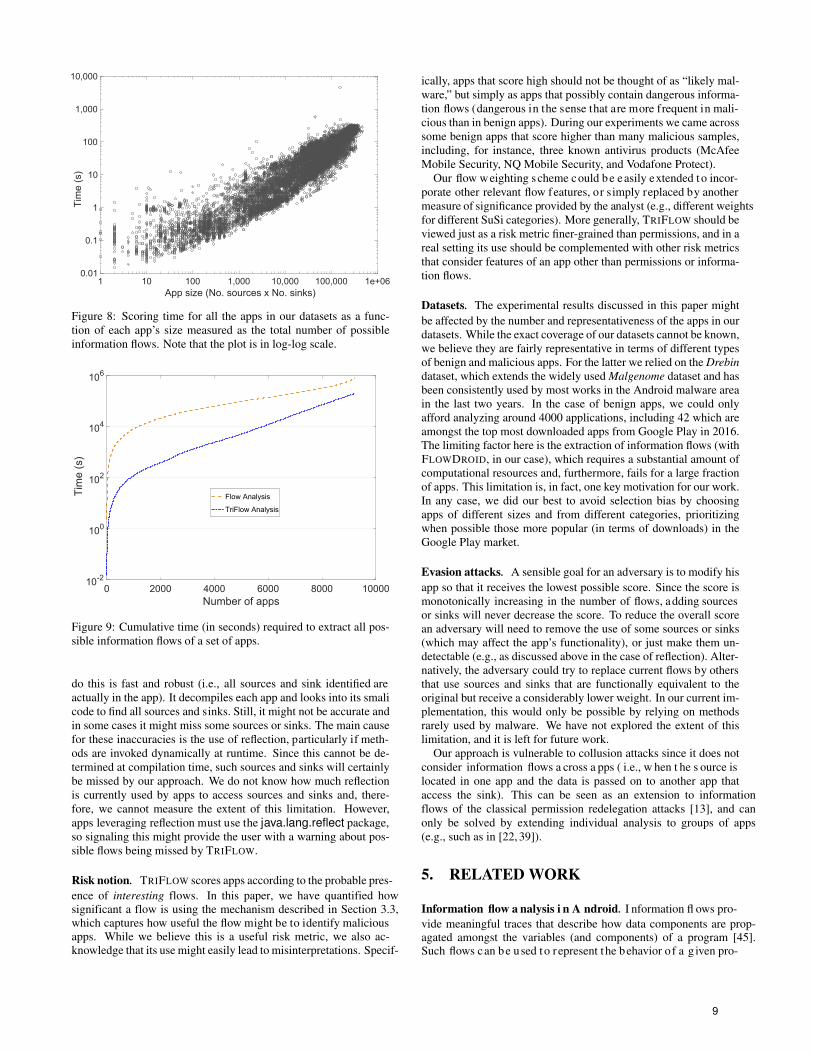
Fig. 8 shows the overall time required to obtain the score for each app as a function of its number of potential flows. On aver-age it takes 56 seconds to triage the entire app. The minimum and maximum scoring time for an app in our dataset is 0.01 seconds and 76.63 minutes, respectively. Approximately 50% of the apps require less than 31 s; 80% of the apps require less than 103 s; and
0 200 400 600 800 1000 1200Number of sources per app
0
100
200
300
400
500
600
Num
ber o
f sin
ks p
er a
pp
Figure 7: Number of sources vs number of sinks for all the apps in our datasets.
90% of the apps require less than 155 s. On average, TRIFLOW re-quires 2.3 ms per potential flow in the app. Execution times are not constant for a given size because not all potential flows will have a non-null probability of occurrence. The higher the number of flows with θf > 0, the higher the number of risk terms that have to be added to the total score. This process is largely non-optimized in our prototype, hence the substantial variability observed in Fig. 8.
When processing a large dataset of apps, most of the computa-tion time goes to the extraction of the information flows. Fig. 9 shows the comparison between the time taken by our approach and FlowDroid. We can observe that FlowDroid is computationally more intensive than TRIFLOW. In particular, we observe an im-provement of about two orders of magnitude for smaller set of apps and about one order of magnitude for larger sets. This is a natural advantage of using a probabilistic predictor with respect to a precise tainting analysis, though it should only be used as an estimation for fast risk analysis.
4. DISCUSSIONWe next discuss a number of potential limitations of our ap-
proach related to its accuracy, the underlying risk notion, the va-lidity of our results, and attacks against the scoring system.
Accuracy. A crucial step in TRIFLOW is the accurate identifica-tion of the sources and sinks present in an app. Our approach to
8
1 10 100 1,000 10,000 100,000 1e+06App size (No. sources x No. sinks)
0.01
0.1
1
10
100
1,000
10,000Ti
me
(s)
Figure 8: Scoring time for all the apps in our datasets as a func-tion of each app’s size measured as the total number of possibleinformation flows. Note that the plot is in log-log scale.
0 2000 4000 6000 8000 10000Number of apps
10-2
100
102
104
106
Tim
e (s
)
Flow Analysis
TriFlow Analysis
Figure 9: Cumulative time (in seconds) required to extract all pos-sible information flows of a set of apps.
do this is fast and robust (i.e., all sources and sink identified are actually in the app). It decompiles each app and looks into its smali code to find all sources and sinks. Still, it might not be accurate and in some cases it might miss some sources or sinks. The main cause for these inaccuracies is the use of reflection, particularly if meth-ods are invoked dynamically at runtime. Since this cannot be de-termined at compilation time, such sources and sinks will certainly be missed by our approach. We do not know how much reflection is currently used by apps to access sources and sinks and, there-fore, we cannot measure the extent of this limitation. However, apps leveraging reflection must use the java.lang.reflect package, so signaling this might provide the user with a warning about pos-sible flows being missed by TRIFLOW.
Risk notion. TRIFLOW scores apps according to the probable pres-ence of interesting flows. In this paper, we have quantified how significant a flow is using the mechanism described in Section 3.3, which captures how useful the flow might be to identify malicious apps. While we believe this is a useful risk metric, we also ac-knowledge that its use might easily lead to misinterpretations. Specif-
ically, apps that score high should not be thought of as “likely mal-ware,” but simply as apps that possibly contain dangerous informa-tion flows (dangerous in the sense that are more frequent in mali-cious than in benign apps). During our experiments we came across some benign apps that score higher than many malicious samples, including, for instance, three known antivirus products (McAfee Mobile Security, NQ Mobile Security, and Vodafone Protect).
Our flow weighting scheme could be easily extended t o incor-porate other relevant flow features, or simply replaced by another measure of significance provided by the analyst (e.g., different weights for different SuSi categories). More generally, TRIFLOW should be viewed just as a risk metric finer-grained than permissions, and in a real setting its use should be complemented with other risk metrics that consider features of an app other than permissions or informa-tion flows.
Datasets. The experimental results discussed in this paper might be affected by the number and representativeness of the apps in our datasets. While the exact coverage of our datasets cannot be known, we believe they are fairly representative in terms of different types of benign and malicious apps. For the latter we relied on the Drebin dataset, which extends the widely used Malgenome dataset and has been consistently used by most works in the Android malware area in the last two years. In the case of benign apps, we could only afford analyzing around 4000 applications, including 42 which are amongst the top most downloaded apps from Google Play in 2016. The limiting factor here is the extraction of information flows (with FLOWDROID, in our case), which requires a substantial amount of computational resources and, furthermore, fails for a large fraction of apps. This limitation is, in fact, one key motivation for our work. In any case, we did our best to avoid selection bias by choosing apps of different sizes and from different categories, prioritizing when possible those more popular (in terms of downloads) in the Google Play market.
Evasion attacks. A sensible goal for an adversary is to modify his app so that it receives the lowest possible score. Since the score is monotonically increasing in the number of flows, adding sources or sinks will never decrease the score. To reduce the overall score an adversary will need to remove the use of some sources or sinks (which may affect the app’s functionality), or just make them un-detectable (e.g., as discussed above in the case of reflection). Alter-natively, the adversary could try to replace current flows by others that use sources and sinks that are functionally equivalent to the original but receive a considerably lower weight. In our current im-plementation, this would only be possible by relying on methods rarely used by malware. We have not explored the extent of this limitation, and it is left for future work.
Our approach is vulnerable to collusion attacks since it does not consider information flows a cross a pps ( i.e., w hen t he s ource is located in one app and the data is passed on to another app that access the sink). This can be seen as an extension to information flows of the classical permission redelegation attacks [13], and can only be solved by extending individual analysis to groups of apps (e.g., such as in [22, 39]).
5. RELATED WORK
Information flow a nalysis i n A ndroid. I nformation fl ows pro-vide meaningful traces that describe how data components are prop-agated amongst the variables (and components) of a program [45]. Such flows can be used to represent the behavior of a given pro-
9

gram, showing how and for what purpose programs are using spe-cific pieces of information [6]. Any information flow is character-ized by two main points defining the direction of the flow, known as the source and the sink. Sources are points within the program where sensitive data are obtained or stored in memory, while sinks are points where such data are leaked out of the program [44].
Unlike traditional desktop operating systems, apps in Android have their own life cycle and multiple execution entry points [19]. There are two types of information flows in Android applications. Explicit information flows analyze data-flow dependencies without considering the control-flow of the program. In contrast, implicit information flows analyze the control-flow dependencies between a source an a sink [31]. State-of-the-art analysis techniques (e.g. FlowDroid [5]) generally rely on explicit flows for two main rea-sons. First, implicit data flows can be tracked at a reasonable cost in most of the applications; and second, tracking such flows are unnecessary for many systems [31].
From another point of view, information flows are categorized as either inter-app or intra-app depending on the type of communi-cation. Inter-app communication, and, as a result, inter-app infor-mation flows are established between components of two different applications [9, 12]. On the opposite side, intra-app data flows are those established between different components of the same ap-plication [35]. In addition, information flows are usually tracked using—static or dynamic—taint analysis [21]. Static taint analysis aims at detecting privacy leaks before the execution of the appli-cation by constructing a control flow graph, while dynamic taint analysis tries to keep track of such leaks in run-time or in a cus-tomized execution environment [18].
There are several recent information flow analysis frameworks for Android (see Table 6). Static taint analysis tools such as Flow-Droid [5], DroidSafe [16], FlowMine [36], CHEX [24], LeakMiner [43], and AndroidLeaks [15] have a relatively low run-time over-head with respect to other information flow frameworks. However, suffer from some critical issues that cannot be overlooked. On the one hand, they are imprecise as they need to simulate run-time behaviors [5], and, as a result, suffer from a high false positive rate [6]. On the other hand, some of these frameworks do not scale well with the number of applications [16]. Finally, applications could use advanced obfuscation techniques to hinder the extraction of information flows (e.g., [38]).
Similar to our approach, authors in MUDFLOW [6] use infor-mation flow analysis to study how malicious and benign apps treat sensitive data. MUDFLOW is able to establish a profile based on sensitive flows that allows them to characterize potential risks that are typically observed in malware. Our system, in a way, is moti-vated by these findings and by the fact that flow extraction involves a non-negligible amount of resources. In this paper, instead of sim-ply analyzing the abnormal usage of sensitive information, we use speculative information flows to further triage Android apps.
Dynamic taint analysis systems such as TaintDroid [10] and Droid-Scope [42] generally compensate for the lack of precision of static tools. Hoowever, these frameworks inherit the limitations of dy-namic analysis systems, i.e., they may miss data flows from parts of the code not explicitly exercised [6,16]. Furthermore, apart from the fact that they impose a high run-time overhead [43], a malicious app could potentially fingerprint a given dynamic monitoring sys-tem to evade detection [5].
Tainting analysis frameworks are generally based on sensitive API calls tracking. Thus, it is paramount that this tracking consid-ers the way apps interact with the system services. In Android, this interaction is stateless. This means that the taint analysis system has to take into account the life-cycle of applications and model all
possible entry points and callbacks defined by the d eveloper. Fur-thermore, sensitive API calls can also be declared in a native library outside of the main Dalvik Executable (DEX) and should also be modeled. Table 6 summarizes the most relevant information flow analysis frameworks discussed in each of the aforementioned cat-egories together with the type of components modeled from the Android OS. Note that FlowDroid and DroidSafe are the only two static tainting frameworks that consider all modeling assumptions simultaneously.
Permission-based risk metrics for Android apps. The develop-ment of metrics and systems to assess risk in Android apps is an area that has received much attention in the last years. Works in this area have generally relied on metadata obtained from the app’s package, such as requested permissions, and from the market, in-cluding the number of downloads, number of views, or the devel-oper’s reputation. Permission-based risk scores have been by far the most commonly explored because of two key advantages: per-missions are relatively easy to understand by users and are com-patible with the risk communication mechanism currently used in Android. Furthermore, app developers can reduce risk by avoiding the use of unnecessary permissions [14].
One of the seminal works in this area is [11], in which the au-thors propose a system based on a number of rules that represent risky permissions to flag apps. More recent contributions intro-ducing permission-based risk metrics include DroidRanger [46], DroidRisk [41], MAST [7], WHYPER [28], RiskMon [20], MADAM [33], and the works of [27] and [23]. The risk metric proposed in DroidRisk [41] is based on the frequency and number of permis-sions an application request. In MAST [7], a risk signal is created based on the declared indicators of the app’ functionality, such as permissions, intent filters, and the presence of native code. The intuition behind this idea is that apps which are stronger in terms of finding relations between these indicators impose a higher mag-nitude of risk and, thus, should be flagged as malicious. WHY-PER [28] uses natural language processing techniques to reveal why an app may need a specific permission, paying attention to permissions’ purposes. MADAM [33] relies mainly on metadata from the market, including the developer’s reputation and market provenance. Finally, RiskMon and the work in [23] consider API traces as well, since some of them are critical and do not require any permissions. Finally, [14], [34], and [29] assign high risk scores to permissions or combination of permissions that are critical and rarely requested by the apps in the same category.
As permission-based metrics are based on metadata of the app obtained through static analysis, they can be imprecise and prone to errors. Other metrics have tried to overcome this by looking into features other than permissions. For instance, RiskRanker [17] in-troduces a risk signal based on root exploits, while [23] proposes a risk score considering static metadata, dynamic information from intents, components, network usage, and the app’s behavior (e.g., whether an app launches other apps). Finally, the majority of met-rics, except [20] and [27], do not take into account the security requirements or expectations of smartphone users. This is partic-ularly important in practice, since risk ultimately depends on each user’s preferences and execution context.
Our approach is complementary to most of these works. While we share the goal of quantifying risk, our primary focus is not on malware detection, but on prioritizing information flow analysis. Furthermore, our flow-based scoring mechanism can be easily in-tegrated with existing metrics based on other risk factors to provide a more comprehensive risk assessment.
10

Table 6: Information flow analysis tools for Android.
Tool Type Information Flows Modeling AssumptionsStatic Dynamic Explicit Implicit Callbacks Life-Cycle Native Code
FlowDroid [5] 3 3 3 3 3
DroidSafe [16] 3 3 3 3 3
CHEX [24] 3 3 3
LeakMiner [43] 3 3 3
AndroidLeaks [15] 3 3 3
TaintDroid [10] 3 3 3 3 3
DroidScope [42] 3 3 3 3 3
6. CONCLUSIONIn this paper, we designed and implemented a novel tool, called
TRIFLOW, that automatically scores Android apps based on a fore-cast of their information flows and their associated risk. Our ap-proach relies on a probabilistic model for information flows and ameasure of how significant each flow is. Both items are experimen-tally obtained from a dataset containing benign and malicious apps.After this training phase, the models are used by a fast mechanismto triage apps, thus providing a queuing discipline for the pool ofapps waiting for a precise information flow analysis.
Our experimental results suggest that TRIFLOW provides a sen-sible ordering based on the potential interest of the app. Given thehuge amount of computational resources demanded by informationflow analysis tools, we believe this could be very helpful to max-imize the expected utility when dealing with large pools of apps.Additionally, TRIFLOW could also be used as a standalone riskmetric for Android apps, providing a complementary perspectiveto alternative risk assessment approaches based on permissions andother static features. Finally, to encourage further research in thisarea, we make our results and implementation available online.
AcknowledgmentsThis work was supported by the MINECO grants TIN2013-46469-R and TIN2016-79095-C2-2-R, and by the CAM grant S2013/ICE-3095. The authors would like to thank the anonymous reviewers fortheir valuable comments.
7. REFERENCES[1] Y. Aafer, W. Du, and H. Yin. Droidapiminer: Mining
api-level features for robust malware detection in android. InInternational Conference on Security and Privacy inCommunication Systems, pages 86–103, 2013.
[2] Y. Acar, M. Backes, S. Bugiel, S. Fahl, P. D. McDaniel, andM. Smith. Sok: Lessons learned from android securityresearch for appified software platforms. In IEEE Symposiumon Security and Privacy, SP 2016, San Jose, CA, USA, May22-26, 2016, pages 433–451, 2016.
[3] B. Andow, A. Nadkarni, B. Bassett, W. Enck, and T. Xie. Astudy of grayware on google play. In 2016 IEEE Securityand Privacy Workshops, SP Workshops 2016, San Jose, CA,USA, May 22-26, 2016, pages 224–233, 2016.
[4] D. Arp, M. Spreitzenbarth, M. Hubner, H. Gascon, andK. Rieck. Drebin: Effective and explainable detection ofAndroid malware in your pocket. In Network and DistributedSystem Security Symposium (NDSS). 2014.
[5] S. Arzt, S. Rasthofer, C. Fritz, E. Bodden, A. Bartel, J. Klein,Y. Le Traon, D. Octeau, and P. McDaniel. Flowdroid: Precise
context, flow, field, object-sensitive and lifecycle-aware taintanalysis for android apps. In ACM SIGPLAN Notices,volume 49, pages 259–269, 2014.
[6] V. Avdiienko, K. Kuznetsov, A. Gorla, A. Zeller, S. Arzt,S. Rasthofer, and E. Bodden. Mining apps for abnormalusage of sensitive data. In IEEE Int. Conference on SoftwareEngineering (ICSE), volume 1, pages 426–436, 2015.
[7] S. Chakradeo, B. Reaves, P. Traynor, and W. Enck. Mast:Triage for market-scale mobile malware analysis. In SixthACM Conference on Security and Privacy in Wireless andMobile Networks, WiSec ’13, pages 13–24, 2013.
[8] W. Chen, D. Aspinall, A. D. Gordon, C. Sutton, andI. Muttik. More semantics more robust: Improving androidmalware classifiers. In 9th ACM Conference on Security &Privacy in Wireless and Mobile Networks, WiSec ’16, pages147–158, 2016.
[9] E. Chin, A. P. Felt, K. Greenwood, and D. Wagner.Analyzing inter-application communication in android. In9th international conference on Mobile systems,applications, and services, pages 239–252, 2011.
[10] W. Enck, P. Gilbert, S. Han, V. Tendulkar, B.-G. Chun, L. P.Cox, J. Jung, P. McDaniel, and A. N. Sheth. Taintdroid: aninformation-flow tracking system for realtime privacymonitoring on smartphones. ACM Transactions on ComputerSystems (TOCS), 32(2):5, 2014.
[11] W. Enck, M. Ongtang, and P. McDaniel. On lightweightmobile phone application certification. In 16th ACMConference on Computer and Communications Security,CCS ’09, pages 235–245, 2009.
[12] P. Faruki, S. Bhandari, V. Laxmi, M. Gaur, and M. Conti.Droidanalyst: Synergic app framework for static anddynamic app analysis. In Recent Advances in ComputationalIntelligence in Defense and Security, pages 519–552. 2016.
[13] A. P. Felt, H. J. Wang, A. Moshchuk, S. Hanna, and E. Chin.Permission re-delegation: Attacks and defenses. In USENIXSecurity Symposium, 2011.
[14] C. S. Gates, N. Li, H. Peng, B. P. Sarma, Y. Qi, R. Potharaju,C. Nita-Rotaru, and I. Molloy. Generating summary riskscores for mobile applications. IEEE Trans. Dependable Sec.Comput., 11(3):238–251, 2014.
[15] C. Gibler, J. Crussell, J. Erickson, and H. Chen.AndroidLeaks: automatically detecting potential privacyleaks in android applications on a large scale. 2012.
[16] M. I. Gordon, D. Kim, J. H. Perkins, L. Gilham, N. Nguyen,and M. C. Rinard. Information flow analysis of androidapplications in droidsafe. In NDSS, 2015.
[17] M. Grace, Y. Zhou, Q. Zhang, S. Zou, and X. Jiang.Riskranker: Scalable and accurate zero-day android malwaredetection. In 10th International Conference on Mobile
11

Systems, Applications, and Services, MobiSys ’12, pages281–294, 2012.
[18] W. Huang, Y. Dong, A. Milanova, and J. Dolby. Scalable andprecise taint analysis for android. In InternationalSymposium on Software Testing and Analysis, pages106–117, 2015.
[19] J.-w. Jang, H. Kang, J. Woo, A. Mohaisen, and H. K. Kim.Andro-dumpsys: anti-malware system based on thesimilarity of malware creator and malware centricinformation. Computers & Security, 2016.
[20] Y. Jing, G.-J. Ahn, Z. Zhao, and H. Hu. Riskmon:Continuous and automated risk assessment of mobileapplications. In 4th ACM Conference on Data andApplication Security and Privacy, CODASPY ’14, pages99–110, 2014.
[21] W. Klieber, L. Flynn, A. Bhosale, L. Jia, and L. Bauer.Android taint flow analysis for app sets. In 3rd ACMSIGPLAN International Workshop on the State of the Art inJava Program Analysis, pages 1–6, 2014.
[22] L. Li, A. Bartel, T. F. Bissyandé, J. Klein, and Y. L. Traon.Apkcombiner: Combining multiple android apps to supportinter-app analysis. In ICT Systems Security and PrivacyProtection: 30th IFIP TC 11 International Conference, SEC2015, Hamburg, Germany, May 26-28, 2015, Proceedings,pages 513–527, 2015.
[23] S. Li, T. Tryfonas, G. Russell, and P. Andriotis. Riskassessment for mobile systems through a multilayeredhierarchical bayesian network. IEEE Transactions onCybernetics, (99):1–11, 2016.
[24] L. Lu, Z. Li, Z. Wu, W. Lee, and G. Jiang. Chex: staticallyvetting android apps for component hijacking vulnerabilities.In ACM conference on Computer and communicationssecurity, pages 229–240, 2012.
[25] E. Mariconti, L. Onwuzurike, P. Andriotis, E. De Cristofaro,G. Ross, and G. Stringhini. Mamadroid: Detecting androidmalware by building markov chains of behavioral models. InThe Network and Distributed System Security Symposium(NDSS), 2017.
[26] McAfee. Threats report. Technical report, McAfee, 2016.[27] A. Mylonas, M. Theoharidou, and D. Gritzalis. Assessing
privacy risks in android: A user-centric approach. In RiskAssessment and Risk-Driven Testing, pages 21–37. 2013.
[28] R. Pandita, X. Xiao, W. Yang, W. Enck, and T. Xie. Whyper:Towards automating risk assessment of mobile applications.In USENIX Security, volume 13, 2013.
[29] H. Peng, C. Gates, B. Sarma, N. Li, Y. Qi, R. Potharaju,C. Nita-Rotaru, and I. Molloy. Using probabilistic generativemodels for ranking risks of android apps. In ACMConference on Computer and Communications Security,CCS ’12, pages 241–252, 2012.
[30] S. Rasthofer, S. Arzt, and E. Bodden. A machine-learningapproach for classifying and categorizing android sourcesand sinks. In 2014 Network and Distributed System SecuritySymposium (NDSS), 2014.
[31] A. Razeen, V. Pistol, A. Meijer, and L. P. Cox. Betterperformance through thread-local emulation. In 17thInternational Workshop on Mobile Computing Systems andApplications, pages 87–92, 2016.
[32] S. Roy, J. DeLoach, Y. Li, N. Herndon, D. Caragea, X. Ou,V. P. Ranganath, H. Li, and N. Guevara. Experimental studywith real-world data for android app security analysis using
machine learning. In 31st Annual Computer SecurityApplications Conference, pages 81–90, 2015.
[33] A. Saracino, D. Sgandurra, G. Dini, and F. Martinelli.Madam: Effective and efficient behavior-based androidmalware detection and prevention. IEEE Transactions onDependable and Secure Computing, (99), 2016.
[34] B. P. Sarma, N. Li, C. Gates, R. Potharaju, C. Nita-Rotaru,and I. Molloy. Android permissions: A perspectivecombining risks and benefits. In 17th ACM Symposium onAccess Control Models and Technologies, SACMAT ’12,pages 13–22, 2012.
[35] R. Schuster and E. Tromer. Droiddisintegrator:Intra-application information flow control in android apps. In11th ACM Asia Conference on Computer andCommunications Security, 2016.
[36] L. Sinha, S. Bhandari, P. Faruki, M. S. Gaur, V. Laxmi, andM. Conti. Flowmine: Android app analysis via data flow. In2016 13th IEEE Annual Consumer Communications &Networking Conference (CCNC), pages 435–441, 2016.
[37] G. Suarez-Tangil, J. E. Tapiador, P. Peris, and A. Ribagorda.Evolution, detection and analysis of malware for smartdevices. IEEE Communications Surveys & Tutorials,16(2):961–987, May 2014.
[38] G. Suarez-Tangil, J. E. Tapiador, and P. Peris-Lopez.Stegomalware: Playing hide and seek with maliciouscomponents in smartphone apps. In 10th InternationalConference on Information Security and Cryptology(Inscrypt), pages 496–515, 2014.
[39] G. Suarez-Tangil, J. E. Tapiador, and P. Peris-Lopez.Compartmentation policies for android apps: Acombinatorial optimization approach. In Int. Conf. Networkand System Security (NSS), pages 63–77, 2015.
[40] Symantec. Internet security threat report. Technical report,Symantec, 2016.
[41] Y. Wang, J. Zheng, C. Sun, and S. Mukkamala. Quantitativesecurity risk assessment of android permissions andapplications. In Data and Applications Security and Privacy,pages 226–241, 2013.
[42] L. K. Yan and H. Yin. Droidscope: seamlessly reconstructingthe os and dalvik semantic views for dynamic androidmalware analysis. In 21st USENIX Security Symposium(USENIX Security 12), pages 569–584, 2012.
[43] Z. Yang and M. Yang. Leakminer: Detect informationleakage on android with static taint analysis. In SoftwareEngineering (WCSE), pages 101–104, 2012.
[44] M.-K. Yoon, N. Salajegheh, Y. Chen, and M. Christodorescu.Pift: Predictive information-flow tracking. In 21stInternational Conference on Architectural Support forProgramming Languages and Operating Systems, pages713–725, 2016.
[45] W. You, B. Liang, J. Li, W. Shi, and X. Zhang. Androidimplicit information flow demystified. In 10th ACMSymposium on Information, Computer and CommunicationsSecurity, pages 585–590, 2015.
[46] Y. Zhou, Z. Wang, W. Zhou, and X. Jiang. Hey, you, get offof my market: Detecting malicious apps in official andalternative android markets. In NDSS, 2012.
12