Levels and Trends of Maternal and Child Health Indicators in ...
Upload
khangminh22Category
view
3download
0
Trends in and Factors Associated with Maternaland Child Health Indicators in Mali
DHS Further Analysis Reports No. 131
April 2020
This publication was produced for review by the United States Agency for International Development. It was prepared by Shireen Assaf, Lwendo Moonzwe Davis, Ahamadou Diallo, and Amadou Kone.
Further Analysis of the Mali Demographic and Health Surveys2006-2018

DHS Further Analysis Reports No. 131
Trends in and Factors Associated with Maternal and Child Health Indicators in Mali:
Further Analysis of the Mali Demographic and Health Surveys 2006-2018
Shireen Assaf 1,2 Lwendo Moonzwe Davis1
Ahamadou Diallo3 Amadou Kone3
ICF Rockville, Maryland, USA
April 2020
1 ICF 2 The DHS Program
3 Institut National de la Statistique (INSTAT)
Corresponding author: Shireen Assaf, International Health and Development, ICF, 530 Gaither Road, Suite 500, Rockville, MD 20850, USA; phone: 301-407-6500; fax: 301-407-6501; email: [email protected]
Acknowledgments: The authors wish to thank Lindsay Mallick for her comments on the report.
Editor: Diane Stoy Document Production: Joan Wardell
This research is implemented with support from the United States Agency for International Development (USAID) through The DHS Program (#720-0AA-18C-00083). The views expressed are those of the authors and do not necessarily reflect the views of USAID or the United States Government.
The DHS Program assists countries worldwide in the collection and use of data to monitor and evaluate population, health, and nutrition programs. Additional information about The DHS Program can be obtained from ICF, 530 Gaither Road, Suite 500, Rockville, MD 20850 USA; telephone: +1 301-407-6500, fax: +1 301-407-6501, email: [email protected], internet: www.DHSprogram.com.
Recommended citation:
Assaf, Shireen, Lwendo Davis Moonzwe, Ahamadou Diallo, and Amadou Kone. 2020. Trends in and Factors Associated with Maternal and Child Health Indicators in Mali: Further Analysis of the Mali Demographic and Health Surveys 2006-2018. DHS Further Analysis Reports No. 131. Rockville, Maryland, USA: ICF.
iii
CONTENTS
TABLES ........................................................................................................................................................ v FIGURES .................................................................................................................................................... vii ABSTRACT ................................................................................................................................................. ix
1 INTRODUCTION .............................................................................................................................. 1
2 DATA AND METHODS ................................................................................................................... 7 2.1 Data ..................................................................................................................................... 7 2.2 Maternal and Child Health Indicators .................................................................................. 7 2.3 Methods .............................................................................................................................. 8
3 RESULTS ...................................................................................................................................... 11 3.1 Antenatal Care .................................................................................................................. 12
3.1.1 ANC visits ............................................................................................................. 12 3.1.2 ANC components ................................................................................................. 15
3.2 Delivery ............................................................................................................................. 17 3.3 Postnatal Care .................................................................................................................. 20 3.4 Vaccination ........................................................................................................................ 21 3.5 Care-seeking for Childhood Diseases .............................................................................. 23
3.5.1 ARI ....................................................................................................................... 23 3.5.2 Fever .................................................................................................................... 23 3.5.3 Diarrhea ............................................................................................................... 25
4 DISCUSSION AND CONCLUSION ............................................................................................... 29 Conclusion ..................................................................................................................................... 31
REFERENCES ............................................................................................................................................ 33
APPENDICES ............................................................................................................................................. 39

v
TABLES
Table 1 Sample sizes for the surveys used in the analysis .................................................... 7
Appendix Table A1 Percent of women age 15-49 attending at least four ANC visits for their most recent birth in the 2 years before the survey by background variables, Mali DHS 2006, 2012, and 2018 ..................................................................................... 39
Appendix Table A2 Percent of women age 15-49 attending their first ANC visit before 4 months of pregnancy for their most recent birth in the 2 years before the survey by background variables, Mali DHS 2006, 2012, and 2018 ......................................... 40
Appendix Table A3 Percent of women age 15-49 who took iron tablets or syrup during pregnancy of their most recent birth in the 2 years before the survey by background variables, Mali DHS 2006, 2012, and 2018 ............................................................. 41
Appendix Table A4 Percent of women age 15-49 who had at least two tetanus toxoid injections during the pregnancy of their most recent birth in the 2 years before the survey by background variables, Mali DHS 2006, 2012, and 2018 ......................... 42
Appendix Table A5 Percent of women age 15-49 who had their blood pressure taken during an ANC visit for their most recent birth in the 2 years before the survey by background variables, Mali DHS 2006, 2012, and 2018 ......................................... 43
Appendix Table A6 Percent of women age 15-49 who had their urine sample taken during an ANC visit for their most recent birth in the 2 years before the survey by background variables, Mali DHS 2006, 2012, and 2018 ......................................... 44
Appendix Table A7 Percent of women age 15-49 who had their blood sample taken during an ANC visit for their most recent birth in the 2 years before the survey by background variables, Mali DHS 2006, 2012, and 2018 ......................................... 45
Appendix Table A8 Percent of births delivered in a health facility in the 2 years before the survey by background variables, Mali DHS 2006, 2012, and 2018 .................................... 46
Appendix Table A9 Percent of births delivered by Cesarean section in the 2 years before the survey by background variables, Mali DHS 2006, 2012, and 2018 ......................... 47
Appendix Table A10 Percent of women age 15-49 who had a postnatal check-up within 2 days of delivering their most recent birth in the 2 years before the survey by background variables, Mali DHS 2012, and 2018 ................................................... 48
Appendix Table A11 Percent of children age 12-23 months who received all basic vaccinations by background variables, Mali DHS 2006, 2012, and 2018 ......................................... 49
Appendix Table A12 Percent of children under age 5 who had ARI symptoms in the 2 weeks before the survey by background variables, Mali DHS 2006, 2012, and 2018 ....... 50
Appendix Table A13 Percent of children under age 5 who received treatment for ARI symptoms in the 2 weeks before the survey by background variables, Mali DHS 2006, 2012, and 2018 ........................................................................................................ 51
Appendix Table A14 Percent of children under age 5 who had fever symptoms in the 2 weeks before the survey by background variables, Mali DHS 2006, 2012, and 2018 ....... 52
vi
Appendix Table A15 Percent of children under age 5 who received treatment for fever symptoms in the 2 weeks before the survey by background variables, Mali DHS 2006, 2012, and 2018 ........................................................................................................ 53
Appendix Table A16 Percent of children under age 5 who had diarrhea symptoms in the 2 weeks before the survey by background variables, Mali DHS 2006, 2012, and 2018 ....... 54
Appendix Table A17 Percent of children under age 5 who received treatment for diarrhea symptoms in the 2 weeks before the survey by background variables, Mali DHS 2006, 2012, and 2018 ..................................................................................... 55
Appendix Table A18 Percent of children under age 5 who received oral rehydration therapy or increased fluids for diarrhea symptoms in the 2 weeks before the survey by background variables, Mali DHS 2006, 2012, and 2018 ......................................... 56
Appendix Table A19 Sample description of variables used in the regression models, Mali 2018 DHS .......................................................................................................................... 57
Appendix Table A20 Adjusted odds ratios for ANC and PNC indicators among women age 15-49 for their most recent birth in the 2 years before the survey, Mali 2018 DHS ........... 58
Appendix Table A21 Adjusted odds ratios for delivery indicators among births in the 2 years before the survey, Mali 2018 DHS ...................................................................................... 59
Appendix Table A22 Adjusted odds ratios for receiving all basic vaccinations (children age 12-23 months) and care-seeking for fever and diarrhea (children under age 5), Mali 2018 DHS ................................................................................................................ 60
vii
FIGURES
Figure 1 Under-5 mortality trends with 95% confidence intervals, number of deaths per 1,000 live births in Mali from 1987 to 2018 ................................................................ 4
Figure 2 Trends in maternal and health indicators, 2006, 2012-13, 2018 Mali DHS ............. 11
Figure 3 Trends in the percentage of women who attended at least 4 ANC visits for their most recent birth in the past 2 years by background variables ....................... 13
Figure 4 Trends in the percentage of women who attended an ANC visit before 4 months of pregnancy for their most recent birth in the past 2 years by background variables ............................................................................................... 14
Figure 5 Adjusted odds ratios for having at least 4 ANC visits and having the first ANC visit before 4 months of pregnancy, Mali DHS 2018 ............................................... 15
Figure 6 Trends in ANC components, Mali DHS 2006, 2012-13, and 2018 .......................... 16
Figure 7 Adjusted odds ratios for receiving at least two tetanus toxoid injections for the most recent birth in the past 2 years before the survey, Mali DHS 2018 ................ 17
Figure 8 Trends in the percentage of births in the past 2 years that are delivered in a health facility by background variables .................................................................... 18
Figure 9 Trends in the percentage of births in the past 2 years that are delivered by C-section by background variables ............................................................................. 19
Figure 10 Adjusted odds ratios for delivery in a health facility and delivery by C-section for births in the 2 years before the survey, Mali DHS 2018 ..................................... 20
Figure 11 Adjusted odds ratios for PNC for mothers within 2 days after delivery in the 2 years before the survey, Mali DHS 2018 ................................................................. 21
Figure 12 Trends in the percentage of children age 12-23 months who received all basic vaccinations by background variables ..................................................................... 22
Figure 13 Adjusted odds ratios for receiving all basic vaccinations among children age 12-23 months, Mali DHS 2018 ................................................................................. 23
Figure 14 Trends in the percentage of children under age 5 who received advice or treatment for fever symptoms by background variables .......................................... 24
Figure 15 Adjusted odds ratios for care-seeking for fever symptoms among children under age 5, Mali DHS 2018.................................................................................... 25
Figure 16 Trends in the percentage of children under age 5 who received advice or treatment for diarrhea symptoms by background variables ..................................... 26
Figure 17 Trends in the percentage of children under age 5 who received ORT or increased fluids for diarrhea symptoms by background variables ........................... 27
Figure 18 Adjusted odds ratios for care-seeking and receiving ORT or increased fluids for diarrhea symptoms among children under age 5, Mali DHS 2018 ..................... 28

ix
ABSTRACT
This paper examines fifteen maternal and child health indicators using the three most recent Demographic and Health Surveys (DHS) conducted in Mali (2006, 2012-13, and 2018). These indicators include antenatal care, postnatal care, delivery in a health facility, Caesarean section delivery, vaccination among children, and care-seeking for acute respiratory infection, fever, and diarrhea for children. The analysis includes examination of overall trends, trends by background variables, and regressions for the most recent survey. One main finding was the lack of improvement in several indicators between the 2012 and 2018 surveys, which coincides with the conflict that began in Mali in 2012. This was especially relevant for antenatal care visits, vaccination, and care-seeking for diarrhea. Large gaps in these indicators were found in the conflict areas, especially in Kidal and Tombouctou, when compared to the other regions. Caesarean section delivery remained low across all background variables and has remained between 2-3% since 2006. This indicates a need for more accessible emergency obstetric care for women and increased awareness of the importance of recognizing danger signs. There were also some indicators that showed improvement between the two most recent surveys. These included delivery in a health facility, postnatal care for the mother, acute respiratory infection, fever care-seeking, and all antenatal components except for having at least two tetanus toxoid injections, which remained unchanged. Almost all indicators showed large disparities by background variables, with the largest in wealth quintile, region, and education level. This highlights the need for services, interventions, and increased awareness that can reach the poorest households and least-educated women in Mali.
Key words: maternal health, child health, antenatal care, postnatal care, delivery, C-section, vaccination, care-seeking, diarrhea, fever, acute respiratory infection
x
1
1 INTRODUCTION
The World Health Organization (WHO) reports that every year approximately 300,000 women and adolescent girls die worldwide because of complications related to pregnancy or childbirth (World Health Organization 2016, 2019). In 2018, about 5.3 million children under age 5 died, with about half of these deaths occurring in sub-Saharan Africa (UNICEF 2019). The Sustainable Development Goals (SDGs) emphasize a holistic approach to achieving sustainable development for all, with an emphasis in SDG 3 on ensuring healthy lives and promoting well-being for people of all ages. More specifically, SDG 3.1 and 3.2 focus on reducing the global maternal mortality ratio (MMR) to less than 70 per 100,000 live births, and ending preventable deaths of newborns and children under age 5 to 12 per 1,000 live births for neonatal mortality and 25 per 1,000 live births for under age 5 mortality by 2030 (World Health Organization 2018).
Over the past decade, there has been a global reduction in maternal mortality. Between 2000 and 2017, the MMR declined by 38% (World Health Organization 2019). However, there is room for improvement. In 2017, 295,000 women died during and following pregnancy and childbirth, with the majority of these deaths being preventable (UNFPA 2019). This burden is greatest in sub-Saharan Africa, which accounted for 66% of the estimated global maternal deaths (UNFPA 2019). Improvements in several key maternal and child health indicators can reduce maternal and child mortality rates.
The under age 5 mortality rate is a good indicator of child health in a country. Although there have been drastic decreases globally in child mortality, a 59% reduction between 1990 and 2018, low- and middle-income countries continue to have disproportionately high rates of under-5 mortality (World Health Organization 2019). Under-5 mortality was highest in the African Region with 76 deaths per 1,000 live births as compared to the European Region with 9 deaths per 1,000 live birth. The rate of under-5 mortality in low-income countries is nearly 14 times higher than in high-income countries (World Health Organization 2019).
As efforts to increase maternal and child health services and interventions grow, it is also important to address the equitability of services. Addressing inequalities in maternal and child health is key to improving overall health and survival. By utilizing survey data collected between 2000-2008 from 54 countries (which include Mali), Barros et al. (2012) assessed how inequalities in maternal, newborn, and child health interventions vary by intervention and country. They found skilled birth attendance (SBA) coverage and four or more antenatal care (ANC) visits to be the most inequitable. Further, services delivered at fixed facilities tended to be more inequitable than services delivered at secondary or tertiary levels of care (Barros et al. 2012). Other challenges in achieving the desired outcomes in maternal mortality include gaps in the availability of comprehensive maternal health services such as emergency obstetric care and the availability of skilled birth attendants (SBAs) (UNFPA 2019). Efforts to improve health outcomes have not been adequate for the coverage of maternal care (Vargas, Ahmed, and Adams 2018).
Antenatal Care
Attendance at ANC reduces maternal and perinatal morbidity and mortality through the detection and treatment of pregnancy-related complications, and indirectly through the referral of women at high risk of developing complications to the appropriate level of care (World Health Organization 2016; Carroli,
2
Rooney, and Villar 2001). In addition, ANC care is important because it is associated with increased facility delivery and postnatal care (PNC) (Berhan and Berhan 2014; Dahiru and Oche 2014).
Although ANC has been encouraged by health-care professionals, rates of ANC utilization remain suboptimal in Mali. The WHO recommends that women have a minimum of four ANC contacts throughout their pregnancy, and that the first contact occur before 4 months of pregnancy (World Health Organization 2016). The WHO also recommends that ANC should include iron intake, at least two tetanus toxoid injections, measurement of blood pressure, and urine and blood samples (World Health Organization 2018).
Several studies have identified reasons why women do not use ANC services. In a systematic review of 21 qualitative studies, Finlayson and Downe (2013) identified three primary themes: cultural and contextual factors, costs, and quality of care during previous ANC visits. Other factors that affected the uptake and early initiation of ANC care included socioeconomic factors such as education, income, employment status; exposure to media or other promotional mechanisms; having a history of obstetric complications; and cultural practices and beliefs (Finlayson and Downe 2013; Gage 2007; Mlambo et al. 2018; Mrisho et al. 2009; Simkhada et al. 2008).
Delivery
Several studies emphasize the critical role of facility-based delivery in reducing maternal mortality. Having an SBA in place at delivery is associated with a reduction in MMRs. In a synthesis of qualitative findings that examined barriers of facility-based delivery, Bohren et al. (2014) identified barriers related to perceptions of pregnancy and delivery, the sociocultural context and care experience, resource availability, and access and perceptions of quality of care. More specifically, the evidence points to traditional and familial influences, distance to the facility, cost of delivery, the perception of poor quality of care at the facility, and fear of unwanted procedures such as Caesarean sections as key barriers (Bohren et al. 2014). Other factors associated with facility delivery include utilization of ANC, the use of a facility during the previous delivery, high quality of care, and proximity to health facility (Gabrysch and Campbell 2009; Moyer and Mustafa 2013). Similar to the predictors of ANC coverage, higher socioeconomic status and level of education are also key predictors of facility delivery (Moyer and Mustafa 2013).
Postnatal Care
Postnatal care is critical to ensure the continued health and well-being of both mothers and their newborns, and is especially important in the first week after delivery because this is a critical period for preventing deaths. Immediate PNC is vital because the first day after birth is the most critical for the survival of both mother and baby. Yet, in the African region, PNC programs are among the weakest of all reproductive and child health programs (Izudi and Amongin 2015; Warren et al. 2006). According to Demographic Health Survey (DHS) data from 23 sub-Saharan African countries, two-thirds of women give birth at home and only 13% have a PNC visit within the first 2 days after birth (Warren et al. 2006). Another analysis of data from 20 countries in sub-Saharan Africa also found that although two-thirds of births were attended by an SBA, only 3% of newborns received the recommended PNC interventions (Carvajal–Aguirre et al. 2017). There are also limited data on the quality of care or services received during PNC, as well as evidence or intervention for improving adherence to PNC (Esopo, Derby, and Haushofer 2018; Warren et al. 2006).
3
Lack of PNC can result in death or disability and represents a missed opportunity to promote healthy behaviors that affect the health of women, newborns, and children. However, in some contexts, limited guidelines about and understanding of PNC further limit access to these services (Mrisho et al. 2009). In addition to adequate care during pregnancy and delivery, PNC practices are critical to improving maternal and child health outcomes. Studies emphasize the importance of clean birth practices to reduce neonatal deaths from sepsis and tetanus. However, there is need for more research on how best to implement clean birth practices, particularly in resource-poor settings (Blencowe et al. 2011).
Vaccination
Vaccinations are recognized as one of the world’s most successful, cost-effective health interventions. It is estimated that 15% of the annual global birth cohort are either not immunized or have not received all the recommended immunizations (Madhi and Rees 2018). Individuals in low- and middle-income countries and hard-to-reach populations are particularly vulnerable to illness that could be prevented by vaccines. Other factors that have been attributed to lower rates of vaccination include maternal education, neighborhood socioeconomic status, having other children under age 5, media access, and household economic status (Madhi and Rees 2018). There are also significant regional as well as within-country variations in the rates of vaccination (Duclos et al. 2009; Madhi and Rees 2018).
Care-seeking for Childhood Diseases
The three primary causes of under-5 mortality in developing countries are diarrhea, malaria, and pneumonia. These illnesses are largely preventable, especially when appropriate care is sought early in the illness. However, the recognition of these illnesses by caregivers in low- and middle-income countries is generally low (Geldsetzer et al. 2013). Integrated Management of Childhood Illnesses (IMCI) and Integrated Community Case Management (iCCM) services utilize trained and supervised community members, such as community health workers (CHWs) to deliver curative interventions in their communities. More specifically, iCCM is a strategy to train, support, and supply CHWs with the resources necessary to diagnose and treat pneumonia, diarrhea, and malaria among children who have difficulty accessing health facilities. The CHWs who administer IMCI or iCCM services are trained to assess the presence of major clinical signs such as cough, diarrhea, fever, and vomiting (Alvarez Moran et al. 2018; Bosch–Capblanch and Marceau 2014). In malaria endemic countries such as Mali, malaria is the primary cause of fever. Thus, care-seeking for children who present with fever is critical for determining the proper diagnosis and treatment (Dicko et al. 2005; Plucinski et al. 2020).
The scaling-up of strategies such as IMCI and iCCM have led to improvements in the identification, diagnosis, and treatment of these childhood illnesses. However, there are additional barriers to early treatment seeking such as sociocultural and religious beliefs and perceptions about the illness, the location of or distance to the services, and resource or financial constraints (Colvin et al. 2013). In many contexts where decisions about care-seeking go beyond the primary caretaker, it is important to consider other social relationships such as the involvement of in-laws, peers, or other extended family members in offering advice and resources, and shaping the meaning of the disease which then contributes to care-seeking behavior (Colvin et al. 2013).
4
Context in Mali
Mali is one of the poorest countries in the world with over half of the people living below the poverty line of less than $2 USD per day (USAID 2015). Coupled with the high rates of poverty, years of armed conflict have delayed progress towards achievement of the SDGs. Although the maternal and child health situation in Mali has improved, the security and political crisis, which has most significantly affected northern Mali, heightened in 2012-2013 and is still ongoing. This situation has had a negative effect on economic and social gains and development opportunities.
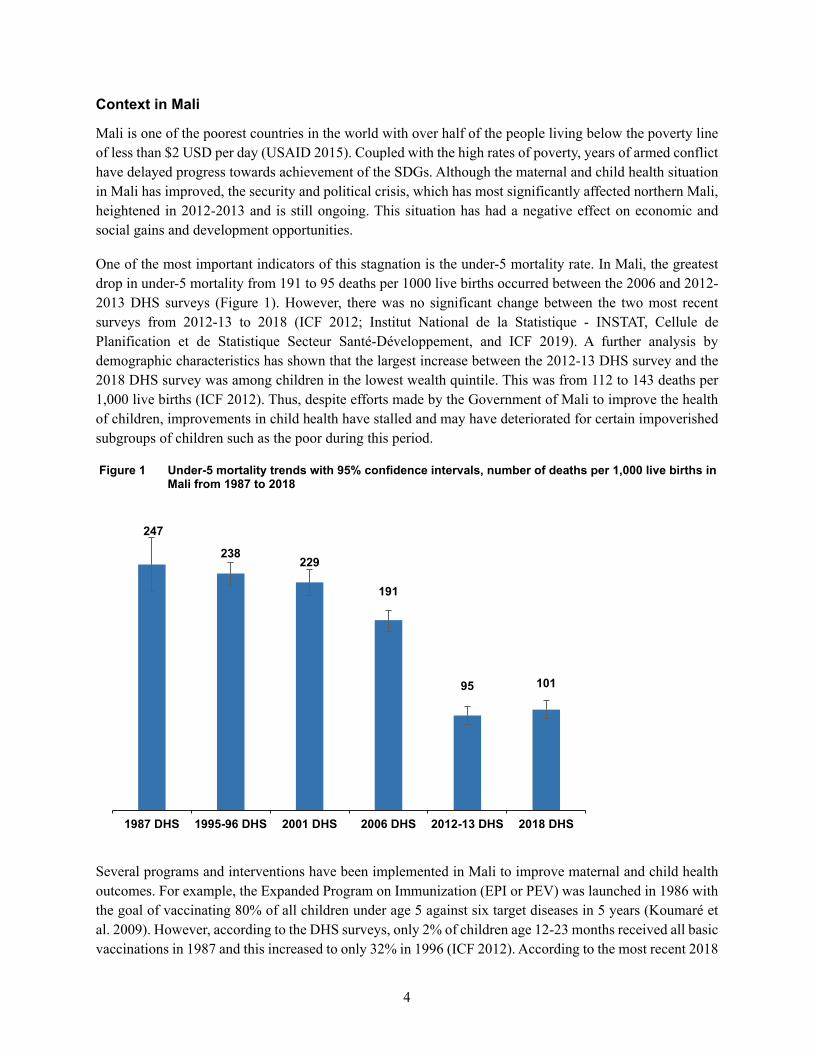
One of the most important indicators of this stagnation is the under-5 mortality rate. In Mali, the greatest drop in under-5 mortality from 191 to 95 deaths per 1000 live births occurred between the 2006 and 2012-2013 DHS surveys (Figure 1). However, there was no significant change between the two most recent surveys from 2012-13 to 2018 (ICF 2012; Institut National de la Statistique - INSTAT, Cellule de Planification et de Statistique Secteur Santé-Développement, and ICF 2019). A further analysis by demographic characteristics has shown that the largest increase between the 2012-13 DHS survey and the 2018 DHS survey was among children in the lowest wealth quintile. This was from 112 to 143 deaths per 1,000 live births (ICF 2012). Thus, despite efforts made by the Government of Mali to improve the health of children, improvements in child health have stalled and may have deteriorated for certain impoverished subgroups of children such as the poor during this period.
Figure 1 Under-5 mortality trends with 95% confidence intervals, number of deaths per 1,000 live births in Mali from 1987 to 2018
Several programs and interventions have been implemented in Mali to improve maternal and child health outcomes. For example, the Expanded Program on Immunization (EPI or PEV) was launched in 1986 with the goal of vaccinating 80% of all children under age 5 against six target diseases in 5 years (Koumaré et al. 2009). However, according to the DHS surveys, only 2% of children age 12-23 months received all basic vaccinations in 1987 and this increased to only 32% in 1996 (ICF 2012). According to the most recent 2018
10195
191
229238
247
2018 DHS2012-13 DHS2006 DHS2001 DHS1995-96 DHS1987 DHS
5
Mali DHS, fewer than half (45%) of children age 12-23 months received all basic vaccinations (Institut National de la Statistique - INSTAT, Cellule de Planification et de Statistique Secteur Santé-Développement, and ICF 2019).
The National Emergency Obstetric Care program was initiated for a period of 5 years from 2004 to 2008 to help reduce the MMR (Ministère de la Santé et l’Hygiène Publique 2017). The aims were to ensure that all facilities have essential obstetric and neonatal care available and to increase the number of facilities with complete obstetric and neonatal emergency care, which includes Caesarean sections and blood transfusions. Although there have been many other interventions, Malian women and families continue to face challenges with the accessibility of health facilities and, especially in the rural areas, financial difficulties and lack of awareness about the importance of preventative care.
Improvements have been made in health-facility delivery in Mali and the urban/rural gap has been narrowing. For example, in 2001, 79% of urban women delivered in a health facility compared to only 25% of rural women. In 2018, 93% of urban women delivered in a health facility compared to 60% of rural women (ICF 2012). With service delivery, obstacles include uneven distribution of trained personnel, shortage of health workers, shortages in medicines, and lack of funding (Ministère de la Santé et l’Hygiène Publique 2017).
The examination of trends in key indicators of maternal and child health is essential in tracking progress, and in identifying gaps and areas that need improvement (Requejo et al. 2015). In this paper, we analyze maternal and child health indicators including ANC, delivery, PNC, vaccinations, and care-seeking for ARI and diarrhea in children. We specifically examine the progress that Mali has made towards these indicators from 2006 to 2018 and identify the populations or areas that need the greatest focus in terms of interventions to improve these health indicators.

7
2 DATA AND METHODS
2.1 Data
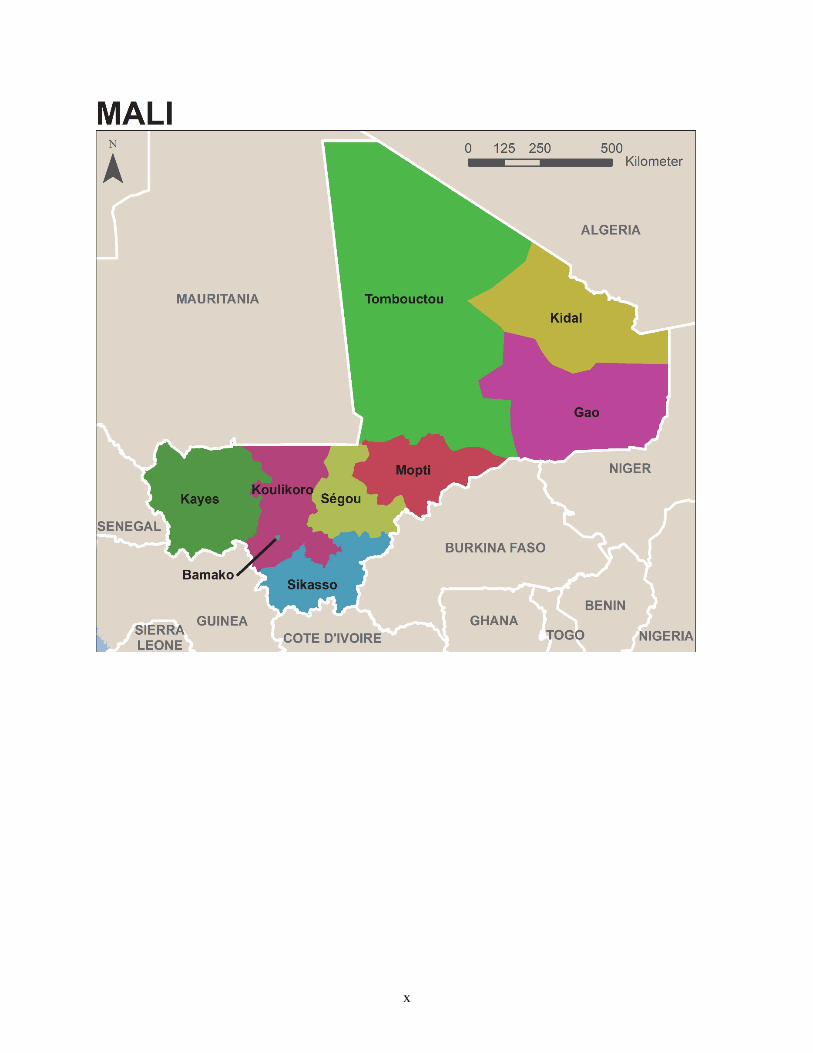
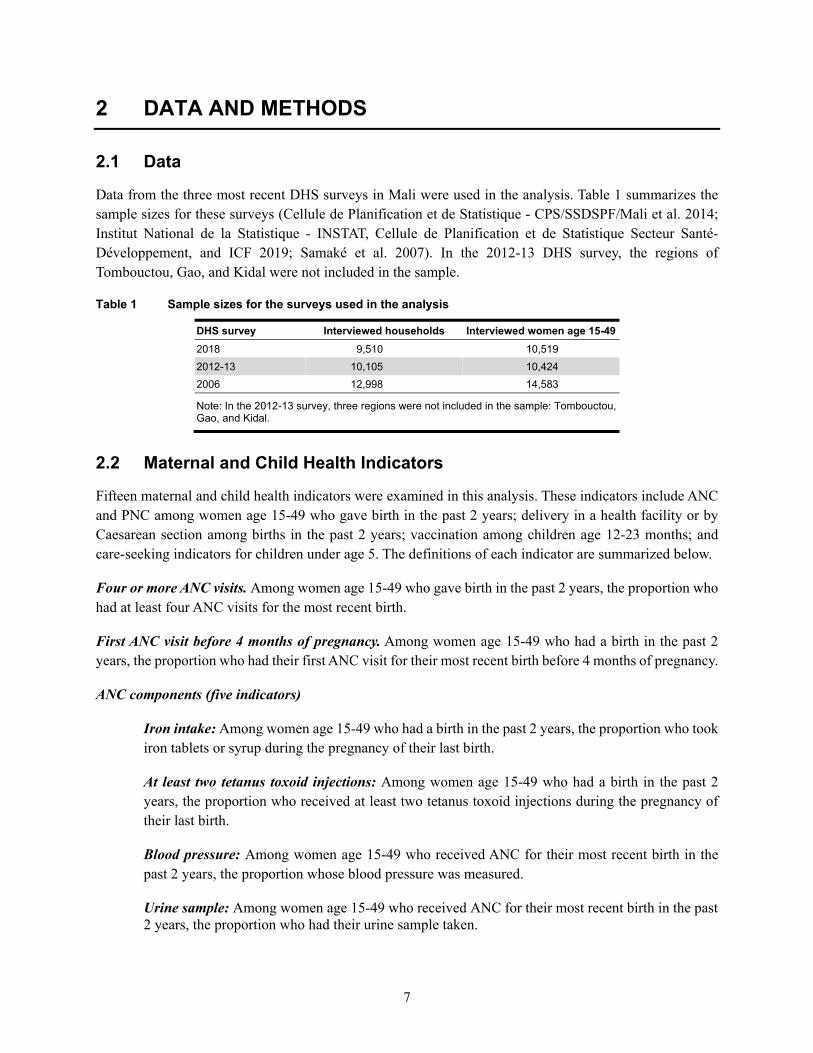
Data from the three most recent DHS surveys in Mali were used in the analysis. Table 1 summarizes the sample sizes for these surveys (Cellule de Planification et de Statistique - CPS/SSDSPF/Mali et al. 2014; Institut National de la Statistique - INSTAT, Cellule de Planification et de Statistique Secteur Santé-Développement, and ICF 2019; Samaké et al. 2007). In the 2012-13 DHS survey, the regions of Tombouctou, Gao, and Kidal were not included in the sample.
Table 1 Sample sizes for the surveys used in the analysis
DHS survey Interviewed households Interviewed women age 15-49 2018 9,510 10,519 2012-13 10,105 10,424 2006 12,998 14,583
Note: In the 2012-13 survey, three regions were not included in the sample: Tombouctou, Gao, and Kidal.
2.2 Maternal and Child Health Indicators
Fifteen maternal and child health indicators were examined in this analysis. These indicators include ANC and PNC among women age 15-49 who gave birth in the past 2 years; delivery in a health facility or by Caesarean section among births in the past 2 years; vaccination among children age 12-23 months; and care-seeking indicators for children under age 5. The definitions of each indicator are summarized below.
Four or more ANC visits. Among women age 15-49 who gave birth in the past 2 years, the proportion who had at least four ANC visits for the most recent birth.
First ANC visit before 4 months of pregnancy. Among women age 15-49 who had a birth in the past 2 years, the proportion who had their first ANC visit for their most recent birth before 4 months of pregnancy.
ANC components (five indicators)
Iron intake: Among women age 15-49 who had a birth in the past 2 years, the proportion who took iron tablets or syrup during the pregnancy of their last birth.
At least two tetanus toxoid injections: Among women age 15-49 who had a birth in the past 2 years, the proportion who received at least two tetanus toxoid injections during the pregnancy of their last birth.
Blood pressure: Among women age 15-49 who received ANC for their most recent birth in the past 2 years, the proportion whose blood pressure was measured.
Urine sample: Among women age 15-49 who received ANC for their most recent birth in the past 2 years, the proportion who had their urine sample taken.
8
Blood sample: Among women age 15-49 who received ANC for their most recent birth in the past 2 years, the proportion who had their blood sample taken.
Delivery in a health facility. Among all births in the last 2 years, the proportion that were delivered in a health facility. Health facilities could be government, private, NGO, or another facility such as a maternity clinic.
Caesarean section delivery (C-section). Among all births in the past 2 years, the proportion that were delivered by C-section.
Postnatal care (PNC) for mother. Among women age 15-49 who had a birth in the past 2 years, the proportion who received a postnatal check-up within 2 days of delivering their most recent birth. This includes women who delivered in a health facility or outside a health facility. Postnatal check-up includes women who received a check from a doctor, midwife, nurse, CHW, or traditional birth attendant. In the Mali 2006 DHS survey, women who delivered in a health facility were excluded from this indicator. Therefore, comparisons will only be made between the 2012 and 2018 DHS surveys.
Full vaccination. The proportion of children age 12-23 months who received the BCG, measles, three doses of either DPT or DPT-HepB-Hib, and three doses of the polio vaccine.
Care-seeking for symptoms of ARI. Among children under age 5 with symptoms of ARI (acute respiratory infection, possibly pneumonia) in the 2 weeks before the survey, the proportion for whom advice or treatment was sought. This only excludes treatment sought from traditional healers. Previous surveys also excluded shops and/or pharmacy from this indicator, while the recent DHS definition of only excluding traditional healers was used for care-seeking indicators.
Care-seeking for symptoms of fever. Among children under age 5 with symptoms of fever in the 2 weeks before the survey, the proportion for whom advice or treatment was sought. This only excludes treatment sought from traditional healers.
Care-seeking for diarrhea. The proportion of children under age 5 who had diarrhea in the 2 weeks before the survey and for whom advice or treatment was sought. This only excludes treatment sought from traditional healers.
Oral rehydration therapy (ORT) or increased fluids for diarrhea. The proportion of children under age 5 who had diarrhea in the 2 weeks before the survey and were given ORT (either oral rehydration salts or recommended homemade fluids) or increased fluids.
2.3 Methods
Tests of association were performed between the indicators and several background variables. For the maternal health indicators, the background variables include women’s age at the birth (<19, 19-24, 25-34, and 35 and above), education (none, primary, secondary, or more), work status in the previous 12 months (did not work, unpaid work, paid work), place of residence, wealth quintile, and region. For the child health indicators, the background variables include the child’s sex, mother’s age at birth, mother’s education, place of residence, wealth quintile, and region. The association test determined whether there are significant disparities in the indicator by the background variable within each survey. The results from the association
9
tests are especially important for the most recent survey because they highlight disparities and gaps in service in order to highlight where interventions are most needed.
Tests of differences in proportions were also performed to determine whether there are significant differences between surveys (both nationally and within subgroups). Three differences were tested, between the 2006 survey and the 2012-13 survey, between the 2012-13 survey and the 2018 survey, and between the 2006 and 2018 survey. The results are summarized in tables as well as plots. In the plots, a solid line between two consecutive surveys indicates a significant difference, while a dotted line indicates an insignificant difference. An asterisk was placed next to the category name in the legend of the plot to represent a significance difference between the 2006 and the 2018 survey on the plot. The values of the difference overall as well as by subgroups are found in the tables. The difference tests by region were excluded for the 2012-13 survey because this survey did not include the regions of Tombouctou, Gao, and Kidal in the sample, and comparisons could not be made with the 2006 and 2018 surveys. This indicates that there will be no stars in the legend as well as the other background variables.
Logistic regressions for the most recent survey (2018) were performed on nine indicators to determine the magnitude of the association between the background variables and the indicator. The regressions were fit for the outcomes of having at least 4 ANC visits, attending the first ANC visit before 4 months of pregnancy, receiving at least two tetanus toxoid injections during the pregnancy, mother had a PNC check within 2 days of delivery, delivery in health facility, delivery by C-section, full vaccination, care-seeking for diarrhea, and the child receiving ORT or increased fluids for diarrhea symptoms. Care-seeking for ARI was excluded from the regression analysis because of a very small sample size (172 unweighted observations overall). The estimates from the regression (odds ratios) were summarized in coefficient plots as well as in the appendix tables.
The background variables included in the regressions for the ANC indicators, PNC, delivery in a health facility, and delivery by C-section are mother’s age at birth, her education level, place of residence, wealth quintile, region, and the number of nearby facilities. The variables included in the regression demonstrate the magnitude of the association presented in the descriptive analyses. In addition, the facility variable was included to examine whether the facility is an important area of intervention. The number of nearby facilities was constructed with data on the location of facilities within a 5 km buffer from the DHS cluster for urban areas, and within a 10 km buffer for rural areas. The data on location of facilities obtained from Maina et al. (2019) was matched with the GPS location of the DHS cluster. The use of the buffer area minimized the effect of the displacement of GPS cluster locations used by the DHS to protect the privacy of the respondents. The constructed number of facilities variable was categorized as none, 1-3 nearby facilities, and more than 3 nearby facilities.
Significance was determined at the 0.05 significance level for all statistical tests used in the analyses, and there were adjustments for sample design and weights. The analysis was performed with Stata 16.

11
3 RESULTS
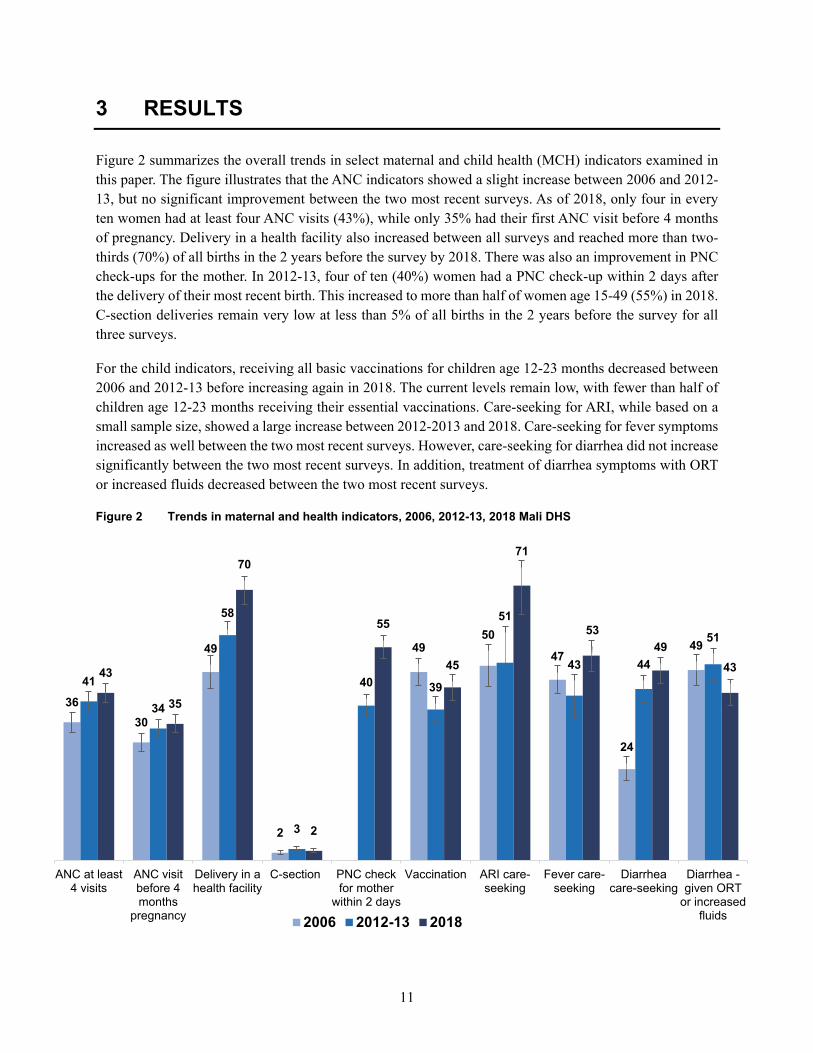
Figure 2 summarizes the overall trends in select maternal and child health (MCH) indicators examined in this paper. The figure illustrates that the ANC indicators showed a slight increase between 2006 and 2012-13, but no significant improvement between the two most recent surveys. As of 2018, only four in every ten women had at least four ANC visits (43%), while only 35% had their first ANC visit before 4 months of pregnancy. Delivery in a health facility also increased between all surveys and reached more than two-thirds (70%) of all births in the 2 years before the survey by 2018. There was also an improvement in PNC check-ups for the mother. In 2012-13, four of ten (40%) women had a PNC check-up within 2 days after the delivery of their most recent birth. This increased to more than half of women age 15-49 (55%) in 2018. C-section deliveries remain very low at less than 5% of all births in the 2 years before the survey for all three surveys.
For the child indicators, receiving all basic vaccinations for children age 12-23 months decreased between 2006 and 2012-13 before increasing again in 2018. The current levels remain low, with fewer than half of children age 12-23 months receiving their essential vaccinations. Care-seeking for ARI, while based on a small sample size, showed a large increase between 2012-2013 and 2018. Care-seeking for fever symptoms increased as well between the two most recent surveys. However, care-seeking for diarrhea did not increase significantly between the two most recent surveys. In addition, treatment of diarrhea symptoms with ORT or increased fluids decreased between the two most recent surveys.
Figure 2 Trends in maternal and health indicators, 2006, 2012-13, 2018 Mali DHS
3630
49
2
4950
47
24
49
41
34
58
3
40 39
51
43 44
51
43
35
70
2
55
45
71
5349
43
ANC at least4 visits
ANC visitbefore 4months
pregnancy
Delivery in ahealth facility
C-section PNC checkfor mother
within 2 days
Vaccination ARI care-seeking
Fever care-seeking
Diarrheacare-seeking
Diarrhea -given ORT
or increasedfluids2006 2012-13 2018
12
The following sections examine these indicators more closely. For each indicator, trends by background variables are discussed, followed by regression results for the most recent survey. These results determine where disparities are greatest and where interventions should be focused.
3.1 Antenatal Care
3.1.1 ANC visits
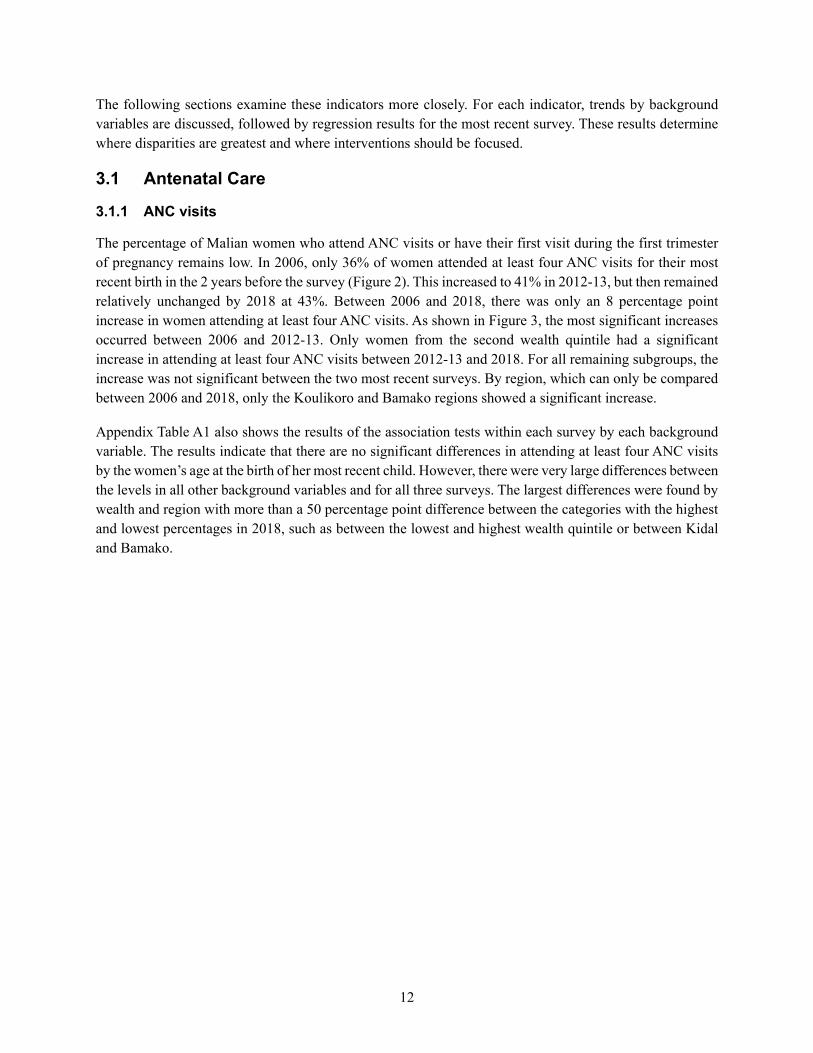
The percentage of Malian women who attend ANC visits or have their first visit during the first trimester of pregnancy remains low. In 2006, only 36% of women attended at least four ANC visits for their most recent birth in the 2 years before the survey (Figure 2). This increased to 41% in 2012-13, but then remained relatively unchanged by 2018 at 43%. Between 2006 and 2018, there was only an 8 percentage point increase in women attending at least four ANC visits. As shown in Figure 3, the most significant increases occurred between 2006 and 2012-13. Only women from the second wealth quintile had a significant increase in attending at least four ANC visits between 2012-13 and 2018. For all remaining subgroups, the increase was not significant between the two most recent surveys. By region, which can only be compared between 2006 and 2018, only the Koulikoro and Bamako regions showed a significant increase.
Appendix Table A1 also shows the results of the association tests within each survey by each background variable. The results indicate that there are no significant differences in attending at least four ANC visits by the women’s age at the birth of her most recent child. However, there were very large differences between the levels in all other background variables and for all three surveys. The largest differences were found by wealth and region with more than a 50 percentage point difference between the categories with the highest and lowest percentages in 2018, such as between the lowest and highest wealth quintile or between Kidal and Bamako.
13
Figure 3 Trends in the percentage of women who attended at least 4 ANC visits for their most recent birth in the past 2 years by background variables
The same patterns were found for the overall trend of women attending their first ANC visit before 4 months of pregnancy (Appendix Table A2). We find a slight, marginally significant increase in this indicator from 30% in 2006 to 34% in 2012-13. However, this remained statistically unchanged in 2018, with only a slight increase to 35%. Figure 4 shows that there was no significant increase by any background variable between the two most recent surveys. By region, Koulikoro, Mopti, and Tombouctou had significant increases in this indicator between 2006 and 2018. The results from the association tests were also similar to the first ANC indicator of at least four visits. There were no significant differences by women’s age at birth. However, there were large disparities in other background variables in all three surveys and especially by education, wealth, and region.

14
Figure 4 Trends in the percentage of women who attended an ANC visit before 4 months of pregnancy for their most recent birth in the past 2 years by background variables
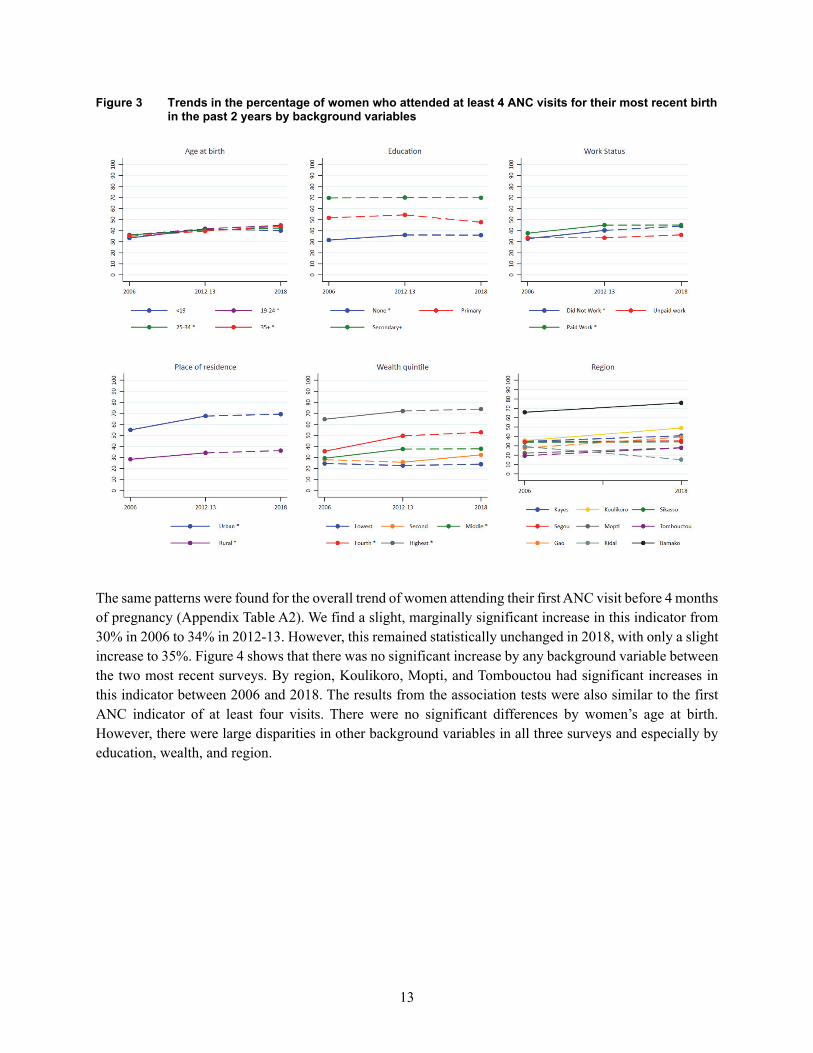
Figure 5 summarizes the results from the logistic regression for the two ANC indicators (having at least four ANC visits and having the first ANC visit before 4 months of pregnancy). The results are also found in Appendix Table A18. These regressions include all the background variables discussed in the trend analysis, as well as a variable to represent the number of nearby facilities. As shown, the largest disparities for both indicators were by education and wealth after controlling for other variables. Women with primary or higher education had higher odds of having at least 4 ANC visits and going to an ANC visit before 4 months of pregnancy compared to women with no education. For women with secondary or higher education, this was more than twice the odds. The odds of ANC attendance for both indicators increased with increasing wealth compared to the lowest wealth quintile. Women from the highest wealth quintile had more than 3 times the odds of ANC attendance compared to women from the lowest quintile.
Several regions had significantly lower odds of ANC attendance compared to Bamako. These include Sikasso, Segou, Mopti, Tombouctou, and Kidal for attending at least 4 ANC visits; and Sikasso and Kidal for attending an ANC before 4 months of pregnancy. Women from the Mopti Region had significantly higher odds of attending ANC before 4 months of pregnancy compared to women from Bamako. Having a nearby facility was only a significant factor for attending at least 4 ANC visits. Women who had more than three nearby facilities had more than twice the odds of attending at least 4 ANC visits compared to women who had no facilities nearby. Having one to three facilities nearby was not significantly different from
15
having no nearby facilities for ANC attendance. As shown in Appendix Table 17, only 3% of women age 15-49 with a birth in the past 2 years lived in an area with more than three nearby facilities.
Figure 5 Adjusted odds ratios for having at least 4 ANC visits and having the first ANC visit before 4 months of pregnancy, Mali DHS 2018
3.1.2 ANC components
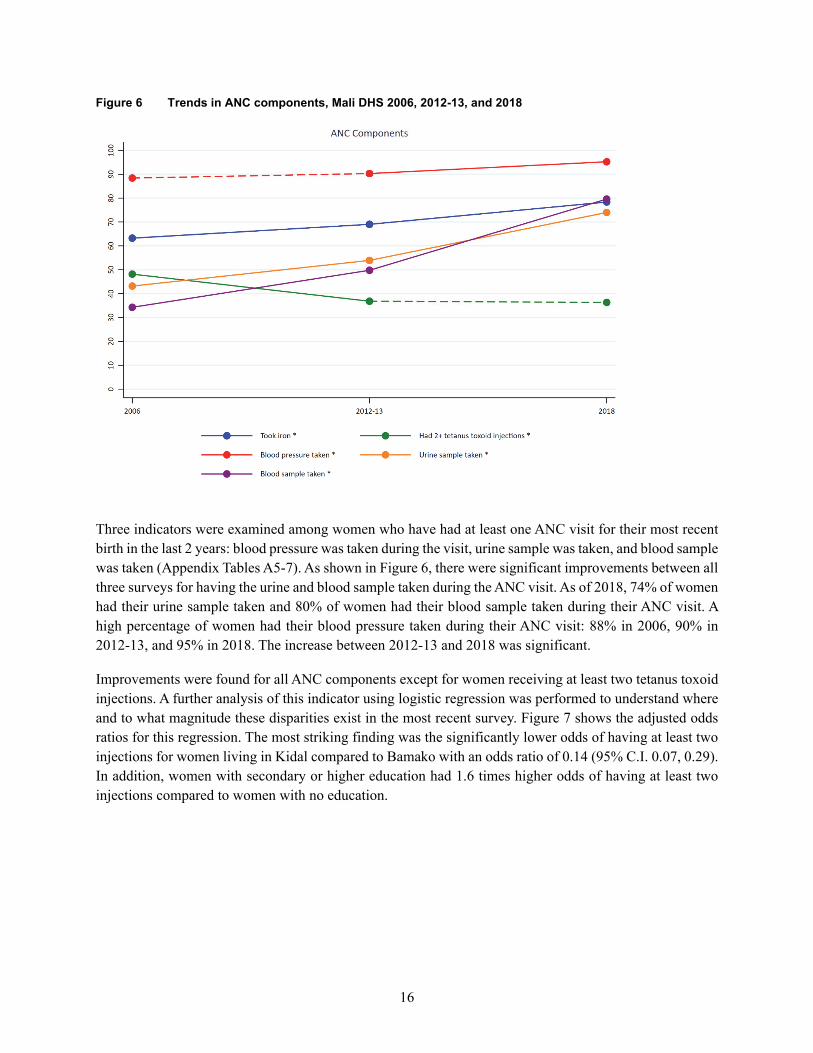
Among women who had birth in the past 2 years, 63% took iron supplements for their most recent birth in 2006. This significantly increased to 69% in 2012-13 and increased again to 78% in 2018 (see Figure 6). As shown in Appendix Table A3, these increases were found across almost all subgroups of women and especially between the two most recent surveys. In contrast, the percentage of women who had at least two tetanus toxoid injections for their most recent birth in the past 2 years decreased significantly from 48% in 2006 to 37% in 2012-13. This decrease was found across almost all subgroups of women as shown in Appendix Table A4. Between 2012-13 and 2018, there was no significant change in this indicator. Tests of association for these two indicators have shown that there are no significant differences between the age groups for women’s age at birth of the most recent child. However, there were large, significant differences between all other background variables within each survey.
16
Figure 6 Trends in ANC components, Mali DHS 2006, 2012-13, and 2018
Three indicators were examined among women who have had at least one ANC visit for their most recent birth in the last 2 years: blood pressure was taken during the visit, urine sample was taken, and blood sample was taken (Appendix Tables A5-7). As shown in Figure 6, there were significant improvements between all three surveys for having the urine and blood sample taken during the ANC visit. As of 2018, 74% of women had their urine sample taken and 80% of women had their blood sample taken during their ANC visit. A high percentage of women had their blood pressure taken during their ANC visit: 88% in 2006, 90% in 2012-13, and 95% in 2018. The increase between 2012-13 and 2018 was significant.
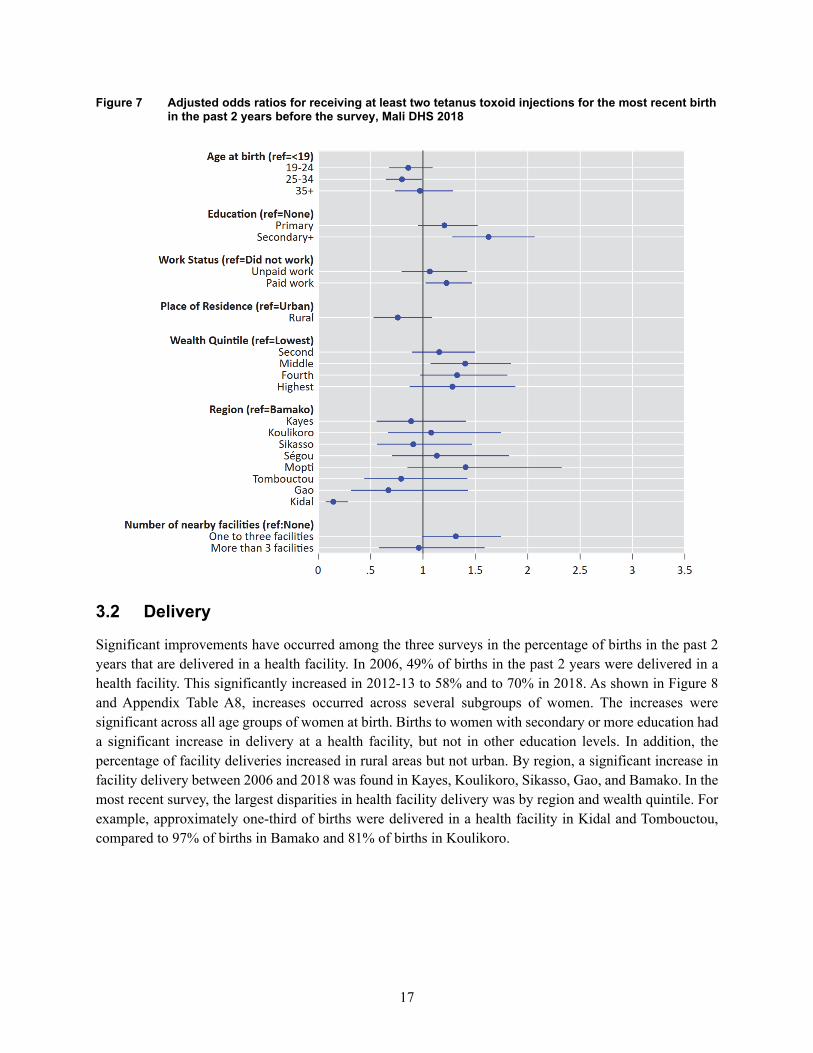
Improvements were found for all ANC components except for women receiving at least two tetanus toxoid injections. A further analysis of this indicator using logistic regression was performed to understand where and to what magnitude these disparities exist in the most recent survey. Figure 7 shows the adjusted odds ratios for this regression. The most striking finding was the significantly lower odds of having at least two injections for women living in Kidal compared to Bamako with an odds ratio of 0.14 (95% C.I. 0.07, 0.29). In addition, women with secondary or higher education had 1.6 times higher odds of having at least two injections compared to women with no education.
17
Figure 7 Adjusted odds ratios for receiving at least two tetanus toxoid injections for the most recent birth in the past 2 years before the survey, Mali DHS 2018
3.2 Delivery
Significant improvements have occurred among the three surveys in the percentage of births in the past 2 years that are delivered in a health facility. In 2006, 49% of births in the past 2 years were delivered in a health facility. This significantly increased in 2012-13 to 58% and to 70% in 2018. As shown in Figure 8 and Appendix Table A8, increases occurred across several subgroups of women. The increases were significant across all age groups of women at birth. Births to women with secondary or more education had a significant increase in delivery at a health facility, but not in other education levels. In addition, the percentage of facility deliveries increased in rural areas but not urban. By region, a significant increase in facility delivery between 2006 and 2018 was found in Kayes, Koulikoro, Sikasso, Gao, and Bamako. In the most recent survey, the largest disparities in health facility delivery was by region and wealth quintile. For example, approximately one-third of births were delivered in a health facility in Kidal and Tombouctou, compared to 97% of births in Bamako and 81% of births in Koulikoro.

18
Figure 8 Trends in the percentage of births in the past 2 years that are delivered in a health facility by background variables
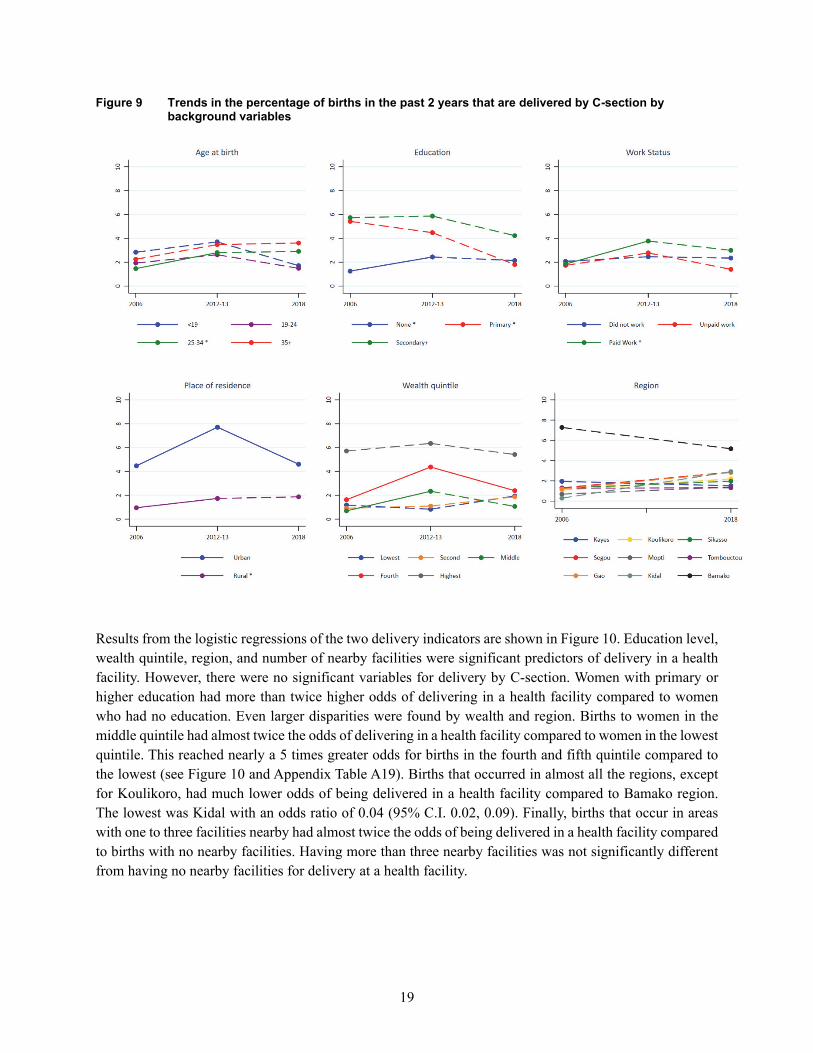
Delivery by C-section remains low and relatively unchanged in Mali. In 2006, only 2% of births in the past 2 years were delivered by C-section (Appendix Table A9). This increased significantly to 3% in 2012-13 and then declined again in 2018 to 2%, although the decline was not significant. Figure 9 shows that most changes between the surveys were not significant. The largest and significant declines between the two most recent surveys were found for births that occurred in urban areas and in the fourth wealth quintile. Of concern is the comparison between 2006 and 2018. In this span of 12 years, there was no significant change in C-section deliveries overall and by almost all subgroups of women. There were no significant changes in C-section deliveries between 2006 and 2018 in any of the regions. The largest and significant decrease found between 2006 and 2018 was for births to women with primary level education (from 5% to 2%).
19
Figure 9 Trends in the percentage of births in the past 2 years that are delivered by C-section by background variables
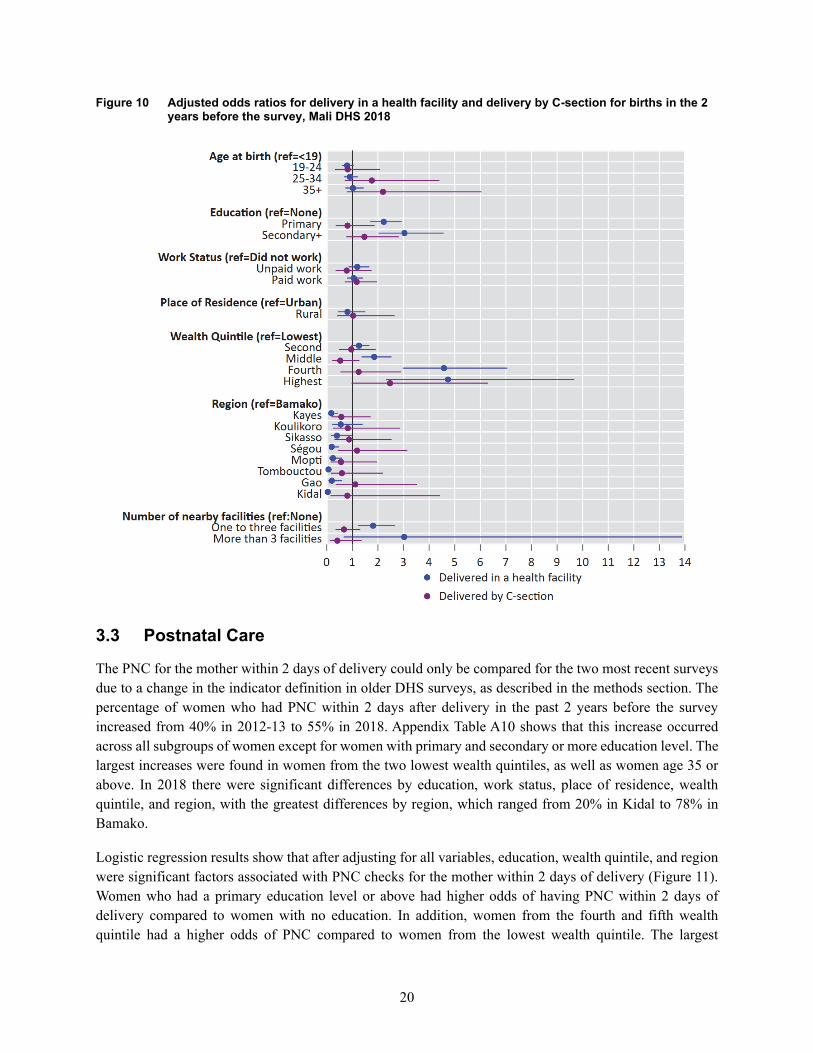
Results from the logistic regressions of the two delivery indicators are shown in Figure 10. Education level, wealth quintile, region, and number of nearby facilities were significant predictors of delivery in a health facility. However, there were no significant variables for delivery by C-section. Women with primary or higher education had more than twice higher odds of delivering in a health facility compared to women who had no education. Even larger disparities were found by wealth and region. Births to women in the middle quintile had almost twice the odds of delivering in a health facility compared to women in the lowest quintile. This reached nearly a 5 times greater odds for births in the fourth and fifth quintile compared to the lowest (see Figure 10 and Appendix Table A19). Births that occurred in almost all the regions, except for Koulikoro, had much lower odds of being delivered in a health facility compared to Bamako region. The lowest was Kidal with an odds ratio of 0.04 (95% C.I. 0.02, 0.09). Finally, births that occur in areas with one to three facilities nearby had almost twice the odds of being delivered in a health facility compared to births with no nearby facilities. Having more than three nearby facilities was not significantly different from having no nearby facilities for delivery at a health facility.
20
Figure 10 Adjusted odds ratios for delivery in a health facility and delivery by C-section for births in the 2 years before the survey, Mali DHS 2018
3.3 Postnatal Care
The PNC for the mother within 2 days of delivery could only be compared for the two most recent surveys due to a change in the indicator definition in older DHS surveys, as described in the methods section. The percentage of women who had PNC within 2 days after delivery in the past 2 years before the survey increased from 40% in 2012-13 to 55% in 2018. Appendix Table A10 shows that this increase occurred across all subgroups of women except for women with primary and secondary or more education level. The largest increases were found in women from the two lowest wealth quintiles, as well as women age 35 or above. In 2018 there were significant differences by education, work status, place of residence, wealth quintile, and region, with the greatest differences by region, which ranged from 20% in Kidal to 78% in Bamako.
Logistic regression results show that after adjusting for all variables, education, wealth quintile, and region were significant factors associated with PNC checks for the mother within 2 days of delivery (Figure 11). Women who had a primary education level or above had higher odds of having PNC within 2 days of delivery compared to women with no education. In addition, women from the fourth and fifth wealth quintile had a higher odds of PNC compared to women from the lowest wealth quintile. The largest
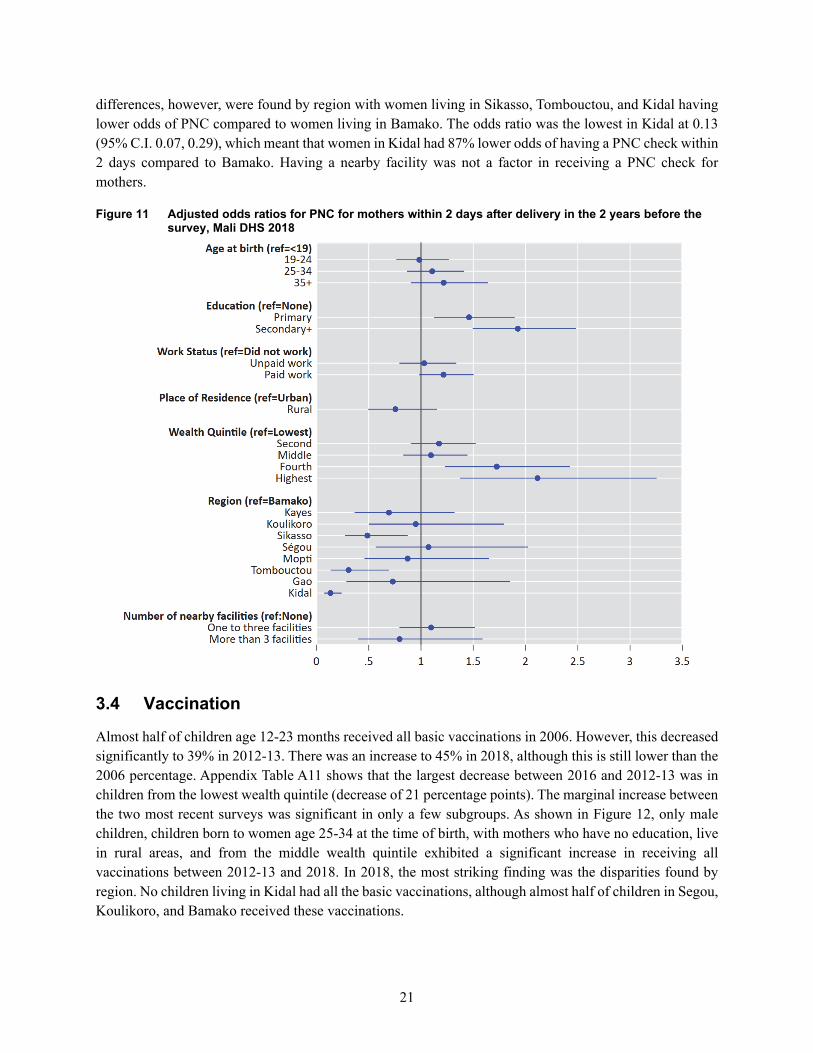
21
differences, however, were found by region with women living in Sikasso, Tombouctou, and Kidal having lower odds of PNC compared to women living in Bamako. The odds ratio was the lowest in Kidal at 0.13 (95% C.I. 0.07, 0.29), which meant that women in Kidal had 87% lower odds of having a PNC check within 2 days compared to Bamako. Having a nearby facility was not a factor in receiving a PNC check for mothers.
Figure 11 Adjusted odds ratios for PNC for mothers within 2 days after delivery in the 2 years before the survey, Mali DHS 2018
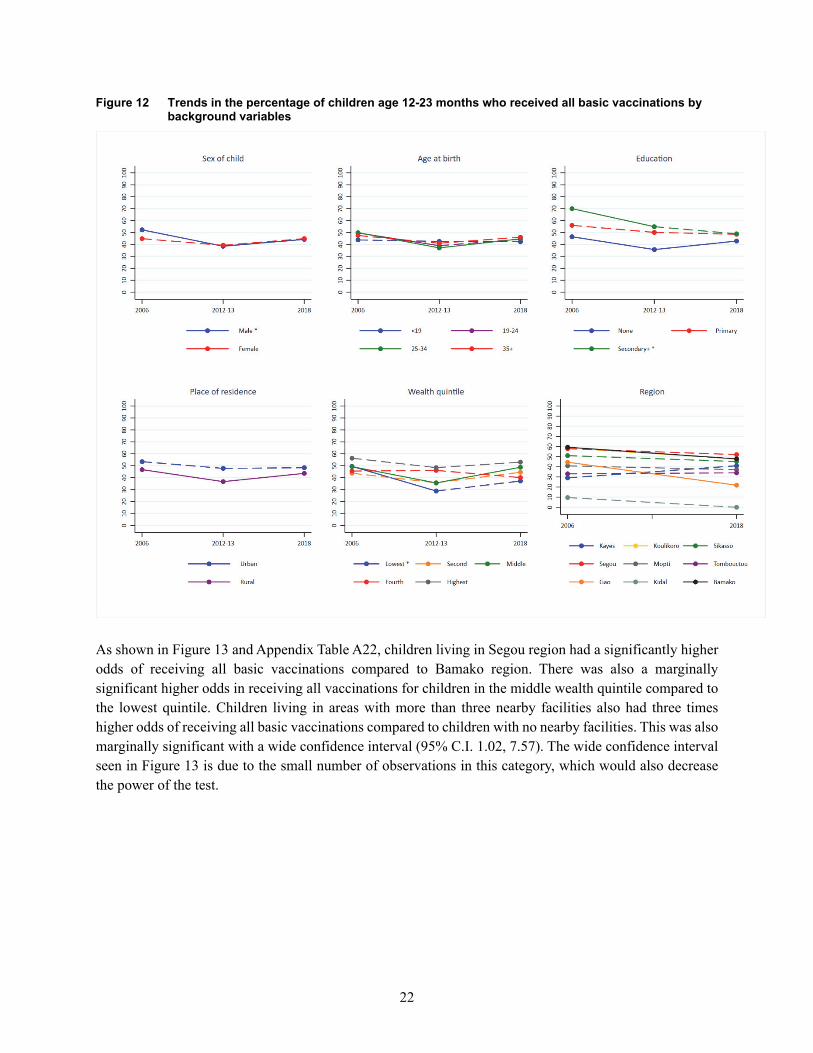
3.4 Vaccination
Almost half of children age 12-23 months received all basic vaccinations in 2006. However, this decreased significantly to 39% in 2012-13. There was an increase to 45% in 2018, although this is still lower than the 2006 percentage. Appendix Table A11 shows that the largest decrease between 2016 and 2012-13 was in children from the lowest wealth quintile (decrease of 21 percentage points). The marginal increase between the two most recent surveys was significant in only a few subgroups. As shown in Figure 12, only male children, children born to women age 25-34 at the time of birth, with mothers who have no education, live in rural areas, and from the middle wealth quintile exhibited a significant increase in receiving all vaccinations between 2012-13 and 2018. In 2018, the most striking finding was the disparities found by region. No children living in Kidal had all the basic vaccinations, although almost half of children in Segou, Koulikoro, and Bamako received these vaccinations.
22
Figure 12 Trends in the percentage of children age 12-23 months who received all basic vaccinations by background variables
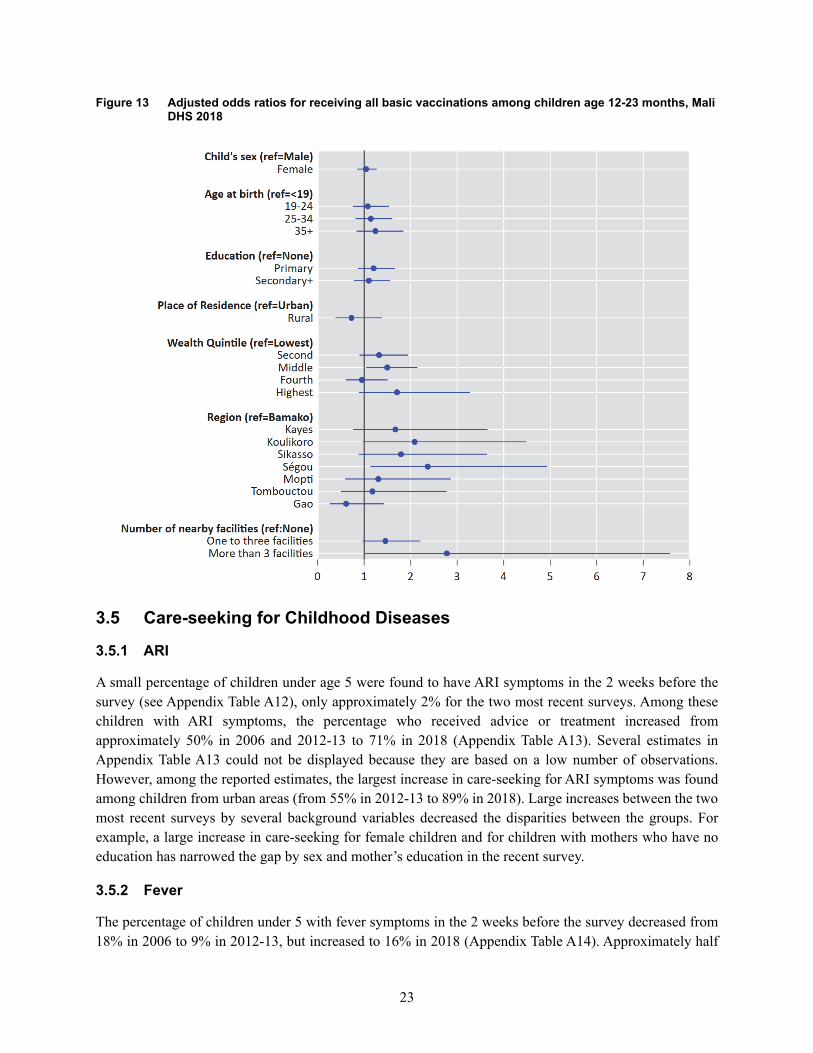
As shown in Figure 13 and Appendix Table A22, children living in Segou region had a significantly higher odds of receiving all basic vaccinations compared to Bamako region. There was also a marginally significant higher odds in receiving all vaccinations for children in the middle wealth quintile compared to the lowest quintile. Children living in areas with more than three nearby facilities also had three times higher odds of receiving all basic vaccinations compared to children with no nearby facilities. This was also marginally significant with a wide confidence interval (95% C.I. 1.02, 7.57). The wide confidence interval seen in Figure 13 is due to the small number of observations in this category, which would also decrease the power of the test.
23
Figure 13 Adjusted odds ratios for receiving all basic vaccinations among children age 12-23 months, Mali DHS 2018
3.5 Care-seeking for Childhood Diseases
3.5.1 ARI
A small percentage of children under age 5 were found to have ARI symptoms in the 2 weeks before the survey (see Appendix Table A12), only approximately 2% for the two most recent surveys. Among these children with ARI symptoms, the percentage who received advice or treatment increased from approximately 50% in 2006 and 2012-13 to 71% in 2018 (Appendix Table A13). Several estimates in Appendix Table A13 could not be displayed because they are based on a low number of observations. However, among the reported estimates, the largest increase in care-seeking for ARI symptoms was found among children from urban areas (from 55% in 2012-13 to 89% in 2018). Large increases between the two most recent surveys by several background variables decreased the disparities between the groups. For example, a large increase in care-seeking for female children and for children with mothers who have no education has narrowed the gap by sex and mother’s education in the recent survey.
3.5.2 Fever
The percentage of children under 5 with fever symptoms in the 2 weeks before the survey decreased from 18% in 2006 to 9% in 2012-13, but increased to 16% in 2018 (Appendix Table A14). Approximately half
24
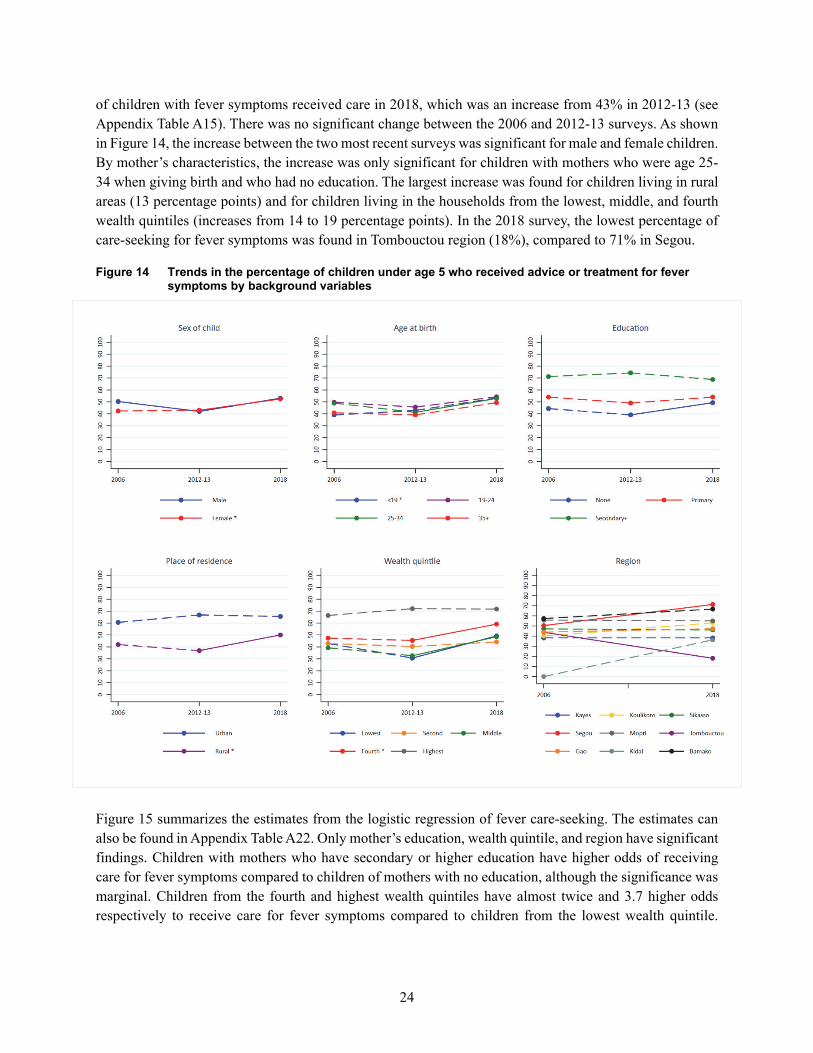
of children with fever symptoms received care in 2018, which was an increase from 43% in 2012-13 (see Appendix Table A15). There was no significant change between the 2006 and 2012-13 surveys. As shown in Figure 14, the increase between the two most recent surveys was significant for male and female children. By mother’s characteristics, the increase was only significant for children with mothers who were age 25-34 when giving birth and who had no education. The largest increase was found for children living in rural areas (13 percentage points) and for children living in the households from the lowest, middle, and fourth wealth quintiles (increases from 14 to 19 percentage points). In the 2018 survey, the lowest percentage of care-seeking for fever symptoms was found in Tombouctou region (18%), compared to 71% in Segou.
Figure 14 Trends in the percentage of children under age 5 who received advice or treatment for fever symptoms by background variables
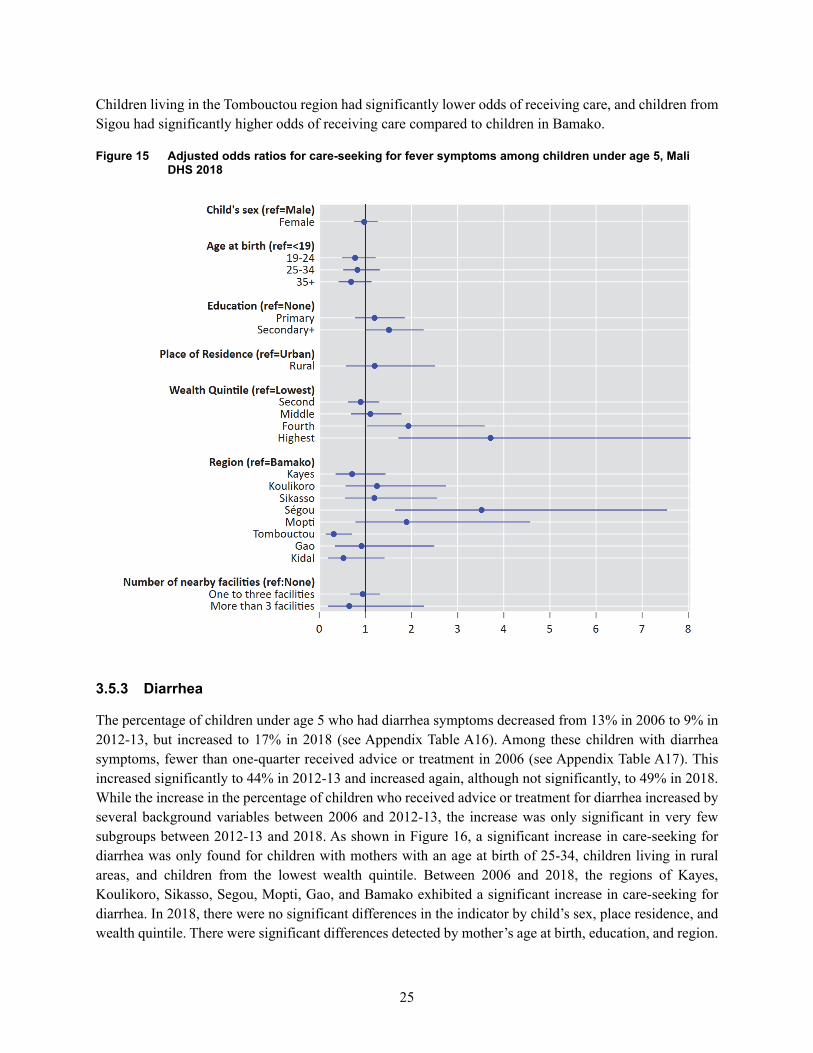
Figure 15 summarizes the estimates from the logistic regression of fever care-seeking. The estimates can also be found in Appendix Table A22. Only mother’s education, wealth quintile, and region have significant findings. Children with mothers who have secondary or higher education have higher odds of receiving care for fever symptoms compared to children of mothers with no education, although the significance was marginal. Children from the fourth and highest wealth quintiles have almost twice and 3.7 higher odds respectively to receive care for fever symptoms compared to children from the lowest wealth quintile.
25
Children living in the Tombouctou region had significantly lower odds of receiving care, and children from Sigou had significantly higher odds of receiving care compared to children in Bamako.
Figure 15 Adjusted odds ratios for care-seeking for fever symptoms among children under age 5, Mali DHS 2018
3.5.3 Diarrhea
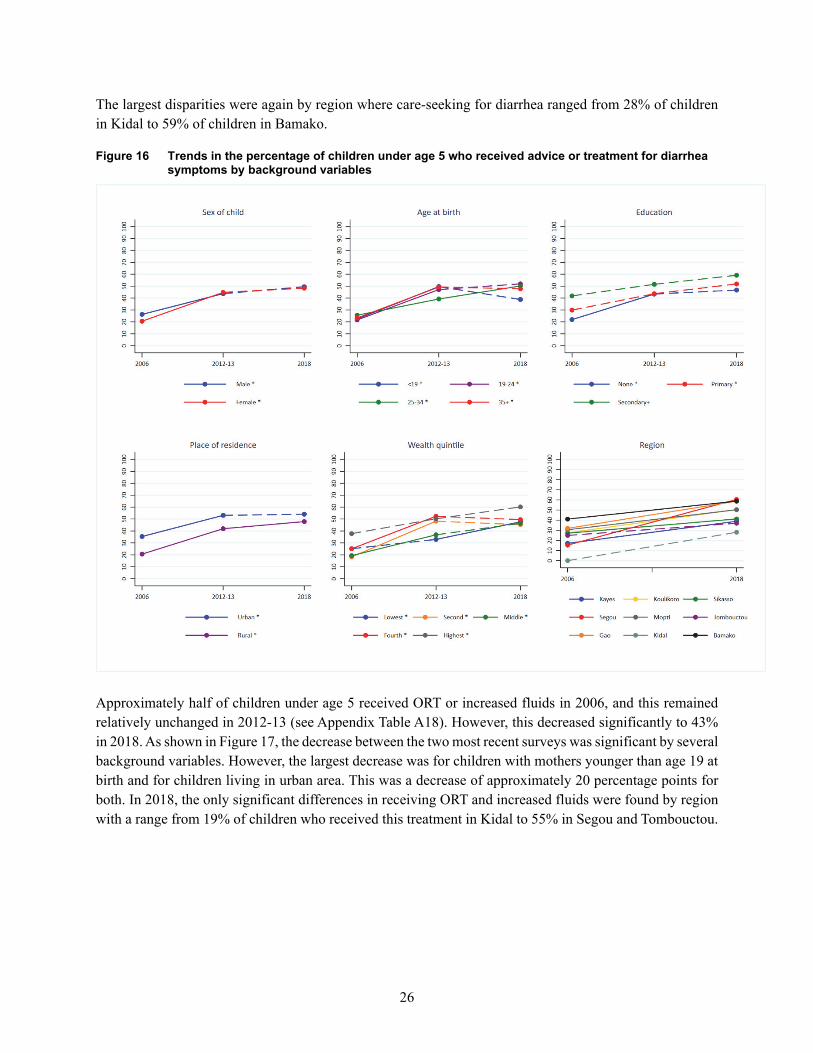
The percentage of children under age 5 who had diarrhea symptoms decreased from 13% in 2006 to 9% in 2012-13, but increased to 17% in 2018 (see Appendix Table A16). Among these children with diarrhea symptoms, fewer than one-quarter received advice or treatment in 2006 (see Appendix Table A17). This increased significantly to 44% in 2012-13 and increased again, although not significantly, to 49% in 2018. While the increase in the percentage of children who received advice or treatment for diarrhea increased by several background variables between 2006 and 2012-13, the increase was only significant in very few subgroups between 2012-13 and 2018. As shown in Figure 16, a significant increase in care-seeking for diarrhea was only found for children with mothers with an age at birth of 25-34, children living in rural areas, and children from the lowest wealth quintile. Between 2006 and 2018, the regions of Kayes, Koulikoro, Sikasso, Segou, Mopti, Gao, and Bamako exhibited a significant increase in care-seeking for diarrhea. In 2018, there were no significant differences in the indicator by child’s sex, place residence, and wealth quintile. There were significant differences detected by mother’s age at birth, education, and region.
26
The largest disparities were again by region where care-seeking for diarrhea ranged from 28% of children in Kidal to 59% of children in Bamako.
Figure 16 Trends in the percentage of children under age 5 who received advice or treatment for diarrhea symptoms by background variables
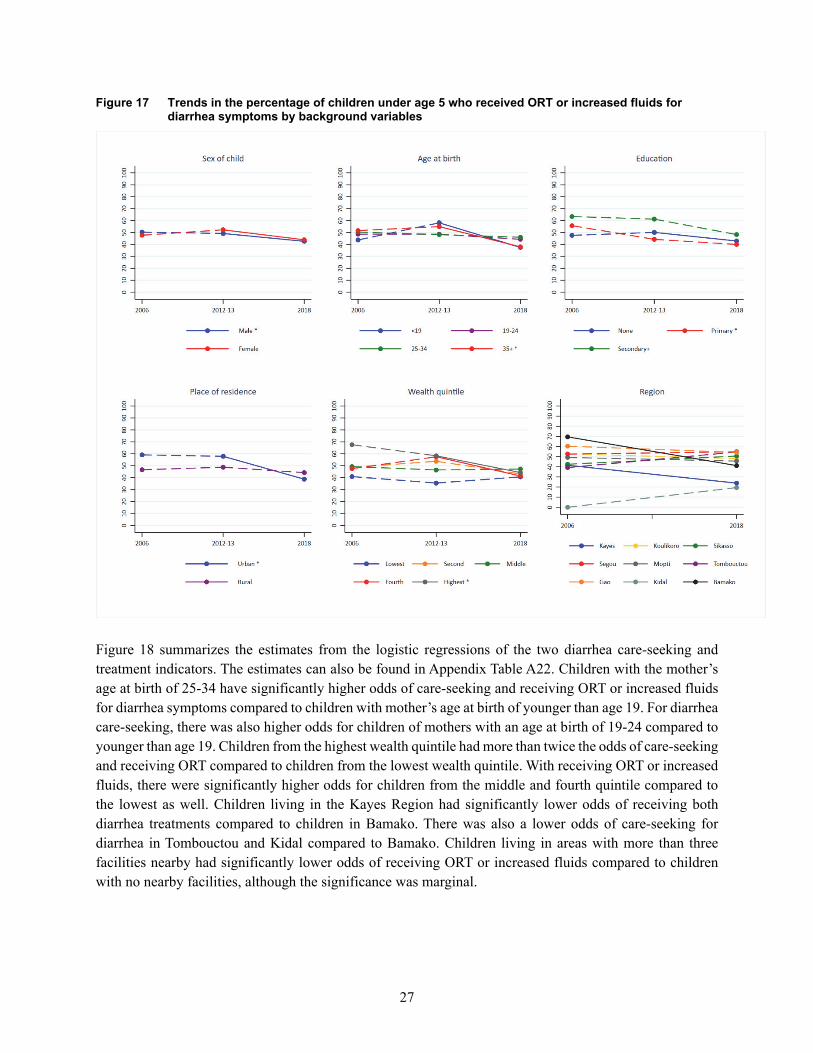
Approximately half of children under age 5 received ORT or increased fluids in 2006, and this remained relatively unchanged in 2012-13 (see Appendix Table A18). However, this decreased significantly to 43% in 2018. As shown in Figure 17, the decrease between the two most recent surveys was significant by several background variables. However, the largest decrease was for children with mothers younger than age 19 at birth and for children living in urban area. This was a decrease of approximately 20 percentage points for both. In 2018, the only significant differences in receiving ORT and increased fluids were found by region with a range from 19% of children who received this treatment in Kidal to 55% in Segou and Tombouctou.
27
Figure 17 Trends in the percentage of children under age 5 who received ORT or increased fluids for diarrhea symptoms by background variables
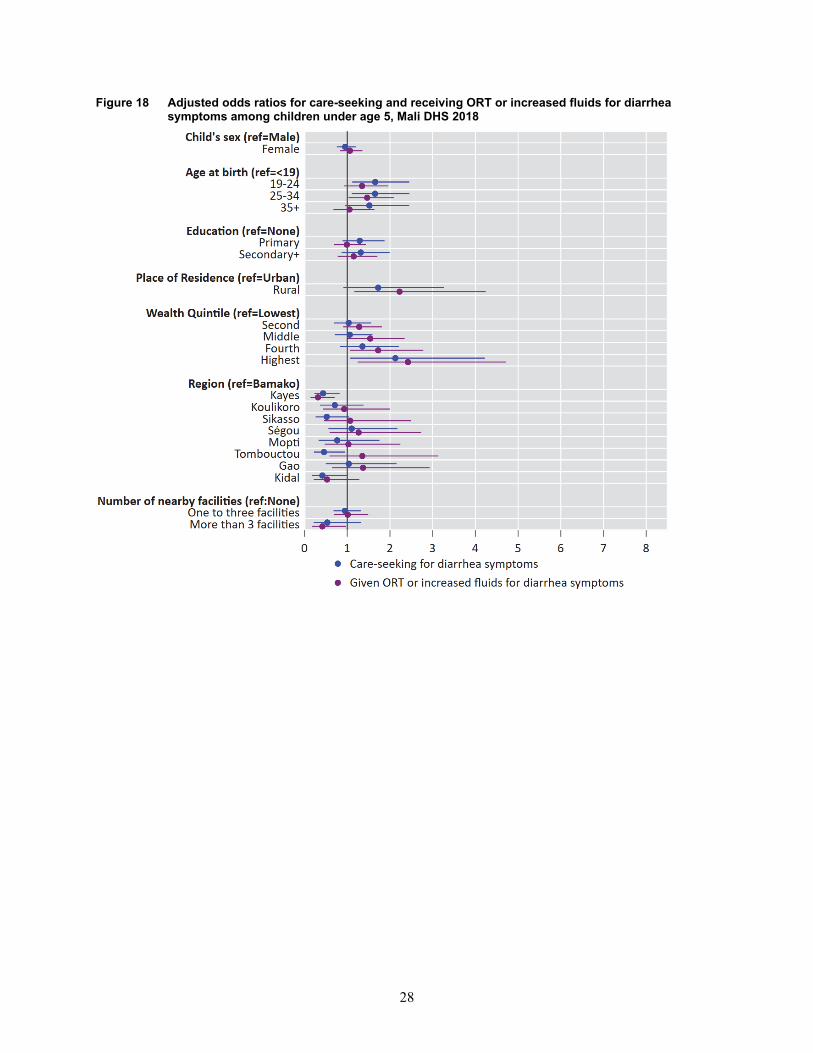
Figure 18 summarizes the estimates from the logistic regressions of the two diarrhea care-seeking and treatment indicators. The estimates can also be found in Appendix Table A22. Children with the mother’s age at birth of 25-34 have significantly higher odds of care-seeking and receiving ORT or increased fluids for diarrhea symptoms compared to children with mother’s age at birth of younger than age 19. For diarrhea care-seeking, there was also higher odds for children of mothers with an age at birth of 19-24 compared to younger than age 19. Children from the highest wealth quintile had more than twice the odds of care-seeking and receiving ORT compared to children from the lowest wealth quintile. With receiving ORT or increased fluids, there were significantly higher odds for children from the middle and fourth quintile compared to the lowest as well. Children living in the Kayes Region had significantly lower odds of receiving both diarrhea treatments compared to children in Bamako. There was also a lower odds of care-seeking for diarrhea in Tombouctou and Kidal compared to Bamako. Children living in areas with more than three facilities nearby had significantly lower odds of receiving ORT or increased fluids compared to children with no nearby facilities, although the significance was marginal.
28
Figure 18 Adjusted odds ratios for care-seeking and receiving ORT or increased fluids for diarrhea symptoms among children under age 5, Mali DHS 2018
29
4 DISCUSSION AND CONCLUSION
One of the important patterns that emerged from the analysis is the stall in improvement in several maternal and child health indicators between the two most recent surveys (between 2012 and 2018). This was apparent for ANC visits, having at least two tetanus injections for women, delivery by C-section, and care-seeking and ORT treatment for children with diarrhea symptoms. This stall can partially be attributed to the conflict that began in northern Mali in 2012 and extended into the Mopti Region and parts of the Koulikoro and Ségou regions (Gesso 2018). During the implementation of the 2012-13 DHS in Mali, there were security concerns, which meant that the northern regions of Tombouctou, Gao, Kidal and parts of Mopti could not be included in the survey (Cellule de Planification et de Statistique - CPS/SSDSPF/Mali et al. 2014). There were also large gaps in the indicators by region, with Kidal and Tombouctou having the lowest coverage compared to the other regions. A study was conducted in 2013, after the 2012 conflict and subsequent displacement in Northern Mali, to understand the association between the levels of conflict and displacement and the availability of sexual and reproductive health care services (Tunçalp et al. 2015). Analysis of 1,581 health care facilities in this study found that the northern regions under conflict had the fewest sexual and reproductive health services available. Services were also more likely to be available in areas with lower concentrations of displaced individuals (Tunçalp et al. 2015).
Other factors may also be contributing to the lack of improvement in some indicators. For example, the largest gaps in the indicators examined by socioeconomic factors were by wealth quintile. This was also found in the regression models after controlling for other variables. Carlson et al. (2011) also found large gaps in nonattendance in ANC and childhood vaccination to be associated with wealth index in Mali. This indicated that services are not reaching women and children from the poorest households, a pattern typically observed across MCH indicators. A law adopted in June 2009 was designed to improve the financial accessibility of health benefits, with a special emphasis on reproductive health services. However, this law favored the families of the civil servants, contractual workers, soldiers, and employees of the public and private sectors. The law did not include the unemployed or independent workers and their families. This placed a greater burden on these families, which are often from the poorest households (Ministère de la Santé et l’Hygiène Publique 2017).
Community and cultural factors can also contribute to the poor performance in MCH indicators. In Mali, women’s odds of utilizing maternal health services are influenced by the practices of those living around them and a level of education of secondary or above (Gage 2007). This implies that community-wide intervention and awareness programs may improve indicators. In Mali, sociocultural determinants related to experiences during pregnancy, risks and emotions associated with pregnancy, onset of labor and delivery, limited autonomy, and control of resources have been shown to contribute to limited utilization of assisted childbirth (Ahmed, Hamelin-Brabant, and Gagnon 2018). In Mali, mothers-in-law play an important role in the maternal health behaviors of their daughters-in-law. Women with mothers-in-law with greater belief in traditional practices were associated with daughters-in-law who were less likely to deliver at a health facility and receive PNC (White et al. 2013).
Other indicators have stalled or deteriorated across the whole country. For example, C-section delivery remains very low across all subgroups of women. By 2018, only 2.4% of births in the 2 years before the survey were delivered by C-section. This suggests that women may not be receiving the emergency obstetric
30
care that they need. The WHO estimates that approximately 10-15% of deliveries require C-sections to save the mother and child (World Health Organization 2018). Having no access to emergency C-sections when needed can be life threatening to both the mother and child. Efforts in Mali have been made to address this important issue. The Emergency Obstetric and Neonatal Care Program was introduced in 2004 to increase the number of facilities that offer complete obstetric and neonatal emergency care (Salim 2012). A decree was also issued by the government in 2005 to make all C-sections free in public facilities, although socioeconomic inequalities in C-section access did not substantially change after implementation of the free C-section policy (Ravit et al. 2018). There are still challenges for women and households to pay for the costs not covered by the government services such as costs for further treatment, medicines, and transportation (Arsenault et al. 2013). These burdens were greater for women who live in rural areas. Another study found that C-section rates were lower for women from poor households, which was also the case after the C-section fee exemption (El-Khoury, Hatt, and Gandaho 2012). There is also the problem of failure to recognize danger signs early during pregnancy in order to reach care in time. The 2012-13 DHS survey found that only 41% of Mali women were informed of signs of pregnancy complications (Cellule de Planification et de Statistique - CPS/SSDSPF/Mali et al. 2014). This question was not included in the 2018 DHS. With health services, there are the challenges of having sufficiently trained personnel who are evenly distributed throughout the country and who are able to provide emergency obstetric care, as well problems with shortages of health workers and medicines (Ministère de la Santé et l’Hygiène Publique 2017; Otchere and Kayo 2007).
The child health indicators of vaccination and care-seeking also appear to be stalling or deteriorating. The Government of Mali has focused on improving vaccination coverage through the EPI (or PEV) program. This has contributed to the increase in vaccination between the two most recent surveys, although fewer than half of children between age 12-23 months have all their basic vaccinations, according to the most recent 2018 survey. In addition, care-seeking for diarrhea has not improved and treatment with ORT has declined between the two most recent surveys. This may be contributing to the stall in the under age 5 mortality as discussed previously. Diarrhea is one of the main causes of death in children under age 5. Treating children for childhood diseases and ensuring that they receive their basic vaccinations are very important for their survival. Awareness, financial difficulties, and access to quality of health-care services are factors. One study of 1,000 children in Bamako, Mali, found that 57% of caretakers sought care for their child’s diarrhea illness from a traditional healer and were more likely to seek care from a traditional healer for more severe diarrheal symptoms (Farag et al. 2013). This may imply that children are not receiving reliable treatment.
The analysis also identified several areas of improvement in Mali. The percentage of births delivered in a health facility, the percentage of women who had a PNC check within 2 days of delivery, and the percentage of children under age 5 who had sought care for their ARI and fever symptoms have also increased significantly. This improvement may be a result of efforts to decentralize the services and facilities. Results from our regression analysis found that having at least one to three facilities nearby increased the likelihood of facility delivery. Proximity to health facilities was identified as one of the main factors of health facility delivery in two review articles (Gabrysch and Campbell 2009; Moyer and Mustafa 2013). There has also been an increased focus on CHWs. Studies have found that well-trained CHWs play an important role in improving MCH indicators, specifically among hard-to-reach populations (Alvarez Moran et al. 2018; Perez et al. 2009). The CHWs have played an important role in increasing access to populations that cannot access health facilities. Several iCCM programs have been introduced across Mali, which have improved
31
child health indicators through diagnosis, treatment, and referral services by CHWs for diarrhea, malaria, and pneumonia (Daviaud et al. 2017; Johnson et al. 2018).
Conclusion
The findings from this analysis have highlighted several areas of concern. The stall and deterioration in some indicators need to be addressed in order to achieve the goals outlined in the 2015 to 2020 Country Development Cooperation Strategy (CDCS), and more specifically, the third development objective that emphasizes the advancement of socioeconomic well-being for all Malians (USAID 2015). The analysis has shown the toll of the 2012 conflict on women and children in Mali, especially those in the northern regions. However, large gaps were also found by wealth quintile and education, which indicated that inequalities are prominent and persistent across the country. Although many efforts have been made to decrease these gaps, more effort is needed to reach the most underserved areas and population subgroups such as those living in rural areas, poor households, or the least educated in Mali.

33
REFERENCES
Ahmed, M. A., L. Hamelin-Brabant, and M. Gagnon. 2018. “Sociocultural Determinants of Nomadic Women’s Utilization of Assisted Childbirth in Gossi, Mali: A Qualitative Study.” BMC Pregnancy and Childbirth 18 (1): 388. https://doi.org/10.1186/s12884-018-2027-3.
Alvarez Moran, J. L., F. G. Alé, E. Rogers, and S. Guerrero. 2018. “Quality of Care for Treatment of Uncomplicated Severe Acute Malnutrition Delivered by Community Health Workers in a Rural Area of Mali.” Maternal & Child Nutrition 14 (1): e12449. https://doi.org/10.1111/mcn.12449.
Arsenault, C., P. Fournier, A. Philibert, K. Sissoko, A. Coulibaly, C. Tourigny, M. Traoré, and A. Dumont. 2013. “Emergency Obstetric Care in Mali: Catastrophic Spending and Its Impoverishing Effects on Households.” Bulletin of the World Health Organization 91: 207-216. https://dx.doi.org/10.2471%2FBLT.12.108969.
Barros, A. J. D., C. Ronsmans, H. Axelson, E. Loaiza, A. D. Bertoldi, G. V. A. França, J. Bryce, J. T. Boerma, and C. G. Victora. 2012. “Equity in Maternal, Newborn, and Child Health Interventions in Countdown to 2015: A Retrospective Review of Survey Data from 54 Countries.” The Lancet 379 (9822): 1225-1233. https://doi.org/10.1016/S0140-6736(12)60113-5.
Berhan, Y., and A. Berhan. 2014. “Antenatal Care as a Means of Increasing Birth in the Health Facility and Reducing Maternal Mortality: A Systematic Review.” Ethiopian Journal of Health Sciences 24: 93-104. https://dx.doi.org/10.4314%2Fejhs.v24i0.9s.
Blencowe, H., S. Cousens, L. C. Mullany, A. C. Lee, K. Kerber, S. Wall, G. L. Darmstadt, and J. E. Lawn. 2011. “Clean Birth and Postnatal Care Practices to Reduce Neonatal Deaths from Sepsis and Tetanus: A Systematic Review and Delphi Estimation of Mortality Effect.” BMC Public Health 11 (3): S11. https://dx.doi.org/10.1186%2F1471-2458-11-S3-S11.
Bosch–Capblanch, X., and C. Marceau. 2014. “Training, Supervision and Quality of Care in Selected Integrated Community Case Management (iCCM) Programmes: A Scoping Review of Programmatic Evidence.” Journal of Global Health 4 (2). https://dx.doi.org/10.7189%2Fjogh.04.020403.
Carlson, M., L. S. Paintain, J. Bruce, J. Webster, and J. Lines. 2011. “Who Attends Antenatal Care and Expanded Programme on Immunization Services in Chad, Mali and Niger? The Implications for Insecticide-Treated Net Delivery.” Malaria Journal 10 (1): 341. https://doi.org/10.1186/1475-2875-10-341.
Carroli, G., C. Rooney, and J. Villar. 2001. “How Effective Is Antenatal Care in Preventing Maternal Mortality and Serious Morbidity? An Overview of the Evidence.” Paediatric and Perinatal Epidemiology 15: 1-42. https://doi.org/10.1046/j.1365-3016.2001.0150s1001.x.
Carvajal–Aguirre, L., A. Amouzou, V. Mehra, M. Ziqi, N. Zaka, and H. Newby. 2017. “Gap between Contact and Content in Maternal and Newborn Care: An Analysis of Data from 20 Countries in Sub–Saharan Africa.” Journal of Global Health 7 (2). https://doi.org/10.7189/jogh.07.020501.

34
Cellule de Planification et de Statistique - CPS/SSDSPF/Mali, Institut National de la Statistique - INSTAT/Mali, Centre d’Études et d’Information Statistiques - INFO-STAT/Mali, and ICF International. 2014. Mali Enquête Démographique et de Santé (EDSM V) 2012-2013. Rockville, Maryland, USA: CPS, INSTAT, INFO-STAT and ICF International. http://dhsprogram.com/pubs/pdf/FR286/FR286.pdf.
Colvin, C. J., H. J. Smith, A. Swartz, J. W. Ahs, J. de Heer, N. Opiyo, J. C. Kim, T. Marraccini, and A. George. 2013. “Understanding Careseeking for Child Illness in Sub-Saharan Africa: A Systematic Review and Conceptual Framework Based on Qualitative Research of Household Recognition and Response to Child Diarrhea, Pneumonia and Malaria.” Social Science & Medicine 86: 66-78. https://doi.org/10.1016/j.socscimed.2013.02.031.
Dahiru, T., and O. Oche. 2014. “Determinants of Antenatal Care, Institutional Delivery and Postnatal Care Services Utilization in Nigeria.” Pan African Medical Journal 2015; 21: 321. https://doi.org/10.11604/pamj.2015.21.321.6527.
Daviaud, E., D. Besada, N. Leon, S. Rohde, D. Sanders, N. Oliphant, and T. Doherty. 2017. “Costs of Implementing Integrated Community Case Management (iCCM) in Six African Countries: Implications for Sustainability.” Journal of Global Health 7 (1). https://doi.org/10.7189/jogh.07.010403.
Dicko, A., C. Mantel, B. Kouriba, I. Sagara, M. A. Thera, S. Doumbia, M. Diallo, et al. 2005. “Season, Fever Prevalence and Pyrogenic Threshold for Malaria Disease Definition in an Endemic Area of Mali.” Tropical Medicine & International Health 10 (6): 550-556. https://doi.org/10.1111/j.1365-3156.2005.01418.x.
Duclos, P., J.-M. Okwo-Bele, M. Gacic-Dobo, and T. Cherian. 2009. “Global Immunization: Status, Progress, Challenges and Future.” BMC International Health and Human Rights 9 (1): S2. https://dx.doi.org/10.1186%2F1472-698X-9-S1-S2.
El-Khoury, M., L. Hatt, and T. Gandaho. 2012. “User Fee Exemptions and Equity in Access to Caesarean Sections: An Analysis of Patient Survey Data in Mali.” International Journal for Equity in Health 11 (1): 49. https://doi.org/10.1186/1475-9276-11-49.
Esopo, K., L. Derby, and J. Haushofer. 2018. “Interventions to Improve Adherence to Antenatal and Postnatal Care Regimens among Pregnant Women in Sub-Saharan Africa: A Systematic Review.”
Farag, T. H., K. L. Kotloff, M. M. Levine, U. Onwuchekwa, A. M. Van Eijk, S. Doh, and S. O. Sow. 2013. “Seeking Care for Pediatric Diarrheal Illness from Traditional Healers in Bamako, Mali.” The American Journal of Tropical Medicine and Hygiene 89 (1_Suppl): 21-28. https://dx.doi.org/10.4269%2Fajtmh.12-0753.
Finlayson, K., and S. Downe. 2013. “Why Do Women Not Use Antenatal Services in Low- and Middle-Income Countries? A Meta-Synthesis of Qualitative Studies.” PLoS Medicine 10 (1): e1001373. https://dx.doi.org/10.1371%2Fjournal.pmed.1001373.
Gabrysch, S., and O. M. Campbell. 2009. “Still Too Far to Walk: Literature Review of the Determinants of Delivery Service Use.” BMC Pregnancy and Childbirth 9 (1): 34. https://doi.org/10.1186/1471-2393-9-34.
35
Gage, A. J. 2007. “Barriers to the Utilization of Maternal Health Care in Rural Mali.” Social Science & Medicine 65 (8): 1666-1682. https://doi.org/10.1016/j.socscimed.2007.06.001.
Gesso, G. S. 2018. “A Critical Analysis of the Requirements for Full Operationalization of the African Standby Force: Lessons Learned from the Eastern Africa Standby Force.” Journal of African-Centred Solutions in Peace and Security Vol. 3, September 2018 3: 60.
ICF. 2012. The DHS Program Statcompiler. http://www.statcompiler.com.
Institut National de la Statistique - INSTAT, Cellule de Planification et de Statistique Secteur Santé-Développement, and ICF. 2019. Mali Demographic and Health Survey 2018. Bamako, Mali: INSTAT/CPS/SS-DS-PF and ICF. http://dhsprogram.com/pubs/pdf/FR358/FR358.pdf.
Izudi, J., and D. Amongin. 2015. “Use of Early Postnatal Care among Postpartum Women in Eastern Uganda.” International Journal of Gynecology & Obstetrics 129 (2): 161-164. https://doi.org/10.1016/j.ijgo.2014.11.017.
Johnson, A. D., O. Thiero, C. Whidden, B. Poudiougou, D. Diakité, F. Traoré, S. Samaké, et al. 2018. “Proactive Community Case Management and Child Survival in Periurban Mali.” BMJ Global Health 3 (2): e000634. http://dx.doi.org/10.1136/bmjgh-2017-000634.
Koumaré, A. K., D. Traore, F. Haidara, F. Sissoko, I. Traoré, S. Dramé, K. Sangaré, et al. 2009. “Evaluation of Immunization Coverage within the Expanded Program on Immunization in Kita Circle, Mali: A Cross-Sectional Survey.” BMC International Health and Human Rights 9 (S1): S13. https://dx.doi.org/10.1186%2F1472-698X-9-S1-S13.
Madhi, S. A., and H. Rees. 2018. “Special Focus on Challenges and Opportunities for the Development and Use of Vaccines in Africa.” Human Vaccines and Immunotherapeutics 14 (10). https://dx.doi.org/10.1080%2F21645515.2018.1522921.
Maina, J., P. O. Ouma, P. M. Macharia, V. A. Alegana, B. Mitto, I. S. Fall, A. M. Noor, R. W. Snow, and E. A. Okiro. 2019. “A Spatial Database of Health Facilities Managed by the Public Health Sector in Sub Saharan Africa.” Scientific Data 6 (1): 1-8. https://doi.org/10.1038/s41597-019-0142-2.
Ministère de la Santé et l’Hygiène Publique. 2017. Évaluation Rapide des Soins Obstétricaux et Néonataux d’Urgence. Mali: Direction Nationale de la Santé.
Mlambo, M., C. Penn, K. Peltzer, and N. Phaswana-Mafuya. 2018. “Multiple Perspectives on Factors Affecting Early Antenatal Care Attendance in the Context of PMCTC in a Rural District of South Africa.” Gender and Behaviour 16 (1): 10646-10667.
Moyer, C. A., and A. Mustafa. 2013. “Drivers and Deterrents of Facility Delivery in Sub-Saharan Africa: A Systematic Review.” Reproductive Health 10 (1): 40. https://doi.org/10.1186/1742-4755-10-40.
Mrisho, M., B. Obrist, J. A. Schellenberg, R. A. Haws, A. K. Mushi, H. Mshinda, M. Tanner, and D. Schellenberg. 2009. “The Use of Antenatal and Postnatal Care: Perspectives and Experiences of Women
36
and Health Care Providers in Rural Southern Tanzania.” BMC Pregnancy and Childbirth 9 (1): 10. https://dx.doi.org/10.1186%2F1471-2393-9-10.
Otchere, S., and A. Kayo. 2007. “The Challenges of Improving Emergency Obstetric Care in Two Rural Districts in Mali.” International Journal of Gynecology & Obstetrics 99 (2): 173-182. https://doi.org/10.1016/j.ijgo.2007.07.004.
Perez, F., H. Ba, S. G. Dastagire, and M. Altmann. 2009. “The Role of Community Health Workers in Improving Child Health Programmes in Mali.” BMC International Health and Human Rights 9 (1): 28. https://doi.org/10.1186/1472-698X-9-28.
Plucinski, M. M., B. Candrinho, M. Dimene, T. Smith, J. Thwing, J. Colborn, E. Rogier, and R. Zulliger. 2020. “Estimation of Malaria-Attributable Fever in Malaria Test–Positive Febrile Outpatients in Three Provinces of Mozambique, 2018.” The American Journal of Tropical Medicine and Hygiene 102 (1): 151-155. https://doi.org/10.4269/ajtmh.19-0537.
Ravit, M., M. Audibert, V. Ridde, M. De Loenzien, C. Schantz, and A. Dumont. 2018. “Do Free Caesarean Section Policies Increase Inequalities in Benin and Mali?” International Journal for Equity in Health 17 (1): 71. https://doi.org/10.1186/s12939-018-0789-x.
Requejo, J. H., J. Bryce, A. J. D. Barros, P. Berman, Z. Bhutta, M. Chopra, B. Daelmans, et al. 2015. “Countdown to 2015 and Beyond: Fulfilling the Health Agenda for Women and Children.” The Lancet 385 (9966): 466-476. https://doi.org/10.1016/S0140-6736(14)60925-9.
Salim, R. 2012. Caesarean Delivery: BoD–Books on Demand.
Samaké, S., S. M. Traoré, S. Ba, É. Dembélé, and M. Diop. 2007. Enquête Démographique Et De Santé Du Mali 2006. Calverton, Maryland, USA: Cellule de Planification et de Statistique du Ministère de la Santé - CPS/MS/Mali, Direction Nationale de la Statistique et de l’Informatique du Ministère de l’Économie, de l’Industrie et du Commerce - DNSI/MEIC/Mali and Macro International. http://dhsprogram.com/pubs/pdf/FR199/FR199.pdf.
Simkhada, B., E. R. v. Teijlingen, M. Porter, and P. Simkhada. 2008. “Factors Affecting the Utilization of Antenatal Care in Developing Countries: Systematic Review of the Literature.” Journal of Advanced Nursing 61 (3): 244-260. https://doi.org/10.1111/j.1365-2648.2007.04532.x.
Tunçalp, Ö., I. S. Fall, S. J. Phillips, I. Williams, M. Sacko, O. B. Touré, L. J. Thomas, and L. Say. 2015. “Conflict, Displacement and Sexual and Reproductive Health Services in Mali: Analysis of 2013 Health Resources Availability Mapping System (Herams) Survey.” Conflict and Health 9 (1): 28. https://doi.org/10.1186/s13031-015-0051-8.
UNFPA. 2019. Trends in Maternal Mortality 2000 to 2017: Estimates by WHO, UNICEF, UNFPA, World Bank Group and the United Nations Population Division. Geneva World Health Organization https://www.unfpa.org/sites/default/files/pub-pdf/Maternal_mortality_report.pdf.
UNICEF. 2019. “United Nations Inter-Agency Group for Child Mortality Estimation (UN IGME).” UNICEF, WHO, World Bank Group and United Nations.
37
USAID. 2015. Country Development Cooperation Strategy: Mali Forward 2015-2020 https://www.usaid.gov/sites/default/files/documents/1860/Mali_CDCS_2015-2020.pdf.
Vargas, V., S. Ahmed, and A. M. Adams. 2018. “Factors Enabling Comprehensive Maternal Health Services in the Benefits Package of Emerging Financing Schemes: A Cross-Sectional Analysis from 1990 to 2014.” PloS One 13 (9): e0201398. https://doi.org/10.1371/journal.pone.0201398.
Warren, C., P. Daly, L. Toure, and P. Mongi. 2006. “Postnatal Care. Opportunities for Africa’s Newborns.” Cape Town, South Africa: Partnership for Maternal, Newborn and Child Health: 79-90.
White, D., M. Dynes, M. Rubardt, K. Sissoko, and R. Stephenson. 2013. “The Influence of Intrafamilial Power on Maternal Health Care in Mali: Perspectives of Women, Men and Mothers-in-Law.” International Perspectives on Sexual and Reproductive Health: 58-68. https://doi.org/10.1363/3905813.
World Health Organization. 2018. WHO Recommendations Non-Clinical Interventions to Reduce Unnecessary Caesarean Sections. Geneva: World Health Organization. https://apps.who.int/iris/bitstream/handle/10665/275377/9789241550338-eng.pdf?ua=1.
World Health Organization. 2019. Global Health Observatory (GHO) Data: Under-Five Mortality. Geneva: World Health Organization. https://www.who.int/gho/child_health/mortality/mortality_under_five_text/en/.
World Health Organization. 2016. WHO Recommendations on Antenatal Care for a Positive Pregnancy Experience: Geneva: World Health Organization.
World Health Organization. 2018. WHO Recommendations on Antenatal Care for a Positive Pregnancy Experience: Summary. Geneva https://apps.who.int/iris/bitstream/handle/10665/259947/WHO-RHR-18.02-eng.pdf?sequence=1.
World Health Organization. 2018 World Health Statistics 2018: Monitoring Health for the SDGs, Sustainable Development Goals. Geneva: World Health Organization. https://apps.who.int/iris/bitstream/handle/10665/272596/9789241565585-eng.pdf?ua=1.
World Health Organization. 2019. Maternal Mortality https://www.who.int/news-room/fact-sheets/detail/maternal-mortality. Geneva: World Health Organization.

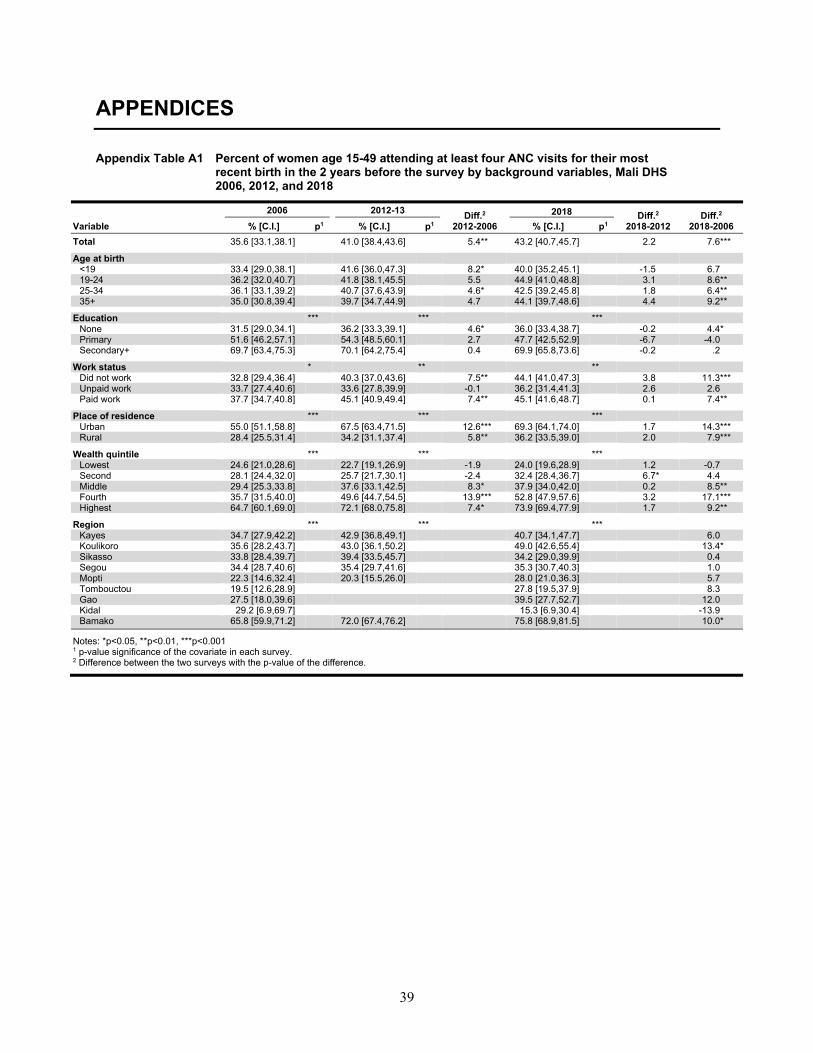
39
APPENDICES
Appendix Table A1 Percent of women age 15-49 attending at least four ANC visits for their most recent birth in the 2 years before the survey by background variables, Mali DHS 2006, 2012, and 2018
2006 2012-13 Diff.2 2012-2006
2018 Diff.2 2018-2012
Diff.2
2018-2006 Variable % [C.I.] p1 % [C.I.] p1 % [C.I.] p1 Total 35.6 [33.1,38.1] 41.0 [38.4,43.6] 5.4** 43.2 [40.7,45.7] 2.2 7.6*** Age at birth
<19 33.4 [29.0,38.1] 41.6 [36.0,47.3] 8.2* 40.0 [35.2,45.1] -1.5 6.7 19-24 36.2 [32.0,40.7] 41.8 [38.1,45.5] 5.5 44.9 [41.0,48.8] 3.1 8.6** 25-34 36.1 [33.1,39.2] 40.7 [37.6,43.9] 4.6* 42.5 [39.2,45.8] 1.8 6.4** 35+ 35.0 [30.8,39.4] 39.7 [34.7,44.9] 4.7 44.1 [39.7,48.6] 4.4 9.2**
Education *** *** *** None 31.5 [29.0,34.1] 36.2 [33.3,39.1] 4.6* 36.0 [33.4,38.7] -0.2 4.4* Primary 51.6 [46.2,57.1] 54.3 [48.5,60.1] 2.7 47.7 [42.5,52.9] -6.7 -4.0 Secondary+ 69.7 [63.4,75.3] 70.1 [64.2,75.4] 0.4 69.9 [65.8,73.6] -0.2 .2
Work status * ** **
Did not work 32.8 [29.4,36.4] 40.3 [37.0,43.6] 7.5** 44.1 [41.0,47.3] 3.8 11.3*** Unpaid work 33.7 [27.4,40.6] 33.6 [27.8,39.9] -0.1 36.2 [31.4,41.3] 2.6 2.6 Paid work 37.7 [34.7,40.8] 45.1 [40.9,49.4] 7.4** 45.1 [41.6,48.7] 0.1 7.4**
Place of residence *** *** ***
Urban 55.0 [51.1,58.8] 67.5 [63.4,71.5] 12.6*** 69.3 [64.1,74.0] 1.7 14.3*** Rural 28.4 [25.5,31.4] 34.2 [31.1,37.4] 5.8** 36.2 [33.5,39.0] 2.0 7.9***
Wealth quintile *** *** ***
Lowest 24.6 [21.0,28.6] 22.7 [19.1,26.9] -1.9 24.0 [19.6,28.9] 1.2 -0.7 Second 28.1 [24.4,32.0] 25.7 [21.7,30.1] -2.4 32.4 [28.4,36.7] 6.7* 4.4 Middle 29.4 [25.3,33.8] 37.6 [33.1,42.5] 8.3* 37.9 [34.0,42.0] 0.2 8.5** Fourth 35.7 [31.5,40.0] 49.6 [44.7,54.5] 13.9*** 52.8 [47.9,57.6] 3.2 17.1*** Highest 64.7 [60.1,69.0] 72.1 [68.0,75.8] 7.4* 73.9 [69.4,77.9] 1.7 9.2**
Region *** *** ***
Kayes 34.7 [27.9,42.2] 42.9 [36.8,49.1] 40.7 [34.1,47.7] 6.0 Koulikoro 35.6 [28.2,43.7] 43.0 [36.1,50.2] 49.0 [42.6,55.4] 13.4*
Sikasso 33.8 [28.4,39.7] 39.4 [33.5,45.7] 34.2 [29.0,39.9] 0.4 Segou 34.4 [28.7,40.6] 35.4 [29.7,41.6] 35.3 [30.7,40.3] 1.0 Mopti 22.3 [14.6,32.4] 20.3 [15.5,26.0] 28.0 [21.0,36.3] 5.7 Tombouctou 19.5 [12.6,28.9] 27.8 [19.5,37.9] 8.3 Gao 27.5 [18.0,39.6] 39.5 [27.7,52.7] 12.0 Kidal 29.2 [6.9,69.7] 15.3 [6.9,30.4] -13.9 Bamako 65.8 [59.9,71.2] 72.0 [67.4,76.2] 75.8 [68.9,81.5] 10.0*
Notes: *p<0.05, **p<0.01, ***p<0.001 1 p-value significance of the covariate in each survey. 2 Difference between the two surveys with the p-value of the difference.
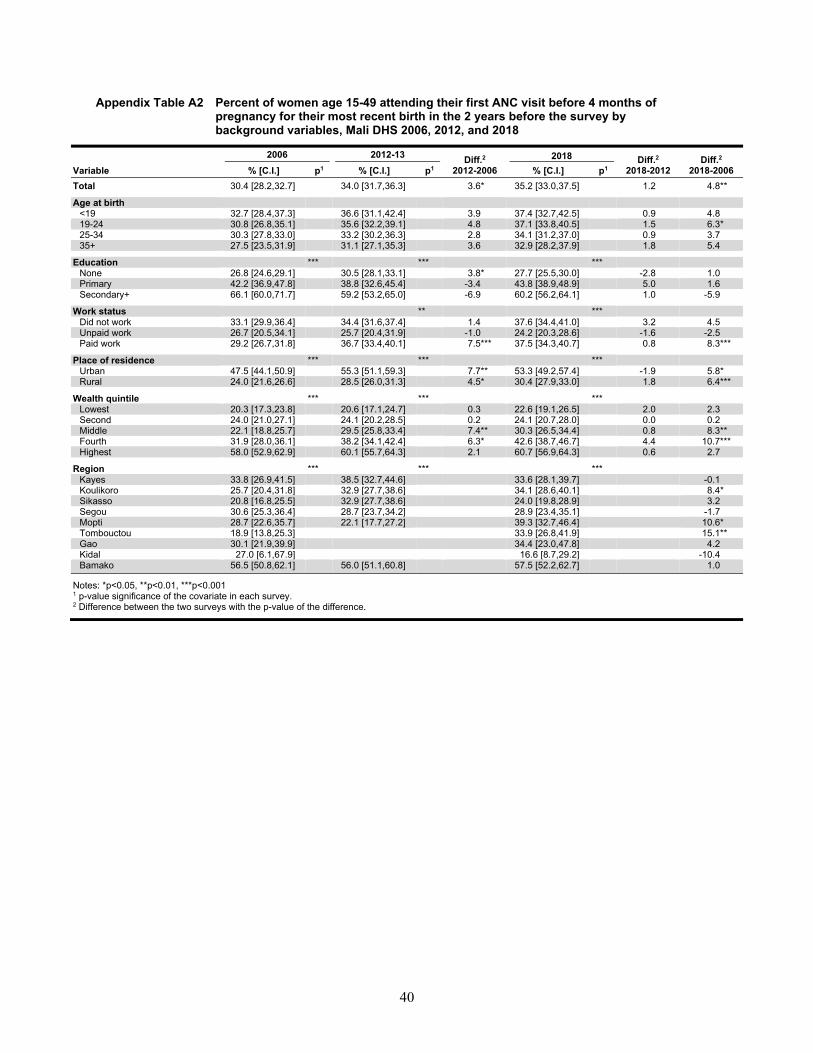
40
Appendix Table A2 Percent of women age 15-49 attending their first ANC visit before 4 months of pregnancy for their most recent birth in the 2 years before the survey by background variables, Mali DHS 2006, 2012, and 2018
2006 2012-13 Diff.2 2012-2006
2018 Diff.2 2018-2012
Diff.2
2018-2006 Variable % [C.I.] p1 % [C.I.] p1 % [C.I.] p1 Total 30.4 [28.2,32.7] 34.0 [31.7,36.3] 3.6* 35.2 [33.0,37.5] 1.2 4.8** Age at birth
<19 32.7 [28.4,37.3] 36.6 [31.1,42.4] 3.9 37.4 [32.7,42.5] 0.9 4.8 19-24 30.8 [26.8,35.1] 35.6 [32.2,39.1] 4.8 37.1 [33.8,40.5] 1.5 6.3* 25-34 30.3 [27.8,33.0] 33.2 [30.2,36.3] 2.8 34.1 [31.2,37.0] 0.9 3.7 35+ 27.5 [23.5,31.9] 31.1 [27.1,35.3] 3.6 32.9 [28.2,37.9] 1.8 5.4
Education *** *** *** None 26.8 [24.6,29.1] 30.5 [28.1,33.1] 3.8* 27.7 [25.5,30.0] -2.8 1.0 Primary 42.2 [36.9,47.8] 38.8 [32.6,45.4] -3.4 43.8 [38.9,48.9] 5.0 1.6 Secondary+ 66.1 [60.0,71.7] 59.2 [53.2,65.0] -6.9 60.2 [56.2,64.1] 1.0 -5.9
Work status ** ***
Did not work 33.1 [29.9,36.4] 34.4 [31.6,37.4] 1.4 37.6 [34.4,41.0] 3.2 4.5 Unpaid work 26.7 [20.5,34.1] 25.7 [20.4,31.9] -1.0 24.2 [20.3,28.6] -1.6 -2.5 Paid work 29.2 [26.7,31.8] 36.7 [33.4,40.1] 7.5*** 37.5 [34.3,40.7] 0.8 8.3***
Place of residence *** *** ***
Urban 47.5 [44.1,50.9] 55.3 [51.1,59.3] 7.7** 53.3 [49.2,57.4] -1.9 5.8* Rural 24.0 [21.6,26.6] 28.5 [26.0,31.3] 4.5* 30.4 [27.9,33.0] 1.8 6.4***
Wealth quintile *** *** ***
Lowest 20.3 [17.3,23.8] 20.6 [17.1,24.7] 0.3 22.6 [19.1,26.5] 2.0 2.3 Second 24.0 [21.0,27.1] 24.1 [20.2,28.5] 0.2 24.1 [20.7,28.0] 0.0 0.2 Middle 22.1 [18.8,25.7] 29.5 [25.8,33.4] 7.4** 30.3 [26.5,34.4] 0.8 8.3** Fourth 31.9 [28.0,36.1] 38.2 [34.1,42.4] 6.3* 42.6 [38.7,46.7] 4.4 10.7*** Highest 58.0 [52.9,62.9] 60.1 [55.7,64.3] 2.1 60.7 [56.9,64.3] 0.6 2.7
Region *** *** ***
Kayes 33.8 [26.9,41.5] 38.5 [32.7,44.6] 33.6 [28.1,39.7] -0.1 Koulikoro 25.7 [20.4,31.8] 32.9 [27.7,38.6] 34.1 [28.6,40.1] 8.4*
Sikasso 20.8 [16.8,25.5] 32.9 [27.7,38.6] 24.0 [19.8,28.9] 3.2 Segou 30.6 [25.3,36.4] 28.7 [23.7,34.2] 28.9 [23.4,35.1] -1.7 Mopti 28.7 [22.6,35.7] 22.1 [17.7,27.2] 39.3 [32.7,46.4] 10.6* Tombouctou 18.9 [13.8,25.3] 33.9 [26.8,41.9] 15.1** Gao 30.1 [21.9,39.9] 34.4 [23.0,47.8] 4.2 Kidal 27.0 [6.1,67.9] 16.6 [8.7,29.2] -10.4 Bamako 56.5 [50.8,62.1] 56.0 [51.1,60.8] 57.5 [52.2,62.7] 1.0
Notes: *p<0.05, **p<0.01, ***p<0.001 1 p-value significance of the covariate in each survey. 2 Difference between the two surveys with the p-value of the difference.
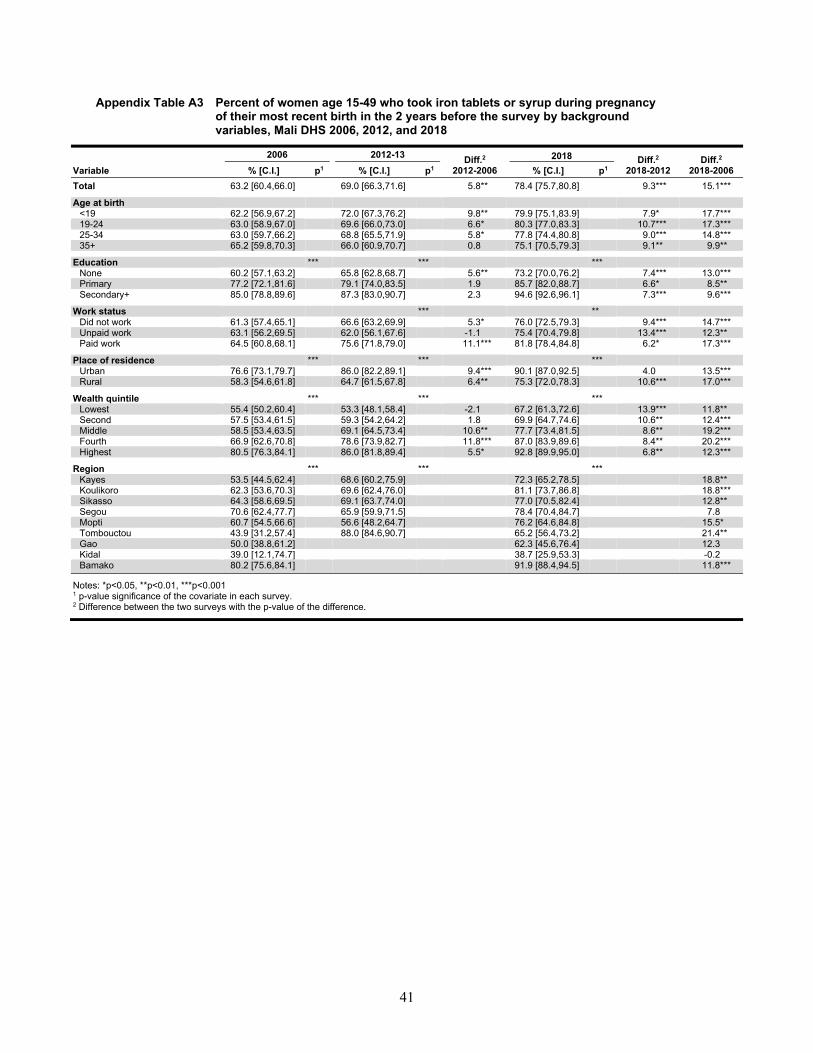
41
Appendix Table A3 Percent of women age 15-49 who took iron tablets or syrup during pregnancy of their most recent birth in the 2 years before the survey by background variables, Mali DHS 2006, 2012, and 2018
2006 2012-13 Diff.2 2012-2006
2018 Diff.2 2018-2012
Diff.2
2018-2006 Variable % [C.I.] p1 % [C.I.] p1 % [C.I.] p1 Total 63.2 [60.4,66.0] 69.0 [66.3,71.6] 5.8** 78.4 [75.7,80.8] 9.3*** 15.1*** Age at birth
<19 62.2 [56.9,67.2] 72.0 [67.3,76.2] 9.8** 79.9 [75.1,83.9] 7.9* 17.7*** 19-24 63.0 [58.9,67.0] 69.6 [66.0,73.0] 6.6* 80.3 [77.0,83.3] 10.7*** 17.3*** 25-34 63.0 [59.7,66.2] 68.8 [65.5,71.9] 5.8* 77.8 [74.4,80.8] 9.0*** 14.8*** 35+ 65.2 [59.8,70.3] 66.0 [60.9,70.7] 0.8 75.1 [70.5,79.3] 9.1** 9.9**
Education *** *** *** None 60.2 [57.1,63.2] 65.8 [62.8,68.7] 5.6** 73.2 [70.0,76.2] 7.4*** 13.0*** Primary 77.2 [72.1,81.6] 79.1 [74.0,83.5] 1.9 85.7 [82.0,88.7] 6.6* 8.5** Secondary+ 85.0 [78.8,89.6] 87.3 [83.0,90.7] 2.3 94.6 [92.6,96.1] 7.3*** 9.6***
Work status *** **
Did not work 61.3 [57.4,65.1] 66.6 [63.2,69.9] 5.3* 76.0 [72.5,79.3] 9.4*** 14.7*** Unpaid work 63.1 [56.2,69.5] 62.0 [56.1,67.6] -1.1 75.4 [70.4,79.8] 13.4*** 12.3** Paid work 64.5 [60.8,68.1] 75.6 [71.8,79.0] 11.1*** 81.8 [78.4,84.8] 6.2* 17.3***
Place of residence *** *** ***
Urban 76.6 [73.1,79.7] 86.0 [82.2,89.1] 9.4*** 90.1 [87.0,92.5] 4.0 13.5*** Rural 58.3 [54.6,61.8] 64.7 [61.5,67.8] 6.4** 75.3 [72.0,78.3] 10.6*** 17.0***
Wealth quintile *** *** ***
Lowest 55.4 [50.2,60.4] 53.3 [48.1,58.4] -2.1 67.2 [61.3,72.6] 13.9*** 11.8** Second 57.5 [53.4,61.5] 59.3 [54.2,64.2] 1.8 69.9 [64.7,74.6] 10.6** 12.4*** Middle 58.5 [53.4,63.5] 69.1 [64.5,73.4] 10.6** 77.7 [73.4,81.5] 8.6** 19.2*** Fourth 66.9 [62.6,70.8] 78.6 [73.9,82.7] 11.8*** 87.0 [83.9,89.6] 8.4** 20.2*** Highest 80.5 [76.3,84.1] 86.0 [81.8,89.4] 5.5* 92.8 [89.9,95.0] 6.8** 12.3***
Region *** *** ***
Kayes 53.5 [44.5,62.4] 68.6 [60.2,75.9] 72.3 [65.2,78.5] 18.8** Koulikoro 62.3 [53.6,70.3] 69.6 [62.4,76.0] 81.1 [73.7,86.8] 18.8***
Sikasso 64.3 [58.6,69.5] 69.1 [63.7,74.0] 77.0 [70.5,82.4] 12.8** Segou 70.6 [62.4,77.7] 65.9 [59.9,71.5] 78.4 [70.4,84.7] 7.8 Mopti 60.7 [54.5,66.6] 56.6 [48.2,64.7] 76.2 [64.6,84.8] 15.5* Tombouctou 43.9 [31.2,57.4] 88.0 [84.6,90.7] 65.2 [56.4,73.2] 21.4** Gao 50.0 [38.8,61.2] 62.3 [45.6,76.4] 12.3 Kidal 39.0 [12.1,74.7] 38.7 [25.9,53.3] -0.2 Bamako 80.2 [75.6,84.1] 91.9 [88.4,94.5] 11.8***
Notes: *p<0.05, **p<0.01, ***p<0.001 1 p-value significance of the covariate in each survey. 2 Difference between the two surveys with the p-value of the difference.

42
Appendix Table A4 Percent of women age 15-49 who had at least two tetanus toxoid injections during the pregnancy of their most recent birth in the 2 years before the survey by background variables, Mali DHS 2006, 2012, and 2018
2006 2012-13 Diff.2 2012-2006
2018 Diff.2 2018-2012
Diff.2
2018-2006 Variable % [C.I.] p1 % [C.I.] p1 % [C.I.] p1 Total 48.1 [45.7,50.6] 36.8 [34.4,39.2] -11.3*** 36.3 [33.9,38.8] -0.5 -11.9*** Age at birth
<19 47.3 [42.8,51.8] 41.8 [36.4,47.3] -5.5 39.5 [34.6,44.6] -2.3 -7.8* 19-24 50.4 [46.5,54.3] 37.8 [34.0,41.6] -12.7*** 37.2 [33.6,40.9] -0.6 -13.3*** 25-34 48.3 [44.8,51.7] 36.2 [33.2,39.3] -12.1*** 34.1 [31.1,37.3] -2.1 -14.2*** 35+ 43.8 [39.1,48.6] 32.6 [28.1,37.4] -11.2** 38.0 [33.5,42.7] 5.4 -5.8
Education *** *** *** None 45.7 [43.0,48.4] 34.2 [31.7,36.8] -11.5*** 33.0 [30.2,35.8] -1.3 -12.7*** Primary 59.0 [54.1,63.7] 43.2 [36.9,49.7] -15.8*** 38.7 [33.9,43.7] -4.5 -20.3*** Secondary+ 66.5 [60.1,72.4] 53.2 [47.1,59.3] -13.3** 48.5 [43.1,54.0] -4.7 -18.0***
Work status *** *
Did not work 47.2 [43.8,50.8] 34.9 [31.6,38.3] -12.4*** 34.5 [31.4,37.6] -0.4 -12.8*** Unpaid work 43.0 [37.1,49.1] 30.2 [24.8,36.1] -12.8** 32.6 [27.1,38.6] 2.4 -10.3* Paid work 49.5 [46.4,52.7] 42.5 [39.3,45.7] -7.1** 39.6 [36.5,42.7] -2.9 -10.0***
Place of residence *** *** ***
Urban 59.7 [55.4,63.9] 48.7 [44.5,52.8] -11.1*** 45.3 [40.2,50.6] -3.3 -14.4*** Rural 43.8 [40.8,46.9] 33.8 [31.0,36.7] -10.1*** 33.9 [31.1,36.8] 0.1 -9.9***
Wealth quintile *** *** ***
Lowest 42.9 [38.6,47.3] 26.9 [22.7,31.6] -16.0*** 29.9 [25.5,34.7] 3.0 -13.0*** Second 42.9 [39.3,46.7] 28.3 [24.2,32.9] -14.6*** 31.8 [27.5,36.3] 3.4 -11.2*** Middle 44.2 [39.1,49.4] 37.3 [33.4,41.5] -6.8* 36.6 [32.4,41.1] -0.7 -7.6* Fourth 49.2 [44.3,54.2] 40.9 [36.9,45.1] -8.3* 39.1 [34.7,43.6] -1.8 -10.2** Highest 63.9 [60.1,67.5] 52.0 [47.6,56.4] -11.9*** 45.7 [40.6,50.9] -6.3 -18.2***
Region ** * *
Kayes 53.4 [45.7,60.9] 42.9 [36.0,50.2] 31.5 [26.5,36.9] -21.9*** Koulikoro 44.6 [38.0,51.4] 36.4 [30.9,42.3] 37.0 [31.7,42.6] -7.6
Sikasso 50.8 [44.8,56.8] 35.2 [30.6,40.0] 32.7 [25.9,40.3] -18.1*** Segou 43.5 [37.5,49.7] 37.1 [31.1,43.6] 37.3 [31.6,43.4] -6.2 Mopti 42.3 [36.0,48.8] 28.3 [22.0,35.5] 39.9 [32.2,48.0] -2.4 Tombouctou 37.1 [26.6,48.9] 43.6 [38.7,48.6] 28.1 [20.1,37.7] -9.0 Gao 48.2 [41.3,55.2] 25.9 [15.2,40.4] -22.3** Kidal 31.7 [7.0,74.0] 7.2 [3.7,13.5] -24.5 Bamako 60.8 [55.9,65.5] 46.0 [38.8,53.3] -14.8***
Notes: *p<0.05, **p<0.01, ***p<0.001 1 p-value significance of the covariate in each survey. 2 Difference between the two surveys with the p-value of the difference.

43
Appendix Table A5 Percent of women age 15-49 who had their blood pressure taken during an ANC visit for their most recent birth in the 2 years before the survey by background variables, Mali DHS 2006, 2012, and 2018
2006 2012-13 Diff.2 2012-2006
2018 Diff.2 2018-2012
Diff.2
2018-2006 Variable % [C.I.] p1 % [C.I.] p1 % [C.I.] p1 Total 88.4 [86.3,90.2] 90.3 [88.7,91.7] 1.9 95.2 [94.0,96.2] 4.9*** 6.8*** Age at birth
<19 87.1 [83.6,90.0] 88.7 [84.6,91.9] 1.6 93.7 [90.1,96.1] 5.0* 6.6** 19-24 89.0 [86.1,91.3] 91.5 [89.3,93.3] 2.5 95.2 [93.3,96.6] 3.7** 6.2*** 25-34 88.7 [85.9,91.1] 89.7 [87.2,91.7] 0.9 95.4 [93.9,96.6] 5.7*** 6.7*** 35+ 87.4 [83.8,90.3] 91.2 [87.4,94.0] 3.8 96.0 [93.6,97.5] 4.8** 8.6***
Education *** ** * None 87.0 [84.6,89.1] 89.1 [87.2,90.8] 2.1 94.3 [92.6,95.6] 5.2*** 7.3*** Primary 93.6 [90.3,95.8] 93.1 [89.4,95.5] -0.5 96.6 [93.6,98.2] 3.5 3.0 Secondary+ 95.2 [90.8,97.6] 95.7 [92.4,97.6] 0.5 97.4 [95.3,98.6] 1.7 2.2
Work status * **
Did not work 85.6 [81.1,89.2] 88.6 [86.3,90.6] 3.0 96.1 [94.6,97.1] 7.4*** 10.5*** Unpaid work 86.4 [80.3,90.9] 87.3 [82.2,91.1] 0.9 95.8 [93.4,97.4] 8.5*** 9.4*** Paid work 90.5 [88.5,92.3] 93.7 [91.7,95.3] 3.2* 94.3 [92.2,95.8] 0.5 3.7**
Place of residence *** *** **
Urban 96.8 [95.3,97.8] 97.3 [96.0,98.1] 0.4 98.1 [96.5,99.0] 0.9 1.3 Rural 84.3 [81.6,86.6] 88.0 [85.8,89.8] 3.7* 94.3 [92.7,95.6] 6.3*** 10.0***
Wealth quintile *** *** ***
Lowest 83.0 [78.5,86.7] 81.1 [75.6,85.6] -1.9 93.9 [90.7,96.1] 12.8*** 10.9*** Second 82.9 [78.9,86.3] 86.8 [82.7,90.1] 3.9 91.9 [87.9,94.6] 5.1 8.9** Middle 86.9 [83.5,89.8] 89.2 [85.6,92.0] 2.3 94.2 [91.8,96.0] 5.0** 7.3*** Fourth 89.3 [85.7,92.1] 92.6 [90.1,94.5] 3.2 96.8 [94.9,98.0] 4.2** 7.5*** Highest 97.6 [96.0,98.6] 98.1 [96.7,98.9] 0.5 98.8 [97.6,99.4] 0.7 1.2
Region ** *** *
Kayes 89.1 [83.4,93.1] 93.0 [88.1,96.0] 96.7 [94.2,98.2] 7.6** Koulikoro 87.3 [79.9,92.2] 94.4 [91.4,96.4] 93.6 [88.8,96.5] 6.3
Sikasso 89.1 [84.9,92.2] 87.2 [83.3,90.3] 92.9 [89.6,95.3] 3.9 Segou 84.3 [79.0,88.5] 89.6 [85.2,92.8] 95.7 [92.6,97.5] 11.3*** Mopti 81.7 [69.6,89.7] 79.6 [71.9,85.6] 94.1 [88.0,97.2] 12.4* Tombouctou 95.2 [88.7,98.0] 96.9 [95.1,98.0] 95.8 [92.3,97.8] 0.7 Gao 89.5 [79.8,94.8] 95.4 [89.8,98.0] 6.0 Kidal 93.8 [82.4,98.0] 94.5 [80.8,98.6] 0.8 Bamako 97.6 [95.5,98.7] 98.6 [96.3,99.5] 1.0
Notes: *p<0.05, **p<0.01, ***p<0.001 1 p-value significance of the covariate in each survey. 2 Difference between the two surveys with the p-value of the difference.
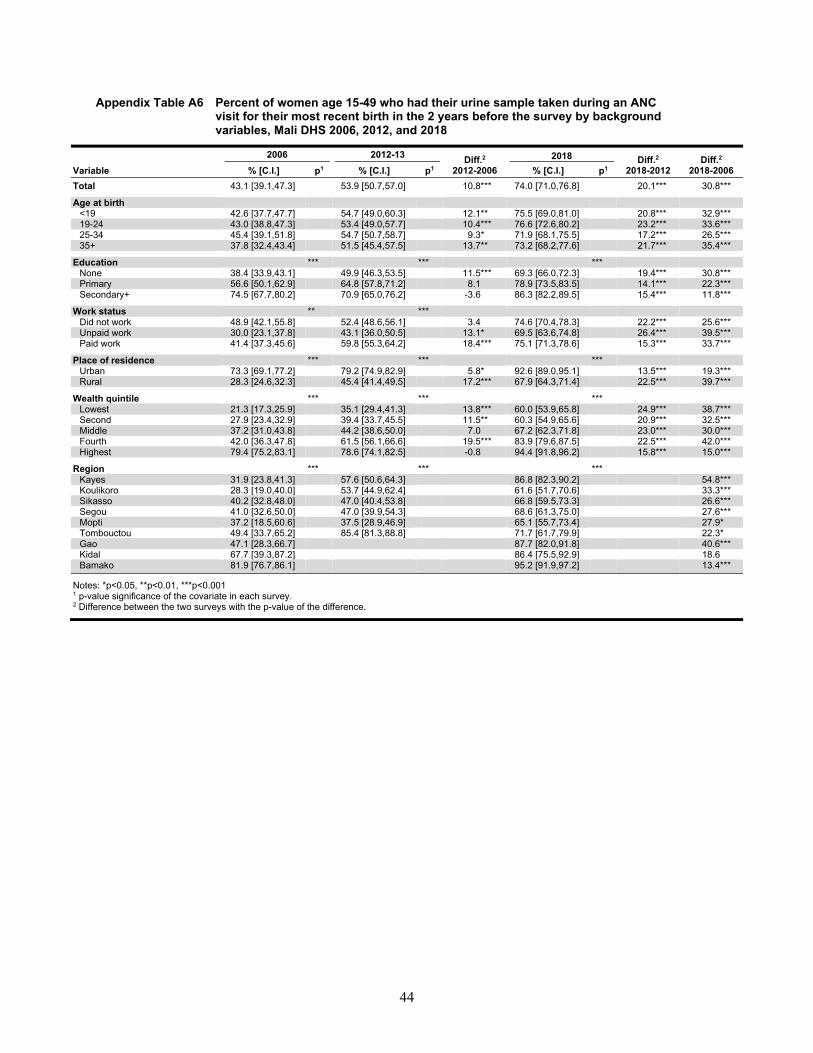
44
Appendix Table A6 Percent of women age 15-49 who had their urine sample taken during an ANC visit for their most recent birth in the 2 years before the survey by background variables, Mali DHS 2006, 2012, and 2018
2006 2012-13 Diff.2 2012-2006
2018 Diff.2 2018-2012
Diff.2
2018-2006 Variable % [C.I.] p1 % [C.I.] p1 % [C.I.] p1 Total 43.1 [39.1,47.3] 53.9 [50.7,57.0] 10.8*** 74.0 [71.0,76.8] 20.1*** 30.8*** Age at birth
<19 42.6 [37.7,47.7] 54.7 [49.0,60.3] 12.1** 75.5 [69.0,81.0] 20.8*** 32.9*** 19-24 43.0 [38.8,47.3] 53.4 [49.0,57.7] 10.4*** 76.6 [72.6,80.2] 23.2*** 33.6*** 25-34 45.4 [39.1,51.8] 54.7 [50.7,58.7] 9.3* 71.9 [68.1,75.5] 17.2*** 26.5*** 35+ 37.8 [32.4,43.4] 51.5 [45.4,57.5] 13.7** 73.2 [68.2,77.6] 21.7*** 35.4***
Education *** *** *** None 38.4 [33.9,43.1] 49.9 [46.3,53.5] 11.5*** 69.3 [66.0,72.3] 19.4*** 30.8*** Primary 56.6 [50.1,62.9] 64.8 [57.8,71.2] 8.1 78.9 [73.5,83.5] 14.1*** 22.3*** Secondary+ 74.5 [67.7,80.2] 70.9 [65.0,76.2] -3.6 86.3 [82.2,89.5] 15.4*** 11.8***
Work status ** ***
Did not work 48.9 [42.1,55.8] 52.4 [48.6,56.1] 3.4 74.6 [70.4,78.3] 22.2*** 25.6*** Unpaid work 30.0 [23.1,37.8] 43.1 [36.0,50.5] 13.1* 69.5 [63.6,74.8] 26.4*** 39.5*** Paid work 41.4 [37.3,45.6] 59.8 [55.3,64.2] 18.4*** 75.1 [71.3,78.6] 15.3*** 33.7***
Place of residence *** *** ***
Urban 73.3 [69.1,77.2] 79.2 [74.9,82.9] 5.8* 92.6 [89.0,95.1] 13.5*** 19.3*** Rural 28.3 [24.6,32.3] 45.4 [41.4,49.5] 17.2*** 67.9 [64.3,71.4] 22.5*** 39.7***
Wealth quintile *** *** ***
Lowest 21.3 [17.3,25.9] 35.1 [29.4,41.3] 13.8*** 60.0 [53.9,65.8] 24.9*** 38.7*** Second 27.9 [23.4,32.9] 39.4 [33.7,45.5] 11.5** 60.3 [54.9,65.6] 20.9*** 32.5*** Middle 37.2 [31.0,43.8] 44.2 [38.6,50.0] 7.0 67.2 [62.3,71.8] 23.0*** 30.0*** Fourth 42.0 [36.3,47.8] 61.5 [56.1,66.6] 19.5*** 83.9 [79.6,87.5] 22.5*** 42.0*** Highest 79.4 [75.2,83.1] 78.6 [74.1,82.5] -0.8 94.4 [91.8,96.2] 15.8*** 15.0***
Region *** *** ***
Kayes 31.9 [23.8,41.3] 57.6 [50.6,64.3] 86.8 [82.3,90.2] 54.8*** Koulikoro 28.3 [19.0,40.0] 53.7 [44.9,62.4] 61.6 [51.7,70.6] 33.3***
Sikasso 40.2 [32.8,48.0] 47.0 [40.4,53.8] 66.8 [59.5,73.3] 26.6*** Segou 41.0 [32.6,50.0] 47.0 [39.9,54.3] 68.6 [61.3,75.0] 27.6*** Mopti 37.2 [18.5,60.6] 37.5 [28.9,46.9] 65.1 [55.7,73.4] 27.9* Tombouctou 49.4 [33.7,65.2] 85.4 [81.3,88.8] 71.7 [61.7,79.9] 22.3* Gao 47.1 [28.3,66.7] 87.7 [82.0,91.8] 40.6*** Kidal 67.7 [39.3,87.2] 86.4 [75.5,92.9] 18.6 Bamako 81.9 [76.7,86.1] 95.2 [91.9,97.2] 13.4***
Notes: *p<0.05, **p<0.01, ***p<0.001 1 p-value significance of the covariate in each survey. 2 Difference between the two surveys with the p-value of the difference.

45
Appendix Table A7 Percent of women age 15-49 who had their blood sample taken during an ANC visit for their most recent birth in the 2 years before the survey by background variables, Mali DHS 2006, 2012, and 2018
2006 2012-13 Diff.2 2012-2006
2018 Diff.2 2018-2012
Diff.2
2018-2006 Variable % [C.I.] p1 % [C.I.] p1 % [C.I.] p1 Total 34.2 [30.9,37.7] 49.8 [46.5,53.0] 15.5*** 79.6 [77.1,81.9] 29.8*** 45.4*** Age at birth **
<19 35.2 [29.9,40.8] 51.1 [44.9,57.1] 15.9*** 79.1 [72.9,84.2] 28.1*** 44.0*** 19-24 37.0 [32.8,41.5] 49.9 [45.6,54.3] 12.9*** 78.8 [75.1,82.1] 28.9*** 41.7*** 25-34 34.3 [30.5,38.3] 50.8 [46.8,54.8] 16.5*** 80.3 [77.1,83.1] 29.5*** 45.9*** 35+ 27.1 [22.6,32.2] 44.7 [39.0,50.5] 17.5*** 79.8 [74.8,83.9] 35.1*** 52.6***
Education *** *** *** None 28.4 [25.2,31.9] 45.3 [41.7,49.0] 16.9*** 75.7 [72.7,78.4] 30.4*** 47.2*** Primary 51.0 [44.4,57.6] 58.0 [50.7,65.1] 7.0 82.1 [78.1,85.6] 24.1*** 31.1*** Secondary+ 72.2 [65.7,77.9] 71.7 [66.0,76.7] -0.5 90.8 [87.2,93.5] 19.1*** 18.6***
Work status *** ** **
Did not work 40.9 [36.1,45.9] 48.6 [44.8,52.4] 7.7* 80.7 [76.9,84.0] 32.1*** 39.8*** Unpaid work 25.3 [18.7,33.4] 39.1 [32.4,46.2] 13.7** 71.6 [66.1,76.6] 32.6*** 46.3*** Paid work 31.2 [27.6,35.1] 55.1 [50.1,60.1] 23.9*** 81.6 [78.6,84.2] 26.5*** 50.4***
Place of residence *** *** ***
Urban 65.9 [61.0,70.5] 80.4 [76.2,84.0] 14.5*** 93.4 [91.1,95.1] 12.9*** 27.5*** Rural 18.6 [15.6,22.1] 39.5 [35.4,43.7] 20.9*** 75.1 [72.0,78.0] 35.6*** 56.5***
Wealth quintile *** *** ***
Lowest 12.7 [9.6,16.6] 30.0 [24.4,36.3] 17.3*** 70.7 [64.8,75.9] 40.7*** 58.0*** Second 17.7 [14.0,22.0] 33.5 [27.9,39.6] 15.8*** 68.5 [63.9,72.7] 35.0*** 50.8*** Middle 25.3 [19.9,31.5] 39.4 [33.4,45.7] 14.1** 74.7 [70.0,78.8] 35.3*** 49.4*** Fourth 31.0 [25.3,37.3] 52.3 [46.0,58.5] 21.3*** 84.5 [80.9,87.5] 32.2*** 53.5*** Highest 75.9 [71.7,79.7] 82.8 [79.0,86.0] 6.9* 96.8 [95.2,97.9] 14.0*** 20.9***
Region *** *** ***
Kayes 27.0 [17.4,39.3] 49.8 [42.0,57.7] 83.9 [79.0,87.8] 56.9*** Koulikoro 19.4 [12.1,29.6] 48.0 [38.9,57.2] 71.4 [63.3,78.3] 52.0***
Sikasso 21.0 [15.5,27.8] 43.3 [36.4,50.5] 70.0 [64.5,74.9] 49.0*** Segou 35.7 [27.5,44.8] 45.2 [37.8,52.8] 76.3 [68.0,83.1] 40.6*** Mopti 23.9 [13.4,38.9] 30.2 [22.4,39.3] 80.5 [72.3,86.6] 56.6*** Tombouctou 37.6 [21.5,57.0] 85.7 [82.0,88.8] 79.0 [69.3,86.2] 41.4*** Gao 46.9 [26.2,68.8] 90.4 [85.2,94.0] 43.5*** Kidal 54.8 [34.4,73.7] 94.5 [80.8,98.6] 39.7** Bamako 80.4 [74.9,85.0] 97.0 [94.9,98.3] 16.6***
Notes: *p<0.05, **p<0.01, ***p<0.001 1 p-value significance of the covariate in each survey. 2 Difference between the two surveys with the p-value of the difference.
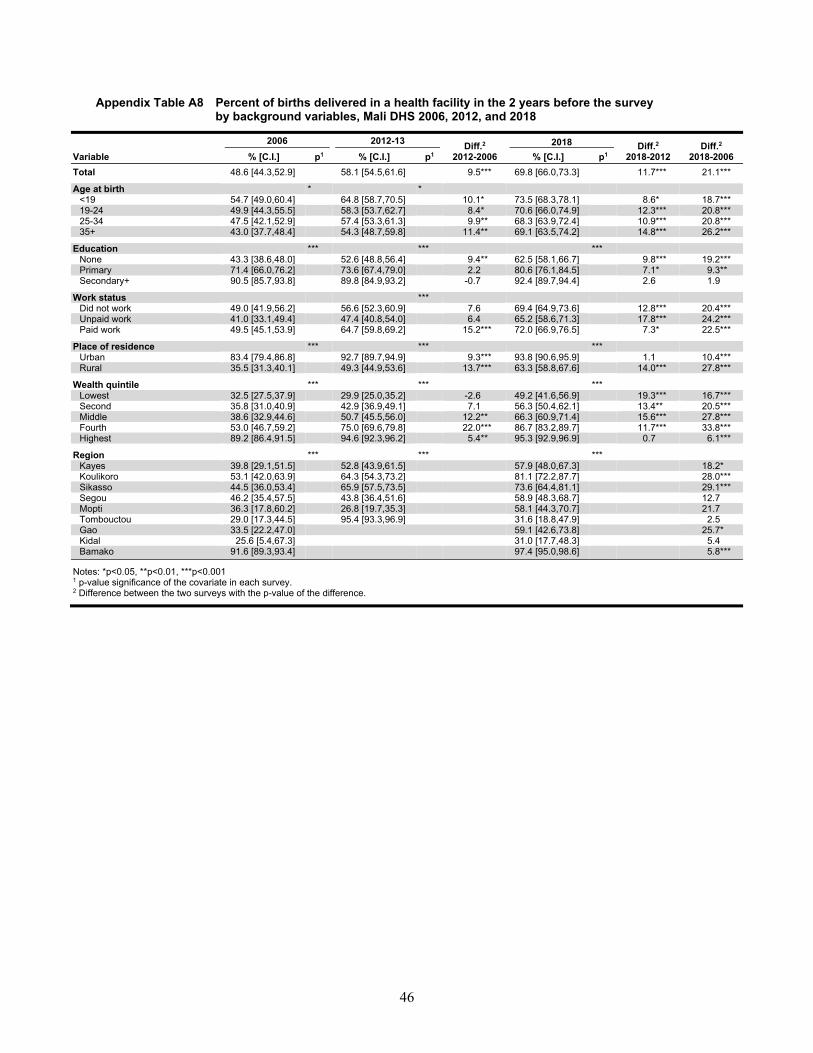
46
Appendix Table A8 Percent of births delivered in a health facility in the 2 years before the survey by background variables, Mali DHS 2006, 2012, and 2018
2006 2012-13 Diff.2 2012-2006
2018 Diff.2 2018-2012
Diff.2
2018-2006 Variable % [C.I.] p1 % [C.I.] p1 % [C.I.] p1 Total 48.6 [44.3,52.9] 58.1 [54.5,61.6] 9.5*** 69.8 [66.0,73.3] 11.7*** 21.1*** Age at birth * *
<19 54.7 [49.0,60.4] 64.8 [58.7,70.5] 10.1* 73.5 [68.3,78.1] 8.6* 18.7*** 19-24 49.9 [44.3,55.5] 58.3 [53.7,62.7] 8.4* 70.6 [66.0,74.9] 12.3*** 20.8*** 25-34 47.5 [42.1,52.9] 57.4 [53.3,61.3] 9.9** 68.3 [63.9,72.4] 10.9*** 20.8*** 35+ 43.0 [37.7,48.4] 54.3 [48.7,59.8] 11.4** 69.1 [63.5,74.2] 14.8*** 26.2***
Education *** *** *** None 43.3 [38.6,48.0] 52.6 [48.8,56.4] 9.4** 62.5 [58.1,66.7] 9.8*** 19.2*** Primary 71.4 [66.0,76.2] 73.6 [67.4,79.0] 2.2 80.6 [76.1,84.5] 7.1* 9.3** Secondary+ 90.5 [85.7,93.8] 89.8 [84.9,93.2] -0.7 92.4 [89.7,94.4] 2.6 1.9
Work status ***
Did not work 49.0 [41.9,56.2] 56.6 [52.3,60.9] 7.6 69.4 [64.9,73.6] 12.8*** 20.4*** Unpaid work 41.0 [33.1,49.4] 47.4 [40.8,54.0] 6.4 65.2 [58.6,71.3] 17.8*** 24.2*** Paid work 49.5 [45.1,53.9] 64.7 [59.8,69.2] 15.2*** 72.0 [66.9,76.5] 7.3* 22.5***
Place of residence *** *** ***
Urban 83.4 [79.4,86.8] 92.7 [89.7,94.9] 9.3*** 93.8 [90.6,95.9] 1.1 10.4*** Rural 35.5 [31.3,40.1] 49.3 [44.9,53.6] 13.7*** 63.3 [58.8,67.6] 14.0*** 27.8***
Wealth quintile *** *** ***
Lowest 32.5 [27.5,37.9] 29.9 [25.0,35.2] -2.6 49.2 [41.6,56.9] 19.3*** 16.7*** Second 35.8 [31.0,40.9] 42.9 [36.9,49.1] 7.1 56.3 [50.4,62.1] 13.4** 20.5*** Middle 38.6 [32.9,44.6] 50.7 [45.5,56.0] 12.2** 66.3 [60.9,71.4] 15.6*** 27.8*** Fourth 53.0 [46.7,59.2] 75.0 [69.6,79.8] 22.0*** 86.7 [83.2,89.7] 11.7*** 33.8*** Highest 89.2 [86.4,91.5] 94.6 [92.3,96.2] 5.4** 95.3 [92.9,96.9] 0.7 6.1***
Region *** *** ***
Kayes 39.8 [29.1,51.5] 52.8 [43.9,61.5] 57.9 [48.0,67.3] 18.2* Koulikoro 53.1 [42.0,63.9] 64.3 [54.3,73.2] 81.1 [72.2,87.7] 28.0***
Sikasso 44.5 [36.0,53.4] 65.9 [57.5,73.5] 73.6 [64.4,81.1] 29.1*** Segou 46.2 [35.4,57.5] 43.8 [36.4,51.6] 58.9 [48.3,68.7] 12.7 Mopti 36.3 [17.8,60.2] 26.8 [19.7,35.3] 58.1 [44.3,70.7] 21.7 Tombouctou 29.0 [17.3,44.5] 95.4 [93.3,96.9] 31.6 [18.8,47.9] 2.5 Gao 33.5 [22.2,47.0] 59.1 [42.6,73.8] 25.7* Kidal 25.6 [5.4,67.3] 31.0 [17.7,48.3] 5.4 Bamako 91.6 [89.3,93.4] 97.4 [95.0,98.6] 5.8***
Notes: *p<0.05, **p<0.01, ***p<0.001 1 p-value significance of the covariate in each survey. 2 Difference between the two surveys with the p-value of the difference.
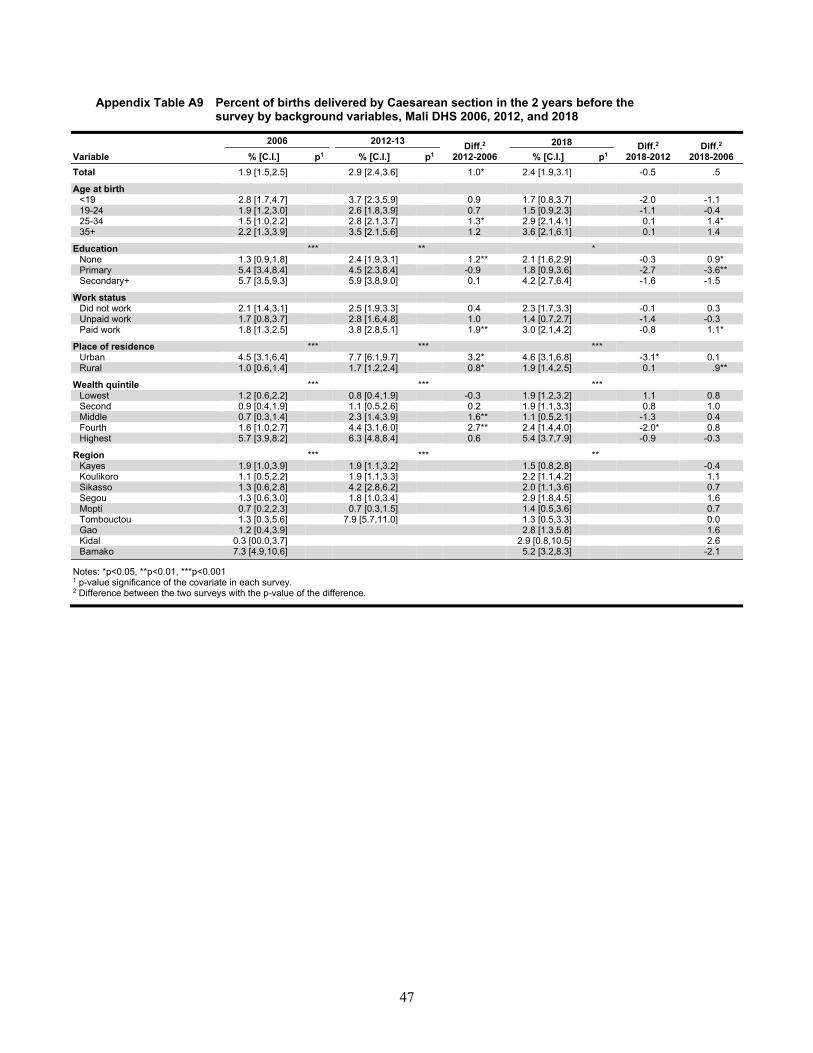
47
Appendix Table A9 Percent of births delivered by Caesarean section in the 2 years before the survey by background variables, Mali DHS 2006, 2012, and 2018
2006 2012-13 Diff.2 2012-2006
2018 Diff.2 2018-2012
Diff.2
2018-2006 Variable % [C.I.] p1 % [C.I.] p1 % [C.I.] p1 Total 1.9 [1.5,2.5] 2.9 [2.4,3.6] 1.0* 2.4 [1.9,3.1] -0.5 .5 Age at birth
<19 2.8 [1.7,4.7] 3.7 [2.3,5.9] 0.9 1.7 [0.8,3.7] -2.0 -1.1 19-24 1.9 [1.2,3.0] 2.6 [1.8,3.9] 0.7 1.5 [0.9,2.3] -1.1 -0.4 25-34 1.5 [1.0,2.2] 2.8 [2.1,3.7] 1.3* 2.9 [2.1,4.1] 0.1 1.4* 35+ 2.2 [1.3,3.9] 3.5 [2.1,5.6] 1.2 3.6 [2.1,6.1] 0.1 1.4
Education *** ** * None 1.3 [0.9,1.8] 2.4 [1.9,3.1] 1.2** 2.1 [1.6,2.9] -0.3 0.9* Primary 5.4 [3.4,8.4] 4.5 [2.3,8.4] -0.9 1.8 [0.9,3.6] -2.7 -3.6** Secondary+ 5.7 [3.5,9.3] 5.9 [3.8,9.0] 0.1 4.2 [2.7,6.4] -1.6 -1.5
Work status
Did not work 2.1 [1.4,3.1] 2.5 [1.9,3.3] 0.4 2.3 [1.7,3.3] -0.1 0.3 Unpaid work 1.7 [0.8,3.7] 2.8 [1.6,4.8] 1.0 1.4 [0.7,2.7] -1.4 -0.3 Paid work 1.8 [1.3,2.5] 3.8 [2.8,5.1] 1.9** 3.0 [2.1,4.2] -0.8 1.1*
Place of residence *** *** ***
Urban 4.5 [3.1,6.4] 7.7 [6.1,9.7] 3.2* 4.6 [3.1,6.8] -3.1* 0.1 Rural 1.0 [0.6,1.4] 1.7 [1.2,2.4] 0.8* 1.9 [1.4,2.5] 0.1 .9**
Wealth quintile *** *** ***
Lowest 1.2 [0.6,2.2] 0.8 [0.4,1.9] -0.3 1.9 [1.2,3.2] 1.1 0.8 Second 0.9 [0.4,1.9] 1.1 [0.5,2.6] 0.2 1.9 [1.1,3.3] 0.8 1.0 Middle 0.7 [0.3,1.4] 2.3 [1.4,3.9] 1.6** 1.1 [0.5,2.1] -1.3 0.4 Fourth 1.6 [1.0,2.7] 4.4 [3.1,6.0] 2.7** 2.4 [1.4,4.0] -2.0* 0.8 Highest 5.7 [3.9,8.2] 6.3 [4.8,8.4] 0.6 5.4 [3.7,7.9] -0.9 -0.3
Region *** *** **
Kayes 1.9 [1.0,3.9] 1.9 [1.1,3.2] 1.5 [0.8,2.8] -0.4 Koulikoro 1.1 [0.5,2.2] 1.9 [1.1,3.3] 2.2 [1.1,4.2] 1.1
Sikasso 1.3 [0.6,2.8] 4.2 [2.8,6.2] 2.0 [1.1,3.6] 0.7 Segou 1.3 [0.6,3.0] 1.8 [1.0,3.4] 2.9 [1.8,4.5] 1.6 Mopti 0.7 [0.2,2.3] 0.7 [0.3,1.5] 1.4 [0.5,3.6] 0.7 Tombouctou 1.3 [0.3,5.6] 7.9 [5.7,11.0] 1.3 [0.5,3.3] 0.0 Gao 1.2 [0.4,3.9] 2.8 [1.3,5.8] 1.6 Kidal 0.3 [00.0,3.7] 2.9 [0.8,10.5] 2.6 Bamako 7.3 [4.9,10.6] 5.2 [3.2,8.3] -2.1
Notes: *p<0.05, **p<0.01, ***p<0.001 1 p-value significance of the covariate in each survey. 2 Difference between the two surveys with the p-value of the difference.
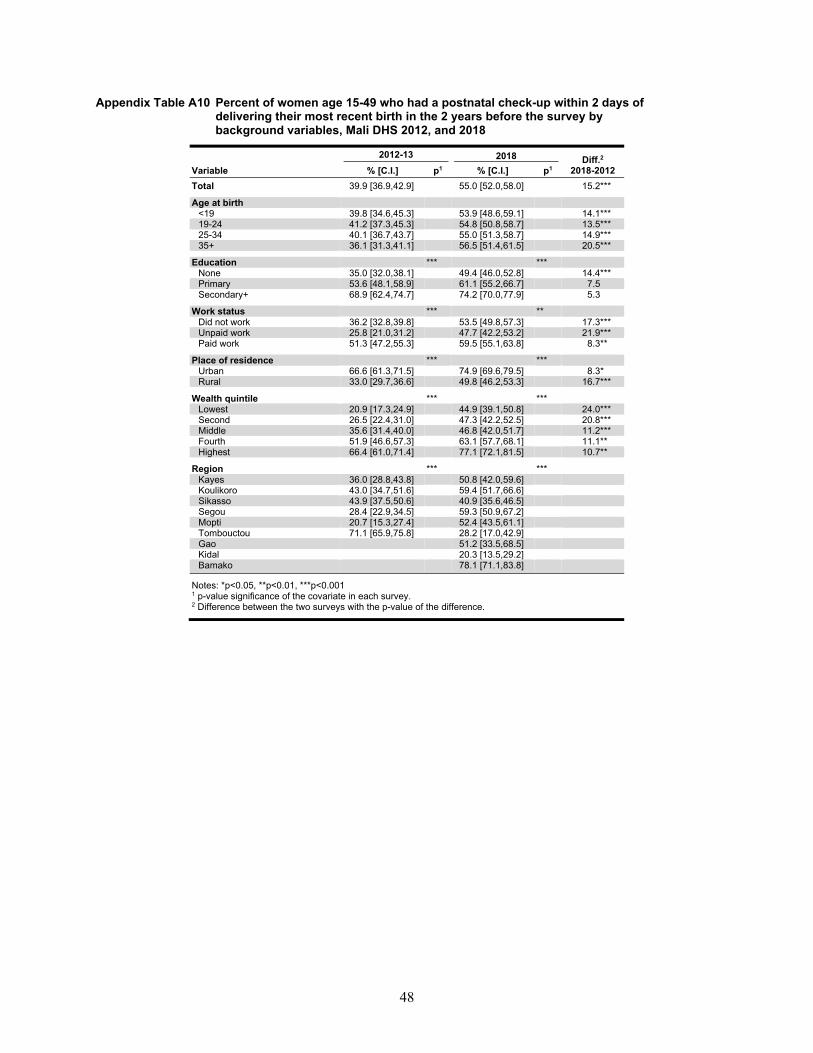
48
Appendix Table A10 Percent of women age 15-49 who had a postnatal check-up within 2 days of delivering their most recent birth in the 2 years before the survey by background variables, Mali DHS 2012, and 2018
2012-13 2018 Diff.2 2018-2012 Variable % [C.I.] p1 % [C.I.] p1
Total 39.9 [36.9,42.9] 55.0 [52.0,58.0] 15.2***
Age at birth <19 39.8 [34.6,45.3] 53.9 [48.6,59.1] 14.1*** 19-24 41.2 [37.3,45.3] 54.8 [50.8,58.7] 13.5*** 25-34 40.1 [36.7,43.7] 55.0 [51.3,58.7] 14.9*** 35+ 36.1 [31.3,41.1] 56.5 [51.4,61.5] 20.5***
Education *** *** None 35.0 [32.0,38.1] 49.4 [46.0,52.8] 14.4*** Primary 53.6 [48.1,58.9] 61.1 [55.2,66.7] 7.5 Secondary+ 68.9 [62.4,74.7] 74.2 [70.0,77.9] 5.3
Work status *** ** Did not work 36.2 [32.8,39.8] 53.5 [49.8,57.3] 17.3*** Unpaid work 25.8 [21.0,31.2] 47.7 [42.2,53.2] 21.9*** Paid work 51.3 [47.2,55.3] 59.5 [55.1,63.8] 8.3**
Place of residence *** *** Urban 66.6 [61.3,71.5] 74.9 [69.6,79.5] 8.3* Rural 33.0 [29.7,36.6] 49.8 [46.2,53.3] 16.7***
Wealth quintile *** *** Lowest 20.9 [17.3,24.9] 44.9 [39.1,50.8] 24.0*** Second 26.5 [22.4,31.0] 47.3 [42.2,52.5] 20.8*** Middle 35.6 [31.4,40.0] 46.8 [42.0,51.7] 11.2*** Fourth 51.9 [46.6,57.3] 63.1 [57.7,68.1] 11.1** Highest 66.4 [61.0,71.4] 77.1 [72.1,81.5] 10.7**
Region *** *** Kayes 36.0 [28.8,43.8] 50.8 [42.0,59.6] Koulikoro 43.0 [34.7,51.6] 59.4 [51.7,66.6]
Sikasso 43.9 [37.5,50.6] 40.9 [35.6,46.5] Segou 28.4 [22.9,34.5] 59.3 [50.9,67.2] Mopti 20.7 [15.3,27.4] 52.4 [43.5,61.1] Tombouctou 71.1 [65.9,75.8] 28.2 [17.0,42.9] Gao 51.2 [33.5,68.5] Kidal 20.3 [13.5,29.2] Bamako 78.1 [71.1,83.8]
Notes: *p<0.05, **p<0.01, ***p<0.001 1 p-value significance of the covariate in each survey. 2 Difference between the two surveys with the p-value of the difference.
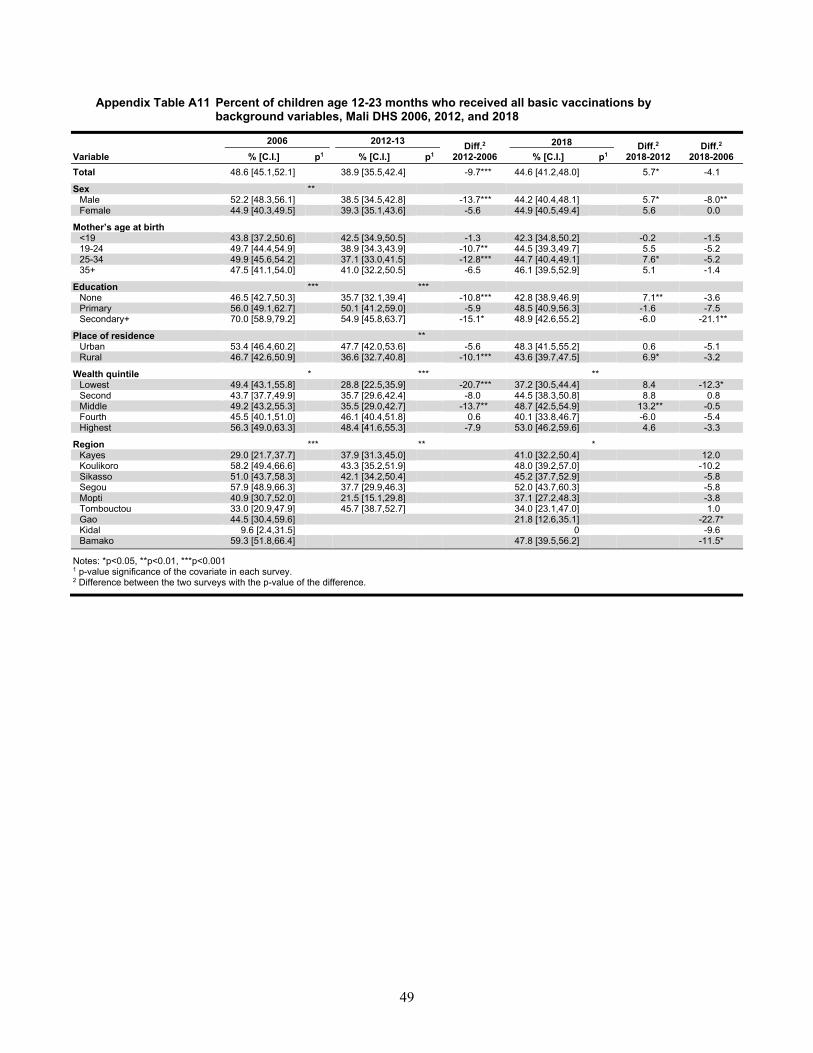
49
Appendix Table A11 Percent of children age 12-23 months who received all basic vaccinations by background variables, Mali DHS 2006, 2012, and 2018
2006 2012-13 Diff.2 2012-2006
2018 Diff.2 2018-2012
Diff.2
2018-2006 Variable % [C.I.] p1 % [C.I.] p1 % [C.I.] p1 Total 48.6 [45.1,52.1] 38.9 [35.5,42.4] -9.7*** 44.6 [41.2,48.0] 5.7* -4.1 Sex **
Male 52.2 [48.3,56.1] 38.5 [34.5,42.8] -13.7*** 44.2 [40.4,48.1] 5.7* -8.0** Female 44.9 [40.3,49.5] 39.3 [35.1,43.6] -5.6 44.9 [40.5,49.4] 5.6 0.0
Mother’s age at birth <19 43.8 [37.2,50.6] 42.5 [34.9,50.5] -1.3 42.3 [34.8,50.2] -0.2 -1.5 19-24 49.7 [44.4,54.9] 38.9 [34.3,43.9] -10.7** 44.5 [39.3,49.7] 5.5 -5.2 25-34 49.9 [45.6,54.2] 37.1 [33.0,41.5] -12.8*** 44.7 [40.4,49.1] 7.6* -5.2 35+ 47.5 [41.1,54.0] 41.0 [32.2,50.5] -6.5 46.1 [39.5,52.9] 5.1 -1.4
Education *** ***
None 46.5 [42.7,50.3] 35.7 [32.1,39.4] -10.8*** 42.8 [38.9,46.9] 7.1** -3.6 Primary 56.0 [49.1,62.7] 50.1 [41.2,59.0] -5.9 48.5 [40.9,56.3] -1.6 -7.5 Secondary+ 70.0 [58.9,79.2] 54.9 [45.8,63.7] -15.1* 48.9 [42.6,55.2] -6.0 -21.1**
Place of residence **
Urban 53.4 [46.4,60.2] 47.7 [42.0,53.6] -5.6 48.3 [41.5,55.2] 0.6 -5.1 Rural 46.7 [42.6,50.9] 36.6 [32.7,40.8] -10.1*** 43.6 [39.7,47.5] 6.9* -3.2
Wealth quintile * *** **
Lowest 49.4 [43.1,55.8] 28.8 [22.5,35.9] -20.7*** 37.2 [30.5,44.4] 8.4 -12.3* Second 43.7 [37.7,49.9] 35.7 [29.6,42.4] -8.0 44.5 [38.3,50.8] 8.8 0.8 Middle 49.2 [43.2,55.3] 35.5 [29.0,42.7] -13.7** 48.7 [42.5,54.9] 13.2** -0.5 Fourth 45.5 [40.1,51.0] 46.1 [40.4,51.8] 0.6 40.1 [33.8,46.7] -6.0 -5.4 Highest 56.3 [49.0,63.3] 48.4 [41.6,55.3] -7.9 53.0 [46.2,59.6] 4.6 -3.3
Region *** ** *
Kayes 29.0 [21.7,37.7] 37.9 [31.3,45.0] 41.0 [32.2,50.4] 12.0 Koulikoro 58.2 [49.4,66.6] 43.3 [35.2,51.9] 48.0 [39.2,57.0] -10.2
Sikasso 51.0 [43.7,58.3] 42.1 [34.2,50.4] 45.2 [37.7,52.9] -5.8 Segou 57.9 [48.9,66.3] 37.7 [29.9,46.3] 52.0 [43.7,60.3] -5.8 Mopti 40.9 [30.7,52.0] 21.5 [15.1,29.8] 37.1 [27.2,48.3] -3.8 Tombouctou 33.0 [20.9,47.9] 45.7 [38.7,52.7] 34.0 [23.1,47.0] 1.0 Gao 44.5 [30.4,59.6] 21.8 [12.6,35.1] -22.7* Kidal 9.6 [2.4,31.5] 0 -9.6 Bamako 59.3 [51.8,66.4] 47.8 [39.5,56.2] -11.5*
Notes: *p<0.05, **p<0.01, ***p<0.001 1 p-value significance of the covariate in each survey. 2 Difference between the two surveys with the p-value of the difference.
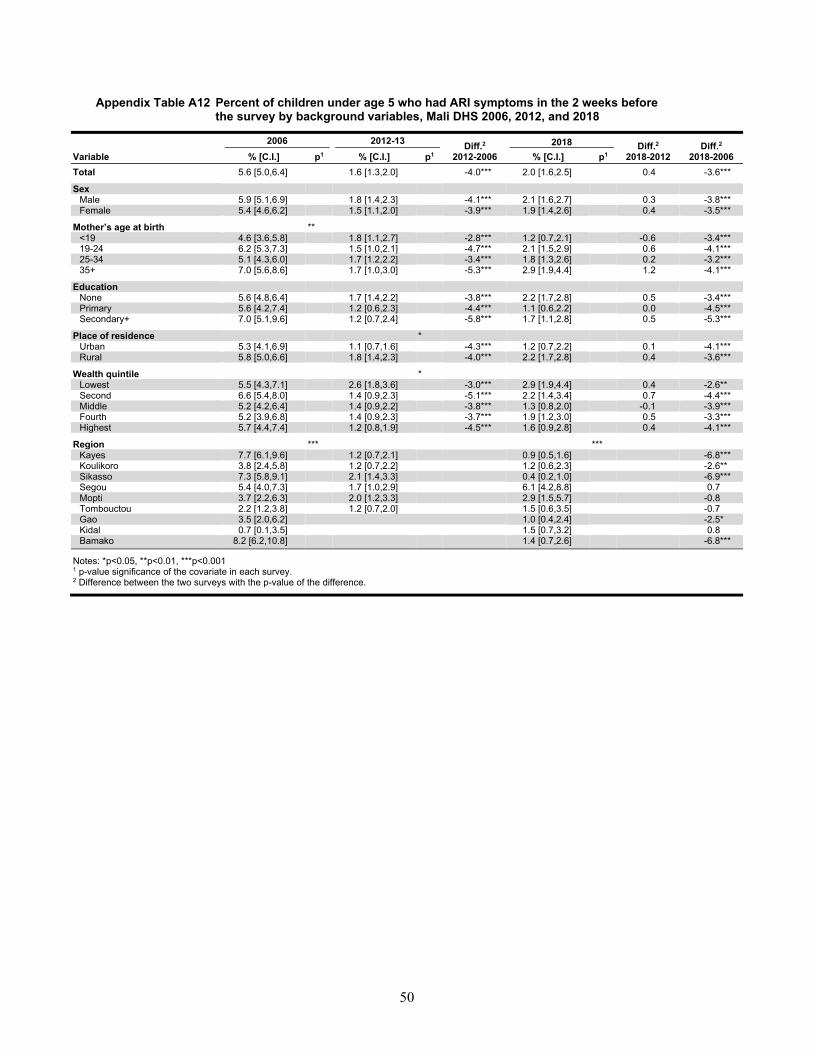
50
Appendix Table A12 Percent of children under age 5 who had ARI symptoms in the 2 weeks before the survey by background variables, Mali DHS 2006, 2012, and 2018
2006 2012-13 Diff.2 2012-2006
2018 Diff.2 2018-2012
Diff.2
2018-2006 Variable % [C.I.] p1 % [C.I.] p1 % [C.I.] p1 Total 5.6 [5.0,6.4] 1.6 [1.3,2.0] -4.0*** 2.0 [1.6,2.5] 0.4 -3.6*** Sex
Male 5.9 [5.1,6.9] 1.8 [1.4,2.3] -4.1*** 2.1 [1.6,2.7] 0.3 -3.8*** Female 5.4 [4.6,6.2] 1.5 [1.1,2.0] -3.9*** 1.9 [1.4,2.6] 0.4 -3.5***
Mother’s age at birth ** <19 4.6 [3.6,5.8] 1.8 [1.1,2.7] -2.8*** 1.2 [0.7,2.1] -0.6 -3.4*** 19-24 6.2 [5.3,7.3] 1.5 [1.0,2.1] -4.7*** 2.1 [1.5,2.9] 0.6 -4.1*** 25-34 5.1 [4.3,6.0] 1.7 [1.2,2.2] -3.4*** 1.8 [1.3,2.6] 0.2 -3.2*** 35+ 7.0 [5.6,8.6] 1.7 [1.0,3.0] -5.3*** 2.9 [1.9,4.4] 1.2 -4.1***
Education
None 5.6 [4.8,6.4] 1.7 [1.4,2.2] -3.8*** 2.2 [1.7,2.8] 0.5 -3.4*** Primary 5.6 [4.2,7.4] 1.2 [0.6,2.3] -4.4*** 1.1 [0.6,2.2] 0.0 -4.5*** Secondary+ 7.0 [5.1,9.6] 1.2 [0.7,2.4] -5.8*** 1.7 [1.1,2.8] 0.5 -5.3***
Place of residence *
Urban 5.3 [4.1,6.9] 1.1 [0.7,1.6] -4.3*** 1.2 [0.7,2.2] 0.1 -4.1*** Rural 5.8 [5.0,6.6] 1.8 [1.4,2.3] -4.0*** 2.2 [1.7,2.8] 0.4 -3.6***
Wealth quintile *
Lowest 5.5 [4.3,7.1] 2.6 [1.8,3.6] -3.0*** 2.9 [1.9,4.4] 0.4 -2.6** Second 6.6 [5.4,8.0] 1.4 [0.9,2.3] -5.1*** 2.2 [1.4,3.4] 0.7 -4.4*** Middle 5.2 [4.2,6.4] 1.4 [0.9,2.2] -3.8*** 1.3 [0.8,2.0] -0.1 -3.9*** Fourth 5.2 [3.9,6.8] 1.4 [0.9,2.3] -3.7*** 1.9 [1.2,3.0] 0.5 -3.3*** Highest 5.7 [4.4,7.4] 1.2 [0.8,1.9] -4.5*** 1.6 [0.9,2.8] 0.4 -4.1***
Region *** ***
Kayes 7.7 [6.1,9.6] 1.2 [0.7,2.1] 0.9 [0.5,1.6] -6.8*** Koulikoro 3.8 [2.4,5.8] 1.2 [0.7,2.2] 1.2 [0.6,2.3] -2.6**
Sikasso 7.3 [5.8,9.1] 2.1 [1.4,3.3] 0.4 [0.2,1.0] -6.9*** Segou 5.4 [4.0,7.3] 1.7 [1.0,2.9] 6.1 [4.2,8.8] 0.7 Mopti 3.7 [2.2,6.3] 2.0 [1.2,3.3] 2.9 [1.5,5.7] -0.8 Tombouctou 2.2 [1.2,3.8] 1.2 [0.7,2.0] 1.5 [0.6,3.5] -0.7 Gao 3.5 [2.0,6.2] 1.0 [0.4,2.4] -2.5* Kidal 0.7 [0.1,3.5] 1.5 [0.7,3.2] 0.8 Bamako 8.2 [6.2,10.8] 1.4 [0.7,2.6] -6.8***
Notes: *p<0.05, **p<0.01, ***p<0.001 1 p-value significance of the covariate in each survey. 2 Difference between the two surveys with the p-value of the difference.

51
Appendix Table A13 Percent of children under age 5 who received treatment for ARI symptoms in the 2 weeks before the survey by background variables, Mali DHS 2006, 2012, and 2018
2006 2012-13 Diff.2 2012-2006
2018 Diff.2 2018-2012
Diff.2
2018-2006 Variable % [C.I.] p1 % [C.I.] p1 % [C.I.] p1 Total 50.2 [44.8,55.7] 51.0 [41.4,60.4] 0.7 70.9 [63.4,77.5] 19.9** 20.7***
Sex Male 49.3 [42.4,56.2] 56.3 [43.0,68.7] 7.0 71.4 [60.4,80.4] 15.2 22.2*** Female 51.3 [44.4,58.1] 44.5 [32.9,56.8] -6.8 70.3 [58.9,79.7] 25.8** 19.0**
Mother’s age at birth
<19 41.4 [29.7,54.1] ND ND 19-24 50.6 [42.3,58.8] 55.8 [37.2,72.9] 5.2 80.0 [63.8,90.0] 24.2* 29.4** 25-34 56.5 [49.0,63.8] 47.5 [34.6,60.8] -9.0 72.9 [60.1,82.8] 25.4** 16.4* 35+ 42.9 [33.9,52.4] ND 59.3 [43.1,73.6]
Education *** None 45.9 [40.1,51.8] 50.6 [40.1,61.0] 4.7 68.1 [59.2,75.8] 17.5* 22.2*** Primary 68.7 [53.9,80.4] ND ND Secondary+ 80.0 [61.4,90.9] ND 87.5 [58.8,97.2]
Place of residence ** Urban 63.6 [53.1,73.0] 54.8 [35.1,73.0] -8.8 88.7 [56.9,97.9] 33.9* 25.0 Rural 45.4 [39.0,51.9] 50.4 [39.8,60.9] 5.0 68.4 [60.2,75.6] 18.0** 23.0***
Wealth quintile *** Lowest 44.5 [33.6,56.0] 45.6 [27.8,64.5] 1.0 74.3 [61.1,84.2] 28.7* 29.8*** Second 46.5 [36.4,56.8] 50.0 [31.5,68.5] 3.5 58.3 [42.0,72.9] 8.3 11.8 Middle 36.7 [27.5,47.0] 41.9 [21.7,65.3] 5.2 60.3 [40.0,77.6] 18.4 23.5* Fourth 49.2 [37.3,61.3] 61.4 [32.7,83.9] 12.1 77.9 [56.9,90.4] 16.5 28.6* Highest 75.9 [65.2,84.1] 63.3 [45.0,78.4] -12.6 85.7 [61.3,95.8] 22.4 9.8
Region ** ** Kayes 43.0 [28.2,59.1] ND ND Koulikoro 30.9 [21.6,41.9] ND ND
Sikasso 53.1 [42.5,63.5] 65.5 [43.8,82.2] ND Segou 43.7 [31.4,56.8] 33.9 [17.3,55.8] 84.1 [75.0,90.3] 40.4*** Mopti 62.7 [50.4,73.5] 37.3 [18.6,60.9] ND Tombouctou ND ND ND Gao 40.2 [19.1,65.7] ND Kidal ND ND Bamako 71.0 [55.8,82.6] ND
Notes: *p<0.05, **p<0.01, ***p<0.001. ND – Not displaced due to estimate based on fewer than 25 unweighted observations. 1 p-value significance of the covariate in each survey. 2 Difference between the two surveys with the p-value of the difference.
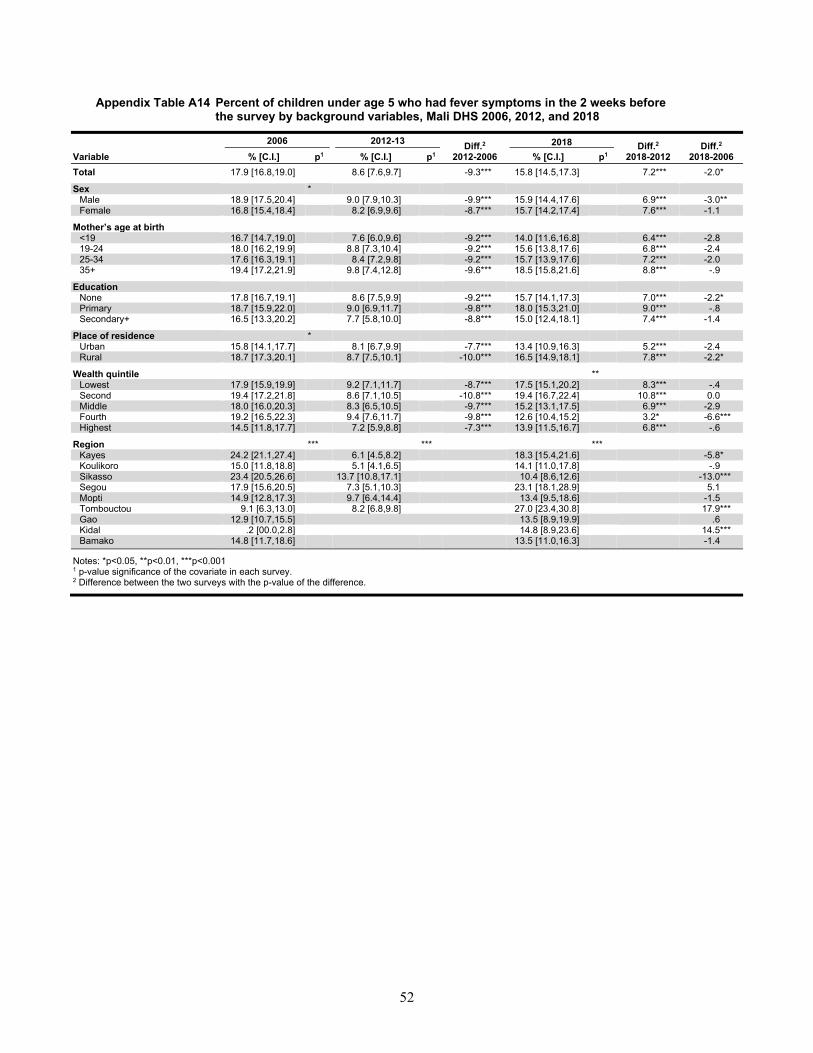
52
Appendix Table A14 Percent of children under age 5 who had fever symptoms in the 2 weeks before the survey by background variables, Mali DHS 2006, 2012, and 2018
2006 2012-13 Diff.2 2012-2006
2018 Diff.2 2018-2012
Diff.2
2018-2006 Variable % [C.I.] p1 % [C.I.] p1 % [C.I.] p1 Total 17.9 [16.8,19.0] 8.6 [7.6,9.7] -9.3*** 15.8 [14.5,17.3] 7.2*** -2.0*
Sex * Male 18.9 [17.5,20.4] 9.0 [7.9,10.3] -9.9*** 15.9 [14.4,17.6] 6.9*** -3.0** Female 16.8 [15.4,18.4] 8.2 [6.9,9.6] -8.7*** 15.7 [14.2,17.4] 7.6*** -1.1
Mother’s age at birth
<19 16.7 [14.7,19.0] 7.6 [6.0,9.6] -9.2*** 14.0 [11.6,16.8] 6.4*** -2.8 19-24 18.0 [16.2,19.9] 8.8 [7.3,10.4] -9.2*** 15.6 [13.8,17.6] 6.8*** -2.4 25-34 17.6 [16.3,19.1] 8.4 [7.2,9.8] -9.2*** 15.7 [13.9,17.6] 7.2*** -2.0 35+ 19.4 [17.2,21.9] 9.8 [7.4,12.8] -9.6*** 18.5 [15.8,21.6] 8.8*** -.9
Education None 17.8 [16.7,19.1] 8.6 [7.5,9.9] -9.2*** 15.7 [14.1,17.3] 7.0*** -2.2* Primary 18.7 [15.9,22.0] 9.0 [6.9,11.7] -9.8*** 18.0 [15.3,21.0] 9.0*** -.8 Secondary+ 16.5 [13.3,20.2] 7.7 [5.8,10.0] -8.8*** 15.0 [12.4,18.1] 7.4*** -1.4
Place of residence * Urban 15.8 [14.1,17.7] 8.1 [6.7,9.9] -7.7*** 13.4 [10.9,16.3] 5.2*** -2.4 Rural 18.7 [17.3,20.1] 8.7 [7.5,10.1] -10.0*** 16.5 [14.9,18.1] 7.8*** -2.2*
Wealth quintile ** Lowest 17.9 [15.9,19.9] 9.2 [7.1,11.7] -8.7*** 17.5 [15.1,20.2] 8.3*** -.4 Second 19.4 [17.2,21.8] 8.6 [7.1,10.5] -10.8*** 19.4 [16.7,22.4] 10.8*** 0.0 Middle 18.0 [16.0,20.3] 8.3 [6.5,10.5] -9.7*** 15.2 [13.1,17.5] 6.9*** -2.9 Fourth 19.2 [16.5,22.3] 9.4 [7.6,11.7] -9.8*** 12.6 [10.4,15.2] 3.2* -6.6*** Highest 14.5 [11.8,17.7] 7.2 [5.9,8.8] -7.3*** 13.9 [11.5,16.7] 6.8*** -.6
Region *** *** *** Kayes 24.2 [21.1,27.4] 6.1 [4.5,8.2] 18.3 [15.4,21.6] -5.8* Koulikoro 15.0 [11.8,18.8] 5.1 [4.1,6.5] 14.1 [11.0,17.8] -.9
Sikasso 23.4 [20.5,26.6] 13.7 [10.8,17.1] 10.4 [8.6,12.6] -13.0*** Segou 17.9 [15.6,20.5] 7.3 [5.1,10.3] 23.1 [18.1,28.9] 5.1 Mopti 14.9 [12.8,17.3] 9.7 [6.4,14.4] 13.4 [9.5,18.6] -1.5 Tombouctou 9.1 [6.3,13.0] 8.2 [6.8,9.8] 27.0 [23.4,30.8] 17.9*** Gao 12.9 [10.7,15.5] 13.5 [8.9,19.9] .6 Kidal .2 [00.0,2.8] 14.8 [8.9,23.6] 14.5*** Bamako 14.8 [11.7,18.6] 13.5 [11.0,16.3] -1.4
Notes: *p<0.05, **p<0.01, ***p<0.001 1 p-value significance of the covariate in each survey. 2 Difference between the two surveys with the p-value of the difference.
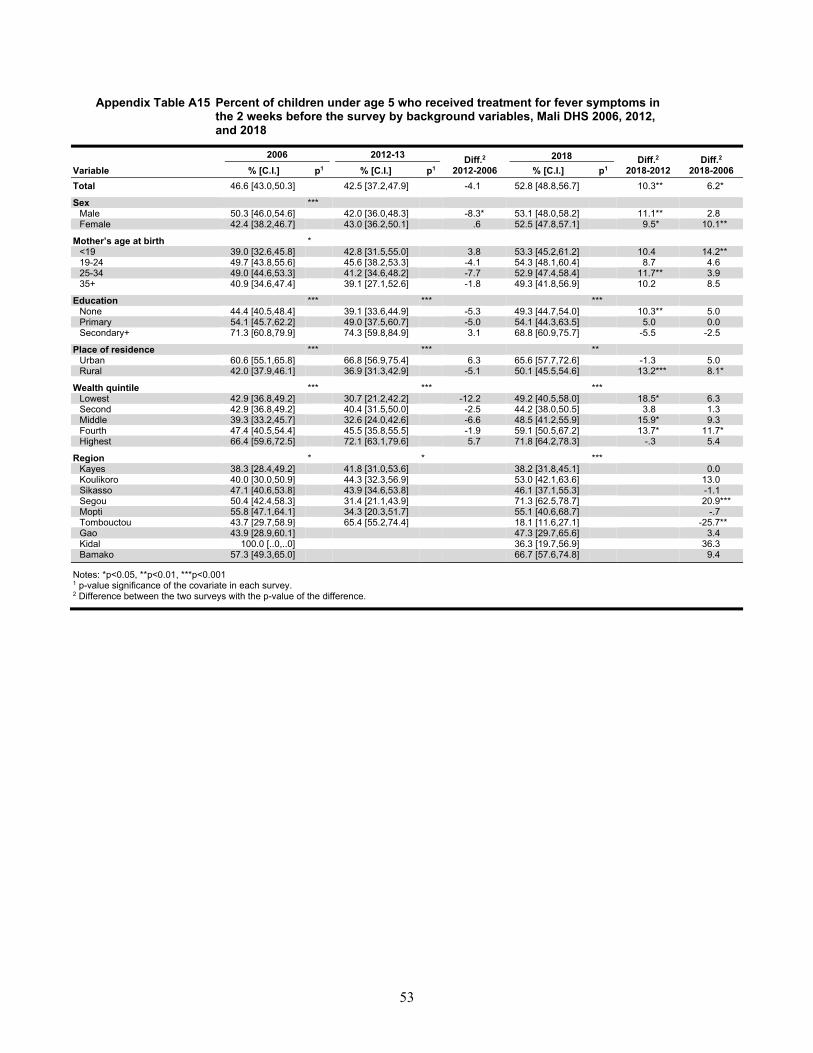
53
Appendix Table A15 Percent of children under age 5 who received treatment for fever symptoms in the 2 weeks before the survey by background variables, Mali DHS 2006, 2012, and 2018
2006 2012-13 Diff.2 2012-2006
2018 Diff.2 2018-2012
Diff.2
2018-2006 Variable % [C.I.] p1 % [C.I.] p1 % [C.I.] p1 Total 46.6 [43.0,50.3] 42.5 [37.2,47.9] -4.1 52.8 [48.8,56.7] 10.3** 6.2*
Sex *** Male 50.3 [46.0,54.6] 42.0 [36.0,48.3] -8.3* 53.1 [48.0,58.2] 11.1** 2.8 Female 42.4 [38.2,46.7] 43.0 [36.2,50.1] .6 52.5 [47.8,57.1] 9.5* 10.1**
Mother’s age at birth *
<19 39.0 [32.6,45.8] 42.8 [31.5,55.0] 3.8 53.3 [45.2,61.2] 10.4 14.2** 19-24 49.7 [43.8,55.6] 45.6 [38.2,53.3] -4.1 54.3 [48.1,60.4] 8.7 4.6 25-34 49.0 [44.6,53.3] 41.2 [34.6,48.2] -7.7 52.9 [47.4,58.4] 11.7** 3.9 35+ 40.9 [34.6,47.4] 39.1 [27.1,52.6] -1.8 49.3 [41.8,56.9] 10.2 8.5
Education *** *** *** None 44.4 [40.5,48.4] 39.1 [33.6,44.9] -5.3 49.3 [44.7,54.0] 10.3** 5.0 Primary 54.1 [45.7,62.2] 49.0 [37.5,60.7] -5.0 54.1 [44.3,63.5] 5.0 0.0 Secondary+ 71.3 [60.8,79.9] 74.3 [59.8,84.9] 3.1 68.8 [60.9,75.7] -5.5 -2.5
Place of residence *** *** ** Urban 60.6 [55.1,65.8] 66.8 [56.9,75.4] 6.3 65.6 [57.7,72.6] -1.3 5.0 Rural 42.0 [37.9,46.1] 36.9 [31.3,42.9] -5.1 50.1 [45.5,54.6] 13.2*** 8.1*
Wealth quintile *** *** *** Lowest 42.9 [36.8,49.2] 30.7 [21.2,42.2] -12.2 49.2 [40.5,58.0] 18.5* 6.3 Second 42.9 [36.8,49.2] 40.4 [31.5,50.0] -2.5 44.2 [38.0,50.5] 3.8 1.3 Middle 39.3 [33.2,45.7] 32.6 [24.0,42.6] -6.6 48.5 [41.2,55.9] 15.9* 9.3 Fourth 47.4 [40.5,54.4] 45.5 [35.8,55.5] -1.9 59.1 [50.5,67.2] 13.7* 11.7* Highest 66.4 [59.6,72.5] 72.1 [63.1,79.6] 5.7 71.8 [64.2,78.3] -.3 5.4
Region * * *** Kayes 38.3 [28.4,49.2] 41.8 [31.0,53.6] 38.2 [31.8,45.1] 0.0 Koulikoro 40.0 [30.0,50.9] 44.3 [32.3,56.9] 53.0 [42.1,63.6] 13.0
Sikasso 47.1 [40.6,53.8] 43.9 [34.6,53.8] 46.1 [37.1,55.3] -1.1 Segou 50.4 [42.4,58.3] 31.4 [21.1,43.9] 71.3 [62.5,78.7] 20.9*** Mopti 55.8 [47.1,64.1] 34.3 [20.3,51.7] 55.1 [40.6,68.7] -.7 Tombouctou 43.7 [29.7,58.9] 65.4 [55.2,74.4] 18.1 [11.6,27.1] -25.7** Gao 43.9 [28.9,60.1] 47.3 [29.7,65.6] 3.4 Kidal 100.0 [..0,..0] 36.3 [19.7,56.9] 36.3 Bamako 57.3 [49.3,65.0] 66.7 [57.6,74.8] 9.4
Notes: *p<0.05, **p<0.01, ***p<0.001 1 p-value significance of the covariate in each survey. 2 Difference between the two surveys with the p-value of the difference.
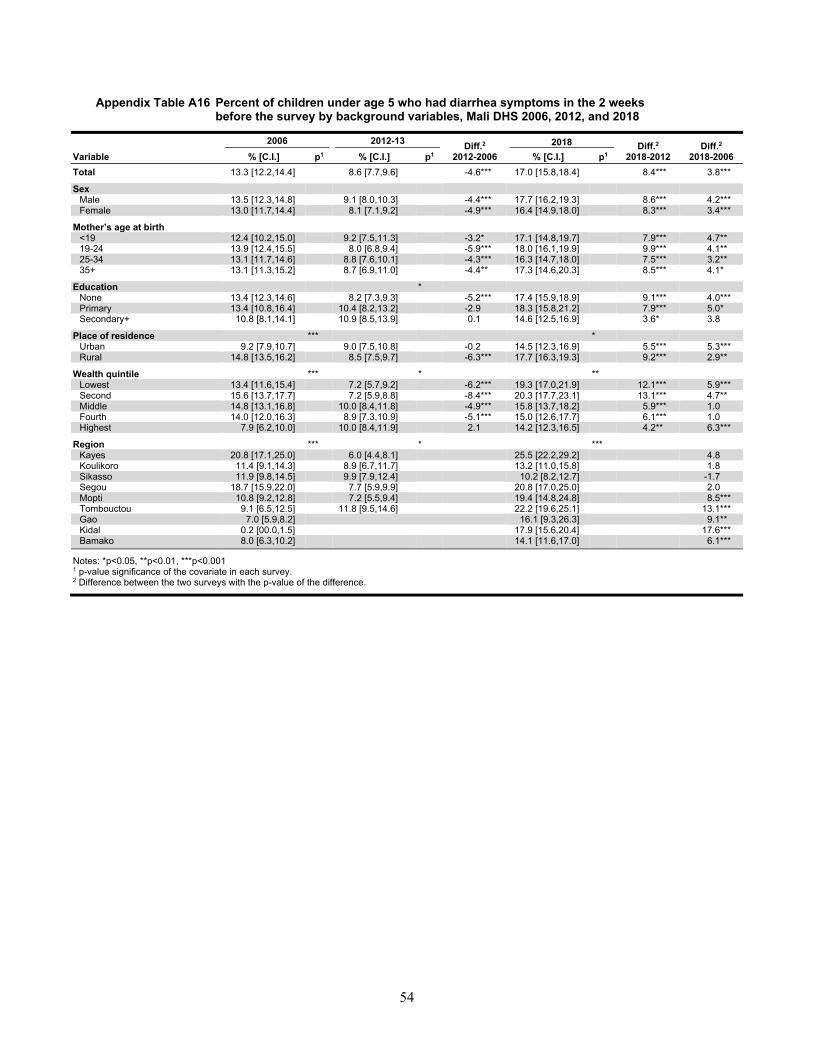
54
Appendix Table A16 Percent of children under age 5 who had diarrhea symptoms in the 2 weeks before the survey by background variables, Mali DHS 2006, 2012, and 2018
2006 2012-13 Diff.2 2012-2006
2018 Diff.2 2018-2012
Diff.2
2018-2006 Variable % [C.I.] p1 % [C.I.] p1 % [C.I.] p1 Total 13.3 [12.2,14.4] 8.6 [7.7,9.6] -4.6*** 17.0 [15.8,18.4] 8.4*** 3.8*** Sex
Male 13.5 [12.3,14.8] 9.1 [8.0,10.3] -4.4*** 17.7 [16.2,19.3] 8.6*** 4.2*** Female 13.0 [11.7,14.4] 8.1 [7.1,9.2] -4.9*** 16.4 [14.9,18.0] 8.3*** 3.4***
Mother’s age at birth <19 12.4 [10.2,15.0] 9.2 [7.5,11.3] -3.2* 17.1 [14.8,19.7] 7.9*** 4.7** 19-24 13.9 [12.4,15.5] 8.0 [6.8,9.4] -5.9*** 18.0 [16.1,19.9] 9.9*** 4.1** 25-34 13.1 [11.7,14.6] 8.8 [7.6,10.1] -4.3*** 16.3 [14.7,18.0] 7.5*** 3.2** 35+ 13.1 [11.3,15.2] 8.7 [6.9,11.0] -4.4** 17.3 [14.6,20.3] 8.5*** 4.1*
Education *
None 13.4 [12.3,14.6] 8.2 [7.3,9.3] -5.2*** 17.4 [15.9,18.9] 9.1*** 4.0*** Primary 13.4 [10.8,16.4] 10.4 [8.2,13.2] -2.9 18.3 [15.8,21.2] 7.9*** 5.0* Secondary+ 10.8 [8.1,14.1] 10.9 [8.5,13.9] 0.1 14.6 [12.5,16.9] 3.6* 3.8
Place of residence *** *
Urban 9.2 [7.9,10.7] 9.0 [7.5,10.8] -0.2 14.5 [12.3,16.9] 5.5*** 5.3*** Rural 14.8 [13.5,16.2] 8.5 [7.5,9.7] -6.3*** 17.7 [16.3,19.3] 9.2*** 2.9**
Wealth quintile *** * **
Lowest 13.4 [11.6,15.4] 7.2 [5.7,9.2] -6.2*** 19.3 [17.0,21.9] 12.1*** 5.9*** Second 15.6 [13.7,17.7] 7.2 [5.9,8.8] -8.4*** 20.3 [17.7,23.1] 13.1*** 4.7** Middle 14.8 [13.1,16.8] 10.0 [8.4,11.8] -4.9*** 15.8 [13.7,18.2] 5.9*** 1.0 Fourth 14.0 [12.0,16.3] 8.9 [7.3,10.9] -5.1*** 15.0 [12.6,17.7] 6.1*** 1.0 Highest 7.9 [6.2,10.0] 10.0 [8.4,11.9] 2.1 14.2 [12.3,16.5] 4.2** 6.3***
Region *** * ***
Kayes 20.8 [17.1,25.0] 6.0 [4.4,8.1] 25.5 [22.2,29.2] 4.8 Koulikoro 11.4 [9.1,14.3] 8.9 [6.7,11.7] 13.2 [11.0,15.8] 1.8
Sikasso 11.9 [9.8,14.5] 9.9 [7.9,12.4] 10.2 [8.2,12.7] -1.7 Segou 18.7 [15.9,22.0] 7.7 [5.9,9.9] 20.8 [17.0,25.0] 2.0 Mopti 10.8 [9.2,12.8] 7.2 [5.5,9.4] 19.4 [14.8,24.8] 8.5*** Tombouctou 9.1 [6.5,12.5] 11.8 [9.5,14.6] 22.2 [19.6,25.1] 13.1*** Gao 7.0 [5.9,8.2] 16.1 [9.3,26.3] 9.1** Kidal 0.2 [00.0,1.5] 17.9 [15.6,20.4] 17.6*** Bamako 8.0 [6.3,10.2] 14.1 [11.6,17.0] 6.1***
Notes: *p<0.05, **p<0.01, ***p<0.001 1 p-value significance of the covariate in each survey. 2 Difference between the two surveys with the p-value of the difference.
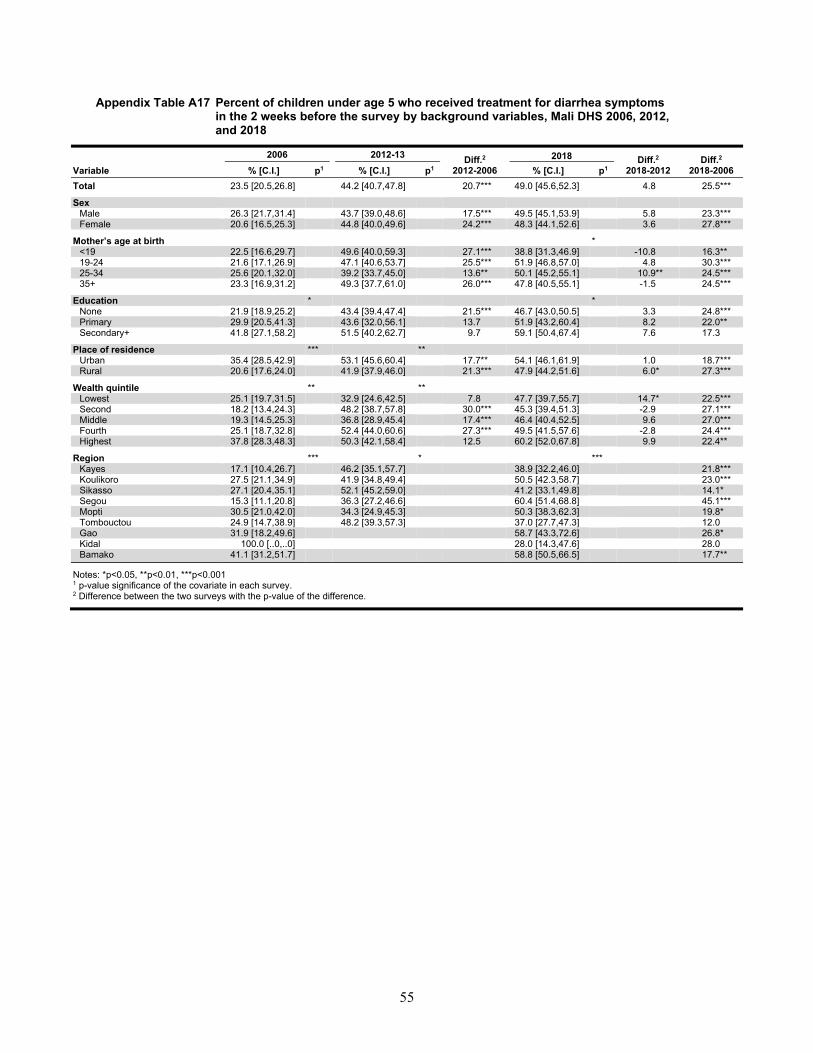
55
Appendix Table A17 Percent of children under age 5 who received treatment for diarrhea symptoms in the 2 weeks before the survey by background variables, Mali DHS 2006, 2012, and 2018
2006 2012-13 Diff.2 2012-2006
2018 Diff.2 2018-2012
Diff.2
2018-2006 Variable % [C.I.] p1 % [C.I.] p1 % [C.I.] p1 Total 23.5 [20.5,26.8] 44.2 [40.7,47.8] 20.7*** 49.0 [45.6,52.3] 4.8 25.5***
Sex Male 26.3 [21.7,31.4] 43.7 [39.0,48.6] 17.5*** 49.5 [45.1,53.9] 5.8 23.3*** Female 20.6 [16.5,25.3] 44.8 [40.0,49.6] 24.2*** 48.3 [44.1,52.6] 3.6 27.8***
Mother’s age at birth *
<19 22.5 [16.6,29.7] 49.6 [40.0,59.3] 27.1*** 38.8 [31.3,46.9] -10.8 16.3** 19-24 21.6 [17.1,26.9] 47.1 [40.6,53.7] 25.5*** 51.9 [46.8,57.0] 4.8 30.3*** 25-34 25.6 [20.1,32.0] 39.2 [33.7,45.0] 13.6** 50.1 [45.2,55.1] 10.9** 24.5*** 35+ 23.3 [16.9,31.2] 49.3 [37.7,61.0] 26.0*** 47.8 [40.5,55.1] -1.5 24.5***
Education * * None 21.9 [18.9,25.2] 43.4 [39.4,47.4] 21.5*** 46.7 [43.0,50.5] 3.3 24.8*** Primary 29.9 [20.5,41.3] 43.6 [32.0,56.1] 13.7 51.9 [43.2,60.4] 8.2 22.0** Secondary+ 41.8 [27.1,58.2] 51.5 [40.2,62.7] 9.7 59.1 [50.4,67.4] 7.6 17.3
Place of residence *** ** Urban 35.4 [28.5,42.9] 53.1 [45.6,60.4] 17.7** 54.1 [46.1,61.9] 1.0 18.7*** Rural 20.6 [17.6,24.0] 41.9 [37.9,46.0] 21.3*** 47.9 [44.2,51.6] 6.0* 27.3***
Wealth quintile ** ** Lowest 25.1 [19.7,31.5] 32.9 [24.6,42.5] 7.8 47.7 [39.7,55.7] 14.7* 22.5*** Second 18.2 [13.4,24.3] 48.2 [38.7,57.8] 30.0*** 45.3 [39.4,51.3] -2.9 27.1*** Middle 19.3 [14.5,25.3] 36.8 [28.9,45.4] 17.4*** 46.4 [40.4,52.5] 9.6 27.0*** Fourth 25.1 [18.7,32.8] 52.4 [44.0,60.6] 27.3*** 49.5 [41.5,57.6] -2.8 24.4*** Highest 37.8 [28.3,48.3] 50.3 [42.1,58.4] 12.5 60.2 [52.0,67.8] 9.9 22.4**
Region *** * *** Kayes 17.1 [10.4,26.7] 46.2 [35.1,57.7] 38.9 [32.2,46.0] 21.8*** Koulikoro 27.5 [21.1,34.9] 41.9 [34.8,49.4] 50.5 [42.3,58.7] 23.0***
Sikasso 27.1 [20.4,35.1] 52.1 [45.2,59.0] 41.2 [33.1,49.8] 14.1* Segou 15.3 [11.1,20.8] 36.3 [27.2,46.6] 60.4 [51.4,68.8] 45.1*** Mopti 30.5 [21.0,42.0] 34.3 [24.9,45.3] 50.3 [38.3,62.3] 19.8* Tombouctou 24.9 [14.7,38.9] 48.2 [39.3,57.3] 37.0 [27.7,47.3] 12.0 Gao 31.9 [18.2,49.6] 58.7 [43.3,72.6] 26.8* Kidal 100.0 [..0,..0] 28.0 [14.3,47.6] 28.0 Bamako 41.1 [31.2,51.7] 58.8 [50.5,66.5] 17.7**
Notes: *p<0.05, **p<0.01, ***p<0.001 1 p-value significance of the covariate in each survey. 2 Difference between the two surveys with the p-value of the difference.
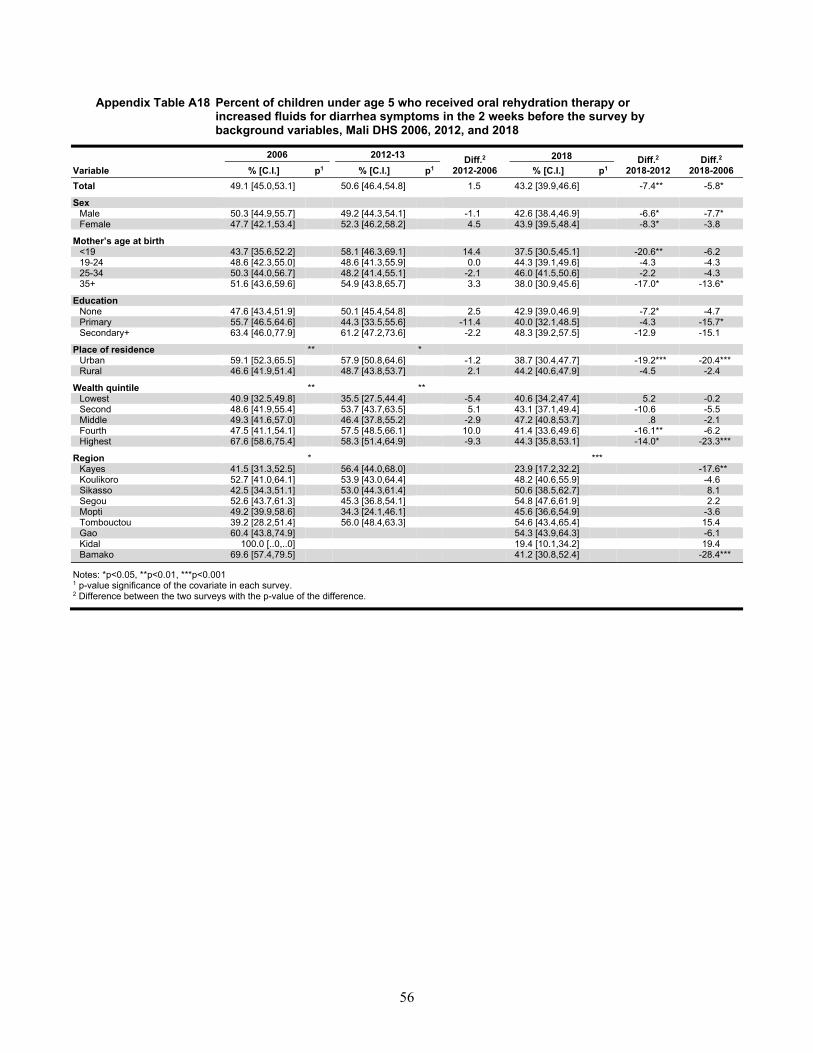
56
Appendix Table A18 Percent of children under age 5 who received oral rehydration therapy or increased fluids for diarrhea symptoms in the 2 weeks before the survey by background variables, Mali DHS 2006, 2012, and 2018
2006 2012-13 Diff.2 2012-2006
2018 Diff.2 2018-2012
Diff.2
2018-2006 Variable % [C.I.] p1 % [C.I.] p1 % [C.I.] p1 Total 49.1 [45.0,53.1] 50.6 [46.4,54.8] 1.5 43.2 [39.9,46.6] -7.4** -5.8* Sex
Male 50.3 [44.9,55.7] 49.2 [44.3,54.1] -1.1 42.6 [38.4,46.9] -6.6* -7.7* Female 47.7 [42.1,53.4] 52.3 [46.2,58.2] 4.5 43.9 [39.5,48.4] -8.3* -3.8
Mother’s age at birth <19 43.7 [35.6,52.2] 58.1 [46.3,69.1] 14.4 37.5 [30.5,45.1] -20.6** -6.2 19-24 48.6 [42.3,55.0] 48.6 [41.3,55.9] 0.0 44.3 [39.1,49.6] -4.3 -4.3 25-34 50.3 [44.0,56.7] 48.2 [41.4,55.1] -2.1 46.0 [41.5,50.6] -2.2 -4.3 35+ 51.6 [43.6,59.6] 54.9 [43.8,65.7] 3.3 38.0 [30.9,45.6] -17.0* -13.6*
Education
None 47.6 [43.4,51.9] 50.1 [45.4,54.8] 2.5 42.9 [39.0,46.9] -7.2* -4.7 Primary 55.7 [46.5,64.6] 44.3 [33.5,55.6] -11.4 40.0 [32.1,48.5] -4.3 -15.7* Secondary+ 63.4 [46.0,77.9] 61.2 [47.2,73.6] -2.2 48.3 [39.2,57.5] -12.9 -15.1
Place of residence ** *
Urban 59.1 [52.3,65.5] 57.9 [50.8,64.6] -1.2 38.7 [30.4,47.7] -19.2*** -20.4*** Rural 46.6 [41.9,51.4] 48.7 [43.8,53.7] 2.1 44.2 [40.6,47.9] -4.5 -2.4
Wealth quintile ** **
Lowest 40.9 [32.5,49.8] 35.5 [27.5,44.4] -5.4 40.6 [34.2,47.4] 5.2 -0.2 Second 48.6 [41.9,55.4] 53.7 [43.7,63.5] 5.1 43.1 [37.1,49.4] -10.6 -5.5 Middle 49.3 [41.6,57.0] 46.4 [37.8,55.2] -2.9 47.2 [40.8,53.7] .8 -2.1 Fourth 47.5 [41.1,54.1] 57.5 [48.5,66.1] 10.0 41.4 [33.6,49.6] -16.1** -6.2 Highest 67.6 [58.6,75.4] 58.3 [51.4,64.9] -9.3 44.3 [35.8,53.1] -14.0* -23.3***
Region * ***
Kayes 41.5 [31.3,52.5] 56.4 [44.0,68.0] 23.9 [17.2,32.2] -17.6** Koulikoro 52.7 [41.0,64.1] 53.9 [43.0,64.4] 48.2 [40.6,55.9] -4.6
Sikasso 42.5 [34.3,51.1] 53.0 [44.3,61.4] 50.6 [38.5,62.7] 8.1 Segou 52.6 [43.7,61.3] 45.3 [36.8,54.1] 54.8 [47.6,61.9] 2.2 Mopti 49.2 [39.9,58.6] 34.3 [24.1,46.1] 45.6 [36.6,54.9] -3.6 Tombouctou 39.2 [28.2,51.4] 56.0 [48.4,63.3] 54.6 [43.4,65.4] 15.4 Gao 60.4 [43.8,74.9] 54.3 [43.9,64.3] -6.1 Kidal 100.0 [..0,..0] 19.4 [10.1,34.2] 19.4 Bamako 69.6 [57.4,79.5] 41.2 [30.8,52.4] -28.4***
Notes: *p<0.05, **p<0.01, ***p<0.001 1 p-value significance of the covariate in each survey. 2 Difference between the two surveys with the p-value of the difference.
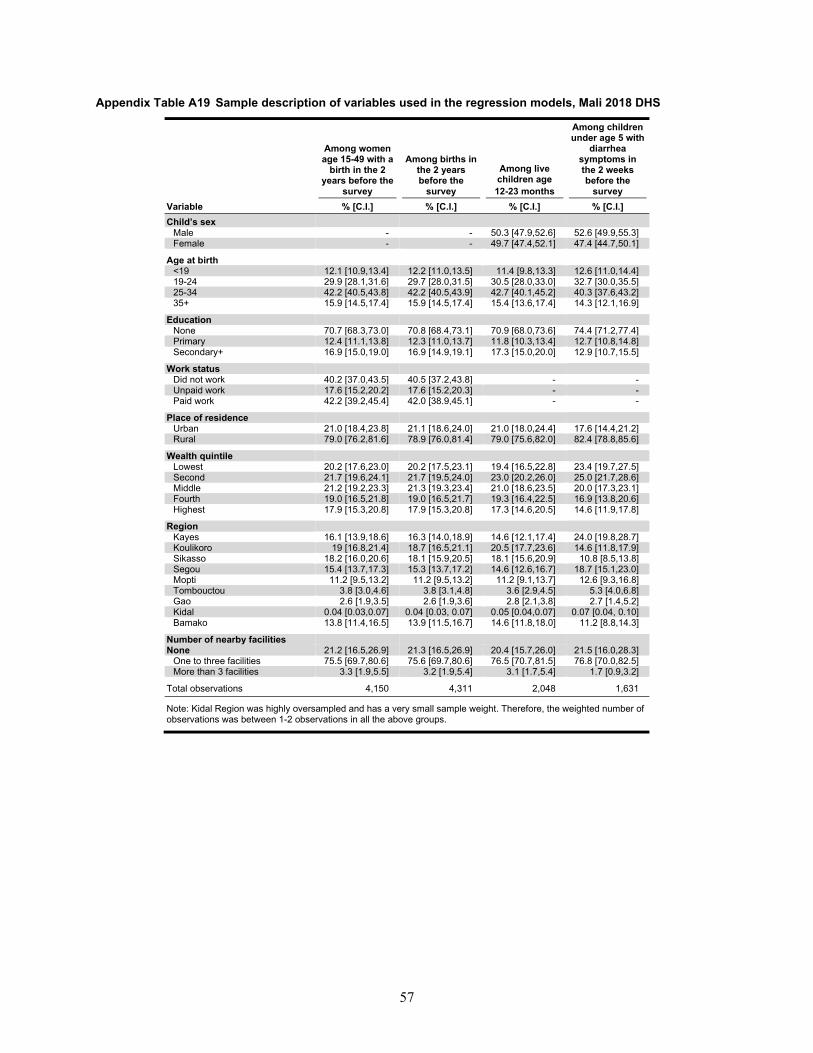
57
Appendix Table A19 Sample description of variables used in the regression models, Mali 2018 DHS
Among women age 15-49 with a
birth in the 2 years before the
survey
Among births in the 2 years before the
survey
Among live children age 12-23 months
Among children under age 5 with
diarrhea symptoms in the 2 weeks before the
survey Variable % [C.I.] % [C.I.] % [C.I.] % [C.I.] Child’s sex
Male - - 50.3 [47.9,52.6] 52.6 [49.9,55.3] Female - - 49.7 [47.4,52.1] 47.4 [44.7,50.1]
Age at birth <19 12.1 [10.9,13.4] 12.2 [11.0,13.5] 11.4 [9.8,13.3] 12.6 [11.0,14.4] 19-24 29.9 [28.1,31.6] 29.7 [28.0,31.5] 30.5 [28.0,33.0] 32.7 [30.0,35.5] 25-34 42.2 [40.5,43.8] 42.2 [40.5,43.9] 42.7 [40.1,45.2] 40.3 [37.6,43.2] 35+ 15.9 [14.5,17.4] 15.9 [14.5,17.4] 15.4 [13.6,17.4] 14.3 [12.1,16.9]
Education None 70.7 [68.3,73.0] 70.8 [68.4,73.1] 70.9 [68.0,73.6] 74.4 [71.2,77.4] Primary 12.4 [11.1,13.8] 12.3 [11.0,13.7] 11.8 [10.3,13.4] 12.7 [10.8,14.8] Secondary+ 16.9 [15.0,19.0] 16.9 [14.9,19.1] 17.3 [15.0,20.0] 12.9 [10.7,15.5]
Work status Did not work 40.2 [37.0,43.5] 40.5 [37.2,43.8] - - Unpaid work 17.6 [15.2,20.2] 17.6 [15.2,20.3] - - Paid work 42.2 [39.2,45.4] 42.0 [38.9,45.1] - -
Place of residence Urban 21.0 [18.4,23.8] 21.1 [18.6,24.0] 21.0 [18.0,24.4] 17.6 [14.4,21.2] Rural 79.0 [76.2,81.6] 78.9 [76.0,81.4] 79.0 [75.6,82.0] 82.4 [78.8,85.6]
Wealth quintile Lowest 20.2 [17.6,23.0] 20.2 [17.5,23.1] 19.4 [16.5,22.8] 23.4 [19.7,27.5]
Second 21.7 [19.6,24.1] 21.7 [19.5,24.0] 23.0 [20.2,26.0] 25.0 [21.7,28.6] Middle 21.2 [19.2,23.3] 21.3 [19.3,23.4] 21.0 [18.6,23.5] 20.0 [17.3,23.1] Fourth 19.0 [16.5,21.8] 19.0 [16.5,21.7] 19.3 [16.4,22.5] 16.9 [13.8,20.6] Highest 17.9 [15.3,20.8] 17.9 [15.3,20.8] 17.3 [14.6,20.5] 14.6 [11.9,17.8]
Region Kayes 16.1 [13.9,18.6] 16.3 [14.0,18.9] 14.6 [12.1,17.4] 24.0 [19.8,28.7] Koulikoro 19 [16.8,21.4] 18.7 [16.5,21.1] 20.5 [17.7,23.6] 14.6 [11.8,17.9] Sikasso 18.2 [16.0,20.6] 18.1 [15.9,20.5] 18.1 [15.6,20.9] 10.8 [8.5,13.8] Segou 15.4 [13.7,17.3] 15.3 [13.7,17.2] 14.6 [12.6,16.7] 18.7 [15.1,23.0] Mopti 11.2 [9.5,13.2] 11.2 [9.5,13.2] 11.2 [9.1,13.7] 12.6 [9.3,16.8] Tombouctou 3.8 [3.0,4.6] 3.8 [3.1,4.8] 3.6 [2.9,4.5] 5.3 [4.0,6.8] Gao 2.6 [1.9,3.5] 2.6 [1.9,3.6] 2.8 [2.1,3.8] 2.7 [1.4,5.2] Kidal 0.04 [0.03,0.07] 0.04 [0.03, 0.07] 0.05 [0.04,0.07] 0.07 [0.04, 0.10] Bamako 13.8 [11.4,16.5] 13.9 [11.5,16.7] 14.6 [11.8,18.0] 11.2 [8.8,14.3]
Number of nearby facilities None 21.2 [16.5,26.9] 21.3 [16.5,26.9] 20.4 [15.7,26.0] 21.5 [16.0,28.3]
One to three facilities 75.5 [69.7,80.6] 75.6 [69.7,80.6] 76.5 [70.7,81.5] 76.8 [70.0,82.5] More than 3 facilities 3.3 [1.9,5.5] 3.2 [1.9,5.4] 3.1 [1.7,5.4] 1.7 [0.9,3.2]
Total observations 4,150 4,311 2,048 1,631
Note: Kidal Region was highly oversampled and has a very small sample weight. Therefore, the weighted number of observations was between 1-2 observations in all the above groups.
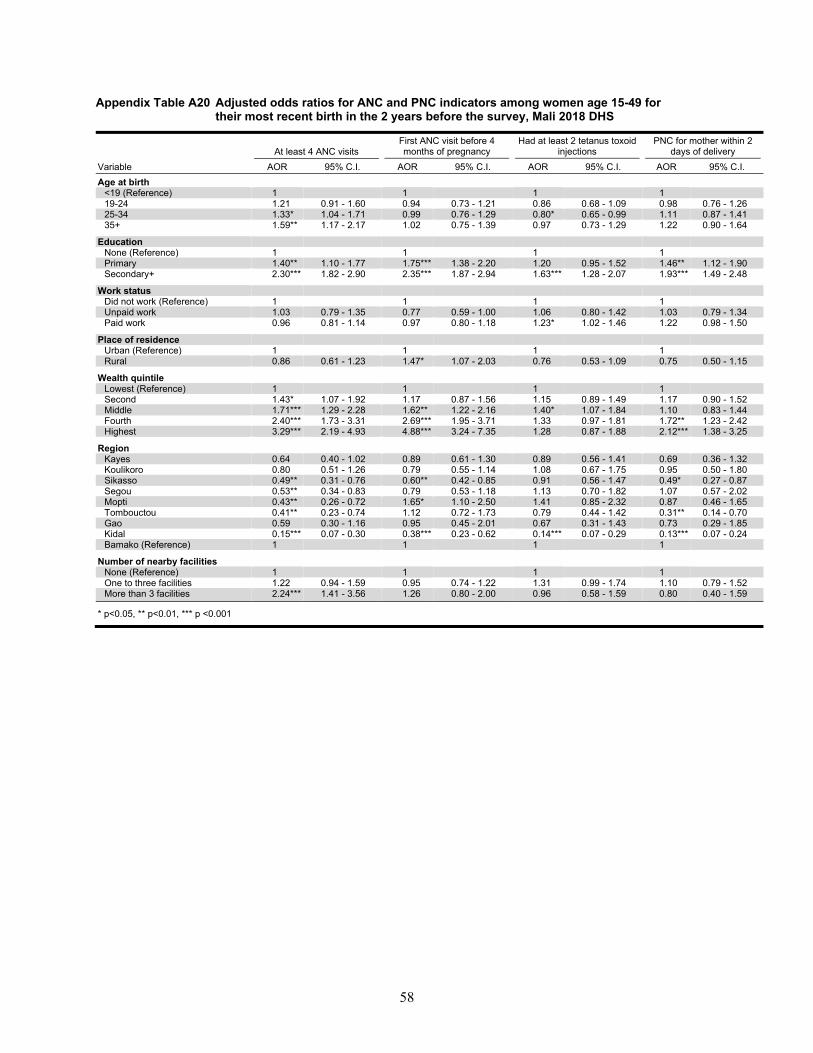
58
Appendix Table A20 Adjusted odds ratios for ANC and PNC indicators among women age 15-49 for their most recent birth in the 2 years before the survey, Mali 2018 DHS
At least 4 ANC visits First ANC visit before 4 months of pregnancy
Had at least 2 tetanus toxoid injections
PNC for mother within 2 days of delivery
Variable AOR 95% C.I. AOR 95% C.I. AOR 95% C.I. AOR 95% C.I. Age at birth
<19 (Reference) 1 1 1 1 19-24 1.21 0.91 - 1.60 0.94 0.73 - 1.21 0.86 0.68 - 1.09 0.98 0.76 - 1.26 25-34 1.33* 1.04 - 1.71 0.99 0.76 - 1.29 0.80* 0.65 - 0.99 1.11 0.87 - 1.41 35+ 1.59** 1.17 - 2.17 1.02 0.75 - 1.39 0.97 0.73 - 1.29 1.22 0.90 - 1.64
Education None (Reference) 1 1 1 1 Primary 1.40** 1.10 - 1.77 1.75*** 1.38 - 2.20 1.20 0.95 - 1.52 1.46** 1.12 - 1.90 Secondary+ 2.30*** 1.82 - 2.90 2.35*** 1.87 - 2.94 1.63*** 1.28 - 2.07 1.93*** 1.49 - 2.48
Work status Did not work (Reference) 1 1 1 1 Unpaid work 1.03 0.79 - 1.35 0.77 0.59 - 1.00 1.06 0.80 - 1.42 1.03 0.79 - 1.34 Paid work 0.96 0.81 - 1.14 0.97 0.80 - 1.18 1.23* 1.02 - 1.46 1.22 0.98 - 1.50
Place of residence Urban (Reference) 1 1 1 1 Rural 0.86 0.61 - 1.23 1.47* 1.07 - 2.03 0.76 0.53 - 1.09 0.75 0.50 - 1.15
Wealth quintile Lowest (Reference) 1 1 1 1 Second 1.43* 1.07 - 1.92 1.17 0.87 - 1.56 1.15 0.89 - 1.49 1.17 0.90 - 1.52 Middle 1.71*** 1.29 - 2.28 1.62** 1.22 - 2.16 1.40* 1.07 - 1.84 1.10 0.83 - 1.44 Fourth 2.40*** 1.73 - 3.31 2.69*** 1.95 - 3.71 1.33 0.97 - 1.81 1.72** 1.23 - 2.42 Highest 3.29*** 2.19 - 4.93 4.88*** 3.24 - 7.35 1.28 0.87 - 1.88 2.12*** 1.38 - 3.25
Region Kayes 0.64 0.40 - 1.02 0.89 0.61 - 1.30 0.89 0.56 - 1.41 0.69 0.36 - 1.32 Koulikoro 0.80 0.51 - 1.26 0.79 0.55 - 1.14 1.08 0.67 - 1.75 0.95 0.50 - 1.80 Sikasso 0.49** 0.31 - 0.76 0.60** 0.42 - 0.85 0.91 0.56 - 1.47 0.49* 0.27 - 0.87 Segou 0.53** 0.34 - 0.83 0.79 0.53 - 1.18 1.13 0.70 - 1.82 1.07 0.57 - 2.02 Mopti 0.43** 0.26 - 0.72 1.65* 1.10 - 2.50 1.41 0.85 - 2.32 0.87 0.46 - 1.65 Tombouctou 0.41** 0.23 - 0.74 1.12 0.72 - 1.73 0.79 0.44 - 1.42 0.31** 0.14 - 0.70 Gao 0.59 0.30 - 1.16 0.95 0.45 - 2.01 0.67 0.31 - 1.43 0.73 0.29 - 1.85 Kidal 0.15*** 0.07 - 0.30 0.38*** 0.23 - 0.62 0.14*** 0.07 - 0.29 0.13*** 0.07 - 0.24 Bamako (Reference) 1 1 1 1
Number of nearby facilities None (Reference) 1 1 1 1 One to three facilities 1.22 0.94 - 1.59 0.95 0.74 - 1.22 1.31 0.99 - 1.74 1.10 0.79 - 1.52 More than 3 facilities 2.24*** 1.41 - 3.56 1.26 0.80 - 2.00 0.96 0.58 - 1.59 0.80 0.40 - 1.59
* p<0.05, ** p<0.01, *** p <0.001
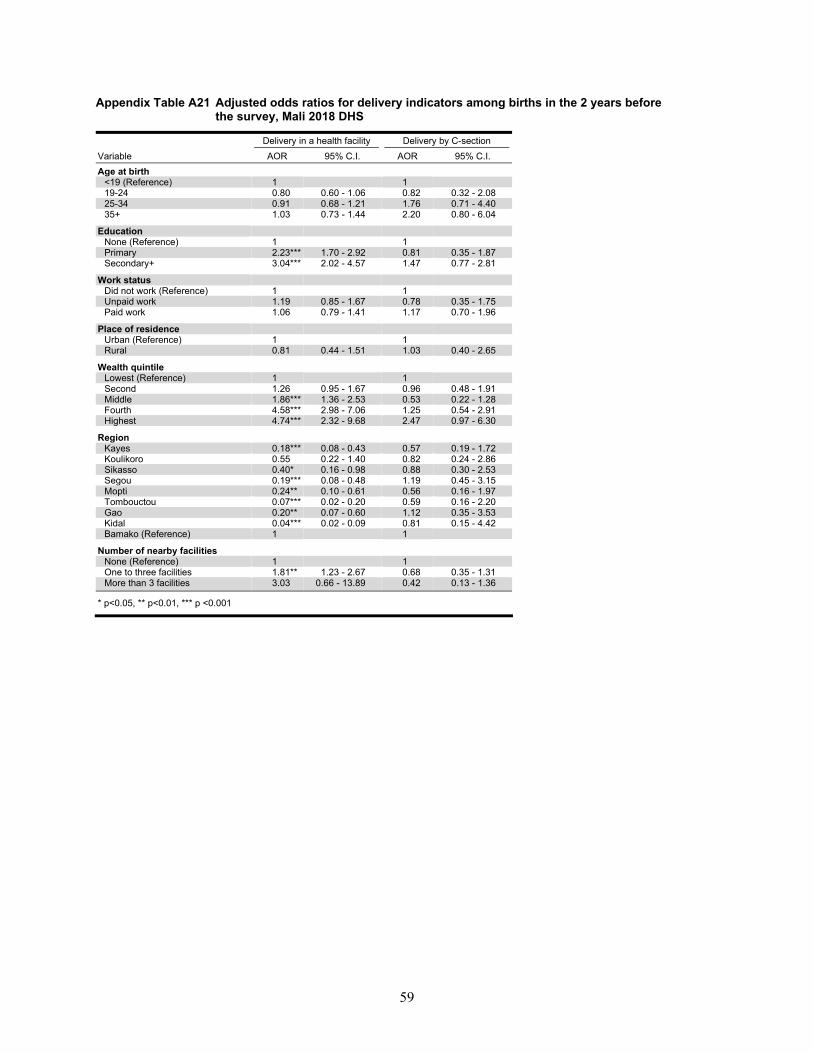
59
Appendix Table A21 Adjusted odds ratios for delivery indicators among births in the 2 years before the survey, Mali 2018 DHS
Delivery in a health facility Delivery by C-section Variable AOR 95% C.I. AOR 95% C.I. Age at birth
<19 (Reference) 1 1 19-24 0.80 0.60 - 1.06 0.82 0.32 - 2.08 25-34 0.91 0.68 - 1.21 1.76 0.71 - 4.40 35+ 1.03 0.73 - 1.44 2.20 0.80 - 6.04
Education None (Reference) 1 1 Primary 2.23*** 1.70 - 2.92 0.81 0.35 - 1.87 Secondary+ 3.04*** 2.02 - 4.57 1.47 0.77 - 2.81
Work status Did not work (Reference) 1 1 Unpaid work 1.19 0.85 - 1.67 0.78 0.35 - 1.75 Paid work 1.06 0.79 - 1.41 1.17 0.70 - 1.96
Place of residence Urban (Reference) 1 1 Rural 0.81 0.44 - 1.51 1.03 0.40 - 2.65
Wealth quintile Lowest (Reference) 1 1 Second 1.26 0.95 - 1.67 0.96 0.48 - 1.91 Middle 1.86*** 1.36 - 2.53 0.53 0.22 - 1.28 Fourth 4.58*** 2.98 - 7.06 1.25 0.54 - 2.91 Highest 4.74*** 2.32 - 9.68 2.47 0.97 - 6.30
Region Kayes 0.18*** 0.08 - 0.43 0.57 0.19 - 1.72 Koulikoro 0.55 0.22 - 1.40 0.82 0.24 - 2.86 Sikasso 0.40* 0.16 - 0.98 0.88 0.30 - 2.53 Segou 0.19*** 0.08 - 0.48 1.19 0.45 - 3.15 Mopti 0.24** 0.10 - 0.61 0.56 0.16 - 1.97 Tombouctou 0.07*** 0.02 - 0.20 0.59 0.16 - 2.20 Gao 0.20** 0.07 - 0.60 1.12 0.35 - 3.53 Kidal 0.04*** 0.02 - 0.09 0.81 0.15 - 4.42 Bamako (Reference) 1 1
Number of nearby facilities None (Reference) 1 1 One to three facilities 1.81** 1.23 - 2.67 0.68 0.35 - 1.31 More than 3 facilities 3.03 0.66 - 13.89 0.42 0.13 - 1.36
* p<0.05, ** p<0.01, *** p <0.001
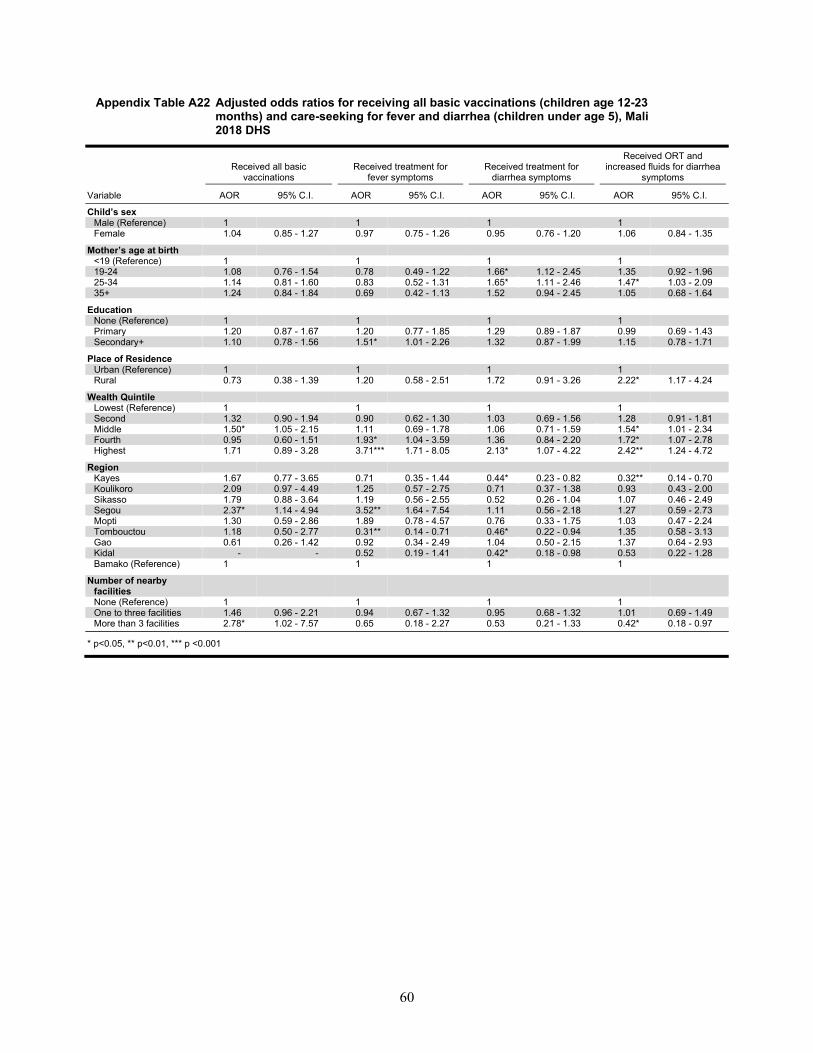
60
Appendix Table A22 Adjusted odds ratios for receiving all basic vaccinations (children age 12-23 months) and care-seeking for fever and diarrhea (children under age 5), Mali 2018 DHS
Received all basic
vaccinations Received treatment for
fever symptoms Received treatment for
diarrhea symptoms
Received ORT and increased fluids for diarrhea
symptoms
Variable AOR 95% C.I. AOR 95% C.I. AOR 95% C.I. AOR 95% C.I.
Child’s sex Male (Reference) 1 1 1 1 Female 1.04 0.85 - 1.27 0.97 0.75 - 1.26 0.95 0.76 - 1.20 1.06 0.84 - 1.35
Mother’s age at birth <19 (Reference) 1 1 1 1 19-24 1.08 0.76 - 1.54 0.78 0.49 - 1.22 1.66* 1.12 - 2.45 1.35 0.92 - 1.96 25-34 1.14 0.81 - 1.60 0.83 0.52 - 1.31 1.65* 1.11 - 2.46 1.47* 1.03 - 2.09 35+ 1.24 0.84 - 1.84 0.69 0.42 - 1.13 1.52 0.94 - 2.45 1.05 0.68 - 1.64
Education None (Reference) 1 1 1 1 Primary 1.20 0.87 - 1.67 1.20 0.77 - 1.85 1.29 0.89 - 1.87 0.99 0.69 - 1.43 Secondary+ 1.10 0.78 - 1.56 1.51* 1.01 - 2.26 1.32 0.87 - 1.99 1.15 0.78 - 1.71
Place of Residence Urban (Reference) 1 1 1 1 Rural 0.73 0.38 - 1.39 1.20 0.58 - 2.51 1.72 0.91 - 3.26 2.22* 1.17 - 4.24
Wealth Quintile Lowest (Reference) 1 1 1 1 Second 1.32 0.90 - 1.94 0.90 0.62 - 1.30 1.03 0.69 - 1.56 1.28 0.91 - 1.81 Middle 1.50* 1.05 - 2.15 1.11 0.69 - 1.78 1.06 0.71 - 1.59 1.54* 1.01 - 2.34 Fourth 0.95 0.60 - 1.51 1.93* 1.04 - 3.59 1.36 0.84 - 2.20 1.72* 1.07 - 2.78 Highest 1.71 0.89 - 3.28 3.71*** 1.71 - 8.05 2.13* 1.07 - 4.22 2.42** 1.24 - 4.72
Region Kayes 1.67 0.77 - 3.65 0.71 0.35 - 1.44 0.44* 0.23 - 0.82 0.32** 0.14 - 0.70 Koulikoro 2.09 0.97 - 4.49 1.25 0.57 - 2.75 0.71 0.37 - 1.38 0.93 0.43 - 2.00 Sikasso 1.79 0.88 - 3.64 1.19 0.56 - 2.55 0.52 0.26 - 1.04 1.07 0.46 - 2.49 Segou 2.37* 1.14 - 4.94 3.52** 1.64 - 7.54 1.11 0.56 - 2.18 1.27 0.59 - 2.73 Mopti 1.30 0.59 - 2.86 1.89 0.78 - 4.57 0.76 0.33 - 1.75 1.03 0.47 - 2.24 Tombouctou 1.18 0.50 - 2.77 0.31** 0.14 - 0.71 0.46* 0.22 - 0.94 1.35 0.58 - 3.13 Gao 0.61 0.26 - 1.42 0.92 0.34 - 2.49 1.04 0.50 - 2.15 1.37 0.64 - 2.93 Kidal - - 0.52 0.19 - 1.41 0.42* 0.18 - 0.98 0.53 0.22 - 1.28 Bamako (Reference) 1 1 1 1
Number of nearby facilities None (Reference) 1 1 1 1 One to three facilities 1.46 0.96 - 2.21 0.94 0.67 - 1.32 0.95 0.68 - 1.32 1.01 0.69 - 1.49 More than 3 facilities 2.78* 1.02 - 7.57 0.65 0.18 - 2.27 0.53 0.21 - 1.33 0.42* 0.18 - 0.97
* p<0.05, ** p<0.01, *** p <0.001
Copyright © 2022 FDOKUMEN