Tree survey and allometric models for tiger bush in northern Senegal and comparison with tree...
11
International Journal of Applied Earth Observation and Geoinformation 13 (2011) 517–527 Contents lists available at ScienceDirect International Journal of Applied Earth Observation and Geoinformation jo u r n al hom epage: www.elsevier.com/locate/jag Tree survey and allometric models for tiger bush in northern Senegal and comparison with tree parameters derived from high resolution satellite data Mads Olander Rasmussen a,b,∗ , Frank-M. Göttsche c , Doudou Diop d , Cheikh Mbow d , Folke-S. Olesen c , Rasmus Fensholt a , Inge Sandholt a a Department of Geography and Geology, University of Copenhagen, Oester Voldgade 10, DK-1350 Copenhagen K, Denmark b GRAS – Geographic Resource Analysis & Science A/S, c/o Department of Geography and Geology, University of Copenhagen, Oester Voldgade 10, DK-1350 Copenhagen K, Denmark c Karlsruhe Institute of Technology, Hermann-von-Helmholtz-Platz 1, 76344 Eggenstein-Leopoldshafen, Germany d Université Cheikh Anta Diop, Faculteé des Sciences et Techniques, Institut des Sciences de l’Environnement, BP 5005 Dakar, Senegal a r t i c l e i n f o Article history: Received 31 March 2010 Accepted 27 January 2011 Keywords: Tree inventory Field survey Tree clumping Image analysis Allometric models Remote sensing a b s t r a c t A tree survey and an analysis of high resolution satellite data were performed to characterise the woody vegetation within a 10 × 10 km 2 area around a site located close to the town of Dahra in the semi- arid northern part of Senegal. The surveyed parameters were tree species, height, tree crown radius, and diameter at breast height (DBH), for which allometric models were determined. An object-based classification method was used to determine tree crown cover (TCC) from Quickbird data. The aver- age TCC from the tree survey and the respective TCC from remote sensing were both about 3.0%. For areas beyond the surveyed areas TCC varied between 3.0% and 4.5%. Furthermore, an empirical cor- rection factor for tree clumping was obtained, which considerably improved the estimated number of trees and the estimated average tree crown area and radius. An allometric model linking TCC to tree stem crosssectional area (CSA) was developed, which allows to estimate tree biomass from remote sens- ing. The allometric models for the three main tree species found performed well and had r 2 -values of about 0.7–0.8. © 2011 Elsevier B.V. All rights reserved. 1. Introduction Estimating tree cover from high resolution remote sensing data is a well established technique and has been employed in numerous studies (e.g. Bai et al., 2005; Bunting and Lucas, 2006; Carreiras et al., 2006; Culvenor, 2002; Hansen et al., 2002; Hirata et al., 2009; Leckie et al., 2003; Pouliot et al., 2002; Song et al., 2010). However, historically most often aerial photography was used to estimate stand parameters like tree size, stand density and, ultimately, stand biomass for forestry management applica- tions. With the launch of very high resolution (approximately 1 m spatial resolution panchromatic) commercial satellites like Ikonos and Quickbird, it is now possible to perform similar studies with spaceborne sensors. The short revisit time, scheduling of image acqusitions and the relative low cost, make data from spaceborne sensors an attractive data source. ∗ Corresponding author at: Department of Geography and Geology, University of Copenhagen, Oester Voldgade 10, DK-1350 Copenhagen K, Denmark. Tel.: +45 3532 2571; fax: +45 3532 2501. E-mail addresses: [email protected], [email protected] (M.O. Rasmussen). In this study we estimate the tree crown cover, number of trees and other tree parameters for a Quickbird scene covering an area close to the town of Dahra in semi-arid northern Sene- gal, West Africa. At first glance tree inventory analyses in areas like the one studied here appear to be of limited use, as tree resources are limited and the potential for economic exploitation is small. However, potentially relevant applications are long term change studies and the estimation of carbon stocks contained in the woody vegetation. The feasibility for increasing carbon storage in natu- ral vegetation for areas with slightly more rain (approximately 600 mm/year) has already been demonstrated by, among others, Toure et al. (2003). The combination of field studies of tree param- eters like height, trunk diameter, and biomass content (both above and below ground) with remote sensing based estimation of tree cover allows large scale inventories of both, current and future car- bon stocks. However, the immediate motivation for this study is to characterise a wider area around a test site, which consists of two towers with instruments used for validating remote sensing products. Tree crown cover is an essential parameter in many appli- cations of remote sensing data, as it significantly influences surface reflectance and temperature as well as surface anisotropy in the vis- ible and in the thermal domain. It is planned to utilise tree crown cover and other tree parameters in a separate study of angular dependency of land surface temperature, e.g. as obtained from the 0303-2434/$ – see front matter © 2011 Elsevier B.V. All rights reserved. doi:10.1016/j.jag.2011.01.007
-
Upload
independent -
Category
Documents
-
view
1 -
download
0
Transcript of Tree survey and allometric models for tiger bush in northern Senegal and comparison with tree...
Journal Identification = JAG Article Identification = 401 Date: May 30, 2011 Time: 9:57 pm
Tc
MFa
b
c
d
a
ARA
KTFTIAR
1
dnCe2uatsasas
CT
(
0d
International Journal of Applied Earth Observation and Geoinformation 13 (2011) 517–527
Contents lists available at ScienceDirect
International Journal of Applied Earth Observation andGeoinformation
jo u r n al hom epage: www.elsev ier .com/ locate / jag
ree survey and allometric models for tiger bush in northern Senegal andomparison with tree parameters derived from high resolution satellite data
ads Olander Rasmussena,b,∗, Frank-M. Göttschec, Doudou Diopd, Cheikh Mbowd,olke-S. Olesenc, Rasmus Fensholta, Inge Sandholta
Department of Geography and Geology, University of Copenhagen, Oester Voldgade 10, DK-1350 Copenhagen K, DenmarkGRAS – Geographic Resource Analysis & Science A/S, c/o Department of Geography and Geology, University of Copenhagen, Oester Voldgade 10, DK-1350 Copenhagen K, DenmarkKarlsruhe Institute of Technology, Hermann-von-Helmholtz-Platz 1, 76344 Eggenstein-Leopoldshafen, GermanyUniversité Cheikh Anta Diop, Faculteé des Sciences et Techniques, Institut des Sciences de l’Environnement, BP 5005 Dakar, Senegal
r t i c l e i n f o
rticle history:eceived 31 March 2010ccepted 27 January 2011
eywords:ree inventoryield survey
a b s t r a c t
A tree survey and an analysis of high resolution satellite data were performed to characterise the woodyvegetation within a 10 × 10 km2 area around a site located close to the town of Dahra in the semi-arid northern part of Senegal. The surveyed parameters were tree species, height, tree crown radius,and diameter at breast height (DBH), for which allometric models were determined. An object-basedclassification method was used to determine tree crown cover (TCC) from Quickbird data. The aver-age TCC from the tree survey and the respective TCC from remote sensing were both about 3.0%. For
ree clumpingmage analysisllometric modelsemote sensing
areas beyond the surveyed areas TCC varied between 3.0% and 4.5%. Furthermore, an empirical cor-rection factor for tree clumping was obtained, which considerably improved the estimated number oftrees and the estimated average tree crown area and radius. An allometric model linking TCC to treestem crosssectional area (CSA) was developed, which allows to estimate tree biomass from remote sens-ing. The allometric models for the three main tree species found performed well and had r2-values ofabout 0.7–0.8.
. Introduction
Estimating tree cover from high resolution remote sensingata is a well established technique and has been employed inumerous studies (e.g. Bai et al., 2005; Bunting and Lucas, 2006;arreiras et al., 2006; Culvenor, 2002; Hansen et al., 2002; Hiratat al., 2009; Leckie et al., 2003; Pouliot et al., 2002; Song et al.,010). However, historically most often aerial photography wassed to estimate stand parameters like tree size, stand densitynd, ultimately, stand biomass for forestry management applica-ions. With the launch of very high resolution (approximately 1 mpatial resolution panchromatic) commercial satellites like Ikonosnd Quickbird, it is now possible to perform similar studies withpaceborne sensors. The short revisit time, scheduling of image
cqusitions and the relative low cost, make data from spaceborneensors an attractive data source.∗ Corresponding author at: Department of Geography and Geology, University ofopenhagen, Oester Voldgade 10, DK-1350 Copenhagen K, Denmark.el.: +45 3532 2571; fax: +45 3532 2501.
E-mail addresses: [email protected], [email protected]. Rasmussen).
303-2434/$ – see front matter © 2011 Elsevier B.V. All rights reserved.oi:10.1016/j.jag.2011.01.007
© 2011 Elsevier B.V. All rights reserved.
In this study we estimate the tree crown cover, number oftrees and other tree parameters for a Quickbird scene coveringan area close to the town of Dahra in semi-arid northern Sene-gal, West Africa. At first glance tree inventory analyses in areas likethe one studied here appear to be of limited use, as tree resourcesare limited and the potential for economic exploitation is small.However, potentially relevant applications are long term changestudies and the estimation of carbon stocks contained in the woodyvegetation. The feasibility for increasing carbon storage in natu-ral vegetation for areas with slightly more rain (approximately600 mm/year) has already been demonstrated by, among others,Toure et al. (2003). The combination of field studies of tree param-eters like height, trunk diameter, and biomass content (both aboveand below ground) with remote sensing based estimation of treecover allows large scale inventories of both, current and future car-bon stocks. However, the immediate motivation for this study isto characterise a wider area around a test site, which consists oftwo towers with instruments used for validating remote sensingproducts. Tree crown cover is an essential parameter in many appli-cations of remote sensing data, as it significantly influences surface
reflectance and temperature as well as surface anisotropy in the vis-ible and in the thermal domain. It is planned to utilise tree crowncover and other tree parameters in a separate study of angulardependency of land surface temperature, e.g. as obtained from the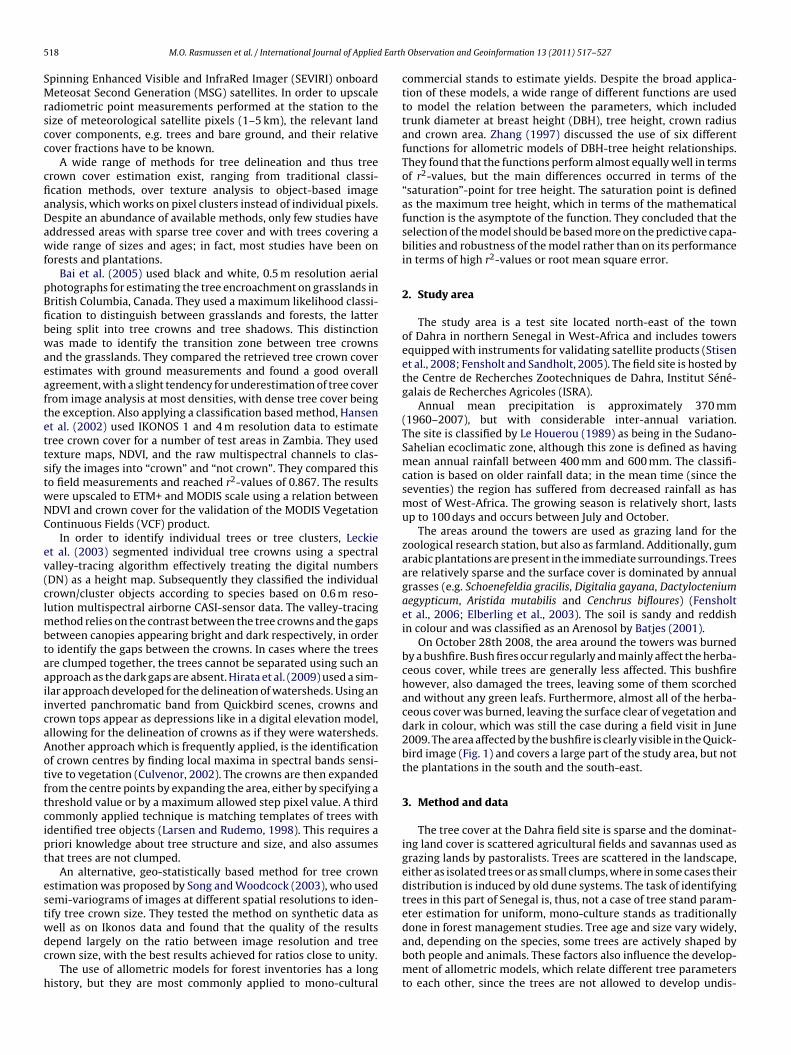
Journal Identification = JAG Article Identification = 401 Date: May 30, 2011 Time: 9:57 pm
5 Earth
SMrscc
cfiaDawf
pBfibwaeaftettstwNC
ev(clmbtaaiicaAotftcipt
estwdc
h
18 M.O. Rasmussen et al. / International Journal of Applied
pinning Enhanced Visible and InfraRed Imager (SEVIRI) onboardeteosat Second Generation (MSG) satellites. In order to upscale
adiometric point measurements performed at the station to theize of meteorological satellite pixels (1–5 km), the relevant landover components, e.g. trees and bare ground, and their relativeover fractions have to be known.
A wide range of methods for tree delineation and thus treerown cover estimation exist, ranging from traditional classi-cation methods, over texture analysis to object-based imagenalysis, which works on pixel clusters instead of individual pixels.espite an abundance of available methods, only few studies haveddressed areas with sparse tree cover and with trees covering aide range of sizes and ages; in fact, most studies have been on
orests and plantations.Bai et al. (2005) used black and white, 0.5 m resolution aerial
hotographs for estimating the tree encroachment on grasslands inritish Columbia, Canada. They used a maximum likelihood classi-cation to distinguish between grasslands and forests, the lattereing split into tree crowns and tree shadows. This distinctionas made to identify the transition zone between tree crowns
nd the grasslands. They compared the retrieved tree crown coverstimates with ground measurements and found a good overallgreement, with a slight tendency for underestimation of tree coverrom image analysis at most densities, with dense tree cover beinghe exception. Also applying a classification based method, Hansent al. (2002) used IKONOS 1 and 4 m resolution data to estimateree crown cover for a number of test areas in Zambia. They usedexture maps, NDVI, and the raw multispectral channels to clas-ify the images into “crown” and “not crown”. They compared thiso field measurements and reached r2-values of 0.867. The resultsere upscaled to ETM+ and MODIS scale using a relation betweenDVI and crown cover for the validation of the MODIS Vegetationontinuous Fields (VCF) product.
In order to identify individual trees or tree clusters, Leckiet al. (2003) segmented individual tree crowns using a spectralalley-tracing algorithm effectively treating the digital numbersDN) as a height map. Subsequently they classified the individualrown/cluster objects according to species based on 0.6 m reso-ution multispectral airborne CASI-sensor data. The valley-tracing
ethod relies on the contrast between the tree crowns and the gapsetween canopies appearing bright and dark respectively, in ordero identify the gaps between the crowns. In cases where the treesre clumped together, the trees cannot be separated using such anpproach as the dark gaps are absent. Hirata et al. (2009) used a sim-lar approach developed for the delineation of watersheds. Using annverted panchromatic band from Quickbird scenes, crowns andrown tops appear as depressions like in a digital elevation model,llowing for the delineation of crowns as if they were watersheds.nother approach which is frequently applied, is the identificationf crown centres by finding local maxima in spectral bands sensi-ive to vegetation (Culvenor, 2002). The crowns are then expandedrom the centre points by expanding the area, either by specifying ahreshold value or by a maximum allowed step pixel value. A thirdommonly applied technique is matching templates of trees withdentified tree objects (Larsen and Rudemo, 1998). This requires ariori knowledge about tree structure and size, and also assumeshat trees are not clumped.
An alternative, geo-statistically based method for tree crownstimation was proposed by Song and Woodcock (2003), who usedemi-variograms of images at different spatial resolutions to iden-ify tree crown size. They tested the method on synthetic data asell as on Ikonos data and found that the quality of the results
epend largely on the ratio between image resolution and treerown size, with the best results achieved for ratios close to unity.The use of allometric models for forest inventories has a longistory, but they are most commonly applied to mono-cultural
Observation and Geoinformation 13 (2011) 517–527
commercial stands to estimate yields. Despite the broad applica-tion of these models, a wide range of different functions are usedto model the relation between the parameters, which includedtrunk diameter at breast height (DBH), tree height, crown radiusand crown area. Zhang (1997) discussed the use of six differentfunctions for allometric models of DBH-tree height relationships.They found that the functions perform almost equally well in termsof r2-values, but the main differences occurred in terms of the“saturation”-point for tree height. The saturation point is definedas the maximum tree height, which in terms of the mathematicalfunction is the asymptote of the function. They concluded that theselection of the model should be based more on the predictive capa-bilities and robustness of the model rather than on its performancein terms of high r2-values or root mean square error.
2. Study area
The study area is a test site located north-east of the townof Dahra in northern Senegal in West-Africa and includes towersequipped with instruments for validating satellite products (Stisenet al., 2008; Fensholt and Sandholt, 2005). The field site is hosted bythe Centre de Recherches Zootechniques de Dahra, Institut Séné-galais de Recherches Agricoles (ISRA).
Annual mean precipitation is approximately 370 mm(1960–2007), but with considerable inter-annual variation.The site is classified by Le Houerou (1989) as being in the Sudano-Sahelian ecoclimatic zone, although this zone is defined as havingmean annual rainfall between 400 mm and 600 mm. The classifi-cation is based on older rainfall data; in the mean time (since theseventies) the region has suffered from decreased rainfall as hasmost of West-Africa. The growing season is relatively short, lastsup to 100 days and occurs between July and October.
The areas around the towers are used as grazing land for thezoological research station, but also as farmland. Additionally, gumarabic plantations are present in the immediate surroundings. Treesare relatively sparse and the surface cover is dominated by annualgrasses (e.g. Schoenefeldia gracilis, Digitalia gayana, Dactylocteniumaegypticum, Aristida mutabilis and Cenchrus bifloures) (Fensholtet al., 2006; Elberling et al., 2003). The soil is sandy and reddishin colour and was classified as an Arenosol by Batjes (2001).
On October 28th 2008, the area around the towers was burnedby a bushfire. Bush fires occur regularly and mainly affect the herba-ceous cover, while trees are generally less affected. This bushfirehowever, also damaged the trees, leaving some of them scorchedand without any green leafs. Furthermore, almost all of the herba-ceous cover was burned, leaving the surface clear of vegetation anddark in colour, which was still the case during a field visit in June2009. The area affected by the bushfire is clearly visible in the Quick-bird image (Fig. 1) and covers a large part of the study area, but notthe plantations in the south and the south-east.
3. Method and data
The tree cover at the Dahra field site is sparse and the dominat-ing land cover is scattered agricultural fields and savannas used asgrazing lands by pastoralists. Trees are scattered in the landscape,either as isolated trees or as small clumps, where in some cases theirdistribution is induced by old dune systems. The task of identifyingtrees in this part of Senegal is, thus, not a case of tree stand param-eter estimation for uniform, mono-culture stands as traditionallydone in forest management studies. Tree age and size vary widely,
and, depending on the species, some trees are actively shaped byboth people and animals. These factors also influence the develop-ment of allometric models, which relate different tree parametersto each other, since the trees are not allowed to develop undis-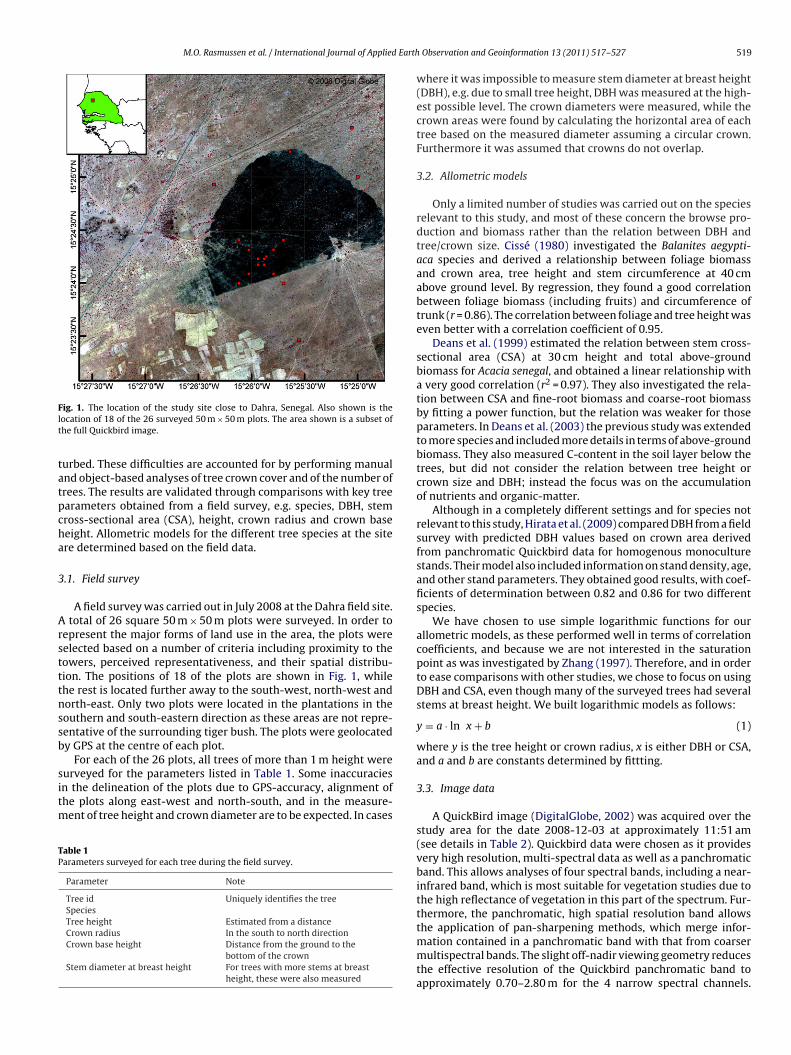
Journal Identification = JAG Article Identification = 401 Date: May 30, 2011 Time: 9:57 pm
M.O. Rasmussen et al. / International Journal of Applied Earth
Flt
tatpcha
3
Arstttnssb
sitm
TP
ig. 1. The location of the study site close to Dahra, Senegal. Also shown is theocation of 18 of the 26 surveyed 50 m × 50 m plots. The area shown is a subset ofhe full Quickbird image.
urbed. These difficulties are accounted for by performing manualnd object-based analyses of tree crown cover and of the number ofrees. The results are validated through comparisons with key treearameters obtained from a field survey, e.g. species, DBH, stemross-sectional area (CSA), height, crown radius and crown baseeight. Allometric models for the different tree species at the sitere determined based on the field data.
.1. Field survey
A field survey was carried out in July 2008 at the Dahra field site. total of 26 square 50 m × 50 m plots were surveyed. In order toepresent the major forms of land use in the area, the plots wereelected based on a number of criteria including proximity to theowers, perceived representativeness, and their spatial distribu-ion. The positions of 18 of the plots are shown in Fig. 1, whilehe rest is located further away to the south-west, north-west andorth-east. Only two plots were located in the plantations in theouthern and south-eastern direction as these areas are not repre-entative of the surrounding tiger bush. The plots were geolocatedy GPS at the centre of each plot.
For each of the 26 plots, all trees of more than 1 m height wereurveyed for the parameters listed in Table 1. Some inaccuracies
n the delineation of the plots due to GPS-accuracy, alignment ofhe plots along east-west and north-south, and in the measure-ent of tree height and crown diameter are to be expected. In cases
able 1arameters surveyed for each tree during the field survey.
Parameter Note
Tree id Uniquely identifies the treeSpeciesTree height Estimated from a distanceCrown radius In the south to north directionCrown base height Distance from the ground to the
bottom of the crownStem diameter at breast height For trees with more stems at breast
height, these were also measured
Observation and Geoinformation 13 (2011) 517–527 519
where it was impossible to measure stem diameter at breast height(DBH), e.g. due to small tree height, DBH was measured at the high-est possible level. The crown diameters were measured, while thecrown areas were found by calculating the horizontal area of eachtree based on the measured diameter assuming a circular crown.Furthermore it was assumed that crowns do not overlap.
3.2. Allometric models
Only a limited number of studies was carried out on the speciesrelevant to this study, and most of these concern the browse pro-duction and biomass rather than the relation between DBH andtree/crown size. Cissé (1980) investigated the Balanites aegypti-aca species and derived a relationship between foliage biomassand crown area, tree height and stem circumference at 40 cmabove ground level. By regression, they found a good correlationbetween foliage biomass (including fruits) and circumference oftrunk (r = 0.86). The correlation between foliage and tree height waseven better with a correlation coefficient of 0.95.
Deans et al. (1999) estimated the relation between stem cross-sectional area (CSA) at 30 cm height and total above-groundbiomass for Acacia senegal, and obtained a linear relationship witha very good correlation (r2 = 0.97). They also investigated the rela-tion between CSA and fine-root biomass and coarse-root biomassby fitting a power function, but the relation was weaker for thoseparameters. In Deans et al. (2003) the previous study was extendedto more species and included more details in terms of above-groundbiomass. They also measured C-content in the soil layer below thetrees, but did not consider the relation between tree height orcrown size and DBH; instead the focus was on the accumulationof nutrients and organic-matter.
Although in a completely different settings and for species notrelevant to this study, Hirata et al. (2009) compared DBH from a fieldsurvey with predicted DBH values based on crown area derivedfrom panchromatic Quickbird data for homogenous monoculturestands. Their model also included information on stand density, age,and other stand parameters. They obtained good results, with coef-ficients of determination between 0.82 and 0.86 for two differentspecies.
We have chosen to use simple logarithmic functions for ourallometric models, as these performed well in terms of correlationcoefficients, and because we are not interested in the saturationpoint as was investigated by Zhang (1997). Therefore, and in orderto ease comparisons with other studies, we chose to focus on usingDBH and CSA, even though many of the surveyed trees had severalstems at breast height. We built logarithmic models as follows:
y = a · ln x + b (1)
where y is the tree height or crown radius, x is either DBH or CSA,and a and b are constants determined by fittting.
3.3. Image data
A QuickBird image (DigitalGlobe, 2002) was acquired over thestudy area for the date 2008-12-03 at approximately 11:51 am(see details in Table 2). Quickbird data were chosen as it providesvery high resolution, multi-spectral data as well as a panchromaticband. This allows analyses of four spectral bands, including a near-infrared band, which is most suitable for vegetation studies due tothe high reflectance of vegetation in this part of the spectrum. Fur-thermore, the panchromatic, high spatial resolution band allowsthe application of pan-sharpening methods, which merge infor-
mation contained in a panchromatic band with that from coarsermultispectral bands. The slight off-nadir viewing geometry reducesthe effective resolution of the Quickbird panchromatic band toapproximately 0.70–2.80 m for the 4 narrow spectral channels.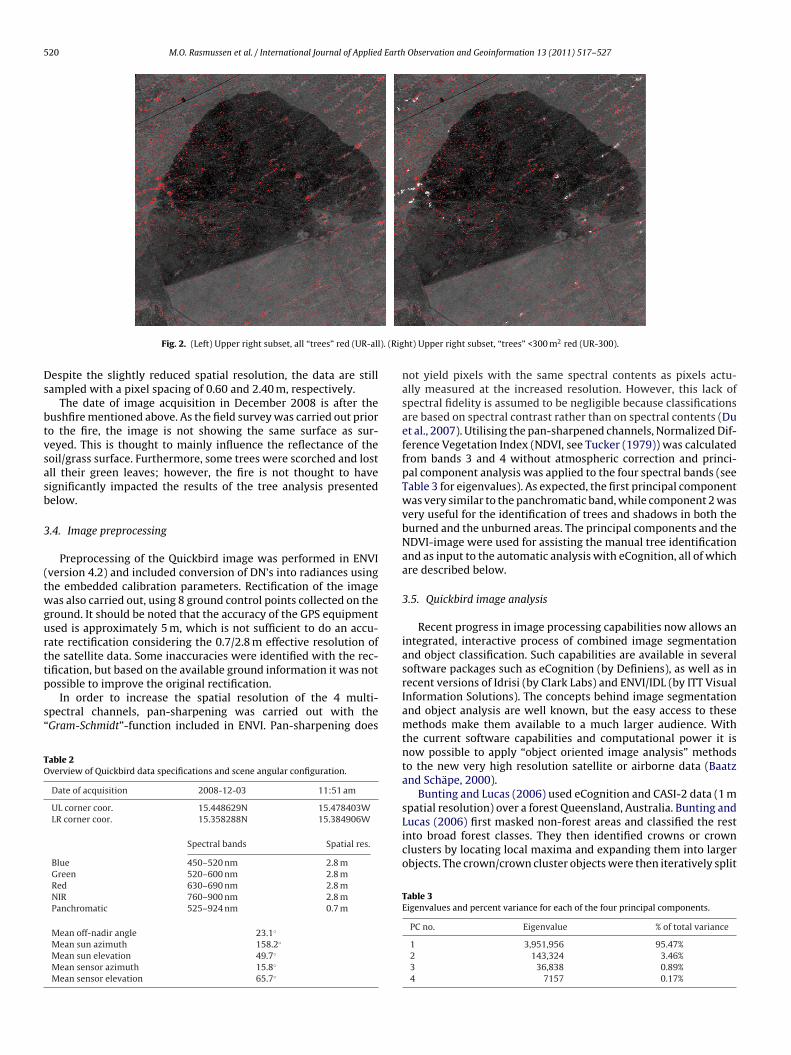
Journal Identification = JAG Article Identification = 401 Date: May 30, 2011 Time: 9:57 pm
520 M.O. Rasmussen et al. / International Journal of Applied Earth Observation and Geoinformation 13 (2011) 517–527
l). (Rig
Ds
btvsasb
3
(twgurttp
s“
TO
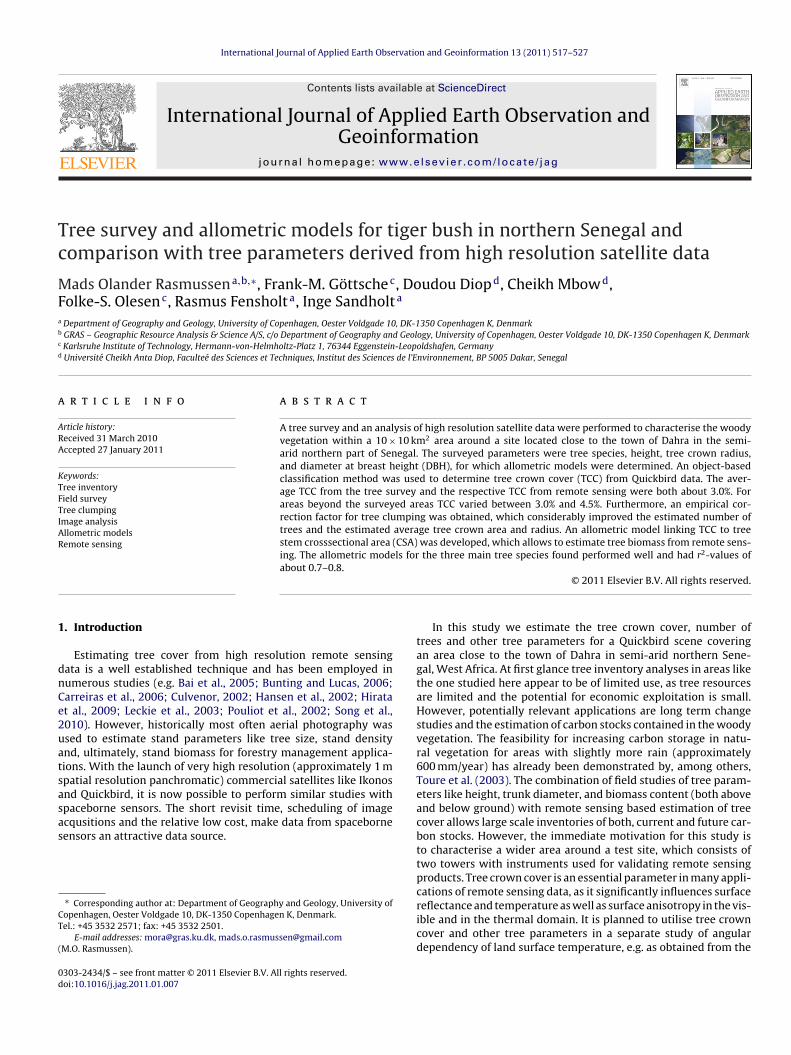
Fig. 2. (Left) Upper right subset, all “trees” red (UR-al
espite the slightly reduced spatial resolution, the data are stillampled with a pixel spacing of 0.60 and 2.40 m, respectively.
The date of image acquisition in December 2008 is after theushfire mentioned above. As the field survey was carried out prioro the fire, the image is not showing the same surface as sur-eyed. This is thought to mainly influence the reflectance of theoil/grass surface. Furthermore, some trees were scorched and lostll their green leaves; however, the fire is not thought to haveignificantly impacted the results of the tree analysis presentedelow.
.4. Image preprocessing
Preprocessing of the Quickbird image was performed in ENVIversion 4.2) and included conversion of DN’s into radiances usinghe embedded calibration parameters. Rectification of the imageas also carried out, using 8 ground control points collected on the
round. It should be noted that the accuracy of the GPS equipmentsed is approximately 5 m, which is not sufficient to do an accu-ate rectification considering the 0.7/2.8 m effective resolution ofhe satellite data. Some inaccuracies were identified with the rec-ification, but based on the available ground information it was not
ossible to improve the original rectification.In order to increase the spatial resolution of the 4 multi-pectral channels, pan-sharpening was carried out with theGram-Schmidt”-function included in ENVI. Pan-sharpening does
able 2verview of Quickbird data specifications and scene angular configuration.
Date of acquisition 2008-12-03 11:51 am
UL corner coor. 15.448629N 15.478403WLR corner coor. 15.358288N 15.384906W
Spectral bands Spatial res.
Blue 450–520 nm 2.8 mGreen 520–600 nm 2.8 mRed 630–690 nm 2.8 mNIR 760–900 nm 2.8 mPanchromatic 525–924 nm 0.7 m
Mean off-nadir angle 23.1◦
Mean sun azimuth 158.2◦
Mean sun elevation 49.7◦
Mean sensor azimuth 15.8◦
Mean sensor elevation 65.7◦
ht) Upper right subset, “trees” <300 m2 red (UR-300).
not yield pixels with the same spectral contents as pixels actu-ally measured at the increased resolution. However, this lack ofspectral fidelity is assumed to be negligible because classificationsare based on spectral contrast rather than on spectral contents (Duet al., 2007). Utilising the pan-sharpened channels, Normalized Dif-ference Vegetation Index (NDVI, see Tucker (1979)) was calculatedfrom bands 3 and 4 without atmospheric correction and princi-pal component analysis was applied to the four spectral bands (seeTable 3 for eigenvalues). As expected, the first principal componentwas very similar to the panchromatic band, while component 2 wasvery useful for the identification of trees and shadows in both theburned and the unburned areas. The principal components and theNDVI-image were used for assisting the manual tree identificationand as input to the automatic analysis with eCognition, all of whichare described below.
3.5. Quickbird image analysis
Recent progress in image processing capabilities now allows anintegrated, interactive process of combined image segmentationand object classification. Such capabilities are available in severalsoftware packages such as eCognition (by Definiens), as well as inrecent versions of Idrisi (by Clark Labs) and ENVI/IDL (by ITT VisualInformation Solutions). The concepts behind image segmentationand object analysis are well known, but the easy access to thesemethods make them available to a much larger audience. Withthe current software capabilities and computational power it isnow possible to apply “object oriented image analysis” methodsto the new very high resolution satellite or airborne data (Baatzand Schäpe, 2000).
Bunting and Lucas (2006) used eCognition and CASI-2 data (1 mspatial resolution) over a forest Queensland, Australia. Bunting and
Lucas (2006) first masked non-forest areas and classified the restinto broad forest classes. They then identified crowns or crownclusters by locating local maxima and expanding them into largerobjects. The crown/crown cluster objects were then iteratively splitTable 3Eigenvalues and percent variance for each of the four principal components.
PC no. Eigenvalue % of total variance
1 3,951,956 95.47%2 143,324 3.46%3 36,838 0.89%4 7157 0.17%
Journal Identification = JAG Article Identification = 401 Date: May 30, 2011 Time: 9:57 pm
M.O. Rasmussen et al. / International Journal of Applied Earth Observation and Geoinformation 13 (2011) 517–527 521
er of g
acd
Qpwttttiitp
ttgbitooMbeQtts
3
o1y“fyo
3
thoa
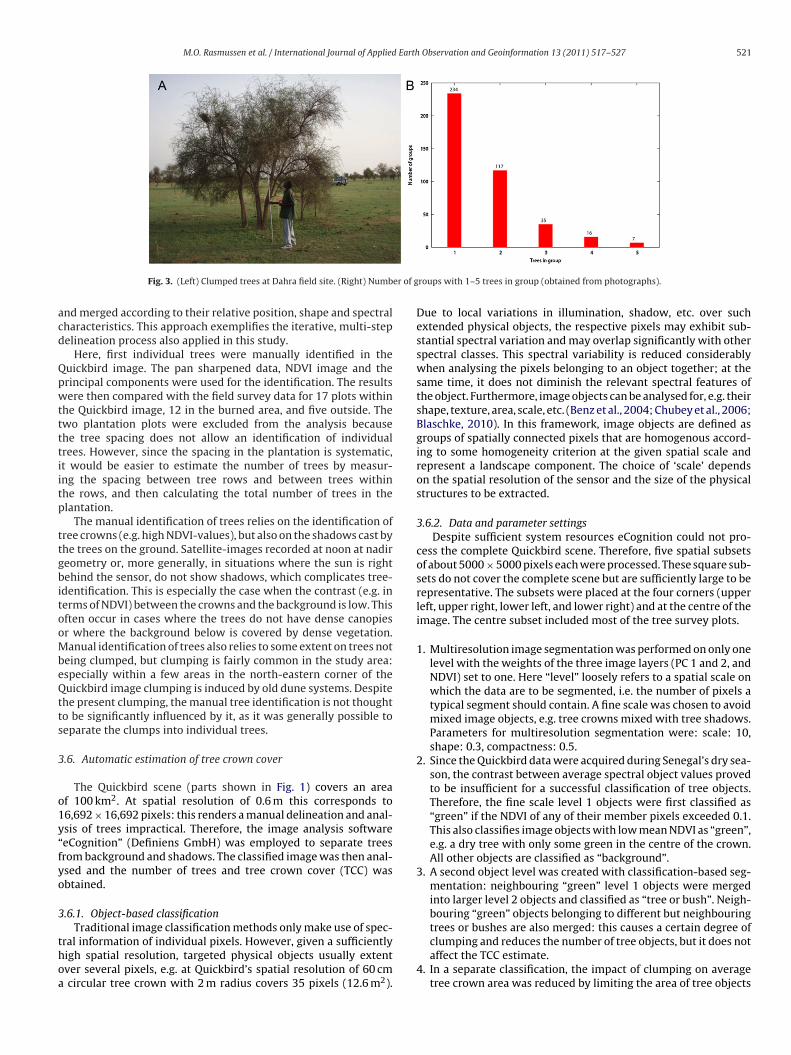
Fig. 3. (Left) Clumped trees at Dahra field site. (Right) Numb
nd merged according to their relative position, shape and spectralharacteristics. This approach exemplifies the iterative, multi-stepelineation process also applied in this study.
Here, first individual trees were manually identified in theuickbird image. The pan sharpened data, NDVI image and therincipal components were used for the identification. The resultsere then compared with the field survey data for 17 plots within
he Quickbird image, 12 in the burned area, and five outside. Thewo plantation plots were excluded from the analysis becausehe tree spacing does not allow an identification of individualrees. However, since the spacing in the plantation is systematic,t would be easier to estimate the number of trees by measur-ng the spacing between tree rows and between trees withinhe rows, and then calculating the total number of trees in thelantation.
The manual identification of trees relies on the identification ofree crowns (e.g. high NDVI-values), but also on the shadows cast byhe trees on the ground. Satellite-images recorded at noon at nadireometry or, more generally, in situations where the sun is rightehind the sensor, do not show shadows, which complicates tree-
dentification. This is especially the case when the contrast (e.g. inerms of NDVI) between the crowns and the background is low. Thisften occur in cases where the trees do not have dense canopiesr where the background below is covered by dense vegetation.anual identification of trees also relies to some extent on trees not
eing clumped, but clumping is fairly common in the study area:specially within a few areas in the north-eastern corner of theuickbird image clumping is induced by old dune systems. Despite
he present clumping, the manual tree identification is not thoughto be significantly influenced by it, as it was generally possible toeparate the clumps into individual trees.
.6. Automatic estimation of tree crown cover
The Quickbird scene (parts shown in Fig. 1) covers an areaf 100 km2. At spatial resolution of 0.6 m this corresponds to6,692 × 16,692 pixels: this renders a manual delineation and anal-sis of trees impractical. Therefore, the image analysis softwareeCognition” (Definiens GmbH) was employed to separate treesrom background and shadows. The classified image was then anal-sed and the number of trees and tree crown cover (TCC) wasbtained.
.6.1. Object-based classificationTraditional image classification methods only make use of spec-
ral information of individual pixels. However, given a sufficientlyigh spatial resolution, targeted physical objects usually extentver several pixels, e.g. at Quickbird’s spatial resolution of 60 cm
circular tree crown with 2 m radius covers 35 pixels (12.6 m2).
roups with 1–5 trees in group (obtained from photographs).
Due to local variations in illumination, shadow, etc. over suchextended physical objects, the respective pixels may exhibit sub-stantial spectral variation and may overlap significantly with otherspectral classes. This spectral variability is reduced considerablywhen analysing the pixels belonging to an object together; at thesame time, it does not diminish the relevant spectral features ofthe object. Furthermore, image objects can be analysed for, e.g. theirshape, texture, area, scale, etc. (Benz et al., 2004; Chubey et al., 2006;Blaschke, 2010). In this framework, image objects are defined asgroups of spatially connected pixels that are homogenous accord-ing to some homogeneity criterion at the given spatial scale andrepresent a landscape component. The choice of ‘scale’ dependson the spatial resolution of the sensor and the size of the physicalstructures to be extracted.
3.6.2. Data and parameter settingsDespite sufficient system resources eCognition could not pro-
cess the complete Quickbird scene. Therefore, five spatial subsetsof about 5000 × 5000 pixels each were processed. These square sub-sets do not cover the complete scene but are sufficiently large to berepresentative. The subsets were placed at the four corners (upperleft, upper right, lower left, and lower right) and at the centre of theimage. The centre subset included most of the tree survey plots.
1. Multiresolution image segmentation was performed on only onelevel with the weights of the three image layers (PC 1 and 2, andNDVI) set to one. Here “level” loosely refers to a spatial scale onwhich the data are to be segmented, i.e. the number of pixels atypical segment should contain. A fine scale was chosen to avoidmixed image objects, e.g. tree crowns mixed with tree shadows.Parameters for multiresolution segmentation were: scale: 10,shape: 0.3, compactness: 0.5.
2. Since the Quickbird data were acquired during Senegal’s dry sea-son, the contrast between average spectral object values provedto be insufficient for a successful classification of tree objects.Therefore, the fine scale level 1 objects were first classified as“green” if the NDVI of any of their member pixels exceeded 0.1.This also classifies image objects with low mean NDVI as “green”,e.g. a dry tree with only some green in the centre of the crown.All other objects are classified as “background”.
3. A second object level was created with classification-based seg-mentation: neighbouring “green” level 1 objects were mergedinto larger level 2 objects and classified as “tree or bush”. Neigh-bouring “green” objects belonging to different but neighbouringtrees or bushes are also merged: this causes a certain degree of
clumping and reduces the number of tree objects, but it does notaffect the TCC estimate.4. In a separate classification, the impact of clumping on averagetree crown area was reduced by limiting the area of tree objects
Journal Identification = JAG Article Identification = 401 Date: May 30, 2011 Time: 9:57 pm
522 M.O. Rasmussen et al. / International Journal of Applied Earth Observation and Geoinformation 13 (2011) 517–527
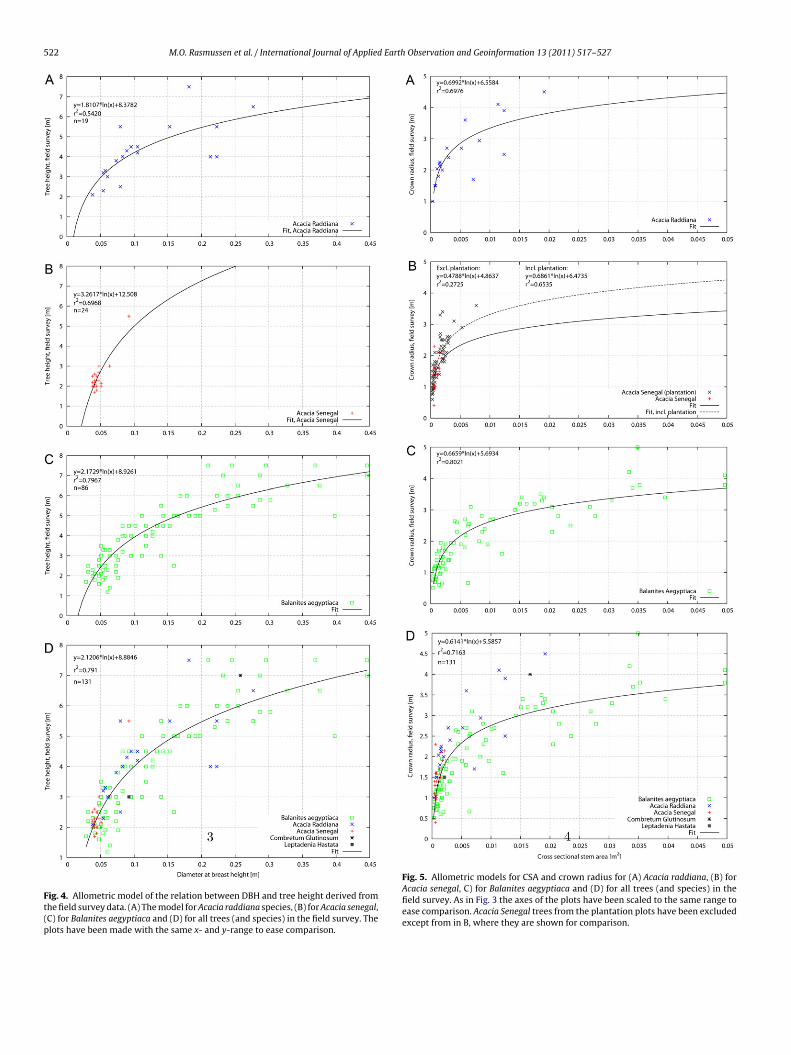
Fig. 4. Allometric model of the relation between DBH and tree height derived fromthe field survey data. (A) The model for Acacia raddiana species, (B) for Acacia senegal,(C) for Balanites aegyptiaca and (D) for all trees (and species) in the field survey. Theplots have been made with the same x- and y-range to ease comparison.
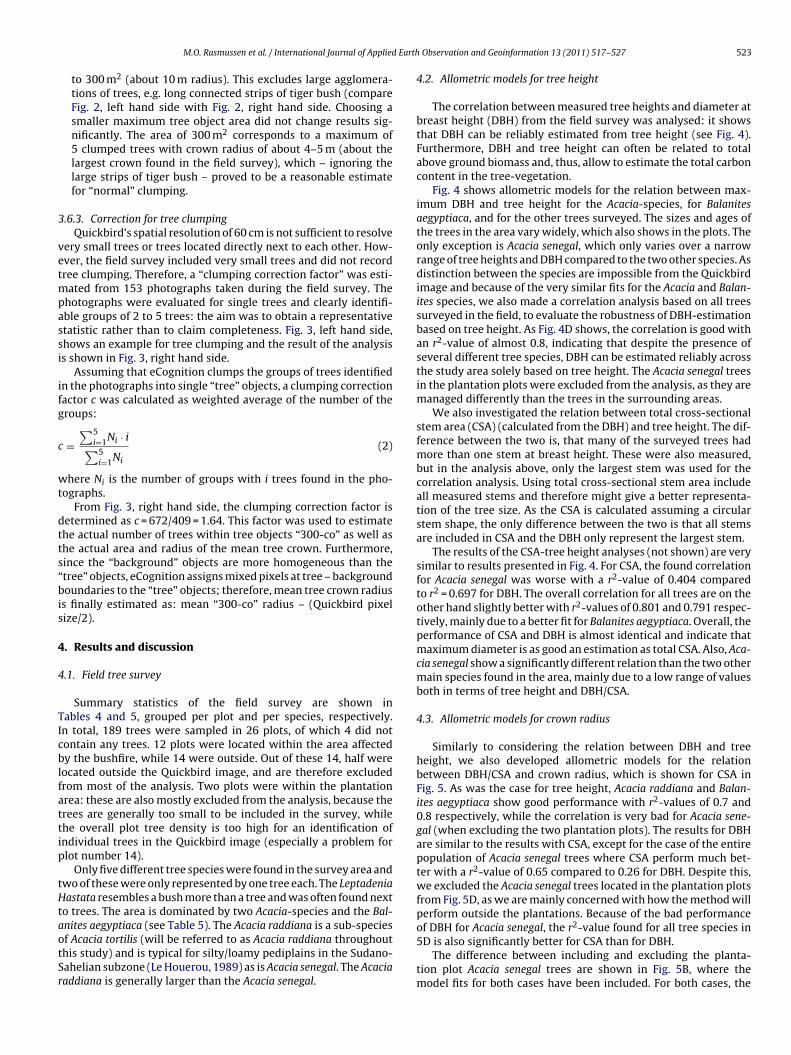
Fig. 5. Allometric models for CSA and crown radius for (A) Acacia raddiana, (B) forAcacia senegal, C) for Balanites aegyptiaca and (D) for all trees (and species) in thefield survey. As in Fig. 3 the axes of the plots have been scaled to the same range toease comparison. Acacia Senegal trees from the plantation plots have been excludedexcept from in B, where they are shown for comparison.
Journal Identification = JAG Article Identification = 401 Date: May 30, 2011 Time: 9:57 pm
Earth
3
vetmpassi
ifg
c
wt
dtts“bis
4
4
TIcblfattip
tHtaotSr
M.O. Rasmussen et al. / International Journal of Applied
to 300 m2 (about 10 m radius). This excludes large agglomera-tions of trees, e.g. long connected strips of tiger bush (compareFig. 2, left hand side with Fig. 2, right hand side. Choosing asmaller maximum tree object area did not change results sig-nificantly. The area of 300 m2 corresponds to a maximum of5 clumped trees with crown radius of about 4–5 m (about thelargest crown found in the field survey), which – ignoring thelarge strips of tiger bush – proved to be a reasonable estimatefor “normal” clumping.
.6.3. Correction for tree clumpingQuickbird’s spatial resolution of 60 cm is not sufficient to resolve
ery small trees or trees located directly next to each other. How-ver, the field survey included very small trees and did not recordree clumping. Therefore, a “clumping correction factor” was esti-
ated from 153 photographs taken during the field survey. Thehotographs were evaluated for single trees and clearly identifi-ble groups of 2 to 5 trees: the aim was to obtain a representativetatistic rather than to claim completeness. Fig. 3, left hand side,hows an example for tree clumping and the result of the analysiss shown in Fig. 3, right hand side.
Assuming that eCognition clumps the groups of trees identifiedn the photographs into single “tree” objects, a clumping correctionactor c was calculated as weighted average of the number of theroups:
=∑5
i=1Ni · i∑5
i=1Ni
(2)
here Ni is the number of groups with i trees found in the pho-ographs.
From Fig. 3, right hand side, the clumping correction factor isetermined as c = 672/409 = 1.64. This factor was used to estimatehe actual number of trees within tree objects “300-co” as well ashe actual area and radius of the mean tree crown. Furthermore,ince the “background” objects are more homogeneous than thetree” objects, eCognition assigns mixed pixels at tree – backgroundoundaries to the “tree” objects; therefore, mean tree crown radius
s finally estimated as: mean “300-co” radius – (Quickbird pixelize/2).
. Results and discussion
.1. Field tree survey
Summary statistics of the field survey are shown inables 4 and 5, grouped per plot and per species, respectively.n total, 189 trees were sampled in 26 plots, of which 4 did notontain any trees. 12 plots were located within the area affectedy the bushfire, while 14 were outside. Out of these 14, half were
ocated outside the Quickbird image, and are therefore excludedrom most of the analysis. Two plots were within the plantationrea: these are also mostly excluded from the analysis, because therees are generally too small to be included in the survey, whilehe overall plot tree density is too high for an identification ofndividual trees in the Quickbird image (especially a problem forlot number 14).
Only five different tree species were found in the survey area andwo of these were only represented by one tree each. The Leptadeniaastata resembles a bush more than a tree and was often found next
o trees. The area is dominated by two Acacia-species and the Bal-nites aegyptiaca (see Table 5). The Acacia raddiana is a sub-species
f Acacia tortilis (will be referred to as Acacia raddiana throughouthis study) and is typical for silty/loamy pediplains in the Sudano-ahelian subzone (Le Houerou, 1989) as is Acacia senegal. The Acaciaaddiana is generally larger than the Acacia senegal.Observation and Geoinformation 13 (2011) 517–527 523
4.2. Allometric models for tree height
The correlation between measured tree heights and diameter atbreast height (DBH) from the field survey was analysed: it showsthat DBH can be reliably estimated from tree height (see Fig. 4).Furthermore, DBH and tree height can often be related to totalabove ground biomass and, thus, allow to estimate the total carboncontent in the tree-vegetation.
Fig. 4 shows allometric models for the relation between max-imum DBH and tree height for the Acacia-species, for Balanitesaegyptiaca, and for the other trees surveyed. The sizes and ages ofthe trees in the area vary widely, which also shows in the plots. Theonly exception is Acacia senegal, which only varies over a narrowrange of tree heights and DBH compared to the two other species. Asdistinction between the species are impossible from the Quickbirdimage and because of the very similar fits for the Acacia and Balan-ites species, we also made a correlation analysis based on all treessurveyed in the field, to evaluate the robustness of DBH-estimationbased on tree height. As Fig. 4D shows, the correlation is good withan r2-value of almost 0.8, indicating that despite the presence ofseveral different tree species, DBH can be estimated reliably acrossthe study area solely based on tree height. The Acacia senegal treesin the plantation plots were excluded from the analysis, as they aremanaged differently than the trees in the surrounding areas.
We also investigated the relation between total cross-sectionalstem area (CSA) (calculated from the DBH) and tree height. The dif-ference between the two is, that many of the surveyed trees hadmore than one stem at breast height. These were also measured,but in the analysis above, only the largest stem was used for thecorrelation analysis. Using total cross-sectional stem area includeall measured stems and therefore might give a better representa-tion of the tree size. As the CSA is calculated assuming a circularstem shape, the only difference between the two is that all stemsare included in CSA and the DBH only represent the largest stem.
The results of the CSA-tree height analyses (not shown) are verysimilar to results presented in Fig. 4. For CSA, the found correlationfor Acacia senegal was worse with a r2-value of 0.404 comparedto r2 = 0.697 for DBH. The overall correlation for all trees are on theother hand slightly better with r2-values of 0.801 and 0.791 respec-tively, mainly due to a better fit for Balanites aegyptiaca. Overall, theperformance of CSA and DBH is almost identical and indicate thatmaximum diameter is as good an estimation as total CSA. Also, Aca-cia senegal show a significantly different relation than the two othermain species found in the area, mainly due to a low range of valuesboth in terms of tree height and DBH/CSA.
4.3. Allometric models for crown radius
Similarly to considering the relation between DBH and treeheight, we also developed allometric models for the relationbetween DBH/CSA and crown radius, which is shown for CSA inFig. 5. As was the case for tree height, Acacia raddiana and Balan-ites aegyptiaca show good performance with r2-values of 0.7 and0.8 respectively, while the correlation is very bad for Acacia sene-gal (when excluding the two plantation plots). The results for DBHare similar to the results with CSA, except for the case of the entirepopulation of Acacia senegal trees where CSA perform much bet-ter with a r2-value of 0.65 compared to 0.26 for DBH. Despite this,we excluded the Acacia senegal trees located in the plantation plotsfrom Fig. 5D, as we are mainly concerned with how the method willperform outside the plantations. Because of the bad performanceof DBH for Acacia senegal, the r2-value found for all tree species in
5D is also significantly better for CSA than for DBH.The difference between including and excluding the planta-tion plot Acacia senegal trees are shown in Fig. 5B, where themodel fits for both cases have been included. For both cases, the
Journal Identification = JAG Article Identification = 401 Date: May 30, 2011 Time: 9:57 pm
524 M.O. Rasmussen et al. / International Journal of Applied Earth Observation and Geoinformation 13 (2011) 517–527
Table 4Statistics for all 26 plots surveyed. %TCC is the percentage of each plot covered be tree crowns calculated assuming circular crown shapes and no tree crown clumping. Allmeasurements are in meters except count and %TCC.
Point Note Count Avg. height Min. height Max. height Avg. DBH Avg. radius %TCC
1 Burned 2 2.90 2.50 3.30 0.34 1.09 0.33 Burned 5 2.84 1.40 4.20 0.22 1.64 2.16 Burned 4 4.88 4.00 5.50 0.39 2.77 4.29 Burned 3 5.50 4.50 7.50 0.71 2.92 3.512 Burned 6 2.68 2.10 3.20 0.21 1.44 1.715 Burned 1 3.00 3.00 3.00 0.44 2.55 0.817 Burned 7 4.26 1.20 7.00 0.41 2.06 5.219 Burned 6 5.28 4.00 7.50 0.60 3.49 10.120 Burned 1 5.50 5.50 5.50 0.70 2.50 0.823 Burned 5 3.78 1.90 5.30 0.42 1.54 2.026 Burned 8 4.26 2.50 7.50 0.40 1.81 4.228 Burned 2 4.15 1.80 6.50 0.47 2.05 1.429 Not burned 5 3.92 2.30 7.50 0.31 1.88 2.530 Not burned 0 0.031 Not burned 14 4.92 1.90 7.50 0.55 2.10 9.432 Not burned 10 3.98 2.10 5.00 0.34 1.97 5.760 Not burned 0 0.047 Outside qb 12 4.49 2.80 6.00 0.46 2.38 9.248 Outside qb 0 0.049 Outside qb 12 3.23 1.60 6.50 0.29 1.60 4.850 Outside qb 22 2.29 1.70 3.00 0.14 1.48 6.451 Outside qb 2 1.90 1.70 2.10 0.11 0.98 0.352 Outside qb 1 7.00 7.00 7.00 0.90 3.10 1.2
0.0 6.50 0.23 1.23 5.7 5.50 0.16 2.15 25.6
eitcarsul
4i
fititwfitawtctf
Fig. 6. Correlation between tree count in the field survey, and from manual identi-fication of trees in the QuickBird image for 17 out of the 26 plots (plantation plots
TS
61 Outside qb 0
14 Plantation 20 2.30 1.2059 Plantation 41 3.00 1.80
ffective range is limited, but including the plantation plots stillmproves the correlation significantly. The lack of correlation forhe non-plantation trees could be explained by the fact that Aca-ia senegal is often used for browse for cows and goats, as wells for firewood. This means that trees are in some cases trimmed,esulting the in crown radius not being indicative of the stemize. This is not the case within the plantation, where trees aresed for gum arabic production and the browsing by animals is
imited.
.4. Comparison between field survey and manual Quickbirdmage analysis for estimating the number of trees
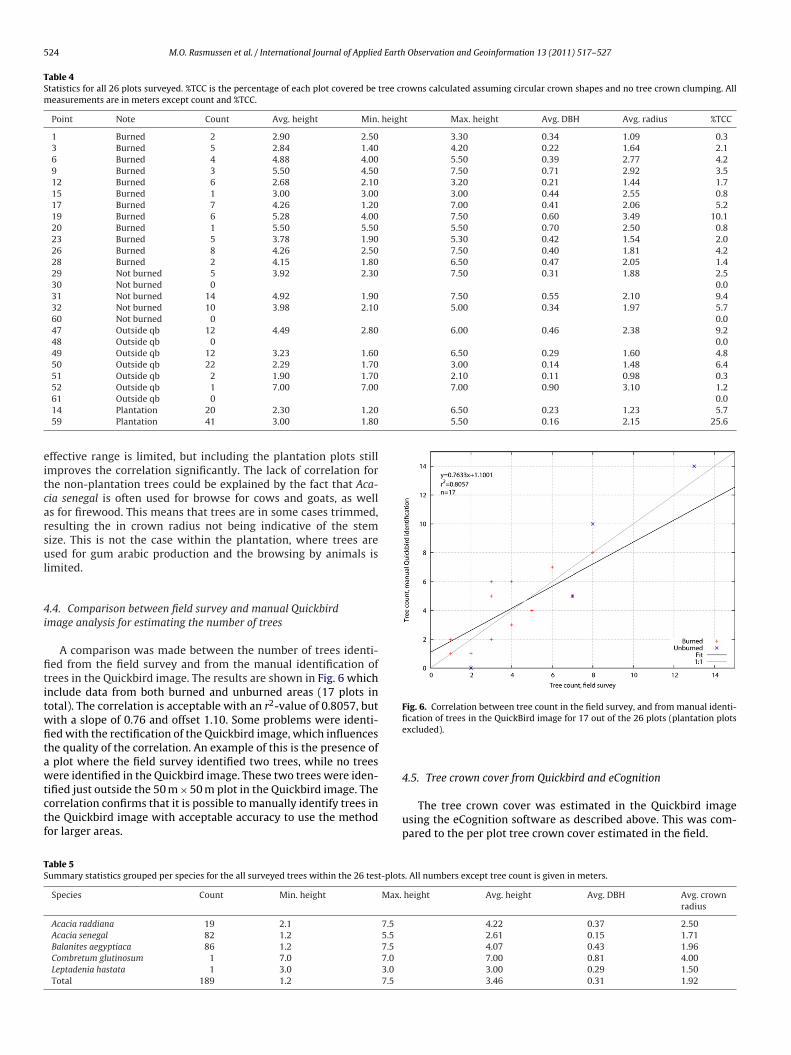
A comparison was made between the number of trees identi-ed from the field survey and from the manual identification ofrees in the Quickbird image. The results are shown in Fig. 6 whichnclude data from both burned and unburned areas (17 plots inotal). The correlation is acceptable with an r2-value of 0.8057, butith a slope of 0.76 and offset 1.10. Some problems were identi-ed with the rectification of the Quickbird image, which influenceshe quality of the correlation. An example of this is the presence of
plot where the field survey identified two trees, while no treesere identified in the Quickbird image. These two trees were iden-
ified just outside the 50 m × 50 m plot in the Quickbird image. Theorrelation confirms that it is possible to manually identify trees inhe Quickbird image with acceptable accuracy to use the methodor larger areas.
able 5ummary statistics grouped per species for the all surveyed trees within the 26 test-plots
Species Count Min. height Max.
Acacia raddiana 19 2.1 7.5
Acacia senegal 82 1.2 5.5
Balanites aegyptiaca 86 1.2 7.5
Combretum glutinosum 1 7.0 7.0
Leptadenia hastata 1 3.0 3.0
Total 189 1.2 7.5
excluded).
4.5. Tree crown cover from Quickbird and eCognition
The tree crown cover was estimated in the Quickbird imageusing the eCognition software as described above. This was com-pared to the per plot tree crown cover estimated in the field.
. All numbers except tree count is given in meters.
height Avg. height Avg. DBH Avg. crownradius
4.22 0.37 2.502.61 0.15 1.714.07 0.43 1.967.00 0.81 4.003.00 0.29 1.503.46 0.31 1.92
Journal Identification = JAG Article Identification = 401 Date: May 30, 2011 Time: 9:57 pm
M.O. Rasmussen et al. / International Journal of Applied Earth Observation and Geoinformation 13 (2011) 517–527 525
Table 6Analyses of upper left (UL), upper right (UR), and centre (CC) spatial subsets of the Quickbird scene. “all” means all objects classified as trees, “300” means only objects withan area less than 300 m2, and “300-co” is the number of trees with less than 300 m2 corrected for clumping (“300” trees times 1.64). The values in brackets for mean “300-co”radii give the radius minus 30 cm (Quickbird pixel/2) to account for the ring of mixed pixels at the perimeter of tree objects.
Subset TCC (%) Total area (m2) Trees Mean area (m2) Mean radius (m)
UL-all 3.7 336,165 9000 37.4 3.4UL-300 – 299,475 8943 33.5 3.3UL-300-co – 299,475 14,666 20.4 2.5 (2.2)UR-all 4.5 403,948 6668 60.6 4.4UR-300 – 265,365 6491 40.9 3.6UR-300-co – 265,365 10,645 24.9 2.8 (2.5)CC-all 3.0 326,049 10,855 30.0 3.1
10,828 27.8 3.017,757 17.0 2.3 (2.0)
tcbT(ttrbfiatwc
ttrtbc(sbte2f
Fs
CC-300 – 301,374
CC-300-co – 301,374
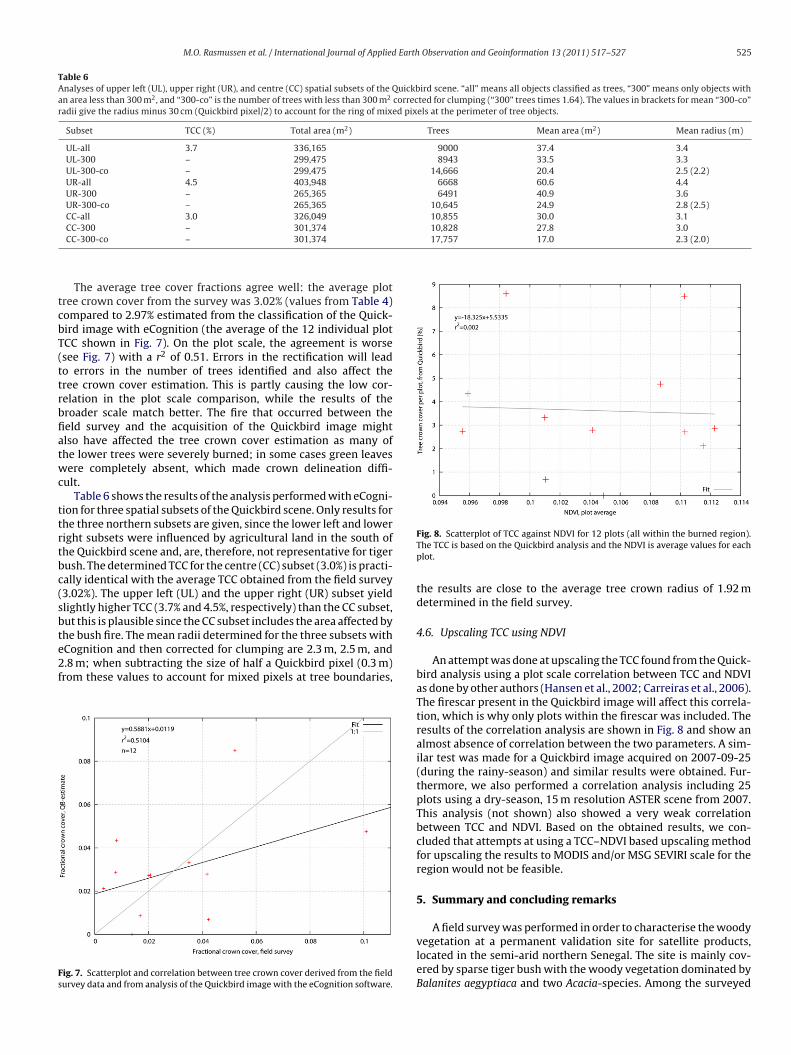
The average tree cover fractions agree well: the average plotree crown cover from the survey was 3.02% (values from Table 4)ompared to 2.97% estimated from the classification of the Quick-ird image with eCognition (the average of the 12 individual plotCC shown in Fig. 7). On the plot scale, the agreement is worsesee Fig. 7) with a r2 of 0.51. Errors in the rectification will leado errors in the number of trees identified and also affect theree crown cover estimation. This is partly causing the low cor-elation in the plot scale comparison, while the results of theroader scale match better. The fire that occurred between theeld survey and the acquisition of the Quickbird image mightlso have affected the tree crown cover estimation as many ofhe lower trees were severely burned; in some cases green leavesere completely absent, which made crown delineation diffi-
ult.Table 6 shows the results of the analysis performed with eCogni-
ion for three spatial subsets of the Quickbird scene. Only results forhe three northern subsets are given, since the lower left and loweright subsets were influenced by agricultural land in the south ofhe Quickbird scene and, are, therefore, not representative for tigerush. The determined TCC for the centre (CC) subset (3.0%) is practi-ally identical with the average TCC obtained from the field survey3.02%). The upper left (UL) and the upper right (UR) subset yieldlightly higher TCC (3.7% and 4.5%, respectively) than the CC subset,ut this is plausible since the CC subset includes the area affected byhe bush fire. The mean radii determined for the three subsets with
Cognition and then corrected for clumping are 2.3 m, 2.5 m, and.8 m; when subtracting the size of half a Quickbird pixel (0.3 m)rom these values to account for mixed pixels at tree boundaries,ig. 7. Scatterplot and correlation between tree crown cover derived from the fieldurvey data and from analysis of the Quickbird image with the eCognition software.
Fig. 8. Scatterplot of TCC against NDVI for 12 plots (all within the burned region).The TCC is based on the Quickbird analysis and the NDVI is average values for eachplot.
the results are close to the average tree crown radius of 1.92 mdetermined in the field survey.
4.6. Upscaling TCC using NDVI
An attempt was done at upscaling the TCC found from the Quick-bird analysis using a plot scale correlation between TCC and NDVIas done by other authors (Hansen et al., 2002; Carreiras et al., 2006).The firescar present in the Quickbird image will affect this correla-tion, which is why only plots within the firescar was included. Theresults of the correlation analysis are shown in Fig. 8 and show analmost absence of correlation between the two parameters. A sim-ilar test was made for a Quickbird image acquired on 2007-09-25(during the rainy-season) and similar results were obtained. Fur-thermore, we also performed a correlation analysis including 25plots using a dry-season, 15 m resolution ASTER scene from 2007.This analysis (not shown) also showed a very weak correlationbetween TCC and NDVI. Based on the obtained results, we con-cluded that attempts at using a TCC–NDVI based upscaling methodfor upscaling the results to MODIS and/or MSG SEVIRI scale for theregion would not be feasible.
5. Summary and concluding remarks
A field survey was performed in order to characterise the woody
vegetation at a permanent validation site for satellite products,located in the semi-arid northern Senegal. The site is mainly cov-ered by sparse tiger bush with the woody vegetation dominated byBalanites aegyptiaca and two Acacia-species. Among the surveyed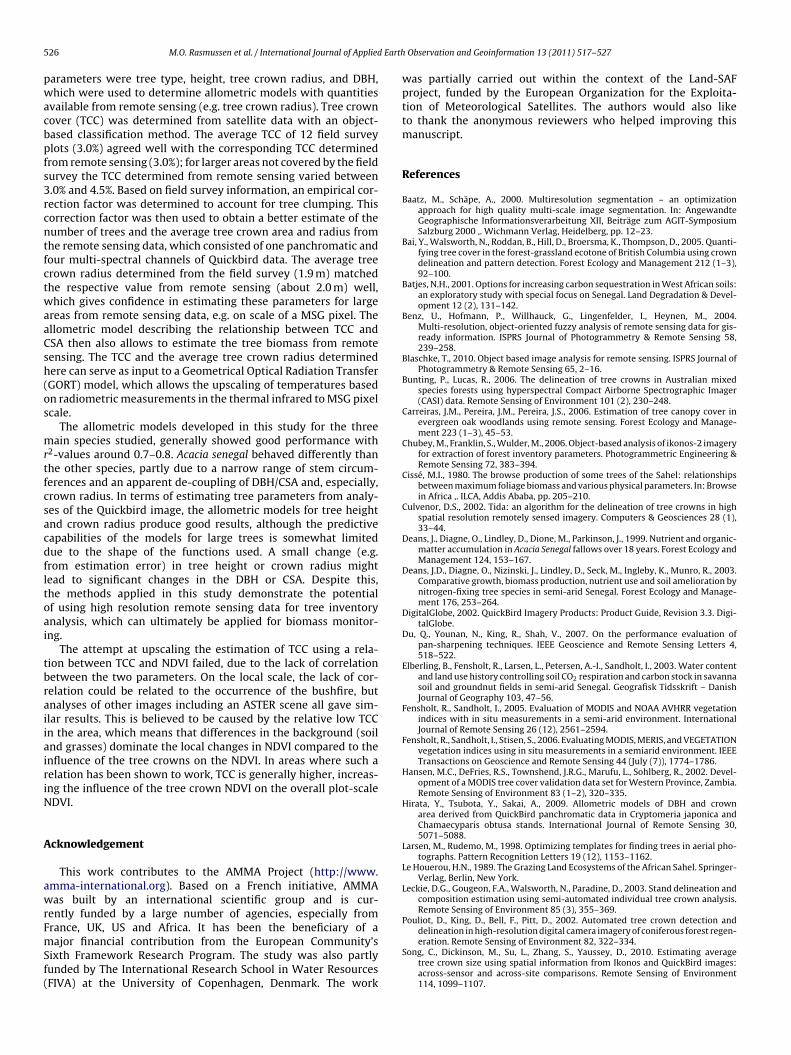
Journal Identification = JAG Article Identification = 401 Date: May 30, 2011 Time: 9:57 pm
5 Earth
pwacbpfs3rcntfctwaaCsh(os
mrtfcsacdfltoai
tbraiiairiN
A
awrFmSf(
26 M.O. Rasmussen et al. / International Journal of Applied
arameters were tree type, height, tree crown radius, and DBH,hich were used to determine allometric models with quantities
vailable from remote sensing (e.g. tree crown radius). Tree crownover (TCC) was determined from satellite data with an object-ased classification method. The average TCC of 12 field surveylots (3.0%) agreed well with the corresponding TCC determinedrom remote sensing (3.0%); for larger areas not covered by the fieldurvey the TCC determined from remote sensing varied between.0% and 4.5%. Based on field survey information, an empirical cor-ection factor was determined to account for tree clumping. Thisorrection factor was then used to obtain a better estimate of theumber of trees and the average tree crown area and radius fromhe remote sensing data, which consisted of one panchromatic andour multi-spectral channels of Quickbird data. The average treerown radius determined from the field survey (1.9 m) matchedhe respective value from remote sensing (about 2.0 m) well,hich gives confidence in estimating these parameters for large
reas from remote sensing data, e.g. on scale of a MSG pixel. Thellometric model describing the relationship between TCC andSA then also allows to estimate the tree biomass from remoteensing. The TCC and the average tree crown radius determinedere can serve as input to a Geometrical Optical Radiation TransferGORT) model, which allows the upscaling of temperatures basedn radiometric measurements in the thermal infrared to MSG pixelcale.
The allometric models developed in this study for the threeain species studied, generally showed good performance with
2-values around 0.7–0.8. Acacia senegal behaved differently thanhe other species, partly due to a narrow range of stem circum-erences and an apparent de-coupling of DBH/CSA and, especially,rown radius. In terms of estimating tree parameters from analy-es of the Quickbird image, the allometric models for tree heightnd crown radius produce good results, although the predictiveapabilities of the models for large trees is somewhat limitedue to the shape of the functions used. A small change (e.g.rom estimation error) in tree height or crown radius mightead to significant changes in the DBH or CSA. Despite this,he methods applied in this study demonstrate the potentialf using high resolution remote sensing data for tree inventorynalysis, which can ultimately be applied for biomass monitor-ng.
The attempt at upscaling the estimation of TCC using a rela-ion between TCC and NDVI failed, due to the lack of correlationetween the two parameters. On the local scale, the lack of cor-elation could be related to the occurrence of the bushfire, butnalyses of other images including an ASTER scene all gave sim-lar results. This is believed to be caused by the relative low TCCn the area, which means that differences in the background (soilnd grasses) dominate the local changes in NDVI compared to thenfluence of the tree crowns on the NDVI. In areas where such aelation has been shown to work, TCC is generally higher, increas-ng the influence of the tree crown NDVI on the overall plot-scaleDVI.
cknowledgement
This work contributes to the AMMA Project (http://www.mma-international.org). Based on a French initiative, AMMAas built by an international scientific group and is cur-
ently funded by a large number of agencies, especially fromrance, UK, US and Africa. It has been the beneficiary of a
ajor financial contribution from the European Community’sixth Framework Research Program. The study was also partlyunded by The International Research School in Water ResourcesFIVA) at the University of Copenhagen, Denmark. The work
Observation and Geoinformation 13 (2011) 517–527
was partially carried out within the context of the Land-SAFproject, funded by the European Organization for the Exploita-tion of Meteorological Satellites. The authors would also liketo thank the anonymous reviewers who helped improving thismanuscript.
References
Baatz, M., Schäpe, A., 2000. Multiresolution segmentation – an optimizationapproach for high quality multi-scale image segmentation. In: AngewandteGeographische Informationsverarbeitung XII, Beiträge zum AGIT-SymposiumSalzburg 2000 ,. Wichmann Verlag, Heidelberg, pp. 12–23.
Bai, Y., Walsworth, N., Roddan, B., Hill, D., Broersma, K., Thompson, D., 2005. Quanti-fying tree cover in the forest-grassland ecotone of British Columbia using crowndelineation and pattern detection. Forest Ecology and Management 212 (1–3),92–100.
Batjes, N.H., 2001. Options for increasing carbon sequestration in West African soils:an exploratory study with special focus on Senegal. Land Degradation & Devel-opment 12 (2), 131–142.
Benz, U., Hofmann, P., Willhauck, G., Lingenfelder, I., Heynen, M., 2004.Multi-resolution, object-oriented fuzzy analysis of remote sensing data for gis-ready information. ISPRS Journal of Photogrammetry & Remote Sensing 58,239–258.
Blaschke, T., 2010. Object based image analysis for remote sensing. ISPRS Journal ofPhotogrammetry & Remote Sensing 65, 2–16.
Bunting, P., Lucas, R., 2006. The delineation of tree crowns in Australian mixedspecies forests using hyperspectral Compact Airborne Spectrographic Imager(CASI) data. Remote Sensing of Environment 101 (2), 230–248.
Carreiras, J.M., Pereira, J.M., Pereira, J.S., 2006. Estimation of tree canopy cover inevergreen oak woodlands using remote sensing. Forest Ecology and Manage-ment 223 (1–3), 45–53.
Chubey, M., Franklin, S., Wulder, M., 2006. Object-based analysis of ikonos-2 imageryfor extraction of forest inventory parameters. Photogrammetric Engineering &Remote Sensing 72, 383–394.
Cissé, M.I., 1980. The browse production of some trees of the Sahel: relationshipsbetween maximum foliage biomass and various physical parameters. In: Browsein Africa ,. ILCA, Addis Ababa, pp. 205–210.
Culvenor, D.S., 2002. Tida: an algorithm for the delineation of tree crowns in highspatial resolution remotely sensed imagery. Computers & Geosciences 28 (1),33–44.
Deans, J., Diagne, O., Lindley, D., Dione, M., Parkinson, J., 1999. Nutrient and organic-matter accumulation in Acacia Senegal fallows over 18 years. Forest Ecology andManagement 124, 153–167.
Deans, J.D., Diagne, O., Nizinski, J., Lindley, D., Seck, M., Ingleby, K., Munro, R., 2003.Comparative growth, biomass production, nutrient use and soil amelioration bynitrogen-fixing tree species in semi-arid Senegal. Forest Ecology and Manage-ment 176, 253–264.
DigitalGlobe, 2002. QuickBird Imagery Products: Product Guide, Revision 3.3. Digi-talGlobe.
Du, Q., Younan, N., King, R., Shah, V., 2007. On the performance evaluation ofpan-sharpening techniques. IEEE Geoscience and Remote Sensing Letters 4,518–522.
Elberling, B., Fensholt, R., Larsen, L., Petersen, A.-I., Sandholt, I., 2003. Water contentand land use history controlling soil CO2 respiration and carbon stock in savannasoil and groundnut fields in semi-arid Senegal. Geografisk Tidsskrift – DanishJournal of Geography 103, 47–56.
Fensholt, R., Sandholt, I., 2005. Evaluation of MODIS and NOAA AVHRR vegetationindices with in situ measurements in a semi-arid environment. InternationalJournal of Remote Sensing 26 (12), 2561–2594.
Fensholt, R., Sandholt, I., Stisen, S., 2006. Evaluating MODIS, MERIS, and VEGETATIONvegetation indices using in situ measurements in a semiarid environment. IEEETransactions on Geoscience and Remote Sensing 44 (July (7)), 1774–1786.
Hansen, M.C., DeFries, R.S., Townshend, J.R.G., Marufu, L., Sohlberg, R., 2002. Devel-opment of a MODIS tree cover validation data set for Western Province, Zambia.Remote Sensing of Environment 83 (1–2), 320–335.
Hirata, Y., Tsubota, Y., Sakai, A., 2009. Allometric models of DBH and crownarea derived from QuickBird panchromatic data in Cryptomeria japonica andChamaecyparis obtusa stands. International Journal of Remote Sensing 30,5071–5088.
Larsen, M., Rudemo, M., 1998. Optimizing templates for finding trees in aerial pho-tographs. Pattern Recognition Letters 19 (12), 1153–1162.
Le Houerou, H.N., 1989. The Grazing Land Ecosystems of the African Sahel. Springer-Verlag, Berlin, New York.
Leckie, D.G., Gougeon, F.A., Walsworth, N., Paradine, D., 2003. Stand delineation andcomposition estimation using semi-automated individual tree crown analysis.Remote Sensing of Environment 85 (3), 355–369.
Pouliot, D., King, D., Bell, F., Pitt, D., 2002. Automated tree crown detection anddelineation in high-resolution digital camera imagery of coniferous forest regen-
eration. Remote Sensing of Environment 82, 322–334.Song, C., Dickinson, M., Su, L., Zhang, S., Yaussey, D., 2010. Estimating averagetree crown size using spatial information from Ikonos and QuickBird images:across-sensor and across-site comparisons. Remote Sensing of Environment114, 1099–1107.

Journal Identification = JAG Article Identification = 401 Date: May 30, 2011 Time: 9:57 pm
Earth
S
S
M.O. Rasmussen et al. / International Journal of Applied
ong, C., Woodcock, C.E., 2003. Estimating tree crown size from multiresolutionremotely sensed imagery. Photogrammetric Engineering & Remote Sensing 69,
1263–1270.tisen, S., Sandholt, I., Noergaard, A., Fensholt, R., Jensen, K.H., 2008. Combining thetriangle method with thermal inertia to estimate regional evapotranspiration– applied to MSG-SEVIRI data in the Senegal River basin. Remote Sensing ofEnvironment 112 (3), 1242–1255.
Observation and Geoinformation 13 (2011) 517–527 527
Toure, A., Rasmussen, K., Diallo, O., Diouf, A., 2003. Actual and potential carbon stocksin the north sudanian zone. A case study: the forests of Delbi and Paniates in
Senegal. Geografisk Tidsskrift, Danish. Journal of Geography 103, 63–70.Tucker, C.J., 1979. Red and photographic infrared linear combinations for monitoringvegetation. Remote Sensing of Environment 8 (2), 127–150.
Zhang, L., 1997. Cross-validation of non-linear growth functions for modelling treeheight–diameter relationships. Annals of Botany 79, 251–257.