Treatment planning and dosimetry for the Harvard-MIT Phase I clinical trial of cranial neutron...
19
PII S0360-3016(02)02862-6 PHYSICS CONTRIBUTION TREATMENT PLANNING AND DOSIMETRY FOR THE HARVARD-MIT PHASE I CLINICAL TRIAL OF CRANIAL NEUTRON CAPTURE THERAPY MATTHEW R. PALMER,PH.D.,* J. TIMOTHY GOORLEY,PH.D.,* † W. S. KIGER, III, PH.D., †‡ PAUL M. BUSSE, M.D., PH.D., ‡ KENT J. RILEY,PH.D., † OTTO K. HARLING,PH.D., † AND ROBERT G. ZAMENHOF,PH.D.* Departments of *Radiology and ‡ Radiation Oncology, Beth Israel Deaconess Medical Center, Harvard Medical School, Boston, MA; † Nuclear Reactor Laboratory, Massachusetts Institute of Technology, Boston, MA Purpose: A Phase I trial of cranial neutron capture therapy (NCT) was conducted at Harvard-MIT. The trial was designed to determine maximum tolerated NCT radiation dose to normal brain. Methods and Materials: Twenty-two patients with brain tumors were treated by infusion of boronophenylala- nine-fructose (BPA-f) followed by exposure to epithermal neutrons. The study began with a prescribed biolog- ically weighted dose of 8.8 RBE (relative biologic effectiveness) Gy, escalated in compounding 10% increments, and ended at 14.2 RBE Gy. BPA-f was infused at a dose 250 –350 mg/kg body weight. Treatments were planned using MacNCTPlan and MCNP 4B. Irradiations were delivered as one, two, or three fields in one or two fractions. Results: Peak biologically weighted normal tissue dose ranged from 8.7 to 16.4 RBE Gy. The average dose to brain ranged from 2.7 to 7.4 RBE Gy. Average tumor dose was estimated to range from 14.5 to 43.9 RBE Gy, with a mean of 25.7 RBE Gy. Conclusions: We have demonstrated that BPA-f–mediated NCT can be precisely planned and delivered in a carefully controlled manner. Subsequent clinical trials of boron neutron capture therapy at Harvard and MIT will be initiated with a new high-intensity, high-quality epithermal neutron beam. © 2002 Elsevier Science Inc. Boron neutron capture therapy (BNCT), Glioblastoma multiforme (GBM), Metastatic melanoma, Boronophe- nylalanine-fructose (BPA-f), Radiotherapy, Clinical trial, Treatment planning. INTRODUCTION Neutron capture therapy (NCT) (1–5) is a binary radia- tion therapeutic modality whose conception dates back almost to the discovery of the neutron itself (6). In boron-mediated NCT (BNCT), the unusually high ther- mal neutron capture cross-section of a stable isotope of boron, 10 B, is employed. After a thermal neutron capture, the excited 11 B nucleus immediately fissions into an alpha particle and a lithium recoil nucleus. These sec- ondary particles deposit, on average, a total energy of 2.34 MeV over a combined range of approximately 10 –14 microns. This relatively short range constrains direct biologic damage to the region of origin. Because of the high linear energy transfer (LET, approximately 200 keV/m) involved during energy deposition, the passage of a small number of alpha particles or lithium ions through the nucleus of a cell is likely to kill that cell (7, 8). Therefore, the objective of BNCT is to concentrate a compound containing 10 B preferentially in cancer cells, then expose a portion of the body to a thermal or epith- ermal neutron beam to employ the 10 B capture process, resulting in a tumoricidal effect. The efficacy of BNCT, therefore, depends on the neutron beam design and, more importantly, on the specificity, biodistribution, and phar- macokinetics of the 10 B carrier compound. These are the critical scientific and engineering issues that have kept BNCT in the developmental stage for more than 30 years. The first clinical use of BNCT was initiated at the Brookhaven Graphite Research Reactor for primary brain cancer by Sweet and Javid (9) in 1951 and later by Farr et al. (10). Initially, 10 glioma patients were treated in the Reprint requests to: Dr. Matthew R. Palmer, Department of Radiology, Beth Israel Deaconess Medical Center, 330 Brookline Ave., Boston, MA 02215. Tel: (617) 667-0176; Fax: (617) 667- 0177; E-mail: [email protected] This work was supported by the United States Department of Energy under contracts DE-FG02-87ER-6060 and DE-FG02- 97ER-62193. Acknowledgments—Recognition is due to the many faculty, staff, and graduate students who helped with the trial, developed instru- mentation, or helped acquire and analyze data: Dr. Lee Chin, Dr. Cynthia Chuang, William Carson, Todd Date, Dr. Irving Kaplan, Jody Kaplan, Edward Lau, Michelle Ledesma, Dr. Xing-Qi Lu, Fred McWilliams, Tom Newton, Shuichi Sakamoto, Dr. Guido Solares, Dr. Lujia Tang, Jerry White, Ben Wilson, and Dr. Sam Yam. Received Sep 27, 2001, and in revised form Mar 28, 2002. Accepted for publication Apr 9, 2002. Int. J. Radiation Oncology Biol. Phys., Vol. 53, No. 5, pp. 1361–1379, 2002 Copyright © 2002 Elsevier Science Inc. Printed in the USA. All rights reserved 0360-3016/02/$–see front matter 1361
-
Upload
independent -
Category
Documents
-
view
1 -
download
0
Transcript of Treatment planning and dosimetry for the Harvard-MIT Phase I clinical trial of cranial neutron...
PII S0360-3016(02)02862-6
PHYSICS CONTRIBUTION
TREATMENT PLANNING AND DOSIMETRY FOR THE HARVARD-MITPHASE I CLINICAL TRIAL OF CRANIAL NEUTRON CAPTURE THERAPY
MATTHEW R. PALMER, PH.D.,* J. TIMOTHY GOORLEY, PH.D.,*† W. S. KIGER, III, PH.D.,†‡
PAUL M. BUSSE, M.D., PH.D.,‡ KENT J. RILEY, PH.D.,† OTTO K. HARLING, PH.D.,† AND
ROBERT G. ZAMENHOF, PH.D.*
Departments of *Radiology and‡Radiation Oncology, Beth Israel Deaconess Medical Center, Harvard Medical School, Boston, MA;†Nuclear Reactor Laboratory, Massachusetts Institute of Technology, Boston, MA
Purpose: A Phase I trial of cranial neutron capture therapy (NCT) was conducted at Harvard-MIT. The trial wasdesigned to determine maximum tolerated NCT radiation dose to normal brain.Methods and Materials: Twenty-two patients with brain tumors were treated by infusion of boronophenylala-nine-fructose (BPA-f) followed by exposure to epithermal neutrons. The study began with a prescribed biolog-ically weighted dose of 8.8 RBE (relative biologic effectiveness) Gy, escalated in compounding 10% increments,and ended at 14.2 RBE Gy. BPA-f was infused at a dose 250–350 mg/kg body weight. Treatments were plannedusing MacNCTPlan and MCNP 4B. Irradiations were delivered as one, two, or three fields in one or twofractions.Results: Peak biologically weighted normal tissue dose ranged from 8.7 to 16.4 RBE Gy. The average dose tobrain ranged from 2.7 to 7.4 RBE Gy. Average tumor dose was estimated to range from 14.5 to 43.9 RBE Gy,with a mean of 25.7 RBE Gy.Conclusions: We have demonstrated that BPA-f–mediated NCT can be precisely planned and delivered in acarefully controlled manner. Subsequent clinical trials of boron neutron capture therapy at Harvard and MITwill be initiated with a new high-intensity, high-quality epithermal neutron beam. © 2002 Elsevier Science Inc.
Boron neutron capture therapy (BNCT), Glioblastoma multiforme (GBM), Metastatic melanoma, Boronophe-nylalanine-fructose (BPA-f), Radiotherapy, Clinical trial, Treatment planning.
INTRODUCTION
Neutron capture therapy (NCT) (1–5) is a binary radia-tion therapeutic modality whose conception dates backalmost to the discovery of the neutron itself (6). Inboron-mediated NCT (BNCT), the unusually high ther-mal neutron capture cross-section of a stable isotope ofboron,10B, is employed. After a thermal neutron capture,the excited 11B nucleus immediately fissions into analpha particle and a lithium recoil nucleus. These sec-ondary particles deposit, on average, a total energy of2.34 MeV over a combined range of approximately10 –14 microns. This relatively short range constrainsdirect biologic damage to the region of origin. Because ofthe high linear energy transfer (LET, approximately 200keV/�m) involved during energy deposition, the passage
of a small number of alpha particles or lithium ionsthrough the nucleus of a cell is likely to kill that cell (7,8). Therefore, the objective of BNCT is to concentrate acompound containing10B preferentially in cancer cells,then expose a portion of the body to a thermal or epith-ermal neutron beam to employ the10B capture process,resulting in a tumoricidal effect. The efficacy of BNCT,therefore, depends on the neutron beam design and, moreimportantly, on the specificity, biodistribution, and phar-macokinetics of the10B carrier compound. These are thecritical scientific and engineering issues that have keptBNCT in the developmental stage for more than 30 years.
The first clinical use of BNCT was initiated at theBrookhaven Graphite Research Reactor for primary braincancer by Sweet and Javid (9) in 1951 and later by Farret al. (10). Initially, 10 glioma patients were treated in the
Reprint requests to: Dr. Matthew R. Palmer, Department ofRadiology, Beth Israel Deaconess Medical Center, 330 BrooklineAve., Boston, MA 02215. Tel: (617) 667-0176; Fax: (617) 667-0177; E-mail: [email protected]
This work was supported by the United States Department ofEnergy under contracts DE-FG02-87ER-6060 and DE-FG02-97ER-62193.Acknowledgments—Recognition is due to the many faculty, staff,and graduate students who helped with the trial, developed instru-
mentation, or helped acquire and analyze data: Dr. Lee Chin, Dr.Cynthia Chuang, William Carson, Todd Date, Dr. Irving Kaplan,Jody Kaplan, Edward Lau, Michelle Ledesma, Dr. Xing-Qi Lu,Fred McWilliams, Tom Newton, Shuichi Sakamoto, Dr. GuidoSolares, Dr. Lujia Tang, Jerry White, Ben Wilson, and Dr. SamYam.
Received Sep 27, 2001, and in revised form Mar 28, 2002.Accepted for publication Apr 9, 2002.
Int. J. Radiation Oncology Biol. Phys., Vol. 53, No. 5, pp. 1361–1379, 2002Copyright © 2002 Elsevier Science Inc.Printed in the USA. All rights reserved
0360-3016/02/$–see front matter
1361

first trial using infusions of isotopically enriched borax atdoses of approximately 200 mg/kg (11, 12). Subse-quently, 18 patients, in two sets, were treated with so-dium pentaborate at doses 25–60 mg 10B per kg bodyweight. Thermal neutron irradiations were delivered insingle and multiple fractions through a makeshift port ontop of the reactor. Patients did not exhibit serious sideeffects and had median survival times on par with whatwould have been expected of patients treated by othermeans at that time. The prominent dermal reactions andthe abundance of viable tumor on autopsy, however,suggested that the thermal neutrons were not adequatelypenetrating.
During the 1950s, Soloway (13), then at MassachusettsGeneral Hospital, and Soloway et al. (14) carried out anintensive search for stable boron carrier compounds withlow toxicity and greater selectivity for glioma. Certainmonosubstituted derivatives of phenylboronic acid werefound to yield high tumor:normal ratios at short timesafter i.p. injections in glioma-bearing mice. To exploitthe rapid dynamic behavior of such a compound, a high-intensity thermal beam would be required. To realize thataim, Brownell and Sweet designed a facility for thenuclear reactor at the Massachusetts Institute of Technol-ogy (MIT) specifically for NCT treatments (15). In 1958,the MIT Nuclear Reactor was commissioned and in-cluded a surgical operating room beneath the reactorcore. In addition, in 1959, the 3-MW Brookhaven Med-ical Research Reactor was commissioned. This facilitycontained horizontal beam ports for high-intensity NCTtreatments. Between 1959 and 1961, 17 patients weretreated at Brookhaven Medical Research Reactor and 18at MIT in clinical trials that, by most accounts, failed andresulted in a hiatus for NCT in the United States thatlasted more than 30 years. Perhaps the context of theseearly trials—presented as alternative “ treatment” ratherthan, in today’ s parlance, Phase I trials— contributed tothe disenchantment with NCT.
A severe limitation in those early trials was the lack ofany method to determine 10B concentrations in tissue orblood on a time scale that would allow modification ofthe treatment duration. During Sweet’ s final clinical trialfor BNCT at MIT, he pioneered the technique for surgi-cally reflecting the scalp, skull, and dura to expose thetumor bed to thermal neutrons (16). This method wasadopted by Hatanaka and exported to Japan, where it wasemployed by Hatanaka and Nakagawa to treat 150 pa-tients after i.v. infusions of sodium borocaptate (17). Amethod to estimate boron dose employing gold wireembedded in the surgical cavity, adapted from Brownelland Sweet (15), was employed by this group (17). Thewire was removed partway through the treatment and cutinto segments, and the activity was measured to deter-mine thermal neutron flux, which is then used to time theremainder of the procedure.
A number of factors are responsible for continuedinterest in BNCT and the reintroduction of clinical trials
in the United States. One factor was the reported successof the Japanese programs in the treatment of high-gradegliomas by Hatanaka and Nakagawa (17) and later byMishima et al. in the treatment of melanoma nodules withBNCT using boronophenylalanine (BPA) (18). Laramoreand Spence showed, however, that American patientswith histologically proven glioblastoma multiforme(GBM) treated in Japan had no discernable extension oflife beyond the expected 12-month median survival ofcontrols (19). In 1994, the very promising results ofCoderre et al. in treating 9L gliosarcomas in rats withBPA-mediated neutron capture therapy (20) were astrong motivating factor for the reintroduction of clinicaltrials. In addition, many technical improvements, such asthe development of epithermal neutron beams with theability to penetrate deep within the brain (21–25), rapidand reliable analytic methods for boron measurement (26,27), the development of computerized treatment planningsystems (28 –30), and the development of physical do-simetry techniques (31), have set the stage for renewedinvestigation of NCT as a clinical modality.
The culmination of these developmental initiatives toachieve modern-era BNCT employing epithermal neutronbeams occurred in 1994, when our team, formerly based atTufts New England Medical Center and MIT, treated thefirst patient in a companion Phase I trial for melanoma ofthe extremities (32). Phase I trials of BNCT for GBM weresubsequently initiated at Brookhaven National Laboratoryin 1994 (33–36) and by our group at Harvard and MIT forGBM and intracranial metastatic melanoma (MM) in 1996(37).
In Europe, a consortium of nations began a Phase I trialof BNCT in 1997 with irradiations delivered in Petten, TheNetherlands (38), and a group from the Czech Republicinitiated a Phase I trial in 2000 (39, 40). These Europeanstudies, as with most of the Japanese studies, are conductedfor primary brain tumors using sodium borocaptate. Trialsfor the treatment of GBM with epithermal beams and BPAas the 10B carrier have been initiated in Finland (41) and inSweden (42). Beyond reactor-based treatment facilities,there is a great deal of interest in accelerator-based BNCT(43, 44), which could result in a more natural integration ofBNCT treatment facilities with hospital-based radiotherapycenters.
Between July 1996 and May 1999, a Phase I clinicaltrial of boron neutron capture therapy for GBM andintracranial MM was conducted as a joint project be-tween research groups at Harvard and MIT. Over the3-year study, 22 patients were treated at the NuclearReactor Laboratory (NRL) at MIT. Imaging, treatmentplanning, dosimetry, patient setup and monitoring, beamcalibration, and prescribed neutron fluence delivery wereconducted in a collaborative project involving the BNCTresearch group based at NRL and the medical physics andmedical teams based in the departments of radiology andradiation oncology at the Beth Israel Deaconess Medical
1362 I. J. Radiation Oncology ● Biology ● Physics Volume 53, Number 5, 2002
Center. This paper summarizes the medical physics as-pects of this trial.
METHODS AND MATERIALS
Dose conventionsEpithermal neutron beams, whether derived from fission
sources or from the targets of accelerators, contain bothneutrons and gamma rays, both of broad energy spectra.When such mixed fields impinge on biologic tissue, fourprincipal dose components need to be considered. They areas follows:
D� “gamma dose,” which is a combination of the dose fromphotons incident in the beam and a dose from promptphotons induced by neutron capture, principally by hy-drogen in the reaction 1H(n,�)1H;
DF “ fast neutron dose,” caused primarily by proton recoilfrom fast neutron interactions, 1H(n,n�)1H;
DT “ thermal neutron dose,” which is the dose due to thermalneutron capture, principally by nitrogen in the reaction14N(n,p)14C; and
DB “boron dose,” which is the dose due to neutron captureby boron, 10B(n,�)7Li.
Dose from all other photons and particles generated in thecascade initiated by the broad spectrum of incident neutronsand photons is relatively minor. Gamma emission fromactivated biologic tissue after irradiation, principally fromsodium and chlorine, is measurable, but results in a negli-gible dose.
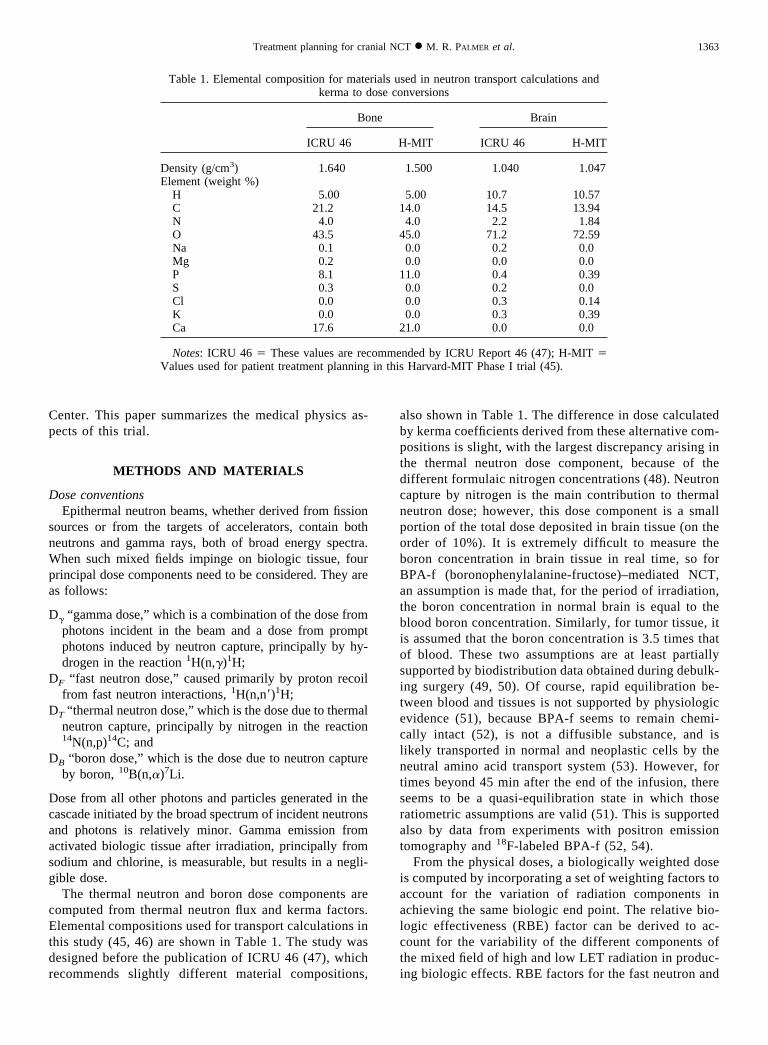
The thermal neutron and boron dose components arecomputed from thermal neutron flux and kerma factors.Elemental compositions used for transport calculations inthis study (45, 46) are shown in Table 1. The study wasdesigned before the publication of ICRU 46 (47), whichrecommends slightly different material compositions,
also shown in Table 1. The difference in dose calculatedby kerma coefficients derived from these alternative com-positions is slight, with the largest discrepancy arising inthe thermal neutron dose component, because of thedifferent formulaic nitrogen concentrations (48). Neutroncapture by nitrogen is the main contribution to thermalneutron dose; however, this dose component is a smallportion of the total dose deposited in brain tissue (on theorder of 10%). It is extremely difficult to measure theboron concentration in brain tissue in real time, so forBPA-f (boronophenylalanine-fructose)–mediated NCT,an assumption is made that, for the period of irradiation,the boron concentration in normal brain is equal to theblood boron concentration. Similarly, for tumor tissue, itis assumed that the boron concentration is 3.5 times thatof blood. These two assumptions are at least partiallysupported by biodistribution data obtained during debulk-ing surgery (49, 50). Of course, rapid equilibration be-tween blood and tissues is not supported by physiologicevidence (51), because BPA-f seems to remain chemi-cally intact (52), is not a diffusible substance, and islikely transported in normal and neoplastic cells by theneutral amino acid transport system (53). However, fortimes beyond 45 min after the end of the infusion, thereseems to be a quasi-equilibration state in which thoseratiometric assumptions are valid (51). This is supportedalso by data from experiments with positron emissiontomography and 18F-labeled BPA-f (52, 54).
From the physical doses, a biologically weighted doseis computed by incorporating a set of weighting factors toaccount for the variation of radiation components inachieving the same biologic end point. The relative bio-logic effectiveness (RBE) factor can be derived to ac-count for the variability of the different components ofthe mixed field of high and low LET radiation in produc-ing biologic effects. RBE factors for the fast neutron and
Table 1. Elemental composition for materials used in neutron transport calculations andkerma to dose conversions
Bone Brain
ICRU 46 H-MIT ICRU 46 H-MIT
Density (g/cm3) 1.640 1.500 1.040 1.047Element (weight %)
H 5.00 5.00 10.7 10.57C 21.2 14.0 14.5 13.94N 4.0 4.0 2.2 1.84O 43.5 45.0 71.2 72.59Na 0.1 0.0 0.2 0.0Mg 0.2 0.0 0.0 0.0P 8.1 11.0 0.4 0.39S 0.3 0.0 0.2 0.0Cl 0.0 0.0 0.3 0.14K 0.0 0.0 0.3 0.39Ca 17.6 21.0 0.0 0.0
Notes: ICRU 46 � These values are recommended by ICRU Report 46 (47); H-MIT �Values used for patient treatment planning in this Harvard-MIT Phase I trial (45).
1363Treatment planning for cranial NCT ● M. R. PALMER et al.
nitrogen capture radiation components have been deter-mined by Morris et al. (55) by irradiating the rat spinalcord and using paralysis within 30 days of irradiation asthe end point. A compound biologic effectiveness factor(CBE), which accounts for radiobiologic effect due to anexogenous compound, was derived using the same tech-nique and end point for concentrations of boron as forBPA in central nervous system tissue (56).
During low-dose-rate, low-LET irradiation, cell survivalis enhanced from repair of sublethal damage (57). For theclinical epithermal beam used in this trial, designated M67,the total low-LET dose rate resulting from incident photonsand photons induced by neutron capture reactions in aphantom approximating a human head is on the order 0.01–0.02 Gy/min. This dose rate is much lower than the typicalreference photon dose rate and therefore necessitates theincorporation of a photon RBE factor, or dose reductionfactor (DRF) (58). Photon dose rate effects have been stud-ied by a number of authors in cell survival experiments andon normal and neoplastic tissue using various biologic endpoints (59, 60). The exact determination of an appropriateDRF is not possible, because of limited data available andbecause of the effect of cell type and physiologic factors onsublethal damage repair rates. An estimated DRF of 0.5 hasbeen chosen for our calculations. This is supported by datapresented by Hall and Brenner (59) for HeLa and astrocytictumor cell lines in culture, where the ratio of dose thatresults in 1% survival delivered at 1 cGy/min to that deliv-ered at 100 cGy/min is in the range of approximately 0.3 to0.7.
RBE and CBE factors for neoplastic tissue may differfrom normal tissue, because of the different cellular mor-phology and the mechanisms for uptake and incorporationof the boronated compound (61). Coderre et al. studiedthese factors for the 9L gliosarcoma tumor model using anin vivo/in vitro assay (62). The experiments were done using250-kVp X-rays, the thermal neutron beam at BrookhavenNational Laboratory, and the thermal neutron beam plusBPA administered intragastrically to achieve a 10B concen-tration of approximately 10 �g/g in the blood during thetime of irradiation. The end points used in determiningtumor RBE and CBE factors adopted in this trial were for1% surviving cell fraction.
RBE and CBE weighting factors used in our trial for eachof the radiation components and for normal and tumor tissueare listed in Table 2. The final biologically weighted dose,
Dw, used in treatment prescription and reporting, is the sumof the four individual dose components and the respectiveRBE or CBE factors, as shown in Eq. 1, as follows:
Dw � w�D� � wFDF � wTDT � wBDB (1)
where w�, wF, wT and wB, are the gamma, fast neutron,thermal neutron, and boron biologic weights, respectively.Accordingly, to distinguish physical and biologicallyweighted doses, the units of Dw are denoted RBE Gy.
PatientsTwenty-four patients were enrolled in the Phase I trial for
intracranial tumors, and 22 continued through to receiveradiation. A summary of patient characteristics appears inTable 3. The trials were approved by the United States Foodand Drug Administration, the United States Nuclear Regu-latory Commission, and institutional review boards at bothMIT and Beth Israel Deaconess Medical Center. Enrollmentwas limited to subjects with either histologically demon-strated GBM or intracranial MM, Karnofsky performancestatus of 70 or above, no prior cranial irradiation, and nohistory of phenylketonuria (37). The 12 male and 10 femalesubjects ranged in age from 24 to 78 years with an averageage of 54 years. Patients were recruited in six dose cohorts,defined by the nominal maximum dose to be delivered tonormal tissue—escalated in compounding 10% incrementsfrom 8.8 RBE Gy at the beginning of the study to 14.2 RBEGy when the study was terminated. The protocol called fora minimum of three patients per dose cohort. To allow foradequate observation, a minimum of 3 months was requiredbetween dose escalation steps. Sixteen of the 20 GBMsubjects were surgically debulked before receiving BNCT,and the remaining four were biopsied for the purpose ofhistologic diagnosis only (See Table 3). MM patients wereneither biopsied nor surgically debulked. In principle, de-bulking surgery could affect the uptake of BPA by disrupt-ing the blood–brain barrier. To reduce this likelihood and toallow time for healing of the craniotomy site and postoper-ative recovery, BNCT was delivered a minimum of 2 weekspost-surgery.
Epithermal neutron treatment facilityTreatments were performed in the medical room at MIT’s
NRL, which is situated directly below the reactor core. A
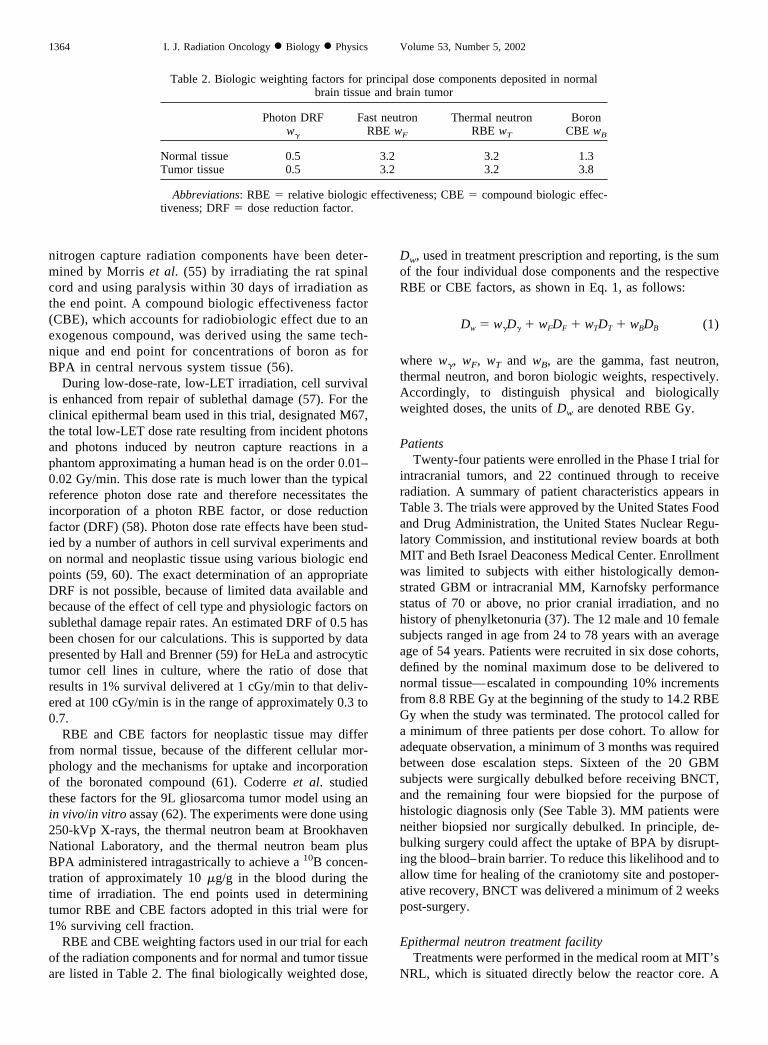
Table 2. Biologic weighting factors for principal dose components deposited in normalbrain tissue and brain tumor
Photon DRFw�
Fast neutronRBE wF
Thermal neutronRBE wT
BoronCBE wB
Normal tissue 0.5 3.2 3.2 1.3Tumor tissue 0.5 3.2 3.2 3.8
Abbreviations: RBE � relative biologic effectiveness; CBE � compound biologic effec-tiveness; DRF � dose reduction factor.
1364 I. J. Radiation Oncology ● Biology ● Physics Volume 53, Number 5, 2002
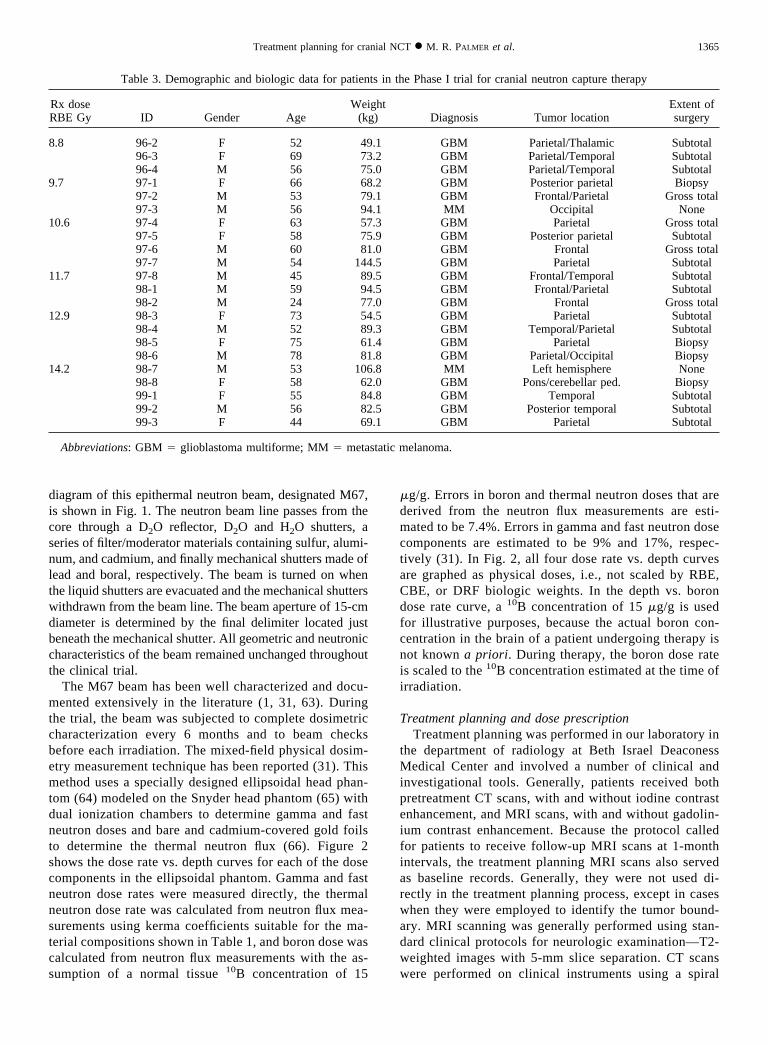
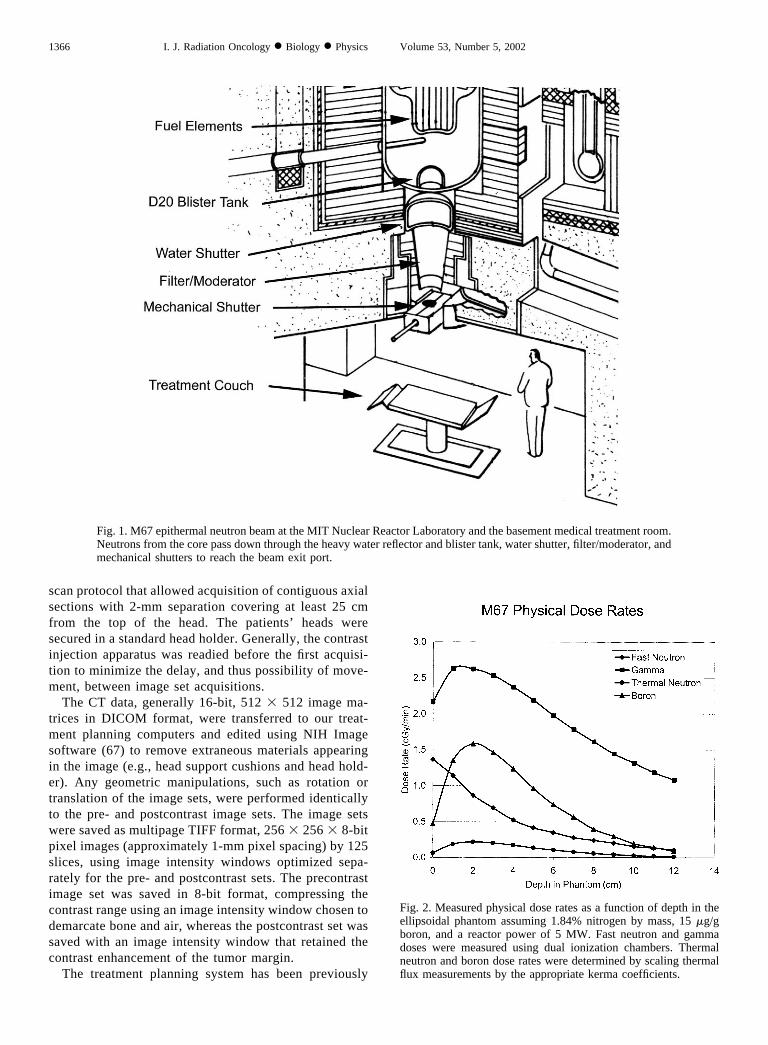
diagram of this epithermal neutron beam, designated M67,is shown in Fig. 1. The neutron beam line passes from thecore through a D2O reflector, D2O and H2O shutters, aseries of filter/moderator materials containing sulfur, alumi-num, and cadmium, and finally mechanical shutters made oflead and boral, respectively. The beam is turned on whenthe liquid shutters are evacuated and the mechanical shutterswithdrawn from the beam line. The beam aperture of 15-cmdiameter is determined by the final delimiter located justbeneath the mechanical shutter. All geometric and neutroniccharacteristics of the beam remained unchanged throughoutthe clinical trial.
The M67 beam has been well characterized and docu-mented extensively in the literature (1, 31, 63). Duringthe trial, the beam was subjected to complete dosimetriccharacterization every 6 months and to beam checksbefore each irradiation. The mixed-field physical dosim-etry measurement technique has been reported (31). Thismethod uses a specially designed ellipsoidal head phan-tom (64) modeled on the Snyder head phantom (65) withdual ionization chambers to determine gamma and fastneutron doses and bare and cadmium-covered gold foilsto determine the thermal neutron flux (66). Figure 2shows the dose rate vs. depth curves for each of the dosecomponents in the ellipsoidal phantom. Gamma and fastneutron dose rates were measured directly, the thermalneutron dose rate was calculated from neutron flux mea-surements using kerma coefficients suitable for the ma-terial compositions shown in Table 1, and boron dose wascalculated from neutron flux measurements with the as-sumption of a normal tissue 10B concentration of 15
�g/g. Errors in boron and thermal neutron doses that arederived from the neutron flux measurements are esti-mated to be 7.4%. Errors in gamma and fast neutron dosecomponents are estimated to be 9% and 17%, respec-tively (31). In Fig. 2, all four dose rate vs. depth curvesare graphed as physical doses, i.e., not scaled by RBE,CBE, or DRF biologic weights. In the depth vs. borondose rate curve, a 10B concentration of 15 �g/g is usedfor illustrative purposes, because the actual boron con-centration in the brain of a patient undergoing therapy isnot known a priori. During therapy, the boron dose rateis scaled to the 10B concentration estimated at the time ofirradiation.
Treatment planning and dose prescriptionTreatment planning was performed in our laboratory in
the department of radiology at Beth Israel DeaconessMedical Center and involved a number of clinical andinvestigational tools. Generally, patients received bothpretreatment CT scans, with and without iodine contrastenhancement, and MRI scans, with and without gadolin-ium contrast enhancement. Because the protocol calledfor patients to receive follow-up MRI scans at 1-monthintervals, the treatment planning MRI scans also servedas baseline records. Generally, they were not used di-rectly in the treatment planning process, except in caseswhen they were employed to identify the tumor bound-ary. MRI scanning was generally performed using stan-dard clinical protocols for neurologic examination—T2-weighted images with 5-mm slice separation. CT scanswere performed on clinical instruments using a spiral
Table 3. Demographic and biologic data for patients in the Phase I trial for cranial neutron capture therapy
Rx doseRBE Gy ID Gender Age
Weight(kg) Diagnosis Tumor location
Extent ofsurgery
8.8 96-2 F 52 49.1 GBM Parietal/Thalamic Subtotal96-3 F 69 73.2 GBM Parietal/Temporal Subtotal96-4 M 56 75.0 GBM Parietal/Temporal Subtotal
9.7 97-1 F 66 68.2 GBM Posterior parietal Biopsy97-2 M 53 79.1 GBM Frontal/Parietal Gross total97-3 M 56 94.1 MM Occipital None
10.6 97-4 F 63 57.3 GBM Parietal Gross total97-5 F 58 75.9 GBM Posterior parietal Subtotal97-6 M 60 81.0 GBM Frontal Gross total97-7 M 54 144.5 GBM Parietal Subtotal
11.7 97-8 M 45 89.5 GBM Frontal/Temporal Subtotal98-1 M 59 94.5 GBM Frontal/Parietal Subtotal98-2 M 24 77.0 GBM Frontal Gross total
12.9 98-3 F 73 54.5 GBM Parietal Subtotal98-4 M 52 89.3 GBM Temporal/Parietal Subtotal98-5 F 75 61.4 GBM Parietal Biopsy98-6 M 78 81.8 GBM Parietal/Occipital Biopsy
14.2 98-7 M 53 106.8 MM Left hemisphere None98-8 F 58 62.0 GBM Pons/cerebellar ped. Biopsy99-1 F 55 84.8 GBM Temporal Subtotal99-2 M 56 82.5 GBM Posterior temporal Subtotal99-3 F 44 69.1 GBM Parietal Subtotal
Abbreviations: GBM � glioblastoma multiforme; MM � metastatic melanoma.
1365Treatment planning for cranial NCT ● M. R. PALMER et al.
scan protocol that allowed acquisition of contiguous axialsections with 2-mm separation covering at least 25 cmfrom the top of the head. The patients’ heads weresecured in a standard head holder. Generally, the contrastinjection apparatus was readied before the first acquisi-tion to minimize the delay, and thus possibility of move-ment, between image set acquisitions.
The CT data, generally 16-bit, 512 � 512 image ma-trices in DICOM format, were transferred to our treat-ment planning computers and edited using NIH Imagesoftware (67) to remove extraneous materials appearingin the image (e.g., head support cushions and head hold-er). Any geometric manipulations, such as rotation ortranslation of the image sets, were performed identicallyto the pre- and postcontrast image sets. The image setswere saved as multipage TIFF format, 256 � 256 � 8-bitpixel images (approximately 1-mm pixel spacing) by 125slices, using image intensity windows optimized sepa-rately for the pre- and postcontrast sets. The precontrastimage set was saved in 8-bit format, compressing thecontrast range using an image intensity window chosen todemarcate bone and air, whereas the postcontrast set wassaved with an image intensity window that retained thecontrast enhancement of the tumor margin.
The treatment planning system has been previously
Fig. 1. M67 epithermal neutron beam at the MIT Nuclear Reactor Laboratory and the basement medical treatment room.Neutrons from the core pass down through the heavy water reflector and blister tank, water shutter, filter/moderator, andmechanical shutters to reach the beam exit port.
Fig. 2. Measured physical dose rates as a function of depth in theellipsoidal phantom assuming 1.84% nitrogen by mass, 15 �g/gboron, and a reactor power of 5 MW. Fast neutron and gammadoses were measured using dual ionization chambers. Thermalneutron and boron dose rates were determined by scaling thermalflux measurements by the appropriate kerma coefficients.
1366 I. J. Radiation Oncology ● Biology ● Physics Volume 53, Number 5, 2002
reported and consists of MacNCTPlan interactive plan-ning software (30, 68) coupled to MCNP 4B Monte Carloradiation transport code (69). There are many reasonswhy treatment planning in general using Monte Carlomethods is desirable, and there is a great deal of interestcurrently in this approach (70, 71). The operation ofMacNCTPlan can be described in two distinct phases.During Part 1, tumor margins are identified, beam entrypoints for up to four fields are defined, and a materialsmodel is produced for generation of an MCNP inputdeck. During Part 2, dose calculations are evaluated bysuperposition of isodose contours on medical image data.Radiation transport calculations using MCNP 4B areperformed between Parts 1 and 2.
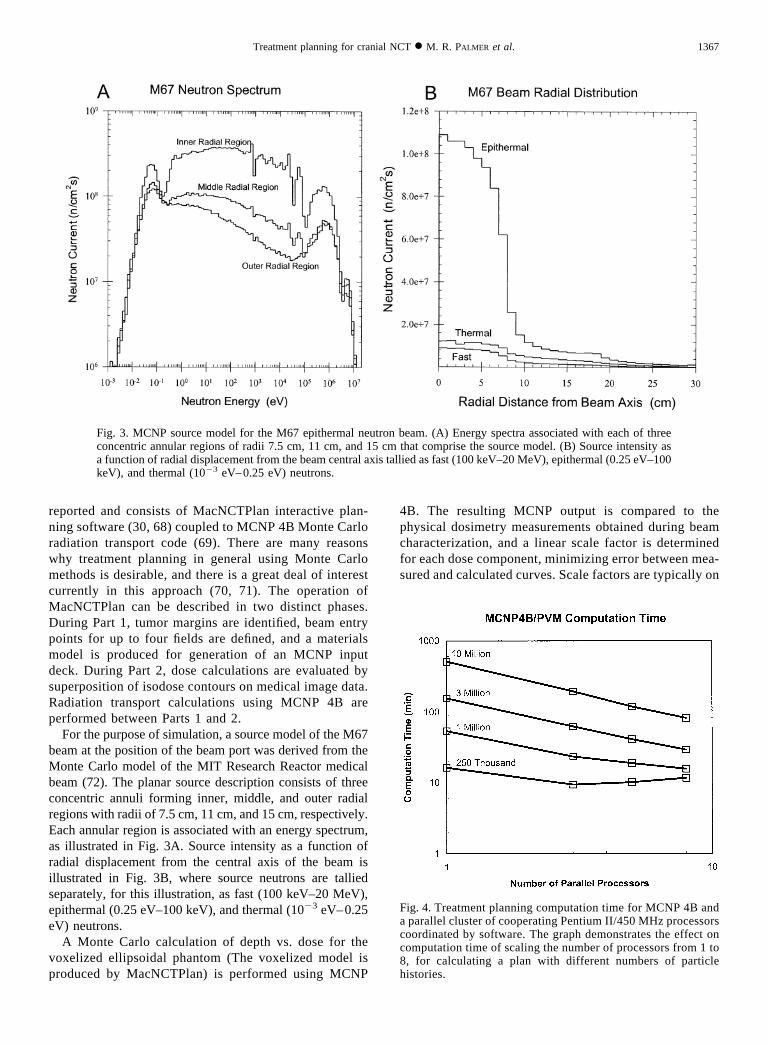
For the purpose of simulation, a source model of the M67beam at the position of the beam port was derived from theMonte Carlo model of the MIT Research Reactor medicalbeam (72). The planar source description consists of threeconcentric annuli forming inner, middle, and outer radialregions with radii of 7.5 cm, 11 cm, and 15 cm, respectively.Each annular region is associated with an energy spectrum,as illustrated in Fig. 3A. Source intensity as a function ofradial displacement from the central axis of the beam isillustrated in Fig. 3B, where source neutrons are talliedseparately, for this illustration, as fast (100 keV–20 MeV),epithermal (0.25 eV–100 keV), and thermal (10�3 eV–0.25eV) neutrons.
A Monte Carlo calculation of depth vs. dose for thevoxelized ellipsoidal phantom (The voxelized model isproduced by MacNCTPlan) is performed using MCNP
4B. The resulting MCNP output is compared to thephysical dosimetry measurements obtained during beamcharacterization, and a linear scale factor is determinedfor each dose component, minimizing error between mea-sured and calculated curves. Scale factors are typically on
Fig. 3. MCNP source model for the M67 epithermal neutron beam. (A) Energy spectra associated with each of threeconcentric annular regions of radii 7.5 cm, 11 cm, and 15 cm that comprise the source model. (B) Source intensity asa function of radial displacement from the beam central axis tallied as fast (100 keV–20 MeV), epithermal (0.25 eV–100keV), and thermal (10�3 eV–0.25 eV) neutrons.
Fig. 4. Treatment planning computation time for MCNP 4B anda parallel cluster of cooperating Pentium II/450 MHz processorscoordinated by software. The graph demonstrates the effect oncomputation time of scaling the number of processors from 1 to8, for calculating a plan with different numbers of particlehistories.
1367Treatment planning for cranial NCT ● M. R. PALMER et al.
the order 0.5–2.0 and serve to calibrate the source modelto the measurements. Subsequent Monte Carlo calcula-tions for treatment planning purposes are scaled by thesame factors.
During MacNCTPlan Part 1, the postcontrast image set isread in, and the tumor margins are delineated manuallyusing a graphics cursor controlled by mouse movement.Sets of polygons defining the tumor volumes are saved.Because the precontrast image set serves as the most reli-able data for automatic determination of materials (air,bone, tissue) based on contrast thresholds, tumor outlineswere reloaded onto the precontrast image set for furthermanipulation and processing in MacNCTPlan. The MCNPmodel is generated as a set of 21 � 21 � 25 cubic 1 cm3
voxels, each of which is associated with a material mixtureassigned during model generation. The set of possible ma-terial mixtures is constrained to a discrete set made up of thepossible combinations of air, bone, brain tissue, and tumor,each to the nearest 20%, in each voxel. There are 56possible material mixtures.
Monte Carlo calculations are in general computation-ally intensive and therefore time-consuming. During thecourse of this clinical trial, however, treatment planningefficiency was vastly improved by the acquisition of
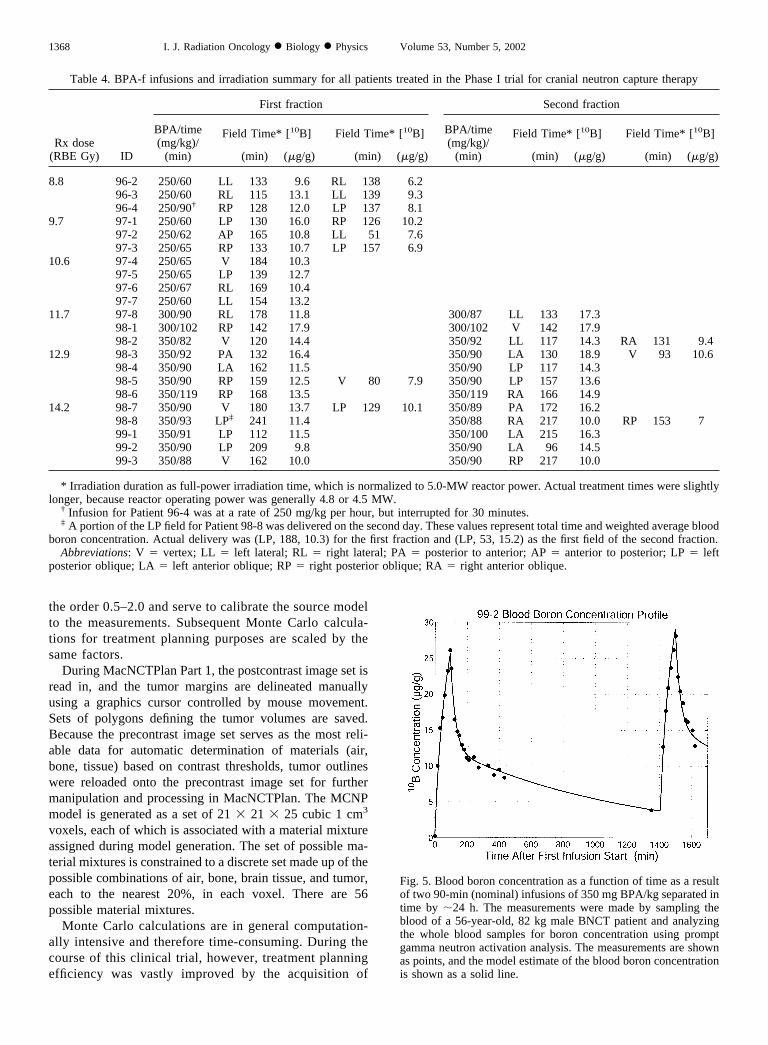
Table 4. BPA-f infusions and irradiation summary for all patients treated in the Phase I trial for cranial neutron capture therapy
Rx dose(RBE Gy) ID
First fraction Second fraction
BPA/time(mg/kg)/
(min)
Field Time* [10B] Field Time* [10B] BPA/time(mg/kg)/
(min)
Field Time* [10B] Field Time* [10B]
(min) (�g/g) (min) (�g/g) (min) (�g/g) (min) (�g/g)
8.8 96-2 250/60 LL 133 9.6 RL 138 6.296-3 250/60 RL 115 13.1 LL 139 9.396-4 250/90† RP 128 12.0 LP 137 8.1
9.7 97-1 250/60 LP 130 16.0 RP 126 10.297-2 250/62 AP 165 10.8 LL 51 7.697-3 250/65 RP 133 10.7 LP 157 6.9
10.6 97-4 250/65 V 184 10.397-5 250/65 LP 139 12.797-6 250/67 RL 169 10.497-7 250/60 LL 154 13.2
11.7 97-8 300/90 RL 178 11.8 300/87 LL 133 17.398-1 300/102 RP 142 17.9 300/102 V 142 17.998-2 350/82 V 120 14.4 350/92 LL 117 14.3 RA 131 9.4
12.9 98-3 350/92 PA 132 16.4 350/90 LA 130 18.9 V 93 10.698-4 350/90 LA 162 11.5 350/90 LP 117 14.398-5 350/90 RP 159 12.5 V 80 7.9 350/90 LP 157 13.698-6 350/119 RP 168 13.5 350/119 RA 166 14.9
14.2 98-7 350/90 V 180 13.7 LP 129 10.1 350/89 PA 172 16.298-8 350/93 LP‡ 241 11.4 350/88 RA 217 10.0 RP 153 799-1 350/91 LP 112 11.5 350/100 LA 215 16.399-2 350/90 LP 209 9.8 350/90 LA 96 14.599-3 350/88 V 162 10.0 350/90 RP 217 10.0
* Irradiation duration as full-power irradiation time, which is normalized to 5.0-MW reactor power. Actual treatment times were slightlylonger, because reactor operating power was generally 4.8 or 4.5 MW.
† Infusion for Patient 96-4 was at a rate of 250 mg/kg per hour, but interrupted for 30 minutes.‡ A portion of the LP field for Patient 98-8 was delivered on the second day. These values represent total time and weighted average blood
boron concentration. Actual delivery was (LP, 188, 10.3) for the first fraction and (LP, 53, 15.2) as the first field of the second fraction.Abbreviations: V � vertex; LL � left lateral; RL � right lateral; PA � posterior to anterior; AP � anterior to posterior; LP � left
posterior oblique; LA � left anterior oblique; RP � right posterior oblique; RA � right anterior oblique.
Fig. 5. Blood boron concentration as a function of time as a resultof two 90-min (nominal) infusions of 350 mg BPA/kg separated intime by �24 h. The measurements were made by sampling theblood of a 56-year-old, 82 kg male BNCT patient and analyzingthe whole blood samples for boron concentration using promptgamma neutron activation analysis. The measurements are shownas points, and the model estimate of the blood boron concentrationis shown as a solid line.
1368 I. J. Radiation Oncology ● Biology ● Physics Volume 53, Number 5, 2002
more powerful processors, the development of a special-ized version of MCNP for treatment planning calcula-tions by Los Alamos National Laboratory (73), and theimplementation of a distributed parallel cooperative net-work of processors (74). Our strategy, therefore, wasusually to embark on a series of calculations with limitedprecision in the initial consideration of approximately4 –10 field orientations. Typically, the initial dose calcu-lations were used to guide adjustments to the beam ori-entation, and the process was repeated in an iterativemanner. This involved MCNP computations with about 1million source neutrons and 1 million source photonsyielding statistical uncertainties of approximately 3% inhigh-dose regions of the brain. Typical wall-clock calcu-lation time with this many source particles, for a singlefield, on a parallel cluster of eight 450-MHz Pentiumprocessors, is approximately 15 min. Subsequently, whenwe had decided on the field or combination of fields, ahigher-precision calculation would be performed with 10million source neutrons and photons, taking approxi-mately 90 min to complete on the same processing sys-tem and reducing statistical uncertainties in low-doseregions of the plan to less than 2% (75). The performanceof the parallel computer network for treatment planningcalculations is illustrated in Fig. 4.
Treatments were planned for one, two, or three fields tobe delivered in one or two fractions. For the purpose of thistrial, a single fraction consisted of any radiation deliveredwithin the same 24-h period. For the first 10 patients, asingle BPA-f infusion was administered, followed by asingle radiation fraction; for the subsequent 12 patients, twofractions involving separate infusions were delivered over 2days. A summary of these aspects of treatment for eachpatient is given in Table 4. Patients receiving three fieldsreceived two fields on one day and one on the other.Irradiation was begun for the first field of each day approx-imately 45 min after the end of the infusion, and if there was
to be a second field that same day, the second field wasinitiated about 1 hour after the end of the first field.
Initially, the objective was to deliver treatments as par-allel-opposed fields; however, this strategy was altered for anumber of reasons. Parallel-opposed fields result in subop-timal treatment plans for many tumor locations. Positioningsubjects for lateral irradiations is also difficult for patientswith reduced mobility and resulted in technical complica-tions due to patient discomfort or motion during the irradi-ation. As we increased our experience with the treatmentplanning system and with practical issues relating to patientpositioning and comfort, our treatment plans increased insophistication. This chronology is also apparent in the sum-mary of Table 4.
BPA administration, blood sample acquisition, andanalysis
Patients were treated with an infusion of BPA-f foreach fraction delivered through a peripheral i.v. line (firsttwo patients) or a central venous catheter (remaining 20patients). BPA-f dose was 250 mg/kg body weight at thestart of the trial and increased in two steps to 350 mg/kgbody weight. BPA-f was infused over usually 60 min(250 mg/kg) or 90 min, and in one case over 120 min.Infusion rates and BPA doses for each patient are listedin Table 4. Blood was sampled every 15 min duringinfusion and for at least 2 hours after the infusion. Be-yond that, blood was sampled every 30 min until the endof irradiation. During treatment, blood was collectedremotely using a long (�10 m), sterile i.v. extension tubefed through a duct in the shielded walls of the treatmentroom. This allowed collection of blood samples withoutinterrupting the irradiation. Blood boron concentrationwas measured using either the prompt gamma neutronactivation analysis system developed in-house at the MITNRL (27), or a Spectroflame ICP-D (Spectro AnalyticalInstruments) inductively coupled plasma–atomic emis-
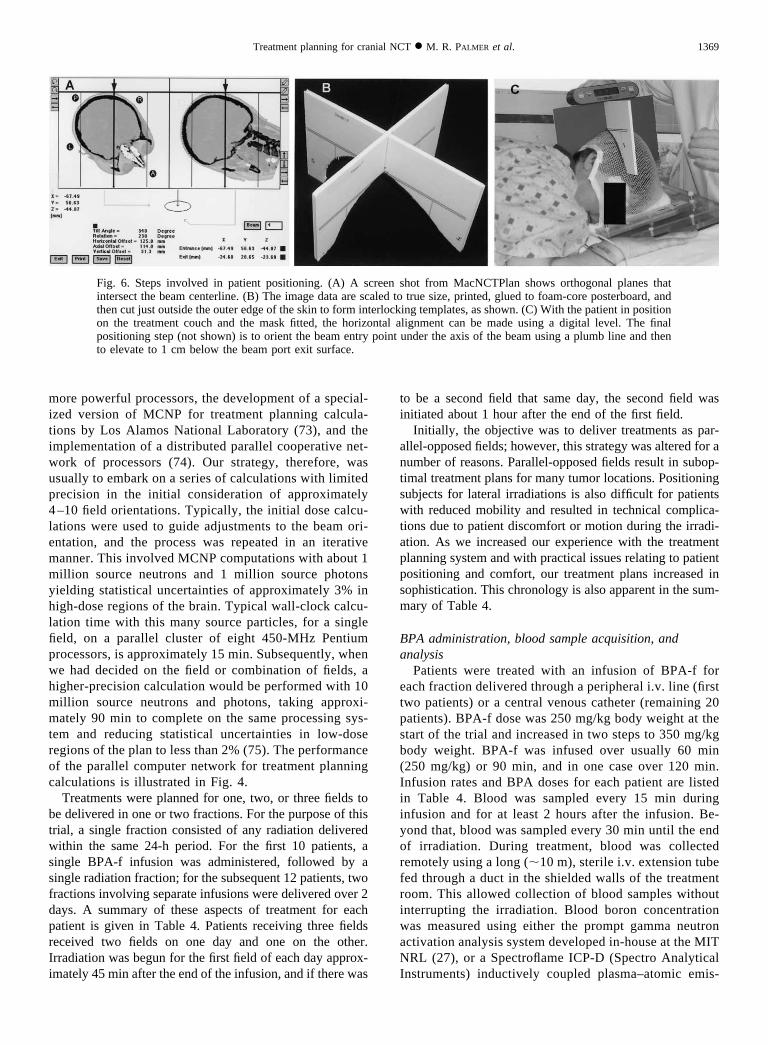
Fig. 6. Steps involved in patient positioning. (A) A screen shot from MacNCTPlan shows orthogonal planes thatintersect the beam centerline. (B) The image data are scaled to true size, printed, glued to foam-core posterboard, andthen cut just outside the outer edge of the skin to form interlocking templates, as shown. (C) With the patient in positionon the treatment couch and the mask fitted, the horizontal alignment can be made using a digital level. The finalpositioning step (not shown) is to orient the beam entry point under the axis of the beam using a plumb line and thento elevate to 1 cm below the beam port exit surface.
1369Treatment planning for cranial NCT ● M. R. PALMER et al.
sion spectrometry analyzer. The two systems for boronanalysis have been well characterized and cross-cali-brated (76). Blood analysis results were typically avail-able within 15–20 min of sample collection, which isadequate considering the length of our irradiations.
Our extensive analysis of blood data and our modeling ofBPA pharmacokinetics (51) allowed us to predict, to a firstapproximation, the blood boron concentration expected dur-ing radiation delivery and therefore the boron-related dosecomponents for both tumor and normal tissue. A bloodboron concentration profile from one of the patients in thetrial who received two 90-min infusions of BPA-f at a doseof 350 mg/kg body weight is shown in Fig. 5.
Solving the model equations for a continuous infusionat a constant rate, the concentration of boron in wholeblood after the end of infusion is described by Eq. 2, asfollows:
C1�t� � A1e��1t � A2e
��2t (2)
where eigenvalues �1 and �2 and constants A1 and A2 aredetermined by the rate and duration of the infusion, threemodel rate constants, and a volume of distribution. This isthe characteristic bi-exponential washout from blood exhib-ited by BPA-f as it is cleared from the body. Eigenvalueswere found to be �1 � 0.036 0.009 min�1 and �2 �0.0014 0.0005 min�1 (n � 21), which correspond towashout half-lives for fast and slow components of 19 minand 490 min, respectively. The full details of the model, aswell as a complete tabulation of blood parameters, appear inKiger et al. (51).
The pharmacokinetic model for 10B concentration inthe blood was used in several ways. First, the model wasan aid to treatment planning: With knowledge of theapproximate schedule for infusion and for delivery ofradiation, it was possible to predict, in advance, theaverage blood boron concentration expected during eachfraction. Typically this was done by assuming the bloodboron parameters identified for a previous patient ofsimilar physical condition and age. Second, during treat-ment, trial fitting was performed, then continually refinedas more data became available, to determine the best fitof the model equations to the blood concentration data.The parameters of the blood boron curve were then usedto extrapolate blood boron concentration to the end ofirradiation. Third, after treatment, when all the bloodsamples had been collected and analyzed, the model wasagain fit to the data to produce the best estimate oftemporal history of blood boron concentration, whichwas then used to compute the average blood boron con-centration for use in retrospective dosimetry.
Patient positioningA treatment couch derived from the original surgical
couch used by Brownell and Sweet (15) was used in thecurrent trial. This device has multiple adjustments tocontrol height, inclination, roll, and flexion. Patients weremade comfortable using Vak-Lok cushions (Med-TechInc., Orange City, IA) and then secured by safety belts.The patients’ heads were immobilized for treatment usingAquaplast thermoplastic mesh (WFR Aquaplast Corp.,Nyckoff, NJ) that was heated, molded to the head, and
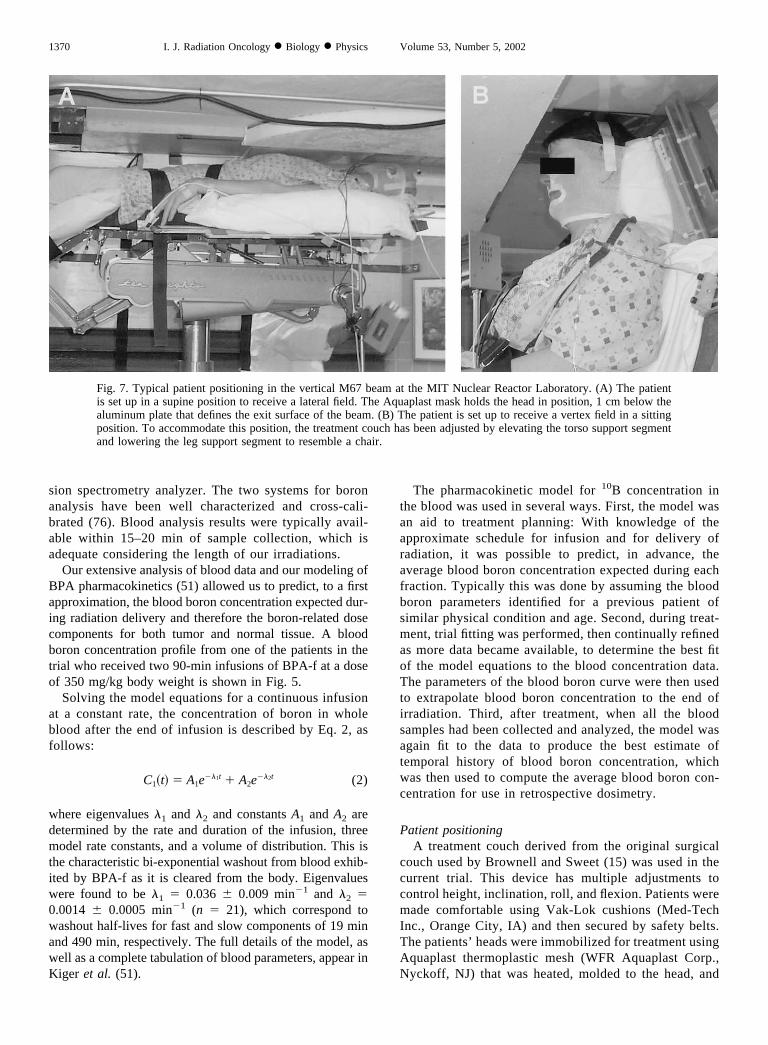
Fig. 7. Typical patient positioning in the vertical M67 beam at the MIT Nuclear Reactor Laboratory. (A) The patientis set up in a supine position to receive a lateral field. The Aquaplast mask holds the head in position, 1 cm below thealuminum plate that defines the exit surface of the beam. (B) The patient is set up to receive a vertex field in a sittingposition. To accommodate this position, the treatment couch has been adjusted by elevating the torso support segmentand lowering the leg support segment to resemble a chair.
1370 I. J. Radiation Oncology ● Biology ● Physics Volume 53, Number 5, 2002
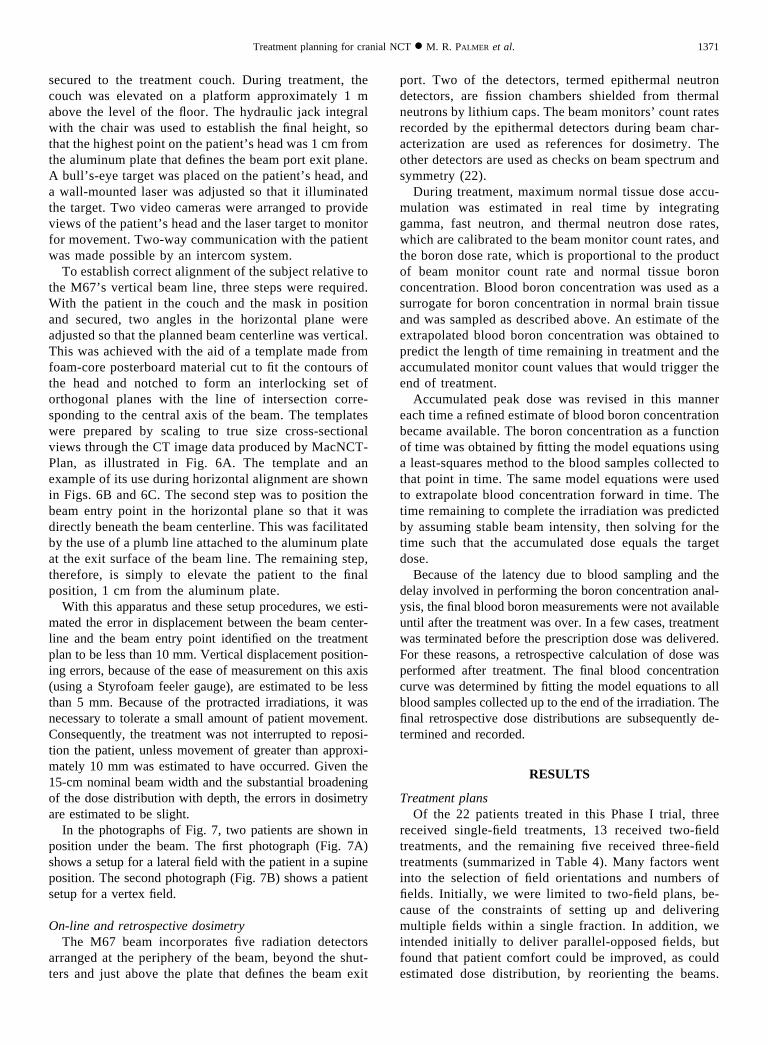
secured to the treatment couch. During treatment, thecouch was elevated on a platform approximately 1 mabove the level of the floor. The hydraulic jack integralwith the chair was used to establish the final height, sothat the highest point on the patient’ s head was 1 cm fromthe aluminum plate that defines the beam port exit plane.A bull’ s-eye target was placed on the patient’ s head, anda wall-mounted laser was adjusted so that it illuminatedthe target. Two video cameras were arranged to provideviews of the patient’ s head and the laser target to monitorfor movement. Two-way communication with the patientwas made possible by an intercom system.
To establish correct alignment of the subject relative tothe M67’ s vertical beam line, three steps were required.With the patient in the couch and the mask in positionand secured, two angles in the horizontal plane wereadjusted so that the planned beam centerline was vertical.This was achieved with the aid of a template made fromfoam-core posterboard material cut to fit the contours ofthe head and notched to form an interlocking set oforthogonal planes with the line of intersection corre-sponding to the central axis of the beam. The templateswere prepared by scaling to true size cross-sectionalviews through the CT image data produced by MacNCT-Plan, as illustrated in Fig. 6A. The template and anexample of its use during horizontal alignment are shownin Figs. 6B and 6C. The second step was to position thebeam entry point in the horizontal plane so that it wasdirectly beneath the beam centerline. This was facilitatedby the use of a plumb line attached to the aluminum plateat the exit surface of the beam line. The remaining step,therefore, is simply to elevate the patient to the finalposition, 1 cm from the aluminum plate.
With this apparatus and these setup procedures, we esti-mated the error in displacement between the beam center-line and the beam entry point identified on the treatmentplan to be less than 10 mm. Vertical displacement position-ing errors, because of the ease of measurement on this axis(using a Styrofoam feeler gauge), are estimated to be lessthan 5 mm. Because of the protracted irradiations, it wasnecessary to tolerate a small amount of patient movement.Consequently, the treatment was not interrupted to reposi-tion the patient, unless movement of greater than approxi-mately 10 mm was estimated to have occurred. Given the15-cm nominal beam width and the substantial broadeningof the dose distribution with depth, the errors in dosimetryare estimated to be slight.
In the photographs of Fig. 7, two patients are shown inposition under the beam. The first photograph (Fig. 7A)shows a setup for a lateral field with the patient in a supineposition. The second photograph (Fig. 7B) shows a patientsetup for a vertex field.
On-line and retrospective dosimetryThe M67 beam incorporates five radiation detectors
arranged at the periphery of the beam, beyond the shut-ters and just above the plate that defines the beam exit
port. Two of the detectors, termed epithermal neutrondetectors, are fission chambers shielded from thermalneutrons by lithium caps. The beam monitors’ count ratesrecorded by the epithermal detectors during beam char-acterization are used as references for dosimetry. Theother detectors are used as checks on beam spectrum andsymmetry (22).
During treatment, maximum normal tissue dose accu-mulation was estimated in real time by integratinggamma, fast neutron, and thermal neutron dose rates,which are calibrated to the beam monitor count rates, andthe boron dose rate, which is proportional to the productof beam monitor count rate and normal tissue boronconcentration. Blood boron concentration was used as asurrogate for boron concentration in normal brain tissueand was sampled as described above. An estimate of theextrapolated blood boron concentration was obtained topredict the length of time remaining in treatment and theaccumulated monitor count values that would trigger theend of treatment.
Accumulated peak dose was revised in this mannereach time a refined estimate of blood boron concentrationbecame available. The boron concentration as a functionof time was obtained by fitting the model equations usinga least-squares method to the blood samples collected tothat point in time. The same model equations were usedto extrapolate blood concentration forward in time. Thetime remaining to complete the irradiation was predictedby assuming stable beam intensity, then solving for thetime such that the accumulated dose equals the targetdose.
Because of the latency due to blood sampling and thedelay involved in performing the boron concentration anal-ysis, the final blood boron measurements were not availableuntil after the treatment was over. In a few cases, treatmentwas terminated before the prescription dose was delivered.For these reasons, a retrospective calculation of dose wasperformed after treatment. The final blood concentrationcurve was determined by fitting the model equations to allblood samples collected up to the end of the irradiation. Thefinal retrospective dose distributions are subsequently de-termined and recorded.
RESULTS
Treatment plansOf the 22 patients treated in this Phase I trial, three
received single-field treatments, 13 received two-fieldtreatments, and the remaining five received three-fieldtreatments (summarized in Table 4). Many factors wentinto the selection of field orientations and numbers offields. Initially, we were limited to two-field plans, be-cause of the constraints of setting up and deliveringmultiple fields within a single fraction. In addition, weintended initially to deliver parallel-opposed fields, butfound that patient comfort could be improved, as couldestimated dose distribution, by reorienting the beams.
1371Treatment planning for cranial NCT ● M. R. PALMER et al.
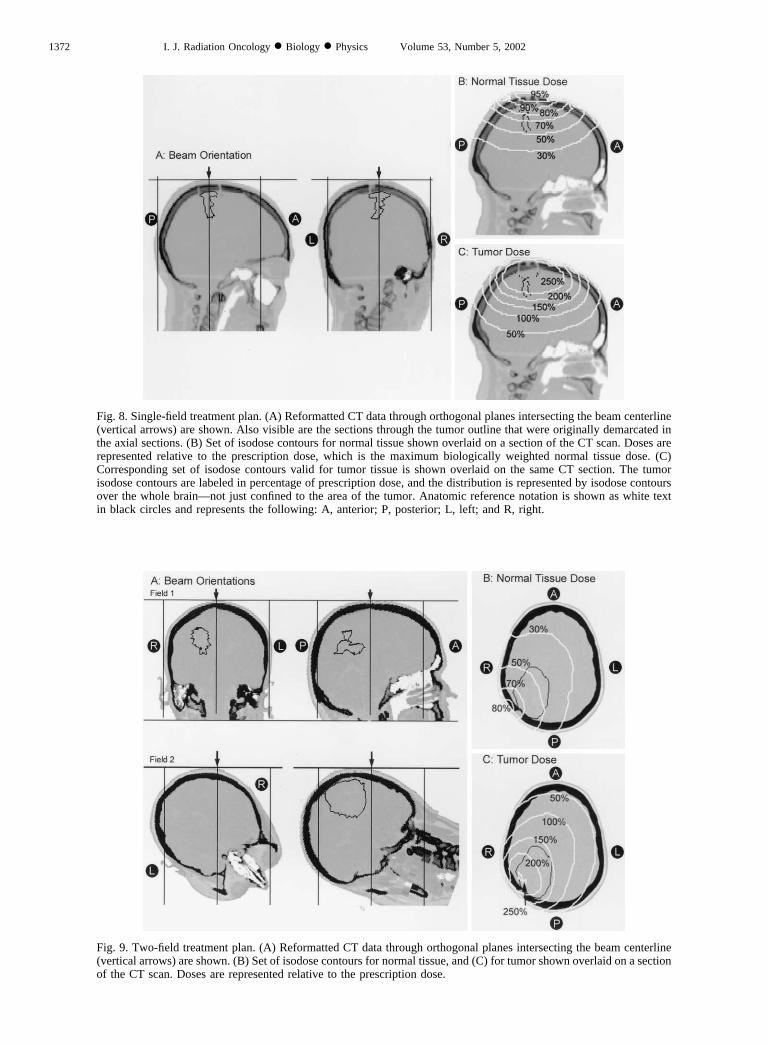
Fig. 8. Single-field treatment plan. (A) Reformatted CT data through orthogonal planes intersecting the beam centerline(vertical arrows) are shown. Also visible are the sections through the tumor outline that were originally demarcated inthe axial sections. (B) Set of isodose contours for normal tissue shown overlaid on a section of the CT scan. Doses arerepresented relative to the prescription dose, which is the maximum biologically weighted normal tissue dose. (C)Corresponding set of isodose contours valid for tumor tissue is shown overlaid on the same CT section. The tumorisodose contours are labeled in percentage of prescription dose, and the distribution is represented by isodose contoursover the whole brain—not just confined to the area of the tumor. Anatomic reference notation is shown as white textin black circles and represents the following: A, anterior; P, posterior; L, left; and R, right.
Fig. 9. Two-field treatment plan. (A) Reformatted CT data through orthogonal planes intersecting the beam centerline(vertical arrows) are shown. (B) Set of isodose contours for normal tissue, and (C) for tumor shown overlaid on a sectionof the CT scan. Doses are represented relative to the prescription dose.
1372 I. J. Radiation Oncology ● Biology ● Physics Volume 53, Number 5, 2002
Generally, the strategy that guided us in selecting be-tween competing plans was to give preference to the planwith the greatest minimum estimated tumor dose. Incases where the tumor is superficially located, a singlefield is near to optimal, and little improvement can beachieved by adding a second field. In one case (Subject97-5), a second field was planned, but not delivered,because of deterioration of the patient’ s clinical status. Intwo cases (Patients 98-3 and 98-8), discomfort causedpatients to request early termination, and so the peak dosedelivered fell significantly short of the prescription.
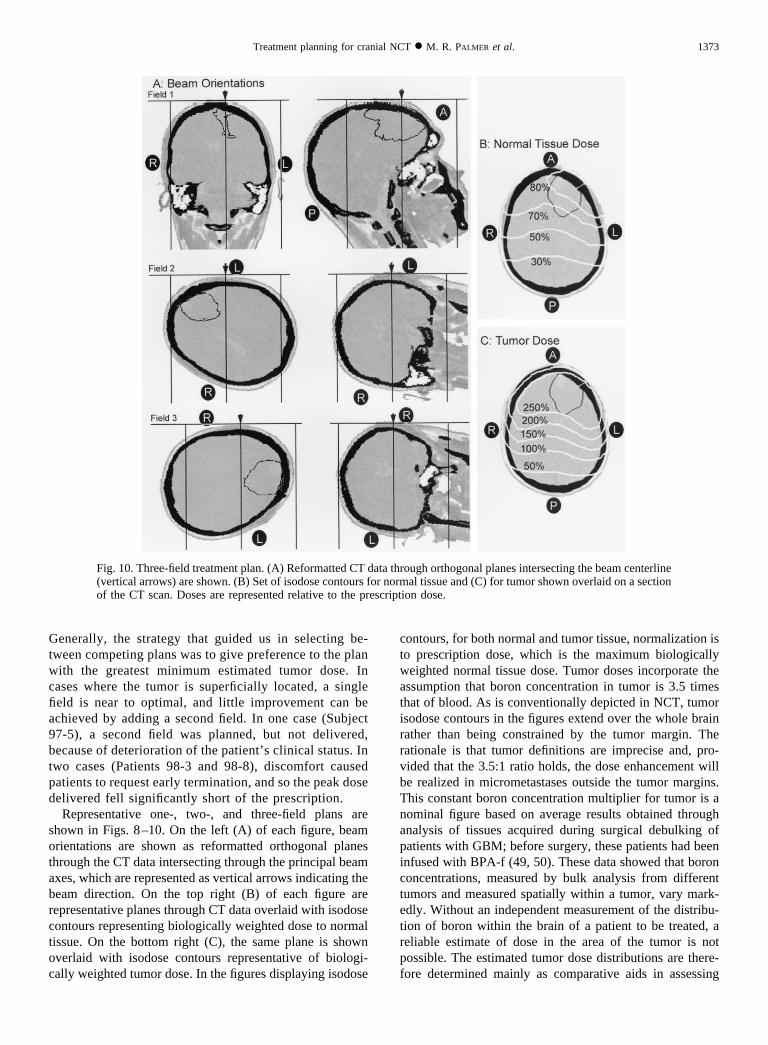
Representative one-, two-, and three-field plans areshown in Figs. 8–10. On the left (A) of each figure, beamorientations are shown as reformatted orthogonal planesthrough the CT data intersecting through the principal beamaxes, which are represented as vertical arrows indicating thebeam direction. On the top right (B) of each figure arerepresentative planes through CT data overlaid with isodosecontours representing biologically weighted dose to normaltissue. On the bottom right (C), the same plane is shownoverlaid with isodose contours representative of biologi-cally weighted tumor dose. In the figures displaying isodose
contours, for both normal and tumor tissue, normalization isto prescription dose, which is the maximum biologicallyweighted normal tissue dose. Tumor doses incorporate theassumption that boron concentration in tumor is 3.5 timesthat of blood. As is conventionally depicted in NCT, tumorisodose contours in the figures extend over the whole brainrather than being constrained by the tumor margin. Therationale is that tumor definitions are imprecise and, pro-vided that the 3.5:1 ratio holds, the dose enhancement willbe realized in micrometastases outside the tumor margins.This constant boron concentration multiplier for tumor is anominal figure based on average results obtained throughanalysis of tissues acquired during surgical debulking ofpatients with GBM; before surgery, these patients had beeninfused with BPA-f (49, 50). These data showed that boronconcentrations, measured by bulk analysis from differenttumors and measured spatially within a tumor, vary mark-edly. Without an independent measurement of the distribu-tion of boron within the brain of a patient to be treated, areliable estimate of dose in the area of the tumor is notpossible. The estimated tumor dose distributions are there-fore determined mainly as comparative aids in assessing
Fig. 10. Three-field treatment plan. (A) Reformatted CT data through orthogonal planes intersecting the beam centerline(vertical arrows) are shown. (B) Set of isodose contours for normal tissue and (C) for tumor shown overlaid on a sectionof the CT scan. Doses are represented relative to the prescription dose.
1373Treatment planning for cranial NCT ● M. R. PALMER et al.
competing plans and cannot be interpreted strictly as dosedelivered to tumor.
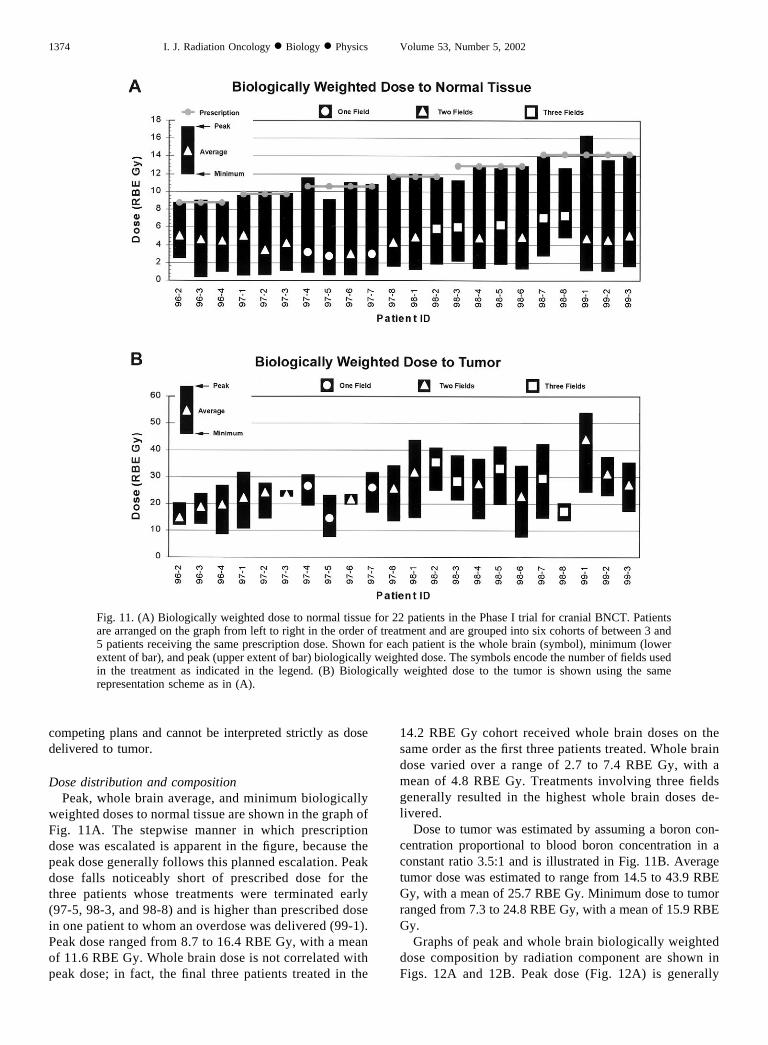
Dose distribution and compositionPeak, whole brain average, and minimum biologically
weighted doses to normal tissue are shown in the graph ofFig. 11A. The stepwise manner in which prescriptiondose was escalated is apparent in the figure, because thepeak dose generally follows this planned escalation. Peakdose falls noticeably short of prescribed dose for thethree patients whose treatments were terminated early(97-5, 98-3, and 98-8) and is higher than prescribed dosein one patient to whom an overdose was delivered (99-1).Peak dose ranged from 8.7 to 16.4 RBE Gy, with a meanof 11.6 RBE Gy. Whole brain dose is not correlated withpeak dose; in fact, the final three patients treated in the
14.2 RBE Gy cohort received whole brain doses on thesame order as the first three patients treated. Whole braindose varied over a range of 2.7 to 7.4 RBE Gy, with amean of 4.8 RBE Gy. Treatments involving three fieldsgenerally resulted in the highest whole brain doses de-livered.
Dose to tumor was estimated by assuming a boron con-centration proportional to blood boron concentration in aconstant ratio 3.5:1 and is illustrated in Fig. 11B. Averagetumor dose was estimated to range from 14.5 to 43.9 RBEGy, with a mean of 25.7 RBE Gy. Minimum dose to tumorranged from 7.3 to 24.8 RBE Gy, with a mean of 15.9 RBEGy.
Graphs of peak and whole brain biologically weighteddose composition by radiation component are shown inFigs. 12A and 12B. Peak dose (Fig. 12A) is generally
Fig. 11. (A) Biologically weighted dose to normal tissue for 22 patients in the Phase I trial for cranial BNCT. Patientsare arranged on the graph from left to right in the order of treatment and are grouped into six cohorts of between 3 and5 patients receiving the same prescription dose. Shown for each patient is the whole brain (symbol), minimum (lowerextent of bar), and peak (upper extent of bar) biologically weighted dose. The symbols encode the number of fields usedin the treatment as indicated in the legend. (B) Biologically weighted dose to the tumor is shown using the samerepresentation scheme as in (A).
1374 I. J. Radiation Oncology ● Biology ● Physics Volume 53, Number 5, 2002
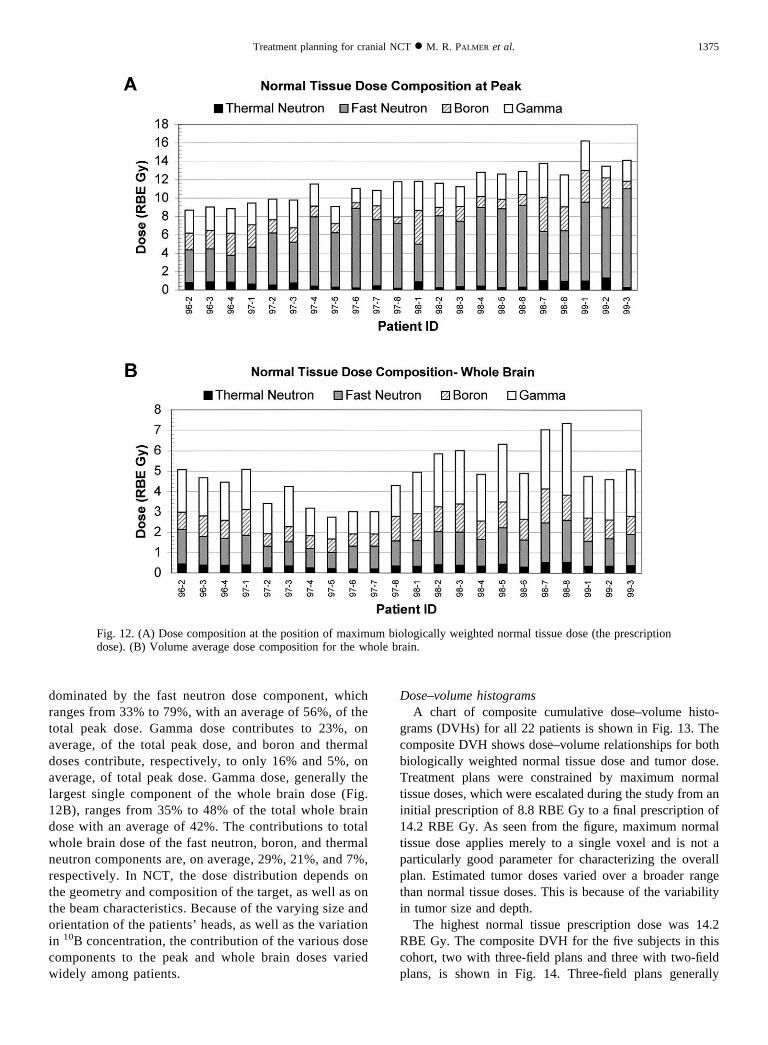
dominated by the fast neutron dose component, whichranges from 33% to 79%, with an average of 56%, of thetotal peak dose. Gamma dose contributes to 23%, onaverage, of the total peak dose, and boron and thermaldoses contribute, respectively, to only 16% and 5%, onaverage, of total peak dose. Gamma dose, generally thelargest single component of the whole brain dose (Fig.12B), ranges from 35% to 48% of the total whole braindose with an average of 42%. The contributions to totalwhole brain dose of the fast neutron, boron, and thermalneutron components are, on average, 29%, 21%, and 7%,respectively. In NCT, the dose distribution depends onthe geometry and composition of the target, as well as onthe beam characteristics. Because of the varying size andorientation of the patients’ heads, as well as the variationin 10B concentration, the contribution of the various dosecomponents to the peak and whole brain doses variedwidely among patients.
Dose–volume histogramsA chart of composite cumulative dose–volume histo-
grams (DVHs) for all 22 patients is shown in Fig. 13. Thecomposite DVH shows dose–volume relationships for bothbiologically weighted normal tissue dose and tumor dose.Treatment plans were constrained by maximum normaltissue doses, which were escalated during the study from aninitial prescription of 8.8 RBE Gy to a final prescription of14.2 RBE Gy. As seen from the figure, maximum normaltissue dose applies merely to a single voxel and is not aparticularly good parameter for characterizing the overallplan. Estimated tumor doses varied over a broader rangethan normal tissue doses. This is because of the variabilityin tumor size and depth.
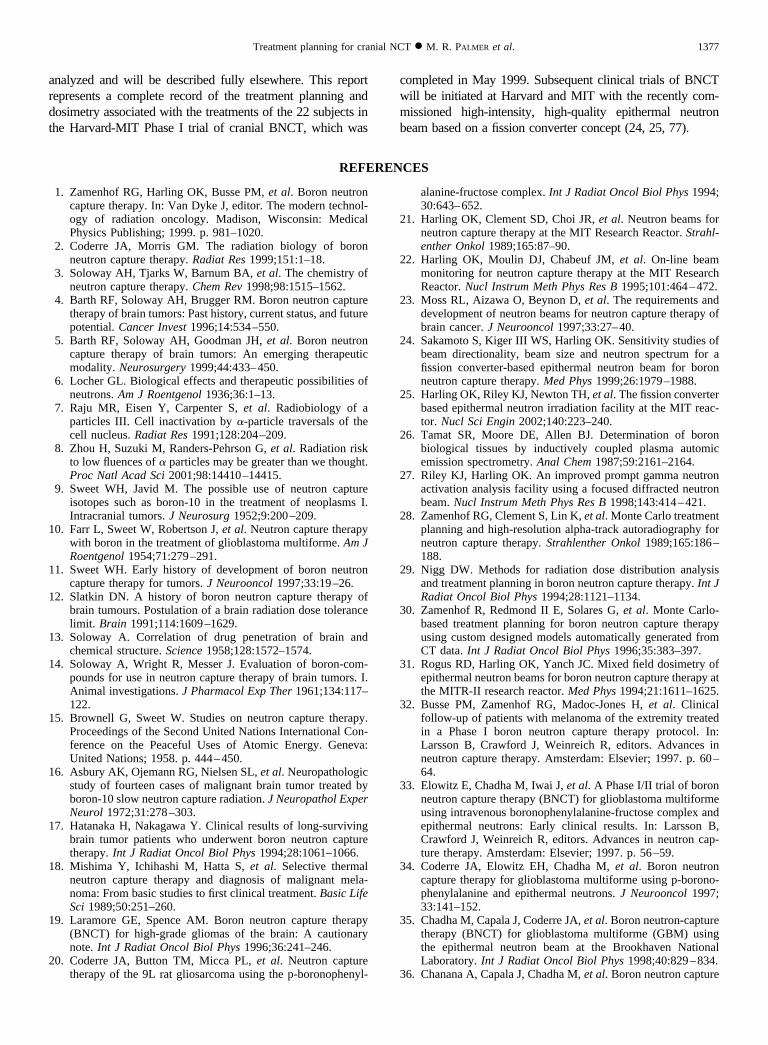
The highest normal tissue prescription dose was 14.2RBE Gy. The composite DVH for the five subjects in thiscohort, two with three-field plans and three with two-fieldplans, is shown in Fig. 14. Three-field plans generally
Fig. 12. (A) Dose composition at the position of maximum biologically weighted normal tissue dose (the prescriptiondose). (B) Volume average dose composition for the whole brain.
1375Treatment planning for cranial NCT ● M. R. PALMER et al.
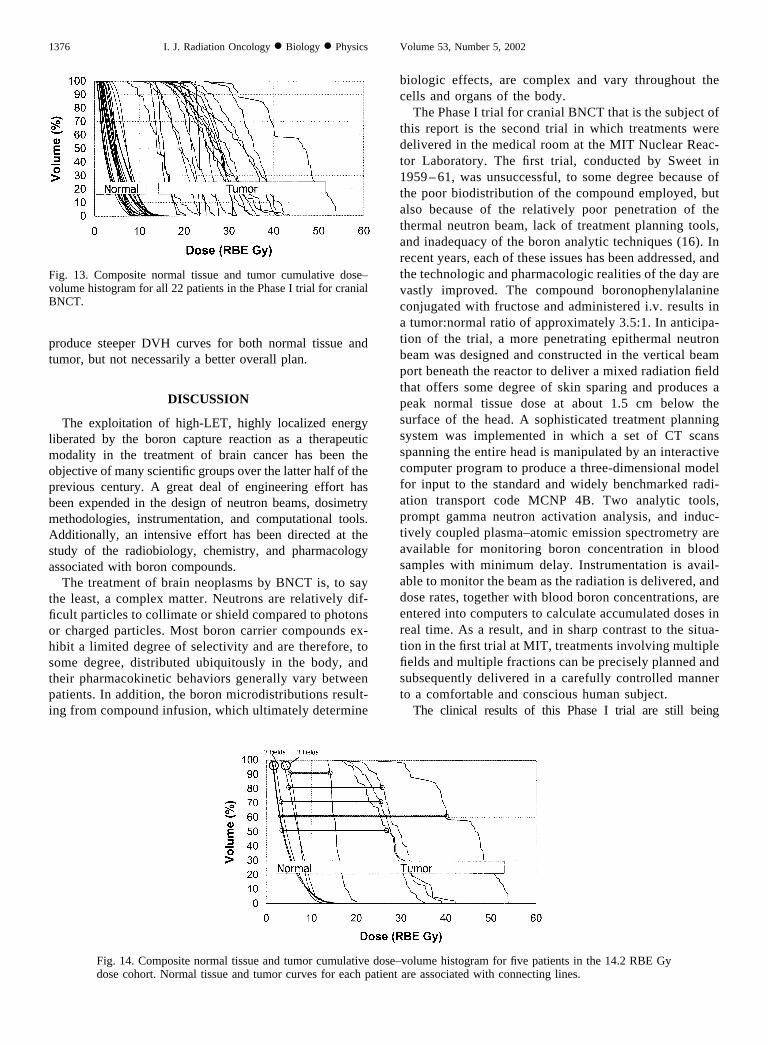
produce steeper DVH curves for both normal tissue andtumor, but not necessarily a better overall plan.
DISCUSSION
The exploitation of high-LET, highly localized energyliberated by the boron capture reaction as a therapeuticmodality in the treatment of brain cancer has been theobjective of many scientific groups over the latter half of theprevious century. A great deal of engineering effort hasbeen expended in the design of neutron beams, dosimetrymethodologies, instrumentation, and computational tools.Additionally, an intensive effort has been directed at thestudy of the radiobiology, chemistry, and pharmacologyassociated with boron compounds.
The treatment of brain neoplasms by BNCT is, to saythe least, a complex matter. Neutrons are relatively dif-ficult particles to collimate or shield compared to photonsor charged particles. Most boron carrier compounds ex-hibit a limited degree of selectivity and are therefore, tosome degree, distributed ubiquitously in the body, andtheir pharmacokinetic behaviors generally vary betweenpatients. In addition, the boron microdistributions result-ing from compound infusion, which ultimately determine
biologic effects, are complex and vary throughout thecells and organs of the body.
The Phase I trial for cranial BNCT that is the subject ofthis report is the second trial in which treatments weredelivered in the medical room at the MIT Nuclear Reac-tor Laboratory. The first trial, conducted by Sweet in1959 –61, was unsuccessful, to some degree because ofthe poor biodistribution of the compound employed, butalso because of the relatively poor penetration of thethermal neutron beam, lack of treatment planning tools,and inadequacy of the boron analytic techniques (16). Inrecent years, each of these issues has been addressed, andthe technologic and pharmacologic realities of the day arevastly improved. The compound boronophenylalanineconjugated with fructose and administered i.v. results ina tumor:normal ratio of approximately 3.5:1. In anticipa-tion of the trial, a more penetrating epithermal neutronbeam was designed and constructed in the vertical beamport beneath the reactor to deliver a mixed radiation fieldthat offers some degree of skin sparing and produces apeak normal tissue dose at about 1.5 cm below thesurface of the head. A sophisticated treatment planningsystem was implemented in which a set of CT scansspanning the entire head is manipulated by an interactivecomputer program to produce a three-dimensional modelfor input to the standard and widely benchmarked radi-ation transport code MCNP 4B. Two analytic tools,prompt gamma neutron activation analysis, and induc-tively coupled plasma–atomic emission spectrometry areavailable for monitoring boron concentration in bloodsamples with minimum delay. Instrumentation is avail-able to monitor the beam as the radiation is delivered, anddose rates, together with blood boron concentrations, areentered into computers to calculate accumulated doses inreal time. As a result, and in sharp contrast to the situa-tion in the first trial at MIT, treatments involving multiplefields and multiple fractions can be precisely planned andsubsequently delivered in a carefully controlled mannerto a comfortable and conscious human subject.
The clinical results of this Phase I trial are still being
Fig. 13. Composite normal tissue and tumor cumulative dose–volume histogram for all 22 patients in the Phase I trial for cranialBNCT.
Fig. 14. Composite normal tissue and tumor cumulative dose–volume histogram for five patients in the 14.2 RBE Gydose cohort. Normal tissue and tumor curves for each patient are associated with connecting lines.
1376 I. J. Radiation Oncology ● Biology ● Physics Volume 53, Number 5, 2002
analyzed and will be described fully elsewhere. This reportrepresents a complete record of the treatment planning anddosimetry associated with the treatments of the 22 subjects inthe Harvard-MIT Phase I trial of cranial BNCT, which was
completed in May 1999. Subsequent clinical trials of BNCTwill be initiated at Harvard and MIT with the recently com-missioned high-intensity, high-quality epithermal neutronbeam based on a fission converter concept (24, 25, 77).
REFERENCES
1. Zamenhof RG, Harling OK, Busse PM, et al. Boron neutroncapture therapy. In: Van Dyke J, editor. The modern technol-ogy of radiation oncology. Madison, Wisconsin: MedicalPhysics Publishing; 1999. p. 981–1020.
2. Coderre JA, Morris GM. The radiation biology of boronneutron capture therapy. Radiat Res 1999;151:1–18.
3. Soloway AH, Tjarks W, Barnum BA, et al. The chemistry ofneutron capture therapy. Chem Rev 1998;98:1515–1562.
4. Barth RF, Soloway AH, Brugger RM. Boron neutron capturetherapy of brain tumors: Past history, current status, and futurepotential. Cancer Invest 1996;14:534–550.
5. Barth RF, Soloway AH, Goodman JH, et al. Boron neutroncapture therapy of brain tumors: An emerging therapeuticmodality. Neurosurgery 1999;44:433–450.
6. Locher GL. Biological effects and therapeutic possibilities ofneutrons. Am J Roentgenol 1936;36:1–13.
7. Raju MR, Eisen Y, Carpenter S, et al. Radiobiology of aparticles III. Cell inactivation by �-particle traversals of thecell nucleus. Radiat Res 1991;128:204–209.
8. Zhou H, Suzuki M, Randers-Pehrson G, et al. Radiation riskto low fluences of � particles may be greater than we thought.Proc Natl Acad Sci 2001;98:14410–14415.
9. Sweet WH, Javid M. The possible use of neutron captureisotopes such as boron-10 in the treatment of neoplasms I.Intracranial tumors. J Neurosurg 1952;9:200–209.
10. Farr L, Sweet W, Robertson J, et al. Neutron capture therapywith boron in the treatment of glioblastoma multiforme. Am JRoentgenol 1954;71:279–291.
11. Sweet WH. Early history of development of boron neutroncapture therapy for tumors. J Neurooncol 1997;33:19–26.
12. Slatkin DN. A history of boron neutron capture therapy ofbrain tumours. Postulation of a brain radiation dose tolerancelimit. Brain 1991;114:1609–1629.
13. Soloway A. Correlation of drug penetration of brain andchemical structure. Science 1958;128:1572–1574.
14. Soloway A, Wright R, Messer J. Evaluation of boron-com-pounds for use in neutron capture therapy of brain tumors. I.Animal investigations. J Pharmacol Exp Ther 1961;134:117–122.
15. Brownell G, Sweet W. Studies on neutron capture therapy.Proceedings of the Second United Nations International Con-ference on the Peaceful Uses of Atomic Energy. Geneva:United Nations; 1958. p. 444–450.
16. Asbury AK, Ojemann RG, Nielsen SL, et al. Neuropathologicstudy of fourteen cases of malignant brain tumor treated byboron-10 slow neutron capture radiation. J Neuropathol ExperNeurol 1972;31:278–303.
17. Hatanaka H, Nakagawa Y. Clinical results of long-survivingbrain tumor patients who underwent boron neutron capturetherapy. Int J Radiat Oncol Biol Phys 1994;28:1061–1066.
18. Mishima Y, Ichihashi M, Hatta S, et al. Selective thermalneutron capture therapy and diagnosis of malignant mela-noma: From basic studies to first clinical treatment. Basic LifeSci 1989;50:251–260.
19. Laramore GE, Spence AM. Boron neutron capture therapy(BNCT) for high-grade gliomas of the brain: A cautionarynote. Int J Radiat Oncol Biol Phys 1996;36:241–246.
20. Coderre JA, Button TM, Micca PL, et al. Neutron capturetherapy of the 9L rat gliosarcoma using the p-boronophenyl-
alanine-fructose complex. Int J Radiat Oncol Biol Phys 1994;30:643–652.
21. Harling OK, Clement SD, Choi JR, et al. Neutron beams forneutron capture therapy at the MIT Research Reactor. Strahl-enther Onkol 1989;165:87–90.
22. Harling OK, Moulin DJ, Chabeuf JM, et al. On-line beammonitoring for neutron capture therapy at the MIT ResearchReactor. Nucl Instrum Meth Phys Res B 1995;101:464–472.
23. Moss RL, Aizawa O, Beynon D, et al. The requirements anddevelopment of neutron beams for neutron capture therapy ofbrain cancer. J Neurooncol 1997;33:27–40.
24. Sakamoto S, Kiger III WS, Harling OK. Sensitivity studies ofbeam directionality, beam size and neutron spectrum for afission converter-based epithermal neutron beam for boronneutron capture therapy. Med Phys 1999;26:1979–1988.
25. Harling OK, Riley KJ, Newton TH, et al. The fission converterbased epithermal neutron irradiation facility at the MIT reac-tor. Nucl Sci Engin 2002;140:223–240.
26. Tamat SR, Moore DE, Allen BJ. Determination of boronbiological tissues by inductively coupled plasma automicemission spectrometry. Anal Chem 1987;59:2161–2164.
27. Riley KJ, Harling OK. An improved prompt gamma neutronactivation analysis facility using a focused diffracted neutronbeam. Nucl Instrum Meth Phys Res B 1998;143:414–421.
28. Zamenhof RG, Clement S, Lin K, et al. Monte Carlo treatmentplanning and high-resolution alpha-track autoradiography forneutron capture therapy. Strahlenther Onkol 1989;165:186–188.
29. Nigg DW. Methods for radiation dose distribution analysisand treatment planning in boron neutron capture therapy. Int JRadiat Oncol Biol Phys 1994;28:1121–1134.
30. Zamenhof R, Redmond II E, Solares G, et al. Monte Carlo-based treatment planning for boron neutron capture therapyusing custom designed models automatically generated fromCT data. Int J Radiat Oncol Biol Phys 1996;35:383–397.
31. Rogus RD, Harling OK, Yanch JC. Mixed field dosimetry ofepithermal neutron beams for boron neutron capture therapy atthe MITR-II research reactor. Med Phys 1994;21:1611–1625.
32. Busse PM, Zamenhof RG, Madoc-Jones H, et al. Clinicalfollow-up of patients with melanoma of the extremity treatedin a Phase I boron neutron capture therapy protocol. In:Larsson B, Crawford J, Weinreich R, editors. Advances inneutron capture therapy. Amsterdam: Elsevier; 1997. p. 60–64.
33. Elowitz E, Chadha M, Iwai J, et al. A Phase I/II trial of boronneutron capture therapy (BNCT) for glioblastoma multiformeusing intravenous boronophenylalanine-fructose complex andepithermal neutrons: Early clinical results. In: Larsson B,Crawford J, Weinreich R, editors. Advances in neutron cap-ture therapy. Amsterdam: Elsevier; 1997. p. 56–59.
34. Coderre JA, Elowitz EH, Chadha M, et al. Boron neutroncapture therapy for glioblastoma multiforme using p-borono-phenylalanine and epithermal neutrons. J Neurooncol 1997;33:141–152.
35. Chadha M, Capala J, Coderre JA, et al. Boron neutron-capturetherapy (BNCT) for glioblastoma multiforme (GBM) usingthe epithermal neutron beam at the Brookhaven NationalLaboratory. Int J Radiat Oncol Biol Phys 1998;40:829–834.
36. Chanana A, Capala J, Chadha M, et al. Boron neutron capture
1377Treatment planning for cranial NCT ● M. R. PALMER et al.
therapy for glioblastoma multiforme: Interim results from thePhaseI/IIdose-escalationstudies.Neurosurgery1999;44:1182–1192.
37. Busse PM, Zamenhof RG, Harling OK, et al. The Harvard-MIT BNCT program: Overview of the clinical trials andtranslational research. In: Hawthorne M, Sheely K, WiersemaR, editors. Frontiers in neutron capture therapy. New York:Kluwer Plenum; 2001. p. 37–60.
38. Sauerwein W, Moss R, Hideghety K, et al. Status report on theEuropean clinical trial of BNCT at Petten (EORTC protocol11961). In: Hawthorne M, Shelly K, Wiersema R, editors.Frontiers in neutron capture therapy. New York: Kluwer Ple-num; 2001. p. 81–86.
39. Burian J, Marek M, Mares V, et al. Neutron-capture therapy ofbrain tumours: Neutron sources, neutron-capture drugs, bio-logical tests and clinical perspectives in the Czech Republic.Physiol Res 1997;42:93–99.
40. Burian J, Marek M, Rataj J, et al. The BNCT Project in theCzech Republic (Abstr). Proceedings of the Ninth Interna-tional Symposium on Neutron Capture Therapy for Cancer.Osaka, Japan; 2000:193–194.
41. Kankaanranta L, Seppala T, Kallio M, et al. First clinicalresults on the Finnish study on BPA-mediated BNCT in gli-oblastoma (Abstr). Proceedings of the Ninth InternationalSymposium on Neutron Capture Therapy for Cancer. Osaka,Japan; 2000:31–32.
42. Skold K, Kierkegaard J, Gudowska I, et al. The Swedishfacility for boron neutron capture therapy. Proceedings of theNinth International Symposium on Neutron Capture Therapyfor Cancer. Osaka, Japan; 2000:39–40.
43. Yanch JC, Zhou XL, Shefer RE, et al. Accelerator-basedepithermal neutron beam design for neutron capture therapy.Med Phys 1992;19:709–721.
44. Blackburn B, Yanch J, Klinkowsein R. Development of ahigh-power water cooled beryllium target for use in acceler-ator-based boron neutron capture therapy. Med Phys 1998;25:1967–1974.
45. Zamenhof RG, Clement SD, Harling OK, et al. Monte Carlobased dosimetry and treatment planning for neutron capturetherapy of brain tumors. In: Harling O, Bernard J, ZamenhofR, editors. Neutron beam design, development and perfor-mance for neutron capture therapy. New York: Plenum; 1990.p. 283–305.
46. Brooks RA, DiChiro G, Keller MR. Explanation of cerebralwhite-grey contrast in computed tomography. J Comput AssistTomogr 1980;4:489.
47. ICRU. Photon, electron, proton, and neutron interaction datafor body tissues, ICRU Report 46. Bethesda, MD: Interna-tional Commission on Radiation Units and Measurements;1992.
48. Goorley JT, Kiger III WS, Zamenhof RG. Reference dosim-etry calculations for neutron capture therapy with comparisonof analytical and voxel models. Med Phys 2002;29:145–156.
49. Coderre JA, Chanana AD, Joel DD, et al. Biodistribution ofboronophenylalanine in patients with glioblastoma multi-forme: Boron concentration correlates with tumor cellularity.Radiat Res 1998;149:163–170.
50. Elowitz EH, Bergland RM, Coderre JA, et al. Biodistributionof p-boronophenylalanine (BPA) in patients with glioblastomamultiforme for use in boron neutron capture therapy. Neuro-surgery 1998;42:463–469.
51. Kiger III WS, Palmer MR, Riley KJ, et al. A pharmacokineticmodel for the concentration of 10B in blood after boronophe-nylalanine-fructose administration in humans. Radiat Res2001;155:611–618.
52. Imahori Y, Ueda S, Ohmori Y, et al. Fluorine-18-labeledfluoroboronophenylalanine PET in patients with glioma.J Nucl Med 1998;39:325–333.
53. Wittig A, Sauerwein W, Coderre J. Mechanisms of transportof p-borono-phenylalanine through the cell membrane in vitro.Radiat Res 2000;153:173–180.
54. Kabalka GW, Smith GT, Dyke JP, et al. Evaluation of fluo-rine-18-BPA-fructose for boron neutron capture treatmentplanning. J Nucl Med 1997;38:1762–1767.
55. Morris GM, Coderre JA, Hopewell JW, et al. Response of thecentral nervous system to boron neutron capture irradiation:Evaluation using rat spinal cord model. Radiother Oncol1994;32:249–255.
56. Coderre JA, Morris GM, Micca PL, et al. Comparative as-sessment of single-dose and fractionated boron neutron cap-ture therapy. Radiat Res 1995;144:310–317.
57. Hall EJ, Cox JD. Physical and biological basis of radiationtherapy. In: Moss WT, Cox JD, editors. Radiation oncology:Rationale, technique, results. St. Louis: Mosby; 1989. p. 1–57.
58. Turensson I. Radiobiological aspects of continuous low dose-rate irradiation and fractionated high dose-rate irradiation.Radiother Oncol 1990;19:1–16.
59. Hall E, Brenner D. The dose-rate effect revisited: Radiobio-logical considerations of importance in radiotherapy. Int JRadiat Oncol Biol Phys 1991;21:1403–1414.
60. Marin L, Smith C, Langston M, et al. Response of glioblas-toma cell lines to low dose rate irradiation. Int J Radiat OncolBiol Phys 1991;21:397–402.
61. Solares G, Kiger III WS, Zamenhof R. Microdosimetry stud-ies at the Harvard/MIT Phase-I clinical trial of boron neutroncapture therapy. In: Larsson B, Crawford J, Weinreich R,editors. Advances in neutron capture therapy. Amsterdam:Elsevier; 1997. p. 171–176.
62. Coderre JA, Makar MS, Micca PL, et al. Derivations ofrelative biological effectiveness for the high-LET radiationsproduced during boron neutron capture irradiations of the 9Lrat gliosarcoma in vitro and in vivo. Int J Radiat Oncol BiolPhys 1993;27:1121–1129.
63. Choi JR, Clement SD, Harling OK, et al. Neutron capturetherapy beams at the MIT research reactor. In: Harling O,Bernard J, Zamenhof R, editors. Neutron beam design, devel-opment, and performance for neutron capture therapy. NewYork: Plenum; 1990. p. 201–218.
64. Harling OK, Roberts KA, Moulin DJ, et al. Head phantomsfor neutron capture therapy. Med Phys 1995;22:579–583.
65. Snyder WS, Ford MR, Warner GG, et al. Estimates for ab-sorbed fractions for monoenergetic photon sources uniformlydistributed in various organs of a heterogeneous phantom.J Nucl Med 1969;S3(Suppl.):47.
66. Attix FH. Introduction to radiological physics and radiationdosimetry. New York: Wiley; 1986. p. 475–500.
67. Rasband W, Bright D. NIH Image: A public domain imageprocessing program for the MacIntosh. J Microbeam AnalysisSoc 1995;4:137–149.
68. Kiger III WS, Zamenhof RG, Solares GR, et al. MacNCTPlan:An improved Macintosh based BNCT treatment planning pro-gram. Trans Am Nucl Soc 1996;75:38–39.
69. Briesmeister JF. MCNP - A General Monte Carlo N ParticleTransport Code, LA12625-M, Version 4B. Los Alamos: LosAlamos National Laboratory; 1997.
70. Mohan R, Antolak J. Monte Carlo techniques should replaceanalytical methods for estimating dose distributions in radio-therapy treatment planning. Med Phys 2001;28:123–126.
71. Arnfield M, Siantar C, Siebers J, et al. The impact of electrontransport on the accuracy of computed dose. Med Phys 2000;27:1266–1274.
72. Redmond II E, Yanch J, Harling O. Monte Carlo simulation ofthe MIT research reactor. Nucl Tech 1994;106:1–14.
73. Goorley J, McKinney G, Adams K, et al. MCNP speed ad-vances in BNCT. Proceedings of the American Nuclear Soci-
1378 I. J. Radiation Oncology ● Biology ● Physics Volume 53, Number 5, 2002

ety Radiation Protection and Shielding Conference; 1998. p.95–98.
74. Goorley J, McKinney G, Adams K, et al. MCNP enhance-ments, parallel computing, and error analysis for BNCT. In:Hawthorne M, Shelly K, Wiersema R, editors. Frontiers inneutron capture therapy. New York: Kluwer Plenum; 2001. p.599–604.
75. Goorley T. Boron neutron capture therapy treatment planning
improvements. M.S. thesis. Massachusetts Institute of Tech-nology; 1998.
76. Riley KJ. Improved boron 10 quantification via PGNAA andICP-AES. Nuclear Engineer’s Thesis. Massachusetts Instituteof Technology; 1997.
77. Kiger III WS, Sakamoto S, Harling OK. Neutronic design ofa fission converter-based epithermal neutron beam for neutroncapture therapy. Nucl Sci Engin 1999;131:1–22.
1379Treatment planning for cranial NCT ● M. R. PALMER et al.