Alouatta caraya: Population density and demography in Northern Argentina
Upload
independentCategory
view
3download
0
SVNY062-Garber May 25, 2005 22:16
CHAPTER ELEVEN
Travel Patterns andSpatial Mapping in
Nicaraguan MantledHowler Monkeys
(Alouatta palliata)Paul A. Garber and Petra E. Jelinek
INTRODUCTION
Studies of foraging and ranging behavior in several primate species indicateevidence of goal-directed travel and relatively straight-line movement betweendistant or out-of-view feeding sites (Carpenter, 1934; Menzel, 1973; Altmann,1974; Milton, 1980, 2000; Sigg and Stolba, 1981; Chapman et al., 1989;Garber, 1989; Gallistel and Cramer, 1996; Menzel, 1996; Janson and Di Bitetti,1997; Janson, 1998; Menzel et al., 2002). Although in some instances groupmembers may deviate from straight-line travel in order to monitor the pro-ductivity and phenological state of potential feeding sites or detour to avoid
Paul A. Garber ! Department of Anthropology, University of Illinois, Urbana, Illinois 61801.Petra E. Jelinek ! University of Illinois, Urbana, Illinois 61801.
New Perspectives in the Study of Mesoamerican Primates: Distribution, Ecology, Behavior, and Conservation,edited by Paul A. Garber, Alejandro Estrada, Mary Pavelka, and LeAndra Luecke. Springer, New York, 2005.
287
SVNY062-Garber May 25, 2005 22:16
288 New Perspectives in the Study of Mesoamerican Primates
areas of high predation risk, in general many researchers have concluded thatprosimians, monkeys, and apes maintain detailed internal representations or“mental maps” of the spatial locations and distributions of major feeding andresting trees within their home range. What is less clear, however, is what typesof information are contained in these maps, how detailed these representationsare, whether landmarks or other physical features of the environment are en-coded singly or as an array, and whether spatial information is represented in aroute-based system or a coordinate-based system (Poucet, 1993; Tomasello andCall, 1997; Shettleworth, 1998; Byrne, 2000; Garber, 2000; Bicca-Marquesand Garber, 2004). Foragers using a route-based representation are expectedto encode spatial information as a learned network of fixed points (nodes),travel routes, landmarks, and other salient features of the environment (Poucet,1993). In contrast, a forager using a metric-based representation is expected toencode spatial information in a coordinate framework in which true distancesand directions between multiple landmarks and goals are used to compute ef-ficient routes of travel (Dyer, 1991; Byrne, 2000; Gibson and Kamil, 2001).
Many species of primates spend the majority of their daily activity budgetsearching for and consuming plant resources such as fruits, flowers, leaves, andseeds (Garber, 1987). Compared to mobile prey such as flying insects and ver-tebrates, these food patches represent fixed points on the landscape. Althoughthe specific locations and distributions of food-bearing trees change seasonally,foragers may encode and associate the locations of important feeding sites withparticular topographical features of the environment or other landmark cuesto aid in foraging success (Biegler and Morris, 1996; Kamil and Cheng, 2001;Roberts, 2001). Landmarks are reference points and may be represented asdistance, direction, and/or distance and direction vectors to a target or goal(Cheng and Spetch, 1998; Roberts, 2001). A single landmark may be used asa beacon to navigate to a target resting or feeding tree, or serve as a point oforientation to redirect travel (i.e., switchpoint or node) (Dyer, 1991; Poucet,1993; Garber, 2000). In other cases, spatial representations may include a con-figuration of several landmarks encoded independently or together and take theform of regularly used routes of travel (Gibson and Kamil, 2001; Garber andBrown, in prep.).
Given species differences in dietary patterns, size and cohesion of foraginggroups, daily path length, speed of travel, and the number of feeding and restingsites visited per day, cognitive strategies used by primate foragers to effectivelyencounter and relocate feeding sites are likely to vary considerably (Janson andDi Bitetti, 1997; Milton, 2000).
SVNY062-Garber May 25, 2005 22:16
Travel Patterns and Spatial Mapping 289
For example, spider monkeys (Ateles spp.) forage in small fission–fusion par-ties exploit home ranges of many hundreds of hectares, and travel up to 3–5 km
Au: Pls checkrunning headok as set?
in a single day (Milton, 1981, 2000; van Roosmalen, 1985). It has been sug- Author: Pleasenote theauthor name“Roosmalen”has beenchanged to“vanRoosmalen” asper thereference list.
gested that spider monkeys maintain a mental representation of a large numberof feeding and resting trees in their home range, and select resting sites based ontheir proximity to major feeding trees (Milton, 1981; Chapman et al., 1989; vanRoosmalen, 1985). This ranging and grouping pattern enables spider monkeysto efficiently exploit a set of widely scattered feeding sites (over 20 individ-ual feeding trees per day, van Roosmalen, 1985). van Roosmalen (1985: 152)points out, however, that whereas some individual spider monkeys (i.e., leadingfemales) appear to possess complex spatial knowledge “and used the shortestpossible connections between consecutive food sources”, other individuals (i.e.,solitary or nonleading females) are “incapable of planning an economic route”.In species exhibiting a fission–fusion social system, individual community mem-bers have access to very different types of information and foraging experiencesand therefore may rely more on self-generated or ego-based information thangroup-based information.
It has been suggested that the selection pressures associated with encodingself-generated information has played a major role in the evolution of enhancedcognitive capabilities in some primate lineages (Milton, 1981, 2000). In com-parison, mantled howler monkeys (Alouatta palliata) are reported to travel insingle line progression as a cohesive social unit, have small day ranges (100–450 m; Carpenter, 1934; Milton, 1980), small home ranges (2–40 ha; Milton,1980; Crockett, 1998), and exploit an average of 1.5 primary feeding trees perday (i.e., trees that account for !20% of feeding time; Milton, 2000). Overa period of 1–2 weeks, these howlers concentrate their feeding, resting, andranging activities on a small set of pivotal trees that are visited and revisitedseveral times daily (Milton, 1980). Given mantled howler feeding and rangingpatterns, most, if not all, group members have access to the same ecologicalinformation (i.e., public information, see Valone, 1989). Carpenter (1934: 36)notes that howlers in his study group traveled “roughly over the same route,which is the shortest distance between the two places”. The degree to whichmantled howler monkeys at other sites also exhibit a route-based pattern oftravel remains unclear.
In this paper, we examine foraging strategies and travel patterns in a groupof Nicaraguan mantled howler monkeys (Alouatta palliata). Specifically, wedocument howler path sequences and use of consecutive feeding and restingsites in order to address a series of questions concerning the degree to which
SVNY062-Garber May 25, 2005 22:16
290 New Perspectives in the Study of Mesoamerican Primates
these primates represent spatial information as a route-based or as a metric-based cognitive representation.
METHODS
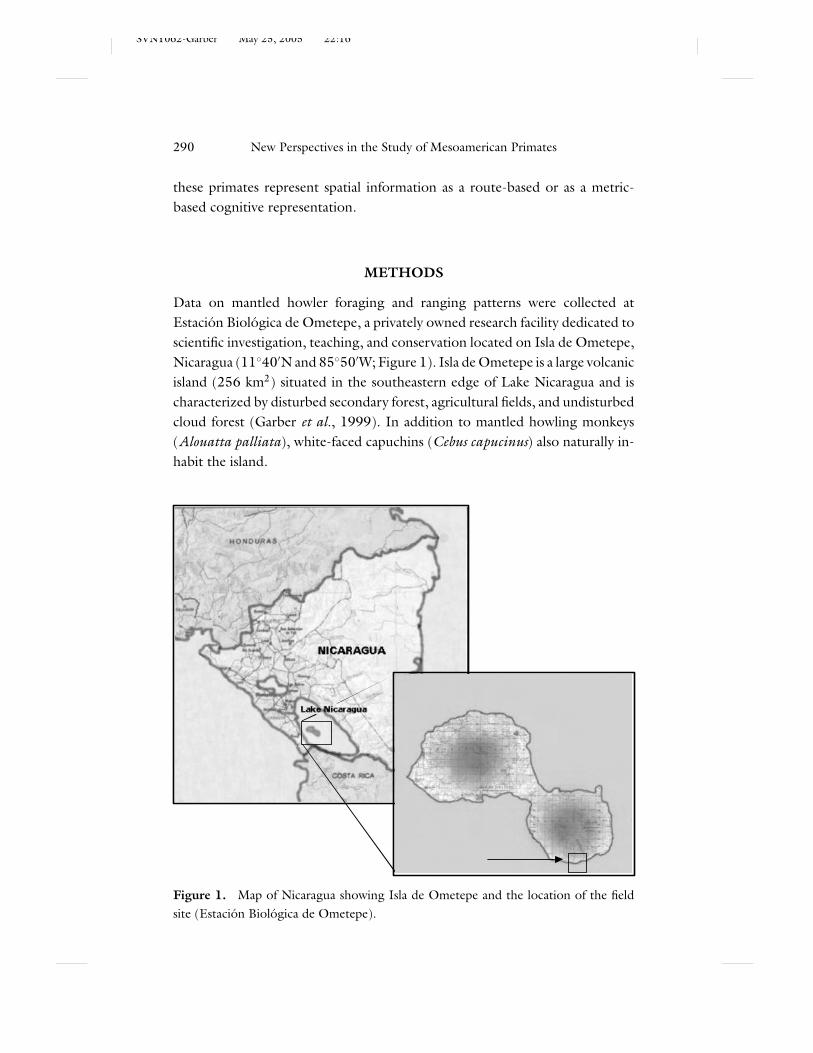
Data on mantled howler foraging and ranging patterns were collected atEstacion Biologica de Ometepe, a privately owned research facility dedicated toscientific investigation, teaching, and conservation located on Isla de Ometepe,Nicaragua (11"40#N and 85"50#W; Figure 1). Isla de Ometepe is a large volcanicisland (256 km2) situated in the southeastern edge of Lake Nicaragua and ischaracterized by disturbed secondary forest, agricultural fields, and undisturbedcloud forest (Garber et al., 1999). In addition to mantled howling monkeys(Alouatta palliata), white-faced capuchins (Cebus capucinus) also naturally in-habit the island.
Figure 1. Map of Nicaragua showing Isla de Ometepe and the location of the fieldsite (Estacion Biologica de Ometepe).
SVNY062-Garber May 25, 2005 22:16
Travel Patterns and Spatial Mapping 291
The home range of our study troop was located in a zone of dry tropicalforest situated near the small town of San Ramon at the foothills of VolcanMaderas (Figure 1). Rainfall in this region of Nicaragua is estimated between1200 and 1800 mm per year (Salas Estrada, 1993). The howler study troop wascomposed of 26–29 individuals including 10 adult females and 12 adult males.All group members were fully habituated to the presence of the observers.Between July and August 2002 (wet season), a total of 102.7 h of data werecollected on the behavior, ecology, and ranging patterns of mantled howlermonkeys. This troop has been the focus of previous field studies (Garber et al.,1999; Bezanson et al., 2001).
Behavioral Data
Behavioral data on howler activity budget, social interactions, and ranging be-havior were collected on focal animals using a 2-min instantaneous time sam-pling technique (Altmann, 1974). Feeding was defined as handling and ingest-ing plant material. Foraging was defined as localized movement in the crownof a feeding tree that was for the specific goal of encountering a food resource.Traveling involved movement between the crowns of trees or within the crownof a tree that was not directly food related. Resting was defined as a periodof inactivity. Social interactions included vocalizations directed at other groupmembers, physical contact, displacement, threats, huddling, and grooming.
During all data collecting periods, a team of two researchers were in the for-est. One researcher was responsible for collecting behavioral data and the otherresearcher was responsible for marking every tree visited by the focal animal.These trees were scored as travel trees, feeding trees, and/or resting trees. Whentraveling between feeding and resting sites, mantled howlers tend to move in asingle line progression (Carpenter, 1934; Milton, 2000), and therefore, we feelconfident that the path taken by the focal animal was similar to the path takenby other group members.
Several of the howlers in our study group were marked with identificationcollars or anklets facilitating recognition in the field. The first animal sightedon a given morning was selected as the focal animal and followed continuously.On those occasions when the focal animal was lost from view for a period of! 4 min, the next animal sighted became the focal animal. On average, thehowlers were followed continuously for 6.5 h per day for 15 consecutive days.We use this 15-day period to illustrate and explain short-term travel patterns,ranging, and patch choice in our mantled howler study group.
SVNY062-Garber May 25, 2005 22:16
292 New Perspectives in the Study of Mesoamerican Primates
Tree Use and Distribution
A trail system and map of the study group’s home range was constructed us-ing a Brunton Transit mounted on a tripod. The trail system consisted of 154marked and mapped points. In addition, each tree the focal animal was ob-served to travel, feed, and rest in (N = 250) was marked with surveyors flag-ging, assigned an identification number, and distances and angles between treeswere measured. The locations and sequential use of trees were plotted daily onthe field map. Thus, we were able to record the spatial position of individualhowlers in relation to 404 mapped points within their small home range. Dailypath lengths were calculated by measuring the straight-line distance betweensequential feeding, resting, foraging, and traveling trees directly off the fieldmap and summed. Trees were considered major feeding and resting sites if theyaccounted for at least 1% of total activity time.
Distribution of Feeding and Resting Sites and Ranging Patterns
In order to determine the spatial distribution of major feeding and resting sites,a grid divided into 25 m $ 25 m squares (N = 63) was overlaid on the fieldmap. We then tallied the number of major feeding and resting trees locatedin each of the 63 quadrats. In addition, we tallied the number of times thefocal animal entered each quadrat in order to determine patterns of habitatutilization, ranging, and the degree to which individual path segments betweenmajor feeding and resting sites were reused during the same day, reused ondifferent days, or whether howlers revisited major feeding sites using a variety ofdifferent travel routes. A route segment was defined as a travel path in which thesame three or more contiguous quadrats were visited and revisited in sequence(i.e., A–B–C = C–B–A). We also identified the order in which major feeding andresting trees were visited over the course of each day, and compared this withthe most efficient tree sequences (in terms of minimizing travel distance) to visitthese sites. An index of circuitry (actual distance/most efficient route distance)was calculated to determine the degree to which howler travel patterns wereconsistent with taking the most efficient route to visit all trees on a daily itinerary.
Habitat Visibility: Field-of-View
Given that howlers have small day ranges, use a core area extensively over alimited period of time, and tend to visit nearby trees, we collected ecological
SVNY062-Garber May 25, 2005 22:16
Travel Patterns and Spatial Mapping 293
information on tree density and stature as an estimate of habitat visibility orthe ability of a forager to sight directly from one major feeding/resting treeto another. Data on tree density were compiled in January 2004 by tallyingthe number of trees located in a hemisphere with radius of 20 m (area of628 m2) around 25 of the 27 major feeding and resting trees (two trees hadbeen damaged or could not be relocated from the previous field season). Thesesampled plots represent approximately 40% of the core area used by the howlersduring our study. For each tree located in the plot with a height of greater than3 m and a diameter at breast height (DBH) of greater than 15 cm (>45 cmcircumference at breast height), we estimated tree height and crown height andmeasured DBH.
For each of the 25 major feeding and resting trees, we measured crowndiameter in two cardinal directions, DBH, as well as estimated tree heightand crown height. We also scored the shape of the tree crown (i.e. circular,ellipsoid, rectangle, square, cone) and used the appropriate volumetric formulato determine crown volume from crown height and diameter
In order to obtain an estimate of a howler’s “field-of-view”, we used theecological information obtained in each plot to reconstruct visibility at the top,middle, or bottom of the crown for each major feeding or resting tree. Thefield-of-view was based on the tree’s height and crown dimensions, as well asthe number, height, and crown dimensions of other trees in each plot thatobstruct the foragers’ view at a particular location in the canopy. For example,if the crowns of 6 of 12 of the surrounding trees overlapped with the height atthe top of the crown of the major tree, a 50% field-of-view score was assigned forthat height. If in that same tree, 10 of 12 of the surrounding trees obstructed theview when a howler was located in the middle of the crown, then a 16% field-of-view score was assigned for that height. Although our field-of-view indexis at best only a crude and relative measure of the degree to which howlerscould sight directly to a subsequent feeding/resting site, we use these datato determine whether howler traveling paths were different when travelingbetween less visible and more visible targets or goals.
RESULTS
Over the course of 15 consecutive observation days, members of our howlerstudy group exploited a home range of 3.9 ha, and fed, rested, and traveled in250 trees. The mean number of trees visited per day was 40.6 (±15.7) and mean
SVNY062-Garber May 25, 2005 22:16
294 New Perspectives in the Study of Mesoamerican Primates
R
R R FR
R R
FR R
R R
R F R F FR R
R
F F
F
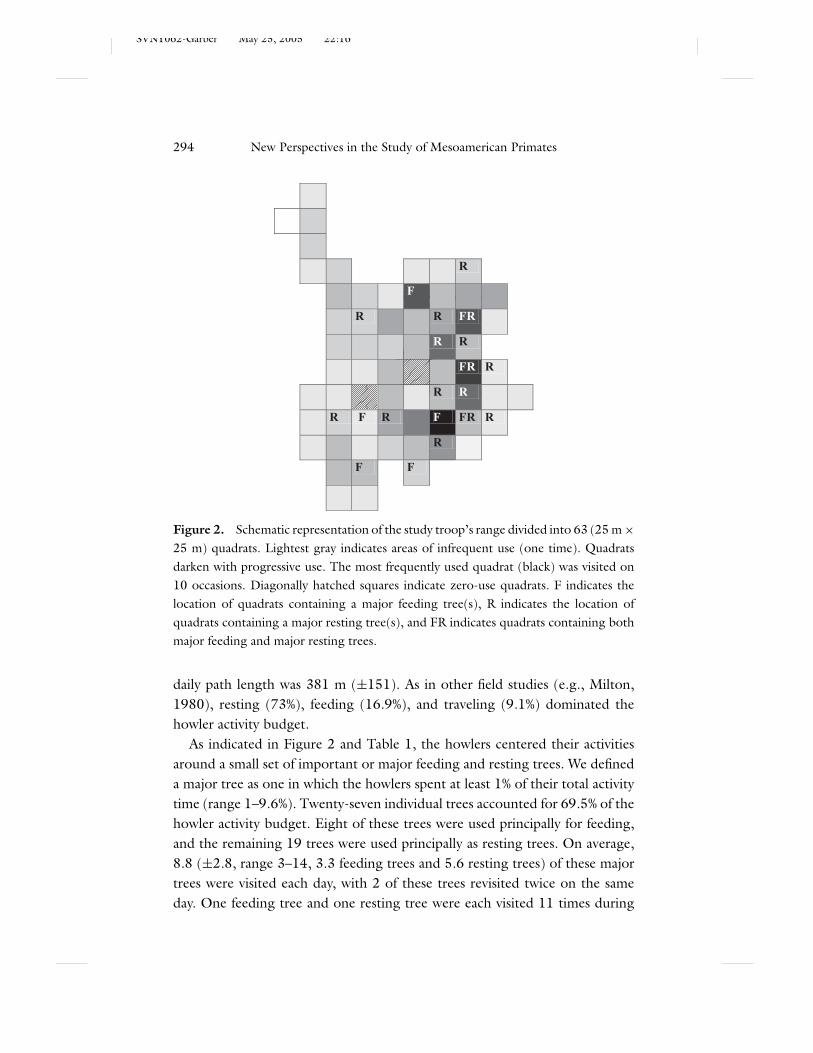
Figure 2. Schematic representation of the study troop’s range divided into 63 (25 m $25 m) quadrats. Lightest gray indicates areas of infrequent use (one time). Quadratsdarken with progressive use. The most frequently used quadrat (black) was visited on10 occasions. Diagonally hatched squares indicate zero-use quadrats. F indicates thelocation of quadrats containing a major feeding tree(s), R indicates the location ofquadrats containing a major resting tree(s), and FR indicates quadrats containing bothmajor feeding and major resting trees.
daily path length was 381 m (±151). As in other field studies (e.g., Milton,1980), resting (73%), feeding (16.9%), and traveling (9.1%) dominated thehowler activity budget.
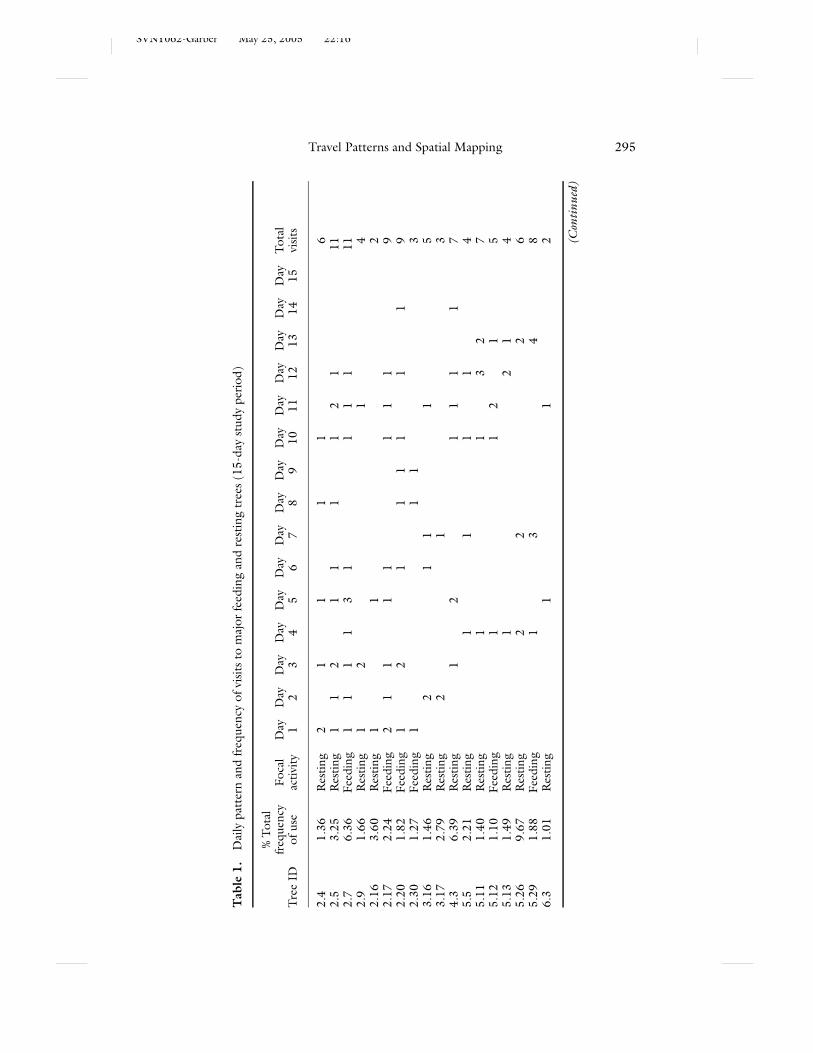
As indicated in Figure 2 and Table 1, the howlers centered their activitiesaround a small set of important or major feeding and resting trees. We defineda major tree as one in which the howlers spent at least 1% of their total activitytime (range 1–9.6%). Twenty-seven individual trees accounted for 69.5% of thehowler activity budget. Eight of these trees were used principally for feeding,and the remaining 19 trees were used principally as resting trees. On average,8.8 (±2.8, range 3–14, 3.3 feeding trees and 5.6 resting trees) of these majortrees were visited each day, with 2 of these trees revisited twice on the sameday. One feeding tree and one resting tree were each visited 11 times during
SVNY062-Garber May 25, 2005 22:16
Travel Patterns and Spatial Mapping 295
Tab
le1.
Dai
lypa
tter
nan
dfr
eque
ncy
ofvi
sitst
om
ajor
feed
ing
and
rest
ing
tree
s(15
-day
stud
ype
riod)
%To
tal
freq
uenc
yFo
cal
Day
Day
Day
Day
Day
Day
Day
Day
Day
Day
Day
Day
Day
Day
Day
Tota
lTr
eeID
ofus
eac
tivity
12
34
56
78
910
1112
1314
15vi
sits
2.4
1.36
Res
ting
21
11
16
2.5
3.25
Res
ting
11
21
11
12
111
2.7
6.36
Feed
ing
11
11
31
11
111
2.9
1.66
Res
ting
12
14
2.16
3.60
Res
ting
11
22.
172.
24Fe
edin
g2
11
11
11
19
2.20
1.82
Feed
ing
12
11
11
11
92.
301.
27Fe
edin
g1
11
33.
161.
46R
estin
g2
11
15
3.17
2.79
Res
ting
21
34.
36.
39R
estin
g1
21
11
17
5.5
2.21
Res
ting
11
11
45.
111.
40R
estin
g1
13
27
5.12
1.10
Feed
ing
11
21
55.
131.
49R
estin
g1
21
45.
269.
67R
estin
g2
22
65.
291.
88Fe
edin
g1
34
86.
31.
01R
estin
g1
12 (C
onti
nued
)
SVNY062-Garber May 25, 2005 22:16
296 New Perspectives in the Study of Mesoamerican Primates
Tab
le1.
Dai
lypa
tter
nan
dfr
eque
ncy
ofvi
sitst
om
ajor
feed
ing
and
rest
ing
tree
s(15
-day
stud
ype
riod)
(Con
tinu
ed)
%To
tal
freq
uenc
yFo
cal
Day
Day
Day
Day
Day
Day
Day
Day
Day
Day
Day
Day
Day
Day
Day
Tota
lTr
eeID
ofus
eac
tivity
12
34
56
78
910
1112
1314
15vi
sits
6.4
2.21
Res
ting
11
11
11
67.
102.
63R
estin
g1
12
7.3
2.04
Feed
ing
11
28.
91.
27R
estin
g1
23
10.1
62.
50Fe
edin
g1
12
10.2
41.
88R
estin
g1
12
11.1
1.40
Res
ting
41
515
.15
2.30
Res
ting
11
16.1
82.
37R
estin
g1
21
4F
tree
visit
s5
24
35
43
42
34
35
11
3.26
7M
ean
Rtr
eevi
sits
55
65
63
63
66
710
95
25.
6M
ean
Indi
vidu
altr
eevi
sits
85
77
87
67
59
910
85
36.
93M
ean
Tota
lvisi
ts/
day
107
108
117
97
89
1113
146
38.
867
Mea
n
Rev
isits
per
day
22
31
30
30
30
23
61
12
Mea
n
The
%tot
alfr
eque
ncy
ofus
efr
omco
lum
n2
does
note
qual
100%
(see
text
).
SVNY062-Garber May 25, 2005 22:16
Travel Patterns and Spatial Mapping 297
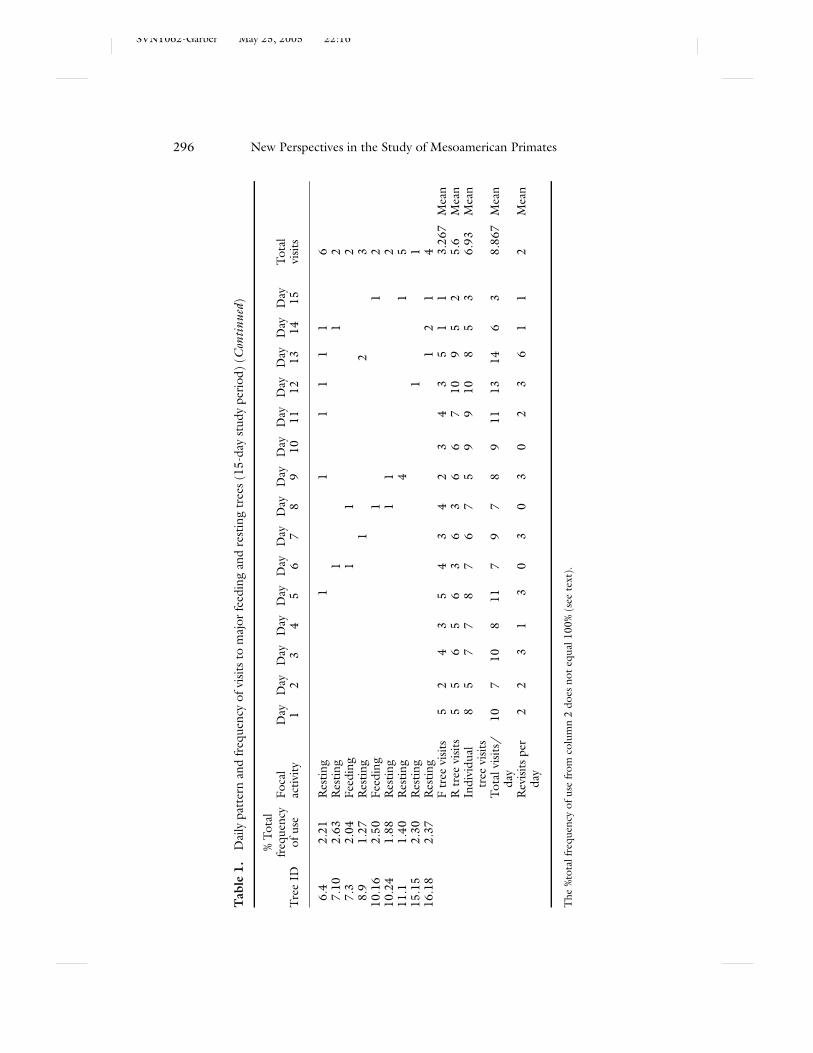
the 15 consecutive day study period. Trees revisited on the same day wereused primarily as resting sites. We direct the remainder of our analysis to ex-amine resource use, distribution, and ranging patterns associated with these 27trees.
Forest Profile and Tree Density
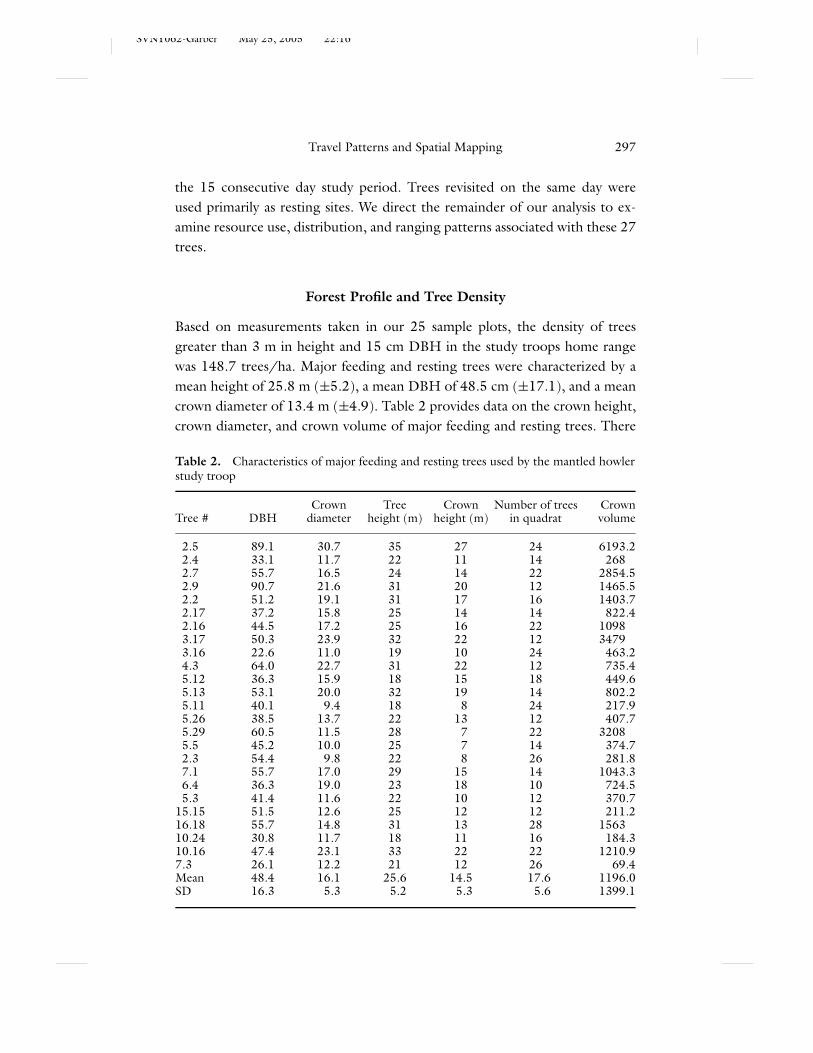
Based on measurements taken in our 25 sample plots, the density of treesgreater than 3 m in height and 15 cm DBH in the study troops home rangewas 148.7 trees/ha. Major feeding and resting trees were characterized by amean height of 25.8 m (±5.2), a mean DBH of 48.5 cm (±17.1), and a meancrown diameter of 13.4 m (±4.9). Table 2 provides data on the crown height,crown diameter, and crown volume of major feeding and resting trees. There
Table 2. Characteristics of major feeding and resting trees used by the mantled howlerstudy troop
Crown Tree Crown Number of trees CrownTree # DBH diameter height (m) height (m) in quadrat volume
2.5 89.1 30.7 35 27 24 6193.22.4 33.1 11.7 22 11 14 2682.7 55.7 16.5 24 14 22 2854.52.9 90.7 21.6 31 20 12 1465.52.2 51.2 19.1 31 17 16 1403.72.17 37.2 15.8 25 14 14 822.42.16 44.5 17.2 25 16 22 10983.17 50.3 23.9 32 22 12 34793.16 22.6 11.0 19 10 24 463.24.3 64.0 22.7 31 22 12 735.45.12 36.3 15.9 18 15 18 449.65.13 53.1 20.0 32 19 14 802.25.11 40.1 9.4 18 8 24 217.95.26 38.5 13.7 22 13 12 407.75.29 60.5 11.5 28 7 22 32085.5 45.2 10.0 25 7 14 374.72.3 54.4 9.8 22 8 26 281.87.1 55.7 17.0 29 15 14 1043.36.4 36.3 19.0 23 18 10 724.55.3 41.4 11.6 22 10 12 370.7
15.15 51.5 12.6 25 12 12 211.216.18 55.7 14.8 31 13 28 156310.24 30.8 11.7 18 11 16 184.310.16 47.4 23.1 33 22 22 1210.97.3 26.1 12.2 21 12 26 69.4Mean 48.4 16.1 25.6 14.5 17.6 1196.0SD 16.3 5.3 5.2 5.3 5.6 1399.1
SVNY062-Garber May 25, 2005 22:16
298 New Perspectives in the Study of Mesoamerican Primates
were no statistically significant differences in any of these features between majorfeeding trees and major resting trees. A comparison (Table 2) with other treesmeasured in these quadrats indicates that major feeding and resting trees were ofsignificantly greater stature (t = 1.65, df = 244, p < 0.0002), DBH (t = 1.96,df = 244, p < 0.0008), and crown diameter (t = 1.97, df = 244, p < 0.0003).In 64% of sample plots, a major tree was the tallest or second tallest tree in thearea.
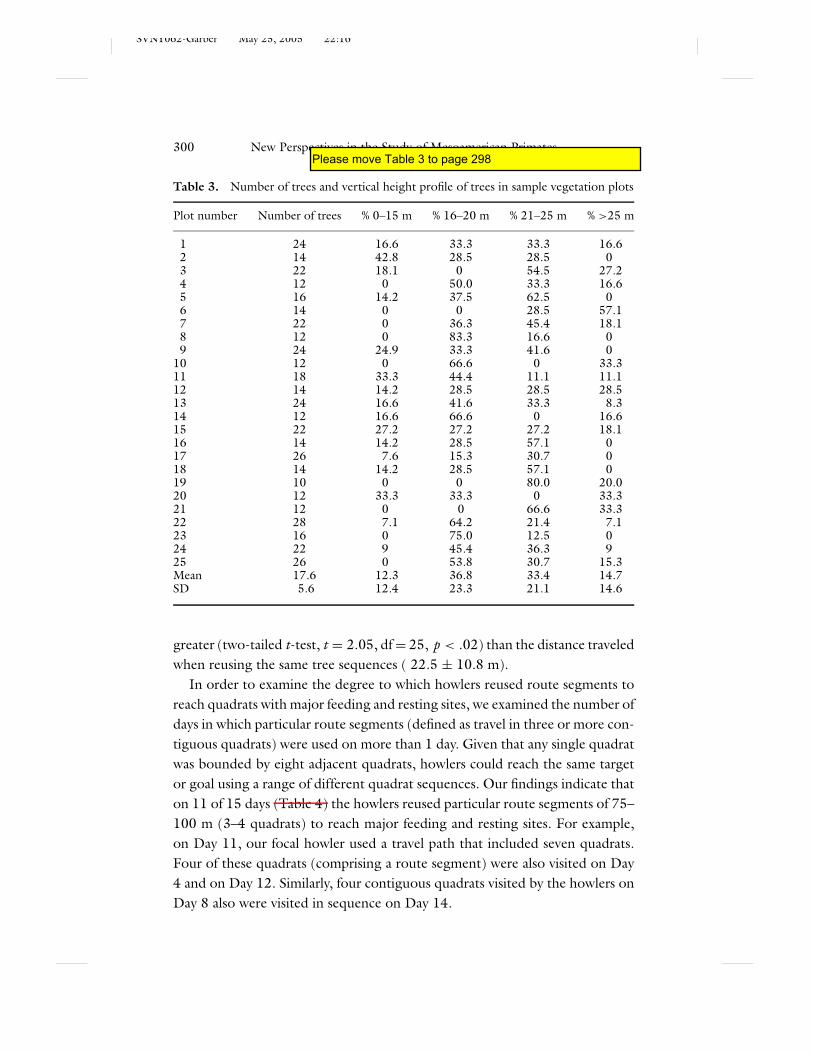
Based on our 25 sample vegetation plots, there was evidence that the sizeand number of trees were not uniformly distributed throughout the groups’home range. The number of trees per plot ranged from 10 to 28 (mean = 17.6± 5.6). The vertical height profile of trees in these plots also varied, with eightplots having no trees over 25 m and four plots with at least one-third of all treesgreater than 25 m. Given these differences in tree density and tree stature, itis likely that certain parts of the forest offer howlers greater opportunities forcontinuous and relatively straight-line travel routes than others.
Visibility in the Canopy
In addressing questions of spatial memory, it is important to obtain a measureof the likelihood that a forager can sight directly from one goal to the next (see“Methods”). A howler with a direct field-of-view is not required to maintain acomplex spatial representation of the landscape in order to take least distanceroutes when traveling between sequential feeding and resting sites. Assumingthat major trees were the targets or goals, we determined the degree to which aforager had an unobstructed view over a minimum distance of 20 m if positionedin the lower, middle, or upper zones of the tree crown.
Our results indicate that when located in the lowest third of the crown of amajor feeding or resting tree, on average 54.7% of the surrounding tree crownsobstructed the howlers’ field-of-view (range: 0–100%). When positioned in themiddle third of the crown, 68.4% (range: 12–100%) of the view was obstructed,and when positioned in the top of the crown of a major tree 22.9% (range0–100%) of the view was obstructed. Values for field-of-view in the lowestlevels of the tree crown are likely to represent minimum values given that wedid not include in our ecological sample trees less than 15 cm DBH and 3 min height. Such trees are common in the howlers’ home range and many haveheight profiles that extend into and filter visual information in the lowest levelsof the major tree crowns.
Please move Table 3 to here
SVNY062-Garber May 25, 2005 22:16
Travel Patterns and Spatial Mapping 299
Given that howlers are reported to spend the majority of their time in theupper and middle levels of the tree crown (Carpenter, 1934), we comparedthe number of days howlers visited major resting and feeding trees with thefield-of-view at the top and middle zones of the crown for that tree. We foundthat trees with high field-of-view scores (70–100% visibility) in the upper crownwere visited on average 4.9 ± 2.8 times over the course of 15 consecutive days,whereas trees with lower visibility (37–50% visibility) were visited only 2.8 ± 1.1times (t = 2.5, df = 25, p = .009). A similar situation occurred using field-of-view scores at the mid-level of the tree crown. Trees with low visibility (12–50%)were visited less frequently (3.5 times per tree) than trees with higher visibilityscores (57–100%, visited 4.75 times per tree). This latter comparison, however,did not reach statistical significance (t = 1.14, df = 23, p = 0.13).
Distribution of Feeding and Resting Sites
In order to determine the distribution of howler resting and feeding sites, wedivided the home range into 63 (25 m $ 25 m) quadrats. Thirteen of these(20.6%) contained one major tree, four (6.3%) contained two major trees, andtwo (3.1%) each contained three major trees. In these latter two quadrats, onecontained three resting trees, while the other included two resting and onemajor feeding tree. Seventy-one percent of quadrats did not contain a majorfeeding or resting tree. Each of the eight major feeding trees was distributed ina different quadrat and spatially restricted to an area of 1.1 ha within the 3.9 hacore areas used during this study (see Figure 2). However, given the small sizeof this core area, and the fact that mean distances between nearest neighborfeeding and resting trees was only 24.7 m (±17.6), these trees were found tobest approximate a uniform distribution (R = 1.23, Z = 2.38, p = .0084).
Ranging Pattern and Use of Major Feeding and Resting Sites
To examine howler foraging strategies and travel patterns, we counted thenumber of times the howlers visited each of the major feeding trees, and howfrequently visits to major feeding trees were from different previous trees ordirections (Table 3). Of the 31 visits to major feeding trees, 38.7% (n = 12)were from the same previous tree, but 61.3% (n = 19) were from differentprevious trees and directions. The mean distance traveled when selecting newtree sequences and directions was 44.7 m (±29.3), which was significantly
SVNY062-Garber May 25, 2005 22:16
300 New Perspectives in the Study of Mesoamerican Primates
Table 3. Number of trees and vertical height profile of trees in sample vegetation plots
Plot number Number of trees % 0–15 m % 16–20 m % 21–25 m % >25 m
1 24 16.6 33.3 33.3 16.62 14 42.8 28.5 28.5 03 22 18.1 0 54.5 27.24 12 0 50.0 33.3 16.65 16 14.2 37.5 62.5 06 14 0 0 28.5 57.17 22 0 36.3 45.4 18.18 12 0 83.3 16.6 09 24 24.9 33.3 41.6 0
10 12 0 66.6 0 33.311 18 33.3 44.4 11.1 11.112 14 14.2 28.5 28.5 28.513 24 16.6 41.6 33.3 8.314 12 16.6 66.6 0 16.615 22 27.2 27.2 27.2 18.116 14 14.2 28.5 57.1 017 26 7.6 15.3 30.7 018 14 14.2 28.5 57.1 019 10 0 0 80.0 20.020 12 33.3 33.3 0 33.321 12 0 0 66.6 33.322 28 7.1 64.2 21.4 7.123 16 0 75.0 12.5 024 22 9 45.4 36.3 925 26 0 53.8 30.7 15.3Mean 17.6 12.3 36.8 33.4 14.7SD 5.6 12.4 23.3 21.1 14.6
greater (two-tailed t-test, t = 2.05, df = 25, p < .02) than the distance traveledwhen reusing the same tree sequences ( 22.5 ± 10.8 m).
In order to examine the degree to which howlers reused route segments toreach quadrats with major feeding and resting sites, we examined the number ofdays in which particular route segments (defined as travel in three or more con-tiguous quadrats) were used on more than 1 day. Given that any single quadratwas bounded by eight adjacent quadrats, howlers could reach the same targetor goal using a range of different quadrat sequences. Our findings indicate thaton 11 of 15 days (Table 4) the howlers reused particular route segments of 75–100 m (3–4 quadrats) to reach major feeding and resting sites. For example,on Day 11, our focal howler used a travel path that included seven quadrats.Four of these quadrats (comprising a route segment) were also visited on Day4 and on Day 12. Similarly, four contiguous quadrats visited by the howlers onDay 8 also were visited in sequence on Day 14.
Please move Table 3 to page 298

SVNY062-Garber May 25, 2005 22:16
Travel Patterns and Spatial Mapping 301
Table 4. Data on the frequency with which howlers revisited individual feeding treesand the frequency those visits were associated with different travel routes
Number of total visits Number of times visited fromFeeding tree ID to feeding tree difference previous tree
2.7 6 42.17 5 32.20 7 52.30 3 35.12 4 35.29 3 17.3 2 2
10.16 1 1Total 31 22
The Traveling Salesperson Problem
To examine the degree to which howler daily ranging patterns were consistentwith a distance-limiting travel itinerary, we examined the sequence of visits tomajor feeding and resting trees (average 8.8) over the course of each day. Ourresults (see Table 5) indicate that on 12 of 15 days, the howlers visited thesetrees in a highly efficient sequence, traveling 0–4% more than the most efficient
Table 5. Comparison of the actual distance traveled by howlers compared to the leastdistance routes between feeding and resting sites (index of circuity is defined in text)
Number of Distance Most efficient Index ofDay nodes traveled (m) route (m) circuitry
1 8 193.5 193.5 12 3 41.5 41.5 13 6 150 150 14 8 151 151 15 9 138.5 138.5 16 8 224.5 166 1.3527 6 125 125 18 7 200.5 192.5 1.0419 5 131 131 1
10 6 152.5 124 1.22511 9 271 231 1.17312 11 230 230 113 9 213 213 114 4 144.5 142.5 1.01415 3 173.5 173.5 1
Sum 2540 2403 15.805Mean 169.3 160.2 1.1

SVNY062-Garber May 25, 2005 22:16
302 New Perspectives in the Study of Mesoamerican Primates
route. Over the entire 15-day sample period, the circuity index, or the actualdistance traveled by the howlers compared to the most efficient daily route, was1.05. Thus, the howlers visited trees in a sequence that resulted in an increasein travel distance of only 5% more than that required by selecting the mostefficient tree sequence. These data indicate that at our study site, howlers haveaccess to and consistently use and reuse travel paths that offer them direct orrelatively straight-line routes to important feeding and resting sites.
DISCUSSION
Recent studies of primate cognitive ecology have examined the kinds of in-formation primates use in decision-making and the spatial strategies primatesemploy in traveling between distant feeding sites or what has been referred to aslarge-scale space (Menzel, 1973; Garber, 1989, 2000; Poucet, 1993; Menzel,1996; Dyer, 1998; Janson, 1998; Menzel et al., 2002). In general, foragersare expected to track their movements in space using a number of differentcognitive mechanisms (Garber and Hannon, 1993; Dyer, 2000; Garber, 2000;Roberts, 2001). These may include path integration (an egocentric frame ofreference in which an individual tracks its movements from a starting point toa goal and then returns by computing a direct or short distance route), use ofsystematic foraging rules to reduce opportunities for backtracking or recross-ing paths (for example, travel in a straight-line for some distance and then turnright, if food is not found, continue in same direction and then turn left), sight-ing directly to a feeding site or a landmark in spatial association to a feeding site,navigating using olfactory or acoustic information, or piloting (encoding thespatial positions of multiple landmark cues to find a target). These mechanismsmay be hierarchical or act in concert, depending on the cognitive abilities ofthe forager and the particular spatial problem encountered (Roberts, 2001).
Although it is possible that individuals in some nonhuman primate speciesmaintain an accurate spatial representation of salient features of the environ-ment as a set of geometric coordinates in large-scale space (real distance anddirection vectors, i.e., vector map defined by Byrne (2000) or mental map asdefined by Dyer (2000)), at present there is little empirical evidence to supportthis (Byrne, 2000; Garber, 2000). In this regard, Poucet (1993) has proposeda model of spatial cognition in which landmarks and travel routes in large-scale space are encoded as topological or route-based representations (i.e., net-work map, Byrne, 2000). In this model, place is encoded as a learned network
SVNY062-Garber May 25, 2005 22:16
Travel Patterns and Spatial Mapping 303
of travel routes, fixed points (nodes), landmarks, and topological features ofthe environment. Within such a network, there may be multiple routes oftravel between sequential feeding sites, but foragers are constrained to “known”routes and path sequences (Poucet, 1993; Garber, 2000). This description ofa topological-based spatial representation is consistent with patterns of traveland foraging in mixed species troops of wild mustached (Saguinus mystax) andsaddleback tamarins (Saguinus fuscicollis) in Peru. Garber (2000) reports thatwithin the 40 ha home range of the study troop there existed a set of frequentlyused turning areas or switch points (18 of 144–50 m $ 50 m quadrats) thatappeared to function in reorienting travel. The tamarins used these quadratsto reach parts of their home range that contained productive feeding sites.Travel patterns consistent with network or route-based “maps” have been re-ported in other primates including hamadryas baboons (Sigg and Stolba, 1981),proboscis monkeys (Boonratana, 2000), orangutans (MacKinnon, 1974), spi-der monkeys (van Roosmalen, 1985; Milton, 1988), and Panamanian mantledhowler monkeys (Milton, 1988).
In the present study, we found that Nicaraguan mantled howler monkeysuse efficient routes to visit and revisit major feeding and resting sites. Duringthe course of our study we identified 27 individual trees that served as majorfeeding and resting sites. These trees were the focus of howler ranging patternsand activity budget. Nicaraguan howlers commonly visited these trees using adistance-limiting travel itinerary. Given that many of these trees were distributedwithin a circumscribed area and were among the tallest trees in the groups’ homerange, in some cases the howlers had access to visual cues that enabled them tosight directly from their present location to a potential feeding site. We found,for example, that feeding and resting trees that were characterized by field-of-view indices were visited more frequently than trees characterized by lowervisibility. In some cases, howlers as well as other primates may prefer to feed,rest, and/or travel in the upper parts of the canopy because this provides thenwith a less obstructed field-of-view in locating resources, spatial landmarks, andpossibly predators.
We also present evidence that howlers commonly visited the same targetfeeding and resting sites from several different previous directions and distances.In these cases, howler movement patterns provide information concerning howspatial information is likely represented in a mental map. Our results indicatethat travel was principally route-based, with certain path segments reused severaltimes and across different days during our study. This is consistent with data
SVNY062-Garber May 25, 2005 22:16
304 New Perspectives in the Study of Mesoamerican Primates
collected by Milton (1980) in a long-term study of ranging patterns of mantledhowler monkeys on Barro Colorado Island, Panama. As in our study, Milton(1980: 105) identified particular arboreal pathways that spanned “a distanceof approximately 100 m or more, connected important pivotal trees . . . ”, andwere reused by howlers on numerous occasions.
Using a limited number of pathways to reach a goal offers an advantagebecause single landmarks provide their most precise spatial information whenviewed from the same perspective or orientation (Byrne, 2000). When ap-proached from a different perspective, a forager may fail to recognize the cor-rect distance, angle, or view between the landmark and the goal. This mayexplain, in part, why many primate species are reported to reuse paths and pathsegments during travel. However, in both our study and Milton’s (1980) studymantled howlers also were found to take direct but alternate routes to reachthe same target feeding or resting site. This suggests that mantled howlers (a)individually encode many different views of a single landmark to relocate eachimportant feeding and resting sites, (b) encode views from several differentindividual landmarks to relocate a given goal, or (c) views using two or morelandmarks are encoded together to relocate the goal (i.e., piloting) (Cheng andSpetch, 1998). Although the use of multiple landmarks to encode spatial in-formation may require an increased capacity to store and integrate a relativelylarge number of points in the environment, Kamil and Cheng (2001: 107)argue that the use of “multiple landmarks functions to increase dramaticallythe precision of searching in the face of errors in the estimation of distanceor direction”. Although we lack sufficient information to identify salient fea-tures of the landscape that may be used by howlers as landmarks to orientand reorient the direction of travel, it is likely that members of our howlerstudy troop maintained information of the locations of numerous intersectingroutes of travel and landmarks within their home range. Reuse of these routesegments is consistent with a typological spatial representation (i.e., networkmap).
Finally, in the current study we monitored howler ranging activities, foragingbehavior, and use of feeding and resting trees during a period of only 15 con-secutive days. It is likely that howlers exhibit a wider range of spatial strategiesthan we observed; however, the patterns documented in Nicaraguan mantledhowlers were extremely similar to patterns documented in more long-term stud-ies of mantled howlers on Barro Colorado Island, Panama (Carpenter, 1934;Milton, 1980, 1988, 2000). Isla de Ometepe (dry tropical forest) and Barro
SVNY062-Garber May 25, 2005 22:16
Travel Patterns and Spatial Mapping 305
Colorado Island (tropical rainforest) represent forests of very different stature,tree species composition, and level of human disturbance. Despite the fact thatmantled howlers on Ometepe occupied small home ranges of 3–4 ha and themantled howlers on BCI exploited home ranges of 30–40 ha, in each habitatindividuals appeared to rely on a complex set of cognitive mechanisms and spa-tial memory to efficiently travel between major resting and feeding sites. In thisregard, studies of cognition in other New World primates offer important com-parative models for examining whether species that exploit larger home ranges,larger day ranges, and/or more highly dispersed or ephemeral resources (i.e.,other Atelines, Cebus, Saimiri, Saguinus, Callimico, Leontopithecus, and Caca-jao) or species that exploit small ranges and focus their daily activities around alimited set of productive feeding sites (i.e., some gum-feeding marmosets suchas Callithrix jacchus andCebuella pygmaea and other species of Alouatta) relyon different types of social, spatial, and ecological information and mental mapsin locating resources.
SUMMARY
In this study, we examined questions of spatial memory and the travel routestaken by Nicaraguan mantled howler monkeys (Alouatta palliata) when mov-ing between major feeding and resting sites. Studies of primate foraging andranging behavior indicate evidence of goal-directed travel and relatively straight-line movement between sequential feeding sites. In the case of mantled howlerson BCI, Panama, Milton (1980) has argued that over the course of severalweeks, group members center their feeding, resting, and ranging activities ona small set of pivotal trees that are visited several times daily. The degree towhich howlers use topological (route-based) spatial representations or geomet-ric (coordinate-based) spatial representations to locate and revisit these feedingand resting sites remains unclear.
In order to address questions concerning goal-directed travel and spatialmemory, we mapped the travel routes taken by a troop of 26–29 mantledhowlers inhabiting Estacion Biologica de Ometepe located on Isla de Ometepe,Nicaragua. Behavioral data were collected during July and August 2002. Overthe course of 15 days and 103 h of observation, all trees the howlers wereobserved to travel, feed, and rest in were marked (N = 250), and distances andangles between trees were measured and mapped. Travel routes were identifiedby following a focal individual for 6–8 h per day.
SVNY062-Garber May 25, 2005 22:16
306 New Perspectives in the Study of Mesoamerican Primates
The mean number of trees visited per day was 40.6 and mean daily path lengthwas 381 m. Overall, howlers were found to take direct routes to feeding andresting sites, and reuse the same route segments on several occasions. Based ondata on canopy visibility, tree distribution, and the distance between sequentialfeeding sites, howlers appear to rely on particular landmark cues to orient andreorient their direction of travel. These results are consistent with the hypothesisthat members of our howler study troop maintained information of the locationsof numerous intersecting routes of travel and landmarks within their homerange. Reuse of these route segments is consistent with a typological or route-based spatial representation.
ACKNOWLEDGMENTS
The authors would like to acknowledge Michelle Bezanson, Anneke DeLuycker,Teague O’Mara, Bernardo Urbani, and Melissa Raguet-Schofield for criticalassistance in collecting behavioral and ecological data in the field. PEJ thanksRudolfo and his two sons for their invaluable assistance in tracking the howlers.We thank Don Rene Molina, Dona Lilian Molina, and Alvaro Molina for theirgenerosity, support, and efforts in maintaining Estacion Biologica de Ometepe.Sara Garber provided assistance in the field and calculated crown volumes ofmajor feeding and resting trees. As always PAG thanks Sara and Jenni for alwaysbeing Sara and Jenni.
REFERENCES
Altmann, J. 1974, Observational study of behaviour: Sampling methods. Behaviour49:227–265.
Altmann, S. A. 1974, Baboons: Space, time, and energy. Am. Zool. 14:221–248.Bezanson, M. F., Garber, P. A., and DeLuycker, A. M. 2001, Patterns of subgroup-
ing and spatial affiliation in a community of mantled howling monkeys (Alouattapalliata). Am. J. Phys. Anthropol. 32(Suppl): 39–40.
Bicca-Marques, J. C. and Garber, P. A. 2004, The use of visual, olfactory, and spatialinformation during foraging in wild nocturnal and diurnal anthropoids: A comparisonamong Aotus, Callicebus, and Saguinus. Am. J. Primatol. 62:171–187.
Biegler, R. and Morris, R. G. M. 1996, Landmark stability: Further studies pointing toa role in spatial learning. Q. J. Exp. Psychol. 49:307–345.
Boonratana, R. 2000, Ranging behavior of proboscis monkey (Nasalis larvatus) in thelower Kinabatanjan, Northern Borneo. Int. J. Primatol. 21:497–518.
please put a ~ on the n of Dona
SVNY062-Garber May 25, 2005 22:16
Travel Patterns and Spatial Mapping 307
Byrne, R. W. 2000, How monkeys find their way: Leadership, coordination, and cogni-tive maps of African baboons, in: S. Boinski and P. A. Garber, eds., On the Move:How and Why Animals Travel in Groups, University of Chicago Press, Chicago,pp. 491–518.
Carpenter, C. R. 1934, A field study of the behavior and social relations of howlingmonkeys. Comp. Psychol. Monogr. 10:1–168.
Chapman, C. A., Chapman, L. J, and McLaughlin, R. L. 1989, Multiple centralplace foraging by spider monkeys: Travel consequences of using many sleepingsites.Oecologia 79:506–511.
Cheng, K. and Spetch, M. L. 1998, Mechanisms of landmark use in mammals andbirds, in: S. D. Healy, ed., Spatial Representation in Animals, Oxford UniversityPress, Oxford, pp. 1–17.
Clark, P. J. and Evans, F. C. 1954, Distance to nearest neighbor as a measure of spatialrelationships in populations. Ecology 35:445–453. Author: Please
cite reference“Clark andEvans, 1954”in the text.
Crockett, C. M. 1998, Conservation biology of the genus Alouatta. Int. J. Primatol.19:549–578.
Dyer, F. C. 1991, Bees acquire route-based memories but not cognitive maps in afamiliar landscape. Anim. Behav. 41:239–246.
Dyer, F. C. 1998, Cognitive ecology of navigation, in: R. Dukas, ed., Cognitive Ecology,University of Chicago Press, Chicago, pp. 201–260.
Dyer, F. C. 2000, Group movement and individual cognition: Lessons from socialinsects, in: S. Boinski and P. A. Garber, eds., On the Move: How and Why AnimalsTravel in Groups, University of Chicago Press, Chicago, pp. 127–164.
Gallistel, C. R. and Cramer, A. E. 1996, Computations on metric maps in mammals:Getting oriented and choosing a muti-destinational route. J. Exp. Biol. 199:211–217.
Garber, P. A. 1987, Foraging strategies among living primates. Ann. Rev. Anthropol.16:339–364.
Garber, P. A. 1989, Role of spatial memory in primate foraging patterns: Saguinusmystax and Saguinus fuscicollis. Am. J. Primatol. 19:203–216.
Garber, P. A. 2000, Evidence for the use of spatial, temporal, and social information byprimate foragers, in: S. Boinski and P. A. Garber, eds., On the Move: How and WhyAnimals Travel in Groups, University of Chicago Press, Chicago, pp. 261–298.
Garber, P. A. and Hannon, B. 1993, Modeling monkeys: A comparison of computergenerated and naturally occurring foraging patterns in 2 species of neotropical pri-mates. Int. J. Primatol. 14:827–852.
Garber, P. A., Pruetz, J. D., Lavallee, A. C., and Lavallee, S. G. 1999, A preliminarystudy of mantled howling monkey (Alouatta palliata) ecology and conservation onIsla de Ometepe, Nicaragua. Neotrop. Primates 7:113–117.

SVNY062-Garber May 25, 2005 22:16
308 New Perspectives in the Study of Mesoamerican Primates
Gibson, B. M. and Kamil, A. C. 2001, Test for cognitive mapping in Clark’s nutcrackers(Nucifraga columbiana). J. Comp. Pyschol. 115:403–407.
Janson, C. 1998, Experimental evidence for spatial memory in wild capuchin monkeys,Cebus apella. Anim. Behav. 55:1229–1243.
Janson, C. H. and Di Bitetti, M. S. 1997, Experimental analysis of food detection incapuchin monkeys: Effects of distance, travel speed, and resource size. Behav. Ecol.Sociobiol. 41:17–24.
Kamil A. C. and Cheng, K. 2001, Way-finding and landmarks: The multiple-bearingshypothesis. J. Exp. Biol. 204:103–113.
MacKinnon, J. 1974, The behaviour and ecology of wild orang-utans (Pongo pygmaeus).Anim. Behav. 22:3–74.
Menzel, C. 1996, Structure-guided foraging in long-tailed macaques. Am. J. Primatol.38:117–132.
Menzel, C. R., Savage-Rumbaugh, E. S., and Menzel, E. W. Jr. 2002, Bonobo (Panpansicus) spatial memory and communication in a 20-hectare forest. Int. J. Primatol.23:601–620.
Menzel, E. W. 1973, Chimpanzee spatial memory organization. Science 182:943–945.Milton, K. 1980, The Foraging Strategy of Howler Monkeys: A Study in Primate Eco-
nomics. Columbia University Press, New York.Milton, K. 1981, Diversity of plant foods in tropical forests as a stimulus to mental
development in primates. Am. Anthropol. 83:534–548.Milton, K. 1988, Foraging behavior and the evolution of primate cognition, in:
R. W. Byrne and A. Whiten, eds., Machiavellian Intelligence: Social Expertise andthe Evolution of Intellect in Monkeys, Apes, and Humans, Clarendon Press, Oxford,pp. 285–305.
Milton, K. 2000, Quo vadis? Tactics of food search and group movements in primatesand other animas, in: S. Boinski and P. A. Garber, eds., On the Move: How and WhyAnimals Travel in Groups, University of Chicago Press, Chicago, pp. 375–417.
Poucet, B. 1993, Spatial cognitive maps in animals: New hypotheses on their structureand neural mechanisms, Psychol. Rev. 100:163–182.
Roberts, W. A. 2001, Spatial representation and the use of spatial codes in animals, in:M. Gattis, ed., Spatial Schemas and Abstract Thought, MIT Press, Cambridge, MA,pp. 15–44.
Salas Estrada, J. B. 1993, Arboles de Nicaragua. Instituto Nicaraguense de RecursosNaturales Y del Ambiente, Managua, Nicaragua.
Shettleworth, S. J. 1998, Cognition, Evolution, and Behavior. Oxford University Press,Oxford.
Sigg, J. and Stolba, J. 1981, Home range and daily march in a hamadryas baboon troop.Folia Primatol. 36:40–75.
SVNY062-Garber May 25, 2005 22:16
Travel Patterns and Spatial Mapping 309
Tomasello, M. and Call, J. 1997, Primate Cognition. Oxford University Press, Oxford.Valone, T. J. 1989, Group foraging: Pubic information, and patch estimation. Oikos
56:357–363.van Roosmalen, M. G. M. 1985, Habitat preferences, diet, feeding strategy and social
organization of the black spider monkey (Ateles paniscus paniscus Linnaeus 1758) inSurinam. Acta Amazonia 15:7–238.

SVNY062-Garber May 25, 2005 22:16
310
Copyright © 2022 FDOKUMEN