
Trapped ions and laser cooling IV - US Government ...
208
l'rMli"lMi1ln7,„'2'' ^'"^'^° * TECH R.I.c AlllOLf TEDTT3 NIST PUBUCATIONS United States Department of Commerce Technology Administration National Institute of Standards and Technology NIST Technical Note 1380
-
Upload
khangminh22 -
Category
Documents
-
view
0 -
download
0
Transcript of Trapped ions and laser cooling IV - US Government ...

l'rMli"lMi1ln7,„'2''^'"^'^° * TECH R.I.c
AlllOLf TEDTT3
NIST
PUBUCATIONS
United States Department of CommerceTechnology AdministrationNational Institute of Standards and Technology
NIST Technical Note 1380

Technical Note 1380
Trapped Ions and Laser Cooling IVSelected publications of the Ion Storage Group of the Time and Frequency Division
Edited by
James C. Bergquist
John J. Bollinger
Wayne M. Itano
Christopher R. MonroeDavid J. Wineland
Time and Frequency Division
Physics Laboratory
National Institute of Standards and Technology
325 BroadwayBoulder, Colorado 80303
Supported in part by
U.S. Office of Naval Research
800 North Quincy
Arlington, Virginia 22217
U.S. Army Research Office
P.O. Box 12211Research Triangle Park, North Carolina 27709
January 1996
, . .—
7
^
U.S. DEPARTMENT OF COMMERCE, Ronald H. Brown, SecretaryTECHNOLOGY ADMINISTRATION, Mary L. Good, Under Secretary for TechnologyNATIONAL INSTITUTE OF STANDARDS AND TECHNOLOGY, AratI Prabhakar, Director

National Institute of Standards and Technology Technical NoteNatl. Inst. Stand. Technol., Tech. Note 1380, 204 pages (January 1996)
CODEN:NTNOEF
U.S. GOVERNMENT PRINTING OFFICEWASHINGTON: 1996
For sale by the Superintendent of Documents, U.S. Government Printing Office, Washington, DC 20402-9325

PREFACE
This collection of papers represents the work of the Ion Storage Group, Time and
Frequency Division, National Institute of Standards and Technology, from May 1992 to
January 1996. It follows the collections of papers contained in NBS Technical Note 1086,
Trapped Ions and Laser Cooling (June 1985), NIST Technical Note 1324, Trapped Ions and
Laser Cooling II (September 1988), and NIST Technical Note 1353, Trapped Ions and Laser
Cooling III (April 1992). Although the primary goal of this work has been the development
of techniques necessary for achieving high resolution spectroscopy, we have also been able to
investigate related areas of research.
Papers listed on page viii were published or prepared during the period May 1992 to
January 1996 but are not included here. Copies can be obtained on request. We intend to
update this publication periodically to include new work. We hope this collection of papers
will be useful to our colleagues in this and related fields.
We acknowledge the contributions of many colleagues to this collection. In
particular, we thank Amy Barton, Ed Bell, Dana Berkeland, Flavio Cruz, Dan Dubin, Ulli
Eichmann, Jon Gilligan, Phil Gould, Dan Heinzen, Steve Jefferts, Brana Jelenkovid, Brian
King, Dawn Meekhof, John Miller, Fred Moore, Martin Poitzsch, Mark Raizen, NormanRamsey, Max Rauner, Andy Steinbach, Carl Weimer, and Joseph Tan. We gratefully
acknowledge the continued support of the U.S. Office of Naval Research and the U.S. ArmyResearch Office. We thank Wendy Ortega Henderson for assembling this collection.
James C. Bergquist
John J. Bollinger
Wayne M. Itano
Christopher R. MonroeDavid J. Wineland
Boulder, Colorado
February 1996
m


CONTENTS
LIST OF ADDITIONAL PUBLICATIONS viii
FREQUENCY STANDARDS AND METROLOGY
1. "Laser stabilization to a single ion," J. C. Bergquist, W. M. Itano, TN-1and D. J. Wineland, in Frontiers in Laser Spectroscopy, proc.
International School of Physics < < Enrico Fermi> > , Course
CXX, ed. by T. W. Hansch and M. Inguscio (North Holland,
Amsterdam, 1994), pp. 359-376.
2. "Ionic crystals in a linear Paul trap," M. G. Raizen, J. M. Gilligan, TN-19
J. C. Bergquist, W. M. Itano, and D. J. Wineland, Phys. Rev.
A41, 6493-6501 (1992).
3. "Cryogenic linear ion trap for accurate spectroscopy," M. E. TN-28
Poitzsch, J. C. Bergquist, W. M. Itano, and D. J. Wineland, Rev.
Sci. Instrum. 67, 129-134 (1996).
4. "Minimizing the time-dilation shift in Penning-trap atomic clocks," TN-34
J. N. Tan, J, J. Bollinger, and D. J. Wineland, Proc., Conf. on
Precision Electromagnetic Meas., Boulder, CO, June, 1994; IEEETrans, on Instrum. Meas. 44, 144-147 (1995).
5. "High-magnetic-field corrections to cesium hyperfme structure," TN-38W. M. Itano, Proc. , Fifth Symp. Freq. Standards and Metrology,
Woods Hole, MA, Oct. 1995 (Worid Scientific).
6. "Application of laser-cooled ions to frequency standards and TN-40metrology," D. J. Wineland, J. C. Bergquist, D. J. Berkeland, J. J.
Bollinger, F. C. Cruz, W. M. Itano, B. M. Jelenkovid, B. E. King,
D. M. Meekhof, J. D. Miller, C. Monroe, and J. N. Tan, ibid.
7. "Accurate measurement of time," W. M. Itano and N. F. Ramsey, TN-49Sci. Am. 269(1), 56-59 and 62-65 (July 1993).
LASER COOLING AND QUANTUM STATE CONTROL
1. "Resolved-sideband Raman cooling of a bound atom to the 3-D TN-57zero-point energy," C. Monroe, D. M. Meekhof, B. E. King, S. R.
Jefferts, W. M. Itano, D. J. Wineland, and P. Gould, Phys. Rev.
Lett. 75, 4011-4014 (1995).

2. "Quantum projection noise: population fluctuations in two-level TN-61systems," W. M. Itano, J. C. Bergquist, J. J. Bollinger, J. M.Gilligan, D. J. Heinzen, F. L. Moore, M. G. Raizen, and D. J.
Wineland, Phys. Rev. AiZ, 3554-3570 (1993).
3. "Spin squeezing and reduced quantum noise in spectroscopy," D. J. TN-78Wineland, J. J. Bollinger, W. M. Itano, F. L. Moore, and D. J.
Heinzen, Phys. Rev. A4^, R6797-R6800 (1992).
4. "Squeezed atomic states and projection noise in spectrosopy," TN-82D. J. Wineland, J. J. Bollinger, W. M. Itano, and D. J. Heinzen,
Phys. Rev. A5Q, 67-88 (1994).
5. "Spin squeezing applied to frequency standards," J. J. Bollinger, TN-104D. J. Wineland, W. M. Itano, and D. J. Heinzen, Proc. Fifth
Symp. Freq. Standards and Metrology, Woods Hole, MA, Oct.
1995 (World Scientific).
6. "Demonstration of a fundamental quantum logic gate," C. Monroe, TN-112D. M. Meekhof, B. E. King, W. M. Itano, and D. J. Wineland,
Phys. Rev. Lett. 7^, 4714-4717 (1995).
INTERFERENCE
1. "Young's interference experiment with light scattered from two TN-116atoms," U. Eichmann, J. C. Bergquist, J. J. Bollinger, J. M.Gilligan, W. M. Itano, D. J. Wineland, and M. G. Raizen, Phys.
Rev. Lett. 7Q, 2359-2362 (1993).
2. "Light scattered from two atoms," W. M. Itano, U. Eichmann, TN-120
J. C. Bergquist, J. J. Bollinger, J. M. Gilligan, M. G. Raizen, and
D. J. Wineland, Proc. Lasers '93, Lake Tahoe, NV, edited by V.
J. Corcoran and T. A. Goldman (STS Press, McLean, VA, 1994),
pp. 412-419.
NON-NEUTRAL PLASMAS AND SINGLE ELECTRON STUDIES
1. "Electrostatic modes of ion-trap plasmas," J. J. Bollinger, D. J. TN-128
Heinzen, F. L. Moore, W. M. Itano, D. J. Wineland, and D. H. E.
Dubin, Phys. Rev. A48, 525-545 (1993).
2. "Electrostatic modes as a diagnostic in Penning-trap experiments,
"
TN-149
C. S. Weimer, J. J. Bollinger, F. L. Moore, and D. J. Wineland,
Phys. Rev. A49, 3842-3853 (1994).
vi

3. "Long-range order in laser-cooled, atomic-ion Wigner crystals TN-161observed by Bragg scattering," J. N. Tan, J. J. Bollinger,
B. Jelenkovid, and D. J. Wineland, Phys. Rev. Lett. 7i, 4198-4201
(1995).
4. "Observation of long-range order in trapped ion plasmas by Bragg TN-165
scattering," J. N. Tan, J. J. Bollinger, B. Jelenkovid, W. M. Itano,
and D. J. Wineland, Proc., Intl. Conf. on the Physics of Strongly
Coupled Plasmas, Binz, Germany, Sept. 11-15, 1995, (World
Scientific).
5. "Laser-cooled positron source," D. J. Wineland, C. S. Weimer, and TN-175
J. J. Bollinger, Proc., Anti-Hydrogen workshop, Munich, July SC-
SI, 1992, ed. by J. Eades, in Hypeifine Interactions 7^, 115-125
(1993).
6. "High-order multipole excitation of a bound electron," TN-186
C. S. Weimer, F. L. Moore, and D. J. Wineland, Phys. Rev. Lett.
70, 2553-2556 (1993).
APPARATUS
1. "Coaxial-resonator driven rf (Paul) trap for strong confinement," TN-190
S. R. Jefferts, C. Monroe, E. W. Bell, and D. J. Wineland, Phys.
Rev. A^, 3112-3116(1995).
vu

ADDITIONAL PUBLICATIONS
The following publications were published or prepared during the period between May 1992
and January 1996, but are not included in this technical note.
1. "Experimental results on normal modes in cold, pure ion plasmas," J. J. Bollinger,
D. J. Heinzen, F. L. Moore, C. S. Weimer, W. M. Itano, and D. J. Wineland, in
Strongly Coupled Plasma Physics, ed. by Van Horn and Ichimaru (University of
Rochester Press, Rochester, NY, 1993), pp. 393-398.
2. "Quantum measurements of trapped ions," W. M. Itano, J. C. Bergquist, J. J.
Bollinger, J. M. Gilligan, D. J. Heinzen, F. L. Moore, M. G. Raizen, and D. J.
Wineland, Proc., Inti. Symp. on Quantum Physics and the Universe, Waseda Univ.,
Tokyo, Japan, Aug. 19-22, 1992, ed. by M. Namiki, K. Maeda, and I. Ohba, Vistas
in Astronomy 37, 169-183 (1993).
3. "Precise spectroscopy for fundamental physics," W. M. Itano, J. C. Bergquist, J. J.
Bollinger, J. M. Gilligan, D. J. Heinzen, F. L. Moore, M. G. Raizen, and D. J.
Wineland, Hyperfme Interactions Tg, 211-220 (1993).
4. "Non-neutral ion plasmas and crystals, laser cooling, and atomic clocks," J. J.
Bollinger, D. J. Wineland, and D. H. E. Dubin, Phys. Plasmas 1, 1403-1414 (1994).
5. "Interference in the resonance fluorescence of two trapped atoms," U. Eichmann,
J. C. Bergquist, J. J. Bollinger, J. M. Gilligan, W. M. Itano, M. G. Raizen, and
D. J. Wineland, Laser Spectroscopy, Proc., Xlth Inti. Conf,, ed. by L. Bloomfield,
T. Gallagher, and D. J. Larson (AIP Conf. Proc. 290, New York, NY, 1994), pp.
43-48.
6. "Paul trap for optical frequency standards," S. R. Jefferts, C. Monroe, A. S. Barton,
and D. J. Wineland, IEEE Trans. Instrum. Meas. 44, 148-150 (1995).
7. "Progress on a cryogenic linear trap for ^^g"*^ ions," M. E. Poitzsch, J. C.
Bergquist, W. M. Itano, and D. J. Wineland, Proc., 1994 IEEE Inti. Frequency
Control Symp., pp. 744-746, June 1994.
8. "Nonneutral ion plasmas and crystals in Penning traps," J. J. Bollinger, J. N. Tan,
W. M. Itano, D. J. Wineland, and D. H. E. Dubin, Proc. Nobel Symp. on Trapped
Charged Particles and Related Fundamental Physics, Lysekil, Sweden, August 1994,
Physica Scripta T59, 352-359 (1995).
9. "Cooling methods in ion traps," W. M. Itano, J. C. Bergquist, J. J. Bollinger, and
D. J. Wineland, ibid, pp. 106-120.
10. "Quantum effects in measurements on trapped ions," D. J. Wineland, J. C. Bergquist,
J. J. Bollinger, and W. M. Itano, ibid, pp. 286-293.
viii

11. "Quantum mechanics with one, two, and many atoms," W. M. Itano, J. C. Bergquist,
J. J. Bollinger, and D. J. Wineland, in Group Theoretical Methods in Physics, Proc.,
XX Intl. Colloquium (Yamada Conference XL, "Quantum mechanics widi one, two,
and many atoms,"), Toyonaka, Japan, 1994, ed. by A. Arima, T. Eguchi, and
N. Nakanishi (World Scientific, Singapore, 1995), pp. 10-18.
12. "Laser-cooled trapped-ion experiments at NIST," J. N. Tan, J. J. Bollinger, A. S.
Barton, and D. J. Wineland, in Non-neutral Plasma Physics II, ed. by J. Fajans and
D. H. E. Dubin, AIP Conf. Proc. 331 (AIP Press, New York, NY, 1995), pp. 215-
228.
13. "A cryogenic linear ion trap for ^^g* frequency standards," J. Miller, M. E.
Poitzsch, F. C. Cruz, D. J. Berkeland, J. C. Bergquist, W. M. Itano. and D. J.
Wineland, Proc., 1995 IEEE Inti. Frequency Control Symp., June 1995, pp. 110-
112.
14. "Quantum mechanically correlated states and atomic clocks," C. Monroe, D. M.Meekhof, B. E. King, W. M. Itano, J. J. Bollinger, and D. J. Wineland, Proc. 1995
Moriond Workshop (Editions Frontieres, Gif-sur-Yvette, France, 1996).
15. "Experiments at NIST with trapped ions: 3-D zero-point cooling, quantum gates,
Bragg scattering, and atomic clocks," C. Monroe, A.S. Barton, J.C. Bergquist,
D. J. Berkeland, J.J. Bollinger, F. Cruz, W.M. Itano, S.R. Jefferts, B.M.Jelenkovid, B.E. King, D.M. Meekhof, J.D. Miller, M.E. Poitzsch, J.N. Tan, and
D.J. Wineland, Proc., 12th Inti. Conf. on Laser Spectroscopy, Capri, Italy, June
1995 (World Scientific), to be published.
16. "Minimizing time dilation in Penning trap ion clocks," J. N. Tan, J. J. Bollinger,
W. M. Itano, and D. J. Wineland, Proc. 5th Symp. on Frequency Standards and
Metrology, Woods Hole, MA, Oct. 1995 (World Scientific) to be published.
17. "Primary atomic frequency standards: New developments," R. E. DruUinger, S. L.
Rolston, and W. M. Itano, in Review ofRadio Science, in press.
18. "CW second harmonic generation with elliptical Gaussian beams," A. Steinbach, M.Rauner, F. C. Cruz, and J. C. Bergquist, Opt. Commun., in press.
19. "Generation of non-classical motional states of a trapped atom," D. M. Meekhof,
C. Monroe, B. King, W. M. Itano, and D. J. Wineland, Phys. Rev. Lett., in press.
20. "A 'Schrodinger Cat' superposition state of an atom," C. Monroe, D. M. Meekhof,
B. E. King, and D. J. Wineland, submitted to Science.
21. "Optimal frequency measurements with maximally correlated states," J. J. Bollinger,
W. M. Itano, D. J. Wineland, and D. J. Heinzen, submitted to Phys. Rev. Lett.
IX

Laser Stabilization to a Single Ion.
J. C. Bergquist, W. M. Itano and D. J. Wineland
Time and Frequency Division, National Institute of Standards and Technology
Boulder, CO 80303
I. - Spectrally narrow Optical Oscillators.
I.l. - Frequency references.
An unperturbed optical resonance in an atom or molecule provides a good
absolute frequency reference, but practically there are limitations. The signal-
to-noise ratio is limited by the number of atoms in the interrogation region and
by saturation of the resonance. If the probe laser is spectrally broad, then the
measured atomic line is broadened, which degrades the stability. Furthermore,
atoms recognize interactions and collisions with neighboring atoms, usually
with shifts to the internal energy level structure. The motion of the atoms also
produces Doppler shifts and broadening. A single laser-cooled atom removes
many of these problems but only with a severe penalty in the signal-to-noise ra-
tio [1]. Even so, by detecting each transition in the single atom, it should be
possible to stabilize the frequency of a laser oscillating in the visible to better
than 10"^^ t"^/^ with an accuracy approaching 10"^*[2], if the laser were suffi-
ciently stable (or spectrally narrow) for times that are comparable to the inter-
rogation time of the transition in the atom.
A two-step approach might then be appropriate; spectrally narrow the laser
by some scheme that offers good short- to medium-term stability {e.g., 1ms to
10 s), then stabilize the frequency of the laser for longer times to a narrow reso-
nance in a single atom. The reference for the short- to medium-term stabiliza-
tion of the laser not only needs good stability in this time frame, but also low
phase and frequency noise. If a Fabry-Perot cavity is used as the frequency dis-
criminator, then the response of the frequency discriminator can be nearly lin-
ear as a function of power and the signal-to-noise ratio can be high [3]. Fre-
quency shifts and fluctuations arise due to thermal distortion in the mirror coat-
ings caused by absorption of Light in a small volume in the dielectric stack and
due to photochemical processes at the surfaces of the coatings. Also, practical
359
TN-1

360 J. C. BERGQUIST, W. M. ITANO and D. J. WINELAND
limits are reached at powers that saturate the detector or at powers (circulating
in the cavity) that cause radiation pressure noise, but the signal-to-noise ratio
from a cavity can be many orders of magnitude larger than that obtained with
atoms. Although there are other types of optical frequency references, the most
widely used is the Fabry-Perot interferometer, principally because the fre-
quency excursions to error-voltage can be extremely large in a high-finesse cav-
ity. We will spend time in the next few sections discussing some of the details
and limits of a suitably stable reference cavity, and then turn our attention to
the single atom.
1.2. - Reference cavity limitations.
We can begin with a brief look at the demands that a spectral purity of 1 Hzplaces on the physical stability of the reference cavity. If the cavity has a length
of 30 cm and the optical wavelength is 500 nm, then the optical-path length be-
tween the mirrors must not change by more than 10 "^^m, the approximate size
of the nucleus of any of the constituent atoms in the dielectric coatings. Re-
searchers who study parity-nonconserving interactions in atomic systems
sometimes use the analogy that a human hair added to the radius of the Earth is
equivalent to the distortion in an atom caused by the parity-nonconserving part
of the Hamiltonian. By the same taken, if the spacer for an optical cavity were
the Earth, a human hair added to the diameter would cause a frequency shift of
about 300 Hz! In the first part of this section, we investigate some of the funda-
mental limits to the attainment of an average spacing between two mirrors that
is stable to better than 1 • 10"^^ and to the achievement of a laser that is spec-
trally narrowed to better than 1 Hz. We will also address some of the limitations
imposed by various environmental factors. We will see that, although funda-
mental limits come from quantum mechanics and thermodynamics, important
practical limitations come from mechanics and gravitational coupling to the
noisy terrestrial environment. In particular, at low Fourier frequencies
( < 100 Hz), seismic noise and pendulum motion dominate the noise budget.
At the quantum level, the measurement of the length of the cavity to which
the laser is locked brings about the inevitable competition between the mea-
surement precision and the perturbation of the measurement to the system.
The measurement precision can be improved by a factor of 1/\N by increasing
the number A'^ of (signal) photons in the measurement interval, whereas the
shot noise of the radiation pressure on the mirrors increases as yN. The opti-
mum flux of signal photons, or input power (assuming 100% of the light is cou-
pled into the cavity on resonance and that the detection efficiency is unity), is
given when both effects are equal in magnitude [4]. For the laser interferome-
ters used in gravity wave detection, the mirrors are suspended as pendulums
and the optimum power is calculated for frequencies cj/Ztz well above the reso-
nance frequency (i}()/2k of the pendulum support. As a function of frequency,
TN-2

LASER STABILIZATION TO A SINGLE ION 361
this limit length uncertainty is given by [5]
(1) Aa;«(4^A//m)i/Vw.
where m is the mass of suspended mirrors and A/ is the measurement band-
width. Interestingly, this is the same measurement precision allowed by the
standard quantum limit [4-7]. In our case the resonator is composed of a single
bar, or spacer, to which the mirrors are rigidly attached. The resonator is then
suspended, often by small-diameter wires, inside a temperature-regulated,
evacuated housing. The resonator bar can also be treated as a harmonic system,
but now the frequency of the lowest mechanical resonance frequency a)Q/2n is
typically greater than a few kHz. The noise spectrum of length fluctuations that
is of particular importance to us is at Fourier frequencies that are below the
lowest resonance frequency of the bar. At frequencies lower than coo/27z and for
optimum power, the measurement precision limit is independent of Fourier
frequency
(2) Aa: - (4^A//my/Va>o .
For cjq/2k = 10 kHz, a cavity finesse of 100000 at A = 500 nm and a near opti-
mum input power of about 3 W, this limit corresponds to a fractional length un-
certainty of less than (5 10"^ w/VHz)(A/)^''^ fo^ ^ typical bar mass of 4kg.
Thus, with as little as 100 [aW incident on the cavity, the quantum fluctuations
in the radiation pressure acting on the mirrors are neghgible, yet there is suffi-
cient signal-to-noise ratio that the frequency of a laser can be made to track the
resonance of the cavity to well below 1 Hz [8] (if only limited by the shot noise of
the detected signal).
The technical fluctuations in the laser light that is coupled into the cavity
must also be considered. If the finesse is 100 000 and the corresponding power
enhancement as high as 30 000, then 100 jj.W of input power translates into 3Wof circulating power when the laser is resonant with the cavity. This in turn
gives a force W on each mirror of about 2 • 10"* N. If the mirrors are treated as
clamped disks of thickness t, the deflection of each mirror, S, is given
by [9]
(3) S = SWrHl-p^)/47:Et\
where the light force is assumed to act uniformly over a concentric area much
less than the area of the mirror. The radius r of the mirror is measured from the
center to the clamped edge, p is Poisson's ratio and E is Young's modulus of
elasticity. For a mirror substrate with a material composition similar to fused
silica, p is about 0.17 and E is about 7 • 10^" N/m^. If t is 5mm and r is 10 mm,then the deflection at the center of the mirror is about 1.7 • 10"^^m for a radia-
tion mode size (wq ) of 200 |j.m. For a cavity that is 30 cm long, the corresponding
fi-actional length change (2S/L) is about 1 • 10"^^, or about 0.5 Hz. The dimen-
TN-3

362 J. C. BERGQUIST, W. M. ITANO and D. J. WINELAND
sions and physical properties of the resonator used in this example are typical.
Cavities have been constructed that have been shorter, that have used thinner
mirrors, and that have coupled in more Ught; all of these conspire to degrade
the frequency stability through fluctuations of the intracavity light intensity.
In our example, if 1 mW of power is used to stabilize the laser to the cavity,
then the amplitude of the circulating light must be constant to about 10% to
achieve a laser stabihty better than 1 Hz. The radiation pressure also works to
stretch the entire bar. The strain, or fractional length change, induced by a
force acting normal to the end of a cylindrical bar of cross-sectional area A is
given by [9]
(4) AL/L = F/AE
.
The fractional length change for 3W of circulating power is about 2.5 • 10~".
This is smaller than the elastic distortion of our typical mirror, and even power
fluctuations as large as 10% would cause only millihertz frequency fluctuations
through this term. The clear indication is that the fluctuations in the circulating
power must be controlled if the laser frequency is to be stabilized to much bet-
ter than 1 Hz. Cavity power fluctuations are caused by intensity fluctuations of
the laser light external to the cavity and by variations in the amount of hght
that is coupled into the cavity. The latter fluctuations are caused, for example,
by any motion of the resonator with respect to the input beam.
Another problem is the local heating of the dielectric mirror coating from
the light circulating in the cavity. With high-finesse low-loss mirror coatings,
one might assume that this would not be an important concern. However, as wehave seen, even with as little as 100 [xW of power coupled into the cavity that
has a finesse of 100000, the circulating power inside the cavity can exceed 3W.If the absorption losses are as little as a few p.p.m., (5 ^ 10) jj.W are absorbed in
the coating. Most of this power is absorbed in the first few layers of the dielec-
tric stack where the light intensity is the highest. When the light amplitude
fluctuates, there is a transient response followed by relaxation to a steady-state
condition. For a radiation mode size of 200 [j.m, we have measured a 2 Hz/(jlW
shift of the cavity resonance to higher frequencies with increased power. The
magnitude has been measured to be as much as 20 Hz per ijlW change in the
power of the input coupled light [10]. Both the thermal distortion of the mirror
and the light pressure problem could be reduced by adjusting the mirror radii
and the cavity length so that the mode size is larger at the mirrors (for example,
by using a near-spherical resonator).
The thermal noise in the bar or spacer must also be considered. We can think
of this as the weak coupling of the fundamental mode of the spacer to its envi-
ronment, e.g., the residual background gas, the wire suspension, radiation from
the walls of the vacuum vessel, etc. If the bar is thermalized to this background
or thermal bath at some physical temperature, T, then the weak coupling to the
thermal bath causes the mode's amplitude to execute a random walk in the do-
TN-4
LASER STABILIZATION TO A SINGLE ION 363
main|Ax| ^ Xr.m.s. • Xr.m.s. is the average deviation of one end of the spacer from
the equilibrium position assuming the other end is fixed. The magnitude of this
deviation can be found by equating the energy in the harmonic motion of the
fundamental mode to k^T. After rearranging, this gives
(5) Xr.^.. = {^hT/M,^coiy^\
where ^b is Boltzmann's constant and M^n is the effective mass of the spacer.
The fluctuation-dissipation theorem states that the time scale on which this ran-
dom walk produces changes of order Xr.m.s. is the same as the time scale given by
the decay time of the fundamental mode [11]. The decay time tq is related to the
quality factor of the fundamental mode by tq = 2Q/ojq. Q is inversely propor-
tional to the fractional energy loss per cycle. For times t shorter than tq, the
mean-square change in the mode's amplitude is XT.m.s. reduced by the ratio t/tq,
^^ -Zr.m.s. '^/'Z'o[12]. Physically, this expresses the fact that a harmonic oscilla-
tor is a tuned system that responds to noise and other perturbations in a narrow
range of frequencies. So, whUe the noise is proportional to temperature, the
fluctuating forces cannot appreciably change the mode amplitude in times short
compared to the decay time.
To reach an appreciation of the size of the length fluctuations due to thermal
noise, we can calculate the frequency of the lowest mode of the spacer and solve
for >^r.m.s. • Alternatively, since M^ff is only estimated, we can equate the work
necessary to stretch or compress a cylindrical bar by Xr.m.s. to the energy k^ T.
The force necessary to elastically stretch a bar by a small amount x is given by
eq. (4),
(6) F = EAx/L.
F diX is the incremental work done by this force in going fi:'om a: to a: + dx. Inte-
grating from X = to X = Xr.m.s. > the work done is
(7) W = EA{xr.^,,f /2L .
When this is equated to k-^ T, Xr.m.s. is simply related to the temperature of the
spacer and to its physical properties,
(8) Xr.m.s.= {^Lk^T/EAY^'.
Recall that, for a spacer made from a material comparable in its properties to
fused sihca, E is about 10^^ N/m^ . If the spacer is 30 cm long and 10 cm in diame-
ter, then Xr.m.s. ~ 1.8 • 10"^^m at a thermal-bath temperature of 300 K. The fre-
quency of a laser in the mid-optical locked to this cavity would move by about
3 Hz for a length change of this magnitude. However, this excursion occurs
dominantly at the vibrational frequency of the lowest fundamental (mechanical)
mode of the spacer. For a fused-sUica spacer of this size, the resonance fre-
quency of its lowest mode is about 10 kHz. Hence, there is little power in the
TN-5

364 J. C. BERGQUIST, W. M. ITANO and D. J. WINELAND
thermally induced sidebands at ± 10 kHz since the modulation index is so
small [13] (== 3 10"^). It is worth noting that the resonant Q in a fused-sUica
bar at room temperature is only about 10^ [14]. Therefore, the decay time for the
lowest mode is about 10 s, and, unlike our colleagues looking for gravity waves
with high-Q resonant-bar detectors, we are sensitive to the full change in the
mode amplitude on time scales of critical interest to us. However, a few hertz at
10 kHz driven by the Brownian motion of the cavity is not a limitation to the
frequency stability nor spectral purity of a 1 Hz laser.
The temperature sensitivity of low-expansion materials suitable for spacers
can be better than 10~^/K, which implies tjK control at the cavity in order to
achieve stabilities of a few hertz. However, if the cavity is suspended in a ther-
mally massive, evacuated chamber, then the thermal coupling to the environ-
ment is primarily radiative. The time constant can exceed a day. Therefore, if
the temperature fluctuations of the walls of the vacuum vessel never exceed
10 mK, then the frequency fluctuation rate of the laser will be less than 1 Hz/s,
independent of the time rate of charge of the wall temperature.
Pressure fluctuations in the gas between the mirrors produce density varia-
tions which in turn cause refractive-index changes. This causes an effective op-
tical-length change to the cavity, nL, where n is the index of refraction for air.
Near room temperature, the index of refraction of dry air is linearly related to
its pressure, P, by
(9) w-l-310-^P,
where P is in Pa (133 Pa = 1 Torr). Thus, even if the cavity is evacuated to 10~^
Pa, the absolute shift in the cavity resonance for optical frequencies near
X «= 500 nm is about 15 Hz (from that of Pa). 10% fluctuations in this pressure
cause frequency excursions of the laser of approximately 1.5 Hz. The air pres-
sure at 10"^ Pa also causes a strain in the bar but the length compression is neg-
ligible. The pressure at 10"^ Pa is less than 10"^ N/m^, which produces an axial
strain in the spacer of about 1 • 10"'^. The fractional length change is not fully
this magnitude since the pressure-induced stress in the axial direction is some-
what compensated by the radial stress. Consequently, in a reasonably stiff
spacer, fluctuations in the cavity length due to fluctuations in the pressure are
dominated by index-of-refraction changes.
Additional limitations to the stability of a laser locked to a Fabry-Perot res-
onator come from technical problems such as optical feedback, intensity fluctua-
tions, beam pointing stability, etc. [15], but seismic noise or ambient vibrations
that cause changes in the cavity length are the most important practical prob-
lems limiting the frequency stability for times longer than a few ms. Generally,
there are two distinct effects: high-frequency vibrations, which may excite fun-
damental mechanical resonances of the bar, and low-frequency vibrations,
which tend to produce nonresonant distortions of the bar. The first effect typi-
TN-6

LASER STABILIZATION TO A SINGLE ION 365
cally occurs at frequencies in the range of (100 -^ 1000) Hz and often can be ef-
fectively eliminated, for example, by mounting the system on alternating lay-
ers of shock-absorbing material and passive masses, such as thin rubber and
cinder block. Low-frequency vibrations ((0.1 ^ 100) Hz), which are typically
driven by ground noise and building vibrations, are much harder to eliminate.
Some sophisticated vibration isolation systems, both active and passive, have
been developed to reduce noise in this frequency interval [16]. While an active
vibration isolation system may ultimately be necessary for sufficient attenua-
tion of seismic noise to reach laser spectral purity below 1 Hz, we, for the mo-
ment, isolate only with passive systems. The simplest method of passive vibra-
tion isolation consists of mounting the device to be isolated on a resilient sup-
port, such as a pendulum or spring. A pendulum isolates in the horizontal plane,
using gravity as its spring constant (note that this spring can be nearly loss-
less). A spring can isolate horizontally and vertically simultaneously. It is rela-
tively simple to show that the attenuation in the amplitude of motion between
the support and the bar increases as a»^ for motion at frequencies higher than
the resonance frequency wq (wq = k/m, spring; a>o = g/l, pendulum). Damping
must be included to limit the ampUtude of motion, aj, at resonance. The re-
sponse of a damped system is
(10) tti = a2(l + iroj)/{l - (w/wo)^ + iroj),
where aj is the amplitude of the motion at the bar, 02 is the amplitude of motion
of the support at frequency w, and F is the coefficient of damping. The ampli-
tude ttj is complex (phase shifted) and everywhere bounded. In practice the
choice of damping is a compromise between low resonant amplitude and suffi-
cient high-frequency isolation. There are more complex passive systems that of-
fer better high-frequency isolation while at the same time reduce the resonance
peaking to a factor of 2 or less [16]. Calculations of the vibration isolation pro-
duced by various mechanical suspensions have been driven by the work done on
gravity wave detectors; a good treatment is that of Veitch [17].
The most important function of the isolation system is to reduce fractional
length changes of the reference cavity to below (ideally, well below) 1 • 10"^^. If
the cavity is suspended with its axis horizontal by wires that act as vertically
stiff pendulums, then it has been demonstrated that the isolation from horizon-
tal vibrations in the direction of the cavity axis can be adequate to attain a sta-
bility approaching 1 Hz [18]. However, a suspended bar is subjected to a dis-
tributed load resulting from the pull of gravity, which produces considerable
stress to the support structure and to the bar. In addition, the bar is not per-
fectly rigid and must distort at some level under its weight and this causes addi-
tional stress. All these stresses can produce sudden acoustical emission [19] at
the rate of up to several per second and at frequencies that may or may not coin-
cide with the eigenfrequencies of the bar. Also, since the wires are essentially
TN-7

366 J. C. BERGQUIST, W. M. ITANO and D. J. WINELAND
stiff to vertical vibrations, these perturbations can be coupled into the bar. If,
though, the wires were connected to the nodal points of the bar, then the exter-
nal force would be unable to excite that mode (or modes) through that nodal po-
sition. Unfortunately, there are many bending modes and vibrational modes
with disparate nodal positions, so, although it is possible to reduce some of the
cavity sensitivity to vertical perturbations, single suspension points are not
sufficient to eliminate excitation of all modes. Further improvement can be
achieved if the cavity is isolated vertically as well. We now turn our attention to
some of the experimental studies pursued over the past few years in the ion
storage group at NIST.
1.3. - Experimental results: cavity comparisons.
In some of our studies, a direct heterodyne comparison of two independently
frequency-stabilized light beams was made. The linewidths and frequency sta-
bilities were analyzed in various ways. The beat note was recorded in an r.f. or
microwave spectrum analyzer, thereby directly displaying the combined
linewidth of the two sources. The signal-to-noise ratio was improved and the
long-term relative frequency drift was studied by averaging many successive
scans of the beat note. It was also possible to use two spectrum analyzers in tan-
dem to identify the specific frequency noise components that contribute to the
laser linewidth. This was particularly useful toward unraveling the noise
sources that cause fluctuations to the length of the cavities. For instance, if the
seismic noise was independently studied with a seismometer, a correspondence
between the seismic-noise terms and the dominant contributors to the laser
linewidth could be made. If the length fluctuations of the two cavities were sim-
ilar in frequency and amplitude, but otherwise independent, the linewidth of ei-
ther frequency-stabilized system is smaller than the recorded beat note by \/2.
If the effective length stability of one cavity had been worse than that of the
other, the measured linewidth would have been be dominated by the frequency
fluctuations of the laser locked to the noisier cavity.
Either the transmitted light beam or the reflected beam that interferes with
the light re-emerging from the cavity can be used to stabilize the frequency of
the laser. In our experiments, we used the beam reflected from the cavity. The
error signal can be derived either near zero frequency or at some higher fre-
quency. Since technical-noise terms are present at low frequencies, it is better
to modulate and detect at a frequency at which the signal-to-noise ratio is limit-
ed by the shot noise in the detected light beam. This is the Pound-Drever-Hall
reflected-sideband technique that has been treated in detail elsewhere [8, 20].
Attention to the optical layout and to the electronic-noise terms is critical to
achieving a spectral linewidth that is smaller than a few hertz. This also has
been discussed in papers by HouGH et al [21] and by Salomon et al. [15]. By sev-
eral separate measurements, the electrical problems in our work were deter-
TN-8

LASER STABILIZATION TO A SINGLE ION 367
mined to be unimportant to the attainment of a laser linewidth below 1 Hz; the
dominant contribution to the laser linewidth were mechanical (and perhaps op-
tical) perturbations that caused length changes in the reference cavity.
The frequency-stabilized light beams were derived from a home-built ring
dye laser oscillating at 563 nm. The wavelength of the laser was chosen because
its frequency would eventually be doubled into the ultraviolet to probe a nar-
row transition in ^^^Hg"^ . Historically, the dye laser was locked in a two-step
process. The laser was pre-stabilized to the order of a few hundred Hz by lock-
ing the laser to a lower-finesse (about 800) cavity. The cavity resonance was
probed by the reflected-sideband technique using a modulation frequency of
about 10 MHz. Rapid frequency fluctuations of the laser were removed by a fast
(bandwidth > 2 MHz) servo driving an intracavity E/0 modulator, and the
lower-frequency fluctuations were corrected by a second-order servo-loop driv-
ing an intracavity PZT-mounted mirror. The frequency-stabilized light was
then transmitted through optical fibers to the high-finesse cavities. Since the
laser linewidth was less than 1 kHz, a smaller-bandwidth (100 kHz), lower-
noise servo could be used to strip the remaining noise from the laser beams.
Again, the reflected-sideband technique was used to probe the resonance of the
high-finesse cavities. In the second stage, the frequency-correcting element
was an acousto-optic modulator through which the laser beam was singly or
doubly passed. The fi^equency corrections were simply written onto the acous-
to-optically shifted beam by the servo. Long-term corrections were fed back to
the low-finesse cavity to maintain frequency alignment of the laser with one of
the high-finesse cavities. The laser power was also stabilized by adjusting the
r.f. power applied to the acousto-optic modulator. The overall intensity regula-
tion was better than 0.1%, but this was applied to the beam before it entered
the cavity. From the arguments made in sect. 1.2, intensity variations in the
Ught circulating in the cavity cause length fluctuations by light pressure
changes and by heat variations in the mirror coatings. Therefore, although wehave not done so yet, it may be better to stabilize the intensity of the light cir-
culating in the resonator by using the light transmitted from the cavity. This
should give a first-order insensitivity of the frequency of the laser to power
fluctuations caused by relative motion between the cavity and the injected light
beam.
The cavities were constructed from a cylindrical, Zerodur[22] rod that was
cut and rough ground to a diameter of about 10 cm and a length of about 27 cm.
A 1 cm round hole was bored along the axis of the spacers, and a smaller one was
bored through the center of the rod midway from the ends and normal to its ax-
is. The smaller bore permitted evacuation of the space between the mirrors.
The length of the cavities and the mirror radii of curvature were chosen so that
the cavities were highly nondegenerate for the spatially transverse modes. In
particular, the frequency of the TEMqi and TEMjo modes are separated from
the lowest-order TEMqo mode by approximately 30% of the free spectral range.
TN-9

368 J. C. BERGQUIST, W. M. ITANO and D. J. WINELAND
Even at the 12th transverse order, the frequencies are still separated from the
lowest-order fundamental mode (modulo c/2L) by several percent of the free
spectral range. This gives good immunity to any line pulling if any light power
is coupled into the higher-order modes. Even so, great care is taken to modematch into the cavities. Note that this high immunity to line pulling would be
somewhat compromised by going toward a near spherical resonator as suggest-
ed in sect. 1.2.
Each cavity is suspended by two thin (250 (xm) molybdenum wires inside a
thick-walled (19.1mm) aluminum vacuum vessel that has an inner diameter of
26.7 cm. The wires are placed as slings under either end of the spacer, about 1/5
the cavity length from each end, in an attempt to support at the nodal positions
for the lowest-order bending mode. The ends of each wire are attached to the in-
ner wall of the vacuum vessel by small clamps. Each wire either travelled verti-
cally upward from either side of the spacer to the wall («U» shaped), or opened
slightly away from the bar («V» shaped). This allowed free movement of the
cavity along the direction of its axis and restricted, but not rigidly, the motion
perpendicular to the axis. Damping of the pendulum motion was weak and dom-
inantly into the table and its padding through the aluminum housing. The alu-
minum vessels are thermally insulated and temperature regulated to the order
of a few mK. The temperature coefficient of the spacers is approximately
6-10"^K"^at7' = 300 K. The thermal time constant from the walls of the evac-
uated aluminum housing to the spacer is on the order of one day, giving ade-
quate isolation to small temperature fluctuations at the vessel walls. Since the
variations in the wall temperature were controlled to less than 10 mK for any
time period, the maximum rate of change in the temperature of the bar did not
exceed lOOpK/s. This corresponds to a frequency fluctuation rate of about
0.3 Hz /s and a maximum frequency change of about 50 kHz. A pressure of
1 • 10"^ Pa (8 • 10"^ Torr) is maintained in each vacuum vessel by an ion pumpthat is rigidly attached to the vessel. This is adequate to give frequency fluctua-
tions of less than 1 Hz for pressiu-e fluctuations of 10%.
The length of the longer rod corresponds to a free spectral range of 622 MHzand the shorter rod has a free spectral range of 562 MHz. The mirrors are highly
pohshed Zerodur substrates that are coated to give high fimesse and good effi-
ciency and then optically contacted to the polished ends of the spacer. The fi-
nesses of the cavities are about 60000 and 90000, respectively, and, for both
cavities, the transmission on resonance exceeded 30%. The high finesse F, or
the long optical storage time, translates into a narrow fringe whose HWHM is
given by c/2LF. Consequently, the ratio of error voltages to frequency excur-
sions can be very high, even for short cavities. Shorter cavities have been con-
structed from ULE[22] that have measured finesses that exceed 130000 (and,
recently, finesses exceeding 10^ have been reported [23]). The frequencies of
the mechanical resonances of these shorter, stiffer bars wQl be about a factor of
3 higher than those of the Zerodur bars. As long as the frequencies of the me-
TN-10

LASER STABILIZATION TO A SINGLE ION 369
chanical vibrations are high enough, a narrow optical resonance can be probed
with high resolution by the unperturbed carrier of the laser spectrum.
The aluminum vacuum vessels rested on Viton [22] rubber strips attached to
v-blocks made of aluminum. The v-blocks were secured to a rigid acrylic plastic
plate. Each reference cavity system was mounted on a separate optical table
that (initially) consisted of surface plates that were deadened by damping their
internal vibrations into sand. The sandbox sat on soft rubber pads and cinder
blocks in one case and on low-pressure inner tubes and cinder block legs in the
second. Noise vibrations from the floor and on the table tops were monitored
with moving-coil seismometers that had a sensitivity of 629V-s/m from ap-
proximately (1 -^ 100) Hz. Measurements of the floor motion in our laboratory
revealed bright resonances at 14.6 Hz, 18.9 Hz and 29.2 Hz on top of a broad
pedestal from about 1 to 40 Hz. The average amplitude of the resonant motion
was greater than 10 ~^ m/s and the pedestal peak was about 10"^ m/s. Isolation
from mechanical vibrations began at frequencies above about 5 Hz for both ta-
ble tops. By 100 Hz the isolation from floor noise for either table had improved
by a factor of 40 or better.
For heterodyning, a small fraction of the frequency-stabilized light from
each cavity was combined on a beam splitter and detected with a fast diode. The
heterodyned signal was amplified and analyzed with two spectrum analyzers
used in series. This allowed us to look directly at the beat note and also Fourier-
analyze the noise terms that contributed to its linewidth. The first analyzer
could be used to observe the beat signal, or as a frequency discriminator. As a
frequency discriminator, the scan was stopped and the analyzer was used as a
tunable r.f. filter/receiver with a variable bandwidth. The center frequency of
the analyzer was then shifted so that the heterodyned signal lay at the half-
power point of the response curve. The bandwidth was adjusted so that the fre-
quency excursions of the beat signal were much less than the bandwidth. This
produced a one-to-one map of frequency excursions-to-voltage excursions
whose Fourier power spectrum could be analyzed in the second low-frequency
((0 -^ 100) kHz) spectrum analyzer. The noise power spectrum in the second an-
alyzer helped to reveal the nature and origin of the vibrational noise that con-
tributes to the linewidth of the stabilized lasers.
The width of the heterodyne signal between the two stabilized lasers was
less than 50 Hz. The noise power spectrum disclosed that low-frequency fluctu-
ations in the range from near zero to 30 Hz dominated this linewidth. The vibra-
tional-noise spectrum measured by the seismometers on the table tops matched
the largest noise components of the beat note. The frequencies of the pendulum
motion of the suspended cavities were about 1.4 Hz and 1.48 Hz which gave FMat these frequencies. There were also bright features in the laser power spectra
that came from the floor motion at 14.6 Hz, 18.9 Hz and 29.2 Hz. The modula-
tion indices of the latter three noise components were about one, so they all had
enough power to contribute to the beat note linewidth. When the pendulum mo-
24 - Rendiconti S.I.F. - CXX
IN- 11
370 J. C. BERGQUIST, W. M. ITANO and D. J. WINELAND
tions of the bars were quiet, their FM contributed Httle to the laser linewidths.
However, the integral of the nearly featureless noise power spectrum from
about Hz to 10 Hz contributed about 15 Hz to the combined spectral purity of
the lasers. Some, if not all, of this noise was mechanical, but it was not clear
how it coupled to the suspended cavity. To help elucidate the connection, wedrove one of the table tops in either the horizontal or vertical direction with a
small loudspeaker connected to an audio signal generator. The motion of the
speaker diaphragm was coupled to the table by a rod glued to the diaphragm
and gently loaded against the table. The table could be driven at frequencies
from a few hertz to about 100 Hz with enough power to be 40 dB above back-
ground noise. When the loudspeaker drove the table in the horizontal plane in a
direction parallel to the axis of the cavity, the isolation of the suspended cavity
was sufficiently good that the beat signal showed little evidence of the pertur-
bation even at the high drive levels. However, when the drive was applied ver-
tically at a level barely perceptible above the vertical background noise, the
heterodyne signal showed added noise power at the drive frequency. The stiff
support in the vertical direction strongly coupled vertical motion into effective
cavity length changes. The sensitivity of the Fabry-Perot cavity to vertical mo-
tion was orders of magnitude higher than for horizontal motion parallel to the
r\/^
/\c
rV
/ \o'co
r>/
\
\1
\
/ \/ \
\
25 Hz/division
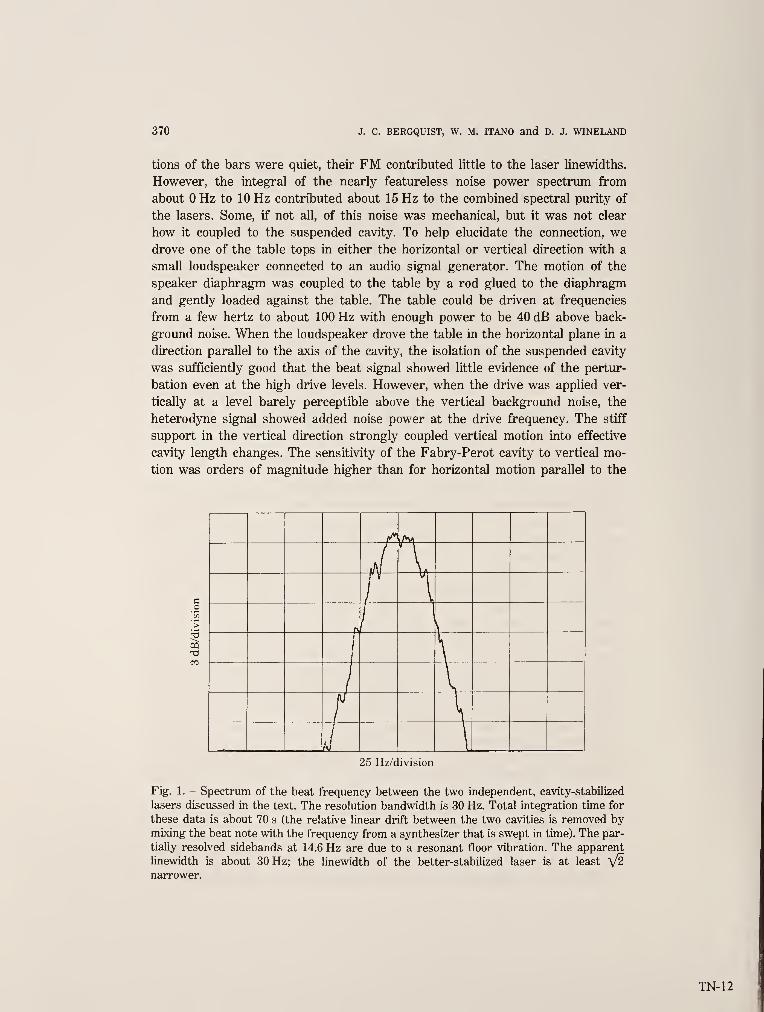
Fig. 1. - Spectrum of the beat frequency between the two independent, cavity-stabilized
lasers discussed in the text. The resolution bandwidth is 30 Hz. Total integration time for
these data is about 70 s (the relative linear drift between the two cavities is removed bymixing the beat note with the frequency from a synthesizer that is swept in time). The par-
tially resolved sidebands at 14.6 Hz are due to a resonant floor vibration. The apparent
hnewidth is about 30 Hz; the linewidth of the better-stabilized laser is at least ^/2
narrower.
TN-12
LASER STABILIZATION TO A SINGLE ION 371
cavity axis. (For practical reasons, we did not drive the table in the horizontal
plane in a direction perpendicular to the cavity axis.)
In order to improve the vertical isolation, one table was suspended just
above the floor with latex-rubber tubing attached to the ceiling. The resonance
frequencies for both the vertical motion and the horizontal pendulum motion
of the suspended table were near 0.33 Hz. These were damped to the floor
with two small dabs of grease, but the damping did not significantly change
the isolation afforded by the latex tubing at higher frequencies. The isolation
from vibrational noise above 1 Hz was more than an order of magnitude
better than that of the quietest sandbox table. This was partially reflected
in the linewidth of the heterodyne signal between the laser radiation stabilized
to the cavity supported on this table and the laser radiation stabilized
to the cavity supported on the best sandbox table; it dropped from about
50 Hz to less than 30 Hz. In fig. 1 the spectrum of the beat frequency
is shown. Zerodur is known to temporally contract with a time constant
of years [8, 24]. The creep rate for both cavities corresponds to a linear
frequency drift of (3 ^ 5) Hz/s, but the rates are not identical. The linear,
relative cavity drift is removed by mixing the beat frequency with the
frequency from a synthesizer that was swept in time. The spectrum of
fig. 1 represents an integration time of 70s. The noise vibrational sidebands
at 14.6 Hz are partially resolved. Note that the linewidth of the best stabilized
laser is at least V^ narrower. The Fourier noise power spectrum from
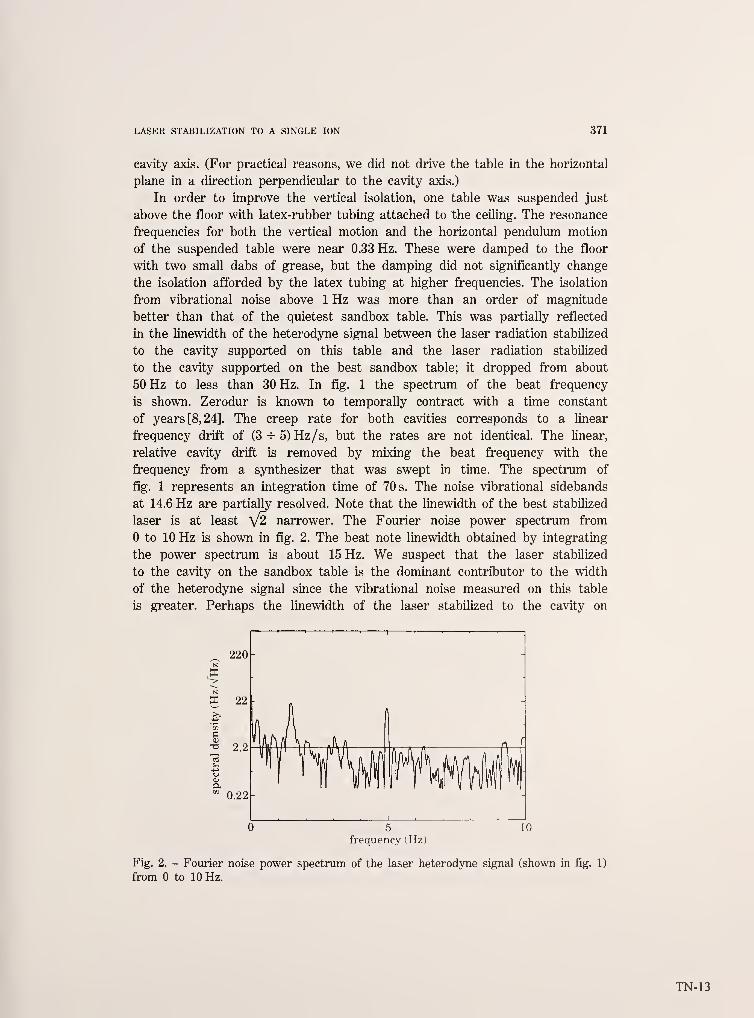
to 10 Hz is shown in fig. 2. The beat note linewidth obtained by integrating
the power spectrum is about 15 Hz. We suspect that the laser stabilized
to the cavity on the sandbox table is the dominant contributor to the width
of the heterodyne signal since the vibrational noise measured on this table
is greater. Perhaps the linewidth of the laser stabilized to the cavity on
220-
0.22-
5 10
frequency (Hz)
Fig. 2. - Fourier noise power spectrum of the laser heterodyne signal (shown in fig. 1)
from to 10 Hz.
IN- 13
372 J. C. BERGQUIST, W. M. ITANO and D. J. WINELAND
the table suspended by the latex tubing is below 1 Hz. We are working
to verify this and to build better cavities.
II. - Single-atom Spectroscopy.
II.l. - Single-ion results.
The ion trapping and laser cooling relevant to our experiments have been
described elsewhere [25, 26]. A ^^^Hg atom is ionized and trapped in the har-
monic pseudopotential well created by an r.f. potential applied between the
electrodes of a miniature Paul trap. The separation between the endcap elec-
trodes (2^0 ) is about 650 [j.m. The frequency of the r.f. potential is about
21 MHz. Its amplitude can be varied up to 1.2 kV; at the maximum r.f. ampli-
tude, the quadratic pseudopotential is characterized by a secular frequency of
nearly 4 MHz. The ion is laser-cooled to a few millikelvin by a few microwatt of
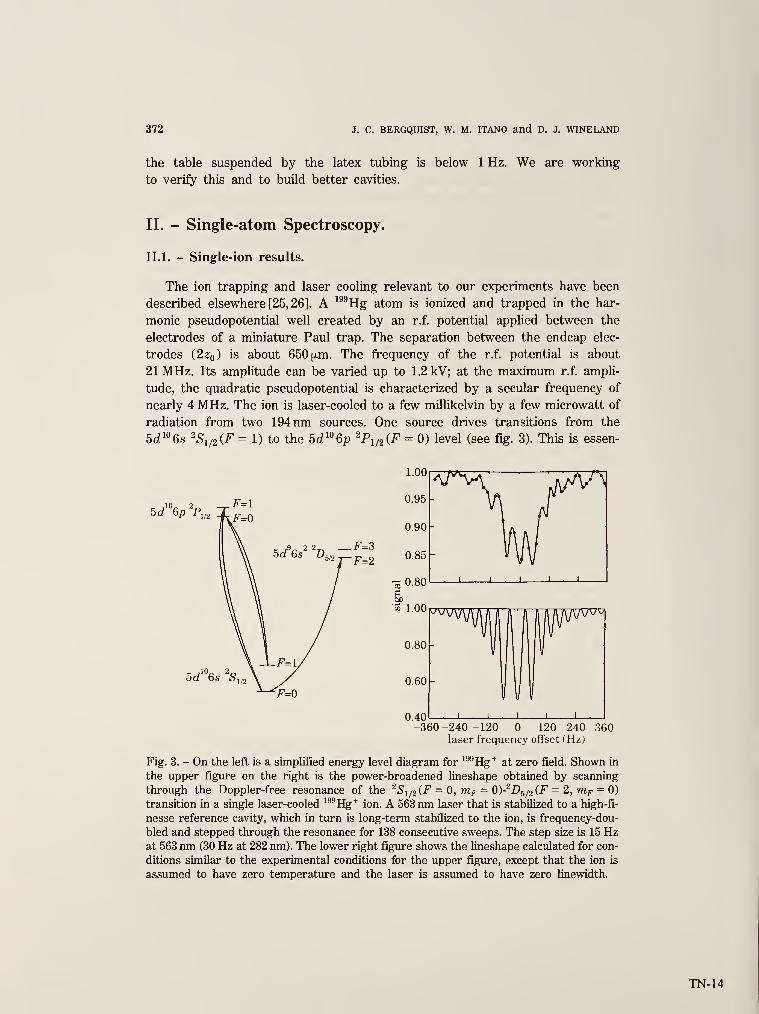
radiation from two 194 nm sources. One source drives transitions from the
5d^%s ^Sy2(F = 1) to the 5d^°6p ^PyziF = 0) level (see fig. 3). This is essen-
5d'°6p'p,
0.40-360 -240 -120 120 240
laser frequency offset (Hz)360
Fig. 3. - On the left is a simplified energy level diagram for ^^Hg"^ at zero field. Shown in
the upper figure on the right is the power-broadened lineshape obtained by scanning
through the Doppler-free resonance of the ^Si/2iF = 0, mF = 0)-^D^f2(F = 2, m,p = 0)
transition in a single laser-cooled '^^Hg^ ion. A 563 nm laser that is stabilized to a high-fi-
nesse reference cavity, which in turn is long-term stabilized to the ion, is frequency-dou-
bled and stepped through the resonance for 138 consecutive sweeps. The step size is 15 Hzat 563 nm (30 Hz at 282 nm). The lower right figure shows the lineshape calculated for con-
ditions similar to the experimental conditions for the upper figure, except that the ion is
assumed to have zero temperature and the laser is assumed to have zero linewidth.
TN-14
LASER STABILIZATION TO A SINGLE ION 373
tially a two-level system suitable for laser cooling, except for weak off-reso-
nance pumping into the ^Si/^^F = 0) state. The second 194 nm source, tuned to
the ^Si/2{F = 0) to ^Pi/2(F = 1) transition, returns the ion to the ground-state
F = 1 hyperfine level. The frequency separation between the two radiation
sources is equal to the sum of the ground- and excited-state hyperfine splittings
(about 47 GHz). The two 194 nm beams propagate coUinearly and irradiate the
ion at an angle of 55° with respect to the symmetry (z) axis of the trap. In this
way, all motional degrees of freedom are cooled to near the Doppler-cooling lim-
it of 1.7 mK. 194 nm fluorescence from the ion, collected in a solid angle of about
5 • 10"^ 47i: sr, is detected with an efficiency of 10% to give a peak count rate on
resonance of about 25000/s. The complication of laser cooling with two lasers is
brought about by the hyperfine structure of ^^^Hg^ . Only an isotope with
nonzero nuclear spin can have first-order, field-independent transitions, which
give great immunity to magnetic-field fluctuations. In ^^^Hg^ , the nuclear spin
is 1/2. Near B = 0, the narrow 5d^%s ^Si/2-5d^6s2 ^D^/z transition at 282 nm is
first-order field-independent. The decay rate of the metastable ^Dr,/2 state cor-
responds to an optical linewidth of less than 2 Hz—certainly, a suitably chal-
lenging test for the stabilized dye laser.
The 282 nm radiation is obtained by frequency doubling the radiation from
the dye laser that is stabilized to the Fabry-Perot cavity on the sandbox table.
(The cavity comparisons were done subsequent to the single-ion studies and wehad not yet suspended a table with latex tubing.) Prior to being frequency-dou-
bled, the 563 nm radiation (beam 1) is passed through an acousto-optic modula-
tor (A/0-1) so that its frequency can be tuned through the S-D resonance. Wealso used A/0-1 to suppress the linear drift of the cavity and the frequency
fluctuations caused by relative motion between the cavity and the ion trap
(which are supported on different tables separated by 3 m). These Doppler ef-
fects can be removed in a fashion similar to that used by Vessot to remove
Doppler frequency shifts between a ground-based microwave source and a
rocket-borne microwave oscillator [27]. Another acousto-optic modulator (A/0-
2) is placed in an auxiliary laser beam (beam 2) near the ion trap. The frequency
of beam 2 need not be stabilized. A/0-2 generates a frequency-shifted beam
(beam 3) that is sent to the cavity table and returned on a path very close
( < 2 cm) to that followed by beam 1. The light paths need not be overlapping in
order to reach a frequency stability of 1 Hz. Beam 3 is recombined with its carri-
er to produce a beat note at the r.f. frequency of A/0-2. However, because the
shifted beam traveled over to the cavity and back to the trap, the frequency
fluctuations caused by relative motion between the tables and atmospheric tur-
bulence are impressed on the beat note. Dividing the beat frequency by 2 gives
the one-way path noise information carried at half the radiofrequency of A/0-2.
If this frequency is summed with the right quadrature to the frequency that
sweeps the stabilized laser through the S-D resonance, then path noise is elimi-
nated. This is equivalent to bringing the cavity and trapped ion together. Step-
TN-15

374 J. C. BERGQUIST, W. M. ITANO and D. J. WINELAND
ping the frequency of the stabilized laser through the S-D resonance and re-
moving the linear cavity drift are accomplished vdth an r.f. drive frequency to
A/0-1 obtained by summing the output of two synthesizers. The frequency of
one synthesizer sweeps opposite to the cavity drift and the frequency of the sec-
ond synthesizer is stepped back and forth, sweeping the frequency of the stabi-
lized laser through the narrow atomic resonance.
The 282 nm radiation and the two-frequency 194 nm source are turned on
and off sequentially using shutters and the acousto-optic modulator. This pre-
vents any broadening of the narrow S-D transition due to the 194 nm radiation.
Electron shelving [25, 28] is used to detect each transition made to the
metastable D state as a function of the frequency of the 282 nm laser. At the be-
ginning of each cycle, both 194 nm lasers irradiate the ion. The fluorescence
counts in a 10 ms period must exceed a minimum threshold (typically 20 counts)
before the interrogation sequence can continue. The 194 nm beams irradiate the
ion for sequential 10 ms periods until the threshold is met. The 194 nm radiation
tuned to the ^Si/2iF = 0)-^Pi/2(F = 1) transition is chopped off for 5ms. During
this time, the 194 nm radiation tuned to the ^Si/2{F = iy^Pi/2iF = 0) transition
optically pumps the ion into the ^Si/2iF = 0) ground state. Then this 194 source
is turned off. One milHsecond later, the 282 nm radiation, tuned to a frequency
resonant or nearly resonant with the ^Si/2iF = 0, vtf = 0)-^D^/2(F = 2, nif = 0)
transition, irradiates the ion for an interrogation period that is varied up to
25 ms. At the end of this period, the 282 nm radiation was turned off and both
194 nm sources were turned on. Another 10ms detection period was used to de-
termine whether a transition to the D state had been made (fluorescence
counts > threshold, no; fluorescence counts < threshold, yes). The result was
recorded as a 1 or (no or yes) and averaged with the previous results at this
frequency. Then the frequency of the 282 nm radiation was stepped and the
measurement cycle repeated.
Since the frequency drift of the 282 nm laser depended not only on the refer-
ence cavity contraction rate, but also on small pressure and temperature
changes, on laser power variations, and so on (as discussed in sect. 1,2), welocked the frequency of the laser to the narrow S-D transition to remove long-
term frequency drifts. To do this, we modified the measurement cycle to in-
clude a locking cycle. We began each measurement cycle by stepping the fre-
quency of the 282 nm radiation to near the half maximum on each side of the res-
onance A^ times (N varied from 8 to 32). At each step, we probed for 5 ms and
then looked for any transition with the electron-shelving technique. We aver-
aged the A^ results from each side of the resonance line, took the difference and
corrected the frequency of the synthesizer used to compensate the cavity drift.
The gain of this lock needed to be properly adjusted to avoid adding frequency
noise to the laser. In this way, variations in the frequency of the 282 nm laser
for time periods exceeding a few seconds were reduced.
In fig. 3, we show the spectrum obtained by scanning in this drift-free way
IN- 16

LASER STABILIZATION TO A SINGLE ION 375
through the Doppler-free resonance of the ^51/2 (F = 0, m^ = 0)-^1)5/2 (-?" =
= 2, thf = 0) transition. The Uneshape shown is the result of 138 consecutive
scans, each of which included a locking cycle. The probe period was 15 ms, and
the step size was 15 Hz at 563 nm (30 Hz at 282 nm). The resonance shows a
clearly resolved triplet with the hnewidth of each component less than 40 Hz( < 80 Hz at 282 nm). We first thought that the triplet structure might be due to
60 Hz modulation of the frequency of the 563 nm laser either due to grounding
problems, line pickup or inadequate servo gain. However, when the radiation
from two independently stabilized laser beams was heterodyned together, the
60 Hz modulation index was far too small to account for the sideband structure
observed on the S-D resonance. In addition, the frequency separation of the
peaks is nearer to 50 Hz, not to 60 Hz. We now think that, most likely, the
triplet structure is caused by Rabi power broadening. The 282 nm radiation is
focussed to a spot size of about 25 ij.m; therefore, on resonance, fewer than 10^
photons/s ( < 1 pW) will saturate the transition. Below, the data is a theoretical
lineshape calculated for an ion a rest, for no broadening due to collisions or laser
bandwidth, for a pulse length of 15 ms and for sufficient power at resonance to
give a 3.5 TT pulse (which roughly corresponds to the power used).
Qualitatively, the figures compare well. The fluctuations from measurement
cycle to measurement cycle in the quantum occupation number of the ion in the
harmonic well of the trap cause variations in the transition probability of the
ion. This, and the finite laser linewidth, likely cause the general broadening and
weakening of the signal. Current efforts are devoted to measuring the narrow
S-D transition using the laser stabilized to the cavity on the suspended table. Acryogenic, linear r.f. Paul trap has been constructed and will soon be tested.
With this trap, it should be possible to laser-cool many ions and to store them
without attrition for days. The increased numbers of trapped ions wUl give a
better signal-to-noise ratio (thereby better stability), but it will still be possible
to have a small second-order Doppler shift. We also plan to investigate the line-
shape and the effects of power broadening in more detail in future experiments.
The authors gratefully acknowledge the contributions of the colleagues who
participated in the work reported here: F. Diedrich, F. Elsner and M. Raizen.
We also acknowledge the support of the Office of Naval Research.
REFERENCES
[1] D. J. WiNELAND, W. M. Itano, J. C. Bergquist and F. L. Wells: in Proceedings ofthe
35th Annual Symposium on Frequency Control, Philadelphia, Pa., May 1981
(copies available from Electronic Industries Assoc, 2001 Eye St., Washington, DC,
20006), p. 602.
TN-17

376 J. C. BERGQUIST, W. M. ITANO and D. J. WINELAND
[2] D. J. WiNELAND, J. C. BERGQUIST, J. J. BOLLINGER, W. M. ItANO, D. J. HeINZEN, S. L.
Gilbert, C. H. Manney and M. G. Raizen: IEEE Trans. Ultrason., Ferroelectr. Fre-
quency Control, 37, 515 (1990).
[3] MiAO Zhu and J. L. Hall: J. Opt. Soc. Am. B., 10, 802 (1993). ,
[4] C. M. Caves: Phys. Rev. Lett, 45, 75 (1980).
[5] W. A. Edelstein, J. Hough, J. R. Pugh and W. Martin: J. Phys. E, 11, 710
(1980).
[6] C. M. Caves: Phys. Rev. Lett, 54, 2465 (1985).
[7] R. Loudon: Phys. Rev. Lett., 47, 815 (1981).
[8] D. HiLS and J. L. Hall: in Frequency Standards and Metrology, edited by A.
DeMarchi (Springer-Verlag, Berlin, 1989), p. 162.
[9] R. J. Reark and W. C. Young: in Formulasfor Stress and Strain (McGraw-Hill, NewYork, N.Y., 1975).
[10] N. Sampras, Stanford University: private communication.
[11] H. B. Callen and R. F. Greene: Phys. Rev., 86, 702 (1952); H. B. Callen and T. A.
Welton: Phys. Rev., 83, 34 (1951).
[12] G. W. Gibbons and S. W. Hawking: Phys. Rev. D, 4, 2191 (1971).
[13] P. F. Panter: Modulation, Noise and Spectral Analysis (McGraw-Hill, New York,
N.Y., 1965).
[14] V. B. Braginsky, V. P. Mitrofanov and V. I. Panov: Systems with Small Dissipation
(University of Chicago Press, Chicago, 111., 1985).
[15] Ch. Salomon, D. Hils and J. L. Hall: /. Opt Soc. Am. B, 5, 1576 (1988).
[16] D. L. Platus: SPIE Proceedings, 1619, 44 (1991); P. R. Saulson: Gravitational As-
tronomy; Instrument Design and Astrophysical Prospects, edited by D. E. McClel-land and H.-A. Bachor (World Scientific, Singapore, 1991), p. 248.
[17] P. J. Veitch: Rev. Sci Instrum., 62, 140 (1991).
[18] J. C. BERGQUIST, W. M. Itano, F. Elsner, M. G. Raizen and D. J. Wineland: in Light
Induced Kinetic Effects on Atoms, Ions, and Molecules, edited by L. Moi, S. GozziNl,
C. Gabbanini, E. Arimondo and F. Strumia (ETS Editrice, Pisa, 1991), p. 291.
[19] F. Larsen: Acoustic Emission (IFI/Plenum, New York, N.Y., 1979).
[20] R. W. P. Drever, J. L. Hall, F. V. Kowalski, J. Hough, G. M. Ford, A. J. Munleyand H. Ward: Appl. Phys. B, 31, 97 (1983).
[21] J. Hough, D. Hils, M. D. Rayman, L.-S. Ma, L. Hollberg and J. L. Hall: Appl.
Phys. B, 33, 179 (1984).
[22] Mention of a commercial product is for technical communication only.
[23] G. Rempe, R. J. Thompson, H. J. Kimble and R. Lalezari: Opt Lett., 17, 363
(1992).
[24] F. Bayer-Helms, H. Darnedde and G. Exner: Metrologia, 21, 49 (1985).
[25] J. C. BERGQUIST, W. M. Itano and D. J. Wineland: Phys. Rev. A, 36, 428
(1987).
[26] J. C. BERGQUIST, D. J. Wineland, W. M. Itano, H. Hemmati, H.-U. Daniel and
G. Leuchs: Phys. Rev. Lett, 55, 1567 (1985).
[27] R. F. C. Vessot, M. E. Levine, E. M. Mattison, E. L. Blomberg, T. E. Hoffman,
G. U. Nystrom, B. F. Farrel, R. Decher, P. B. Eby, C. R. Baugher, J. W. Watts,
D. L. Teuber and F. D. Wills: Phys. Rev. Lett, 45, 2081 (1980).
[28] H. Dehmelt: Bull. Am. Phys. Soc, 20, 60 (1975); J. Phys. (Paris) Colloq., 42, C8-299
(1981).
TN-18

PHYSICAL REVIEW A VOLUME 45, NUMBER 9 1 MAY 1992
Ionic crystals in a linear Paul trap
M. G. Raizen,* J. M. Gilligan, J. C. Bergquist, W. M. Itano, and D. J. Wineland
Time and Frequency Division, National Institute ofStandards and Technology, Boulder, Colorado 80303
(Received 31 October 1991)
We describe a configuration for a linear Paul rf ion trap. This trap can store a long string of ions with
a small second-order Doppler shift, comparable to that achieved with a single ion in a quadrupole Paul
trap. Crystallized strings of trapped ions, as well as more complicated structures, have been observed in
the trap. We report an observation of the 40.5-GHz ground-state hyperfine interval of "'Hg^ by
microwave-optical double-resonance spectroscopy and discuss prospects for a microwave frequency
standard based on a trapped string of ions.
PACS number(s): 32.80.Pj, 32.30.Bv, 95.55.Wk, 36.40.+ d
I. INTRODUCTION
Experiments with trapped and laser-cooled ions have
been motivated by the possibility for high-accuracy spec-
troscopy, improved frequency standards, and experi-
ments in fundamental physics. For a large range of spec-
troscopic experiments, the goal for ion confinement is the
Lamb-Dicke regime, in which the extent of the motion of
each ion is much less than the wavelength of an atomic
transition. For an optical transition this requirement is
severe. In a quadrupole rf Paul trap, the total kinetic en-
ergy of a single trapped ion can be on the order of the
secular kinetic energy, and confinement of a single laser-
cooled ion to the Lamb-Dicke regime for an optical tran-
sition has been verified spectroscopically in Ba"*" [1,2] andHg"^ [3]. Laser cooling can significantly reduce the
second-order Doppler shift due to the ion motion, whichcan otherwise limit the accuracy of a spectroscopic mea-
surement. As an example, for a single ^^^Hg"*" ion laser-
cooled to the Doppler limit [4], the fractional second-
order Doppler shift is
<Av/vo> = -2.3X10" 18
(Ref. [5]).
In many experiments it is advantageous or even neces-
sary to work with a larger number of ions. However, in a
quadrupole rf Paul trap, two or more ions are pushed by
their mutual Coulomb repulsion from the center of the
trap to regions where the rf field is stronger. This leads
to increased ampHtude of the micromotion [6-8], Hmits
the achievable confinement, and may inhibit laser cooling
[7,8]. One way to circumvent this problem is to design a
trap in which the rf field vanishes along a line instead of
at a single point. This goal has led to the development of
the linear trap.
The linear-trap design descends from a "racetrack"
configuration rf quadrupole trap first used by Drees andPaul for the short-term confinement of an electron-ion
plasma [9] and later used by Church to trap atomic ions
for longer times [10]. The racetrack trap resembles a
quadrupole mass filter bent into a closed path. Chargedparticles are confined to trajectories along the closed path
formed by the electrodes. Dehmelt first suggested using a
string of ions in a linear trap to suppress the second-order
Doppler shift [11]. In addition to confining the ions radi-
ally, it is desirable to fix the axial positions of the ions. In
racetrack traps, axial localization can arise from patch
effects on the trap electrodes, which pin ions in one re-
gion of the trap. Coulomb repulsion among the ions then
localizes the remaining ions. The traps described here
and in Ref. [12] provide axial confinement with a pur-
posely applied static electric field. This allows the trap to
confine the ions more strongly to their axial positions
than racetrack traps do and gives more control over the
axial positions. The static field weakens the radial
confinement, as will be discussed below. Also, racetrack
traps can confine both positively and negatively charged
particles simultaneously, while traps such as ours, which
use static confining potentials, cannot.
Prestage, Dick, and Maleki have trapped a cloud ofi99jjg+
JQjjg elongated along the axis of a Hnear trap and
have demonstrated a '^^Hg^ microwave frequency stan-
dard with excellent frequency stability [12]. Crystallized
strings of laser-cooled ^^Mg"*" ions have been observed in
a racetrack-type trap at the Max Planck Institute for
Quantum Optics [13]. We have constructed a Hnear rf
trap and observed simple crystallized linear structures of
up to 33 '^^Hg"*^ ions [14]. By varying the strength of the
axial confining potential, we have also observed morecomplex structures.
In Sec. II we discuss the theory of the linear trap and
provide details of our trap. We then present images of
trapped crystallized structures of ions and compare these
observations with the results of numerical simulations.
We next describe an observation of the 40.5-GHz
ground-state hyperfine transition using microwave-
optical double-resonance spectroscopy with a trapped
string of '^^Hg^ ions and discuss the potential for a mi-
crowave frequency standard based on this transition. Weconclude with a discussion of future experiments and
prospects.
II. THEORY AND DESIGN OF THE LINEAR TRAP
The starting point in the discussion of our linear trap is
the quadrupole mass analyzer [15,16]. This device con-
Work of the U. S. Government45 6493 Not Subiect to U. S. r.onvHtrht
TN-19

6494 RAIZEN, GILLIGAN, BERGQUIST, ITANO, AND WINELAND 45
sists of four parallel rods. Typically, each rod has circu-
lar cross section in the plane perpendicular to the axis of
the trap, as shown in Fig. 1 . A time-varying rf potential
Focoslir is applied to two opposing rods. The remaining
two rods are held at rf ground. The rf electric fields are
transverse to the axis of the mass analyzer. The time-
varying potential near the axis can be approximated by
^=^ 1 + -
RcosQ,t (1)
where R is the distance from the axis to the surface of the
electrodes. For sufficiently high drive frequency O, a par-
ticle of mass m and charge q moves in an effective pseu-
dopotential
<I)= ^vl
4m ft^/?^(x
Iq
where
o),=qVQ/(V2m^R
(2)
(3)
is the angular frequency of oscillations in the radial direc-
tion [12,15,16].
To reduce the anharmonicity of our trap, we chose the
rods to have radius /?' = 1.03/?. The anharmonicity is
minimized with a ratio of 1.146 [17], but is not dramati-
cally worse for our design. A numerical multipole expan-
sion of the field for the geometry of our trap shows that
near the axis the harmonic term in the pseudopotential is
1% smaller than that predicted by Eq. (2). The total con-
tribution of anharmonic terms in the pseudopotential, up
to order {r /R )"^, is less than 0.1% of the quadratic term
for (r /R)<Q.l, where r is the distance from the trap
axis. While electrodes with hyperbolic cross sections
would give a more nearly harmonic pseudopotential, the
use of circular rods facilitates construction and is a goodcompromise since we are primarily interested in confining
the ions near the axis. Such a geometry has found wide
use as a mass analyzer, but it cannot function as a trap
Vn cos Vtt y\j
V
K3^0
FIG. 1. Cross section of a linear quadrupole trap. An alter-
nating rf voltage Focosflr is applied to a pair of diagonally op-
posite rods. The other pair of rods is maintained at rf ground.
In the actual trap, the radius R' of the rods is 0.794 mm, 1.03
times the distance R (0.769 mm) from the trap axis to the sur-
face of the rods.
since particles can move freely along the axis.
To confine the ions axially, a static potential can be ap-
plied from opposing sides along the axis, creating a re-
gion in the center in which particles can be trapped. Fig-
ure 2 shows how this is accomplished in our trap. Eachof the circular trap rods is divided into two sections of
unequal length. The static potential of the longer "cen-
tral" sections is maintained at ground and a static bias
voltage Uq is applied to the shorter "end" sections. The
segmented design divides the trap into three regions
along the axis: two end regions where the end segments
of two rods overlap the central segments of the other two
and a central region where all four central segments over-
lap. As a function of axial position, the static potential
has a minimum in the central region of the trap. The
static potential thus provides axial confinement, but is ex-
pected to add far greater anharmonicity to the trap po-
tential than does the use of circular rods.
A schematic diagram of the actual trap is shown in
Fig. 3. Four circular rods, 12.6 mm long and 1.588 mmin diameter, are aligned with their axes parallel at a radi-
al distance of 1.563 mm from a common axis (the z axis).
Each rod is made of two segments of beryllium copper:
an end segment 5 mm long and a central segment 7.5 mmlong. The central region of the trap, where the four cen-
tral segments overlap, is 2.5 mm long. The two segments
are electrically isolated from each other using spacers of
alumina and machinable ceramic, as shown in Fig. 4.
This configuration allows independent static potentials to
be applied to the segments of the rods. The insulating
spacers are hidden from the outside of the rods, as shownin Fig. 4, to avoid perturbations caused by surface charge
on the insulators. The ends of the rods are held in two
machinable ceramic fixtures (not shown), which are
themselves held together by four outer support rods (also
not shown). The fixtures were coated with titanium, ex-
cept where the trap electrodes are held, and grounded in
OOoo
(a)
i\ u
I'o
(b)
FIG. 2. (a) End view and (b) side view of the linear trap,
showing how the axial confining potential is applied. For sim-
plicity, the rf potentials are not indicated on this figure. Each
trap rod is divided into two sections that are rf common and
held at different static potentials. The dashed lines show the
divisions between the sections of the rear rods (which are hid-
den behind the front ones). The short segments of the rods are
held at a positive static potential Uq and the long segments at
static ground, as indicated for the front rods. With this ar-
rangement, we create an axially confining potential for positive
ions in the region where the four longer segments overlap. In
our trap, this region has length 2zo = 2.5 mm

45 IONIC CRYSTALS IN A LINEAR PAUL TRAP 6495
VQCOsflt + AUi
Vq cos fit + Uq
VQCOsQt + AU2
A^3
Uq + At/5
Ac/4
Off
\^
FIG. 3. Linear-trap configuration. An rf voltage Vocosilt is
applied to diagonally opposite electrodes as shown. The seg-
ments of each rod are rf common so that each central segment
can be biased at a different static potential A U, yet remain at the
same rf potential. The end segments of the electrodes are 5 mmlong, much longer than the 0.769-mm radial distance from the
axis of the trap to surface of the rods, so the rf electric fields in
the center section of the trap are nearly parallel to the xy plane.
The region in the center of the trap in which the four central
segments of the electrodes overlap is 2.5 mm long. To trap posi-
tive ions along the z axis, the four central segments are held
near static ground potential and a positive static potential Uq is
placed on the end segments. Small potentials AU^-^U^ can be
applied to the central segments to compensate for contact and
patch potentials on the electrodes. The axial position of the
ions can be varied by applying a bias A C/5 to one set of end seg-
ments. The ions are detected by an imaging photomultiplier
tube that looks along an axis normal to the z axis and 45° to the
X and y axes.
order to minimize effects due to charging of exposed insu-
lators.
An rf potential is applied to two opposing rods, while
the two other rods are kept at rf ground. The two seg-
ments that make up each rod are rf common. The end
segment of each rod is biased at a static voltage Uq > 0,
Beryllium copper
Insuloting spocer
•2.5 mm
.588 mm
12.6 mm
FIG. 4. Section through two trap rods (the front rods in Fig.
2). The end segment of each trap rod is a sleeve that fits over an
insulating spacer, which in turn fits over an extension of the
central segment. The insulating spacer is completely hidden
from the outside of the rod to prevent surface charge on the in-
sulators from perturbing the trap potential.
and the central segment is nominally held at zero. This
arrangement confines positive ions within the central re-
gion of the trap. To compensate for contact and patch
potentials on the trap electrodes, there are provisions for
applying small static bias potentials (AC/i -^U^ in Fig. 3)
to the central segments of the individual rods and to one
pair of end segments (A C/5 ).
The rf voltage is supplied by a helical resonator, which
acts as a resonant transformer with a 40: 1 turns ratio. Toallow the different segments of the rods to have different
static potentials while remaining at the same rf potential,
the secondary winding of the helical resonator is a trifilar
coil, whose three filaments supply the voltages
FoCosflr + At/j, Vocosilt + Uq, and Focosftr +AC/2, as
shown in Fig. 3. The rf-grounded rods are capacitively
coupled to one another. The resonator produces up to
about 700 V ampHtude at its 12.7 MHz resonant frequen-
cy when driven with about 5W. The high-voltage output
is monitored with a capacitive voltage divider, which has
been calibrated with 10% accuracy.
Because there is so httle symmetry to the trap, describ-
ing the static potential in detail would require a full
three-dimensional numerical solution. However, the re-
gion of interest is near the midpoint of the trap axis, a
saddle point of the static potential. In this region the
static potential can be approximated by the harmonic po-
tential
<f>s
m
[z^-Ux^+y^)]
=-.5(.- [x^+y^] (4)
where Zq is half the length of the central region of the
trap (zo = 1.25 mm for our trap), /c is a geometric factor
(/fwO. 31 for our trap; see below), and
(0^ = {2KqUQ/mzQ)2 \l/2(5)
is the angular frequency of axial oscillations in the trap.
The factor k depends on the geometry of the trap, and
hence will vary with Zq, so the secular frequency does not
scale simply as I/zq. The pseudopotential well in the ra-
dial direction is weakened by the addition of the static
potential and is given by
m<!>,=— {coi-^coiKx'+y
2q
= -^{co:)Hx'+y')2q
where
— ^,,2_ l^,2^1/2
(6)
(7)
is the angular frequency of radial oscillations in the pres-
ence of the static potential.
The radial size of the trap was chosen to allow
confinement of Hg^ ions near the Lamb-Dicke regime
for a 194-nm optical transition. We define the Lamb-Dicke regime by the criterion that the rms motion of
each ion be less than X/l-rr, where A is the waveleneth ofTN-21
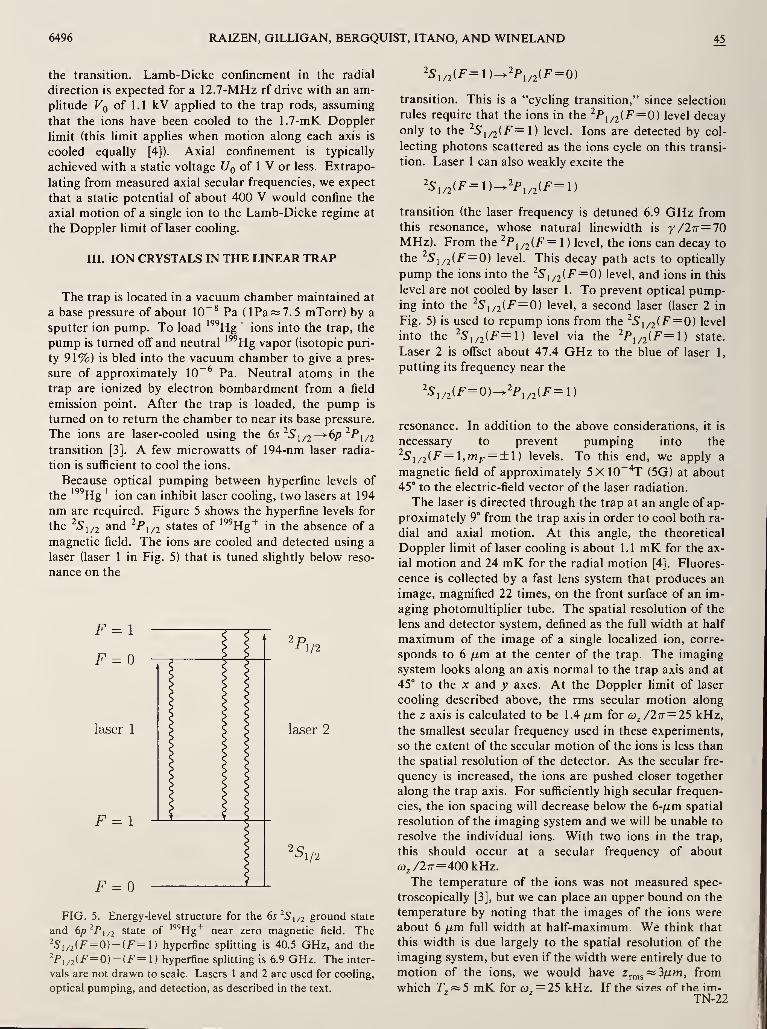
6496 RAIZEN, GILLIGAN, BERGQUIST, ITANO, AND WINELAND 45
the transition. Lamb-Dicke confinement in the radial
direction is expected for a 12.7-MHz rf drive with an am-
plitude Fq of 1.1 kV applied to the trap rods, assuming
that the ions have been cooled to the 1.7-mK Doppler
limit (this limit applies when motion along each axis is
cooled equally [4]). Axial confinement is typically
achieved with a static voltage [/q of 1 V or less. Extrapo-
lating from measured axial secular frequencies, we expect
that a static potential of about 400 V would confine the
axial motion of a single ion to the Lamb-Dicke regime at
the Doppler limit of laser coohng.
III. ION CRYSTALS IN THE LINEAR TRAP
The trap is located in a vacuum chamber maintained at
a base pressure of about 10~^ Pa (lPaw7.5 mTorr) by a
sputter ion pump. To load '^^Hg"*" ions into the trap, the
pump is turned off and neutral '^^Hg vapor (isotopic puri-
ty 91%) is bled into the vacuum chamber to give a pres-
sure of approximately 10~^ Pa. Neutral atoms in the
trap are ionized by electron bombardment from a field
emission point. After the trap is loaded, the pump is
turned on to return the chamber to near its base pressure.
The ions are laser-cooled using the 65 ^5,/2—>-6/) ^Pi/2
transition [3]. A few microwatts of 194-nm laser radia-
tion is sufficient to cool the ions.
Because optical pumping between hyperfine levels of
the '^^Hg'*' ion can inhibit laser cooling, two lasers at 194
nm are required. Figure 5 shows the hyperfine levels for
the ^S,/2 and '^P\/2 states of '^^Hg"*" in the absence of a
magnetic field. The ions are cooled and detected using a
laser (laser 1 in Fig. 5) that is tuned slightly below reso-
nance on the
F = l
F =
laser 1
F = l
F =
1/2
laser 2
>l/2
FIG. 5. Energy-level structure for the 6s ^8^/2 ground state
and 6p^Pi/2 state of '^'Hg"'' near zero magnetic field. The
^S,/2(F=0)-(F=1) hyperfine splitting is 40.5 GHz, and the
^Pi/2(F=0)-(F=1) hyperfine splitting is 6.9 GHz. The inter-
vals are not drawn to scale. Lasers 1 and 2 are used for cooling,
optical pumping, and detection, as described in the text.
transition. This is a "cycling transition," since selection
rules require that the ions in the ^P 1/2(^ = 0) level decay
only to the ^5,/2(F=l) level. Ions are detected by col-
lecting photons scattered as the ions cycle on this transi-
tion. Laser 1 can also weakly excite the
'1/2 :F=i)^2p,/2(F=i)
transition (the laser frequency is detuned 6.9 GHz fromthis resonance, whose natural linewidth is 7/277= 70
MHz). From the ^Pi/2(jF= 1 ) level, the ions can decay to
the ^Si/2(F= 0) level. This decay path acts to optically
pump the ions into the ^Si/2(F=0) level, and ions in this
level are not cooled by laser 1. To prevent optical pump-ing into the ^5,/2(F= 0) level, a second laser (laser 2 in
Fig. 5) is used to repump ions from the ^Si/2(F= 0) level
into the ^51/2(^=1) level via the ^Pi/2(F=1) state.
Laser 2 is offset about 47.4 GHz to the blue of laser 1,
putting its frequency near the
2S,/2(F= 0)- 'Pwiif- 1)
resonance. In addition to the above considerations, it is
necessary to prevent pumping into the
^5i/2(F= l,W;r = + l) levels. To this end, we apply a
magnetic field of approximately 5X lO"'^ (5G) at about45° to the electric-field vector of the laser radiation.
The laser is directed through the trap at an angle of ap-
proximately 9° from the trap axis in order to cool both ra-
dial and axial motion. At this angle, the theoretical
Doppler limit of laser cooling is about 1.1 mK for the ax-
ial motion and 24 mK for the radial motion [4]. Fluores-
cence is collected by a fast lens system that produces an
image, magnified 22 times, on the front surface of an im-
aging photomultiplier tube. The spatial resolution of the
lens and detector system, defined as the full width at half
maximum of the image of a single localized ion, corre-
sponds to 6 fim at the center of the trap. The imaging
system looks along an axis normal to the trap axis and at
45° to the X and y axes. At the Doppler limit of laser
cooling described above, the rms secular motion along
the z axis is calculated to be 1.4 fim for 6;^/27r=25 kHz,
the smallest secular frequency used in these experiments,
so the extent of the secular motion of the ions is less than
the spatial resolution of the detector. As the secular fre-
quency is increased, the ions are pushed closer together
along the trap axis. For sufficiently high secular frequen-
cies, the ion spacing will decrease below the 6-/im spatial
resolution of the imaging system and we will be unable to
resolve the individual ions. With two ions in the trap,
this should occur at a secular frequency of about
6),/277-=400kHz.
The temperature of the ions was not measured spec-
troscopically [3], but we can place an upper bound on the
temperature by noting that the images of the ions were
about 6 fj.m full width at half-maximum. We think that
this width is due largely to the spatial resolution of the
imaging system, but even if the width were entirely due to
motion of the ions, we would have z^^^^i/xm, from
which F^ w 5 mK for co, = 25 kHz. If the sizes nf the im-TN-22

45 IONIC CRYSTALS IN A LINEAR PAUL TRAP 6497
ages of the ions were primarily due to thermal motion,
the images would be elliptical, since the secular frequen-
cies in the radial and axial directions are different. The
lack of eccentricity in the images supports our supposi-
tion that the widths are due to the imaging system and,
hence, that the axial temperature is significantly less than
5 mK for ft), =25 kHz.
The secular frequencies of the ions are measured by ap-
plying a drive to the trap electrodes and observing a drop
in the fluorescence as the drive sweeps through resonance
[18]. The drop in fluorescence when the amphtude of the
secular motion increases is due to the combined effects of
the ion's motion taking it out of the laser beam and of
Doppler shifts detuning the ion resonance. These mea-
surements permit a quantitative comparison between the
observed ion configurations and numerical simulations.
The secular frequencies were measured at several
different rf and static voltages and showed the expected
functional dependence on the voltages. The measured
values for the axial secular frequency co^ were proportion-
al to the square root of the static voltage. The constant k
in Eq. (5) was determined from the measured secular fre-
quencies to be 0.31 with an uncertainty of about 10%.
The unperturbed radial secular frequency co^ was deter-
mined from the measured secular frequencies co'^ and co^
using Eq. (7). The values for co^ were proportional to the
rf voltage and were consistently 17% ± 10% lower than
predicted by Eq. (3), where the uncertainty is dominated
by a systematic error in measuring the rf voltage applied
to the trap. For very small axial voltages (less than about
100 mV), the effects of local static fields, due to surface
charge or patch potentials on the electrodes, make it
difficult to characterize the axial potential.
By varying the neutral Hg background pressure and
the duration and intensity of the electron bombardmentwhen loading the trap, we can capture different numbers
of '^^Hg"*" ions. We have observed single ions and crys-
talline structures of up to 33 ions, as well as much larger
clouds that did not crystallize. The simplest crystalline
configuration of ions is a linear string, which is obtained
when a)'^»(o^. We have observed crystalhzed linear
strings of 2 to 33 ions.
Figure 6 shows images of linear crystals containing 1
5
and 33 ions. The number of ions we can observe in such
crystals is limited by our ability to image the entire string
while resolving the individual ions. Large strings, such as
the string in Fig. 6(b), are longer than the approximately
200-jUm-long region in which the laser intersects the trap
axis, and it is not possible to illuminate the whole string
at once. To obtain this picture, it was necessary to sweep
the position of the laser beam back and forth to il-
luminate the whole string. A more powerful laser could
illuminate a larger area with sufficient intensity to ob-
serve the ions easily. Alternatively, more ions could be
confined within the illuminated region by increasing co^,
but the imaging optics cannot resolve ions less than about
6 /xm apart, so this approach would require improved im-
aging optics. We have formed crystallized strings with
enough ions that when the spacing between the ions wassufficient for the imaging system to resolve them, the
strings were longer than the field of view of the imaging
(a) #
100 Jim
(b)
0% #•
100|im
FIG. 6. (a) A picture of a linear crystal of 15 ions, (b) A pic-
ture of a linear crystal of 33 ions. This string was longer than
the region of the trap axis illuminated by the cooling laser. Toobtain an image of the entire string, it was necessary to sweep
the laser beam back and forth.
system (about 300/im). The fact that only part of the
string was illuminated by the coohng laser did not seem
to inhibit coohng and crystallization, although whenmuch larger clouds of ions were trapped, crystallization
was not observed. A limitation to forming extremely
long strings may be our inability to compensate for the
effects of local perturbations to the static potential due to
patch fields or surface charge. In the present trap, static
potentials can be independently applied to three of the
four trapping rods to compensate for such perturbations.
This technique works well for short strings, but as the
length of the string approaches the radial dimension of
the trap (about 750 /im), the patch fields may vary over
the length of the string. In this case, we expect the static
compensation to be less effective.
Figure 7(a) shows the measured positions of eight ions
in a string and the positions calculated by a numerical
simulation. The simulation, performed with no adjust-
able parameters, determines equilibrium positions for the
ions by minimizing the potential energy of a given num-ber of particles in harmonic radial and axial wells, with
Coulomb repulsion between the particles. The secular
frequencies used for the simulation were determined by
scaling previously measured secular frequencies by the
static and rf voltages applied to the trap. The hnear
configurations of ions are quite insensitive to the radial
secular frequency, because the ions are confined to the
axis of the trap.
The ions can be pushed into planar or three-
dimensional configurations by increasing co^ relative to
0)'^. The simplest structure beyond a linear string is a pla-
nar zigzag. Figure 8 shows such a structure composed of
1 1 ions (10 '^^Hg"*" ions and 1 impurity ion, which did not
fluoresce). We think that the impurity ion is another iso-
tope of mercury, which would be consistent with the
91% isotopic purity of the mercury vapor used to load
the trap. This structure was obtained by lowering the rf
voltage on the trap. Figure 7(b) compares the measuredpositions of the ions to the predictions of a calculation.
To obtain agreement between the zigzag configuration
TN-23

6498 RAIZEN, GILLIGAN, BERGQUIST, ITANO, AND WINELAND 45
and a numerical simulation with 11 '^^Hg"*" ions, it was
necessary to introduce into the calculations an ad hoc
asymmetry of about 20% between the secular frequencies
in the x and y directions. This azimuthal asymmetryforces the ions to He in a plane; without it, the calculation
predicts a quasihelical structure that disagrees
significantly with the observed ion positions. The axial
secular frequency co^ and the smaller radial secular fre-
quency co'y were determined by scaling previously mea-
sured secular frequencies by the voltages present on the
trap when this crystal was observed. The larger radial
secular frequency co'^ was set to l.lco'y.
The source of the azimuthal asymmetry in the poten-
tial well is not known. One possible cause is unequal con-
tact or patch potentials on the trap rods. Another possi-
ble cause is the azimuthal asymmetry of the static trap-
ping field. At the geometric center of the trap the static
field should be the same in the x and y directions. How-ever, the position of the ions along the axis was not neces-
sarily at the center and varied from load to load. Wesuspect that this was due to surface charge deposited dur-
ing loading. When the ions are not at the midpoint of the
trap axis, there is a quadrupole component to the radial
static field, which breaks the azimuthal symmetry of the
20
: (a)
'1
-^ •f + + +
11 1 1 T
•
i 1 1
100 -50 100
z (/xm)
FIG. 7. Observed positions of ions in the trap (crosses) and
positions predicted by a numerical simulation (circles). The
arms of the crosses extend to the half-maximum intensity points
of the images (about 4 /im radius). The coordinates are as in
Fig. 3: z represents the displacement along the trap axis and _v,
represents the projection of the radial displacement onto the im-
age plane, (a) A linear crystal of 8 ions. The secular frequencies
used for the calculation are co'r/2TT= 435 kHz and CL)./2n= 4\.l
kHz. These frequencies were determined by scaling secular fre-
quencies measured under different conditions by the voltages
present on the trap when this image was acquired, (b) A non-
linear crystal of 1 1 ions. One site in the crystal was occupied by
an impurity, which did not fluoresce. An asymmetry between
the X and y directions was introduced ad hoc to make the re-
sults of the calculation agree with the data. This asymmetry
makes o)'^ = l.lco'y and confines the structure to the yz plane.
The secular frequencies used for the calculation are
w;/27r= 92.4 kHz, co',/2Tr=ll kHz, and «,/2i7=31 kHz. Thefrequencies cj'y and w^ were determined by scaling frequencies
measured under different conditions by the voltages present on
the trap when this image was acquired.
."A •••»
50|xm
FIG. 8. A picture of a crystal of 11 ions in a zigzag
configuration. The crystal consists of 10 '^'Hg^ ions and 1 im-
purity ion, which did not fluoresce. This is the same crystal
shown in Fig. 7 (b).
effective radial potential given by Eq. (6). In the case of
Fig. 7(b), the axial secular frequency is approximately
40% of the mean radial secular frequency, and it seems
plausible that the quadrupole asymmetry could produce
the observed planar structure. However, further work is
required to characterize the asymmetry more completely.
The observed crystalline structures are closely related
to the structures predicted for cold ions in storage rings
[19]. With many ions and small co'^, we have observed
complex crystalhzed structures which appear to be non-
planar and require further study. To conduct a systemat-
ic and quantitative study of two- and three-dimensional
crystallized structures, we will have to ehminate the az-
imuthal asymmetry from our trap or characterize it morecompletely.
IV. MICROWAVE-OPTICAL DOUBLE RESONANCE
A string of cold ions is of great interest for high-
resolution spectroscopy and improved frequency stan-
dards. With imaging techniques, each ion can be treated
as an independent atomic clock. Using Dehmelt's "elec-
tron shelving" technique, we should be able to detect the
clock transition with 100% efficiency in each ion
[1,3,20,21]. This would make the signal nearly immuneto fluctuations arising from, for example, fluctuations in
the laser intensity.
Consider a clock that uses the Ramsey separated-field
method in the time domain to interrogate the clock tran-
sition at angular frequency coq. The clock transition is ex-
cited by two phase-coherent pulses of radiation, each of
duration A 7"^, separated by a time T^ (AT^ «T]i). By
probing the clock transition on each side of the Ramseypeak, we can obtain an error signal to correct the average
frequency of an oscillator to match the atomic resonance
coq [16,22]. The fractional frequency stabihty of such a
locked oscillator, as characterized by the two-sample Al-
lan variance [23], is
a (t) = [tNTj^coI)-1/2
(8)
where r is the averaging time (t> Tj^) and A'^ is the num-
ber of atoms. Thus, it is advantageous to use large A'^, (Oq,
Tjf , and t. The trap environment can make long interro-
gation times Tj^ possible (r;j=550 s has been achieved
with ^Be"*" ions in a Penning trap [22]).
To achieve high accuracy, we must minimize and ac-
count for external perturbations due to electric, magnet-
TN-24

45 IONIC CRYSTALS IN A LINEAR PAUL TRAP 6499
ic, and gravitational fields. These include ion-trap and
ion-ion interactions, collisions with neutral background
atoms, external magnetic and electric fields, and gravita-
tional red shifts [5,6,11,24,25]. For a microwave transi-
tion in a cold string of '^^Hg"'" ions, it should be possible
to reduce these effects to the point where the uncertainty
in the transition frequency is dominated by the uncertain-
ty in the second-order Doppler shift. When the secular
motion is cooled to the Doppler limit, the fractional
second-order Doppler shift can be as low as — 2X10~'*
[16]. This hmit can be realized if the ions he exactly
along the axis of the trap, where the rf trapping fields ap-
proach zero. In this case, the kinetic energy in the rf mi-
cromotion is about equal to that in the secular motion,
and the two make approximately equal contributions to
the second-order Doppler shift. If contact or patch po-
tentials on the trap electrodes push the ions away from
the region of minimum rf field, the kinetic energy in the
micromotion, and hence the second-order Doppler shift,
can be significantly greater. Thus, in a clock based on
this trap, it will be necessary to adjust the static shim-
ming potentials At/i-At/4 on the trap rods to compen-
sate for contact and patch potentials.
This potential for very high accuracy has led us to in-
vestigate the possibility of a microwave frequency stan-
dard based on the 40.5-GHz ground-state hyperfine split-
ting of '^^Hg'*' with a trapped and laser-cooled string of
ions. This transition is, to first order, independent of
magnetic field at zero field. For a Ramsey interrogation
time of Tj^ = 100 s and 6)o/27r=40. 5 GHz, the frequency
stability of a clock "ensemble" of A'^ = 50 ions would be
(a) Initially, lasers 1 and 2 and both sets of Helmholtz
coils are on. This allows the ions to be laser-cooled.
(b) Laser 2 is turned off and the ions are optically
pumped by laser 1 into the F= ground state.
(c) Both lasers are turned off. The second set of
Helmholtz coils is switched off, reducing the magnetic
field to approximately 1.6X 10~^ T. The
25,/2(F= 0)->^S,/2(F=l)
ground-state hyperfine transition is driven using the
Ramsey method with two microwave pulses, each of
duration AT^ and separated by a time T^. The pulse
duration AT^ is adjusted to be close to the value that
gives a it/2 pulse at the resonant frequency. At the mi-
crowave intensities used here, this was obtained for
AT^j -0.13 s.
(d) the second set of Helmholtz coils is switched back
on, laser 1 is turned on, and the number of photons
counted by the detector during a gate time is recorded.
Only those ions that made the microwave transition are
in the (F~l) hyperfine level of the ground state, so only
those ions fluoresce. With laser 2 off", these ions are even-
tually optically pumped into the (F= 0) level and cease
fluorescing. The gate time is chosen to be shorter than
the optical pumping time. In these experiments, gate
times of 30-40 ms were used (at the laser intensity used
here, the time constant for optical pumping was about 50
ms).
cr„(T) = 5.5XlO" •14, 1/2
where r is expressed in seconds.
As a first step toward this goal, we have recently ob-
served the 40.5-GHz ground-state hyperfine transition of
a string of '^^Hg"*" ions by microwave-optical double reso-
nance. In this preliminary observation the total fluores-
cence of the entire string of ions was detected. Fluctua-
tions in the fluorescence from the ion cloud due to ampli-
tude and frequency noise in the cooling and detection
laser were too large for us to detect transitions with
100% efficiency. To describe the measurement sequence,
we rely on the discussion of laser coohng and optical
pumping given in Sec. Ill and on the level diagram
shown in Fig. 5. To prevent optical pumping into the
^S,/2(F= l,myr = ±l) levels of the ground state, it was
necessary to apply a magnetic field while the cooling
lasers were on. However, we also wanted to observe the
microwave transition in near-zero magnetic field, so weused two sets of Helmholtz coils. One set was used to
nearly cancel the ambient magnetic field in the trap. Nomagnetic shielding was used. The residual field near the
trap was measured to be approximately 1.6X10"^ T(0.16 G). A second set of coils produced the field used to
prevent optical pumping when laser 1 was on. Thecurrent in the second set of coils was switched off and onto switch the field between 1.6X10^^ T and approxi-
mately 5X lO"'^ T, respectively. The sequence of the ex-
periment is the following.
c
oocoo0.
-0.4 -0.2 0.0 0.2
f - 40 507 348 013.3 Hz
0.4
FIG. 9. Microwave-optical double-resonance spectrum of the
ground-state hyperfine transition in "^Hg"*" at 40.5 GHz. This
figure shows the central peak of a Ramsey resonance, obtained
using the measurement sequence described in the text, with a
linear string of eight ions in the trap. The circles represent the
measured fluorescence, and the solid line is a cosine function fit
to the data. For this measurement 7;, = 1.8 s, AT^ =0.130 s,
and each point is the average of 27 measurements. Including
time for cooling, pumping, and detection, each measurement cy-
cle takes about 3 s.
TN-25

6500 RAIZEN, GILLIGAN, BERGQUIST, ITANO, AND WINELAND 45
At the end of this sequence, the frequency of the mi-
crowave source is stepped, and the sequence is repeated.
The results of many scans of the microwave frequency
are averaged together. Several sets of data were acquired,
with Tjf ranging from 0.32 to 1.8 s. The result of one ob-
servation, using a string of eight ions, is shown in Fig. 9.
The linewidth, determined by a least-squares fit of a
cosine function to the data, is 251 ±6 mHz, giving a frac-
tional resolution of 6.2X 10~'^, and showing good agree-
ment with the 254-mHz theoretical Hnewidth for the
0.1 3-s pulse duration and 1.8-s free precession time used
in this measurement. Because we did not take advantage
of the nearly 100% detection efficiency that would be
possible if we counted the fluorescence from each ion in-
dividually, the signal-to-noise ratio is limited by fluctua-
tions in the ion fluorescence caused by intensity and fre-
quency noise in laser 1. With this amount of noise, the
diff'erence between a pure cosine and the central lobe of a
Ramsey profile is insignificant. The amount of technical
noise from laser 1 also means that the stability figure
given by Eq. (8) is not applicable.
V. FUTURE PROSPECTS
Future experiments will measure the fluorescence from
each ion individually. It should be possible to detect the
microwave transition with 100% efficiency if the fluores-
cence detection efficiency is high enough that when laser
1 is turned on, many photons are detected from each ion
in the (F= 1 ) level before it is optically pumped into the
(F = 0) level. If laser 1 is detuned by half a hnewidth
from the
transition, the number of photons scattered by an ion in
the ^51/2(^=1) level before it is pumped into the (F= 0)
level is approximately the square of the ratio of 6.9 GHz[the detuning of laser 1 from the
2S,/2(F-l)^2p^^^(^=l)
transition] to 35 MHz (half the radiative hnewidth). This
gives about 4X10'^ photons. Therefore, the detection
efficiency must be significantly greater than the inverse of
this number, 2.5X10"^. If this condition is met, it
should be possible to detect the microwave transitions
with nearly 100% efficiency. By observing the rate of
quantum jumps by a single ion in the trap, we determined
the rate at which the ion fluoresced [26], and by compar-
ing this rate to the count rate from the detector, we mea-
sured the overall detection efficiency of our present ap-
paratus to be about 1 X 10"'*, which is marginally accept-
able.
To reach the very high accuracy which should be pos-
sible with such a clock, it will be advantageous to use
longer interrogation times. To reduce the effects of col-
lisions with neutral background gas atoms and molecules
during long interrogation intervals, we plan to use cryo-
genic pumping. Although in our preliminary measure-
ments the fluorescence was collected from the entire
string, it should be possible to treat each ion as an in-
dependent clock, since our imaging system resolves the
individual ions in the string. Beyond the applications to
high-accuracy spectroscopy, the possibility of confining a
string of ions so that each is in the Lamb-Dicke regime
should permit experiments in fundamental physics, such
as studies of interference, cavity QED, and collective be-
havior.
ACKNOWLEDGMENTS
We thank Sarah Gilbert and Fred Moore for helpful
comments on this paper. This work was supported by
the U.S. Office of Naval Research and the U.S. Air Force
Office of Scientific Research.
*Present address: Department of Physics, University of
Texas at Austin, Austin, TX 78712.
[1] G. Janik, W. Nagourney, and H. Dehmelt, J. Opt. Soc.
Am. B 2, 1251 (1985); W. Nagourney, N. Yu, and H.
Dehmelt, Opt. Commun. 79, 176 (1990).
[2] I. Siemers, M. Schubert, R. Blatt, W. Neuhauser, and P.
Toschek (unpublished).
[3] J. C. Bergquist, W. M. Itano, and D. J. Wineland, Phys.
Rev. A 36, 428 (1987); F. Diedrich, J. C. Bergquist, W. M.
Itano, and D. J. Wineland, Phys. Rev. Lett. 62, 403 (1989).
[4] See, for example, W. M. Itano and D. J. Wineland, Phys.
Rev. A 25, 35 (1982); D. J. Wineland and W. M. Itano,
Phys. Today 40 (6), 34(1987).
[5] D. J. Wineland, W. M. Itano, J. C. Bergquist, and R. G.
Hulet, Phys. Rev. A 36, 2220 (1987); D. J. Wineland, W.
M. Itano, J. C. Bergquist, J. J. Bollinger, F. Diedrich, and
S. Gilbert, in Frequency Standards and Metrology,
Proceedings of the Fourth Symposium, Ancona, Italy,
1988, edited by A. DeMarchi (Springer, Berlin, 1989), pp.
71-77.
[6] D. J. Wineland, in Precision Measurement and Fundamen-
tal Constants II, edited by B. N. Taylor and W. D. Phil-
lips, Natl. Bur. Stand. (U.S.) Spec. Publ. No. 617 (U.S.
GPO, Washington, DC, 1984), p. 83.
[7] R. G. DeVoe, J. Hoffnagle, and R. G. Brewer, Phys. Rev.
A 39, 4362 (1989).
[8] R. Bliimel, C. Kappler, W. Quint, and H. Walther, Phys.
Rev. A 40, 808(1989).
[9] J. Drees and W. Paul, Z. Phys. 180, 340 (1964).
[10] D. A. Church, J. Appl. Phys. 40, 3127 (1969).
[11] H. G. Dehmelt, in Frequency Standards and Metrology
(Ref. [5]), p. 286.
[12] J. D. Prestage, G. J. Dick, and L. Maleki, J. Appl. Phys.
66, 1013 (1989); IEEE Trans. Instrum. Meas. 40, 132
(1991).
[13] H. Walther, in Proceedings of the Workshop on Light In-
duced Kinetic Effects on Atoms, Ions, and Molecules, edit-
ed by L. Moi et al. (ETS Editrice, Pisa, Italy, 1991), p.
TN-26

45 IONIC CRYSTALS IN A LINEAR PAUL TRAP 6501
261; G. Birkl, S. Kassner, W. Quint, and H. Walther
(private communication).
[14] M. G. Raizen, J. C. Bergquist, W. M. Itano, and D. J.
Wineland, in Quantum Electronics Laser Science, 1991
Technical Digest Series (Optical Society of America,
Washington, DC, 1991), Vol. 11, p. 170; M. G. Raizen, J.
M. Gilligan, J. C. Bergquist, W. M. Itano, and D. J. Wine-
land, J. Mod. Opt. (to be published).
[15] W. Paul, H. P. Reinhard, and U. von Zahn, Z. Phys. 152,
143(1958).
[16] D. J. Wineland, J. C. Bergquist, J. J. Bollinger, W. M.
Itano, D. J. Heinzen, S. L. Gilbert, C. H. Manney, and M.
G. Raizen, IEEE Trans. Ultrason. Ferroelectr. Freq. Con-
trol 37, 515 (1990).
[17] D. R. Denison, J. Vac. Sci. Technol. 8, 266 (1971).
[18] D. J. Wineland, J. J. Bollinger, and W. M. Itano, Phys.
Rev. Lett. 50, 628(1983).
[19] R. W. Hasse and J. P. Schiffer, Ann. Phys. (N.Y.) 203, 419
(1990): R. W. Hasse and J. P. Schiffer, in Proceedings of
the Workshop on Crystalline Ion Beams, Wertheim, Ger-
many [Gesellschaft fiir Schwerionenforschung Report No.
GSI-89-10, 1989 (unpublished)]; D. Habs, ibid.
[20] W. Nagourney, J. Sandberg, and H. Dehmelt, Phys. Rev.
Lett. 56, 2797(1986).
[21] T. Sauter, W. Neuhauser, R. Blatt, and P. E. Toschek,
Phys. Rev. Lett. 57, 1696 (1986); T. Sauter, R. Blatt, W.Neuhauser, and P. E. Toschek, Opt. Commun. 60, 287
(1986).
[22] J. J. Bollinger, D. J. Heinzen, W. M. Itano, S. L. Gilbert,
and D. J. Wineland, IEEE Trans. Instrum. Meas. 40, 126
(1991).
[23] J. A. Barnes et al., IEEE Trans. Instrum. Meas. IM-20,
105(1971).
[24] W. M. Itano, L. L. Lewis, and D. J. Wineland, Phys. Rev.
A 25, 1233(1982).
[25] D. J. Wineland, W. M. Itano, J. C. Bergquist, J. J. Bol-
Hnger, and J. D. Prestage, Ann. Phys. (Paris) 10, 737
(1985).
[26] W. M. Itano, J. C. Bergquist, R. G. Hulet, and D. J. Wine-
land, Phys. Rev. Lett. 59, 2732 (1987).
TN-27

Cryogenic linear ion trap for accurate spectroscopy
M. E. Poitzsch,^' J. C. Bergquist, W. M. Itano, and D. J. WinelandTime and Frequency Division, National Institute of Standards and Technology,
Boulder, Colorado 80303
(Received 15 May 1995; accepted for publication 11 October 1995)
We have observed linear "crystals" of up to tens of laser-cooled '^^Hg"*" ions in a linear rf ion trap.
The trap operates at liquid-He temperature and is designed for use as a prototype 40.5 GHzfrequency standard with high accuracy and stability. © 7996 American Institute of Physics.
[80034-6748(96)05001-1]
I. INTRODUCTION
The 40.5 GHz ground-state hyperfine transition of the
'^Hg"^ ion provides the basis for a high-performance micro-
wave frequency standard.'"^ Our work on '^Hg"^ has been
devoted to obtaining a system that will provide high accu-
racy as well as high stability.^ To help achieve this goal, we
have incorporated laser cooling to suppress the second-order
Doppler shift.
In this paper, we report preliminary results using a rf ion
trap in a cryogenic (~4 K) environment. This should yield
high vacuum, thereby reduce ion loss and frequency shifts
due to background gas collisions, should provide the basis
for superconducting magnetic shielding, and will suppress
shifts due to blackbody radiation.^
Figure 1 shows the energy levels of interest in the
'^^Hg^ ion. The ^Sy2{F=l,M = 0) to ^5,/2(F= 0,M = 0)
ground-state hyperfine splitting is ~40.5 GHz. It has no first-
order Zeeman shift near zero field and is used as the clock
(F=l) to 2Pi/2(F= 0)transition.' ^ The upper-state ^P 1/2
hyperfine splitting is ~7 GHz. Laser cooling and fluores-
cence detection are accomplished using the 194 nm electric
dipole cycling transition from the ground ^Si/2iF= 1) state
to the excited ^PyjiP^^) state. ^'^ The natural linewidth of
this strongly allowed transition is 70 MHz, which is more
than an order of magnitude larger than the width of the 194
nm laser used for cooling and detection. To prevent optical
pumping of the ion into the F=0 ground-state sublevel by
off-resonant driving of the ^5i/2(F= 1) to ^PmiF— 1) tran-
sition and subsequent decay, a second (collinear) laser at 194
nm is present during the laser cooling and tuned about 47.4
GHz to the blue of the main cooling laser
Previously, a rf-trap '^^Hg"^ ion frequency standard (us-
ing helium buffer gas cooling) was shown to have high fre-
quency stability.^ It contained yV«=2X10^ ions and had a
fractional second-order Doppler shift of approximately
-2X10"'^ More recently, a short-term fractional frequency
instability of <7X lO"'"* t"''^ has been demonstrated in a
linear rf trap (also using helium buffer gas cooling), which
operated with A^^2.5X10^ ions, and a fractional second-
order Doppler shift of approximately -4X10"'^ was
inferred."* In comparison, the fractional second-order Doppler
shift of a single '^^Hg^ ion laser cooled to the Doppler limit
is about -2X10~'^ (see Ref 8). The fractional frequency
shift of the 40.5 GHz clock transition with magnetic field is
0.24B^, where B is expressed in teslas. Thus, a '^^Hg"*" ion
confined in an ion trap at near-zero magnetic field and laser
cooled to the Doppler limit should constitute a highly accu-
rate 40.5 GHz microwave frequency standard. To improve
the signal-to-noise ratio (and hence the fractional frequency
stability), it will, however, be desirable to have many '^^Hg"^
ions, all with equally low Doppler shifts.
II. LINEAR RF ION TRAP
The linear rf quadrupole trap, which uses four rf rods for
radial confinement and a static axial potential for longitudi-
nal confinement, was developed as a way of confining mul-
tiple ions with low Doppler shifts due to rf
micromotion."*'^'^"" In this scheme, the four rods are config-
ured as in a rf mass analyzer, with a zero-field node along the
center line instead of at a single point as in a spherical Paul
quadrupole rf trap.'^ Axial confinement is achieved by apply-
ing static potentials at the ends of the trap, using positively
biased rings, pins, or split sections in the trap rods. Figure 2
shows the linear rf trap used in the present cryogenic experi-
ment. The four rf rods are 7?' =0.20 mm in radius, centered
on a radius of /? + 7?'=0.64 mm from the trap axis (about
half the size of our previous linear rf trap^). Axial confine-
ment is achieved by positively biasing rings (electrodes Cand R in Fig. 2), separated by 4 mm, at either end of the
four-rod quadrupole.
Two (diagonally opposite) rf rods of the trap are driven
with a rf potential Vq cos(nr), while the odier two rf rods are
maintained at rf ground. Near the trap axis, the time-varying
potential is approximately a saddle-point potential in x and
J.
^0 / x--y^,
(1)
"Present address: Schlumberger-Anadrill, Sugar Land, TX llllS.
where x and y are the transverse coordinates. The centers of
the two rf-driven rods intersect the x axis, one at ~{R + R')
and the other at R + R' . The approximation assumes that the
rods of circular cross section give the same potential as rods
whose surfaces are equipotentials of Eq. (1). If the drive
frequency H is high enough (that is, much higher than the
ion's radial secular oscillation frequency), the ion of mass mand charge q will experience an approximately harmonic
pseudopotential that confines in both ;c and ^'i
Rev. Sci. Instrum. 67 (1), January 1996 0034-6748/96/67(1 )/1 29/6/$6.00 1996 American Institute of Physics 129
TN-28

6p ^P^a 6.9 GHz
i99Hg* ^o +47.4 GHz
6s ^S.
FIG. 1. Diagram of the hyperfine energy levels of the "'Hg'^ ground 65^51/2
state and the 6p^Py2 state. Here vq corresponds to a wavelength of 194.2
nm. The 40.5 GHz ground-state hyperfine transition is intended for use as a
reference for a frequency standard.
m^{x,y)'^—a)l{x^ + y^). (2)
where (o^ is the radial angular oscillation frequency (secular
frequency), which is given by
qVo0) =
yllmCLR^(3)
Axial confinement (along z) results from biasing the
rings at either end of the trap with a positive potential Uq .
Near the center of the trap, an ion experiences the static
saddle-point potential
mcl>,{x,y,z)^—<ol[z'-Hx' + y')l (4)
where the axial angular oscillation frequency o)^ is given by
(O,
mzo(5)
The separation of the rings is 2zo=4.0 mm, and /c is a geo-
metrical factor that is ~0.004 in this trap (as determined
from measurements of w^). As Eq. (4) indicates, the radial
pseudopotential <t> is weakened by the addition of the static
axial potential. Thus, the effective radial angular oscillation
frequency is
0)1 = {0)1 -0)1/2)1/2
(6)
Under typical operating conditions in this trap, we expect
ojr/27r«=350 kHz and a»,/27r«=25 kHz, assuming CI/2tt=\3
MHz, Vo=100 V, and Uo = 25 V.
Endcap
^Laser Beam Path
(a)
R
Linear RFQuadrupole Electrodes
FIG. 2. Schematic diagram of the linear rf (Paul) trap electrodes, (a) Side
view (normal to the trap z axis). The experimental trap is located between
"endcap" electrodes C and R. Trapping normal to c is provided by pon-
deromotive forces resulting from rf voltage applied between diagonally op-
posite quadrupole electrodes [Eq. (1)]. Trapping along the c direction is
provided by applying a static positive potential f/g between the endcap
electrodes and quadrupole rods [Eqs. (4) and (5)]. The region between elec-
trodes L and C is intended for loading ions which are then transferred to the
experimental trap. The paths for two of the laser beams are shown in black.
A third laser beam (not shown) passes through the center of the trap and
normal to the figure, (b) View along the z axis showing the endcap elec-
trodes with the four rf-quadrupole electrodes superimposed. The shaded
area indicates relief for passage of the laser beams shown in (a).
130 Rev. Sci. Instrum., Vol. 67, No. 1, January 1996 Linear ion trap
TN-29

As shown in Fig. 2, the trap's axial-confinement "ring"
electrodes are in fact, bored-out conical disks of beryllium
copper, appropriately drilled to allow laser access to the trap
center. The four rf rods are beryllium-copper wires. The di-
mensions of the quadrupole rods were chosen to allow //I
light collection from the center of the trap. Also, the choice
of the small R dimension makes the trap radially unstable,
due to the Mathieu instability, for unwanted contaminant
ions (created during the loading procedure) with (u^>Cl/2 or,
equivalently
w^ 10.6m X'0
100 V (7)
where u is the atomic mass unit. The four outer support rods
for the trap structure are alumina (AI2O3) rods sheathed in
thin beryllium-copper tubing of an outer diameter of 1.28
mm. These support rods can each receive independent bias-
ing potentials to "shim" the ions back onto the trap's geo-
metrical center line, in the event that patch charges on the
rod electrodes should cause the trap's geometrical and dc
electrical centers to not coincide. (Without this compensa-
tion, the ions could experience large rf electric fields and
undergo substantial rf micromotion.) The ceramic insulating
endpieces that define the positions of the trap rods are high-
purity alumina slabs 2.0 mm in thickness, with appropriately
placed laser beam access holes.
Figure 2(a) shows that the electrodes form two linear
traps in tandem. The leftmost trap, between electrodes L and
C, is intended for capturing ions in the initial loading pro-
cess. Ions would then be pushed through electrode C into the
experimental trap (between electrodes C and R). This design
was implemented with the idea of gaining immunity from
contact potentials or electric charge buildup on the electrodes
near where the ions were loaded.
Appropriately placed mirrors allow laser cooling to be
performed along any one of three noncoplanar directions at
the center of the trap, as illustrated in Fig. 2(a): in the plane
of the page at ±20° to the trap's z axis or normal to the plane
of the page (using a small mirror located directly below the
trap). We require only one of the beams shown in Fig. 2(a)
for cooling, optical pumping, and detection. The three beam
paths are required for probing the velocity distribution in
three dimensions. The kinetic temperatures achievable in
these cooling geometries are derived using Ref. 13. The tem-
peratures at the Doppler-cooling limit with either of the
±20° beams correspond to rradiai^5.6 mK and T^^^^^^l.l
mK, under the assumption that the radiation is emitted iso-
tropically. These temperatures imply a fractional second-
order Doppler shift of the 40.5 GHz hyperfine transition fre-
quency that is approximately -5.5X10"'^.
Previously, a slightly larger linear rf trap, in which the
rods were segmented in such a way that dc potential differ-
ences could be applied to the different segments, was used,
thus providing axial confinement.^ In that apparatus, operat-
ing at room temperature and at a pressure of about 10"^ Pa,
several tens of '^^Hg"*^ ions were crystallized at fixed posi-
tions in a single row along the trap's nodal center line. Such
a geometry is optimal for the present frequency standard ap-
plication, since the ions can be imaged independently for
improved signal-to-noise ratio, and all have approximately
the same low second-order Doppler shift as a single ion in a
quadrupole trap. The major limitation of this previous appa-
ratus was the background gas pressure in the vacuum cham-
ber, which was high enough that ions would be lost in sev-
eral minutes due to chemical reactions. For a frequency
standard application, it is desirable to be able to interrogate a
particular ensemble of ions, located at relatively fixed posi-
tions, for periods of many hours, several days, or longer.
Also, even at 10~* Pa, shifts of the transition frequency with
changes in the background gas pressure could limit the
accuracy.'"*
III. CRYOGENIC LINEAR RF ION TRAP
Our solution to the background gas pressure problem is
to maintain the trap and vacuum vessel at liquid-He tempera-
ture (~4 K). At this low temperature, most gases cryopump
to the walls of the chamber, giving a very low background
pressure. In a similar sealed vacuum can, lowered to 4 K,
Gabrielse et al.^^ report background pressures below 10"'"*
Pa. Thus by lowering the pressure by several orders of mag-
nitude, we should be able to store trapped ions for at least
several days, interrogate them with Ramsey free-precession
times as long as tens or hundreds of seconds, and eliminate
or greatly reduce pressure shifts of the 40.5 GHz clock fre-
quency. In addition, the 4 K temperature should allow us to
operate a superconducting shield around the ion trap region
to help in shielding changes in the magnetic field.
We have constructed and have made initial tests of a
prototype apparatus based on these concepts. The trap de-
scribed in Sec. II and related components are mounted in an
In-sealed OFHC copper vacuum can (see Fig. 3), inside a
nested liquid-He/liquid-N2 Dewar, heat sunk to the outside
bottom of the liquid-He reservoir and surrounded by radia-
tion shields at 4 and 77 K. Figure 4 shows a schematic view
of the small vacuum can mounted inside its nested
liquid-He/liquid-N2 Dewar, which has a liquid-He hold time
of about four days. Optical access to the trap region is
through windows around the base of the Dewar, aligned with
baffled holes in the radiation shields and windows in the
sides of the can. The laser beams are introduced into the
vacuum apparatus through In-sealed fused silica windows.'^
Electrical and microwave access is through heat-sunk ca-
bling leading down from connectors on the Dewar's top
vacuum flange. The cables are routed along the liquid-N2 and
liquid-He reservoirs, into the radiation-shielded 4 K space
around the experimental vacuum can, to cryogenic vacuum
feedthroughs on the sides of the can. The 13 MHz rf drive
for the trap (see below) and the dc currents for the field coils
surrounding the trap are routed down the neck of the Dewar,
through the liquid-He, and into the can by cryogenic
feedthroughs in its top plate (which is also the bottom plate
for the liquid-He reservoir). The superconducting shield con-
sists of a 5 fim coating of lead, electroplated onto the inside
of the copper vacuum vessel.
The rf potential Vq is applied to the trap electrodes by a
resonant step-up transformer. In the frequency range of inter-
est here, the most convenient type of resonator consists of a
helical "secondary" coil that is effectively K/4 in length in-
Rev. Sci. Instrum., Vol. 67, No. 1, January 1996 Linear ion trap 131
TN-30

HelmhottzColl
(One Pair Shown) Indium-Sealed
Quartz Window
Microwave
DC Lines Feed Through
Objective Lens
Collected
RuorescenceLight Path
FIG. 3. Top view of pillbox vacuum assembly. The trap is shown at the
center of the diagram in the same orientation as Fig. 2(a). Two of the laser
beam paths are shown at 20° with respect to the trap z axis. The top of this
pillbox asssembly forms the bottom of the liquid-He reservoir shown in
Fig. 4.
side a shielding cylindrical can,'^ with an inductive-coupling
input "primary" loop at the end of the input coaxial line. In
our cryogenic apparatus, it is desirable to dissipate as little rf
power as possible into the liquid helium. Thus, we con-
structed a superconducting lead helical resonator with
(2 '^3000 when attached to the trap apparatus. The losses are
mainly in the connecting leads and not in the resonator. (The
resonator by itself had an unloaded Q in excess of 200 000.)
It was determined that 4 mW of rf at 13 MHz produced an
amplitude Vo^^l^O V at the trap rods. The superconducting
resonator sits at the bottom of the Dewar reservoir, immersed
in liquid He, with the high-potential end of its secondary coil
attached to a copper cryogenic feedthrough leading through
the top plate of the experimental vacuum chamber and con-
nected to the two rf-driven rods of the trap. The input cou-
pling loop is a small off-axis coil, attached to a stainless-steel
coaxial cable leading out through the top of the Dewar
through an O-ring compression seal. This coaxial cable can
be rotated from outside the Dewar so as to orient the cou-
pling loop properly for optimized power coupling into the
resonator.
The trap is surrounded by orthogonal pairs of small
coils, each consisting of 350-600 turns of 0.076 nun diam
Nb wire, in order to produce the desired magnetic field com-
ponents inside the superconducting shield. The coils allow
arbitrary x, y, and z components of magnetic induction to be
produced at the trap center with efficiencies of 5-10 /iT/mA
(in each coil).
To ensure 100%-efficient "electron shelving" detection,
we need to collect a large fraction of the ions'
132 Rev. Sci. Instrum., Vol. 67, No. 1, January 1996
Thermal
Contact Point
Resonant RFTransformer
Copper Plate
Trap Pill-Box
FIG. 4. Side view of cryostat assembly (not to scale). The pillbox containing
the trap and related hardware is bolted to a copper plate which forms the
bottom of the liquid-He reservoir. The resonant rf transformer is shown on
top of this copper plate. The high-voltage output lead is connected to a
vacuum feedthrough which is then connected to the trap quadrupole elec-
trodes inside the trap pillbox.
fluorescence.''^ For this reason, the imaging objective lens
has a large numerical aperture. Also, it is advantageous to be
able to resolve the fluorescence of the individual ions so as to
be able to detect them independently using different portions
of the photocathode of the imaging UV detector. The lens
used in the experiment therefore also has resolving power at
194 nm sufficient to resolve point objects separated by less
than 4 /u,m. The field of view over which the lens can image
with aberrations insignificant at this level is about 250 /xm.
The / number is //I, with the lens's front surface sitting 8.1
mm away from the center of the trap. In order for the lens to
be capable of surviving temperature cycles over a range of
about 370 K ("bakeout" temperature during vacuum pro-
cessing) to 4 K (operational temperature in the experiment),
the housing for the five-element lens was constructed of the
same UV-grade fused silica as the elements themselves, and
the assembly was performed without any bonding agent or
cushioning material.
Loading the trap with '^^Hg"^ ions is accomplished by
decomposing a sample of isotopically enriched (92%)
'^^HgO powder in a small ceramic oven tube wound with
heater wire, located below the trap. A fraction of the diffuse
beam of '^^Hg atoms is ionized at the center of the trap by
electrons emitted by a field-emitter point. When a sample of
ions has been captured, the oven and electron beam are
turned off, and the vacuum chamber returns to a uniform 4 Ktemperature from whatever local warming has occurred.
We first tried loading ions between electrodes L and C
[see Fig. 2(a)] and transferring them to the experimental trap.
This was unsuccessful. If the ions were loaded between elec-
trodes L and C, we were unable to push them through elec-
trode C into the experimental trap by biasing electrode L
Linear ion trap
TN-31

* 4» ^ ^ # « m
FIG. 5. A linear crystal of laser-cooled '"Hg* ions, illuminated by 194 nm radiation. The gaps are due to the presence of other ions, possibly other mercury
isotopes, which do not fluoresce at the same wavelength as '"Hg"^. The spacing between adjacent ions is —lOfim.
with a positive potential with respect to electrode C (up to
about 250 V). This result may have been caused by shielding
from the quadrupole rf electrodes and by the non-negligible
thickness of the central conical electrode. Subsequent to
these experiments, the HgO source and electron source were
moved near the experimental trap and the ions were created
and captured directiy into this trap.
We load and optically resolve individual cold ions, coa-
lesced into linear crystals with interion spacings of 10-30
fim. We have seen crystals ranging in number from one to
several tens of ions, very similar in appearance to those re-
ported in Ref. 5. An example is shown in Fig. 5. With laser
cooling, these crystals are stable over periods of at least 10 h.
One rough measure of the background gas pressure is the
rate at which trapped "impurity" ions (which show up as
readily identifiable nonfluorescing spots in the crystal) ex-
change places with their '^^Hg"*" ion neighbors. In the room-
temperature apparatus at 10~^ Pa, these interchanges oc-
curred every few minutes, but they do not occur over periods
of several hours or more in our cryogenic vacuum.
We have observed all three ground-state hyperfine mi-
crowave transitions (AM=0,±1) by the method discussed in
Refs. 5 and 7.
IV. PROSPECTS
We plan to study the microwave transitions in detail after
making technical improvements to the magnetic shielding,
the nulling of the residual rf micromotion, and the micro-
wave local oscillator frequency synthesis. The scheme for
operating this apparatus as a microwave clock will initially
be that described for the room-temperature experiment.^ The
ions will be imaged onto separate portions of the detector's
photocathode and detected individually as an ensemble of
independent atomic clocks. Dehmelt's technique of electron
shelving can be used to detect the clock transition in each ion
with nearly 100% efficiency.^''* Under these assumptions,
the fractional frequency stability is given by*
o-yi t)
1
(Oq ^NT^r(8)
where Wo/2 77=40.5 GHz, A'^ is the number of ions in the
linear crystal ensemble, T/j is the free-precession time be-
tween the two phase-coherent rf pulses (in Ramsey's interro-
gation scheme), and T>Tjf^ is the averaging time. Assuming a
100 s Ramsey interrogation time, the short-term fractional
frequency stability of an ensemble of 30 ions would be
—7X10"''' r""'^, and longer free-precession times with
linger samples of ions seem possible. Tne fractional second-
order Doppler shift to the frequency should be no greater
than a few parts in lO'* with ions on the trap's nodal center
line, cooled to the Doppler limit. "Pie second-order Zeemanshift, as a fraction of 40.5 GHz, is equal to O.IAB^, where B
is in teslas. Control of this shift may require conventional
external magnetic shielding as well as the internal supercon-
ducting magnetic shield surrounding the trap. With suffi-
cientiy cold ion and small field fluctuations, a fractional in-
accuracy of <1X10 of the clock frequency appears
attainable.
In addition, this apparatus contains features (the super-
conducting coil pairs) that should allow us to investigate new
effects based on motional Zeeman coherences. These include
a novel cooling scheme (proposed by Harde'^) using optical
pumping in conjunction with a motional magnetic coupling
between the spin orientation and the harmonic oscillator state
of the ions in the trap potential, as well as a scheme for
"squeezing" the total ensemble spin,^° which could improve
the signal-to-noise ratio in frequency standards where the
dominant noise contribution is projection noise.'
ACKNOWLEDGMENTS
We thank John Miller for making improvements in the
light-collection optics used to acquire the image shown in
Fig. 5. We thank Dale Thoele, Doug Gallagher, Richard
McLaughlin, and David Kelley for their fine technical sup-
port in the construction of the apparatus as well as Donald
McDonald and Ronald Ono for their advice on cryogenic
matters. We thank John Miller and Joseph Tan for reading
the manuscript. This work was supported by the U. S. Office
of Naval Research.
'F. G. Major and G. Werth, Phys. Rev. Lett. 30, 1155 (1973).
^M. D. McGuire, R. Petsch, and G. Werth, Phys. Rev. A 17, 1999 (1978).
^L. S. Cutler, R. R Giffard, R J. Wheeler, and G. M. R. Winkler, in Pro-
ceedings of the 41st Annual Frequency Control Symposium. Philadelphia,
1987 (IEEE, Piscataway, NJ, 1987), pp. 12-19.
''R. L. Tjoelker, J. D. Prestage, G. J. Dick, and L. Maleki, in Proceedings of
the 1993 IEEE International Frequency Control Symposium, Salt Lake
City. UT. 1993 (IEEE, Piscataway, NJ, 1993), pp. 132-138.
^M. G. Raizen, J. M. Gilligan, J. C. Bergquist, W. M. Itano, and D. J.
Wineland, Phys. Rev. A 45, 6493 (1992).
*W. M. Itano, L. L. Lewis, and D. J. Wineland, Phys. Rev. A 25, 1233
(1982).
^W. M. Itano, J. C. Bergquist, J. J. Bollinger, J. M. Gilligan, D. J. Heinzen,
F. L. Moore, M. G. Raizen, and D. J. Wineland, Phys. Rev. A 47, 3554
(1993).
*D. J. Wineland, J. C. Bergquist, J. J. Bollinger, W. M. Itano, D. J. Heinzen,
S. L. Gilbert, C. H. Manney, and M. G. Raizen, IEEE Trans. Ultrason.
Ferroelectr. Freq. Control 37, 515 (1990).
'P T. H. Fisk, M. A. Lawn, and C. Coles, Appl. Phys. B 57, 287 (1993).
'°J. D. Prestage, G. J. Dick, and L. Maleki, J. Appl. Phys. 66, 1013 (1989).
" H. G. Dehmelt, in Frequency Standards and Metrology. Proceedings of the
4th Symposium. Ancona. Italy. 1988, edited by A. DeMarchi (Springer-
Verlag, Berlin, 1989), p. 286.
'^W Paul, O. Osberghaus, and E. Fischer, Frosch. Berichte des Wirtschaft-
mmistenums rsordrnem-Westtaien, Mr. 413 (lyssj.
'^W. M. Itano and D. J. Wineland, Phys. Rev. A 25, 35 (1982).
'"D. J. Wineland, J. C. Bergquist, J. J. Bolhnger, W. M. Itano, F. L. Moore,
J. M. Gilligan, M. G. Raizen, D. J. Heinzen, C. S. Weimer, and C. H.
Manney, in Laser Manipulation of Atoms and Ions, Proceedings of the
International School ofPhysics "Enrico Fermi," Course CXVIII, Varenna,
Rev. Sci. Instrum., Vol. 67, No. 1, January 1996 Linear ion trap 133
TN-32

Italy, edited by E. Arimondo, W. D. Phillips, and F. Strumia (North- '«H. G. Dehmelt, IEEE Trans. Instrum Meas IM-31 83 (1982)
_
Holland. Amsterdam, 1992), pp. 553-567. i^H. Harde, in International Conference on Quantum Electronics TechnicalG. Gabnelse X. Fei, W. Jhe, L. A. Orozco, J. Tan, R. L. Tjoelker, J. Haas, Digest, Series 1990 (Optical Society of America, Washington. DC. 1990)H. Kalmowsky, T. A. Trainor, and W. Kells, Am. Inst. Phys. Conf. Ser. Vol. 8, p. 278.
le^^n^t^ ^'o^^^- .
, „ ,„„ „„„,,'°D- J- Wineland, J. J. Bollinger. W. M. Itano, F L. Moore, and D. J.
nS; „,.?' ^^^- '^"'- ^ '^°^ ^^^^^^- "^'"^^"> Phys. Rev. A 46. R6797 (1992); D. J. Wineland. J. J. Bollinger.
W. W. Macalpme and R. O. Schildknecht. Proc. IRE 47, 2099 (1959). W. M. Itano, and D. J. Heinzen. ibid. 50 67 (1994)
134 Rev. Sci. Instrum., Vol. 67, No. I.January 1996 i i„^ .Linear ion trap
TN-33

144 IEEE TRANSACTIONS ON INSTRUMENTATION AND MEASUREMENT. VOL. 44. NO. 2. APRIL 1995
Minimizing the Time-Dilation Shift
in Penning Trap Atomic Clocks
Joseph N. Tan, J. J. Bollinger, and D. J. Wineland
Abstract—If environmental perturbations are made negligible,
the time-dilation shift is expected to give one of the largest
systematic uncertainties in a stored ion clock. In general, this shift
increases with the number of trapped ions. Fluctuations in the
time dilation shift therefore could limit the frequency stability of
an ion clock. We show that in a Penning trap, relativistic time di-
lation can be minimized if the laser-cooled ions are prepared in a
special spheroidal state. In addition, a modest stabilization of the
spheroid near the minimum-shift configuration can significantly
reduce fluctuations in the time dilation. The results obtained for
a single-species ion clock also provide a good approximation for
a sympathetically cooled system.
I. Introduction
ONE of the goals of the Time and Frequency Division
at NIST-Boulder is to realize an ion frequency standard
with absolute uncertainty better than 1 part in 10^^. In recent
years, experiments at NIST with ^Be^ ions stored in a Penning
trap have demonstrated that an RF oscillator can be steered
by a nuclear spin-flip "clock" transition (~ 303 MHz) with
ay{T) '^3y.\0~^- / y/r fractional frequency stability [l]-[4].
If collisional shifts [3], [4] are negligible, the expected perfor-
mance of a stored ion clock using the Ramsey method [5] of
interrogation is limited by the "projection-noise" [6] frequency
instability
1
2'kUo^/NTrt(1)
and the uncertainty in the time-dilation shift (second-order
Doppler shift)
2 6-2(2)
The frequency stability (1), depends on the clock transition
frequency Uo, the number of ions TV, the Ramsey interrogation
period Tr, and the averaging time r :$> Tr. The possibility
of using "squeezed" atomic states to obtain higher frequency
stability than (1) is being explored [7]. The time-dilation shift,
(2). depends on the average squared velocity {v') of the ions.
A systematic error of 5x 10"^"^ due to time dilation has been
determined for a stored ^Be"^ ion clock [l]-[4]. In this paper,
we give a detailed treatment of the time-dilation effects in
Penning traps to identify the important factors for optimized
performance [8].
Manuscript received July 1, 1994; revised October 15, 1994. This workwas supported in part by the Office of Naval Research.
The authors are with Time and Frequency Division, NIST, Boulder, CO80303 USA.IEEE Log Number 9408707.
II. Laser-Cooled, Single-Species Ion Clock
The simplest stored-ion clock consists of one trapped ion,
with charge q and mass M. In an ideal Penning trap, the ion is
confined by a pure quadrupole electrostatic potential superim-
posed on a uniform magnetic field. The motions of the trapped
ion consist of a harmonic oscillation (angular frequency tUz)
along the trap's symmetry axis, a high-frequency cyclotron
orbit (a.'^) about the magnetic field, and a low-frequency
magnetron orbit (tUm = '^;/2u;^) about the trap 2-axis that
generates a gv x B force for radial confinement [9]. A suitable
internal transition (e.g., between hyperfine levels) which is
field-independent at a particular field Bo, can be used in a
frequency standard. If the ion motions are cooled (or heated
in the case of the magnetron orbit) to their ground states, the
time-dilation shift in the selected "clock transition" is very
small. The potentially high accuracy obtainable with a single
ion (N — 1), however, exacts a cost in low signal-to-noise
ratio and long averaging times.
The signal-to-noise ratio and frequency stability can be
improved significantly by using large numbers of ions—see
(1). However, the time-dilation shift also increases with the
number of ions. This is because, in general, a larger ion
"cloud" extends farther from the trap axis, and because, for
stable trapping, an ion cloud or plasma [10], [11] must rotate
(spin) about the trap's symmetry axis (taken as 2:-axis). This
rotation frequency tUr lies in the range
< UJr < IJ^n (3)
where u;^ = cjc — Wm, and ujc is the cyclotron frequency
Uc = qBo/M. The accompanying thermal motions of the ions
can be reduced greatly by Doppler laser cooling (typically
to < 1 K, with a cooling limit of ~ 1 mK for ^Be"^). Wecan assume that the time dilation due to thermal motions is
negligible, and hereon study the T = K limit. In a nearly
ideal Penning trap [9], the laser-cooled ions form a uniform
density spheroid bounded by
+ -1 =1 (4)
with an aspect ratio a = Zg/vg which varies in a known
way with the rotation frequency ujr [10], [11]. When the
gv X B radial restoring force is weak (uJr -^ i^m) or when
the centrifugal force is very strong {ur — o;^), the spheroid
is stretched into a thin circular disk (a -^ 0). Hence, near the
upper and lower bounds of Ur, the magnitude of the time-
dilation shift {Au/uo — —ulrljbc^) for the thin disk of ions
0018-9456/95$04.00 © 1995 IEEETN-34
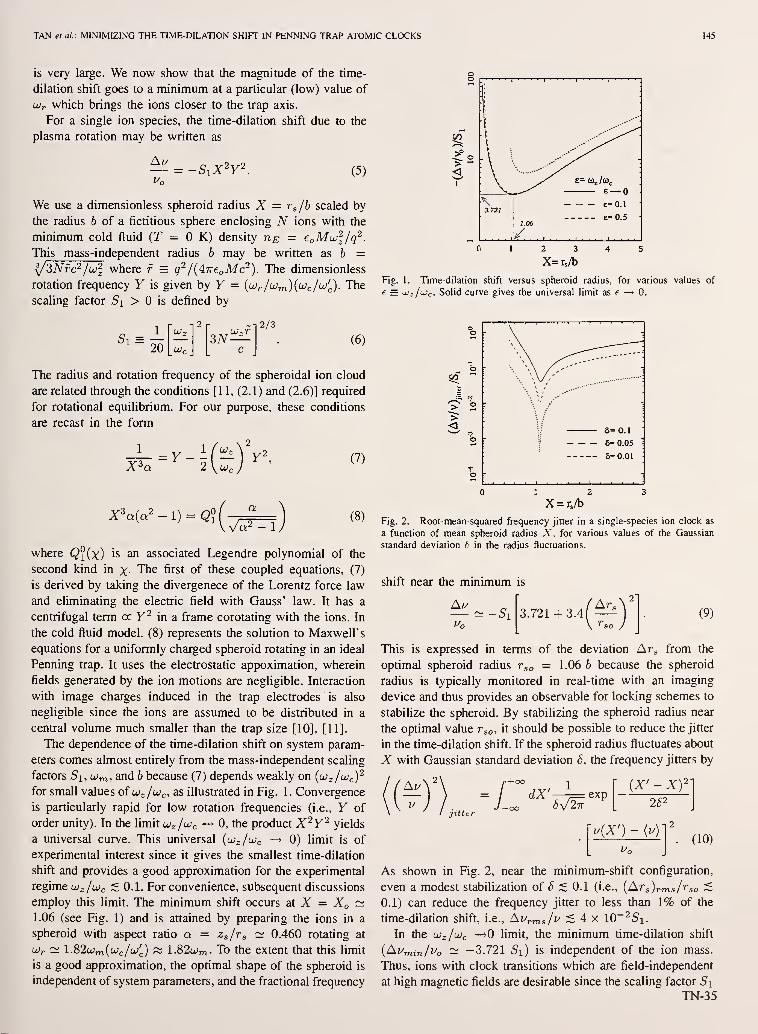
TAN et ai: MINIMIZING THE TIME-DILATION SHIFT IN PENNING TRAP ATOMIC CLOCKS 145
is very large. We now show that the magnitude of the time-
dilation shift goes to a minimum at a particular (low) value of
uir which brings the ions closer to the trap axis.
For a single ion species, the time-dilation shift due to the
plasma rotation may be written as
/\u2i^2= -SiX'Y (5)
We use a dimensionless spheroid radius X = rg/b scaled by
the radius 6 of a fictitious sphere enclosing A^ ions with the
minimum cold fluid (T — K) density ue = CoMujl/q^.
This mass-independent radius h may be written as 6 =yZNh^^JuJl where r = q~ /(ArreoMc-). The dimensionless
rotation frequency Y is given by y = {ujr/ujm){i^c/^c)- The
scaling factor Si > is defined by
Si =1 UJ-
2tj-rl
3iV-^2U yjc_ c
--12/3
(6)
The radius and rotation frequency of the spheroidal ion cloud
are related through the conditions [1 1, (2.1) and (2.6)] required
for rotational equilibrium. For our purpose, these conditions
are recast in the form
X^a 2 V LOrY\
^^"^"^-^ = ^<7^)
(7)
(8)
where <5i(x) is an associated Legendre polynomial of the
second kind in x- The first of these coupled equations, (7)
is derived by taking the divergenece of the Lorentz force law
and eliminating the electric field with Gauss' law. It has a
centrifugal term oc y^ in a frame corotating with the ions. In
the cold fluid model, (8) represents the solution to Maxwell's
equations for a uniformly charged spheroid rotating in an ideal
Penning trap. It uses the electrostatic appoximation, wherein
fields generated by the ion motions are negligible. Interaction
with image charges induced in the trap electrodes is also
negligible since the ions are assumed to be distributed in a
central volume much smaller than the trap size [10], [11].
The dependence of the time-dilation shift on system param-
eters comes almost entirely from the mass-independent scaling
factors Si, ujm, and 6 because (7) depends weakly on {uj^/uJcY
for small values of u,/uc, as illustrated in Fig. 1. Convergence
is particularly rapid for low rotation frequencies (i.e., Y of
order unity). In the limit u^/lUc —> 0, the product X^Y'^ yields
a universal curve. This universal (w^/wc —> 0) limit is of
experimental interest since it gives the smallest time-dilation
shift and provides a good approximation for the experimental
regime uJz/uJc < 0.1. For convenience, subsequent discussions
employ this limit. The minimum shift occurs at X = Xo ~1.06 (see Fig. 1) and is attained by preparing the ions in a
spheroid with aspect ratio a = Zg/rg ~ 0.460 rotating at
Ur c^ l.S2LJrn{<^c/i^'c) « 1.82ujm- To the cxtent that this limit
is a good approximation, the optimal shape of the spheroid is
independent of system parameters, and the fractional frequency
CO
><
Fig. 1. Time-dilation shift versus spheroid radius, for various values of
€ = uJ:/u>c. Solid curve gives the universal limit as e — 0.
Fig. 2. Root-mean-squared frequency jitter in a single-species ion clock as
a function of mean spheroid radius A", for various values of the Gaussian
standard deviation 6 in the radius fluctuations.
shift near the minimum is
3.721+3.4Ar,
(9)
This is expressed in terms of the deviation Ar^ from the
optimal spheroid radius r^o = 1 .06 fc because the spheroid
radius is typically monitored in real-time with an imaging
device and thus provides an observable for locking schemes to
stabilize the spheroid. By stabilizing the spheroid radius near
the optimal value rgo, it should be possible to reduce the jitter
in the time-dilation shift. If the spheroid radius fluctuates about
X with Gaussian standard deviation 6. the frequency jitters by
jitter
dX'—7=exp{X' -X
2(52
i21
u{X') - {u)(10)
As shown in Fig. 2, near the minimum-shift configuration,
even a modest stabilization of 5 < 0.1 (i.e., (Ars)rms/'"so ~0.1) can reduce the frequency jitter to less than 1% of the
time-dilation shift, i.e., t^Vrmsl^ S 4 x lO^^Si.
In the ijJzl^c —*0 limit, the minimum time-dilation shift
{/^Urnin/j^o — —3.721 Si) is independent of the ion mass.
Thus, ions with clock transitions which are field-independent
at high magnetic fields are desirable since the scaling factor Si
TN-35

146 IEEE TRANSACTIONS ON INSTRUMENTATION AND MEASUREMENT, VOL. 44, NO. 2. APRIL 1995
TABLE I
Expected Performance for a Single-Species Ion Clock with A' =10^,
Tr = 100 s, f> = 0.46, AND rso = 4.2 mm. Equation (1) is Used to
Evaluate (jy. Values of i/o and Bo are Taken from [12], [13]
Ion t/o (GHz) So(T) W^/Uc <7,(1 s)
xlO^s
minimum
xl0i5
^Be+ 0.303016 0.8194 0.0989 53 -241
«Mg+ 0.291996 1.2398 0.1089 55 -105
6^Zn+ ~1 -8.0 0.0276 16 -2.5
199Hg+ 20.9 43.9 0.0087 0.76 -0.084
201 Hg+ 7.73 3.91 0.0979 2.1 -11
is inversely proportional to the square of the magnetic field.
The expected performance for several systems with N =10^,
Tji = 100 s, and fixed spheroid dimensions (a = 0.46,
rso — 4.2 mm) is given in Table I. The gain in frequency
stability with large numbers of ions will allow measurements
of the time-dilation shift in reasonably short integration time.
Since Si oc Vo (K is the trapping voltage), it should be
possible, by measuring the minimally shifted clock frequency
for various 14, to extrapolate down to the Vq = limit for the
unshifted clock frequency to an accuracy limited by Oy{T).
The slope of the extrapolation would provide an independent
determination of the number of ions.
III. Sympathetically Cooled Ion Clock
In a frequency standard, it is desirable to interrogate the
clock transition without the perturbations (a.c. Stark shifts)
caused by the cooling laser. If the heating by the envi-
ronment is sufficiently weak, then the cooling laser can be
turned off during the interrogation cycles. However, when
the interrogation time is rather long or heating is significant,
continuous cooling of the clock ions is required. This cooling
can be provided by using a second, simultaneously-stored
laser-cooled ion species, which sympathetically cools the clock
ions through the Coulomb coupling between species [14]-[16].
When the second ion species, the "coolant" ions, have smaller
charge-to-mass ratio than the clock ions, the two species of
ions centrifugally separate [14]-[16] with the coolant ions
occupying an annular region surrounding a central core of
clock ions. Ramsey interrogation times as long as Tr ~550 s have been attained using laser-cooled ^^IVIg"*" ions to
sympathetically cool ^Be"^ clock ions [3], [4]. Moreover, the
time-dilation shift is smaller for sympathetically cooled clocks
since the clock ions are distributed closer to the axis than in
a single-species configuration.
For low rotation frequency and u>z/uJc < 1, the surface
enclosing the two species may be approximated by the sphe-
roidal surface for a single species. This is because, for a
single species in this limit, the centrifugal term in (7) becomes
negligible and the ion distribution becomes independent of ion
Fig. 3. Cross-sectional diagram of a two-species ion plasma for an ion clock.
Coolant ions occupy the annular region surrounding the clock ions (shown
darker) in the cylindrical core.
N/N,
Fig. 4. Ratio of the time-dilation shift in a sympathetically cooled clock to
that in a single-species clock. The number of clock ions is fixed.
mass to order {uj,/uc)'^. Therefore, if a cylindrical core is re-
moved from a minimum-shift configuration and is substituted
by an equal number of clock ions, as illustrated in Fig. 3, the
spheroidal boundary is well preserved. Neglecting the small
gap [14]-[16] between the two species, (5) and (9) derived for
the time-dilation shift in a single species, are still applicable to
the cylindrical core of clock ions provided the scaling factor
Si is replaced by
Ss = S'lA (11)
where S{ is Si evaluated assuming N = Ni + N2 {Ni is the
number of clock ions and A^2 is the number of coolant ions)
and A is defined by
2/3]/ ; vo \
1A = 13iV2
2A^ N1+N2(12)
Fig. 4 plots S2/S1 as a function of N2/N1, comparing the
time-dilation shift in a two-species clock to that in a single-
species clock with the same number of clock ions A^i. In the
regime N2/N1 > 1, we have S2/S1 ~ {5/6) i/N^/N^- For
a typical N2/N1 ~ 10, the time-dilation shift is about 60%
smaller than in a single-species clock.
The design and realization of an ion frequency standard, of
course, must take into account other considerations [12]. For
instance, preliminary studies showed that the ^Be"*" hyperfine
clock transition (303 MHz) has an unexpectedly large pressure
shift { (-1.7±0.4)xl0-^ Pa-^ for CH4} [3], [4]. For some
ions, a cryogenic environment may be required to suppress this
effect. Significant improvement in both frequency stability and
accuracy also requires the ability to trap and laser-cool large
numbers of ions, as well as to characterize and control the ion
distribution for minimizing the time-dilation shift. Experiments
TN-36

TAN etai: MINIMIZING THE TIME-DILATION SHIFT IN PENNING TRAP ATOMIC CLOCKS 147
are underway in a new Penning trap [17] designed for these
and other studies.
Acknowledgment
The authors thank A. Barton and S. Gilbert for carefully
reading the manuscript.
References
[1] J. J. Bollinger, J. D. Prestage, W. M. Itano, and D. J. Wineland,
"Laser-cooled-atomic frequency standard," Phys. Rev. Lett., vol. 54, pp.
1000-1003, 1985.
[2] J. J. Bollinger, D. J. Heinzen, W. M. Itano, S. L. Gilbert, and D. J.
Wineland, "Test of the linearity of quantum mechanics by rf spec-
troscopy of the ^Be"*" ground state." Phys. Rev. Lett., vol. 63, pp.
1031-1034, 1989.
[3] , "A 303-MHz frequency standard based on trapped Be+ ions,"
IEEE Trans. Instrum. Meas.. vol. 40, pp. 126-128, Apr. 1991.
[4] D. J. Wineland, etal., "Reent experiments on trapped ions at the National
Institute of Standards and Technology," in E. Arimondo, W. D. Phillips,
and F. Strumia, Ed. Laser Manipulation ofAtoms and Ions. New York:
North-Holland, 1992, pp. 553-567.
[5] N. F. Ramsey, Molecular Beams. London: Oxford Univ. Press, 1956,
p. 124.
[6] W. M. Itano, J. C. Bergquist, J. J. Bollinger, J. M. Gilligan, D. J. Heinzen
et ai, "Quantum projection noise: Population fluctuations in two-level
systems," Phys. Rev. A. vol. 47, pp. 3554-3570, 1993.
[7] D. J. Wineland, J. J. Bollinger, W. M. Itano, and D. J. Heinzen,
"Squeezed atomic states and projection noise in spectroscopy," Phys.
Rev. A, vol. 50, pp. -67-88, 1994.
[8] J. N. Tan, J. J. Bollinger, and D. J. Wineland, "Experiments with large
numbers of laser-cooled, trapped ions," Bull. APS, vol. 39, p. 1218,
1994.
[9] L. S. Brown and G. Gabrielse, "Geonium theory: Physics of an electron
or ion in a Penning trap," Rev. Mod. Phys., vol. 58, no. 1, pp. 233-31 1,
1986.
[10] L. R. Brewer, J. D. Prestage, J. J. Bollinger, W. M. Itano, D. J.
Larson, and D. J. Wineland, "Static properties of a non-neutral ^Be^-ion
plasma," Phys. Rev. A, vol. 38, pp. 859-873, 1988.
[11] J. J. Bollinger, D. J. Heinzen, F. L. Moore, W. M. Itano, D. J. Wineland,
and D. H. E. Dubin, "Electrostatic modes of ion-trap plasmas," Phys.
Rev. A. vol. 48, pp. 525-545, 1993.
[12] D. J. Wineland, J. C. Bergquist, J. J. Bollinger. W. M. Itano, D. J.
Heinzen et al. "Progress at NIST toward absolute frequency standards
using stored ions," IEEE Trans. Ult. Per. Freq. Control, vol. 37, no. 6,
pp. 515-523, 1990.
[13] W. M. Itano and D. J. Wineland, "Frequency and time standards
utilizing laser-cooled ions," Bull. APS, vol. 24, p. 11 85, 1979; "Precision
measurement of the ground-state hyperfine constant of -^Mg'^ ," Phys.
Rev. A. vol. 24, p. 1364, 1981.
[14] D. J. Larson, J. C. Bergquist, J. J. Bollinger, W. M. Itano. and D. J.
Wineland, "Sympathetic cooling of trapped ions: A laser-cooled two-
species nonneutral ion plasma," Phys. Rev. Lett., vol. 57, pp. 70-74,
1986.
[15] T. M. O'Neil, "Centrifugal separation of a multispecies pure ion
plasma," Phys. Fluids, vol. 24, pp. 1447-1451, 1981.
[16] J. J. Bollinger, et al, "Ion trapping techniques: Laser cooling and
sympathetic cooling," in E. H. Ottewitte and W. Kells, Ed., Intense
Positron Beams. Singapore: World Scientific, 1988, pp. 63-73.
[17] J. N. Tan, J. J. Bollinger, and D. J. Wineland, "A new Penning trap for
laser-cooling large ion numbers," Bull. APS, vol. 38, p. 1972, 1993.
TN-37

HIGH-MAGNETIC-FIELD CORRECTIONS TOCESIUM HYPERFINE STRUCTURE *
WAYNE M. ITANOTime and Frequency Division, National Institute of Standards and Technology,
Boulder, Colorado 80303, USA
Corrections to the Breit-Rabi formula for the ground state of ^^^Cs aire calculated. For a recently
proposed high-magnetic-field frequency standard, the corrections amount to a few peirts in 10^^
.
De Marchi has proposed a cesium atomic-beam frequency standard based on the {Mp =—1, AMp — 0) transition, at the magnetic field (jB w 82 mT) where the derivative of the
frequency with respect to B is zero,^ and has carried out preliminary experiments? In order
for this to be a primary frequency standard, it is necessary to relate the measured frequency
to that of the zero-field transition frequency z/Q) which defines the SI unit of time. The Breit-
Rabi formula predicts the frequency to be y/15/16fo = 8 900 727438.257 Hz.^ For higher
accuracy, additional terms must be taken into account.
Three corrections to the Breit-Rabi formula have been measured for the ground-state
hyperfine structure of rubidium by Larson and coworkers.^"^ These are the dipole dia-
magnetic shift, the quadrupole diamagnetic shift, and the hyperfine-assisted Zeeman shift.
These terms have not yet been measured for cesium.
The dipole diamagnetic shift results from a cross term between the contact hyperfine
interaction and the atomic diamagnetic interaction in second-order perturbation theory.
This leads to a shift, proportional to B^ , in the dipole hyperfine constant A. I evaluated
the perturbation sum over states, including the continuum, by solving an inhomogeneous
differential equation for the perturbed wavefunction. I used an empirical potential for the
valence electron derived by Klapisch.^ The result is 6A/A = 5.46 x 10~^° B^, where B is
expressed in teslas. This leads to an increase in the {Mf — —1) field-independent transition
frequency of 33 mHz. Previous calculations have been reported by Bende/ and by Ray et
alf In order to check the method, I used Klapisch's potential to calculate 6A/A for rubidium.
The result is 10% below the experimental value. I estimate an accuracy of around 20% for
the present calculation in cesium.
The quadrupole diamagnetic shift results from a cross term between the nuclear quadru-
pole hyperfine interaction and the electronic diamagnetic interaction in second-order per-
turbation theory. The interaction is diagonal in Mj and Mj. The perturbation sum over
states is the same one that appears in the calculation of the quadrupole shielding factor
7oo-'* Using the value ToolCs"*") = —86.8,^ I obtain the result
(M7,Mj|ffQD|Mz,Mj) = -4.6 X iq-b^^ [3M|^-^/(/ + 1)]^
^^^
The result is in hertz if B is expressed in teslas. A similar calculation for rubidium yields a
coefficient in good agreement with experiment."* For cesium, the estimate of the coefficient
'Work of the US government. Not subject to US copyright.
TN-38

for the shift is probably accurate within around 30%. However, for the special case of the
{Mp = — 1) field-independent transition, the shift vanishes. The two states involved in the
transition are (|- 1/2, -1/2) ±
|
- 3/2, l/2))/\/5, in the \Mi, Mj) basis, where + refers to
the higher-energy state and — to the lower-energy state. Hence, the states are shifted by
the same amount, since they have the same M/-content.
The hyperfine-assisted Zeeman shift was explained by Fortson as a third-order pertur-
bation, in which the contact hyperfine interaction acts twice and the electronic Zeeman
interaction acts once.^° Fortson gave diagonal matrix elements in the |M/,Mj) basis. For
the (Mp = — 1) field-independent transition, it is necessary to extend Fortson's calcula-
tion to include off-diagonal matrix elements. In the \[IJ)F^Mp) basis, the nonzero matrix
elements for ^^^Cs are
(3,MF|iyHAz|4,Mir) = AhpB^Jw - M^. (2)
Fortson used quantum-defect theory to make a semi-empirical estimate for (5 in rubidium;
it agreed with experiment within 10%. The same method, applied to cesium, yields /3 = 88
mHz/T. For the [Mp = —1) field-independent transition, the shift at 5 = 82 mT is
— 2v'T5/?5 = —56 mHz. This estimate of the shift is probably accurate within around 30%.
To achieve a theoretical error of 10~^* in the total frequency, which is the projected
accuracy of the high-field frequency standard,^ the larger shifts must be known within less
than 1%. This could possibly be done by ah initio calculations or by experiments carried
out at much higher magnetic field, similar to those of Larson and coworkers in rubidium.
Acknowledgments
This work was supported by the Office of Naval Research and the Army Research Office.
References
1. A. De Marchi, in Proc. 7th European Frequency and Time Forum, Neuchatel, Switzer-
land, 1993, p. 541.
2. G. Costanzo, E. Rubiola, A. De Marchi, in Proc. 9th European Frequency and Time
Forum, Besangon, France 1995 (in press).
3. N. P. Economou, S. J. Lipson, and D. J. Larson, Phys. Rev. Lett. 38, 1394 (1977).
4. S. J. Lipson, G. D. Fletcher, and D. J. Larson, Phys. Rev. Lett. 57, 567 (1986).
5. G. D. Fletcher, S. J. Lipson, and D. J. Larson, Phys. Rev. Lett. 58, 2535 (1987).
6. M. Klapisch, C. R. Acad. Sci. Paris 265, 914 (1967).
7. P. L. Bender, in Quantum Electronics, Proceedings of the Third International
Congress, Paris, ed. P. Grivet and N. Bloembergen (Columbia Univ. Press, NewYork, 1964), p. 263.
8. S. N. Ray, M. Vajed-Samii, and T. P. Das, Bull. Am. Phys. Soc. 24, 477 (1979).
9. H. M. Foley, R. M. Sternheimer, and D. Tycko, Phys. Rev. 93, 734 (1954).
10. N. Fortson, Phys. Rev. Lett. 59, 988 (1987).
TN-39

APPLICATION OF LASER-COOLED IONSTO FREQUENCY STANDARDS AND METROLOGY*
D. J. Wineland, J. C. Bergquist, D. Berkeland, J. J. Bollinger, F. C. Cruz,
W. M. Itano, B. M. Jel^ikovid, B. E. King, D. M. Me^hof,J. D. Miller, C. Monroe, M. Rauner, and J. N. Tan
National Institute of Standards and Technology, Time and Frequency Division
Boulder, CO, 80303
E-mail: [email protected]
ABSTRACT
With the first experiments on laser cooling, it was realized that a principal application
of the technique would be to reduce Doppler shifts in frequoicy standards. Laser cooling is
still thought to be essential to achieve uncertainty significantly smaller than 1 part in 10'^;
however, a number of other problems must be solved to achieve this goal with stored atomic
ions. For both RF/microwave and optical frequmcy standards based on trapped ions, some of
these problems are discussed. Laser cooling of tnq)ped ions also spears to be important for
other reasons in metrology. For example, for frequency standards, cooling to the zero-point of
motion should enable the creation of quantum mechanically correlated states for improved
signal-to-noise ratio in spectroscopy, or provide accurate measuremoit of Stark shifts. Cooling
to the zero-point of motion also enables the creation of nonclassical states of motion or
correlated states which may be applicable to sensitive detection, quantum computation, or to
test quantum measurement principles. Techniques to achieve laser cooling to the zero-point of
motion are briefly described.
1. Introduction
The first laser cooling experiments^'^ were accomplished on trapped ions in
1978. It was apparent then that one important application for laser cooling would be
the reduction of the time-dilation (2nd-order-Doppler) shift in frequency standards. In
fact by 1980, temperatures achieved from laser cooling on ions were low enough that
the corresponding time-dilation shift was significantly below 1 part in 10^*. This is
illustrated in Fig. 1, where we plot time-dilation shifts (shown as a fraction of the
transition frequency) corresponding to temperatures reported in some laser cooling
experiments. Since these shifts are significantly smaller than the smallest reported
inaccuracies for atomic clocks, we can ask why the overall accuracies reported do not
approach these numbers.
One source of the discrepancy is that, for trapped ions, laser cooling affects
only the thermal or random modes of motion. However, ion motion in both Paul and
Penning traps^* in part consists of unavoidable coherent motion; this motion can result
in large ion velocities and accompanying Doppler shifts. In a Penning trap, a cloud
of ions must rotate about the_ symmetry axis of the trap. The velocity associated with
this rotation gives rise to a v x B Lorentz force which provides trapping normal to
the symmetry axis. For large clouds, the velocity in this rotation motion can be
significantly larger than the thermal velocity in the axial and cyclotron motions (which
can be laser-cooled), thereby limiting the degree to which the time-dilation shift can
* Contribution of the U.S. Government; not subject to U.S. copyright.
TN-40
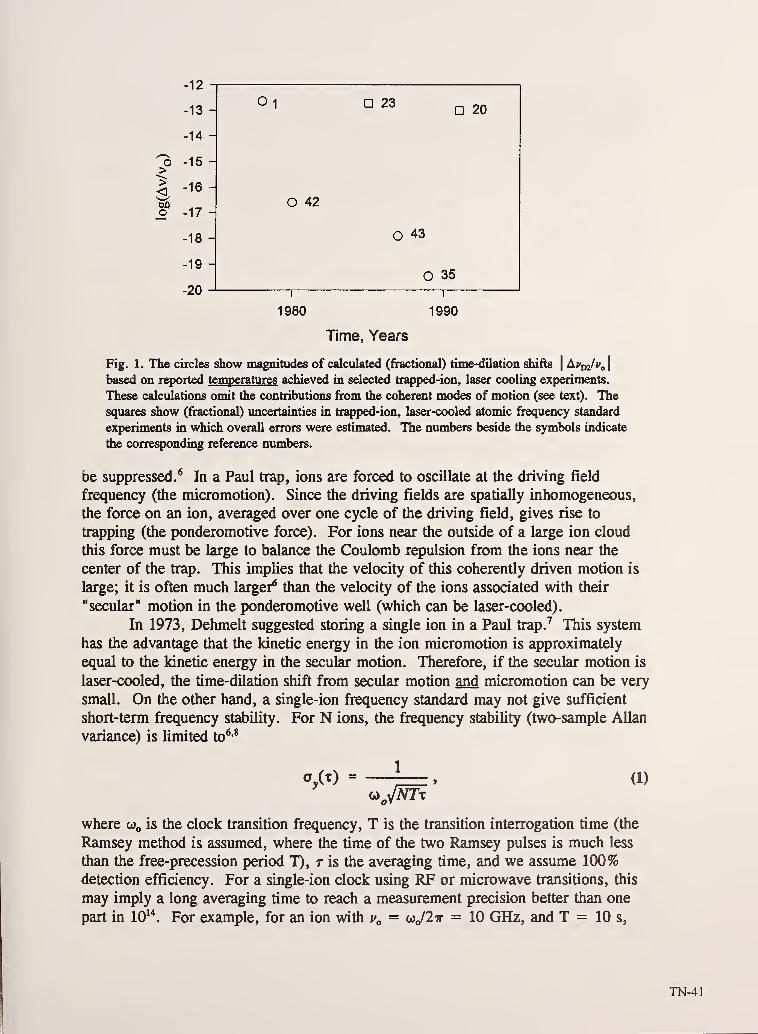
o
<o
1980 1990
Time, Years
Fig. 1. The circles show magnitudes of calculated (fractional) time-dilation shifts | Ai^/^o |
based on r^>orted temperatures achieved in selected trapped-ion, laser cooling experiments.
These calculations omit the contributions from the coherent modes of motion (see text). The
squares show (fractional) imcertainties in trapped-ion, laser-cooled atomic frequency standard
experiments in which overall errors were estimated. The nimibers beside the symbols indicate
the corresponding reference numbers.
be suppressed.* In a Paul trap, ions are forced to oscillate at the driving field
frequency (the micromotion). Since the driving fields are spatially inhomogeneous,
the force on an ion, averaged over one cycle of the driving field, gives rise to
trapping (the ponderomotive force). For ions near the outside of a large ion cloud
this force must be large to balance the Coulomb repulsion from the ions near the
center of the trap. This implies that the velocity of this coherently driven motion is
large; it is often much larger* than the velocity of the ions associated with their
"secular" motion in the ponderomotive well (which can be laser-cooled).
In 1973, Dehmelt suggested storing a single ion in a Paul trap.^ This system
has the advantage that the kinetic energy in the ion micromotion is approximately
equal to the kinetic energy in the secular motion. Therefore, if the secular motion is
laser-cooled, the time-dilation shift from secular motion and micromotion can be very
small. On the other hand, a single-ion frequency standard may not give sufficient
short-term frequency stability. For N ions, the frequency stability (two-sample Allan
variance) is limited to*'*
a/x) = 1
(^Jtn\(1)
where cOo is the clock transition frequency, T is the transition interrogation time (the
Ramsey method is assumed, where the time of the two Ramsey pulses is much less
than the free-precession period T), t is the averaging time, and we assume 100%detection efficiency. For a single-ion clock using RF or microwave transitions, this
may imply a long averaging time to reach a measurement precision better than one
part in 10*'*. For example, for an ion with v^ = ujlir = 10 GHz, and T = 10 s,
TN-41

Eq. (1) implies (7y(r) = 5.0x10'^^ t"'*. Therefore, in general, for both Penning and
Paul trap RF/microwave frequency standards, where we desire large N to make 0^(7)
sufficiently small, we require methods to minimize the velocity in the coherent modes
of motion. Some strategies are discussed below.
If the velocity in the coherent motion can be suppressed sufficiently, Doppler
cooling' will suffice (at least for the next generation of frequency standards) to
provide small enough time-dilation shifts for frequency standards. If we neglect the
velocity in the coherent modes of motion, minimum temperatures achieved from
Doppler cooling give rise to a time-dilation shift of Avjyi/v^ = -3.3x10'^*(7/2t)/M
where 7/2T is the laser-cooling transition linewidth in megahertz and M is the ion
mass in relative atomic mass units. For example, for ^''Hg'^ ions (y/lr = 70 MHz,M = 199 u), we could expect Avoif^o = - 1.2x10".
However, there now appear to be other reasons for achieving better laser
cooling - in particular for reaching the zero-point energy state of motion. Newapplications are emerging for this extreme form of laser cooling, both for frequency
standards and other forms of metrology. Some of these applications and methods to
reach the zero-point energy through laser cooling are discussed below. Reference 10
provides a more comprehensive review of cooling methods in ion traps.
2. Reductioii of the coherent motion (micromotion) in a Paul trap
One way to suppress the velocity in the micromotion and still achieve a large
number of ions for good signal-to-noise ratio is to use an elongated "linear" trap
geometry. In this type of trap, shown schematically in Fig. 2, the RF electric fields
vanish along the axis of the trap. Therefore, if ions are confined near the trap axis in
an elongated ion cloud geometry, the micromotion can be suppressed. This idea was
first developed and used by Prestage et al." In part, because of the relatively small
time-dilation shift, excellent stabilities have been achieved in clocks where the ions'
secular motion in a linear trap is cooled by buffer gas (see the contributions at this
conference by Tjoelker et al. and Fisk et al.).
Dehmelt suggested applying this idea to frequency standards in its limiting
form,^^ that is, where a single string of ions is confined to the trap axis like "beads on
a string." Here, as for a single ion in a spherical quadrupole trap, the velocity of
micromotion can be approximately the same as for the secular motion. With laser
cooling, the time-dilation shifts can therefore be very small. At NIST, this idea is
being pursued for application to a frequency standard of high accuracy. Strings of
laser cooled ^'^g'^ ions have been obtained in a room temperature apparatus" and in
a cryogenic (4 K) apparatus^"* whose good vacuum suppresses collisional frequency
shifts and ion loss from chemical reactions. The bottom part of Fig. 2 shows an
image of a string of laser cooled '''Hg'^ ions taken in this cryogenic apparatus. The
Munich group has also achieved strings of laser-cooled (Mg"^) ions in a race-track-
type trap*^; this type of apparatus could also be used for frequency standard
applications.
Another approach to suppress micromotion is to use arrays of conventional
(spherical quadrupole) ion traps."" Here, single laser-cooled ions could be stored in
each trap thereby ensuring small time-dilation shifts. Important technical problems
appear to be the loading, addressing, and detecting of the individual ions.
TN-42

r VoCOsQt
Fig. 2. The i^)per part of the figure shows a schematic diagram of the electrode configuration
for a linear Paul-RF trap." Typical parameters for trapping '*^g"^ ions are: rod-electrode
separation of (proximately 1 mm, V^ =: 400 V, and C/2x ss. 10 MHz. The lower part of the
figure shows an image of a string of ^^g*^ ions, illiuninated with 194 imi radiation, Xskesa.
with a UV-s^isitive, photon counting imaging tube. The spacing betwe^i adjac^it ions is
approximately 10 iim. The "g^s" in the string are occupied by inqiurity ions, most likely
other isotopes of Hg"^, which do not fluoresce because the frequ^icies of their resonant
transitions do not coincide with the 194 nm ^.^ -» ^.^ transition of ^'^g'*'.
3. Reduction of the coherent (rotation) motion in a Penning trap
Following the example of the linear or racetrack Paul traps, the coherent
motion in a Penning trap could be suppressed by storing ions near the axis of the
trap - ideally as a single string along the axis. A more modest approach might be
the following. For a cloud of laser-cooled ions in a Penning trap, as the radius of the
cloud is varied, the time-dilation shift goes through a minimum (see Ref. 18 and Tan,
et al., this conference). Therefore if the cloud of ions is stabilized at this extremum
point, the time-dilation shift and its fluctuations can be made very small.
Any configuration of ions in a Penning trap is in an unstajble equilibrium (as
opposed to a sample of ions in a Paul trap). Therefore, once created, the
configuration would not be preserved if, for example, collisions are present. Torques
from laser scattering could restore the configuration but at the expense of possible
perturbing effects from the cooling laser.
4. Sympathetic laser cooling
One solution to the problems associated with Penning trap cloud stability is
sympathetic laser cooling.^' As an example, in the laser-cooled frequency standard
experiment reported in Ref. 20, a ^^ ion sample was cooled sympathetically,
through Coulomb coupling, by a simultaneously stored, surrounding cloud of Mg"^
ions which were directly laser-cooled. This method has the advantage that the laser
cooling (and laser torques) can be applied continuously to the Mg* ions, thereby
maintaining the geometry and temperature of the 'Be* ions. Because the frequency of
TN-43

the Mg"^ optical cooling transition is significantly different than the optical transitions
in 'Be'^, the 'Be* ions are not appreciably perturbed by the Mg* cooling laser beam.
It should be possible to apply this technique to sympathetically cool a string of ions in
a Penning trap or a cloud that is configured to give the minimum time-dilation shift.^*
Sympathetic cooling might also be employed to advantage in a (linear) Paul
trap. When long Ramsey interrogation times T are desired, the ions may heat from,
for example, RF heating. However, in a long string of ions, cooling could be applied
to ions on one end which then cool the "clock" ions sympathetically. In principle, the
"cooling ions" could be of the same species if the string is long enough or, if the
string is bent around a (light-baffled) comer or, if the clock ions are shielded by a
coupling electrode^^ to minimize the perturbing effects of scattered light from the
cooling ions.
5. Laser-cooled, trapped-ion, optical frequency standards
Most researchers agree that, in the future, the most accurate and stable clocks
will be made using optical or higher frequency transitions. From Eq. (1), if the clock
transition frequency is high enough, then a single ion would give good short term
stability. For example for the ^Svi -* ^Dsa 282 nm transition in ^''Hg*, assuming N =1, T = 0.01 s (the radiative lifetime of the '^D^n level is approximately 0.1 s), Eq. (1)
implies <7y(r) = 1.5x10"^* r'^. As discussed above, the time-dilation shift could be
very small. In addition, shorter interrogation times will mitigate the effects of various
sources of ion heating, since clock cycles could be alternated with relatively frequent
laser cooling. Work on optical frequency standards is represented by several groups
at this conference; see, for example, the stored-ion contributions by Barwood, et al.
,
Fermigier, et al.. Gill, et al., Knoop, et al., Madej, et al., Nagoumey, et al., Peik, et
al. , and Tamm and Engelke.
Currently, laser local oscillators are not as stable as desired. A representation
of the state of the art for trapped-ion optical frequency standards is given in Ref. 22,
where a laser with frequency bandwidth of less dian 25 Hz (for 60 s averaging times)
was locked to the 282 nm quadrupole transition in a single laser-cooled ^''Hg'^ ion.
Finally, an additional technical difficulty for all optical frequency standards is
that of comparing laser local oscillators to other oscillators (particularly oscillators at
low frequency). Several approaches are discussed in these proceedings.
6. Present and future laser-cooled ion frequency standards
So far, there has been only one report of an ion-based, laser-cooled atomic
frequency standard whose accuracy has been evaluated. In this experiment, laser-
cooled ^Bq* ions in Penning trap were used.^ A second evaluation^" of this system
uncovered an unexpected background gas pressure shift. This shift was apparently
caused, in part, by background methane gas, which has a strong perturbing effect on
'Be"^ ion hyperfine structure.^ (Interestingly, methane does not have nearly as large a
perturbing effect in the ^^^Yb"^ experiments reported by Bauch and Tamm at this
conference.) At present, the inaccuracy of the laser-cooled 'Be'^ ion clock is limited
to about one part in 10" from this pressure shift.^®
Further work is required to minimize possible pressure shifts and a number of
other typical systematic effects (for example, magnetic field shifts) present in all
TN-44

frequency standards. However, we can be optimistic tiiat frequency standards based
on laser-cooled ions will eventually have inaccuracies considerably smaller than 1 part
in 10^*, perhaps as small as 1 part in 10" or less.^'"*^
7. Applications of trapped ions which are laser-cooled to the zero-point of motion
Although Doppler cooling should yield sufficientiy small time-dilation shifts
for frequency standards, there now appear to be other reasons for achieving better
laser cooling. At very low kinetic energies, the quantum nature of the motion
becomes apparent; this quantized motion, particularly the zero-point state, can be used
for various purposes.
For example, when inaccuracies of optical clocks become smaller than one
part in 10^^, Stark shifts may become significant.^ As Dehmelt has pointed out", the
intercombination transitions in group niA ions are superior in this regard, although
for various technical reasons, optical quadrupole S - D transitions in other ions can
be easier to implement. The quadratic Stark shifts on these latter transitions depend
on the kinetic energy of the ions. Since the secular motion is quantized, the quadratic
Stark shift from the secular motion becomes quantized. This could be used to identify
the zero-point energy states of the ion^ or, conversely, the Stark shift could be
calibrated from its discrete spectrum caused by quantized motion.
Another possible frequency standard application of zero-point cooling is to
improve the quantum-limited signal-to-noise ratio in the detection process (see Ref. 28
and Bollinger, et al., this conference). If spectroscopy is performed on atoms which
are first prepared in particular quantum mechanically correlated, or entangled, states,
the frequency stability would be given by ay(r) = 1/(woN(Tt)'*) rather than that given
by Eq. (1). In this case, the time to reach a desired measurement precision would be
reduced in proportion to 1/N.
Outside the realm of frequency standards, there may be other metrological
applications of ions which are laser-cooled to the zero-point of motion. Cirac and
Zoller have recentiy suggested a very interesting scheme to perform quantum
computation using an array of ions confined in a linear trap.^' Quantum computers
have received attention lately because of their ability to crack the most common form
of public-key encryption. The first quantum logic gates using prepared input "qubits"
have now been realized using trapped ions which are first cooled to the zero-point
energy. ^° A second possible application might be to the generation of multiparticle
"EPR"-type correlated states which would be interesting from the standpoint of
quantum measurement theory. ^^ Finally, if a single ion or single mode of oscillation
is cooled to the zero-point state, it is possible to generate nonclassical states of motion
such as squeezed states^^-^*'^^'^' (see also Blatt et al., this conference). Such states
may be useful for sensitive detection, for example, mass spectroscopy at the quantum
leveP*. In all of these applications, efficient cooling to the zero-point of motion is a
crucial prerequisite.
8. Methods for zero-point laser cooling
With the use of Doppler cooling,' minimum energies for a bound atom in one
dimension are approximately equal to ^7/2, where 2t^ is Planck's constant and 7 is
the natural linewidth of the cooling transition. For an atom bound in a harmonic well
TN-45

with "vibrational" frequency Wv, this energy can be expressed as fiQi^(<n^> +V^)
where nv is the harmonic oscillator quantum number. Since Doppler cooling is valid
in the regime where 7 > co^, limiting kinetic energies for Doppler cooling necessarily
imply <ny> > 1.
When 6)v > 7, cooling can be achieved in the "resolved sideband" regime.**
Consider a two-level atom characterized by resonant transition frequency wq and
radiative linewidth 7. If a laser beam (frequency wj is incident along the direction of
the atomic motion, the absorption spectrum is composed of a "carrier" at frequency
Wo and resolved frequency-modulation sidebands spaced by Wv which are generated
from the Doppler effect. Cooling occurs if the laser is tuned to a lower sideband, for
example, at Wl = wq-Wv ^ this case, photons of energy ^(cob-cov) are absorbed and
spontaneously emitted photons of average energy ^coq return tiie atom to its ground
internal state (assuming that fiojy is much greater than the photon recoil energy).
Therefore, the atom's kinetic energy is reduced by ^co^ per scattering event. Cooling
proceeds until the atom's mean vibrational quantum number in the harmonic well is
given by^' (n^),^ = (y/2(a^)^ < 1. Two experiments on single ions have reported
laser cooling to the zero-point of motion.^'"'** In Ref. 36, resolved-sideband stimulated
Raman transitions replaced single photon transitions; cooling to the zero-point of
motion was achieved 98% of the time in 1-D and 92% of the time in 3-D. Before
correlated states between ions can be obtained, zero-point cooling must be extended to
certain modes (such as the center-of-mass oscillation) on collections of N (^ 2) ions.
Dramatic advances in laser cooling of neutral atoms were made witii the
introduction of polarization-gradient and Sisyphus cooling.'^ Because of this success,
it was interesting to investigate whether or not these methods would yield < n^> =for bound atoms. Theoretical investigations have shown that particular applications of
Sisyphus cooling or polarization-gradient cooling^*'^''"' to trapped atoms appear to give
cooling near <n> = 1, but not <n> -» 0. More recentiy, it has been suggested
that ions in the n = state could be selected from a distribution by null detection.^^
Other discussions of laser cooling appear in the contributions to this conference by
Knoop et al. , Sugiyama and Yoda, and Alekseev and Krylova.
9. SummaryLaser cooling, which can suppress time-dilation shifts, appears to be essential
to achieve high accuracy in atomic frequency standards. However, before the benefits
of laser cooling can be realized with trapped ions, the velocity in the coherent or
nonthermal modes of motion must be suppressed. We have discussed several
approaches which address this problem. It also appears that laser cooling may have
other benefits in metrology. We have pointed out the application of zero-point laser
cooling to the generation of correlated states for improved signal-to-noise ratio in
spectroscopy, fundamental quantum measurements and quantum computation.
10. Acknowledgements
We gratefully acknowledge the support of the U.S. Office of Naval Research
and the U.S. Army Research Office. We thank D. Howe, D. Lee, J. Kitching, and
M. Young for helpful comments on the manuscript.
TN-46

11. References:
1. D.J. Wineland, R.E. Drullinger, and F.L. Walls, Phys. Rev. Lett. 40, 1639
(1978).
2. Neuhauser, M. Hohenstatt, P. Toschek, and H. Dehmelt, Phys. Rev. Lett. 41, 233
(1978).
3. H.G. Dehmelt, Adv. At. Mol. Phys. 1, 53 (1967) and 5, 109 (1969).
4. D.J. Wineland, Wayne M. Itano, and R.S. VanDyck, Jr., Adv. At. Mol. Phys. 12,
135 (1983).
5. R. C. Thompson, Adv. At. Mol. Phys. M, 253 (1993),
6. D. J. Wineland, J. C. Bergquist, J. J. Bollinger, W. M. Itano, D. J. Heinzen, S.
L. Gilbert, C. H. Manney, and M. G. Raizen, IEEE Trans, on Ultrasonics,
Ferroelectrics, and Frequency Control 22, 515 (1990).
7. H.G. Dehmelt, Bull. Am. Phys. Soc. IS, 1521 (1973).
8. W. M. Itano, J. C. Bergquist, J. J. Bollinger, J. M. Gilligan, D. J. Heinzen, F. L.
Moore, M. G. Raizen, and D. J. Wineland, Phys. Rev. A47, 3554 (1993).
9. see, for example: D.J. Wineland and W.M. Itano, Physics Today, vol. 40, no. 6,
p. 34 (1987).
10. W. M. Itano, J. C. Bergquist, J. J. Bollinger, and D. J. Wineland, Proceedings
of the Nobel Symposium on Trapped Charged Particles and Related Fundamental
Physics, Lyseldl, Sweden, August, '94, to be published in Physica Scripta.
11. J. Prestage, G. J. Dick and L. Maleki, J. Applied Physics, ^, 1013 (1989); J.
D. Prestage, G. J. Dick, and L. Maleki, IEEE Trans. Instnim. and Meas. 4Q, 132
(1991).
12. H. G. Dehmelt, in Frequency Standards and Metrology, Proc. 4th Symposium,
ed. by A. DeMarchi, Ancona, Italy (Springer-Verlag, Berlin, Heidelberg, 1989) p.
286.
13. M. G. Raizen, J. M. Gilligan, J. C. Bergquist, W. M. Itano, and D. J.
Wineland, Phys. Rev. A45, 6493 (1992).
14. M. E. Poitzsch, J. C. Bergquist, W. M. Itano, and D. J. Wineland, Proc. 1994
IEEE International Frequency Control Symposium, p. 744, June, 1994; J. Miller, M.E. Poitzsch, F. C. Cruz, D. J. Berkeland, J. C. Bergquist, W. M. Itano. and D. J.
Wineland, 1995 IEEE International Frequency Control Symposium, June, 1995.
15. G. Birkl, S. Kassner, and H. Walther, Nature 251, 310 (1992).
16. F. Major, J. Phys. Lett. 2S, L221 (1977).
17. R. Brewer, R. G. DeVoe, and R. Kallenbach, Phys. Rev. A46, R6781 (1992).
18. J. N. Tan, J. J. Bollinger, and D. J. Wineland, Proc. Conf. Prec.
Electromagnetic Meas., Boulder, CO, June, 1994; IEEE Transactions on
Instrumentation and Measurement 44, 144 (1995).
19. D.J. Larson, J.C. Bergquist, J.J. Bollinger, W.M. Itano, and D.J. Wineland,
Phys. Rev. Lett. 52, 70 (1986).
20. J. J. Bollinger, D. J. Heinzen, W. M. Itano, S. L. Gilbert, and D. J. Wineland,
IEEE Trans, on Instrum. and Measurement 4Q, 126 (1991).
21. D. J. Heinzen and D. J. Wineland, Phys. Rev. A42, 2977 (1990).
22. J. C. Bergquist, W. M. Itano, and D. J. Wineland, in Frontiers in Laser
Spectroscopyyproc. International School of Physics < < Enrico Fermi> > , Course
TN-47

CXX, ed. by T. W. Hansch and M. Inguscio, (North Holland, Amsterdam, 1994),
pp. 359 - 376.
23. J. J. Bollinger, J.D. Prestage, W.M. Itano, and D.J. Wineland, Phys. Rev. Lett.
54, 1000-1003 (1985).
24. D. J. Wineland, J. C. Bergquist, J. J. Bollinger, W. M. Itano, F. L. Moore, J.
M. Gilligan, M. G. Raizen, D. J. Heinzen, C. S. Weimer, and C. H. Manney, in
Laser Manipulation ofAtoms and Ions, ed. by E. Arimondo, W. D. Phillips, and F.
Strumia (North-Holland, Amsterdam, 1992), pp. 553-567.
25. H. Dehmelt, in Frequency Standards and Metrology, Proc. 4th Symposium, ed.
by A. DeMarchi, Ancona, Italy (Springer-Verlag, Berlin, Heidelberg) p. 15.
26. D.J. Wineland, W.M. Itano, J.C. Bergquist and R.G. Hulet, Phys. Rev. A26,
2220 (1987).
27. N. Yu, X. Zhao, H. Dehmelt, and W. Nagoumey, Phys. Rev. A5Q, 2738 (1994).
28. D. J. Wineland, J. J. Bollinger, W. M. Itano, and D. J. Heinzen, Phys. Rev.
A5Q, 67 (1994).
29. J. I. Cirac and P. Zoller, Phys. Rev. Lett. 74, 4091 (1995).
30. C. Monroe, D. M. Meekhof, B. E. King, W. M. Itano, and D. J. Wineland,
Phys. Rev. Lett. 75, 4714-4717 (1995).
31. D. M. Greenberger, M. A. Home, and A. Zeilinger, Phys. Today 4^(8), 22
(1993).
32. J. I. Cirac, A. S. Parkins, R. Blatt, and P. Zoller, Phys. Rev. Lett. 7Q, 556
(1993); J. I. Cirac, R. Blatt, A. S. Parkins, and P. Zoller, Phys. Rev. Lett. 7Q, 762
(1993).
33. D. M. Meekhof, C. Monroe, B. King, W. M. Itano, D. J. Wineland, submitted.
34. D. J. Wineland and H. G. Dehmelt, BuU. Am. Phys. Soc. 2Q, 637 (1975).
35. F. Diedrich, J.C. Bergquist, W. M. Itano, and D.J. Wineland, Phys. Rev. Lett.
62, 403 (1989).
36. C. Monroe, D. M. Meekhof, B. E. King, S. R. Jefferts, W. M. Itano, D. J.
Wineland, and P. Gould, Phys. Rev. Lett. 75, 4011-4104 (1995).
37. see, for example, C. Cohen-Tannoudji and W. D. Phillips, Phys. Today 4^(10),
33 (1990).
38. D. J. Wineland, J. Dalibard, and C. Cohen-Tannoudji, J. Opt. Soc. Am. B2, 32
(1992).
39. J. I. Cirac, R. Blatt, A. S. Parkins, and P. Zoller, Phys. Rev. A4S, 1434 (1993).
40. S. M. Yoo and J. Javanainen, Phys. Rev. A48, R30 (1993); J. Javanainen and S.
M. Yoo, Phys. Rev. A48, 3776 (1993).
41. J. Eschner, B. Appasamy, and P. E. Toschek, Phys. Rev. Lett. 74, 2435 (1995).
42. W. Neuhauser, M. Hohenstatt, P. E. Toschek, and H. Dehmelt, Phys. Rev. A22,
1137 (1980).
43. J.C. Bergquist, W.M. Itano and D.J. Wineland, Phys. Rev. A2^, 428 (1987).
TN-48
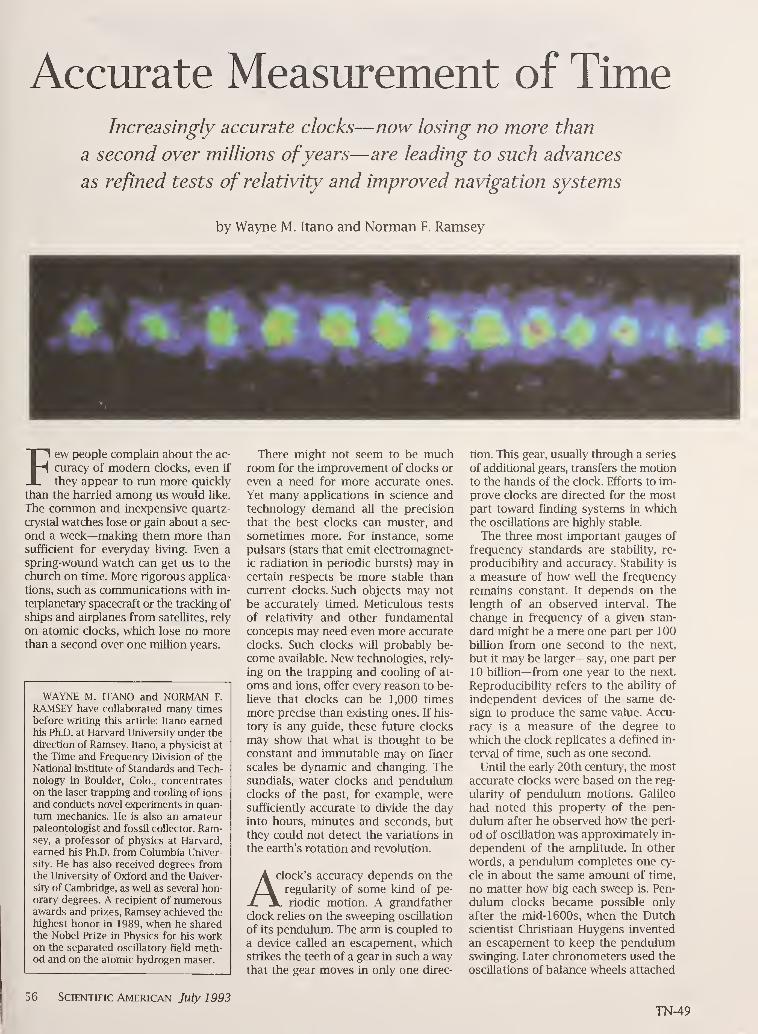
Accurate Measurement of TimeIncreasingly accurate clocks—now losing no more than
a second over millions ofyears—are leading to such advances
as refined tests of relativity and improved navigation systems
by Wayne M. Itano and Norman F. Ramsey
Few people complain about the ac-
curacy of modern clocks, even If
they appear to run more quickly
than the harried among us would like.
The common and inexpensive quartz-
crystal watches lose or gain about a sec-
ond a week—making them more than
sufficient for everyday living. Even a
spring-woimd watch can get us to the
church on time. More rigorous applica-
tions, such as communications with in-
terplanetary spacecraft or the tracking of
ships and airplanes from sateUites, rely
on atomic clocks, which lose no morethan a second over one million years.
WAYNE M. ITANO and NORMAN F.
RAMSEY have collaborated many times
before writing this article: Itano earnedhis Ph.D. at Harvard University under the
direction of Ramsey. Itano, a physicist at
the Time and Frequency Division of the
National Institute of Standards and Tech-
nology in Boulder, Colo., concentrates
on the laser trapping and cooling of ions
and conducts novel experiments in quan-
tum mechanics. He is also an amateurpaleontologist and fossil collector. Ram-sey, a professor of physics at Harvard,
earned his Ph.D. from Columbia Univer-
sity. He has also received degrees fromthe University of Oxford and the Univer-
sity of Cambridge, as well as several hon-orary degrees. A recipient of numerousawards and prizes, Ramsey achieved the
highest honor in 1989, when he sharedthe Nobel Prize in Physics for his workon the separated oscillatory field meth-od and on the atomic hydrogen maser.
There might not seem to be muchroom for the improvement of clocks or
even a need for more accurate ones.
Yet many applications in science andtechnology demand all the precision
that the best clocks can muster, andsometimes more. For instance, somepulsars (stars that emit electromagnet-
ic radiation in periodic bursts) may in
certain respects be more stable than
current clocks. Such objects may not
be accurately tuned. Meticulous tests
of relativity and other fimdamentalconcepts may need even more accurate
clocks. Such clocks will probably be-
come available. New technologies, rely-
ing on the trapping and cooling of at-
oms and ions, offer every reason to be-
Ueve that clocks can be 1,000 times
more precise than existing ones. If his-
tory is any guide, these future clocks
may show that what is thought to beconstant and Immutable may on finer
scales be dynamic and changing. Thesundials, water clocks and pendulvmiclocks of the past, for example, weresufficiently accurate to divide the daymto hours, minutes and seconds, but
they could not detect the variations In
the earth's rotation and revolution.
Aclock's accuracy depends on the
regularity of some kind of pe-
L riodic motion. A grandfather
clock relies on the sweeping oscillation
of its pendulum. The arm is coupled to
a device called an escapement, whichstrikes the teeth of a gear m such a waythat the gear moves In only one direc-
tion. This gear, usually through a series
of additional gears, transfers the motion
to the hands of the clock. Efforts to Im-
prove clocks are directed for the mostpart toward finding systems m whichthe oscillations are highly stable.
The three most important gauges of
frequency standards are stability, re-
producibility and accuracy. StabUity is
a measure of how well the frequency
remains constant. It depends on the
length of an observed interval. Thechange In frequency of a given stan-
dard might be a mere one part per 100
billion from one second to the next,
but it may be larger—say, one part per
10 billion—from one year to the next.
Reproducibility refers to the ability of
Independent devices of the same de-
sign to produce the same value. Accu-
racy is a measure of the degree to
which the clock replicates a defined In-
terval of time, such as one second.
Until the early 20th century, the mostaccurate clocks were based on the reg-
ularity of pendulum motions. Gahleo
had noted this property of the pen-
dulum after he observed how the peri-
od of oscUlation was approximately In-
dependent of the amplitude. In other
words, a pendulmn completes one cy-
cle In about the same amount of time,
no matter how big each sweep is. Pen-
dulimi clocks became possible only
after the mid-1600s, when the Dutchscientist Christiaan Huygens Invented
an escapement to keep the pendulumswinging. Later chronometers used the
oscillations of balance wheels attached
56 Scientific American 7u/y J 993TN-49

TRAPPED MERCURY IONS, separated by about 10 microns, flu-
oresce under illumination by ultraviolet light (photograph).
The ions are held by oscillating electric fields generated byelectrodes (cutaway diagram). Static electric potentials (not
shown) prevent the ions from escaping through the ends of
the trap. Strings of trapped ions may lead to new timing de-
vices more stable than conventional atomic clocks.
to springs. These devices had the ad-
vantage of being portable.
Considerable ingenuity went Into
improving the precision of pendulumand balance-wheel clocks. Clockmak-ers would compensate for temperature
changes by combining materials with
different rates of thermal expansion.
A more radical approach came in the
1920s, when William H. Shortt, a Brit-
ish engineer, devised a clock in which a
"slave pendulum" was synchronized to
a "free pendulum." The free pendulumoscillates in a low-pressure environment
and does not have to operate any clock
mechanism. Instead it actuates an elec-
trical switch that helps to keep the
slave pendulum synchronized. As a re-
sult, the period of the Shortt clock is
extremely stable. These clocks had anerror of a few seconds In a year (about
one part per 10 million) and becamethe reference used in laboratories.
The next major advance in timekeep-
ing was based on the developmentof quartz-crystal electronic oscillators.
The frequency of such devices dependson the period of the elastic vibration of
a carefully cut quartz crystal. The vi-
brations are electronically maintained
through a property of such crystals
called piezoelectricity. A mechanical
strain on the crystal produces a low
electric voltage; inversely, a voltage in-
duces a small strain.
The quartz vibrates at a frequency
that depends on the shape and dimen-
sions of the crystal. In some wrist-
watches, it is cut into the shape of a
tioning fork a few millimeters long. In
other timepieces, it is a flat wafer. Thequartz is connected to an electric cir-
aiit that produces an alternating cur-
rent. The electrical feedback from the
quartz causes the frequency of the cir-
cuit to match the frequency at whichthe crystal naturally vibrates (usually
32,768 hertz). The alternating current
from the circuit goes to a frequency di-
vider, a digital electronic device that
generates one output pulse for a fixed
number of input pulses. The divider
also actuates either a mechanical or
digital electronic display.
In the late 1920s Joseph W. Hortonand Warren A. Marrison, then at Bell
Laboratories, made the first clock based
on a quartz-crystcil oscillator. In the
1940s quartz-crystal clocks replaced
Shortt pendulimi clocks as primary lab-
oratory standards. These clocks were
stable to about 0.1 millisecond per day
(about one part per biUion). Relatively
inexpensive, quartz clocks continue to
be extensively used. The timekeeping el-
ements of common quartz watches andclocks are simplified and miniaturized
versions of quartz frequency standards.
Quartz wristwatches became commononce the abihty emerged to cut the
quartz into thin, tuning-fork shapes reli-
ably and to manufacture miniature, low-
power digital electronic components.
Yet quartz-crystal clocks prove inad-
equate for many scientific applications,
such as tests of relativity. According
to Albert Einstein's calculations, gravity
distorts both space and time. The differ-
ence in gravitational potential causes
time to pass more quickly high in the at-
mosphere than it does on the surface.
The difference is slight. Time runs about
30 nullionths of a second per year faster
at the top of Movmt Everest than it does
at sea level. Only atomic frequency stan-
dards achieve the requisite precision.
The quantized energy levels in at-
oms and molecules provide the
physical basis for atomic frequen-
cy standards. The laws of quantum me-chanics dictate that the energies of a
boimd system, such as an atom, have
certain discrete values. An electromag-
netic field can boost an atom from one
energy level to a higher one. The pro-
cess can also work in reverse. If the
atom is in a high energy level, it can
drop to a lower level by emitting elec-
tromagnetic energy.
The maximtmi amoimt of energy is
absorbed or emitted at a definite fre-
quency—the resonance frequency, or
the difference between the two energy
levels divided by Planck's constant.
This value is sometimes called the Bohr
frequency. Such frequencies make ideal
time standards because they are ex-
tremely stable. Time can be kept by ob-
serving the frequencies at which elec-
tromagnetic energy is emitted or ab-
sorbed by the atoms. In essence, the
atom serves as the master pendulimi
whose oscillations are counted to markthe passage of time.
Although we have described generad
quantum properties, the effects exploit-
ScEENTiFic American July 1993 57
TN-50
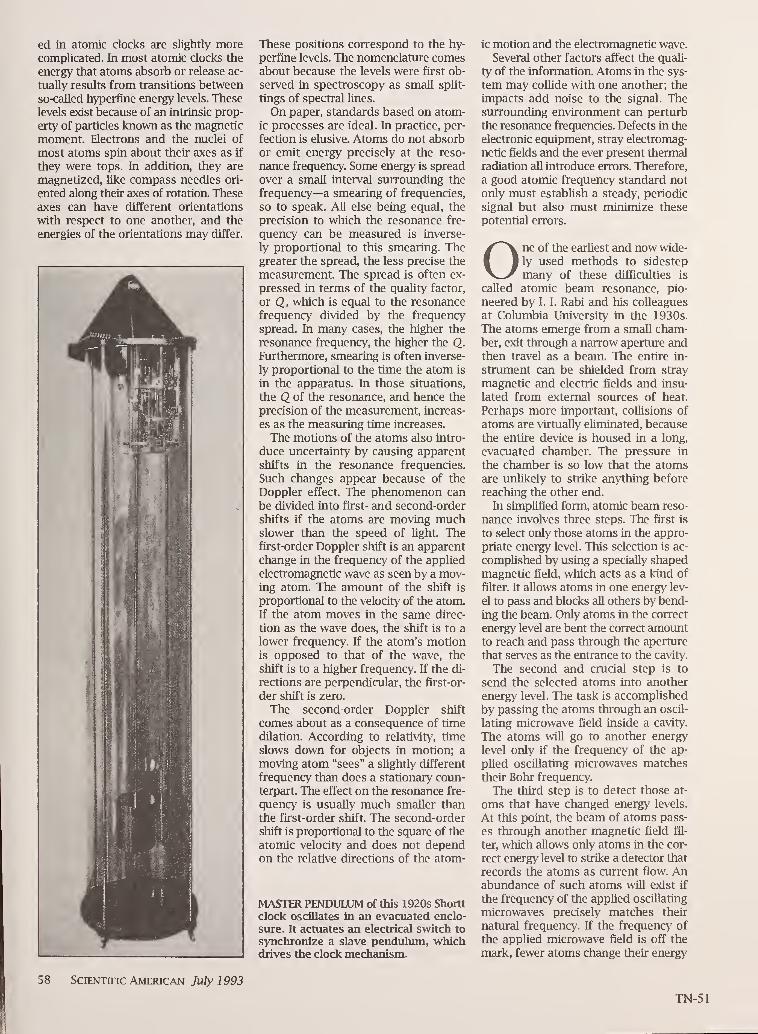
ed in atomic docks are slightly morecomplicated. In most atomic clocks the
energy that atoms absorb or release ac-
tually results from transitions betweenso-called hyperfine energy levels. These
levels exist because of an intrinsic prop-
erty of particles known as the magnetic
moment. Electrons and the nuclei of
most atoms spin about their axes as if
they were tops. In addition, they are
magnetized, like compass needles ori-
ented along their axes of rotatioiL These
axes can have different orientations
with respect to one another, and the
energies of the orientations may differ.
These positions correspond to the hy-
perfine levels. The nomenclature comesabout because the levels were first ob-
served in spectroscopy as small split-
tings of spectral lines.
On paper, standcirds based on atom-
ic processes are ideal. In practice, per-
fection is elusive. Atoms do not absorb
or emit energy precisely at the reso-
nance frequency. Some energy is spread
over a small interval surrounding the
frequency—a smearing of frequencies,
so to speak. All else being equal, the
precision to which the resonance fre-
quency can be measured is inverse-
ly proportional to this smearing. Thegreater the spread, the less precise the
measurement. The spread is often ex-
pressed in terms of the quality factor,
or Q, which is equal to the resonance
frequency divided by the frequency
spread. In many cases, the higher the
resonance frequency, the higher the Q.
Furthermore, smearing is often inverse-
ly proportional to the time the atom is
in the apparatus. In those situations,
the Q of the resonance, and hence the
precision of the measurement, increas-
es as the measuring time increases.
The motions of the atoms also intro-
duce uncertainty by causing apparent
shifts in the resonance frequencies.
Such changes appear because of the
Doppler effect. The phenomenon can
be divided into first- and second-order
shifts if the atoms are moving muchslower than the speed of light. Thefirst-order Doppler shift is an apparent
change in the frequency of the appUedelectromagnetic wave as seen by a mov-ing atom. The amount of the shift is
proportional to the velocity of the atom.
If the atom moves in the same direc-
tion as the wave does, the shift is to a
lower frequency. If the atom's motionis opposed to that of the wave, the
shift is to a higher frequency. If the di-
rections are perpendicular, the first-or-
der shift is zero.
The second-order Doppler shift
comes about as a consequence of time
dilation. According to relativity, time
slows down for objects in motion; a
moving atom "sees" a slightly different
frequency than does a stationary coun-
terpart. The effect on the resonance fre-
quency is usually much smellier than
the first-order shift. The second-order
shift is proportional to the square of the
atomic velocity and does not dependon the relative directions of the atom-
MASTER PENDULUM of this 1920s Shortt
clock oscillates in cin evacuated enclo-
sure. It actuates an electriccd switch to
synchronize a slave pendulum, whichdrives the clock mechanism.
ic motion and the electromagnetic wave.
Several other factors affect the quali-
ty of the information. Atoms in the sys-
tem may coUide with one another; the
impacts add noise to the signal. Thesvtrroimding environment can perturb
the resonance frequencies. Defects in the
electronic equipment, stray electromag-
netic fields and the ever present thermal
radiation all introduce errors. Therefore,
a good atomic frequency standard not
only must establish a steady, periodic
signal but also must minimize these
potential errors.
One of the earliest and now wide-
ly used methods to sidestep
many of these difficulties is
called atomic beam resonance, pio-
neered by 1. 1. Rabi and his colleagues
at Columbia University in the 1930s.
The atoms emerge from a small cham-ber, exit through a narrow aperture andthen travel as a beam. The entire in-
strument can be shielded from stray
magnetic eind electric fields and insu-
lated from external sources of heat.
Perhaps more important, coUisions of
atoms are virtually eliminated, because
the entire device is housed in a long,
evacuated chamber. The pressure in
the chcimber is so low that the atomsare vmlikely to strike anything before
reaching the other end.
In simplified form, atomic beam reso-
nance involves three steps. The first is
to select only those atoms in the appro-
priate energy level. This selection is ac-
complished by using a specially shaped
magnetic field, which acts as a kind of
filter. It allows atoms in one energy lev-
el to pass and blocks aU others by bend-
ing the beam. Only atoms in the correct
energy level are bent the correct amountto reach and pass through the aperture
that serves as the entrance to the cavity.
The second and crucial step is to
send the selected atoms into another
energy level. The task is accompUshedby passing the atoms through an oscil-
lating microwave field inside a cavity.
The atoms will go to another energy
level only if the frequency of the ap-
plied oscillating microwaves matches
their Bohr frequency.
The third step is to detect those at-
oms that have chcinged energy levels.
At this point, the beam of atoms pass-
es through another magnetic field fil-
ter, which allows only atoms in the cor-
rect energy level to strike a detector that
records the atoms as current flow. Anabimdance of such atoms will exist if
the frequency of the applied oscillating
microwaves precisely matches their
natural frequency. If the frequency of
the applied microwave field is off the
mark, fewer atoms change their energy
58 Scientific American July J 993
TN-51

levels, and so fewer will strike the detector. One knows, therefore, that the
applied microwaves match the natural
frequency of the atoms if the niunber
of atoms striking the detector is max-imal. An electronic feedback mecha-nism, called a servo loop, keeps this
value constant. If it finds that the cur-
rent from the detector is falling off, it
changes the frequency of the applied
field imtU the current reaches a maxi-
mum again.
By keeping the current from the de-
tector at a maximvun, the servo loop
maintains the frequency of the applied
microwave field at the natural frequen-
cy of the atoms. To measure time, onecouples the applied field to a frequen-
cy divider, which generates timing puls-
es. By analogy, the atoms represent the
quartz crystcil in a watch or the master
pendulum in a Shortt clock. The ap-
plied microwave field is the oscillating
circuit or the slave pendulum, whichactucdly drives the clock mechanism.Minor variations of the atomic beam
standard exist. For example, in some devices the atoms that undergo a change
in energy level are made to miss, rath-
er than strike, the detector. Not muchdifference in accuracy exists, however.
Rather all the versions to some extent
represent trade-offs in terms of size,
cost and complexity.
A more important modification of
the atomic beam came in 1949, whenone of us (Ramsey) invented the so-
called separated oscillatory field meth-
od. Instead of Irradiating the atomswith a single applied field, this tech-
nique relies on two fields, separated bysome distance along the beam path. Ap-
plying the oscillating field in two steps
has many benefits, including a narrow-
ing of the resonance and the elimination
of the first-order Doppler shift. Jerrold
R. Zacharias of the Massachusetts Insti-
tute of Technology and Louis Essen andJohn V. L. Parry of the Natioucd Physi-
cal Laboratory in Teddington, England,
adapted this method to working fre-
quency standards in the mid-1950s.
Currently the separated oscillatory
field method provides the most repro-
ducible clocks. The best ones are locat-
ed at a few national laboratories, al-
though smaller and less accurate ver-
sions are commercially available. Thedocks rely on cesixim, which has several
advantages over other elements. It has a
relatively high resonance frequency—about 9,192 megahertz—and low reso-
nance width, which lead to an excellent
Q. Cesium can also be detected readily
and efiidentiy; all that is needed is a hot
meted filament. When a cesivmi atomstrikes the filament, it ionizes and be-
comes observable as electric current.
Resonance Frequency
Atomic frequency standards de-
L pend on the quantization of
the internal energies of atoms or
molecules. A pair of such energy
levels, shown here as levels f, and
£2, is associated with an atom-
ic resonance. The resonance fre-
quency f, at which it absorbs or
emits electromagnetic radiation, is
f= (fj- f|)//7, where h is Planck's
constant. The radiation, however,
is not precisely f but instead is
spread over a range near f, called
A^. The precision to which fcanbe measured is proportional to
the quality factor, Q, defined by
Q = f/Af. The higher the Q, the
more stable the clock.
>-
oUJ
The Qs of these standards are about
100 miUion, exceeding the Qof quartz
wristwatches by a factor of several thou-
sand. The greatest reproducibilities are
about a part per 10^''. The best cesiumfrequency standards cire so much morereprodudble than the rate of rotation
and revolution of the earth that in
1967 the second was defined as 9,192,-
631,770 periods of the resonance fre-
quency of the cesium 133 atom.
One of the most promising im-
provements in cesivmi atomic-
beam standards is the use of
optical piunping to select the atomic
states. Beginning in the 1950s optical-
pumping techniques were devdoped byFrands Bitter of M.I.T., Alfred Kastler
and Jean Brossd of the Ecole NormaleSuperieure ctnd others. In this method,light, rather than a magnetic Add, selects atoms in the desired states. Before
the atoms are subjected to the micro-
wave fidd, radiation from a laser is usedto drive (or pump) the atoms from oneenergy levd into another. In fact, onecan control the number of atoms in en-
ergy levds by tuning the frequency of
the light.
After the atoms have been irradiat-
ed by the microwave fidd, they pass
through a second light beam. Only at-
oms occupying the correct energy levd
absorb this light, which they quickly re-
emit. A Ught-sensitive detector records
the reemissions and converts theminto a measurable current. As in atomic
beam resonance that relies on magnet-ic sdection, one knows that the applied
microwave fidd matches the natural
frequency of the atoms if the current
from the detector is at a maximum.Using light instead of magnets has
many advantages. Perhaps the most cru-
dal is that, with the right optical-pump-
ing techniques, all the atoms in the
beam can be put into the desired energy
levd. Magnetic sdection merdy filters
out those that are in the other energy
levels. Hence, the signal strength fromoptical pumping is much higher than it
is from magnetic sdection. Researchers
at various laboratories are devdopingoptically pimiped cesivun atomic-beamdocks. One such dock, at the National
Institute of Standards and Technology
(mist) in Boulder, Colo., has recentiy be-
come the primary frequency standard
for the U.S. Designated nist-7, it has anexpected error of one second in about
one million years, making it many times
more stable than its predecessor.
There is an optically pumped atom-
ic dock that is available commerdal-ly. Such a dock is based on the 6,835-
megahertz, hyperfine resonance of ru-
bidium 87. Rather than moving through
the apparatus as a beam, the rubidiumatoms are contained in a glass cell. TheceU also houses a mixture of gases that
prevents the rubidium atoms from col-
liding with the ceU walls. A discharge
lamp containing rubidiiun vapor, rath-
er than a laser, irradiates the atoms. Aphotovoltaic sensor on the opposite
side of the cell detects changes in the
amount of Ught absorbed by the at-
oms. The atoms are prepared, the mi-
crowaves applied and the Ught detected
in one cell. As a result, rubidium dockscan be made to fit in a cube about 10
centimeters on a side. In contrast, cesi-
um beam docks can extend from about
50 centimeters to more than five me-ters. Rubidium docks are also muchless expensive than are cesiimi ones.
The drawback is that the rubidiumdevices are generally less accurate andless reprodudble. The Q of rubidiumstandards is about 10 million, a factor
of 10 less than the cesivmi beam's qual-
ity factor; their reproducibility is only
about a part per 10'". Shifts in the reso-
nance frequency mostly account for
the poor reprodudbiUty. The frequent
collisions of the rubidium atoms with
other gas molecules cause the shifts.
But the rubidium standards' short-term
stabilities are good—in fact, better than
those of some cesium atomic beams.
The atomic docks described thus far
work in a rather roundabout way—by
SoDENTinc American July 1993 59
TN-52
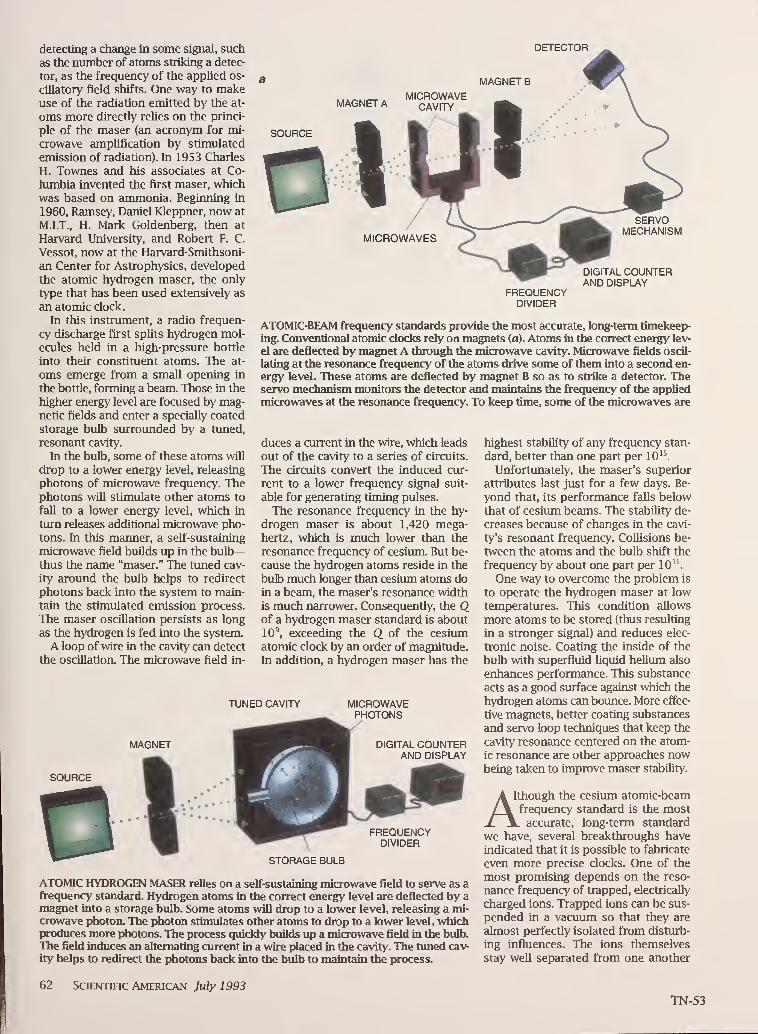
detecting a change in some signal, such
as the number of atoms striking a detec-
tor, as the frequency of the applied os-
cillatory field shifts. One way to makeuse of the radiation emitted by the at-
oms more directly relies on the princi-
ple of the maser (an acronym for mi-
crowave amplification by stimulated
emission of radiation). In 1953 Charles
H. Townes and his associates at Co-
lumbia invented the first maser, which
was based on ammonia. Beguining in
1960, Ramsey, Daniel Kleppner, now at
M.I.T., H. Mark Goldenberg, then at
Harvard University, cind Robert F. C.
Vessot, now at the Harvard-Smithsoni-
an Center for Astrophysics, developed
the atomic hydrogen maser, the only
type that has been used extensively as
an atomic clock.
In this instrument, a radio frequen-
cy discharge first splits hydrogen mol-
ecules held in a high-pressure bottle
into their constituent atoms. The at-
oms emerge from a small opening in
the bottle, forming a beam. Those in the
higher energy level are focused by mag-netic fields and enter a specially coated
storage bulb surrovmded by a tuned,
resonant cavity.
In the bulb, some of these atoms will
drop to a lower energy level, releasing
photons of microwave frequency. Thephotons will stimulate other atoms to
fall to a lower energy level, which in
turn releases additional microwave pho-
tons. In this manner, a self-sustaining
microwave field builds up in the bulb-thus the name "maser." The tuned cav-
ity arovmd the bulb helps to redirect
photons back into the system to main-
tain the stimulated emission process.
The maser oscillation persists as long
as the hydrogen is fed into the system.
A loop of wire in the cavity can detect
the osdllation. The microwave field in-
DETECTOR
MAGNET B
MAGNET A
FREQUENCYDIVIDER
DIGITAL COUNTERAND DISPLAY
ATOMIC-BEAM frequency standards provide the most accurate, long-term timekeep-
ing. Conventional atomic clocks rely on magnets {a). Atoms in the correct energy lev-
el are deflected by magnet A through the microwave cavity. Microwave fields oscil-
lating at the resonance frequency of the atoms drive some of them into a second en-
ergy level. These atoms are deflected by magnet B so as to strike a detector. Theservo mechanism monitors the detector and maintains the frequency of the applied
microwaves at the resonance frequency. To keep time, some of the microwaves are
duces a current in the wire, which leads
out of the cavity to a series of circuits.
The circuits convert the induced cur-
rent to a lower frequency signal suit-
able for generating timing pulses.
The resonance frequency in the hy-
drogen maser is about 1,420 mega-hertz, which is much lower than the
resonance frequency of cesium. But be-
cause the hydrogen atoms reside in the
bulb much longer than cesium atoms doin a beam, the maser's resonance width
is much narrower. Consequently, the Qof a hydrogen maser standard is about10^, exceeding the Q of the cesiumatomic clock by an order of magnitude.
In addition, a hydrogen maser has the
TUNED CAVITY MICROWAVEPHOTONS
MAGNET
SOURCE ^H
OlDIGITAL COUNTER
AND DISPLAY
highest stabiUty of any frequency stan-
dard, better than one part per 10 '^
Unfortunately, the maser's superior
attributes last just for a few days. Be-
yond that, its performance falls belowthat of cesium beams. The stabihty de-
creases because of changes in the cavi-
ty's resonant frequency. CoUisions be-
tween the atoms and the bulb shift the
frequency by about one part per 10".
One way to overcome the problem is
to operate the hydrogen maser at lowtemperatures. This condition allows
more atoms to be stored (thus resulting
in a stronger signal) and reduces elec-
tronic noise. Coating the inside of the
bulb with superfluid liquid heUimi also
enhances performance. This substance
acts as a good surface against which the
hydrogen atoms can boimce. More effec-
tive magnets, better coating substances
and servo loop techniques that keep the
cavity resonance centered on the atom-
ic resonance cire other approaches nowbeing taken to improve maser stability.
FREQUENCYDIVIDER
AltlASTORAGE BULB
ATOMIC HYDROGEN MASER relies on a self-sustaining microwave field to serve as afrequency standard. Hydrogen atoms in the correct energy level are deflected by amagnet into a storage bulb. Some atoms will drop to a lower level, releasing a mi-
crowave photon. The photon stimulates other atoms to drop to a lower level, whichproduces more photons. The process quickly builds up a microwave field in the bulb.
The field induces an alternating current in a wire placed in the cavity. The tuned cav-
ity helps to redirect the photons back into the bulb to maintain the process.
Ithough the cesium atomic-beam
frequency standard is the mostaccurate, long-term standard
we have, several breakthroughs have
indicated that it is possible to fabricate
even more precise clocks. One of the
most promising depends on the reso-
nance frequency of trapped, electrically
charged ions. Trapped ions can be sus-
pended in a vacuum so that they are
almost perfectly isolated from disturb-
ing influences. The ions themselves
stay well separated from one another
62 SciENTinc American July 1993
TN-53

'A
MICROWAVECAVITY
SOURCE
LASER A
IMICROWAVES
SERVOMECHANISM
DIGITAL COUNTERAND DISPLAY
FREQUENCYDIVIDER
directed to a device that divides the frequency into usable timing pulses. Optically
pumped standards ([?) use light rather than magnets to select atoms. Laser A pimipsthe atoms into the right energy level, preparing them to be excited by the micro-
waves. Only atoms placed in the correct energy level by the microwaves absorb light
from laser B. They quickly reemit that energy, which is sensed by a photodetector.
An optically pumjied clock using cesiimi atoms at the National bistitute of Standards
and Technology, called Nisr-7, now keeps time for the U.S. (photograph).
because they have the same electric
charge. Hence, they do not suffer col-
lisions with other particles or with
the walls of the chamber. Ions can betrapped for long periods, sometimesfor days.
Two different types of traps are
used. In a Penning trap, a combination
of static, nonuniform electric fields anda static, uniform magnetic field holds
the ions. In a radio frequency trap (of-
ten called a Paul trap), an oscillating,
nonuniform electric field does the job.
Each type of trap has its own character-
istic shortcoming. The strong magnet-
ic fields of Penning traps can alter the
resonance frequency. The electric field
in Paul traps Ccin create heating effects
that cause Doppler shifts. The kind of
trap chosen depends on its suitability
for a particvilar experimental setup.
Workers at Hewlett-Packard, the Jet
Propulsion Laboratory in Pasadena,
CaM., and elsewhere have fabricated ex-
perimental standard devices using Paul
traps. The particles trapped were mer-
cury 199 ions. This ion was selected
because it has the highest hyperfine
frequency—40.5 gigahertz—of aU the
atoms that are appropriate for the
trapping technique. A few million suchions are caught between the electric
fields generated by electrodes. Thenthe ions are optically pumped by ultra-
violet radiation from a lamp. Subse-
quent operation resembles that of the
optically pumped standards, but the
maximum Qs of trapped-ion standards
exceed 10'^ This value is 10,000 times
greater than that for current cesiiun
beam clocks. Their short-term stabili-
ties are also extremely good, cilthough
they do not yet reach those of hydro-
gen masers. The second-order Dopplershift limits the reproducibility to about
one part per lO'l
The Doppler shifts can be greatly re-
duced by laser cooling. In 1975 David J.
Wineland, now at mist, Hans G. Deh-
melt of the University of Washington,Theodor W. Hansch, now at the Univer-
sity of Munich, and Arthur L. Schawlowof Stanford University first proposedsuch a technique. In essence, a beamof laser light is used to reduce the ve-
locities of the ions. Particles directed
against the laser beam absorb some of
the laser photon's momentum. As a re-
sult, the particles slow down. To com-pensate for the Doppler shifting as the
particle moves against the laser, onetunes the beam to a frequency slightly
lower than that produced by a strongly
allowed resonance transition.
Many laboratories are developing fre-
quency standards based on laser-cooled
ions in traps. A standard based on be-
ryllium 9 ions, laser-cooled in a Penning
trap, has been constructed. Its repro-
ducibility is about one part per 10'^
Umited as it is by coUisions of the ions
with neutral molecules. Improvementsin the quality of the vacuiun should
significantly increase the reproducibili-
ty because the imcertainty of the sec-
ond-order Doppler shift is only about
five parts per 10^^
During flie past few years, there have
been spectacular developments in trap-
ping and coohng neutral atoms, which
had been more difficult to achieve than
trapping ions. Particularly effective la-
ser cooling results from the use of three
pairs of oppositely directed laser-cool-
ing beams along three mutually perpen-
dicular paths. A moving atom is then
slowed down in whatever direction it
moves. This effect gives rise to the desig-
nation "optical molasses." Several inves-
tigators have contributed to this break-
through, including William D. Phillips
of NiST in Gaithersburg, Md., Claude
Cohen-Tannoudji and Jean DaUbard of
the Ecole Normale Superieure and Ste-
ven Chu of Stanford [see "Laser Trap-
ping of Neutral Particles," by Steven Oiu;
SciENTinc American, February 1992].
Neutral-atom traps can store higher
densities of atoms than can ion traps,
because ions, being electrically charged,
are kept apart by their mutual repul-
sion. Other things being equal, a larger
nvunber of atoms results in a higher
signal-to-noise ratio.
The main hurdle in using neutral
atoms as frequency standards is that
the resonances of atoms in a trap are
strongly affected by the laser fields. Adevice called the atomic fotmtain sur-
mounts the difficulty. The traps capture
and cool a sample of atoms that are
then given a Uft upward so that they
move into a region free of laser light.
The atoms then faU back down under
the influence of gravity. On the way up
SciENTinc American July 1993 63TN-54

and again on the way down, the atomspass through an oscillatory field. In this
way, resonance transitions are induced,
just as they are in the separated oscil-
latory field beam apparatus.
The Q of such a device can be higher
than that of an atomic beaim because
the time between the two passages can
be longer. Experiments on atomic foun-
tains have been done by Chu and his
co-workers at Stanford and by AndreClairon of the Primary Laboratory of
Time and Frequency in Paris and Chris-
tophe Salomon of the Ecole NormaleSuperieure and their co-workers.
Much current research is directed
toward laser-cooled ions in traps that
resonate in the optical realm, where fre-
quencies are many thousands of giga-
hertz. Such standards provide a prom-ising basis for accurate clocks because
of their high Q. Investigators at nist
have observed a Q of 10" in the ultra-
violet resonance of a single laser-cooled,
trapped ion. This value is the highest Qthat has ever been seen in an optical or
microwave atomic resonance. Because
LASER
LASER
% MICROWAVECAVITY
of technical difficulties, none of the op-
tlccd frequency clocks constructed so
far, however, has operated over extend-
ed periods.
The variety of high-performance
frequency standards that exist
today might seem to obviate the
need for future devices of even greater
performance. After £iU, current atomic
clocks are so accvirate that they have
redefined some of our basic units. Asmentioned ecirUer, the second is nowbased on the resonance frequency of
the cesium atom. Also by intemationeil
agreement, the meter is defined as the
distance light travels in 1/299,792,458
of a second. The voltage imit is main-
tained by the characteristic frequency
associated with a voltage that appears
in a so-called Josephson jimction in a
superconducting circuit.
There are, however, applications that
tax the capacity of modern clocks. Ra-
dio astronomy is a good example. As-
tronomers often use several telescopes
spaced thousands of kilometers apart
MICROWAVESLASER
LASER
ATOMIC FOUNTAIN uses atoms that have been cooled and trapped by sbc
laser beams (J). The vertical beams then briefly impart an upward velocity
to the atoms. The atoms rise, passing through the microwave cavity on the
way up (2) and again on the way down (3). The rest of the process resem-bles optically pumped atomic-bccun standards: the atoms pass through an-
other laser beam (4), and their fluorescence is recorded by a photodetector(5). Servo loops and frequency dividers {not shown) generate timing pulses.
64 Scientific American July 1993
TN-55

to study a stellar object, a technique
that dramatically increases the resolu-
tion [see "Radio Astronomy by Very-
Long-Baseline Interferometry," by An-
thony C. S. Redhead; SciENTinc Ameri-
can, June 1982]. Two radio telescopes
spaced 10,000 kilometers apart have aneffective angular resolution more than
one million times better than either tele-
scope alone. But to combine the data
from each telescope appropriately, in-
vestigators need to know precisely
when each telescope received the signal.
Present-day hydrogen masers have the
stability required for such observa-
tions. More stable clocks may be need-
ed for space-borne radio telescopes.
Highly stable clocks are essential for
the best tests of relativity. Timing mea-surements of millisecond pulseirs, someof which are as stable as the best atomic
docks, offer evidence for gravity waves.
In 1978 Joseph H. Taylor, Jr., and his as-
sociates at Princeton University foundthat the period of a binary-pulsar sys-
tem has been slowly varying by just the
amount that would be expected for the
loss of energy by gravitational radia-
tion, as predicted by general relativi-
ty. Greater precision can be achieved
if measurements are taken over manyyears, so clocks with better long-term
stability would be useful.
In other tests of relativity, Vessot
and his colleagues confirmed the pre-
dicted increase in clock rates at high al-
titudes. They sent on board a rocket a
hydrogen maser and measured the
small, relativistic clock shift to within
an accuracy of 0.007 percent at an alti-
tude of 10,000 kilometers. Highly sta-
ble clocks have also been used by Irwin
I. Shapiro, now at the Harvard-Smithso-
nian Center for Astrophysics, to ob-
serve the relativistic delay of a Ught sig-
nal passing by the sun.
Ultraprecise timekeeping has morepractical applications as well—mostnotably, for navigation. The location of
Voyager 2 as it sped by Neptune wasdetermined by its distance from eachof three widely separated radar tele-
scopes. Each of these distances in turn
was obtained from accurate measure-ments of the eight hours it took for
light to travel from each telescope to
the spacecraft and return.
Navigation is, of course, also impor-
tant on the earth. One of the latest ap-
plications of precise clocks is the satel-
lite-based assemblage called the Global
Positioning System, or GPS. This system
relies on atomic clocks on board orbit-
ing satellites. The GPS enables anyonewith a suitable radio receiver and com-puter to determine his or her position to
approximately 10 meters and the cor-
rect time to better than 10'' second.
Coordinating Time Scales
In the article, we discuss the measurement of an interval of time, such as
a second or a minute. This process requires only a good clock. But to be
able to state that an event happened at a particular time, say, 22 seconds af-
ter 12:31 P.M. on July 5, 1993, requires synchronization with a clock that is,
by mutual agreement, the standard. The world's "standard clock" exists onpaper as an average of the best clocks in the world. The International Bureau
of Weights and Measures in Sevres, France, is responsible for coordinating
international time. This coordinated time scale is called International Atomic
Time, orTAI.
Many users require a time scale that keeps pace with the rotation of the
earth. That is, averaged over a year, the sun should be at its zenith in Green-
wich, England, at noon. The day as determined by the apparent position of
the sun is irregular but on the average longer than the 24 hours as defined
by TAI. To compensate, another time scale, called Coordinated Universal
Time, or UTC, is specified by occasionally adding or subtracting a wholenumber of seconds from TAI. These seconds, or leap seconds, are inserted
or deleted, usually on December 31 or June 30, to keep UTC within 0.9 sec-
ond of the time as defined by the rotation of the earth. The record of leap
seconds must be consulted to determine the exact interval between twostated times.
Two observers monitoring the samesateUite can synchronize their docks to
within a few nanoseconds.
It is expected that the GPS will have
widespread practical applications, such
as pinpointing the positions of ships,
airplanes and even private automobiles.
The GPS was used during the 1991 Per-
sian Gulf War to enable troops to de-
termine their positions on the desert.
Commercial receivers can be purchased
for less than $1,000, although these
civilian versions are limited to an accu-
racy of about 100 meters because of de-
liberate scrambling of the signals trans-
mitted from the satellites. A fuU com-plement of 24 satellites would give 24-
hour, worldwide coverage. The system
is nearly complete.
These and other apphcations showthe importance of time and frequen-
cy standards. The anticipated improve-
ments in standards will increase the ef-
fectiveness of the current uses and open
the way for new functions. Only time
will teU what these uses will be.
FURTHER READING
From Sundials to Atomic Clocks: Un-
derstanding Time and Frequency. J.
Jespersen and J. Fitz-Randolph. Dover,
1982.
History of Atomic Clocks. N. F. Ram-sey in Journal of Research of the Nation-
al Bureau of Standards, Vol. 88, No. 5,
pages 301-320; September/October 1983.
Precise Measurement of Time. N. F. Ram-sey in American Scientist, Vol. 76, No. I,
pages 42-49; January/February 1988.
Time and Frequency. Special issue of Pro-
ceedings of the IEEE. Vol. 79, No. 7; July
1991.
Scientific American July 1993 65
TN-56

Volume 75, Number 22 PHYSICAL REVIEW LETTERS 27 November 199>
Resolved-Sideband Raman Cooling of a Bound Atom to the 3D Zero-Point Energy
C. Monroe. D. M. Meekhof, B. E. King, S. R. Jefferts. W. M. Itano, and D. J. Wineland
Time and Frequency Division. National Institute of Standards and Technology. Boulder. Colorado 80303
P. Gould
Department of Phvsics, University of Connecticut. Storrs. Connecticut 06269(Received 19 December 1994)
We report laser cooling of a single ^Be* ion held in a rf (Paul) ion trap to where it occupies the
quantum-mechanical ground state of motion. With the use of resolved-sideband stimulated Ramancooling, the zero point of motion is achieved 98% of the time in ID and 92*7^ of the time in 3D.
Cooling to the zero-point energy appears to be a crucial prerequisite for future experiments such as the
realization of simple quantum logic gates applicable to quantum computation.
PACS numbers: 32.80.Pj, 42.50.Vk. 42.65.Dr
Dramatic progress in the field of atomic laser cooling
has provided cooling of free or weakly bound atoms
to temperatures near the Doppler cooling limit [1], near
the photon recoil limit [2], and, more recently, below
the photon recoil limit [3,4]. For a tightly bound atom,
a more natural energy scale is given by the quantized
vibrational level n, where the energy is £ = ha)y{n + 5)
for an atom confined in a harmonic potential of frequency
a>„. In this case, the fundamental cooling limit is the
« = zero-point energy of the binding potential. In this
Letter, we demonstrate a new technique for laser cooling
a trapped atom to the 3D zero-point energy.
Attainment of the 3D ground state is significant for twoprimary reasons: (i) it appears to be a goal of intrinsic
interest as it is the fundamental limit of cooling for
a bound atom and approaches the ideal of an isolated
particle at rest and (ii) it will be important in future
planned experiments. For example, once the ion is cooled
to the « = state, it should be possible to realize the
Jaynes-Cummings interaction [5] in the regime of strong
coupling and generate other nonclassical states of motion
such as squeezed states [6-8]. If the collective motion
of two or more trapped ions can be cooled to the zero
point, it may be possible to transfer correlation from the
external motional state to the internal spin state of the
ions. Generating "EPR"-like atomic spin states would not
only be interesting from the point of view of quantummeasurements [9], but may also allow a reduction of
quantum noise in spectroscopy [6,7]. Zero-point cooling
combined with long coherence times may make it possible
to construct a quantum computer [10]. Cirac and Zoller
have proposed a quantum computer based on a system of
trapped ions, in which information is stored in the spin
and motional states of the ions [11]. The fundamental
switching action in this implementation of a quantumcomputer is a coherent exchange between the spin state of
an individual ion and a collective vibrational state of all
the ions. Cooling to the zero-point energy and realizing
the Jaynes-Cummings coupling is critical to this scheme.
We cool a single beryllium ion bound in a rf (Paul) ion
trap to near the zero-point energy using resolved-sideband
laser cooling with stimulated Raman transitions along
the lines suggested in Ref. [6]. The idea of resolved-
sideband laser cooling with a single-photon transition is as
follows [12]. Consider a two-level atom characterized by
resonant transition frequency &>o and radiative linewidth
y. We assume the atom is confined by a ID harmonic
well of vibration frequency to^ » y. If a laser beam(frequency ojl) is incident along the direction of the
atomic motion, the absorption spectrum is composed
of a "carrier" at frequency &>o and resolved frequency-
modulation sidebands spaced by Wy, which are generated
from the Doppler effect. Cooling occurs if the laser is
tuned to a lower sideband, for example, at uiL = wq —
(Oy. In this case, photons of energy ^(&>o ~ (^v) are
absorbed and spontaneously emitted photons of average
energy flcDQ return the atom to its initial internal state
thereby reducing the atom's kinetic energy by ficoy per
scattering evenir(assuming Hcoy is much greater than the
photon recoil energy). Cooling proceeds until the atom's
mean vibrational quantum number in the harmonic well is
given by (n)n,in — (y/2<w„)^ «: 1 [1,13]. The interaction
with the laser is significantly reduced once in the « =state; thus the zero-point state satisfies the operational
definition of a dark state [14] for y/a>y sufficiently small.
Resolved-sideband cooling in 2D was previously achieved
on a '^^Hg"*" ion using a narrow single-photon optical
quadrupole transition [15].
For laser cooling with stimulated Raman transitions
[4,6,16,17], the single-photon transition is replaced by
a stimulated Raman transition between metastable levels
(e.g., hyperfine or Zeeman electronic ground stated, and
spontaneous Raman transitions irreversibly recycle the in-
ternal state of the atom. Stimulated Raman cooling of-
fers the important practical advantages that the cooling
linewidth can be varied experimentally, and the effective
laser linewidth can be made very narrow by the use of
optical frequency modulators. These features of stimu-
0031-9007/95/75(22)/4011(4)$06.00 © 1995 The American Physical Society 4011
TN-57

Volume 75, Number 22 PHYSICAL REVIEW LETTERS 27 November 1995
lated Raman cooling have already been used to achieve
very low temperatures for free or weakly bound neutral
atoms in the unresolved-sideband limit [4]. Since narrow
single-photon transitions are not required, the resolved-
sideband Raman cooling technique described here can be
generalized to many ion species and may also be applied
to strongly bound neutral atoms held in dipole traps [18]
and optical lattices [19].
The experiment is conducted as follows. We first
achieve (ny) — 1 in 3D (u = x,y,z) by performing
Doppler cooling on an allowed electric dipole transition
(y large) and making the trap strong enough that (Oy — 7-
This Doppler "precooling" places the ion into the Lamb-Dicke regime (Ajc <c A/Itt, where Ax is the rms spread
of the ion position and A is the wavelength of the dipole
transition). We reduce (riy) further in 3D by employing
a second stage of cooling on narrower Raman transitions
between hyperfine ground states (yRam "^ <Wu)- Finally
we extract (riy) by measuring the asymmetry of the
resolved motional sidebands in the Raman absorption
spectrum [15].
A single ^Be"^ ion is stored in a coaxial-resonator-based
rf (Paul) ion trap (ro = 170 /mm, zo — 130 /im) described
in Ref. [20]. A potential Vq cosCHoO is applied to the ring
(Vo - 600 V, Clo/ln - 231 MHz), yielding ^Be^ pseu-
dopotential oscillation frequencies of (oi^, Qjy,oj.)/27T —(11.2, 18.2, 29.8) MHz along the principal axes of the trap
[21]. Once a ^Be"*" ion is loaded in the trap, its lifetime is
about 6 h (background pressure <10"^ Pa).
The geometry and polarizations of the various laser
beams as well as the relevant energy levels in ^Be"*" are
summarized in Fig. 1. The quantization axis is defined
by an applied magnetic field |B| ==0.18 mT. Laser
radiation (beam D2, a'^ polarized) detuned slightly to
the red of the ~S\/2{F = 2) —» ^Pa/T transitions (A =313 nm, y/ln — 19.4 MHz, ~P3/2 hyperfine structure
— 1 MHz) is directed at oblique angles to all the principal
axes of the trap, providing Doppler precooling in all trap
dimensions. A second 313 nm source (beam Dl, cr'^
polarized) tuned to the ^S\/2iF = 1) —* ^Ps/i transition
prevents optical pumping to the F = 1 ground state.
A pair of Raman beams is also directed into the trap
(beams Rl and R2) to drive a much narrower transition
between the 'S\/2 \F = 2) and \F = 1) hyperfine ground
states of ''Be^ through the virtual ^P\/2 state. The
Raman beams are detuned —12 GHz to the red of
the "5 1/2— ~P\/2 transition with a difference frequency
very near the ~5i/2 hyperfine splitting of coq/Itt ~
1.250 GHz. A third 313 nm source (beam D3, cr'^
polarized) is tuned to the "5i/2(F = 2) — 'P\/2{F = 2)
transition and depletes the \F.mf) = |2. 1) ground state.
Beams Dl. D2, and D3 are derived from two frequency-
doubled dye lasers, producing 5-10 /xW of power in
each beam, enough to saturate the ion near resonance.
Beams R\ and R2 are derived from a third frequency-
doubled dye laser, providing a few mW of power in each
(a) (b)
FIG. 1. (a) Laser beam geometry. The trap ring electrode
(in the x-y plane) is shown rotated 45° into the page
(the endcap electrodes along the z axis are not shown; see
Ref. [20]). A magnetic field B defines a quantization axis
along x/V2 + y/2 -I- z/2, and laser beam polarizations are
indicated. Fluorescence light is collected along the direction
perpendicular to the page, (b) Relevant ^Be^ energy levels
(not to scale), indicated by F, rriF, quantum numbers in the
^Si/2 ground state OP fine-structure splitUng is =197 GHz,
^S]/2 hyperfine splitting is (oq/Itt — 1.250 GHz, and the ^Pj/z
hyperfine and Zeeman structure is not resolved). All optical
transitions are near A = 313 nm. Dl and D2: Doppler
precooling and detection beams; D3: |2, 1) deplefion beam; R]and R2: Raman beams. The detuning of R 1 and R2 from the
'Pi/2 U-ansition is A/lv — 12 GHz.'5,/2
beam. The difference frequency of the Raman beams
is tunable over the range 1200-1300 MHz with the use
of a double-pass acousto-optic modulator (AOM). The
counterpropagating Raman beams are also at oblique
angles to the trap's principal axes and are therefore
sensitive to motion in all dimensions. All beams are
shuttered with AOMs. The 313 nm fluorescence from the
trapped ion is imaged through f/2 optics onto a position-
sensitive photomultiplier tube, resulting in a photon count
rate as high as —10 kHz (quantum efficiency —2 XlO"'*). The background count rate is —100 Hz.
Doppler precooling, Raman cooling, and measurement
of the Raman absorption spectrum are accomplished
by following the sequence outlined in Table I. After
precooling (beams Dl, D2, and D3), the ion is prepared
in the ^Si/2|2, 2) electronic ground state by turning off
beam D2. The relative tuning of the Raman beams is set
to a first lower (red) sideband near a>o " w„, driving a
stimulated Raman transition from the |2, 2)|n„) state to
the |l,l)|«i, - 1) state. The ion is then recycled with
nearly resonant beams Dl and D3, inducing spontaneous
Raman transitions predominantly to the |2, 2)|«y — 1)
state. This cycling of stimulated and spontaneous Raman
transitions (steps 3 and 4 of Table I) is repeated as desired
on any or all of the three dimensions. The relative
tuning of the Raman beams is then set near a»o + 5pr,
and a stimulated Raman "probe" transition is driven
between the states, where An^j = 0, ±1. The probability
of driving the probe transition is then measured by
4012
TN-58

Volume 75, Number 22 PHYSICAL REVIEW LETTERS 27 November 1995
driving a stimulated Raman "exchange tt pulse" from
|2,2)|«„) <- |l,l)|/jy), followed by driving the cycling
^5i/2|2,2) -* 2/'3/2|3,3) transition with beam D2 and
gating and collecting the fluorescence. (The exchange tt
pulse in step 6 of the table reduces the fluorescence noise
when {riy) — 0.) The ion scatters thousands of photons
on the cycling transition before decaying into the 1 1 , 1
)
electronic state due to imperfect circular polarization of
beam D2, resulting in a net quantum efficiency near 1.
As this sequence is repeated at —A kHz, 5pr is slowly
swept, yielding the Raman absorption spectrum.
The Raman carrier represents the transition |2, 2) |/iy) ^|l,l)|«i,) and occurs at 5pr = (compensating for sta-
ble Zeeman and ac Stark shifts of —2 MHz). In the
Lamb-Dicke regime, the carrier feature has strength Ic =sin^(nTpr), where 11 = g\g2/^ is the carrier Rabi flop-
ping frequency, Xpr is the exposure time of the atom to
the probe Raman beams, g \ and g2 are the resonant Rabi
frequencies of Raman beams Rl and ^2, and A is the
detuning of the Raman beams from the excited state (we
assume A » y,g],g2) [6]. In each dimension, blue and
red sidebands occurring at 5pr = ±a»„ represent the tran-
sitions |2,2) \ny) •^ |1, l)\ny ± 1). The strengths of the
blue and red sidebands in the Lamb-Dicke regime are
given by /„^'"« = {sin^[aTprVvin, + D'^^]) and Il^<^=
(sin^[nTprr7y«y^]), where the average is performed over
the distribution of «„. The Lamb-Dicke parameters are
given by rj^ = Sk^r^ = (0.21, 0.12, 0.09), where Sk^ =Iky is the component of the difference in the counterprop-
agating Raman beam wave vectors in the uth dimension,
and r„ = (^/2/na»„)'/^ is the spread of the n^ = Q wave
function. The sideband Rabi flopping frequencies Clriv
are typically a few hundred kilohertz, thus the absorption
features are well resolved and spontaneous emission dur-
ing all stimulated Raman processes is negligible.
A Raman absorption spectrum of the first blue and red
sidebandsof the X direction (5pr = ±w) is shown in Fig. 2
(solid points) for Doppler precooling only (omitting steps
3 and 4 in Table I). Similar features appear at 5pr = ±coy
and ±a>;. If n^ is thermally distributed, then it is straight-
forward to show that /;"V/^^'"^ = («i.)/(l + {riv)), inde-
pendent of fl Tpr 7)v . By recording several spectra varying
Tpr, we find the ratio of red to blue sideband strength re-
mains approximately constant, indicating a nearly thermal
distribution of «i,. (We ensure that fl is the same on the
blue and red sidebands.) We measure {riy) for a variety
of red detunings of Doppler precooling beams D 1 and D2and obtain values as low as {riy) — (0.47, 0.30, 0.18) in the
three dimensions at a detuning of about -30 MHz (we es-
timate — 10% uncertainties in the measurements). At other
detunings, we measure values as high as (n^) — 7. These
values and their behavior with detuning are consistent with
the theoretical limit of Doppler cooling [17].
Figure 2 includes a Raman absorption spectrum follow-
ing additional sideband Raman cooling (hollow points).
Five Raman cooling cycles in the x dimensions are em-
-11 11
Raman detuning (MHz)
FIG. 2. Raman absoqjtion spectrum of a single '^Be" ion
after Doppler precooling (solid points) and after five cycles
of additional resolved sideband stimulated Raman cooling on
the X dimension (hollow points). The observed count rate
is normalized to the probability P{|2, 2)} of the ion being
in the |2, 2) state. The first blue and red sidebands of the
X dimension are shown at S^r/lir — ±11.2 MHz. Similar
sidebands are found near ±18.2 MHz (y dimension) and at
±29.8 MHz (z dimension). For precooling, the asymmetry in
the sidebands indicates a thermal average vibrational occupation
number of (/?,) = 0.47(5). For Raman cooling, the reduction
of the red sideband and growth of the blue sideband implies
further Raman cooling in the .v dimension to («,) = 0.014(10).
The widths of the features are consistent with the 2.5 yiis
Raman probe time. Each point represents an average of 400
measurements, corresponding to =5 min of integration time for
the entire data set. The lines connect the data points.
ployed (steps 3 and 4 of Table I with co^ = (o^). The
exposure time XRam of the last Raman pulse is set so
that nTRam''7jr — 7r/2 or TRam — 2.5 /iS, corresponding
to nearly a tt pulse from the rix = 1 state to the n, =state. The durations of the earlier pulses are set shorter
to optimize the cooling. The recycle time between each
stimulated Raman transition is about 7 ^ts, ample time
for the ion to scatter the expected average of —3 photons
from beams Dl and D3 and ultimately get recycled to
the |2, 2) state. The suppression of the red sideband
(and growth of the blue sideband) indicates the extent
of the additional cooling, from {n^) — 0.47 to («f) =0.014(10) (the n,, = state is occupied =98% of the
time). We observe no further cooling by increasing
the number of Raman cooling cycles beyond about five
and see little sensitivity to the details of the Ramancooling pulse durations. As discussed above, we verify
that the distribution oi n^ is nearly thermal after Ramancooling. We achieve resolved-sideband Raman cooling
in 3D by sequentially driving on all three red sidebands.
Five cycles of cooling are applied to each dimension
(order xyzxyz . . .) by alternating the tuning of the Ramancooling beams between the three red sidebands. From
the measured asymmetry of each pair of sidebands, we
infer 3D Raman cooling to («„) = (0.033, 0.022, 0.029),
or the Hx = riy = n~ — 3D ground state being occupied
=^92% of the time.
The limit of Raman cooling is determined by heating
from off-resonant stimulated-Raman transitions [expected
to result in a limit of (n;c)stRam =" {g\g2)^/iiOv^)^ =
4013
TN-59

Volume 75, Number 22 PHYSICAL REVIEW LETTERS 27 November 1995
TABLE I. Timing sequence for Doppler precooling, resolved-sideband stimulated Raman cooling and Raman detection of («„).
As the sequence is repeated through steps 1
repeated as desired within the sequence.
-7, 5pr is slowly swept across absorption features. Raman cooling steps (3 and 4) are
Duration Beams RamanStep i/MS) D1,D3 D2 Rl, R2 tunnting Function
1 =50 On On Off
2 =7 On Off Off
3 1-3 Off Off On a»o ~ w„
4 -7 On Off Off
5 1-3 Off Off On COo + 5pr
6 = 1 Off Off On Wo7 =200 Off On Off
Doppler precool
Prepare in |2,2) state
Stimulated Raman transition |2, 2)|«y) —' |1, l)|ni, — 1)
Spontaneous Raman recycle |1,1)|«„ — 1) — |2,2)|m„ - 1)
Probe (rt„) with stimulated Raman transitions |2, 2)|«„) -* |1, \)\n'^}
Exchange tt pulse: |2, 2)|ni,) —» |1, 1)|«„)
Detect transition in step 5: cycle on |2, 2) — |3, 3); collect fluorescence
10~^] and heating from off-resonant spontaneous emis-
sion from the Raman beams [a limit of (rtjc)spRam —
ig\g2/^^)Vxy'''Ram — 10~^]. We believe the minimummeasured value of («^) = 0.02 may be due to anomalous
heating of the ion, which we measure to be d{n)/dt —+ l/msec by inserting various amounts of time between
cooling probing. We are currently investigating the
source of this heating.
This work is supported by the Office of Naval Research
and the Army Research Office. We acknowledge consid-
erable contributions from J. C. Bergquist. We thank N. R.
Newbury, J. D. Miller, and M. Young for comments on
the manuscript.
[1] D.J. Wineland and W. M. Itano, Phys. Today 40. No. 6,
34(1987).
[2] C. Cohen-Tannoudji and W. D. Phillips, Phys. Today 43,
No. 10,33 (1990).
[3] A. Aspect, E. Arimondo, R. Kaiser, N. Vansteenkiste, and
C. Cohen-Tannoudji, Phys. Rev. Lett. 6L 826 (1988); J.
Lawall, F. Bardou, B. Saubamea, M. Leduc, A. Aspect,
and C. Cohen-Tannoudji, Phys. Rev. Lett. 73, 1915
(1994).
[4] M. Kasevich and S. Chu, Phys. Rev. Lett. 69, 1741 (1992);
H. Lee, C. Adams, N. Davidson, B. Young, M. Weitz, M.Kasevich, and S. Chu, in Atomic Physics XIV. edited by
D.J. Wineland, C.E. Wieman, and S.J. Smith (AIP Press,
New York, 1995), p. 258.
[5] E.T. Jaynes and C.W. Cummings, Proc. IEEE 5L 89
(1963).
[6] D.J. Heinzen and D.J. Wineland, Phys. Rev. A 42. 2977
(1990).
[7] D.J. Wineland. J.J. Bollinger. W. M. Itano, and D.J.
Heinzen, Phys. Rev. A 50. 67 (1994).
[8] J. 1. Cirac. A. S. Parkins. R. Blatt. and P. Zoller, Phys. Rev.
Lett. 70. 556 (1993); J.l. Cirac, R. Blatt, A.S. Parkins,
and P. Zoller, Phys. Rev. Lett. 70, 762 (1993).
[9] D. M. Greenberger, M. A. Home, and A. Zeilinger, Phys.
Today 46, No. 8. 22(1993).
[10] A. Ekert. in Atomic Physics XIV, edited by D.J. Wineland,
C.E. Wieman, and S.J. Smith (AIP Press, New York.
1995), p. 450, and references therein.
[11] J.I. Cirac and P. Zoller, Phys. Rev. Lett. 74, 4091
(1995).
[12] D.J. Wineland and H. Dehmelt, Bull. Am. Phys. Soc. 20,
637 (1975).
[13] W. Neuhauser, M. Hohenstatt, P. Toschek, and H.
Dehmelt. Phys. Rev. Lett. 41, 233 (1978).
[14] R. Dum. P. Marte, T. Pellizari, and P. Zoller, Phys. Rev.
Lett. 73, 2829(1994).
[15] F. Diedrich, J.C. Bergquist, W.M. Itano, and D.J.
Wineland. Phys. Rev. Lett. 62, 403 (1989).
[16] P.E. Toschek, Phys. (Paris) 10, 761 (1985); H. Dehmelt,
G. Janik, and W. Nagoumey, Bull. Am. Phys. Soc. 30, 111
(1985); B. Appasamy, I. Siemers, Y. Stalgies, J. Eschner,
R. Blatt, W. Neuhauser, and P. E. Toschek, Appl. Phys. B60,473 (1995).
[17] M. Lindberg and J. Javanainen, J. Opt. Soc. Am. B 3,
1008 (1986).
[18] S. Chu, J.E. Bjorkholm, A. Ashkin, and A. Cable, Phys.
Rev. Lett. 57, 314 (1986); W.D. Phillips, in Laser
Manipalation of Atoms and Ions, Proceedings of the
International School of Physics "Enrico Fermi," Varenna,
1991, edited by E. Arimondo and W.D. Phillips (North-
Holland, Amsterdam, 1992), p. 325; J.D. Miller, R.A.
Cline, and D.J. Heinzen, Phys. Rev. A 47, R4567 (1993).
[19] P. Verkerk, B. Lounis, C. Salomon, and C. Cohen-
Tannoudji, Phys. Rev. Lett. 68, 3861 (1992); P. Jessen, C.
Gerz, P. Lett, W. Phillips, S. Rolston, R. Spreeuw, and C.
Westbrook. Phys. Rev. Lett. 69. 49 (1992); A. Hemmerich
and T. Hansch, Phys. Rev. Lett. 70, 410 (1993).
[20] S.R. Jefferts. C. Monroe, E. Bell, and D.J. Wineland,
Phys. Rev. A 51, 3112 (1995).
[21] The drive frequency Ho = 231 MHz is much larger
than the pseudopotential vibration frequencies a»t,, so the
contribution of the driven "micromotion" at Hq to the
overall amplitude of the ion motion is very small. This
includes the micromotion induced §5i>m static background
fields, which are minimized with compensation electrodes
(see Ref. [20]). Moreover the small FM micromotion
sidebands at ±flo are well resolved (D.q » y) and far
from the region of interest in the absorption spectrum.
Thus the trap can be accurately approximated as a simple
harmonic oscillator with frequencies a»i,.
4014
TN-60
PHYSICAL REVIEW A VOLUME 47, NUMBER 5 MAY 1993
Quantum projection noise: Population fluctuations in two-level systems
W. M. Itano, J. C. Bergquist, J. J. Bollinger, J. M. Gilligan, D. J. Heinzen,* F. L. Moore,*
M. G. Raizen,* and D. J. WinelandTime and Frequency Division, National Institute of Standards and Technology, Boulder, Colorado 8030S
(Received 9 December 1992)
Measurements of internal energy states of atomic ions confined in traps can be used to illustrate
fundamental properties of quantum systems, because long relaocation times and observation times
are available. In the experiments described here, a single ion or a few identical ions were prepared in
well-defined superpositions of two internal energy eigenstates. The populations of the energy levels
were then measured. For an individual ion, the outcome of the measurement is uncertain, unless the
amplitude for one of the two eigenstates is zero, and is completely uncertain when the magnitudes
of the two ampUtudes are equal. In one experiment, a single ^^^Hg"*" ion, confined in a linear rf
trap, was prepared in various superpositions of two hyperfine states. In another experiment, groups
of ^Be"^ ions, ranging in size from about 5 to about 400 ions, were confined in a Penning trap and
prepared in various superposition states. The measured population fluctuations were greater whenthe state amplitudes were equal than when one of the amplitudes was nearly zero, in agreement
with the predictions of quantum mechanics. These fluctuations, which we call quantum projection
noise, are the fundamental source of noise for population measurements with a fixed number of
atoms. These fluctuations are of practical importance, since they contribute to the errors of atomic
fi"equency standards.
PACS number(s): 03.65.Bz, 32.80.Pj, 32.30.Bv
I. INTRODUCTION
Quantum mechanics is not a deterministic theory, even
though the time development of the quantum-state vec-
tor is governed by the Schrodinger equation, which is de-
terministic. That is, quantum mechanics does not, in
general, predict the result of an experiment. Rather,
it provides a prescription for predicting the probability
of observing a given result. The relationship of the
quantum-state vector to the physical system that it de-
scribes is central to the interpretation of quantum me-
chanics. There are at least two distinct interpretations
of the quantum state [1].
According to the Copenhagen interpretation, the state
vector provides a complete description of an individual
system (a single atom, for example). This is not the only
definition of the Copenhagen interpretation, but it is the
one that we adopt here. According to this interpretation,
the state vector of a system develops in time according
to the Schrodinger equation until a measurement causes
it to be projected into an eigenstate of the dynamical
variable that is being measured. The assumption that
the state vector "collapses" in this manner is considered
unattractive by some, because of its ad hoc nature.
According to another interpretation, sometimes called
the statistical-ensemble interpretation, the state vector is
merely a mathematical construct which describes an en-
semble of similarly prepared systems [2-4] . One commonmisconception is that this interpretation is not capable of
describing an experiment on a single atom. In this case,
the state vector describes a conceptual ensemble (a Gibbs
ensemble) of similarly prepared atoms. The single atomin the experiment is a member of that ensemble. Experi-
mentally, an ensemble is generated by repeatedly prepar-
ing the state of the atom and then making a measure-
ment. The state vector, in this interpretation, is analo-
gous to a statistical distribution function of the kind that
appears in classical statistical mechanics. The difference
is that, in quantum mechanics, there is no underlying
microscopic theory which can predict the behavior of a
single system, even in principle. The statistical-ensemble
interpretation has the virtue of avoiding the necessity of
"reducing" or "collapsing" the state vector.
In spite of occasional claims to the contrary [5] , it ap-
pears that the Copenhagen and statistical-ensemble in-
terpretations do not differ in their predictions of exper-
iments when properly applied [6]. In practice, either in-
terpretation may motivate a particular calculation. For
example, some problems in quantum optics have been
solved by simulating the behavior of the wave function
of a single atom, explicitly including the reduction of
the wave function at random times [7-10]. Such meth-
ods follow naturally from the Copenhagen interpretation
(which is not to say that the practitioners of these meth-
ods would necessarily advocate the Copenhagen inter-
pretation as opposed to the statistical-ensemble interpre-
tation). On the other hand, the conventional method
of solving the density-matrix equations follows naturally
from the statistical-ensemble interpretation. The re-
sults of averaging many wave-function simulations are
the same as those of solving the density-matrix equa-
tions. The experiments described here can be interpreted
within either framework.
Perhaps the simplest example of the indeterminism of
quantum mechanics is the behavior of a two-level sys-
tem prepared in a superposition ji/^) = c^|.<4) -\- cb\B) of
the two states \A) and \B) and subjected to a measure-
Work of the U. S. GovernmentNot subject to U. S. copyright47 3554
TN-61

47 QUANTUM PROJECTION NOISE: POPULATION . . 3555
ment. The measurement yields one indication or "pointer
reading" for a system in |^) and another for a system
in \B). Except when either ca or Cb is zero, the out-
come of the meeisurement cannot be predicted with cer-
tainty. Provided that the state vector is properly nor-
malized (|cAp + |cb|^ = 1), |caP = Pa, and |cbP = Pbare the probabilities of finding the system in \A) or \B).
The indeterminacy is present no matter how accurately
the state has been prepared. It is an inherent feature of
quantum mechanics. We will call this source of measure-
ment fluctuations "quantum projection noise," since it
can be interpreted as arising from the random projection
of the state vector into one of the states compatible with
the measurement process.
In some experiments we have a sample of A'' identical
systems that are effectively independent. If we carry out
the same kind of state preparation and measurement as
that just described for a single system, then we should
get the same result as by repeating the experiment Ntimes. That is, the sum over all N atoms of the measured
quantity should have the same mean and fluctuations as
the sum of A'' independent measurements on one system.
The internal states of a set of A'' ions in an ion trap con-
stitute a system of this type. The ions are well separated
from each other by their mutual Coulomb repulsion, so,
to a very good approximation, the state of one ion has
no effect on that of another ion. If all of the ions are
subjected to the same optical and radiofrequency fields,
they can all be described by the same state vector for
their internal degrees of freedom. In an ion trap, unlike
an atomic beam, for example, we can repeatedly prepare
and observe the same set of N atoms.
To illustrate the main ideas, we will first describe a
simplified version of the experiment. The actual experi-
ments, carried out with single ^^^Hg"^ ions in a linear rf
trap and with numbers of ^Be"*" ions ranging from about
5 to 400 in a Penning trap, will be explained in detail in
later sections.
Consider a single atom, or several identical atoms, with
three energy levels \A), \B), and \C) (see Fig. 1). The
FIG. 1. A simplified energy-level diagram of an atom of
the type used in the experiments. The atom or atoms are
prepared in a superposition of \A) and \B) by a combination
of laser optical pumping and rf excitation. The state is mea-
sured by applying laser radiation resonant with the |B) —> \C)
transition. If the atom is in \A), it does not absorb any pho-
tons from the laser beam and remains in \A). If the atom
is in \B), the laser radiation drives it to \C). The atom then
decays back to \B) and emits a photon. It can then be excited
to \C) again.
lower two levels \A) and \B) are stable. They are sepa-
rated by a radiofrequency photon energy. Level \C) de-
cays, by emission of an optical photon, to \B) only. Thestate vector is prepared in a superposition of \A) and\B) hy first preparing it in \A) and then applying an rf
pulse near the \A) —> \B) transition frequency. Any de-
sired superposition of \A) and \B) can be obtained bycontrolling the frequency, amplitude, and duration of the
rf pulse. The number of atoms in \B) is then measured.
The measurement is made by applying a laser beam that
is resonant with the transition from \B) to \C) and de-
tecting the photons emitted in the decay from \C) to \B).
If an atom is found in \B) when the laser pulse is applied,
it is excited to \C). It quickly decays to |5) and emits a
photon. It can then be excited bcick to \C) by the laser
and emits another photon. Thus, an atom in \B) emits a
series of many photons, while an atom in \A) emits none.
The rate at which photons are emitted by the entire sam-
ple of atoms is proportional to the number of atoms in
\B) when the laser beam is applied. If there is only one
atom in the sample volume, the detection is particularly
simple: If some photons are emitted, the atom was in
\B); otherwise it was in \A). Quantum-amplification de-
tection of this type, sometimes called electron shelving,
was first proposed by Dehmelt [11] and, to the best of
our knowledge, was first used by Wineland et al. [12].
In the preceding discussion, we assumed that each
atom either emits a burst of photons or does not. Accord-
ing to the Copenhagen interpretation, the wave function
of each atom is a superposition of \A) and \B) before
the measurement and collapses to one state or the other
when the detection laser beam is applied. According to
the statistical-ensemble interpretation, the atom is found
to be in \A) or \B) when the measurement is made, with
probabilities pa and pb, respectively. There is no point
in asking which state the atom was in just before the
measurement, since this is not a question that can be
answered by the experiment.
Quantum projection noise in the measured populations
of states prepared in superpositions may be of some prac-
tical interest. This point was discussed previously, in the
context of atomic frequency standards, by Wineland et
al. in Appendix A of Ref. [13]. In some atomic frequency
standards, such as cesium atomic beams, a signal which
is proportional to the population of a particular quantumstate is measured as a function of the frequency of an ap-
plied rf field. The signal is a maximum (or a minimum,depending on the detection method used) when the fre-
quency matches the transition frequency ujq between two
atomic states and decreases when the frequency increases
or decreases from this value (see Fig. 2). The frequency
to of an oscillator is matched to the resonance frequency
ujo by measuring the signal at two frequencies to — Auj
and u! + Au! and making a correction to u by an amountproportional to the difference between the two signals.
In the example shown in Fig. 2, the signal at a; -I- Au) is
less than the signal at oj — Acj, which indicates that umust be decreased in order to match uq. If the noise is
independent of the position on the resonance line shape,
measurements at the points of maximum slope would give
the greatest sensitivity for determining uiq. However, the
TN-62

3556 W. M. ITANO et al. 47
Oc
0)
/^ ' ^
0) \
Ci)—Acj i
/
\/ I—
i
cj+Ao)
V/frequency
FIG. 2. A graph of the mean detected signed as a function
of the frequency of the applied field for a resonance like that
used in an atomic clock. The signal is proportional to the
population of a particular energy level after the field has been
applied. The maximum signal occurs at firequency cjo- If the
fine shape is sjrmmetric, uq, can be determined by measuring
the signaJ at two different frequencies u — Aui and w+Aw and
Vcirying u until the signal intensities aie equal. The frequency
u> determined in this way is an estimate of ujq.
noise will in general vary with the signal level, due to
quantum projection noise and also to other causes. As-
sume we have the extreme case where the only noise is
quantum projection noise, where the maximum and the
minima of the line shape correspond to pure energy eigen-
states \A) and \B), and where the half-intensity points
correspond to equal superpositions of |.i4) and \B). In
that case, it is not so obvious what the optimum value
of Aa; should be. The noise goes to zero at the maximaand minima of the Une shape, where the sensitivity to
frequency deviations also goes to zero. The noise is the
greatest at the half-intensity points, which, for a typi-
cal line shape, is where the frequency sensitivity is ap-
proximately the greatest. It will be shown later that the
precision with which the line center can be determined
is independent of Ao;, if the line shape has a cosinu-
soidal form, often a good approximation when Ramsey's
separated-oscillatory-field resonance method [14] is used.
II. THEORY
A. Single atom
Suppose a single system, such as a single atom, is pre-
pared in a well-defined superposition of two stable or
metastable states \A) and \B), which have energies Hlua
and hujB- This could be done by preparing the atom in
I
A), by optical pumping, for example, and then applying
a neaurly resonant rf field of well-controlled fi-equency, am-
plitude, and duration. Suppose that the system is in \A)
at time t = 0. We then apply an oscillatory perturbation
V which has matrix elements:
{A\V\A) = {B\V\B)=0,
{A\V\B) = {B\V\A)* = Kbe'^K
The state at a later time f > is [14]
(2.1)
(2.2)
m))=CA{t)\A)+CB{t)\B)
smn
.26
V2nt
-^^sml-|exp
Sit+ cos I
-— exp
--(a; -uja -(jJB)t
-{u -uja -u>B)t
\B),
\A)
(2.3)
(2.4)
where
Uq = ub — l-^A,
n= V(u;o-w)2 + (26)2.
(2.5)
(2.6)
In deriving Eq. (2.4), we assumed that V does not in-
duce transitions to states other than \A) and \B) and that
spontaneous decay can be neglected. Also, all other per-
turbations, such as those due to collisions, are assumedto be negligible. For the levels studied experimentally
in this work, which are hyperfine Zeeman sublevels of
ground electronic states of atoms, spontaneous decay can
be neglected. Such states decay primarily by magnetic
dipole radiation. The rate for magnetic dipole decay from
a higher sublevel |e) to a lower level \g) is
7(e -^ g) =4u;3eg
Shc^\{e\M\' (2.7)
where hueg is the energy difference between je) and \g)
and n is the magnetic dipole operator. For typical val-
ues of the parameters for transitions between hyperfine-
Zeeman sublevels, the mean lifetime for spontaneous de-
cay is many years. For example, ifugg = 27r x 30 GHz and
|(e|/i|5)| = fJ-B, where hb is the Bohr magneton, then the
decay rate given by Eq. (2.7) is 2.7 x 10"^^ s~^; that is,
the lifetime is 1200 years.
In order to prepare a state with a given value of pb =|cB(Op! W6 can adjust b, u, and the time t during which
V is applied. For example, if a; = ujq, then
Pb = sin^f ir )
= sin^(6t). (2.8)
Any value of ps from to 1 can be obtained by adjusting
the value of the product bt. Alternatively, it may be moreconvenient to vary w, keeping 6 and t fixed at values so
TN-63

47 QUANTUM PROJECTION NOISE: POPULATION 3557
that bt — TT. (This is what is done in order to observe
the resonance hne shape, for example.) This induces a
complete inversion (ps = 1) at exact resonance (cj =loq). Any value of pb down to can be obtained by
varying co between ujq and wq — ^iry/S/t or between uq
and ujQ + 27r\/3/t.
Ramsey's method of separated oscillatory fields [14]
is another way of creating a given value of pb- In
this method, the perturbation is applied in two phase-
coherent pulses of duration r with a delay T between
them. If the strength of the perturbation b is adjusted
so that br = 7r/2, then ps = \cb{T + 2r)p can be madeto take any value between and 1 by varying u. If, in
addition, t <^T and \u> — u)q\t <C 1, the probability psto be in \B) at time T + 2t is
PB^\{l+cos[{u-uo)T]}. (2.9)
An expression valid for arbitrary values of the parameters
has been given by Ramsey [14].
It is useful to define a vector operator r on the subspace
spanned by j^l) and \B). The components of r are defined
as
r, = \{\A){B\^-\B){A\\
r2^\{\A){B\-\B){A\\
r^^\{\B){B\-\A){A\).
(2.10)
The operator r is equivalent to a spin-^ angular mo-
mentum operator, since it operates on a two-dimensional
complex vector space and since the commutators satisfy
the same algebra:
\r^,rA =ieiikrk, (2.11)
where €ijk is the Levi-Civita symbol. For a general pure
state of the form of Eq. (2.3), the expectation values of
these operators are
(ri) = 1{c*aCb + c*bCa) = I sine cos0,
(r2) = ^{c*aCb - c*bCa) = ^ sini9 sin0,
(r3) = i(|cB|'-|c^|^) = i
(2.12)
cos 9,
where we have used the notation (ri) = {ip\ri\ijj), etc.
The expectation values can be represented geometrically
by a three-dimensional vector (r ) of length | . The spher-
ical polar angles (^,0) define the orientation of (r). As
pointed out by Feynman, Vernon, and Hellwarth [15],
this representation is sometimes useful because of the
way in which the evolution of the quantum state can be
visualized as a rotation of a vector. The quantities {2(ri)
,
2(r2), 2(r3)} are equivalent to the quantities {ri, r2, r^}
defined by Feynman, Vernon, and Hellwarth. The reason
for using the definition of r given by Eq. (2.10), rather
than one differing by a factor of 2, is that r then corre-
sponds precisely to a spin-| angular momentum opera-
tor. The vector representation can be generalized to deal
with mixed states (statistical ensembles of pure states),
but that will not be necessary here. The third componentof r is proportional to the internal energy operator. The
eigenstates of r^ with eigenvalues m = —^ and m = +^correspond to \A) and \B), respectively.
The variance of the measurement of the state {\A) or
\B)) of a single atom is particularly simple to calculate.
We define a projection operator Pb = \B){B\. The ex-
pectation value of Pb is |cbP = Pb, the probability of a
measurement finding the atom in \B). The variance of
the measurement is
(APb)^ = {{Pb - (Pb)?)
= {pI-2{Pb)Pb + {Pb?) (2.13)
= (Pb) - (Pb)' = {Pb) - {Pb}' (2.14)
= {Pb){1-{Pb))=Pb{1-Pb). (2.15)
In Eq. (2.14), we have used the fact that
P'b = {\B){B\){\B){B\)^\B){B\=Pb. (2.16)
Equation (2.15) shows that the uncertainty is zero when
Pb is or 1 and has its maximum value when Pb = 2-
B. N atoms
If cooperative effects can be neglected over the time
of the experiments, we may consider the atoms to be
independent. For the systems used in the experiments,
the decay rate of an individual atom is extremely small.
It is possible for a suitably prepared collection ofN atoms
to exhibit a maximum spontaneous-decay rate per atomof about A'' times the usual rate given by Eq. (2.7), due
to cooperative effects [16]. Even if the rate is enhanced
by a factor of A'', though, it can still be ignored for the
small values of N that were used in these experiments.
One natural way to calculate the fluctuations of the
measured populations is to consider the A'' atoms to be
independent and to combine the probabilities according
to the binomial distribution [17]. Let N^ and Nb be the
numbers of atoms found to be in \A) and \B), respectively
{Na + Nb = N). Then, according to this model, the
probability of measuring a given value of A^b is
P{Nb,N,pb) = Nl
NbI{N - Nb)1{pBf^l-pB)^''-''^\
(2.17)
where pb = |cbP is the probability for a single atom to
be in \B) and (1 — Pb) = Pa ^ |ca|^ is the probability
to be in |^). The variance of the binomial distribution is
[17]
a^ =Npb{1-Pb)- (2.18)
The variance is zero when ps = or ps = 1 and has
its maximum value of A''/4 when Pb = ^- For N = 1,
Eq. (2.18) agrees with Eq. (2.15). Figure 3 shows plots of
probability distributions calculated from Eq. (2.17), for
A" = 20 and PS =0,0.1,...,!.
In general, it would be better to use a formalism that
treats the N atoms as a combined quantum system. This
should give a correct description both when cooperative
TN-64

3558 W. M. ITANO et al. 47
FIG. 3. A plot of the probability distributions of Nb, the
number of atoms in|B) , for ps = 0,0.1,...,!. The total num-
ber of atoms N is 20. As pB increases from 0, the distribution
broadens and reaches its maximum variance at pb = 0.5. As
PB increases beyond 0.5 the distribution narrows, eventually
becoming a spike at Nb = 20 for ps = 1.
effects are important and when they are negligible. Each
two-level atom can be described by a spin-^ operator Tj,
defined as in Eq. (2.10), where i = 1,...,N labels the
atom. The eigenstates of ri^ with eigenvalues rrii = —^
or +1 correspond, respectively, to the \A) and \B) states
of the ith atom, which we denote by \Ai) and \Bi). Onebasis for the 2^-dimensional Hilbert space of A'' atoms is
provided by the direct-product states of the form
N\mi, 1712,..., tun) = Yll'^i)- (2.19)
1=1
A collective-angular-momentum operator for the Natoms can be defined by
N
R-E (2.20)
t=i
It is implicitly assumed that each term in the summationis multiplied by the identity operators for all of the other
atoms. Another basis for N atoms is given by states of
the form 1^, R, M), which are linear combinations of the
product states defined by Eq. (2.19) [16]. Here, R{R+l)2
is the eigenvalue of R , M is the eigenvalue of R3, and gis an index that may be required to provide a complete
set of labels. The eigenvalue M is related to the variables
previously defined by
M=^{Nb-Na), (2.21)
(2.22)
Thus, fluctuations in M correspond directly to fluctua-
tions in Nb, although M and Nb differ by a constant.
The state in which all of the atoms are in \A) has
R = ^N and M = -^N and is nondegenerate. This
state is denoted by
N N\R=^N,M = -^N) = ll\m,^
t=i
(2.23)
t=i
We assume the atoms are far enough apart that they
do not overlap spatially, so that symmetrization or an-
tisymmetrization of the total wave function is unneces-
sary. Suppose that we apply the same perturbation to
all of the atoms, so that the state of the ith atom goes
to Cyi|Ai) + cslBi) for each i. That is, the new state is
N]l{CA\Ai)+CB\Bi)). (2.24)
t=i
We can visualize this as a rotation of the collective state
vector from the negative Rz axis {9 = it) to new values of
9 and given in terms of c^i and cb by Eq. (2.12). Equiv-
alently, it can be described as a rotation of the coordinate
system by tt — ^ about the original R2 axis, followed by a
rotation of —^ about the new R3 axis. The properties of
states of this kind were discussed by Arecchi et al. [18],
who called them atomic coherent states. They also called
them Bloch states, because they resemble the spin states
studied in nuclear magnetic resonance. The new state
given by Eq. (2.24) is a linear combination of the states
\R = ^N, M), for M = -^N, -^N + 1,. . . ,^N, since it
is generated from Eq. (2.23) by a rotation. This state is
M=N/2
\R^^^N,9,<I>)= Yl D\^%^{0,n-9,-<l>)M=-N/2
x\R=^N,M), (2.25)
where Dj^ -n/2 ^^ ^ matrix element of the rotation oper-
ator as defined in Eq. (4.1.10) of Ref. [19]. If the system
is prepared in the state given by Eq. (2.25), the prob-
ability of measuring a given value of M is the absolute
square of the coefficient oi \R= ^N, M), which is
ftl„ch(M, N, 0) = |Di^{.%j(0,T - e, -4>)\^
= [<%.(-«)]'
m~ {\N + M)\{\N - M)\
cosQJV+2M
smN-2M
(2.26)
(2.27)
(2.28)
(2.29)
TN-65

47 QUANTUM PROJECTION NOISE: POPULATION 3559
N\
Nb\{N - NbV-
Nb\{N - Nb)\
mNbKN - NbV-
cos^ r 1 f sin^ -5j
(N-Nb)
[i(l +cos^)]^«[i(l -cos^)](^-^«)
(2.30)
(2.31)
(2.32)
The final result is the same as Eq. (2.17), which was
obtained by another method. Arecchi et al. obtained
an equivalent result from the algebraic properties of the
angular momentum operators, without explicitly makinguse of the rotation-operator matrix elements [18]. The
quantity rfi5^-%2 *" ^^- (2-27) is defined in Eq. (4.1.12)
of Ref. [19]. Equation (2.28) follows from Eq. (2.27)
by making use of Eqs. (4.2.4)-(4.2.6) of Ref. [19]. The
expUcit form for d^j^ ^^',^{6) given in Eq. (2.29) is firom
Eq. (4.1.27) of Ref. [19]. Equation (2.30) results from
using Eq. (2.22) to express M in terms of Nb and N,and Eq. (2.31) follows by making use of trigonometric
identities. The final expression [Eq. (2.32)] results from
using Eq. (2.12) to express cos^ in terms of ps = |cs|^-
The variance of the measured value of M can be cal-
culated by the standard formula
(Ai?3)' = {RD - {Rs)' (2.33)
For a state with the form of Eq. (2.24), in which the CAi 's
and cb;'s are the same for all z, {R3) and (R^) can be
easily be evaluated:
A''
(^3) = j{Pb-Pa), (2.34)
and
^\[k'"))(2.35)
N N
^JUl^^'^^^h) (2.36)
i=l j=l
N
i=l i,j
(2.37)
N N(N-l), ,2= 4+4 ^^^ ^^^
• (2.38)
In obtaining Eq. (2.38), we used the fact that the first
sum in Eq. (2.37) contains A^ terms, all equal to
ic*AM^\+c*B,{B,\)rl{cAMi) + CBABi))
\CA,\+
|CBil =4, (2.39)
and the second sum contains N{N — 1) terms, all equal
to
icAAAi\+c*BABi\)icX{A2\+c*B,{B2\)rur2,
x{caMi)+cb^\Bi)){caM2)+cb^\B2))
JCBil \caA'
2 2
= j{PB -PAf-
cb. \<^A,
2 J
(2.40)
Substituting the values of {R3) and (R^) from Eqs.
(2.34) and (2.38) into Eq. (2.33), we obtain
2_N,iV(iV-l),^_ _,2 N\__ _ ,2
N,
(Pb-Pa) --^{pb-PaY
= j[i-{PB-PAf]
= j{1-\Pb-{1-Pb)?}
= NpBil~PB)- (2.41)
This result agrees with Eq. (2.18), which was based on the
properties of the binomial distribution. Equation (2.41)
was derived for the special case of an uncorrelated TV-
atom system in which all of the atoms have the samestate vector. For more general states, in which the state
vectors of different atoms are correlated with each other,
it may be possible for the variance to be either larger or
smaller than this value [20-23].
The error of an atomic frequency standard depends on
the ratio of the noise in the signal to the firequency deriva-
tive of the signal. Aside firom an additive constant, the
signal of an idealized frequency standard with N atoms
is proportional to {R3). The quantum projection noise
is proportional to -^/(Aila)^. If the Ramsey method is
used, so that pb is given by Eq. (2.9), the ratio of the
quantum projection noise to the frequency derivative is
independent of the frequency u at which the measure-
ment is made:
djRz) \NT sin[{u - uJo)T],
1
^(^3) TyfN'
(2.42)
(2.43)
(2.44)
The error is proportional to 1/\/N, which is sometimes
called the shot-noise limit. If noise from other sources
is significant, the ratio is not constant, and it is best toTN-66

3560 W. M. ITANO et al. 47
measure the signal near the points of maximum slope. If
the Ramsey method is not used, the exact trade-oflF of
Eq. (2.44) does not hold, but the situation is not greatly
different.
A simple graphicad representation of a Bloch state
can be used to provide an estimate of (AiJa)^ which
agrees qualitatively with the result of Eq. (2.41). Wecan represent the Bloch state \R = ^N,M = —^N) =
\R = ^N,9 = tt) by the set of all vectors of length
FIG. 4. Graphical representations of Bloch states
-iiV) = \R = \N,6 = tt),\R = \NM =(a)
. . .
(b)
\R = \N,e = f ,</. = 0), and (c) \R = \N,e = 0). Theimcerteiinty in the number of atoms in \B) (or \A)) is rep-
resented by the spread in the third {R3) component for the
points on the circle surrounding the base of the cone. Theuncertainty goes to zero for (a) and (c) and has its largest
value for (b).
^/R{R^\^ having their third {Rz) component equal to
—R. This set forms a cone whose base has a radius
equal to y/R, as shown in Fig. 4(a). The feict that
{^Rzf = for this state is represented by the fact that
all of the points on the circle surrounding the base of the
cone have the same third component. The Bloch state
\R = \N,e = ^7r,0 = 0) is represented by Fig. 4(b).
The points on the base of the cone have third compo-nents which vary over a range of ±\/R, while the rms
deviation is approximately y/R/2. Thus, we obtain the
estimate (Aila)^ w R/2. For a Bloch state with an ar-
bitrary value of 6, we cam use the same method to makethe estimate
(Ail3)2 « |sin2 = NpBil -Pb). (2.45)
This agrees with the actual value, which is given by
Eq. (2.41). The Bloch state \R = \N,d = 0) is rep-
resented by Fig. 4(c). For this state, (Aila)^ = 0.
III. SINGLE-ATOM EXPERIMENT
Quantum-state preparation and detection experiments
were carried out with ^^^Hg"*" ions confined in a Unear rf
trap. Detailed observations were made of single ions,
although some experiments were also carried out with
several simultaneously trapped ions.
A. ^®*Hg+ energy levels
Figure 5 shows the energy levels of ^^^Hg"*" which were
important for the experiments. The ground electronic
state has the configuration 5d^°6s ^Si/2- The first electric
dipole transition, at 194 nm, is to the 5d^°6p^Pi/2 state.
The metastable 5d^65^ ^^3/2 and 5c^6s^ ^^^5/2 states (not
shown in Fig. 5) lie below the ^Pi/2 state. The ^^^Hg nu-
cleus has spin ^, so both the ^Si/2 and the ^Pi/2 states are
split by hyperfine interactions into states with total angu-
lar momentum F = and F = 1. For both the ^5i/2 and
^Pi/2 states, the F = \ hyperfine state is higher in energy
than the F = hyperfine state. The ^Si/2 hyperfine split-
'^'""^ tl/
laser 1
,
/
F=l y/
65^51/2
F=0
FIG. 5. Energy levels of ^^^Hg"*". The transition between
the ^Si/2 and ^P\/2 states is at 194 nm. The hyperfine split-
tings in the ^Si/2 and ^Pi/2 states are 40.5 and 6.9 GHz, re-
spectively. The ^Si/2 (F = 1) state is detected by exciting
the ^Si/2 (F = 1) -> ^Pi/2 (F = 0) transition with laser 1.
TN-67

47 QUANTUM PROJECTION NOISE: POPULATION . . . 3561
ting has been measured by microwave resonance methods
to be 40.507 347 996 9(3) GHz [24]. The '^Pi/2 hyperfine
splitting has been measured by Fabry-Perot interferom-
etry to be 6.955(90) GHz [25]. The natural linewidth of
the 2Pi/2 state is about 70 MHz [26,27].
B. Apparatus
The ^^^Hg"*" ions were confined in a linear rf trap that
consisted of four parallel cylindrical electrodes of radius
0.794 mm arranged symmetrically around a central axis
[28]. The distance from the central axis to the inner sur-
face of each electrode was 0.769 mm. The rf potentials
on any two adjacent electrodes were 180° out of phase.
The amplitude of the rf potential difference between twoadjacent electrodes was about 500 V, and its frequency
was 12.7 MHz. The electric fields produced by these elec-
trodes created a force which pushed the ions to the cen-
tral axis. The electrodes were divided into sections, to
which static electric potentials of 1 V or less were applied
to keep the ions from escaping along the axis.
Ions were produced by electron-impact ionization of
neutral atoms inside the trap volume. A sample of ^^^Hg
of isotopic purity 91% was used. Typically, the pressure
was about 10~^ Pa (1 Pa « 7.5 mTorr), except when the
ions were being created, when it weis raised to a higher
level. The ions were confined to a region of a few hun-
dred micrometers extent around the center of the trap.
After being laser cooled, an individual ion was localized
in position to about 1 jjira or less.
Narrow-band cw radiation at 194 nm was required for
laser cooUng and optical detection of the ^^^Hg"*" ions.
This was generated by a combination of second-harmonic
generation and sum-frequency mixing, starting with cwlasers [29]. About 5 ^W of 194-nm radiation were avail-
able. In order to laser cool and continuously observe the
ions, 194-nm radiation near both the '^Si/2{F = 1) ^2Pi/2(F = 0) and the 251/2 (F = 0) -^ ^Pi/2{F = 1)
transition wavelengths was required [28]. We call these
two sources laser 1 and laser 2. Otherwise, with only
laser 1 or laser 2 on, the ions were optically pumped to
a hyperfine state which could not absorb the 194-nm ra-
diation. Also, in order to prevent trapping of the ions in
Zeeman sublevels of the ^Si/2{F = 1) state, we had to
apply a magnetic field of approximately 5 x 10~^ T at an
angle of approximately 45° with respect to the electric
field vector of the radiation from laser 1 (see Appendix)
.
The magnitude and orientation of the magnetic field were
controlled by several pairs of Helmholtz coils. The 194-
nm beams were directed through the trap at an angle of
9° with respect to the trap axis, so that both the axial
and radial degrees of freedom were laser cooled. For this
geometry, the theoretical Doppler cooling limit was 1.1
mK for the axial motion and 24 mK for the radial motion
[30].
Some of the 194-nm radiation emitted by the ions
perpendicular to the trap axis was focused by a multi-
element lens onto a two-dimensional imaging photon-
counting tube. The probability of a photon emitted by anion being detected was about 10~^. Individual ions could
be resolved with this apparatus. Some images showingseveral clearly resolved ions have been published previ-
ously [28]. The electronics could be adjusted so that the
photons from any rectangular region of the image, for ex-
ample, a region including only one ion, could be countedseparately. To a good approximation, the ions in the trap
do not interact and are independent.
A stable source of 40.5-GHz radiation was required for
exciting the '^Si/^iF = 0) -^ (F = 1) hyperfine transi-
tion. The output of a 10.125-GHz frequency synthesizer
was amplified and then frequency multiplied by four. Theoutput of the frequency multiplier was directed at theions with a horn antenna.
The data from the photon-counting tube were recorded
by a computer. The computer also controlled the light
shutters, a microwave switch, the firequency of the mi-
crowave frequency synthesizer, and the magnitude andorientation of the magnetic field.
C. State preparation and detection
Optical pumping can be used to prepare the ions in
either the {F = 1) or the {F = 0) hyperfine level of
the ^51/2 ground state. In order to prepare them in the
(F = 1) state, both laser 1 and laser 2 are left on. If
an ion in the ground (F = 1) state is excited to the
2Pi/2(F = 0) state, it is forbidden by electric dipole se-
lection rules from decaying to the ground {F — 0) state,
so it must return to the (F = 1) state. There is a weaJc
transition rate from the ground (F = 1) state to the
ground (F = 0) state, via the "^Pi/^iF — 1) state. This
rate is approximately 3 x 10~^ times the rate of leaving
the ground (F = 1) state and returning to the same state,
via the '^P\/2 (F = 0) state, since laser 1 is far from reso-
nance with the '^Si/2{F = 1) —> ^Pi/2{F = 1) transition.
If an ion does malce a transition to the ground (F = 0)
state, laser 2 quickly drives it back to the '^Pi/2{F — 1)
state, which decays, with probability |, to the ground
(F = 1) state. If laser 1 and laser 2 are both blocked at
the same time, the ion will be in the ground (F = 1) state
with high probability, after a few multiples of the ^Pi/2
state lifetime (2.3 ns). This method does not select out
a particular Mp Zeeman sublevel of the ground (F = 1)
state. If desired, a single Mp state could be selected byswitching the polarization of laser 1 (to right or left cir-
cular polarization with propagation along the magnetic
field for Mp = ±1 or linear polarization perpendicular to
the magnetic field for Mp = 0). However, this was not
done in this work.
An ion can be prepared in the ^Si/2{F = 0) hyperfine
level by blocking laser 2 while leaving laser 1 unblocked.
For a typical intensity of laser 1, the ion is pumped to the
ground (F — 0) state in about 10 ms. In contrast to the
previous method, the ion is prepared in a single Mp state.
Laser 1 can also pump an ion from the ground (F = 0)
state to the ground (F = 1) state. However, the rate for
(F = 0) ^ (F = 1) is less than that for (F = 1) ^ (F =0), mainly because laser 1 is farther from resonance for
this process. In the steady state, the probability of being
in the (F = 0) state is about 94% (see Appendix). A
TN-68

3562 W. M. ITANO et al. 47
possible way to improve the state selection, for a single
ion, is to observe the 194-nm photons emitted and to
block laser 1 when the fluorescence drops to zero.
There is a probability of about 10"^ that an ion in
the ^Pi/2 state will decay to the ^r>3/2 metastable state
rather than to the ^5i/2 state [27]. The ^Dz/2 state has
a lifetime of 9.2 ms and decays, with about equal proba-
bility, to the ^5i/2 state or to the metastable ^D^/2 state,
which has a Ufetime of 86 ms [27,31]. This process is a
potential problem for the state-selection methods, since
the metastable states decay randomly to both ground hy-
perfine states. The effect was kept small by reducing the
intensity of laser 1 so that the transition rate to the ^1)3/2
state was less than about 1 s~^.
After the ion was prepared in the ground {F = 0)
state, any desired superposition with the ground {F =1,Mf = 0) state could be created by applying rf fields
of well-controlled frequency, amplitude, and duration.
These two states were used, because the magnetic shift of
the transition frequency is queidratic, rather than linear,
in the field. Thus, the transition frequency was stable
enough to create the superposition states consistently.
State detection was carried out by counting the 194-
nm photons emitted by the ions for a period, typically
15 ms, with laser 1 unblocked and laser 2 blocked. Themean number of photons detected was proportional to
the number of ions in the (F = 1) state. However, the
number is subject to statistical fluctuations, since the
detection is essentially a Poissonian process. Also, laser
intensity fluctuations lead to fluctuations in the overall
counting rate.
Quantitative studies were made with only a single ion.
In this case, the ion was presumed to be in the (F = 1)
state if the number of photons detected was greater than
a given threshold value and in the {F = 0) state if it wasnot. This threshold was set empirically, and was usually
either or 1. There was some possibility of error with
this detection method. Dark counts from the phototube
or photons scattered from some surface and then detected
could lead to a false (F = 1) signal. Also, since the
mean number of photons detected from an (F = 1) ion
was small (about 5 in 15 ms), it was possible that not
enough of them would be observed, thus leading to a
false (F = 0) signal. If the detection efficiency could beimproved, both of these problems could be reduced byusing a higher threshold number of photons to distinguish
between (F = 1) and (F = 0).
D. Results
The ability to prepare an ion in either the (F = 0)
or (F = 1) ground hyperfine state is shown in Fig. 6.
Each vertical line denotes the detection of a single pho-
ton at a particular time. The detection electronics were
adjusted so that photons firom only a single ion were de-
tected. Before recording the data shown in Fig. 6(a), the
ion was prepared in the ground (F = 1) state by leaving
both laser 1 and laser 2 unblocked for about 0.1 s andthen blocking them both. After a short delay, laser 1
was unblocked, and for 0.1 s, the photons were counted.
0.00 0.02 0.04 0.06 0.08 0.10
Time (s)
0.00 0.02 0.04 0.06 0.08 0.10
Time (s)
FIG. 6. Typical record of the detected photons from a sin-
gle ^^^Hg"*" ion prepared in the ground (a) (F = 1) state and
(b) (F = 0) state. The horizontad axis represents the time
after laser 1, the detection laser, is unblocked. Eax;h vertical
line represents the detection of a single photon. In (a), eight
photons were detected (two photons were too close in time to
resolve on the graph). In (b), no photons were detected.
Their detection times were recorded with a resolution of
100 /is. In the example shown in Fig. 6(a), eight photons
were recorded, but two of them were too nearly simul-
taneous to be resolved on the graph. Before recording
the data shown in Fig. 6(b), the ion was prepared in the
ground (F = 0) state by leaving laser 1 unblocked and
laser 2 blocked for 0.05 s. Laser 1 was then blocked. After
a short delay, laser 1 was unblocked again, and the com-
puter was set to record photons, as for Fig. 6(a). Nonewas recorded, so, with high probability, the ion was in
the (F == 0) state.
Figure 7 shows the results of 100 successive single-ion
state preparation and detection cycles of the type shown
in Fig. 6. Preparation of the (F = 1) state [Fig. 7(a)] was
alternated with that of the (F = 0) state [Fig. 7(b)], so
that slow drifts in parameters such as the laser intensity
would affect both plots in the same way. Each point rep)-
resents the mean photon-count rate during a given 0.5-ms
period after laser 1 was unblocked. The data firom the
first 1.5 ms, which was the time required for the light
shutter to open fully, are not shown. The solid curve in
Fig. 7(a) is a least-squares fit of the data to a decreasing
exponential plus a constant base line. The fitted time
constant of the exponential is 8.66 ±0.41 ms. The fitted
amplitude of the exponential is 769 ± 22 counts/s. Thefitted base line is 47.3 ± 4.3 counts/s. The solid line
in Fig. 7(b) corresponds to 47.3 counts/s, the base fine
determined firom Fig. 7(a). This value does not differ sig-
nificantly from the mean of all of the points in Fig. 7(b),
which is 50.05 counts/s. The background count rate due
to all sources other than photons emitted by the ion was
measured by detuning laser 1 far ft-om resonance. This
TN-69
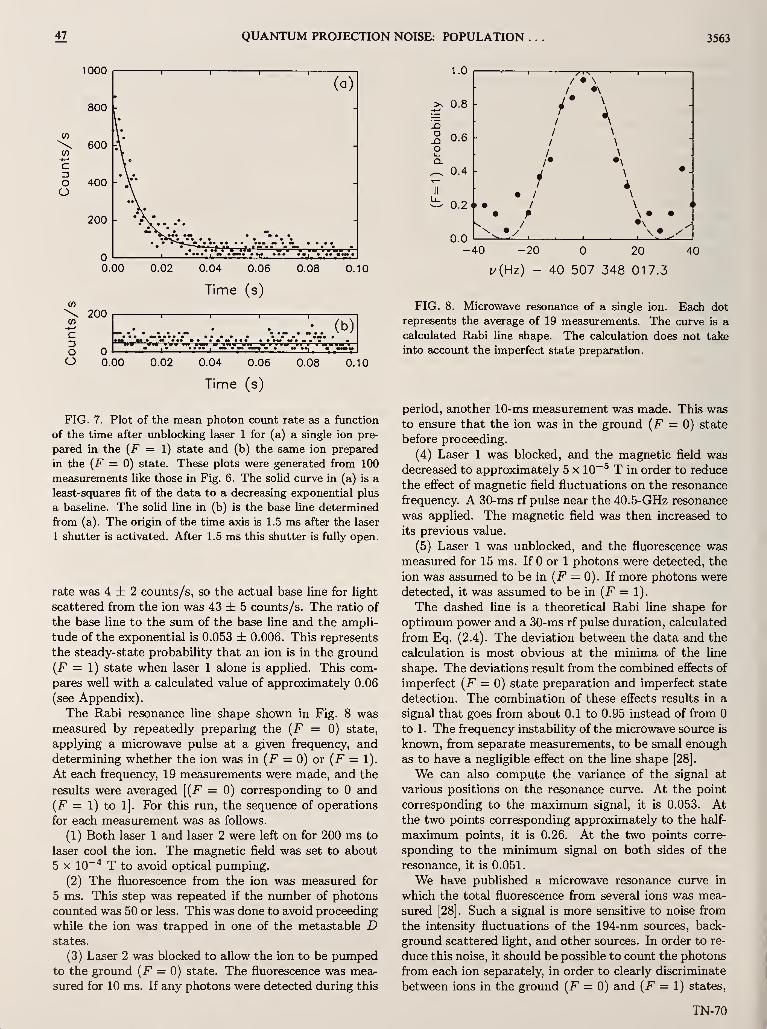
47 QUANTUM PROJECTION NOISE: POPULATION 3563
c
oo
\J\J<J 1
(a)
800 r -
600
V*
-
400• \ •
\* *-
200•V*• \* \ *
••
•• • ••
•
• •• •• • •
• • • •• • •
• • ••• •• • •• •
-
n «•• • •(• • • • • •_,
0.00 0.02 0.04 0.06 0.08 0.10
Time (s)CO\(n*-*
c13
Oo
200• (b)
~w« mwm—> — via— • «H—•»— —
a
w aw
0.00 0.02 0.04 0.06 0.08 0.10
Time (s)
FIG. 7. Plot of the mean photon count rate as a function
of the time after unblocking laser 1 for (a) a single ion pre-
pared in the {F — 1) state and (b) the same ion prepared
in the (F = 0) state. These plots were generated from 100
measurements like those in Fig. 6. The solid curve in (a) is a
least-squares fit of the data to a decreasing exponential plus
a basehne. The solid line in (b) is the base hne determined
from (a). The origin of the time axis is 1.5 ms after the laser
1 shutter is activated. After 1.5 ms this shutter is fully open.
rate was 4 ± 2 counts/s, so the actual base line for light
scattered from the ion was 43 ± 5 counts/s. The ratio of
the base line to the sum of the base line and the ampli-
tude of the exponential is 0.053 ± 0.006. This represents
the steady-state probability that an ion is in the ground
(F = 1) state when laser 1 alone is applied. This com-
pares well with a calculated value of approximately 0.06
(see Appendix).
The Rabi resonance line shape shown in Fig. 8 wasmeasured by repeatedly preparing the {F = 0) state,
applying a microwave pulse at a given frequency, anddetermining whether the ion was in (F = 0) or (F = 1).
At each frequency, 19 measurements were made, and the
results were averaged [(F = 0) corresponding to and
(F = 1) to 1]. For this run, the sequence of operations
for each measurement was as follows.
(1) Both laser 1 and laser 2 were left on for 200 ms to
laser cool the ion. The magnetic field was set to about
5 X 10~^ T to avoid optical pumping.
(2) The fluorescence from the ion was measured for
5 ms. This step was repeated if the number of photons
counted was 50 or less. This was done to avoid proceeding
while the ion was trapped in one of the metastable Dstates.
(3) Laser 2 was blocked to allow the ion to be pumpedto the ground (F — 0) state. The fluorescence was mea-
sured for 10 ms. If any photons were detected during this
1.0
>> 0.8
5 0.6o
1 ' ,TTT 1T—
/ • \
/ •\
- /• \ -
/
/
\
\
/ \"
1 \
/• •\
• /
\
\
• .
> • / \ i
• p \ • •^ ^ / •\V
.ii. 1 —
0.4
0.0-40 -20 20 40
l/(Hz) - 40 507 348 017.3
FIG. 8. Microwave resonance of a single ion. Each dot
represents the average of 19 measurements. The curve is a
calculated Rabi Une shape. The calculation does not taJce
into account the imperfect state preparation.
period, another 10-ms measurement was made. This wasto ensure that the ion was in the ground (F — 0) state
before proceeding.
(4) Laser 1 was blocked, and the magnetic field wasdecreased to approximately 5 x 10~^ T in order to reduce
the effect of magnetic field fluctuations on the resonance
frequency. A 30-ms rf pulse near the 40.5-GHz resonance
was applied. The magnetic field was then increased to
its previous value.
(5) Laser 1 wets unblocked, and the fluorescence was
measured for 15 ms. If or 1 photons were detected, the
ion was assumed to be in (F = 0). If more photons were
detected, it was assumed to be in (F = 1).
The dashed line is a theoretical Rabi line shape for
optimum power and a 30-ms rf pulse duration, calculated
from Eq. (2.4). The deviation between the data and the
calculation is most obvious at the minima of the line
shape. The deviations result from the combined effects of
imperfect (F = 0) state preparation and imperfect state
detection. The combination of these effects results in a
signal that goes from about 0.1 to 0.95 instead of from
to 1 . The frequency instability of the microwave source is
known, from separate measurements, to be small enough
as to have a negligible effect on the line shape [28].
We can also compute the variance of the signal at
various positions on the resonance curve. At the point
corresponding to the maximum signal, it is 0.053. Atthe two points corresponding approximately to the half-
maximum points, it is 0.26. At the two points corre-
sponding to the minimum signal on both sides of the
resonance, it is 0.051.
We have published a microwave resonance curve in
which the total fluorescence from several ions was mea-
sured [28]. Such a signal is more sensitive to noise from
the intensity fluctuations of the 194-nm sources, back-
ground scattered light, and other sources. In order to re-
duce this noise, it should be possible to count the photons
from each ion separately, in order to clearly discriminate
between ions in the ground (F = 0) and (F = 1) states,
TN-70

3564 W. M. ITANO et al. 47
Num
5 10
ber of counts
5
(c)
-
5
n ll.l.lll 1
5 10
Number of counts
15 5 10
Number of counts
15
FIG. 9. Photon count distributions for a
single ^^^Hg"*" ion prepared in (a) the (F=0,
Mf=0) state, (b) the (F=l, Mf=0) state,
and (c) an equal superposition of these two
states. The bars represent the number of
cases in which a given number of fluores-
cence photons was detected when the detec-
tion laser was appUed. The number of mea-
surements was 38 for (a), 19 for (b), and 38
for (c).
as was done here with a single ion.
Figure 9 shows the distributions of the numbers of pho-
tons detected at various points on the resonance curve of
Fig. 8. Figure 9(a) shows the distribution at the points
corresponding to the minima on both sides of the reso-
nance. In most cases, no photons were observed. How-ever, in a few cases one or more photons were observed,
presumably due to a combination of background scat-
tered light and imperfect state preparation. Figure 9(b)
shows the distribution at the maximum of the resonance.
There is a broad distribution of numbers of photons de-
tected, with a mean of about 5.5. In one measurement,
no photons were measured. This may have been due
to imperfect state preparation or to the possibility that
no photons were detected, even though some were emit-
ted. Figure 9(c) shows the distribution at the two half-
maximum points on the resonance. The distribution is a
superposition of those at the maximum and the minima.
This bimodal distribution is the signature of the quan-
tum projection noise for the single-atom case. That is,
for a superposition state with equal amplitudes of the two
components, the measurement finds the ion randomly in
one state or the other.
bers 1-8, as shown in Fig. 10, which correspond, in order
of decreasing energy, to |-§,+|), |-^,+^), 1+ 5,+^),
|j_3 ,i\ 1,3 _lv 1,1 _U |_1 _1\ andl-^ -^\i'2''2''l'2' 2''l~2' 2''l 2' 2'' I 2 ' 2'
"
The 313-nm transition to the 2p'^Pzj2 electronic state was
used for state selection and detection.
B. Apparatus
The experimental apparatus and techniques have been
described previously [32-35]. The Penning trap was
made of cylindrical electrodes, to which static electric
potentials were applied. It was inserted into the bore of
a superconducting solenoid magnet, which generated a
uniform magnetic field Bq of approximately 0.82 T. The
combination of the electrostatic potentials and uniform
magnetic field trapped the ions in three dimensions. The
pressure in the trap was approximately 10~* Pa. The
ions were created by electron-impact ionization of neu-
tral atoms.
The state preparation experiments required that the
313-nm light be blocked for some periods in order to avoid
IV. iV-ATOM EXPERIMENT
A^'-atom quantum-state preparation and detection ex-
periments were carried out with ^Be"'" ions in a Penning
trap. The Penning trap was used, rather than the rf
trap, because the number of atoms that could be stably
trapped could be varied from a few to several thousand.
However, loading and detecting single ions was difiicult
with this apparatus.
A. ^Be+ energy levels
Figure 10 shows the energy levels of ^Be"*" which were
important for the experiments. The ground electronic
state has the configuration 2s ^S 1/2- The ^Be nucleus
has spin |, so the ground state has eight hyperfine Zee-
man sublevels. In a high magnetic field, as is present in
the Penning trap, the energy eigenstates are approximate
eigenstates of I^ and J^ , the z components of the nuclear
and electronic angular momenta. The static magnetic-
field direction defines the z axis. These eigenstates will
be referred to by their main components in the |M/, Mj)basis. For brevity, they will also be referred to by num-
25^51/2
FIG. 10. Level diagram for ^Be"*". The grotmd-state Zee-
man hyperfine states are labeled by nvunbers 1-8. Their quan-
tum numbers axe given in the text. Laser radiation at 313 nmoptically pumps most of the ions into state 4. These atoms are
then transferred to state 3 and then to state 2 by rf tt pulses.
Other rf pulses then create a superposition of states 1 and 2.
Atoms which remain in state 2 are transferred bax;k to state
4. The laser reuiiation is applied again, and the number of
atoms in state 4 is determined from the fluorescence intensity
in the first second after the laser radiation is reappUed.
TN-71

47 QUANTUM PROJECTION NOISE: POPULATION 3565
perturbations of the energy levels. In order to keep the
^Be"*" ion plasma from heating and increasing its spatial
extent when the 313-nm light was not available for laser
cooling, approximately 1000 ^^Mg"'" ions were trapped
and laser cooled at the same time. This cooled the ^Be"*"
ions by long-range Coulomb collisions [36]. The 280-nm
3s'^5i/2 —> 'ip^Pz/2 transition was used for laser cooling
the 2^Mg+ ions.
The 313-nm and 280-nm beams required for state selec-
tion and detection of the ^Be"*" ions and for laser cooling
the ^^Mg"*" were generated by frequency doubling the out-
puts of cw dye lasers in nonlinear crystals. Fluorescence
from the ions was focused by a multielement lens onto the
photocathode of an imaging photon-counting tube. Theoverall detection efficiency was approximately 2 x 10""*.
To generate the rf magnetic fields required for the state
preparation and detection, the amplified output of a fre-
quency synthesizer was coupled into a wire loop antenna.
The light shutters, rf switches, and frequency synthesizer
were controlled by a computer, which also recorded the
photon counts.
C. Ion-number measurement
In the ^^^Hg"'" experiments, the number of ions could
be determined directly from the image. This could not be
done for the ^Be"*" ions in the Penning trap, since they
rotate rapidly around the z axis. Therefore, the num-ber was determined indirectly. Calculations based on a
charged fiuid model relate the density of the ion plasma
to its shape, for given external fields [36-38]. The shapes
and sizes of the nonneutral, ion plasmas were determined
by moving the laser beam and observing the imaged fluo-
rescence. The product of the density and volume yielded
the number of ions with an uncertainty estimated to be
about 30%.
D. State preparation and detection
In the ^Be"*" experiments, coherent superpositions of
two internal states (states 1 and 2) were created and then
subjected to measurements. These states were chosen be-
cause, for a value of Bq near 0.8194 T, the first derivative
of the transition frequency with respect to Bq goes to
zero. The resulting insensitivity to magnetic-field fluctu-
ations makes it easier to generate coherent superposition
states reproducibly.
The state preparation began by subjecting the ions to
313-nm radiation, polarized perpendicular to the mag-
netic field, for approximately 15 s. The frequency of the
313-nm radiation was slightly below the 2s'^Si/2 {Mj =
+|,Mj = +\) -> 2p2p3/2 {Mj = +|,M/ = +1) transi-
tion frequency. This is a cycling transition, since electric
dipole selection rules require that the ion return to the
ground-state sublevel that it started from. Spontaneous
Raman transitions induced by the 313-nm radiation es-
tablished a steady state in which approximately y| of the
ions were in state 4 and the remaining ^ were in state
5. This optical pumping has been discussed previously
[12,39] and studied experimentally [40]. There are fluctu-
ations about these average values, since any given ion is
continually making transitions between states. The ions
could have been completely optically pumped into state
4 by circularly polarized light propagating along the z
axis, but this was not convenient experimentally.
The 313-nm beam was blocked to stop the optical
pumping and to prevent perturbations to the ^Be"*" en-
ergy levels. Next, the ions in state 4 were transferred to
state 3 and then to state 2 by 0.2 s resonant rf pulses.
These were tt pulses; that is, the products of the rf mag-
netic fields and the pulse durations were adjusted so that
6t = TT in Eq. (2.8). The frequencies were 320 712 280
Hz for the (4 -^ 3) transition and 311 493 688 Hz for the
(3 —> 2) transition. The Ramsey method was then used
to create various superpositions of states 1 and 2. Thetwo Ramsey rf pulses were 0.5 s long and were separated
by 5 s; the frequency was 303 016 377.265 Hz.
Then a measurement was made of the number of ions
in state 2. First, the ions in state 2 were transferred to
state 3 and then to state 4 by applying the tt pulses in the
opposite order. Then the 313-nm beam was unblocked,
and the fluorescence photons were counted for 1 s.
The ions which were left in state 5 at the time that the
313-nm beam was blocked (about ^ of the total num-ber) contributed to the fluorescence signal. This is so,
because the time constant for exchanging population be-
tween states 4 and 5 by spontaneous Raman transitions
was about 0.1 s, which was much less than the 1-s obser-
vation time. The time constant for ions in state 1 to be
optically pumped to states 4 and 5 was approximately
10 s. Therefore, the number of ions pumped from state
1 back to states 4 and 5 could be neglected.
E. Results
Ion plasmas containing numbers of ^Be"*" ions ranging
from a few to a few hundred were studied. Figures 11(a)-
11(d) show the results from plasmas containing approx-
imately 5, 21, 72, and 385 ions. The rf power for the
(2 —> 1) Ramsey resonance was adjusted so as to give a
minimum fluorescence signal at the line center. Measure-
ments were made at rf frequencies corresponding to the
transition maximum (minimum fluorescence), the first
upper and lower transition minima (maximum fluores-
cence), and the points halfway between the transition
maximum and the upper and lower transition minima.
The measured signal is the number of photons detected
in the first second after the laser is unblocked. This is
S = B + K{Ni + N^), (4.1)
where B is the background signal, A^4 and N^ are the
numbers of ions in states 4 and 5, and K is a, constant
which must be calibrated for a given set of conditions.
At the line center, the signal is B + {KN/17), where Nis the total number of ^Be"*" ions, while at the points of
maximum fluorescence, it is B + KN. For the N = 5, 21,
72, and 385 data shown in Figs. ll(a)-ll(d), K = 87.3,
TN-72
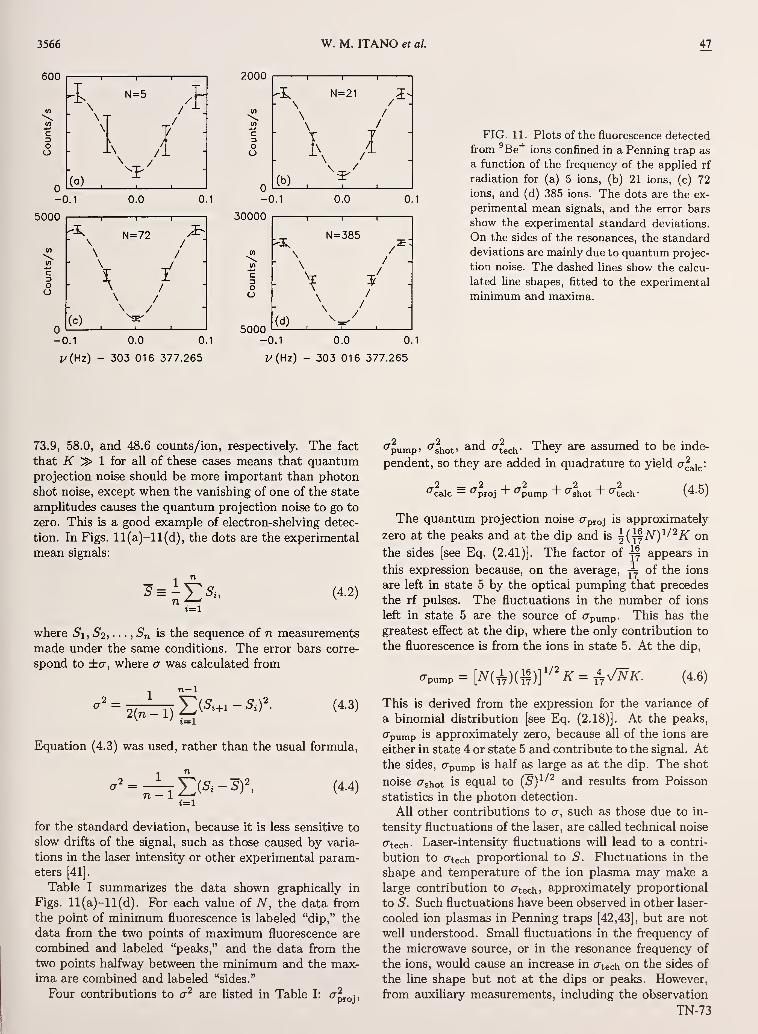
5000
c3oo
-T1 r
N=72 ^.
\iI
-0.1
\ /\ /
0.0 0.1
ly(Hz) - 303 016 377.265
W. M. ITANO et al.
2000
V)
3oo
11 1
'X N=21 5
\.,/"
-0.1
(b)
0.0 0.1
30000
3Oo
1 r
N=385
\\
5000-0.1
(d)/
_] L.
0.0 0.1
Z/(Hz) - 303 016 377.265
47
FIG. 11. Plots of the fluorescence detected
from ^Be"*" ions confined in a Penning trap as
a function of the frequency of the apphed rf
radiation for (a) 5 ions, (b) 21 ions, (c) 72
ions, and (d) 385 ions. The dots are the ex-
perimental mean signals, and the error bars
show the experimental standard deviations.
On the sides of the resonances, the standard
deviations are mainly due to quantum projec-
tion noise. The dashed hues show the calcu-
lated line shapes, fitted to the experimental
minimum and maxima.
73.9, 58.0, and 48.6 counts/ion, respectively. The fact
that X ^ 1 for all of these cases means that quantumprojection noise should be more important than photon
shot noise, except when the vanishing of one of the state
amplitudes causes the quantum projection noise to go to
zero. This is a good example of electron-shelving detec-
tion. In Figs. ll(a)-ll(d), the dots are the experimental
mean signals:
1 "
(4.2)
where 5i, 52, . ..
, 5„ is the sequence of n measurements
made under the same conditions. The error bars corre-
spond to ±a, where a was calculated from
n-l
Equation (4.3) was used, rather than the usual formula,
1 ""
1=1
Sf, (4.4)
for the standard deviation, because it is less sensitive to
slow drifts of the signal, such as those caused by varia-
tions in the laser intensity or other experimental param-eters [41].
Table I summarizes the data shown graphically in
Figs. ll(a)-ll(d). For each value of N, the data fromthe point of minimum fluorescence is labeled "dip," the
data from the two points of maximum fluorescence are
combined and labeled "peaks," and the data from the
two points halfway between the minimum and the max-ima are combined and labeled "sides."
Four contributions to cr^ are listed in Table I: cr?proji
pump
'
^shot' and a^ They are assumed to be inde-
pendent, so they are added in quadrature to yield<7^aic'
tech'
_2 2 2 2 2= ^proj "T" ^pump "I" ^shot + ^tech* (4.5)
The quantum projection noise iTproj is approximately
zero at the peaks and at the dip and is ^{^N)^/'^K on
the sides [see Eq. (2.41)]. The factor of y| appears in
this expression because, on the average, jj of the ions
are left in state 5 by the optical pumping that precedes
the rf pulses. The fluctuations in the number of ions
left in state 5 are the source of <t,pump- This has the
greatest effect at the dip, where the only contribution to
the fluorescence is from the ions in state 5. At the dip.
<7pump=[N{^){^)Y^'K=^VNK. (4.6)
This is derived from the expression for the variance of
a binomial distribution [see Eq. (2.18)]. At the peaks,
is approximately zero, because all of the ions are'pump
either in state 4 or state 5 and contribute to the signal. At
the sides, Cpump is half as large as at the dip. The shot
noise cTshot is equal to (5)^^^ and results from Poisson
statistics in the photon detection.
All other contributions to a, such as those due to in-
tensity fluctuations of the laser, are called technical noise
(Ttech- Laser-intensity fluctuations will lead to a contri-
bution to (Ttech proportional to S. Fluctuations in the
shape and temperature of the ion plasma may make a
large contribution to (Ttech) approximately proportional
to S. Such fluctuations have been observed in other laser-
cooled ion plasmas in Penning traps [42,43], but are not
well understood. Small fluctuations in the frequency of
the microwave source, or in the resonance frequency of
the ions, would cause an increase in (Ttech on the sides of
the line shape but not at the dips or peaks. However,
from auxiliary measurements, including the observation
TN-73

47 QUANTUM PROJECTION NOISE: POPULATION 3567
TABLE I. Mean signals S and variances cr^ for TV = 5, 21, 72, and 385 ^Be''' ions. The terms
"dip," "peaks," and "sides" refer to the points of minimum fluorescence, the points of maximumfluorescence, and the points halfway between the minima and the maxima, respectively. The numberof measurements is n. The measured varieince is cTexpt- The calculated variance a^a,\c is equeil to
<^proj + <^pump + Cshot + <''?ech • The VEilue of (T^xpt at the peaks was used to empirically determine
CTtech- Hence cr^^ic is not hsted at the peaks, since it is necessarily equal to CTexpt- However, the
agreement between (Texpt and CTcaic at the sides and at the dip is a test of the theory. The units for
N Position n S
(counts)
_2C'expt
2"proj
_2'^pump C^shot
^2^tech
_2^calc
(10^ counts^)
5 dip 19 89 1.0 «0 2.1 0.1 0.1 2.3
5 sides 38 275 6.6 9.0 0.5 0.3 0.7 10.5
5 peaks 38 500 2.8 kO ^0 0.5 2.3
21 dip 30 232 5.5 %o 6.3 0.2 0.1 6.6
21 sides 60 810 37.8 27.0 1.6 0.8 1.3 30.7
21 peaks 60 1693 7.6 wO «0 1.7 5.9
72 dip 30 498 11.5 «o 13.4 0.5 0.3 14.2
72 sides 60 2432 61.0 57.0 3.4 2.4 6.3 69.1
72 peaks 60 4429 25.2 «0 wO 4.4 20.8
385 dip 30 6642 69 «o 50 7 26 83
385 sides 60 16108 600 214 13 16 151 394
385 peaks 60 24 253 367 kO wO 24 343
of lineshapes as narrow as 900 fxHz [34] , we determined
that this potential source of noise was negligible. Since
known contributions to cTtech are roughly proportional to
S, cTtech was determined empirically from crgxpt at the
peaks, where the only other contribution to a is CTshoti
which is small. For A^ = 5, 21, 72, and 385, atech/S at
the peaks was 9.6%, 4.5%, 3.2%, and 2.4%, respectively.
The values of crtech at the sides and the dips were esti-
mated by assuming that, for a given set of experimental
conditions, atech was proportional to S.
The entries on Table I show that different types of noise
dominate at each of the three positions on the line: <7prQj
on the sides, cTp^rnp ^^ ^he dip, and crtech ^^ ^^^ peaks.
Shot noise is not a large contribution for any of the cases
shown in Table I. Considering the uncertainties in the
experimental parameters, particularly in N, the agree-
ment between cTg^pt and u^^ij. is quite good. Figure 12
shows that the noise on the sides of the lines is mainly
attributable to quantum projection noise. The quantity
plotted is a/AS and is defined as
o- _ CTexpt (sides)
AS 5(peaks) - 5(dip)(4.7)
The dashed line is the theoretical prediction for quantumprojection noise alone:
yVf _ 0.515
AS " 8//V ~\/iV
'proj(4.8)
The deviation of the experiment from theory for large
A^ is presumably due to technical noise. As noted pre-
viously, CTtech /-S" decreases as N increases, apparently be-
cause the ion plasma becomes more stable in shape and
temperature. However, it should not continue to decrease
indefinitely with N , since the contribution from laser in-
tensity fluctuations, for example, should approach a con-
stant value for large N . Hence a
j
AS should approach
a constant value for large N rather than continuing to
decrease as 1/VN . For A^ = 10 000, (Tproi/S is approxi-
mately 1% on the sides, while we might, from the present
results, expect atech/S to be about 2%. This is consis-
tent with previous experimental results from a firequency
<0.1
0.01
-1—I I I I I II] 1—I I M I iri
I ' ' ' I I
10 100
N
1000
FIG. 12. Plot of the normalized standard deviations as a
function of N, the number of ^Be"*" ions. The quantity a/ASis the ratio of the experimental standard deviation on the
sides of the resonance to the difference in the signal between
the peaks and the dip. The dashed line is the theoretical
prediction for the contribution from quantum projection noise
alone. „^ ^ _TN-74
I

3568 W. M. ITANO et al. 47
standard based on 5000-10 000 ^Be+ ions [34]. However,
there is no fundamental reason that the technical noise
cannot be greatly reduced.
V. CONCLUSION
We have prepared one or many ions in well-defined su-
perpositions of two states and then measured the popula-
tion of one of these states. The population measurements
display quantum fluctuations which are greatest whenthe amplitudes of the two states are equal. In the case
of a single ion, where photon scattering is used to distin-
guish between the two states, the fluctuations take the
form of random switching between two distinguishable
conditions — the observation of zero photons (or back-
ground) or of some photons. There is good agreement
between the observations and theoretical predictions for
both one and many ions.
Population fluctuations of the type observed here
(quantum projection noise) are present and could be ob-
served in other kinds of experiments, for example, those
using atomic or neutron beams. Quantum projection
noise might be observed in neutron interferometry [44].
In this case, the two neutron beams which emerge from
the interferometer correspond to the two energy states
\A) and \B). Introducing a phase shift in one arm of
the interferometer allows one to create coherent super-
position states. Ranch et al. [44] show counting-rate his-
tograms for phase shifts corresponding to the maximumand minimum counting rates in one beam. However, they
do not show the histograms for a phase shift halfway be-
tween a maximum and a minimum, which might show an
increased variance due to quantum projection noise.
In the preceding discussions, the single-atom and N-atom experiments were treated from different perspec-
tives. This was because of the different experimental
methods which were used for the ^^^Hg+ and ^Be+. How-
ever, if the N atoms are uncorrelated, there is not a fun-
damental difference between the two cases. We could
simulate the results of an A'^-atom measurement by mak-ing N successive measurements on a single atom andsumming the results.
In many experiments, quantum projection noise wouldbe obscured by other forms of noise, such as fluctuations
in the beam intensity or the statistics of the detection
process. In the experiments described here, trapping
nearly eliminates fluctuations in the number of atoms,
and the electron-shelving detection method nearly elim-
inates statistical fluctuations in the detection, thereby
making quantum projection noise the dominant source
of noise. In spectroscopic measurements on fixed num-bers of atoms, where transitions are detected by monitor-
ing changes in population, this is the fundamental noise
limit.
ACKNOWLEDGMENTS
We acknowledge financial support from the Office of
Naval Research. We thank Jean Dalibard for pointing
out the simple calculation of the variance for one atom[Eq. (2.15)].
APPENDIX: OPTICAL PUMPING IN i»»Hg+
For low enough laser intensities, optical pumpingamong the Zeeman hyperfine sublevels of the ground
state of ^^^Hg+ can be described by population rate equa-
tions. The following set of equations applies to the pop-
ulations of the Zeeman hyperfine sublevels of the 6s ^5i/2
and &p^P\/2 states, when a linearly polarized optical field
of the form E(r, t) = iEo cos(k r — cj^f ), nearly resonant
with the ^Si/2{F = 1)
applied:
^Pi/2{F — 0) transition, is
^ = -^sm^eR^L{A)P, - 1(1 + cos2^) (^) R^Pi + ^{P, + P5 + Pe),
^ = -isin2eiloL(A)P3 - i(l + cos2^) {^^ R0P3 + |(P4 + Pe + ^7),
^ = i sin^ ^i?oi^(A)(Pi + P3) + cos'' e R^L{A)P2 - 7P4,
dPs 1.2 7/2
A5 + ApIi^Po + cos^e{^^ RoPi + lsin'eC^] R^P2-^Ps,
dPe 2a( 7/2—— = cos 6 -—-dt VA5 +^"J
RQP^ + \sm^d(^^ RoiPi + P3) - yPe,
dPi 1.2^^ =isin^e(—^dt 2
V As -1- AjPoPo + ^sin2^(^) P0P2 + cos2 ^
(^ ] R^Ps-jPj.7/2
Ap(ill\Ap
(Al)
(A2)
(A3)
(A4)
(A5)
(A6)
(A7)
(A8)
TN-75
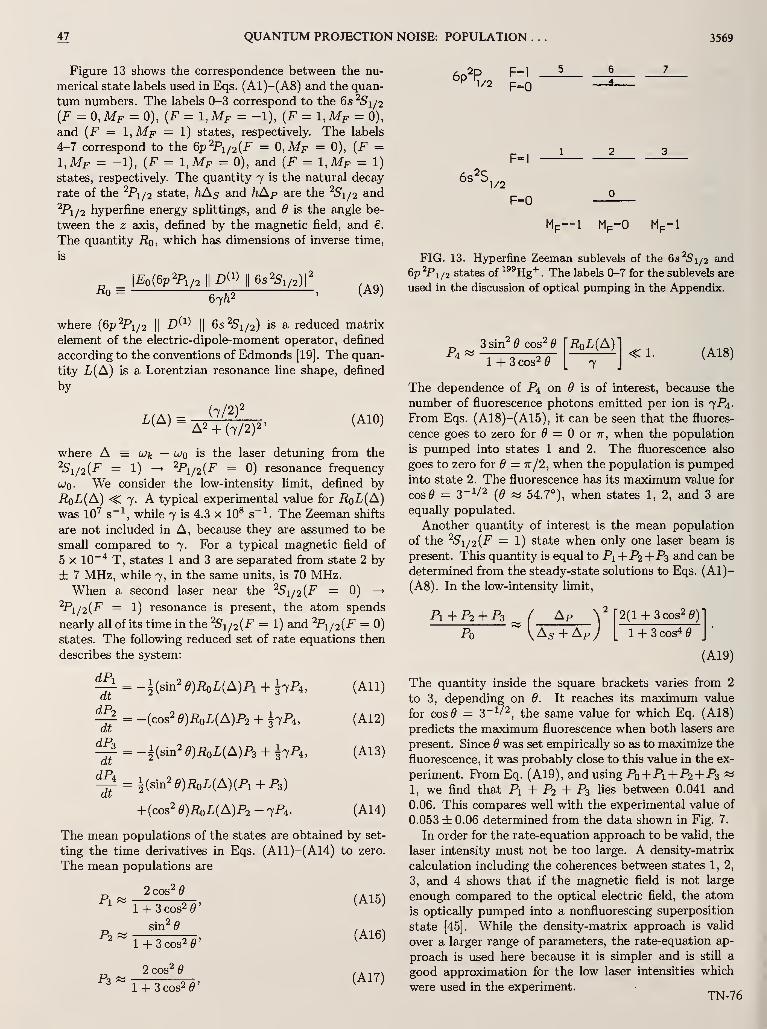
47 QUANTUM PROJECTION NOISE: POPULATION 3569
Figure 13 shows the correspondence between the nu-
merical state labels used in Eqs. (Al)-(A8) and the quan-
tum numbers. The labels 0-3 correspond to the 6s ^51/2
{F^O,Mf = 0), {F = 1,Mf^-1), {F^1,Mf^0),and {F = 1,Mf = 1) states, respectively. The labels
4-7 correspond to the 6p^Pi/2{F = 0,Mf = 0), {F =1,Mf = -1), {F = 1,Mf = 0), and (F = 1,Mf = 1)
states, respectively. The quantity 7 is the natural decay
rate of the ^Pi/2 state, HAs and hAp are the ^5i/2 and
^Pi/2 hyperfine energy splittings, and 9 is the angle be-
tween the z axis, defined by the magnetic field, and e.
The quantity Rq, which has dimensions of inverse time,
is
Rq67/12
(A9)
where {Qp^Pi/2II
D^^^\\ 65^5^/2) is a reduced matrix
element of the electric-dipole-moment operator, defined
according to the conventions of Edmonds [19]. The quan-
tity L{A) is a Lorentzian resonance line shape, defined
by
L(A). (^/^)^
A2 + (7/2)2'(AlO)
where A = Wfe — cjq is the laser detuning from the
251/2 (F = 1) ^ ^Pi/2{F = 0) resonance frequency
ujQ. We consider the low-intensity limit, defined by
RqL{A) <^ 7. a typical experimental value for RqL{A)was 10'^ s~^, while 7 is 4.3 x 10^ s~^. The Zeeman shifts
are not included in A, because they are assumed to be
small compared to 7. For a typical magnetic field of
5 X 10~^ T, states 1 and 3 are separated from state 2 by
± 7 MHz, while 7, in the same units, is 70 MHz.When a second laser near the ^5i/2(F = 0) —
>
'^Pi/2{F = 1) resonance is present, the atom spends
nearly all of its time in the ^5i/2(F = 1) and ^Pi/2(F = 0)
states. The following reduced set of rate equations then
describes the system:
HP^ = -^{smH)RoL{A)P, + ^7^4,
-^ = -(cos^ e)RoL{A)P2 + ^7^4,dP2 ^
dt^ 2
dt
dP
= -Usm^e)RoL{A)P3 + hP^,dP3
^ = Usin^9)RoL{A){P, + Ps)
+(cos2 9)R^L{A)P2 - 7F4.
(All)
(A12)
(A13)
(A14)
The mean populations of the states are obtained by set-
ting the time derivatives in Eqs. (All)-(A14) to zero.
The mean populations are
(A15)
(A16)
P3
2 cos2 9"
l + 3cos2 9'
sin^e~
l + 3cos2 9'
2 cos2 9
l + 3cos2e'(A17)
6p2p1/2
F-1
F=0
6s2S1/2
F-0
Mp— 1 Mp-0 Mp-1
FIG. 13. Hyperfine Zeeman sublevels of the 6s^Si/2 and
6p ^Pi/2 states of ^^^Hg+. The labels 0-7 for the sublevels are
used in the discussion of optical pumping in the Appendix.
3sin^gcos2g
1 -h 3 cos2 9
RoL{A)
7<1. (A18)
The dependence of P4 on 9 is of interest, because the
number of fluorescence photons emitted per ion is 7P4.
Prom Eqs. (A18)-(A15), it can be seen that the fluores-
cence goes to zero for ^ = or tt, when the population
is pumped into states 1 and 2. The fluorescence also
goes to zero for 9 = tt/2, when the population is pumpedinto state 2. The fluorescence has its maximum value for
cos 9 = 3~^/2 (^ ~ 54.7°), when states 1, 2, and 3 are
equally populated.
Another quantity of interest is the mean population
of the '^Si/2{F — 1) state when only one laser beam is
present. This quantity is equal to P1+P2 +P3 and can be
determined from the steady-state solutions to Eqs. (Al)-
(A8). In the low-intensity limit,
Pi + P2 + P3
As + Aj
2(l + 3cos2g)
TTTcos^y
(A19)
The quantity inside the square brackets varies from 2
to 3, depending on 9. It reaches its maximum value
for cos^ — 3~^/2^ the same value for which Eq. (A18)
predicts the maximum fluorescence when both lasers are
present. Since 9 was set empirically so as to maximize the
fluorescence, it was probably close to this value in the ex-
periment. Prom Eq. (A19), and using P0 +P1+P2 + P3 «^
1, we find that Pi -I- P2 + P3 lies between 0.041 and
0.06. This compares well with the experimental value of
0.053 ± 0.06 determined from the data shown in Fig. 7.
In order for the rate-equation approach to be valid, the
laser intensity must not be too large. A density-matrix
calculation including the coherences between states 1, 2,
3, and 4 shows that if the magnetic field is not large
enough compared to the optical electric field, the atom
is optically pumped into a nonfiuorescing superposition
state [45]. While the density-matrix approach is valid
over a larger range of parameters, the rate-equation ap-
proach is used here because it is simpler and is still a
good approximation for the low laser intensities which
were used in the experiment. ^ „^TN-76
3570 W. M. ITANO et al. 47
* Present address: Department of Physics, University of [23
Texas, Austin, TX 78712.
[1] L. E. Ballentine, Am. J. Phys. 55, 785 (1987). [24
[2] L. E. Ballentine, Rev. Mod. Phys. 42, 358 (1970).
[3] A. Peres, Am. J. Phys. 54, 688 (1986).
[4] D. Home and M. A. B. Whitaker, Phys. Rep. 210, 2i23
(1992).
[5] M. Pavicic, in Problems in Quantum Physics II, Gdansk, [25
1989, edited by J. Mizerski et al. (World Scientific, Sin-
gapore, 1990), pp. 440-452. [26
[6] D. Home and M. A. B. Whitaker, Phys. Lett. A 160, 325
(1991). [27
[7] J. Dalibard, Y. Castin, and K. M0lmer, Phys. Rev. Lett.
68, 580 (1992). [28
[8] H. J. Carmichael, R. J. Brecha, and P. R. Rice, Opt.
Commun. 82, 73 (1991).
[9] G. C. Hegerfeldt and T. S. Wilsner, in Quantum [29
Systems—Foundations and Symmetries: Proceedings of
the Second International Wigner Symposium, Goslar, [30
1991, edited by W. Scherer, H. D. Doebner, and F.
Schroeck, Jr. (World Scientific, Singapore, 1992).
[10] R. Dum, P. Zoller, and H. Ritsch, Phys. Rev. A 45, 4879 [31
(1992).
[11] H. G. Dehmelt, Bull. Am. Phys. Soc. 20, 60 (1975). [32
[12] D. J. Wineland, J. C. Bergquist, W. M. Itano, and R. E.
DruUinger, Opt. Lett. 5, 245 (1980). [33;
[13] D. J. Wineland, W. M. Itano, J. C. Bergquist, and F. L.
Walls, in Proceedings of the 35th Annual Frequency Con- [34
trol Symposium, Philadelphia, 1981, NTIS Doc. No. AD-Al 10870 (Electronic Industries Association, Washington,
DC, 1981), pp. 602-611 [reprinted in Trapped Ions and [35
Laser Cooling, edited by D. J. Wineland, W. M. Itano, J.
C. Bergquist, and J. J. BoUinger, Natl. Bur. Stand. (U.S.) [36
Technical Note 1086 (U.S. GPO, Washington, DC, 1985),
pp. TN-47-TN-56].
[14] N. F. Ramsey, Molecular Beams (Oxford University [37^
Press, London, 1956).
[15] R. P. Feynman, F. L. Vernon, Jr., and R. W. Hellwarth, [38
J. Appl. Phys. 28, 49 (1957).
[16] R. H. Dicke, Phys. Rev. 93, 99 (1954).
[17] P. R. Bevington, Data Reduction and Error Analysis for [39
the Physical Sciences (McGraw-Hill, New York, 1969).
[18] F. T. Arecchi, E. Courten, R. Gilmore, and H. Thomas, [40
Phys. Rev. A 6, 2211 (1972).
[19] A. R. Edmonds, Angular Momentum in Quantum Me- [41
chanics (Princeton University Press, Princeton, NJ,
1974). [42
[20] B. Yurke, Phys. Rev. Lett. 56, 1515 (1986); B. Yurke,
S. L. McCall, and J. R. Klauder, Phys. Rev. A 33, 4033 [43
(1986).
[21] M. Kitagawa and M. Ueda, Phys. Rev. Lett. 67, 1852
(1991); in Noise in Physical Systems and 1/f Fluctua-
tions, Proceedings of the International Conference, Ky-
oto, Japan, 1991, edited by T. Musha, S. Sato, and M. [44
Yamamoto (lOS, Burke, VA, 1992), p. 355.
[22] G. S. Agarwal and R. R. Puri, Phys. Rev. A 41, 3782 [45
(1990).
D. J. Wineland, J. J. Bollinger, W. M. Itano, F. L. Moore,
and D. J. Heinzen, Phys. Rev. A 46, 6797 (1992).
L. S. Cutler, R. P. Giffard, and M. D. McGuire, in Pro-
ceedings of the 13th Annual Precise Time and Time In-
terval Applications and Planning Meeting, edited by L.
J. Rueger, NASA Conf. Publ. 2220 (NASA, Washington,
DC, 1982), pp. 563-578.
Y. Guern, A. Bideau-Mehu, R. Abjean, and A. Johannin-
Gilles, Phys. Scr. 14, 273 (1977).
P. Eriksen and O. Poulsen, J. Quant. Spectrosc. Radiat.
Transfer 23, 599 (1980).
W. M. Itano, J. C. Bergquist, R. G. Hulet, and D. J.
Wineland, Phys. Rev. Lett. 59, 2732 (1987).
M. G. Raizen, J. M. Gilligan, J. C. Bergquist, W. M.Itano, and D. J. Wineland, J. Mod. Opt. 39, 233 (1992);
Phys. Rev. A 45, 6493 (1992).
H. Hemmati, J. C. Bergquist, and W. M. Itano, Opt.
Lett. 8, 73 (1983).
See, for example, W. M. Itano and D. J. Wineland, Phys.
Rev. A 25, 35 (1982); D. J. Wineland and W. M. Itano,
Phys. Today 40 (6), 34 (1987).
A. G. Calamai and C. E. Johnson, Phys. Rev. A 42, 5425
(1990).
J. J. Bollinger, D. J. Heinzen, W. M. Itano, S. L. Gilbert,
and D. J. Wineland, Phys. Rev. Lett. 63, 1031 (1989).
S. L. Gilbert, J. J. Bollinger, and D. J. Wineland, Phys.
Rev. Lett. 60, 2022 (1988).
J. J. Bollinger, D. J. Heinzen, W. M. Itano, S. L. Gilbert,
and D. J. Wineland, IEEE Trans. Instrum. Meas. 40, 126
(1991).
W. M. Itano, D. J. Heinzen, J. J. Bollinger, and D. J.
Wineland, Phys. Rev. A 41, 2295 (1990).
D. J. Larson, J. C. Bergquist, J. J. Bollinger, W. M.
Itano, and D. J. Wineland, Phys. Rev. Lett. 57, 70
(1986).
D. J. Wineland, J. J. Bollinger, W. M. Itano, and J. D.
Prestage, J. Opt. Soc. Am. B 2, 1721 (1985).
L. R. Brewer, J. D. Prestage, J. J. Bolhnger, W. M. Itano,
D. J. Larson, and D. J. Wineland, Phys. Rev. A 38, 859
(1988).
R. G. Hulet and D. J. Wineland, Phys. Rev. A 36, 2758
(1987).
R. G. Hulet, D. J. Wineland, J. C. Bergquist, and W. M.
Itano, Phys. Rev. A 37, 4544 (1988).
H. Mark and J. Workman, Statistics in Spectroscopy
(Academic, San Diego, 1991), pp. 57-68.
R. C. Thompson, G. P. Barwood, and P. Gill, Appl. Phys.
B 46, 87 (1988).
W. M. Itano, L. R. Brewer, D. J. Larson, J. J. BoUinger,
S. L. Gilbert, and D. J. Wineland, in Frequency Standards
and Metrology, Proceedings of the Fourth Symposium,
Ancona, Italy, edited by A. De Marchi (Springer-Verlag,
Berlin, 1989), p. 447.
H. Rauch, J. Summhammer, M. Zawisky, and E. Jericha,
Phys. Rev. A 42, 3726 (1990).
W. M. Itano (unpublished calculations).
TN-77

PHYSICAL REVIEW A VOLUME 46, NUMBER 1
1
1 DECEMBER 1992
Spin squeezing and reduced quantum noise in spectroscopy
D. J. Wineland, J. J. Bollinger, W. M. Itano, and F. L. MooreTime and Frequency Division, National Institute of Standards and Technology, Boulder, Colorado 80303
D. J. Heinzen
Physics Department. University of Texas, Austin, Texas 78712
(Received 25 March 1992)
We investigate the quantum-mechanical noise in spectroscopic experiments on ensembles of N two-
level (or spin-i) systems where transitions are detected by measuring changes in state population. By
preparing correlated states, here called squeezed spin states, we can increase the signal-to-nose ratio in
spectroscopy (by approximately /V '^^ in certain cases) over that found in experiments using uncorrelat-
ed states. Possible experimental demonstrations of this enhancement are discussed.
PACS number(s): 42.50.Lc, 03.65. Bz, 42.50.Dv
Squeezed states of the electromagnetic field have re-
ceived much attention for over a decade [I] and have now
been applied to fundamental metrology such as the reduc-
tion of noise in optical interferometers below the standard
quantum limit [2]. Related to this are theoretical investi-
gations of noise reduction in fermion interferometers with
correlated input states [3,4). In this paper we investigate
an application of squeezing to the reduction of quantum-
mechanical noise in spectroscopic experiments on ensem-
bles of two-level systems. We also suggest how this
squeezing might be realized in an experiment.
We will be specifically interested in experiments where
transitions are detected by measuring the changes in pop-
ulation of one of the two levels. This is to be contrasted
with experiments which detect the radiation transmitted
through an absorber; these experiments benefit from
squeezed radiation [5]. We first show that preparation of
correlated input states (squeezed spin states) improves, in
a fundamental way, the signal-to-noise ratio (SNR) in
any spectroscopic experiment which is limited by the
quantum-mechanical uncertainty in the measurement of
the level populations. We then discuss, as an example, a
possible experimental realization of this improvement us-
ing laser-cooled stored ions, where the SNR is currently
limited by quantum fluctuations in measured populations
[6].
Since the dynamics of a two-level system interacting
with radiation are the same as the dynamics of a spin-
j
particle in a magnetic field [7] we will discuss only the
latter case. We begin by assuming an ensemble of A' spin
S=j systems each with magnetic moment /i =/ioS and
whose direct dipole-dipole interaction can be neglected.
Each spin interacts with an externally applied magnetic
field Boi (flo=const) through the Hamiltonian Hq= — fi- (Bqz) = h(OoSz where (Oq is the precession fre-
quency of each spin about the z axis. We assume A' is
fixed and the relaxation negligible [6]. Suppose all the
spins are initially prepared at time / =0 in the I"})state. In this case, the spin wave function for the ensem-
ble can be represented by the Dicke state \j,M = — J)
where J =S/S, (S, is the spin of the /th particle), J =N/2,and M={J,} [8]. For this state, AA(/ =0) =Ay^(0)
= (y/2)'''^ and AJ^iO) =0, where AA is the square root of
the variance of operator /I, {AA)^= {A'^} — {A)^. In Fig.
I (a), the lower cone shows, pictorially, a more general ini-
tial state with (J) =(7^)2, iJz) <0, and AJyKAJ^ in a
reference frame which corotates about the z axis with the
spin precession frequency ojq. In this rotating frame, the
field Bq transforms to zero and the state remains station-
ary [9].
We perform spectroscopy (here, essentially nuclear
magnetic or electron spin resonance) using the Ramseymethod of separated oscillatory fields [9]. Description in
terms of the Ramsey method leads to mathematical
simplification, but the improvement of SNR is quite gen-
eral. The Ramsey method consists of applying an oscillat-
<^(^*2f^,,)>
4) = (u -cojr
FIG. 1. Pictorial representation of the Ramsey method of
spectroscopy in a frame corotating with the spin precession fre-
quency. In (a), the lower cone represents the initial spin state
for the Ramsey spectroscopy described in the text. After appli-
cation of the second n/l pulse [upper cone in (b)], we detect the
number of spins in the|+ j ) state.
M R6797 Work of the U. S. Government
Not subject to U. S. copyright
TN-78

R6798 WINELAND, BOLLINGER, ITANO, MOORE, AND HEINZEN 46
ing classical field yB\(t)cos((ot) where a>= (oo. This field
can be decomposed into two fields which rotate about the
z axis; one of these fields B, (|B;.| =B\/D rotates in the
same direction as the spin precession and the other can
usually be neglected as is assumed here [9]. We will as-
sume that B\ is nonzero and constant with value 5io from
time r =0 to t=t„ii such that ilRt„i2 = n/2 and
l<w~<0ok;r/2«l, where nR=noB\o/i2h) is the Rabi fre-
quency. At / =0 in the rotating frame, B^ lies along the yaxis as shown in Fig. 1 (a). The lower cone of Fig. 1 (a) ro-
tates about B,- and preserves its size and shape so that
after time t„/2, the cone lies along the x axis. At / =t„/2,
B\ is reduced to zero and the cone remains stationary
along X. After a time T i^t„/2), B\ is made equal to B\q
again for a time t„/2. If (o^(oq, B^ is now at an angle
^ = {a) — (OQ)T with respect to its original direction and
the cone precesses about B;- as shown in Fig. 1 (b). At
time tf=T+ 2t„/2, the number of particles in the |+ y)
state is measured. The expected number of particles (A' + )
in the |+y) state, where N+=J + J:, is given by the
Ramsey resonance curve
(yv + ) =7 - (^z (O))cos(w - 0)0)7^ • (1)
The discussions of correlated-particle interferometer ex-
periments [3,4] parallel the description of the Ramseymethod.
With A' constant we eliminate noise due to fluctuations
in A' as found in an atomic beam experiment. However,
successive measurements of A'+ for a particular value of
co — coo fluctuate by AA'+ due to fluctuations in the num-ber of spins measured to be in the |
+ y ) state. This
produces apparent fluctuations in the center frequency
of the Ramsey curve, given by \Aco\=AN +/\BiN + }/d(o\
=AJz(tf)/\d{J:(tf)}/dco\. It is these fluctuations wedesire to make small. If the initial state is the |y, —J)Dicke state, we find \Aa)\os~UTN^^^. The somewhat
surprising independence of IAwIds on ^ occurs because
the quantum noise is proportional to the slope of (A' + ). In
the presence of added noise it is advantageous to operate
at frequencies co where \d{N + }/da)\ is maximized in
which case (A^"*") =7 =A'/2. This condition on (o is as-
sumed in the remaining discussion. The frequency noise
|Ac(j|ds has been observed in experiments on trapped ions
[6]. By use of suitably prepared "squeezed" initial spin
states, which show correlations between the individual
spin-y particles, it should be possible to achieve |A(u|
< IAo^Ids- Hence, we define squeezing in Ramsey spec-
troscopy as ^R < \ where
^R = \Aco\/\Aa)\os'=[2J]'^^AJyiO)/\{JAO)}\ (2)
Spin squeezing has been defined in other ways. Fromthe commutation relations for angular momentum, the
corresponding uncertainty relation can be given by
AJxAJy> |<yzV2| and the expressions which follow from
cyclic permutations. From this expression, it is natural to
define squeezed states [10] as those where AJi/\{Jj)/
2|'''^<1 for some i^j&{x,y,z}. This squeezing is
present in Bloch states [8], which are obtained by rotating
the |y, ±7) Dicke states [10]. For example, during the
first Ramsey pulse [Fig. 1(a)], AJj\U,)l2y'^-icosey'^
< 1. However, these rotated |7, ±7) Dicke states have
^R = I and do not improve the spectroscopy we describe
here. Spin squeezing might also be defined as follows [4]:
Let A7< denote the smallest uncertainty of a spin com-
ponent perpendicular to mean spin vector (J). The spin is
squeezed if ^spin < 1 where
^spin=A7</|a)/2|'/^ (3)
For the Bloch states, i^spin'^^l- A squeezed spin state with
i^spin < 1 can be rotated so that (J)=(7z)z and A7< =A7^and can then be used in Ramsey spectroscopy with
^/,=(7/|a)|)'%in.We now examine possible methods to prepare the ini-
tial squeezed spin state. For a single particle (7=y),
^spin,*?/?^ 1- For 7 > 1. states with ^^p\„,^R< 1 can be
prepared using an interaction proportional to the square
of angular momentum operators [4]. Because we were
unable to find a physical interaction of this type for our
problem, we have investigated an interaction of the form— HoJxzB' cosicomtp). Here, B' has units of a field gra-
dient (dBx/dz), 2 =zo(o +a) is the quantum-mechanical
amplitude of a harmonic oscillator of frequency ftj^, zq is
its zero-point amplitude [zq—Az (coherent state)], a^ and
a are raising and lowering operators, tp is the time during
the preparation period, and we assume (Oz^oo- For a
suitable choice of com, this interaction gives rise to a reso-
nant coupling between J and z. In the interaction picture
and in the rotating-wave approximation it has the form
Hi = -hilU +a+J-a^) ,(4a)
for cOm =coo~ (Oz and
H2=^-hnU+a^ + J-a) ,(4b)
for ci)r„=coo+ o)2 where J + =Jx + iJy, J-=iJ+) , and
n=/io5'zo/4/i.
The Heisenberg equations of motion for a and 7- can
be solved analytically for Eqs. (4) when dJ:/dtp =0. If
the initial spin state is the |7, — 7) Dicke state, this
amounts to the small-angle approximation 7^ = — 71
where I is the identity operator [11]. For the interaction
//i, we find
2(, =1<^spin=<?^=COS^fi;vrp + ^z('A'=0)sin^a^rp, (5)
where n^^An^ and ^^(/p =0) = Az(rp =0)/Az (coherent
State) is the initial squeezing of the harmonic oscillator.
Therefore if t,^ (/^ =0) < 1 , this squeezing is transferred to
the spins (in a time k/2D.n) like wave-function exchange
between coupled harmonic oscillators [12]. Because of
the limited validity of the small-angle approximation, we
have numerically evaluated Schrodinger's equation to
compute i^spin and £,r for two special cases shown in Figs. 2
and 3 assuming an initial |7, — 7) Dicke state. For our
implementation of squeezing [Eqs. (4)], these figures
show the improvement in SNR which can be obtained
over the quantum limit obtained with uncorrelated input
states.
This squeezing can, in principle, be generated by the in-
teraction of an ensemble of atoms with a single-mode cav-
ity field [1,11,13]. It can be viewed as the complement of
TN-79

^ SPIN SQUEEZING AND REDUCED QUANTUM NOISE IN . . . R6799
(a) 10
0.5
^R •
^sp,n
AJ=l
. small antheory
.\\-' <n^(0)> O
I
<— "°^n o <>
0.0 0.5
P (0)^ 7
2.5
2.0
1.5
1.0
0.5
1.0
(a) 10
0.9
0.8 1
<
^R •
^spin
5 10<n,(t =0)>
(b)1-0
0.5
0.0
1 . 1 1 . 1 11
1 1 1
o f ^-~^.
ispin
e^(o) o
^8
(b) 10.
10
J
100
FIG. 2. Squeezed spin state preparation assuming the in-
teraction of Eq. (4a) and assuming the harmonic oscillator is
initially in the squeezed vacuum state where (z(?p=0)>
=(z(/p=0)>=0, ^zUp=0) < !. In (a), we plot the first minima
(as a function of preparation time tp) of <^spin, the resulting
value of ^R, and the corresponding value of {nzilp=0))
i = {aHO)alo)}) vs ^Aip=0) for the case 7 = 1. As expected,
the small-angle theory is valid for ^j(/p =0)— 1, ({nAO))^0).
In (b), we show the first minimum values (as a function of
preparation time tp) of <^spin which have also been minimized
with respect to ^z(tp =0), the resulting value of ^r, and the cor-
responding values of ^2 itp =0) vs J.
the squeezing of a single-mode radiation field by coupling
to an ensemble of spins [11,1 3]. It might also be generat-
ed in an ensemble of trapped ions where the harmonic os-
cillator corresponds to the center-of-mass (cm.) oscilla-
tion in a particular (z) direction. For simplicity, we con-
sider A' ions trapped along the axis of a linear rf trap [14].
The two-level system is the Zeeman doublet for an un-
paired electron on each ion. B' is a gradient field dB^/dz
generated by current /^y in two wires (which could double
as trap electrodes) situated as the positions z = ±zt rela-
tive to the ions. We assume the Coulomb interaction be-
tween the ions is large enough that the frequencies of the
ions' internal modes are significantly different from w,.
The cm. mode is first laser cooled to the zero-point state
[15]. A "squeezed vacuum" state of the cm. mode (ap-
propriate for Fig. 2) could be obtained by suddenly chang-
ing the ions' well depth or driving the z oscillation
parametrically at Ico^ [12]. A coherent state of nonzero
amplitude (appropriate for Fig. 3) could be created by
suddenly changing the center position of the well or driv-
ing the zero-point state with a classical resonant excita-
tion [12]. When po is equal to two Bohr magnetons, wefind il/27r=2Iyzf^ -^{Moijln)'^'^ where ly, zt, M,and cDz/ln are expressed in amperes, centimeters, atomic
mass units, and megahertz, respectively. For 7^=0.1 A,
zr=O.OI cm, Af =24u (^''Mg + ), and w,/2;r = I MHz, we
0.5
0.0
' ' ' ' '11111.1
fR •f
^^o :
^~^
1
-^ <n^(0)> o|-
^^•^• 1
q 100
A
10
10
J
100
FIG. 3. Squeezed spin state preparation assuming the in-
teraction of Eq. (4b) and assuming the harmonic oscillator is
initially prepared in a coherent state [^2(/p=0) = l] with
izitp =0))?iO and (zitp =0)) =0. In (a) we show the first mini-
ma of i^spin (as a function of tp), and the resulting values of ^r vs
(nz Up =0)) for 7 = 1 . In (b), we show the first minimum values
(as a function of preparation time tp) of i^spin which have also
been minimized with respect to {rizUp =0)), the resulting values
of ^R, and the corresponding values of irizUp =0)> vs J. We find
the first minima of i^spin (as a function of tp) occur after Uz) has
reached its maximum value and the spin vector is moving back
toward the negative z axis. In this case the squeezed state must
be rotated back to the negative z axis before applying the Ram-sey fields.
find n/2;r— 400 Hz. The interesting cooling method pro-
posed by Harde [16] uses the same parametric coupling
described here. For Ramsey spectroscopy, the relative
phase between the squeezing and Ramsey fields must be
reproducible from measurement to measurement.
When A' is even, there exist correlated states where
^R={N/l+\)~^''^ (see also Ref. [3]) in which case the
uncertainty in the measurement of coq will be approxi-
mately proportional to TV~' rather than the usual A'
~'''^.
For example, for A' =2 (7 = 1), the |7 = l,A/=0) Dicke
state is maximally squeezed ((J) =0 for this state, but
^R1/2
as |(J)| —* 0). It can be used in Ramsey spec-
troscopy by detecting j} rather than 7^ [17]. For this
state the correlations between spins is clear. If one spin is
measured to be in the + j ( — y ) state, the other spin
will be found in the — y (+ y ) state. Starting from the
|«z=0)|7 = l, A/ = — 1) state, we can prepare this
squeezed state by making w^ anharmonic to break the de-
generacy of the 5/Jz = 1 transitions. With a classical field
we drive to the1 1 )| I ,
—1 ) state and then turn the anhar-
monicity off. We then apply the interaction of Eq. (4a) to
drive to the |0>| 1,0) squeezed state.
In summary, it should be possible to improve the
signal-to-noise ratio in spectroscopic experiments which
TN-80

R6800 WINELAND, BOLLINGER, ITANO, MOORE, AND HEINZEN 46
detect the changes of state population over the case where
uncorrelated particles are used. It might also be possible
to demonstrate spin squeezing in individual atoms or ions
with / > 1 such as in the Zeeman sublevels of a particular
hyperfine state [17]. The relatively large value of il sug-
gests that cavity-QED problems in the strong-coupling
(weak relaxation) regime might be studied in the ion sys-
tem. The correlated states described here could be used in
Bell's inequality experiments. A possibility is the creation
of multiparticle correlated states which strongly violate
Bell's inequality [18]. The individual particle states could
be detected with nearly 100% efficiency [6].
We gratefully acknowledge the support of ONR. Wethank M. Kitagawa for sending us copies of the work of
Ref. [4]. D.J.H. acknowledges support from the Sloan
Foundation. We also thank J. Bergquist, J. Kimble, M.Poitzsch, C. Weimer, and B. Yurke for comments on the
manuscript.
[I] See for example the feature issue edited by H. J. Kimble
and D. F. Walls, J. Opt. Soc. Am. B 4, 1450 (1987); spe-
cial issue edited by R. Loudon and P. L. Knight, J. Mod.
Opt. 34, Nos. 6/7 (1987); H. J. Kimble, in Fundamental
Systems in Quantum Optics, edited by J. Dalibard, J. M.
Raimond, and J. Zinn-Justin (Elsevier, New York, 1991).
[2] M. Xiao, L.-A. Wu, and H. J. Kimble, Phys. Rev. Lett.
59, 278 (1987); P. Grangier, R. E. Slusher, B. Yurke, and
A. LaPorta, ibid. 59, 2153 (1987).
[3] B. Yurke, Phys. Rev. Lett. 56, 1515 (1986); B. Yurke, S.
L. McCall, and J. R. Klauder, Phys. Rev. A 33, 4033
(1986).
[4] M. Kitagawa and M. Ueda, Phys. Rev. Lett. 67, 1852
(1991); in Noise in Physical Systems and Iff Fluctua-
tions, edited by T. Musha, S. Sato, and M. Yamamoto(Ohmsha, Ltd., Tokyo, 1 99 1 ), p. 355; and (unpublished).
[5] C. K. Hong, S. R. Friberg, and L. Mandel, Appl. Opt. 24,
3877 (1985); B. Yurke and E. A. Whittaker, Opt. Lett.
12, 236 (1987); A. Heidmann, R. J. Horowicz, S. Rey-
naud, E. Giacobino, C. Fabre, and G. Camy, Phys. Rev.
Lett. 59, 2555 (1987); M. Xiao, L.-A. Wu, and H. J.
Kimble, Opt. Lett. 13, 476 (1988); C. D. Nabors and R.
M. Shelby, Phys. Rev. A 42, 556 (1990); P. R. Tapster, S.
F. Seward, and J. G. Rarity, ibid. 44, 3266 (1991).
[6] W. M. hano et al. (unpublished).
[7] R. P. Feynman, F. L. Vernon Jr., and R. W. Hellwarth, J.
Appl. Phys. 28, 49 (1957).
[8] See for example, F. T. Arecchi, E. Courtens, R. Gilmore,
and H. Thomas, Phys. Rev. A 6, 221 1 (1972).
[9] N. F. Ramsey, Molecular Beams (Oxford, London,
1963), p. 124.
[10] D. F. Walls and P. Zoller, Phys. Rev. Lett. 47, 709
(1981); K. Wodkiewicz and J. Eberly, J. Opt. Soc. Am. B
2, 458 (1985); J. D. Macomber and R. Lynch, J. Chem.
Phys. 83, 6514 (1985).
[ll] See, for example, S. Haroche and J. M. Raimond, Adv.
At. Mol. Phys. 20, 347 (1985); S. Haroche, M. Brune, and
J. M. Raimond, in Atomic Physics 12, edited by J. C.
Zorn and R. R. Lewis (AIP, New York, 1991), p. 204; G.
Rempe, M. O. Scully, and H. Walther, ibid., p. 219.
[12] D. J. Heinzen and D. J. Wineland, Phys. Rev. A 42, 2977
(1990).
[13] A. Heidmann, J. M. Raimond, and S. Reynaud, Phys.
Rev. Lett. 54, 326 (1985); S. M. Barnett and M.-A. Du-
pertuis, J. Opt. Soc. Am. B 4, 505 (1987); M.-A. Duper-
tuis, S. M. Barnett, and S. Stenholm, ibid. 4, 1 124 (1987);
M. G. Raizen, L. A. Orozco, M. Xiao, T. L. Boyd, and H.
J. Kimble, Phys. Rev. Lett. 59, 198 (1987).
[14] M. G. Raizen et ai, Phys. Rev. A 45, 6493 (1992).
[15] F. Diedrich, J. C. Bergquist, W. M. Itano, and D. J. Wine-
land, Phys. Rev. Lett. 62, 403 (1989).
[16] H. Harde, in International Conference on Quantum Elec-
tronics Technical Digest, Series 1990, Vol. 8 (Optical So-
ciety of America, Washington, DC, 1990), p. 278.
[17] K. Abdullah, C. Carlberg, E. D. Commins, H. Gould, and
S. B. Ross, Phys. Rev. Lett. 65, 2347 (1990).
[18] D. M. Greenberger, M. Home, and A. Zeilinger, in Bell's
Theorem, Quantum Theory, and Conceptions of the
Universe, edited by M. Kafatos (Kluwer Academic, Dor-
drecht, The Netherlands, 1989), p. 69.
TN-81

PHYSICAL REVIEW A VOLUME 50, NUMBER 1 JULY 1994
Squeezed atomic states and projection noise in spectroscopy
D. J. Wineland, J. J. Bollinger, and W. M. Itano
Time and Frequency Division, National Institute ofStandards and Technology, Boulder, Colorado 80303
D. J. Heinzen
Physics Department, University of Texas, Austin, Texas 78712
(Received 11 January 1994)
We investigate the properties of angular-momentum states which yield high sensitivity to rotation.
We discuss the application of these "squeezed-spin" or correlated-particle states to spectroscopy. Tran-
sitions in an ensemble of A'^ two-level (or, equivalently, spin-y) particles are assumed to be detected by
observing changes in the state populations of the particles (population spectroscopy). When the particles'
states are detected with 100% efficiency, the fundamental limiting noise is projection noise, the noise as-
sociated with the quantum fluctuations in the measured populations. If the particles are first prepared in
particular quantum-mechanically correlated states, we find that the signal-to-noise ratio can be improved
over the case of initially uncorrected particles. We have investigated spectroscopy for a particular case
of Ramsey's separated oscillatory method where the radiation pulse lengths are short compared to the
time between pulses. We introduce a squeezing parameter ^^ which is the ratio of the statistical uncer-
tainty in the determination of the resonance frequency when using correlated states vs that when using
uncorrected states. More generally, this squeezing parameter quantifies the sensitivity of an angular-
momentum state to rotation. Other squeezing parameters which are relevant for use in other contexts
can be defined. We discuss certain states which exhibit squeezing parameters ^j(^N~^^^. We investigate
possible experimental schemes for generation of squeezed-spin states which might be applied to the spec-
troscopy of trapped atomic ions. We find that applying a Jaynes-Cummings-type coupling between the
ensemble of two-level systems and a suitably prepared harmonic oscillator results in correlated states
with^^<l.
PACS number(s): 03.65.Bz, 32.80.Pj, 06.30.Ft
I. INTRODUCTION
Intriguing features of quantum-mechanically correlat-
ed particles have become well known through the cele-
brated gedanken experiment of Einstein, Poldolsky, and
Rosen (EPR) [1]. The most important of these have been
demonstrated in "EPR-type" experiments which use
correlated photons [2,3]. Optical fields have also provid-
ed the basis for numerous studies devoted to nonclassical
harmonic-oscillator states such as squeezed states [4-7].
Demonstrated applications of squeezed optical states in-
clude the improvement of the signal-to-noise ratio in in-
terferometers [8,9] and absorption spectroscopy [10]. Bycontrast, analogous studies of correlated or squeezed
states of material particles are much less common, al-
though they may lead to interesting new phenomena and
applications.
First, it should be possible to generate squeezed states
of harmonic oscillators which are not associated with the
electromagnetic field. For example, as a result of the in-
vestigations devoted to the detection of gravitational
waves with macroscopic antennas [11,12], it should be
possible to generate squeezing in a material harmonic os-
cillator. In atomic physics, it has recently become possi-
ble to generate quantized states of motion for trapped
atoms [13-16]. Therefore, it may also be possible to
generate states of squeezed position or momentum for
these atomic particles [15,17-21]. In addition, interest-
ing studies have been devoted to the (phase) correlations
between the different internal states within the same
atomic particle (as opposed to correlations between
different atomic particles). As a recent example, atten-
tion has been focused on atomic states which yield disper-
sion without absorption and "lasing without inversion"
[22].
In this paper, we examine methods for the generation
of quantum-mechanical correlations between the internal
states of different atomic particles and investigate the use
of these correlated atoms in spectroscopy. For example,
consider atoms which have two internal levels with corre-
sponding wave functions denoted1 1 ) and
1 2 ) . For the
case of two such atoms, a and b, we will be interested in
finding ways to generate correlated or "entangled" states
of the form
i/'= [2cosh(20)]"'/2
X(e-^|2)j2),+e''*e^|l)Jl),), (1)
where the subscripts refer to the atoms. (Here, the entan-
glement of the particle wave functions is evident because
the total wave function cannot be written as the product
of wave functions of the separate atoms). These states
(for 0^-0, (f)-^TT) are the correlated two-particle states
discussed in Bohm's version of the Einstein, Podolsky,
and Rosen experiment [23]. We will be interested in
finding ways to generate these states and the analogous
1050-2947/94/50( 1 )/67(22)/$06.00 50 67 ©1994 The American Physical Society
TN-82

68 WINELAND, BOLLINGER, ITANO, AND HEINZEN 50
correlated states for much larger numbers of particles.
If we make the connection between spin-y particles
and two-level systems [24], such states can also be called
"squeezed-spin" states, where squeezing is defined in
analogy to the squeezing for the electromagnetic field.
Various aspects of spin squeezing have been considered
previously [25-38]. For example, in the work of Ref.
[26], the relationship between squeezing in a two-level
system and squeezing of the radiation which is emitted by
the two-level system is discussed. Reference [33] consid-
ers the generation of correlated or squeezed-spin states,
in ensembles of two-level systems, by broadband squeezed
vacuum radiation. The use of correlated states in inter-
ferometers has been discussed in Refs. [30] and [35]; these
states correspond formally to the squeezing of angular-
momentum operators.
We have found it useful to investigate spin squeezing in
the context of spectroscopy. Part of the reason for this is
that we were led to consider it as a natural outgrowth of
our experiments on the spectroscopy of stored atomic
ions [39,40]. Also, the squeezed-spin states that are use-
ful in one physical context or application are not neces-
sarily the ones of interest in another. For example, the
form of spin squeezing discussed in Refs. [25-28,33]
does not, as we describe below, appear to be relevant for
the spectroscopy we describe here. However, the methodof spectroscopy we assume is formally equivalent to the
description of particle interferometry discussed earlier
[30,35]. Therefore, the same form of squeezed states is of
interest in both contexts even though the states describe
quite different physical systems and will require different
interactions to be produced. The states of interest in
spectroscopy and interferometry can be put in a moregeneral context. In any system which can be represented
by a net angular momentum J, the states we are interest-
ed in are those which give the highest angular resolution
of ( J ) about a particular axis.
In our experiments on stored ions [39], we detect atom-
ic transitions by observing changes in atomic state popu-
lation. Typically, we first localize an ensemble ofN iden-
tical atoms in a trap, where N remains fixed throughout
the experiments. We initially prepare each of the atomsin the same internal eigenstate, which we take to be state
1 1 ) . We then apply (classical) radiation, which we will
call the clock radiation, to the atoms. The clock radia-
tion has a frequency that drives the atoms from state1 1
)
to another state, designated state1 2 ) . After application
of this radiation, an atom is, in general, in a coherent su-
perposition state Ci|l)+C2|2), where |c, P+ |c2l'^= 1.
We assume that relaxation of states 1 and 2 is negligible;
this is usually a good approximation for stored atomic
ions. We then detect the number of atoms in state1 1 ) (or
|2 )). In the detection process, we will find the atom to be
in either state 1 or state 2; that is, the measurement can
be thought of as projecting the atom into one of these
states [40]. If we perform this preparation, irradiation,
and detection many times, on average, we will detect
A'^i= |cil^iV atoms to be in state 1. However, unless
|cil = l or 0, the number of atoms found in state 1 will
fluctuate from measurement to measurement. We call
these fluctuations "projection noise" [40]. They are given
by
A7V, = [Ar|c,P(l-|c,P)]2\ll/2
Recently, we have reduced all other sources of noise in
the experiments so that the signal-to-noise ratio is limited
by projection noise [40]. In those experiments, AiVj was
given by the expression above. The ability to see the pro-
jection noise clearly was enabled by detecting a fixed
number of atomic ions with high efficiency.
Projection noise is the fundamental limiting noise in
spectroscopic experiments which detect transitions by
monitoring changes in population on a fixed number of
particles. In Ref. [38], we have investigated, theoretical-
ly, ways to increase the signal-to-noise ratio over what
has been observed in Ref. [40], that is, when all of the
atoms are initially prepared in the same internal eigen-
state. This can be accomplished if we can initially
prepare the atoms in particular correlated states.
The generation and detection of correlated atomic par-
ticle states by the methods described below is interesting
because it would allow the investigation of squeezed
states outside the domain of the electromagnetic field.
Also, the increase in signal-to-noise ratio possible in spec-
troscopy with correlated states may be of practical in-
terest. A dramatic example is the following: In atomic
clocks which use uncorrelated atoms and are limited by
projection noise, the signal-to-noise ratio is equal to
K(Nt)^^'^, where A'^ is the number of atoms, r is the total
measurement time, and K is a constant. However, if the
atoms are initially prepared in particular correlated
states, the signal-to-noise ratio would be equal to KNt^ '^.
Therefore an atomic clock using lO"^ correlated atoms
would yield the same precision in 1 s as an atomic clock
using lO"' uncorrelated atoms taking 300 years. On a less
ambitious scale, the attainment of modest squeezing
should also be of practical significance. This is particu-
larly true in measurements on atomic clocks where pre-
cision measurements take many days, weeks, or even
years of averaging time. Therefore, for example, even if a
squeezing of only ^r~\ is obtained ( ^^ defined in Sec.
V A), a four-day measurement of a certain precision is re-
duced to a one-day measurement.
The purpose of the present paper is to extend the dis-
cussion of Ref. [38]. As in that paper, we will be interest-
ed in two things: (1) identifying states which reduce pro-
jection noise in the context of spectroscopy, and (2) howthese states might be generated in an experiment. Wewill concentrate on squeezing in systems of trapped
atoms because it is relevant to our experimental work and
might be where such effects will first be demonstrated.
However, the results are quite general, and the increase
in signal-to-noise ratio will, in principle, apply to spec-
troscopy on any ensemble of two-level systems.
In Sec. II, we discuss the signal-to-noise ratio, or
transition-frequency measurement uncertainty, in spec-
troscopic experiments which detect transitions by observ-
ing changes in level populations. As is often done, we use
the analogy between spectroscopy on two-level systems
and spectroscopy on spin-y systems. This analogy will
lead to a useful pictorial representation of the noise and
TN-83

50 SQUEEZED ATOMIC STATES AND PROJECTION NOISE IN 69
will make obvious what is desired of the squeezed-spin
states. In Sec. Ill, we apply this analysis to a special case
of spectroscopy which uses Ramsey's method of separat-
ed oscillatory fields [41]. Here, we discuss the connection
between Ramsey's method and interferometry. In Sec.
IV, we examine the signal-to-noise ratio when the parti-
cles are initially prepared in particular uncorrected pure
states. This is essentially a summary of the results of Ref.
[40]. In Sec. V, we show that some correlated particle
states can be used in spectroscopy to increase the signal-
to-noise ratio over that found in experiments which use
uncorrelated particles. We define a squeezing parameter
^;j which is relevant for these experiments and also showthat ^n expresses the measurement sensitivity of an
angular-momentum state to rotations. In Sec. VI, we dis-
cuss alternate definitions of spin squeezing. In Sees. VII
and VIII, we investigate possible ways to generate the
correlated states useful for spectroscopy. The difficulty
will be in finding a practical scheme; we discuss somepossibilities in Sec. VIII. Although the discussion will
apply to an arbitrary number N of correlated particles, in
many cases we will find it useful to illustrate various as-
pects of the squeezing for two particles.
II. POPULATION SPECTROSCOPY
We are interested in the spectroscopy of an ensemble of
A'^ identical two-level particles. We assume that transi-
tions are detected by observing changes in the popula-
tions of the two levels after application of classical radia-
tion. It will be convenient to use the fact that the dynam-ics of an individual two-level system interacting with ra-
diation is the same as the dynamics of a spin-y particle in
a magnetic field [24]. This spin representation provides a
simple pictorial way to follow the evolution of operators
(or quantum states) under the influence of radiation. For
an ensemble of particles, the spin representation also pro-
vides a simple way to visualize the noise in the measure-
ment of populations, which will make obvious what is
desired of the correlated states discussed in Sec. V.
Therefore, we begin by assuming that we have an en-
semble of N identical particles, where N is fixed. Eachparticle has spin S where S= ~. Associated with each
spin is a magnetic moment fi=[IqS. We assume that the
particles are far enough apart that they do not overlap
spatially, so that antisymmetrization (or symmetrization
for integral-spin two-level particles) of the total wavefunction is unnecessary. We will also assume the parti-
cles are far enough apart that the direct dipole-dipole
coupling or other direct interactions between particles
can be neglected. Relaxation is assumed to be negligible.
These are good approximations for many spectroscopic
experiments on trapped atomic ions where the storage
time is long, the background gas pressure is low, and the
Coulomb repulsion between ions typically restricts parti-
cle separations to greater than 1 /zm.
We apply a uniform external magnetic field BqZ to the
ensemble of spins, so the Hamiltonian for each particle is
given by
where coq^ —^oBq/H. The eigenstates of this Hamiltoni-
an are the \m) = \+j) andI
~ y ) states where
S^\m)—m\m). The Heisenberg equation for S is
aS/8r=6)oXS ,(3)
H()~-fi-Bo-ii(Of;S, , (2)
where 6>o— ^o^- ^f the particles are electrons, Ho—gjfJ-B
where gj{^—2) is the electron g factor and /ig is the
Bohr magneton. In this case, a»o>0 and S precesses in
the +(f) direction defined by Eq. (3). The upper and lower
energy levels of this two-level system correspond to the
I
+ Y ) andI~y ) states, respectively.
In spectroscopy, we are interested in experimentally
measuring coq. In our spin-y model, the spectroscopy is
essentially equivalent to NMR (nuclear magnetic reso-
nance) on a spin-y nucleus or ESR (electron spin reso-
nance). In general, we might be interested in the case
where the particles are first prepared in a mixed state. In
this case, we would employ a density matrix treatment to
describe the evolution of the system. However, since wewill be concerned with maximizing the signal-to-noise ra-
tio, we will assume that the particles are initially
prepared in pure states with an average value of S which,
for most of our discussion, we take to be aligned along
the z axis and denote (S^). {(A) denotes the mean
value of operator A.) We then apply (classical) radiation,
which we call the spectroscopic or "clock" radiation, at a
frequency a> (near coq), which changes (S^). The mea-
surement apparatus is configured to detect this change in
(S^). We assume the amplitude and duration of the ra-
diation is adjusted so that (S^) reverses sign when
An alternative method of performing spectroscopy is
to observe the radiation transmitted through the sample
of particles. If the intensity of the radiation is chosen ap-
propriately, the maximum change in the transmitted in-
tensity corresponds to the condition o)= coq. In some
cases, for example, when A'^ is large and the clock radia-
tion weak, the fluctuations of the detected radiation
(which limit the signal-to-noise ratio) are dominated by
the fundamental quantum fluctuations of this radiation.
In these experiments, the signal-to-noise ratio can be im-
proved by using squeezed radiation [10,42-46]. Here,
we have assumed that the radiation used for the spectros-
copy is classical: that is, it is in a coherent state, and the
number of photons in the radiation source is large
enough that the quantum fluctuations in this radiation
can be neglected. We assume all sources of technical
noise (for example, fluctuations in the amplitude of the
clock radiation caused by an unstable power supply) are
also negligible. Since N is assumed constant, fluctuations
in N, such as those which occur in an atomic-beam exper-
iment, are absent.
In the measurement of S^ , we assume that each particle
is projected into either the l+y) or |— y) eigenstate
[40]. We will assume that we can detect which state the
particle is measured to be in with 100% efficiency. With
these assumptions, the noise in the measurements of S^
(for the same value of co) from measurement to measure-
ment is due to fluctuations in finding particles in either
theI
+ y ) orI
— y ) eigenstate.
TN-84

70 WINELAND, BOLLINGER, ITANO, AND HEINZEN 50
It will be useful to use a formalism which treats the Nparticles as a combined quantum system. This has the
advantage that, for one choice of basis states, it will pro-
vide a simple way to visualize the measurement noise
when the particles are either uncorrected or correlated.
One possible choice of basis states is the set of direct-
product states
Wi./n1'"'2'
N
/ = 1
mi), (4)
where |m, ) is an eigenstate for the rth particle. Howev-er, we will use another common representation in which
we define a collective angular-momentum operator
NJ=2 (5)
where S, is the spin operator for the /th particle. The set
of basis states we use are of the familiar form \J,M),
which are linear combinations of the states in Eq. (4)
[47,48]. For these states, J^\J,M)=-J(J +l)\J,M) and
JJJ,M)=M\J,M).
Heisenberg picture
In the presence of the field Bg, Eqs. (3) and (5) yield the
Heisenberg equation for J (see Fig. 1):
aj/af=<yoXJ • (6)
The clock radiation is assumed to be a classical field,
which rotates about the z axis, of the form
B,=5, xcos{(ot + 6)+ -.—rysm(cot + 0) (7)
where co^coq and the factor Wq/I'^oI insures that Bi ro-
tates in the same sense as 6)o. In general, 5, is also a
function of time. We assume that Bi
is switched rapidly
FIG. 1. Pictorial representation of the precession of the an-
gular momentum J about an applied magnetic field B. The an-
gular momentum is assumed to have a net magnetic moment
fi=HoJ, where /io>0 for the figure. The figure represents the
motion of ( J ) or the operator J in the Heisenberg representa-
tion [Eq. (6)].
between and some constant value. In practice, the
clock radiation may be an oscillating (magnetic) field
which is perpendicular to Bg. This oscillating magnetic
field can be decomposed into two rotating fields: one
which rotates at frequency (o [given by Eq. (7)], and the
other rotating in the opposite sense. Usually the effects
of the oppositely rotating field can be neglected [41]
(rotating-wave approximation); we assume this to be the
case here.
To solve for the system evolution, it will be convenient
to transform to a frame which rotates at frequency o)
[41,49]. In this frame of reference, the angular momen-tum J^ will interact with the effective field
B= z5,+5i(xcos0+ysin0) ,
where
B^=BQ + -hai/^Q= BQ((x)Q~o))/a)Q .
Without loss of generaUty, we will assume = v/2, in
which case
B= z5, + y5, . (8)
In this rotating frame, the Hamiltonian is given by
(9)
C0^where (o' = a)^z.+ u>^, (o^ = —fiQB^/ii= (OQ— co,
= —^qB^ /h, and J is now the angular momentum in the
rotating frame. We have omitted an explicit subscript or
superscript on J since only J^ will be measured and J^ is
the same in both frames. The Heisenberg equation for J
in the rotating frame is
aj/3r = 6)'XJ (10)
In Fig. 1 we represent, pictorially, the time evolution of J
(or (J)) when jIq, coq— ci>>Q, \o}qi~cl)\^\(o-^\, and
<J(f=0)) = -z|<y,(0))|.
As discussed by Ramsey [41], we could now transform
to a second frame which rotates about B at a frequency
— jUgB /^. In this frame, the effective magnetic field is
and therefore wave functions (in the Schrodinger picture)
or operators (in the Heisenberg picture) remain constant.
In this case, the system evolution is obtained by applying
the appropriate rotation operators to the initial (laborato-
ry) wave function or operators. In this paper, we will de-
scribe the system evolution in the first rotating frame cor-
responding to Eq. (10).
We will assume that, after application of the clock ra-
diation, the detector measures the number of particles
N j^ in the \+\) state. In the Heisenberg picture, this is
given by the operator
N+{tf)=J,{tf) + JI (11)
where / is the identity operator and tj- is the "final" time
corresponding to the time just after the clock radiation is
applied. For a particular value of co, we denote a single
measurement of N^ by {N^)^, and the average of Mmeasurements of A'^+ by (N+)j^f. By making measure-
ments of {N+(tf))nf for various values of co, we obtain a
resonance curve as a function of co. To find ojn. we could
TN-85
50 SQUEEZED ATOMIC STATES AND PROJECTION NOISE IN . 71
fit this resonance curve to a particular function. The un-
certainty in the determination of cOq would result from
the noise in our measurements of {N+(tj-))nf at each
value of (o.
In many cases of experimental interest, we can assume
the resonance curve is symmetric about coq] this is true
for the spin-y example discussed here when
<J(f =0)) = -z|<7^(0))|. In this case, rather than
fitting to the entire resonance curve, it will, in general, be
advantageous to measure iV+ at particular values of co
which minimize the uncertainty in the apparent position
(as a function of (o) of the curve. For a particular value of
CO, the deviation of the apparent position of the curve
from the true curve ( A''_,_ ) is given by
dcoM = [(N+ )M-(N+)]/{d{N+)/d(o) , (12)
where the subscript M on da denotes the results for Mmeasurements. The magnitude of the rms fluctuations of
8a> for repeated measurements of (A'^_|_)i
at a particular
value of CO is given by
\^co\=^N+{tJ)/\^{N+)/^co\
=u,{tf)/\^{j,(tj))/M , (13)
where, as usual, for operator A, ^A is the square root of
the variance, {AA)^={ A'^) — { aV. If we make Mmeasurements at a particular value of co, the uncertainty
in the value of coq is reduced to|Aa)|j|^ =
|A6)|(M)~'^^.
Given A^ and tj-, our task in spectroscopy is to minimize
|A6l)|. Equivalently, since the signal-to-noise ratio can be
defined as being proportional to |A(y|^', we therefore
want to maximize signal-to-noise ratio.
If the exact form of the resonance curve were known, it
would be necessary to measure the curve at only one fre-
quency to determine the best value of coq. This is imprac-
tical since, for example, the height of the resonance curve(a|{j^(0))|) depends on the exact value of 5, and this
may not be precisely determined. However, when the
resonance curve is symmetric about coq, this difficulty is
overcome, experimentally, by measuring two points on
the resonance curve, at frequencies a)^>coQ and cog
<coq where co ^—coQ^coQ— cog. If (N _^_{co= co^))
= {N ^{co= cog)), then (co ^+cob)/2= coq. In practice,
we approximate this condition with a servo mechanism
[50].
III. POPULATION SPECTROSCOPYUSING THE RAMSEY METHOD
In order to illustrate the basic ideas behind the im-
provement in signal-to-noise ratio using correlated states,
we will examine|Awl for a special case of the resonance
method due to Ramsey [41]. This is an important case to
analyze because, experimentally, for a given time tj- in
which to apply the clock radiation, the narrowest
linewidths are obtained with this method. The Ramseymethod [41] breaks the resonance period {t=0- 7 mtothree parts. In the special case discussed here, during the
first part of the resonance period, B j is nonzero and con-
stant with value B,^ from time f=0 to t = t„n such that'10 7r/2
n^f^/2 = 7r/2 and D.^ »\co— coq\, where fl^ =/iQ5,o/^ is
usually called the Rabi frequency. At time f^/2, Bi is re-
duced to zero. After an additional time T, Bi is again
made equal to B^q for a time r^/j and then reduced to
zero. We will assume that 5, is switched between zero
and 5 10 in a time much less than r^/2 in which case
fy- = 2?^/2 + r. We make the further assumption that
With these assumptions, and assuming (J(0))
= —z.\{J^(0))\, during the first part of the Ramsey
period, that is, during the first "Ramsey pulse,"
B=5^z+5,oy — 5,oy. In the rotating frame, from Eq.
(10), J (or (J)) precesses around the y axis until it lies
along the x axis at which point 5, is reduced to [Fig.
2(a)]. From time t = t„/2 to ?^/2 + r, J precesses around
B=5^z so that J(? ^/2 + T ) lies at an angle (coq~co)T with
respect to x but still in the x-y plane [Fig. 2(b)]. In the
third part of the Ramsey period, from time f ^/2 + T to
2t„/2 + T= tj-, J again precesses around Bi^y so that at
time tj- it lies in the y-z plane [Fig. 2(c)]. At this point,
A'^+ or, equivalently, J^ is measured [Eq. (11)]. We have
{N +(tf)) =J - {J,{0))cos(coo-co)T ,(14)
which is the Ramsey resonance curve for T»t^/2 [51].
In general, we can choose B'^Q = +(n+\)Trfi/{yiQt^/2)
(n =0,1,2,3, ... ) with the same result [52]. Other
choices of B^q will result in smaller values of
13 { J^ ( ?y ) ) /bco
I
. For brevity we will assume « = 0.
Application of the Ramsey fields corresponds, in the
Heisenberg picture in the rotating frame, to the transfor-
mations
Jy{tf)=J^(0)smco,T + Jy(0)cosco,T
(15)
(16)
and
J^(tf)= -J,(0)coso),T+Jy{0)smco,T , (17)
where co^=coq—co. Therefore, in general, from Eqs. (11)
and(15)-(17),
<A^+(r^))=J-</,(0))cos6>,r+<7^(0))sin&),r
2il/2=j-[{j,(o)y+{jy{o)y]
Xcos[&),r+ tan"'[(^.(0))/(J,(0))]]
(18)
and
A«r=|A7,(0)'cosV7^ + ^-^/0) sin^r
+ [{j(0)){j^{0))-^{j^{0)JJ0)+JJ0)J,{0))]sm2co,T][T({J^(0))smco,T+{J (0))cosco,T)]-2
(19)
TN-86

72 WINELAND, BOLLINGER, ITANO, AND HEINZEN 50
We see from Eq. (18) that the resonance curve is not sym-metric about 6^0 unless (J^(0))=0. Even when{ 7^,(0) ) =0, for initial states where
{J,{0)JA0) + JA0)J^{0))^0,
(a) t = - t,,j
(b) t = t,,2 -* t„2 + T
(Wo - ^)T
(c) t = t,„ + T -» 2t,„ + T = t,
FIG. 2. Pictorial representation of the three parts of the
Ramsey separated-field method. The figures apply to a frame
which rotates with the applied time-varying field given by Eq.
(7) of the text. Part (a) shows the precession of J during the first
"7r/2 pulse." In (b), J precesses about the residual field B^. In
(c), J rotates into the y-z plane under the application of the
second 7r/2 pulse. We assume |Bj « |B,| and t„/2 « T, so the
total "interrogation time" tf= t^/2 + T+ t^/2=^T. After the
second -rr/2 pulse, J^itj-) is measured; this yields the signal used
in spectroscopy [Eqs. (11) and (14)].
the quantum noise on the Ramsey curve AiV+(ry)
[ =AJ^(ry )] is not symmetric about coq. This is not neces-
sarily a problem for finding the best value of coq since the
contribution to the noise in a measurement of
N+{co^)— N+(cog) from this term drops out. If we as-
sume
{J,{0}JJ0)+JJ0)J,(0)) = {JA0))=0,
then
I
AwlT^{J,m)h\n^ai,T
(20)
In practice, some additional noise will be present in the
measurement of A'^^. Assuming that this noise is un-
correlated with the projection noise and with o), the noise
A.N+(tj-) in the measurement of A'^+ must be replaced by
[AA^+(r^)HAiV^dd]'^^ where AiV^d^ is the rms value of
the added noise. From Eq. (13), Eq. (20) becomes
\Ao}\T^{JAQ))hin^co,T
(21)
Equation (21) shows that with Ay^(0)^0 and/or
choices (Dq— o)AA'^add'^0, |A(y| is minimized for the
= ±(«+l)7r/r(«=0,l,2,3, . . .) [53].
Independent of the values of A7^(0) and ^N^^^,|Aft;| is
minimized for «=0 or equivalently for coq— co
= ±Tr/{2T). These values of o)q— (o will be assumed
throughout the remainder of the paper except where not-
ed. In other words, we will measure the resonance curve
at frequencies co ^=(o-\-tt/(1T) and 0)^=0) — tt/(IT)
where |a;—
cjqI is assumed to be much less than v/{2T).
In terms of Eq. (14), this means that we measure N ^ at
two frequencies corresponding to the half-intensity points
on the central lobe of the Ramsey resonance curve. With
this assumption on co^ and (Og, |A(y| is independent of
(y,(0)//0)+ /^(0)J,(0)) and <J^(0)).
In the remainder, we will assume AA^^^^^j «AJj,(0), in
which case we end up with a simple expression for lAwl
[38]:
|Aa;|=AJJO)/[rK/,(0))|] (22)
We can represent /!^N+{t/ = Ay^(?y)] pictorially.
More generally, we can represent AJ^, AJ^, and AJ^ by
an "error spheroid" (or error ellipsoid) [28] which lies at
the end of the vector J and whose dimensions are given
by A/^, AJy, and AJ^. This is shown schematically in
Fig. 3 for the case (j) = -|<J)|z. (In Refs. [29], [36],
[38], and [40], AJ^ and AT^, are represented as semimajor
axes of an ellipse placed at the end of, and perpendicular
to, (J).) The pictorial representation shown in Fig. 3
will be useful for the method of spectroscopy described
above, but is somewhat hmited. For example, certain
states with (J) = -|<J)|z and {J,Jy+JyJ,)^0 might
have, in a (primed) coordinate system rotated with
respect to the spheroid shown in Fig. 3, a value of
A.J^<A.J^,A.Jy,A,J^. This state might be more appropri-
ately represented with an error spheroid which is tilted
TN-87

50 SQUEEZED ATOMIC STATES AND PROJECTION NOISE IN . . . 73
with respect to the one shown in Fig. 3. Also, when(J) = — KJ)|z, and \{J)\ ¥^J, the distribution of mea-
sured values of J^ is not symmetric about {J^(0)).
Therefore the error spheroid should be distorted along z.
A more accurate representation is given by plotting the
probability distributions for N+{tf) which are, in gen-
eral, asymmetric about (N^itf)} (see, for example. Fig.
3 of Ref. [40]). Other pictorial methods can be used to
describe the probability distribution for measurements of
7V+ or J. For example, Ref. [37] provides a way of
visualizing correlated or squeezed-spin states through the
use of Wigner functions for angular momentum.Since we have chosen Q)Q— co= ±7r/{2T), the evolution
of the error spheroid at various times during the Ramseyperiod has a simple representation, as shown in Fig. 4.
Since the three parts of the Ramsey period correspond to
7r/2 rotations about -Bjoy, B^% and 5,oy, respectively,
the evolution of the variances is particularly easy to fol-
low. In Fig. 4(d), we plot {N+(tj^)) as a function of o)
FIG. 3. Pictorial representation of the fluctuations in the
measured values ofJ^, Jy, and J^. In this figure < J) is taken to
point along the negative z axis. The dimensions of the axes of
the spheroid are AJ^, A7^, and AJ^ where A/,^= <//) — < J, )^
and i=x,y,z.
(a) t = -* tw/2
= AJ,(0)
(b) t = Kn - Kn + T
AL(t,,2 + T)> = AT(0)
(c) t = t,,2 + T - 2t,;2 + T ^ tf
AJ,(tf) = AJ rO)
(d) <N^(g>
N
J+ |<J(0)>|
AJ^(t,)=AN^(t,)
J-|<J(0)>|.
FIG. 4. Pictorial representation of the evolution of < J ) and the fluctuations at various parts of the Ramsey method for the condi-
tion coo-co=Tr/2T. From these figures we see that the fluctuations in 7V+(f/) are given by AJ^f) or AJ^(O). In part (d) of the
figure, we show the point on the Ramsey curve corresponding to (Oq—(o=tt/2T. AiV+ represents the rms fluctuations for repeated
measurements of iV+ for coq-co^tt/IT. For part (d), we have assumed that the initial state is such that < J ) is aligned with the nega-
tive z axis but|{ J ) |
< 7.
TN-88

74 WINELAND, BOLLINGER, ITANO, AND HEINZEN 50
[Eq. (14)], the particular point on the resonance curve
corresponding to coQ— co= Tr/(2T), and the corresponding
value of the uncertainty in the measurement AN+itj-)
AJyiO).
A. Schrodinger picture
In some cases, it will be useful to represent the system
dynamics in the Schrodinger picture. As before, we as-
sume we are in the rotating frame in which Bj is station-
ary [Eq. (8)]. In this frame, operators will now be as-
sumed to be time independent, and the wave function
evolves according to
*(r)=C/(f,0)*(0) (23)
where the evolution operator U is the solution to the
equation i-fidU/dt=H,U [54].
In the case of two particles (7=1), for example, fol-
lowing the application of the Ramsey fields, we have
U(tf,0)
(coso)^T—\) —iVlsinco^T (cosd^^T+l)
i'^lsino^T —Icosco^T iV'2sinco^T
icosco^T+l) —iVlsincOi-T (cosco^T—l)
(24)
where we use the notation
V'=a|l,l)+fe|l,0>+c|l,-l) (25)
B. Comparison of Ramsey spectroscopy to interferometry
Yurke and co-workers [29-31] and others [55] have
discussed the connection between a linear lossless passive
device with two input and output ports and the SU(2)
symmetry group. They construct abstract operators
[56] J^=(a\a^+alaO/2,
)"i
32+02^1 )/2, Jy = —i(a\a2
[2^2)' ^^^ N = (a\ai— 0202),
J^ = —i(a\a2—ala] )/2,
where a-
and Oj (/ = 1,2) are the creation and annihilation opera-
tors for particles (bosons or fermions) entering ports 1 or
2 of the device. For example, the system might be pho-
tons injected into a Mach-Zehnder interferometer. These
abstract operators 7, {i=x,y,z) have the same
mathematical properties as the angular-momentumoperators and therefore the interferometer can be de-
scribed in terms of this abstract spin space. A'^ corre-
sponds to the total number of particles entering both
ports of the interferometer. Beam splitters anddiflFerential phase shifters between the two arms of the in-
terferometer behave like rotations of the net spin opera-
tor. If we compare our case to this formalism for inter-
ferometers, the Ramsey spectroscopy we discuss is for-
mally equivalent to a Mach-Zehnder interferometer
where the two Tr/2 Ramsey pulses are identified with 50-
50 beam spHtters in the interferometer, and the phase
shift incurred between the spin precession and the ap-
plied field in Ramsey spectroscopy corresponds to the
differential phase shift between the interferometer arms.
If we define the phase sensitivity in Ramsey spectroscopy
as A(f)jf =LcoT, then the sensitivity of the Ramsey methodis equivalent to the phase sensitivity of a Mach-Zehnderinterferometer [see Eq. (13) of this paper and Eq. (3.16) of
Ref. [29]]. Because of this connection, we wish to create
the same form of correlated input states as desired for in-
terferometers.
IV. SPECTROSCOPY OF UNCORRELATED PARTICLES
In this section, we consider the particles to be initially
uncorrelated and independent. This case is treated in de-
tail in Ref. [40]. Because the particles are assumed to be
uncorrelated, the initial wave function can be written as a
direct product
rl){Q)-- n '^/(o)
'
(26)
1 = 1
where 1/^,(0) is the initial wave function for particle /.
By optical pumping techniques we can prepare atoms
in energy eigenstates. Therefore, in our spin-y model, we
will be particularly interested in the case where all of the
particles are initially prepared in, for example, the
j/',(0)=|— y) state. In this case, the initial state is
represented by the wave function
xl,(Q)=\J =N/2,M=-N /2) = Y[ l-j),/ = i
(27)
which is a particular Dicke state [47]. For this state,
</,(0)) =and
J, A/J0)= 0, AyJ0)= AJ,(0)= (//2)'''^
{N+(tf))=\N[\+co%(co- 0)^)7] .
Equation (20) is identical to Eq. (22) for all values of co^
since A.J^(0)= 0. In this case, the best value of Wq can be
determined independent of where we measure on the res-
onance curve. This somewhat surprising result occurs
because the quantum noise ANj^{tf) is proportional to
the signal slope ^{N + )/9a) for all values of co. There-
fore, from Eq. (13), |Aft>| is independent of our choice of
CO. The noise is equal to zero on the peaks and valleys of
the Ramsey resonance curve because, there, we detect
eigenstates of 7^ [Fig. 5(a)]. Unfortunately, the sensitivity
to frequency shifts is also equal to on the peaks and val-
leys since the slope of the Ramsey curve is equal to 0. Asdiscussed in the last section, if AN^^^ is not negligible, we
TN-89

50 SQUEEZED ATOMIC STATES AND PROJECTION NOISE IN . . . 75
minimize |A&)| if we operate at frequencies coq—co
= ±(n -\-\)tt/T (n =0,1,2,3, • • •), and, for simplicity, wehave restricted ourselves io (j}Q— co= +\Tr/T.
It is instructive to consider the evolution of the wave
function in the Schrodinger picture. For example, for
J = l, our initial wave function is |l, — l) [a=b=Q,c =1 in Eq. (25)]. After appHcation of the Ramsey fields
we have from Eq. (24)
^lj{tf)= \(co%o)J+\)\\,\)^-^%mo),T\\,Q) + \{co%oiJ-\)\\,-\)
= (cos6)^r/2| + )] + / smo^T /2\ — ),)(cos&)^r/2| + )2+ / ^inco^T /l\ — )2)
(28)
where, for simplicity, we write| + 1 ) =
|+ ) and
I
— y ) =I
— ) . The evolution operator for particle j
satisfies i-fidUj/dt=H^Uj and ^j(tj) is the wave func-
tion of particle j after being acted upon by the Ramseyfields. Therefore, the final wave function is the product
of the final wave functions of the individual particles.
The particles remain uncorrelated (or unentangled) after
application of the Ramsey fields. This is true for the ap-
plication of any form of the (classical) clock radiation and
for any number of particles since the initial wave function
is given by Eq. (26) and U{tj) = X[Uj{tf).
This case (when all particles are initially prepared in
eigenstates) serves as a benchmark and has been realized
experimentally. In Ref. [40], we reported spectroscopic
experiments on ^Be"*^ and '^^Hg"*" ions where the signal-
to-noise ratio was Hmited by the projection noise A7V+ in
the measurements. In these experiments, the ions were
prepared in eigenstates corresponding to the initial Dicke
state given by Eq. (27) in our spin-y model. For this case
I
A«| is given by Eq. (22), which we denote
1 1
AdJ DST(2J il/2 TN 1/2
(29)
This value of |A6;| is the minimum that can be obtained
using uncorrelated states in the Ramsey spectroscopy de-
scribed above. It is Hmited by the fundamental quantumfluctuations in the measurement. This limitation on |A<y|
observed in the experiments led us to consider the possi-
bility of using correlated states for spectroscopy where
even smaller values of|A&)| might be obtained.
V. SPECTROSCOPY OF CORRELATED PARTICLES
A. Squeezing parameter for spectroscopy
Before we examine specific states which can reduce
I
A(y| below lAcyl^s, we introduce a parameter which indi-
cates the level of improvement. As described in the last
section, |Aa)|i5s provides a useful benchmark. Therefore
we will define a "squeezing" parameter
= {1J)'^^UA0)/\{JA0))\,
(30)
where |Aw|, U.itf), {Jyitf)), AJ^(O), and {J,m) refer
to the new states to be considered and the subscript Rdenotes that this is the relevant squeezing parameter for
the particular form of the Ramsey method of spectrosco-
py considered. The goal of the paper is to examine ways
to make ^^ less than 1 and as small as possible.
More generally, consider a state with arbitrary (J).
Let e denote a direction perpendicular to (J) ((J)-e=0)
such that A(J-e) is a minimum. This state can always be
rotated (by, for example, application of a classical field)
<N^(g>
<N^(g>--
FIG. 5. Plot oi {N +(tf)) and LN +(tf) for three values of acorresponding to cjq—w=0, v/2T, and tt/T, for 7V=2 (7=1).
For both (a) and (b), ^m= (e-^\\,\) +e^\\,-\))/
[2cosh(20)]'^^. In (a), we assume 0^>-oo, that is, the initial
state is the |l, — l) Dicke state. For coq — (o= and v/T, the
noise ^N +{tf) = since the corresponding final states
^(fy^)= il,l) and |l, — l) are eigenstates. However, the sensi-
tivity to frequency fluctuations 8< iV+ ( ?/ ) ) /8ai also goes to zero
at these frequencies, so the signal-to-noise ratio is not improved.
In general, for ^(0)=|/, —/) (or \J,J)), the error Aco in our
determination of a)o [Eqs. (13) and (22)] is independent of <y. In
(b), = 0.25. This state leads to a reduced value of Ata for
coQ-(o= rr/2T(^K=0.11%). However, for |wo-a>|^Oand tt/T,
A<a increases substantially over case (a).
TN-90

76 WINELAND, BOLLINGER, ITANO, AND HEINZEN 50
so that e and ( J ) point along the y and negative z axes,
respectively. This state can then be used in Ramsey spec-
troscopy with ^^ given by Eq. (30). If we define
A7j^ = A(J-e), a more general definition of ^^ is given by
^;j=(2J)'/2AJ,/KJ)| . (31)
B. Squeezing parameter to indicate sensitivity to rotation
We may view the squeezing parameter ^j^ as having a
more general geometrical interpretation which indicates
the degree to which we can sense rotations of angular
momentum states. This generalization can then be ap-
plied to specific cases such as interferometry [29] or spec-
troscopy [38]. To see this, first consider a state which has
{J) = — z|(7^)| (Fig. 3). Suppose we are interested in
measuring a small rotation of J about the x axis by the
angle 6. A way to do this is to measure Jy . We define 6
through the relation {Jy)=sind\(J)\. The mean-
squared noise in is given by (A0)^ =(d(Jy ) /dd)^. Therefore the precision of the angle mea-
surement is given by Ad= ^Jy/(cosd\{J)\), which is
minimized for 6= ±mr (« =0, 1,2, . . . ). More generally,
for a state with arbitrary (j), consider rotations (pirj) of
(j) about an axis ij where (J)-^= 0. We can measure
these rotations by measuring J^=a-J where
a-{l)=a-TJ= 0. In this case the uncertainty in our mea-surement of ^(^) is given by
A(^ = AJi/KJ)| (32)
If we compare this angle uncertainty to the value Ac^^g
obtained using the Bloch states (states obtained from the
\J, —J) Dicke states by a rotation [48]), we can define a
squeezing parameter indicating sensitivity to rotation as
Ai^/A^Dg. We have
A<^/A<^ds= (27)'/2^J^/Kj)|=|^ (33)
Therefore the subscript R can also be used to signify rota-
tion and 1"^ the improved sensitivity to rotations using
squeezed-spin states.
From this definition of squeezing, we gain a pictorial
representation of what is desired in this kind of
squeezed-spin state. Referring to Fig. 3 and Eq. (30),
(31), or (33), we desire a state where \{J)\ is as long as
possible and the error spheroid is compressed as much as
possible in a direction perpendicular to ( J ) [along y in
Fig. 3(a)], but, at the same time, minimizing AJj^/KJ)|.
As discussed in Sec. V C and in Refs. [30] and [34], somestates show the best squeezing when |(J)|^0. The pic-
torial representation of such a state is a spheroid nearly
centered on the origin with My(Q)« A7^(0), Ay^(O).
C. A simple example (squeezed states for N =2)
Consider two particles which are initially prepared in
the state
V'(0)= [2cosh(2a)]~'/^
X(e-V)il + >2+ eV)i|->2) • (34)
This is a correlated or entangled state of particles 1 and 2
since the wave function cannot be written as a direct
product (except for 0^ + oo). Many properties of this
kind of state have been considered by Rashid [25], whoinvestigated states of the form
*'(/,M,0)= C^exp(-07Jexp(-/7r/^/2)|J,M ),
where C^ is a normalization constant. The state in Eq.
(34) is, to an overall phase factor, the Rashid state
^'( 1,0,0). It has also been considered in Ref. [32] in the
context of the radiation emitted by the two particles. It
would be produced by coupling the two particles to a
broadband squeezed vacuum [33]. This state has the
properties that {J^{0)) = {JJO))=0, <J,(0))
A//(0) = i-(l= -tanh20, Ay^'(0)= i-( 1 +sech20),
-sech20), AJ,(O)= sech20, and ^^ =sech0[(cosh20)/2]'''^. This state also satisfies the condition
AJ^{0)AJy(0)= -^\{j^{0))\ and is therefore a minimum-
uncertainty state [25]. When 6 is large, i/'(0)^1 1, — 1
)
and ^ji^l; this is just the initial state considered in the
example in Sec. IV. When 6 is small,
|^^(l+0V2)/2'^. Therefore, as 6^0,^,i^\/V2=l/VN. We can also show that, for / = 1,
the state of Eq. (34) is the state which minimizes ^j^
.
In Fig. 5, we plot the Ramsey resonance curve
({N^(tj-)) vs (o) when using this initial state for two
cases, 0-^00(|-^ = 1) and = 0. 25 (^;j= 0.728). We also
plot the fluctuations AN+it^-) for values of co given by
((Oq— co)T= 0, tt/I, and w. For (coq— co)T= and n, we
see that plotting AN+itj-) is some what misleading be-
cause, for example, values of A'^_|_(ry^) outside the range of
0-2 are not allowed. However, at the primary values of
interest, (ci)Q~co)T= ±Tr/2, AN_^.{tf) gives a reasonable
representation of the fluctuations between measurements.
From Fig. 5(b), the key point is that, although the am-
plitude of the Ramsey curve becomes smaller, the noise
at the probe frequencies (coQ— co)T— +Tr/2 becomes
smaller more rapidly. Therefore the signal-to-noise ratio
(oc |A&)|^') is increased at these frequencies. It is also
clear that the signal-to-noise ratio approaches near the
peaks and valleys of the curve; hence it is important to
probe near the half-intensity points.
A physical explanation for the noise reduction is as fol-
lows. In the Schrodinger picture, for 0^0, the final
wave function (to an overall phase factor) is given from
Eqs. (24) and (34) as
Xl>(tf l,0)=(|+),|-)2+|-)il+)2)/^2
This state has the property that, if J^ is measured for ei-
ther particle 1 or 2, we find {J^)=0; that is, it is equally
likely to find the particle in the|+ ) or the
|
— ) state.
On the other hand, when we measure J^ sequentially for
each particle, we find opposite values of J^ for each parti-
cle. For example, if when measuring particle 1 we find it
to be in theI
+ )i
state, then xl)( tj- ) has been projected
into thel
+ )il~)2 state. Therefore, when 7^ is mea-
sured for particle 2, we find it to be in theI
— )2 state.
This property of correlated states is at the heart of the
correlations observed in two-particle EPR experiments
TN-91

50 SQUEEZED ATOMIC STATES AND PROJECTION NOISE IN 77
[1,23]. The correlations exist even if the particles do not
interact.
Letting d-^0 in Eq. (34) clearly shows the correlations
between particles but gives rise to practical problems
since the signal ( « |<y^(0) ) | =tanh20) also approaches 0.
More generally, for 6—>-0, <J)-*0 and the signal goes to
zero for any form of the (classical) resonance radiation,
since any excitation, Ramsey or otherwise, is equivalent
to a rotation. Therefore, for example, in the presence of
added noise, we want to choose a value of 6 which mini-
mizes |A6j| given by Eq. (21).
D. Squeezed states for other values ofN
We first consider N=\ (7 = { ). We would not expect a
way to make |;^ < 1 because there is only one particle and
the issue of correlations does not arise. For /= {, the
most general initial pure state can be written in the form
iA(O)= cos0/2e ~"*^2| + ) +sme/2e'^^^\- )
in which case 1^ = ( 1 + tan^^ cos^<t> )'
''^ > 1
.
For A^ > 2, states which give rise to minimum values of
^f^ are not immediately apparent. For example, for
A'^ = 3, as the parameters of the wave function are varied,
local minima can be found. Using a minimization pro-
gram we find locally minimum states
^(0)^0.935||,|>+0.354|j,-l)
and V(0) = *'(|,i,0), the Rashid state for 6-^0. These
states give locally minimum values of ^j^ with values
^n ^0.76 and_0.66, respectively. Neither of these states
has ^^ = 1 /a/AT =0.577.
Finding states which minimize ^j^ becomes more com-plicated for larger N. NeverthelesSj^ we can guess at
states which approximate ^,^= \/Vn . When N is odd,
consider the relatively simple ^«a/ states (considered pre-
viously by Yurke [30] for interferometers)
rfjUf) = —^{\j,\)^\J,-{)) (AT odd (35)
The appropriate initial states can be obtained through ro-
tations (for example for reversing the order of the Ram-sey pulses)^ These states have the property that
^R={\/VN)[l/(\ + \/N)]. When N is even consider
the final states
1
^(tf)=—^sina|y, 1 ) -H/ cosa|y,0)
7=^sina|y, — 1 ) (A^ even)V2
-1/2
(36)
For these states, ^^ =( 1 +A^/2)"'^Vcosa. For N= l,
this state is equivalent to the Rashid state of Eq. (34). Wesee that ^^ is minimized for a^-0, but as noted in Sec.
V C, the amplitude of the Ramsey curve also goes to zero
as a^^Q. Agarwal and Puri [34] have shown that the
states of Rashid [25]
vl''(7,M,0) = Cjvexp( -07, )exp( -inJ^ /1)\J,M )
can be used in Ramsey spectroscopy and give minimum
values of ^r=[\^-U^-M^)/J]-^^^ for 0^0. There-
fore, for A^ even, ^n=(\+N /l)'^^'^ with M=0. For A^
odd, ^«=[1+(A^^-1)/2A^]''^^ with M = ±\. This
gives a value of ^j^ somewhat smaller than the states of
Eq. (35).
E. Minimum value of ^^
Although the particular Rashid states considered by
Agarwal and Puri [34] give the best value of squeezing of
the states considered above, it is useful to consider the
minimum possible value of ^^ . We find that ^^ ^N~^''^
from the inequalities
>(7/2)'/VA7 >(2J)-'/2= A^-'^2 _ (37)
The first inequality follows from the uncertainty principle
applied to angular momentum, AJy >| ( 7, ) |
/2^J^ (see
Sec. VIA). The second inequality follows from A,J^ 17.
This last relation can be seen by noting that, if we quan-
tize the angular momentum along the x direction, it is
straightforward to show that the states with the largest
value of A7^ are of the form
^,=2-'/2(|7,7),+e"^|7,-7)j,
in which case ^J^ =7. In the states considered above, the
only state which shows this maximum degree of squeez-
ing is the 7 = 1 state considered in Eq. (34).
VI. ALTERNATE DEFINITIONS OF SPIN SQUEEZING
A. Squeezing parameter based on
angular-momentum commutation relations
Different definitions of spin squeezing can be used de-
pending on the context in which squeezing is considered.
From the commutation relations for angular momentum,the uncertainty relations between different components of
the angular momentum are given by
A7,A7 >K7,)/2| (38)
and the expressions which follow from cyclic permuta-
tions of indices. From these uncertainty relations, it is
natural to define squeezed-spin states as states where
AV,<K7,)/2| for i^j. Hence a squeezing parameter
for this "natural" definition of squeezing might be writ-
ten as
^„=A7,/|(7,.)/2r^ i^jG(x,y,z) (39)
Squeezing in the context of this definition is discussed in
Refs. [26-28] and [33]. For example. Walls and Zoller
[26] illustrate the relation between spin squeezing defined
in this way and the squeezing in resonance fluorescence
light from two-level atoms. This squeezing is exhibited
by Bloch states which are states derived from the
|7, —7 ) Dicke states by a rotation. We can see this using
Eq. (10). During the first Ramsey pulse where a'^coiy
(corresponding to a rotation about y), the angular-
momentum operators transform according to
TN-92

78 WINELAND, BOLLINGER, ITANO, AND HEINZEN 50
JAt)=JAO)cosco,t—J^{0)sinco,t erated by interaction of the spins through nonlinear
and
JAt)=JJO)cosco,t+JAO)sma),t
Therefore, if we define squeezing as ^„=A/^/
|(yJ/2^/^ we find ^„{t )= cos^ ^^co ^t < I when
^(0)=|/,-/>.
B. Squeezing parameter to indicate tlie degree of correlation
As pointed out by Kitagawa and Ueda [36] the
definition of squeezing discussed in Sec. VI A does not
necessarily reflect the correlations between particles. For
example, the Bloch states remain uncorrelated under ro-
tation [cf. Eq. (28)] even though they show ^„ < 1 . Kita-
gawa and Ueda therefore regard the spin to be squeezed
only if the variance of one spin component J^ normal to
the mean spin vector is smaller than the variance for a
Bloch state (=J/2) [36]. In this view, a spin-squeezing
parameter might be defined as
^5 = A/^/(//2)'/2^ (40)
where the i subscript refers to an axis perpendicular to
(j) where the minimum value of AJ is obtained. Asqueezed-spin state
(l'^ < 1 ) can be rotated so that
( J ) = ( J^ ) z and A7| = A/^, and could be used in Ramseyspectroscopy (or interferometry) with ^r=(J /\{Jz)\)is-
In Ref. [38], we used a somewhat different definition of l;^
which we called I'spjn-
VII. GENERATION OF SQUEEZED-SPIN STATES
As discussed in the last section, states for which ^„<lcan be generated by rotations of the \J,±J) Dicke states.
Since |^/j= ^s = 1 for these states, we do not consider
them further. The specific correlated or squeezed states
considered in Refs. [29-31] and in Eqs. (35) and (36)
above were constructed to emphasize the benefits of spin
squeezing in the context of various experiments, but gen-
erators for these states were not given.
Rashid [25] investigated the class of angular-
momentum states which satisfy the equality in Eq. (38).
These minimum-uncertainty or "intelligent" states can be
formed from the \J,M) Dicke states by the transforma-
tion of the form
^'{J,M,d}= Cf^exp{-ej,)exp{-iTrJ^/2)\J,M),
where C/y is a normalization constant. These kinds of
states show ^j^^N'^^'^ for 0^-0 as discussed in Sec.
VD. Agarwal and Puri have shown [33] that the
^'(J,0,d) Rashid states for integral / can be created by
the interaction of an ensemble of two-level or spin-y par-
ticles with broadband squeezed vacuum radiation.
Barnett and Dupertuis [32] considered the correlated
states between pairs of particles (1 and 2) generated by a
Hamiltonian of the form H = i(g*J^ + J2+ —gJi-Jj-)^where J+=J^ +iJy and J_—J^ ~^'^y ^^^ ^^^ usual rais-
ing and lowering operators. Kitagawa and Ueda [35,36]
considered the squeezed-spin states, for arbitrary A'^, gen-
Hamiltonians of the form H = fixJ^ and
H = fix(J\ —J^- )/2i. Both of these interactions lead to
useful squeezing. They have shown that the Coulomb in-
teraction between electrons in the two arms of an elec-
tron interferometer corresponds to a Hamiltonian of the
form H — fixJ2 and might be used to generate the
squeezed states in that system.
A. Coupling to a harmonic oscillator
In Ref. [38], we considered the spin squeezing pro-
duced when an ensemble of two-level particles was cou-
pled to a (single) harmonic oscillator. One reason weconsidered this coupling was the prior theoretical demon-
stration of the complementary eff"ect—harmonic-
oscillator squeezing through the same coupling to two-
level systems [57] (see also Ref. [21]). The hope was that,
for certain initial conditions, the same type of system
might produce spin squeezing. As discussed below, it
may be possible to realize coupling to a suitable harmonic
oscillator, whereas we have not thought of a practical
way to realize the couplings discussed by Kitagawa and
Ueda [35,36] for ensembles of two-level atoms.
Therefore, in the laboratory frame, the Hamiltonian weconsider is given by
Hi = -2fi[l{a^+ a)(J++J_)cosco^t ,
(41)
where the first term is given by Eqs. (2) and (5), a and a
are the creation and annihilation operators for the har-
monic oscillator of frequency o^ and amplitude
z=ZQ[a-\-a^), and Cl represents the strength of the cou-
pling, which we assume, in general, is sinusoidally modu-
lated at frequency co^. It will be useful to transform to
the interaction picture where, for n= 0, the operators (or
wave functions) are constant in time. In this interaction
picture, the new operators are given by a=a cxpiico^t),
J_=J_ exp(icoQt), and the adjoint expressions. The
operators J are the operators in the rotating frame intro-
duced in the subsection of Sec. II. In this interaction pic-
ture, the Hamiltonian representing the coupUng becomes
+ aJ+e
Hco^—Oq)!
(42)
where, for convenience, we have dropped the tilde sym-
bols ( ~ ). Resonant interactions occur for two values of
0)^. For oj^^coq and co^ = ±(coq— co^), the Hamiltonian
is
Hi=-—nmaJ++a^J_) , (43)
plus high-frequency terms which we neglect (rotating-
wave approximation). This is the Hamiltonian of the
Jaynes-Cummings model [58] which is of considerable in-
terest in quantum optics. For= ±(a)o+ cJz ), the Hamiltonian is
o),^con and «.
TN-93
50 SQUEEZED ATOMIC STATES AND PROJECTION NOISE IN 79
H,= -fin{a^J++aJ. (44) ^l{t)= ^l{0 )cos^ft^ t + sin^ft^ t
plus high-frequency terms which we neglect. When ando}q=co2, n should be replaced by 2D, in the expressions
for Hi and Hj. For brevity, we will assume co^^^coq. H^and H2 are essentially equivalent since H^ becomes H2 if
we switch the roles of theI
+ j ) andI
— y ) states for
each particle.
We now consider the preparation of the spins into
correlated states through the interactions H^ or Hj- Thestates which are prepared this way could then be used in
Ramsey spectroscopy. For simplicity of notation, we will
consider this preparation phase to start at r— 0. Howev-er, this time should not be confused with the time whenthe first Ramsey pulse is applied.
B. Approximate solution
One way squeezing can be imparted to the spins is by
first squeezing the harmonic oscillator and transferring
this squeezing to the spins through fT, [38]. To get a
feeling for how this works without making the problem
mathematically complicated, consider the following spe-
cial case. The spin is assumed to be initially prepared in
the \J,—J) Dicke state and the harmonic oscillator is
prepared in a squeezed vacuum state characterized
by (z(r=0)) = <z(0))=0 and Az(0) < Az(coherent
state)=Zo- W^ ^^^ characterize the squeezing of the har-
monic oscillator by the parameters ^^(t)^Az(t)/zQ or
^y(f) = Az{f)/(«^Zo). The condition ^^ < 1 indicates am-
plitude squeezing and ^^ < 1 indicates velocity or momen-tum squeezing. When Hy applies, the Heisenberg equa-
tions of motion are
da /dt = iilJ_ , dJ_ /dt liDaJ, (45)
and the adjoint expressions. We now make the assump-
tion that the initial mean number of quanta {«(0))= (a (O)a(O)) in the harmonic oscillator is small enough
and/or A'^ is large enough that the value of ( J^ ) does not
change appreciably during the time //, is applied. In this
case, we make the approximation J^(t)= —JI, where / is
the identity operator. With this approximation, the
Heisenberg equations of motion can be solved analytical-
ly to give
J ^{t)=J _{0)cosn!^t + iN(n/CLf^)a(0)smnf^t ,
a{t) = a(0)cosi:if^t+iJ_(0)N~^^hmn;^t ,
and the adjoint expressions, where ft^^iVH^.
these equations, we find
(46)
(47)
From
(48)
(49)
^l(t)= f,{0)cos^aj^t+sm^aj^t
(50)
(51)
\I/2/In Eq. (49), we make the definition ^^^ =(27)'^^A/^/
I(7^ ) |. If a state with ^r^x <^ is produced, it could be
used in Ramsey spectroscopy by first rotating the state by
tt/2 about the z axis so that ^^ ^ ~^^R,y —^r • From Eqs.
(48) and (49), we can create squeezed-spin states by first
squeezing the harmonic oscillator (|;^(0) < 1 or ^^^(O) < 1)
and transferring the squeezing to the spins. Correspond-
ingly, from Eqs. (50) and (51) we see that the squeezing is
"drained away" from the harmonic oscillators as it is
transferred to the spins. In this small-angle approxima-
tion, squeezing is transferred to the spins like wave-
function exchange between harmonic oscillators [18].
The squeezing is sinusoidally transferred back and forth
between the harmonic oscillator and the spins; however,
in a more precise treatment, where we no longer assume
(J^) to be constant, this will no longer be true. We find
the same expressions for ^R(t), ^R^x^t), ^^(t), and ^^(t)
when o)^=±(coq+ co^) {Hj apphes), t/'(0)= |J, +/), and
if we make the small-angle approximation J^ — +JI.
For Hy, if we instead assume ij;(0)=\J,+J) and make
the small-angle approximation /^(r)= +//, we find
(52)
(53)
(54)
(55)
The same expressions are found for Hj if we assume
i/'(0)=|y, —7) and make the small-angle approximation
J^(t)= —JI. In these cases, for short times, no squeezing
is transferred to the spins and the harmonic-oscillator
squeezing degrades.
C. Numerical solution
Because of the limited validity of the small-angle ap-
proximation, we have integrated Schrodinger's equation
for Hy and H2 for some special cases. We write the wave
function for the combined harmonic-oscillator -spin en-
semble as
*c(')=2c„,m(^)I«)I^> (56)
«,M
where|n ) are the harmonic-oscillator eigenstates and we
use the shorthand notation \M) = \J,M) since / is a con-
stant of the motion for i/, and H2. From Schrodinger's
equation, we find for H^
11/2/rfC,,^/dx=/(« + l)'^^[y(y + l)-M(M-l)]'/X+,,^_, + /«'^^[;(7 + l)-M(M+l)]'^X_,,M + , , (57)
where x = Ctt. We have integrated this equation and the corresponding one for H2 using a fourth-order Runge-Kutta
method [59]. For the initial wave function, we assume the atoms and harmonic oscillator are uncorrelated so that the
wave function can be written as a direct product ™j q
,

80 WINELAND, BOLLINGER, ITANO, AND HEINZEN 50
*J0)= ^c„m\n) V'(O) , (58)
where c„(0) are the initial harmonic-oscillator wave-
function coefficients [60] and we will assume xplO)
= \J, —J ) or \J, +J). Of course, we must truncate the
basis of harmonic-oscillator states; an adequate numberof states is determined by increasing the basis until the re-
sult remains unchanged.
For / = 1, we also solved Schrodinger's equation for
Hi and H2 with a different numerical approach. For
J = l, the Hamiltonians i/j or H2 can be written as
blocks of 3 X 3 matrices on the diagonal and zeros else-
where. Explicitly, Hi only couples states where « +M is
a constant and H2 only couples the states|« — 1 ) |
— 1 )
,
|«)|0), and |n + l)| + l). The 3X3 matrices corre-
sponding to the Hamiltonian of the coupled states were
diagonalized and the wave function for the combined
harmonic-oscillator-spin ensemble written as a sum over
the eigenstates. The time evolution of the wave function
(q)
2.5
2.0
in 1.5
•My
1.0
0.5
0.0
^R•
^S
<n(0)>
-small— angle
theory—
»
- 0.5
o—60.0
2.5
2.0
1.5
1.0
A
cV
0.0
(b)
1.0
•My
0.5
•My
I 1
1 1
1 1 r
1 1 1
' "1
, , ,1
1 1 1 1 1 1 1
1
^R •
11 1 1 1 1 1
1
0.5 1.0 1
P (0)
(c)
11 '^ >
1.0<
My00 \ • /
>
0.3
>
A0.8
a:My
/
\ \ / ;
0.2
)
cV
0.7
0.6
0.5
°\ \. y -°
0.1
-
^R • ^0—0-^ -
<n>
1
10
J
100
1
nt
FIG. 6. Plots of ^R [Eq. (30)] and ^s [Fq- (^)] assuming the squeezed-spin states are prepared by coupling a single harmonic oscil-
lator to the spins via the interaction H^ [Eq. (43)]. We assume i/'(0)= | J, —J ) and the harmonic oscillator to be initially prepared in
the squeezed vacuum state where (z(0)) = <z(0))=0 and |:^ ( ) < 1 . In (a), J = 1 . We plot the values of the first minima of ^^ and ^5
as a function of time after H^ is turned on [refer to (c)] vs the initial value of ^^(0). We also plot the value of («(0)) = (a^c2 ) vs
^^(0). In addition, we plot the prediction of the small-angle theory, ^« =^5 = |;^(0), as a dashed line. As expected, the small-angle
theory is valid only for very small values of ^^(0) (or (n )). In (b), we plot the first minimum values of ^^ and ^5 less than 1, after /f
,
is turned on, vs J. For each point, i^^iO) has been adjusted to give the smallest value of ^^ and ^5. In (c), we plot ^k, ^S' ^nd ( « ) as a
function of time for y= 1 , and |;,(0)=0.60. At ilt^ 1.35, ^b reaches its minimum value of =^0.84.^TN-95

50 SQUEEZED ATOMIC STATES AND PROJECTION NOISE IN . .
is then obtained from the time evolution of the eigen-
states. With this method a larger number of harmonic-
oscillator states could be included in the calculation. Weobtained results that agreed with the numerical approach
described above. This method can be generalized for
J>1 with the complication that (2/ + l)X(27 + l) ma-
trices would need to be diagonalized.
In Fig. 6, we plot 1"^ and ^^ ^^^ ^\ assuming
rp{0)—\J,—J) and assuming the oscillator is initially in
an amplitude-squeezed vacuum state where (z(0))
= ( z ( ) ) = and ^^{0)<\. This figure indicates the hm-
ited validity of the small-angle approximation, which is
shown as a dashed line. We see that there are states for
whichl^s< 1 while |^^ > 1. This emphasizes the need to
define squeezing in the context of a particular problem.
From Fig. 6(a), we also see that the minimum values of
^5 and ^ji are obtained for diiferent initial values of
^^(0). In Fig. 6(c) we plot the evolution of ^^, l'^, and
(n ) as functions of time for 7 = 1 and |;^(0)= 0.60. Ini-
tially, ^ji becomes greater than 1 but eventually reaches a
minimum value of 0.840 corresponding to that shown in
Fig. 6(a).
In Fig. 7, we plot ^j^^ and ^^ for Hj assuming
xp{0)= \J, —J ) and assuming the oscillator is initially in a
coherent state where <z(0))^0, (z(0))=0, and ^^(0)
= |^y(0)=l. Before using the resulting states in Ramseyspectroscopy, we want to first rotate { J ) so that it points
along the negative z axis and then rotate the state about
the z axis by 7r/2 so that the squeezing in the x direction
is transferred to the y direction (^R^x~^^R,y—^R ) The
harmonic oscillator, in combination with Hj, drives the
spin ( J) to lie in the y-z plane. This is indicated in Fig.
7(c) where we plot, for 7= 1, ^r^' is,x> and (n ) vs time
and (J(/)) as viewed in the — x direction, assuming the
value of («(0)) which minimizes ^nx- Spin squeezing
along these lines may be of practical interest since we re-
quire the initial harmonic-oscillator state to be only a
coherent state, not a squeezed state.
A squeezed state of the harmonic oscillator can be gen-
erated by parametric pumping of the oscillator at fre-
quency 2co^. In the laboratory frame this pumping in-
teraction can be represented by
Hp{lah)=- mO-pia+a^ )hm2co, t «
z
hinlo), t .
If we add this interaction to i^j, the total Hamiltonian in
the interaction frame becomes
H-^ = -'nf^{aJ++a^J_) + ifiVLp(a^-{a^9) (59)
plus high-frequency terms which we neglect. In general,
we could let fip vary in time. The case considered in Fig.
6 is equivalent to having ftp nonzero and large for a very
short time after r=0 and then allowing the system to
evolve under the influence of //[. In Fig. 8, we consider a
special case where ftp and ft are constant in time and ap-
plied together. We show a plot of ^p and ^^ ^^ time for
J = \, i/'(0) = |l, — l), the harmonic oscillator initially in
the vacuum state [<z(0)) = <z(0)) =0, and
^,(0)= |:„(0)= 1], andftp/ft=0.23. This value of ftp /ft
yields a (local) minimum in ^p for these initial conditions.
<n(t=0)>
(c)
2.0
1.5
0.5
0.0
^R •
^So
y <n> o -o—
o
8.0
6.0
Ac
4.0^
2.0
1 2
nt
FIG. 7. Plots of ^^.^ [or ^^, Eq. (31)] and ^s [Eq. (40)] as-
suming the squeezed-spin states are prepared by coupling a har-
monic oscillator to the spins via the interaction Hi [Eq. (44)].
We assume ;/'(0)= |/, — /) and the harmonic oscillator is ini-
tially prepared in a coherent state where (z(0))=5^0, {i(0))=0,
and |:,(0)= ^„(0)=1. In (a), J = \. We plot the values of the
first minima of ^g^ and |;s, as a function of time after H^ is
turned on [refer to (c)] vs <«(0)). In (b), we plot the values of
the first minima of ^^ and ^s less than 1 after Hi is turned on vs
J. For each point, (z(0) ) has been adjusted to give the smallest
value of |;« and ^s- The harmonic oscillator, in combination
with Hi, drives the spin ( J ) to he in the y-z plane. Before using
the resulting states in Ramsey spectroscopy, we want to first ro-
tate ( J ) so that it points along the negative z axis and then ro-
tate the state about the z axis by tt/I so that the squeezing in
the X direction is transferred to the y direction
(^«,x -^^R.y=iR )• In (c), we plot, for 7 = 1, ^r^^, ^s,x, and (n)^
vs time and (J{t)), shown as an arrow, as viewed in the — x
direction, assuming the value of ( «(0) ) which minimizes ^r,;.
TN-96

82 WINELAND, BOLLINGER, ITANO, AND HEINZEN 50
1.0
- 0.5 -
en
0.0
-^o
^/•^*.
-•—•-
-o-o-~.
^R •
1 1
2
Qt4
^O-o-o
FIG. 8. For / = 1, we plot ^« [Eq. (31)] and ^s [Eq. (40)] vs
time assuming the squeezed-spin state is prepared by coupling a
parametrically pumped harmonic oscillator to the spins via the
interaction H^ [Eq. (59)]. We assume V'(0)=|l, — 1) and the
harmonic oscillator is initially prepared in the vacuum state.
The curves use the value ilp/il=0.23 which minimizes (locally)
the value of ^r at ilt ^2.5. At certain times, the values of both
^R and ^5 are reduced below those found in Fig. 6(a).
The values of both |^^ and ^^ ^""^ ^^^^ than in the case of
Fig. 6(a).
VIII. POSSIBLE EXPERIMENTAL METHODS
As shown by Agarwal and Puri [33,34], a way to pro-
duce good squeezing is to couple the spins to a broadband
squeezed vacuum. However, this may be difficult in prac-
tice, because all spatial modes of the field must be
squeezed [61]. These modes are then properly phased
only at a particular spatial location and the atoms mustall be locahzed about this point to within a small fraction
of a wavelength. For optical transitions with stored ions
this is difficult because the Coulomb repulsion typically
results in ion-ion separations of more than 1 jum. Neutral
atoms could be confined with spacings less than X, but
then the direct dipole-dipole coupling must be included.
An alternative strategy might be to confine the atoms in a
cavity that is driven by a squeezed vacuum field [61].
From the previous section, another way to produce
spin squeezing is to first prepare a harmonic oscillator in
a squeezed or coherent state and then couple the oscilla-
tor to the spins through a Jaynes-Cummings-type interac-
tion [Eqs. (43) or (44)]. Using the extensive work on
"cavity QED" as a guide, this could be accomplished by
the interaction of an ensemble of atoms with a suitably
prepared electromagnetic field of a single cavity mode[4-7,62-64]. In these types of experiments, the pres-
ence of thermal noise and/or cavity and atomic relaxa-
tion would reduce the degree of spin squeezing that could
be achieved. Although we can expect these problems to
be overcome in the future, it may be useful to consider al-
ternate systems. Our experiments have led us to consider
coupling of the internal levels of atoms to a different har-
monic oscillator— that associated with the oscillation of
atoms in a trap. In this paper, we will concentrate on the
use of trapped atomic ions, but many of the considera-
tions apply to trapped neutral atoms as well.
A. Trapped-atomic-ion oscillator
The interest in a trapped-ion oscillator is due to its po-
tential immunity from relaxation and thermal noise exci-
tation. To a good approximation, a single ion confined in
an ion trap [65,66] can be modeled as a charged harmonic
oscillator. For an ensemble of ions localized near the
center of the trap this model is also valid for the center-
of-mass (cm.) motion of the ensemble [66]. In what fol-
lows, we will assume all internal mode frequencies are
shifted away from the cm. frequency by the ions'
Coulomb interaction. The cm. charged harmonic oscil-
lator is subject to radiative decay and heating from the
environment. It can be considered to be confined in a
cavity formed by the trap electrodes. Typically, the
wavelength of the harmonic-oscillator radiation (corre-
sponding to oscillation frequencies of a few megahertz or
less) is much larger than the dimensions of the trap elec-
trodes. A useful representation of this situation is to
model the cm. motion of the harmonically bound ion (in
one direction) as a series LC circuit which is shunted by
the capacitance of the trap electrodes as shown in Fig. 9
[66]. The resistance r is due to losses in the electrodes
and conductors which connect the electrodes. Theequivalent inductance of the ions is given [66] by
l^md^/NiZq)^ where m is the ion mass, d the charac-
teristic internal dimension of the ion-trap electrodes, Nthe ion number, Zq the charge of a single ion (^ =charge
of the proton), and we neglect geometrical factors on the
order of 1. The resistance r both damps and imparts
thermal energy to the ions with time constant I /r. Tocharacterize the damping and thermal heating, we calcu-
late the time t* for heating the ion's cm. motion from
the « =0 to the n = 1 state,
t* = lfi(o,/{rksT)^2.9{co^/2Tr)d^M(u)/(NrTZ^) ,
(60)
where kg is Boltzmann's constant, T the temperature of
AC,:^
IONS
FIG. 9. Equivalent circuit representation of one component
(z) of the trapped ions' center-of-mass motion coupled to the
surrounding trap electrodes (from Ref. [66]). We have
l^md^/NiZq)^ where m is the ion mass, d the characteristic
internal dimension of the ion-trap electrodes, A'^ the ion number,
Zq the charge of a single ion (9=charge of proton), and we
neglect geometrical factors on the order of unity. The resis-
tance r is due to losses in the electrodes and conductors which
connect the electrodes. The equivalent capacitance of the ion,
c = 1 /cojl, is typically much less than Cj- which is usually on the
order of a few picofarads. As discussed in the text, damping
and thermal heating from r can be neglected in many cases.
TN-97

50 SQUEEZED ATOMIC STATES AND PROJECTION NOISE IN 83
resistor r, co^ is the oscillation frequency, and the ion
mass M is expressed in atomic mass units. For co^ /27r=
3
MHz, d = 2 mm, M=100 u, N =2, r = 0. IH, r= 300 K,
and Z = 1, we obtain f * ^58 s. In this case, and in gen-
eral when Hci)^ « kg T, the decay time from n = 1 to « =is much longer. In the experiment reported in Ref. [13],
(co,/2-rr^5 MHz, d ^0.1 mm, M ^200 u, N=\, r^300K, and Z = 1), t* was measured to be 0.17 s even thoughno care was taken to make r small or to reduce external
sources of noise. If we can make Cl large enough{»l/t*), it should be possible to avoid the effects of
damping and thermal heating on the ion harmonic oscil-
lator.
Similarly, it should be possible to avoid radiative relax-
ation in the two-level system. This is particularly true if
the levels are separated by rf or microwave frequencies
where radiative decay rates can be extremely small [41].
Even at optical frequencies, many forbidden transitions
have radiative decay times on the order of seconds or
longer and may be viable as candidates for spin squeez-
ing.
B. Squeezed or coherent states of ion motion
A single trapped ion can be laser cooled to its quantumground state of motion [13]. It should also be possible to
extend this technique to cool the cm. motion of an en-
semble of ions to the ground state. In analogy with
methods used in quantum optics, a squeezed vacuumstate of the cm. mode (appropriate for Fig. 6) could be
obtained from the ground state by suddenly changing the
ion's well depth or parametrically modulating the well
depth at 2ci>^ as indicated by the second term in Eq. (59)
[17,18]. A coherent state of nonzero amplitude (ap-
propriate for Fig. 7) could be obtained from the vacuumstate by suddenly shifting the center position of the ions'
well, or by driving the oscillator with a classical resonant
excitation [17,18].
Cirac et al. [19] have shown that the ion could be laser
cooled and squeezed at the same time by superimposing
the nodes of two standing-wave laser beams at the meanposition of the ions and tuning the laser frequencies to
the first lower and upper sidebands of the two-level tran-
sition frequency, that is, to ajg—
^j^ and coq+ o)^. Indepen-
dently of the way the harmonic-oscillator state is pro-
duced, the phase of the oscillator and/or squeezing must
be referenced to the phase of the clock radiation in a pre-
dictable and reproducible way.
C. Possible realizations of the
Jaynes-Cummings-model coupling
After the harmonic-oscillator state is prepared, squeez-
ing could be imparted to the spins (or two-level systems)
by application of the Jaynes-Cummings interaction given
by Eqs. (43) or (44). This form of coupling has already
been realized to couple the spin and cyclotron motion of
a single electron in the classic g-2 experiments of
Dehmelt and his collaborators [67]. In Ref. [38], we con-
sidered one possible realization of the Jaynes-Cummingsmodel for atoms. We considered A'^ ions having an un-
paired outer electron which are trapped along the axis of
a linear rf trap [68] where, here, we take the axis of the
trap to be in the y direction. The ions are subjected to a
homogeneous magnetic field which quantizes the spins
according to Eq. (2). We then superimpose an inhomo-
geneous field gradient B '= dB^ /dz whose value, averaged
over the ions' orbits, is zero. However, as the ions oscil-
late, they experience a motional oscillating magnetic field
which tends to flip the spin and reduce or increase the
ions' cm. harmonic oscillator as in Eq. (43) for H^ [69].
The B' field could be generated by a current /y in twowires (which could double as trap electrodes) situated at
the positions z = ±Zj- relative to the ions. We find
n/2Tr^2I zfHMco^/2Tr)-1/2
where /,,, Zj, M, and
cl)^/2tt are expressed in amperes, centimeters, atomic
mass units, and megahertz, respectively. For 7^=0. 1 A,
Zj = Q>.0\ cm, M = 24 u(^^Mg + ), and 6J, 7277=1 MHz, wefind n 7277^400 Hz.
Blockley, Walls, and Risken [70] have shown that the
Jaynes-Cummings model is realized for a harmonically
bound atom or ion which interacts with a traveling-wave
laser tuned near the transition frequency of the atom.
They assume the atom is confined to the Lamb-Dickelimit and the resulting coupling strength is much smaller
than the oscillator frequency [£L«(o^ in our Eq. (41)]. If
the laser is tuned to the first upper or lower motional
sideband of the atomic transition, and spontaneous emis-
sion from the excited state can be neglected, Rabi oscilla-
tions occur between ground and excited states accom-
panied by oscillations between adjacent harmonic-
oscillator states. Cirac et al. [71] have shown that the
Jaynes-Cummings model is realized for the harmonic
motion of a two-level ion confined to the Lamb-Dickelimit whose mean position is located at the node of a
standing-wave laser field tuned near the ion's transition
frequency. In both cases, if a suitably narrow optical lev-
el (one with weak relaxation) can be used, one might hope
to impart squeezing to optical levels. These schemes
could, in principle, also be applied to transitions of muchlower frequency (infrared or microwave frequencies).
The coupling Cl would be reduced for the same value of
co^ (reduced Lamb-Dicke parameter) but the radiative de-
cay could be expected to be considerably reduced.
References [12-1A] and [18] have theoretically con-
sidered the use of stimulated Raman transitions to
achieve laser cooling of trapped ions to the zero-point en-
ergy. (Stimulated Raman transitions have recently been
used to cool free atoms to a kinetic energy less than that
corresponding to the recoil of one photon [75].) The sys-
tems used to achieve this cooling can also be used to real-
ize the Jaynes-Cummings model. Under certain condi-
tions, stimulated Raman transitions produce a Rabi oscil-
lation [18] which can be described by an effective Jaynes-
Cummings interaction. For convenience, we use the no-
tation of Ref. [18].
Reference [18] considered stimulated Raman laser
cooling to proceed by repeated applications of a sequen-
tial, two-step process. Figure 10 illustrates the first step
of this process, where we have restricted our attention to
harmonic motion (of frequency o^) along one direction
taken to be the z direction. The eigenstates of the system
TN-98

84 WINELAND, BOLLINGER, ITANO, AND HEINZEN 50
FIG. 10. Schematic representation of the energy levels for
stimulated Raman transitions between internal (electronic) lev-
els 1 and 2 of the trapped ion. The states are designated by the
notation \n,j ) where n denotes the ion harmonic-oscillator level
and 7 = 0,1,2 denotes the electronic state, k) and k2 are the
wave vectors for the traveling-wave fields which couple elec-
tronic level to levels 1 and 2. We assume A»w^. In the
figure, we schematically show the |2,1 )<-*|l,2) stimulated Ra-
man transition. Under the assumptions discussed in the text,
the stimulated Raman transitions are equivalent to a Jaynes-
Cummings-type coupling between electronic levels 1 and 2 and
the harmonic (center-of-mass) motion of the ions.
are denoted by \n,q) = \n)\q)^ where n is the occupa-
tion number of the harmonic motion and q =0,1,2denotes a particular electronic level. Decay from levels
|l)g and |2)^ is assumed to be negligible; level lO)^ de-
cays at rate y. The ions are irradiated by two laser beamswith classical field amplitudes Ej=Rc\EQjexp[i(kj-r— cojt)]] (7 = 1,2) which couple level \0)^ to levels |l)^
and |2)^ with Rabi frequencies gjQ^\fijQ-EQj\/2ii where
fiQj is the dipole matrix element between states |0)g and
ly/g. The frequencies of the beams are assumed to be
equal to a>^=coQ^ — A — co2+b and co2 = coq2
is the transition frequency between states |rt,0)
\n,j). We assume 0)01,0)02» A »ct)^ »8. The ions are
initially prepared in the electronic state11 )g. When the
ions are confined to the Lamb-Dicke limit (amplitude of
motion « 1 /kj^ where kj^ = k^ -z), a reduction in the
harmonic-oscillator energy by Hco^ occurs by stimulated
Raman transitions |«,l)^|«,0)^|n — 1,2) and
|n, 1 )->!« — l,0)->|n — 1,2) which reduce n by 1. In
the second step of the cooling process, a laser tuned near
o)o2 causes spontaneous Raman transitions from level
|2)^ back to |l)^. In the Lamb-Dicke limit, transitions
of the form |« — l,2)^-|n — l,0)-^|n — 1,1) are dom-inant in this second step. Therefore, after the two steps
A where coqj
and
of the cooling process, ( « ) is reduced by 1 . After repeat-
ed applications of this two-step process, the ions are
eventually cooled until (n ) « 1 [18].
The first step of the cooling process realizes a Jaynes-
Cummings coupling between the ions' harmonic oscilla-
tor and the internal levels11 )g and |2 )^. If we ensure the
condition A»TrY /(2\bkJzQn^^^), where 6/c^ = ^2z ~^iz'then the ions undergo stimulated Raman transitions with
negligible probability of spontaneous decay from level
|0)^ [18]. Under these conditions, the first step of the
cooling process is adequately described by amplitude
equations derived from Schrodinger equation. If wewrite the wave function for the system as
*(r)=2 2 ^""^n g=0
'1,9" ,q) (61)
then Schrodinger's equation leads to the amplitude equa-
tions [18]
cfa„,,/ir = -^2 2 ««.,^ "'"''' K,,,n' (62)
n' q' =
where fico n,q,n is the energy of state \n,q) minus the
energy of state ]n',q') and F„^ „.^. is the matrix element
of the perturbation — /i-(E, + E2) between states \n,q)
and \n',q'). If
0;, O)20 »A»7,g,o,g20.«z
we can adiabatically eliminate the excited states from the
equations. With the additional assumption that
0)^ »gj/J^, and neglecting terms in the equations of
motion that vary with frequency co^ or higher, we arrive
at the amplitude equations
\/2„i&tda„j/dt = iAsia„j-n*n ^^^e a.
1,2
and
da,_i^2/dt = i^s2^n-\,2+ ^*n^^^e -ibK'",1
(63)
(64)
A<where O.* =g^Qg2Qbk^z^/^, A^i^gjo/A, and ^52
=g2o/A. The first terms in these equations are due to
the ac Stark shifts of levels11 )^ and |2 )^ by lasers 1 and
2, respectively. If A »|c[;,o— ojjol, we have
Asi = (gio+.?i2)/A, and ^s2= '<s\o+sl\)/^^ where
g,2 = lAtio'Eo2l/2^ and gj, = |/i2o'Eoil/2^- We can now
make the transformations a„^ = iA„^t\^p{il^s\t) and
a„2^^«,2exp(/A52?)- If we let 8 = A^-, — A52, the equa-
tions of motion become
dA„,/dt=iQ.*n'''A'«,! 1,2
and
dA n-1,2 /dt= ia*n'^'A
n,\
(65)
(66)
The choice of 8 is that which compensates for the
differential ac Stark shifts in levels ll)^ and \2) ^ and
makes (0^ — 0)2 resonant with the first lower motional side-
band of the stimulated Raman transition. These equa-
tions are identical to Eqs. (57) (for J = j) if we make the
identification A n,r >C„ 1/2 and AnXwe identify the lO^, and |2)^
'«, + 1/2' that is, if
states of Fig. 10 with the
TN-99

50 SQUEEZED ATOMIC STATES AND PROJECTION NOISE IN . 85
I
— ) andI+ ) states of the spin-| model. Hence, when
spontaneous Raman transitions can be neglected, the sys-
tem of Fig. 10 gives rise to the Jaynes-Cummings modelcoupling between the two-level system consisting of states
|l)^ and |2)^, and the z cm. harmonic motion of the
ions. This causes Rabi oscillations between states|n , 1
)
and \n — 1,2) at frequency ft*« '^^.
To indicate possible experimental parameters, we con-
sider the ^Si/2(F=l)^^Pi/2-^^5,/2(F= 2) stimulated
Raman transition in ^Be"*" (1= 313 nm, (ii2Q— (o-^Q=\.25
GHz). If we assume \bk^\ = \k^\, co^/lv— S MHz,
S\Q^S20 = 1^^ MHz, A/27r= 20 GHz, we find
|8A:^ZoN0.21, ft*/27r^l50 kHz, and the probability of
spontaneous emission from the excited state during the
time for complete transfer from the F = \ to F = 1
ground state [18] to be approximately 0.01. If we assume
that |Uio=/i2o~9(0-5 X 10~^ cm) where q is the electron
charge and that the ions are at the center of Gaussian
laser beams with waist u;o = 20 yum, then we require ap-
proximately 325 /iW in each beam.
Realizations of the Jaynes-Cummings model using op-
tical transitions are potentially interesting because the
coupling frequencies fl may be much higher than that
provided by inhomogeneous magnetic fields acting onelectron spins. In addition, lasers may allow spin squeez-
ing to be applied to atomic levels which are of more in-
terest for atomic clocks, such as hyperfine and optical
transitions.
IX. SUMMARY AND DISCUSSION
In this paper, we have discussed the application of
correlated particle states, or squeezed-spin states, to spec-
troscopy. Spin squeezing in other contexts has been dis-
cussed elsewhere [25-37]. This work extends that of a
previous paper which introduced some of the ideas [38].
Transitions are assumed to be excited by classical radia-
tion and detected by observing changes in the state popu-
lations of the particles (population spectroscopy). In this
case, the fundamental limiting noise is projection noise
[40], the noise associated with the quantum fluctuations
in the measurement of populations. We find that the
signal-to-noise ratio can be improved over the case of ini-
tially uncorrelated particles if the particles are first
prepared in particular quantum-mechanically correlated
or squeezed-spin states. We have considered a particular
case of Ramsey's separated-oscillatory-field method of
spectroscopy [41] since it gives the narrowest linewidth
for a given interaction time. We introduce a squeezing
parameter |;^ which is the ratio of the uncertainty in the
determination of the resonance frequency when using
correlated states vs that when using uncorrelated states.
This squeezing parameter has more general applicability,
in that it gives a measure of the sensitivity of angular-
momentum states to rotation. Since one description of
interferometers is formally equivalent to Ramsey spec-
troscopy, the squeezing parameter might also be used in
that context. Other squeezing parameters which are
relevant in other contexts can be defined. We discussed
certain states which exhibit a squeezing |;^ ^iV^'^^. Be-
cause of our experimental background in the spectrosco-
py of stored atomic ions, we have investigated possible
experimental schemes which might yield ^^^ < 1 in this
system.
The investigation and demonstration of squeezed-spin
states is interesting for various reasons. These studies ex-
tend the realm of squeezing beyond the electromagnetic
field. The ideas apply, in principle, to particle inter-
ferometry [29-31,35,36] and spectroscopy. From the
practical side, since some trapped-ion spectroscopy ex-
periments are currently limited by projection noise [40],
the use of squeezed-spin states would yield more precise
measurements. As a byproduct of these investigations wehave discussed some schemes where it might be possible
to realize the Jaynes-Cummings model [58] by coupling
atomic internal levels to harmonic particle motion. In
practice, this might allow the study of this fundamental
quantum system and related cavity-QED experiments in
the regime of weak relaxation and high detection
efficiency. Also, it may be possible to generate correlated
states which would be useful in multiparticle EPR experi-
ments [2,38].
In spectroscopy, if we assume that the state prepara-
tion and detection time are small compared to the Ram-sey interrogation time T, and if the measurement noise is
limited by projection noise, the measurement uncertainty
of the particle's transition frequency Oq, expressed frac-
tionally, is [76]
Aft) h(OoirNT)
1/2(67)
where t»T is the total measurement time and ^j^ ac-
counts for the use of correlated states. In a particular ap-
plication, if we require a certain fractional frequency-
measurement precision and if A'^ and T are fixed, then the
time r required to reach this measurement precision is
proportional to |;| . The reduction in measurement time
due to |;^ < 1 would be particularly important in manyapplications using atomic clocks, where, to reach the
highest measurement precision, the frequency is averaged
over very long times, perhaps years. For states with
^j^=N~^^'^, the required measurement time would be re-
duced by A'^.
We emphasize the importance of setting and maintain-
ing the phase relationship between the fields which
prepare the squeezed-spin states and the Ramsey fields.
In the case where the squeezed-spin state is prepared by
couphng to a harmonic oscillator, we must maintain the
correct phase relationship between the oscillation of the
harmonic oscillator, the coupling D. at frequency co^ , and
the Ramsey fields. When we start from a squeezed-
vacuum state of the harmonic oscillator, slight phase er-
rors will increase the value of ^^ that is obtained, but
should not affect the accuracy of the measurement since
the correlated state that is created should have
{Jy{0))=0 [see Eq. (18)]. However, in the case where
the squeezed-spin state is created from a coherent har-
monic oscillator, it may be difficult to ensure that
{Jy{0))=0. The resulting off"set in the Ramsey curve
would affect the accuracy (that is, it would give a sys-
tematic offset in our determination of Oq), but if the oflFset
IN- 100

86 WINELAND, BOLLINGER, ITANO, AND HEINZEN 50
can be maintained constant it will not affect the relative
measurement precision attained.
After the particles are put in squeezed-spin states, the
correlations exist even though the particles do not in-
teract. During the application of the squeezing Hamil-
tonian, the particles interact through their mutual cou-
pling to the quantized harmonic oscillator(s). After this
preparation stage, the particles do not interact even
though the correlations remain. When the final particle
states are measured, these correlations between particles
are manifested even though, as in the classic EPR experi-
ment, the particles have no way of "communicating" be-
tween one another.
In Sec. V C, we noted that it may be necessary to workwith states that are not maximally squeezed since, when
^j^ reaches its minimum value, the signal also approaches
[for example, 6-^0 in Eq. (34)]. However, we can re-
cover the advantages of squeezing without losing the sig-
nal by using a different measurement strategy. We can
accomphsh this by measuring higher moments of J^. Asan example, we consider measuring J^ rather than J^ (or
iV+) [38,77]. We illustrate the idea for Af = 2 (/=1). Let
V'(0)=|1,0). Using Eq. (24) we obtain
{jHtf)}=sm^(o^T
and
MJ^(tf))- [sinlco^T
(68)
(69)
As a function of co (or co^), (J^itj-)) oscillates twice as
fast as (J.itf)) [in Eq. (14)]. In analogy with Eq. (13),
the frequency imprecision for a single measurement is
given by
\Aco\=MJ^(tf))/\d{J^{t^))/Qco\ = \/2T, (70)
which is_ independent of co. Therefore, effectively,
^R = 1 /y'2 ( = 1 /Vn ) is obtained. For states of higher
J, the maximum sensitivity may be given by measuring
higher moments or combinations of higher moments.Although we are most interested in states which exhib-
it quantum correlations between different particles, someof the interesting features and spectroscopic advantages
of squeezed states can be studied in a different model sys-
tem. In particular, consider an individual atom with
7 > y. As a concrete example assume 7=1, as in the
^5i/2 (F= 1 ) ground hyperfine state of '^^Hg'*'. Suppose
we are interested in measuring the Zeeman transition fre-
quency for AMf = ±1 transitions when the ion is placed
in a weak magnetic field. By weak, we mean a field wherethe Zeeman energy is much smaller than the ground-state
hyperfine frequency, so the Zeeman sublevels are split
equally. Suppose the ion is prepared in the \F—\,M = 0) state. This state is equivalent to the squeezed
state of Eq. (34) for 0^-0. We then apply radiation
which drives the ion from the |l,0) state to the |l,l)
and1 1, — 1 ) states. We can measure Jj, after application
of the Zeeman radiation, by measuring the probability
that the ion is detected to be in the |l,0) state by
methods similar to those of Refs. [40] and [68]. As out-
lined in the last paragraph, this effectively gives
^;j=2~'^^. One possible apphcation of spin squeezing
within a Zeeman level is for improved signal-to-noise ra-
tio in electric-dipole-moment (EDM) experiments [77].
Several issues need further investigation. For example,
we have not proved that, for a given measurement time
T, the minimum value of Ao) is obtained for the particu-
lar method of spectroscopy we have assumed. Even for
this method, other states may more closely approach the
lower hmit of ^r—N~^^'^ than the particular Rashid
states investigated by Agarwal and Puri [34]. In consid-
ering the parametrically pumped oscillator [Eq. (59)], we
have not optimized the squeezing for initial conditions or
form of flp(t). In considering the application of H^ (or
Hj), we have not considered all possible initial condi-
tions, interaction times, or forms of ft(f).
In all that we have discussed, we have assumed wave
functions constructed with \J,M ) basis states where
J= N/2. This is because, prior to preparation of the
spin-squeezed states, we assume initial states of the form
\J =N /2,M), and the generators for the squeezed states
preserve J. For completeness, we should consider similar
basis states with J <N /2. Since, in general, ^^ is larger
for smaller values of J, we suspect that the smallest
values of ^^ are obtained for states with J =N /2.
In the spectroscopy we have described, we have as-
sumed that, once the initial states are prepared, transi-
tions are driven by classical fields. It will be interesting
to investigate the signal-to-noise ratio when the spectros-
copy is performed with quantized fields. In this case, we
could consider both the case where transitions are detect-
ed by observing changes in state population and when
they are detected by looking at changes in the transmit-
ted or scattered radiation.
From the experimental side, we are hopeful that
simpler practical ways can be found to generate spin
squeezing than the schemes we have discussed. Never-
theless, even if states with only modest squeezing could
be produced they would be very important in spectrosco-
py and perhaps other applications.
ACKNOWLEDGMENTS
We gratefully acknowledge the support of ONR. Wethank G. S. Agarwal for sending a prepubhcation copy of
Ref [34]. We thank C. Monroe, J. Tan, M. Young, and
P. Zoller for critical comments on the manuscript.
[1] A. Einstein, B. Podolsky, and N. Rosen, Phys. Rev. 47,
777(1935).
[2] For a recent review, see D. M. Greenberger, M. A. Home,and A. Zeilinger, Phys. Today 46 (8), 22 (1993), and refer-
ences therein.
[3] We note the EPR experiment using protons reported by
M. Lamehi-Rachti and W. Mittig, Phys. Rev. D 14, 2543
(1976), and the recently proposed experiment using corre-
lated Hg atoms: E. Fry, in Lasers '92, Proceedings of the
International Conference, Houston, TX, edited by C. P.
TN-101
50 SQUEEZED ATOMIC STATES AND PROJECTION NOISE IN 87
Wang (STS, McLean, VA, 1993), p. 621. See also the ear-
lier review by J. F. Clauser and A. Shimony, Rep. Prog.
Phys. 41, 1881 (1978).
[4] J. Opt. Soc. Am. B 4, 1450-1741 (1987), special issue on
squeezed states of the electromagnetic field, edited by H. J.
Kimble and D. F. Walls.
[5] J. Mod. Opt. 34, 709-1020 (1987), special issue onsqueezed light, edited by R. Loudon and P. L. Knight.
[6] H. J. Kimble, in Fundamental Systems in Quantum Optics,
Proceedings of the Les Houches Summer School of
Theoretical Physics, Session LIII, Les Houches, France,
1990, edited by J. Dahbard, J. M. Raimond, and J. Zinn-
Justin (Elsevier, Amsterdam, 1992), p. 545.
[7] S. Reynaud, A. Heidmann, E. Giacobino, and C. Fabre, in
Progress in Optics, edited by E. Wolf (North-Holland, Am-sterdam, 1992), Vol. 30, pp. 3-85.
[8] M. Xiao, L. A. Wu, and H. J. Kimble, Phys. Rev. Lett. 59,
278 (1987).
[9] P. Grangier, R. E. Slusher, B. Yurke, and A. LaPorta,
Phys. Rev. Lett. 59, 2153 (1987).
[10] E. S. Polzik, J. Carri, and H. J. Kimble, Phys. Rev. Lett.
68,3020(1992).
[11] C. M. Caves, K. S. Thorne, R. W. P. Drever, V. D. Sand-
berg, and M. Zimmermann, Rev. Mod. Phys. 52, 341
(1980).
[12] V. B. Braginsky, Y. I. Vorontsov, and K. S. Thorne, Sci-
ence 209, 547 (1980).
[13] F. Diedrich, J. C. Bergquist, W. M. Itano, and D. J. Wine-
land, Phys. Rev. Lett. 62, 403 (1989).
[14] P. Verkerk, B. Lounis, C. Salomon, C. Cohen-Tannoudji,
J.-Y. Courtois, and G. Grynberg, Phys. Rev. Lett. 68,
3861 (1992).
[15] P. S. lessen, C. Gerz, P. D. Lett, W. D. Philhps, S. L. Rol-
ston, R. J. C. Spreeuw, and C. I. Westbrook, Phys. Rev.
Lett. 69, 49(1992).
[16] A. Hemmerich and T. W. Hansch, Phys. Rev. Lett. 70,
410(1993).
[17] J. C. Bergquist, F. Diedrich, W. M. Itano, and D. J. Wine-
land, in Laser Spectroscopy IX, edited by M. S. Feld, J. E.
Thomas, and A. Mooradian (Academic, San Diego, 1989),
p. 274.
[18] D. J. Heinzen and D. J. Wineland, Phys. Rev. A 42, 2977
(1990).
[19] J. I. Cirac, A. S. Parkins, R. Blatt, and P. Zoller, Phys.
Rev. Lett. 70, 556(1993).
[20] B. Baseia, R. Vyas, and V. S. Bagnato, Quantum Opt. 5,
155(1993).
[21] H. Zeng and F. Lin, Phys. Rev. A 48, 2393 (1993).
[22] S. E. Harris, Phys. Rev. Lett. 62, 1033 (1989); E. S. Fry, X.
Li, D. Nikonov, G. G. Padmabandu, M. O. Scully, A. V.
Smith, F. K. Tittel, C. Wang, S. R. Wilkinson, and S.-Y.
Zhu, ibid. 70, 3253 (1993); W. E. van der Veer, R. J. J. van
Diest, A. Donszelmann, and H. B. van Linden van den
Heuvell, ibid. 70, 3243 (1993), and references therein.
[23] D. Bohm, Quantum Theory (Prentice-Hall, Englewood
Cliffs, NJ, 1951), p. 611.
[24] R. P. Feynman, F. L. Vernon, Jr., and R. W. Hellwarth, J.
Appl. Phys. 28, 49(1957).
[25] M. A. Rashid, J. Math. Phys. 19, 1391 (1978); 19, 1397
(1978).
[26] D. F. Walls and P. Zoller, Phys. Rev. Lett. 47, 709 (1981).
[27] K. Wodkiewicz and J. Eberly, J. Opt. Soc. Am. B 2, 458
(1985); P. K. Aravind, ibid. 5, 1545 (1988).
[28] J. D. Macomber and R. Lynch, J. Chem. Phys. 83, 6514
(1985).
[29] B. Yurke, S. L. McCall, and J. R. Klauder, Phys. Rev. A33,4033(1986).
[30] B. Yurke, Phys. Rev. Lett. 56, 1515 (1986).
[31] B. Yurke and E. A. Whittaker, Opt. Lett. 12, 236 (1987).
[32] S. M. Bamett and M.-A. Dupertuis, J. Opt. Soc. Am. B 4,
505 (1987).
[33] G. S. Agarwal and R. R. Puri, Phys. Rev. A 41, 3782
(1990).
[34] G. S. Agarwal and R. R. Puri, Phys. Rev. A (to be pub-
lished).
[35] M. Kitagawa and M. Ueda, Phys. Rev. Lett. 67, 1852
(1991); in Noise in Physical Systems and \/f Fluctuations,
edited by T. Musha, S. Sato, and M. Yamamoto (Ohmsha,
Tokyo, 1991), p. 355.
[36] M. Kitagawa and M. Ueda, Phys. Rev. A 47, 5138 (1993).
[37] G. S. Agarwal, J. P. Dowhng, and W. P. Schleich, in
Proceedings of the Second Workshop on Squeezed States
and Uncertainty Relations, Moscow, 1992, edited by Y. S.
Kim and V. I. Man'ko (NASA, Goddard Spaceflight
Center, in press).
[38] D. J. Wineland, J. J. BoUinger, W. M. Itano, F. L. Moore,
and D. J. Heinzen, Phys. Rev. A 46, R6797 (1992).
[39] Trapped Ions and Laser Cooling III, edited by J. C.
Bergquist, J. J. Bollinger, W. M. Itano, and D. J. Wine-
land, Natl. Inst. Stand. Technol. (U.S.) Tech. Note No.
1353 (U.S. GPO, Washington, DC, 1992).
[40] W. M. Itano, J. C. Bergquist, J. J Bolhnger, J. M. GiUigan,
D. J. Heinzen, F. L. Moore, M. G. Raizen, and D. J.
Wineland, Phys. Rev. A 47, 3554 (1993).
[41] N. F. Ramsey, Molecular Beams (Oxford University, Lon-
don, 1963).
[42] C. K. Hong, S. R. Friberg, and L. Mandel, Appl. Opt. 24,
3877(1985).
[43] A. Heidmann, R. J. Horowicz, S. Reynaud, E. Giacobino,
C. Fabre, and G. Camy, Phys. Rev. Lett. 59, 2555 (1987).
[44] M. Xiao, L.-A. Wu, and H. J. Kimble, Opt. Lett. 13, 476
(1988).
[45] C. D. Nabors and R. M. Shelby, Phys. Rev. A 42, 556
(1990).
[46] P. R. Tapster, S. F. Seward, and J. G. Rarity, Phys. Rev.
A 44, 3266(1991).
[47] R. H. Dicke, Phys. Rev. 93, 99 (1954).
[48] F. T. Arecchi, E. Courtens, R. Gilmore, and H. Thomas,
Phys. Rev. A 6, 2211 (1972).
[49] In Ref. [38], we transformed to a frame rotating at Oq-
[50] J. J. BoUinger, J. D. Prestage, W. M. Itano, and D. J.
Wineland, Phys. Rev. Lett. 54, 1000 (1985); J. J. Bollinger,
D. J. Heinzen, W. M. Itano, S. L. Gilbert, and D. J. Wine-
land, /7?/J. 63, 1031 (1989).
[51] From the form of Eq. (14), it is only possible to determine
<ao modulo In/{IT) where / is an integer. Experimentally,
the "central lobe" of the Ramsey pattern is identified by
varying T and observing which lobe is stationary, or using
the Rabi resonance method (B^ constant from r=0 to ty)
which gives a (lower-resolution) resonance curve peaked at
COq.
[52] A choice of « > can be experimentally useful to test for
any systematic effects associated with the power of the
clock radiation.
[53] For a choice of « >0, it is possible to investigate experi-
mentally a class of systematic effects, such as the presence
of a systematic term of the form K,{co— coo) {K^ a con-
stant) which adds to the signal {N+(tf)) given in Eq. (14).
IN- 102

88 WINELAND, BOLLINGER, ITANO, AND HEINZEN 50
This "background slope" effect can be accounted for by
determining (Oq for various values of n, which effectively
measures K^
.
[54] A. Messiah, Quantum Mechanics (Wiley, New York,
1961).
[55] R. A. Campos, B. E. A. Saleh, and M. C. Teich, Phys.
Rev. A 40, 1371(1989).
[56] These operators have also been considered earlier by J.
Schwinger in a reformulated theory of angular momen-tum. See J. Schwinger, in Quantum Theory of Angular
Momentum, edited by L. C. Biedenham and H. van Dam(Academic, New York, 1965).
[57] A. Heidmann, J. M. Raimond, and S. Reynaud, Phys.
Rev. Lett. 54, 326(1985).
[58] E. T. Jaynes and lsJ*W. Cummings, Proc. IEEE 51, 89
(1963).
[59] W. H. Press, B. P. Flannery, S. A. Teukolsky, and W. T.
Vetterling, Numerical Recipes (Cambridge University,
New York, 1986), p. 547.
[60] See, for example, R. W. Henry and S. C. Glotzer, Am. J.
Phys. 56, 318 (1988).
[61] C. W. Gardiner, Phys. Rev. Lett. 56, 1917 (1986); A. S.
Parkins and C. W. Gardiner, Phys. Rev. A 40, 3796 (1989).
[62] S. Haroche and J. M. Raimond, Adv. At. Mol. Phys. 20,
347(1985).
[63] S. Haroche, M. Brune, and J. M. Raimond, in Atomic
Physics 12, edited by J. C. Zom and R. R. Lewis (AIP,
New York, 1991), p. 204; S. Haroche, in Fundamental Sys-
tems in Quantum Optics (Ref. [6]), p. 767.
[64] G. Rempe, M. O. Scully, and H. Walther, in Atomic Phys-
ics 12 (Ref. [63]), p. 219.
[65] H. G. Dehmeh, Adv. At. Mol. Phys. 3, 53 (1967); 5, 109
(1969).
[66] D. J. Wineland and H. G. Dehmelt, J. Appl. Phys. 46, 919
(1975).
[67] H. Dehmelt, Science 247, 539 (1990).
[68] M. G. Raizen, J. M. Gilligan, J. C. Bergquist, W. M.Itano, and D. J. Wineland, Phys. Rev. A 45, 6493 (1992).
[69] This coupling was previously considered in a cooling
scheme discussed by H. Harde, in International Confer-
ence on Quantum Electronics Technical Digest Series 1990
(Optical Society of America, Washington, DC, 1990), Vol.
8, p. 278.
[70] C. A. Blockley, D. F. Walls, and H. Risken, Europhys.
Lett. 17, 509(1992).
[71] J. I. Cirac, R. Blatt, A. S. Parkins, and P. Zoller, Phys.
Rev. Lett. 70, 762(1993).
[72] H. Dehmelt, G. Janik, and W. Nagoumey, Bull. Am.Phys. Soc. 30, 111 (1985).
[73] M. Lindberg and J. Javanainen, J. Opt. Soc. Am. B 3, 1(X)8
(1986).
[74] P. E. Toschek and W. Neuhauser, J. Opt. Soc. Am. B 6,
2220(1989).
[75] M. Kasevich and S. Chu, Phys. Rev. Lett. 69, 1741 (1992).
[76] D. J. Wineland, W. M. Itano, J. C. Bergquist, J. J. Bol-
linger, S. L. Gilbert, and F. Diedrich, in Frequency Stan-
dards and Metrology, Proceedings of the Fourth Symposi-
um on Frequency Standards and Metrology, Ancona, Ita-
ly, 1988, edited by A. De Marchi (Springer-Verlag, Berlin,
Heidelberg, 1989), p. 71.
[77] This measurement scheme has been used in other experi-
ments. See, for example, K. Abdullah, C. Carlberg, E. D.
Commins, H. Gould, and S. B. Ross, Phys. Rev. Lett. 65,
2347 (1990). The noise in that experiment, however, was
not dominated by projection noise.
IN- 103

SPIN SQUEEZING APPLIED TO FREQUENCY STANDARDS'
J.J. Bollinger, D.J. Wineland, and Wayne M. Itano
Time and Frequency Div. , NIST, 325 Broadway, Boulder, CO 80303
E-mail: [email protected]
and
D.J. Heinzen
Physics Dept. , University of Texas, Austin, TX 78712
ABSTRACT
In experiments on N atoms initially prepared in uncorrected states, the precision of a
transition frequency measurement (limited only by the quantum fluctuations in the
measurement) improves as N"''^. We show that the precision of a frequency measurement
can improve as N"', if the atoms are prepared in particular quantum mechanically
correlated states. These correlated states can be interpreted as squeezed spin states in
analogy with the squeezing that has been discussed with reference to the electromagnetic
field. We discuss states which provide the maximum possible precision in a transition
frequency measurement and briefly describe possible methods for generating correlated
states.
1. Spin Squeezing and Ramsey Spectroscopy
In this manuscript we consider tlie spectroscopy of N two-level atoms, where
transitions are driven by classical radiation and detected by measuring changes in the
state populations. We assume that the relaxation of the atomic states can be neglected.
The use of correlated states to improve the signal-to-noise ratio in this type of
spectroscopy has been discussed recently under the subject of spin squeezing. ^"^ In
particular, Refs. 1 and 2 discuss spin squeezing for the Ramsey technique of separated
oscillatory fields (SOF). After reviewing this discussion below, we discuss in Sec. 2 the
best squeezed spin states for N=2 atoms. In Sec. 3 we give a state that can be used in
Ramsey spectroscopy to provide a frequency imprecision of (NT)"' where T is the time
of a single measurement. From a time-energy uncertainty relation, we show that this is
the best precision possible. Finally in the last section we briefly describe possible
methods for generating correlated or squeezed spin states of ions in a trap.
LetI
e) denote the excited state of a two-level atom and|g) the ground state, and
consider the case where N atoms are uncorrelated and each atom is initially prepared in
its ground state |g). Because any two-level system interacting with classical radiation
*Work of the US government; not subject to US copyright.
TN-104

is equivalent to a spin-V2 magnetic dipole in a magnetic field/ the initial state of the
composite system for this case is equivalent to the|J=N/2, Mj=-N/2) state of a J=N/2
spin. This initial (t=0) state has (J,>o=-N/2, (JJo=(Jy)o=0, and AJ,(0)=AJy(0)=N'''V2.
(Here (A)t denotes the expectation value of an operator A at time t and AA(t)=(AA^)t'^%
where AA^=A^-(A)'^.) The Hamiltonian for the equivalent spin system is H= — /i-B
where /i=/XoJ is the magnetic moment of the composite system and B is the applied
field. Here B=BoZ + Bi, where B^ is a time independent field set by the frequency of
the transition {oiQ=-iJi^Jh, where we assume iUo<0), and Bj is an applied oscillating
field used to perform spectroscopy on the atoms. We assume Bj is perpendicular to, and
is rotating about the z axis according to Bi=Bi[-xsinwt + ycoscot]. In the Ramsey SOFtechnique,^ Bj is applied (that is, nonzero) for two periods of length t^/2=ir/(2fiR) where
Q^=\ix^x\lh is the Rabi frequency, separated by a period of length T during which
Bi=0. Throughout this manuscript we assume 1]r > > |cOo— ^^1 and T > > t^/2 which
results in a simple expression for the Ramsey lineshape. In a frame of reference rotating
with Bi, the first pulse rotates the spin vector about Bj (the y axis in the rotating frame)
by 90°. The spin vector then precesses about the z axis during the field free period,
acquiring an angle (cOo-ca)T relative to the x axis in the rotating frame. This angle could
be read out by measuring, for example, J^ in the rotating frame. Experimentally this is
done by the second 7r/2 pulse, which rotates the spin vector by 90° about the Bi axis,
and then measuring the number of atoms in |e), or equivalently J^. We obtain
(7^),^= (M2)cos(co,-co)r (1)
where tf=2t^/2+T.
Measurements of J^ along with Eq. (1) can be used to estimate the frequency Wo.
Because of the statistical nature of quantum mechanics, the number of particles which
make a transition to |e) from measurement to measurement will fluctuate by ^i^{\.f).^
This produces an uncertainty in the estimate of co^, of|Aco| =^^J^\.f)l\d{^^Jb(j3\. We
obtain
|Aco| = A7/0)/[r|(7^>J] = AT-'/^-i (2)
independent of co. (Experimental measurements are usually made with co — C0o±7r/(2T)
where Eq. (1) has its steepest slope. This minimizes the effect of any added technical
noise.) The fundamental noise limit of Eq. (2) has been achieved with small numbers
of ions in a trap.^ Qualitatively, the dependence of|Aco| on AJy(O) in Eq. (2) can be
understood from the picture that the Ramsey SOF technique measures the accumulated
angle (cjo-w)T of a spin in the x-y plane which is precessing about the z axis. In
particular, spectroscopy with the Ramsey SOF technique is equivalent to determining the
rotation of a spin state (after the first 7r/2 pulse) about the z axis. The precision of this
TN-105

measurement is limited by the uncertainty of the spin normal to the mean spin vector and
in the x-y plane, which here is AJy(O). The idea of spin squeezing is to start with a state
{J)=z{J^)q such that AJy(O) < N'^V2, Such a state can be used to improve the frequency
resolution in Ramsey spectroscopy if the squeezing parameter ^r = (2J)'^AJy(0)/1 (Jjo I
< 1.^ The parameter ^r is a measure of the improvement in Ramsey spectroscopy over
the case where the initial state consists of uncorrected atoms. States with ^r < 1 are
in general entangled; they cannot be written as a product of individual atomic wave
functions. These states are multiparticle versions of the correlated two-particle states
discussed in the Einstein-Podolsky-Rosen experiments. Spin squeezing has also been
discussed in the context of interferometry.^"" The discussion there parallels the
discussion here because there is a one-to-one correspondence between the Ramsey SOFtechnique and a Mach-Zehnder interferometer.
2. Two-Atom Squeezed States
For simplicity, consider N=2 (J = l) and let the mean spin vector be parallel to
the z-axis, (J )=(Jjz. In this case it is straightforward to show that the state with the
best squeezing (lowest value of ^r) is
lO =(2cosh(2e)r^{e-'\J=l,m,=l} +^^1,-1)}, (3)
where 6 is determined by (Jj=-tanh(2^). As discussed above, except for the 0-»±oo
limits, this is a correlated state of the two atoms; it cannot be written as the product of
individual atomic states. In addition, AJy^ = y2(l-sech(20)), AJx^= V2(l + sech(2^)), and
^R^v/2sech^/(cosh(2^))'''\ The smallest (that is, best) values of ^r are obtained for small
6. As ^-*0, ^r-*1A/2. However, as d-M), the mean spin vector (J )=(Jz)z and the SOFsignal also approach 0. The next section indicates how this problem can be solved by
detecting an operator different than J^.
3. Optimal Frequency Measurements
Some squeezed states for N>2 are discussed in Refs. 2 and 3. Reference 3
shows that certain "intelligent" states, discussed in detail by Rashid,'^ provide a
squeezing ^^->V2N''^' as N-^oo. By detecting an operator different than J^,, we can fmd
a state with a squeezing ^r=N"'''\ In order to motivate the choice of this state, recall that
the angle (cOo-w)T which is measured in the Ramsey method is, in the rotating frame, just
the phase factor e'^^o"^"^ that the excited state | e) acquires relative to the ground state| g)
during the free precession period T. Consequently it may be possible to improve the
precision of Ramsey spectroscopy by making a coherent superposition (after the first x/2
pulse) of two energy eigenstates whose energies differ by more than ^(coo-w). For N
TN-106

two-level atoms the eigenstates|N/2,-N/2) and |N/2, N/2) provide the largest energy
difference, with an accumulated phase difference of N(a)o-a))T over the free precession
period. It appears that the state
1 1^^) ={ I NI2,NI2) +
I
Nil, -NI2)]lV2 (4)
may therefore provide a frequency imprecision of (NT)'\ which is N''^ smaller than that
provided by N independent atoms. However, because (i/'^l J I^Am) = 0» some operator
other than J^ with higher-order tensor components must be detected.
Consider the operator O =.n a^. which is a product of the z-component Pauli spin
matrices for the atoms. For J=N/2 this operator is diagonal in the |J, Mj) basis with
eigenvalues (— 1/"'^-'. (This follows by expressing|J,Mj) as a sum over all states which
are products of individual spin up or spin down states with J-Mj spins down.) Quantum
jump detection can be used to measure O (or JJ without added noise. "^ The result of
measuring x atoms in the spin up state is assigned the value (-1)^". Suppose at the end
of the first 7r/2 pulse the state10^) is created. After the second -^12 pulse we detect {O)^^
= {i/f\0\\pf) where
• '> r
\^.) =e ^'.-'^"•-"^^'H^^)(5)
Explicit computation gives (0)t^=(-l)^cos[N(cOo-w)T] and, because 0^ = 1,
(A(y)t^=sin^[N(cOo-a))T]. By detecting the operator O, we can therefore use the state
I^^ in spectroscopy with a frequency imprecision
|Aco| = AO(rp/|a(0),/da)| = {NT)-' (6)
independent of w.
The Ramsey method measures cOo by measuring the phase cOoT (we now use the
laboratory frame of reference) which state|e) acquires relative to
|g) during the free
precession period; that is, cOq is measured by observing the free time evolution of the
system. With the state1 1/'^,) a frequency imprecision of (NT)"^ is obtained. We show
that this is in fact the best precision that can be obtained on N identical two-level atoms
undergoing free time evolution. This follows from an application of the time-energy
uncertainty principle
bt'' (AH^y > fiV4,
C^)
where (A//^) is the variance of the Hamiltonian and 5f- is the variance in estimating time,
derived from measurements of an operator of the system. (In many texts dt is interpreted
TN-107
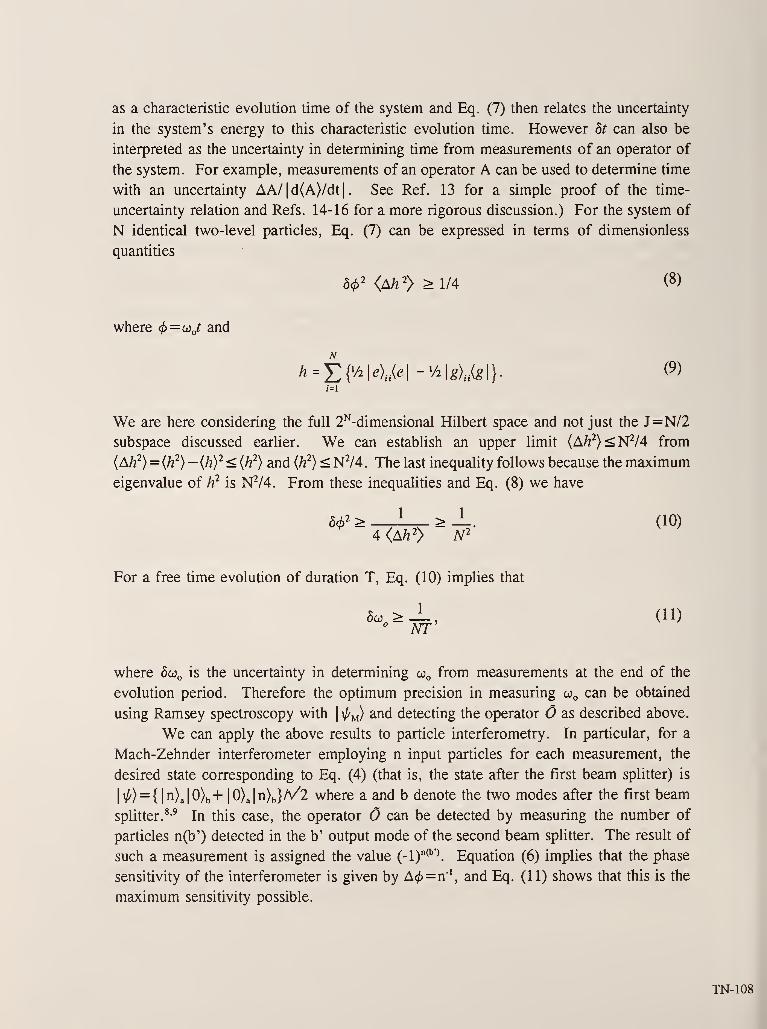
as a characteristic evolution time of the system and Eq. (7) then relates the uncertainty
in the system's energy to this characteristic evolution time. However dt can also be
interpreted as the uncertainty in determining time from measurements of an operator of
the system. For example, measurements of an operator A can be used to determine time
with an uncertainty AA/|d(A)/dt| . See Ref. 13 for a simple proof of the time-
uncertainty relation and Refs. 14-16 for a more rigorous discussion.) For the system of
N identical two-level particles, Eq. (7) can be expressed in terms of dimensionless
quantities
6</)2 <M2> >l/4 (8)
where <l>=03j and
h=Y:{V2\eUe\-V2\gUg\}. (9)
We are here considering the full I'^-dimensional Hilbert space and not just the J=N/2
subspace discussed earlier. We can establish an upper limit (A/z^)<lSP/4 from
{Ah^)={h^)—{hy < {h^) and (h^) < N^/4. The last inequality follows because the maximum
eigenvalue of h^ is lSP/4. From these inequalities and Eq. (8) we have
5</)2> i >J_. (10)4<A/2 2> N^
For a free time evolution of duration T, Eq. (10) implies that
5a;>J-, (11)
where Sco^ is the uncertainty in determining o)^ from measurements at the end of the
evolution period. Therefore the optimum precision in measuring co^, can be obtained
using Ramsey spectroscopy with1 1/-^) and detecting the operator O as described above.
We can apply the above results to particle interferometry. In particular, for a
Mach-Zehnder interferometer employing n input particles for each measurement, the
desired state corresponding to Eq. (4) (that is, the state after the first beam splitter) is
10) = { I n>a 1 0)b+ 1 0)a 1 n)b}A/2 where a and b denote the two modes after the first beam
splitter. ^'^ In this case, the operator O can be detected by measuring the number of
particles n(b') detected in the b' output mode of the second beam splitter. The result of
such a measurement is assigned the value (-1)°^'\ Equation (6) implies that the phase
sensitivity of the interferometer is given by A0=n'\ and Eq. (11) shows that this is the
maximum sensitivity possible.
TN-108

4. Methods for Making Squeezed States
In this section we briefly discuss several ideas for making squeezed spin states
with ions in a trap. (There are also ideas for making squeezed spin states with neutral
atoms. One possibility replaces the center-of-mass mode of the ion cloud discussed
below with an electromagnetic cavity mode.^^) Ion traps provide an isolated environment
for the internal energy states of trapped ions. At first sight, this isolation appears to
make correlating the internal states of the trapped ions difficult. However, with cooling,
the translational states of the trapped ions can be strongly interacting. (For example,
with laser cooling, ions in a linear rf trap freeze into a 1-D string.'*-'^) In the schemes
discussed so far for generating correlated states of trapped ions, the internal states of the
ions are coupled to a particular (shared) motional degree of freedom. In Refs. 1 and 2,
quasi-static inhomogeneous fields and stimulated Raman transitions were discussed as
possible methods for coupling ground state hyperfine levels of an ion with the center-of-
mass (COM) mode of a trapped ion cloud. The ions were assumed to be prepared in
either one of the|N/2, +N/2) states and all ions were assumed to see the same coupling
with the COM mode. (For the stimulated Raman interaction, this will be satisfied if the
laser beam waists and confocal parameters are large compared to the ion cloud.) In this
case, in the interaction picture and the rotating wave approximation, the interaction Hi
between the internal states and the COM mode can take the form of a Jaynes-Cummings-
type interaction
H^ = -m(J^a+J_a') (12)
where a'^ (a) is the raising (lowering) operator for the COM mode, J+ (J_) is the raising
(lowering) operator for the J=N/2 ladder of atomic states, and Q is the strength of the
interaction. Two different schemes were investigated. In one, the COM mode is
initially assumed to be a coherent state and in the other a squeezed state. The interaction
of Eq. (12) was then applied for a specific time and the resulting squeezing of the spins
calculated. In general, this method results in a mixed state of the ions' internal states
and the COM mode, and a squeezing less than the optimal value discussed in the last
section. By preparing appropriate (probably nonclassical) states of the COM mode, we
may be able to prepare to prepare the state| i/'m). For example, with N=2 the coupling
in Eq. (12) can be used to evolve the |n = l)|J = l, Mj=-1) state into the |n=0)|J= l,
Mj=0) state. For N=2, the internal state differs from \\p^) by a rotation.
More recently, Cirac and Zoller ^° have discussed the use of a string of N ions
in a linear rf trap for quantum computation and described a method for preparing general
quantum states of this system. Their method i«^ similar to that discussed in the previous
paragraph but differs in that it uses a well focussed laser beam to couple the internal
states of individual ions with a mode of the ion string. The mode is initially prepared
TN-109

in |n=0). The laser beam is then used to address an individual ion and correlate, or
entangle, the internal state of the ion with the mode. The laser beam can then be used
to address a different ion and change the correlation between the ion and the mode to a
correlation between two different ions. Reference 20 lays out the steps needed to prepare
the state Ji/'m)- Here we discuss the simple case of N=2. We assume lasers can be
focussed and used to drive transitions on an individual ion without perturbing the other
ion. (If |g) and |e) are hyperfme levels of an atomic ground state, lasers can be used
to drive a stimulated Raman transition between the states.'^') Suppose that the 2 ions are
prepared in the initial state |g)j|g)2|n=0) where the indices refer to the internal states
of ions 1 and 2 and|n=0) is the n=0 state of a mode of the 2-ion string. First a 1^12-
pulse on the blue sideband of ion 1 takes the |g)i|g)2|n=0) state into the
|g)2{|g)ili^=0)+|e)i|n = l)}A/2 state. This is then followed by a tt pulse on the red
sideband of ion 2. This leaves the |g)i|g)2|n=0) state unperturbed, but takes the
I £)i 1 2)2 1 n = 1) state into the| e)i |
e)2 1 n =0) state. In this manner1 1/'^) can be prepared
for N=2.
5. Acknowledgements
We gratefully acknowledge the support of the Office of Naval Research and the
Army Research Office. We thank Joseph Tan, John Kitching, and Matt Young for their
comments on the manuscript.
6. References
1. D.J. Wineland, J.J. Bollinger, W.M. Itano, F.L. Moore, and D.J. Heinzen,
Phys. Rev. A46 (1992) R6797.
2. D.J. Wineland, J.J. Bollinger, W.M. Itano, and D. J. Heinzen, Phys. Rev. A50
(1994) 67.
3. G.S. Agarwal and R.R. Puri, Phys. Rev. A49 (1994) 4968.
4. R.P. Feynman, F.L. Vernon Jr., and R.W. Hellwarth, J. Appl. Phys. 28 (1957)
49.
5. N.F. Ramsey, Molecular Beams (Oxford, London, 1963), p. 124.
6. W.M. Itano, J.C. Bergquist, J.J. Bollinger, J.M. Gilligan, D.J. Heinzen, F.L.
Moore, M.G. Raizen, and D.J. Wineland, Phys. Rev. A47 (1993) 3554.
7. As discussed in Refs. 1 and 2, to achieve the full benefit of a squeezed state, the
oscillating field in the x/2 pulses must have the correct phase relative to the
squeezed state.
8. B. Yurke, S.L. McCall, and J.R. Klauder, Phys. Rev. A33 (1986) 4033.
9. B. Yurke, Phys. Rev. Lett. 56 (1986) 1515.
TN-UO

10. M. Kitagawa and M. Ueda, Phys. Rev. Lett. 67 (1991) 1852.
11. M. Kitagawa and M. Ueda, Phys. Rev. A47 (1993) 5138.
12. M.A. Rashid, J. Math. Phys. 19 (1978) 1391; 19 (1978) 1397.
13. A. Messiah, Quantum Mechanics, Vol. I (North-Holland, Amsterdam, 1961) pp.
319-320.
14. C.W. Helstrom, Quantum Detection and Estimation Theory (Academic, NewYork, 1976), Chaps. VIII.2.C and VIII.4.C.
15. A.S. Holevo, Probabilistic and Statistical Aspects of Quantum Theory (North-
Holland, Amsterdam, 1982), Chaps. III.2, III. 8, IV. 7, and VI. 3.
16. S.L. Braunstein and CM. Caves, Phys. Rev. Lett. 72 (1994) 3439.
17. H.J. Kimble, to appear in Laser Spectroscopy XII, edited by M. Ignuscio, (World
Scientific); M, Brune, F. Schmidt-Kaler, J. Dreyer, A. Maali, and J.M.
Raimond, to appear in Laser Spectroscopy XII, edited by M. Ignuscio, (World
Scientific).
18. M.G. Raizen, J.M. Gilligan, J.C. Bergquist, W.M. Itano, and D.J. Wineland,
Phys. Rev. A45 (1992) 6493.
19. G. Birkl, S. Kassner, and H. Walther, Nature 357 (1992) 310.
20. J.I. Cirac and P. ZoUer, Phys. Rev. Lett. 74 (1995) 4091.
21. C. Monroe, D.M. Meekhof, B.E. King, S.R.Jefferts, W.M. Itano, and D.J.
Wineland, "Resolved-sideband Raman cooling of a bound atom to the zero-point
energy," to be published in Phys. Rev. Lett..
TN-ii;
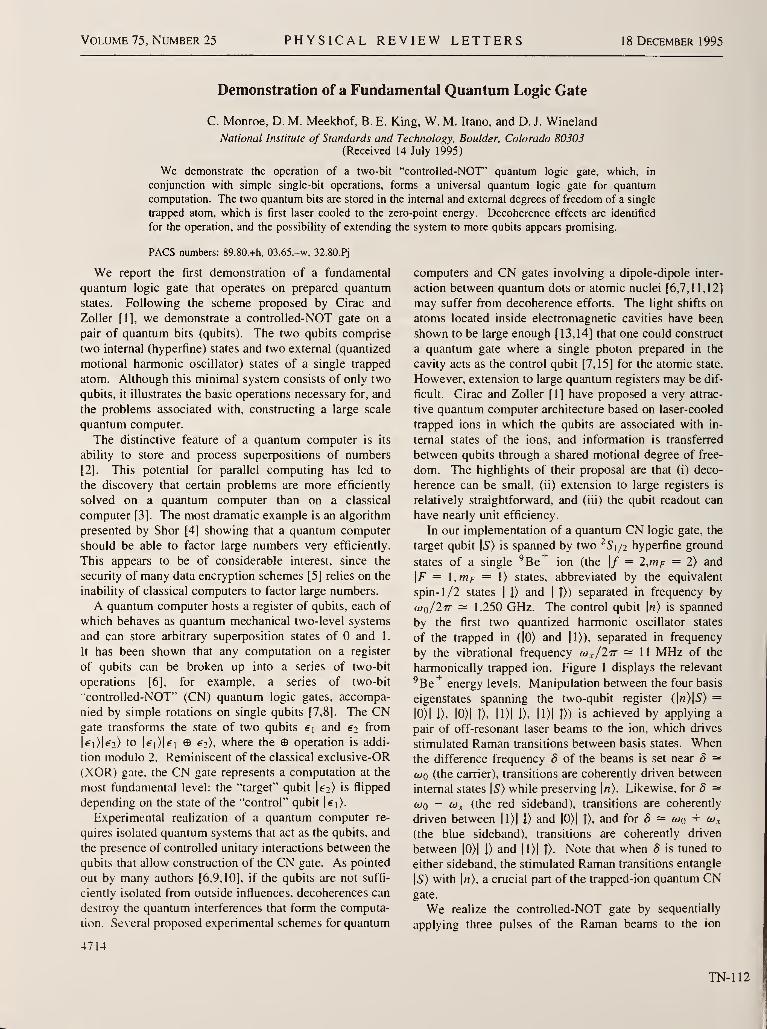
Volume 75, Number 25 PHYSICAL REVIEW LETTERS 18 December 1995
Demonstration of a Fundamental Quantum Logic Gate
C. Monroe, D. M. Meekhof, B. E. King, W. M. Itano, and D. J. Wineland
National Institute of Standards and Technology. Boulder, Colorado 80303(Received 14 July 1995)
We demonstrate the operation of a two-bit "controlled-NOT" quantum logic gate, which, in
conjunction with simple single-bit operations, forms a universal quantum logic gate for quantum
computation. The two quantum bits are stored in the internal and external degrees of freedom of a single
trapped atom, which is first laser cooled to the zero-point energy. Decoherence effects are identified
for the operation, and the possibility of extending the system to more qubits appears promising.
PACS numbers: 89.80.+h, 03.65.-w, 32.80.Pj
We report the first demonstration of a fundamental
quantum logic gate that operates on prepared quantum
states. Following the scheme proposed by Cirac and
Zoller [1], we demonstrate a controlled-NOT gate on a
pair of quantum bits (qubits). The two qubits comprise
two internal (hyperfine) states and two external (quantized
motional harmonic oscillator) states of a single trapped
atom. Although this minimal system consists of only two
qubits, it illustrates the basic operations necessary for, and
the problems associated with, constructing a large scale
quantum computer.
The distinctive feature of a quantum computer is its
ability to store and process superpositions of numbers
[2]. This potential for parallel computing has led to
the discovery that certain problems are more efficiently
solved on a quantum computer than on a classical
computer [3]. The most dramatic example is an algorithm
presented by Shor [4] showing that a quantum computer
should be able to factor large numbers very efficiently.
This appears to be of considerable interest, since the
security of many data encryption schemes [5] relies on the
inability of classical computers to factor large numbers.
A quantum computer hosts a register of qubits, each of
which behaves as quantum mechanical two-level systems
and can store arbitrary superposition states of and 1.
It has been shown that any computation on a register
of qubits can be broken up into a series of two-bit
operations [6], for example, a series of two-bit
"controlled-NOT" (CN) quantum logic gates, accompa-
nied by simple rotations on single qubits [7,8]. The CNgate transforms the state of two qubits €\ and ei from
|ei)|e2) to ki)|6] © 62), where the © operation is addi-
tion modulo 2. Reminiscent of the classical exclusive-OR
(XOR) gate, the CN gate represents a computation at the
most fundamental level: the "target" qubit If:) is flipped
depending on the state of the "control" qubit \€\).
Experimental realization of a quantum computer re-
quires isolated quantum systems that act as the qubits, and
the presence of controlled unitary interactions between the
qubits that allow construction of the CN gate. As pointed
out by many authors [6,9,10], if the qubits are not suffi-
ciently isolated from outside influences, decoherences can
destroy the quantum interferences that form the computa-
tion. Several proposed experimental schemes for quantum
4714
computers and CN gates involving a dipole-dipole inter-
action between quantum dots or atomic nuclei [6,7,1 1,12]
may suffer from decoherence efforts. The light shifts on
atoms located inside electromagnetic cavities have been
shown to be large enough [13,14] that one could construct
a quantum gate where a single photon prepared in the
cavity acts as the control qubit [7,15] for the atomic state.
However, extension to large quantum registers may be dif-
ficult. Cirac and Zoller [1] have proposed a very attrac-
tive quantum computer architecture based on laser-cooled
trapped ions in which the qubits are associated with in-
ternal states of the ions, and information is transferred
between qubits through a shared motional degree of free-
dom. The highlights of their proposal are that (i) deco-
herence can be small, (ii) extension to large registers is
relatively straightforward, and (iii) the qubit readout can
have nearly unit efficiency.
In our implementation of a quantum CN logic gate, the
target qubit |5) is spanned by two ^5i/2 hyperfine ground
states of a single ^Be ion (the \f = 2,mf = 2) and
|F = \,mf = 1) states, abbreviated by the equivalent
spin- 1/2 states| ]) and
| |)) separated in frequency by
(oq/Itt — 1.250 GHz. The control qubit \n) is spanned
by the first two quantized harmonic oscillator states
of the trapped in (|0) and |1)), separated in frequency
by the vibrational frequency (jj^jItt — 11 MHz of the
harmonically trapped ion. Figure 1 displays the relevant
^Be^ energy levels. Manipulation between the four basis
eigenstates spanning the two-qubit register (|«)|5) =
10)1 i), |0)| T), 1 1)1 i), 1 1)1 D) is achieved by applying a
pair of off-resonant laser beams to the ion, which drives
stimulated Raman transitions between basis states. Whenthe difference frequency 5 of the beams is set near 8 —
a>o (the carrier), transitions are coherently driven between
internal states |5) while preserving \n). Likewise, for 5 —ctiQ — u>r^ (the red sideband), transitions are coherently
driven between |1)| 1) and |0)| |), and for 5 — wq + f^x
(the blue sideband), transitions are coherently driven
between |0)| 1) and |1)| ])• Note that when 5 is tuned to
either sideband, the stimulated Raman transitions entangle
|5) with |«), a crucial part of the trapped-ion quantum CNgate.
We realize the controlled-NOT gate by sequentially
applying three pulses of the Raman beams to the ion
TN-112

Volume 75, Number 25 PHYSICAL REVIEW LETTERS 18 December 1995
Detection
(c+)
l0>|aux>
FIG. 1. ^Be^ energy levels. The levels indicated with
thick lines form the basis of the quantum register: internal
levels are |5) = \ i) and| T) CSi/jlF = 2,mf = 2) and
^5i/2|F = l,m/r = 1) levels, respectively, separated by
(Oq/Iv = 1.250 GHz), and |aux) = ^SipjF = 2,w/r = 0)
(separated from| 1) by —2.5 MHz); external vibrational levels
are \n) = |0) and |1) (separated by coJItt - 11.2 MHz).Stimulated Raman transitions between ^Si/j hyperfine states
are driven through the virtual ^Pi/2 level (A — 50 GHz) with
a pair of =313 nm laser beams. Measurement of 5 is accom-pHshed by driving the cycling
| [}—
» ^P3/2\F = 3,mf = 3)
transition with cr^ -polarized light and detecting the resulting
ion fluorescence.
according to the following format:
(a) A 7r/2 pulse is applied on the carrier transition.
The effect is described by the operator V'^^(77-/2)
in the notation of Ref. [1].
(b) A In pulse is applied on the blue sideband
transition between| t) and an auxiliary atomic (1)
level |aux) (see Fig. 1).
(c) A 77-/2 pulse is applied on the carrier transition,
with a 77- phase shift relative to (a), leading to the
operator V^^H-ir/l) of Ref. [1].
The 7r/2 pulses in steps (a) and (c) cause the spin |5)
to undergo + 1 /4 and - 1 /4 of a complete Rabi cycle,
respectively, while leaving |n) unchanged. The auxiliary
transition in step (b) simply reverses the sign of any
component of the register in the 1 1)| |) state by inducing a
complete Rabi cycle from |1)| |) — |0)|aux) — -|1)| ]}.
The auxiliary level |aux) is the ^S\/2 \F = 2, m/r = 0)
ground state, split from the| i) state by virtue of a
Zeeman shift of —2.5 MHz resulting from a 0.18 mTapplied magnetic field (see Fig. 1). Any component of
the quantum register in the |«) = |0) state is unaffected
by the blue sideband transition of step (b), and the effects
of the two Ramsey 7t/2 pulses cancel. On the other hand,
any component of the quantum register in the |1)| t) state
acquires a sign change in step (b), and the two Ramseypulses add constructively, effectively "flipping" the target
qubit by tt radians. The truth table of the CN operation
is as follows:
Input state — Output state
10)11)- 10)11)
10)1 T)- 10)1 T) (2)
IDID- IDIT)
IDIT)- 11)11).
The experiment apparatus is described elsewhere
[16,17]. A single ^Be"^ ion is stored in a coaxial-
resonator rf-ion trap [17], which provides pseudopotential
oscillation frequencies of (tt)^, a»v. a<-)/2 77 — (11.2, 18.2,
29.8) MHz along the principal axes of the trap. We cool
the ion so that the rix = vibrational ground state is occu-
pied ===95% of the time by employing resolved-sideband
stimulated Raman cooling in the x dimension, exactly
as in Ref. [16]. The two Raman beams each contain
= 1 mW of power at ==313 nm and are detuned —50 GHzred of the ^P\/2 excited state. The Raman beams are
applied to the ion in directions such that their wave-vector
difference 5 k points nearly along the x axis of the
trap; thus the Raman transitions are highly insensitive to
motion in the other two dimensions. The Lamb-Dicke
parameter is rj;^ = Skxo — 0.2, where xq — 7nm is
the spread of the n^ = wave function. The carrier
(l«)l 1) — \n)\ T)) Rabi frequency is Cl(/l7r - 140 kHz,
the red (|1)|1)- |0)| T)) and blue (|0)| 1) - |1)| !))
sideband Rabi frequencies are rj^^lo/lir — 30 kHz, and
the auxiliary transition (|1)| t)—
* |0)| 1)) Rabi frequency
is 77;ci^aux/27r — 12 kHz. The difference frequency of
the Raman beams is tunable from 1200 to 1300 MHzwith the use of a double pass acousto-optic modulator
(AOM), and the Raman pulse durations are controlled
with additional switching AOMs. Since the Raman beams
are generated from a single laser and an AOM, broadening
of the Raman transitions due to a finite laser linewidth is
negligible [18].
Following Raman cooling to the |0)| 1) state, but before
application of the CN operation, we apply appropriately
tuned and timed Raman pulses to the ion, which can
prepare an arbitrary state of the two-qubit register. For
instance, to prepare a |1)| 1) eigenstate, we apply a npulse on the blue sideband followed by a tt pulse on
the carrier (|0)| 1) -^ |1)| T) — 1 1)1 1))- We perform two
measurements to detect the population of the register
after an arbitrary sequence of operations. First, wemeasure the probability P{S =1} that the target qubit
\S) is in the| 1) state by collecting the ion fluorescence
when cr"*" -polarized laser radiation is applied resonant
with the cycling| 1)
—» ^P:i/2\F = 3,m/r = 3) transition
(radiative linewidth y/lir — 19.4 MHz at A = 313 nm;
see Fig. 1). Since this radiation does not appreciably
couple to the| f) state (relative excitation probability:
—5 X 10"^), the fluorescence reading is proportional to
P{S =1}. For 5 = 1, we collect on average ==1 photon
per measurement cycle [16]. Once 5 is measured, we
4715
TN-113

Volume 75, Number 25 PHYSICAL REVIEW LETTERS 18 December 1995
perform a second independent measurement that provides
the probability P{n = 1} that the control bit \n) is in the
|1) state: After the same operation sequence is repeated,
an appropriate Raman pulse is added just prior to the
detection of 5. This "detection preparation" pulse maps
|/j) onto \S}. For instance, if we first measure S to be i,
we repeat the experiment with the addition of a "tt pulse"
on the red sideband. Subsequent detection of S resulting
in the presence (absence) of fluorescence indicates that
n = (1). Likewise, if we first measure S to be t, werepeat the experiment with the addition of a 'V pulse"
on the blue sideband. Subsequent detection of S resulting
in the presence (absence) of fluorescence indicates that
n = 1 (0).
In the above measurement scheme, we do not obtain
phase information about the quantum state of the register
and therefore do not measure the complete transformation
matrix associated with the CN operation. The phase
information could be obtained by performing additional
operations (similar to those described above) prior to the
measurement of S. Here, we demonstrate the key features
of the CN gate by (i) verifying that the populations
of the register follow the truth table given in (2), and
(ii) demonstrating the conditional quantum dynamics
associated with the CN operation.
To verify the CN truth table, we separately prepare each
of the four eigenstates spanning the register (|«)|5) =|0)| i), |0)| T), 1 1)1 i),|l)l T)), then apply the CN operation
given in ( 1 ). We measure the resulting register population
as described above after operation of the CN gate, as
shown in Fig. 2. When the control qubit is prepared
in the \n) = |0) state, the measurements show that the
gate preserves 5 with high probability, whereas when the
initial control qubit is prepared in the \n) = |1) state, the
CN gate flips the value of S with high probability. In
contrast, the gate preserves the population n of the control
qubit \n) with high probability, verifying that the register
populations follow the CN truth table expressed in (2).
The fact that the measured probabilities are not exactly
zero or one is primarily due to imperfect laser-cooling,
imperfect state preparation and detection preparation, and
decoherence effects.
To illustrate the conditional dynamics of a quantum
logic gate, we desire to perform a unitary transforma-
tion on one physical system conditioned upon the quan-
tum state of another subsystem [19]. To see this in the
present experiment, it is useful to view steps (a) and (c)
of the CN operations given in (1) as Ramsey radiation
pulses [20], which drive the \n)\ i)—
» \n)\ ]} transition
—
with the addition of the perturbation (b) inserted between
the pulses. If we now vary the frequency of the Ramseypulses, we obtain the typical sinusoidal Ramsey interfer-
ence pattern indicative of the coherent evolution between
states |5) = | i) and| t). However, the final population
5 depends on the status of the control qubit \n). This
is illustrated in Fig. 3 where we plot the measured prob-
ability P{S = 1} as a function of detuning of the Ram-
4716
1= Prob.(IS = Prob.(|n=l>)
|0>lt> I |I)|i>
Initial State
|l>lt>
FIG. 2. Controlled-NOT (CN) truth table measurements for
eigenstates. The two horizontal rows give measured final
values of n and S with and without operation of the CN gate,
expressed in terms of the probabilities P{n = 1} and P{S =1}.
The measurements are grouped according to the initial prepared
eigenstate of the quantum register (|0)| 1), |0)| T), 1 1)1 1), or
1 1)1 t)). Even without CN operations, the probabilities are not
exactly or 1 due to imperfect laser-cooling, state preparation
and detection preparation, and decoherence effects. However,with high probability, the CN operation preserves the value of
the control qubit n, and flips the value of the target qubit 5only if n = 1.
sey pulses. For initial state |0)| i), we obtain the normal
Ramsey spectrum since step (b) is inactive. For initial
state [1)1 i), the Ramsey spectrum is inverted indicating
the conditional control (by quantum bit \n)) of the dynam-
ics of the Ramsey pulses. Appropriate Ramsey curves are
also obtained for initial states |0)| t) and |1)| f)-
The switching speed of the CN gate is approximately
20 kHz, limited mainly by the auxiliary Itt pulse in step
(b) given in (1). This rate could be increased with more
Raman beam laser power, although a fundamental limit in
switching speed appears to be the frequency separation of
the control qubit vibrational energy levels, which can be
as high as 50 MHz in our experiment [17].
We measure a decoherence rate of a few kHz in the
experiment, adequate for a single CN gate operating at
a speed of —20 kHz, but certainly not acceptable for a
more extended computation. We identify several sources
responsible for decoherence, including instabilities in the
laser beam power and the relative position of the ion with
respect to the beams, fluctuating external magnetic fields
(which can modulate the qubit phases), and instabilities
in the rf-ion trap drive frequency and voltage amplitude.
Substantial reduction of these sources of decoherence can
be expected. Other sources of decoherence that maybecome important in the future include external heating
and dissipation of the ion motion [16,21], and spontaneous
emission caused by off-resonant transitions. We note that
decoherence rates of under 0.001 Hz have been achieved
for internal-state ion qubits [22].
The single-ion quantum register in the experiment com-
prises only two qubits and is therefore not useful for com-
putation. However, if the techniques described here are
applied to a collection of many ions cooled to the n =state of collective motion, it should be possible to imple-
TN-114

Volume 75, Number 25 PHYSICAL REVIEW LETTERS 18 December 1995
1 0)1 4') initial state
1 1)1 4-) initial state
II
Ramsey detuning (kHz)
FIG. 3. Ramsey spectra of the controlled-NOT (CN) gate.
The detuning of the Ramsey Tr/2 pulses of the CN gate [steps
(a) and (c)] is swept, and 5 is measured, expressed in terms of
the probability P{S = [}. The solid points correspond to initial
preparation in the \n)\S) = |0)| j) state, and the hollow points
correspond to preparation in the \n)\S) = |1)| i) state. Theresulting patterns are shifted in phase by tt rad. This flipping
of \S) depending on the state of the control qubit indicates the
conditional dynamics of the gate. Similar curves are obtained
when the \n)\S) = |0)| t) and |1)| t) states are prepared. Thelines are fits by a sinusoid, and the width of the Ramsey fringes
is consistent with the —50 /isec duration of the CN operation.
ment computations on larger quantum registers. For ex-
ample, the CN gate between two ions (m and n) might be
realized by mapping the internal state of the mth ion onto
the collective vibrational state of all ions, applying the
single-ion CN operation demonstrated in this work to the
nth ion, then returning the vibrational state back to the in-
ternal state of the mth ion. (This mapping may be achieved
by simply driving a tt pulse on the red of blue sideband of
the mth ion.) This approach is equivalent to the scheme
proposed by Cirac and Zoller [1,23]. An arbitrary compu-
tation may then be broken into a number of such operations
on different pairs of ions, accompanied by single qubit ro-
tations on each ion (carrier transitions) [6-8].
We are currently devoting effort into the multiplexing
of the register to many ions. Several technical issues
remain to be explored in this scaling, including laser-
cooling efficiency, the coupling of internal vibrational
modes due to trap imperfections, and the unique address-
ing of each ion with laser beams. Although we can trap
and cool a few ions in the current apparatus, other ge-
ometries such as the linear rf-ion trap [24] or an array
of ion traps each confining a single ion [25] might be
considered.
This work is supported by the U.S. Office of Naval
Research and the U.S. Army Research Office. Weacknowledge useful contributions from J. C. Bergquist
and J.J. Bollinger. We thank Robert Peterson, DanaBerkeland, and Chris Myatt for helpful suggestions on the
manuscript.
[1] J.l. Cirac and P. Zoller, Phys. Rev. Lett. 74. 4091 (1995).
[2] R.P. Feynman. Int. J. Theor. Phys. 21. 467 (1982); Opt.
News 11, 11 (1985).
[3] D. Deutsch, Proc. R. Soc. London A 425, 73 (1989); D.
Deutsch and R. Jozsa, Proc. Soc. London A 439, 554
(1992).
[4] P. Shor, in Proceedings of the 35th Annual Symposium
on the Foundations of Computer Science (IEEE Computer
Society Press, New York, 1994), p. 124.
[5] R. L. Rivest, A. Shamir, and L. Adelman, Comm. ACM,28, 120(1978).
[6] D.P. DiVincenzo, Phys. Rev. A 51, 1015 (1995).
[7] A. Barenco, D. Deutsch, A. Ekert, and R. Jozsa, Phys.
Rev. Lett. 74,4083 (1995).
[8] A. Barenco, C.H. Bennett, R. Cleve, D.P. DiVincenzo,
N. Margolus, P. Shor, T. Sleator, J. Smolin, and H.
Weinfurter, Phys. Rev. A 52, 3457 (1995).
[9] R. Landauer, in Proceedings of the Drexel-4 Symposium
on Quantum Nonintegrability-Quantum Classical Corre-
spondence, edited by D. H. Feng and B-L. Hu (Interna-
tional Press, Boston, to be published).
[10] W.G. Unruh, Phys. Rev. A 51, 992 (1995).
[11] K. Obermeyer, W.G. Teich, and G. Mahler, Phys. Rev. B37,8111 (1988).
[12] S. Lloyd, Science 261, 1569 (1993).
[13] M. Brune, P. Nussenzveig, F. Schmidt-Kaler, F. Bemar-
dot, A. Maali, J.M. Raimond, and S. Haroche, Phys. Rev.
Lett. 72, 3339 (1994); M. Brune, F. Schmidt-Kaler, J.
Deyer, A. Maali, and J. M. Raimond, "Laser Spectroscopy
XII, " edited by M. Inguscio (World Scientific, Singapore,
to be published).
[14] H.J. Kimble, in "Laser Spectroscopy XHI" Ref. [13].
[15] T. Sleator and H. Weinfurter, Phys. Rev. Lett. 74, 4087
(1995).
[16] C. Monroe, D.M. Meekhof, B.E. King, S.R. Jefferts,
W.M. Itano, D.J. Wineland, and P. Gould, Phys. Rev.
Lett. 75, 4011 (1995).
[17] S.R. Jefferts, C. Monroe, E.W. Bell, and D.J. Wineland,
Phys. Rev. A 51, 3112 (1995).
[18] J. E. Thomas, P. R. Hemmer, S. Ezekiel, C. C. Leiby, R. H.
Picard, and C. R. Willis, Phys. Rev. Lett. 48, 867 (1982).
[19] A. Ekert and R. Jozsa, Rev. Mod. Phys. (to be published).
[20] N. F. Ramsey, Molecular Beams (Oxford University Press,
London, 1956).
[21] F. Diedrich, J.C. Bergquist, W.M. Itano, and D.J.
Wineland, Phys. Rev. Lett. 62, 403 (1989).
[22] J.J. Bollinger, D.J. Heinzen, W.M. Itano, S. L. Gilbert,
and D.J. Wineland, IEEE Trans. Instrum. Meas. 40, 126
(1991).
[23] The controlled-NOT operator proposed in Ref. [1]
is Vy-(7T/2)Ul;°U;-Wl;°VyH-Tr/2), adopting their
notation. This is equivalent to the controlled-NOT
operator proposed here between ions m and «,
U!„'>vy-{TT/2)U;'vyH-TT/2)Ul;'', since V„ and
Urn commute.
[24] M.G. Raizen, J.M. Gilhgan, J.C. Bergquist, W.M. Itano,
and D.J. Wineland, Phys. Rev. A 45, 6493 (1992).
[25] F. Major, J. Phys. (Pans) Lett. 38, L221 (1977); R.
Brewer, R. G. DeVoe, and R. Kallenbach, Phys. Rev. A46, R6781 (1992).
4717
TN-115
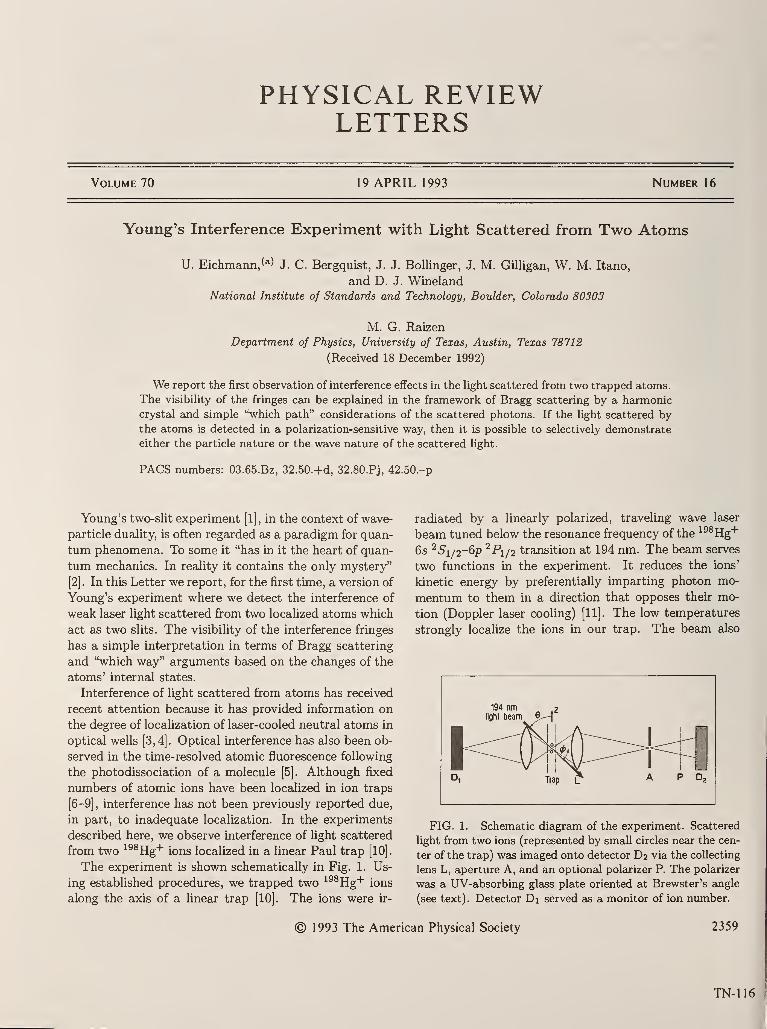
PHYSICAL REVIEWLETTERS
Volume 70 19 APRIL 1993 Number 16
Young's Interference Experiment with Light Scattered from Two Atoms
U. Eichmann/^) J. C. Bergquist, J. J. Bollinger, J. M. Gilligan, W. M. Itano,
and D. J. WinelandNational Institute of Standards and Technology, Boulder, Colorado 8030S
M. G. Raizen
Department of Physics, University of Texas, Austin, Texas 78712
(Received 18 December 1992)
We report the first observation of interference effects in the light scattered from two trapped atoms.
The visibility of the fringes can be explained in the framework of Bragg scattering by a harmonic
crystal and simple "which path" considerations of the scattered photons. If the light scattered by
the atoms is detected in a polarization-sensitive way, then it is possible to selectively demonstrate
either the particle nature or the wave nature of the scattered light.
PACS numbers: 03.65.Bz, 32.50.+d, 32.80.Pj, 42.50.-p
Young's two-slit experiment [1], in the context of wave-
particle duality, is often regarded as a paradigm for quan-
tum phenomena. To some it "has in it the heart of quan-
tum mechanics. In reality it contains the only mystery"
[2]. In this Letter we report, for the first time, a version of
Young's experiment where we detect the interference of
weak laser light scattered from two localized atoms which
act as two slits. The visibility of the interference fringes
has a simple interpretation in terms of Bragg scattering
and "which way" arguments based on the changes of the
atoms' internal states.
Interference of light scattered from atoms has received
recent attention because it has provided information on
the degree of localization of laser-cooled neutral atoms in
optical wells [3,4]. Optical interference has also been ob-
served in the time-resolved atomic fluorescence following
the photodissociation of a molecule [5]. Although fixed
numbers of atomic ions have been localized in ion traps
[6-9] , interference has not been previously reported due,
in part, to inadequate localization. In the experiments
described here, we observe interference of light scattered
from two ^^®Hg+ ions localized in a linear Paul trap [10].
The experiment is shown schematically in Fig. 1. Us-
ing established procedures, we trapped two ^^®Hg+ ions
along the axis of a linear trap [10]. The ions were ir-
radiated by a linearly polarized, traveling wave laser
beam tuned below the resonance frequency of the ^^^Hg"*"
65 ^5i/2-6p ^Pi/2 transition at 194 nm. The beam serves
two functions in the experiment. It reduces the ions'
kinetic energy by preferentially imparting photon mo-
mentum to them in a direction that opposes their mo-
tion (Doppler laser cooling) [11]. The low temperatures
strongly localize the ions in our trap. The beam also
FIG. 1. Schematic diagram of the experiment. Scattered
light from two ions (represented by small circles near the cen-
ter of the trap) was imaged onto detector D2 via the collecting
lens L, aperture A, and an optional polarizer P. The polarizer
was a UV-absorbing glass plate oriented at Brewster's angle
(see text). Detector Di served as a monitor of ion number.
© 1993 The American Physical Society 2359
TN-116

Volume 70, Number 16 PHYSICAL REVIEW LETTERS 19 APRIL 1993
acts as the light source for the interference experiment.
It was directed through the center of the trap at an an-
gle ^=62° with respect to the trap axis (z axis). Thebeam waist was about 50 /xm and the laser power could
be varied to a maximum of about 50 /zW. A 7.77 MHzrf drive with an amplitude Vq — 1 kV confined the ions
radially while a static voltage Uq applied to both ends of
the trap provided axial confinement. Scattered light was
observed with two position-sensitive imaging detectors
Di and D2 (Fig. 1). On one side, a lens system pro-
duced a real image of the ions on detector Di [10]. This
allowed for continuous monitoring to make sure that ex-
actly two ions had been trapped. On the opposite side,
detector D2 was set up to measure the intensity of the
light as a function of the scattering angle. This scat-
tered light was collected with an //I lens and imaged
with a magnification of 4.7 onto an aperture 300 ^m in
diameter. The light that passed through the aperture
was directed onto the position-sensitive photocathode of
detector D2 about 0.1 m from the aperture. Although
the interference fringes could, in principle, be detected
using D2 alone, the lens and aperture suppressed back-
ground stray light firom reaching the detector. With this
configuration, detector D2 covered an in-plane detection
angle (p = 10° to 45°, where (p is defined with respect
to the 194 nm beam direction and the plane is defined
by the traps z axis and the 194 nm beam. The out-of-
plane detection angle $ ranged from —15° to 15°. Theion separation d could be adjusted by varying the axial
voltage Uq- The separation can be calculated with our
trap parameters using the formula d — 19.4Uq ', where
d is in //m and Uq is in volts [8]. In the experiment,
Uq was varied between 10 V and 200 V, which produced
spacings from 9 fim to 3.3 /xm, respectively. At these sep-
arations, the dipole-dipole interaction between ions can
be neglected.
Figure 2 shows examples of the experimental results
with polarization-insensitive detection. The fringes were
recorded at three different ion separations: 5.4 /xm,
4.3 /xm, and 3.7 /xm. The fringe spacing increases with
decreasing ion separation, as expected. Additionally, the
firinge contrast is highest close to the forward scattering
direction and deterioriates with increasing 0. At higher
angles(f),
the scattered light loses its coherence due to
the residual ion motion.
We have performed calculations that quantitatively de-
scribe the fringe contrast and spacing. These calculations
proceed along the same lines as those for Bragg scattering
by a harmonic crystal [12] and use Fermi's "golden rule"
to determine the scattering rate from an initial state to
a final state. Since our detector does not diflFerentiate
between elastically and inelastically scattered light, both
processes contribute to the detected interference signal.
We have calculated the loss of contrast caused by the
residual ion velocity at our ion temperatures and find it
to be negligible. Also, loss of fringe contrast due to the
resulting variations in the energy of the scattered light is
2360
$
FIG. 2. Interference pattern for three different ion separ
rations: (a) 5.4 ^m, (b) 4.3 ^m, and (c) 3.7 /um. The two
white spots are caused by stray reflections of the laser beam.
negligible. We obtain the scattered light intensity as a
function of momentum transfer ^q = ^(kout — kjn):
7(q) = 27o(l + cos(g,d)exp{-([q- (ui - U2)]2)/2}),
(1)
where kout and kjn are the scattered and incident pho-
ton wave vectors and Iq represents the scattered inten-
sity of a single ion (assumed to be equal for both ions).
The brackets(
) denote an ensemble average and Uj de-
notes the displacement of the ith ion from its equilib-
rium position. We assume that the positions of the ions
are characterized by a thermal distribution of the nor-
mal modes of the two ions in the trap. These modes are
the stretch mode along the trap axis, two rocking or tilt
modes normal to the trap axis, and the center-of-mass
modes. Excitation of these modes during the scattering
process gives rise to inelastic light scattering similar to
phonon excitation processes in Bragg scattering by crys-
tals. If we could measure only the elastically scattered
contribution, it would have 100% fringe contrast indepen-
dent of the momentum transfer, but the intensity would
be weighted by an overall exponential factor (the Debye-
Waller factor) as it is in the case of elastic Bragg scat-
tering by crystals. The fringe contrast expressed by the
exponential factor in Eq. (1) is due to the contribution of
inelEistic scattering processes in the interference of light
scattered from two atoms. For two ions with fixed posi-
TN-117

Volume 70, Number 16 PHYSICAL REVIEW LETTERS 19 April 1993
tions, Eq. (1) recalls the result obtained by Heitler in his
classic treatment of resonance fluorescence [13] giving a
fringe contrast equal to 1. The center-of-mass modes are
absent from the exponential factor. These modes do not
contribute to loss of fringe contrast, because they do not
affect the relative phase of the scattered light.
We can calculate ([q • (ui — U2)]^) from the residual
kinetic energy (temperature) in the normal modes of the
two ions given by kBTj/2 = mjUj'j{Xj)/2, where ks is
the Boltzmann constant, j denotes the mode, ruj is the
effective ion mass for mode j (for the stretch and tilt
modes rrij equals one-half of the single ion mass), and
{Xj) is the mean squared amplitude of the modes. At the
Doppler-cooling Umit, the kinetic energy of the stretch
mode is {1 + [3 cos^(^)]~^}^7/8 and the kinetic energy of
the rocking mode is {1 + [3sin^(^)]-^};i7/8 [11], where
7 is the natural linewidth. Since the laser detuning and
the degree of saturation were not precisely determined,
we might expect somewhat higher kinetic energies. Thefrequencies of the normal modes are conveniently ex-
pressed in terms of the single-ion secular frequencies,
which can be easily measured. We have Wgtretch = V^ujz
and wtiit = (oj'^ — ^l)^^'^, where the single-ion axial and
radial secular frequencies at the maximum applied volt-
ages were about Uz/2t:=1 MHz and u'j./2t:—1.5 MHz,respectively.
To "compare our data with theory, we normalized the
interference data with respect to the detected fluores-
cence light of a single ion. This method compensates
for net efficiency variations across the detector. Further-
more, we need to include a constant background intensity
lb. This background is partly due to stray light, partly
due to incoherent fluorescence radiation (see below), and
partly due to quantum jumps from the 6p '^P\/2 state into
the metastable level 5(i^6s ^Dz/2 [14], which leave only
one ion fluorescing. The background due to single-ion
fluorescence caused by quantum jumps depends on the
mean population of the 6p ^Pi/2 state and the lifetime of
the metastable state.
We fltted Eq. (1) (including h) to the data and found
excellent agreement for all measured interference pat-
terns with a temperature of about twice the 1.7 mKDoppler-cooling limit. Radial confinement was about
30 nm, and the residual amplitude in the axial direction
was about 60 nm to 300 nm, depending on Uq. Figure 3
shows an example where C/o=193 V, corresponding to an
ion separation of 3.4 jim..
Our experiment resembles the classic Young's two-slit
arrangement with the slits replaced by the two atoms.
In discussions of Young's type interference experiments,
the position-momentum uncertainty relation is often used
to show that it is impossible to determine through which
slit the photon or particle passes without interacting with
the photon or particle strongly enough to destroy the in-
terference pattern. The position-momentum uncertainty
relation need not be invoked; the destruction of the in-
terference can arise due to correlation between the mea-
FIG. 3. Shown are the interference fringes for d=3.35 /zm
together with a fit to the data. For these data, the tempera-
ture of the ions was determined to be 1.5 times higher than
the temperature at the Doppler-cooling limit.
surement apparatus and the measured system [15]. Thepresent experiment offers the possibility to obtain "which
path" information by exploiting the internal level struc-
ture of the atom. The ^^^Hg"*" ground state 6s ^5i/2 and
the excited state 6p ^Pi/2 are twofold degenerate with re-
spect to the magnetic quantum number rrij. The effect
of this level structure is that scattering linearly polar-
ized light off the two ions can result in either tt- or a-
polarized scattered light. Assume that only one photon
is scattered at a time. In the case of 7r-polarized scattered
light (Amj = transition) the ions' final states are the
same as the initial states. Which atom scattered the pho-
ton cannot be determined. Quantum mechanics therefore
predicts that interference must be present in the light
scattered from the two ions. On the other hand, obser-
vation of the (T-polarized scattered light (|Amj|= 1 tran-
sition) indicates that the final state of one atom differs
from its initial state. This allows us, at least in principle,
to distinguish the scattering atom from the "spectator"
atom, and hence to determine which path the photon
traveled. Consequently, there is no interference in the
light scattered from the ions. In this context, the exis-
tence of interference fringes indicates wavelike behavior,
while the absence of fringes, consistent with a single pho-
ton trajectory, which begins at the source, intersects one
of the atoms, and continues to the detector, indicates a
particlelike behavior. Thus, polarization-sensitive detec-
tion of the scattered photons can serve as a switch to
extract either the wavelike or the particlelike character
of the scattered photon. These two complementary pic-
tures are essentially classical. Both types of behavior are
contained in the quantum description. The interference
then occurs between Fejniman path amplitudes, and the
presence or absence of fringes depends on whether or not
there are two or one possible paths from the initial state
to the final state.
Our simple "which path" considerations are confirmed
2361
TN-118

Volume 70, Number 16 PHYSICAL REVIEW LETTERS 19 APRIL 1993
FIG. 4. Polarization-sensitive detection of the scattered
light (unnormalized) : (a) 7r-polarized scattered light, show-
ing interference; (b) cr-polarized scattered light, showing no
interference pattern as explained in the text.
by a detailed theoretical study of the coherence proper-
ties of the resonance fluorescence from a single atom with
the same level structure as ^^^Hg"*" [16]. It reveals that
for a weak, linearly polarized field, only the 7r-polarized
scattered light is coherent, while the cr-polarized compo-
nents are incoherent.
In our experiment, polarization-sensitive detection of
the 194 nm scattered light was accomplished with a glass
plate oriented at Brewster's angle. It was mounted be-
tween the aperture and the detector. Light linearly po-
larized normal to the plane of incidence of the Brewster
plate was reflected toward the detector with about 15%efficiency. Light polarized in the plane of incidence was
transmitted into the glass, where it was absorbed. Con-
sequently, with the laser beam polarized normal to the
plane of incidence, 7r-scattered light was detected. Con-
versely, when the laser beam was polarized in the plane of
incidence, the 7r-scattered light was absorbed, and only
(7-scattered light reached the detector. Figure 4 shows
the results (unnormalized) of the polarization-sensitive
detection. Figure 4(a) displays the interference pattern
£is expected for the case of 7r-scattered light. Whencr-scattered light was detected, no interference pattern
could be observed [Fig. 4(b)], in agreement with the
quantum mechanical predictions.
In summary, we have reported the observation of inter-
ference fringes in the light scattered from two localized
atoms driven by a weak leiser fleld. The measured fringe
pattern and contrast can be explained in the firamework
of Bragg scattering by a harmonic crystal. These results
show that interference measurements provide another
method to determine ion temperatures and separations in
traps. By exploiting the atom's internal level structure,
we showed, without invoking the position-momentum un-
certainty relation, that the possibility of determining the
path of the scattered photon destroyed the interference
fringes.
Future prospects include measurements of the depen-
dence of the fringe contrast on the saturation of the
atomic transition, since the coherent component de-
creases in a predictable way as the light field intensity
is increased [17]. We plan to study the interference pat-
tern of more than two ions and have already been able
to observe the interference pattern of three ions. Finally,
heterodyne measurements could distinguish the different
contributions of the elastic and inelastic scattering pro-
cesses to the interference pattern.
We gratefully acknowledge the support of ONR. U.E.
gratefully acknowledges financial support of the Deutsche
Forschungsgemeinschaft. We thank M. E. Poitzsch and
J. Tan for their suggestions on the manuscript.
^^^ Permanent address: Universitat Freiburg, 7800 Freiburg,
Germany.
See, e.g., Great Experiments in Physics, edited by M.H.Shamos (Henry Holt and Company, New York, 1959), p.
93.
R. Feynman, R. Leighton, and M. Sands, The FeynmanLectures on Physics (Addison-Wesley, Reading, 1965),
Vol. ni, p. 1-1.
P. Verkerk, B. Lounis, C. Salomon, C. Cohen-Tannoudji,
J.-Y. Courtois, and G. Grynberg, Phys. Rev. Lett. 68,
3861 (1992).
P.S. Jessen, C. Gerz, P.D. Lett, W.D. Phillips, S.L. Rol-
ston, R.J.C. Spreeuw, and C.I. Westbrook, Phys. Rev.
Lett. 69, 49 (1992).
P. Grangier, A. Aspect, and J. Vigue, Phys. Rev. Lett.
54, 418 (1985).
W. Neuhauser, M. Hohenstatt, P.E. Toschek, and H.
Dehmelt, Phys. Rev. A 22, 1137 (1980); Th. Sauter, H.
GiUiaus, I. Siemers, R. Blatt, W. Neuhauser, and P.E.
Toschek, Z. Phys. D 10, 153 (1988).
F. Diedrich, E. Peik, J.M. Chen, W. Quint, and H.
Walther, Phys. Rev. Lett. 59, 2931 (1987).
D.J. Wineland, J.C. Bergquist, W.M. Itano, J.J.
Bollinger, and C.H. Manney, Phys. Rev. Lett. 59, 2935
(1987).
R.G. Brewer, J. Hoffnagle, R.G. DeVoe, L. Reyna, and
W. Henshaw, Nature (London) 344, 305 (1990).
M.G. Raizen, J.M. Gilhgan, J.C. Bergquist, W.M. Itano,
and D.J. Wineland, Phys. Rev. A 45, 6493 (1992).
The trap asymmetry reported in this reference has been
greatly reduced.
W.M. Itano and D.J. Wineland, Phys. Rev. A 25, 35
(1982).
N.W. Ashcroft Eind N.D. Mermin, Solid State Physics
(Saunders College, Philadelphia, 1976), Appendix N.
W. Heitler, The Quantum Theory of Radiation (Dover,
New York, 1984), p. 194.
W.M. Itano, J.C. Bergquist, R.G. Hulet, and D.J.
Wineland, Phys. Rev. Lett. 59, 2732 (1987).
M.O. Scully, B.-G. Englert, and H. Walther, Nature
(London) 351, 111 (1991).
D. Polder and M. F. H. Schuurmans, Phys. Rev. A 14,
1468 (1976).
L. Mandel, Phys. Rev. A 28, 929 (1983); C.K. Hong, Z.Y.
Ou, and L. Mandel, Phys. Rev. A 37, 3006 (1988).
[1
[2:
[3:
[4
[5]
[6]
[7]
[8]
[9
[lo:
11
12
13;
14
is;
17
2362TN-119

LIGHT SCATTERED FROM TWO ATOMS*
W. M. Itano, U. Eichmann," J. C. Bergquist, J. J. Bollinger,
J. M. Gilligan.t M. G. Raizen.tt and D. J. Wineland
National Institute of Standards and Technology
325 Broadway Street
Boulder, Colorado 80303
Abstract
We have observed interference fringes, like those in Young's clcissic experiment, in the laser light scattered
by two trapped atoms. The interference fringes are present only in one polarization of the scattered light.
The polarization dependence is related to the complementarity principle, which forbids the simultaneous
observation of wave-like and particle-like aspects of light. The interference fringes are due to processes
in which a single photon scatters from two atoms. We describe methods which might be used to observe
other interference effects due to two photons scattering from two atoms.
Introduction
We have observed Young's interference fringes resulting from the light scattered from two atoms. In Young's original
experiments, sunlight, passing through two slits, produced a pattern of closely-spaced fringes on another screen. Those
observations established the wave nature of light and resulted in the first accurate determination of the wavelength of
light.i
Interference experiments of this form have played an important part in the conceptual development of quantum
mechanics. Either matter (electrons, for example) or light can display interference (a wave-like property). However, if it
is possible to infer which slit the matter or light passed through, thereby extracting a particle-like property, interference is
not observed. Wave-particle duality is a particular example of a more general principle, the principle of complementarity,
which states, "For each degree of freedom, the dynamical variables are a pair of complementary variables."^ Variables
are complementary if a precise determination of one implies an inability to predict the other. For example, the position
and momentum of a particle are complementary variables, since, according to Heisenberg's uncertainty principle, the
product of their uncertainties must be greater than h/2. In our experiments, in contrast to various gedanken experiments,
complementarity is enforced in a manner which does not require the position-momentum uncertainty relations.
Experimental Apparatus
194 nmlight beam 9.
»bt
Figure 1: Diagram of the experimental apparatus.
Figure 1 shows the experimental apparatus, which has been described previously.^ A linear rf trap"* was used to confinei98jjg+
iQijg jui98jjg+^
^Yie lowest-frequency electric-dipole transition is from the ground 6s^5i/2 level to the Qp^Pi/2
level at 194 nm. The ions were laser-cooled to temperatures of a few millikelvins with a beam of linearly polarized,
'Work of the National Institute of Standards and Technology. Not subject to U.S. copyright.
"Present address: Max Bom Institut, Berlin, Germany.
^Present address: Environmental Research Laboratory, National Oceanic and Atmospheric Administration, Boulder, Colorado.
'Present address: Department of Physics, University of Texas, Austin, Texas.
TN-120

continuous-wave light. Cooling in the trap resulted in strong localization of the ions, which is essential for observation of
interference fringes. The trap potentials were arranged so that a pair of ions would be oriented along the symmetry (z)
axis of the trap. The laser beam intersected the ions at an angle 6 of 62* with respect to the trap axis. Light emitted by
the ions was focused by a lens L through an aperture A and then directed to the surface of an imaging detector D2. This
detector was used to observe the fringes. The cixis of the detection optics was in the plane defined by the laser beamand the trap axis. The in-plane detection angle
<i>varied from 15* to 45* with respect to the laser beam direction. The
out-of-plane detection angle varied from -15* to -f-15*. Optionally, a linear polarizer P was inserted before D2. Another
lens system formed a real image of the ions on another imaging detector Di. This image was used to determine whenthere were precisely two ions in the trap.
One-Photon Two-Atom Scattering
Our version ofYoung's interference experiment, in which the
two slits are replaced by two atoms, is an example of a case
in which each photon interferes only with itself. (We call this
second-order interference, i.e., second-order in the fields, in
order to distinguish it from other forms of interference to
be discussed later.) From the point of view of quantummechanics, we expect interference whenever there are two
or more possible paths from a given initial state to the samefinal state. The absolute square of the sum of the complex
amplitudes assigned to these paths yields the probability for
the final state. The two paths which yield the interference
are represented by the two parts of Fig. 2. In each path, the
photon, represented by the wavy arrow, is scattered by one
of the two atoms, represented by circles, and reaches the
detector, represented by the half circle. After the photon
is detected, there is no way to tell which atom scattered it,
i.e., which of the two paths the system took.
An example of interference data is shown in Fig. 3. Thetwo ions were separated by 3.4 /im. The angular separation
of successive fringes is about 3*. The angle
<f)between the
incident and scattered photon directions increaises to the
right. Interference fringes were obtained for ion separations varying from 9 ^m to 3.3 /im. The angular separation of
the fringes increased as the distance between the ions was decreased. The fringe visibility was observed to decrease with
increasing 0.
The dependence of the fringe spacing on the ion separation and the variation in the fringe visibility with angle are
contained in the following expression for the intensity I of the scattered light as a function of q, where hq — ft(^out — ^in).
and ^,n and ^out are the wavevectors of the incoming and outgoing photons:
+
Figure 2: The two paths which contribute to the Young's
interference fringes. The paths correspond to the photon
being scattered by one atom or the other and then being
detected.
/(g) = 2/0 [1 + cos{q,d) exp {- {[q- {uy - u,)]') /2}] . (1)
In this expression, 7o is the intensity due to scattering by a single ion, d is the ion separation, and ui and U2 are the
displacements of the ions 1 and 2 from their equilibrium positions. The angular brackets denote an ensemble average.
Equation (1) was derived by methods similar to those used for Bragg scattering by a harmonic crystal.^' ^ The fringe
separation is contained in the factor coslq^d) and is therefore inversely proportional to d. The fringe visibility depends on
the quantity (^[q- {ui — tl2)]^). The visibility is greatest in the forward scattering direction, where g = 0, and decreases
with increasing scattering angle and with increasing ion temperature. The temperature of the ions has been determined
from the rate of decrease in fringe visibility with angle and is approximately equal to the theoretically calculated value.^
The data shown in Fig. 3 were obtained with polarization-insensitive detection. When a linear polarizer was placed in
front of the detector, the fringes were present only in the light having polarization in the plane defined by the polarization
of the incident light and ^out (7r-polarization) and not in the light having the orthogonal polarization ((X-polarization).
Figure 4 shows interference patterns observed in (a) 7r-polarized and (b) tr-polarized light. The 7r-polarization shows high
fringe visibility, while the c-polarization shows no fringes, only the slow variation with scattering angle of the detection
sensitivity.
TN-121

Figure 3: Interference fringes observed for an ion separation of 3.4 /im. The deviation from the forward scattering
direction increases to the right.
C/3
Figure 4: Intensity of the scattered light from two ions as a function of the scattering angle 4>- (a) 7r-polarized light, (b)
CT-polarized light. Only the 7r-polarized light shows interference fringes. The data are not normalized for the detection
efficiency, which varies with 4>-
TN-122
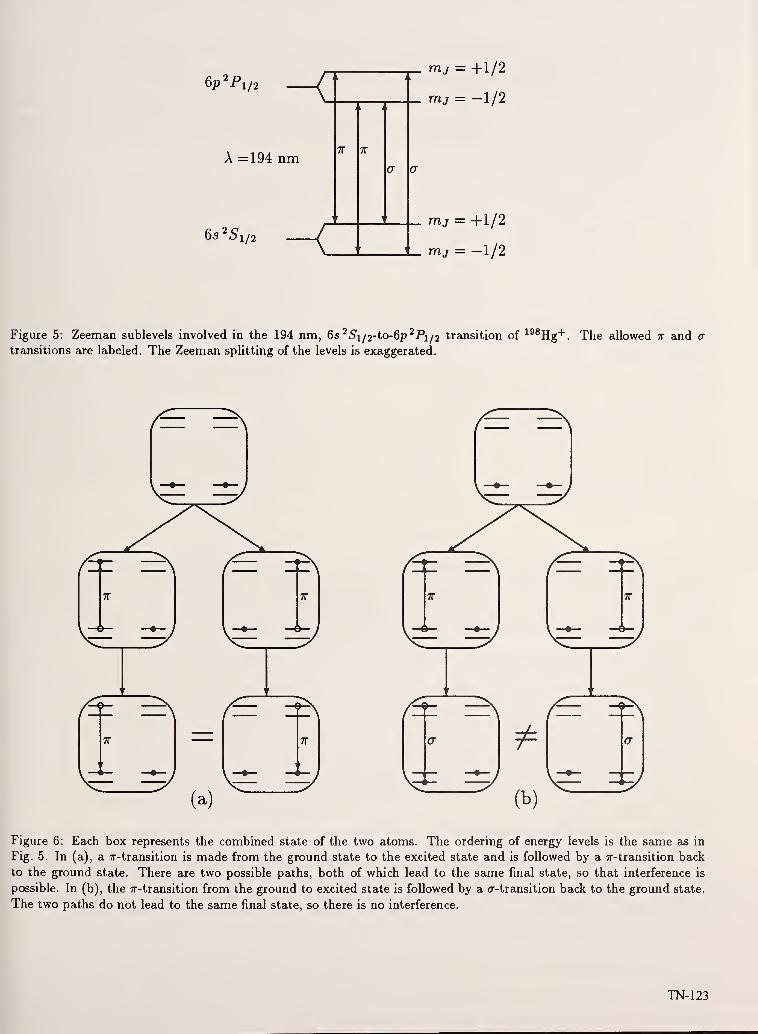
6p2Pi/2-<I
A =194 nm
65^51/2
TT
-<1
W
mj = +1/2
mj = -1/2
mj = +1/2
mj = -1/2
Figure 5: Zeeman sublevels involved in the 194 nm, 6s^5i/2-to-6p^Pi/2 transition of ^^^Hg+. The allowed x and a-
transitions are labeled. The Zeeman splitting of the levels is exaggerated.
TT
TT
TT
TT
(a)
/^^
7^
^^^(b)^^^Figure 6: Each box represents the combined state of the two atoms. The ordering of energy levels is the same as in
Fig. 5. In (a), a tt-transition is made from the ground state to the excited state and is followed by a ir-transition back
to the ground state. There are two possible paths, both of which lead to the same final state, so that interference is
possible. In (b), the 7r-transition from the ground to excited state is followed by a (T-transition back to the ground state.
The two paths do not lead to the same final state, so there is no interference.
TN-123

The source of the polarization dependence of the fringe visibility lies in the internal level structure of the ^^^Hg'*' ion
and in basic principles of quantum mechanics. Figure 5 shows the magnetic sublevels involved in the 6s'^5i/2-to-6p'^Pi/2
transition. The static magnetic field is small enough that we are free to define the quantization axis of the ions to be
along the electric polarization vector of the incident light. If the static magnetic field is along some other direction, then
the Zeeman sublevels defined according to the electric polarization vector are not stationary states. This does not change
the analysis as long as the Zeeman precession frequency is much less than the inverse of the scattering time, which is
approximately equal to the 6p^Pi/2-state lifetime (2.3 ns). In the experiments described here, the magnetic field was
small enough that this was always the case.
The TT-transitions (Amy = 0) and tr-transitions (Amy = ±1) are labelled in Fig. 5. The incident laser light drives
only TT-transitions from the ground to the excited state. However, the decay from the excited state to the ground state
can be either a 7r-transition or a (r-transition. If the decay is a 7r-transition, the atom returns to the same mj sublevel it
occupied before it absorbed a photon. Hence, it is not possible to tell, by examining the atoms, which one scattered the
photon. On the other hand, if the decay is a cr-transition, the atom returns to a different mj sublevel and it would be
possible in principle to examine the atoms after the scattering and tell which one scattered the photon. In the context of
the principle of complementarity, a particle-like property is present, and interference, a wave-like property, must vanish.
From a more modern point of view, we say that interference occurs when there is more than one transition amplitude
connecting the initial and final states.^ Figure 6 illustrates this point of view. There are four possible initial states of the
combined system of two atoms, since each atom can be in either of two mj sublevels. We consider a particular initial
state, in which both atoms are in the mj = -1-1/2 sublevel. All four choices of initial states contribute to the interference
fringes in the same way. In Fig. 6(a), a 7r-polarized photon is absorbed and a 7r-polarized photon is emitted. There are
two paths for this process. Since they lead to the same final state, interference can occur. In Fig. 6(b), a ;r-polarized
photon is absorbed and a cr-polarized photon is emitted. There are two paths for this process. However, they lead to
different final states, so there is no interference.
Polder and Schuurmans'^ calculated the spectrum of resonance fluorescence from a (.7 = l/2)-to-(J = 1/2) transition.
They found that, for low intensities, the 7r-polarized scattered light is coherent with the incident light, while the <r-
polarized scattered light is not. Thus, it is reasonable that the ir-polarized light should show interference fringes while
the cr-polarized light should not. The fringe visibility for the 7r-polarized light should decrease with intensity, since, as
is the case for two-level atoms,®' ^ the ratio of incoherent scattering to coherent scattering increases with intensity. Theintensity dependence of the visibility has not yet been examined experimentally.
Two-Photon Two-Atom Scattering
Next, we consider the interference process represented by Fig. 7. Two photons are scattered by two atoms and are each
detected at different spatial positions. However, it is not possible to tell which atom scatters which photon, so there is
interference between the two paths. This is a kind of fourth-order interference (i.e., fourth-order in the fields), which can
persist even when there is no second-order interference. The interference effects that we have labeled fourth-order and
second-order are called second-order and first-order, respectively, by others,^ since they are second-order and first-order
in the intensities.
Interference by independent quantum sources has been discussed in detail by various authors. ^°' ^^ If the sources
are independent, there is no stationary interference pattern. However, both classical and quantum calculations predict
intensity correlations between two detectors. In particular, if the sources are two single atoms, there will be a finite
coincidence rate if the detectors are separated by n interference fringes (n=0, 1,2,.. .) and no coincidences if the detectors
are separated by n -f- 1/2 fringes.^" In this case, the quantum calculation predicts a fringe visibility of 1, while the
corresponding classical calculation predicts a visibility less than or equal to 1/2. The difference arises from the fact that
a single atom cannot emit two photons simultaneously. After emitting one photon, it must be excited to the upper state
again before it can emit another. In the classical calculation, the simultaneous detection of two photons emitted by the
same atom is allowed, and this gives rise to a background signal that reduces the fringe visibility. The observation of a
fringe visibility greater than 1/2 for independently phased atoms would thus be an example of a quantum phenomenonhaving no classical analog.
Consider a simple case originally treated by Dicke.^^ Two two-level atoms are both in the excited state and are
separated by much more than the wavelength of the light that they emit (see Fig. 8). This state can be written as |e)i|e)2,
where e denotes the excited state of an atom and 1 and 2 label the two atoms. The first photon can be emitted in any
direction consistent with the dipole radiation pattern of a single atom. The state of the atoms immediately after the first
photon has been emitted can be symmetric, i.e., (|e)i|g)2 + |g)i|e)2)/\/2, or antisymmetric, i.e., (|e)i|g)2 — |g)i|e)2)/>/2,
where g denotes the ground state of an atom. In general, the state can be a linear combination of these two cases.
TN-124
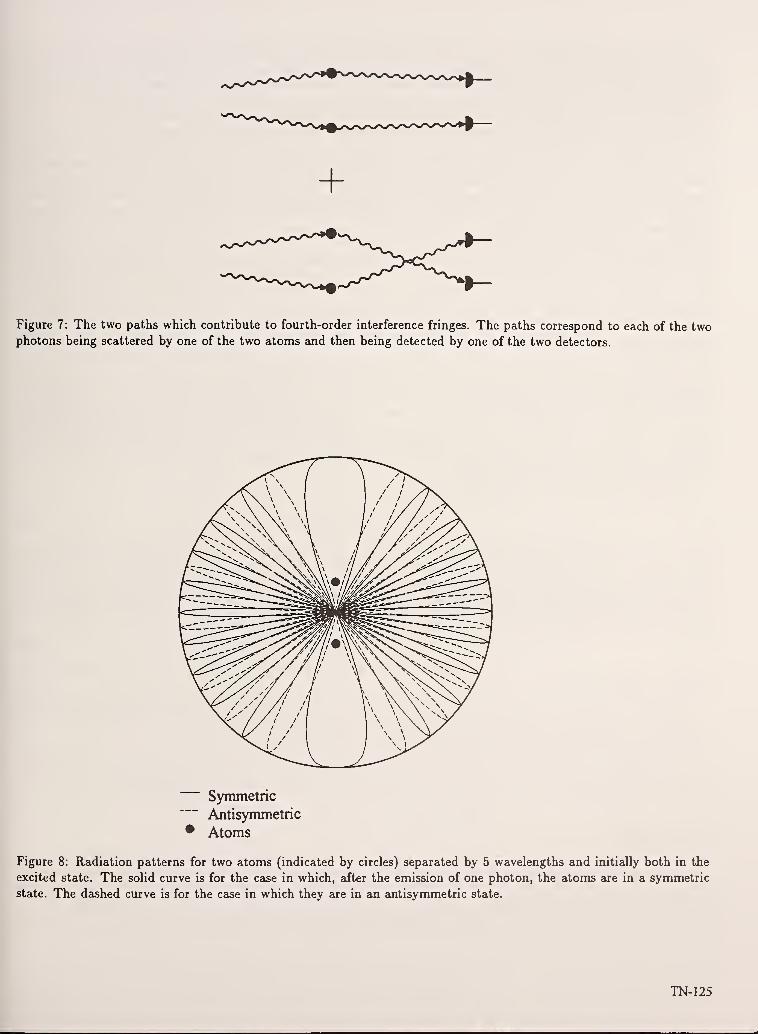
+
Figure 7: The two paths which contribute to fourth-order interference fringes. The paths correspond to each of the twophotons being scattered by one of the two atoms and then being detected by one of the two detectors.
Symmetric
Antisymmetric
• Atoms
Figure 8: Radiation patterns for two atoms (indicated by circles) separated by 5 wavelengths and initially both in the
excited state. The solid curve is for the case in which, after the emission of one photon, the atoms are in a symmetric
state. The dcished curve is for the case in which they are in an antisymmetric state.
TN-125

Like the radiation pattern of pair of classical dipoles, the probability distribution for the emission of the second
photon is made up of many interference fringes. A pair of classical dipoles has a pattern which shifts according to their
relative phases. Here, the pattern shifts according to the relative phases of the wavefunctions of the two atoms. Figure 8
shows an example, for a separation of five wavelengths. If the wavefunction is symmetric with respect to the two atoms,
the radiation pattern is given by the solid curve. If it is antisymmetric, it is given by the dashed curve. If it is a linear
combination of symmetric and antisymmetric wavefunctions, it is intermediate between the two curves.
The direction of the second photon is constrained by the direction of the first. It cannot be in a direction differing
by n + 1/2 fringes and has the greatest probability of differing by n fringes. The emission of the first photon fixes the
symmetry of the wavefunction and hence the probability distribution for the emission of the second photon. The symmetry
must be such that the direction of the first photon is along a fringe (lobe) of the radiation pattern. It is important to
remember that each photon is emitted by both atoms. If, after the emission of the first photon, a measurement is madeto determine which of the atoms is in the excited state, the coherent superposition is totally destroyed, and the second
photon can be emitted in any direction.
Consider the following modification of the experiment. Wait until the first photon is detected. Its direction of emission
fixes the symmetry of the wavefunction. Then, before the second photon is emitted, change the separation between the
atoms to a different value. In an ion trap, this can be done by changing the electric potentials on the electrodes. This
changes the radiation pattern, adding or subtracting fringes. The second photon will be emitted into a fringe of the newradiation pattern. Thus, the second photon can be aimed toward certain directions and away from others by controlling
the distance between the atoms.
Estimated Signals
Experimentally, a higher data- collection rate could be achieved by exciting the atoms continuously and using coincidence
detection, rather than by sequentially exciting the atoms and then detecting the emitted photons. It should be possible
to observe fourth-order interference with a slight modification of the present experimental apparatus. Two imaging
detectors would be used, together with fast coincidence electronics. In order to avoid the intensity variations due to
the second-order interference [as in Fig. 4(a)], only the <7-polarized light should be detected. For each coincidence, the
position of both photons would be recorded.
Let iJcoinc he the detected coincidence rate. Then,
-Rcoinc = 2(7;ilscatt) <5r, (2)
where t] is the fraction of scattered photons that are detected, ilscatt is the rate at which photons are scattered by one
atom, and 6t is the coincidence time window. A reasonable value for t} is 10"^, assuming a detection solid angle of 1%and a detector quantum efficiency, including the polarizer efficiency, of 10%. If the incident light intensity is high enough
to saturate the transition, Racatt approaches 7/2, where 7 is the decay rate of the upper state. The coincidence time
window 6t should be less than the coherence time for the fourth-order interference, which is less than or approximately
equal to 7"^. If we let St « 0.257~^, then
Hcoinc w 1.25 X 10-'^7-(3)
For Hg"^, where 7 w 4.3 x 10® s~^, iJcoinc '^ 54 s~^. Thus, it should be possible to observe a fringe pattern with a few
minutes of observation time.
Other ions might be better suited than Hg"^ for this experiment. For example, Mg"*" hcis a smaller mass, thus allowing
better spatial localization, and a longer resonance wavelength, thus allowing the use of more efficient detectors and
polarizers. On the other hand, it has a smaller value of 7 than Hg"*" (7 s» 2.7 x 10® s~^).
It would also be of interest to observe the coincidences in the 7r-polarized light, particularly in the high-intensity
limit. In this limit, the second-order interference disappears, but the fourth-order interference remains.^ The visibility
of the fourth-order interference fringes is 1 for arbitrary intensity, but the time window during which it can be observed
decreases with intensity.
Quantum Erasers
The term "quantum eraser" was used by Scully and Driihl^^ to describe a gedanken experiment involving the observation
of interference fringes in the light scattered by two atoms. Other forms of quantum erasers have been described. ^'*' ^^
The common element is that interference is destroyed when it is possible to tell, in principle, which path the system
has taken, and is recovered when that information is erased or hidden. In Scully and Driihl's original proposal, two
atoms are excited by a laser pulse. In the case of two-level atoms, interference fringes are observed, as in the case of
TN-126

TT-polarized emission discussed in the previous Section. In the case of three-level atoms, interference is not observed when
the light emission from the atoms is accompanied by a transition to a level different than the one occupied before the
laser pulse. This is because it is possible to tell which atom scattered the photon, as in the previous case of cr-polarized
emission. This information is erased by exciting the atoms to a fourth level, from which they decay back to the initial
level. Fringes are recovered, but only in a coincidence measurement, which is in principle similar to the fourth-order
interference experiment that we have proposed. The experiment can be operated in a "delayed choice" mode. That is,
the interference fringes can be made to appear or not, depending on whether or not a shutter is operated, even though
this is done after the photon is on its way to the detector.
The fourth-order interference experiment we have proposed is a kind of quantum ereiser, though, in common with some
other quantum erasers,^'*' ^^ it lacks the "delayed-choice" feature. If we detect only the <T-polarized light, no interference
fringes are detected in a non-coincidence experiment. In principle the states of the atoms could have been mecisured
before and after the photon scattering, and it would be possible to tell which atom scattered the photon. In a coincidence
detection, both atoms have scattered a photon and have changed their states. However, it is impossible to tell which
atom scattered which photon. That is, it is impossible to tell which of the paths shown in Fig. 7 the system took. This
is what makes it possible to observe interference fringes.
Conclusion
We have observed Young's interference fringes in the light scattered from two localized atoms. The interference patterns
can be used to infer the separation and temperature of the two atoms. The fact that the interference appears only
for one polarization of the light has a simple explanation based on the fact that only paths leading to the same final
state can interfere. Fourth-order interference effects might be observed by detecting coincidences in two photon detectors.
This work was supported by the Office of Naval Research.
References
[1
[2:
[3:
[4:
[6;
[8:
[9
[10
[11
[12
[13;
[14;
[15;
In Great Experiments in Physics, edited by M. H. Shamos (Henry Holt and Company, New York, 1959), p. 93.
M. 0. Scully, B.-G. Englert, and H. Walther, Nature 351, 111 (1991).
U. Eichmann, J. C. Bergquist, J. J. Bollinger, J. M. Gilligan, W. M. Itano, D. J. Wineland, and M. G. Raizen, Phys.
Rev. Lett. 70, 2359 (1993).
M. G. Raizen, J. M. Gilligan, J. C. Bergquist, W. M. Itano, and D. J. Wineland, Phys. Rev. A 45, 6493 (1992).
N. W. Ashcroft and N. D. Mermin, Solid State Physics (Saunders College, Philadelphia, 1976), Appendix N.
C. Cohen-Tannoudji, J. Dupont-Roc, and G. Grynberg, Photons and Atoms (Wiley, New York, 1989), pp. 204-215.
D. Polder and M. F. H. Schuurmans, Phys. Rev. A 14, 1468 (1976).
B. R. Mollow, Phys. Rev. 188, 1969 (1969).
Th. Richter, Opt. Commun. 80, 285 (1991).
L. Mandel, Phys. Rev. A 28, 929 (1983).
H. Paul, Rev. Mod. Phys. 58, 209 (1986).
R. H. Dicke, in Quantum Electronics, proceedings of the Third International Conference, Paris, edited by P. Grivet
and N. Bloembergen (Columbia University Press, New York, 1964) p. 35.
M. 0. Scully and K. Driihl, Phys. Rev. A 25, 2208 (1982).
P. G. Kwiat, A. M. Steinberg, and R. Y. Chiao, Phys. Rev. A 45, 7729 (1992).
A. G. Zajonc, L. J. Wang, X. Y. Zou, and L. Mandel, Nature 353, 507 (1991).
IN- 127

PHYSICAL REVIEW A VOLUME 48, NUMBER 1 JULY 1993
Electrostatic modes of ion-trap plasmas
J. J. Bollinger, D. J. Heinzen,* F. L. Moore,* Wayne M. Itano, and D. J. Wineland
Time and Frequency Division, National Institute ofStandards and Technology, Boulder, Colorado 80303
Daniel H. E. DubinDepartment ofPhysics, University of California at San Diego, La Jolla, California 92093
(Received 4 January 1993)
The electrostatic modes of a non-neutral plasma confined in a Penning or Paul (rf) trap are discussed
in the limit that the Debye length is small compared to the plasma dimensions and the plasma dimen-
sions are small compared to the trap dimensions. In this limit the plasma shape is spheroidal and analyt-
ic solutions exist for all of the modes. The solutions for the modes of a Paul-trap plasma are a special
case of the modes of a Penning-trap plasma. A simple derivation of some of the low-order quadrupole
modes is given. Experimental measurements of these mode frequencies on plasmas of laser-cooled Be^
ions in a Penning trap agree well with the calculations. A general discussion of the higher-order modes
is given. The modes provide a nondestructive method for obtaining information on the plasma density
and shape. In addition, they may provide a practical limit to the density and number of charged parti-
cles that can be stored in a Penning trap.
PACS number(s): 32.80.Pj, 32.90. +a, 52.25.Wz, 52.35.Fp
I. INTRODUCTION
Penning traps [1,2] typically use a uniform magnetic
field superimposed along the axis of azimuthally sym-
metric electrodes to confine charged particles. Radial
confinement is provided by the axial magnetic field and
axial confinement is provided by electrostatic potentials
applied to the trap electrodes (see Fig. 1). Paul (rf) traps
[1] use an electrode structure similar to Penning traps,
but there is no magnetic field, and a combination of rf
and electrostatic potentials are applied to trap electrodes.
Charged particles are confined by the inhomogeneous rf
fields (the pondermotive force) to a region of minimum rf
field strength near the trap center. Penning and Paul
traps are used in a number of studies on charged atomic
particles such as mass spectroscopy [3-8], high-precision
magnetic-moment measurements [1,9,10], high-resolution
spectroscopy and frequency standards [1,11-14],
charge-transfer studies [15], non-neutral-plasma studies
[2,16-21], and antimatter storage [7,22-24]. In many of
these experiments more than one charged atomic particle
(a "cloud") are stored in the trap and cooled to low tem-
peratures. A cloud of charged particles in a Penning trap
can be considered a plasma, in particular a non-neutral
plasma, when the Debye length is less than the cloud di-
mensions. This paper discusses the electrostatic modes of
these plasmas in the limit that the Debye length is muchless than the plasma dimensions and when the plasma di-
mensions are small compared to the trap dimensions. Asdiscussed below, the modes of a Paul-trap plasma are de-
scribed by a special case of the Penning-trap plasma
modes. Therefore in this paper we concentrate our dis-
cussion on the modes of Penning-trap plasmas and show
how solutions for the modes of an rf-trap plasma follow
from the Penning-trap results.
Measurement of the plasma mode frequencies mayhave applications for ion trap experiments. For example,
mass spectroscopy experiments done with a cloud or plas-
ma of ions in a Penning trap can have systematic shifts
associated with the distances of the ions from the trap
center and the small anharmonicities of the trapping po-
Imager
Lens _^[ ^,_—-.^ I
System y^"^ ^^
MicrowaveHorn
TorqueBeam
CoolingBeam
9Be+Plasma
FIG. 1. Sketch of a Penning trap used to make mode mea-
surements on a plasma of 'Be'*' ions. The size of the plasma is
exaggerated. The trap electrodes (shown in cross section) are
right circular cylinders with inner radius po=\.n cm. Theyprovide a quadratic potential near the trap center with
^2~0-236. Some other Penning traps use hyperboloids of re-
volution as trap electrodes. The laser beams, microwave horn,
and imaging system are used in the measurement of the plasma
modes as described in Sec. IV.
1050-2947/93/48( 1 )/525(2 1 )/$06.00 48 525
Work of the U. S. GovernmentNot subject *" TT c .^„„^-j,*^^^

526 J. J. BOLLINGER et al. 48
tential [6,25,26]. In high-resolution atomic spectroscopy
of ions in a Penning trap, one of the largest systematic
shifts is the second-order Doppler shift associated with
the EXB rotation of the ions about the magnetic field
axis of the trap [12]. The larger the radius of the plasma,
the larger the second-order Doppler shift. A third appH-
cation is illustrated by experiments which measure
electron-ion recombination by passing an electron beamthrough a sample of ions trapped in a Penning trap [27].
In these studies, it would be desirable to have a direct
knowledge of the geometrical overlap of the electron
beam with the ion sample. In all of the above examples,
the plasma shape and density, along with the number of
trapped ions, determine the radial and axial positions of
the ions and therefore the size of the required correc-
tions. Similar considerations apply to experiments on
ions in a Paul trap. In some cases the plasma shape anddensity can be determined with a laser [20,28]. Whenthis or other techniques are not available, detection of the
plasma modes, perhaps through induced image currents
in the trap electrodes, could provide this information.
Recent experiments have trapped positron [23] and an-
tiproton [7,24] plasmas in Penning traps. The current
techniques for obtaining information about these plasmas
involves ejecting the plasma from the trap. Detection of
the plasma modes should provide a nondestructive diag-
nosis for obtaining information on the antimatter plasma
density, temperature, and shape. A goal of the an-
timatter work is the high-density storage of large num-bers of positrons and antiprotons for transport to
different laboratories around the world. Field errors in
the trapping potential can excite plasma modes andenhance radial transport. Excitation of the plasma
modes may therefore set a practical hmit on the density
and number of antiparticles that can be stored in a Pen-
ning trap.
In addition to having potential applications to current
experiments, the electrostatic modes of a Penning-trap
plasma may also provide a tool for studying the dynamicsof non-neutral and strongly coupled plasmas. A simple,
analytic form has been obtained for all of the electrostatic
modes of a low-temperature Penning-trap plasma [29].
This is the only finite length geometry for which exact
mode eigenfrequencies and eigenfunctions have been cal-
culated. Therefore the Penning trap may provide an in-
teresting geometry for the study of plasma modes and
their importance to the dynamical behavior of non-
neutral plasmas. For example, it should be possible to
study how errors in the trapping fields couple to the plas-
ma modes and enhance radial transport [19]. Measure-
ment of the damping of the modes should provide infor-
mation on the plasma's viscosity. This measurement
could presumably be done with a strongly correlated
plasma over a range of magnetic field strengths where
very little information is available.
In Sec. II we review the static properties of a cold,
Penning-trap plasma in thermal equilibrium. We assume
the trapped particle number iV» 1 . For sufficiently low
temperature or small Debye length, the plasma has con-
stant density. If the plasma dimensions are small com-
pared to the trap electrode dimensions, then the confining
potential may be assumed to be quadratic and the eflFect
of image charges neglected. In this case, the plasma has a
spheroidal boundary with an aspect ratio determined bythe plasma density and the axial restoring force of the
trap. This is the starting point for describing and calcu-
lating the modal excitations of a plasma in thermal equi-
librium. In Sec. Ill we describe a simple but exact calcu-
lation for some of the quadrupole modes of a spheroidal
Penning-trap plasma. We show how these modes could
be used to measure the density and shape of a Penning-
trap plasma. Section IV compares the results of the
quadrupole mode calculations with measurements [21]
done on about 2000 laser-cooled ^Be"*" ions in a Penningtrap. In that section we show how a zero-frequency
quadrupole mode was excited by a misalignment of the
magnetic field axis with respect to the electrostatic sym-metry axis of the trap. Excitation of this mode tended to
limit the plasma density. Section V discusses the higher-
order modes of a Penning-trap plasma [29]. Modes that
can be excited by static field errors are identified.
II. STATIC PROPERTIES
The Penning trap shown in Fig. 1 consists of four cy-
hndrical electrodes. The outer cylinders are called the
"end-cap" electrodes in analogy with the end caps of a
hyperboHc Penning trap [1]. The inner cyHnders are elec-
trically shorted and together called the "ring" electrode.
With a positive potential Vj apphed to the end-cap elec-
trodes with respect to the ring electrode, positively
charged particles (ions) can be electrostatically confined
in the direction of the trap axis. A static, uniform mag-netic field B=Bz parallel to the trap's symmetry axis
confines the ions in the radial direction. Near the center
of the trap, where the ions are confined, the radial com-ponent of the trap electric field is directed outward. This
field produces an EX B circular drift of the ions about the
symmetry axis of the trap. As the ions rotate through the
magnetic field, they experience a Lorentz force directed
radially inward.
With sufficiently long confinement, the ions evolve to a
state of thermal equiUbrium characterized by a uniform
"rigid" rotation of the ions at a frequency «, [18,28,30].
Specifically, the rotation frequency o^ is independent of
radius. In the Umit of zero temperature, the plasma den-
sity Hq and plasma frequency cOp are constant in the plas-
ma interior and drop abruptly to at the plasma edge.
The density depends on the rotation frequency according
to (Systeme International units are used throughout)
nn =2€Qmco^{fl— cOr)
(2.1)
where Q.=qB /m is the ion cyclotron frequency, q and mare the charge and mass of the ion, and €q is the permit-
tivity of the vacuum. The plasma frequency is therefore
related to the rotation frequency through the equation
COr
Com— 2(0^01—0)/, (2.2)
In this paper we use the convention that the symbols o)^
IN- 129

48 ELECTROSTATIC MODES OF ION-TRAP PLASMAS 527
and ft denote positive quantities. However, for positive
ions, the sense of the rotation and the sense of the cyclo-
tron motion with respect to B are actually negative.
Specifically, when viewed from above the x-y plane, the
ions move in clockwise orbits. For nonzero tempera-
tures, the density drops to at the plasma edge in a dis-
tance on the order of a Debye length A.^ [18,30], where
1/2
(2.3)
€okT
"09
k is Boltzmann's constant, and T is the ion temperature.
For kj) « (plasma dimensions), the plasma therefore has
a uniform density, given by Eq. (2.1), with sharp boun-
daries. For very low temperatures, there are correlations
in the ion positions [20,31,32], and the ion density is not
constant over length scales small compared to the in-
terion spacing (~n^'^^). However, as long as the in-
terion spacing is small compared to the plasma dimen-
sions (that is, as long as the number of ions A'^» 1 ) and
small compared to the wavelength of the plasma modes,
the plasma can be treated as a constant-density plasma
even in the presence of spatial correlations.
The plasma boundary has a simple shape in the hmit
that the plasma dimensions are small compared to the
trap dimensions [28,33]. Near its center, the electrostatic
potential of the trap, relative to the potential at the trap
center, can be written as
<l>j'(r,z)--
mco'
Aq-Hz' (2.4)
where r and z are cylindrical coordinates, and co^ is the
frequency at which a single trapped ion (or the center-of-
mass of a cloud of ions) oscillates along the z axis. For
the cylindrical trap of Fig. 1,
0),
4qVjA2
mpl
1/2
(2.5)
where p^ is the inner radius of the trap electrodes and A 2
is a dimensionless parameter that depends on the
geometry of the trap design. For the trap of Fig. 1,
^2~0-236. In general, the total electrostatic potential is
the sum of the trap potential, the space-charge potential
of the ions, and a potential due to the induced image
charges on the trap electrodes. If the plasma dimensions
are much less than the trap dimensions, the trap potential
over the region of the plasma is given by Eq. (2.4), and
the effect of the induced image charges can be neglected.
In this case the shape of the plasma boundary is a
spheroid (an ellipsoid of revolution) as shown in Fig. 2
[28,33]. Let Ivq and 2zo denote the diameter and the axi-
al extent of the plasma as shown in Fig. 2. The plasma
aspect ratio a=Zo//'o is related [28] to the plasma fre-
quency (Op and the trap axial frequency a^ by
(litp
(a^-1 1I/2 /(a^-i: (2.6)
where QP is the associated Legendre function of the
second kind [34]. When the plasma is a prolate spheroid
FIG. 2. Spheroidal shape of a Penning-trap plasma. This
shape is obtained under the conditions of thermal equilibrium
and kj) « (plasma dimensions)« (trap dimensions).
(a > 1), Eq. (2.6) can be written as
,2Oi,
Oin
1
a^-1^in "p + 1
Up-\1
"P ^™2_iU/2ia'-lY
(2.7)
When the plasma is an oblate spheroid (a< 1), Eq. (2.6)
can be written as
(o.
co„
1
a^-lWq tan
-1
"0-1 Un =
a
(l-a2)'/2 •
(2.8)
Figure 3 shows a graph of o)] /(oj versus the plasma as-
pect ratio a. Experimental measurements of £t)j.,a)^, and a
discussed in Ref. [28] are in good agreement with the
CV2
C\2
FIG. 3. Relationship between the plasma aspect ratio a and
(ol/coj for spheroidal-shaped plasmas in a Penning trap. The
solid Hne is a theoretical curve from Eq. (2.6) with no adjustable
parameters. The experimental measurements, described in Ref.
[28], were taken with two different traps at three different axial
frequencies between co, /fl= 0. 07 1 and 0.121.
IN- 130

528 J. J. BOLLINGER et al. 48
theoretical calculation of Eq. (2.6).
In the next section the potential inside a uniformly
charged spheroid (the space-charge potential of a cold
Penning-trap plasma) will be used to calculate some of
the quadrupole mode frequencies. For r,z inside the plas-
ma, the space-charge potential<f>j
can be written
[28,33,35] as
(f)j(r,z)=— mor.
6q-[a{a)r'^^-b(a)z^] , (2.9)
where a is the plasma aspect ratio, cOp is the plasma fre-
quency given by Eq. (2.2), b(a) =3(2?(a/(a2- 1)'/^)/
(a^— 1), and Poisson's equation requires
2a(a)+ bia)= 3. A spherical plasma has a =b = 1. Atthe limit b =3, the aspect ratio a=0, and the plasma is
an infinitely thin disk. (Because we require Zq »Xj), here
infinitely thin means Zq «rQ.) With a=j, the aspect ra-
tio a is infinite, and the plasma is an infinitely long cylin-
drical column (zo»A-o). In Eq. (2.9) we choose the po-
tential at the center of the spheroid to be 0. If the poten-
tial is chosen to be at oo , then Eq. (2.9) neglects a term
which depends on the plasma aspect ratio a but is in-
dependent of r and z.
It is instructive to consider the plasma equilibrium as a
function of rotation frequency o^ for fixed trapping con-
ditions (fixed co^, ft, and AO. Constant density equilibria
exist for 6)^ < ft /V2 and co^ <co^<D,—co^, where
fi)„=ft/2-(ftV4-£yV2)\W2 (2.10)
is a single-ion magnetron frequency [1]. For (o^ slightly
larger than co^ , col /o)^ ^ 1 , and the plasma is shaped like
a pancake (an oblate spheroid). In the limit that
(o^^-co^, the plasma's aspect ratio a—>0, and the
plasma's radius Tq^ oo . As co^ increases, co] /co^ de-
creases and the plasma's aspect ratio a increases by de-
creasing Kq and increasing Zq. At a)^ = ft/2 the plasma
attains its maximum aspect ratio (smallest r^ and largest
Zq) and maximum density ng=€QmD,^/2q^. The condi-
tion aj^ = ft/2 is often called Brillouin flow [36]. In a
frame of reference rotating with the plasma, the motion
of an individual ion within the non-neutral plasma con-
sists of circular gyrations (perturbed cyclotron orbits) at
the frequency Cl— 2co^. At Brillouin flow, these gyrating
orbits become free streaming (straight-line trajectories),
and the plasma behaves in many ways like an unmagnet-
ized plasma [36]. Therefore at 6)^ = ft/2, a Penning-trap
plasma behaves dynamically like a plasma confined in an
rf (Paul) trap (neglecting the rf micromotion). As co^ in-
creases beyond ft/2, the plasma's aspect ratio a and den-
sity Mq decrease. Because «o is an even function of co^
about (0^ = 0. /2 [see Eq. (2.1)], the plasma's aspect ratio,
radius, and axial extent are even functions of co^ about
co^ = ft /2. Figure 4 shows a graph of the radius of a plas-
ma of ^Be"^ ions as a function of rotation frequency. The
plasma's rotation frequency and radius were measured
with techniques described in Sec. IV. Good agreement
was obtained between the observed and predicted depen-
dence of the plasma's radius on rotation frequency.
cj /n
FIG. 4. Radius Kq of a plasma of ==2000 'Be"*^ ions as a func-
tion of rotation frequency cOr- The radius is plotted in units of
Tj, , the plasma radius at the Brillouin limit, and the rotation fre-
quency is plotted in units of the cyclotron frequency n. The
solid line is a theoretical curve involving no adjustable parame-
ters. The data were taken as described in Sec. IV with
il/2Tr= 1.4 MHz and co,/il=0. 151.
With the assumption of thermal equilibrium and max(Xp, nQ^^^)« (plasma dimensions) « (trap dimen-
sions), a Penning-trap plasma has uniform density with a
spheroidal boundary. Modal excitations on this equilibri-
um can be conveniently described with spheroidal coordi-
nates by two integers {l,m) with / > 1 and m >0 [29].
(Negative integral values of m are allowed, but do not
give rise to new modes.) The index m denotes an azimu-
thal dependence e"""^ of the plasma mode potential. Theindex / describes the variation along a spheroidal surface
(for example, the plasma boundary) in a direction perpen-
dicular to<f>.
In this paper. Sees. Ill and IV give a simple,
detailed discussion of some of the / =2 modes and Sec. Vgives a general discussion of higher-order modes of a
Penning-trap plasma. Excitation of an / = 2 mode pro-
duces a quadrupole deformation of the plasma shape.
The / = 1 modes are the famiUar center-of-mass modes.
Here the ion plasma's shape remains unchanged, but the
center-of-mass of the plasma executes one of the three
motions of a single ion in a Penning trap. For example,
the (1,0) mode is the axial center-of-mass mode at fre-
quency CO2- There are two (1,1) modes which correspond
to the perturbed cyclotron and magnetron center-of-mass
modes at frequencies ft — co„ and to^ . (In experiments on
long columns of electrons where the induced image
charges cannot be neglected, the analog of the magnetron
center-of-mass mode is the / = 1 diocotron mode [37,38].)
These center-of-mass frequencies can, in general, be mea-
sured or calculated very precisely. Figure 3 gives the
(1,0) mode frequency or co^ in units of the plasma fre-
quency as a function of the plasma aspect ratio or shape.
Because cOp is typically unknown, a measurement of co^
does not provide information on the plasma aspect ratio.
However, measurement of an / = 2 mode frequency along
with the (1,0) mode frequency will determine the plasma's
aspect ratio and density.

48 ELECTROSTATIC MODES OF ION-TRAP PLASMAS 529
III. QUADRUPOLE PLASMA MODES
In this section we calculate two diflFerent types of / =2Penning-trap plasma modes. This is done by making a
guess for the plasma eigenmode, then verifying that this
guess is a mode of the plasma and calculating the eigen-
frequency. In particular, we consider small axial and ra-
dial displacements of the ions from their equilibrium po-
sitions consistent with the assumed eigenmode. A self-
consistent calculation of the axial and radial restoring
forces gives two linear diflFerential equations describing
the motion of the axial and radial displacements. Wethen require that the eigenfrequencies from these twoequations be equal.
A. (2,0) modes
We first consider an azimuthally symmetric quadru-
pole mode. We assume that in this mode the plasma al-
ways stays spheroidal, but the aspect ratio of the plasma
oscillates in time as shown in Fig. 5. This mode turns out
to be a (2,0) mode [29]. Let p=x+iy and z denote the
equilibrium radial and axial position of an ion (or group
of ions) in a plasma with an equilibrium density Kq and
aspect ratio a. The displacements from equilibrium
p^p[\+l{t)].(3.1)
parametrized by 6 and b = bj^+ibj, give another
spheroidal plasma but with a density and aspect ratio
given by
a-
(l+e)|l+6|2
1+e(3.2)
|1+5|
where |1+5| = [(l+5;j )^+ 8^]'^^ Here e, 8^, and 5/
characterize axial, radial, and azimuthal displacements.
For an eigenmode the axial and radial displacements
should have the same time dependence. We assume
€{t)
b„{t)V (3.3)
where 7], the mode parameter, is independent of time.
FIG. 5. Sketch of one cycle of the (2,0) mode at time inter-
vals r/4 where T=2Tr/co2o is the period of the mode. The plas-
ma always stays spheroidal with a uniform density, but the as-
pect ratio oscillates in time.
Equations (2.4) and (2.9) can be used to calculate the elec-
tric field at the displaced ion positions with the results
that
Ei = -
mco„
3q
36)z^a[a(l+€)\l+8\'^]
20)1 (l+6)|l+8pp(l+S)
_ fn(Op
39
39
mcol,
A(d,€)p(\+8),
3^z^6[a(l+6)|l+6rM
CO' (l + e)|l+6p
39-B{b,e)z{l+€)
(3.4)
z(l+6)
(3.5)
Here E^ and E^ are the components of the electric field
perpendicular and parallel to the z axis and cOp is the
equilibrium plasma frequency. The equations describing
the radial and axial motions of the displaced ions are
^[p(i+5)j+/n-|-{p(i+6)j
coz—^^(6,e)p(l + 6)=0,
CO
dt{z{l+e)}-^B(d,€)z(\+€)=0
(3.6)
(3.7)
After transforming to a frame rotating at the equilibri-
um rotation frequency co^ and keeping terms no higher
than first order in 8 and 6, we obtain linear differential
equations for 8 and e. The equations are
d^ ~ d ~ ^l-7Y8+ /(ft-2a),)^8 {-{r]A,+ A^)5,i=0, (3.8)dt dt 3
d^^^2-'-^{B,+B,/'n}e^0. (3.9)
Here A^ = dA{0,0)/d6R and ^, = a^(0,0)/a6, with
similar definitions for B^ and ^g. There are no first-order
bj terms in the expansion of A and B, because A and Bare even functions of 8/. The real and imaginary parts of
Eq. (3.8) can be solved simultaneously. The solution is
oscillatory with eigenfrequency cojo given by
,2
CO2 —20
COn
(n-2co,y—^(77^,+^g) (3.10)
The eigenfrequency of Eq. (3.9) is given by
.2
^20~ , {B, + B,/ri\ (3.11)
The requirement that the two eigenfrequencies be equal
gives a quadratic equation for r]. Substitution of the solu-
tions for 7] back into either Eq. (3.10) or (3.11) gives the
(2,0) mode frequency CO20. After a number of algebraic
manipulations we findIN- 132

530 J. J. BOLLINGER et al. 48
+ \22(6)^)
2(a)'= al+(o'n
+
20'ml-4n2(c^2. -4/3)]'/2 (3.12)
Here ll^= fi— 2<y, is the vortex frequency (the cyclotron
frequency as seen in the rotating frame),
ft„ =(fti^+a)p )'^^ is the upper hybrid frequency, and
2 2 3a
ia^-l)3/2Q'2
(a^-1) 1/2(3.13)
The lower-frequency mode [denoted by the negative sign
in Eq. (3.12)] is called a plasma mode and is characterized
by 17 < and a mode frequency cojo 5 fi/V3. The higher-
frequency mode [denoted by the positive sign in Eq.
(3.12)] is called an upper hybrid mode and is character-
ized by r]>0 and a mode frequency cojq - ft/^3. Plasma
and upper hybrid modes are discussed in Sec. V. The fre-
quency coq is the (2,0) plasma mode frequency in the ab-
sence of a magnetic field (that is, ft^^-0 or a plasma
confined by a uniform background of opposite charge). It
is a mode frequency of a cold cloud of ions in an rf trap.
Most Penning-trap experiments are done with eo^KKil.
For simplicity we therefore discuss the two modes of Eq.
(3.12) for this experimentally interesting case. Figure 6
shows a graph of cojo and ^20 ^s a function of rotation fre-
quency for a)^ /n= 0. 1 5 1 . In the limit of low rotation
frequencies (co^-^o^) the plasma mode frequency ap-
proaches cOp. At <y^=<y^, the mode frequency
a)^=6) =co^. In this limit the mode parameter 17 for the
plasma mode frequency is large in magnitude and nega-
tive. The plasma mode looks predominantly Hke an axial
stretch mode with only small radial excursions which are
1.0
0.8
a 0.6
oCM
3 0.4
0.2
0.0
V 1 T 1 —r-
-
V"^^,
/
.ny"\
r "30/" S
0.0 0.2 0.4 0.6
cj /n0.8 1.0
FIG. 6. Graph of the plasma CO20 and upper hybrid CO20 mode
frequencies [from Eq. (3.12)] as a function of rotation frequency
(Or for <U2 /ft= 0.151. Also shown are the vortex frequency
il^—Q,— 2cOr (dotted line) and the plasma frequency cOp (dashed
line) in units of the cyclotron frequency.
180° out of phase with the axial excursions. This is be-
cause for (o^^co^ «ri the magnetic field in the rotating
frame ( «ft— 2w^) is large and constrains the radial ex-
cursions of the plasma. At the Brillouin limit (n^,=0) or
in a cold plasma confined in an rf trap, the plasma modefrequency equals coq and the mode parameter rj=—2.This means the volume and therefore the density of the
plasma stay constant during the excitation of this mode.
At the Brillouin limit, the plasma mode therefore consists
of incompressible deformations of the plasma shape (a
surface mode). The (2,0) plasma mode of a spheroidal
plasma is similar to an m =0 plasma mode of a cylindri-
cal plasma column with a wavelength equal to the plasma
length [37,38].
The upper hybrid mode frequency approaches
fl^=ft— 2w^ for low rotation frequencies and is equal to
n— 2co^ at (0^=0)^. In this hmit the mode parameter tj
for the upper hybrid mode is small and positive (radial
excursions » axial excursions). For low rotation fre-
quencies we can show that this mode looks like a
coherent excitation of the perturbed cyclotron orbits of
the ions. For two ions on opposite sides of the trap axis,
the perturbed cyclotron orbits are 1 80° out of phase. Atthe Brillouin limit (or for ions confined in an rf _trap), the
upper hybrid mode is equal to o)p = il/V2. Here
7] = a~^, which implies that the plasma oscillates (or
"breathes") from a small spheroid to a larger confocal
spheroid and back again. The electric field outside the
plasma does not change under such an oscillation. This
can be called a bulk mode because it is confined to the
plasma interior and is difficult to couple to with external
fields. Both of the (2,0) modes are symmetric (even func-
tions) about the Brillouin condition (6i)^ = ft/2), as can be
seen in Fig. 6.
If either one of the (2,0) mode frequencies can be mea-
sured, it can be used together with the (1,0) mode fre-
quency 0}^ and the cyclotron frequency ft to obtain the
plasma rotation frequency co^. The plasma rotation fre-
quency can then be used to determine the plasma's densi-
ty Wq ^nd aspect ratio a from Eqs. (2.1), (2.2), and (2.6).
Figure 7(a) shows points of constant 6)20 (the upper hy-
brid frequency) and Fig. 7(b) shows points of constant w^(the plasma mode frequency) on graphs of rotation fre-
quency versus the trap axial frequency. All frequencies
are normahzed by ft. The axial frequency co^ [equivalent-
ly the (1,0) mode frequency] depends only on the trap
design and the potential difference between the trap end
cap and ring electrodes. Typically it can be measured or
calculated very precisely. Similarly the cyclotron fre-
quency can be measured or calculated very precisely and
the operating point for co^ /ft along the x axis of Fig. 7
precisely determined. A measurement of a (2,0) modefrequency can then be used with Fig. 7 to determine the
rotation frequency. Figure 7(b) shows that the plasma
mode frequency CO20 gives accurate information on (o^ /ft
mainly for slow rotation frequencies sUghtly greater than
co^ . However, the upper hybrid frequency gives accurate
information on 6)^ /ft over a wide range of conditions,
especially over the experimentally interesting range
&)2/ft«l. Section IV describes some (2,0) mode mea-
TN-133

48 ELECTROSTATIC MODES OF ION-TRAP PLASMAS 531
surements on plasmas of ^Be"*" ions. The modes were ex-
cited by applying an oscillatory potential between the
ring electrode and the trap end caps which was resonant
with the mode frequencies.
Figure 7 assumes a spheroidal plasma with A,^,,
Hq^''^ « (plasma dimensions) as discussed in Sec. XL
However, even for finite temperatures, the (2,0) modesshould provide useful information on the plasma rotation
frequency. For example, in the limit that the ion space-
charge fields can be neglected, the upper hybrid mode fre-
quency is ft— 26)^. The diflFerence between ft— 2a)„ and
the measured upper hybrid mode frequency is therefore a
measure of the importance of the space-charge fields.
Also, an oscillatory drive on the ring electrode at
il— 2co^ can parametrically excite the perturbed cyclo-
0.5
FIG. 7. Sensitivity of the (2,0) mode frequencies for deter-
mining the plasma rotation frequency. Points of constant (a)
upper hybrid frequency CO20 or (b) plasma mode frequency coio
are plotted on a graph of rotation frequency cOr vs the trap axial
frequency o)^ (in units of the cyclotron frequency CI). A mea-
surement of co^, il, and CO20 or «m can be used with these graphs
to determine the rotation frequency. The cojo plots are sym-
metric about <y,/fl=0.5. The boundary defined by the low-Or
end of the curves denotes the condition (Or—o)„. Ion
confinement requires (o^^co^.
tron motion of the plasma center of mass [the high-
frequency (1,1) mode] whose frequency is ft— o)^ in the
laboratory frame. This parametric excitation requires an
initial, nonzero mode ampHtude.
B. (2,1) modes
We now consider an azimuthally asymmetric quadru-
pole mode. As in the previous section, we let p=x+iyand z denote the equihbrium radial and axial position of
an ion (or group of ions) in a plasma with an equilibrium
density Kq and aspect ratio a. We guess that there is a
mode described by displacements from equilibrium of the
form
X —i-X +8z cos(co2it) ,
z ^z + e[x cos( co2it)+y sin( co2i't ) ] .
(3.14)
As the subscripts in Eq. (3.14) indicate, this turns out to
be a (2,1) mode. The superscript lab indicates that the
description is in the laboratory frame of reference. [This
labehng was not required with the azimuthally symmetric
(2,0) mode because its frequency is the same in either the
laboratory or rotating frame.] Equation (3.14) can be
rewritten using complex notation as
p-^p+ 8(t)z,
z^z + Re{?(r)p*j ,
(3.15)
where the time dependence is now included in 5(f) and
?(f), the asterisk denotes the complex conjugate. Redenotes the real part, and
?(?)
6(f)V (3.16)
where the mode parameter 77 is independent of time and
real. Equation (3.15) transforms a uniform density
spheroid into a uniform density elhpsoid. The elhpsoid is
rotated with respect to the original, equilibrium spheroid
by an angle \f\, where, to first order in ? and 5,
1
(3.17)
a
The modulus| f |
denotes the magnitude of the rotation
angle. The phase of f denotes the plane in which the ro-
tation takes place. Specifically, the rotation occurs about
the unit vector ( Imf /|f |, —Rey/\y\,0) or, equivalent-
ly, the p= —if axis. To first order in ? and S, the tilted
ellipsoid is a spheroid with the same aspect ratio as the
equilibrium spheroid. Therefore to calculate the electric
field at the displaced ion positions to first order in ? and
5, we have only to calculate the electric field inside the
equilibrium spheroid rotated by an angle \f\ about the
p= —if axis. We obtain
mcol _ mcolE^^^^{p + bz)+—^(a -b)fz
E,^
2q
tncOr
Iq
3q
-(a-b)Re{fp*}
(3.18)
(3.19)
TN-134

532 J. J. BOLLINGER et al. 48
Here ojp is the equilibrium plasma frequency and a {a)
and bia) are evaluated at the equilibrium aspect ratio a.
After transforming to a frame rotating at the equilibri-
um rotation frequency, the following diflFerential equa-
tions are obtained for ^^^cxp{io}^t]5 and
?^=exp{/6),f I?:
,2
4T8,+/av4s.--^/(a)(aHr7)S,=0dt^ at 3
d' ^ "^P f, ^ + 1 ?^=0
(3.20)
(3.21)
Here
f(a)= [a{a)-b(a)]/{l-a^)= {(\-3col/(ol)/(l-a^).
With the convention that the time dependence of S^ and
?^ is given by exp(ico2\t), Eqs. (3.20) and (3.21) give the
following two equations for co2\, the (2,1) mode eigenfre-
quency in the rotating frame. We obtain
COr
-<y^i-ft^2i—r^/(a)(a'+7/)=0 ,
1 ^p+ 1 =0
(3.22)
(3.23)
When Eqs. (3.22) and (3.23) are solved simultaneously, a
cubic equation for -q is obtained.
illv+ -^fia)(a^+ V^(V-'^)^=0 . (3.24)
Solutions for 77 from Eq. (3.24) can be plugged back into
either Eq. (3.22) or (3.23) to obtain values of tuji for three
diflFerent (2,1) modes. The laboratory (2,1) mode frequen-
cy co2\ 'S obtained from 6>2^i^=(y2i ~<yr- With the conven-
tion used here, a positive 6)21 (^2*1'') denotes a counter-
clockwise precession when viewed from above the x-y
plane in the rotating (laboratory) frame. This agrees with
the usual right-hand rule for the sign of an angular fre-
quency.
Figure 8 shows a graph of the three different (2,1)
mode frequencies (in the laboratory) versus rotation fre-
quency for 6)^ /n= 0.151. As discussed in the previous
two paragraphs, all three modes correspond to a tilt of
the equilibrium spheroid with respect to the z axis. This
tilted spheroid then precesses about the trap symmetryaxis at the frequency a>2i' as shown in Fig. 9. Because the
density remains constant during the mode excitation, all
three (2,1) modes are surface modes. The modes with the
highest and lowest values of|<y2^i''|
are characterized by
77 >0 (axial and radial excursions in phase). The third
mode with intermediate frequency is characterized by
T/<0 (axial and radial excursions 180° out of phase). For
the mode with the highest value of|<y2^i'|
in Fig. 8, the
tilted spheroid precesses rapidly at a frequency near fl.
For co^^co^ «fl, the mode frequency approaches
co^f^ ^—(fl — co^) and the mode parameter satisfies r/« 1
.
Equations (3.15) and (3.16) show that the axial excursions
are small compared to the radial excursions and the pre-
cession can be thought of as being due to a coherent (al-
though asymmetric in z) excitation of individual ion cy-
0.2
0.0V
1
-0.2 -
^ -0.4
-^3 -0.6
-
-0.8 -
\-1.0
0.0 0.2 0.4 0.6 0.8 1.
cj /n
FIG. 8. Graph of the three (2,1) mode frequencies coix as a
function of the plasma rotation frequency cOr for 6;j/Q=0. 151.
The mode frequencies in the laboratory frame are plotted. The
mode with the lowest value of Itu^i*"! has a frequency equal to
foro,/n=0.219.
clotron orbits. For low rotation frequencies, this mode is
classified as an upper hybrid mode (see Sec. V). For the
mode with the lowest \co2\\ i^ Fig- 8, the tilted spheroid
precesses at a low frequency. For co^
«
ft and
6), ^6t)^«ft, the mode parameter satisfies 7/»l and
a)2\^a>2—o)r. Here this mode can be thought of as a
coherent (and azimuthally asymmetric) excitation of the
axial motion of individual ions. For low rotation fre-
quencies, this mode is classified as a magnetized plasma
mode (see Sec. V). At the Brillouin hmit, the highest-
and lowest-frequency modes both have r/=l, and their
frequencies are equally spaced about — ft/2. Stated
FIG. 9. Sketch of the (2,1) mode in the laboratory frame.
The plasma spheroid is tilted with respect to the z axis and
precesses about the z axis at co2t'- In this figure the sense of the
precession is positive. The picture in the rotating frame is the
same except the precession occurs at the frequency
IN- 135

48 ELECTROSTATIC MODES OF ION-TRAP PLASMAS 533
diflferently, in the rotating frame the two modes have
equal and opposite frequencies at the Brillouin Umit.
Near the Brillouin limit, these two modes are classified as
evanescent modes (see Sec. V). The intermediate frequen-
cy mode has rj<0. For co^KKil and lo^^a^ «ft, the
intermediate mode has |7;|»1 and (o^2\—~^z~'^r-Therefore this mode has an interpretation similar to the
lowest-frequency mode. However, the behavior of this
mode is quite different for a>^»oi^. At the Brillouin
limit 7}=— a}, which means that the plasma shape does
not change (that is, the plasma spheroid does not tilt),
and this mode frequency in the rotating frame is 0.
Therefore this mode vanishes at the Brillouin hmit and is
called a magnetized plasma mode (see Sec. V).
Figure 8 shows that the (2,1) mode with the lowest
magnitude of frequency in the laboratory frame is at
ft)^ /ft= 0.2 19 for 0)^ /ft =0.151. This zero-frequency
mode can be excited by a static field error [19,21,39].
From the ion's point of view (the rotating frame) the stat-
ic field error looks hke a rotating field with a frequency
co^. When 0)21=6)^ or (o^2\~^2\~(^r~^ the (2,1) mode is
excited. Section IV describes the excitation of the static
(2.1) mode by a tilt of the electrode symmetry axis of the
trap relative to the trap magnetic field axis. If the rota-
tion frequency (o^ was increased from small values by an
external torque, excitation of this mode tended to limit
(o^ to values less than the rotation frequency where
4f= 0.
In addition to the (2,0) and (2,1) modes, there are two
(2.2) modes. The (2,2) modes are discussed with the other
l—m modes in Sec. V. In a (2,2) mode, the plasma forms
an ellipsoid with unequal principal axes in the x-y plane.
The ellipsoid rotates about the z axis at the (2,2) modefrequency. A measurement of one of the (2,1) or (2,2)
mode frequencies can be used to determine the plasma ro-
tation frequency and aspect ratio in the same manner as
described for the (2,0) modes (see Fig. 7).
IV, EXPERIMENTAL RESULTS
In this section we compare experimental measurements
of some quadrupole modes of a Penning-trap plasma with
the calculations of Sec. III. Much of the experimental
work has been described previously in Ref. [21]. Typical-
ly between 1000 and 5000 ^Be"*" ions were stored in a cy-
hndrical Penning trap shown schematically in Fig. 1.
Most of the experimental work was done with 5 =0.82 Twhere ft(^Be"^)/27r= 1400 kHz. Some singly charged,
heavier ions were created when the ^Be"*" ions were creat-
ed or loaded into the trap. In addition, singly charged,
heavier ions slowly formed after loading ^Be"*", presum-
ably due to ion-molecule reactions involving the ^Be"*"
ions. Their presence appeared to shift the observed modefrequencies. We could eliminate them from the trap by
momentarily raising Vj so that 6>^ /ft > 1 /a/2 for the
heavier ions, making them unstable. In practice wewould raise Vj to satisfy 0)^/0.^0.61 for ^Be"*". We then
obtained repeatable and consistent measurements for the
mode frequencies.
Radiation pressure from a laser was used to cool the
^Be"*" plasma [20,21,28]. A 313-nm laser (power
==^100)tiW) was tuned 10-50 MHz below the rest
frequency (Oq of the 2s ^5i/2(mj = +y, mj = H-y)
-^2p ^P3/2( j,y) transition in ^Be"*". In addition to cool-
ing the ions, this laser optically pumped the ions into the
(y, j) ground state [28]. The ions were detected by imag-
ing the laser-induced ion fluorescence onto the photo-
cathode of a photon-counting imaging tube (see Fig. 1).
A real-time display of the image was used to monitor
qualitatively the plasma's kinetic energy; a hot plasma
had a more diff"use boundary and less ion fluorescence.
With this simple diagnostic we were unable to distinguish
between an increase in the random thermal energy of the
ions and the excitation of a coherent modal motion of the
plasma. The cooling laser was split into two beams. Onebeam (shown in Fig. 1) was directed perpendicularly to
the 2 axis near the center of the trap. The second beam(not shown in Fig. 1) was used along with the first beamwhen the lowest ion temperatures were desired
[20,21,28]. It was directed at a 51° angle with respect to
the z axis. (The projection of this beam along the z axis
cooled the ion's axial motion directly.) With laser cool-
ing, the ^Be"*" ions quickly evolved into a near thermal
equilibrium distribution and could be confined for manyhours [28]. The temperature of the ions could be mea-
sured from the Doppler broadening of an optical transi-
tion [28]. Typical temperatures ranged from 5 to 200
mK. (Here temperature refers to the Maxwell-
Boltzmann velocity distribution which occurs in thermal
equihbrium in the rotating frame.)
The plasma density was determined from Eq. (2.1) by
measuring the plasma rotation frequency. We measured
the rotation frequency by driving the ( m^ = + y,
my = +y)—»-(+y, — y) clcctron spin-flip transition at fre-
quency oi^ in the Is ^S^/2 ^^^^ ground state. The transi-
tion frequency o)^ is approximately equal to 22 GHz at
5 =0.82 T. The transition was observed as a decrease in
the ion fluorescence when the frequency of the appHed
microwave field is resonant with 0^ [40]. In addition, a
decrease in the ion fluorescence was observed at the side-
band frequencies 6jj±<y^. This is because from the ion's
point of view the phase and amplitude of the microwave
field are modulated due to the rotation of the plasma.
This produces sidebands in the microwave spectrum ob-
served by the ions at (o^+cOr [41]. Measurement of these
sidebands enabled co^/Itt to be determined to about 5
kHz. At 5 =0.82 T, the ^Be"*" ion densities usually were
measured to be greater than lOVcm^. This density with
temperatures less than 200 mK results in Debye lengths
less than 10 jim. With 1000-5000 ions in the trap, the
typical plasma dimensions were between 100 and 1000
jum, which is one or two orders of magnitude larger than
A^). The radius of the cylindrical trap electrodes (1.27 cm)
was another order of magnitude larger. Consequently the
laser-cooled ^Be"*" plasmas satisfied the condition
Xj) « (plasma dimensions)« (trap dimensions) and
formed constant density, spheroidal plasmas. The axial
frequency co^ was measured by applying an oscillating po-
tential to one of the end caps [42]. The cyclotron fre-
quency ft was calculated from the magnetic field. The
magnetic field was determined accurately from measure-
TN-136

534 J. J. BOLLINGER et ah 48
ments of the electron spin-flip or nuclear spin-flip transi-
tion frequencies in the ^Be"*" ground state.
The angular momentum and therefore the rotation fre-
quency (0^ of the ^Be"*" plasmas were controlled by a
torque from the radiation pressure of a second, weak
laser beam (power ^2 ^W) whose frequency coj was
tuned above the cooling transition frequency coq. This
torque beam (see Fig. 1) was directed perpendicularly to
the z axis but displaced from the z axis through the side
of the plasma which recedes from the laser beam due to
the plasma rotation. This beam imparted to the plasma a
torque which tended to increase the plasma rotation fre-
quency co^. Initially the plasma was cooled by the cooling
laser beam with the result that 6>^ «n. The torque laser
beam was then directed through the side of the plasma
with a frequency coj- tuned slightly below (Oq. As coj- was
increased above coq,coj- became resonant with the frequen-
cy of the Doppler-shifted ions in the torque beam. This
produced ion fluorescence and a torque on the plasma
which increased the rotation frequency. As shown in
Fig. 4, an increase in co^ produced a decrease in the plas-
ma radius Tq for ct), <ft/2 and an increase in Tq for
co^ > n/2. The plasma radius was measured with the im-
aging tube. Accurate measurements of the plasma's axial
extent were more difficult to obtain. However, we could
qualitatively check that the plasma obtained its max-
imum axial extent (and therefore maximum aspect ratio)
at the Brillouin limit by scanning the position of one of
the laser beams along the axial direction.
By appropriate tuning of the torque laser frequency
and with some adjustment of the positions of the coohng
and torque lasers, we could obtain a steady-state, equilib-
rium plasma with a rotation frequency anywhere in the
allowed range from co„ to ft— «„. In addition to supply-
ing a torque, the torque laser also supplied energy to the
plasma when C[)7'>6}o [^3]. Equilibrium occurred whenthe energy input from the torque laser was removed by
the cooling laser and when the laser beam torques and
torques from static field asymmetries summed to 0. Wewere also able to increase co^ to values greater than ft/2
by using just the cooling laser. An increase in the cooling
laser frequency increased co^- In this case, however, the
rotation frequency sensitively depended on the cooling
laser frequency and a steady-state condition was moredifficult to achieve.
We discovered [21] that as the plasma rotation fre-
quency was increased, there was a range of rotation fre-
quencies where the plasma acquired a diflFuse boundary
and a low level of ion fluorescence characteristic of a hot
plasma. The range over which this apparent heating oc-
curred depended sensitively on the alignment of the
trap's symmetry axis with the magnetic field axis. Let ^o
denote the angle between these two axes. If we assume
that the trap is aligned when the apparent heating reso-
nance is minimized, then we could adjust 6q<0.0V by
searching for an alignment which gave no apparent heat-
ing. For df^yOA" the plasma rotation frequency could
not be increased beyond the point at which heating first
occurred. This heating resonance appeared to get
stronger with an increase in the number of ions. We have
been able to identify this heating resonance as an excita-
tion of a collective (2,1) plasma mode by the static field
asymmetry associated with the misahgnment of the trap
symmetry axis with the magnetic field. Figure 10 showsthe measured rotation frequencies where heating oc-
curred with 00— 0-02° for different trap axial frequencies.
Also shown (solid hne) is the calculated rotation frequen-
cy at which £02^/'= 0, that is, co,=co2i as calculated from
Eqs. (3.22)-(3.24). Excellent agreement is obtained be-
tween the predicted and measured rotation frequencies
where heating is observed.
We did not attempt to understand the source of energy
in the heating resonance. However, two possibihties are
listed below. A static asymmetry cannot change the total
energy of the plasma, but it can convert potential to
thermal energy by producing an expansion of the plasma.
Because the ratio of potential to thermal energy is large
in our plasmas, a small expansion can produce a large in-
crease in the ion thermal energy. This energy source in-
creases with the potential energy per ion of the plasma.
For example, it increases with the ion number or plasma
density. With the lasers operating continuously, the
time-averaged plasma radius does not change. However,
the plasma radius may fluctuate. For example, there
could be a small plasma expansion between photon
scattering events, balanced by a plasma contraction whena photon is scattered. Heat could be generated by expan-
sion during plasma fluctuations. Another source of ener-
gy is the torque laser. The energy input from this laser
could increase when the static (2,1) resonance is excited if
there is an increase in the scatter rate from this laser.
If the density is increased from low values correspond-
ing to co^ «ft/2, excitation of the static (2,1) mode mayprovide a practical hmit to the density and number of
charged particles that can be stored in a Penning trap.
For large ion numbers or Oq > 0. 1° we were unable to ob-
tain densities greater than nQ(cOr=co2i). For
6)^ /ft > 0.53, Fig. 10 shows that 6)^=021 occurs for
G
FIG. 10. Rotation frequency co^ at which heating was ob-
served as a function of the single-particle axial frequency co^.
Both frequencies are expressed in units of the cyclotron frequen-
cy il. The experimental data were obtained with 1000-5000
'Be"*" ions stored in the trap of Fig. 1. The soHd hne indicates
the calculated rotation frequency &>, at which &>2i=0. This is a
universal curve involving no adjustable parameters.
TN-137

48 ELECTROSTATIC MODES OF ION-TRAP PLASMAS 535
6}^ /ft > 0.5 and therefore the static (2,1) mode will not
prevent reaching the Brillouin hmit in this case. Howev-er, for a high magnetic field and a trap with large dimen-
sions, the condition (o^ /ft > 0.53 may be difficult to ob-
tain because of practical limitations on the voltage that
can be applied to the trap electrodes. In addition,
(y^ /ft =0.5 with 6J^ /ft =0.5 3 occurs for an aspect ratio
a =0.44. For storage of a large number of charged parti-
cles, this would require a trap with a large radius. How-ever, a large volume trap is more easily constructed by
extending it axially while keeping the radius fixed [44].
For storage of large ion numbers, the plasma dimensions
may not be small compared to the trap dimensions. This
changes the calculation of the modes because the trap po-
tential will not, in general, be quadratic and the image
charges in the trap electrodes cannot be neglected. In
spite of the difficulty of increasing co^ (and the density)
through the point where the heating resonance occurs,
there is still the potential to "jump through" this condi-
tion by sudden switching of co^ or creating the plasma
with 0)^ > 1 6)21 1
.
Laser torques were also used to increase co^ in ^Be"*"
plasmas consisting of 40 (XX) ^Be"*" ions at 5 =6 T. Wewere unable to remove possible contaminant ions at this
high magnetic field because of the high voltages required
on the trap electrodes. In addition, we did not have a mi-
crowave source (=^160 GHz at B=6 T) to drive the
ground-state electron spin-flip transition and measure the
plasma rotation frequency. However, a rough measure of
cOr could be obtained from the plasma aspect ratio. Wewere able to obtain rotation frequencies cOr>Cl/2. Fig-
ure 11 shows an image of a rapidly rotating Be"*" plasma
with <y^/27r=;ft/27r=10 MHz. The propeller shape of
the ion fluorescence is due to the fast rotation of the plas-
ma. The ions get excited in the laser beam, but decay
outside the laser beam because the 8.2-ns lifetime of the
excited P state is longer than the typical transit time
FIG. 1 1 . Image of the ion fluorescence of a rapidly rotating
'Be+ plasma at 5=6 T with &),/27r^ft/2ir= 10 MHz.Fluorescence due to the perpendicular and diagonal cooling
beams is observed. The plasma diameter in the z =0 plane is
approximately 1 mm. The ion kinetic energy due to rotation at
the radial edge of the plasma is approximately 50 eV.
through the beam. The (2,1) heating resonance was muchstronger and more sensitive to the magnetic field align-
ment at B =6 T than in our work at 0.8 T. This mayhave been due to the larger number of trapped ions at
5 = 6 T. We also observed additional heating resonances
at lower rotation frequencies than the (2,1) heating reso-
nance. Section V discusses other static modes that are
potential candidates for these additional heating reso-
nances. We note that many of these resonances tend to
hmit the plasma density to even lower values than the
static (2,1) resonance.
Density hmits on trapped ion plasmas have also been
reported in other Penning-trap experiments. In Ref. [45]
the experimentally observed ion fluorescence in a Pen-
ning trap was interpreted in terms of limits to the ion
density imposed by single-particle resonant transport
[46]. In single-particle resonant transport, enhanced
transport (and lower ion density) may occur when the ax-
ial bounce frequency of an individual ion is commensu-rate with the ion's rotation frequency. In this process an
individual ion resonantly interacts with an external field
error. This is different from transport due to the excita-
tion of a zero-frequency mode where a collective plasma
mode resonantly interacts with an external field error. In
our work we observe no evidence for single-particle reso-
nant transport as an important mechanism for limiting
the ion density. An important difference between our
work and that of Ref. [45] is the ion temperature. In our
work the ions are sufficiently cold that the ion-ion col-
lision time is short compared to the axial bounce time.
The experimental measurements of Ref. [45] were done
on relatively hot ion clouds (^5000 K) where the ions
may bounce faster than they coUide. In addition, the De-
bye length in this work was Ukely comparable to or larger
than the cloud dimensions. In this case the ion density is
not constant, and calculation of the space-charge-shifted
axial bounce frequency of an individual ion requires a
model diffierent from the cold thermal equilibrium dis-
cussed in Sec. II. The theoretical analysis of Ref. [45] ^would be more convincing with a self-consistent calcula-
tion of the space-charge shifts. Such a self-consistent cal-
culation is described in Ref. [47]. When space charge is
important, the potential variation in the axial direction is
no longer harmonic, so the axial bounce frequency de-
pends on the ion temperature and axial dimension of the
ion cloud. Both of these dependencies are neglected in
Ref. [45].
We also measured the (2,0) plasma and upper hybrid
modes. These modes were excited by applying a
sinusoidal potential between the two central and two
outer electrodes in Fig. 1. They were detected by a
change in the ion fluorescence when the frequency of the
applied rf was resonant with the mode frequency. This
change was presumably caused by a change in the ions'
Doppler width and possibly by a change in the laser
beam-plasma overlap. Measurements of the plasma
mode frequency as a function of the plasma rotation fre-
quency are shown in Fig. 12 for two different trap axial
frequencies. The soUd Unes show the plasma mode fre-
quency calculated from Eqs. (3.12), (3.13), and (2.6).
Again, good agreement between the predicted and ob-
TN-138

536 J. J. BOLLINGER et al. 48
0.40
0.35
.^ 0.30
oIw3 0.25
0.20
0.15
_ - -
^i>^-»*- TfTTTT..
:
/,••' A cj^/n = 0.256-
• a;yn = 0.151-
— — ~ ~ _ J
^p-^-^* . ^. . . • w ^ w
r . 1
0.0 0.1 0.2 0.3 0.4 0.5
FIG. 12. Plasma mode frequency 6J^ as a function of the ro-
tation frequency cOr for two different axial frequencies co^. All
frequencies are expressed in units of the cyclotron frequency ft.
The circles and triangles give the experimental data. The solid
lines give the cold-fluid model predictions for cojo- The dashed
and dotted lines give the high- and low-magnetic-field calcula-
tions for cl>2o, respectively. The dotted line corresponds to the
oj^ frequency for an rf-trap plasma with the same density and
aspect ratio.
served modes is obtained with no adjustable parameters.
Figure 12 shows two additional calculations. In the first,
shown as dashed lines, the magnetic field is assumed to be
eflFectively infinite; that is, the ions are not allowed to
move radially, and the mode frequency is calculated as-
suming a simple axial stretch of the charged spheroid.
The mode frequency in this case is calculated from Eq.
(3.11) by setting the 5 5/77 term equal to 0. In the second
calculation, shown as dotted lines, the magnetic field is
assumed to be effectively 0; that is, the curve shows coq
[see Eq. (3.13)]. From this figure, the (2,0) plasma modebehaves like a mode of a strongly magnetized plasma at
low rotation frequencies and an unmagnetized plasma
near the Brillouin limit. We attempted to excite the
upper hybrid (2,0) mode with a drive frequency near the
upper hybrid frequency. A resonance (a change in the
ion fluorescence) was observed as the frequency of the ap-
plied rf was swept. The amplitude of the drive was de-
creased until the resonance signal was barely detectable.
Figure 13 shows a plot of the measured resonance fre-
quency along with a calculation of the upper hybrid (2,0)
mode from Eqs. (3.12), (3.13), and (2.6). Agreement is
good, indicating that the observed resonance was likely
the excitation of the upper hybrid (2,0) mode. As dis-
cussed in Sec. V, our drive could also potentially excite
an upper hybrid (4,0) mode. For the conditions of this
experiment, the two mode frequencies would be difficult
to distinguish. However, for sufficiently weak drive
strength, the (2,0) mode should be excited more strongly
than the (4,0) mode. We could not excite this upper hy-
brid mode near the Brillouin limit because, as discussed
in Sees. Ill and V, the upper hybrid modes becomedifficult to couple to with external fields there.
The agreement obtained here with the zero-
temperature calculations requires that Xj)
«
(plasma
dimensions)« (trap dimensions). This condition is usual-
FIG. 13. Upper hybrid mode frequency CO20 as a function of
the rotation frequency co^ for co^ /ft = 0. 1 5 1 . All frequencies are
expressed in units of the cyclotron frequency ft. The circles
give the experimental data. The uncertainty for measurements
done at low rotation frequencies is approximately the size of the
circles. At high rotation frequencies the uncertainties increase
because the mode becomes diflBcult to excite. The solid line
gives the cold-fluid model predictions.
ly easy to satisfy with a laser-cooled ion plasma and, in
fact, may not be difficult to satisfy with a cryogenic
{T=4 K) plasma. For example, a plasma with
tiQ^lOi^ /cm^ at r =4 K has a Debye length A.^, =44 /zm.
Consequently if the dimensions of this plasma are greater
than 1 mm, the inequaUty Xj) « (plasma dimensions) is
satisfied. A plasma with Zq = Tq =^ 1 mm and
n Q ~ 10^/cm^ requires loading A-irrqM q /3 = 4 X 1
0"*
charged particles within 1 mm of the trap axis. Thecharged particles must then be cooled and evolve into a
thermal equilibrium state before the plasma radius ex-
pands [18,46] due to radial transport produced by trap
asymmetries. For electrons this appears to be possible
because at large magnetic fields (5^6 T) the cyclotron
radiation time is short ( < 1 s) and the time over which
the plasma spreads due to trap asymmetries can be long
[16] (many hours). In addition, localized sources such as
field emission points can be used to load many electrons
close to the trap axis. For ions which cannot be laser
cooled the inequahty for a zero-temperature plasma maybe more difficult to achieve. This is because radiative
cooUng times are typically longer. In addition, the radial
transport in Penning traps due to trap asymmetries is
likely faster for ions than electrons because of the larger
ion mass. However, with care in loading the plasma, or
with the development of a technique to reduce the plasma
radius and increase the ion density, it should be possible
to satisfy the conditions for a zero-temperature plasma
with ions at 4 K. Ions in a Paul trap can be rapidly
cooled to the temperature of a background buffer gas. In
this case it should be possible to obtain a plasma where
the Debye length is small compared to the plasma dimen-
sions. Some experiments in Paul traps approximate this
regime [47].
V. GENERAL LINEAR MODES
The quadratic oscillations discussed in Sees. Ill and IV
are important special cases of an infinite set of hnear nor-
TN-139

48 ELECTROSTATIC MODES OF ION-TRAP PLASMAS 537
mal modes. Although we have, up to now, emphasized
the behavior of the quadratic modes, there are several
reasons to consider the general modes here. First, al-
though the general higher-order modes have not yet been
experimentally measured, we will see that it should be
possible to observe at least a few of them using the sameexperimental techniques as were described in Sec. IV.
Second, a deeper understanding of the quadratic modesmay follow from consideration of their place in the
hierarchy of general oscillations. Finally, a simple exact
analytic solution for all of these modes has been found
[29].
In Sec. V A we briefly review some features of this gen-
eral solution. We then discuss a simple form of the gen-
eral dispersion relation for the modes which allows one to
obtain numerical solutions of the mode frequencies using
a polynomial-root-finding algorithm. We also consider
some examples, including some of the modes which can
be resonantly driven by applying an oscillating potential
between the two end electrodes and the center electrodes.
In Sec. V B, we focus on modes which can be resonantly
driven by static field errors. We find that such reso-
nances occur in profusion, becoming dense when the
cloud rotation frequency is small compared to the cyclo-
tron frequency.
A. Description of the normal modes
In order to obtain a general solution for the normal
modes several assumptions must be made. We assume
the cloud is near thermal equilibrium, and we assume the
oscillations around this equilibrium are small so that wecan linearize the equations of motion. The temperature is
assumed to be sufficiently small that pressure effects on
the fluid dynamics are negligible, and correlation effects
are also neglected; these are good approximations provid-
ed that both the Debye length and interparticle spacing
are small compared to both the size of the cloud and the
wavelength of the mode. Electromagnetic eff'ects are
neglected (that is, VXE=VXH=0 in Maxwell's equa-
tions) since the cloud is small and the mode frequency is
relatively low, and the effect on the dynamics of image
charges in the electrodes is neglected.
These approximations are identical to those used in the
earlier sections and apply well to present experiments on
small cold ion clouds. However, unlike in the previous
analysis, we do not assume a particular form for the den-
sity perturbations. Rather, a general linear perturbation
is employed. The dynamics are described in a frame ro-
tating at the constant rotation frequency co^ of the equi-
librium plasma. In this frame the plasma is stationary
and the density, fluid velocity, and the potential are per-
turbed from their equilibrium values:
n(x,t)= nQ{ii)+ bn(\,t),
v(x,?)=0+5v(x,r) ,
^(x,^)--<^o(x) + V'(x,r) ,
(5.1a)
(5.1b)
(5.1c)
where bn, 6v, and i/* are the perturbed density, fluid ve-
locity, and potential, respectively. The equilibrium densi-
ty /2o(*) is uniform within the plasma spheroid and zero
outside, and <{>q is the total equilibrium potential in a ro-
tating frame, equal to [28]
2q
The first two terms in(f>Q
are the external trap and space-
charge potentials, given by Eqs. (2.4) and (2.9), respec-
tively, and the last term is a pseudopotential due to rota-
tion through the magnetic field.
We substitute Eqs. (5.1) into the cold-fluid equations
[48] describing conservation of momentum and particle
number, as well as into Poisson's equation. In the rotat-
ing frame, the cold-fluid equations have the same form as
in an inertial frame (for example, the laboratory frame),
except that the electrostatic potential is changed as indi-
cated above and the cyclotron frequency is changed to
the vortex frequency 0,^—0,-20)^. When equilibrium
force balance is taken into account and the equations are
linearized in the small perturbations, we obtain the
linearized continuity, momentum, and Poisson equations
of cold-fluid theory:
dbn+ V-(«o6v)=0,
-^ + -^VV'-6vXft^=0,at "m
2,/.= _-2-V'V bn
(5.2a)
(5.2b)
(5.2c)
where z is a unit vector along the z axis. Equation (5.2b)
and further equations implicitly assume q >0. For
q <0, fly-^ — 0,y. Using the assumption that the per-
turbed quantities have a time dependence of the form
e~"^' in the rotating frame (so that co is the mode fre-
quency as seen in this frame), a differential equation for xp
follows from standard algebraic manipulations of Eqs.
(5.2):
V-e-Vt/'=0 ,(5.3a)
where e is the cold-plasma dielectric tensor. In Cartesian
coordinates
e= le-,
-l€2
^3
(5.3b)
where 6, = 1 ill), €2=n^p /[coico^- 0.1)],
and 63 = 1— (i)^/&)^. Equation (5.3a) is just Maxwell's
equation V-D — for a medium with a linear frequency-
dependent anisotropic dielectric tensor e. After a solu-
tion to Eqs. (5.2) for the perturbed potential ^ is found,
Eqs. (5.2) can be used to calculate the perturbed density
bn and perturbed fluid velocity Sv.
The normal mode problem requires a solution to Eq.
(5.3) subject to the boundary condition that ^-^0 at
infinity, which is a problem in the theory of electrostatics.
Outside the plasma e=l and rp satisfies Laplace's equa-
tion, V^i/'°"'= 0. Inside the plasma the dielectric tensor is
anisotropic and the solution of Eq. (5.3a) is more compli-
TN-140

538 J. J. BOLLINGER et al. 48
cated. The inner and outer solutions must be matched
across the plasma-vacuum boundary according to
,/,in— ,/,outIW V I boundary '
n-e-Vi/''"=n-VV'°"'I boundary
{5.4a)
(5.4b)
where n is a unit vector normal to the plasma-vacuumboundary.
Although the formulation of the problem as one in the
theory of electrostatics is a step forward, simple solutions
are generally available only in one of the standard
geometries for which a separable solution exists, and this
is not a standard geometry. The surface of the plasma is
spheroidal, while the dielectric tensor is anisotropic with
a different, cylindrical, symmetry. However, Ref. [29]
showed that Eq. (5.3) does in fact have a separable solu-
tion in an unusual frequency-dependent coordinate sys-
tem. This is the only known exact analytic solution for
normal modes in a magnetized plasma of finite size. Thesolution for the mode potential is
MCr(|'i/^)^r(^2)e""'^""" (outside plasma),
"^^J5P/'"(fi/^)^r(^2)e"'"^""'* (inside plasma) ,
^^"^^
where A and B are constants and Ql" and P/" are associ-
ated Legendre functions. Outside the plasma, the solu-
tion is expressed in terms of spheroidal coordinates [49]
(^1,^2'^^ defined by the relations
x = [{fi-d^){\-^l)y^^cos<f> ,
The coordinatel^i
is a generalized distance coordinate
taking the valueI", e[zo,oo) outside the cloud, ^2 is a
generalized latitude in the range [—1,1] and<f>
is the usual
azimuthal angle. Surfaces of constant ^^ are confocal
spheroids with the surface of the cloud defined by ^^^ =Zq,
and surfaces of constant ^2 ^""^ confocal hyperboloids.
The foci are a distance 2\d\ apart, where d^ = ZQ — rl.
The coordinates {^i,^2'^^ become the usual spherical
coordinates ( r, cos0,(f)
) when Zq = rg
.
Inside the cloud the coordinates (|^i,|'2,<^) are em-
ployed in order to obtain a separable solution. These
coordinates are transformed spheroidal coordinates
defined by the equations
X = [(|?-rf')(l-|^)]>/2coS(^,
y = [(f,-d'){\-il)]''^sm<l>, (5.6)
2(6,/63)'/^= ^,^2
where d^=z^ — r\ and ZQ^Zo^^i/^a)'^'^- These coordi-
nates are frequency dependent; the different possible to-
pologies of the coordinate surfaces are discussed in Ref.
[29].
Returning to Eq. (5.5), we note that different normal
modes are enumerated by the integers / and m, where
/ > and \m\<l. In fact, values of m < do not give rise
to new modes if negative frequencies are allowed. There-
fore m > is assumed throughout, and negative frequen-
cies are allowed. For m¥'0, positive and negative fre-
quency modes rotate about the z axis in opposite direc-
tions. As discussed in Sec. Ill, we use the convention
that modes with positive frequency rotate counterclock-
wise when viewed from above the x-y plane (so that
d<f>/dt >0 for (o>0). The two directions of rotation are
not equivalent due to the apphed magnetic field. Themode frequencies for positively and negatively charged
particles diflFer by a minus sign.
For a given pair (l,m) the mode potential outside the
cloud decays away like s*~'~*' at large distances s fromthe cloud center [because Qi"(x)-^x
-(/ + i)for large x
and ^x^>-s for large s\. The modes can also be
diflFerentiated by the number of oscillations in ^. For ex-
ample, there are I —m zeros in the potential as one movesin ^2 along a given spheroid outside the plasma from one
pole to the other [that is, from |;2= 1 to — 1 on a constant
{^\,^) curve]. This is because Pf^ix) has / —m zeros in
the range [—1,1].
The variation of the potential outside the cloud is in-
dependent of the mode frequency, up to the overall con-
stant A. However, inside the cloud, the frequency depen-
dence of the coordinates (through their dependence on ej
and 63) impHes that the behavior of the mode potential
varies depending on the mode frequency, the plasma fre-
quency and vortex frequency [except for two exceptional
cases described in Eqs. (5.9) and (5.10) below]. This
behavior can be understood qualitatively from the spatial
Fourier transform of Eq. (5.3a),
e,kl+€,k^=0 , (5.7)
where k^ and k^ are the components of the wave vector
perpendicular and parallel to the magnetic field, respec-
tively. When co/cOp and fl/Wp are such that ei/e3<0, a
solution of this equation exists with both kj^ and k^ real,
which is a propagating mode. However, when e, /e^ > 0,
Eq. (5.7) implies that either kj^ or k^ must be imaginary
and the mode is evanescent. The frequency dependence
of the 6's imphes that the propagating mode relation
ei/e3<0 is satisfied by frequencies in the ranges
0< |6j| <min[(y , In^l] and max[(y^, |0^,| ] < |w| <ft„,
where ft„ =(ft}J+ft^)'^^ is the upper hybrid frequency.
Modes in the first frequency range are called magnetized
plasma oscillations, and modes in the second frequency
range are called upper hybrid modes [50]. As we will see
presently, evanescent modes occur only when |ft^,| <o)p,
and such modes have frequencies in the range
|ft^| <\oi\<a}p. These regimes are shown in Fig. 14 as a
function of the rotation frequency. (Here, remember that
both the vortex frequency and the plasma frequency are
functions of co^.) Modes with frequencies faUing in areas
labeled A are magnetized plasma modes, modes falling
in areas B are upper hybrid modes, and modes falling in
C are evanescent.
Modes which are evanescent have a different potential
variation within the cloud than modes which are propa-
gating. Propagating modes reflect off the interior surface
of the spheroid and set up a standing-wave pattern inside
the cloud, whereas evanescent modes propagate along the
cloud surface but decay with distance from the surface
TN-141

48 ELECTROSTATIC MODES OF ION-TRAP PLASMAS 539
0.4 0.6
FIG. 14. Sketch showing the areas of allowed mode frequen-
cies w as a function of the rotation frequency a>, . Modes in re-
gions A, B, and C are, respectively, magnetized plasma, upper
hybrid, and evanescent modes.
into the plasma. (Because of the curvature of the cloud's
surface, this decay is algebraic rather than the exponen-
tial decay we would observe for an evanescent mode at a
planar interface.)
For example, the zeros of the (2,0) mode potential
within the cloud are shown in Fig. 15 for the case of a
spherical plasma with ily/cOp =0.5. As discussed in Sees.
Ill and IV, there are two possible forms for the potential
corresponding to a high-frequency upper hybrid mode[labeled (a)] and a lower-frequency mode [labeled (b)].
The upper hybrid mode is propagating, but for this value
of ^y/ci)p the lower-frequency mode is evanescent, decay-
ing with distance into the plasma. This behavior is best
observed in Figs. 15(c) and 15(d), which show the poten-
tial variation of the modes along z =0 and r =0, respec-
tively.
Furthermore, either Fig. 15(a) or Figs. 15(c) and 15(d)
show that the potential of the upper hybrid mode nearly
vanishes along the cloud surface, so there is almost no
potential variation exterior to the cloud. This is because
as fly/cOp —>0 (the Brillouin limit in a Penning trap or the
condition for ions in a Paul trap) the upper hybrid modeshave frequency co— cOp and, as shown below, become bulk
plasma oscillations with ^°"'=0. If ft^/cj. ^0 and
oi-^o)p, then 6=0 and Eq. (5.4) implies V^°"'-n= along
the plasma boundary. The only solution which satisfies
both the boundary condition at the plasma and ^°"'—>-0
at infinity is ^°"*=0. Furthermore in the Cl^/cOp ^-0 hmit
the magnetized plasma modes disappear as their frequen-
cy a>^>-0. Thus, only the evanescent modes with 61/63 >
may be observable near the 11^/0)^^0 limit if only elec-
trostatic detection of the modes is employed. In this lim-
it the evanescent modes satisfy V^i/''"= 0, so from Eq.
(5.2) there is no density perturbation except at the surface
of the cloud. In this hmit the evanescent modes induce
incompressible deformations of the cloud's shape, and for
this reason they are often called surface modes.
As a second example, the interior potential variation of
the four possible (4,0) normal mode potentials are shownin Fig. 16, again for a spherical cloud with ft^/a)p=0.5.
Like the (2,0) modes, these modes could also be driven by
in-phase oscillation of the end-cap potentials. There are
now four zeros in the exterior potential as we move from
pole to pole along the spheroid, as can be observed in
Figs. 16(a)- 16(d). Figures 16(a) and 16(b) correspond to
upper hybrid modes, whereas Fig. 16(d) is a magnetized
plasma mode and Fig. 16(c) is an evanescent mode. Thedecay of the evanescent mode with distance into the plas-
FIG. 15. (a) and (b) show the zeros of the potential for the
two 1=2, m=0 modes in a spherical plasma with Q,^/cOp=0.5.
(a) is the upper hybrid mode and (b) is the plasma mode which is
evanescent for these conditions. In (c) the variation of the mode
potential (normalized to the potential at the plasma center) is
shown as a function of cylindrical radius r in the z =0 plane,
and in (d) the potential is shown as a function of z along r =0.
TN-142

540 J. J. BOLLINGER et al. 48
(a)
1 /
\
(c) (d)
ma is most easily observed in Figs. 16(e) and 16(f). Just as
with the (2,0) modes, for this relatively low value of
^y/(Op the upper hybrid modes induce almost no poten-
tial variation outside the cloud, as opposed to the mag-
netized plasma mode or the evanescent mode.
Finally, there are two exceptional cases for which the
form of the mode potential is independent of co, (Op , and
fl^. When / =m or / =m + 1 , we can substitute into Eq.
(5.5) the general form of the Legendre function P/",
(/-m)/2
7=0
2\m/2_ -.l — m—lj(5.8)
where the /p^'s are given numbers, and use Eq. (5.6) to
show that
t(m,m)= Ar'"e'^'"'^~'^'^
and
V'i(m +l,m) =Br'"zemHm4>— {ot)
(5.9)
(5.10)
(e)
> 0.5
(f)
Noc
FIG. 16. (a) -(d) show the zeros of the potential for the four
/=4,m=0 modes in a spherical plasma cloud with
ily/cOp =0. 5, in order of highest frequency (a) to lowest frequen-
cy (d). In (e) the variation of the mode potential (normalized to
the potential at the plasma center) is shown as a function of cy-
lindrical radius r in the z =0 plane, and in (f) the potential is
shown as a function of z along r=0. The labels (a) -(d) corre-
spond to Fig. 15(a)- 15(d).
where A and B are constants. (In fact, for all / and m, V*'"
can be expressed as a finite-order multinomial in x, y, andz.) In the cases of Eqs. (5.9) and (5.10) the form of the
mode potential is independent of co, oi„, and fl^, because
the mode satisfies 8^i^'"/3z^=0 and V^V'"~0 separately,
and so Eq. (5.3a) is satisfied for any 6] and €y Further-
more, these particular modes satisfy V^^'"= 0, so they
cause incompressible deformations of the cloud for all cOp
and fl^,; that is, they are always surface modes. For exam-
ple, for the case of the (2,1) mode, t/-;^ ,,=^e''^"'"'Vz,
which is the potential inside a tilted cloud precessing at
frequency co, in agreement with the analysis of Sec. III.
The (1,0) and (1,1) modes are also examples of incompres-
sible cloud deformations, which correspond to the well-
known axial center-of-mass and magnetron modes.
The (2,2) mode is an incompressible distortion of the
cloud into a triaxial ellipsoid, leaving the length of the
cloud fixed at 2zo. In general, the (/,/) modes are finite
length extensions of the z-independent diocotron and
upper hybrid surface modes of cylindrical non-neutral
plasmas [51].
Although the I =m and / =m + 1 surface modes ap-
pear to be fundamentally different from other magnetized
plasma, upper hybrid, and evanescent modes, in fact they
display many characteristics which are similar to these
modes. For example, when co^ «£l two of the three (2,1)
oscillations can be thought of as finite length versions of
magnetized plasma modes in a cylindrical column. Themodes (indicated by the upper two curves in Fig. 8) have
m =\ and a half wavelength potential variation over the
length of the column; they rotate in opposite directions
around the column. Similarly, the other (2,1) mode is a
finite length version of an upper hybrid oscillation which
also has a half wavelength variation over the columnlength. Modes with larger values of / simply have morewavelengths fitted into the column length, and so are not
fundamentally different. Indeed, we will soon see that the
frequencies of these I =m and / =m + 1 modes behave in
a qualitatively similar fashion as those of the other propa-
gating and evanescent modes. When discussing the gen-
TN-143

48 ELECTROSTATIC MODES OF ION-TRAP PLASMAS 541
eral frequency dependence of the modes, we therefore do
not need to make a distinction between these modes and
modes with other values of / and m.
Turning now to the normal mode frequencies, Ref. [29]
showed that substitution of Eq. (5.5) into Eq. (5.4) leads
to two homogeneous linear equations for A and B which
have a nontrivial solution only if
e^Pr+ma '^^a'-
1/2
M ^2
€^/€,
a^-l
1/2
Q!(5.11)
Here P!;"=PJ"(a/{a^-€^/€^)^^^), Qr= Qr(aAa^— 1)*^^), a=ZQ/rQ, and the primes denote diflFerentiation
with respect to the entire argument.
The general behavior of the solutions to this equation
was considered in Ref. [29]. Here, we discuss a
simplification of Eq. (5.11) which aids in the determina-
tion of the solutions, and we consider some examples.
Analysis of the roots of this nonlinear equation is aided
by the fact that it can be expressed as a polynomial in the
frequency co. This polynomial can be derived by substitu-
tion of Eq. (5.8) into Eq. (5.11), which leads, after somealgebra, to the expression
1-x(/
2\m/2-m)/2
j=0ma^{€i + e2)+ (l —m —2j)e^— a
(a2_i)l/2= (5.12)
r
where x =0/(0^—63/61)'^^. The factor before the sumis nonzero and can be discarded. Furthermore, since
x~^-'=( 1—63/0^61)^, and €], €2, and €3 are rational func-
tions of CO, the sum itself may be expressed as a polynomi-
al in CO. For example, e^/€x = ((ip-— £l\)(ap-—ci?p)/
[(o\oi^-al], and e^ + €2^(o)^-^oiil^-(ol)/[oi{ai+ a^)].
Substitution of these results into Eq. (5.12) leads, after
some further reduction, to the following polynomial
equation:
(/-m)/2
(5.13)
where
a, =pi (a)+ ftJ (/--m -IjW-co])-(a^- 1)1/2 gm^
b=aW{(o^-£ll)-{(o^-col){oi^-al) ,
+ ma^(o{co^—(0^p +6)0^)
and
The function int[(/— m)/2] denotes the largest integer
less than or equal to ( / —m ) /2.
This form of the dispersion relation (the dependence of
CO on a for a given l,m) is considerably more simple to
solve numerically than Eq. (5.12), using any polynomial-
root-finding algorithm. Furthermore, the equation leads
to some simple analytic results. For example, we can
count the number of normal modes by determining the
order of the polynomial. The order is
3+4int[(/ — m)/2]; however, we must be careful to ex-
clude any spurious roots generated in the derivation of
Eq. (5.13) through multiplication by resonant denomina-
tors of 6], €2, or €3. When m —0 and / is odd, there is a
single spurious root at <y= — ft^ [due to the (co+ il^) term
in Oj]. If m =0 and / is even there are three spurious
roots at (y2= and co= — fl^,. Subtracting out these roots
from the total, we find for m =0 there are 2/ normal
modes. However, when m =0, Eq. (5.13) is a polynomial
of order / in co^. The roots then come in / pairs at ±co,
and the pairs do not really correspond to two separate
modes; indeed, Eq. (5.5) shows that the mode potential is
identical for both ±co when m =0.
When m¥^0 and when / —m is even, there is a single
spurious root at co= 0, while when / —m is odd, there are
no spurious roots. Thus, when /—m is even there are
[2(/— m)+ 2] modes, and when /—m is odd there are
[2(/— m)+l] modes. The roots no longer come in ±a)
pairs because, for mv^O, modes with positive and nega-
tive frequencies rotate in opposite directions around the z
axis, and these directions are not equivalent because of
the magnetic field.
Some simple analytic results are also possible for the
mode frequencies when /=Anor/=m+l. In this case
only the j —0 term survives from Eq. (5.13) and the
modes are determined by the equation 0^ = 0. WhenI =m this is a quadratic equation with roots given by
co,j = -a,/2±V^lM+ coj/[l-{rQ/lad)Ql'/QJ] .
(5.14)
For n^>0 the low-frequency mode (upper sign) corre-
sponds to the diocotron mode of a cylindrical non-neutral
plasma [51] and the high-frequency mode (lower sign) is a
IN- 144

542 J. J. BOLLINGER et al. 48
surface mode in the upper hybrid frequency regime.
When / =m +1, Eq. (5.13) becomes
(a)
(a,+Pi)coHo) + n^)-a,(ocol-n^l=0 , (5.15)
where a/ = l+a^(/-l) and l3, = -[a/{a^
-l)'^^]e/"'7e/~'- There are three solutions for the
mode frequency which, when / = 2, are the same as the
solutions of Eqs. (3.22)-(3.24) for the (2,1) mode. When/ = 1, one of the roots is spurious and the other two ap-
proach the single-particle axial bounce frequency
(o^=(Op/{ H-/3, )'''^in agreement with Eq. (2.6); this is the
axial center-of-mass mode.
Results for the frequencies when I =m +2,m +3, ... require the solution of even higher-order po-
lynomial equations. We have found the solutions numeri-
cally, and some results are displayed in Figs. 17(a)- 17(c)
as functions of the rotation frequency co^ . It is important
to remember here that both H^ and Op are functions of
the CO/, in fact, in the rotating frame the plasma becomes
unmagnetized at the Brillouin limit 11^=0.
Examination of the mode frequencies at the Brillouin
limit (equivalent to the case of ions in a Paul trap) shows
that for given / and m there are two modes which become
unmagnetized surface plasma oscillations. These surface
mode frequencies are described by the particularly simple
limiting form of Eq. (5.11), ei=PrQr'/Pr'QP [here the
argument of the P,'"'s simplifies to a/{a}—W^\ Thus,
when n^=0 there are a pair of surface modes with fre-
quencies of opposite sign. For n^=?^0 but |ft^| <(i)p and
/^ 00 , these modes are evanescent, approachmg the
magnetized surface plasma frequencies +fl„/A/2. This
result is independent of the shape of the cloud. However,
for \£i^>(i)p the behavior of these two modes depends on
m. When m =0 the pair of modes remains in the mag-netized plasma regime (oKojp, as shown in Figs. 17(b)
and 17(c). When m^O, however, only one mode remains
in the magnetized plasma regime, while the other enters
the upper hybrid range, as shown in Fig. 17(a).
The rest of the modes always remain in either the mag-netized plasma or upper hybrid regime. Their numbersare as follows; when m 7^0 there are / —m magnetized
plasma modes and 2int[(/ — m)/2] upper hybrid modes;
when m =0 there are int[(/ — 1 )/2] pairs of magnetized
plasma modes, and int[//2] pairs of upper hybrid modes.
[These numbers can be determined by analysis of the
solutions of Eq. (5.13) in the hmits Cl^^- oo and ft^^-0.]
Finally, we compare the frequencies of (2,0) and (4,0)
modes, which, like the (2,0) modes, can be excited using
the technique described in Sec. IV. The frequency of the
evanescent (4,0) mode, shown in Fig. 17(b) for the experi-
mental value co^/Cl = 0.l5l, is quite different from the
evanescent (2,0) frequency, which was measured experi-
mentally. Evanescent branches with higher / are even
further^ removed from the / =2 root, approaching
fty /V2. This provides further evidence that the mea-
sured mode shown in Fig. 12 is in fact a (2,0) mode exci-
tation and not a higher-order oscillation. However, it
should be possible to excite other m =0 even / modes us-
ing the same experimental technique. For larger values
of w, /ft, however, the evanescent (2,0) mode becomes
a3
a3
a
1 V'y/-
0.8^»-^
^^^..xjy°
'
•
'
.V0.6
•y ^•
/ •;°° ^
8»'S° ^
0.4
/oooooo-°::-*••..
1ftOOOt
0.2 7 ...••0"°°°° 8*
"::::::!>..:^iSS^«i?ssssssss-»''
0.2 0.4 0.6 0.8 1
CO /Q.
(b) 1
0.6
0.4I-
;
0.2
' _oOOOO°°°°ooooooooooooooooooooooooooooooo \.o
(c) 1
0.4 0.6
(o/Qr
FIG. 17. Mode frequencies co in the rotating frame vs rota-
tion frequency oi^ for different values of (l,m) and co^ (From
Sec. VB, co^^'°= co— m(Or-) For aKO the diagrams should be
reflected through the point («;.,w)= (ft/2,0). Also shown for
comparison are the upper hybrid frequency Hu^cOr) (solid
curve), the vortex frequency £iJ,(o,) (dotted curve), the plasma
frequency copico,) (dot-dashed curvj), and in (c) the surface
upper hybrid frequency D,^{o}r)/^2 (dashed curve). All fre-
quencies are expressed in units of the cyclotron frequency CI. (a)
6;,/a=0.151; (/,m)= (2,l), filled circles; (/,m)= (5,l), open
circles. The (2,1) modes for this condition are also shown in
Fig. 8 in the laboratory frame, (b) w,/n= 0.151; (/,m) = (2,0),
filled circles; (/,/n)= (4,0), open circles. The (2,0) modes for
this condition are also shown in Fig. 6. They are the same in
the laboratory or rotating frame, (c) 0)^/11=0.5; (/,m) = (2,0),
filled circles; (/,m)= (4,0), open circles.
TN-145

48 ELECTROSTATIC MODES OF ION-TRAP PLASMAS 543
nearly degenerate with the evanescent (4,0) mode [see
Fig. 17(c)], making it more difficult to distinguish be-
tween modes with different values of / merely from fre-
quency measurements.
B. Resonances between modes and static field errors
Now that the linear modes have been enumerated, weturn to the problem of modes driven by an external
source. In particular, as we saw in Sec. IV, a static field
error can drive to large amplitude a (2,1) mode, when the
mode satisfies the linear resonance condition that it has
zero frequency in the laboratory frame. In this section
we consider the resonance between a static error and
modes with general ( /,m ).
In the rotating frame, modes have a variation propor-
tional to exp{im<f>— io)t). The azimuthal angle(f>
as
viewed in the rotating frame is related to the angle (^^ as
viewed in the laboratory frame through the GaHlean
transformation (f>=(f>i+ci)^t. Therefore, the condition
that a mode has zero frequency in the laboratory frame is
(o—meOr (5.16)
Solutions of this equation can be found graphically in
Fig. 17 by finding the intersections of the line given byEq. (5.16) and the curves of mode frequency versus rota-
tion frequency. In general, for a given / and m there are
/ —m intersections for m^O and no intersections whenm —0. [Equation (5.16) implicitly assumes m>0 andpositively charged, trapped particles as discussed earher.
With the sign convention used here where co^ is always
positive, the condition for negatively charged particles is
co= —mo)^.]
For a given co^/D, the solutions of Eq. (5.16) provide
specific values of co^/fl at which resonances can occur
between a static error and a mode with given (l,m).
These values trace out curves as co^/fl is varied; the
curves are plotted for m = 1 and m =2 in Fig. 18. Since
modes with / —m odd are odd in z, these modes will be
excited (in linear theory) only by errors which are also
odd in z, such as the error induced by a tilt of the elec-
trodes with respect to the magnetic field. Similarly, er-
rors which are even in z excite modes with I —m even.
Furthermore, only modes with the same value of m as the
perturbation can be excited (in Hnear theory). This im-
plies that the tilt field error, which (for small tilt angles) is
(a) 1
0.8
0.6
0.4
0.2
"^1
'""^^^7^-^ 4,1
--6,1
\.y/>'\ -
- ^-'^^^^y-
'^S^^
(b)
0.25 ._ 0.5 0.75
a3"
1 "^
^S. "»*
I I --3,1— 5,1
0.8 ^^^s^U
0.6-
\
0.4-
/^'v^^0.2
I
V
1 1
0.25 0.5
(o/Q0.75
(c) 0.5 (d) 0.5
0.25 ,^ 0.5CO /Q
0.75
a3'
0.25 0.5
o)/Q0.75
FIG. 18. Values of a,/^ and a^ /U for which different m = 1 and m =2 modes become zero frequency in the laboratory frame.
The limiting points U and P, which fall on the confinement boundary, are discussed in the text. The confinement boundary, defined
by (i),=a)„ and W;. = fi— <u„, where a)„ is given by Eq. (2.10), is also drawn. The m = 1 modes are shown in (a) and (b), and the m =2
modes are shown in (c) and (d). Modes odd in z are shown in (a) and (c) and modes even in z are shown in (b) and (d). The curve for
the zero-frequency (2,1) mode in (a) is the curve in Fig. 10.
IN- 146

544 J. J. BOLLINGER et al. 48
an A72 = 1 perturbation that is odd in z, can linearly
resonate only with the (2,1), (4,1), (6,1), .. . modes.
The (2,1) mode is most strongly excited since it has the
slowest spatial variation and hence has the largest "over-
lap" with the slowly varying tilt error. Furthermore, the
(4,1) and (6,1) resonance curves have quite diflFerent forms
from the (2,1) curve, which indicates that the excitation
observed in the experiments is in fact a (2,1) mode, not a
higher-order excitation. However, the other resonances
may also be measurable.
Turning now to the hmiting behavior of the resonance
curves, we observe that in the rotating-frame mode fre-
quencies are always less than the upper hybrid frequency
ft„ =(6;^+ft^)^^^. Then Eq. (5.16) impUes that resonant
rotation frequencies must satisfy the relation
m(o,<V 0)1 + 0.1= V2a),{a-(D,)+ m-lco,
which can be solved to give
<u,/n<(Vm2-l-l)/(m2-2)=l, 0.366,0.261,. . . .
This implies that as m increases the resonances becomepacked into a smaller and smaller region of the experi-
mental operating regime. Since most experiments
operate in the regime 6j^/ft«l, we may have cause to
worry that these many resonances could have a deleteri-
ous effect on the plasma confinement. However, the
mode resonances with smaller values of / and m are most
dangerous since they are more easily excited by perturba-
tions with slow spatial variation, and larger / and mmodes may be heavily damped due to viscous eflFects or
coUisionless Landau damping [52].
Other limiting values of the resonance curves can also
be found. For example, consider the limit in which the
plasma becomes extremely oblate, that is, a thin disk or
pancake. This occurs along the edge of the confinement
region defined by the equations oir = co^ and co^ = Cl — (o^,
where w^ is given by Eq. (2.10). In this limit, the modefrequencies approach either ft^ or (Op. In the former case
resonances occur when fl^=ma)^, or
a),/n=l/(m+2) = l,l,l,....
This limit is labeled by the point P in Fig. 18. In the
latter case resonances occur when cOp=ma)^, which can
be solved for co^ to yield
6),/ft= 2/(m2+ 2)= |,l,^,....
This limit is labeled by the point 17. Resonance curves
which connect to the point P are due to magnetized plas-
ma modes, whereas curves connecting to point U are dueto resonances with upper hybrid modes.
Finally, we briefly discuss how the strength of these
resonances should behave as the size or density of the
plasma increases. Since the plasma is generally small
compared to the distance to the electrodes, external field
errors have slow spatial variation compared to the plas-
ma size, and hence only the lowest-order / and m reso-
nances should be observed. However, as the plasma in-
creases in size higher-order modes have a larger "over-
lap"' with the field error. Furthermore, as either plasmasize or density is increased more electrostatic energy is h-
berated by radial expansion of the plasma due to the
torque of the error acting on the cloud. Thus, we expect
heating due to resonances to increase as more ions are
trapped, and more resonances with higher values of / andm should be observable. This qualitative picture appears
to agree with observations of higher density ion clouds.
However, a quantitative analysis of this important ques-
tion involves effects which are beyond the scope of this
work, such as the effect of viscosity. Landau damping,
laser light pressure, and nonlinearities on the saturation
level of the mode amplitude. These issues need to be con-
sidered in a future paper.
ACKNOWLEDGMENTS
We thank John Schiffer for stimulating discussions on
this subject and Steve Jefferts and Steve Barlow for their
comments and careful reading of the manuscript. Wegratefully acknowledge support by the U.S. Office of
Naval Research Contract No. N00014-92-F-0038.
D.H.E.D. acknowledges the support of the U.S. Office of
Naval Research Contract No. N00014-89-J-1714 as well
as National Science Foundation Grants No. PHY87-06358 and No. PHY9 1-20240.
'Current address: Department of Physics, University of
Texas, Austin, TX 78712.
[1] H. G. Dehmelt, Adv. At. Mol. Phys. 3, 53 (1967); 5, 109
(1969); D. J. Wineland, W. M. Itano, and R. S. Van Dyck,
Jr., ibid. 19, 135 (1983); R. C. Thompson, Adv. At. Mol.
Opt. Phys. (to be published).
[2] J. H. Malmberg and J. S. deGrassie, Phys. Rev. Lett. 35,
577(1975).
[3] M. L. Gross and D. L. Rempel, Science 226, 261 (1984); A.
G. Marshall, Ace. Chem. Res. 18, 316 (1985).
[4] R.S. Van Dyck, Jr., P. B. Schwinberg, and S. H. Bailey, in
Atomic Masses and Fundamental Constants 6, edited by
J.A. Nolan, Jr. and W. Benenson (Plenum, New York,
1980), p. 173; R. S. Van Dyck, Jr., D. L. Farnham, and P.
B. Schwinberg, Phys. Scr. 46, 257 (1992).
[5]E. A. Cornell, R. M. Weisskoff, K. R. Boyce, R. W.
Flanagan, Jr., G. P. Lafyatis, and D. E. Pritchard, Phys.
Rev. Lett. 63, 1674(1989).
[6] G. Bollen, R. B. Moore, G. Savard, and H. Stolzenberg, J.
Appl. Phys. 68,4355(1990).
[7] G. Gabrielse, X. Fei, L. A. Orozco, R. L. Tjoelker, J.
Hass, H. Kalinowsky, T. A. Trainor, and W. Kells, Phys.
Rev. Lett. 65, 1317(1990).
[8] D. Hagena and G. Werth, Europhys. Lett. 15, 491 (1991);
J. Kern, T. Engel, D. Hagena, and G. Werth, Phys. Scr.
46, 575 (1992).
[9] R. S. Van Dyck, Jr., P. B. Schwinberg, and H. G. Deh-
melt, Phys. Rev. D 34, 722 (1986); Phys. Rev. Lett. 59, 26
(1987).
[10] M. Hubrich, H. Knab, K. H. Knoell, and G. Werth, Z.
Phys. D 18, 113(1991).
[\\] Frequency Standards and Metrology, Proceedings of the
IN- 147

48 ELECTROSTATIC MODES OF ION-TRAP PLASMAS 545
Fourth Symposium on Frequency Standards and Metrolo-
gy, Ancona, Italy, edited by A. De Marchi (Springer- [27
Verlag, Berlin, 1989).
[12] J. J. Bollinger, D. J. Heinzen, W. M. Itano, S. L. Gilbert,
and D. J. Wineland, Phys. Rev. Lett. 63, 1031 (1989); J. J. [28
Bollinger et al., IEEE Trans. Instrum. Meas. 40, 126
(1991); D. J. Wineland, et al, IEEE Trans. Ultrason. Fer-
roelectrics Freq. Control 37, 5 1 5 ( 1990). [29
[13] J. D. Prestage, G. J. Dick, and L. Maleki, IEEE Trans. In- [30
strum. Meas. 40, 132 (1991); L. S. Cutler, R. P. GiflFard, P.
J. Wheeler, and G. M. R. Winkler, in Proceedings of the [31
Forty-First Annual Frequency Symposium, IEEE Catalog
No. 87CH2427-3 (IEEE, New York, 1987), p. 12 (copies [32;
are available from NTIS, 5285 Port Royal Rd.,
Springfield, VA 22161); M. Jardino, M. Desaintfuscien, [33
R. Barillet, J. Viennet, P. Petit, and C. Audoin, Appl.
Phys. 24, 107 (1981). [34
[14] A. Muench, M. Berkler, Ch. Gerz, D. Wilsdorf, and G.
Werth, Phys. Rev. A 35, 4147 (1987). [35
[15] D. A. Church, in Physics of Electronic and Atomic Col-
lisions, edited by S. Datz (North-Holland, Amsterdam, [36
1982), p. 533; D. A. Church et al., Nuclear Instrum.
Methods Phys. Res. Sect. B 56/57, 417 (1991). [37
[16] J. H. Malmberg, C. F. Driscoll, B. Beck, D. L. Eggleston,
J. Fajans, K. Fine, X.-P. Huang, and A. W. Hyatt, in [38
Non-Neutral Plasma Physics, Proceedings of the Symposi-
um on Non-Neutral Plasma Physics, edited by C. W. [39
Roberson and C. F. Driscoll, AIP Conf. Proc. No. 175 [40
(AIP, New York, 1988), p. 28.
[17] C. F. Driscoll and K. S. Fine, Phys. Fluids B 2, 1359 [41
(1990).
[18] C. F. Driscoll, J. H. Malmberg, and K. S. Fine, Phys. Rev. [42
Lett. 60, 1290(1988).
[19] D. L. Eggleston, T. M. O'Neil, and J. H. Malmberg, Phys. [43
Rev. Lett. 53, 982 (1984); D. L. Eggleston and J. H. Malm-
berg, ibid. 59, 1675 (1987). [44
[20] S. L Gilbert, J. J. Bollinger, and D. J. Wineland, Phys.
Rev. Lett. 60, 2022 (1988). [45
[21] D. J. Heinzen, J. J. Bollinger, F. L. Moore, W. M. Itano,
and D. J. Wineland, Phys. Rev. Lett. 66, 2080 (1991); 66, [46
3087E(1991).
[22] P. B. Schwinberg, R. S. Van Dyck, Jr., and H. G. Deh- [47
melt, Phys. Lett. 81A, 119 (1981).
[23] C. M. Surko, M. Leventhal, and A. Passner, Phys. Rev.
Lett. 62,901 (1989). [48
[24] G. Gabrielse, X. Fei, L.A. Orozco, R. L.Tjoelker, J. Hass,
H. Kahnowsky, T. A. Trainor, and W. Kells, Phys. Rev. [49
Lett. 63, 1360 (1989); 65, 1317 (1990).
[25] R. S. Van Dyck, Jr. and P. B. Schwinberg, Phys. Rev. [50
Lett. 47, 395 (1981); R. S. Van Dyck, Jr., F. L. Moore, D.
L. Farnham, and P. B. Schwinberg, Int. J. Mass Spectrom. [51
Ion Processes 66, 327(1985). [52
[26] R. S. Van Dyck, Jr., F. L. Moore, D. L. Farnham, and P.
B. Schwinberg, Phys. Rev. A 40, 6308 (1989).
F. L. Walls and G. H. Dunn, J. Geophys. Res. 79, 1911
(1974); R. A. Heppner, F. L. Walls, W. T. Armstrong, and
G. H. Dunn, Phys. Rev. A 13, 1000 (1976).
L. R. Brewer, J. D. Prestage, J. J. BoUinger, W. M. Itano,
D. J. Larson, and D. J. Wineland, Phys. Rev. A 38, 859
(1988).
D. H. E. Dubin, Phys. Rev. Lett. 66, 2076 (1991).
S. A. Prasad and T. M. O'Neil, Phys. Fluids 22, 278
(1979).
D. H. E. Dubin and T. M. O'Neil, Phys. Rev. Lett. 60, 511
(1988).
J. H. Malmberg and T. M. O'Neil, Phys. Rev. Lett. 39,
1333(1977).
D. J. Wineland, J. J. Bollinger, W. M. Itano, and J. D.
Prestage, J. Opt. Soc. Am. B 2, 1721 (1985).
P. M. Morse and H. Feshbach, Methods of Theoretical
Physics (McGraw-HiU, New York, 1963), Chap. 10.
J. B. Jeffries, S. E. Barlow, and G. H. Dunn, Int. J. Mass
Spectrom. Ion Processes 54, 169 (1983).
R. C. Davidson, in Non-Neutral Plasma Physics [16], p.
139.
J. S. deGrassie and J. H. Malmberg, Phys. Fluids 23, 63
(1980).
S. A. Prasad and T. M. O'Neil, Phys. Fluids 26, 665
(1983).
R. Keinigs, Phys. Fluids 24, 860 (1981); 27, 1427 (1984).
D. J. Wineland, J. C. Bergquist, M. W. Itano, and R. E.
DruUinger, Opt. Lett. 5, 245 (1980).
H. S. Lakkaraju and H. A. Schuessler, J. Appl. Phys. 53,
3967(1982).
D. J. Wineland, J. J. Bolhnger, and W. M. Itano, Phys.
Rev. Lett. 50, 628 (1983); 50, 1333E (1983).
W. M. Itano, L. R. Brewer, D. J. Larson, and D. J. Wine-
land, Phys. Rev. A 38, 5698 (1988).
C. F. Driscoll, in Low Energy Antimatter, edited by David
Cline (World Scientific, Singapore, 1986), pp. 184-195.
J. Yu, M. Desaintfuscien, and F. Plumelle, Appl. Phys. B48, 55 (1989).
C. F. Driscoll and J. H. Malmberg, Phys. Rev. Lett. 50,
167(1983).
L. S. Cutler, C. A. Flory, R. P. Giffard, and M. D.
McGuire, Appl. Phys. B 39, 251 (1986); L. S. Cutler, R. P.
Giffard, and M. D. McGuire, ibid. 36, 137 (1985).
R. C. Davidon, Theory of Nonneutral Plasmas (Benjamin,
Reading, MA, 1974), pp. 14-16, and 43.
P. M. Morse and H. Feshbach, Methods of Theoretical
Physics (McGraw-Hill, New York, 1963), Chap. 5.
F. F. Chen, Introduction to Plasma Physics (Plenum, NewYork, 1974), pp. 88-94.
R. C. Davidson, Theory ofNonneutral Plasmas [48], p. 62.
N. A. Krall and A. W. Trivelpiece, Principles of Plasma
Physics (San Francisco Press, San Francisco, 1986), p. 386.
TN-148

PHYSICAL REVIEW A VOLUME 49, NUMBER 5 MAY 1994
Electrostatic modes as a diagnostic in Penning-trap experiments
Carl S. Weimer, J. J. Bollinger, F. L. Moore,* and D. J. Wineland
Time and Frequency Division, National Institute ofStandards & Technology, 325 Broadway, Boulder, Colorado 80303
(Received 4 October 1993)
A subset of the electrostatic modes of a cold cloud of electrons, a non-neutral electron plasma, trapped
in a Penning trap has been observed and identified using a recent theoretical model. The detection of
these modes is accomplished using electronic techniques which could apply to any ion species. The
modes are observed in the low-density, low-rotation limit of the cloud where the cloud approaches a
two-dimensional charged disk. We observe both axially symmetric and asymmetric drumhead modes.
The shape, rotation frequency, and density of the cloud are found in a real-time nondestructive manner
by measuring the frequency of these modes. In addition, it is found that radio-frequency sideband cool-
ing compresses the cloud, increasing its density. The ability to measure and control the density of a
trapped ion cloud might be useful for experiments on low-temperature ion-neutral-atom collisions,
recombination rates, and studies of the confinement properties of non-neutral plasmas.
PACS number(s): 32.80.Pj, 35.80.+ s, 52.25.Wz, 52.35.Fp
Penning ion traps have become an important tool in
studies involving low-energy charged particles [1]. Re-
cently, a theory of the electrostatic fluid modes of a plas-
ma confined in a Penning trap (and Paul rf trap) was
developed [2-4]. A number of these modes were ob-
served experimentally in a plasma of Be"*" ions using opti-
cal fluorescence techniques [3,4]. By measuring the
eigenfrequencies of two or more of these modes, plasma
characteristics such as density, rotation frequency, and
shape can be found nondestructively. Several types of ex-
periment would benefit from this information. For exam-
ple [1,4], experiments on recombination rates,
ion-neutral-atom and ion-ion collisions, and strongly
coupled systems depend on the ion sample density, size,
and shape. These modes can also be used to study the
confinement properties of the trap. However, a general
method for detecting these modes is desired. Optical
detection of the modes, as demonstrated in Ref. [3], is
practical only for a small number of ion species. The
method of characterizing the plasma by ejecting the plas-
ma from the trap onto a set of charge collectors [5] has
the disadvantage (for some experiments) of being a des-
tructive measurement.
The object of the work reported here was to investigate
detection techniques which would allow these mode fre-
quencies to be measured nondestructively for any type of
'Present address: Dept. of Physics, University of Texas, Aus-
tin, TX 78712.
ion species. To do this, we used electronic methods for
detecting the modes and electron plasmas to test the
methods. Related observations with trapped ions have
been made by Barlow, JeflFries, and Dunn [6], and with
electrons and positrons by Tinkle, Greaves, and Surko
[7]. In the low-density, low-rotation limit of the electron
plasmas we were able to detect a number of modes. Bycomparing the frequency dependence of the detected
modes with the theoretical model by Dubin [2,4], an
identification of the modes was made. This allowed us to
calculate the density and aspect ratio of the electron plas-
mas and study their evolution. By combining this infor-
mation with a measurement of the number of electrons,
the plasma size could then be determined.
A second goal of this work was to find a way to manip-
ulate and increase the plasma density. For trapped atom-
ic ions, lasers can be used to apply a torque to the plas-
ma, compressing it and increasing its density [3,4,8]. In
addition, lasers can be used to cool the atomic ion plas-
ma, reducing its temperature to below 10 mK [8]. Thepossibility of compression of a non-neutral plasma by
wave excitation has also been discussed [9]. In the workreported here, we found that the parametric coupHng
technique called magnetron sideband cooling [10,11] in-
creased the electron plamsa density. This technique uses
only radio-frequency fields, is independent of the internal
structure of the ion, and therefore can be used for any
type of ion. The ability to increase a trapped plasma's
density and decrease its temperature is important for a
number of experiments including proposals to produce
antihydrogen [12]. A prominent candidate for antihydro-
gen formation is a three-body collision (e'^,e'^,p) whosecross section scales as nlT~'^^^, where «o is the density
and Tihe temperature [12,13].
1050-2947/94/49(5)/3842(12)/$06.00 49 3842 ©1994 The American Physical Society
IN- 149

49 ELECTROSTATIC MODES AS A DIAGNOSTIC IN PENNING- 3843
I. THEORY
A Penning trap [1,5,10,11] confines charged particles
by combining static magnetic and electric fields. Refer-
ring to Fig. 1, a static voltage Vq applied between the
endcaps and ring forms a potential (in spherical coordi-
nates).
<P(r,9,(l>)=Vo 2 C2„(r/rfrP2„(cos6») , (1)
n=0
where Pjn ^rc the Legendre polynomials and C2„ are con-
stants. Here d =r, /a/2 is a characteristic trap size, with
r, the ring's internal radius (for our trap, rf =3.54 mm).The electrode shapes are designed so that the dominantterm in the electrostatic expansion is that labeled by C2.
This results in a potential VQC2[z^-ix^+y^)/2]/2d^which confines the electrons axially in a harmonic well.
In this case, the axial center-of-mass (cm.) motion of the
electrons is the same as that of a single electron and has a
frequency (o^ — ilcjqVQ/md^)^^^ where q/m is the
charge-to-mass ratio. A homogeneous axial magnetic
field Bq is superimposed on this electric potential ensur-
ing radial confinement. In the radial plane the center-of-
mass motion is composed of two superimposed circular
motions: the EXB (or magnetron) motion at frequency
0)^, and the modified cyclotron motion at frequency
a)[=a)c—o)^, where co^=qBQ/m (SI units). In general.
rco: -o)„co'^, and for our experiments, (o„ KKco^ «(o[.
Cryogenic cooling used in this work was capable of re-
ducing the electron temperature to close to 4 K. For the
magnetic fields used here, and with 4 K temperatures, the
cyclotron radius of an electron was small compared with
the distance of closest approach between two electrons.
Under this condition the plasma is strongly magnetized
and the coupling between motion parallel and perpendic-
ular to the magnetic field is weak [14,15]. This may have
resulted in two different temperatures for motion parallel
and perpendicular to the magnetic field. Except for a
possible difference in these temperatures, we assume the
electrons had sufficient time to evolve (due to
electron/electron collisions) to a state of thermal equilib-
rium. In an experiment [16] with electrons with eV ener-
gies, global equilibration times were measured to be
about 1 s at 5o=0.01 T. This time should increase with
larger magnetic fields. It may scale as 5 g or Bq depend-
ing on the conditions of the plasma [16-18]. For our ex-
periment the non-center-of-mass modes were not ob-
served until times greater than 100 s.
Over long times, trapped plasmas have been observed
to undergo a radial expansion resulting in a decrease in
their aspect ratio and density with time and eventual gra-
dual particle loss from the trap as the particles strike the
ring electrode. In the absence of external torques, the to-
tal canonical angular momentum of the plasma is con-
served [19], which places a limit on the radial expansion
and the number of electrons that can be lost from the
trap. Therefore, some external torque is responsible for
this radial transport of particles and energy [20]. For ex-
periments done in high vacuum apparatus (such as used
here), the most likely candidates for this external torque
are azimuthally asymmetric components in the trapping
electric or magnetic fields [14]. Resonant enhancementof this transport rate can occur if the static field asym-metries couple to collective modes [3].
In thermal equilibrium, a cold electron (or ion) plasmawith dimensions much less than those of the Penning-
trap electrodes can be modeled as a uniform density
spheroid which rigidly rotates about z at the rotation fre-
quency co^, with (o^ <(Or<o)'c [3,4,21-23]. The density is
nQ = 2EQmcOr(co^—cOr)/q^ in the plasma interior and falls
off at the plasma boundary over a distance approximately
equal to the Debye length X^ = (zQkT/n^q^)^^^, where k
is Boltzmann's constant, T the temperature, and Zq the
permittivity of free space. For a comparison of experi-
ment with theory, we will assume that the plasma is
sufficiently cold that the Debye length is much smaller
than the cloud dimensions. The plasma frequency (o.,
defined by (oj=q^nQ/mEQ, is related to the rotation fre-
quency by C0p—2o}^(o)^—a)^). The maximum density
occurs for (0^=0)^/2, which is called the Brillouin limit.
The aspect ratio of the plasma, defined by a=Zo/rowith 2zq the cloud length and 2ro its diameter, is a func-
tion of the rotation frequency and therefore the density
[23]. As (0^-^10^/2 (Brillouin limit) the aspect ratio in-
creases to its maximum value. If, in addition, (o^ «cOc'
the cloud is a long cigar shape (prolate spheroid) along z.
For either co^^>-co^ or co^—>-co'^, a decreases and the cloud
becomes a flat pancake shape (oblate spheroid). An exact
expression relating a and co^ is given in Refs. [4] and [23].
For a« 1, this expression can be expanded to first order
in a with the result (Op^co^il +ira/4).
We have neglected the effects of correlations in the
plasma due to the electron/electron Coulomb interaction
[24]. A measure of these correlations is the coupling con-
stant r = q^/{4TreQa^kT), where a^ is the Wigner-Seitz ra-
dius given by 47ra/no/3= 1. For F« 1, the plasma acts
as a weakly interacting gas, so correlations can be ig-
nored. For r> 1, the plasma correlation increases and
the plasma becomes liquidlike. As F further increases,
the plasma crystalUzes into a rotating lattice. In a Pen-
ning trap, the onset of crystallization has been directly
observed using laser-cooled Be^ ions [25]. A similar
crystallization has also been reported in other systems,
for example, in Paul traps [26], electrons on Hquid helium
[27], and, in the high-density limit, electrons in GaAsjunctions [28]. For the work here, r^O.2 was measured
and therefore correlations can be ignored. In general,
even in the presence of spatial correlations, if the
electron/electron spacing is short compared to the wave-
length of the modes, the plasma can be treated as a
constant-density plasma.
The theory of the electrostatic fluid modes of a cold,
constant-density, spheroidal plasma confined by a har-
monic well was solved analytically for some simple cases
in Refs. [3] and [4], and was solved for the general case
by Dubin [2,4]. The theory, appHed at the Brillouin lim-
it, also applies to ion plasmas in the rf or Paul trap [4].
Dubin assumes that the plasma is in thermal equilibrium
and its temperature sufficiently low that pressure effects
can be ignored. In addition he assumes that a^ and X^
TN-150

3844 WEIMER, BOLLINGER, MOORE, AND WINELAND 49
are much less than the plasma dimensions and the wave-length of the modes. By combining the continuity,
momentum, and Poisson's equations, the differential
equation for the electric potential was solved using scaled
spheroidal coordinates. The solutions are a set of modepotentials expressed as products of associated Legendrefunctions P^ and Ql" and a factor e'('"^-"", where
(f)is
the azimuthal angle about the trap axis and a> is the modefrequency. Here / and m are integers which label the
modes, with l>\m\. Without loss of generality, m >0may be assumed and negative frequencies allowed.
As examples of these modes [2-4] the (/,m)= (l,0)
mode is just the axial center-of-mass mode. There are two
(1,1) modes which are just the magnetron and cyclotron
center-of-mass modes, so all the 1 = 1 modes are center-
of-mass modes. The / = 2 modes correspond to quadru-
pole deformations of the plasma shape. For example,
there are two (2,0) modes. Here the plasma shape
remains spheroidal, but the aspect ratio of the spheroid
oscillates in time. The low-frequency (2,0) mode is a
quadrupole oscillation where the axial and radial extents
of the plasma oscillate out of phase with each other. Thehigh-frequency (2,0) mode is similar, except that the axial
and radial extents oscillate in phase as if the plasma were
breathing. The three (2,1) modes are azimuthally asym-
metric modes. For these modes, for small amplitude, the
z axis of the plasma tips and precesses relative to the
magnetic axis. In general, since the mode potential is
proportional to e'""^, modes with m =0 are azimuthally
symmetric while those with m > are azimuthally asym-
metric. The (1,0) and (1,1) modes (center-of-mass modes)
are commonly observed both with electronic and optical
detection. The (2,0) and (2,1) modes have been observed
using optical detection, and excitation of a (2,1) mode by
a static field asymmetry was observed to heat the cloud
[3].
A polynomial equation for the mode eigenfrequencies
in a frame rotating at frequency a>^ is given in Eq. (5.13)
of Ref. [4]. The mode frequencies in the laboratory frame
are related to those in the rotating frame by
ft)/^ ( lab )= £l)/^( rotating )
— m£t)^, where the term mco^ is
due to the Doppler shift. For co^ «(o^ «co^, the modesfall into three frequency ranges: high-frequency modeswith co~o}[, intermediate-frequency modes with o)~co^
(or cOp), and low-frequency modes with co^co^ (or oi^).
Because of our detection technique (described below), the
modes which we detected were the intermediate-
frequency modes. For co^, to^ KKco^ (the case here), they
are magnetized plasma modes [4]. Here we summarizethe w =0 and m = 1 intermediate mode frequencies with
/ —w < 7 in the a« 1 (low-density) limit. This was ob-
tained by solving Eq. (5.13) of Ref. [4] for each value of /
and m, to first order in a in the Hmit co^cOp «co^ [29].
In the laboratory frame
K[^~^^«]\co
k[l-M7ra]^^s.ol
=l^p
'
<y7,oi=
\co„ (2)
'^" [0)p±C0,,
CO,6,ll\(0p±(0, ,
\^l,l\-(^p^(^r .
I'^z^co.-^^Traco,
(Og\C0 ±0), ,
3,0l\Ct)n
and in addition, for completeness,
and to first order in a
i^p^^zi^ + j-n-a],
co, = {(ol/2o},)[l + \7ra] .
The braces and ± signs indicate when there are morethan one intermediate mode frequencies to first order in
a. Notice that for all values of / and m (except for
I —m = 1 ) there are mode frequencies which decrease
with decreasing a. In general, these frequencies occur for
more than one mode; they are degenerate to first order in
a. However, when / —m is odd, there are also mode fre-
quencies that increase with decreasing a. Each of these
frequencies occurs for a single, nondegenerate mode. Thecenter-of-mass modes (1,0) and (1,1) are independent of aand this the density of the cloud. However, (1) anhar-
monic terms in the trapping potential [n > 1 in Eq. (1)],
and (2) image charge shifts, which are neglected in these
expressions, cause the cm. frequencies to depend slightly
on their amplitudes of oscillation as well as the spatial
distribution of the plasma in the trap. As a result of
these effects, as the plasma expands due to radial trans-
port the cm. mode frequencies will shift slightly.
By knowing co^ and identifying and measuring the fre-
quency of any non-center-of-mass mode (or alternatively
by measuring the frequencies of any two non-center-of-
TN-15I
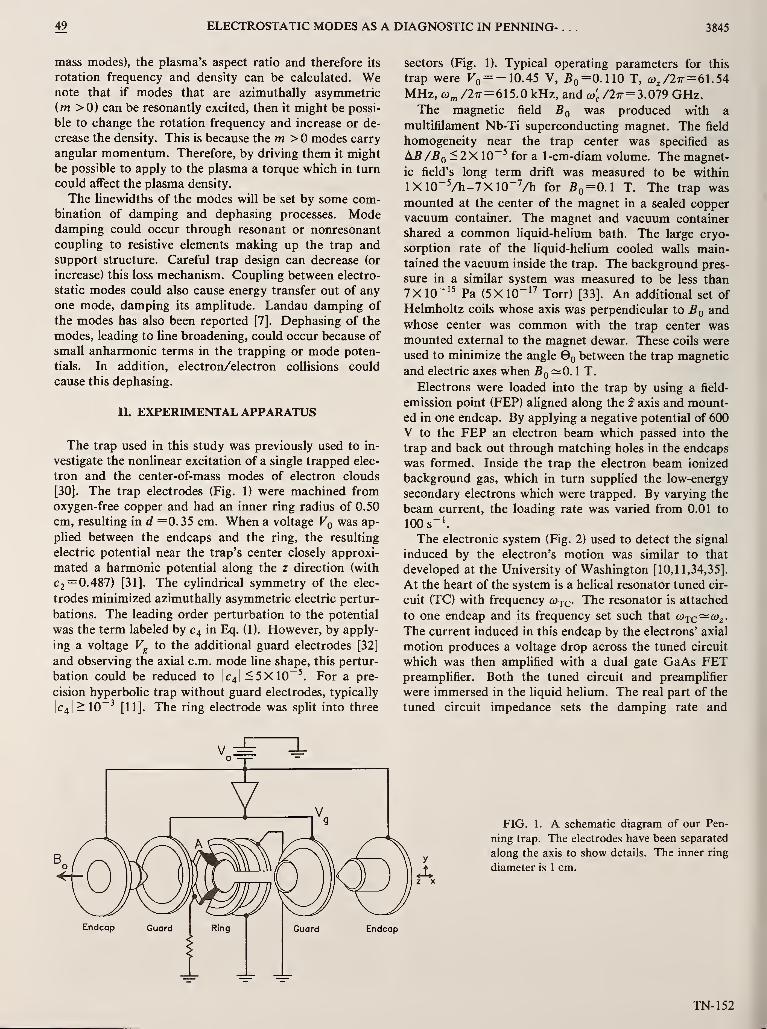
49 ELECTROSTATIC MODES AS A DIAGNOSTIC IN PENNING- . 3845
mass modes), the plasma's aspect ratio and therefore its
rotation frequency and density can be calculated. Wenote that if modes that are azimuthally asymmetric
(m >0) can be resonantly excited, then it might be possi-
ble to change the rotation frequency and increase or de-
crease the density. This is because the m > modes carry
angular momentum. Therefore, by driving them it might
be possible to apply to the plasma a torque which in turn
could affect the plasma density.
The linewidths of the modes will be set by some com-bination of damping and dephasing processes. Modedamping could occur through resonant or nonresonant
coupling to resistive elements making up the trap andsupport structure. Careful trap design can decrease (or
increase) this loss mechanism. Couphng between electro-
static modes could also cause energy transfer out of any
one mode, damping its amplitude. Landau damping of
the modes has also been reported [7]. Dephasing of the
modes, leading to hne broadening, could occur because of
small anharmonic terms in the trapping or mode poten-
tials. In addition, electron/electron collisions could
cause this dephasing.
II. EXPERIMENTAL APPARATUS
The trap used in this study was previously used to in-
vestigate the nonlinear excitation of a single trapped elec-
tron and the center-of-mass modes of electron clouds
[30]. The trap electrodes (Fig. 1) were machined from
oxygen-free copper and had an inner ring radius of 0.50
cm, resulting in d =0.35 cm. When a voltage Vq was ap-
plied between the endcaps and the ring, the resulting
electric potential near the trap's center closely approxi-
mated a harmonic potential along the z direction (with
^2 =0.487) [31]. The cylindrical symmetry of the elec-
trodes minimized azimuthally asymmetric electric pertur-
bations. The leading order perturbation to the potential
was the term labeled by c^ in Eq. (1). However, by apply-
ing a voltage Vg to the additional guard electrodes [32]
and observing the axial cm. mode hne shape, this pertur-
bation could be reduced to |c4l<5X10~^. For a pre-
cision hyperbolic trap without guard electrodes, typically
|c4l>10~^ [11]. The ring electrode was split into three
sectors (Fig. 1). Typical operating parameters for this
trap were Fo = - 10.45 V, ^q =0.1 10 T, co,/2Tr=6l.54
MHz, o)„ /2ir=615.0 kHz, and co'^ /27r=3.079 GHz.The magnetic field Bq was produced with a
multifilament Nb-Ti superconducting magnet. The field
homogeneity near the trap center was specified as
A5 /Bq < 2 X 10~^ for a 1-cm-diam volume. The magnet-
ic field's long term drift was measured to be within
lX10"5/h-7X10"^/h for 5o=0.1 T. The trap wasmounted at the center of the magnet in a sealed coppervacuum container. The magnet and vacuum container
shared a common liquid-helium bath. The large cryo-
sorption rate of the liquid-helium cooled walls main-
tained the vacuum inside the trap. The background pres-
sure in a similar system was measured to be less than7X10"'^ Pa (5X10~'^ Torr) [33]. An additional set of
Helmholtz coils whose axis was perpendicular to Bq andwhose center was common with the trap center wasmounted external to the magnet dewar. These coils wereused to minimize the angle Qq between the trap magnetic
and electric axes when Bq^OAT.Electrons were loaded into the trap by using a field-
emission point (FEP) ahgned along the f axis and mount-
ed in one endcap. By applying a negative potential of 600
V to the FEP an electron beam which passed into the
trap and back out through matching holes in the endcaps
was formed. Inside the trap the electron beam ionized
background gas, which in turn supphed the low-energy
secondary electrons which were trapped. By varying the
beam current, the loading rate was varied from 0.01 to
100s"'.
The electronic system (Fig. 2) used to detect the signal
induced by the electron's motion was similar to that
developed at the University of Washington [10,11,34,35].
At the heart of the system is a helical resonator tuned cir-
cuit (TC) with frequency cojq. The resonator is attached
to one endcap and its frequency set such that cojq^co^.
The current induced in this endcap by the electrons' axial
motion produces a voltage drop across the tuned circuit
which was then amplified with a dual gate GaAs FETpreamplifier. Both the tuned circuit and preamplifier
were immersed in the liquid helium. The real part of the
tuned circuit impedance sets the damping rate and
FIG. 1. A schematic diagram of our Pen-
ning trap. The electrodes have been separated
along the axis to show details. The inner ring
diameter is 1 cm.
Endcap Endcap
IN- 152

3846 WEIMER, BOLLINGER, MOORE, AND WINELAND 49
linewidth of the axial cm. motion [10,11,36]. The axial
cm. Unewidth Aw^ for our experiment was A&j^ =N X 19
s"' for (02=a)jQ, where N was the number of electrons.
Therefore, an estimate for the number of electrons
trapped was made by measuring Aco^. The thermal am-
plitude of the axial cm. motion (and the cyclotron cm.motion via synchrotron radiation) had a characteristic
temperature set by the liquid-helium bath, T =4 K.
Different detection methods were used in this study.
The following is a brief description of each.
1. Noise power. In this detection method the noise in-
duced in the endcap by the electrons' thermal motion was
detected using a spectrum analyzer which acted as a
square-law power detector [34,36]. When this spectrum
analyzer was used to detect noise near the axial cm. fre-
quency, a noise decrease (or "dip") was observed for
co^^cojQ as the electrons short circuited the tuned
circuit's noise voltage [36]. A noise peak occurred for
values of co^ outside of the tuned circuit resonance [36].
The advantage of this detection technique was that it was
passive, requiring no oscillating drive voltages to be ap-
plied to the trap.
A related detection method is sometimes called the
"bolometric" method [6,34,36,37]. In this method, the
spectrum analyzer's local oscillatory frequency is fixed so
that only noise power around co^ is observed. A paramet-
ric drive at 2co^ can be apphed to heat the cloud increas-
ing coUisions and coupUng between the modes. An oscil-
lating drive voltage at frequency coj^co^ can simultane-
ously be appHed to any of the trap electrodes. If the elec-
trons absorb energy at coj, and if some of this energy is
Mixer
FIG. 2. A schematic diagram of the electronic detection sys-
tem used in detecting the electrostatic modes of the electron
plasma. The primary detection method was to look at the noise
induced in one endcap using the spectrum analyzer, with the
voltages at oj and oj^od set to zero amplitude. In addition, the
response of the plasma to the coherent drives coj and co^od was
also detected and recorded by the X-Y recorder. A dynamic sig-
nal analyzer which recorded the fast Fourier transform (FFT) of
the response was used as a diagnostic tool. V^„ is the ser-
vomechanism correction voltage.
coupled through some mechanism to the axial cm.motion at (o^, then an increase in the noise is observed.
2. Coherent. In this method, typically, the electrostat-
ic well is modulated at a frequency (Of^^/2ir=l MHzproducing frequency modulation sidebands on o)^. Asecond drive of frequency coj is then applied to an endcap
with a)J^(02+o)JJ^^. As co^j is swept through resonance
with the sideband (6>^=<y2+a)^od), the electrons' axial
cm. is excited, and this excitation is turn induces a signal
in the other endcap near co^. This signal is then amplified
and phase-sensitively (linearly) detected with a double-
heterodyne receiver [10,11,35]. The modulation allows
the drive to be applied at a frequency different than (Oiq,
thus preventing saturation of the preampHfier. This
method is very sensitive to small coherent changes in the
axial cm. ampHtude.
3. Axial frequency shift. Because of imperfections in
the static trap fields (c2„^0 for « > 1, and Bq not homo-geneous) and because of relativistic effects, the axial cm.motion is sHghtly anharmonic and weakly coupled to the
other degrees of freedom [10,30,38]. As an example, the
axial cm. frequency co^ becomes dependent on the ampH-tude of oscillation of the cm. magnetron motion. If the
magnetron motion is excited, the axial frequency shifts
because of the residual c^ term in the trap potential. For
a change of r^ =0—*r^o i" the magnetron amplitude, the
axial frequency shifts by do)2/co2^3c^r^Q/(2c2d^). Toobserve the axial frequency shift, an electronic ser-
vomechanism is used [10,38]. An axial drive is used to
weakly excite the axial cm. motion. The response to this
drive is then detected and the output of the coherent
phase detector is integrated and added (fedback) to Vq
with the correct sign. This effectively locks the axial fre-
quency, holding it fixed relative to the (synthesized) drive
and modulation frequencies. Any effiect which would
otherwise change the axial cm. frequency is observable
by monitoring the correction signal of the servo.
An additional experimental technique which was inves-
tigated was a parametric mode-coupling technique called
magnetron sideband cooling [10,11,39], which is analo-
gous to laser cooling [40]. It was first reported in experi-
ments involving single electrons at the University of
Washington [10]. The technique is used to reduce the
metastable magnetron cm. ampUtude by parametrically
coupUng this motion to the axial cm. motion which is
damped by its coupHng to the tuned circuit (a)2=6)Tc)-
This parametric coupling is accomplished by applying a
spatially inhomogeneous electric potential of the form
<f>(x,y,z)=VpXZ cos(co2+o)m)t. The magnetron ampli-
tude can be damped to a theoretical Umit given by
r^=2[(co„/(o,){r^)]^^^, where (r^)^^^ is the thermal-
ized axial amplitude. Similarly, the magnetron motion
can be damped through coupling to the cyclotron
motion. Theoretical models of the cooling have not in-
cluded plasma effects [11,39,41], although plasma models
for parametric couphngs between plasma modes might
apply [42]. Evidence that sideband cooling affects the ra-
dial transport rate of a plasma has been found previously,
in that, with the cooling on, cloud lifetimes are extremely
long [33]. However, the effect of sideband cooling on the
IN- 153

49 ELECTROSTATIC MODES AS A DIAGNOSTIC IN PENNING- 3847
aspect ratio and density of a plasma has not been studied
before. For our trap the sideband coohng drive was ap-
phed to the ring sector A. The necessary axial depen-
dence to the drive arose from the different impedances at-
tached to the endcaps.
III. EXPERIMENTAL RESULTS
A. Observation of the modes from the noise power
Detection of the noise power of the induced currents in
one endcap (method 1 above) gave the most definitive re-
sults, so we focused our attention there. After a cloud of
electrons was loaded and the field emitter (and all drives)
turned off, the axial cm. motion with frequency o)^ =6^1 q
could be seen in the noise spectrum (see inset in Fig. 3).
Initially, the frequency of the cm. motion decreased
slightly with time. At a later point in time, noise peaks
began to appear in the noise spectrum (Fig. 3). The fre-
quencies of these noise peaks increased in time, with
some crossing the axial cm. frequency and others ap-
proaching it asymptotically (Fig. 4). If q)^=cojq, so the
axial cm. signal was a noise dip, then as the peaks ap-
proached (o^ they too would change to noise dips, then
back to peaks after the crossing. After the last crossing,
the frequency of the axial cm. mode would begin to in-
crease slightly. Eventually, one by one, the amplitudes of
the peaks decreased until they were no long observable,
with the axial cm. mode typically the last to be seen.
Surprisingly, it was found that the larger the value of IC4I
the smaller the absolute frequency shift of the axial
center of mass.
The number of noise peaks which were observed de-
10
i-
D
OQ.
0)
n
B -
W1.0 t = 150 sB„ = 0.11 TN = 43 000 electrons
t = 1720 s
Tuned Circuit
Frequency Marker
60. B 61.0 61.2 61.4 61.6 61.8 62.0 62.2 62.4
Frequency (MHz)
FIG. 3. The noise spectrum induced in one endcap as seen
by the spectrum analyzer (resolution bandwidth is 10 kHz). Thebroad peak centered at 61.6 MHz is the axial tuned circuit reso-
nance excited by thermal (^4 K) noise. The inset shows the
noise spectrum of a newly loaded cloud (r = 150 s after loading)
in which only the axial center-of-mass mode and tuned circuit
resonance are seen, and with co^ slightly detuned from cojc- In
the main figure the signals from six electrostatic modes includ-
ing the axial center of mass mode can be seen at a later time
(f = 1720 s after loading). Here Bq =0. 1 1 T.
62.4
62.0
61.6
oc<0 61.2
CTVU- 60.8
60.4
- V. ...rrr (2.1)
,.•••••',•••**
...... (4.1)
•;;.... (6.1)
(1.0):-•• '.'.:•.::'.•
(8.1) (1.0)
(3.0)
1
(5.0)
1
(7,0)
1 .1. 1 1
500 1000 1500 2000 2500 3000 3500
Time (seconds)
FIG. 4. A plot of the frequencies of the modes vs time after
the cloud was loaded. The modes are labeled by their (/,/n)
values. These data were taken using a spectrum analyzer and
were from the same data set as in Fig. 3. For these data the
sideband cooling was off and the guard electrode voltage de-
tuned so that |c4l=;4X10~\ The measurement uncertainty in
the frequency is less than the symbol size used in the plot and is
the same for all points.
pended most strongly on the number of electrons in a
cloud. For clouds of 7000 electrons only the cm. signal
and one other peak were observed. For clouds of 70 000
electrons as many as ten peaks besides the axial cm. peak
were observed. The time at which the first additional
noise peak appeared was found to be strongly dependent
on the magnetic-field strength Bq. For Bq = 0.11, 0.25,
and 1.4 T (and for all A?^ between 7000 and 70000) the first
peaks (other than the co^ q= co2 mode, which was seen im-
mediately) appeared at the respective average times 520,
2000, and 15 800 s after loading. The modes were ob-
served as the clouds' aspect ratio decreased below
a ~ 0.02. It was likely that the magnetic-field dependence
was partly due to a slower radial expansion with larger
magnetic fields. Also, the larger magnetic fields should
have produced a more tightly confined electron beamthat was used to load the electrons. This probably result-
ed in an initial cloud of smaller radial dimension.
Figure 4 shows a plot of the frequency of the noise
peaks, including the axial center-of-mass peak, as a func-
tion of the elapsed time after an electron cloud was load-
ed into the trap. As discussed above, the frequency of the
center-of-mass peak decreased slightly for early times
after loading and then increased slightly. The figure
shows two sets of noise peaks: those which asymptotical-
ly approach the axial center-of-mass frequency co^ and
those which asymptotically approach co^+co^. These
peaks can be identified with some of the electrostatic
mode frequencies of Eq. (2) for a pancake shaped (strong-
ly oblate) plasma (a«l). The peaks which asymptoti-
cally approach co^ can only be m =0 modes. The peaks
which asymptotically approach co^+co^ can only be
m =1 modes. In addition to the noise peaks shown in
Fig. 4, some peaks were observed at early times and ap-
peared to be m =2 modes. These modes were only
detected for a brief time which made their identification
uncertain.IN- 154
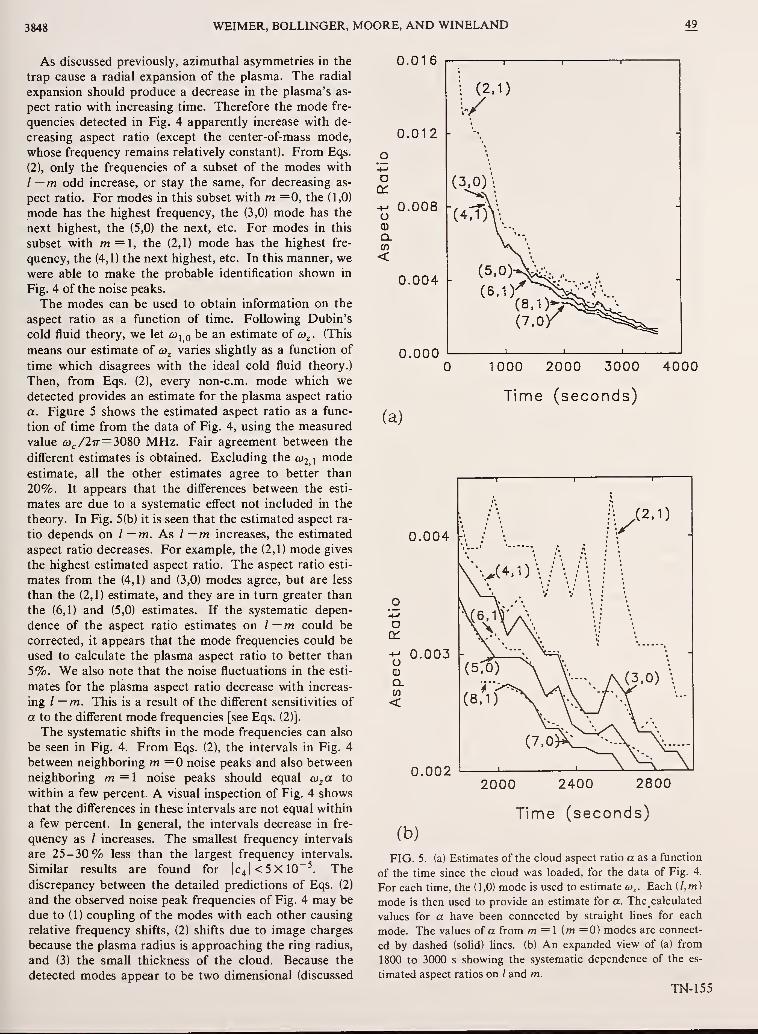
3848 WEIMER, BOLLINGER, MOORE, AND WINELAND 49
As discussed previously, azimuthal asymmetries in the
trap cause a radial expansion of the plasma. The radial
expansion should produce a decrease in the plasma's as-
pect ratio with increasing time. Therefore the mode fre-
quencies detected in Fig. 4 apparently increase with de-
creasing aspect ratio (except the center-of-mass mode,
whose frequency remains relatively constant). From Eqs.
(2), only the frequencies of a subset of the modes with
l—m odd increase, or stay the same, for decreasing as-
pect ratio. For modes in this subset with m — 0, the (1,0)
mode has the highest frequency, the (3,0) mode has the
next highest, the (5,0) the next, etc. For modes in this
subset with m =1, the (2,1) mode has the highest fre-
quency, the (4,1) the next highest, etc. In this manner, wewere able to make the probable identification shown in
Fig. 4 of the noise peaks.
The modes can be used to obtain information on the
aspect ratio as a function of time. Following Dubin's
cold fluid theory, we let co^q be an estimate of co^. (This
means our estimate of co^ varies shghtly as a function of
time which disagrees with the ideal cold fluid theory.)
Then, from Eqs. (2), every non-cm. mode which wedetected provides an estimate for the plasma aspect ratio
a. Figure 5 shows the estimated aspect ratio as a func-
tion of time from the data of Fig. 4, using the measured
value 6j^/27r=3080 MHz. Fair agreement between the
different estimates is obtained. Excluding the CO21 modeestimate, all the other estimates agree to better than
20%. It appears that the differences between the esti-
mates are due to a systematic effect not included in the
theory. In Fig. 5(b) it is seen that the estimated aspect ra-
tio depends on l—m. As l—m increases, the estimated
aspect ratio decreases. For example, the (2,1) mode gives
the highest estimated aspect ratio. The aspect ratio esti-
mates from the (4,1) and (3,0) modes agree, but are less
than the (2,1) estimate, and they are in turn greater than
the (6,1) and (5,0) estimates. If the systematic depen-
dence of the aspect ratio estimates on / —m could be
corrected, it appears that the mode frequencies could be
used to calculate the plasma aspect ratio to better than
5%. We also note that the noise fluctuations in the esti-
mates for the plasma aspect ratio decrease with increas-
ing l—m. This is a result of the different sensitivities of
a to the different mode frequencies [see Eqs. (2)].
The systematic shifts in the mode frequencies can also
be seen in Fig. 4. From Eqs. (2), the intervals in Fig. 4
between neighboring m =0 noise peaks and also between
neighboring m=l noise peaks should equal co^a to
within a few percent. A visual inspection of Fig. 4 shows
that the differences in these intervals are not equal within
a few percent. In general, the intervals decrease in fre-
quency as / increases. The smallest frequency intervals
are 25-30% less than the largest frequency intervals.
Similar results are found for |c4l<5Xl0~^. Thediscrepancy between the detailed predictions of Eqs. (2)
and the observed noise peak frequencies of Fig. 4 may be
due to (1) couphng of the modes with each other causing
relative frequency shifts, (2) shifts due to image charges
because the plasma radius is approaching the ring radius,
and (3) the small thickness of the cloud. Because the
detected modes appear to be two dimensional (discussed
0.016
0.012
Dct:
o0)
<
0.008
0.004
0.0001000 2000 3000
Time (seconds)
4000
(a)
0.004
oa:
o
Q.CO
<
0.003
0.002
1 1
• ' '•
A /(2.1)
V....' •-. .-, i
\^>(4.1)\/\/\ .
•
- \ "> ^^ '•_
(5:0) \ \-....^
M?'°) \
(7^^' 1
v^H;2000 2400 2800
(b)
Time (seconds)
FIG. 5. (a) Estimates of the cloud aspect ratio a as a function
of the time since the cloud was loaded, for the data of Fig. 4.
For each time, the (1,0) mode is used to estimate co,. Each (/,w )
mode is then used to provide an estimate for a. The calculated
values for a have been connected by straight lines for each
mode. The values of a from m =1 (m =0) modes are connect-
ed by dashed (solid) lines, (b) An expanded view of (a) from
1800 to 3000 s showing the systematic dependence of the es-
timated aspect ratios on / and m.
IN- 155
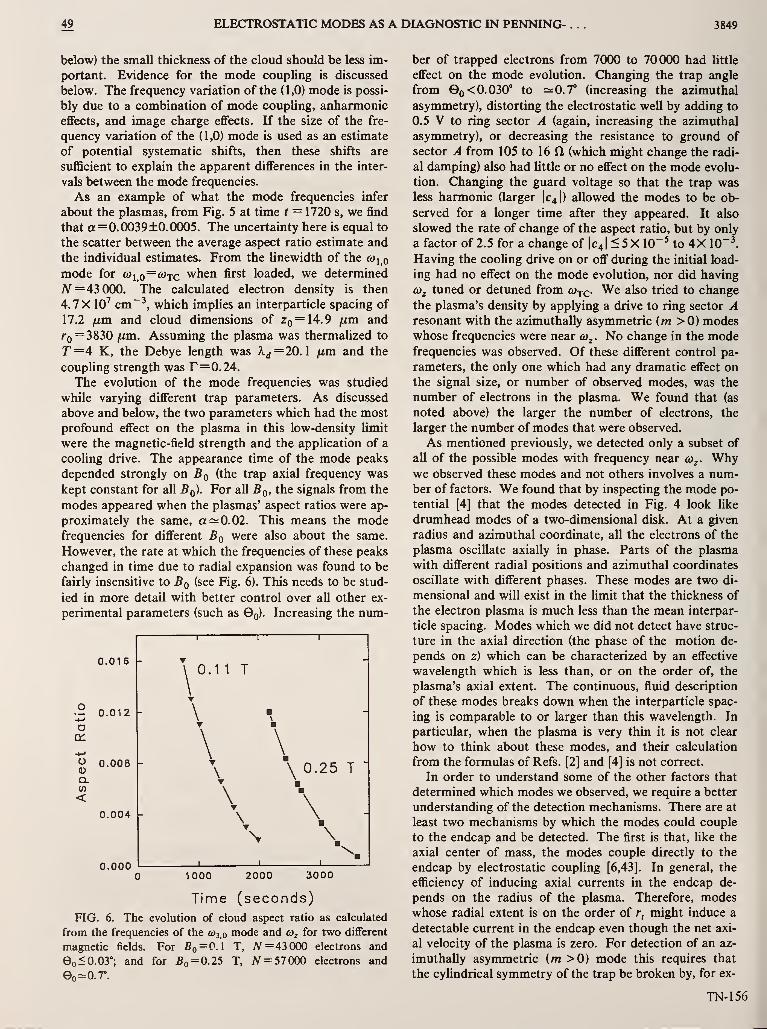
49 ELECTROSTATIC MODES AS A DIAGNOSTIC IN PENNING-
.
3849
below) the small thickness of the cloud should be less im-
portant. Evidence for the mode coupling is discussed
below. The frequency variation of the (1,0) mode is possi-
bly due to a combination of mode coupUng, anharmonic
eflFects, and image charge effects. If the size of the fre-
quency variation of the (1,0) mode is used as an estimate
of potential systematic shifts, then these shifts are
sufficient to explain the apparent differences in the inter-
vals between the mode frequencies.
As an example of what the mode frequencies infer
about the plasmas, from Fig. 5 at time t = 1720 s, we find
that a=0.0039±0.0005. The uncertainty here is equal to
the scatter between the average aspect ratio estimate and
the individual estimates. From the hnewidth of the co^q
mode for 6)],o~^tc when first loaded, we determined
N =43 000. The calculated electron density is then
4.7X 10^ cm~^, which impUes an interparticle spacing of
17.2 jum and cloud dimensions of Zq= \4.9 /xm and
ro= 3830 fitn. Assuming the plasma was thermaUzed to
T=4 K, the Debye length was kj=20.l /xm and the
coupling strength was r=0.24.The evolution of the mode frequencies was studied
while varying different trap parameters. As discussed
above and below, the two parameters which had the most
profound effect on the plasma in this low-density limit
were the magnetic-field strength and the application of a
cooling drive. The appearance time of the mode peaks
depended strongly on ^q (the trap axial frequency was
kept constant for all ^q). For all ^q, the signals from the
modes appeared when the plasmas' aspect ratios were ap-
proximately the same, a ^0.02. This means the modefrequencies for different Bq were also about the same.
However, the rate at which the frequencies of these peaks
changed in time due to radial expansion was found to be
fairly insensitive to Bq (see Fig. 6). This needs to be stud-
ied in more detail with better control over all other ex-
perimental parameters (such as Gq). Increasing the num-
o
-Mo
Cl(0
<
0.016
I 1
^\ 0.11 T-
0.012
T
\T
\
\
\0.008
0.004
T\
\T\
\ 0.25 T"
\ -
n nnn
TXT
1 1
\1
1000 2000 3000
Time (seconds)
FIG. 6. The evolution of cloud aspect ratio as calculated
from the frequencies of the co^o mode and co^ for two diflFerent
magnetic fields. For Bq=OA T, TV =43 000 electrons and
Go<0.03°; and for 5o=0-25 T, iV = 57000 electrons and
00-0. r.
ber of trapped electrons from 7000 to 70000 had little
effect on the mode evolution. Changing the trap angle
from 00 < 0.030° to ==0.7° (increasing the azimuthal
asymmetry), distorting the electrostatic well by adding to
0.5 V to ring sector A (again, increasing the azimuthal
asymmetry), or decreasing the resistance to ground of
sector A from 105 to 16 ft (which might change the radi-
al damping) also had Uttle or no effect on the mode evolu-
tion. Changing the guard voltage so that the trap wasless harmonic (larger IC4I) allowed the modes to be ob-
served for a longer time after they appeared. It also
slowed the rate of change of the aspect ratio, but by only
a factor of 2.5 for a change of IC4I < 5 X 10~' to 4X 10~^
Having the cooUng drive on or off during the initial load-
ing had no effect on the mode evolution, nor did having
6)2 tuned or detuned from cojq. We also tried to change
the plasma's density by applying a drive to ring sector Aresonant with the azimuthally asymmetric (m >0) modeswhose frequencies were near co^ . No change in the modefrequencies was observed. Of these different control pa-
rameters, the only one which had any dramatic effect on
the signal size, or number of observed modes, was the
number of electrons in the plasma. We found that (as
noted above) the larger the number of electrons, the
larger the number of modes that were observed.
As mentioned previously, we detected only a subset of
all of the possible modes with frequency near oy^. Whywe observed these modes and not others involves a num-ber of factors. We found that by inspecting the mode po-
tential [4] that the modes detected in Fig. 4 look hke
drumhead modes of a two-dimensional disk. At a given
radius and azimuthal coordinate, all the electrons of the
plasma oscillate axially in phase. Parts of the plasma
with different radial positions and azimuthal coordinates
oscillate with different phases. These modes are two di-
mensional and will exist in the limit that the thickness of
the electron plasma is much less than the mean interpar-
ticle spacing. Modes which we did not detect have struc-
ture in the axial direction (the phase of the motion de-
pends on z) which can be characterized by an effective
wavelength which is less than, or on the order of, the
plasma's axial extent. The continuous, fluid description
of these modes breaks down when the interparticle spac-
ing is comparable to or larger than this wavelength. In
particular, when the plasma is very thin it is not clear
how to think about these modes, and their calculation
from the formulas of Refs. [2] and [4] is not correct.
In order to understand some of the other factors that
determined which modes we observed, we require a better
understanding of the detection mechanisms. There are at
least two mechanisms by which the modes could couple
to the endcap and be detected. The first is that, like the
axial center of mass, the modes couple directly to the
endcap by electrostatic coupUng [6,43]. In general, the
efficiency of inducing axial currents in the endcap de-
pends on the radius of the plasma. Therefore, modeswhose radial extent is on the order of r, might induce a
detectable current in the endcap even though the net axi-
al velocity of the plasma is zero. For detection of an az-
imuthally asymmetric (m >0) mode this requires that
the cylindrical symmetry of the trap be broken by, for ex-
TN-156

3850 WEIMER, BOLLINGER, MOORE, AND WINELAND 49
ample, a misalignment of the trap's electric and magnetic
axes [44].
A second coupling mechanism for detection would be
that the modes couple directly to the axial cm. mode,
which in turn couples to the endcap. This coupling could
be by field asymmetries or mediated by image currents in-
duced in the electrodes. For an ideal trap, small plasma
size, and low mode excitation, all the modes are indepen-
dent and therefore there would be no such coupling be-
tween the modes. However, Fig. 7 shows a narrow fre-
quency span as the frequencies of two of the modes inter-
sect that of the axial cm. The (2,1) mode forms an an-
ticrossing (or avoided crossing) with the axial center-of-
mass mode; the mode frequencies never overlap. This is a
general characteristic of two coupled oscillators [45].
Further evidence of the mode coupling was observed in
the mode linewidths. Modes with frequencies diflFerent
from co^ by more than 150 kHz had full width at half
maximum (FWHM) hnewidths less than 10 kHz. These
linewidths were observed to increase as the mode fre-
200
Frequency (MHz)FIG. 7. A series of noise spectra (as in Fig. 3) of a cloud of
20000 electrons (with IC4I <5X10~^ 5o=0.11 T) showing an
avoided crossing between the axial center-of-mass mode and the
CO21 mode (plus an avoided crossing of an unidentified mode at
f«380 s). As the modes approach each other they couple to-
gether resulting in the mode frequencies never becoming equal.
The modes were identified by observing their behavior after the
cloud was first loaded and also their asymptotic behavior for
long times. The resolution bandwidth is 10 kHz.
quencies approached co^, as would be expected since the
axial center-of-mass linewidth was larger.
These two detection mechanisms are not completely in-
dependent, making it difficult for us to differentiate be-
tween them. In addition, we might observe the modesthrough a combination of the two mechanisms. Addi-tional evidence comes from the fact that we did not
detect the m = 1 subset of modes whose frequencies wentas (o^—a>^~k(l)a, where k(l) is a constant which de-
pends on / [see Eq. (2)]. This was true for both
(0^—0)^ ^cojQ and co^ ~oi^ <oiic- These modes have the
same mode potential as the subset of modes whose fre-
quencies went as co^+co^—kil)a, which we did detect.
However, this subset of modes which we did detect
crossed or had a small detuning from co^, while the others
did not. Another important factor was that, when wepurposely increased the trap azimuthal asymmetry (as
discussed above), the signal size and number of observed
m —\ modes did not noticeably increase. Also, when weincreased IC4I we were able to observe all the modes for a
longer time. Together, these observations imply that cou-
pling to the axial cm. mode might have been the moreimportant detection mechanism for us.
B. Effect of sideband cooling
The eflFects of sideband cooling were studied by first
loading a cloud and allowing it to evolve to the point
where some of the other modes besides the axial cm.mode were observed. Then a strong sideband cooling
drive was applied with frequency co^+co„ (for co^^cojq).
After a few seconds, all the modes other than the cm.mode disappeared. In addition, the cm. mode frequency
was back to its initial loading value. If the drive was then
turned off, the other modes reappeared in approximately
the same time, and in the same order, as a newly loaded
cloud. This process was found to be very repeatable.
Each time after the strong cooling drive was applied, the
mode frequencies evolved at the same time and rate as
that of a newly loaded cloud, except that the time was
measured from when the drive was turned oflF. Thus,
after each time the cooling was applied, the plasma densi-
ty was reset back to the same value. Electrons were lost
only when the cloud was allowed to expand radially until
they struck the ring electrode before the cooling drive
was applied. The point at which electrons began to be
lost was consistent with the ring electrode radius being
equal to the cloud radius as calculated from the mode fre-
quencies. A typical drive strength to observe the eflFect of
the sideband cooling drive was F^ /Fg ^ 10""* at ring sec-
tor A for 10000 electrons and 5o=0. 1 T, where V^ is
the voltage on A. Similar results were found for the
diflFerent magnetic fields used, as well as with the cooling
drive applied at frequency coj—co^+lto^ with a larger
drive amplitude. With a weak coohng drive on continu-
ously, additional modes were observed in the noise spec-
trum but they were not positively identified.
From these observations we conclude that the sideband
cooling not only can stop radial expansion, but can re-
verse it by increasing the rotation frequency, and thus the
aspect ratio and density, of the cloud. The rotation fre-
quency was increased to approximately the same value as
IN- 157

49 ELECTROSTATIC MODES AS A DIAGNOSTIC IN PENNING- . . . 3851
the loading value. Applying the drive after the cloud ex-
panded increased the aspect ratio by more than a factor
of 20 from a < 0. 00 1 to a > 0. 02. For our conditions this
impUes an increase in the density of >3%. The mecha-
nism for this compression of the cloud and what deter-
mines the Umit to that compression are not known. Onepossibility is that the parametric coupling directly
reduces the magnetron center-of-mass ampUtude just as
for a single electron. Then, anharmonic terms in the
trapping potential might couple the magnetron cm.mode to other non-cm. modes [36] resulting in a
compression. A second possible mechanism is that the
parametric drive directly couples some other azimuthally
asymmetric mode whose frequency is close to <y^ (Uke
the lower frequency coj^i mode) to the axial center-of-
mass mode. The coohng would then proceed until the az-
imuthally asymmetric mode frequency had shifted awayfrom the resonance condition as the plasma density in-
creased. Both of these mechanisms are possible in that
we observed: (1) apparent electrostatic coupling between
cm. and azimuthally asymmetric non-cm. modes (see
Fig. 7) and (2) parametric coupling between a cm. and an
azimuthally asymmetric non-cm. mode (discussed
below).
C. Alternate detection methods
Detection of non-cm. modes was also possible using
the other techniques discussed in Sec. II. The"bolometric" technique (described in method 1 above)
did not detect any modes, but it was not thoroughly test-
ed. However, by using coherent detection (method 2
above) some of the modes were detected. Figure 8 shows
the output of the phase-sensitive detector when the drive
frequency was swept through (d^+cOj^^^. Two modes be-
sides the axial cm. mode are seen in the figure. This
demonstrates that not only can we detect these modescoherently, but also that we can excite them with exter-
nal drives.
Figure 9 shows the servo correction voltage in the axial
frequency shift detection method (method 3 of above).
Here the axial cm. frequency was kept fixed by the ser-
vomechanism while a drive was applied to ring sector A.
For 5o=0. 1 T, a resonance appeared when the drive fre-
quency was between ~ 1(X) and 500 kHz, and the reso-
nance had a dispersive line shape. As time increased, this
resonant frequency increased, always staying below oi^.
The resonance was very repeatable from cloud to cloud
and was observable on clouds with as few as 300 elec-
trons. As the drive strength was increased, the line shape
became hysteretic, depending on the direction that the
drive frequency was swept and the amplitude of the drive.
Evidence for the origin of this resonance was found
when we simultaneously detected both the noise spec-
trum (method 1) and the axial frequency shift (method 3).
We found that the resonant frequency of the dispersive
resonance occurred at exactly the measured diflFerence
frequency between fu^^^i.o ^"*^ ^2,1 for ^^^ the time the
resonance could be observed. However, this dispersive
resonance could be observed only after the (02^ , mode had
crossed over a>^. Apparently the drive was capable of
parametrically coupling together the (2,1) mode and the
J I I I I L
3 61.4 61.5 61.6 61.7 61.8 61.9
Frequency (MHz)FIG. 8. Data taken using coherent detection (method 2 in the
text) with (o^^o^xc and a detection bandwidth of 10 Hz. The
axial potential well was modulated at £iJn,od/27r= 1 MHz. Acoherent drive applied to one endcap was swept across
o>2 + (o^ad 2nd the response detected phase sensitively in the ab-
sorptive mode. These data were taken for Bq—0.\\ T,
A'^=26000 electrons, and IC4I <5X 10~'. The signals from the
axial center-of-mass plus two other modes can be seen.
axial cm. mode, similar to magnetron sideband cooling.
This was done either directly by the parametric electric
field or indirectly through the field's modulating the
coherent axial motion necessary for the detection. This
mode coupling might also explain the dispersive Une
shape since, as the modes become more strongly coupled
, i
3 -
2 -
NX
1
•4-*
H-
Ic(/)
VHB -1
X< -2
-3 -
-4540 580550 560 570
Frequency (kHz)
FIG. 9. The detection of the coi^ \ mode by monitoring the
correction voltage to the locked axial center-of-mass frequency
when a spatially inhomogeneous drive was applied through ring
sector A and its frequency swept through coi^^—co^ (method 3 in
the text). These data were taken for 5o =0. 1 1 T, A^ = 3000 elec-
trons, IC4I < 5 X 10~^ and (o„ /2it=615 kHz. The arrows show
the direction of the sweep. The hysteresis in this dispersive reso-
nance can be seen. For sufficiently hard drives, the axial fre-
quency could be shifted by much more than its linewidth.
TN-158I

3852 WEIMER, BOLLINGER, MOORE, AND WINELAND 49
together by the field, the modes would form an avoided
crossing [45]. Our detecting just the frequency of the axi-
al cm. mode, while varying the coupling by sweeping the
drive frequency, would result in a dispersive line shape.
This line shape would become more hysteretic the
stronger the coupling strength.
IV. DISCUSSION AND CONCLUSIONS
We have shown that it is possible to detect the electro-
static modes of a pure electron plasma in a Penning trap
using nondestructive electronic methods. We detected
several azimuthally symmetric and asymmetric modes in
the low-density limit where the plasma approaches a
two-dimensional charged disk. We observed these modes
in the low-density limit because the noise power detection
technique which we primarily used is facihtated by the
mode frequencies being close to the axial center-of-mass
frequency. This occurs for the intermediate frequency
modes when the plasma density is low. We found that
the frequencies of these modes fit Dubin's theoretical
model [2,4] reasonably well. Also, we found that wecould excite these modes directly with external drives,
and in addition, by parametrically coupling modes to-
gether. The observation of these modes allowed the rota-
tion frequency, shape, and density of the plasma to be
determined. From auxiliary measurements of the elec-
tron number, we could then determine the plasma size.
The detection techniques demonstrated here should workfor any type of non-neutral trapped plasma, and should
be applicable to the detection of modes other than the in-
termediate frequency modes. Other modes might also be
detectable with a different geometry of electrodes to act
as induced current detectors. The modes observed here
may correspond to some of the features reported by Bar-
low [6], but a comparison is difficult because of
differences in the detection.
In studying these modes we also observed behavior
which departed from Dubin's model. This included a
time dependence to the axial center-of-mass mode fre-
quency due in part to the plasma radial expansion in an
anharmonic trap. Also, we observed coupling between
the axial center-of-mass mode and other modes evi-
denced, primarily, by avoided crossing behavior as their
frequencies became degenerate. It is likely that this cou-
pling is one cause for the deviations between observed
and predicted mode frequencies, and will have to be stud-
ied further in order to get a more complete picture of the
plasmas' characteristics. In addition, in comparing our
data with Dubin's theory we found there to be a sys-
tematic shift in our measured aspect ratios as a function
of / —m where ( /,m ) is the mode used to determine the
aspect ratio. To be able to measure plasma aspect ratios
to much better than 20% will require this systematic
effect to be understood and corrected for.
We also demonstrated that the parametric coupling
technique called magnetron sideband cooling, which cou-
ples the magnetron and axial center-of-mass motions, not
only stops the radial expansion of the plasma, but actual-
ly compresses the plasma increasing its density. Themechanism for this compression needs to be found in
hopes of achieving higher densities with this technique.
An interesting test would be to look for compression by
sideband cooling when the coupling is between the mag-
netron and cyclotron motions. The ability to control the
density without requiring optical methods might open
new avenues for the study of cold non-neutral plasmas in
Penning traps.
This study leaves a number of issues to be investigated.
While the origin for the coupling between modes might
be related to static electric field asymmetries, this needs
to be studied further. Also, the mechanisms by which the
modes are detected need not be positively identified. Adetailed study of the signal amplitudes and linewidths of
the modes would be a helpful first step towards solving
these problems. A detailed study of the hnewidths might
also yield information on electron/electron collisions in
trapped plasmas. If trapped, strongly coupled electron
plasmas could be achieved, then these mode linewidths
might be a measure of spatial correlations in the plasma.
For example, in experiments on electrons localized near
the surface of liquid heHum, it has been demonstrated
that the linewidth of shear wave resonances depended on
r [46]. Similar results have been predicted for the elec-
trostatic mode linewidths discussed here [47].
One important plasma parameter which we could not
easily control was the plasma temperature T. Other
groups have controlled their ion and electron plasmas'
temperatures by introducing a buffer gas (e.g., Refs. [7],
[43], and [48]). This has the disadvantages of applying an
external torque on the cloud causing it to expand, being
limited to temperatures greater than 4 K, and introduc-
ing what can be undesirable ion/neutral collisions
affecting the physics to be studied. The problem of radial
expansion due to the torque apphed by the buffer gas can
be eliminated by applying simultaneously a sideband
cooling drive [48]. However, as noted in the introduc-
tion, there is also interesting physics to be studied for
temperatures less than 4 K. Two methods which allow
temperature control of the plasma for T < 4 K are using
a dilution refrigerator, or sympathetic coohng by laser-
cooled ions [49]. While both these methods are practical,
they suffer from being expensive and difficult to imple-
ment. However, with advances in space-borne ^He
liquefiers, a liquefier well suited for cryogenic ion trap ex-
periments has been developed [50]. These liquefiers act
as both refrigerator and thermal isolator allowing the
temperature to be varied within the range 0.3 to 30 K.
While such a device would not give the lowest achievable
temperature, it would give a useful control parameter.
ACKNOWLEDGMENTS
We gratefully acknowledge the support of ONR for
this work. We would like to thank Dan Dubin for his
help on the mode theory. We would also like to thank
Steve Jefferts, Joseph Tan, and Matt Young for their
comments on the manuscript.
IN- 159

49 ELECTROSTATIC MODES AS A DIAGNOSTIC IN PENNING- . . . 3853
[1] For reviews see Fred L. Walls and Gordon H. Dunn,
Phys. Today 27 (8), 30 (1974); Phys. Scr. T22, 21 (1988);
Int. J. Mass. Spectrom. Ion Proc. 106, 1 (1991); J. Mod.
Opt. 39, 193 (1992); Phys. Scr. 46, 255 (1992); 46, 544
(1992); Hyperfine Interact. 76, 3 (1993); D.A. Church,
Phys. Rep. 228, 253 (1993); R. Thompson, Adv. At. Mol.
Phys. 31, 253 (1993).
[2] Daniel H. E. Dubin, Phys. Rev. Lett. 66, 2076 (1991).
[3] D. J. Heinzen, J. J. Bollinger, F. L. Moore, Wayne M.
Itano, and D. J. Wineland, Phys. Rev. Lett. 66, 2080
(1991).
[4] J. J. Bollinger, D. J. Heinzen, F. L. Moore, W. M. Itano,
D. J. Wineland, and D. H. E. Dubin, Phys. Rev. A 48, 525
(1993).
[5] J. H. Malmberg and J. S. deGrassie, Phys. Rev. Lett. 35,
577 (1975); A. J. Peurrung and J. Fajans, Rev. Sci. In-
strum. 64, 52(1993).
[6] Stephan Barlow, Ph.D. thesis. University of Colorado,
1984 (unpublished).
[7] M. D. Tinkle, R. G. Greaves, C. M. Surko, R. L. Spencer,
and G. W. Mason, Phys. Rev. Lett. 72, 352 (1994).
[8] D. J. Wineland, R.E. Drullinger, and F. L. Walls, Phys.
Rev. Lett. 40, 1639 (1978); Wayne M. Itano, L. R. Brewer,
D. J. Larson, and D. J. Wineland, Phys. Rev. A 38, 5698
(1988).
[9] D. L. Eggleston, T. M. O'Neil, and J. H. Malmberg, Phys.
Rev. Lett. 53,982(1984).
[10] Robert S. Van Dyck, Jr., Paul B. Schwinberg, and H. G.
Dehmelt, in New Frontiers in High Energy Physics, edited
by Behram Kursunoglu, Arnold Perlmutter, and Linda F.
Scott (Plenum, New York, 1978).
[11] Lowell S. Brown and Gerald Gabrielse, Rev. Mod. Phys.
58,233(1986).
[12] G. Gabrielse, S. L. Ralston, L. Haarsma, and W. Kells,
Phys. Lett. A 129, 38(1988).
[13] Michael E. Glinsky and Thomas M. O'Neil, Phys. Fluids
6 3,1279(1991).
[14] A. W. Hyatt, C. F. Driscoll, and J. H. Malmberg, Phys.
Rev. Lett. 59, 2975 (1987).
[15] M. E. Glinsky, T. M. O'Neil, M. N. Rosenbluth, K.
Tsurata, and S. Ichimaru, Phys. Fluids B 4, 1 156 (1992).
[16] C. F. Driscoll, J. H. Malmberg, and K. S. Fine, Phys. Rev.
Lett. 60, 1290(1988).
[17] T. M. O'Neil, Phys.Rev. Lett. 55, 943 (1985).
[18] D. H. E. Dubin and T. M. O'Neil, Phys. Rev. Lett. 60,
1286(1988).
[19] T. M. O'Neil, Phys. Fluids 23, 2216 (1980).
[20] J. S. deGrassie and J. H. Malmberg, Phys. Fluids 23, 63
(1980); C. F. Driscoll and J. H. Malmberg, Phys. Rev.
Lett. 50, 167 (1983).
[21] S. A. Prasad and T. M. O'Neil, Phys. Fluids 22, 278
(1979).
[22] J. B. Jeifries, S. E. Barlow, and G. H. Dunn, Int. J. Mass.
Spectrom. Ion Proc. 54, 169 (1983).
[23] L. R. Brewer, J.D. Prestage, J. J. Bollinger, Wayne M.Itano, D. J. Larson, and D. J. Wineland, Phys. Rev. A 38,
859(1988).
[24] J. H. Malmberg and T. M. O'Neil, Phys. Rev. Lett. 39,
1333 (1977).
[25] S. L. Gilbert, J. J. BolHnger, and D. J. Wineland, Phys.
Rev. Lett. 60, 2022 (1988).
[26] F. Diedrich, E. Peik, J. M. Chen, W. Quint, and H. Walth-
er, Phys. Rev. Lett. 59, 2931 (1987); D. J. Wineland, J. C.
Bergquist, Wayne M. Itano, J. J. Bollinger, and C. H.
Manney, ibid. 59, 2935 (1987); Th. Sauter, M. Gilhaus, I.
Siemers, R. Blatt, W. Neuhauser, and P. E. Toschek, Z.
Phys. D 10, 153 (1988); G. Birkl, S. Kassner, and H.
Walther, Nature 357, 310 (1992).
[27] C. C. Grimes and G. Adams, Phys. Rev. Lett. 42, 795
(1979).
[28] Anil Khurana, Phys. Today 14 (12), 17 (1990).
[29] Dr. D. H. E. Dubin has calculated a closed-form solution
for the modes in this limit.
[30] Carl S. Weimer, F. L. Moore, and D. J. Wineland, Phys.
Rev. Lett. 70, 2553 (1993).
[31] Earl C. Beaty, J. Appl.Phys. 61, 2118 (1987).
[32] R. S. Van Dyck, Jr., D. J. Wineland, P. A. Ekstrom, andH. G. Dehmelt, Appl. Phys. Lett. 28, 446 (1976).
[33] G. Gabrielse, X. Fei, L. A. Orozco, R. L. Tjoelker, J.
Haas, H. KaUnowsky, T. A. Trainor, and W. Kells, Phys.
Rev. Lett. 65, 1317(1990).
[34] H. G. Dehmeh and F. L. Walls, Phys. Rev. Lett. 21, 127
(1968).
[35] D. Wineland, P. Ekstrom, and H. Dehmelt, Phys. Rev.
Lett. 31, 1279(1973).
[36] D. J. Wineland and H. G. Dehmelt, J. Appl. Phys. 46, 919
(1975).
[37] R. S. Van Dyck, Jr., F. L. Moore, D. L. Famham, P. B.
Schwinberg, and H. G. Dehmelt, Phys. Rev. A 36, 3455
(1987); J. Tan and G. Gabrielse, Phys. Rev. Lett. 67, 3090
(1991).
[38] F. L. Moore, L. S. Brown, D. L. Franham, S. Jeon, P. B.
Schwinberg, and R. S. Van Dyck, Jr., Phys. Rev. A 46,
2653 (1992).
[39] D. Wineland and H. Dehmelt, Int. J. Mass Spectrom. Ion
Phys. 16, 338 (1975); Erratum 19, 251 (1976).
[40] D. J. Wineland and W. M. Itano, Phys. Rev. A 20, 1521
(1979).
[41] D. J. Wineland, J. Appl. Phys. 50, 2528 (1979); Carl S.
Weimer, Ph.D. thesis, Colorado State University, 1992
(unpublished).
[42] John David Crawford and T. M. O'Neil, Phys. Fluids 30,
2076(1987).
[43] S. E. Barlow, J. A. Luine, and G. H. Dunn, Int. J. Mass
Spectrom. Ion Proc. 74,97(1986).
[44] G. W. Hart, Phys. Fluids B 3, 2987 (1991); T. B. Mitchell,
Ph.D. thesis, University of California at San Diego, 1993
(unpublished).
[45] Claude Cohen-Tannoudji, Metrologia 13, 161 (1977);
Claude Cohen-Tannoudji, Bernard Diu, and Franck
Laloe, Quantum Mechanics I (Wiley, New York, 1977),
pp. 405-411; Eric A. Cornell, Robert WeisskofT, Kevin
Boyce, and David E. Pritchard, Phys. Rev. A 41, 312
(1990).
[46] G. Deville, A. Valdos, E. Y. Andrei, and F. I. B. Williams,
Phys. Rev. Lett. 53, 588 (1984).
[47] D. H. E. Dubin, in Strongly Coupled Plasma Physics, edit-
ed by H. M. Van Horn and S. Ichimara (University of Ro-
chester Press, Rochester, 1993), pp. 399-406.
[48] G. Savard, St. Becker, G. Bollen, H. J. Kluge, R. B.
Moore, Th. Otto, L. Schweikhard, H. Stolzenberg, and U.
Wiess, Phys. Lett. A 158, 247 (1991).
[49] D. J. Larson, J. C. Bergquist, J. J. Bollinger, Wayne M.Itano, and D. J. Wineland, Phys. Rev. Lett. 57, 70 (1986);
D. J. Wineland C. S. Weimer, and J. J. BolHnger,
Hyperfine Interac. 76, 115 (1993).
[50] Franco Pavese and Danilo Ferri, in Advances in Cryogenic
Engineering, edited by R. W. Fast (Plenum, New York,
1990), Vol. 35.
IN- 160

Volume 75, Number 23 PHYSICAL REVIEW LETTERS 4 December 1995
Long-Range Order in Laser-Cooled, Atomic-Ion Wigner Crystals Observed byBragg Scattering
Joseph N. Tan, J.J. Bollinger, B. Jelenkovic,* and D.J. Wineland
Time and Frequency Division, National Institute of Standards and Technology, Boulder, Colorado 80303(Received 26 June 1995)
We report the first observation of Bragg scattering from atomic ions confined in an electromagnetic
trap. The results reveal long-range order and give evidence for bulk behavior in a strongly coupled
collection of laser-cooled ^Be"^ ions in a Penning trap. Long-range order emerges in approximately
spherical clouds with as few as 5 X 10"* ions (cloud radius ro = 37a where a = Wigner-Seitz radius).
Bulk behavior is evident with 2.7 X 10^ trapped ions (ro = 65a), with Bragg scattering patterns
characteristic of a body-centered cubic lattice.
PACS numbers: 32.80.Pj, 52.25.Wz
Systems of crystallized charged particles have gained
wide interest, with implications for the pure Coulomb sys-
tems of one-component plasmas [1], trapped atomic ions
[1-3], ion storage rings [4], and dense astrophysical matter
[5], and for the shielded Coulomb systems of colloidal sus-
pensions [6] and dusty plasmas [7]. For example, Paul rf
traps have been used to study crystallization and melting of
small "Coulomb clusters" [8]. In both the rf and Penning
traps, cold ions form shell structures when the dimensions
of the system exceed a few interparticle spacings [9,10].
Such transitions of Coulomb fluids into crystal-like struc-
tures are examples of Wigner crystallization in the clas-
sical regime (i.e., the wave functions of the particles do
not overlap). However, the pure Coulomb systems real-
ized so far are not large enough to neglect surface effects
and hence do not allow observation of infinite-volume or
bulk behavior [11]. For example, the "micromotion" of
ions in the rf trap, which generates the trapping potential,
can cause heating which limits the smallest dimension of
laser-cooled ion collections to a few interparticle spacings
[3]. The drawback of the Penning trap (which uses static
trapping fields) vis-a-vis the rf trap is that the ions rotate
about the trap magnetic field— this has hindered imaging
of the ion crystals as seen in Paul traps [3,8,10]. However,
the Penning trap, which has no micromotion heating, can
potentially store very large systems of laser-cooled ions
and hence was used in the studies here.
In related works, optical lattices formed by the interfer-
ence of intersecting laser beams have been used to localize
and cool neutral atoms [12,13]. Unlike the ion Wigner
crystals, optical lattices are not formed by the interaction
of the confined atoms; rather, they conform to the periodic
confinement wells created by the laser standing waves.
Also, trapped ions differ from systems of colloidal suspen-
sions and dusty plasmas in that the ions interact through
a pure Coulomb (rather than a Yukawa-type) potential,
and the charges (q) and masses (m) of the particles are
identical.
A system of ions confined in a Penning trap (hereafter
called an "ion cloud") is an example of a one-component
plasma (OCP) [1]. A OCP is a system of identical
charged particles that is neutralized by a uniform-density
background of opposite charge. The thermodynamic
properties of an ion OCP are fully characterized by the
coupling parameter
^2
r s 1
(1)477 60 aksT
'
the ratio of the nearest-neighbor Coulomb interaction
energy to the thermal energy (ksT) of an ion. The
Wigner-Seitz radius a, a measure of the interparticle
spacing, is defined by 47ra^no/3 = 1, where «o is the
density of the neutralizing background (which is formally
equivalent to the confinement fields in ion traps), and is
equal to the ion density at low temperatures [1]. Anunbounded OCP is predicted to exhibit liquidlike behavior
for r > 2 and undergo a liquid-solid phase transition to
a bcc lattice at T = 172 [14]. The OCP has become one
of the most carefully studied models in statistical physics
because the interaction is simple and because of its
importance in understanding dense astrophysical plasmas
[5]. In contrast to the growing number of theoretical
works, there are few laboratory systems to test the models.
Until now, only shell structures have been observed with
A'^ < 1.5 X 10"^ ions in a Penning trap [9], and in a race-
track rf trap [3,10]. This shell phase can be viewed as
arising from the strong influence of the curved surface
of a small cloud [11]. Simulation studies show that the
ions in each shell form distorted (2D) hexagonal lattices,
exhibiting short-range order with little correlation between
shells [4,15].
We report here the first observation of Bragg scatter-
ing from laser-cooled ions in a trap [16]. In ion clouds
with all dimensions much larger than the Wigner-Seitz
radius, we find interesting departures from the earlier
observed shell phase [9]. Shell structures are still ob-
served with N < 2 X 10* ions (or radii ro < 27a for
spherical clouds). Long-range order emerges with as few
as // ~ 5 X 10"* ions (ro = 37a). We show that for
N ^ 2.1 X 10^ ions (ro = 65a) the Bragg scattering pat-
4198
TN-161

Volume 75, Number 23 PHYSICAL REVIEW LETTERS 4 December 1995
tern is consistent with a bcc lattice. The ion crystals are
estimated to be >150 /xm (~20a) long on a side.
Theoretical estimates indicate that /-q S 50a is required
for bulk behavior [11,17]. We have built a large Penning
trap wherein clouds with N < 2.1 X 10^ ions (ro ^ 65a)
and r values as high as 600 have been attained. The
trap is formed by a 127 mm long stack of cylindrical
electrodes with 40.6 mm inner diameter, in a 10~^ Pa
vacuum. A NMR superconductive magnet provides a
uniform magnetic field (Bq = 4.5 T) parallel to the trap
axis (z axis), confining the ions in orbits around this axis
(cyclotron frequency of (1/277- = qBo/m = 7.55 MHz).
A static electric field, generated by applying Vq = 1 kVbetween the end and central electrodes, confines the ions
along the z axis near the center (z = 0) of the trap (a
single ion oscillates at o),/2tt = 795 kHz).
The trapped ^Be"*" ions are cooled by a laser beampropagating along the z axis (Fig. 1) and are optically
pumped into the 25^5i/2(A// = -^.My = —2) state by
tuning the laser frequency (A = 313 nm) slightly below
the 2s^S\/2{—2>2)~^^P^P^/2{~2^~7) resonance fre-
quency [2]. A laser-cooled ion cloud first condenses into
a bounded fluid state (a liquid drop). In a Penning trap
with quadratic potential and negligible image charge ef-
fects, a laser-cooled ion cloud forms a uniform density
spheroid bounded by {x^ + y^)/rj + z^/z] — 1 (for a
spherical cloud, Ts "= Zs — ^0) [18]. The residual ther-
mal motions are superimposed upon a rigid rotation of the
ion cloud about the z axis. The aspect ratio a = Zs/rs
of the spheroid varies with its rigid rotation frequency Wr
[18,19]. A laser beam directed normal to the z axis (not
shown in Fig. 1 and turned off during the Bragg scatter-
ing) can exert a torque and change ojr within 40.8 kHz <<jjr/2TT < 7.51 MHz, thus controlling the shape and den-
sity of the cloud [18]. An //5 imaging system along the
Polarizer 2 ^i
1^^ photocathode
'Lens 2
aperture A
photocathode
A
»LeDsl
'beam deflector
\hPolarizer 1 -*
\
laser beam
1 Pemiing trap
vacuum envelope
FIG. 1. Schematic diagram (not to scale) for detection of
Bragg scattering from an ion cloud, shown as a small prolate
spheroid, inside a Penning trap. An //5 imaging system (left)
monitors the shape of the cloud, thereby giving the ion density.
The diffraction pattern is relayed to the upper photocathode,
filtered by a small aperture (A) and crossed polarizers, as
described in the text.
X axis, with a laser beam along the z axis (beam waist
~ 0.4 mm S Tj, power ~200 /xW), gives a side-view im-
age of the ion cloud, thus monitoring Zs and Tj which, in
turn, yields a, a, (Or, no, and A^ [18].
Bragg scattering is used to study the spatial correlations
because the rigid rotation of the ion cloud makes it
difficult to image a crystal lattice. The photons resonantly
scattered by the ions interfere to form Bragg-scattering
peaks at certain angles determined by the crystal lattice.
Because A/a ~ 0.04, the diffraction pattern occurs very
close to the laser beam direction (Fig. 1), within about
0. 1 rad. Since the ions scatter far fewer photons than the
vacuum windows, special care is needed to minimize this
potentially strong background.
As shown in Fig. 1 (not to scale), the laser beam (k, =27rz/A) propagates first through a linear polarizer 1,
and then into the vacuum chamber. Upon exiting the
ion trap, the laser beam is diverted away from the
detector by a set of mirrors. The photons scattered by
the ions (k^ = 27rkj/A) are collected by lens 1 (/ =19 cm, z = 25.5 cm from the ions), forming an image
of the ion cloud at a small aperture (A) to reduce the
background. The diffraction pattern is then relayed by
lens 2 (/ = 24 cm) to the photocathode of a photon-
counting imager (z = 160 cm). The linear polarizer 2
is inserted after the aperture. The polarization axes
of polarizers 1 and 2 are crossed to attenuate, with
extinction ratio ^ 6 X 10^, the stray light that leaks
through the small aperture and has the same polarization
as polarizer 1. The photons scattered from the ions,
however, are attenuated only by a factor of 2 since they
are mainly circularly polarized.
The Bragg scattering from ion clouds with A^ S 5 XlO'* ions (ro S 37a) exhibits long-range order charac-
teristic of a crystal. Because of the ion cloud rotation
{cor /27r ~ 10^ Hz), the dots in a crystalline Laue pat-
tern are rotated into rings. (A ring pattern will also be
produced by a crystalline powder or fluid.) Figure 2(a)
gives an example of a Bragg scattering pattern obtained
with N = 2J X 10^ trapped ions with long-range order.
The circular intensity maxima are Bragg peaks, with radii
inversely proportional to the Wigner-Seitz radius a. Tofacilitate analysis, a differential scattering cross section
is generated from each diffraction pattern by averaging
the photon counts azimuthally about the z axis, as il-
lustrated in Fig. 2(b). A density-independent plot is ob-
tained by using the dimensionless parameter A^a, where
Ak is the length of the vector Ak = k, — k^. This can
be compared with the interference function [20] or the
static structure factor SiAka) calculated for various sys-
tems. For incoherent scattering, 5(A/:a) = 1. The short
correlation lengths (~a) of the fluid and shell phases
are reflected in their SiAka), shown in Fig. 2(c) [21],
which have only one strong, narrow peak. In contrast.
Fig. 2(b) has four strong, narrow peaks indicating the
presence of a crystal. Similar diffraction patterns for
4199
TN-162

Volume 75, Number 23 PHYSICAL REVIEW LETTERS 4 December 1995
solid = supercooled fluid f = 1000
dotted = shell structure F > 500
15.0
FIG. 2(color). Observed Bragg scattering from N = 2.1 X10^ ions (a) and (b) compared with the S(^ka) calculated for
a supercooled fluid and an TV = 5 X 10^ ion cloud with shells
(c) [21]. The diffraction pattern ions (a) is partially blocked,
as indicated by a rectangular shadow due to the laser beamdeflector and a square shadow due to a wire mech. The color
scale is logarithmic. The total flux reaching the detector is
= 1 X 10* photons/s but is attenuated to avoid saturating the
photocathode. The field of view subtends a 5.4° scattering
angle from the z axis. The differential cross section (b) is
obtained by azimuthally averaging (a) about the z axis.
N > 5 X 10** ions (ro > 37a) have been obtained with
up to nine narrow Bragg peaks. Such long-range order
is not observed every time we cooled an ion cloud. In
this case, if a crystal was formed, the reason it was not
observed may be that some crystal orientations did not
produce Bragg peaks.
The crystal structure may be determined from the
positions of the Bragg peaks [22]. For an unbounded
OCP the minimum-energy structure is a body-centered
cubic (bcc) lattice [14]. However, there are metastable
structures with slightly higher energies, such as the face-
centered cubic (fee) and the hexagonal close-packed
(hep) lattices [11.23]. In a bounded ion cloud, residual
surface effects may determine which structure dominates.
An analysis of data from a cloud with N Si 2.7 x10"' ions (ro == 65a) shows that the diffraction patterns
are consistent with a bcc lattice. Figure 3(a), the evidence
of bulk behavior, shows a histogram of the number of
observed Bragg peaks (not intensity) as a function of
\ka. constructed with no adjustable parameters from
14 diffraction patterns obtained from the same ion cloud
(/V = 2.7 X lO"" ions) with various Wigner-Seitz radii
(20 < a/ A < 27). Typically the ion cloud was heated
and recooled several times between each recorded pattern.
1 2 3 4 5 6 7 8 9 10 11 12 13 14 15
best-fit Aka
FIG. 3. Evidence of bulk behavior in an ion OCP. Histogram(a) counts the number of observed peaks (not intensity) fromvarious diffraction patterns of the same cloud (A' = 2.7 x10^ ions), with no adjustable parameters (a is determined fromthe observed a). By fitting to the bcc lattice for the Wigner-Seitz radius a, even the high Aka peaks are observed to be
consistent with a bcc lattice (b). The ticks indicate the location
of Bragg peaks for various lattice types.
The scatter of the peak positions in Fig. 3(a) is consistent
with the ~5% uncertainty in the determination of the
Wigner-Seitz radius a from the observed value of the
aspect ratio a. This uncertainty also makes comparison
with known lattices difficult for Aka > 10, where the
density of Bragg peaks is higher. However, for Aka <10, the bcc lattice is the best match to the observed
patterns. Having identified the lattice, we can also
determine the Wigner-Seitz radius a by fitting each
pattern to the calculated bcc peaks. With these fitted
values of a, the histogram Fig. 3(b) matches the bcc
lattice very well even as far as Aka ~ 14.
The minimum size of the ion crystals can be esti-
mated from the intensity widths of the Bragg peaks [see
Fig. 2(b)]. For a perfect crystal of characteristic length
L. the finite-size broadening of the Bragg peaks is esti-
mated by the formula L == A/A, where A is the angular
FWHM of the Bragg peak [24]. We find that, on average,
A ~ 2 mrad. This gives L ~ 150 /im (~20a). With the
typical density («o ~ 5 X 10^/cm^), this corresponds to a
few thousand ions per crystal. This is a lower limit since
the observed widths can be instrumentally broadened, as
suggested by the small change in A with A^.
The relative intensity of the Bragg peaks indicates
that the ions do not freeze into a "powdered" sample of
randomly oriented crystals. For example, in some cases,
peaks expected in such a powder pattern are missing.
The crystallized region may be surrounded by at least
=20 shells on the cloud surface (based on a simulation
with 2 X 10"* ions) [25]. For a cloud with 2.7 x 10^
ions these boundary shells contain about 2.3 X 10^ ions.
4200
TN-I63

Volume 75, Number 23 PHYSICAL REVIEW LETTERS 4 December 1995
The scattering from the shells may contribute to the size
of the first Bragg peaks, but will produce a fairly flat
background [SiAka) ~ 1] for the other peaks. As shown
in Fig. 2(b), the Bragg peaks are superimposed upon a
broad background. Many of the observed Bragg peaks
are often as large as, if not a few times larger than, the
background. If these are Bragg peaks from a single crystal,
the crystal must contain A^ ~ 10"* ions (for L ~ 240 /xm
or 35a on a side) in order to produce peak intensities
greater than the background due to 2.3 X 10^ ions.
In the future, we hope to remove the averaging due to
the rigid rotation by stroboscopic detection of the Bragg
scattering. This could be useful in determining whether
the ions form more than one crystal. It may reveal other
types of crystals in the ion OCP. Quasicrystals, for exam-
ple, would produce a fivefold azimuthal symmetry in the
diffraction pattern [26]. The uncertainty in Wigner-Seitz
radius a can be reduced by measuring (Or directly [18].
This work is supported by the Office of Naval Re-
search. We acknowledge useful and stimulating discus-
sions with D. H. E. Dubin, J. P. Schiffer, H. E. DeWitt, and
S. Ichimaru. We thank J. P. Schiffer for providing simu-
lation data of shell structure, D. H. E. Dubin for providing
calculations of SiAka) from shells and OCP fluids, and S.
Ichimaru for permission to reproduce the fluidlike S{Aka)
[plotted in Fig. 2(c)]. We thank S. Gilbert, S. Jefferts,
H. J. M. Hanley and M. Young for useful comments on
the manuscript.
*0n leave from the Institute of Physics, University of
Belgrade, Yugoslavia.
[1] J.H. Malmberg and T.M. O'Neil, Phys. Rev. Lett. 39,
1333 (1977).
[2] J. J. Bollinger and D. J. Wineland, Phys. Rev. Lett. 53, 348
(1993).
[3] H. Walther, Adv. At. Opt. Phys. 31, 137 (1993).
[4] A. Rahman and J. P. Schiffer, Phys. Rev. Lett. 57, 1133
(1986); J. P. Schiffer, Phys. Rev. Lett. 61, 1843 (1988);
D. Habs, Max-Planck Institut fur Kemphysik, Heidelberg,
Report No. MPI H-1987-V10, 1987 (unpublished).
[5] S. Ogata and S, Ichimaru, Astrophys. J. 361, 511 (1990);
T. Strohmayer et ai, Astrophys. J. 375, 679 (1991).
[6] N. A. Clark, A.J. Hurd, and B.J. Ackerson, Nature
(London) 281, 57 (1979); C.A. Murray, W.O. Sprenger,
and R.A. Weak, Phys. Rev. B 42, 688 (1990); L.B. Chenet ai, Phys. Rev. Lett. 69, 688 (1992).
[7] J.H. Chu and Lin I. Phys. Rev. Leu. 72. 4009 (1994);
H. Thomas, G. E. Morfill, V. Demmel, and J. Goree, Phys.
Rev. Lett. 73, 652 (1994).
[8] R.F. Wuerker et ai, J. Appl. Phys. 30, 342 (1959);
F. Diedrich et al, Phys. Rev. Lett. 59, 2931 (1987); D.J.
Wineland et al. Phys. Rev. Le«. 59, 2935 (1987).
[9] S.L. Gilbert, J.J. Bollinger, and D.J. Wineland, Phys.
Rev. Lett. 60, 2022(1988).
[10] G. Birkl, S. Kassner, and H. Walther, Nature (London)
357,310(1992).
[11] D. H. E. Dubin. Phys. Rev. A 40, 1 140 (1989).
[12] P. Verkerk et al, Phys. Rev. Leu. 68, 3861 (1992);
P.S. Jessen et ai. Phys. Rev. LeU. 69, 49 (1992);
A. Hemmerich and T. W. Hansch, Phys. Rev. Lett. 70,
410(1993).
[13] D.R. Meacher et ai, Phys. Rev, Lett. 74, 1958 (1995).
and references therein.
[14] W.L. Slattery, G.D. Doolen, and H.E. DeWitt, Phys.' Rev. A 26, 2255 (1982); D.H.E. Dubin. Phys. Rev. A
42, 4972 (1990).
[15] D.H.E. Dubin and T. M. O'Neil, Phys. Rev. Lett. 60. 51
1
(1988); R.W. Hasse and J. P. Schiffer, Ann. Phys. (N.Y.)
203,419(1990).
[16] Some preliminary results are in J.N. Tan et ai. Non-
neutral Plasma Physics II, edited by J. Fajans and D. H. E.
Dubin (AIP Press, New York, 1995), p. 215.
[17] R.W. Hasse and V.V. Avilov, Phys. Rev. A 44, 4506
(1991).
[18] J.J. Bollinger et at., Phys. Rev. A 54, 525 (1993).
[19] L.R. Brewer et ai, Phys. Rev. A 38, 859 (1988).
[20] A. Guinier, X-Ray Diffraction in Crystals, Imperfect
Crystals, and Amorphous Bodies (Dover Publications,
Inc., New York, 1994), p. 29.
[21] The supercooled fluid S(Aka), calculated for an un-
bounded system with F = 1000. is from Fig. 6(b) in
S. Ichimaru et al, Phys. Rep. 149, 91 (1987). The shell
phase S(Aka) is calculated from simulation data for an
N = 5000 spherical cloud and F > 500, received from
J. P. Schiffer. Similar shells S(Aka) have been calculated
by D. H. E. Dubin.
[22] N.W. Ashcroft and N.D. Mermin, Solid State Physics
(Holt, Reinhart, and Winston, Philadelphia, 1976), pp.
104-107.
[23] S. Ogata. Phys. Rev. A 45, 1122 (1992).
[24] Guinier (Ref. [20]), pp. 125-130.
[25] J. P. Schiffer, in Non-neutral Plasma II, edited by J. Fajans
and D.H.E. Dubin (AIP. New York, 1995), p. 191.
[26] M. V. Jaric, Phys. Rev. B 34, 4685 (1986); S. Ogata and
S. Ichimaru, Phys. Rev. A 39, 1333 (1989); H.C. Jeong
and P.J. Steinhardt, Phys. Rev. Lett. 73, 1943 (1994).
4201
TN-164

OBSERVATION OF LONG-RANGE ORDER IN TRAPPED IONPLASMAS BY BRAGG SCATTERING^
JOSEPH N. TAN, JJ. BOLLINGER, B. JELENKOVIC*, WAYNEM. ITANO, and D.J. WINELAND
National Institute of Standards and Technology
325 Broadway, Boulder, CO 80303
ABSTRACTWe have detected long-range order (crystal lattices) in atomic ions confined in a
Penning trap. The crystals were observed by the Bragg scattering of nearly resonant
laser light at small (1-5°) scattering angles. Long-range order was observed in
approximately spherical plasmas with as few as 5x10'' ions (plasma radius ro«37awswhere aws = Wigner-Seitz radius). With 2.7x10^ trapped ions (ro«65aws), Bragg
scattering patterns were obtained that were consistent with a body-centered cubic lattice.
1. Introduction
Charged particles in a trap form a realistic model of a classical one-component
plasma (OCP). For example, in a Penning trap under conditions of thermal equilibrium
the trapping fields provide a uniform background of opposite charge. ' With Doppler
laser-cooling on trapped ions, temperatures of a few millikelvins can be obtained with
densities greater than 10* cm'^ which results in couplings T = q^/(4xeoawskBT) > 250.^'^
Here q is the ion charge, e^ is the permittivity of the vacuum, aws is the Wigner-Seitz
radius, kg is Boltzmann's constant, and T is the ion temperature. These couplings are
larger than the predicted liquid-solid phase transition (F— 172)'* for an infinite OCP and
enable trapped ion plasmas to be used to study strongly coupled one-component plasmas.
However, in the trapped ion experiments to date, the boundary and relatively small size
of the ion plasmas have strongly affected the observed spatial correlations. In plasmas
where the smallest dimension is only a few interparticle spacings, the ions form curved
shells which approximately conform with the boundary of the plasma. ^"^ These shell
structures have been observed with imaging techniques in both the Penning and rf
traps.*"^°
In this manuscript we describe some recent experiments on approximately
spherical plasmas of up to 4.7x10^ Be"*" ions whose dimensions are large compared to
aws- Through Bragg scattering we occasionally observe the presence of long-range order
or crystal lattices in the ion plasmas. Crystal lattices have been observed in the shielded
Coulomb systems of colloidal suspensions" and dusty plasmas'^. However, we believe
this is the first observation'^ of crystal lattices in a pure Coulomb strongly coupled
^ork of the US Government; not subject to US copyright
'On leave from the Institute of Physics, University of Belgrade, Yugoslavia
TN-165

plasma. We use the Penning trap in this work because it permits dimensionally large
plasmas to be laser-cooled. The Penning trap'"* uses a uniform, static magnetic field to
confine ions in directions perpendicular to the magnetic field. A static electric field is
used to confine ions in the direction parallel to the magnetic field. Due to the axial
magnetic field and the radial electric field in a Penning trap, the ion plasma rotates about
the magnetic field axis of the trap. The plasma rotation makes it difficult to directly
image the ions in a crystal. However, Bragg scattering can still be used to observe the
crystals. In the final section of this manuscript we also discuss a time-resolved
experiment where the Bragg scattering signal is used to measure the plasma rotation
frequency.
In an infinite, homogeneous one-component plasma, the body-centered cubic
(bcc), face-centered cubic (fee), and hexagonal close-packed (hep) lattices have the same
Madelung energy within 1 part in 10'', with the bcc lattice the energetically favored
configuration.^^ For a finite system, the surface energy and details of the boundary also
determine the energetically favored configuration. Dubin^^ considered a zero-temperature
model which was infinite and homogeneous in two dimensions but bounded and confined
in the third direction by a quadratic potential. He found that if the system was greater
than ~ 60 lattice planes (in the bounded direction), a bcc-like structure was the minimumenergy configuration. However, with less than 60 lattice planes the minimum energy
configuration depended sensitively on the exact number of lattice planes. This calculation
indicates that a trapped ion plasma may need to be larger than 60 lattice spacings along
its smallest dimension to exhibit behavior which is not strongly influenced by the plasma
boundary. A different analytical method developed by Hasse gives a comparable
prediction.'^ With a spacing of — LSa^s between typical low order lattice planes,'^ a
spherical plasma with a diameter of 60xl.5aws consists of ^9x10"* ions. We have
observed long-range order (crystals) in approximately spherical plasmas with greater than
5x10"* ions. With 2.7x10^ ions, the observed Bragg scattering pattern was
predominantly consistent with a bcc lattice, the expected infinite volume structure.
2. Experimental Set-up
Figure 1 shows a sketch of our experimental set-up. The Penning trap is formed
by a 127 mm stack of cylindrical electrodes with 40.6 mm inner diameter, in a 10* Pa
vacuum (133 Pa = 1 Torr). A superconductive magnet provides a uniform magnetic
field (B„=4.5 T) parallel to the symmetry axis (^Be"^ cyclotron frequency of
fi/27r=qBo/m=7.55 MHz, where m is the ion mass). The static electric field is
generated by applying Vo=l kV between the end and central electrodes of the trap (a
single ion oscillates at 00^/27r= 795 kHz).
The trapped ^Be"^ ions are laser-cooled and optically pumped into the
2s^S,^(Mi=-3/2, Mj = -l/2) state by tuning the laser frequency (X«313 nm) slightly
below the 2s2S,^(-3/2,-l/2) -* 2p%2(-3/2, -3/2) resonance frequency.^''* A laser-
cooled ion plasma in thermal equilibrium forms a uniform density plasma (number
density nj with sharp boundaries. In a Penning trap with quadratic potential ($ =
TN-166

polarizer 2 >
aperture A
photocathode
lens 1
'beam deflector
I
polarizer 1
laser beam
Pemiing trap
vacuum envelope
Figure 1. Schematic diagram (not to scale) of the
experimental set-up for detection of the Bragg scattering as
described in the text.
m(j}^[2z^-T^y[2q]) and in which
image charge effects from the trap
electrodes are negligible, the
boundary is a spheroid given by
(x^+y^)/T,^ + z^lz^ = 1 (for a
spherical plasma r,= z, = rJ . The
residual thermal motions of the
ions are superimposed upon a
rigid rotation of the plasma about
the magnetic field axis (z-axis) at
a frequency oj^. The aspect ratio
0L = zJi^ of the spheroid varies
with cOf.^^''^ A laser beam directed
normal to the z-axis (not shown in
Fig. 1 and turned off during the
Bragg scattering) can exert a
torque that changes co^ within 40.8
kHz < co,/(2x) < 7.51 MHz,thus controlling the shape and
density of the plasma.'^ An f/5 imaging system along an axis perpendicular to the z-axis,
with a laser beam along the z-axis (beam waist— 0.4 mm, power— 200 jwW), gives a
side-view image of the ion plasma, thus monitoring z^ and r^, which, in turn, yield a., w^,
"oj ^wsj and the number N of trapped ions.^^ Typical values for these parameters in the
work described here are a—l, Wr/(27r)~125 kHz, no~'4xl0^ aws~8.4 ^m. (The
measurement of w^ and therefore most of these parameters is significantly improved by
an autocorrelation measurement of the Bragg-scattered light described in the last section.)
The laser beam along the z-axis in Fig. 1 is used both to laser-cool the ions and
also to perform the Bragg scattering. Because X/aws ^ 0.04, the diffraction pattern
occurs at small angles (a few degrees) relative to the initial beam direction. The main
purpose of the Bragg scattering apparatus in Fig. 1 is to detect the light scattered at small
angles by the ions while hiding from the forward-scattered light from the vacuum
windows. The incident laser beam (ki=2'7rz/X) first passes through linear polarizer 1,
and then into the vacuum chamber. Upon exiting the ion trap, the laser beam is diverted
away from the detector by a set of mirrors. The photons scattered by the ions
(k3= (2x/X)(i^) are collected by lens 1 (f=19 cm, z=25.5 cm from the ions), forming an
image of the ions at a small aperture (A) to reduce the background. The diffraction
pattern is then relayed by lens 2 (f«24 cm) to the photocathode of a photon-counting
imaging tube (z~160 cm). Linear polarizer 2 is inserted after the aperture. The
polarization axes of polarizers 1 and 2 are crossed to attenuate, with extinction ratio >10^, stray light which leaks through the small aperture and has the same polarization as
polarizer 1. The photons from the ions are attenuated by only a factor of 2 since they
are mainly circularly polarized. The angular acceptance of the system is limited by lens
1 to be +5.4°. For plasmas of a few hundred thousand ions, the ion fluorescence is
TN-167

strong enough that it was necessary to insert a 10-20 dB attenuator in front of the photon-
counting imaging tube.
3. Bragg Scattering Results
The following procedure was typically used in obtaining a Bragg scattering
pattern. First, the perpendicular (to the z-axis) laser beam was used to set the density
and aspect ratio of the cloud. Typical densities were n^- 4 x 10^ cm'^ with aspect ratios
close to spherical (between 0.5 and 2). The perpendicular beam was then blocked and
the parallel beam unblocked with its frequency well below atomic resonance where little
scattering takes place. The frequency of the parallel beam was then increased to near
resonance and a Bragg scattering pattern was recorded. The laser frequency was then
detuned and increased again (or perhaps the laser was blocked and then unblocked) and
another pattern was recorded. The expansion of the plasma was slow enough that this
process could be repeated many times before the perpendicular beam was used to reset
the plasma density and aspect ratio. On some occasions we observed Bragg scattering
patterns that consisted of several sharp rings such as shown in Fig. 2a. Patterns like this
with up to 9 narrow rings were observed with as few as N= 6x10'^ trapped ions. Thecircular intensity maxima in Fig. 2a are Bragg peaks. The radius of a Bragg peak is
inversely proportional to aws, a fact which was verified by changing the Wigner-Seitz
radius using laser torque. Figure 2b is a differential scattering cross section generated
from Fig. 2a by averaging the photon counts azimuthally about the z-axis (the laser beamaxis which is normal to the figure). Figure 2b is qualitatively different from the static
structure factor S(q) in Fig. 2c for the quenched OCP fluid and shell structure, ^° both of
which exhibit short range order characteristic of a fluid. Here q=|k-k^
|=(4'7r/X)sin(0/2)
where 6 is the scattering angle. The fluid-like patterns have only one strong narrow
peak. In contrast. Fig. 2b has 4 narrow peaks which indicate the formation of a crystal
lattice. As mentioned earlier, such long-range order was not observed every time wecooled an ion plasma. We have not determined whether this was because a crystal had
not formed or a crystal had formed but was not observed (because, for example, the
crystal orientation did not produce Bragg peaks).
In order to compare the Bragg peak positions with the calculated positions for the
bcc, fee and hep lattices, the radii of the Bragg rings must be calibrated in terms of the
scattering angle. This was done for a set of 14 diffraction patterns which were obtained
on a plasma of 2.7x10-^ ions. For each pattern, aws was determined with about 5%uncertainty from the measured a. Figure 3a shows a histrogram of the number of
observed Bragg peaks as a function of qa^s- For qa^s < 10, the histogram shows 5
groups of peaks. These groups are consistent with a bcc lattice but not an fee lattice.
(They are also nominally consistent with a subset of hep peaks, but if many hep crystals
were forming randomly, we would expect to see more groups or at least broader groups
of peaks.) Comparison of the groups of peaks with different calculated Bragg peaks for
qav/s > 10 is limited by the uncertainty in the determination of aws- However, if aws is
determined by fitting each diffraction pattern used in Fig. 3a to the calculated bcc peaks.
TN-168

we see from Fig. 3b that with 2.7 x 10^ trapped ions the Bragg peaks are consistent with
a bcc lattice even as far as qaws— 14.
A lower limit on the size of the ion crystals can be obtained from the widths of
the Bragg peaks as observed in Fig. 2b. A crystal with dimension L has a Bragg-peak
width of A - X/L, where A is the angular FWHM of the Bragg peak. We find that, on
;(c)
CO
» I
II—r—I—I—[-
-I—I—I r
solid = supercooled fluid r = 1000
dotted = shell structure F > 500
0.0 2.5 5.0 7.5 10.0 12.5 15.0
ws
Figure 2. (a) Bragg scattering pattern observed from 2.7 x 10' ions showing the presence of a crystal(s).
The diffraction pattern is partially blocked by a rectangular shadow due to the laser beam deflector and a
square shadow due to a wire mesh, (b) Differential cross-section obtained from an azimuthal average of
(a) about the z-axis. (c) Fluid-like S(q) calculated for a super-cooled OCP and an N= 5xlO^ ion cloud
with shells.^
TN-169

average, A — 2 mrad, which gives L— 150 /xm (~20aws) and a few thousand ions per
crystal. This is a lower limit, since the observed widths could be instrumentally
broadened. The negligible change measured in A with N supports such broadening. In
addition, the intensity in the Bragg peaks increased with N, which indicates that the
crystal size is growing with the number of trapped ions. The crystallized region is
probably surrounded by at least -20 shells (based on a simulation with 2x10^ ions).^^
For a plasma with 2.7x10^ ions, this corresponds to about 2.3x10^ ions or a large
fraction of the total plasma in these boundary shell layers. The positions of these ions
are correlated only over a few interparticle spacings and may be the source of the
background signal in Fig. 2b. If the peaks in Fig. 2b are due to Bragg scattering off a
single crystal, we estimate that the crystal must contain — IC ions in order to produce
peak intensities greater than the uncorrelated background due to 2.3x10^ ions.
14 15
1 2 3 4 5 6 7 8 9 10 11 12 13 14 15
best-fit qaw
Figure 3. The number of observed peaks (not intensity) from 14 diffraction patterns with N= 2.7xl0^
ions. In (a) there are no adjustable parameters (a^s is determined from the observed a). In (b), a^s is
determined by fitting the diffraction patterns used in (a) to a bcc lattice. The ticks indicate the location of
Bragg peaks for the simple cubic, hep, fee, and bcc lattices.
TN-1701

4. Time-Resolved Experiments
The Bragg scattering pattern from a single, stationary crystal consists of dots (a
Laue pattern). In our experiment the crystal rotates (o)J(It) — 125 kHz) about the
magnetic field axis (which is aligned with the laser beam axis to within 0.5°). This
rotation turns the Laue pattern of dots into rings. At any given point on a ring, the light
intensity should be modulated at the rotation frequency or a multiple of the rotation
frequency if the ring consists of more than one dot. The experimental set-up in Fig. 1
was modified to look for a time dependence of the Bragg-scattered light. The camera
in Fig. 1 was replaced with a mirror which made a 45° angle with respect to the laser
beam axis (the z-axis). The mirror had a small hole drilled parallel to the z-axis which
could be positioned on one of the Bragg rings. The light which passed through this hole
was detected by a photomultiplier tube. A pulse from the photomultiplier triggered a
multichannel scaler. The multichannel scaler then measured the arrival times of
photomultiplier pulses for —0.5 ms after the trigger. The Bragg scattering pattern
reflected from the 45° mirror was re-imaged onto the camera.
Figure 4a shows an example of an autocorrelation pattern obtained on the first
ring from a plasma of 4.7 x 10^ trapped ions. The pattern indicates that the ring consists
of 4 equally spaced dots of unequal intensity. From the side-view image of the plasma,
27r/cOr is determined within — 15%, which unambiguously identifies the period of the
autocorrelation pattern. However, a strong autocorrelation signal can be used to improve
the measurement of w, to —0.1% with less than 10 s of averaging. The output of the
phototube was also used to "trigger" the camera recording the Bragg-scattered light. Apulse from the phototube would enable the position of a photon to be recorded if it
arrived within a window (duration much less than 2x/cOr) that was a fixed delay after the
photomultiplier pulse. Figure 4b shows the gated image that was recorded
simultaneously with the autocorrelation pattern in Fig. 4a. The gated Laue pattern
provides more information for determining the crystal type and the crystal orientation
relative to the laser beam. So far most, but not all, of the Laue patterns we have
observed are consistent with a single crystal.
The data in Fig. 4 can be understood as Bragg scattering off a single bcc or fee
crystal as follows. First, Bragg scattering is observed at small (1-5°) scattering angles.
This means that the planes which give rise to Bragg-scattered light are nearly vertical
(parallel to the z-axis). Second, a Bragg ring with momentum transfer q will persist over
an angular change in crystal orientation of — (27r/L)/q. For low-order planes, q— (2'7r/a),
where a is the lattice constant (a[bcc] =2.03aws; a[fcc] =2.56aws)- For our small crystals,
this means the crystal can be tilted with respect to the z-axis over a range a/L— 0.1 rad
or 5° and still give rise to the same Bragg peak. This means a low order, nearly vertical
plane will produce two Laue dots separated by 180°. The four equally spaced dots
making up the first Bragg ring in Fig. 4 are therefore produced by two vertical planes
which are 90°from each other. This rules out the hep lattice as a possibility; however
the planes could be bcc 110 planes or fee 200 planes where the laser beam is
approximately aligned with a 4-fold symmetry axis of the cubic cell. The rest of the
TN-171

c0)
c
(a)
1200
900
600
300
10 20 30
Time (^s)
. '<{W{'-t ":.
,
40
- • -^ »i;>- '>4^'S{;,.' -.k^-i^. . - ,. '*^
i'V
4 •
^ • " i'C
(b) • •=:s-''-
'•"
Figure 4. (a) Autocorrelation pattern and (b) gated image simultaneously obtained on 4.7x10^ trapped
ions. The photomultiplier tube was sampling counts from the first ring.
Laue pattern in Fig. 4b is consistent with this interpretation. To distinguish between bcc
and fee in this case, an absolute angular calibration of the rings must be done. We are
doing this with the time resolved set-up as well as analyzing other Laue patterns. This
will enable us to check with increased confidence that the lattice most frequently formed
with a few hundred thousand trapped ions is bcc.
5. Acknowledgements
We gratefully acknowledge the support of the US Office of Naval Research. Weacknowledge stimulating discussions with D.H.E. Dubin, J. P. Schiffer, H.E. DeWitt,
TN-172

and S. Ichimaru. We thank J, P. Schiffer for providing simulation data of shell structure,
D.H.E. Dubin for providing calculations of S(q) from shells and OCP fluids, and S.
Ichimaru for permission to reproduce S(q) for the supercooled OCP fluid (Fig. 2c). Wealso thank D. Berkeland, F. Cruz, and M. Young for carefully reading the manuscript.
6. References
1. J.H. Malmberg and T.M. O'Neil, Phys. Rev. Lett. 39 (1977) 1333.
2. J.J. Bollinger and D.J. Wineland, Phys. Rev. Lett. 53 (1984) 348.
3. J.J. Bollinger, D.J. Wineland, and D.H.E. Dubin, Phys. Plasmas 1 (1994) 1403.
4. E.L. Pollock and J.P. Hansen, Phys. Rev. A8 (1973) 3110; W.L. Slatterly, G.D.
Doolen, and H.E. DeWitt, Phys. Rev. A26 (1982) 2255; S. Ogata and S. Ichimaru,
Phys. Rev. A36 (1987) 5451; D.H.E. Dubin, Phys. Rev. A42 (1990) 4972.
5. A. Rahman and J.P. Schiffer, Phys. Rev. Lett. 57 (1986) 1133.
6. H. Totsuji, in Strongly Coupled Plasma Physics, ed. F.J. Rogers and H.E. Dewitt
(Plenum, New York, 1987) p. 19.
7. D.H.E. Dubin and T.M. O'Neil, Phys. Rev. Lett. 60 (1988) 511.
8. S.L. Gilbert, J.J. Bollinger, and D.J. Wineland, Phys. Rev. Lett. 60 (1988) 2022.
9. G. Birkl, S. Kassner, and H. Walther, Nature 357 (1992) 310.
10. R.F. Wuerker, H. Shelton, and R.V. Langmuir, J. Appl. Phys. 30 (1959) 342; F.
Diedrich, E. Peik, J.M. Chen, W. Quint, and H. Walther, Phys. Rev. Lett. 59
(1987) 2931; D.J. Wineland, J.C. Bergquist, W.M. Itano, J.J. Bollinger, and C.H.
Manney, Phys. Rev. Lett. 59 (1987) 2935; Th. Sauter, H. Gilhaus, W. Neuhauser,
R. Blatt, and P. Toschek, Europhys. Lett. 7 (1988) 317.
11. N.A. Clark, A.J. Hurd, and B.J. Ackerson, Nature 281 (1979) 57; C.A. Murray
and D.G. Grier, Amer. Sci. 83 (1995) 238; L.B. Chen, C.F. Zukoski, B.J.
Ackerson, H.J.M. Hanley, G.C. Straty, J. Barker and C.J. Glinka, Phys. Rev. Lett.
69 (1992) 688.
12. J.H. Chu and Lin I, Phys. Rev. Lett. 72 (1994) 4009; H. Thomas, G.E. Morfill, V.
Demmel, and J. Goree, Phys. Rev. Lett. 73 (1994) 652.
13. Preliminary results are in J.N. Tan, J.J. Bollinger, A.S. Barton, and D.J. Wineland,
in Non-Neutral Plasma Physics II, ed. J. Fajans and D.H.E. Dubin (AIP Press,
New York, 1995) p. 215.
14. H.G. Dehmelt, Adv. At. Mol. Phys. 3 (1967) 53; 5 (1969) 109.
15. S.G. Brush, H.L. Sahlin, and E. Teller, J. Chem. Phys. 45 (1966) 2102.
16. D.H.E. Dubin, Phys. Rev. A40 (1989) 1140.
17. R.W. Hasse and V.V. Avilov, Phys. Rev. A44 (1991) 4506.
18. L.R. Brewer, J.D. Prestage, J.J. Bollinger, W.M. Itano, D.J. Larson and D.J.
Wineland, Phys. Rev. A38 (1988) 859.
19. J.J. Bollinger, D.J. Heinzen, F.L. Moore, W.M. Itano, D.J. Wineland, and D.H.E.
Dubin, Phys. Rev. A48, (1993) 525.
20. The supercooled S(q), calculated for an unbounded OCP with T = 1000, is from Fig.
6b in S. Ichimaru, H. lyetomi, and S. Tanaka, Phys. Rep. 149 (1987) 91. The shell
TN-173

21.
structure S(q) is calculated from the simulation data, received from J. P. Schiffer,
for an N=5000 spherical plasma with r>500. Similar shell S(q) have been
calculated by D.H.E. Dubin.
J.P. Schiffer, in Non-Neutral Plasma Physics II, ed. J. Fajans and D.H.E. Dubin
(AIP Press, New York, 1995) p. 191.
TN-174

Hyperfine Interactions 76 (1993) 1 15-125 115
Laser-cooled positron source
DJ. Wineland, C.S. Weimer and J.J. Bollinger
Time andFrequency Division, NIST. Boulder. CO 80303. USA
We examine, theoretically, the feasibility of producing a sample of cold (<4 K), high-den-
sity (« lO'^/cm^) positrons in a Penning trap. We assume 'Be"*" ions are first loaded into the
trap and laser-cooled to approximately 10mK where they form a uniform density column cen-
tered on the trap axis. Positrons from a moderator are then injected into the trap along the
direction of the magnetic field through an aperture in one endcap of the trap so that they inter-
sect the 'Be"*" column. Positron/'Be"*" Coulomb collisions extract axial energy from the posi-
trons and prevent them from escaping back out the entrance aperture. Coohng provided by
cyclotron radiation and sympathetic cooling with the laser-cooled 'Be^ ions causes the posi-
trons to eventually coalesce into a cold coliunn along the trap axis. We present estimates of the
efficiency for capture of the positrons and estimates ofdensities and temperatures of the result-
ing positron column. Positrons trapped in this way may be interesting as a source for antihydro-
gen production, as an example of a quantum plasma, and as a possible means to produce a
bright beam ofpositrons by leaking them out along the axis ofthe trap.
1. Introduction
1.1. MOTIVATION AND BACKGROUND
For over a decade, slow positron beams using moderators [1-3] have found use
in diverse areas such as the formation ofpositronium, measurement ofatomic scat-
tering cross sections, and surface studies. In addition to the importance of slow
positron beams, it would be useful to have an accimiulator and reservoir of cold
positrons for various experiments. An important application of such a reservoir
might be for forming antihydrogen by passing cold antiprotons through the posi-
tron reservoir and relying on three-body recombination [4]. Since the recombina-
tion rate is expected to scale as n^T"^/^, where n and T are the positron density and
temperature [4,5], it is important to achieve as high a density and as low a tempera-
ture as possible in the reservoir.
A cold positron reservoir has other potential applications. Surko et al. [6] point
out possible applications such as the study ofelectron/positron recombination, the
Contribution of the National Institute of Standards and Technology; not subject to UScopyright.
© J.C. Baltzer AG, Science Publishers
IN- 175
1 16 D.J. Wineland et al. / Laser-cooledpositron source
Study of resonances in electron/positron scattering [6,7], a positron source for ac-
celerators, a diagnostic for fusion plasmas, and studies of basic plasma physics.
With the techniques described here, the resulting positron plasma may reach the
conditions for a quantum plasma [8] in the sense that hu^ >k^T where a;p is the plas-
ma frequency and k^ is the Boltzmann constant. The techniques described here
may also be useful for providing a reservoir ofcold high-Z ions or other ions which
are difficult to cool by other means.
If cold positrons are extracted from the reservoir, a beam source with high
brightness might be obtained. Such a source might be useful in atomic scattering
experiments which seek to observe positron/atom scattering resonances, diffrac-
tion from atoms, and high angular resolution [3].
Several other groups have already investigated and demonstrated trapping of
positrons in Penning traps. Schwinberg, Van Dyck, and Dehmelt have captured
small numbers of positrons in a Penning trap by injecting positrons from a ^^Na
source through an aperture in one endcap of the trap and extracting the axial en-
ergy by resistive damping of the currents induced in the electrodes [9]. Gabrielse
and Brown have discussed a similar idea with potential increased loading efficiency
by use of a moderated positron source [10]. Surko et al. have achieved a nonneutral
positron plasma stored in a Penning trap [6]. In this work, positrons from a modera-
tor are injected into the trap and their energy reduced by collisions with back-
ground gas. Conti, Ghaffari, and Steiger have trapped positrons in a Penning trap
by injecting positrons from a moderator through one endcap while ramping the vol-
tage of the trap [11]. Mills has discussed a scheme for positron accumulation in a
magnetic bottle [12].
In this paper, we investigate the feasibility of making a positron accumulator
and reservoir by injecting positrons from a moderator through an aperture in one
endcap of a Penning trap and extracting axial energy from them through collisions
with a simultaneously trapped laser-cooled ion plasma.
1.2. BASIC IDEA
The basic idea of the scheme is illustrated in fig. 1 . We assume that 'Be'*' ions
are first loaded into a Penning trap and laser-cooled by established techniques [13].
With only ^Be"*" ions in the trap, the ions form a uniform density nonneutral ion
plasma (temperature Ti^^o^) « 10 mK) which rotates about the trap axis at fre-
quency (jj. We will assume the Debye length of the plasma is small compared to its
dimensions. Therefore, the potential inside the plasma is independent of the axial
coordinate. We assume that positrons from a moderator are injected through an
off-axis aperture in one endcap (endcap 1) with just enough energy to pass through
the center of the aperture. The potential at the center of the aperture is less than
the potential V\ of endcap 1 because of the proximity of the tube (held at potential
Vt<V\) between the moderator and endcap 1. The diameter of the 'Be"*" plasma
is assumed to be large enough that the incoming positrons pass through the ^Be"^
TN-176

D.J. Winelandetal. / Laser-cooledpositron source 117
ENDCAP 2
POSITRONMODERATOR
SOURCE T
APERTURE ^^
Fig. 1. Schematic diagram of a possible Pemiing trap apparatus for capturing and cooling positrons
injected into the trap from a moderator. The trap magnetic field (not shown) is assumed parallel to the
axis ofthe electrodes. The 'Be"*" ions damp the motion ofthe positrons along the B field direction caus-
ing them to be trapped. As the positrons are cooled, they are forced inside the 'Be'*' ions where they
eventually form a cold column centered on the trap axis.
ion plasma. The other trap endcap (endcap 2) is biased at a potential V2 which is
sufficient to reflect the positrons back through the ^Be"*" plasma. Positrons inside
the ^Be''' plasma also rotate about the trap axis at approximately frequency a;. If a;
is large enough and/ or the ^Be"*" plasma is sufficiently long, the positrons will
have been displaced azimuthually when they approach endcap 1 from inside the
trap and are reflected by the potential V\ back through the 'Be''" plasma. As the po-
sitrons pass through the 'Be'*' ions they undergo Coulomb collisions which extract
axial energy from them. At the low energies we consider, positron annihilation by
collisions with the 'Be"*" ions is suppressed by Coulomb repulsion. Initially, the posi-
trons' axial energy is primarily transferred into their cyclotron motion energy since
the recoil energy of the 'Be"*" ions is small. If these collisions extract enough axial
energy before the positrons encounter the entrance aperture again, they will be
trapped. Ifthe entrance aperture is mounted off axis, the positrons can make manyoscillations along the trap axis (and through the 'Be"*" ions) before encountering
the entrance aperture again. This is the same idea proposed by Dehmelt et al. [14]
and used successfully by Schwinberg et al. [9] except we assume the axial energy is
extracted by t^/^"Rt^ collisions rather than resistive damping.
Once trapped, the positrons cool by cyclotron radiation and sympathetic cool-
ing with the cold 'Be"*" ions. When sufficiently cooled, the positrons coalesce to a
uniform density plasma column along the trap axis which co-rotates with the 'Be"*"
plasma (both at frequency oJ) as shown in fig. 1 [8,15,16]. At low temperatures, the
TN-177

118 D.J. Winelandetal. / Laser-cooledpositron source
^Be"*" plasma separates from the positron plasma forming an annular region out-
side the positron plasma [8,15,16]. Quahtatively, the separation occurs because of
the larger outward centrifugal force on the ^Be^ ions. The positron cyclotron mo-tion is strongly coupled to the ambient temperature To (4K assumed here) by cyclo-
tron radiation. At temperatures below about 10 K, the positron axial motion
decouples from the cyclotron motion [17] and we expect the positron axial or "par-
allel" motion temperature T\\ to be reduced to less than Tq by the Coulomb interac-
tion with the cold 'Be"^ ions. Therefore we expect the parallel temperature T\\ to
be lower than the cyclotron or "perpendicular" temperature Tj.. For a;< /2/2, the
positron and ^Be"^ plasma densities will be approximately equal [8] and limited by
the maximimi attainable ^Be"*" plasma density (Brillouin density). Here we will
make the approximation «(e+) w n{ Be"*") = n. Since the Brillouin density for an
ion species ofmassM scales as B^/M, where B is the magnitude of the Penning trap
magnetic field, we want B as large as possible andM as small as possible. This is
the reason for choosing ^Be"*" ions; other ions would work in the scheme described
here, but 'Be"*" has the smallest mass of any of the positive ions which can be easily
laser cooled therefore giving the highest density {n « 10^° cm~^ for 5 = 6 T).
1 .3. USEFUL FEATURESOFA LASER-COOLED POSITRONSOURCE
If this reservoir of cold positrons can be achieved, it should have some interest-
ing features compared to those of other schemes. (1) Under the assumptions
described below, the efficiency of capturing moderated positrons can be very high,
approaching unity. (2) Relatively direct visual information is available on the posi-
tron plasma. By use of imaging techniques, the ^Be"*" plasma can be observed in
real time [13,18]. The positron plasma is then observed by the "hole" it creates in
the image ofthe 'Be"*" plasma. In this way we obtain fairly direct information on the
size and shape of the positron plasma. (3) If there is sufficient Coulomb coupling
between the positrons and 'Be"*" ions, the density and temperature of both species
can be determined by spectroscopic techniques [1 3,1 8]. (4) The density ofboth plas-
mas can be varied by controlling the angularmomentum imparted to the 'Be"*" plas-
ma by the laser [13,18]. (5) The apparatus can be operated at high vacuum,
thereby reducing positron loss due to annihilation or positron formation with neu-
tral background gas.
1 .4.APPROXIMATIONS
The calculations contained here are, admittedly, based on approximations. In
addition, the availability of a moderated source with certain characteristics (in
particular a small energy spread, A£i = 0.1 eV) is freely assumed. The purpose of
these notes is to give an estimate of what might be achievable with the proposed
technique.
IN- 178

D.J. Winelandetal. / Laser-cooledpositron source 119
2. Positron capture
2.1 . POSITRON INJECTION
We assume positrons are emitted from a moderator (fig. 1) with axial energy
spread and cyclotron energy spread both equal to A^",. They enter the Penning trap
along magnetic field lines through a tube held at potential Fj. We assume they en-
ter the trap through a circular aperture in endcap 1 which is offset from the trap
axis by distance R^. Near the center of the aperture the potential is between V\ and
Ft; we consider an area A\ (= Tir^) centered on the aperture which is smaller than
the geometrical area ofthe aperture. The area A\ is such that V\ minus the potential
within A\ is larger than A^i. We make the approximation that over v4i the potential
is constant and equal to Fa, where Fi > Fa> Ft and V\ - FA>A£i. Outside A\,
we assume the potential is equal to V\ . We assume the potential Fg is adjusted so
that the positrons have just enough axial energy to spill over the potential Fa and
enter the trap. The positrons then are accelerated to an energy E\ by the potential
difference between Fa and the ^Be"^ plasma potential (f)p{Rx) at radius Rp^; we have
Ei = q[V\ — (j)^{R\)) + Eq, where q is the positron charge and Eq (« A^i) is the
mean axial kinetic energy of the positrons at the aperture. When the positrons enter
the plasma they drift through it with a velocity {2E\/m) ', wherem is the positron
mass. Positrons exit the far side of the plasma and are then reflected back by end-
cap 2. They then traverse the plasma in the opposite direction and approach endcap
1 . If the length of the plasma is long compared to the spacings between the plasma
and the endcaps, the positrons spend most of their time in the plasma. Therefore,
upon returning to endcap 1 for the first time, they rotate an azimuthal angle
Ad « 7wh{lEilmy^'^ = 0.n{uj/{n/2))hBEr^/^, (1)
where A^ is in radians, uj is the plasma rotation frequency, and in the last expres-
sion the plasma length h is expressed in cm, B in T, Ei in eV and Q is the ^Be"*" cyclo-
tron frequency. We have Q/2n = 1 .70 x B[Y] MHz when B is expressed in T. If A^
is larger than the angle subtended by the effective entrance aperture
^a(~ 2rA/i?A), then positrons are again reflected back into the plasma where they
have a greater chance to lose axial energy [14]. As long as A^> 6a,, the positrons ty-
pically take 2{ln/6\) passes through the ^Be"*" plasma before encountering the en-
trance aperture again. If A0<^a, only a fraction of the positrons which enter the
trap make multiple bounces [19]. In order to have all of the positrons enter the trap
we want ^j > A^*!. We would like E^ to be as small as possible to satisfy the condi-
tionM > 6\ and to make the positrons scatter through the largest angles.
Ifthe length ofthe positron/'Be"^ plasma ismuch longer than its diameter, the po-
tential inside the plasma as a function of radius is approximately equal to that ofan
infinitely long uniformly charged cylinder inside ofa concentric grounded cylinder.
Therefore the potential at radius r inside theplasma is approximatelyequal to
TN-179

n =
120 D.J. Winelandetal. / Laser-cooledpositron source
4,p{r) « ngnr^ll ln(r,/rp) + 1 - {r/rp)% (2)
where r^ is the plasma radius, and r^ is the radius of the grounded outer cyHndrical
"wall" electrode. Since the potential inside the plasma is independent of the axial
coordinate, to keep the plasma confined along the axis, we require Vq, V2 > <f>p{0),
where Vq is the potential on the central portion of endcap 1 as shown in fig. 1 . Weadjust Vo and Vi (and Vj and Fj) so that Ei is kept small. This implies Vq > V\ and
that the end of the plasma bulges out towards endcap 1 at the radius R\. The 'Be'*'
plasma density n is related to the rotation frequency u by [20]
whereM is the ^Be"^ mass and in the last expression B is expressed in T. The maxi-
mum density, called the Brillouin density, is obtainedwhenu = Q/2.
2.2. POSITRONDAMPING
We assume that the positrons initially lose axial kinetic energy by Coulomb scat-
tering off the 'Be"*" ions. This transfers some of the initial positron axial kinetic en-
ergy Ei into cyclotron motion energy. We assume that the cyclotron motion
energy is predominantly extracted by cyclotron radiation in the first stages ofcool-
ing. In the first stages of the cooling, a good approximation is to assume that the
'Be"*" ions are stationary and infinitely heavy; cooling of the positrons by the recoil
of the ^Be"*" ions is negligible. We assume that the positrons scatter through a net
angle ^s (relative to the magnetic field direction) before encountering the entrance
aperture from inside the plasma. The scattering angle ^s results primarily from mul-
tiple small angle scattering of the positrons in the ^Be"*" plasma. The mean scatter-
ing angle <^s> = 0. The mean-squared scattering angle is nonzero and given by
[21]
(A0s)' = <^>=^^ln(!»„,ax/^min), (4)
where L is the effective length of the plasma. When A9>dA, L is equal to
2h{2n/9/Cl- For a weakly magnetized plasma ftmax/^min is given by Vc/b, where r^ is
the positron cyclotron radius and b is the distance of closest approach
(b = q^/k^T) [22]. For the plasma to be weakly magnetized, we require rc/b»l.
We assume that \mfiir^ w AEi, where fi^ is the positron cyclotron frequency.
Therefore, we can write
r,/b = 131Q^^^^, (5)
where the energies are expressed in eV and the field in T. Therefore, when A0>6a,we can write eq. (4) in the form
TN-180

D.J. Winelandetal. / Laser-cooledpositron source 121
A^s = 1.28 X \Q-%n{r^/b)nh/eK]^"'/E;, (6)
where the angles are expressed in radians, h in cm, n in cm"^, and E\ in eV.
From simple geometric considerations, the axial energy lost before re-encounter-
ing the entrance aperture (assuming the initial cyclotron energy is much less than
EOis
AEs=EiSm^9s. (7)
We will make the approximation that the positrons are captured if A£'s>A£i.
Therefore from eq. (7), positrons are captured ifthey scatter through angles greater
than 6c where
ec = sm-\AEi/Eif\ (8)
Ifwe assume that the distribution of angles ^s is Gaussian, the fraction ofpositrons
which enter the trap and are captured is given by
r7c = l-erf(^c/(2'/'A^s)). (9)
In table 1 , we list values ofrjc for various positron and ^Be"*" plasma parameters.
3. Beam source
In addition to using this configuration as a cold positron reservoir, it might
also be possible to use it as a positron beam source by leaking positrons out a hole in
endcap 2, which is centered on the trap axis. If the positrons are injected into the
trap at an arbitrarily slow rate, they can be extracted as a beam with an internal
temperature governed by the final equilibrium conditions achieved for the reser-
voir discussed in the previous section. For a beam source we would like as high a
throughput as possible. Therefore it is useful to estimate the temperature of the ex-
Table 1
Calculated values of n/2n, 6\, A9, n, 0p(O), rc/b, rjc, and T - To for various values of input para-
meters. We assume A = 10 cm and Afj = 0.1 eV for all entries. The last column for (T - To) applies
only for the positron beam source described in the text (for all rows we assume dN/dt = 10' s~'). The
first row gives a high value of r/c but requires a very high trap potential (>(^p(0)). The last two rows
assume the entrance aperture for positrons is centered on the trap axis.
B Ei ta Ra rp /•w 2w/Q n/2n 9a M n </)p(0) Tclb r/c {T - To)
(T) (eV) (cm) (cm) (cm) (cm) (MHz) (rad) (rad) (lO'o (V)
cm-3)
(K)
10 1 0.05 0.5 0.7 2.0 0.5 17 0.2 9.0 2.2 15200 73 0.91 0.013
5 1 0.05 0.25 0.4 2.0 0.1 8.5 0.4 0.9 0.14 427 147 0.55 2.52
5 10 0.025 0.25 0.3 1.0 0.1 8.5 0.2 0.28 0.14 194 1470 0.27 44.8
10 10 - - 0.1 1.0 0.5 17 2n 2.2 560 734 0.11 6.38
10 10 - - 0.1 0.5 0.1 17 2n 0.56 107 734 0.001 25.2
TN-181

122 D.J. Winelandetal. / Laser-cooledpositron source
tracted beam versus throughput. As a conservative estimate we will assume that
the positron energy is extracted only by cyclotron radiation. In steady state, energy
balance is therefore described by the expression (d£'/df)i^ ~ {dE/di)^ + {dE/dt\,
where {dE/dt):^^ is the energy input from the incoming positron beam, {dE/dt)^ is
the energy extracted by cyclotron radiation, and {dE/dt\ is the energy removed by
the extracted beam. The cyclotron energy decays at the rate 7c ^ 0.395^ [T] s~^
This rate is lower than the equilibration rate between T\\^ and Tj, for temperatures
down to about 10 K (for n « 10^, 5 w 6 T, see fig. 3 of ref. [23]), therefore above
this temperature T\\ = T± = T. In this case, the expression for energy balance can
be written
{dN/dt)Ei = \ioNk^{T - To) + lkBT{dN/dt), (10)
where (dN/dt) is the positron flux, A'^ is the total number of trapped positrons,
and To is the ambient temperature. This equation yields the solution
r-7-„.4.43><,0^(^^. (U)
where Ej is given in eV and B in T. Examples are included in table 1 . Similar consid-
erations must be addressed to ensure that the laser beams can remove the (canoni-
cal) angular momentum and energy input to the ^Be"^ ions due to the incoming
positrons. With care these requirements can be satisfied. For small values of
dN/dt, the parallel and perpendicular motions become decoupled [22] and weexpect Ty « Tj, ~ 4 K. In this case the positron plasma is expected to be strongly
coupled. Under these conditions, it may be possible to extract a "string" of posi-
trons which is located on the axis of the trap [18]. For these positrons, the angular
momentum is zero, so when the positrons are extracted from the B field, the trans-
verse energy can be quite small. In the extraction to zero magnetic field, the cyclo-
tron energy is converted to axial energy spread. At ^ « 6 T and Tl ~ 4 K, the
cyclotron energy is concentrated in the n = and 1 quantum levels, so the axial
energy of the extracted positrons is concentrated in two energy peaks.
4. Experiments
Cooling positrons with 'Be"*" ions has not been tried yet. However, some impor-
tant aspects of the scheme have been demonstrated by using one laser-cooled ion
species to sympathetically cool another ion species. In fig. 2 we show an image ta-
ken by viewing along the z axis of a Penning trap [13,18]. In this (UV) photograph,
a column of 'Be"*" ions, centered on the trap axis, is sympathetically cooled by la-
ser-cooled Mg"*" ions at a magnetic field B w 0.82 T [24]. We have also demon-
strated the use oflaser torque to control the shape and density ofa ^Be"*" ion plasma,
reaching densities very near the Brillouin density (n « 10*°cm~^for5 « 6T)[13].
TN-182

D.J. Winelandetal. / Laser-cooledpositron source 123
1 mm
'Be^
26A/f«+Mg^
'I1 mm
Fig. 2. Ultraviolet photograph showing the Hght scattered from laser beams which intersect a
'Be"'^/^*Mg"'^ plasma confined in a Penning trap {B = 0.82 T). The view is along the direction of the
trap axis (and B field) as described in refs. [13,18]. The laser beam for the Mg"*" ions intersects only a
portion of the Mg"*" plasma whose boundary is indicated by the dashed lines. The separation of the
species is probably exaggerated because the photograph required a double exposure. The optics were
refocused between the 313 nm ('Be"*^) and 280 nm (Mg"*") images. This probably resulted in different
magnifications of the two wavelengths. The separation between plasmas is expected to be approxi-
mately equal to the interparticle spacing for low rotation frequencies (a>« /?/2) [ 1 5 , 1 6]
.
5. Discussion
If the configuration above can be achieved, antihydrogen formation from
three-body recombination with cold antiprotons passed through the positron plas-
ma should be very efficient. If the positron plasma is strongly magnetized, the re-
combination rate should depend on T\\ as rP'T'^ '. In this case the probability of
antihydrogen formation might be unity for one pass of cold antiprotons through
the positron plasma [4,5]. Similarly, for the positron plasma to be quantized we re-
quire ^p>/:b7'||.
On the theoretical side, more exact calculations are required to achieve better es-
timates of r)c and other parameters. We have omitted any details of the positron
cooling for T'< 10 K. For example, for u!«Q, the separation between plasmas is
approximately the interparticle spacing. As u> approaches Q, the separation be-
comes large compared to the interparticle spacing and the Debye length [8,15]. In
this case, we expect the thermal coupling between the positron axial motion and the
^Be"*" ions to become weak. If the coupling between the positron axial motion and
the ^Be"*" ions remains relatively weak compared to the coupling between parallel
and perpendicular positron motions for T « 4 K, then T\\ will not be significantly
below T±. In principle, we could decouple the positrons' cyclotron motion from the
ambient temperature by avoiding the resonances of the cavity formed by the trap
electrodes [25]. However, this decoupling will be more difficult to achieve for plas-
mas whose dimensions are large compared to the cyclotron wavelength.
IN- 183
124 D.J. Winelandetal. / Laser-cooledpositron source
On the experimental side, we have assumed narrow energy distributions A£ifrom the moderator, which we have implicitly assumed is in the trap magnetic field.
These values of A£i must be demonstrated experimentally. Use of a transmission
moderator would be desirable; the high energy particles from the moderator could
perhaps be rejected with an .E x 5 filter.
The long ^Be"*" plasmas assumed here (// = 10 cm) have not been demonstrated
yet. This is an important question which must be resolved experimentally; in gener-
al, longer plasmas are more prone to mode excitation from static field azimuthal
asymmetry which Hmits their density [13]. Currently we are assembling a new appa-
ratus which should allow us to investigate the storage of large plasmas. If the de-
sired long plasmas are difficult to achieve, it should be possible to stack shorter
plasmas with traps stacked along the axis of the system. This configuration mayalso have the advantage that between the trap sections, E x B azimuthal drift sec-
tion could be configured to increase A^ for the incident positrons.
The ideas presented here should apply to the trapping ofother ions such as multi-
ply charged ions which are difficult to cool by other means. In principle, these ideas
would apply to coohng of antiprotons or other negative ions. This would require
use of simultaneously stored laser-cooled negative ions. Unfortunately, laser cool-
ing of negative ions has not been achieved so far because of the apparent lack of a
suitable optical transition in a negative ion. Sympathetic laser cooling of negative
ions might be achieved using a coupled trap geometry [26].
Acknowledgement
We thank the US Office ofNaval Research for support. We thank S. Gilbert, S.
Jefferts, T. Steiger, D. Sullivan and M. Young for helpful comments on the manu-script. We acknowledge helpful discussion with B.R. Beck, R.S. Conti, G. Gab-rielse, M.E. Glinsky, A.P. Mills, T.M. O'Neil, T.D. Steiger, T.S. Stein and CM.Surko.
References
[1] A.P. Mills Jr., Hyp. Int. 44 (1988) 107;
P.J. Schultz and K.G. Lynn, Rev. Mod. Phys. 60 (1988) 701, and references therein.
[2] A. Rich, R.S. Conti, D.W. Gidley, M. Skalsey, J. Van House and P.W. Zitzewitz, Hyp. Int. 44
(1988)125.
[3] L. Dou, W.E. Kauppila, C.K. Kwan and T.S. Stein, Phys. Rev. Lett. 68 (1992) 291 3;
T.S. Stein, private communication.
[4] G. Gabrielse, S.L. Rolston, L. Haarsma and W. Kells, Phys. Lett. A129 (1988) 38.
[5] M.E. Glinsky and T.M. O'Neil, Phys. Fluids B3 (1991) 1279.
[6] CM. Surko, M. Leventhal, A. Passner and F.J. Wysocki, in: Non-neutral Plasma Physics, eds.
C.W. Roberson and C.F. Driscoll (AIP Press, New York, 1988) p. 75;
CM. Surko, M. Leventhal and A. Passner, Phys. Rev. Lett. 62 (1989) 901;
T.J. Murphy andCM. Surko, Phys. Rev. Lett. 67 (1991) 2954.
IN- 184

D.J. Winelandetal. / Laser-cooledpositron source 125
[7] T.E. Cowan etal., Bull. Am. Phys. Soc. 34(1989) 1812.
[8] J.J. Bollinger, L.R. Brewer, J.C. Bergquist, W.M. Itano, D.J. Larson, S.L. Gilbert andD.J. Wineland, in: Intense Positron Beams, eds. E.H. Ottewitte and W. Kells (World Scientific,
Singapore, 1988) p. 63.
[9] P.B. Schwinberg, R.S. Van Dyck and H.G. Dehmelt, Phys. Lett. 8 1A (198 1) 1 19.
[10] G. Gabrielse and B.L. Brown, in: The Hydrogen Atom, eds. G.F. Bassani, M. Inguscio and
T.W. Hansch (Springer, Berlin, 1989) p. 196.
[1 1] R.S. Conti, B. Ghaffari andT.D. Steiger, Nucl. Instr. Meth. Phys. Res. A299 (1990) 420;
B. Ghaffari, R.S. Conti andT.D. Steiger, Bull. Am. Phys. Soc. 37 (1992) 1 148.
[12] A.P. Mills Jr., in: Positron Scattering in Gases, eds. J.W. Humberston and M.R.C. McDowell(Plenum Press, New York, 1 984) p. 1 2 1
.
[13] D.J. Heinzen, J.J. Bollinger, F.L. Moore, W.M. Itano and D.J. Wineland, Phys. Rev. Lett. 66
(1991) 2080; erratum 66 (1991) 3087.
[14] H.G. Dehmelt, P.B. Schwinberg and R.S. Van Dyck Jr., Int. J. Mass Spectrom. Ion Phys. 26
(1978)107.
[15] T.M. O'Neil, Phys. Fluids 24(1981) 1447.
[16] D.J. Larson, J.C. Bergquist, J.J. Bollinger, W.M. Itano and D.J. Wineland, Phys. Rev. Lett. 57
(1986)70.
[17] T.M. O'Neil and P.G. Hjorth.Phys. Fluids 13 (1985)3241.
[18] S.L. Gilbert, J.J. Bollinger and D.J. Wineland, Phys. Rev. Lett. 60 (1988) 2022.
[19] P.B. Schwinberg, Thesis, Department of Physics, University ofWashington, USA.
[20] J.H. MalmbergandT.M. O'Neil, Phys. Rev. Lett. 39(1977) 1333.
[21] N.A. Krall and T.W. Trivelpiece, Principles of Plasma Physics (McGraw-Hill, New York,
1973) p. 292.
[22] M.E. Glinsky, T.M. O'Neil, M.N. Rosenbluth, K. Tsuruta and S. Ichimaru, Phys. Fluids B4
(1992)1156.
[23] B.R. Beck, J. Fajans and J.H. Malmberg, Phys. Rev. Lett. 68 (1992) 317.
[24] J.J. Bollinger, D.J. Heinzen, W.M. Itano, S.L. Gilbert and D.J. Wineland, IEEE Trans. Instr.
Measurement 40 (1991) 126.
[25] J. Tan and G. Gabrielse, Phys. Rev. Lett. 67 (1991) 3090.
[26] D.J. Heinzen and D.J. Wineland, Phys. Rev. A42 (1990) 2977.
TN-185

Volume 70, Number 17 PHYSICAL REVIEW LETTERS 26 April 1993
High-Order Multipole Excitation of a Bound Electron
Carl S. Weimer/"' F. L. Moore/''^ and D. J. Wineland
Time and Frequency Division, National Institute of Standards and Technology, Boulder, Colorado 80303(Received 9 November 1992)
The nonlinear resonant response of a bound electron to a time-varying spatially inhomogeneous elec-
tric field was studied experimentally. By use of the artificial atom "geonium" (an electron bound in a
Penning trap), we observed up to ninth-order multipole (pentacosiododecapole) coherent excitation of
the electron's magnetron motion, and up to third-order (octupole) excitation of the cyclotron motion.
Also, by applying two fields simultaneously, we have observed coherent stimulated Raman excitation of
the electron's motion.
PACS numbers: 42.65. Ky, 36.90.+r, 42.79.Nv
The interaction of an electromagnetic field with a
medium is, in general, nonlinear. There are three com-
mon origins of the nonlinearity [1-3]: (l) the interaction
of the charges with the spatial inhomogeneity of the exci-
tation fields, (2) the anharmonic binding of the medium's
charges, and (3) the interaction of the medium with the
magnetic component of the field. A number of resonant
nonlinear effects have been studied, for example, harmon-
ic generation, multiwave mixing, and multiphoton absorp-
tion. These nonlinear effects have almost exclusively re-
lied on electric dipole transitions (with notable exceptions
[4]), and the origin of the nonlinearities falls primarily
into the second category. The first nonlinear mechanism,
which corresponds to excitation of higher-order multipole
transitions, is less common. Although multipole excita-
tion is observed in some atomic and nuclear physics ex-
periments, the excitation and detection are usually in-
coherent. We have studied this nonlinear mechanism by
using an artificial atom [5]: an electron bound in a Pen-
ning trap [6-8]. This has provided for the first time a
means to excite and detect, coherently, high-order mul-
tipole transitions, and observe high-order subharmonic
generation. We have also observed several degenerate
and nondegenerate nonlinear parametric processes which
have been discussed by Kaplan and Ding [2,3]. Our ob-
servations complement the body of work on coherent har-
monic excitation and multiwave mixing in atoms.
An electron bound in a Penning trap can be thought of
as the artificial atom "geonium" [6-8]. The "nucleus" of
geonium (the trap) is created with the electrodes (and
fields) shown schematically in Fig. 1. A static voltage Vq
applied between the end caps and ring forms a potential
(in spherical coordinates)
<D(r,0,0) = KoZ C2n(r/d)^"P2n(cose) ,
/i=0(1)
where the Pzn are the Legendre polynomials and the Cjn
are constants. Here ^=/-o/V2 =3.54 mm is a charac-
teristic trap size, with /-q the ring internal radius. The
term labeled by C2 forms a harmonic well along the z
axis. Our trap is designed to have C2 =0.477, and
C4= C6— [9]. Applying a voltage Vg to two additional
guard electrodes [10] allows C4 to be varied; in practice.
|C4|<5xl0~ . Although IC4I was small, it remains the
dominant electrostatic perturbation to our harmonic po-
tential term. The leading perturbation to an applied
homogeneous magnetic field Bqz is a magnetic quadru-
pole bottle [6-8] of order 52/^0 = 7x10"^ cm~^ due to
magnet imperfections and the copper electrode diamagne-
tism. Bo was measured to have a minimum long term
drift rate of \(dBo/dt)/Bo\ =7x 10"^ h "', and for times
on the order of 1 min, field fluctuations of ABo/Bo— 2
xlO"^for5o=0.1 T.
The motion of a nonrelativistic electron bound in an
ideal Penning trap (C„ =0 for n>2, Bq homogeneous) is
composed of three independent modes [6-8]. The axial
(z) motion is harmonic with amplitude r^ and frequency
(0^={.2C2qyQ/md^)^'^ where q/m is the electron's
charge-to-mass ratio. In the radial {x-y) plane the
motion is two superimposed circular motions: the magne-
tron motion of radius r^ and frequency cOm corresponding
to the ExB drift of the electron, and the cyclotron
motion of radius r^ and frequency a)'c—a)c~com where
(Oc =qBo/mc. For Kq = -1 0.45 V and 5o =0. 1 T we ob-
tain (o,/27c = 6\.5 MHz, W;„/2;r = 615 kHz, cOc/2k = 3.0S
GHz, and in general we maintain (o'c^coz^com- The ax-
ial energy is damped [F^ (measured) — 20 s~'] by con-
necting a resonant tuned circuit to one of the end cap
electrodes (analogous to a two-level atom in a resonant
optical cavity) [6-8,11]. The magnetron motion is meta-
Endcap
FIG. I. A schematic diagram of the Penning trap used in the
experiment. The electrodes have been separated along the z
axis to show details.
© 1993 The American Physical Society TN-1862553

Volume 70, Number 17 PHYSICAL REVIEW LETTERS 26 APRIL 1993
stable. However, its amplitude can be damped at a vari-
able rate of 0< F^w < y H to a theoretical limit of r^
= 2{{o)J(o,){r^)V'^ [where {r})^'^ is the thermalized
(7=4 K) axial amplitude] by the use of sideband cooling
[6-8]. The cyclotron energy is radiatively damped at the
free space rate modified by the presence of the trap and
secondary electrodes [12] [rf(measured)=0. 1 s~' (1
s~') for Bq—0.\ T (1.4 T)]. Three main factors lead to
deviations from the ideal motion: (I) anharmonic terms
in the electrostatic potential {C„^0,n>2), (2) relativis-
tic effects, and (3) inhomogeneity of the magnetic field
[6-8,13]. These cause the electron's modes of motion to
be slightly anharmonic and weakly coupled together.
A single electron is loaded into the trap using estab-
lished techniques [6-8,11]. The frequencies cD^MmyCOc
are measured by applying oscillating drive potentials to
different electrodes and observing a resonant response of
the electron's motion. For the axial motion, the electron's
response is observed by measuring the image currents in-
duced in one end cap using a phase sensitive heterodyne
detector (analogous to phase sensitive detection of atomic
resonance fluorescence) [6-8,1 1]. We chose to detect the
magnetron or cyclotron excitations via their coupling to
the axial motion [6-8]. Specifically, the observed axial
frequency depended upon the magnetron amplitude due
to the electrostatic C4 term, and it depended on the cyclo-
tron amplitude due to the slight magnetic field inhomo-
geneity 82- For example, for a magnetron excitation
(r„=0^r^o), A(oJ(o,= -3C4(r„,oy/2C2d^. The shift
*' 1
L^ -ir^
^'
^ ^oh\AnAPi ,
'
.»
c V ^\l\ \' w
V 13 \ *>
o-1
K*^' = -
,?
isbeat 1( .
notes ^ f\
K) J'
L"
"5
h ^
.
** \ \}%vc1« , 1
1 . A A/> J lAll>JA/)AilA/\)3 r •(IfffW^MX 0.5 H2ortiJ
-. i .,
Mm
Drive Frequency cj^
FIG. 2. The subharmonic response of order wd/wm — ^ of the
center-of-mass magnetron motion of a cloud of approximately
seventy electrons. Baselines for the two traces have been offset
for clarity. The arrows show the direction the drive frequency
was swept (at a rate of 0.1 Hz/s). The axial frequency shifts
due to the magnetron excitation (the vertical steps) and the
beat note between the free oscillation at com and the subhar-
monically excited oscillation at cod/S are observed. For this
figure the sideband cooling was off and the magnetron ampli-
tude had been initialized in a large orbit. The inset shows a
representation of this coherent process for particular quantum
levels.
A(Oz is effectively observed by monitoring the correction
voltage of an electronic servomechanism that locks the
axial frequency to an external reference [6-8]. If, in ad-
dition to the driven oscillation (at frequency <o</) there is
a free (or thermally excited) oscillation at (o^, then an
interference beat note at wj — ci}„ will be observable in
the correction voltage [7,14]. If a second coherent drive
field is applied with frequency coq, then three beat notes
can be observed with frequencies (Od — (Om, (Oo — CDm, and
(Od — (oq. The magnetron and cyclotron motions are ex-
cited by applying a drive voltage to sector A of the ring
electrode (Fig. I). To estimate the (x-y) drive field the
electrode geometry is approximated by a box with sides of
length (IxJyJz) =2d(-/2,y/2, 1 ). One side of the box per-
pendicular to X (representing sector A) is assumed to be
at a potential Vj with respect to the other sides. This
model gives the resulting potential (in the x-y plane)
<t>Ax,y,0) = Vdj;,J,a„,„(x/d)'"(y/d)' (2)
with am.n constants [15].
A quantum description of the nonlinear excitation in-
volves calculating amplitudes for processes like those in
the insets in Figs. 2 and 3. However, in our experiment
the mean occupation numbers of the electron's quantized
motion were much larger than I, so a classical model
suffices [2,3]. When excited by a homogeneous field, the
magnetron and cyclotron motions can be treated as one-
40
m•o
30
-g 20Z3
E<10
1
1 1 1
ISS 10
Frequency (Hz)
FIG. 3. The Fourier transform of the response of the magne-
tron motion of a single electron to drive fields at frequencies oo,
(0\, and o>2. The magnetron free oscillation is at frequency (Om,
and the driven oscillations are at fi)o •" (Um ~ 2 ;r(7 Hz) and
(02 — (oi = (tim "^ 2n(4 Hz), with (U| =ft)m + 2;r(97 Hz). Three in-
terference beat notes are observed. For short averaging times,
r < 10 s, the amplitudes and widths of the three beat notes were
comparable. For longer averaging times (r = IOO s is shown
here) the beat note responses between the driven and free oscil-
lations (left two peaks) broaden and decay because of the mag-
netic field noise affecting the free oscillation. The beat between
two driven oscillations (right peak) is unaffected (other than an
amplitude modulation noise pedestal) and its width remains
limited by the resolution of the dynamic signal analyzer (FFT).
When measured with a phase detector, this peak showed that
the nonlinear response was phase coherent with the drives. Theinset shows a representation of this stimulated Raman response
at <U2~ft)|.
2554TN-187

Volume 70, Number 17 PHYSICAL REVIEW LETTERS 26 April 1993
dimensional harmonic oscillators. For an inhomogeneous
drive field this is no longer true, but the main effect of the
field inhomogeneity is to modify somewhat the strength
and phase of the force. We therefore assume that the x
components of the magnetron and cyclotron motions obey
the approximate equations of motion (ignoring mode cou-
pling)
x + rjx + (ojxl\+^U)+p2(x/dy+p4(x/d)*+]'^ajFd[aQ-¥a\(xld)-\-ai{x/d)^-\- hosicojt) ,
(3)
where Fd^gYd/md, ao-0.19, ai -0.35, 02-0.29, and
03=0.13 [from Eq. (2)], and j refers to either the cyclo-
tron or magnetron motion. This equation neglects the yand z dependence of the force. However, since the a, are
only approximate, this further simplification should not
significantly affect the results. For the magnetron motion
(Oj^Om, aj''Oimlioim-o)'c)—-(oJ(Oc, and Pi^^Ci+i-
For the cyclotron motion (oj — <Uc, aj— (o'cl{oi'c — oim) — \,
and the ^, arise from the relativistic mass shift [13l. Theterm ^(r) is a multiplicative noise term tl6] which, in our
experiment, is caused primarily by the magnetic field
fluctuations. The magnetic component of the drive fields
[category (3) of the introduction] can be shown to be
negligible here. Equation (3) holds also for the center-
of-mass motion of small clouds of electrons (cloud size
«(/); experimentally, both small clouds and single elec-
trons were used.
Equation (3) is solved by assuming solutions of the
form xU)''A{t)co%[o}t+<l)U)] where y4(r) and tpit) are
slowly varying. Nearly resonant excitation (o— toy) of
the motion can occur when cod—ncoj, n an integer, in
which case 0) = {l/n)(0d. This corresponds to subhar-
monic excitation (i.e., frequency division). It can be
caused by (I) the electron's motion in the inhomogeneous
drive field [a, in Eq. (3)], and/or (2) the anharmonic
motion of the electron [Pi in Eq. (3)], as noted in the in-
troduction. The first is due to electric multipole transi-
tions of frequency nwj. The second is due to dipole tran-
sitions of frequency ncoj which arise from mixing of
the quantum oscillator levels due to the anharmonicity.
Since p„-\<^n^a„-\/aQ for our experiment, Eq. (3) can
be used to show that the first mechanism dominates.
Parametric excitation (« =2) has been observed previous-
ly in traps for the axial motion of a single electron [II]
and clouds of electrons [17-19].
If we neglect Pi with / > 2, Eq. (3) reduces to Duffing's
equation [3] driven by a nonlinear force. Subharmonic
response of order n exhibits both hysteresis and n stable
phases of response relative to the phase of the drive [2,3].
In addition, from Eq. (3), a steady state response requires
[for|(r)-0] [3,20]
ajOn-iFd(A/d) n-l (4)
l"-^(Ojd
Therefore Fd and A must exceed certain threshold values
Fdt and Af. The origin of these thresholds is that the en-
ergy supplied by the drive at Wd to the oscillation at (OdIn
is dependent upon the amplitude A of that oscillation and
must overcome the damping. No such threshold exists
for harmonic excitation (frequency multiplication), (Od
— (Ojim. The initial amplitude At necessary for subhar-
monic response can be generated by a resonant homo-geneous drive ((Od— (Oj), a thermal drive, or a free oscil-
lation. When frequency noise is included [^it)^0], Tj in
Eq. (4) is replaced by an effective damping rate which
depends upon the form of the noise [16], and the frequen-
cy sweep rate of the drive. However, the ratios of Eq. (4)
for different orders of n should be insensitive to Tj.
Subharmonic excitation of the magnetron motion was
observed for « — 1 -9 on samples of up to about seventy
electrons when the magnetron amplitude was initialized
in a large orbit. Both the frequency shift and modulation
of the axial frequency (by the beat notes) were observed
as the magnetron amplitude resonantly increased. This is
seen in Fig. 2 for « — 5, where the beat note is due to the
interference between the magnetron free oscillation and
the subharmonically excited driven oscillation.
With a single electron the threshold values for subhar-
monic response for n=2, 3, and 4 were measured with
the initial magnetron amplitude cooled to its minimumvalue (set by the sideband cooling). Independently, we
determined the magnetron amplitude at its sideband cool-
ing limit by varying C4 and measuring the resulting
change in com [8,14]. This gave r^—220± 140 /im, or
Tm— (55±35)rtheo, where rtheo is the theoretical cooling
limit. This disagreement with theory is consistent with
measurements made by other groups, and its origin is not
known [7,8,14]. We measured the threshold values
Vdin =2) =6 /iV, Vdin =3) =300 /iV, and Vdin =4) =6mV, for ft>^/2;r=615.0 kHz (i9o'=0.1 T, sideband cooling
off, sweep rate 0.1 Hz/s). From these measurements
and Eq. (4), we calculated 01/02 = 1. 6 ± 1.0 and 01/03
= 1.0-^;^. These agree with the values given by the elec-
trostatic model [Eq. (2)] within the measurement uncer-
tainty. Similar results were found for C0m/2n =41.34 kHz
(fio=1.4T).
The origin of the subharmonic response at « = 3 was
experimentally investigated. This response could arise
from the excitation of the octupole moment of the magne-
tron orbit, or from a weakly allowed dipole transition due
to the C4 anharmonic term in the trap electrostatic poten-
tial. Changing the guard voltage allowed C4 to be varied
in small steps from C4<5xl0~^ to >4xl0~^ Nochange in the required threshold drive strength was ob-
served. If the subharmonic response had been due to the
anharmonic component of the magnetron motion, this
threshold drive strength would be proportional to |C4~' I-
The more general resonance condition [21] cod^in/
m)(Om, rn,n^\ was also investigated. We observed reso-
nant excitation when o}d~\(Om (for Vd = 'i mV, (Oml'^Jt
=615.0 kHz, and the same conditions as above), which
corresponds to three-photon excitation of the quadrupole
\
IN- 1882555

Volume 70, Number 17 PHYSICAL REVIEW LETTERS 26 APRIL 1993
resonance.
For two drive fields we observed stimulated Raman ex-
citation of the magnetron motion when (O2=qo)\=ro)m
with (^ = 1, /• = 1,2,3) and ((7 = 1,2,3, r=\). These reso-
nances could be observed either with the sideband cooling
(damping) on or off, and typical detunings A = ft>i— w^= 2;r(l to 150 Hz). Resonant enhancement of the re-
sponse was observed as A was decreased. The beating be-
tween these excitations and the free magnetron oscillation
was observed as well as the anharmonic pulling of the
magnetron frequency. When another driven oscillation
near too— fi>m was generated, three beat notes were ob-
served, two between the driven and free oscillations, and
one between the two driven oscillations near oim (see Fig.
3). The observation of these beat notes allows the mag-
netron responses (linear or nonlinear) to be measured in a
continuous phase sensitive manner [20].
We observed subharmonic excitation of order n = 2 and
3 for a single electron's cyclotron motion (o)c/2k= 3
GHz). Since co'c^com, magnetic field drift and noise
caused significantly more dephasing of the cyclotron
motion than that of the magnetron motion; this resulted
in poor quantitative agreement between the cyclotron re-
sults and the simple theory. When two drive fields were
applied with frequencies coj and a)\, stimulated Ramanexcitation of the cyclotron motion of a single electron was
observed for a}2~ o)\^=(j)'c with a)\=oi'c + di. Resonant
enhancement of the response was observed as the detun-
ing A was decreased; typically A/2;r=IOO to 600 kHz.
Magnetic field noise prevented us from observing beat
notes between the different cyclotron excitations.
In summary, we have observed, coherently, high-order
nonlinear resonant excitation of a single bound electron's
motion as well as that of the center-of-mass motion of a
cloud of electrons. These effects were observed in the
limit where the nonlinearity was dominated by the mul-
tipole interaction between the electron and the drive field.
Initial comparisons with a simple one-dimensional theory
show quantitative agreement for excitation of the magne-
tron motion. Detailed quantitative comparisons between
experiment and theory requires better magnetic field sta-
bility, better estimates for the shape of the drive fields
(the a,) and orbit amplitudes, as well as the extension of
Eq. (3) to three dimensions. In addition, the effects of
mode coupling and noise-induced fluctuations of the
mode frequencies must be included in the nonlinear
analysis, especially because they can inhibit very high-
order excitation. Experimentally, it should be possible to
greatly reduce the magnetic field noise, which in turn
should facilitate high-order subharmonic excitation of
the cyclotron motion. If very high-order subharmonic
response can be observed a)=a)dln with n — \Q^, the sys-
tem could have applications in frequency metrology
[3,22]. In general, this system might be useful in studies
of the effect of noise on nonequilibrium phase transitions
[16], as well as chaotic behavior in the transition from
classical to quantum dynamics.
We thank J. Bergquist, J. Bollinger, R. Fox, S. Jefferts,
2556
D. Sullivan, and M. Young for their comments on the
manuscript. We gratefully acknowledge the support of
the Office of Naval Research and the U.S. Air Force
Office of Scientific Research.
^"^Also at Colorado State University, Fort Collins, CO80523.
^'''Current address: Physics Department, University of Tex-
as at Austin, Austin, TX 78712.
[1] N. Bloembergen, Nonlinear Optics (Benjamin, NewYork, 1965).
[2] A. E. Kaplan, Phys. Rev. Lett. 56, 456 (1986).
[3] A. E. Kaplan, Opt. Lett. 12, 489 (1987); Alexander E.
Kaplan and Yu J. Ding, IEEE J. Quantum Electron. 24,
1470 (1988), and references therein.
[4] D. C. Hanna, M. A. Yuratich, and D. Cotter, Nonlinear
Optics of Free Atoms and Molecules (Springer-VerJag,
Berlin, 1979), and references therein.
[5] Marc A. Kastner, Phys. Today 46, No. 1, 24 (1993).
[6] Robert S. Van Dyck, Jr., Paul B. Schwinberg, and HansG. Dehmelt, Phys. Rev. D 34, 722 (1986).
[7] Robert S. Van Dyck, Jr., Paul B. Schwinberg, and HansG. Dehmelt, in New Frontiers in High-Energy Physics,
edited by Behram Kursunoglu, Arnold Perimutter, and
Linda F. Scott (Plenum, New York, 1978).
[8] Lowell S. Brown and Gerald Gabrielse, Rev. Mod. Phys.
58,233 (1986).
[9] Ear! C. Beaty, J. Appl. Phys. 61, 2118 (1987), and un-
published calculations.
[10] R. S. Van Dyck, Jr., D. J. Wineland, P. A. Ekstrom, and
H. G. Dehmelt, Appl. Phys. Lett. 28, 446 (1976).
[II] D. Wineland, P. Ekstrom, and H. Dehmeh, Phys. Rev.
Lett. 31, 1279 (1973).
[12] R. S. Van Dyck, Jr., P. B. Schwinberg, and H. G. Deh-
melt, in Atomic Physics 9, edited by R. S. Van Dyck, Jr.
and E. N. Fortson (World Scientific, Singapore, 1984);
Gerald Gabrielse and Hans Dehmelt, Phys. Rev. Lett. 55,
67 (1985).
[13] Gerald Gabrielse, Hans Dehmelt, and William Kells,
Phys. Rev. Lett. 54, 537 (1985).
[14] F. L. Moore, L. S. Brown, D. L. Farnham, S. Jeon, P. B.
Schwinberg, and R. S. Van Dyck, Jr., Phys. Rev. A 46,
2653 (1992).
[15] J. D. Jackson, Classical Electrodynamics (Wiley, NewYork, 1975), 2nd ed.
[16] R. L. Stratonovich, Topics in the Theory of RandomNoise (Gordon and Breach, New York, 1967), Vol. II; A.
Schenzle and H. Brand, Phys. Rev. A 20, 1628 (1979);
H. Haken, Synergetics (Springer-Verlag, Berlin, 1978).
[17] H. G. Dehmelt and F. L. Walls, Phys. Rev. Lett. 21, 127
(1968).
[18] R. S. Van Dyck, Jr., F. L. Moore, D. L. Farnham, P. B.
Schwinberg, and H. G. Dehmelt, Phys. Rev. A 36, 3455
(1987).
[19] J. Tan and G. Gabrielse, Phys. Rev. Lett. 67, 3090
(1991).
[20] Carl S. Weimer, Ph.D. thesis, Colorado State University,
1992.
[21] N. N. Bogoliubov and Y. A. Mitropolsky, Asymptotic
Methods in the Theory of Non-Linear Oscillations (Hin-
dustan, Delhi, India, 1961).
[22] D. J. Wineland, J. Appl. Phys. 50, 2528 (1979).
TN-189

PHYSICAL REVIEW A VOLUME 51, NUMBER 4 APRIL 1995
Coaxial-resonator-driyen rf (Paul) trap for strong confinement
S. R. Jefferts, C. Monroe, E. W. Bell,* and D. J. Wineland
National Institute ofStandards and Technology, Boulder, Colorado 80303
(Received 22 August 1994)
We describe a variant of the quadrupole ri" (Paul) ion trap capable of localization of a trapped ion to
much less than an optical wavelength (Lamb-Dicke regime). The trapping potentials are generated by a
high-Q, vacuum-compatible, quarter-wave resonator driven at about 240 MHz. The binding strength of
the trap has been characterized. The trap contains compensation electrodes which allow the cancella-
tion of stray static electric fields within the trap. Secular frequencies of tens of megahertz have been
achieved for trapped magnesium and beryllium ions.
PACS number(s): 32.80.Pj
I. INTRODUCTION
In this paper we describe an ion trap apparatus capable
of very strong confinement. Strong confinement is impor-
tant in several applications. In optical atomic spectrosco-
py, strong confinement allows the attainment of the
Lamb-Dicke condition whereby the extent of the atom's
motion is less than X/2ir, where k is the wavelength of
the exciting radiation [1]. Attainment of the Lamb-Dicke condition is important because it suppresses
broadening due to the first-order Doppler effect, which,
in harmonically bound atoms, takes the form of motion-
induced sidebands [2-5]. It also suppresses the fluctua-
tions of the "carrier" from measurement to measurement
[6]. More recently, strong confinement has been suggest-
ed as a way to observe the effects of super and subradi-
ance for two closely spaced atoms under well-controlled
conditions [7]. Achievement of the Lamb-Dicke limit also
suggests experiments on single-atom cavity QED and
nonclassical atomic fluorescence features under con-
trolled conditions [8,9].
With strong confinement, we should be able to achieve
resolved sideband cooling [10,11] using allowed electric-
dipole transitions. Previously, resolved sideband cooling
has been achieved using weakly allowed optical transi-
tions [11]. For resolved sideband cooling, we require that
the trap is made deep enough that the atom oscillation
frequencies (o),, / =x,y,z) satisfy 6), »7, where y is the
linewidth of the transition. Use of resolved sidebands on
allowed electric-dipole transitions has the potential ad-
vantage that cooling to the ground state of motion can be
achieved very rapidly. Resolved sidebands should also
facilitate precise measurement of the lifetimes of rapidly
decaying levels by measuring the linewidth of the
resolved carrier.
In a Penning trap [12], single-ion confinement is limit-
ed by the strength of binding along the magnetic-field
direction, which we can characterize by the (harmonic)
binding frequency co^. For stable trapping in the radial
direction, we must have o)^ < co^ /v^, where co^ is the ion
cyclotron frequency. This impHes Inv^^o^Kl'^^^QB/M, where Q is the ion charge, B is the
magnetic-field strength, and M is the ion mass. For
5 = 10 T, Q = le, and M =9 u (e.g., ^Be+ ), v^ < 12 MHz.In this paper, we discuss only the Paul trap because, for
practical field strengths, the binding should be stronger.
For a single ion bound in a quadrupole rf Paul trap
[12], the axial or z frequency o}^ must satisfy o}^-^/^,
where ft is the rf drive frequency. If we assume that the
static potential apphed between the electrodes is zero,
then, at the Mathieu stability limit (9^ =0.908) [12,13] in
an axially symmetric trap, 6>2(max)= ft/2 and the radial
secular frequency is given by <y^(max)^0. 35a)^(max).
The maximum secular frequencies can then be character-
ized by the expression for V2(max) [12,13]
1/2
V;,(max) =
ft 7277 1
Indr
QVo
0.908M(1)
'Present address: National Institute of Standards and Technol-
ogy, Building 221, Gaithersburg, MD 20899.
where Q is the ion charge, Vq is the peak rf potential ap-
plied between the ring and end caps, M is the ion mass,
and do is the characteristic trap dimension. For a trap
with hyperbolic electrodes, 2dl = rl+2zl, where Tq is the
inner radius of the ring electrode and 2zq is the iimer
end-cap to end-cap distance. Using Q = le, M =9 u,
Fo = 2 kV, and c?o = 0. 15 mm, we find v^(max)^164
MHz and v^(max)^58 MHz. These conditions would al-
low resolved sidebands on the S—>-P transition in ^Be"*",
where y /2'n= 19.4 MHz. If we assume v^ = 58 MHz and
the ion is cooled to the ground sate of motion, the Lamb-
Dicke parameter is 27rXoA= 0.063, where Xq is the
spread of the zero-point wave function.
From Eq. (1), to achieve strong confinement, we re-
quire large values of Kg and small values of dg- Implicit-
ly, we assume that ft is adjusted to give stable trapping,
that is, £i>2(o^. Large values of Fq can be limited by
electric-field breakdown or arcing. Also, if the high volt-
age is generated external to the required vacuum enclo-
sure for the trap, the voltage at the trap is reduced by the
capacitance of the vacuum feedthroughs. This problem
becomes more difficult for the required high values of ft.
As the trap dimensions are reduced, it becomes more
51 3112TN-190

51 COAXIAL-RESONATOR-DRIVEN rf (PAUL) TRAP FOR 3113
difficult to machine the desired electrode shapes. This
problem can be minimized by using simpler electrode
shapes where the leading anharmonic terms in the trap
potential can be nulled for appropriate electrode shapes.
For example, nominally quadrupolar electrodes with sim-
ple conical surfaces can be used [14]. "Planar" traps
formed with holes in parallel plates [15,16] or with con-
ducting rings [16] simplify construction even further.
These electrodes have the advantage that they can be
made small by using lithographic techniques [16].
As multielectrode traps (such as the conventional
quadrupole trap) become smaller, the relative electrode
positions also become more difficult to maintain. Oneway to eliminate this problem is to keep either the ring or
end-cap electrodes small and let the complementary
electrode(s) recede to large distances. The Paul-Straubel
or "ring" trap [17] is essentially a ring electrode with the
end caps at large distances. This trap has been analyzed
[16,18,19] and demonstrated for Ba"*" ions [18] and In"*"
ions [19]. For this kind of trap, an efficiency e can be
defined as the ratio of the rf voltage required in a quadru-
pole trap with hyperbolic electrodes to the voltage re-
quired in the ring trap (of the same internal ring diame-
ter) which gives the same secular frequency. References
[16,18,19] find £ in the range of 0.1-0.2. In a similar
spirit, Janik, Prestage, and Maleki [20] have analyzed the
case of a linear trap with two and three electrodes rather
than four electrodes as for the quadrupole hnear trap.
For the two-electrode trap they find e^^^O. 25.
The "end-cap" trap is complementary to the Paul-
Straubel trap in that it has closely spaced end cap elec-
trodes with the ring receding to infinity. Schrama et al.
[19] analyzed and demonstrated a version of this trap us-
ing Mg"*" ions. They find an efficiency e in the range of
0.2-0.5. Both the Paul-Straubel or ring trap and the
end-cap trap additionally provide a more open optical ac-
cess for collecting ion fluorescence hght than the conven-
tional quadrupole trap.
In the work described below [21], we discuss a strategy
for achieving large values of Vq and ft and small values
of do in a trap with nominal quadrupolar geometry where
II. DESCRIPTION
The trap described here is very simple; it consists of
two thin sheets of metal: the first, the ring, has a hole,
the second, perpendicular to the first, has a slit and acts
as the end caps. The arrangement is illustrated in Fig. 1.
One trap constructed with this geometry is used for trap-
ping ^'*Mg'^ ions and has a ring inner diameter Ir^ of 0.43
mm. The end-cap slit width 2zq is 0.32 mm. Themolybdenum sheet from which the trap was constructed
was 0.13 mm thick. As shown in Fig. 1, the relative posi-
tion of the trap electrodes is maintained by ceramic posi-
tioning rods.
The trap is mounted at the end of an ultrahigh-
vacuum-compatible coaxial quarter-wave resonant
transmission line. This oxygen-free high-conductivity
copper quarter-wave line is installed inside a vacuum en-
closure which has fused silica windows to allow the pas-
sage of uv laser beams for cooling and probing the atomand resonance fluorescence light from the ions. Thetransmission line is resonant at a frequency of approxi-
mately 240 MHz and has an unloaded quahty factor Q„on the order of 2000. The transmission line is excited
with a small loop antenna at the base of the transmission
Hne. The area of the loop is adjusted so that, on reso-
nance, the antenna plus resonator presents a 50-ft load to
the driving amplifier. With some care adjusting the cou-
pHng, voltage standing-wave ratios of less than 1 .05 canbe achieved. With 1 W of incident rf power, the calculat-
ed rf trapping voltage Vq at the trap is about 700 V peak,
neglecting the trap capacitance and end effects of the
resonator. From the modeled trap parameters (Sec. Ill)
and the measured secular frequencies (below), we calcu-
late the actual voltage between the ring and end caps to
be Vq =; 600 V for 1 W of incident power. We have been
unable to apply voltage much beyond 1 kV due to a vacu-
um discharge problem which we are attempting to solve.
One advantage of this type of design results from the
fact that the rf voltage at the vacuum feedthrough is
small, thus minimizing problems associated with high-
voltage breakdown at or before the feedthrough as well as
reduction of the resonator Q by the vacuum feedthrough.
An extension of the design would be to mount the "ring"
electrode at the antinode of a half-wave transmission line
resonator with the end caps attached to the outer wall of
the transmission line. This geometry would allow a
direct current to be passed through the ring electrode to
evaporate any contaminants on the trap ring [18].
Uncontrolled static electric fields arising from contact
potentials or charged patches can cause significant prob-
lems in miniature rf traps. These fields displace ions fromthe zero of the rf trapping fields, thereby leading to un-
desirable increases in the "micromotion" amplitudes [18].
A common scheme for dealing with these problems is the
introduction of "compensation electrodes," which are
used to cancel the stray electric fields in the trapping re-
gions. We have included compensation electrodes, simi-
lar to those used by Nagourney [22], in the manner
shown in Fig. 1. Static potentials appHed to various com-
binations of the compensation electrodes allow for can-
cellation of static electric fields in an arbitrary direction
in the trapping region.
With zero static potential between the electrodes andin the pseudopotential approximation, the secular
(motional) frequencies of a trapped ion can be expressed
as
«,=«,^2QVq
mdlQ,(2)
where a, is a numerical constant for ion motion along the
/th axis (/ =x,y,z; see Fig. 1). In the case of a quadrupo-
lar hyperbolic ion trap, the constant a, is j for the x and
y directions and 1 for the z direction. The trap described
here breaks the symmetry about the z direction, causing
oi^<cOy. In the pseudopotential approximation, with
zero static electric field between the trap electrodes,
co^+o)y=co^. Measured ion motional frequencies for this
trap fall in the ratios of co^/o^—OAO and co^/co, =0.60.lN-191

3114 JEFFERTS, MOhfROE, BELL, AND WINELAND 51
50Q Feedthrough
;- Vacuum Flange
Compensation Eleclrodes(4ea) -
Optical Access Holes
-
Fine Thread Adjuster Serein/
Ceramic Adjuster Rod i of 4-
bctor of Transmission Lme^Center Condui
Detail - Adjuster Rod:
FIG. 1 . Approximate scale drawing of the coaxial resonator and rf trap electrodes (shown in an expanded view in the lower right
of the figure). The ring electrode is attached to the inner conductor at the position of the antinode of the quarter-wave hne. The end
cap electrode is held near the rf ground by the short section of center conductor at the right-hand side of the resonator. The resona-
tor is driven by a coaxial line external to the vacuum system shown at the left. The area of the loop antenna is adjusted so the resona-
tor (on resonance) presents a matched load (50 ft) to the input line. The resonator is surrounded by a vacuum envelope (not shown in
the figure) which has quartz windows to allow the passage of uv laser beams and fluorescence light. The position of the ring electrode
relative to the end cap electrode is maintained by four adjustable ceramic rods (alumina) shown in the detail in the lower left of the
figure. Static potentials are applied to four compensation electrodes to compensate for stray electric fields due to contact potentials
and charge buildup on the trap electrodes. For a proper selection of compensation potentials, the average position of a single trapped
ion coincides with the position of a zero rf electric field. The two compensation electrodes in front of the end cap electrode are
shown in the expanded view in the lower right of the figure. Two more compensation electrodes (behind the end cap electrode) are
not shown in the figure.
The secular frequencies of trapped ^^Mg"*" ions were mea-
sured by monitoring the intensity of scattered laser-
cooling light (A. ^280 nm) as an rf drive was applied to
one of the compensation electrodes and swept over the
frequency range which included the secular motion fre-
quencies. Data taken with a single trapped ^"^Mg"*" ion
and Fo=^450 V at frequency ft are shown in Fig. 2. The
measurements of ion secular frequencies at a given rf
voltage in ft yield the efficiency of this trap relative to the
normal hyperbolic rf trap. From these measurements, wecan assign a trap efficiency factor e of about 0.9 for the
axial (z) direction of this trap. This compares favorably
with the efficiency factor of about 0. 1 3 for the single-ring
trap [18] and between 0.2 and 0.5 for the multiring trap
[16], or end cap trap [19]. We have constructed a similar
but slightly smaller trap (a-q^O. 15 mm, Zo=0. 10 mm),
for ^Be"*" ions; this trap has demonstrated confinement
with secular axial frequencies in excess of 50 MHz(ft 7277= 230 MHz), the largest secular frequency report-
ed to date to our knowledge. Previously, secular frequen-
o ^
IsQ_
m tK**f* II w^tr'iiii <"< i^itMiipti^'itijL.5 MHz 3.5 MH^ 5.5 MHz
Frequencquency
FIG. 2. Response of a single ^"^Mg"*" ion to an oscillating po-
tential applied to one of the compensation electrodes shown in
Fig. 1. The cooling laser for ^'*Mg"'" ions is tuned several
linewidths to the red of the ^Si/2—>-'^Pi/2 transition. When the
ion is excited by the oscillating electric field, the Doppler shift
caused by its increased velocity leads to an increase in fluores-
cence scattering. The three resonances shown correspond to ex-
citation of the three secular frequencies co^yW^, and co^-
IN- 192

51 COAXIAL-RESONATOR-DRIVEN rf (PAUL) TRAP FOR 3115
cies of approximately 10 MHz have been reported for
Ba"*" ions [16,18]. In this second trap the secular frequen-
cy was inferred by measuring the ion-ion spacing at low
rf-drive levels, which calibrates the "spring" constant of
the trap, and then scaling the spring constant to higher
rf-trapping voltages. This measurement, coupled with
the modeled electric potential in the trap (below) and the
results from the first trap using trapped ^'*Mg''", allows
the assignment of the secular frequencies at arbitrary
values of the rf-trapping voltage. The secular frequencies
will be limited by the requirement that co^ <D,/2 for
stable trapping (Mathieu stability hmit). To increase 6)^,
one must increase O,; one way this can be accomplished
with no change to the apparatus is by driving the
transmission line at the first overtone, thereby raising ft,
and hence the limit on co^, by a factor of 3.
III. MODELING
This trap design does not lend itself well to analytic
methods of solution for the electric potential in the trap-
ping region, so the trap potential must be modeled using
a computer program which can describe the full three-
dimensional extent of the trap electrodes. We have per-
formed modeling of the three-dimensional trap structure
using the MAFIA [23] computer program.
The ring and end-cap electrodes of the ^'*Mg''' trap
were discretized on a cubical mesh whose overall side was1.02 mm on a side with a distance between individual
mesh points of 0.013 mm. The mesh axes lay along the
same coordinate system as the trap coordinate system
shown in Fig. 1, with the origin centered on the trap.
The compensation electrodes were not included in the
model. The mesh spacing was chosen so there were a
sufficient number of mesh points to describe the smallest
feature of the trap. The electrostatic field was then calcu-
lated and the secular frequencies determined from the
field. The calculated motional frequencies are in the ra-
tios 0)^ /(o^ =0.44 and o)y /co^ =0. 63, in reasonable agree-
ment with the measured ratios of co^/co2=0A0 and
o)y/iL>^=0.60. The relatively coarse grid used in the trap
modehng limits the accuracy of the modeled trap poten-
tial thus causing the calculated co^ and cOy to not sum ex-
actly to 0)^.
Higher-order terms in the potential are also of impor-
tance. These have also been estimated by fitting the
MAFIA results to the expansion (in spherical coordinates)
^(r,d,<f)]
n=0
In
Pi^icosO) (3)
As a result of the reflection symmetry in % the odd order
terms in the expansion have been eliminated. The con-
stant Cj is the coefficient of the quadrupolar trapping po-
tential and is of order 1 . The C^ term in the expansion,
the lowest-order correction to the described quadrupole
potential, is less than 0.3. Higher-order even terms in the
expansion have not been calculated.
Due to the small size of the trap, significant misalign-
ment of the trap electrodes is a possibihty. To determine
the sensitivity of the trapping potential to this effect, pos-
sible misalignments of the components of the trap were
modeled. Several cases where the end caps were shifted
up to 0.13 mm relative to the ring in the y and z direc-
tions were computed. This distance corresponds to about
one-third of the ring diameter and represents a "worst"
case misalignment. The predicted motional frequencies
for maximal misahgnment differed by less than 5% from
the frequencies for the aligned case. This calculated shift
is approximately the uncertainty introduced due to
discretizing the trap on the finite mesh used. Therefore,
it seems that small misalignments of the trap electrodes
do not significantly alter the characteristics of the trap.
IV. CONCLUSIONS
This trap has demonstrated the highest secular fre-
quencies for trapped ions reported to date and can be ex-
tended to even higher frequencies. Unlike some other
designs, it retains the trapping efficiency of conventional
hyperbolic quadrupolar designs, thereby allowing larger
traps to be built to achieve a given secular frequency and
thus relaxing dimensional tolerance requirements. Use of
a coaxial-resonator-based design minimizes problems as-
sociated with high-voltage breakdown and facilitates the
attainment of high values of the drive frequency fl.
ACKNOWLEDGMENTS
Support for this project has been provided by the
ONR. S.R.J, and CM. received financial support from
the National Research Council. We thank J. C.
Bergquist for help in setting up the coohng laser used in
these experiments. A. S. Barton provided significant help
in the early stages of this work. We thank the AT-7 code
group at Los Alamos National Laboratories for the use of
the MAFIA modehng program. We thank R. Blatt, J.
Miller, and M. Young for helpful comments on the
manuscript.
[1] R. H. Dicke, Phys. Rev. 89, 472 (1953).
[2] D. J. Wineland and W. M. Itano, Phys. Rev. A 20, 1521
(1979); J. C. Bergquist, W. M. Itano, and D. J. Wineland,
ibid. 36,428(1987).
[3] W. Neuhauser, M. Hohenstatt, P. E. Toschek, and H. G.
Dehmelt, Phys. Rev. A 22, 1137 (1980).
[4] G. Janik, W. Nagoumey, and H. Dehmelt, J. Opt. Soc.
Am. 2, 1251 (1985).
[5] A. A. Madej, K. J. Siemsen, J. D. Sankey, R. F. Clark, and
J. Vanier, IEEE Trans. Instrum. Meas. 42, 234 (1993).
TN-193
3116 JEFFERTS, MONROE, BELL, AND WINELAND 51
[6] H. Dehmelt, Bull. Am. Phys. Soc. 18, 1521 (1973).
[7] R. G. Devoe and R. G. Brewer, Bull. Am. Phys. Soc. 38,
1140(1993).
[8] Fundamental Systems in Quantum Optics, Proceedings of
the Les Houches Summer School of Theoretical Physics,
Session LIII, Les Houches, France, 1990, edited by J.
Dalibard, J. M. Raimond, and J. Zinn-Justin (Elsevier,
Amsterdam, 1992).
[9] W. Vogel, Phys. Rev. Lett. 67, 2450 (1991); W. Vogel and
R. Blatt, Phys. Rev. A 45, 3319 (1992).
[10] D. J. Wineland and H. DehmeU, Bull. Am. Phys. Soc. 20,
637(1975).
[1 1] F. Diedrich, J. C. Bergquist, W. M. Itano, and D. J. Wine-
land, Phys. Rev. Lett. 62, 403 (1989).
[12] H. G. Dehmelt, Adv. At. Mol. Phys. 3, 53 (1967); 5, 109
(1969); D. J. Wineland, W. M. Itano, and R. S. Van Dyck,
Jr., ibid. 19, 135 (1983); R. C. Thompson, ibid. 31, 63
(1993).
[13] R. F. Wuerker, H. Shelton, and R. V. Langmuir, J. Appl.
Phys. 30,342(1959).
[14] E. C. Beaty, J. Appl. Phys. 61, 21 18 (1987).
[15] M. H. Prior and H. A. Shugart, Phys. Rev. Lett. 27, 902
(1971).
[16] R. G. Brewer, R. G. DeVoe, and R. Kallenbach, Phys.
Rev. A46,R6781(1992).
[17] H. Straubel, Naturwissenschaften 18, 506 (1955).
[18] N. Yu, W. Nagourney, and H. Dehmelt, J. Appl. Phys. 69,
3779(1991).
[19] C. A. Schrama, E. Peik, W. W. Smith, and H. Walther,
Opt. Commun. 101, 32(1993).
[20] G. R. Janik, J. D. Prestage, and L. Maleki, J. Appl. Phys.
67,6050(1990).
[21] S. R. JeflFerts, C. Monroe, A. S. Barton, and D. J. Wine-
land, Bull. Am. Phys. Soc. 39, 1167 (1994).
[22] W. Nagourney (private communication).
[23] T. Weiland, mafia (Release 3.1), October 1991, CST,
Ohlystrasse 69, D-6100 Darmstadt, Germany.
IN- 194

NIST Technical Publications
Periodical
Journal of Research of the National Institute of Standards and Technology—Reports NIST research
and development in those disciplines of the physical and engineering sciences in which the Institute is
active. These include physics, chemistry, engineering, mathematics, and computer sciences. Paperscover a broad range of subjects, with major emphasis on measurement methodology and the basic
technology underlying standardization. Also included from time to time are survey articles on topics
closely related to the Institute's technical and scientific programs. Issued six times a year.
Nonperiodicals
Monographs—Major contributions to the technical literature on various subjects related to the Institute's
scientific and technical activities.
Handbooks—Recommended codes of engineering and industrial practice (including safety codes)
developed in cooperation with interested industries, professional organizations, and regulatory bodies.
Special Publications—Include proceedings of conferences sponsored by NIST, NIST annual reports, andother special publications appropriate to this grouping such as wall charts, pocket cards, andbibliographies.
Applied Mathematics Series—Mathematical tables, manuals, and studies of special interest to physicists,
engineers, chemists, biologists, mathematicians, computer programmers, and others engaged in scientific
and technical work.
National Standard Reference Data Series—Provides quantitative data on the physical and chemical
properties of materials, compiled from the world's literature and critically evaluated. Developed under a
worldwide program coordinated by NIST under the authority of the National Standard Data Act (Public
Law 90-396). NOTE: The Journal of Physical and Chemical Reference Data (JPCRD) is published bi-
monthly for NIST by the American Chemical Society (ACS) and the American Institute of Physics (AIP).
Subscriptions, reprints, and supplements are available from ACS, 1155 Sixteenth St., NW, Washington,
DC 20056.
Building Science Series—Disseminates technical information developed at the Institute on building
materials, components, systems, and whole structures. The series presents research results, test
methods, and performance criteria related to the structural and environmental functions and the durability
and safety characteristics of building elements and systems.
Technical Notes—Studies or reports which are complete in themselves but restrictive in their treatment
of a subject. Analogous to monographs but not so comprehensive in scope or definitive in treatment of
the subject area. Often serve as a vehicle for final reports of work performed at NIST under the
sponsorship of other government agencies.
Voluntary Product Standards—Developed under procedures published by the Department of Commercein Part 10, Title 15, of the Code of Federal Regulations. The standards establish nationally recognized
requirements for products, and provide all concerned interests with a basis for common understanding of
the characteristics of the products. NIST administers this program in support of the efforts of private-
sector standardizing organizations.
Consumer Information Series—Practical information, based on NIST research and experience, covering
areas of interest to the consumer. Easily understandable language and illustrations provide useful
background knowledge for shopping in today's technological marketplace.
Order the above NIST publications from: Superintendent of Documents, Government Printing Office,
Washington, DC 20402.
Order the following NIST publications—FIPS and NISTIRs—from the National Technical Information
Service, Springfield, VA 22161.
Federal Information Processing Standards Publications (FIPS PUB)—Publications in this series
collectively constitute the Federal Information Processing Standards Register. The Register serves as the
official source of information in the Federal Government regarding standards issued by NIST pursuant to
the Federal Property and Administrative Services Act of 1949 as amended. Public Law 89-306 (79 Stat.
1127), and as implemented by Executive Order 11717 (38 FR 12315, dated May 11, 1973) and Part 6 of
Title 15 CFR (Code of Federal Regulations).
NIST Interagency Reports (NISTIR)—A special series of interim or final reports on work performed by
NIST for outside sponsors (both government and non-government). In general, initial distribution is
handled by the sponsor; public distribution is by the National Technical Information Service, Springfield,
VA 22161, in paper copy or microfiche form.

U.S. Department of CommerceNational Institute of Standards and Technology325 BroadwayBoulder, Colorado 80303-3328
Official BusinessPenalty for Private Use, $300