Transport and environment: facing a dilemma — TERM 2005
56
Transport and environment: facing a dilemma TERM 2005: indicators tracking transport and environment in the European Union EEA Report No 3/2006 ISSN 1725-9177
-
Upload
khangminh22 -
Category
Documents
-
view
6 -
download
0
Transcript of Transport and environment: facing a dilemma — TERM 2005
Transport and environment: facing a dilemma
TERM 2005: indicators tracking transport and environment in the European Union
EEA Report No 3/2006
ISSN 1725-9177

EEA Report No 3/2006
Transport and environment: facing a dilemma
TERM 2005: indicators tracking transport and environment in the European Union

Cover design: EEACover photo © Frédérick Cirou, PhotoAltoLeft photo © Flo HolzingerRight photo © Flo HolzingerLayout: Scanprint A/S, EEA
Legal notice The contents of this publication do not necessarily reflect the official opinions of the European Commission or other institutions of the European Communities. Neither the European Environment Agency nor any person or company acting on behalf of the Agency is responsible for the use that may be made of the information contained in this report.
All rights reserved No part of this publication may be reproduced in any form or by any means electronic or mechanical, including photocopying, recording or by any information storage retrieval system, without the permission in writing from the copyright holder. For translation or reproduction rights please contact EEA (address information below).
Information about the European Union is available on the Internet. It can be accessed through the Europa server (http://europa.eu.int).
Luxembourg: Office for Official Publications of the European Communities, 2006
ISBN 92-9167-811-2ISSN 1725-9177
© EEA, Copenhagen 2006
European Environment AgencyKongens Nytorv 61050 Copenhagen KDenmarkTel.: +45 33 36 71 00Fax: +45 33 36 71 99Web: www.eea.eu.intEnquiries: www.eea.eu.int/enquiries
3
Contents
Transport and environment: facing a dilemma
Contents
Key messages ............................................................................................................ 4
Introduction ............................................................................................................... 6
Transport in perspective ............................................................................................ 8
1 Freight transport volumes grow with no clear signs of decoupling from GDP ......12
2 Passenger transport volumes have paralleled economic growth .......................... 14
3 Greenhouse gas emissions from transport are growing ....................................... 16
4 Harmful emissions decline, but air quality problems require continued attention ............................................................................................. 18
5 Road freight continues to gain market share ...................................................... 20
6 Air passenger transport grows, while the shares of road and rail remain constant ...................................................................................... 22
7 Developments in fuels contribute to emission reductions .................................... 24
8 Car occupancy and lorry load factors decline in countries for which data are available ................................................................................ 26
9 New technology can cut emissions and fuel consumption, but more effort is needed to achieve CO2 targets ................................................. 28
10 Price structures are increasingly aligned with and yet well below external costs level ............................................................................ 30
References ............................................................................................................... 32
TERM indicators ........................................................................................................ 36
Metadata and supplementary information on figures ............................................... 37
Data annex ............................................................................................................... 39
Transport and environment: facing a dilemma4
Key messages
Key messages
1 Freight transport volumes grow with no clear signs of decoupling from GDP
More goods are transported farther and more frequently. This results in increased CO2 emissions and slows the decline in air pollutant emissions. Relative decoupling of growth in freight volumes from economic growth has only been achieved in the EU-10, where the growth in GDP exceeds the high growth in transport volume.
2 Passenger transport volumes have paralleled economic growth
Passenger transport volumes have grown in most Member States. Relative decoupling has been achieved in only five new EU Member States. It is, however, likely that with time development in the EU-10 will parallel the older ones.
3 Greenhouse gas emissions from transport are growing
Transport's energy consumption (and their emission of greenhouse gases) are increasing steadily because transport volumes are growing faster than the energy efficiency of different means of transport. The increase in greenhouse gas emissions from transport threatens European progress towards its Kyoto targets. Therefore, additional policy initiatives and instruments are needed.
4 Harmful emissions decline, but air quality problems require continued attention
Transport, especially road transport, is becoming cleaner because of increasingly strict emission standards for the different transport modes. Nevertheless, air quality in cities does not yet meet the limit values set by European regulation and still has a major negative impact on human health.
5 Road freight continues to gain market share
Road transport has gained a greater and rising share of the freight market. This development constitutes a move farther away from the EU objective of stabilising the share at its 1998 level. At present, there are policy initiatives aimed at a modal shift for long-distance and large-scale transport.
6 Air passenger transport grows, while the share of road and rail remain constant
Changing the modal split towards rail transport and away from passenger cars is not being achieved. There are still no signs of this common transport policy goal being met. Both modes are growing at the same rate as total passenger transport volume. In addition, the share of aviation is increasing whereas the share of bus and coach is decreasing.
7 Developments in fuels contribute to emission reductions
All countries where data are currently available have met the 2005 limit value for low sulphur content in road transport fuels. The remaining ones are expected to hit their targets as well. In addition, some countries have already achieved the 2009 target on zero sulphur fuels. Moreover, steps towards sulphur reduction are being taken in other modes. However, much work remains to be done.
The share of biofuels is increasing, although currently reported shares are below the targets of the biofuels directive.
5
Key messages
Transport and environment: facing a dilemma
8 Car occupancy and lorry load factors decline in countries for which data are available
There are few data available on occupancy rates and load factors. Data for those countries show average occupancy rates for passenger cars are lower than a decade ago. Growing car ownership, the decreasing average size of households and disperse spatial patterns are the main causes for low occupancy rates. The limited data available also show a trend towards poorer use of heavy goods vehicle capacity. Apparently, the higher transport costs, resulting from lower utilisation, are exceeded by benefits such as reduced production costs. A reverse of these market trends could reduce environmental impact.
9 New technology can cut emissions and fuel consumption, but more effort is needed to achieve CO2 targets
New engine and vehicle technologies have entered the market, reducing pollutant emissions
and improving fuel efficiency. Although the fuel efficiency of passenger cars has improved in recent years, more effort is required from car manufacturers to meet the goals of the voluntary CO2 commitment. Additional effort will be required by all stakeholders to bring the Community's objective of 120 g of CO2/km within reach.
10 Price structures are increasingly aligned with and yet well below external costs level
There are a number of initiatives to align price structures better with the external impact of transport. However, transport prices are generally well below the marginal social cost level. This is resulting in over-consumption of transport. Further improvement of transport pricing is an opportunity to better balance the benefits and negative impacts of transport.
Transport and environment: facing a dilemma6
Introduction
Introduction
This report represents a summary of 10 selected issues from the EEA's TERM (transport and environment reporting mechanism) set of transport and environment integration indicators.
The objective is to indicate some of the main challenges to reducing the environmental impacts of transport, and to make suggestions for improving the environmental performance of the transport system as a whole. The report examines 10 key issues which need to be addressed in the coming years. These issues are derived from seven policy questions that form the backbone of TERM. As with previous TERM reports, this report evaluates the indicator trends in terms of progress towards existing objectives and targets. This is carried out using EU policy documents and various transport and environmental directives.
The selection of information presented in this report does not represent a full inventory of conclusions that can be extracted from TERM. Rather, the aim is to provide broad coverage of TERM. Readers are therefore encouraged to seek further information in the TERM fact sheets themselves.
TERM: a two-layer information system
TERM reports have been published as an official indicator-based reporting mechanism since 2000. As one of the environmental assessment tools of the common transport policy (EC, 2001b), it offers important guidelines for the development of EU policies. With this report, the EEA aims to show the main developments over the past decade and the challenges that lie ahead.
Currently, TERM consists of 40 indicators (see overview in the 'TERM indicators' section ) that are structured around seven policy questions (see box). It addresses various target groups, ranging from high-level policy-makers to technical policy experts. It is therefore set up as a two-layer information system with different degrees of analytical detail.
This report aggregates the key messages from the indicators. Indicator fact sheets constitute a more detailed information layer. The fact sheets provide an in-depth assessment for each indicator, including: an overview of the main policy context and existing EU policy targets related to the indicator; an analysis of data quality and shortcomings; a description of metadata; and recommendations for future improvement of the indicator and data. The TERM indicator fact sheets form the reference information system of this report and can be downloaded from the EEA website (http://themes.eea.eu.int/Sectors_and_activities/transport/indicators).
Scope of the report
The report aims to cover all EEA member countries: 25 EU Member States, three candidate countries (Romania, Bulgaria and Turkey), and Norway, Iceland and Liechtenstein. Switzerland will become a member in 2006 and provides data in some cases. Where data are not complete, this is generally noted.
Most indicators cover the years since 1990, subject to data availability, but there are cases where data for the EU-10 have only become available recently or where the transition from a centrally planned to market economy has led to such big changes that comparisons become irrelevant.
Unless other sources are given, all assessments covered in this report are taken from TERM fact sheets and are based on data from Eurostat.
The underlying fact sheets used for this report have been developed by the European Topic Centre for Air and Climate Change and the consulting company CE-Delft. The project was managed and the final version of the text written by Peder Jensen of the EEA.
7
Introduction
Transport and environment: facing a dilemma
TERM policy context, process and concept
The Amsterdam Treaty identifies integration of environmental and sectoral policies as the way forward to sustainable development. The European Council, at its summit in Cardiff in 1998, requested the Commission and transport ministers to focus their efforts on developing integrated transport and environment strategies. At the same time, and following initial work by the EEA on transport and environment indicators, the joint Transport and Environment Council invited the Commission and the EEA to set up a transport and environment reporting mechanism (TERM), which should enable policy-makers to gauge the progress of their integration policies. The sixth environmental action programme (EC, 2001c) and the EU strategy for sustainable development (EC, 2001a) re-emphasise the need for integration strategies and for monitoring environmental themes as well as sectoral integration.
The main aim of TERM is to monitor the progress and effectiveness of transport and environment integration strategies on the basis of a core set of indicators. The TERM indicators were selected and grouped to address seven key questions.
1. Is the environmental performance of the transport sector improving?2. Are we getting better at managing transport demand and at improving the modal split?3. Are spatial and transport planning becoming better coordinated so as to match transport demand to the
need for access?4. Are we optimising the use of existing transport infrastructure capacity and moving towards a better
balanced intermodal transport system?5. Are we moving towards a fairer and more efficient pricing system which ensures that external costs are
internalised?6. How rapidly are cleaner technologies being implemented and how efficiently are vehicles being used?7. How effectively are environmental management and monitoring tools being used to support policy- and
decision-making?
The TERM indicator list covers the most important aspects of the transport and environment system (driving forces, pressures, state of the environment, impacts and societal responses — the DPSIR framework). It represents a long-term vision of the indicators that are ideally needed to answer the above questions.
The TERM process is steered jointly by the European Commission (Directorate-General for the Environment, Directorate-General for Transport and Energy, and Eurostat) and the EEA. The EEA member countries and other international organisations provide input and are consulted on a regular basis.
Transport and environment: facing a dilemma8
Transport in perspective
Transport in perspective
Europe is faced with a dilemma: how to sustain the current high level of access and mobility while avoiding their negative impact. Solving this issue will require long-term, sustained efforts across many policy fields.
Today's European lifestyle depends greatly on access to a reliable transport system, and most Europeans see mobility as a prerequisite for a good life. Yet, at the same time there are concerns about the impact, e.g. noise, accidents, biodiversity loss and air quality, of the transport system on the quality of life. So, there is a dilemma: transport serves as well as harms people. But resolving the dilemma requires more than just recognition of its existence.
Transport is mostly a means to an end, but transport users are locked into production and consumption patterns that are not easily changed in the short term, i.e. companies are located in certain places and need supplies, people need to go to work, children need to go to school etc. The transport supply and demand patterns that Europe experiences today are the results of decades of planned and unplanned developments. Changing these patterns in a more sustainable direction is a long term issue. The many different policy fields which affect transport demand, such as spatial planning, industrial development and agriculture, must all integrate the aim of reduced transport demand as a policy driver. Such policy integration could allow a reduction in transport demand without reducing access to activities, e.g. locating activities closer together.
There is still a need for further action in the Member States to ensure that air quality objectives of the sixth environmental action programme are met. This is the case despite the fact that air emissions have been the focus of regulation for many years via ever tighter emission standards.
Emission of air pollutants has been reduced significantly — around one third in EEA member
countries — over the past decade. This has been due to technical improvements implemented in response to EU emission legislation. More progress is in the pipeline. Even stricter standards will come into force and old vehicles will be replaced by new, cleaner ones. The development in technical characteristics of vehicles as well as the introduction of cleaner fuels has mostly affected road transport. This is because emission standards for other transport modes are in some aspects less restrictive and were introduced later. Road transport dominates the land transport market. It is generally the form of transport, and is used closest to people. Thus, more people are exposed to its pollutants. Therefore, it has been appropriate to pay particular attention to it. However, as a result of the progress made on road transport emissions technology, attention must now be paid to the other modes of transport as well.
Marine transport is responsible for a very large share of freight transport (three quarters of total EU freight transport). This is, mainly on the high seas, where emission regulation is less strict. As an example, the sulphur content of marine fuels was recently capped at 4.5 %. However, as the average marine fuel today only contains 3.0 % sulphur, the effect of this measure will be small. More importantly, the same regulation requires that fuel containing less than 1.5 % sulphur is used in the Baltic Sea, North Sea and by passenger vessels everywhere. At berth in port the limit is 0.1 %. Although this is still 20 times higher than for road transport fuels, it will have a positive impact on sulphur emissions. Aviation fuel, rail diesel and fuel for inland barges have sulphur content between that of road and maritime fuels.
In spite of the large reduction in emissions from transport, EEA member countries are still faced with air quality problems. Measurements show that many cities are not on track to meet the air quality limit values set for particulate matter for 2005 or for NO2 for 2010. Ozone incidents are frequent, and the air quality limit values set for ozone in 2010 are widely exceeded already. Traffic is not the only source of the emissions behind these figures, but traffic does play an important role in the exposure of people to high concentrations of pollutants. This
Transport in perspective
Transport and environment: facing a dilemma 9
is due to emissions at street level which are in close proximity to the general public. Moreover, traffic is a significant source of emissions of fine and ultra-fine particles in cities and there is growing evidence which shows that the effect that fine particles has on health has been underestimated. Under the 'Clean air for Europe' programme it has recently been estimated that each year as many as 370 000 people die prematurely due to air pollution. These deaths are mainly because of fine particles and ozone. The draft thematic strategy on air pollution aims to further cut emissions of air pollutants to meet air quality objectives by 2020. This would also require further reductions from road transport.
Addressing transport's contribution to climate change will require further measures aimed at technically improving vehicles and at curbing transport demand growth.
As a first step to limit climate change effects, all EU Member States have committed themselves to reducing the emissions of greenhouse gases in accordance with the Kyoto Protocol. The EU-15 have a joint target and all other Member States, except Cyprus and Malta, have individual targets. Since greenhouse gas emissions from transport have increased by around 23 % since 1990, the reductions of emissions in other sectors of economic activity have to a large extent been offset. This now makes it difficult to meet the Kyoto targets. If, in the long run, the global temperature rise should be limited to a maximum of 2 °C, as agreed by the EU Council, the concentration of all greenhouse gases in the atmosphere must stabilise at a level no higher than about 550 ppm, corresponding to a CO2 level of 450 ppm or perhaps even substantially lower. In 2005, the EU Environment Council concluded that in order to meet these targets developed countries would need to develop reduction pathways to allow a 15 to 30 % reduction in emissions by 2020, and 60 to 80 % by 2050. This would mean that transport, which presently emits around one fifth of all greenhouse gases, could end up using the entire emission quota by 2050 if no action is taken.
The main reason for the growth in greenhouse gas emissions from the transport sector has been that the growth in transport volumes has not been offset by effective measures. Growth of transport volumes has also been shown to be closely linked to growth of GDP. Although there is a desire for economic growth, the negative impacts of transport are extremely undesirable. Most activities that contribute towards increases in GDP include an
element of transport. Therefore, decoupling of transport growth from economic growth requires close examination of the internal efficiency of the use of transport in different sectors of the economy. In the short term, measures like improvements of logistics and better use of more efficient modes of transport can in some cases reduce transport volumes significantly. However, in the long run, consumption patterns and levels will have to be addressed as well.
Better vehicle technology also holds a promise of progress. The car makers' voluntary commitment to reducing average CO2 emissions to 140 grams/km is a step in the right direction. But the mid-term evaluation of this commitment shows that industry needs to make greater efforts if targets are to be met. In view of this and the overall Community objective of 120 grams/km, the effort to align vehicle taxation with environmental performance should be seen as a push in an environmentally more sound direction. The emissions of other vehicle classes such as light-duty vehicles should also be addressed, as they make up a significant share of the vehicle fleet.
Transport volume growth is undermining improvements. However, long-term policies in many sectors of the economy can reduce transport emissions of greenhouse gases.
In spite of the initiatives mentioned above, transport emissions of greenhouse gases are presently growing. The main offender is the growth in transport demand, which is not being offset by the energy efficiency of vehicles. Policy development therefore needs to address transport growth if absolute reductions in greenhouse gas emissions are to be achieved.
Freight transport volumes are closely tied to production processes, and the distance between individual parts of the process and the distance to the consumer. If consumption patterns move towards less transport-intensive products (e.g. services rather than industrial products), the growth trend could be lowered. Similarly, demand could be reduced if production and consumption processes moved closer together. Currently, freight transport is growing at the same rate as GDP, but data show a strong shift in the EU-10, where GDP is growing significantly faster than transport volumes. This masks an opposite tendency in the EU-15. The development in the EU-10 may be a temporary situation as large structural changes are taking place
Transport and environment: facing a dilemma
Transport in perspective
10
in the economy that will eventually end. Therefore, more attention should be devoted to freight transport volume growth.
Passenger transport volume data are sketchier, as countries are not obliged to report these to Eurostat. Nevertheless, it appears that economic growth is also outpacing the growth in passenger transport volumes in the EU-10.
From a historical perspective, there have been two constant factors of importance for passenger transport demand. On average, people have tended to have a more or less fixed time budget for transport, as well as a more or less fixed share of their income for transport. People react to the extra choice that faster and/or cheaper transport gives them by doing things that they could not do before. The 'budget' is like a saturation threshold: how much time are people willing to spend on transport, and how much money?
A fixed time budget means that additional transport infrastructure will eventually be used as long as it provides faster travel. People are willing to travel farther if speeds increase. The supply of additional transport infrastructure is therefore not just a matter of meeting demand but also a strong driving force for increased transport volumes.
The fixed income share means that people react to increased income with more expensive travel habits (e.g. using a car rather than public transport modes, and making more use of air travel) over time. Because this often entails a time advantage, the trips can be longer as well. The crux of the issue is: when given the freedom to choose, people do things they otherwise could or would not have done. This results in more transport. Individual car users gain increased choice, but this choice comes at a cost to the environment.
The strong increases in aviation volumes — interrupted by a short break due to the terrorist attacks in the USA in 2001 and the SARS epidemic in 2002 — have attracted considerable attention. This increase is due in part to the rise of low-cost air travel in Europe, where flight tickets are available at prices comparable to theatre tickets. A response has been a discussion on the introduction of economic instruments to reduce emissions, especially via emission trading in CO2 quotas. How this would work in practice is still open for discussion, and the impact on ticket prices and transport volumes is equally a matter of debate. According to model calculations, the impact on prices and volumes could be quite limited but would still provide a
source of funds to pay for emission reductions in other sectors. However, the impact on ticket prices depends strongly on the emission quotas allocated to air transport, so any estimate now must be seen as speculative.
Increased use of economic instruments on transport users is still an option that is discussed more than it is implemented.
Effective transport systems, not least marine transport, are important dimensions in the process of globalisation. Today, freight transport is so cheap and reliable that it is worthwhile for companies to exploit differences in production costs, e.g. lower wages, taxes or other parameters, in different countries across Europe or globally. Transport is just one element in the globalisation process, and it is by no means certain that even significant increases in oil prices would put much of a dent in the process. But transport causes a range of effects that are currently not included in transport prices. Methodologies for estimating and pricing these effects are under development. Although individual examples do exist, they are still far from being reflected in transport charges. One such example is Sweden. Here, the environmental performance of ships determines the price for the use of certain sea routes.
In road and rail freight, the use of taxes and charges to cover different effects are more established than in marine and aviation, even though the primary objective of charging (where used) has been to finance or refinance infrastructure or to raise public revenues. Indeed, the debate on the directive on charging for the use of the road network (the Eurovignette directive) is centred on this issue; namely, should charges only be used to recover construction and maintenance costs of infrastructure or should environmental aspects also be taken into account in setting the charge levels? From a socioeconomic point of view, introducing a fee (roughly) equal in level and in structure to the different impacts (internalisation of external costs) for all transport modes would lead to a more efficient transport system, even if there are uncertainties on the estimation and pricing of effects. The Swiss truck toll system is a good example of a system designed on the basis of environmental performance. In EU rail legislation, introducing charges to reflect environmental impact is made conditional to similar charges in other modes.
The use of economic instruments in passenger transport has not developed much either. London is
Transport in perspective
Transport and environment: facing a dilemma 11
planning to expand its congestion charging scheme and Stockholm has started field trails of an urban charging scheme. In addition, many motorways in the EU are tolled for financing reasons but with limited or no reflection of environmental performance in the charge structure. A higher degree of reflection of external costs on motorways could however have a detrimental effect. If such charging schemes are not extended to all roads, traffic could be diverted away from large roads to minor ones. The European Commission has launched ideas for a harmonisation of annual vehicle circulation taxes based on rated emission of CO2. This could provide incentives to the purchase of more fuel-efficient vehicles.
Another way to reduce greenhouse gas emissions is by using lower net carbon fuels such as biofuels. Biofuels are made from biomass, which absorbs carbon while growing. They thus represent a lower carbon route to transport fuels. However, they are not carbon neutral as there are emissions related to tilling, harvesting and fertilising. Biofuels also require large areas of land for production and compete with both other land uses (e.g. extensive farming or forestation) and other uses of biomass, such as fuel for heat and power plants. From a climate-change point of view, the important aspect is which fuels (in terms of CO2 emission per kWh of useful energy) are replaced by biomass and not whether the fuel goes into heat and power or into transport. Being among the few alternatives to petrol and diesel, biofuels are seen as important for the security of transport energy supply. At present, biofuels make up less than 1 % of total road transport fuel consumption, while petrol
Transport will remain dependent on fossil fuels for many years to come. Biofuels are so far just a niche fuel.
and diesel cover 98 %. The remaining 1 % is mostly covered by gas.
In the medium term, there is an expectation that more advanced production processes for biofuels will be developed which will allow a broader range of plants to be used. In the long run, biomass could serve as feedstock for the production of hydrogen for fuel cells. In this case, the environmental benefits could be significant, especially in terms of local air quality. Fuel-cell cars only emit water, but their mass production is still far off. Also, if hydrogen is not produced in a sustainable manner (but from coal or natural gas), the positive impact could be limited or even negative.
Moving towards a more sustainable transport system requires an integrated approach. Problems should be considered well in advance and not just tackled at the end-of-pipe phase via emission regulation. Regional policy, structural policy, employment policy, agricultural policy etc. all have an impact on transport demand. Integration of environmental considerations into other policy areas (as agreed to by the European Council in Cardiff in 1998) therefore requires that in all of these policy areas consideration is given not only to the direct environmental impact but also the impact on transport demand. Such an approach is necessary to solve the problems and to form a sustainable transport sector.
Contrary to press reports, there is no single cure for transport related environment problems. Therefore, there is a need to work on all fronts to minimise damage. All policy areas must consider both the direct environmental impact of policies and the transport impact of policy developments.
Transport and environment: facing a dilemma12
Freight transport volumes grow with no clear signs of decoupling from GDP
1 Freight transport volumes grow with no clear signs of decoupling from GDP
More goods are transported farther and more frequently. This results in increased CO2 emissions and slows the decline in air pollutant emissions. Relative decoupling of growth in freight volumes from economic growth has only been achieved in the EU-10, where the growth in GDP exceeds the high growth in transport volume.
More goods are transported over longer distances and more frequently than ever before. As a result, freight transport volumes have grown 34 % over the past decade (see Data annex, Table 1). This has led to an increase in transport CO2 and noise emissions, and slowed the decline in emissions of air pollutants (see Sections 3 and 4). During the same period, the economy grew by only 26 %, implying that freight transport intensities have increased.
Freight transport growth is a market-driven process. Growing incomes enable people to consume more and this in turn increases transport demand. Distances between consumers and producers grow, facilitated by the removal of barriers to trade in the internal market and in the wider world. A familiar result of this is that supermarkets offer products, e.g. fruit and vegetables, from all corners of the world. Production chains are also subject to globalisation. Components are produced all over the world and assembled at various locations. This happens because the differences in production costs are higher than the transport costs, making transport more profitable than local production. In short, low transport costs allow companies to benefit from differences in labour costs and skills in different regions (see Section 5).
Since 1995, the growth in transport volumes in Europe as a whole has almost paralleled growth in GDP. In the EU-15 transport growth tends to exceed GDP growth. The objective of decoupling growth in transport volume from growth in GDP, as set in the Commission's sustainable development strategy (EC, 2001a), has not been achieved. The transport growth rate differs from country to country, showing that high economic growth can go hand in hand with relatively low growth of freight transport volumes
(see Data annex, Figure 1). Some of the impacts of transport have been decoupled from transport growth to some extent. For example, air pollutant emissions and traffic accident fatalities are decreasing in spite of traffic growth. But without any overall improvement in energy efficiency of freight vehicles, transport volumes will have to decline for CO2 emissions to fall.
The transport intensity, measured as tonne-km per euro GDP, is much higher in the EU-10, but has declined by 13 % since 1995 (see Data annex, Table 3). This decoupling is linked to the transition to more service-oriented economies, as is the case in the EU-15. The differences show that high economic growth or a more competitive economy do not categorically imply higher transport intensities. If the decline in transport intensity continues to fall to the levels seen in the EU-15, decoupling in the EU-10 could continue at the current pace for decades. But in spite of decoupling, transport volumes have grown and continue to grow in the EU-10.
In the proposed Marco Polo II programme (see Section 5), the European Commission addresses traffic volume directly for the first time. The 'Traffic avoidance' part of the programme sets a target of 10.5 billion tonne-km to be avoided between 2007 and 2013 without economic disadvantage (Ecorys, 2004). This corresponds to 0.7 % of the roughly 1 500 billion tonne-km performed by lorries in the EU-25 or the equivalent of three months of transport growth (see Data annex, Tables 1 and 5).
Transport emissions are the product of kilometres driven and the emissions per vehicle kilometre. Most of the success enjoyed so far has been on the reductions of emissions per distance unit. However, this success has been neutralised to a significant extent by a failure to tackle traffic volumes. In economic welfare theory, the optimal transport volume is reached when the overall costs of an additional transport activity (including external costs) is equal to its benefits. Because the prices of freight transport do not cover all external effects (see Section 10), there is an over-consumption of freight transport.
Freight transport volumes grow with no clear signs of decoupling from GDP
Transport and environment: facing a dilemma 13
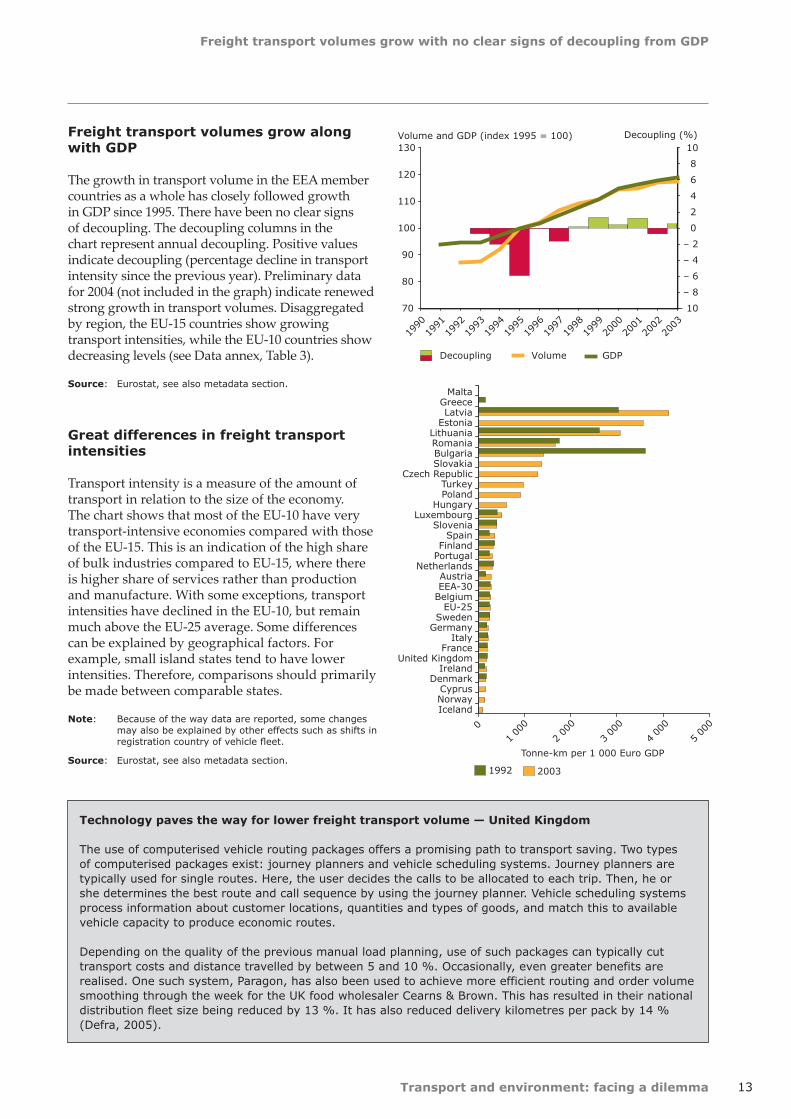
Freight transport volumes grow along with GDP
The growth in transport volume in the EEA member countries as a whole has closely followed growth in GDP since 1995. There have been no clear signs of decoupling. The decoupling columns in the chart represent annual decoupling. Positive values indicate decoupling (percentage decline in transport intensity since the previous year). Preliminary data for 2004 (not included in the graph) indicate renewed strong growth in transport volumes. Disaggregated by region, the EU-15 countries show growing transport intensities, while the EU-10 countries show decreasing levels (see Data annex, Table 3).
Source: Eurostat, see also metadata section.
Great differences in freight transport intensities
Transport intensity is a measure of the amount of transport in relation to the size of the economy. The chart shows that most of the EU-10 have very transport-intensive economies compared with those of the EU-15. This is an indication of the high share of bulk industries compared to EU-15, where there is higher share of services rather than production and manufacture. With some exceptions, transport intensities have declined in the EU-10, but remain much above the EU-25 average. Some differences can be explained by geographical factors. For example, small island states tend to have lower intensities. Therefore, comparisons should primarily be made between comparable states.
Note: Because of the way data are reported, some changes may also be explained by other effects such as shifts in registration country of vehicle fleet.
Source: Eurostat, see also metadata section.
70
80
90
100
110
120
130
1990
1991
1992
1993
1994
1995
1996
1997
1998
1999
2000
2001
2002
2003
Volume and GDP (index 1995 = 100)
– 10
– 8
– 6
– 4
– 2
0
2
4
6
8
10 Decoupling (%)
Decoupling Volume GDP
IcelandNorwayCyprus
DenmarkIreland
United KingdomFrance
ItalyGermanySweden
EU-25BelgiumEEA-30Austria
NetherlandsPortugalFinland
SpainSlovenia
LuxembourgHungary
PolandTurkey
Czech RepublicSlovakiaBulgariaRomaniaLithuania
EstoniaLatvia
GreeceMalta
Tonne-km per 1 000 Euro GDP
1992 2003
02 00
0
3 00
0
4 00
0
5 00
0
1 00
0
Technology paves the way for lower freight transport volume — United Kingdom
The use of computerised vehicle routing packages offers a promising path to transport saving. Two types of computerised packages exist: journey planners and vehicle scheduling systems. Journey planners are typically used for single routes. Here, the user decides the calls to be allocated to each trip. Then, he or she determines the best route and call sequence by using the journey planner. Vehicle scheduling systems process information about customer locations, quantities and types of goods, and match this to available vehicle capacity to produce economic routes.
Depending on the quality of the previous manual load planning, use of such packages can typically cut transport costs and distance travelled by between 5 and 10 %. Occasionally, even greater benefits are realised. One such system, Paragon, has also been used to achieve more efficient routing and order volume smoothing through the week for the UK food wholesaler Cearns & Brown. This has resulted in their national distribution fleet size being reduced by 13 %. It has also reduced delivery kilometres per pack by 14 % (Defra, 2005).
Transport and environment: facing a dilemma14
Passenger transport volumes have paralleled economic growth
2 Passenger transport volumes have paralleled economic growth
Passenger transport volumes have grown in most Member States. Relative decoupling has been achieved in only five new EU Member States. It is, however, likely that with time development in the EU-10 will parallel the older ones.
Between 1990 and 2002, passenger transport volumes in the EEA member countries grew by 30 % and GDP increased by 27 % over the same period. Therefore, passenger transport volumes have followed economic development, as is traditionally expected (OECD, 2003). A notable exception to the overall picture is Germany, where demand has declined every year since 1999 while the economy has grown (see Data annex, Figure 2).
The decoupling of transport growth from economic growth is a central aim in the common transport policy (EC, 2001b). Although there are no convincing signs of decoupling for the whole period 1990–2002, there is a difference between the first and last half of this period. From 1990 to 1996, the growth in transport volumes slightly overshot the increase in GDP. However, the developments in passenger travel during the period 1997–2002 somewhat lagged behind the swift rise of GDP. There was, therefore, decoupling towards the end of the period, but not for the period as a whole.
Passenger transport volumes per capita are higher in the EU-15 than in the new ones. The growth rates differ from country to country, showing that high economic growth does not imply faster growing passenger transport volumes (see Data annex, Figure 5). For instance, economic growth in the EU-10 has generally exceeded that of the EU-15, but passenger transport has not quite expanded at the same rate (data are only available for the Czech Republic, Hungary, Poland, Slovenia and Slovakia). An explanation can be that reaction to rapidly increasing incomes does not happen immediately. When the economy expands rapidly it is therefore possible to see time lags. This in turn means that transport growth could continue for a while even if growth in the economy slowed down.
Research has shown that people on average tend to spend a fixed share of their income and of their time on transport (the Brever law). Therefore, greater income is a major driver of increased transport volumes (WBCSD, 2001) and higher transport speeds boost the number of passenger kilometres. For instance, higher incomes and improved transport infrastructure had led to leisure travel becoming a significant contributor to the increased passenger transport volumes. Spatial developments are important determinants of transport volumes as well, for example the construction of an out-of-town shopping mall requires mobility of shoppers and creates transport demand.
The environmental impact of the transport system depends both on the technology in vehicles and on the transport volumes. Emission standards are gradually being tightened, but volume growth reduces the effect of environmentally enhanced technology. Pricing is being discussed as a tool to address transport volumes. For instance, price elasticities show that the transport volume responds to changes in fuel prices (see Data annex, Figure 4). Therefore, although transport volumes increased between 1990 and 2002, an increase in fuel prices prevented even faster growth (see Data annex, Figure 3).
Passenger transport volumes have paralleled economic growth
Transport and environment: facing a dilemma 15
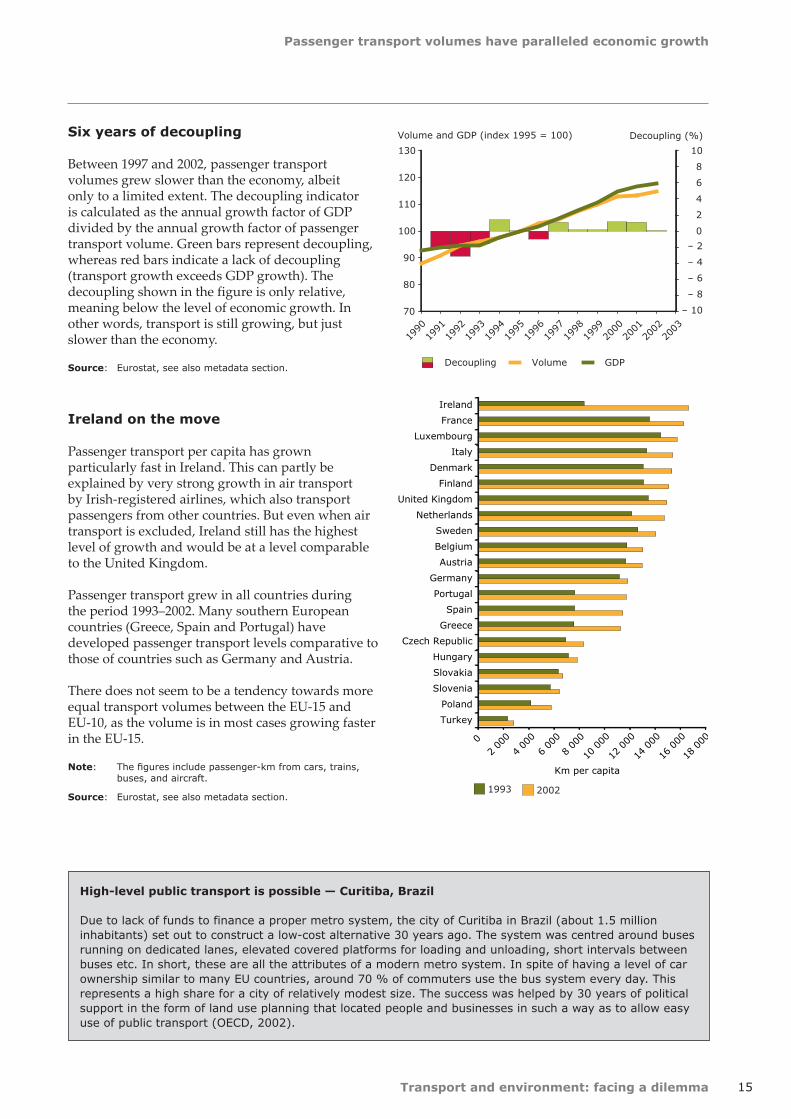
Six years of decoupling
Between 1997 and 2002, passenger transport volumes grew slower than the economy, albeit only to a limited extent. The decoupling indicator is calculated as the annual growth factor of GDP divided by the annual growth factor of passenger transport volume. Green bars represent decoupling, whereas red bars indicate a lack of decoupling (transport growth exceeds GDP growth). The decoupling shown in the figure is only relative, meaning below the level of economic growth. In other words, transport is still growing, but just slower than the economy.
Source: Eurostat, see also metadata section.
Ireland on the move
Passenger transport per capita has grown particularly fast in Ireland. This can partly be explained by very strong growth in air transport by Irish-registered airlines, which also transport passengers from other countries. But even when air transport is excluded, Ireland still has the highest level of growth and would be at a level comparable to the United Kingdom.
Passenger transport grew in all countries during the period 1993–2002. Many southern European countries (Greece, Spain and Portugal) have developed passenger transport levels comparative to those of countries such as Germany and Austria.
There does not seem to be a tendency towards more equal transport volumes between the EU-15 and EU-10, as the volume is in most cases growing faster in the EU-15.
Note: The figures include passenger-km from cars, trains, buses, and aircraft.
Source: Eurostat, see also metadata section.
70
80
90
100
110
120
130
Volume and GDP (index 1995 = 100)
– 10
– 8
– 6
– 4
– 2
0
2
4
6
8
10
Decoupling Volume GDP
Decoupling (%)
1990
1991
1992
1993
1994
1995
1996
1997
1998
1999
2000
2001
2002
2003
02 00
0
4 00
0
6 00
0
8 00
0
10 000
12 000
14 000
16 000
18 000
Turkey
Poland
Slovenia
Slovakia
Hungary
Czech Republic
Greece
Spain
Portugal
Germany
Austria
Belgium
Sweden
Netherlands
United Kingdom
Finland
Denmark
Italy
Luxembourg
France
Ireland
Km per capita
1993 2002
High-level public transport is possible — Curitiba, Brazil
Due to lack of funds to finance a proper metro system, the city of Curitiba in Brazil (about 1.5 million inhabitants) set out to construct a low-cost alternative 30 years ago. The system was centred around buses running on dedicated lanes, elevated covered platforms for loading and unloading, short intervals between buses etc. In short, these are all the attributes of a modern metro system. In spite of having a level of car ownership similar to many EU countries, around 70 % of commuters use the bus system every day. This represents a high share for a city of relatively modest size. The success was helped by 30 years of political support in the form of land use planning that located people and businesses in such a way as to allow easy use of public transport (OECD, 2002).
Transport and environment: facing a dilemma16
Greenhouse gas emissions from transport are growing
3 Greenhouse gas emissions from transport are growing
Transport's energy consumption (and their emission of greenhouse gases) increases steadily because transport volumes are growing faster than the energy efficiency of different means of transport. The increase in greenhouse gas emissions from transport threatens European progress towards its Kyoto targets. Therefore, additional policy initiatives and instruments are needed.
In the EU-15, transport now accounts for 21 % of total greenhouse gas (GHG) emissions (excluding international aviation and maritime transport). For the EEA area as a whole the number is slightly lower. While GHG emissions of many other sectors are decreasing, the contribution from transport keeps growing. Since 1990, the emissions have grown by around 23 % (excluding international aviation and maritime transport; see Data annex, Figure 6). Projections made under UNFCCC reporting show a continuation of the trend. Even with all planned reduction measures included, the emissions will grow a further few percentage points by 2010 (EEA, 2005b).
The share of transport is also growing in final energy consumption. Transport now accounts for 31 % of final energy consumption in the 25 EU Member States (excluding international maritime transport; see Data annex, Table 6). The large difference between GHG emission and energy consumption is partly explained by inclusion of international aviation in the energy figure, and partly by the use of more CO2-intensive fuels (coal) in electricity production.
The growth in transport's GHG emissions and energy use can to a large extent be explained by increasing transport volumes (see Sections 1 and 2). The growth in road transport, in particular, contributes to this increase. Road transport contributes most in absolute terms to the growth in GHG emissions from transport in the EU-25 (excluding international aviation and maritime transport). The expected growth in road freight transport results in a projected increase in energy demand of around 20 % over the next decade. The average European passenger car is becoming more efficient each year and total energy demand
from passenger cars alone is expected to decrease by 2.1 % over the coming decade. Fuel efficiency improvements are expected to more than offset the 16.4 % projected growth in transport by passenger cars. Nevertheless, total emissions from the road sector are projected to increase by 10.3 % between 2005 and 2015 (EC, 2003a).
In addition to the transport modes covered by the Kyoto Protocol, international aviation and maritime shipping also have significant GHG emissions. Aviation is growing faster than any other transport mode and CO2 emissions grew by 62 % in the EU-15 between 1990 and 2003. Therefore, aviation (including international aviation) now accounts for 13.6 % of transport (including international aviation but excluding maritime transport) CO2 emissions. In addition to this, the non-CO2 climate effects of aviation from NOX emissions and contrail formation should be taken into account as soon as scientific knowledge improves. The total impact of aviation is estimated at two to four times the direct impact of CO2 emissions alone (IPCC, 1999).
Maritime transport is responsible for 13 % of the world's total transport GHG emissions at the moment. Projections foresee a growth of 35–45 % in absolute levels between 2001 and 2020, based on expectations of continued growth in world trade (Eyring et al., 2005). Non-CO2 (mainly SO2) emissions of shipping are believed to have a cooling effect because of their interaction with cloud formation and the direct reflection of sunlight by particles. The magnitude of this effect is still poorly understood. But as air quality regulations to limit these emissions come into force, there may be an increasing need to address GHG emissions with stronger measures.
Neither maritime nor the international share of aviation are covered by the Kyoto Protocol. The political pressure to reduce emissions has therefore hitherto been weaker than for road transport, where for example industry has committed itself to voluntary reductions. However, with the recent communication on aviation and climate change impact (EC, 2005g) this situation may be changing.
Greenhouse gas emissions from transport are growing
Transport and environment: facing a dilemma 17
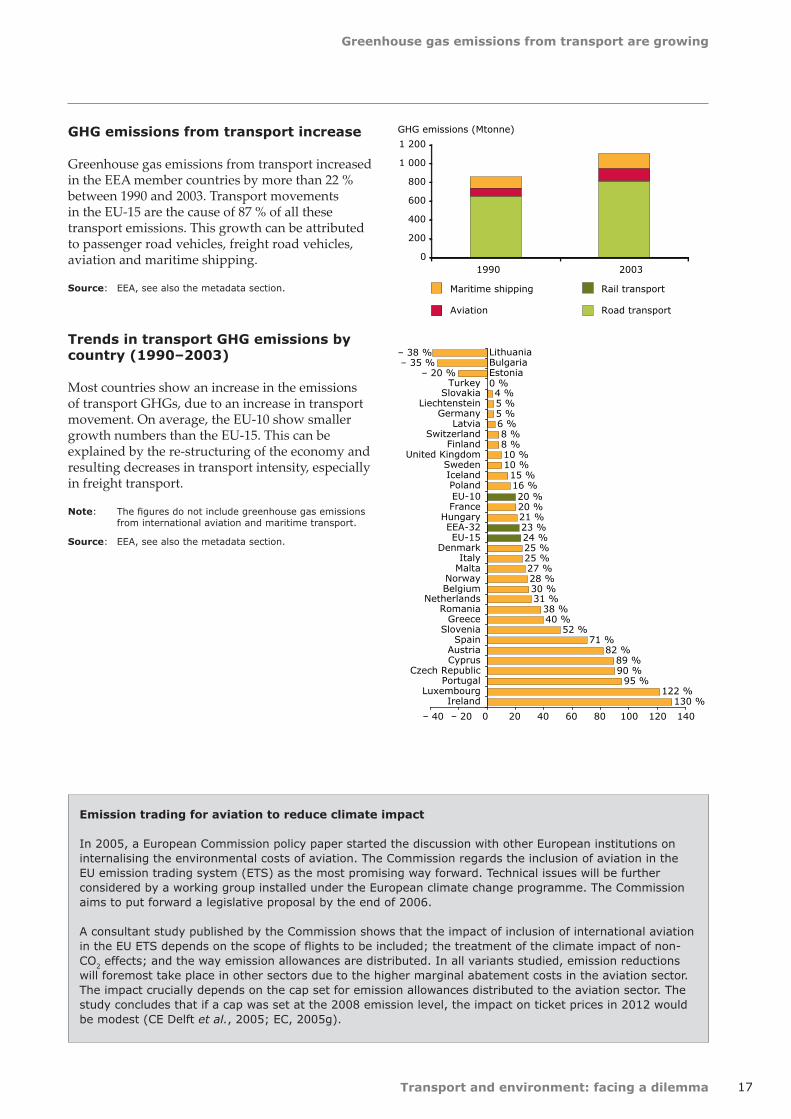
GHG emissions from transport increase
Greenhouse gas emissions from transport increased in the EEA member countries by more than 22 % between 1990 and 2003. Transport movements in the EU-15 are the cause of 87 % of all these transport emissions. This growth can be attributed to passenger road vehicles, freight road vehicles, aviation and maritime shipping.
Source: EEA, see also the metadata section.
Trends in transport GHG emissions by country (1990–2003)
Most countries show an increase in the emissions of transport GHGs, due to an increase in transport movement. On average, the EU-10 show smaller growth numbers than the EU-15. This can be explained by the re-structuring of the economy and resulting decreases in transport intensity, especially in freight transport.
Note: The figures do not include greenhouse gas emissions from international aviation and maritime transport.
Source: EEA, see also the metadata section.
Emission trading for aviation to reduce climate impact
In 2005, a European Commission policy paper started the discussion with other European institutions on internalising the environmental costs of aviation. The Commission regards the inclusion of aviation in the EU emission trading system (ETS) as the most promising way forward. Technical issues will be further considered by a working group installed under the European climate change programme. The Commission aims to put forward a legislative proposal by the end of 2006.
A consultant study published by the Commission shows that the impact of inclusion of international aviation in the EU ETS depends on the scope of flights to be included; the treatment of the climate impact of non-CO2 effects; and the way emission allowances are distributed. In all variants studied, emission reductions will foremost take place in other sectors due to the higher marginal abatement costs in the aviation sector. The impact crucially depends on the cap set for emission allowances distributed to the aviation sector. The study concludes that if a cap was set at the 2008 emission level, the impact on ticket prices in 2012 would be modest (CE Delft et al., 2005; EC, 2005g).
0
200
400
600
800
1 000
1 200
1990 2003
GHG emissions (Mtonne)
Maritime shipping
Aviation
Rail transport
Road transport
130 %122 %
95 %90 %89 %
82 %71 %
52 %40 %38 %
31 %30 %28 %27 %25 %25 %24 %23 %21 %20 %20 %
16 %15 %
10 %10 %8 %8 %
6 %5 %5 %4 %
0 %– 20 %
– 35 %– 38 %
– 40 – 20 0 20 40 60 80 100 120 140
IrelandLuxembourg
PortugalCzech Republic
CyprusAustria
SpainSlovenia
GreeceRomania
NetherlandsBelgiumNorway
MaltaItaly
DenmarkEU-15
EEA-32Hungary
FranceEU-10PolandIcelandSweden
United KingdomFinland
SwitzerlandLatvia
GermanyLiechtenstein
SlovakiaTurkey
EstoniaBulgariaLithuania
Transport and environment: facing a dilemma18
Harmful emissions decline, but air quality problems require continued attention
4 Harmful emissions decline, but air quality problems require continued attention
Transport, especially road transport, is becoming cleaner because of increasingly strict emission standards for the different transport modes. Nevertheless, air quality in cities does not yet meet the limit values set by European regulation and still has a major negative impact on human health.
The emissions of acidifying substances, particulate matter and ozone precursors from transport fell by between 30 and 40 % from 1990 to 2003 in the EEA member countries (excluding international aviation and maritime transport). The decrease in emissions can be attributed to EU emission legislation. Regulation first targeted road vehicles from the end of the 1980s via EU emission standards. Standards for two-wheelers, barges, diesel trains and mobile machinery have come into force more recently. The further tightening of emission standards is foreseen in the coming years.
Maritime emissions are regulated by Annex VI to the Marpol convention, adopted in 1997. In May 2005, the annex entered into force. It sets standards for NOX emissions, and in addition sets limits for the sulphur content of fuel oil. The general sulphur limit for marine fuel is 4.5 % (45 000 ppm), and 1.5 % in the Baltic, North Sea and English Channel (see Section 7). Most marine engine manufacturers have been building engines compliant with this standard since 2000, so replacement of older technology has already been ongoing for five years. The EU average marine fuel sulphur content is around 3.0 % (see Data annex, Table 2) and therefore the general limit will not have much effect on sulphur emissions. But in the three specific protection areas there will be some reduction in emissions. In total, maritime transport contributes to about 20 % of NOX and 77 % of SOX emissions from the transport sector in the EEA area (see Data annex, Figures 7 and 8). Because of lack of effectiveness of the IMO regulations, the European Commission is considering a proposal for tighter emission standards (EC, 2005b).
Recently the EC's 'Clean air for Europe' (CAFE) programme estimated that more than 370 000 people die prematurely each year due to current air pollution levels (e.g. from fine particulate matter and ozone). Current Community legislation on ambient air quality sets limit values for air pollutants and aims to improve ambient air quality to protect public health and the environment. For particles (PM10), a limit value came into force in January 2005: a yearly average value (40 μg/m3) and a 24 hour average (50 μg/m3) that shall not be exceeded for more than 35 days per year. But already early in 2005 it became apparent that several major European cities would exceed this limit. In 2010, a limit value of 40 μg/m3 for NO2 will enter into force. The figure on next page shows that current annual average concentrations exceed both the limit values for PM10 and NO2. Furthermore, projections show that these concentrations will most likely not comply with the limit values in all cities by 2010 (EC, 2004b). The increasing share of diesel vehicles is a significant problem within this context.
To achieve air quality in the EU that does not significantly impact on human health, the Commission has adopted a communication proposing a thematic strategy on air pollution (EC, 2005b). The strategy sets out a long-term perspective for clean air in Europe by an orientation for future measures. This may lead to appropriate measures and a reduction of air quality problems. The proposed measures would result in annual health benefits — without counting environmental damage — evaluated at between EUR 42 billion and EUR 135 billion in 2020. This figure outweighs the costs by a factor of at least six.
Harmful emissions decline, but air quality problems require continued attention
Transport and environment: facing a dilemma 19
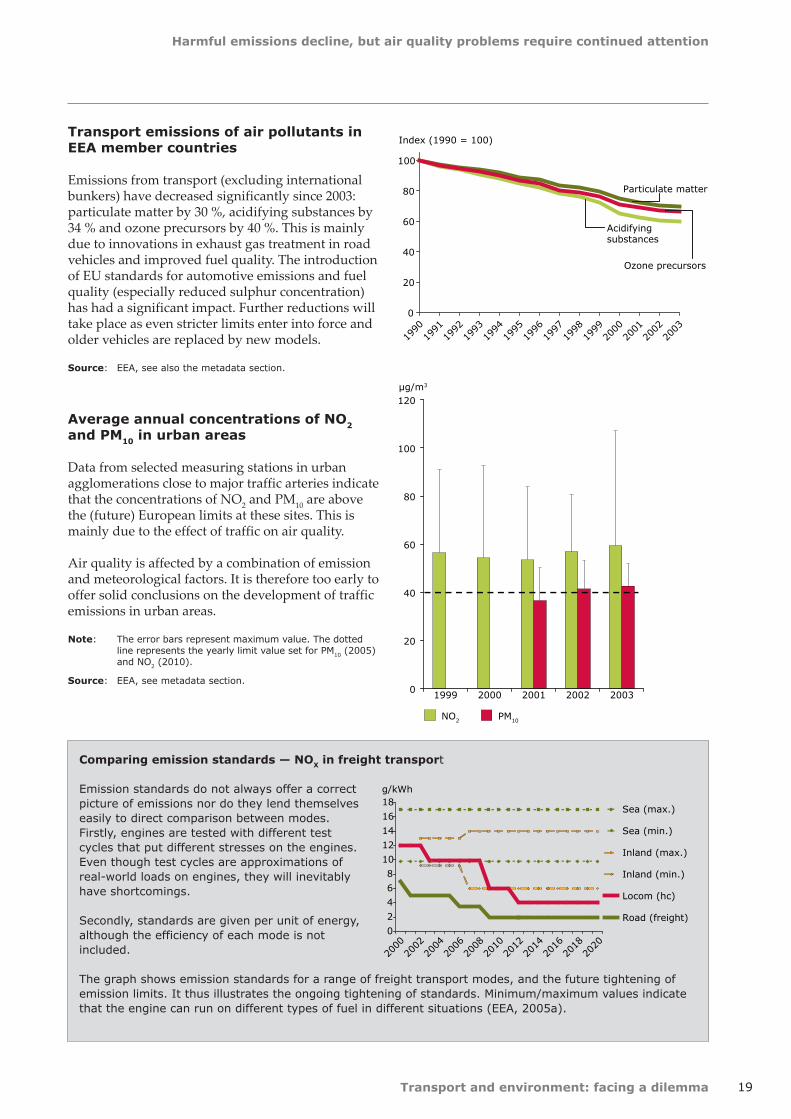
Transport emissions of air pollutants in EEA member countries
Emissions from transport (excluding international bunkers) have decreased significantly since 2003: particulate matter by 30 %, acidifying substances by 34 % and ozone precursors by 40 %. This is mainly due to innovations in exhaust gas treatment in road vehicles and improved fuel quality. The introduction of EU standards for automotive emissions and fuel quality (especially reduced sulphur concentration) has had a significant impact. Further reductions will take place as even stricter limits enter into force and older vehicles are replaced by new models.
Source: EEA, see also the metadata section.
Average annual concentrations of NO2 and PM10 in urban areas
Data from selected measuring stations in urban agglomerations close to major traffic arteries indicate that the concentrations of NO2 and PM10 are above the (future) European limits at these sites. This is mainly due to the effect of traffic on air quality.
Air quality is affected by a combination of emission and meteorological factors. It is therefore too early to offer solid conclusions on the development of traffic emissions in urban areas.
Note: The error bars represent maximum value. The dotted line represents the yearly limit value set for PM10 (2005) and NO2 (2010).
Source: EEA, see metadata section.
0
20
40
60
80
100
1990
1991
1992
1993
1994
1995
1996
1997
1998
1999
2000
2001
2002
2003
Index (1990 = 100)
Ozone precursors
Particulate matter
Acidifyingsubstances
0
20
40
60
80
100
120
1999 2000 2001 2002 2003
μg/m3
NO2 PM10
Comparing emission standards — NOX in freight transport
Emission standards do not always offer a correct picture of emissions nor do they lend themselves easily to direct comparison between modes. Firstly, engines are tested with different test cycles that put different stresses on the engines. Even though test cycles are approximations of real-world loads on engines, they will inevitably have shortcomings.
Secondly, standards are given per unit of energy, although the efficiency of each mode is not included.
The graph shows emission standards for a range of freight transport modes, and the future tightening of emission limits. It thus illustrates the ongoing tightening of standards. Minimum/maximum values indicate that the engine can run on different types of fuel in different situations (EEA, 2005a).
0
2
4
6
8
10
12
14
16
18
2000
2002
2004
2006
2008
2010
2012
2014
2016
2018
2020
g/kWh
Sea (max.)
Sea (min.)
Inland (max.)
Inland (min.)
Locom (hc)
Road (freight)
Transport and environment: facing a dilemma20
Road freight continues to gain market share
5 Road freight continues to gain market share
Road transport has gained a greater and rising share of the freight market. This development constitutes a move further away from the EU objective of stabilising the share at its 1998 level. At present, there are policy initiatives aimed at a modal shift for long-distance and large-scale transport.
Over the past decade, road transport has increased its share of the inland freight transport market to 77 %. Since 1998, the share of road transport has increased by 2.6 %. Further action is therefore needed to achieve the objectives of the EU White Paper on common transport policy. These objectives call for a return of the alternative modes to their 1998 share by 2010, and then increase this from then onwards (see Data annex, Table 4).
Road, rail, inland navigation, maritime shipping and aviation are modes of transport that operate in the freight market. Maritime shipping is excluded from analysis because of a lack of reliable data. However, it accounts for transport volumes matching those of road, if only intra-EU sea transport is included. It also vastly exceeds all other modes, if intercontinental transport is included (see Data annex, Figure 9). Air freight transport volumes are growing rapidly, albeit from a low level (EEA, 2006: Fact sheet 13a).
The causes of the continuing rise in the share of road transport lie in the competitive advantage of the lorry and van. They are generally faster, cheaper, more reliable and more flexible when compared to other modes. These qualities play a part in a growing demand for just-in-time delivery. Moreover, high real estate prices, especially in city centres, favour frequent deliveries rather than large storage capacity. Distribution strategies of trade companies have changed. Decentralised stocks near main clients have been replaced by fewer, but larger centralised stocks which increases average distances and thus the amount of road transport. Another cause is that the production and trade of high-value goods, which is a market dominated by road transport, grew significantly whereas bulk
industries, which are more affined to rail transport, declined (EEA, 2006: Fact sheet 13a). Finally, while many barriers for international road transport have been removed, the harmonisation process required for smooth international rail transport (mainly rail technical issues) is still under way.
Various EU policies have been aimed at modal shift, such as the railway packages, initiatives on infrastructure charging and the Marco Polo programmes. The proposed Marco Polo II programme (EC, 2004a) has the objective to shift at least the expected increase of international freight transport, 144 billion tonne-km in the period 2007–2013, off the road. With EUR 106 million available per year, Marco Polo II ambitiously aims at a shift of nearly 200 tonne-km per euro.
The main argument of modal shift policies lies in the environmental performance of the different modes of transport. The train is on average more environmentally friendly than the lorry. However, environmental performance generally depends more on installed technology and logistical characteristics than on mode per se. If these factors are taken into account, certain shifts from road to rail or water may in some cases actually increase the environmental burden. Moreover, specific measures aimed at modal shift, like building new rail infrastructure, may boost the transport volume of rail without decreasing road transport volumes. In those cases, the net effect is higher transport volume and higher total emissions (CE Delft, 2003). In the light of this and the difficulty of establishing a true shift from one mode to another, the contribution of each modal shift project to a reduction of transport emissions should be carefully verified.
Road freight continues to gain market share
Transport and environment: facing a dilemma 21
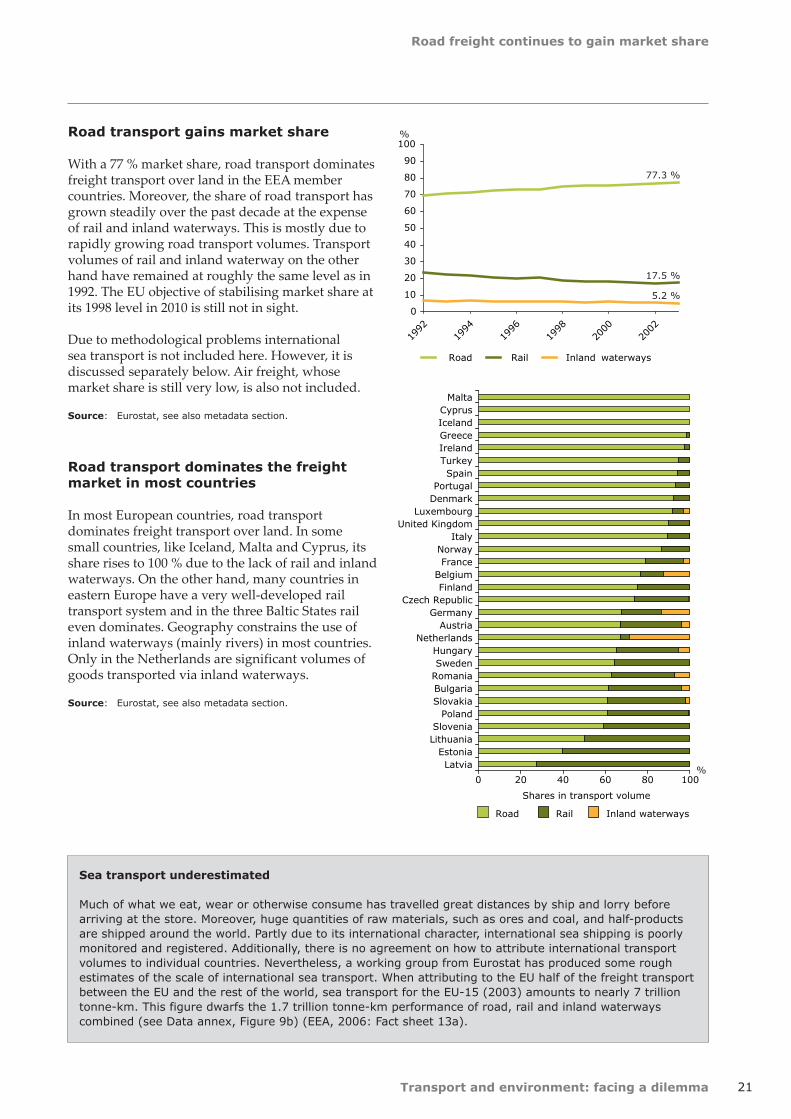
Road transport gains market share
With a 77 % market share, road transport dominates freight transport over land in the EEA member countries. Moreover, the share of road transport has grown steadily over the past decade at the expense of rail and inland waterways. This is mostly due to rapidly growing road transport volumes. Transport volumes of rail and inland waterway on the other hand have remained at roughly the same level as in 1992. The EU objective of stabilising market share at its 1998 level in 2010 is still not in sight.
Due to methodological problems international sea transport is not included here. However, it is discussed separately below. Air freight, whose market share is still very low, is also not included.
Source: Eurostat, see also metadata section.
Road transport dominates the freight market in most countries
In most European countries, road transport dominates freight transport over land. In some small countries, like Iceland, Malta and Cyprus, its share rises to 100 % due to the lack of rail and inland waterways. On the other hand, many countries in eastern Europe have a very well-developed rail transport system and in the three Baltic States rail even dominates. Geography constrains the use of inland waterways (mainly rivers) in most countries. Only in the Netherlands are significant volumes of goods transported via inland waterways.
Source: Eurostat, see also metadata section.
0
10
20
30
40
50
60
70
80
90
100
1992
1994
1996
1998
2000
2002
Road Rail Inland waterways
%
77.3 %
17.5 %
5.2 %
0 20 40 60 80 100
LatviaEstonia
LithuaniaSlovenia
PolandSlovakiaBulgariaRomaniaSwedenHungary
NetherlandsAustria
GermanyCzech Republic
FinlandBelgium
FranceNorway
ItalyUnited Kingdom
LuxembourgDenmarkPortugal
SpainTurkeyIrelandGreeceIcelandCyprus
Malta
Shares in transport volume
Road Rail Inland waterways
%
Sea transport underestimated
Much of what we eat, wear or otherwise consume has travelled great distances by ship and lorry before arriving at the store. Moreover, huge quantities of raw materials, such as ores and coal, and half-products are shipped around the world. Partly due to its international character, international sea shipping is poorly monitored and registered. Additionally, there is no agreement on how to attribute international transport volumes to individual countries. Nevertheless, a working group from Eurostat has produced some rough estimates of the scale of international sea transport. When attributing to the EU half of the freight transport between the EU and the rest of the world, sea transport for the EU-15 (2003) amounts to nearly 7 trillion tonne-km. This figure dwarfs the 1.7 trillion tonne-km performance of road, rail and inland waterways combined (see Data annex, Figure 9b) (EEA, 2006: Fact sheet 13a).
Transport and environment: facing a dilemma22
Air passenger transport grows, while the shares of road and rail remain constant
6 Air passenger transport grows, while the shares of road and rail remain constant
Changing the modal split towards rail transport and away from passenger cars is not being achieved. There are still no signs of this common transport policy goal being met. Both modes are growing at the same rate as total passenger transport volume. In addition, the share of aviation is increasing whereas the share of bus and coach is decreasing.
The shares of passenger transport by car (about 73 %) and rail (about 6 %) have remained stable since the mid-1990s. The share of aviation in the total passenger transport volume has increased rapidly to about 12 % in 2002. The share of bus and coach transport has declined by a quarter since 1990 to 9 %. Non-motorised modes are not included in these figures, but the share of walking and cycling in 2000 was slightly below that of rail transport (see Data annex, Figure 12). Due to the overall growth of transport, the absolute volume of each transport mode has either remained constant or grown.
Changing the modal balance in favour of rail transport is one of the main goals of the common transport policy (CTP) (EC, 2001b). Official statistics for passenger transport up to 2002 show no modal shift from road to rail. In addition, statistics covering the period 1990–2004 show a roughly stable volume for passenger transport by rail (see Data annex, Figure 11), whereas road transport is likely to have grown. These trends lie in stark contrast to the goals of the CTP.
The main drivers behind the current growth of transport demand are income, spatial developments, and individualised activity patterns (see examples TRL, 2004; Aarts, 1996). During recent decades these drivers have induced a demand for increasingly fast and flexible transport. For instance, urban sprawl has led to more transport and an increased dependency on the car. On the supply side, factors such as the availability of infrastructure, travel speed, comfort and transport prices co-determine the transport volumes of the various modes (ECMT, 1998a).
The faster and flexible transport modes (passenger cars, aircraft, and to some extent high-speed rail) have gained market share due to increasing levels of income, a growth in available infrastructure capacity and stable or decreasing transport prices.
A good example of the impact of supply factors is the French network of high-speed rail (TGV). This network has not only induced some modal shift from air to rail, but created some extra transport demand as well. The number of additional holiday trips by TGV has increased and a 'TGV commuter belt', a range of towns and cities located approximately 200 km from Paris, has emerged (CE Delft, 2004, based on French national statistics).
Policy measures aimed at modal shift may also cause this type of unintended side-effect. The environmental impact of larger shares for modes like rail and bus depends on the way they have been accomplished. For measures like building new infrastructure or offering free public transport, the intended modal shift from car to public transport is often accompanied by a shift from walking or cycling to motorised public transport. It can also yield an increase in the total transport volume (see Section 2). The negative environmental impact of these types of unintended side-effects may exceed the environmental gains of the intended modal shift (CE Delft, 2003). Furthermore, evaluating important modal shift targets is made even more precarious by the difficulty of establishing any substantial shift from individual to public transport. Therefore, the net environmental impact of measures aimed at modal shift needs to be monitored.
Air passenger transport grows, while the shares of road and rail remain constant
Transport and environment: facing a dilemma 23
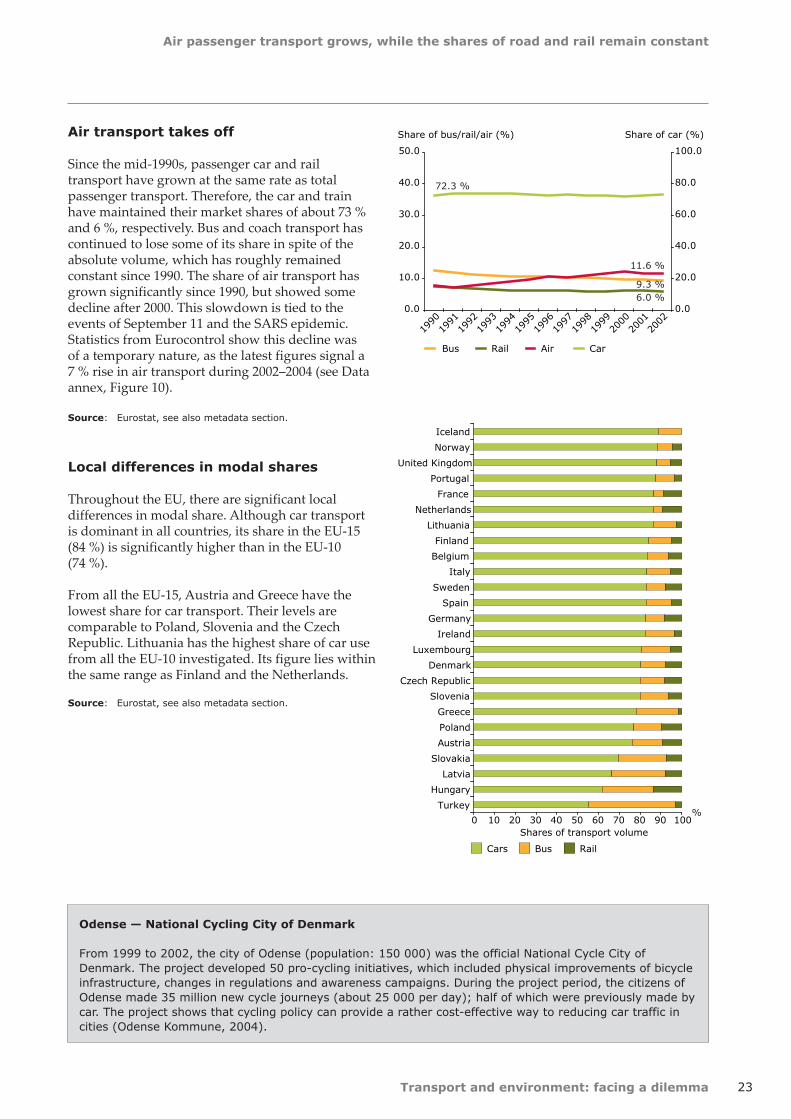
Air transport takes off
Since the mid-1990s, passenger car and rail transport have grown at the same rate as total passenger transport. Therefore, the car and train have maintained their market shares of about 73 % and 6 %, respectively. Bus and coach transport has continued to lose some of its share in spite of the absolute volume, which has roughly remained constant since 1990. The share of air transport has grown significantly since 1990, but showed some decline after 2000. This slowdown is tied to the events of September 11 and the SARS epidemic. Statistics from Eurocontrol show this decline was of a temporary nature, as the latest figures signal a 7 % rise in air transport during 2002–2004 (see Data annex, Figure 10).
Source: Eurostat, see also metadata section.
Local differences in modal shares
Throughout the EU, there are significant local differences in modal share. Although car transport is dominant in all countries, its share in the EU-15 (84 %) is significantly higher than in the EU-10 (74 %).
From all the EU-15, Austria and Greece have the lowest share for car transport. Their levels are comparable to Poland, Slovenia and the Czech Republic. Lithuania has the highest share of car use from all the EU-10 investigated. Its figure lies within the same range as Finland and the Netherlands.
Source: Eurostat, see also metadata section.
0.0
10.0
20.0
30.0
40.0
50.0
1990
1991
1992
1993
1994
1995
1996
1997
1998
1999
2000
2001
2002
Share of bus/rail/air (%)
0.0
20.0
40.0
60.0
80.0
100.0
Share of car (%)
Bus Rail Air Car
72.3 %
6.0 %9.3 %
11.6 %
0 10 20 30 40 50 60 70 80 90 100
Turkey
Hungary
Latvia
Slovakia
Austria
Poland
Greece
Slovenia
Czech Republic
Denmark
Luxembourg
Ireland
Germany
Spain
Sweden
Italy
Belgium
Finland
Lithuania
Netherlands
France
Portugal
United Kingdom
Norway
Iceland
Shares of transport volume
Cars Bus Rail
%
Odense — National Cycling City of Denmark
From 1999 to 2002, the city of Odense (population: 150 000) was the official National Cycle City of Denmark. The project developed 50 pro-cycling initiatives, which included physical improvements of bicycle infrastructure, changes in regulations and awareness campaigns. During the project period, the citizens of Odense made 35 million new cycle journeys (about 25 000 per day); half of which were previously made by car. The project shows that cycling policy can provide a rather cost-effective way to reducing car traffic in cities (Odense Kommune, 2004).
Transport and environment: facing a dilemma24
Developments in fuels contribute to emission reductions
7 Developments in fuels contribute to emission reductions
All countries where data are currently available have met the 2005 limit value for low sulphur content in road transport fuels. The remaining ones are expected to hit their targets as well. In addition, some countries have already achieved the 2009 target on zero sulphur fuels. Moreover, steps towards sulphur reduction are being taken in other modes as well. However, much work remains to be done.
There was a deadline in 2005 for the reduction of sulphur in road transport fuel to an upper limit of 50 ppm, and it will be followed by a further deadline for 10 ppm ('zero') in 2009. Official reporting is not yet available, but information from a number of Member States indicates that the 2005 limit value has been met in these countries (see Data annex, Table 7). These data also show that zero sulphur fuels are being made available more and more. In 2003, the combined share of low and zero sulphur petrol and diesel was 49 % and 45 % respectively, with a close to equal split between the two (EC, 2003b). Reducing the sulphur content of fuels will have a significant impact on exhaust emissions, as it will enable the introduction of more sophisticated after-treatment systems and improve their durability. Furthermore, exhaust of sulphur compounds contribute to acidification of the environment as well as to the formation of particles.
The maritime shipping sector has become the single biggest source of SO2 in the EU because it has lagged behind land-based transport in environmental improvement (see Data annex, Table 2). With the entry into force of Directive 2005/33/EC (EC, 2005h), a limit of 1.5 % (15 000 ppm) was set on fuel sulphur content for fuels used in the Baltic Sea and the North Sea (including the English Channel). The same limit was also applied to passenger vessels on regular services to or from EU ports. Furthermore, the sulphur content of fuels used by inland vessels and by seagoing ships at berth in EU ports will be limited to 0.1 % (1 000 ppm) from 2010. The International Maritime Organisation's Marpol
Annex VI will come into force in May 2006 (IMO, 1997). This will limit sulphur content to 4.5 % (45 000 ppm) in all other waters. But the effect on emissions will be limited because the average sulphur content for marine fuels is at present around 3.0 % (29 900 ppm).
Greenhouse gas emission reduction and increasing concerns over security of energy supply are driving the biofuels policy. The directive on biofuels (EC, 2003d) has caused significant developments in this field. The directive sets non-binding targets for biofuel consumption in road transport: 2 % of petrol and diesel by 2005, and 5.75 % by 2010. All EU Member States have now set their own targets (see Data annex, Table 8) and are implementing policies to achieve them (EC, 2005c). Biofuel production is increasing rapidly. In the period 2003–2004, biodiesel production in the EU-25 increased by 29 % and bioethanol by 16 %.
The benefits of current biofuels, in terms of reduced greenhouse gas emission, are smaller than their share in consumption. This is due to emissions of greenhouse gases (see Data annex, Figure 13) and pollutants produced during cultivation of the biomass (Concawe, 2004). Production also competes with other applications of biomass (such as food or bio-electricity production), and large amounts of land are required to cultivate the biomass needed. This may affect the intensity of agricultural land use and may have a negative effect on biodiversity (EEA, 2004a). Work is ongoing in many countries to develop better biomass-to-fuel conversion technology and more environmentally benign crop rotation. These factors will have to be taken into account in the development of renewable energy policy.
The share of biofuels is increasing, although currently reported shares are below the targets of the biofuels directive.

Developments in fuels contribute to emission reductions
Transport and environment: facing a dilemma 25
Low-sulphur fuel use in the EU-15 (2003)
Low- and zero-sulphur fuels have gradually penetrated the markets in the EU-15, as countries have offered incentives for using these fuels. But the refiners' capacities to deliver the cleaner fuels have experienced bottleneck problems. Therefore, the gradual penetration illustrates capacity build up, whereas the geographical distribution of sales represents national incentives. Notably, Germany has led in pushing for the use of low sulphur fuels. Other countries are now following this example (see Data annex, Table 7).
Source: European Commission, see also metadata section.
Biodiesel and bioethanol production data (1992–2004)
There are many different types of biofuel, but in the EU market only bioethanol and biodiesel play any role. Due to a growing number of EU Member States providing government incentives for biofuel, the production of both biodiesel and bioethanol has increased strongly since 1998. Biofuel production for 2004 equals about 0.7 % of total road transport fuels consumed (based on energy content). In 2004, Germany was the leading biodiesel producer (54 % of production), whereas Spain was the main bioethanol producer (66 %). Note that the EU biofuels target is set for biofuel consumption, not for production. However, biofuel consumption data for the total EU are not yet available for 2004 (see Data annex, Table 8). Therefore production data has been used.
Source: EurObservER, see also metadata section.
Note: The horizontal line in the graph represents 1 % of road transport fuel consumption, equivalent to half of the 2005 target for biofuels consumption.
Oil is not running out, but energy supply security concerns emerge
In the World Energy Outlook 2004 (IEA, 2004), the IEA concludes that with current government policies, the world's energy needs will be almost 60 % higher in 2030 than today, and fossil fuels will continue to dominate the global energy mix. Transport relies on oil for more than 98 % of energy consumption, and is therefore vulnerable to shrinking oil supplies. There is, therefore, a great interest in timing of global oil production's peak. Experts disagree on the exact timing, but agree that it is most likely to happen within the next 25 years. When it does happen, a number of alternative options to energy saving and renewable energy such as producing synthetic fuels from natural gas, coal or oil-sand will become more economically viable than today. However, the life-cycle emissions of greenhouse gases of these alternatives are in some cases higher than conventional fuels, and therefore will represent an additional burden to the environment.
< 10 ppm sulphur
< 50 ppm sulphur
Regular
0 20
Petrol
DieselPetrol
DieselPetrol
DieselPetrol
DieselPetrol
DieselPetrol
DieselPetrol
DieselPetrol
DieselPetrol
DieselPetrol
DieselPetrol
DieselPetrol
DieselPetrol
DieselPetrol
DieselPetrol
DieselPetrol
Diesel
40 60 80 100
%
EU-15
Austria
Greece
Portugal
Denmark
Luxembourg
Ireland
Germany
Spain
Sweden
Italy
Belgium
Finland
Netherlands
France
United Kingdom
0
20
40
60
80
100
120
140
1992
1993
1994
1995
1996
1997
1998
1999
2000
2001
2002
2003
2004
Energy content (PJ)
Biodiesel production in the EU
Bioethanol production in the EU
Transport and environment: facing a dilemma26
Car occupancy and lorry load factors decline in countries for which data are available
8 Car occupancy and lorry load factors decline in countries for which data are available
There are few data available on occupancy rates and load factors. Data for a few countries show average occupancy rates for passenger cars are lower than a decade ago. Growing car ownership, the decreasing average size of households, and disperse spatial patterns are the main causes for low occupancy rates. The limited data available also show a trend towards poorer use of heavy goods vehicle capacity. Apparently, the higher transport costs, resulting from lower utilisation, are exceeded by benefits such as reduced production costs. A reverse of these market trends could reduce environmental impact.
The data in TERM show that in a few countries, for which reliable data are available, the utilisation of road transport vehicles is declining. The occupancy rate of passenger cars has long been declining at a steady pace. But the average load factor has also declined for heavy goods vehicles, albeit at a lower rate. A decrease in the share of empty rides with heavy goods vehicles is largely compensated for by a decrease in the average load factor of loaded trips. As a result, more vehicle-kilometres are necessary for the same number of tonne-kilometres or passenger-kilometres. Improvement in the use of available capacity in transport vehicles could allow for the current amount of goods or passengers to be transported, at a lower environmental cost.
No clear trends appear for public transport modes, but train occupancies are generally low. For most countries, less than 30 % of the seats are on average occupied. Aircraft occupancy rates are much higher at around 60 % (see Data annex, Table 9).
A main driver behind the decreasing occupancy rates of passenger cars is the growth in car ownership (up from 305 to 380 cars per 1 000 inhabitants during the 1990s). Furthermore, the average size of households has declined over the past 15 years. Changes in lifestyles and disperse spatial pattern (urban sprawl) have led to individual transport patterns that cannot be pooled easily. As a result, people travel more either with less people in the vehicle or alone.
The decline in the utilisation of heavy goods vehicles can, to a large extent, be attributed to the rise of strategies such as supply chain management and just-in-time deliveries of freight loads. Smaller but more frequent loads are delivered exactly when needed. While offering benefits, the greater flexibility required by the transporters leaves less room to optimise load factors. Furthermore, trade companies have changed their distribution policy from decentralised stocks to a small number of large distribution centres using fleets of bigger lorries over longer distances. Improvement in logistics enabled hauliers to find a load to bring on the return more often, making fewer lorries return empty. However, this trend has not reversed the overall trend of declining use. While more efficient loading generally leads to economic savings, these are outweighed by costs involved in achieving the efficiency gains, such as costs of storage.
Car-sharing or ride-sharing schemes exist in many countries. Both schemes increase the use of existing cars, but only ride sharing is likely to increase the occupancy rates. In the countries for which data are available, neither type of scheme has been applied on a scale large enough to alter the general trend of declining occupancy rates.
Evidently, unused capacity exists. Although improving occupancy rates and load factors is a difficult task, it is not impossible. History tells us that better utilisation is possible and that differences between individual countries do exist. However, it is not easy for policymakers to improve load factors directly, for these are mainly the result of market-driven forces. Efficiency is heavily influenced by price and availability of transport. As transport has become more affordable and more people have their own cars, incentives to make fuller use of existing capacity are declining. Making transport users pay for the full external costs of their transport activity will, through fairer but also higher prices, provide an incentive to improve efficiency.
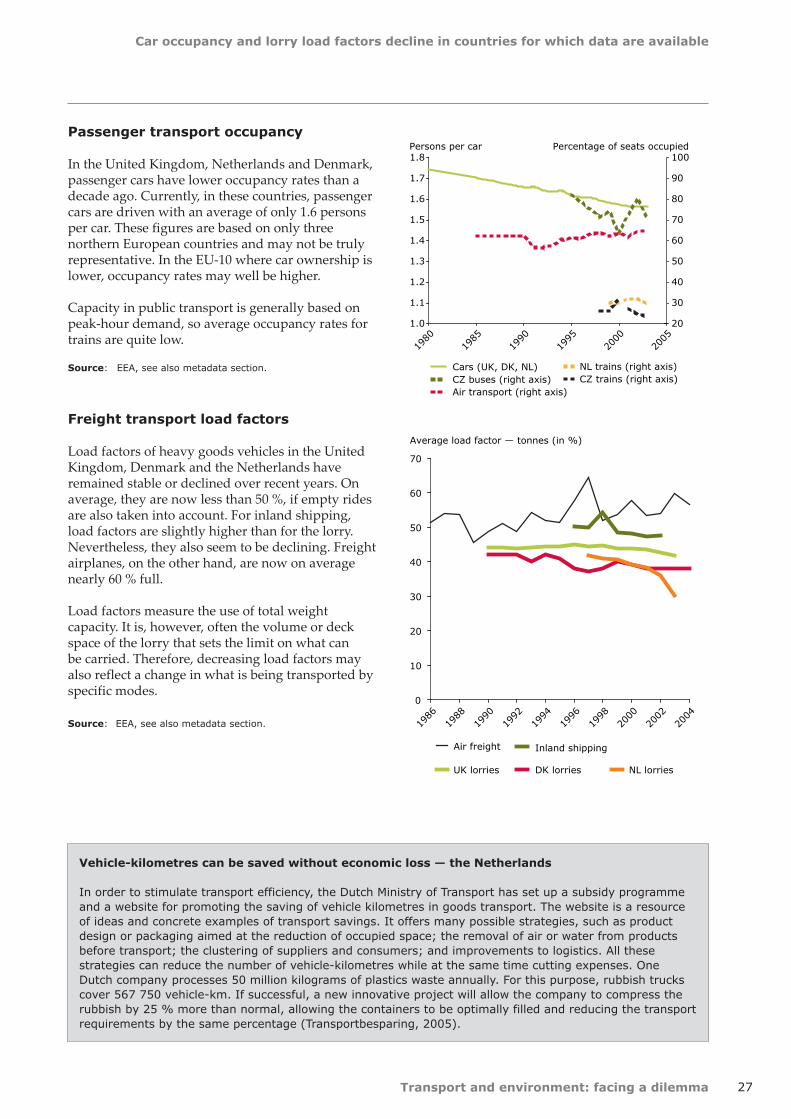
Car occupancy and lorry load factors decline in countries for which data are available
Transport and environment: facing a dilemma 27
Passenger transport occupancy
In the United Kingdom, Netherlands and Denmark, passenger cars have lower occupancy rates than a decade ago. Currently, in these countries, passenger cars are driven with an average of only 1.6 persons per car. These figures are based on only three northern European countries and may not be truly representative. In the EU-10 where car ownership is lower, occupancy rates may well be higher.
Capacity in public transport is generally based on peak-hour demand, so average occupancy rates for trains are quite low.
Source: EEA, see also metadata section.
Freight transport load factors
Load factors of heavy goods vehicles in the United Kingdom, Denmark and the Netherlands have remained stable or declined over recent years. On average, they are now less than 50 %, if empty rides are also taken into account. For inland shipping, load factors are slightly higher than for the lorry. Nevertheless, they also seem to be declining. Freight airplanes, on the other hand, are now on average nearly 60 % full.
Load factors measure the use of total weight capacity. It is, however, often the volume or deck space of the lorry that sets the limit on what can be carried. Therefore, decreasing load factors may also reflect a change in what is being transported by specific modes.
Source: EEA, see also metadata section.
1.0
1.1
1.2
1.3
1.4
1.5
1.6
1.7
1.8
1980
1985
1990
1995
2000
2005
Persons per car
20
30
40
50
60
70
80
90
100Percentage of seats occupied
Cars (UK, DK, NL)CZ buses (right axis)Air transport (right axis)
NL trains (right axis)CZ trains (right axis)
0
10
20
30
40
50
60
70
1986
1988
1990
1992
1994
1996
1998
2000
2002
2004
Average load factor — tonnes (in %)
Air freight Inland shipping
UK lorries DK lorries NL lorries
Vehicle-kilometres can be saved without economic loss — the Netherlands
In order to stimulate transport efficiency, the Dutch Ministry of Transport has set up a subsidy programme and a website for promoting the saving of vehicle kilometres in goods transport. The website is a resource of ideas and concrete examples of transport savings. It offers many possible strategies, such as product design or packaging aimed at the reduction of occupied space; the removal of air or water from products before transport; the clustering of suppliers and consumers; and improvements to logistics. All these strategies can reduce the number of vehicle-kilometres while at the same time cutting expenses. One Dutch company processes 50 million kilograms of plastics waste annually. For this purpose, rubbish trucks cover 567 750 vehicle-km. If successful, a new innovative project will allow the company to compress the rubbish by 25 % more than normal, allowing the containers to be optimally filled and reducing the transport requirements by the same percentage (Transportbesparing, 2005).
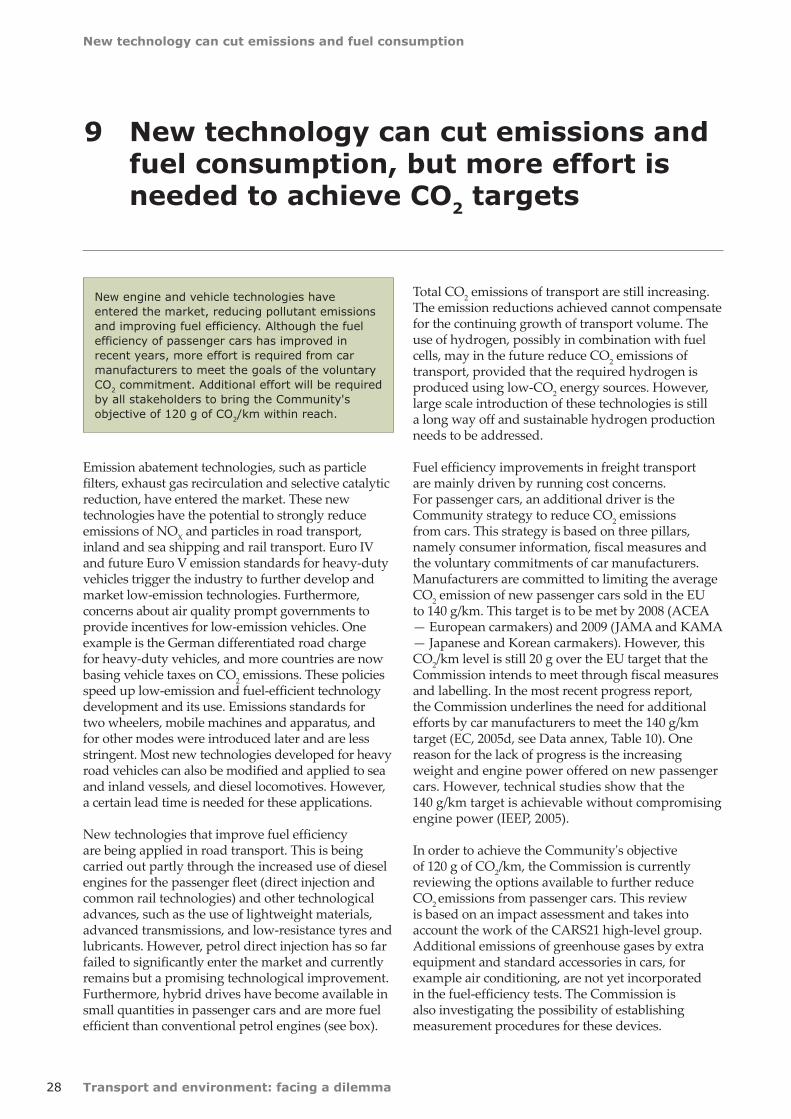
Transport and environment: facing a dilemma28
New technology can cut emissions and fuel consumption
9 New technology can cut emissions and fuel consumption, but more effort is needed to achieve CO2 targets
New engine and vehicle technologies have entered the market, reducing pollutant emissions and improving fuel efficiency. Although the fuel efficiency of passenger cars has improved in recent years, more effort is required from car manufacturers to meet the goals of the voluntary CO2 commitment. Additional effort will be required by all stakeholders to bring the Community's objective of 120 g of CO2/km within reach.
Emission abatement technologies, such as particle filters, exhaust gas recirculation and selective catalytic reduction, have entered the market. These new technologies have the potential to strongly reduce emissions of NOX and particles in road transport, inland and sea shipping and rail transport. Euro IV and future Euro V emission standards for heavy-duty vehicles trigger the industry to further develop and market low-emission technologies. Furthermore, concerns about air quality prompt governments to provide incentives for low-emission vehicles. One example is the German differentiated road charge for heavy-duty vehicles, and more countries are now basing vehicle taxes on CO2 emissions. These policies speed up low-emission and fuel-efficient technology development and its use. Emissions standards for two wheelers, mobile machines and apparatus, and for other modes were introduced later and are less stringent. Most new technologies developed for heavy road vehicles can also be modified and applied to sea and inland vessels, and diesel locomotives. However, a certain lead time is needed for these applications.
New technologies that improve fuel efficiency are being applied in road transport. This is being carried out partly through the increased use of diesel engines for the passenger fleet (direct injection and common rail technologies) and other technological advances, such as the use of lightweight materials, advanced transmissions, and low-resistance tyres and lubricants. However, petrol direct injection has so far failed to significantly enter the market and currently remains but a promising technological improvement. Furthermore, hybrid drives have become available in small quantities in passenger cars and are more fuel efficient than conventional petrol engines (see box).
Total CO2 emissions of transport are still increasing. The emission reductions achieved cannot compensate for the continuing growth of transport volume. The use of hydrogen, possibly in combination with fuel cells, may in the future reduce CO2 emissions of transport, provided that the required hydrogen is produced using low-CO2 energy sources. However, large scale introduction of these technologies is still a long way off and sustainable hydrogen production needs to be addressed.
Fuel efficiency improvements in freight transport are mainly driven by running cost concerns. For passenger cars, an additional driver is the Community strategy to reduce CO2 emissions from cars. This strategy is based on three pillars, namely consumer information, fiscal measures and the voluntary commitments of car manufacturers. Manufacturers are committed to limiting the average CO2 emission of new passenger cars sold in the EU to 140 g/km. This target is to be met by 2008 (ACEA — European carmakers) and 2009 (JAMA and KAMA — Japanese and Korean carmakers). However, this CO2/km level is still 20 g over the EU target that the Commission intends to meet through fiscal measures and labelling. In the most recent progress report, the Commission underlines the need for additional efforts by car manufacturers to meet the 140 g/km target (EC, 2005d, see Data annex, Table 10). One reason for the lack of progress is the increasing weight and engine power offered on new passenger cars. However, technical studies show that the 140 g/km target is achievable without compromising engine power (IEEP, 2005).
In order to achieve the Community's objective of 120 g of CO2/km, the Commission is currently reviewing the options available to further reduce CO2 emissions from passenger cars. This review is based on an impact assessment and takes into account the work of the CARS21 high-level group. Additional emissions of greenhouse gases by extra equipment and standard accessories in cars, for example air conditioning, are not yet incorporated in the fuel-efficiency tests. The Commission is also investigating the possibility of establishing measurement procedures for these devices.
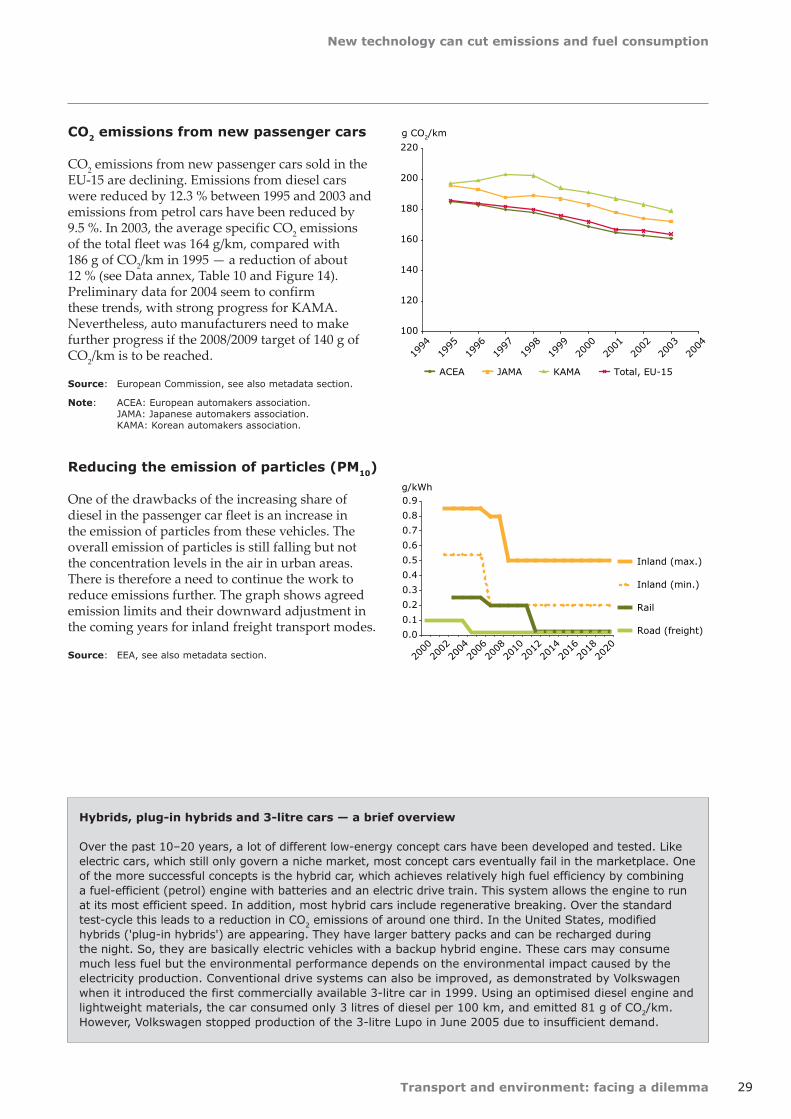
New technology can cut emissions and fuel consumption
Transport and environment: facing a dilemma 29
CO2 emissions from new passenger cars
CO2 emissions from new passenger cars sold in the EU-15 are declining. Emissions from diesel cars were reduced by 12.3 % between 1995 and 2003 and emissions from petrol cars have been reduced by 9.5 %. In 2003, the average specific CO2 emissions of the total fleet was 164 g/km, compared with 186 g of CO2/km in 1995 — a reduction of about 12 % (see Data annex, Table 10 and Figure 14). Preliminary data for 2004 seem to confirm these trends, with strong progress for KAMA. Nevertheless, auto manufacturers need to make further progress if the 2008/2009 target of 140 g of CO2/km is to be reached.
Source: European Commission, see also metadata section.
Note: ACEA: European automakers association. JAMA: Japanese automakers association. KAMA: Korean automakers association.
Reducing the emission of particles (PM10)
One of the drawbacks of the increasing share of diesel in the passenger car fleet is an increase in the emission of particles from these vehicles. The overall emission of particles is still falling but not the concentration levels in the air in urban areas. There is therefore a need to continue the work to reduce emissions further. The graph shows agreed emission limits and their downward adjustment in the coming years for inland freight transport modes.
Source: EEA, see also metadata section.
100
120
140
160
180
200
220
1994
1995
1996
1997
1998
1999
2000
2001
2002
2003
2004
g CO2/km
ACEA JAMA KAMA Total, EU-15
0.0
0.1
0.2
0.3
0.4
0.5
0.6
0.7
0.8
0.9g/kWh
Inland (max.)
Inland (min.)
Rail
Road (freight)
2000
2002
2004
2006
2008
2010
2012
2014
2016
2018
2020
Hybrids, plug-in hybrids and 3-litre cars — a brief overview
Over the past 10–20 years, a lot of different low-energy concept cars have been developed and tested. Like electric cars, which still only govern a niche market, most concept cars eventually fail in the marketplace. One of the more successful concepts is the hybrid car, which achieves relatively high fuel efficiency by combining a fuel-efficient (petrol) engine with batteries and an electric drive train. This system allows the engine to run at its most efficient speed. In addition, most hybrid cars include regenerative breaking. Over the standard test-cycle this leads to a reduction in CO2 emissions of around one third. In the United States, modified hybrids ('plug-in hybrids') are appearing. They have larger battery packs and can be recharged during the night. So, they are basically electric vehicles with a backup hybrid engine. These cars may consume much less fuel but the environmental performance depends on the environmental impact caused by the electricity production. Conventional drive systems can also be improved, as demonstrated by Volkswagen when it introduced the first commercially available 3-litre car in 1999. Using an optimised diesel engine and lightweight materials, the car consumed only 3 litres of diesel per 100 km, and emitted 81 g of CO2/km. However, Volkswagen stopped production of the 3-litre Lupo in June 2005 due to insufficient demand.
Transport and environment: facing a dilemma30
Price structures are increasingly aligned with and yet well below external costs level
10 Price structures are increasingly aligned with and yet well below external costs level
There are a number of initiatives to align price structures better with the external impact of transport. However, transport prices are generally well below the marginal social cost level. This is resulting in an over-consumption of transport. Further improvement of transport pricing is an opportunity to better balance the benefits and negative impacts of transport.
In recent years, a number of countries have implemented road charges for lorries, which have been differentiated according to environmental performance. These countries include Switzerland (2001), Austria (2004) and Germany (2005). Currently, the Czech Republic and the United Kingdom are also working on plans for road pricing for lorries. However, charge levels of existing schemes are still well below marginal infrastructure and external costs. For passenger car traffic, schemes using road charges related to environmental performance are rare, but examples include the congestion charge trial in Stockholm, which started in January 2006, and extension of the area for the London congestion charge.
In aviation, price structures are adapted to environmental performance at some locations. Heathrow and Gatwick followed Sweden by introducing landing and take-off emission charges. However, these new charges are, unlike in Sweden, well below external cost levels. Excise duty on fuel for domestic flights has been introduced in the Netherlands, and other countries have expressed similar plans. Meanwhile, the Commission is working on plans for including the emissions from international aviation in the European Union emission trading scheme for greenhouse gases. This would constitute an alternative to fuel taxation (see Section 3), which is banned on international aviation by international agreements.
For road freight transport, the Euro-vignette directive' (EC, 2003c) is currently being amended. It is intended to lay down certain rules defining the conditions under which user charges and tolls may be applied for road use by heavy goods vehicles.
From a socioeconomic point of view, the optimal charge would include all external and infrastructure costs, but a more likely outcome of the co-decision procedure is that the amendment will only allow the introduction of charge structures (not charge levels) that are more in line with external effects. A crucial point of discussion is whether revenues should be earmarked for infrastructure investments. Earmarking revenues may lead to more investment than would have occurred from social cost–benefit analysis.
In the proposal for a directive on passenger car-related taxes, the Commission proposes to abolish vehicle registration tax and, during the phase-out period, differentiate tax by the CO2 emission rate of cars. Annual circulation taxes are to be tied to CO2 emission rates as well. At least 25 % of the revenue from each of these taxes should originate from its CO2-based component by December 2008 and 50 % by the end of 2010 (EC, 2005e). Several countries have already taken initiatives in this direction.
The total external costs of transport were estimated at EUR 650 billion in 2000 for the EU-15, Switzerland and Norway. This is equivalent to 7 % of GDP. More than 80 % of these costs relate to accidents, air pollution and climate change (see Data annex, Figure 15). Noise and congestion can lead to substantial social costs in specific cases as well (Infras/IWW, 2004). The burden of external and infrastructure costs lies with society as a whole, and not just with transport users. 'Fair and efficient pricing', as targeted by the Commission (EC, 2001b), means that transport users should pay a fee commensurate with the marginal social costs. This is both 'efficient' because users will have an (economic) incentive to reduce the external effects of their trips, e.g. by using relatively clean, fuel-efficient and safe vehicles, and 'fair' because the polluter pays. 'Fair and efficient pricing' may also lead to a reduction of transport volume where transport is presently under-priced. Full internalisation of external and infrastructure costs will maximise the transport system's contribution to society's welfare, further improving market efficiency and providing incentives to reduce environmental impacts. However, this could be considered a 'double-edged sword' in terms of the Lisbon strategy.
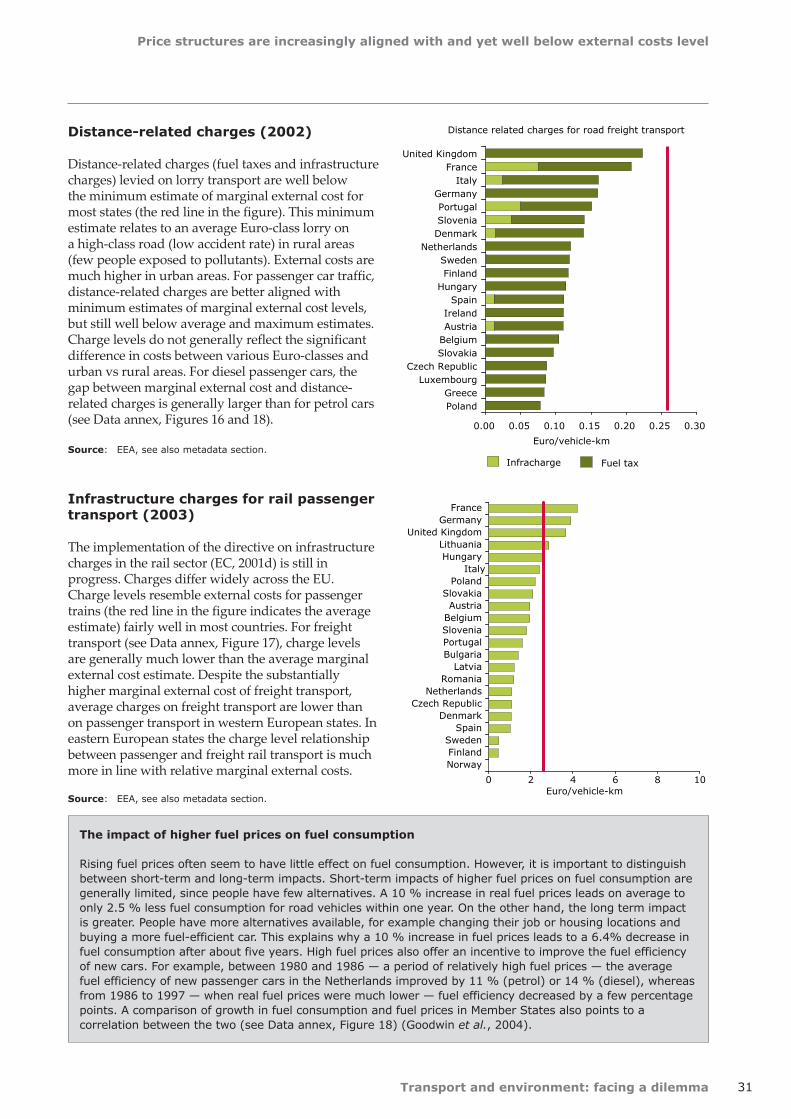
Price structures are increasingly aligned with and yet well below external costs level
Transport and environment: facing a dilemma 31
Distance-related charges (2002)
Distance-related charges (fuel taxes and infrastructure charges) levied on lorry transport are well below the minimum estimate of marginal external cost for most states (the red line in the figure). This minimum estimate relates to an average Euro-class lorry on a high-class road (low accident rate) in rural areas (few people exposed to pollutants). External costs are much higher in urban areas. For passenger car traffic, distance-related charges are better aligned with minimum estimates of marginal external cost levels, but still well below average and maximum estimates. Charge levels do not generally reflect the significant difference in costs between various Euro-classes and urban vs rural areas. For diesel passenger cars, the gap between marginal external cost and distance-related charges is generally larger than for petrol cars (see Data annex, Figures 16 and 18).
Source: EEA, see also metadata section.
Infrastructure charges for rail passenger transport (2003)
The implementation of the directive on infrastructure charges in the rail sector (EC, 2001d) is still in progress. Charges differ widely across the EU. Charge levels resemble external costs for passenger trains (the red line in the figure indicates the average estimate) fairly well in most countries. For freight transport (see Data annex, Figure 17), charge levels are generally much lower than the average marginal external cost estimate. Despite the substantially higher marginal external cost of freight transport, average charges on freight transport are lower than on passenger transport in western European states. In eastern European states the charge level relationship between passenger and freight rail transport is much more in line with relative marginal external costs.
Source: EEA, see also metadata section.
Distance related charges for road freight transport
0.00 0.05 0.10 0.15 0.20 0.25 0.30
United KingdomFrance
ItalyGermanyPortugalSloveniaDenmark
NetherlandsSwedenFinland
HungarySpain
IrelandAustria
BelgiumSlovakia
Czech RepublicLuxembourg
GreecePoland
Euro/vehicle-km
Infracharge Fuel tax
0 2 4 6 8 10
FranceGermany
United KingdomLithuaniaHungary
ItalyPoland
SlovakiaAustria
BelgiumSloveniaPortugalBulgaria
LatviaRomania
NetherlandsCzech Republic
DenmarkSpain
SwedenFinlandNorway
Euro/vehicle-km
The impact of higher fuel prices on fuel consumption
Rising fuel prices often seem to have little effect on fuel consumption. However, it is important to distinguish between short-term and long-term impacts. Short-term impacts of higher fuel prices on fuel consumption are generally limited, since people have few alternatives. A 10 % increase in real fuel prices leads on average to only 2.5 % less fuel consumption for road vehicles within one year. On the other hand, the long term impact is greater. People have more alternatives available, for example changing their job or housing locations and buying a more fuel-efficient car. This explains why a 10 % increase in fuel prices leads to a 6.4% decrease in fuel consumption after about five years. High fuel prices also offer an incentive to improve the fuel efficiency of new cars. For example, between 1980 and 1986 — a period of relatively high fuel prices — the average fuel efficiency of new passenger cars in the Netherlands improved by 11 % (petrol) or 14 % (diesel), whereas from 1986 to 1997 — when real fuel prices were much lower — fuel efficiency decreased by a few percentage points. A comparison of growth in fuel consumption and fuel prices in Member States also points to a correlation between the two (see Data annex, Figure 18) (Goodwin et al., 2004).
Transport and environment: facing a dilemma32
References
References
Aarts, 1996, 'Habit and decision-making — The case of travel mode choice', PhD thesis, H. Aarts, Nijmegen: Katholieke Universiteit Nijmegen.
AEA, 2005, STAR 2005, companion volume to the AEA yearbook 2005, AEA (Association of European Airlines), 2004 (http://www.aea.be).
AirBase, 2005, a database on air quality developed and maintained by the European Environment Agency's ETC/Air and Climate Change (http://air-climate.eionet.eu.int/databases/aibase.html).
Asecap, 2005, Statistical Bulletin, several editions, ASECAP, 2005 (www.asecap.org).
Belgium, 2005, 'Progress report on the promotion of biofuels in Belgium in 2005', 13 July 2005, http://europa.eu.int/comm/energy/res/legislation/biofuels_members_states_en.htm).
CBS, 2005, 'Totale vervoersprestatie van de Nederlandse bevolking naar provincie', Statistics Netherlands (CBS), 2005, available via the Statline tool (http://statline.cbs.nl/StatWeb/).
CE Delft, 2003, 'To shift or not to shift, that's the question — The environmental performance of the principal modes of freight and passenger transport in the policy-making context', CE Delft, March 2003.
CE Delft, 2004, 'Accessibility and spatial planning in TERM', Delft, November 2004.
CE Delft et al, 2005, 'Giving wings to emission trading — Inclusion of aviation under the European emission trading system (ETS): design an impacts', CE Delft, Oeko Insitut, CATE, 2005 (www.ce.nl).
Concawe, 2004, 'Well-to-wheels analysis of future automotive fuels and powertrains in the European context', a joint report by Concawe, EUCAR and JRC (the Joint Research Centre of the European Commission), 2004.
Defra, 2005, The validity of food miles as an indicator of sustainable development, Annex 4 'Win–win company policies in food logistics', UK Department for Environment, Food and Rural Affairs (DEFRA), July 2005 (http://statistics.defra.gov.uk/esg/reports/foodmiles/annex4.pdf).
DfT, 2005a, 'Transport trends', seventh edition, Trend 1.3a/b, UK Department for Transport, June 2005 (http://www.dft.gov.uk/stellent/groups/dft_transstats/documents/page/dft_transstats_026283.xls).
DfT, 2005b, 'Transport Statistics Bulletin — Transport of goods by road in Great Britain: 2004', SB (05) 29, UK Department for Transport, 2005 (http://www.dft.gov.uk/stellent/groups/dft_transstats/documents/downloadable/dft_transstats_039350.pdf).
DS, 2005, Dataset on 'NVG5 — Danske lastbilers kapacitetsudnyttelse' ['Capacity utilisation of Danish lorries'], September 2005, available from the Statistics Denmark website (www.statistikbanken.dk).
EC, 1998, Directive 98/70/EC of the European Parliament and of the Council of 13 October 1998 relating to the quality of petrol and diesel fuels and amending Directive 93/12/EEC, European Commission, 1998.
EC, 2000, Good practice in freight transport — A sourcebook, European Commission, Office for Official Publications of the European Communities, Luxembourg (http://europa.eu.int/comm/environment/trans/freight/index.htm).
EC, 2001a, Communication from the Commission entitled 'A sustainable Europe for a better world: a European Union strategy for sustainable development', the Commission's proposal to the Gothenburg European Council, Commission of the European Communities, COM(2001) 264 final, Brussels, 15 May 2001.
EC, 2001b, 'European transport policy for 2010: time to decide' White Paper, European Commission, Brussels, 2001.
References
Transport and environment: facing a dilemma 33
EC, 2001c, Environment 2010: 'Our future, our choice — The sixth environmental action programme' COM(2001) 31 final, European Commission.
EC, 2001d, Directive 2001/14/EC on the allocation of railway infrastructure capacity and the levying of charges for the use of railway infrastructure and safety certification, Europan Commission, 2001.
EC, 2002, EU transport in figures — Statistical pocketbook 2002, European Commission Directorate-General for Energy and Transport in cooperation with Eurostat, Brussels, Belgium.
EC, 2003a, European energy and transport — Trends to 2030, European Commission, 2003 (http://europa.eu.int/comm/dgs/energy_transport/figures/trends_2030/index_en.htm).
EC, 2003b, Directive 2003/17/EC of the European Parliament and of the Council of 3 March 2003 amending Directive 98/70/EC relating to the quality of petrol and diesel fuels, European Commission, 2003.
EC, 2003c, Proposal for a directive of the European Parliament and of the Council amending Directive 1999/62/EC on the charging of heavy goods vehicles for the use of certain infrastructures, European Commission, 2003.
EC, 2003d, Directive 2003/30/EC on the promotion of the use of biofuels or other renewable fuels for transport, European Commission, 2003.
EC, 2004a, Proposal for a regulation of the European Parliament and of the Council establishing the second Marco Polo programme for the granting of Community financial assistance to improve the environmental performance of the freight transport system (Marco Polo II), COM(2004) 478 final, Brussels, 14 July 2004 (http://europa.eu.int/comm/transport/marcopolo/legal/doc/com_2004_0478_en.pdf).
EC, 2004b, 'Second position paper on particulate matter', CAFE working group on particulate matter, 20 December 2004 (http://europa.eu.int/comm/environment/air/cafe/pdf/working_groups/2nd_position_paper_pm.pdf).
EC, 2005a, 'Full speed ahead for clean ships as EU Parliament adopts marine fuel directive in second reading', press release, April 2005 (http://europa.eu.int/rapid/pressReleasesAction.do?reference=IP/05/ 428&format=HTML&aged=0&language=EN&guiLanguage=en).
EC, 2005b, Communication from the Commission to the Council and the European Parliament entitled 'Thematic strategy on air pollution', COM(2005)446, 21 September 2005 (http://europa.eu.int/eurlex/lex/LexUriServ/site/en/com/2005/com2005_0446en01.pdf).
EC, 2005c, Member State reports on the implementation of Directive 2003/30/EC (http://europa.eu.int/comm/energy/res/legislation/biofuels_members_states_en.htm).
EC, 2005d, Communication from the Commission to the Council and the European Parliament entitled 'Implementing the Community strategy to reduce CO2 emissions from cars — Fifth annual communication on the effectiveness of the strategy', COM(2005) 269 final, European Commission. 2005.
EC, 2005e, Proposal for a Council directive on passenger car-related taxes, COM(2005) 261, European Commission, 2005.
EC, 2005f, Report from the Commission entitled 'Quality of petrol and diesel fuel used for road transport in the EU — Second annual report (Reporting year 2003)', COM(2005) 69 final, European Commission, 2005.
EC, 2005g, Communication from the Commission to the Council, the European Parliament, the European Economics and Social Committee and the Committee of the Regions entitled 'Reducing the climate change impact of aviation', COM(2005) 459, European Commission, 2005.
EC, 2005h, Directive 2005/33/EC amending Directive 1999/32/EC as regards the sulphur content of marine fuels.
EC, 2005j, Energy and transport in figures 2004, European Commission, Energy and Transport DG in collaboration with Eurostat, 2005.
ECMT, 1998a, ECMT Round Table No 105, Infrastructure-induced mobility, ISBN 9282112322, Source: OECD Transport (volume 1998).
ECMT, 1998b, 'Efficient transport for Europe, policies for internalisation of external costs', European Conference of Ministers of Transport (ECMT), Paris, France, 1998.
ECN, 2005, Overview and analysis of national reports on the EU biofuel directive, prospects and barriers for 2005, E. P. Deurwaarder, ECN Biomass, May 2005.
Transport and environment: facing a dilemma
References
34
Ecorys, 2004, Ex ante evaluation — Marco Polo II (2007–2013), Final report — 1, Ecorys Transport, Rotterdam, 15 June 2004.
EEA, 2004a, 'Transport biofuels: exploring links with the energy and agriculture sectors', EEA briefing 4, 2004.
EEA, 2004c, Annual European Community greenhouse gas inventory 1990–2002 and inventory report 2004, EEA Technical Report 2/2004, Copenhagen.
EEA, 2005a, 'Status of policy and data on non-road transport modes', informal report, European Environment Agency (EEA), 2005.
EEA, 2005b, Greenhouse gas emission trends and projections in Europe 2005, European Environment Agency (EEA).
EEA, 2005d, Eionet data service, TERM indicator 12, refers to data from UN Statistics Division (Civil aviation traffic, passenger kilometres) (http://dataservice.eionet.eu.int/dataservice/) (restricted access).
EEA, 2005e, Personal communication with the EEA's principal contacts for transport in Finland (Marko Vihervuori) and Germany (Birgit Georgi).
EEA, 2006, TERM fact sheets, published continuously since 2000, available on the EEA website (http://themes.eea.eu.int/Sectors_and_activities/transport/indicators); see complete list of indicators in the table at the end of this reference section.
EEA–ETC/ACC, 2004, Manipulated data based on the 2004 update of Member States' data reported to UNECE/CLRTAP/EMEP. Base data are available on the EMEP website (http://webdab.emep.int/).
EMEP/Corinair, 1996, Atmospheric emission inventory guidebook — First edition, EEA, Copenhagen 1996.
ETT, 2004, 'Comparison of passenger vehicle fuel economy and greenhouse gas emission standards around the world', Energy and Transportation Technologies LLC and World Resources Institute for the Pew Center on Global Climate Change, 2004.
EurObservER, 2005, 'Biofuels Barometer 2005', EurObservER, June 2005.
Eurocontrol, 2005, Unpublished data received directly from Eurocontrol.
Eurostat, 2004, Eurostat, free data available on the web site http://www.europa.eu.int/comm/eurostat/.Assessment based on unpublished electronic update from the Structural Indicators database. Supplied by Boryana Milusheva (Eurostat), December 2004.
Eurostat, 2005a, Eurostat, free data available on the web site http://www.europa.eu.int/comm/eurostat/.Assessment based on unpublished electronic update from the Structural Indicators data set. Supplied by Boryana Milusheva (Eurostat), January 2005.
Eurostat, 2005b, Eurostat, free data available on the web site http://www.europa.eu.int/comm/eurostat/.Assessment based on unpublished preliminary estimates by Eurostat's sea transport working group meeting in February 2005, provided by Boryana Milusheva (Eurostat), March 2005.
Eurostat, different volumes, Eurostat's Oil Bulletin, Volumes 1980–2002, (http://europa.eu.int/comm/energy/oil/bulletin/index_en.htm).
Eyring et al, 2005, V. Eyring, H. W. Köhler, A. Lauer, and B. Lemper, 'Emissions from international shipping — Part 2: Impact of future technologies on scenarios until 2050', DLR-Institut für Physik der Atmosphäre, Wessling, Germany.
Goodwin et al., 2004, 'Elasticities of road traffic and fuel consumption with respect to price and income: a review', P. Goodwin, J. Dargay and M. Hanly, Transport Reviews, Vol. 24, No 3, May 2004, pp. 275–292.
IATA, 2001, Flight path to excellence, ISBN 92-9171-615-4.
IEA, 2004, World Energy Outlook 2004, International Energy Agency, 2004.
IEEP, 2005, Service contract to carry out economic analysis and business impact assessment of CO2 emissions reduction measures in the automotive sector, Institute for European Environmental Policy, TNO and Centre for Automotive Industry Research, for the European Commission, Environment DG, 2005.
IMO, 1997, 'Marpol Annex VI', International Maritime Organisation (IMO), 1997.
Infras, 2000, 'External costs of transport (accidents, environmental and congestion costs) in western Europe', Paris, Infras Zurich, IWW, University of Karlsruhe, 2000.
References
Transport and environment: facing a dilemma 35
Infras/IWW, 2004, 'External costs of transport — Update study', Infras/IWW, 2004.
IPCC, 1999, Aviation and the global atmosphere, 1999, a special report of IPCC working groups I and III in collaboration with the Scientific Assessment Panel to the Montreal Protocol on Substances that Deplete the Ozone Layer, J. E. Penner, D. H. Lister, D. J. Griggs, D. J. Dokken and M. McFarland (eds), Cambridge University Press, UK, 373 pp.
MDCR, 2002, Transport yearbook 2002, Czech Ministry of Transport (MDCR), 2002 (http://www.mdcr.cz/english/index23.htm).
NS, 2004, Annual reports: 2004, 2003, 2000 and 1999, Dutch Railways (NS), 2004. (http://www.ns.nl).
Odense Komunne, 2004, Evaluering af Odense — Danmarks Nationale Cykelby (in Danish; English summary).
Odyssee, 2003, Energy efficiency data, received by e-mail (http://www.odyssee-indicators.org/).
OECD, 2002, Shaping the urban environment in the 21st century — The DAC reference manual on urban environmental policy, OECD, 2002.
OECD, 2003, Analysis of the links between transport and economic growth, working party on national environmental policy and working group on transport.
Poland, 2005, Second report to the European Commission for 2004 under Article 4(1) of Directive 2003/30/EC of the European Parliament and of the
Council on the promotion of the use of biofuels or other renewable fuels for transport, compiled by the Ministry for Agriculture and Rural Development, June 2005 (http://europa.eu.int/comm/energy/res/legislation/biofuels_members_states_en.htm).
Slovenia, 2005, The use of biofuels in fuel in the transport sector in the Republic of Slovenia — Overview of data relating to the Republic of Slovenia pursuant to Article 4(1) of Directive 2003/30/EC for the 2005 reporting year, Ministry of the Environment and Spatial Planning, September, 2005 (http://europa.eu.int/comm/energy/res/legislation/biofuels_members_states_en.htm).
Transportbesparing, 2005, (www.transportbesparing.nl) (Dutch only), developed by the Directorate-General for Freight Transport of the Ministry of Transport, Public Works and Water Management, September 2005.
TRL, 2004, The demand for public transport: a practical guide — TRL report TRL593, TRL Limited, Universities of Leeds, Oxford and Westminster and University College London, ISSN 0968-4107.
UIC, 2005, International Union of Railways (UIC) (www.railway-energy.org).
WBCSD, 2001, Mobility 2001 — World mobility at the end of the 20th century and its sustainability, World Business Council on Sustainable Development.
WHO, 2004, Health aspects of air pollution, results from the WHO project 'Systematic review of health aspects of air pollution in Europe (http://europa.eu.int/comm/environment/air/cafe/activities/pdf/e83080.pdf).
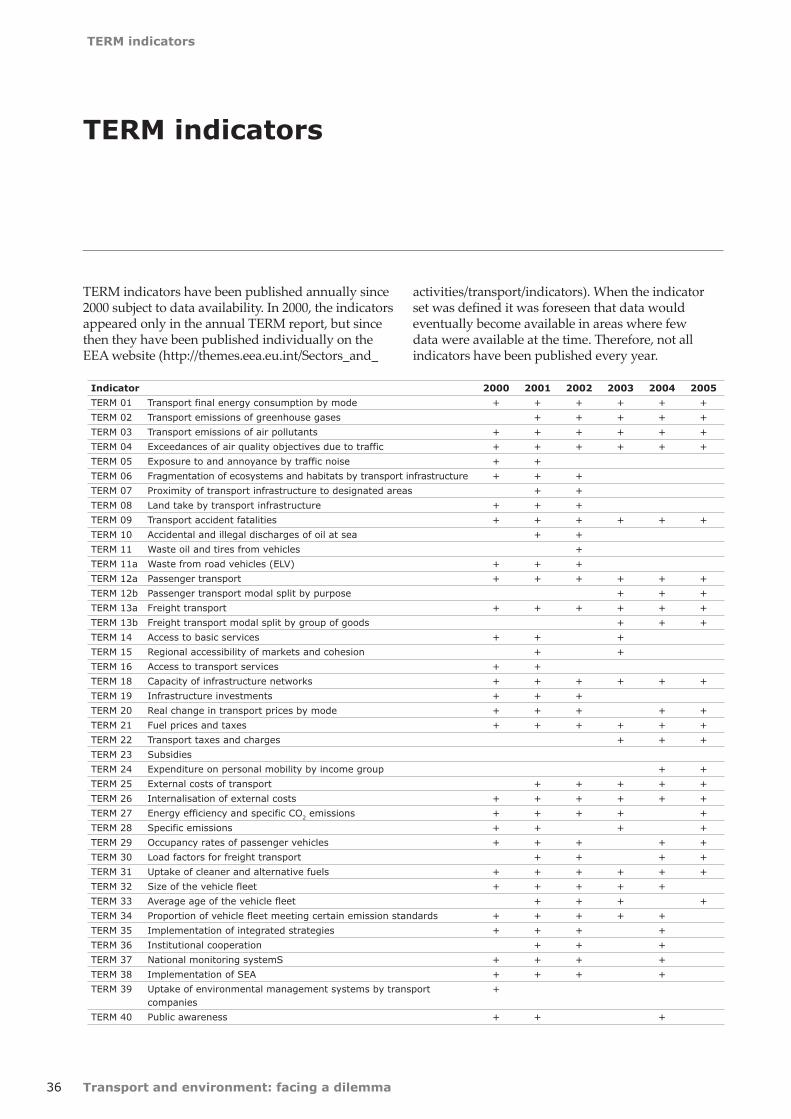
Transport and environment: facing a dilemma36
TERM indicators
TERM indicators
TERM indicators have been published annually since 2000 subject to data availability. In 2000, the indicators appeared only in the annual TERM report, but since then they have been published individually on the EEA website (http://themes.eea.eu.int/Sectors_and_
activities/transport/indicators). When the indicator set was defined it was foreseen that data would eventually become available in areas where few data were available at the time. Therefore, not all indicators have been published every year.
Indicator 2000 2001 2002 2003 2004 2005
TERM 01 Transport final energy consumption by mode + + + + + +
TERM 02 Transport emissions of greenhouse gases + + + + +
TERM 03 Transport emissions of air pollutants + + + + + +
TERM 04 Exceedances of air quality objectives due to traffic + + + + + +
TERM 05 Exposure to and annoyance by traffic noise + +
TERM 06 Fragmentation of ecosystems and habitats by transport infrastructure + + +
TERM 07 Proximity of transport infrastructure to designated areas + +
TERM 08 Land take by transport infrastructure + + +
TERM 09 Transport accident fatalities + + + + + +
TERM 10 Accidental and illegal discharges of oil at sea + +
TERM 11 Waste oil and tires from vehicles +
TERM 11a Waste from road vehicles (ELV) + + +
TERM 12a Passenger transport + + + + + +
TERM 12b Passenger transport modal split by purpose + + +
TERM 13a Freight transport + + + + + +
TERM 13b Freight transport modal split by group of goods + + +
TERM 14 Access to basic services + + +
TERM 15 Regional accessibility of markets and cohesion + +
TERM 16 Access to transport services + +
TERM 18 Capacity of infrastructure networks + + + + + +
TERM 19 Infrastructure investments + + +
TERM 20 Real change in transport prices by mode + + + + +
TERM 21 Fuel prices and taxes + + + + + +
TERM 22 Transport taxes and charges + + +
TERM 23 Subsidies
TERM 24 Expenditure on personal mobility by income group + +
TERM 25 External costs of transport + + + + +
TERM 26 Internalisation of external costs + + + + + +
TERM 27 Energy efficiency and specific CO2 emissions + + + + +
TERM 28 Specific emissions + + + +
TERM 29 Occupancy rates of passenger vehicles + + + + +
TERM 30 Load factors for freight transport + + + +
TERM 31 Uptake of cleaner and alternative fuels + + + + + +
TERM 32 Size of the vehicle fleet + + + + +
TERM 33 Average age of the vehicle fleet + + + +
TERM 34 Proportion of vehicle fleet meeting certain emission standards + + + + +
TERM 35 Implementation of integrated strategies + + + +
TERM 36 Institutional cooperation + + +
TERM 37 National monitoring systemS + + + +
TERM 38 Implementation of SEA + + + +
TERM 39 Uptake of environmental management systems by transport companies
+
TERM 40 Public awareness + + +
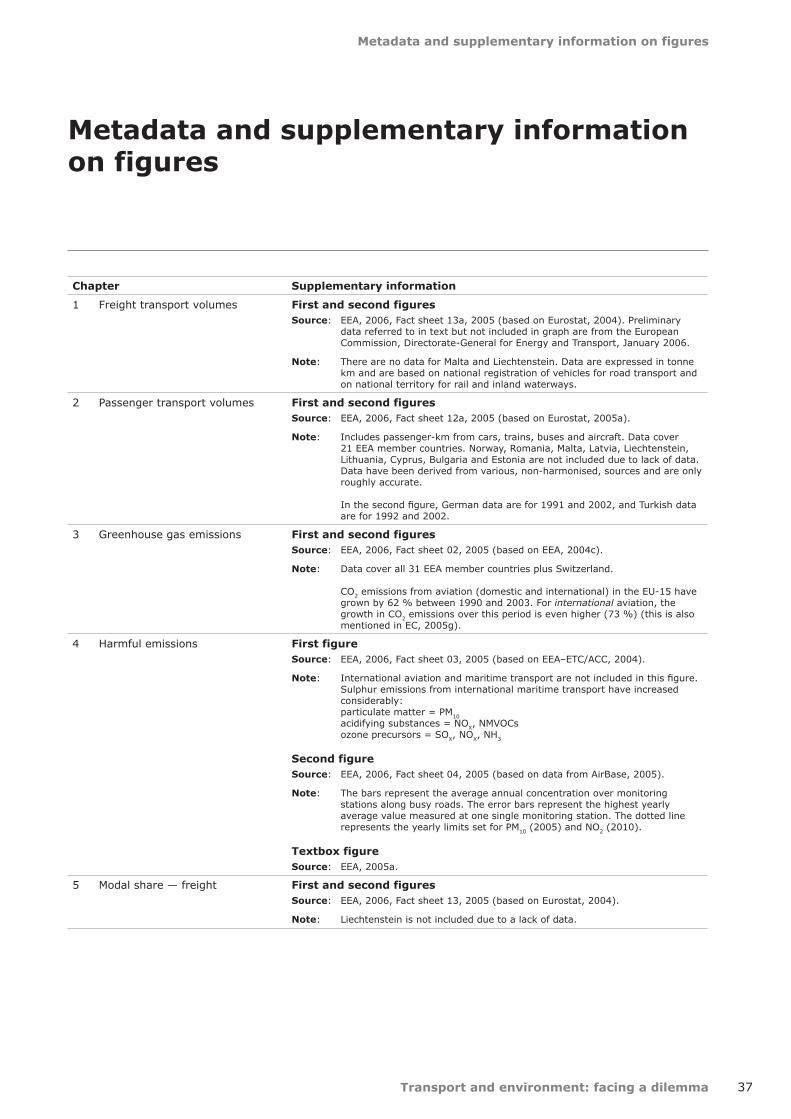
37
Metadata and supplementary information on figures
Transport and environment: facing a dilemma
Metadata and supplementary information on figures
Chapter Supplementary information
1 Freight transport volumes First and second figuresSource: EEA, 2006, Fact sheet 13a, 2005 (based on Eurostat, 2004). Preliminary
data referred to in text but not included in graph are from the European Commission, Directorate-General for Energy and Transport, January 2006.
Note: There are no data for Malta and Liechtenstein. Data are expressed in tonne km and are based on national registration of vehicles for road transport and on national territory for rail and inland waterways.
2 Passenger transport volumes First and second figuresSource: EEA, 2006, Fact sheet 12a, 2005 (based on Eurostat, 2005a).
Note: Includes passenger-km from cars, trains, buses and aircraft. Data cover 21 EEA member countries. Norway, Romania, Malta, Latvia, Liechtenstein, Lithuania, Cyprus, Bulgaria and Estonia are not included due to lack of data. Data have been derived from various, non-harmonised, sources and are only roughly accurate. In the second figure, German data are for 1991 and 2002, and Turkish data are for 1992 and 2002.
3 Greenhouse gas emissions First and second figuresSource: EEA, 2006, Fact sheet 02, 2005 (based on EEA, 2004c).
Note: Data cover all 31 EEA member countries plus Switzerland. CO2 emissions from aviation (domestic and international) in the EU-15 have grown by 62 % between 1990 and 2003. For international aviation, the growth in CO2 emissions over this period is even higher (73 %) (this is also mentioned in EC, 2005g).
4 Harmful emissions First figure Source: EEA, 2006, Fact sheet 03, 2005 (based on EEA–ETC/ACC, 2004).
Note: International aviation and maritime transport are not included in this figure. Sulphur emissions from international maritime transport have increased considerably: particulate matter = PM10 acidifying substances = NOX, NMVOCs ozone precursors = SOX, NOX, NH3
Second figure Source: EEA, 2006, Fact sheet 04, 2005 (based on data from AirBase, 2005).
Note: The bars represent the average annual concentration over monitoring stations along busy roads. The error bars represent the highest yearly average value measured at one single monitoring station. The dotted line represents the yearly limits set for PM10 (2005) and NO2 (2010).
Textbox figureSource: EEA, 2005a.
5 Modal share — freight First and second figuresSource: EEA, 2006, Fact sheet 13, 2005 (based on Eurostat, 2004).
Note: Liechtenstein is not included due to a lack of data.
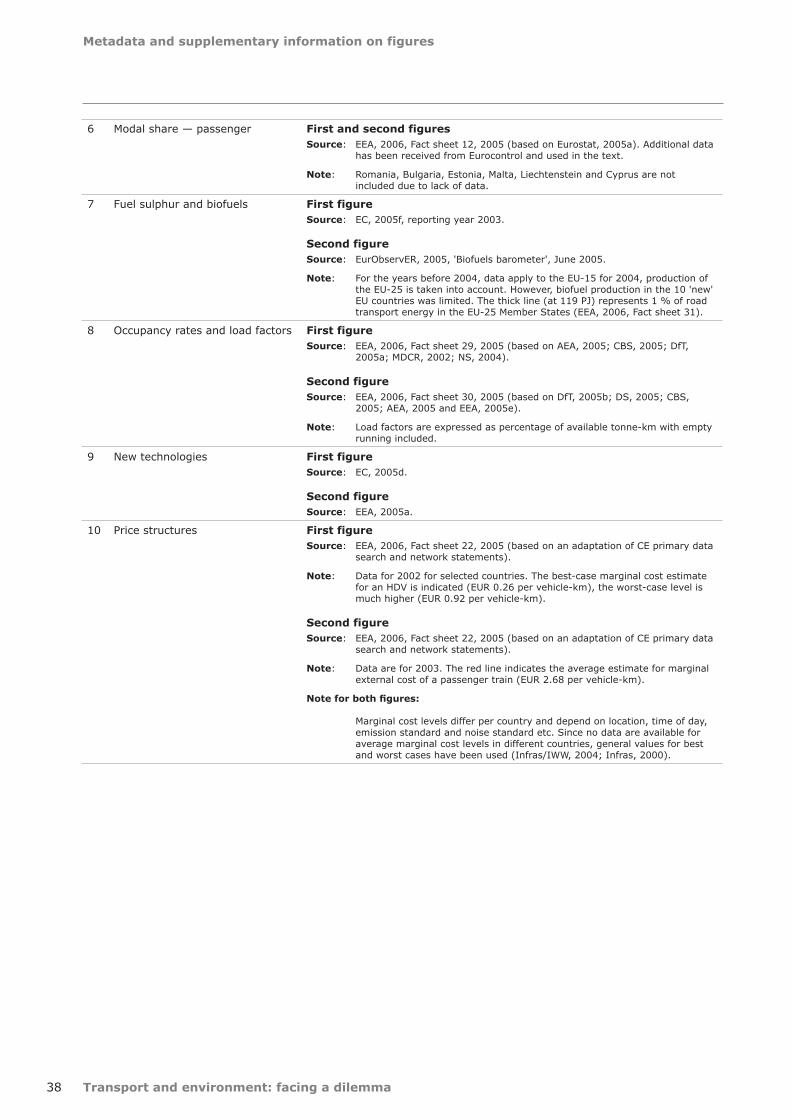
Transport and environment: facing a dilemma
Metadata and supplementary information on figures
38
6 Modal share — passenger First and second figuresSource: EEA, 2006, Fact sheet 12, 2005 (based on Eurostat, 2005a). Additional data
has been received from Eurocontrol and used in the text.
Note: Romania, Bulgaria, Estonia, Malta, Liechtenstein and Cyprus are not included due to lack of data.
7 Fuel sulphur and biofuels First figure Source: EC, 2005f, reporting year 2003.
Second figureSource: EurObservER, 2005, 'Biofuels barometer', June 2005.
Note: For the years before 2004, data apply to the EU-15 for 2004, production of the EU-25 is taken into account. However, biofuel production in the 10 'new' EU countries was limited. The thick line (at 119 PJ) represents 1 % of road transport energy in the EU-25 Member States (EEA, 2006, Fact sheet 31).
8 Occupancy rates and load factors First figureSource: EEA, 2006, Fact sheet 29, 2005 (based on AEA, 2005; CBS, 2005; DfT,
2005a; MDCR, 2002; NS, 2004).
Second figureSource: EEA, 2006, Fact sheet 30, 2005 (based on DfT, 2005b; DS, 2005; CBS,
2005; AEA, 2005 and EEA, 2005e).
Note: Load factors are expressed as percentage of available tonne-km with empty running included.
9 New technologies First figureSource: EC, 2005d.
Second figureSource: EEA, 2005a.
10 Price structures First figureSource: EEA, 2006, Fact sheet 22, 2005 (based on an adaptation of CE primary data
search and network statements).
Note: Data for 2002 for selected countries. The best-case marginal cost estimate for an HDV is indicated (EUR 0.26 per vehicle-km), the worst-case level is much higher (EUR 0.92 per vehicle-km).
Second figureSource: EEA, 2006, Fact sheet 22, 2005 (based on an adaptation of CE primary data
search and network statements).
Note: Data are for 2003. The red line indicates the average estimate for marginal external cost of a passenger train (EUR 2.68 per vehicle-km).
Note for both figures: Marginal cost levels differ per country and depend on location, time of day, emission standard and noise standard etc. Since no data are available for average marginal cost levels in different countries, general values for best and worst cases have been used (Infras/IWW, 2004; Infras, 2000).
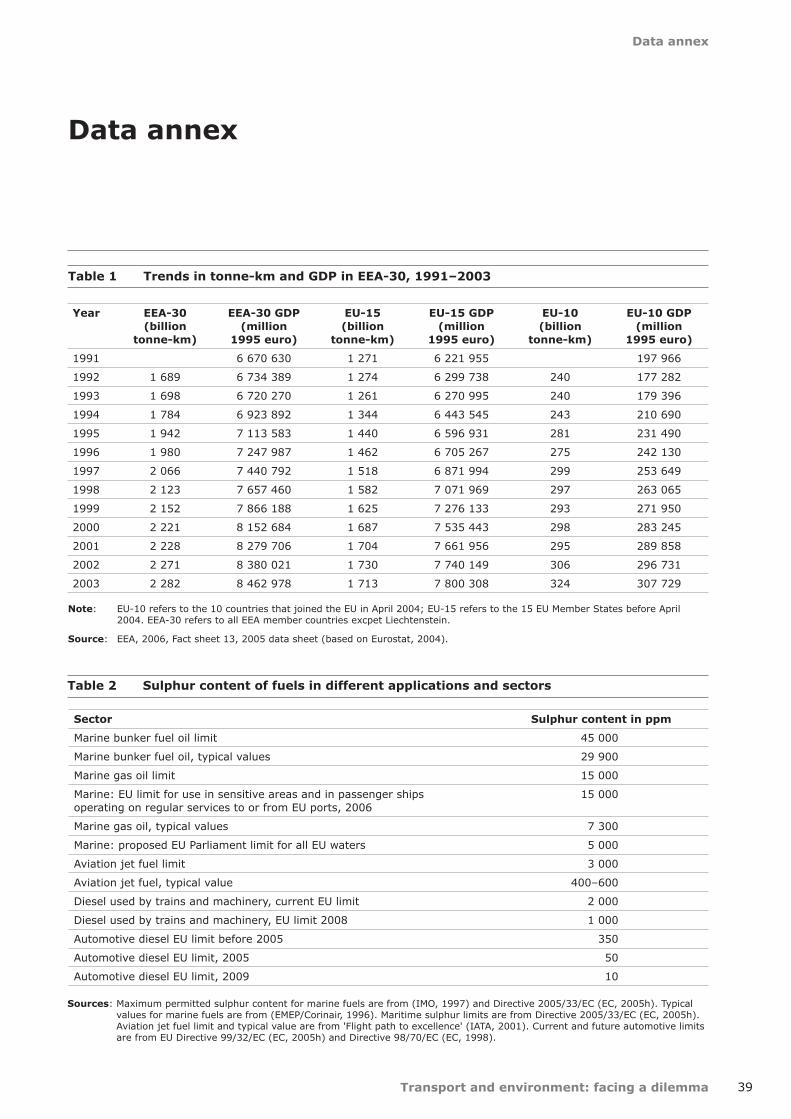
39
Data annex
Transport and environment: facing a dilemma
Table 1 Trends in tonne-km and GDP in EEA-30, 1991–2003
Note: EU-10 refers to the 10 countries that joined the EU in April 2004; EU-15 refers to the 15 EU Member States before April 2004. EEA-30 refers to all EEA member countries excpet Liechtenstein.
Source: EEA, 2006, Fact sheet 13, 2005 data sheet (based on Eurostat, 2004).
Year EEA-30 (billion
tonne-km)
EEA-30 GDP (million
1995 euro)
EU-15 (billion
tonne-km)
EU-15 GDP (million
1995 euro)
EU-10 (billion
tonne-km)
EU-10 GDP (million
1995 euro)
1991 6 670 630 1 271 6 221 955 197 966
1992 1 689 6 734 389 1 274 6 299 738 240 177 282
1993 1 698 6 720 270 1 261 6 270 995 240 179 396
1994 1 784 6 923 892 1 344 6 443 545 243 210 690
1995 1 942 7 113 583 1 440 6 596 931 281 231 490
1996 1 980 7 247 987 1 462 6 705 267 275 242 130
1997 2 066 7 440 792 1 518 6 871 994 299 253 649
1998 2 123 7 657 460 1 582 7 071 969 297 263 065
1999 2 152 7 866 188 1 625 7 276 133 293 271 950
2000 2 221 8 152 684 1 687 7 535 443 298 283 245
2001 2 228 8 279 706 1 704 7 661 956 295 289 858
2002 2 271 8 380 021 1 730 7 740 149 306 296 731
2003 2 282 8 462 978 1 713 7 800 308 324 307 729
Data annex
Table 2 Sulphur content of fuels in different applications and sectors
Sector Sulphur content in ppm
Marine bunker fuel oil limit 45 000
Marine bunker fuel oil, typical values 29 900
Marine gas oil limit 15 000
Marine: EU limit for use in sensitive areas and in passenger ships operating on regular services to or from EU ports, 2006
15 000
Marine gas oil, typical values 7 300
Marine: proposed EU Parliament limit for all EU waters 5 000
Aviation jet fuel limit 3 000
Aviation jet fuel, typical value 400–600
Diesel used by trains and machinery, current EU limit 2 000
Diesel used by trains and machinery, EU limit 2008 1 000
Automotive diesel EU limit before 2005 350
Automotive diesel EU limit, 2005 50
Automotive diesel EU limit, 2009 10
Sources: Maximum permitted sulphur content for marine fuels are from (IMO, 1997) and Directive 2005/33/EC (EC, 2005h). Typical values for marine fuels are from (EMEP/Corinair, 1996). Maritime sulphur limits are from Directive 2005/33/EC (EC, 2005h). Aviation jet fuel limit and typical value are from 'Flight path to excellence' (IATA, 2001). Current and future automotive limits are from EU Directive 99/32/EC (EC, 2005h) and Directive 98/70/EC (EC, 1998).
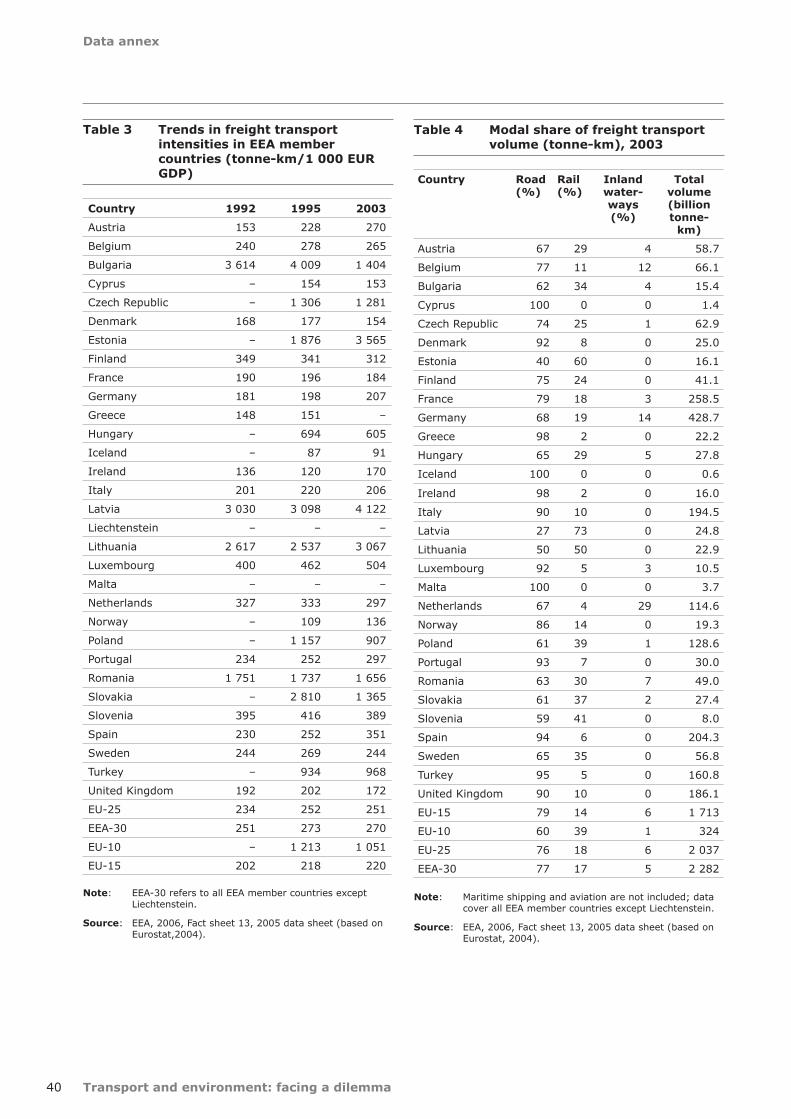
Transport and environment: facing a dilemma
Data annex
40
Table 3 Trends in freight transport intensities in EEA member countries (tonne-km/1 000 EUR GDP)
Country 1992 1995 2003
Austria 153 228 270
Belgium 240 278 265
Bulgaria 3 614 4 009 1 404
Cyprus – 154 153
Czech Republic – 1 306 1 281
Denmark 168 177 154
Estonia – 1 876 3 565
Finland 349 341 312
France 190 196 184
Germany 181 198 207
Greece 148 151 –
Hungary – 694 605
Iceland – 87 91
Ireland 136 120 170
Italy 201 220 206
Latvia 3 030 3 098 4 122
Liechtenstein – – –
Lithuania 2 617 2 537 3 067
Luxembourg 400 462 504
Malta – – –
Netherlands 327 333 297
Norway – 109 136
Poland – 1 157 907
Portugal 234 252 297
Romania 1 751 1 737 1 656
Slovakia – 2 810 1 365
Slovenia 395 416 389
Spain 230 252 351
Sweden 244 269 244
Turkey – 934 968
United Kingdom 192 202 172
EU-25 234 252 251
EEA-30 251 273 270
EU-10 – 1 213 1 051
EU-15 202 218 220
Note: EEA-30 refers to all EEA member countries except Liechtenstein.
Source: EEA, 2006, Fact sheet 13, 2005 data sheet (based on Eurostat,2004).
Table 4 Modal share of freight transport volume (tonne-km), 2003
Country Road (%)
Rail (%)
Inland water-ways (%)
Total volume (billion tonne-
km)
Austria 67 29 4 58.7
Belgium 77 11 12 66.1
Bulgaria 62 34 4 15.4
Cyprus 100 0 0 1.4
Czech Republic 74 25 1 62.9
Denmark 92 8 0 25.0
Estonia 40 60 0 16.1
Finland 75 24 0 41.1
France 79 18 3 258.5
Germany 68 19 14 428.7
Greece 98 2 0 22.2
Hungary 65 29 5 27.8
Iceland 100 0 0 0.6
Ireland 98 2 0 16.0
Italy 90 10 0 194.5
Latvia 27 73 0 24.8
Lithuania 50 50 0 22.9
Luxembourg 92 5 3 10.5
Malta 100 0 0 3.7
Netherlands 67 4 29 114.6
Norway 86 14 0 19.3
Poland 61 39 1 128.6
Portugal 93 7 0 30.0
Romania 63 30 7 49.0
Slovakia 61 37 2 27.4
Slovenia 59 41 0 8.0
Spain 94 6 0 204.3
Sweden 65 35 0 56.8
Turkey 95 5 0 160.8
United Kingdom 90 10 0 186.1
EU-15 79 14 6 1 713
EU-10 60 39 1 324
EU-25 76 18 6 2 037
EEA-30 77 17 5 2 282
Note: Maritime shipping and aviation are not included; data cover all EEA member countries except Liechtenstein.
Source: EEA, 2006, Fact sheet 13, 2005 data sheet (based on Eurostat, 2004).
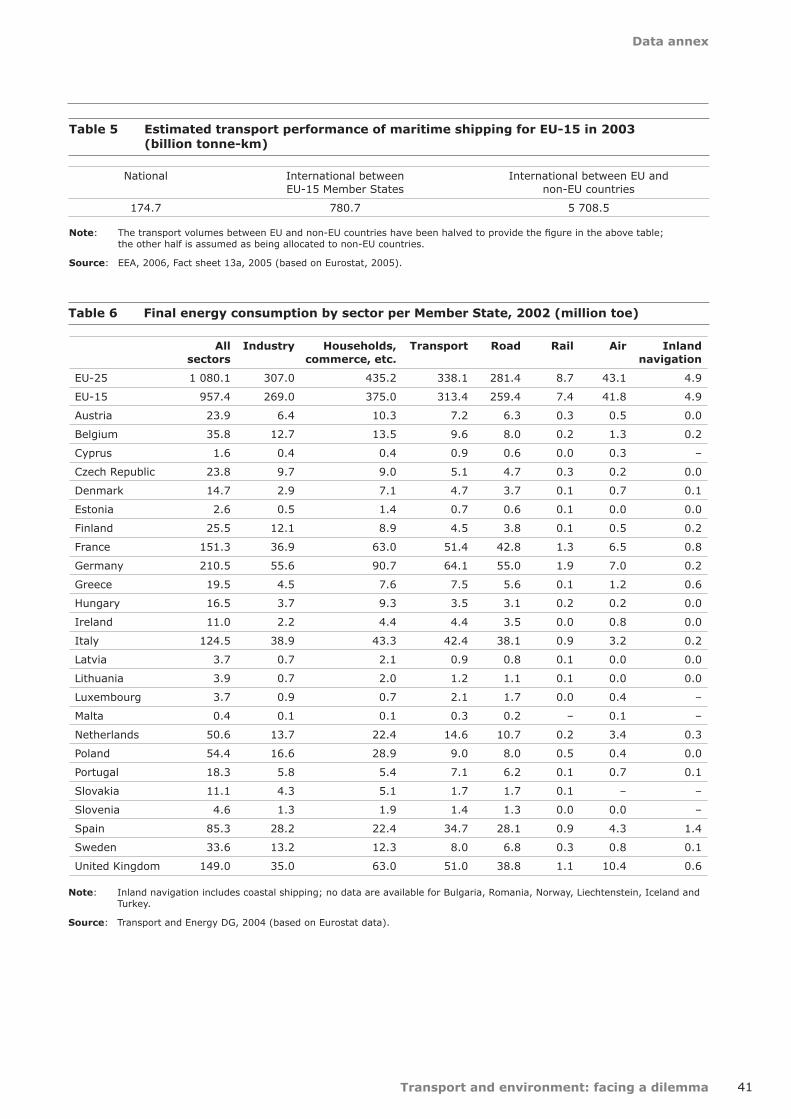
Data annex
Transport and environment: facing a dilemma 41
Table 6 Final energy consumption by sector per Member State, 2002 (million toe)
All sectors
Industry Households, commerce, etc.
Transport Road Rail Air Inland navigation
EU-25 1 080.1 307.0 435.2 338.1 281.4 8.7 43.1 4.9
EU-15 957.4 269.0 375.0 313.4 259.4 7.4 41.8 4.9
Austria 23.9 6.4 10.3 7.2 6.3 0.3 0.5 0.0
Belgium 35.8 12.7 13.5 9.6 8.0 0.2 1.3 0.2
Cyprus 1.6 0.4 0.4 0.9 0.6 0.0 0.3 –
Czech Republic 23.8 9.7 9.0 5.1 4.7 0.3 0.2 0.0
Denmark 14.7 2.9 7.1 4.7 3.7 0.1 0.7 0.1
Estonia 2.6 0.5 1.4 0.7 0.6 0.1 0.0 0.0
Finland 25.5 12.1 8.9 4.5 3.8 0.1 0.5 0.2
France 151.3 36.9 63.0 51.4 42.8 1.3 6.5 0.8
Germany 210.5 55.6 90.7 64.1 55.0 1.9 7.0 0.2
Greece 19.5 4.5 7.6 7.5 5.6 0.1 1.2 0.6
Hungary 16.5 3.7 9.3 3.5 3.1 0.2 0.2 0.0
Ireland 11.0 2.2 4.4 4.4 3.5 0.0 0.8 0.0
Italy 124.5 38.9 43.3 42.4 38.1 0.9 3.2 0.2
Latvia 3.7 0.7 2.1 0.9 0.8 0.1 0.0 0.0
Lithuania 3.9 0.7 2.0 1.2 1.1 0.1 0.0 0.0
Luxembourg 3.7 0.9 0.7 2.1 1.7 0.0 0.4 –
Malta 0.4 0.1 0.1 0.3 0.2 – 0.1 –
Netherlands 50.6 13.7 22.4 14.6 10.7 0.2 3.4 0.3
Poland 54.4 16.6 28.9 9.0 8.0 0.5 0.4 0.0
Portugal 18.3 5.8 5.4 7.1 6.2 0.1 0.7 0.1
Slovakia 11.1 4.3 5.1 1.7 1.7 0.1 – –
Slovenia 4.6 1.3 1.9 1.4 1.3 0.0 0.0 –
Spain 85.3 28.2 22.4 34.7 28.1 0.9 4.3 1.4
Sweden 33.6 13.2 12.3 8.0 6.8 0.3 0.8 0.1
United Kingdom 149.0 35.0 63.0 51.0 38.8 1.1 10.4 0.6
Note: Inland navigation includes coastal shipping; no data are available for Bulgaria, Romania, Norway, Liechtenstein, Iceland and Turkey.
Source: Transport and Energy DG, 2004 (based on Eurostat data).
Table 5 Estimated transport performance of maritime shipping for EU-15 in 2003 (billion tonne-km)
National International between EU-15 Member States
International between EU and non-EU countries
174.7 780.7 5 708.5
Note: The transport volumes between EU and non-EU countries have been halved to provide the figure in the above table; the other half is assumed as being allocated to non-EU countries.
Source: EEA, 2006, Fact sheet 13a, 2005 (based on Eurostat, 2005).
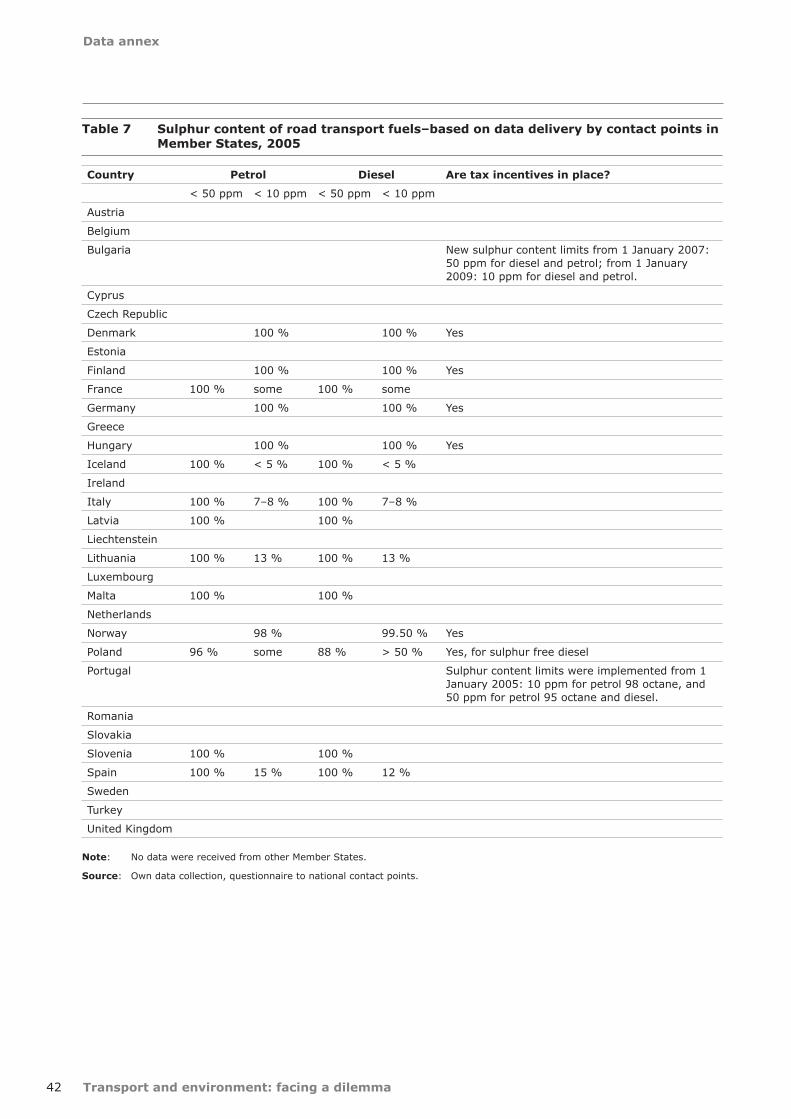
Transport and environment: facing a dilemma
Data annex
42
Table 7 Sulphur content of road transport fuels–based on data delivery by contact points in Member States, 2005
Country Petrol Diesel Are tax incentives in place?
< 50 ppm < 10 ppm < 50 ppm < 10 ppm
Austria
Belgium
Bulgaria New sulphur content limits from 1 January 2007: 50 ppm for diesel and petrol; from 1 January 2009: 10 ppm for diesel and petrol.
Cyprus
Czech Republic
Denmark 100 % 100 % Yes
Estonia
Finland 100 % 100 % Yes
France 100 % some 100 % some
Germany 100 % 100 % Yes
Greece
Hungary 100 % 100 % Yes
Iceland 100 % < 5 % 100 % < 5 %
Ireland
Italy 100 % 7–8 % 100 % 7–8 %
Latvia 100 % 100 %
Liechtenstein
Lithuania 100 % 13 % 100 % 13 %
Luxembourg
Malta 100 % 100 %
Netherlands
Norway 98 % 99.50 % Yes
Poland 96 % some 88 % > 50 % Yes, for sulphur free diesel
Portugal Sulphur content limits were implemented from 1 January 2005: 10 ppm for petrol 98 octane, and 50 ppm for petrol 95 octane and diesel.
Romania
Slovakia
Slovenia 100 % 100 %
Spain 100 % 15 % 100 % 12 %
Sweden
Turkey
United Kingdom
Note: No data were received from other Member States.
Source: Own data collection, questionnaire to national contact points.
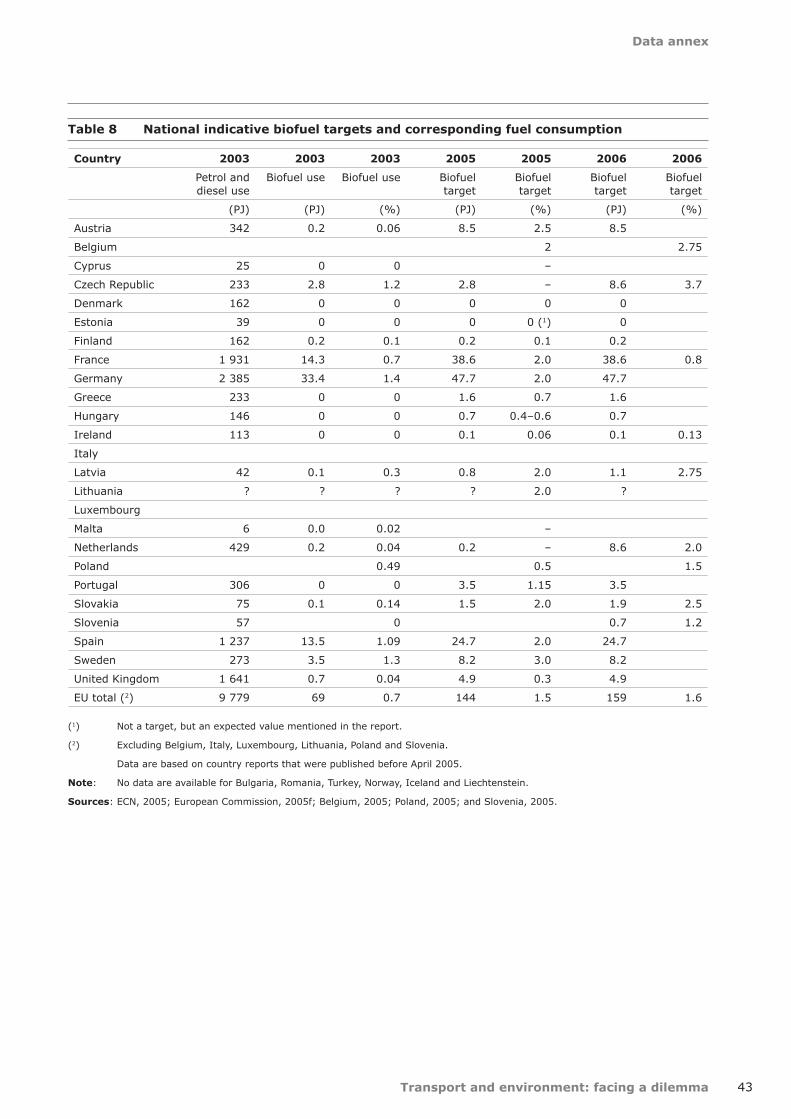
Data annex
Transport and environment: facing a dilemma 43
Country 2003 2003 2003 2005 2005 2006 2006
Petrol and diesel use
Biofuel use Biofuel use Biofuel target
Biofuel target
Biofuel target
Biofuel target
(PJ) (PJ) (%) (PJ) (%) (PJ) (%)
Austria 342 0.2 0.06 8.5 2.5 8.5
Belgium 2 2.75
Cyprus 25 0 0 –
Czech Republic 233 2.8 1.2 2.8 – 8.6 3.7
Denmark 162 0 0 0 0 0
Estonia 39 0 0 0 0 (1) 0
Finland 162 0.2 0.1 0.2 0.1 0.2
France 1 931 14.3 0.7 38.6 2.0 38.6 0.8
Germany 2 385 33.4 1.4 47.7 2.0 47.7
Greece 233 0 0 1.6 0.7 1.6
Hungary 146 0 0 0.7 0.4–0.6 0.7
Ireland 113 0 0 0.1 0.06 0.1 0.13
Italy
Latvia 42 0.1 0.3 0.8 2.0 1.1 2.75
Lithuania ? ? ? ? 2.0 ?
Luxembourg
Malta 6 0.0 0.02 –
Netherlands 429 0.2 0.04 0.2 – 8.6 2.0
Poland 0.49 0.5 1.5
Portugal 306 0 0 3.5 1.15 3.5
Slovakia 75 0.1 0.14 1.5 2.0 1.9 2.5
Slovenia 57 0 0.7 1.2
Spain 1 237 13.5 1.09 24.7 2.0 24.7
Sweden 273 3.5 1.3 8.2 3.0 8.2
United Kingdom 1 641 0.7 0.04 4.9 0.3 4.9
EU total (2) 9 779 69 0.7 144 1.5 159 1.6
(1) Not a target, but an expected value mentioned in the report.
(2) Excluding Belgium, Italy, Luxembourg, Lithuania, Poland and Slovenia.
Data are based on country reports that were published before April 2005.
Note: No data are available for Bulgaria, Romania, Turkey, Norway, Iceland and Liechtenstein.
Sources: ECN, 2005; European Commission, 2005f; Belgium, 2005; Poland, 2005; and Slovenia, 2005.
Table 8 National indicative biofuel targets and corresponding fuel consumption
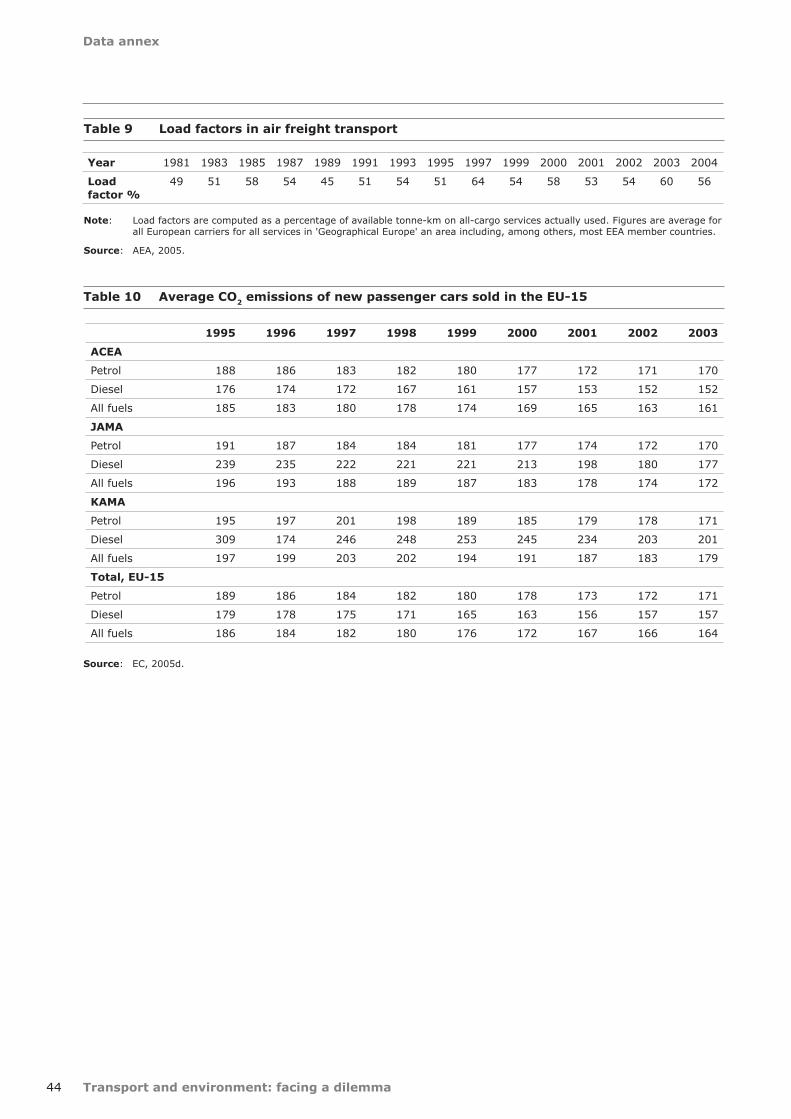
Transport and environment: facing a dilemma
Data annex
44
Table 10 Average CO2 emissions of new passenger cars sold in the EU-15
1995 1996 1997 1998 1999 2000 2001 2002 2003
ACEA
Petrol 188 186 183 182 180 177 172 171 170
Diesel 176 174 172 167 161 157 153 152 152
All fuels 185 183 180 178 174 169 165 163 161
JAMA
Petrol 191 187 184 184 181 177 174 172 170
Diesel 239 235 222 221 221 213 198 180 177
All fuels 196 193 188 189 187 183 178 174 172
KAMA
Petrol 195 197 201 198 189 185 179 178 171
Diesel 309 174 246 248 253 245 234 203 201
All fuels 197 199 203 202 194 191 187 183 179
Total, EU-15
Petrol 189 186 184 182 180 178 173 172 171
Diesel 179 178 175 171 165 163 156 157 157
All fuels 186 184 182 180 176 172 167 166 164
Source: EC, 2005d.
Year 1981 1983 1985 1987 1989 1991 1993 1995 1997 1999 2000 2001 2002 2003 2004
Load factor %
49 51 58 54 45 51 54 51 64 54 58 53 54 60 56
Table 9 Load factors in air freight transport
Note: Load factors are computed as a percentage of available tonne-km on all-cargo services actually used. Figures are average for all European carriers for all services in 'Geographical Europe' an area including, among others, most EEA member countries.
Source: AEA, 2005.
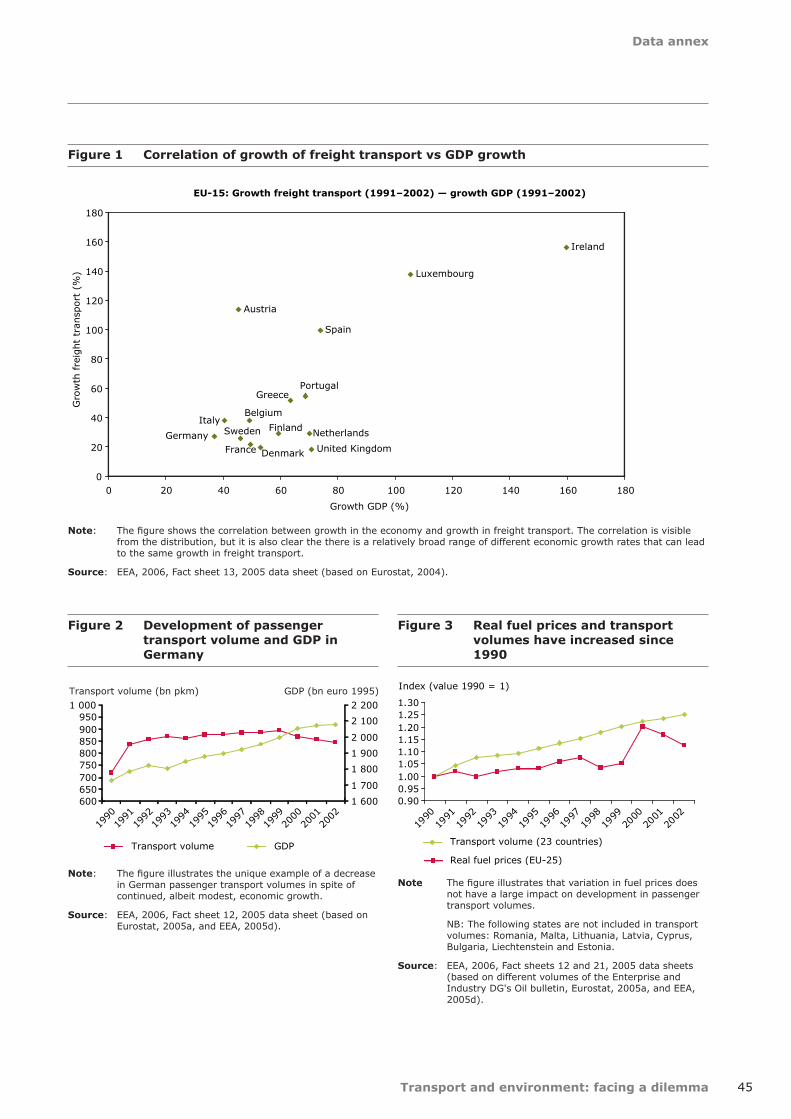
Data annex
Transport and environment: facing a dilemma 45
Figure 1 Correlation of growth of freight transport vs GDP growth
Note: The figure shows the correlation between growth in the economy and growth in freight transport. The correlation is visible from the distribution, but it is also clear the there is a relatively broad range of different economic growth rates that can lead to the same growth in freight transport.
Source: EEA, 2006, Fact sheet 13, 2005 data sheet (based on Eurostat, 2004).
EU-15: Growth freight transport (1991–2002) — growth GDP (1991–2002)
Belgium
Spain
Ireland
Italy
Luxembourg
Austria
United KingdomDenmark
Germany
Greece
France
Netherlands
Portugal
FinlandSweden
0
20
40
60
80
100
120
140
160
180
0 20 40 60 80 100 120 140 160 180
Growth GDP (%)
Gro
wth
fre
ight
tran
sport
(%
)
Figure 2 Development of passenger transport volume and GDP in Germany
600650700750800850900950
1 000
1990
1991
1992
1993
1994
1995
1996
1997
1998
1999
2000
2001
2002
1 600
1 700
1 800
1 900
2 000
2 100
2 200
Transport volume GDP
Transport volume (bn pkm) GDP (bn euro 1995)
Note: The figure illustrates the unique example of a decrease in German passenger transport volumes in spite of continued, albeit modest, economic growth.
Source: EEA, 2006, Fact sheet 12, 2005 data sheet (based on Eurostat, 2005a, and EEA, 2005d).
Figure 3 Real fuel prices and transport volumes have increased since 1990
0.900.951.001.051.101.151.201.251.30
1990
1991
1992
1993
1994
1995
1996
1997
1998
1999
2000
2001
2002
Index (value 1990 = 1)
Transport volume (23 countries)
Real fuel prices (EU-25)
Note The figure illustrates that variation in fuel prices does not have a large impact on development in passenger transport volumes.
NB: The following states are not included in transport volumes: Romania, Malta, Lithuania, Latvia, Cyprus, Bulgaria, Liechtenstein and Estonia.
Source: EEA, 2006, Fact sheets 12 and 21, 2005 data sheets (based on different volumes of the Enterprise and Industry DG's Oil bulletin, Eurostat, 2005a, and EEA, 2005d).
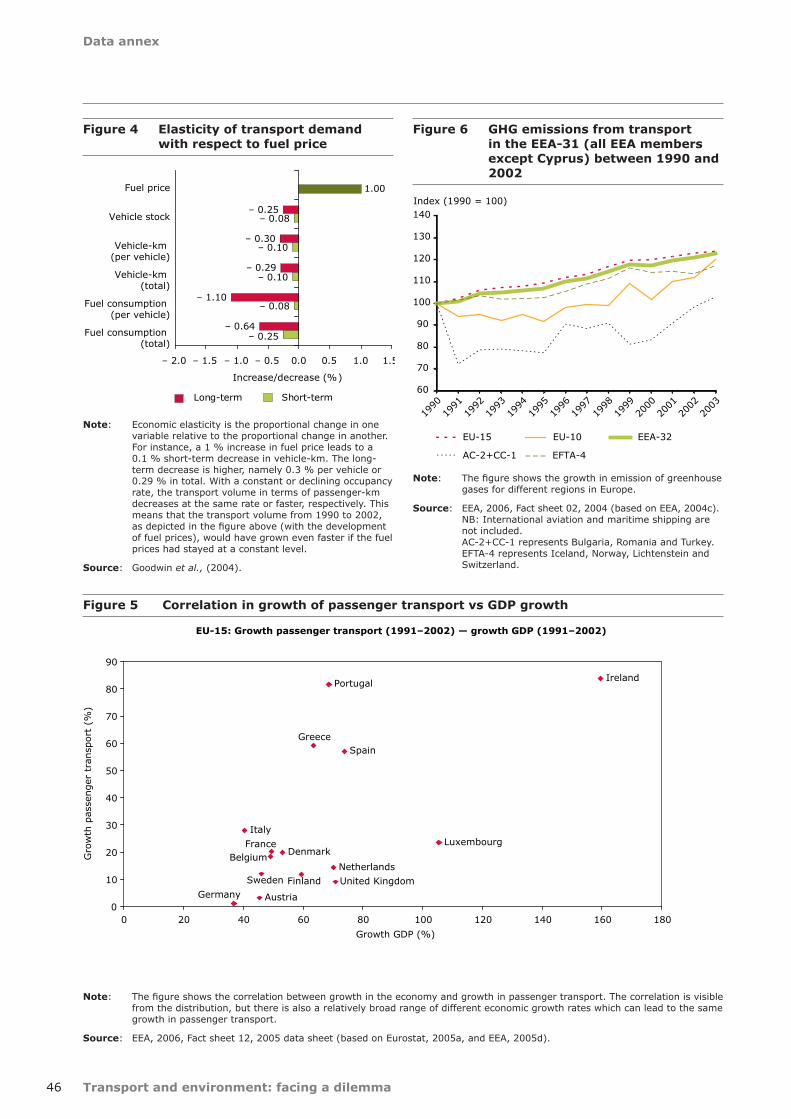
Transport and environment: facing a dilemma
Data annex
46
Figure 4 Elasticity of transport demand with respect to fuel price
– 0.25
– 0.08
– 0.10
– 0.10
– 0.08
1.00
– 0.64
– 1.10
– 0.29
– 0.30
– 0.25
– 2.0 – 1.5 – 1.0 – 0.5 0.0 0.5 1.0 1.5
Fuel consumption (total)
Fuel consumption (per vehicle)
Vehicle-km (total)
Vehicle-km (per vehicle)
Vehicle stock
Fuel price
Increase/decrease (%)
Long-term Short-term
Note: Economic elasticity is the proportional change in one variable relative to the proportional change in another. For instance, a 1 % increase in fuel price leads to a 0.1 % short-term decrease in vehicle-km. The long-term decrease is higher, namely 0.3 % per vehicle or 0.29 % in total. With a constant or declining occupancy rate, the transport volume in terms of passenger-km decreases at the same rate or faster, respectively. This means that the transport volume from 1990 to 2002, as depicted in the figure above (with the development of fuel prices), would have grown even faster if the fuel prices had stayed at a constant level.
Source: Goodwin et al., (2004).
Figure 5 Correlation in growth of passenger transport vs GDP growth
EU-15: Growth passenger transport (1991–2002) — growth GDP (1991–2002)
Denmark
Germany
GreeceSpain
Ireland
ItalyLuxembourg
Netherlands
Austria
Portugal
BelgiumFrance
FinlandSweden United Kingdom
0
10
20
30
40
50
60
70
80
90
0 20 40 60 80 100 120 140 160 180
Growth GDP (%)
Gro
wth
pas
senger
tra
nsp
ort
(%
)
Note: The figure shows the correlation between growth in the economy and growth in passenger transport. The correlation is visible from the distribution, but there is also a relatively broad range of different economic growth rates which can lead to the same growth in passenger transport.
Source: EEA, 2006, Fact sheet 12, 2005 data sheet (based on Eurostat, 2005a, and EEA, 2005d).
Figure 6 GHG emissions from transport in the EEA-31 (all EEA members except Cyprus) between 1990 and 2002
60
70
80
90
100
110
120
130
140
1990
1991
1992
1993
1994
1995
1996
1997
1998
1999
2000
2001
2002
2003
Index (1990 = 100)
EU-15 EU-10 EEA-32
AC-2+CC-1 EFTA-4
Note: The figure shows the growth in emission of greenhouse gases for different regions in Europe.
Source: EEA, 2006, Fact sheet 02, 2004 (based on EEA, 2004c). NB: International aviation and maritime shipping are not included. AC-2+CC-1 represents Bulgaria, Romania and Turkey. EFTA-4 represents Iceland, Norway, Lichtenstein and Switzerland.
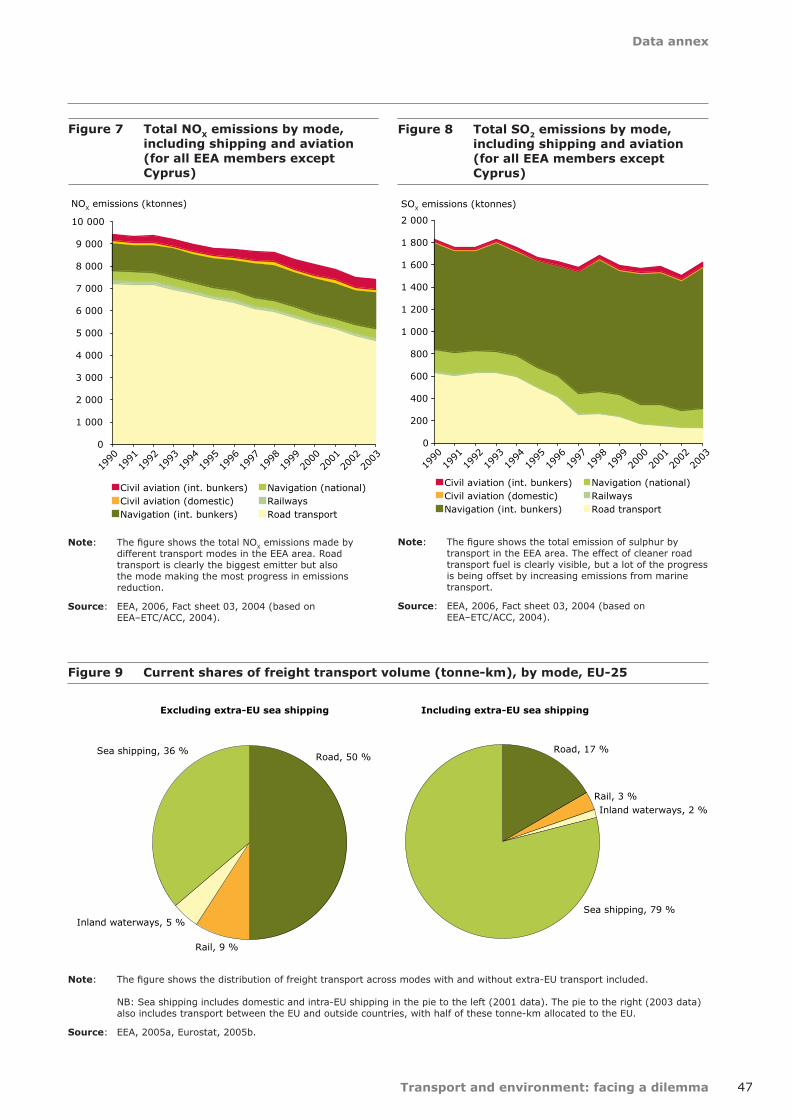
Data annex
Transport and environment: facing a dilemma 47
Figure 7 Total NOX emissions by mode, including shipping and aviation (for all EEA members except Cyprus)
0
1 000
2 000
3 000
4 000
5 000
6 000
7 000
8 000
9 000
10 000
1990
1991
1992
1993
1994
1995
1996
1997
1998
1999
2000
2001
2002
2003
NOX emissions (ktonnes)
Civil aviation (int. bunkers)Civil aviation (domestic)Navigation (int. bunkers)
Navigation (national)RailwaysRoad transport
Note: The figure shows the total NOX emissions made by different transport modes in the EEA area. Road transport is clearly the biggest emitter but also the mode making the most progress in emissions reduction.
Source: EEA, 2006, Fact sheet 03, 2004 (based on EEA–ETC/ACC, 2004).
Figure 8 Total SO2 emissions by mode, including shipping and aviation (for all EEA members except Cyprus)
0
200
400
600
800
1 000
1 200
1 400
1 600
1 800
2 000
1990
1991
1992
1993
1994
1995
1996
1997
1998
1999
2000
2001
2002
2003
SOX emissions (ktonnes)
Civil aviation (int. bunkers)Civil aviation (domestic)Navigation (int. bunkers)
Navigation (national)RailwaysRoad transport
Note: The figure shows the total emission of sulphur by transport in the EEA area. The effect of cleaner road transport fuel is clearly visible, but a lot of the progress is being offset by increasing emissions from marine transport.
Source: EEA, 2006, Fact sheet 03, 2004 (based on EEA–ETC/ACC, 2004).
Figure 9 Current shares of freight transport volume (tonne-km), by mode, EU-25
Road, 50 %
Rail, 9 %
Inland waterways, 5 %
Sea shipping, 36 % Road, 17 %
Rail, 3 %Inland waterways, 2 %
Sea shipping, 79 %
Excluding extra-EU sea shipping Including extra-EU sea shipping
Note: The figure shows the distribution of freight transport across modes with and without extra-EU transport included. NB: Sea shipping includes domestic and intra-EU shipping in the pie to the left (2001 data). The pie to the right (2003 data) also includes transport between the EU and outside countries, with half of these tonne-km allocated to the EU.
Source: EEA, 2005a, Eurostat, 2005b.
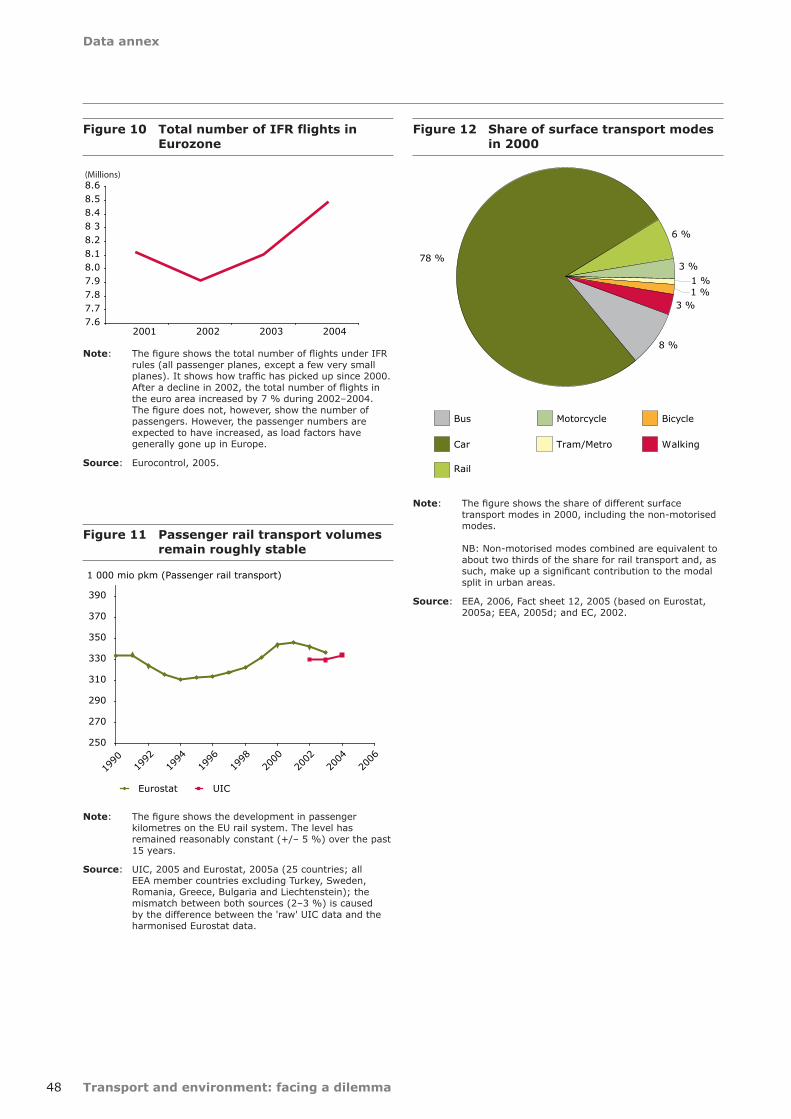
Transport and environment: facing a dilemma
Data annex
48
Figure 10 Total number of IFR flights in Eurozone
7.67.77.87.98.08.18.28 38.4 8.5 8.6
2001 2002 2003 2004
(Millions)
Note: The figure shows the total number of flights under IFR rules (all passenger planes, except a few very small planes). It shows how traffic has picked up since 2000. After a decline in 2002, the total number of flights in the euro area increased by 7 % during 2002–2004. The figure does not, however, show the number of passengers. However, the passenger numbers are expected to have increased, as load factors have generally gone up in Europe.
Source: Eurocontrol, 2005.
Figure 11 Passenger rail transport volumes remain roughly stable
250
270
290
310
330
350
370
390
1990
1992
1994
1996
1998
2000
2002
2004
2006
1 000 mio pkm (Passenger rail transport)
Eurostat UIC
Note: The figure shows the development in passenger kilometres on the EU rail system. The level has remained reasonably constant (+/– 5 %) over the past 15 years.
Source: UIC, 2005 and Eurostat, 2005a (25 countries; all EEA member countries excluding Turkey, Sweden, Romania, Greece, Bulgaria and Liechtenstein); the mismatch between both sources (2–3 %) is caused by the difference between the 'raw' UIC data and the harmonised Eurostat data.
Figure 12 Share of surface transport modes in 2000
8 %
78 %
6 %
3 %
1 %1 %
3 %
Bus
Car
Rail
Motorcycle
Tram/Metro
Bicycle
Walking
Note: The figure shows the share of different surface transport modes in 2000, including the non-motorised modes. NB: Non-motorised modes combined are equivalent to about two thirds of the share for rail transport and, as such, make up a significant contribution to the modal split in urban areas.
Source: EEA, 2006, Fact sheet 12, 2005 (based on Eurostat, 2005a; EEA, 2005d; and EC, 2002.
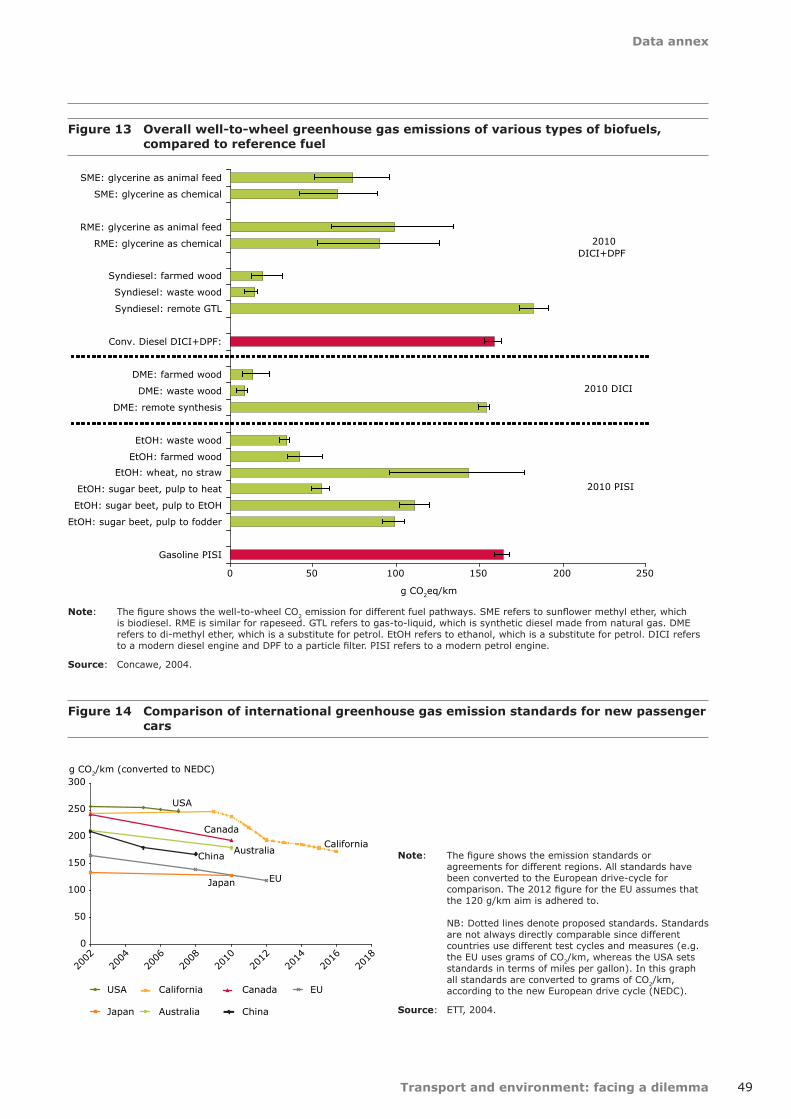
Data annex
Transport and environment: facing a dilemma 49
Figure 13 Overall well-to-wheel greenhouse gas emissions of various types of biofuels, compared to reference fuel
0 50 100 150 200 250
SME: glycerine as animal feed
SME: glycerine as chemical
RME: glycerine as animal feed
RME: glycerine as chemical
Syndiesel: farmed wood
Syndiesel: waste wood
Syndiesel: remote GTL
Conv. Diesel DICI+DPF:
DME: farmed wood
DME: waste wood
DME: remote synthesis
EtOH: waste wood
EtOH: farmed wood
EtOH: wheat, no straw
EtOH: sugar beet, pulp to heat
EtOH: sugar beet, pulp to EtOH
EtOH: sugar beet, pulp to fodder
Gasoline PISI
g CO2eq/km
2010 DICI+DPF
2010 PISI
2010 DICI
Note: The figure shows the well-to-wheel CO2 emission for different fuel pathways. SME refers to sunflower methyl ether, which is biodiesel. RME is similar for rapeseed. GTL refers to gas-to-liquid, which is synthetic diesel made from natural gas. DME refers to di-methyl ether, which is a substitute for petrol. EtOH refers to ethanol, which is a substitute for petrol. DICI refers to a modern diesel engine and DPF to a particle filter. PISI refers to a modern petrol engine.
Source: Concawe, 2004.
Figure 14 Comparison of international greenhouse gas emission standards for new passenger cars
USA
California
Canada
EUJapan
AustraliaChina
0
50
100
150
200
250
300
2002
2004
2006
2008
2010
2012
2014
2016
2018
g CO2/km (converted to NEDC)
USA California Canada EU
Japan Australia China
Note: The figure shows the emission standards or agreements for different regions. All standards have been converted to the European drive-cycle for comparison. The 2012 figure for the EU assumes that the 120 g/km aim is adhered to. NB: Dotted lines denote proposed standards. Standards are not always directly comparable since different countries use different test cycles and measures (e.g. the EU uses grams of CO2/km, whereas the USA sets standards in terms of miles per gallon). In this graph all standards are converted to grams of CO2/km, according to the new European drive cycle (NEDC).
Source: ETT, 2004.

Transport and environment: facing a dilemma
Data annex
50
Figure 15 External costs for various modes
0 1 2 3 4
Petrol car worst
Petrol car best
Petrol carcharges
Diesel carworst
Diesel car best
Diesel carcharges
Euro/10vkm
Climate change Infrastructure Air pollutionAccidents Noise
0 2 4 6 8 10
Diesel bus
Passengertrain
Passengertrain charges
Aircraft shortdistance
Euro/10vkm
Climate change Infrastructure Air pollutionAccidents Noise
0 5 10 15 20
HDV 32-40tonnes worst
HDV 32-40tonnes best
HDV charges
Electric freighttrain
Freight traincharges
Inland vessel
Inland vesselcharges
Euro/10vkm
Climate change Infrastructure Air pollutionAccidents Noise
Note: The three figures show estimates for the external costs of different modes of transport disaggregated on impact categories. The best and worst bars represent the use of the vehicle in different situations urban/rural, congested/non-congested.
Source: EEA, 2006, Fact sheets 21, 22 and 25 (based on data from Infras, 2000, and ECMT, 1998b).

Data annex
Transport and environment: facing a dilemma 51
Figure 16 Distance-related charges for the EU-15 in 2002 (EUR/vehicle-km) and minimum estimates for marginal cost
0.00 0.02 0.04 0.06
EU-15
United Kingdom
France
Germany
Netherlands
Portugal
Italy
Spain
Denmark
Belgium
Sweden
Finland
Austria
Luxembourg
Ireland
Greece
Infra chargeFuel charge
0.00 0.02 0.04 0.06
EU-15
United Kingdom
France
Germany
Netherlands
Portugal
Italy
Spain
Denmark
Belgium
Sweden
Finland
Austria
Luxembourg
Ireland
Greece
Infra chargeFuel charge
Diesel passenger carsPetrol passenger cars
Note: The figures show the distance-related charges for petrol and diesel cars in 2002. This can be compared to minimum estimates of marginal external costs (red lines). NB: The maximum estimates of marginal costs are considerably higher. The variable charges have been calculated with country-specific fuel efficiencies and fuel charges. Tolls for Greece could not be included in these figures due to lack of information. The best- and worst-case marginal cost estimates are EUR 0.048 and EUR 0.133 respectively for a petrol car, and EUR 0.056 and EUR 0.163 for a diesel passenger car (see EEA, 2006, Fact sheet 25 EU — External costs of transport). The best-case values are indicated with a red line. Road figures relate to 2002 due to the time lag in statistics on traffic volume.
Sources: Odyssee, 2003; Eurostat, different volumes; EEA, 2006, Fact sheet 25 EU — External costs of transport, 2005; and Asecap, 2005.
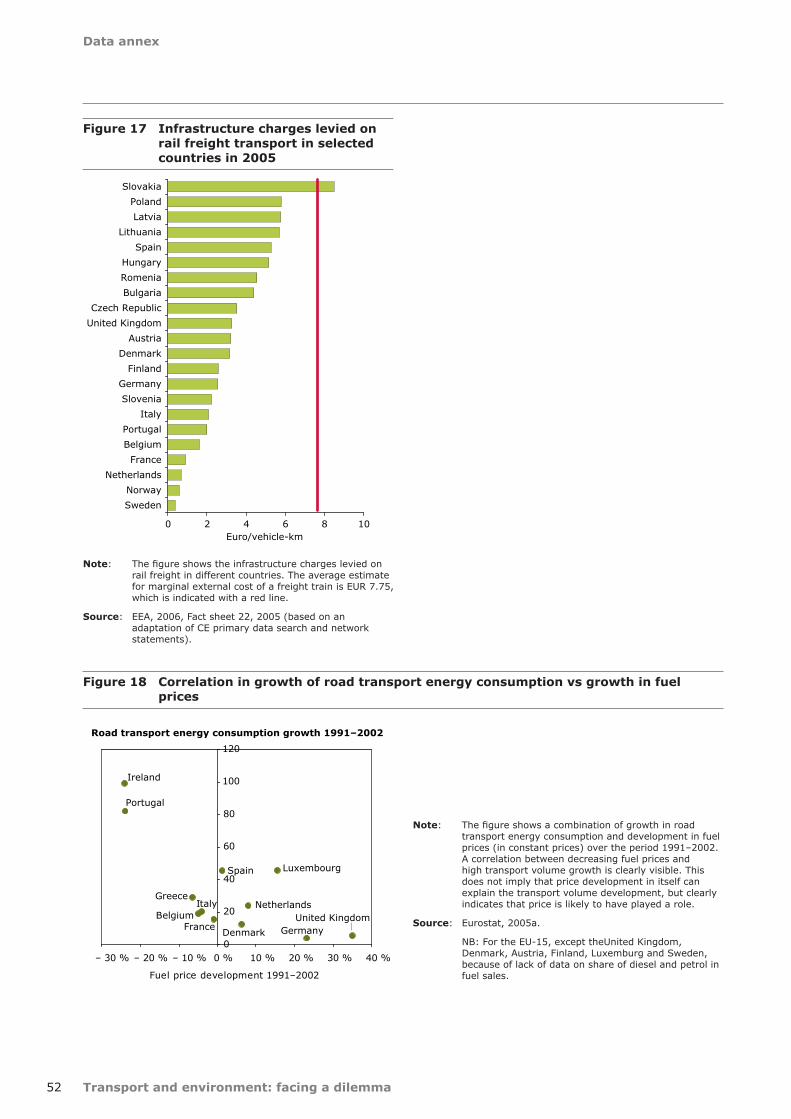
Transport and environment: facing a dilemma
Data annex
52
Figure 17 Infrastructure charges levied on rail freight transport in selected countries in 2005
0 2 4 6 8 10
Slovakia
Poland
Latvia
Lithuania
Spain
Hungary
Romenia
Bulgaria
Czech Republic
United Kingdom
Austria
Denmark
Finland
Germany
Slovenia
Italy
Portugal
Belgium
France
Netherlands
Norway
Sweden
Euro/vehicle-km
Note: The figure shows the infrastructure charges levied on rail freight in different countries. The average estimate for marginal external cost of a freight train is EUR 7.75, which is indicated with a red line.
Source: EEA, 2006, Fact sheet 22, 2005 (based on an adaptation of CE primary data search and network statements).
Figure 18 Correlation in growth of road transport energy consumption vs growth in fuel prices
Note: The figure shows a combination of growth in road transport energy consumption and development in fuel prices (in constant prices) over the period 1991–2002. A correlation between decreasing fuel prices and high transport volume growth is clearly visible. This does not imply that price development in itself can explain the transport volume development, but clearly indicates that price is likely to have played a role.
Source: Eurostat, 2005a.
NB: For the EU-15, except theUnited Kingdom, Denmark, Austria, Finland, Luxemburg and Sweden, because of lack of data on share of diesel and petrol in fuel sales.
BelgiumItaly
0
20
40
60
80
100
120
– 30 % – 20 % – 10 % 0 % 10 % 20 % 30 % 40 %
Fuel price development 1991–2002
Road transport energy consumption growth 1991–2002
Ireland
Portugal
LuxembourgSpain
United KingdomGermanyDenmark
Netherlands
France
Greece
European Environment Agency
Transport and environment: facing a dilemma TERM 2005: indicators tracking transport and environment in the European Union
2006 — 52 pp. — 21 x 29.7 cm
ISBN 92-9167-811-2
SALES AND SUBSCRIPTIONS
Publications for sale produced by the Office for Official Publications of the European Communities are available from our sales agents throughout the world.
How do I set about obtaining a publication?Once you have obtained the list of sales agents, contact the sales agent of your choice and place your order.
How do I obtain the list of sales agents?• Go to the Publications Office website http://publications.eu.int/• Or apply for a paper copy by fax +352 2929 42758
European Environment AgencyKongens Nytorv 61050 Copenhagen KDenmark
Tel.: +45 33 36 71 00Fax: +45 33 36 71 99
Web: www.eea.eu.intEnquiries: www.eea.eu.int/enquiries
TH
-AL-0
6-0
02-E
N-C
Price (excluding VAT): EUR 15.00