Transitioning to Sustainable Civil Infrastructure Systems
221
Syracuse University Syracuse University SURFACE SURFACE Dissertations - ALL SURFACE June 2017 Transitioning to Sustainable Civil Infrastructure Systems: Green Transitioning to Sustainable Civil Infrastructure Systems: Green Stormwater Management and Engineering Design Thinking Stormwater Management and Engineering Design Thinking Carli Denyse Flynn Syracuse University Follow this and additional works at: https://surface.syr.edu/etd Part of the Engineering Commons Recommended Citation Recommended Citation Flynn, Carli Denyse, "Transitioning to Sustainable Civil Infrastructure Systems: Green Stormwater Management and Engineering Design Thinking" (2017). Dissertations - ALL. 675. https://surface.syr.edu/etd/675 This Dissertation is brought to you for free and open access by the SURFACE at SURFACE. It has been accepted for inclusion in Dissertations - ALL by an authorized administrator of SURFACE. For more information, please contact [email protected].
-
Upload
khangminh22 -
Category
Documents
-
view
0 -
download
0
Transcript of Transitioning to Sustainable Civil Infrastructure Systems

Syracuse University Syracuse University
SURFACE SURFACE
Dissertations - ALL SURFACE
June 2017
Transitioning to Sustainable Civil Infrastructure Systems: Green Transitioning to Sustainable Civil Infrastructure Systems: Green
Stormwater Management and Engineering Design Thinking Stormwater Management and Engineering Design Thinking
Carli Denyse Flynn Syracuse University
Follow this and additional works at: https://surface.syr.edu/etd
Part of the Engineering Commons
Recommended Citation Recommended Citation Flynn, Carli Denyse, "Transitioning to Sustainable Civil Infrastructure Systems: Green Stormwater Management and Engineering Design Thinking" (2017). Dissertations - ALL. 675. https://surface.syr.edu/etd/675
This Dissertation is brought to you for free and open access by the SURFACE at SURFACE. It has been accepted for inclusion in Dissertations - ALL by an authorized administrator of SURFACE. For more information, please contact [email protected].

Abstract
Green infrastructure has been endorsed by many practitioners and organizations as a
more sustainable approach to stormwater management. Decisions on how to best design
municipal green infrastructure systems can be complicated by factors such as uncertainties about
the performance and public acceptance of particular technologies. Thus, deciding how to design
sustainable stormwater management systems requires engineers not only to reflect upon the
fundamental principles used to conceptualize their designs, but also to consider how a broad
array of social, economic, and environmental factors both influence and are influenced by their
work.
This thesis examines factors that influence the design and adoption of sustainable civil
infrastructure systems in two research areas: (1) municipal stormwater management decisions in
the United States, and (2) student understanding of engineering design principles. The objective
of this thesis is to identify elements of engineering design and related decision-making processes
that can provide engineers, stormwater management stakeholders, and engineering educators
with lessons and tools that can advance the sustainable development of stormwater management
systems.
One challenge to understanding how particular factors may lead to sustainable outcomes
is devising a tractable way to organize and document them. Using observations from national
meetings and an extensive literature review, I develop a social-ecological framework for
identifying factors that condition the adoption of green infrastructure technologies by stormwater
management authorities. Findings from this work demonstrate a need to more fully develop
robust descriptions of technological attributes within a social-ecological framework for urban
stormwater systems, particularly for technology decision-making activities such as green
infrastructure adoption.
Understanding past outcomes of engineering planning within a particular context can
provide useful insight for future decision-making. I conduct a case study on the evolution of
stormwater management planning in Onondaga County, New York between 1998 and 2009, in
which plans for certain unpopular gray infrastructure technologies were eventually replaced in
part by a large-scale green infrastructure program. I find that the adoption of this program was
driven by an alignment of several sociopolitical factors, including the presence of a policy
entrepreneurship coalition in support of alternative stormwater management plans, the election of
a key political official who acknowledged the needs of local stakeholders, and a shift in mindset
of local and national officials as to what technologies are effective for stormwater management.
A growing number of U.S. cities are adopting green infrastructure programs for
stormwater management, particularly for combined sewer overflow mitigation. Viewing green
infrastructure program adoption in combined sewer communities as a policy innovation, I
develop an empirical model to differentiate factors associated with a sewer management
authority’s binary decision to adopt or not adopt a large-scale green infrastructure program, and
factors associated with decisions related to the extent of planned program implementation. This
study finds that the binary decision to adopt a municipal green infrastructure program for
combined sewer overflow management is largely driven by municipal population size and
precipitation characteristics, while the extent of program implementation is also driven by
socioeconomic characteristics of municipal residents and the amount of total capital needs
required to achieve combined sewer overflow compliance.

Engineers must be able to mathematically model the complexities of fundamental
physical processes within real systems, such as green infrastructure systems for stormwater
management. Many engineering processes are built upon fundamental concepts of mass and
energy balances, in which mathematical models are used to analyze rates of change and
accumulated quantities across system boundaries of interest. The Rate and Accumulation
Concept Inventory (RACI) is an assessment tool that I developed to measure students’
mathematical and physical understandings of such concepts. I use data from an administration of
the RACI (N=305) to assess evidence of the tool’s validity and reliability through structural
equation modeling and multidimensional item response theory. Validity and reliability evidence
indicates that the RACI can appropriately be used to measure students’ overall understanding of
rate and accumulation processes.
Case-based teaching methods have been suggested as a best practice for introducing
students to ethical decision-making scenarios. By sensitizing future engineers to the concerns of
stakeholders who are impacted by engineering decisions, educators can better prepare them to
create designs that address social outcome criteria such as welfare and justice. Using case study
findings related to stakeholder concerns and engineering decisions for stormwater management
planning in Onondaga County, I develop a case-based teaching module on engineering decision-
making for use in undergraduate civil and environmental engineering courses. Assessments from
three years of module implementation demonstrate that the module can be used to meet multiple
learning objectives and enhance student understanding of stakeholder engagement principles.
TRANSITIONING TO SUSTAINABLE CIVIL INFRASTRUCTURE SYSTEMS:
GREEN STORMWATER MANAGEMENT AND ENGINEERING DESIGN THINKING
by
Carli Denyse Flynn
B.S., Cornell University, 2009 M.S., Carnegie Mellon University, 2010
DISSERTATION
Submitted in partial fulfillment of the requirements for the degree of Doctor of Philosophy in Civil Engineering
Syracuse University May 2017

Copyright © Carli Denyse Flynn 2017
All Rights Reserved

vi
Acknowledgments
I would like to express my sincere gratitude to my advisor, Dr. Cliff Davidson, for his
support and mentorship throughout my doctoral studies. Dr. Davidson’s insightful and intelligent
outlook helped to guide me through the complexities of sustainable engineering, especially while
I explored research endeavors outside of traditional engineering methods. He has been a
wonderful role model for me and I strive to follow in his footsteps. It has been an honor and a
privilege to work with him.
I would like to thank my committee members, Dr. David Chandler, Dr. Sharon Dotger,
Dr. Laura Steinberg, and Dr. Peter Wilcoxen, for spending many hours providing their unique
perspectives and constructive feedback on my work. Their insights and thoughtful questions
forced me to think critically about my research, while allowing me room to learn and improve
my work. I would also like to thank Dr. Julie Hasenwinkel for serving as my defense chair and
for supporting engineering education initiatives at Syracuse University.
During my time in Syracuse, I was fortunate to get to know many wonderful people. I
would like to thank the Onondaga Lake community members who shared their stories with me,
which inspired much of my work. I would also like to thank the many undergraduate students
who participated in my research projects and inspired my work to uncover best practices in
engineering education. The graduate students and faculty members at the Center for Policy
Research introduced me to a broad array of policy research methods that have greatly influenced
my projects. I would like to thank all of the graduate students across colleges, departments, and
organizations whom I have had the privilege to call my colleagues and friends. In particular, I

vii
would like to thank my Ph.D. partner in crime, Mallory Squier-Babcock, who helped me to laugh
and reflect throughout my time in Syracuse.
My deepest appreciation goes to my family. I thank my brothers, Patrick and Michael, for
believing in me over all these years. I thank Michael Sullivan, for his patience, encouragement,
and love that he has shared with me every day since we first met. Lastly, I have no words that
can wholly capture my gratitude for my parents, Elizabeth and Stephen, who have provided their
endless love and support to me throughout my life. I dedicate this dissertation to you both.

viii
Table of Contents
Chapter 1 Introduction .................................................................................................................... 1
1.1 Motivation ............................................................................................................................. 1
1.2 Urban Water Infrastructure Systems ..................................................................................... 2
1.3 Thesis Overview .................................................................................................................... 3
1.4 References ............................................................................................................................. 5
Chapter 2 Adapting the social-ecological system framework for urban stormwater management: The case of green infrastructure adoption ....................................................................................... 7
2.1 Abstract ................................................................................................................................. 7
2.2 Introduction ........................................................................................................................... 7
2.3 Methods ............................................................................................................................... 11
2.4 Results ................................................................................................................................. 13
2.5 Discussion ........................................................................................................................... 17
2.6 Conclusions ......................................................................................................................... 20
2.7 References ........................................................................................................................... 22
Appendix 2 ................................................................................................................................ 29
Chapter 3 Transforming a waterscape: Application of the social-ecological framework to assess the evolution of stormwater governance in Onondaga County, New York, USA ........................ 61
3.1 Abstract ............................................................................................................................... 61
3.2 Introduction ......................................................................................................................... 61
3.3 Background ......................................................................................................................... 63
3.4 Methods ............................................................................................................................... 65
3.5 Results ................................................................................................................................. 67
3.5.1 Stage 1 .......................................................................................................................... 67
3.5.2 Stage 2 .......................................................................................................................... 69
3.5.3 Stage 3 .......................................................................................................................... 72
3.5.4 Application of Urban Stormwater SES Framework ..................................................... 73
3.5.5 Institutional Power ........................................................................................................ 78
3.5.6 Adaptive Governance ................................................................................................... 80
3.6 Conclusions ......................................................................................................................... 83
3.7 References ........................................................................................................................... 85

ix
Chapter 4 An assessment of sustainable stormwater system planning in the United States ......... 91
4.1 Abstract ............................................................................................................................... 91
4.2 Introduction ......................................................................................................................... 91
4.3 Background ......................................................................................................................... 94
4.3.1 Municipal Stormwater Management in the U.S. .......................................................... 94
4.3.2 GI Program Adoption as a Policy Innovation .............................................................. 99
4.4 Methods ............................................................................................................................. 100
4.4.1 Study Population......................................................................................................... 100
4.4.2 Adoption Criteria ........................................................................................................ 101
4.4.3 Independent Variable Selection .................................................................................. 102
4.4.4 Data Description ......................................................................................................... 106
4.4.5 Model Specifications .................................................................................................. 110
4.5 Results ............................................................................................................................... 111
4.6 Discussion and Conclusions .............................................................................................. 115
4.7 References ......................................................................................................................... 117
Appendix A4 ........................................................................................................................... 121
Chapter 5 Development and psychometric testing of the Rate and Accumulation Concept Inventory ..................................................................................................................................... 133
5.1 Abstract ............................................................................................................................. 133
5.2 Introduction ....................................................................................................................... 134
5.3 Theoretical Basis ............................................................................................................... 135
5.3.1 Conceptual understanding .......................................................................................... 136
5.3.2 Concept Inventories and Development of the RACI .................................................. 137
5.3.2.1 Stage 1: Cognitive Basis .......................................................................................... 139
5.3.2.2 Stage 2-3: Observation Basis and Initial Interpretation ........................................... 142
5.4 Study Goal ......................................................................................................................... 144
5.5 Results ............................................................................................................................... 145
5.5.1 Stage 4: Interpretation Basis ....................................................................................... 145
5.5.2 Classical Test Theory ................................................................................................. 148
5.5.3 Item Response Theory ................................................................................................ 150
5.5.4 Structural Analysis ..................................................................................................... 154
5.6 Limitations and Future Work ............................................................................................ 164
5.7 Conclusions ....................................................................................................................... 165

x
5.8 References ......................................................................................................................... 166
Appendix A5 ........................................................................................................................... 173
RACI 2.0 Question Items .................................................................................................... 174
Chapter 6 Development of a case-based teaching module to improve student understanding of stakeholder engagement processes within engineering systems design ..................................... 185
6.1 Abstract ............................................................................................................................. 185
6.2 Introduction ....................................................................................................................... 186
6.3 Context and Motivation for Module Development ........................................................... 186
6.4 Theoretical Background .................................................................................................... 187
6.4.1 Case-Based Learning .................................................................................................. 188
6.4.2 Learning Cycle-Based Instruction .............................................................................. 189
6.5 Module Design and Implementation ................................................................................. 189
6.5.1 Case Selection and Context ........................................................................................ 189
6.5.2 Initial Module Implementation ................................................................................... 191
6.5.3 Formative Assessment Tool ....................................................................................... 193
6.5.3 Revisions to the Module and Assessment Tools ........................................................ 194
6.6 Results ............................................................................................................................... 195
6.7 Conclusions and Future Work ........................................................................................... 201
6.8 References ......................................................................................................................... 201
Chapter 7 Conclusions ................................................................................................................ 204
7.1 Summary of Findings ........................................................................................................ 204
7.2 References ......................................................................................................................... 207

xi
List of Tables Table 2.1 Modified second through fifth tier attributes of the urban stormwater SES framework....................................................................................................................................................... 15
Table A2.1 Modified framework for green infrastructure adoption in urban stormwater social-ecological systems ........................................................................................................................ 29
Table 4.1 Major U.S. legislative and regulatory actions related to municipal stormwater control....................................................................................................................................................... 95
Table 4.2 Major U.S. EPA Office of Water policy memos, action strategies, and collaboration efforts related to green infrastructure ............................................................................................ 98
Table 4.3 Variable description and data sources ........................................................................ 108
Table 4.4 Summary statistics ...................................................................................................... 109
Table 4.5 Hurdle model of GI adoption for CSO management .................................................. 112
Table A4.1 Descriptions of adopted GI programs ...................................................................... 125
Table A4.2 Hurdle model of gray infrastructure expenses for GI program adopting communities..................................................................................................................................................... 130
Table A4.3 Hurdle model of GI adoption for CSO management with outliers removed ........... 131
Table A4.4 Sensitivity of hurdle model to population scale ....................................................... 132
Table 5.1 Research stages and strategies for RACI development .............................................. 139
Table 5.2 Taxonomy of RACI subscales and corresponding question items ............................. 146
Table 5.3 Stage 4 study population demographics ..................................................................... 147
Table 5.4 Summary statistics ...................................................................................................... 148
Table 5.5 Summary of classical test theory values for question items ....................................... 149
Table 5.6 Cronbach’s alpha for RACI subscales ........................................................................ 156
Table 5.7 Exploratory factor analysis for RACI 2.0 ................................................................... 157
Table 5.8 Inter-factor correlation matrix .................................................................................... 158
Table 5.9 Fit index for confirmatory factor analysis models ...................................................... 163
Table A5.1 Categorical judgment scheme for concept inventory evaluation ............................. 173
Table 6.1 Module design components ........................................................................................ 190
Table 6.2 Stakeholder groups included in initial module ........................................................... 192
Table 6.3 Technological aspects of gray and green infrastructure ............................................. 193
Table 6.4 Stakeholder groups included in revised module ......................................................... 195
Table 6.5 Student evaluations of 2014 module ........................................................................... 196
Table 6.6 Student self-assessments of learning outcomes .......................................................... 200

xii
List of Figures Figure 2.1 Sequence of data collection and analysis .................................................................... 11
Figure 2.2 First tiers of the urban stormwater SESF .................................................................... 14
Figure 3.1 Evolution of Onondaga County’s Stormwater SES, 1998-2009 ................................. 74
Figure 4.1 Planned capital expenses for GI programs ................................................................ 103
Figure 4.2 Survey results on the involvement of NGOs in GI planning .................................... 107
Figure A4.1 Survey results on the adoption and implementation of GI plans ............................ 121
Figure A4.2 Survey results on the role of leadership in GI planning ......................................... 122
Figure A4.3 Survey results on the characterization of stakeholder interactions in GI planning 123
Figure A4.4 Survey results on involvement of various groups in GI planning .......................... 124
Figure 5.1 Path diagram showing generalized hypothetical cognitive model for rate and accumulation understanding ....................................................................................................... 140
Figure 5.2 : Scatterplot of item difficulty and discrimination values for RACI 2.0……………150
Figure 5.3 Two-parameter item response function for all post-test RACI 2.0 question items ... 151
Figure 5.4 Two-parameter item information function for all post-test RACI 2.0 question items..................................................................................................................................................... 152
Figure 5.5 Test information function for RACI 2.0 .................................................................... 153
Figure 5.6 Tetrachoric correlation heat map for the RACI 2.0 ................................................... 155
Figure 5.7 Path diagram for the Model 1 with factor loadings ................................................... 161
Figure 5.8 Path diagram for the Model 2 with factor loadings ................................................... 162
Figure 6.1 Student responses to “What did you enjoy most about today’s activities?” .............. 197
Figure 6.2 Student responses to “What suggestions do you have for improvement of today’s activities?” .................................................................................................................................. 198
1
Chapter 1 Introduction
1.1 Motivation
Anthropogenic environmental changes have eroded the resilience of major components of
ecosystem functioning that provide the appropriate living environments and ecological services
that humanity depends on to exist (Rockström et al., 2009). Sustainable development is widely
recognized as an essential strategy to decrease the negative impacts of anthropogenic activities,
despite multiple interpretations of its underlying concepts (Glavič and Lukman, 2007; Redclift,
2005; WCED, 1987). Attainment of large-scale sustainable development goals requires
collaborative efforts across governments, corporations, nonprofit organizations, academia, and
individuals.
Engineers can play a pivotal role in the design and implementation of sustainable
development strategies. Several professional engineering organizations have responded to
concerns of sustainable development by adopting principles of sustainable engineering design
and amending their codes of practice. For instance, the American Society of Civil Engineers
amended its first Code of Ethics Canon in 1996 to include sustainable development principles
(ASCE, 2008). While the need to consider sustainability as an inherent part of engineering
practice has been widely accepted, embedding it in daily practice remains to be fully realized
(Jones et al., 2017).
Many researchers argue that there is a need to integrate the physical and social science
disciplines with engineering to address the ecological, economic, and social processes of
sustainable development (Clark and Dickson, 2003; Kates et al., 2001; Mihelcic et al., 2003).
The importance of interdisciplinary efforts in building sustainable solutions to critical

2
environmental problems is becoming more apparent to many policy makers, scientists, and
engineers who seek to encourage research and education at the interfaces of different disciplines
(Hollander et al., 2016). Interdisciplinary and transdisciplinary research that balances
disciplinary perspectives and actively involves stakeholders and decision-makers can provide
research that is both more useful and readily accepted (Reid et al., 2010).
There are considerable challenges to integrating sustainable engineering into
undergraduate education, particularly in addressing the normative social dimensions of
sustainable development (Allenby et al., 2009). It is unrealistic to expect students with little
“real-world” experience to understand the complexities of sustainable engineering design
through traditional instructional methods. Instead, introducing pedagogical elements such as
historical context, decision-making problems, and ethical problems into the classroom can help
students to develop a sustainable design mindset. At the same time, conceptual knowledge of
fundamental mathematic and scientific principles is central to the practice of engineering
(Sheppard et al., 2007; Streveler et al., 2008). Thus, engineering students must develop deep
conceptual understandings of both the engineering processes that underlie complex
environmental systems as well as the broad array of social and economic factors that influence
the design of sustainable engineered systems.
1.2 Urban Water Infrastructure Systems
Cities across the U.S. are facing mounting water crises that threaten social and
environmental sustainability due to population growth, deteriorating infrastructure, and climate
change. These issues stem in part from unforeseen consequences of engineering system designs
that fail to incorporate the complexity of social and ecological factors that are affected by these

3
systems. For instance, the rationale that 19th and early 20th century engineers used to build
thousands of miles of combined sewer systems throughout the U.S. has left a legacy of water
pollution problems that policy-makers continue to deal with today (Tarr, 1979). As an immediate
replacement of centralized urban water systems is an economically unrealistic option, transitions
toward sustainable water systems through redevelopment projects will be needed to provide
adequate water services for future generations (Daigger, 2009; Sedlak, 2014).
Traditionally, water infrastructure decisions have been framed from a function, safety,
and cost perspectives, without important stakeholders effectively engaged in developing
integrated, sustainable solutions (Guest et al., 2009). While many technological approaches exist
that can transition water infrastructure systems to more sustainable and resilient states, their
implementation is limited by institutional impediments and uncertainties about the design,
performance, and life cycle costs of new technologies. Thus, there is a need for more robust
decision-making frameworks for water infrastructure systems that integrate evaluation methods
based on sustainable development principles and engagement with a wide range of stakeholders
in defining and implementing solutions
1.3 Thesis Overview
In summary, challenges to sustainable stormwater management include a lack of
appropriate design and planning methodologies that incorporate interdisciplinary research to
identify and implement the most sustainable solution in a particular context. Similarly,
challenges to educating the next generation of engineers include a lack of appropriate
educational tools that adequately prepare students to take on such approaches to sustainable
engineering design. The objective of this thesis is to identify elements of such a decision-making

4
methodology that can provide engineers, stormwater management stakeholders, and engineering
educators with lessons and tools that can advance the sustainable development of stormwater
management systems. This work brings together an assessment of sustainable stormwater
management planning in the United States with investigations of student understanding of
engineering design principles. The intent of this research is to explore two different but related
problems: (1) a need to understand key factors affecting sustainable stormwater technology
adoption and implementation in municipalities, and (2) a need for engineering students to apply
fundamental scientific and mathematical principles while incorporating complex social
constraints within engineering design problems. This thesis includes five chapters that aim to
address these challenges of sustainable engineering design.
Interdisciplinary research is facilitated when common vocabulary is shared by scholars
working on a particular system of interest. A framework is a type of ontology that can aid in the
organization and accumulation of knowledge from empirical studies through a shared
understanding the concepts and terms used in interdisciplinary research endeavors. In Chapter 2,
I propose a framework for identifying factors that condition the adoption of green infrastructure
technologies by stormwater management authorities. The application of this framework can be
useful in the analysis of social-ecological outcomes at multiple scales. Chapter 3 presents a case
study that utilizes the revised framework to describe and evaluate changes in stormwater
management planning in Onondaga County, NY between 1998 and 2009. In Chapter 4, I use
select factors from the framework to build an empirical model to analyze combined sewer
management authorities’ decisions related to green infrastructure program adoption.
Many engineering processes are built upon the basic principles of mass and energy
balances, which invoke the use of mathematical models derived from the fundamental theorem

5
of calculus to analyze rates of change and accumulation across system boundaries of interest.
Chapter 5 provides evidence of the validity and reliability of an assessment tool designed to
measure students’ understanding of rate and accumulation concepts. Investigating various social
elements of engineering practice in the classroom can improve students’ recognition of ethical
problems in real-world settings and provide an understanding of sustainable decision-making.
Chapter 6 describes the development and use of a case-based active-learning module to enhance
student understanding of stakeholder engagement principles.
1.4 References
Allenby, B., Murphy, C.F., Allen, D., and C.I. Davidson. 2009. Sustainable engineering education in the United States. Sustainability Science 4(1), 7–15. doi:10.1007/s11625-009-0065-5
ASCE, 2008. The ASCE Code of Ethics: Principles, Study, and Application. American Society of Civil Engineers.
Clark, W.C., and N.M. Dickson. 2003. Sustainability science: the emerging research program. Proceedings of the National Academy of Sciences 100(14), 8059–8061.
Daigger, G.T. 2009. Evolving urban water and residuals management paradigms: Water reclamation and reuse, decentralization, and resource recovery. Water Environment Research 81(8), 809–823.
Glavič, P., and R. Lukman. 2007. Review of sustainability terms and their definitions. Journal of Cleaner Production 15(18), 1875–1885.
Guest, J.S., Skerlos, S.J., Barnard, J.L., Beck, M.B., Daigger, G.T., Hilger, H., Jackson, S.J., Karvazy, K., Kelly, L., Macpherson, L., Mihelcic, J.R., Pramanik, A., Raskin, L., Van Loosdrecht, M.C.M., Yeh, D., and N.G. Love. 2009. A new planning and design paradigm to achieve sustainable resource recovery from wastewater. Environmental Science & Technology 43(16), 6126-6130.
Hollander, R., Amekudzi-Kennedy, A., Bell, S., Benya, F., Davidson, C.I., Farkos, C., Fasenfest, D., Guyer, R., Hjarding, A., Lizotte, M., Quigley, D., Watts, D., and K. Whitefoot. 2016. Network priorities for social sustainability research and education: Memorandum of the Integrated Network on Social Sustainability Research Group. Sustainability: Science, Practice, & Policy 12(1).

6
Jones, S.A., Michelfelder, D., and I. Nair. 2017. Engineering managers and sustainable systems: the need for and challenges of using an ethical framework for transformative leadership. Journal of Cleaner Production 140, 205–212.
Kates, R.W., Clark, W.C., Corell, R., Hall, J.M., Jaeger, C.C., Lowe, I., McCarthy, J.J., Schellnhuber, H.J., Bolin, B., Dickson, N.M., Faucheux, S., Gallopin, G.C., Grübler, A., Huntley, B., Jäger, J., Jodha, N.S., Kasperson, R.E., Mabogunje, A., Matson, P., Mooney, H., Moore, B., O’Riordan, T., and U. Svedin. 2001. Sustainability science. Science 292(5517), 641–642.
Mihelcic, J.R., Crittenden, J.C., Small, M.J., Shonnard, D.R., Hokanson, D.R., Zhang, Q., Chen, H., Sorby, S.A., James, V.U., Sutherland, J.W., and J.L. Schnoor. 2003. Sustainability science and engineering: the emergence of a new metadiscipline. Environmental Science & Technology 37(23), 5314–5324.
Redclift, M., 2005. Sustainable development (1987–2005): An oxymoron comes of age. Sustainable Development 13(4), 212–227.
Reid, W.V., Chen, D., Goldfarb, L., Hackmann, H., Lee, Y.T., Mokhele, K., Ostrom, E., Raivio, K., Rockström, J., Schellnhuber, H.J., and A. Whyte. 2010. Earth system science for global sustainability: grand challenges. Science 330(6006), 916–917.
Rockström, J., Steffen, W., Noone, K., Persson, Å., Chapin, F.S., Lambin, E.F., Lenton, T.M., Scheffer, M., Folke, C., Schellnhuber, H.J., Nykvist, B., de Wit, C.A., Hughes, T., van der Leeuw, S., Rodhe, H., Sörlin, S., Snyder, P.K., Costanza, R., Svedin, U., Falkenmark, M., Karlberg, L., Corell, R.W., Fabry, V.J., Hansen, J., Walker, B., Liverman, D., Richardson, K., Crutzen, P., and J.A. Foley. 2009. A safe operating space for humanity. Nature 461(7263), 472–475.
Sedlak, D. 2014. Water 4.0: The past, present, and future of the world’s most vital resource. Yale University Press. New Haven, CT, USA.
Sheppard, S., Colby, A., Macatangay, K., and W. Sullivan. 2007. What is engineering practice? International Journal of Engineering Education 22(3), 429-438.
Streveler, R.A., Litzinger, T.A., Miller, R.L., and P.S. Steif. 2008. Learning conceptual knowledge in the engineering sciences: Overview and future research directions. Journal of Engineering Education 97(3), 279–294.
Tarr, J.A. 1979. The separate vs. combined sewer problem: a case study in urban technology design choice. Journal of Urban History 5, 308–339.
World Commission on Environment and Development (WCED). 1987. Our Common Future. Oxford University Press. Oxford, United Kingdom.

7
Chapter 2 Adapting the social-ecological system framework for urban stormwater management: The case of green infrastructure adoption1
2.1 Abstract
Stormwater management has long been a critical societal and environmental challenge for
communities. An increasing number of municipalities are turning to novel approaches such as
green infrastructure to develop more sustainable stormwater management systems. However,
there is a need to better understand the technological decision-making processes that lead to
specific outcomes within urban stormwater governance systems. We used the social-ecological
system (SES) framework to build a classification system for identifying significant variables that
influence urban stormwater governance decisions related to green infrastructure adoption. To
adapt the framework, we relied on findings from observations at national stormwater meetings in
combination with a systematic literature review on influential factors related to green
infrastructure adoption. We discuss our revisions to the framework that helped us understand the
decision by municipal governments to adopt green infrastructure. Remaining research needs and
challenges are discussed regarding the development of an urban stormwater SES framework as a
classification tool for knowledge accumulation and synthesis.
2.2 Introduction
The lack of well-integrated urban stormwater management strategies throughout the past
century has left a heritage of environmental and social problems that policy-makers continue to
deal with today. Municipal stormwater management plans in many developed countries have
1 This paper is published in the Ecology and Society. It is cited in the rest of the dissertation as Flynn and Davidson (2016).

8
favored the use of gray infrastructure (e.g., sewer separation projects, deep storage tunnels, and
regional treatment facilities). These engineering solutions can be costly, tend to promote
centralized subsurface conveyance systems with end-of-pipe treatment, and often take years to
complete. Despite major investments in stormwater infrastructure, urban areas continue to
experience critical problems in managing water flows, including flooding, surface water
impairment, and combined sewer overflows (U.S. EPA 2004, National Research Council 2009,
Coles et al. 2012).
Recent advances in stormwater management methods seek to enhance the sustainability
of urban water systems. For instance, stormwater systems that include green infrastructure (GI),
also known as low impact development, are recognized as a more sustainable approach. GI
technologies are designed to protect or restore the natural hydrology of a site, capturing
stormwater volume through the use of engineered systems that mimic natural hydrologic
systems. Comprehensive GI programs can be implemented for a variety of outcomes, including
flood control, surface water quality improvement, and water harvesting, in conjunction with a
broad range of additional outcomes such as ecosystem restoration, air quality improvement, and
urban heat reduction (Hatt et al. 2004, Villarreal et al. 2004, Walsh et al. 2005, Tzoulas et al.
2007). However, there are potential practical limitations for GI to achieve sustainable outcomes
for municipalities, such as a limited capacity for storing and infiltrating stormwater.
The decision to adopt a comprehensive GI program is influenced by a complex array of social
and biophysical factors. To explore such complexities, an urban water system can be understood
as a social-ecological system (SES), or a collection of dynamic systems that coevolve through
interactions among actors, institutions, and water systems, such as source water, groundwater,

9
wastewater, and stormwater (Berkes et al. 1998, Holling and Gunderson 2002). The stormwater
flows and storage volumes within an urban water SES represent common-pool resources, in that
water quality and available storage volumes are diminished as runoff flows through urban
environments. These issues prompt the need for public authorities to establish various standards
related to the management of stormwater.
A fundamental component of urban stormwater SESs is the role of technology as a
critical interface between the social and ecological structures, which allows actors to shape
different processes to achieve outcomes in system functioning (Ferguson et al. 2013).
Technologies also act as a feedback mechanism between the social and biophysical systems of an
SES. Walker et al. (2004) describe the potential of an SES intervention to create a new system
when the conditions of an existing system are weakened. Stormwater management systems that
are exclusively composed of gray infrastructure may result in urban water system weakening
because these technology systems are considered neither sustainable nor sufficiently resilient to
accommodate climatic changes, and may result in unforeseen outcomes such as high economic
costs and environmental justice issues (Pahl-Wostl 2007, Novotny et al. 2010, Dominguez et al.
2011, Pyke et al. 2011, Wendel et al. 2011, De Sousa et al. 2012). Alternatively, large-scale use
of GI in stormwater management planning represents an opportunity for transformational shifts
in urban water SESs away from point source solutions to decentralized, systematic techniques
that may also bring multiple benefits to communities (Shuster and Garmestani 2015).
There is a need to more easily relate attributes and configurations of urban stormwater
SESs to particular outcomes, such as the development of comprehensive GI programs. Several
frameworks exist which conceptualize and operationalize SES dynamics, each of which may

10
provide different types of diagnostic insights. Thus, an analyst must be clear about the aim and
purpose of any diagnostic procedure, and hence, which analytic framework will support the
specific procedure being undertaken (Ferguson et al. 2013). Binder et al. (2013) provide an
overview of the prevailing frameworks for analyzing SESs, and provide guidance on the
selection of an appropriate framework. Scholars studying water systems have developed
frameworks that identify key processes and structures affecting their governance (Pahl-Wostl et
al. 2010, Wiek and Larson 2012). Because GI represents a suite of innovative technologies for
many urban water SESs, it is necessary to first identify and define attributes that may prove to be
significant in social-ecological interactions before establishing causal mechanisms linking
conditions and governance outcomes. Providing a framework to organize and document SES
attributes can serve this function.
Our primary goal is to identify the influential SES attributes related to the development of
municipal urban stormwater programs that feature GI. We chose the SES framework because it
provides a systematic and comprehensive method for defining system attributes and identifying
those that are associated with outcomes of interest (Ostrom 2007, 2009). Numerous
environmental case studies have applied the SES framework while adding or redefining
attributes to best characterize the SES of interest (Fleischman et al. 2010, Gutiérrez et al. 2011,
Cinner et al. 2012, Basurto et al. 2013, Nagendra and Ostrom 2014, Marshall 2015, Partelow and
Boda 2015). No such effort has been previously undertaken to assess the suitability of the SES
framework to characterize urban stormwater management systems. We use qualitative methods
to identify and define the attributes most commonly associated with the inclusion of GI in
municipal urban stormwater programs.

11
2.3 Methods
The identification of attributes associated with GI adoption in municipal urban
stormwater programs included several phases of data collection and analysis (Fig. 2.1).
Exploratory work began with observations at GI summits in 2013 and 2014, in which delegates
from U.S. municipalities were invited to discuss their respective community’s GI programs.
Extensive field notes from both meetings were coded line-by-line to identify factors that affected
decisions to adopt municipal GI programs. The resulting codes were grouped into general
categories of attributes that emerged during the analysis process. These categories were then
incorporated into the SES framework, using first- and second-tier modifications, as suggested by
McGinnis and Ostrom (2014), Epstein et al. (2013), and Vogt et al. (2015), as the initial
framework.
Figure 2.1 Sequence of data collection and analysis

12
Another stage of data collection included a literature review of original research efforts
related to the adoption and implementation of GI in urban stormwater systems. Green
infrastructure, green stormwater infrastructure (GSI), low impact design (LID), and best
management practices (BMPs) are among the terms used for various suites of urban stormwater
management technologies. We refer to GI, GSI, and LID technologies are “GI” because these
terms are often used synonymously (Fletcher et al. 2014). Searches were carried out using
Scopus, Web of Knowledge, and Google Scholar. Key words included in the literature review
were “green infrastructure,” “low impact development,” “stormwater,” and “municipal.”
Searches were conducted for studies published between 2000 and 2015. In total, 135 articles,
theses, and reports were reviewed for their relevance to factors affecting the adoption and
implementation of GI technologies for municipal programs. Reasons for exclusion included a
study focus on adoption of water systems other than stormwater (e.g., drinking water,
wastewater), or an exclusive focus on GI technology design attributes outside the context of
municipal stormwater management program implementation (e.g., experimental findings).
Studies were not excluded on the basis of study design, the scale or primary design goal of
stormwater technologies discussed, nor the geographical location of the study; however, most
studies reviewed were based in the United States or Australia. This process resulted in 83 studies
that met the criteria, and thus formed the basis of the review.
Qualitative document analysis techniques were used to identify factors that influence
municipal GI programs in each of the collected studies. These methods often involve the
development of a “protocol,” which is tested on each unit of analysis and revised based on the
quality and likely efficiency of the results (Altheide et al. 2008). The SES framework adapted in
the initial research phase served as a beginning protocol that consisted of identified attributes

13
related to GI adoption. After analyzing each study of the literature review, new findings were
organized within the protocol. After all studies were analyzed, each study was reviewed a second
time to test the protocol. This process resulted in the addition or redefining of second-tier SES
framework attributes and the development of new third-, fourth-, and fifth-tier attributes
presented in Table 2.1. Working definitions were developed for each attribute and are included in
Appendix A2, along with at least three citations of illustrative studies collected in the literature
review for the highest tier of each nested attribute added to the SES framework. Listed citations
for each attribute are not presented as definitive authoritative sources nor as a comprehensive
listing of all studies in which the attribute was identified. Rather, they represent examples of how
scholars have applied the concept in other studies.
2.4 Results
The SES framework organizes system attributes into nested tiers. The first-tier attributes
of the SES framework, as defined for an urban stormwater management system, are summarized
in Fig. 2.2. The resource system (RS) is defined as an urban stormwater system; i.e., the system
of water flows that results from wet weather. Multiple sets of resource units (RU) can be defined
within an urban stormwater system, such as units of stormwater or the storage volumes available
for stormwater throughout the system. The governance system (GS) includes the sets of rules
agreed upon by national, state, and local organizations for managing urban stormwater. The
actors (A) category includes individuals and groups that interact with the urban stormwater
system. Multiple categories of actors can be defined, including individuals and groups that are
involved in rule-making processes, and property owners that are affected by stormwater
management decisions. Attributes from each of these categories provide inputs to action
situations, where interactions (I) among actors transform these inputs into various outcomes,

14
which can be measured by outcome criteria (O). Additional influences flow between the focal
SES attributes and related ecosystems (ECO); ecological rules (ER); and social, economic, and
political settings (S).
Figure 2.2 First tiers of the urban stormwater SESF, adapted from Ostrom (2009) and Epstein et. al (2013)
Table 2.1 summarizes the changes made to the SES framework. A detailed summary of
the modifications, along with working definitions and illustrative references, are provided in
Appendix A2. Because the study focus is only on changes related to resource management
programs, the findings led to detailed expansions of multiple governance system and actor
attributes. Attributes for RU, ECO, ER, and S were not modified beyond second-tier changes
suggested by McGinnis and Ostrom et al. (2014) and Vogt et al. (2015), though many of these

15
Table 2.1 Modified second through fifth tier attributes of the urban stormwater SES framework. Factors modified from McGinnis and Ostrom (2014), Epstein et. al (2013), and Vogt et. al (2015) that are specific for GI adoption in urban stormwater SESs are noted with italic
Social, Economic, and Political Settings (S) Governance Systems (GS) Actors (A) Resource Systems (RS) S1 – Economic development GS1 – Policy area A1 – Number of actors RS1 – Sector S2 – Demographic trends GS2 – Geographical scale A2 – Socioeconomic attributes RS2 – Clarity of system boundaries S3 – Political stability GS3 – Population A3 – History or past experiences RS3 – Size of resource system S4 – Government policies GS4 – Regime type A3.1 – Experimentation RS4 – Human-constructed facilities S5 – Market incentives GS5 – Rule-making organizations A3.2 – Environmental injustices RS4.1 - Locations S6 – Media organization GS5.1 – Number of organizations A4 – Location RS4.1.1 – Availability for potential facilities S7 – Technology GS5.2 – Institutional diversity A5 – Leadership/entrepreneurship RS4.2 – Functionality GS5.3 – Economic resources A5.1 – Policy entrepreneur RS5 – Productivity of system Related Ecosystems (ECO) GS5.4 – Human resources A5.2 – Policy community RS6 – Equilibrium properties ECO1 – Climate patterns GS6 – Rules-in-use A6 – Norms (trust-reciprocity)/social capital RS6.1 – Frequency/timing of disturbances ECO2 – Pollution patterns GS6.1 – Operational -choice rules A6.1 – Trust RS7 – Predictability of system dynamics ECO3 – Flows into and out of focal SES GS6.1.1 – Stormwater ordinances A6.2 – Reciprocity RS8 – Storage characteristics GS6.1.1.1 – Technical basis A6.3 – Social capital RS8.1 – Soil characteristics Ecological Rules (ER) GS6.1.1.2 – Administrative apparatus A7 – Knowledge of SES/mental models RS8.2 – Imperviousness ER1 – Physical Rules GS6.1.1.3 – Enforcement provisions A7.1 – Types of knowledge RS9 – Location ER2 – Chemical Rules GS6.1.2 – Stormwater utility funding scheme A7.1.1 – Traditional ecological knowledge RS10 – Ecological history ER3 – Biological Rules GS6.1.2.1 – Price instrument A7.1.2 – Local ecological knowledge RS10.1 – Human use and disturbance ER3 – Biological Rules GS6.1.2.2 – Credits or fee reduction A7.1.3 – Technical expertise GS6.1.3 – Stormwater management plans A7.2 – Mechanisms to share knowledge Resource Units (RU) Action Situations: Interactions (I) → GS6.1.3.1 – Operations and maintenance A7.3 – Scale of mental models RU1 – Resource unit mobility Outcomes (O) GS6.1.4 – Related regulations A8 – Importance of resource (dependence) RU2 – Growth or replacement rate Interactions (I) GS6.2 – Collective-choice rules A9 – Technology available RU3 – Interaction among resource units I1 – Harvesting GS6.2.1 – Enforcement responsibilities A9.1 – Ownership RU4 – Economic value I2 – Information sharing GS6.3 – Constitutional-choice rules A9.2 – Research support RU5 – Number of units I3 – Deliberation processes GS6.1.3 – Stormwater management plans A9.2.1 - Environmental performance RU6 – Distinctive characteristics I4 – Conflicts GS6.1.3.1 – Operations and maintenance A9.2.1.1 – Stormwater management RU7 – Spatial and temporal distribution I5 – Investment activities GS6.1.4 – Related regulations A9.2.1.2 – Environmental "co-benefits" I6 – Lobbying activities GS6.2 – Collective-choice rules A9.2.2 – Social benefits I7 – Self-organizing activities GS6.2.1 – Enforcement responsibilities A9.2.3 – Design and complexity I8 – Networking activities GS6.3 – Constitutional-choice rules A9.2.4 – Maintenance procedures I9 – Monitoring activities GS7 – Property-rights systems A9.2.5 – Reliability I10 – Evaluative activities GS7.1 – Watercourse law A9.3.1 – Capital GS7.1.1 – Prior appropriation doctrine A9.3.2 – Operation and maintenance Outcome Criteria: GS8 – Repertoire of norms and strategies A9.4 – Perceptions/attitudes O1 – Social performance measures GS8.1 – Diversity O2 – Ecological performance measures GS8.2 – Risk tolerance O3 – Externalities to other SESs GS9 – Network structure GS9.1 – Horizontal GS9.2 – Vertical GS10 – Historical continuity

16
attributes have direct and important effects on the design of municipal stormwater management
programs. Additional studies on implementing various technological designs may result in a
more detailed account for influential attributes in these categories.
Multiple third-, fourth-, and fifth-tier variables were added to describe various attributes
of stormwater management technologies that are available to actors within the SES (A9), such as
research support (A9.2), associated costs (A9.3), and perceptions of particular technologies
(A9.4). The addition of third-, fourth-, and fifth-tier variables related to human-constructed
facilities (RS4) designates both the types and functionalities of existing and potential stormwater
infrastructure. A notable factor related to the construction of GI technologies is the availability of
suitable locations for potential facilities (RS4.1.1), which is often associated with other factors
such as local soil characteristics (RS8.1) (Shuster et al. 2014). Additional tiers allow for a
detailed account of the assortment of resources and rules used by organizations to manage GI
technologies. Stormwater ordinances (GS6.1.1) often acted as a barrier to GI implementation
(Nowacek et al. 2003, Lassiter 2007, Stockwell 2009, Dochow 2013). Another common barrier
was lack of sufficient program funding (Clean Water America Alliance 2011, Siglin 2012, Winz
et al. 2014), which is associated with limited economic resources available to rule-making
organizations (GS5.3), type of stormwater utility funding schemes (GS6.1.2), and socioeconomic
attributes of actors (A2). Multiple attributes of actors that interact with and manage stormwater
resources were found to influence GI program adoption, such as the leadership efforts of policy
entrepreneurs (A5) and policy communities (A5.2), multiple actor knowledge types (A7.1),
experimentation (i.e., technology pilot projects) (A3.1), and environmental injustices (A3.2).

17
2.5 Discussion
In the broadest sense, integration of GI into an urban stormwater management system can
be understood as the development of human-constructed facilities (RS4) across diffuse locations
(RS4.1) using available technologies (A9) to alter the storage characteristics of an urban
stormwater system (RS8). In developing this SES framework, additional third-, fourth-, and fifth-
tier variables were needed to account for complex arrangements of social and biophysical factors
that affect GI implementation. Operational-choice rules (GS6.1), such as ordinances, funding
schemes, and comprehensive management plans, were found to be among the most complex
factors. These rules are often further complicated by related SES regulations (GS6.1.4), such as
zoning, building codes, and demolition practices (Lassiter 2007, Carter and Fowler 2008, Shuster
et al. 2014). These related regulations are often managed by separate organizations, which may
create barriers to GI implementation if the regulations are prohibitive. Property-rights systems
that include prior-appropriation doctrines (GS7.1.1) can limit the choices of GI technologies
(e.g., rainwater collection systems for some communities in the western United States) (Jensen
2008, Salkin 2009).
Funding was found to be among the most frequently cited barriers to GI (Godwin et al.
2008, Roy et al. 2008, Brown et al. 2009, Earles et al. 2009, Ruppert and Clark 2009, Stockwell
2009, Clean Water America Alliance 2011), most often in reference to the limited economic
resources of enforcement organizations (GS5.1.1.2) and a lack of information on the cost-
effectiveness of GI (A9.3). In the studies reviewed, stormwater management programs were
enforced primarily by public organizations that selected stormwater management technologies to
meet outcome criteria in a cost-effective manner. Environmental services associated with GI
(A9.2.1.2), such as reducing urban heat island effects or promoting recreational opportunities,

18
were cited as drivers for adoption when these benefits were quantifiable (Nowacek et al. 2003,
Madden 2010). This suggests that it is difficult to maintain clear institutional boundaries when
assessing the market and nonmarket value of GI because there may be additional benefits that GI
can bring to a community beyond stormwater management.
The financial concerns of enforcement organizations are complicated by the design of
effective stormwater utility funding schemes (GS6.1.2). Many funding schemes are predicated
on the extent of total impervious area of urban land parcels because this metric has frequently
been used to predict levels of surface water impairments due to stormwater runoff (Booth and
Jackson 1997, Parikh et al. 2005). However, studies suggest that the subset of impervious
surfaces that route runoff directly to surface waters via sewer pipes, known as directly connected
impervious area or effective impervious area, may be responsible for most surface water
impairments due to urbanization (Brabec et al. 2002, Walsh 2004, Walsh et al. 2005, Roy and
Shuster 2009). Thus, stormwater utility funding schemes based on total impervious area rather
than effective impervious area may not lead to desired SES outcomes. Additional limitations of
utility funding schemes may develop if financial credits for GI are calculated as a one-time credit
based on the initial installation without including ongoing performance and maintenance criteria,
or if residential property owners are not included in financial incentive programs (Parikh et al.
2005).
Technological attributes are described in both the social and ecological domains of the
SES framework. While it has been argued that there is no need to create a separate technological
domain (McGinnis and Ostrom 2014), we demonstrate a need to more fully develop robust
descriptions of technological attributes within urban stormwater SESs because these attributes

19
act as key feedback mechanisms between the social and ecological domains. Historically,
technological innovations in urban water SESs have been shown to bring about desired social
and ecological regime shifts, such as a reduction in water-borne illness and a decrease in the
frequency of algal blooms due to eutrophic states of receiving waters (Melosi 1999, Smith et al.
1999). Urban water infrastructure choices may also lead to unforeseen consequences over long
periods. For example, combined sewer systems were once deemed to be the most appropriate
choice for urban settings due to factors such as cost-effectiveness and availability of water
courses for overflow disposal (Tarr 1979). These decisions have left a legacy of water pollution
problems for many communities, as combined sewer overflows continue to impair surface waters
and create human health hazards (U.S. EPA 2004, Donovan et al. 2008, Gooré Bi et al. 2015).
By developing a comprehensive categorization of technological attributes within an SES
framework, policy-makers will be better equipped to make well-informed decisions concerning
technology selection for desired urban water SES outcomes.
Though additional characterizations were not added within several second-tier categories,
such as resource units (RU) and outcome criteria (O), attributes in these categories have
important implications for stormwater management technology decisions. For instance,
stormwater management plans are traditionally designed according to the spatial and temporal
distribution of stormwater flows in an urban area (RU7), which will be affected by changes in
local precipitation patterns (RU2). The spatial and temporal distribution of stormwater volumes
within an urban setting places clear boundaries on which technologies should be considered and
where they should be situated in an urban setting (Askarizadeh et al. 2015). Additionally, the
criteria used to select stormwater management technologies, such as relative cost-effectiveness
or ecological performance measures, will often strongly influence enforcement officials’

20
decision-making processes (Flynn et al. 2014). Expansion of these attribute categories may be
necessary when considering research questions related to the design of specific stormwater
technologies or the influence of particular outcome criteria.
Some limitations of the modified framework attributes should be noted. Because several
programs reviewed in the literature are in early phases of development, some SES framework
attributes are likely relevant to only nascent GI implementation. However, an analysis of GI
technologies in urban stormwater SESs over longer timescales may result in other variables
having a greater effect (Brown et al. 2013). Much of the research we reviewed relies on case
study methods such as the solicitation of particular actors’ perceptions. Thus, some factors listed
may pertain to specific actors or institutions, such as engineering firms, municipal officials,
developers, or community residents. Additional studies can provide further insights into the
possibility of shared, complementary interactions among actors within specific situations that
result in the development of successful GI programs. It is also important to note that while the
literature review was not restricted to studies from particular geographic locations, most studies
were based in the United States or Australia, which prescribe similar stormwater governance
structures. Researchers who use the revised SES framework in studies of community-based
stormwater governance regimes may need to add more detailed characterizations of particular
attributes (such as property-rights systems or collective-choice rules), or may need to omit others
(such as particular operational rules).
2.6 Conclusions
We developed a modified SES framework to recognize the combinations of influential
variables related to the development of municipal urban stormwater management programs that

21
feature extensive use of GI technologies. The modifications made to the SES framework
revealed the need for additional attribute tiers related to variables such as available technologies,
actor characterizations, and operational-choice rules. Our findings demonstrate that affecting
change in the built structure of urban stormwater systems involves multiple interacting attributes
of the actors and governance systems within an SES.
The framework we developed should be interpreted as a flexible, proposed framework
rather than a definitive set of variables that will be relevant in all urban stormwater SES cases.
Other studies highlight qualities of particular attributes within adapted SES frameworks to
explore dynamic interactions and outcomes of interest (Fleischman et al. 2010, Basurto et al.
2013, Nagendra and Ostrom 2014, Leslie et. al 2015, Partelow and Boda 2015). The revised
framework we presented highlights key factors of GI adoption that can be further explored using
various theories and models to assess outcomes of interest related to urban stormwater SESs
seeking to adopt GI technologies (Flynn et al. 2014). Tiers may be added or omitted to
accommodate particular theories and research questions.
There is a need to explore the specific, contextual factors affecting the decision to adopt
particular management approaches in urban stormwater SESs. The growing popularity of GI
systems across municipalities carries a risk that these technologies will be perceived as a panacea
for stormwater management (Ostrom 2007). However, there continues to be a need for a more
sophisticated quantitative understanding of how GI technologies bring out particular SES
outcomes. Neither a fully green nor entirely gray infrastructure approach to stormwater
management will likely be optimal at any location. Instead, long-term solutions must be built
around improved knowledge of factors influencing water quantity and quality in urban areas, and

22
leveraging the services and capacities of both gray and green infrastructure. Such understanding
should include the consideration of the unique characteristics of a particular urban water SES.
2.7 References
Altheide, D., M. Coyle, K. DeVriese, and C. Schneide. 2008. Emergent qualitative document analysis. Pages 127–151 in S. N. Hesse-Biber, and P. Leavy, editors. Handbook of emergent methods. Guilford Press, New York, USA.
Askarizadeh, A., M. A. Rippy, T. D. Fletcher, D. L. Feldman, J. Peng, P. Bowler, A. S. Mehring, B. K. Winfrey, J. A. Vrugt, A. AghaKouchak, S. C. Jiang, B. F. Sanders, L. A. Levin, S. Taylor, and S. B. Grant. 2015. From rain tanks to catchments: use of low-impact development to address hydrologic symptoms of the urban stream syndrome. Environmental Science & Technology 49(19):11264–11280. http://pubs.acs.org/doi/abs/10.1021/acs.est.5b01635 http://dx.doi.org/10.1021/acs.est.5b01635
Basurto, X., S. Gelcich, and E. Ostrom. 2013. The social-ecological system framework as a knowledge classificatory system for benthic small-scale fisheries. Global Environmental Change 23(6):1366–1380. http://dx.doi.org/10.1016/j.gloenvcha.2013.08.001
Berkes, F., C. Folke, and J. Colding. 1998. Linking social and ecological systems: management practices and social mechanisms for building resilience. Cambridge University Press, Cambridge, UK.
Binder, C. R., J. Hinkel, P. W. G. Bots, and C. Pahl-Wostl. 2013. Comparison of frameworks for analyzing social-ecological systems. Ecology and Society 18(4):26. http://dx.doi.org/10.5751/ES-05551-180426
Booth, D. B., and C. R. Jackson. 1997. Urbanization of aquatic systems: degradation thresholds, stormwater detection, and the limits of mitigation. Journal of the American Water Resources Association 33(5):1077–1090. http://dx.doi.org/10.1111/j.1752-1688.1997.tb04126.x
Brabec, E., S. Schulte, and P. L. Richards. 2002. Impervious surfaces and water quality: a review of current literature and its implications for watershed planning. Journal of Planning Literature 16(4):499–514. http://dx.doi.org/10.1177/088541202400903563
Brown, R., M. Farrelly, and N. Keath. 2009. Practitioner perceptions of social and institutional barriers to advancing a diverse water source approach in Australia. Water Resources Development 25(1):15–28. http://dx.doi.org/10.1080/07900620802586090
Brown, R. R., M. A. Farrelly, and D. A. Loorbach. 2013. Actors working the institutions in sustainability transitions: the case of Melbourne's stormwater management. Global Environmental Change 23(4):701–718. http://dx.doi.org/10.1016/j.gloenvcha.2013.02.013

23
Carter, T., and L. Fowler. 2008. Establishing green roof infrastructure through environmental policy instruments. Environmental Management 42:151–164. http://dx.doi.org/10.1007/s00267-008-9095-5
Cinner, J. E., T. R. McClanahan, M. A. MacNeil, N. A. J. Graham, T. M. Daw, A. Mukminin, D. A. Feary, A. L. Rabearisoa, A. Wamukota, N. Jiddawi, S. J. Campbell, A. H. Baird, F. A. Januchowski-Hartley, S. Hamed, R. Lahari, T. Morove, and J. Kuange. 2012. Comanagement of coral reef social-ecological systems. Proceedings of the National Academy of Sciences of the United States of America 109(14):5219–5222. http://dx.doi.org/10.1073/pnas.1121215109
Clean Water America Alliance. 2011. Barriers and gateways to green infrastructure. Washington, D.C., USA. [online] URL: http://uswateralliance.org/sites/uswateralliance.org/files/publications/Barriers-and-Gateways-to-Green-Infrastructure.pdf
Coles, J. F., G. McMahon, A. H. Bell, L. R. Brown, F. A. Fitzpatrick, B. S. Eikenberry, M. D. Woodside, T. F. Cuffney, W. L. Bryant, K. Cappiella, L. Fraley-McNeal, and W. P. Stack. 2012. Effects of urban development on stream ecosystems in nine metropolitan study areas across the United States. U.S. Geological Survey Circular 1373. [online] URL: http://pubs.usgs.gov/circ/1373/pdf/Circular1373.pdf
De Sousa, M. R. C., F. A. Montalto, and S. Spatari. 2012. Using life cycle assessment to evaluate green and grey combined sewer overflow control strategies. Journal of Industrial Ecology 16(6):901–913. http://dx.doi.org/10.1111/j.1530-9290.2012.00534.x
Dochow, D. 2013. Transforming tradition: a case study of stormwater management in Clark County, Washington to assess barriers to low impact development strategies. Thesis. Evergreen State College, Olympia, Washington, U.S.A. [online] URL: http://archives.evergreen.edu/masterstheses/Accession86-10MES/Dochow_D2013.pdf
Dominguez, D., B. Truffer, and W. Gujer. 2011. Tackling uncertainties in infrastructure sectors through strategic planning: the contribution of discursive approaches in the urban water sector. Water Policy 13(3):299–316. http://dx.doi.org/10.2166/wp.2010.109
Donovan, E., K. Unice, J. D. Roberts, M. Harris, and B. Finley. 2008. Risk of gastrointestinal disease associated with exposure to pathogens in the water of the Lower Passaic River. Applied and Environmental Microbiology 74:994–1003. http://dx.doi.org/10.1128/AEM.00601-07
Earles, A., D. Rapp, J. Clary, and J. Lopitz. 2009. Breaking down the barriers to low impact development in Colorado. Pages 1–10 in S. Starrett, editor. World Environmental and Water Resources Congress 2009: Great Rivers, May 2009. http://dx.doi.org/10.1061/41036(342)91
Epstein, G., J. M. Vogt, S. K. Mincey, M. Cox, and B. Fischer. 2013. Missing ecology: integrating ecological perspectives with the social-ecological system framework. International Journal of the Commons 7(2):432–453. http://dx.doi.org/10.18352/ijc.371
24
Ferguson, B. C., R. R. Brown, and A. Deletic. 2013. Diagnosing transformative change in urban water systems: theories and frameworks. Global Environmental Change 23(1):264–280. http://dx.doi.org/10.1016/j.gloenvcha.2012.07.008
Fleischman, F., K. Boenning, G. A. Garcia-Lopez, S. Mincey, M. Schmitt-Harsh, K. Daedlow, M. C. Lopez, X. Basurto, B. Fischer, and E. Ostrom. 2010. Disturbance, response, and persistence in self-organized forested communities: analysis of robustness and resilience in five communities in southern Indiana. Ecology and Society 15(4):9. [online] URL: http://www.ecologyandsociety.org/vol15/iss4/art9/
Fletcher, T. D., W. Shuster, W. F. Hunt, R. Ashley, D. Butler, S. Arthur, S. Trowsdale, S. Barraud, A. Semadeni-Davies, J.-L. Bertrand-Krajewski, P. S. Mikkelsen, G. Rivard, M. Uhl, D. Dagenais, and M. Viklander. 2014. SUDS, LID, BMPs, WSUD and more – the evolution and application of terminology surrounding urban drainage. Urban Water Journal 12:1–18.
Flynn, C. D., C. I. Davidson, and J. Mahoney. 2014. Transformational changes associated with sustainable stormwater management practices in Onondaga County, New York. Pages 89–100 in J. Crittenden, C. Hendrickson, and B. Wallace, editors. ICSI 2014: creating infrastructure for a sustainable world. http://ascelibrary.org/doi/abs/10.1061/9780784478745.009
Godwin, D., B. L. Parry, F. A. Burris, S. S. Chan, and A. Punton. 2008. Barriers and opportunities for low impact development: case studies from three Oregon communities. Oregon State University, Corvallis, Oregon, USA. [online] URL: http://seagrant.oregonstate.edu/sites/default/files/sgpubs/onlinepubs/w06002.pdf
Gooré Bi, E., F. Monette, and J. Gasperi. 2015. Analysis of the influence of rainfall variables on urban effluents concentrations and fluxes in wet weather. Journal of Hydrology 523:320–332. http://dx.doi.org/10.1016/j.jhydrol.2015.01.017
Gutiérrez, N. L., R. Hilborn, and O. Defeo. 2011. Leadership, social capital and incentives promote successful fisheries. Nature 470(7334):386–389. http://dx.doi.org/10.1038/nature09689
Hatt, B. E., T. D. Fletcher, C. J. Walsh, and S. L. Taylor. 2004. The influence of urban density and drainage infrastructure on the concentrations and loads of pollutants in small streams. Environmental Management 34:112–124. http://dx.doi.org/10.1007/s00267-004-0221-8
Holling, C. S., and L. H. Gunderson. 2002. Panarchy: understanding transformations in human and natural systems. Island Press, Washington D.C., USA.
Jensen, M. A. 2008. Feasibility of rainwater harvesting for urban water management in Salt Lake City. Thesis. University of Utah, Salt Lake City, Utah, USA. [online] URL: http://content.lib.utah.edu/utils/getfile/collection/etd2/id/1406/filename/image
Lassiter, R. 2007. An assessment of impediments to low-impact development in the Virginia portion of the Chesapeake Bay watershed. Thesis. Virginia Commonwealth University,

25
Richmond, Virginia, USA. [online] URL: http://scholarscompass.vcu.edu/cgi/viewcontent.cgi?article=1891&context=etd
Leslie, H. M., X. Basurto, M. Nenadovic, L. Sievanen, K. C. Cavanaugh, J. J. Cota-Nieto, B. E. Erisman, E. Finkbeiner, G. Hinojosa-Arango, M. Moreno-Báez, and S. Nagavarapu, S. M. W. Reddy, A. RodrÃguezf, K. Siegel, J. J. Ulibarria-Valenzuela, A. Hudson Weaver, and O. Aburto-Oropeza. 2015. Operationalizing the social-ecological systems framework to assess sustainability. Proceedings of the National Academy of Sciences of the United States of America 112(19):5979–5984. http://dx.doi.org/10.1073/pnas.1414640112
Madden, S. A. 2010. Choosing green over gray: Philadelphia's innovative stormwater infrastructure plan. Thesis. Massachusetts Institute of Technology, Cambridge, Massachusetts, USA. [online] URL: http://www.mit.edu/afs.new/athena/dept/cron/project/urban-sustainability/Stormwater_Sarah%20Madden/sarahmadden_thesis_MIT.pdf
Marshall, G. 2015. A social-ecological systems framework for food systems research: accommodating transformation systems and their products. International Journal of the Commons 9:881–908. http://dx.doi.org/10.18352/ijc.587
McGinnis, M. D., and E. Ostrom. 2014. Social-ecological framework: initial changes and continuing challenges. Ecology and Society 19(2):30. [online] URL: http://dx.doi.org/10.5751/ES-06387-190230
Melosi, M. V. 1999. The sanitary city: urban infrastructure in American from colonial times to the present. Johns Hopkins University Press, Baltimore, Maryland, USA.
Nagendra, H., and E. Ostrom. 2014. Applying the social-ecological system framework to the diagnosis of urban lake commons in Bangalore, India. Ecology and Society 19(2):67. http://dx.doi.org/10.5751/ES-06582-190267
National Research Council. 2009. Urban stormwater management in the United States. National Academies Press, Washington, D.C., USA [online] URL: http://www.nap.edu/catalog/12465/urban-stormwater-management-in-the-united-states
Novotny, V., J. Ahern, and P. Brown. 2010. Water centric sustainable communities: planning, retrofitting and building the next urban environment. John Wiley & Sons, Hoboken, New Jersey, USA. http://dx.doi.org/10.1002/9780470949962
Nowacek, D., E. Nelson, and J. Petchenik. 2003. Social and institutional barriers to stormwater infiltration. Wisconsin Department of Natural Resources-Bureau of Integrated Science Services. [online] URL: http://www.kitsaplid.org/resources/Barriers_to_SW_Infiltration.pdf
Ostrom, E. 2007. A diagnostic approach for going beyond panaceas. Proceedings of the National Academy of Sciences of the United States of America 104(39):15181–15187. http://dx.doi.org/10.1073/pnas.0702288104

26
Ostrom, E. 2009. A general framework for analyzing sustainability of social-ecological systems. Science 325(5939):419–422. http://dx.doi.org/10.1126/science.1172133
Ostrom, E., M. Cox, and E. Schlager. 2014. An assessment of the institutional analysis and development framework. Pages 267–306 in P. A. Sabatier, and C. Weible, editors. Theories of the Policy Process. Third edition. Westview Press, Colorado, USA.
Pahl-Wostl, C. 2007. Transitions towards adaptive management of water facing climate and global change. Water Resources Management 21(1):49–62. http://dx.doi.org/10.1007/s11269-006-9040-4
Pahl-Wostl, C., G. Holtz, B. Kastens, and C. Knieper. 2010. Analyzing complex water governance regimes: the management and transition framework. Environmental Science & Policy 13(7):571–581. http://dx.doi.org/10.1016/j.envsci.2010.08.006
Parikh, P., M. A. Taylor, T. Hoagland, H. Thurston, and W. Shuster. 2005. Application of market mechanisms and incentives to reduce stormwater runoff: an integrated hydrologic, economic and legal approach. Environmental Science & Policy 8(2):133–144. http://dx.doi.org/10.1016/j.envsci.2005.01.002
Partelow, S., and C. Boda. 2015. A modified diagnostic social-ecological system framework for lobster fisheries: case implementation and sustainability assessment in Southern California. Ocean & Coastal Management 114:204–217. http://dx.doi.org/10.1016/j.ocecoaman.2015.06.022
Pyke, C., M. P. Warren, T. Johnson, J. LaGro Jr., J. Scharfenberg, P. Groth, R. Freed, W. Schroeer, and E. Main. 2011. Assessment of low impact development for managing stormwater with changing precipitation due to climate change. Landscape and Urban Planning 103(2):166–173. http://dx.doi.org/10.1016/j.landurbplan.2011.07.006
Roy, A. H., and W. D. Shuster. 2009. Assessing impervious surface connectivity and applications for watershed management. Journal of the American Water Resources Association 45(1):198–209. http://dx.doi.org/10.1111/j.1752-1688.2008.00271.x
Roy, A. H., S. J. Wenger, T. D. Fletcher, C. J. Walsh, A. R. Ladson, W. D. Shuster, H. W. Thurston, and R. R. Brown. 2008. Impediments and solutions to sustainable, watershed-scale urban stormwater management: lessons from Australia and the United States. Environmental Management 42(2):344–359. http://dx.doi.org/10.1007/s00267-008-9119-1
Ruppert, T., and M. Clark. 2009. Understanding and overcoming legal and administrative barriers to LID: a Florida case study. Pages 1–10 in N. She and M. Char, editors. Low impact development for urban ecosystem and habitat protection. International Low Impact Development Conference 2008, Seattle, Washington, USA, November 16–19, 2008. http://dx.doi.org/10.1061/41009(333)50

27
Salkin, P. E. 2009. Sustainability and land use planning: greening state and local land use plans and regulations to address climate change challenges and preserve resources for future generations. William and Mary Environmental Law and Policy Review 34:121.
Shuster, W. D., S. Dadio, P. Drohan, R. Losco, and J. Shaffer. 2014. Residential demolition and its impact on vacant lot hydrology: implications for the management of stormwater and sewer system overflows. Landscape and Urban Planning 125:48–56. http://dx.doi.org/10.1016/j.landurbplan.2014.02.003
Shuster, W. D., and A. S. Garmestani. 2015. Adaptive exchange of capitals in urban water resources management: an approach to sustainability? Clean Technologies and Environmental Policy 17(6):1393–1400. http://dx.doi.org/10.1007/s10098-014-0886-5
Siglin, D. D. 2012. Municipal use of green stormwater infrastructure in the Delaware River Basin: barriers, drivers, and opportunities for implementation. Thesis. Pennsylvania State University, Pennsylvania, USA. [online] URL: https://etda.libraries.psu.edu/paper/15290/12231
Smith, V. H., G. D. Tilman, and J. C. Nekola. 1999. Eutrophication: impacts of excess nutrient inputs on freshwater, marine, and terrestrial ecosystems. Environmental Pollution 100:179–196. http://dx.doi.org/10.1016/S0269-7491(99)00091-3
Stockwell, A. 2009. Analysis of barriers to low impact development in the North Coast Redwood Region, California. Thesis. Humboldt State University, Arcata, California, USA. [online] URL: http://humboldt-dspace.calstate.edu/bitstream/handle/2148/595/stockwell_thesis_2.12.10_FINAL2.pdf?sequence=1
Tarr, J. A. 1979. The separate vs. combined sewer problem: a case study in urban technology design choice. Journal of Urban History 5(3):308–339.
Tzoulas, K., K. Korpela, S. Venn, V. Yli-Pelkonen, A. Kaźmierczak, J. Niemela, and P. James. 2007. Promoting ecosystem and human health in urban areas using green infrastructure: a literature review. Landscape and Urban Planning 81(3):167–178. http://dx.doi.org/10.1016/j.landurbplan.2007.02.001
United States Environmental Protection Agency (U.S. EPA). 2004. Report to Congress: impacts and control of CSOs and SSOs. No. EPA 833-R-04-001.
Villarreal, E. L., A. Semadeni-Davies, and L. Bengtsson. 2004. Inner city stormwater control using a combination of best management practices. Ecological Engineering 22:279–298. http://dx.doi.org/10.1016/j.ecoleng.2004.06.007
Vogt, J. M., G. B. Epstein, S. K. Mincey, B. C. Fischer, and P. McCord. 2015. Putting the “E” in SES: unpacking the ecology in the Ostrom social-ecological system framework. Ecology and Society 20(1):55. http://dx.doi.org/10.5751/ES-07239-200155

28
Walker, B., C. S. Holling, S. R. Carpenter, and A. Kinzig. 2004. Resilience, adaptability and transformability in social-ecological systems. Ecology and Society 9(2):5. [online] URL: http://www.ecologyandsociety.org/vol9/iss2/art5/
Walsh, C. J. 2004. Protection of in-stream biota from urban impacts: minimise catchment imperviousness or improve drainage design? Marine & Freshwater Research 55(3):317–326. http://dx.doi.org/10.1071/mf03206
Walsh, C. J., T. D. Fletcher, and A. R. Ladson. 2005. Stream restoration in urban catchments through redesigning stormwater systems: looking to the catchment to save the stream. Journal of the North American Benthological Society 24(3):690–705. http://dx.doi.org/10.1899/04-020.1
Wendel, H. E. W., J. A. Downs, and J. R. Mihelcic. 2011. Assessing equitable access to urban green space: the role of engineered water infrastructure. Environmental Science & Technology 45:6728–6734. http://dx.doi.org/10.1021/es103949f
Wiek, A., and K. L. Larson. 2012. Water, people, and sustainability—a systems framework for analyzing and assessing water governance regimes. Water Resource Management 26(11):3153–3171. http://dx.doi.org/10.1007/s11269-012-0065-6
Winz, I., S. Trowsdale, and G. Brierley. 2014. Understanding barrier interactions to support the implementation of sustainable urban water management. Urban Water Journal 11(6):497–505. http://dx.doi.org/10.1080/1573062x.2013.832777

29
Appendix 2
Table A2.1 Modified framework for green infrastructure adoption in urban stormwater social-ecological systems. References provided as working definitions and illustrative examples from the literature.
Tier Level
Attribute
Working Definition
Definition
References†, and Select
Illustrative Examples‡
Second Third Fourth Fifth
Ecological Rules (ER) The broader context of laws, theories, and principles developed in the natural sciences
Epstein et al. (2013)†
ER1 Physical rules Laws, theories, and principles of or relating to nature and properties of matter and energy
ER2 Chemical rules Laws, theories, and principles of or relating to composition, structure, properties, and change of matter
ER3 Biological rules Laws, theories, and principles of or relating to living organisms
Social, economic, and political settings (S) The broader context within which the governance system per se is located, including the effects of
McGinnis (2011)†

30
market dynamics and cultural change
S1
Economic development Efforts that seek to improve the economic well-being and quality of life for a community
Madden (2010)‡, Winz et al. (2014)‡
S2 Demographic trends Developments and changes in human populations
Travaline et al. (2015)‡
S3 Political stability Degree of durability and integrity of a current government regime
S4
Government policies Sets forth policies that address public issues related to, or otherwise effect, stormwater flows
Roy et al. (2008)‡, Dunn (2010)‡, Dochow (2013)‡, Holloway et al. (2014)‡
S5
Market incentives Policies that incentivize certain stormwater management approaches
Carter and Fowler (2008)‡, Dunn (2010)‡, Clean Water America Alliance (2011)‡, Dochow (2013)‡
S6 Media organization
Characteristics of entities engaged in disseminating information to the general public through mass communication channels
Madden (2010)‡, Cettner et al. (2014) b

31
S7
Technology
Broader cultural settings and development context that affect the technologies regularly used by actors in their interactions with the resource units
Clean Water America Alliance (2011)‡, Siglin (2012)‡, Cettner et al. (2014b)‡
Resource Units (RU)
Characteristics of the units extracted from a resource system, which can then be consumed or used as an input in production or exchanged for other goods or services.
McGinnis (2011)†
RU1 Resource unit mobility Ability for resource units to move throughout the resource system
RU2 Growth or replacement rate
Absolute or relative descriptions of changes in quantities (x) of resource units
over time (t)
Basurto et al. (2013)†, Clean Water America Alliance (2011)‡
RU3 Interaction among resource units
Interactions among resource units during different time periods affecting the
future structure of the population
Basurto et al. (2013)†
RU4 Economic value Value of resource units in relation to the portfolio of resources available to
Basurto et al. (2013)†, Clean

32
actors Water America Alliance (2011)‡
RU5 Number of units Amount of individual resource units in resource system
RU6 Distinctive markings
Characteristics that can be identified in resource units and affect actors’ behavior toward them
Basurto et al. (2013)†
RU7 Spatial and temporal distribution
Allocation patterns of resource units across a geographic area in a particular
time period
Basurto et al. (2013)†
Resource systems (RS)
The biophysical system from which resource units are extracted and through which the levels of the focal resource are regenerated by natural dynamic processes
McGinnis (2011)†
RS1
Sector Characteristic(s) of a resource system that distinguishes it from other resource systems
Ostrom (2007)†
RS2
Clarity of system boundaries
Biophysical characteristics that make feasible for actors to determine where the resource system starts or ends
Basurto et al. (2013)†

33
RS3
Size of resource system Absolute or relative descriptions of the spatial extent of a resource system
Basurto et al. (2013)†
RS4
Human-constructed facilities Facilities produced by actors that affect the resource system
RS4.1
Locations
Spatial extent where facilities are constructed by actors
Perez-Pedini et al. (2005)‡, Montalto et al. (2013)‡, Askarizadeh et al. (2015)‡
RS4.1.1
Potential facilities
Availability of suitable locations for potential facilities
Clean Water America Alliance (2011)‡, Hammitt (2010)‡, Shuster et al. (2014)‡
RS4.2
Functionality
Degree to which stormwater management facilities achieve desired outcomes
Nowacek et al. (2003)‡, Siglin (2012)‡, Keeley et al. (2013)‡, Flynn et al. (2014)‡
RS5
Productivity of system Rate of generation of resource units
Clean Water America Alliance (2011)‡ ,

34
Askarizadeh et al. (2015)‡
RS6
Equilibrium properties
Characterization of the type of attractor of a resource system along a range from one to multiple (chaotic) attractors
RS6.3
Frequency/timing of disturbances
Characterization of extreme events (e.g., intense wet weather events)
Madden (2010)‡, Clean Water America Alliance (2011)‡, Keeley et al. (2013)‡, Cettner et al. (2014a)‡
RS7 Predictability of system
dynamics
Degree to which actors are able to forecast or identify patterns in environmentally driven variability on recruitment
Basurto et al. (2013)†, Askarizadeh et al. (2015)‡
RS8
Storage characteristics Degree to which the resource units can be retained or detained
RS8.1
Soil characteristics Hydrologic characteristics of soils
Nowacek et al. (2003)‡, Clean Water America Alliance (2011)‡, Shuster et al. (2014)‡, Rhea et al. (2014)‡

35
RS8.2 Impervious surface area Amount of system coverage by materials that inhibit water infiltration
Dietz and Clausen (2008)‡,
Roy and Shuster (2009)‡, Kertesz et al. (2014)‡
RS9
Location Spatial and temporal extent where resource units are found by actors
Hammitt (2010)‡, Madden (2010)‡, Askarizadeh et al. (2015)‡
RS10
Ecosystem history Past interactions that affect current actors' behaviors and stormwater management plans
RS10.3
Human use and disturbance
Past interactions in which actors have greatly degraded resource system quality
Shandas and Messer, (2008)‡, Hammitt (2010)‡, Madden (2010)‡, Flynn et al. (2014)‡
Governance systems (GS)
The prevailing set of processes or institutions through which the rules shaping the behavior of the actors are set and revised
McGinnis (2011)†
GS1
Policy area Rule systems tailored for a particular area of knowledge, geography, or time
Basurto et al. (2013)†, Holloway et al. (2014)‡

36
GS2 Geographical scale of
governance system
Defined area that participates in, or is subject to, the system of governance
McGinnis and Ostrom (2014)†, Nowacek et al. (2003)‡, Siglin (2012)‡, Stockwell (2009)‡
GS3
Population Defined group of people that participates in, or is subject to, the system of governance
McGinnis and Ostrom (2014)†
GS4
Regime type Specifies the logic upon which the overarching governance system is organized
McGinnis and Ostrom (2014)†
GS5
Rule-making organizations
Institutions recognized by external actors and/or authorities that facilitate formal structured interactions among actors affected by these institutions
McGinnis and Ostrom (2014)†
GS5.1
Number of organizations
Number of organizations affecting decision-making processes related to stormwater management in the watershed
Madden (2010)‡,, (Shuster et al., 2008)‡
, Hammitt (2010)‡, Keeley et al. (2013)‡
GS5.2 Institutional diversity Degree of variation represented among rule-making organizations (including public sector, private
Stockwell (2009)‡, Hammitt

37
sector, nongovernmental, community-based, or hybrid organizations)
(2010)‡, Keeley et al. (2013)‡
GS5.3
Economic resources
Funds available to an organization that are used for the creation, operation and maintenance of the stormwater management program. Funds may be generated through a variety of means such as a variety of taxes, service charges, exactions, assessments, grants, loans, and bonds.
Debo and Reese (2003)†, (Clean Water America Alliance (2011)‡, Keeley et al. (2013)‡
GS5.4
Human resources
Human capital available to an organization for the creation, operation and maintenance of the stormwater management program.
Roy et al. (2008)‡, Stockwell (2009)‡, Winz et al. (2014)‡
GS6
Rules-in-use
Regulations or principles that specify the values of the working components of an action situation, each of which has emerged as the outcome of interactions in an adjacent action situation at a different level of analysis or arena of choice.
Ostrom et al. (1994)†, Clean Water America Alliance (2011)‡, Winz et al. (2014)‡
GS6.1
Operational-choice rules
Set of regulations or principles governing the implementation of practical decisions by individuals authorized or allowed to take these
McGinnis (2011)†, Hammitt (2010)‡

38
actions, often as a result of collective choice processes
GS6.1.1
Stormwater ordinances and regulations
Sets forth public policies directly related to drainage, flood control, and water quality aspects of stormwater, as well as the legal framework for permitting implementation of the controls.
Debo and Reese (2003)†, Hammitt (2010)‡, Madden (2010)‡, Siglin (2012)‡
GS6.1.1.1 Technical basis
Performance standards, design criteria and information provided by rule-making organizations to assist designers in complying with ordinances and regulations.
Debo and Reese (2003)†, Roy et al. (2008)‡, Hammitt (2010)‡, Dochow (2013)‡
GS6.1.1.2 Administrative apparatus
Required procedures, such as approvals, permits, and inspections, to ensure that measures meet technical and legal requirements
Debo and Reese (2003)†, Jaffe et al. (2010)‡, Kulkarni, (2012)‡, Dochow (2013)‡
GS6.1.1.3 Enforcement provisions Procedures for penalties (such as sanctions) applied to rule violators
Dunn (2010)‡, Hammitt (2010)‡,
Jaffe et al. (2010)‡
GS6.1.2
Stormwater utility funding scheme
Premise that urban drainage systems are public systems
Debo and Reese (2003)†, (Fletcher et al., 2011)‡,

39
Keeley et al. (2013)‡
GS6.1.2.1 Price instrument
Fee or tax collected from ratepayers (e.g., property owners) in exchange for demand placed on stormwater system. May exist as a stormwater user fee or runoff charge.
Debo and Reese (2003)†, (Thurston et al., 2003)‡, Parikh et al. (2005)†, Hammitt (2010)‡
GS6.1.2.2 Credits or fee reductions
Mechanism to reduce utility fees. Can be derived though several bases, including the class of property, location within watershed, or activities on the property that reduce stormwater impacts.
Debo and Reese (2003)†, Carter and Fowler (2008)‡,
(Thurston et al., 2010)‡, Kertesz et al. (2014)‡
GS6.1.3 Stormwater management plans
Comprehensive management plan outlining regulations, outcome criteria, technical approaches, financing strategies, and engineering design manuals
Madden (2010)‡, Kulkarni, (2012)‡ Keeley et al. (2013)‡
GS6.1.3.1 Operation and maintenance procedures
Specifies responsibilities, objectives, standards, approaches, and protocols related to the operation and maintenance of stormwater management infrastructure
Nowacek et al. (2003)‡, Clean Water America Alliance (2011)‡, Montalto et al. (2013)‡

40
GS6.1.4 Related regulations
Sets forth public policies that affect the implementation of decisions related to stormwater management (e.g., zoning codes, building codes).
Lassiter (2007)‡, Carter and Fowler (2008)‡, Hammitt (2010)‡
GS6.2
Collective-choice rules
Set of regulations or principles governing institution creation and policy decision-making by actors who are authorized (or allowed) to do so, often as a result of constitutional-choice processes
McGinnis (2011)†
GS6.3
Constitutional-choice rules
Set of regulations or principles governing the processes though which collective-choice stormwater management procedures are defined and legitimized, often resulting in a state or federal guideline or law
McGinnis (2011)†, Dunn (2010)‡, Winz et al. (2014)‡
GS7
Property-rights systems
Systems of interrelated rights that determine which actors have been authorized to carry out which actions with respect to a specified good or service
McGinnis (2011)†
GS7.1 Watercourse law Water laws pertaining to water within a defined watercourse
Debo and Reese (2003)†, Holloway et al. (2014)‡

41
GS7.1.1 Prior appropriation doctrine
Private water laws that are established by the date when beneficial uses were first initiated and tied to place and type of use, not location.
Debo and Reese (2003)†, Jensen (2008)‡, LaBadie (2010)‡, Salkin (2009)‡
GS8 Repertoire of norms and
strategies
Collection of actions and behaviors that actors regularly use, as shaped by the broader social and cultural setting
McGinnis and Ostrom (2014)†, Cettner et al. (2014a)‡, Cote and Wolfe (2014)‡
GS8.1
Diversity
Degree of diversity in norms and strategies related to stormwater management decisions
Nowacek et al. (2003)‡, Hammitt (2010)‡, Madden (2010)‡, Winz et al. (2014)‡
GS8.2
Risk tolerance
Degree to which actors are willing to take action in spite of uncertainties
(Singh, 2006)‡, Olorunkiya et al. (2012)‡, Cettner et al. (2014a)‡
GS9
Network structure The connections among the rule-making organizations and the population subject to these rules
McGinnis and Ostrom (2014) a, Madden (2010)‡, Cettner et al. (2014)‡, Winz et al. (2014a)‡

42
GS9.1
Horizontal
Connections that link actors with each other to act collectively for a common purpose
Shandas and Messer, (2008)‡, Madden (2010)‡, Keeley et al. (2013)‡
GS9.2
Vertical
Connections that link actors with other organizations across levels
Hammitt (2010)‡, Dochow (2013)‡, Keeley et al. (2013)‡, Shuster et al. (2008)‡
GS10
Historical continuity The length of time for which a particular form of governance has been in place
McGinnis and Ostrom (2014)†
Actors (A) Attributes of the individuals or groups that interact with resource units
McGinnis and Ostrom (2014)†
A1
Number of relevant actors
Number of actors affecting decision-making processes related to stormwater management in the watershed
Madden (2010)‡, Keeley et al. (2013)‡, Holloway et al. (2014)‡
A2
Socioeconomic attributes
Characteristics of actors related to social and economic dimensions affecting stormwater management plans
Hammitt (2010)‡, Montalto et al. (2013)‡, Keeley et al. (2013)‡,

43
Travaline et al. (2015)‡
A3
History or past experiences Past interactions that affect current actors' behaviors and stormwater management plans
Montalto et al. (2013)‡, Baptiste (2014)‡, Baptiste et al. (2015)‡,
Travaline et al. (2015)‡
A3.1
Experimentation
Variations in use patterns to increase knowledge of stormwater system dynamics (e.g., demonstration projects)
Madden (2010)‡, Shuster et al., (2013)‡, Marks (2014)‡
A3.2 Environmental justice
Degree to which the development, implementation, and enforcement of stormwater management plans reflect a fair treatment and meaningful involvement of all people regardless of race, color, national origin, or income
Perreault et al. (2012)‡, Flynn et al. (2014)‡, Wolch et al. (2014)‡
A4
Location Physical place where actors are in relation to components of the resource system
Thurston et al. (2010)‡
A5
Leadership/entrepreneurship
Actors who have skills useful to organize collective action and are followed by their peers/ Non-exertion of power particularly of the public/
Hammitt (2010)‡, Winz et al. (2014)‡

44
A5.1
Policy entrepreneur
Individuals who introduce and advocate for policy alternatives in many different settings, and invest time and energy to increase the chances for an idea to be placed on the decision agenda
Kingdon (1995)†, Godwin et al., (2008)‡, Madden (2010)‡, Flynn et al. (2014)‡
A5.2
Policy community
Group composed of specialists in a given policy area developing policy alternatives
Kingdon (1995)†, Shandas and Messer, (2008)‡, Madden (2010)‡ Flynn et al. (2014)‡
A6 Norms (trust-reciprocity)
and social capital
Degree by which one or several individuals can draw upon or rely on others for support or assistance in times of need
Hammitt (2010)‡, Cettner et al., (2014b)‡, Winz et al. (2014)‡
A6.1
Trust
Measure of the extent to which members of a community feel confident that other members will not take maximum advantage of their vulnerabilities and/or live up to their agreements even if doing so may not be in their immediate interest.
McGinnis (2011)†, Nowacek et al. (2003)‡, Shandas and Messer, (2008)‡, Flynn et al. (2014)‡, Travaline et al. (2015)‡
A6.2
Reciprocity
Norm of behavior that encourages members of a group to cooperate
McGinnis (2011)†, Shandas

45
with others who have cooperated with them in previous encounters.
and Messer, (2008)‡, Clean Water America Alliance (2011)‡
A6.3
Social capital
Resources that an individual can draw upon in terms of relying on others to provide support or assistance in times of need, or a group’s aggregate supply of such potential assistance, as generated by stable networks of important interactions among members of that community.
McGinnis (2011)†, Roy et al. (2008)‡, Dochow (2013)‡, Green et al. (2012)‡
A7 Knowledge of SES/mental
models
Degree to which actors understand and make sense of the characteristics and/or dynamics of the SES
Basurto et al. (2013)†, Clean Water America Alliance (2011)‡,
A7.1
Types of knowledge
Types of knowledge actors use to understand SES
A7.1.1
Traditional ecological knowledge
Degree to which actors make use of the cumulative body of knowledge, practices and beliefs evolving by adaptive processes and handed down through generations by cultural transmissions about the relationship of living beings (including humans) with one another and with their environment
Berkes (2012)†, Mbilinyi et al., (2005)‡, Flynn et al. (2014)‡, Winz et al. (2014)‡

46
A7.1.2
Local ecological knowledge
Degree to which actors make use of knowledge and beliefs held by a specific group of people related to their environment acquired over the lifetime of individual generations
Olsson and Folke (2001)† McGarry (2007)‡, Winz et al. (2014)‡, Baptiste et al. (2015)‡
A7.1.3
Technical expertise
Skills held by an actor related to specific technologies
Hammitt (2010)‡, Keeley et al. (2013)‡, Winz et al. (2014)‡
A7.2 Mechanisms to share knowledge
Practices allow actors to learn characteristics of the resource at sufficiently rapid rates leading to behaviors affecting the state of the resource
Thurston et al. (2010)‡, Dolowitz et al. (2012)‡, Green et al. (2012)‡
A7.3
Scale of mental models
Representation of the physical extent of actors’ understanding regarding SES characteristics and dynamics
Madden (2010)‡ , Hellier (2012)‡,
(Cettner, 2012)‡
A8 Importance of resource
(dependence)
Siglin (2012)‡
A9
Technology available Attributes of the stormwater technologies available to actors
Clean Water America Alliance (2011)‡
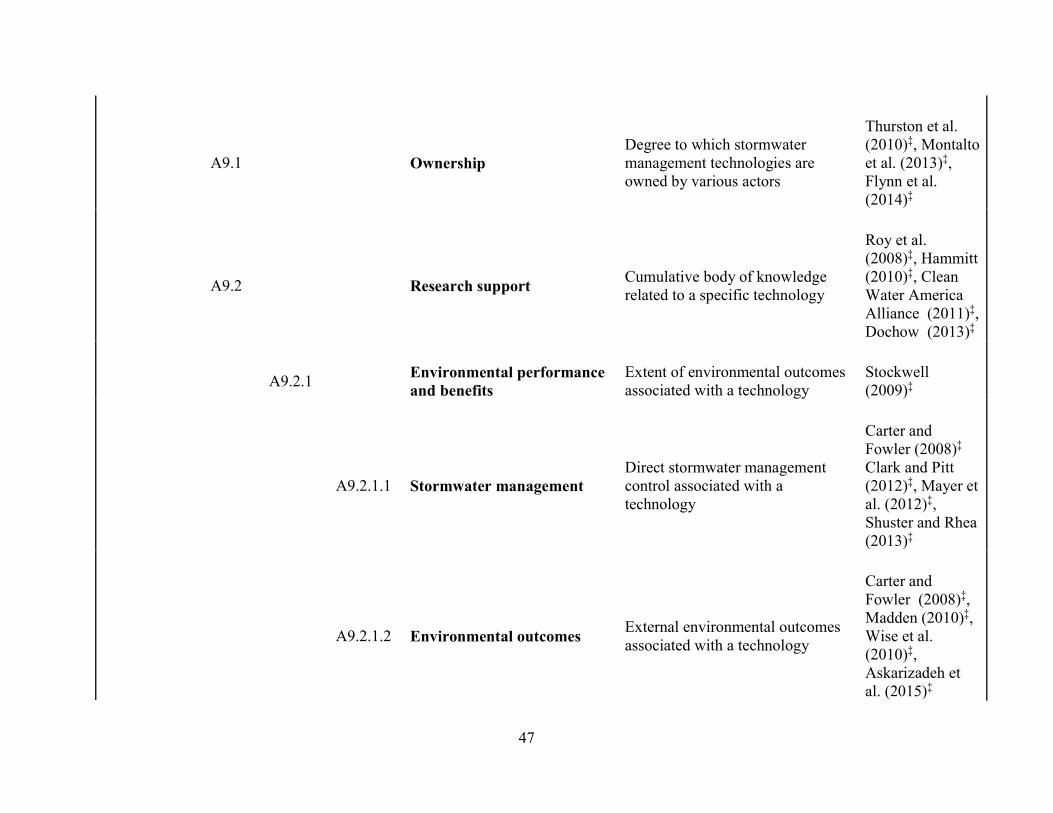
47
A9.1
Ownership
Degree to which stormwater management technologies are owned by various actors
Thurston et al. (2010)‡, Montalto et al. (2013)‡, Flynn et al. (2014)‡
A9.2
Research support
Cumulative body of knowledge related to a specific technology
Roy et al. (2008)‡, Hammitt (2010)‡, Clean Water America Alliance (2011)‡, Dochow (2013)‡
A9.2.1
Environmental performance and benefits
Extent of environmental outcomes associated with a technology
Stockwell (2009)‡
A9.2.1.1 Stormwater management
Direct stormwater management control associated with a technology
Carter and Fowler (2008)‡ Clark and Pitt (2012)‡, Mayer et al. (2012)‡, Shuster and Rhea (2013)‡
A9.2.1.2 Environmental outcomes
External environmental outcomes associated with a technology
Carter and Fowler (2008)‡, Madden (2010)‡, Wise et al. (2010)‡, Askarizadeh et al. (2015)‡

48
A9.2.2
Social outcomes
Extent of social outcomes associated with a technology
Clean Water America Alliance (2011)‡, Kondo et al. (2015)‡
A9.2.3
Complexity of design
Degree to which technology designs are easily replicable
Nowacek et al. (2003)‡, Roy et al. (2008)‡, Hammitt (2010)‡, Dochow (2013)‡
A9.3.4 Maintenance procedures Known practices that maximize the continued functionality of a technology
Lord and Hunt (2008)‡, Clean Water America Alliance (2011)‡, Keeley et al. (2013)‡
A9.2.5 Reliability Extent to which a technology produces the same outcomes on repeated trials
Nowacek et al. (2003)‡, Olorunkiya et al. (2012)‡
A9.3
Associated costs Expenses related to a technology
Perez-Pedini et al. (2005)‡, Roy et al. (2008)‡, Jaffe (2011)‡, Dochow (2013)‡

49
A9.3.1
Capital
Fixed, one-time expenses related to the implementation of a technology
Winz et al. (2014)‡, Thurston et al. (2010)‡, Cote and Wolfe (2014)‡
A9.3.2
Operation and maintenance
Ongoing expenses related to the operation and maintenance of a technology
Clean Water America Alliance (2011)‡, Keeley et al. (2013)‡, Winz et al. (2014)‡
A9.4
Perceptions/attitudes
Subjective assessments on various technology attributes
Siglin (2012)‡, Keeley et al. (2013)‡ , Marks (2014)‡, Carlet (2015)‡
Activities and Processes (I)
I1 Harvesting Gathering of resource units
I2 Information sharing Exchanges of knowledge between actors and/or groups
Roy et al. (2008)‡ Madden (2010)‡, Dolowitz et al. (2012)‡
I3 Deliberation processes Activities related to the of weighing options
Madden (2010)‡

50
I4 Conflicts
Form of disagreement or discord that arise when the beliefs or actions of one or more members of a group are either resisted by or unacceptable to one or more members of another group
Flynn et al. (2014)‡
I5 Investment activities Contributions of financial and other resources by the managers or producers of a public good/service
McGinnis (2011)†, Hammitt (2010)‡, Madden (2010)‡
I6 Lobbying activities Actions that attempt to influence decisions made by rule-making individuals and/or organizations
Madden (2010)‡
I7 Self-organizing activities Interactions among actors that increase some form of overall order or coordination
Roy et al. (2008)‡ Winz et al. (2014)‡
I8 Networking activities
Meetings which build social structure between actors, connecting them through various social familiarities
Roy et al. (2008)‡ Hammitt (2010)‡, Madden (2010)‡
I9 Monitoring activities Accumulation of new knowledge related to system attributes
Stockwell (2009)‡ Flynn et al. (2014)‡,
Askarizadeh et al. (2015)‡

51
I10 Evaluative activities
Determination of which aspects of the observed outcomes are deemed satisfactory and which aspects are in need of improvement
McGinnis (2011)† , Madden (2010)‡, Winz et al. (2014)‡
Outcome Criteria (O)
Evaluative criteria used to determine which aspects of observed outcomes are deemed satisfactory and which aspects are in need of improvement.
McGinnis (2011)†, (Holloway et al. (2014)‡
O1
Social performance measures Indicators that describe various social conditions
Brown and Farrelly (2008)‡, Madden (2010)‡, Winz et al. (2014)‡
O2 Ecological performance
measures Indicators that describe various ecological conditions
Burns et al. (2012)‡, Mayer et al. (2012)‡ (Roy et al., 2014)‡
O3
Externalities to other SESs Indicators that describe impacts on other SESs
Tzoulas et al. (2007)‡, Foster et al. (2011)‡, Mayer et al. (2012)‡
Related ecosystems (ECO) The broader ecological context within which the focal resource system is located, including the
McGinnis and Ostrom (2014)†

52
determinants of many potential exogenous influences
ECO1 Climate patterns Recurring characteristics of the statistical distribution of weather over an extended period of time
Clean Water America Alliance (2011)‡
ECO2 Pollution patterns Recurring characteristics of contaminants that cause adverse effects
Lassiter (2007)‡, Hammitt (2010)‡
ECO3 Flows into and out of focal SES
Movement patterns of various SES attributes
Nowacek et al. (2003)‡ , Madden (2010)‡, Winz et al. (2014)‡
†Reference for attribute definition ‡ Reference that provides illustration of example of attribute’s relationship to green infrastructure adoption in urban stormwater SESs
References
Askarizadeh, A., M.A. Rippy, T.D. Fletcher, D.L. Feldman, J. Peng, P. Bowler, A.S. Mehring, B.K. Winfrey, J.A. Vrugt, A. AghaKouchak, S.C. Jiang, B.F. Sanders, L.A. Levin, S. Taylor, and S.B. Grant. 2015. From Rain Tanks to Catchments: Use of Low-Impact Development to Address Hydrologic Symptoms of the Urban Stream Syndrome. Environmental Science and Technology. 49(19), 11264–11280. doi:10.1021/acs.est.5b01635
Baptiste, A.K. 2014. “Experience is a great teacher”: citizens’ reception of a proposal for the implementation of green infrastructure as stormwater management technology. Community Development 45(4), 337–352. doi:10.1080/15575330.2014.934255
Baptiste, A.K., C. Foley, and R. Smardon. 2015. Understanding urban neighborhood differences in willingness to implement green infrastructure measures: a case study of Syracuse, NY. Landscape and Urban Planning 136, 1–12. doi:10.1016/j.landurbplan.2014.11.012

53
Basurto, X., S. Gelcich, and E. Ostrom. 2013. The social–ecological system framework as a knowledge classificatory system for benthic small-scale fisheries. Global Environmental Change 23(6): 1366–1380. doi:10.1016/j.gloenvcha.2013.08.001
Berkes, F. 2012. Sacred Ecology, 3rd ed. Routledge, New York, New York, U.S.A.
Brown, R., and M. Farrelly. 2008. Sustainable urban stormwater management in Australia: professional perceptions on institutional drivers and barriers, in: Proceedings of the 11th International Conference on Urban Drainage, Edinburgh, Scotland. Citeseer.
Burns, M.J., T.D. Fletcher, C.J. Walsh, A.R. Ladson, and B.E. Hatt. 2012. Hydrologic shortcomings of conventional urban stormwater management and opportunities for reform. Landscape and Urban Planning 105(3), 230–240.
Carlet, F. 2015. Understanding attitudes toward adoption of green infrastructure: A case study of US municipal officials. Environmental Science & Policy. 51, 65–76. doi:10.1016/j.envsci.2015.03.007
Carter, T., and L. Fowler. 2008. Establishing Green Roof Infrastructure Through Environmental Policy Instruments. Environmental Management 42(1), 151–164. doi:10.1007/s00267-008-9095-5
Cettner, A. 2012. Overcoming inertia to sustainable stormwater management practice (PhD Thesis). Lulea University of Technology: Lulea, Sweden.
Cettner, A., R. Ashley, A. Hedström, and M. Viklander, M. 2014a. Assessing receptivity for change in urban stormwater management and contexts for action. Journal of Environmental Management 146, 29–41. doi:10.1016/j.jenvman.2014.07.024
Cettner, A., R. Ashley, A. Hedström, and M. Viklander, M. 2014b. Sustainable development and urban stormwater practice. Urban Water Journal 11(3), 185–197. doi:10.1080/1573062X.2013.768683
Clark, S.E., R. Pitt. 2012. Targeting treatment technologies to address specific stormwater pollutants and numeric discharge limits. Water Research. 46(20), 6715–6730. doi:10.1016/j.watres.2012.07.009
Clean Water America Alliance, 2011. Barriers and Gateways to Green Infrastructure. Washington D.C., U.S.A.

54
Cote, S.A., and S. Wolfe. 2014. Assessing the Social and Economic Barriers to Permeable Surface Utilization for Residential Driveways in Kitchener, Canada. Environmental Practice 16, 6–18. doi:10.1017/S1466046613000641
Debo, T.N., and A. Reese. 2003. Municipal stormwater management, Second Edition. ed. CRC Press, Boca Raton, Florida, U.S.A.
Dietz, M.E., and J.C. Clausen, J.C. Stormwater runoff and export changes with development in a traditional and low impact subdivision. Journal of Environmental Management 87(4), 560–566.
Dochow, D., 2013. Transforming Tradition: A Case Study of Stormwater Management in Clark County, Washington to Assess Barriers to Low Impact Development Strategies (MA Thesis). Evergreen State College. Olympia, Washington, U.S.A. [online] http://archives.evergreen.edu/masterstheses/Accession86-10MES/Dochow_D2013.pdf
Dolowitz, D., M. Keeley, and D. Medearis. 2012. Stormwater management: can we learn from others? Policy Studies. 33(6), 501–521. doi:10.1080/01442872.2012.722289
Dunn, A.D. 2010. Siting green infrastructure: legal and policy solutions to alleviate urban poverty and promote healthy communities. Boston College Environmental Affairs Law Review. 37, 41.
Epstein, G., J.M. Vogt, S.K. Mincey, M. Cox, and B. Fischer. 2013. Missing ecology: integrating ecological perspectives with the social-ecological system framework. International Journal of the Commons 7(2), 432–453.
Fletcher, T.D., C.J. Walsh, D. Bos, V. Nemes, S.R. Rakesh, T. Prosser, B. Hatt, and R. Birch. 2011. Restoration of stormwater retention capacity at the allotment-scale through a novel economic instrument. Water Science & Technology. 64(2).
Flynn, C.D., C.I. Davidson, and J. Mahoney. 2014. Transformational Changes Associated with Sustainable Stormwater Management Practices in Onondaga County, New York. In ICSI 2014: Creating Infrastructure for a Sustainable World, eds. J. Crittenden, C. Hendrickson, and B. Wallace, November 2014, pp. 89–100. doi: 10.1061/9780784478745.009
Foster, J., A. Lowe, and S. Winkelman. 2011. The value of green infrastructure for urban climate adaptation. Center for Clean Air Policy, February. Washington, D.C., U.S.A.

55
Godwin, D., B.L. Parry, F.A. Burris, S.S. Chan, and A. Punton. 2008. Barriers and opportunities for low impact development: case studies from three Oregon Communities. Oregon Sea Grant, Oregon State University Corvallis, Oregon, U.S.A.
Green, O.O., W.D. Shuster, L.K. Rhea, A.S. Garmestani, and H.W. Thurston. 2012. Identification and induction of human, social, and cultural capitals through an experimental approach to stormwater management. Sustainability. 4(8), 1669–1682.
Hammitt, S.A. 2010. Toward sustainable stormwater management: overcoming barriers to green infrastructure (MS Thesis). Massachusetts Institute of Technology, Cambridge, Massachusetts, U.S.A. [online] URL: http:// http://www.mit.edu/afs.new/athena/dept/cron/project/urban-sustainability/Stormwater_Sarah%20Madden/Shammitt_thesis_final.pdf
Hellier, J. 2012. Ecologists and Organizers: Participatory Research for Shared Understanding in the Green Seattle Partnership (MS Thesis). University of Washington. Seattle, Washington, U.S.A. [online] https://dlib.lib.washington.edu/researchworks/handle/1773/20555
Holloway, C.F., C.H. Strickland Jr, M.B. Gerrard, and D.M. Firger. 2014. Solving the CSO Conundrum: Green Infrastructure and the Unfulfilled Promise of Federal-Municipal Cooperation. Harvard Environmental Law Review. 38, 335.
Jaffe, M.S., M. Zellner, E. Minor, M. Gonzalez-Meler, L. Cotner, D. Massey, H. Ahmed, M. Elberts, H. Sprague, S. Wise, and B. Miller. 2010. Using green infrastructure to manage urban stormwater quality: a review of selected practices and state programs. Illinois Environmental Protection Agency. Springfield, IL, USA.
Jaffe, M. 2011. Environmental Reviews & Case Studies: Reflections on Green Infrastructure Economics. Environmental Practice 12(04), 357–365. doi:10.1017/S1466046610000475
Jensen, M.A. 2008. Feasibility of rainwater harvesting for urban water management in Salt Lake City (MS Thesis). The University of Utah. Salt Lake City, Utah, U.S.A. [online] http://content.lib.utah.edu/cdm/ref/collection/etd2/id/1406
Keeley, M., A. Koburger, D.P. Dolowitz, D. Medearis, D. Nickel, and W. Shuster. 2013. Perspectives on the Use of Green Infrastructure for Stormwater Management in Cleveland and Milwaukee. Environmental Management 51(6), 1093–1108. doi:10.1007/s00267-013-0032-x

56
Kertesz, R., O.O. Green, and W.D. Shuster. 2014. Modeling the hydrologic and economic efficacy of stormwater utility credit programs for US single family residences. Water Science & Technology 70(11).
Kingdon, J.W. 1995. Agendas, Alternatives and public policies. Harper Collins. New York, New York, USA.
Kondo, M.C., S.C. Low, J. Henning, and C.C. Branas. 2015. The Impact of Green Stormwater Infrastructure Installation on Surrounding Health and Safety. American Journal of Public Health. 105(3), e114–e121. doi:10.2105/AJPH.2014.302314
Kulkarni, M. 2012. Implementation of green infrastructure as stormwater management in Portland, Oregon (MS Report). Kansas State University. Manhattan, Kansas, U.S.A. [online] https://krex.k-state.edu/dspace/handle/2097/13780
LaBadie, K. 2010. Identifying barriers to low impact development and green infrastructure in the Albuquerque Area (MS Thesis). The University of New Mexico. Albuquerque, New Mexico, U.S.A. [online] www.wrri.nmsu.edu/research/rfp/studentgrants08/reports/LaBadie.pdf
Lassiter, R. 2007. An Assessment of Impediments to Low-Impact Development in the Virginia Portion of the Chesapeake Bay Watershed (MS Thesis). Virginia Commonwealth University. Richmond, Virginia, U.S.A.[online] http://scholarscompass.vcu.edu/etd/892/?mode=full
Lord, W.G., and W.F. Hunt. 2008. Stormwater BMP Maintenance and Certification Program in North Carolina, USA. In Low Impact Development for Urban Ecosystem and Habitat Protection. eds. N. She; and M. Char. American Society of Civil Engineers. pp. 1–6. doi: 10.1061/41009(333)64
Madden, S. A. 2010. Choosing green over gray: Philadelphia’s innovative stormwater infrastructure plan. Massachusetts Institute of Technology. Cambridge, Massachusetts, U.S.A. [online] URL: http://www.mit.edu/afs.new/athena/dept/cron/project/urban-sustainability/Stormwater_Sarah%20Madden/sarahmadden_thesis_MIT.pdf
Marks, A. 2014. Stormwater management in Boston: to what extent are demonstration projects likely to enable citywide use of green infrastructure? Massachusetts Institute of Technology.

57
Mayer, A.L., W.D. Shuster, JJ. Beaulieu, M.E. Hopton, L.K. Rhea, A.H. Roy, and H.W. Thurston. 2012. Environmental reviews and case studies: Building green infrastructure via citizen participation: A six-year study in the Shepherd Creek (Ohio). Environmental Practice. 14(01), 57–67.
Mbilinyi, B.P., S.D. Tumbo, H.F. Mahoo, E.M. Senkondo, and N. Hatibu. 2005. Indigenous knowledge as decision support tool in rainwater harvesting. Physics and Chemistry of the Earth, Parts A/B/C. 30(11-16), 792–798. doi:10.1016/j.pce.2005.08.022
McGarry, S. 2007. Local Ecological Knowledge of Flooding in the Madison Valley Neighborhood of Seattle, Washington (MA Thesis). Evergreen State College. Olympia, Washington, U.S.A. [online] http://archives.evergreen.edu/masterstheses/Accession86-10MES/McGarry_S%20MESThesis%202007.pdf
McGinnis, M.D. 2011. An introduction to IAD and the language of the Ostrom workshop: a simple guide to a complex framework. Policy Studies Journal 39(1), 169–183.
McGinnis, M. D., E. and Ostrom. 2014. Social-ecological framework: initial changes and continuing challenges. Ecology and Society 19(2): 30. http://dx.doi.org/10.5751/ES-06387-190230
Montalto, F.A., T.A. Bartrand, A.M. Waldman, K.A. Travaline, C.H. Loomis, C. McAfee, J.M. Geldi, G.J. Riggall, and L.M. Boles. 2013. Decentralised green infrastructure: the importance of stakeholder behaviour in determining spatial and temporal outcomes. Structure and Infrastructure Engineering 9(12), 1187–1205.
Nowacek, D., E. Nelson, and J. Petchenik. 2003. Social and Institutional Barriers to Stormwater Infiltration. Wisconsin Department of Natural Resources-Bureau of Integrated Science Services. Madison, Wisconsin, U.S.A. [online] www.kitsaplid.org/resources/Barriers_to_SW_Infiltration.pdf
Olorunkiya, J., E. Fassman, and S. Wilkinson. 2012. Risk: A fundamental barrier to the implementation of low impact design infrastructure for urban stormwater control. Journal of Sustainable Development. 5(9), 27.
Olsson, P., and C. Folke. 2001. Local ecological knowledge and institutional dynamics for ecosystem management: A study of Lake Racken watershed, Sweden. Ecosystems. 4(2), 85–104.

58
Ostrom, E., 2007. A diagnostic approach for going beyond panaceas. Proceedings of the National Academy of Sciences 104(39), 15181–15187. doi:10.1073/pnas.0702288104
Ostrom, E., R. Gardner, and J. Walker. 1994. Rules, Games, and Common-pool Resources. University of Michigan Press. Ann Arbor, Michigan, U.S.A.
Parikh, P., M.A. Taylor, T. Hoagland, H. Thurston, and W. Shuster. 2005. Application of market mechanisms and incentives to reduce stormwater runoff: An integrated hydrologic, economic and legal approach. Environmental Science & Policy. 8(2), 133–144.
Perez-Pedini, C., J.F. Limbrunner, and R.M. Vogel. 2005. Optimal location of infiltration-based best management practices for storm water management. Journal of Water Resources Planning and Management 131(6), 441–448.
Perreault, T., S. Wraight, and M. Perreault. 2012. Environmental injustice in the Onondaga lake waterscape, New York State, USA. Water Alternatives 5(2), 485–506.
Rhea, L., W. Shuster, J. Shaffer, and R. Losco. 2014. Data proxies for assessment of urban soil suitability to support green infrastructure. Journal of Soil and Water Conservation. 69(3), 254–265.
Roy, A.H., L.K. Rhea, A.L. Mayer, W.D. Shuster, J.J. Beaulieu, M.E. Hopton, M.A. Morrison, and A.S. Amand. 2014. How Much Is Enough? Minimal Responses of Water Quality and Stream Biota to Partial Retrofit Stormwater Management in a Suburban Neighborhood. PLoS One 9(1), e85011. doi:http://dx.doi.org.libezproxy2.syr.edu/10.1371/journal.pone.0085011
Roy, A.H., and W.D. Shuster. 2009. Assessing impervious surface connectivity and applications for watershed management. Journal of the American Water Resources Association. 45(1), 198–209.
Roy, A.H., S.J. Wenger, T.D. Fletcher, C.J. Walsh, A.R. Ladson, W.D. Shuster, H.W. Thurston, and R.R. Brown. 2008. Impediments and solutions to sustainable, watershed-scale urban stormwater management: lessons from Australia and the United States. Environmental management. 42(2), 344–359.
Salkin, P.E. 2009. Sustainability and Land Use Planning: Greening State and Local Land Use Plans and Regulations to Address Climate Change Challenges and Preserve Resources for Future Generations. William and Mary Environmental Law and Policy Review. 34, 121.

59
Shandas, V., and W. B. Messer. 2008. Fostering Green Communities Through Civic Engagement: Community-Based Environmental Stewardship in the Portland Area. Journal of the American Planning Association. 74(4), 408–418. doi:10.1080/01944360802291265
Shuster, W., and L. Rhea. 2013. Catchment-scale hydrologic implications of parcel-level stormwater management (Ohio USA). Journal of hydrology. 485, 177–187.
Shuster, W.D., S. Dadio, P. Drohan, R. Losco, and J. Shaffer. 2014. Residential demolition and its impact on vacant lot hydrology: Implications for the management of stormwater and sewer system overflows. Landscape and Urban Planning. 125, 48–56.
Shuster, W.D., A.S. Garmestani, O.O.Green, L.K. Rhea, A.H. Roy, and H.W. Thurston. 2013. Catchment-scale stormwater management via economic incentives–an overview and lessons-learned, in: Proceedings of the 8th International Conference of NOVATECH. GRAIE, Lyon, France.
Shuster, W.D., M.A. Morrison, and R. Webb. 2008. Front-loading urban stormwater management for success – A perspective incorporating current studies on the implementation of retrofit low-impact development. Cities and the Environment.1(2), 8.
Siglin, D.D. 2012. Municipal Use of Green Stormwater Infrastructure in The Delaware River Basin: Barriers, Drivers, And Opportunities for Implementation (MS Thesis). The Pennsylvania State University. State College, Pennsylvania, U.S.A. [online] https://etda.libraries.psu.edu/paper/15290/12231
Singh, C. 2006. The process of and barriers to environmentally-oriented real estate development: examining the role of organizational structure, project delivery methods and contracts in low impact development (MS Thesis). Massachusetts Institute of Technology. Cambridge, Massachusetts, U.S.A. [online] http://dspace.mit.edu/handle/1721.1/37465
Stockwell, A. 2009. Analysis of Barriers to Low Impact Development in the North Coast Redwood Region, California (MS Thesis). Humboldt State University. Arcata, California, U.S.A. [online] http://humboldt-dspace.calstate.edu/handle/2148/595
Thurston, H.W., H.C. Goddard, D. Szlag, and B. Lemberg. 2003. Controlling storm-water runoff with tradable allowances for impervious surfaces. Journal of Water Resources Planning and Management 129(5), 409–418.
Thurston, H.W., M.A. Taylor, W.D. Shuster, A.H. Roy, and M.A. Morrison. 2010. Using a reverse auction to promote household level stormwater control. Environmental Science & Policy. 13(5), 405–414.

60
Travaline, K., F. Montalto, and C. Hunold. 2015. Deliberative Policy Analysis and Policy-making in Urban Stormwater Management. Journal of Environmental Policy & Planning. 17(5), 691–708. doi:10.1080/1523908X.2015.1026593
Tzoulas, K., K. Korpela, S. Venn, V. Yli-Pelkonen, A. Kaźmierczak, J. Niemela, and P. James. 2007. Promoting ecosystem and human health in urban areas using green infrastructure: a literature review. Landscape and Urban Planning. 81(3), 167–178.
Winz, I., S. Trowsdale, and G. Brierley. 2014. Understanding barrier interactions to support the implementation of sustainable urban water management. Urban Water Journal 11(6), 497–505.
Wise, S., J. Braden, D. Ghalayini, J. Grant, C. Kloss, E. MacMullan, S. Morse, F. Montalto, D. Nees, D. Nowak, S. Peck, S. Shaikh, and C. Yu. 2010. Integrating Valuation Methods to Recognize Green Infrastructure’s Multiple Benefits, in: Low Impact Development 2010: Redefining Water in the City. Eds. S. Struck, and K. Lichten. American Society of Civil Engineers, pp. 1123–1143. doi: 10.1061/41099(367)98
Wolch, J.R., J. Byrne, and J.P Newell. 2014. Urban green space, public health, and environmental justice: The challenge of making cities “just green enough.” Landscape and Urban Planning. 125, 234–244. doi:10.1016/j.landurbplan.2014.01.017

61
Chapter 3 Transforming a waterscape: Application of the social-ecological framework to assess the evolution of stormwater governance in Onondaga County, New York, USA
3.1 Abstract
The social-ecological systems framework provides a classification structure of attributes and
processes that are common to social-ecological systems. This paper illustrates the use of this
framework to identify key attributes and processes related to the adoption of a municipal green
stormwater infrastructure program. A case study on the urban stormwater social-ecological
system in Onondaga County, New York, examines the factors related to transformational
changes within local stormwater management planning. Important changes occurred in the
program goals, political leadership, economic opportunities, and knowledge sources used in
stormwater program design. These changes are discussed within the context of institutional
power relations and governance characteristics. The findings make explicit the importance of
integrating diverse stakeholder goals and adaptive decision making to address urban water
management challenges.
3.2 Introduction
Historically, stormwater management plans in the U.S. have favored gray infrastructure,
or technologies that either enhance or supplement existing sewer infrastructure. In many
communities, urban stormwater objectives are changing in response to socio-political drivers
(Brown et al. 2009, Moglia et al. 2012). Alternatives to gray infrastructure include an array of
technologies broadly referred to as green stormwater infrastructure (GI), also known as low
impact design. GI is designed to protect, restore, or mimic the natural hydrology of a site.
Examples of GI include green roofs, rain gardens, street trees, and permeable pavement. It has

62
been theorized that GI can improve social-ecological system resilience through improved urban
temperature regulation, air quality management, enhanced biodiversity, and increased
recreational values (Tzoulas, et al., 2007). Using solely gray stormwater infrastructure and
neglecting GI has been linked to negative social-ecological outcomes such as high economic
costs, environmental justice issues, and an inability to accommodate climatic change (Novotny et
al. 2010, Pyke et al. 2011, Wendel et al. 2011, De Sousa et al. 2012).
Hundreds of communities are finding ways to integrate GI into local stormwater
infrastructure systems, including Onondaga County, New York, USA. For decades, Onondaga
County’s stormwater management plans implemented only gray infrastructure technologies to
reach strict ecological outcomes as dictated in a regulatory compliance order, resulting in
disapproval and protest from multiple stakeholder groups. In 2009, these plans changed
significantly with the addition of GI projects and redesign of unfavorable planned gray
infrastructure projects. The revised plans explicitly acknowledged the effects of various
stormwater infrastructure practices have on both the local residents and broader watershed
ecology.
As more communities seek to avoid negative social-ecological outcomes related to
stormwater management planning, there is a need to more easily relate attributes and
configurations of urban stormwater systems to particular outcomes. Frameworks can help in the
accumulation of knowledge from empirical studies and the identification of universal elements
and relationships that lead to particular outcomes. The social-ecological system (SES)
framework gives equal attention to the biophysical and ecological foundations of institutional
systems that influence social-ecological decision-making processes (Ostrom 2007, 2009). We
hypothesize that the SES framework can aid researchers in diagnosing challenges related to the

63
stormwater management and exploring strategies to avoid negative social-ecological outcomes.
This paper presents a case study on the evolution of stormwater management practices in
Onondaga County. An urban water management SES framework (Flynn and Davidson, 2016) is
used to explore the interactions between key SES attributes that led to the adoption of new
stormwater management plans. Two key objectives of this research are (1) to explore the
evolution of SES attributes that led to GI adoption in the case study, and (2) to provide an
illustrative case of positive environmental transformation that connects issues of institutional
power, environmental injustice, and social exclusion using an adapted SES framework. Findings
from this analysis are used to explore broader changes of institutional power relations and
adaptive governance characteristics from the case that are not explicitly defined within the SES
framework.
3.3 Background
Wicked water management problems are related to collective action dilemmas, in which
actors must overcome short-term individual incentives to achieve socially preferred outcomes in
the management of common pool resources (Ostrom et al. 1994, Adams et al. 2003). To
appreciate this complexity, it is helpful to consider a water management system as an example of
a social-ecological system (SES), defined by both its social components, such as water users,
policymakers, governing institutions, and cultural relations to local water supplies, as well as its
ecological components, such as water flows (e.g., precipitation, groundwater, surface water,
wastewater, stormwater, etc.), climate, and topography. Similarly, the concept of a water
landscape, or “waterscape,” has been used to explicitly acknowledge the interacting linkages
between social and environmental attributes of water, power, and governance within water
management systems (Swyngedouw 1999, Harris 2006, Loftus 2009, Loftus and Lumsden 2008,

64
Perreault et. al 2012). Within this waterscape concept, attributes such as water use and rights are
often considered as expressions of power relations.
Numerous SES attributes have the potential to affect the patterns of collective action and
outcomes related to sustainable resource governance (Agrawal 2001, Ostrom 2009). Because
urban water management SESs involve a vast number and diversity of stakeholders, solutions to
overcoming collective action problems in these contexts often require an emphasis on
institutional interactions and decisions, rather than those of individual actors. Many scholars
have explored the effects of institutional characteristics and arrangements on large scale water
management systems (Blomquist et. al 2004, Kerr 2007, Meinzen-Dick 2007, Schlager and
Blomquist 2008, Schlager and Heikkila 2011).
Several conceptual frameworks aim to identify the complex attributes of common pool
resource systems. The SES framework bridges disciplinary and methodological boundaries by
providing classification of important SES attributes and relationships (Ostrom 2007, Ostrom
2009, McGinnis and Ostrom 2014). It draws on an understanding of individual actors,
governance systems, resource units, and resources systems as interacting elements. Revisions to
the SES framework continue to develop as new cases and theoretical insights address limitations
of the framework (Basurto et al. 2013, Epstein et al. 2013, Vogt et al. 2015). Past common pool
resource and SES research has faced criticism for inadequately addressing how power, politics,
and inequality affect governance processes (Goldman 1997, Agrawal 2014). The SES framework
may assist in the analysis of institutional power; because it is not explicitly defined within the
framework, power must be operationalized using select attributes (Epstein et al. 2014).

65
3.4 Methods
The overall empirical research and analysis approach to the study is based on a case study
research design, as the context of stormwater management transformations in Onondaga County
between 1998 and 2009 is viewed as a major part of the study (Yin 2013). A blend of descriptive
and exploratory case study designs are used to both develop a complete description of the
transformation with its context and to develop causal inferences on why important changes took
place (Hancock and Algozzine 2015; Bryman 2015). Triangulation methods, using document
analysis and interviews, were used to identify important factors that acted as both inputs and
outputs of action situations related to stormwater management decisions in Onondaga County
between 1998 and 2009.
Data for this study were collected through several iterations. Regulatory orders that
stipulated the establishment and amendment of Onondaga County’s stormwater management
program were collected as the preliminary document archive. Initial coding of these documents
assisted in identifying a purposeful sample of interviewees and informed the production of an
interview guide. The interview guide was designed to collect information regarding the
stakeholders’ knowledge and attitudes that were associated with the evolution of local
stormwater management plans. A semi-structured format allowed interviewees to recount events
from their own perspective. A “snowball sampling” approach (Biernacki and Waldorf 1981)
enabled both the expansion of the interviewee sample and the document archive for this case. At
the closing of all interviews, participants were asked to suggest other individuals or organizations
relevant to the case, as well as documents that would provide insight to the events related to GI
adoption. This approach carries a risk of reinforcing the silencing of stakeholder perspectives due
to the limited social network of initially chosen interviewees. This risk was offset by

66
independently reviewing documents for additional interviewees and ensuring professionally
diverse interviewees were represented in the sample. In total, 11 in-person interviews were
conducted with government officials, community group representatives, and water quality
researchers.
An SES framework adapted for urban stormwater management (Flynn and Davidson,
2016) is used to describe and organize these findings. Identifying what SES attributes are linked
to particular outcomes is complicated by the dynamic interactions and evolution of multiple
variables. Cole et al. (2014) address this problem by analyzing variables as pre-existing
conditions and significant outcomes and effects of adjacent action situations. A similar process
was used in this study to describe the findings in three analytical stages: pre-existing conditions
during a traditional infrastructure stage (Stage 1), a transition stage when multiple adjacent
actions took place (Stage 2), and the significant outcomes of the early GI implementation stage
(Stage 3).
Results from the SES framework application are used to highlight dynamic power
relations that characterize this case. Epstein et al. (2014) propose a four-step process for testing
the effect of power within an SES study: (1) adopt relevant definitions or theories of power, (2)
classify chosen definitions in terms of one or more SES framework attributes, (3) choose how to
operationalize or measure those attributes for empirical analysis, and (4) analyze the effects of
measured attributes on the outcomes of interest. Institutional power is considered in this study, as
many theoretical connections to institutional power emerged during the data analysis process of
this study. Institutional power can be operationalized at several levels of rule-making, as defined
within the SES framework. Operational-level rules dictate what, when and how resources are
accessed and used (or in the case of stormwater, conveyed and collected), whereas collective-

67
choice rules provide a framework for how and by whom operational rules are created and
modified. Thus, rules that define and constrain the operational activities of SES actors are
established by collective-choice processes (McGinnis and Ostrom 2014). Several SES
framework attributes from Table 2.1 are used to examine the institutional power relations at the
operational and collective levels, including actors’ history of use (A3), participation of
organizations in rule-making processes (GS5), and their perceived fairness of operational rules
(GS6.1) and collective-choice rules (GS6.2).
3.5 Results
3.5.1 Stage 1
Onondaga County’s political boundaries contain at least a portion of four lakes and eight
sub-watersheds that drain to one of two major watersheds2. The Onondaga Lake watershed
covers 738 square kilometers in Central New York and drains to Onondaga Lake, located along
the edge of the City of Syracuse, which is the largest city within Onondaga County. Combined
sewers, which convey both wastewater and stormwater, comprise approximately 58% of the
sewer system in the city. While the City of Syracuse is responsible for the private sewer laterals,
the County government owns and operates the large combined sewer trunk lines that convey city
sewage to the County’s wastewater treatment plant. During wet weather, combined sewer
overflows (CSOs) release a flow of untreated sanitary sewage and stormwater to the lake’s
tributaries.
Onondaga Lake is the central ecological feature of an urban water SES that has
experienced multiple environmental crises and transformations throughout the 20th century due
2 A map of watersheds in Onondaga County is available here: http://www.ongov.net/planning/documents/map_gallery/Watersheds%20in%20Onondaga%20County.pdf

68
to the large contribution of municipal and industrial wastes to the lake. Nutrient-rich treatment
plant effluents led to a hypereutrophic state in the lake, resulting in high populations of
phytoplankton, increased turbidity, extended periods of hypolimnetic anoxia, and a decrease in
ecosystem function (Effler and O’Donnell 2010, Canale and Effler 1989) Drastic changes in lake
ecological regimes led to socioeconomic shifts. For instance, during the early half of the 20th
century, thriving fisheries and resort industries that had operated since the 1800s slowly died out
as the lake’s water quality deteriorated. Swimming was banned in 1940 due to elevated bacteria
counts and poor water clarity, and all fishing was banned in 1972 due to mercury contamination
(Thompson 2002, Landers 2006). CSOs have been a persistent issue in restoration of the lake.
Originally, the sewer system included over 90 CSO points that discharged an average of once per
week.
In the U.S., CSO water management policies are designed around federal and state
regulations which aim to improve urban water quality and prevent human health risks. The
passage of the 1972 Clean Water Act by the U.S. Congress created a national framework for
establishing water quality standards and discharges to surface waters, requiring industries and
municipalities to implement pollution control programs (Clean Water Act, 1972). Under this
framework, municipal CSO abatement programs focus on infrastructure projects that reduce
stormwater flows within the combined sewer system (e.g., sewer separation, storage tanks for
CSO volume), and enhance water quality (e.g., additional or enhanced treatment facilities).
Onondaga County’s Department of Water Environment Protection began implementing
stormwater management plans for CSO control after a 1988 lawsuit. The Atlantic States Legal
Foundation, a local nonprofit, filed the lawsuit against Onondaga County, alleging that the
discharges from the wastewater treatment plant and CSOs were in violation of the Clean Water

69
Act. In 1989, Onondaga County entered into a judgment of consent with Atlantic States Legal
Foundation and the New York State Department of Environmental Conservation (NYSDEC),
requiring the County to execute a series of studies and develop a CSO management plan. In
1990, the Onondaga Lake Management Conference was established and was tasked with
developing and coordinating the implementation of a comprehensive restoration, conservation,
and management plan for Onondaga Lake. The organization consisted of six voting members,
each of which was a governmental organization at either the federal, state, or local level. Studies
and negotiations of the compliance plans ensued until an amended consent judgment as executed
in 1998. At the time, existing gray infrastructure solutions captured or eliminated about 74% of
the total annual CSO volume. The 1998 amended consent judgement required the annual CSO
volume capture rate to increase to 85%, along with increased removal of floatable waste as well
as more stringent water quality standards for bacteria in the lake by 2012. Approved technologies
for the plan included multiple regional treatment facilities, which would provide primary
treatment to disinfect CSOs. The Midland regional treatment facility was the largest proposed
facility and was to be built in the Southside neighborhood, home to a high proportion of low
income and minority residents near Onondaga Creek, a main tributary of Onondaga Lake.
3.5.2 Stage 2
In 1999, the Onondaga Lake Partnership replaced the Onondaga Lake Management
Conference, though its voting membership comprised of the same six governmental
organizations. The exclusion of many stakeholder groups from the planning and decision-making
processes resulted in an opposition to the proposed gray infrastructure projects, most notably
among members of Onondaga Nation, a sovereign member of the Haudenosaunee Confederacy
of native nations, and the residents of the Southside neighborhood of Syracuse. Onondaga Nation

70
retains a section of its original territory within Onondaga County south of the City of Syracuse.
As Onondaga Lake has been considered a sacred site by the Onondaga people for over a
thousand years, Onondaga leaders argue that the infringement of their nation’s traditional
resource use rights and degradation of the lake have harmed their people’s cultural, economic,
physical, emotional, and spiritual well-being (Perreault et al., 2012). Onondaga Nation remains
committed to fulfilling its vision of cooperative resource management and environmental
stewardship of the lake to restore natural hydrological cycles (Onondaga Nation 2010). Despite
the filing of a Land Rights Action in 2005, no formal recognition of these traditional rights has
yet been made. Southside residents viewed the Midland treatment facility as a stigmatizing
environmental injustice. In 2000, a nonprofit organization, the Partnership for Onondaga Creek
(POC), was formed and began organizing protests, lobbying policy makers, and developing
alternative solutions to the Midland treatment facility, such as increasing the use of underground
storage technologies. The POC began to collaborate with the Onondaga Nation and other
stakeholders to form a policy community around alternative stormwater management solutions
(Tauxe 2011). The alternative plans proposed by the POC gained the support of most other
stakeholders including the City of Syracuse. The City refused to sell property to the County
government for the Midland treatment facility, citing concerns from residents who opposed the
plan (Weiner 2002). Claiming a historical and legal interest in Onondaga Creek, Onondaga
Nation was granted admission to the stormwater planning negotiations. With the support of the
Onondaga Nation, the POC was also admitted as a party to the negotiations (Adams 2003).
Ultimately, the County ended negotiations on the Midland treatment facility location and gained
a court order in 2002 to take the City land. The Midland treatment facility construction resulted
in several social damages and injustices in the Southside community (Lane and Heath 2007,

71
POC 2006). An “anti-treatment facility” sentiment grew throughout the County along with a lack
of trust in the stormwater management decision makers.
Several communities in the U.S. began to experiment with GI technologies in the 1990s.
The success of early projects led to an influential 2006 report that stimulated national groups to
promote GI, including the U.S. Environmental Protection Agency (EPA) in 2007 (Kloss et al.
2006, U.S. EPA 2007) Around this time, the POC, Onondaga Nation and other local groups and
stakeholders in Onondaga County began to develop alternative plans in which GI would replace
unfavorable technologies such as regional treatment facilities (Knauss, 2010). However, the pre-
existing County leadership made it difficult for new plans to gain approval. Onondaga County’s
previous stormwater management plans were limited by a governance network with long
standing officials who supported only gray infrastructure solutions. This network had developed
a high level of interconnectivity between engineering firms and the County and State
governments which supported established stormwater management solutions (Tauxe 2011).
A local politician who was familiar with the backlash against regional treatment facility
sentiment of local residents and the alternative plans proposed by the POC began a campaign for
County Executive in 2007. During this time, she reached out to Onondaga Nation and POC to
better understand their goals for stormwater management. She also learned of scientific studies
that suggested treatment facility would not provide a comprehensive solution to reduce bacteria
loadings to the tributaries of Onondaga Lake. Shortly after taking office in January 2008, she
obtained a moratorium on construction of a regional treatment facility that was to be built in
downtown Syracuse. Any changes to the program would require approval by prosecuting parties
of the original consent judgment (the NYSDEC and Atlantic States Legal Foundation) and a
federal judge. Working together with these parties as well as the POC and Onondaga Nation, the

72
County received permission to evaluate alternative engineering solutions for CSO management.
Several committees were created by the County Executive to consider how to move forward. The
committees included representatives from the Onondaga Nation, POC, and other formerly
excluded stakeholder groups. Each committee made recommendations to the County Executive’s
administration regarding revised management plans, though the Executive retained the authority
to decide on the final plans.
3.5.3 Stage 3
The committees’ findings were incorporated into a revised amended consent judgement
in November 2009, requiring Onondaga County to use both gray infrastructure and GI in its
stormwater management plans. Previously, several municipalities throughout the U.S. had
integrated GI into consent decrees as supplemental environmental projects. However, Onondaga
County’s amended consent judgement represented the first time in the U.S. that GI was listed as
a direct legal requirement in the reduction of CSOs (Garrison and Hobbs 2011). Revised gray
infrastructure projects were also required, including a large storage tank in place of the
downtown regional treatment facility. The gray infrastructure projects completed between 1998
and 2009 increased the annual CSO volume capture rate to an estimated 84.6% on a system-wide
basis. The 2009 judgement stipulated a higher annual CSO volume capture rate of 95%, up from
the target of 85% stipulated in the 1998 judgement. This was agreed upon due to modeling
estimates suggesting that had all original planned gray infrastructure project been built, they
would have captured 95% annual CSO volume. Thus, the changes made in 2009 would also need
to reach this level.
The revised plans were approved not only because replacing select gray projects with GI
would be less intrusive, but also because they were estimated to save Onondaga County more

73
than $20 million in meeting regulatory requirements. The revised stormwater program budget of
approximately $400 million set aside $78 million specifically for GI projects, which reflects a
reallocation of funds originally designated towards the regional treatment facilities. Aside from
cost savings, the rapid development of GI projects throughout the County would not have been
possible without additional economic opportunities developed by County officials. The majority
of funds for the GI program are financed through independently-secured bond debt. This is due
to a loan and bond process that favors large centralized projects such as gray infrastructure
(Flynn et al. 2014). Additional funding originated from grant programs for GI projects that did
not exist prior to 2009. Another unique economic opportunity is the development of a public-
private partnership program for GI, which set aside funds to offer reimbursement incentives to
businesses and non-profits to install GI on their property.
3.5.4 Application of Urban Stormwater SES Framework
Multiple SES framework attributes were identified as key factors that shifted over the
course of the three transformation stages. These variables are listed in Figure 3.1, beginning with
S1 and S7 and continuing down to O2. Note that most variables experienced a change between
Stage 1 and Stage 3 as indicated in the figure. For example, for variable S1, there was no grant
funding for green infrastructure during Stage 1, but grants became available by the time of Stage
3. Several key attributes that were identified did not change during the time period explored and
thus acted as system parameters, which are listed as bolded attributes in Stage 1. All Stage 1
attributes set conditions for the principal activities that are listed in the figure under Stage 2,
beginning with I4 and continuing down to I10. The activities are organized to convey a
progression of the types of activities and interactions that occurred over time. While the
significant outcomes in variables are listed in Stage 3, many of these changes took place

74
Figure 3.1 Evolution of Onondaga County’s Stormwater SES, 1998-2009. Bolded items in Stage 1 indicate parameters that did not change between Stage 1 and 3

75
gradually throughout Stage 2 as a result of feedback loops and interactions during various
activities and processes. The variables describing the “Actors” category depict changes related to
the individuals or groups that are involved in rule-making processes related to Onondaga
County’s stormwater management plans.
The norms of the pre-existing political administration in Onondaga County’s governance
network included long standing actors who were accustomed to implementing only gray
infrastructure solutions for CSO compliance (GS8), leading to conflict (I4) with excluded
stakeholder groups that were dissatisfied with these solutions. As these stakeholder groups began
to share information (I2) and network (I8), they self-organized (I7) into a policy community
(A5.2) as they lobbied (I6) to support alternative stormwater management plans. A policy
window, or an opportunity for a policy proposal to move onto the political agenda, can be
opened when two key attributes are present: an alternative policy proposal and a policy
entrepreneur, or an individual who is willing to introduce and advocate for policy alternatives
(Kingdon 1995). The 2007 election for County Executive can be interpreted as the major impetus
for the opening of a policy window for a new stormwater management program featuring
extensive use of GI. The new County Executive acted as a policy entrepreneur (A5.1) by
collaborating with the policy community of excluded stakeholders in support of GI and seeking
additional sources of knowledge (A7.1). The multi-stakeholder steering committees included a
greater number of actors in decision-making processes (GS5.1), including a diverse set of
formerly excluded stakeholder groups that had experienced a history of environmental injustices
(GS5.2, A3.2). This integration of stakeholders within these committees formalized a stronger
horizontal network structure (GS9.1) that allowed for information sharing and deliberations (I2,
I3) between the County government and key stakeholders. This collaboration led to increased

76
trust and reciprocity (A6) and enhanced social outcomes in the County’s stormwater
management plans (O1). Various social performance measures can be used to assess the value of
the County’s revised stormwater management plans. The use of GI created the potential for
additional “co-benefits” (A9.3.1.2), such as increased recreational value and improved health
statistics (Tzoulas et al. 2007). Onondaga County’s GI efforts include goals to enhance social
benefits of infrastructure projects through job programs, strategic project placement, and avoided
social costs associated with additional regional treatment facility and pipeline projects. Both the
environmental and social outcomes of GI can enhance the long-term social well-being of
communities in Onondaga County, though these benefits will be realized over time periods
beyond Stage 3 of this analysis.
Increased knowledge (A7.1) from monitoring efforts (I9) revealed that the proposed gray
infrastructure solutions would not provide a comprehensive solution to Onondaga County’s
environmental problems, despite achieving the desired CSO volume control. A local
environmental non-profit organization conducted a study in 2007 that revealed high levels of
bacteria in tributaries flowing into Onondaga Lake during dry weather, suggesting that there
were sources of contamination other than CSOs leading to non-compliance of state standards for
bacteria (Hughes 2008). Because regional treatment facilities would provide only primary
disinfection treatment to manage bacteria loadings from CSOs, they were deemed inadequate to
reach compliance due contamination sources associated with the existing sewer infrastructure
(RS4.2).
The original consent judgement represents a set of constitutional rules (GS6.3) for
stormwater management. This judgment stipulated that Onondaga County, as the owner of the
central combined sewer lines (A9.2), was required to achieve the ecological performance

77
measures (O2) of capturing or eliminating CSO volumes and reducing bacteria levels in
Onondaga Lake. The desired ecological performance outcomes did not change between 1998 and
2009. However, the constitutional rules regarding how the CSO volumes would be mitigated did
change. The 1998 judgement included a conditional statement that only if there are “proven
technologies available that could satisfy the requirement of the amended consent judgement in a
less costly manner” could the agreed upon plans be revised. The 2009 judgement changed the
constitutional rules of how CSO volume could be managed, acknowledging that GI technologies
would be utilized by the County to achieve the CSO control requirements The revised plans
represent a change in the operational rules (GS6.1.3), dictating the gray and green technologies
that would be implemented.
Two key attribute changes that are reflected in the acceptance of GI in the revised
consent judgement plans include the change in technological settings of accepted stormwater
management technologies (S7) and accepted norms of the governing system (GS8). Technology
settings refer to the broader set of established technological solutions that are generally
considered to be effective stormwater management practices. While GI technologies had been
used in several municipalities of the U.S. in the 1990s, such as Portland and Seattle, they were
not nationally recognized in the U.S. as an effective stormwater management practice until the
U.S. EPA’s promotion of GI in 2007 (U.S. EPA 2007). This change in mindset of the EPA, a
national rule-making organization, acted as an exogenous system setting change and provided
momentum to local stakeholders in Onondaga County to develop stormwater plans which
included GI. New economic opportunities, including public-private partnerships as well as
federal and state assistance (S1), made GI cost effective against gray infrastructure alternatives.

78
3.5.5 Institutional Power
The application of the SES framework identified multiple system attributes and
interactions that shifted over the time period examined in this case study. This identification
process leaves some questions about the heterogeneous interactions between actors and their
desired outcomes. For instance, several groups of actors held differing perceptions of justice
regarding Onondaga County’s original stormwater management plans, as well as varying degrees
of participation in decision-making processes. To explore this heterogeneity, we consider the
interactions among several SES framework attributes as dynamic institutional power relations.
Perreault et al. (2012) analyze the multiple modes of environmental injustices that arose from
uneven power relationships in water resource management in Onondaga County. Their study
provides a detailed account of the historical and geographical perspectives of the Onondaga
Nation and Southside residents, and uncovers the multi-scale nature of environmental injustices
related to water resources in Central New York. The results from our study build on these
findings with insights on the institutional power dynamics and arrangements within the case of
stormwater management planning between 1998 and 2009.
One approach to measuring power is to assess differences in the interests of actors who
are involved in rule-making processes at various levels, and the interests of those who are not.
Under the ruling of the amended consent judgement, the collective-choice rules (GS6.2) stipulate
that the power to negotiate the stormwater management plans is held by the County government
and the prosecuting parties (NYSDEC and Atlantic States Legal Foundation). The County
Executive holds a high level of power in the County government, in that this actor can
unilaterally make decisions regarding operational rules for stormwater management (GS6.1). The
power relations in Stages 1 and 2 connect to the first two faces of power as defined by Steven

79
Lukes (2005). According to Lukes’s second face of power, an imbalance exits when groups are
prevented from representing their interests in political processes by virtue of the actions of
another group. This imbalance is found in Stage 1, as the Onondaga Nation and POC perceived
the stormwater management plans as unjust and insufficient, and both groups were excluded
from negotiations during inputs to rule-making (GS5). Early in the transition period of Stage 2, a
shift in the second face of power dynamics occurred as the both parties were invited into voice
their concerns during the negotiations on the sale of City land to build the Midland Treatment
Plant. It should be noted that while the POC and Onondaga Nation participated in negotiations
during Stages 2, their legitimacy to participate and effect change in the CSO management
planning was never formalized. However, the County ultimately moved forward with the original
plans, using their designated power from the amended consent judgement to do so. These
circumstances can be understood as an exertion of Lukes’s first face of power, such that groups
participating in collective choice decisions fail to produce rules that align with the interests of all
groups. Thus, the shift in the second face of power was not enough to effect change in the
County’s plans. The described imbalances in both Luke’s first and second faces of power and
resulted in resistance to institutional change and undesirable social-ecological outcomes present
in Stage 1 and much of the conflict throughout Stage 2.
Another approach to understanding forms of institutional power is to assess the activities
and processes that create institutions that are resistant to change. One such process is a positive
feedback of increasing returns along a particular decision pathway, which privileges some
groups with a greater share of benefits and institutional control that enhances their bargaining
power (Arthur 1989, North 1990, Pierson 2000). The individual that held the position of County
Executive during Stage 1 and most of Stage 2 was, at the time, the longest running county

80
executive in New York State, holding the office for 20 years. During this time, many of the
consulting engineering firms had personal connections to the County administration and faced
lucrative opportunities to design and implement stormwater management projects (POC 2006,
Tauxe 2011). This feedback between the County’s plans and engineering solutions ended after a
change in the individual attributes of the elected County Executive (A3, A6). The 2008 incoming
County Executive had experienced the early planning negotiations as a previous member of the
Syracuse City Common Council, and she had opposed many of the County’s plans. During her
campaign, she sought guidance from the POC and Onondaga Nation to develop a strategy for
alternative proposals. With her election, the shift in the norms of the County Executive reduced
the difference between the goals of the County and other stakeholder groups.
3.5.6 Adaptive Governance
The institutional power dynamics in this case can be understood within the context of
evolving environmental governance processes that shaped multiple SES outcomes. Onondaga
County’s revised stormwater management approaches embody many characteristics of adaptive
governance (Flynn et al. 2014). Adaptive governance is defined as the range of interactions
between actors, networks, organizations, and institutions emerging in pursuit of a desired state
for SESs (Chaffin et al. 2014). This collaborative approach to governing SESs is often associated
with an increased capacity to adapt to changing social and biophysical circumstances including
shocks and surprises (Dietz et al. 2003, Folke et al. 2005). Two key characteristics of adaptive
governance are a polycentric governance structure, or a system in which political power or
legitimacy is dispersed to separate organizations with overlapping jurisdictions that do not stand
in hierarchical relationship (Skelcher 2005, Huitema et al. 2009); and adaptive management
strategies, in which actors build and make continuous use of SES knowledge through

81
experiments and monitoring efforts to inform policy (Holling 1978, Brunner et. al 2005, Folke et
al. 2005).
In Stage 1, the institutional arrangement of Onondaga County’s stormwater governance
system consisted of a limited number of governmental organizations (GS5.1, GS5.2) operating
under a hierarchical structure of rule-making (GS9.2). The Onondaga Lake Partnership’s original
mission was to act as a bridging organization by coordinating stakeholders, activities, and
information related to watershed management projects. Between 1999 and 2009, the Onondaga
Lake Partnership increased its diversity of member organizations in outreach and project
committees; however, the power for decision-making remained with the government
organizations in the executive committee, and little progress was made in legitimizing the
concerns of multiple stakeholder groups.
Adaptive governance emergence is often initiated by a crisis or release event in an SES
(Chaffin et al. 2014) and is fostered by individual leadership and trust building among
stakeholders at the local level (Olsson et al. 2004, Folke et al. 2005, Olsson et al. 2007). The
2008 election of a new County Executive released past feedback mechanisms of institutional
power. Similar to a policy window, a “window of opportunity” for adaptive governance can be
opened when shadow networks and key leaders come together (Olsson et al. 2006). The policy
community formed by the POC and Onondaga Nation can also be understood as a shadow
network, or an informal collection of individuals or groups without rule-making power. The
2008 planning committees formed by the County Executive created formal institutional
arrangements for this shadow network and other stakeholders to interact, share knowledge, and
build trust. These committees grew into a polycentric governance structure of multiple formal
partnerships between Onondaga County and local nongovernmental and community

82
organizations (GS5.1, GS5.2), thus enhancing the local horizontal network for stormwater
governance (GS9.1). For example, the Environmental Finance Center at Syracuse University, a
university-based organization that promotes the development of sustainable communities and
intergovernmental cooperation, was tasked with leading education and outreach efforts for GI
projects in Onondaga County. In 2013, the Onondaga Lake Partnership transitioned into a more
inclusive bridging organization called the Onondaga Lake Watershed Partnership, operating as a
neutral information clearinghouse for watershed dialogue and decisions with membership open
to all watershed stakeholders.
The changes in the stormwater management institutional network created opportunities
for adaptive management practices, particularly related to the continuous incorporation of new
knowledge into management decisions. Beginning with the 2008 planning committees,
stakeholders were able to share knowledge and negotiate a common vision for stormwater
governance. Several long-term monitoring efforts have existed to collect data on the Onondaga
Lake watershed, some of which are commissioned by Onondaga County. Additional scientific
studies conducted by nongovernmental organizations first provided an impetus for the County to
consider management solutions beyond regional treatment facilities. The 2009 amended consent
judgement set up additional monitoring efforts, where new data are used to evaluate and modify
stormwater management models. Annual reporting requirements are used to determine
compliance with ecological outcomes, as well as to adapt stormwater infrastructure plans as new
information is obtained. The Onondaga Lake Watershed Partnership works to continuously
gather and facilitate input from stakeholders to develop a shared community vision for the
restoration of the Onondaga Lake watershed.

83
3.6 Conclusions
An adapted SES framework was applied to the evolving stormwater management
practices in Onondaga County, NY. This aided in the identification of the social and ecological
factors that affected the decision to adopt GI projects beginning in 2009. The dynamic nature of
these factors was considered by organizing the findings in three stages: pre-existing conditions
during a traditional infrastructure stage (Stage 1), a transition stage when adjacent actions took
place (Stage 2), and the outcomes and effects of the early GI implementation stage (Stage 3).
Several actions and interactions were determined to be critical in the transition to GI adoption,
including ecosystem monitoring, knowledge sharing, and lobbying efforts. Multiple SES
attributes shifted throughout the transition, including the governance network structure, program
goals, economic incentives, and the broader technological mindset for stormwater management.
Select attributes were used to examine the institutional power relations and adaptive governance
characteristics within Onondaga County’s stormwater governance network.
The application of the SES framework to the evolving stormwater management practices
in Onondaga County highlights the combination of SES attributes associated with a transition
towards more sustainable stormwater governance practices. This transition is primarily
understood through the examination of the social dynamics and political ecology of urban
stormwater management that are embedded in the decision-making processes for stormwater
infrastructure. In the case of Onondaga County, the interactions among actors, particularly
among a policy community and policy entrepreneur for GI, were critical to the adoption of a GI
program. The level of local leadership efforts to create a set of new common goals has been
pinpointed as a critical factor in the adoption of GI in other U.S. communities (Hammitt 2010,
Madden 2010), as well as the emergence of adaptive governance practices (Österblom and Folke

84
2013, Shuster and Garmestani 2015). Knowledge related to ecological system attributes, in
particular the functionality of existing infrastructure systems, was found to affect stakeholders’
conceptualization of the urban stormwater SES and which management practices would achieve
desired ecological outcomes. The revised stormwater governance system represents a shift
towards a more adaptive governance approach that includes multiple stakeholder perspectives,
which may lead to more sustainable outcomes for the Onondaga Lake SES.
Certain limitations to these findings should be addressed. Firstly, conclusions drawn
from any singular case study are limited. Further, data for this case study includes stakeholder
interviews, which may be biased due to personal memory or opinion. Additionally, the adoption
of a GI program does not necessarily imply that meaningful changes have taken place across an
urban stormwater SES and may lead to other environmental justice issues (Wolch et al. 2014).
Thus, the acknowledgment of past environmental injustices does not suggest that future
injustices will be avoided. When analyzing urban water SESs, defining the outcomes of interest
will likely determine which variables are most pertinent, or how certain variables are interpreted.
Finally, the conclusions do not suggest that underlying power dynamics or issues of
marginalization have been overcome by the reforms of stormwater management plans or
governance structure. Rather, they signify a shift towards more open and adaptive decision-
making processes. As many governments are facing challenges that limit their ability to regulate
and maintain urban common pool resources, models of adaptive governance could provide more
inclusive, equitable, and sustainable institutional alternatives.

85
3.7 References
Adams, W.M., D. Brockington, J. Dyson, and B. Vira. 2003. Managing tragedies: understanding conflict over common pool resources. Science 302, 1915–1916.
Adams, C.M. 2003. Defending our place: Protest on the Southside of Syracuse (MA Thesis). Syracuse University, Syracuse, New York, U.S.A.
Agrawal, A. 2014. Studying the commons, governing common-pool resource outcomes: Some concluding thoughts. Environmental Science and Policy 36, 86–91.
Agrawal, A. 2001. Common property institutions and sustainable governance of resources. World Development. 29(10), 1649–1672.
Arthur, W.B. 1989. Competing technologies, increasing returns, and lock-in by historical events. The Economic Journal. 99, 116–131.
Basurto, X., S. Gelcich, and E. Ostrom. 2013. The social–ecological system framework as a knowledge classificatory system for benthic small-scale fisheries. Global Environmental Change 23, 1366–1380.
Biernacki, P., and D. Waldorf. 1981. Snowball sampling: Problems and techniques of chain referral sampling. Sociological Methods & Research. 10, 141–163.
Blomquist, W.A., E. Schlager, and T. Heikkila. 2004. Common waters, diverging streams: Linking institutions to water management in Arizona, California, and Colorado. Resources for the Future. Washington, D.C., U.S.A.
Brown, R.R., N. Keath, and T.H.F. Wong. 2009. Urban water management in cities: historical, current and future regimes. Water Science and Technology. 59.
Brunner, R.D., T.A. Steelman, L. Coe-Juell, C.M. Cromley, C.M. Edwards, and D.W. Tucker. 2005. Adaptive governance: Integrating science, policy, and decision making. Columbia University Press. New York, New York, USA.
Canale, R.P., and S.W. Effler. 1989. Stochastic phosphorous model for Onondaga Lake. Water Research. 23(8), 1009–1016.
Chaffin, B.C., H. Gosnell, and B.A. Cosens. 2014. A decade of adaptive governance scholarship: synthesis and future directions. Ecology and Society. 19(3), 56.
Clean Water Act. 1972, 33 U.S.C. § 1251 et seq. (2002). [online] http://epw.senate.gov/water.pdf
Cole, D.H., G. Epstein, and M.D. McGinnis. 2014. Toward a New Institutional Analysis of Social-Ecological Systems (NIASES): Combining Elinor Ostrom’s IAD and SES Frameworks. Indiana Legal Studies Research Paper. 299. [online] http://papers.ssrn.com/sol3/papers.cfm?abstract_id=2490999

86
De Sousa, M.R., F.A. Montalto, and S. Spatari. 2012. Using life cycle assessment to evaluate green and grey combined sewer overflow control strategies. Journal of Industrial Ecology. 16(6), 901–913.
Dietz, T., E. Ostrom, and P.C. Stern. 2003. The struggle to govern the commons. Science 302(5652), 1907–1912.
Effler, S.W., and S.M. O’Donnell. 2010. A long-term record of epilimnetic phosphorus patterns in recovering Onondaga Lake, New York. Fundamental and Applied Limnology. 177(1), 1–18.
Epstein, G., A. Bennett, R. Gruby, L. Acton, and M. Nenadovic. 2014. Studying Power with the Social-Ecological System Framework, in: Understanding Society and Natural Resources. Springer, pp. 111–135.
Epstein, G., J.M. Vogt, S.K. Mincey, M. Cox, and B. Fischer, B. 2013. Missing Ecology: Integrating Ecological Perspectives with the Social-Ecological System Framework. International Journal of the Commons 7 (2): 432–453.
Flynn, C.D., C.I. Davidson, and J. Mahoney. 2014. Transformational Changes Associated with Sustainable Stormwater Management Practices in Onondaga County, New York. In ICSI 2014: Creating Infrastructure for a Sustainable World, eds. J. Crittenden, C. Hendrickson, and B. Wallace, November 2014, pp. 89–100. doi: 10.1061/9780784478745.009
Flynn, C.D., and C.I. Davidson, 2016. “Adapting the Social-Ecological System Framework for Urban Stormwater Management: The Case of Green Infrastructure Adoption.” Ecology and Society, 21(4).
Folke, C., T. Hahn, P. Olsson, and J. Norberg. 2005. Adaptive governance of social-ecological systems. Annual Review of Environment and Resources. 30, 441–473.
Freeman, D.M. 2000. Wicked water problems: Sociology and local water organizations in addressing water resources policy. Journal of the American Water Resources Association. 36, 483–491. doi:10.1111/j.1752-1688.2000.tb04280.x
Garrison, N., and K. Hobbs. 2011. Rooftops to Rivers II: Green Strategies for Controlling Stormwater and Combined Sewer Overflows. Natural Resources Defense Council, Washington D.C.
Goldman, M., 1997. ‘Customs in common’: The epistemic world of the commons scholars. Theory and Society. 26(1), 1–37. doi:10.1023/A:1006803908149
Hammitt, S.A. 2010. Toward sustainable stormwater management: overcoming barriers to green infrastructure (MA Thesis). Massachusetts Institute of Technology. Cambridge, Massachusetts, U.S.A. [online] http://dspace.mit.edu/handle/1721.1/59735
Harris, L.M. 2006. Irrigation, gender, and social geographies of the changing waterscapes of southeastern Anatolia. Environment and Planning D: Society and Space. 24(2), 187.

87
Holling, C.S., editor. 1978. Adaptive environmental assessment and management. John Wiley & Sons, New York, New York, U.S.A.
Hughes, D.J. 2008. An Analysis of Onondaga County Bacteria Monitoring Data. Onondaga Environmental Institute, Syracuse, New York, U.S.A.
Huitema, D., E. Mostert, W. Egas, S. Moellenkamp, C. Pahl-Wostl, and R. Yalcin. 2009. Adaptive water governance: assessing the institutional prescriptions of adaptive (co-) management from a governance perspective and defining a research agenda. Ecology and Society. 14(1), 26.
Kerr, J., 2007. Watershed management: lessons from common property theory. International Journal of the Commons. 1(1), 89–110.
Kingdon, J.W., 1995. Agendas, Alternatives and public policies. Harper Collins. N. Y. USA.
Kloss, C., C. Calarusse, and N. Stoner. 2006. Rooftops to rivers: Green strategies for controlling stormwater and combined sewer overflows. Natural Resources Defense Council, Washington D.C.
Knauss, Tim. 2010. “Activists’ Persistence on Sewage Pushed Onondaga County to ‘Go Green.’” The Syracuse Post Standard, Syracuse, New York, U.S.A. January 18.
Landers, Jay. 2006. New Life for Onondaga Lake. Civil Engineering 76 (5): 64–71, 86.
Lane, A., and T. Heath. 2007. Environmental Racism in Syracuse, NY: A Case Study of Government’s Failure to Protect an Endangered Waterway and a Neglected Community. In The State of Environmental Justice in America. Washington DC: Howard University Law School. [online] www.onondagacreek.org/resources/presentation/howard-university-ej-conference
Loftus, A., 2009. Rethinking political ecologies of water. Third World Quarterly. 30(5), 953–968.
Loftus, A., and F. Lumsden. 2008. Reworking hegemony in the urban waterscape. Transactions of the Institute of British Geographers. 33(1), 109–126.
Ludwig, D. 2001. The era of management is over. Ecosystems 4(8), 758–764.
Lukes, S. 2005. Power: A radical view, 2nd ed. Palgrave Macmillan, Basingstoke, U.K.
Madden, S.A. 2010. Choosing green over gray: Philadelphia’s innovative stormwater infrastructure plan (MA Thesis). Massachusetts Institute of Technology. Cambridge, Massachusetts, U.S.A. [online] http://dspace.mit.edu/handle/1721.1/59750
McGinnis, M.D., and E. Ostrom., 2014. Social-ecological system framework: initial changes and continuing challenges. Ecology and Society. 19(2). doi:10.5751/ES-06387-190230

88
Meinzen-Dick, R. 2007. Beyond panaceas in water institutions. Proceedings of the National Academy of Sciences. 104(39), 15200–15205.
Moglia, M., A.K. Sharma, and S. Maheepala. 2012. Multi-criteria decision assessments using Subjective Logic: Methodology and the case of urban water strategies. Journal of Hydrology. 452–453, 180–189. doi:10.1016/j.jhydrol.2012.05.049
North, D.C., 1990. Institutions, institutional change and economic performance. Cambridge University Press, Cambridge, U.K.
Novotny, V., J. Ahern, and P. Brown, P. 2010. Water centric sustainable communities: planning, retrofitting and building the next urban environment. John Wiley & Sons. New York, New York, U.S.A.
Olsson, P., C. Folke, V. Galaz, T. Hahn, and L. Schultz. 2007. Enhancing the fit through adaptive co-management: creating and maintaining bridging functions for matching scales in the Kristianstads Vattenrike Biosphere Reserve Sweden. Ecology and Society. 12(1), 28.
Olsson, P., C. Folke, and T. Hahn. 2004. Social-ecological transformation for ecosystem management: the development of adaptive co-management of a wetland landscape in southern Sweden. Ecology and Society. 9(4), 2.
Olsson, P., L.H. Gunderson, S.R. Carpenter, P. Ryan, L. Lebel, C. Folke, and C.S. Holling. 2006. Shooting the rapids: navigating transitions to adaptive governance of social-ecological systems. Ecology and Society. 11(1), 18.
Onondaga Nation. 2010. “Onondaga Nation’s Vision for a Clean Onondaga Lake.” [online] http://www.onondaganation.org/land-rights/onondaga-nations-vision-for-a-clean-onondaga-lake/.
Österblom, H., and C. Folke. 2013. Emergence of Global Adaptive Governance for Stewardship of Regional Marine Resources. Ecology and Society. 18(2). doi:10.5751/ES-05373-180204
Ostrom, E., 2009. A General Framework for Analyzing Sustainability of Social-Ecological Systems. Science 325, 419–422. doi: 10.1126/science.1172133
Ostrom, E., 2007. A diagnostic approach for going beyond panaceas. Proceedings of the National Academy of Sciences. 104(39), 15181–15187. doi:10.1073/pnas.0702288104
Ostrom, E., R. Gardner, and J. Walker. 1994. Rules, Games, and Common-pool Resources. University of Michigan Press. Ann Arbor, Michigan, U.S.A.
Perreault, T., S. Wraight, and M. Perreault. 2012. Environmental injustice in the Onondaga lake waterscape, New York State, USA. Water Alternatives. 5(2), 485–506.
Pierson, P. 2000. Increasing returns, path dependence, and the study of politics. American Political Science Review. 94(02), 251–267.

89
POC (Partnership for Onondaga Creek). 2006. A study in environmental racism: “New and significant” information regarding Title VI Claim 03R-04-R2. [online] www.onondagacreek.org/resources/research/study-environmental-racism
Pyke, C., M.P. Warren, T. Johnson, J. LaGro Jr, J. Scharfenberg, P. Groth, R. Freed, W. Schroeer, and E. Main, E. 2011. Assessment of low impact development for managing stormwater with changing precipitation due to climate change. Landscape and Urban Planning. 103(2), 166–173.
Rittel, H.W., and M.M. Webber. 1973. Dilemmas in a general theory of planning. Policy Sciences. 4(2), 155–169.
Schlager, E., and W. Blomquist. 2008. Embracing Watershed Politics. University Press of Colorado, Boulder, Colorado, U.S.A.
Schlager, E., T. Heikkila. 2011. Left high and dry? Climate change, common-pool resource theory, and the adaptability of western water compacts. Public Administration Review. 71(3), 461–470.
Shuster, W., and A. Garmestani. 2015. Adaptive exchange of capitals in urban water resources management: an approach to sustainability? Clean Technologies and Environmental Policy 17(6), 1393–1400. doi:10.1007/s10098-014-0886-5
Skelcher, C. 2005. Jurisdictional integrity, polycentrism, and the design of democratic governance. Governance 18(1), 89–110.
Swyngedouw, E. 1999. Modernity and hybridity: nature, regeneracionismo, and the production of the Spanish waterscape, 1890–1930. Annals of the Association of American Geographers. 89, 443–465.
Tauxe, C. 2011. Onondaga Lake Cleanup: A Case Study of Environmental Conflict & Cross-Cultural Coalition. Peace Studies Journal. 4(1).
Thompson, D.H. 2002. The Golden Age of Onondaga Lake Resorts, 1st ed. Purple Mountain Press, Fleischmanns, New York, U.S.A.
Tzoulas, K., K. Korpela, S. Venn, V. Yli-Pelkonen, A. Kaźmierczak, J. Niemela, and P. James. 2007. Promoting ecosystem and human health in urban areas using green infrastructure: a literature review. Landscape and Urban Planning. 81(3), 167–178.
U.S. EPA. 2007. “Green Infrastructure Statement of Intent.” U.S. EPA. [online] http://water.epa.gov/infrastructure/greeninfrastructure/upload/gi_intentstatement.pdf
Vogt, J.M., G.B. Epstein, S.K. Mincey, B.C. Fischer, and P. McCord. 2015. Putting the “E” in SES: unpacking the ecology in the Ostrom social-ecological system framework. Ecology and Society. 20, 55.

90
Weiner, M. 2002. County wins round in sewage plant fight. The Syracuse Post Standard, Syracuse, New York, U.S.A. November 22.
Wendel, H.E.W., J.A. Downs, and J.R. Mihelcic. 2011. Assessing equitable access to urban green space: the role of engineered water infrastructure. Environmental Science and Technology. 45(16), 6728–6734.
Wolch, J.R., J. Byrne, and J.P. Newell. 2014. Urban green space, public health, and environmental justice: The challenge of making cities “just green enough.” Landscape and Urban Planning. 125, 234–244. doi:10.1016/j.landurbplan.2014.

91
Chapter 4 An assessment of sustainable stormwater system planning in the United States
4.1 Abstract
Improvements to stormwater management infrastructure systems are a critical social and
environmental need in most municipalities of the U.S., particularly those with combined sewer
systems. This study examines the adoption of sustainable stormwater management initiatives in
the U.S., with a focus on green stormwater infrastructure program adoption in large combined
sewer municipalities. Results from surveys of municipal leaders are incorporated into a
framework that identifies significant variables that influence municipal green infrastructure
program adoption. A hurdle model is used to assess the factors that influence management
authorities’ decision to adopt green infrastructure programs, and the factors associated with the
extent of program adoption. We find that the decision to adopt a green infrastructure program is
strongly driven by the population size and precipitation event characteristics of a municipality.
The extent of program adoption is shown to be additionally driven by municipal socioeconomic
characteristics, including residents’ political preferences, median household income, and
unemployment rate.
4.2 Introduction
Municipal wet weather sources of pollution are among the greatest contributors to
modern water quality impairment, aquatic ecosystem degradation, and stream function damage
(National Research Council, 2009). Throughout the past century, urban stormwater management
systems in the U.S. have expanded vast networks of centralized subsurface conveyance
technologies with end of pipe treatment to remedy surface water impairments. Most current

92
stormwater regulations favor the continued use of these traditional or gray infrastructure systems
that either enhance or supplement existing sewer infrastructure. Gray infrastructure engineering
solutions are designed to efficiently handle large amounts of urban runoff volumes. However,
they are associated with multiple societal costs, including high economic costs, negative
community health effects, and, depending on the technology, harmful environmental effects.
Furthermore, gray infrastructure stormwater management technologies encourage the continued
development of impervious urban infrastructure, exacerbating the source of most urban
stormwater problems. Many researchers have pointed out that this current paradigm for urban
stormwater management is neither sustainable nor resilient enough to accommodate climatic
change (De Sousa et al., 2012; Novotny et al., 2010; Pyke et al., 2011).
To decrease the reliance on inefficient centralized treatment systems, distributed systems
of green infrastructure (GI) have been adopted in many U.S. metropolitan areas. GI is designed
to protect or restore the natural hydrology of a system, capturing stormwater volume through the
use of soils, vegetation, and engineered systems that mimic nature. GI supports the principals of
Low Impact Development (LID), an approach to land development or re-development that works
with nature to manage stormwater close to its source. GI can be utilized at site-scale through
practices such as green roofs, permeable pavement, and rain gardens; and at the watershed-scale
through practices such as riparian buffers, flood plain preservation or restoration, and wetland
creation or preservation.
Various regions of the U.S. have utilized GI for distinct primary goals. Cities in the
Northeast, Midwest, and Pacific Northwest tend to implement GI as part of water quality
compliance efforts, particularly those related to combined sewer overflows (CSOs). On the other
hand, cities in water stricken areas of the U.S. tend to focus on GI for water reuse as well as

93
stormwater discharge issues related to water quality. In addition to these primary goals, many
municipalities often consider the adoption of GI programs within a framework of sustainability
goals that seek to maximize welfare gains for the respective communities, such as community
revitalization, “green job” creation, and climate change mitigation and adaptation. Because gray
infrastructure technologies do not seek to enhance the ecological resiliency of communities and
are associated with high societal costs, integrating widespread use of GI into watershed focused
planning represents a shift towards more sustainable environmental planning and stormwater
management methods.
Many case studies have explored the barriers facing individual communities after
stormwater management authorities have made the decision to adopt a GI program (Hammitt,
2010; Madden, 2010; U.S. EPA, 2010). Fewer studies have sought to bring together a more
comprehensive view of common barriers to GI program adoption faced by multiple communities
(Clean Water America Alliance, 2011; Roy et al., 2008). White and Boswell (2007) investigate
the adoption of best practices for stormwater management across municipal governments in
Kansas and find little difference in the quality of management responses across adopters. Several
studies have also focused on the effects of select stages or processes on GI adoption, such as
learning through communication channels (Dolowitz et al., 2012) and the perceptions of risk
effect adoption decisions (Olorunkiya et al., 2012). A study by Carlet (2015) finds evidence that
the perceived usefulness of the ecological and technical benefits of GI influences municipal
planners’ and engineers’ attitudes toward adoption.
There is a need to develop a deeper understanding of why growing numbers of U.S.
municipalities are considering the adoption of GI technologies, and to what degree these
technologies are being used. Viewing the adoption of a comprehensive municipal GI program as

94
a policy innovation, this paper investigates how social, environmental, and economic factors
influence the decisions of CSO management authorities. Survey findings are incorporated into
previous work that identified significant factors that influence municipal GI program adoption
(Flynn and Davidson, 2016). The identified factors are used to investigate key differences
affecting whether or not GI technologies are adopted by CSO management authorities in large
U.S. cities, and the degree to which adopting authorities plan to implement GI technologies. This
article is significant in several ways. First, as the article considers the adoption of an innovative
infrastructure program for municipal governments, both the scale of the type of policy it
considers are relatively underexamined in policy innovation studies. Second, the wide range of
implementation plans associated with GI programs offers a unique opportunity to assess the
intensive margin of adoption in a policy innovation, a measure that is less often assessed in
policy innovation studies.
4.3 Background
4.3.1 Municipal Stormwater Management in the U.S.
Municipal policies to manage wet weather discharges in U.S. municipalities are designed
around federal and state regulations which aim to improve urban water quality and prevent
human health risks. Table 4.1 summarizes key legislative and regulatory action undertaken by
the U.S. government in response to public concern regarding stormwater pollution. The Clean
Water Act enacted a permit program, the National Pollutant Discharge Elimination System
(NPDES), to manage and control point source discharges of pollution. Current regulatory and
management approaches address municipal wet weather discharges under at least two distinct
NPDES programs: stormwater management for municipal separate sewer systems, and
wastewater management for CSOs, sanitary sewer overflows, and peak flow discharges at

95
Table 4.1 Major U.S. legislative and regulatory actions related to municipal stormwater control (adapted from National Research Council, 2009)
Government Actions Enactment
Date(s) Summary and Implications
Federal Water Pollution Control Act
1948, 1952, 1955
Provided federal financial assistance to state & local governments for wastewater treatment plans and state water pollution control programs
Water Quality Act 1965 Required federally approved state water quality standards and implementation plans
Federal Water Pollution Control Act Clean Water Act Section 303(d) Clean Water Act Section 208
1972
Prohibited discharge of pollutants into surface waters without a permit
Outlines water-quality based strategies required if pollution remains after technology-based standards
Designated and funded development of regional water quality management plans
Clean Water Act Sections 301 and 402
1977, 1987 Regulated the release of toxic pollutants and established technology treatment standards for conventional pollutants and priority toxic pollutants
NRDC vs. Costle 1977 Stormwater discharges in the National Pollution Discharge Elimination System (NPDES) program
Clean Water Act Amended Sections 301 and 402
1987 Required the management of urban stormwater pollution and stormwater permit programs for urban areas and industry
National CSO Control Strategy
1989 Encouraged states to develop NPDES permitting strategies for CSOs, and recommended six minimum CSO control measures
EPA’s Phase I Stormwater Permit Rules
1990 Application and permit requirements for large and medium municipalities (≥ population of 100,000); light and heavy industrial facilities; and construction activity ≥ 5 acres
Combined Sewer Overflow Control Policy
1994
Assigns primary responsibility for CSO control implementation and enforcement to NPDES authorities and water quality standards authorities. Established objectives for CSO communities to 1) document and implement nine minimum controls measures, and 2) develop and implement a long-term control plan (LTCP)
EPA’s Phase II Stormwater Permit Rules
1999 Permit requirements for all census-defined urbanized areas, and construction sites 1 to 5 acres
Total Maximum Daily Load (TMDL) Program Litigation
1997-2001
Courts order EPA to establish TMDLs in a number of states if the states fail to do so. Assigns Waste Load Allocations for stormwater discharges which must be incorporated as effluent limitations in permits
Wet Weather Water Quality Act
2000 CSO Control Policy endorsed in the Clean Water Act

96
treatment facilities. In 1987, the U.S. Congress mandated that the U.S. Environmental Protection
Agency (U.S. EPA) control certain stormwater discharges under NPDES, resulting in the Phase I
Stormwater Rules (1990) and Phase II Stormwater Rule (1999) that set forth requirements for
municipal separate storm sewer systems. The 1994 Combined Sewer Overflow Control Policy
put in place a national approach to manage CSOs through the NPDES permit program, providing
guidance for municipalities to implement CSO control measures in a flexible and cost-effective
manner. Management plans produced by CSO management authorities are referred to as a Long-
Term Control Plan (LTCP), which encompass several stages of analysis a CSO management
authority must complete (e.g., characterization of a sewer system, defining control targets, and
development and evaluation of alternative approaches to meet control targets).
There are notable distinctions between CSO control plans and municipal separate
stormwater management plans. The Phase I rules required municipal separate stormwater system
operators to develop a stormwater management program that reduces pollutant loadings and
removes system pollutants to the "maximum extent practicable," which is left to be defined by
each operator. Basic NPDES permit provisions for municipal separate stormwater systems are
targeted at eliminating illicit discharges and controlling runoff from construction sites,
redevelopment sites, and newly developed areas. These provisions can present large
administrative burdens to municipal separate stormwater system operators, but generally do not
require operators to fund large-scale capital infrastructure projects for wet weather control.
Alternatively, for many cities with combined sewer systems, compliance with CSO control
targets represent greater challenges to meeting water quality standards and require large financial
investments to reach compliance. While federal and state funding assistance is available, local
ratepayers ultimately fund the majority of CSO control projects. Thus, CSO control programs

97
represent significant municipal investments that compete with other local programs. The
financial requirements for the combined sewer system upgrades needed in U.S. communities to
reach federal regulatory compliance was estimated at $48 billion in 2012 (U.S. EPA, 2016).
Municipal CSO LTCPs that were developed between 1994 and 2007 focused on gray
infrastructure projects that reduce stormwater flows and enhance water quality through operation
and maintenance practices, collection system controls, and storage facilities, and treatment
facilities. While a 1995 EPA guidance document for LTCPs identified particular GI measures as
potential source controls for wet weather (U.S. EPA, 1995), some municipal authorities faced
barriers to using GI approaches for CSO compliance and instead adopted experimental or
demonstration approaches for stormwater management (Siddique, 2009). During this time
period, GI approaches were also commonly implemented as a form of injunctive relief in
municipal Clean Water Act settlements. One example of an early GI program is the City of
Portland’s downspout disconnection program, which achieved about 4,400 disconnections per
year from 1995 to 2006, removing approximately 1.5 billion gallons of stormwater per year from
the combined sewer system (Portland Bureau of Environmental Services, 2010). The success of
early demonstration projects led an influential 2006 report on the use of GI in various
communities (Kloss et al., 2006), as well collaborative efforts between the EPA and national
groups to promote GI as an environmentally preferable approach for stormwater management.
Since 2007, the US EPA’s Office of Water has released several policy memos and other
forms of support for authorized permitting authorities to structure their permits as well as
guidance or criteria for stormwater plans and CSO LTCPs to utilize GI approaches. Table 4.2
summarizes some of various efforts of the EPA to encourage the use of GI to manage wet
weather. While an increasing number of cities and states are integrating GI provisions into

98
Table 4.2 Major U.S. EPA Office of Water policy memos, action strategies, and collaboration efforts related to green infrastructure
Document Date Summary and Implications Using Green Infrastructure to Protect Water Quality in Stormwater, CSO, Nonpoint Source and other Water Programs
March 2007
Promotes GI as a viable stormwater management solution across multiple EPA regulatory water programs.
Green Infrastructure Statement of Intent
April 2007
Formalized collaborative effort between EPA and four national organizations to promote GI in stormwater control programs
Use of Green Infrastructure in NPDES Permits and Enforcement
August 2007
Encourages incorporation of GI into NPDES stormwater permits and CSO LTCPs. Pledged that EPA could and would use GI in its future enforcement activities.
Action Strategy for Managing Wet Weather with Green Infrastructure
January 2008
Identified objectives for the EPA and partner organizations to develop strategies to stimulate the use of GI throughout the US.
Protecting Water Quality with Green Infrastructure in Water EPA Permitting and Enforcement Programs
April 2011
Reaffirms official commitment to work with communities to incorporate GI into stormwater permits and remedies for noncompliance
Green Long Term Control Plan (LTCP) – EZ
July 2011
Template for CSO communities to assess GI as part of LTCPs
Achieving Water Quality through Integrated Municipal Stormwater and Wastewater
October 2011
Encourages EPA Regions to assist their state and local partners in pursuing an integrated planning approach to Clean Water Act stormwater obligations.
Integrated Municipal Stormwater and Wastewater Planning Approach Framework
June 2012
Framework for integrated planning to facilitate the use of sustainable and comprehensive solutions “that protect human health, improve water quality, manage stormwater as a resource, and support other economic benefits and quality of life attributes that enhance the vitality of communities.”
Federal Agency Support for the Green Infrastructure Collaborative
July 2014
Established partnership among seven federal agencies and outlines commitments of each agency in promoting GI
Green Infrastructure Collaborative Statement of Intent
October 2014
Established network of 26 academic, nongovernmental, and private sector organizations committed to the advancement of GI in US communities

99
municipal separate stormwater system permits, GI capital projects have been more commonly
adopted by sewer management authorities in combined sewer system municipalities. CSO
management authorities have sought multiple ways to adopt GI programs for CSO control,
including the replacement of specific gray infrastructure projects in LTCPs with GI, public-
private partnerships, and adaptive management programs that implement GI over time.
4.3.2 GI Program Adoption as a Policy Innovation
This study considers the adoption of a GI program for CSO management to be a policy
innovation, as it represents a new program that guides infrastructure decisions for CSO
management authorities. A policy innovation is generally defined as the adoption of a new policy
or program by a government entity that had never utilized it previously (Walker, 1969).
Numerous studies have sought to understand and explain why government agencies adopt
particular policies or programs (Berry and Berry, 1990, 1999; Mintrom and Norman, 2009;
Mintrom and Vergari, 1998; Walker, 1969). While most policy innovative research has focused
on states as an adopter, an increasing amount of research has focused on the determinants of
local policy innovation (Godwin and Schroedel, 2000; Shipan and Volden, 2006), including local
environmental policy innovations (Krause, 2011; Pitt, 2010; Vasi, 2006; Wang, 2013; Zahran et
al., 2008).
Traditional technology adoption models seek to measure the extensive margin of
adoption, or a binary assessment of whether an innovation is adopted or not, and fail to capture
the degree of intensity to which technologies are used once adopted (Comin and Mestieri, 2013).
Alternatively, the intensive margin, or a measure of the intensity of the use of an innovation, is a
key component in developing an understanding of its diffusion. GI programs for CSO
management have a wide range of implementation plans, from hundreds of thousands of dollars

100
for small-scale projects to billions of dollars for city-wide projects. While many policy
innovations studies investigate only the extensive margin of a particular policy, this study
investigates the intensive margin of adoption of GI program adoption, which can provide insight
on the influential factors that distinguish “deep” and “superficial” commitments (Berry and
Berry, 1999).
Common determinants of policy innovation include the political, economic, and social
characteristics of a particular governance system. Local context has been shown to affect the
likelihood of an innovation’s adoption, particularly regarding the local relevance and viability for
the innovation, and the availability of local resources to accommodate adoption of the innovation
(Ormrod, 1990). This study hypothesizes that a CSO management authority’s decisions related to
GI program adoption are determined by the relative strengths of motivations and obstacles to
environmental action, and by the resources available to overcome those obstacles.
4.4 Methods
4.4.1 Study Population
The population considered in this study includes U.S. CSO management authorities that
provide combined sewer services for an urban population of at least 100,000 people3. A 2004 US
EPA report lists 828 NPDES permits for authorized CSO discharges (U.S. EPA, 2004, p.
Appendix D). These data were used to identify the CSO management authorities and associated
combined sewer system municipalities. Each NPDES permit number was used to identify
permittees (referred to here as the CSO management authorities, or simply “authorities”). The
largest combined sewer system municipality managed by an authority was identified using
3 This population threshold was chosen in part due to the lack of planning documents available from authorities below this threshold.

101
NPDES permit information and CSO management authority websites. Data from the 2010 U.S.
census were used to account for the population of each serviced municipality, resulting in 68
authorities identified as providing combined sewer management services for municipalities with
populations of 100,000 or above. Documentation on the LTCPs for each community was
collected through municipal websites and emails with municipal officials. Municipalities were
removed from the study population if CSO compliance goals had been met before the year-end
2015 without the adoption of a GI program specifically for CSO compliance efforts. This process
resulted in 53 CSO management authorities remaining in the study population. In cases when
more than one CSO authority provides combined sewer services to a municipality, authorities are
considered separately if each has a unique CSO compliance management plan.
4.4.2 Adoption Criteria
In reviewing the LTCPs of authorities in this population, GI approaches were often found
to be adopted in two stages. First, a pilot program of GI demonstration projects is adopted to
allow for authorities to directly monitor the effectiveness of various GI approaches. This is
followed by a decision on whether a large-scale program is appropriate for CSO management
goals. While many authorities report the adoption of demonstration projects, data on the timing
and funding related to pilot programs were not consistently available across the study population.
Thus, the GI programs considered in this study are only large-scale programs for CSO
management. We define a large-scale program as one that dedicates at least one percent of
overall planned capital expense funds to GI projects for CSO management. The present value of
funding dedicated to an adopted GI program adjusted to 2010 dollars is used as an assessment of
the intensive margin of GI program adoption. Alternative metrics for the intensive margin were
considered, such as the estimated gallons of stormwater captured by planned GI projects relative

102
to gray projects; however, these data were also not consistently available across all plans. For
plans with funds allocated as flexible spending under the principle of adaptive management, we
use 50% of the flexible spending value toward total GI funding. In cases when a funding range
was given, the average value is used. The GI program is considered to be adopted once it is
approved by a municipal government agency (e.g., a common council) or NPDES permitting
authority. While many municipal governments may adopt GI programs that are not associated
with the LTCPs of CSO management authorities, these are not considered within this study.
Unapproved strategic plans recommended to or by a managing authority, and GI programs
adopted as a form of injunction relief, are also not considered as a large-scale GI program
adoption. In cases when multiple GI program updates were released by an authority before 2015,
data on the earliest adoption of a large-scale GI program are used. Of the 53 CSO authorities in
the study population, 22 were found to have adopted large-scale GI programs. Table A4.1 in
Appendix A provides descriptions of the data sources for the adopted programs. Figure 4.1
shows the distribution of logged GI program funding amounts, adjusted to 2010 dollars. The
natural log of GI funding is used to account for the positive skew of adopted GI program
funding.
4.4.3 Independent Variable Selection
Independent variable selection builds on previous research that identified significant
factors that influence municipal decisions related to GI adoption (Flynn and Davidson, 2016).
Select variables from this study are categorized according to a social-ecological framework for
municipal GI adoption. This framework organizes the internal determinants of a decision-making

103
Figure 4.1 Planned capital expenses for GI programs
0
1
2
3
4
5
6
7
8
log
(Pla
nn
ed G
I C
apit
al E
xpen
ses,
in 2
010
mil
lion
$)
Combined Sewer Municipality

104
process into three categories: Resource System, Governance System, and Actors.
4.4.3.2 Resource System
CSO control programs represent significant municipal investments that are required to
meet Clean Water Act compliance goals. The communities considered in this study have a wide
range of capital infrastructure needs for CSO abatement to meet these goals, as each community
has implemented various stages of CSO management compliance efforts. The total funds needed
for an authority to reach Clean Water Act compliance for CSO management are used as a control
for the maximum potential infrastructure funding that a CSO authority is hypothesized to
undertake.
A key measure of a stormwater management technology’s effectiveness is the
performance criteria to which the control is designed. A design storm is a typical approach to the
sizing of stormwater control approaches. Design storms are defined by a recurrence interval
designation (i.e., 1-year), indicating the probability that a storm of a certain size will occur
during any given year, and a recurrence interval duration designation (i.e., 24-hour). Stormwater
control measures such as GI approaches generally designed for smaller precipitation events
(National Research Council, 2009). Thus, it is hypothesized that municipalities with smaller
design storm sizes will be more likely to adopt a GI program.
4.4.3.2 Governance System
CSO management authorities are tasked with making critical decision regarding financial
resource allocations for capital infrastructure projects while under strict regulatory environments.
Funding limitations are among the most frequently cited barriers to GI (Godwin et al. 2008, Roy
et al. 2008, Brown et al. 2009, Earles et al. 2009, Ruppert and Clark 2009, Stockwell 2009), most

105
often in reference to the limited economic resources of enforcement organizations. As GI
technologies are often viewed as less proven than traditional approaches, CSO management
authorities may be less willing to allocate capital infrastructure funds to GI projects for
compliance goals if the degree of effectiveness is uncertain, particularly if economic resources
are scarce. Research on state policy adoption has found that larger states with greater economic
resources are more likely to adopt policy innovations (Berry, 1994; McLendon et al., 2005;
Walker, 1969). Furthermore, larger cities have been found to have higher rates of innovation
(Bettencourt et al., 2007a; Hagerstrand, 1968), and to dedicate more administrative resources to
planning initiatives (Burby and May, 1998). Accordingly, this study hypothesizes that larger and
wealthier municipalities are more likely to have the resources necessary to adapt existing CSO
management plans to include GI programs. Conversely, if GI programs are adopted as additional
programs rather than a substitute for current infrastructure, interest in GI program adoption has
to compete with other municipal priorities such as economic development and job growth. CSO
management program funding guidance has commonly cited municipal unemployment rate as a
primary measure of a municipality’s ability to pay for CSO capital infrastructure projects. Thus,
unemployment rate is used in this study as a competing factor that may hamper the incentive to
adopt a large-scale GI program.
4.4.3.3 Actors
A survey was administered to municipal officials involved in GI planning efforts to
collect additional data on factors that influence GI adoption. The survey included both open
ended questions and questions with a five point Likert scale to collect both descriptive and
quantitative data on each municipality. Administration took place during a 2014 national summit
on GI that included delegates from US communities that had adopted or explored GI programs.
106
Surveys results for select questions from delegates representing 15 CSO management authorities
in this study population are included Appendix A4.
Figure 4.2 shows the results for questions regarding the characterization of non-
governmental organizations (NGOs) in GI planning efforts. The majority of delegates
consistently agreed or strongly agreed that NGOs were successful in encouraging GI initiatives
at a residential and governmental level, while in both a supportive and supervisory role. Open-
ended questions allowed respondents to name the organizations that collaborated in GI adoption
efforts. The most common types of NGOs listed were environmental organizations, particularly
those related to water initiatives, and community development organizations. Interest group
models of local policy adoption suggest that policy emerges from interest group competition,
with the groups that effectively utilize political resources to lobby local elected officials being
more likely to see their preferred policies adopted (Lubell et al., 2009). It is hypothesized that
higher economic resources available to a municipality’s nonprofit environmental organizations
will increase the likelihood of GI program adoption.
The adoption of sustainable initiatives and policies in the US are often characterized by
partisanship (Chandler, 2009; Guber, 2001). An independent variable indicating local political
leanings is used to estimate the level of resident level support or opposition that may accompany
the adoption of a GI program. It is hypothesized that a higher percentage of Democratic Party
voters will lead to an increased likelihood of large-scale GI program adoption.
4.4.4 Data Description
Table 4.3 summarizes data sources used, while Table 4.4 provides summary statistics for
each variable. For resource system factors, the average size of precipitation events is estimated

107
Figure 4.2 Survey results on the involvement of NGOs in GI planning
0%
10%
20%
30%
40%
50%
60%
70%
80%
90%
StronglyDisagree
Disagree Uncertain Agree Strongly Agree
Local non-governmental organizations (NGOs) that support GI initiatives are present.
Local NGOs are successful in encouraging greater use of GI amongst governmentalorganizations.
Local NGOs are successful in encouraging greater use of GI amongst citizens.
Local NGOs serve as environmental watchdog organizations to monitor the actions ofgovernment.
I believe that local NGOs are helpful to GI initiatives.

108
Table 4.3 Variable description and data sources
Factors Variable Measurement (Data Source)
Resource System
Average size of precipitation event
2-year 24-hour precipitation event size, inches (NOAA Precipitation Frequency Data Server)
Quality of built infrastructure
Capital needs for CSO infrastructure to reach Clean Water Act goals (2008 U.S. EPA Clean Watersheds Needs Survey)
Governance System
Population City population, 2010 (US Census)
Economic resources
Median household income, 2010 (American Communities Survey) Unemployment rate, 2010 (American Communities Survey)
Actors
Socioeconomic attributes
% Democratic Vote, 2008 # (2008 Presidential Election, CQ Press)
Environmental leadership
Assets of registered environmental nonprofits, 2010 # (National Center for Charitable Statistics)
Notes: # indicates County level data. Per capita values for data collected at the County level are normalized using County population values collected from the 2010 US Census. For municipalities with multiple counties, a weighted average based on the population of each county that resides in municipality is used.
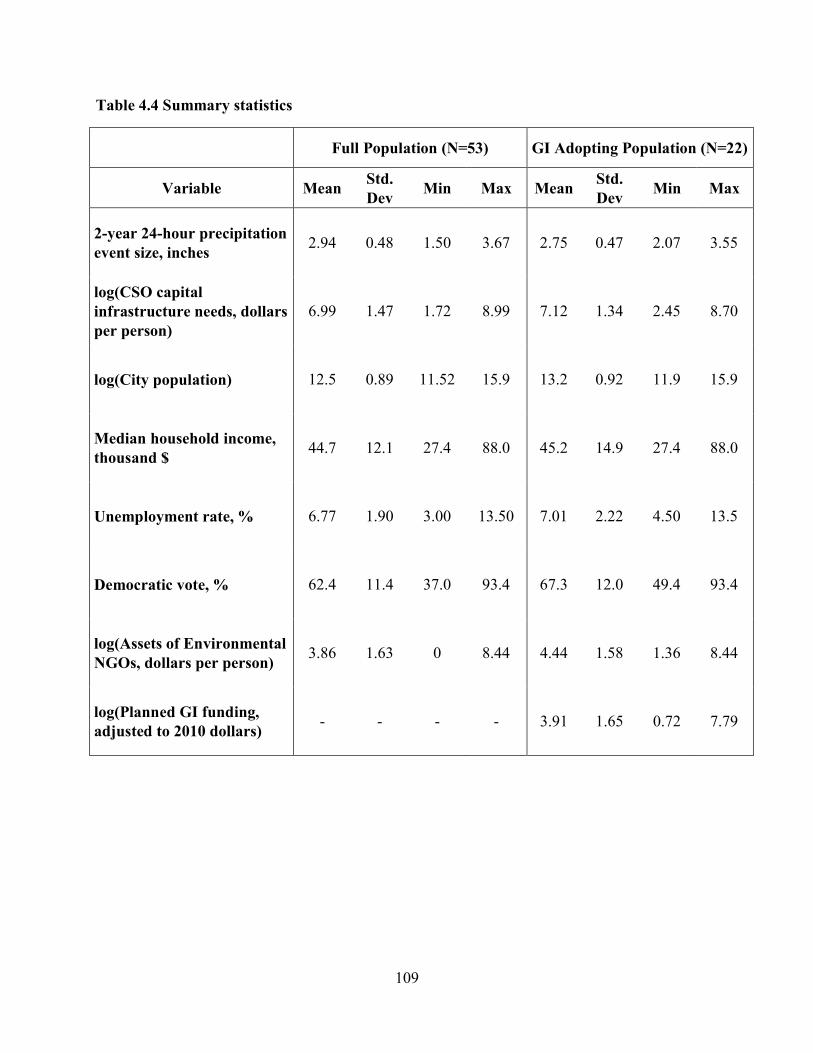
109
Table 4.4 Summary statistics
Full Population (N=53) GI Adopting Population (N=22)
Variable Mean Std. Dev
Min Max Mean Std. Dev
Min Max
2-year 24-hour precipitation event size, inches
2.94 0.48 1.50 3.67 2.75 0.47 2.07 3.55
log(CSO capital infrastructure needs, dollars per person)
6.99 1.47 1.72 8.99 7.12 1.34 2.45 8.70
log(City population) 12.5 0.89 11.52 15.9 13.2 0.92 11.9 15.9
Median household income, thousand $
44.7 12.1 27.4 88.0 45.2 14.9 27.4 88.0
Unemployment rate, % 6.77 1.90 3.00 13.50 7.01 2.22 4.50 13.5
Democratic vote, % 62.4 11.4 37.0 93.4 67.3 12.0 49.4 93.4
log(Assets of Environmental NGOs, dollars per person)
3.86 1.63 0 8.44 4.44 1.58 1.36 8.44
log(Planned GI funding, adjusted to 2010 dollars)
- - - - 3.91 1.65 0.72 7.79

110
using a 2-year, 24-hour precipitation frequency from the National Oceanic and Atmospheric
Administration Precipitation Frequency Data Server. The quality of an authority’s sewer
infrastructure is determined using the capital funding needs for CSO infrastructure to reach
Clean Water Act goals from the 2008 Clean Watersheds Needs Survey (U.S. EPA, 2012),
normalized on a per capita basis. Unemployment rate and median household income fare
collected from the American Communities Survey. Percentage of Democratic Party voters are
measured using the percent total Democratic votes in the 2008 Presidential Election as reported
by CQ Press (CQ Press, 2017). Data from the National Center for Charitable Statistics (NCCS,
2016) are used for environmental leadership, measured using the annual assets of registered
environmental nonprofits. Population data are collected from the 2010 U.S. Census.
4.4.5 Model Specifications
To empirically examine the influence of factors on the extensive and intensive margins of
adopting a comprehensive GI program, a lognormal hurdle model is used. Hurdle models were
first proposed by Cragg (1971) to allow for two sets of explanatory variables in the
determination of purchasing behaviors. This approach allows for the non-adoption of a large-
scale GI program to be treated as a corner solution (as opposed to unobserved) and for the
program adoption and funding decisions to be determined by separate combinations of factors.
The lognormal hurdle model (Wooldridge, 2010) is characterized as
= ∗ = 1[ + > 0] exp( + ) (1)
where is the observed value of GI program funding, is the binary selection variable for
adoption, and ∗ is the latent variable representing GI program adoption, is a vector of
explanatory variables describing the adoption selection, is a vector of coefficients, is a

111
standard normal error term, is a set of explanatory variables describing the program funding
amount, is a vector of coefficients, and and are independent, homoscedastic, normally
distributed error terms. The selection equation is governed by a probit model. Vectors and
are kept identical to assess the effects of each variable in the two decision stages. The model is
estimated using maximum likelihood techniques in Stata with the log likelihood as follows:
= 1[ = 0] log[1 − (γ )] + 1[ > 0] log[ (γ )] (2)
+1[ > 0] log log( ) − − log(σ) − log( )
To relax the assumption homoscedasticity of , heteroskedastic conditional variance is modeled
as
( ) = exp(2 ) (3)
where is a set of exogenous variables, and is the parameter vector. In this study, is
hypothesized to vary with municipal population, as factors that are not explicitly defined in the
model likely have population scaling effects (Bettencourt et al., 2007b, 2007a).
4.5 Results
Table 4.5 presents the regression results of GI program adoption for equation (1) and
average marginal effects of the selection probability and conditional GI program funding
amounts with respect to all independent variables. Table A4.2 in Appendix A4 presents the
regression results for the same model fitted to the outcome variable of planned gray
infrastructure expenses for GI program adopting communities. The results in Tables 4.5 and
A4.2 indicate that the extent of both GI spending and gray infrastructure spending are strongly
driven by remaining funding required for CSO compliance goals and municipal population.
These variables are considered as controls in assessing the extent of any type of CSO

112
Table 4.5 Hurdle model of GI adoption for CSO management Selection of GI Program Amount of GI Funding
Variable (1) (2) (1) (2)
2-year 24-hour precipitation event size, inches -1.635** (0.676)
-1.985** (0.683)
-0.379*** (0.148)
-0.995*** (0.341)
log(Capital needs for CSO infrastructure, dollars per person)
0.361* (0.225)
0.592** (0.246)
0.242*** (0.051)
0.629*** (0.134)
log(City population, thousand people) 1.636***
(0468) 1.967*** (0.521)
0.368*** (0.073)
0.934*** (0.158)
Median household income, thousand $ 0.007
(0.036) -0.012 (0.036)
-0.019*** (0.006)
-0.049*** (0.015)
Unemployment rate, % -0.144 (0.216)
-0.274 (0.216)
-0.136*** (0.035)
-0.352*** (0.090)
Democratic vote, % 0.021
(0.032) 0.038
(0.033) 0.018** (0.008)
0.046** (0.020)
log(Assets of environmental NGOs, dollars per person)
0.106 (0.192)
0.013 (0.195)
-0.095** (0.045)
-0.250** (0.122)
constant -19.528***
(6.280)
-3.238*** (0.099)
log(σ) log(City population, thousand people) -0.102***
(0.012)
N 53
Log likelihood -17.670
AIC 69.340
Note: GI funding levels are logged values in million dollars adjusted to 2010 price. Columns 1 and 3 report coefficient estimates from maximum likelihood, and column 2 and 4
report the corresponding average marginal effect. Standard errors in parentheses. ***p<0.01, **p<0.05, *p<0.1

113
management fund planning. The heteroskedasticity of the error term modeled with the natural
logarithm of municipal population was found to be significant for both the conditional GI
program funding level and conditional gray infrastructure funding level.
Precipitation event size characteristics are found to be strongly significant in both the
selection and amount decision levels for GI program adoption. This supports the hypothesis that
municipalities experiencing large precipitation events more frequently relative to the other CSO
communities in this population are less likely to adopt GI for CSO management, and tend to
dedicate less overall funding toward a GI program when a program is adopted. A growing body
of research has demonstrated the effectiveness of GI approaches during large events (Horst et al.,
2010; Lewellyn et al., 2015). This suggests that authorities may be unaware of the effectiveness
of GI approaches for larger storm events, or that perceptions of GI limitations may have a greater
influence on GI adoption decisions than research supporting the effectiveness of GI technologies.
However, it should be noted that storm size characteristics are associated with climatic regions of
the U.S., suggesting that the influence of this factor may include regional variation
characteristics not captured in this model.
In terms of governance resource factors, median household income and unemployment
rate were found to be strongly significant in the GI funding amount decision level but not the
program selection decision level. The strong negative effect of unemployment rate supports the
hypothesis that GI programs may be competing for other municipal program and development
funding, as a higher rate of municipal unemployment results in less GI program funding adopted.
Interestingly, median household income is also shown to have a significant negative relationship
with the amount of GI program funding. One possible explanation for this relationship is that
authorities that adopt large-scale GI programs do so in part for community redevelopment

114
purposes. The relationship between higher amounts of GI funding with lower median household
incomes may suggest that some authorities adopt a greater extent of GI technologies that provide
additional public services in municipal populations that are experiencing a greater relative level
of fiscal stress.
The coefficient on the voting preference influence is positive and moderately statistically
significant at the program amount decision, indicating an increased amount of GI funding
adopted in cities with a higher percentage of residents with Democratic voting preferences. This
corresponds with research on ideological preferences for sustainability policies (Chandler, 2009;
Guber, 2001). The coefficient for local environmental NGO support is negative in both the
selection and amount models, and moderately significant at the amount model level, which
indicates a higher per capita level of environmental NGO assets is associated with lower levels
of GI program funding. One possible explanation for this unexpected result is that communities
with lower levels of environmental NGO assets are able to effectively do “more with less”
through campaigning for their policy interests without the need for monetary funding. Another
reason may be that there are higher levels of per capita environmental NGO assets in
communities where public authorities take less action for sustainability initiatives such as GI
programs, and residents have effectively built more capital to fill the need for local
environmental initiatives. Alternative functional forms for this variable were tested, such as the
number of environmental NGOs per capita or using metrics for environmental NGOs categorized
as water-initiative based organizations, and the overall model results and marginal effects were
similar in each case. In comparing these findings with those from the survey results, the
regression results suggest that the metrics used in this study are not able to fully capture the
strength of interactions of individual organizations in their lobbying efforts for GI programs.

115
Two authorities’ GI program amounts were identified as outliers, with values over two
standard deviations above the mean. These data points were removed from the population, and
the remaining population was used to re-analyze the fit of the model presented in Table 4.5.
Table A4.3 in Appendix A4 shows the results for GI program adoption with outliers removed.
Overall, the coefficients and average marginal effects for most independent variables in both the
selection model and amount model remain relatively consistent. The sensitivity of municipal
population size is tested using County level population data, collected from the 2010 US Census.
These results are included in Table A4.4 in Appendix A4. The models display little variation in
the significance or effect sizes across all independent variables for both the selection and funding
amount models.
4.6 Discussion and Conclusions
Over the past decade, GI programs have transformed from site-scale demonstration
projects to city-wide initiatives that seek to reduce the negative social and ecological impact of
highly impervious urban environments. This study provides the first comprehensive, quantitative
assessment of factors influencing stormwater management authorities’ decisions related to GI
program adoption. Overall, we find that the decision to adopt a large-scale GI program is
strongly driven by the population size and precipitation event characteristics of a municipality,
while the extent of program adoption is additionally driven by municipal socioeconomic
characteristics, including residents’ political preferences, median household income, and
unemployment rate.
Assessing CSO management authorities’ decisions related to GI program adoption provides
a first step to understanding sustainable design decisions related to municipal stormwater
management systems. Two limitations of this study that can guides future research should be

116
noted. First, the GI programs analyzed are the initial GI program plans adopted by CSO
management authorities. Initial program plans only capture preliminary commitments and goals
for implementation. Some authorities may choose to commit additional funds over time, while
authorities that do not have legal stipulations for specific plans or funding amounts may choose
to implement less GI than original commitment levels. Thus, the findings on the extent of GI
plan adoption reflect a particular willingness and ability to adopt a degree of GI at the start of a
program. How GI technologies are implemented over time by CSO management authorities and
other stormwater management authorities deserves additional research in the future.
Second, this study focuses only on GI capital projects by CSO management authorities
for CSO compliance. Thus, it does not give a full picture of GI adoption in municipalities. Many
municipalities adopt substitutes for the capital improvement GI programs adopted by CSO
managing authorities. For instance, GI policies are commonly adopted within municipal
stormwater management ordinances to require or encourage low impact development practices
on new and redevelopment sites. Capital programs such as those for CSO management are also
commonly adopted in other municipal departments, such as parks and recreation or
transportation departments. Finally, GI may be adopted by CSO management authorities after
Clean Water Act compliance goals have already been reached. Examining the diffusion of policy
substitutes for GI capital improvement programs would provide a more complete picture of how
and why municipal authorities choose to adopt GI policies.

117
4.7 References
Berry, F.S. 1994. Innovation in public management: The adoption of strategic planning. Public Administration Review 322–330.
Berry, F.S., and W.D. Berry. 1999. Innovation and diffusion models in policy research. in P.A. Sabatier and C.M. Weible (eds.). Theories of the Policy Process. Westview Press. Boulder, CO, USA.
Berry, F.S., and W.D. Berry. 1990. State lottery adoptions as policy innovations: An event history analysis. American Political Science Review 84, 395–415.
Bettencourt, L., Lobo, J., Helbing, D., Kühnert, C., and G.B. West. 2007a. Growth, innovation, scaling, and the pace of life in cities. Proceedings of the National Academy of Sciences 104, 7301–7306.
Bettencourt, L., Lobo, J., and D. Strumsky. 2007b. Invention in the city: Increasing returns to patenting as a scaling function of metropolitan size. Research Policy 36, 107–120.
Burby, R.J., and P.J. May. 1998. Intergovernmental Environmental Planning: Addressing the Commitment Conundrum. Journal of Environmental Planning and Management 41, 95–110.
Carlet, F. 2015. Understanding attitudes toward adoption of green infrastructure: A case study of US municipal officials. Environmental Science & Policy 51, 65–76. doi:10.1016/j.envsci.2015.03.007
Chandler, J., 2009. Trendy solutions: Why do states adopt sustainable energy portfolio standards? Energy Policy 37, 3274–3281.
Clean Water America Alliance, 2011. Barriers and Gateways to Green Infrastructure. Washington D.C.
Comin, D.A., and M. Mestieri. 2013. Technology diffusion: Measurement, causes and consequences. National Bureau of Economic Research.
CQ Press, 2017. CQ Press voting and elections collection [http://library.cqpress.com/elections/index.php] (accessed 3.23.17).
Cragg, J.G. 1971. Some statistical models for limited dependent variables with application to the demand for durable goods. Econometrica: Journal of the Econometric Society 829–844.
De Sousa, M.R., Montalto, F.A., and S. Spatari. 2012. Using life cycle assessment to evaluate green and grey combined sewer overflow control strategies. Journal of Industrial Ecology 16, 901–913.
Dolowitz, D., Keeley, M., and D. Medearis. 2012. Stormwater management: Can we learn from others? Policy Studies 33, 501–521. doi:10.1080/01442872.2012.722289

118
Flynn, C.D., and C.I. Davidson. 2016. Adapting the social-ecological system framework for urban stormwater management: the case of green infrastructure adoption. Ecology and Society 21. doi:10.5751/ES-08756-210419
Godwin, M.L., and J.R. Schroedel. 2000. Policy diffusion and strategies for promoting policy change: Evidence from California local gun control ordinances. Policy Studies Journal 28, 760–776.
Guber, D.L. 2001. Voting preferences and the environment in the American electorate. Society & Natural Resources 14, 455–469.
Hagerstrand, T. 1968. Innovation Diffusion as a Spatial Process. University of Chicago Press, Chicago, IL, USA.
Hammitt, S.A. 2010. Toward sustainable stormwater management: Overcoming barriers to green infrastructure. Massachusetts Institute of Technology.
Horst, M., Welker, A.L., and R.G. Traver. 2010. Multiyear performance of a pervious concrete infiltration basin BMP. Journal of Irrigation and Drainage Engineering 137, 352–358.
Kloss, C., Calarusse, C., and N. Stoner. 2006. Rooftops to rivers: Green strategies for controlling stormwater and combined sewer overflows. Natural Resources Defense Council, Washington D.C., USA.
Krause, R.M. 2011. Policy innovation, intergovernmental relations, and the adoption of climate protection initiatives by US cities. Journal of Urban Affairs 33, 45–60.
Lewellyn, C., Lyons, C.E., Traver, R.G., and B.M. Wadzuk. 2015. Evaluation of seasonal and large storm runoff volume capture of an infiltration green infrastructure system. Journal of Hydrologic Engineering 21, 04015047.
Lubell, M., Feiock, R., and S. Handy. 2009. City adoption of environmentally sustainable policies in California’s Central Valley. Journal of the American Planning Association 75, 293–308.
Madden, S.A. 2010. Choosing green over gray: Philadelphia’s innovative stormwater infrastructure plan. Massachusetts Institute of Technology.
McLendon, M.K., Heller, D.E., and S.P. Young. 2005. State postsecondary policy innovation: Politics, competition, and the interstate migration of policy ideas. The Journal of Higher Education 76, 363–400.
Mintrom, M., and P. Norman. 2009. Policy entrepreneurship and policy change. Policy Studies Journal 37, 649–667.
Mintrom, M., and S. Vergari. 1998. Policy networks and innovation diffusion: The case of state education reforms. The Journal of Politics 60, 126–148.

119
National Research Council (NRC). 2009. Urban Stormwater Management in the United States. National Academies Press, Washington D.C., USA
National Center for Charitable Statistics (NCCS). [http://nccs.urban.org/]
Novotny, V., Ahern, J., and P. Brown. 2010. Water Centric Sustainable Communities: Planning, Retrofitting and Building the Next Urban Environment. John Wiley & Sons. Hoboken, NJ, USA.
Olorunkiya, J., Fassman, E., and S. Wilkinson. 2012. Risk: A fundamental barrier to the implementation of low impact design infrastructure for urban stormwater control. Journal of Sustainable Development 5, 27.
Ormrod, R.K. 1990. Local context and innovation diffusion in a well-connected world. Economic Geography 66, 109–122.
Pitt, D. 2010. The impact of internal and external characteristics on the adoption of climate mitigation policies by US municipalities. Environment and Planning C: Government and Policy 28, 851–871.
Portland Bureau of Environmental Services, 2010. City of Portland: Post-2011 CSO Facilities Plan (No. ASFO WQ-NWR-91-75).
Pyke, C., Warren, M.P., Johnson, T., LaGro Jr, J., Scharfenberg, J., Groth, P., Freed, R., Schroeer, W., and E. Main. 2011. Assessment of low impact development for managing stormwater with changing precipitation due to climate change. Landscape and Urban Planning 103, 166–173.
Roy, A.H., Wenger, S.J., Fletcher, T.D., Walsh, C.J., Ladson, A.R., Shuster, W.D., Thurston, H.W., and R.R. Brown. 2008. Impediments and solutions to sustainable, watershed-scale urban stormwater management: lessons from Australia and the United States. Environmental Management 42, 344–359.
Shipan, C.R., and C. Volden. 2006. Bottom-up federalism: The diffusion of antismoking policies from US cities to states. American Journal of Political Science 50, 825–843.
Siddique, M.R., 2009. LID in regulatory water pollution control programs: The District of Columbia experience, in: Low Impact Development for Urban Ecosystem and Habitat Protection. November 16-19, 2008. Seattle, WA, USA. pp. 1–6.
U.S. EPA, 1995. Combined Sewer Overflows: Guidance for Long-Term Control Plan (No. EPA 832-B-95-002).
U.S. EPA, 2004. Report to Congress: Impacts and Control of CSOs and SSOs (No. EPA 833-R-04-001).

120
U.S. EPA, 2010. Green Infrastructure Case Studies [http://nepis.epa.gov/Exe/ZyPDF.cgi/P100FTEM.PDF?Dockey=P100FTEM.PDF] (accessed 10.19.14).
U.S. EPA, 2012. Clean Water Needs Survey 2008: Report to Congress. (No. EPA 832-R-10-002).
U.S. EPA, 2016. Clean Water Needs Survey 2012: Report to Congress. (No. EPA 830-R-15005).
Vasi, I.B. 2006. Organizational environments, framing processes, and the diffusion of the program to address global climate change among local governments in the United States, in: Sociological Forum. Springer, pp. 439–466.
Walker, J.L., 1969. The diffusion of innovations among the American states. American Political Science Review 63, 880–899.
Wang, R. 2013. Adopting local climate policies: What have California cities done and why? Urban Affairs Review 49, 593–613.
White, S.S., and M.R. Boswell. 2007. Stormwater quality and local government innovation. Journal of the American Planning Association 73, 185–193. doi:10.1080/01944360708976152
Wooldridge, J.M., 2010. Econometric analysis of cross section and panel data. MIT press.
Zahran, S., Brody, S.D., Vedlitz, A., Grover, H., and C. Miller. 2008. Vulnerability and capacity: explaining local commitment to climate-change policy. Environment and Planning C: Government and Policy 26, 544–562.

121
Appendix A4
Figure A4.1 Survey results on the adoption and implementation of GI plans
0%
10%
20%
30%
40%
50%
60%
70%
80%
90%
100%
StronglyDisagree
Disagree Uncertain Agree Strongly Agree
Considerations of social criteria (e.g., health and recreation benefits) are important in theapproval of GI projects.
The experiences of other communities pursuing GI initiatives has provided valuable knowledgeto the development of local GI projects.
Interdepartmental coordination issues present barriers to GI project implementation.
Operation and maintenance issues present barriers to GI project implementation.

122
Figure A4.2 Survey results on the role of leadership in GI planning
0%
10%
20%
30%
40%
50%
60%
StronglyDisagree
Disagree Uncertain Agree Strongly Agree
Local leadership efforts provided a major impetus for the pursuit of GI projects.
Much of the effort related to the pursuit of GI projects can be linked to a single individual.
Much of the effort related to the pursuit of GI projects can be linked to a collaborative orpartnership organization.

123
Figure A4.3 Survey results on the characterization of stakeholder interactions in GI planning
0%
5%
10%
15%
20%
25%
30%
35%
40%
45%
50%
Strongly Disagree Disagree Uncertain Agree Strongly Agree
There is a history of a high degree of trust and reciprocity between stakeholders for GI projects.
There is currently a high degree of trust and reciprocity between stakeholders for GI projects.
There is a history of excluding certain groups of stakeholders from water managementinfrastructure decision making processes.
There is a currently an exclusion of certain groups of stakeholders from water managementinfrastructure decision making processes.
There is a local history of environmental injustices related to water management infrastructure.

124
Figure A4.4 Survey results on involvement of various groups in GI planning
0%
10%
20%
30%
40%
50%
60%
70%
80%
Strongly Disagree Disagree Uncertain Agree Strongly Agree
Representatives from indigenous communities are involved with planning GI projects andinitiatives.
Representatives from a diversity of socioeconomic groups are involved with planning GIprojects and initiatives.
A collaborative or partnership organization consisting of multiple stakeholders (e.g.,government authorities, academics, and NGOs, etc.) exists for the development of GI plans.
Monitoring activities for GI projects are conducted by various stakeholders in addition togovernment organizations.

125
Table A4.1 Descriptions of adopted GI programs
Authority Name Combined Sewer City Managed
Total Planned Capital
Funding for GI Notes and source used for funding amount
City of Akron Akron, OH 46
On November 13, 2009, the City of Akron agreed to a consent decree for CSO compliance. This agreement and a 2011 LTCP update allows for green for gray replacement of previous plans. The City of Akron submitted an Integrated Plan to the EPA in August of 2015. The overall program is referred to as “Akron Waterways Renewed!”. Three green projects from the Integrated Plan were approved in December 2015, totaling $46 million in planned costs.
City of Aurora, IL Aurora, IL 3.44
The City of Aurora and Fox Metro Water Reclamation Plant collaborate on the investigation, maintenance and repair of combined and separated sewers throughout the City of Aurora. The City of Aurora’s LTCP (dated March 2010, revised April 25, 2011, approved July 31, 2014) includes several GI projects (2010 LTCPU, Table 5.02-01)
Massachusetts Water Resources Authority (MWRA)
Boston, MA 13.8
One LTCP is shared by MWRA and the City of Cambridge. MWRA’s final CSO LTCP was approved in 1998 and revised in 2006. The total cost of the CSO control program is $857 million (FY12 CIP). The revised CSO control plan for the Alewife Brook comprises several component projects that were individually incorporated into the Court Schedule in April 2006. In 1997, MWRA originally agreed to $13.8 million for a wetlands project in the court schedule (out of $487 million when EPA and DEP approved the Final CSO Facilities Plan and Environmental Impact Report in 1997). Sources: MWRA 2004 Annual LTCP progress report, page 13 MWRA 2013 Annual LTCP progress report
Boston Water and Sewer Commission (BWSC)
Boston, MA 2.24
A consent decree was signed in 2012 requiring BWSC to initiate GI demonstration projects and to control pollutants other than sewage, using GI best practices to manage these pollutants wherever possible. Source: BWSC 2014-2016 Capital Improvement Program (2013), Table 15

126
Buffalo Sewer Authority (BSA) Buffalo, NY 92.61
On April 30, 2012 BSA submitted a LTCP, which has since been revised and was submitted on January 10, 2014. On April 14, 2014, the plan including GI was approved by the Environmental Protection Agency and the New York State Department of Environmental Conservation. Source: BSA 2014 LTCP, Table ES-6
Metropolitan Water Reclamation District of Greater Chicago (MWRD)
Chicago, IL 37.5
1972 began the Tunnel and Reservoir Plan (TARP) for flood control and pollution prevention. In 1995, TARP was approved as the LTCP for MWRDGC, Chicago, and 40 satellite communities. In 2011, MWRD entered a consent decree for CSO violations (was delayed until 2014 approval). The consent decree contains a requirement that MWRD spend $25-50 million to develop 10 million gallons in retention capacity using GI by 2015 Source: 2014 consent decree requires $25-50 million dollars be spent on GI. / Note: The City of Chicago has several GI programs (e.g., green roof and green alley programs) embedded in a number of departments, including $50M GI strategy released in 2014. However, the City does not have separate consent decree or LTCP.
Metropolitan Sewer District (MSD)
Cincinnati, OH
34.41
Consent Decree was entered in 2006 for a global wet weather plan. Final Wet Weather Improvement Plan approved in federal court in 2010 that focuses on CSO control and implementation of SSO correction plan. MSD has a three-prong approach – storage and conveyance, product control, and source control to control sources of overflows (includes GI). Cost: Capped at $1.5 billion over a period of 19 years. Source: 2010 Wet Weather Improvement Plan, Attachments 1B and 4 (Attachment 4 items includes: Green Program, Regional BMPs, and Long Term Projects)
Northeast Ohio Regional Sewer District (NEORSD)
Cleveland, OH
42
Original plan approved in 2003. Revised 2010 plan includes combination of gray infrastructure and GI at a cost of $3 billion over 25 years. NEORSD signed a Consent Decree in July 2011 which replaced a LCTP submitted in 2003. Source: Appendix 3 of 2010 Consent Decree (signed 2010, filed 7/7/11)
City of Columbus, Department of Public Utilities
Columbus, OH
373
LTCP and Wet Weather Management Plan (WWMP) submitted in 2005 and approved in 2009, estimated to cost $2.5B over 20 years. In 2012, Columbus’s “Blueprint Columbus” plan was proposed (and officially accepted in 2015) as a replacement to the 2005 WWMP. Blueprint plan is projected to cost a total of about $1.78B and GI is $373M Source: 2015 Columbus Blueprint, p 153, approved by the Ohio EPA on December 1, 2015

127
Detroit Water and Sewerage Department (DWSD)
Detroit, MI 50
Detroit adopted a LTCP in 1993 with a $2.2 billion CSO program. The primary aspect of Detroit’s plan, the Upper Rouge Tunnel (est. to cost $1.5 billion) was cancelled in 2009 due to financial hardship that exceeded EPA’s criteria. Detroit’s Alternative Rouge River Control Plan includes 25 phased projects focusing on GI (to reduce CSO volume by 10-20%). Source: 2011 Alternative Rouge River Control Plan
Kansas City’s Water Services Kansas City,
MO 114
Kansas City submitted an Overflow Control Plan in 2008, including a GI program. If pilots are successful, additional gray infrastructure projects may be replaced with GI. Overall cost is approximately $2.5 billion control plan over 25 years Source: 2009 Overflow Control Program, Table 12-20 / Note: Total of programmatic elements plus Combined Sewer System Items. GI items are all programmatic elements minus Blue River Watershed Management Plan, GI pilots, and Distributes Storage for Outfalls 059 and 069. Approved by the MDNR by letter dated April 14, 2010
Louisville and Jefferson County Metropolitan Sewer District (MSD)
Louisville, KY
47
Louisville and Jefferson County MSD entered a 2005 Consent Decree, which was amended in 2009. Approved Plan (2009) includes $47M to GI. An Integrated Overflow Abatement Plan (IOAP) will be constructed over next 13 years at cost of $850 million and will address both combined systems as well as sewer systems with overflows. Source: Integrated Overflow Abatement Plan, Final CSO LTCP Volume 2 of 3 / MSD received a conditional letter of approval from the regulatory agencies on October 23, 2009.
The City of Omaha Omaha, NE 24.76
First LTCP was submitted to Nebraska Department of Environmental Policy (NDEQ) in September 2009, and was approved by NDEQ in February 2010. The 2009 cost estimate was $1.66B (2009$) with 15-year schedule. 2014 LTCPU includes improvements to the WTP, added facilities, deep tunnel, 2 retention treatment basins, 2 storage tanks, and GI plan. Source: 2014 LTCPU, approved by NDEQ in January 2015
New York City Department of Environmental Protection
New York City, NY
2426
In 2007, PlanNYC formed inter-agency task force and released a Sustainable Stormwater Management Plane in 2008. In 2010, NYDEP released Green Infrastructure Plan, which extends on 2008 plan and provides details on CSO management through GI. 2011 consent decree amendment states that LTCPs will incorporate elements of plan to achieve 10% city-wide application rate by 2030. Source: 2011 consent decree (March 13, 2012 - The New York State DEC and New York City DEP announced an agreement on 2011 enforcement order)
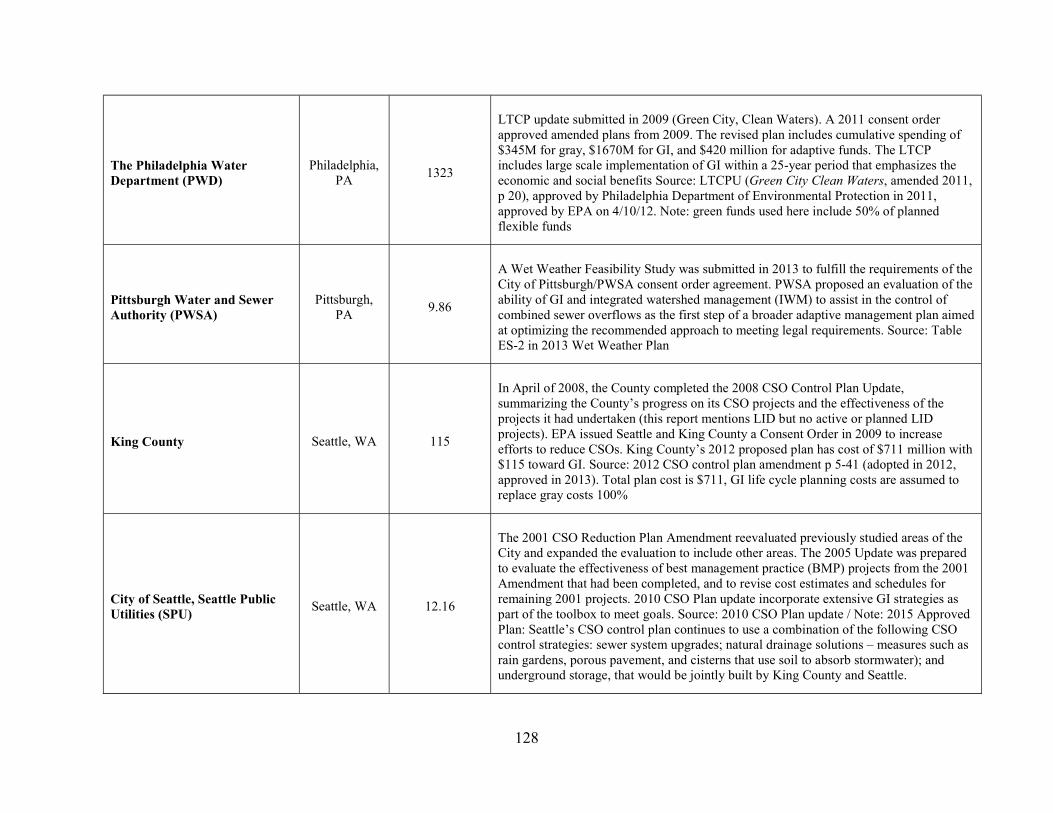
128
The Philadelphia Water Department (PWD)
Philadelphia, PA
1323
LTCP update submitted in 2009 (Green City, Clean Waters). A 2011 consent order approved amended plans from 2009. The revised plan includes cumulative spending of $345M for gray, $1670M for GI, and $420 million for adaptive funds. The LTCP includes large scale implementation of GI within a 25-year period that emphasizes the economic and social benefits Source: LTCPU (Green City Clean Waters, amended 2011, p 20), approved by Philadelphia Department of Environmental Protection in 2011, approved by EPA on 4/10/12. Note: green funds used here include 50% of planned flexible funds
Pittsburgh Water and Sewer Authority (PWSA)
Pittsburgh, PA
9.86
A Wet Weather Feasibility Study was submitted in 2013 to fulfill the requirements of the City of Pittsburgh/PWSA consent order agreement. PWSA proposed an evaluation of the ability of GI and integrated watershed management (IWM) to assist in the control of combined sewer overflows as the first step of a broader adaptive management plan aimed at optimizing the recommended approach to meeting legal requirements. Source: Table ES-2 in 2013 Wet Weather Plan
King County Seattle, WA 115
In April of 2008, the County completed the 2008 CSO Control Plan Update, summarizing the County’s progress on its CSO projects and the effectiveness of the projects it had undertaken (this report mentions LID but no active or planned LID projects). EPA issued Seattle and King County a Consent Order in 2009 to increase efforts to reduce CSOs. King County’s 2012 proposed plan has cost of $711 million with $115 toward GI. Source: 2012 CSO control plan amendment p 5-41 (adopted in 2012, approved in 2013). Total plan cost is $711, GI life cycle planning costs are assumed to replace gray costs 100%
City of Seattle, Seattle Public Utilities (SPU)
Seattle, WA 12.16
The 2001 CSO Reduction Plan Amendment reevaluated previously studied areas of the City and expanded the evaluation to include other areas. The 2005 Update was prepared to evaluate the effectiveness of best management practice (BMP) projects from the 2001 Amendment that had been completed, and to revise cost estimates and schedules for remaining 2001 projects. 2010 CSO Plan update incorporate extensive GI strategies as part of the toolbox to meet goals. Source: 2010 CSO Plan update / Note: 2015 Approved Plan: Seattle’s CSO control plan continues to use a combination of the following CSO control strategies: sewer system upgrades; natural drainage solutions – measures such as rain gardens, porous pavement, and cisterns that use soil to absorb stormwater); and underground storage, that would be jointly built by King County and Seattle.

129
City of Spokane Spokane, WA 40
2005 plan estimated to cost $314M; 2013 update: $183M; 2014 integrated plan: determined that implementing GI solely for the purpose of CSO reduction is not cost‐effective when compared with storage and conveyance facilities, but GI will be implemented jointly with other infrastructure improvements, GI projects listed at a total capital cost of $40M, On May 5, 2014, the Spokane City Council passed a resolution, adopting the City's Integrated Clean Water Plan. A final draft of the plan was completed in December 2014. Source: 2013 Spokane Integrated plan
Metropolitan St. Louis Sewer District (MSD)
St. Louis, MO
100
2011 Consent Decree and Approved Plan: Ongoing system improvements as well as new components, including GI. Total plan is $ 1.8 billion for CSO control plan, including $100 million for enhanced GI. 25-year baseline schedule for implementing CSO controls with substantial rate increases. Source: 2011 Consent Decree (approved 8/4/2011) and associated LTCP (capital costs in Table ES-2, also present PV)
Onondaga County Syracuse, NY 83
GI program adopted with 2009 amended consent judgement. Revised plans replaced several large gray infrastructure projects, including a regional treatment facility. Cumulative GI costs estimated at $83M Source: GI Program report (Onondaga County, New York Save the Rain Program 2010-2018 Green Infrastructure Plan, page 7)
District of Columbia Water and Sewer Authority (D.C. Water/WASA)
Washington DC
90
The LTCP was developed in 2002 and approved in 2004, included $3M in LID demonstration projects on WASA projects (out of $1262B, ~0.2% overall spending). Pages 9-4 and 9-5 point out barriers to extensive LID). The LTCP was estimated to cost $1.3 billion. 2015 LTCPU (Clean Rivers Project) - On May 20, 2015, the EPA, the Department of Justice, DC Water and the District of Columbia agreed to the Consent Decree Modifications included in the revised agreement that will cost $2.6 billion and take 15 years to complete.GI Projects: $60 million for GI in Rock Creek and $30 million for GI for the Potomac CSOs 027, 028 and 029.

130
Table A4.2 Hurdle model of gray infrastructure expenses for GI program adopting communities
Selection of GI Program Amount of Gray Infrastructure Funding
Variable (1) (2) (3) (4)
2-year 24-hour precipitation event size, inches -1.635** (0.676)
-3.528*** (1.374)
-0.083 (0.074)
-0.450 (0.389)
log(Capital needs for CSO infrastructure, dollars per person)
0.361* (0.225)
1.149** (0.490)
0.201*** (0.025)
1.087*** (0.135)
log(City population, thousand people) 1.636***
(0468) 3.688*** (1.012)
0.163*** (0.033)
0.869*** (0.163)
Median household income, thousand $ 0.007
(0.036) 0.022
(0.074) 0.004
(0.002) 0.022
(0.016)
Unemployment rate, % -0.144 (0.216)
-0.299 (0.442)
-0.002 (0.017)
-0.009 (0.090)
Democratic vote, % 0.021
(0.032) 0.035
(0.066) -0.004 (0.003)
-0.021 (0.020)
log(Assets of environmental NGOs, dollars per person)
0.106 (0.192)
0.220 (0.400)
0.0009 (0.022)
-0.005 (0.121)
constant -19.528***
(6.280)
-1.45*** (0.470)
log(σ) log(City population, thousand people) -0.156***
(0.011)
N 53
Log likelihood -13.962 AIC 61.926
Note: Gray infrastructure funding levels are logged values in million dollars adjusted to 2010 price. Columns 1 and 3 report coefficient estimates from maximum likelihood, and
column 2 and 4 report the corresponding average marginal effect. Standard errors in parentheses. ***p<0.01, **p<0.05, *p<0.1

131
Table A4.3 Hurdle model of GI adoption for CSO management with outliers removed
Selection of GI Program Amount of GI Funding Variable (1) (2) (3) (4)
2-year 24-hour precipitation event size, inches -1.633** (0.675)
-1.779*** (0.636)
-0.375** (0.156)
-0.946*** (0.347)
log(Capital needs for CSO infrastructure, dollars per person)
0.360 (0.224)
0.520** (0.230)
0.242*** (0.054)
0.613*** (0.146)
log(City population, thousand people) 1.631*** (0.478)
1.740*** (0.475)
0.368** (0.073)
0.828*** (0.286)
Median household income, thousand $ 0.007
(0.007) -0.008 (0.033)
-0.017** (0.008)
-0.044** (0.018)
Unemployment rate, % -0.143 (0.215)
-0.229 (0.197)
-0.126*** (0.049)
-0.318*** (0.112)
Democratic vote, % 0.020
(0.032) 0.032
(0.030) 0.017* (0.009)
0.023* (0.023)
log(Assets of environmental NGOs, dollars per person)
0.107 (0.192)
0.025 (0.178)
-0.091* (0.045)
-0.229* (0.131)
constant -19.46***
(6.309)
-2.952*** (0.099)
log(σ) log(City population, thousand people) -0.098***
(0.012)
N 51 Log likelihood -16.617
AIC 67.233
Note: GI funding levels are logged values in million dollars adjusted to 2010 price. Columns 1 and 3 report coefficient estimates from maximum likelihood, and column 2 and 4 report
the corresponding average marginal effect. Standard errors in parentheses. ***p<0.01, **p<0.05, *p<0.1

132
Table A4.4 Sensitivity of hurdle model to population scale
Selection of GI Program Amount of GI Funding Variable (1) (2) (3) (4)
2-year 24-hour precipitation event size, inches -1.145** (0.563)
-0.329 (0.164)
-0.329 (0.164)
-0.666* (0.395)
log(Capital needs for CSO infrastructure, dollars per person)
0.372** (0.182)
0.277*** (0.052)
0.277*** (0.052)
0.724*** (0.143)
log(County population, thousand people) 1.403** (0.552)
0.237** (0.097)
0.237** (0.097)
0.595** (0.237)
Median household income, thousand $ -0.040 (0.026)
-0.019** (0.009)
-0.019** (0.009)
-0.050** (0.023)
Unemployment rate, % -0.529* (0.283)
-0.183** (0.072)
-0.183** (0.072)
-0.478*** (0.178)
Democratic vote, % 0.050
(0.035) 0.022** (0.010)
0.022** (0.010)
0.058** (0.024)
log(Assets of environmental NGOs, dollars per person)
-0.005 (0.199)
-0.091* (0.054)
-0.091* (0.054)
-0.239 (0.146)
constant -15.39**
(7.00)
-1.960 (1.489)
log(σ) log(County population, thousand people)
-0.085***
(0.011)
N 53 Log likelihood -22.147
AIC 78.293
Note: GI funding levels are logged values in million dollars adjusted to 2010 price. Columns 1 and 3 report coefficient estimates from maximum likelihood, and column 2 and 4 report
the corresponding average marginal effect. Standard errors in parentheses. ***p<0.01, **p<0.05, *p<0.1

133
Chapter 5 Development and psychometric testing of the Rate and Accumulation Concept Inventory
5.1 Abstract
A fundamental understanding of rate and accumulation principles is important for educating
engineers across all sub-disciplines. A method is needed to assess engineering students’
conceptual understanding of these principles and to evaluate instruction. This article describes
the development of the Rate and Accumulation Concept Inventory (RACI) instrument and
provides an analysis of its validity and reliability, along with a discussion of its use in
engineering courses. This instrument is designed to test (1) overall mastery of rate and
accumulation concepts, and (2) mastery of these concepts within particular contexts (e.g.,
mathematics, mass flow, and heat flow). The RACI can also be used to assess curricular
interventions aimed at changing students’ conceptual understanding of rate and accumulation
principles. Exploratory findings on students’ conceptual understanding prompted the
development of a pilot RACI survey. Two different pilot survey administrations took place, with
adjustments made to the instrument between each. Data from the most recent administration (N=
305) are used to assess evidence of validity and reliability through structural equation modeling,
multidimensional item response theory, and Cronbach’s alpha. Validity and reliability evidence
indicates that the RACI can be used to measure students’ overall understanding of the concepts
identified. Issues of potential construct underrepresentation were uncovered in two of the context
categories. The evidence of reliability and validity shows that the RACI may be a useful tool to
assess engineering student understanding of rate and accumulation principles. Potential uses of
the RACI included measurements of changes in student understanding over time, and the

134
effectiveness of educational interventions intended to affect understanding. Additional research
stages will enhance the validity and reliability of the RACI as a diagnostic tool.
5.2 Introduction
There is a growing recognition that many engineering students are not learning as much
as instructors assume. Of particular concern are the high numbers of students who leave
undergraduate engineering courses with scientifically incorrect ideas related to fundamental
processes. This study investigates engineering students’ conceptual understanding of rate and
accumulation processes in various physical contexts. These processes bring together scientific
principles of a particular physical context (e.g., water flow or heat flow) with mathematical
models that are used to analyze rates of change and accumulation across system boundaries of
interest. Thus, for students to improve their ability to learn about and manage complex systems,
they must have a strong conceptual understanding of calculus fundamentals, and then be able to
interpret how these fundamentals are associated with real world phenomena.
Examples of rate and accumulation processes are mass and energy balances, which are
conceptual models used by engineers in many disciplines and contexts. These models are used in
structural analysis by civil and mechanical engineers, heat-work relationships by chemical
engineers, and fate and transport modeling by environmental engineers. These processes are also
used in so-called “stocks and flows” problems by engineers in different types of design
problems. Research shows that most people’s intuitive understanding of stocks and flows is poor,
and student misconceptions related to rate and accumulation processes have been known for
some time (Carlson et al., 2003; Sweeney and Sterman, 2000, 2007; Thompson, 1994a). Students
may form misconceptions of rate and accumulation processes for numerous reasons. For

135
example, certain focusing phenomena used in the classroom have been linked to students
incorrectly generalizing slopes as differences in quantities rather than ratios (Lobato et al., 2003).
Knowing how students think and learn about rate and accumulation processes in complex
systems can help educators better prepare students for their engineering careers. This paper
describes the development of the Rate and Accumulation Concept Inventory (RACI), which was
designed to address the need for an assessment tool to measure student understanding of rate and
accumulation processes across multiple contexts. While many concept inventories have been
developed to assess students’ understanding of either mathematical principles or scientific
concepts related to particular topics, the RACI combines these both of these important types of
understanding in one assessment tool. This article presents a psychometric analysis of the RACI
to ascertain its viability as a research instrument. We begin with a background on conceptual
understanding and psychometric analysis before applying those theories to the evaluation of the
RACI. Finally, we conclude with recommendations for the refinement of the RACI and its
appropriate current uses.
5.3 Theoretical Basis
Several decades of research have led to different approaches to assessing conceptual
understanding in students. We will present literature on conceptual understanding and highlight
key methods on developing and analyzing concept inventories. We then summarize the
exploratory work that demonstrated the need for the inventory, followed by a discussion of the
development of the conceptual categories and question items included in the RACI.

136
5.3.1 Conceptual understanding
Conceptual understanding refers to an individual’s collection of concepts (i.e., pieces or
clusters of knowledge), beliefs (i.e., propositional relationships between concepts), and mental
models (i.e., groups of meaningfully related beliefs and concepts that allow one to explain
phenomena and make predictions) related to a particular topic (Streveler et al., 2014).
Conceptual change, defined as the process of altering some aspect of one’s conceptual
understanding to be consistent with scientific understanding, has long been recognized as a
fundamental aspect of learning (Duit and Treagust, 2003; Mayer, 2002). Constructivism provides
a foundation for research of conceptual change, as it implies that one’s pre-existing knowledge
affects how new knowledge is encountered (Fosnot and Perry, 1996; Piaget, 1973; Von
Glasersfeld, 1989; Vygotsky, 1980). Thus, how a student acquires new knowledge can be
affected by misconceptions, which we define as some aspect of one’s conceptual understanding
that is different from what is known to be scientifically or mathematically correct (sensu
National Research Council, 2012).
Several prominent theories exist which seek to describe the structure of students’
conceptual understanding related to particular topics. Many researchers propose that conceptual
understanding exists as coherent categorizations of one’s concepts, beliefs, and mental models,
which can be organized along shared properties (Carey, 1985; Chi et al., 2012; Chi and Roscoe,
2002; Clement, 1983; McCloskey, 1983; Vosniadou, 2007, 1994; Vosniadou and Brewer, 1992;
Vosniadou et al., 2008). This view suggests that students maintain stable ways of thinking about
a particular topic (including misconceptions) because their knowledge is structured in coherent
or theory-like ways. Alternatively, knowledge can be understood as separate pieces of intuitions
based on experiences, which one can learn to relate and establish meaningful relationships

137
(diSessa, 2008, 2002, 1988; Minstrell, 2001). Thus, the “knowledge in pieces” theory (diSessa,
1983) posits that a students’ conceptual understanding on a topic is comprised of
phenomenological primitives (p-prims), which are self-explanatory schemata that are generally
apparent to people in real-world contexts. In this sense, our definition of a misconception could
be interpreted as a misapplication of a p-prim. Furthermore, conceptual change would require
corresponding p-prims to be re-contextualized to create normative conceptual understanding
(diSessa, 2008).
While there are key differences in these two views, there is strong evidence for them both
and they are not necessarily incompatible (Özdemir and Clark, 2007). Several researchers have
argued that both models are needed to fully explain conceptual understanding (Hammer, 1996;
Taber, 2008). For instance, Brown and Hammer (2008) propose a conceptual system in which
cognitive structures arise from the interactions of smaller conceptual elements similar to p-prims.
The tension between these views can also be construed as a question of that grain size of the
conceptual understanding elements that are studied (diSessa, 2008). How conceptual
understanding is structured has important implications for how conceptual understanding is
assessed in the RACI, which is discussed below.
5.3.2 Concept Inventories and Development of the RACI
Assessing engineering students’ conceptual understanding before a course begins can
provide instructors with valuable feedback. Concept inventories are assessment instruments that
have been used in several math, science, and engineering disciplines as a way to provide reliable
and valid assessment of students’ misconceptions. The work of Hestenes et al. (1992) on the
Force Concept Inventory established many of the protocols for concept inventory development,

138
which have since been further established by many authors (Adams and Wieman, 2011; Steif and
Dantzler, 2005; Streveler et al., 2011, 2003).
One of the most critical issues in developing a concept inventory is the process used to
establish content validity. Several educational measurement theorists argue that test validation
should involve iteration that begins with evidence-based approaches to determine the constructs
worthy of assessment (Kane, 2013; Lissitz and Samuelsen, 2007). For example, the “assessment
triangle” (Pellegrino et al., 2014, 2001) is an evidence-based framework for instrument
development that consists of three underlying elements: cognition, observation, and
interpretation. First, a model of student cognition and learning should be developed that
demonstrates how students represent and develop new knowledge on a topic. Second, observable
tasks or situations must be identified that allow a researcher to observe students’ performance
and provide evidence of their competencies. Third, a method must be established for interpreting
the performance evidence.
The assessment triangle framework is used to describe the iterative process used in the
development of the RACI. We developed the current version through four stages of research
(Table 5.1). The concept inventory development steps suggested by Richardson (2005) and
analytical framework suggested by Jorion et. al (2015) also provided insight on the data
collection and analytical methods at each stage. Past findings from stages 1-3 are summarized
below, and new findings for research stage 4 are discussed in this paper.

139
Table 5.1 Research stages and strategies for RACI development
Research Stage
Assessment Triangle Corner(s)
Data Collection Methods
Analytical Methods Resulting Actions
1. Exploratory Work
Cognitive
Open ended survey instruments based on class activities
Video and audio recordings of student work
Rubric scoring of surveys
Pre- & post- testing of surveys
Line-by-line transcript analysis
Articulate concepts to assess in new instrument
2. Instrument Development
Observation
Construct initial RACI, using open-ended questions for untested items
Content validity testing
Begin pilot testing
3. Pilot study #1
Observation
and Interpretation
RACI administered to small population
Interviews
Rubric scoring of open ended question items
Preliminary validity and reliability testing
Design multiple-choice answers
Revise, delete, add items
4. Pilot study #2
Interpretation RACI administered to larger population
Classical test theory and item response theory analyses
Exploratory factor analysis, tentative confirmatory factor model
Formulate tentative factor analysis model
Revise, delete, add items
5.3.2.1 Stage 1: Cognitive Basis
Our study began in an urban hydrology unit that is part of a sophomore course entitled
“Sustainability in Civil and Environmental Systems” that is required for all civil engineering and
environmental engineering undergraduate majors at a university in the Northeast U.S. Several
methods were used to study student learning of engineering concepts related to water flow
processes. We first developed original survey instruments to assess student understanding of two
topics: first order calculus and water flow. Multiple representations of understanding were

140
assessed in the survey questions, including equations, graphs, mental models, and descriptions.
Video and audio recordings of student activities were analyzed to identify patterns in students’
discourse. These findings were triangulated with the survey results to draw inferences about
students’ conceptual understanding. Results suggested the existence of persistent misconceptions
among the students, specifically the inability to distinguish between rate and accumulation
processes (Flynn et al., 2014).
A key finding was that many students often struggled to understand fundamental
scientific concepts relating to a particular physical context, and had difficulty correctly using
mathematical models when analyzing rate and accumulation processes. This led us to develop a
theoretical cognitive model, in which students have a broad conceptual understanding of rate and
accumulation problems that is shaped by mathematical understandings and scientific
understandings (Figure 5.1).
Mathematics education has long been considered to exist in a different domain of
learning from physical sciences. This view stems from the argument that since mathematics is
based on deductive proofs and not on experiments, it should be separated from the empirical
pattern of scientific development and change (Kuhn, 1962). However, it can be argued that the
Mathematical Understandings
Rate and Accumulation
Processes
Scientific Understandings
Figure 5.1 Path diagram showing generalized hypothetical cognitive model for rate and accumulation understanding

141
conceptual change theories for scientific understanding can be successfully applied to
mathematics learning (Vosniadou, 2008), as math students have been found to develop naïve
presuppositions that affect learning much like in the physical sciences (Dehaene, 2011; Gelman,
2000; Lipton and Spelke, 2003).
Many studies have investigated the relationships between mathematical and scientific
abilities and understandings. A study by Meltzer (2002) suggested that students’ pre-instruction
algebra skills may be associated with their ability to gain physics conceptual knowledge.
Similarly, Wage, Buck, and Wright (2005) used correlations between student scores on the
Signals and Systems concept inventory and grades in prerequisite mathematics courses to claim
that the mathematical understanding of students contributes to conceptual learning of signals and
systems concepts. Fewer studies have investigated the way in which a scientific or mathematical
context can affect a student’s understanding. Potgieter et al. (2008) investigated whether student
difficulties in undergraduate chemistry problems were due to deficiencies in their mathematics
understanding or the complexity of transferring mathematical understanding to a scientific
domain, concluding that fundamental mathematical understanding was the primary issue for
most students. Jones (2015) examined students as they applied their mathematical knowledge to
science and engineering problems by examining their definite integral conceptualizations in both
a pure mathematics and an applied physics context, finding that a Riemann sum-based
conceptualization was highly productive in applied contexts.
There may be many complex conceptual elements that shape a student’s scientific or
mathematical understanding of rate and accumulation problems. For instance, students should be
proficient with their mathematical understandings of variables, functions, differentiation, and
integration. Mathematical misconceptions of rate of change and accumulation processes have

142
been well researched (Ärlebäck et al., 2013; Carlson et al., 2003; Confrey and Smith, 1994;
Doerr et al., 2013; Thompson, 1994a, 1994b; Thompson and Silverman, 2008; Zandieh, 2000).
There is evidence that students have weak understandings of the concepts of variables (Martin,
2000; White and Mitchelmore, 1996), the concepts of functions (Carlson, 1998; Confrey and
Smith, 1994; Monk, 1992; Oehrtman et al., 2008), and covariational reasoning, or the ability to
coordinate two varying quantities while attending to how they change in relation to each other
(Carlson et al., 2002). Many science and engineering education studies have shown that students
frequently confound physical factors involved in rate and accumulation problems. For instance,
rate of change and accumulation misconceptions have been identified in studies on energy
transfer (Miller et al., 2006; Prince et al., 2012), chemical reactions (Thomas and Schwenz,
1998), and induced current (Thong and Gunstone, 2008).
5.3.2.2 Stage 2-3: Observation Basis and Initial Interpretation
Work began on the development of an assessment tool that would assess students’
conceptual understanding of rate and accumulation processes. Several existing concept
inventories were considered for their suitability as assessment instruments (Gray et al., 2005;
Martin et al., 2003; Shallcross, 2010). While some of these inventories include questions to
assess student understanding of particular rate and accumulation processes, they tend to be
context-specific for particular science and engineering disciplines. Because rate and
accumulation processes represent a fundamental conceptual framework that spans many
engineering disciplines, the RACI is not intended to be a discipline specific concept inventory.
The preliminary concepts included in the first beta-version of the RACI were identified
using the cognitive basis study results and a literature review of rate and accumulation
conceptual understanding in other engineering disciplines. Three categories of concepts were

143
included: (1) mathematical understandings of first order calculus, (2) physical factors involved in
mass flow, and (3) physical factors involved in heat flow. Ten sets of questions were included
with thirty individual question items in total. The questions were designed to be representative of
knowledge that students would be expected to know after a first-year coursework in calculus and
physics. Two question sets were modified problems from an introductory calculus textbook (W.
Briggs and L. Cochran, 2010). These questions were included to assess students’ ability to
interpret rate and accumulation processes using graphical representation of rate of change
functions. A third calculus question set was adapted from research that investigates students’
covariational reasoning abilities (Carlson et al., 2002). The mass flow category included original
inventory items developed from the exploratory study over a number of iterations with several
engineering instructors and graduate students. These question items were designed to assess
student understanding of physical principles that define water flow processes. While student
understanding of heat flow principles was not directly tested in Stage 1 of our research, several
studies have shown that students frequently confound factors that affect energy transfer rates
with those that affect the total amount of energy transfer (Miller et al., 2006; Prince et al., 2012).
The heat flow question items for the RACI were taken directly from a rate and accumulation
processes subsection of the Heat and Energy Concept Inventory, developed by Prince et al.
(2012) with the primary author’s permission. Two of these question items were designed to
assess mass flow principles, and were categorized as such in the study analysis.
Questions item formats were open-ended unless the question had been previously
developed and assessed for its validity and reliability. The open-ended questions allowed for the
collection of a range of student reasoning responses for each question. Incorrect responses were
categorized by multiple graders according to the type of misconception suggested in the

144
students’ work. These categories were then combined into a single rubric for the grading of each
question. Confidence ratings were also included to assess potentially confusing or overly
difficult problems. Initial pilot testing of the RACI using a pre- and post-course testing scheme
indicated persistent misconceptions across multiple contexts. Internal consistency reliability was
assessed on an earlier version of the RACI using the Kuder-Richardson Formula 20. This yielded
a value of 0.77 for the instrument and ranges of 0.64 to 0.76 for the three contextual categories
(Flynn et al., 2015), suggesting satisfactory consistency. Structural analysis was not completed
during this stage of research, as the study populations were low (N=75).
5.4 Study Goal
Misconceptions of scientific and mathematical principles related to rate and accumulation
processes is widespread across many disciplines, and thus a concept inventory on rate and
accumulation processes across several contexts is warranted. Such an inventory can help
instructors design pedagogical interventions that will enhance student learning on these
principles. The objective of this research is to provide instructors a tool to measure the degree to
which a student’s misconceptions of rate and accumulation processes is related to mathematical
understandings of rate of change problems and physical understandings of particular processes,
such as water flow and heat flow processes. Specifically, the primary goals of the RACI are to
assess (1) overall mastery of rate and accumulation concepts, and (2) mastery of these concepts
within particular contexts. This paper describes reliability and validity testing of the RACI that
was conducted to assess the degree of support for these goals. Results from a recent pilot test are
used to assess the validity and reliability of question items and concept categories. The analysis
methodologies suggested by the Evidentiary Validity Framework (Jorion et al., 2015b) are used
to assess the validity of each of the primary goals of the RACI. Methods to assess claim 1
145
include classical test theory methods (Cronbach’s alpha, standard error of measurement, alpha-if-
item-deleted, item discrimination, and item difficulty) and item-response theory tests. Methods to
asses claim 2 include subscale alphas and factor analyses. Table A5.1 in Appendix A5 includes
criteria used for the qualitative judgments that were assigned for rating each test.
5.5 Results
5.5.1 Stage 4: Interpretation Basis
Phase 4 of the RACI development aims to continue the improvement of the RACI’s
validity, reliability, and fairness. The results of Phase 3 led to the development of a second pilot
version of the RACI (referred to as “RACI 2.0”), which began with the refinement or removal of
several question items. The rubric for scoring in the initial development phase was used to
develop multiple choice answers, including “distractor” choices, for each question item. RACI
2.0 includes additional question items from the Precalculus Concept Assessment instrument that
are identified as “rate and accumulation” questions (Carlson et al., 2010), with the author’s
permission. In total, RACI 2.0 includes 25 question items. Five sets of questions are two-tiered,
in that two related question items are presented as a factual question followed by a conceptual
question. For this analysis, two-tiered sets of question items are coded as correct when both
question items are correctly answered. Five sets of two-tiered question items followed this
coding scheme; thus, the total possible score for RACI 2.0 is 20. Confidence ratings were
removed from the RACI 2.0 pilot test to reduce test taking time requirements. Test questions for
RACI 2.0 are include in Appendix A5.
A taxonomy of the RACI was developed (Table 5.2) to synthesize the understandings and
abilities that are included in the RACI question items. The subscales used in the Precalculus
Concept Assessment taxonomy (Carlson et al., 2010) provided a basis for some of the RACI

146
taxonomy. While most mathematical questions on the RACI are presented within a physical
context, such as a person walking in a line or water filling a particular shape, the questions are
not designed to test scientific principles related to the particular context. Four question items (1a,
1b, 5 and 9) feature water flow as a representative rate of change process but are identified in the
mathematical concept category, as they require no knowledge of the physical properties related
to water flow. Several question items require multiple types of reasoning abilities and functional
representations. As categories for items are not mutually exclusive, they are not analyzed as
unique subscales within the RACI.
Table 5.2 Taxonomy of RACI subscales and corresponding question items
Subscale Questions Total question
score
Reasoning Abilities
Process view of function items
1a, 1b, 2a, 2b, 2c, 3, 4, 6, 9 9
Covariation reasoning 1a, 2a, 2b, 2c, 3, 5, 7, 8, 10, 12,
13.1, 13.2, 14, 15a, 15b 12
Computational abilities 1a, 1b, 2a, 2b, 2c, 4, 9 7
Functional Representations
Graphical 1a, 1b, 2a, 2b, 2c, 3, 5, 7, 9 9
Equation 4, 6, 9 3
Descriptive 8, 10, 11, 12, 13.1, 13.2, 14,
15a, 15b 9
Concept Category
Mathematics 1a, 1b, 2a, 2b, 2c, 3, 4, 5, 6, 7, 9 11
Mass flow 8, 10, 11, 12, 15a, 15b 6
Heat flow 13.1, 13.2, 14 3

147
The Stage 4 pilot test population includes students from a variety of disciplines enrolled in
either a sophomore or junior level class engineering course (Table 5.3). Tests were administered
in eight courses across three private universities in the Northeast U.S. in 2015 or 2016 using a
pre-course and post-course testing scheme. Pre-course tests were given in the first two weeks of
a course, and post-tests were given in the final two weeks of a course. Pre-course and post-course
tests were collected for all but two courses, in which only post-tests were collected. The post-test
population is used for the reliability and validity testing due to the larger number of respondents
(N=305).
Table 5.3 Stage 4 study population demographics
Post-test Responses (N=305)
Major
Civil 124 (40.7%)
Chemical 35 (11.5%)
Environmental 61 (20.0%)
Mechanical/Aerospace 63 (20.7%)
Other 22 (7.2%)
Academic
Level
Sophomore 192 (63.0%)
Junior 63 (20.7%)
Senior 43 (14.1%)
Other 7 (2.3%)
Gender
Female 52 (17.0%)
Male 252 (82.6%)
Nonbinary 1 (0.33%)
GPA Cumulative GPA 2.70

148
Table 5.4 Summary statistics
Total Possible Score Mean Standard Deviation
Mathematics 11 6.55 (59.6%) 2.39
Mass flow 6 2.55 (42.5%) 1.30
Heat flow 3 0.73 (24.5%) 0.92
Overall 20 9.84 (49.2%) 3.48
5.5.2 Classical Test Theory
Table 5.4 summarizes the results for the overall test and the three concept categories. The
mean observed score was 9.84 out of 20 points, or 49.2%. The overall Cronbach’s alpha value is
0.70, indicating an average level of reliability as an overall assessment tool. Table 5.5
summarizes the question item difficulty, discrimination, and Cronbach’s alpha value for the
RACI if the item is deleted. Four question items had alpha-if-deleted values equal to or greater
than the overall test alpha (Q1b, Q11, Q13.2, and Q15b).

149
Table 5.5 Summary of classical test theory values for question items. Bolded numbers indicate a value that does not meet recommended threshold criteria
Item Item
Difficulty Item
Discrimination Alpha-if-deleted
Q1a 0.65 0.46 0.69 Q1b 0.89 0.18 0.71 Q2a 0.75 0.40 0.69 Q2b 0.50 0.48 0.68 Q2c 0.70 0.36 0.69 Q3 0.45 0.58 0.67 Q4 0.53 0.35 0.69 Q5 0.48 0.39 0.69 Q6 0.48 0.42 0.69 Q7 0.80 0.47 0.68 Q8 0.28 0.41 0.69 Q9 0.33 0.34 0.69
Q10 0.90 0.30 0.69 Q11 0.22 0.20 0.71 Q12 0.47 0.39 0.69
Q13.1 0.29 0.41 0.69 Q13.2 0.09 0.27 0.70 Q14 0.35 0.60 0.67 Q15a 0.40 0.39 0.69 Q15b 0.29 0.27 0.70
Figure 5.2 compares the difficulty and discrimination values for each item. Question item
Q13.2 fell below the recommended difficulty level but not for discrimination. Other item
difficulties ranged from 0.22 to 0.89. One item fell slightly below recommended values for
discrimination (Q1b), while other discrimination values ranged from 0.210 to 0.654.

150
Figure 5.2 : Scatterplot of item difficulty and discrimination values for RACI 2.0. Each dot represents an individual question item or grouped two-tier question. Recommended minimum and maximum values are denoted by the dotted lines. One item did not meet the recommended values for difficulty (Q13.2) and one fell below the recommended value for discrimination (Q1b).
5.5.3 Item Response Theory
Item response theory analyses were performed using one-parameter, two-parameter, and
three-parameter logistic models. The models were compared with the Akaike information
criterion fit statistic, with the two-parameter model resulting in the best fit. Figure 5.3 shows the
two-parameter item response functions as indicated by the cumulative probability of answering
an item correctly across the students’ proficiency (theta) scale, i.e., the latent trait continuum. In
cQ1b
cQ10
cQ11
cQ13.2
0
0.1
0.2
0.3
0.4
0.5
0.6
0.7
0.8
0.9
1
0.0 0.2 0.4 0.6 0.8 1.0
Item
Dis
crim
inat
ion
Item Difficulty

151
general, the curves begin with low values of student ability and rise with increasing probabilities
of answering the item correctly along with increasing student ability. The theta location at the
inflection point of the curve indicates the item’s degree of difficulty. The two-parameter model
includes both estimated difficulty and discrimination parameters, allowing curves to have
different slopes. Steeper slopes indicate higher levels of discrimination across student abilities.
The majority of question items demonstrated close model-data fit, with the exception of items
Q1b, Q11, and Q13.2, and Q15b. Item Q10 also has a weaker fit for the post-course populations,
as it was found to have a lower level of difficulty than other questions.
Figure 5.3 Two-parameter item response function for all post-test RACI 2.0 question items. Two items (Q1b and Q11) deviate from the standard model shape, while other items generally fit the two-parameter model well. Question items Q13.2 and Q15b were among the more difficult question items, but generally conform to the shape of the model.

152
Figure 5.4 Two-parameter item information function for all post-test RACI 2.0 question items.
The item information function for the RACI is shown in Figure 5.4. As scores for each
item are binary, the amount of information each question item provides is proportional to the
discrimination parameter. Items Q3, Q7, and Q14 provide the most information for this study
population. The results reiterate the overall weak discrimination power of item Q10, other than
for students who performed poorly (i.e. those with a lower theta). Similarly, item Q13.2 only
provided useful discrimination information for higher performing students. As the majority of
this pilot test population includes sophomore engineering students who may not have been
Q3Q7
Q14
Q1aQ2b
Q10
Q13.2
0
0.2
0.4
0.6
0.8In
form
atio
n
-4 -2 0 2 4Theta

153
exposed to heat flow concepts, item 13.2 may be too difficult for certain populations and
teaching contexts.
The item information functions are summed to obtain a test information function (Figure
5.5). This plot shows how well the instrument can estimate person locations. The test
information curve peaks at an approximate theta value of zero, suggesting that the RACI
provides the most information for average students. As the curve moves away from that point in
either direction, the standard error of the test information function increases, and the instrument
provides less and less information about student understanding.
Figure 5.5 Test information function for RACI 2.0
0.5
0.7
0.8
0.6
Sta
ndar
d E
rro
r
12
34
5In
form
atio
n
-4 -2 0 2 4Theta
Test information Standard error

154
On the basis of the item testing analysis, two items were removed for the structural
analyses: Q1b and Q11. Both items had higher alpha-with-item-deleted values and did not fit
well in one or both pre-course and post-course information response models. The results suggest
that the current form Q1b may be too easy compared to other RACI items, while Q11 may be
misleading and thus would require revision in subsequent versions of the RACI. Item 13.2 and
item 15 did not have excellent results in the item testing analysis but were retained for the
structural analysis to test if they fit well with the theoretical constructs of the RACI.
5.5.4 Structural Analysis
5.5.4.1 Tetrachoric Correlation
Covariation among item responses is used as an initial analysis of the possible underlying
structure within the RACI. Tetrachoric correlations constitute an adjusted version of Pearson
correlations that are appropriate for pairs of items discretely scored right/wrong (Bonett and
Price, 2005). The RACI item-pair tetrachoric correlations are shown graphically by a heat map
for the study population (Figure 5.6). The heat map matrix is symmetric, and items are ordered
according to the three contextual RACI concept categories. The pattern of tetrachoric
correlations shown in Figure 5.6 indicates the strongest correlations in the Heat Flow subscale.
Correlations are moderately strong among question items in the Mathematics subscale,
particularly among Q1a-Q3. Question items Q8-Q12 in the Mass Flow subscale also showed
moderate correlations, while Q15a and Q15b were among the weaker correlations within the
Mass Flow subscale and across all other question items. Two other outlying items are Q9, which
has weak correlations with all other items, and Q14, which is moderately correlated with many
items in other subscales.

155
Figure 5.6 Tetrachoric correlation heat map for the RACI 2.0. Darker shaded squares indicating strong correlations between correctly answered items. Question items are grouped according to their conceptual subscale category (MATH = Mathematics, MF= Mass Flow, and HF=Heat Flow) with borders added to interpret these theoretical groupings.
5.5.4.2 Subscale Alphas
Subscale reliabilities (Cronbach’s alphas) were estimated for each of the three context
subscales using the post-course population (Table 5.6). Individual subscale alpha values ranged
from 0.42 to 0.65. Because Cronbach’s alpha is influenced by test length, lower values of
subscale alphas may result in part from small numbers of items per subscale.
MATH_Q1aMATH_Q2aMATH_Q2bMATH_Q2cMATH_Q3MATH_Q4MATH_Q5MATH_Q6MATH_Q7MATH_Q9
MF_Q8MF_Q10MF_Q12
MF_Q15aMF_Q15bHF_Q13.1HF_Q13.2
HF_Q14
.
MA
TH
_Q1a
MA
TH
_Q2a
MA
TH
_Q2b
MA
TH
_Q2c
MA
TH
_Q3
MA
TH
_Q4
MA
TH
_Q5
MA
TH
_Q6
MA
TH
_Q7
MA
TH
_Q9
MF
_Q
8M
F_
Q1
0M
F_
Q1
2M
F_
Q1
5aM
F_
Q1
5bH
F_Q
13.1
HF
_Q13
.2H
F_Q
14
0
.2
.4
.6
.8
1
Co
rrel
atio
n
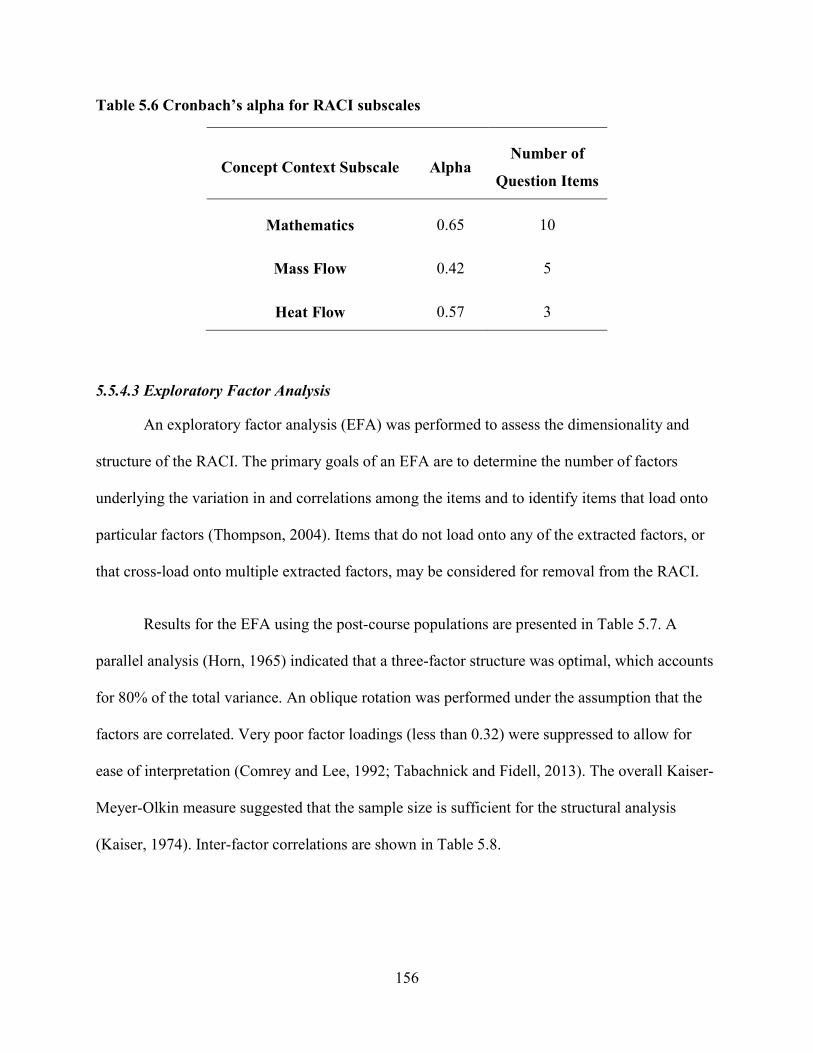
156
Table 5.6 Cronbach’s alpha for RACI subscales
Concept Context Subscale Alpha Number of
Question Items
Mathematics 0.65 10
Mass Flow 0.42 5
Heat Flow 0.57 3
5.5.4.3 Exploratory Factor Analysis
An exploratory factor analysis (EFA) was performed to assess the dimensionality and
structure of the RACI. The primary goals of an EFA are to determine the number of factors
underlying the variation in and correlations among the items and to identify items that load onto
particular factors (Thompson, 2004). Items that do not load onto any of the extracted factors, or
that cross-load onto multiple extracted factors, may be considered for removal from the RACI.
Results for the EFA using the post-course populations are presented in Table 5.7. A
parallel analysis (Horn, 1965) indicated that a three-factor structure was optimal, which accounts
for 80% of the total variance. An oblique rotation was performed under the assumption that the
factors are correlated. Very poor factor loadings (less than 0.32) were suppressed to allow for
ease of interpretation (Comrey and Lee, 1992; Tabachnick and Fidell, 2013). The overall Kaiser-
Meyer-Olkin measure suggested that the sample size is sufficient for the structural analysis
(Kaiser, 1974). Inter-factor correlations are shown in Table 5.8.

157
Table 5.7 Exploratory factor analysis for RACI 2.0
Question Item
Subscale Factor Loadings
Mathematics Heat Flow Mass Flow
Q1a 0.68
Q2a 0.77
Q2b 0.57
Q2c 0.55
Q3 0.57
Q4
Q5
Q6 0.51
Q7 0.64
Q9 0.34
Q13.1 0.85
Q13.2 0.68
Q14 0.64
Q15a 0.45
Q15b 0.32
Q8 0.56
Q10 0.64
Q12 0.70

158
Table 5.8 Inter-factor correlation matrix
Factor Factor Name 1 2 3
1 Mathematics 1
2 Heat Flow 0.379 1
3 Mass Flow 0.359 0.313 1
Most question items loaded onto the predefined conceptual subscales, and thus the
conceptual subscale names are presented for the three factors in Table 5.7. However, there are
several exceptions. Two question items (Q4 and Q5) did not have strong loadings on any of the
factors. Three items loaded on unexpected factors (Q9 on Mass Flow, Q15a and Q15b on Heat
Flow), though these loadings are the lowest of the retained factor loadings and thus account for
little of the overlapping variance.
We believe there are several interpretations for these unexpected loadings. Messick
(1995) notes two threats to instrument validity are (1) construct underrepresentation, in which an
instrument does not actually represent what it is designed to measure; and (2) construct irrelevant
variance, in which something other than the actual measured trait is influencing results (Douglas
and Purzer, 2015). It is likely that items Q4, Q5 and Q9 have poor results in the factor analysis
due to construct irrelevant variance, as students must use overlapping reasoning abilities and
understandings to answer these items (see Table 5.2 for classifications). Without these items, the
only item in the Mathematics category that does not involve covariational reasoning is Q6; thus,
this category may be dominated by this particular mathematical understanding. Furthermore,
because all question items in the Mass Flow and Heat Flow categories also assess covariational
understanding, it is possible that this is the predominant concept of rate and accumulation
understanding that is assessed in the RACI.

159
There are several interpretations for the unexpected loadings for Q15a and Q15b. First,
there may be a level of contract irrelevant variance due to the style of question wording effecting
student responses. Because these items are derived from the same concept inventory as all other
items in the Heat Flow subscale, there may be subtle differences in question wording that prompt
students differently than other items. There may also be several interpretations for construct
underrepresentation. One possibility is students interpret the context for these items (a solution of
dye being absorbed by sponges) as more similar to that of heat flow, and thus use similar
understandings to think about the problem. Alternatively, a closer examination of the physical
factors involved in the processes for both the Mass Flow and Heat Flow categories reveal
interesting patterns. The problem context for question items Q8 and Q12 focus on two physical
factors related to water flow, namely water column height and drain size, while the contexts for
the processes presented in question items Q13.1, Q13.2, Q14, Q15a, and Q15b focus on how the
physical factors of surface area, amount, and gradient influence heat and mass transfer. Thus, the
exploratory factor results may point to issues of construct underrepresentation due to categories
labeled for physical context rather than the physical understandings that students are using when
answering these items. Recategorizing items Q15a and Q15b as Heat Flow problems slightly
lowers the Heat Flow subscale Cronbach’s alpha to a value of 0.56, but increases the Mass Flow
subscale alpha significantly to a value of 0.65.
5.5.4.4 Tentative Confirmatory Factor Analysis
A confirmatory factor analysis was performed to explore the extent to which the item
covariances conformed to the hypothesized cognitive model for rate and accumulation
understanding. Two models were considered in this analysis. Model 1 (Figure 5.7) represents an
independence model, in which the subgroups of concepts and their associated items are
160
completely separable. Model 2 (Figure 5.8) represents a higher-order factor model that reflects
our hypothesis that students have a broad conceptual understanding of rate and accumulation
processes that shapes performance on all concepts and items. Factor analyses were conducted for
two additional models in order to investigate findings from the exploratory factor analysis. In
Model 3, question items Q15a and Q15b are recategorized to the Heat Flow factor, as both items
loaded on this factor in the exploratory analysis. Finally, Model 4 uses the categorizations in
Model 3, but eliminates question items that did not load on any factor (Q4, Q5, and Q9). Results
for the confirmatory factor analysis are presented in Table 5.9. Factor loadings using
standardized regression weights are shown on the paths in Figures 5.7 and 5.8 for Models 1 and
2, respectfully.
For Model 1, most items have moderate loading scores (> 0.3) with the exception of
items Q15b and Q13.2. All loadings are significant at the p=0.01 level with the exception of
items Q9 and Q10, which are significant at the p=0.05 level, and Q15b, which was not found to
be significant in this model. Model 1 did not display strong fit to the data, with most indexes
falling below recommended cutoff values.
In Model 2, most items have moderate factor loading scores (> 0.3) with the exception
of items Q4 and Q9 on MATH, and Q15b on MF. All loadings were significant at the p=0.01
level with the exception of item Q15b, which was significant at the p=0.05 level. Relations
between three conceptual subscales (MATH, MF, and HF) are explained by their shared variance
with the higher order factor (RA). All three subscales had very good loadings on the higher-order
factor, indicating that a proportion of the variance in each conceptual grouping of factors can be
explained by a common factor. Overall, Model 2 displayed a good fit to the data, with most

161
indexes either approaching or exceeding the recommended cutoff values (e.g., Comparative fit
index (CFI) > .90; Root mean squared error of approximation (RMSEA) < .03).
Figure 5.7 Path diagram for the Model 1 with factor loadings (standardized regression weights)

162
Figure 5.8 Path diagram for the Model 2 with factor loadings (standardized regression weights)

163
Table 5.9 Fit index for confirmatory factor analysis models
Model
Fit statistic Recommended
Value 1 2 3 4
Likelihood ratio
Degrees of freedom n/a 135 132 132 101
Chi-square (model vs
baseline)
Low relative to
df 247.2** 171.7* 165.1* 124.8
Population error
Root mean squared error of
approximation (RMSEA) <0.03 0.052 0.031 0.029 0.028
Probability RMSEA <= 0.05 High 0.351 0.995 0.998 0.995
Standardized root mean
squared residual (SRMR) Small 0.090 0.051 0.049 0.047
Information criteria
Akaike's information criterion
(AIC) Lower values 6458 6388 6382 5551
Baseline comparison
Comparative fit index (CFI) > 0.9 0.769 0.918 0.932 0.947
Tucker-Lewis index (TLI) > 0.9 0.738 0.905 0.921 0.937
Note: *=significant at p=0.05, **=significant at p=0.01

164
Models 3 and 4 also display overall good fit to the data, with most indexes showing
marginally better values than Model 2. The differences between Models 2 and 3 align with the
exploratory factor results that pointed to possible issues of construct underrepresentation in the
Mass Flow and Heat Flow categories. However, because the fit statistics for Models 3 and 4
show only marginal improvements, additional studies will need to be conducted to define the
conceptual understanding that are currently categorized as Mass Flow and Heat Flow, and to
determine if additional question items should be removed from the Mathematics category.
5.6 Limitations and Future Work
Douglas and Purzar (2015) discuss the ongoing developmental nature of assessment tools
such as concept inventories, suggesting that establishing a tool’s validity is never quite over.
While many of the results presented in this paper point to an average level of validity for this
version of the RACI, there are several research steps that may improve its diagnostic abilities.
Because some results pointed to possible construct underrepresentation in the physical science
context categories, additional research should focus on the cognitive and observation corners of
the RACI. This can be achieved through additional observations of student learning coupled with
interviews to examine how students solve particular problems. Another approach to increasing
the overall validity for the RACI would be to conduct a Delphi study, which is a structured
process for collecting and distilling knowledge from a group of experts that has been used in the
development of several concept inventories (Goldman et al., 2008; Linstone et al., 1975;
Streveler et al., 2003).
A common goal for some concept inventories is the diagnosis a student’s propensity for
misconceptions or common errors using patterns of distractor response patterns (Jorion et al.,
2015). Diagnostic classification modeling or a combination of item response theory and
165
diagnostic classification models can be used to assess student misconceptions (Bradshaw and
Templin, 2014; Jorion et al., 2015). While this stage of the RACI development did not include
the aim of diagnosing misconceptions, future work should include the development of a Q-
matrix (a binary representation of cognitive attributes associated with each answer choice) for
existing question items, and plans to develop addition items that will assist in the diagnosis of
particular misconceptions.
The conclusions drawn from administrations of the RACI also have certain limitations
that should be acknowledged. While statistical measures supported the sample size of this study
for the tests conducted in this paper, the samples of students in the RACI pilot tests have thus far
been generally small. Also, convenience samples were used rather than random samples. While
efforts were made to collect results from students enrolled in different courses at different
universities, some of these findings may be unique to particular populations of students. Because
the pre-course sample of this pilot test population was much smaller than the post-course sample,
the pre-course analysis was excluded from this paper. As much of the usefulness of concept
inventories lies in formative pre-course assessments, future stages of this study should seek to
include larger, random samples of pre-course and post-course populations across various
institutions and disciplines. As new versions of the RACI are developed that further establish its
reliability and validity, pre-course and post-course findings may aid in the development of
instructional techniques designed to address particular student misconceptions.
5.7 Conclusions
We developed the RACI over several iterative developmental stages in order to assess
students’ conceptual understanding of rate and accumulation processes. Psychometric tests were
performed to assess the reliability and validity of the RACI. The Cronbach’s alpha provided

166
evidence of an average level of reliability for the overall test and mathematics category, and poor
reliability for the mass flow and heat flow categories. Item testing analysis suggested the
removal of two question items from the instrument. Structural equation modeling provided
evidence that most of the remaining items mapped to the three contextual categories defined in
our cognitive model, and that a higher order factor of rate and accumulation understanding
explains the shared variance of the context categories. Issues of potential construct
underrepresentation were uncovered in two of the context categories. Additional research stages
for RACI development should focus on modeling student cognition and learning, and developing
additional question items that align with the cognitive model.
5.8 References
Adams, W.K., and C.E. Wieman. 2011. Development and validation of instruments to measure learning of expert-like thinking. International Journal of Science Education 33, 1289–1312.
Ärlebäck, J.B., Doerr, H.M., and A.H. O’Neil. 2013. A modeling perspective on interpreting rates of change in context. Mathematical Thinking and Learning 15, 314–336. doi:10.1080/10986065.2013.834405
Bonett, D.G., and R.M. Price. 2005. Inferential methods for the tetrachoric correlation coefficient. Journal of Educational and Behavioral Statistics 30, 213–225.
Bradshaw, L., and J. Templin. 2014. Combining item response theory and diagnostic classification models: A psychometric model for scaling ability and diagnosing misconceptions. Psychometrika 79, 403–425.
Brown, D.E., Hammer, D., 2008. Conceptual change in physics. in: International Handbook of Research on Conceptual Change. Routledge, London, pp. 127–154.
Carey, S. 1985. Conceptual change in childhood. MIT Press, Cambridge, MA, USA.
Carlson, M., Jacobs, S., Coe, E., Larsen, S., and E. Hsu. 2002. Applying covariational reasoning while modeling dynamic events: A framework and a study. Journal for Research in Mathematics Education 352–378.
Carlson, M., Oehrtman, M., and N. Engelke. 2010. The precalculus concept assessment: A tool for assessing students’ reasoning abilities and understandings. Cognition and Instruction 28, 113–145.

167
Carlson, M.P. 1998. A cross-sectional investigation of the development of the function concept. CBMS Issues in Mathematics Education 7, 114–162.
Carlson, M.P., Smith, N., and J. Persson. 2003. Developing and connecting calculus students’ notions of rate-of change and accumulation: The fundamental theorem of calculus. International Group for the Psychology of Mathematics Education 2, 165–172.
Chi, M.T., and R.D. Roscoe. 2002. The processes and challenges of conceptual change, in: Limón, M. and L. Mason. Reconsidering Conceptual Change: Issues in Theory and Practice. Springer, Berlin, Germany. pp. 3–27.
Chi, M.T., Roscoe, R.D., Slotta, J.D., Roy, M., and C.C. Chase. 2012. Misconceived causal explanations for emergent processes. Cognitive science 36, 1–61.
Clement, J. 1983. A conceptual model discussed by Galileo and used intuitively by physics students. Mental Models 2, 325–339.
Comrey, A.L., and H.B. Lee. 1992. A First Course in Factor Analysis. Erlbaum, Hillsdale, NJ, USA.
Confrey, J., and E. Smith. 1994. Exponential functions, rates of change, and the multiplicative unit. Educational Studies in Mathematics 26, 135–164.
Dehaene, S. 2011. The Number Sense: How the Mind Creates Mathematics. Oxford University Press, Oxford, United Kingdom.
diSessa, A.A., 2008. A Bird's-Eye View of the “Pieces” vs. “Coherence” Controversy (from the “Pieces” side of the Fence), in S. Vosniadou (ed.). International Handbook of Research on Conceptual Change. Routledge. Abingdon, United Kingdom. pp. 35–60.
diSessa, A.A., 2002. Why “Conceptual Ecology” is a Good Idea, in: Limón, M. and L. Mason. Reconsidering Conceptual Change: Issues in Theory and Practice. Springer, Berlin, Germany. pp. 28–60.
diSessa, A.A., 1988. Knowledge in Pieces, in: Forman, G., and P.B. Pufall. Constructivism in the Computer Age. Erlbaum, Hillsdale, NJ, USA.
diSessa, A.A., 1983. Phenomenology and the evolution of intuition. Mental models 15–34.
Doerr, H.M., Arleback, J.B., and A.H. O’Neil. 2013. Interpreting and communicating about phenomena with negative rates of change. in 2013 ASEE Annual Conference & Exposition, Atlanta, Georgia p. 23.809.1-23.809.16.
Douglas, K.A., and Ş. Purzer. 2015. Validity: Meaning and Relevancy in Assessment for Engineering Education Research. Journal of Engineering Education. 104(2), 108–118. doi:10.1002/jee.20070
168
Duit, R., Treagust, D.F., 2003. Conceptual change: A powerful framework for improving science teaching and learning. International Journal of Science Education 25, 671–688.
Flynn, C.D., Davidson, C.I., and S. Dotger. 2014. Engineering Student Misconceptions about Rate and Accumulation Processes. in 2014 ASEE Zone I Conference. Bridgeport, CT, USA.
Flynn, C.D., Davidson, C.I., Dotger, S., and M. Sullivan. 2015. Development and Pilot Test of the Rate and Accumulation Concept Inventory. in 2015 ASEE Annual Conference and Exposition. Seattle, WA, USA.
Fosnot, C.T., and R.S. Perry. 1996. Constructivism: A psychological theory of learning. in Constructivism: Theory, Perspectives, and Practice. Teachers College Press. New York, NY, USA. pp8–33.
Gelman, R. 2000. The epigenesis of mathematical thinking. Journal of Applied Developmental Psychology 21, 27–37.
Goldman, K., Gross, P., Heeren, C., Herman, G., Kaczmarczyk, L., Loui, M.C., and C. Zilles. 2008. Identifying Important and Difficult Concepts in Introductory Computing Courses Using a Delphi Process, in: Proceedings of the 39th SIGCSE Technical Symposium on Computer Science Education. New York, NY, USA, pp. 256–260. doi:10.1145/1352135.1352226
Gray, G.L., Costanzo, F., Evans, D., Cornwell, P., Self, B., and J.L. Lane. 2005. The dynamics concept inventory assessment test: A progress report and some results. in 2005 American Society for Engineering Education Annual Conference & Exposition.
Hammer, D. 1996. Misconceptions or p-prims: How may alternative perspectives of cognitive structure influence instructional perceptions and intentions. The Journal of the Learning Sciences 5, 97–127.
Hestenes, D., Wells, M., and G. Swackhamer. 1992. Force concept inventory. The Physics Teacher 30, 141–158.
Horn, J.L. 1965. A rationale and test for the number of factors in factor analysis. Psychometrika 30, 179–185.
Jones, S.R. 2015. Areas, anti-derivatives, and adding up pieces: Definite integrals in pure mathematics and applied science contexts. The Journal of Mathematical Behavior 38, 9–28.
Jorion, N., Gane, B.D., DiBello, L.V., and J.W. Pellegrino. 2015a. Developing and validating a concept inventory. in 2015 ASEE Annual Conference and Exposition. Seattle, WA, USA.
Jorion, N., Gane, B.D., James, K., Schroeder, L., DiBello, L.V., and J.W. Pellegrino. 2015b. An analytic framework for evaluating the validity of concept inventory claims. Journal of Engineering Education, 104, 454–496. doi:10.1002/jee.20104
Kaiser, H.F. 1974. An index of factorial simplicity. Psychometrika 39, 31–36.

169
Kane, M.T. 2013. Validating the interpretations and uses of test scores. Journal of Educational Measurement 50, 1–73.
Kuhn, T. 1962. The Structure of Scientific Revolutions. The University of Chicago Press, Chicago, IL, USA.
Linstone, H.A., and M. Turoff, eds. 1975. The Delphi Method: Techniques and Applications. Addison-Wesley. Reading, MA, USA
Lipton, J.S., Spelke, E.S., 2003. Origins of number sense: Large-number discrimination in human infants. Psychological science 14, 396–401.
Lissitz, R.W., and K. Samuelsen.2007. Further clarification regarding validity and education. Educational Researcher 36, 482–484.
Lobato, J., Ellis, A.B., and R. Munoz. 2003. How “focusing phenomena” in the instructional environment support individual students’ generalizations. Mathematical Thinking and Learning 5, 1–36. doi:10.1207/S15327833MTL0501_01
Martin, J., Mitchell, J., and T. Newell. 2003. Development of a concept inventory for fluid mechanics. in 33rd Annual Frontiers in Education, 2003. p. T3D–23–T3D–28 Vol.1. doi:10.1109/FIE.2003.1263340
Martin, T. 2000. Calculus students’ ability to solve geometric related-rates problems. Mathematics Education Research Journal 12, 74–91.
Mayer, R.E., 2002. Understanding conceptual change: A commentary. in: M. Limón and L. Mason (eds.). Reconsidering Conceptual Change: Issues in Theory and Practice. Springer, Berlin, Germany. pp. 101–111.
McCloskey, M. 1983. Naive theories of motion. Mental Models 299–324.
Meltzer, D.E., 2002. The relationship between mathematics preparation and conceptual learning gains in physics: A possible “hidden variable” in diagnostic pretest scores. American Journal of Physics 70, 1259–1268.
Messick, S., 1995. Validity of psychological assessment: Validation of inferences from persons’ responses and performances as scientific inquiry into score meaning. American Psychologist 50, 741.
Miller, R., Streveler, R., Olds, B., Chi, M., Nelson, M., and M. Geist. 2006. Misconceptions about rate processes: Preliminary evidence for the importance of emergent conceptual schemas in thermal and transport sciences. in 2006 Annual ASEE Conference & Exposition, p. 11.933.1-11.933.20.

170
Minstrell, J., 2001. Facets of students’ thinking: Designing to cross the gap from research to standards-based practice. in K. Crowley (ed.) Designing for Science: Implications from Everyday, Classroom, and Professional Settings. Erlbaum. Mahwah, NJ, USA. pp. 415–443.
Monk, S., 1992. Students’ understanding of a function given by a physical model. The concept of function. Aspects of Epistemology and Pedagogy 25, 175–194.
National Research Council, 2012. Discipline-based education research: Understanding and improving learning in undergraduate science and engineering. National Academies Press. Washington D.C., USA.
Oehrtman, M., Carlson, M., and P.W. Thompson. 2008. Foundational reasoning abilities that promote coherence in students’ function understanding. in M. Carlson and C. Rasmussen (eds.) Making the connection: Research and Teaching in Undergraduate Mathematics Education Mathematical Association of America. Washington D.C., USA. pp. 27–42.
Özdemir, G., and D.B. Clark. 2007. An overview of conceptual change theories. Eurasia Journal of Mathematics, Science & Technology Education 3, 351–361.
Pellegrino, J.W., Chudowsky, N., and R. Glaser. 2001. Knowing what students know: The science and design of educational assessment. National Academy Press. Washington D.C., USA.
Pellegrino, J.W., DiBello, L.V., and S.P. Brophy. 2014. The science and design of assessment in engineering education. in A. Johri and B.M. Olds (eds.). Cambridge Handbook of Engineering Education Research. Cambridge University Press. Cambridge, United Kingdom. pp.571–598.
Piaget, J. 1973. To Understand is to Invent: The Future of Education. Grossman, New York, NY, USA.
Potgieter, M., Harding, A., and J. Engelbrecht. 2008. Transfer of algebraic and graphical thinking between mathematics and chemistry. Journal of Research in Science Teaching 45, 197–218.
Prince, M., Vigeant, M., and K. Nottis. 2012. Development of the heat and energy concept inventory: Preliminary results on the prevalence and persistence of engineering students’ misconceptions. Journal of Engineering Education 101, 412–438.
Richardson, J. 2005. Concept inventories: Tools for uncovering STEM students’ misconceptions. in Invention and impact: Building excellence in undergraduate science, technology, engineering and mathematics (STEM) education. American Association for the Advancement of Science. Washington D.C., USA. pp. 19–25.
Shallcross, D.C. 2010. A concept inventory for material and energy balances. Education for Chemical Engineers 5, e1–e12. doi:10.1016/j.ece.2009.10.002

171
Steif, P.S., and J.A. Dantzler. 2005. A Statics Concept Inventory: Development and Psychometric Analysis. Journal of Engineering Education 94, 363–371. doi:10.1002/j.2168-9830.2005.tb00864.x
Streveler, R., Brown, S., Herman, G., Montfort, D., 2014. Conceptual change and misconceptions in engineering education. in A. Johri and B.M. Olds (eds.). Cambridge Handbook of Engineering Education Research. Cambridge University Press. Cambridge, United Kingdom. pp.83–102.
Streveler, R.A., Miller, R.L., Santiago-Román, A.I., Nelson, M.A., Geist, M.R., and B.M. Olds. 2011. Rigorous methodology for concept inventory development: Using the ‘assessment triangle’ to develop and test the thermal and transport science concept inventory (TTCI). International Journal of Engineering Education 27, 968-984.
Streveler, R.A., Olds, B.M., Miller, R.L., and M.A. Nelson. 2003. Using a Delphi study to identify the most difficult concepts for students to master in thermal and transport science. in Proceedings of the 2003 Annual ASEE Conference.
Sweeney, L.B., and J.D. Sterman. 2000. Bathtub dynamics: initial results of a systems thinking inventory. System Dynamics Review 16, 249–286.
Sweeney, L.B., and J.D. Sterman. 2007. Thinking about systems: student and teacher conceptions of natural and social systems. System Dynamics Review. 23, 285–311. doi:10.1002/sdr.366
Tabachnick, B.G., and L.S. Fidell. 2013. Using Multivariate Statistics. Sage Publications. Thousand Oaks, CA, USA.
Taber, K.S. 2008. Conceptual resources for learning science: Issues of transience and grain-size in cognition and cognitive structure. International Journal of Science Education 30, 1027–1053.
Thomas, P.L., and R.W. Schwenz. 1998. College physical chemistry students’ conceptions of equilibrium and fundamental thermodynamics. Journal of Research in Science Teaching 35, 1151–1160.
Thompson, B. 2004. Exploratory and Confirmatory Factor Analysis: Understanding Concepts and Applications. American Psychological Association. Washington D.C., USA.
Thompson, P.W. 1994a. Images of rate and operational understanding of the fundamental theorem of calculus. Educational Studies in Mathematics 26, 229-274.
Thompson, P.W. 1994b. The development of the concept of speed and its relationship to concepts of rate. in G. Harel & J. Confrey (eds.). The development of multiplicative reasoning in the learning of mathematics. SUNY Press. Albany, NY, USA. pp. 179–234.

172
Thompson, P.W., and J. Silverman, J. 2008. The concept of accumulation in calculus. in M.P. Carlson and C. Rasmussen (eds.). Making the connection: Research and teaching in undergraduate mathematics. Mathematical Association of America. Washington D.C., USA. pp. 43-52.
Thong, W.M., and R. Gunstone. 2008. Some student conceptions of electromagnetic induction. Research in Science Education 38, 31–44. doi:10.1007/s11165-007-9038-9
Von Glasersfeld, E. 1989. Cognition, construction of knowledge, and teaching. Synthese 80, 121–140.
Vosniadou, S., Brewer, W.F., 1992. Mental models of the earth: A study of conceptual change in childhood. Cognitive psychology 24, 535–585.
Vosniadou, S. 1994. Capturing and modeling the process of conceptual change. Learning and Instruction 4, 45–69.
Vosniadou, S. 2007. The conceptual change approach and its re-framing. in S. Vosniadou, A. Baltas, and X. Vamvakoussi (eds.). Reframing the Conceptual Change Approach in Learning and Instruction. Elsevier. Oxford, United Kingdom. pp. 1–15.
Vosniadou, S. 2008. Conceptual Change Research: An Introduction. in S. Vosniadou (ed.). International Handbook of Research on Conceptual Change. Routledge, New York, NY, USA. pp. xiii–xxviii.
Vosniadou, S., Vamvakoussi, X., Skopeliti, I., Vosniadou, S., 2008. The framework theory approach to the problem of conceptual change. in S. Vosniadou (ed.). International Handbook of Research on Conceptual Change. Routledge, New York, NY, USA. pp.3–34.
Vygotsky, L.S., 1980. Mind in Society: The Development of Higher Psychological Processes. Harvard University Press. Cambridge, MA, USA.
W. Briggs, and L. Cochran. 2010. Calculus. Pearson. Boston, MA, USA.
Wage, K.E., Buck, J.R., Wright, C.H., and T.B. Welch. 2005. The signals and systems concept inventory. IEEE Transactions on Education 48, 448–461.
White, P., and M. Mitchelmore. 1996. Conceptual knowledge in introductory calculus. Journal for Research in Mathematics Education 79–95.
Zandieh, M., 2000. A theoretical framework for analyzing student understanding of the concept of derivative. CBMS Issues in Mathematics Education 8, 103–127.

173
Appendix A5
Table A5.1 Categorical judgment scheme for concept inventory evaluation (adapted from Jorion et. al, 2015)
Analysis Excellent Good Average Poor Unacceptable
Classical test theory
Item Statistics
Difficulty 0.2 to 0.8 0.2 to 0.8
(3) 0.1 to 0.9
0.1 to 0.9 (3)
0.0 to 1.0
Discrimination > 0.2 > 0.1 > 0.0 > -0.2 > -1.0
Total score reliability
Cronbach’s alpha of total score
> 0.9 > 0.8 > 0.65 > 0.5 > 0.0
Cronbach’s alpha-with-item- deleted
All items less than overall α
(3) (6) (9) > (9)
Item response theory
Individual item measures
All items fit the model (2) (4) (6) (8) (10)
Structural analyses
Exploratory factor analysis Conforms to pre-directed constructs
(5) (10) (15) > (15)
Confirmatory factor analysis
Item loading > 0.3 > 0.3 (3) > 0.1 > 0.1 (3) > -1.0
Comparative fit index > 0.9 > 0.8 > 0.7 > -0.6 > 0.0
Root-mean-square error approximation
< 0.03 < 0.05 < 0.10 < 0.20 > 0.20
Note: Cell values in parenthesis indicate the number of items that can fall outside of this recommendation

174
RACI 2.0 Question Items
1. A reservoir is filled with a single inflow pipe. The reservoir is empty when the inflow
pipe is opened at t = 0. The flow rate of water into the reservoir (in m3/hr) with respect to time, t, is shown below.
a. How much water flows into the reservoir in the first 2 hours?
a. 1 m3 b. 2 m3 c. 4 m3 d. 9 m3 e. 10 m3 f. 16 m3
b. What is the flow rate of water into the reservoir at hour 4?
a. 1 m3/hr b. 2 m3/hr c. 4 m3/hr d. 9 m3/hr e. 10 m3/hr f. 16 m3/hr
0
1
2
3
4
5
6
7
0 1 2 3 4 5 6 7
Flo
w r
ate
of w
ater
(m
3 /hr
)
t (hr)

175
2. The figures below show velocity functions with respect to time, t, for two people walking along two straight paths.
Person A: Person B:
a. Which person is further from their starting position at t = 4?
a. Person A b. Person B c. Both are the same distance from their respective starting point
b. Which person travels a greater total distance over the time interval t = 0 to t = 4?
a. Person A b. Person B c. Both travel the same total distance
c. Which person has a greater acceleration at t = 4?
a. Person A b. Person B c. Both have the same acceleration at this time
-2
-1
0
1
2
3
4
0 1 2 3 4
velo
city
(ft
/sec
)
t (sec)-2
-1
0
1
2
3
4
0 1 2 3 4ve
loci
ty (
ft/s
ec)
t (sec)

176
3. The given graph represents speed vs. time for two cars. (Assume the cars start from the same position and are traveling in the same direction.) Use this information and the graph below to answer item a.
time 1 hour
a. What is the relationship between the position of car A and car B at t = 1 hr.?
a. Car A and car B are colliding. b. Car A is ahead of car B. c. Car B is ahead of car A. d. Car B is passing car A. e. The cars are at the same position.
4. The distance, s (in feet), traveled by a car moving in a straight line is given by the function, s(t) = t2 + t, where t is measured in seconds. Find the average velocity for the time period from t = 1 to t = 4.
a. 5 ft/sec b. 6 ft/sec c. 9 ft/sec d. 10 ft/sec e. 11 ft/sec
spee
d

177
5. The following graph represents the height of water as a function of volume as water is poured into a container. Which container is represented by this graph?
__a__ __b__ __c__ __d__ __e__
Volume H
eigh
t

178
6. A baseball card increases in value according to the function, ( ) = + , where b
gives the value of the card in dollars and t is the time (in years) since the card was
purchased. Which of the following describe what conveys about the situation?
I. The card’s value increases by $5 every two years.
II. Every year the card’s value is 2.5 times greater than the previous year.
III. The card’s value increases by dollars every year.
a. I only b. II only c. III only d. I and III only e. I, II and III
7. Using the graph below, explain the behavior of function f on the interval from x = 5 to x = 12.
a. Increasing at an increasing rate. b. Increasing at a decreasing rate. c. Increasing at a constant rate. d. Decreasing at a decreasing rate. e. Decreasing at an increasing rate.

179
8. Two bathtubs are partially filled with water and have identical outlet drains which are plugged. The width and height of the bathtubs are equal, but the length of Bathtub 1 is twice that of Bathtub 2. The water level in both bathtubs is equal and no water is entering either bathtub.
a. If the outlet drains of each bathtub are unplugged at the same time, how will the water flow rates of the outlet drains compare? a. Outlet water flow rate in Bathtub 1 is greater than that of Bathtub 2 b. Outlet water flow rate in Bathtub 1 is less than that of Bathtub 2 c. Outlet water flow rate in Bathtubs are equal
b. Because…
I. Flow rates will depend on the surface area of water in the tubs II. Flow rates will depend on the height of water in the tubs
III. Flow rates will depend on the size of the drains
a. I only b. II only c. III only d. I and II only e. I and III only f. II and II only g. I, II and III

180
9. A hose is used to fill an empty wading pool. The graph shows volume (in gallons) in the pool as a function of time (in minutes). Which of the following defines a formula for computing time, t, as a function of the volume, v?
a. ( ) =
b. ( ) = 2 c. ( ) =
d. ( ) = 2 e. None of the above
0
1
2
3
0 1 2 3
volu
me
time

181
10. Two identical sinks are connected with a single pipe as shown. Both sinks are partially filled with water. The sinks are fixed at the same height.
Sink 1 Sink 2
a. Additional water is added to Sink 1 by pouring water from a pitcher. As the water is being added to Sink 1, the water level in Sink 2 will be:
a. Rising b. Falling c. Remaining the same d. Unknown (not enough information to select one of these three answers)
11. A gardener has two identical planter boxes that are filled with different mixtures of potting soil. The first box contains soil with 50% porosity (or void space) and the second box contains soil with 40% porosity. Both planters are completely dry, so the gardener uses two hoses with equal constant water flow rates to water both planters simultaneously. a. Which of the planters will collect water at a faster rate?
a. Planter 1 will collect water at a faster rate. b. Planter 2 will collect water at a faster rate. c. Both systems will collect water at the same rate. d. Unknown (not enough information to select one of these three answers)

182
12. Two identical graduated cylinders with identical spigots at the bottom are partially filled with water. The water level in Graduated Cylinder 1 (GC1) is twice that of Graduated Cylinder 2 (GC2). a. If the spigots of each graduated cylinder are opened fully at the same time, how will
the water flow rates of the spigots compare? a. Spigot water flow of GC1 will be greater than that of GC 2 b. Spigot water flow of GC1 will be less than that of GC 2 c. Spigot water flows are equal
b. Because…
a. Additional water will result in slower flow rate out of the spigot b. The water flow rates are proportional only to the size of the cylinders and spigots c. A higher water level will create more pressure on the water which will increase
the water flow rate d. Equal gravitational forces acting on the water in each cylinder will create equal
water flow rates
13. You would like to melt ice which is at 0°C using hot blocks of metal as an energy source. One option is to use one metal block at a temperature of 200°C and a second option is to use two metal blocks each at a temperature of 100°C. Each individual metal block is made from the same material and has the same mass and surface area. Assume that the heat capacity is not a function of temperature.
a. If the blocks are placed in identical insulated containers filled with ice water, which
option will ultimately melt more ice?
a. Either option will melt the same amount of ice. b. The two 100°C blocks c. The one 200°C block.

183
b. Because…
a. 2 blocks have twice as much surface area as 1 block so the energy transfer rate will be higher when more blocks are used.
b. Using a higher temperature block will melt the ice faster because the larger temperature difference will increase the rate of energy transfer.
c. The amount of energy transferred is proportional to the mass of blocks and the change in block temperature during the process.
d. The temperature of the hotter block will decrease faster as energy is transferred to the ice water.
c. Which option will melt ice more quickly?
a. Either option will melt ice at the same rate. b. The two 100°C blocks. c. The one 200°C block.
d. Because…
a. 2 blocks have twice as much surface area as 1 block so the energy transfer rate will be higher when more blocks are used.
b. The higher temperature block creates a larger temperature gradient which will increase the rate of energy transfer.
c. The temperature of the hotter block will decrease faster as energy is transferred to the ice water.
d. The rate of heat transfer is proportional to the surface area of blocks and the temperature difference between the blocks and ice.

184
14. You have a glass of tea in a well-insulated cup that you would like to cool off before drinking. You also have 2 ice cubes to use in the cooling process and an equivalent mass of crushed ice. a. Assuming no energy is lost from the tea into the room, which form of ice (cubes or
crushed ice) added to your tea will give a lower final drink temperature? a. The crushed ice. b. The ice cubes. c. Either will lower the drink temperature the same amount.
b. Because… a. Energy transfer is proportional to the mass of ice used. b. Crushed ice will melt faster and will transfer energy from the tea faster. c. Ice cubes contain less energy per mass that crushed ice so tea will cool more. d. Ice cubes have a higher heat capacity than crushed ice. e. Crushed ice has more surface area so energy transfer rate will be higher.
15. An engineering student has two beakers containing mixtures of dye in water. The first beaker has a 1% dye solution (1 gram of dye in 100 grams of water) and the second beaker has an equal volume of a 2% dye solution (2 grams of dye in 100 grams of water). The student places 2 identical sponges in the 1% dye solution and 1 sponge in the 2% dye solution. a. Which of these combinations will absorb more dye?
a. The two sponges in the 1% solution will absorb more dye. b. The one sponge in the 2% solution will absorb more dye. c. Both systems will absorb the same amount of dye.
b. Which of these combinations will initially absorb dye at a faster rate?
a. Two sponges in the 1% solution will absorb dye at a faster rate. b. One sponge in the 2% solution will absorb dye at a faster rate. c. Both systems will absorb dye from solution at the same rate.

185
Chapter 6 Development of a case-based teaching module to improve student understanding of stakeholder engagement processes within engineering systems design4
6.1 Abstract
This paper introduces a case-based teaching module designed to increase student understanding
of the importance of stakeholder engagement processes in the design of sustainable civil
infrastructure engineering systems. A case study on past technology adoption and environmental
injustices related to stormwater management plans in Onondaga County, NY, provides the basis
for an active learning module on integrating stakeholder engagement in engineering design
processes. The module begins with a review of relevant historical events, including community
unrest when the needs of certain stakeholder groups were ignored. A simulation activity begins
with students divided into groups, each representing an assigned stakeholder community. The
students predict what engineering designs will most directly affect their stakeholder group and
how various design solutions may impact other groups. Assessment tools are used to gauge the
students’ learning outcomes and perceptions of stakeholder engagement and engineering design
after the module. Results from three implementations of the module demonstrate that the
activities effectively increased student understanding of the complexities related to the
engineering design processes, particularly stakeholder engagement activities. The module has
also been shown to improve student motivation and interest in course material. These results
provide insights for instructors seeking effective ways to bring stakeholder concerns into the
classroom.
4 This chapter is adapted from a 2016 paper published in New Developments in Engineering Education for Sustainable Development

186
6.2 Introduction
Engineers are now being tasked with understanding the broader social, economic, and
environmental implications of their work (Allenby et al., 2009). This presents a need for
educational approaches that can enable future engineers to think holistically and incorporate a
complexity of new constraints in practice (Davidson et al., 2007). It is unrealistic to expect
students with little “real-world” experience to understand these complexities through traditional
instructional methods. Instead, introducing pedagogical elements such as historical context,
decision-making, and ethics into the classroom can aid in the development of “post-
conventional” engineers. This term has been used to describe engineers who have a sense of
autonomy in their work and see and treat engineering work as requiring complex decision
making and social responsibility (Nair, 1997).
This paper proposes that case-based teaching modules that include simulation activities can
better prepare engineering students to appreciate the complex situations they will encounter on
the job. For this study, a stakeholder engagement simulation exercise on selecting management
practices for stormwater management was developed to help civil and environmental engineering
students learn to apply sustainability concepts and principles. The module makes use of active
and collaborative teaching pedagogies within a learning cycle framework.
6.3 Context and Motivation for Module Development
The module was originally designed for the course Sustainability in Civil and
Environmental Systems, a sophomore core course for Civil and Environmental Engineering
majors at Syracuse University. The course encompasses a broad range of topics integrating

187
sustainability into a traditional introductory environmental engineering course with the following
primary instructional objectives:
A. Introduce principles of sustainability and systems as applied to the natural and built
environments;
B. Provide skills necessary for quantitative assessments of civil and environmental
engineering problems;
C. Use principles developed in class to evaluate and solve complex open-ended
environmental problems and communicate the results of the analysis.
The course material is primarily covered in lectures, or a combination of lecture and in-
class problem solving activities. The course is divided into four topic areas: population, energy,
water, and air. Within the water unit, topics include water contaminants, physical properties of
water and the hydrologic cycle, municipal water and wastewater, and urban water management
including sustainable approaches for controlling urban stormwater runoff.
6.4 Theoretical Background
Active learning methods have consistently shown an increase in student performance in
undergraduate courses in science, technology, engineering, and mathematics disciplines
(Freeman et al., 2014; Prince and Felder 2006; Prince 2004). Several researchers have suggested
that active learning methods may be especially useful in allowing students to better understand
sustainability principles (Huntzinger et al., 2007; Korkmaz, 2011; Siller, 2001). The case-based
urban water stakeholder simulation module designed in this study employs several pedagogies to
promote active student learning.

188
6.4.1 Case-Based Learning
Inductive learning begins with a context for learning rather than fundamental theories and
concepts. Inquiry-based learning is an inductive learning method based on the constructivist
theory of learning that knowledge is constructed by the learner. Students assume responsibility
for the learning process by engaging in experiences and experiments to solve a problem.
Inductive teaching strategies provide students with opportunities to engage in experience-driven
learning within collaborative learning environments (Prince and Felder, 2006).
Case-based learning is a type of inductive learning method in which students are
presented with the context of a case study with complex, ill-defined problems to consider. Case-
based learning goes beyond the constructivist theory of learning in that it defines a model of
cognition that can be turned to for advice and for predictions that can be simulated to test ideas,
thus allowing students to draw productive lessons from a case and transfer their knowledge to
future situations (Jonassen and Land, 1999). Case-based methods have also been shown to be a
preferred inductive learning style among instructors and students (Srinivasan et al., 2007).
To design case-based modules as effective inductive learning tools, the context of the
case is described but the actual decisions made are withheld so students can inductively develop
their own solutions to the problems presented (Lynn, 1999). The following steps to structure
case-based discussions have been suggested to optimize the student learning experience in case-
based environments (Kardos, 1979): (1) review of the case content, (2) statement of problems,
(3) collection of relevant information, (4) development of alternatives, (5) evaluation of
alternatives, (6) selection of a course of action, and (7) evaluation of solutions and review of
actual case outcomes.

189
6.4.2 Learning Cycle-Based Instruction
The steps proposed for case-based learning closely follow several learning cycle models.
For instance, Kolb’s experiential learning theory, which asserts that experiences play a key role
in the learning process, suggests that student learning occurs in two stages: grasping experiences
(through a concrete experience phase and an abstract conceptualization phase) and transforming
experiences (through a reflective observation phase and an active experimentation phase) (Kolb,
1984). Based on this theory, Kolb postulates that complete learning occurs when students engage
in all four phases of a learning cycle, and that instructors can promote complete learning by
designing course materials to encourage students to complete all learning cycle phases (Kolb et
al., 2001).
6.5 Module Design and Implementation
The module employed in this study was designed to make use of case-based learning
methods within a learning-cycle-based instructional framework. The seven steps suggested for
case study design by Kardos (1979) were used in the design of the urban water stakeholder
simulation module, as summarized in Table 6.1.
6.5.1 Case Selection and Context
Preparation for case-based learning is very demanding, as instructors must be intimately
familiar with the history and current state of decisions related to the case in order to actively
respond to questions during the case (Kardos, 1979). This case was selected based on the
authors’ expertise on sustainable urban water systems and depth of knowledge on stakeholder
perspectives (Flynn et al., 2014; Flynn and Davidson, 2016). The context of the case takes place
in Onondaga County, located in Central New York. Onondaga County operates a combined
sewer system and must provide a control plan to manage combined sewer overflows (CSOs).

190
Table 6.1 Module design components
Steps for Case-Based Module Development
Module Features Pedagogy Elements
(1) Review of the case content
Mini lecture, videos and discussions of stormwater engineering design and Onondaga County context
Grasping experiences through concrete experience and abstract conceptualization
(2) Statement of problem
As a member of a key stakeholder group in Onondaga County, what type of technologies or solutions would you consider and why?
Case-based problem
(3) Collection of relevant information, and (4) Development of alternatives
Stakeholder simulation activity: student group discussion aided by floating facilitators
Student collaboration; transforming experiences primarily through active experimentation
(5) Evaluation of alternatives, and (6) Selection of a course of action
Environmental, economic, social and ethical considerations used to evaluate each set of proposals
Student collaboration; transforming experiences primarily through reflective observation
(7) Evaluation of solutions and review of actual case outcomes
Summary of actual changes to Onondaga County’s stormwater management plans
Grasping experiences through abstract conceptualization
Most municipal CSO control plans in the U.S. make use of traditional “gray infrastructure”
solutions, or CSO control technologies that either enhance or supplement existing sewer
infrastructure, which tend to be large in scale and cost. Implementing only gray infrastructure
systems for urban stormwater management is neither sustainable nor sufficiently resilient to
accommodate climatic changes (Novotny et al., 2010; Pyke et al., 2011). Conversely, urban
stormwater systems that include green infrastructure (GI) technologies are recognized as a more
sustainable management approach. Onondaga County’s original CSO management plans
included multiple expensive gray infrastructure technologies that were considered unjust and
insufficient by many local community members. While all major regulating and regulated parties

191
were directly involved in the Onondaga County CSO management planning process, several
important stakeholder groups were not. Over time, the environmental injustices stemming from
this exclusion led to the social unrest of many groups in Onondaga County, particularly the
Onondaga Nation and the residents of the Southside neighborhood (Perreault et al., 2012).
6.5.2 Initial Module Implementation
The first implementation of the module took place in 2014 during a single lecture period
lasting eighty minutes. Instruction began with grasping experiences through a mini-lecture on
why stormwater engineering design is both necessary and inherently complex. Early module
content also described available technology options and the stakeholders that are affected by
each option. Urban stormwater management issues were reviewed and local contextualization
was provided with videos of recent localized flooding on campus and the surrounding
neighborhoods. The module continued with a discussion of these issues and how the framing of
water issues impacts the goals, system boundaries and specific solutions. Stakeholder
engagement processes were introduced and a variety of different stakeholder groups involved
with and affected by municipal stormwater management decisions were discussed. Students were
then presented with the context of the Onondaga County case study. Information on changes to
Onondaga County’s stormwater management plans to include widespread use of GI technologies
were intentionally left out of the module to elicit original student ideas as the module progressed.
The case-based simulation activity was designed to promote the active experimentation
phase of learning, as students explored how they would advocate for particular engineering
solutions while representing a certain stakeholder group within Onondaga County, and
considered what consequences would occur if their solutions were chosen. Background on the
case and on each stakeholder group was presented to the students and is shown in Table 6.2. The

192
four stakeholder groups described in Table 6.2 were selected from the multiple stakeholders
involved with this case. The class was divided into four equal groups, each representing one
stakeholder group. Potential solutions using gray infrastructure and GI were reviewed, as
summarized in Table 6.3. Information on technology options was presented for the time period
of 2007-2008, when GI technologies were acknowledged as a potential alternative to gray
infrastructure technologies but not widely implemented. Students were then asked to answer the
following question with their group: As a member of a key stakeholder group in Onondaga
County, what type of technologies or solutions would you consider and why?
Table 6.2 Stakeholder groups included in initial module
Several possible considerations were provided to the students, including economic
limitations and opportunities, political and community culture, current ecosystem conditions,
current state of existing infrastructure, legal constraints, and current and future climatic
conditions. Students were provided time to discuss the various technology options within their
groups. A floating facilitator model was employed with four instructors moving from group to
group during the discussion period to respond to student questions. Each facilitator had studied
Stakeholder Group Primary Interests
Onondaga County Government
Must meet consent judgment criteria to treat or mitigate 400 million gallons of annual CSO volume and decrease bacteria, phosphorus and trash loadings to Onondaga Lake using proven technologies in a cost-effective manner
Engineering firms Must design proven and cost effective stormwater management solutions to meet the needs of their client (Onondaga County)
Southside residents Proximity of invasive infrastructure projects, localized and basement flooding, construction disruptions, aesthetics, recreation, health
Onondaga Nation Lake is a sacred site; Onondaga Nation follows a vision of environmental stewardship and cooperative resource management

193
different aspects of this case over multiple years and was able to provide robust answers to
student questions. After the discussion, students were asked to advocate for their technology
selection and to provide support based on the goals and concerns of their stakeholder group. The
class ended with an open discussion of the various proposals and a brief presentation of the
actual solutions implemented in Onondaga County.
Table 6.3 Technological aspects of gray and green infrastructure
Technological Aspect
Gray Infrastructure Green Infrastructure
Materials Human manufactured materials Human manufactured and natural materials
Benefits Single purpose technologies for stormwater mitigation and treatment
Multifunctional technologies with multiple environmental and social benefits
Distribution and capacity
Large capacity to centrally treat and transport stormwater
Varied capacities to treat and manage stormwater through a diffuse network
System integration Concentrates stormwater and pollutants to be treated with chemicals
Complementary to existing infrastructure; systems-thinking design
6.5.3 Formative Assessment Tool
A formative assessment tool was administered directly following the module
implementation to provide feedback on its effectiveness as a teaching tool. The assessment also
provided information on student self-evaluations of learning outcomes, as well as their overall
enjoyment of the module activities and structure. The initial formative assessment tool included
a three point Likert scale (Disagree, Agree, or Strongly Agree) to assess students’ perceived level
of understanding on several topics after the module. Two open-ended questions were included to
elicit student comments on their satisfaction of the module. Certain questions from this tool were

194
administered during the subsequent implementations to assess if changes made to the module
produced any positive effects in students’ perceptions and satisfaction.
6.5.3 Revisions to the Module and Assessment Tools
Based on formative assessment findings from the first-year implementation (to be
discussed in Section 6.6.1), several changes were made to the structure of the module. Activities
were spread out over two eighty-minute lecture periods, and an innovative classroom space has
also been utilized to allow for enhanced interaction of small groups within a large classroom
setting. The first lecture period serves as an expansion of the mini-lecture to allow for additional
discussion of stormwater management principles and possible needs of various stakeholder
groups. This lecture focuses on seven stages of an engineering design process: problem
definition, gathering information, generating ideas, modeling, feasibility analysis, evaluation,
and decision-making. Research by Atman et. al (2007) suggests that engineering students spend
significantly less time in the stages of problem definition, gathering information, generating
ideas, evaluation, and decision-making stages. As these stages present opportunities for
stakeholder input, the importance of stakeholder engagement throughout each of these stages is
emphasized during the lecture activities.
The second period is dedicated to the simulation activity. Additional stakeholder groups
(summarized in Table 6.4) were added in order to promote additional student interactions during
the activity, and introduce additional complexity for students to consider during decision-making
processes. An expansion of the initial formative assessment tool was developed using Bloom’s
Taxonomy as a framework to assess learning outcomes (Bloom et al., 1956). The revised tool is
administered before and after module implementation to assess learning outcomes through
student self-evaluations on fourteen question items using a five point Likert scale.
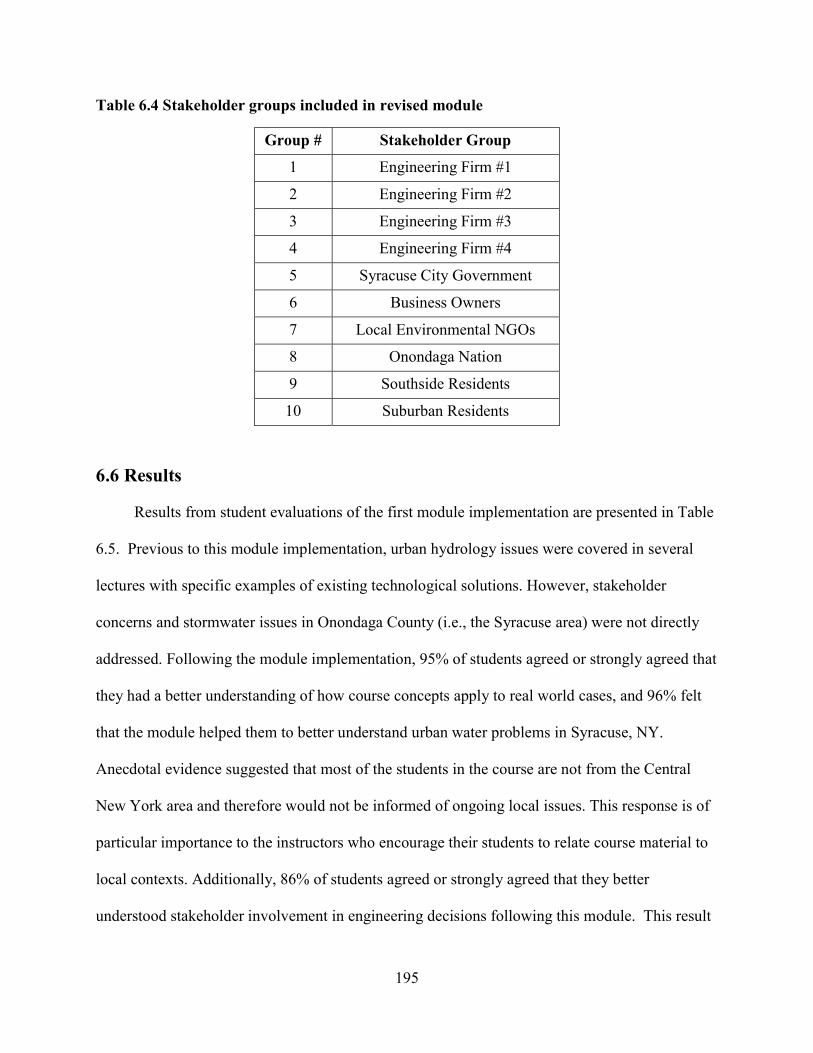
195
Table 6.4 Stakeholder groups included in revised module
Group # Stakeholder Group
1 Engineering Firm #1
2 Engineering Firm #2
3 Engineering Firm #3
4 Engineering Firm #4
5 Syracuse City Government
6 Business Owners
7 Local Environmental NGOs
8 Onondaga Nation
9 Southside Residents
10 Suburban Residents
6.6 Results
Results from student evaluations of the first module implementation are presented in Table
6.5. Previous to this module implementation, urban hydrology issues were covered in several
lectures with specific examples of existing technological solutions. However, stakeholder
concerns and stormwater issues in Onondaga County (i.e., the Syracuse area) were not directly
addressed. Following the module implementation, 95% of students agreed or strongly agreed that
they had a better understanding of how course concepts apply to real world cases, and 96% felt
that the module helped them to better understand urban water problems in Syracuse, NY.
Anecdotal evidence suggested that most of the students in the course are not from the Central
New York area and therefore would not be informed of ongoing local issues. This response is of
particular importance to the instructors who encourage their students to relate course material to
local contexts. Additionally, 86% of students agreed or strongly agreed that they better
understood stakeholder involvement in engineering decisions following this module. This result

196
is also notable, as increasing students’ ability to understand the complexities of engineering
design decisions was a primary objective of the module.
Table 6.5 Student evaluations of 2014 module (N=30)
Question Disagree Agree Strongly
Agree
As a result of today’s activities, I have a better understanding of how concepts learned in this course apply to the real world.
5% 75% 20%
As a result of today’s activities, I have a better understanding of how different stakeholders influence engineering decisions.
14% 59% 27%
As a result of today’s activities, I have a better understanding of urban water problems in the Syracuse area.
4% 60% 36%
I enjoyed today’s activities. 25% 57% 18%
Student responses to open-ended questions for three years of module implementation are
summarized in Figures 6.1 and 6.2. Two instructors categorized the open comments based on
common themes and language that students used to describe their experiences in the module. The
first open-ended question asked what the students enjoyed most about the class activity. These
comments were classified into seven groups. Many students mentioned that they enjoyed
working in groups and enjoyed learning about the various interests of the different stakeholders.
In comparing responses between the first year of the module implementation (2014) and the
second and third implementations (i.e., after the module was modified), several trends in student
preferences stand out. The largest differences are an increase in students’ enjoyment stemming
from “real-world” complexities and a connection to their future careers. This suggests that the
revised module succeeds in expanding students’ understanding of how material learned in the
classroom will apply to future engineering design projects they may encounter in their careers.
Many students consistently responded positively to incorporating more group interactions during

197
class time. Several responses to this question also indicated an increase in student motivation to
continue investigating stormwater engineering issues. Two such comments are included below:
“I thought the lecture was well done and I found it to be engaging, interesting and extremely useful. This was possibly the most useful lecture I have here at Syracuse and reminded me why I chose engineering.” “I enjoyed how it was based off of real world problems, which made it feel a lot more realistic. It was the first time I have been involved in an activity that has shown me what I may deal with in my future profession.”
Figure 6.1 Student responses to “What did you enjoy most about today’s activities?”
0%
5%
10%
15%
20%
25%
30%
EnhancedCourse
Experience
LocalConnection
Real WorldComplexity
StakeholderInterests
InteractiveGroup Work
Connectionto ClassMaterial
EngineeringCareer
2014 (30 comments) 2015 (77 comments) 2016 (52 comments)

198
A second open-ended assessment question relates to improvements that can be made to the
module. Responses to this question are summarized in Figure 6.2. In 2014, most comments
related to group size and limited interaction within the groups, while in 2015 and 2016 the
primary area of improvement identified by the students is more time to work through the
simulation activity. Requests for additional information or structure within the module tend to be
consistent across all years.
Figure 6.2 Student responses to “What suggestions do you have for improvement of today’s activities?”
0%
10%
20%
30%
40%
50%
More Time LogisticalIssues
MoreInformationor Structure
MoreInteraction
None Other
2014 (16 comments) 2015 (70 comments) 2016 (52 comments)

199
Results from student self-assessments of learning outcomes for 2015 and 2016 are
summarized in Table 6.6. Student responses to multiple questions are averaged according to each
Bloom’s Taxonomy level, and a paired two sample t-test for differences in means is used to
assess the significance of changes in student knowledge at each level before and after module
implementation. All results for both years show significant learning gains across all taxonomy
levels. Because control data is not available for equivalent learning outcomes without using the
simulation activity, these results cannot precisely demonstrate the effectiveness of the case-study
module against traditional classroom learning activities. However, when considered along with
student responses of overall satisfaction with the module, the revised version of the module is
shown able to both meet the learning outcomes of the course, particularly in regards to students’
analysis of complex open-ended environmental problems, while enhancing the learning
experience for students.
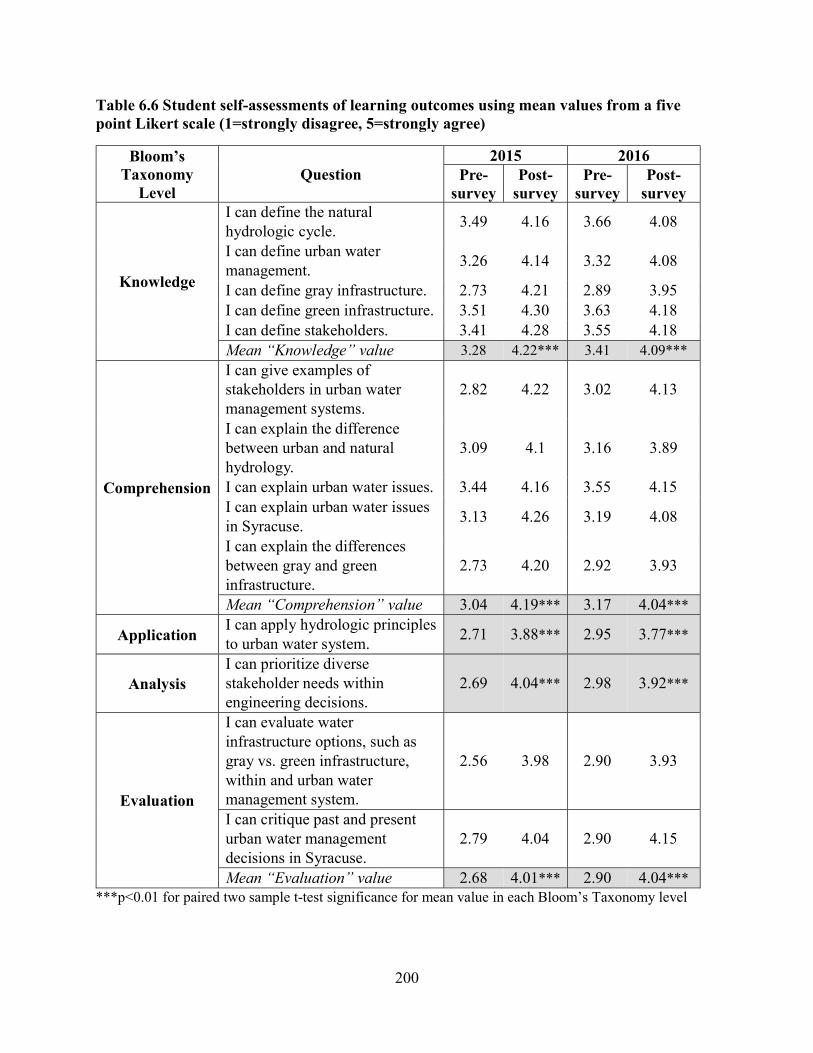
200
Table 6.6 Student self-assessments of learning outcomes using mean values from a five point Likert scale (1=strongly disagree, 5=strongly agree)
Bloom’s Taxonomy
Level Question
2015 2016 Pre-
survey Post-
survey Pre-
survey Post-
survey
Knowledge
I can define the natural hydrologic cycle.
3.49 4.16 3.66 4.08
I can define urban water management.
3.26 4.14 3.32 4.08
I can define gray infrastructure. 2.73 4.21 2.89 3.95 I can define green infrastructure. 3.51 4.30 3.63 4.18 I can define stakeholders. 3.41 4.28 3.55 4.18 Mean “Knowledge” value 3.28 4.22*** 3.41 4.09***
Comprehension
I can give examples of stakeholders in urban water management systems.
2.82 4.22 3.02 4.13
I can explain the difference between urban and natural hydrology.
3.09 4.1 3.16 3.89
I can explain urban water issues. 3.44 4.16 3.55 4.15 I can explain urban water issues in Syracuse.
3.13 4.26 3.19 4.08
I can explain the differences between gray and green infrastructure.
2.73 4.20 2.92 3.93
Mean “Comprehension” value 3.04 4.19*** 3.17 4.04***
Application I can apply hydrologic principles to urban water system.
2.71 3.88*** 2.95 3.77***
Analysis I can prioritize diverse stakeholder needs within engineering decisions.
2.69 4.04*** 2.98 3.92***
Evaluation
I can evaluate water infrastructure options, such as gray vs. green infrastructure, within and urban water management system.
2.56 3.98 2.90 3.93
I can critique past and present urban water management decisions in Syracuse.
2.79 4.04 2.90 4.15
Mean “Evaluation” value 2.68 4.01*** 2.90 4.04*** ***p<0.01 for paired two sample t-test significance for mean value in each Bloom’s Taxonomy level

201
6.7 Conclusions and Future Work
To encourage active student engagement in learning about sustainable urban stormwater
system design, a case-based module was developed and implemented in a sophomore civil and
environmental engineering course. Assessment results suggest that the module effectively
increased student understanding of complex decision making processes required of engineers.
The instructors observed high levels of student involvement and engagement in the material
throughout the module, particularly during the simulation activity. Students enjoyed the
collaborative learning activities and focus on a local engineering case study involving diverse
stakeholder concerns.
Several modifications were applied after initial module implementation in response to
student suggestions, such as the addition of multiple stakeholder groups and activities during the
stakeholder engagement simulation. Several student comments from the first-year
implementation also suggested the need for additional reflective observation time. Learning
activities are now designed as a two-day module, with one full lecture period dedicated to
simulation activities. An innovative classroom space has also been utilized to allow for enhanced
interaction of small groups within a large classroom setting. Additional work on this module
aims to further engage students with local, real-world situations that foster an understanding of
the complexities of inclusive, human-centered design processes.
6.8 References
Allenby, B., Murphy, C.F., Allen, D., and C.I. Davidson. 2009. “Sustainable Engineering Education in the United States.” Sustainability Science, 4 (1): 7–15. Atman, C.J., Adams, R.S., Cardella, M.E., Turns, J., Mosborg, S., and J. Saleem. 2007. Engineering design processes: A comparison of students and expert practitioners. Journal of Engineering Education 96, 359–379.

202
Bloom, B.S., Engelhart, M.D., Furst, E.J., Hill, W.H., and D.R. Krathwohl. 1956. Taxonomy of educational objectives: The classification of educational goals. Handbook 1: Cognitive Domain. David McKay. New York, NY, USA. Davidson, C. I., Matthews, H.S., Hendrickson, C.T., Bridges, M.W., Allenby, B.R., Crittenden, J.C., and Y. Chen. 2007. Adding sustainability to the engineer’s toolbox: A challenge for engineering educators. Environmental Science & Technology, 41 (14): 4847–49. Flynn, C.D., and C.I. Davidson, 2016. Adapting the Social-Ecological System Framework for Urban Stormwater Management: The Case of Green Infrastructure Adoption. Ecology and Society, 21(4). Flynn, C.D., Davidson, C.I., and J. Mahoney. 2014. Transformational changes associated with sustainable stormwater management practices in Onondaga County, New York. in ICSI 2014: Creating Infrastructure for a Sustainable World. American Society of Civil Engineers. Long Beach, CA, USA. 1:89–100. Freeman, S., Eddy, S.L., McDonough, M., Smith, M.K., Okoroafor, N., Jordt, H., and M.P. Wenderoth. 2014. Active learning increases student performance in science, engineering, and mathematics. Proceedings of the National Academy of Sciences, 111 (23): 8410–15. Huntzinger, D.N., Hutchins, M.J., Gierke, J.S., and J.W. Sutherland. 2007. Enabling sustainable thinking in undergraduate engineering education. International Journal of Engineering Education, 23 (2): 218. Jonassen, D.H., and S.M. Land. 1999. Theoretical Foundations of Learning Environments. Routledge, Oxford, UK. Kardos, G. 1979. Engineering cases in the classroom. Proceedings of the National Conference on Engineering. http://www.civeng.carleton.ca/ECL/cclas.html.
Kolb, D.A. 1984. Experiential Learning: Experience as the Source of Learning and Development. Prentice-Hall, Englewood Cliffs, NJ, USA. Kolb, D.A., Boyatzis, R.E., and C. Mainemelis. 2001. Experiential learning theory: Previous research and new directions. Perspectives on Thinking, Learning, and Cognitive Styles, 1: 227–247. Korkmaz, S. 2011. Case-Based and Collaborative-Learning Techniques to Teach Delivery of Sustainable Buildings. Journal of Professional Issues in Engineering Education and Practice, 138 (2): 139–44. Lynn, L. E. 1999. Teaching and Learning with Cases: A Guidebook. CQ Press. Washington D.C., USA

203
Nair, I. 1997. Decision making in the engineering classroom. Journal of Engineering Education, 86 (4): 349–56.
Novotny, V., Ahern, J., and P. Brown. 2010. Water Centric Sustainable Communities: Planning, Retrofitting and Building the next Urban Environment. John Wiley & Sons, Hoboken, NJ, USA. Perreault, T., Wraight, S., and M. Perreault. 2012. Environmental injustice in the Onondaga Lake waterscape, New York State, USA.” Water Alternatives 5 (2): 485–506.
Prince, M. 2004. Does active learning work? A Review of the Research.” Journal of Engineering Education, 93 (3): 223–31. Prince, M.J., and R.M. Felder. 2006. Inductive teaching and learning methods: Definitions, comparisons, and research bases. Journal of Engineering Education, 95 (2): 123–38. Pyke, C., Warren, M.P., Johnson, T., LaGro, J., Scharfenberg, J., Groth, P., Freed, R., Schroeer, W., and E. Main. 2011. Assessment of low impact development for managing stormwater with changing precipitation due to climate change. Landscape and Urban Planning, 103 (2): 166–73. Siller, T. J. 2001. Sustainability and critical thinking in civil engineering curriculum. Journal of Professional Issues in Engineering Education and Practice, 127 (3): 104–8. Srinivasan, M., Wilkes, M., Stevenson, F., Nguyen, T., and S. Slavin. 2007. Comparing problem-based learning with case-based learning: Effects of a major curricular shift at two institutions.” Academic Medicine, 82 (1): 74–82.

204
Chapter 7 Conclusions
This research has the potential to inform current decision-makers on influential factors
related to the design and implementation of sustainable civil infrastructure systems, and guide
best practices in education that will influence future engineers’ understanding of sustainable
systems design principles. From a policy innovation perspective, this research contributes to a
deeper understanding of sustainable infrastructure adoption as both an environmental outcome-
based and community-interest driven process. From a pedagogical perspective, this work reveals
a need for engineering faculty to both develop strategies that can address student misconceptions
related to rate and accumulation problems and provide opportunities to actively engage in
learning complex engineering design concepts.
7.1 Summary of Findings
In the first study of this thesis, described in Chapter 2, I developed a social-ecological
framework for categorizing factors that condition the adoption of GI programs by stormwater
management authorities. While it has been argued that there is no need to create a separate
technological domain in the social-ecological framework (McGinnis and Ostrom 2014), this
study demonstrates a need to more fully develop robust descriptions of technological attributes
within an urban stormwater system, particularly for technology decision-making activities. This
framework can provide guidance for officials and professionals in the development of more
sustainable stormwater management planning methods. This research may also provide insight
for other sustainable technology decision-making frameworks.
The second study of this thesis, described in Chapter 3, describes a case study that
analyzes the evolution of stormwater management plans in Onondaga County, NY, from 1998 to

205
2009. Interviews with stakeholders and document analysis were used to identify important
factors that led stormwater management authorities to overhaul existing CSO management plans
by adopting a comprehensive GI program to replace certain gray projects. Findings suggest that
the adoption of this program can be understood as an alignment of several sociopolitical factors,
including the presence of a policy entrepreneurship coalition in support of alternative stormwater
management plans, the election of a key political official who acknowledged the needs of local
stakeholders, and a shift in mindset of local and national officials as to what technologies are
effective for stormwater management. These findings demonstrate the importance of integrating
diverse stakeholder goals and adaptive decision making to address urban stormwater
management challenges.
In the study described in Chapter 4, I developed an empirical model of GI program
adoption decisions in large U.S. communities with combined sewer systems. A sewer
management authority’s decision to adopt a large-scale GI program is modeled as a two-tier
decision to separately assess factors that influence the decision to adopt a program, and factors
that influence decisions related to the extent of planned program implementation. I find that the
decision to adopt a large-scale municipal GI program is largely driven by the population size of a
municipality and precipitation characteristics, while the extent of program implementation is also
driven by socioeconomic characteristics of municipal residents in addition to the total amount of
remaining capital infrastructure needs for CSO compliance. By examining the motivation for and
barriers to green infrastructure adoption, this research has important implications for
environmental governance at the municipal level.

206
Knowing how students think and learn about rate and accumulation processes in complex
systems can help educators better prepare students for their engineering careers. This work
provides educators with a reliable and valid assessment tool that can be used to identify gaps in
student understanding of rate and accumulation processes. The study described in Chapter 5
provides evidence of validity and reliability of the RACI through structural equation modeling
and multidimensional item response theory. Validity and reliability evidence indicates that the
RACI can be used to measure students’ overall understanding of all concepts identified. Factor
analysis findings point to issues of possible construct underrepresentation in certain subscales of
conceptual understanding; thus, evidence for the validity of RACI subscales is limited.
This research also provides educators with findings on incorporating broad, complex
constraints such as stakeholder needs into undergraduate engineering coursework. The study
discussed in Chapter 6 describes the development and use of a case-based learning module for
use in a sophomore civil and environmental engineering class. Findings from Chapter 2 of this
dissertation are used to develop a case-based teaching module on incorporating stakeholder
engagement processes in engineering system design. This study demonstrates the overall success
of using a simulation activity to engage students in complex engineering decision-making
scenarios. Thus far, each implementation of the module has been shown to enhance student
understanding of stakeholder engagement principles, as well as overall satisfaction with course
material. While the module presented in this thesis can be incorporated in other engineering
courses, the success of a case study module may be determined in part by an educator’s level of
expertise on the case materials. Preparation for case-based learning can be quite demanding, and
instructors should be very familiar with the history and current state of the case to provide
nuanced responses to student questions. This should be viewed as a worthy task, as exposure to

207
open-ended, real-world scenarios can help engineering students appreciate the complex design
considerations that will be required of them in their careers.
7.2 References
McGinnis, M. D., and E. Ostrom. 2014. Social-ecological framework: initial changes and continuing challenges. Ecology and Society 19(2):30. [online] URL: http://dx.doi.org/10.5751/ES-06387-190230

208
Vita
NAME OF AUTHOR: Carli Denyse Flynn PLACE OF BIRTH: Clifton Heights, PA, USA DATE OF BIRTH: 3 August 1987 EDUCATION: Bachelor of Science in Biological Engineering and Environmental Engineering, 2009
Cornell University, Ithaca, NY, USA Master of Science in Civil and Environmental Engineering, 2010 Carnegie Mellon University, Pittsburgh, PA, USA