Transitional CpG methylation between promoters and retroelements of tissue-specific genes during...
16
Journal of Cellular Biochemistry 102:224–239 (2007) Transitional CpG Methylation Between Promoters and Retroelements of Tissue-Specific Genes During Human Mesenchymal Cell Differentiation Moo-Il Kang, 1 Hye-Soo Kim, 1 Yu-Chae Jung, 2 Young-Ho Kim, 2 Seung-Jin Hong, 2 Mi-Kyoung Kim, 1 Ki-Hyun Baek, 1 Chun–Choo Kim, 1 and Mun-Gan Rhyu 2 * 1 Department of Internal Medicine, College of Medicine, The Catholic University of Korea, Seoul, Korea 2 Department of Microbiology, College of Medicine, The Catholic University of Korea, Seoul, Korea Abstract In general, methylation of the promoter regions is inversely correlated with gene expression. The transitional CpG area between the promoter-associated CpG islands and the nearby retroelements is often methylated in a tissue-specific manner. This study analyzed the relationship between gene expression and the methylation of the transitional CpGs in two human stromal cells derived from the bone marrow (BMSC) and adipose tissue (ATSC), both of which have a multilineage differentiation potential. The transitional CpGs of the osteoblast-specific (RUNX2 and BGLAP), adipocyte-specific (PPARg2), housekeeping (CDKN2A and MLH1), and mesenchyme-unrelated (RUNX3) genes were examined by methylation-specific PCR. The expression of each gene was measured using reverse-transcription PCR analysis. The RUNX2, BGLAP, and CDKN2A genes in the BMSC, and the PPARg2 gene in the ATSC exhibited hypomethylation of the transitional CpGs along with the strong expression. The CpG island of RUNX3 gene not expressed in both BMSC and ATSC was hypermethylated. Transitional hypomethylation of the MLH1 gene was accompanied by the higher expression in the BMSC than in the ATSC. The weakly methylated CpGs of the PPARg2 gene in the BMSC became hypomethylated along with the strong expression during the osteoblastic differentiation. There were no notable changes in the transitional methylation and expression of the genes other than PPARg2 after the differentiation. Therefore, the transitional methylation and gene expression established in mesenchymal cells tend to be consistently preserved under the induction of differentiation. Weak transitional methylation of the PPARg2 gene in the BMSC suggests a methylation- dependent mechanism underlying the adiopogenesis of bone marrow. J. Cell. Biochem. 102: 224 – 239, 2007. ß 2007 Wiley-Liss, Inc. Key words: methylation; mRNA expression; cell differentiation; mesenchymal cell Stromal cells derived from bone marrow (BMSC) and adipose tissue (ATSC) can prolif- erate easily and differentiate in vitro into a variety of cell lineages such as osteoblasts, chondrocytes, adipocytes, and myoblasts [Kern et al., 2006]. These two mesenchymal cells are considered promising resources for stem cell therapy in the regeneration of tissue with a mesenchymal origin. Currently, it is not known if this multi-lineage potential produces sepa- rate precursor cells that exist in vivo, or if the stem cell potential emerges in the in vitro culture conditions. In contrast, it has been suggested that mesenchymal cells are inher- ently unstable and shift from one lineage to another [Dennis and Charbord, 2002]. For example, the aging process, which is one of the causes of osteoporosis, is associated with the increased adipogenesis and decreased osteogen- esis of mesenchymal cells in the bone marrow. Eventually, the red marrow turns yellow and the differentiation capacity of the BMSC in elderly people becomes inefficient [Justesen et al., 2001; Pei and Tontonoz, 2004]. The RUNX2 [Komori et al., 1997; Otto et al., 1997] and PPARg2 [Ross et al., 1990; Tontonoz et al., 1994] genes are well-known ‘‘master ß 2007 Wiley-Liss, Inc. Moo-Il Kang and Hye-Soo Kim have contributed equally to this work. Grant sponsor: The Ministry of Health & Welfare, Republic of Korea; Grant number: 0405-DB01-0104-0006. *Correspondence to: Mun-Gan Rhyu, MD, PhD, Depart- ment of Microbiology, College of Medicine, The Catholic University of Korea, 505 Banpo-dong, Socho-gu, Seoul 137-701, Korea. E-mail: [email protected] Received 21 August 2006; Accepted 9 January 2007 DOI 10.1002/jcb.21291
-
Upload
independent -
Category
Documents
-
view
1 -
download
0
Transcript of Transitional CpG methylation between promoters and retroelements of tissue-specific genes during...

Journal of Cellular Biochemistry 102:224–239 (2007)
Transitional CpG Methylation Between Promotersand Retroelements of Tissue-Specific Genes DuringHuman Mesenchymal Cell Differentiation
Moo-Il Kang,1 Hye-Soo Kim,1 Yu-Chae Jung,2 Young-Ho Kim,2 Seung-Jin Hong,2
Mi-Kyoung Kim,1 Ki-Hyun Baek,1 Chun–Choo Kim,1 and Mun-Gan Rhyu2*1Department of Internal Medicine, College of Medicine, The Catholic University of Korea, Seoul, Korea2Department of Microbiology, College of Medicine, The Catholic University of Korea, Seoul, Korea
Abstract In general, methylation of the promoter regions is inversely correlated with gene expression. Thetransitional CpGarea between the promoter-associatedCpG islands and the nearby retroelements is oftenmethylated in atissue-specific manner. This study analyzed the relationship between gene expression and the methylation of thetransitional CpGs in two human stromal cells derived from the bone marrow (BMSC) and adipose tissue (ATSC), both ofwhich have amultilineage differentiation potential. The transitional CpGs of the osteoblast-specific (RUNX2andBGLAP),adipocyte-specific (PPARg2), housekeeping (CDKN2A and MLH1), and mesenchyme-unrelated (RUNX3) genes wereexamined by methylation-specific PCR. The expression of each gene was measured using reverse-transcription PCRanalysis. The RUNX2, BGLAP, and CDKN2A genes in the BMSC, and the PPARg2 gene in the ATSC exhibitedhypomethylation of the transitional CpGs alongwith the strong expression. The CpG island of RUNX3 gene not expressedin both BMSC andATSCwas hypermethylated. Transitional hypomethylation of theMLH1 genewas accompanied by thehigher expression in the BMSC than in the ATSC. The weakly methylated CpGs of the PPARg2 gene in the BMSC becamehypomethylated alongwith the strong expressionduring the osteoblastic differentiation. Therewere nonotable changes inthe transitional methylation and expression of the genes other than PPARg2 after the differentiation. Therefore, thetransitionalmethylationandgene expression established inmesenchymal cells tend tobe consistently preservedunder theinduction of differentiation. Weak transitional methylation of the PPARg2 gene in the BMSC suggests a methylation-dependent mechanism underlying the adiopogenesis of bone marrow. J. Cell. Biochem. 102: 224–239, 2007.� 2007 Wiley-Liss, Inc.
Key words: methylation; mRNA expression; cell differentiation; mesenchymal cell
Stromal cells derived from bone marrow(BMSC) and adipose tissue (ATSC) can prolif-erate easily and differentiate in vitro into avariety of cell lineages such as osteoblasts,chondrocytes, adipocytes, and myoblasts [Kernet al., 2006]. These two mesenchymal cells areconsidered promising resources for stem cell
therapy in the regeneration of tissue with amesenchymal origin. Currently, it is not knownif this multi-lineage potential produces sepa-rate precursor cells that exist in vivo, or if thestem cell potential emerges in the in vitroculture conditions. In contrast, it has beensuggested that mesenchymal cells are inher-ently unstable and shift from one lineage toanother [Dennis and Charbord, 2002]. Forexample, the aging process, which is one of thecauses of osteoporosis, is associated with theincreasedadipogenesis anddecreased osteogen-esis of mesenchymal cells in the bone marrow.Eventually, the red marrow turns yellow andthe differentiation capacity of the BMSC inelderly people becomes inefficient [Justesenet al., 2001; Pei and Tontonoz, 2004].
The RUNX2 [Komori et al., 1997; Otto et al.,1997] and PPARg2 [Ross et al., 1990; Tontonozet al., 1994] genes are well-known ‘‘master
� 2007 Wiley-Liss, Inc.
Moo-Il Kang and Hye-Soo Kim have contributed equally tothis work.
Grant sponsor: The Ministry of Health &Welfare, Republicof Korea; Grant number: 0405-DB01-0104-0006.
*Correspondence to: Mun-Gan Rhyu, MD, PhD, Depart-ment of Microbiology, College of Medicine, The CatholicUniversity of Korea, 505 Banpo-dong, Socho-gu, Seoul137-701, Korea. E-mail: [email protected]
Received 21 August 2006; Accepted 9 January 2007
DOI 10.1002/jcb.21291

genes’’ that drive the osteoblastic andadipocyticdifferentiation of mesenchymal cells, respec-tively. Generally, it is believed that the specifi-cation of the cell lineage is established basedon a cell-intrinsic epigenetic program thatguides genome-wide DNA methylation duringmammalian embryogenesis and development[Holliday and Pugh, 1975]. Individual embryo-nic cells reconstruct new methylation marksafter initial genome-wide demethylation, whichseparates the embryo with high-level methyla-tion from the placenta with low-level methyla-tion [Reik et al., 2001]. Postnatal increases anddecreases in methylated CpGs of certain DNAsequenceshavebeendetected in specific tissues,suggesting that the methylation-variable CpGsare associated with somatic cell differentiation[Shiota, 2004]. Therefore, it is important todetermine if a methylation-dependent mech-anism is involved in the expression of themesenchyme-related genes as well as thedifferentiation of mesenchymal cells towardmultiple lineages.Binding motifs for transcription factors
usually overlap with a CpG-rich island, whichensures easy access to the transcription factors[Bird, 1986; Larsen et al., 1992]. The Alu andL1 retroelements, which are highly repetitivesequences that are distributed throughoutthe human genome, elicit the spread of CpGmethylation into nearby genomic sequences[Hata and Sakaki, 1997; Yates et al., 1999;Arnaud et al., 2000]. Although the CpG islandsare consistently unmethylated in most tissuetypes, some transitional CpG sites betweenretroelements and promoters are methylatedto various levels in a tissue-specific manner[Kang et al., 2006]. Methylation-variable CpGsassociated with the retroelements could befound near the boundaries of CpG islands andat the nonisland CpG sites close to the tran-scription start sites of the genes lacking CpGislands [Kang et al., 2006; Kim et al., 2006],which are expected to influence the phenotypeplasticity of mesenchymal cells through theDNA methylation-dependent mechanism.Tissue-specific transitionalmethylation between
the transcription start site and the nearestretroelements was previously described for themesenchyme-related (RUNX2) and -unrelated(RUNX3) genes as well as the housekeepinggenes (CDKN2A andMLH1) [Kang et al., 2006;Kim et al., 2006]. This study examined tissue-specific transitional methylation and gene
expression in the BMSC and ATSC under thedifferentiation induction and oxidative stress.The transitional CpG sites of the mesenchyme-related genes (RUNX2, BGLAP, and PPARg2)were completelyhypomethylatedalongwith theincreased gene expression. Interestingly, thetransitionalCpGsof thePPARg2gene thatwereweakly methylated in the BMSC were comple-tely hypomethylated under the osteogenicinduction and oxidative stress in agreementwithapropensity of thebonemarrow toundergoadipogenesis.
MATERIALS AND METHODS
Preparation of Primary Cells
Bonemarrow specimens were diluted with anequal volume of a-minimum essential medium(a-MEM) and were layered carefully on Ficoll-Hypaque. The cell pellets obtained by density-gradient centrifugation were suspended in astandard a-MEM medium containing 10% fetalbovine serum (FBS), and were plated at 4� 105
nucleated cells/ml. The adipose tissue obtainedduring abdominal surgery was minced anddigested with 0.1% collagenase for 40 min at378C. The tissue-collagense mixture wasdiluted with a twofold volume of a standarda-MEM medium, and centrifuged for 10 min.The supernatant containing the lipid dropletswas discarded. The cells that settled at thebottom were collected with the standard a-MEMmedium. The Institutional Review Boardapproved this study, and written informedconsent was obtained from each person priorto the study.
Stromal cells derived from bone marrow andadipose tissuewere culture-expanded for a totalof 4–5 weeks. When the culture dishes werealmost confluent, theculturedcellsweredetach-ed using trypsin, plated at 5� 104 cells/ml in75 cm2 T-flasks, and nourished with a standardmedium for 3 days. The primary cultures werethen grown under the following three differentconditions: control, differentiation induction,and H2O2 treatment.
Differentiation Induction and Oxidative Stress
For the differentiation induction, the attachedcells were grown with the osteogenic sup-plements (0.1 mM dexamethasone, 10 mM b-glycerophosphate, and50mg/mlascorbic acid) oradipogenic supplements (1 mM dexamethasone,
Tissue-Specific Methylation During Cell Differentiation 225
10mMinsulin, 200mMindomethacin, and0.5mMisobutyl-methylxanthine) for a further 2 weeks.The histochemical stain for alkaline phospha-tase was carried out to check the level ofosteogenic differentiation. The cells were fixedin 4% paraformaldehyde and 0.2 M cacodylicacid for 10 min at 48C, and incubated with anALP solution (Sigma, St. Louis, MO, USA) for1 h at 378C. Cells stained with pink cytoplasmindicated the alkaline phosphatase activity. Anintracellular lipid droplet in the adipogenicmedia was stained with Oil Red O. The cellswere fixed in 60% isopropyl alcohol for 10 minand incubated in 2% Oil Red O reagent (Sigma)for 10 min at room temperature. The stainedcells showed cytoplasmic red vacuoles.
The BMSC and ATSC were grown in astandard a-MEM medium until they hadreached 50% confluence and were treated withH2O2 at a concentration of 0, 0.1, 0.3, and0.5 mM in a standard medium without FBS for24 h. The cells were then grown in standarda-MEM medium including 10% FBS for 7 days.The cells from each group were harvested andfrozen at �708C to evaluate the level of DNAmethylation and mRNA expression.
DNA Modification by Sodium Bisulfite
Ninetymicroliters of thegenomicDNA (20ng/ml) was denatured with 10 ml of 3 M NaOHfor 15 min at 378C prior to sodium bisulfitemodification. For sodium bisulfite modification,100 ml of the denatured DNA was treated with1,040 ml of 2.3 M sodium bisulfite and 60 ml of10 mM hydroquinone for 12 h at 508C. Themodified DNA was purified using WizardDNA purification resin (Promega, Madison,WI, USA), precipitated with ethanol, and dis-solved in 35 ml of a 5 mM Tris buffer (pH 8.0).One microliter aliquot of the modified DNAsolution was placed in a PCR tube and stored at�208C.
Methylation-Specific PCR and Sequencingof Bisulfite-Modified DNA
The coding andnoncoding sequence informat-ion for the RUNX2, BGLAP, PPARg2, CDKN2A,MLH1, and RUNX3 genes was obtained fromthe human genome database (http://genome.ucsc.edu). The genomic locations and annota-tions of the retroelements were derived fromthe RepeatMasker program output (http://ftp.genome.washington.edu/RM/RepeatMasker.html)
based on RepBase [Jurka, 2000]. A CpG islandwas defined as a DNA segment with a GþCcontent �50%, longer than 200 bp nucleotides,and an Obs/Exp CpG ratio over 0.6 [Gardiner-Garden and Frommer, 1987]. The methylation-specific PCR (MSP) primers of the six geneswere designed between promoters and retro-elements, as shown in Figure 1 and Tables Iand II.
The methylation status of the transitionalCpGswas estimatedusing the semiquantitativeMSP protocol reported elsewhere [Hong et al.,2005; Kang et al., 2006]. MSP analysis wasperformed in a minimum number of amplifica-tion rounds for sub-plateau DNA amplificationusing the radioisotope. The bisulfite-modifiedDNA was amplified and labeled by a hot-startPCR containing a-32P dTTP (PerkinElmer,Boston, MA, USA) and dNTP mixture through32 PCR cycles. The PCR products were loadedonto a nondenaturing polyacrylamide gel andvisualized by repeated autoradiography usinga radioluminograph scanner (BAS 2500, FujiPhoto Film, Kanakawa, Japan). The highspecificity of eachMSPprimer setwas validatedusing the universal methylated and unmethy-lated DNAs. The amplification intensity of themethylation and unmethylation primer setsincreased linearly with increasing percentageof the control DNA in theMSP template-primermixtures. The methylation density was calcu-lated from the relative proportion of a methyla-tion band in the combined total of methylationand unmethylation band intensities. All MSPexperiments were performed using three inde-pendent samples and each experiment wasrepeated twice to confirm the same result.
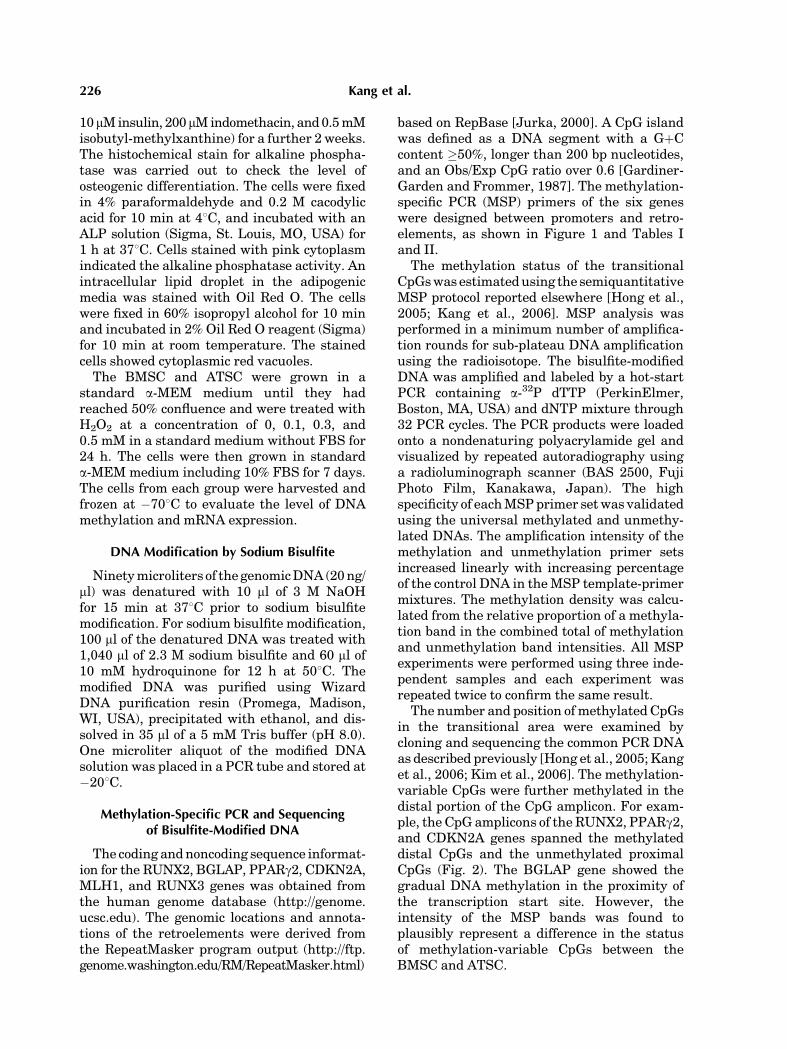
The number and position of methylated CpGsin the transitional area were examined bycloning and sequencing the common PCR DNAas described previously [Hong et al., 2005; Kanget al., 2006; Kim et al., 2006]. The methylation-variable CpGs were further methylated in thedistal portion of the CpG amplicon. For exam-ple, the CpG amplicons of the RUNX2, PPARg2,and CDKN2A genes spanned the methylateddistal CpGs and the unmethylated proximalCpGs (Fig. 2). The BGLAP gene showed thegradual DNA methylation in the proximity ofthe transcription start site. However, theintensity of the MSP bands was found toplausibly represent a difference in the statusof methylation-variable CpGs between theBMSC and ATSC.
226 Kang et al.

Fig. 1. Schematic diagram of the coverage of the CpG islandsand the retroelement distributions in the 50-end regions of the sixgenes examined by methylation-specific PCR analysis. The fivegeneswithCpG islandswere examinedusingmore thanonePCRprimer set spanning the CpG island and the nonisland CpGsbetween the transcription start sites and the retroelements. The
P2 promoters of the RUNX2, PPARg2, and RUNX3 genesexpressing two isoforms [Zhu et al., 1995; Bangsow et al.,2001; Xiao et al., 2003] overlap with the CpG islands. TheBGLAP genewithout a CpG islandwas examined at the proximalCpG site to the transcription start site.
TABLE I. Summary of CpG Sites and Exons Examined in Stromal Cells Derived From BoneMarrow and Adipose Tissue
Gene symbolGene description and
RefSeq IDGene
size (bp)CpG islandsize (bp)
CpG amplicon (bp)a
mRNAexonsUnmethylation Methylation
RUNX2 Osteoblast differentiation 128,905 2,226 �3,883 �3,883 1–2NM_004348 (P2 promoter) �3,061 �3,061
�1,947 �1,947�852 �850
þ1,573 þ1,573BGLAP Osteocalcin precursor 1,108 Absence �502 �502 1–4
NM_199173PPARg2 Adipocyte differentiation 145,405 906 �141 �141 3–6
NM_138711 (P2 promoter) �1,563 �1,563CDKN2A Cell cycle G1 control 26,739 1,375 �1,580 �1,575 1–2
NM_058195 �85 �85þ776 þ775
MLH1 DNA mismatch repair gene 57,357 1,128 �1,098 �1,098 9–11NM_000249 �660 �655
RUNX3 Gastric mucosa differentiation 30,310 4,493 �1,790 �1,790 1–2NM_004350 (P2 promoter) �1,166 �1,166
�559 �559�219 �217þ952 þ952
aDistance from the transcription start site of each gene.
Tissue-Specific Methylation During Cell Differentiation 227
Semiquantitative Reverse-Transcription PCR
The cDNA was synthesized in a 100 ml ofreactionmixture containing the totalRNA(1mg),a random primer (3.2 mg), 10� PCR buffer,MgCl2 (5 mM), dNTP (1.0 mM of each dATP,dGTP, dCTP,anddTTP),RNase inhibitor (50U),and AMV reverse transcriptase (20 U). Thisreaction mixture was incubated at 258C for10 min and then at 428C for 60 min. The cDNA(1 ml) was amplified in a 20 ml reaction mixturecontaining a 10� PCR buffer, MgCl2 (25 mM),dNTP (2.5 mM of each dATP, dGTP, dCTP, anddTTP), the primers (10 pmol for each forwardand reverse sequence primer), and Taq DNApolymerase (0.5 U). The primers of the genesexamined were designed, as noted in Tables I
and II. The RUNX2, PPARg2, and RUNX3genes have two promoters (upstream/distal P1and downstream/proximal P2) that regulate theexpression of two isoforms [Zhu et al., 1995;Bangsow et al., 2001; Xiao et al., 2003], of whichtheproximalP2promoters overlappingwith theCpG islands were examined. Each reaction wasinitiated in 948C for 5min; followed by 30 cyclesof 948C for 1 min (denaturation), 55–608C for1 min (annealing), 728C for 1 min (extension);and terminated in 728C for 10min. The reverse-transcription PCR (RT-PCR) products wereelectrophoresed on a 1.5% agarose gel andvisualized by ethidium bromide staining. Forsemiquantitative PCR, the linear range ofamplification was first established with similarresults being obtained from the duplicated PCR
TABLE II. Primer Sequences Used in Methylation and mRNA Analyses
Ampliconsites Primera Forward Reverse
Ampliconsize (bp)
RUNX2, �3.8 kb U AGGTTTAGTTAGTTTTAGTTG CCACTAAATACCCTAACAACA 113M AGGTTTAGTTAGTTTTAGTCG CCACTAAATACCCTAACAACG 113
�3.0 kb U TGTTTGAGTGTATATGAGTGGAT TCTCTCAAATCCCACAAACAACCA 123M TGTTCGAGTGTATATGAGTGGAC TCTCTCGAATCCCACAAACGACCG 123
�1.9 kb U GGATTTTTTGGTTTTTGTGGGT CTCTAACTAAATCAATCATTACA 127M GATTTTTCGGTTTTTGCGGGC CTCTAACTAAATCGATCATTACG 126
�0.7 kb U GGTTTTGGAAATTGTATATGGTGT AAACAACAAATCTCAAACCTACA 96M TTTCGGAAATTGTATACGGCGC AACAACGAATCTCGAACCTACG 93
þ1.6 kb U GTTTGAGGGTGGGTGGTAGTTGT ACTACCCCAAAAAATCTAAATCA 127M GTTTGAGGGCGGGTGGTAGTCGC ACTACCCCGAAAAATCTAAATCG 127RT CCCCACGACAACCGCACCAT CGCTCCGGCCCACAAATCTC 289
BGLAP, �0.5 kb U AGGGTAGGGTTTGAGTTGTT AATACCTCACAATACCCCCA 86M AGGGTAGGGTTTGAGTCGTC AATACCTCGCAATACCCCCG 86RT CCTGAAAGCCGATGTGGTC CTCACACTCCTCGCCCTAT 262
PPARg2, �1.5 kb U AGAAGAGAAAATTAAGGGATTT ATAACTTACCCTTCACACAACA 117M AGAAGAGAAAATTAAGGGATTC ATAACTTACCCTTCACACGACG 117
�0.2 kb U GGTTAGGTTTTGTGTTTTGATGT CCTAACTACACACTCCATCCA 111M GGTTAGGTTTTGTGTTTTGACGC CCTAACTACGCGCTCCATCCG 111RT AAGACCACTCCCACTCCTTTG GTCAGCGGACTCTGGATTCA 554
CDKN2A,�1.5 kb U TTGGGATTAGGTTTAGTTTTGG CTATAAAACCCTATCAACTCACACT 130M TCGGGATTAGGTTTAGTTTCG AAACCCTATCGACTCACGCT 125
�0.1 kb U TGTTTATTTTTGTTTTGTAGGTG AAAACTCAAAACCATTCCAA 129M TGTTTATTTTCGTTTCGTAGGC AAAACTCAAAACCGTTCCGA 129
þ0.8 kb U GTATTTTAGGAAGTTGTTGTTTGT TTTTCTCCCCAACCTCCCAACA 101M GTATTTTAGGAAGTCGTTGTTTGC TTTTTCTCCCCAACCTCCCGACG 102RT GGTTCTTGGTGACCCTCC ACCAGCGTGTCCAGGAGG 331
MLH1, �1.0 kb U GATTTTAGGATTGTTGATATGAGT AAACTACCTCCTAATCTTTATCCA 126M GATTTTAGGATTGTCGATATGAGC AACTACCTCCTAATCTTTATCCG 125
�0.6 kb U TTTTGATGTAGATGTTTTATTA-GGGTTGT
ACCACCTCATCATAACTACCCACA 121
M ACGTAGACGTTTTATTAGGGTCGC CCTCATCGTAACTACCCGCG 115RT ACTCTTCATCAACCATCGTC TTGTGGATTTAACCATCTCC 314
RUNX3, �1.7 kb U TGGGGTTAGATTTTTGTTGTTTTT ATAAAATCTTACAACCACCATCA 107M CGGGGTTAGATTTTCGTTGTTTTC ATAAAATCTTACGACCACCGTCG 107
�1.1 kb U TGTTAAATTGGGGATAGGT AACCACAAACCACCACAACA 151M TGTTAAATCGGGGATAGGC AACCACAAACCGCCACAACG 151
�0.5 kb U GATGTGTTGTATAGTTAATTGGT TCCCCATTAAACAACCTCCA 97M CGCGTCGTATAGTTAATCGGC TCCCCGTTAAACGACCTCCG 95
�0.1kb U GGAAAGTAGAAGTGGTGGGGTTT ACTAACCAAACAAACTACAAACA 128M GAAAGTAGAAGCGGCGGGGTTC ACTAACCGAACAAACTACGAACG 125
þ1.0 kb U GTTGTTTTAATGGGAGTAGGGAT CAAAATAAAACAAAAACACCTCA 147M GTCGTTTTAATGGGAGTAGGGAC GAAATAAAACGAAAACGCCTCG 147RT AGGCATTGCGCAGCTCAGCGGAGTA TCTGCTCCGTGCTGCCCTCGCACT 150
aThe genomic position of each MSP primer sets is indicated with the gene symbol and the distance (kb nucleotides) from thetranscription start site.Unmethylation (U),methylation (M), and reverse-transcription (RT)PCRprimersweremade for eachgene.Thebold sequences with a single underline indicate bisulfite-modified nucleotides.
228 Kang et al.
reactions. The glyceraldehyde-3-phosphate de-hydrogenase (GAPDH)-specific primers wereused for the internal control PCR and allRT-PCR signals were normalized to this value.
RESULTS
Transitional CpG Methylation BetweenTranscription Start Sites and Retroelements
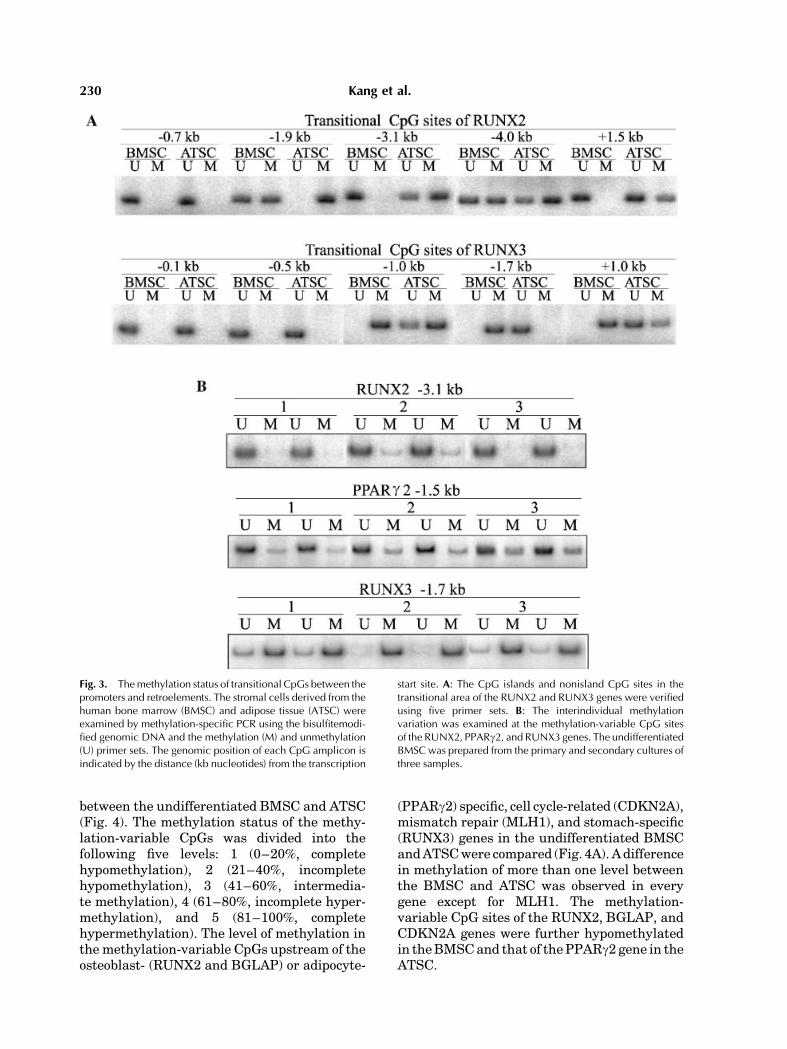
The transitional area between the transcrip-tion start sites and the nearby retroelementsupstream of the six genes was examined usingMSP analysis with the bisulfite-modified geno-mic DNA obtained from the BMSC and ATSC.The P2 promoter regions of the RUNX2 andRUNX3 genes containing the long CpG islandswere verified using five MSP primer sets(Fig. 3A). The proximal CpG sites of the longCpG islands were consistently unmethylated inboth BMSC and ATSC. There was a differencein the level ofmethylation of the distal CpG site,at a distance of 1.0–4.0 kb, between the BMSCand ATSC. The transitional CpGs of thePPARg2andCDKN2Agenesweredifferentially
methylated in the nonisland CpG sites near thepromoter-associated CpG islands.
The individual variations in methylationwere examined at the methylation-variableCpG sites of the RUNX2, PPARg2, and RUNX3genes, which contain CpG islands (Fig. 3B).Three BMSC samples were grown in theprimary and secondary cultures using a stan-dard medium. The methylation status of themethylation-variable CpG sites in a BMSCsample in the primary and secondary cultureswas identical. The methylation-variable CpGsite of the RUNX2 gene was completely hypo-methylated in all samples and that of thePPARg2 gene was completely or incompletelyhypomethylated. The CpG island of the RUNX3gene was completely or incompletely hyper-methylated.
Transitional CpG Methylation and mRNAExpression in Mesenchymal Cells
The transitional area of each gene wasexamined at one methylation-variable CpG siteshowing the greatest difference in methylation
Fig. 2. Comparison of the density of methylation estimated bysemiquantitative methylation-specific PCR (MSP) and sequen-cing of the common PCR DNA. The genomic DNA was purifiedfrom the primary cultures of undifferentiated stromal cells ofbone marrow (BMSC) and adipose tissue (ATSC). The density ofmethylation was estimated based on the standard curve of MSPbands and is indicatedbelow the electrophoretic lanes. The lanes
markedUandM indicate the PCRbands of the unmethylated andmethylated primer sets, respectively. The common primer setsencompassing the MSP primer sequences were used. The CpGsites on the MSP primers are represented in the box. Theunmethylated and methylated CpG sites are shown by the openand closed circles, respectively.
Tissue-Specific Methylation During Cell Differentiation 229
between the undifferentiated BMSC and ATSC(Fig. 4). The methylation status of the methy-lation-variable CpGs was divided into thefollowing five levels: 1 (0–20%, completehypomethylation), 2 (21–40%, incompletehypomethylation), 3 (41–60%, intermedia-te methylation), 4 (61–80%, incomplete hyper-methylation), and 5 (81–100%, completehypermethylation). The level of methylation inthe methylation-variable CpGs upstream of theosteoblast- (RUNX2 and BGLAP) or adipocyte-
(PPARg2) specific, cell cycle-related (CDKN2A),mismatch repair (MLH1), and stomach-specific(RUNX3) genes in the undifferentiated BMSCandATSCwere compared (Fig. 4A).Adifferencein methylation of more than one level betweenthe BMSC and ATSC was observed in everygene except for MLH1. The methylation-variable CpG sites of the RUNX2, BGLAP, andCDKN2A genes were further hypomethylatedin theBMSCand that of thePPARg2 gene in theATSC.
Fig. 3. Themethylation status of transitional CpGs between thepromoters and retroelements. The stromal cells derived from thehuman bone marrow (BMSC) and adipose tissue (ATSC) wereexamined by methylation-specific PCR using the bisulfitemodi-fied genomic DNA and the methylation (M) and unmethylation(U) primer sets. The genomic position of each CpG amplicon isindicated by the distance (kb nucleotides) from the transcription
start site. A: The CpG islands and nonisland CpG sites in thetransitional area of the RUNX2 and RUNX3 genes were verifiedusing five primer sets. B: The interindividual methylationvariation was examined at the methylation-variable CpG sitesof the RUNX2, PPARg2, and RUNX3 genes. The undifferentiatedBMSC was prepared from the primary and secondary cultures ofthree samples.
230 Kang et al.
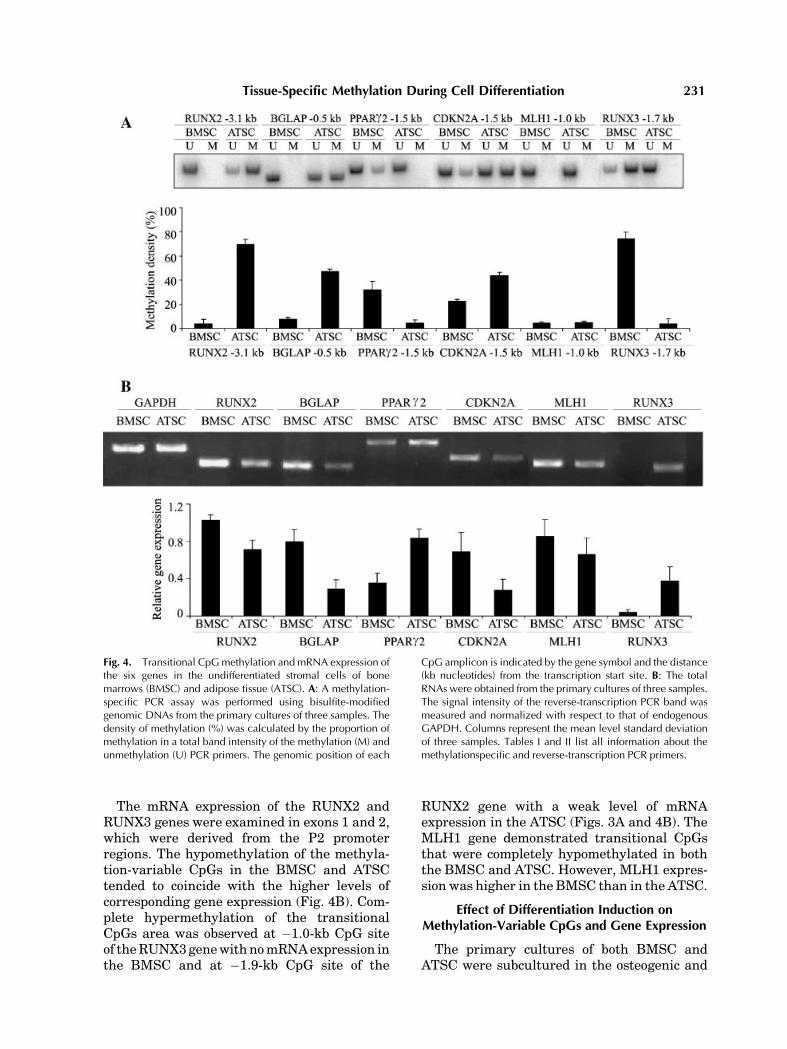
The mRNA expression of the RUNX2 andRUNX3 genes were examined in exons 1 and 2,which were derived from the P2 promoterregions. The hypomethylation of the methyla-tion-variable CpGs in the BMSC and ATSCtended to coincide with the higher levels ofcorresponding gene expression (Fig. 4B). Com-plete hypermethylation of the transitionalCpGs area was observed at �1.0-kb CpG siteof theRUNX3genewithnomRNAexpression inthe BMSC and at �1.9-kb CpG site of the
RUNX2 gene with a weak level of mRNAexpression in the ATSC (Figs. 3A and 4B). TheMLH1 gene demonstrated transitional CpGsthat were completely hypomethylated in boththe BMSC and ATSC. However, MLH1 expres-sion was higher in the BMSC than in the ATSC.
Effect of Differentiation Induction onMethylation-Variable CpGs and Gene Expression
The primary cultures of both BMSC andATSC were subcultured in the osteogenic and
Fig. 4. Transitional CpGmethylation and mRNA expression ofthe six genes in the undifferentiated stromal cells of bonemarrows (BMSC) and adipose tissue (ATSC). A: A methylation-specific PCR assay was performed using bisulfite-modifiedgenomic DNAs from the primary cultures of three samples. Thedensity of methylation (%) was calculated by the proportion ofmethylation in a total band intensity of the methylation (M) andunmethylation (U) PCR primers. The genomic position of each
CpG amplicon is indicated by the gene symbol and the distance(kb nucleotides) from the transcription start site. B: The totalRNAs were obtained from the primary cultures of three samples.The signal intensity of the reverse-transcription PCR band wasmeasured and normalized with respect to that of endogenousGAPDH. Columns represent the mean level standard deviationof three samples. Tables I and II list all information about themethylationspecific and reverse-transcription PCR primers.
Tissue-Specific Methylation During Cell Differentiation 231
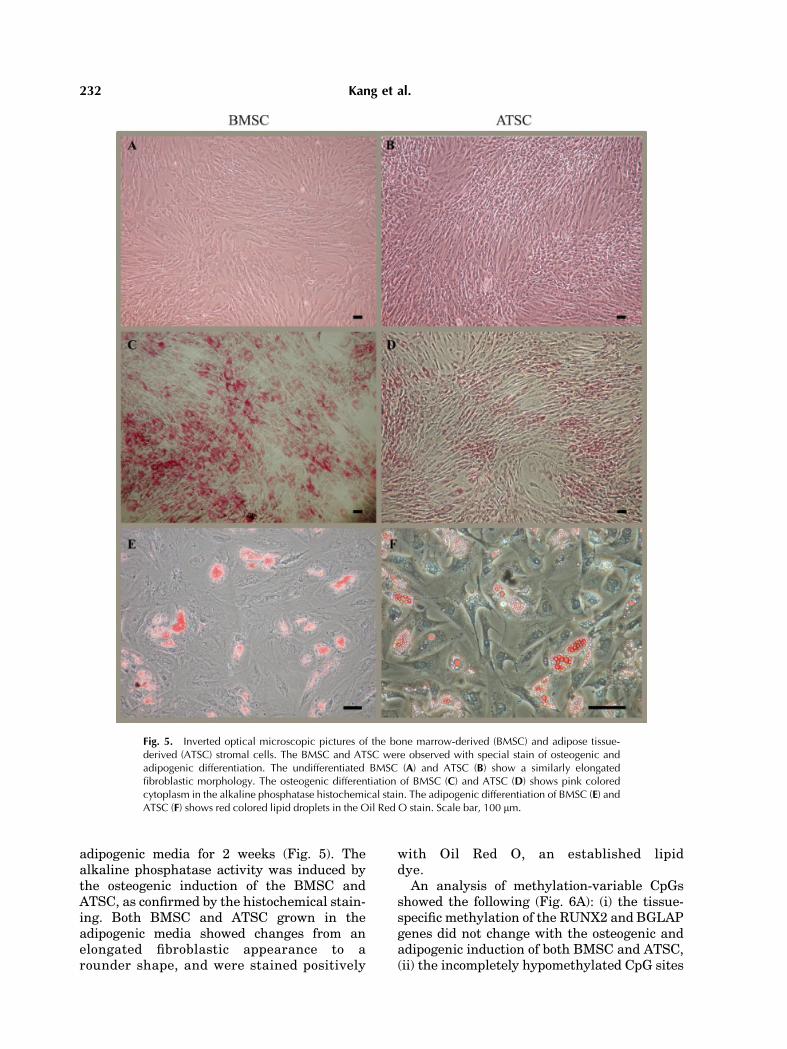
adipogenic media for 2 weeks (Fig. 5). Thealkaline phosphatase activity was induced bythe osteogenic induction of the BMSC andATSC, as confirmed by the histochemical stain-ing. Both BMSC and ATSC grown in theadipogenic media showed changes from anelongated fibroblastic appearance to arounder shape, and were stained positively
with Oil Red O, an established lipiddye.
An analysis of methylation-variable CpGsshowed the following (Fig. 6A): (i) the tissue-specific methylation of the RUNX2 and BGLAPgenes did not change with the osteogenic andadipogenic induction of both BMSC and ATSC,(ii) the incompletely hypomethylated CpG sites
Fig. 5. Inverted optical microscopic pictures of the bone marrow-derived (BMSC) and adipose tissue-derived (ATSC) stromal cells. The BMSC and ATSC were observed with special stain of osteogenic andadipogenic differentiation. The undifferentiated BMSC (A) and ATSC (B) show a similarly elongatedfibroblastic morphology. The osteogenic differentiation of BMSC (C) and ATSC (D) shows pink coloredcytoplasm in the alkaline phosphatase histochemical stain. The adipogenic differentiation of BMSC (E) andATSC (F) shows red colored lipid droplets in the Oil Red O stain. Scale bar, 100 mm.
232 Kang et al.
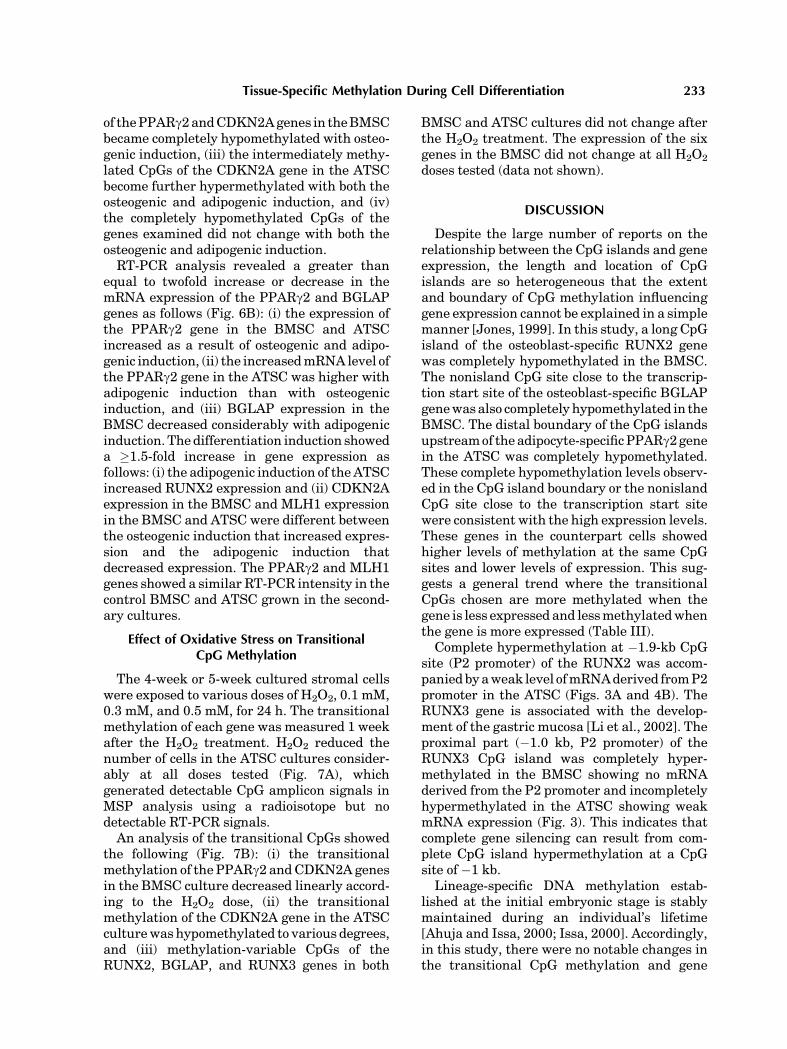
of thePPARg2andCDKN2Agenes in theBMSCbecame completely hypomethylated with osteo-genic induction, (iii) the intermediately methy-lated CpGs of the CDKN2A gene in the ATSCbecome further hypermethylated with both theosteogenic and adipogenic induction, and (iv)the completely hypomethylated CpGs of thegenes examined did not change with both theosteogenic and adipogenic induction.RT-PCR analysis revealed a greater than
equal to twofold increase or decrease in themRNA expression of the PPARg2 and BGLAPgenes as follows (Fig. 6B): (i) the expression ofthe PPARg2 gene in the BMSC and ATSCincreased as a result of osteogenic and adipo-genic induction, (ii) the increasedmRNA level ofthe PPARg2 gene in the ATSC was higher withadipogenic induction than with osteogenicinduction, and (iii) BGLAP expression in theBMSC decreased considerably with adipogenicinduction. Thedifferentiation induction showeda �1.5-fold increase in gene expression asfollows: (i) the adipogenic induction of theATSCincreased RUNX2 expression and (ii) CDKN2Aexpression in the BMSC and MLH1 expressionin the BMSC and ATSC were different betweenthe osteogenic induction that increased expres-sion and the adipogenic induction thatdecreased expression. The PPARg2 and MLH1genes showed a similar RT-PCR intensity in thecontrol BMSC and ATSC grown in the second-ary cultures.
Effect of Oxidative Stress on TransitionalCpG Methylation
The 4-week or 5-week cultured stromal cellswere exposed to various doses of H2O2, 0.1 mM,0.3 mM, and 0.5 mM, for 24 h. The transitionalmethylation of each gene was measured 1 weekafter the H2O2 treatment. H2O2 reduced thenumber of cells in the ATSC cultures consider-ably at all doses tested (Fig. 7A), whichgenerated detectable CpG amplicon signals inMSP analysis using a radioisotope but nodetectable RT-PCR signals.An analysis of the transitional CpGs showed
the following (Fig. 7B): (i) the transitionalmethylation of the PPARg2 andCDKN2Agenesin the BMSC culture decreased linearly accord-ing to the H2O2 dose, (ii) the transitionalmethylation of the CDKN2A gene in the ATSCculturewas hypomethylated to various degrees,and (iii) methylation-variable CpGs of theRUNX2, BGLAP, and RUNX3 genes in both
BMSC and ATSC cultures did not change afterthe H2O2 treatment. The expression of the sixgenes in the BMSC did not change at all H2O2
doses tested (data not shown).
DISCUSSION
Despite the large number of reports on therelationship between the CpG islands and geneexpression, the length and location of CpGislands are so heterogeneous that the extentand boundary of CpG methylation influencinggene expression cannot be explained in a simplemanner [Jones, 1999]. In this study, a long CpGisland of the osteoblast-specific RUNX2 genewas completely hypomethylated in the BMSC.The nonisland CpG site close to the transcrip-tion start site of the osteoblast-specific BGLAPgenewasalso completely hypomethylated in theBMSC. The distal boundary of the CpG islandsupstreamof theadipocyte-specificPPARg2genein the ATSC was completely hypomethylated.These complete hypomethylation levels observ-ed in the CpG island boundary or the nonislandCpG site close to the transcription start sitewere consistent with the high expression levels.These genes in the counterpart cells showedhigher levels of methylation at the same CpGsites and lower levels of expression. This sug-gests a general trend where the transitionalCpGs chosen are more methylated when thegene is less expressed and lessmethylatedwhenthe gene is more expressed (Table III).
Complete hypermethylation at �1.9-kb CpGsite (P2 promoter) of the RUNX2 was accom-paniedbyaweak level ofmRNAderived fromP2promoter in the ATSC (Figs. 3A and 4B). TheRUNX3 gene is associated with the develop-ment of the gastric mucosa [Li et al., 2002]. Theproximal part (�1.0 kb, P2 promoter) of theRUNX3 CpG island was completely hyper-methylated in the BMSC showing no mRNAderived from the P2 promoter and incompletelyhypermethylated in the ATSC showing weakmRNA expression (Fig. 3). This indicates thatcomplete gene silencing can result from com-plete CpG island hypermethylation at a CpGsite of �1 kb.
Lineage-specific DNA methylation estab-lished at the initial embryonic stage is stablymaintained during an individual’s lifetime[Ahuja and Issa, 2000; Issa, 2000]. Accordingly,in this study, there were no notable changes inthe transitional CpG methylation and gene
Tissue-Specific Methylation During Cell Differentiation 233
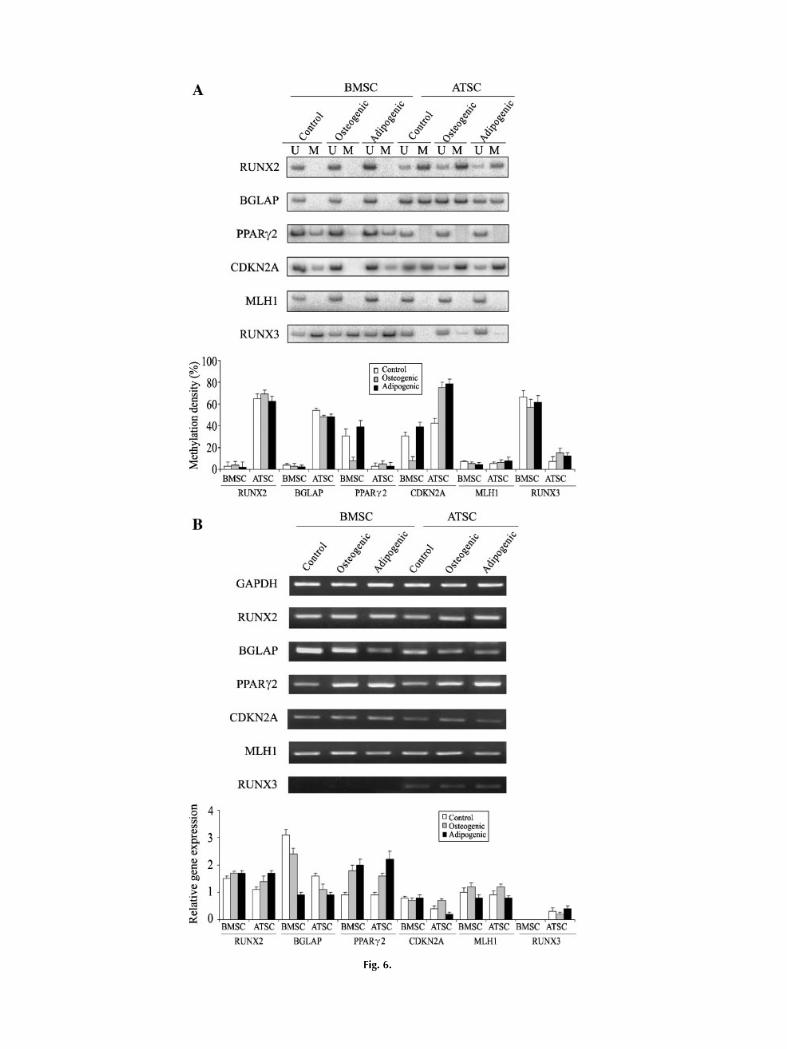
Fig. 6.

expressionafter the induction of differentiation,or only slight differences in the methylationstatus between the different differentiationinductions. However, the transitional CpGs ofthe PPARg2 gene in the BMSC were hypo-methylated after the osteoblast differentiation,and those of the CDKN2A gene in the ATSCwere hypermethylated after the adipocyte dif-ferentiation (Table III). The spread of DNAmethylation is not static, but instead varies atindividual CpG sites in the same-type cells(Fig. 7). A wide spectrum of variously methy-lated alleles in the transitional area is believedto reach a dynamic equilibrium in a given tissueenvironment [Turker, 2002]. It is possible that asubset of stromal cells predominantly expand inresponse to cell-external stimulation, leading tomethylation alterations. The transitional areaof the PPARg2 and CDKN2A genes was closelybordered by the L1 or LTR elements, whereasthe longCpG islands of the RUNX2 andRUNX3genes that showed insignificant methylationand expression alterations neighbored a fewretroelements (Fig. 1). Because the L1 elementscan initiate the long-distance spread of tissue-specific methylation [Kang et al., 2006; Kimet al., 2006], the L1-associated CpGs in thetransitional area of the PPARg2 and CDKN2Agene are likely to be often related tomethylationalterations.There are well-known clinical conditions that
predispose BMSC to adipogenesis. Avascularnecrosis of the hips is associated with the long-term use of steroids as well as with a fatembolism [Chang et al., 1993; Assouline-Dayanet al., 2002]. Glucocorticoid-induced bone lossincreases the level of adipogenesis anddecreases the level of osteogenesis in the bonemarrow [Mazziotti et al., 2006].Oxidative stressis believed to link aging and age-related osteo-porosis [Basu et al., 2001]. As a person ages, thefat content of the bone marrow increases andforms a more yellow marrow [Justesen et al.,2001; Pei andTontonoz, 2004]. In this study, thePPARg2 gene in the BMSC was bordered by
incompletely hypomethylated transitionalCpGs, which were completely hypomethylatedafter exposure to the steroid-containing mediaand a H2O2 treatment. Weak transitionalmethylation of the PPARg2 gene in the bonemarrow environment is likely to be prone tocomplete hypomethylation, suggesting that amethylation-dependent mechanism is involvedin senile aswell as steroid-induced osteoporosis.
Weak transitional methylation of thePPARg2 gene in the BMSC became hypomethy-lated during osteogenic induction but not dur-ing adipogenic induction (Fig. 6A). Thetransitional CpGs of the PPARg2 gene werehypomethylated in a manner independent ofthe steroid dose in the culture media, becausethe steroid dose was higher in the adipogenicmedium than in the osteogenic medium. Withrespect tomethylation kinetics, the reestablish-ment of methylation on a newly replicated DNAstrand is needed in order to continue cell-specific gene expression in the subsequent cellcycle. A strong link between the timing oftranscription and replication provides opportu-nities for maintaining the level of DNA methy-lation [Schubeler et al., 2002; Woodfine et al.,2004]. Most cells in the heterogeneousmethyla-tion state synchronously enter the cell cycle andgo through one or two rounds of cell divisionbefore differentiating [Tseng et al., 2005]. Thein vitro osteogenic induction appears to initiatenewly synchronized expansion, and furtherincrease the proportion of the BMSC containingthe hypomethylated transitional CpGs of thePPARg2 gene.
The transitional CpGs of the CDKN2A gene,which were intermediately methylated in theATSC, were further hypermethylated duringboth osteogenic and adipogenic induction. TheRT-PCR results showed a high CDKN2Aexpression in BMSC and a low CDKN2Aexpression in ATSC. Previous studies reportedthat the proliferation and differentiation ofmesenchymal cells was differentially checkedby the CDKN2A (BMSC) and E2F (ATSC) cell
Fig. 6. Transitional CpGmethylation and expression profiles ofthe six genes examined in the stromal cells derived from bonemarrow (BMSC) and adipose tissue (ATSC). Both BMSC andATSC were grown in the standard media for 4 or 5 weeks andsubcultured in the osteogenic or adipogenic supplements. Theundifferentiated stromal cells for the control experiments weregrown in a standard medium for the same culture period. TheBMSC and ATSC were examined by both methylation-specific
(A) and reversetranscription (B) PCR analyses. The methylationstatus of the transitional CpGs is reported as themean percentageof methylated CpGs estimated from the PCR bands amplified bythemethylation (M) andunmethylation (U) primers. The intensityof the reverse-transcription PCR band was measured andnormalized with respect to that of the endogenous GAPDH.Columns represent the mean level standard deviation of theresults of three samples in each culture condition.
Tissue-Specific Methylation During Cell Differentiation 235
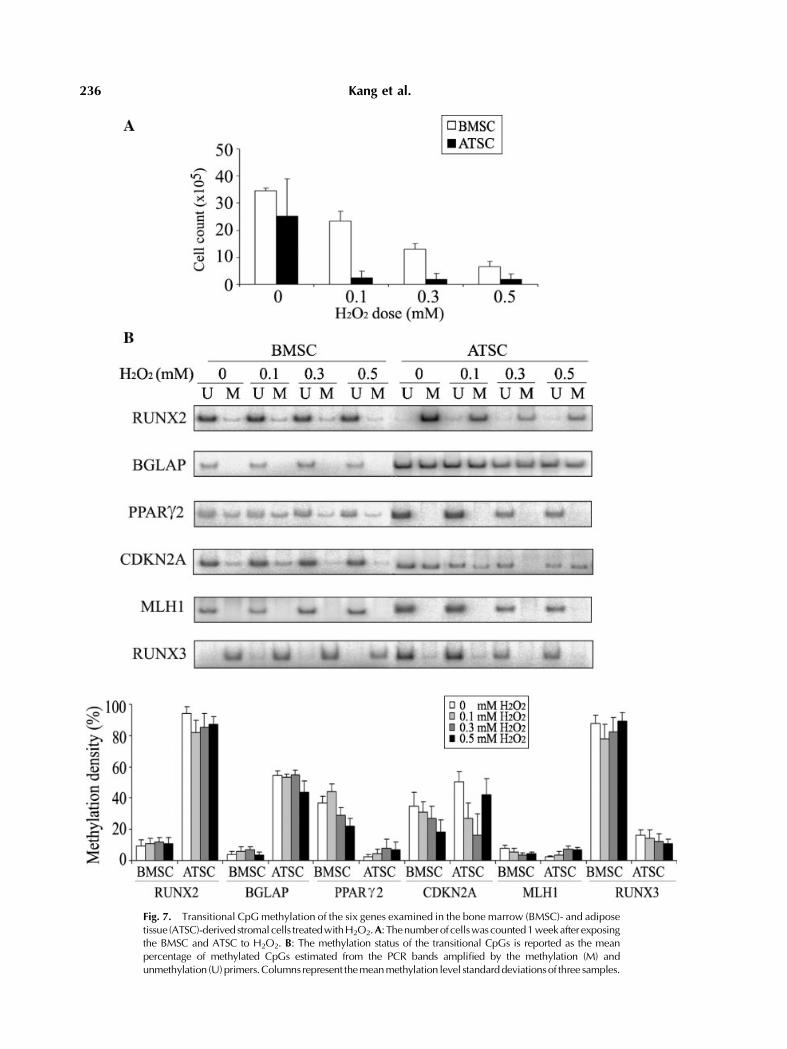
Fig. 7. Transitional CpGmethylation of the six genes examined in the bone marrow (BMSC)- and adiposetissue (ATSC)-derived stromalcells treatedwithH2O2.A: Thenumberof cellswascounted1weekafter exposingthe BMSC and ATSC to H2O2. B: The methylation status of the transitional CpGs is reported as the meanpercentage of methylated CpGs estimated from the PCR bands amplified by the methylation (M) andunmethylation (U)primers.Columns represent themeanmethylation level standarddeviationsof three samples.
236 Kang et al.

cycle regulators [Oliva et al., 2003; Miard andFajas, 2005]. This suggests that the CDKN2Agene can be suppressed by transitional hyper-methylation during the differentiation of ATSCunder the control of the E2F cell cycle regula-tors.The BMSC treated with H2O2 showed hypo-
methylation alterations in the transitionalCpGs of the PPARg2 and CDKN2A genes inproportion to the H2O2 dose added to the BMSCculture. The number of cells in the ATSCcultures decreased considerably after the H2O2
treatment compared with that of the BMSCculture (Fig. 7A). The ATSC treated with H2O2
showed hypomethylation at various levels inthe transitional CpGs of the CDKN2A gene(Fig. 7B). A previous study reported that lowdoses of reactive oxygen species stimulate cellproliferation, but high doses cause cellulardamage and cell cycle arrest [Yoon et al.,2002]. It is possible that the transitional CpGsof the CDKN2A gene are hypermethylated in asmall proportion ofBMSCanda large fraction ofATSC, which undergo cell death and cell cyclearrest due to a susceptibility to oxidative stress.Consequently, most of the viable cells resistantto the H2O2 treatment are likely to contain thehypomethylated alleles of the PPARg2 andCDKN2A genes.The adipocyte-specific PPARg2 gene in the
BMSC showed transitional CpGs hypomethyla-tion and increased expression after the osteo-genic differentiation. The expression of thePPARg2 gene might be enhanced in the osteo-genicmedia enriched in lineage-specific factors.The expression of the osteoblast-specific
RUNX2 gene did not change in the osteogenicmedia. A previous study reported that theRUNX2 expression can be increased on asubstrate culture mimicking a tissue environ-ment such as lamin, fibronectin, and collagen[Cool and Nurcombe, 2005]. The RUNX2 genehaving two promoters is believed to autoregu-lated by negative feedback on their own promo-ters to stringently control gene expression in atissue environment [Ogawa et al., 1993; Stew-art et al., 1997; Xiao et al., 2003].
In conclusion, a section of hypomethylatedCpGs in the transitional area between promo-ters and retroelements is associated withincreased gene expression in mesenchymalcells. Mesenchymal cells withstand the tissue-specific methylation of transitional CpGs underthe in vitro induction of differentiation. It issuggested that mesenchymal cells can transi-ently shift from one position to another largelydependent on the lineage-specific factors addedto the culture media. This provides importantinformation for stemcell therapy,which is still ahighly experimental procedure that has not yetreached clinical applications. Interestingly, theweak transitional CpG methylation of theadipocyte-specific PPARg2 gene in BMSC wasprone to hypomethylation under osteogenicinduction and oxidative stress, suggesting theinvolvement of a methylation-dependent mech-anism in the adipogenesis of bone marrow.
REFERENCE
Ahuja N, Issa JP. 2000. Aging, methylation and cancer.Histol Histopathol 15:835–842.
TABLE III. Relationships Between Transitional CpG Methylation and Gene Expression inMesenchymal Cellsa
Predifferentiation Differentiation
Marrow Fat Marrow Fat
MSP RT-PCR MSP RT-PCR MSP RT-PCR MSP RT-PCR
Tissue-specific genesRUNX2 � þþþ þþþ þþ � þþþ þþþ þþþBGLAP � þþþþ þþ þþ � þþþ þþ þPPARg2 þ þ � þþþ � þþþ � þþþþRUNX3 þþþþ � þþþ þ þþþþ � þþþ þ
Housekeeping genesCDKN2A þ þþ þþ þ � þþ þþþ þMLH1 � þþ � þ � þþ � þþ
aMSP, methylation-specific PCR. The methylation status of the methylation-variable CpGs was divided into the following five levels:(0–20%, �; 21–40%, þ; 41–60%, þþ; 61–80%, þþþ; 81–100%, þþþþ). RT-PCR, reverse-transcription PCR. The RT-PCR results inFigures 4 and 6 were divided into five levels; strong PPARg2 expression in differentiated adipocytes and bone-specific BGLAPexpression (þþþþ), bone-specific RUNX2 and fat-specific PPARg2 expression (þþþ), housekeeping CDKN2A and MLH1 expression(þþ), weak expression in counterpart cell type (þ), and silenced RUNX2 (�) gene in the marrow.
Tissue-Specific Methylation During Cell Differentiation 237

Arnaud P, Goubely C, Pelissier T, Deragon JM. 2000. SINEretroposons can be used in vivo as nucleation centers forde novo methylation. Mol Cell Biol 20:3434–3441.
Assouline-Dayan Y, Chang C, Greenspan A, Shoenfeld Y,Gershwin ME. 2002. Pathogenesis and natural history ofosteonecrosis. Semin Arthritis Rheum 32:94–124.
Bangsow C, Rubins N, Glusman G, Bernstein Y, NegreanuV, Goldenberg D, Lotem J, Ben Asher E, Lancet D,Levanon D, Groner Y. 2001. The RUNX3 gene-sequence,structure and regulated expression. Gene 279:221–232.
Basu S, Michaelsson K, Olofsson H, Johansson S, MelhusH. 2001. Association between oxidative stress and bonemineral density. Biochem Biophys Res Commun 288:275–279.
Bird AP. 1986. CpG-rich islands and the function of DNAmethylation. Nature 321:209–213.
Chang CC, Greenspan A, Gershwin ME. 1993. Osteone-crosis: Current perspectives on pathogenesis and treat-ment. Semin Arthritis Rheum 23:47–69.
Cool SM, Nurcombe V. 2005. Substrate induction ofosteogenesis from marrow-derived mesenchymal precur-sors. Stem Cells Dev 14:632–642.
Dennis JE, Charbord P. 2002. Origin and differentiation ofhuman and murine stroma. Stem Cells 20:205–214.
Gardiner-Garden M, Frommer M. 1987. CpG islands invertebrate genomes. J Mol Biol 196:261–282.
Hata K, Sakaki Y. 1997. Identification of critical CpG sitesfor repression of L1 transcription by DNA methylation.Gene 189:227–234.
Holliday R, Pugh JE. 1975. DNA modification mechanismsand gene activity during development. Science 187:226–232.
Hong SJ, Kim YH, Choi YD, Min KO, Choi SW, Rhyu MG.2005. Relationship between the extent of chromosomallosses and the pattern of CpG methylation in gastriccarcinomas. J Korean Med Sci 20:790–805.
Issa JP. 2000. The epigenetics of colorectal cancer. Ann NYAcad Sci 910:140–153.
Jones PA. 1999. The DNA methylation paradox. TrendsGenet 15:34–37.
Jurka J. 2000. Repbase update: A database and anelectronic journal of repetitive elements. Trends Genet16:418–420.
Justesen J, Stenderup K, Ebbesen EN, Mosekilde L,Steiniche T, Kassem M. 2001. Adipocyte tissue volumein bone marrow is increased with aging and in patientswith osteoporosis. Biogerontology 2:165–171.
Kang MI, Rhyu MG, Kim YH, Jung YC, Hong SJ, Cho CS,Kim HS. 2006. The length of CpG islands is associatedwith the distribution of Alu and L1 retroelements.Genomics 87:580–590.
Kern S, Eichler H, Stoeve J, Kluter H, Bieback K. 2006.Comparative analysis of mesenchymal stem cells frombone marrow, umbilical cord blood, or adipose tissue.Stem Cells 24:1294–1301.
Kim YH, Hong SJ, Jung YC, Kim SJ, Seo EJ, Choi SW,Rhyu MG. 2006. The 5’-end transitional CpGs betweenthe CpG islands and retroelements are hypomethylatedin association with loss of heterozygosity in gastriccancer. BMC Cancer 6:180.
Komori T, Yagi H, Nomura S, Yamaguchi A, Sasaki K,Deguchi K, Shimizu Y, Bronson RT, Gao YH, Inada M,SatoM, Okamoto R, Kitamura Y, Yoshiki S, Kishimoto T.1997. Targeted disruption of Cbfa1 results in a complete
lack of bone formation owing to maturational arrest ofosteoblasts. Cell 89:755–764.
Larsen F, Gundersen G, Lopez R, Prydz H. 1992. CpGislands as genemarkers in the human genome. Genomics13:1095–1107.
Li QL, Ito K, Sakakura C, Fukamachi H, Inoue K, Chi XZ,Lee KY, Nomura S, Lee CW, Han SB, Kim HM, Kim WJ,Yamamoto H, Yamashita N, Yano T, Ikeda T, Itohara S,Inazawa J, Abe T, Hagiwara A, Yamagishi H, Ooe A,Kaneda A, Sugimura T, Ushijima T, Bae SC, Ito Y. 2002.Causal relationship between the loss of RUNX3 expres-sion and gastric cancer. Cell 109:113–124.
Mazziotti G, Angeli A, Bilezikian JP, Canalis E, Giustina A.2006. Glucocorticoid-induced osteoporosis: An update.Trends Endocrinol Metab 17:144–149.
Miard S, Fajas L. 2005. Atypical transcriptional regulatorsand cofactors of PPARgamma. Int J Obes (Lond) 29(Suppl 1):S10–S12.
Ogawa E, Maruyama M, Kagoshima H, Inuzuka M, Lu J,Satake M, Shigesada K, Ito Y. 1993. PEBP2/PEA2represents a family of transcription factors homologousto the products of the Drosophila runt gene and thehuman AML1 gene. Proc Natl Acad Sci USA 90:6859–6863.
Oliva A, Borriello A, Zeppetelli S, Di Feo A, Cortellazzi P,Ventriglia V, Criscuolo M, Zappia V, Della RF. 2003.Retinoic acid inhibits the growth of bone marrowmesenchymal stem cells and induces p27Kip1 andp16INK4A up-regulation. Mol Cell Biochem 247:55–60.
Otto F, Thornell AP, Crompton T, Denzel A, Gilmour KC,Rosewell IR, Stamp GW, Beddington RS, Mundlos S,Olsen BR, Selby PB, Owen MJ. 1997. Cbfa1, a candidategene for cleidocranial dysplasia syndrome, is essential forosteoblast differentiation and bone development. Cell89:765–771.
Pei L, Tontonoz P. 2004. Fat’s loss is bone’s gain. J ClinInvest 113:805–806.
Reik W, Dean W, Walter J. 2001. Epigenetic reprogram-ming in mammalian development. Science 293:1089–1093.
Ross SR, Graves RA, Greenstein A, Platt KA, Shyu HL,Mellovitz B, Spiegelman BM. 1990. A fat-specific enhan-cer is the primary determinant of gene expression foradipocyte P2 in vivo. Proc Natl Acad Sci USA 87:9590–9594.
Schubeler D, Scalzo D, Kooperberg C, van Steensel B,Delrow J, Groudine M. 2002. Genome-wide DNA replica-tion profile for Drosophila melanogaster: A link betweentranscription and replication timing. Nat Genet 32:438–442.
Shiota K. 2004. DNA methylation profiles of CpG islandsfor cellular differentiation and development inmammals.Cytogenet Genome Res 105:325–334.
Stewart M, Terry A, Hu M, O’Hara M, Blyth K, Baxter E,Cameron E, Onions DE, Neil JC. 1997. Proviral inser-tions induce the expression of bone-specific isoforms ofPEBP2alphaA (CBFA1): Evidence for a new myc colla-borating oncogene. Proc Natl Acad Sci U S A 94:8646–8651.
Tontonoz P, Hu E, Graves RA, Budavari AI, SpiegelmanBM. 1994. mPPAR gamma 2: Tissue-specific regulator ofan adipocyte enhancer. Genes Dev 8:1224–1234.
Tseng YH, Butte AJ, Kokkotou E, Yechoor VK, Taniguchi CM,Kriauciunas KM, Cypess AM, Niinobe M, Yoshikawa K,
238 Kang et al.

Patti ME, Kahn CR. 2005. Prediction of preadipocytedifferentiation by gene expression reveals role of insulinreceptor substrates and necdin. Nat Cell Biol 7:601–611.
Turker MS. 2002. Gene silencing in mammalian cells andthe spread of DNA methylation. Oncogene 21:5388–5393.
Woodfine K, Fiegler H, Beare DM, Collins JE, McCann OT,Young BD, Debernardi S, Mott R, Dunham I, Carter NP.2004. Replication timing of the human genome. HumMolGenet 13:191–202.
Xiao ZS, Simpson LG, Quarles LD. 2003. IRES-dependenttranslational control of Cbfa1/Runx2 expression. J CellBiochem 88:493–505.
Yates PA, Burman RW, Mummaneni P, Krussel S, TurkerMS. 1999. Tandem B1 elements located in a mousemethylation center provide a target for de novo DNAmethylation. J Biol Chem 274:36357–36361.
Yoon SO, Yun CH, Chung AS. 2002. Dose effect of oxidativestress on signal transduction in aging. Mech Ageing Dev123:1597–1604.
Zhu Y, Qi C, Korenberg JR, Chen XN, Noya D, Rao MS,Reddy JK. 1995. Structural organization of mouseperoxisome proliferator-activated receptor gamma(mPPAR gamma) gene: Alternative promoter use anddifferent splicing yield two mPPAR gamma isoforms.Proc Natl Acad Sci USA 92:7921–7925.
Tissue-Specific Methylation During Cell Differentiation 239