Transforming Governance for a Resilient Future - United ...
256
Our World at Risk: Transforming Governance for a Resilient Future United Nations Office for Disaster Risk Reduction 2022
-
Upload
khangminh22 -
Category
Documents
-
view
3 -
download
0
Transcript of Transforming Governance for a Resilient Future - United ...
Our World at Risk: Transforming Governance for a Resilient Future
United Nations Office for Disaster Risk Reduction
2022
To download the full report, visit: www.undrr.org/GAR2022
To share your comments and news on GAR on Twitter and Facebook, please use #GAR2022
The designations employed and the presentation of the material in this publication do not imply the expression of any opinion whatsoever on the part of the Secretariat of the United Nations concerning the legal status of any country or territory or of its authorities or concerning the delimitations of its frontiers or boundaries. The designations of country groups in the text and the tables are intended solely for statistical or analytical convenience and do not necessarily express a judgment about the stage reached by a particular country or area in the development process. Mention of the names of firms and commercial products does not imply the endorsement of the United Nations.
Some rights reserved. This work is made available under the Creative Commons Attribution-NonCommercial 3.0 IGO licence (CC BY-NC IGO); creativecommons.org/licenses/by-nc/3.0/igo/legalcode
Under the terms of this licence, this work may be copied, redistributed and adapted for non-commercial purposes, provided that the work is appropriately cited. In any use of this work, there should be no suggestion that UNDRR endorses any specific organization, products or services.
The use of the UNDRR logo is not permitted. If a translation of this work is created, it must include the following disclaimer along with the required citation below: “This translation was not created by the United Nations Office for Disaster Risk Reduction (UNDRR). UNDRR is not responsible for the content or accuracy of this translation.”
UNDRR information products are available for non-commercial use. Requests for commercial use, rights and licensing should be submitted via: www.undrr.org/contact-us
This publication may be freely quoted but acknowledgement of the source is requested.
Citation: United Nations Office for Disaster Risk Reduction (2022). Global Assessment Report on Disaster Risk Reduction 2022: Our World at Risk: Transforming Governance for a Resilient Future. Geneva.
ISBN: 9789212320281
© 2022 UNITED NATIONS OFFICE FOR DISASTER RISK REDUCTION
For additional information, please contact:
United Nations Office for Disaster Risk Reduction (UNDRR)
7bis Avenue de la Paix, CH1211 Geneva 2, Switzerland. Tel: +41 22 917 89 08
Our World at Risk: Transforming Governance for a Resilient Future
United Nations Office for Disaster Risk Reduction
2022

ContentsForeword ix
Preface x
Acknowledgements xi
Executive summary xiii
1. Introduction: Rewiring systems for a resilient future 11.1 Key concepts of this report 1
1.1.1 Disasters, hazards and vulnerability 21.1.2 Towards an understanding of systemic risk 41.1.3 Measuring and valuing the wrong things 51.1.4 How human minds simplify complexity and what this means for
disaster decision-making 61.1.5 Why risk communication is essential 71.1.6 Why data is essential for understanding systemic risk 8
1.2 Transforming risk governance in the era of systemic risk 81.3 Overview of the structure of this report 9
COVID-19 and systemic risk 11
Part I: The challenge 16
2. Our world at risk 172.1 Reality check – risk versus perceived risk 17
2.1.1 Risk perceptions 172.1.2 Disaster loss and poverty 192.1.3 Disaster loss and hunger 222.1.4 Disaster loss and gender inequality 242.1.5 Risk and urbanization 27
2.2 The Sendai Framework at the halfway point: Getting it right towards 2030 292.2.1 Fragile progress in reducing the human cost of disasters 292.2.2 Alarming trends – growing economic cost of disasters 322.2.3 Beyond direct loss 342.2.4 The Sendai Framework’s “substantially reduce” targets 352.2.5 The Sendai Framework’s “substantially increase” targets 36
2.3 Ways forward 41
v
3. Systemic risk as a challenge to sustainable development 423.1 Risky business – the intersection of risk and sustainable development 43
3.1.1 Disaster risk reduction as a means to sustainable development 433.1.2 Reconciling poverty alleviation and sustainable consumption 463.1.3 Disaster risk reduction and sustainable development within planetary boundaries 48
3.2 Ways forward 52
4. How human choices drive vulnerability, exposure and disaster risk 544.1 Systemic risk is increasing due to human actions 54
4.1.1 Inequality, poverty, discrimination and environmental degradation drive risk 574.1.2 Human choices affect the severity of both intensive and extensive risk 57
4.2 Understanding the root causes of vulnerability is essential 58 Understanding vulnerability requires looking across sectors 59
4.3 Improving data supports a better understanding of vulnerability and exposure 61 Policy choices can accelerate risk reduction 64
4.4 Ways forward 66
5. How systems undervalue key assets and opportunities for learning 675.1 Shortcomings of incumbent approaches to risk management 67
5.1.1 Measuring the wrong things 675.1.2 Short-term thinking 685.1.3 Myopia that ignores transboundary and systemic impacts 695.1.4 Results of measuring the wrong things 70
5.2 Wicked problems and systems-based approaches 725.2.1 Enable systems thinking and systems approaches 725.2.2 Integrate diverse knowledge 735.2.3 Recognize that deep uncertainty is a characteristic of wicked problems 735.2.4 Use diagnostic approaches 735.2.5 Use a variation of the “precautionary principle” and “planetary boundaries” 73
5.3 A long-term, holistic and systemic perspective 735.4 Ways forward 76
6. Shifting perceptions on risk 776.1 Learning from indigenous knowledge and ways of knowing 786.2 Established “scripts” and the systemic nature of risk 81
6.2.1 Limitations of habits 816.2.2 Learning about the properties of systems 836.2.3 No more fixing 836.2.4 Building habits of examining habits 83
6.3 Relational practices to explore the way forward 886.3.1 Enhancing the technical practice of disaster risk management 886.3.2 Generating and using warm data 90
6.4 Ways forward 91
vi
Part II: The role of biases and communication in risk reduction 92
7. How human biases and decision processes affect risk reduction outcomes 937.1 Why human decision-making processes matter 937.2 Bounded rationality 957.3 Social, psychological and individual factors influencing risk perception 98
7.3.1 Core social motives 987.3.2 Social environment and culture 101
7.4 Engaging across decision-making processes 1037.4.1 Awareness is not enough 1037.4.2 Individual and structural pressures in risk decision systems 1047.4.3 How understanding biases can help accelerate disaster risk reduction 106
7.5 Ways forward 107
8. Addressing biases to increase investment in risk reduction 1088.1 The impact of biases and heuristics on risk-related decision-making 108
8.1.1 Example 1: Failure to invest in wildfire risk reduction measures 1108.1.2 Example 2: Failure to purchase flood insurance 1108.1.3 Example 3: Failure to invest in solar panels to reduce the risk from
climate change 1108.2 Reworking risk messaging and incentives to promote financial investment in
disaster risk reduction 1118.2.1 Listening to experts 1118.2.2 Reframing the presentation of risk information 1128.2.3 Redirecting financial incentives and regulatory frameworks towards resilience 1168.2.4 Evaluating strategies 120
8.3 Role of key stakeholders in implementing disaster risk reduction measures 1208.3.1 Public sector 1208.3.2 Risk assessment experts 1228.3.3 Private sector 1228.3.4 Communities and local governments 123
8.4 Ways forward 123
9. Advancing risk communication 1249.1 Risk communication is a process 126
9.1.1 Are you listening? 1269.1.2 Is it strategic? 1299.1.3 Is it creative? 1329.1.4 Is it making a difference? 132
9.2 Media and communication systems influence risk and its management 1349.2.1 High technology and low access 1349.2.2 True or false? 1359.2.3 Skill and will 136
9.3 Novel collaborations are needed 1369.4 Ways forward 138
vii
Part III: Towards a more resilient future 142
10. Emerging approaches to assessing systemic risk 14310.1 The era of networked risk 14310.2 Building scenarios and digital twins, and finding tipping points 14610.3 Transferring knowledge from financial systemic risk modelling to support
disaster risk reduction 14710.3.1 Financial systemic risk modelling 14710.3.2 Transferring modelling to disaster risk reduction 14910.3.3 Other methods to quantify systemic risk 154
10.4 New and emerging technologies and science for improved understanding of system collapse and natural systems 156
10.5 Ways forward 158
11. From big data to better decisions 16011.1 Filling gaps in data sources 16111.2 Unique advantages of Earth observation data to assess risk and damage 16311.3 Machine learning methods can be a game-changer, but come with caveats and risks 16811.4 Localized perspectives of climate information: the case of small island
developing States 16911.5 A data-driven hive mind – strengthening decisions through co-design 17011.6 Getting data used – towards managing risk not just disasters 17511.7 Ways forward 178
12. Transitions to systemic risk governance 17912.1 Transforming risk governance 180
Context and challenge: big world, small planet 18112.2 How to transition? 187
Steps towards a whole systems approach 18912.3 Ways forward 195
Food systems and systemic risk 197
13. Conclusions 20213.1 Living with a new risk landscape 202
13.1.1 Moving towards institutions that are comfortable with uncertainty is necessary 20213.1.2 Building resilience is fundamental to climate action and achievement of the
Sustainable Development Goals 20313.1.3 The first line of defence in resilience building is addressing the root causes
and drivers of vulnerability 20313.2 A call to action to accelerate risk reduction 203
How to better address systemic risk: Key case study examples from GAR2022 207
Abbreviations and acronyms 210
References 211
viii
ForewordNothing undermines sustainable development like disasters. They can destroy decades of progress in an instant. Understanding and managing disaster risk is essential to achieving the Sustainable Development Goals.
This sixth edition of the United Nations Global Assessment Report on Disaster Risk Reduction – Our World at Risk: Transforming Governance for a Resilient Future comes at a critical time for the future of humanity. The continued threat of climate disruption is intensifying at a disturbing pace in every region, with disproportionate impact on the poor and vulnerable. Meanwhile, the COVID-19 pandemic has upended lives around the world. Both crises pose a major threat to achieving the Sustainable Development Goals.
Sadly, all too often after a major crisis, we tend to go back to business as usual, leaving vulnerabilities in our societies unaddressed. That is why in my report, Our Common Agenda, I have called for better preparation and response to major global risks. Progress on disaster risk reduction must be urgently prioritized as a precondition for sustainable development. Being ready saves lives – and money. Sound disaster risk management and increased resilience can safeguard hard-won gains in health, education, water, sanitation and more. It can also prevent new risk by ensuring that social and economic development are risk-informed.
Our World at Risk calls on Member States and leaders to look at how governance systems can evolve, particularly given the increased occurrence and intensity of disasters. In an age of complex risk, with cascading impacts, we must break down siloed thinking and replace it with an all-of-society approach. Local communities and the people most affected by disasters need to be part of the conversation. While decisions should be based on science, they can be complemented by rich sources of information, such as indigenous and traditional knowledge, which can add a deeper understanding of specific challenges.
The report offers valuable recommendations to reduce risk and increase resilience. It also details how innovations in systemic risk modelling offer a promising mechanism to better anticipate and respond to risk. Not least, our financial systems must account for risk, with adequate financing for disaster prevention and reduction in the face of the growing climate emergency. We must limit global heating to 1.5°C, which entails reducing emissions to 45% below 2010 levels by 2030, and we must dramatically boost investments in adaptation and resilience, including closing the early warning gap within 5 years. If we are to rise to the challenges of the twenty-first century, we need systemic thinking, coordination and response to disaster risk. That is how we can create a more sustainable, resilient and equitable future for all.
António Guterres
United Nations Secretary-General
ix
PrefaceAs this Global Assessment Report on Disaster Risk Reduction 2022 (GAR2022) goes to print, the world finds itself in some of the darkest days in living memory. The war in Ukraine becomes more devastating every day, and COVID-19 has affected every corner of the world. The latest Intergovernmental Panel on Climate Change report warns that without immediate and deep emission reductions across all sectors, keeping global warming below the 1.5°C threshold will be impossible.
In the years since the previous GAR, the COVID-19 pandemic has shown starkly how a hazard can cascade across systems, but also how people and societies can adopt new behaviours when the problem and the needs for action are clear.
As the Sendai Framework for Disaster Risk Reduction 2015–2030 is approaching its midpoint, this GAR encourages us to reflect on the progress we have made so far and the road ahead. It clearly highlights that we are not on track to achieve most of the Sendai Framework’s global targets, but it also provides pathways and solutions to accelerate action and reverse this trend.
GAR2022 highlights country case study examples, tools and ideas for how to address systemic risk and transform how we think about risk – including addressing biases and prejudices of which we are sometimes not conscious. It also encourages action to make risk governance fit for purpose in the context of the climate emergency and an increasingly complex and interconnected world.
GAR2022 is a call to action to better understand and act to address systemic risk and to invest in building resilient communities and global systems. Whether we can achieve the Sendai Framework in the coming years to 2030 is decisive in the race to reach the Sustainable Development Goal targets, for a sustainable and resilient future for all.
There is no time to waste; we need to act now.
Mami Mizutori
Special Representative of the Secretary-General for Disaster Risk Reduction
Head of the United Nations Office for Disaster Risk Reduction
x
Acknowledgements Global Assessment Report on Disaster Risk Reduction (GAR) Advisory Board
Chair
Mami Mizutori, Special Representative of the Secretary-General for Disaster Risk Reduction.
Members
Kelvin Berryman, Government of New Zealand / Aotearoa; Melody Brown Burkins, Dartmouth College; Kirsten Dunlop, Climate-KIC; Wadid Erian, Cairo University; Paolo Garonna, Association of Italian Insurers and Libera Università Internazionale degli Studi Sociali “Guido Carli”; Yana Gevorgyan, Group on Earth Observations Secretariat; Haruo Hayashi, Kyoto University; Peter Head, Ecological Sequestration Trust; Ronald Jackson, United Nations Development Programme; Molly Jahn, University of Wisconsin-Madison; Patrick Kangwa, Government of the Republic of Zambia; Kamal Kishore, Government of the Republic of India; Allan Lavell, Latin American Social Science Faculty; Shuaib Lwasa, Makerere University; Malini Mehra, GLOBE International; Aromar Revi, Indian Institute for Human Settlements; Juan Pablo Sarmiento, Florida International University; Youba Sokona, The South Centre and Intergovernmental Panel on Climate Change; Renato Solidum, Government of the Republic of the Philippines and Marsh McLennan; Alex Wittenberg, Marsh McLennan; and Saini Yang, Beijing Normal University.
Global leads
Coordinating lead author: Jenty Kirsch-Wood, United Nations Office for Disaster Risk Reduction (UNDRR); project coordinator: Rhea Katsanakis, UNDRR; UNDRR Secretariat internal review: Loretta Hieber Girardet, Animesh Kumar and Ricardo Mena; UNDRR communications and outreach: Rosalind Cook, Frédéric Delpech, Jeanette Elsworth and Fanny Langella.
Contributors Chapter lead authors
Irasema Alcántara-Ayala, Institute of Geography, Universidad Nacional Autónoma de México and Mountain Research Initiative; Daniela Di Filippo, UNDRR; Markus Enenkel, Harvard Humanitarian Initiative, Harvard University and World Bank Disaster Risk Financing and Insurance Program; Marie-Valentine Florin, International Risk Governance Council; Franz W. Gatzweiler, Institute of Urban Environment, Chinese Academy of Science; Franziska Gaupp, Potsdam Institute for Climate Impact Research; Jane Hadjion, behavioural consultant; Susanne Hanger-Kopp, ETH Zurich; Jenty Kirsch-Wood, UNDRR; Howard Kunreuther, Wharton School, University of Pennsylvania; Joanne Linnerooth-Bayer, International Institute for Applied Systems Analysis; Galimira Markova, UNDRR; Michael Obersteiner, International Institute for Applied Systems Analysis; Roger Pulwarty, National Oceanic and Atmospheric Administration; Lisa Robinson, BBC Media Action; Conor Seyle, One Earth Future Foundation; Hulda Thorisdottir, Psychology and Political Science Department, University of Iceland; Stefan Thurner, Complex Science Hub, Medical University of Vienna; Alonso Brenes Torres, La Red de Estudios Sociales en Prevención de Desastres en América Latina and Integrated Research on Disaster Risk; and Scott Williams, independent systems innovations adviser.
Contributing authors
Carolina Adler, Mountain Research Initiative; Walid Afifi, Department of Communication, University of California Santa Barbara; Nora Bateson, International Bateson Institute; Bob Bishop, ICES Foundation; Wouter Botzen, Institute for Environmental Studies, Vrije Universiteit Amsterdam; Stephen Broomell, Social and Decision Science, Carnegie Mellon University; Mike Clarke, MRC Methodology Hub, School of Medicine, Dentistry, and Biomedical Sciences, Queen’s University of Belfast; Victor Del Rio Vilas, World Health Organization;
xi
Denyse S. Dookie, Grantham Research Institute on Climate Change and the Environment, London School of Economics and Political Science; Love Ekenberg, Computer and System Science, University of Stockholm; Eleonore Fournier-Tombs, United Nations Institute; Luis Gerardo, United Nations Department of Economic and Social Affairs; Robin Gregory, Decision Research; Michael Hagenlocher, United Nations University, Institute for Environment and Human Security; Jim Hall, School of Geography and the Environment, Oxford University; Theodora Hannides, BBC Media Action; Loretta Hieber Girardet, UNDRR; Mark Illiffe, United Nations Global Geospatial Information Management, United Nations Statistics Division; Halima Kahiya, Wajir Community Radio; Rhea Katsanakis, UNDRR; Adriana Keating, Zurich Flood Risk Alliance; Christine Kenney, Joint Centre for Disaster Research, Massey University; Nadeja Komendantova, International Institute for Applied Systems Analysis; Berber Kramer, International Food Policy Research Institute; Andrew Kruczkiewicz, International Research Institute for Climate and Society, Earth Institute, Columbia University; Animesh Kumar, UNDRR; Jieling Liu, University of Lisbon; Leonardo Milano, Centre for Humanitarian Data, United Nations Office for the Coordination of Humanitarian Affairs; Giuseppe Molinario, World Bank; Anthony Oliver-Smith, University of Florida; Daniel Osgood, International Research Institute for Climate and Society, Columbia University; Mark Quigley, School of Geography, Earth and Atmospheric Sciences, University of Melbourne; Sahar Safaie, Sage On Earth Consulting Ltd; Mandira Shrestha, ICIMOD and Mountain Research Initiative; Iain Stewart, Royal Scientific Society, Plymouth University; Eleanor Stokes, Universities Space Research Association; Costis Toregas, Cyber Security and Privacy Research Institute, The George Washington University; Coleen Vogel, School of Animal, Plant and Environmental Science, University of Witwatersrand; Timm Walker, Deutsche Gesellschaft für Internationale Zusammenarbeit; and Liu Wei, Luohan Academy.
Reviewers
David Alexander, University College London; Simone Balog-Way, World Bank Global Facility for Disaster Reduction and Recovery; Julie Downs, Downs Research Lab, Social and Decision Sciences, Carnegie Mellon University; Adam Fysh, UNDRR; Marc Gordon, UNDRR; Ailsa Holloway, Stellenbosch University; Molly Jahn, Jahn Research Group, University of Wisconsin-Madison; Shanna N. McClain, National Aeronautics and Space Administration Earth Science Division; Andrew Revkin, Columbia Climate School; and Michelle Zucker, Climate-KIC.
Peer review of contributing papers Coordinating organization: The University of Auckland; peer review coordination: JC Gaillard and Martin Joe, The University of Auckland.
Design and productionTechnical and substance editor: Mary Picard, Humanitarian Consulting; editor: Caren Brown; design, graphics and layout: Donna Kirstein; references and sources: Rosanna Drew, Humanitarian Consulting; maps and cartography: United Nations Geospatial Information Section; image editing: Gershon De La Cruz and Tomislava Tomova, UNDRR; printing: Imprimerie Gonnet.
Financial resources UNDRR expresses its deep appreciation to all the donors that have supported its work, allowing production of this Global Assessment Report on Disaster Risk Reduction 2022.
xii
Executive summaryThe central question for this Global Assessment Report on Disaster Risk Reduction 2022 (GAR2022) is how governance systems can evolve to better address the systemic risks of the future. In today’s crowded and interconnected world, disaster impacts increasingly cascade across geographies and sectors, as the coronavirus disease (COVID-19) pandemic and climate change are rapidly making clear. Despite progress, risk creation is outstripping risk reduction. Disasters, economic loss and the underlying vulnerabilities that drive risk, such as poverty and inequality, are increasing just as ecosystems and biospheres are at risk of collapse. Global systems are becoming more connected and therefore more vulnerable in an uncertain risk landscape. Such systems include ecologies, food systems, supply chains, economies and social services. Local risks, like a new virus in Wuhan, China, can become global; global risks like climate change are having major impacts in every locality. Indirect, cascading impacts can also be significant. For example, many countries felt the negative economic impact of the COVID-19 pandemic months before ever registering a single case of the disease. Without increased action to build resilience to systemic risk, the United Nations Sustainable Development Goals cannot be achieved.
GAR2022 highlights that:
● The climate emergency and the systemic impacts of the COVID-19 pandemic point to a new reality.
● Understanding and reducing risk in a world of uncertainty is fundamental to achieving genuinely sustainable development.
● The best defence against future shocks is to transform systems now, to build resilience by addressing climate change and to reduce the vulnerability, exposure and inequality that drive disasters.
GAR2022 explores how, around the world, structures are evolving to better address systemic risks. In the face of accelerating climate change impacts, doing more of the same will not be enough. However, action is possible. This report shows how governance systems can evolve to reflect the interconnected value of people, the planet and prosperity. It outlines how actions such as changing what is measured to account for factors such as sustainability, the value of ecosystems and future climate change impacts can have a powerful effect, including unmasking dangerous imbalances in existing systems. Investment in understanding risk is the foundation for sustainable development. However, this needs to link to a reworking of financial and governance systems to account for the real costs of current actions. Without this, financial balance sheets and governance decision-making will remain fragmented, and will be rendered increasingly inaccurate and ineffective.
The report also explores how designing systems to work with, not against, the way human minds make decisions can support accelerated action. Innate biases and mental short cuts can make people’s thinking myopic, or prone to inertia, oversimplification or herding when making decisions around risk. This helps explain why people, and the institutions they work for, can resist making good decisions about risk, even in the face of clear scientific data. These biases are particularly likely to kick in when risks are newly felt, and therefore unfamiliar, as is the case with many systemic risks such as climate change or a pandemic.
Reframing risk information, policies and products to present expert risk understanding differently can help overcome this hurdle. Designing in consultation with affected populations, building on existing expertise and local knowledge, and leveraging technology to help support better communication and dialogue around risk can increase the effectiveness and acceptance of change.
xiii
Building on innovations in modelling systemic financial crises, GAR2022 outlines how similar methods are now being applied to better understand the cascading, cross-sectoral impacts of systemic risk on sustainable development. It shows how both developed and developing countries are innovating to improve analytics. Emerging methods better depict impacts in key systems like food, infrastructure and supply chains, which cascade across sectors and geographies. These further drive social impacts such as increased inequality, migration and conflict.
These technological advances are powerful tools in accelerating risk understanding. However, in a world of certain uncertainty, no model can accurately predict what is a fundamentally unpredictable future. Science can help identify positive pathways, test options and find weak points. But it cannot predict across the infinite variables of a complex world. GAR2022 therefore highlights examples where human experience and global models are coming together to apply data more effectively to support better decision-making around risk. Local food security projects in Kenya are using state-of-the-art climate information to discuss options
for resilient agriculture with local partners. A “deep demonstration approach” is being applied in Viet Nam where innovators and governments are working together to co-design a green circular economy and better understand and address systemic risk. Examples given from around the world highlight how options exist to better leverage technology, enhance participation, and increase the use of local and indigenous knowledge to create the agile flexible systems necessary to build resilience in today’s complex world.
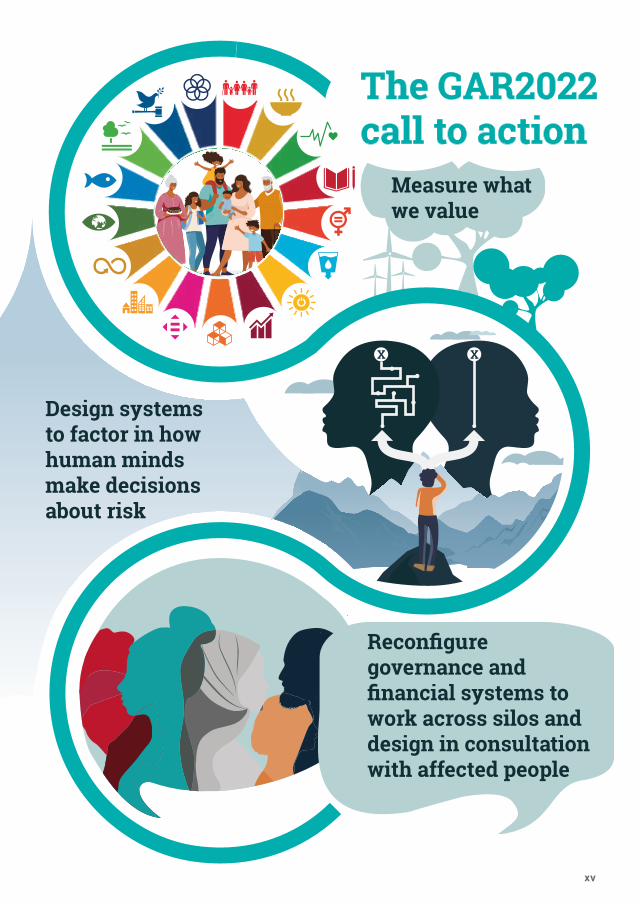
To accelerate essential risk reduction and resilience building, GAR2022 calls for action to:
1. Measure what we value.
2. Design systems to factor in how human minds make decisions about risk.
3. Reconfigure governance and financial systems to work across silos and design in consultation with affected people.
As climate change impacts gather pace, the baseline for how future generations will view inaction is clear. The time to act is now.
xiv
XX
Reconfigure governance and financial systems to work across silos and design in consultation with affected people
Design systems to factor in how human minds make decisions about risk
Measure what we value
The GAR2022 call to action
xv

1. Introduction: Rewiring systems for a resilient futureDisaster risk was increasing globally, even before the advent of the coronavirus disease (COVID-19) pandemic. More people were killed or affected by disasters in the last 5 years than in the previous 5 years. Intensive and extensive risks are growing at an unprecedented rate. Human action is creating greater and more dangerous risk. Disasters have increasing impacts on communities and whole systems as risk multiplies. Everyone is living downstream of something else. Global impacts become local, and vice versa. Impacts also cascade across sectors, creating new challenges.
Recent large-scale disasters – including the COVID-19 pandemic and major weather events that caused supply chain disruptions – have led many to conclude that something new is happening. Increasingly, people live in a world in which disaster risk manifests systemically, inflicting damage across the vital systems and infrastructure upon which human societies and economies depend. Despite commitments to build resilience, tackle climate change and create sustainable development pathways, current societal, political and economic choices are doing the reverse. Human actions continue to push the planet towards its existential and ecosystem limits. In the face of intensifying climate change impacts and increasing system threats, risk reduction efforts often seem too little and too late.
In the wake of the COVID-19 pandemic and the hottest decade on record, there is growing momentum to change how the global community manages risk, and a willingness to accelerate action on climate change. In the aftermath of
disasters, psychologists note there is a moment when individuals are particularly open to change. The current phase of the COVID-19 crisis is perhaps such a moment that should not be wasted.
To change course, new approaches are needed. It is possible to manage the risks of the future more effectively, but only if action is taken now to rework
local, national and globalized systems to prevent and respond to systemic risk.
This Global Assessment Report on Disaster Risk Reduction 2022 (GAR2022) focuses on how change is possible, and how governance systems can evolve to respond to an increasingly challenging planetary and socioeconomic environment. It highlights how tools and approaches already in place in the disaster risk reduction (DRR) community can be adjusted, enhanced and scaled up to help create a risk-resilient future.
1.1 Key concepts of this reportThree key global agreements on DRR, climate change and sustainable development provide the foundation for multilateral action to manage risk and promote sustainable development towards 2030 (Box 1.1).
Building on this foundation, addressing systemic risk requires working across systems and disciplines, but a common “risk language” or set of interoperable standards or definitions still remains elusive. This section therefore gives an introduction to key terms and concepts elaborated in GAR2022 from the perspective of DRR.
1
1.1.1 Disasters, hazards and vulnerabilityThe United Nations Office for Disaster Risk Reduction (UNDRR) defines a disaster as a “serious disruption of the functioning of a community or a society at any scale due to hazardous events interacting with conditions of exposure, vulnerability and capacity, leading to one or more of the following: human, material, economic and environmental losses and impacts” (UNDRR, n.d.). Disasters stem from a combination of hazards with vulnerability and exposure of people and assets.
In this context, a hazard is a “process, phenomenon or human activity that may cause loss of life, injury or other health impacts, property damage, social and economic disruption or environmental degradation” (UNDRR, n.d.). The origins of hazards can be natural or human-made, and span a wide range of environmental, technological and biological hazards,
including meteorological, hydrological, extra-terrestrial, geological, environmental, chemical, biological, technological and societal factors. UNDRR and the International Science Council recently convened a wide-reaching expert-driven exercise, the Hazard Definition and Classification Review, which outlined over 300 hazard types that can contribute to disasters (UNDRR, 2020a). They include common events such as storms and floods and also less-frequent events such as pandemics and chemical accidents.
Vulnerability describes “the conditions determined by physical, social, economic and environmental factors or processes which increase the susceptibility of an individual, a community, assets or systems to the impacts of hazards” (UNDRR, n.d.). Exposure is the “situation of people, infrastructure, housing, production capacities and other tangible human assets located in hazard-
Box 1.1. Risk reduction in the global agreements
The Sendai Framework on Disaster Risk Reduction 2015–2030 (Sendai Framework) focuses on the adoption of measures that address all dimensions of disaster risk – hazard, exposure, vulnerability and coping capacity – to prevent the creation of new risk, reduce existing risk and increase resilience. It incorporates a strong focus on inclusiveness “through the implementation of integrated and inclusive economic, structural, legal, social, health, cultural, educational, environmental, technological, political and institutional measures that prevent and reduce hazard exposure and vulnerability to disaster, increase preparedness for response and recovery, and thus strengthen resilience” (United Nations, 2015a).
Transforming our World: the 2030 Agenda for Sustainable Development (2030 Agenda) sets out 17 Sustainable Development Goals (SDGs) and provides a comprehensive global policy framework towards ending all forms of poverty, hunger, inequalities among and within countries (based on gender and other socioeconomic status), and tackling environmental degradation and climate change, while ensuring “no one is left behind” (United Nations, 2015b). Its suite of planned worldwide positive changes will help reduce most elements of disaster risk. The SDGs incorporate multiple Sendai Framework targets as well as climate change and sustainability targets.
The Paris Agreement steers action towards global climate change adaptation and the mitigation goal of limiting global warming to well below 2°C above pre-industrial levels, and preferably to 1.5°C. Article 7 outlines the global adaptation goal, which includes the need to incorporate sustainable development in adaptation planning (United Nations, 2015c). The Warsaw International Mechanism for Loss and Damage associated with Climate Change Impacts under the United Nations Framework Convention on Climate Change also recognizes the importance of averting, minimizing and addressing loss and damage due to climate change, including extreme weather and slow-onset hazards and changes (UNFCCC, 2013). Comprehensive risk assessment, risk insurance facilities and climate risk pooling are important tools that link climate action under the Paris Agreement with risk reduction under the Sendai Framework.
2
prone areas” (UNDRR, n.d.). When hazards combine with vulnerability and exposure, disasters are most likely to occur because exposure increases the impacts and vulnerability reduces coping capacity (UNDRR, n.d.).
That vulnerability and exposure are core to causing disasters highlights the role of human decisions in creating disasters. Disasters are not “natural” events, but instead are a function of how humans interact with their environment. The root causes of disaster risk and disasters stem from structural conditions of a particular mode of development and growth. They are also shaped through social, economic, cultural and political processes, and conditions, practices, priorities, choices and values that unfold over time (Oliver-Smith et al., 2016, 2017).
The drivers of disasters are in part defined in the context of limited access to power structures and resources, and attached to economic and political systems (Blaikie et al., 2004). Root or underlying causes are bound up with deep-rooted, fundamental
or structural drivers relating to development ideologies, cultural factors, ingrained habits, social inequality and other processes that all have a role in the creation of risk and disasters.
Disasters are traditionally divided into rapid-onset events (like typhoons, earthquakes or flash floods) or slow-onset events (like droughts, saltwater intrusion or desertification) where impacts manifest over months or years. While most hazards are natural, some, like air, pollution, are largely human made.
Disasters are also usefully characterized as either extensive or intensive. Extensive disasters are high-frequency localized events that manifest over a dispersed area, causing recurrent small- and medium-scale impacts. Examples include small- or medium-sized seasonal storms, floods and droughts. Intensive disasters risk relates to large-scale events, typically affecting large cities or densely populated areas. They are caused by high-severity hazards such as major earthquakes or once-in-a-generation floods (UNISDR, 2015).
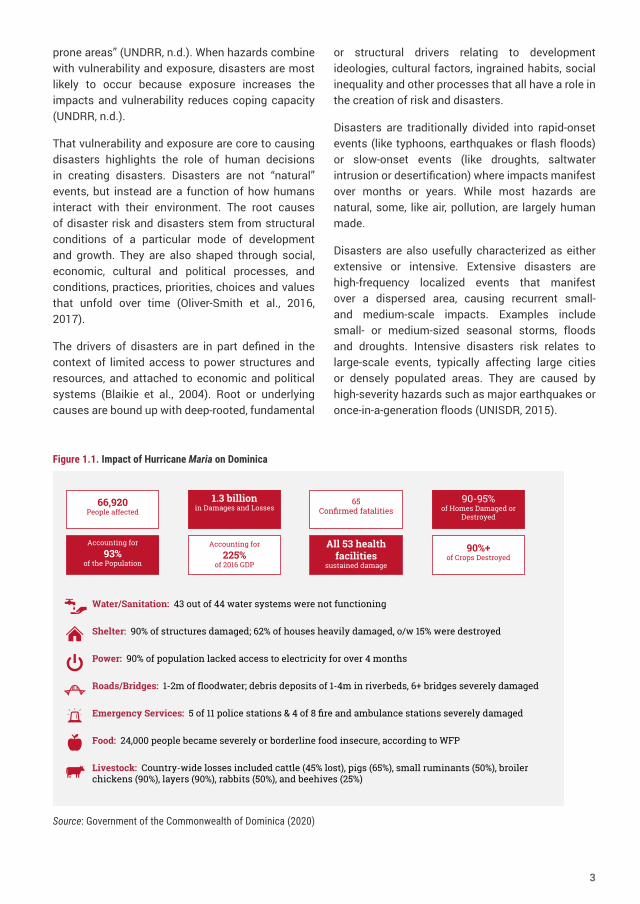
66,920People affected
Accounting for93%
of the Population
65Confirmed fatalities
90-95%of Homes Damaged or
Destroyed
1.3 billionin Damages and Losses
All 53 health facilities
sustained damage
90%+of Crops Destroyed
Accounting for225%
of 2016 GDP
Water/Sanitation: 43 out of 44 water systems were not functioning
Shelter: 90% of structures damaged; 62% of houses heavily damaged, o/w 15% were destroyed
Power: 90% of population lacked access to electricity for over 4 months
Roads/Bridges: 1-2m of floodwater; debris deposits of 1-4m in riverbeds, 6+ bridges severely damaged
Emergency Services: 5 of 11 police stations & 4 of 8 fire and ambulance stations severely damaged
Food: 24,000 people became severely or borderline food insecure, according to WFP
Livestock: Country-wide losses included cattle (45% lost), pigs (65%), small ruminants (50%), broiler chickens (90%), layers (90%), rabbits (50%), and beehives (25%)
Figure 1.1. Impact of Hurricane Maria on Dominica
Source: Government of the Commonwealth of Dominica (2020)
3
As exemplified in Figure 1.1, the impacts of a single devastating storm can have major long-term impacts (Maskrey et al., 2022). Disaster impacts on national well-being can be particularly pronounced in small nations such as Dominica, where 90% of the island’s approximately 75,000 people live in coastal areas at high risk to storms and other disasters. Similar long-term impacts may be expected in other small island developing States (SIDS) such as Tonga, which are affected by hazards such as underwater volcanic eruptions, tsunamis and their cascading impacts.
1.1.2 Towards an understanding of systemic riskA key focus of this GAR2022 is how systemic risk is affecting sustainable development, and what can be done to better address and reduce losses from systemic impacts. The concept of systemic risk is based on the notion that the risk of an adverse outcome of a policy, action or hazard event can depend on how the elements of the affected systems interact with each other. This can either aggravate or reduce the overall effect of the constituent parts. Interactions occur through positive or negative feedback processes. Systemic risk creates the chance of system malfunction or even collapse (Sillmann et al., 2022).
Even though the notion of “systemic risk” is at least a few decades old, the term is still used in different ways across disciplines (Faulhaber et al., 1990; Sillmann et al., 2022). Although systemic risk analysis is regularly applied in financial systems and in medicine, it is now increasingly being considered in Earth systems analysis, climate science and DRR. Triggered by the repercussions of the systemic global financial crisis of the late 2000s, the perception of systemic risk has often focused on global and catastrophic or even existential risks (Helbing, 2013; WEF, 2021a; Sillmann et al., 2022). However, systemic risk can occur at all spatial scales, from local to regional, national and global.
Systemic risk can be endogenous to, or embedded in, a system that is not itself considered to be a risk and is therefore not generally tracked or managed. Systems can contain latent, or cumulative, risk potential to impede overall system performance when some characteristics of the system change (UNDRR, 2019).
Systemic risk does not necessarily lead to a complete system failure. However, as outlined throughout this report, the design and evolution of modern human systems is creating new risks. Some of those risks, like climate change and biodiversity loss, are existential in nature. The impacts of systemic risk cascade across sectors, such as food–health–water–energy, and/or among communities, countries and continents. For example, in the pursuit of ever more efficient food systems, there is now far greater reliance on trade to fill or compensate for local or national production gaps or to absorb oversupply. This so-called “efficiency” of the system has led to reduced margins or buffers against unplanned interruptions such as local conflict, natural hazards or international crises that reduce trade. This increases the potential for cascading risk throughout and beyond food systems (see the Food systems and systemic risk case study after Chapter 12).
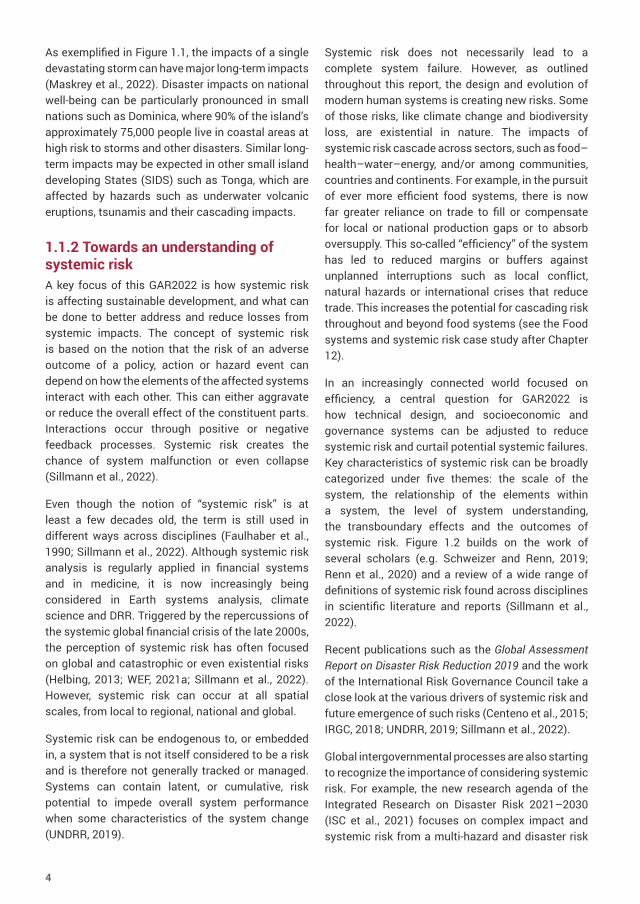
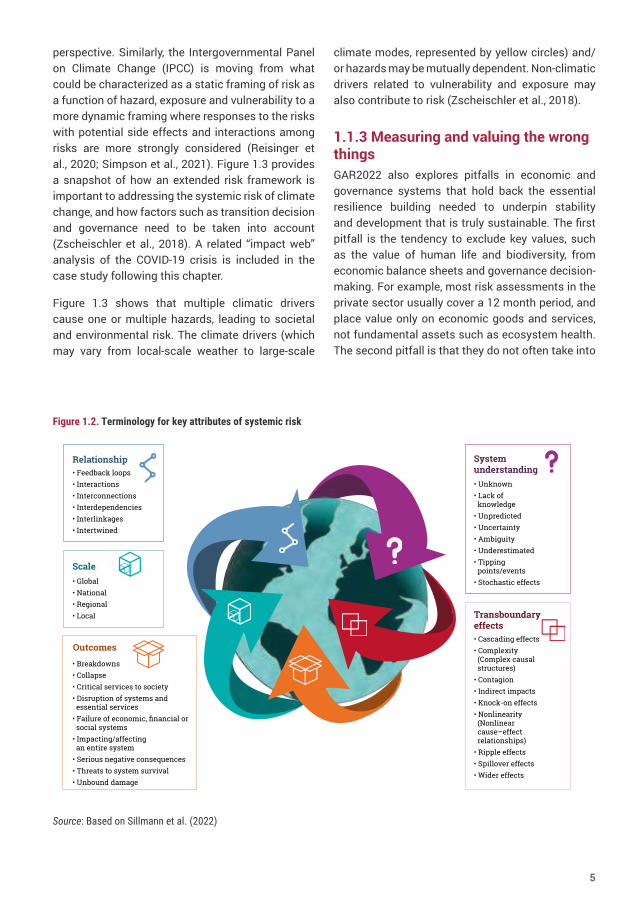
In an increasingly connected world focused on efficiency, a central question for GAR2022 is how technical design, and socioeconomic and governance systems can be adjusted to reduce systemic risk and curtail potential systemic failures. Key characteristics of systemic risk can be broadly categorized under five themes: the scale of the system, the relationship of the elements within a system, the level of system understanding, the transboundary effects and the outcomes of systemic risk. Figure 1.2 builds on the work of several scholars (e.g. Schweizer and Renn, 2019; Renn et al., 2020) and a review of a wide range of definitions of systemic risk found across disciplines in scientific literature and reports (Sillmann et al., 2022).
Recent publications such as the Global Assessment Report on Disaster Risk Reduction 2019 and the work of the International Risk Governance Council take a close look at the various drivers of systemic risk and future emergence of such risks (Centeno et al., 2015; IRGC, 2018; UNDRR, 2019; Sillmann et al., 2022).
Global intergovernmental processes are also starting to recognize the importance of considering systemic risk. For example, the new research agenda of the Integrated Research on Disaster Risk 2021–2030 (ISC et al., 2021) focuses on complex impact and systemic risk from a multi-hazard and disaster risk
4
Scale
Relationship
• Unknown• Lack of
knowledge• Unpredicted• Uncertainty• Ambiguity• Underestimated• Tipping
points/events• Stochastic effects
Outcomes
System understanding• Feedback loops
• Interactions• Interconnections• Interdependencies• Interlinkages• Intertwined
• Global• National• Regional• Local
• Breakdowns • Collapse• Critical services to society• Disruption of systems and
essential services• Failure of economic, financial or
social systems• Impacting/affecting
an entire system• Serious negative consequences• Threats to system survival• Unbound damage
• Cascading effects • Complexity
(Complex causal structures)
• Contagion• Indirect impacts• Knock-on effects• Nonlinearity
(Nonlinear cause–effect relationships)
• Ripple effects• Spillover effects• Wider effects
Transboundary effects
Figure 1.2. Terminology for key attributes of systemic risk
Source: Based on Sillmann et al. (2022)
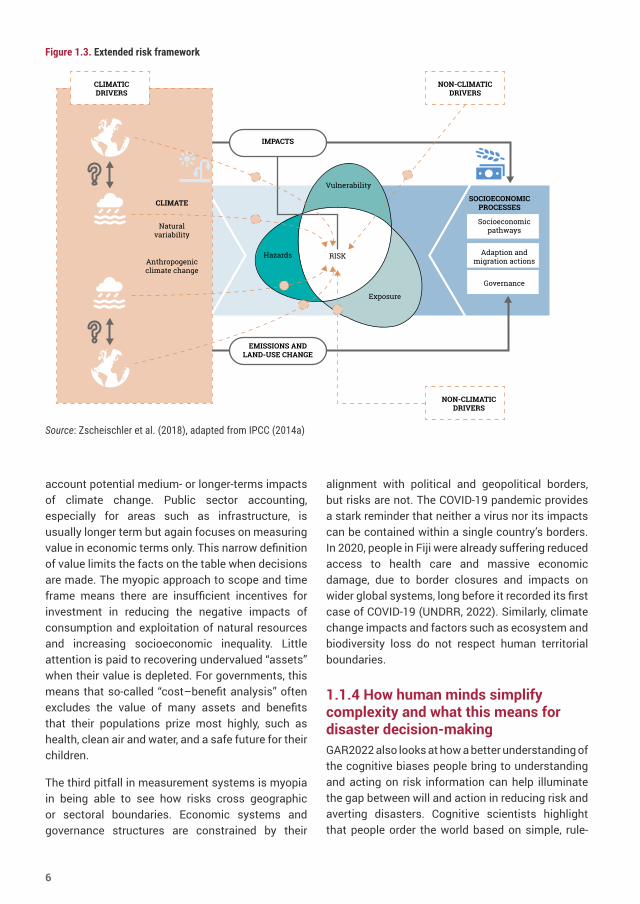
perspective. Similarly, the Intergovernmental Panel on Climate Change (IPCC) is moving from what could be characterized as a static framing of risk as a function of hazard, exposure and vulnerability to a more dynamic framing where responses to the risks with potential side effects and interactions among risks are more strongly considered (Reisinger et al., 2020; Simpson et al., 2021). Figure 1.3 provides a snapshot of how an extended risk framework is important to addressing the systemic risk of climate change, and how factors such as transition decision and governance need to be taken into account (Zscheischler et al., 2018). A related “impact web” analysis of the COVID-19 crisis is included in the case study following this chapter.
Figure 1.3 shows that multiple climatic drivers cause one or multiple hazards, leading to societal and environmental risk. The climate drivers (which may vary from local-scale weather to large-scale
climate modes, represented by yellow circles) and/or hazards may be mutually dependent. Non-climatic drivers related to vulnerability and exposure may also contribute to risk (Zscheischler et al., 2018).
1.1.3 Measuring and valuing the wrong things GAR2022 also explores pitfalls in economic and governance systems that hold back the essential resilience building needed to underpin stability and development that is truly sustainable. The first pitfall is the tendency to exclude key values, such as the value of human life and biodiversity, from economic balance sheets and governance decision-making. For example, most risk assessments in the private sector usually cover a 12 month period, and place value only on economic goods and services, not fundamental assets such as ecosystem health. The second pitfall is that they do not often take into
5
account potential medium- or longer-terms impacts of climate change. Public sector accounting, especially for areas such as infrastructure, is usually longer term but again focuses on measuring value in economic terms only. This narrow definition of value limits the facts on the table when decisions are made. The myopic approach to scope and time frame means there are insufficient incentives for investment in reducing the negative impacts of consumption and exploitation of natural resources and increasing socioeconomic inequality. Little attention is paid to recovering undervalued “assets” when their value is depleted. For governments, this means that so-called “cost–benefit analysis” often excludes the value of many assets and benefits that their populations prize most highly, such as health, clean air and water, and a safe future for their children.
The third pitfall in measurement systems is myopia in being able to see how risks cross geographic or sectoral boundaries. Economic systems and governance structures are constrained by their
alignment with political and geopolitical borders, but risks are not. The COVID-19 pandemic provides a stark reminder that neither a virus nor its impacts can be contained within a single country’s borders. In 2020, people in Fiji were already suffering reduced access to health care and massive economic damage, due to border closures and impacts on wider global systems, long before it recorded its first case of COVID-19 (UNDRR, 2022). Similarly, climate change impacts and factors such as ecosystem and biodiversity loss do not respect human territorial boundaries.
1.1.4 How human minds simplify complexity and what this means for disaster decision-making GAR2022 also looks at how a better understanding of the cognitive biases people bring to understanding and acting on risk information can help illuminate the gap between will and action in reducing risk and averting disasters. Cognitive scientists highlight that people order the world based on simple, rule-
Vulnerability
Hazards RISK
Exposure
CLIMATIC DRIVERS
NON-CLIMATIC DRIVERS
EMISSIONS AND LAND-USE CHANGE
IMPACTS
NON-CLIMATIC DRIVERS
CLIMATE SOCIOECONOMIC PROCESSES
Governance
Socioeconomicpathways
Adaption and migration actions
Naturalvariability
Anthropogenicclimate change
Figure 1.3. Extended risk framework
Source: Zscheischler et al. (2018), adapted from IPCC (2014a)
6
of-thumb decisions (heuristics) that reinforce their basic psychological motives and expectations, even though they are not aware this is happening. These individual decision-making processes interact with the social environment, and cultural and governance norms. Although humans often believe the decisions they make about how to manage risk are driven by reasoning and data, scientists now understand more about how human minds are configured to make decisions, and how this often distorts the use of risk information in decision-making.
Human thinking can be divided into two main types: decisions that require “thinking slow” and those that rely on “thinking fast” (Kahneman, 2013). Thinking slow mode is the deliberate thinking that most people have in mind when speaking of human reasoning, and is focused on expectation maximization. This is the kind of decision-making associated with sound long-term development and well-reasoned personal choices and good governance.
There is also another form of thinking that is equally important, although more often associated with the kinds of quick decisions needed in “fight or flight” situations. Human minds are configured to consider disasters as thinking fast events that require quick and binary decision-making. However, risk reduction and resilience building, as well as planned or anticipatory humanitarian action, also require deliberate or slow thinking at the individual and organizational levels.
In addition to thinking fast and slow, human minds have developed other short cuts to cope with complexity, which may negatively affect their ability to make decisions on disaster risk. Under most conditions, people use heuristics, or mental short cuts, to help find solutions to the problems faced. These tend to simplify decision-making, rather than making a full and complete calculation of a best overall answer. People are almost never aware of their use of those mental short cuts, as they mostly originate in the part of the brain that processes automatic behaviours.
One of the most commonly used short cuts is to simplify complexity by attempting to determine a linear cause and effect (Kahneman, 2013). However, as the discussion on systemic risk above outlines, this tendency to oversimplify may not be serving
human societies well in coping with the complexity of global challenges. Issues such as addressing climate change or reducing the impacts of a global pandemic cannot be reduced to a simple linear decision-making process.
There are other heuristics that may also be hindering people’s ability to make sound decisions when it comes to managing disaster risk, such as a tendency to focus only on what is in front of them (myopia) and the human belief that bad things will not happen to them (optimism).
This understanding of human decision-making may point to how to rework systems to accelerate risk reduction. If incentives in the social environment can be aligned with these heuristics or biases, and governance systems are reconfigured to be conducive towards fostering risk-informed behaviour and decision-making, the possibility of significant behaviour change is real. For example, studies show decision makers are much more likely to undertake loss reduction measures if they are told there is more than a one in five chance of having at least one severe wildfire, flood or other disaster causing damage to their property over the next 25 years, rather than being told there is a 1 in 100 annual probability of such a disaster (Slovic et al., 1978). This suggests greater attention to the design of products, services and communications methods can increase the efficacy of risk reduction efforts. It also means governance systems need to improve consultative and “reality check” processes, to enable more considered and agile decision-making in the face of systemic risk.
1.1.5 Why risk communication is essential Failing to communicate effectively about risk – indeed, failing to communicate at all – can fuel rumour, erode trust, hamper solutions and increase risk.
Communication strategies that reflect the systemic nature of risk and that are rooted in ongoing dialogue can improve understanding of exposure, vulnerability and hazards. Such processes can also acknowledge and respect local priorities, indigenous knowledge and world-views. They can spark innovation, work across generations, build trust
7
and increase transparency. This can boost people’s confidence and motivation to make informed decisions and to act, ultimately contributing to a shift in how societies relate to risk.
Societies have more data about risk than ever before. However, it remains rare to have productive conversations about it with the right people, at the right times and at the right scale. If there is to be a shift in how people understand, deliberate and act on risk, radical advances are required in how this is done. This requires mutual communication and cross-boundary and cross-disciplinary collaborations that bring expertise, multiple perspectives, strategic vision and creativity. There is also a need for greater emphasis on recognizing the biases that lead key private and public sector decision makers, as well as the general public, to deny or ignore disasters and other extreme events.
1.1.6 Why data is essential for understanding systemic risk In the information age, experts can enable the development of tools and provide services, but the “last mile” is up to decision makers and local stakeholders. An entire ecosystem is required to generate risk understanding and engage communities at risk. Doing this means acknowledging and exploring the degree to which algorithms are a product of the perspectives, priorities and biases of their developers. It also requires considering the ethics and human rights implications of risk analytics and technology-driven solutions such as artificial intelligence. Without data, disaster decision-making is blind. Without the infrastructure to interpret the data and instrumentalize the decisions, risk governance is paralysed.
Data-driven DRR systems can help to manage disaster risks and prevent unnecessary suffering, but only if risk management becomes part of a common DNA of stakeholders at different levels, and if policymakers understand there is a need to accept uncertainty. Otherwise, even the most advanced big data strategy cannot reduce risk. Exploiting the added value of data-driven risk management systems requires the development of a “hive mind”, where different disciplines and perspectives come together to better understand options and inform decisions. This requires fostering a risk
culture based on mutual trust among generalists, specialists and communities at risk. Such an approach requires common terminologies or jargon, the collaborative identification of bottlenecks and a direct link to governance decision-making.
Reducing, managing and avoiding creating risk require an in-depth understanding of spatially and temporally complex processes at different scales. The gaps between remote sensing, modelled, official data sources and what is happening on the ground are often too big for the data to be successfully used for local analysis or projects. However, participatory processes and crowdsourcing approaches can typically close this gap, particularly given advances in communications technologies.
To help contextualize existing data and highlight critical data gaps, it is important to capture realistically how to minimize uncertainty within translated risk data, and how to break down the barriers of co-production by recognizing and embracing local needs and concerns. These same approaches are equally important in helping to understand potential future vulnerability and exposure through prospective disaster risk management (DRM) (IPCC, 2021a; Birkmann et al., 2015; Jurgilevich, 2021).
1.2 Transforming risk governance in the era of systemic risk Effective risk reduction requires awareness, the formation of an intent to act, the identification and selection of a plan of action, and the execution of that plan. Biases and influences can distort effective action at each stage. For example, a focus on achieving economic growth under current development models is creating unstable and unsustainable human systems, thus increasing systemic risk in the form of climate change and biodiversity loss. A myopic focus on growth as the main signal of well-being has led to a failure to invest a small percentage of global gross domestic product (GDP) in preventing the existential threat of climate change. This means that governments fail to invest in risk reduction measures or to recognize the exponential growth potential of crises (as witnessed during the COVID-19 pandemic). This leads to the
8
social vulnerabilities of individuals and groups being ignored, and failure in addressing structural inequalities that drive hazards to become disasters.
Immediate actions that can help catalyse the required transformations necessary to address systemic risk include:
1. Measure what we value.
2. Design systems to factor in how human minds make decisions about risk.
3. Reconfigure governance and financial systems to work across silos and design in consultation with affected people.
The challenges and potential solutions available to help better address systemic risk for a sustainable future are explored throughout this report. GAR2022 aims to take a fresh look at what can be done to get global risk reduction efforts back on track, to help governments and policymakers consider their options and to inspire action to accelerate risk reduction. These goals and concerns are also shared by stakeholders in all regions (Box 1.2).
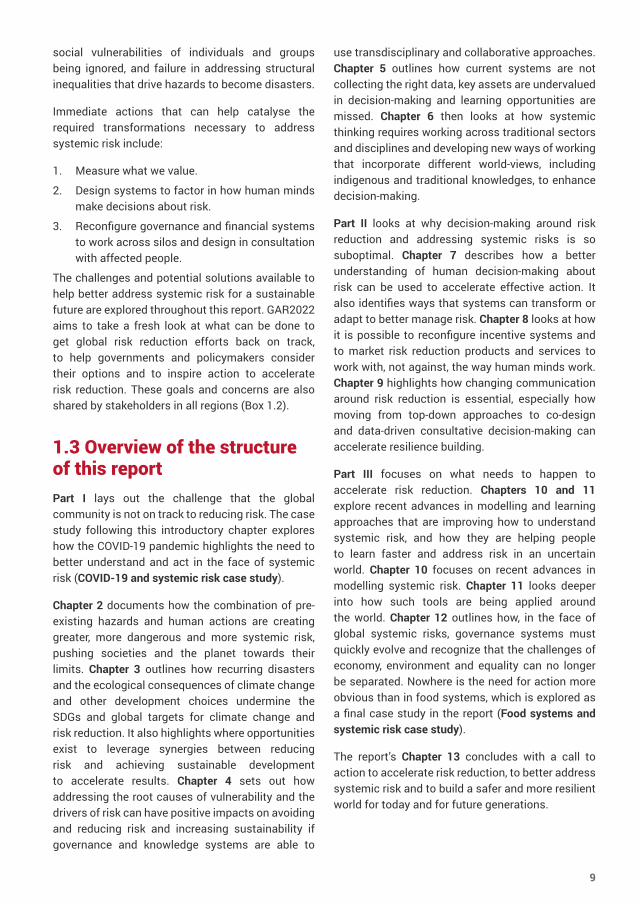
1.3 Overview of the structure of this reportPart I lays out the challenge that the global community is not on track to reducing risk. The case study following this introductory chapter explores how the COVID-19 pandemic highlights the need to better understand and act in the face of systemic risk (COVID-19 and systemic risk case study).
Chapter 2 documents how the combination of pre-existing hazards and human actions are creating greater, more dangerous and more systemic risk, pushing societies and the planet towards their limits. Chapter 3 outlines how recurring disasters and the ecological consequences of climate change and other development choices undermine the SDGs and global targets for climate change and risk reduction. It also highlights where opportunities exist to leverage synergies between reducing risk and achieving sustainable development to accelerate results. Chapter 4 sets out how addressing the root causes of vulnerability and the drivers of risk can have positive impacts on avoiding and reducing risk and increasing sustainability if governance and knowledge systems are able to
use transdisciplinary and collaborative approaches. Chapter 5 outlines how current systems are not collecting the right data, key assets are undervalued in decision-making and learning opportunities are missed. Chapter 6 then looks at how systemic thinking requires working across traditional sectors and disciplines and developing new ways of working that incorporate different world-views, including indigenous and traditional knowledges, to enhance decision-making.
Part II looks at why decision-making around risk reduction and addressing systemic risks is so suboptimal. Chapter 7 describes how a better understanding of human decision-making about risk can be used to accelerate effective action. It also identifies ways that systems can transform or adapt to better manage risk. Chapter 8 looks at how it is possible to reconfigure incentive systems and to market risk reduction products and services to work with, not against, the way human minds work. Chapter 9 highlights how changing communication around risk reduction is essential, especially how moving from top-down approaches to co-design and data-driven consultative decision-making can accelerate resilience building.
Part III focuses on what needs to happen to accelerate risk reduction. Chapters 10 and 11 explore recent advances in modelling and learning approaches that are improving how to understand systemic risk, and how they are helping people to learn faster and address risk in an uncertain world. Chapter 10 focuses on recent advances in modelling systemic risk. Chapter 11 looks deeper into how such tools are being applied around the world. Chapter 12 outlines how, in the face of global systemic risks, governance systems must quickly evolve and recognize that the challenges of economy, environment and equality can no longer be separated. Nowhere is the need for action more obvious than in food systems, which is explored as a final case study in the report (Food systems and systemic risk case study).
The report’s Chapter 13 concludes with a call to action to accelerate risk reduction, to better address systemic risk and to build a safer and more resilient world for today and for future generations.
9
Box 1.2. Regional perspectives on risk governance challenges and opportunities
Regional assessment reports, regional platforms, action plans and evolving DRR agendas in Africa, the Americas, the Arab States, Asia and the Pacific, and Europe and Central Asia, highlight the challenges and opportunities that shape regional, national and local implementation. All regional platforms met during November 2021, although the formal Asia-Pacific Ministerial Conference on Disaster Risk Reduction was deferred due to the pandemic.
Risk as a social construct, and new risk governance approaches
● Applying a systems-based approach and inclusive, transdisciplinary and accountable disaster risk governance mechanisms is a means to overcome related underlying risk factors.
● The COVID-19 pandemic has exacerbated the systemic impacts of risk, including loss of lives and livelihoods, damage to infrastructure and displacement. Even before the pandemic, disasters had become a major cause of forced displacement, requiring concerted action to reduce risk at the local, national and regional levels.
● Strengthened transboundary collaborative mechanisms to understand risks, enhanced governance and reduction of existing, emerging and future risks are crucial to address the impacts.
● Ecosystem management and use of traditional wisdom and practices were highlighted in the Africa region and the Pacific region.
● Financial and social disclosure of climate risk and green and disaster-resilient economic recovery is crucial to enhance collective responsibility for leaving no one behind, a focus in all regions.
Gender equality and women as key agents of change
● There is great emphasis in the regions on the key role of women as leaders and agents of change to build resilient development pathways, actively participating in the creation and implementation of DRR strategies, policies, plans and programmes.
● The negative impacts of the COVID-19 pandemic on social and economic development have created disproportionate vulnerability and exposure for women and girls, all of which undermine efforts to achieve the 2030 Agenda as well as regional agendas. The various regional forums have called for the adoption of a gender-based approach that accounts for the needs of women, the elderly, children, youth and persons with disabilities, as well as for a new social contract for inclusive all-of-society approaches to build resilience.
New collaborations and partnerships
● All the regional gatherings identified collaboration and alliance building across critical sectors as vital to tackling complex and compounding risk. Opportunities for collaboration include strengthening data sharing at country and regional levels and increased provision of evidence-based scientific research and analysis for decision-making.
● Stronger partnerships among institutions responsible for DRR, environmental management, climate change action, planning and finance and other sectors can ensure a coherent, integrated and all-of-society approach to DRR and climate change adaptation at all levels.
● Indigenous, local knowledge systems and practices can foster the integration of age and cultural perspectives into the design and implementation of DRR and climate change adaptation strategies and plans, while recognizing the importance to protect cultural heritage from disaster risks.
Sources: AfRPDRR (2021a, 2021b); Amach (2021); APP-DRR (2021); ARPDRR (2021a, 2021b); EFDRR (2021a, 2021b); PRP (2021); RPDRR-AC (2021a, 2021b); UNDRR (2021a, 2021b)
10
Case study
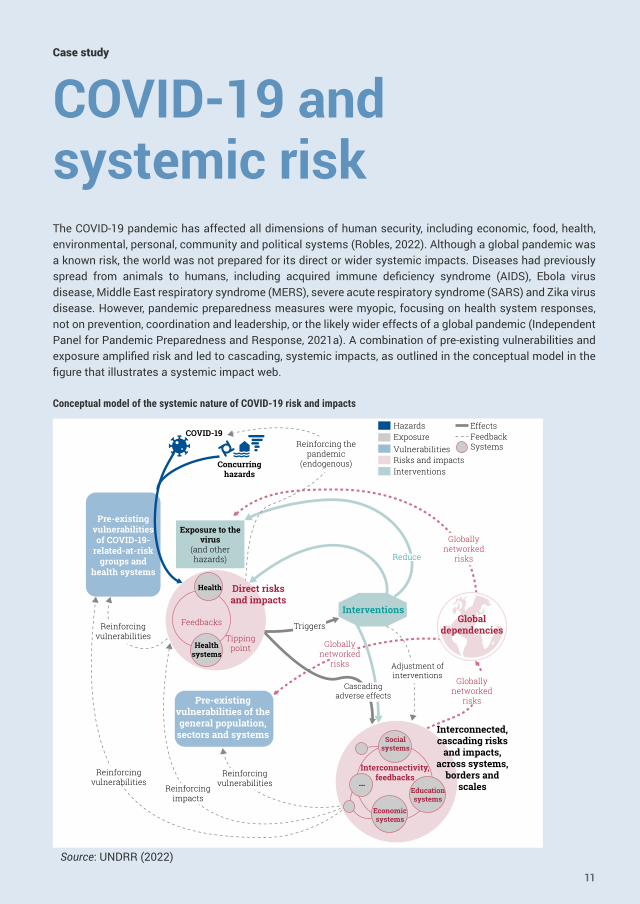
COVID-19 and systemic risk The COVID-19 pandemic has affected all dimensions of human security, including economic, food, health, environmental, personal, community and political systems (Robles, 2022). Although a global pandemic was a known risk, the world was not prepared for its direct or wider systemic impacts. Diseases had previously spread from animals to humans, including acquired immune deficiency syndrome (AIDS), Ebola virus disease, Middle East respiratory syndrome (MERS), severe acute respiratory syndrome (SARS) and Zika virus disease. However, pandemic preparedness measures were myopic, focusing on health system responses, not on prevention, coordination and leadership, or the likely wider effects of a global pandemic (Independent Panel for Pandemic Preparedness and Response, 2021a). A combination of pre-existing vulnerabilities and exposure amplified risk and led to cascading, systemic impacts, as outlined in the conceptual model in the figure that illustrates a systemic impact web.
Pre-existing vulnerabilities of COVID-19-
related-at-risk groups and
health systems
Pre-existing vulnerabilities of the general population,
sectors and systems
Direct risks and impacts
Interconnected, cascading risks
and impacts, across systems,
borders and scales
Interventions
COVID-19
Concurring hazards
Exposure to the virus
(and other hazards)
Reinforcing vulnerabilities
Reinforcing impacts
Reinforcing vulnerabilities
Globally networked
risks
Globally networked
risks
Social systems
Education systems
Economic systems
...
Interconnectivity, feedbacks
Health
Health systems
Feedbacks
Tipping point
Reduce
Globally networked
risks
Global dependenciesTriggers
Adjustment of interventions
Cascading adverse effects
Reinforcing the pandemic
(endogenous)
HazardsExposureVulnerabilitiesRisks and impactsInterventions
EffectsFeedbackSystems
Reinforcing vulnerabilities
Source: UNDRR (2022)
Conceptual model of the systemic nature of COVID-19 risk and impacts
11
CASE STUDY:
COVID-19 AND
SYSTEMIC RISK
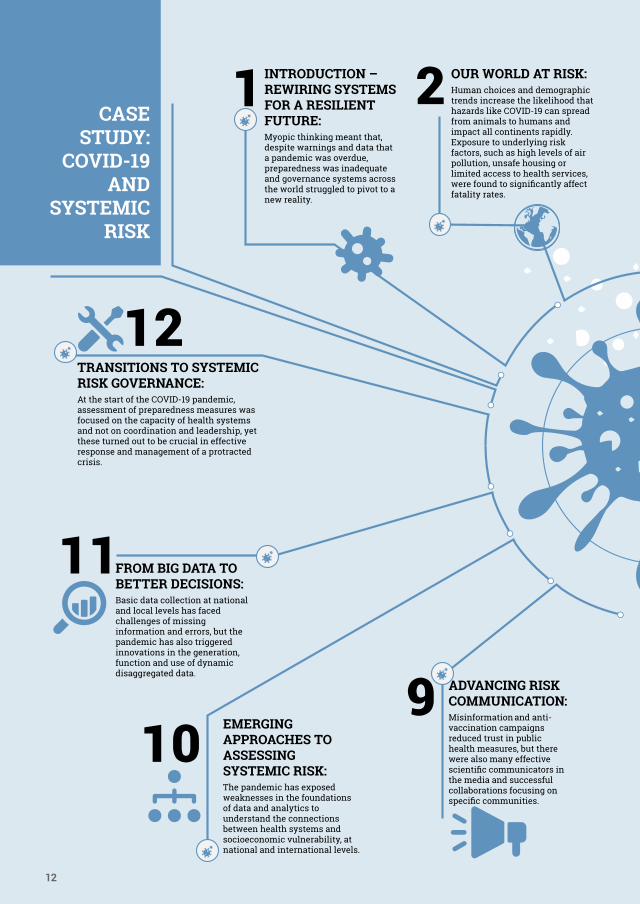
INTRODUCTION – REWIRING SYSTEMS FOR A RESILIENT FUTURE: Myopic thinking meant that, despite warnings and data that a pandemic was overdue, preparedness was inadequate and governance systems across the world struggled to pivot to a new reality.
1 OUR WORLD AT RISK: Human choices and demographic trends increase the likelihood that hazards like COVID-19 can spread from animals to humans and impact all continents rapidly. Exposure to underlying risk factors, such as high levels of air pollution, unsafe housing or limited access to health services, were found to significantly affect fatality rates.
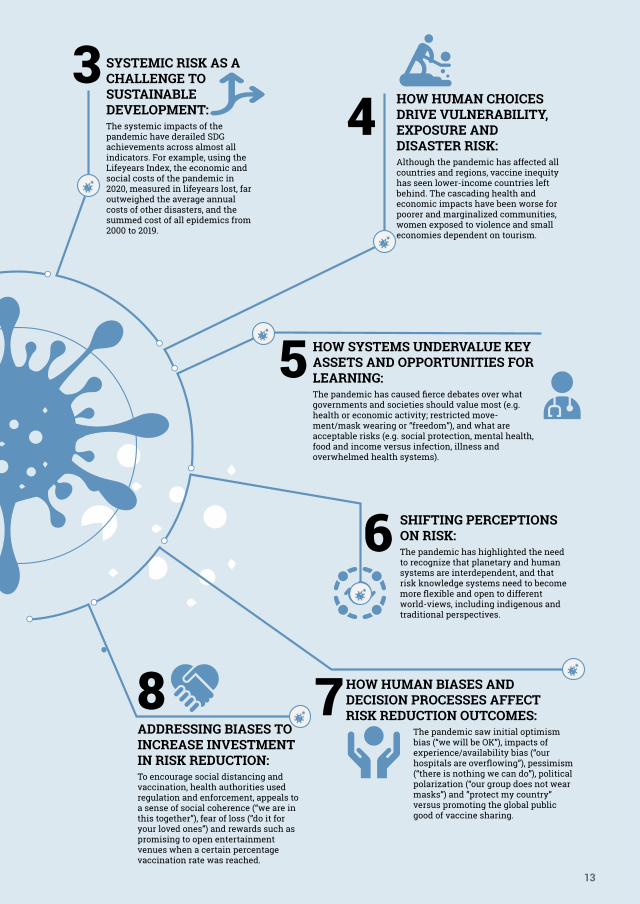
2SYSTEMIC RISK AS A CHALLENGE TO SUSTAINABLE DEVELOPMENT: The systemic impacts of the pandemic have derailed SDG achievements across almost all indicators. For example, using the Lifeyears Index, the economic and social costs of the pandemic in 2020, measured in lifeyears lost, far outweighed the average annual costs of other disasters, and the summed cost of all epidemics from 2000 to 2019.
3HOW HUMAN CHOICES DRIVE VULNERABILITY, EXPOSURE AND DISASTER RISK: Although the pandemic has affected all countries and regions, vaccine inequity has seen lower-income countries left behind. The cascading health and economic impacts have been worse for poorer and marginalized communities, women exposed to violence and small economies dependent on tourism.
4
HOW SYSTEMS UNDERVALUE KEY ASSETS AND OPPORTUNITIES FOR LEARNING: The pandemic has caused fierce debates over what governments and societies should value most (e.g. health or economic activity; restricted move-ment/mask wearing or “freedom”), and what are acceptable risks (e.g. social protection, mental health, food and income versus infection, illness and overwhelmed health systems).
5TRANSITIONS TO SYSTEMIC RISK GOVERNANCE: At the start of the COVID-19 pandemic, assessment of preparedness measures was focused on the capacity of health systems and not on coordination and leadership, yet these turned out to be crucial in effective response and management of a protracted crisis.
12
FROM BIG DATA TO BETTER DECISIONS: Basic data collection at national and local levels has faced challenges of missing information and errors, but the pandemic has also triggered innovations in the generation, function and use of dynamic disaggregated data.
11
EMERGING APPROACHES TO ASSESSING SYSTEMIC RISK: The pandemic has exposed weaknesses in the foundations of data and analytics to understand the connections between health systems and socioeconomic vulnerability, at national and international levels.
10ADVANCING RISK COMMUNICATIONMisinformation and anti- vaccination campaigns reduced trust in public health measures, but there were also many effective scientific communicators in the media and successful collaborations focusing on specific communities.
9
SHIFTING PERCEPTIONS ON RISK: The pandemic has highlighted the need to recognize that planetary and human systems are interdependent, and that risk knowledge systems need to become more flexible and open to different world-views, including indigenous and traditional perspectives.
6
HOW HUMAN BIASES AND DECISION PROCESSES AFFECT RISK REDUCTION OUTCOMES:
The pandemic saw initial optimism bias (“we will be OK”), impacts of experience/availability bias (“our hospitals are overflowing”), pessimism (“there is nothing we can do”), political polarization (“our group does not wear masks”) and ”protect my country” versus promoting the global public good of vaccine sharing.
7ADDRESSING BIASES TO INCREASE INVESTMENT IN RISK REDUCTION: To encourage social distancing and vaccination, health authorities used regulation and enforcement, appeals to a sense of social coherence (“we are in this together”), fear of loss (“do it for your loved ones”) and rewards such as promising to open entertainment venues when a certain percentage vaccination rate was reached.
8:
12
CASE STUDY:
COVID-19 AND
SYSTEMIC RISK
INTRODUCTION – REWIRING SYSTEMS FOR A RESILIENT FUTURE: Myopic thinking meant that, despite warnings and data that a pandemic was overdue, preparedness was inadequate and governance systems across the world struggled to pivot to a new reality.
1 OUR WORLD AT RISK: Human choices and demographic trends increase the likelihood that hazards like COVID-19 can spread from animals to humans and impact all continents rapidly. Exposure to underlying risk factors, such as high levels of air pollution, unsafe housing or limited access to health services, were found to significantly affect fatality rates.
2SYSTEMIC RISK AS A CHALLENGE TO SUSTAINABLE DEVELOPMENT: The systemic impacts of the pandemic have derailed SDG achievements across almost all indicators. For example, using the Lifeyears Index, the economic and social costs of the pandemic in 2020, measured in lifeyears lost, far outweighed the average annual costs of other disasters, and the summed cost of all epidemics from 2000 to 2019.
3HOW HUMAN CHOICES DRIVE VULNERABILITY, EXPOSURE AND DISASTER RISK: Although the pandemic has affected all countries and regions, vaccine inequity has seen lower-income countries left behind. The cascading health and economic impacts have been worse for poorer and marginalized communities, women exposed to violence and small economies dependent on tourism.
4
HOW SYSTEMS UNDERVALUE KEY ASSETS AND OPPORTUNITIES FOR LEARNING: The pandemic has caused fierce debates over what governments and societies should value most (e.g. health or economic activity; restricted move-ment/mask wearing or “freedom”), and what are acceptable risks (e.g. social protection, mental health, food and income versus infection, illness and overwhelmed health systems).
5TRANSITIONS TO SYSTEMIC RISK GOVERNANCE: At the start of the COVID-19 pandemic, assessment of preparedness measures was focused on the capacity of health systems and not on coordination and leadership, yet these turned out to be crucial in effective response and management of a protracted crisis.
12
FROM BIG DATA TO BETTER DECISIONS: Basic data collection at national and local levels has faced challenges of missing information and errors, but the pandemic has also triggered innovations in the generation, function and use of dynamic disaggregated data.
11
EMERGING APPROACHES TO ASSESSING SYSTEMIC RISK: The pandemic has exposed weaknesses in the foundations of data and analytics to understand the connections between health systems and socioeconomic vulnerability, at national and international levels.
10ADVANCING RISK COMMUNICATIONMisinformation and anti- vaccination campaigns reduced trust in public health measures, but there were also many effective scientific communicators in the media and successful collaborations focusing on specific communities.
9
SHIFTING PERCEPTIONS ON RISK: The pandemic has highlighted the need to recognize that planetary and human systems are interdependent, and that risk knowledge systems need to become more flexible and open to different world-views, including indigenous and traditional perspectives.
6
HOW HUMAN BIASES AND DECISION PROCESSES AFFECT RISK REDUCTION OUTCOMES:
The pandemic saw initial optimism bias (“we will be OK”), impacts of experience/availability bias (“our hospitals are overflowing”), pessimism (“there is nothing we can do”), political polarization (“our group does not wear masks”) and ”protect my country” versus promoting the global public good of vaccine sharing.
7ADDRESSING BIASES TO INCREASE INVESTMENT IN RISK REDUCTION: To encourage social distancing and vaccination, health authorities used regulation and enforcement, appeals to a sense of social coherence (“we are in this together”), fear of loss (“do it for your loved ones”) and rewards such as promising to open entertainment venues when a certain percentage vaccination rate was reached.
8:
13
The challenge
The COVID-19 pandemic has heightened existing vulnerabilities in health systems. Rapid development of vaccines has been accompanied by inequality of access, with distribution favouring wealthier countries (Global Dashboard for Vaccine Equity; UNDP (n.d.a)) despite international commitments such as the COVAX Facility (Gavi et al., n.d.) and the World Health Organization (WHO) global COVID-19 vaccination strategy (WHO, 2021a). As health systems were overwhelmed by COVID-19 patients, many people with chronic conditions had to delay treatment, thus affecting the quality of care and longer-term health outcomes (Independent Panel for Pandemic Preparedness and Response, 2021a). Mental health has deteriorated globally, and many countries are also reporting a “shadow pandemic” of gender-based violence (Sri et al., 2021).
The pandemic has had wide-ranging impacts across systems. Using the Lifeyears Index, the economic and social costs of the pandemic in 2020, measured in Lifeyears lost, far outweighed the average annual costs of all other disasters and the summed cost of all epidemics from 2000 to 2019 (Doan and Noy, 2022). As of June 2021, the World Bank estimated the direct and indirect effects of COVID-19 had pushed 97 million more people into poverty (Mahler et al., 2021). Sectors that could not move online and small countries reliant on tourism were particularly affected by restricted movement and travel (e.g. in the Caribbean and the Pacific). A survey in six Latin American cities found the greatest reduction in well-being was associated with the loss of work or income, although social cohesion provided a significant level of protection, highlighting the role of social capital in resilience building (Castro et al., forthcoming). Global financial and budgeting systems were also not prepared to cope with a major systemic risk arising from outside their sector.
The pandemic has exacerbated inequality. Unemployment rose in the United States of America during 2020, by 3.6% for men and 4.0% for women on average, with a greater increase for Black /
African American women at 4.9% and the highest for Hispanic / Latina women, at 6.2%. This reflects a concentration of marginalized communities and women overall in lower-paid, less-secure work (WEF, 2021b). Surveys in urban and rural areas in three African countries (Burkina Faso, Ethiopia and Nigeria) identified serious consequences for SDG achievements, including in education, nutrition and food security (Hamer, 2021). Schooling became impossible for half of the Asia and the Pacific regions, where families already lacked access to the Internet, and the loss of household income made education unaffordable for many families, especially affecting girls’ education (Nguyen, 2021) (Chapter 4). A study of systemic impacts of the pandemic in the old city of Ahmedabad, India, showed this pattern in detail (Kanji et al., 2022) (Chapter 12).
Measuring what we valueDuring the pandemic, basic data collection at national and local levels has faced challenges (Dean, 2021), but the crisis also triggered innovations in the generation, function and use of dynamic disaggregated data to understand vulnerability in systems and their cascading effects. After a slow start, the global response included rapid sharing and constant analysis of real-time data on COVID-19 symptoms and physiological impacts, successes or failures in experimental treatments, epidemiological data on where and how fast it spread, rates of death and acute illness, and also the research into, and trials of, vaccines (Ellenberg and Morris, 2021). Freely available human mobility data, collected by a Google platform and other open-technology platforms and devices, has been used to evaluate community mitigation strategies aimed at restricting the movement of people. In some cases, it was possible to model the spread of the virus based on actual movements (Ilin et al., 2021).
14
Designing systems to factor in how human minds make decisions about risk
The pandemic response illustrated positive and negative extremes in how people make decisions about risk, and what prompts governments and individuals to act. A multi-country study found that the best predictor of adherence to COVID-19 restrictions is a sense of “we are all in it together and we all need to come out of it together” (Jetten et al., 2020). A successful example in Viet Nam also saw the Government adopt a strategy that evoked patriotism and bravery for compliance (Independent Panel for Pandemic Preparedness and Response, 2021b). Public compliance with mask wearing and social distancing were initially a challenge in Italy, but personal experiences soon led to a perception that COVID-19 was a serious and relevant threat. Residents became more active in undertaking preventive actions compared with their European neighbours who had not yet experienced these impacts (Meier et al., 2020). Compliance with mask-wearing orders or other COVID-19 mitigation measures in the United Kingdom of Great Britain and Northern Ireland and in the United States quickly became polarized. For many, it was less a question of rational risk reduction than public display of political identities (Choma et al., 2021; Kahane, 2021).
WHO referred to an “infodemic” of too much information overall and too much false or misleading information (WHO and PAHO, 2022). In some cases, the infodemic caused confusion, mistrust and risk-taking behaviours and an undermining of the public health response. In Myanmar, where Internet access had surged only recently, unreliable information about COVID-19 abounded online, with people sharing posts about how various common foods and beverages could cure the disease (BBC
Media Action, 2020). To counter this, a national communication campaign, Let’s Beat COVID Together, included a popular Facebook page that facilitated two-way communication so people could ask questions and share experiences (Partnership for Healthy Cities, 2020).
Reconfiguring governance and financial systems to work across silos and design in consultation with affected peopleCountries with prior experience of SARS, including China, the Republic of Korea and Thailand, responded more quickly and effectively than other countries to contain the spread of the disease. Their populations were sensitized to the threat of pandemics due to prior experience, and they had already reconfigured institutions that were better able to work across silos to address pandemic spread (Thompson, 2020). In an effort to extend the reach of “collaborative intelligence” in future pandemic response, WHO has also launched a global hub for pandemic and epidemic intelligence (WHO, 2021b).
15
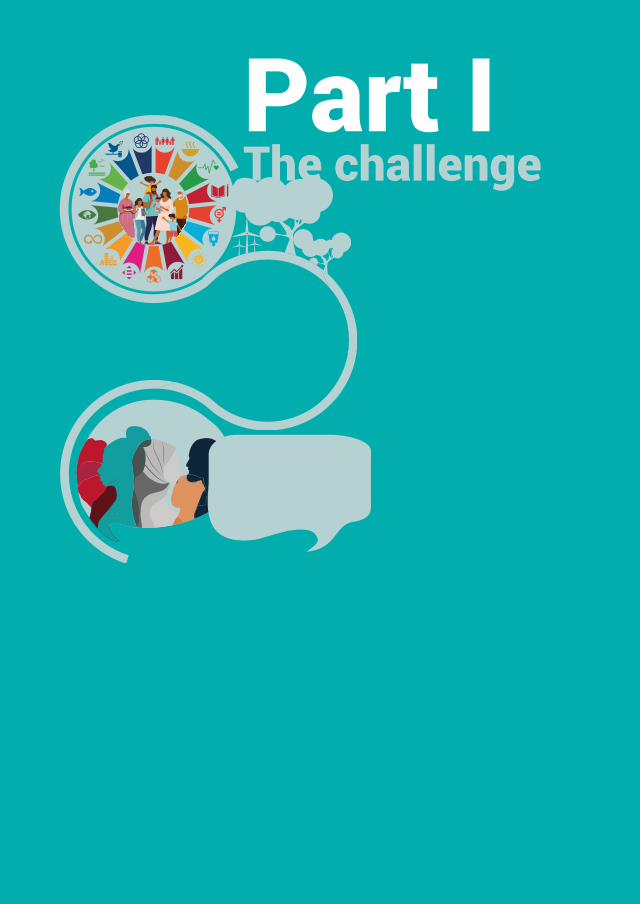
Part IThe challenge
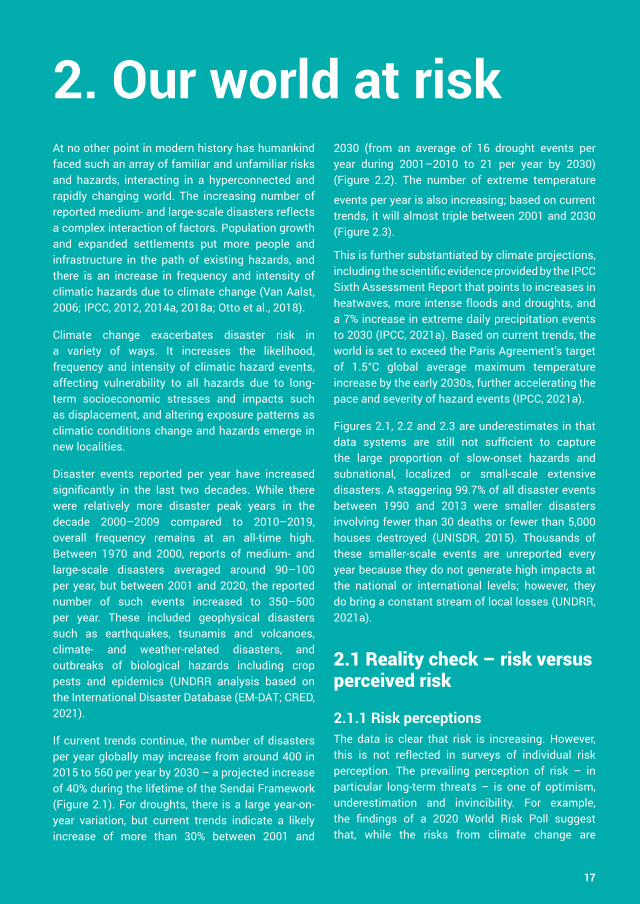
2. Our world at riskAt no other point in modern history has humankind faced such an array of familiar and unfamiliar risks and hazards, interacting in a hyperconnected and rapidly changing world. The increasing number of reported medium- and large-scale disasters reflects a complex interaction of factors. Population growth and expanded settlements put more people and infrastructure in the path of existing hazards, and there is an increase in frequency and intensity of climatic hazards due to climate change (Van Aalst, 2006; IPCC, 2012, 2014a, 2018a; Otto et al., 2018).
Climate change exacerbates disaster risk in a variety of ways. It increases the likelihood, frequency and intensity of climatic hazard events, affecting vulnerability to all hazards due to long-term socioeconomic stresses and impacts such as displacement, and altering exposure patterns as climatic conditions change and hazards emerge in new localities.
Disaster events reported per year have increased significantly in the last two decades. While there were relatively more disaster peak years in the decade 2000–2009 compared to 2010–2019, overall frequency remains at an all-time high. Between 1970 and 2000, reports of medium- and large-scale disasters averaged around 90–100 per year, but between 2001 and 2020, the reported number of such events increased to 350–500 per year. These included geophysical disasters such as earthquakes, tsunamis and volcanoes, climate- and weather-related disasters, and outbreaks of biological hazards including crop pests and epidemics (UNDRR analysis based on the International Disaster Database (EM-DAT; CRED, 2021).
If current trends continue, the number of disasters per year globally may increase from around 400 in 2015 to 560 per year by 2030 – a projected increase of 40% during the lifetime of the Sendai Framework (Figure 2.1). For droughts, there is a large year-on-year variation, but current trends indicate a likely increase of more than 30% between 2001 and
2030 (from an average of 16 drought events per year during 2001–2010 to 21 per year by 2030) (Figure 2.2). The number of extreme temperature
events per year is also increasing; based on current trends, it will almost triple between 2001 and 2030 (Figure 2.3).
This is further substantiated by climate projections, including the scientific evidence provided by the IPCC Sixth Assessment Report that points to increases in heatwaves, more intense floods and droughts, and a 7% increase in extreme daily precipitation events to 2030 (IPCC, 2021a). Based on current trends, the world is set to exceed the Paris Agreement’s target of 1.5°C global average maximum temperature increase by the early 2030s, further accelerating the pace and severity of hazard events (IPCC, 2021a).
Figures 2.1, 2.2 and 2.3 are underestimates in that data systems are still not sufficient to capture the large proportion of slow-onset hazards and subnational, localized or small-scale extensive disasters. A staggering 99.7% of all disaster events between 1990 and 2013 were smaller disasters involving fewer than 30 deaths or fewer than 5,000 houses destroyed (UNISDR, 2015). Thousands of these smaller-scale events are unreported every year because they do not generate high impacts at the national or international levels; however, they do bring a constant stream of local losses (UNDRR, 2021a).
2.1 Reality check – risk versus perceived risk
2.1.1 Risk perceptionsThe data is clear that risk is increasing. However, this is not reflected in surveys of individual risk perception. The prevailing perception of risk – in particular long-term threats – is one of optimism, underestimation and invincibility. For example, the findings of a 2020 World Risk Poll suggest that, while the risks from climate change are
17
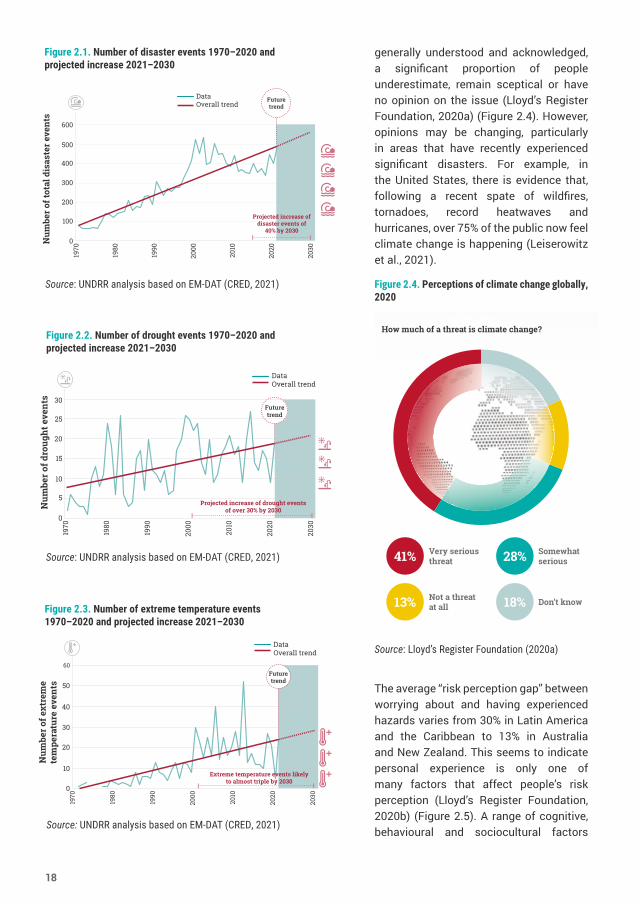
generally understood and acknowledged, a significant proportion of people underestimate, remain sceptical or have no opinion on the issue (Lloyd’s Register Foundation, 2020a) (Figure 2.4). However, opinions may be changing, particularly in areas that have recently experienced significant disasters. For example, in the United States, there is evidence that, following a recent spate of wildfires, tornadoes, record heatwaves and hurricanes, over 75% of the public now feel climate change is happening (Leiserowitz et al., 2021).
Figure 2.4. Perceptions of climate change globally, 2020
Source: Lloyd’s Register Foundation (2020a)
The average “risk perception gap” between worrying about and having experienced hazards varies from 30% in Latin America and the Caribbean to 13% in Australia and New Zealand. This seems to indicate personal experience is only one of many factors that affect people’s risk perception (Lloyd’s Register Foundation, 2020b) (Figure 2.5). A range of cognitive, behavioural and sociocultural factors
0
300
1970
1980
1990
2000
2010
2020
2030
100
200
400
500
600
Num
ber o
f tot
al d
isas
ter e
vent
s
Future trend
DataOverall trend
Projected increase of disaster events of
40% by 2030
Figure 2.1. Number of disaster events 1970–2020 and projected increase 2021–2030
Source: UNDRR analysis based on EM-DAT (CRED, 2021)
Future trend
0
15
1970
1980
1990
2000
2010
2020
2030
5
10
20
25
30
Num
ber o
f dro
ught
eve
nts
DataOverall trend
Projected increase of drought events of over 30% by 2030
Figure 2.2. Number of drought events 1970–2020 and projected increase 2021–2030
Source: UNDRR analysis based on EM-DAT (CRED, 2021)
0
30
1970
1980
1990
2000
2010
2020
2030
10
20
40
50
60
Num
ber o
f ext
rem
ete
mpe
ratu
re e
vent
s
DataOverall trend
Future trend
Extreme temperature events likely to almost triple by 2030
Figure 2.3. Number of extreme temperature events 1970–2020 and projected increase 2021–2030
Source: UNDRR analysis based on EM-DAT (CRED, 2021)
How much of a threat is climate change?
Very serious threat41% Somewhat
serious28%
Not a threatat all13% Don’t know18%
18
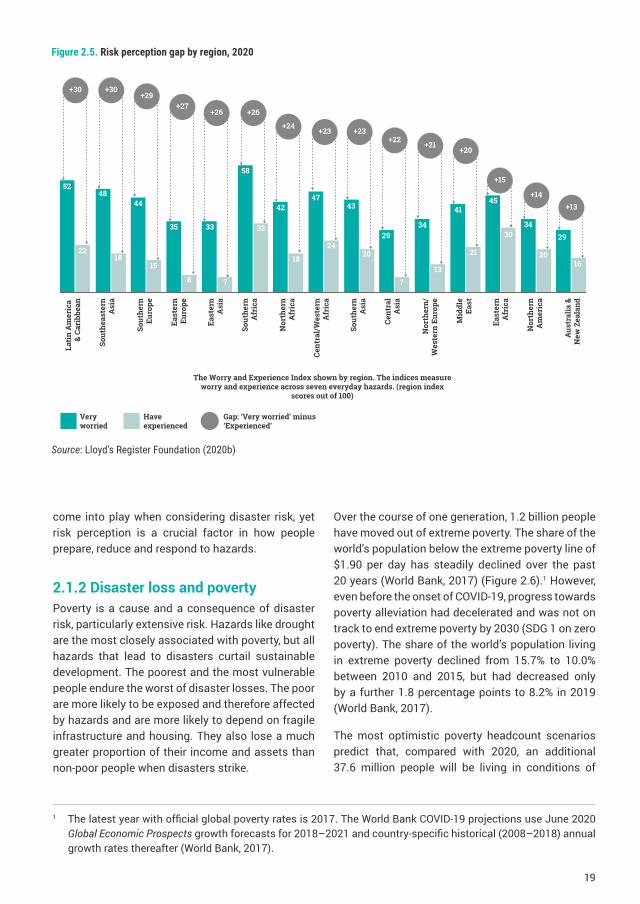
come into play when considering disaster risk, yet risk perception is a crucial factor in how people prepare, reduce and respond to hazards.
2.1.2 Disaster loss and povertyPoverty is a cause and a consequence of disaster risk, particularly extensive risk. Hazards like drought are the most closely associated with poverty, but all hazards that lead to disasters curtail sustainable development. The poorest and the most vulnerable people endure the worst of disaster losses. The poor are more likely to be exposed and therefore affected by hazards and are more likely to depend on fragile infrastructure and housing. They also lose a much greater proportion of their income and assets than non-poor people when disasters strike.
1 The latest year with official global poverty rates is 2017. The World Bank COVID-19 projections use June 2020 Global Economic Prospects growth forecasts for 2018–2021 and country-specific historical (2008–2018) annual growth rates thereafter (World Bank, 2017).
Over the course of one generation, 1.2 billion people have moved out of extreme poverty. The share of the world’s population below the extreme poverty line of $1.90 per day has steadily declined over the past 20 years (World Bank, 2017) (Figure 2.6).1 However, even before the onset of COVID-19, progress towards poverty alleviation had decelerated and was not on track to end extreme poverty by 2030 (SDG 1 on zero poverty). The share of the world’s population living in extreme poverty declined from 15.7% to 10.0% between 2010 and 2015, but had decreased only by a further 1.8 percentage points to 8.2% in 2019 (World Bank, 2017).
The most optimistic poverty headcount scenarios predict that, compared with 2020, an additional 37.6 million people will be living in conditions of
52
22
48
18
29
16
Lati
n A
mer
ica
& Ca
ribb
ean
Sout
heas
tern
Asi
a
Sout
hern
Euro
pe
East
ern
Euro
pe
East
ern
Asi
a
Sout
hern
Afr
ica
Nor
ther
nA
fric
a
Cent
ral/
Wes
tern
Afr
ica
Sout
hern
Asi
a
Cent
ral
Asi
a
Nor
ther
n/W
este
rn E
urop
e
Mid
dle
East
East
ern
Afr
ica
Nor
ther
nA
mer
ica
Aust
ralia
&N
ew Z
eala
nd
Gap: ‘Very worried’ minus ‘Experienced’
Have experienced
Very worried
44
15
35
8
33
7
58
32
42
18
47
24
43
20
29
7
34
13
41
21
45
3034
20
+30
+13
+15
+20+21
+22+23+23
+24
+26+26+27
+29+30
+14
The Worry and Experience Index shown by region. The indices measure worry and experience across seven everyday hazards. (region index
scores out of 100)
Figure 2.5. Risk perception gap by region, 2020
Source: Lloyd’s Register Foundation (2020b)
19
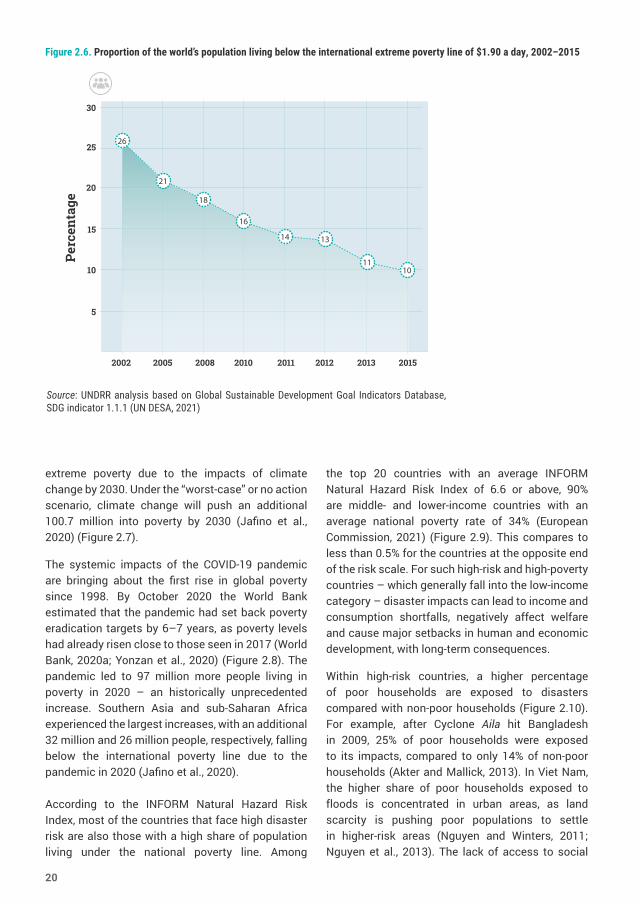
Figure 2.6. Proportion of the world’s population living below the international extreme poverty line of $1.90 a day, 2002–2015
Source: UNDRR analysis based on Global Sustainable Development Goal Indicators Database, SDG indicator 1.1.1 (UN DESA, 2021)
2002
10
5
15
20
25
30
2005 2008 2010 2011 2012 2013 2015
Perc
enta
ge
21
18
16
14 13
1110
26
extreme poverty due to the impacts of climate change by 2030. Under the “worst-case” or no action scenario, climate change will push an additional 100.7 million into poverty by 2030 (Jafino et al., 2020) (Figure 2.7).
The systemic impacts of the COVID-19 pandemic are bringing about the first rise in global poverty since 1998. By October 2020 the World Bank estimated that the pandemic had set back poverty eradication targets by 6–7 years, as poverty levels had already risen close to those seen in 2017 (World Bank, 2020a; Yonzan et al., 2020) (Figure 2.8). The pandemic led to 97 million more people living in poverty in 2020 – an historically unprecedented increase. Southern Asia and sub-Saharan Africa experienced the largest increases, with an additional 32 million and 26 million people, respectively, falling below the international poverty line due to the pandemic in 2020 (Jafino et al., 2020).
According to the INFORM Natural Hazard Risk Index, most of the countries that face high disaster risk are also those with a high share of population living under the national poverty line. Among
the top 20 countries with an average INFORM Natural Hazard Risk Index of 6.6 or above, 90% are middle- and lower-income countries with an average national poverty rate of 34% (European Commission, 2021) (Figure 2.9). This compares to less than 0.5% for the countries at the opposite end of the risk scale. For such high-risk and high-poverty countries – which generally fall into the low-income category – disaster impacts can lead to income and consumption shortfalls, negatively affect welfare and cause major setbacks in human and economic development, with long-term consequences.
Within high-risk countries, a higher percentage of poor households are exposed to disasters compared with non-poor households (Figure 2.10). For example, after Cyclone Aila hit Bangladesh in 2009, 25% of poor households were exposed to its impacts, compared to only 14% of non-poor households (Akter and Mallick, 2013). In Viet Nam, the higher share of poor households exposed to floods is concentrated in urban areas, as land scarcity is pushing poor populations to settle in higher-risk areas (Nguyen and Winters, 2011; Nguyen et al., 2013). The lack of access to social
20
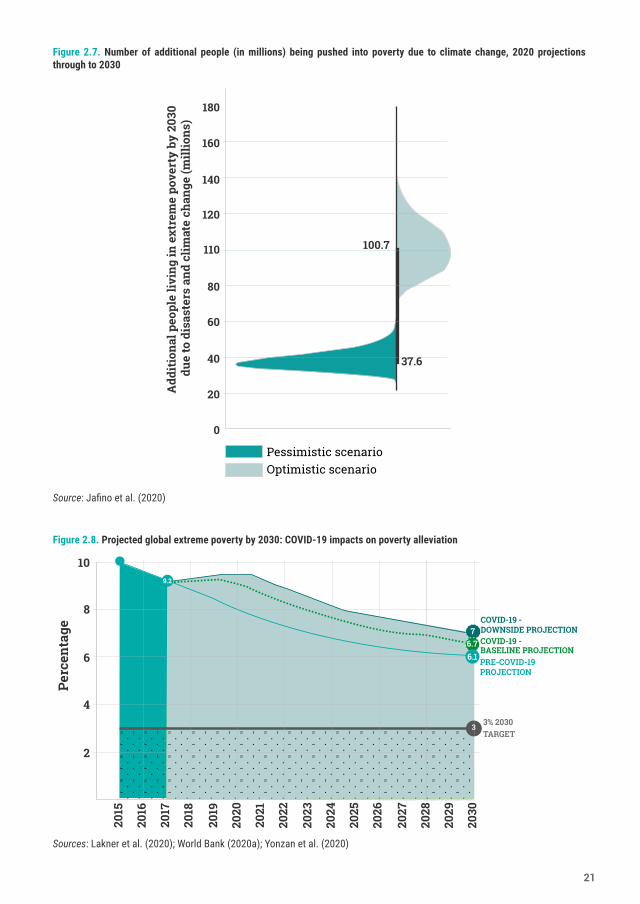
60
0
110
120
160
180
Add
itio
nal p
eopl
e liv
ing
in e
xtre
me
pove
rty
by 2
030
due
to d
isas
ters
and
clim
ate
chan
ge (m
illio
ns)
20
40
80
140
100.7
37.6
Pessimistic scenarioOptimistic scenario
9.2
3
6.77
2015
4
2
6
8
10
Perc
enta
ge
2016
2017
2018
2019
2020
2021
2022
2023
2024
2025
2026
2027
2028
2029
2030
6.1
COVID-19 - DOWNSIDE PROJECTIONCOVID-19 -BASELINE PROJECTIONPRE-COVID-19 PROJECTION
3% 2030 TARGET
Figure 2.7. Number of additional people (in millions) being pushed into poverty due to climate change, 2020 projections through to 2030
Source: Jafino et al. (2020)
Figure 2.8. Projected global extreme poverty by 2030: COVID-19 impacts on poverty alleviation
Sources: Lakner et al. (2020); World Bank (2020a); Yonzan et al. (2020)
21
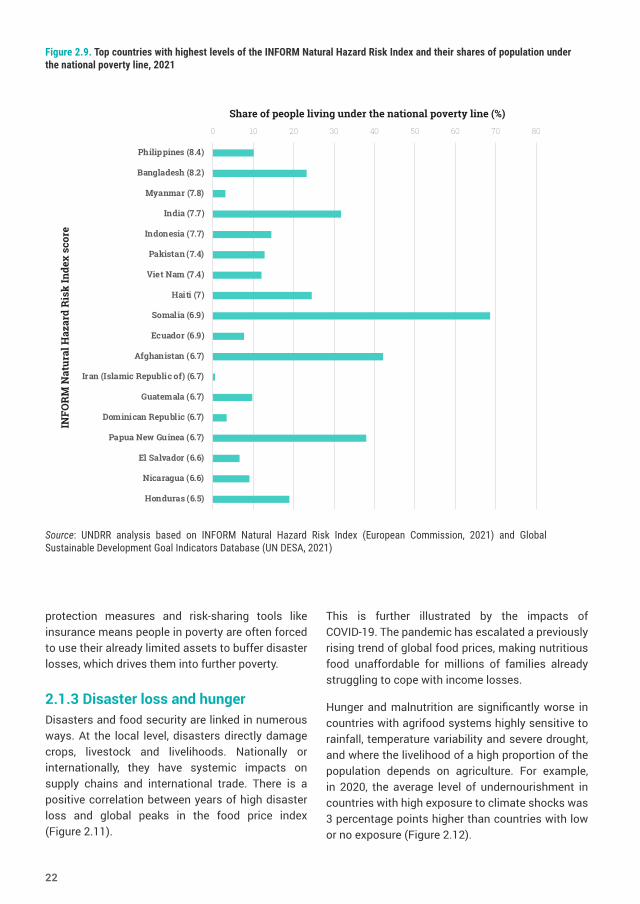
0 10 20 30 40 50 60 70 80
Philippines (8.4)
Bangladesh (8.2)
Myanmar (7.8)
India (7.7)
Indonesia (7.7)
Pakistan (7.4)
Viet Nam (7.4)
Haiti (7)
Somalia (6.9)
Ecuador (6.9)
Afghanistan (6.7)
Iran (Islamic Republic of) (6.7)
Guatemala (6.7)
Dominican Republic (6.7)
Papua New Guinea (6.7)
El Salvador (6.6)
Nicaragua (6.6)
Honduras (6.5)
Share of people living under the national poverty line (%)
INFO
RM
Nat
ural
Haz
ard
Ris
k In
dex
scor
eFigure 2.9. Top countries with highest levels of the INFORM Natural Hazard Risk Index and their shares of population under the national poverty line, 2021
Source: UNDRR analysis based on INFORM Natural Hazard Risk Index (European Commission, 2021) and Global Sustainable Development Goal Indicators Database (UN DESA, 2021)
protection measures and risk-sharing tools like insurance means people in poverty are often forced to use their already limited assets to buffer disaster losses, which drives them into further poverty.
2.1.3 Disaster loss and hungerDisasters and food security are linked in numerous ways. At the local level, disasters directly damage crops, livestock and livelihoods. Nationally or internationally, they have systemic impacts on supply chains and international trade. There is a positive correlation between years of high disaster loss and global peaks in the food price index (Figure 2.11).
This is further illustrated by the impacts of COVID-19. The pandemic has escalated a previously rising trend of global food prices, making nutritious food unaffordable for millions of families already struggling to cope with income losses.
Hunger and malnutrition are significantly worse in countries with agrifood systems highly sensitive to rainfall, temperature variability and severe drought, and where the livelihood of a high proportion of the population depends on agriculture. For example, in 2020, the average level of undernourishment in countries with high exposure to climate shocks was 3 percentage points higher than countries with low or no exposure (Figure 2.12).
22
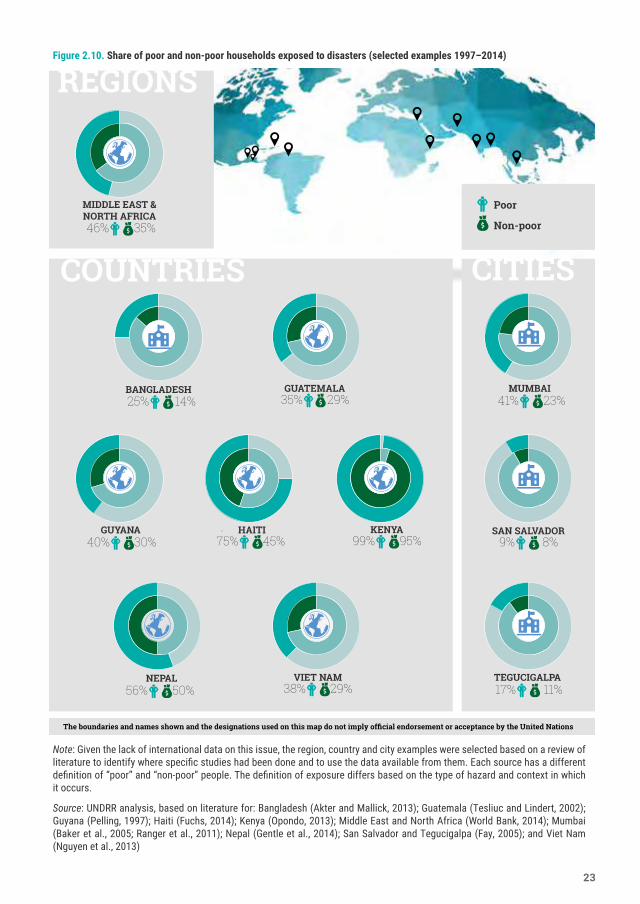
Figure 2.10. Share of poor and non-poor households exposed to disasters (selected examples 1997–2014)
COUNTRIES CITIES
REGIONS
KENYA99% 95%
MIDDLE EAST &NORTH AFRICA46% 35%
VIET NAM38% 29%
NEPAL56% 50%
Non-poor
Poor
GUYANA40% 30%
HAITI75% 45%
GUATEMALA35% 29%
SAN SALVADOR9% 8%
MUMBAI41% 23%
The boundaries and names shown and the designations used on this map do not imply official endorsement or acceptance by the United Nations
TEGUCIGALPA17% 11%
BANGLADESH25% 14%
Note: Given the lack of international data on this issue, the region, country and city examples were selected based on a review of literature to identify where specific studies had been done and to use the data available from them. Each source has a different definition of “poor” and “non-poor” people. The definition of exposure differs based on the type of hazard and context in which it occurs.
Source: UNDRR analysis, based on literature for: Bangladesh (Akter and Mallick, 2013); Guatemala (Tesliuc and Lindert, 2002); Guyana (Pelling, 1997); Haiti (Fuchs, 2014); Kenya (Opondo, 2013); Middle East and North Africa (World Bank, 2014); Mumbai (Baker et al., 2005; Ranger et al., 2011); Nepal (Gentle et al., 2014); San Salvador and Tegucigalpa (Fay, 2005); and Viet Nam (Nguyen et al., 2013)
23
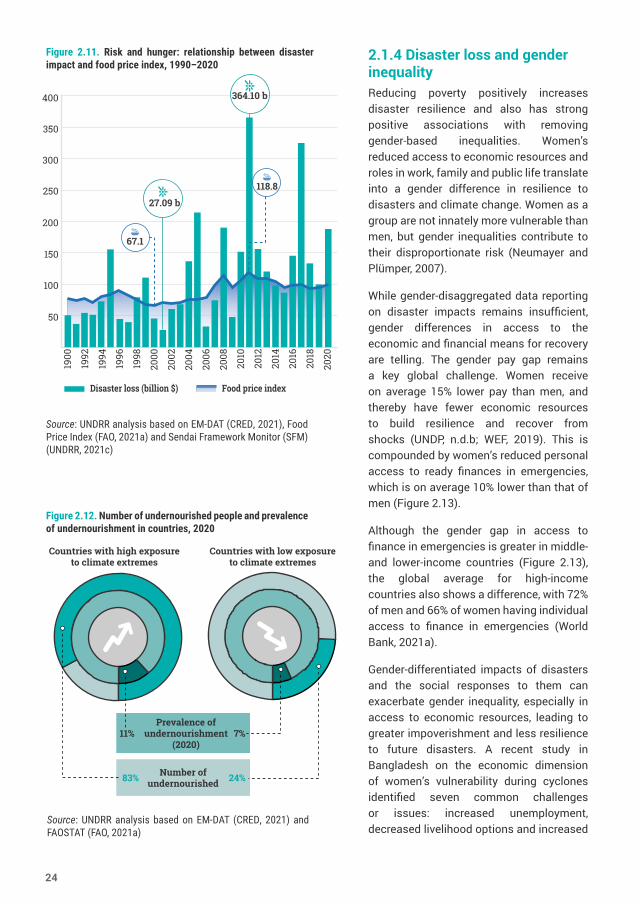
50
100
150
200
300
350
400
250
1900
1992
1994
1996
1998
2000
2002
2004
2006
2008
2010
2012
2014
2016
2018
2020
Disaster loss (billion $) Food price index
364.10 b
67.1
118.8
27.09 b
Figure 2.11. Risk and hunger: relationship between disaster impact and food price index, 1990–2020
Source: UNDRR analysis based on EM-DAT (CRED, 2021), Food Price Index (FAO, 2021a) and Sendai Framework Monitor (SFM) (UNDRR, 2021c)
Countries with low exposure to climate extremes
Countries with high exposure to climate extremes
Number of undernourished
Prevalence of undernourishment
(2020)
83%
11% 7%
24%
Figure 2.12. Number of undernourished people and prevalence of undernourishment in countries, 2020
Source: UNDRR analysis based on EM-DAT (CRED, 2021) and FAOSTAT (FAO, 2021a)
2.1.4 Disaster loss and gender inequality Reducing poverty positively increases disaster resilience and also has strong positive associations with removing gender-based inequalities. Women’s reduced access to economic resources and roles in work, family and public life translate into a gender difference in resilience to disasters and climate change. Women as a group are not innately more vulnerable than men, but gender inequalities contribute to their disproportionate risk (Neumayer and Plümper, 2007).
While gender-disaggregated data reporting on disaster impacts remains insufficient, gender differences in access to the economic and financial means for recovery are telling. The gender pay gap remains a key global challenge. Women receive on average 15% lower pay than men, and thereby have fewer economic resources to build resilience and recover from shocks (UNDP, n.d.b; WEF, 2019). This is compounded by women’s reduced personal access to ready finances in emergencies, which is on average 10% lower than that of men (Figure 2.13).
Although the gender gap in access to finance in emergencies is greater in middle- and lower-income countries (Figure 2.13), the global average for high-income countries also shows a difference, with 72% of men and 66% of women having individual access to finance in emergencies (World Bank, 2021a).
Gender-differentiated impacts of disasters and the social responses to them can exacerbate gender inequality, especially in access to economic resources, leading to greater impoverishment and less resilience to future disasters. A recent study in Bangladesh on the economic dimension of women’s vulnerability during cyclones identified seven common challenges or issues: increased unemployment, decreased livelihood options and increased
24
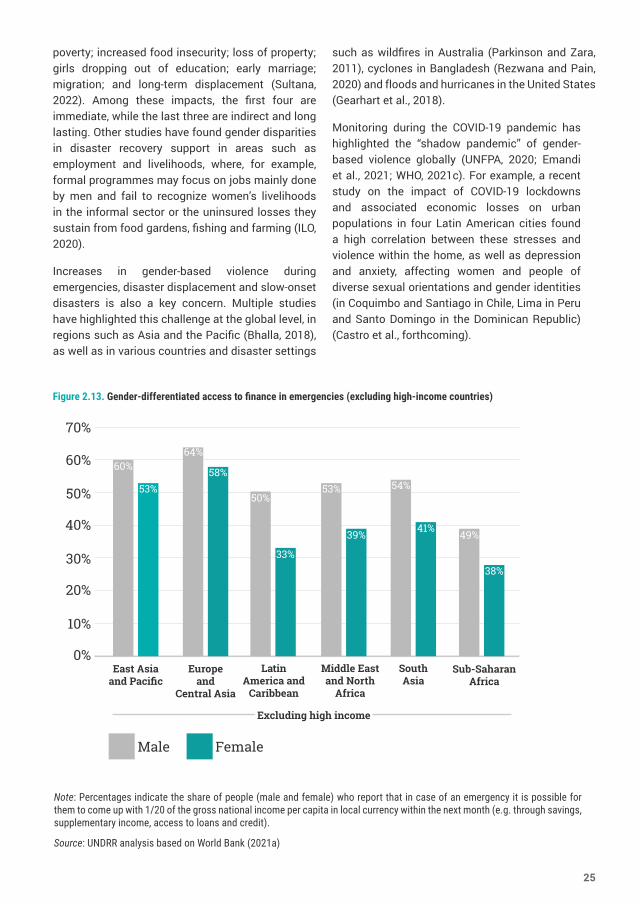
poverty; increased food insecurity; loss of property; girls dropping out of education; early marriage; migration; and long-term displacement (Sultana, 2022). Among these impacts, the first four are immediate, while the last three are indirect and long lasting. Other studies have found gender disparities in disaster recovery support in areas such as employment and livelihoods, where, for example, formal programmes may focus on jobs mainly done by men and fail to recognize women’s livelihoods in the informal sector or the uninsured losses they sustain from food gardens, fishing and farming (ILO, 2020).
Increases in gender-based violence during emergencies, disaster displacement and slow-onset disasters is also a key concern. Multiple studies have highlighted this challenge at the global level, in regions such as Asia and the Pacific (Bhalla, 2018), as well as in various countries and disaster settings
such as wildfires in Australia (Parkinson and Zara, 2011), cyclones in Bangladesh (Rezwana and Pain, 2020) and floods and hurricanes in the United States (Gearhart et al., 2018).
Monitoring during the COVID-19 pandemic has highlighted the “shadow pandemic” of gender-based violence globally (UNFPA, 2020; Emandi et al., 2021; WHO, 2021c). For example, a recent study on the impact of COVID-19 lockdowns and associated economic losses on urban populations in four Latin American cities found a high correlation between these stresses and violence within the home, as well as depression and anxiety, affecting women and people of diverse sexual orientations and gender identities (in Coquimbo and Santiago in Chile, Lima in Peru and Santo Domingo in the Dominican Republic) (Castro et al., forthcoming).
0%
10%
20%
30%
40%
50%
70%
60%
SouthAsia
Middle East and North
Africa
Latin America and
Caribbean
East Asia and Pacific
Europe and
Central Asia
Sub-Saharan Africa
60%
53%
64%
58%
50%
33%
53%
39%
54%
41% 49%
38%
Male Female
Excluding high income
Figure 2.13. Gender-differentiated access to finance in emergencies (excluding high-income countries)
Note: Percentages indicate the share of people (male and female) who report that in case of an emergency it is possible for them to come up with 1/20 of the gross national income per capita in local currency within the next month (e.g. through savings, supplementary income, access to loans and credit).
Source: UNDRR analysis based on World Bank (2021a)
25
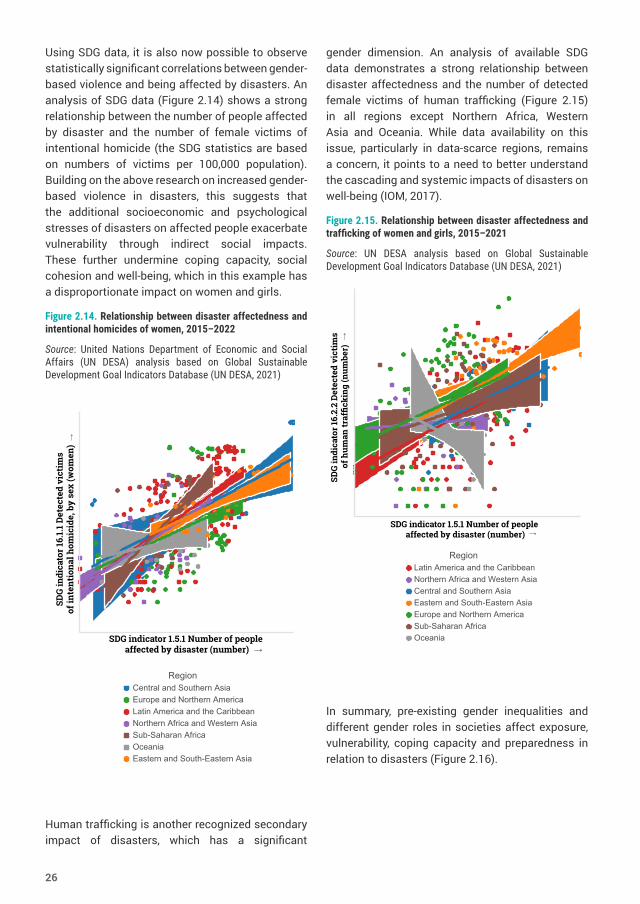
Using SDG data, it is also now possible to observe statistically significant correlations between gender-based violence and being affected by disasters. An analysis of SDG data (Figure 2.14) shows a strong relationship between the number of people affected by disaster and the number of female victims of intentional homicide (the SDG statistics are based on numbers of victims per 100,000 population). Building on the above research on increased gender-based violence in disasters, this suggests that the additional socioeconomic and psychological stresses of disasters on affected people exacerbate vulnerability through indirect social impacts. These further undermine coping capacity, social cohesion and well-being, which in this example has a disproportionate impact on women and girls.
Figure 2.14. Relationship between disaster affectedness and intentional homicides of women, 2015–2022
Source: United Nations Department of Economic and Social Affairs (UN DESA) analysis based on Global Sustainable Development Goal Indicators Database (UN DESA, 2021)
Human trafficking is another recognized secondary impact of disasters, which has a significant
gender dimension. An analysis of available SDG data demonstrates a strong relationship between disaster affectedness and the number of detected female victims of human trafficking (Figure 2.15) in all regions except Northern Africa, Western Asia and Oceania. While data availability on this issue, particularly in data-scarce regions, remains a concern, it points to a need to better understand the cascading and systemic impacts of disasters on well-being (IOM, 2017).
Figure 2.15. Relationship between disaster affectedness and trafficking of women and girls, 2015–2021
Source: UN DESA analysis based on Global Sustainable Development Goal Indicators Database (UN DESA, 2021)
In summary, pre-existing gender inequalities and different gender roles in societies affect exposure, vulnerability, coping capacity and preparedness in relation to disasters (Figure 2.16).
SDG
indi
cato
r 16.
2.2
Det
ecte
d vi
ctim
s o
f hum
an tr
affic
king
(num
ber)
SDG indicator 1.5.1 Number of people affected by disaster (number)
SDG
indi
cato
r 16.
1.1
Det
ecte
d vi
ctim
sof
inte
ntio
nal h
omic
ide,
by
sex
(wom
en)
SDG indicator 1.5.1 Number of people affected by disaster (number)
26
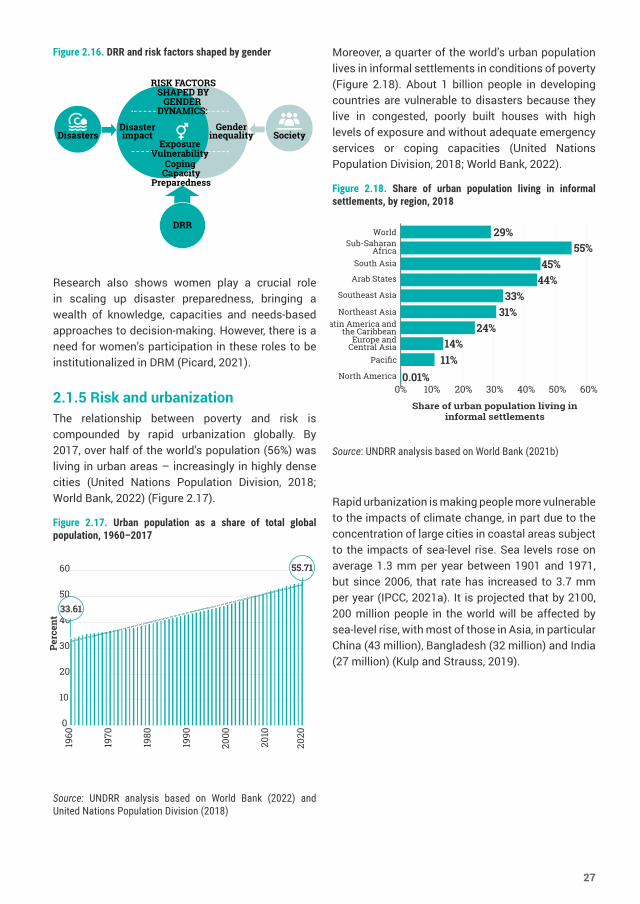
Figure 2.16. DRR and risk factors shaped by gender
Research also shows women play a crucial role in scaling up disaster preparedness, bringing a wealth of knowledge, capacities and needs-based approaches to decision-making. However, there is a need for women’s participation in these roles to be institutionalized in DRM (Picard, 2021).
2.1.5 Risk and urbanization The relationship between poverty and risk is compounded by rapid urbanization globally. By 2017, over half of the world’s population (56%) was living in urban areas – increasingly in highly dense cities (United Nations Population Division, 2018; World Bank, 2022) (Figure 2.17).
Figure 2.17. Urban population as a share of total global population, 1960–2017
Source: UNDRR analysis based on World Bank (2022) and United Nations Population Division (2018)
Moreover, a quarter of the world’s urban population lives in informal settlements in conditions of poverty (Figure 2.18). About 1 billion people in developing countries are vulnerable to disasters because they live in congested, poorly built houses with high levels of exposure and without adequate emergency services or coping capacities (United Nations Population Division, 2018; World Bank, 2022).
Figure 2.18. Share of urban population living in informal settlements, by region, 2018
Source: UNDRR analysis based on World Bank (2021b)
Rapid urbanization is making people more vulnerable to the impacts of climate change, in part due to the concentration of large cities in coastal areas subject to the impacts of sea-level rise. Sea levels rose on average 1.3 mm per year between 1901 and 1971, but since 2006, that rate has increased to 3.7 mm per year (IPCC, 2021a). It is projected that by 2100, 200 million people in the world will be affected by sea-level rise, with most of those in Asia, in particular China (43 million), Bangladesh (32 million) and India (27 million) (Kulp and Strauss, 2019).
DRR
Society
RISK FACTORS SHAPED BY
GENDERDYNAMICS:
Exposure Vulnerability
Coping Capacity
Preparedness
DisastersDisasterimpact
Genderinequality
0
10
20
30
40
50
60
1960
1970
1980
1990
2000
2010
Perc
ent
2020
55.71
33.61
WorldSub-Saharan
AfricaSouth Asia
Arab States
Southeast Asia
Northeast AsiaLatin America and
the CaribbeanEurope and
Central AsiaPacific
10% 20% 30% 40% 50% 60%
29%55%
45%44%
33%31%
24%14%
11%
Share of urban population living in informal settlements
0%North America 0.01%
27
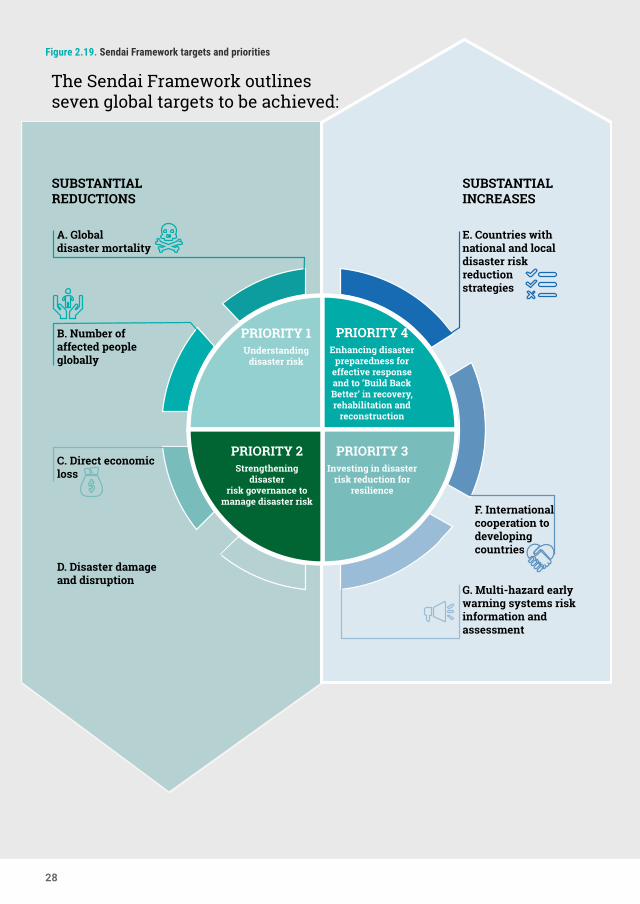
SUBSTANTIAL REDUCTIONS
SUBSTANTIAL INCREASES
PRIORITY 1Understanding
disaster risk
PRIORITY 4Enhancing disaster
preparedness for effective response and to ‘Build Back Better’ in recovery, rehabilitation and
reconstruction
PRIORITY 2Strengthening
disaster risk governance to
manage disaster risk
PRIORITY 3Investing in disaster
risk reduction for resilience
A. Global disaster mortality
B. Number of affected people globally
C. Direct economic loss
D. Disaster damage and disruption
E. Countries with national and local disaster risk reduction strategies
F. International cooperation to developing countries
G. Multi-hazard early warning systems risk information and assessment
The Sendai Framework outlines seven global targets to be achieved:
Figure 2.19. Sendai Framework targets and priorities
28
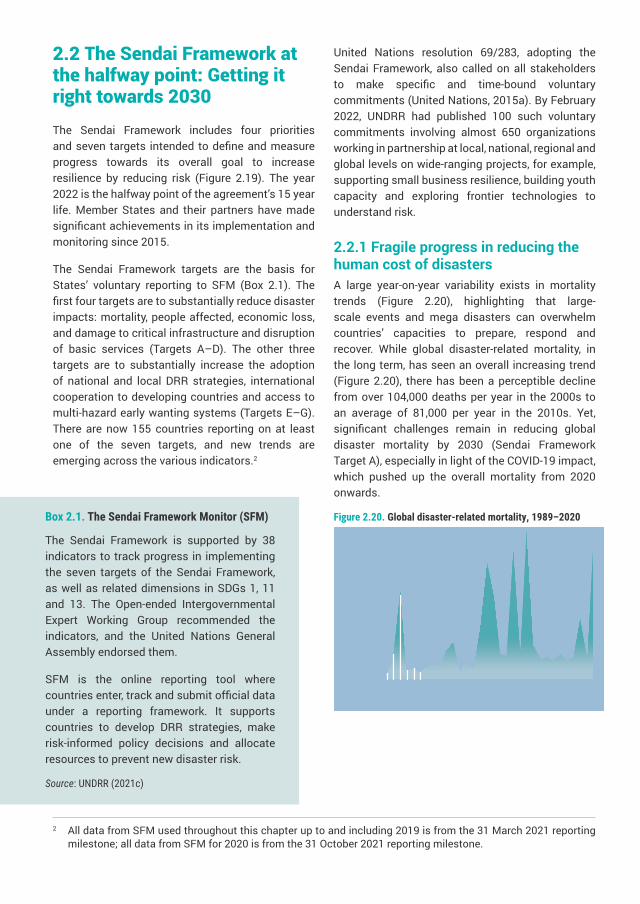
2.2 The Sendai Framework at the halfway point: Getting it right towards 2030
The Sendai Framework includes four priorities and seven targets intended to define and measure progress towards its overall goal to increase resilience by reducing risk (Figure 2.19). The year 2022 is the halfway point of the agreement’s 15 year life. Member States and their partners have made significant achievements in its implementation and monitoring since 2015.
The Sendai Framework targets are the basis for States’ voluntary reporting to SFM (Box 2.1). The first four targets are to substantially reduce disaster impacts: mortality, people affected, economic loss, and damage to critical infrastructure and disruption of basic services (Targets A–D). The other three targets are to substantially increase the adoption of national and local DRR strategies, international cooperation to developing countries and access to multi-hazard early wanting systems (Targets E–G). There are now 155 countries reporting on at least one of the seven targets, and new trends are emerging across the various indicators.2
2 All data from SFM used throughout this chapter up to and including 2019 is from the 31 March 2021 reporting milestone; all data from SFM for 2020 is from the 31 October 2021 reporting milestone.
United Nations resolution 69/283, adopting the Sendai Framework, also called on all stakeholders to make specific and time-bound voluntary commitments (United Nations, 2015a). By February 2022, UNDRR had published 100 such voluntary commitments involving almost 650 organizations working in partnership at local, national, regional and global levels on wide-ranging projects, for example, supporting small business resilience, building youth capacity and exploring frontier technologies to understand risk.
2.2.1 Fragile progress in reducing the human cost of disasters A large year-on-year variability exists in mortality trends (Figure 2.20), highlighting that large-scale events and mega disasters can overwhelm countries’ capacities to prepare, respond and recover. While global disaster-related mortality, in the long term, has seen an overall increasing trend (Figure 2.20), there has been a perceptible decline from over 104,000 deaths per year in the 2000s to an average of 81,000 per year in the 2010s. Yet, significant challenges remain in reducing global disaster mortality by 2030 (Sendai Framework Target A), especially in light of the COVID-19 impact, which pushed up the overall mortality from 2020 onwards.
Figure 2.20. Global disaster-related mortality, 1989–2020 Box 2.1. The Sendai Framework Monitor (SFM)
The Sendai Framework is supported by 38 indicators to track progress in implementing the seven targets of the Sendai Framework, as well as related dimensions in SDGs 1, 11 and 13. The Open-ended Intergovernmental Expert Working Group recommended the indicators, and the United Nations General Assembly endorsed them.
SFM is the online reporting tool where countries enter, track and submit official data under a reporting framework. It supports countries to develop DRR strategies, make risk-informed policy decisions and allocate resources to prevent new disaster risk.
Source: UNDRR (2021c)
1990
1995
2000
2005
2010
2015
2020
50,000100,000150,000200,000250,000
Num
ber o
f peo
ple
300,000350,000
Note: The mortality rate for 2020 includes deaths related to COVID-19; however, due to incomplete reporting, this figure does not reflect the complete impact of COVID-19 in terms of mortality.
Source: UNDRR analysis based on DesInventar (UNDRR, 2021d), EM-DAT (CRED, 2021) and SFM (UNDRR, 2021c)
29

Evidence points to the benefits of disaster preparedness actions by countries, such as the preparation of DRR strategies as a means of saving lives and alleviating disaster impacts. The number of countries with local governments that adopt tailored national DRR strategies is strongly and positively correlated with a reducing disaster mortality rate over time (SDG indicator 13.1.3 / Sendai Framework Target E and SDG indicator 1.5.1 / Sendai Framework Target A) (Figure 2.21). While this does not establish direct causality between local strategies and reduced disaster mortality, the development of such strategies is the type of investment in local risk reduction that, among other things, results in reduced mortality.
The overall number of people affected by disasters (Sendai Framework Target B) is on a moderate downward trend (Figure 2.22). Over the past 20 years, the average number of people affected has decreased from 228 million in the 2000s to just under 200 million in the 2010s. This uses the Sendai Framework reporting definition of people affected
by disasters as people ill or injured, with damaged or destroyed dwellings, or whose livelihoods were disrupted or destroyed by disasters.
Figure 2.22. Number of people affected by disasters globally, 1989–2020
Source: UNDRR analysis based on DesInventar (UNDRR, 2021d), EM-DAT (CRED, 2021) and SFM (UNDRR, 2021c)
100,000
200,000
300,000
400,000
500,000
Num
ber o
f peo
ple
600,000
700,000
1990
2020
2015
2010
2005
2000
1995
SDG indicator 13.1.3 Local governments that adopt and implement local DRR strategies in line with national strategiesSDG indicator 1.5.1 Deaths due to disaster
Num
ber
of p
eopl
e af
fect
edby
dis
aste
r
Num
ber
of lo
cal g
over
nmen
ts th
at a
dopt
an
d im
plem
ent l
ocal
DR
R s
trat
egie
sin
line
wit
h na
tion
al s
trat
egie
s
20,00040,000
60,000
80,000
100,000
2009
2008
2007
2006
2005
2014
2013
2012
2011
2010
2019
2018
2017
2016
2015
120,000
140,000
160,000
180,000
180,000
200,000
5,000
10,000
15,000
20,000
25,000
30,000
35,000
40,000
45,000
0
Figure 2.21. Relationship between disaster-related deaths and adoption of local DRR strategies, 2005–2019
Source: UNDRR analysis based on SFM (UNDRR, 2021c)
30
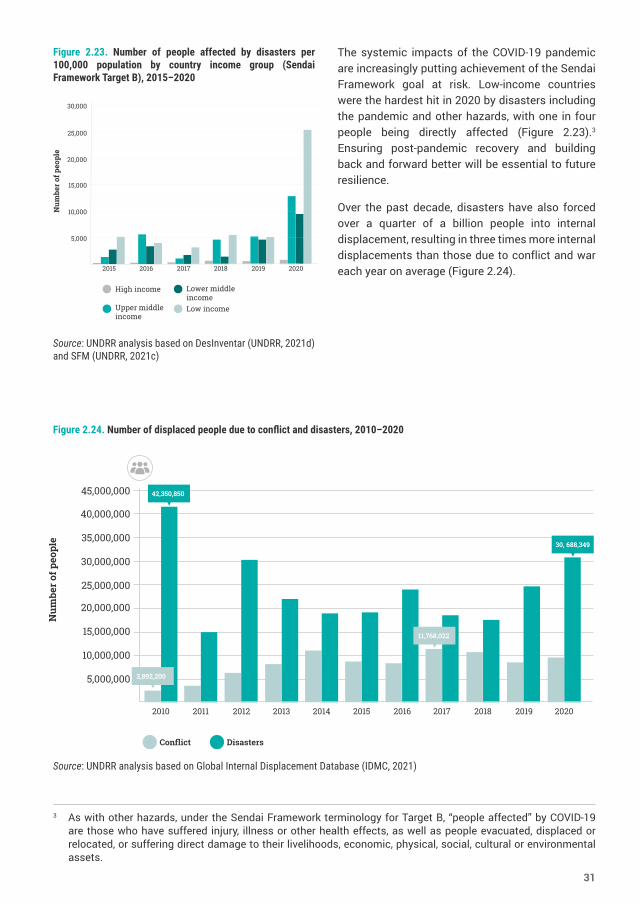
3 As with other hazards, under the Sendai Framework terminology for Target B, “people affected” by COVID-19 are those who have suffered injury, illness or other health effects, as well as people evacuated, displaced or relocated, or suffering direct damage to their livelihoods, economic, physical, social, cultural or environmental assets.
The systemic impacts of the COVID-19 pandemic are increasingly putting achievement of the Sendai Framework goal at risk. Low-income countries were the hardest hit in 2020 by disasters including the pandemic and other hazards, with one in four people being directly affected (Figure 2.23).3 Ensuring post-pandemic recovery and building back and forward better will be essential to future resilience.
Over the past decade, disasters have also forced over a quarter of a billion people into internal displacement, resulting in three times more internal displacements than those due to conflict and war each year on average (Figure 2.24).
Num
ber o
f peo
ple
5,000
10,000
15,000
20,000
25,000
30,000
2015 20172016 2018 20202019
High income
Upper middle income
Lower middle incomeLow income
Source: UNDRR analysis based on DesInventar (UNDRR, 2021d) and SFM (UNDRR, 2021c)
Figure 2.23. Number of people affected by disasters per 100,000 population by country income group (Sendai Framework Target B), 2015–2020
Num
ber o
f peo
ple
5,000,000
10,000,000
15,000,000
20,000,000
25,000,000
30,000,000
35,000,000
40,000,000
45,000,000
2010 2011 2012 2014 2015 2016 20172013 2018 2019 2020
Conflict Disasters
30, 688,349
42,350,850
2,892,200
11,768,022
Figure 2.24. Number of displaced people due to conflict and disasters, 2010–2020
Source: UNDRR analysis based on Global Internal Displacement Database (IDMC, 2021)
31
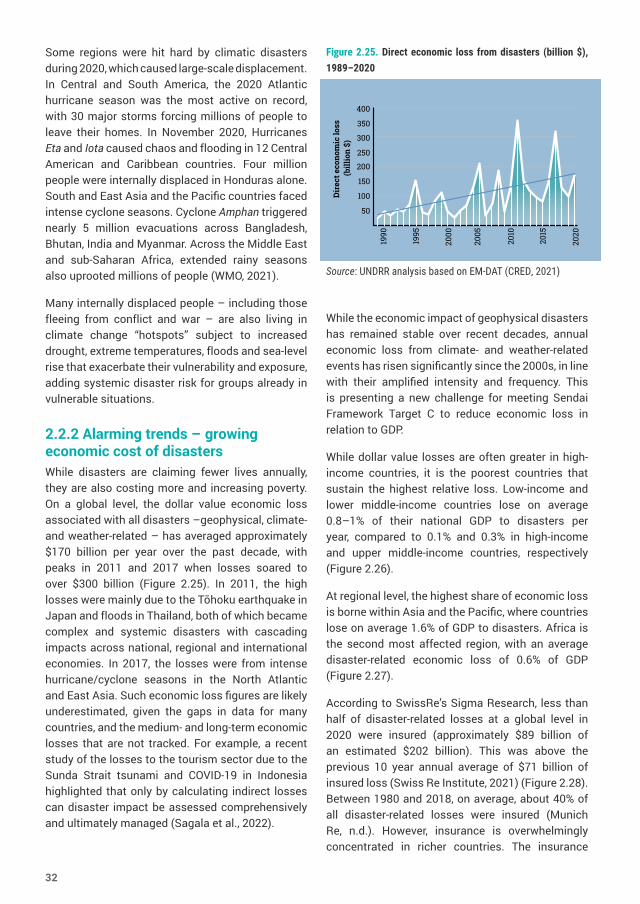
Some regions were hit hard by climatic disasters during 2020, which caused large-scale displacement. In Central and South America, the 2020 Atlantic hurricane season was the most active on record, with 30 major storms forcing millions of people to leave their homes. In November 2020, Hurricanes Eta and Iota caused chaos and flooding in 12 Central American and Caribbean countries. Four million people were internally displaced in Honduras alone. South and East Asia and the Pacific countries faced intense cyclone seasons. Cyclone Amphan triggered nearly 5 million evacuations across Bangladesh, Bhutan, India and Myanmar. Across the Middle East and sub-Saharan Africa, extended rainy seasons also uprooted millions of people (WMO, 2021).
Many internally displaced people – including those fleeing from conflict and war – are also living in climate change “hotspots” subject to increased drought, extreme temperatures, floods and sea-level rise that exacerbate their vulnerability and exposure, adding systemic disaster risk for groups already in vulnerable situations.
2.2.2 Alarming trends – growing economic cost of disasters While disasters are claiming fewer lives annually, they are also costing more and increasing poverty. On a global level, the dollar value economic loss associated with all disasters –geophysical, climate- and weather-related – has averaged approximately $170 billion per year over the past decade, with peaks in 2011 and 2017 when losses soared to over $300 billion (Figure 2.25). In 2011, the high losses were mainly due to the Tōhoku earthquake in Japan and floods in Thailand, both of which became complex and systemic disasters with cascading impacts across national, regional and international economies. In 2017, the losses were from intense hurricane/cyclone seasons in the North Atlantic and East Asia. Such economic loss figures are likely underestimated, given the gaps in data for many countries, and the medium- and long-term economic losses that are not tracked. For example, a recent study of the losses to the tourism sector due to the Sunda Strait tsunami and COVID-19 in Indonesia highlighted that only by calculating indirect losses can disaster impact be assessed comprehensively and ultimately managed (Sagala et al., 2022).
Figure 2.25. Direct economic loss from disasters (billion $), 1989–2020
Source: UNDRR analysis based on EM-DAT (CRED, 2021)
While the economic impact of geophysical disasters has remained stable over recent decades, annual economic loss from climate- and weather-related events has risen significantly since the 2000s, in line with their amplified intensity and frequency. This is presenting a new challenge for meeting Sendai Framework Target C to reduce economic loss in relation to GDP.
While dollar value losses are often greater in high-income countries, it is the poorest countries that sustain the highest relative loss. Low-income and lower middle-income countries lose on average 0.8–1% of their national GDP to disasters per year, compared to 0.1% and 0.3% in high-income and upper middle-income countries, respectively (Figure 2.26).
At regional level, the highest share of economic loss is borne within Asia and the Pacific, where countries lose on average 1.6% of GDP to disasters. Africa is the second most affected region, with an average disaster-related economic loss of 0.6% of GDP (Figure 2.27).
According to SwissRe’s Sigma Research, less than half of disaster-related losses at a global level in 2020 were insured (approximately $89 billion of an estimated $202 billion). This was above the previous 10 year annual average of $71 billion of insured loss (Swiss Re Institute, 2021) (Figure 2.28). Between 1980 and 2018, on average, about 40% of all disaster-related losses were insured (Munich Re, n.d.). However, insurance is overwhelmingly concentrated in richer countries. The insurance
50
100
150
200
350
400
250
300
Dir
ect e
cono
mic
loss
(b
illio
n $)
2020
1990
1995
2000
2005
2010
2015
32
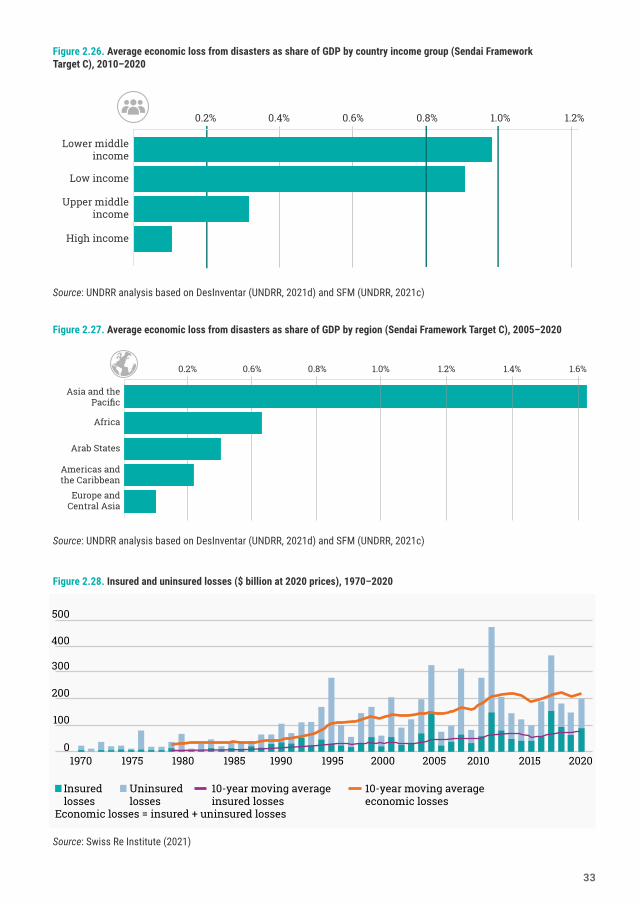
Europe and Central Asia
Americas and the Caribbean
Arab States
Africa
Asia and the Pacific
0.2% 0.6% 0.8% 1.0% 1.2% 1.4% 1.6%
High income
Upper middle income
Low income
Lower middle income
0.2% 0.4% 0.6% 0.8% 1.0% 1.2%
Figure 2.26. Average economic loss from disasters as share of GDP by country income group (Sendai Framework Target C), 2010–2020
Source: UNDRR analysis based on DesInventar (UNDRR, 2021d) and SFM (UNDRR, 2021c)
Figure 2.27. Average economic loss from disasters as share of GDP by region (Sendai Framework Target C), 2005–2020
Source: UNDRR analysis based on DesInventar (UNDRR, 2021d) and SFM (UNDRR, 2021c)
1970 1975 1980 1985 1990 1995 2000 2005 2010 2015 2020
100
200
300
400
500
0
Insuredlosses
Uninsuredlosses
10-year moving average insured losses
10-year moving average economic losses
Economic losses = insured + uninsured losses
Figure 2.28. Insured and uninsured losses ($ billion at 2020 prices), 1970–2020
Source: Swiss Re Institute (2021)
33
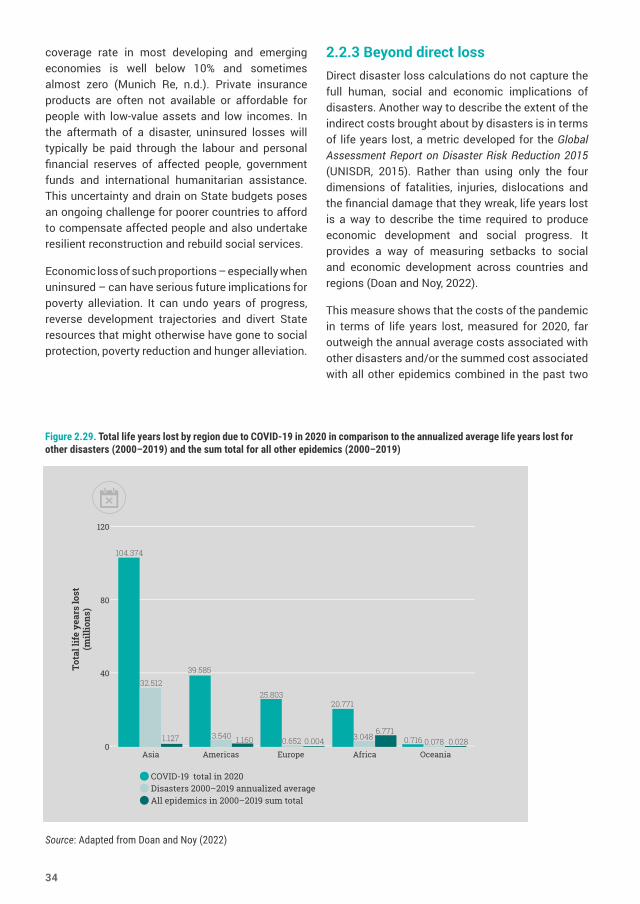
coverage rate in most developing and emerging economies is well below 10% and sometimes almost zero (Munich Re, n.d.). Private insurance products are often not available or affordable for people with low-value assets and low incomes. In the aftermath of a disaster, uninsured losses will typically be paid through the labour and personal financial reserves of affected people, government funds and international humanitarian assistance. This uncertainty and drain on State budgets poses an ongoing challenge for poorer countries to afford to compensate affected people and also undertake resilient reconstruction and rebuild social services.
Economic loss of such proportions – especially when uninsured – can have serious future implications for poverty alleviation. It can undo years of progress, reverse development trajectories and divert State resources that might otherwise have gone to social protection, poverty reduction and hunger alleviation.
2.2.3 Beyond direct lossDirect disaster loss calculations do not capture the full human, social and economic implications of disasters. Another way to describe the extent of the indirect costs brought about by disasters is in terms of life years lost, a metric developed for the Global Assessment Report on Disaster Risk Reduction 2015 (UNISDR, 2015). Rather than using only the four dimensions of fatalities, injuries, dislocations and the financial damage that they wreak, life years lost is a way to describe the time required to produce economic development and social progress. It provides a way of measuring setbacks to social and economic development across countries and regions (Doan and Noy, 2022).
This measure shows that the costs of the pandemic in terms of life years lost, measured for 2020, far outweigh the annual average costs associated with other disasters and/or the summed cost associated with all other epidemics combined in the past two
0
40
80
120
104.374
39.585
25.80332.512
1.127 3.540 1.160 0.652 0.004
20.771
3.0486.771
0.716 0.078 0.028Asia Americas Europe Africa Oceania
Tota
l lif
e ye
ars
lost
(mill
ions
)
COVID-19 total in 2020Disasters 2000–2019 annualized averageAll epidemics in 2000–2019 sum total
Source: Adapted from Doan and Noy (2022)
Figure 2.29. Total life years lost by region due to COVID-19 in 2020 in comparison to the annualized average life years lost for other disasters (2000–2019) and the sum total for all other epidemics (2000–2019)
34
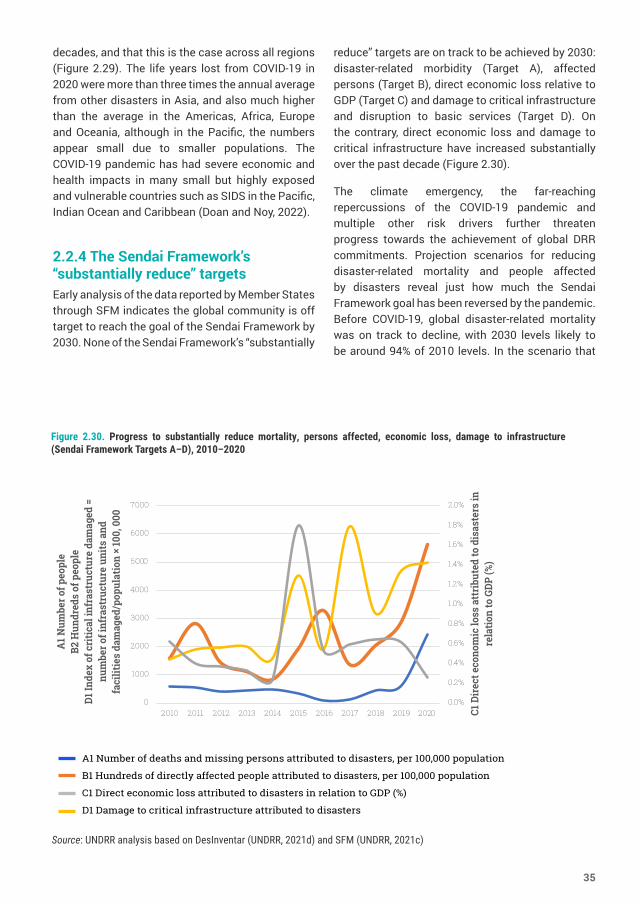
decades, and that this is the case across all regions (Figure 2.29). The life years lost from COVID-19 in 2020 were more than three times the annual average from other disasters in Asia, and also much higher than the average in the Americas, Africa, Europe and Oceania, although in the Pacific, the numbers appear small due to smaller populations. The COVID-19 pandemic has had severe economic and health impacts in many small but highly exposed and vulnerable countries such as SIDS in the Pacific, Indian Ocean and Caribbean (Doan and Noy, 2022).
2.2.4 The Sendai Framework’s “substantially reduce” targetsEarly analysis of the data reported by Member States through SFM indicates the global community is off target to reach the goal of the Sendai Framework by 2030. None of the Sendai Framework’s “substantially
reduce” targets are on track to be achieved by 2030: disaster-related morbidity (Target A), affected persons (Target B), direct economic loss relative to GDP (Target C) and damage to critical infrastructure and disruption to basic services (Target D). On the contrary, direct economic loss and damage to critical infrastructure have increased substantially over the past decade (Figure 2.30).
The climate emergency, the far-reaching repercussions of the COVID-19 pandemic and multiple other risk drivers further threaten progress towards the achievement of global DRR commitments. Projection scenarios for reducing disaster-related mortality and people affected by disasters reveal just how much the Sendai Framework goal has been reversed by the pandemic. Before COVID-19, global disaster-related mortality was on track to decline, with 2030 levels likely to be around 94% of 2010 levels. In the scenario that
0.0%
0.2%
0.4%
0.6%
0.8%
1.0%
1.2%
1.4%
1.6%
1.8%
2.0%
0
1000
2000
3000
4000
5000
6000
7000
2010 2011 2012 2013 2014 2015 2016 2017 2018 2019 2020 C1 D
irec
t eco
nom
ic lo
ss a
ttri
bute
d to
dis
aste
rs in
re
latio
n to
GDP
(%)
A1 N
umbe
r of p
eopl
e B2
Hun
dred
s of
peo
ple
D1 In
dex
of c
ritic
al in
fras
truc
ture
dam
aged
=
num
ber o
f inf
rast
ruct
ure
units
and
fa
cilit
ies
dam
aged
/pop
ulat
ion ×
100,
000
A1 Number of deaths and missing persons attributed to disasters, per 100,000 population
B1 Hundreds of directly affected people attributed to disasters, per 100,000 population
C1 Direct economic loss attributed to disasters in relation to GDP (%)
D1 Damage to critical infrastructure attributed to disasters
Figure 2.30. Progress to substantially reduce mortality, persons affected, economic loss, damage to infrastructure (Sendai Framework Targets A–D), 2010–2020
Source: UNDRR analysis based on DesInventar (UNDRR, 2021d) and SFM (UNDRR, 2021c)
35
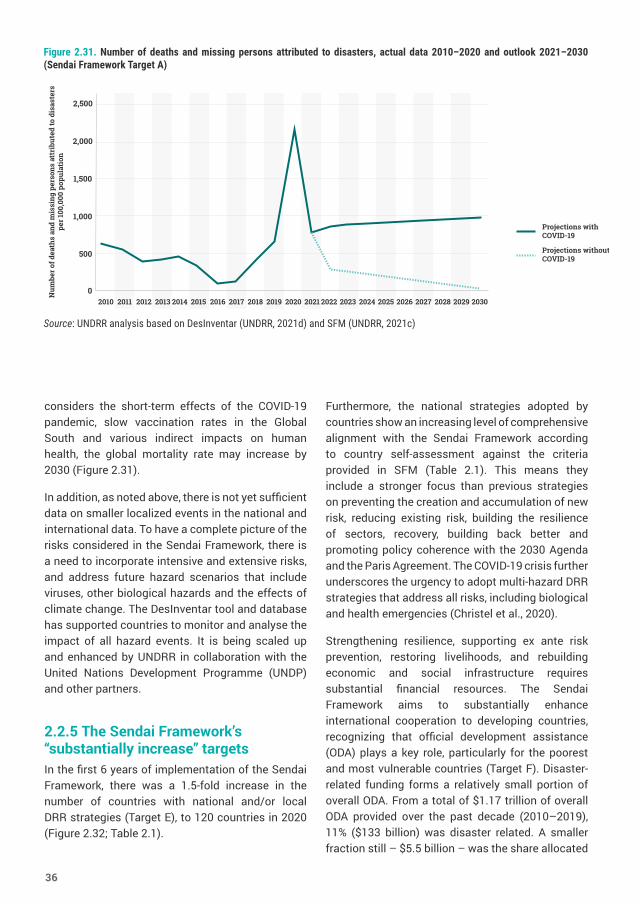
considers the short-term effects of the COVID-19 pandemic, slow vaccination rates in the Global South and various indirect impacts on human health, the global mortality rate may increase by 2030 (Figure 2.31).
In addition, as noted above, there is not yet sufficient data on smaller localized events in the national and international data. To have a complete picture of the risks considered in the Sendai Framework, there is a need to incorporate intensive and extensive risks, and address future hazard scenarios that include viruses, other biological hazards and the effects of climate change. The DesInventar tool and database has supported countries to monitor and analyse the impact of all hazard events. It is being scaled up and enhanced by UNDRR in collaboration with the United Nations Development Programme (UNDP) and other partners.
2.2.5 The Sendai Framework’s “substantially increase” targetsIn the first 6 years of implementation of the Sendai Framework, there was a 1.5-fold increase in the number of countries with national and/or local DRR strategies (Target E), to 120 countries in 2020 (Figure 2.32; Table 2.1).
Furthermore, the national strategies adopted by countries show an increasing level of comprehensive alignment with the Sendai Framework according to country self-assessment against the criteria provided in SFM (Table 2.1). This means they include a stronger focus than previous strategies on preventing the creation and accumulation of new risk, reducing existing risk, building the resilience of sectors, recovery, building back better and promoting policy coherence with the 2030 Agenda and the Paris Agreement. The COVID-19 crisis further underscores the urgency to adopt multi-hazard DRR strategies that address all risks, including biological and health emergencies (Christel et al., 2020).
Strengthening resilience, supporting ex ante risk prevention, restoring livelihoods, and rebuilding economic and social infrastructure requires substantial financial resources. The Sendai Framework aims to substantially enhance international cooperation to developing countries, recognizing that official development assistance (ODA) plays a key role, particularly for the poorest and most vulnerable countries (Target F). Disaster-related funding forms a relatively small portion of overall ODA. From a total of $1.17 trillion of overall ODA provided over the past decade (2010–2019), 11% ($133 billion) was disaster related. A smaller fraction still – $5.5 billion – was the share allocated
Figure 2.31. Number of deaths and missing persons attributed to disasters, actual data 2010–2020 and outlook 2021–2030 (Sendai Framework Target A)
Source: UNDRR analysis based on DesInventar (UNDRR, 2021d) and SFM (UNDRR, 2021c)
2010
500
1,000
1,500
2,000
2,500
02011 2012 2013 2014 2015 2016 2017 2018 2019 2020 2021 2022 2023 2024 2025 2026 2027 2028 2029 2030
Num
ber o
f dea
ths
and
mis
sing
per
sons
att
ribu
ted
to d
isas
ters
per 1
00,0
00 p
opul
atio
n
Projections with COVID-19
Projections without COVID-19
36
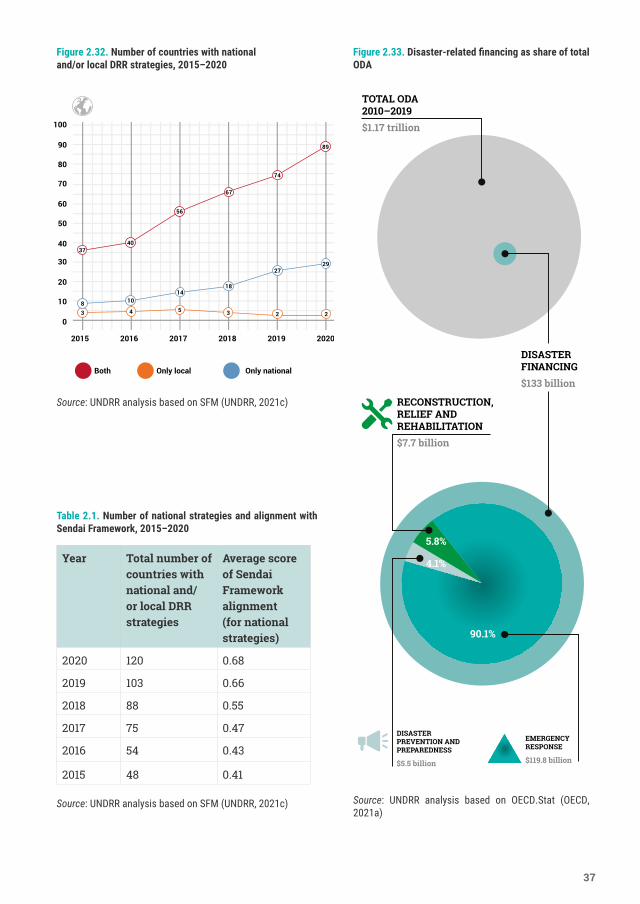
Table 2.1. Number of national strategies and alignment with Sendai Framework, 2015–2020
Year Total number of countries with national and/or local DRR strategies
Average score of Sendai Framework alignment (for national strategies)
2020 120 0.68
2019 103 0.66
2018 88 0.55
2017 75 0.47
2016 54 0.43
2015 48 0.41
Source: UNDRR analysis based on SFM (UNDRR, 2021c)
Both Only nationalOnly local
10
0
30
20
50
40
70
60
80
100
90
2015 2016 2017 2018 2019 2020
3 4 5 3 2 2
8 1014
18
2729
3740
56
67
74
89
Source: UNDRR analysis based on SFM (UNDRR, 2021c)
TOTAL ODA 2010–2019$1.17 trillion
DISASTER FINANCING$133 billion
DISASTER PREVENTION AND PREPAREDNESS
$5.5 billion
4.1%
5.8%
RECONSTRUCTION, RELIEF AND REHABILITATION$7.7 billion
EMERGENCY RESPONSE
$119.8 billion
90.1%
Figure 2.33. Disaster-related financing as share of total ODA
Source: UNDRR analysis based on OECD.Stat (OECD, 2021a)
Figure 2.32. Number of countries with national and/or local DRR strategies, 2015–2020
37
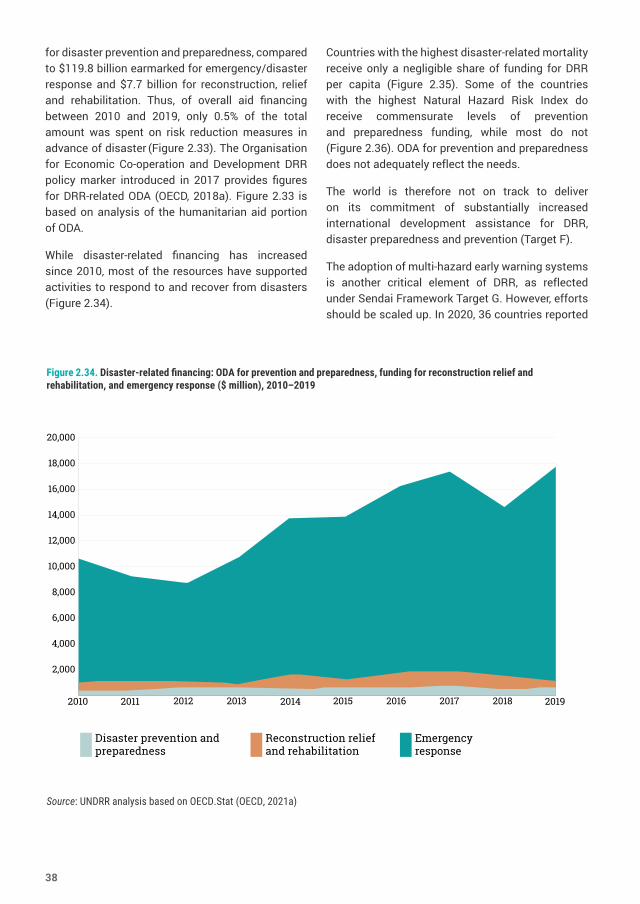
for disaster prevention and preparedness, compared to $119.8 billion earmarked for emergency/disaster response and $7.7 billion for reconstruction, relief and rehabilitation. Thus, of overall aid financing between 2010 and 2019, only 0.5% of the total amount was spent on risk reduction measures in advance of disaster (Figure 2.33). The Organisation for Economic Co-operation and Development DRR policy marker introduced in 2017 provides figures for DRR-related ODA (OECD, 2018a). Figure 2.33 is based on analysis of the humanitarian aid portion of ODA.
While disaster-related financing has increased since 2010, most of the resources have supported activities to respond to and recover from disasters (Figure 2.34).
Countries with the highest disaster-related mortality receive only a negligible share of funding for DRR per capita (Figure 2.35). Some of the countries with the highest Natural Hazard Risk Index do receive commensurate levels of prevention and preparedness funding, while most do not (Figure 2.36). ODA for prevention and preparedness does not adequately reflect the needs.
The world is therefore not on track to deliver on its commitment of substantially increased international development assistance for DRR, disaster preparedness and prevention (Target F).
The adoption of multi-hazard early warning systems is another critical element of DRR, as reflected under Sendai Framework Target G. However, efforts should be scaled up. In 2020, 36 countries reported
Figure 2.34. Disaster-related financing: ODA for prevention and preparedness, funding for reconstruction relief and rehabilitation, and emergency response ($ million), 2010–2019
Source: UNDRR analysis based on OECD.Stat (OECD, 2021a)
4,000
6,000
8,000
12,000
14,000
16,000
18,000
20,000
10,000
2,000
2010 2011 2012 2013 2014 2015 2016 2017 2018 2019
Disaster prevention and preparedness
Reconstruction relief and rehabilitation
Emergencyresponse
38
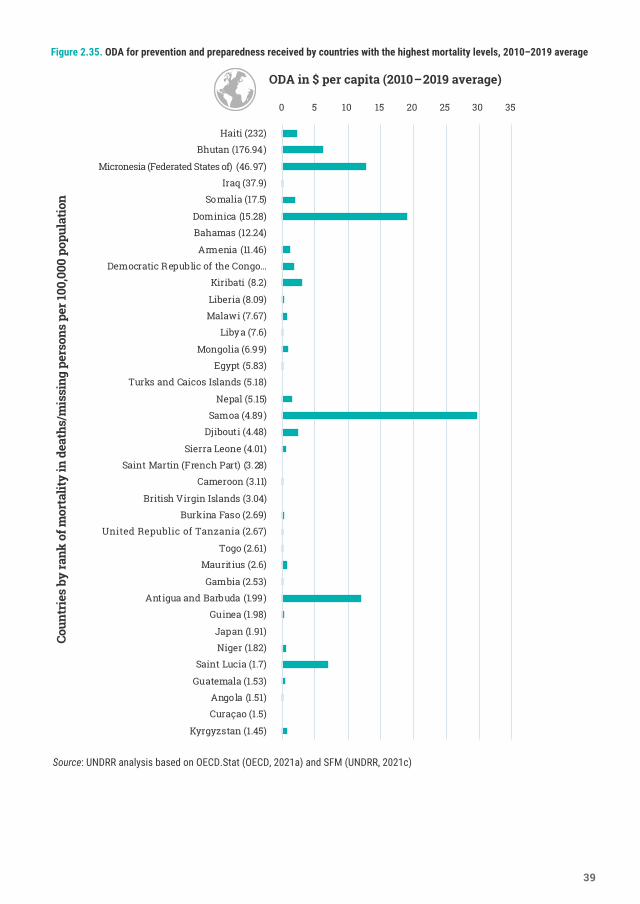
Figure 2.35. ODA for prevention and preparedness received by countries with the highest mortality levels, 2010–2019 average
0 5 10 15 20 25 30 35
Haiti (232)
Bhutan (176.94)
Micronesia (Federated States of) (46.97)
Iraq (37.9)
Somalia (17.5)
Dominica (15.28)
Bahamas (12.24)
Armenia (11.46)
Democratic Republic of the Congo…
Kiribati (8.2)
Liberia (8.09)
Malawi (7.67)
Libya (7.6)
Mongolia (6.99)
Egypt (5.83)
Turks and Caicos Islands (5.18)
Nepal (5.15)
Samoa (4.89)
Djibouti (4.48)
Sierra Leone (4.01)
Saint Martin (French Part) (3.28)
Cameroon (3.11)
British Virgin Islands (3.04)
Burkina Faso (2.69)
United Republic of Tanzania (2.67)
Togo (2.61)
Mauritius (2.6)
Gambia (2.53)
Antigua and Barbuda (1.99)
Guinea (1.98)
Japan (1.91)
Niger (1.82)
Saint Lucia (1.7)
Guatemala (1.53)
Angola (1.51)
Curaçao (1.5)
Kyrgyzstan (1.45)
ODA in $ per capita (2010–2019 average)Co
untr
ies
by ra
nk o
f mor
talit
y in
dea
ths/
mis
sing
per
sons
per
100,
000
popu
latio
n
Source: UNDRR analysis based on OECD.Stat (OECD, 2021a) and SFM (UNDRR, 2021c)
39
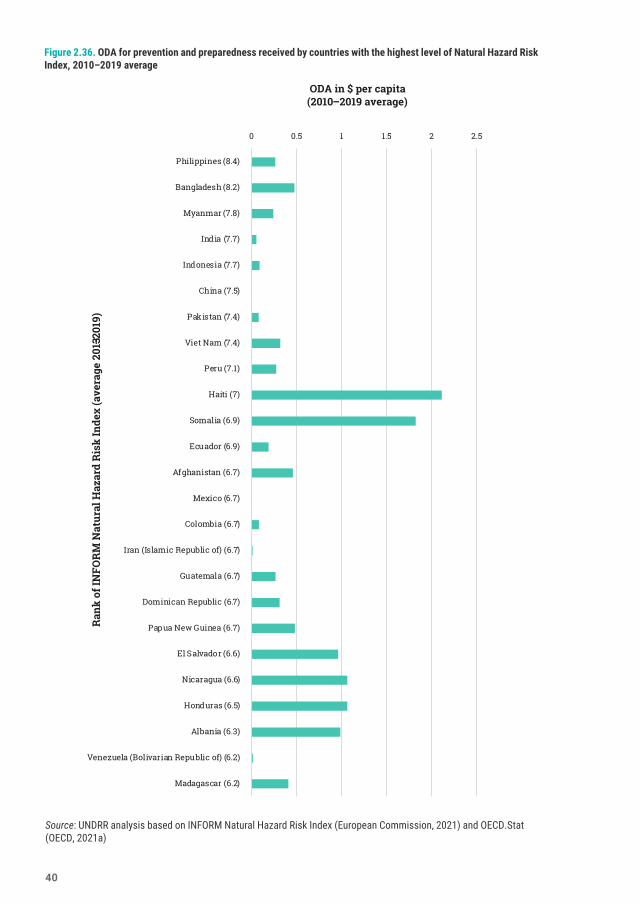
0 0.5 1 1.5 2 2.5
Philippines (8.4)
Bangladesh (8.2)
Myanmar (7.8)
India (7.7)
Indonesia (7.7)
China (7.5)
Pakistan (7.4)
Viet Nam (7.4)
Peru (7.1)
Haiti (7)
Somalia (6.9)
Ecuador (6.9)
Afghanistan (6.7)
Mexico (6.7)
Colombia (6.7)
Iran (Islamic Republic of) (6.7)
Guatemala (6.7)
Dominican Republic (6.7)
Papua New Guinea (6.7)
El Salvador (6.6)
Nicaragua (6.6)
Honduras (6.5)
Albania (6.3)
Venezuela (Bolivarian Republic of) (6.2)
Madagascar (6.2)
Ran
k of
INFO
RM
Nat
ural
Haz
ard
Ris
k In
dex
(ave
rage
201
3–201
9)ODA in $ per capita
(2010–2019 average)
Figure 2.36. ODA for prevention and preparedness received by countries with the highest level of Natural Hazard Risk Index, 2010–2019 average
Source: UNDRR analysis based on INFORM Natural Hazard Risk Index (European Commission, 2021) and OECD.Stat (OECD, 2021a)
40
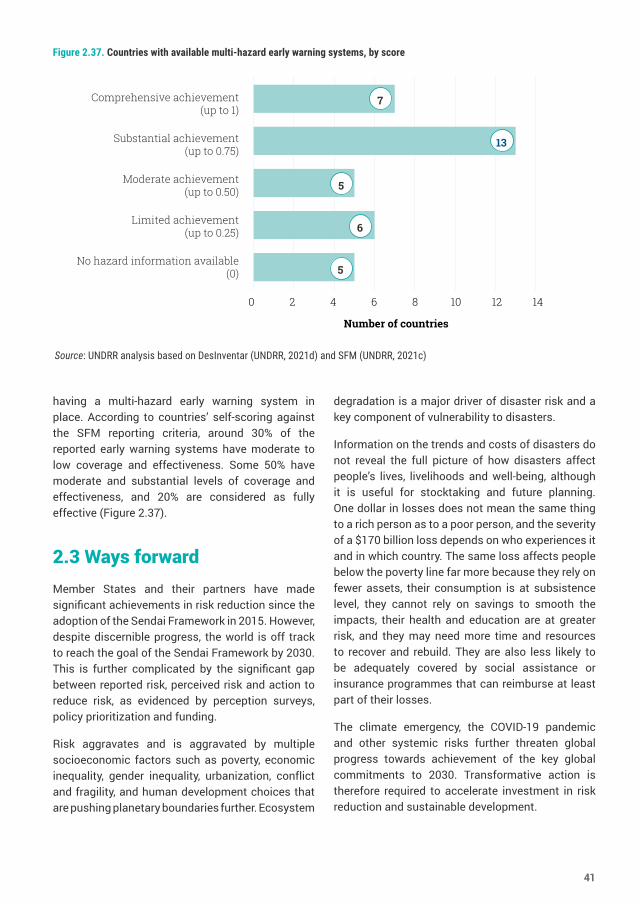
having a multi-hazard early warning system in place. According to countries’ self-scoring against the SFM reporting criteria, around 30% of the reported early warning systems have moderate to low coverage and effectiveness. Some 50% have moderate and substantial levels of coverage and effectiveness, and 20% are considered as fully effective (Figure 2.37).
2.3 Ways forward Member States and their partners have made significant achievements in risk reduction since the adoption of the Sendai Framework in 2015. However, despite discernible progress, the world is off track to reach the goal of the Sendai Framework by 2030. This is further complicated by the significant gap between reported risk, perceived risk and action to reduce risk, as evidenced by perception surveys, policy prioritization and funding.
Risk aggravates and is aggravated by multiple socioeconomic factors such as poverty, economic inequality, gender inequality, urbanization, conflict and fragility, and human development choices that are pushing planetary boundaries further. Ecosystem
degradation is a major driver of disaster risk and a key component of vulnerability to disasters.
Information on the trends and costs of disasters do not reveal the full picture of how disasters affect people’s lives, livelihoods and well-being, although it is useful for stocktaking and future planning. One dollar in losses does not mean the same thing to a rich person as to a poor person, and the severity of a $170 billion loss depends on who experiences it and in which country. The same loss affects people below the poverty line far more because they rely on fewer assets, their consumption is at subsistence level, they cannot rely on savings to smooth the impacts, their health and education are at greater risk, and they may need more time and resources to recover and rebuild. They are also less likely to be adequately covered by social assistance or insurance programmes that can reimburse at least part of their losses.
The climate emergency, the COVID-19 pandemic and other systemic risks further threaten global progress towards achievement of the key global commitments to 2030. Transformative action is therefore required to accelerate investment in risk reduction and sustainable development.
0 2 4 6 8 10 12 14
Comprehensive achievement(up to 1)
Substantial achievement (up to 0.75)
Moderate achievement (up to 0.50)
Limited achievement (up to 0.25)
No hazard information available (0)
7
13
5
6
5
Number of countries
Figure 2.37. Countries with available multi-hazard early warning systems, by score
Source: UNDRR analysis based on DesInventar (UNDRR, 2021d) and SFM (UNDRR, 2021c)
41
3. Systemic risk as a challenge to sustainable developmentDisasters, climate change and their systemic impacts can undermine all three pillars of sustainable development: social, environmental and economic. As evidenced by the COVID-19 pandemic, this is occurring more rapidly and more unpredictably than anticipated, across multiple sectors, dimensions and scales. With only 8 years left to achieve the 2030 Agenda and the Sendai Framework targets, progress is not occurring at the pace and scale required. Progress to achieve the Paris Agreement goal to limit global warming to well below 2°C, and preferably to 1.5°C above pre-industrial levels, is also not on track. A failure to meet the Paris Agreement goal will lead to further increases in the intensity and frequency of climatic hazard events, and the compounding and cascading disasters they cause.
Managing risk in all its dimensions – hazard, exposure and vulnerability – and strengthening resilience to shocks and systemic crises is an end in itself and also a critical means of achieving sustainable development. This chapter highlights how investing in risk reduction can accelerate progress towards achieving global climate and sustainable development targets, and also how unsustainable development pathways lead to greater systemic risk.
Development is not merely set back by disasters, it is also an essential factor in the creation of risk. Development that is not sustainable exacerbates existing risk and creates conditions
for the emergence of new risk. This includes overexploitation of the environment and the building of cities and critical infrastructure that are not resilient. It is estimated that $94 trillion will be invested in infrastructure globally in the next 25 years to sustain economic growth (Global Infrastructure Hub, 2021). This enormous collective effort to improve human development outcomes must be risk informed, as must wider development efforts. Newly developed physical and social infrastructure that is unsafe or risk blind may be exposed to natural hazards, shocks and stresses that cause severe consequences for people and economic activity. Likewise, degraded physical infrastructure, such as communications, electricity and train systems, can also create direct and systemic risk because these are essential networks. Disruptions to such infrastructure can lead to wider system failures and cascading impacts if they fail during a disaster.
This chapter examines statistical data on the interactions among SDGs from the perspective of risk reduction. Many SDGs and their domains are mutually reinforcing, leading to synergies and complementarities in policy outcomes. Truly sustainable development occurs when a combination of systems come together to increase well-being across the domains of people, planet and prosperity. When this is not the case, systemic risk occurs, and the likelihood of disasters increases. Global progress towards the 2030 Agenda crucially depends on nations and the international
42
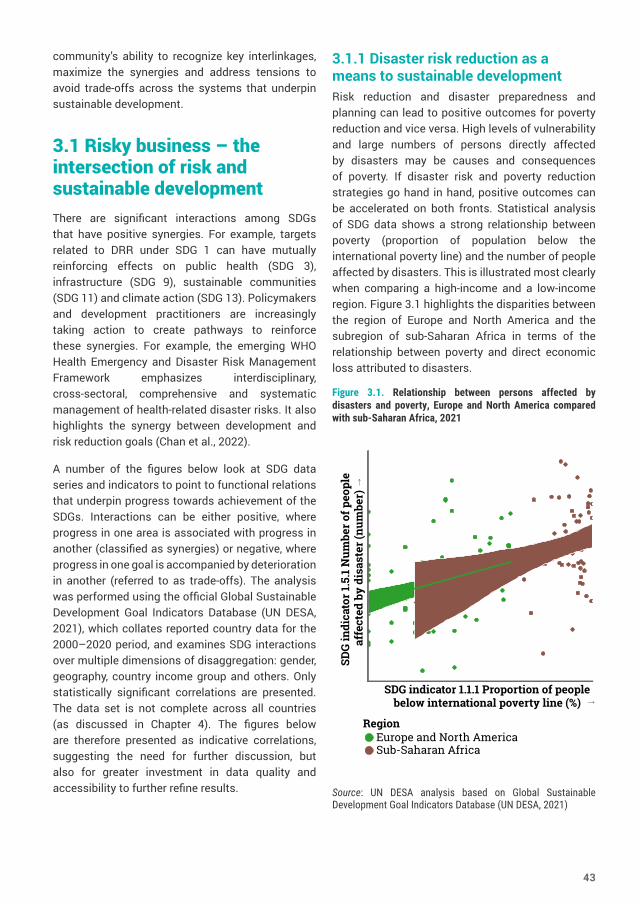
community’s ability to recognize key interlinkages, maximize the synergies and address tensions to avoid trade-offs across the systems that underpin sustainable development.
3.1 Risky business – the intersection of risk and sustainable developmentThere are significant interactions among SDGs that have positive synergies. For example, targets related to DRR under SDG 1 can have mutually reinforcing effects on public health (SDG 3), infrastructure (SDG 9), sustainable communities (SDG 11) and climate action (SDG 13). Policymakers and development practitioners are increasingly taking action to create pathways to reinforce these synergies. For example, the emerging WHO Health Emergency and Disaster Risk Management Framework emphasizes interdisciplinary, cross-sectoral, comprehensive and systematic management of health-related disaster risks. It also highlights the synergy between development and risk reduction goals (Chan et al., 2022).
A number of the figures below look at SDG data series and indicators to point to functional relations that underpin progress towards achievement of the SDGs. Interactions can be either positive, where progress in one area is associated with progress in another (classified as synergies) or negative, where progress in one goal is accompanied by deterioration in another (referred to as trade-offs). The analysis was performed using the official Global Sustainable Development Goal Indicators Database (UN DESA, 2021), which collates reported country data for the 2000–2020 period, and examines SDG interactions over multiple dimensions of disaggregation: gender, geography, country income group and others. Only statistically significant correlations are presented. The data set is not complete across all countries (as discussed in Chapter 4). The figures below are therefore presented as indicative correlations, suggesting the need for further discussion, but also for greater investment in data quality and accessibility to further refine results.
3.1.1 Disaster risk reduction as a means to sustainable developmentRisk reduction and disaster preparedness and planning can lead to positive outcomes for poverty reduction and vice versa. High levels of vulnerability and large numbers of persons directly affected by disasters may be causes and consequences of poverty. If disaster risk and poverty reduction strategies go hand in hand, positive outcomes can be accelerated on both fronts. Statistical analysis of SDG data shows a strong relationship between poverty (proportion of population below the international poverty line) and the number of people affected by disasters. This is illustrated most clearly when comparing a high-income and a low-income region. Figure 3.1 highlights the disparities between the region of Europe and North America and the subregion of sub-Saharan Africa in terms of the relationship between poverty and direct economic loss attributed to disasters.
Figure 3.1. Relationship between persons affected by disasters and poverty, Europe and North America compared with sub-Saharan Africa, 2021
Source: UN DESA analysis based on Global Sustainable Development Goal Indicators Database (UN DESA, 2021)
SDG
indi
cato
r 1.5
.1 N
umbe
r of p
eopl
e af
fect
ed b
y di
sast
er (n
umbe
r)
SDG indicator 1.1.1 Proportion of people below international poverty line (%)
RegionEurope and North AmericaSub-Saharan Africa
43
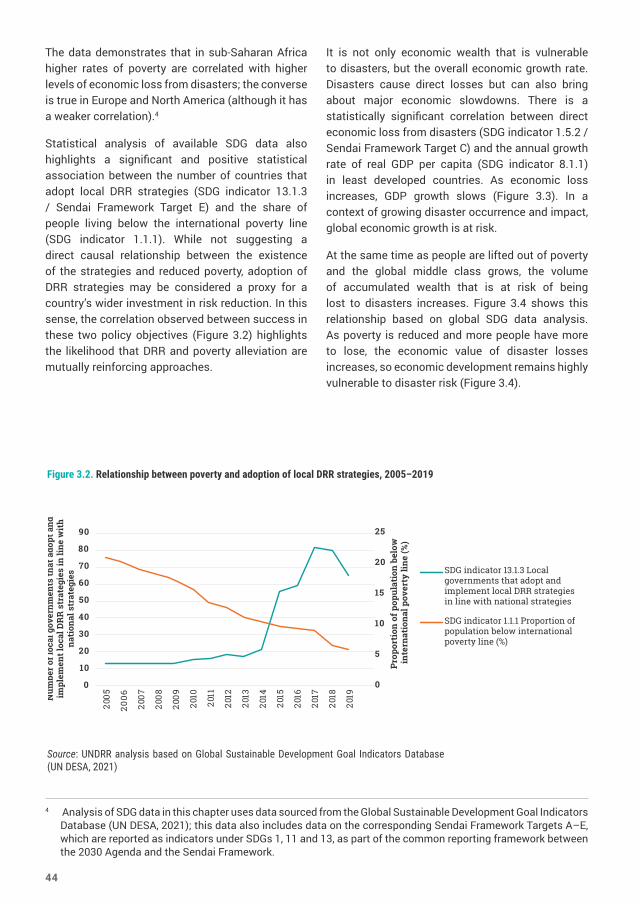
The data demonstrates that in sub-Saharan Africa higher rates of poverty are correlated with higher levels of economic loss from disasters; the converse is true in Europe and North America (although it has a weaker correlation).4
Statistical analysis of available SDG data also highlights a significant and positive statistical association between the number of countries that adopt local DRR strategies (SDG indicator 13.1.3 / Sendai Framework Target E) and the share of people living below the international poverty line (SDG indicator 1.1.1). While not suggesting a direct causal relationship between the existence of the strategies and reduced poverty, adoption of DRR strategies may be considered a proxy for a country’s wider investment in risk reduction. In this sense, the correlation observed between success in these two policy objectives (Figure 3.2) highlights the likelihood that DRR and poverty alleviation are mutually reinforcing approaches.
4 Analysis of SDG data in this chapter uses data sourced from the Global Sustainable Development Goal Indicators Database (UN DESA, 2021); this data also includes data on the corresponding Sendai Framework Targets A–E, which are reported as indicators under SDGs 1, 11 and 13, as part of the common reporting framework between the 2030 Agenda and the Sendai Framework.
It is not only economic wealth that is vulnerable to disasters, but the overall economic growth rate. Disasters cause direct losses but can also bring about major economic slowdowns. There is a statistically significant correlation between direct economic loss from disasters (SDG indicator 1.5.2 / Sendai Framework Target C) and the annual growth rate of real GDP per capita (SDG indicator 8.1.1) in least developed countries. As economic loss increases, GDP growth slows (Figure 3.3). In a context of growing disaster occurrence and impact, global economic growth is at risk.
At the same time as people are lifted out of poverty and the global middle class grows, the volume of accumulated wealth that is at risk of being lost to disasters increases. Figure 3.4 shows this relationship based on global SDG data analysis. As poverty is reduced and more people have more to lose, the economic value of disaster losses increases, so economic development remains highly vulnerable to disaster risk (Figure 3.4).
Num
ber o
f loc
al g
over
nmen
ts th
at a
dopt
and
im
plem
ent l
ocal
DR
R s
trat
egie
s in
line
wit
h na
tion
al s
trat
egie
s
Prop
orti
on o
f pop
ulat
ion
belo
w
inte
rnat
iona
l pov
erty
line
(%)
0
10
20
30
40
50
60
70
2005
2007
2008
2009
2010
2011
2012
2013
2014
2015
2016
2017
2018
2019
2006
80
90
0
5
10
15
20
25
SDG indicator 13.1.3 Local governments that adopt and implement local DRR strategies in line with national strategies
SDG indicator 1.1.1 Proportion of population below international poverty line (%)
Figure 3.2. Relationship between poverty and adoption of local DRR strategies, 2005–2019
Source: UNDRR analysis based on Global Sustainable Development Goal Indicators Database (UN DESA, 2021)
44
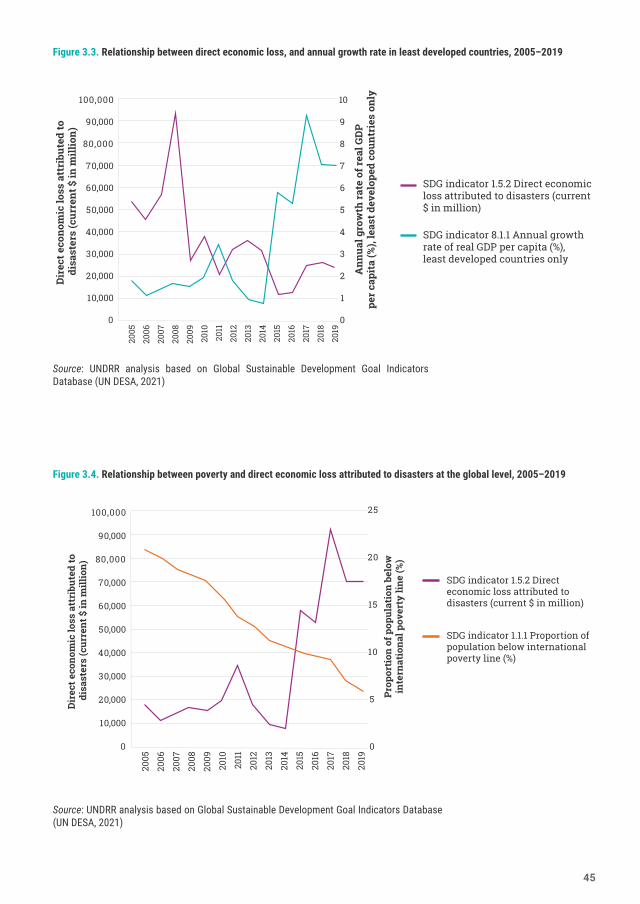
2005
2006
2007
2008
2009
2010
2011
2012
2013
2014
2015
2016
2017
2018
2019
SDG indicator 1.5.2 Direct economic loss attributed to disasters (current $ in million)
SDG indicator 8.1.1 Annual growth rate of real GDP per capita (%), least developed countries only
Dir
ect e
cono
mic
loss
att
ribu
ted
to
disa
ster
s (c
urre
nt $
in m
illio
n)
Ann
ual g
row
th r
ate
of r
eal G
DP
per
capi
ta (%
), le
ast d
evel
oped
cou
ntri
es o
nly
0
10,000
20,000
30,000
40,000
50,000
60,000
70,000
80,000
90,000
100,000
0
1
2
3
4
5
6
7
8
9
10
Figure 3.3. Relationship between direct economic loss, and annual growth rate in least developed countries, 2005–2019
Source: UNDRR analysis based on Global Sustainable Development Goal Indicators Database (UN DESA, 2021)
2005
2006
2007
2008
2009
2010
2011
2012
2013
2014
2015
2016
2017
2018
2019
SDG indicator 1.5.2 Direct economic loss attributed to disasters (current $ in million)
SDG indicator 1.1.1 Proportion of population below international poverty line (%)
Dir
ect e
cono
mic
loss
att
ribu
ted
to
disa
ster
s (c
urre
nt $
in m
illio
n)
Prop
orti
on o
f pop
ulat
ion
belo
w
inte
rnat
iona
l pov
erty
line
(%)
0
10,000
20,000
30,000
40,000
50,000
60,000
70,000
80,000
90,000
100,000
0
5
10
15
20
25
Source: UNDRR analysis based on Global Sustainable Development Goal Indicators Database (UN DESA, 2021)
Figure 3.4. Relationship between poverty and direct economic loss attributed to disasters at the global level, 2005–2019
45
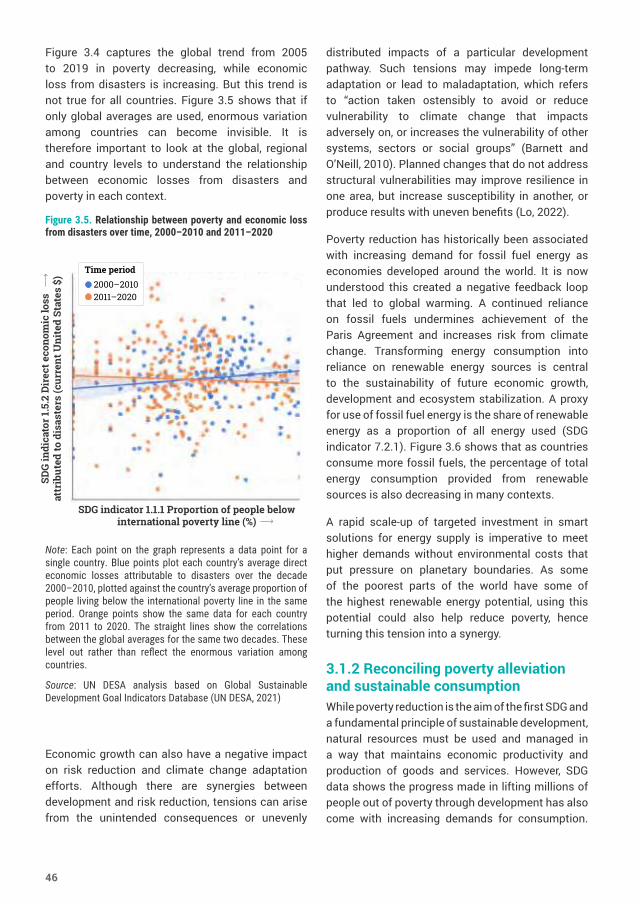
Figure 3.4 captures the global trend from 2005 to 2019 in poverty decreasing, while economic loss from disasters is increasing. But this trend is not true for all countries. Figure 3.5 shows that if only global averages are used, enormous variation among countries can become invisible. It is therefore important to look at the global, regional and country levels to understand the relationship between economic losses from disasters and poverty in each context.
Figure 3.5. Relationship between poverty and economic loss from disasters over time, 2000–2010 and 2011–2020
Note: Each point on the graph represents a data point for a single country. Blue points plot each country’s average direct economic losses attributable to disasters over the decade 2000–2010, plotted against the country’s average proportion of people living below the international poverty line in the same period. Orange points show the same data for each country from 2011 to 2020. The straight lines show the correlations between the global averages for the same two decades. These level out rather than reflect the enormous variation among countries.
Source: UN DESA analysis based on Global Sustainable Development Goal Indicators Database (UN DESA, 2021)
Economic growth can also have a negative impact on risk reduction and climate change adaptation efforts. Although there are synergies between development and risk reduction, tensions can arise from the unintended consequences or unevenly
distributed impacts of a particular development pathway. Such tensions may impede long-term adaptation or lead to maladaptation, which refers to “action taken ostensibly to avoid or reduce vulnerability to climate change that impacts adversely on, or increases the vulnerability of other systems, sectors or social groups” (Barnett and O’Neill, 2010). Planned changes that do not address structural vulnerabilities may improve resilience in one area, but increase susceptibility in another, or produce results with uneven benefits (Lo, 2022).
Poverty reduction has historically been associated with increasing demand for fossil fuel energy as economies developed around the world. It is now understood this created a negative feedback loop that led to global warming. A continued reliance on fossil fuels undermines achievement of the Paris Agreement and increases risk from climate change. Transforming energy consumption into reliance on renewable energy sources is central to the sustainability of future economic growth, development and ecosystem stabilization. A proxy for use of fossil fuel energy is the share of renewable energy as a proportion of all energy used (SDG indicator 7.2.1). Figure 3.6 shows that as countries consume more fossil fuels, the percentage of total energy consumption provided from renewable sources is also decreasing in many contexts.
A rapid scale-up of targeted investment in smart solutions for energy supply is imperative to meet higher demands without environmental costs that put pressure on planetary boundaries. As some of the poorest parts of the world have some of the highest renewable energy potential, using this potential could also help reduce poverty, hence turning this tension into a synergy.
3.1.2 Reconciling poverty alleviation and sustainable consumptionWhile poverty reduction is the aim of the first SDG and a fundamental principle of sustainable development, natural resources must be used and managed in a way that maintains economic productivity and production of goods and services. However, SDG data shows the progress made in lifting millions of people out of poverty through development has also come with increasing demands for consumption.
Time period2000–20102011–2020
SDG
indi
cato
r 1.5
.2 D
irec
t eco
nom
ic lo
ss
attr
ibut
ed to
dis
aste
rs (c
urre
nt U
nite
d St
ates
$)
SDG indicator 1.1.1 Proportion of people below international poverty line (%)
46
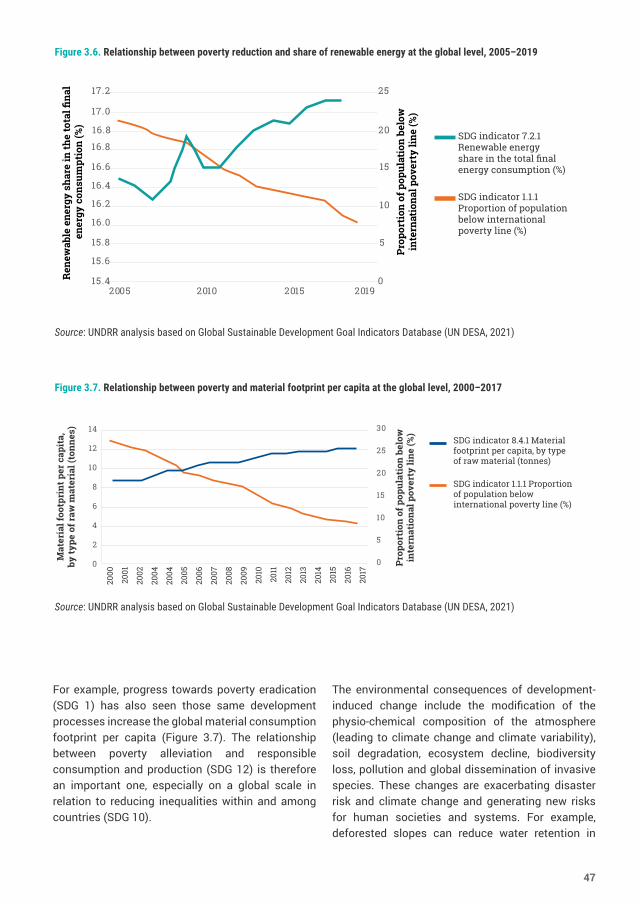
For example, progress towards poverty eradication (SDG 1) has also seen those same development processes increase the global material consumption footprint per capita (Figure 3.7). The relationship between poverty alleviation and responsible consumption and production (SDG 12) is therefore an important one, especially on a global scale in relation to reducing inequalities within and among countries (SDG 10).
The environmental consequences of development-induced change include the modification of the physio-chemical composition of the atmosphere (leading to climate change and climate variability), soil degradation, ecosystem decline, biodiversity loss, pollution and global dissemination of invasive species. These changes are exacerbating disaster risk and climate change and generating new risks for human societies and systems. For example, deforested slopes can reduce water retention in
15.6
2005 2010 2015 2019
SDG indicator 7.2.1 Renewable energy share in the total final energy consumption (%)
SDG indicator 1.1.1 Proportion of population below international poverty line (%)
15.8
16.0
16.2
16.4
16.6
16.8
16.8
17.0
17.2
15.4 0
25
20
15
10
5
Ren
ewab
le e
nerg
y sh
are
in th
e to
tal fi
nal
ener
gy c
onsu
mpt
ion
(%)
Prop
orti
on o
f pop
ulat
ion
belo
win
tern
atio
nal p
over
ty li
ne (%
)
Figure 3.6. Relationship between poverty reduction and share of renewable energy at the global level, 2005–2019
Source: UNDRR analysis based on Global Sustainable Development Goal Indicators Database (UN DESA, 2021)
Figure 3.7. Relationship between poverty and material footprint per capita at the global level, 2000–2017
Source: UNDRR analysis based on Global Sustainable Development Goal Indicators Database (UN DESA, 2021)
2000
2001
2002
2004
2004
2005
2006
2007
2008
2009
2010
2011
2012
2013
2014
2015
2016
2017
SDG indicator 8.4.1 Material footprint per capita, by type of raw material (tonnes)
SDG indicator 1.1.1 Proportion of population below international poverty line (%)
Mat
eria
l foo
tpri
nt p
er c
apit
a,by
type
of r
aw m
ater
ial (
tonn
es)
Prop
orti
on o
f pop
ulat
ion
belo
win
tern
atio
nal p
over
ty li
ne (%
)
0
2
4
6
8
10
12
14
0
5
10
15
20
25
30
47
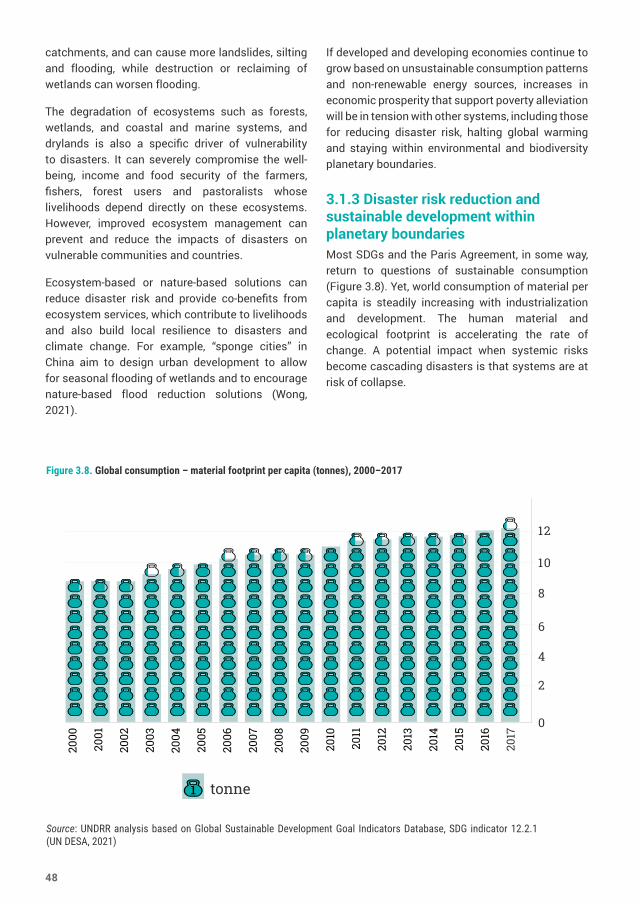
catchments, and can cause more landslides, silting and flooding, while destruction or reclaiming of wetlands can worsen flooding.
The degradation of ecosystems such as forests, wetlands, and coastal and marine systems, and drylands is also a specific driver of vulnerability to disasters. It can severely compromise the well-being, income and food security of the farmers, fishers, forest users and pastoralists whose livelihoods depend directly on these ecosystems. However, improved ecosystem management can prevent and reduce the impacts of disasters on vulnerable communities and countries.
Ecosystem-based or nature-based solutions can reduce disaster risk and provide co-benefits from ecosystem services, which contribute to livelihoods and also build local resilience to disasters and climate change. For example, “sponge cities” in China aim to design urban development to allow for seasonal flooding of wetlands and to encourage nature-based flood reduction solutions (Wong, 2021).
If developed and developing economies continue to grow based on unsustainable consumption patterns and non-renewable energy sources, increases in economic prosperity that support poverty alleviation will be in tension with other systems, including those for reducing disaster risk, halting global warming and staying within environmental and biodiversity planetary boundaries.
3.1.3 Disaster risk reduction and sustainable development within planetary boundariesMost SDGs and the Paris Agreement, in some way, return to questions of sustainable consumption (Figure 3.8). Yet, world consumption of material per capita is steadily increasing with industrialization and development. The human material and ecological footprint is accelerating the rate of change. A potential impact when systemic risks become cascading disasters is that systems are at risk of collapse.
tonne
2
12
2009
2008
2007
2002
2005
2014
2013
2012
2011
2010
2017
2016
2015
2004
2003
2006
2001
2000
1
8
10
6
4
0
Figure 3.8. Global consumption – material footprint per capita (tonnes), 2000–2017
Source: UNDRR analysis based on Global Sustainable Development Goal Indicators Database, SDG indicator 12.2.1 (UN DESA, 2021)
48
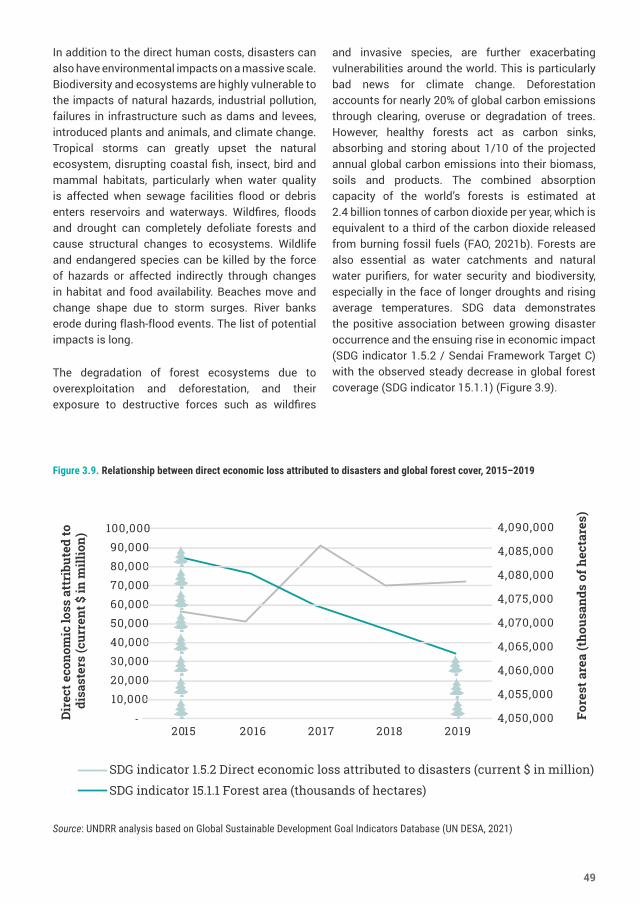
In addition to the direct human costs, disasters can also have environmental impacts on a massive scale. Biodiversity and ecosystems are highly vulnerable to the impacts of natural hazards, industrial pollution, failures in infrastructure such as dams and levees, introduced plants and animals, and climate change. Tropical storms can greatly upset the natural ecosystem, disrupting coastal fish, insect, bird and mammal habitats, particularly when water quality is affected when sewage facilities flood or debris enters reservoirs and waterways. Wildfires, floods and drought can completely defoliate forests and cause structural changes to ecosystems. Wildlife and endangered species can be killed by the force of hazards or affected indirectly through changes in habitat and food availability. Beaches move and change shape due to storm surges. River banks erode during flash-flood events. The list of potential impacts is long.
The degradation of forest ecosystems due to overexploitation and deforestation, and their exposure to destructive forces such as wildfires
and invasive species, are further exacerbating vulnerabilities around the world. This is particularly bad news for climate change. Deforestation accounts for nearly 20% of global carbon emissions through clearing, overuse or degradation of trees. However, healthy forests act as carbon sinks, absorbing and storing about 1/10 of the projected annual global carbon emissions into their biomass, soils and products. The combined absorption capacity of the world’s forests is estimated at 2.4 billion tonnes of carbon dioxide per year, which is equivalent to a third of the carbon dioxide released from burning fossil fuels (FAO, 2021b). Forests are also essential as water catchments and natural water purifiers, for water security and biodiversity, especially in the face of longer droughts and rising average temperatures. SDG data demonstrates the positive association between growing disaster occurrence and the ensuing rise in economic impact (SDG indicator 1.5.2 / Sendai Framework Target C) with the observed steady decrease in global forest coverage (SDG indicator 15.1.1) (Figure 3.9).
Figure 3.9. Relationship between direct economic loss attributed to disasters and global forest cover, 2015–2019
Source: UNDRR analysis based on Global Sustainable Development Goal Indicators Database (UN DESA, 2021)
-
20,00030,00040,00050,00060,00070,000
2015 2016 2017 2018 20194,050,000
4,055,000
4,090,000
4,060,000
4,065,000
4,070,000
4,085,000
4,080,000
4,075,000
10,000
80,00090,000
100,000
SDG indicator 1.5.2 Direct economic loss attributed to disasters (current $ in million)
SDG indicator 15.1.1 Forest area (thousands of hectares)
Dir
ect e
cono
mic
loss
att
ribu
ted
to
disa
ster
s (c
urre
nt $
in m
illio
n)
Fore
st a
rea
(tho
usan
ds o
f hec
tare
s)
49
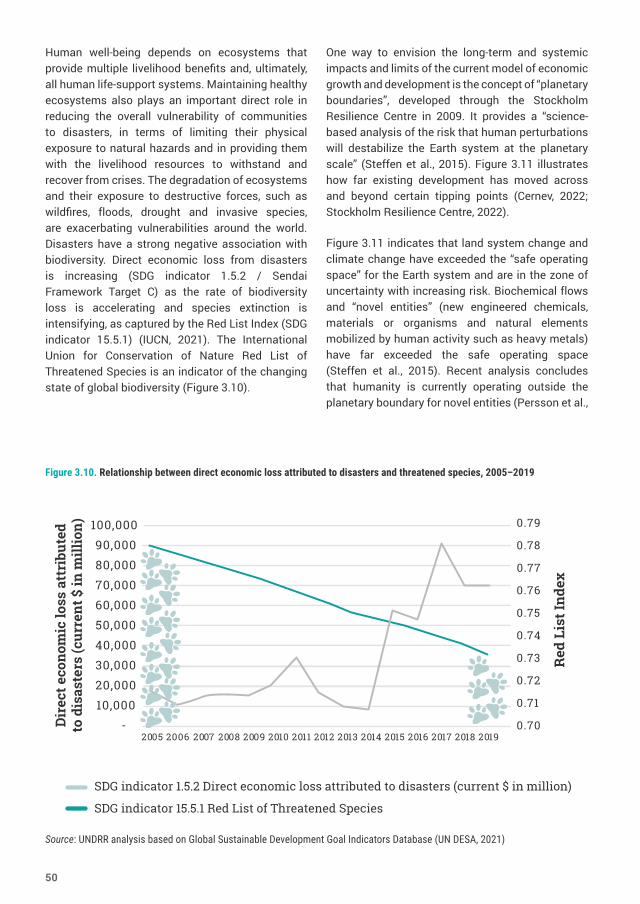
Human well-being depends on ecosystems that provide multiple livelihood benefits and, ultimately, all human life-support systems. Maintaining healthy ecosystems also plays an important direct role in reducing the overall vulnerability of communities to disasters, in terms of limiting their physical exposure to natural hazards and in providing them with the livelihood resources to withstand and recover from crises. The degradation of ecosystems and their exposure to destructive forces, such as wildfires, floods, drought and invasive species, are exacerbating vulnerabilities around the world. Disasters have a strong negative association with biodiversity. Direct economic loss from disasters is increasing (SDG indicator 1.5.2 / Sendai Framework Target C) as the rate of biodiversity loss is accelerating and species extinction is intensifying, as captured by the Red List Index (SDG indicator 15.5.1) (IUCN, 2021). The International Union for Conservation of Nature Red List of Threatened Species is an indicator of the changing state of global biodiversity (Figure 3.10).
One way to envision the long-term and systemic impacts and limits of the current model of economic growth and development is the concept of “planetary boundaries”, developed through the Stockholm Resilience Centre in 2009. It provides a “science-based analysis of the risk that human perturbations will destabilize the Earth system at the planetary scale” (Steffen et al., 2015). Figure 3.11 illustrates how far existing development has moved across and beyond certain tipping points (Cernev, 2022; Stockholm Resilience Centre, 2022).
Figure 3.11 indicates that land system change and climate change have exceeded the “safe operating space” for the Earth system and are in the zone of uncertainty with increasing risk. Biochemical flows and “novel entities” (new engineered chemicals, materials or organisms and natural elements mobilized by human activity such as heavy metals) have far exceeded the safe operating space (Steffen et al., 2015). Recent analysis concludes that humanity is currently operating outside the planetary boundary for novel entities (Persson et al.,
Figure 3.10. Relationship between direct economic loss attributed to disasters and threatened species, 2005–2019
Source: UNDRR analysis based on Global Sustainable Development Goal Indicators Database (UN DESA, 2021)
-
20,00030,00040,00050,00060,00070,000
0.70
0.71
0.78
0.72
0.73
0.74
0.77
0.76
0.75
10,000
80,00090,000
100,000 0.79
2005 2007 2008 2009 2010 2011 2012 2013 2014 2015 2016 2017 2018 20192006
SDG indicator 1.5.2 Direct economic loss attributed to disasters (current $ in million)
SDG indicator 15.5.1 Red List of Threatened Species
Dir
ect e
cono
mic
loss
att
ribu
ted
to d
isas
ters
(cur
rent
$ in
mill
ion)
Red
Lis
t Ind
ex
50
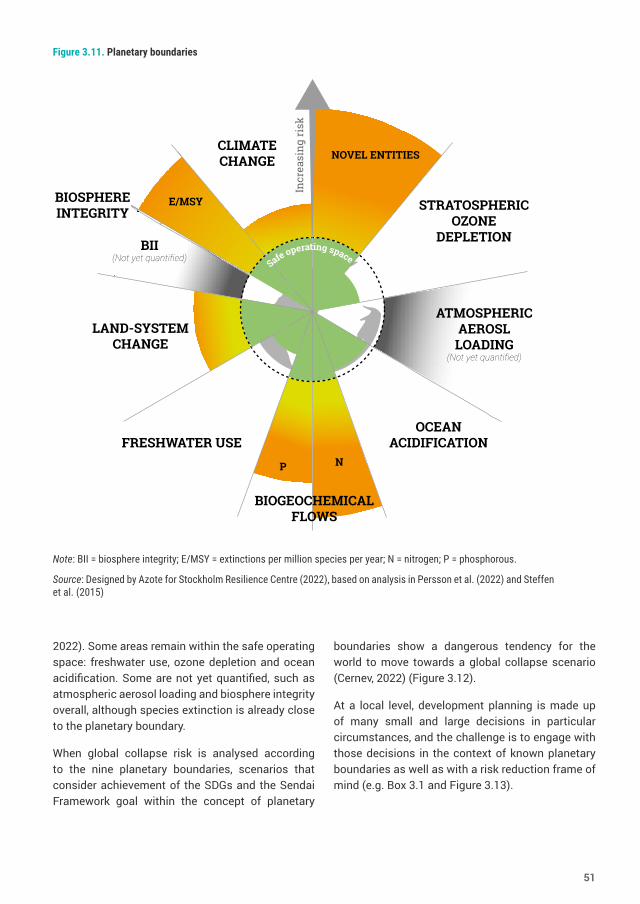
2022). Some areas remain within the safe operating space: freshwater use, ozone depletion and ocean acidification. Some are not yet quantified, such as atmospheric aerosol loading and biosphere integrity overall, although species extinction is already close to the planetary boundary.
When global collapse risk is analysed according to the nine planetary boundaries, scenarios that consider achievement of the SDGs and the Sendai Framework goal within the concept of planetary
boundaries show a dangerous tendency for the world to move towards a global collapse scenario (Cernev, 2022) (Figure 3.12).
At a local level, development planning is made up of many small and large decisions in particular circumstances, and the challenge is to engage with those decisions in the context of known planetary boundaries as well as with a risk reduction frame of mind (e.g. Box 3.1 and Figure 3.13).
LAND-SYSTEM CHANGE
FRESHWATER USEOCEAN
ACIDIFICATION
STRATOSPHERIC OZONE
DEPLETION
ATMOSPHERIC AEROSL
LOADING (Not yet quantified)
CLIMATE CHANGE
BIOSPHERE INTEGRITY
BII(Not yet quantified)
BIOGEOCHEMICAL FLOWS
P N
E/MSY
NOVEL ENTITIES
Incr
easi
ng ri
sk
Safe operating space
Figure 3.11. Planetary boundaries
Note: BII = biosphere integrity; E/MSY = extinctions per million species per year; N = nitrogen; P = phosphorous.
Source: Designed by Azote for Stockholm Resilience Centre (2022), based on analysis in Persson et al. (2022) and Steffen et al. (2015)
51
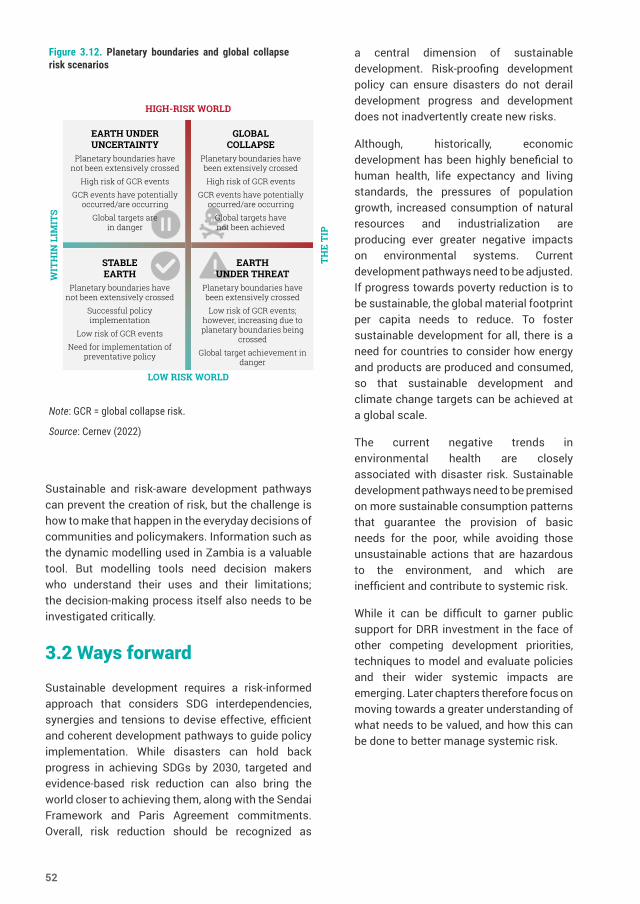
Sustainable and risk-aware development pathways can prevent the creation of risk, but the challenge is how to make that happen in the everyday decisions of communities and policymakers. Information such as the dynamic modelling used in Zambia is a valuable tool. But modelling tools need decision makers who understand their uses and their limitations; the decision-making process itself also needs to be investigated critically.
3.2 Ways forward
Sustainable development requires a risk-informed approach that considers SDG interdependencies, synergies and tensions to devise effective, efficient and coherent development pathways to guide policy implementation. While disasters can hold back progress in achieving SDGs by 2030, targeted and evidence-based risk reduction can also bring the world closer to achieving them, along with the Sendai Framework and Paris Agreement commitments. Overall, risk reduction should be recognized as
Figure 3.12. Planetary boundaries and global collapse risk scenarios
Note: GCR = global collapse risk.
Source: Cernev (2022)
HIGH-RISK WORLD
LOW RISK WORLD
WIT
HIN
LIM
ITS
THE
TIP
EARTH UNDER UNCERTAINTY
Planetary boundaries have not been extensively crossed
High risk of GCR events
GCR events have potentially occurred/are occurring
Global targets are in danger
STABLE EARTH
Planetary boundaries have not been extensively crossed
Successful policy implementation
Low risk of GCR events
Need for implementation of preventative policy
EARTH UNDER THREAT
Planetary boundaries have been extensively crossed
Low risk of GCR events; however, increasing due to planetary boundaries being
crossed
Global target achievement in danger
GLOBAL COLLAPSE
Planetary boundaries have been extensively crossed
High risk of GCR events
GCR events have potentially occurred/are occurring
Global targets have not been achieved
a central dimension of sustainable development. Risk-proofing development policy can ensure disasters do not derail development progress and development does not inadvertently create new risks.
Although, historically, economic development has been highly beneficial to human health, life expectancy and living standards, the pressures of population growth, increased consumption of natural resources and industrialization are producing ever greater negative impacts on environmental systems. Current development pathways need to be adjusted. If progress towards poverty reduction is to be sustainable, the global material footprint per capita needs to reduce. To foster sustainable development for all, there is a need for countries to consider how energy and products are produced and consumed, so that sustainable development and climate change targets can be achieved at a global scale.
The current negative trends in environmental health are closely associated with disaster risk. Sustainable development pathways need to be premised on more sustainable consumption patterns that guarantee the provision of basic needs for the poor, while avoiding those unsustainable actions that are hazardous to the environment, and which are inefficient and contribute to systemic risk.
While it can be difficult to garner public support for DRR investment in the face of other competing development priorities, techniques to model and evaluate policies and their wider systemic impacts are emerging. Later chapters therefore focus on moving towards a greater understanding of what needs to be valued, and how this can be done to better manage systemic risk.
52
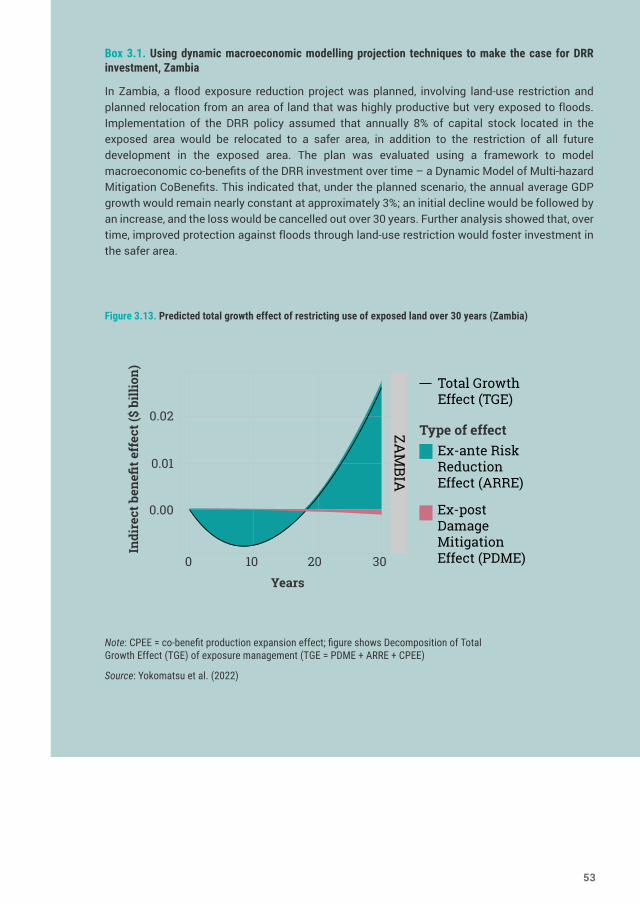
Box 3.1. Using dynamic macroeconomic modelling projection techniques to make the case for DRR investment, Zambia
In Zambia, a flood exposure reduction project was planned, involving land-use restriction and planned relocation from an area of land that was highly productive but very exposed to floods. Implementation of the DRR policy assumed that annually 8% of capital stock located in the exposed area would be relocated to a safer area, in addition to the restriction of all future development in the exposed area. The plan was evaluated using a framework to model macroeconomic co-benefits of the DRR investment over time – a Dynamic Model of Multi-hazard Mitigation CoBenefits. This indicated that, under the planned scenario, the annual average GDP growth would remain nearly constant at approximately 3%; an initial decline would be followed by an increase, and the loss would be cancelled out over 30 years. Further analysis showed that, over time, improved protection against floods through land-use restriction would foster investment in the safer area.
Figure 3.13. Predicted total growth effect of restricting use of exposed land over 30 years (Zambia)
Note: CPEE = co-benefit production expansion effect; figure shows Decomposition of Total Growth Effect (TGE) of exposure management (TGE = PDME + ARRE + CPEE)
Source: Yokomatsu et al. (2022)
0.00
Indi
rect
ben
efit e
ffec
t ($
billi
on)
0.01
0.02
20100 30Years
Ex-ante Risk Reduction Effect (ARRE)
Ex-post Damage Mitigation Effect (PDME)
Type of effect
Total Growth Effect (TGE)
ZAM
BIA
53
4. How human choices drive vulnerability, exposure and disaster riskDisasters are not natural. They occur due to human choices and a lack of risk reduction. When disaster impacts cascade from one system or sector to another, as with systemic risks, pre-existing inequality and vulnerabilities amplify negative impacts.
Even though experts cannot be certain about the exact timing, location and magnitude of a hazard event, they can be certain that those most affected will be communities living in unsafe conditions, such as in poorly built housing or in areas with substandard infrastructure. Disaster risk develops over time, due to complex interactions between the human and natural spheres. A disaster is not something that should be thought of as an isolated event in a particular moment (Cutter et al., 2015; Hagenlocher et al., 2020).
Risk from hazards is being amplified by human interventions in nature. However, these changes tend to be confused with, or misinterpreted as, natural extreme events (IPCC, 2012, 2021a). For example, variability in rainfall is increasingly leading to drought in areas where human water-use practices are unsustainable. And human action is also creating some hazards such as air pollution (Lavell and Maskrey, 2014).
To explore why current risk reduction efforts are insufficient, this chapter looks at the human actions that lead to increased disaster vulnerability and exposure. It highlights how social inequality and
the decision-making processes of individuals and institutions create and amplify vulnerability and exposure, and therefore disaster and climate risk. It goes on to suggest actions such as stepping up “forensic” analysis of disasters, working across sectoral silos to identify weak points in system resilience and engaging communities to determine solutions, to help accelerate risk reduction action.
4.1 Systemic risk is increasing due to human actions
Fuego Volcano in Guatemala erupted on 3 June 2018, causing 461 deaths and affecting over 1.7 million people (CRED, 2021). This event heightened international, regional and national awareness of advances in predicting volcanic hazards. Population growth and demographic shifts in the urban and peri-urban areas around the volcano heightened exposure to the eruption. Many of those who lost their lives were people from lower-income households who had recently moved into the area, and who were living in informal settlements in unsafe locations (World Bank, 2018a).
Although government authorities in Guatemala had responsibility for scientific evidence and the communication and management of volcanic risk, private businesses and local communities played an essential role in early warning. For example,
54
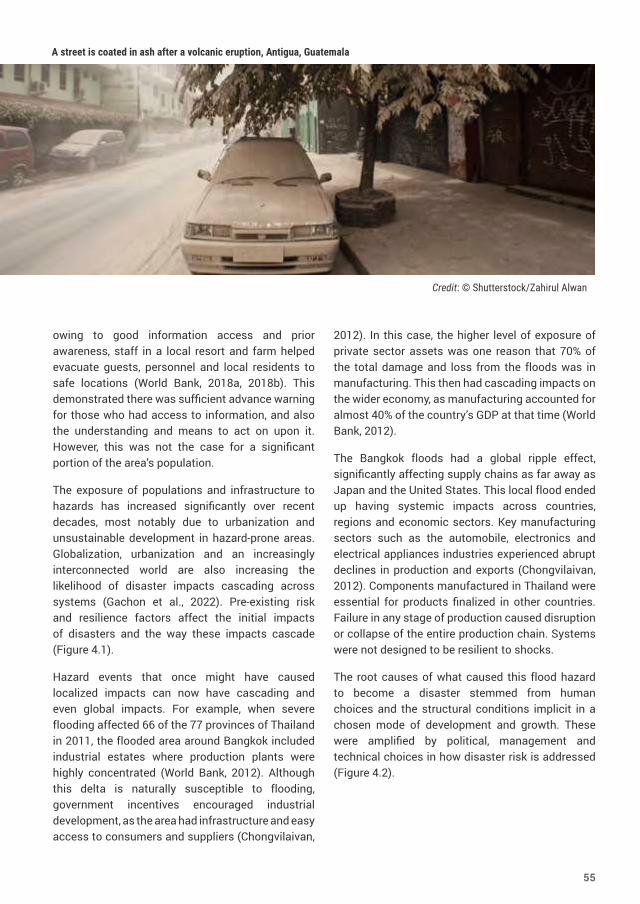
owing to good information access and prior awareness, staff in a local resort and farm helped evacuate guests, personnel and local residents to safe locations (World Bank, 2018a, 2018b). This demonstrated there was sufficient advance warning for those who had access to information, and also the understanding and means to act on upon it. However, this was not the case for a significant portion of the area’s population.
The exposure of populations and infrastructure to hazards has increased significantly over recent decades, most notably due to urbanization and unsustainable development in hazard-prone areas. Globalization, urbanization and an increasingly interconnected world are also increasing the likelihood of disaster impacts cascading across systems (Gachon et al., 2022). Pre-existing risk and resilience factors affect the initial impacts of disasters and the way these impacts cascade (Figure 4.1).
Hazard events that once might have caused localized impacts can now have cascading and even global impacts. For example, when severe flooding affected 66 of the 77 provinces of Thailand in 2011, the flooded area around Bangkok included industrial estates where production plants were highly concentrated (World Bank, 2012). Although this delta is naturally susceptible to flooding, government incentives encouraged industrial development, as the area had infrastructure and easy access to consumers and suppliers (Chongvilaivan,
2012). In this case, the higher level of exposure of private sector assets was one reason that 70% of the total damage and loss from the floods was in manufacturing. This then had cascading impacts on the wider economy, as manufacturing accounted for almost 40% of the country’s GDP at that time (World Bank, 2012).
The Bangkok floods had a global ripple effect, significantly affecting supply chains as far away as Japan and the United States. This local flood ended up having systemic impacts across countries, regions and economic sectors. Key manufacturing sectors such as the automobile, electronics and electrical appliances industries experienced abrupt declines in production and exports (Chongvilaivan, 2012). Components manufactured in Thailand were essential for products finalized in other countries. Failure in any stage of production caused disruption or collapse of the entire production chain. Systems were not designed to be resilient to shocks.
The root causes of what caused this flood hazard to become a disaster stemmed from human choices and the structural conditions implicit in a chosen mode of development and growth. These were amplified by political, management and technical choices in how disaster risk is addressed (Figure 4.2).
A street is coated in ash after a volcanic eruption, Antigua, Guatemala
Credit: © Shutterstock/Zahirul Alwan
55
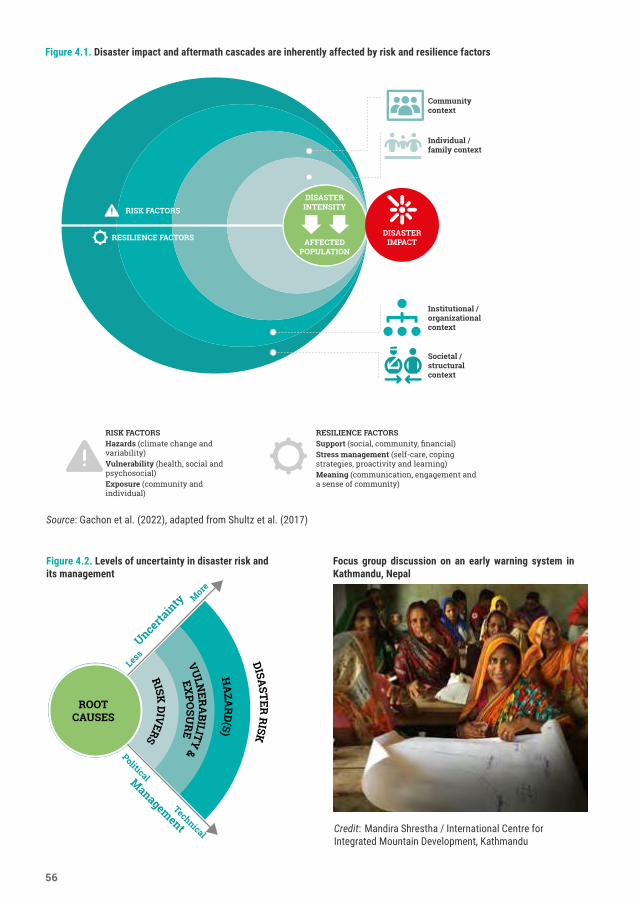
Figure 4.1. Disaster impact and aftermath cascades are inherently affected by risk and resilience factors
Source: Gachon et al. (2022), adapted from Shultz et al. (2017)
Individual / family context
RISK FACTORSHazards (climate change and variability)Vulnerability (health, social and psychosocial)Exposure (community and individual)
Institutional / organizational context
Societal / structural context
DISASTER INTENSITY
AFFECTED POPULATION
DISASTER IMPACT
RISK FACTORS
RESILIENCE FACTORS
Community context
RESILIENCE FACTORSSupport (social, community, financial)Stress management (self-care, coping strategies, proactivity and learning)Meaning (communication, engagement and a sense of community)
HA
ZARD
(S)
VULN
ERABILITY &
RISK DIVERS
EXPO
SURE
DISASTER
RISK
ROOT CAUSES
Less
More
Uncertain
ty
Political
Technical
Management
Figure 4.2. Levels of uncertainty in disaster risk and its management
Credit: Mandira Shrestha / International Centre for Integrated Mountain Development, Kathmandu
Focus group discussion on an early warning system in Kathmandu, Nepal
56
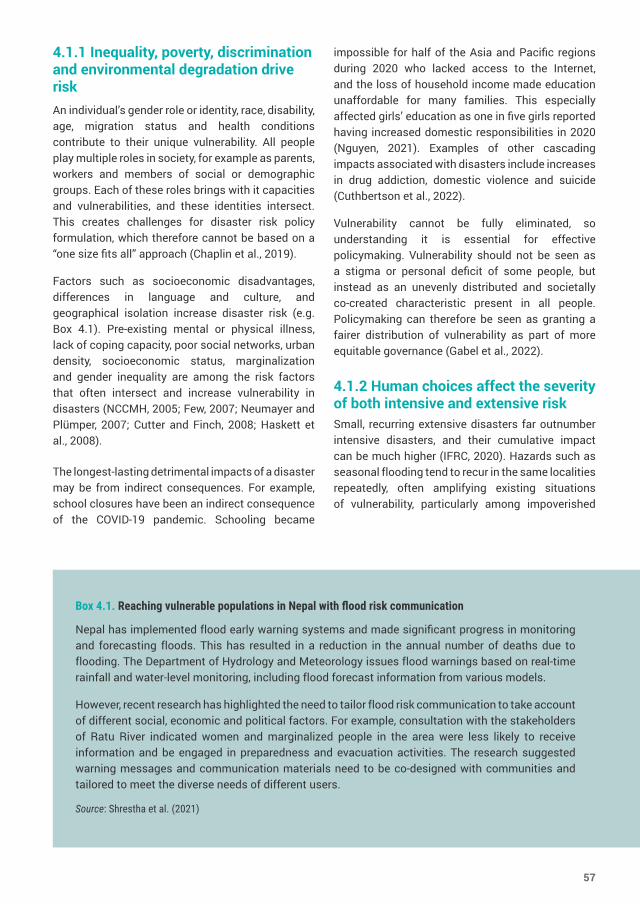
4.1.1 Inequality, poverty, discrimination and environmental degradation drive risk An individual’s gender role or identity, race, disability, age, migration status and health conditions contribute to their unique vulnerability. All people play multiple roles in society, for example as parents, workers and members of social or demographic groups. Each of these roles brings with it capacities and vulnerabilities, and these identities intersect. This creates challenges for disaster risk policy formulation, which therefore cannot be based on a “one size fits all” approach (Chaplin et al., 2019).
Factors such as socioeconomic disadvantages, differences in language and culture, and geographical isolation increase disaster risk (e.g. Box 4.1). Pre-existing mental or physical illness, lack of coping capacity, poor social networks, urban density, socioeconomic status, marginalization and gender inequality are among the risk factors that often intersect and increase vulnerability in disasters (NCCMH, 2005; Few, 2007; Neumayer and Plümper, 2007; Cutter and Finch, 2008; Haskett et al., 2008).
The longest-lasting detrimental impacts of a disaster may be from indirect consequences. For example, school closures have been an indirect consequence of the COVID-19 pandemic. Schooling became
impossible for half of the Asia and Pacific regions during 2020 who lacked access to the Internet, and the loss of household income made education unaffordable for many families. This especially affected girls’ education as one in five girls reported having increased domestic responsibilities in 2020 (Nguyen, 2021). Examples of other cascading impacts associated with disasters include increases in drug addiction, domestic violence and suicide (Cuthbertson et al., 2022).
Vulnerability cannot be fully eliminated, so understanding it is essential for effective policymaking. Vulnerability should not be seen as a stigma or personal deficit of some people, but instead as an unevenly distributed and societally co-created characteristic present in all people. Policymaking can therefore be seen as granting a fairer distribution of vulnerability as part of more equitable governance (Gabel et al., 2022).
4.1.2 Human choices affect the severity of both intensive and extensive riskSmall, recurring extensive disasters far outnumber intensive disasters, and their cumulative impact can be much higher (IFRC, 2020). Hazards such as seasonal flooding tend to recur in the same localities repeatedly, often amplifying existing situations of vulnerability, particularly among impoverished
Box 4.1. Reaching vulnerable populations in Nepal with flood risk communication
Nepal has implemented flood early warning systems and made significant progress in monitoring and forecasting floods. This has resulted in a reduction in the annual number of deaths due to flooding. The Department of Hydrology and Meteorology issues flood warnings based on real-time rainfall and water-level monitoring, including flood forecast information from various models.
However, recent research has highlighted the need to tailor flood risk communication to take account of different social, economic and political factors. For example, consultation with the stakeholders of Ratu River indicated women and marginalized people in the area were less likely to receive information and be engaged in preparedness and evacuation activities. The research suggested warning messages and communication materials need to be co-designed with communities and tailored to meet the diverse needs of different users.
Source: Shrestha et al. (2021)
57
or disadvantaged communities. Consultations undertaken by the Global Network of Civil Society Organisations for Disaster Reduction with 750 at-risk communities across 50 countries highlighted localized flooding as the single most damaging phenomenon (Chavda et al., 2022) (e.g. Box 4.2). It was also identified as one of the most complex risks to reduce and manage at local level. This is because its impacts are deeply shaped by development decisions, ecosystem exploitation/adaptation, and the different vulnerabilities and exposure within and among communities (Chavda et al., 2022).
Skewed development priorities, climate change, fragile governance and environmental degradation are extending the footprint of extensive disaster risk. Factors such as loss of species and habitats, and trade in wildlife (legal and illegal), have even shaped emergent hazards such as zoonotic diseases that transfer from animals to humans, causing epidemics and pandemics such as COVID-19 (Alcántara-Ayala et al., 2021).
4.2 Understanding the root causes of vulnerability is essentialSocial science provides critical insights into the root causes and drivers of vulnerability that can help policymakers make decisions about how to manage systemic disaster risk. Taking a forensic approach to look at the root causes and drivers of risk can help identify and understand how best it can be addressed.
For example, the Fuego Volcano disaster outlined in section 4.1 above was analysed from a forensic investigations of disasters perspective to examine what proportion of the damage and human loss was avoidable and what were the inherent consequences of this sudden and explosive eruption.
About 54,000 people lived within a 10 km radius of Fuego Volcano, and more than 1 million within a 30 km radius. Analysis of the disaster unveiled a series of factors and processes that led to the materialization of a socially constructed disaster. Human choices resulted in increased vulnerability
Box 4.2. Extensive risk for remote communities in the Lao People’s Democratic Republic
In the Lao People’s Democratic Republic, the most remote rural communities are the poorest, many are minority ethnic groups, and they have difficulty accessing health services and education, thus limiting their opportunities in work and livelihoods. They also have higher rates of disability than national averages, due to injuries from war and unexploded ordnance (mainly men) and the effects of disease (mainly women), which is highly stigmatized and severely affects their ability to access education and work, especially women and girls with a disability (Holzaepfel et al., 2018; Government of the Lao People’s Democratic Republic, 2020). These social and economic disadvantages underpin the further impoverishment of many of these communities caused by frequent seasonal flooding, which has worsened in recent decades due to changes in rainfall patterns and to increased exposure with new settlements. Government and non-governmental organization efforts to enhance the prospects of these communities focus on the underlying socioeconomic vulnerabilities of their situation, aiming to increase their opportunities to exercise resilience through improved livelihoods as well as to address the physical aspects of flood management (Government of the Lao People’s Democratic Republic, 2018, 2021).
58
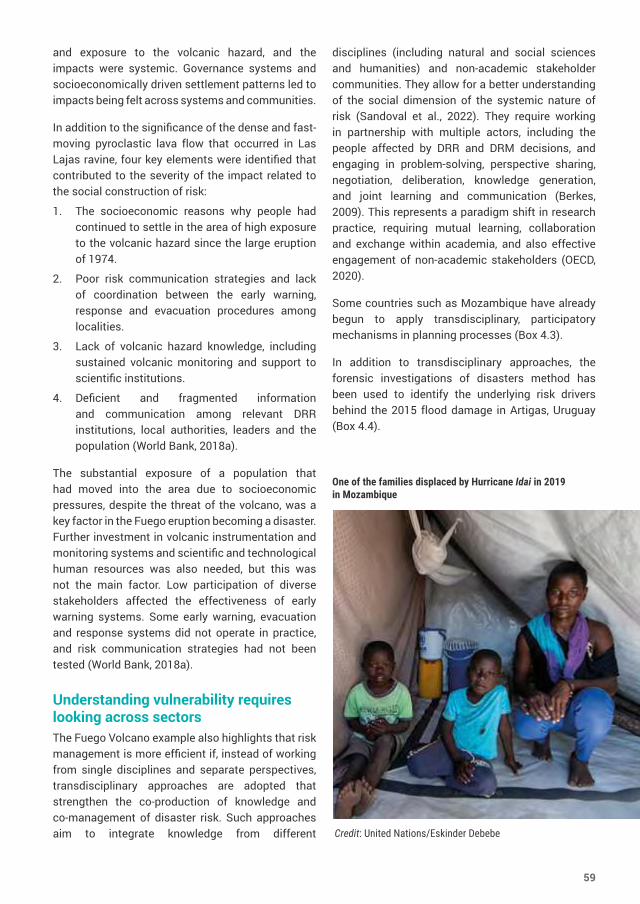
and exposure to the volcanic hazard, and the impacts were systemic. Governance systems and socioeconomically driven settlement patterns led to impacts being felt across systems and communities.
In addition to the significance of the dense and fast-moving pyroclastic lava flow that occurred in Las Lajas ravine, four key elements were identified that contributed to the severity of the impact related to the social construction of risk:
1. The socioeconomic reasons why people had continued to settle in the area of high exposure to the volcanic hazard since the large eruption of 1974.
2. Poor risk communication strategies and lack of coordination between the early warning, response and evacuation procedures among localities.
3. Lack of volcanic hazard knowledge, including sustained volcanic monitoring and support to scientific institutions.
4. Deficient and fragmented information and communication among relevant DRR institutions, local authorities, leaders and the population (World Bank, 2018a).
The substantial exposure of a population that had moved into the area due to socioeconomic pressures, despite the threat of the volcano, was a key factor in the Fuego eruption becoming a disaster. Further investment in volcanic instrumentation and monitoring systems and scientific and technological human resources was also needed, but this was not the main factor. Low participation of diverse stakeholders affected the effectiveness of early warning systems. Some early warning, evacuation and response systems did not operate in practice, and risk communication strategies had not been tested (World Bank, 2018a).
Understanding vulnerability requires looking across sectorsThe Fuego Volcano example also highlights that risk management is more efficient if, instead of working from single disciplines and separate perspectives, transdisciplinary approaches are adopted that strengthen the co-production of knowledge and co-management of disaster risk. Such approaches aim to integrate knowledge from different
disciplines (including natural and social sciences and humanities) and non-academic stakeholder communities. They allow for a better understanding of the social dimension of the systemic nature of risk (Sandoval et al., 2022). They require working in partnership with multiple actors, including the people affected by DRR and DRM decisions, and engaging in problem-solving, perspective sharing, negotiation, deliberation, knowledge generation, and joint learning and communication (Berkes, 2009). This represents a paradigm shift in research practice, requiring mutual learning, collaboration and exchange within academia, and also effective engagement of non-academic stakeholders (OECD, 2020).
Some countries such as Mozambique have already begun to apply transdisciplinary, participatory mechanisms in planning processes (Box 4.3).
In addition to transdisciplinary approaches, the forensic investigations of disasters method has been used to identify the underlying risk drivers behind the 2015 flood damage in Artigas, Uruguay (Box 4.4).
One of the families displaced by Hurricane Idai in 2019 in Mozambique
Credit: United Nations/Eskinder Debebe
59
Box 4.3. Multisectoral and transdisciplinary strategy on internal displacement in Mozambique
The National Policy and Strategy for Internal Displacement Management in Mozambique addresses Sendai Framework Target B, to substantially reduce the number of people affected by disasters. The policy covers all forms of displacement within Mozambique, as the country is greatly exposed to climate hazards and has recently faced conflict leading to displacement.
Under the policy, the National Institute for Disaster Risk Reduction and Management is responsible for addressing displacement and tasked with ensuring all government ministries and agencies coordinate their actions. The relevant ministries (e.g. education, health and social services) must each fulfil assigned tasks to ensure services to and protection of displaced people. They are required to include these in their yearly programming and budget plans. Mozambique ensured ownership across the government by creating a national-level multisectoral transdisciplinary team to develop the policy. Members of the team visited the resettlement camps, listening to displaced people’s needs and meeting with local-level DRR managers. The media were invited to report on these visits, bringing national attention to the plight of the thousands of displaced people, and resulting in high-level political commitment to drafting and approving the policy in record time. The policy mandates action once displacement has occurred and, crucially, focuses on prevention, resilience building and finding durable solutions for displaced people. Mozambique is now strengthening capacity to ensure the policy is put into action at the local level.
Sources: B. Gualandi, S. Llosa and N. Tivane, personal communications (2021)
Box 4.4. Using forensic analysis in 2015 floods in Artigas, Uruguay
In northern Uruguay, the cities of Artigas and Bella Union are highly dependent on two rivers for their daily activities, the Cuareim and Uruguay. The economic, social and cultural aspects of development of Artigas Department lie in a fragile balance and coexistence between these cities and the rivers. Furthermore, the river basins cross international borders with Argentina and Brazil.
Recent evidence indicates some changes may be occurring in the relationship between the cities and the rivers, some of which are induced by changes in El Niño–Southern Oscillation patterns. One indicator is the increasing trend of flood events such as the 2015 floods.
The 2015 floods were so serious that they drew the attention of national media and governmental authorities, changing the debate about how climate change could affect known disaster risks in Uruguay (Verde et al., 2017). A consortium of the National System for Emergencies and international organizations embarked on a forensic analysis. They applied the forensic investigation of flood disasters method (Ramírez and Herrera-Lozano, 2015) to identify the underlying risk drivers behind the disaster, to enhance the analytical capacities of the local government and to define an action plan for reducing future flood impacts.
The critical areas for discussion were the following. (a) How unusual were the 2015 floods? (b) Which socioeconomic features could explain the concentration and distribution of impacts? (c) What kind of evidence is available for identifying changes in climate features in the area?
60
4.3 Improving data supports a better understanding of vulnerability and exposure
Understanding the diverse dimensions of vulnerability and exposure, and the interdependency across systems, can accelerate the effectiveness of risk reduction. However, doing this requires access to data and analysis. Local vulnerability information is often not available, or coverage is inconsistent. Information on disasters is also often siloed from information on vulnerability.
National statistical offices have traditionally produced geospatially enabled population, environmental and economic information at national and subnational scales. However, they have not been involved in producing data related
to disasters or disaster risk. Disaster information is usually provided by the institutions devoted to disaster response or civil protection at the national level. At the global level, initiatives undertaken through EM-DAT, DesInventar, SFM, the World Bank and the INFORM Natural Hazard Risk Index provide information or evaluations on the impacts of disasters.
Global disaster reporting systems tend to undercount small-scale extensive disasters such as localized flooding. These “silent disasters” are often missed due to under-reporting at national level and thresholds applied in global databases (e.g. economic loss and numbers affected) (IFRC, 2021). For example, looking at historical records of flooding in Uganda, far fewer flooding events were reported in the national DesInventar records compared with in the local media. A much smaller
(d) Which institutional mechanisms are in place for regulating the human influence (urban and agriculture expansion) in the vicinities of the rivers? These questions led the local consultation and resulted in findings and conclusions to inform the department’s planning document:
● Better data and modelling are needed for multinational basin analysis. Although insufficient, the scientific evidence shows changes in the climate features of the river basins, which require further analysis to foresee the new average values in the Cuareim and Uruguay River basins. Argentina, Brazil and Uruguay share the basins; however, cooperation efforts for joint analysis remain unexplored, despite the significant potential this initiative could have for the three countries.
● The socioeconomic context highlighted the relevance of comprehensive social interventions. Impacts and losses were concentrated in low-income areas. Most of the families affected by the 2015 flood lacked stable income sources and did not have options for reallocation without governmental support. Many affected families returned to their homes after the flood, increasing the risk of being affected during the next El Niño–Southern Oscillation episode. Relocation efforts developed in the past failed to install families in a new context with access to labour markets. As a result, most of the families left their new houses and returned to the margins of the rivers.
● Local regulation requires enhanced risk zoning. Governance is at the core of risk reduction initiatives in Artigas. Normative instruments such as the urban plan can issue mandatory zoning to avoid further occupation of areas close to the river margins. Although it is well known that these areas contain most of the flood risk, the urban plan does not restrict occupation in all the areas. Moreover, the local capacity to enforce the plan is low, and families keep moving to the flood-plains.
Source: A. Brenes Torres, personal communication (2021)
61
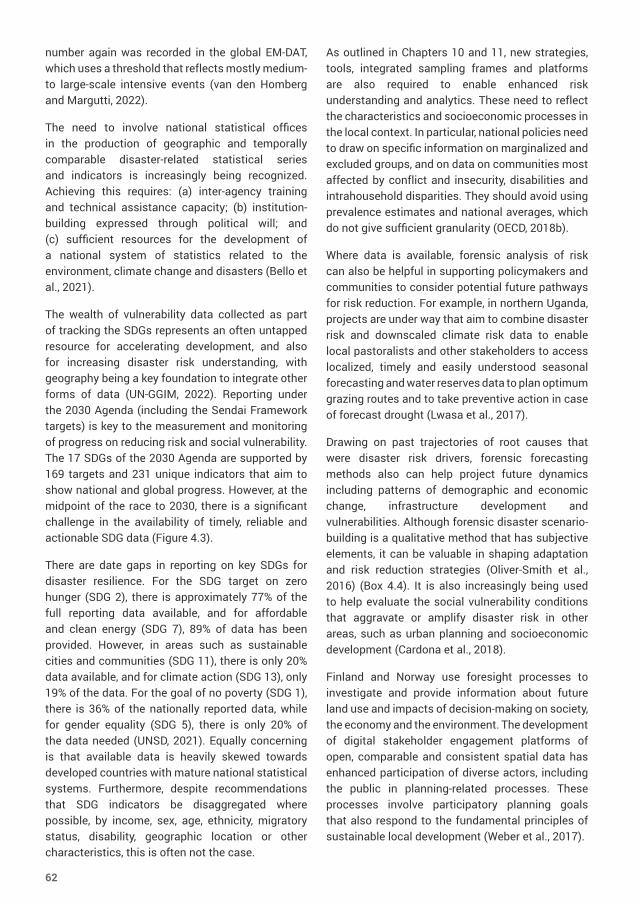
number again was recorded in the global EM-DAT, which uses a threshold that reflects mostly medium- to large-scale intensive events (van den Homberg and Margutti, 2022).
The need to involve national statistical offices in the production of geographic and temporally comparable disaster-related statistical series and indicators is increasingly being recognized. Achieving this requires: (a) inter-agency training and technical assistance capacity; (b) institution-building expressed through political will; and (c) sufficient resources for the development of a national system of statistics related to the environment, climate change and disasters (Bello et al., 2021).
The wealth of vulnerability data collected as part of tracking the SDGs represents an often untapped resource for accelerating development, and also for increasing disaster risk understanding, with geography being a key foundation to integrate other forms of data (UN-GGIM, 2022). Reporting under the 2030 Agenda (including the Sendai Framework targets) is key to the measurement and monitoring of progress on reducing risk and social vulnerability. The 17 SDGs of the 2030 Agenda are supported by 169 targets and 231 unique indicators that aim to show national and global progress. However, at the midpoint of the race to 2030, there is a significant challenge in the availability of timely, reliable and actionable SDG data (Figure 4.3).
There are date gaps in reporting on key SDGs for disaster resilience. For the SDG target on zero hunger (SDG 2), there is approximately 77% of the full reporting data available, and for affordable and clean energy (SDG 7), 89% of data has been provided. However, in areas such as sustainable cities and communities (SDG 11), there is only 20% data available, and for climate action (SDG 13), only 19% of the data. For the goal of no poverty (SDG 1), there is 36% of the nationally reported data, while for gender equality (SDG 5), there is only 20% of the data needed (UNSD, 2021). Equally concerning is that available data is heavily skewed towards developed countries with mature national statistical systems. Furthermore, despite recommendations that SDG indicators be disaggregated where possible, by income, sex, age, ethnicity, migratory status, disability, geographic location or other characteristics, this is often not the case.
As outlined in Chapters 10 and 11, new strategies, tools, integrated sampling frames and platforms are also required to enable enhanced risk understanding and analytics. These need to reflect the characteristics and socioeconomic processes in the local context. In particular, national policies need to draw on specific information on marginalized and excluded groups, and on data on communities most affected by conflict and insecurity, disabilities and intrahousehold disparities. They should avoid using prevalence estimates and national averages, which do not give sufficient granularity (OECD, 2018b).
Where data is available, forensic analysis of risk can also be helpful in supporting policymakers and communities to consider potential future pathways for risk reduction. For example, in northern Uganda, projects are under way that aim to combine disaster risk and downscaled climate risk data to enable local pastoralists and other stakeholders to access localized, timely and easily understood seasonal forecasting and water reserves data to plan optimum grazing routes and to take preventive action in case of forecast drought (Lwasa et al., 2017).
Drawing on past trajectories of root causes that were disaster risk drivers, forensic forecasting methods also can help project future dynamics including patterns of demographic and economic change, infrastructure development and vulnerabilities. Although forensic disaster scenario-building is a qualitative method that has subjective elements, it can be valuable in shaping adaptation and risk reduction strategies (Oliver-Smith et al., 2016) (Box 4.4). It is also increasingly being used to help evaluate the social vulnerability conditions that aggravate or amplify disaster risk in other areas, such as urban planning and socioeconomic development (Cardona et al., 2018).
Finland and Norway use foresight processes to investigate and provide information about future land use and impacts of decision-making on society, the economy and the environment. The development of digital stakeholder engagement platforms of open, comparable and consistent spatial data has enhanced participation of diverse actors, including the public in planning-related processes. These processes involve participatory planning goals that also respond to the fundamental principles of sustainable local development (Weber et al., 2017).
62
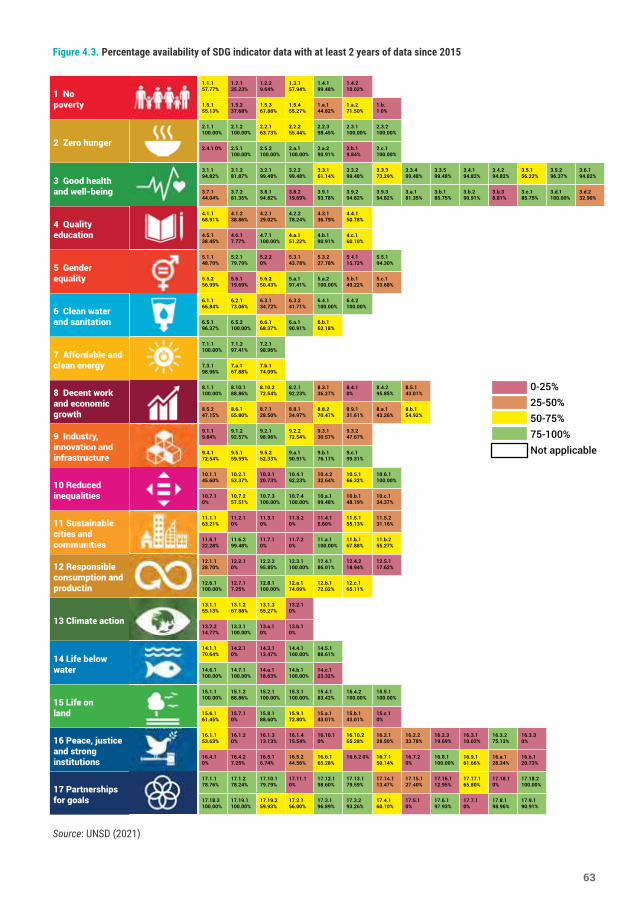
Figure 4.3. Percentage availability of SDG indicator data with at least 2 years of data since 2015
Source: UNSD (2021)
1 Nopoverty
1.1.1 57.77%
1.2.1 35.23%
1.2.2 9.64%
1.3.1 57.94%
1.4.1 99.48%
1.4.2 10.02%
1.5.1 55.13%
1.5.2 37.68%
1.5.3 67.88%
1.5.4 55.27%
1.a.1 44.82%
1.a.2 71.50%
1.b.1 0%
2 Zero hunger
2.1.1 100.00%
2.1.2 100.00%
2.2.1 63.73%
2.2.2 55.44%
2.2.3 98.45%
2.3.1 100.00%
2.3.2 100.00%
2.4.1 0% 2.5.1 100.00%
2.5.2 100.00%
2.a.1 100.00%
2.a.2 90.91%
2.b.1 9.84%
2.c.1 100.00%
3 Good health and well-being
3.1.1 94.82%
3.1.2 81.87%
3.2.1 99.48%
3.2.2 99.48%
3.3.1 61.14%
3.3.2 99.48%
3.3.3 73.29%
3.3.4 99.48%
3.3.5 99.48%
3.4.1 94.82%
3.4.2 94.82%
3.5.1 56.22%
3.5.2 96.37%
3.6.1 94.82%
3.7.1 44.04%
3.7.2 81.35%
3.8.1 94.82%
3.8.2 19.69%
3.9.1 93.78%
3.9.2 94.82%
3.9.3 94.82%
3.a.1 81.35%
3.b.1 85.75%
3.b.2 90.91%
3.b.3 8.81%
3.c.1 85.75%
3.d.1 100.00%
3.d.2 32.90%
4 Quality education
4.1.1 68.91%
4.1.2 38.86%
4.2.1 29.02%
4.2.2 78.24%
4.3.1 36.79%
4.4.1 50.78%
4.5.1 38.45%
4.6.1 7.77%
4.7.1 100.00%
4.a.1 51.22%
4.b.1 90.91%
4.c.1 60.10%
5 Gender equality
5.1.1 48.70%
5.2.1 79.79%
5.2.2 0%
5.3.1 43.78%
5.3.2 27.78%
5.4.1 15.72%
5.5.1 94.30%
5.5.2 56.99%
5.6.1 19.69%
5.6.2 50.43%
5.a.1 97.41%
5.a.2 100.00%
5.b.1 49.22%
5.c.1 33.68%
6 Clean water and sanitation
6.1.1 66.84%
6.2.1 73.06%
6.3.1 34.72%
6.3.2 41.71%
6.4.1 100.00%
6.4.2 100.00%
6.5.1 96.37%
6.5.2 100.00%
6.6.1 68.37%
6.a.1 90.91%
6.b.1 62.18%
7 Affordable and clean energy
7.1.1 100.00%
7.1.2 97.41%
7.2.1 98.96%
7.3.1 98.96%
7.a.1 67.88%
7.b.1 74.09%
8 Decent work and economic growth
8.1.1 100.00%
8.10.1 88.86%
8.10.2 72.54%
8.2.1 92.23%
8.3.1 36.27%
8.4.1 0%
8.4.2 95.85%
8.5.1 43.01%
8.5.2 47.15%
8.6.1 65.80%
8.7.1 28.50%
8.8.1 34.97%
8.8.2 70.47%
8.9.1 31.61%
8.a.1 43.26%
8.b.1 54.92%
9 Industry, innovation and infrastructure
9.1.1 9.84%
9.1.2 92.57%
9.2.1 98.96%
9.2.2 72.54%
9.3.1 30.57%
9.3.2 47.67%
9.4.1 72.54%
9.5.1 59.59%
9.5.2 52.33%
9.a.1 90.91%
9.b.1 76.17%
9.c.1 99.31%
10 Reduced inequalities
10.1.1 45.60%
10.2.1 53.37%
10.3.1 20.73%
10.4.1 92.23%
10.4.2 32.64%
10.5.1 66.32%
10.6.1 100.00%
10.7.1 0%
10.7.2 57.51%
10.7.3 100.00%
10.7.4 100.00%
10.a.1 99.48%
10.b.1 48.19%
10.c.1 34.37%
11 Sustainable cities and communities
11.1.1 63.21%
11.2.1 0%
11.3.1 0%
11.3.2 0%
11.4.1 5.60%
11.5.1 55.13%
11.5.2 31.16%
11.6.1 22.28%
11.6.2 99.48%
11.7.1 0%
11.7.2 0%
11.a.1 100.00%
11.b.1 67.88%
11.b.2 55.27%
12 Responsible consumption and productin
12.1.1 28.70%
12.2.1 0%
12.2.2 95.85%
12.3.1 100.00%
12.4.1 86.01%
12.4.2 18.94%
12.5.1 17.62%
12.6.1 100.00%
12.7.1 7.25%
12.8.1 100.00%
12.a.1 74.09%
12.b.1 72.02%
12.c.1 65.11%
13 Climate action
13.1.1 55.13%
13.1.2 67.88%
13.1.3 55.27%
13.2.1 0%
13.2.2 14.77%
13.3.1 100.00%
13.a.1 0%
13.b.1 0%
14 Life below water
14.1.1 70.64%
14.2.1 0%
14.3.1 13.47%
14.4.1 100.00%
14.5.1 88.61%
14.6.1 100.00%
14.7.1 100.00%
14.a.1 18.63%
14.b.1 100.00%
14.c.1 23.32%
15 Life on land
15.1.1 100.00%
15.1.2 88.86%
15.2.1 100.00%
15.3.1 100.00%
15.4.1 83.42%
15.4.2 100.00%
15.5.1 100.00%
15.6.1 61.45%
15.7.1 0%
15.8.1 88.60%
15.9.1 72.80%
15.a.1 43.01%
15.b.1 43.01%
15.c.1 0%
16 Peace, justice and strong institutions
16.1.1 53.63%
16.1.2 0%
16.1.3 13.13%
16.1.4 15.54%
16.10.1 0%
16.10.2 65.28%
16.2.1 28.50%
16.2.2 33.78%
16.2.3 19.69%
16.3.1 10.02%
16.3.2 75.13%
16.3.3 0%
16.4.1 0%
16.4.2 7.25%
16.5.1 6.74%
16.5.2 44.56%
16.6.1 65.28%
16.6.2 0% 16.7.1 50.14%
16.7.2 0%
16.8.1 100.00%
16.9.1 61.66%
16.a.1 28.24%
16.b.1 20.73%
17 Partnerships for goals
17.1.1 78.76%
17.1.2 78.24%
17.10.1 79.79%
17.11.1 0%
17.12.1 98.60%
17.13.1 79.59%
17.14.1 13.47%
17.15.1 27.40%
17.16.1 12.95%
17.17.1 65.80%
17.18.1 0%
17.18.2 100.00%
17.18.3 100.00%
17.19.1 100.00%
17.19.2 59.93%
17.2.1 56.00%
17.3.1 96.89%
17.3.2 93.26%
17.4.1 60.10%
17.5.1 0%
17.6.1 97.93%
17.7.1 0%
17.8.1 98.96%
17.9.1 90.91%
0-25%25-50%50-75%75-100%Not applicable
63
Recognizing data challenges, a recently developed SDGs Geospatial Roadmap aims to encourage the use of geospatial and location-based information to augment official data for SDG reporting to help fill data gaps (IAEG-SDGs WGGI, 2022). Chapter 10 further explores emerging innovative uses of these approaches.
Future scenario-building approaches for environmental sustainability and development are also being applied to planning of water usage and river basin management in the transboundary Indus basin (Box 4.5).
Policy choices can accelerate risk reduction Policy choices can promote resilience building, or can become root causes, drivers and amplifiers of disaster risk. For example, a policy of housing
evictions of low-income residents can accentuate disaster vulnerability in cities. The dismantling of environmental laws that protect natural reserves can exacerbate climate change and lead to deforestation, reduced water quality and a higher risk of flooding or landslides. Top-down reconstruction and social protection approaches that require affected communities to accept government or institutional plans while limiting community active participation and agency in enacting post-disaster efforts can also become drivers of disaster risk rather than creating long-term resilience (Bowen et al., 2020; Wu, 2022). The absence of grass-roots input can maintain systemic risks and societal inequalities, jeopardizing long-term sustainable development (Wu and Drolet, 2016; Chavda et al., 2022; Wu, 2022).
Conversely, well-designed adaptive social protection efforts can reduce vulnerability and exposure (e.g. geographic, social and economic) and build
Box 4.5. Co-designing future water resource pathways in the Indus basin
The Indus basin is home to about 250 million people across Afghanistan, China, India and Pakistan. Approximately 110 million people living in the basin are living in extreme poverty (Wada et al., 2019). With low to moderate levels of access to basic services, health care and education, large parts of the basin’s population are vulnerable to climate change impacts and have low adaptive capacity, with the population expected to increase. Strategic decisions need to be made across the different sectors and countries to ensure sustainable development pathways for the basin’s region. These are especially relevant in managing the transboundary governance of risks that transcend multiple jurisdictions and hazards and which may have impacts over long distances in other surrounding areas, such as in mountainous regions.
Stakeholders across different sectors and countries representing three basin development priorities – economy, society and environment – used a game-like scenario policy tool to develop and co-define a joint vision about existing challenges and possible pathways for the Indus basin. Figure 4.4 illustrates a business-as-usual scenario agreed by stakeholders as the likely future based on current development pathways, which is one of increasing risk. Then it indicates three resilient future scenarios according to different stakeholder preferences, values and world-views. The pathways to each of these identify trade-offs that need to be weighted to reach them, for example, developing large-scale water infrastructure versus small-scale nature-based solutions may lead to alternative pathways. The internal drivers represented are measures and policies that basin stakeholders (subnational to regional) have the ability to agree and adopt. The external drivers are global factors such as climate change and economic shocks that are the sphere of uncertainty against which regional pathways need to be adapted to become robust.
Source: Schinko et al. (2022)
64
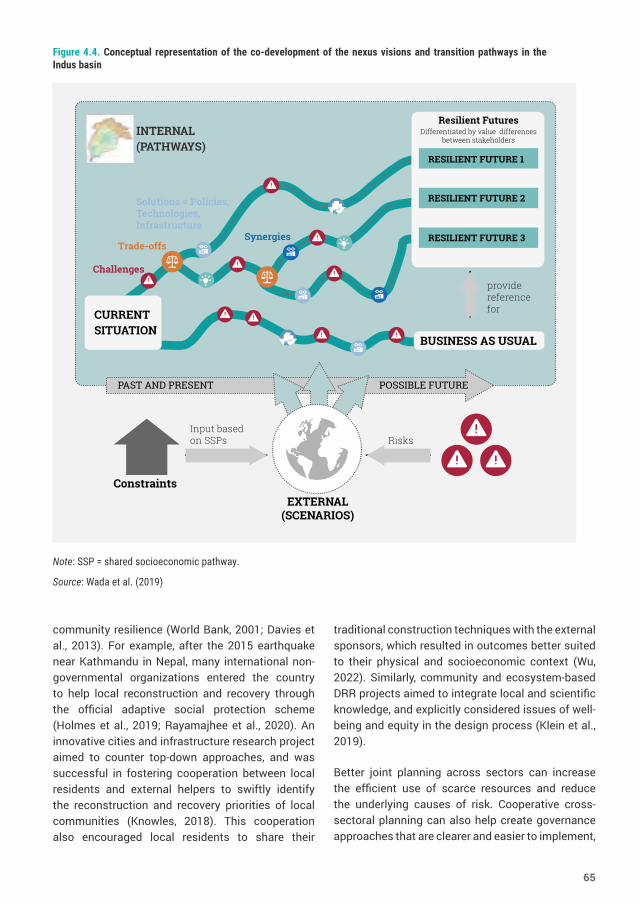
community resilience (World Bank, 2001; Davies et al., 2013). For example, after the 2015 earthquake near Kathmandu in Nepal, many international non-governmental organizations entered the country to help local reconstruction and recovery through the official adaptive social protection scheme (Holmes et al., 2019; Rayamajhee et al., 2020). An innovative cities and infrastructure research project aimed to counter top-down approaches, and was successful in fostering cooperation between local residents and external helpers to swiftly identify the reconstruction and recovery priorities of local communities (Knowles, 2018). This cooperation also encouraged local residents to share their
traditional construction techniques with the external sponsors, which resulted in outcomes better suited to their physical and socioeconomic context (Wu, 2022). Similarly, community and ecosystem-based DRR projects aimed to integrate local and scientific knowledge, and explicitly considered issues of well-being and equity in the design process (Klein et al., 2019).
Better joint planning across sectors can increase the efficient use of scarce resources and reduce the underlying causes of risk. Cooperative cross-sectoral planning can also help create governance approaches that are clearer and easier to implement,
INTERNAL(PATHWAYS)
RESILIENT FUTURE 1
RESILIENT FUTURE 2
RESILIENT FUTURE 3
Resilient FuturesDifferentiated by value differences
between stakeholders
BUSINESS AS USUAL
CURRENT SITUATION
provide reference for
PAST AND PRESENT POSSIBLE FUTURE
Constraints
Input based on SSPs Risks
EXTERNAL (SCENARIOS)
Challenges
SynergiesTrade-offs
Solutions = Policies, Technologies, Infrastructure
Figure 4.4. Conceptual representation of the co-development of the nexus visions and transition pathways in the Indus basin
Note: SSP = shared socioeconomic pathway.
Source: Wada et al. (2019)
65
thus reducing the administrative burden of local governments. For example, research in Jagobiao Barangay in the Philippines identified the siloed nature of local policymaking. Local government officials reported there were nearly 40 separate national plans they were required to implement in their district (GNDR, 2019). Better joint planning can reduce such fragmentation.
Efforts to reduce the root causes of vulnerability and exposure can be particularly effective during a post-disaster recovery and reconstruction period. For example, after the devastation of the 2010 Chilean earthquake and tsunami, in several of the worst-hit communities in Constitución, Chile, the Government provided disaster survivors with “half a good house” living units (Moore, 2016; Wu, 2022). The unfinished half allowed dwellers freedom to expand according to their own needs (Zilliacus, 2016). This type of housing structure was highly appreciated by the local residents, especially low-income families, who could arrange their limited resources to meet their urgent priorities (Franco, 2016). The long-term benefits strongly illustrated that these residents continually improved their housing, to support their ongoing recovery and prepare for prospective extreme events (Moore, 2016). This example portrays the capacity of communities to facilitate their post-disaster housing reconstruction and carry out their own recovery agenda (Wu, 2022).
4.4 Ways forward Disasters are the result of dynamic interactions among hazards, pre-existing local vulnerability and exposure. They are the effects of human choices, and are affected by the socioeconomic, technological and demographic characteristics of a society (IPCC, 2018a; UNDRR, 2019; Gachon et al., 2022). Good disaster risk governance aims to avoid the creation of situations of vulnerability and exposure by tackling drivers and root causes of risk. Addressing the root causes and drivers of vulnerability and exposure reduces risk and contributes to sustainable development.
Development pathways, whether planned or unplanned, frequently increase vulnerability and exposure to known hazards. The Fuego Volcano example shows how forensic disaster analysis
approaches are useful for decision makers. Forensic approaches combine retrospective longitudinal analysis, disaster scenarios, comparative case analysis and meta-analysis research, along with enhanced involvement of development stakeholders. This gives a holistic understanding of particular events and ways to accelerate future risk reduction (Burton, 2015; Oliver-Smith et al., 2016, 2017). However, understanding risks requires investing in data and analysis that can help better understand how and why disasters occur. Disaster data is used as an input to policy formulation and practice and to measure the outcomes, so these should be mutually reinforcing processes.
The adoption of green or transformative approaches in disaster recovery is sometimes seen as the way to transformation, and it is true that such efforts have long been needed. Green recovery, regenerative agriculture and similar practices should be in place to support implementation of the Sendai Framework and the SDGs. However, these need to be considered within broader efforts to address structural inequalities and wider human development.
Addressing the root causes of disasters requires a political and social commitment to sociocultural change. Present and future dimensions of vulnerability, exposure and hazards of communities, sectors and systems are intertwined with modes of governance and development planning in each geographic area, whether national, regional or local.
Disaster risk governance should be backed by open and transparent collective action, vertical and horizontal cooperation and coordination among actors, and different ways of defining and reaching consensus regarding sectoral policies with positive impact in a geographic region. It implies multichannel governance, with horizontal relations among actors and their territories (Davoudi et al., 2008). It also needs to focus on the local level, including local government resources and capacity, and deeper collaboration with civil society and communities (Chavda et al., 2022).
66
5. How systems undervalue key assets and opportunities for learningRisk assessment has traditionally favoured quantitative data analysis based on short-term and economics-based approaches. However, in the context of today’s increasingly complex systemic risk, there is often a gap between the information available and accessible and the knowledge that needs to be used. This chapter looks at this challenge from three key angles. First, it argues there is a need to get better at collecting “traditional” data, particularly on vulnerability, exposure and disaster loss and damage. Second, it is necessary to acknowledge that systems often measure the wrong things, and take a risky short-term, myopic approach. Third, it highlights that the very concept of cause-and-effect risk assessment needs to be reconsidered, and that systemic risk assessment has much to learn from emerging good practices in management of so-called “wicked” problems that require flexible, curious and participatory management. Then, it concludes by presenting the evolutions needed to overcome shortcomings to better assess and manage systemic risk.
5.1 Shortcomings of incumbent approaches to risk managementGovernance systems are not collecting the right data, key assets are being undervalued in decision-making and learning opportunities are being missed. Measuring value more holistically is
essential to reducing and managing risk. This needs to be considered across governance systems and the private sector, not only within DRM authorities. Disasters are intrinsically interlinked with systemic disaster risks from development, and vice versa (Keating et al., 2016; Keating and Hanger-Kopp, 2020).
There are three pitfalls with the way in which value is defined in the incumbent approach to risk management: indices measure the wrong things, they take a short-term approach and they are myopic in that they fail to take into account cascading impacts and/or transboundary risks. All three of these limitations hinder the ability to effectively understand, assess and act on complex and systemic risk.
5.1.1 Measuring the wrong thingsThe old adage that “what gets measured gets managed” is highly relevant in the risk management space. Factors not measured are excluded from financial balance sheets and governance decision-making. Current risk reduction efforts focus largely on valuing a narrow set of immediate, short-term impacts, but therefore fail to measure other factors such as biodiversity loss, deforestation and unpaid care.
Systems also fail to account for the value of less-tangible assets that become crucial when less-predictable systemic risks emerge. For example,
67
during the COVID-19 crisis, it has become evident that countries do not have a way to measure the value of having strong, flexible, well-managed companies that can produce essential key items such as medicine and hand sanitizer during crises. Non-market values to humans in areas such as social and religious customs and aesthetic value are also undervalued; these are key to human well-being, as is the value of biodiversity to ecosystems including the human ability to survive.
Other important indices (e.g. the economic value of human life) remain ethically contentious and are therefore often excluded from corporate balance sheets and government decision-making. Better quantification of the real extent of financial and social assets at risk is essential, particularly in an uncertain and volatile climate future.
Furthermore, the understanding and application of how to account for impacts that cascade into or over one another is limited. A building designed to withstand flooding and high winds may simultaneously contain no design consideration for airflow in the event of a pandemic. Equally, the design of a dam in one jurisdiction traditionally considers only the risk to the communities and environments in that same jurisdiction. Such design decisions are also usually made based on historical and limited trend data. In the context of systemic risks such as climate change, this means that infrastructure may rapidly become “out of date” and vulnerable.
5.1.2 Short-term thinkingThe second pitfall is the time frame over which the destruction and creation of value is considered in risk management. Most disaster impact assessments typically take a short-term view. This short-termism means little data and insights on indirect or concatenated impacts, or ripple effects, are available for risk managers wanting to understand more comprehensively the potential positive and negative consequences of events (Ladds et al., 2017). In addition, there is considerable empirical evidence that individuals exhibit a myopic bias when making risk-based decisions for low-probability events (Meyer and Kunreuther, 2017) (Chapter 8).
There have recently been changes in the legislation of jurisdictions across the world to balance Milton Friedman’s theory that a company’s sole responsibility is to its shareholders (Harris, 2018; Atkins, 2019). In corporate reporting, a wider range of risks is beginning to be considered alongside the financial balance sheet. Such a change represents a significant shift in what corporations consider valuable and therefore what risks they manage; however, more remains to be done.
Private sector risk assessments typically consider the value created or lost over 12 months. This is evidenced by the alignment to this time frame of shareholder reporting and incentive schemes such as employee bonuses. There is often a lack of experience in to how to integrate systemic risk reduction initiatives with much longer time frames. However, there are also some good counter-examples, such as the work of the Economic Commission for Latin America and the Caribbean over the last four decades. This has made a major contribution to changing short-term corporate thinking on disaster risk, in particular through the development of a widely recognized disaster impact assessment methodology (ECLAC, 2014).
Even staying exclusively in the economics sphere, the indirect and long-term impacts of disasters are likely much greater than the acknowledged short-term ones. Hochrainer-Stigler et al. (2019) estimated the available financial resources and expected annual disaster loss for Austria, including direct and indirect damage. They found an urgent need for increased investment in prospective risk management, even for medium-level risk (50–100 year return periods) due to the largely unacknowledged risk from indirect losses.
Social and environmental values are often created and lost during financial value creation. The impact of the short time frame is that, even when they are accounted for, the time frame over which the value of social or environmental assets is lost is considerably shorter than the time taken to repair them. For example, a balance sheet will not yet include the destruction of groundwater by mining over 40 years of production against the 200+ years it will take to recover, or take into account the
68
species loss as a result of such destruction. Many balance sheets would be shown to be untenable if loss were accounted for in this way. Likewise, many risk assessments would be deemed to require urgent and widespread attention if assessed over longer time frames, such as those related to climate change. This short-termism is a dangerous form of simplification that masks latent and potentially highly expensive risks built into financial systems.
However, long-term risk assessment is possible, and there are examples in other sectors and systems that provide sources for learning. Within the insurance industry and some parts of the investment communities, financial returns are routinely assessed over multiple decades, but this thinking is not prevalent in other parts of the financial system. Similarly, the private sector has developed methods for consideration of safety factors in infrastructure design that look at cascading impacts of design choices. These can provide lessons for other sectors. In the public sector, risk assessments typically take a longer view than 12 months, particularly in the case of infrastructure, but the practice of discounting means impacts beyond 20–30 years effectively become ignored.
It is particularly concerning that even where longer-term time frames are considered, the mechanisms for integrating systemic risks, particularly from climate change, are not yet developed. This represents a growing and potentially game-changing risk to current systems and longer-term investments. Reconsidering the choice of discount rate and better accounting for climate change present opportunities to act on investment risk and promote intergenerational equity.
5.1.3 Myopia that ignores transboundary and systemic impactsThe third pitfall of current systems is that they tend to align with political and geopolitical borders, thereby ignoring systemic and transboundary risks. The impact of a virus or risk to biodiversity from consumptive behaviours in one country may be minimal or even invisible in that country, but devastating for an adjacent, economically and politically separate community. For example, in February 2021, a cold wave in Texas, United States,
left semiconductor plants without electricity, affecting microchip manufacturing and consumers across the world, disrupting an estimated $30 billion of global trade (Williams, 2021). Semiconductor supply chain shortages in Taiwan Province of China in mid-2021 due to the COVID-19 pandemic have also had global impacts on manufacturing supply chains (Feigenbaum and Nelson, 2021).
Global corporations span political and geographical boundaries, and hold more financial resources than many nations, so the choices they make about which risks to govern and who they regard as their primary stakeholders have the potential for significant positive impacts on systemic risk.
Improving understanding of the transboundary nature of risk can also positively reinforce disaster resilience. For example, during the COVID-19 outbreak, a major distributor of electronic components in China, TTI, temporarily locked down due to the country’s pandemic prevention policy. However, TTI took rapid actions to scale up the operation of its warehouses in the Americas, Asia and Europe to receive incoming shipments from suppliers and make outgoing shipments to customers to fill the resulting supply chain gap (TTI, 2020; Haraguchi et al., 2022). Similarly, around the world, during the first waves of the COVID-19 pandemic, the flexibility of global manufacturers to rapidly adapt and adjust manufacturing capacity to meet new and unexpected demand for products such as hand sanitizer and face masks became a key asset in addressing the pandemic (Table 5.1). The DRR community can potentially learn from such examples of flexibility.
There are few mechanisms measuring transboundary systemic risks, let alone planning for and providing redress from transboundary impacts. The maturity of models that convert the value of these elements to the common economic unit – money – has increased significantly in recent years, but a gap remains (Chapter 10). Although independent models exist, integration and dependencies are complicated and messy and are usually considered only partially, if at all (Steffen et al., 2020). And this is where it is important to complement such models with approaches that recognize how “messy” interdependencies are part
69
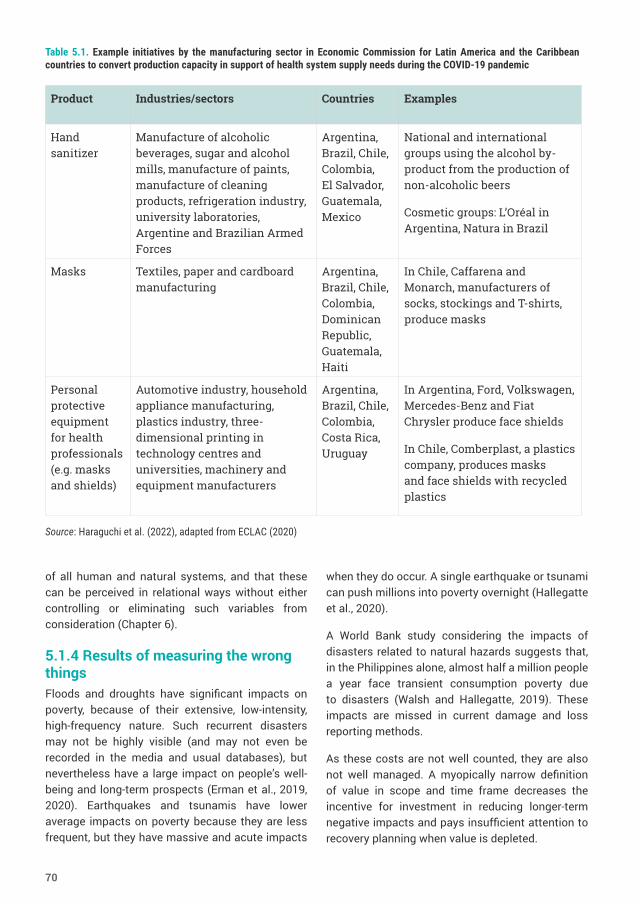
of all human and natural systems, and that these can be perceived in relational ways without either controlling or eliminating such variables from consideration (Chapter 6).
5.1.4 Results of measuring the wrong thingsFloods and droughts have significant impacts on poverty, because of their extensive, low-intensity, high-frequency nature. Such recurrent disasters may not be highly visible (and may not even be recorded in the media and usual databases), but nevertheless have a large impact on people’s well-being and long-term prospects (Erman et al., 2019, 2020). Earthquakes and tsunamis have lower average impacts on poverty because they are less frequent, but they have massive and acute impacts
when they do occur. A single earthquake or tsunami can push millions into poverty overnight (Hallegatte et al., 2020).
A World Bank study considering the impacts of disasters related to natural hazards suggests that, in the Philippines alone, almost half a million people a year face transient consumption poverty due to disasters (Walsh and Hallegatte, 2019). These impacts are missed in current damage and loss reporting methods.
As these costs are not well counted, they are also not well managed. A myopically narrow definition of value in scope and time frame decreases the incentive for investment in reducing longer-term negative impacts and pays insufficient attention to recovery planning when value is depleted.
Product Industries/sectors Countries Examples
Hand sanitizer
Manufacture of alcoholic beverages, sugar and alcohol mills, manufacture of paints, manufacture of cleaning products, refrigeration industry, university laboratories, Argentine and Brazilian Armed Forces
Argentina, Brazil, Chile, Colombia, El Salvador, Guatemala, Mexico
National and international groups using the alcohol by-product from the production of non-alcoholic beers
Cosmetic groups: L’Oréal in Argentina, Natura in Brazil
Masks Textiles, paper and cardboard manufacturing
Argentina, Brazil, Chile, Colombia, Dominican Republic, Guatemala, Haiti
In Chile, Caffarena and Monarch, manufacturers of socks, stockings and T-shirts, produce masks
Personal protective equipment for health professionals (e.g. masks and shields)
Automotive industry, household appliance manufacturing, plastics industry, three-dimensional printing in technology centres and universities, machinery and equipment manufacturers
Argentina, Brazil, Chile, Colombia, Costa Rica, Uruguay
In Argentina, Ford, Volkswagen, Mercedes-Benz and Fiat Chrysler produce face shields
In Chile, Comberplast, a plastics company, produces masks and face shields with recycled plastics
Table 5.1. Example initiatives by the manufacturing sector in Economic Commission for Latin America and the Caribbean countries to convert production capacity in support of health system supply needs during the COVID-19 pandemic
Source: Haraguchi et al. (2022), adapted from ECLAC (2020)
70
The way in which people assess time and value is creating a compounding negative impact on systemic risk and inhibiting achievement of the Sendai Framework goal and the 2030 Agenda. A short-term focus can miss significant disaster impacts, and also fail to understand and ultimately address the dynamic interconnections between disaster risk and long-term well-being (Keating et al., 2016). A shift is required from an almost exclusive focus on the protection of privatized gains in financial systems, strategic economic infrastructure and global supply chains, towards the management and reduction of socialized risks (Maskrey et al., 2022).
Consideration of safety factors requires a long-term view, but even in this context, the importance of systemic features is not always recognized. Furthermore, the understanding and the application of how to account for impacts that cascade into or over one another are limited.
Myopia affects approaches to handling complex, existential systemic risk such as biodiversity loss. Despite being high on the list of grand societal challenges, biodiversity does not receive the focus that is intuitively appropriate for something widely accepted as being essential to food security and human well-being (FAO, 2019; Zeng et al., 2020).
Deforestation, changes in forest habitats, poorly regulated agricultural land and mismanaged urban growth have resulted in a range of conditions that increase the likelihood and impact of globally significant health events such as outbreaks of vector-borne diseases and pandemics. These changes have altered the composition of wildlife communities, greatly increased the contact of humans with wildlife, and altered niches that harbour pathogens, increasing the chance they will come into contact with humans (UNESCO, 2020; Platto et al., 2021).
The current system of risk determination and mitigation deals predominantly with market exchange values. Although these may be used to justify biodiversity protection measures, the exchange values for biodiversity and ecosystems constitute only a fraction of the real benefit of these systems (Gowdy, 1997; Alho, 2008; Conniff,
2010). Lessons can be learned from Costa Rica, which effectively combined protecting areas for conservation with innovative payments for ecosystem services and strict enforcement of regulations on biodiversity protection, hydrological services and carbon sequestration (section 8.3.1). Forest protection measures in Brazil and Indonesia have also shown that human disease risk can be reduced indirectly by management of the landscape, ecosystems and the biodiversity they contain (Whitmee et al., 2015).
One of the starkest examples of this circular logic or complex interactions is that of disaster poverty traps. Poverty traps occur when a household or community’s response to a disaster reduces their well-being in the longer term and ultimately reinforces their vulnerability to the next disaster event, resulting in a vicious cycle from which it is almost impossible to escape. A family might get caught in a disaster poverty trap when forced to use erosive coping strategies following losses from a disaster (Heltberg et al., 2012). Erosive coping strategies are short-term fixes with devastating long-term consequences, such as selling productive livestock, removing children from formal education, arranging for girls to marry early to relieve economic pressure or gain income, or taking out a high-interest loan.
Recent examples of erosive coping strategies during the COVID-19 pandemic are the national policies in Australia and Chile that allowed pension fund contributors to draw on savings in their pension funds to cover basic needs during the crisis. In Chile, this was a frank process of impoverishment whose impact will be seen in future years when those who used these funds in advance will see their pensions severely diminished: “Official data shows that, up to February 2021, close to 10.5 million people withdrew money using the first or second withdrawals and, of those, 30 percent depleted their accounts” (Evans and Pienknagura, 2021).
In the worst cases, industries, governments and individuals can contribute “negative resilience” (Gallopín, 2006) or “perverse resilience” (Holling, 2001; Ráez-Luna, 2008). This occurs when systems that are oppressive and exploitative of humans and ecosystems are resistant to change.
71
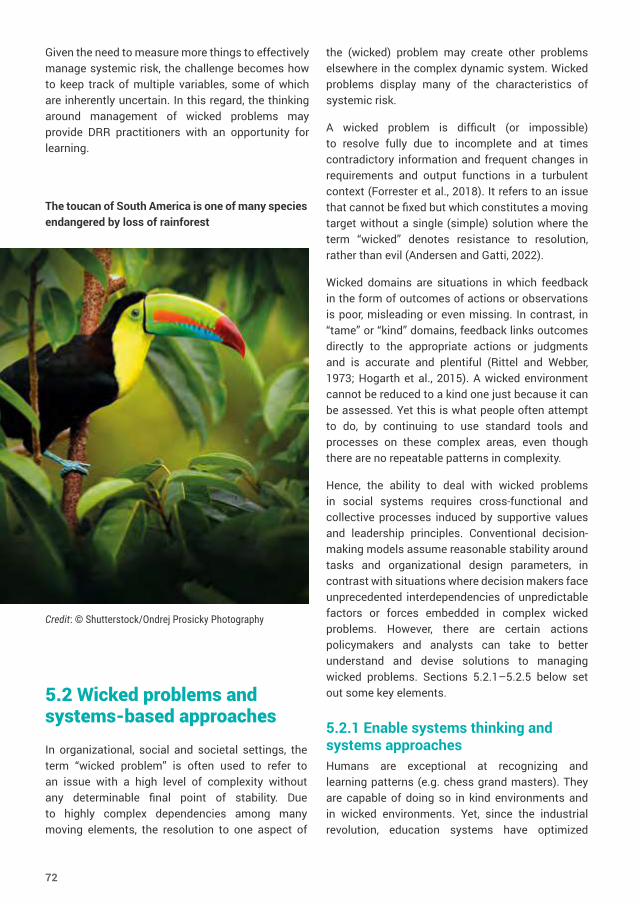
Given the need to measure more things to effectively manage systemic risk, the challenge becomes how to keep track of multiple variables, some of which are inherently uncertain. In this regard, the thinking around management of wicked problems may provide DRR practitioners with an opportunity for learning.
The toucan of South America is one of many species endangered by loss of rainforest
Credit: © Shutterstock/Ondrej Prosicky Photography
the (wicked) problem may create other problems elsewhere in the complex dynamic system. Wicked problems display many of the characteristics of systemic risk.
A wicked problem is difficult (or impossible) to resolve fully due to incomplete and at times contradictory information and frequent changes in requirements and output functions in a turbulent context (Forrester et al., 2018). It refers to an issue that cannot be fixed but which constitutes a moving target without a single (simple) solution where the term “wicked” denotes resistance to resolution, rather than evil (Andersen and Gatti, 2022).
Wicked domains are situations in which feedback in the form of outcomes of actions or observations is poor, misleading or even missing. In contrast, in “tame” or “kind” domains, feedback links outcomes directly to the appropriate actions or judgments and is accurate and plentiful (Rittel and Webber, 1973; Hogarth et al., 2015). A wicked environment cannot be reduced to a kind one just because it can be assessed. Yet this is what people often attempt to do, by continuing to use standard tools and processes on these complex areas, even though there are no repeatable patterns in complexity.
Hence, the ability to deal with wicked problems in social systems requires cross-functional and collective processes induced by supportive values and leadership principles. Conventional decision-making models assume reasonable stability around tasks and organizational design parameters, in contrast with situations where decision makers face unprecedented interdependencies of unpredictable factors or forces embedded in complex wicked problems. However, there are certain actions policymakers and analysts can take to better understand and devise solutions to managing wicked problems. Sections 5.2.1–5.2.5 below set out some key elements.
5.2.1 Enable systems thinking and systems approaches Humans are exceptional at recognizing and learning patterns (e.g. chess grand masters). They are capable of doing so in kind environments and in wicked environments. Yet, since the industrial revolution, education systems have optimized
5.2 Wicked problems and systems-based approaches
In organizational, social and societal settings, the term “wicked problem” is often used to refer to an issue with a high level of complexity without any determinable final point of stability. Due to highly complex dependencies among many moving elements, the resolution to one aspect of
72
delving deeper and more narrowly, transmitting information rather than connecting it. However, a resurgence of systems thinking is now occurring, from the structure of projects to the role of intergenerational facilitators (Hogan, 2019). A similar revolution is needed in the realm of work to combat many of the processes that discourage people from identifying and connecting information or seeking external “non-expert” input. It is these types of connections that are needed to respond to the wicked problems that risk governance seeks to address.
In practice, systems thinking is reflected in many day-to-day skills. Providing room in the work environment to hone the habits of systems thinking can be a first small step towards mainstreaming systems approaches (Waters Center for Systems Thinking, 2020).
5.2.2 Integrate diverse knowledge The system of learning in most countries is designed to reward early and hyper specialization, sinking people deeper into the trenches of highly specialized knowledge (Epstein, 2019). While this is necessary to advance knowledge, it can also miss the opportunity to seize insights generated in interdisciplinary, intersectoral, interdepartmental, integration of knowledge. This does not mean specialized knowledge is not important, but it also needs to be integrated effectively with broader transdisciplinary approaches, as well as indigenous and traditional knowledge systems and polycultural ways of knowing (Chapter 6).
5.2.3 Recognize that deep uncertainty is a characteristic of wicked problems Existing approaches for planning under deep uncertainty are likely to be most useful when they seize opportunities to draw on collective intelligence. Adaptation pathway approaches, which are popular also in flood risk management, are gaining traction as a method in this area. They have the capacity to explicitly address systemic characteristics such as path dependencies (Werners et al., 2021; Hanger-Kopp et al., 2022).
5.2.4 Use diagnostic approachesDiagnostic approaches (checklists) can also be useful to identify problems and decide whether their environment or their constituent parts are wicked or kind (Peters and Tarpey, 2019). This is part of the evolution needed in how to approach the problems and generation of responses to systemic risk.
5.2.5 Use a variation of the “precautionary principle” and “planetary boundaries”Principle 15 of the 1992 Rio Declaration on Environment and Development is now an established principle of environmental law. It adopts the precautionary approach to threats that are serious or could potentially cause irreversible damage. This means that cost-effective measures should be taken to prevent the threats being realized, rather than waiting for full scientific certainty, which may come too late or be impossible to determine in complex systems (United Nations, 1992; Pinto-Bazurco, 2020). The idea of outer limits can also be applied, such as the concept of planetary boundaries developed by the Stockholm Resilience Centre (2021). The concept of planetary boundaries certainly applies to existential threats if not to lesser global ones.
5.3 A long-term, holistic and systemic perspectiveIn an increasingly interconnected and complex world, where the risks faced are compounding and cascading, the dominant approach to risk management is no longer fit for purpose. A systems-based approach is needed to understand contemporary drivers of risk and of impacts when risks are realized.
Fortunately, there are promising signs that systems are beginning to transform to take into account some of the present limitations in managing systemic risk.
The Group of Twenty (G20) Financial Stability Board created the Task Force on Climate-related Financial Disclosures to improve and increase reporting of
73
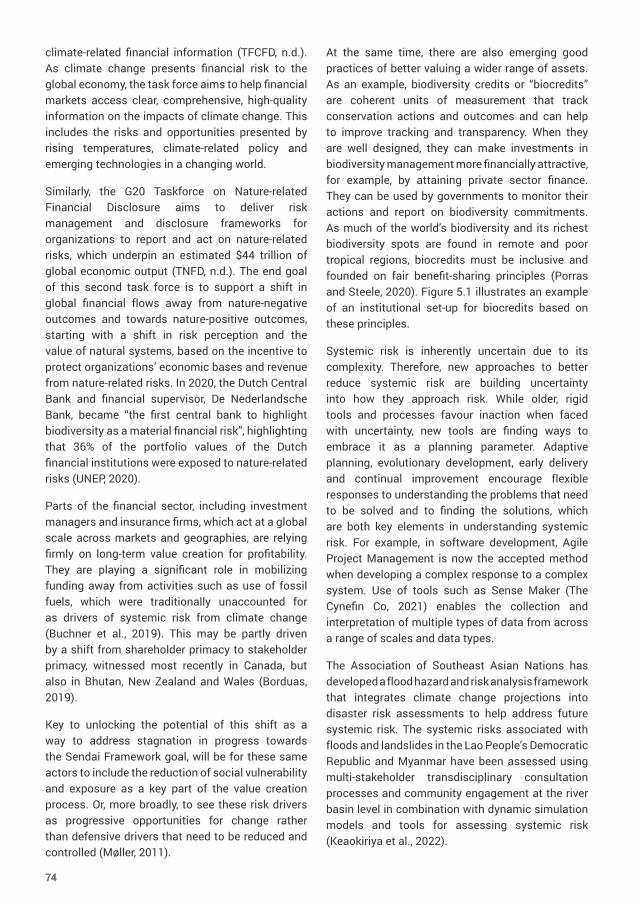
climate-related financial information (TFCFD, n.d.). As climate change presents financial risk to the global economy, the task force aims to help financial markets access clear, comprehensive, high-quality information on the impacts of climate change. This includes the risks and opportunities presented by rising temperatures, climate-related policy and emerging technologies in a changing world.
Similarly, the G20 Taskforce on Nature-related Financial Disclosure aims to deliver risk management and disclosure frameworks for organizations to report and act on nature-related risks, which underpin an estimated $44 trillion of global economic output (TNFD, n.d.). The end goal of this second task force is to support a shift in global financial flows away from nature-negative outcomes and towards nature-positive outcomes, starting with a shift in risk perception and the value of natural systems, based on the incentive to protect organizations’ economic bases and revenue from nature-related risks. In 2020, the Dutch Central Bank and financial supervisor, De Nederlandsche Bank, became “the first central bank to highlight biodiversity as a material financial risk”, highlighting that 36% of the portfolio values of the Dutch financial institutions were exposed to nature-related risks (UNEP, 2020).
Parts of the financial sector, including investment managers and insurance firms, which act at a global scale across markets and geographies, are relying firmly on long-term value creation for profitability. They are playing a significant role in mobilizing funding away from activities such as use of fossil fuels, which were traditionally unaccounted for as drivers of systemic risk from climate change (Buchner et al., 2019). This may be partly driven by a shift from shareholder primacy to stakeholder primacy, witnessed most recently in Canada, but also in Bhutan, New Zealand and Wales (Borduas, 2019).
Key to unlocking the potential of this shift as a way to address stagnation in progress towards the Sendai Framework goal, will be for these same actors to include the reduction of social vulnerability and exposure as a key part of the value creation process. Or, more broadly, to see these risk drivers as progressive opportunities for change rather than defensive drivers that need to be reduced and controlled (Møller, 2011).
At the same time, there are also emerging good practices of better valuing a wider range of assets. As an example, biodiversity credits or “biocredits” are coherent units of measurement that track conservation actions and outcomes and can help to improve tracking and transparency. When they are well designed, they can make investments in biodiversity management more financially attractive, for example, by attaining private sector finance. They can be used by governments to monitor their actions and report on biodiversity commitments. As much of the world’s biodiversity and its richest biodiversity spots are found in remote and poor tropical regions, biocredits must be inclusive and founded on fair benefit-sharing principles (Porras and Steele, 2020). Figure 5.1 illustrates an example of an institutional set-up for biocredits based on these principles.
Systemic risk is inherently uncertain due to its complexity. Therefore, new approaches to better reduce systemic risk are building uncertainty into how they approach risk. While older, rigid tools and processes favour inaction when faced with uncertainty, new tools are finding ways to embrace it as a planning parameter. Adaptive planning, evolutionary development, early delivery and continual improvement encourage flexible responses to understanding the problems that need to be solved and to finding the solutions, which are both key elements in understanding systemic risk. For example, in software development, Agile Project Management is now the accepted method when developing a complex response to a complex system. Use of tools such as Sense Maker (The Cynefin Co, 2021) enables the collection and interpretation of multiple types of data from across a range of scales and data types.
The Association of Southeast Asian Nations has developed a flood hazard and risk analysis framework that integrates climate change projections into disaster risk assessments to help address future systemic risk. The systemic risks associated with floods and landslides in the Lao People’s Democratic Republic and Myanmar have been assessed using multi-stakeholder transdisciplinary consultation processes and community engagement at the river basin level in combination with dynamic simulation models and tools for assessing systemic risk (Keaokiriya et al., 2022).
74
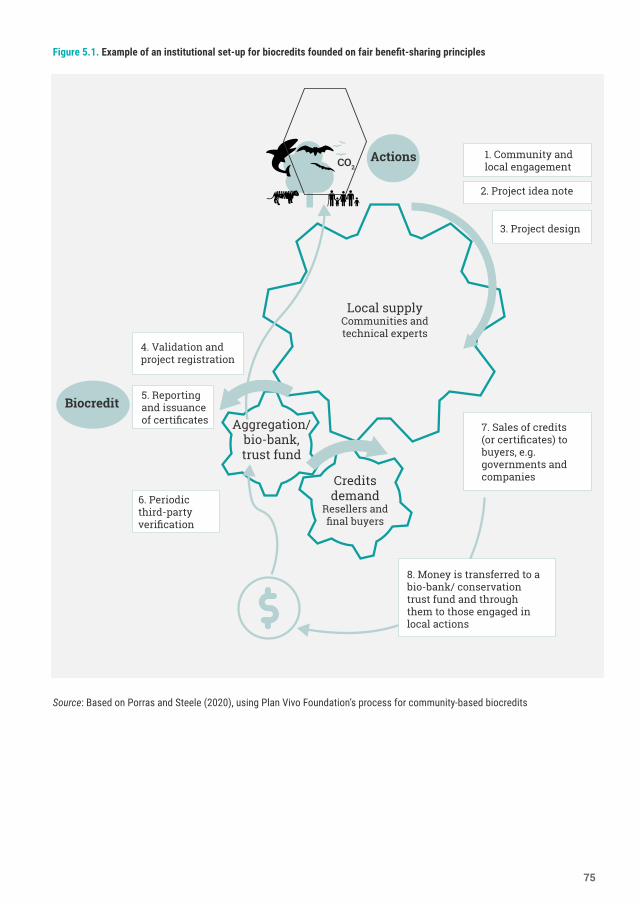
Local supplyCommunities and technical experts
Aggregation/bio-bank, trust fund
Credits demand
Resellers and final buyers
Biocredit
1. Community and local engagement
2. Project idea note
3. Project design
7. Sales of credits (or certificates) to buyers, e.g. governments and companies
6. Periodic third-party verification
5. Reporting and issuance of certificates
4. Validation and project registration
ActionsCO2
8. Money is transferred to a bio-bank/ conservation trust fund and through them to those engaged in local actions
Figure 5.1. Example of an institutional set-up for biocredits founded on fair benefit-sharing principles
Source: Based on Porras and Steele (2020), using Plan Vivo Foundation’s process for community-based biocredits
75
5.4 Ways forwardThe terms “systemic” and “complex” convey connection and dynamism. This means that every risk, every potential negative outcome, may at the same time be a driver that can potentially cause another negative outcome. These outcomes may either amplify or dampen one another, thus increasing or decreasing the impacts on the system. It is important to note this dynamic interconnectedness can also reduce risk and increase resilience; this is what systemic risk governance seeks to achieve.
Current practices of attributing measurement and value linked to traditional economic practices also need to evolve to better address systemic risk at the global level. There are two emerging ways forward for assessing and managing systemic risk: (a) the application of systems-based approaches to address the dynamic drivers of risk and (b) the mobilization of collective intelligence for these approaches to provide impactful outcomes.
Existing knowledge, including from the management of wicked problems, points to logical steps to take and methods that can be employed immediately. New ways of combining modelling and data-driven approaches with community consultations are emerging. As the chapters in Part III outline in more detail, knowledge co-production efforts need to be
more closely linked to improve large-scale modelling efforts. Increasing the value of attributes such as flexibility and the ability to work across traditional sectoral and geographical boundaries are key in the effective management of systemic risk (Haraguchi et al., 2022).
Having diverse subject matter experts contribute to developing shared outcomes will highlight differences and create confrontation at collective and individual levels. Most people do not willingly put themselves in situations where their expertise is questioned. Confrontation and conflict are created because people are taught that in such situations, there are those who gain something and those who lose something.
It is essential that governance systems, not DRM institutions only, engage in risk reduction efforts. To be effective for a systemic approach, risk reduction cannot be viewed as a competitive advantage or information to be protected, as that limits damage control to the impact on each corporation or institution. Managing the complex systemic risks of the future will require mobilization of large numbers of people and significant financial resources. It is cost-effective to invest in a sustainable future, but the investment will be possible only if government as a whole, and the private sector, acknowledge its importance and invest in building resilience.
A landslide renders a mountain road impassable, cutting off rural villages in northern Lao People’s Democratic Republic
Credit: © Shutterstock/Matyas Rehak
76
6. Shifting perceptions on riskWhen does linear problem-solving fail, and how can people’s decision-making become better informed to understand and manage the systemic nature of risk? Later chapters look at managing risk from the perspective of new conceptual, mathematical and computational methods, predominantly in network and complexity science. This chapter recognizes that complex problems are not susceptible to simple, predetermined solutions, and examines the question from a different angle. Focusing on ecological–social risk, it aims to look from the perspective of different world-views and knowledge systems about how humans understand and act in the world they inhabit. This is required to explore, recognize and move beyond some established habits of mind and to see in new ways that enable human societies to tackle ecological–social risk at the local and planetary scales.
This chapter also argues that knowledge systems based in linear causality and clear-cut concepts of true and false rarely recognize that the creation of that knowledge is selective and relative to the knower’s context. Such an approach to risk focuses on some contexts to the exclusion of others, effectively hampering a systemic understanding of human and planetary systems and risk.
For example, in community-based DRR, there is usually a strong dichotomy maintained between local or traditional knowledge and scientific knowledge. A critical review of such approaches is needed to see how they can become truly inclusive of local communities and their knowledge. Otherwise, they may be processes that are done at community level by outsiders rather than with communities (Maskrey, 2011). This can mask exclusion, dichotomy and the dominance of one knowledge system over another, behind the “promise of participation” delivered through community-based approaches (Trogrlic, 2022).
A first step is to shift from the idea of people and systems being simply interconnected, to the concepts of interdependent and interrelational thinking and acting in systems. This requires a shift from thinking of individuals and organizations as external and separate entities to an understanding that they are all part of the same system. Approaches also need to change, from a focus on control, quantification and competition, to the idea of exploration, mutual learning and compassion.
This process requires humility, curiosity and a new scientific respect for relational world-views. Innovative approaches such as the collection of “warm data” can help this process (section 6.3.2). Such approaches can help improve risk understanding, and point at ways of routinizing, even bureaucratizing, the exercise of imagination, which is essential to understanding the systemic nature of risk (Pozek, 2022).
The chapter next gives some insights into indigenous or traditional knowledges from a relational world-view. It demonstrates how indigenous communities are adapting and integrating new technologies and participating in and influencing government and official processes for risk reduction. It then explores how scientific values and habits of mind can inhibit human capacity to find new ways of knowing, and looks at some recent innovations in how to move beyond these limitations. It concludes by suggesting some possible ways forward.
77
6.1 Learning from indigenous knowledge and ways of knowing
“Manawa whenua, wē moana uriuri, hōkikitanga kawenga”
“From the heart of the land, to the depths of the sea; repositories of knowledge abound”
A Maori proverb (Reilly, 2008)
The traditional indigenous Maori world-view in New Zealand is formed around the understanding that humanity is created through eco-genealogical connections to the land, which is understood as a foundational ancestor. Many indigenous peoples’ appreciation of ancestral lands, and all they contain, manifest in deep emotional, spiritual and familial attachments. Acknowledging the interconnectedness and interdependencies of humanity and the natural world also draws attention to the intergenerational obligations imposed by this material heritage, and the moral responsibility of enacting continual and considered stewardship at all times (Kenney and Phibbs, 2014, 2015).
Similar deep relational ties are common to many indigenous and traditional cultures that bind successive generations to maintaining the environmental, social and spiritual well-being of living lands, which are intimately linked to the embodiment of identities (both human and non-human) (Marsden, 1992; Agrawal, 1995; King et al., 2007; Langton et al., 2012). Elements of the natural world – fauna, flora, waterways and terrains – are considered to have agency alongside humanity, as illustrated in the personification of rivers and mountains in Maori culture (Whyte, 2014).
This systemic approach to understanding the connection between communities and ecosystems is increasingly being understood within wider political systems. For example, in the New Zealand legal system (O’Donnell and Talbot-Jones, 2018), the Whanganui River is recognized as a legal person (New Zealand Government, 2017). Drawing
on similar cultural traditions, the constitutions of the Plurinational State of Bolivia and of Ecuador also recognize Mother Nature as having rights that governments are required to protect (Shelton, 2015). Rather than excluding contexts, this approach to decision-making embraces contexts and works adaptively with, instead of attempting to control or conquer, complex living systems.
Local or traditional knowledge is also highly dynamic and includes opportunities for communities to create “hybrid knowledge” on risk by using traditional methods and triangulating with data gained through science and technology (Trogrlic, 2022). In the face of changes in planetary systems due to climate change and overexploitation of ecosystems, communities around the world are seeking new ways to understand and manage ecological–social risk.
On the island of Sulawesi, Indonesia, Kaili communities are the largest ethnic group in the city of Palu. They have built past knowledge of hazards into specific names for disaster-related phenomena, such as lingu (earthquake), lembotalu (for tsunamis, which literally means three big waves) and nalodo (for post-earthquake liquefaction), as well as informative folk songs about previous events. The Kaili communities also established safe areas named kinta, which they believed to be safe from liquefaction phenomena. During a mass liquefaction in the Petobo district of Palu in 2018, the houses in kinta proximity were only mildly affected, with their use as safe areas avoiding loss of life and significant damage and loss (Triyanti et al., 2022).
“Getting scientists to consider the validity of indigenous knowledge is like swimming upstream in cold, cold water. They’ve been so conditioned to be sceptical of even the hardest of hard data that bending their minds towards theories that are verified without the expected graphs or equations is tough. Couple that with the unblinking assumption that science has cornered the market on truth and there’s not much room for discussion.”
(Kimmerer, 2020)
78
In New Zealand, following the 2010–2011 and 2016 earthquakes in Canterbury, the local Maori tribe Ngāi Tahu partnered with central and local governments in ensuring environmental restoration, biodiversity and future sustainability of the region. Collaboration with Environment Canterbury encompassed the geophysical profiling of Ngāi Tahu lands and earthquake changes, global information system mapping of sites of tribal significance and restoration of traditional food gathering sites (Kenney, 2019). Project results have shaped measures for protecting cultural heritage values, informed regional planning and supported economic recovery in Canterbury. Longer-term outcomes include the development of heritage risk models that map risks to traditional assets and the creation of heritage risk alerts that categorize graduated outcomes in terms of risk exposure (ECan, 2013).
Also in New Zealand, the Maori tribe Ngāti Rangi resident around the active stratovolcano Mount Ruapehu uses traditional knowledge of volcanic activity to inform contemporary risk management planning (Pardo et al., 2015). Indigenous indicators of increasing volcanic activity, changes in fauna behaviour and the reaction of flora to altered soil chemistry are documented, while digital sensors and cameras have also been deployed at ancestral monitoring locations (Gabrielsen et al., 2017). In this context, modern scientific technologies are operationalized alongside service to holistic cultural stewardship and the preservation of an eco-genealogical relationship, because Mount Ruapehu is considered an eponymous ancestor by Ngāti Rangi (New Zealand Government, 2019).
As climate change has exacerbated the incidence and intensity of extreme weather events globally (IPCC, 2021b), flooding disasters have also increased, creating social devastation, economic destabilization, infrastructure destruction, and environmental erosion and collapse, especially in indigenous communities (Kelman, 2015). Yet, there is evidence of indigenous or traditional cultural attributes being mobilized (Saunders, 2017; Dube and Munsaka, 2018) to predict flood risks and facilitate broader community recovery and resilience following significant flooding events (Hiwasaki et al., 2014).
Flood management planning in some areas in Nepal and on the Tibetan Plateau rely on traditional approaches to forecasting and responding to floods. Flood mitigation and prevention practices include cultivating flood-resilient crops and creating drainage channels and moats. Community-based early warning systems use environmental indicators to identify patterns associated with the onset of flooding. These may range from cloud shapes, rainfall patterns and fauna activity, to wind velocity, star positions and outside temperatures (Gautam et al., 2007; Dewan, 2015). Local communities respond with emergency preparedness measures, including stockpiling resources, raising storage areas for essential supplies, moving living spaces to the second storey of houses, relocating animals to higher ground and establishing evacuation routes. Immediately following flooding events, traditional health remedies (e.g. green coconut water used to treat diarrhoea, cholera and dysentery; Adams and Bratt, 1992) are also used in the absence of other “conventional” response and recovery resources.
“In a culture where the myth of objectivism is very much alive and truth is always absolute truth, the people who get to impose their metaphors on the culture get to define what we consider to be true – absolutely and objectively true.
All cultures have myths, and people cannot function without myth any more than they can function without metaphor. And just as we often take the metaphors of our own culture as truths, so we often take the myths of our own cultures as truths. The myth of objectivism is particularly insidious in this way. Not only does it purport not to be a myth, but it makes both myths and metaphors objects of belittlement and scorn: according to the objectivist myth, myths and metaphors cannot be taken seriously because they are not objectively true. However, the myth of objectivism is itself not objectively true.”
(Lakoff and Johnson, 2003)
79
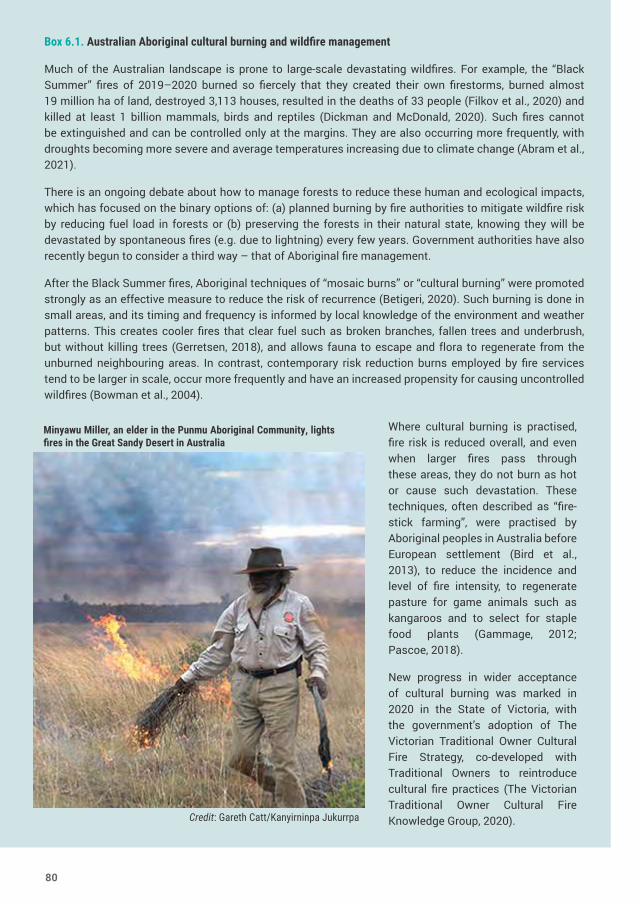
Box 6.1. Australian Aboriginal cultural burning and wildfire management
Much of the Australian landscape is prone to large-scale devastating wildfires. For example, the “Black Summer” fires of 2019–2020 burned so fiercely that they created their own firestorms, burned almost 19 million ha of land, destroyed 3,113 houses, resulted in the deaths of 33 people (Filkov et al., 2020) and killed at least 1 billion mammals, birds and reptiles (Dickman and McDonald, 2020). Such fires cannot be extinguished and can be controlled only at the margins. They are also occurring more frequently, with droughts becoming more severe and average temperatures increasing due to climate change (Abram et al., 2021).
There is an ongoing debate about how to manage forests to reduce these human and ecological impacts, which has focused on the binary options of: (a) planned burning by fire authorities to mitigate wildfire risk by reducing fuel load in forests or (b) preserving the forests in their natural state, knowing they will be devastated by spontaneous fires (e.g. due to lightning) every few years. Government authorities have also recently begun to consider a third way – that of Aboriginal fire management.
After the Black Summer fires, Aboriginal techniques of “mosaic burns” or “cultural burning” were promoted strongly as an effective measure to reduce the risk of recurrence (Betigeri, 2020). Such burning is done in small areas, and its timing and frequency is informed by local knowledge of the environment and weather patterns. This creates cooler fires that clear fuel such as broken branches, fallen trees and underbrush, but without killing trees (Gerretsen, 2018), and allows fauna to escape and flora to regenerate from the unburned neighbouring areas. In contrast, contemporary risk reduction burns employed by fire services tend to be larger in scale, occur more frequently and have an increased propensity for causing uncontrolled wildfires (Bowman et al., 2004).
Where cultural burning is practised, fire risk is reduced overall, and even when larger fires pass through these areas, they do not burn as hot or cause such devastation. These techniques, often described as “fire-stick farming”, were practised by Aboriginal peoples in Australia before European settlement (Bird et al., 2013), to reduce the incidence and level of fire intensity, to regenerate pasture for game animals such as kangaroos and to select for staple food plants (Gammage, 2012; Pascoe, 2018).
New progress in wider acceptance of cultural burning was marked in 2020 in the State of Victoria, with the government’s adoption of The Victorian Traditional Owner Cultural Fire Strategy, co-developed with Traditional Owners to reintroduce cultural fire practices (The Victorian Traditional Owner Cultural Fire Knowledge Group, 2020). Credit: Gareth Catt/Kanyirninpa Jukurrpa
Minyawu Miller, an elder in the Punmu Aboriginal Community, lights fires in the Great Sandy Desert in Australia
80
Extreme heat events, drought and wildfire also challenge indigenous and traditional communities’ adaptive capacities, as they do for industrial agriculture, forestry and water resources management (Berkes, 1999; Langton, 2010).
The burning practices of indigenous peoples have also played a critical role in the creation and stewardship of ecosystems in North America, including by the Karuk and Yurok in California, United States, in particular to manage the California hazelnut tree (Bibby, 2004; Kalies and Yocom Kent, 2016; Lake et al., 2017). Polycultural knowledge about such risk can sometimes be made through governments and institutional actors learning from indigenous cultures about ecological management practices that go back millenniums, such as Australian Aboriginal techniques for land management through fire (Box 6.1).
6.2 Established “scripts” and the systemic nature of risk The current scientific world-view is a representation (or manifestation) of the culture and the conditions of the system in which people are making their decisions, despite its foundation in the idea of objective knowledge. However, people and institutions inside this world-view rarely recognize the extent to which it is a way of knowing that operates within a particular context. A perspective that allows for the complexity and multiplicity of contexts is needed to understand the systemic nature of risk.
6.2.1 Limitations of habitsA key challenge of operating and making decisions under conditions of significant uncertainty is the human tendency towards the formation of habits. Everyone forms habits, it is how human brains have evolved, or not evolved. A habit always begins with a single decision at some point in time. Repeating that decision, or that way of making a decision, becomes a habit over time. And habits are undeniably hard to change, particularly when it comes to decisions made under uncertainty when the holding to scripts and scripted ways of making decisions dominate.
These are habits of thinking that are “efficient”, but they limit people’s capacity to understand and act on the systemic nature of risk.
The world-view that people bring when approaching challenging decision-making moments is also an underlying and rarely acknowledged habit. However, it can lead to a simple dualistic (“right” or “wrong”) approach, which provides an increased sense of certainty that gives decision makers an illusion of control. These scripts can serve useful purposes at times. Seeing a lion charging means run. But what do these scripts mean for decision makers in complex institutional or bureaucratic settings? What if running from the lion is not, after all, the best way to avoid becoming prey, and that deeper knowledge of lions and their environment could lead to avoiding the risk, or responding more effectively?
The scripted approach can prevent decision makers from being able to recognize patterns outside the dimensions or parameters of the scripts they are effectively working within – for example, outside the protocols of their institutional setting. It means if people are making decisions within a setting where it is implicitly understood that decisions always have a right or wrong answer, then they will act accordingly and seek simple answers to complex questions. Over time, this behaviour can lock in significant limitations and flaws that create additional risk when viewed from a systems perspective. The challenge, then, is how to break free from dualistic decision-making approaches and get into new habits of examining old habits when making a decision that is itself a result of a habit.
Making decisions based on the systemic nature of risk is never simple, and it is important to find ways to release people from their scripts. There is a need to find ways of managing systemic or complex cascading risk within dynamic societal and environmental contexts (and within the contexts of those contexts), all of which are constantly shifting. Complex decision-making environments require decision makers to allow all, or as many as possible, of the different contexts to be perceived at the same time; not just those that are convenient to expedite a decision, such as focusing only on the economic or political outcomes.
81
People will often continue to try to make sense or understand a risk-related problem (or come to an “objective” decision point) based on the elimination or exclusion of many of the contexts. This may feel like an appropriate way to navigate the complexity of the systemic nature of risk and yet it excludes relevant contexts.
How can the curiosity needed to address complex systemic risk be reconciled with the need for those in positions of governance and decision-making authority to make decisions?
Box 6.2. Deep demonstration and small business in a circular economy future in Viet Nam
The UNDP deep demonstration approach, called the Sensemaking and Acceleration Protocol, is being used in programmes for building resilience in micro-, small- and medium-sized enterprises (MSMEs) in Viet Nam in the wake of COVID-19 (Ulziikhuu, 2020). It takes a systems perspective in terms of sectoral scope and timescale, asking how to boost the performance of MSMEs in COVID-19 recovery and also how they can be part of a long-term “circular economic rebound” in Viet Nam (Wiesen et al., 2021).
MSMEs are the backbone of the Viet Nam economy, accounting for 98% of all enterprises and 40% of GDP (Wiesen et al., 2021). However, the question of their future resilience is not simply about growth. The country’s economic growth in recent years has been based on the linear “take–make–waste” model that has put increasing pressure on ecosystems and depleted natural capital. Continuing this growth model would not meet the country’s long-term goal of development based on increased productivity, innovation and competitiveness that is in harmony with sustainable development.
Such change will not occur merely by applying new environmental regulations to current linear, extractive and polluting economic growth. It is not a matter only of preserving the environment, and it does not belong only to a single ministry. It needs to be rooted in governance innovation and cross-ministerial collaboration. The approach of aiming for a circular economy requires wider system change that is transformative of the current socioeconomic logics.
The challenge is how to achieve such transformation. The model being applied is described as a “sense–reframe–position–transform” model. Currently in the sensing phase, it aims to “see” the system in a new way and understand various drivers and their connections, before attempting to plan how to change them.
One of the contexts this phase is looking at is the role of financial capital in changing behaviours in the system, investigating the effects that leveraging existing capital and resources could have across different programmes to catalyse transformation. It is also looking at distinctive features of Vietnamese culture and building on traditional understandings, such as the circular economy practices used in the agriculture sector for decades. However, there is a gap in public awareness about what the transition would mean and what changes are needed in consumption and production practices. The model establishes a process for identifying the dimensions of these challenges and working experimentally and collaboratively towards a broad vision, but the intermediate components of the system transformation are not yet known because these will emerge from the process.
Source: Wiesen et al. (2021)
82
6.2.2 Learning about the properties of systemsAn alternative approach to scripted decision-making in the midst of complexity and with significant uncertainty is being able to adopt a perspective that can perceive a much wider range of contexts. An example is the UNDP systems innovation approach being used in Viet Nam (Box 6.2). This approach focuses on the conditions of the system in which a decision is made, rather than focusing solely on the decision itself as if it is made in isolation.
The Viet Nam initiative will appear too open ended for many observers. How will anyone know whether or not it was successful if the outcomes are not predetermined? This involves a shift in thinking, to explore how different systems of learning and knowing can inform each other to help scientists and policymakers step outside some old habits of thought in reducing risk. However, supporters of this approach note it is the very state of uncertainty that creates potential to learn about the properties of the systems through the process of making decisions.
This is a powerful form of learning that can shift the structures (or the conditions of the system), and ultimately shift the culture and world-views in which the decision makers exist. It is potentially critical in opening new possibilities for decisions based on a more adaptive understanding of the systemic nature of risk rather than maintaining a rigid certain approach to the irreducible complexity of challenges like the climate crisis, ecological breakdown or transitioning energy systems.
Another example of adopting a “learning about the properties of systems” approach within a complex system is the Inclusive City-Community Forecasting and Early Warning Service, known as Developing Risk Awareness through Joint Action, being used in Kenya and the United Republic of Tanzania (Resurgence, 2020a). It is a practical, ecosystemic approach that is working in Dar es Salaam and Nairobi with a wide range of interested people including those living in informal settlements and municipal and national government representatives (Box 6.3, including Figure 6.1).
6.2.3 No more fixingThe challenges of reducing loss of life, limiting economic and wider ecological impacts, and minimizing loss of systems function are difficult to approach. However, when a decision is approached as a way to achieve a pre-specified outcome, this constrains the possibilities for learning to the decision itself. Instead, approaching from the perspective of perceiving the wider sets of constantly shifting, dynamically interacting contexts embraces unprecedented opportunities for learning about the properties of the systems. This learning is possible by releasing decision makers from the perceived need to fix a specific problem and work on issues identified from the relationships of the systems in which the problem exists.
It is important to establish a learning culture that allows those who are making the decisions to start a journey of “building their muscles”, developing their capabilities and building their ability to perceive the conditions of the system that give rise to the manifestation of risk, as was done in Australia (Box 6.4).
6.2.4 Building habits of examining habitsDecision makers need to be humble about their ability to perceive all of the multiple contexts giving rise to the conditions of the systems that result in risks being manifest. In doing so, they will then be building on the ability to focus attention increasingly on the drivers – the messy, constantly shifting dynamics of all of the systems that are interacting with each other – that give rise to the contexts which establish the conditions of the systems that result in the risks that drive disasters. This will kick-start a new habit of examining habits.
The global community now needs to decide to restore relationships by embracing pluralistic ways of knowing, rather than perpetuating dualistic ways, to build human understanding and ways of managing the systemic nature of risk.
83
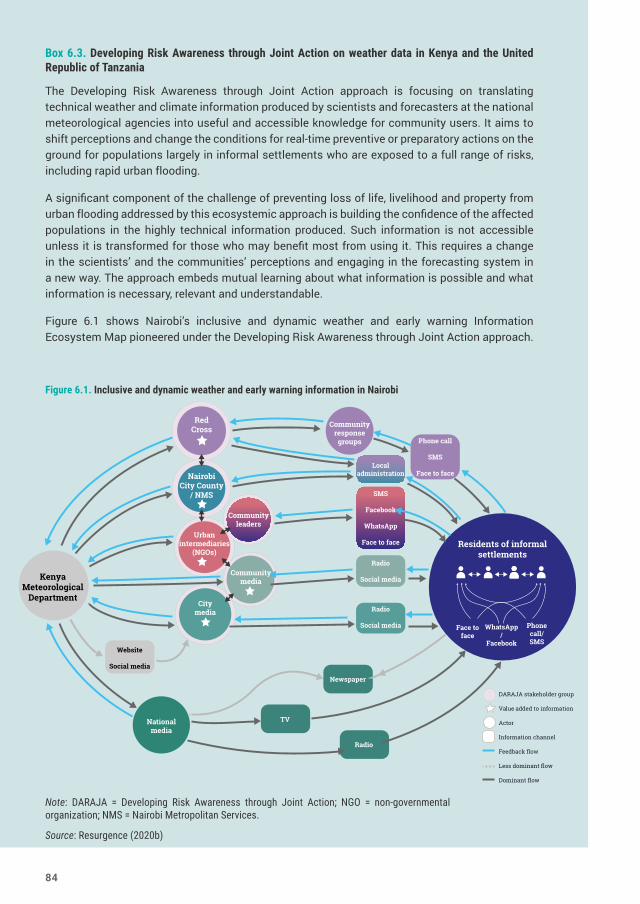
DARAJA stakeholder group
Value added to information
Actor
Information channel
Feedback flow
Less dominant flow
Dominant flow
Kenya Meteorological
Department
RedCross
Nairobi City County
/ NMS
Urban intermediaries
(NGOs)
Community media
Citymedia
Nationalmedia
Community leaders
Website
Social media
Community response
groups
Local administration
SMS
Face to face
Radio
Social media
Radio
Social media
Newspaper
Radio
Phone call
SMS
Face to face
Residents of informal settlements
Face to face
WhatsApp/
Phone call/SMS
TV
Figure 6.1. Inclusive and dynamic weather and early warning information in Nairobi
Note: DARAJA = Developing Risk Awareness through Joint Action; NGO = non-governmental organization; NMS = Nairobi Metropolitan Services.
Source: Resurgence (2020b)
Box 6.3. Developing Risk Awareness through Joint Action on weather data in Kenya and the United Republic of Tanzania
The Developing Risk Awareness through Joint Action approach is focusing on translating technical weather and climate information produced by scientists and forecasters at the national meteorological agencies into useful and accessible knowledge for community users. It aims to shift perceptions and change the conditions for real-time preventive or preparatory actions on the ground for populations largely in informal settlements who are exposed to a full range of risks, including rapid urban flooding.
A significant component of the challenge of preventing loss of life, livelihood and property from urban flooding addressed by this ecosystemic approach is building the confidence of the affected populations in the highly technical information produced. Such information is not accessible unless it is transformed for those who may benefit most from using it. This requires a change in the scientists’ and the communities’ perceptions and engaging in the forecasting system in a new way. The approach embeds mutual learning about what information is possible and what information is necessary, relevant and understandable.
Figure 6.1 shows Nairobi’s inclusive and dynamic weather and early warning Information Ecosystem Map pioneered under the Developing Risk Awareness through Joint Action approach.
84
Box 6.4. Profiling interconnected causes and cascading systemic disaster risk in Australia
Australia has undertaken a national learning process about the properties of systems without a predetermined form for the outcomes. The Government’s National Resilience Taskforce, together with Emergency Management Australia, led an interactive process to investigate what makes Australia vulnerable to disaster. The results were published in the report Profiling Australia’s Vulnerability: The Interconnected Causes and Cascading Effects of Systemic Disaster Risk (National Resilience Taskforce, 2018) and informed the Australian national DRR framework.
At the start of the process, not much was known nationally about what people’s preferences and value priorities were when at risk of being severely affected by disaster loss. Significantly, profiling systemic vulnerability recognized that everyone and everything is vulnerable to the effects or disruption caused by severe to catastrophic events. Often, vulnerability is mistakenly perceived as a sign of weakness, with a tendency to downplay personal, institutional and community vulnerability, especially for people of affluence or in power.
The process had two principal objectives and products to deliver:
1. New knowledge, in the form of stories, concepts, understanding, narratives and/or data about key drivers of vulnerability from a wide cross section of people through workshops designed for this purpose.
2. A national vulnerability profile that reflected inclusive understandings of the complex interdependent nature of the causes of vulnerability, the roles and responsibilities for tackling these, and the hope and agency for driving change.
The approach and methods were designed to be repeatable and adaptable, and to result in co-producing a systems understanding of disaster. They used visual representation of cause and effect, and generated associated stories of lived experience that underwent extensive synthesizing and sense-making. The report narrates how risk and vulnerability are created, transferred and experienced during disasters, including stories of experiences and the values affected or lost.
These stories and the system patterns identified highlight that tensions, conflicts in values and different ideas on acceptable trade-offs can arise among different parts of society and among different roles within organizations. For example: a prosperous now versus a prosperous future; ourselves versus others; blame versus learning; stability versus change; people versus planet; tangible versus intangible; and liberties versus regulation.
A “resilience checklist” was also developed that assists in the discovery of what “doing things differently” looks like. Figure 6.2 builds on the resilience checklist and illustrates the three different pathways or ways of thinking, deciding and acting in the Australian context: doing things the same, doing things better and doing things differently.
Sources: O’Connell et al. (2018, 2020); Buchtmann (nee Osuchowski) et al. (2022)
85
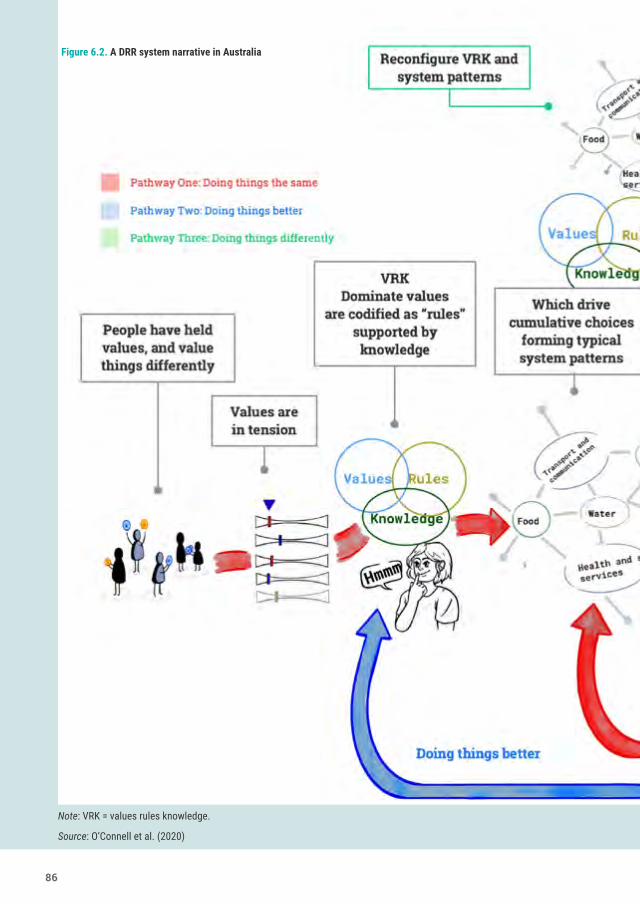
Figure 6.2. A DRR system narrative in Australia
Note: VRK = values rules knowledge.
Source: O’Connell et al. (2020)
86
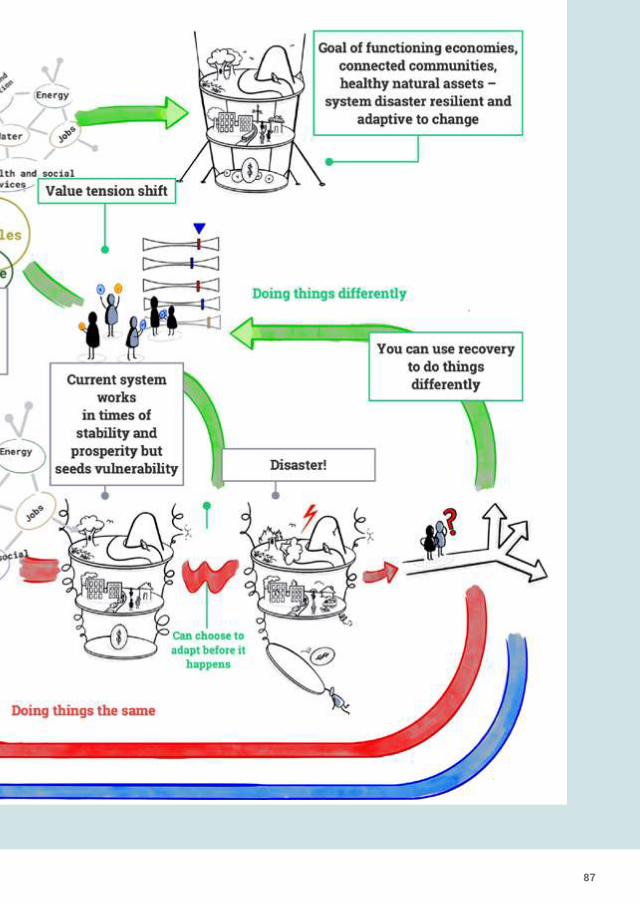
87
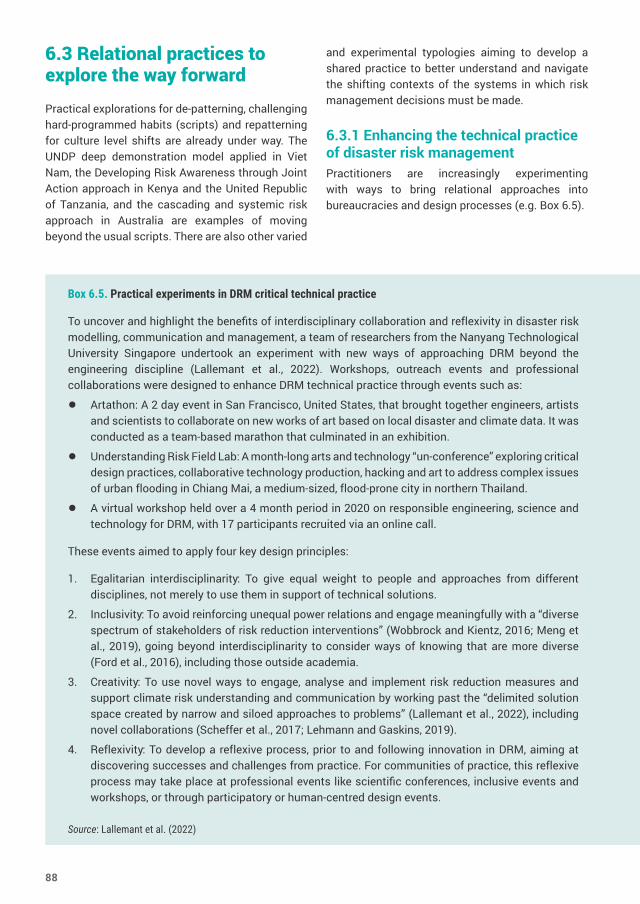
6.3 Relational practices to explore the way forward
Practical explorations for de-patterning, challenging hard-programmed habits (scripts) and repatterning for culture level shifts are already under way. The UNDP deep demonstration model applied in Viet Nam, the Developing Risk Awareness through Joint Action approach in Kenya and the United Republic of Tanzania, and the cascading and systemic risk approach in Australia are examples of moving beyond the usual scripts. There are also other varied
and experimental typologies aiming to develop a shared practice to better understand and navigate the shifting contexts of the systems in which risk management decisions must be made.
6.3.1 Enhancing the technical practice of disaster risk managementPractitioners are increasingly experimenting with ways to bring relational approaches into bureaucracies and design processes (e.g. Box 6.5).
Box 6.5. Practical experiments in DRM critical technical practice
To uncover and highlight the benefits of interdisciplinary collaboration and reflexivity in disaster risk modelling, communication and management, a team of researchers from the Nanyang Technological University Singapore undertook an experiment with new ways of approaching DRM beyond the engineering discipline (Lallemant et al., 2022). Workshops, outreach events and professional collaborations were designed to enhance DRM technical practice through events such as:
● Artathon: A 2 day event in San Francisco, United States, that brought together engineers, artists and scientists to collaborate on new works of art based on local disaster and climate data. It was conducted as a team-based marathon that culminated in an exhibition.
● Understanding Risk Field Lab: A month-long arts and technology “un-conference” exploring critical design practices, collaborative technology production, hacking and art to address complex issues of urban flooding in Chiang Mai, a medium-sized, flood-prone city in northern Thailand.
● A virtual workshop held over a 4 month period in 2020 on responsible engineering, science and technology for DRM, with 17 participants recruited via an online call.
These events aimed to apply four key design principles:
1. Egalitarian interdisciplinarity: To give equal weight to people and approaches from different disciplines, not merely to use them in support of technical solutions.
2. Inclusivity: To avoid reinforcing unequal power relations and engage meaningfully with a “diverse spectrum of stakeholders of risk reduction interventions” (Wobbrock and Kientz, 2016; Meng et al., 2019), going beyond interdisciplinarity to consider ways of knowing that are more diverse (Ford et al., 2016), including those outside academia.
3. Creativity: To use novel ways to engage, analyse and implement risk reduction measures and support climate risk understanding and communication by working past the “delimited solution space created by narrow and siloed approaches to problems” (Lallemant et al., 2022), including novel collaborations (Scheffer et al., 2017; Lehmann and Gaskins, 2019).
4. Reflexivity: To develop a reflexive process, prior to and following innovation in DRM, aiming at discovering successes and challenges from practice. For communities of practice, this reflexive process may take place at professional events like scientific conferences, inclusive events and workshops, or through participatory or human-centred design events.
Source: Lallemant et al. (2022)
88
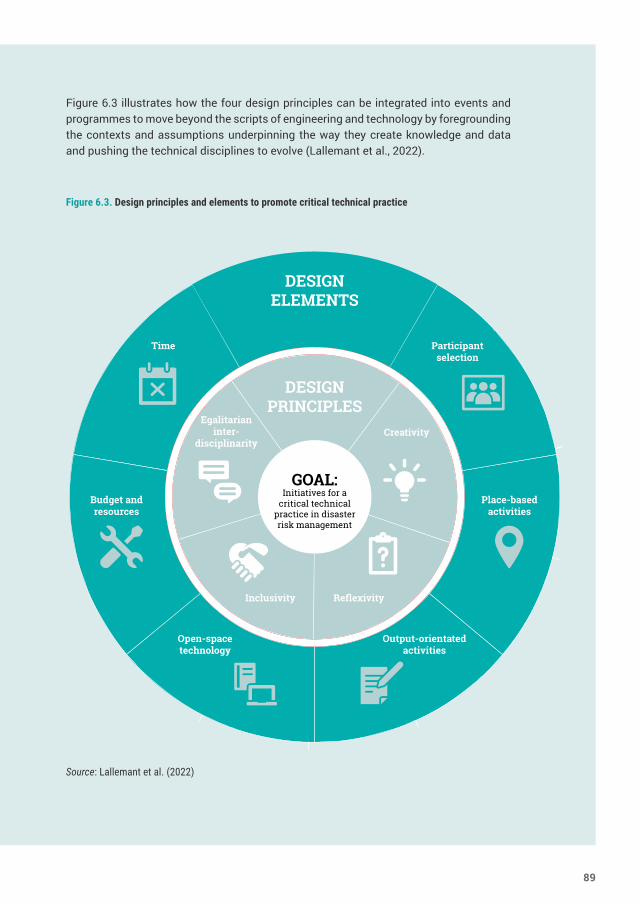
GOAL:Initiatives for a
critical technical practice in disaster risk management
DESIGN ELEMENTS
DESIGN PRINCIPLES
Participant selection
Time
Output-orientatedactivities
Open-spacetechnology
Place-basedactivities
Budget andresources
CreativityEgalitarian
inter-disciplinarity
Inclusivity Reflexivity
Figure 6.3. Design principles and elements to promote critical technical practice
Source: Lallemant et al. (2022)
Figure 6.3 illustrates how the four design principles can be integrated into events and programmes to move beyond the scripts of engineering and technology by foregrounding the contexts and assumptions underpinning the way they create knowledge and data and pushing the technical disciplines to evolve (Lallemant et al., 2022).
89
6.3.2 Generating and using warm data
“One of the biggest shifts in my thinking thanks to the warm data lab has been around the nature of technology. I used to believe that technology was inherently neutral, but I now see that line of reasoning as naïve. A technology does not exist independently from its contexts. And these contexts are part of complex systems. So, it’s clear to me now that we need to think hard about whether certain technologies should ever be built or released.”
David Jones, Executive Producer/Principal Program Manager, Office Envisioning, Microsoft (International Bateson Institute, n.d.)
As ecological–social systems are relational in nature, some practitioners such as the International Bateson Institute are experimenting with methods to gather and impart relational information in new ways. Warm data is a type of information to develop in tandem with existing forms of data. Since the subject being perceived dictates the need to understand in different ways, these methods aim to produce different kinds of information. However, the kind of information produced is intentionally a slippery mess of variables, changes and ambiguities. It does not sit nicely in graphs or models, and it takes longer to produce. As it describes relational interdependencies, it must also include the necessary contradictions, paradoxes, binds, double-binds and inconsistencies that occur in interrelational processes over time. The creation of warm data is the delivery of these multiple descriptions in active comparison, usually in a form that permits and even encourages the subjectivity of the observer (Box 6.6).
Box 6.6. Zero Step Warm Data Project on Energy, International Bateson Institute and UNDP
The International Bateson Institute, together with UNDP and other partners, facilitated the Zero Step Warm Data Project prototype in May and June 2021 as a complementary process to the formal United Nations High-Level Dialogue on Energy. It used a “people need people” online format to bring together more than 700 people on all continents across more than 25 countries in 67 warm data sessions (People Need People, 2020).
Participants in the prototype, including United Nations staff, private sector businesses, governments and communities, were able to experience a shift in perception, and to appreciate that shifting perceptions is the action that shifts everything and opens new possibilities for a range of decisions that could previously not be seen or acted upon.
The zero-step prototype opened a new space to explore that the problems of energy access and energy transition are not about the amount of energy, not the access to technology, not the availability of data and not the amount of finance. Energy access and energy transition problems are within the business models, within the economic models, within the politics, within the history, within the education and, ultimately, within the culture, all of which are descriptions of each other. It was agreed it was important to find ways together across the wider high-level dialogue on energy processes. The aim was to be quicker to mutually learn that choices being made to continue current (linear) trajectories of change, and not to challenge deeply embedded habits, assumptions and relationships with energy are the exact choices that are resulting in a collective inability to manage the results of those choices.
Source: People Need People (2020)
90
6.4 Ways forward
The examples of traditional and experimental approaches to understanding ecological–social risk presented in this chapter constitute a wide range of possibilities to use and create new polycultural and transcontextual knowledges and to apply them in practice. The common characteristics are that these approaches aim to be non-linear, relational and inclusive of different world-views, to bring an awareness of different contexts and the way that knowledge is being created and used. They aim to help create a picture of systems and relations among ecosystems, and to encourage a shift towards humility and curiosity in decision-making.
These methods shift away from measures of success that reinforce narrowly defined behaviours which hold decision makers into scripted ways of perceiving. Instead, the exploratory methods aim to help people see the constantly shifting patterns within the complex systems in which they are being asked to make decisions. They have the potential to bring a deeper understanding of the systems of knowledge and decision-making, and the risks that are part of current models of understanding ecological–social risk.
These traditional and new approaches involve:
● Communities who continue to practice risk management from within their indigenous and traditional knowledge systems, who also bring relational and interdependent world-views into wider community engagement and their own use of technology.
● Groups of governmental and scientific experts intent on working with communities to “translate” the systemic nature of risk and scientific data for use with and by a range of groups.
● Methods to push technical disciplines engaged in DRR to evolve towards a greater understanding of their own contexts and to adopt relational approaches.
● Open-ended collaborative deep learning processes intended to leave behind the scripts and understand the contexts to create the new forms of knowledge and data needed to address ecological–social risk.
All of these are showing promise. Some may ultimately reinforce, in different ways, the scriptedness and the narrowness of contexts from which their proponents are trying to achieve escape velocity. It is the experimentation with new patterns of behaviours and new patterns of relationships that is most important in finding a way, or finding multiple ways, to tackle the legacy of past and future patterns of human thought and action that increase ecological–social risk.
Fundamentally, these explorations include holding and honouring each other’s stories, connecting and caring, investing in flexibility and relationships, and exploring new metaphors and myths that create possibilities for new realities for decision makers through wider and less-constrained perceptions. These approaches help decision makers focus on the appropriate modalities for risk management and risk reduction interventions in complex, adaptive systems contexts (i.e. within societies and nature). They are needed to work in parallel with other forms of data and analysis of risk in systems, to reframe how to see and address risk at local and planetary scales.
91
XX XX
Part IIThe role of biases and communication in risk reduction
7. How human biases and decision processes affect risk reduction outcomesAlthough humans have classified themselves as Homo sapiens (wise hominids), in most daily situations people rely on quick short cuts (heuristics) to allow mostly accurate decisions, rather than on a deep and full assessment of the relative costs and benefits of each decision. Research into decision-making has concluded this occurs for a variety of reasons relating to the basic architecture of human minds and the large amount of information processed every waking minute. Habits of mind become biases that interact with people’s social motives and the world around them to determine the decisions they make. This also affects the decisions made individually and collectively about how to cope with disasters. This chapter offers insights into why human minds form habits that are resistant to change, how these cognitive biases can result in suboptimal decision-making around disasters and also how understanding this can be harnessed to accelerate effective risk reduction.
7.1 Why human decision-making processes matterIn 2007, the people of Iceland endured the largest banking collapse as a percentage of an economy ever (The Economist, 2008). This crash led to sharp, albeit short-lived decreases in human security including cuts to government programmes, increases in unemployment and a significant loss
of faith in Icelandic political institutions. These contributed to political instability and street protests. The collapse was eminently predictable when viewed from a historical perspective. So, how was it that this systemic risk went “unseen” for so long?
On close inspection, the investments that underpinned the growth of the financial system in Iceland, but also internationally, were based on unsustainable beliefs about the growth in global housing markets and on loans that were increasingly unlikely to ever be repaid.
After the crash, the Government of Iceland confronted the fact that the systems designed to prevent this kind of failure – from the formal regulatory systems to the informal governance mechanisms – had failed (Hreinsson et al., 2010). It then established an investigative commission, which concluded that the Government and the larger social environment had allowed a slow and steady growth of systemic risk until it reached the point of collapse.
The investigative commission’s Working Group on Ethics specifically examined questions of what influenced the decision-making that drove the systemic risk. It concluded the formal and informal systems that surrounded the financial institutions – the corporate culture inside the banks, the incentive-based salaries and the weak financial regulatory system – were set up to reward short-term decision-
93

B4
- =
+
+
+
+
+
+
-
-
-
+
+
+
+
+ +
++
+
+
+
+
+
+
+
++
-
-
-
=
-
-
-+
+ + -
+
+
-
-
+
+
+-
+
+
+
+
-
+
-
-
-
-
+
+
+
+
+
+
+++
+
Reinforcing effects
NaturalGDP
Balancing effects
Output gap (GDP – nGDP)
GDP
R2
MACROECONOMY
R1
B1
Credit availability
Solvency/capital ratio
Growth of balance sheet
Cost of interest payments
MARKET DISCIPLINE
R
National pride
Complicated business
environment
POLITICAL INTERVENTION
Goal-driventhinking
“Good news”
Public image
of bank
Press uncriticality
Foreign criticism
discredited
SOCIETAL FACTORS
R R
PR work and donations
Public trust towards banks
Small population
Enforcement strictness
Political leverageMaterial
rewards
Authorities’ discipline
Risk
Fiscal policy
Size of balance
sheet
B3
B2
Profits
Authorities’ ability to provide
liquidity and backup
Central bank currency reserves
Perceivedrun
Liquidation premium
Market manipulation
Shareholder leverage
Risk-seeking behaviour
Socially responsible behaviour
Bad owner selection
BANK MANAGEMENT
Management cohesiveness
Internal social reward
R2
R
Figure 7.1. Systemic risk in the Icelandic financial system, 2007
Note: nGDP = nominal GDP; PR = public relations.
Source: Arnarson et al. (2011)
94
making and emphasize narrow, immediate concerns about short-term financial gain. In addition, the principle that ownership and responsibility must go hand in hand had been deactivated (as it had in most countries around the world) as the Government had become the ultimate guarantor of the financial institutions. For these reasons, the deeper or more systemic concerns, including questions of overall sustainability, were regularly overlooked by the government and social environment (Arnarson et al., 2011).
All this took place within a particular cultural context that further compounded the risk factors. Iceland is a small, homogeneous society with a strong sense of national identity. In the years before the crisis, bankers and business people were perceived as the nation’s representatives who were raising the country’s status abroad and enhancing wealth at home. Almost everyone in Iceland was benefiting from the financial boom, so there was little motivation to critically question the bankers’ behaviour.
The Iceland example illustrates the key challenge that is also central to understanding inaction around DRR. It is easy for governance systems to create conditions that reward decisions made on the basis of incomplete information and that emphasize short-term benefits at the expense of real longer-term risk (Figure 7.1).
While biases are part of the human cognitive system, it does not mean such negative outcomes are inevitable. The underlying biases people bring to the table affect the collective response to disaster risk, but they are not inherently negative. Rather, they interact with larger cultural and institutional systems to cause outcomes.
Larger systems can shift towards rewarding and encouraging effective risk reduction, but this requires action. This shift is all the more urgent given the current levels of global risk, especially arising from climate change.
Changes to basic incentive structures can support different behavioural outcomes in the case of financial systems. Changing how such systems price risk is a powerful tool. For example, in Florida,
United States, although the State Government intervened to subsidize the increasing costs of insuring buildings constructed in areas increasingly at risk to hurricanes, several companies ceased offering insurance at all, on the basis that the future risk was too significant (Kunreuther, 2011). This highlights the cost of the risk. It also underscores the importance of interactions between governments and markets in pricing risk, which can be significant. It reveals opportunities for connecting private insurance approaches with governmental compensation, or combining private responsibility with nationwide solidarity. This may be a valuable systems-based approach to support long-term thinking where the cost of bearing such risk is weighed and considered a public good (Danielson and Ekenberg, 2013).
7.2 Bounded rationalityThe information processing ability of any human is orders of magnitude more complex than that of any computer, but it is not infinite. Analysing the world and making decisions about how to act takes time and energy. The complexity of the world often pushes people to engage with more information than they can consider consciously. Human minds therefore use different tricks and short cuts to help prioritize what issues and events to focus on, and how deeply to process the information related to those issues and events.
Psychologists like to say humans have evolved to be “cognitive misers” (Fiske and Taylor, 1991). In general, human systems use the smallest amount of focus and attention necessary to understand and solve problems. Doing so is evolutionarily smart – it allows humans to juggle multiple different tasks simultaneously and maintain awareness of their environment to keep scanning for potential threats. People can devote their full attention to reasoned examination of best solutions to any question they are considering, but such attention is not the typical way they interact with decisions.
If everyone went about their grocery shopping by thinking thoroughly and rationally for every single item and the combination of how to maximize health, price, environmental and any other
95
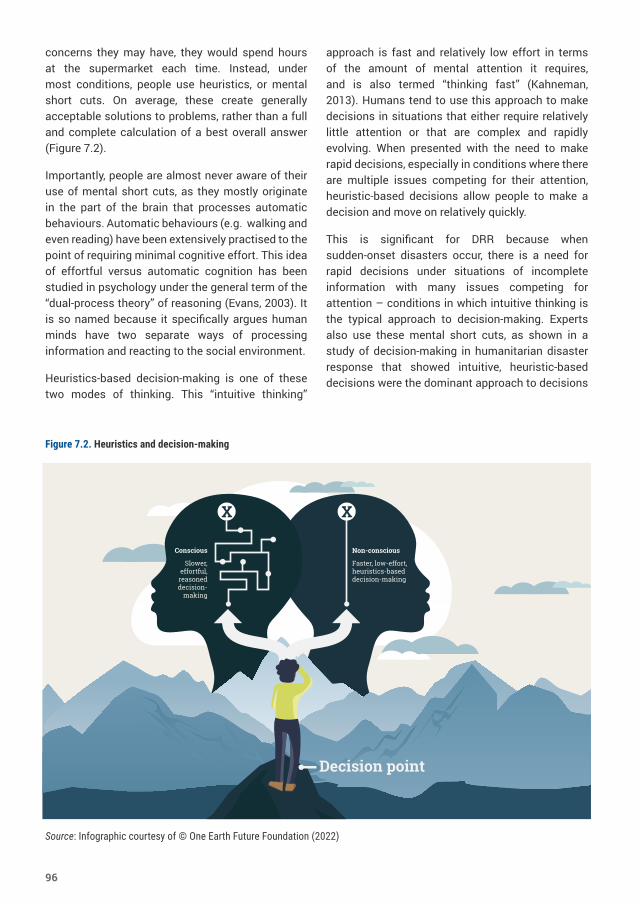
concerns they may have, they would spend hours at the supermarket each time. Instead, under most conditions, people use heuristics, or mental short cuts. On average, these create generally acceptable solutions to problems, rather than a full and complete calculation of a best overall answer (Figure 7.2).
Importantly, people are almost never aware of their use of mental short cuts, as they mostly originate in the part of the brain that processes automatic behaviours. Automatic behaviours (e.g. walking and even reading) have been extensively practised to the point of requiring minimal cognitive effort. This idea of effortful versus automatic cognition has been studied in psychology under the general term of the “dual-process theory” of reasoning (Evans, 2003). It is so named because it specifically argues human minds have two separate ways of processing information and reacting to the social environment.
Heuristics-based decision-making is one of these two modes of thinking. This “intuitive thinking”
approach is fast and relatively low effort in terms of the amount of mental attention it requires, and is also termed “thinking fast” (Kahneman, 2013). Humans tend to use this approach to make decisions in situations that either require relatively little attention or that are complex and rapidly evolving. When presented with the need to make rapid decisions, especially in conditions where there are multiple issues competing for their attention, heuristic-based decisions allow people to make a decision and move on relatively quickly.
This is significant for DRR because when sudden-onset disasters occur, there is a need for rapid decisions under situations of incomplete information with many issues competing for attention – conditions in which intuitive thinking is the typical approach to decision-making. Experts also use these mental short cuts, as shown in a study of decision-making in humanitarian disaster response that showed intuitive, heuristic-based decisions were the dominant approach to decisions
Non-conscious
Faster, low-effort, heuristics-based decision-making
Conscious
Slower, effortful,
reasoned decision-
making
XX
Decision point
Figure 7.2. Heuristics and decision-making
Source: Infographic courtesy of © One Earth Future Foundation (2022)
96
in disaster response (Comes, 2016). In contrast, decision-making to prevent the development of new risk, to reduce known risk outside the context of an immediate crisis, and to perceive and address systemic risk requires deliberative thinking, or “thinking slow”.
Heuristics may also be tuned to optimize perceptions of cost and benefit in a person’s local environment. They provide quick answers to common problems and have developed precisely because they work well in most situations. However, these heuristics introduce identifiable biases that do not always result in good decisions, especially when the situation is complex or high pressured. Heuristics respond to specific and immediate environmental cues. They focus attention and decisions on imminent crises, but they mean that slower-moving risks, frequent low-impact disasters or crises with long lead times, and their systemic impacts, can easily be overlooked by intuitive thinking (Broomell, 2020). While, in general, any individual person can be successful in operating according to deep or engaged decision-making, on aggregate, “thinking fast” represents the most common way that people engage with decisions.
Biases, or heuristics, that can emerge and which are particularly relevant in disaster decision-making include:
● Myopia and simplification, or the tendency to simplify complex problems and make decisions based on limited and personally relevant information.
● The tendency to overemphasize information that is more easily remembered or made salient by a specific environment.
● Anchoring, or using an irrelevant number as the basis for decision under conditions of great uncertainty.
● Optimism and overconfidence, or a general tendency for people to see situations as less threatening than they are and to see themselves as more capable than they are.
● The status quo bias and loss aversion, or the tendency to accept existing situations (even if negative) and to be concerned more about the risk of loss than the potential gain.
Not all decisions are made by heuristics. The second process of decision-making, “deliberative thinking”, involves a conscious consideration of the different benefits and risks of different possible choices. Such rational decision-making is exceptionally powerful and is at the core of humans’ evolutionary success – but it is also effortful in time and attention, and is something people do not always do. Some theories suggest people do it only if they feel the automatic response needs to be double checked or corrected. People are more likely to use deliberative models when aware that the decisions are highly important, when they have time to make a decision and when they feel they have sufficient information to make a good decision.
In practice, this means people are more likely to take problems seriously and engage with the need for DRR when those problems are consequential, made salient or active by the environment, when they threaten direct and personal loss, and when they affect individuals directly. An example of this comes from risk reduction decisions around volcanic activity. Some volcanic eruptions easily meet the criteria above: they are characterized by visible indicators of danger or rapidly evolving situations that focus attention, loud noises, or other elements that drive salience, loss aversion and other heuristics to encourage people to pay attention – and react – to imminent risk of disaster.
In contrast, other types of volcanic activity have fewer of these elements but are equally dangerous. An assessment of the social dynamics of volcanic risk found successful communication was facilitated in part by the consistent transmission of specific risk information, particularly in locally relevant languages and by locally trusted representatives (Barclay et al., 2008). When the risk was seen as a slower developing risk over a longer term, or was less clear or politically polarized – as in volcanic dangers in Guadeloupe, Montserrat and Tenerife – at-risk populations were much less likely to engage effectively in DRR. Therefore, the challenges for governments are how to promote good decisions and how to create systems to expose risky cognitive biases to incentivize those good decisions instead.
97
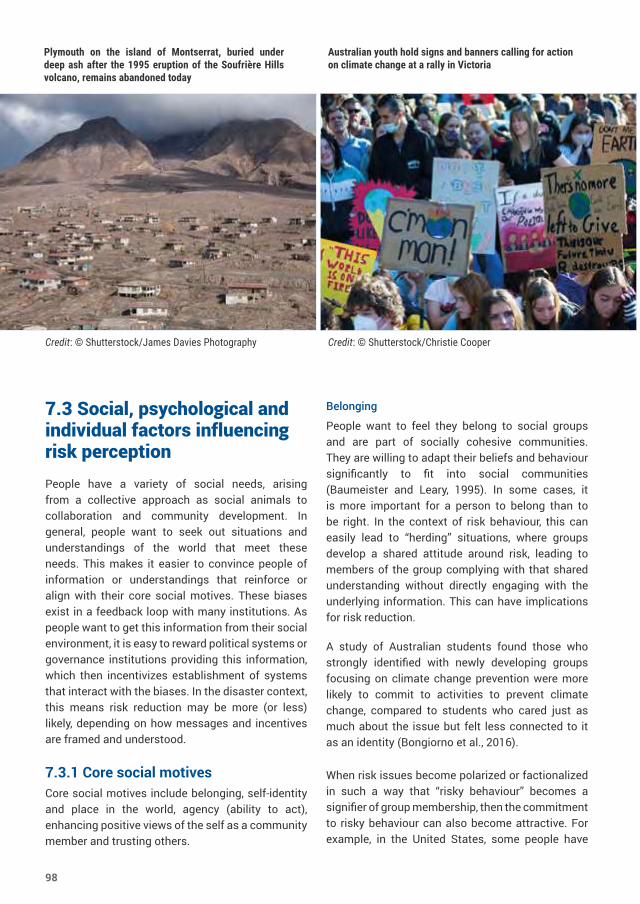
7.3 Social, psychological and individual factors influencing risk perceptionPeople have a variety of social needs, arising from a collective approach as social animals to collaboration and community development. In general, people want to seek out situations and understandings of the world that meet these needs. This makes it easier to convince people of information or understandings that reinforce or align with their core social motives. These biases exist in a feedback loop with many institutions. As people want to get this information from their social environment, it is easy to reward political systems or governance institutions providing this information, which then incentivizes establishment of systems that interact with the biases. In the disaster context, this means risk reduction may be more (or less) likely, depending on how messages and incentives are framed and understood.
7.3.1 Core social motivesCore social motives include belonging, self-identity and place in the world, agency (ability to act), enhancing positive views of the self as a community member and trusting others.
Belonging
People want to feel they belong to social groups and are part of socially cohesive communities. They are willing to adapt their beliefs and behaviour significantly to fit into social communities (Baumeister and Leary, 1995). In some cases, it is more important for a person to belong than to be right. In the context of risk behaviour, this can easily lead to “herding” situations, where groups develop a shared attitude around risk, leading to members of the group complying with that shared understanding without directly engaging with the underlying information. This can have implications for risk reduction.
A study of Australian students found those who strongly identified with newly developing groups focusing on climate change prevention were more likely to commit to activities to prevent climate change, compared to students who cared just as much about the issue but felt less connected to it as an identity (Bongiorno et al., 2016).
When risk issues become polarized or factionalized in such a way that “risky behaviour” becomes a signifier of group membership, then the commitment to risky behaviour can also become attractive. For example, in the United States, some people have
Australian youth hold signs and banners calling for action on climate change at a rally in Victoria
Credit: © Shutterstock/Christie Cooper
Plymouth on the island of Montserrat, buried under deep ash after the 1995 eruption of the Soufrière Hills volcano, remains abandoned today
Credit: © Shutterstock/James Davies Photography
98
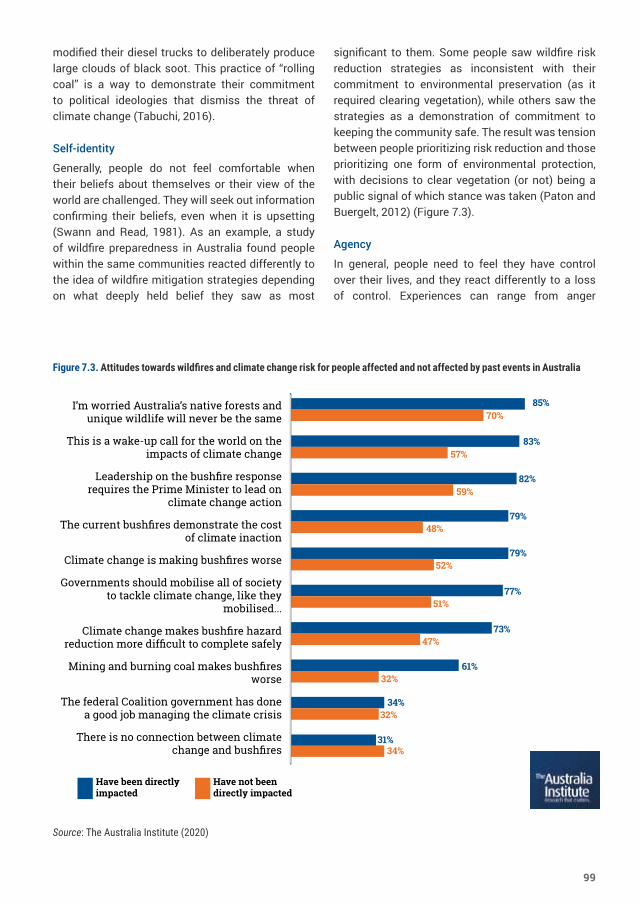
modified their diesel trucks to deliberately produce large clouds of black soot. This practice of “rolling coal” is a way to demonstrate their commitment to political ideologies that dismiss the threat of climate change (Tabuchi, 2016).
Self-identity
Generally, people do not feel comfortable when their beliefs about themselves or their view of the world are challenged. They will seek out information confirming their beliefs, even when it is upsetting (Swann and Read, 1981). As an example, a study of wildfire preparedness in Australia found people within the same communities reacted differently to the idea of wildfire mitigation strategies depending on what deeply held belief they saw as most
significant to them. Some people saw wildfire risk reduction strategies as inconsistent with their commitment to environmental preservation (as it required clearing vegetation), while others saw the strategies as a demonstration of commitment to keeping the community safe. The result was tension between people prioritizing risk reduction and those prioritizing one form of environmental protection, with decisions to clear vegetation (or not) being a public signal of which stance was taken (Paton and Buergelt, 2012) (Figure 7.3).
Agency
In general, people need to feel they have control over their lives, and they react differently to a loss of control. Experiences can range from anger
I’m worried Australia’s native forests and unique wildlife will never be the same
This is a wake-up call for the world on the impacts of climate change
Leadership on the bushfire response requires the Prime Minister to lead on
climate change action
The current bushfires demonstrate the cost of climate inaction
Climate change is making bushfires worse
Governments should mobilise all of society to tackle climate change, like they
mobilised...
Climate change makes bushfire hazard reduction more difficult to complete safely
Mining and burning coal makes bushfires worse
The federal Coalition government has done a good job managing the climate crisis
There is no connection between climate change and bushfires
Have been directly impacted
Have not been directly impacted
85%70%
83%57%
82%59%
79%48%
79%52%
77%51%
73%47%
61%32%
34%32%
31%34%
Figure 7.3. Attitudes towards wildfires and climate change risk for people affected and not affected by past events in Australia
Source: The Australia Institute (2020)
99
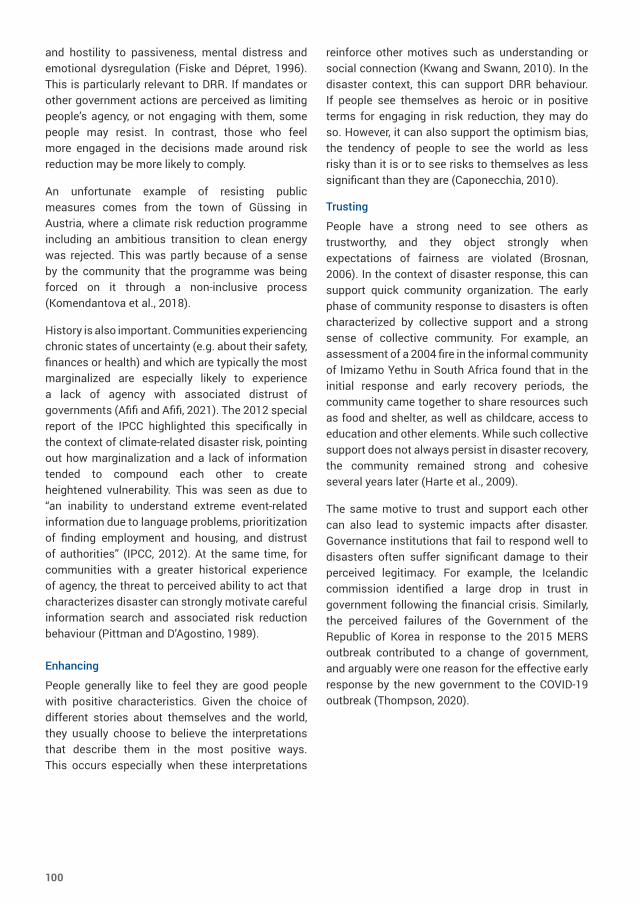
and hostility to passiveness, mental distress and emotional dysregulation (Fiske and Dépret, 1996). This is particularly relevant to DRR. If mandates or other government actions are perceived as limiting people’s agency, or not engaging with them, some people may resist. In contrast, those who feel more engaged in the decisions made around risk reduction may be more likely to comply.
An unfortunate example of resisting public measures comes from the town of Güssing in Austria, where a climate risk reduction programme including an ambitious transition to clean energy was rejected. This was partly because of a sense by the community that the programme was being forced on it through a non-inclusive process (Komendantova et al., 2018).
History is also important. Communities experiencing chronic states of uncertainty (e.g. about their safety, finances or health) and which are typically the most marginalized are especially likely to experience a lack of agency with associated distrust of governments (Afifi and Afifi, 2021). The 2012 special report of the IPCC highlighted this specifically in the context of climate-related disaster risk, pointing out how marginalization and a lack of information tended to compound each other to create heightened vulnerability. This was seen as due to “an inability to understand extreme event-related information due to language problems, prioritization of finding employment and housing, and distrust of authorities” (IPCC, 2012). At the same time, for communities with a greater historical experience of agency, the threat to perceived ability to act that characterizes disaster can strongly motivate careful information search and associated risk reduction behaviour (Pittman and D’Agostino, 1989).
Enhancing
People generally like to feel they are good people with positive characteristics. Given the choice of different stories about themselves and the world, they usually choose to believe the interpretations that describe them in the most positive ways. This occurs especially when these interpretations
reinforce other motives such as understanding or social connection (Kwang and Swann, 2010). In the disaster context, this can support DRR behaviour. If people see themselves as heroic or in positive terms for engaging in risk reduction, they may do so. However, it can also support the optimism bias, the tendency of people to see the world as less risky than it is or to see risks to themselves as less significant than they are (Caponecchia, 2010).
Trusting
People have a strong need to see others as trustworthy, and they object strongly when expectations of fairness are violated (Brosnan, 2006). In the context of disaster response, this can support quick community organization. The early phase of community response to disasters is often characterized by collective support and a strong sense of collective community. For example, an assessment of a 2004 fire in the informal community of Imizamo Yethu in South Africa found that in the initial response and early recovery periods, the community came together to share resources such as food and shelter, as well as childcare, access to education and other elements. While such collective support does not always persist in disaster recovery, the community remained strong and cohesive several years later (Harte et al., 2009).
The same motive to trust and support each other can also lead to systemic impacts after disaster. Governance institutions that fail to respond well to disasters often suffer significant damage to their perceived legitimacy. For example, the Icelandic commission identified a large drop in trust in government following the financial crisis. Similarly, the perceived failures of the Government of the Republic of Korea in response to the 2015 MERS outbreak contributed to a change of government, and arguably were one reason for the effective early response by the new government to the COVID-19 outbreak (Thompson, 2020).
100
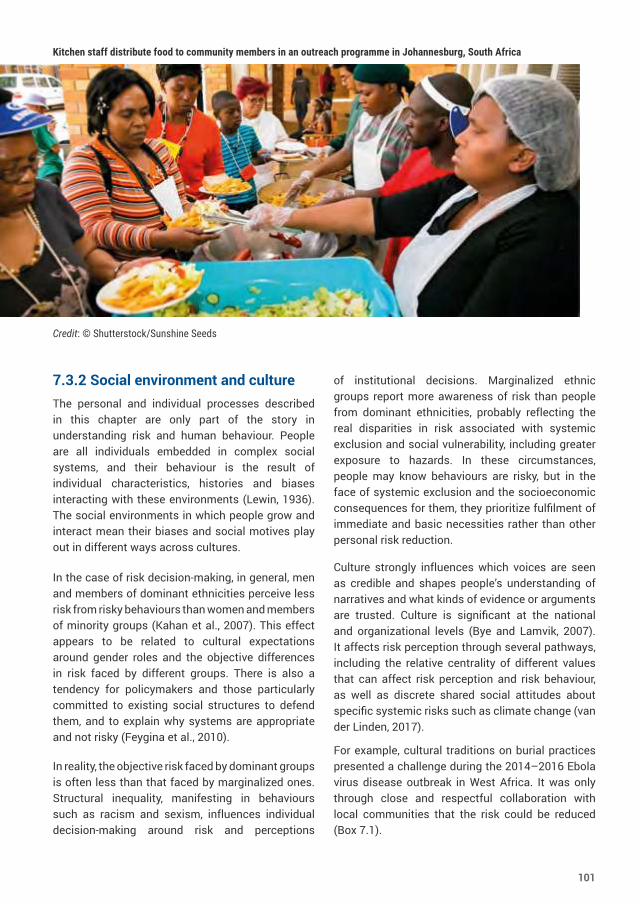
7.3.2 Social environment and cultureThe personal and individual processes described in this chapter are only part of the story in understanding risk and human behaviour. People are all individuals embedded in complex social systems, and their behaviour is the result of individual characteristics, histories and biases interacting with these environments (Lewin, 1936). The social environments in which people grow and interact mean their biases and social motives play out in different ways across cultures.
In the case of risk decision-making, in general, men and members of dominant ethnicities perceive less risk from risky behaviours than women and members of minority groups (Kahan et al., 2007). This effect appears to be related to cultural expectations around gender roles and the objective differences in risk faced by different groups. There is also a tendency for policymakers and those particularly committed to existing social structures to defend them, and to explain why systems are appropriate and not risky (Feygina et al., 2010).
In reality, the objective risk faced by dominant groups is often less than that faced by marginalized ones. Structural inequality, manifesting in behaviours such as racism and sexism, influences individual decision-making around risk and perceptions
of institutional decisions. Marginalized ethnic groups report more awareness of risk than people from dominant ethnicities, probably reflecting the real disparities in risk associated with systemic exclusion and social vulnerability, including greater exposure to hazards. In these circumstances, people may know behaviours are risky, but in the face of systemic exclusion and the socioeconomic consequences for them, they prioritize fulfilment of immediate and basic necessities rather than other personal risk reduction.
Culture strongly influences which voices are seen as credible and shapes people’s understanding of narratives and what kinds of evidence or arguments are trusted. Culture is significant at the national and organizational levels (Bye and Lamvik, 2007). It affects risk perception through several pathways, including the relative centrality of different values that can affect risk perception and risk behaviour, as well as discrete shared social attitudes about specific systemic risks such as climate change (van der Linden, 2017).
For example, cultural traditions on burial practices presented a challenge during the 2014–2016 Ebola virus disease outbreak in West Africa. It was only through close and respectful collaboration with local communities that the risk could be reduced (Box 7.1).
Kitchen staff distribute food to community members in an outreach programme in Johannesburg, South Africa
Credit: © Shutterstock/Sunshine Seeds
101
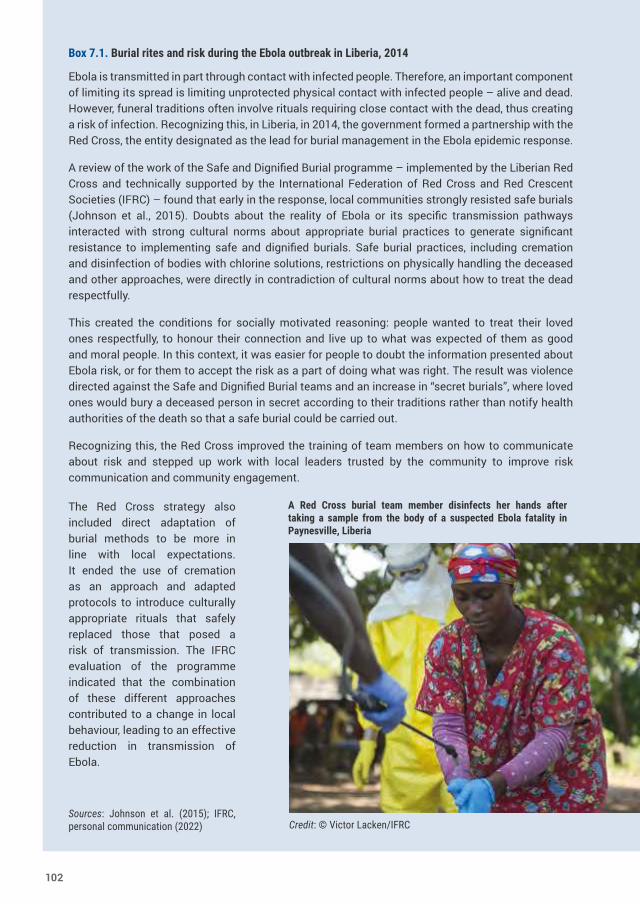
Box 7.1. Burial rites and risk during the Ebola outbreak in Liberia, 2014
Ebola is transmitted in part through contact with infected people. Therefore, an important component of limiting its spread is limiting unprotected physical contact with infected people – alive and dead. However, funeral traditions often involve rituals requiring close contact with the dead, thus creating a risk of infection. Recognizing this, in Liberia, in 2014, the government formed a partnership with the Red Cross, the entity designated as the lead for burial management in the Ebola epidemic response.
A review of the work of the Safe and Dignified Burial programme – implemented by the Liberian Red Cross and technically supported by the International Federation of Red Cross and Red Crescent Societies (IFRC) – found that early in the response, local communities strongly resisted safe burials (Johnson et al., 2015). Doubts about the reality of Ebola or its specific transmission pathways interacted with strong cultural norms about appropriate burial practices to generate significant resistance to implementing safe and dignified burials. Safe burial practices, including cremation and disinfection of bodies with chlorine solutions, restrictions on physically handling the deceased and other approaches, were directly in contradiction of cultural norms about how to treat the dead respectfully.
This created the conditions for socially motivated reasoning: people wanted to treat their loved ones respectfully, to honour their connection and live up to what was expected of them as good and moral people. In this context, it was easier for people to doubt the information presented about Ebola risk, or for them to accept the risk as a part of doing what was right. The result was violence directed against the Safe and Dignified Burial teams and an increase in “secret burials”, where loved ones would bury a deceased person in secret according to their traditions rather than notify health authorities of the death so that a safe burial could be carried out.
Recognizing this, the Red Cross improved the training of team members on how to communicate about risk and stepped up work with local leaders trusted by the community to improve risk communication and community engagement.
A Red Cross burial team member disinfects her hands after taking a sample from the body of a suspected Ebola fatality in Paynesville, Liberia
The Red Cross strategy also included direct adaptation of burial methods to be more in line with local expectations. It ended the use of cremation as an approach and adapted protocols to introduce culturally appropriate rituals that safely replaced those that posed a risk of transmission. The IFRC evaluation of the programme indicated that the combination of these different approaches contributed to a change in local behaviour, leading to an effective reduction in transmission of Ebola.
Sources: Johnson et al. (2015); IFRC, personal communication (2022) Credit: © Victor Lacken/IFRC
102
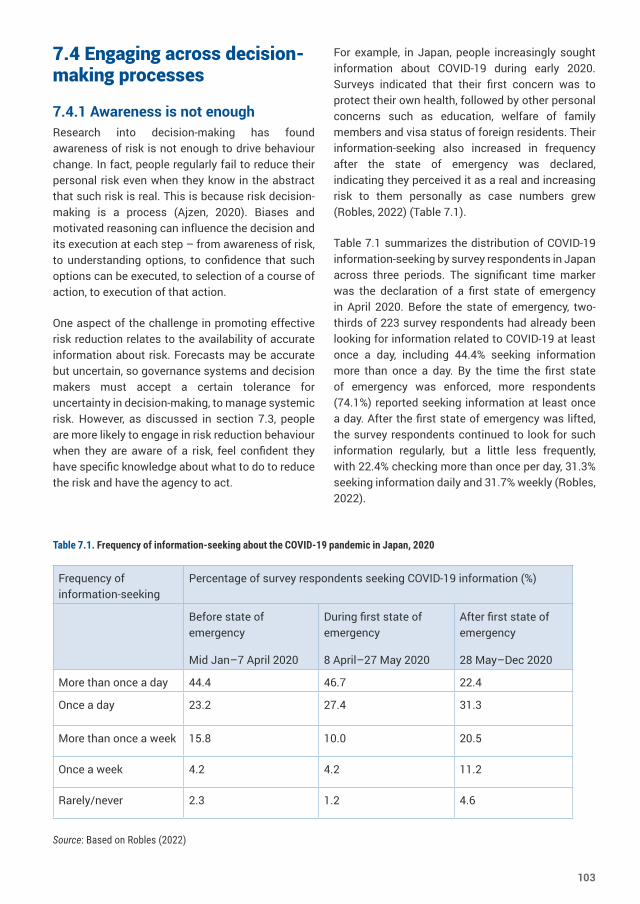
7.4 Engaging across decision-making processes
7.4.1 Awareness is not enough Research into decision-making has found awareness of risk is not enough to drive behaviour change. In fact, people regularly fail to reduce their personal risk even when they know in the abstract that such risk is real. This is because risk decision-making is a process (Ajzen, 2020). Biases and motivated reasoning can influence the decision and its execution at each step – from awareness of risk, to understanding options, to confidence that such options can be executed, to selection of a course of action, to execution of that action.
One aspect of the challenge in promoting effective risk reduction relates to the availability of accurate information about risk. Forecasts may be accurate but uncertain, so governance systems and decision makers must accept a certain tolerance for uncertainty in decision-making, to manage systemic risk. However, as discussed in section 7.3, people are more likely to engage in risk reduction behaviour when they are aware of a risk, feel confident they have specific knowledge about what to do to reduce the risk and have the agency to act.
For example, in Japan, people increasingly sought information about COVID-19 during early 2020. Surveys indicated that their first concern was to protect their own health, followed by other personal concerns such as education, welfare of family members and visa status of foreign residents. Their information-seeking also increased in frequency after the state of emergency was declared, indicating they perceived it as a real and increasing risk to them personally as case numbers grew (Robles, 2022) (Table 7.1).
Table 7.1 summarizes the distribution of COVID-19 information-seeking by survey respondents in Japan across three periods. The significant time marker was the declaration of a first state of emergency in April 2020. Before the state of emergency, two-thirds of 223 survey respondents had already been looking for information related to COVID-19 at least once a day, including 44.4% seeking information more than once a day. By the time the first state of emergency was enforced, more respondents (74.1%) reported seeking information at least once a day. After the first state of emergency was lifted, the survey respondents continued to look for such information regularly, but a little less frequently, with 22.4% checking more than once per day, 31.3% seeking information daily and 31.7% weekly (Robles, 2022).
Frequency of information-seeking
Percentage of survey respondents seeking COVID-19 information (%)
Before state of emergency
Mid Jan–7 April 2020
During first state of emergency
8 April–27 May 2020
After first state of emergency
28 May–Dec 2020
More than once a day 44.4 46.7 22.4
Once a day 23.2 27.4 31.3
More than once a week 15.8 10.0 20.5
Once a week 4.2 4.2 11.2
Rarely/never 2.3 1.2 4.6
Table 7.1. Frequency of information-seeking about the COVID-19 pandemic in Japan, 2020
Source: Based on Robles (2022)
103
Governments or other stakeholders that emphasize risk reduction methods requiring specific capacity run the risk of overlooking capacity limitations, such as calls for evacuation that assume people will have the transportation necessary to evacuate, or that the evacuating population is sufficiently able-bodied to do so.
Even if people know risk exists and if they have the capacity to reduce it – two big “ifs” – they may not execute the recommended risk reduction behaviour. The biases discussed in this chapter can also lead to a status quo bias in which people are comfortable with situations even as they become increasingly risky. Those “biases” may also, in some cases, represent accurate judgments. Some people and communities may have historical reasons not to engage in risk reduction behaviour advocated by sources with little to no knowledge or appreciation of the conditions of their lives and restrictions therein (Komendantova et al., 2016).
For example, wildfire risk is increasing in many countries, due to increasing construction in the urban–wildland interface and the systemic risks of climate change. Residents and property owners in high-risk areas can take risk reduction actions if they have the means, some through their own labour and some requiring financial investments not available to everyone. Research from Australia (McLennan et al., 2015) and the United States (Martin et al., 2009) has consistently found people who are more aware of the potential risk of wildfires report more intention to take steps to reduce risk. However, this is mediated in part by whether people feel they have options they can take to meaningfully reduce risk – if people feel less capable of executing mitigation strategies or less aware of them, they report less willingness to take risk reduction action. The selection of strategies is also important. Research from Australian at-risk communities suggests a significant proportion of the respondents reported plans to stay in place and defend their buildings from wildfires using strategies that would likely not work (McLennan et al., 2015).
7.4.2 Individual and structural pressures in risk decision systemsTo understand behavioural outcomes, it is necessary to think less in terms of individual-based approaches and more in larger structural and systemic ways that show how individual decisions are influenced by larger social systems. These may include issues such as laws, policies, systems, physical designs, discrimination, restricted access, financial constraints and other aspects of lived experience that help facilitate or constrain behaviours (Blankenship et al., 2006).
Individual decisions and individual abilities to make good choices about DRR have to be understood in the context of community histories and the structural reasons that prevent individuals effectively accessing the information and resources needed to reduce risk. Their decisions are influenced by social norms, due to direct capacity limitations and even through the impact of chronic uncertainty on the neurology of those who live with it (Fugariu et al., 2020). As a rule, people are also inclined to attribute their success to internal factors (e.g. intelligence or personality), whereas unfortunate outcomes are blamed on unfortunate circumstances.
Unfortunately, institutional structures often appear to reinforce biases towards higher-risk behaviour, as shown by the Iceland example in section 7.1 above. Before the systemic failure, when there was an abundance of liquidity and most investments turned a profit due to unusually favourable market conditions, bankers attributed this to their own brilliance or hard work (Thórisdóttir and Karólínudóttir, 2014). This led to an overestimation of their ability to take appropriate business risks, and resulted in a lack of critical assessment, ever riskier decision-making or both.
Such optimism is particularly risky when it coincides with formal and informal incentives within wider systems. For example, in the financial system, investments in stocks are nominally based on long-term assessments of the economic performance
104
of the investment vehicle. In practice, investors are much more likely to make decisions based on short-term gains and losses. This creates a cyclical incentive structure where recipients of investment are incentivized to do whatever they can to deliver short-term performance increases, which then rewards short-term investors (Rappaport, 2005).
In the case of the 2008 global financial crash, the focus on short-term performance created conditions where those people taking risky decisions were rewarded more than those who were not – right up until the crash happened. In the face of this pressure, it is easy for motivated reasoning to encourage herding behaviour. If peers are being rewarded for behaviour that is perhaps risky, but perhaps not, the combination of social pressure, optimism biases and fear of missing out can encourage people to take risks that a more sober assessment might suggest are unwise.
Individual investors may harbour doubts about the increasingly risky investment behaviour of their colleagues but will hesitate to voice their concerns because of the false belief that nobody else shares them. This demonstrates the importance of the need for social belonging and avoiding anything that might lead to ostracism. However, this same characteristic can also be harnessed for positive social change. If members of a group believe others in their group care about disaster preparedness and have made adequate arrangements, they too will be more likely to follow suit.
These same cognitive biases in social systems can also be used to positive effect. An example from Indonesia helps provide insights on how better understanding cognitive biases can accelerate effective disaster recovery (Box 7.2).
Box 7.2. Social connection for resilient recovery in East Java, Indonesia
In 2006, a mudflow inundated 12 villages and destroyed more than 10,000 homes in the Sidoarjo district of East Java (Farida, 2014). In responding to this disaster, the local government unintentionally took two separate approaches to supporting recovery: one more in line with existing social motives for social connection and identity maintenance, and one less supportive of these motives. Survivors from one village, Renokenongo, were housed in temporary camps set up close to each other and close to their original village. Survivors from another village, Siring, were dispersed.
While survivors of both villages were provided with some compensation for their loss, the community of Renokenongo was able to re-establish community identities and community rituals as well as establish networks of mutual support in ways that the Siring community was less supported in doing. Survivors from Siring originally struggled to reconnect with each other and with the loss of their connection to the village itself (including opposition from the government to their listing their residence as Siring instead of the locations they were placed), but over time they were able to establish community connections with each other through electronic communications. Both communities organized to support each other and demand fair treatment from the government and the natural gas company identified as the cause of the disaster. However, the preservation of the Renokenongo social and cultural context appears to have had a significant impact on its community resilience, while the inadvertent intervention in the Siring social structures had the opposite effect (Farida, 2014).
105
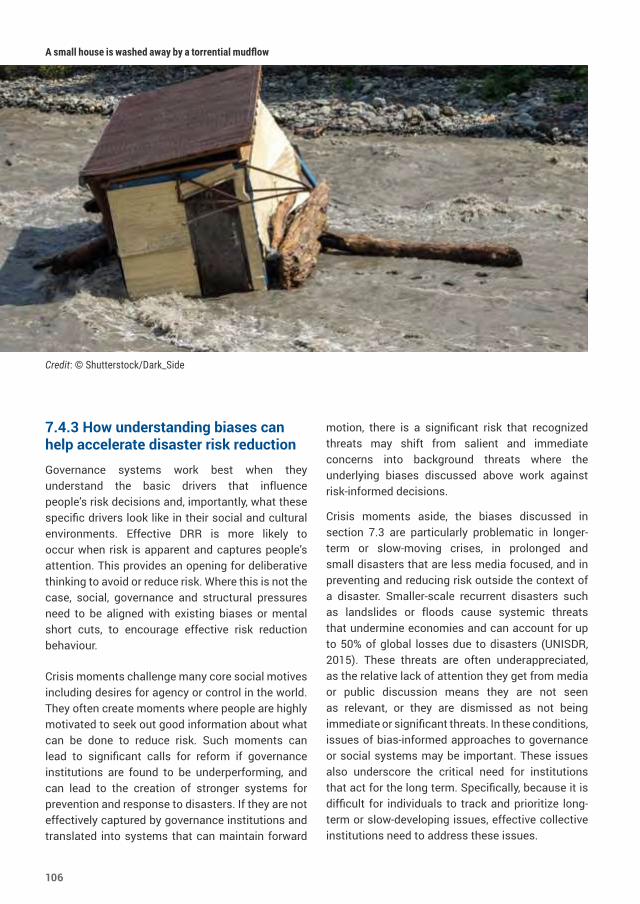
7.4.3 How understanding biases can help accelerate disaster risk reductionGovernance systems work best when they understand the basic drivers that influence people’s risk decisions and, importantly, what these specific drivers look like in their social and cultural environments. Effective DRR is more likely to occur when risk is apparent and captures people’s attention. This provides an opening for deliberative thinking to avoid or reduce risk. Where this is not the case, social, governance and structural pressures need to be aligned with existing biases or mental short cuts, to encourage effective risk reduction behaviour.
Crisis moments challenge many core social motives including desires for agency or control in the world. They often create moments where people are highly motivated to seek out good information about what can be done to reduce risk. Such moments can lead to significant calls for reform if governance institutions are found to be underperforming, and can lead to the creation of stronger systems for prevention and response to disasters. If they are not effectively captured by governance institutions and translated into systems that can maintain forward
A small house is washed away by a torrential mudflow
Credit: © Shutterstock/Dark_Side
motion, there is a significant risk that recognized threats may shift from salient and immediate concerns into background threats where the underlying biases discussed above work against risk-informed decisions.
Crisis moments aside, the biases discussed in section 7.3 are particularly problematic in longer-term or slow-moving crises, in prolonged and small disasters that are less media focused, and in preventing and reducing risk outside the context of a disaster. Smaller-scale recurrent disasters such as landslides or floods cause systemic threats that undermine economies and can account for up to 50% of global losses due to disasters (UNISDR, 2015). These threats are often underappreciated, as the relative lack of attention they get from media or public discussion means they are not seen as relevant, or they are dismissed as not being immediate or significant threats. In these conditions, issues of bias-informed approaches to governance or social systems may be important. These issues also underscore the critical need for institutions that act for the long term. Specifically, because it is difficult for individuals to track and prioritize long-term or slow-developing issues, effective collective institutions need to address these issues.
106
7.5 Ways forwardGreater public awareness of human biases and how they play out may help reduce their impact. Ensuring meaningful opportunities for engagement and participation, for example in the early warning or communication processes, may also be useful. Clearly and transparently communicating preferences, criteria and trade-offs during policy development can enhance the quality of decision-making processes (Ekenberg et al., 2017). For example, preferences may differ around economic or safety-oriented considerations, short-term versus long-term effects and risks affecting local communities directly compared with systemic risk from more distant sources.
Further analysis is needed on how biases and heuristics dampen or amplify perceptions about potential risk scenarios in the present or the future. To reduce the impact of behavioural and cognitive biases, people should have access to data describing situations they can relate to psychologically, and authorities must design risk communication and programmes that take into account these known heuristics and biases.
Developing social systems that engage directly with existing biases to support more just and more effective systems for risk reduction can also be useful. There is no reason why social systems cannot be developed that deliberately build on human predispositions to support effective risk reduction. Bias-informed incentives can shape behaviour in ways that produce positive and effective action. One way to do this is by formally changing incentives to align rewards with long-term and short-term or heuristic-driven decisions. Such changes can improve risk performance by supporting behaviour in line with what would be expected from risk-informed decisions, even if the decisions are made for reasons other than a full assessment.
Increasing the accessibility of tools to manage risk is also fundamental to a stable climate future and continued sustainable development. For example, changing pricing systems to move the costs of environmental challenges closer in time
to the decisions that generate them may be a tool for using short-term and salience-driven biases to support effective climate action.
Overall, this chapter has highlighted that:
● DRR actions should be informed by an awareness that engagement, uptake and compliance will not be the same across different communities. Structural, historical, cultural and individual factors will influence how people are motivated to engage with risk reduction recommendations.
● Governments and other stakeholders should incorporate an analysis of biases and social motives into planning for behaviour change to reduce risk. Whenever possible, actions should be designed to reinforce social motives and align with biases rather than require people to behave contrary to them.
● Structural constraints on behaviour should also be considered in making risk reduction recommendations, including issues such as the capacity and history of different communities and their existing resources.
107
8. Addressing biases to increase investment in risk reductionWhy is it that individuals and governments still do not invest enough in DRR, despite experience and evidence of its value? Why is there such a gap between the intention to reduce risk and action taken to build resilience, despite the availability of scientific data and advice on risk? What are the cognitive biases and financial incentives that work for and against smarter investments in risk reduction?
This chapter suggests that the cognitive biases and mental short cuts (heuristics) outlined in Chapter 7 influence the decision processes of those at risk from disasters and of the key decision makers concerned with their welfare. It outlines how an understanding of biases and heuristics can make action to promote risk reduction more effective. In many countries, tools such as insurance are not widely available or are seldom applied to cover losses from disasters. Investment in pre-emptive risk reduction is also insufficient. Governments often rely on other economic incentives or regulations to encourage investment in DRR. These include low-interest loans or grants and community engagement processes, and the enforcement of risk reduction policies, building codes and land-use regulations. This chapter suggests an understanding of biases and heuristics in decision-making can help make the design of such products, policies, regulations and standards more effective.
The first section looks at how individuals make decisions about risk reduction and how cognitive
biases affect those decisions. The second section considers how this knowledge can be applied in governance and financial systems. The third section outlines the role that different stakeholders (e.g. individuals, communities, the private sector and the public sector) can play in this process. Overall, the chapter highlights the need to rework the way current institutional arrangements design and account for the costs of disaster-related losses, particularly long-term risks. Adjusting the design of products can make them more effective, but new financial products and incentives that can better address the impacts of systemic risks are also needed. Just as green bonds have helped accelerate renewable energy finance, similar products are needed to incentivize and ease investment in disaster- and climate-resilient products.
8.1 The impact of biases and heuristics on risk-related decision-makingRecent experience of a disaster event often creates a willingness to invest in risk reduction, which leads to long-term benefits for a community facing recurring hazards. For example, in the United States, following Hurricane Andrew in 1992, the State of Florida re-evaluated its standards and enacted a new building code in 2001. It moved from being a state with poorly enforced building codes to having one of the most effective codes in the country. A study of the difference in realized damage from hurricanes
108
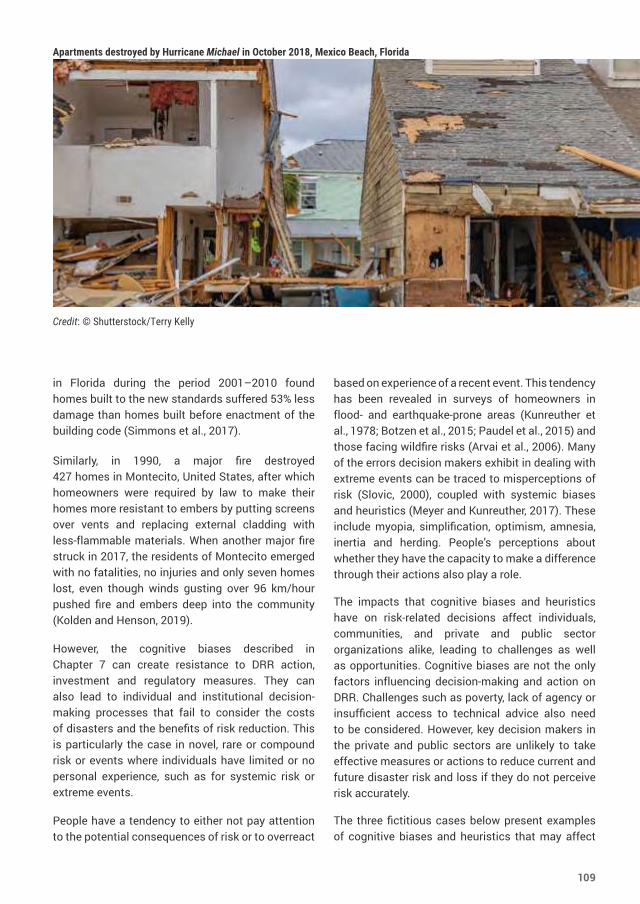
in Florida during the period 2001–2010 found homes built to the new standards suffered 53% less damage than homes built before enactment of the building code (Simmons et al., 2017).
Similarly, in 1990, a major fire destroyed 427 homes in Montecito, United States, after which homeowners were required by law to make their homes more resistant to embers by putting screens over vents and replacing external cladding with less-flammable materials. When another major fire struck in 2017, the residents of Montecito emerged with no fatalities, no injuries and only seven homes lost, even though winds gusting over 96 km/hour pushed fire and embers deep into the community (Kolden and Henson, 2019).
However, the cognitive biases described in Chapter 7 can create resistance to DRR action, investment and regulatory measures. They can also lead to individual and institutional decision-making processes that fail to consider the costs of disasters and the benefits of risk reduction. This is particularly the case in novel, rare or compound risk or events where individuals have limited or no personal experience, such as for systemic risk or extreme events.
People have a tendency to either not pay attention to the potential consequences of risk or to overreact
based on experience of a recent event. This tendency has been revealed in surveys of homeowners in flood- and earthquake-prone areas (Kunreuther et al., 1978; Botzen et al., 2015; Paudel et al., 2015) and those facing wildfire risks (Arvai et al., 2006). Many of the errors decision makers exhibit in dealing with extreme events can be traced to misperceptions of risk (Slovic, 2000), coupled with systemic biases and heuristics (Meyer and Kunreuther, 2017). These include myopia, simplification, optimism, amnesia, inertia and herding. People’s perceptions about whether they have the capacity to make a difference through their actions also play a role.
The impacts that cognitive biases and heuristics have on risk-related decisions affect individuals, communities, and private and public sector organizations alike, leading to challenges as well as opportunities. Cognitive biases are not the only factors influencing decision-making and action on DRR. Challenges such as poverty, lack of agency or insufficient access to technical advice also need to be considered. However, key decision makers in the private and public sectors are unlikely to take effective measures or actions to reduce current and future disaster risk and loss if they do not perceive risk accurately.
The three fictitious cases below present examples of cognitive biases and heuristics that may affect
Apartments destroyed by Hurricane Michael in October 2018, Mexico Beach, Florida
Credit: © Shutterstock/Terry Kelly
109
individual- or community-level decisions about investing in DRR. The examples relate to key systemic risk challenges, namely protecting against catastrophic hazard damage and taking action to reduce the impacts of climate change by switching from fossil fuels to energy-efficient and renewable energy technologies.
8.1.1 Example 1: Failure to invest in wildfire risk reduction measuresThe Rai family purchased a house in a community subject to wildfire damage, but none of the family members have themselves experienced a fire. They decide not to invest in fire-proofing measures and not to clear vegetation in the front yard. These are decisions that reflect various biases, such as:
● Myopia: This is reflected in the decision not to invest in wildfire risk reduction because the upfront costs of making the property safer are perceived to be too high relative to the short-term benefits of undertaking these measures.
● Simplification: This is evidenced by the focus on the short term, and a belief that the chances of a wildfire are so low that the potential consequences on the house are not considered.
● Optimism: This often goes hand in hand with simplification. In this case, their inaction is based on an optimistic underestimation of the likelihood of a recurrent disaster causing damage to the property.
8.1.2 Example 2: Failure to purchase flood insurance The Kamau family, whose residence is in a flood-prone area, did not purchase flood insurance until after flooding damaged the house, even though coverage to pay for losses was highly subsidized. Instead of learning from that experience, the Kamau family members decided to cancel their flood insurance policy several years later because they did not suffer losses from another flood.
As in the previous example, several biases are at play:
● Optimism: Before suffering damage, the likelihood of a disaster was perceived as
being so low that they did not pay attention to potential consequences and concluded they did not need insurance.
● Simplification: After a disaster they focused on uninsured losses and decided to buy coverage without fully considering the likelihood of another flood occurring that would cause damage to the house.
● Amnesia: Having not experienced losses from floods in the following years, they cancelled their insurance policy because the impact of being uninsured before the previous flood faded from memory and they felt premiums had been wasted.
8.1.3 Example 3: Failure to invest in solar panels to reduce the risk from climate change The Gonzalez family members are considering installing solar panels on the roof of their home because they are concerned about the impacts of climate change and know this action reduces greenhouse gas (GHG) emissions. After reflecting on whether to do it now, given there are other pressing issues on their agenda and budget constraints, they decide to wait due to the following biases:
● Myopia: This is reflected in the decision to focus on the high upfront costs of installing solar panels without considering savings from lower electricity expenses in the years to come and the potential to be self-sufficient if the grid is damaged during a disaster.
● Inertia: The family is unsure about the best course of action, so decide to maintain the status quo even when a more desirable alternative exists.
● Herding: As none of the neighbours have invested in solar panels, why should they?
110
8.2 Reworking risk messaging and incentives to promote financial investment in disaster risk reduction
Understanding the cognitive biases at work in the above examples helps to suggest how public policy and financial incentives can be reworked to promote risk reduction more effectively. A solid risk analysis based on listening to experts remains the bedrock for effective DRR. However, the way this information is applied is of equal importance. This section looks at four elements essential to risk reduction action:
● Listening to experts.
● Reframing the presentation of risk information.
● Redirecting financial incentives and regulatory frameworks towards resilience.
● Evaluating strategies.
8.2.1 Listening to experts Scientific risk assessments by experts are essential in designing strategies for reducing risk and future losses from extreme events. They can assist members of the public and key decision makers by providing the most accurate available information on risk. This information needs to be communicated in a clear and transparent manner. To illustrate what “listening the experts” might mean, consider each of the three examples discussed in section 8.1.
Failure to invest in wildfire risk reduction measures
For key decision makers to reduce the risk associated with wildfires, they need the following data from experts and informed interested parties:
● The probabilities of primary fires from external sources (e.g. nearby forests) that can damage or destroy properties in their community and the uncertainties associated with these probabilities.
● The potential direct damage to properties and indirect losses to the community from fires of different magnitudes and the uncertainties surrounding these estimates.
● The risk of fires that spread from one property to another as a function of whether each of these properties has invested in mitigation measures.
● The most cost-effective mitigation measures to protect individual properties.
● The expected costs and benefits, should a wildfire occur, if the property owners and communities adopt specific mitigation measures.
● The impacts of climate change on the above estimates.
Failure to purchase insurance against catastrophic damage
Those considering purchasing insurance against potential losses from future disasters need the following information from experts and informed interested parties:
● The probability of future disasters causing damage to the property.
● The magnitude of the damage that would occur using different scenarios of future disasters.
● The cost of insurance as a function of the deductible and coverage amount.
● The reduction in the insurance premium for investing in DRR measures.
Failure to install solar panels
For key decision makers to advise property owners on whether to install solar panels on their homes or facilities, they need the following data:
● The upfront costs of installing solar panels and how these costs can be spread over time.
● The expected benefits from the reduction in electricity costs, including the possibility that excess electricity generated can be resold to the grid.
● The reduction in GHG emissions over time when switching from fossil fuel energy to solar power.
● The impact that utilizing energy-efficient technologies will have on reducing losses from future disasters related to natural hazards and other extreme events.
Expert insights are essential to provide sound advice on each of the issues above, and solutions will vary based on the specific hazards and vulnerabilities encountered. Such insights are invaluable in helping design products and services tailored to local conditions, and in ensuring individuals have the information they need to make good decisions.
111
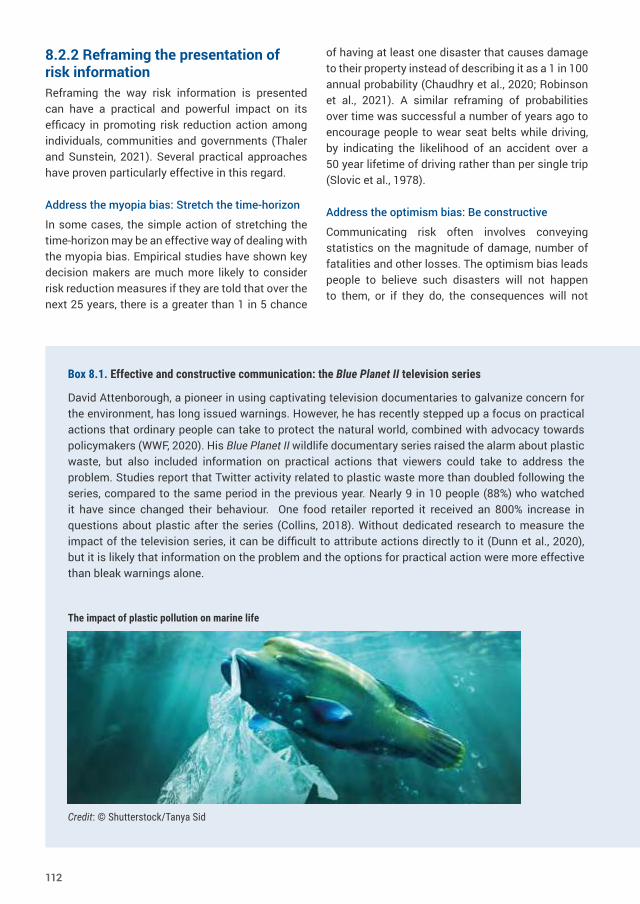
8.2.2 Reframing the presentation of risk information Reframing the way risk information is presented can have a practical and powerful impact on its efficacy in promoting risk reduction action among individuals, communities and governments (Thaler and Sunstein, 2021). Several practical approaches have proven particularly effective in this regard.
Address the myopia bias: Stretch the time-horizon
In some cases, the simple action of stretching the time-horizon may be an effective way of dealing with the myopia bias. Empirical studies have shown key decision makers are much more likely to consider risk reduction measures if they are told that over the next 25 years, there is a greater than 1 in 5 chance
of having at least one disaster that causes damage to their property instead of describing it as a 1 in 100 annual probability (Chaudhry et al., 2020; Robinson et al., 2021). A similar reframing of probabilities over time was successful a number of years ago to encourage people to wear seat belts while driving, by indicating the likelihood of an accident over a 50 year lifetime of driving rather than per single trip (Slovic et al., 1978).
Address the optimism bias: Be constructive
Communicating risk often involves conveying statistics on the magnitude of damage, number of fatalities and other losses. The optimism bias leads people to believe such disasters will not happen to them, or if they do, the consequences will not
Box 8.1. Effective and constructive communication: the Blue Planet II television series
David Attenborough, a pioneer in using captivating television documentaries to galvanize concern for the environment, has long issued warnings. However, he has recently stepped up a focus on practical actions that ordinary people can take to protect the natural world, combined with advocacy towards policymakers (WWF, 2020). His Blue Planet II wildlife documentary series raised the alarm about plastic waste, but also included information on practical actions that viewers could take to address the problem. Studies report that Twitter activity related to plastic waste more than doubled following the series, compared to the same period in the previous year. Nearly 9 in 10 people (88%) who watched it have since changed their behaviour. One food retailer reported it received an 800% increase in questions about plastic after the series (Collins, 2018). Without dedicated research to measure the impact of the television series, it can be difficult to attribute actions directly to it (Dunn et al., 2020), but it is likely that information on the problem and the options for practical action were more effective than bleak warnings alone.
The impact of plastic pollution on marine life
Credit: © Shutterstock/Tanya Sid
112
be severe. Some communicators attempt to shake audiences out of their optimism bias via vivid, sometimes horrific, descriptions of just how dire outcomes can be.
A review of public health communication studies found that if fear was used, people were more likely to act if it was also combined with strong efficacy messages (Witte and Allen, 2000). This implies negative framing should be accompanied by communication that supports a sense of agency, hope, motivation, self- and collective-efficacy, and, importantly, practical steps required for change. Failing to do so can leave people feeling powerless, anxious and overwhelmed – sentiments that can provoke mental shutdown and crush the ingenuity and energy required to tackle big challenges.
For example, a recent study of a wildfire-prone community in the city of Valparaíso, Chile, found psychological factors like a perceived lack of control over their lives and the environment crucially influenced people’s risk management behaviour. It hindered preventive actions and also made risk reduction a secondary issue for many. Even if people were aware of the risk and experienced fires several times per year, few collaborative actions resulted from the risk awareness (Lara Mesa, 2021). Pointing to positive and practical actions individuals can take is often a more effective approach (Box 8.1).
Address the simplification bias: Construct scenarios
One way to frame risk more effectively to address the simplification bias is to construct a range of scenarios to highlight the consequences of disasters occurring, including a worst-case scenario. For example, Mexico City faces seismic hazards that depend on the occurrence of various types of earthquakes, primarily due to site effects that amplify the ground motion (Reinoso and Ordaz, 1999). A recent project by the National University of Mexico considered the uncertainties associated with future earthquakes in Mexico City using three groups of seismic scenarios: (a) scenarios reflecting the likelihood of damage from future earthquakes, (b) scenarios estimating maximum and recurring losses from earthquakes and (c) historical, well-known seismic scenarios and their consequences. These scenarios were then used to develop
estimates of structural damage to the city for use by decision makers in risk reduction planning (Reinoso et al., 2022).
To better address systemic risks, scenarios can also be developed that assess cascading and compound risks and indirect disaster losses. Showing potential direct and indirect losses can help highlight the necessity of pre-emptive risk reduction across a range of sectors. Such scenarios should not rely on economic metrics only, as this can lead to a tendency to highlight DRR interventions as successful if they protect high-value areas rather than high-vulnerability areas (Lallemant et al., 2020; Markhvida et al., 2020). Additional metrics can include the number or measure of “years of life saved”, which is calculated consistently in the field of public health (Tengs et al., 1995), and broader impacts across wider sectors, including impacts on potential tax revenue. For example, in Barbados, the cascading economic impacts of hurricanes have been analysed to estimate direct and indirect losses, including potential cascading impacts across the economy and society (Box 8.2).
Scenarios can be even more effective if they also compare the costs of action and inaction. If this calculation is not done, there is a danger that investments may become “invisible” to observers, because when a hazard occurs losses are not incurred (as the disaster has been effectively prevented). Figure 8.1 shows how this “invisibility” can manifest following an investment in constructing houses on stilts in a flood-prone area. In this case, four scenarios (A to D) contrasting the costs of action with inaction can help make the benefits of DRR clearer, using visual representation and description.
Scenarios are also particularly important in making the case for climate change action, as the negative impacts of this major risk are undervalued in economic and social systems. To illustrate this point, consider the expected flood damage due to sea-level rise combined with population growth in high-risk areas. An analysis of 136 major coastal cities around the world revealed that sea-level rise of an optimistic 20 cm by 2050 will cause the average annual flood losses in those cities to increase to $1.2 trillion in that year, compared to only $52 billion in 2005. A more pessimistic scenario in
113
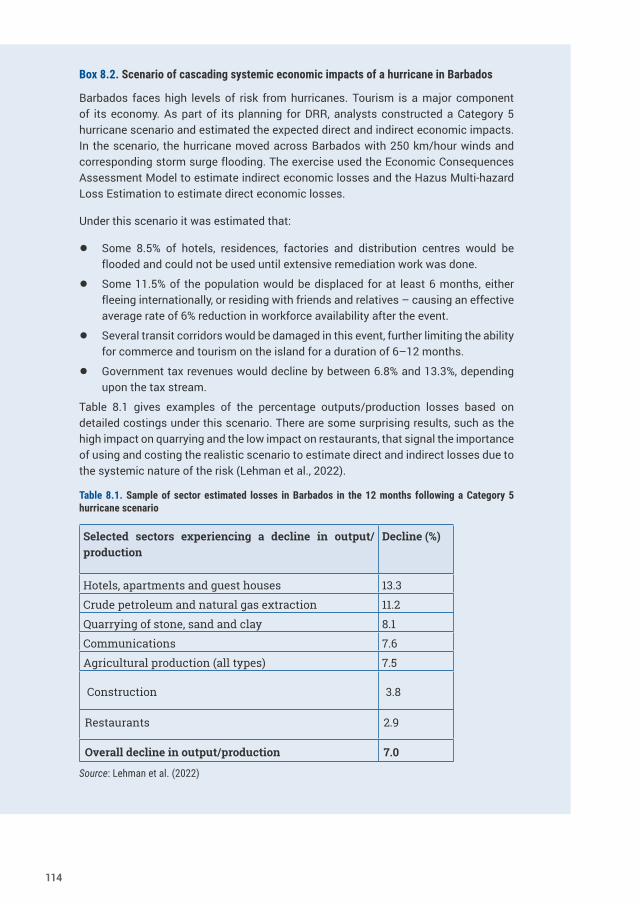
Box 8.2. Scenario of cascading systemic economic impacts of a hurricane in Barbados
Barbados faces high levels of risk from hurricanes. Tourism is a major component of its economy. As part of its planning for DRR, analysts constructed a Category 5 hurricane scenario and estimated the expected direct and indirect economic impacts. In the scenario, the hurricane moved across Barbados with 250 km/hour winds and corresponding storm surge flooding. The exercise used the Economic Consequences Assessment Model to estimate indirect economic losses and the Hazus Multi-hazard Loss Estimation to estimate direct economic losses.
Under this scenario it was estimated that:
● Some 8.5% of hotels, residences, factories and distribution centres would be flooded and could not be used until extensive remediation work was done.
● Some 11.5% of the population would be displaced for at least 6 months, either fleeing internationally, or residing with friends and relatives – causing an effective average rate of 6% reduction in workforce availability after the event.
● Several transit corridors would be damaged in this event, further limiting the ability for commerce and tourism on the island for a duration of 6–12 months.
● Government tax revenues would decline by between 6.8% and 13.3%, depending upon the tax stream.
Table 8.1 gives examples of the percentage outputs/production losses based on detailed costings under this scenario. There are some surprising results, such as the high impact on quarrying and the low impact on restaurants, that signal the importance of using and costing the realistic scenario to estimate direct and indirect losses due to the systemic nature of the risk (Lehman et al., 2022).
Table 8.1. Sample of sector estimated losses in Barbados in the 12 months following a Category 5 hurricane scenario
Selected sectors experiencing a decline in output/production
Decline (%)
Hotels, apartments and guest houses 13.3
Crude petroleum and natural gas extraction 11.2
Quarrying of stone, sand and clay 8.1
Communications 7.6
Agricultural production (all types) 7.5
Construction 3.8
Restaurants 2.9
Overall decline in output/production 7.0
Source: Lehman et al. (2022)
114
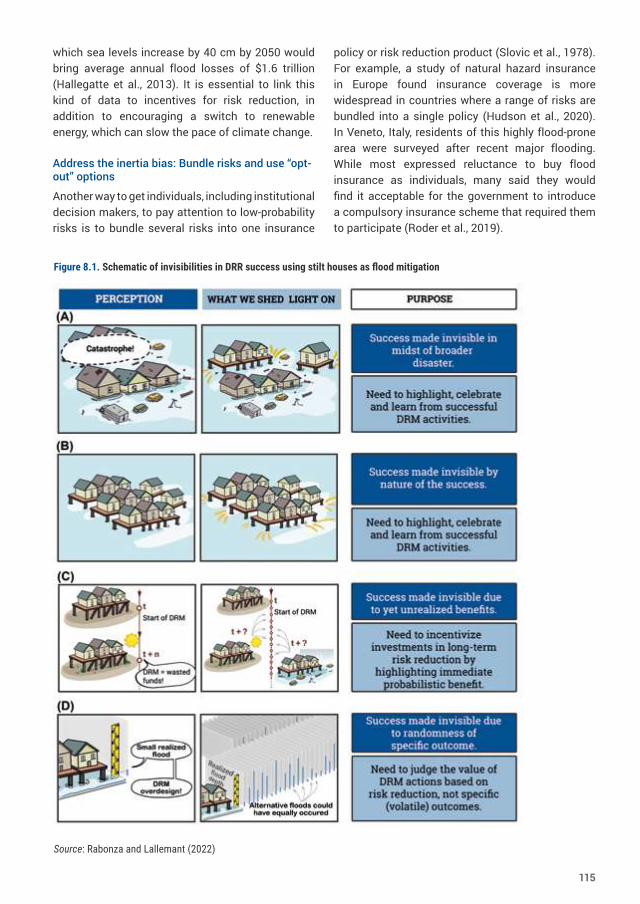
which sea levels increase by 40 cm by 2050 would bring average annual flood losses of $1.6 trillion (Hallegatte et al., 2013). It is essential to link this kind of data to incentives for risk reduction, in addition to encouraging a switch to renewable energy, which can slow the pace of climate change.
Address the inertia bias: Bundle risks and use “opt-out” options
Another way to get individuals, including institutional decision makers, to pay attention to low-probability risks is to bundle several risks into one insurance
policy or risk reduction product (Slovic et al., 1978). For example, a study of natural hazard insurance in Europe found insurance coverage is more widespread in countries where a range of risks are bundled into a single policy (Hudson et al., 2020). In Veneto, Italy, residents of this highly flood-prone area were surveyed after recent major flooding. While most expressed reluctance to buy flood insurance as individuals, many said they would find it acceptable for the government to introduce a compulsory insurance scheme that required them to participate (Roder et al., 2019).
Figure 8.1. Schematic of invisibilities in DRR success using stilt houses as flood mitigation
Source: Rabonza and Lallemant (2022)
115
In addition, field and controlled experiments in behavioural economics reveal consumers are more likely to stick with the default options rather than going to the trouble of opting out in favour of some other alternative (Jachimowicz et al., 2019). This tendency was highlighted in a study of 1,187 homeowners in flood-prone areas of the Netherlands and the United Kingdom. It compared two options: (a) providing flood insurance as the default on an existing insurance policy, with a choice to opt out of this coverage, and (b) giving a homeowner the option to add flood coverage to the existing policy. The first product design option resulted in a higher proportion of homeowners having flood insurance, including those with little to no flood-related experience (Robinson et al., 2021).
These examples of working with, not against, how people make decisions about insurance can also be applied to other areas to promote effective risk reduction and climate change action. For example, property developers can make solar panels the default by informing buyers they will be installed on the roof of a new house unless the owners decide they would prefer not to have them. Lenders and real-estate agents can provide an economic incentive to maintain solar panels by indicating electricity bills would be lower than if fossil fuels were the source of energy (Kunreuther et al., 2021).
Address the herding bias: Create social norms
Working with, and building upon, existing social norms and practices can help address the herding bias and contribute to positive risk reduction practices. Religion, customs, social norms and other dimensions influence how people think and behave around risk. Attempting to change fundamental beliefs is likely to be counterproductive and unethical, and may risk undermining existing local and indigenous knowledge (Chapter 6). However, well-designed policies can help encourage change towards positive behaviours. For example, if policies promote a social norm for property owners to invest in solar panels, or adhere to building codes, and those who adopt these measures are given a seal of approval, neighbours will be more likely to follow suit.
The success of any social norm campaign will require the media to help promote it. Box 8.3 shows
how communications campaigns were used to convince residents in Nepal to invest in seismic-resistant measures when rebuilding damaged homes following the 2015 earthquake.
Risk communication can also hold up common beliefs and practices for reflection and discussion, particularly if trusted peers help lead the discussion. For example, in Australia and the United States, research shows men more often than women drive into flood water without knowing its depth and thus have higher death rates. A man who feels driving through flood water or working through extreme heat is a sign of masculinity might be reminded by a colleague that dying needlessly is not heroic and will devastate his family. People who feel there is no point taking precautions ahead of a storm because fate is in the hands of God might be gently challenged by a religious leader who points out that God also gave them the ability to develop evacuation plans. Special arrangements and specific formats for communications may also be required to address the needs of minority communities within a targeted region. These should take into account existing community decision-making systems and approaches (Mercer et al., 2009; Chapter 6 above).
Using tools such as role modelling uncommon or “unthinkable” behaviour can help prompt discussion across groups, spark innovation, push boundaries and give people confidence to do things differently, as in flood-affected communities in Bangladesh (Box 8.4). It can also prompt critical reflection on the trade-offs between short-term and longer-term benefits, and help people check their assumptions, weigh their options and recognize near-term incentives for longer-term planning.
8.2.3 Redirecting financial incentives and regulatory frameworks towards resilience Economic incentives to invest in DRR and other policies to encourage risk reduction can help to overcome the disadvantages of myopia and short-term thinking.
Short-term economic incentives
Well-designed policies and products can make it easier for people to invest in benefits that become visible over several years. For example, offering a
116
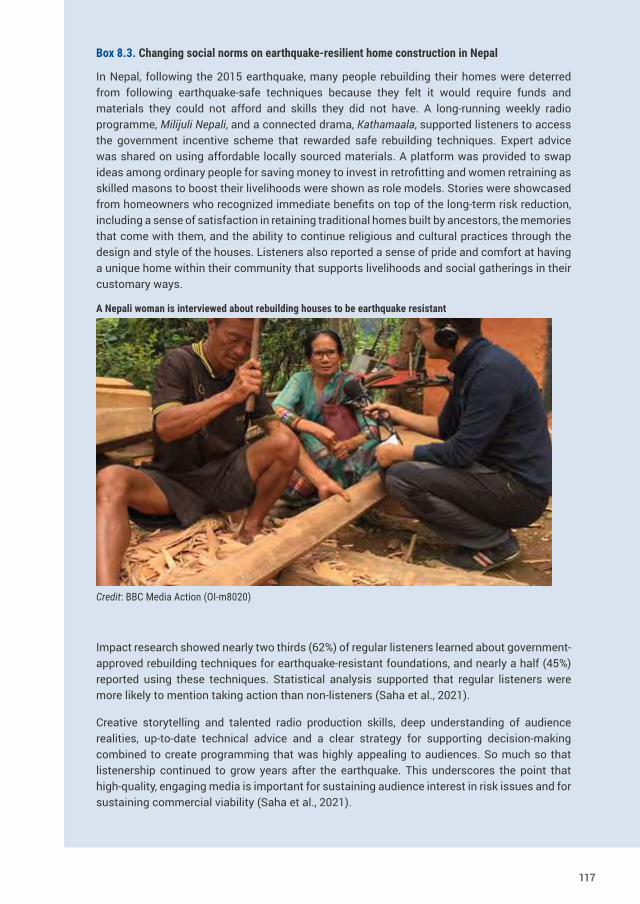
Box 8.3. Changing social norms on earthquake-resilient home construction in Nepal
In Nepal, following the 2015 earthquake, many people rebuilding their homes were deterred from following earthquake-safe techniques because they felt it would require funds and materials they could not afford and skills they did not have. A long-running weekly radio programme, Milijuli Nepali, and a connected drama, Kathamaala, supported listeners to access the government incentive scheme that rewarded safe rebuilding techniques. Expert advice was shared on using affordable locally sourced materials. A platform was provided to swap ideas among ordinary people for saving money to invest in retrofitting and women retraining as skilled masons to boost their livelihoods were shown as role models. Stories were showcased from homeowners who recognized immediate benefits on top of the long-term risk reduction, including a sense of satisfaction in retaining traditional homes built by ancestors, the memories that come with them, and the ability to continue religious and cultural practices through the design and style of the houses. Listeners also reported a sense of pride and comfort at having a unique home within their community that supports livelihoods and social gatherings in their customary ways.
A Nepali woman is interviewed about rebuilding houses to be earthquake resistant
Credit: BBC Media Action (OI-m8020)
Impact research showed nearly two thirds (62%) of regular listeners learned about government-approved rebuilding techniques for earthquake-resistant foundations, and nearly a half (45%) reported using these techniques. Statistical analysis supported that regular listeners were more likely to mention taking action than non-listeners (Saha et al., 2021).
Creative storytelling and talented radio production skills, deep understanding of audience realities, up-to-date technical advice and a clear strategy for supporting decision-making combined to create programming that was highly appealing to audiences. So much so that listenership continued to grow years after the earthquake. This underscores the point that high-quality, engaging media is important for sustaining audience interest in risk issues and for sustaining commercial viability (Saha et al., 2021).
117
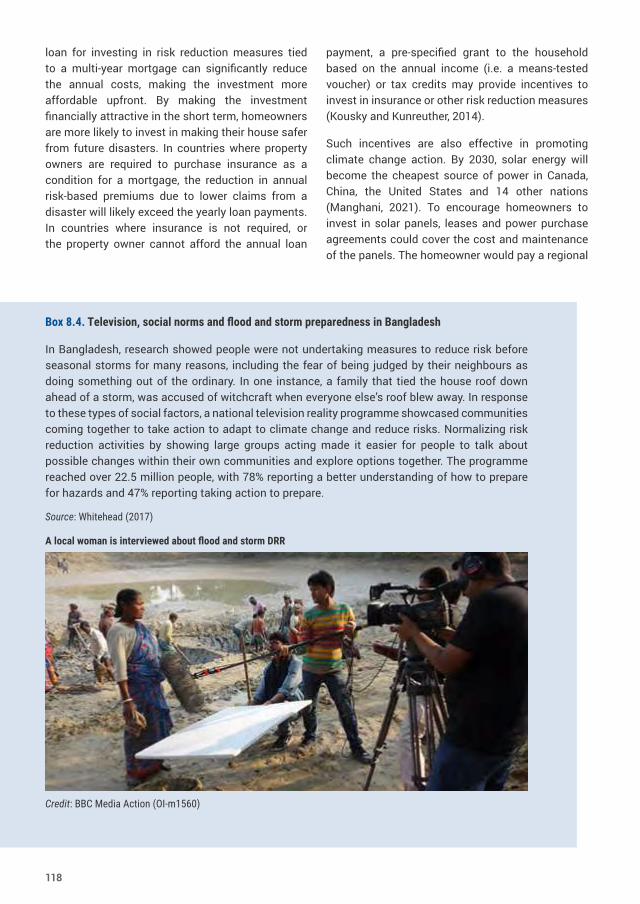
loan for investing in risk reduction measures tied to a multi-year mortgage can significantly reduce the annual costs, making the investment more affordable upfront. By making the investment financially attractive in the short term, homeowners are more likely to invest in making their house safer from future disasters. In countries where property owners are required to purchase insurance as a condition for a mortgage, the reduction in annual risk-based premiums due to lower claims from a disaster will likely exceed the yearly loan payments. In countries where insurance is not required, or the property owner cannot afford the annual loan
payment, a pre-specified grant to the household based on the annual income (i.e. a means-tested voucher) or tax credits may provide incentives to invest in insurance or other risk reduction measures (Kousky and Kunreuther, 2014).
Such incentives are also effective in promoting climate change action. By 2030, solar energy will become the cheapest source of power in Canada, China, the United States and 14 other nations (Manghani, 2021). To encourage homeowners to invest in solar panels, leases and power purchase agreements could cover the cost and maintenance of the panels. The homeowner would pay a regional
Box 8.4. Television, social norms and flood and storm preparedness in Bangladesh
In Bangladesh, research showed people were not undertaking measures to reduce risk before seasonal storms for many reasons, including the fear of being judged by their neighbours as doing something out of the ordinary. In one instance, a family that tied the house roof down ahead of a storm, was accused of witchcraft when everyone else’s roof blew away. In response to these types of social factors, a national television reality programme showcased communities coming together to take action to adapt to climate change and reduce risks. Normalizing risk reduction activities by showing large groups acting made it easier for people to talk about possible changes within their own communities and explore options together. The programme reached over 22.5 million people, with 78% reporting a better understanding of how to prepare for hazards and 47% reporting taking action to prepare.
Source: Whitehead (2017)
A local woman is interviewed about flood and storm DRR
Credit: BBC Media Action (OI-m1560)
118
government or a private company a fee lower than the savings in the electricity bill (Sendy, 2020). This can contribute to a positive cycle where greater economies of scale, increased competition and improved institutional arrangements (e.g. streamlined permitting processes) reduce costs and create incentives for further technological innovation and supply chain efficiencies. Experts estimate such factors will drive the cost of solar energy down from the current price by 15–20% over the next decade, making this investment even more attractive.
In California, a government regulation builds the long-term economic benefits of solar energy into new constructions. Since 2020, all new single-family and multifamily residences must be built with solar panels (Rogers, 2019). The California Energy Commission, which approved this legislation, estimates the monthly mortgage payment on a house will increase by $40 a month but the owner will save an average of $80 a month on electricity. As the cost of the solar panels is included in the mortgage, the owner’s costs are effectively lowered from the moment they purchase the house. A further regulation will place similar requirements on new commercial structures and high-rise residential projects from 2023 (Penn, 2021), which will also become part of the Building Standards Code. Over the next 30 years, this regulation will reduce GHG emissions equivalent to taking nearly 2.2 million cars off the road for a year (Rogers, 2019).
Risk-based insurance premiums
Risk-based insurance premiums are another tool that can help overcome the challenge that investment appears too costly relative to the shorter-term reduction in damage. Such premiums can offer lower costs to entities that have invested in preventive risk reduction measures. Catastrophe models have been developed and improved over the past 30 years, to assess the likelihood and damage from disasters of different magnitudes and intensities. Insurers and reinsurers utilize the estimates from these models to determine risk-based premiums and how much coverage to offer in hazard-prone areas (Grossi and Kunreuther, 2005). The estimates can also be used as a baseline for understanding which DRR activities can best reduce the risk to a particular asset.
In France, a disaster insurance system called Catastrophes Naturelles incentivizes implementation of risk prevention plans to reduce risk as part of local flood risk management. These plans can prescribe high-risk zones in which new development is not allowed and recommend or require risk reduction measures to reduce flood-related damage. The insurance system encourages communities to implement their plans by imposing higher deductibles on those who lag behind in implementation (Poussin et al., 2013).
A continued reliance on short time-horizons as the basis for financial decisions remains a significant contributor to the failure of policymakers, investors, corporations and project developers to fully consider and respond to disaster risks. Much of the policy, regulation and accounting practice does not mandate consideration or disclosure of the financial impacts of disasters. However, mispricing or underestimating these risks can have a financial impact on an institution’s income statement or balance sheet, whether it is a company, a credit organization or an institutional investor. The consequences of this are significant and growing. By contrast, a taxation system that measures the real cost and provides an incentive by returning a portion of revenue to taxpayer’s local regions changes the financial and social incentives (e.g. Box 8.5).
Box 8.5. Carbon taxes in Costa Rica
Costa Rica was one of the earliest countries to begin to combat climate change through financial levers, when it adopted an innovative carbon tax on fuel in 1997. There is a connection for taxpayers between fuel use and benefits to their own communities, since a portion of the revenue goes to pay farmers and indigenous communities to protect and regrow tropical forests. The tax generates $33 million annually for these groups; it has helped reverse deforestation and benefited the economy. In 2018, 98% of the electricity in Costa Rica came from renewable energy sources.
Source: King (2019)
119
8.2.4 Evaluating strategiesStrategies for DRR at any geographic scale must be able to address the following questions: how well do proposed strategies prevent losses over time and are the monitoring metrics of choice properly capturing progress towards the goal of reducing losses as early as possible? Addressing these is not easy, and solutions often require a trade-off between efficiency and equity. Efficiency is normally determined by undertaking a cost–benefit analysis that compares the risk reduction benefits with the investment and maintenance costs of DRR measures. Equity is measured by comparing the utility of the poorest families under the proposed strategy relative to the current programme (Boardman et al., 2018). It is also increasingly important to consider how future generations will fare under different risk management strategies, given the significant negative impacts of climate change.
8.3 Role of key stakeholders in implementing disaster risk reduction measuresEnsuring the values and agendas of key stakeholders are aligned towards risk reduction, ideally in a single strategic direction, is essential for effective DRR programmes and policies. However, different stakeholders will have different roles and responsibilities, as outlined below.
8.3.1 Public sector Governments and public sector entities play perhaps the most crucial role in ensuring the frameworks to accelerate risk reduction are in place. They should also take steps to address equality of income and equity and fairness issues by assisting residents and small businesses financially so they can afford to invest in DRR. At the most basic level, governments need to ensure regulations are in place to prevent, reduce or ensure the resilience of construction in unsafe locations, such as flood-plains, areas subject to sea-level rise or areas at extremely high risk of fire or other hazards.
To do this, governments also need to better understand the climate projections for their
jurisdictions. They should work with experts to update design standards to ensure resilient infrastructure design, particularly against increased temperatures, higher-intensity rainfall and drought impacts. In parallel, assessing the risks to current critical infrastructure under a range of future scenarios likely to occur within their lifetime is essential. Implementing these cost-effective protection measures can help reduce the need for costly humanitarian assessments, saving money and suffering.
It is imperative for the public sector to incentivize the transition from fossil fuel to renewable energy sources by subsidizing solar and wind power initiatives and aiding property owners interested in utilizing renewable energy as a source of power. Actions such as putting a price on carbon via emission trading systems or carbon taxes can reduce the emissions that are increasing disasters and stimulate the innovation, diffusion and adoption of renewable energy, as Costa Rica has done (Box 8.5). Where possible, the public sector can also help create quality new jobs by committing additional funds for research and development of innovations in areas key to the climate transition, such as solar and wind energy and battery storage development.
Taking measures to improve the targeting of humanitarian assistance so grant-based assistance is provided to the most vulnerable people, and ensuring longer-term assistance is provided through loans not handouts for those with resources, can also help incentivize future risk reduction. Encouraging private sector enterprises to review the resilience and sustainability to systemic risks of their own operations can send important signals to encourage preparedness. Also, encouraging insurers to provide protection against losses from disasters by supplying reinsurance coverage against catastrophic losses for those who take preventive measures can help ensure safety nets are in place (van den Bergh and Botzen, 2020).
The public sector is also key in creating a new “social contract” to incentivize investment in disaster resilience. It can help specify the responsibilities and liabilities of national governments, financing bodies and the private sector to manage the negative externalities arising from disaster risks.
120
National governments and regulators need to define sustainable, disaster-resilient investments and encode risk metrics to change investor behaviour and raise awareness of disaster risks. Box 8.6 provides examples of how this is increasingly occurring through the deployment of green finance instruments such as resilience bonds.
The annual climate change adaptation costs for developing countries are estimated to be in the range $140 billion to $300 billion per year by 2030,
and between $280 billion and $500 billion per year by 2050 if global warming is limited to 2°C above pre-industrial levels (UNEP, 2016). However, these estimates are likely underrepresenting the real need when taking into account the capital requirements for making existing and planned infrastructure investments resilient to climate change. Globally, the need for infrastructure investment is forecast to reach $94 trillion by 2040, and a further $3.5 trillion will be required to meet the United Nations SDGs on renewable energy and water (Oxford Economics,
Box 8.6. Innovative finance for risk reduction: green bonds for climate resilience
Bonds are a major source of investment for the public and private sectors. Since the first labelled green bond in 2007 by the European Investment Bank, $1.5 trillion of labelled green bonds has been issued worldwide from a diverse range of issuers, including sovereigns, municipalities, national development banks, financial institutions and corporates. About 16.4% (1,265) of green bonds (7,725 deals) have included activities related to adaptation and resilience, mostly in the water and water-related sectors. Of these, 79% were issued by developed markets, 15% from supranational institutions and only 6% from emerging markets (Qadir et al., 2021). Recent examples include:
● Société nationale des chemins de fer français, the French national state-owned railway company, has used green bonds to finance the protection of natural resources and biodiversity in addition to low-carbon transport and rail energy efficiency.
● The city of Malmö in Sweden, one of the earliest municipal green bond issuers, used two issuances to raise funds for climate change adaptation and resilience measures for sustainable management of water, wastewater, land and natural resources.
● The Asian Development Bank issued a bond in 2019 that prominently featured adaptation and resilience activities. Investments include the Mongolian Ulaanbaatar Green Affordable Housing and Resilient Urban Renewal Sector Project, which is building 10,000 energy-efficient and low-carbon housing units as part of 20 new eco-districts with resilience infrastructure like roads, water, sewerage, heating pipes and greenhouses for urban farming.
● Grupo Rotoplas, a corporate entity in Mexico, issued a $523 million green bond in 2017 that included resilience finance for innovative water solutions in markets where clean water is scarce due to droughts, water pollution and unreliable water infrastructure.
The benefits of green bonds include that they provide issuers access to low-cost capital to finance their investment pipelines and help broaden their investor base, as demand for green bonds far outstrips supply. They are also well suited to large-scale projects that require capital investment ahead of revenues and help unlock discounted finance through blended finance facilities and funds. They also help bring visibility to resilience features and improve internal processes that enhance risk management and strengthen internal relationships and commitment to sustainability (Qadir et al., 2021).
121
2017). Assuming all of these infrastructure investments will require resilience features, the adaptation finance gap is likely to be at the scale of trillions of dollars rather than billions.
In the face of these needs, adaptation finance flows remain woefully insufficient. Total tracked public and private investment in climate adaptation in 2018 was $30 billion worldwide (Buchner et al., 2019). Public finance will be insufficient to meet adaptation financing needs, particularly in developing countries. While there is limited data on private investment flows, securing private investment for adaptation remains a challenge. However, in 2018, GHG emissions reduction finance accounted for 93% of total climate-related investment flows globally (Buchner et al., 2019). Climate resilience bonds could help increase investment in adaptation and accelerate a resilient sustainable climate transition (Qadir et al., 2021).
8.3.2 Risk assessment experts The scientific community and sectoral experts such as engineers have key roles to play in providing accurate estimates of the probability and consequences of maintaining the status quo or implementing adaptation measures to reduce future risks. For full transparency, these experts should also specify the uncertainty associated with the estimates. They can then advise households and government agencies which adaptation and risk reduction measures are desirable to implement and most cost-effective. Given the differences in expert estimates, members of the public are likely to focus on the views of those who support their decision on whether to undertake DRR measures.
8.3.3 Private sectorThe private sector also has a major role to play in accelerating risk reduction action and in reducing losses from future disasters. For example, banks and financial institutions that provide property improvement loans can require specific risk reduction measures to be undertaken as a condition for a mortgage.
In designing new houses, apartments and business facilities, developers can avoid construction on flood-plains or in areas affected by sea-level rise.
They can also elevate newly constructed buildings (Aerts et al., 2014) and install other DRR measures such as shutters on windows when constructing new property in coastal areas subject to hurricanes. Developers can also negotiate a wind energy land agreement with landowners for wind energy projects such as wind turbines (Frassetto et al., 2018).
Real-estate agents can provide relevant information to potential buyers and sellers of environmental features and highlight how they may increase the value of properties. In this regard, a study by Zillow revealed that houses in the United States with solar energy systems sold for 4.1% more on average than comparable houses without solar power. For the median-valued house, this translated to an additional $9,274 (Mikhitarian, 2019).
The insurance industry can provide coverage to residents and businesses facing a specific risk and offer premium discounts if they undertake measures that reduce future damage and hence insurance claims. Moreover, given the risk assessment expertise in the insurance industry, insurers can play an important role in informing policyholders on the risks they face and effective risk reduction measures, and in providing information on risk globally, even in areas where insurance penetration is low.
All parts of the private sector can take action to reduce the risk of disasters, including by ensuring business continuity when disasters cannot be prevented and by reducing their carbon footprints. Learning from the COVID-19 crisis, the ability to pivot production to address systemic risks is a private sector strength. Looking across a range of risks, private health-care organizations and employers can play an important role in promoting safety and in addressing hazards such as pandemics (Bode et al., 2020). Indirect actions can also help create awareness of good practices. For example, the Netherlands introduced energy performance labels in 2008 to provide information on energy efficiency of homes to potential buyers, which has been capitalized into the purchase price of properties (Brounen and Kok, 2011).
122
8.3.4 Communities and local governmentsA major challenge in implementing protective measures to reduce current and future risk is convincing local governments and the public of the importance of reducing damage from future disasters. To address this challenge, communities can hold meetings or other outreach events where key leaders and experts highlight the impact of severe disasters on homes, including indirect losses, such as the economic and psychological costs of evacuating if homes are severely damaged during a disaster. They could point out that adopting DRR measures would likely have enabled them to remain at home. Community leaders can also emphasize that when it comes to hazards such as wildfires, making houses and commercial and public properties safer is likely to reduce the damage to neighbouring houses.
Local and national governments can also enact or modify building codes and impose land-use regulations to reduce future losses from floods, hurricanes, earthquakes and wildfires, and implement nature-based solutions to limit risk from natural hazards. For example, in the southern Cotswolds in the United Kingdom, local communities collaborated with landowners to create in-channel, riparian, field and woodland structures that lowered the flood risk by reducing high water flows and increasing the infiltration capacity of soils (Short et al., 2019).
The non-governmental sector also has a key role to play in highlighting actions that can be taken by individuals, and local, state/province/county and federal/national governments to reduce risks, pilot and test innovative approaches, and scale up good practices in risk reduction.
8.4 Ways forward Understanding how individuals and key decision makers behave with respect to potential disasters is critical for developing the effective products, services and communication strategies needed to accelerate risk reduction and climate change action. Considering and taking action to address common cognitive biases and heuristics in relation to disaster risk can increase the effectiveness and
efficiency of interventions. The same biases that influence individuals can also influence government decision makers.
Reframing the probability and consequences of future disasters and the available options for consideration can work with how people make decisions and bring attention to the importance of adopting DRR measures now. These methods are best deployed as part of a risk management strategy that combines community-based practices, good risk communication, short-term economic incentives, or tools such as insurance or resilience bonds, and well-enforced regulations and standards. However, they do not replace the need to understand underlying systemic risks and vulnerabilities, and the need to help lower-income groups who may not be able to afford DRR measures, by providing grants, loans or other means.
Addressing risk biases alone is not enough. DRR policies and strategies need to be backed up by solid risk data, clear information on options, and the probabilities and consequences of maintaining the status quo or choosing to undertake loss reduction measures. Effective action requires understanding how individuals make decisions, but also being aware of the needs, values and agendas of other stakeholders, particularly governments and the private sector. Considering the viewpoints of a range of interested parties, including public sector organizations and legislative bodies at all levels of government, non-governmental organizations, business organizations, developers, real-estate agents and local communities, is key to effective action. This is particularly important in resource-scarce environments where competition for funding and the political costs of inefficiency are often highest.
Overall, there is a need to rework the way current institutional arrangements design and account for the costs of disaster-related losses, particularly with regard to long-term risks. Adjusting the design of products can make them more effective, but new approaches and financial products need to be scaled up to address the impacts of systemic risk and to reduce the future impact of climate change.
123
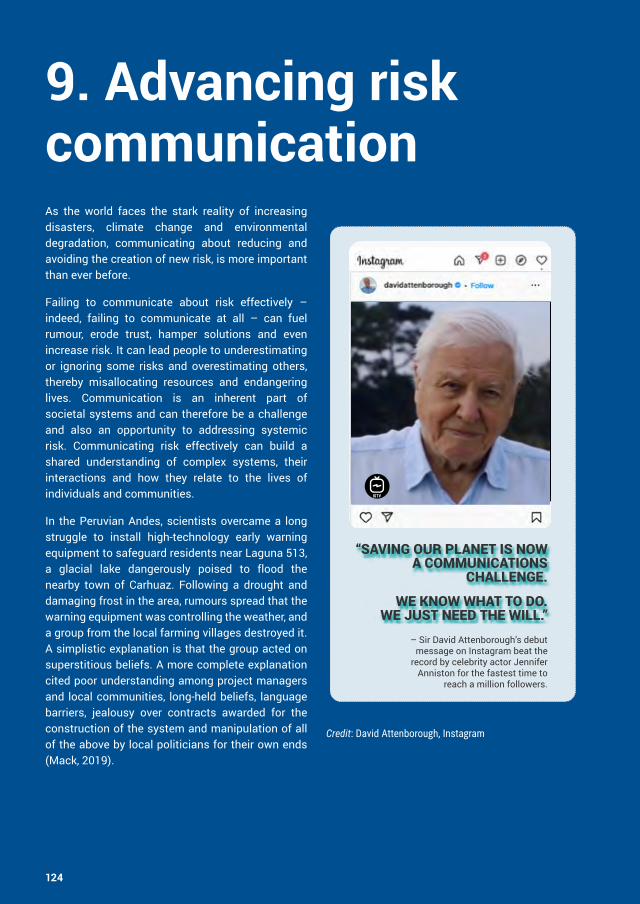
9. Advancing risk communication As the world faces the stark reality of increasing disasters, climate change and environmental degradation, communicating about reducing and avoiding the creation of new risk, is more important than ever before.
Failing to communicate about risk effectively – indeed, failing to communicate at all – can fuel rumour, erode trust, hamper solutions and even increase risk. It can lead people to underestimating or ignoring some risks and overestimating others, thereby misallocating resources and endangering lives. Communication is an inherent part of societal systems and can therefore be a challenge and also an opportunity to addressing systemic risk. Communicating risk effectively can build a shared understanding of complex systems, their interactions and how they relate to the lives of individuals and communities.
In the Peruvian Andes, scientists overcame a long struggle to install high-technology early warning equipment to safeguard residents near Laguna 513, a glacial lake dangerously poised to flood the nearby town of Carhuaz. Following a drought and damaging frost in the area, rumours spread that the warning equipment was controlling the weather, and a group from the local farming villages destroyed it. A simplistic explanation is that the group acted on superstitious beliefs. A more complete explanation cited poor understanding among project managers and local communities, long-held beliefs, language barriers, jealousy over contracts awarded for the construction of the system and manipulation of all of the above by local politicians for their own ends (Mack, 2019).
Credit: David Attenborough, Instagram
“SAVING OUR PLANET IS NOW A COMMUNICATIONS
CHALLENGE.
WE KNOW WHAT TO DO. WE JUST NEED THE WILL.”
– Sir David Attenborough’s debut message on Instagram beat the
record by celebrity actor Jennifer Anniston for the fastest time to
reach a million followers.
124
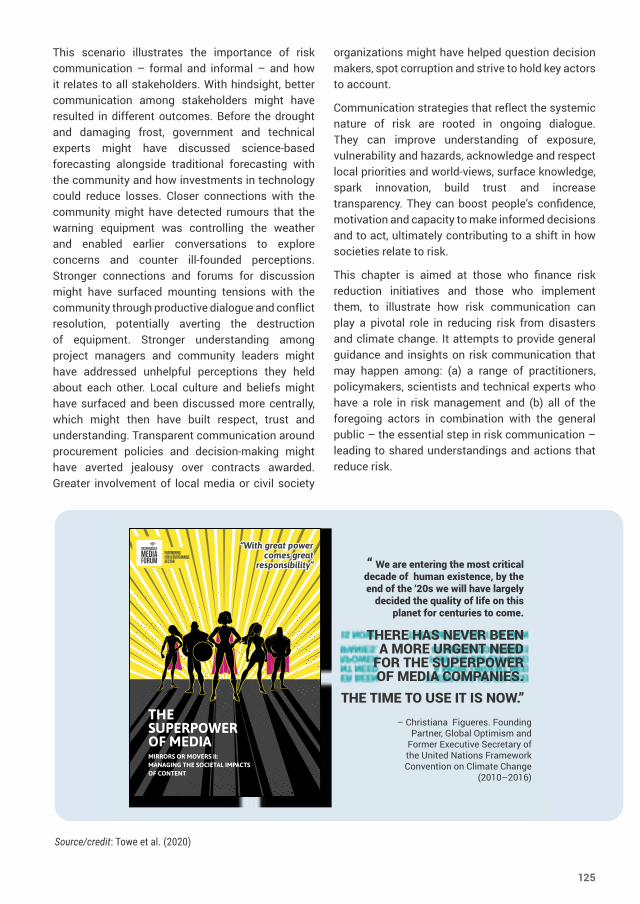
This scenario illustrates the importance of risk communication – formal and informal – and how it relates to all stakeholders. With hindsight, better communication among stakeholders might have resulted in different outcomes. Before the drought and damaging frost, government and technical experts might have discussed science-based forecasting alongside traditional forecasting with the community and how investments in technology could reduce losses. Closer connections with the community might have detected rumours that the warning equipment was controlling the weather and enabled earlier conversations to explore concerns and counter ill-founded perceptions. Stronger connections and forums for discussion might have surfaced mounting tensions with the community through productive dialogue and conflict resolution, potentially averting the destruction of equipment. Stronger understanding among project managers and community leaders might have addressed unhelpful perceptions they held about each other. Local culture and beliefs might have surfaced and been discussed more centrally, which might then have built respect, trust and understanding. Transparent communication around procurement policies and decision-making might have averted jealousy over contracts awarded. Greater involvement of local media or civil society
organizations might have helped question decision makers, spot corruption and strive to hold key actors to account.
Communication strategies that reflect the systemic nature of risk are rooted in ongoing dialogue. They can improve understanding of exposure, vulnerability and hazards, acknowledge and respect local priorities and world-views, surface knowledge, spark innovation, build trust and increase transparency. They can boost people’s confidence, motivation and capacity to make informed decisions and to act, ultimately contributing to a shift in how societies relate to risk.
This chapter is aimed at those who finance risk reduction initiatives and those who implement them, to illustrate how risk communication can play a pivotal role in reducing risk from disasters and climate change. It attempts to provide general guidance and insights on risk communication that may happen among: (a) a range of practitioners, policymakers, scientists and technical experts who have a role in risk management and (b) all of the foregoing actors in combination with the general public – the essential step in risk communication – leading to shared understandings and actions that reduce risk.
1
THE SUPERPOWER OF MEDIAMIRRORS OR MOVERS II: MANAGING THE SOCIETAL IMPACTS OF CONTENT
“With great power “With great power comes great comes great
responsibility”responsibility”
THERE HAS NEVER BEEN A MORE URGENT NEED
FOR THE SUPERPOWER OF MEDIA COMPANIES.
THE TIME TO USE IT IS NOW.”– Christiana Figueres. Founding
Partner, Global Optimism and Former Executive Secretary of the United Nations Framework Convention on Climate Change
(2010–2016)
“ We are entering the most critical decade of human existence, by the end of the ‘20s we will have largely
decided the quality of life on this planet for centuries to come.
Source/credit: Towe et al. (2020)
125
9.1 Risk communication is a processRisk communication is an “interactive process of exchange of information and opinion among individuals, groups, and institutions”, as defined by the National Research Council in the United States (National Research Council, 1989). The aims of risk communication and the actors involved vary widely – spanning education, advocacy and debate – and include scientists, civil society, policymakers, the private sector and beyond. This definition was published over 30 years ago, yet most risk communication initiatives today remain top-down, peripheral, under-resourced and poorly evaluated.
The notion of risk communication as a process is too often overshadowed by a singular focus on products such as apps, maps, graphs, games, posters and posts on social media. These can be important tools, but they should have a clear purpose, rooted in a wider strategy that nurtures inclusive, informed and ongoing conversations that support decision-making over time.
Risk communication is an inherent component across risk reduction, whether it is recognized and resourced as such or not. Risk is a part of daily life, and people will communicate about it with or without the expertise and insight already available.
If future investments in risk communication are to be effective, they must depart from a reliance on one-way messaging to allow for broader conversations that support informed, transparent decision-making about risk reduction across society and everyday life. They must also find ways to communicate and respond to people’s perceptions and cognitive biases around systemic risk. There is no formula for risk communication (Balog-Way et al., 2020), but having clarity on the essential components is critical. With the right resourcing and expertise, risk communication can transform how actors across society understand risk and act on it, ultimately underpinning success in engaging all of society in DRR, which is one of the principles of the Sendai Framework.
9.1.1 Are you listening? Nurturing all-of-society dialogues about risk
The Sendai Framework urges conventional expert-driven command and control risk reduction approaches to become more people centred, focusing on engagement and dialogue with multiple stakeholders, especially the at-risk public. The empirical evidence base indicates traditional top-down approaches can result in suboptimal risk responses from key stakeholders, particularly the general public. Technical, passive, one-way risk communication can be poorly interpreted (Eiser et al., 2012) and is often misunderstood (Burningham et al., 2008). It may undermine trust in emergency management authorities (Fischhoff, 2013). It may also be ineffective in triggering action if it does not address why people and institutions do not act, especially in perceiving, understanding and addressing systemic risk. Occasionally, it may involve all four negatives. Perhaps most notable is the case of the 2009 L’Aquila earthquake in Italy, when incomplete, imprecise and contradictory information about the seismic hazard from risk authorities created a false sense of confidence among a proportion of local residents, with tragic consequences when disaster struck (Sellnow et al., 2017).
Dialogic approaches are difficult to implement because there are so many stakeholders. Risk management requires input from the public sector, private sector, academia and civil society, creating a web of multi-stakeholder interactions, which are prone to miscommunication (Basher, 2006).
Among institutions, this might simply be not appreciating how data generated in one agency could improve decisions in another. Intrinsic and external factors might impair coordination among agencies, hinder wider political buy-in and generate conflicts of interest. This may be countered by risk managers maintaining open dialogues among and across the various responsible agencies, which requires robust internal communication protocols.
Among the general public, the sociodemographics of communities at risk are varied and changing, particularly in cities experiencing rising migration and diversifying social and economic conditions. This strains conventional risk communication.
126
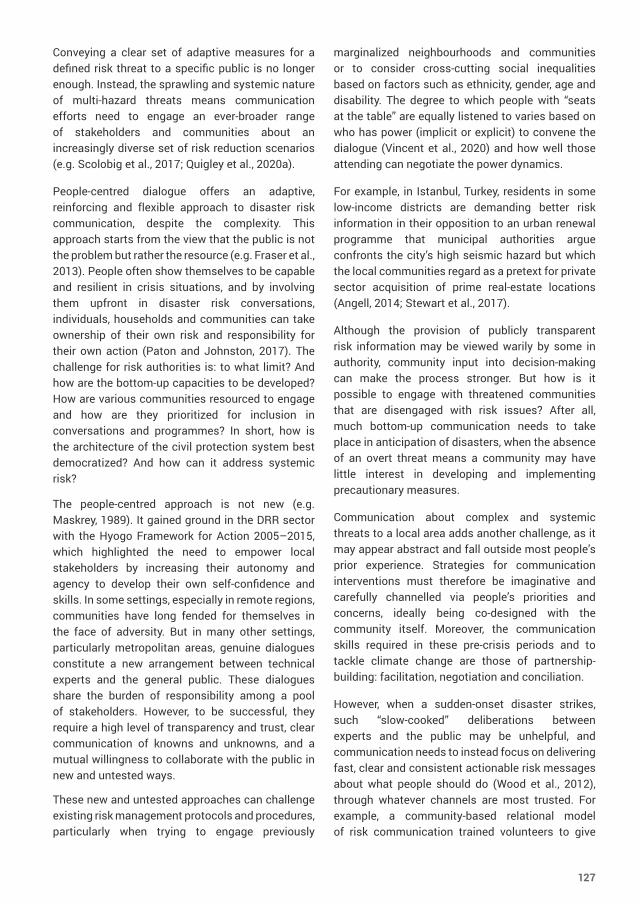
Conveying a clear set of adaptive measures for a defined risk threat to a specific public is no longer enough. Instead, the sprawling and systemic nature of multi-hazard threats means communication efforts need to engage an ever-broader range of stakeholders and communities about an increasingly diverse set of risk reduction scenarios (e.g. Scolobig et al., 2017; Quigley et al., 2020a).
People-centred dialogue offers an adaptive, reinforcing and flexible approach to disaster risk communication, despite the complexity. This approach starts from the view that the public is not the problem but rather the resource (e.g. Fraser et al., 2013). People often show themselves to be capable and resilient in crisis situations, and by involving them upfront in disaster risk conversations, individuals, households and communities can take ownership of their own risk and responsibility for their own action (Paton and Johnston, 2017). The challenge for risk authorities is: to what limit? And how are the bottom-up capacities to be developed? How are various communities resourced to engage and how are they prioritized for inclusion in conversations and programmes? In short, how is the architecture of the civil protection system best democratized? And how can it address systemic risk?
The people-centred approach is not new (e.g. Maskrey, 1989). It gained ground in the DRR sector with the Hyogo Framework for Action 2005–2015, which highlighted the need to empower local stakeholders by increasing their autonomy and agency to develop their own self-confidence and skills. In some settings, especially in remote regions, communities have long fended for themselves in the face of adversity. But in many other settings, particularly metropolitan areas, genuine dialogues constitute a new arrangement between technical experts and the general public. These dialogues share the burden of responsibility among a pool of stakeholders. However, to be successful, they require a high level of transparency and trust, clear communication of knowns and unknowns, and a mutual willingness to collaborate with the public in new and untested ways.
These new and untested approaches can challenge existing risk management protocols and procedures, particularly when trying to engage previously
marginalized neighbourhoods and communities or to consider cross-cutting social inequalities based on factors such as ethnicity, gender, age and disability. The degree to which people with “seats at the table” are equally listened to varies based on who has power (implicit or explicit) to convene the dialogue (Vincent et al., 2020) and how well those attending can negotiate the power dynamics.
For example, in Istanbul, Turkey, residents in some low-income districts are demanding better risk information in their opposition to an urban renewal programme that municipal authorities argue confronts the city’s high seismic hazard but which the local communities regard as a pretext for private sector acquisition of prime real-estate locations (Angell, 2014; Stewart et al., 2017).
Although the provision of publicly transparent risk information may be viewed warily by some in authority, community input into decision-making can make the process stronger. But how is it possible to engage with threatened communities that are disengaged with risk issues? After all, much bottom-up communication needs to take place in anticipation of disasters, when the absence of an overt threat means a community may have little interest in developing and implementing precautionary measures.
Communication about complex and systemic threats to a local area adds another challenge, as it may appear abstract and fall outside most people’s prior experience. Strategies for communication interventions must therefore be imaginative and carefully channelled via people’s priorities and concerns, ideally being co-designed with the community itself. Moreover, the communication skills required in these pre-crisis periods and to tackle climate change are those of partnership-building: facilitation, negotiation and conciliation.
However, when a sudden-onset disaster strikes, such “slow-cooked” deliberations between experts and the public may be unhelpful, and communication needs to instead focus on delivering fast, clear and consistent actionable risk messages about what people should do (Wood et al., 2012), through whatever channels are most trusted. For example, a community-based relational model of risk communication trained volunteers to give
127
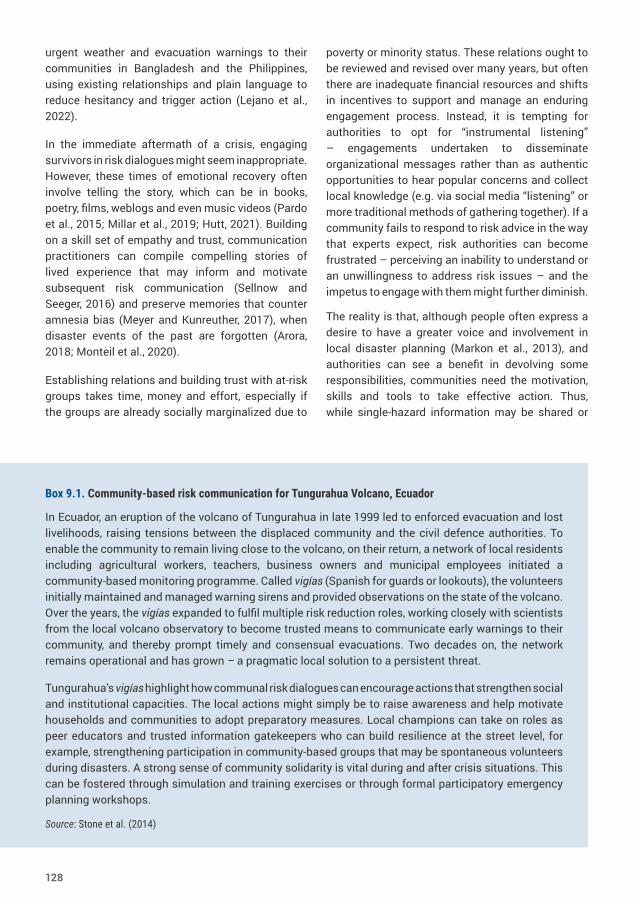
urgent weather and evacuation warnings to their communities in Bangladesh and the Philippines, using existing relationships and plain language to reduce hesitancy and trigger action (Lejano et al., 2022).
In the immediate aftermath of a crisis, engaging survivors in risk dialogues might seem inappropriate. However, these times of emotional recovery often involve telling the story, which can be in books, poetry, films, weblogs and even music videos (Pardo et al., 2015; Millar et al., 2019; Hutt, 2021). Building on a skill set of empathy and trust, communication practitioners can compile compelling stories of lived experience that may inform and motivate subsequent risk communication (Sellnow and Seeger, 2016) and preserve memories that counter amnesia bias (Meyer and Kunreuther, 2017), when disaster events of the past are forgotten (Arora, 2018; Monteil et al., 2020).
Establishing relations and building trust with at-risk groups takes time, money and effort, especially if the groups are already socially marginalized due to
poverty or minority status. These relations ought to be reviewed and revised over many years, but often there are inadequate financial resources and shifts in incentives to support and manage an enduring engagement process. Instead, it is tempting for authorities to opt for “instrumental listening” – engagements undertaken to disseminate organizational messages rather than as authentic opportunities to hear popular concerns and collect local knowledge (e.g. via social media “listening” or more traditional methods of gathering together). If a community fails to respond to risk advice in the way that experts expect, risk authorities can become frustrated – perceiving an inability to understand or an unwillingness to address risk issues – and the impetus to engage with them might further diminish.
The reality is that, although people often express a desire to have a greater voice and involvement in local disaster planning (Markon et al., 2013), and authorities can see a benefit in devolving some responsibilities, communities need the motivation, skills and tools to take effective action. Thus, while single-hazard information may be shared or
Box 9.1. Community-based risk communication for Tungurahua Volcano, Ecuador
In Ecuador, an eruption of the volcano of Tungurahua in late 1999 led to enforced evacuation and lost livelihoods, raising tensions between the displaced community and the civil defence authorities. To enable the community to remain living close to the volcano, on their return, a network of local residents including agricultural workers, teachers, business owners and municipal employees initiated a community-based monitoring programme. Called vigías (Spanish for guards or lookouts), the volunteers initially maintained and managed warning sirens and provided observations on the state of the volcano. Over the years, the vigías expanded to fulfil multiple risk reduction roles, working closely with scientists from the local volcano observatory to become trusted means to communicate early warnings to their community, and thereby prompt timely and consensual evacuations. Two decades on, the network remains operational and has grown – a pragmatic local solution to a persistent threat.
Tungurahua’s vigías highlight how communal risk dialogues can encourage actions that strengthen social and institutional capacities. The local actions might simply be to raise awareness and help motivate households and communities to adopt preparatory measures. Local champions can take on roles as peer educators and trusted information gatekeepers who can build resilience at the street level, for example, strengthening participation in community-based groups that may be spontaneous volunteers during disasters. A strong sense of community solidarity is vital during and after crisis situations. This can be fostered through simulation and training exercises or through formal participatory emergency planning workshops.
Source: Stone et al. (2014)
128
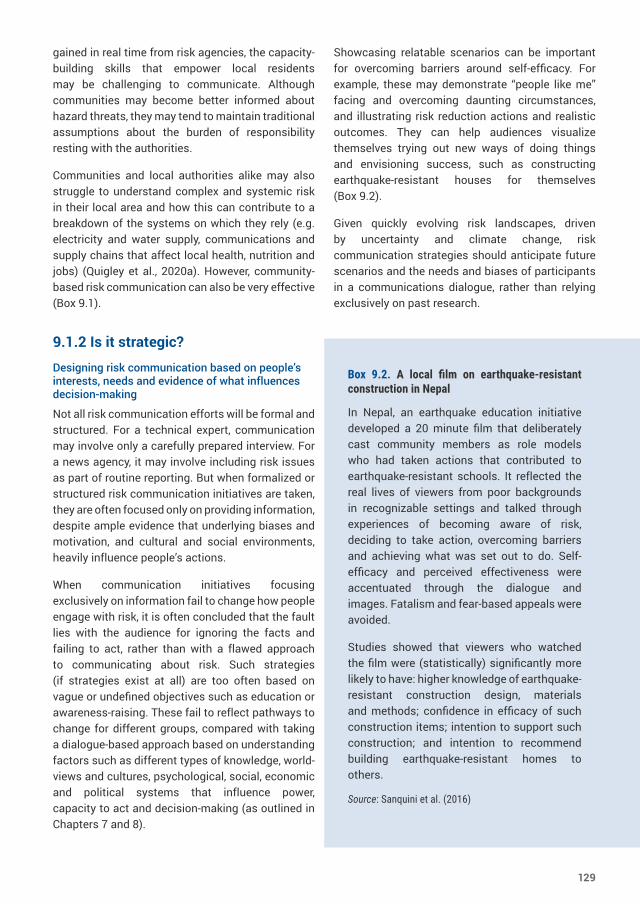
gained in real time from risk agencies, the capacity-building skills that empower local residents may be challenging to communicate. Although communities may become better informed about hazard threats, they may tend to maintain traditional assumptions about the burden of responsibility resting with the authorities.
Communities and local authorities alike may also struggle to understand complex and systemic risk in their local area and how this can contribute to a breakdown of the systems on which they rely (e.g. electricity and water supply, communications and supply chains that affect local health, nutrition and jobs) (Quigley et al., 2020a). However, community-based risk communication can also be very effective (Box 9.1).
9.1.2 Is it strategic?
Designing risk communication based on people’s interests, needs and evidence of what influences decision-making
Not all risk communication efforts will be formal and structured. For a technical expert, communication may involve only a carefully prepared interview. For a news agency, it may involve including risk issues as part of routine reporting. But when formalized or structured risk communication initiatives are taken, they are often focused only on providing information, despite ample evidence that underlying biases and motivation, and cultural and social environments, heavily influence people’s actions.
When communication initiatives focusing exclusively on information fail to change how people engage with risk, it is often concluded that the fault lies with the audience for ignoring the facts and failing to act, rather than with a flawed approach to communicating about risk. Such strategies (if strategies exist at all) are too often based on vague or undefined objectives such as education or awareness-raising. These fail to reflect pathways to change for different groups, compared with taking a dialogue-based approach based on understanding factors such as different types of knowledge, world-views and cultures, psychological, social, economic and political systems that influence power, capacity to act and decision-making (as outlined in Chapters 7 and 8).
Showcasing relatable scenarios can be important for overcoming barriers around self-efficacy. For example, these may demonstrate “people like me” facing and overcoming daunting circumstances, and illustrating risk reduction actions and realistic outcomes. They can help audiences visualize themselves trying out new ways of doing things and envisioning success, such as constructing earthquake-resistant houses for themselves (Box 9.2).
Given quickly evolving risk landscapes, driven by uncertainty and climate change, risk communication strategies should anticipate future scenarios and the needs and biases of participants in a communications dialogue, rather than relying exclusively on past research.
Box 9.2. A local film on earthquake-resistant construction in Nepal
In Nepal, an earthquake education initiative developed a 20 minute film that deliberately cast community members as role models who had taken actions that contributed to earthquake-resistant schools. It reflected the real lives of viewers from poor backgrounds in recognizable settings and talked through experiences of becoming aware of risk, deciding to take action, overcoming barriers and achieving what was set out to do. Self-efficacy and perceived effectiveness were accentuated through the dialogue and images. Fatalism and fear-based appeals were avoided.
Studies showed that viewers who watched the film were (statistically) significantly more likely to have: higher knowledge of earthquake-resistant construction design, materials and methods; confidence in efficacy of such construction items; intention to support such construction; and intention to recommend building earthquake-resistant homes to others.
Source: Sanquini et al. (2016)
129
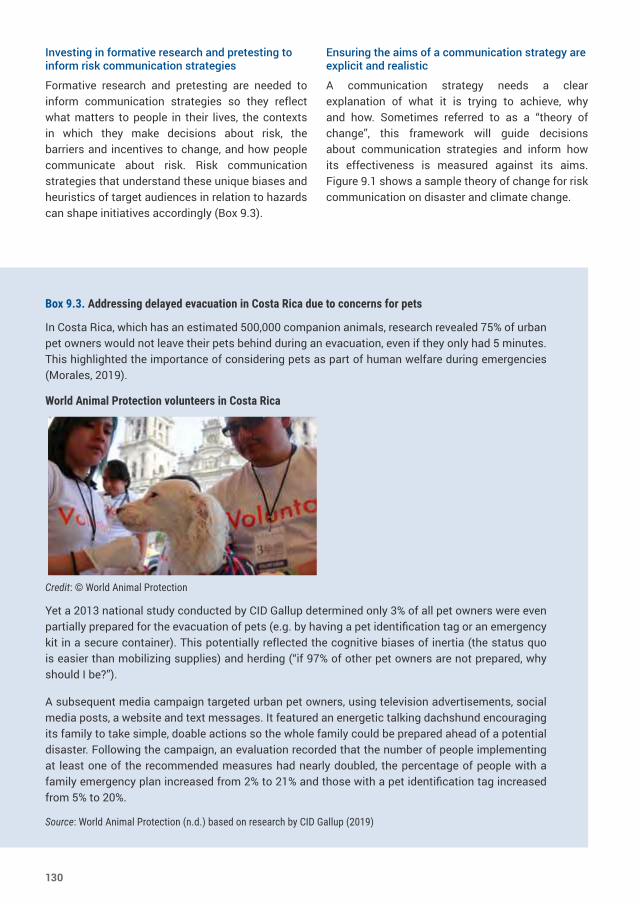
Investing in formative research and pretesting to inform risk communication strategies
Formative research and pretesting are needed to inform communication strategies so they reflect what matters to people in their lives, the contexts in which they make decisions about risk, the barriers and incentives to change, and how people communicate about risk. Risk communication strategies that understand these unique biases and heuristics of target audiences in relation to hazards can shape initiatives accordingly (Box 9.3).
Ensuring the aims of a communication strategy are explicit and realistic
A communication strategy needs a clear explanation of what it is trying to achieve, why and how. Sometimes referred to as a “theory of change”, this framework will guide decisions about communication strategies and inform how its effectiveness is measured against its aims. Figure 9.1 shows a sample theory of change for risk communication on disaster and climate change.
Measuring the effectiveness of risk communication is an emerging field with a limited evidence base. A systematic review of the effects of disaster risk communication interventions found an absence of high-quality, robust trials (Bradley et al., 2014). This may be the result of limited funding for impact research, ill-defined and unrealistic aims, and weak indicators to measure success. However, the adoption of new forms of risk communication without an adequate evidence base is failing those who need to receive, understand, discuss and act on content about risk.
Box 9.3. Addressing delayed evacuation in Costa Rica due to concerns for pets
In Costa Rica, which has an estimated 500,000 companion animals, research revealed 75% of urban pet owners would not leave their pets behind during an evacuation, even if they only had 5 minutes. This highlighted the importance of considering pets as part of human welfare during emergencies (Morales, 2019).
World Animal Protection volunteers in Costa Rica
Credit: © World Animal Protection
Yet a 2013 national study conducted by CID Gallup determined only 3% of all pet owners were even partially prepared for the evacuation of pets (e.g. by having a pet identification tag or an emergency kit in a secure container). This potentially reflected the cognitive biases of inertia (the status quo is easier than mobilizing supplies) and herding (“if 97% of other pet owners are not prepared, why should I be?”).
A subsequent media campaign targeted urban pet owners, using television advertisements, social media posts, a website and text messages. It featured an energetic talking dachshund encouraging its family to take simple, doable actions so the whole family could be prepared ahead of a potential disaster. Following the campaign, an evaluation recorded that the number of people implementing at least one of the recommended measures had nearly doubled, the percentage of people with a family emergency plan increased from 2% to 21% and those with a pet identification tag increased from 5% to 20%.
Source: World Animal Protection (n.d.) based on research by CID Gallup (2019)
130
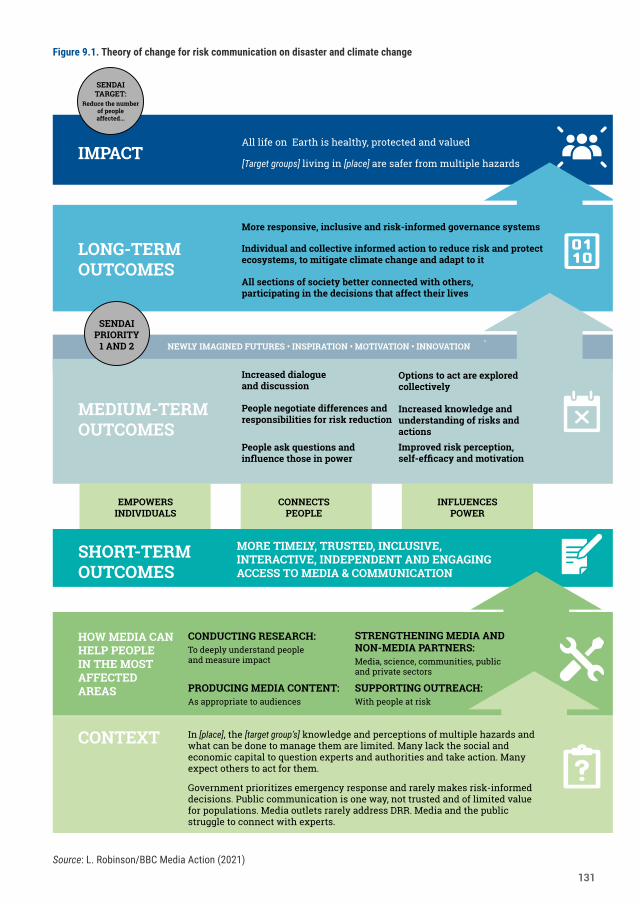
EMPOWERS INDIVIDUALS
Individual and collective informed action to reduce risk and protect ecosystems, to mitigate climate change and adapt to it
More responsive, inclusive and risk-informed governance systems
CONDUCTING RESEARCH: To deeply understand people and measure impact
PRODUCING MEDIA CONTENT:As appropriate to audiences
SENDAI TARGET:
Reduce the number of people affected...
SENDAI PRIORITY
1 AND 2
Government prioritizes emergency response and rarely makes risk-informed decisions. Public communication is one way, not trusted and of limited value for populations. Media outlets rarely address DRR. Media and the public struggle to connect with experts.
In [place], the [target group’s] knowledge and perceptions of multiple hazards and what can be done to manage them are limited. Many lack the social and economic capital to question experts and authorities and take action. Many expect others to act for them.
STRENGTHENING MEDIA AND NON-MEDIA PARTNERS: Media, science, communities, public and private sectors
SUPPORTING OUTREACH: With people at risk
MORE TIMELY, TRUSTED, INCLUSIVE, INTERACTIVE, INDEPENDENT AND ENGAGING ACCESS TO MEDIA & COMMUNICATION
CONNECTS PEOPLE
INFLUENCES POWER
Increased knowledge and understanding of risks and actionsImproved risk perception, self-efficacy and motivation
Increased dialogue and discussion
People ask questions and influence those in power
Options to act are explored collectively
People negotiate differences and responsibilities for risk reduction
NEWLY IMAGINED FUTURES • INSPIRATION • MOTIVATION • INNOVATION
All sections of society better connected with others, participating in the decisions that affect their lives
[Target groups] living in [place] are safer from multiple hazards
All life on Earth is healthy, protected and valuedIMPACT
LONG-TERMOUTCOMES
MEDIUM-TERM OUTCOMES
HOW MEDIA CAN HELP PEOPLE IN THE MOST AFFECTED AREAS
SHORT-TERM OUTCOMES
CONTEXT
Source: L. Robinson/BBC Media Action (2021)
Figure 9.1. Theory of change for risk communication on disaster and climate change
131
9.1.3 Is it creative? Using engaging tactics, rooted in robust strategies for change
The data, science and guidance around reducing risk and avoiding the creation of new risk can come across as dense, dull, daunting or otherwise less important than everyday concerns such as family, friends, finances and fun. Creative communication tactics can break through these challenges and engage busy people on issues they would rather not think about, including grappling with systemic risk that may seem theoretical or implausible. This may be equally relevant for policymakers facing competing priorities. Creative, innovative communication is vital for gaining attention, helping people see things differently, evoking emotion and establishing personal connections with mundane, complex or abstract concepts, as well as prompting discussion and nurturing dialogue in the ways described above.
Engaging with the general public or specific groups requires connecting with them on their terms, usually through styles and mediums they already value and enjoy. Partnering with already established channels can leverage existing reach, and save time and resources. Pretesting content with audiences will avoid costly mistakes and unintended negative consequences.
Creative disaster risk communication need not be explicitly about disaster risk. A radio show in Japan held cooking competitions to see who could make the tastiest dish from non-perishable goods in a disaster preparedness “grab bag” over a mini gas burner. A late-night television show in the United States joked about the perverse incentives of insurance and coastal homes in areas regularly exposed to flooding and hurricanes (Last Week Tonight, 2017). These examples also have commercial appeal, meeting audience needs for high-quality entertainment while addressing everyday concerns, which can drive up audience figures and attract higher advertising revenue.
There has been a surge in recent years in using creative tactics to communicate risk, from art installations visualizing data to singing, dancing “flash mobs” in response to climate change. Yet creativity alone – in the absence of a robust strategy rooted in a deep understanding of people’s realities
and how they make decisions – might result in an entertaining or intriguing experience but fall short of prompting meaningful shifts in how people think, feel or act on risk. For example, photographs of air pollution particles up close might generate a sense of awe but fail to influence how people perceive the risk to their health or meaningfully inform conversations about how air quality could be improved.
In the area of art, climate and the environment, talented artists are making captivating science-related pieces with the explicit aim of prompting greater care for the environment. However, there is limited evidence of pro-environmental actions taken as a result and limited reference to explicit strategies informed by what influences target audience behaviour (Kruczkiewicz, 2018; Kennedy, 2019; Hahn and Berkers, 2020). There may be untapped potential for increasing the impact of artistic outputs (niche or mainstream) if they are underpinned by an understanding of what influences decision-making around risk.
Risk communication initiatives that blend physical science, social science, strategic planning and creativity into outputs targeting clear goals and objectives are likely to have the most impact. These can be brought together to inform and empower local communities to begin reducing their own risk, as with reality television programme in Cambodia (Box 9.4).
9.1.4 Is it making a difference?
Measuring the effectiveness of risk communication efforts against their aims
Knowing if risk communication is making a difference and meeting goals is critical to all stakeholders. Evaluation is part of good practice, demonstrating value for money and justifying funding. Unfortunately, evaluations are often not thought about until the end of projects when budgets are limited, timelines are tight and opportunities to capture baselines are missed. Building effective monitoring and evaluation systems into risk communication initiatives increases the chances of success and informs future investments. Allocating a minimum of approximately 5–10% for monitoring and evaluation within project budgets is generally recommended (Frenkel, 2016).
132
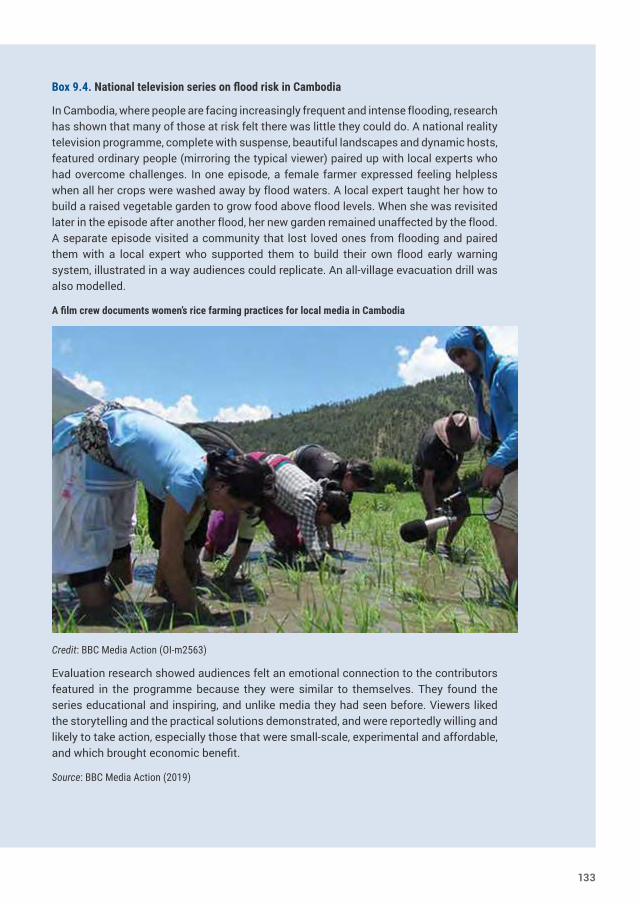
Box 9.4. National television series on flood risk in Cambodia
In Cambodia, where people are facing increasingly frequent and intense flooding, research has shown that many of those at risk felt there was little they could do. A national reality television programme, complete with suspense, beautiful landscapes and dynamic hosts, featured ordinary people (mirroring the typical viewer) paired up with local experts who had overcome challenges. In one episode, a female farmer expressed feeling helpless when all her crops were washed away by flood waters. A local expert taught her how to build a raised vegetable garden to grow food above flood levels. When she was revisited later in the episode after another flood, her new garden remained unaffected by the flood. A separate episode visited a community that lost loved ones from flooding and paired them with a local expert who supported them to build their own flood early warning system, illustrated in a way audiences could replicate. An all-village evacuation drill was also modelled.
A film crew documents women’s rice farming practices for local media in Cambodia
Credit: BBC Media Action (OI-m2563)
Evaluation research showed audiences felt an emotional connection to the contributors featured in the programme because they were similar to themselves. They found the series educational and inspiring, and unlike media they had seen before. Viewers liked the storytelling and the practical solutions demonstrated, and were reportedly willing and likely to take action, especially those that were small-scale, experimental and affordable, and which brought economic benefit.
Source: BBC Media Action (2019)
133
Risk communication practitioners can learn from advances within the broader field of communication for development, to understand what is needed for effective communication, drawing on health and behaviour models (Fishbein and Cappella, 2006). In addition to individual case studies of impact (e.g. those highlighted in this report), strategies used in communication for development can provide a helpful framework for risk communicators to draw on and adapt when designing initiatives. The existing evidence base within the communication sector can also help to inform risk communication theories of change and measurable indicators for monitoring and evaluation.
Evaluating risk communication (i.e. assessing the effectiveness of an intervention) is critical for identifying the impacts, results and consequences of the intervention.
9.2 Media and communication systems influence risk and its managementThe contexts in which people generate, share, consume and use information influence how risk communication happens in societies and the impact it has. Media and communication systems can themselves contribute to actions that affect resilience. Risk managers should consider key elements of these systems, how they can affect risk levels and risk management, and how to apply resources accordingly. There are many elements affecting risk communication, including access to media and telecommunication technology, false and misleading information, and capacity of media professionals to communicate risk effectively.
9.2.1 High technology and low access
Leveraging new technology, but minding the “digital divide”
Advances in media technology and falling production costs have brought over half of the world’s population online (Garrity, 2019), presenting exciting opportunities for increased access to information and the means of communicating about disaster risk at scale and speed. This matters for marginalized populations at risk who have previously been reliant on word of mouth, excluded from open sources of
information, and subject to differing perspectives that may influence their decisions about risk and affect their ability to engage in dialogue about it. Now, many people can access information about risks they face (across hazards and time frames), possible ways of managing risk and examples of what is working in communities around the world.
Digital media is also directly connecting people from different levels of privilege and power, enabling many more individuals to ask questions, share knowledge and opinions, and participate in societal dialogue. This can spark innovation, unlock solutions, highlight voices that may otherwise go unheard and hold leaders accountable in new ways. However, the digital divide remains real. This includes educational, language, cultural, gender and age barriers that affect people’s capacity to participate meaningfully in such communication even if the technology is available in their community or household. Risk communication strategies must equally cater to this half of the world’s population who, practically speaking, remain offline, including the world’s poorest and most at risk, as well as those who have only limited Internet access due to cost, availability, disempowerment, disability or choice.
Separately, advances in technology can help visualize data and create proxy risk experiences that can motivate reflection in the same ways real events do, from Earth observations to virtual reality. These tools are especially important for understanding systemic risk, which often cannot be “seen” by means of anything other than digital models, and the realization of systemic risk can be hard to imagine. Technology to support experiential understanding of risk is especially important, knowing that direct experience with a disaster can affect risk perceptions, thereby hedging against the myopia bias.
For example, in the United States, the Weather Channel used “immersive mixed reality” to illustrate flood scenarios ahead of a threatening forecast. In one case this involved simulating rising flood waters around a weather presenter as she conveyed potential impacts and emerging dangers, urging people to heed advice (NewscastStudio, 2018). Video games and virtual reality have been shown to engage audiences and support learning, yet they come with inherent challenges, including cost
134
(Mani et al., 2016; Skinner, 2020). Research in the Netherlands showed users of a highly immersive virtual reality environment that simulated the impact of a flood on a home were more willing to invest significantly in flood risk measures (Mol et al., 2022).
In the absence of online access, it is important to understand how traditional broadcast media and telecommunication flows happen and to design communication strategies in response. In such cases, radio, television, telephone text messages and reliable interpersonal channels remain powerful and effective means of connecting with populations in vulnerable situations.
In “media limited” or “media dark” areas, methods of communicating about risk have often been established and trusted over generations. Risk communication initiatives can build on these, and may involve storytelling or connecting with people moving to, through and from these areas as potential conduits of risk information, such as market-goers, mobile health or outreach workers, bus or motorbike drivers, entertainers and more. Basic early warning systems are also used in many areas and may involve flags, bells, drums, smoke signals, lights, loudspeakers and other methods.
9.2.2 True or false?
Proactively managing false and misleading information that heightens risk
The speed of change within media and communication systems has outpaced legislation, public-interest business models, and media and digital skill rates, leaving people more susceptible to false and misleading information and more likely to share it. This matters for people making critical decisions about risk that will affect their lives and livelihoods. It also matters for risk management officials, as a poorly informed public can make decisions that exacerbate existing risks and create new ones, especially amid uncertainty. Officials themselves can also struggle to determine what information is valid.
The spread of information considered false or misleading is not a new phenomenon. The problem is context specific and affects different groups of people in different ways. For example, studies have
found false news on Twitter travelled significantly further, faster, deeper and more broadly than the truth (Vosoughi et al., 2018).
Sources of false and misleading information vary, from governments or politicians, scammers, conspiracy theorists or celebrities, to religious or traditional leaders, relatives and friends (Spring, 2020). Trusted public figures can also amplify false or misleading information by drawing attention to it among large audiences.
Reasons why people create, consume and share false or misleading information are varied: to be helpful or cope with uncertainty, to feel a sense of belonging, for fun, to discredit it or to cause harm. This information can originate in face-to-face conversations in a community and spread online, or it can spread from online to offline, potentially reaching groups with no Internet access at all.
Hazard scientists speaking beyond their boundaries of expertise, for example speculating on images or data, have the potential to cause harm by conveying incomplete or misleading analyses, thereby undermining trust in authoritative sources. Scientists who are speaking within or at the periphery of their areas of expertise should communicate clearly and confirm interviewers or similar counterparts have understood, to avoid misinformation being relayed as a result.
Risk communication strategies must plan for and proactively manage false and misleading information that can heighten disaster risk and damage trust. Research is ongoing to identify the best strategies and tactics to tackle the problem, which will vary by country, context and target audience.
Managing false and misleading information ultimately requires systemic changes to how media is produced, consumed, regulated and amplified. Commercial business models for media reward content that evokes emotion over critical thinking. At an audience level, a combination of approaches is likely to be most effective and may include the provision of accurate information in engaging formats through trusted sources (including fact-checking approaches and dispelling rumours), improving media and digital literacy. They may include “inoculation” approaches, which involve
135
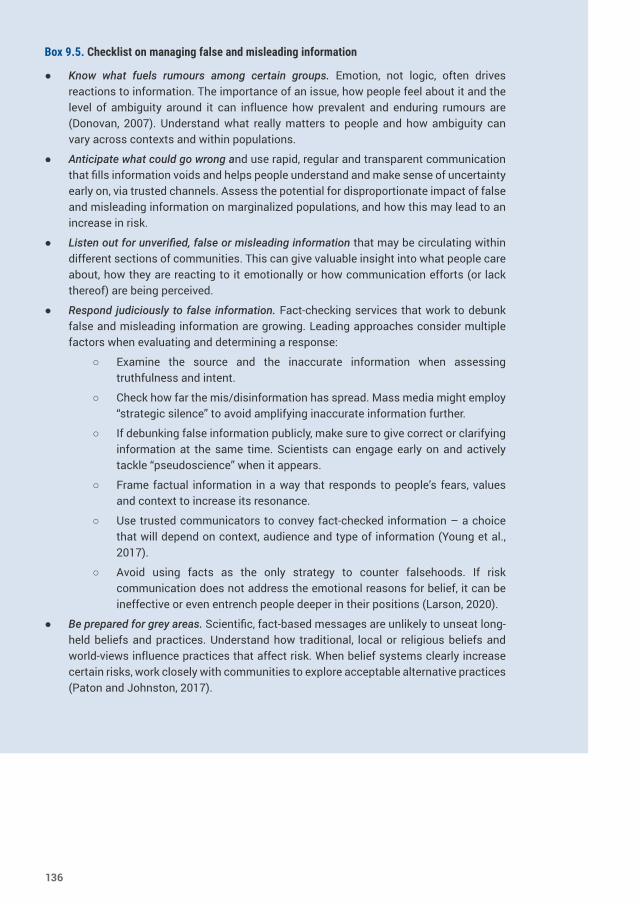
Box 9.5. Checklist on managing false and misleading information
● Know what fuels rumours among certain groups. Emotion, not logic, often drives reactions to information. The importance of an issue, how people feel about it and the level of ambiguity around it can influence how prevalent and enduring rumours are (Donovan, 2007). Understand what really matters to people and how ambiguity can vary across contexts and within populations.
● Anticipate what could go wrong and use rapid, regular and transparent communication that fills information voids and helps people understand and make sense of uncertainty early on, via trusted channels. Assess the potential for disproportionate impact of false and misleading information on marginalized populations, and how this may lead to an increase in risk.
● Listen out for unverified, false or misleading information that may be circulating within different sections of communities. This can give valuable insight into what people care about, how they are reacting to it emotionally or how communication efforts (or lack thereof) are being perceived.
● Respond judiciously to false information. Fact-checking services that work to debunk false and misleading information are growing. Leading approaches consider multiple factors when evaluating and determining a response:
○ Examine the source and the inaccurate information when assessing truthfulness and intent.
○ Check how far the mis/disinformation has spread. Mass media might employ “strategic silence” to avoid amplifying inaccurate information further.
○ If debunking false information publicly, make sure to give correct or clarifying information at the same time. Scientists can engage early on and actively tackle “pseudoscience” when it appears.
○ Frame factual information in a way that responds to people’s fears, values and context to increase its resonance.
○ Use trusted communicators to convey fact-checked information – a choice that will depend on context, audience and type of information (Young et al., 2017).
○ Avoid using facts as the only strategy to counter falsehoods. If risk communication does not address the emotional reasons for belief, it can be ineffective or even entrench people deeper in their positions (Larson, 2020).
● Be prepared for grey areas. Scientific, fact-based messages are unlikely to unseat long-held beliefs and practices. Understand how traditional, local or religious beliefs and world-views influence practices that affect risk. When belief systems clearly increase certain risks, work closely with communities to explore acceptable alternative practices (Paton and Johnston, 2017).
136
warning people of the types of mis/disinformation they may be exposed to, or the application of mass media storytelling initiatives that reflect the irrational elements of people’s relationship with information (van der Linden et al., 2020). These storytelling approaches are more sensitive to the social or emotional context in which information is consumed, and can influence individual beliefs, societal attitudes and norms about what safe and responsible information consumption, production and sharing involves.
Risk communication strategies must also account for beliefs that cannot be judged as either true or false, but instead reflect varied world-views that shape audience relationships with risk. For example, in New Zealand, members of the Ngāti Rangi tribe conceptualize the volcanic Mount Ruapehu as their ancestor, who provides benefits to the tribe and regulates the balance within their territory (Pardo et al., 2015). Discussions about risk reduction may therefore be productively framed through dialogues that are less about controlling the Earth and labelling natural processes as hazards, and more about living in harmony with volcanism using traditional conservation practices and culturally appropriate risk reduction strategies.
Risk communicators can proactively address potentially false and misleading information by listening to people’s concerns, anticipating potential opportunities for misinformation and disinformation, acknowledging uncertainty and differing beliefs, and responding judiciously (Box 9.5).
9.2.3 Skill and will
Building the capacity of local media to create accurate, engaging content on risk reduction and creating incentives to do so
Media and creative outlets hold a privileged role in people’s lives and therefore have great potential to connect with audiences about risk. Yet they cannot leverage this opportunity to its full potential without adequate resources.
Local and national media professionals are under pressure to deliver content appealing to audiences under tight deadlines and budgets. These range from news and current affairs to entertainment and sports.
Deciphering the technical details of disaster risk and how they relate to audiences’ everyday lives can be complicated, and sourcing experts who can explain it may absorb more time than journalists and producers have.
Unlocking content that makes a difference to people’s lives can be achieved by building the basic capacity of media editors, reporters, producers and creatives to: (a) understand local hazards and systemic risk from multiple angles (scientific, social, political, etc.) and (b) create unique, dynamic, engaging and interactive programming around these issues.
Training journalists to produce DRR reporting is often not enough. Decision makers within media houses need support to explore the business and editorial justifications for departing from standard content that already brings in revenue.
In least developed countries, financial support for production costs will go a long way. Media practitioners may be operating without pay, batteries, generator fuel or access to vehicles to visit remote areas and seek stories of risk from vulnerable audiences.
Investment in building the technical skill and the editorial will of media actors to address disaster risk can enable them to extend the reach of programming to a larger scale. This can, in turn, increase the impact of other risk reduction efforts.
9.3 Novel collaborations are needed There is more data about risk than ever before. However, using such data to shift how society understands, deliberates and acts on risk requires radically advancing communication about it, including how to transform data to information and then to knowledge that enables action. This demands novel collaborations that connect multiple perspectives, complement expertise, align strategic vision and foster creativity.
This all-of-society approach to risk communication requires people who understand risk, from a
137
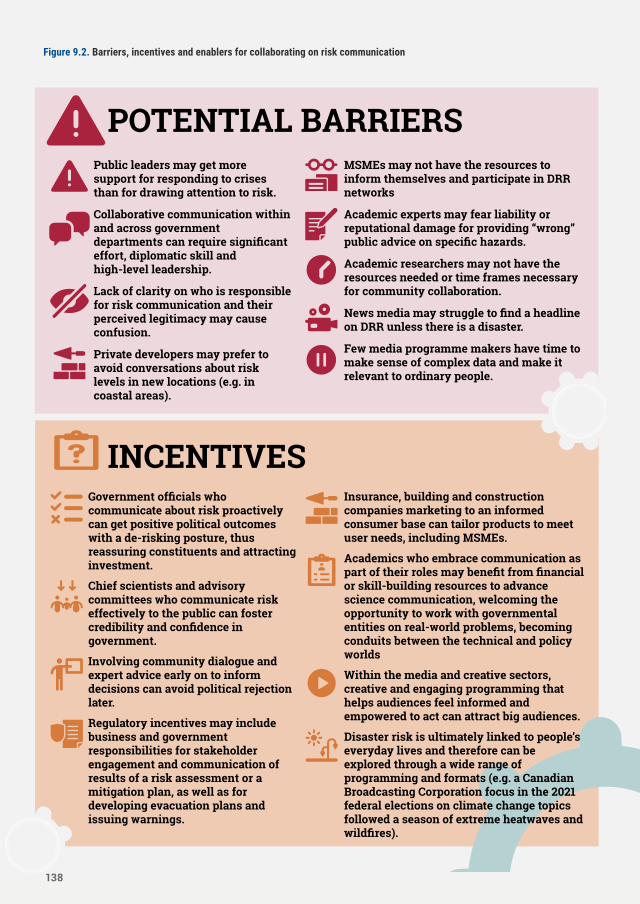
POTENTIAL BARRIERS Public leaders may get more
support for responding to crises than for drawing attention to risk.
Collaborative communication within and across government departments can require significant effort, diplomatic skill and high-level leadership.
Lack of clarity on who is responsible for risk communication and their perceived legitimacy may cause confusion.
Private developers may prefer to avoid conversations about risk levels in new locations (e.g. in coastal areas).
MSMEs may not have the resources to inform themselves and participate in DRR networks
Academic experts may fear liability or reputational damage for providing “wrong” public advice on specific hazards.
Academic researchers may not have the resources needed or time frames necessary for community collaboration.
News media may struggle to find a headline on DRR unless there is a disaster.
Few media programme makers have time to make sense of complex data and make it relevant to ordinary people.
INCENTIVES Government officials who
communicate about risk proactively can get positive political outcomes with a de-risking posture, thus reassuring constituents and attracting investment.
Chief scientists and advisory committees who communicate risk effectively to the public can foster credibility and confidence in government.
Involving community dialogue and expert advice early on to inform decisions can avoid political rejection later.
Regulatory incentives may include business and government responsibilities for stakeholder engagement and communication of results of a risk assessment or a mitigation plan, as well as for developing evacuation plans and issuing warnings.
Insurance, building and construction companies marketing to an informed consumer base can tailor products to meet user needs, including MSMEs.
Academics who embrace communication as part of their roles may benefit from financial or skill-building resources to advance science communication, welcoming the opportunity to work with governmental entities on real-world problems, becoming conduits between the technical and policy worlds
Within the media and creative sectors, creative and engaging programming that helps audiences feel informed and empowered to act can attract big audiences.
Disaster risk is ultimately linked to people’s everyday lives and therefore can be explored through a wide range of programming and formats (e.g. a Canadian Broadcasting Corporation focus in the 2021 federal elections on climate change topics followed a season of extreme heatwaves and wildfires).
PEOPLE ARE WILLING AND EFFECTIVE AT COLLABORATING ON RISK COMMUNICATION WHEN STRONG RELATIONSHIPS ARE IN PLACE. Nurturing these includes identifying each other’s objectives and differences to build trust and develop the skills to communicate effectively.
“KNOWLEDGE BROKERS” can play an important role in “translating” across sectors and aligning conversations with positive outcomes. For example, the Science Media Centre (United Kingdom) and the work of UNDRR on strengthening the capacity of local journalists aim to broker better connections, and therefore information flows, among journalists, scientists, disaster risk experts and decision makers.
POLICYMAKERS, INCLUDING SCIENTIFIC ADVISERS, hold a delicate balance of trust among themselves, and with the public and scientific communities. Inevitably, there will be disagreements, but communicating multiple scenarios along with benefits and drawbacks for the public may foster productive conversations and solutions.
CLEAR COMMUNICATION on different scenarios and risk reduction options for business can foster relationships and collaboration within the private sector, government and civil society (e.g. the Asian Preparedness Partnership).
PUBLIC-FACING ACADEMIC EXPERTS can benefit from expanding their fields of knowledge by working in DRR, but also have a responsibility to know their limits and refrain from commenting on areas beyond their scope of expertise.
INNOVATIVE COLLABORATIONS are needed more than ever to support media content that is free from political interest, economically viable and serves the public good, inclusive of languages and interests across societies.
FINANCE FOR COLLABORATION on risk communication is increasingly important, at a time when financial constraints on independent media (whether online, broadcast or in print) are intensified by the economic downturn from COVID-19. These can curtail public interest content.
EFFECTIVE COLLABORATION with the media and creative sectors is enabled if individuals and agencies approach with interesting stories, simple language, ready-to-go, skilled interviewees, and insight into how issues of DRR affect audiences’ everyday lives. Understanding the media remits and time frames (varying from hours to even years, depending on the type of media output) they are working towards is essential.
ENABLERS
Figure 9.2. Barriers, incentives and enablers for collaborating on risk communication
138
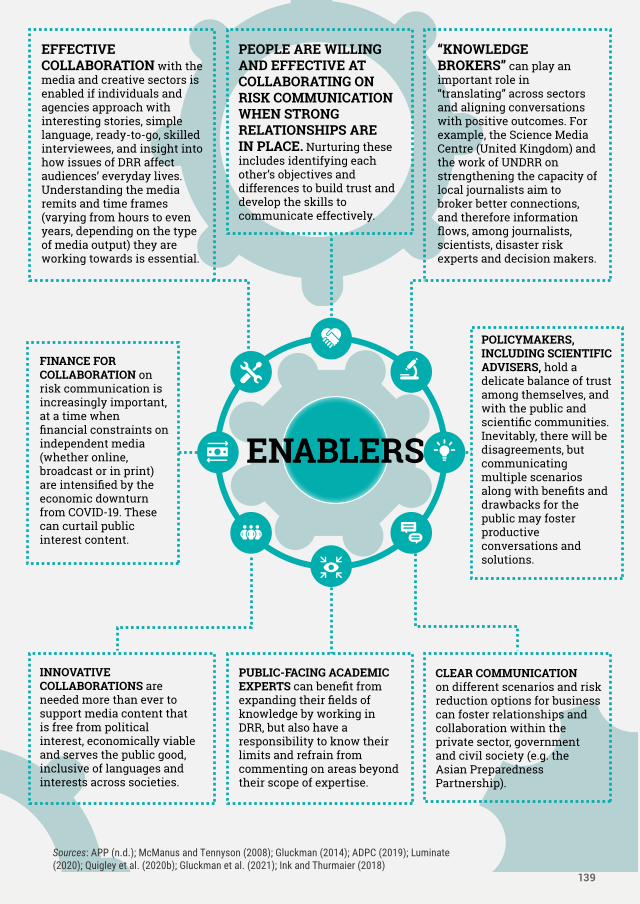
POTENTIAL BARRIERS Public leaders may get more
support for responding to crises than for drawing attention to risk.
Collaborative communication within and across government departments can require significant effort, diplomatic skill and high-level leadership.
Lack of clarity on who is responsible for risk communication and their perceived legitimacy may cause confusion.
Private developers may prefer to avoid conversations about risk levels in new locations (e.g. in coastal areas).
MSMEs may not have the resources to inform themselves and participate in DRR networks
Academic experts may fear liability or reputational damage for providing “wrong” public advice on specific hazards.
Academic researchers may not have the resources needed or time frames necessary for community collaboration.
News media may struggle to find a headline on DRR unless there is a disaster.
Few media programme makers have time to make sense of complex data and make it relevant to ordinary people.
INCENTIVES Government officials who
communicate about risk proactively can get positive political outcomes with a de-risking posture, thus reassuring constituents and attracting investment.
Chief scientists and advisory committees who communicate risk effectively to the public can foster credibility and confidence in government.
Involving community dialogue and expert advice early on to inform decisions can avoid political rejection later.
Regulatory incentives may include business and government responsibilities for stakeholder engagement and communication of results of a risk assessment or a mitigation plan, as well as for developing evacuation plans and issuing warnings.
Insurance, building and construction companies marketing to an informed consumer base can tailor products to meet user needs, including MSMEs.
Academics who embrace communication as part of their roles may benefit from financial or skill-building resources to advance science communication, welcoming the opportunity to work with governmental entities on real-world problems, becoming conduits between the technical and policy worlds
Within the media and creative sectors, creative and engaging programming that helps audiences feel informed and empowered to act can attract big audiences.
Disaster risk is ultimately linked to people’s everyday lives and therefore can be explored through a wide range of programming and formats (e.g. a Canadian Broadcasting Corporation focus in the 2021 federal elections on climate change topics followed a season of extreme heatwaves and wildfires).
PEOPLE ARE WILLING AND EFFECTIVE AT COLLABORATING ON RISK COMMUNICATION WHEN STRONG RELATIONSHIPS ARE IN PLACE. Nurturing these includes identifying each other’s objectives and differences to build trust and develop the skills to communicate effectively.
“KNOWLEDGE BROKERS” can play an important role in “translating” across sectors and aligning conversations with positive outcomes. For example, the Science Media Centre (United Kingdom) and the work of UNDRR on strengthening the capacity of local journalists aim to broker better connections, and therefore information flows, among journalists, scientists, disaster risk experts and decision makers.
POLICYMAKERS, INCLUDING SCIENTIFIC ADVISERS, hold a delicate balance of trust among themselves, and with the public and scientific communities. Inevitably, there will be disagreements, but communicating multiple scenarios along with benefits and drawbacks for the public may foster productive conversations and solutions.
CLEAR COMMUNICATION on different scenarios and risk reduction options for business can foster relationships and collaboration within the private sector, government and civil society (e.g. the Asian Preparedness Partnership).
PUBLIC-FACING ACADEMIC EXPERTS can benefit from expanding their fields of knowledge by working in DRR, but also have a responsibility to know their limits and refrain from commenting on areas beyond their scope of expertise.
INNOVATIVE COLLABORATIONS are needed more than ever to support media content that is free from political interest, economically viable and serves the public good, inclusive of languages and interests across societies.
FINANCE FOR COLLABORATION on risk communication is increasingly important, at a time when financial constraints on independent media (whether online, broadcast or in print) are intensified by the economic downturn from COVID-19. These can curtail public interest content.
EFFECTIVE COLLABORATION with the media and creative sectors is enabled if individuals and agencies approach with interesting stories, simple language, ready-to-go, skilled interviewees, and insight into how issues of DRR affect audiences’ everyday lives. Understanding the media remits and time frames (varying from hours to even years, depending on the type of media output) they are working towards is essential.
ENABLERS
Sources: APP (n.d.); McManus and Tennyson (2008); Gluckman (2014); ADPC (2019); Luminate (2020); Quigley et al. (2020b); Gluckman et al. (2021); Ink and Thurmaier (2018)
139
technical perspective or otherwise, and who also connect, communicate and collaborate with others about it. Skills to span social and professional boundaries are increasingly important, especially amidst heightened attention on the systemic nature of risk, involving a greater diversity of actors across scientific disciplines, government and society (Delozier and Burbach, 2021). However, in many sectors, practitioners are not rewarded for attempts to foster diverse, cross-disciplinary collaborations, which may consume resources an organization does not have. Diverse collaborations face common challenges such as power imbalances, conflicting interests and incentives, differing agendas, various ways of working (protocols, reporting lines and speed), use of different language and jargon, and low levels of trust (Tennyson, 2011).
Differing views and priorities around risk can make it hard to even broach the topic of risk at all. While technical experts may be steeped in the details of hazards and threats, general populations may prioritize immediate concerns such as earning a day’s wage and putting dinner on the table. Furthermore, different constructs and world-views will colour conversations about risk across cultures and societies; “risk” is a term that does not translate into all languages (Gabrielsen et al., 2017).
To build strong working relationships among risk communicators, key challenges for decision makers include the barriers, incentives and enablers for collaboration on risk reduction and how can these be taken into account to address increasingly systemic risk (Figure 9.2).
9.4 Ways forward
Key conclusions to enhancing risk communication include:
● Prioritize listening and connecting with those most often left out: Risk communication is a dynamic process that involves many stakeholders, with information flowing formally and informally, among technical and non-technical actors.
● Conduct targeted research to inform communication strategies that respond to what drives decision-making and action: Robust risk communication efforts should reflect the psychological, social and political influences that shape how people understand, perceive and act on risk.
● Resource initiatives with the funding and expertise required: Formal risk communication initiatives should be informed by robust strategies for change coupled with creativity, with clear aims to make a measurable difference.
● Ensure risk communication initiatives account for access to media and communication, false and misleading information, and local media capacities: Media and communication systems can directly influence risk levels and risk management.
● Build incentives and relationships across social and professional boundaries to communicate effectively: Novel collaborations are needed to communicate about risk effectively.
140
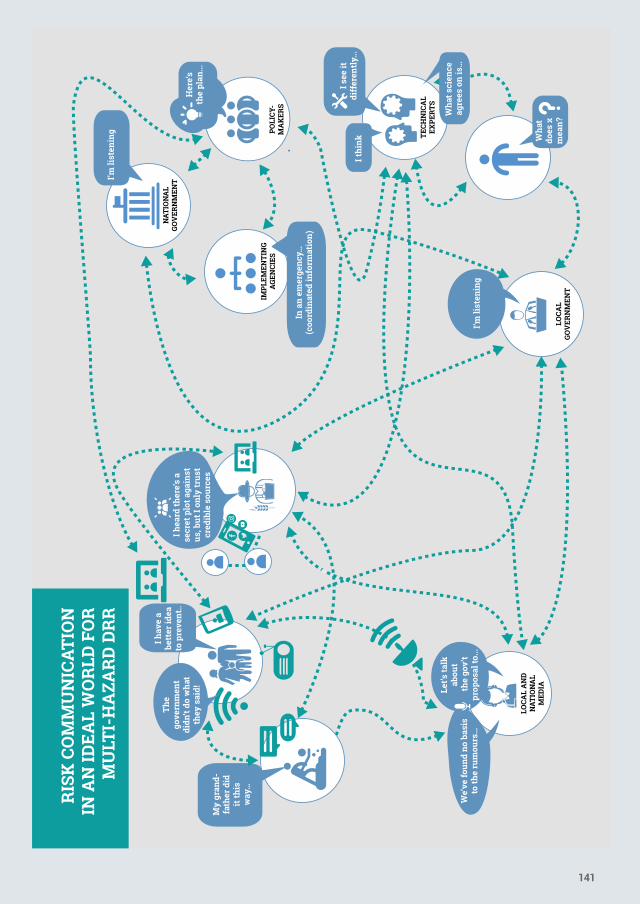
I hea
rd th
ere’
s a
secr
et p
lot a
gain
st
us, b
ut I
only
trus
t cr
edib
le s
ourc
es
I hav
e a
bett
er id
ea
to p
reve
nt..
The
gove
rnm
ent
didn
’t do
wha
t th
ey s
aid!
Let’s
talk
ab
out
the
gov’
t pr
opos
al to
...
My
gran
d-fa
ther
did
it
this
w
ay…
I see
it
diff
eren
tly.
..
Her
e’s
the
plan
...
I thi
nk
Wha
t sci
ence
ag
rees
on
is…
We’
ve fo
und
no b
asis
to
the
rum
ours
…I’m
list
enin
g
LOCA
L GO
VER
NM
ENT
TECH
NIC
AL
EXPE
RTS
POLI
CY-
MA
KER
S
LOCA
L A
ND
N
ATIO
NA
LM
EDIA
NAT
ION
AL
GOV
ERN
MEN
T
IMPL
EMEN
TIN
GA
GEN
CIES
Wha
t do
es x
m
ean?
I’m li
sten
ing
In a
n em
erge
ncy…
(c
oord
inat
ed in
form
atio
n)
RIS
K C
OM
MU
NIC
ATIO
N
IN A
N ID
EAL
WO
RLD
FO
R
MU
LTI-
HA
ZAR
D D
RR
141
Part IIITowards a more resilient future
10. Emerging approaches to assessing systemic riskNetworks have become essential to modern living, but they are also the physical propagators of systemic risk. Disasters do not need to be on a catastrophic scale to demonstrate the fragility of infrastructure networks and the often-unforeseen consequences of interdependence.
The scale of disasters in recent years (e.g. the appearance of previously unknown infectious diseases, devastating wildfires and supply chain disruptions) has demonstrated that something new is happening. Societal vulnerabilities and systemic risk are amplified in today’s globalized world through interconnected digital and physical infrastructures, globally integrated supply chains and enhanced human mobility. These networks are susceptible to breakdowns, infections and attacks, including from malicious third parties.
This chapter looks at emerging methods to assess systemic risk. It provides an overview of models, tools and methodologies being developed around the world to better measure systemic risk and its impacts, and how these tools can be used to support policy decisions to reduce risk.
10.1 The era of networked riskThe terrorist attacks of 11 September 2001 in the United States spurred a huge amount of new activity
relating to national security, including for resilience of infrastructure systems. Coming at about the same time as developments in network science, this led to a rapid flourishing in understanding the behaviour, and notably the failure, of infrastructure systems.
The arrival of extremely damaging hurricanes in the United States, notably Hurricane Katrina in New Orleans in 2005 and Hurricane Sandy in New York and neighbouring States in 2012, highlighted that critical infrastructure vulnerability is a reality in developed economies. Weather-related disasters like Katrina and Sandy also raised awareness of the potential impacts of climate change, including rising sea levels and increasing hurricane frequency and severity.
The impacts of these events, and of the Fukushima Daiichi nuclear disaster in Japan triggered by an earthquake and tsunami in 2011, led to reconsideration of infrastructure resilience in industrialized and developing countries far from where these disasters occurred. For example, partly because of these disasters, the City of London reviewed the standard of its protection against storm surge flooding and other risks to critical infrastructure, while flood risk management in the Netherlands was comprehensively reviewed to put plans in place to adapt to future changes (Deltacommissie, 2008; Pitt, 2008; Hall, 2018; Pescaroli et al., 2022).
Part III143
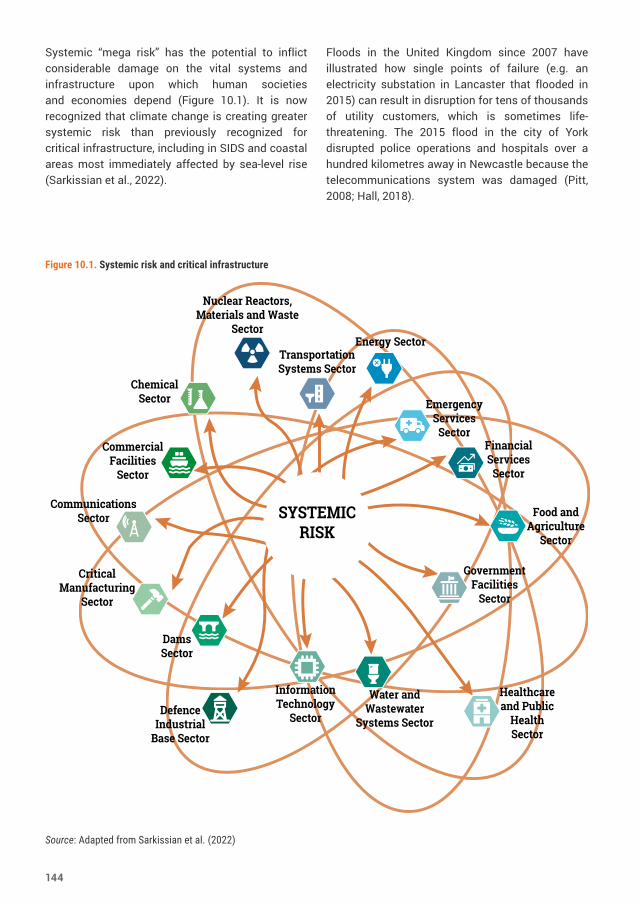
Energy Sector
Nuclear Reactors, Materials and Waste
Sector
Transportation Systems Sector
Food and Agriculture
Sector
Emergency Services
SectorFinancial Services
Sector
Water and Wastewater
Systems Sector
Government Facilities
Sector
Healthcare and Public
Health Sector
Dams Sector
Information Technology
SectorDefence Industrial
Base Sector
Communications Sector
Critical Manufacturing
Sector
Commercial Facilities
Sector
Chemical Sector
SYSTEMIC RISK
Systemic “mega risk” has the potential to inflict considerable damage on the vital systems and infrastructure upon which human societies and economies depend (Figure 10.1). It is now recognized that climate change is creating greater systemic risk than previously recognized for critical infrastructure, including in SIDS and coastal areas most immediately affected by sea-level rise (Sarkissian et al., 2022).
Floods in the United Kingdom since 2007 have illustrated how single points of failure (e.g. an electricity substation in Lancaster that flooded in 2015) can result in disruption for tens of thousands of utility customers, which is sometimes life-threatening. The 2015 flood in the city of York disrupted police operations and hospitals over a hundred kilometres away in Newcastle because the telecommunications system was damaged (Pitt, 2008; Hall, 2018).
Figure 10.1. Systemic risk and critical infrastructure
Source: Adapted from Sarkissian et al. (2022)
144
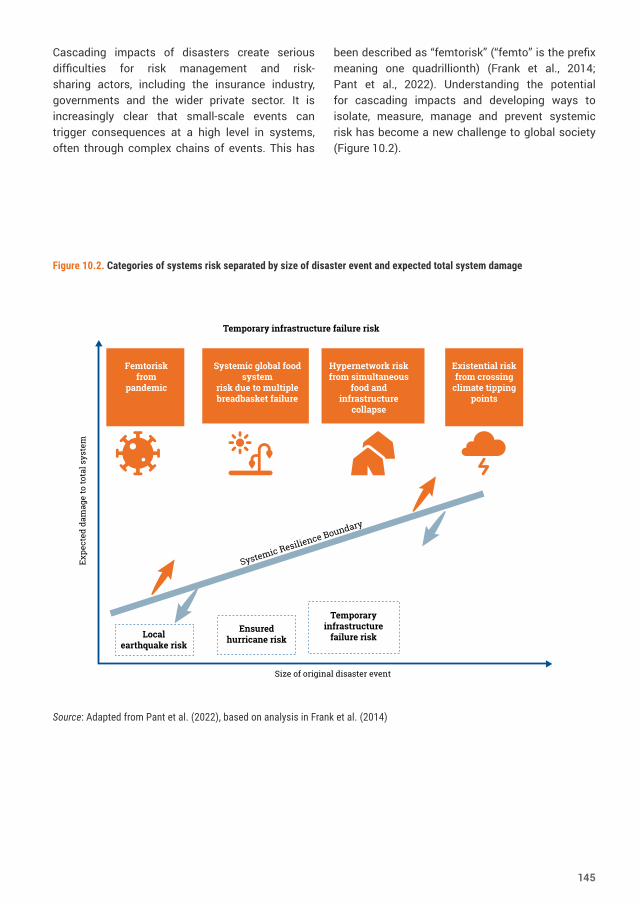
Cascading impacts of disasters create serious difficulties for risk management and risk-sharing actors, including the insurance industry, governments and the wider private sector. It is increasingly clear that small-scale events can trigger consequences at a high level in systems, often through complex chains of events. This has
been described as “femtorisk” (“femto” is the prefix meaning one quadrillionth) (Frank et al., 2014; Pant et al., 2022). Understanding the potential for cascading impacts and developing ways to isolate, measure, manage and prevent systemic risk has become a new challenge to global society (Figure 10.2).
Ensured hurricane risk
Temporary infrastructure
failure riskLocal earthquake risk
Temporary infrastructure failure risk
Femtorisk from
pandemic
Systemic global food system
risk due to multiple breadbasket failure
Hypernetwork risk from simultaneous
food and infrastructure
collapse
Existential risk from crossing
climate tipping points
Size of original disaster event
Figure 10.2. Categories of systems risk separated by size of disaster event and expected total system damage
Source: Adapted from Pant et al. (2022), based on analysis in Frank et al. (2014)
145
10.2 Building scenarios and digital twins, and finding tipping points
The science of systemic risk and systemic risk management is still in a primordial state. System-wide collapse is often the result of a default, malfunction or failure of a single, seemingly minor, component of a system that passes the stress or impact on to its neighbours in the network. In this way, small impacts or stresses can spread rapidly through the network, and self-reinforcing cascades result. Collapse often occurs without detectable or observable precursors, making it look as if systemic catastrophic disasters occur out of nowhere. Until recently, a lack of data and insufficient computing power have meant it was not practically possible to really “see” these complex networks, and to identify the kinds of tipping points that lead to crashes. However, recent advances in systemic risk understanding and computer power are making it possible to assess and understand the structures of the underlying networks.
After decades of trying to find tipping points in various contexts (e.g. financial crises, fast economic downturns, ecological collapse or climate change), the origin of the problem has been identified clearly: the details of the underlying financial, economic and ecological networks do matter. Understanding tipping points is not only about how networks look and function but also how they are connected within themselves and with other networks.
Systemic risk, variously described by terms such as “correlation structures”, “tipping points” (Krönke et al., 2020) or “risk propagation”, can be modelled using the concept of networks. Networks are often visualized as a series of nodes and links, which are connected along lines and planes and also in three dimensions. Fluctuations in one node in an economic network (e.g. a commodity price) lead to changes in other nodes (e.g. the price of retail goods or services), which may then affect poorer people’s access to food and health services. Networks can be multidimensional, consisting of different layers representing different types of interactions (e.g. financial flows on one level and labour migration
on another level), which interact with each other. Examples for the policy relevance of network models are bank stress tests and systemic risk analyses after the 2008 financial crisis to ensure financial stability. For example, a liquidity stress test of the Turkish banking sector was conducted by simulating a network topology of mutual liabilities among financial institutions (Akdoğan and Yildirim, 2014). Networks are also dynamic over time, which means nodes and links change between time steps.
Network modelling methods do not enable prediction of the exact tipping points, such as on which day the stock markets will crash, or when supply chains will cease to function, or when the aim of limiting global warming to 1.5°C above pre-industrial levels is irreversibly lost. Events like these are typically triggered by events that cannot be predicted, like a political scandal. However, given a trigger event, these methods can predict what the consequences will be throughout the system. For example, if Bank A declares bankruptcy on day 1, what does that mean for Bank B on day 7? Will it be able to repay liabilities to Bank C, or will it become illiquid, and have to declare bankruptcy as well? Network modelling methods can tell observers what happens after the tipping point is reached.
In essence, the basic approach to network modelling is as follows: (a) data sets are converted to network information that identifies nodes and links and (b) this data is used in combination with knowledge of how shocks propagate in that specific system, which makes it possible to compute systemic risk. This is often done in a framework of “agent-based modelling”, where analysts can control and set hypothetical scenarios for triggering events or policy interventions. Agent-based models aim to test the efficacy of certain kinds of policy interventions. They can help answer questions such as: would it be better in the long term for workers in this country if the government bails out Bank A with tax money, or would that benefit only the bank owners? In this case, if the analysts know the networks of mutual liabilities among banks in the financial networks, they can anticipate default dynamics and their consequences. If the analysts take into account many possible initial defaults, they can systematically identify the institutional
146
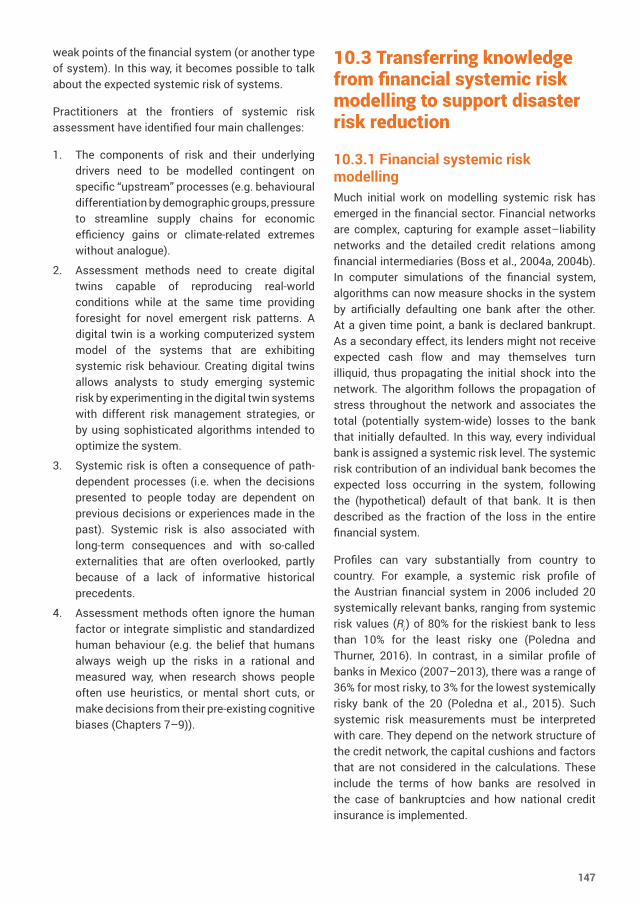
weak points of the financial system (or another type of system). In this way, it becomes possible to talk about the expected systemic risk of systems.
Practitioners at the frontiers of systemic risk assessment have identified four main challenges:
1. The components of risk and their underlying drivers need to be modelled contingent on specific “upstream” processes (e.g. behavioural differentiation by demographic groups, pressure to streamline supply chains for economic efficiency gains or climate-related extremes without analogue).
2. Assessment methods need to create digital twins capable of reproducing real-world conditions while at the same time providing foresight for novel emergent risk patterns. A digital twin is a working computerized system model of the systems that are exhibiting systemic risk behaviour. Creating digital twins allows analysts to study emerging systemic risk by experimenting in the digital twin systems with different risk management strategies, or by using sophisticated algorithms intended to optimize the system.
3. Systemic risk is often a consequence of path-dependent processes (i.e. when the decisions presented to people today are dependent on previous decisions or experiences made in the past). Systemic risk is also associated with long-term consequences and with so-called externalities that are often overlooked, partly because of a lack of informative historical precedents.
4. Assessment methods often ignore the human factor or integrate simplistic and standardized human behaviour (e.g. the belief that humans always weigh up the risks in a rational and measured way, when research shows people often use heuristics, or mental short cuts, or make decisions from their pre-existing cognitive biases (Chapters 7–9)).
10.3 Transferring knowledge from financial systemic risk modelling to support disaster risk reduction
10.3.1 Financial systemic risk modellingMuch initial work on modelling systemic risk has emerged in the financial sector. Financial networks are complex, capturing for example asset–liability networks and the detailed credit relations among financial intermediaries (Boss et al., 2004a, 2004b). In computer simulations of the financial system, algorithms can now measure shocks in the system by artificially defaulting one bank after the other. At a given time point, a bank is declared bankrupt. As a secondary effect, its lenders might not receive expected cash flow and may themselves turn illiquid, thus propagating the initial shock into the network. The algorithm follows the propagation of stress throughout the network and associates the total (potentially system-wide) losses to the bank that initially defaulted. In this way, every individual bank is assigned a systemic risk level. The systemic risk contribution of an individual bank becomes the expected loss occurring in the system, following the (hypothetical) default of that bank. It is then described as the fraction of the loss in the entire financial system.
Profiles can vary substantially from country to country. For example, a systemic risk profile of the Austrian financial system in 2006 included 20 systemically relevant banks, ranging from systemic risk values (Ri ) of 80% for the riskiest bank to less than 10% for the least risky one (Poledna and Thurner, 2016). In contrast, in a similar profile of banks in Mexico (2007–2013), there was a range of 36% for most risky, to 3% for the lowest systemically risky bank of the 20 (Poledna et al., 2015). Such systemic risk measurements must be interpreted with care. They depend on the network structure of the credit network, the capital cushions and factors that are not considered in the calculations. These include the terms of how banks are resolved in the case of bankruptcies and how national credit insurance is implemented.
147
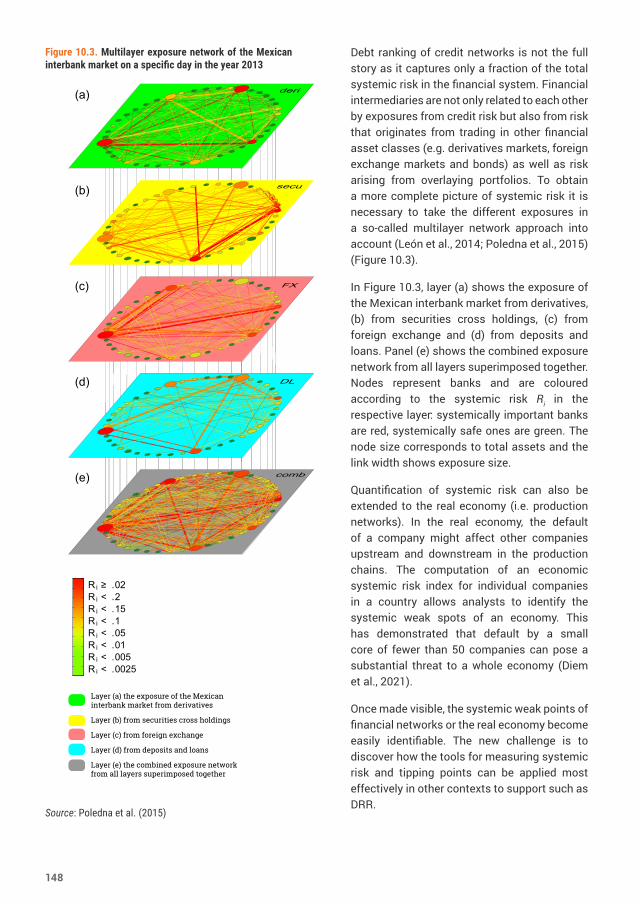
secu
FX
DL
deri
comb
Layer (a) the exposure of the Mexican interbank market from derivatives
Layer (b) from securities cross holdings
Layer (c) from foreign exchange
Layer (d) from deposits and loans
Layer (e) the combined exposure network from all layers superimposed together
Ri < .Ri < .R i < .R i < .R i < .R i < .R i < .R i ≥ .02
Figure 10.3. Multilayer exposure network of the Mexican interbank market on a specific day in the year 2013
Source: Poledna et al. (2015)
Debt ranking of credit networks is not the full story as it captures only a fraction of the total systemic risk in the financial system. Financial intermediaries are not only related to each other by exposures from credit risk but also from risk that originates from trading in other financial asset classes (e.g. derivatives markets, foreign exchange markets and bonds) as well as risk arising from overlaying portfolios. To obtain a more complete picture of systemic risk it is necessary to take the different exposures in a so-called multilayer network approach into account (León et al., 2014; Poledna et al., 2015) (Figure 10.3).
In Figure 10.3, layer (a) shows the exposure of the Mexican interbank market from derivatives, (b) from securities cross holdings, (c) from foreign exchange and (d) from deposits and loans. Panel (e) shows the combined exposure network from all layers superimposed together. Nodes represent banks and are coloured according to the systemic risk Ri in the respective layer: systemically important banks are red, systemically safe ones are green. The node size corresponds to total assets and the link width shows exposure size.
Quantification of systemic risk can also be extended to the real economy (i.e. production networks). In the real economy, the default of a company might affect other companies upstream and downstream in the production chains. The computation of an economic systemic risk index for individual companies in a country allows analysts to identify the systemic weak spots of an economy. This has demonstrated that default by a small core of fewer than 50 companies can pose a substantial threat to a whole economy (Diem et al., 2021).
Once made visible, the systemic weak points of financial networks or the real economy become easily identifiable. The new challenge is to discover how the tools for measuring systemic risk and tipping points can be applied most effectively in other contexts to support such as DRR.
148
10.3.2 Transferring modelling to disaster risk reductionOn 8 September 2011, a transmission line near Yuma in Arizona, United States, was tripped. On its own, this was not a major fault, but it meant that power flows instantaneously redistributed throughout the system, including into lower-voltage infrastructure, creating sizeable voltage deviations and equipment overloads. This, combined with high demand due to hot weather, caused cascading outages resulting in a mass blackout (NERC, 2012). It affected two nuclear generators at the San Onofre power plant, and cut electricity supply to over 1.5 million customers (NERC, 2012), affecting up to 5 million people (The Guardian, 2011). Lack of power then caused release of untreated sewage. During the blackout, which lasted 12 hours, the disruption of emergency communications made it difficult to notify people that sewage had infiltrated San Diego’s drinking water. Altogether, almost 32,000 m3 of sewage was released from plants in southern California and Mexico, and 7 million people lost power (Lehmann, 2014; Pant et al., 2022). Systemic risk modellers are increasingly looking at such incidents, and testing whether methods similar to those applied to financial systems could be used to help plan how to handle, and ideally prevent, other systemic risks from becoming disasters.
Systemic risk depends on the nature of the system being studied. Financial systemic risk is different (although linked) to the systemic risk of an economy, or to the nature of collapse in an ecosystem. Exposure networks among actors in financial markets are fundamentally different from, for example, supply chain shocks in the real economy. In financial systems, networks are made up of promises of future cash flows. In the real economy, networks are made up of the flows of material goods and services. Consequently, the impact of a default of a company in a supply chain sets off different impacts through the network, compared with a default of a bank in a financial network. Systemic modelling of other systems, let alone the entire Earth system, is even more complex. However, in the age of big data and due to the development of new conceptual, mathematical and computational methods, predominantly in network and complexity science, systemic risk is increasingly being quantified.
Many of the new methods to assess systemic risk combine structural features of the underlying networks of a system with properties of the actors and regularities (elements that are regular) and how they organize their interactions.
The capacity of analysts to conduct infrastructure network risk assessment at large scales, including national and globally, has been facilitated by advances in data availability and improved analytics. Some examples of such advances and innovative tools are:
● Global data on climate hazard layers, including models that assess flood risk locally and globally, such as (a) the Southeast Asia Disaster Risk Insurance Facility flood risk assessment model (SEADRIF, 2021); (b) the Global Flood Risk with IMAGE Scenarios, a modelling tool to assess changes in flood risk at the global scale under a wide range of climate and socioeconomic scenarios (PBL Netherlands Environmental Assessment Agency, 2020); and (c) Fathom catastrophe insurance flood modelling (Fathom, 2022).
● Global infrastructure asset data sets, such as: (a) OpenStreetMap (OpenStreetMap Foundation, n.d.); (b) the World Resources Institute’s Global Power Plant Database (Global Energy Observatory et al., 2021); and (c) tools for synthesizing these data sets where data is incomplete, such as gridfinder that tracks global energy infrastructure (gridfinder, n.d.).
● Generic asset fragility curves (e.g. the engineering assessment used by Miyamoto International in a World Bank assessment of asset fragility in the Caribbean (Rozenberg et al., 2021).
● Data sets of infrastructure usage at national and global scales (e.g. power network access, traffic data and the automatic identification system for shipping data).
● Multiregional input–output models that enable estimates of the full economic costs of infrastructure disruption.
● Ex post economic assessments that enable model validation (e.g. after the 2011 Thailand floods).
● Engineering estimates of the costs of adaptation.
149
These types of tools support risk assessment and DRR decision-making, using local and global data sets.
Better base data has also enabled significant advances in measuring how processes such as digitization and electrification are leading to increased interdependence between infrastructure and other networks. It is also providing vital insights into how resource scarcity, for example in water or energy, is intensifying interdependencies across systems. Such interdependences can be:
● Geographic (two or more systems are co-located in physical space)
● Physical (a physical output from one system is a necessary input to another)
● Cyber (information produced by a system affects the operation of another)
● Human (shared dependencies on people, e.g. workers, organizational or social systems)
Where such data becomes available in a detailed enough way, quantification of systemic properties can become a reality for the first time. This is a better foundation for understanding systemic risk in order to reduce it.
Analysis of these systems enables modellers to identify weak points in an economy or critical infrastructure, anticipate tipping points generally, and understand the geopolitical roles, strengths and weaknesses of national supply chains. This analysis can be used for networks of supply chains, critical infrastructure like the power grid, distribution and trade networks, material flows, and also for logistics networks, or networks of information flow, societal networks between people and institutions, opinion formation processes and the like. All of these systems have inherent risk and they are often directly or indirectly affected by hazards such as floods, storms and even epidemics and pandemics.
Analysis of the likelihood of failure of a given asset, given a particular hazard scenario such as a flood, involves understanding the geometry of the asset (e.g. its elevation relative to the flood level), its condition and function. This is critical information for those managing essential infrastructure and services, to reduce the level of systemic risk in these systems, and to increase their resilience to other hazards. Though comprehensive analysis at a national scale is still some way off for most
countries, significant elements of the analysis are already in place. For example, analysis of network vulnerabilities and customer disruptions helps identify hotspots of vulnerability, such as in the electricity network for the United Kingdom (Figure 10.4 and Figure 10.5).
For a DRR approach, the crucial step is to use information on the properties of systems and their systemic risk to prioritize interventions that increase resilience. The business case for such interventions usually rests on comparison of the cost of the intervention with the cost of the losses it will help to avoid. A version of this cost–benefit calculation for electricity substations in the United Kingdom was conducted, exploring a variety of possible interventions, such as building flood protection around substations, raising plants above the ground and relocating substations. This resulted in prioritization of some substations for investment in protective measures, though that prioritization was also sensitive to estimates of the scale of economic impact if they failed. Therefore, a robustness analysis was also conducted, to illustrate over what range of economic impacts such investments in protection would continue to be cost beneficial (Pitt, 2008; Hall, 2018).
Figure 10.4 shows a system-of-systems model representation of interdependent infrastructure networks providing electricity services to customers in England and Wales. Also shown is the real-world hierarchy present in the electricity network providing service to customers in England and Wales (Pant et al., 2022).
The system-of-systems representations of infrastructure networks has been key in understanding how interdependencies, while desirable for improving infrastructure performance and increasing systems efficiencies, create cascading effects, where small initial failures manifest as larger events (Watts, 2002; Pant et al., 2022). For example, by interrogating network data from electricity transmission and distribution network operators in England and Wales and using statistical techniques to fill in missing data, it has been possible to develop the full electricity network hierarchy for England and Wales and the dependence of most other infrastructure assets on that network (Figure 10.5).
150
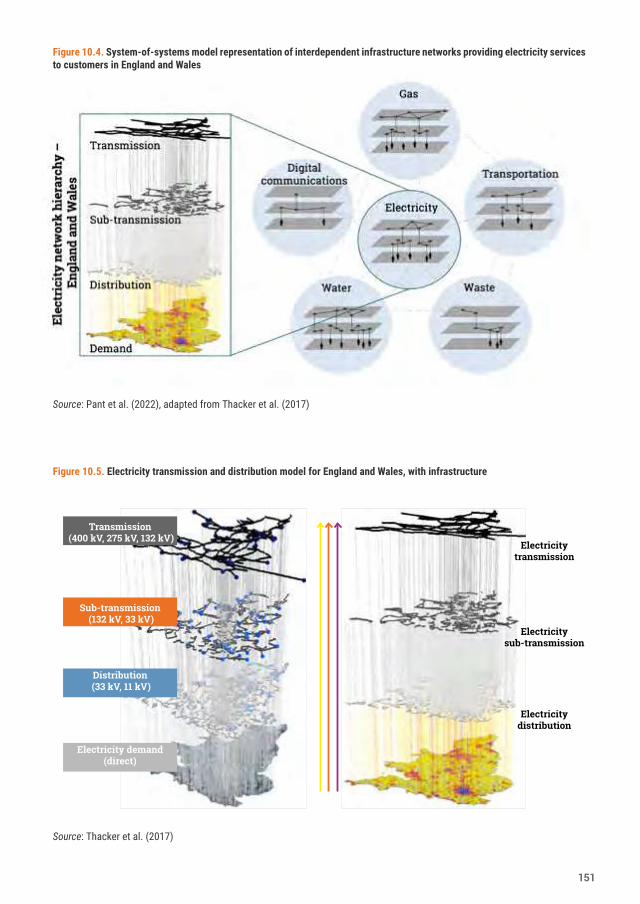
Figure 10.4. System-of-systems model representation of interdependent infrastructure networks providing electricity services to customers in England and Wales
Source: Pant et al. (2022), adapted from Thacker et al. (2017)
The boundaries and names shown and the designations used on this map do not imply offi cial endorsement or acceptance by the United Nations
Transmission (400 kV, 275 kV, 132 kV)
Sub-transmission (132 kV, 33 kV)
Distribution (33 kV, 11 kV)
Electricity demand(direct)
Electricitytransmission
Electricity sub-transmission
Electricitydistribution
Figure 10.5. Electricity transmission and distribution model for England and Wales, with infrastructure
Source: Thacker et al. (2017)
151
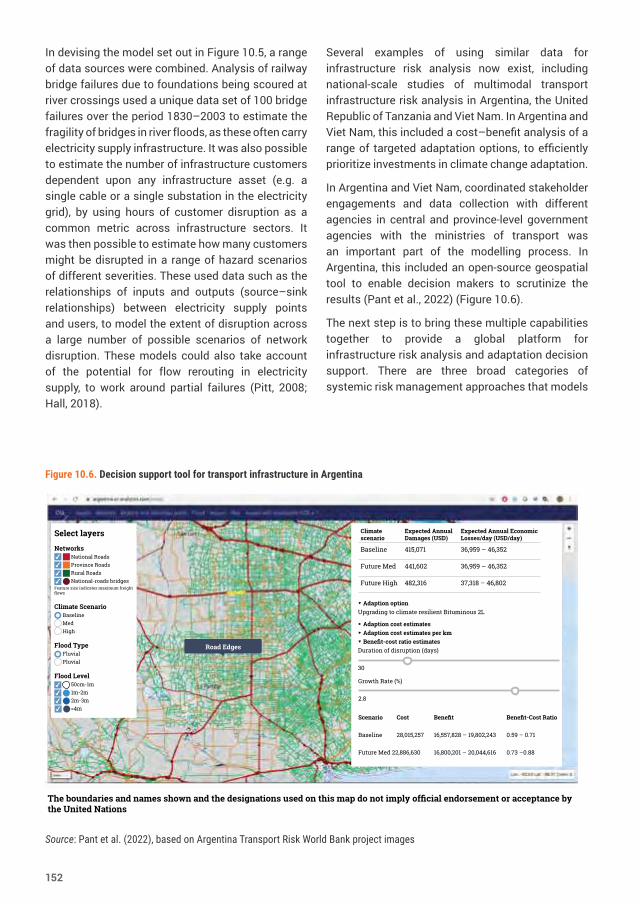
In devising the model set out in Figure 10.5, a range of data sources were combined. Analysis of railway bridge failures due to foundations being scoured at river crossings used a unique data set of 100 bridge failures over the period 1830–2003 to estimate the fragility of bridges in river floods, as these often carry electricity supply infrastructure. It was also possible to estimate the number of infrastructure customers dependent upon any infrastructure asset (e.g. a single cable or a single substation in the electricity grid), by using hours of customer disruption as a common metric across infrastructure sectors. It was then possible to estimate how many customers might be disrupted in a range of hazard scenarios of different severities. These used data such as the relationships of inputs and outputs (source–sink relationships) between electricity supply points and users, to model the extent of disruption across a large number of possible scenarios of network disruption. These models could also take account of the potential for flow rerouting in electricity supply, to work around partial failures (Pitt, 2008; Hall, 2018).
Several examples of using similar data for infrastructure risk analysis now exist, including national-scale studies of multimodal transport infrastructure risk analysis in Argentina, the United Republic of Tanzania and Viet Nam. In Argentina and Viet Nam, this included a cost–benefit analysis of a range of targeted adaptation options, to efficiently prioritize investments in climate change adaptation.
In Argentina and Viet Nam, coordinated stakeholder engagements and data collection with different agencies in central and province-level government agencies with the ministries of transport was an important part of the modelling process. In Argentina, this included an open-source geospatial tool to enable decision makers to scrutinize the results (Pant et al., 2022) (Figure 10.6).
The next step is to bring these multiple capabilities together to provide a global platform for infrastructure risk analysis and adaptation decision support. There are three broad categories of systemic risk management approaches that models
The boundaries and names shown and the designations used on this map do not imply offi cial endorsement or acceptance by the United Nations
Select layers
NetworksNational RoadsProvince RoadsRural RoadsNational-roads bridges
Feature size indicates maximum freight fl ows
Climate ScenarioBaselineMedHigh
Flood TypeFluvial Pluvial
Flood Level50cm-1m1m-2m2m-3m>4m
✔✔✔✔
✔✔✔✔
Road Edges
Scenario Cost Benefi t Benefi t-Cost Ratio
Baseline 28,015,257 16,557,828 – 19,802,243 0.59 – 0.71
Future Med 22,886,630 16,800,201 – 20,044,616 0.73 –0.88
Growth Rate (%)
2.8
Climate scenario
Expected Annual Damages (USD)
Expected Annual Economic Losses/day (USD/day)
Baseline 415,071 36,959 – 46,352
Future Med 441,602 36,959 – 46,352
Future High 482,316 37,318 – 46,802
▼ Adaption optionUpgrading to climate resilient Bituminous 2L
▶ Adaption cost estimates ▶ Adaption cost estimates per km▼ Benefi t-cost ratio estimatesDuration of disruption (days)
30
Figure 10.6. Decision support tool for transport infrastructure in Argentina
Source: Pant et al. (2022), based on Argentina Transport Risk World Bank project images
152
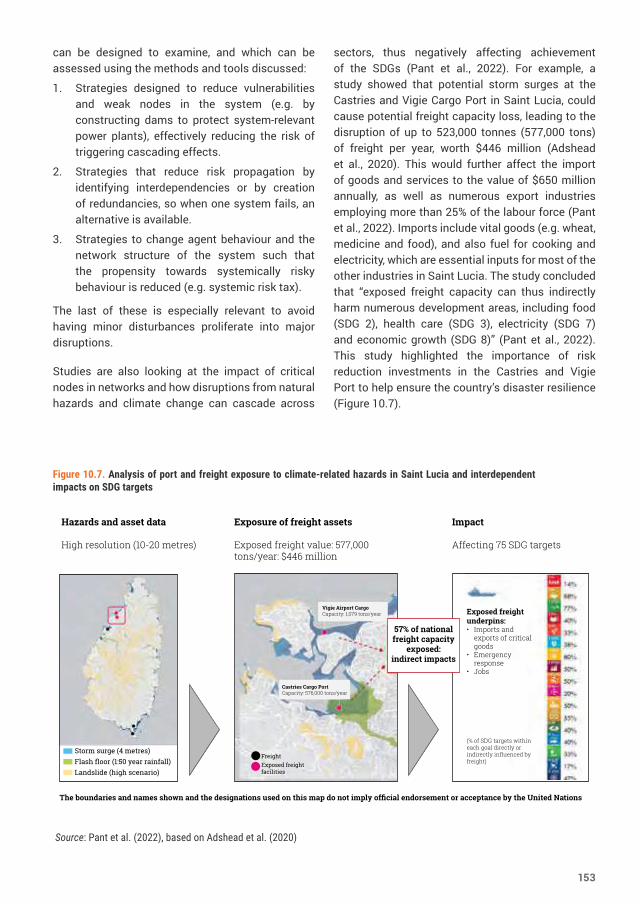
can be designed to examine, and which can be assessed using the methods and tools discussed:
1. Strategies designed to reduce vulnerabilities and weak nodes in the system (e.g. by constructing dams to protect system-relevant power plants), effectively reducing the risk of triggering cascading effects.
2. Strategies that reduce risk propagation by identifying interdependencies or by creation of redundancies, so when one system fails, an alternative is available.
3. Strategies to change agent behaviour and the network structure of the system such that the propensity towards systemically risky behaviour is reduced (e.g. systemic risk tax).
The last of these is especially relevant to avoid having minor disturbances proliferate into major disruptions.
Studies are also looking at the impact of critical nodes in networks and how disruptions from natural hazards and climate change can cascade across
sectors, thus negatively affecting achievement of the SDGs (Pant et al., 2022). For example, a study showed that potential storm surges at the Castries and Vigie Cargo Port in Saint Lucia, could cause potential freight capacity loss, leading to the disruption of up to 523,000 tonnes (577,000 tons) of freight per year, worth $446 million (Adshead et al., 2020). This would further affect the import of goods and services to the value of $650 million annually, as well as numerous export industries employing more than 25% of the labour force (Pant et al., 2022). Imports include vital goods (e.g. wheat, medicine and food), and also fuel for cooking and electricity, which are essential inputs for most of the other industries in Saint Lucia. The study concluded that “exposed freight capacity can thus indirectly harm numerous development areas, including food (SDG 2), health care (SDG 3), electricity (SDG 7) and economic growth (SDG 8)” (Pant et al., 2022). This study highlighted the importance of risk reduction investments in the Castries and Vigie Port to help ensure the country’s disaster resilience (Figure 10.7).
The boundaries and names shown and the designations used on this map do not imply offi cial endorsement or acceptance by the United Nations
Hazards and asset data
High resolution (10-20 metres)
Exposure of freight assets
Exposed freight value: 577,000tons/year: $446 million
Impact
Affecting 75 SDG targets
Storm surge (4 metres)Flash fl oor (1:50 year rainfall)Landslide (high scenario)
FreightExposed freight facilities
Castries Cargo PortCapacity: 576,000 tons/year
Exposed freight underpins: • Imports and
exports of critical goods
• Emergency response
• Jobs
(% of SDG targets within each goal directly or indirectly infl uenced by freight)
Vigie Airport CargoCapacity: 1,079 tons/year
57% of national freight capacity
exposed: indirect impacts
Figure 10.7. Analysis of port and freight exposure to climate-related hazards in Saint Lucia and interdependent impacts on SDG targets
Source: Pant et al. (2022), based on Adshead et al. (2020)
153
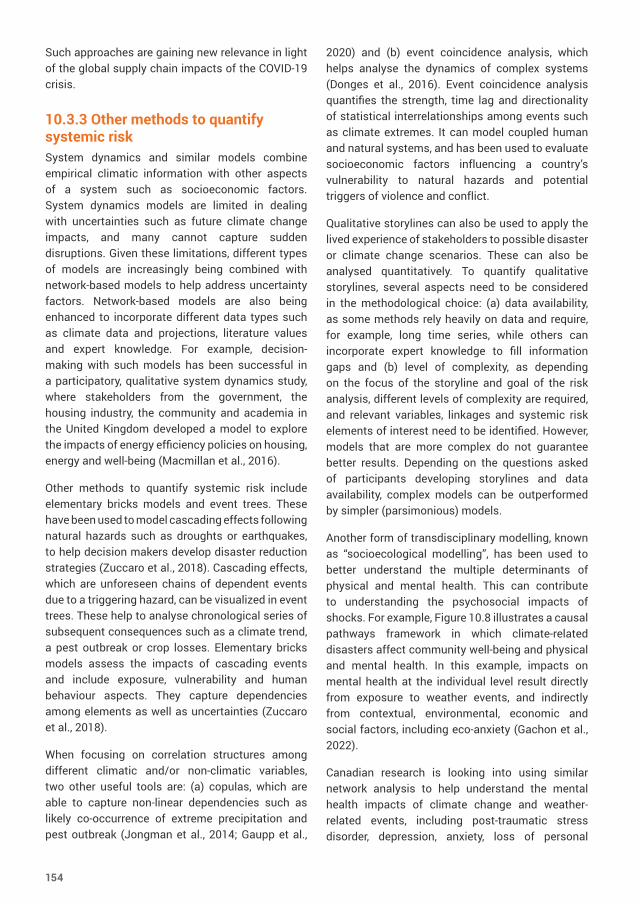
Such approaches are gaining new relevance in light of the global supply chain impacts of the COVID-19 crisis.
10.3.3 Other methods to quantify systemic riskSystem dynamics and similar models combine empirical climatic information with other aspects of a system such as socioeconomic factors. System dynamics models are limited in dealing with uncertainties such as future climate change impacts, and many cannot capture sudden disruptions. Given these limitations, different types of models are increasingly being combined with network-based models to help address uncertainty factors. Network-based models are also being enhanced to incorporate different data types such as climate data and projections, literature values and expert knowledge. For example, decision-making with such models has been successful in a participatory, qualitative system dynamics study, where stakeholders from the government, the housing industry, the community and academia in the United Kingdom developed a model to explore the impacts of energy efficiency policies on housing, energy and well-being (Macmillan et al., 2016).
Other methods to quantify systemic risk include elementary bricks models and event trees. These have been used to model cascading effects following natural hazards such as droughts or earthquakes, to help decision makers develop disaster reduction strategies (Zuccaro et al., 2018). Cascading effects, which are unforeseen chains of dependent events due to a triggering hazard, can be visualized in event trees. These help to analyse chronological series of subsequent consequences such as a climate trend, a pest outbreak or crop losses. Elementary bricks models assess the impacts of cascading events and include exposure, vulnerability and human behaviour aspects. They capture dependencies among elements as well as uncertainties (Zuccaro et al., 2018).
When focusing on correlation structures among different climatic and/or non-climatic variables, two other useful tools are: (a) copulas, which are able to capture non-linear dependencies such as likely co-occurrence of extreme precipitation and pest outbreak (Jongman et al., 2014; Gaupp et al.,
2020) and (b) event coincidence analysis, which helps analyse the dynamics of complex systems (Donges et al., 2016). Event coincidence analysis quantifies the strength, time lag and directionality of statistical interrelationships among events such as climate extremes. It can model coupled human and natural systems, and has been used to evaluate socioeconomic factors influencing a country’s vulnerability to natural hazards and potential triggers of violence and conflict.
Qualitative storylines can also be used to apply the lived experience of stakeholders to possible disaster or climate change scenarios. These can also be analysed quantitatively. To quantify qualitative storylines, several aspects need to be considered in the methodological choice: (a) data availability, as some methods rely heavily on data and require, for example, long time series, while others can incorporate expert knowledge to fill information gaps and (b) level of complexity, as depending on the focus of the storyline and goal of the risk analysis, different levels of complexity are required, and relevant variables, linkages and systemic risk elements of interest need to be identified. However, models that are more complex do not guarantee better results. Depending on the questions asked of participants developing storylines and data availability, complex models can be outperformed by simpler (parsimonious) models.
Another form of transdisciplinary modelling, known as “socioecological modelling”, has been used to better understand the multiple determinants of physical and mental health. This can contribute to understanding the psychosocial impacts of shocks. For example, Figure 10.8 illustrates a causal pathways framework in which climate-related disasters affect community well-being and physical and mental health. In this example, impacts on mental health at the individual level result directly from exposure to weather events, and indirectly from contextual, environmental, economic and social factors, including eco-anxiety (Gachon et al., 2022).
Canadian research is looking into using similar network analysis to help understand the mental health impacts of climate change and weather-related events, including post-traumatic stress disorder, depression, anxiety, loss of personal
154
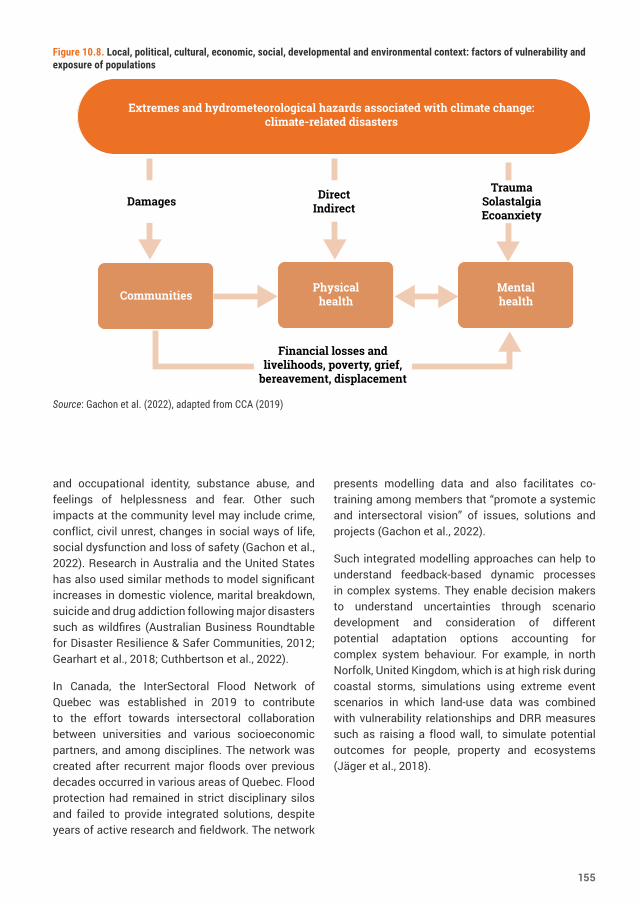
and occupational identity, substance abuse, and feelings of helplessness and fear. Other such impacts at the community level may include crime, conflict, civil unrest, changes in social ways of life, social dysfunction and loss of safety (Gachon et al., 2022). Research in Australia and the United States has also used similar methods to model significant increases in domestic violence, marital breakdown, suicide and drug addiction following major disasters such as wildfires (Australian Business Roundtable for Disaster Resilience & Safer Communities, 2012; Gearhart et al., 2018; Cuthbertson et al., 2022).
In Canada, the InterSectoral Flood Network of Quebec was established in 2019 to contribute to the effort towards intersectoral collaboration between universities and various socioeconomic partners, and among disciplines. The network was created after recurrent major floods over previous decades occurred in various areas of Quebec. Flood protection had remained in strict disciplinary silos and failed to provide integrated solutions, despite years of active research and fieldwork. The network
presents modelling data and also facilitates co-training among members that “promote a systemic and intersectoral vision” of issues, solutions and projects (Gachon et al., 2022).
Such integrated modelling approaches can help to understand feedback-based dynamic processes in complex systems. They enable decision makers to understand uncertainties through scenario development and consideration of different potential adaptation options accounting for complex system behaviour. For example, in north Norfolk, United Kingdom, which is at high risk during coastal storms, simulations using extreme event scenarios in which land-use data was combined with vulnerability relationships and DRR measures such as raising a flood wall, to simulate potential outcomes for people, property and ecosystems (Jäger et al., 2018).
Communities
Financial losses and livelihoods, poverty, grief,
bereavement, displacement
Extremes and hydrometeorological hazards associated with climate change:climate-related disasters
Physical health
Mental health
Damages DirectIndirect
Trauma SolastalgiaEcoanxiety
Figure 10.8. Local, political, cultural, economic, social, developmental and environmental context: factors of vulnerability and exposure of populations
Source: Gachon et al. (2022), adapted from CCA (2019)
155
10.4 New and emerging technologies and science for improved understanding of system collapse and natural systems
Hazard-related disasters resulting in system collapse are among the most complex, but also most necessary systems to understand. For example, the 2011 earthquake and tsunami in Japan led to a nuclear meltdown and cost 18,000 lives and over $350 billion in damage. More recently, the Australian wildfires in 2019–2020 destroyed 3,000 homes, caused 33 deaths and cost the economy an estimated $28.4 billion (Filkov et al., 2020). In the United States, the Texas big freeze of February 2021 left more than 4.5 million customers (more than 10 million people) without electricity at its peak, some for several days. Its cascading effects included impacts on drinking water treatment and medical services, and it resulted in an estimated economic loss of $130 billion in Texas alone (Busby et al., 2021).
Systemic risk is complex in nature, multilayered and dynamic. Natural systems tend to re-establish multiple local equilibrium conditions whenever and wherever possible, even though such local stabilities are fragile and may be disrupted easily. However, the rapid expansion of industrialization across the world has created disruptions to nature of enormous proportions, to such an extent that humans now face the challenge of finding a more harmonious symbiosis between society and nature.
Creating a full-system conception needs to tie together many specialized experts, subsystems and sciences, requiring that analysts and policymakers try to understand how everything is connected and everything is continuously transforming.
Uncovering systemic risk entails an understanding of how events of a particular character in one domain trigger events in neighbouring domains, thereby causing possible cascading crises throughout the entire system, or system of systems, like falling dominoes.
Complex, non-linear, adaptive systems can be numerically modelled using a combination of methods from physics, chemistry, geology, seismology, oceanography, biology, sociology, network theory, utilities, trade flows, financial services and economics. Modelling difficulty increases from the beginning to the end in this list. Three basic model genres exist: physics based, agent based, and stock and flow based. Digital twins combined elements of these.
Vast amounts of data are coming in from Earth observing satellites, aircraft, drones, ships, radiosondes carried into the atmosphere such as weather balloons, lidar, radar, sonar, seismographs, and devices and cameras from the Internet of Things. Such data is often preprocessed by local smart phones, tablets, computers and laptops, and then sent wirelessly to the Internet for additional processing at large data centres. However, the amount of data being collected is increasing each year at a faster rate than the computer capacity coming online. Rather than being overwhelmed by such big data, digital modelling is a tool to assist the human mind to visualize, comprehend and make sense of this tsunami of data.
Data is first ingested into the model or models as initial conditions, from which computations can begin, time step by time step, to deliver future states. Results can then be compared with real-world measurements, and if unsatisfactory, the model(s) can be corrected and the simulation cycles repeated. Accuracy can be statistically improved by averaging the outputs from an ensemble, with each member commencing with slightly different initial conditions. Given sufficient iterations, the combined use of artificial intelligence and machine learning methods can ultimately guide changes to a model’s internal structure and parameters, producing even more accuracy.
Output from models can be displayed in visual formats, from desktop computers to auditoriums, even planetariums, all of which are convenient for sharing and discussion among decision makers. Many “what if” questions can be asked and parameters tweaked before final decisions are taken.
156
Such modelling and simulation methods contribute greatly to predictive analytics and scenario analysis of systemic risk, especially in complex systems. However, to be effective in the real world, the combined deployment of modelling resources and decision processes needs to produce options for action sufficiently in advance, to allow decision makers time to avoid impending threats to the enterprise, or to the public at large. For this reason, faster data-collection rates, better model resolution and higher computing performance are always in demand by governments, research organizations and industry.
The science of climate modelling can pull many of these factors together. For example, there are Coupled Model Intercomparison Projects under oversight of the World Climate Research Programme. These projects regularly model the Earth’s projected climate change due to ongoing anthropogenic GHG emissions. They consider various possible shared socioeconomic pathways created within the energy research community. The projections to be drawn from each Coupled Model Intercomparison Project phase are timed to feed into a corresponding IPCC Assessment Report. The current pairing is between Phase 6 and the IPCC Sixth Assessment Report, targeted for completion in 2022. The previous paired reports in 2014 heavily informed Parties to the United Nations Framework Convention on Climate Change during negotiation of the landmark Paris Agreement in 2015.
There are over 100 models submitted to IPCC Phase 6, emanating from 25 modelling centres around the world. Within these models, there are coding elements representing the atmosphere, ocean dynamics and land developments, which may be either shared or developed locally. After calculations for prescribed shared socioeconomic pathways are completed by each submitted model, a multi-model mean is derived, which will then become the main reference point for the IPCC Sixth Assessment Report deliberations.
Within the Coupled Model Intercomparison Project series, all models are run backwards in time, to establish their credibility in hindcasting prior climate events, as well as forwards in time at various
intervals up to the year 2100. Each model’s results are collated and compared in great detail, especially against climate knowledge that may be available from other sources.
Selections from the full portfolio of models are also chosen to form special-purpose sub-ensembles for projecting the climate effects of potential human interventions such as land-use modification, carbon dioxide removal or geoengineering, and impacts on the oceans.
There is now an additional challenge in computing power. Calculations performed by supercomputers at the high end of the top 500 list of the most powerful commercially available computer systems have already surpassed previously known performance levels. Their performance is measured on the basis of “floating-point operations per second”: they have achieved speeds of 100 “petaflops” (1015 floating-point operations per second) and are heading towards an “exaflop” level of speed (1018 floating-point operations per second). However, it is expected that increasing resolution of Earth observations from drones, oceanic wave-gliders, lidar systems and Internet of Things devices, and the demand for hyper locality in climate projections, will soon push the needs of climate science computing further still.
An example of a formidable challenge that the DRR community needs to embrace is the creation of topological maps of long-run systemic risk. Climate models were not designed to project weather extremes for the year 2050. However, robust planning for climate adaptation in many sectors that already exhibit systemic risk will require improved capabilities of Earth system models. In this vein, the concept of topological maps of systemic risk through time was proposed by Molly Jahn in 2015 and included in the Global Assessment Report on Disaster Risk Reduction 2019 (UNDRR, 2019). These are dynamic, temporal and geospatial representations of risk at multiple scales including representation of the functioning of multiple, complex, non-linear, interlocking systems and interlinkages across the risks broadly defined in the Sendai Framework. Their purpose is to provide an understanding of the current and future conditions on Earth to manage uncertainty through identification of precursor
157
signals and anomalies, including sensitivities to change, system reverberations, bleed-over and feedback loops, by utilizing artificial intelligence and collective human intelligence.
Artificial intelligence/machine learning applications are also being used to support risk analysis and systemic risk reduction. New machine architectures are emerging rapidly to deal with the special requirements of convolution neural networks (artificial neural networks most commonly applied to analyse visual imagery), deep learning, training and inferencing. However, how to measure and compare machine performance for these purposes is still a matter of much debate.
10.5 Ways forward Many challenges remain in creating methods to fully understand systemic risk. Although some communities of systemic risk management exist (e.g. the systemic risk hub in finance), systemic risk is not assessed in all DRR circles. Basic data infrastructures do not yet exist to conduct sensible digital twinning exercises to assess systemic risk for operational decision-making. For example, stress testing for systemic risk behaviour of the global food system is currently not possible because high-resolution data (e.g. crop management data) of basic production information, and even more so data about globally dependent supply chains, is not available. This is because of the large number of farmers and supply chain actors, but also because of factors such as data privacy issues.
It is clear that despite advances in modelling and analytics, system modelling methods are a tool to understand and help reduce systemic risk, not a panacea. Uncertainties remain, even though the tools are powerful and help understand connections and potential trajectories. The main insights to take forward from this chapter about measuring systemic risk using models, and applying the results to DRR decision-making, are:
● The science around understanding, measuring and managing systemic risk is mature enough to support societal decision-making processes that aim to avoid or reduce risk of and from systems failure.
● Approaches from complexity science, in particular network theory and agent-based modelling, have demonstrated their usefulness in understanding systemic risk.
● Through simulation and optimization, it is possible to identify the best intervention points to reduce systemic risk. In this context, risk measures for catastrophic system failure have been in use for decades and have been applied to identify the most effective intervention points to reduce the likelihood of trigger moments and increase systemic risk resilience to acceptable levels.
● Theories for innovative policy instruments have been developed that can help reduce systemic risk. The effectiveness of such policy tools can be tested in computerized simulation experiments. Such policy instruments typically provide individualized incentives to agents to change their idiosyncratic and networking strategies such that the entire network adapts its structure and metabolism to higher degrees of systemic risk elimination and resilience in a self-organizing mode.
● Timeliness, completeness and accessibility of data appear as the main obstacles to the application and use of systemic risk assessments for inclusion in policy and operational decision-making. This is partly because a systemic risk might be embedded in a system where a node is in itself not considered to pose a risk or to be at risk. The necessity to track, predict and manage interdependencies is generally not visible or even understood before the occurrence of a disaster. Digital twins of the total system that approximate properties of unobserved node behaviour and links can help identify potential propensities of systemic risk behaviour and thereby guide targeted data collection.
● The nature of systemic risk is versatile depending on the system. There is not yet a standardized way to model systemic risk. However, all assessments of systemic risk share the basic feature that data sets are converted to network information for nodes and links, then in a second step, systemic risk measures are applied to quantify the
158
system’s propensity to systemic risk. Standard assessment procedures are emerging in a few sectors such as finance. In the finance sector, generally accepted systemic risk measures have been established, and data is collected on a multitude of systemic risk indicators, mostly for early warning purposes. The measurement and assessment of systemic risk is currently restricted to short-term time perspectives.
● An area requiring more development and methodological advances is long-term systemic risk assessment. These assessments require well-functioning digital twins that can project future states of the world. Their development and application would enable more dynamic and granular understanding of the systems, including providing insights into the complex, volatile climate future.
The tools described above remain powerful resources to support better understanding of systemic risk, and can provide improved analytics to help accelerate risk reduction action.
159
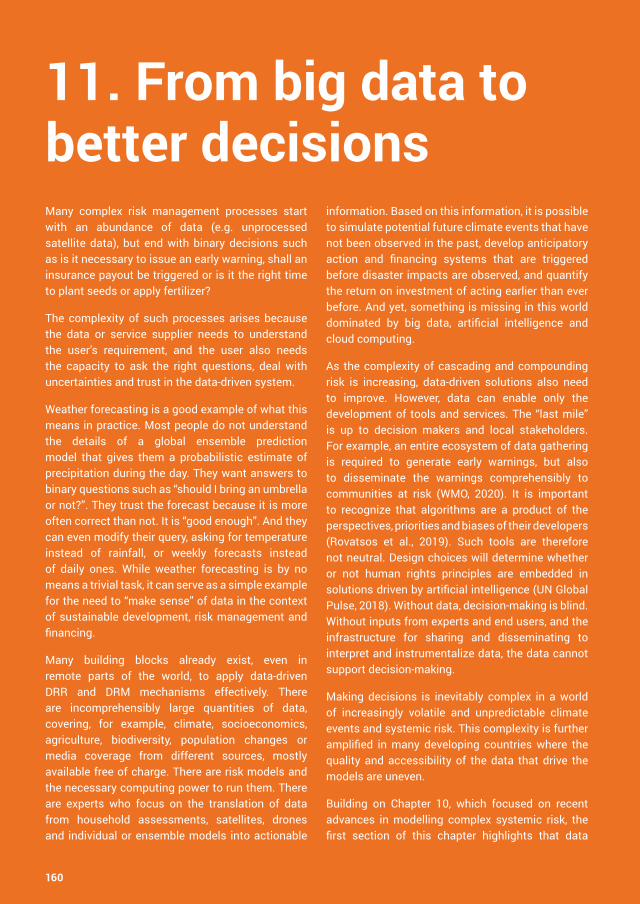
11. From big data to better decisions Many complex risk management processes start with an abundance of data (e.g. unprocessed satellite data), but end with binary decisions such as is it necessary to issue an early warning, shall an insurance payout be triggered or is it the right time to plant seeds or apply fertilizer?
The complexity of such processes arises because the data or service supplier needs to understand the user’s requirement, and the user also needs the capacity to ask the right questions, deal with uncertainties and trust in the data-driven system.
Weather forecasting is a good example of what this means in practice. Most people do not understand the details of a global ensemble prediction model that gives them a probabilistic estimate of precipitation during the day. They want answers to binary questions such as “should I bring an umbrella or not?”. They trust the forecast because it is more often correct than not. It is “good enough”. And they can even modify their query, asking for temperature instead of rainfall, or weekly forecasts instead of daily ones. While weather forecasting is by no means a trivial task, it can serve as a simple example for the need to “make sense” of data in the context of sustainable development, risk management and financing.
Many building blocks already exist, even in remote parts of the world, to apply data-driven DRR and DRM mechanisms effectively. There are incomprehensibly large quantities of data, covering, for example, climate, socioeconomics, agriculture, biodiversity, population changes or media coverage from different sources, mostly available free of charge. There are risk models and the necessary computing power to run them. There are experts who focus on the translation of data from household assessments, satellites, drones and individual or ensemble models into actionable
information. Based on this information, it is possible to simulate potential future climate events that have not been observed in the past, develop anticipatory action and financing systems that are triggered before disaster impacts are observed, and quantify the return on investment of acting earlier than ever before. And yet, something is missing in this world dominated by big data, artificial intelligence and cloud computing.
As the complexity of cascading and compounding risk is increasing, data-driven solutions also need to improve. However, data can enable only the development of tools and services. The “last mile” is up to decision makers and local stakeholders. For example, an entire ecosystem of data gathering is required to generate early warnings, but also to disseminate the warnings comprehensibly to communities at risk (WMO, 2020). It is important to recognize that algorithms are a product of the perspectives, priorities and biases of their developers (Rovatsos et al., 2019). Such tools are therefore not neutral. Design choices will determine whether or not human rights principles are embedded in solutions driven by artificial intelligence (UN Global Pulse, 2018). Without data, decision-making is blind. Without inputs from experts and end users, and the infrastructure for sharing and disseminating to interpret and instrumentalize data, the data cannot support decision-making.
Making decisions is inevitably complex in a world of increasingly volatile and unpredictable climate events and systemic risk. This complexity is further amplified in many developing countries where the quality and accessibility of the data that drive the models are uneven.
Building on Chapter 10, which focused on recent advances in modelling complex systemic risk, the first section of this chapter highlights that data
160
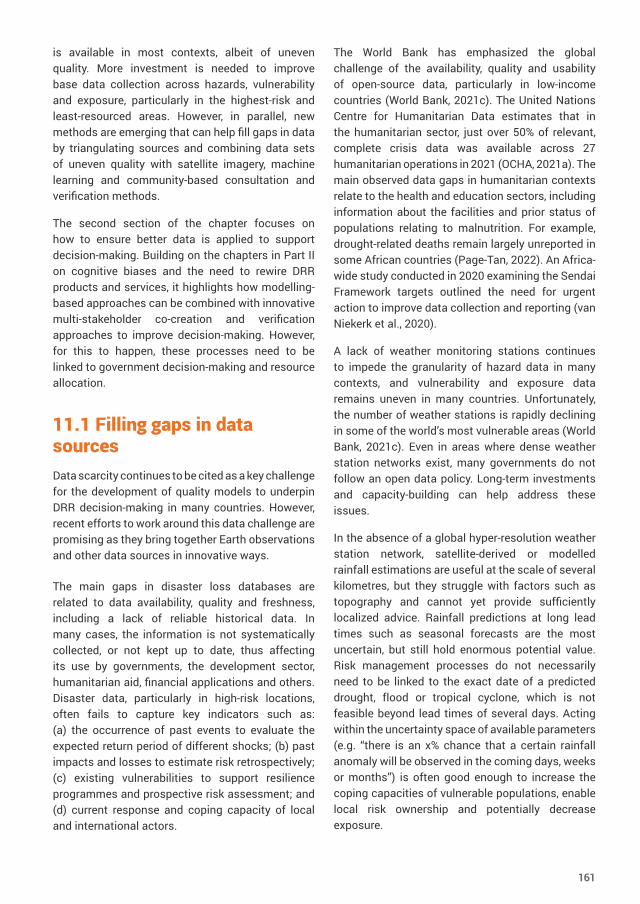
is available in most contexts, albeit of uneven quality. More investment is needed to improve base data collection across hazards, vulnerability and exposure, particularly in the highest-risk and least-resourced areas. However, in parallel, new methods are emerging that can help fill gaps in data by triangulating sources and combining data sets of uneven quality with satellite imagery, machine learning and community-based consultation and verification methods.
The second section of the chapter focuses on how to ensure better data is applied to support decision-making. Building on the chapters in Part II on cognitive biases and the need to rewire DRR products and services, it highlights how modelling-based approaches can be combined with innovative multi-stakeholder co-creation and verification approaches to improve decision-making. However, for this to happen, these processes need to be linked to government decision-making and resource allocation.
11.1 Filling gaps in data sourcesData scarcity continues to be cited as a key challenge for the development of quality models to underpin DRR decision-making in many countries. However, recent efforts to work around this data challenge are promising as they bring together Earth observations and other data sources in innovative ways.
The main gaps in disaster loss databases are related to data availability, quality and freshness, including a lack of reliable historical data. In many cases, the information is not systematically collected, or not kept up to date, thus affecting its use by governments, the development sector, humanitarian aid, financial applications and others. Disaster data, particularly in high-risk locations, often fails to capture key indicators such as: (a) the occurrence of past events to evaluate the expected return period of different shocks; (b) past impacts and losses to estimate risk retrospectively; (c) existing vulnerabilities to support resilience programmes and prospective risk assessment; and (d) current response and coping capacity of local and international actors.
The World Bank has emphasized the global challenge of the availability, quality and usability of open-source data, particularly in low-income countries (World Bank, 2021c). The United Nations Centre for Humanitarian Data estimates that in the humanitarian sector, just over 50% of relevant, complete crisis data was available across 27 humanitarian operations in 2021 (OCHA, 2021a). The main observed data gaps in humanitarian contexts relate to the health and education sectors, including information about the facilities and prior status of populations relating to malnutrition. For example, drought-related deaths remain largely unreported in some African countries (Page-Tan, 2022). An Africa-wide study conducted in 2020 examining the Sendai Framework targets outlined the need for urgent action to improve data collection and reporting (van Niekerk et al., 2020).
A lack of weather monitoring stations continues to impede the granularity of hazard data in many contexts, and vulnerability and exposure data remains uneven in many countries. Unfortunately, the number of weather stations is rapidly declining in some of the world’s most vulnerable areas (World Bank, 2021c). Even in areas where dense weather station networks exist, many governments do not follow an open data policy. Long-term investments and capacity-building can help address these issues.
In the absence of a global hyper-resolution weather station network, satellite-derived or modelled rainfall estimations are useful at the scale of several kilometres, but they struggle with factors such as topography and cannot yet provide sufficiently localized advice. Rainfall predictions at long lead times such as seasonal forecasts are the most uncertain, but still hold enormous potential value. Risk management processes do not necessarily need to be linked to the exact date of a predicted drought, flood or tropical cyclone, which is not feasible beyond lead times of several days. Acting within the uncertainty space of available parameters (e.g. “there is an x% chance that a certain rainfall anomaly will be observed in the coming days, weeks or months”) is often good enough to increase the coping capacities of vulnerable populations, enable local risk ownership and potentially decrease exposure.
161
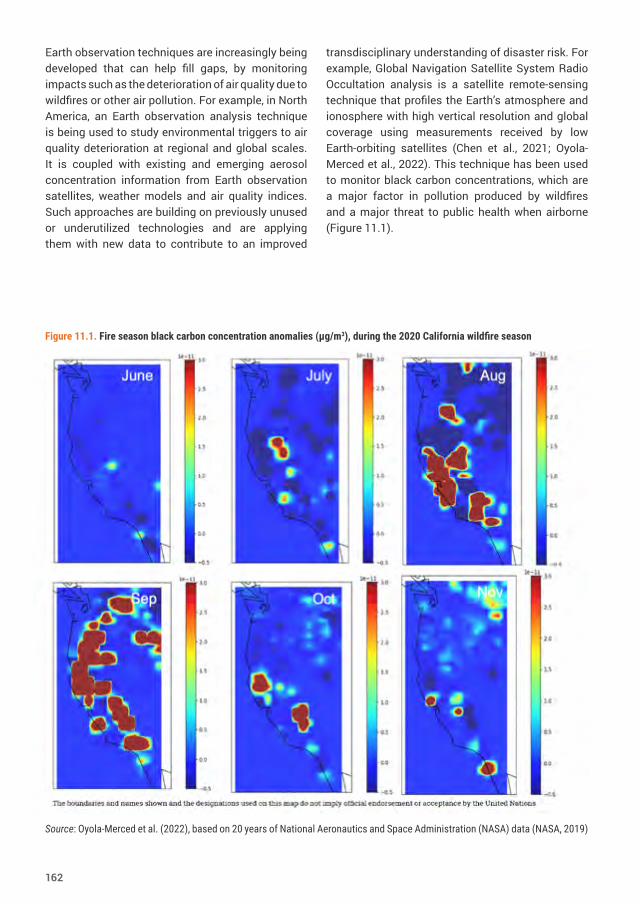
Earth observation techniques are increasingly being developed that can help fill gaps, by monitoring impacts such as the deterioration of air quality due to wildfires or other air pollution. For example, in North America, an Earth observation analysis technique is being used to study environmental triggers to air quality deterioration at regional and global scales. It is coupled with existing and emerging aerosol concentration information from Earth observation satellites, weather models and air quality indices. Such approaches are building on previously unused or underutilized technologies and are applying them with new data to contribute to an improved
transdisciplinary understanding of disaster risk. For example, Global Navigation Satellite System Radio Occultation analysis is a satellite remote-sensing technique that profiles the Earth’s atmosphere and ionosphere with high vertical resolution and global coverage using measurements received by low Earth-orbiting satellites (Chen et al., 2021; Oyola-Merced et al., 2022). This technique has been used to monitor black carbon concentrations, which are a major factor in pollution produced by wildfires and a major threat to public health when airborne (Figure 11.1).
Figure 11.1. Fire season black carbon concentration anomalies (μg/m3), during the 2020 California wildfire season
Source: Oyola-Merced et al. (2022), based on 20 years of National Aeronautics and Space Administration (NASA) data (NASA, 2019)
162
Figure 11.1 shows fire season black carbon concentration anomalies in micrograms of gaseous pollutant per cubic metre of ambient air (μg/m3) during the 2020 wildfire season in California. Calculated using 20 years of NASA Modern-Era Retrospective analysis for Research and Applications (Version 2) (Oyola-Merced et al., 2022), it shows how data already collected over many years can be used to establish baselines to demonstrate changes and anomalies from current events.
Data quality issues are related to the spatial and temporal detail of risk data, as well as the lack of standard definitions for impact and other potential biases in the data-collection processes (OCHA, 2021b). A major data gap is that impact data for a given disaster is usually only collected in the immediate aftermath of a shock, which limits understanding of secondary and long-term impacts and the efficacy of disaster recovery activities.
Data may also be available but difficult to use (e.g. not available in a machine-readable form), thus severely limiting its potential use. This has been an issue for COVID-19 data in some humanitarian contexts (OCHA, 2021b). The involvement of multiple actors in data collection also means it is not always interoperable, making it hard for information systems to exchange data and for risk experts to extract insights from it. Several initiatives are trying to address these issues by providing standards for data sharing among organizations, a consistent framework for describing and sharing the most common types of data used in risk assessment, and standards for reporting analytical models (GFDRR et al., 2021; OCHA, 2021b; Google, n.d.).
The issues highlighted in this section are often the result of lack of resources, technical capacity and guidance provided to actors involved in data collection, coupled with poor infrastructure, standards and support for making risk information available. These problems can be addressed through high-level prioritization of data, including long-term financing for existing and new initiatives, investments in capacity-building, and laws conducive to ethical and effective management of personal data.
11.2 Unique advantages of Earth observation data to assess risk and damage
Machine learning methods are being applied to big data sources, to help bridge the data gap. These can produce novel insights from the data that would be impossible to obtain manually.
Satellites that are generating several terabytes (1 terabyte = 1,000 gigabytes) of data per day are at the forefront of strategies to use big data for DRR. Earth observation, which refers to the use of satellite, aerial and drone technology to observe the planet, has already been used extensively to monitor disaster impacts and recovery. During a catastrophic event, 17 international space agencies share data from their fleets of 61 satellites, free of charge, through the International Charter Space and Major Disasters collaboration. This enables coordination of resources and expertise for rapid response. Increasingly, private companies also publicly release disaster-related imagery and data. Since climatic hazards that bring on disasters are accompanied by certain cloud types, dense “film-reel” type temporal records of clouds from Earth observation data are now better able to provide closer to real-time impact assessments.
Most commonly, satellite data is used to improve knowledge about hazards. Droughts, storms, earthquakes, volcanoes, changes in ocean currents, sea-level rise and extreme weather are all routinely monitored by the instruments on satellites. These are used for early warning of hazardous events, and to understand long-term changes in climate and potential impacts on people and the planet. However, satellites also have a role in proactive DRR, especially related to seasonal weather forecasts.
Earth observation data complements ground-collected data and plays a pivotal role in risk assessment and reduction, with three main advantages. First, satellites acquire imagery over the Earth’s whole landmass, which creates a consistent and comprehensive data record, even over the most remote places. Second, satellite data is spatially explicit, with fine spatial granularity, with the scale of locally relevant data most often resolved at neighbourhood or even building scales.
163
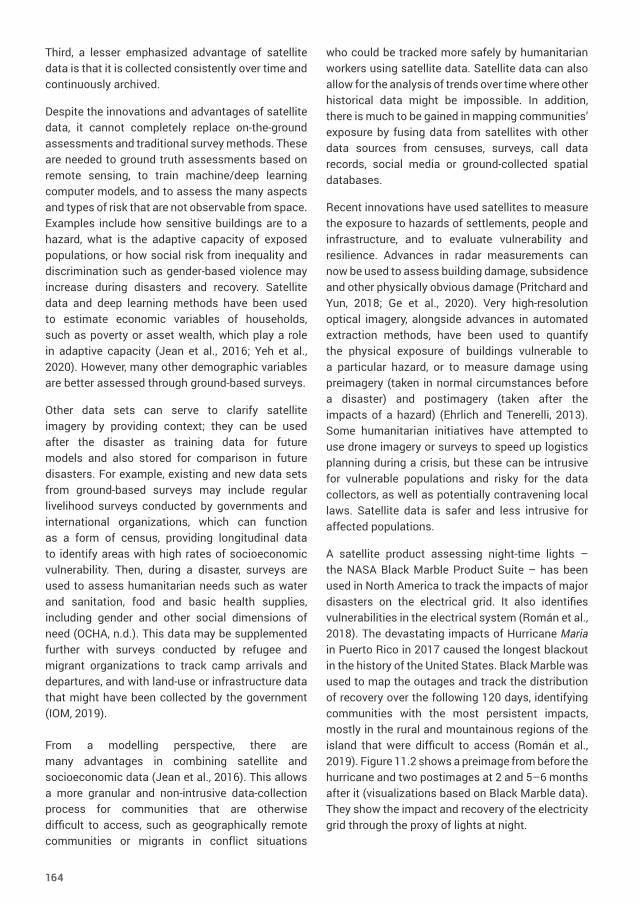
Third, a lesser emphasized advantage of satellite data is that it is collected consistently over time and continuously archived.
Despite the innovations and advantages of satellite data, it cannot completely replace on-the-ground assessments and traditional survey methods. These are needed to ground truth assessments based on remote sensing, to train machine/deep learning computer models, and to assess the many aspects and types of risk that are not observable from space. Examples include how sensitive buildings are to a hazard, what is the adaptive capacity of exposed populations, or how social risk from inequality and discrimination such as gender-based violence may increase during disasters and recovery. Satellite data and deep learning methods have been used to estimate economic variables of households, such as poverty or asset wealth, which play a role in adaptive capacity (Jean et al., 2016; Yeh et al., 2020). However, many other demographic variables are better assessed through ground-based surveys.
Other data sets can serve to clarify satellite imagery by providing context; they can be used after the disaster as training data for future models and also stored for comparison in future disasters. For example, existing and new data sets from ground-based surveys may include regular livelihood surveys conducted by governments and international organizations, which can function as a form of census, providing longitudinal data to identify areas with high rates of socioeconomic vulnerability. Then, during a disaster, surveys are used to assess humanitarian needs such as water and sanitation, food and basic health supplies, including gender and other social dimensions of need (OCHA, n.d.). This data may be supplemented further with surveys conducted by refugee and migrant organizations to track camp arrivals and departures, and with land-use or infrastructure data that might have been collected by the government (IOM, 2019).
From a modelling perspective, there are many advantages in combining satellite and socioeconomic data (Jean et al., 2016). This allows a more granular and non-intrusive data-collection process for communities that are otherwise difficult to access, such as geographically remote communities or migrants in conflict situations
who could be tracked more safely by humanitarian workers using satellite data. Satellite data can also allow for the analysis of trends over time where other historical data might be impossible. In addition, there is much to be gained in mapping communities’ exposure by fusing data from satellites with other data sources from censuses, surveys, call data records, social media or ground-collected spatial databases.
Recent innovations have used satellites to measure the exposure to hazards of settlements, people and infrastructure, and to evaluate vulnerability and resilience. Advances in radar measurements can now be used to assess building damage, subsidence and other physically obvious damage (Pritchard and Yun, 2018; Ge et al., 2020). Very high-resolution optical imagery, alongside advances in automated extraction methods, have been used to quantify the physical exposure of buildings vulnerable to a particular hazard, or to measure damage using preimagery (taken in normal circumstances before a disaster) and postimagery (taken after the impacts of a hazard) (Ehrlich and Tenerelli, 2013). Some humanitarian initiatives have attempted to use drone imagery or surveys to speed up logistics planning during a crisis, but these can be intrusive for vulnerable populations and risky for the data collectors, as well as potentially contravening local laws. Satellite data is safer and less intrusive for affected populations.
A satellite product assessing night-time lights – the NASA Black Marble Product Suite – has been used in North America to track the impacts of major disasters on the electrical grid. It also identifies vulnerabilities in the electrical system (Román et al., 2018). The devastating impacts of Hurricane Maria in Puerto Rico in 2017 caused the longest blackout in the history of the United States. Black Marble was used to map the outages and track the distribution of recovery over the following 120 days, identifying communities with the most persistent impacts, mostly in the rural and mountainous regions of the island that were difficult to access (Román et al., 2019). Figure 11.2 shows a preimage from before the hurricane and two postimages at 2 and 5–6 months after it (visualizations based on Black Marble data). They show the impact and recovery of the electricity grid through the proxy of lights at night.
164
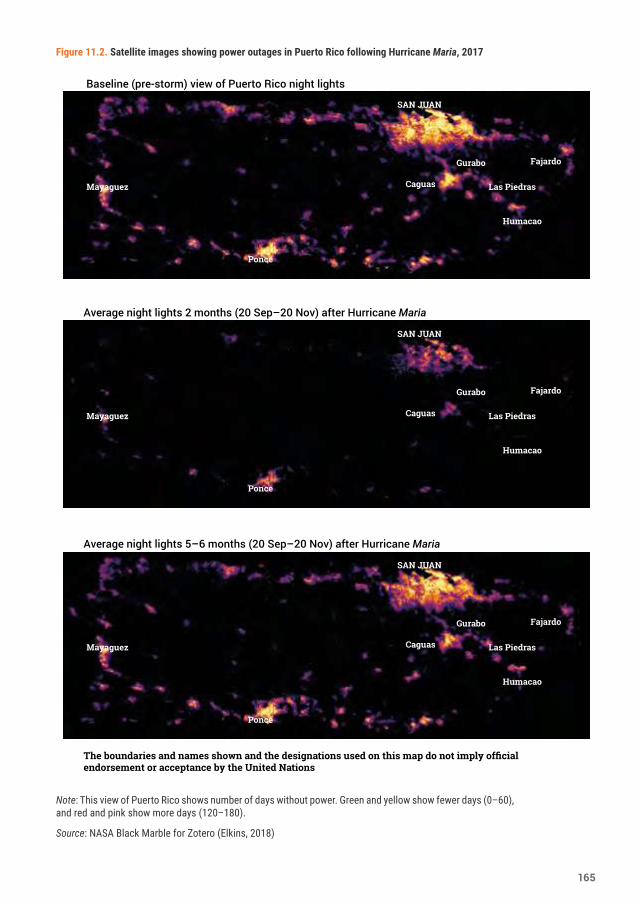
Figure 11.2. Satellite images showing power outages in Puerto Rico following Hurricane Maria, 2017
Note: This view of Puerto Rico shows number of days without power. Green and yellow show fewer days (0–60), and red and pink show more days (120–180).
Source: NASA Black Marble for Zotero (Elkins, 2018)
Baseline (pre-storm) view of Puerto Rico night lights
SAN JUAN
Fajardo
Humacao
Las Piedras
Gurabo
Caguas
Ponce
Mayaguez
Average night lights 2 months (20 Sep–20 Nov) after Hurricane Maria
Average night lights 5–6 months (20 Sep–20 Nov) after Hurricane Maria
The boundaries and names shown and the designations used on this map do not imply official endorsement or acceptance by the United Nations
SAN JUAN
Fajardo
Humacao
Las Piedras
Gurabo
Caguas
Ponce
Mayaguez
SAN JUAN
Fajardo
Humacao
Las Piedras
Gurabo
Caguas
Ponce
Mayaguez
165
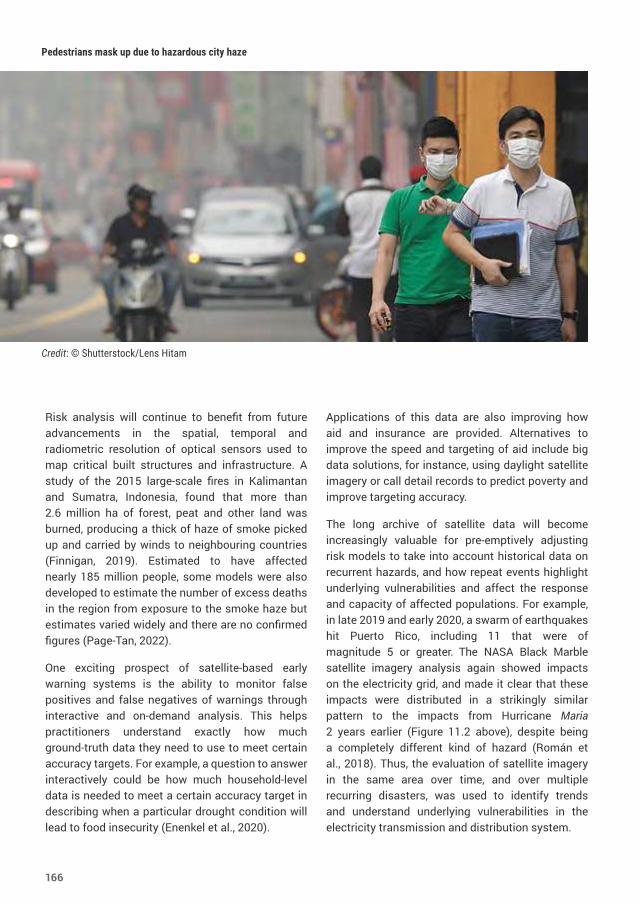
Risk analysis will continue to benefit from future advancements in the spatial, temporal and radiometric resolution of optical sensors used to map critical built structures and infrastructure. A study of the 2015 large-scale fires in Kalimantan and Sumatra, Indonesia, found that more than 2.6 million ha of forest, peat and other land was burned, producing a thick of haze of smoke picked up and carried by winds to neighbouring countries (Finnigan, 2019). Estimated to have affected nearly 185 million people, some models were also developed to estimate the number of excess deaths in the region from exposure to the smoke haze but estimates varied widely and there are no confirmed figures (Page-Tan, 2022).
One exciting prospect of satellite-based early warning systems is the ability to monitor false positives and false negatives of warnings through interactive and on-demand analysis. This helps practitioners understand exactly how much ground-truth data they need to use to meet certain accuracy targets. For example, a question to answer interactively could be how much household-level data is needed to meet a certain accuracy target in describing when a particular drought condition will lead to food insecurity (Enenkel et al., 2020).
Applications of this data are also improving how aid and insurance are provided. Alternatives to improve the speed and targeting of aid include big data solutions, for instance, using daylight satellite imagery or call detail records to predict poverty and improve targeting accuracy.
The long archive of satellite data will become increasingly valuable for pre-emptively adjusting risk models to take into account historical data on recurrent hazards, and how repeat events highlight underlying vulnerabilities and affect the response and capacity of affected populations. For example, in late 2019 and early 2020, a swarm of earthquakes hit Puerto Rico, including 11 that were of magnitude 5 or greater. The NASA Black Marble satellite imagery analysis again showed impacts on the electricity grid, and made it clear that these impacts were distributed in a strikingly similar pattern to the impacts from Hurricane Maria 2 years earlier (Figure 11.2 above), despite being a completely different kind of hazard (Román et al., 2018). Thus, the evaluation of satellite imagery in the same area over time, and over multiple recurring disasters, was used to identify trends and understand underlying vulnerabilities in the electricity transmission and distribution system.
Pedestrians mask up due to hazardous city haze
Credit: © Shutterstock/Lens Hitam
166
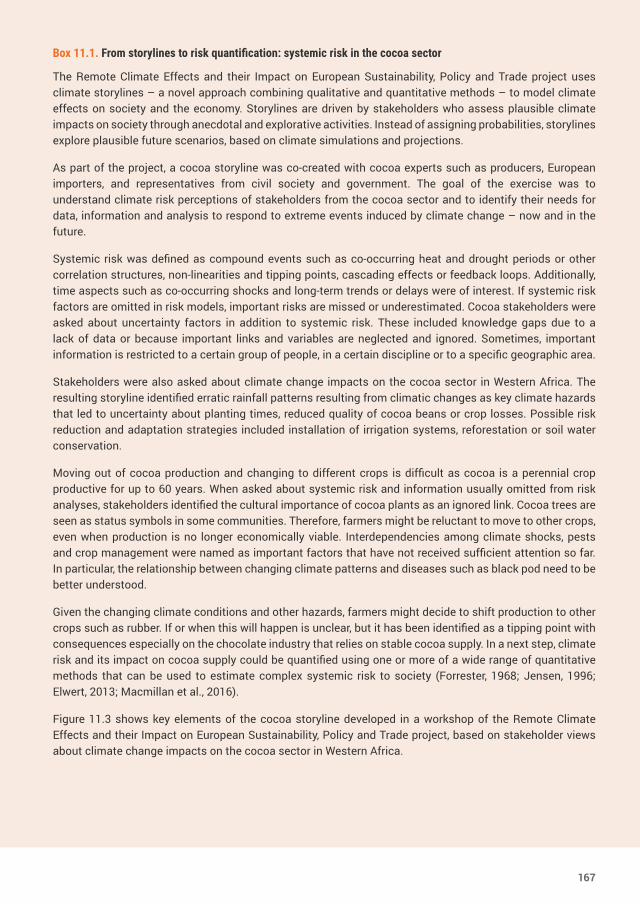
Box 11.1. From storylines to risk quantification: systemic risk in the cocoa sector
The Remote Climate Effects and their Impact on European Sustainability, Policy and Trade project uses climate storylines – a novel approach combining qualitative and quantitative methods – to model climate effects on society and the economy. Storylines are driven by stakeholders who assess plausible climate impacts on society through anecdotal and explorative activities. Instead of assigning probabilities, storylines explore plausible future scenarios, based on climate simulations and projections.
As part of the project, a cocoa storyline was co-created with cocoa experts such as producers, European importers, and representatives from civil society and government. The goal of the exercise was to understand climate risk perceptions of stakeholders from the cocoa sector and to identify their needs for data, information and analysis to respond to extreme events induced by climate change – now and in the future.
Systemic risk was defined as compound events such as co-occurring heat and drought periods or other correlation structures, non-linearities and tipping points, cascading effects or feedback loops. Additionally, time aspects such as co-occurring shocks and long-term trends or delays were of interest. If systemic risk factors are omitted in risk models, important risks are missed or underestimated. Cocoa stakeholders were asked about uncertainty factors in addition to systemic risk. These included knowledge gaps due to a lack of data or because important links and variables are neglected and ignored. Sometimes, important information is restricted to a certain group of people, in a certain discipline or to a specific geographic area.
Stakeholders were also asked about climate change impacts on the cocoa sector in Western Africa. The resulting storyline identified erratic rainfall patterns resulting from climatic changes as key climate hazards that led to uncertainty about planting times, reduced quality of cocoa beans or crop losses. Possible risk reduction and adaptation strategies included installation of irrigation systems, reforestation or soil water conservation.
Moving out of cocoa production and changing to different crops is difficult as cocoa is a perennial crop productive for up to 60 years. When asked about systemic risk and information usually omitted from risk analyses, stakeholders identified the cultural importance of cocoa plants as an ignored link. Cocoa trees are seen as status symbols in some communities. Therefore, farmers might be reluctant to move to other crops, even when production is no longer economically viable. Interdependencies among climate shocks, pests and crop management were named as important factors that have not received sufficient attention so far. In particular, the relationship between changing climate patterns and diseases such as black pod need to be better understood.
Given the changing climate conditions and other hazards, farmers might decide to shift production to other crops such as rubber. If or when this will happen is unclear, but it has been identified as a tipping point with consequences especially on the chocolate industry that relies on stable cocoa supply. In a next step, climate risk and its impact on cocoa supply could be quantified using one or more of a wide range of quantitative methods that can be used to estimate complex systemic risk to society (Forrester, 1968; Jensen, 1996; Elwert, 2013; Macmillan et al., 2016).
Figure 11.3 shows key elements of the cocoa storyline developed in a workshop of the Remote Climate Effects and their Impact on European Sustainability, Policy and Trade project, based on stakeholder views about climate change impacts on the cocoa sector in Western Africa.
167
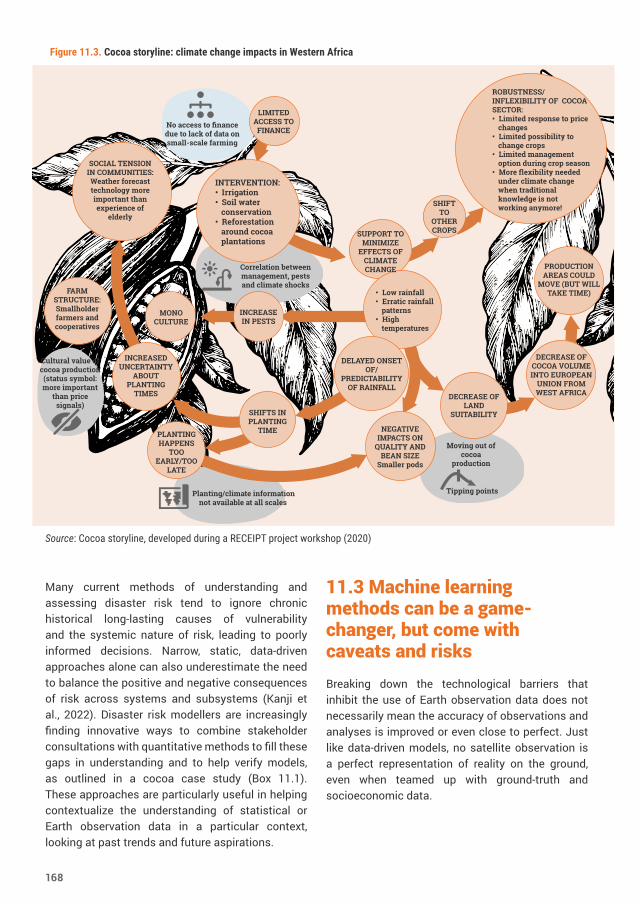
Many current methods of understanding and assessing disaster risk tend to ignore chronic historical long-lasting causes of vulnerability and the systemic nature of risk, leading to poorly informed decisions. Narrow, static, data-driven approaches alone can also underestimate the need to balance the positive and negative consequences of risk across systems and subsystems (Kanji et al., 2022). Disaster risk modellers are increasingly finding innovative ways to combine stakeholder consultations with quantitative methods to fill these gaps in understanding and to help verify models, as outlined in a cocoa case study (Box 11.1). These approaches are particularly useful in helping contextualize the understanding of statistical or Earth observation data in a particular context, looking at past trends and future aspirations.
11.3 Machine learning methods can be a game-changer, but come with caveats and risksBreaking down the technological barriers that inhibit the use of Earth observation data does not necessarily mean the accuracy of observations and analyses is improved or even close to perfect. Just like data-driven models, no satellite observation is a perfect representation of reality on the ground, even when teamed up with ground-truth and socioeconomic data.
LIMITED ACCESS TO
FINANCENo access to finance due to lack of data on small-scale farming
INTERVENTION:• Irrigation• Soil water
conservation• Reforestation
around cocoa plantations
SUPPORT TO MINIMIZE
EFFECTS OF CLIMATE CHANGE
SHIFT TO
OTHER CROPS
ROBUSTNESS/INFLEXIBILITY OF COCOA SECTOR:• Limited response to price
changes• Limited possibility to
change crops• Limited management
option during crop season• More flexibility needed
under climate change when traditional knowledge is not working anymore!
SOCIAL TENSION IN COMMUNITIES: Weather forecasttechnology more important than experience of
elderly
Correlation between management, pests and climate shocks
• Low rainfall• Erratic rainfall
patterns• High
temperatures
PRODUCTION AREAS COULD
MOVE (BUT WILL TAKE TIME)
DECREASE OF COCOA VOLUME INTO EUROPEAN
UNION FROM WEST AFRICADECREASE OF
LAND SUITABILITY
Tipping points
Moving out of cocoa
production
DELAYED ONSET OF/
PREDICTABILITY OF RAINFALL
SHIFTS IN PLANTING
TIME NEGATIVE IMPACTS ON
QUALITY AND BEAN SIZE
Smaller pods
Planting/climate information not available at all scales
PLANTING HAPPENS
TOO EARLY/TOO
LATE
INCREASED UNCERTAINTY
ABOUT PLANTING
TIMES
INCREASE IN PESTS
MONOCULTURE
FARM STRUCTURE:Smallholder farmers and cooperatives
Cultural value of cocoa production
(status symbol: more important
than price signals)
Figure 11.3. Cocoa storyline: climate change impacts in Western Africa
Source: Cocoa storyline, developed during a RECEIPT project workshop (2020)
168
Socioeconomic data must be used in a way that minimizes limitations, privacy and identification issues, inaccuracies and biases that increase personal risk and injustice. It should also not create decision-making inefficiencies and errors. For example, there is a strong risk of “re-identification” of people based on a combination of data sets that would not identify them if used alone. This is of particular concern when anonymized data is layered, which can lead to the “mosaic effect” of putting the personal data picture back together again (McInerney, 2020). It is particularly risky in situations of conflict where the position of vulnerable populations, if known, can lead to further violence (Kaurin, 2019), or when responders are providing confidential services relating to gender-based violence in contexts where victims and/or survivors may face legal penalties, social stigma or violent recriminations (Gaillard et al., 2017; Bhalla, 2018; GBVIMS, 2021; Call to Action Partners, n.d.).
A major factor limiting the use of data for risk assessment is thus the lack of safe, ethical and effective management of personal and non-personal data. The implementation of data responsibility in practice is often inconsistent within and across response contexts and organizations, especially for the socioeconomic impacts of disasters (IASC, 2021). This is mainly related to a lack of common definitions and standards, and associated inconsistencies in the understanding and use of data governance, including roles and responsibilities of different stakeholders.
Satellite data provides precision in contexts where surveys or socioeconomic data would not, but there are also numerous cases where populations on the move do not want to be tracked. There have been reports of such data being used to identify areas where children might be, to recruit them for militias or terrorist organizations, or to target stateless migrants with violence. While there are cases for using this data, the privacy, security and cybersecurity of vulnerable populations should be protected and always strongly considered.
Use of satellite remote-sensing data can also lead to a generalization bias if there is not enough ground-truth or socioeconomic data. For example, photointerpretation of satellite images is used for
analysing road infrastructure and residential areas or to understand the population’s vulnerability to physical hazards in a particular location. Certain attributes of these features can be directly inferred in automated ways, for example, by classifying image features such as building roofs based on their materials or their shapes. However, in many cases, satellite remote sensing is limited in its ability to tag a feature accurately with the same characteristics observable on the ground. A building can be a school, a hospital, a residence or a commercial unit, but discerning these from space is often impossible. These and many other types of ancillary observations can often be made only on the ground and used to train and test machine learning models that classify satellite imagery (Kontgis et al., 2021). A bias can therefore emerge where a complex situation is reduced to an overly simplistic narrative. The impact that these simplifications have on vulnerable populations should be taken into account (GFDRR et al., 2021).
11.4 Localized perspectives of climate information: the case of small island developing States
Systemic risk understanding is challenging in many SIDS, despite their high levels of exposure and growing climate change risk. This is due to the narrow range of relevant and verified climate information available, a paucity of economic data aggregation and its analysis within a disaster and climate context, as well as cultural barriers in understanding local perspectives. Underlying factors such as high transaction costs, reliance on external capital and high debt rates compound the small size, human resource limitations and multilayered vulnerability of SIDS.
There are ongoing efforts to improve the quality and quantity of Earth observation information and climate services for SIDS, as well as the capacity and capabilities of their National Meteorological and Hydrological Services (Climate Studies Group Mona, 2020). However, improvements at various levels have been limited due to challenges in data collection for small islands, the resolution of
169
global climate models, limited and fragmented observation networks, interruptions to satellite data transmission, and difficulty accessing and disseminating climate information (Sem, 2007).
A study of the barriers and enablers for demand and use of climate information in the Caribbean showed that, while finance remains a critical factor, a wide range of enabling conditions are necessary for effective use of climate information The most cited barriers relate to the application of climate information within the local context, including limitations in interpreting the data, the appropriateness of its format or relevance to the region, data visualization, real-time availability and level of certainty (Dookie et al., 2021).
A low level of awareness about climate information was also highlighted in the Caribbean study (e.g. local agency officials may not know data exists or where to access it). Interviewees suggested a need for climate information that is “translated for action” and readily applied by users, including island-based contextual or sector-relevant data, and including quantitative impacts or benefits of taking the suggested action. The study also identified the need for improved awareness of, access to and collaboration on climate information (Dookie et al., 2021).
Climate data providers, users and decision makers need to be collectively aware of location-specific contexts and complexities, and engaged in dialogue on the benefits of using Earth observations for decision-making. In essence, there are needs to: reduce concerns about uncertainty, by minimizing uncertainty and developing understanding about how best to use data that is inherently uncertain; translate data into understandable information about risk; and break down barriers to co-production by recognizing and embracing local needs and concerns.
11.5 A data-driven hive mind – strengthening decisions through co-design Making sense of data in the context of complex risk management processes means: (a) understanding the role of stakeholders at different scales; (b) co-
designing solutions; and (c) developing tools or platforms that link hazard with socioeconomic and other data objectively and transparently (Egan et al., 2018). This kind of hive-mind approach can help verify and test models, ensure flexibility and provide insights despite the inherent uncertainty manifested through complex, systemic risk. Such processes require including interested stakeholders, generalists, specialists and communities at risk. They also require mutual understanding of terminology and jargon, and the collaborative identification of bottlenecks and solutions. Such efforts also require a direct link to governance mechanisms, finance and policy processes to ensure insights are applied.
Such hive-mind processes can play a crucial role in contextualizing concepts like vulnerability and exposure in local terms in ways that numeric-based indices often miss. For example, an analysis was done as part of wider studies to measure how resilience affected COVID-19 risk across Chicago, United States. Figure 11.4 shows how four different social vulnerability indices rank the same populations living in urban Chicago, with darker shades of blue indicating community areas with higher social vulnerability scores (Lewis et al., 2022).
Gaps among remote-sensing, modelled and official data sources, and what is happening on the ground, are often too big for the data to be successfully used for decision-making (Osgood et al., 2018). However, participatory processes and crowdsourcing approaches can typically close these gaps, particularly given advances in communications technology. For example, remote-sensing models of agricultural yields may require information on the crop location and sowing date to adequately reflect actual yields. Crops, locations and sowing may be entered into the model through additional remote-sensing studies. However, in the face of a drought, a farmer must make choices, and may choose to plant different crops in different locations than in the static crop maps. Sowing dates may not be based on the rainfall proxied by satellites, but perhaps the availability of farm labourers. A farmer may choose to resow using a different crop following a problematic start to the season. These differences need to be factored into the data, and the farmers and those around them must have the best information
170
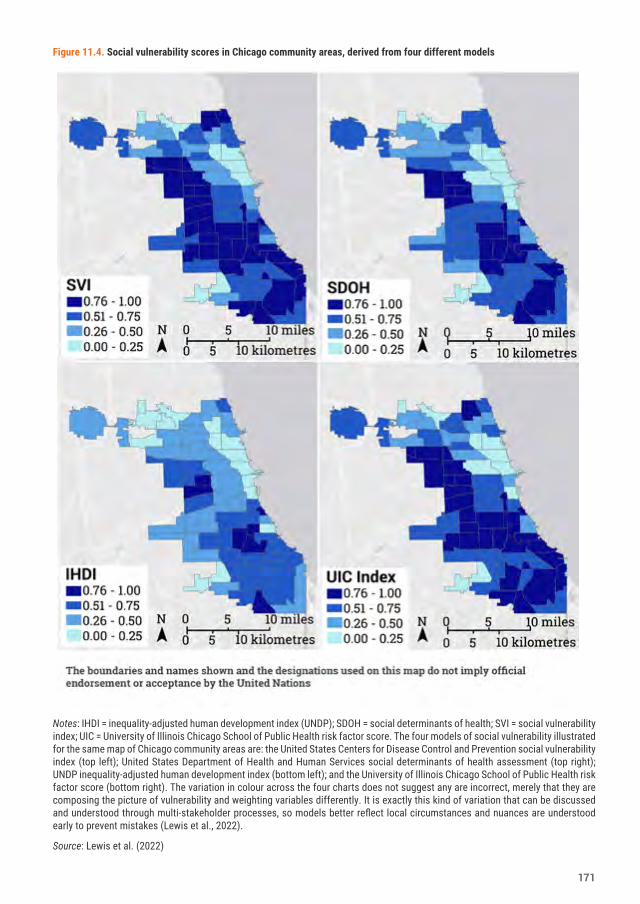
Figure 11.4. Social vulnerability scores in Chicago community areas, derived from four different models
Notes: IHDI = inequality-adjusted human development index (UNDP); SDOH = social determinants of health; SVI = social vulnerability index; UIC = University of Illinois Chicago School of Public Health risk factor score. The four models of social vulnerability illustrated for the same map of Chicago community areas are: the United States Centers for Disease Control and Prevention social vulnerability index (top left); United States Department of Health and Human Services social determinants of health assessment (top right); UNDP inequality-adjusted human development index (bottom left); and the University of Illinois Chicago School of Public Health risk factor score (bottom right). The variation in colour across the four charts does not suggest any are incorrect, merely that they are composing the picture of vulnerability and weighting variables differently. It is exactly this kind of variation that can be discussed and understood through multi-stakeholder processes, so models better reflect local circumstances and nuances are understood early to prevent mistakes (Lewis et al., 2022).
Source: Lewis et al. (2022)
171
available to make the best decisions. Therefore, the models require inputs potentially going beyond the accuracy of crop maps, rainfall estimates or model accuracy in crop growth. It is also necessary to reflect the additional, unobservable situation on the ground, including human-driven dynamics.
Remote-sensing techniques and models fed by Earth observations include inherent uncertainties and inaccuracies. When estimates from alternative sources are compared, they have differences that must be reconciled. In this reconciliation, input from local experts and people being represented by the data is an essential ingredient for arriving at data reflecting the true situation. Even in situations where the situation is accurately represented, local inputs are important to reconcile perspectives and expectations with the data, to inform actions, to explain why an action is being taking or to explain why people are being asked to perform actions or follow protocols.
In the climate change sphere, a new generation of “climate science translators” is evolving to break down silos among data suppliers, analysts, model developers and decision makers (Enenkel and Kruczkiewicz, 2022). As detailed in Chapter 9, diverse approaches are being tried, such as in relationship-based risk communication with communities in Kenya (Box 11.2).
There are now feasible ways to rely on affected communities for data collection at large scales and along short timelines (Enenkel et al., 2020). Relying on technology and the rapid growth of telecommunications availability, participatory processes are becoming possible in a relatively new kind of crowdsourcing: processes where data gathering, data reconciliation and model/product design are performed at scale, with the crowd at the core of the data and design process. These are often described as “crowdcore” data gathering, a method that uses crowdsourcing approaches involving large numbers of people in multiple workflows, interacting in coordinated ways to clean and process data and provide feedback into algorithms.
Psychological and political factors may bias responses in community consultation processes. The data from focus groups and crowdcore
processes is different from that of sensors, and must be treated differently, without assumptions that biases are random and will therefore be averaged out as data size increases. Recollection may be too difficult for accurate information and may be biased towards particular events with strong triggers. Reporting may be biased due to economic incentives, for example, if a farmer could obtain more resources by strategic reporting of specific events. Processes, technologies and access to communications may be biased to amplify the voices of the powerful and may attenuate the perspectives of women and marginalized communities.
More work must be done to address these challenges, as well as to increase the cost-effectiveness and reach of the approaches and build them more deeply and efficiently into the design and project implementation processes. Research on strategies to identify and address psychological or mental challenges in recollection and to incentivize accurate reporting though financial incentives or “gamification” is valuable (Osgood et al., 2018). Gamification is the use of game design elements in non-game contexts to educate, incentivize, collect information from and reconcile information with players.
Research to better identify the data needs of women and marginalized groups is also essential to better understand what participatory and crowdcore processes are effective, and where there are important gaps that need to be addressed through other means such as qualitative research.
There is growing evidence that some of the projected climate change impacts on farmers, fishers, pastoralists and other food producers in the form of extreme weather or climate events can be reduced by tailored, data-driven disaster risk financing and anticipatory action mechanisms. Pre-agreed risk-layering mechanisms, risk modelling frameworks and payout mechanisms improve the speed and efficiency of financial response during stressful times, ideally saving lives, reducing fiscal impact and protecting development gains. However, dealing with uncertainties related to data characterizing climate shocks before their impacts are measurable or visible increases the complexity of decision support systems (IFRC, 2019; World
172
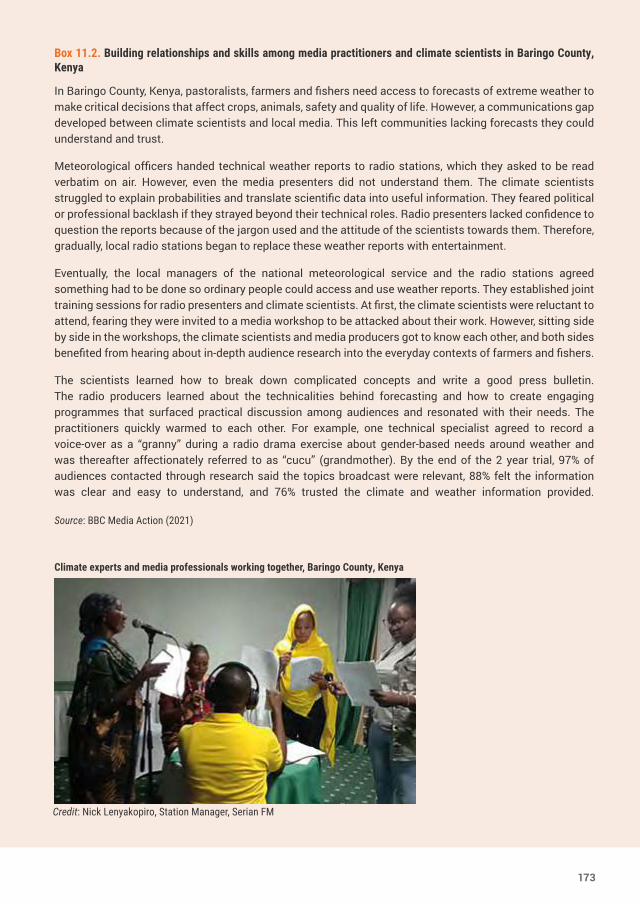
Box 11.2. Building relationships and skills among media practitioners and climate scientists in Baringo County, Kenya
In Baringo County, Kenya, pastoralists, farmers and fishers need access to forecasts of extreme weather to make critical decisions that affect crops, animals, safety and quality of life. However, a communications gap developed between climate scientists and local media. This left communities lacking forecasts they could understand and trust.
Meteorological officers handed technical weather reports to radio stations, which they asked to be read verbatim on air. However, even the media presenters did not understand them. The climate scientists struggled to explain probabilities and translate scientific data into useful information. They feared political or professional backlash if they strayed beyond their technical roles. Radio presenters lacked confidence to question the reports because of the jargon used and the attitude of the scientists towards them. Therefore, gradually, local radio stations began to replace these weather reports with entertainment.
Eventually, the local managers of the national meteorological service and the radio stations agreed something had to be done so ordinary people could access and use weather reports. They established joint training sessions for radio presenters and climate scientists. At first, the climate scientists were reluctant to attend, fearing they were invited to a media workshop to be attacked about their work. However, sitting side by side in the workshops, the climate scientists and media producers got to know each other, and both sides benefited from hearing about in-depth audience research into the everyday contexts of farmers and fishers.
The scientists learned how to break down complicated concepts and write a good press bulletin. The radio producers learned about the technicalities behind forecasting and how to create engaging programmes that surfaced practical discussion among audiences and resonated with their needs. The practitioners quickly warmed to each other. For example, one technical specialist agreed to record a voice-over as a “granny” during a radio drama exercise about gender-based needs around weather and was thereafter affectionately referred to as “cucu” (grandmother). By the end of the 2 year trial, 97% of audiences contacted through research said the topics broadcast were relevant, 88% felt the information was clear and easy to understand, and 76% trusted the climate and weather information provided.
Source: BBC Media Action (2021)
Climate experts and media professionals working together, Baringo County, Kenya
Credit: Nick Lenyakopiro, Station Manager, Serian FM
173
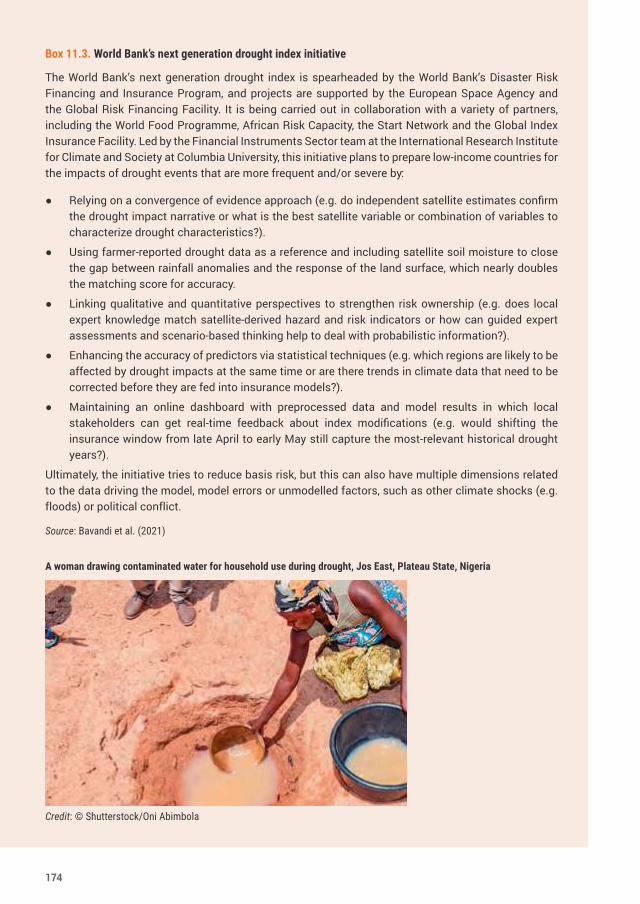
Box 11.3. World Bank’s next generation drought index initiative
The World Bank’s next generation drought index is spearheaded by the World Bank’s Disaster Risk Financing and Insurance Program, and projects are supported by the European Space Agency and the Global Risk Financing Facility. It is being carried out in collaboration with a variety of partners, including the World Food Programme, African Risk Capacity, the Start Network and the Global Index Insurance Facility. Led by the Financial Instruments Sector team at the International Research Institute for Climate and Society at Columbia University, this initiative plans to prepare low-income countries for the impacts of drought events that are more frequent and/or severe by:
● Relying on a convergence of evidence approach (e.g. do independent satellite estimates confirm the drought impact narrative or what is the best satellite variable or combination of variables to characterize drought characteristics?).
● Using farmer-reported drought data as a reference and including satellite soil moisture to close the gap between rainfall anomalies and the response of the land surface, which nearly doubles the matching score for accuracy.
● Linking qualitative and quantitative perspectives to strengthen risk ownership (e.g. does local expert knowledge match satellite-derived hazard and risk indicators or how can guided expert assessments and scenario-based thinking help to deal with probabilistic information?).
● Enhancing the accuracy of predictors via statistical techniques (e.g. which regions are likely to be affected by drought impacts at the same time or are there trends in climate data that need to be corrected before they are fed into insurance models?).
● Maintaining an online dashboard with preprocessed data and model results in which local stakeholders can get real-time feedback about index modifications (e.g. would shifting the insurance window from late April to early May still capture the most-relevant historical drought years?).
Ultimately, the initiative tries to reduce basis risk, but this can also have multiple dimensions related to the data driving the model, model errors or unmodelled factors, such as other climate shocks (e.g. floods) or political conflict.
Source: Bavandi et al. (2021)
A woman drawing contaminated water for household use during drought, Jos East, Plateau State, Nigeria
Credit: © Shutterstock/Oni Abimbola
174
Bank, 2020b). An emerging initiative that links forecast with risk financing is the World Bank’s next generation drought index initiative (Box 11.3).
The R4 Rural Resilience Initiative also utilizes approaches that employ a strategy of convergence of evidence (WFP, 2022). This tries to utilize the strengths of each data source, while being aware of their weaknesses, and using other information to address them. In recent years, these efforts have formally included information from hundreds of villages into annual satellite and model insurance design and monitoring processes. They are being scaled for effective coverage of entire nations. For example, Zambia has recently completed a crowdcore process utilizing electronic forms and structured meetings sampling.
A number of index insurance and forecast based financing projects are applying hybrid approaches that include in-person focus groups, survey technology, automated telephone calls and two-way telephone messaging surveys. These are directly ingested into the software systems for the data cleaning index and forecast trigger design. The software systems are operated by local experts, who use their expertise and experience to first identify, and then follow up on data issues reflected in the reconciliation process to authenticate the data, which is then used by local experts in product design.
11.6 Getting data used – towards managing risk not just disastersData-driven systems can help to manage disaster risk and reduce suffering, but only if risk management becomes standard practice for stakeholders at different levels. However, this kind of systemic risk understanding requires new ways of thinking about data and new types of consultation and verification with experts and communities. It also requires a willingness to accept in policymaking that there is always a degree of uncertainty in risk information.
It is not necessarily the availability of resources, technologies or even regulatory frameworks that are a roadblock in risk reduction. As outlined in
Part II, it may be that the underlying narrative for inaction follows established patterns, such as the view that these occurrences are natural and cannot be averted, or that the residual risk is deemed acceptable for whatever reason. Biases such as inherent optimism or myopia may be hindering anticipatory financing, expenditure may seem unjustifiable because it does not serve immediate needs and large emergencies may be perceived as being too infrequent to present a real risk. This way of thinking about risk also neglects the impacts of smaller, frequently recurring extensive disasters that are also highly costly if losses are aggregated. Short-term interests and societal perceptions of “acceptable risk” may further limit social demand for action by governments, which in turn do not feel incentivized to act against such benchmarks set by the public.
Poorer countries often rely on the international community for financing humanitarian assistance in the wake of a large-scale disaster. This may be due to the absence of sufficient institutional capacity, effective risk reduction strategies and resources for response. Initiatives to apply improved modelling and metrics to the design of anticipatory action responses to disasters are helping improve efficiency and speed up the process of mobilizing resources from the international community. This access to data reduces the likelihood of aid operations that are “too little too late”, when a disaster is already causing widespread food insecurity, morbidity and mortality.
Investment in reducing existing risk and preventing the generation of new risk is fundamental to sustainable development. Rather than pre-emptive risk reduction being “in vain” if the potential hazards or shocks do not occur, there is evidence that acting before disasters has a positive effect on wider development. For example, in the case of drought risk, studies show every $1.00 spent yields around $1.60 in social value through impacts such as increased food consumption, income or livestock health, even when a drought did not occur (Weingärtner et al., 2020).
As discussed in Chapter 8, the fundamental challenge is how to create social demand for reducing risk if individuals, including government
175
decision makers, have other priorities. Or how financing structures and risk reduction products and services can be re-engineered to better enable them to use information on risk more effectively. Strengthening social safety nets, anticipatory action, parametric insurance and risk layering are all examples of how this challenge can be met.
Governments can choose social safety net approaches to finance the costs of hazard impacts and system shocks through social assistance, including through the creation of DRR and response funds as part of regular state budgets. If financed through tax revenue, such schemes are essentially “opt-in” measures because they apply to everyone through government policies. This can avoid the optimism bias and economic entry barriers to insurance often faced for high-risk, poorer populations. Such strategies are often cost-effective to manage extensive risk, for responding to small- and medium-sized events that cumulatively have comparable or even greater impacts than isolated, extreme events, but do not happen all at once. These are most effective when investment in DRR has been prioritized in advance, and is supported by contingency plans and financial strategies that allow governments to reduce risk and act early.
Risk-reducing strategies are effective in protection against moderate recurring losses. However, for most countries, the reserves needed to prepare for major disasters are so high that the opportunity costs would outweigh the expected benefits if such a catastrophe occurred. Thus, countries need alternative risk financing strategies (e.g. a layering approach) to obtain rapid access to large amounts of cash when faced with a major disaster (Figure 11.5).
The advances in the use of satellite data, big data and models to enhance DRR outlined in this chapter have paved the way for a new generation of parametric and index-based financing solutions that can help manage the risk of loss. These can be used in contexts where there is a middle class able to pay premiums (ideally also through opt-out rather than not opt-in schemes) and at larger scales for governments.
Parametric insurance or financing, which ideally relies on a series of independent satellite-derived
estimates to define an insured hazard by objective means, is a suitable tool for more-extreme, less-frequent events. Individuals, governments or other institutions can choose to take up insurance that triggers payouts in the event of, for example, a drought, hurricane or disease outbreak. In the case of agricultural risk insurance in low-income countries, which are often characterized by small field sizes, parametric approaches can be much faster and result in lower premiums, because there is no need for loss assessments. For governments, payouts can be processed quickly and used to finance a rapid disaster response operation if they are designed at the time of enrolment so an insurance payout can automatically set a response operation in motion.
Figure 11.5 illustrates how investment in DRR can eliminate many of the frequently recurring low- to medium-sized losses from disasters, but there is an increasing need to also use risk financing to transfer or share the losses from less-frequent medium-sized to extreme events.
A lot of the emphasis in work around DRR through parametric or index insurance and anticipatory action focuses on improving the accuracy of models or insurance indices, in other words, reducing “basis risk”. This is the mismatch between insurance payouts and needs on the ground. Although it is important to minimize basis risk, an emphasis on “getting the index right” has shifted attention away from other important performance aspects of index insurance including: (a) the speed, accuracy and costs at which a payout reaches beneficiaries; (b) the types of risks that insurers transfer to international reinsurance markets; and (c) whether index insurance instruments are targeting the appropriate layer of risk.
In the case of very large-scale or particularly extensive disasters, it can make sense for governments to develop strategies to share or transfer the risks to state and individual assets to global markets. For example, African Risk Capacity, a specialized agency of the African Union, was established to help African governments improve their capacities to better plan, prepare and respond to extreme weather events and disasters. It has made more than $60 million in payouts for early response and assisted more than 2.1 million vulnerable people – a major achievement
176
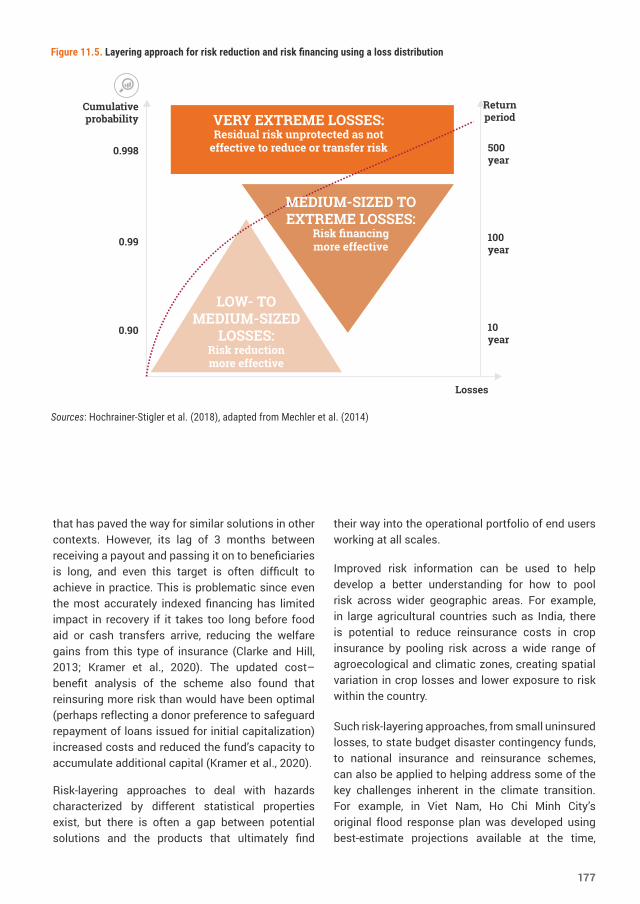
0.90
0.99
0.998
10 year
100 year
500 year
VERY EXTREME LOSSES:Residual risk unprotected as not
effective to reduce or transfer risk
MEDIUM-SIZED TO EXTREME LOSSES:
Risk financing more effective
LOW- TO MEDIUM-SIZED
LOSSES:Risk reduction more effective
Losses
Return period
Cumulative probability
Figure 11.5. Layering approach for risk reduction and risk financing using a loss distribution
Sources: Hochrainer-Stigler et al. (2018), adapted from Mechler et al. (2014)
that has paved the way for similar solutions in other contexts. However, its lag of 3 months between receiving a payout and passing it on to beneficiaries is long, and even this target is often difficult to achieve in practice. This is problematic since even the most accurately indexed financing has limited impact in recovery if it takes too long before food aid or cash transfers arrive, reducing the welfare gains from this type of insurance (Clarke and Hill, 2013; Kramer et al., 2020). The updated cost–benefit analysis of the scheme also found that reinsuring more risk than would have been optimal (perhaps reflecting a donor preference to safeguard repayment of loans issued for initial capitalization) increased costs and reduced the fund’s capacity to accumulate additional capital (Kramer et al., 2020).
Risk-layering approaches to deal with hazards characterized by different statistical properties exist, but there is often a gap between potential solutions and the products that ultimately find
their way into the operational portfolio of end users working at all scales.
Improved risk information can be used to help develop a better understanding for how to pool risk across wider geographic areas. For example, in large agricultural countries such as India, there is potential to reduce reinsurance costs in crop insurance by pooling risk across a wide range of agroecological and climatic zones, creating spatial variation in crop losses and lower exposure to risk within the country.
Such risk-layering approaches, from small uninsured losses, to state budget disaster contingency funds, to national insurance and reinsurance schemes, can also be applied to helping address some of the key challenges inherent in the climate transition. For example, in Viet Nam, Ho Chi Minh City’s original flood response plan was developed using best-estimate projections available at the time,
177
but conditions have vastly diverged from those projections. The frequency of extreme rainfall events has increased by a factor of 3 (Lempert et al., 2013), and unexpected urbanization in low-lying areas over the last few decades has dramatically increased exposure beyond previous planning assumptions.
11.7 Ways forwardThe COVID-19 crisis, and climate change projections of increased intensity and volatility of hazards exemplify the inherent uncertainty of systemic risk. This underscores the importance of preparing now for an uncertain future.
This chapter has shown how technological and modelling advances can help fill data gaps in understanding risk when combined with community-based verification and ground truthing. It has also highlighted how these combined approaches can lay the foundation for better management of systemic risk, even in the highest risk settings. However, doing this will require co-design and flexibility of approaches, advances in putting in place anticipatory action and prevention measures, as well as new risk sharing and transfer products and approaches.
Effectively addressing systemic risk requires discussing uncomfortable topics, such as how to moderate and arrive at a societally well-recognized consensus around acceptable risk or something approximating that. For example, how do localities like Ho Chi Minh City decide to plan for their climate future? No model or satellite data can provide a definitive answer to such questions. These technologies support but cannot replace decision-making processes. Science-based approaches can help ground discussions with good data, but consultative processes only will build buy-in and political momentum for such wicked problems.
Governmental systems need to be capable of using the data and the outcomes of participatory processes to ground policy decisions and actions to avoid generating risk, and to reduce and manage systemic risk. The integration of modelling and other data innovations into decision processes has the potential to inform a common and joint frame of reference essential for coping better with future disasters and risk reduction planning.
178
12. Transitions to systemic risk governanceAs humans have altered their natural environment and changed it to a “big world, small planet” (Rockström and Klum, 2015) or a “full world” (Daly, 2005), the logic of how to value, choose and make decisions – in other words, how to govern – has changed. In addition, the scale and impacts of human activities are now less frequently absorbed by nature and are becoming increasingly transparent. Feedback cycles are shorter and faster, and the consequences that human actions have for nature rebound onto human health and well-being (Figure 12.1). Many stakeholders are seeking to make human systems more resilient, for example by transitioning to sustainable energy, food or waste management systems.
This chapter aims to encourage countries to plan and invest for transformative change by outlining possible pathways and enablers to overcome the inhibiting forces and disincentives that can prevent these efforts from being effective. It does not prescribe a particular approach or model, as choices depend on each country’s societal preferences – their political, cultural and economic specificities. Rather, it focuses on how to analyse the existing approach to risk governance in each context and how to identify innovations and pathways towards transformative change. It provides policymakers and practitioners with options, suggestions and general recommendations about how societies might move from types of governance adapted to individual (linear) risks to new types of governance that are able to address systemic risk.
Governance is sometimes referred to as the “play of the game” rather than merely the “rules of the game” (North, 2005; Shepsle, 2010). It is used in this report
to refer to the regimes, arrangements, structures, strategies and processes by which rules, laws and policies are agreed upon and made, and collective decisions are taken and implemented. These are not always fixed. The most effective forms of governance can adapt to facilitate rapid responses to crises, as well as monitor slower changes and respond with longer-term measures (Kahneman, 2013; IPCC, 2012; Olson, 2016; IRGC, 2018).
Conventional approaches to risk governance have tended to be based on linear or well-established cause-and-effect relationships of incidents or evidence. The risk of long-term system degradation resulting in cascading impacts and tipping points increases if events and/or impacts persist for long periods or occur frequently (UNDRR, 2021e). Governance in the context of systemic risk requires considering causal structures and dynamic evolutions. Systemic risk has multiple causes and effects, feedback mechanisms marked by uncertainties and the potential for cascading or compounding events that lead to failure of the systems that humans depend upon.
Systemic risk governance requires new processes and also action to enhance innovation and actively encourage transformative change, meaning a change in the system’s fundamental nature, state, structure or function (Béné et al., 2012; O’Brien and Sygna, 2013). While there is a rich literature on the concept of transformation (Roggema et al., 2012; O’Brien and Sygna, 2013; IRGC, 2018), the IPCC definitions are well adapted to the subject of disaster risk governance. The synthesis of the IPCC Fifth Assessment Report defined transformation as “a change in the fundamental attributes of natural
179
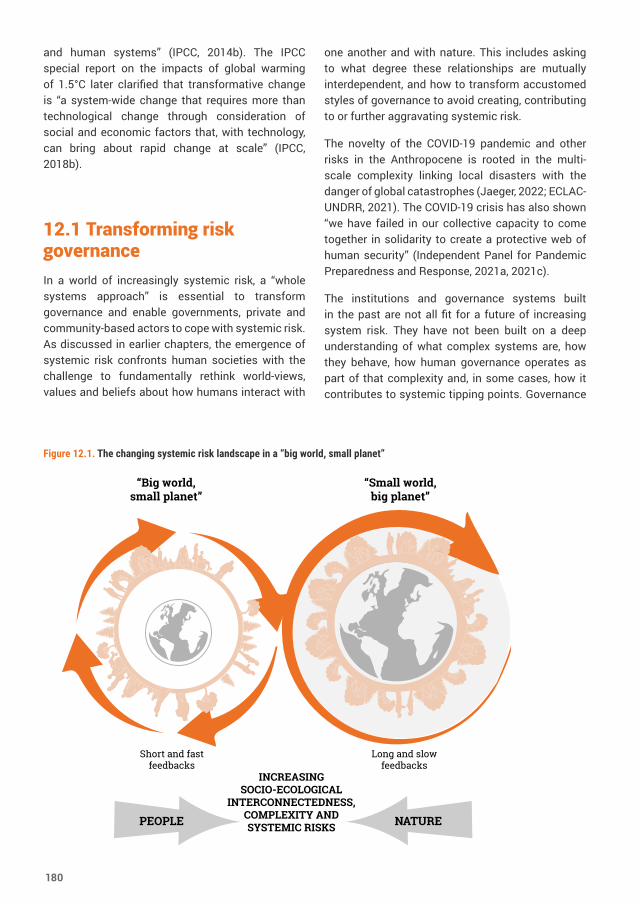
and human systems” (IPCC, 2014b). The IPCC special report on the impacts of global warming of 1.5°C later clarified that transformative change is “a system-wide change that requires more than technological change through consideration of social and economic factors that, with technology, can bring about rapid change at scale” (IPCC, 2018b).
12.1 Transforming risk governanceIn a world of increasingly systemic risk, a “whole systems approach” is essential to transform governance and enable governments, private and community-based actors to cope with systemic risk. As discussed in earlier chapters, the emergence of systemic risk confronts human societies with the challenge to fundamentally rethink world-views, values and beliefs about how humans interact with
one another and with nature. This includes asking to what degree these relationships are mutually interdependent, and how to transform accustomed styles of governance to avoid creating, contributing to or further aggravating systemic risk.
The novelty of the COVID-19 pandemic and other risks in the Anthropocene is rooted in the multi-scale complexity linking local disasters with the danger of global catastrophes (Jaeger, 2022; ECLAC-UNDRR, 2021). The COVID-19 crisis has also shown “we have failed in our collective capacity to come together in solidarity to create a protective web of human security” (Independent Panel for Pandemic Preparedness and Response, 2021a, 2021c).
The institutions and governance systems built in the past are not all fit for a future of increasing system risk. They have not been built on a deep understanding of what complex systems are, how they behave, how human governance operates as part of that complexity and, in some cases, how it contributes to systemic tipping points. Governance
PEOPLE NATURE
“Small world, big planet”
“Big world, small planet”
Short and fast feedbacks
Long and slow feedbacks
INCREASING SOCIO-ECOLOGICAL
INTERCONNECTEDNESS, COMPLEXITY AND SYSTEMIC RISKS
Figure 12.1. The changing systemic risk landscape in a “big world, small planet”
180
at multiple levels and in various sectors is challenged to embrace transformation, informed by new data, knowledge and actors.
Traditional approaches to governing risk are being overwhelmed by the compounding and cascading nature of systemic risk and the decisions that flow from it, which also contribute to reaching thresholds and tipping points (UNDRR, 2021e). Although there is consensus on the aims of transformative adaptation to promote sustainable and equitable societies, as well as many successful examples, the question of how to achieve it at scale is still evolving.
Context and challenge: big world, small planet Two important consequences from living in a big world on a small planet are that: (a) the impacts humans have on planetary health rebound and affect human health and well-being, faster, more surprisingly and more directly than in the past (Whitmee et al., 2015) and (b) humanity must understand itself as part of the broader system that humans aim to change. Instead of standing outside and controlling ecological and planetary systems, there is increasing recognition that humans have always been part of them – an insight some cultures have observed for millenniums (see Chapter 6). Intrinsic values such as purpose, commons and mutuality, which have received little attention in economic impact assessments, are now receiving more attention as normative approaches for resilience (Brondízio and Gatzweiler, 2010; de Jong, 2021). This has direct implications for the kind of science and the choice of methods needed to generate knowledge for transformation.
The overarching challenge in shifting to transformative risk governance is how to address complexity in actionable ways, given the scale of the problem. As the risk landscape is becoming more complex, the social transformations are also becoming more complex and systemic. “As society confronts increasingly complex risks, the governance system itself becomes more complex” (Jacobzone et al., 2020). The concepts and language of risk also need to change to align with the new magnitude and species of threat (Hanger-Kopp and Handmer, 2022). One approach to begin tackling
this challenge is the Australian effort to move to a more systemic, rather than multi-hazard, approach to risk reduction and management (Box 12.1 and Figure 12.2).
Different depths of leverage points or system properties need to be identified to transform systems (Meadows, 1999). It seems evident that transformational change requires the use of levers in all three spheres: the practical, the political and the personal. Practical or operational measures can be shallower and have little leverage, while levers in the political and personal spheres, like paradigms and values, have more leverage for transformational change (Lasswell, 1971; O’Brien and Sygna, 2013). However, it is in the practical sphere that partnerships are derived and trust is developed.
A focus on the practical sphere alone can lead to failures because the enabling environment for addressing longer-term risk may be lacking, or the actions may lead to short-term outcomes that increase long-term vulnerabilities. For example, as discussed in Chapters 7 and 8, people may not cooperate with public health restrictions if their existing cognitive biases mean they do not perceive a risk that requires action. The political sphere includes economic, political, legal, social and cultural systems. It considerably influences and determines the effectiveness of institutions and governance structures and the extent that they can produce equitable and sustained benefits over time. Finally, the personal sphere addresses personal capacities, beliefs, trust, paradigms and values.
Addressing complex problems such as food insecurity requires a full spectrum approach that looks across the practical, the political and the personal spheres (Sharma, 2007). This means that, when applied to food security, for example: (a) the practical sphere leads to providing food for immediate relief; (b) the political sphere changes policies for food subsidies and creates market incentives for food production, accessibility and quality; and (c) the personal sphere embodies universal values of dignity, equality and compassion. New approaches are being developed to work across these three spheres, as well as across disciplines, such as the use of theatre and the arts to identify and govern complex risk (Box 12.2).
181

Box 12.1. Addressing systemic risk in Australia
Since 2019, Australia has experienced extensive and extended drought conditions, the worst wildfires on record, the east Australia floods (2021) and the COVID-19 pandemic. Although these events were extraordinary, they were not unpredictable or unimaginable. The Australian Government has developed a National Disaster Risk Reduction Framework, and in this context, it proposed to develop a “national risk statement”. The national process identified a need to support all sectors with authoritative information and guidance to include systemic risk and resilience in their risk management practices. This required shifting the predominant focus beyond the occurrence of natural hazard events to include systemic vulnerability and new approaches to disaster risk and resilience assessment.
One challenge in moving to a risk reduction approach (including risk prevention and avoidance) is that the well-resourced and high-performing emergency management agencies in Australia have created high community expectations for response services and low tolerance for loss. However, as the insurer of last resort, the growing costs for this model are ultimately shouldered by the Australian taxpayer through state and federal governments. As the then Minister for Agriculture, Drought and Emergency Management, David Littleproud stated: “One of the fundamental objectives of the National Disaster Risk Reduction Framework is the least tangible: changing the mind-sets of Australians”; he emphasized the need to consider how to “embed resilience into planning, policies, systems and services” and to achieve cultural change around disaster resilience, a conscious shift in the policy focus and a serious reflection on values (Littleproud, 2020; Buchtmann (nee Osuchowski) et al., 2022).
The process commenced with an exploration of:
1. What purpose would a national risk statement serve and who would use it?
2. If credible hazard-based information already exists, what is missing?
3. Is national risk-based information needed to prepare for an uncertain future?
It identified that: (a) risk reduction is a critical factor in creating safer environments so more people have the opportunity to exercise resilience; (b) as safety is predicated on minimizing the potential for harm, vulnerability needs addressing directly as the key element of any DRR strategy; and (c) there is benefit in building a knowledge base to better understand the systemic drivers of vulnerability and the decisions and choices that create disaster risk.
It was also emphasized that policies to reduce the impact of disasters need to recognize the limits of predictive science for guiding the way to an uncertain future and focus on the design of healthy decision processes. The distinction between vulnerability-based and standard risk-based (likelihood multiplied by consequence, as found in International Organization for Standardization standard 31000) approaches was also considered (Sarewitz et al., 2003; Blaikie et al., 2004; Wisner et al., 2011; Buchtmann (nee Osuchowski) et al., 2022).
182
Through this process, leaders are being equipped to: understand the disaster risk system, made up of the interconnected systems of society; find points of intervention to address the underlying causes of disaster; and champion people, ideas and processes to enable activities such as assessments, engagements or decision-making to be done differently.
A suite of six guidance documents supports decision makers in how to: identify and assess the causes and effects of vulnerability and what can be done to reduce these; navigate governance constraints; consider uncertainty about future climate and disaster risk through scenario thinking and scenario analysis; and identify, evaluate or incentivize investment options when the purpose is to reduce vulnerability as well as create economic impact
Source: Buchtmann (nee Osuchowski) et al. (2022)
While the approach taken demonstrates an effective national process to tackle systemic risk in Australia, it remains striking that the planetary systemic risk of global climate change is not yet addressed in follow-up actions.
183
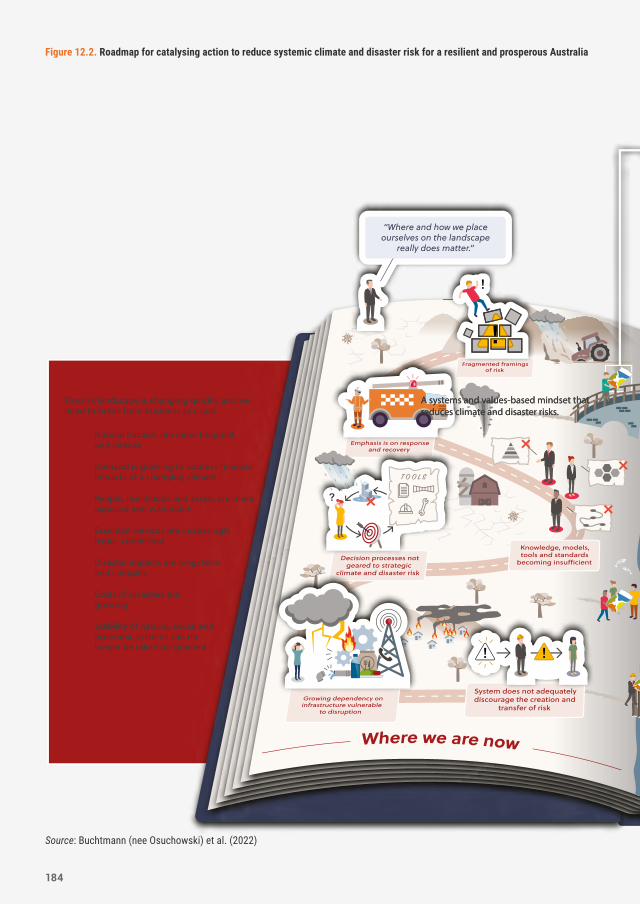
A systems and values-based mindset that reduces climate and disaster risks.
A systems and values-based mindset that reduces climate and disaster risks.
A systems and values-based mindset that reduces climate and disaster risks.
Source: Buchtmann (nee Osuchowski) et al. (2022)
Figure 12.2. Roadmap for catalysing action to reduce systemic climate and disaster risk for a resilient and prosperous Australia
184
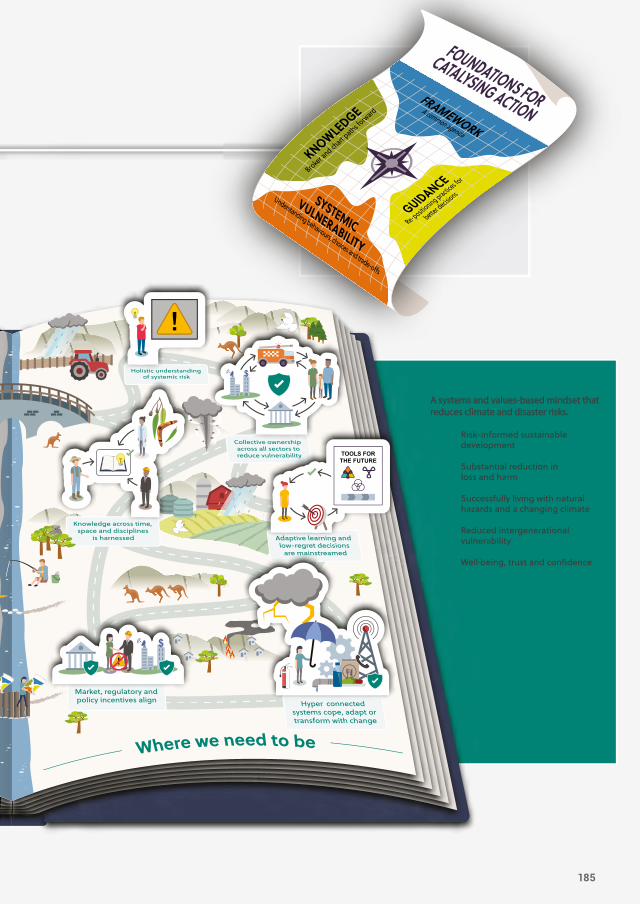
A systems and values-based mindset that reduces climate and disaster risks.
A systems and values-based mindset that reduces climate and disaster risks.
A systems and values-based mindset that reduces climate and disaster risks.
Figure 12.2. Roadmap for catalysing action to reduce systemic climate and disaster risk for a resilient and prosperous Australia
185
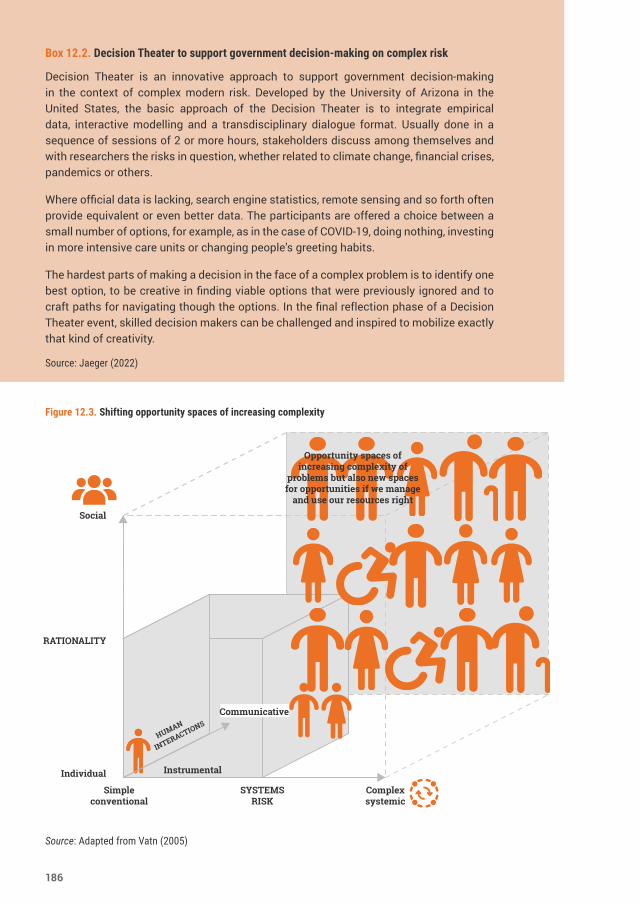
Box 12.2. Decision Theater to support government decision-making on complex risk
Decision Theater is an innovative approach to support government decision-making in the context of complex modern risk. Developed by the University of Arizona in the United States, the basic approach of the Decision Theater is to integrate empirical data, interactive modelling and a transdisciplinary dialogue format. Usually done in a sequence of sessions of 2 or more hours, stakeholders discuss among themselves and with researchers the risks in question, whether related to climate change, financial crises, pandemics or others.
Where official data is lacking, search engine statistics, remote sensing and so forth often provide equivalent or even better data. The participants are offered a choice between a small number of options, for example, as in the case of COVID-19, doing nothing, investing in more intensive care units or changing people’s greeting habits.
The hardest parts of making a decision in the face of a complex problem is to identify one best option, to be creative in finding viable options that were previously ignored and to craft paths for navigating though the options. In the final reflection phase of a Decision Theater event, skilled decision makers can be challenged and inspired to mobilize exactly that kind of creativity.
Source: Jaeger (2022)
Individual
RATIONALITY
Simple conventional
SYSTEMS RISK
Complex systemic
HUMAN
Social
INTERACTIONS
Opportunity spaces of increasing complexity of
problems but also new spaces for opportunities if we manage
and use our resources right
Instrumental
Communicative
Figure 12.3. Shifting opportunity spaces of increasing complexity
Source: Adapted from Vatn (2005)
186
Figure 12.3 illustrates there is a need to move away from a simple model of human action, because, in a small-planet context, this creates externalities and multiple failures. The simple model assumes people are rational economic actors driven by individual outcomes alone, and that there are zero transaction costs and no marketable “goods” in question (bottom left corner in the three-dimensional diagram). Under this model, new actions would come from a combination of individual rationality, instrumental or strategic behaviour or interactions, and simple (private) goods in the realm of market governance. But as shifts in human values, interactions and rationality take place, new opportunity spaces for doing things differently are opened, because related institutional changes also occur (Figure 12.3). Those opportunity spaces provide the space for people to interact and think more communicatively rather than in purpose-driven (instrumental) ways, and to think more socially than individualistically. The emergence of collaborative governance platforms is an example of increasing human interactions and communication to create opportunity spaces and better address systemic risk (Ansell and Gash, 2018; Kreiling et al., 2020).
Figure 12.3 illustrates the expansion of the decision-making space needed to govern systemic risk of increasing complexity. It takes the three dimensions of rational decision-making, human interactions and systems risk. For the most effective governance of systemic risk, rational decision-making needs to move from the individual to the social (societal) level, human interactions need to move from instrumental to being more communicative (interactive) and understandings of risk needs to encompass greater complexity. When these three dimensions are working together, there is a much larger space of opportunity to tackle complex systemic risk.
System change does not always need new governmental structures if the existing collaborative governance practices and legal framework are sufficiently dynamic. One such example is the long-established relationship between the scientific community and civil protection in Italy (Box 12.3).
12.2 How to transition?One theory of complexity governance outlines two different underlying styles of action: exploitation and exploration (Duit and Galaz, 2008). “Exploitation” is where costs of operations are being minimized within a given set of rules. “Exploration” is about learning and experimentation. It involves gathering, analysing and accumulating information, self-monitoring and creating knowledge about the state in which a system is in. Exploration is also about trial and error, experimentation and testing, as well as re-evaluating and re-applying new rules, policies and practices. It can therefore be more costly in time, trust building and resources than exploitation. Exploitation and exploration can also be defined as types of behaviour that people or organizations adopt according to whether they act within a given set of rules or are motivated to explore new ways of doing things in changing circumstances (Ostrom, 1983).
Different combinations of these two types of behaviour lead to different governance arrangements or different types of governance. Rigid or steady-state governance types are characterized by high levels of exploitation and low levels of exploration. Such rigid governance types can become efficient as long as the circumstances in which they operate are reliable and stable. Responsiveness to external changes is slow. There is a reluctance to change due to the extent of sunk costs in the form of investments made to optimize the system to become efficient in its operations within the established paradigm.
Flexible governance types have a high capacity for exploration but can lack the capacity for exploitation. Fragile governance types show weak capabilities of exploitation and exploration. Institutional failures are often used to explain fragility, such as lack of property rights, low levels of trust and social capital, or the absence of the rule of law and the presence of corruption.
A robust type of governance is characterized by the combination of a high capacity of exploitation and
187
Box 12.3. DRR in Italy – collaboration between civil protection and science
Disaster science is increasingly described as moving progressively from single-discipline research, through multidisciplinary approaches, towards interdisciplinary and transdisciplinary research, but so far this path tends to be within the scientific or academic community (Ismail-Zadeh et al., 2017). In Italy, the legislation and practice built over almost three decades aims to ensure this collaboration, in the form of action-oriented transdisciplinary research, is also co-produced with technical decision makers in civil protection agencies (Dolce and Bucci, 2022).
The Civil Protection Department is part of the Prime Minister’s Office. It is multilevel and has responsibilities in a wide range of fields related to DRR, disaster preparedness, response and recovery. It is based on Legislative Decree 1/2018, the Civil Protection Code, which regulates the National Civil Protection Service. This law describes the scientific community as part of the operational structures under the code, signalling a collaboration formally dating back to 1992 when the first law on civil protection was passed, but which began in 1976 in the aftermath of the Friuli earthquake (Dolce and Bucci, 2022).
One mechanism that has helped to build and consolidate this effective interaction between the civil protection decision-making level and the scientific community is the so-called “hybrid expert”. Hybrid experts are civil servants who have solid expertise in research and in public administration, and are able to understand and use the language of the two fields. Their expertise is recognized by the scientific and decision-making communities, and they play an interface role to link the demands, expectations and (often short) timescales of decision makers and the data, information, uncertainties and (longer) timescales of scientists (Dolce and Bucci, 2022).
Some specific outputs and cooperation from the civil protection–science collaboration are:
● The Italian national seismic risk model, included in the national risk assessment submitted to the European Commission in 2018 (ICPD, 2018). It is based on a broad scientific consensus around a model developed by a large community of engineers involving most universities in Italy and research institutes with expertise in seismic risk (Dolce and Bucci, 2022).
● The Italian National Alert System for Tsunamis, which has been operating since January 2017 and consists of the National Institute of Geophysics and Volcanology, the Italian Institute for Environmental Protection and Research, and the Civil Protection Department (Kahneman, 2013; IPCC, 2012; Olson, 2016; IRGC, 2018).
● The Italian Center for Research on Risk Reduction, a consortium established under the aegis of the Civil Protection Department and formed by research institutes and centres (CI3R, n.d.). It aims to create a network of multidisciplinary competences to carry out prevention and preparedness activities for civil protection and, more generally, towards DRR with a multirisk, multisectoral and systemic approach (Dolce and Bucci, 2022).
188
an equally high capacity of exploration. On the one hand, institutions provide stability and reliability within which the efficiency of interactions can be improved and the costs reduced over the long term. On the other hand, their adaptive capacity and agility are sufficiently high to deal with sudden changes, cooperative action and complex decision-making situations. Air traffic control systems and military organizations are examples of such robustness (Duit and Galaz, 2008).
Robust types of governance are in the best position to deal with systemic risk. This implies the transition pathways for governance towards better systemic risk governance would move from being fragile and rigid towards becoming more robust.
How can stakeholders know which types of risk they are dealing with and which types of governance they need to employ for the best possible outcomes? One approach is by means of a collaborative system modelling tool showing how high or low systemic risk can be identified (Vester, 2014, 2007). If the components of a system are all highly and tightly interconnected, the system is in a critical state in which small interventions can lead to large system-wide changes, cascading effects and system collapse. In this case, systemic risk is high, so governance approaches need to be able to explore carefully, test and experiment to minimize undesired costly consequences. If system components are not as hyperconnected as in the previous scenario, there is more time for system change, and the risk of system collapse is lower (Wagener-Lohse et al., 2011).
Systemic risk governance requires local-level understanding and assessment of risk through the lens of systems analysis and in light of underlying structural vulnerabilities. Such an assessment was conducted in the old city of Ahmedabad, Gujarat State, India, in 2020 during the first peak of COVID-19 infections (Box 12.4 and Figure 12.4).
Steps towards a whole systems approachSystems modelling is becoming more widely used as a helpful way to understand systemic risk and therefore to adopt effective modes of systemic risk governance, as discussed in Chapters 10 and 11.
Eight steps can be identified to model a system, which are reiterative and similar to a learning cycle (Pulwarty et al., 2009; Vester, 2014):
1. Start with a question, system description and definition of stakeholders.
2. Determine the system variables and criteria.
3. Check the systemic relevance of system variables.
4. Define the impact of all system variables on all others.
5. Map the systemic role of system variables and identify levers for system change.
6. Identify interdependencies, causal loops and feedbacks.
7. Undertake scenario analysis and simulation.
8. Evaluate system variables and reformulate the starting question.
The International Risk Governance Center developed a similar stepwise approach to address systemic risks in situations that require adaptations to new contexts, or transformation of an organization to prevent undesirable regime change and to trigger transitions of a system to preferable regimes (IRGC, 2018). The Wuppertal Institute (Wuppertal Institute, 2022) has further distilled these ideas into the concept of knowledge transition in which there are three steps (Figure 12.5):
1. Gain knowledge of a system during the problem analysis phase.
2. Develop a vision and guiding principles during the building of target knowledge.
3. Transform knowledge from experimentation and learning.
189
Box 12.4. Systemic factors in COVID-19 cases and public health measures in Ahmedabad World Heritage City, India, 2020
Interviews with residents of the old city of Ahmedabad revealed their perception of the risk from COVID-19 was overshadowed by financial concerns during restricted movement regulations between March and June 2020. Popular interpretations of information and information overload led to mistrust and fuelled activities that went against the security protocols put in place. However, social cohesion in the form of inter and intracommunity relationships and social connections acted as “stress sponges” for psychological and financial stresses.
The nationwide lockdown and enforced closures directly affected livelihoods and the education sector in the old city. Low income levels and patterns of livelihoods meant most people did not have savings to sustain them over a long period of almost no income.
Based on the above themes, a causal loop diagram was prepared to illustrate the causality behind case surges and high mortality in the old city of Ahmedabad (Figure 12.4). This illustrates some of the findings of the study and shows, for example that:
● Higher-income households had better access to health-care systems and facilities than lower-income households. However, as case numbers grew, the load on existing health-care facilities and systems also grew, resulting in a feedback loop of reduced access to health care, even for those with more financial resources, leading to more cases and more deaths.
● Schools shifting to online learning required households to have access to the Internet, phones and laptop computers. In poor or middle-class households with more than two or three children, the sharing of such resources became a problem, if they had any access at all. Procuring new technology like laptop computers or phones was out of the question, even for those who could afford them, because the lockdown had already stopped businesses from operating (except those engaged in essential services). Therefore, access to education was reduced for households with lower financial resources (with a likely future impact on earning capacity).
● In time, the lockdown of businesses also caused a deterioration in household financial situations overall, and access to basic necessities began to be affected. The stresses on the availability or access to food and other basic necessities were met by different volunteer groups and special initiatives of the local government like Vegetables on Wheels, but mostly people relied on each other, inter and intracommunity associations (“pols”) for support, for finances and basic necessities. Thus, social cohesion – a systemic capacity – which has been found to be deep rooted in the old city, surfaced as a saviour.
● Due to the decreasing access to basic necessities, people began to visit markets to replenish supplies and also began hoarding additional supplies, all of which was in violation of the restrictions on movement and the COVID-19 expected code of behaviour. The transmission of the virus increased, leading to a surge in cases, which eventually led to the closure of Kalupur vegetable market, the largest fresh vegetable market of the city. This then made it more difficult for people in the old city and other parts of Ahmedabad to access sufficient fresh food.
Contemporary ways of understanding and assessing risk often consider the status quo and rarely look into how risk in systems has been shaped over a period of time. For example, in the context of COVID-19 in the old city of Ahmedabad, the percentages of population residing in a one-room household or with more than five people living in a household appeared to be dominant factors in the spread of the disease. This is the result of historical socioeconomic realities. Thus, recurrence of a similar outbreak would lead to comparable consequences if these underlying vulnerabilities were not addressed. An important takeaway for policymakers in this regard is to investigate such contemporary and historical causes of social and economic vulnerabilities, so they can be addressed through integration of risk reduction within contexts that perpetuate vulnerability and generate risk.
Source: Kanji et al. (2022)
190
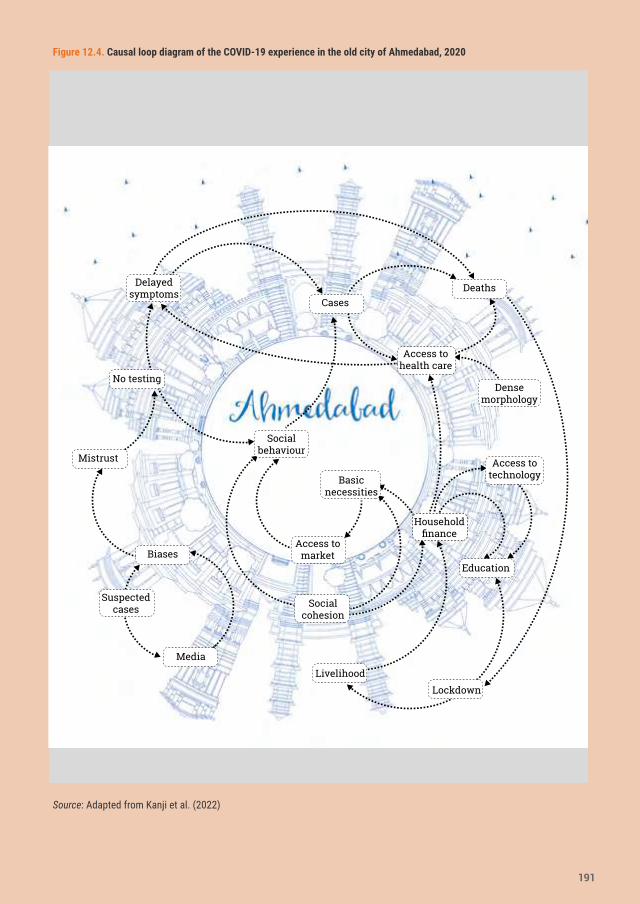
LockdownLivelihood
Education
Access to technology
Household finance
Basic necessities
Social cohesion
Dense morphology
Deaths
Access to health care
Cases
Delayed symptoms
Social behaviour
Access to market
No testing
Media
Mistrust
Suspectedcases
Biases
Figure 12.4. Causal loop diagram of the COVID-19 experience in the old city of Ahmedabad, 2020
Source: Adapted from Kanji et al. (2022)
191
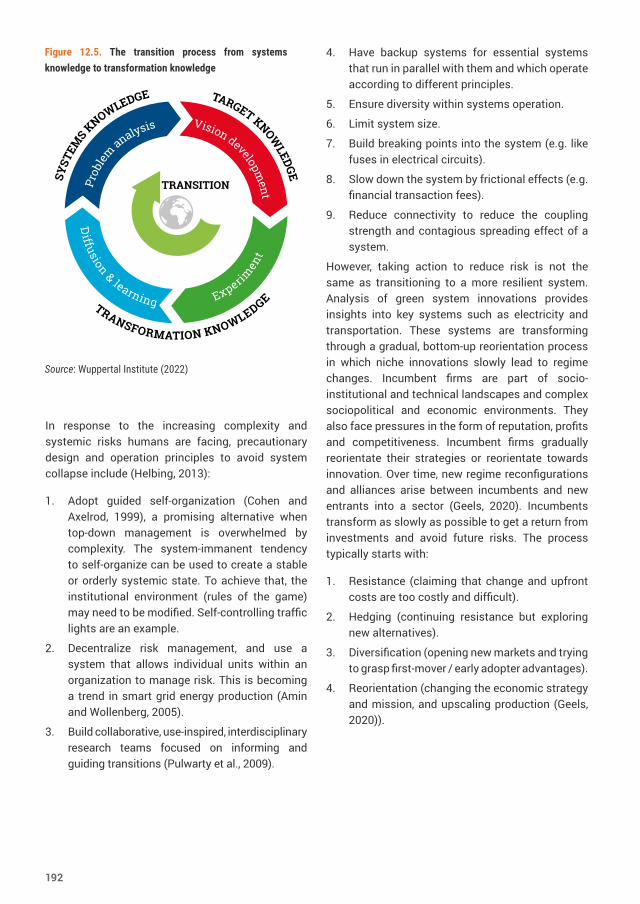
In response to the increasing complexity and systemic risks humans are facing, precautionary design and operation principles to avoid system collapse include (Helbing, 2013):
1. Adopt guided self-organization (Cohen and Axelrod, 1999), a promising alternative when top-down management is overwhelmed by complexity. The system-immanent tendency to self-organize can be used to create a stable or orderly systemic state. To achieve that, the institutional environment (rules of the game) may need to be modified. Self-controlling traffic lights are an example.
2. Decentralize risk management, and use a system that allows individual units within an organization to manage risk. This is becoming a trend in smart grid energy production (Amin and Wollenberg, 2005).
3. Build collaborative, use-inspired, interdisciplinary research teams focused on informing and guiding transitions (Pulwarty et al., 2009).
Figure 12.5. The transition process from systems knowledge to transformation knowledge
Source: Wuppertal Institute (2022)
Prob
lem
analysis Vision development
Experimen
t
Diffusion & learning
SYST
EMS K
NOWLEDGE TARGET KNOWLEDGE
TRANSFORMATION KNOWLEDGE
TRANSITION
4. Have backup systems for essential systems that run in parallel with them and which operate according to different principles.
5. Ensure diversity within systems operation.
6. Limit system size.
7. Build breaking points into the system (e.g. like fuses in electrical circuits).
8. Slow down the system by frictional effects (e.g. financial transaction fees).
9. Reduce connectivity to reduce the coupling strength and contagious spreading effect of a system.
However, taking action to reduce risk is not the same as transitioning to a more resilient system. Analysis of green system innovations provides insights into key systems such as electricity and transportation. These systems are transforming through a gradual, bottom-up reorientation process in which niche innovations slowly lead to regime changes. Incumbent firms are part of socio-institutional and technical landscapes and complex sociopolitical and economic environments. They also face pressures in the form of reputation, profits and competitiveness. Incumbent firms gradually reorientate their strategies or reorientate towards innovation. Over time, new regime reconfigurations and alliances arise between incumbents and new entrants into a sector (Geels, 2020). Incumbents transform as slowly as possible to get a return from investments and avoid future risks. The process typically starts with:
1. Resistance (claiming that change and upfront costs are too costly and difficult).
2. Hedging (continuing resistance but exploring new alternatives).
3. Diversification (opening new markets and trying to grasp first-mover / early adopter advantages).
4. Reorientation (changing the economic strategy and mission, and upscaling production (Geels, 2020)).
192
An example of the process of initial resistance to change followed by reorientation is the response of the car industry in the United States around safety innovations. It took the industry 30 years, initially resisting and implementing the new safety regulations in full only when consumers made safety features in cars their preferred choice. In the United States, the car industry is still in the hedging phase regarding climate change and emissions reduction technology. A key message here is the need to understand incumbent firms as part of the problem and also as part of the potential solution for transition to more sustainable, green systems (Geels, 2020).
Many systems need reorientation due to the increasing interconnectedness of social and ecological systems. As socioecological complexity increases, human societies’ destructive environmental impacts trigger the need for institutional innovation to be reflexive and not just responsive (Gatzweiler et al., 2022). Responsive feedback within an existing institutional system can be useful to protect and prevent a system from collapsing every time a change in the environment occurs. This responsive feature underlines the original purpose of rules in a society,
which is to create stability and reliability of social interactions. However, integration, centralization or decentralization are not sufficiently reflexive for institutions of the Anthropocene, which must innovate constantly to survive in a changing environment (Gatzweiler et al., 2022).
An important area of innovation in this sphere is the use of nature-based solutions to reduce disaster risk and environmental degradation. This concept covers diverse approaches such as ecosystem-based adaptation and DRR, blue and green infrastructure, and natural water retention measures. These are solutions “inspired and supported by nature, which are cost-effective, simultaneously provide environmental, social and economic benefits and help build resilience. Such solutions bring more, and more diverse, nature and natural features and processes into cities, landscapes and seascapes, through locally adapted, resource-efficient and systemic interventions” (European Commission, n.d.). They are an important way to address systemic risks and transformative adaptation (Palomo et al., 2021). Nature-based approaches are underpinned by an understanding of human societies as part of environmental systems. For example, China has implemented some of the world’s largest
Box 12.5. Nature-based solutions in Wolong, China
The Natural Forest Conservation Program in Wolong National Nature Reserve, Sichuan Province, China, is a programme for reducing the systemic risk from floods and landslides, in an area located in a global hotspot region of monsoon seasonal floods and landslides, and with threats to biodiversity (particularly the endangered giant pandas).
The Wolong afforestation project was carried out from 1999 to 2001 in upstream tributaries of the Yangtze River in the Wolong National Nature Reserve, western Sichuan mountains. The State Forestry Administration provided the direct funding needed and subsequent forest management. This project introduced a forest management concession contractual system that was a pioneering model in China, and which closely involved local stakeholders. The regulatory framework was in part directed to households, offering rewards for monitoring illegal logging in designated areas, as well as official sanctions against illegal logging (Martin et al., 2021).
193
Local communities and interviewees reported effective outcomes as: reduced landslide and downstream flood risks and increased awareness and acceptance of the nature conservation approach (Martin et al., 2021); reversal of deforestation in the Wolong National Nature Reserve with substantial gains in forests and their ecosystems in just a few years; and positive impacts on the local economy and community well-being from the enhanced household income (through the incentive system) and the ecological infrastructure necessary for developing nature-based tourism (Martin et al., 2019). The project thus promoted risk reduction, biodiversity, climate change adaptation and mitigation, as well as an equitable distribution of the benefits and costs (Pauleit et al., 2017; UNDRR, 2020b).
Participants in the project considered there were several governance enablers that contributed to effective implementation. First, a catastrophic event drew international and national official attention to Wolong as the “home of giant pandas” under threat (Liu et al., 2001; Martin et al., 2019, 2021) Second, Wolong’s status as a protected area and as a special district with independent government functions and financial resources was essential for enabling the programme, because it provided flexibility and funding for locally adaptive solutions (Martin et al., 2019, 2021). Third, the reserve’s governing bodies and administrative bodies at township and lower levels were coordinated by an innovative cross-departmental Natural Forest Conservation Program committee, which was able to integrate the different agendas for disaster protection, conservation and economic development (Martin et al., 2021). This can be described as a polycentric arrangement across sectors and administrative scales of a type demonstrated in other contexts to be indispensable for governing systemic risk (Kickbusch and Gleicher, 2012; Independent Group of Scientists appointed by the Secretary-General, 2019; Martin et al., 2019). In Wolong, the cross-sectoral and multi-scale collaboration that emerged broke administrative silos typical in public administrations (Martin et al., 2021).
The fourth, and crucial, governance enabler in Wolong was the engagement of local community residents and leaders. Party officials consulted village leaders and households on the incentive system for preventing illegal logging (Martin et al., 2019), using town hall meetings across the nature reserve to achieve a broad consensus for their reforms and to reshape the scheme based on villagers’ input (Martin et al., 2021).
While studies show the Natural Forest Conservation Program and subsequent programmes have significantly increased forest cover and reduced erosion, depending on the region and local context, there have been mixed results on farmer livelihoods (Cao et al., 2010; Yang, 2013), water availability and biodiversity (Hua et al., 2016) and habitat for the giant pandas (Li et al., 2017).
The Natural Forest Conservation Program nevertheless demonstrates how synergies in disaster protection, climate change mitigation and adaptation, biodiversity, social equality and human welfare can be used through a concerted and inclusive transition to nature-based solutions. Importantly, although its multi-scale and cross-sectoral (polycentric) collaboration began as partly ad hoc and dependent on local champions, it was then institutionalized, which gave it the permanency needed for upscaling. This also demonstrates the underlying characteristics of governance processes that can forge pathways towards transformative adaptation and systemic risk management (Martin et al., 2019, 2021).
194
programmes for nature-based solutions, to tackle its increasing systemic risk from floods, landslides and other hazards, as well as environmental and related socioeconomic challenges (Liu et al., 2008; Yang, 2013; Martin et al., 2021) (Box 12.5).
12.3 Ways forward This chapter has addressed the question of how to take a whole systems approach for transitioning towards systemic risk governance. Achieving ambitious targets requires leadership, enhanced multilevel governance, vision, widespread participation in transformative change and, most critically, processes for sustaining partnerships. The COVID-19 pandemic has shown that national responses to global risks are not enough to realize the fundamental governance transformations needed for successful proactive and prospective risk management (ECLAC-UNDRR, 2021).
Such transformations include integrated planning that addresses specific land-use decisions or local landscape participatory planning, gender-based inclusion, microenterprises and local institutions. These can identify hotspot areas, pressures on land use and water, and scaling of sustainable and inclusive management response options (Liniger et al., 2017; UNDRR, 2021e) As illustrated in the Wolong case study, the window of opportunity provided by a focusing event and the engagement of local community residents and leaders are central. The case from Italy showed the importance of developing hybrid experts, also referred to as “norm entrepreneurs”, who become trusted and knowledgeable brokers in facilitating transitions and keeping the critical system nodes in view, in particular contexts (UNDRR, 2021e). To adopt a contextual orientation to systematically developing and sustaining partnerships is to identify ways that decisions affect and are affected by elements of social processes: participants, perspectives, situations, values, strategies, outcomes and effects (Lasswell, 1971; Stibbe et al., 2018; UNDRR, 2021e).
In response to the question of what and how to change styles of governance when confronted with systemic risks, the following enabling circumstances are identified as part of a whole systems approach that can facilitate a transition towards transformative governance, and place stakeholders in a better position to address systemic risks:
● Systemic risk emerges from complex system properties and needs to be better understood and addressed by whole systems approaches. There is an urgent need for more investment (including through international cooperation mechanisms) in capacity for monitoring, data gathering, applied research and making information accessible. These are needed to support prospective risk management. Governance arrangements need to be inclusive of all stakeholders affected by emerging systemic risk.
● Stakeholders who aim for transformation towards systemic risk governance should understand themselves as part of the system, affecting and being affected by it, rather than perceiving themselves as standing outside the system with the goal of controlling it.
● The nature of systemic risk makes design and control approaches less effective, and calls for decentralized, centralized and polycentric styles of governance.
● Continuous, deliberative and accelerated learning cycles are central to effective governance arrangements for systemic risk.
● Enablers and levers for transforming governance arrangements that are able to respond to systemic risk are found in the practical, political–institutional and personal spheres.
● Governance arrangements for systemic risk should be part of continuous and accelerated learning cycles.
195
● Leadership is helpful to guide governance transitions towards managing systemic risk and this can occur at multiple levels within organizations.
● The structure and operation of governance arrangements for systemic risk should be based on systems science and be able to generate systems knowledge, target knowledge and transformation knowledge.
● Advancements in general complexity science literacy can help navigate decision makers and their staff towards governance arrangements that better respond to systemic risk.
The sustainability of partnerships is fundamentally determined by trust and shaped by the continuation of relationships among people. Rather than relying solely on external motivators for individual compliance (e.g. retribution and incentives), it is preferable to focus on internal motivators, including
trust in others (Ostrom, 1990; Hamm et al., 2013; Stern and Coleman, 2015; Song et al., 2019). This trust is founded on: capabilities that include rational thinking based on credible, accessible and relevant information; procedural aspects such as processes for equitable engagement and capacity-building; and the personal sphere, or affinitive frames, being the reasons for and the ability to place trust in others.
196
Case study
Food systems and systemic risk In late 2021, global food prices hit a 10 year high due to a combination of factors including poor wheat harvests in key producing countries and lower food oil production due to labour shortages (Silver, 2021; FAO, 2021c). Coming after 2 years of wider socioeconomic disruption from the COVID-19 pandemic, it was a stark reminder of the systemic risk inherent in global food systems, and the intimate connections between food security and the wider global economy. With climate change accelerating the intensity of hazards and increasing volatility in food prices, it is imperative to build greater resilience into food systems (UNDRR, 2021e).
Food availability for different communities and countries is underpinned by volatile and often fragile systems of production, processing and distribution, laced with profound global inequalities (OECD, 2021b). SDG 2 on zero hunger is underpinned by a recognition that access to a healthy diet is a human right, and that equality in food systems is central to achieving it. However, food systems have been optimized over decades for “productivity” (of calories) and efficiency, providing calorie-rich but often nutrient-poor diets. Achieving resilience to disasters and climate change in food systems means addressing the root causes and drivers of food insecurity. Planning and monitoring DRR policy interventions to ensure no one is left behind also requires a combination of traditional and indigenous knowledge and experimental thinking.
The governance and market systems for food production and distribution have high levels of systemic risk. For example, drought impacts on global food supply are usually managed through substitution from other sources (UNDRR, 2021e). But drought-related reduction in food production in major agricultural countries can strongly influence global food trade and pricing, with repercussions especially on poorer populations in areas that may be distant from the drought.
In the worst case, synchronous failures in several core food-producing areas (“breadbaskets”) can lead to wider systemic effects with severe repercussions, including social unrest (Gaupp et al., 2020). Simultaneous drought, flood or wildfire events affecting connected breadbaskets like Argentina, Australia, Brazil, Europe and the United States could lead to a global food price crisis and potentially trigger other systemic risks. In view of climate variability at the global scale, there is increased probability of multiple breadbasket failures (Gaupp et al., 2020).
For policymakers, supporting more resilient food systems requires addressing the “triple challenge” of balancing: (a) food security and nutrition, (b) livelihoods and (c) environmental sustainability. It also requires a better understanding of how food production systems, as well as food processing and distribution structures, interact with each other and with other systems. Achieving this will require more flexible and responsive governance and financing mechanisms that incentivize built-in redundancy and diversification in systems and incorporate better risk understanding and greater participation of stakeholders in decision-making (Chapter 12).
197
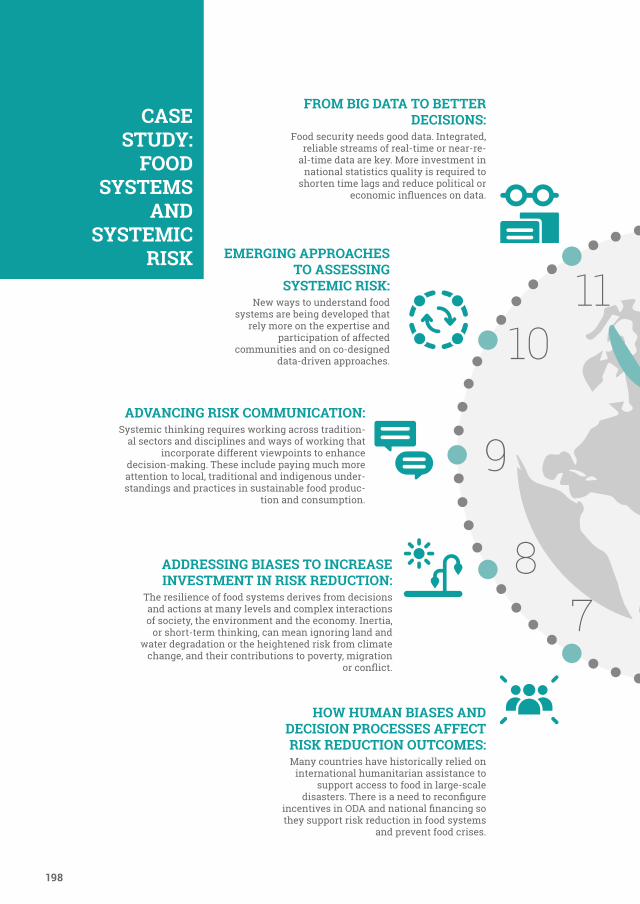
TRANSITIONS TO SYSTEMIC RISK GOVERNANCE: In the face of global systemic risk, governance systems must evolve quickly and recognize that the challenges of economy, environment and equality can no longer be separated. As resources, goods and people travel across political and geographic boundaries, risk reduction and adaptive activities must be co-managed by all relevant stakeholders.
INTRODUCTION – REWIRING SYSTEMS FOR A RESILIENT FUTURE: As human societies push the planet towards its existential and ecosystem limits, food systems are exposed to, and contribute to, growing levels of risk.
FROM BIG DATA TO BETTER DECISIONS:
Food security needs good data. Integrated, reliable streams of real-time or near-re-
al-time data are key. More investment in national statistics quality is required to
shorten time lags and reduce political or economic influences on data.
HOW SYSTEMS UNDERVALUE KEY ASSETS AND OPPORTUNITIES FOR LEARNING: Countries need financial strategies that allow them to prevent crises by reducing risk and acting early, including through anticipatory, forecast-based and data-driven financing for food security risk.
HOW HUMAN BIASES AND DECISION PROCESSES AFFECT RISK REDUCTION OUTCOMES: Many countries have historically relied on
international humanitarian assistance to support access to food in large-scale
disasters. There is a need to reconfigure incentives in ODA and national financing so they support risk reduction in food systems
and prevent food crises.
SHIFTING PERCEPTIONS ON RISK: Governments are starting to acknowledge the value of traditional conservation practices such as the long-standing systems in the Middle East that regulate livestock grazing in line with the dry season.
ADVANCING RISK COMMUNICATION:Systemic thinking requires working across tradition-
al sectors and disciplines and ways of working that incorporate different viewpoints to enhance
decision-making. These include paying much more attention to local, traditional and indigenous under-standings and practices in sustainable food produc-
tion and consumption.
EMERGING APPROACHES TO ASSESSING
SYSTEMIC RISK: New ways to understand food
systems are being developed that rely more on the expertise and
participation of affected communities and on co-designed
data-driven approaches.
ADDRESSING BIASES TO INCREASE INVESTMENT IN RISK REDUCTION:
The resilience of food systems derives from decisions and actions at many levels and complex interactions of society, the environment and the economy. Inertia,
or short-term thinking, can mean ignoring land and water degradation or the heightened risk from climate
change, and their contributions to poverty, migration or conflict.
OUR WORLD AT RISK: Food insecurity risk is unevenly spread. It is estimated there are enough calories produced to meet the calorific needs of every human alive on the planet, but tens of thousands of people die every day from starvation, and millions more face lifelong disabilities as a result of undernutrition.
HOW HUMAN CHOICES DRIVE VULNERABILITY, EXPOSURE AND DISASTER RISK:The nexus between risk governance and development is seen in relation to reduction of poverty, access to sufficient and consistent supplies of nutritious food, good health, clean water, affordable energy, and climate change adaptation and mitigation (SDGs 1, 2, 3, 6, 7 and 13).
SYSTEMIC RISK AS A CHALLENGE TO SUSTAINABLE DEVELOPMENT: There have been increasing calls to adopt a “food systems approach” to stabilizing prices and securing equitable and universal access to sufficient nutritious food. This requires simultaneous progress on the “triple challenge” of balancing (a) food security and nutrition, (b) livelihoods and (c) environmental sustainability.
CASE STUDY:
FOOD SYSTEMS
AND SYSTEMIC
RISK 12
6
11 110 2
7 58 4
9 3
198
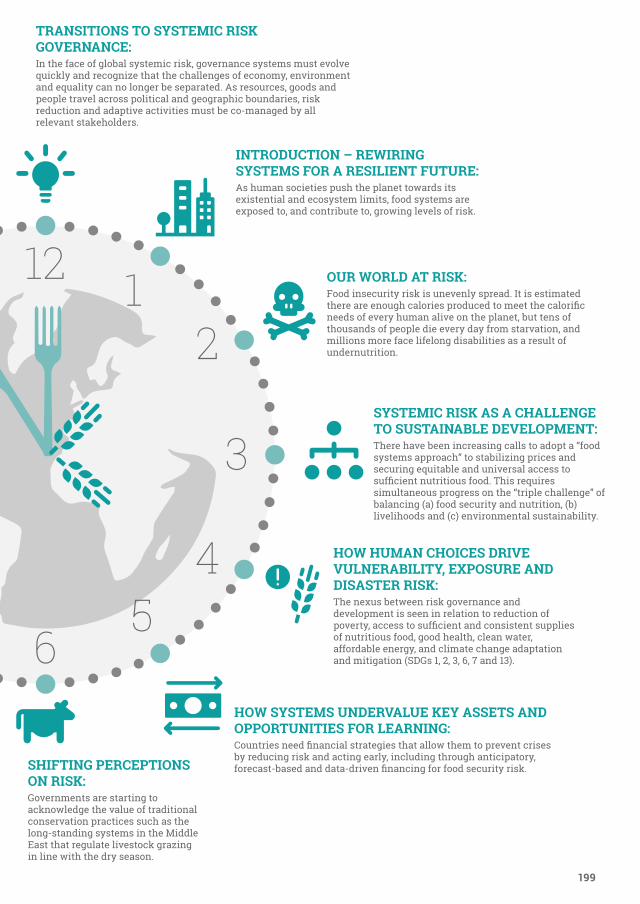
TRANSITIONS TO SYSTEMIC RISK GOVERNANCE: In the face of global systemic risk, governance systems must evolve quickly and recognize that the challenges of economy, environment and equality can no longer be separated. As resources, goods and people travel across political and geographic boundaries, risk reduction and adaptive activities must be co-managed by all relevant stakeholders.
INTRODUCTION – REWIRING SYSTEMS FOR A RESILIENT FUTURE: As human societies push the planet towards its existential and ecosystem limits, food systems are exposed to, and contribute to, growing levels of risk.
FROM BIG DATA TO BETTER DECISIONS:
Food security needs good data. Integrated, reliable streams of real-time or near-re-
al-time data are key. More investment in national statistics quality is required to
shorten time lags and reduce political or economic influences on data.
HOW SYSTEMS UNDERVALUE KEY ASSETS AND OPPORTUNITIES FOR LEARNING: Countries need financial strategies that allow them to prevent crises by reducing risk and acting early, including through anticipatory, forecast-based and data-driven financing for food security risk.
HOW HUMAN BIASES AND DECISION PROCESSES AFFECT RISK REDUCTION OUTCOMES: Many countries have historically relied on
international humanitarian assistance to support access to food in large-scale
disasters. There is a need to reconfigure incentives in ODA and national financing so they support risk reduction in food systems
and prevent food crises.
SHIFTING PERCEPTIONS ON RISK: Governments are starting to acknowledge the value of traditional conservation practices such as the long-standing systems in the Middle East that regulate livestock grazing in line with the dry season.
ADVANCING RISK COMMUNICATION:Systemic thinking requires working across tradition-
al sectors and disciplines and ways of working that incorporate different viewpoints to enhance
decision-making. These include paying much more attention to local, traditional and indigenous under-standings and practices in sustainable food produc-
tion and consumption.
EMERGING APPROACHES TO ASSESSING
SYSTEMIC RISK: New ways to understand food
systems are being developed that rely more on the expertise and
participation of affected communities and on co-designed
data-driven approaches.
ADDRESSING BIASES TO INCREASE INVESTMENT IN RISK REDUCTION:
The resilience of food systems derives from decisions and actions at many levels and complex interactions of society, the environment and the economy. Inertia,
or short-term thinking, can mean ignoring land and water degradation or the heightened risk from climate
change, and their contributions to poverty, migration or conflict.
OUR WORLD AT RISK: Food insecurity risk is unevenly spread. It is estimated there are enough calories produced to meet the calorific needs of every human alive on the planet, but tens of thousands of people die every day from starvation, and millions more face lifelong disabilities as a result of undernutrition.
HOW HUMAN CHOICES DRIVE VULNERABILITY, EXPOSURE AND DISASTER RISK:The nexus between risk governance and development is seen in relation to reduction of poverty, access to sufficient and consistent supplies of nutritious food, good health, clean water, affordable energy, and climate change adaptation and mitigation (SDGs 1, 2, 3, 6, 7 and 13).
SYSTEMIC RISK AS A CHALLENGE TO SUSTAINABLE DEVELOPMENT: There have been increasing calls to adopt a “food systems approach” to stabilizing prices and securing equitable and universal access to sufficient nutritious food. This requires simultaneous progress on the “triple challenge” of balancing (a) food security and nutrition, (b) livelihoods and (c) environmental sustainability.
CASE STUDY:
FOOD SYSTEMS
AND SYSTEMIC
RISK 12
6
11 110 2
7 58 4
9 3
199
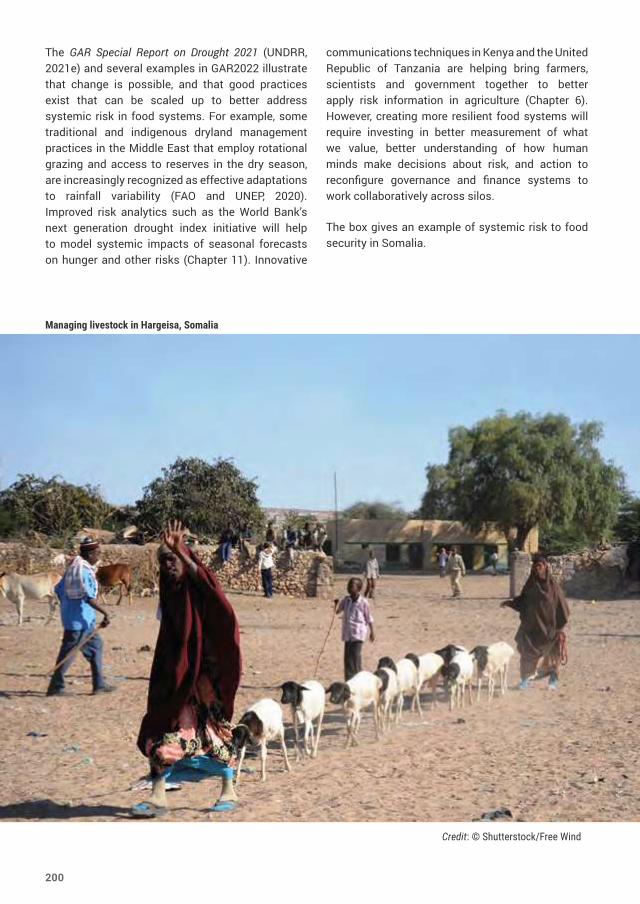
The GAR Special Report on Drought 2021 (UNDRR, 2021e) and several examples in GAR2022 illustrate that change is possible, and that good practices exist that can be scaled up to better address systemic risk in food systems. For example, some traditional and indigenous dryland management practices in the Middle East that employ rotational grazing and access to reserves in the dry season, are increasingly recognized as effective adaptations to rainfall variability (FAO and UNEP, 2020). Improved risk analytics such as the World Bank’s next generation drought index initiative will help to model systemic impacts of seasonal forecasts on hunger and other risks (Chapter 11). Innovative
communications techniques in Kenya and the United Republic of Tanzania are helping bring farmers, scientists and government together to better apply risk information in agriculture (Chapter 6). However, creating more resilient food systems will require investing in better measurement of what we value, better understanding of how human minds make decisions about risk, and action to reconfigure governance and finance systems to work collaboratively across silos.
The box gives an example of systemic risk to food security in Somalia.
Managing livestock in Hargeisa, Somalia
Credit: © Shutterstock/Free Wind
200
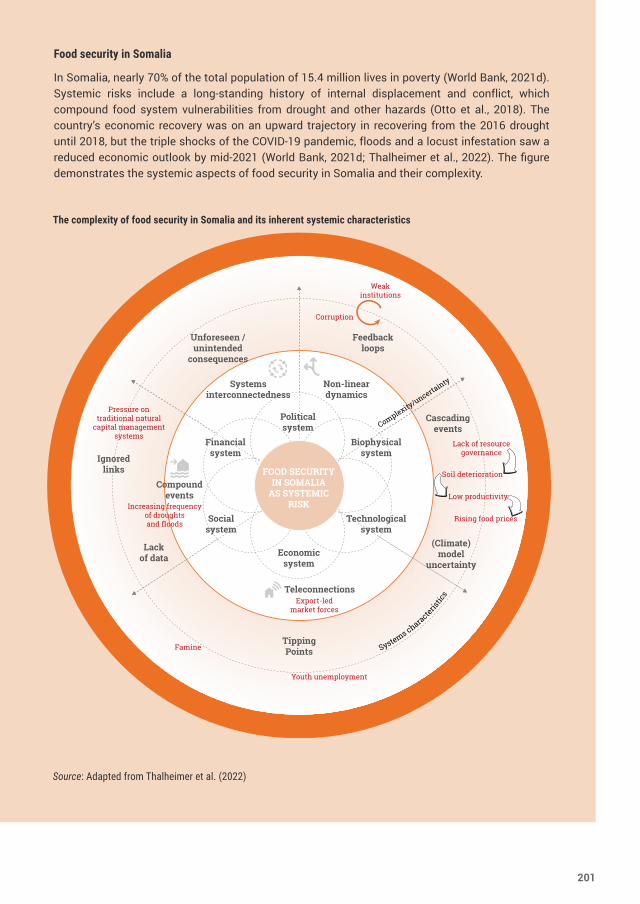
Food security in Somalia
In Somalia, nearly 70% of the total population of 15.4 million lives in poverty (World Bank, 2021d). Systemic risks include a long-standing history of internal displacement and conflict, which compound food system vulnerabilities from drought and other hazards (Otto et al., 2018). The country’s economic recovery was on an upward trajectory in recovering from the 2016 drought until 2018, but the triple shocks of the COVID-19 pandemic, floods and a locust infestation saw a reduced economic outlook by mid-2021 (World Bank, 2021d; Thalheimer et al., 2022). The figure demonstrates the systemic aspects of food security in Somalia and their complexity.
FOOD SECURITY IN SOMALIA
AS SYSTEMIC RISK
Political system
Economic system
Non-linear dynamics
Systems interconnectedness
Compoundevents
Unforeseen / unintended
consequences
Feedbackloops
Cascadingevents
Biophysicalsystem
Technological system
Socialsystem
Financialsystem
Teleconnections
TippingPoints
(Climate)model
uncertainty
Lackof data
Ignoredlinks
Pressure ontraditional natural
capital managementsystems
Corruption
Weakinstitutions
Lack of resourcegovernance
Soil deterioration
Low productivity
Rising food prices
Export-ledmarket forces
Youth unemployment
Famine
Complexity/uncerta
inty
Systems characterist
ics
Increasing frequencyof droughtsand floods
The complexity of food security in Somalia and its inherent systemic characteristics
Source: Adapted from Thalheimer et al. (2022)
Credit: © Shutterstock/Free Wind
201
13. ConclusionsRisk is increasing globally, as are the number and costs of disasters. Intensive and extensive risks are growing at an unprecedented rate. Human action is creating greater and more dangerous risk. As risk multiplies, it has increasing impacts on communities and also on whole systems. Everyone is living downstream of something else. Global impacts become local, and vice versa. They cascade across sectors, creating new challenges. If current trends continue, the number of disasters per year globally may increase by 40% during the lifetime of the Sendai Framework from 2015 to 2030. For droughts, there is a large year-on-year variation, but current trends indicate a likely increase of more than 30% between 2001 and 2030. The number of extreme temperature events per year is also increasing, and based on current trends will almost triple between 2001 and 2030. While disasters are claiming fewer lives annually, they are also costing more and increasing poverty. Economic losses from disasters have more than doubled over the past three decades, showing an increase of 145% from an average of around $70 billion per year in the 1990s to over $170 billion per year in the decade ending in 2020.
Approximately 40% of this loss is insured. However, such coverage is overwhelmingly concentrated in developed countries, with insurance coverage rates in the developing world averaging less than 9%. There are many systemic risks and trends, like sea-level rise, for which insurance is not an option.
GAR2022 has shown it is possible and imperative to accelerate action for risk-informed sustainable development. Good development does not need to create risk. When investment reduces risk, systemic benefits also cascade across systems. For example, reducing urban black smog emissions reduces carbon dioxide, incentivizes cleaner energy, reduces pollution and improves health outcomes. As such, it is imperative to align climate change and COVID-19 recovery investment to reduce risk and stabilize sustainable development.
13.1 Living with a new risk landscape GAR2022 has outlined that the climate emergency and systemic impacts of the COVID-19 pandemic point to a new reality. In a world of certain uncertainty, understanding risk is fundamental to achieving genuinely sustainable development. The best defence against future shocks is to transform systems now and build resilience by addressing climate change and other hazards. This includes reducing the vulnerability, exposure and inequality that drive disasters. Action is possible. There is a wealth of experience and learning from within DRR practice that can be drawn upon. Learning in real time from the systemic impact of major events like the COVID-19 pandemic is also important.
13.1.1 Moving towards institutions that are comfortable with uncertainty is necessaryThe planning systems and institutional culture of the twentieth century worked towards fixed time frames, for known outcomes in contexts that were largely stable and linear, or were assumed to be. The complexity of today’s world and the destabilization of global ecosystems through climate change and other direct human impacts require that twenty-first century institutional cultures must become more comfortable with uncertainty. They need to manage responsively within wider parameters of possible outcomes rather than assuming there are static targets to meet.
This does not mean discounting science, which provides essential insights on trends, relationships and solutions. It does mean recognizing that the sheer number of variables within systemic global risk makes it impossible to settle on a single trajectory. Planners need to consider “baskets” of possible outcomes, to be more agile in identifying when changes in assumptions are needed, and to respond to those changes actively. Governance
202
systems need urgently to adapt their accepted methods for setting targets, to reward learning from mistakes, and to reassess how to communicate more clearly around trends and uncertainty. This report has provided insights on how this can be done, from the National Resilience Taskforce in Australia (Chapters 6 and 12), to significant work developing systemic modelling methods (Chapter 10) and the use of combined technologies and community information through tools like the World Bank’s next generation drought index (Chapter 11).
13.1.2 Building resilience is fundamental to climate action and achievement of the Sustainable Development GoalsSocieties around the world deserve governance systems that look holistically at how people, the planet and prosperity interact, not only today but also in the climate future. Increasingly, expert processes such as those of IPCC have demonstrated the extent of future risk across systems. However, just as risk is interconnected, so are solutions. For example, regenerating ecosystems through replanting forests in river catchments can have a positive multiplier effect by reducing erosion and flood exposure, cleaning water supplies, sequestering carbon and increasing local livelihoods.
Similar synergies for action exist across the Sendai Framework, the Paris Agreement and the SDGs of the 2030 Agenda. Harnessing efficiencies across systems is particularly important for accelerating development in countries where resources are limited. Governments need to put more effort into planning in a comprehensive manner, to scale up risk governance by working across sectors and at different levels to gain these positive multiplier effects. Good examples include the efforts to co-design future water pathways for the Indus basin (Chapter 4), and resilience bonds that bring co-benefits to combat climate change and develop infrastructure that is more resilient (Chapter 8).
13.1.3 The first line of defence in resilience building is addressing the root causes and drivers of vulnerabilitySocietal choices are at the heart of why some individuals and groups are more vulnerable to disasters, experience proportionally greater immediate impacts due to exposure and lack of resources, and face slower recovery and long-term impoverishment. Unpacking the dynamics that drive vulnerability, including structural inequality, is key to the effective targeting and execution of risk reduction efforts that leave “no one behind”. Insights into how this can be done come from the use of forensic disaster analysis in Guatemala and Nepal (Chapter 4), new approaches to seeing systemic risk (Chapter 6) and innovative consultation and risk communication methods (Chapter 9).
GAR2022 identifies three key bottlenecks that are hindering progress on reducing risk:
● Governance systems are measuring and valuing the wrong things (Chapter 5).
● Products and services work against, not with, how human minds and institutions make decisions (Chapters 5–8).
● Current methods fail to understand and manage risk as it cascades across systems and sectors (Chapters 5 and 10–12).
Action is possible to address each of these bottlenecks. The report outlines examples where this is being done; however, transforming systems requires immediate, concerted action.
13.2 A call to action to accelerate risk reductionThree key actions for policymakers, combined, can catalyse the required transformations necessary to address systemic risk:
1. Measure what we value.
2. Design systems to factor in how human minds make decisions about risk.
3. Reconfigure governance and financial systems to work across silos and design in consultation with affected people.
203
1. To help measure what we valueThe world is not on track to reduce risk. The costs of disasters are increasing in both social and economic terms, threatening sustainable development (Chapters 2 and 3). Balance sheets ignore key variables, particularly undervaluing climate change risk, costs to ecosystems and the positive social benefits of risk reduction. The real costs of extensive risk are especially undervalued, and this gap is widening as major climate change impacts such as sea-level rise gather pace. To help measure what we value key actions are to:
1.1 Rework financial systems to account for the real costs of risk, particularly long-term risks, and rework investment and insurance systems to incentivize risk reduction
Governments and the financial industry urgently need to improve how they account for the extent of financial assets at risk under various future climate change scenarios. Social and environmental impact assessments undertaken during the initiation of projects need to be extended to include regular reporting by the public sector, major companies, investments and pension funds. Risk myopia means there are few safe options offered for risk-resilient investments. Just as green bonds helped accelerate the finance of renewable energy, similar financial products are needed to incentivize and ease investment that is resilient to disaster risk and climate change. For example, since 1997, Costa Rica has led in the use of financial levers to promote conservation and climate change action, using carbon tax revenues to fund forest preservation and sustainable development (Chapter 8). More recently, in 2020, De Nederlandsche Bank became the first central bank to track biodiversity as a material financial risk. This action revealed that 36% of the portfolio values of the Dutch financial institutions were exposed to nature-related risk (Chapter 5).
1.2 Adapt national fiscal planning and risk financing to consider risk and uncertainty
Public sector finance “stress-testing” methodologies need to be extended to learn from the COVID-19 pandemic, and to test for a wider range of systemic risks with potentially cascading impacts. National budgets also need to evolve to include risk and uncertainty components, so financial planners can
become more adept at adaptive planning and are better able to pivot resources in crisis situations. New impact modelling techniques show how, in places such as Saint Lucia, a storm surge can have cascading impacts across the economy that threaten sustainable development (Chapter 10). National and regional approaches to disaster and climate risk financing that layer risk through different forms of insurance and contingency funds also provide ways to deal with various levels of risk and uncertainty (Chapters 2, 8 and 11).
2. To help design systems to factor in how human minds make decisions about riskPolicymakers and providers of DRR products and services to households and communities continue to undervalue how risk perceptions, including cognitive biases, influence decision-making. To help design systems that factor in how human minds make decisions about risk, key actions are to:
2.1 Recognize the role of people’s perceptions of risk and biases to close the gap between intention and action in reducing risk
Adjusting how insurance products are marketed can have a transformative impact on ensuring risk-resilient investment. This includes reframing risk approaches such as using opt-out rather than opt-in schemes for flood insurance (Chapters 8 and 11). Improving codes and standards, and also the communication around why they are necessary, is key. For example, after the 2010 earthquake and tsunami, the Government of Chile helped incentivize safe construction by providing funds to poor families to cover the cost of “half a good house” that adhered to building code, but which also allowed personalization of homes by owners (Chapter 4).
2.2 Recognize the value of risk analytics as a tool but not a panacea
Lessons learned from the COVID-19 pandemic show that the success rates of models were uneven in predicting the spread of the disease within and among countries. Decision makers went from an over-reliance on models to extreme scepticism about their utility. Modelling tools can help people to think about things in a better way, but they
204
cannot predict the future with granular accuracy. No models are 100% reliable. However, they are essential tools as long as the people who interpret them do not have unrealistic expectations of their omnipotence or dismiss them. Governments can, and should, invest in data analytics, but only if quality models and big data use are combined with methods to draw on local knowledge, community feedback and expert opinion. For example, in West Africa, resilience strategies for the cocoa industry are being developed using climate change models combined with storylines, co-created with producers, importers and representatives from civil society and government (Chapter 11). In Finland and Norway, land-use foresight processes are used to help investigate impacts of decision-making on society, the economy and the environment. Methods combine digital stakeholder engagement platforms, spatial data and a range of outreach tools to engage the public in planning processes (Chapter 4).
3. To help reconfigure governance and financial systems to work across silos and design in consultation with affected peopleGovernance and financial systems are not yet embracing transdisciplinary approaches and tend to take top-down approaches. To help reconfigure governance and financial systems to work across silos and design in consultation with affected people, key actions are to:
3.1 Embrace a new “risk language” that cuts across multiple disciplines
DRM actors and other sectors speak differently about risk and too often operate in sectoral “silos”. There is a need to look more at systems, not individual hazards, and to work across disciplines. This requires increased efforts to create common terminologies and provide open access data across disciplines to create shared knowledge, encourage lateral collaboration and speed up the pace of learning. Disaster risk modellers have been learning from tools developed to measure cascading effects during the last financial crisis and from enterprise risk management approaches. But this learning needs to go both ways between governments and communities, and be built into
planning and budgeting processes (Chapter 11). In Samburu County, Kenya, pastoralists, farmers and fishers needed access to forecasts of extreme weather to make critical decisions that affect crops, animals, and their own safety and quality of life. A communication gap that developed between these end users, climate scientists and local media was bridged by a trust-building collaboration that developed ways to translate scientific data into useful information for local communities (Chapter 11). At the global level, initiatives such as the UNDRR and International Science Council joint Hazard Definition and Classification Review, the new Centre of Excellence for Climate and Disaster Resilience established by UNDRR and the World Meteorological Organization (Chapter 1) and similar inter-agency collaborations that upgrade disaster damage and loss reporting are helping to increase the interoperability and utility of data systems. Such efforts need to be supported to enable enhanced risk understanding at a global level.
3.2 Step up participation, transparency and citizen dialogue in risk decision-making to accelerate learning and necessary adjustments
Modern technology provides opportunities to accelerate learning and to quickly pick up signals essential for effective risk management in an uncertain future. But acting on these signals requires nuanced forms of communication with the public, and particularly better communication with higher-risk groups. Enhanced social protection systems targeted towards at-risk groups can be a good vehicle for better understanding who is most vulnerable to emerging risks and for ensuring effective anticipatory action to prevent acute humanitarian crises. For example, post-disaster analysis in Guatemala showed how awareness and community dialogue and action were central to effective action after a volcanic eruption (Chapter 4). In New Zealand, citizen dialogue has been able to harness vital local indigenous knowledge essential to improve ecosystem management (Chapter 6). In Wolong, China, participatory governance and cross-government systems for forest conservation were key to local support for a transition to nature-based solutions, adaptation and systemic risk management (Chapter 12).
205
3.3 Enhance multi-scale risk management
Rifts can emerge between the national and local levels during major crises, as was the case in many jurisdictions during the COVID-19 crisis. Autonomy for local-level action is essential. More emphasis is required in scenario planning to manage extensive disasters and to handle governance issues resulting from cascading impacts. For example, adjustments made to health systems based on local knowledge and feedback were essential to building trust during the 2014 Ebola outbreak in Liberia (Chapter 7). In Canada, an InterSectoral Flood Network of Quebec presents modelling data and also explicitly facilitates co-training among members to promote a vision that is systemic and intersectoral, engaging universities and various socioeconomic partners and disciplines (Chapter 10).
This report has outlined how immediate action around these three areas can help governments, local communities and individuals better position themselves to cope with a volatile, uncertain future. The keys to building resilience and accelerating sustainable development are measuring what we value, designing systems around the way people make decisions on risk, and reconfiguring governance and financial systems to work collaboratively and across silos. As climate change impacts gather pace, we know what is at stake for future generations. The baseline is established. The time for action is now.
206
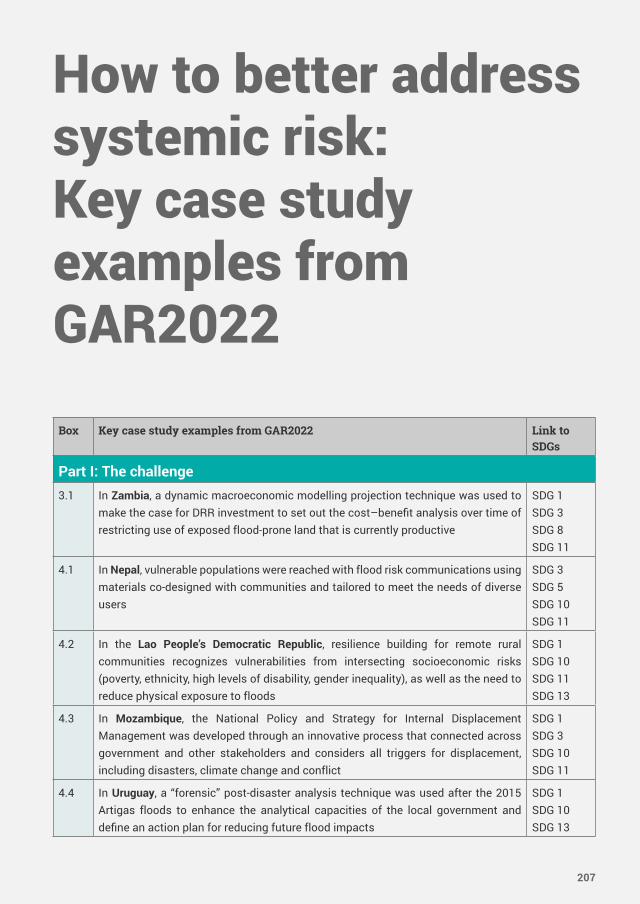
How to better address systemic risk: Key case study examples from GAR2022
Box Key case study examples from GAR2022 Link to SDGs
Part I: The challenge3.1 In Zambia, a dynamic macroeconomic modelling projection technique was used to
make the case for DRR investment to set out the cost–benefit analysis over time of restricting use of exposed flood-prone land that is currently productive
SDG 1SDG 3SDG 8SDG 11
4.1 In Nepal, vulnerable populations were reached with flood risk communications using materials co-designed with communities and tailored to meet the needs of diverse users
SDG 3 SDG 5SDG 10SDG 11
4.2 In the Lao People’s Democratic Republic, resilience building for remote rural communities recognizes vulnerabilities from intersecting socioeconomic risks (poverty, ethnicity, high levels of disability, gender inequality), as well as the need to reduce physical exposure to floods
SDG 1SDG 10SDG 11SDG 13
4.3 In Mozambique, the National Policy and Strategy for Internal Displacement Management was developed through an innovative process that connected across government and other stakeholders and considers all triggers for displacement, including disasters, climate change and conflict
SDG 1 SDG 3SDG 10SDG 11
4.4 In Uruguay, a “forensic” post-disaster analysis technique was used after the 2015 Artigas floods to enhance the analytical capacities of the local government and define an action plan for reducing future flood impacts
SDG 1SDG 10SDG 13
207
4.5 For the Indus basin, the countries that share this major water catchment have co-designed future water resource pathways, applying a scenario-based policy tool to develop and co-define a joint vision about existing challenges and possible pathways for the basin
SDG 1SDG 8SDG 13SDG 15
6.1 In Australia, the State of Victoria co-developed The Victorian Traditional Owner Cultural Fire Strategy, with Traditional Owners and the environment department to reintroduce Cultural Fire practices that reduce human and ecosystem risk from wildfires
SDG 10SDG 12SDG 13SDG 15
6.2 In Viet Nam, a diverse group of stakeholders is engaged in COVID-19 recovery planning using a “deep demonstration” approach focusing on small business and financial incentives, to help transition to a circular economy future in harmony with sustainable development
SDG 1 SDG 9SDG 11SDG 12SDG 15
6.3 In Kenya and the United Republic of Tanzania, the Developing Risk Awareness through Joint Action approach translates technical weather and climate information produced by scientists and forecasters into useful, accessible knowledge for community users
SDG 1 SDG 3 SDG 9SDG 13
6.4 In Australia, the National Resilience Taskforce has led an interactive process about what makes Australia vulnerable to disasters including analysing its exposure to systemic risk
SDG 1SDG 10SDG 13SDG 15
Part II: The role of biases and communication in risk reduction7.1 In Liberia during the 2014 Ebola epidemic, the International Federation of Red
Cross and Red Crescent Societies improved training and communication about risk, working with trusted local community leaders, leading to changes in burial practices that reduced risk
SDG 3SDG 6 SDG 9
7.2 In Indonesia, following a mudflow inundating 12 villages, one community that was able to stay together during the government-supported recovery showed a relatively fast and resilient return to normal due to social connection and identity maintenance
SDG 1 SDG 3SDG 10
8.2 In Barbados, innovative scenario-based modelling was applied to estimate direct and indirect economic losses from a potential Category 5 storm, demonstrating likely systemic impacts throughout the economy
SDG 1 SDG 9SDG 13
8.3 In Nepal, a long-running weekly radio programme was used to swap ideas among ordinary people on how to cheaply retrofit their homes for earthquake resilience; it also role modelled women retraining as skilled masons to boost their livelihoods
SDG 1 SDG 5 SDG 9SDG 10
8.4 In Bangladesh, a national television reality programme was used to showcase communities coming together to take action to adapt to climate change and reduce risk
SDG 1SDG 10SDG 11
208
8.5 In Costa Rica, a carbon tax has been applied since 1997, which includes a connection for taxpayers between fuel use and benefits to their own communities, with a portion of the revenue going to pay farmers and indigenous communities to protect and regrow tropical forests
SDG 1SDG 10SDG 15
8.6 In France, Mexico, Mongolia and Sweden, innovative finance for risk reduction in the form of green bonds and other finance for climate resilience are being used to support public and private sector investment in climate- and disaster-resilient infrastructure and other large-scale projects
SDG 7SDG 8 SDG 9SDG 11
9.1 In Ecuador, community-based risk communication for Tungurahua volcano uses a network of local residents that links with the established risk management system, enabling the community to remain living close to the restless volcano
SDG 1SDG 3 SDG 9SDG 10
9.2 In Nepal, a local film on earthquake-resistant construction that cast community members as role models was successful in informing and motivating community listeners to build earthquake-resistant homes
SDG 3SDG 11
9.3 In Costa Rica, an innovative risk communication campaign addressed local concerns to increase interest and pre-emptive action in risk reduction, including that fear for the safety of pets was likely to delay evacuation
SDG 3SDG 10SDG 15
9.4 In Cambodia, a national reality television programme that featured community members learning how to reduce flood risk helped to change a prevailing view that there was little they could do, by demonstrating practical successes
SDG 1SDG 3SDG 10
Part III: Towards a more resilient future 11.2 In Kenya, food producers have been able to access enhanced forecasts of extreme
weather to make critical decisions that affect crops, animals, and their own safety and quality of life
SDG 1SDG 10SDG 13SDG 15
12.1 In Australia, planning approaches are being adjusted to include systemic vulnerability and new approaches to disaster risk and resilience assessment
SDG 1 SDG 8SDG 13
12.3 In Italy, legislation underpins collaboration to ensure that action-oriented transdisciplinary research is co-produced with technical decision makers in civil protection agencies
SDG 3 SDG 8 SDG 9
12.4 In India, in the old city of Ahmedabad, the initial experience of COVID-19 impacts provided important lessons for later government approaches, demonstrating that in a poor socioeconomic area, people did not have the financial and food resources to comply with restrictions on movement in the absence of social protection measures
SDG 1 SDG 3SDG 10SDG 11
12.5 In China, the National Forest Conservation Program in Wolong National Nature Reserve demonstrates how a cross-sectoral and local governance approach can bring positive synergies between disaster protection (nature-based solutions to floods), climate mitigation and adaptation, maintaining biodiversity, social equity and human welfare
SDG 1SDG 10SDG 13SDG 15
209
Abbreviations and acronyms2030 Agenda Transforming our World: the 2030 Agenda for Sustainable Development
AIDS acquired immune deficiency syndrome
COVID-19 coronavirus disease
DRM disaster risk management
DRR disaster risk reduction
EM-DAT International Disaster Database
G20 Group of Twenty
GAR2022 Global Assessment Report on Disaster Risk Reduction 2022
GDP gross domestic product
GHG greenhouse gas
IFRC International Federation of Red Cross and Red Crescent Societies
IPCC Intergovernmental Panel on Climate Change
MERS Middle East respiratory syndrome
MSME micro-, small- and medium-sized enterprise
NASA National Aeronautics and Space Administration
ODA official development assistance
SARS severe acute respiratory syndrome
SDG Sustainable Development Goal
Sendai Framework Sendai Framework for Disaster Risk Reduction 2015–2030
SFM Sendai Framework Monitor
SIDS small island developing States
UNDP United Nations Development Programme
UNDRR United Nations Office for Disaster Risk Reduction
UN DESA United Nations Department of Economic and Social Affairs
WHO World Health Organization
210
References Abram, N.J., B.J. Henley, A. Sen Gupta, T.J.R. Lippmann,
H. Clarke, A.J. Dowdy, J.J. Sharples, R.H. Nolan, T. Zhang, M.J. Wooster, J.B. Wurtzel, K.J. Meissner, A.J. Pitman, A.M. Ukkola, B.P. Murphy, N.J. Tapper and M.M. Boer (2021). Connections of climate change and variability to large and extreme forest fires in southeast Australia. Communications Earth & Environment, vol. 2, no. 1, pp. 1–17.
Adams, W. and D.E. Bratt (1992). Young coconut water for home rehydration in children with mild gastroenteritis. Tropical and Geographical Medicine, vol. 44, no. 1–2, pp. 149–153.
ADPC (Asian Disaster Preparedness Center) (2019). iPrepare Business Annual Report 2019. Bangkok. www.adpc.net/Igo/category/ID1598/doc/2020-rVMy51-ADPC-iPrepare_Annual_Report_2019.pdf
Adshead, D., L.I. Fuldauer, S. Thacker, O. Román García, S. Vital, F. Felix, C. Roberts, H. Wells, G. Edwin, A. Providence and J.W. Hall (2020). Saint Lucia: National Infrastructure Assessment. Copenhagen: United Nations Office for Project Services. content.unops.org/publications/Saint-Lucia-National-Infrastructure-Assessment.pdf
Aerts, J.C.J.H., W.J.W. Botzen, K. Emanuel, N. Lin, H. de Moel and E.O. Michel-Kerjan (2014). Evaluating flood resilience strategies for coastal megacities. Science, vol. 344, no. 6183, pp. 473–475.
Afifi, W.A. and T.D. Afifi (2021). Uncertainty and coping during COVID-19. In Communicating COVID-19: Interdisciplinary Perspectives, M. Lewis, E. Govender and K. Holland, eds., pp. 325–344. Cham: Palgrave Macmillan. doi.org/10.1007/978-3-030-79735-5_16
AfRPDRR (8th Africa Regional Platform for Disaster Risk Reduction) (2021a). Report of the Drafting Committee on the 8th Africa Regional Platform for Disaster Risk Reduction: 18 November 2021, Nairobi. Towards disaster risk-informed development for a resilient Africa in a COVID-19 transformed world. United Nations Office for Disaster Risk Reduction. afrp.undrr.org/sites/default/files/2021-11/Report%20of%20the%20Drafting%20Committee%20for%20the%20High-level%20Meeting-19%20Nov%202021_0.pdf
__________ (2021b). Declaration of the Seventh High-Level Meeting on Disaster Risk Reduction: Nairobi, Kenya, 19 November 2021. Towards disaster risk-informed development for a resilient Africa in a COVID-19 transformed world. United Nations Office for Disaster Risk Reduction. www.undrr.org/publication/declaration-seventh-high-level-meeting-disaster-risk-reduction
Agrawal, A. (1995). Dismantling the divide between indigenous and scientific knowledge. Development and Change, vol. 26, no. 3, pp. 413–439.
Ajzen, I. (2020). The theory of planned behavior: Frequently asked questions. Human Behavior and Emerging Technologies, vol. 2, no. 4, pp. 314–324.
Akdoğan, K. and B.D. Yildirim (2014). Non-core liabilities as an indicator of systemic risk and a liquidity stress test application on Turkish Banking System. Iktisat Isletme ve Finans, vol. 29, no. 338, pp. 39–66.
Akter, S. and B. Mallick (2013). The poverty-vulnerability-resilience nexus: Evidence from Bangladesh. Ecological Economics, vol. 96, pp. 114–124.
Alcántara-Ayala, I., I. Burton, A. Lavell, E. Mansilla, A. Maskrey, A. Oliver-Smith and F. Ramírez-Gómez (2021). Editorial: Root causes and policy dilemmas of the COVID-19 pandemic global disaster. International Journal of Disaster Risk Reduction, vol. 52, no. 101892.
Alho, C.J.R. (2008). The value of biodiversity. Brazilian Journal of Biology, vol. 68, no. 4, pp. 1115–1118.
Amach, O. (2021). With a new action plan in hand Asia-Pacific eyes opportunities in 2022. www.undrr.org/news/new-action-plan-hand-asia-pacific-eyes-opportunities-2022
Amin, S.M. and B.F. Wollenberg (2005). Toward a smart grid: Power delivery for the 21st century. IEEE Power and Energy Magazine, vol. 3, no. 5, pp. 34–41.
Andersen, T.J. and L. Gatti (2022). Generating Solutions to Systemic Risks through On-Going Experimentation on Invested Space-Forms. GAR2022 Contributing Paper. Geneva: United Nations Office for Disaster Risk Reduction. www.undrr.org/GAR2022
Angell, E. (2014). Assembling disaster: Earthquakes and urban politics in Istanbul. City, vol. 18, no. 6, pp. 667–678.
Ansell, C. and A. Gash (2018). Collaborative platforms as a governance strategy. Journal of Public Administration Research and Theory, vol. 28, no. 1, pp. 16–32.
APP (Asian Preparedness Partnership) (n.d.). www.adpc.net
APP-DRR (Asia-Pacific Partnership for Disaster Risk Reduction) (2021). Asia-Pacific Action Plan 2021-2024 for Implementation of the Sendai Framework for Disaster Risk Reduction 2015-2030. Geneva: United Nations Office for Disaster Risk Reduction. www.undrr.org/publication/asia-pacific-action-plan-2021-2024-implementation-sendai-framework-disaster-risk
211
Arnarson, M., Þ. Kristjánsson, A. Bjarnason, H. Sverdrup, and K.V. Ragnarsdóttir (2011). The Icelandic Economic Collapse: A Systems Analysis Perspective on Financial, Social and World System Links. Reykjavik: University of Iceland. skemman.is/bitstream/1946/9908/2/IcelandicBankReportPrintedVersion.pdf
Arora, S. (2018). Post-disaster memoryscapes: Communicating disaster risks and climate change after the Leh flash floods in 2010. Communication and the Public, vol. 3, no. 4, pp. 310–321.
ARPDRR (Fifth Arab Regional Platform for Disaster Risk Reduction) (2021a). Prioritized Plan of Action for Disaster Risk Reduction 2021-2024. From Risk to Resilience: Accelerating Local Action for Disaster Risk Reduction, 8–11 November 2021, Rabat, Morocco. rp-arabstates.undrr.org/
__________ (2021b). The Rabat Declaration for Disaster Risk Reduction. From Risk to Resilience: Accelerating Local Action for Disaster Risk Reduction, 8–11 November 2021, Rabat, Morocco. www.undrr.org/publication/rabat-declaration-disaster-risk-reduction
Arvai, J., R. Gregory, D. Ohlson, B. Blackwell and R. Gray (2006). Letdowns, wake-up calls, and constructed preferences: People’s responses to fuel and wildfire risks. Journal of Forestry, vol. 104, no. 4, pp. 173–181.
Atkins, S. (2019). Shareholder primacy already requires directors to actively consider non-shareholder interests: The debate with a false premise and the downside of law reform. Norton Rose Fulbright. www.nortonrosefulbright.com/en/knowledge/publications/3b8ed971/shareholder-primacy-already-requires-directors-to-actively-consider--non-shareholder-interests
Australian Business Roundtable for Disaster Resilience & Safer Communities (2012). The Economic Cost of the Social Impact of Natural Disasters. Sydney: Deloitte Access Economics. http://australianbusinessroundtable.com.au/assets/documents/Report%20-%20Social%20costs/Report%20-%20The%20economic%20cost%20of%20the%20social%20impact%20of%20natural%20disasters.pdf
Baker, J., R. Basu, M. Cropper, S. Lall and A. Takeuchi (2005). Urban Poverty and Transport: The Case of Mumbai. World Bank Policy Research Working Paper 3693. Washington, D.C.: The World Bank. openknowledge.worldbank.org/bitstream/handle/10986/8602/wps3693.pdf?sequence=1&isAllowed=y
Balkovic, J., P. Burek, E. Byers, A. Deppermann, S. Frank, M. Gidden, P. Greve, P. Havlik, T. Kahil, B. Willaarts, S. Langan, V. Krey, P. Magnuszewski, B. Mayor Rodriguez, A. Palazzo, S. Parkinson, M. Poblete Cazenave, K. Riahi, M. van Dijk, A. Vinca and Y. Wada (2018). Integrated Solutions for Water, Energy and Land. Progress Report 3. Laxenburg: United Nations Industrial Development
Organization and International Institute for Applied Systems Analysis. http://pure.iiasa.ac.at /id/eprint/15892/
Balog-Way, D., K. McComas and J. Besley (2020). The evolving field of risk communication. Risk Analysis, vol. 40, no. S1, pp. 2240–2262.
Barclay, J., K. Haynes, T. Mitchell, M. Solana, R. Teeuw, A. Harwood, H. Crossweller, P. Cole, D. Pyle, C. Lowe, C. Fearnley and I. Kelman (2008). Framing volcanic risk communication within disaster risk reduction: Finding ways for the social and physical sciences to work together. Geological Society, vol. 305, pp. 165–177.
Barnett, J. and S. O’Neill (2010). Maladaptation. Global Environmental Change, vol. 20, pp. 211–213.
Basher, R. (2006). Global early warning systems for natural hazards: Systematic and people-centred. Philosophical Transactions of the Royal Society A: Mathematical, Physical and Engineering Sciences, vol. 364, no. 1845, pp. 2167–2182.
Baumeister, R.F. and M.R. Leary (1995). The need to belong: Desire for interpersonal attachments as a fundamental human motivation. Psychological Bulletin, vol. 117, no. 3, pp. 497–529.
Bavandi, A., C. Aubrecht and M. Enenkel (2021). Faster and better risk indicators: Introducing the next generation drought index (NGDI) project. Financial Protection Forum. www.financialprotectionforum.org/blog/faster-and-better-risk-indicators-introducing-the-next-generation-drought-index-ngdi-project
BBC Media Action (2019). Neighbours Together: Evaluation Report. Unpublished but available upon request.
__________ (2020). How Are Young People in Myanmar Encountering Fake News and Misinformation Online? http://downloads.bbc.co.uk/mediaaction/pdf/research-summaries/myanmar-fake-news-youth-april2020.pdf
__________ (2021). Weather Wise: Improving Access and Knowledge of Climate Information. www.bbc.co.uk/mediaaction/publications-and-resources/research/summaries/research-summary-wiser-east-africa-jan2021
Bello, O., A. Bustamante and P. Pizarro (2021). Planning for Disaster Risk Reduction within the Framework of the 2030 Agenda for Sustainable Development. Project Documents (LC/TS.2020/108). Santiago: Economic Commission for Latin America and the Caribbean. repositorio.cepal.org/bitstream/handle/11362/46639/1/S2000452_en.pdf
Béné, C., R.G. Wood, A. Newsham and M. Davies (2012). Resilience: New Utopia or New Tyranny? Reflection About the Potentials and Limits of the Concept of Resilience in Relation to Vulnerability Reduction Programmes. IDS Working Paper, vol. 2012, no. 405. www.preventionweb.net/publication/resilience-new-utopia-or-new-tyranny
212
Berkes, F. (1999). Sacred Ecology: Traditional Ecological Knowledge and Resource Management. Philadelphia: Taylor & Francis.
__________ (2009). Evolution of co-management: Role of knowledge generation, bridging organizations and social learning. Journal of Environmental Management, vol. 90, no. 5, pp. 1692–702.
Betigeri, A. (2020). How Australia’s indigenous experts could help Australia deal with devastating wildfires. time.com/5764521/australia-bushfires-indigenous-fire-practices/
Bhalla, P. (2018). The Responsibility to Prevent and Respond to Sexual and Gender-Based Violence in Disasters and Crises. Kuala Lumpur: International Federation of Red Cross and Red Crescent Societies. apo.org.au/node/184271
Bibby, B. (2004). Precious Cargo: California Indian Cradle Baskets and Childbirth Traditions. Berkeley: Heyday Books.
Bird, R.B., N. Tayor, B.F. Codding and D.W. Bird (2013). Niche construction and dreaming logic: Aboriginal patch mosaic burning and varanid lizards (Varanus gouldii) in Australia. Proceedings of the Royal Society B: Biological Sciences, vol. 280, no. 1772.
Birkmann, J., S. Cutter, D. Rothman, T. Welle, M. Garschagen, B. van Ruijven, B. O’Neill, B. Preston, S. Kienberger, O. Cardona, T. Siagian, D. Hidayati, N. Setiadi, C., Binder, B. Hughes and R. Pulwarty (2015). Scenarios for vulnerability: Opportunities and constraints in the context of climate change and disaster risk. Climatic Change, vol. 133, no. 1, pp. 53–68.
Bjarnadóttirm M.V., G.A. Hansen and M.J. Flannery (2010). Antecedents and Causes of the Collapse of the Icelandic Banks in 2008 and Related Events, P. Hreinsson, S. Benediktsdóttir and T. Gunnarsson, eds. (in Icelandic). Reykjavik: Rannsóknarnefnd Alþingis. www.rna.is/media/skjol/RNABindi8.pdf
Blaikie, P., T. Cannon, I. Davis and B. Wisner (2004). At Risk: Natural Hazards, People’s Vulnerability and Disasters. London and New York: Routledge.
Blankenship, K., S.R. Friedman, S. Dworkin and J. Mantell (2006). Structural interventions: Concepts, challenges and opportunities for research. Journal of Urban Health: Bulletin of the New York Academy of Medicine, vol. 83, no. 1, pp. 59–72.
Boardman, A.E., D.H. Greenberg, A.R. Vining and D.L. Weimer (2018). Cost-Benefit Analysis: Concepts and Practice. New York: Cambridge University Press.
Bode, M., M. Craven, M. Leopoldseder, P. Rutten and M. Wilson (2020). Contact tracing for COVID-19: New considerations for its practical application. www.mckinsey.com/industries/public-and-social-sector/our-insights/contact-tracing-for-covid-19-new-considerations-for-its-practical-application
Bongiorno, R., C. McGarty, T. Kurz, S.A. Haslam and C.G. Sibley (2016). Mobilizing cause supporters through group-based interaction: Group interaction and mobilization. Journal of Applied Social Psychology, vol. 46, no. 4, pp. 203–215.
Borduas, C.-É. (2019). Stakeholders’ primacy: Paradigm shift confirmed. www.nortonrosefulbright.com/en-ca/knowledge/publ icat ions/a979357b/stakeholders-primacy-paradigm-shift-confirmed
Boss, M., H. Elsinger, M. Summer and S. Thurner (2004a). Network topology of the interbank market. Quantitative Finance, vol. 4, no. 6, pp. 677–684.
Boss, M., M. Summer and S. Thurner (2004b). Contagion flow through banking networks. In Computational Science - ICCS 2004, M. Bubak, G.D. van Albada, P.M.A. Sloot and J. Dongarra, eds., pp. 1070–1077. Berlin: Springer. link.springer.com/chapter/10.1007/978-3-540-24688-6_138
Botzen, W.J.W., H. Kunreuther and E. Michel-Kerjan (2015). Divergence between individual perceptions and objective indicators of tail risks: Evidence from floodplain residents in New York City. Judgment and Decision Making, vol. 10, no. 4, p. 21.
Bowen, T., C. del Ninno, C. Andrews, S. Coll-Black, U. Gentilini, K. Johnson, Y. Kawasoe, A. Kryeziu, B. Maher and A. Williams (2020). Adaptive Social Protection: Building Resilience to Shocks. Washington, D.C.: The World Bank. openknowledge.worldbank.org/handle/10986/33785
Bowman, D., A. Walsh and L. Prior (2004). Landscape analysis of Aboriginal fire management in Central Arnhem Land, north Australia. Journal of Biogeography, vol. 31, no. 2, pp. 207–223.
Bradley, D.T., M. McFarland and M. Clarke (2014). The effectiveness of disaster risk communication: a systematic review of intervention studies. PLoS Currents, vol. 6.
Brondízio, E. and F. Gatzweiler (2010). The socio-cultural context of ecosystem and biodiversity valuation. The economics of ecosystems and biodiversity: Ecological and economic foundations. In The Economics of Ecosystems and Biodiversity Ecological and Economic Foundations, P. Kumar, ed., pp. 149–174. London and Washington, D.C.: Earthscan Routledge.
Broomell, S.B. (2020). Global–local incompatibility: The misperception of reliability in judgment regarding global variables. Cognitive Science, vol. 44, no. 4, p. e12831.
Brosnan, S.F. (2006). Nonhuman species’ reactions to inequity and their implications for fairness. Social Justice Research, vol. 19, no. 2, pp. 153–185.
Brounen, D. and N. Kok (2011). On the economics of energy labels in the housing market. Journal of Environmental Economics and Management, vol. 62, no. 2, pp. 166–179.
Buchner, B., A. Clark, A. Falconer, R. Macquarie, C. Meattle, R. Tolentino and C. Wetherbee (2019). Global Landscape of Climate Finance 2019. London: Climate Policy Initiative. www.climatepolicyinitiative.org/wp-content/uploads/2019/11/2019-Global-Landscape-of-Climate-Finance.pdf
Buchtmann (nee Osuchowski), M., J. Edwards, C. AFSM, D. O’Connell, R. Wise and P. Box (2022). National Leadership: How a Change in Thinking About
213
Vulnerability and Systemic Disaster Risk is Shaping Nation-Wide Reforms and National Programs of Work in Disaster Risk Reduction in Australia. GAR2022 Contributing Paper. Geneva: United Nations Office for Disaster Risk Reduction. www.undrr.org/GAR2022
Burningham, K., J. Fielding and D. Thrush (2008). “It’ll never happen to me”: Understanding public awareness of local flood risk. Disasters, vol. 32, no. 2, pp. 216–238.
Burton, I. (2015). The forensic investigation of root causes and the post-2015 framework for disaster risk reduction. International Journal of Disaster Risk Reduction, vol. 12, pp. 1–2.
Busby, J.W., K. Baker, M.D. Bazilian, A.Q. Gilbert, E. Grubert, V. Rai, J.D. Rhodes, S. Shidore, C.A. Smith and M.E. Webber (2021). Cascading risks: Understanding the 2021 winter blackout in Texas. Energy Research & Social Science, vol. 77, p. 102106.
Bye, R. and G.M. Lamvik (2007). Professional culture and risk perception: Coping with danger on board small fishing boats and offshore service vessels. Reliability Engineering and System Safety, vol. 92, no. 12, pp. 1756–1763.
Call to Action Partners (n.d.). Call to action on protection from gender-based violence in emergencies. www.calltoactiongbv.com
Cao, S., G. Wang and L. Chen (2010). Assessing effects of afforestation projects in China: Cao and colleagues reply. Nature, vol. 466, no. 7304, pp. 315–315.
Caponecchia, C. (2010). It won’t happen to me: An investigation of optimism bias in occupational health and safety. Journal of Applied Social Psychology, vol. 40, no. 3, pp. 601–617.
Cardona, O.-D., G. Bernal, P.M. Fraume, C. Villegas, D. González C., M.A. Escovar, M.L. Carreño and M.C.M. Fraume (2018). Atlas de Riesgo de Colombia: Revelando los Desastres Latentes. Bogotá, D.C.: Unidad Nacional para la Gestión del Riesgo de Desastres. www.preventionweb.net/publication/at las-de-r iesgo-de-colombia-revelando- los-desastres-latentes
Castro, C.-P., J.-P. Sarmiento, A. Arrieta and S. Arensburg (forthcoming). Evaluation of Subjective Well-being and Social Cohesion in Compliance with Physical Distancing in the Framework of COVID-19.
CCA (Council of Canadian Academies) (2019). Canada’s Top Climate Change Risks: The Expert Panel on Climate Change Risks and Adaptation Potential. Ottawa. www.cca-reports.ca/wp-content/uploads/2019/07/Report-Canada-top-climate-change-risks.pdf
Centeno, M.A., M. Nag, T.S. Patterson, A. Shaver and A.J. Windawi (2015). The emergence of global systemic risk. Annual Review of Sociology, vol. 41, no. 1, pp. 65–85.
Cernev, T. (2022). Global Catastrophic Risk and Planetary Boundaries: The Relationship to Global Targets and Disaster Risk Reduction. GAR2022 Contributing
Paper. Geneva: United Nations Office for Disaster Risk Reduction. www.undrr.org/GAR2022
Chan, E.Y.Y., Z. Huang, K.K.C. Hung and C.S. Wong (2022). The Health Emergency and Disaster Risk Management: An Emerging Framework for Achieving Synergies among the Sendai Framework, the 2030 Agenda for Sustainable Development, the New Urban Agenda and the Paris Agreement. GAR2022 Contributing Paper. Geneva: United Nations Office for Disaster Risk Reduction. www.undrr.org/GAR2022
Chaplin, D., E. Lovell and J. Twigg (2019). Intersectional Approaches to Vulnerability Reduction and Resilience-Building, no. 12. BRACED Knowledge Manager, Overseas Development Institute and UKaid. odi.org/en/publications/intersectional-approaches-to-vulnerability-reduction-and-resilience-building/
Chaudhry, S.J., M. Hand and H. Kunreuther (2020). Broad bracketing for low probability events. Journal of Risk and Uncertainty, vol. 61, no. 3, pp. 211–244.
Chavda, S., V. Drigo and J. Tau (2022). Why Are People Still Losing Their Lives and Livelihoods to Disaster? 100,000 Perceptions of Risk from Views From the Frontline 2019. GAR2022 Contributing Paper. Geneva: United Nations Office for Disaster Risk Reduction. www.undrr.org/GAR2022
Chen, S.-Y., C.-P. Shih, C.-Y. Huang and W.-H. Teng (2021). An impact study of GNSS RO data on the prediction of Typhoon Nepartak (2016) using a multiresolution global model with 3D-hybrid data assimilation. Weather and Forecasting, vol. 36, no. 3, pp. 957–977.
Choma, B.L., G. Hodson, D. Sumantry, Y. Hanoch and M. Gummerum (2021). Ideological and psychological predictors of Covid-19-related collective action, opinions, and health compliance across three nations. Journal of Social and Political Psychology, vol. 9, no. 1, pp. 123–143.
Chongvilaivan, A. (2012). Thailand’s 2011 Flooding: Its Impact on Direct Exports and Global Supply Chains. Policy Brief No. 34. Bangkok: ARTNeT Secretariat and United Nations Economic and Social Commission for Asia and the Pacific. www.unescap.org/resources/thailand%E2%80%99s-2011-flooding-its-impacts-direct-exports-and-global-supply-chain-disruptions
Christel, R., D. Florentina, S. Sahar and H. Ruud (2020). Words into Action Guidelines: Developing National Disaster Risk Reduction Strategies. Geneva: United Nations Office for Disaster Risk Reduction. www.undrr.org/publication/words-action-guidelines-developing-national-disaster-risk-reduction-strategies
CI3R (Italian Center for Research on Risk Reduction) (n.d.) CI3R: Provides a multi-risk approach through multidisciplinary competencies within a national - EU - international perspective. www.ci3r.it/en/home-english/
CID Gallup (2019). CID Gallup: Leader in socio-economic research. www.cidgallup.com/
214
Clarke, D. and R.V. Hill (2013). Cost-Benefit Analysis of the African Risk Capacity Facility. Discussion Paper. Washington, D.C.: International Food Policy Research Institute. www.ifpri.org/publication/cost-benefit-analysis-african-risk-capacity-facility
Climate Resilience Executing Agency (2020). Dominica Climate Resilience and Recovery Plan 2020-2030. Government of the Commonwealth of Dominica. dominica.gov.dm/images/documents/CRRP-Final-042020.pdf
Climate Studies Group Mona, eds. (2020). The State of the Caribbean Climate. Caribbean Development Bank. www.caribank.org/publications-and-resources/resource-library/publications/state-caribbean-climate
Cohen, M.D. and R. Axelrod (1999). Harnessing Complexity: Organizational Implications of a Scientific Frontier. New York: Free Press.
Collins, R. (2018). Waitrose & Partners Food and Drink Report 2018-19. Waitrose and Partners. www.waitrose.com/content/dam/waitrose/Inspiration/Waitrose%20&%20Partners%20Food%20and%20Drink%20Report%202018.pdf
Comes, T. (2016). Cognitive biases in humanitarian sensemaking and decision-making lessons from field research. In 2016 IEEE International Multi-Disciplinary Conference on Cognitive Methods in Situation Awareness and Decision Support (CogSIMA), pp. 56–62. San Diego: Institute of Electrical and Electronics Engineers. ieeexplore.ieee.org/document/7497786
Conniff, R. (2010). What are species worth? Putting a price on biodiversity. Yale School of the Environment. e360.yale.edu/features/what_are_species_worth_putting_a_price_on_biodiversity
CRED (Centre for Research on the Epidemiology of Disasters) (2019). International Emergency Disasters Database (EM-DAT). http://www.emdat.be/database
Cuthbertson, J., F. Archer, A. Robertson and J.M. Rodriguez-Llanes (2022). Societal Disruption as a Disaster. Exploring Suicide, Drug Addiction and Domestic Violence in Australia Through a Disaster Risk Reduction Lens. GAR2022 Contributing Paper. Geneva: United Nations Office for Disaster Risk Reduction. www.undrr.org/GAR2022
Cutter, S.L. and C. Finch (2008). Temporal and spatial changes in social vulnerability to natural hazards. Proceedings of the National Academy of Sciences, vol. 105, no. 7, pp. 2301–2306.
Cutter, S.L., A. Ismail-Zadeh, I. Alcántara-Ayala, O. Altan, D.N. Baker, S. Briceño, H. Gupta, A. Holloway, D. Johnston, G.A. McBean, Y. Ogawa, D. Paton, E. Porio, R.K. Silbereisen, K. Takeuchi, G.B. Valsecchi, C. Vogel and G. Wu (2015). Global risks: Pool knowledge to stem losses from disasters. Nature, vol. 522, no. 7556, pp. 277–279.
Daly, H.E. (2005). Economics in a full world. Scientific American, vol. 293, pp. 100–107.
Danielson, M. and L. Ekenberg (2013). A risk-based decision analytic approach to assessing multi-
stakeholder policy problems. Integrated catastrophe risk modeling: Supporting policy processes. In Integrated Catastrophe Risk Modeling. Advances in Natural and Technological Hazards Research, A. Amendola, T. Ermolieva, J. Linnerooth-Bayer and R. Mechler, eds., vol. 32. Dordrecht: Springer Netherlands.
Davies, M., C. Béné, A. Arnall, T. Tanner, A. Newsham and C. Coirolo (2013). Promoting resilient livelihoods through adaptive social protection: Lessons from 124 programmes in South Asia. Development Policy Review, vol. 31, no. 1, pp. 27–58.
Davoudi, S., N. Evans, F. Governa and M. Santangelo (2008). Territorial governance in the making. Approaches, methodologies, practices. Boletin de la Asociacion de Geografos Espanoles, no. 46, pp. 33–52.
Dean, N. (2021). Statistical successes and failures during the COVID-19 pandemic: Comments on Ellenberg and Morris. Statistics in Medicine, vol. 40, no. 11, pp. 2515–2517.
de Jong, M. (2021). Inclusive capitalism: The emergence of a new purpose paradigm in economics and business administration and its implications for public policy. Global Public Policy and Governance, vol. 1, no. 2, pp. 159–174.
Delozier, J.L. and M.E. Burbach (2021). Boundary spanning: Its role in trust development between stakeholders in integrated water resource management. Current Research in Environmental Sustainability, vol. 3, p. 100027.
Deltacommissie (2008). Working Together with Water: Findings of the Deltacommissie 2008. The Hague. http://www.deltacommissie.com/doc/deltareport_full.pdf
Dewan, T.H. (2015). Societal impacts and vulnerability to floods in Bangladesh and Nepal. Weather and Climate Extremes, vol. 7, pp. 36–42.
Diem, C., A. Borsos, T. Reisch, J. Kertész and S. Thurner (2021). Quantifying firm-level economic systemic risk from nation-wide supply networks. arxiv.org/abs/2104.07260v1
Doan, N. and I. Noy (2022). A Global Measure of the Impact of COVID-19 in 2020 in Comparison to the Average Annual Cost of all Other Disasters (2000-2019). GAR2022 Contributing Paper. Geneva: United Nations Office for Disaster Risk Reduction. www.undrr.org/GAR2022
Dolce, M. and D.D. Bucci (2022). Building an Effective Collaboration between Civil Protection Decision-Makers and Scientists for DRR: The Italian Experience. GAR2022 Contributing Paper. Geneva: United Nations Office for Disaster Risk Reduction. www.undrr.org/GAR2022
Donges, J.F., C.-F. Schleussner, J.F. Siegmund and R.V. Donner (2016). Event coincidence analysis for quantifying statistical interrelationships between event time series. The European Physical Journal Special Topics, vol. 225, no. 3, pp. 471–487.
215
Donovan, P. (2007). How idle is idle talk? One hundred years of rumor research. Diogenes, vol. 54, no. 1, pp. 59–82.
Dookie, D., D. Conway and S. Dessai (2021). Perceptions of Climate Information in the Caribbean: Implications for Adaptation. No. EGU21-12628. Copernicus Meetings. meetingorganizer.copernicus.org/EGU21/EGU21-12628.html
Dube, E. and E. Munsaka (2018). The contribution of indigenous knowledge to disaster risk reduction activities in Zimbabwe: A big call to practitioners. Jàmbá: Journal of Disaster Risk Studies, vol. 10, no. 1, p. 493.
Duit, A. and V. Galaz (2008). Governance and complexity—emerging issues for governance theory. Governance: An International Journal of Policy, Administration, and Institutions, vol. 21, no. 3, pp. 311–335.
Dunn, M.E., M. Mills and D. Veríssimo (2020). Evaluating the impact of the documentary series Blue Planet II on viewers’ plastic consumption behaviors. Conservation Science and Practice, vol. 2, no. 10.
ECan (Environment Canterbury) (2013). Important steps taken in Ngāi Tahu, Environment Canterbury Partnership. Press release. www.scoop.co.nz/stories/AK1302/S00396/ngai-tahu-environment-canterbury-partnership.htm?from-mobile=bottom-link-01
ECLAC (Economic Commission for Latin America and the Caribbean) (2014). The Handbook for Disaster Assessment (in Spanish). Santiago. www.cepal.org/es/publicaciones/35894-manual-la-evaluacion-desastres
__________ (2020). Sectors and Businesses Facing COVID-19: Emergency and Reactivation. Santiago. www.cepal.org/en/publications/45736-sectors-and-businesses-facing-covid-19-emergency-and-reactivation
ECLAC-UNDRR (Economic Commission for Latin America and the Caribbean and United Nations Office for Disaster Risk Reduction) (2021). The Coronavirus Disease (COVID-19) Pandemic: An Opportunity for a Systemic Approach to Disaster Risk for the Caribbean. www.undrr.org/publication/undrr-eclac-report-coronavirus-disease-covid-19-pandemic-opportunity-systemic-approach
EFDRR (European Forum for Disaster Risk Reduction) (2021a). European Forum for Disaster Risk Reduction ROADMAP 2021-2030: For a Disaster-Resilient European and Central Asian Region by 2030. Belgium: United Nations Office for Disaster Risk Reduction. efdrr.undrr.org/sites/default/fi les/2021-11/EFDRR%20Roadmap%202021-2030.pdf
__________ (2021b). Chair’s Summary. efdrr.undrr.org/sites/default/files/2021-12/2021%20EFDRR%20Chair%27s%20Summary.pdf
Egan, A., D. Angelson, G. Benchwick and P. Okello (2018). Global Environment Facility. www.thegef.org/news/power-farmers-climate-information-and-early-warnings-save-lives-and-build-resilience-uganda
Ehrlich, D. and P. Tenerelli (2013). Optical satellite imagery for quantifying spatio-temporal dimension of physical exposure in disaster risk assessments. Natural Hazards: Journal of the International Society for the Prevention and Mitigation of Natural Hazards, vol. 68, no. 3, pp. 1271–1289.
Eiser, J.R., A. Bostrom, I. Burton, D.M. Johnston, J. McClure, D. Paton, J. van der Pligt and M.P. White (2012). Risk interpretation and action: A conceptual framework for responses to natural hazards. International Journal of Disaster Risk Reduction, vol. 1, pp. 5–16.
Ekenberg, L., K. Hansson, M. Danielson and G. Cars (2017). Deliberation, Representation, Equity: Research Approaches, Tools and Algorithms for Participatory Processes. Cambridge: Open Book Publishers. www.openbookpublishers.com/product/546
Ellenberg, S.S. and J.S. Morris (2021). AIDS and COVID: A tale of two pandemics and the role of statisticians. Statistics in Medicine, vol. 40, no. 11, pp. 2499–2510.
Elwert, F. (2013). Graphical causal models. In Handbook of Causal Analysis for Social Research, S.L. Morgan, ed., pp. 245–273. Dordrecht: Springer. citeseerx.ist.psu.edu/viewdoc/download?doi= 10.1.1.364.7505&rep=rep1&type=pdf
Emandi, R., J. Encarnacion, P. Seck and R.J. Tabaco (2021). Measuring the Shadow Pandemic: Violence against Women during COVID-19. New York: UN Women. data.unwomen.org/sites/default/files/documents/Publications/Measuring-shadow-pandemic.pdf
Enenkel, M., M.E. Brown, J.V. Vogt, J.L. McCarty, A. Reid Bell, D. Guha-Sapir, W. Dorigo, K. Vasilaky, M. Svoboda, R. Bonifacio, M. Anderson, C. Funk, D. Osgood, C. Hain and P. Vinck (2020). Why predict climate hazards if we need to understand impacts? Putting humans back into the drought equation. Climatic Change, vol. 162, no. 3, pp. 1161–1176.
Enenkel, M. and A. Kruczkiewicz (2022). The humanitarian sector needs clear job profiles for climate science translators – more than ever during a pandemic. Bulletin of the American Meteorological Society.
Epstein, D. (2019). Range: Why Generalists Triumph in a Specialized World. New York: Riverhead Books.
Erman, A., E. Motte, R. Goyal, A. Asare, S. Takamatsu, X. Chen, S. Malgioglio, A. Skinner, N. Yoshida and S. Hallegatte (2020). The road to recovery the role of poverty in the exposure, vulnerability and resilience to floods in Accra. Economics of Disasters and Climate Change, vol. 4, no. 1, pp. 171–193.
Erman, A., M. Tariverdi, M. Obolensky, X. Chen, R.C. Vincent, S. Malgioglio, J. Rentschler, S. Hallegatte and N. Yoshida (2019). Wading out the Storm: The Role of Poverty in Exposure, Vulnerability and Resilience to Floods in Dar es Salaam. Policy Research Working Paper No. 8976. Washington, D.C.: The World Bank. openknowledge.worldbank.org/handle/10986/32269
European Commission (2021). INFORM. drmkc.jrc.ec.europa.eu/inform-index
216
__________ (n.d.). Nature-based solutions. ec.europa.eu/info/research-and-innovation/research-area/environment/nature-based-solutions_en
Evans, C. and S. Pienknagura (2021). Assessing Chile’s Pension System: Challenges and Reform Options. IMF Working Paper No. WP/21/232. Washington, D.C.: International Monetary Fund. www.elibrary.imf.org/view/journals/001/2021/232/article-A001-en.xml
Evans, J.S.B.T. (2003). In two minds: Dual-process accounts of reasoning. Trends in Cognitive Sciences, vol. 7, no. 10, pp. 454–459.
FAO (Food and Agriculture Organization) (2019). The State of the World’s Biodiversity for Food and Agriculture. Rome: FAO Commission on Genetic Resources for Food and Agriculture Assessments. www.fao.org/documents/card/en/c/ca3129en/
__________ (2021a). FAOSTAT. Suite of food security indicators. www.fao.org/faostat/en/#data/FS
__________ (2021b). The Impact of Disasters and Crises on Agriculture and Food Security: 2021. Rome. www.fao.org/documents/card/en/c/cb3673en/
__________ (2021c). FAO food price index: World food situation (December 2021 release). www.fao.org/worldfoodsituation/foodpricesindex/en/
FAO (Food and Agriculture Organization of the United Nations) and UNEP (United Nations Environment Programme) (2020). The State of the World’s Forests 2020: Forests, Biodiversity and People. Rome. www.fao.org/documents/card/en/c/ca8642en
Farida, A. (2014). Reconstructing social identity for sustainable future of Lumpur Lapindo victims. Procedia Environmental Sciences, vol. 20, pp. 468–76.
Fathom (2022). A new benchmark in global flood mapping. www.fathom.global/
Faulhaber, G.R., A. Phillips and A.M. Santomero (1990). Payment risk, network risk, and the role of the Fed. In The U.S. Payment System: Efficiency, Risk and the Role of the Federal Reserve: Proceedings of a Symposium on the U.S. Payment System Sponsored by the Federal Reserve Bank of Richmond, D.B. Humphrey, ed. Dordrecht: Springer.
Fay, M. (2005). The Urban Poor in Latin America. Washington, D.C.: The World Bank. openknowledge.worldbank.org/handle/10986/7263
Feigenbaum, E.A. and M.R. Nelson (2021). Taiwan’s Opportunities in Emerging Industry Supply Chains. Carnegie Endowment for International Peace. carnegieendowment.org/2021/11/24/taiwan-s-opportunities-in-emerging-industry-supply-chains-pub-85850
Few, R. (2007). Health and climatic hazards: Framing social research on vulnerability, response and adaptation. Global Environmental Change, vol. 2, no. 17, pp. 281–295.
Feygina, I., J.T. Jost and R.E. Goldsmith (2010). System justification, the denial of global warming, and the possibility of “system-sanctioned change”. Personality and Social Psychology Bulletin, vol. 36, no. 3, pp. 326–338.
Filkov, A.I., T. Ngo, S. Matthews, S. Telfer and T.D. Penman (2020). Impact of Australia’s catastrophic
2019/20 bushfire season on communities and environment. Retrospective analysis and current trends. Journal of Safety Science and Resilience, vol. 1, no. 1, pp. 44–56.
Finnigan, G. (2019). The Natural Environment as a Disaster Hazard—the Growing Global Health Threat. GAR2019 Contributing Paper. Geneva: United Nations Office for Disaster Risk Reduction. www.preventionweb.net/publication/natural-environment-disaster-hazard-growing-global-health-threat
Fischhoff, B. (2013). The sciences of science communication. Proceedings of the National Academy of Sciences, vol. 110, no. 3, pp. 14033–14039.
Fishbein, M. and J.N. Cappella (2006). The role of theory in developing effective health communications. Journal of Communication, vol. 56, no. 1, pp. S1–S17.
Fiske, S.T. and E. Dépret (1996). Control, interdependence and power: Understanding social cognition in its social context. European Review of Social Psychology, vol. 7, no. 1, pp. 31–61.
Fiske, S.T. and S.E. Taylor (1991). Social Cognition. New York: McGraw-Hill.
Ford, J.D., L. Cameron, J. Rubis, M. Maillet, D. Nakashima, A.C. Willox and T. Pearce (2016). Including indigenous knowledge and experience in IPCC assessment reports. Nature Climate Change, vol. 6, no. 4, pp. 349–353.
Forrester, J., R. Taylor, L. Pedoth and N. Matin (2018). Wicked problems. In Framing Community Disaster Resilience: Resources, Capacities, Learning, and Action, H. Deeming, M. Fordham, C. Kuhlicke, L. Pedoth, S. Schneiderbauer and C. Shreve, eds., pp. 61–75. Chichester and Hoboken: John Wiley & Sons.
Forrester, J.W. (1968). Principles of Systems. Waltham: Pegasus Communications.
Franco, J.T. (2016). Alejandro Aravena wins 2016 Pritzker Prize. www.archdaily.com/780203/alejandro -aravena-wins-2016-pritzker-prize
Frank, A.B., M.G. Collins, S.A. Levin, A.W. Lo, J. Ramo, U. Dieckmann, V. Kremenyuk, A. Kryazhimskiy, J. Linnerooth-Bayer, B. Ramalingam, J.S. Roy, D.G. Saari, S. Thurner and D. von Winterfeldt (2014). Dealing with femtorisks in international relations. Proceedings of the National Academy of Sciences, vol. 111, no. 49, pp. 17356–17362.
Fraser, S., G. Leonard and D.M. Johnston (2013). Intended Evacuation Behaviour in a Local Earthquake and Tsunami at Napier, New Zealand. GNS Science Report 2013/26. Lower Hutt: Institute of Geological and Nuclear Sciences Limited. www.gns.cri.nz/static/pubs/2013/SR%202013-026.pdf
Frassetto, E.A., R.L. Monroe, S.J. Phillips, B.D. Craig, S.S. Curtiss, T.L. McMahan, C.M. Gaffney, C.T. Marriott, A.C. Courtney, G.R. Barnum, J. Johns, J. Martin, J.A. Girolami, K.F. Oles, H.L. Stewart, K.E. D’Ambrosio, G.F. Jenner, K.T. Pearson, A.D. Schurle, W.L. Clydesdale, K.D. Johnson, J.M. Shore, S.D. Hilton, J.D. Sacks, R.D. McFall and K. Scott (2018). The Law of Wind: A Guide to Business and Legal Issues. Portland: Stoel Rives. files.stoel.com/files/books/LawofWind.PDF
217
Frenkel, S. (2016). This is what happens when millions of people suddenly get the Internet. BuzzFeed News, 20 November. www.buzzfeednews.com/article/sheerafrenkel/fake-news-spreads-trump-around-the-world
Fuchs, A. (2014). Shocks and Poverty in Haiti. Authors’ workshop “Poverty and Climate Change Flagship - An Overview of the LAC Region” (presentation). haiti-now.org/wp-content/uploads/2017/05/2014-Shocks-and-Poverty-in-Haiti.pdf
Fugariu, V., M.H. Zack, J.N. Nobrega, P.J. Fletcher and F.D. Zeeb (2020). Effects of exposure to chronic uncertainty and a sensitizing regimen of amphetamine injections on locomotion, decision-making, and dopamine receptors in rats. Neuropsychopharmacology, vol. 45, no. 5, pp. 811–822.
Gabel, F., M. Krüger, C. Morsut and C. Kuran (2022). Bridging the Gap between Vulnerable Groups and Vulnerable Situations: Towards an Integrative Perspective New Assessment on Vulnerability for Disaster Risk Reduction. GAR2022 Contributing Paper. Geneva: United Nations Office for Disaster Risk Reduction. www.undrr.org/GAR2022
Gabrielsen, H., J. Procter, H. Rainforth, T. Black, G. Harmsworth and N. Pardo (2017). Reflections from an indigenous community on volcanic event management, communications and resilience. In Observing the Volcano World: Volcano Crisis Communication, C.J. Fearnley, D.K. Bird, K. Haynes, W.J. McGuire and G. Jolly, eds., pp. 463–479. Cham: Springer International Publishing. doi.org/10.1007/11157_2016_44
Gachon, P., A.-S. Gousse-Lessard, D. Maltais, L. Lessard, B. Motulsky, M. Genereux and V. Vermeulen (2022). Intersectoral Research and Multi-Risk Approaches in Québec: Systemic Risk Management and its Psychosocial Consequences. GAR2022 Contributing Paper. Geneva: United Nations Office for Disaster Risk Reduction. www.undrr.org/GAR2022
Gaillard, J.C., A. Gorman-Murray and M. Fordham (2017). Sexual and gender minorities in disaster. Gender, Place & Culture, vol. 24, no. 1, pp. 18–26.
Gallopín, G. (2006). Linkages between vulnerability, resilience, and adaptive capacity. Global Environmental Change, vol. 16, pp. 293–303.
Gammage, B. (2012). The Biggest Estate on Earth: How Aborigines Made Australia. Sydney: Allen and Unwin.
Garrity, J. (2019). The State of Broadband: Broadband as a Foundation for Sustainable Development. Geneva: International Telecommunication Union and United Nations Educational, Scientific and Cultural Organization. Geneva. www.itu.int/dms_pub/itu-s/opb/pol/S-POL-BROADBAND.20-2019-PDF-E.pdf
Gatzweiler, F., J. Liu, K. Hagedorn and T. Rong (2022). Transitions towards Systemic Sustainability in the Anthropocene. GAR2022 Contributing Paper. Geneva: United Nations Office for Disaster Risk Reduction. www.undrr.org/GAR2022
Gaupp, F., J. Hall, S. Hochrainer-Stigler and S. Dadson (2020). Changing risks of simultaneous global breadbasket failure. Nature Climate Change, vol. 10, no. 1, pp. 54–57.
Gautam, D., K. Gautam and D. Pokhrel (2007). Climate Change Impacts and Adaptation Strategies by Poor and Excluded Communities in Western Nepal: A Comprehensive Study of Banganga River Basin: Arghakhanchi and Kapilvastu. Kathmandu: Action Aid Nepal.
Gavi, CEPI (Coalition for Epidemic Preparedness Innovations), UNICEF (United Nations Children’s Fund) and WHO (World Health Organization) (n.d.). COVAX Facility. www.gavi.org/covax-facility
GBVIMS (Gender-Based Violence Information Management System) (2021). www.gbvims.com/
Ge, P., H. Gokon and K. Meguro (2020). A review on synthetic aperture radar-based building damage assessment in disasters. Remote Sensing of Environment, vol. 240, pp. 111693.
Gearhart, S., M. Perez-Patron, T.A. Hammond, D.W. Goldberg, A. Klein and J.A. Horney (2018). The impact of natural disasters on domestic violence: An analysis of reports of simple assault in Florida (1999–2007). Violence and Gender, vol. 5, no. 2, pp. 87–92.
Geels, F.W. (2020). Micro-foundations of the multi-level perspective on socio-technical transitions: Developing a multi-dimensional model of agency through crossovers between social constructivism, evolutionary economics and neo-institutional theory. Technological Forecasting and Social Change, vol. 152, no. C.
Gentle, P., R. Thwaites, D. Race and K. Alexander (2014). Differential impacts of climate change on communities in the middle hills region of Nepal. Natural Hazards, vol. 74, no. 2, pp. 815–836.
Gerretsen, I. (2018). Fight fires with indigenous knowledge, researchers say. Thomson Reuters Foundation. www.reuters.com/article/us-global-wildfire-climatechange/fight-fires-with-indigenous-knowledge-researchers-say-idUSKBN1KY0XP
GFDRR (Global Facility for Disaster Reduction and Recovery), World Bank, Deltares and University of Toronto (2021). Responsible AI for Disaster Risk Management: Working Group Summary. Washington, D.C.: GFDRR and The World Bank.
Global Energy Observatory, Google, KTH Royal Institute of Technology in Stockholm, Enipedi and World Resources Institute (2021). Global Power Plant Database. datasets.wri.org/dataset/globalpowerplantdatabase
Global Infrastructure Hub. (2021). Infrastructure outlook. G20. outlook.gihub.org/
Gluckman, P. (2014). Policy: The art of science advice to government. Nature, vol. 507, no. 7491, pp. 163–165.
Gluckman, P.D., A. Bardsley and M. Kaiser (2021). Brokerage at the science–policy interface: From conceptual framework to practical guidance.
218
Humanities and Social Sciences Communications, vol. 8, no. 1, pp. 1–10.
GNDR (Global Network of Civil Society Organizations for Disaster Reduction) (2019). Views from the frontline global report: Why are people still losing their lives and livelihoods to disasters? global-report.vfl.world/
Google (n.d.). The value of a shared understanding of AI models. modelcards.withgoogle.com/about
Government of Lao People’s Democratic Republic (2018). Post-Disaster Needs Assessment: 2018 Floods. Vientiane. www.gfdrr.org/en/publication/post-disaster-needs-assessment-2018-floods-lao-pdr
__________ (2020). Disability Monograph of Lao PDR: From the 2015 Population and Housing Census. Vientiane: Ministry of Planning and Investment Lao Statistics Bureau. lao.unfpa.org/sites/default/files/pub-pdf/1.disability_monograph_laos_en_final_29_nov_2020_print.pdf
__________ (2021). National Strategy on Disaster Risk Reduction (NSDRR) 2021 – 2030. Vientiane.
Government of the Commonwealth of Dominica (2020). Dominica Climate Resilience and Recovery Plan 2020-2030. dominica.gov.dm/images/documents/CRRP-Final-042020.pdf
Gowdy, J.M. (1997). The value of biodiversity: Markets, society, and ecosystems. Land Economics, vol. 73, no. 1, pp. 25–41.
gridfinder (n.d.). Global energy infrastructure. gridfinder.org/
Grossi, P. and H. Kunreuther (2005). Catastrophe Modeling: A New Approach to Managing Risk, C.C. Patel, ed. Boston: Springer. link.springer.com/book/10.1007/b100669
Hagenlocher, M., A. Thieken, S. Schneiderbauer, I. Aguirre Ayerbe, P. Dobes, A. Donovan, C. Morsut, N. Paris, L. Pedoth and F. Tonmoy (2020). Risk assessment. In Science for Disaster Risk Management 2020: Acting Today, Protecting Tomorrow, A. Casajus Valles, M. Marin Ferrer, K. Poljanšek and I. Clark, eds. Luxembourg: Publications Office of the European Union. drmkc.jrc.ec.europa.eu/knowledge/science-for-drm/science-for-disaster-risk-management-2020
Hahn, U. and P. Berkers (2020). Visualizing climate change: An exploratory study of the effectiveness of artistic information visualizations. World Art, vol. 11, no. 1, pp. 95–119.
Hall, J. (2018). Using System-of-Systems Modelling and Simulation to Inform Sustainable Infrastructure Choices. Oxford: Infrastructure Transitions Research Consortium. www.itrc.org.uk/using-system-of-systems-modelling-and-simulation-to-inform-sustainable-infrastructure-choices/#7
Hallegatte, S., C. Green, R.J. Nicholls and J. Corfee-Morlot (2013). Future flood losses in major coastal cities. Nature Climate Change, vol. 3, no. 9, pp. 802–806.
Hallegatte, S., A. Vogt-Schilb, J. Rozenberg, M. Bangalore and C. Beaudet (2020). From poverty to disaster and back: A review of the literature. Economics of Disasters and Climate Change, vol. 4, no. 1, pp. 223–247.
Hamer, D.H. (2021). Short-term and potentially long-term negative impacts of COVID-19 in sub-Saharan Africa: Evidence from the Africa research, implementation science, and education network rapid monitoring survey. The American Journal of Tropical Medicine and Hygiene, vol. 105, no. 2, pp. 269–270.
Hamm, J., L. PytlikZillig, M. Herian, A. Tomkins, H. Dietrich and S. Michaels (2013). Trust and intention to comply with a water allocation decision: The moderating roles of knowledge and consistency. Ecology and Society, vol. 18, no. 4, p. 49.
Hanger-Kopp, S. and J. Handmer (2022). The Need for a New Narrative on Risk in an Era of Systemic Existential Threats. GAR2022 Contributing Paper. Geneva: United Nations Office for Disaster Risk Reduction. www.undrr.org/GAR2022
Hanger-Kopp, S., T. Thaler, S. Seebauer, T. Schinko and C. Clar (2022). Defining and operationalizing path dependency for the development and monitoring of adaptation pathways. Global Environmental Change, vol. 72, p. 102425.
Haraguchi, M., W. She and M. Taniguchi (2022). Conversion as an Adaptation Strategy for Supply Chain Resilience to the COVID-19 Pandemic. GAR2022 Contributing Paper. Geneva: United Nations Office for Disaster Risk Reduction. www.undrr.org/GAR2022
Harris, J. (2018). Shareholder Primacy in Changing Times. Corporate and Commercial Law Conference 2018. The Supreme Court of New South Wales. www.supremecourt.justice.nsw.gov.au/Documents/Publications/Corporate%20and%20Commercial%20Law%20Conference/2018/ProfessorJasonHarris_Shareholder%20Primacy%20in%20Changing%20Times_SupremeCourtLawConference_2018-11-20.pdf
Harte, E.W., I.R.W. Childs and P.A. Hastings (2009). Imizamo Yethu: A case study of community resilience to fire hazard in an informal settlement Cape Town, South Africa. Geographical Research, vol. 47, no. 2, pp. 142–154.
Haskett, M.E., S.S. Scott, K. Nears and M.A. Grimmett (2008). Lessons from Katrina: Disaster mental health service in the Gulf Coast region. Professional Psychology: Research and Practice, vol. 39, no. 1, pp. 93–99.
Helbing, D. (2013). Globally networked risks and how to respond. Nature, vol. 497, no. 7447, pp. 51–59.
Heltberg, R., N. Hossain and A. Reva (2012). Living through Crises: How the Food, Fuel, and Financial Shocks Affect the Poor. Washington, D.C.: The World Bank. openknowledge.worldbank.org/handle/10986/6013
219
Hiwasaki, L., L. Emmanuel and S.R. Syamsidik (2014). Local and Indigenous Knowledge for Community Resilience: Hydro-meteorological Disaster Risk Reduction and Climate Change Adaptation in Coastal and Small Island Communities. Jakarta: United Nations Educational Scientific and Cultural Organization Office Jakarta and Regional Bureau for Science in Asia and the Pacific. unesdoc.unesco.org/ark:/48223/pf0000228711
Hochrainer-Stigler, S., J. Balkovič, K. Silm and A. Timonina-Farkas (2019). Large scale extreme risk assessment using copulas: An application to drought events under climate change for Austria. Computational Management Science, vol. 16, no. 4, pp. 651–669.
Hochrainer-Stigler, S., A. Keating, J. Handmer and M. Ladds (2018). Government liabilities for disaster risk in industrialized countries: A case study of Australia. Environmental Hazards, vol. 17, no. 5, pp. 418–435.
Hogan, M. (2019). Grandmothers, teachers, and systems thinking facilitators. www.psychologytoday.com/intl/blog/in-one-lifespan/201907/grandmothers-teachers-and-systems-thinking-facilitators
Hogarth, R.M., T. Lejarraga and E. Soyer (2015). The two settings of kind and wicked learning environments. Current Directions in Psychological Science, vol. 24, no. 5, pp. 379–385.
Holling, C.S. (2001). Understanding the complexity of economic, ecological, and social systems. Ecosystems, vol. 4, no. 5, pp. 390–405.
Holmes, R., F. Samuels, M. Evans and A. Ghimire (2019). The Contribution of Nepal’s Social Security Allowance Schemes to Emergency Flood Response. Briefing Note. London: Overseas Development Institute. cdn.odi.org/media/documents/12714.pdf
Holzaepfel, E., L. Anderberg, M. Feenstra and K. Seibold (2018). USAID Lao PDR Gender Analysis on Disability: Gender Analysis Final Report. Washington, D.C.: United States Agency for International Development. pdf.usaid.gov/pdf_docs/PA00SZS5.pdf
Hua, F., X. Wang, X. Zheng, B. Fisher, L. Wang, J. Zhu, Y. Tang, D.W. Yu and D.S. Wilcove (2016). Opportunities for biodiversity gains under the world’s largest reforestation programme. Nature Communications, vol. 7, no. 1.
Hudson, P., L.T. De Ruig, M.C. de Ruiter, O.J. Kuik, W.J.W. Botzen, X. Le Den, M. Persson, A. Benoist and C.N. Nielsen (2020). An assessment of best practices of extreme weather insurance and directions for a more resilient society. Environmental Hazards, vol. 19, no. 3, pp. 301–321.
Hutt, M. (2021). Earthquake aftersongs: Music videos and the imagining of an online Nepali public. Popular Communication, vol 20, no.1, pp. 42–59.
IAEG-SDGs WGGI (Inter-agency and Expert Group on the SDGs Working Group on Geospatial Information) (2022). The SDGs Geospatial Roadmap. Geneva. ggim.un.org/meetings/GGIM-committee/11th-Session/documents/The_Geospatial_SDGs_Roadmap_WGGI_IAEG_SDGs_20210804.pdf
IASC (Inter-Agency Standing Committee) (2021). IASC Operational Guidance on Data Responsibility in Humanitarian Action. Operational Guidance. Geneva. interagencystandingcommittee.org/system/files/2021-02/IASC%20Operational%20Guidance%20on%20Data%20Responsibility%20in%20Humanitarian%20Action-%20February%202021.pdf
ICPD (Italian Civil Protection Department) (2018). National Risk Assessment. Overview of the Potential Major Disasters in Italy: Seismic, Volcanic, Tsunami, Hydro-Geological/Hydraulic and Extreme Weather, Droughts and Forest Fire Risks. Italy: Presidency of the Council of Ministers, Italian Civil Protection Department.
IDMC (Internal Displacement Monitoring Centre) (2021). Global Internal Displacement Database. www.internal-displacement.org/database/displacement-data
IFRC (International Federation of Red Cross and Red Crescent Societies) (2019). The Cost of Doing Nothing: The Humanitarian Price of Climate Change and how it can be Avoided. Geneva. www.ifrc.org/sites/default/files/2021-07/2019-IFRC-CODN-EN.pdf
__________ (2020). World Disasters Report 2020: Come Heat or High Water: Tackling the Humanitarian Impacts of the Climate Crisis Together. Geneva. reliefweb.int/sites/reliefweb.int/files/resources/20201116_WorldDisasters_Full_compressed.pdf
__________ (2021). Saving lives in silent disasters. ifrc.medium.com/saving-lives-in-silent-disasters-7af839ce5379
Ilin, C., S. Annan-Phan, X.H. Tai, S. Mehra, S. Hsiang and J.E. Blumenstock (2021). Public mobility data enables COVID-19 forecasting and management at local and global scales. Scientific Reports, vol. 11, no. 1, p. 13531.
ILO (International Labour Organization) (2020). A Gender-Responsive Employment Recovery: Building Back Fairer. Policy Brief. Geneva. www.ilo.org/wcmsp5/groups/public/---ed_emp/documents/publication/wcms_751785.pdf
Independent Group of Scientists appointed by the Secretary-General (2019). Global Sustainable Development Report 2019: The Future Is Now: Science for Achieving Sustainable Development. New York: United Nations. reliefweb.int/sites/reliefweb.int/files/resources/24797GSDR_report_2019.pdf
Independent Panel for Pandemic Preparedness and Response (2021a). COVID-19: Make it the Last Pandemic. theindependentpanel.org/wp-content/uploads/2021/05/COVID-19-Make-it-the-Last-Pandemic_final.pdf
__________ (2021b). Centering Communities in Pandemic Preparedness and Response. Background Paper 10. the independentpanel .org/wp-content/u p l o a d s / 2 0 2 1 / 0 5 / B a c k g r o u n d - p a p e r - 1 0 -community-involvement.pdf
220
__________ (2021c). Second Report on Progress. t h e i n d e p e n d e n t p a n e l . o r g / w p - c o n t e n t /uploads/2021/01/Independent-Panel_Second-Report-on-Progress_Final-15-Jan-2021.pdf
Ink, D. and K. Thurmaier (2018). The Impossible Alaska Recovery (Chapter 4). Getting Things Done with Courage and Conviction. Irvine: Melvin & Leigh.
International Bateson Institute (n.d.). Testimonials. warmdatalab.net/testimonials
IOM (International Organization for Migration) (2017). IOM learns of “slave market” conditions endangering migrants in North Africa. Geneva. www.iom.int/news/iom-learns-slave-market-conditions-endangering-migrants-north-africa
__________ (2019). Displacement Tracking Matrix. dtm.iom.int/
IPCC (Intergovernmental Panel on Climate Change) (2012). Climate change: New dimensions in disaster risk, exposure, vulnerability, and resilience. In Managing the Risks of Extreme Events and Disasters to Advance Climate Change Adaptation. A Special Report of Working Groups I and II of the Intergovernmental Panel on Climate Change, C.B. Field, V. Barros, T.F. Stocker, D. Qin, D.J. Dokken, K.L. Ebi, M.D. Mastrandrea, K.J. Mach, G.-K. Plattner, S.K. Allen, M. Tignor and P.M. Midgley, eds. Cambridge and New York: Cambridge University Press. www.ipcc.ch/report/managing-the-risks-of-extreme-events-and-disasters-to-advance-climate-change-adaptation/
__________ (2014a). Climate Change 2014: Impacts, Adaptation, and Vulnerability: Part A: Global and Sectoral Aspects. Working Group II Contribution to the Fifth Assessment Report of the Intergovernmental Panel on Climate Change, C.B. Field, V.R. Barros, D.J. Dokken, K.J. Mach, M.D. Mastrandrea, T.E. Bilir, M. Chatterjee, K.L. Ebi, Y.O. Estrada, R.C. Genova, B. Girma, E.S. Kissel, A.N. Levy, S. MacCracken, P.R. Mastrandrea and L.L. White, eds. Cambridge and New York: Cambridge University Press. www.ipcc.ch/site/assets/uploads/2018/02/WGIIAR5-FrontMatterA_FINAL.pdf
__________ (2014b). Climate Change 2014: Synthesis Report. Contribution of Working Groups I, II and III to the Fifth Assessment Report of the Intergovernmental Panel on Climate Change, R.K. Pachauri and L.A. Meyer, eds. Geneva. www.ipcc.ch/site/assets/uploads/2018/02/SYR_AR5_FINAL_full.pdf
__________ (2018a). Summary for policymakers. In Global Warming of 1.5°C. An IPCC Special Report on the Impacts of Global Warming of 1.5°C above Pre-Industrial Levels and Related Global Greenhouse Gas Emission Pathways, in the Context of Strengthening the Global Response to the Threat of Climate Change, Sustainable Development, and Efforts to Eradicate Poverty, V. Masson-Delmotte, P. Zhai, H.-O. Pörtner, D. Roberts, J. Skea, P.R. Shukla, A. Pirani, W. Moufouma-Okia, C. Péan, R. Pidcock, S. Connors, J.B.R. Matthews, Y. Chen, X. Zhou, M.I. Gomis, E. Lonnoy, T. Maycock, M. Tignor and T. Waterfield, eds. Geneva. www.ipcc.ch/
site/assets/uploads/sites/2/2019/05/SR15_SPM_version_report_LR.pdf
__________ (2018b). Global Warming of 1.5°C. An IPCC Special Report on the Impacts of Global Warming of 1.5°C above Pre-industrial Levels and Related Global Greenhouse Gas Emission Pathways, in the Context of Strengthening the Global Response to the Threat of Climate Change, Sustainable Development, and Efforts to Eradicate Poverty, V. Masson-Delmotte, P. Zhai, H.O. Pörtner, D. Roberts, J. Skea, P.R. Shukla, A. Pirani, W. Moufouma-Okia, C. Péan, R. Pidcock, S.J.B. Connors, R. Matthews, Y. Chen, X. Zhou, M.I. Gomis, E. Lonnoy, T. Maycock, M. Tignor and T. Waterfield, eds. Geneva. www.ipcc.ch/site/assets/uploads/sites/2/2019/06/SR15_Full_Report_High_Res.pdf
__________ (2021a). Summary for policymakers. In Climate Change 2021: The Physical Science Basis. Contribution of Working Group I to the Sixth Assessment Report of the Intergovernmental Panel on Climate Change, V. Masson-Delmotte, P. Zhai, A. Pirani, S. L. Connors, C. Péan, S. Berger, N. Caud, Y. Chen, L. Goldfarb, M. I. Gomis, M. Huang, K. Leitzell, E. Lonnoy, J.B.R. Matthews, T. K. Maycock, T. Waterfield, O. Yelekçi, R. Yu and B. Zhou, eds. Cambridge and New York: Cambridge University Press. www.ipcc.ch/report/ar6/wg1/downloads/report/IPCC_AR6_WGI_SPM_final.pdf
__________ (2021b). Climate Change 2021: The Physical Science Basis. Contribution of Working Group I to the Sixth Assessment Report of the Intergovernmental Panel on Climate Change, V. Masson-Delmotte, P. Zhai, A. Pirani, S. L. Connors, C. Péan, S. Berger, N. Caud, Y. Chen, L. Goldfarb, M.I. Gomis, M. Huang, K. Leitzell, E. Lonnoy, J.B.R. Matthews, T. K. Maycock, T. Waterfield, O. Yelekçi, R. Yu and B. Zhou, eds. Cambridge and New York: Cambridge University Press. www.ipcc.ch/report/ar6/wg1/downloads/report/IPCC_AR6_WGI_Full_Report.pdf
IRGC (International Risk Governance Center) (2018). Guidelines for the Governance of Systemic Risks. Lausanne. infoscience.epfl.ch/record/257279
ISC (International Science Council), UNDRR (United Nations Office for Disaster Risk Reduction) and IRDR (Integrated Research on Disaster Risk) (2021). A Framework for Global Science in support of Risk Informed Sustainable Development and Planetary Health, J. Handmer, C. Vogel, B. Payne, A.-S. Stevance, J. Kirsch-Wood, M. Boyland, Q. Han, F. Lian, eds. Paris, Geneva and Beijing. council.science/wp-content/uploads/2020/06/DRR_GlobalScience-Framework-FINAL.pdf
Ismail-Zadeh, A.T., S.L. Cutter, K. Takeuchi and D. Paton (2017). Forging a paradigm shift in disaster science. Natural Hazards, vol. 86, no. 2, pp. 969–988.
IUCN (International Union for Conservation of Nature) (2021). The IUCN Red List of Threatened Species. www.iucnredlist.org/en
Jachimowicz, J.M., S. Duncan, E.U. Weber and E.J. Johnson (2019). When and why defaults influence
221
decisions: A meta-analysis of default effects. Behavioural Public Policy, vol. 3, no. 2, pp. 159–186.
Jacobzone, S., C. Baubion, J. Radisch, S. Hochrainer-Stigler, J. Linnerooth-Bayer, W. Liu, E. Rovenskaya and U. Dieckmann (2020). Strategies to govern systemic risks. In Systemic Thinking for Policy Making: The Potential of Systems Analysis for Addressing Global Policy Challenges in the 21st Century, W. Hynes, M. Lees and J. Müller, eds. Paris: Organisation for Economic Co-operation and Development Publishing. doi.org/10.1787/e3edb3a4-en
Jaeger, C. (2022). The Challenge of Anthropocene Risks. GAR2022 Contributing Paper. Geneva: United Nations Office for Disaster Risk Reduction. www.undrr.org/GAR2022
Jafino, B.A., B. Walsh, J. Rozenberg and S. Hallegatte (2020). Revised Estimates of the Impact of Climate Change on Extreme Poverty by 2030. Working Paper. Washington, D.C: The World Bank. openknowledge.worldbank.org/handle/10986/34555
Jäger, W.S., E.K. Christie, A.M. Hanea, C. den Heijer and T. Spencer (2018). A Bayesian network approach for coastal risk analysis and decision making. Coastal Engineering vol. 134, pp. 48–61.
Jean, N., M. Burke, M. Xie, W.M. Davis, D.B. Lobell and S. Ermon (2016). Combining satellite imagery and machine learning to predict poverty. Science, vol. 353, no. 6301, pp. 790–794.
Jensen, F.V. (1996). An Introduction to Bayesian Networks. London: UCL Press.
Jetten, J., S.D. Reicher, S.A. Haslam and T. Cruwys, eds. (2020). Together Apart: The Psychology of COVID-19. Thousand Oaks: SAGE Publications.
Johnson, G., J. Bedford, A. McClelland, A. Tiffany and B. Dalziel (2015). Evaluating the Impact of Safe and Dignified Burials for Stopping Ebola Transmission in West Africa: Summary Findings from the Anthropological Study in Guinea. Geneva, Port Moresby and York: International Federation of Red Cross and Red Crescent Societies, Guinea Red Cross National Society and Anthrologica. www.anthrologica.com/project/evaluating-impact-safe-and-dignified-burials-stopping-ebola-transmission-west-africa
Jongman, B., S. Hochrainer-Stigler, L. Feyen, J.C.J.H. Aerts, R. Mechler, W.J.W. Botzen, L.M. Bouwer, G. Pflug, R. Rojas and P.J. Ward (2014). Increasing stress on disaster-risk finance due to large floods. Nature Climate Change, vol. 4, no. 4, pp. 264–68.
Jurgilevich, A. (2021). Governance modes and epistemologies of future-oriented vulnerability assessments: Example of a mixed-methods approach. Futures, vol. 128, p. 102717.
Kahan, D.M., D. Braman, J. Gastil, P. Slovic and C.K. Mertz (2007). Culture and identity-protective cognition: Explaining the white-male effect in risk perception. Journal of Empirical Legal Studies, vol. 4, no. 3, pp. 465–505.
Kahane, L.H. (2021). Politicizing the mask: Political, economic and demographic factors affecting mask
wearing behavior in the USA. Eastern Economic Journal, vol. 47, no. 2, pp. 163–183.
Kahneman, D. (2013). Thinking, Fast and Slow? New York: Farrar, Straus and Giroux.
Kalies, E. and L.L. Yocom Kent (2016). Tamm review: Are fuel treatments effective at achieving ecological and social objectives? A systematic review. Forest Ecology and Management, vol. 375, pp. 84–95.
Kanji, R., T. Gound, A. Tiwari and N. Dave (2022). Exploring the Concept of Disaster Risk Balancing through the Interaction of Sibling Systems within Larger Systems of Interest: Developing a Framework to Understand the Systemic Nature of Disaster Risk. GAR2022 Contributing Paper. Geneva: United Nations Office for Disaster Risk Reduction. www.undrr.org/GAR2022
Kaurin, D. (2019). Data Protection and Digital Agency for Refugees. World Refugee Council Research Paper No. 12. Waterloo: World Refugee Council and Centre for International Governance Innovation. www.cigionline.org/publications/data-protection-and-digital-agency-refugees/
Keaokiriya, P., P.S.V.R. Krishna, B. Shivakoti, T. Goto, H. Sakai, A. Dewi, S. Jayasinghe, R.D. Kartiko, N.M.S.I. Arambepola and S. Basnayake (2022). Disaster Risk Reduction in the ASEAN Region: Understanding and Assessing Systematic Risks of Floods and Landslides in a River Basin Context. GAR2022 Contributing Paper. Geneva: United Nations Office for Disaster Risk Reduction. www.undrr.org/GAR2022
Keating, A. and S. Hanger-Kopp (2020). Practitioner perspectives of disaster resilience in international development. International Journal of Disaster Risk Reduction, vol. 42, p. 101355.
Keating, A., K. Venkateswaran, M. Szoenyi, K. MacClune and R. Mechler (2016). From event analysis to global lessons: Disaster forensics for building resilience. Natural Hazards and Earth System Sciences, vol. 16, no. 7, pp. 1603–1616.
Kelman, I. (2015). Climate change and the Sendai Framework for Disaster Risk Reduction. International Journal of Disaster Risk Science, vol. 6, no. 2, pp. 117–127.
Kennedy, J. (2019). Initiating ecological change through sound art. www.jokennedysound.com/blog/initiating-ecological-change-through-sound-art
Kenney, C. (2019). Ahi Kā Roa, Ahi Kā Ora Ōtautahi: Māori, recovery trajectories and resilience in Canterbury, New Zealand. In Population, Development, and the Environment, H. James, ed., pp. 375–394. Singapore: Springer Singapore.
Kenney, C. and S. Phibbs (2014). Shakes rattles and roll outs: The untold story of Māori engagement with community recovery, social resilience and urban sustainability in Christchurch, New Zealand. Procedia Economics and Finance, vol. 18, pp. 754–762.
__________ (2015). A Māori love story: Community-led disaster management in response to the Ōtautahi (Christchurch) earthquakes as a framework
222
for action. International Journal of Disaster Risk Reduction, vol. 14, no. 1, pp. 46–55.
Kickbusch, I. and D. Gleicher (2012). Governance for Health in the 21st Century. Copenhagen: World Health Organization, Regional Office for Europe. apps.who.int/ir is/bitstream/handle/10665/ 326429/9789289002745-eng.pdf
Kimmerer, R.W. (2020). Braiding Sweetgrass: Indigenous Wisdom, Scientific Knowledge and the Teachings of Plants. London: Penguin Press.
King, M.W. (2019). How brain biases prevent climate action. www.bbc.com/future/article/20190304-human-evolution-means-we-can-tackle-climate-change
King, D., J. Goff and A. Skipper (2007). Māori environmental knowledge and natural hazards in Aotearoa-New Zealand. Journal of The Royal Society of New Zealand, vol. 37, no. 2, pp. 59–73.
Klein, J.A., C.M. Tucker, C.E. Steger, A. Nolin, R. Reid, K.A. Hopping, E.T. Yeh. M.S. Pradhan, A. Taber, D. Molden, R. Ghate, D. Choudhury, I. Alcántara-Ayala, S. Lavorel, B. Müller, A. Grêt-Regamey, R.B. Boone, P. Bourgeron, E. Castellanos, X. Chen, S. Dong, M. Keiler, R. Seidl, J. Thorn and K. Yager (2019). An integrated community and ecosystem-based approach to disaster risk reduction in mountain systems. Environmental Science & Policy, vol. 94, pp. 143–152.
Knowles, C. (2018). How the Nepal Earthquake Continues to Reshape People’s Lives. The British Academy. www.thebritishacademy.ac.uk/blog/how-nepal-earthquake-continues-re-shape-peoples-lives/
Kolden, C.A. and C. Henson (2019). A socio-ecological approach to mitigating wildfire vulnerability in the wildland urban interface: A case study from the 2017 Thomas Fire. Fire, vol. 2, no. 1, p. 9
Komendantova, N., M. Riegler and S. Neumueller (2018). Of transitions and models: Community engagement, democracy, and empowerment in the Austrian energy transition. Energy Research & Social Science, vol. 39, pp. 141–151.
Komendantova, N., A. Scolobig, A. Garcia, D. Monfort and K. Fleming (2016). Multi-risk approach and urban resilience. International Journal of Disaster Resilience in the Built Environment, vol. 7, no. 2, pp. 114–132.
Kontgis, C., P. Kerins and E. Mackres (2021). How land use paints a clearer picture of urban life. World Resources Institute. www.wri.org/insights/insider-how-land-use-paints-clearer-picture-urban-life
Kousky, C. and H. Kunreuther (2014). Addressing affordability in the national flood insurance program. Journal of Extreme Events, vol. 1, no. 1.
Kramer, B., R. Rusconi and J.W. Glauber (2020). Five Years of Regional Risk Pooling: An Updated Cost-Benefit Analysis of the African Risk Capacity. Discussion Paper. Washington, D.C.: International Food Policy Research Institute. ebrary.ifpri.org/digital/collection/p15738coll2/id/134046
Kreiling, L., D.K.R. Robinson and D. Winickoff (2020). Collaborative Platforms for Innovation in Advanced Materials. OECD Science, Technology and Industry Policy Papers. No. 95. Paris: Organisation for Economic Co-operation and Development Publishing. www.oecd-ilibrary.org/science-and-technology/collaborative-platforms-for-innovation-in-advanced-materials_bb5225f1-en
Krönke, J., N. Wunderling, R. Winkelmann, A. Staal, B. Stumpf, O.A. Tuinenburg and J.F. Donges (2020). Dynamics of tipping cascades on complex networks. Physical Review E, vol. 101, no. 4, p. 042311.
Kruczkiewicz, A. (2018). Climate and music, beyond sonification: Balance-unbalance 2016. Leonardo, vol. 51, no. 2, pp. 179–180.
Kulp, S.A. and B.H. Strauss (2019). New elevation data triple estimates of global vulnerability to sea-level rise and coastal flooding. Nature Communications, vol. 10, no. 1, p. 4844.
Kunreuther, H., R. Ginsberg, L. Miller, P. Sagi, P. Slovic, B. Borkan and N. Katz (1978). Disaster Insurance Protection: Public Policy Lessons. New York: John Wiley & Sons.
Kunreuther, H. (2011). Reducing the risk of catastrophes. www.nber.org/reporter/2011number1/reducing-risk-catastrophes
Kunreuther, H., A. Polise and Q. Spellmeyer (2021). Addressing Biases That Impact Homeowners’ Adoption of Solar Panels. NBER Working Papers No. 28678. National Bureau of Economic Research. ideas.repec.org/p/nbr/nberwo/28678.html
Kwang, T. and W.B. Swann (2010). Do people embrace praise even when they feel unworthy? A review of critical tests of self-enhancement versus self-verification. Personality and Social Psychology Review, vol. 14, no. 3, pp. 263–280.
Ladds, M., A. Keating, J. Handmer and L. Magee (2017). How much do disasters cost? A comparison of disaster cost estimates in Australia. International Journal of Disaster Risk Reduction, vol. 21, pp. 419–429.
Lake, F.K., V. Wright, P. Morgan, M. McFadzen, D. McWethy and C. Stevens-Rumann (2017). Returning fire to the land: Celebrating traditional knowledge and fire. Journal of Forestry, vol. 115, no. 5, pp. 343–53.
Lakner, C., D.G. Mahler, M. Negre and E. Beer (2020). How Much Does Reducing Inequality Matter for Global Poverty? Global Poverty Monitoring Technical Note. Washington, D.C.: The World Bank. documents1.worldbank.org/curated/en/765601591733806023/pdf/How-Much-Does-Reducing-Inequality-Matter-for-Global-Poverty.pdf
Lakoff, G. and M. Johnson (2003). Metaphors We Live By. Chicago: University of Chicago Press.
Lallemant, D., R. Bicksler, K. Barns, P. Hamel, R. Soden and S. Bannister (2022). Towards a Critical Technical Practice in Disaster Risk Management: Lessons from Designing Collaboration Events. GAR2022
223
Contributing Paper. Geneva: United Nations Office for Disaster Risk Reduction. www.undrr.org/GAR2022
Lallemant, D., S. Loos, J.W. McCaughey, N. Budhathoki and F. Khan (2020). Supporting Equitable Disaster Recovery through Mapping and Integration of Social Vulnerability into Post-Disaster Impact Assessments. Informatics for Equitable Recovery Project. Earth Observatory Singapore. www.research-collection.ethz.ch/handle/20.500.11850/423856
Langton, M. (2010). The resource curse: New outback principalities and the paradox of plenty. In Still the Lucky Country?, J. Schultz, ed., pp. 47–63. GriffithReview No. 28.
Langton, M., M. Parsons, S. Leonard, K. Auty, D. Bell, P. Burgess, S. Edwards, R. Howitt, S. Jackson, V. McGrath and J. Morrison (2012). National Climate Change Adaptation Research Plan for Indigenous Communities. Gold Coast: National Climate Change Adaptation Research Facility. terranova.org.au/repository/nccarf/national -cl imate-change-adaptation-research-plan-for-indigenous-communities
Lara Mesa, R. (2021). Social vulnerability to environmental hazards: How cognitive factors influence preventive behavior to forest fires in people living in the wildland-urban interface. A case study of the Valparaiso region, Chile. Thesis, Radboud University, Nijmegen School of Management.
Larson, H.J. (2020). A call to arms: Helping family, friends and communities navigate the COVID-19 infodemic. Nature Reviews Immunology, vol. 20, no. 8, pp. 449–450.
Lasswell, H.D. (1971). A Pre-View of Policy Sciences. Elsevier: New York.
LastWeekTonight (2017). Floods: Last Week Tonight with John Oliver (HBO). www.youtube.com/watch?v=pf1t7cs9dkc
Lavell, A. and A. Maskrey (2014). The future of disaster risk management. Environmental Hazards, vol. 13, no. 4, pp. 267–280.
Lehman, W., M.K. Light, R.J. Nugent III and J. Burns (2022). Economic Consequences Assessment Model (ECAM): A Tool & Methodology for Measuring Indirect Economic Effects. GAR2022 Contributing Paper. Geneva: United Nations Office for Disaster Risk Reduction. www.undrr.org/GAR2022
Lehmann, E. (2014). Infrastructure threatened by climate change poses a national crisis. Scientific American. www.scientificamerican.com/article/infrastructure-threatened-by-climate-change-poses-a-national-crisis/
Lehmann, J. and B. Gaskins (2019). Learning scientific creativity from the arts. Palgrave Communications, vol. 5, no. 1, pp. 1–5.
Leiserowitz, A., E. Maibach, S. Rosenthal, J. Kotcher, J. Carman, L. Neyens, J. Marlon, K. Lacroix and M. Goldberg (2021). Climate Change in the American Mind - September 2021. New Haven: Yale University and George Mason University.
Lejano, R.P., M.S. Rahman, L. Kabir, E. Casas and M. Pormon (2022). Design and Implementation of a Relational Model of Risk Communication. GAR2022 Contributing Paper. Geneva: United Nations Office for Disaster Risk Reduction. www.undrr.org/GAR2022
Lempert, R., N. Kalra, S. Peyraud, Z. Mao, S.B. Tan, D. Cira and A. Lotsch (2013). Ensuring Robust Flood Risk Management in Ho Chi Minh City. Policy Research Working Paper No. 6456. Washington, D.C.: The World Bank. doi.org/10.1596/1813-9450-6465
León, C., R. Berndsen and L. Renneboog (2014). Financial Stability and Interacting Networks of Financial Institutions and Market Infrastructures. European Banking Center Discussion Paper Series No. 2014-011. No. ID 2502832. Rochester: Social Science Research Network. papers.ssrn.com/abstract=2502832
Lewin, K. (1936). Principles of Topological Psychology. McGraw-Hill Publications in Psychology. New York and London: McGraw-Hill Book Company.
Lewis, L.P., F. Petit, J.R. Hummel, J.D. Bergerson, S.O. Schleuter, B.J. Smith, A.M. Wagnar, K.A. Feffer and C. Macal (2022). Understanding COVID-19 Public Health Outcomes as a Function of Systemic Risks and Community Resilience: A Socio-Technical Assessment Framework to Inform Governance Strategies on Social Vulnerability, Workforce Exposure, and Resource Accessibility. GAR2022 Contributing Paper. Geneva: United Nations Office for Disaster Risk Reduction. www.undrr.org/GAR2022
Li, B., S. Pimm, S. Li, L. Zhao and C. Luo (2017). Free-ranging livestock threaten the long-term survival of giant pandas. Biological Conservation, vol. 216, pp. 18–25.
Liniger, H., R.M. Studer, P. Moll and U. Zander (2017). Making Sense of Research for Sustainable Land Management. Leipzig: Centre for Development and Environment, University of Bern, Switzerland and Helmholtz-Centre for Environmental Research GmbH – UFZ. www.ufz.de/export/data/2/126685_full_version_WOCAT_Glues.pdf
Littleproud, H.D. (2020). Overcoming systemic vulnerability through the National Disaster Risk Reduction Framework. Australian Journal of Emergency Management, vol. 35, no. 3.
Liu, J., M. Linderman, Z. Ouyang, L. An, J. Yang and H. Zhang (2001). Ecological degradation in protected areas: The case of Wolong Nature Reserve for giant pandas. Science, vol. 292, no. 5514, pp. 98–98.
Liu, J., S. Li, Z. Ouyang, C. Tam and X. Chen (2008). Ecological and socioeconomic effects of China’s policies for ecosystem services. Proceedings of the National Academy of Sciences, vol. 105, no. 28, pp. 9477–9482.
Lloyd’s Register Foundation (2020a). The majority of people around the world are concerned about climate change. The Lloyd’s Register Foundation World Risk Poll. wrp.lrfoundation.org.uk/explore-the-poll/the-majority-of-people-around-the-world-are-concerned-about-climate-change/
224
__________ (2020b). Thirty-four per cent of people worldwide worry about serious harm from severe weather. The Lloyd’s Register Foundation World Risk Poll. wrp.lrfoundation.org.uk/explore-the-poll/34-per-cent-of-people-worldwide-worry-about-serious-harm-from-severe-weather/
Lo, A. (2022). Synergies and Trade-Offs Between Sustainable Economic Development and Climate Change Adaptation. GAR2022 Contributing Paper. Geneva: United Nations Office for Disaster Risk Reduction. www.undrr.org/GAR2022
Luminate (2020). Enabling Media Markets to Work for Democracy: An International Fund for Public Interest Media. Feasibility study. luminategroup.com/storage/894/IFPIM-Feasibility-Study.pdf
Lwasa, S., A. Buyinza and B. Nabaasa (2017). Weather forecasts for pastoralism in a changing climate: Navigating the data space in North Eastern Uganda. Data Science Journal, vol. 16, no. 50, pp. 1–13.
Mack, E. (2019). Climate change has made the world’s deadliest lake way more dangerous. C/net. www.cnet.com/features/earth-day-2021-climate-change-has-made-the-worlds-deadliest-lake-way-more-dangerous/
Macmillan, A., M. Davies, C. Shrubsole, N. Luxford, N. May, L.F. Chiu, E. Trutnevyte, Y. Bobrova and Z. Chalabi (2016). Integrated decision-making about housing, energy and wellbeing: A qualitative system dynamics model. Environmental Health, vol. 15, no. 1, p. S37.
Mahler, D.G., N. Yonzan, C. Lakner, R.A.C. Aguilar and H. Wu (2021). Updated estimates of the impact of COVID-19 on global poverty: Turning the corner on the pandemic in 2021? blogs.worldbank.org/opendata/updated-estimates-impact-covid-19-global-poverty-turning-corner-pandemic-2021
Manghani, R. (2021). Total eclipse: How falling costs will secure solar’s dominance in power. www.woodmac.com/horizons/how-falling-costs-will-secure-solars-dominance-in-power
Mani, L., P. Cole and I. Stewart (2016). Using video games for volcanic hazard education and communication: An assessment of the method and preliminary results. Natural Hazards and Earth System Sciences, vol. 16, no. 7, pp. 1673–1689.
Markhvida, M., B. Walsh, S. Hallegatte and J. Baker (2020). Quantification of disaster impacts through household well-being losses. Nature Sustainability, vol. 3, no. 7, pp. 538–547.
Markon, M.-P.L., J. Crowe and L. Lemyre (2013). Examining uncertainties in government risk communication: Citizens’ expectations. Health, Risk & Society, vol. 15, no. 4, pp. 313–332.
Marsden, M. (1992). God, man and universe: A Maori view. In Te Ao Hurihuri: Aspects of Maoritanga, M. King, ed., pp. 117–137. Auckland: Reed Publishing.
Martin, J., J. Linnerooth-Bayer, W. Liu, A. Scolobig and J. Balsiger (2019). NBS In-Depth Case Study Analysis of the Characteristics of Successful Governance Models. Deliverable 5.1 of the PHUSICOS project, According
to nature. H2020 Project PHUSICOS. phusicos.eu/wp-content/uploads/2020/10/D5_1_NBS-in-depth-case-study-analysis_Final.pdf
Martin, J., A. Scolobig, J. Linnerooth-Bayer, W. Liu and J. Balsiger (2021). Catalyzing innovation: Governance enablers of nature-based solutions. Sustainability, vol. 13, no. 4, p. 1971.
Martin, W.E., I.M. Martin and B. Kent (2009). The role of risk perceptions in the risk mitigation process: The case of wildfire in high risk communities. Journal of Environmental Management, vol. 91, no. 2, pp. 489–498.
Maskrey, A. (1989). Disaster Mitigation: A Community Based Approach. Oxford: Oxfam GB. policy-practice.oxfam.org/resources/disaster-mitigation-a-community-based-approach-121119/
__________ (2011). Revisiting community-based disaster risk management. Environmental Hazards, vol. 10, no. 1, pp. 42–52.
Maskrey, A., G. Jain and A. Lavell (2021). The Social Construction of Systemic Risk: Towards an Actionable Framework for Risk Governance. Discussion Paper. New York: United Nations Development Programme. w w w. u n d p . o rg / p u b l i c a t i o n s / u n d p - s o c i a l -construction-systemic-risk-towards-actionable-framework-risk-governance
__________ (2022). The Social Construction of Systemic Risk: Towards an Actionable Framework for Risk Governance. GAR2022 Contributing Paper. Geneva: United Nations Office for Disaster Risk Reduction. www.undrr.org/GAR2022
McInerney, C. (2020). Data environment mapping to assess the mosaic effect. centre.humdata.org/data-environment-mapping-to-assess-the-mosaic-effect/
McLennan, J., D. Paton and R. Beatson (2015). Psychological differences between south-eastern Australian householders’ who intend to leave if threatened by a wildfire and those who intend to stay and defend. International Journal of Disaster Risk Reduction, vol. 11, pp. 35–46.
McManus, S. and R. Tennyson (2008). Talking the Walk: A Communication Manual for Partnership Practitioners. Oxford: International Business Leaders Forum on behalf of The Partnering Initiative. thepartneringinitiative.org/wp-content/uploads/2014/08/TalkingTheWalk.pdf
Meadows, D. (1999). Leverage Points: Places to Intervene in a System. Hartland: The Sustainability Institute. http://drbalcom.pbworks.com/w/file/fetch/35173014/Leverage_Points.pdf
Mechler, R., L.M. Bouwer, J. Linnerooth-Bayer, S. Hochrainer-Stigler, J.C.J.H. Aerts, S. Surminski and K. Williges (2014). Managing unnatural disaster risk from climate extremes. Nature Climate Change, vol. 4, no. 4, pp. 235–237.
Meier, K., T. Glatz, M.C. Guijt, M. Piccininni, M. van der Meulen, K. Atmar, A.-T.C. Jolink, T. Kurth, J.L. Rohmann and A.H.Z. Najafabadi (2020). Public perspectives on protective measures during the
225
COVID-19 pandemic in the Netherlands, Germany and Italy: A survey study. PLOS One, vol. 15, no. 8, p. e0236917.
Meng, A., C. Disalvo and E. Zegura (2019). Collaborative data work towards a caring democracy. Proceedings of the ACM on Human-Computer Interaction, vol. 3, pp. 1–23.
Mercer, J., I. Kelman, L. Taranis and S. Suchet-Pearson (2009). Framework for integrating indigenous and scientific knowledge for disaster risk reduction. Disasters, vol. 34, no. 1, pp. 214–239.
Meyer, R. and H. Kunreuther (2017). The Ostrich Paradox: Why We Underprepare for Disasters. Philadelphia: Wharton School Press.
Mikhitarian, S. (2019). Homes with solar panels sell for 4.1% more. Zillow. www.zillow.com/research/solar-panels-house-sell-more-23798/
Millar, P., C. Thomson, J. Smithies and J. Middendorf (2019). The challenge, the project, and the politics: Lessons From six years of the UC CEISMIC Canterbury Earthquakes Digital Archive. In Crisis and Disaster in Japan and New Zealand: Actors, Victims and Ramifications, pp. 159–179. Singapore: Palgrave Macmillan.
Mol, J.M., W.J.W Botzen and J.E. Blasch (2022). After the virtual flood: Risk perceptions and flood preparedness after virtual reality risk communication. Judgment and Decision Making, vol. 17, no. 1, pp. 189–214.
Møller, R.Y. (2011). Drivers of Risk Management: Adapting Risk Management to Organisational Motives. Research Executive Summary Series, vol. 7, no. 7. London: Chartered Institute of Management Accountants. www.cimaglobal.com/Documents/Thought_leadership_docs/Management%20and%20financial%20accounting/drivers-risk-management_FINAL.pdf
Monteil, C., J. Barclay and A. Hicks (2020). Remembering, forgetting, and absencing disasters in the post-disaster recovery process. International Journal of Disaster Risk Science, vol. 11, no. 3, pp. 287–299.
Moore, R. (2016). Alejandro Aravena: The shape of things to come. The Guardian, 10 April. www.theguardian.com/artanddesign/2016/apr/10/architect -alejandro-aravena-pritzker-prize-elemental-housing-iquique-constitucion-tsunami-defences
Morales, E. (2019). “Trueno” Preparedness Campaign for Pet Owners in Costa Rica 2012-2014. GAR2019 Contributing Paper. Geneva: United Nations Office for Disaster Risk Reduction. www.undrr.org/publication/trueno-preparedness-campaign-pet-owners-costa-rica-2012-2014
Munich Re (n.d.). Risks posed by natural disasters. www.munichre.com/en/risks/natural-disasters-losses-are-trending-upwards.html
NASA (National Aeronautics and Space Administration) (2019). MERRA-2. gmao.gsfc.nasa.gov/reanalysis/MERRA-2/
NASA SVS (National Aeronautics and Space Administration Scientific Visualization Studio)
(2018). NASA’s Black Marble night lights used to examine disaster recovery in Puerto Rico. svs.gsfc.nasa.gov/4658
NCCMH (National Collaborating Centre for Mental Health) (2005). Post-Traumatic Stress Disorder (PTSD) The Management of PTSD in Adults and Children in Primary and Secondary Care. Leicester: National Institute for Health and Care Excellence. pubmed.ncbi.nlm.nih.gov/21834189/
National Research Council (1989). Improving Risk Communication. Washington, D.C.: The National Academies Press.
National Resilience Taskforce (2018). Profiling Australia’s Vulnerability: The Interconnected Causes and Cascading Effects of Systemic Disaster Risk. Australian Government, Department of Home Affairs. www.aidr.org.au/media/6682/national-resilience-taskforce-profiling-australias-vulnerability.pdf
NERC (North American Electric Reliability Corporation) (2011). Arizona-Southern California Outages on September 8, 2011: Causes and Recommendations. w w w. n e rc . c o m / p a / r r m / e a / S e p t e m b e r % 2 02011%20Southwest%20Blackout%20Event%20Document%20L/AZOutage_Report_01MAY12.pdf
Neumayer, E. and T. Plümper (2007). The gendered nature of natural disasters: The impact of catastrophic events on the gender gap in life expectancy, 1981–2002. Annals of the Association of American Geographers, vol. 97, no. 3, pp. 551–566.
New Zealand Government (2017). Te Awa Tupua (Whanganui River Claims Settlement) Act 2017. www.legislation.govt.nz/act/public/2017/0007/latest/whole.html
__________ (2019). Ngāti Rangi Claims Settlement Act 2019. www.legislation.govt.nz/act/public/2019/0040/latest/LMS48115.html
Newscast Studio (2018). The Weather Channel hurricane flooding immersive mix reality with Erika Navarro. www.youtube.com/watch?v=K75YFndkAZY
Nguyen, H., H.M. Hien, R. Shaw and T.T.M. Thi (2013). Community based disaster risk management in Vietnam. Forms of Community Participation in Disaster Risk Management Practices, pp. 119–131.
Nguyen, M. and P. Winters (2011). The impact of migration on food consumption patterns: The case of Vietnam. Food Policy, vol. 36, no. 1, pp. 71–87.
Nguyen, V. (2021). A new legacy of inequality behind COVID-19. United Nations Economic and Social Commission for Asia and the Pacific. www.unescap.org/blog/new-legacy-inequality-behind-covid-19
North, D.C. (2005). Institutions and the performance of economies over time. In Handbook of New Institutional Economics, pp. 21–30. Dordrecht: Springer. siliconflatirons.org/documents/initiatives/IRLEdaytwo/North_Institutions_and_the_Performance.pdf
O’Brien, K. and L. Sygna (2013). Responding to climate change: The three spheres of transformation. Proceedings of the Conference Transformation in a Changing Climate, 19–21 June 2013, Oslo,
226
Norway. University of Oslo, pp. 16–23. www.sv.uio.no/iss/english/research/projects/adaptation/publications/1-responding-to-climate-change---three-spheres-of-transformation_obrien-and-sygna_webversion_final.pdf
OCHA (United Nations Office for the Coordination of Humanitarian Affairs) (2021a). The Humanitarian Exchange Language. OCHA Centre for Humanitarian Data. hxlstandard.org/
__________ (2021b). The State of Open Humanitarian Data 2021: Assessing Data Availability Across Humanitarian Crises. New York: OCHA Centre for Humanitarian Data. reliefweb.int/report/world/state-open-humanitarian-data-2021-assessing-data-availability-across-humanitarian
__________ (n.d.). Needs assessment: Overview. www.humanitarianresponse.info/en/programme-cycle/space/page/assessments-overview
O’Connell, D., R. Wise, R. Williams, N. Grigg, S. Meharg, M. Dunlop, V. Doerr, J. Meyers, J. Edwards, M. Osuchowski and M. Crosweller (2018). Approach and Methods for Co-Producing a Systems Understanding of Disaster. Technical Report Supporting the Development of the Australian Vulnerability Profile. Canberra: Commonwealth Scientific and Industrial Research Organisation. doi.org/10.25919/5bc778a6a4d34
O’Connell, D., N. Grigg, Y. Maru, E. Bohensky, H. Dayna, T. Measham, R. Wise, M. Dunlop, S. Patterson, S. Vaidya and S. Lade (2020). A Resilience Checklist – a Guide for Doing Things Differently and Acting Collectively (Resilience Checklist Version 1.0 July 2020). Canberra: Commonwealth Scientific and Industrial Research Organisation. publications.csiro.au/publications/publication/PIcsiro:EP205362
O’Donnell, E. and J. Talbot-Jones (2018). Creating legal rights for rivers: Lessons from Australia, New Zealand, and India. Ecology and Society, vol. 23, no. 1.
OECD (Organisation for Economic Co-operation and Development) (2018a). DAC Working Party on Development Finance Statistics. Revision of the Reporting of the Directives: Sections Relating to the Approved SDG Focus Field and Changes to Policy Markers and Types of Aid. Formal meeting of the Working Party on Development Finance Statistics (WP-STAT), 22–23 November 2018, Organisation for Economic Co-operation and Development, Boulogne. DCD/DAC/STAT(2018)52. Paris. one.oecd.org/document/DCD/DAC/STAT(2018)52/en/pdf
__________ (2018b). Data and Diagnostics to Leave No One Behind. Development Cooperation Report 2018: Joining Forces to Leave No One Behind. Paris. doi.org/10.1787/dcr-2018-en
__________ (2020). Addressing Societal Challenges Using Transdisciplinary Research. OECD Science, Technology and Industry Policy Papers No. 88. Paris. doi.org/10.1787/0ca0ca45-en
__________ (2021a). OECD.Stat. stats.oecd.org/__________ (2021b). Making Better Policies for Food
Systems. Paris. doi.org/10.1787/ddfba4de-en
Oliver-Smith, A., I. Alcántara-Ayala, I. Burton and A. Lavell (2017). The social construction of disaster risk: Seeking root causes. International Journal of Disaster Risk Reduction, vol. 22, pp. 469–474.
__________ (2016). Forensic Investigations of Disasters (FORIN): A Conceptual Framework and Guide to Research. Beijing: Integrated Research on Disaster Risk. www.irdrinternational.org/uploads/files/2020/08/n0EpdIvgoGZuwbrhioKRFLQiw5XlLfF1vIDE7tEB/FORIN-2-29022016.pdf
Olson, R.L. (2016). Missing the Slow Train: How Gradual Change Undermines Public Policy & Collective Action. Washington, D.C.: Woodrow Wilson Center. www.wilsoncenter.org/sites/default/fi les/media/documents/event/slow_threats_report.pdf
One Earth Future Foundation (2022). Infographic.OpenStreetMap Foundation (n.d.). OpenStreetMap.
www.openstreetmap.org/ Opondo, D.O. (2013). Erosive coping after the 2011
floods in Kenya. International Journal of Global Warming, vol. 5, no. 4, pp. 452–466.
Osgood, D., B. Powell, R. Diro, C. Farah, M. Enenkel, M.E. Brown, G. Husak, S.L. Blakeley, L. Hoffman and J.L. McCarty (2018). Farmer perception, recollection, and remote sensing in weather index insurance: An Ethiopia case study. Remote Sensing, vol. 10, no. 12, p. 1887.
Ostrom, E. (1990). Governing the Commons: The Evolution of Institutions for Collective Action. Political Economy of Institutions and Decisions. Cambridge: Cambridge University Press.
Ostrom, V. (1983). Freedom and organization. In Workshop in Political Theory and Policy Analysis. The 1984 American Political Science Association Meetings, Panel on Freedom and Organization. Working Paper W83-16.
Otto, F.E.L., S. Philip, S. Kew, S. Li, A. King and H. Cullen (2018). Attributing high-impact extreme events across timescales—a case study of four different types of events. Climatic Change, vol. 149, no. 3, pp. 399–412.
Oxford Economics (2017). Global Infrastructure Outlook. www.oxfordeconomics.com/recent-releases/99f4fa86-a314-4762-97c6-fac8bdcbe40a
Oyola-Merced, M.I., A.B. Craddock, C. Ao and O. Verkhoglyadova (2022). Transdisciplinary Application of Global Navigation Satellite System Radio Occultation (GNSS-RO) to Characterize Atmospheric Hazards and Model Systemic Risk. GAR2022 Contributing Paper. Geneva: United Nations Office for Disaster Risk Reduction. www.undrr.org/GAR2022
Page-Tan, C. (2022). Data Tools for Assessing Disaster Risk Reduction: An Analysis of Literature Using Open-Access Disaster Risk Reduction Spatial Datasets to Implement the Sendai Framework. GAR2022 Contributing Paper. Geneva: United Nations Office for Disaster Risk Reduction. www.undrr.org/GAR2022
Palomo, I., B. Locatelli, I. Otero, M. Colloff, E. Crouzat, A. Cuni-Sanchez, E. Gómez-Baggethun, A. González-
227
García, A. Grêt-Regamey, A. Jiménez-Aceituno, B. Martín-López, U. Pascual, N. Zafra-Calvo, E. Bruley, M. Fischborn, R. Metz and S. Lavorel (2021). Assessing nature-based solutions for transformative change. One Earth, vol. 4, no. 5, pp. 730–741.
Pant, R., J.W. Hall, E.E. Koks, H. Paltan, X. Hu, C. Zorn and T. Russell (2022). From Local to Global Scales - Quantifying Climate Risks and Adaptation Opportunities for Networked Infrastructure Systems. GAR2022 Contributing Paper. Geneva: United Nations Office for Disaster Risk Reduction. www.undrr.org/GAR2022
Pardo, N., H. Wilson, J.N. Procter, E. Lattughi and T. Black (2015). Bridging Māori indigenous knowledge and western geosciences to reduce social vulnerability in active volcanic regions. Journal of Applied Volcanology, vol. 4, no. 5.
Parkinson, D. and C. Zara (2011). ‘The Way He Tells It…’: Relationships after Black Saturday. Wangaratta: Women‘s Health Goulburn North East. www.g e n d e r a n d d i s a s t e r. c o m . a u / w p - c o n t e n t /uploads/2015/06/Doc-005-The-Way-He-Tells-it.pdf
Partnership for Healthy Cities (2020). Mass Media Campaign to Promote Behaviour Change and Solidarity Through the COVID-19 Pandemic: Yangon, Myanmar. Partnership for Healthy Cities. cities4health.org/assets/library-assets/yangon_final_oct-2020.pdf
Pascoe, B. (2018). Dark Emu: Aboriginal Australia and the Birth of Agriculture. Sydney: Magabala Books.
Paton, D. and P. Buergelt (2012). Community engagement and wildfire preparedness: The influence of community diversity. In Wildfire and Community: Facilitating Preparedness and Resilience, D. Paton and F. Tedim, eds., pp. 241–259. Springfield: Charles C. Thomas Publisher.
Paton, D. and D. Johnston (2017). Disaster Resilience: An Integrated Approach. Springfield: Charles C. Thomas Publisher.
Paudel, Y., W.J.W. Botzen and J.C.J.H. Aerts (2015). Influence of climate change and socio-economic development on catastrophe insurance: A case study of flood risk scenarios in the Netherlands. Regional Environmental Change, vol. 15, no. 8, pp. 1717–1729.
Pauleit, S., T. Zölch, R. Hansen, T.B. Randrup and C.K. van den Bosch (2017). Nature-based solutions and climate change – four shades of green. In Nature-Based Solutions to Climate Change Adaptation in Urban Areas: Linkages between Science, Policy and Practice. Theory and Practice of Urban Sustainability Transitions, pp. 29–49. Cham: Springer International Publishing. doi.org/10.1007/978-3-319-56091-5_3
PBL Netherlands Environmental Assessment Agency (2020). IMAGE Integrated model to assess the global environment. models.pbl.nl/image/index.php/Flood_risks
Pelling, M. (1997). What determines vulnerability to floods: A case study in Georgetown, Guyana. Environment and Urbanization, vol. 9, no. 1, pp. 203–226.
Penn, I. (2021b). California panel backs solar mandate for new buildings. The New York Times, 11 August. www.nytimes.com/2021/08/11/business/energy-environment/california-solar-mandates.html
People Need People (2020). International Bateson Institute. www.peopleneedpeople.online
Persson, L., B.M.C. Almroth, C.D. Collins, S. Cornell, C.A. de Wit, M.L. Diamond, P. Fantke, M. Hassellöv, M. MacLeod, M.W. Ryberg, P.S. Jørgensen, P. Villarrubia-Gómez, Z. Wang and M.Z. Hauschild (2022). Outside the safe operating space of the planetary boundary for novel entities. Environmental Science & Technology, vol. 56, no. 3, pp. 1510–1521.
Pescaroli, G., K. Guida, J. Reynolds and D. Alexander (2022). Managing Systemic Risk in Emergency Management, Organizational Resilience and Climate Change Adaptation. GAR2022 Contributing Paper. Geneva: United Nations Office for Disaster Risk Reduction. www.undrr.org/GAR2022
Peters, B.G. and M. Tarpey (2019). Are wicked problems really so wicked? Perceptions of policy problems. Policy and Society, vol. 38, no. 2, pp. 218–236.
Picard, M. (2021). Beyond Vulnerability to Gender Equality and Women’s Empowerment and Leadership in Disaster Risk Reduction: Critical Actions for the United Nations System. New York and Geneva: UN Women, United Nations Population Fund and United Nations Office for Disaster Risk Reduction. www.unwomen.org/en/digital-library/publications/2021/11/research-paper-beyond-vulnerability-to-gender-equality
Pinto-Bazurco, J.F. (2020). The Precautionary Principle. Still Only One Earth: Lessons from 50 Years of UN Sustainable Development Policy. Brief 4. Winnipeg: International Institute for Sustainable Development. www.iisd.org/system/files/2020-10/still-one-earth-precautionary-principle.pdf
Pitt, M. (2008). Learning Lessons from the 2007 Floods [The Pitt Review]. London: Cabinet Office. webarchive.nationalarchives.gov.uk/ukgwa/20100812084907mp_/http://archive.cabinetoffice.gov.uk/pittreview/_/media/assets/www.cabinetoffice.gov.uk/flooding_review/pitt_review_full%20pdf.pdf
Pittman, T.S. and P.R. D’Agostino (1989). Motivation and cognition: Control deprivation and the nature of subsequent information processing. Journal of Experimental Social Psychology, vol. 25, no. 6, pp. 465–480.
Plan Vivo Foundation (n.d.). Plan Vivo Foundation: For nature, climate and communities. www.planvivo.org/
Platto, S., J. Zhou, Y. Wang, H. Wang and E. Carafoli (2021). Biodiversity loss and COVID-19 pandemic: The role of bats in the origin and the spreading of the disease. Biochemical and Biophysical Research Communications, vol. 538, pp. 2–13.
228
Poledna, S., J.L. Molina-Borboa, S. Martínez-Jaramillo, M. van der Leij and S. Thurner (2015). The multi-layer network nature of systemic risk and its implications for the costs of financial crises. Journal of Financial Stability, vol. 20, no. C, pp. 70–81.
Poledna, S. and S. Thurner (2016). Elimination of systemic risk in financial networks by means of a systemic risk transaction tax. Quantitative Finance, vol. 16, no. 10, pp. 1599–1613.
Porras, I. and P. Steele (2020). Making the Market Work for Nature: How Biocredits Can Protect Biodiversity and Reduce Poverty. IIED Issue Paper. London: International Institute for Environment and Development. pubs.iied.org/sites/default/files/pdfs/migrate/16664IIED.pdf
Poussin, J.K., W.J.W. Botzen and J.C.J.H. Aerts (2013). Stimulating flood damage mitigation through insurance: An assessment of the French CatNat system. Environmental Hazards, vol. 12, no. 3–4, pp. 258–277.
Pozek, N. (2022). Avoiding “Failure of Imagination”: Informing Scenario Planning with Creative Practices. GAR2022 Contributing Paper. Geneva: United Nations Office for Disaster Risk Reduction. www.undrr.org/GAR2022
Pritchard, M.E. and S.-H. Yun (2018). Satellite radar imaging and its application to natural hazards. In Natural Hazards, R.P. Singh and D. Bartlett, eds., pp. 95–114. New York: CRC Press.
PRP (Pacific Resilience Partnership) (2021). Pacific Resilience Meeting 2021 Report. www.resilientpacific.org/sites/default/files/2021-11/2021%20PRM%20report.pdf
Pulwarty, R.S., C. Simpson and C.R. Nierenberg (2009). The regional integrated sciences and assessments (RISAs): Crafting assessments for the long haul. In Integrated Regional Assessments of Global Climate Change, J.J. Knight, ed. Cambridge: Cambridge University Press. cpo.noaa.gov/portals/0/Docs/RISA/CitationPulwartyetal.pdf
Qadir, U., K. Pillay, A. Creed, B. Boulle, K. Tukiainen, O. Lala, M. Tapia, D. Molloy and J.J. Rae (2021). Green Bonds for Climate Resilience: State of Play and Roadmap to Scale. Rotterdam: Global Center on Adaptation. gca.org/wp-content/uploads/2021/09/State-of-Play-and-Roadmap-to-Scale-V2.pdf
Quigley, M.C., J. Attanayake, A. King and F. Prideaux (2020a). A multi-hazards earth science perspective on the COVID-19 pandemic: The potential for concurrent and cascading crises. Environment Systems and Decisions, vol. 40, no. 2, pp. 199–215.
Quigley, M.C., W. Saunders, C. Massey, R. Van Dissen, P. Villamor, H. Jack and N. Litchfield (2020b). The utility of earth science information in post-earthquake land-use decision-making: The 2010–2011 Canterbury earthquake sequence in Aotearoa New Zealand. Natural Hazards and Earth System Sciences, vol. 20, no. 12, pp. 3361–3385.
Rabonza, M.L. and D. Lallemant (2022). Shedding Light on Avoided Disasters: Measuring Invisible Benefits
of Disaster Risk Reduction Using Counterfactual Probabilistic Analysis. GAR2022 Contributing Paper. Geneva: United Nations Office for Disaster Risk Reduction. www.undrr.org/GAR2022
Ráez-Luna, E. (2008). Third world inequity, critical political economy, and the ecosystems approach. In The Ecosystem Approach: Complexity, Uncertainty, and Managing for Sustainability, D. Waltner-Toews, J.J. Kay and N.-M.E. Lister, eds. New York: Columbia University Press.
Ramírez, A.I. and L.A. Herrera-Lozano (2015). Forensic analysis of floods: A methodological guide. Water Technology and Sciences (in Spanish), vol. 6, no. 1, pp. 25–48.
Ranger, N., S. Hallegatte, S. Bhattacharya, M. Bachu, S. Priya, K. Dhore, F. Rafique, P. Mathur, N. Naville, F. Henriet, C. Herweijer, S. Pohit and J. Corfee-Morlot (2011). An assessment of the potential impact of climate change on flood risk in Mumbai. Climatic Change, vol. 104, no. 1, pp. 139–167.
Rappaport, A. (2005). The economics of short-term performance obsession. Financial Analysts Journal, vol. 61, no. 3, pp. 65–79.
Rayamajhee, V., A.K. Bohara and V.H. Storr (2020). Ex-post coping responses and post-disaster resilience: A case from the 2015 Nepal earthquake. Economics of Disasters and Climate Change, vol. 4, no. 3, pp. 575–599.
RECEIPT (2020). Cocoa storyline: Developed during a RECEIPT project workshop.
Reilly, M.P.J. (2008). What is Māori studies? Manawa Whenua, Wē Moana Uriuri, Hōkikitanga Kawenga. Dunedin: Te Tumu, School of Māori, Pacific and Indigenous Studies at the University of Otago. ourarchive.otago.ac.nz/b i t s t r e a m / h a n d l e / 1 0 5 2 3 / 5 1 5 9 / R e i l l y _ 1 .pdf?sequence=4&isAllowed=y
Reinoso, E. and M. Ordaz (1999). Spectral ratios for Mexico City from free-field recordings. Earthquake Spectra, vol. 15, no. 2, pp. 273–295.
Reinoso, E., P. Quinde, M. Contreras and D. Gómez (2022). Identification of the Highest Risk Buildings in Mexico City. GAR2022 Contributing Paper. Geneva: United Nations Office for Disaster Risk Reduction. www.undrr.org/GAR2022
Reisinger, A., M. Howden, C. Vera, M. Garschagen, M. Hurlbert, S. Kreibiehl, K.J. Mach, K. Mintenbeck, B. O’Neill, M. Pathak, R. Pedace, H.-O. Pörtner, E. Poloczanska, M.R. Corradi, J. Sillmann, M. van Aalst, D. Viner, R. Jones, A.C. Ruane and R. Ranasinghe (2020). Guidance Note – The Concept of Risk in the IPCC Sixth Assessment Report: A Summary of Cross Working Group Discussions. Geneva: Intergovernmental Panel on Climate Change. www.ipcc.ch/event/guidance-note-concept-of-risk-in-the-6ar-cross-wg-discussions/
Renn, O., M. Laubichler, K. Lucas, W. Kröger, J. Schanze, R.W. Scholz and P.-J. Schweizer. (2020). Systemic risks from different perspectives. Risk Analysis.
229
Resurgence (2020a). DARAJA Endline Data Analysis: Learning Outcomes Workshop, September 2020. www.resurgence.io/wp-content/uploads/2019/01/Learning-review-deck_master-.pptx
__________ (2020b). DARAJA: Development of locally accurate weather forecasts. www.resurgence.io/solutions/climate-risk-visualisation-and-communication/daraja/
Rezwana, N. and R. Pain (2020). Gender-based violence before, during, and after cyclones: slow violence and layered disasters. Disasters, vol. 45, no. 4, pp. 741–761.
Rittel, H.W.J. and M.M. Webber (1973). Dilemmas in a general theory of planning. Policy Sciences, vol. 4, no. 2, pp. 155–169.
Robinson, P.J., W.J.W. Botzen, H. Kunreuther and S.J. Chaudhry (2021). Default options and insurance demand. Journal of Economic Behavior and Organization, vol. 183, pp. 39–56.
Robles, L.R. (2022). A Human Security Perspective in Understanding Risk Information During the COVID-19 Pandemic. GAR2022 Contributing Paper. Geneva: United Nations Office for Disaster Risk Reduction. www.undrr.org/GAR2022
Rockström, J. and M. Klum (2015). Big World, Small Planet: Abundance Within Planetary Boundaries. London: Yale University Press.
Roder, G., P. Hudson and P. Tarolli (2019). Flood risk perceptions and the willingness to pay for flood insurance in the Veneto region of Italy. International Journal of Disaster Risk Reduction, vol. 37, p. 101172.
Rogers, P. (2019). Solar power required for all new California homes starting Jan. 1. The Mercury News, 15 December. www.mercurynews.com/2019/12/15/solar-power-required-for-all-new-california-homes-starting-jan-1/
Roggema, R., T. Vermeend and A. van den Dobbelsteen (2012). Incremental change, transition or transformation? Optimising change pathways for climate adaptation in spatial planning. Sustainability, vol. 4, no. 10, pp. 2525–2549.
Román, M.O., Z. Wang, Q. Sun, V. Kalb, S.D. Miller, A. Molthan, L. Schultz, J. Bell, E.C. Stokes, B. Pandey, K.C. Seto, D. Hall, T. Oda, R.E. Wolfe, G. Lin, N. Golpayegani, S. Devadiga, C. Davidson, S. Sarkar, C. Praderas, J. Schmaltz, R. Boller, J. Stevens, O.M.R. González, E. Padilla, J. Alonso, Y. Detrés, R. Armstrong, I. Miranda, Y. Conte, N. Marrero, K. MacManus, T. Esch and E.J. Masuoka (2018). NASA’s Black Marble nighttime lights product suite. Remote Sensing of Environment, vol. 210, pp. 113–143.
Román, M.O., E.C. Stokes, R. Shrestha, Z. Wang, L. Schultz, E.A.S. Carlo, Q. Sun, J. Bell, A. Molthan, V. Kalb, C. Ji, K.C. Seto, S. N. McClain and M. Enenkel (2019). Satellite-based assessment of electricity restoration efforts in Puerto Rico after Hurricane Maria. PloS One, vol. 14, no. 6, p. e0218883.
Rovatsos, M., B. Mittelstadt and A. Koene (2019). Landscape Summary: Bias in Algorithmic Decision-
making: What is Bias in Algorithmic Decision-making, How Can We Identify It, And How Can We Mitigate It? Edinburgh: UK Government.
Rozenberg, J., N. Browne, S. De Vries Robbé, M. Kappes, W. Lee and A. Prasad (2021). 360° Resilience: A Guide to Prepare the Caribbean for a New Generation of Shocks. Washington, D.C.: The World Bank. elibrary.worldbank.org/doi/book/10.1596/36405
RPDRR-AC (Regional Platform for DRR for the Americas & the Caribbean) (2021a). Ministerial Declaration: Fourth High-Level Meeting of Ministers and Authorities on the Implementation of the Sendai Framework for Disaster Risk Reduction 2015-2030 in the Americas and the Caribbean. 7th Regional Platform for DRR for the Americas & the Caribbean: Building Resilient Economies. Geneva: United Nations Office for Disaster Risk Reduction. www.undrr.org/publication/ministerial-declaration-fourth-high-level-meeting-ministers-and-authorities
__________ (2021b). Regional Action Plan for the Implementation of the Sendai Framework for Disaster Risk Reduction 2015-2030 in the Americas and the Caribbean (Updated November 2021). 7th Regional Platform for DRR for the Americas & the Caribbean: Building Resilient Economies. Geneva: United Nations Office for Disaster Risk Reduction. rp-americas.undrr.org/sites/default/files/inline-files/Regional%20Action%20Plan_EN.pdf
Sagala, S., A. Rosyidie, D. Azhari, A. Ramadhani, T.K. Rinaldy and A. Prabu Dian (2022). Supply Chain Resilience: The Indirect Economic Implication of Sunda Strait (Krakatoa) Tsunami and COVID-19 Outbreak to the Tourism Hospitality Supply Chain in Pandeglang, Indonesia. GAR2022 Contributing Paper. Geneva: United Nations Office for Disaster Risk Reduction. www.undrr.org/GAR2022
Saha, S., S.G. Pradhan and A. Siwakoti (2021). Communicating to reduce disaster risk through radio in Nepal: A case study of Milijuli Nepali and Kathamaala. Progress in Disaster Science, vol. 10, p. 100161.
Sandoval, V., G. Forino, J. von Meding, C. Gonzelez-Muzzio, K. Chmutina, H. Páez, I. Tomassi, W. Cheek, V. Marchezini and M. Boyland (2022). The Role of Public and Private Sectors in Disaster Capitalism: An International Overview. GAR2022 Contributing Paper. Geneva: United Nations Office for Disaster Risk Reduction. www.undrr.org/GAR2022
Sanquini, A.M., S.M. Thapaliya and M.M. Wood (2016). A communications intervention to motivate disaster risk reduction. Disaster Prevention and Management, vol. 25, no. 3, pp. 345–359.
Sarewitz, D., R. Pielke Jr. and M. Keykhah (2003). Vulnerability and risk: Some thoughts from a political and policy perspective. Risk Analysis, vol. 23, no. 4.
Sarkissian, R.D., J.-M. Cariolet, Y. Diab and M. Vuillet (2022). A Holistic Approach to Assess the Systemic Resilience of Critical Infrastructures; Insights from the Caribbean Island of Saint-Martin in the Aftermath
230
of Hurricane Irma. GAR2022 Contributing Paper. Geneva: United Nations Office for Disaster Risk Reduction. www.undrr.org/GAR2022
Saunders, W.S.A. (2017). Setting the Scene: The Role of Iwi Management Plans in Natural Hazard Management. GNS Science Consultancy Report 2017/30. Lower Hutt: GNS Science. www.gns.cri.nz/static/download/NHRP/RNC-NHRP/Session-5-Planning-for-Resilience/3_Saunders-Iwi_Management_Plans_RNC-NHRP_Forum.pdf
Scheffer, M., M. Baas and T. Bjordam (2017). Teaching originality? Common habits behind creative production in science and arts. Ecology and Society, vol. 22, no. 2.
Schinko, T., M.-S. Attems, R. Burtscher, A. French, J. Mochizuki, M. Rauter, P. Magnuszewski and B. Willaarts (2022). Prospects and Challenges of Transdisciplinary Research Approaches for Managing and Communicating Climate-Related Risks. GAR2022 Contributing Paper. Geneva: United Nations Office for Disaster Risk Reduction. www.undrr.org/GAR2022
Schweizer, P.-J. and O. Renn (2019). Governance of Systemic Risks for Disaster Prevention and Mitigation. Contributing Paper to GAR 2019. Geneva: United Nations Office for Disaster Risk Reduction. www.researchgate.net/publ icat ion/335339691_Governance_of_Systemic_Risks_for_Disaster_Prevention_and_Mitigation
Scolobig, A., M. Pelling, J. Martin, J. Linnerooth-Bayer, T. Deubelli, W. Liu and A. Oen (forthcoming). Transformative adaptation through nature-based solutions. Global Environmental Change.
Scolobig, A., N. Komendantova and M. Arnaud (2017). Mainstreaming multi-risk approaches into policy. Geosciences, vol. 7, no. 4, p. 129.
SEADRIF (2021). Southeast Asia Disaster Risk Insurance Faculty. seadrif.org/faq/
Sellnow, D.D., J. Iverson and T.L. Sellnow (2017). The evolution of the operational earthquake forecasting community of practice: the L’Aquila communication crisis as a triggering event for organizational renewal. Journal of Applied Communication Research, vol. 45, no. 2, pp. 121–139.
Sellnow, T.L. and M. Seeger (2016). Narratives of Crisis: Telling Stories of Ruin and Renewal. Stanford: Stanford University Press.
Sem, G. (2007). Vulnerability and Adaptation to Climate Change in Small Island Developing States. Bonn: United Nations Framework Convention on Climate Change. unfccc.int/files/adaptation/adverse_effects_and_response_measures_art_48/application/pdf/200702_sids_adaptation_bg.pdf
Sendy, A. (2020). Solar lease vs. solar PPA. www.solarreviews.com/blog/pros-and-cons-of-leasing-solar-buying-ppa-agreements
Sharma, M. (2007). Personal to planetary transformation. Kosmos Journal. www.kosmosjournal.org/article/personal-to-planetary-transformation/
Shelton, D. (2015). Nature as a legal person. VertigO - la revue électronique en sciences de l’environnement, no. 22. doi.org/10.4000/vertigo.16188
Shepsle, K.A. (2010). The Rules of the Game: What Rules? Which Game? Understanding Institutions and Development Economics Conference at the Center for New Institutional Social Science, Washington University in St Louis, 4–5 November 2010. http://citeseerx.ist.psu.edu/viewdoc/download?doi=10.1.1.644.5248 &rep=rep1&type=pdf
Short, C., L. Clarke, F. Carnelli, C. Uttley and B. Smith (2019). Capturing the multiple benefits associated with nature-based solutions: Lessons from a natural flood management project in the Cotswolds, UK. Land Degradation & Development, vol. 30, no. 3, pp. 241–252.
Shrestha, M., M. Gurung, V. Khadgi, N. Wagle, S. Banarjee, U. Sherchan, B. Parajuli and A. Mishra (2021). The last mile: Flood risk communication for better preparedness in Nepal. International Journal of Disaster Risk Reduction, vol. 56, p. 102118.
Shultz, J.M., M. Espinola, A. Rechkemmer, M.A. Cohen and Z. Espinel (2017). Prevention of disaster impact and outcome cascades. In The Cambridge Handbook of International Prevention Science. Cambridge Handbooks in Psychology, M. Israelashvili and J.L. Romano, eds., pp. 492–519. New York: Cambridge University Press. doi.org/10.1017/9781316104453.022
Sillmann, J., I. Christensen, S. Hochrainer-Stigler, J.-T. Huang-Lachmann, S. Juhola, K. Kornhuber, M. Mahecha, M. Reichstein, A.C. Ruane, P.-J. Schweizer and S. Williams (2022). A Briefing Note on Systemic Risk. Paris: International Science Council.
Silver, K. (2021). Inflation: Global food prices hit fresh 10-year high, UN says. BBC News, 5 November. www.bbc.com/news/business-59172665
Simmons, K.M., J. Czajkowski and J. Done (2017). Economic Effectiveness of Implementing a Statewide Building Code: The Case of Florida. SSRN Scholarly Paper. No. 2963244. Rochester: Social Science Research Network. papers.ssrn.com/abstract=2963244
Simpson, N.P., K.J. Mach, A. Constable, J. Hess, R. Hogarth, M. Howden, J. Lawrence, R.J. Lempert, V. Muccione, B. Mackey, M.G. New, B. O’Neill, F. Otto, H.-O. Pörtner, A. Reisinger, D. Roberts, D.N. Schmidt, S. Seneviratne, S. Strongin, M. van Aalst, E. Totin and C.H. Trisos (2021). A framework for complex climate change risk assessment. One Earth, vol. 4, no. 4, pp. 489–501.
Skinner, C. (2020). Flash flood!: A SeriousGeoGames activity combining science festivals, video games, and virtual reality with research data for communicating flood risk and geomorphology. Geoscience Communication, vol. 3, no. 1, pp. 1–17.
Slovic, P. (2000). The Perception of Risk. London and Sterling: Earthscan Publications.
231
Slovic, P., B. Fischhoff and S. Lichtenstein (1978). Accident probabilities and seat belt usage: A psychological perspective. Accident Analysis & Prevention, vol. 10, no. 4, pp. 281–285.
Song, A.M., O. Temby, D. Kim, A. Saavedra Cisneros and G.M. Hickey (2019). Measuring, mapping and quantifying the effects of trust and informal communication on transboundary collaboration in the Great Lakes fisheries policy network. Global Environmental Change, vol. 54, pp. 6–18.
Spring, M. (2020). Coronavirus: The seven types of people who start and spread viral misinformation. BBC News, 4 May. www.bbc.com/news/blogs-trending-52474347
Sri, A.S., P. Das, S. Gnanapragasam and A. Persaud (2021). COVID-19 and the violence against women and girls: ‘The shadow pandemic’. International Journal of Social Psychiatry, vol. 67, no. 8, pp. 971–973.
Steffen, W., K. Richardson, J. Rockström, S.E. Cornell, I. Fetzer, E.M. Bennett, R. Biggs, S.R. Carpenter, W. de Vries, C.A. de Wit, C. Folke, D. Gerten, J. Heinke, G.M. Mace, L.M. Persson, V. Ramanathan, B. Reyers and S. Sörlin (2015). Planetary boundaries: Guiding human development on a changing planet. Science, vol. 347, no. 6223, p. 1259855.
Steffen, W., K. Richardson, J. Rockström, H.J. Schellnhuber, O.P. Dube, S. Dutreuil, T.M. Lenton and J. Lubchenco (2020). The emergence and evolution of Earth system science. Nature Reviews Earth & Environment, vol. 1, no. 1, pp. 54–63.
Stern, M.J. and K.J. Coleman (2015). The multidimensionality of trust: Applications in collaborative natural resource management. Society & Natural Resources, vol. 28, no. 2, pp. 117–132.
Stewart, I.S., J. Ickert and R. Lacassin (2017). Communicating seismic risk: The geoethical challenges of a people-centred, participatory approach. Annals of Geophysics, vol. 60.
Stibbe, D., S. Reid and J. Gilbert (2018). Maximising the Impact of Partnerships for the SDGs: A Practical Guide to Partnership Value Creation. Oxford and New York: The Partnering Initiative and United Nations Department of Economic and Social Affairs. sustainabledevelopment.un.org/content/documents/2564Maximising_the_impact_of_partnerships_for_the_SDGs.pdf
Stockholm Resilience Centre (2021). The nine planetary boundaries. www.stockholmresil ience.org/research/planetary-boundaries/the-nine-planetary-boundaries.html
__________ (2022). Earth’s safe planetary boundary for pollutants – including plastics – exceeded. scitechdaily.com/earths-safe-planetary-boundary-for-pollutants-including-plastics-exceeded/
Stone, J., J. Barclay, P. Simmons, P.D. Cole, S.C. Loughlin, P. Ramón and P. Mothes (2014). Risk reduction through community-based monitoring: The vigías of Tungurahua, Ecuador. Journal of Applied Volcanology, vol. 3, no. 1, p. 11.
Sultana, N. (2022). Understanding the economic dimensions of women’s vulnerability during cyclones: The Bangladesh perspective. International Journal of Disaster Risk Reduction, vol. 70, p. 102730.
Swann, W.B. and S.J. Read (1981). Self-verification processes: How we sustain our self-conceptions. Journal of Experimental Social Psychology, vol. 17, no. 4, pp. 351–372.
Swiss Re Institute (2019). Natural Catastrophes and Man-Made Disasters in 2018: “Secondary” Perils on the Frontline. Zurich. www.swissre.com/dam/jcr:c37eb0e4-c0b9-4a9f-9954-3d0bb4339bfd/sigma2_2019_en.pdf
__________ (2021). Natural Catastrophes in 2020: Secondary Perils in the Spotlight, but Don’t Forget Primary-Peril Risks. Sigma no. 1/2021. Zurich. www.swissre.com/dam/jcr:ebd39a3b-dc55-4b34-9246-6dd8e5715c8b/sigma-1-2021-en.pdf
Tabuchi, H. (2016). ‘Rolling coal’ in diesel trucks, to rebel and provoke. The New York Times, 4 September. www.nytimes.com/2016/09/05/business/energy-environment/rolling-coal-in-diesel-trucks-to-rebel-and-provoke.html
TFCFD (Task Force on Climate-related Financial Disclosures) (n.d.). www.fsb-tcfd.org/
Tengs, T.O., M.E. Adams, J.S. Pliskin, D.G. Safran, J.E. Siegel, M.C. Weinstein and J.D. Graham (1995). Five-hundred life-saving interventions and their cost-effectiveness. Risk Analysis, vol. 15, no. 3, pp. 369–390.
Tennyson, R. (2011). The Partnering Toolbook: An Essential Guide to Cross-Sector Partnering. Oxford: The Partnering Initiative. thepartneringinitiative.org/publications/toolbook-series/the-partnering-toolbook/
Tesliuc, E.D. and K. Lindert (2002). Vulnerability: A Quantitative and Qualitative Assessment. Guatemala Poverty Assessment Program. http://citeseerx.ist.psu.edu/viewdoc/download?doi=10.1.1.201.1746 &rep=rep1&type=pdf
Thacker, S., R. Pant and J.W. Hall (2017). System-of-systems formulation and disruption analysis for multi-scale critical national infrastructures. Reliability Engineering & System Safety, vol. 167, pp. 30–41.
Thaler, R.H. and C.R. Sunstein (2021). Nudge: The Final Edition. New York: Penguin Books.
Thalheimer, L., C. Webersik and F. Gaupp (2022). Systemic Risks Emerging from Compound Vulnerabilities. GAR2022 Contributing Paper. Geneva: United Nations Office for Disaster Risk Reduction. www.undrr.org/GAR2022
The Australia Institute (2020). Polling – Bushfire Crisis and Concern about Climate Change. Canberra. australiainstitute.org.au/wp-content/uploads/2020/12/Polling-January-2020-bushfire-impacts-and-climate-concern-web.pdf
The Cynefin Co (2021). SenseMaker. thecynefin.co/sensemaker-2/
232
https://www.stockholmresilience.org/research/planetary-boundaries/the-nine-planetary-boundaries.html
https://www.stockholmresilience.org/research/planetary-boundaries/the-nine-planetary-boundaries.html
The Economist (2008). Cracks in the crust. 13 December. www.economist.com/briefing/2008/12/11/cracks-in-the-crust
The Guardian (2011). Mass blackout hits California, Arizona and Mexico. 9 September. www.theguardian.com/world/2011/sep/09/blackout-california-arizona-mexico-san-diego
The Victorian Traditional Owner Cultural Fire Knowledge Group (2020). The Victorian Traditional Owner Cultural Fire Strategy. Melbourne: The Victorian Traditional Owner Cultural Fire Knowledge Group and Department of Environment, Land, Water and Planning. knowledge.aidr.org.au/media/6817/fireplusstrategyplusfinal.pdf
Thompson, D. (2020). What’s behind South Korea’s COVID-19 exceptionalism? www.theatlantic.com/ideas/archive/2020/05/whats-south-koreas-secret/611215/
Thórisdóttir, H. and K.E. Karólínudóttir (2014). The boom and the bust: Can theories from social psychology and related disciplines account for one country’s economic crisis? Analyses of Social Issues and Public Policy, vol. 14, no. 1, pp. 281–310.
TNFD (Taskforce on Nature-related Financial Disclosures) (n.d.). tnfd.global/
Towe, R., D. Witte and C. Toennesen (2020). The Superpower of Media: Mirrors or Movers II: Managing the Societal Impact of Content. London: The Responsible Media Forum and Carnstone Partners. carnstone.com/insight?insight=90
Triyanti, A., G.A.K. Surtiari, J. Lassa, R. Djalante, I. Rafliana and N.R. Hanifa (2022). Governance Strategies in Indonesia for Addressing Systemic Risks: Where Do We Stand and the Future Outlook. GAR2022 Contributing Paper. Geneva: United Nations Office for Disaster Risk Reduction. www.undrr.org/GAR2022
Trogrlic, R.S. (2022). Why Community-Based Disaster Risk Reduction Fails to Learn from Local Knowledge? Experiences from Malawi. GAR2022 Contributing Paper. Geneva: United Nations Office for Disaster Risk Reduction. www.undrr.org/GAR2022
TTI (2020). Coronavirus COVID-19 updates. www.tti.com/content/ttiinc/en/resources/coronavirus-updates.html
Ulziikhuu, B. (2020). Thinking fast and slow in times of crisis. undp-ric.medium.com/thinking-fast-and-slow-in-times-of-crisis-117bb6861b96
UN DESA (United Nations Department of Economic and Social Affairs) (2021). Global Sustainable Development Goal Indicators Database. unstats.un.org/sdgs/UNSDG/IndDatabasePage
UN Global Pulse (2018). Policy. www.unglobalpulse.org/policy/
UN-GGIM (United Nations Committee of Experts on Global Geospatial Information Management) (2022). Integrated Geospatial Information Framework. United Nations Statistics Division. http://igif.un.org/
UNDP (United Nations Development Programme) (n.d.a). Global dashboard for vaccine equity. data.undp.org/vaccine-equity/
__________ (n.d.b). Gender inequality index (GII). http://hdr.undp.org/en/content/gender-inequality-index-gii
UNDRR (United Nations Office for Disaster Risk Reduction) (2019). Global Assessment Report on Disaster Risk Reduction 2019. Geneva. www.undrr.org/publication/global-assessment-report-disaster-risk-reduction-2019
__________ (2020a). Hazard Definition and Classification Review. Technical Report. Geneva. www.undrr.org/publication/hazard-definition-and-classification-review
__________ (2020b). Ecosystem-Based Disaster Risk Reduction: Implementing Nature-Based Solutions for Resilience. Bangkok: UNDRR Regional Office for Asia and the Pacific. www.undrr.org/publication/ecosystem-based-d isaster - r isk - reduct ion -implementing-nature-based-solutions-0
__________ (2021a). Regional Assessment Report on Disaster Risk in Latin America and the Caribbean (RAR 2021). Geneva. www.undrr.org/publication/undrr-roamc-regional-assessment-report-disaster-risk-latin-america-and-caribbean-rar
__________ (2021b). Regional Assessment Report on Disaster Risk Reduction in the Arab Region. Geneva. www.undrr.org/publication/regional-assessment-report-disaster-risk-reduction-arab-region-2021
__________ (2021c). Sendai Framework Monitor. Geneva. sendaimonitor.undrr.org/
__________ (2021d). DesInventar Open Source Initiative. www.desinventar.net/
__________ (2021e). GAR Special Report on Drought 2021. Geneva. www.undrr.org/publication/gar-special-report-drought-2021
__________ (2022). Understanding and Managing Cascading and Systemic Risks: Lessons from COVID-19. Geneva.
__________ (n.d.). Terminology. www.undrr.org/terminology
UNEP (United Nations Environment Programme) (2016). The Adaptation Gap Report 2016. Nairobi. climateanalytics.org/publications/2016/the-adaptation-gap-report-2016/
__________ (2020). How the Dutch Central Bank is leading on nature-related risks. www.unepfi.org/news/themes/ecosystems/how-the-dutch-central-bank-is-leading-on-nature-related-risks/
UNESCO (United Nations Educational, Scientific and Cultural Organization) (2020). Pandemics to increase in frequency and severity unless biodiversity loss is addressed. en.unesco.org/news/pandemics-increase-frequency-and-severity-unless-biodiversity-loss-addressed
UNFCCC (United Nations Framework Convention on Climate Change) (2013). Warsaw International Mechanism for Loss and Damage Associated with Climate Change Impacts (WIM). unfccc.int/topics/adaptation-and-resilience/workstreams/loss-and-
233
damage-ld/warsaw-international-mechanism-for-loss-and-damage-associated-with-climate-change-impacts-wim#eq-1
UNFPA (United Nations Population Fund) (2020). Coronavirus Disease (COVID-19) Preparedness and Response UNFPA Interim Technical Brief: Gender Equality and Addressing Gender-Based Violence (GBV) and Coronavirus Disease (COVID-19) Prevention, Protection and Response. New York. www.unfpa.org/sites/default/files/resource-pdf/COVID-19_Preparedness_and_Response_-_UNFPA_Interim_Technical_Briefs_Gender_Equality_and_GBV_23_March_2020_.pdf
UNISDR (United Nations International Strategy for Disaster Reduction) (2015). Global Assessment Report on Disaster Risk Reduction 2015: Making Development Sustainable: The Future of Disaster Risk Management. Geneva. www.preventionweb.net/english/hyogo/gar/2015/en/gar-pdf/GAR2015_EN.pdf
United Nations (1992). Rio Declaration on Environment and Development, United Nations Conference on Environment and Development, Rio de Janeiro 3-14 June 1992. A/CONF.151/26 (Vol. I). www.un.org/en/development/desa/population/migration/genera lassembly/docs/g loba lcompact/A_CONF.151_26_Vol.I_Declaration.pdf
__________ (2015a). Resolution adopted by the General Assembly on 3 June 2015, Sendai Framework for Disaster Risk Reduction 2015–2030. 23 June. A/RES/69/283. www.un.org/en/development/desa/population/migration/generalassembly/docs/globalcompact/A_RES_69_283.pdf
__________ (2015b). Resolution adopted by the General Assembly on 25 September 2015, Transforming our World: The 2030 Agenda for Sustainable Development. 21 October. A/RES/70/1. www.un.org/ga/search/view_doc.asp?symbol=A/RES/70/1&Lang=E
__________ (2015c). Paris Agreement. unfccc.int/sites/default/files/english_paris_agreement.pdf
United Nations Population Division (2018). World Urbanization Prospects 2018. population.un.org/wup/
UNSD (United Nations Statistics Division) (2021). UN Statistics Division SDG Open Data website. Geneva. unstats-undesa.opendata.arcgis.com/
van Aalst, M.K. (2006). The impacts of climate change on the risk of natural disasters. Disasters, vol. 30, no. 1, pp. 5–18.
van den Bergh, J. and W. Botzen (2020). Low-carbon transition is improbable without carbon pricing. Proceedings of the National Academy of Sciences, vol. 117, no. 38, pp. 23219–23220.
van den Homberg, M. and J. Margutti (2022). Enriching Impact Data by Text Mining Digital Media. GAR2022 Contributing Paper. Geneva: United Nations Office for Disaster Risk Reduction. www.undrr.org/GAR2022
van der Linden, S. (2017). Determinants and measurement of climate change risk perception, worry, and concern. In Oxford Research Encyclopedia of Climate Science, M. Nisbett, ed. Oxford: Oxford University Press. www.researchgate.net/publ icat ion/315761091_Determinants_and_Measurement_of_Climate_Change_Risk_Perception_Worry_and_Concern
van der Linden, S., J. Roozenbeek and J. Compton (2020). Inoculating against fake news about COVID-19. Frontiers in Psychology, vol. 11, p. 2928.
van Niekerk, D., C. Coetzee and L. Nemakonde (2020). Implementing the Sendai Framework in Africa: Progress against the targets (2015–2018). International Journal of Disaster Risk Science, vol. 11, no. 2, pp. 179–189.
Vatn, A. (2005). Institutions and the Environment. Cheltenham: Edward Elgar.
Verde, J., M. Garay, T. Ghizzoni and L. Echebarne (2017). Compartiendo Lecciones Apprendidas: El Antes, Durante y Despues de Las Inundaciones. Facultad de Enfermería, Comisión Sectorial de Educación Permanente. udelar.edu.uy/eduper/wp-content/uploads/sites/29/2018/03/lecaprendid.pdf
Vester, F. (2007). The Art of Interconnected Thinking: Tools and Concepts for a New Approach to Tackling Complexity. Munich: Management, Cybernetics, Bionics, Verlag.
__________ (2014). Malik Sensitivity Model®Prof.Vester: The Computerized System Tools for a New Management of Complex Problems. Commercial software package. St Gallen: Malik Management Centre. www.frederic-vester.de/uploads/InformationEnglishSM.pdf
Vincent, K., S. Carter, A. Steynor, E. Visman and K.L. Wågsæther (2020). Addressing power imbalances in co-production. Nature Climate Change, vol. 10, no. 10, pp. 877–878.
Vosoughi, S., D. Roy and S. Aral (2018). The spread of true and false news online. Science, vol. 359, no. 6380, pp. 1146–1151.
Wada, Y., A. Vinca, S. Parkinson, B.A. Willaarts, P. Magnuszewski, J. Mochizuki, B. Mayor, Y. Wang, P. Burek, E. Byers, K. Riahi, V. Krey, S. Langan, M. van Dijk, D. Grey, A. Hillers, R. Novak, A. Mukherjee, A. Bhattacharya, S. Bhardwaj, S.A. Romshoo, S. Thambi, A. Muhammad, A. Ilyas, A. Khan, B.K. Lashari, R.B. Mahar, R. Ghulam, A. Siddiqi, J. Wescoat, N. Yogeswara, A. Ashraf, B.S. Sidhu and J. Tong (2019). Co-designing Indus water-energy-land futures. One Earth, vol. 1, no. 2, pp. 185–194.
Wagener-Lohse, G., Ch. Hohm et al. (2011). Future Forest Report. Helping Europe Tackling Climate Change. The Voice of the Regions. Europe’s Forest and Climate Change. Interreg IV Project. Brandenburg: MIL Ministry for Infrastructure and Agriculture of Brandenburg.
Walsh, B. and S. Hallegatte (2019). Measuring Natural Risks in the Philippines: Socioeconomic Resilience and Wellbeing Losses. Policy Research Working Paper 8723. Washington, D.C.: The
234
World Bank. openknowledge.worldbank.org/handle/10986/31227
Waters Center for Systems Thinking (2020). Habits of a systems thinker course. thinkingtoolsstudio.waterscenterst.org/courses/habits
Watts, D.J. (2002). A simple model of global cascades on random networks. Proceedings of the National Academy of Sciences, vol. 99, no. 9, pp. 5766–5771.
Weber, R., S.M. Eilertsen and L. Suopajärvi (2017). Local Land Use Planning: Guidance on Spatial Data, Geographic Information Systems and Foresight in the Arctic. REGINA Report 2017:1. Nordregio, Stockholm. static1.squarespace.com/static/5649b47fe4b0b9e2752c60c9/t/588369d46a49636e23cf90a0/1485007417592/REGINA+Local+land+use+report+2017_1.pdf
WEF (World Economic Forum) (2019). Global Gender Gap Report 2020. Cologny, Switzerland. www.weforum.org/reports/gender-gap-2020-report-100-years-pay-equality
__________ (2021a). The Global Risks Report 2021 16th Edition. Cologny, Switzerland. www3.weforum.org/docs/WEF_The_Global_Risks_Report_2021.pdf
__________ (2021b). Global Gender Gap Report 2021. Cologny, Switzerland. www3.weforum.org/docs/WEF_GGGR_2021.pdf
Weingärtner, L., E. Wilkinson and T. Pforr (2020). The Evidence Base on Anticipatory Action. Rome: World Food Programme. docs.wfp.org/api/documents/WFP-0000110236/download/
Werners, S.E., R.M. Wise, J.R.A. Butler, E. Totin and K. Vincent (2021). Adaptation pathways: A review of approaches and a learning framework. Environmental Science & Policy, vol. 116, pp. 266–275.
WFP (World Food Programme). n.d. The R4 Rural Resilience Initiative. www.wfp.org/r4-rural-resilience-initiative
Whitehead, S. (2017). Building Resilience: How Research Has Been Used to Develop and Evaluate a Media and Communication Approach. London: BBC Media Action. vdocuments.net/building-resilience-bbc-media-action-approaches-to-building-resilience-are-still.html
Whitmee, S., A. Haines, C. Beyrer, F. Boltz, A.G. Capon, B.F. de S. Dias, A. Ezeh, H. Frumkin, P. Gong, P. Head, R. Horton, G.M. Mace, R. Marten, S.S. Myers, S. Nishtar, S.A. Osofsky, S.K. Pattanayak, M.J. Pongsiri, C. Romanelli, A. Soucat, J. Vega and D. Yach (2015). Safeguarding human health in the Anthropocene epoch: Report of The Rockefeller Foundation–Lancet Commission on planetary health. The Lancet, vol. 386, no. 10007, pp. 1973–2028.
WHO (World Health Organization) (2021a). Strategy to Achieve Global Covid-19 Vaccination by Mid-2022. Geneva. cdn.who.int/media/docs/default-source/immunization/covid-19/strategy-to-achieve-global-covid-19-vaccination-by-mid-2022.pdf?sfvrsn=5a68433c_5
__________ (2021b). WHO Hub for Pandemic and Epidemic Intelligence: Better Data. Better Analytics.
Better Decisions. Geneva. cdn.who.int/media/docs/default-source/2021-dha-docs/who_hub.pdf?sfvrsn=8dc28ab6_5
__________ (2021c). Devastatingly pervasive: 1 in 3 women globally experience violence. www.who.int/news/item/09-03-2021-devastatingly-pervasive-1-in-3-women-globally-experience-violence
WHO (World Health Organization) and PAHO (Pan American Health Organization) (2022). Infodemic. www.who.int/health-topics/infodemic/the-covid-19-infodemic#tab=tab_1
Whyte, K.P. (2014). Indigenous women, climate change impacts, and collective action. Hypatia, vol. 29, no. 3, pp. 599–616.
Wiesen, C., I. Uusikyla, M. Rivoal, L.T.T. Hien, B.H. Binh, N.T. Luong, P.H. Lan and A. Oprunenco (2021). What would a circular economic rebound mean for Viet Nam? medium.com/@undp.innovation/what-would-a-circular-economic-rebound-mean-for-viet-nam-dbd279619c03
Williams, A. (2021). Your car, toaster, even washing machine, can’t work without them. And there’s a global shortage. The New York Times, 14 March. www.nytimes.com/2021/05/14/opinion/semicondctor-shortage-biden-ford.html
Wisner, B., J. Gaillard and I. Kelman (2011). The Routledge Handbook of Hazards and Disaster Risk Reduction. London and New York: Routledge.
Witte, K. and M. Allen (2000). A meta-analysis of fear appeals: Implications for effective public health campaigns. Health Education & Behavior, vol. 27, no. 5, pp. 591–615.
WMO (World Meteorological Organization) (2020). State of Climate Services 2020 Report: Move from Early Warnings to Early Action. public.wmo.int/en/media/press-release/state-of-climate-services-2020-report-move-from-early-warnings-early-action
__________ (2021). State of the Global Climate 2020. WMO-No. 1264. Geneva. library.wmo.int/index.php?lvl=notice_display&id=21880#.YfyHJvFBzuS
Wobbrock, J. and J. Kientz (2016). Research contributions in human-computer interaction. Interactions, vol. 23, no. 3, pp. 38–44.
Wong, T. (2021). The man turning cities into giant sponges to embrace floods. BBC News, 11 November. www.bbc.com/news/world-asia-china-59115753
Wood, M.M., D.S. Mileti, M. Kano, M.M. Kelley, R. Regan and L.B. Bourque (2012). Communicating actionable risk for terrorism and other hazards. Risk Analysis, vol. 32, no. 4, pp. 601–615.
World Animal Protection (n.d.). Animals in disasters: Thunder – case study Costa Rica. animalsindisasters.org/case-studies/thunder
World Bank (2001). Social Protection Sector Strategy. Washington, D.C. elibrary.worldbank.org/doi/abs/10.1596/0-8213-4903-1
__________ (2012). Thai Flood 2011: Rapid Assessment for Resilient Recovery and Reconstruction Planning. Washington, D.C. openknowledge.worldbank.org/handle/10986/26862
235
__________ (2014). Climate Change and Migration: Evidence from the Middle East and North Africa. Washington, D.C.: International Bank for Reconstruction and Development / The World Bank. openknowledge.worldbank.org/handle/10986/18929
__________ (2017). Poverty. data.worldbank.org/topic/poverty?end=2017&start=2017
__________ (2018a). Forensic Analysis of the Conditions of Disaster Risk in the 2018 Volcano of Fire (Volcán de Fuego) Eruption. No. AUS0000904. Washington, D.C. documents1.wor ldbank.org/curated/en/531531560920057222/pdf/Forensic-Analysis-of-the-Conditions-of-Disaster-Risk-in-the-2018-Volcano-of-Fire-Volc%C3%A1n-de-Fuego-Eruption-Opportunities-for-the-Strengthening-of-Disaster-Risk-Management-in-Guatemala.pdf
__________ (2018b). June 3, 2018 Volcán de Fuego, Guatemala, Eruption. Global Rapid Post Disaster Damage Estimation (GRADE) Report. No. AUS0000903. Washington, D.C. documents1.worldbank.org/curated/en/760221560927444567/text/Volc%C3%A1n-de-Fuego-Guatemala-Eruption-Global-Rapid-Post-Disaster-Damage-Estimation-Grade-Report.txt
__________ (2020a). Poverty and Shared Prosperity 2020: Reversals of Fortune. Washington, D.C.: International Bank for Reconstruction and Development and The World Bank. openknowledge.worldbank.org/bitstream/handle/10986/34496/9781464816024.pdf
__________ (2020b). COVID-19 to add as many as 150 million extreme poor by 2021. www.worldbank.org/en/news/press-release/2020/10/07/covid-19-to-add-as-many-as-150-million-extreme-poor-by-2021
__________ (2021a). The Global Findex Database 2017. globalfindex.worldbank.org/
__________ (2021b). Population living in slums (% of urban population). data.worldbank.org/indicator/EN.POP.SLUM.UR.ZS
__________ (2021c). World Development Report 2021: Data for Better Lives. Washington, D.C. wdr2021.worldbank.org
__________ (2021d). Somalia economic update, June 2021: Investing in health to anchor growth. Washington, D.C. openknowledge.worldbank.org/handle/10986/36312
__________ (2022). Urban population (% of total population). data.worldbank.org/indicator/SP.URB.TOTL.IN.ZS
Wu, H. (2022). Grassroots Adaptive Social Protection: Diverse Benefits of Survivors’ Self-Reconstruction Efforts after Wenchuan Earthquake. GAR2022 Contributing Paper. Geneva: United Nations Office for Disaster Risk Reduction. www.undrr.org/GAR2022
Wu, H. and J. Drolet (2016). Adaptive social protection: Climate change adaptation and disaster risk reduction. In Social Development and Social Work Perspectives on Social Protection, pp. 96–119. Abingdon, UK: Routledge.
Wuppertal Institute (2022). Transformative research. Wuppertal Institute for Climate, Environment and Energy. wupperinst.org/en/research/transformative-research
WWF (World Wide Fund for Nature) (2020). David Attenborough: A life on our planet. www.wwf.org.uk/updates/david-attenborough-life-our-planet
Yang, W. (2013). Ecosystem services, human well-being, and policies in coupled human and natural systems. PhD thesis, Michigan State University. d.lib.msu.edu/etd/4074
Yeh, C., A. Perez, A. Driscoll, G. Azzari, Z. Tang, D. Lobell, S. Ermon and M. Burke (2020). Using publicly available satellite imagery and deep learning to understand economic well-being in Africa. Nature Communications, vol. 11, no. 1.
Yokomatsu, M., J. Mochizuki, E.T. Leon and P.A. Burek (2022). Macroeconomic Co-Benefits of DRR Investment – Assessment Using the Dynamic Model of Multi-Hazard Mitigation CoBenefits (DYNAMMICs) Model. GAR2022 Contributing Paper. Geneva: United Nations Office for Disaster Risk Reduction. www.undrr.org/GAR2022
Yonzan, N., C. Lakner and D.G. Mahler (2020). Projecting global extreme poverty up to 2030: How close are we to World Bank’s 3% goal? blogs.worldbank.org/opendata/projecting-global-extreme-poverty-2030-how-close-are-we-world-banks-3-goal
Young, D.G., K.H. Jamieson, S. Poulsen and A. Goldring (2017). Fact-checking effectiveness as a function of format and one: Evaluating FactCheck.org and FlackCheck.org. Journalism & Mass Communication Quarterly, vol. 95, no. 1.
Zeng, Y., S. Maxwell, R.K. Runting, O. Venter, J.E.M. Watson and L.R. Carrasco (2020). Environmental destruction not avoided with the Sustainable Development Goals. Nature Sustainability, vol. 3, no. 10, pp. 795–798.
Zilliacus, A. (2016). Half a house builds a whole community: elemental’s controversial social housing. www.archdaily.com/797779/half-a-house-builds-a-whole-community-elementals-controversial-social-housing
Zscheischler, J., S. Westra, B.J.J.M. van den Hurk, S.I. Seneviratne, P.J. Ward, A. Pitman, A. Aghakouchak, D.N. Bresch, M. Leonard, T. Wahl and X. Zhang (2018). Future climate risk from compound events. Nature Climate Change, vol. 8, no. 6, pp. 469–477.
Zuccaro, G., D. De Gregorio and M.F. Leone (2018). Theoretical model for cascading effects analyses. International Journal of Disaster Risk Reduction, vol. 30, pp. 199–215.
236