Anti-oxidant status in embryonic, post-hatch and larval stages of Asian seabass ( Lates calcarifer
RESEARCH ARTICLE
Transcriptome Analysis of Post-Hatch BreastMuscle in Legacy and Modern BroilerChickens Reveals Enrichment of SeveralRegulators of Myogenic GrowthRichard V. N. Davis1, Susan J. Lamont2, Max F. Rothschild2, Michael E. Persia2,Chris M. Ashwell3, Carl J. Schmidt4*
1 Dept. Biological Sciences, University of Delaware, Newark, Delaware, 19716, United States of America,2 Dept. of Animal Science, Iowa State University, Ames, Iowa, 50011, United States of America, 3 Dept. ofPoultry Science, North Carolina State University, Raleigh, North Carolina, 27695, United States of America,4 Dept. of Animal and Food Sciences, University of Delaware, Newark, Delaware, 19716, United States ofAmerica
AbstractAgriculture provides excellent model systems for understanding how selective pressure, as
applied by humans, can affect the genomes of plants and animals. One such system is
modern poultry breeding in which intensive genetic selection has been applied for meat pro-
duction in the domesticated chicken. As a result, modern meat-type chickens (broilers)
exhibit enhanced growth, especially of the skeletal muscle, relative to their legacy counter-
parts. Comparative studies of modern and legacy broiler chickens provide an opportunity to
identify genes and pathways affected by this human-directed evolution. This study used
RNA-seq to compare the transcriptomes of a modern and a legacy broiler line to identify dif-
ferentially enriched genes in the breast muscle at days 6 and 21 post-hatch. Among the
15,945 genes analyzed, 10,841 were expressed at greater than 0.1 RPKM. At day 6 post-
hatch 189 genes, including several regulators of myogenic growth and development, were
differentially enriched between the two lines. The transcriptional profiles between lines at
day 21 post-hatch identify 193 genes differentially enriched and still include genes associat-
ed with myogenic growth. This study identified differentially enriched genes that regulate
myogenic growth and differentiation between the modern and legacy broiler lines. Specifi-
cally, differences in the ratios of several positive (IGF1, IGF1R, WFIKKN2) and negative
(MSTN, ACE) myogenic growth regulators may help explain the differences underlying the
enhanced growth characteristics of the modern broilers.
PLOS ONE | DOI:10.1371/journal.pone.0122525 March 30, 2015 1 / 17
OPEN ACCESS
Citation: Davis RVN, Lamont SJ, Rothschild MF,Persia ME, Ashwell C, Schmidt CJ (2015)Transcriptome Analysis of Post-Hatch Breast Musclein Legacy and Modern Broiler Chickens RevealsEnrichment of Several Regulators of MyogenicGrowth. PLoS ONE 10(3): e0122525. doi:10.1371/journal.pone.0122525
Academic Editor: Andre van Wijnen, University ofMassachusetts Medical, UNITED STATES
Received: April 21, 2014
Accepted: February 21, 2015
Published: March 30, 2015
Copyright: © 2015 Davis et al. This is an openaccess article distributed under the terms of theCreative Commons Attribution License, which permitsunrestricted use, distribution, and reproduction in anymedium, provided the original author and source arecredited.
Data Availability Statement: The data discussed inthis publication have been deposited in NCBI's GeneExpression Omnibus (GEO) and are accessiblethrough GEO Series accession number GSE65217(http://www.ncbi.nlm.nih.gov/geo/query/acc.cgi?acc=GSE65217).
Funding: This project was supported by Agricultureand Food Research Initiative Competitive Grant2011-67003-30228 from the United StatesDepartment of Agriculture National Institute of Foodand Agriculture received by CJS, SJL, MFR, MEP
BackgroundThe advent of modern agriculture in the early 20th century led to intensive genetic selection formeat (broiler) and egg (layer) production traits in the domesticated chicken. To improve pro-duction, the broiler chicken underwent genetic selection for rapid growth, particularly of theskeletal muscle tissue. In 1950 a broiler took 16 weeks before going to market while by 1990birds were going to market by 6 to 7 weeks [1–4]. Because of this intense selective pressure,broiler chickens provide an excellent platform to identify the genes and alleles selected by thishuman-directed evolution.
One way to evaluate the effects of selection is to compare the growth characteristics andgene expression patterns of modern broilers with legacy birds that exhibit growth propertiessimilar to those of meat-type birds prior to intense selection [5–8]. The legacy line used in thisstudy is maintained at the University of Illinois as an inbred line with growth characteristicssimilar to those of meat-production birds from the late 1940s (we refer to these birds as Illinoisbirds). The Illinois birds are the result of a cross between New Hampshire males, and femalescarrying the Columbian feather pattern [8]. Our prior studies have focused on allometric, mor-phometric and feed efficiency comparisons between the modern Ross 708 broiler and the Illi-nois line [8]. At all time-points after D7 post-hatch until the end of the trial at D35 post-hatch,Ross 708 birds were significantly larger than the Illinois birds with the Ross 708 birds, on aver-age depositing mass 1.8 times faster than the Illinois birds. This difference in mass was evenmore pronounced when only the breast muscle mass was compared. The Ross 708 birds depos-ited breast muscle mass at a rate 3.8 times greater than the Illinois birds [8].
Comparing the breast muscle growth patterns between the two lines also revealed a signifi-cant difference following day 14 post-hatch. In the Illinois birds, the normalized breast musclemass (breast muscle mass/bird mass) remained constant after day 14 whereas the Ross 708 nor-malized breast muscle mass continued to increase [8]. Given these observations, we hypothe-sized that genes affecting muscle growth and differentiation along with ones affecting energymetabolism would be differentially regulated between the breast muscle of the Ross 708 and Il-linois lines, and that the transcriptomes would have different relationships before and after thegrowth-inflection point of day 14. To test this hypothesis, RNA-seq was used to comparethe gene expression patterns of the breast muscle from Ross 708 and Illinois birds bracketingthe 14-day post-hatch period. The transcript levels of 15,945 genes were analyzed in the breastmuscle of post-hatch day 6 (D6) and day 21 (D21) Illinois and Ross 708 chickens.
Methods
Animal Rearing and Tissue CollectionRoss 708 and Illinois chickens were raised in the same house on the University of Delawarefarm and provided with food and water ad libitum. Birds were euthanized by cervical disloca-tion and tissue samples were excised from the posterior region of the left pectoralis majormus-cle, flash frozen in liquid nitrogen and then stored at -80 oC until RNA isolation.
Ethics StatementThis study was carried out in strict accordance with the recommendations in the Guide for theCare and Use of Laboratory Animals of the National Institutes of Health. The protocol was ap-proved by the Committee on the Ethics of Animal Experiments of the University of Delaware(Permit Number: 2703-12-10).
Transcriptome Analysis of Modern and Legacy Chicken Breast Muscle
PLOS ONE | DOI:10.1371/journal.pone.0122525 March 30, 2015 2 / 17
and CMA. Activities at Iowa State University werealso supported by the College of Agriculture and LifeSciences, State of Iowa and Hatch funding receivedby SJL and MFR. The funders had no role in studydesign, data collection and analysis, decision topublish, or preparation of the manuscript.
Competing Interests: The authors have declaredthat no competing interests exist.
RNA IsolationTotal RNA was isolated from approximately 30 mg samples of Pectoralis major tissue using theQiagen RNeasy Mini Kit as per the manufacturer’s instructions. Total RNA was extracted from12 D6 samples (6 Ross 708, 6 Illinois) and 12 D21 samples (6 Ross 708, 6 Illinois). RNA con-centration was assessed with a Nanodrop ND-100 spectrophotometer. Overall quality of theRNA was assessed using an Agilent 2100 Bioanalyzer.
mRNA Purification, cDNA synthesis and RNA-seq Library PreparationmRNA was purified from total RNA extracts by separation with magnetic oligo-dt beads.cDNA constructs were synthesized from purified mRNA samples and prepared for sequencingusing the Ilumina TruSeq RNA Sample Preparation Kit (Ilumina, San Diego, CA) as per themanufacturers instructions.
Sequencing and AlignmentPrepared libraries were sequenced using the HiSeq 2000 Sequencing System (Ilumina) at theDelaware Biotechnology Institute’s Sequencing and Genotyping Center (Newark, DE). All D6libraries, both Ross 708 and Illinois, were sequenced to a depth of ~10 million reads per library.For the D21 time point, four Ross 708 libraries and two Illinois libraries were also sequenced ata depth of ~10 million reads per library. Due to improvements in efficiency at the sequencingfacility two D21 Ross 708 libraries and three D21 Illinois libraries were sequenced at a depth of~30 million reads per library. 12 D6 libraries (6 Ross 708 and 6 Illinois) and 11 D21 libraries (6Ross 708 and 5 Illinois) were aligned to the 2006 version of the chicken genome sequence andannotation using the ERANGE package [9].
Power Analysis and Experimental DesignA random subset of D6 samples (2 Ross 708 and 2 Illinois) was supplied to Scotty [10], a toolfor power analysis and experimental design of RNA-seq experiments, in order to simulate pilotdata, per the designer’s suggestion. The results of the power analysis indicate that the numberof replicates and depth of sequencing provide sufficient power to detect>75% of differentiallyenriched genes at a p-value of 0.05. The same analysis was performed with the D21 samplesand the results of the power analysis indicate that the number of replicates and depth of se-quencing provide sufficient power to detect>75% of differentially enriched genes at a p-valueof 0.05. All comparisons were made within time points and across lines, i.e. D6 Ross 708 iscompared to D6 Illinois but is not directly compared to D21 Ross 708.
Transcriptional Profiling and Analysis of Differential Gene ExpressionThe sequencing data discussed in this publication have been deposited in NCBI’s Gene Expres-sion Omnibus [11] and are accessible through GEO series accession number GSE65217 (http://www.ncbi.nlm.nih.gov/geo/query/acc.cgi?acc=GSE65217). Statistical analyses were performedusing JMP software. We determined the ratio of reads per kilobase of gene per million mappedreads (RPKM) between the Ross 708 and Illinois lines on D6 and D21 and performed a log2transformation on this ratio. Genes whose ratios fell greater than 2 standard deviations fromthe mean, with a p-value< 0.05 were identified as differentially expressed between the twolines. Text mining was performed and informative terms (iTerms) were generated from the dif-ferentially expressed gene lists using eGIFT [12]. Gene ontology analysis was performed usingthe lists of differentially enriched genes with the AgBase GOSlim ontology, and the AgBasetools GORetriever and GOSlimViewer [13]. Any GO terms with>10 instances at either D6 or
Transcriptome Analysis of Modern and Legacy Chicken Breast Muscle
PLOS ONE | DOI:10.1371/journal.pone.0122525 March 30, 2015 3 / 17
D21 were used to generate figures with R [14]. Finally, the 30 most enriched genes from eachline at each time point were further examined by manual review of the literature.
Quantitative reverse transcription polymerase chain reaction (qRT-PCR)VerificationComplimentary DNA (cDNA) was synthesized from previously isolated Ross 708 and Illinoisbreast muscle RNA using the Superscript II first strand synthesis kit (Invitrogen). cDNA con-centration and quality were assessed with a Nanodrop ND-100 spectrophotometer (NanodropTechnology, Wilmington, DE) and diluted to 90 ng/μl of cDNA. Diluted cDNA samples and12 different primer pairs, designed to isolate specific genes, were used to conduct quantitativePCR. Quantitative PCR was done using the 7500 Fast Real Time PCR System (Applied Biosys-tems). The glioblastoma amplified sequence (GBAS) gene was used as the control gene to nor-malize for the amount of cDNA in the qPCR reaction. Each reaction was done in triplicate.Fold differences between the Heritage and Ross line gene expression levels were determined bydelta-delta method, statistical analysis of Real Time PCR data [15].
Several myogenic regulatory genes were selected for verification via probe-based qPCR.Primers and probes were designed using Primer Express 3.0 software (Life Technologies) andchecked for specific mapping to the chicken genome using BLAT [16]. Custom oligonucleo-tides were also designed for each primer-probe set to construct standard curves for quantifica-tion. These custom standards consisted of the forward primer, probe and reverse complementof the reverse primer each separated by a single nucleotide. Probe qPCR reactions were pre-pared using the QuantiTect probe qPCR kit (Qiagen) and reactions were performed using the7500 Fast Real Time PCR System (Applied Biosystems).
Results and Discussion
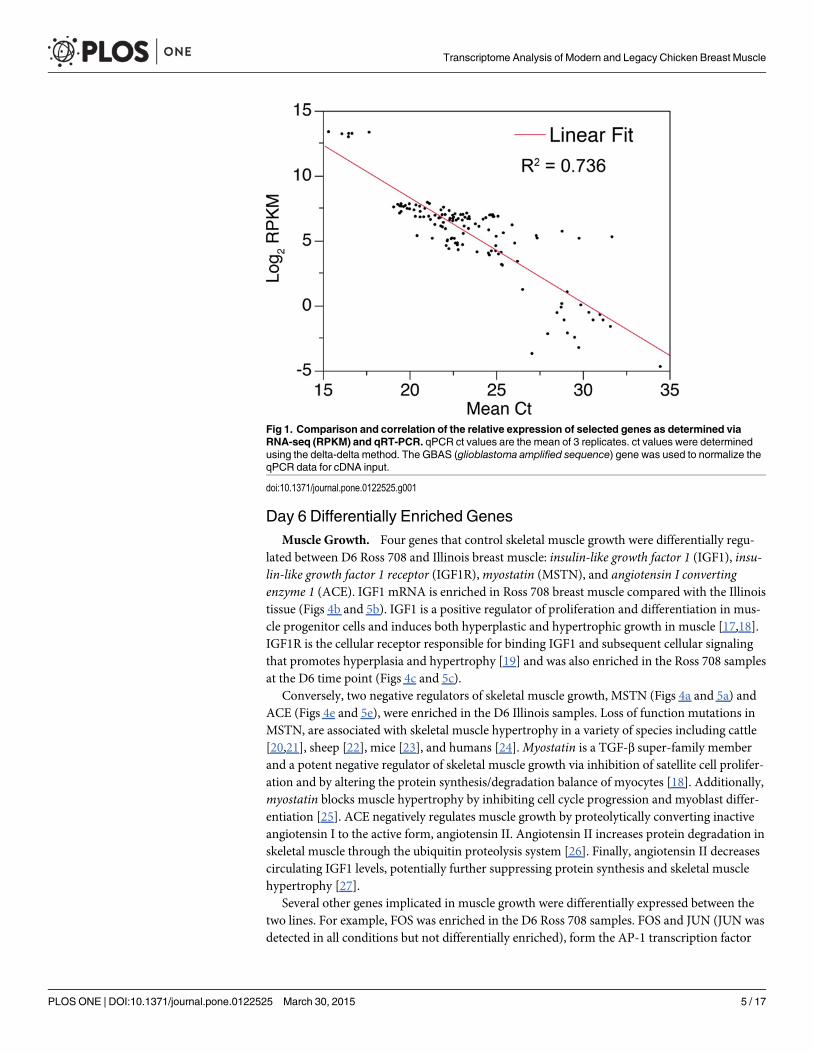
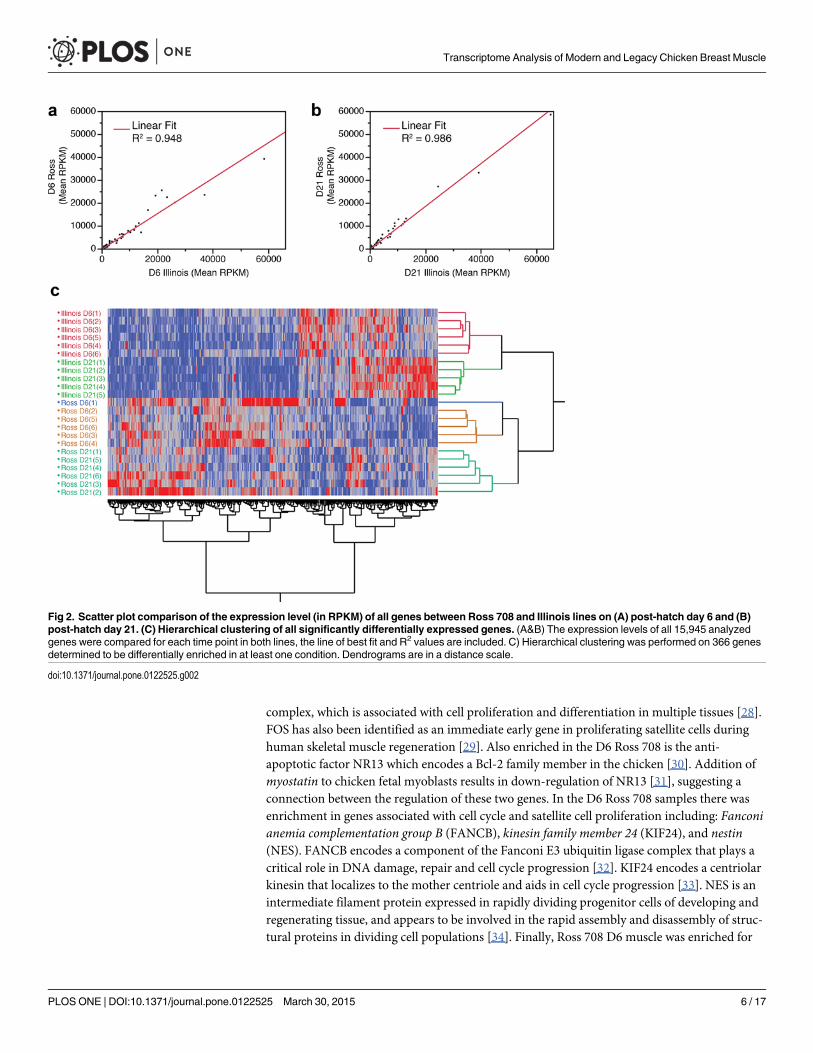
Differential expression of breast muscle genesA total of 15,945 genes were analyzed for their expression level, expressed in reads per kilobaseof transcript per million mapped reads (RPKM), in breast muscle tissue from both Ross 708and Illinois birds; of these, 10,841 genes were expressed with an RPKM> 0.1, the thresholdthat corresponds to reliable results when assayed by quantitative RT-PCR (Fig 1). Comparingthe RPKM values for all genes from the Ross and Illinois birds at day 6 and day 21 shows ahigh relationship between the samples (Day 6 R2 = 0.948 and Day 21 R2 = 0.986) (Fig 2A and2B) and hierarchical clustering segregated the data first by line then by day (Fig 2C).
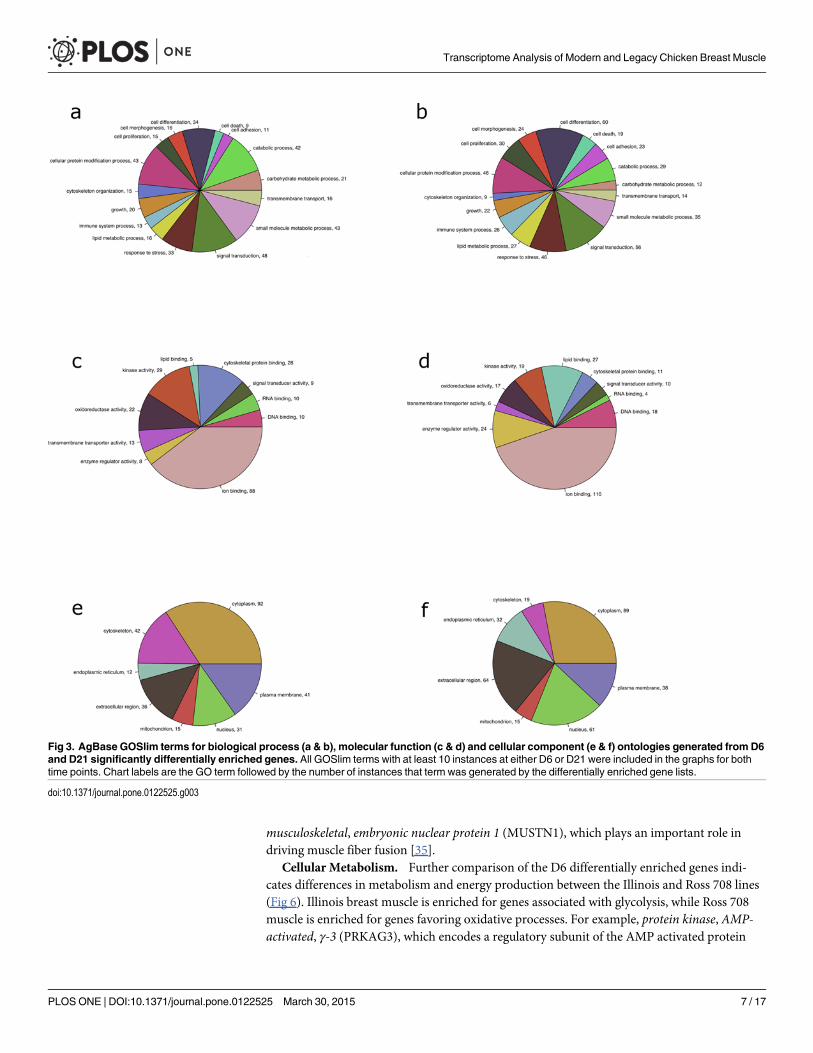
Subsequently, genes were identified that exhibited significant differential enrichment be-tween the two lines on either D6 or D21 post-hatch. The D6 Ross 708 breast muscle expressed93 genes that were enriched relative to the Illinois samples, while the Illinois muscle showedenrichment for 96 gene transcripts (S1 Table). The D21 Ross 708 breast muscle was enrichedfor 138 transcripts while the Illinois muscle expressed 55 genes that were enriched relative tothe Ross 708 D21 samples (S2 Table). Gene ontology (GO) analysis performed on the differen-tially enriched genes lists indicated that several important biological processes, including cellproliferation, cell differentiation, growth, catabolic processes, and metabolic processes, weredifferentially regulated at D6 (Fig 3a) and D21 (Fig 3b). Important molecular functions affectedincluded lipid binding, oxidoreductase activity, kinase activity and other enzyme regulator ac-tivities (Fig 3c and 3d). Finally, differences in cellular components such as the extracellular re-gion and the cytoskeleton were observed at both D6 (Fig 3e) and D21 (Fig 3f).
Transcriptome Analysis of Modern and Legacy Chicken Breast Muscle
PLOS ONE | DOI:10.1371/journal.pone.0122525 March 30, 2015 4 / 17
Day 6 Differentially Enriched GenesMuscle Growth. Four genes that control skeletal muscle growth were differentially regu-
lated between D6 Ross 708 and Illinois breast muscle: insulin-like growth factor 1 (IGF1), insu-lin-like growth factor 1 receptor (IGF1R),myostatin (MSTN), and angiotensin I convertingenzyme 1 (ACE). IGF1 mRNA is enriched in Ross 708 breast muscle compared with the Illinoistissue (Figs 4b and 5b). IGF1 is a positive regulator of proliferation and differentiation in mus-cle progenitor cells and induces both hyperplastic and hypertrophic growth in muscle [17,18].IGF1R is the cellular receptor responsible for binding IGF1 and subsequent cellular signalingthat promotes hyperplasia and hypertrophy [19] and was also enriched in the Ross 708 samplesat the D6 time point (Figs 4c and 5c).
Conversely, two negative regulators of skeletal muscle growth, MSTN (Figs 4a and 5a) andACE (Figs 4e and 5e), were enriched in the D6 Illinois samples. Loss of function mutations inMSTN, are associated with skeletal muscle hypertrophy in a variety of species including cattle[20,21], sheep [22], mice [23], and humans [24].Myostatin is a TGF-β super-family memberand a potent negative regulator of skeletal muscle growth via inhibition of satellite cell prolifer-ation and by altering the protein synthesis/degradation balance of myocytes [18]. Additionally,myostatin blocks muscle hypertrophy by inhibiting cell cycle progression and myoblast differ-entiation [25]. ACE negatively regulates muscle growth by proteolytically converting inactiveangiotensin I to the active form, angiotensin II. Angiotensin II increases protein degradation inskeletal muscle through the ubiquitin proteolysis system [26]. Finally, angiotensin II decreasescirculating IGF1 levels, potentially further suppressing protein synthesis and skeletal musclehypertrophy [27].
Several other genes implicated in muscle growth were differentially expressed between thetwo lines. For example, FOS was enriched in the D6 Ross 708 samples. FOS and JUN (JUN wasdetected in all conditions but not differentially enriched), form the AP-1 transcription factor
Fig 1. Comparison and correlation of the relative expression of selected genes as determined viaRNA-seq (RPKM) and qRT-PCR. qPCR ct values are the mean of 3 replicates. ct values were determinedusing the delta-delta method. The GBAS (glioblastoma amplified sequence) gene was used to normalize theqPCR data for cDNA input.
doi:10.1371/journal.pone.0122525.g001
Transcriptome Analysis of Modern and Legacy Chicken Breast Muscle
PLOS ONE | DOI:10.1371/journal.pone.0122525 March 30, 2015 5 / 17
complex, which is associated with cell proliferation and differentiation in multiple tissues [28].FOS has also been identified as an immediate early gene in proliferating satellite cells duringhuman skeletal muscle regeneration [29]. Also enriched in the D6 Ross 708 is the anti-apoptotic factor NR13 which encodes a Bcl-2 family member in the chicken [30]. Addition ofmyostatin to chicken fetal myoblasts results in down-regulation of NR13 [31], suggesting aconnection between the regulation of these two genes. In the D6 Ross 708 samples there wasenrichment in genes associated with cell cycle and satellite cell proliferation including: Fanconianemia complementation group B (FANCB), kinesin family member 24 (KIF24), and nestin(NES). FANCB encodes a component of the Fanconi E3 ubiquitin ligase complex that plays acritical role in DNA damage, repair and cell cycle progression [32]. KIF24 encodes a centriolarkinesin that localizes to the mother centriole and aids in cell cycle progression [33]. NES is anintermediate filament protein expressed in rapidly dividing progenitor cells of developing andregenerating tissue, and appears to be involved in the rapid assembly and disassembly of struc-tural proteins in dividing cell populations [34]. Finally, Ross 708 D6 muscle was enriched for
Fig 2. Scatter plot comparison of the expression level (in RPKM) of all genes between Ross 708 and Illinois lines on (A) post-hatch day 6 and (B)post-hatch day 21. (C) Hierarchical clustering of all significantly differentially expressed genes. (A&B) The expression levels of all 15,945 analyzedgenes were compared for each time point in both lines, the line of best fit and R2 values are included. C) Hierarchical clustering was performed on 366 genesdetermined to be differentially enriched in at least one condition. Dendrograms are in a distance scale.
doi:10.1371/journal.pone.0122525.g002
Transcriptome Analysis of Modern and Legacy Chicken Breast Muscle
PLOS ONE | DOI:10.1371/journal.pone.0122525 March 30, 2015 6 / 17
musculoskeletal, embryonic nuclear protein 1 (MUSTN1), which plays an important role indriving muscle fiber fusion [35].
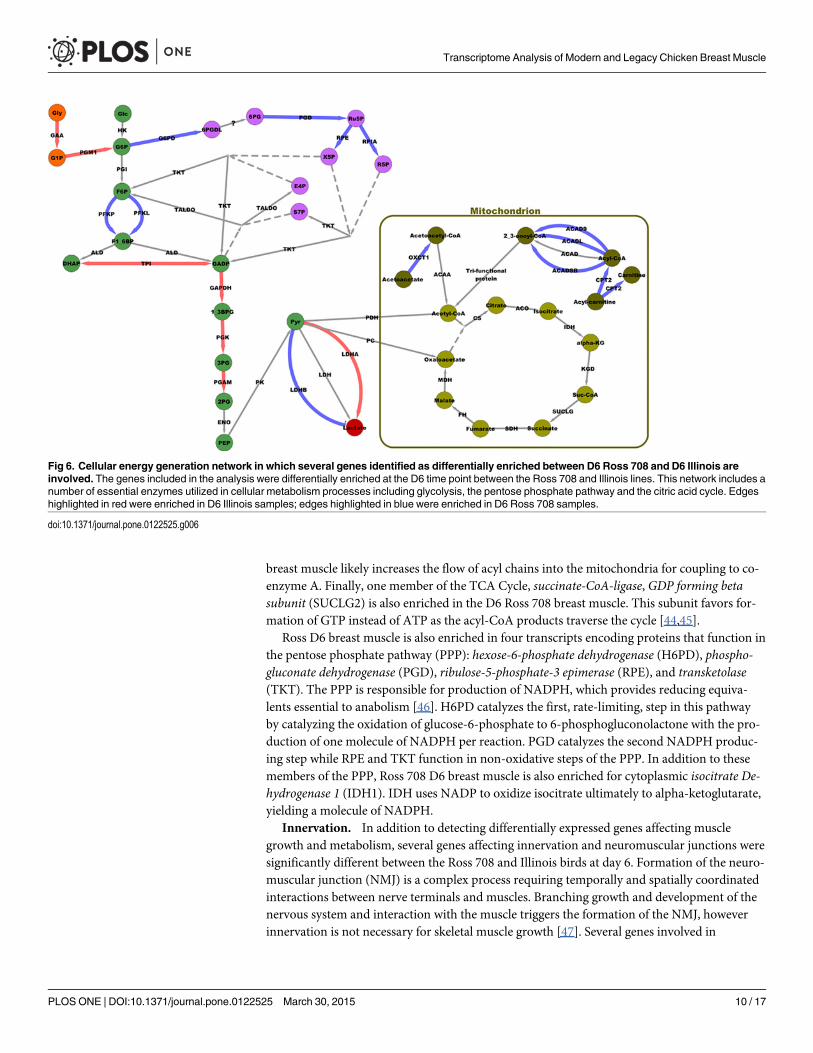
Cellular Metabolism. Further comparison of the D6 differentially enriched genes indi-cates differences in metabolism and energy production between the Illinois and Ross 708 lines(Fig 6). Illinois breast muscle is enriched for genes associated with glycolysis, while Ross 708muscle is enriched for genes favoring oxidative processes. For example, protein kinase, AMP-activated, γ-3 (PRKAG3), which encodes a regulatory subunit of the AMP activated protein
Fig 3. AgBase GOSlim terms for biological process (a & b), molecular function (c & d) and cellular component (e & f) ontologies generated from D6and D21 significantly differentially enriched genes. All GOSlim terms with at least 10 instances at either D6 or D21 were included in the graphs for bothtime points. Chart labels are the GO term followed by the number of instances that term was generated by the differentially enriched gene lists.
doi:10.1371/journal.pone.0122525.g003
Transcriptome Analysis of Modern and Legacy Chicken Breast Muscle
PLOS ONE | DOI:10.1371/journal.pone.0122525 March 30, 2015 7 / 17

kinase (AMPK), was enriched in D6 Illinois samples. AMPK is a master regulator of glucoseuptake, glycogen levels, and fatty acid oxidation [36]. Activated AMPK increases glycolytic me-tabolism while suppressing lipid and cholesterol biosynthesis and metabolism [37]. In additionto PRKAG3, several important glycolytic enzymes are enriched in D6 Illinois samples includ-ing: Triosephosphate isomerase 1 (TPI1), Glyceraldehyde-3-phosphate dehydrogenase (GAPDH)and Phosphoglycerate kinase 1 (PGK1). TPI1 encodes the subunits of a homodimeric enzymethat catalyzes the isomerization of dihydroxy-acetone phosphate (DHAP) to glyceraldehyde-3-phosphate (GADP). The next step in the glycolysis is catalyzed by GAPDH, which catalyzesthe phosphorylation of GADP to 1,3-bisphosphoglycerate (1,3BPG). Finally, PhosphoglycerateKinase 1 (PGK1) catalyzes the conversion of 1,3BPG to 3-phosphoglycerate (3-PG), yielding 2ATP in the process.
Complementing enrichment of transcripts encoding glycolytic enzymes, in the D6 Illinoisbirds is increased expression of two genes, α-acid glucosidase (GAA) and phosphoglucomutase1 (PGM1), that connect glycogen breakdown to glycolysis. GAA is a lysosomal enzyme essen-tial for the release of glucose from glycogen while PGM1 reversibly catalyzes the isomerizationof glucose-1-phosphate, the result of glycogen breakdown, to glucose-6-phosphate, which isthe entry point for glycolysis. In addition, lactate dehydrogenase A (LDHA), which represents abranching point in the production of energy from glucose, is enriched in D6 Illinois samples.
Fig 4. Expression levels, in mean RPKM, of major myogenic growth regulators differentially enriched between Ross 708 and Illinois breast musclesamples. Expression level is the mean RPKM of a given gene for each condition. Error bars represent 1 SEM. Ross 708 D6 n = 6, Illinois D6 n = 6, Ross 708D21 n = 6, Illinois D21 n = 5. * indicates significant at p< 0.05
doi:10.1371/journal.pone.0122525.g004
Transcriptome Analysis of Modern and Legacy Chicken Breast Muscle
PLOS ONE | DOI:10.1371/journal.pone.0122525 March 30, 2015 8 / 17
Pyruvate can either enter the oxidative TCA cycle or be converted to lactate by LDH for exportfrom the cell [38]. LDH is a tetrameric enzyme composed of various combinations of two sub-units, LDHA and LDHB. The enzymatic activity of these subunits varies with LDHB exhibitingmaximum activity at low pyruvate concentrations while LDHAmaintains activity at high pyru-vate concentrations. The ability of LDHA to maintain catalytic function in high concentrationsof pyruvate favors the conversion of pyruvate to lactate and, thus, a shift away from oxidativemetabolism [38]. This is consistent with the fast-muscle type seen in the breast muscle ofchickens [39].
Further analysis of the D6 Ross 708 breast muscle samples suggest that this tissue is en-riched for gene products supporting energy production via oxidative phosphorylation. Peroxi-some proliferator-activated receptor γ co-activator 1-α (PPARGC1A) is a transcriptionalco-activator enriched in the D6 Ross 708 samples that promotes myoblast proliferation, mito-chondrial biogenesis, and lipid transport, along with fatty acid and glucose oxidation [40–42].Six gene transcripts that function in acyl oxidation are enriched in the D6 Ross 708 muscle:CD36, acyl-CoA dehydrogenase 9 (ACAD9), acyl-CoA dehydrogenase, long chain (ACADL)and acyl-CoA dehydrogenase short/branched chain (ACADSB), 3-oxoacid CoA transferase1(OXCT1), and carnitine palmitoyltransferase 2 (CPT2). CD36 is a class B scavenger receptorthat functions as a fatty acid transporter in chicken skeletal muscle [43]. CD36 localizes to theplasma membrane and mitochondria; at the plasma membrane CD36 functions in fatty aciduptake, whereas in the mitochondria it functions to import fatty acids for oxidation [43].ACAD9, ACADL and ACADSB, all function in the oxidation of their respective acyl substrateswhile OXCT1 functions in ketone body oxidation. Enrichment for CPT2 in the D6 Ross 708
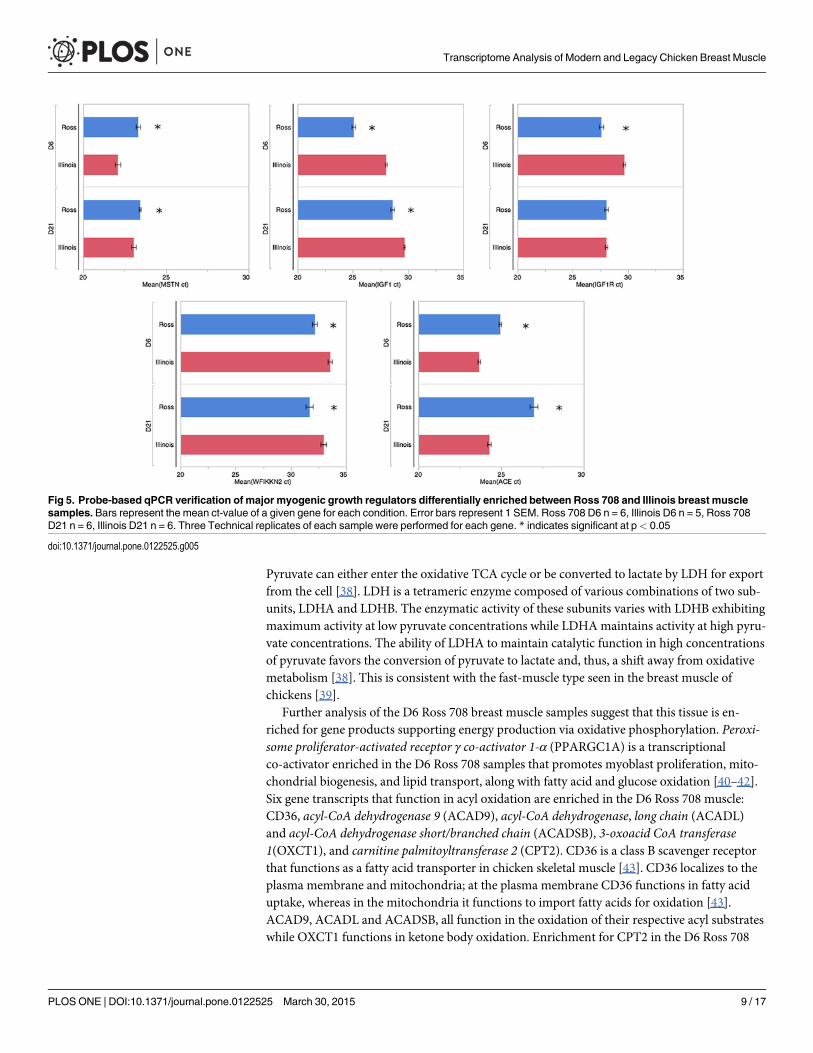
Fig 5. Probe-based qPCR verification of major myogenic growth regulators differentially enriched between Ross 708 and Illinois breast musclesamples. Bars represent the mean ct-value of a given gene for each condition. Error bars represent 1 SEM. Ross 708 D6 n = 6, Illinois D6 n = 5, Ross 708D21 n = 6, Illinois D21 n = 6. Three Technical replicates of each sample were performed for each gene. * indicates significant at p< 0.05
doi:10.1371/journal.pone.0122525.g005
Transcriptome Analysis of Modern and Legacy Chicken Breast Muscle
PLOS ONE | DOI:10.1371/journal.pone.0122525 March 30, 2015 9 / 17
breast muscle likely increases the flow of acyl chains into the mitochondria for coupling to co-enzyme A. Finally, one member of the TCA Cycle, succinate-CoA-ligase, GDP forming betasubunit (SUCLG2) is also enriched in the D6 Ross 708 breast muscle. This subunit favors for-mation of GTP instead of ATP as the acyl-CoA products traverse the cycle [44,45].
Ross D6 breast muscle is also enriched in four transcripts encoding proteins that function inthe pentose phosphate pathway (PPP): hexose-6-phosphate dehydrogenase (H6PD), phospho-gluconate dehydrogenase (PGD), ribulose-5-phosphate-3 epimerase (RPE), and transketolase(TKT). The PPP is responsible for production of NADPH, which provides reducing equiva-lents essential to anabolism [46]. H6PD catalyzes the first, rate-limiting, step in this pathwayby catalyzing the oxidation of glucose-6-phosphate to 6-phosphogluconolactone with the pro-duction of one molecule of NADPH per reaction. PGD catalyzes the second NADPH produc-ing step while RPE and TKT function in non-oxidative steps of the PPP. In addition to thesemembers of the PPP, Ross 708 D6 breast muscle is also enriched for cytoplasmic isocitrate De-hydrogenase 1 (IDH1). IDH uses NADP to oxidize isocitrate ultimately to alpha-ketoglutarate,yielding a molecule of NADPH.
Innervation. In addition to detecting differentially expressed genes affecting musclegrowth and metabolism, several genes affecting innervation and neuromuscular junctions weresignificantly different between the Ross 708 and Illinois birds at day 6. Formation of the neuro-muscular junction (NMJ) is a complex process requiring temporally and spatially coordinatedinteractions between nerve terminals and muscles. Branching growth and development of thenervous system and interaction with the muscle triggers the formation of the NMJ, howeverinnervation is not necessary for skeletal muscle growth [47]. Several genes involved in
Fig 6. Cellular energy generation network in which several genes identified as differentially enriched between D6 Ross 708 and D6 Illinois areinvolved. The genes included in the analysis were differentially enriched at the D6 time point between the Ross 708 and Illinois lines. This network includes anumber of essential enzymes utilized in cellular metabolism processes including glycolysis, the pentose phosphate pathway and the citric acid cycle. Edgeshighlighted in red were enriched in D6 Illinois samples; edges highlighted in blue were enriched in D6 Ross 708 samples.
doi:10.1371/journal.pone.0122525.g006
Transcriptome Analysis of Modern and Legacy Chicken Breast Muscle
PLOS ONE | DOI:10.1371/journal.pone.0122525 March 30, 2015 10 / 17
innervation and neuromuscular junction formation were enriched in the D6 Illinois samplescompared with the Ross 708 breast muscle. Among these was purinergic receptor P2Y, G-pro-tein coupled, 1 (P2RY1), which localizes to the neuromuscular junction [48], and acts as a tro-phic factor to promote localization of acetylcholine receptor and acetylcholine esterase to theNMJ [48]. Additionally, the potassium inward-rectifying channel, subfamily J,member 12(KCNJ12,), which localizes to the NMJ [49] was enriched in D6 Illinois samples. The kyphosco-liosis peptidase (KY) transcript, also enriched in D6 Illinois, encodes a cytoskeleton-associatedprotease that is involved in proper maturation and stabilization of NMJs [50].
The D6 Illinois samples also showed enrichment for neuronal specific genes involved inNMJ formation including vesicle-associate membrane protein 1 (VAMP1), neurogranin(NRGN), and leucine-rich repeat and Ig domain containing 1 (LINGO1). VAMP1 is a primarycomponent of the protein complex involved in docking and/or fusion of synaptic vesicles withthe presynaptic membrane [51]. VAMP1 is not found in satellite cells or myofibers, but ratherin pre-synaptic regions of neurons in muscle [52]. NRGN is a post-synaptic protein kinase sub-strate that is involved in calmodulin signaling, and acts as a third messenger in synaptic devel-opment and remodeling [53]. LINGO1 encodes a component of the Nogo-A signaling receptorcomplex. Nogo-A signaling affects the cytoskeleton of neurons through RhoA and Rho Kinase(ROCK) activity and is critical for branching of peripheral nerves [54]. Two genes products po-tentially involved in innervation were enriched in the D6 Ross 708 samples: cholinergic recep-tor, nicotinic, alpha 1 (CHRNA1) and cholinergic receptor,muscarinic 4 CHRM4. Both of thesereceptor subunits are found at the neuromuscular junctions [55].
Day 21 Differentially Enriched GenesMuscle Growth. In the D21 samples expression levels of IGF1 remained enriched in Ross
708 (Figs 4b and 5b) samples while ACE transcripts remained elevated in the Illinois breastmuscle (Figs 4e and 5e). In contrast, by post-hatch day 21 the Ross 708 and the Illinois samplesshowed similar expression of IGF1R (Fig 4c) and MSTN (Fig 4a) in the RNA-seq data. Probe-based qPCR confirmed similar expression of IGF1R between Ross 708 and Illinois samples(Fig 5c); however probe-based qPCR results indicated that MSTNmRNA expression remainssignificantly enriched in the Illinois samples at the D21 time point (Fig 5a). In addition to thesefactors, theWAP, follistatin/kazal, immunoglobulin, kunitz and netrin domain containing 2(WFIKKN2) gene was enriched in D21 Ross 708 breast muscle (Fig 4d). WFIKKN2 is a nega-tive regulator of MSTN through its follistatin domain, and overexpression of WFIKKN2 inmice causes muscle hypertrophy after birth by sequestering MSTN [56–58]. Unlike the D21samples, the RNA-seq expression data did not show a significant enrichment for WFIKKN2mRNA at the D6 time point (Fig 4d); however probe-based qPCR follow-up showed both D6and D21 Ross 708 samples to be significantly enriched for WFIKKN2 mRNA (Fig 5d).
Another D21 Ross 708 enriched transcript with a role in myogenesis encodes small muscleprotein, x-linked (SMPX). Myoblasts over-expressing SMPX are enlarged due to formation ofmembrane ruffles and lamellipodia and IGF1 supplementation of cultures overexpressingSMPX induces myotube hypertrophy [59]. The HOP homeobox gene (HOPX) mRNA is en-riched in D21 Ross breast muscle. HOPX encodes an atypical homeobox protein that does nothave the capacity to bind DNA but can potentiate skeletal muscle differentiation through inter-action with enhancer of polycomb 1 (Epc1) [60]. Epc1 was expressed in all conditions but wasnot differentially expressed. In mice, HOPX knockout individuals showed an inhibition of skel-etal muscle differentiation and impairments in muscle regeneration [60].
Cysteine and glycine-rich protein 3 (CSRP3), which is associated with myogenic differentia-tion was also enriched in D21 Ross 708 breast muscle relative to D21 Illinois samples. CSRP3 is
Transcriptome Analysis of Modern and Legacy Chicken Breast Muscle
PLOS ONE | DOI:10.1371/journal.pone.0122525 March 30, 2015 11 / 17
found in both the cytosol and the nucleus; the cytosolic form serves as a scaffold for structuralproteins, while the nuclear CSRP3 serves as a cofactor for basic helix-loop-helix (bHLH) tran-scription factors including MYOD1 and myogenin (detected in both lines on both days). Thesetranscription factors bind the E-box motif and promote the transcription of genes at multiplecritical stages of muscle growth and differentiation [61,62]. In the Illinois line, only one addi-tional gene affecting muscle growth, MYOD1, was enriched at D21. MYOD1 is responsible forwithdrawal from the cell cycle and commitment toward terminal myogenic differentiation [63].
Cellular Metabolism and Innervation. As at D6, IDH1 is still elevated in the D21 Ross708 compared with the D21 Illinois breast muscle. The D21 Ross 708 breast muscle shows en-richment formidikine (MDK), which encodes a small neurite-derived heparin binding growthfactor that participates in signaling during NMJ formation [64]
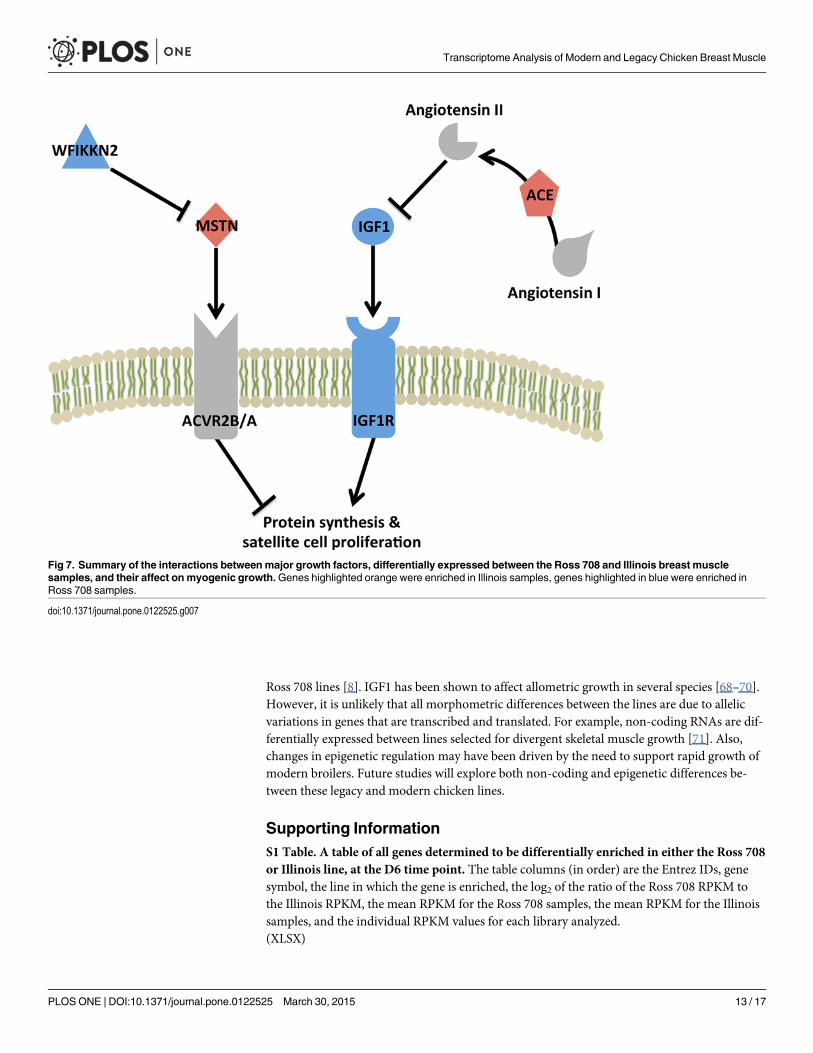
Implications of Day 6 and 21 Gene Expression PatternsMyogenesis is a complex process that begins with a pool of proliferative progenitor cells and re-sults in terminally differentiated, multi-nucleated myofibers. Typically the number of musclefibers is determined during the embryonic stage of development [65]. In the post-hatch chick-en, the increase in muscle size is a result of proliferation and fusion of myogenic progenitorcells (satellite cells) to existing myotubes, increasing the number of nuclei and the capacity forprotein synthesis [66]. Furthermore, breast muscle growth in these broiler chicken lines can bedivided into two time frames: pre and post-day 14 [8]. From hatch through day 14, the breastmuscle of both the modern Ross 708 and Illinois line exhibit rapid growth relative to the totalbody, although the Ross 708 breast muscle grows approximately 3-fold faster than the Illinoisline during this time. When normalized to the total bird mass, the relative growth of the Illinoisbreast muscle plateaus after post-hatch day 14, while the Ross 708 birds continues to increasethe relative proportion of breast muscle. While the breast muscle continues to grow in bothlines, only the Ross 708 birds continue to add more breast muscle relative to the growth ofother tissues after D14 [8]. We hypothesize that IGF1, IGF1R, MSTN, WFIKKN2 and ACEmay form the basis for a network of interacting factors in which the breast muscle growth is aconsequence of the ratio of these growth promoting and inhibiting factors (Fig 7). The signifi-cantly elevated levels of IGF1, IGF1R and WFIKKN2 compared to MSTN and ACE seen at day6 (Figs 4 and 5) in the Ross 708 birds may play a role the rapid relative growth of this breastmuscle tissue prior to day 14. By day 21 post-hatch, the ratio of IGF, IGF1R and WFIKKN2 toMSTN and ACE has decreased, but is still higher in the Ross 708 tissue relative to Illinois breastmuscle. Conceivably, this elevated ratio of growth promoters to inhibitors results in the positiveallometric growth of the Ross 708 breast muscle while the growth of this muscle in the Illinoisbirds becomes proportional to other tissues. Given the pleiotropic effects of IGF, MSTN [67]and ACE, selection that affects changes in their expression would be expected to have multiple,systemic effects on organ systems.
ConclusionsWe have compared gene expression patterns between the breast muscle tissues of an Illinoisand modern chicken line. The Illinois line had been selected for improved growth performanceuntil the late 1940s while the Ross 708 line is still undergoing selection for meat productiontraits. A major distinction between these lines is the significant elevation in breast muscle yieldin the modern (Ross 708) line. We hypothesized that selection has affected expression of multi-ple genes affecting muscle growth. Based on this transcriptome analysis, likely gene candidatesfor direct effect on muscle yield include IGF1, IGF1R, WFIKKN2, MSTN and ACE. Further-more, these growth factors may affect other allometric differences between the Illinois and
Transcriptome Analysis of Modern and Legacy Chicken Breast Muscle
PLOS ONE | DOI:10.1371/journal.pone.0122525 March 30, 2015 12 / 17
Ross 708 lines [8]. IGF1 has been shown to affect allometric growth in several species [68–70].However, it is unlikely that all morphometric differences between the lines are due to allelicvariations in genes that are transcribed and translated. For example, non-coding RNAs are dif-ferentially expressed between lines selected for divergent skeletal muscle growth [71]. Also,changes in epigenetic regulation may have been driven by the need to support rapid growth ofmodern broilers. Future studies will explore both non-coding and epigenetic differences be-tween these legacy and modern chicken lines.
Supporting InformationS1 Table. A table of all genes determined to be differentially enriched in either the Ross 708or Illinois line, at the D6 time point. The table columns (in order) are the Entrez IDs, genesymbol, the line in which the gene is enriched, the log2 of the ratio of the Ross 708 RPKM tothe Illinois RPKM, the mean RPKM for the Ross 708 samples, the mean RPKM for the Illinoissamples, and the individual RPKM values for each library analyzed.(XLSX)
Fig 7. Summary of the interactions betweenmajor growth factors, differentially expressed between the Ross 708 and Illinois breast musclesamples, and their affect on myogenic growth.Genes highlighted orange were enriched in Illinois samples, genes highlighted in blue were enriched inRoss 708 samples.
doi:10.1371/journal.pone.0122525.g007
Transcriptome Analysis of Modern and Legacy Chicken Breast Muscle
PLOS ONE | DOI:10.1371/journal.pone.0122525 March 30, 2015 13 / 17
S2 Table. A table of all genes determined to be differentially enriched in either the Ross708 or Illinois line, at the D21 time point. The table columns (in order) are the EntrezIDs, gene symbol, the line in which the gene is enriched, the log2 of the ratio of the Ross708 RPKM to the Illinois RPKM, the mean RPKM for the Ross 708 samples, the meanRPKM for the Illinois samples, and the individual expression values (in RPKM) for eachlibrary analyzed.(XLSX)
Author ContributionsConceived and designed the experiments: RVND SJL MFR MEP CMA CJS. Performed the ex-periments: RVND CJS. Analyzed the data: RVND CJS. Contributed reagents/materials/analysistools: RVND SJL MFRMEP CMA CJS. Wrote the paper: RVND.
References1. Griffin HD, Goddard C. Rapidly growing broiler (meat-type) chickens. Their origin and use for compara-
tive studies of the regulation of growth. International Journal of Biochemistry. 1994; 26: 19–28. PMID:8138043
2. Konarzewski M, Gavin A, McDevitt R, Wallis IR. Metabolic and organ mass responses to selectionfor high growth rates in the domestic chicken (Gallus domesticus). Physiol Biochem Zool. 2000; 73:237–248. PMID: 10801402
3. Thomas CH, BlowWL, Cockerham CC, Glazener EW. The heritability of body weight, gain, feed con-sumption, and feed conversion in broilers. Poultry Science. 1958; 37: 862–869.
4. Warren DC. A half century of advances in the genetics and breeding improvement of poultry. PoultryScience. 1958; 37: 3–20.
5. Havenstein GB, Ferket PR, Scheideler SE, Larson BT. Growth, livability, and feed conversion of 1957vs 1991 broilers when fed “typical” 1957 and 1991 broiler diets. Poultry Science. 1994; 73: 1785–1794.PMID: 7877934
6. Havenstein GB, Ferket PR, Scheideler SE, Rives DV. Carcass composition and yield of 1991 vs 1957broilers when fed “typical” 1957 and 1991 broiler diets. Poultry science. 1994; 73: 1795–1804. PMID:7877935
7. Qureshi MA, Havenstein GB. A comparison of the immune performance of a 1991 commercial broilerwith a 1957 randombred strain when fed “typical” 1957 and 1991 broiler diets. Poultry science. 1994;73: 1805–1812. PMID: 7877936
8. Schmidt CJ, Persia ME, Feierstein E, Kingham B, Saylor WW. Comparison of a modern broiler line anda heritage line unselected since the 1950s. Poult Sci. 2009; 88: 2610–2619. doi: 10.3382/ps.2009-00055 PMID: 19903960
9. Mortazavi A, Williams BA, McCue K, Schaeffer L, Wold B. Mapping and quantifying mammalian tran-scriptomes by RNA-Seq. Nat Methods. 2008; 5: 621–628. doi: 10.1038/nmeth.1226 PMID: 18516045
10. Busby MA, Stewart C, Miller CA, Grzeda KR, Marth GT. Scotty: a web tool for designing RNA-Seq ex-periments to measure differential gene expression. Bioinformatics. 2013; 29: 656–657. doi: 10.1093/bioinformatics/btt015 PMID: 23314327
11. Edgar R, Domrachev M, Lash AE. Gene Expression Omnibus: NCBI gene expression and hybridizationarray data repository. Nucleic Acids Res. 2002; 30: 207–210. PMID: 11752295
12. Tudor CO, Schmidt CJ, Vijay-Shanker K. eGIFT: mining gene information from the literature. BMC Bio-informatics. 2010; 11: 418. doi: 10.1186/1471-2105-11-418 PMID: 20696046
13. McCarthy FM,Wang N, Magee GB, Nanduri B, Lawrence ML, Camon EB et al. AgBase: a functionalgenomics resource for agriculture. BMCGenomics. 2006; 7: 229. PMID: 16961921
14. R Core Team (2013) R: A language and environment for statistical computing. Available: http://www.R-project.org/. Accessed 26 Feb 2015.
15. Yuan JS, Reed A, Chen F, Stewart CNJ. Statistical analysis of real-time PCR data. BMC Bioinformat-ics. 2006; 7: 85. PMID: 16504059
16. Doerks T, Copley RR, Schultz J, Ponting CP, Bork P. Systematic identification of novel protein domainfamilies associated with nuclear functions. Genome Res. 2002; 12: 47–56. PMID: 11779830
Transcriptome Analysis of Modern and Legacy Chicken Breast Muscle
PLOS ONE | DOI:10.1371/journal.pone.0122525 March 30, 2015 14 / 17
17. Duclos MJ. Insulin-like growth factor-I (IGF-1) mRNA levels and chicken muscle growth. J Physiol Phar-macol. 2005; 56 Suppl 3: 25–35. PMID: 16077194
18. Price ER, Bauchinger U, Zajac DM, Cerasale DJ, McFarlan JT, Gerson AR et al. Migration- andexercise-induced changes to flight muscle size in migratory birds and association with IGF1 and myos-tatin mRNA expression. J Exp Biol. 2011; 214: 2823–2831. doi: 10.1242/jeb.057620 PMID: 21832125
19. Rommel C, Bodine SC, Clarke BA, Rossman R, Nunez L, Stitt TN et al. Mediation of IGF-1-inducedskeletal myotube hypertrophy by PI(3)K/Akt/mTOR and PI(3)K/Akt/GSK3 pathways. Nat Cell Biol.2001; 3: 1009–1013. PMID: 11715022
20. Grobet L, Martin LJ, Poncelet D, Pirottin D, Brouwers B, Riquet J et al. A deletion in the bovine myosta-tin gene causes the double-muscled phenotype in cattle. Nat Genet. 1997; 17: 71–74. PMID: 9288100
21. McPherron AC, Lee SJ. Double muscling in cattle due to mutations in the myostatin gene. Proc NatlAcad Sci U S A. 1997; 94: 12457–12461. PMID: 9356471
22. Clop A, Marcq F, Takeda H, Pirottin D, Tordoir X, Bibe B et al. A mutation creating a potential illegitimatemicroRNA target site in the myostatin gene affects muscularity in sheep. Nat Genet. 2006; 38: 813–818.PMID: 16751773
23. Szabo G, Dallmann G, Muller G, Patthy L, Soller M, Varga L. A deletion in the myostatin gene causesthe compact (Cmpt) hypermuscular mutation in mice. MammGenome. 1998; 9: 671–672. PMID:9680391
24. Schuelke M, Wagner KR, Stolz LE, Hubner C, Riebel T, KomenW et al. Myostatin mutation associatedwith gross muscle hypertrophy in a child. N Engl J Med. 2004; 350: 2682–2688. PMID: 15215484
25. Rodgers BD, Garikipati DK. Clinical, agricultural, and evolutionary biology of myostatin: a comparativereview. Endocr Rev. 2008; 29: 513–534. doi: 10.1210/er.2008-0003 PMID: 18591260
26. Yoshida T, Semprun-Prieto L, Sukhanov S, Delafontaine P. IGF-1 prevents ANG II-induced skeletalmuscle atrophy via Akt- and Foxo-dependent inhibition of the ubiquitin ligase atrogin-1 expression. AmJ Physiol Heart Circ Physiol. 2010; 298: H1565-70. doi: 10.1152/ajpheart.00146.2010 PMID:20228261
27. Brink M, Wellen J, Delafontaine P. Angiotensin II causes weight loss and decreases circulatinginsulin-like growth factor I in rats through a pressor-independent mechanism. J Clin Invest. 1996; 97:2509–2516. PMID: 8647943
28. Angel P, Karin M. The role of Jun, Fos and the AP-1 complex in cell-proliferation and transformation.Biochim Biophys Acta. 1991; 1072: 129–157. PMID: 1751545
29. Puntschart A, Wey E, Jostarndt K, Vogt M, Wittwer M, Widmer HR et al. Expression of fos and jungenes in human skeletal muscle after exercise. Am J Physiol. 1998; 274: C129-37. PMID: 9458721
30. Lee RM, Gillet G, Burnside J, Thomas SJ, Neiman P. Role of Nr13 in regulation of programmed celldeath in the bursa of Fabricius. Genes Dev. 1999; 13: 718–728. PMID: 10090728
31. YangW, Zhang Y, Ma G, Zhao X, Chen Y, Zhu D. Identification of gene expression modifications inmyostatin-stimulated myoblasts. Biochem Biophys Res Commun. 2005; 326: 660–666. PMID:15596150
32. Sato K, Toda K, Ishiai M, Takata M, Kurumizaka H. DNA robustly stimulates FANCD2monoubiquityla-tion in the complex with FANCI. Nucleic Acids Res. 2012; 40: 4553–4561. doi: 10.1093/nar/gks053PMID: 22287633
33. Kobayashi T, TsangWY, Li J, LaneW, Dynlacht BD. Centriolar kinesin Kif24 interacts with CP110 to re-model microtubules and regulate ciliogenesis. Cell. 2011; 145: 914–925. doi: 10.1016/j.cell.2011.04.028 PMID: 21620453
34. Michalczyk K, Ziman M. Nestin structure and predicted function in cellular cytoskeletal organisation.Histol Histopathol. 2005; 20: 665–671. PMID: 15736068
35. Liu C, Gersch RP, Hawke TJ, Hadjiargyrou M. Silencing of Mustn1 inhibits myogenic fusion and differ-entiation. Am J Physiol Cell Physiol. 2010; 298: C1100-8. doi: 10.1152/ajpcell.00553.2009 PMID:20130207
36. Winder WW. Energy-sensing and signaling by AMP-activated protein kinase in skeletal muscle. J ApplPhysiol. 2001; 91: 1017–1028. PMID: 11509493
37. Hardie DG, Sakamoto K. AMPK: a key sensor of fuel and energy status in skeletal muscle. Physiology(Bethesda). 2006; 21: 48–60. PMID: 16443822
38. Dawson DM, Goodfriend TL, Kaplan NO. Lactic Dehydrogenases: Functions of the Two Types Ratesof Synthesis of the two Major Forms can be Correlated with Metabolic Differentiation. Science. 1964;143: 929–933. PMID: 14090142
39. Ono Y, Iwamoto H, Takahara H. The relationship between muscle growth and the growth of differentfiber types in the chicken. Poult Sci. 1993; 72: 568–576. PMID: 8464795
Transcriptome Analysis of Modern and Legacy Chicken Breast Muscle
PLOS ONE | DOI:10.1371/journal.pone.0122525 March 30, 2015 15 / 17
40. Lin J, Wu H, Tarr PT, Zhang CY, Wu Z, Boss O et al. Transcriptional co-activator PGC-1 alpha drivesthe formation of slow-twitch muscle fibres. Nature. 2002; 418: 797–801. PMID: 12181572
41. Summermatter S, BaumO, Santos G, Hoppeler H, Handschin C. Peroxisome proliferator-activatedreceptor {gamma} coactivator 1{alpha} (PGC-1{alpha}) promotes skeletal muscle lipid refueling in vivoby activating de novo lipogenesis and the pentose phosphate pathway. J Biol Chem. 2010; 285:32793–32800. doi: 10.1074/jbc.M110.145995 PMID: 20716531
42. Wende AR, Schaeffer PJ, Parker GJ, Zechner C, Han DH, Chen MM et al. A role for the transcriptionalcoactivator PGC-1alpha in muscle refueling. J Biol Chem. 2007; 282: 36642–36651. PMID: 17932032
43. Guo J, Shu G, Zhou L, Zhu X, Liao W, Wang S et al. Selective transport of long-chain fatty acids byFAT/CD36 in skeletal muscle of broilers. Animal. 20121–8.
44. Johnson JD. Genetic Evidence for the Expression of ATP- and GTP-specific Succinyl-CoA Synthe-tases in Multicellular Eucaryotes. Journal of Biological Chemistry. 1998; 273: 27580–27586. PMID:9765291
45. Lambeth DO, Tews KN, Adkins S, Frohlich D, Milavetz BI. Expression of two succinyl-CoA synthetaseswith different nucleotide specificities in mammalian tissues. J Biol Chem. 2004; 279: 36621–36624.PMID: 15234968
46. Schenk G, Duggleby RG, Nixon PF. Properties and functions of the thiamin diphosphate dependent en-zyme transketolase. Int J Biochem Cell Biol. 1998; 30: 1297–1318. PMID: 9924800
47. Witzemann V. Development of the neuromuscular junction. Cell Tissue Res. 2006; 326: 263–271.PMID: 16819627
48. Choi RC, ManML, Ling KK, Ip NY, Simon J, Barnard EA et al. Expression of the P2Y1 nucleotide recep-tor in chick muscle: its functional role in the regulation of acetylcholinesterase and acetylcholine recep-tor. J Neurosci. 2001; 21: 9224–9234. PMID: 11717356
49. Leonoudakis D, Conti LR, Anderson S, Radeke CM, McGuire LM, AdamsME et al. Protein traffickingand anchoring complexes revealed by proteomic analysis of inward rectifier potassium channel (Kir2.x)-associated proteins. J Biol Chem. 2004; 279: 22331–22346. PMID: 15024025
50. Blanco G, Coulton GR, Biggin A, Grainge C, Moss J, Barrett M et al. The kyphoscoliosis (ky) mouse isdeficient in hypertrophic responses and is caused by a mutation in a novel muscle-specific protein.HumMol Genet. 2001; 10: 9–16. PMID: 11136708
51. Liu Y, Sugiura Y, Lin W. The role of synaptobrevin1/VAMP1 in Ca2+-triggered neurotransmitter releaseat the mouse neuromuscular junction. J Physiol. 2011; 589: 1603–1618. doi: 10.1113/jphysiol.2010.201939 PMID: 21282288
52. Tajika Y, Sato M, Murakami T, Takata K, Yorifuji H. VAMP2 is expressed in muscle satellite cells andup-regulated during muscle regeneration. Cell Tissue Res. 2007; 328: 573–581. PMID: 17468895
53. Zhong L, Cherry T, Bies CE, Florence MA, Gerges NZ. Neurogranin enhances synaptic strengththrough its interaction with calmodulin. EMBO J. 2009; 28: 3027–3039. doi: 10.1038/emboj.2009.236PMID: 19713936
54. Petrinovic MM, Duncan CS, Bourikas D, Weinman O, Montani L, Schroeter A et al. Neuronal Nogo-Aregulates neurite fasciculation, branching and extension in the developing nervous system. Develop-ment. 2010; 137: 2539–2550. doi: 10.1242/dev.048371 PMID: 20573699
55. Chang YF, Chou HJ, Yen YC, Chang HW, Hong YR, Huang HW et al. Agrin induces associationof Chrna1 mRNA and nicotinic acetylcholine receptor in C2C12 myotubes. FEBS Lett. 2012; 586:3111–3116. doi: 10.1016/j.febslet.2012.07.068 PMID: 22884571
56. Kondas K, Szlama G, Trexler M, Patthy L. Both WFIKKN1 andWFIKKN2 have high affinity for growthand differentiation factors 8 and 11. J Biol Chem. 2008; 283: 23677–23684. doi: 10.1074/jbc.M803025200 PMID: 18596030
57. Monestier O, Brun C, Heu K, Passet B, Malhouroux M, Magnol L et al. Ubiquitous Gasp1 overexpres-sion in mice leads mainly to a hypermuscular phenotype. BMCGenomics. 2012; 13: 541. doi: 10.1186/1471-2164-13-541 PMID: 23046573
58. Szlama G, Kondas K, Trexler M, Patthy L. WFIKKN1 andWFIKKN2 bind growth factors TGFbeta1,BMP2 and BMP4 but do not inhibit their signalling activity. FEBS J. 2010; 277: 5040–5050. doi: 10.1111/j.1742-4658.2010.07909.x PMID: 21054789
59. Palmer S, Groves N, Schindeler A, Yeoh T, Biben C, Wang CC et al. The small muscle-specific proteinCsl modifies cell shape and promotes myocyte fusion in an insulin-like growth factor 1-dependent man-ner. J Cell Biol. 2001; 153: 985–998. PMID: 11381084
60. Kee HJ, Kim JR, Nam KI, Park HY, Shin S, Kim JC et al. Enhancer of polycomb1, a novel homeodo-main only protein-binding partner, induces skeletal muscle differentiation. J Biol Chem. 2007; 282:7700–7709. PMID: 17192267
Transcriptome Analysis of Modern and Legacy Chicken Breast Muscle
PLOS ONE | DOI:10.1371/journal.pone.0122525 March 30, 2015 16 / 17
61. Arber S, Halder G, Caroni P. Muscle LIM protein, a novel essential regulator of myogenesis, promotesmyogenic differentiation. Cell. 1994; 79: 221–231. PMID: 7954791
62. Xu X, Qiu H, Du ZQ, Fan B, Rothschild MF, Yuan F et al. Porcine CSRP3: polymorphism and associa-tion analyses with meat quality traits and comparative analyses with CSRP1 and CSRP2. Mol Biol Rep.2010; 37: 451–459. doi: 10.1007/s11033-009-9632-1 PMID: 19634002
63. Olson EN. Regulation of muscle transcription by the MyoD family. The heart of the matter. CirculationResearch. 1993; 72: 1–6. PMID: 8380257
64. Sakakima H, Kamizono T, Matsuda F, Izumo K, Ijiri K, Yoshida Y. Midkine and its receptor in regenerat-ing rat skeletal muscle after bupivacaine injection. Acta Histochem. 2006; 108: 357–364. PMID:16965805
65. Smith JH. Relation of Body Size to Muscle Cell Size and Number in the Chicken. Poultry Science.1963; 42: 283–290.
66. Berkes CA, Tapscott SJ. MyoD and the transcriptional control of myogenesis. Semin Cell Dev Biol.2005; 16: 585–595. PMID: 16099183
67. Ye X, Brown SR, Nones K, Coutinho LL, Dekkers JC, Lamont SJ. Associations of myostatin gene poly-morphisms with performance and mortality traits in broiler chickens. Genet Sel Evol. 2007; 39: 73–89.PMID: 17212949
68. Brogiolo W, Stocker H, Ikeya T, Rintelen F, Fernandez R, Hafen E. An evolutionarily conservedfunction of the Drosophila insulin receptor and insulin-like peptides in growth control. Curr Biol. 2001;11: 213–221. PMID: 11250149
69. Emlen DJ, Warren IA, Johns A, Dworkin I, Lavine LC. A mechanism of extreme growth and reliable sig-naling in sexually selected ornaments and weapons. Science. 2012; 337: 860–864. doi: 10.1126/science.1224286 PMID: 22837386
70. Lavine LC, Hahn LL, Warren IA, Garczynski SF, Dworkin I, Emlen DJ. Cloning and characterization ofan mRNA encoding an insulin receptor from the horned scarab beetle Onthophagus nigriventris (Cole-optera: Scarabaeidae). Arch Insect Biochem Physiol. 2013; 82: 43–57. doi: 10.1002/arch.21072 PMID:23136112
71. Li T, Wu R, Zhang Y, Zhu D. A systematic analysis of the skeletal muscle miRNA transcriptome ofchicken varieties with divergent skeletal muscle growth identifies novel miRNAs and differentially ex-pressed miRNAs. BMC genomics. 2011; 12: 186. doi: 10.1186/1471-2164-12-186 PMID: 21486491
Transcriptome Analysis of Modern and Legacy Chicken Breast Muscle
PLOS ONE | DOI:10.1371/journal.pone.0122525 March 30, 2015 17 / 17
Copyright © 2022 FDOKUMEN