Training Methods to Improve Sports Performance and Health
182
Edited by Training Methods to Improve Sports Performance and Health Bruno Gonçalves, Jorge Bravo and Hugo Folgado Printed Edition of the Special Issue Published in International Journal of Environmental Research and Public Health www.mdpi.com/journal/ijerph
-
Upload
khangminh22 -
Category
Documents
-
view
2 -
download
0
Transcript of Training Methods to Improve Sports Performance and Health
Edited by
Training Methods to Improve Sports Performance and Health
Bruno Gonçalves, Jorge Bravo and Hugo Folgado
Printed Edition of the Special Issue Published in
International Journal of Environmental Research and Public Health
www.mdpi.com/journal/ijerph

Training Methods to Improve SportsPerformance and Health


Training Methods to Improve SportsPerformance and Health
Editors
Bruno Goncalves
Jorge Bravo
Hugo Folgado
MDPI • Basel • Beijing • Wuhan • Barcelona • Belgrade • Manchester • Tokyo • Cluj • Tianjin

Editors
Bruno Goncalves
Departamento de Desporto e
Saude, Escola de Saude e
Desenvolvimento Humano
Universidade de Evora
Evora
Portugal
Jorge Bravo
Departamento de Desporto e
Saude, Escola de Saude e
Desenvolvimento Humano
Universidade de Evora
Evora
Portugal
Hugo Folgado
Departamento de Desporto e
Saude, Escola de Saude e
Desenvolvimento Humano
Universidade de Evora
Evora
Portugal
Editorial Office
MDPI
St. Alban-Anlage 66
4052 Basel, Switzerland
This is a reprint of articles from the Special Issue published online in the open access journal
International Journal of Environmental Research and Public Health (ISSN 1660-4601) (available at: www.
mdpi.com/journal/ijerph/special issues/Training Methods).
For citation purposes, cite each article independently as indicated on the article page online and as
indicated below:
LastName, A.A.; LastName, B.B.; LastName, C.C. Article Title. Journal Name Year, Volume Number,
Page Range.
ISBN 978-3-0365-2967-7 (Hbk)
ISBN 978-3-0365-2966-0 (PDF)
© 2022 by the authors. Articles in this book are Open Access and distributed under the Creative
Commons Attribution (CC BY) license, which allows users to download, copy and build upon
published articles, as long as the author and publisher are properly credited, which ensures maximum
dissemination and a wider impact of our publications.
The book as a whole is distributed by MDPI under the terms and conditions of the Creative Commons
license CC BY-NC-ND.

Contents
About the Editors . . . . . . . . . . . . . . . . . . . . . . . . . . . . . . . . . . . . . . . . . . . . . . vii
Sara Oftadeh, Abbas Bahram, Rasoul Yaali, Farhad Ghadiri and Wolfgang I. Schollhorn
External Focus or Differential Learning: Is There an Additive Effect on Learning a Futsal Goal
Kick?
Reprinted from: Int. J. Environ. Res. Public Health 2021, 19, 317, doi:10.3390/ijerph19010317 . . . 1
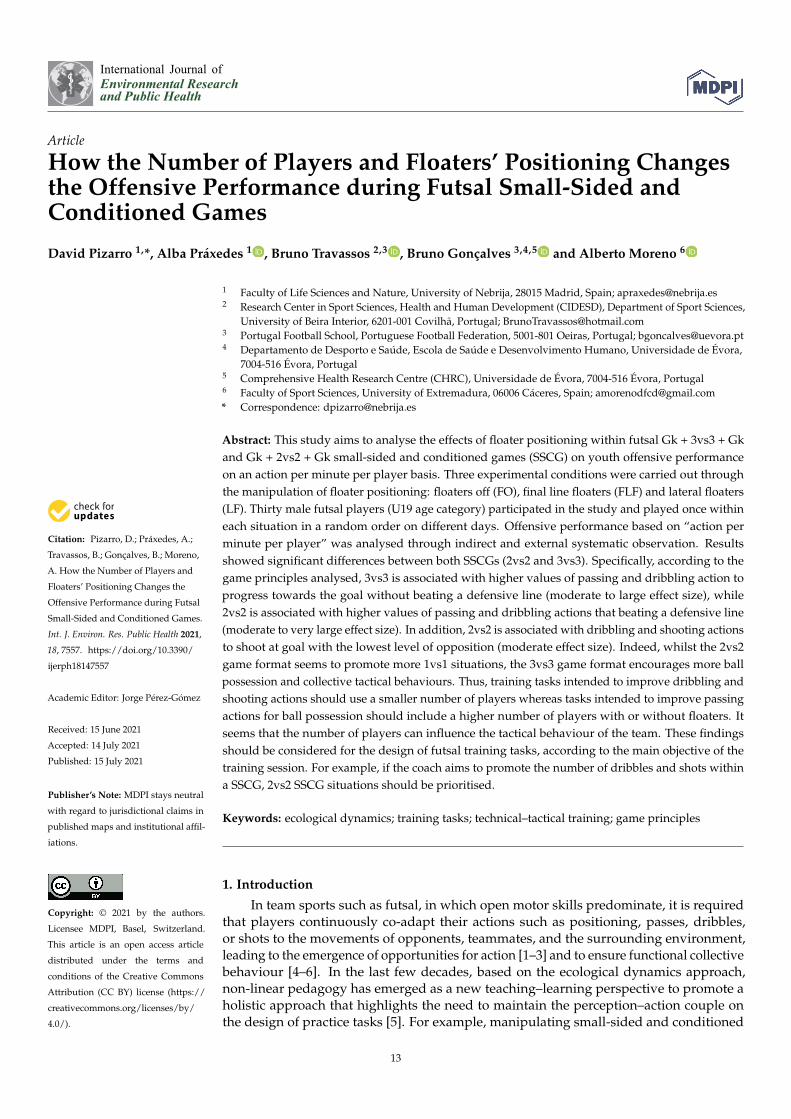
David Pizarro, Alba Praxedes, Bruno Travassos, Bruno Goncalves and Alberto Moreno
How the Number of Players and Floaters’ Positioning Changes the Offensive Performance
during Futsal Small-Sided and Conditioned Games
Reprinted from: Int. J. Environ. Res. Public Health 2021, 18, 7557, doi:10.3390/ijerph18147557 . . . 13
Jorge Arede, Sogand Poureghbali, Tomas Freitas, John Fernandes, Wolfgang I. Schollhorn
and Nuno Leite
The Effect of Differential Repeated Sprint Training on Physical Performance in Female
Basketball Players: A Pilot Study
Reprinted from: Int. J. Environ. Res. Public Health 2021, 18, 12616, doi:10.3390/ijerph182312616 . 23
Ching-Feng Cheng, Yu-Hsuan Kuo, Wei-Chieh Hsu, Chu Chen and Chi-Hsueh Pan
Local and Remote Ischemic Preconditioning Improves Sprint Interval Exercise Performance in
Team Sport Athletes
Reprinted from: Int. J. Environ. Res. Public Health 2021, 18, 10653, doi:10.3390/ijerph182010653 . 39
Julius B. Apidogo, Johannes Burdack and Wolfgang I. Schollhorn
Repetition without Repetition or Differential Learning of Multiple Techniques in Volleyball?
Reprinted from: Int. J. Environ. Res. Public Health 2021, 18, 10499, doi:10.3390/ijerph181910499 . 49
Haochong Liu, Bo Leng, Qian Li, Ye Liu, Dapeng Bao and Yixiong Cui
The Effect of Eight-Week Sprint Interval Training on Aerobic Performance of Elite Badminton
Players
Reprinted from: Int. J. Environ. Res. Public Health 2021, 18, 638, doi:10.3390/ijerph18020638 . . . 67
Luis Vaz, Wilbur Kraak, Marco Batista, Samuel Honorio and Helder Miguel Fernandes
Using Anthropometric Data and Physical Fitness Scores to Predict Selection in a National U19
Rugby Union Team
Reprinted from: Int. J. Environ. Res. Public Health 2021, 18, 1499, doi:10.3390/ijerph18041499 . . . 79
Ghaith Aloui, Souhail Hermassi, Aymen Khemiri, Thomas Bartels, Lawrence D. Hayes and
El Ghali Bouhafs et al.
An 8-Week Program of Plyometrics and Sprints with Changes of Direction Improved Anaerobic
Fitness in Young Male Soccer Players
Reprinted from: Int. J. Environ. Res. Public Health 2021, 18, 10446, doi:10.3390/ijerph181910446 . 87
Joaquın Gonzalez-Rodenas, Rodrigo Aranda-Malaves, Andres Tudela-Desantes, Pedro de
Matıas-Cid and Rafael Aranda
Different Pitch Configurations Constrain the Playing Tactics and the Creation of Goal Scoring
Opportunities during Small Sided Games in Youth Soccer Players
Reprinted from: Int. J. Environ. Res. Public Health 2021, 18, 10500, doi:10.3390/ijerph181910500 . 101
v

Olha Podrihalo, Leonid Podrigalo, Władysław Jagiełło, Sergii Iermakov and Tetiana
Yermakova
Substantiation of Methods for Predicting Success in Artistic Swimming
Reprinted from: Int. J. Environ. Res. Public Health 2021, 18, 8739, doi:10.3390/ijerph18168739 . . . 115
Nuno Batalha, Jose A. Parraca, Daniel A. Marinho, Ana Conceicao, Hugo Louro and Antonio
J. Silva et al.
The Acute Effects of a Swimming Session on the Shoulder Rotators Strength and Balance of Age
Group Swimmers
Reprinted from: Int. J. Environ. Res. Public Health 2021, 18, 8109, doi:10.3390/ijerph18158109 . . . 123
Moises Marquina, Jorge Lorenzo-Calvo, Jesus Rivilla-Garcıa, Abraham Garcıa-Aliaga and
Ignacio Refoyo Roman
Effects on Strength, Power and Speed Execution Using Exercise Balls, Semi-Sphere Balance Balls
and Suspension Training Devices: A Systematic Review
Reprinted from: Int. J. Environ. Res. Public Health 2021, 18, 1026, doi:10.3390/ijerph18031026 . . . 133
Catarina Goncalves, Armando Raimundo, Ana Abreu and Jorge Bravo
Exercise Intensity in Patients with Cardiovascular Diseases: Systematic Review with
Meta-Analysis
Reprinted from: Int. J. Environ. Res. Public Health 2021, 18, 3574, doi:10.3390/ijerph18073574 . . . 151
vi
About the Editors
Bruno Goncalves
Bruno Goncalves is an associate professor at the University of Evora and researcher at the
Comprehensive Health Research Centre (CHRC). He graduated with a PhD in collective movement
behaviour in association football, where he developed expertise in capturing and filtering data
using high-tech instruments and in advanced processing computations. His research focuses on the
identifcation of new variables that capture collective, exploratory, adaptive, and emergent behaviour
principles in team-sport settings.
Jorge Bravo
Jorge Bravo is an assistant professor at the University of Evora and researcher at the
Comprehensive Health Research Centre (CHRC). He graduated with a PhD in Sports Performance at
the University of Extremadura, developing expertise in the management of physiological biomarkers
in children and adolescents. His research interests are the conception and development of interactive
exercise programs for health management, particularly in cardiac patients and older people.
Hugo Folgado
Hugo Folgado is an assistant professor at the Department of Sport and Health of the University
of Evora. His main research interests are performance analysis and technology development and
application in team sports, particularly in football associations. His works explore players’ movement
coordination and performance during competitive matches and training situations. He also studies
context manipulation for the development of players, particularly considering multidimensional
performance indicators.
vii

�����������������
Citation: Oftadeh, S.; Bahram, A.;
Yaali, R.; Ghadiri, F.; Schöllhorn, W.I.
External Focus or Differential
Learning: Is There an Additive Effect
on Learning a Futsal Goal Kick? Int.
J. Environ. Res. Public Health 2022, 19,
317. https://doi.org/10.3390/
ijerph19010317
Academic Editors: Bruno Gonçalves,
Jorge Bravo and Hugo Folgado
Received: 30 October 2021
Accepted: 24 December 2021
Published: 29 December 2021
Publisher’s Note: MDPI stays neutral
with regard to jurisdictional claims in
published maps and institutional affil-
iations.
Copyright: © 2021 by the authors.
Licensee MDPI, Basel, Switzerland.
This article is an open access article
distributed under the terms and
conditions of the Creative Commons
Attribution (CC BY) license (https://
creativecommons.org/licenses/by/
4.0/).
International Journal of
Environmental Research
and Public Health
Article
External Focus or Differential Learning: Is There an AdditiveEffect on Learning a Futsal Goal Kick?
Sara Oftadeh 1,*, Abbas Bahram 1, Rasoul Yaali 1 , Farhad Ghadiri 1 and Wolfgang I. Schöllhorn 2,*
1 Faculty of Physical Education and Sport Sciences, Kharazmi University of Tehran, Tehran 14155-6455, Iran;
[email protected] (A.B.); [email protected] (R.Y.); [email protected] (F.G.)2 Department for Training and Movement Science, Johannes Gutenberg-University Mainz,
55128 Mainz, Germany
* Correspondence: [email protected] (S.O.); [email protected] (W.I.S.)
Abstract: (1) Background: How to optimally promote the process of acquiring and learning a
new motor skill is still one of the fundamental questions often raised in training and movement
science, rehabilitation, and physical education. This study is aimed at investigating the effects of
differential learning (DL) and the elements of OPTIMAL theory on learning a goal-kicking skill in
futsal, especially under the conditions of external and internal foci. (2) Methods: A total of 40 female
beginners were randomly assigned to, and equally distributed among, five different interventions.
Within a pretest and post-test design, with retention and transfer tests, participants practiced for
12 weeks, involving two 20-min sessions per week. The tests involved a kicking skill test. Data
were analyzed with a one-way ANOVA. (3) Results: Statistically significant differences with large
effect sizes were found between differential learning (DL) with an external focus, DL with an internal
focus, DL with no focus, traditional training with an external focus, and traditional training with
control groups in the post-, retention, and transfer tests. (4) Conclusions: The results indicate the
clear advantages of DL. It is well worth putting further efforts into investigating a more differentiated
application of instructions combined with exercises for DL.
Keywords: differential learning; OPTIMAL theory; external focus; motor learning; futsal
1. Introduction
How to optimally promote the process of acquiring and learning a new motor skillmore effectively is still reckoned as one of the core questions in movement science, therapy,and training science [1]. Classically, the traditional approach to skill acquisition is basedon reductionist-atomistic thinking, accompanied by an excessive emphasis on cognitionsince the “cognitive turn” in the 1960s [2]. This is a way of thinking that is mainly basedon linear models, explicit verbalization, a lot of imitations, and the internalization ofknowledge about a correct prototype that is shown by a lot of repetition and correctiveinstructions to avoid making mistakes [3]. In the same context, learners are expectedto copy the role models of motor patterns [4], mostly derived from the averages of thebest athletes in their disciplines. To support the learners during this process, manual [5],mechanical [6–8], verbal [9], and visual [10] guidance is also suggested in the form ofaugmented feedback [11–13]. Following this traditional logic of a control loop with externalfeedback, the main theoretically assumed key factors influencing skill learning [14] wouldfirst need to be identified, and their interactions would need to be appropriately understoodby practitioners and coaches to establish a strong theoretical basis for an appropriatepedagogical approach [15].
More recently, the assumptions proposed for this traditional repetitive and model-oriented approach have been increasingly challenged by the upcoming system dynamicsand complexity theory in general [16], and football in particular [17]. From a practical
1
Int. J. Environ. Res. Public Health 2022, 19, 317
perspective, the repetitive approach became questioned. The process of acquiring more dif-ficult gross motor movements, in which all learners typically begin with the same exerciseand then progress to the final learning goal with the identical sequence of exercises, is in-creasingly being challenged. In this process, each exercise must be repeated until only smalldifferences are made apparent from the partial target model. When the purported targetmovement has been successfully achieved, the approach stagnates in the exclusive repe-tition of the movements, and only the hope for additional conditional progress providesfurther motivation. By reliably identifying individuals not only through their biome-chanical movement patterns [18,19], but also through a recognition of the emotions [20]and the fatigue phases [21] within an individual, as well as of individuality, even acrossdisciplines [22], the main premises of the traditional approach have been deconstructed.As a result, the question arises about the necessity of repetition and prototypes, sinceindividuals, situations, and ongoing changes must be dealt with. Given the extremely lowprobability of executing two identical movements [21,23,24], particularly during a futsalmatch or similar games with an infinite number of player constellations, traditional learningmethods rely primarily on repetitions to realize an ideal movement, and sustainability inerror corrections should be reconsidered [25].
Although differential learning (DL) theory is explicitly silent about psychologicalaspects and applies instructions with both internal (joint angles) [26] and external foci(variable targets) [27], as well as with a metaphoric (moving in animal styles) [28] focusin its experiments, DL is occasionally associated with the internal focus [29]. In the caseof learning a tennis forehand stroke [30], the focus should be on performing the forehandwith an extended elbow, and then with a flexed elbow, then stiff knees, and so on [31].In a volleyball experiment, the DL idea of increased noise was realized by means ofmoving similar various animals (metaphorically) that were creatively announced by eachserver [28]. To achieve maximum variety in field hockey, participants either changed theirbodily positions in response to some internally connected instructions, or they had tochange the target for which they were externally attempting [27]. Nonetheless, systematicinvestigations concerning the interdependencies of variable movements and the foci ofinstruction are missing.
A quite different and more recently suggested approach to support motor learninghas been developed with the OPTIMAL approach [32]. While the DL approach, in thebeginning, focused more on the variety of external stimuli that result from an interactionof active and passive forces, as well as on the conditions applied on the organization ofthe central nervous structures through variable movements via mechanoreceptors [16,33]before the increased fluctuations were adapted to an individual’s movement noise [26]the OPTIMAL approach is more rooted in sports psychology, as it addresses the specificmental aspects of movements, such as motivation and attention [34]. Lewthwaite and Wulfproposed the OPTIMAL theory of motor learning, involving two motivational variables(enhanced expectancies and support for autonomy) and an attention variable (e.g., the focusof external attention) affecting optimal performance. The enhanced expectancies, mainlyinitiated by corresponding instructions, refer to an increase in individual expectations forpositive experiences or success [34], while support for autonomy is said to be a conditionthat supports the need of people to be in control or to be autonomous over their actions [35].As for the attention variable, studies on the OPTIMAL theory indicate that having aninstructed external focus of attention on the intended movement effect (e.g., implementtrajectory, hitting the target, exerting force against the ground) typically results in moreeffective and efficient performances or learning, as compared with the internal focus onbody landmarks [36]. In fact, OPTIMAL theory predicts that an external focus of attentionis more beneficial for motor learning than an internal one [37].
Therefore, the general aim of this study was to evaluate the effects of the DL approachand the elements of the OPTIMAL theory on the goal-kicking performance in futsal, incomparison to a purely repetitive approach. More specifically, the hypotheses to be testedwere that the DL intervention would not only outperform the external-focus interven-
2

Int. J. Environ. Res. Public Health 2022, 19, 317
tion, but also that both interventions would have significantly larger effects compared torepetition-only learning, and, finally, that the combination of both interventions wouldoutperform the DL-only intervention, with or without an internal attentional focus [29,36].
2. Materials and Methods
2.1. Participants
A total of 40 school girls, aged 16 to 18 years and recruited from the city of Baghmalek,Khuzestan Province, Iran, voluntarily participated in this study, and were randomly as-signed to five equal groups with different instructions during the interventions: (a) DL withan external focus (DL/EF n = 8); (b) DL with an internal focus (DL/IF n = 8); (c) DL withouta specific focus (DL/C n = 8); (d) Traditional training with an external focus (T/EF n = 8);and (e) Traditional training without a specific focus (T/C n = 8). The inclusion criteriawere as follows: no history of formal futsal training, and no reported disease or injury. Theexclusion criterion is specified as follows: absenteeism in any of the training sessions. Thestudy was approved by the university’s Institutional Review Board, with the ethics code:“IR.KHU.REC.1399.04”. Using G-Power (version 3.1), the sample size was estimated at thesignificance level of 0.05, with a 0.80 statistical power, and an effect size of 0.6 (mediumto large effect size), using the statistical one-way ANOVA method [37,38]. Accordingly,40 people were assigned to five groups with different interventions.
The demographic information for all the groups is presented in Table 1. Specifically,the average age of all the participants was 16.97 ± 2.28 years, their mean body mass was58.62 ± 4.27 kg, and their mean body height was 159.36 ± 3.73 cm.
Table 1. Demographic characteristics of the five intervention groups.
VariableTotal
Mean ± SDDL/EF
Mean ± SDDL/IF
Mean ± SDDL/C
Mean ± SDT/EF
Mean ± SDT/C
Mean ± SD
Age (year) 16.97 ± 2.28 17.3 ± 2.27 17.07 ± 2.16 16.87 ± 2.11 16.79 ± 2.33 16.82 ± 2.53
Mass (kg) 58.62± 4.27 59.74 ± 4.09 58.83 ± 4.47 58.74 ± 3.96 58.4 ± 4.16 57.41 ± 4.67
Height (cm) 159.36 ± 3.73 159.28 ± 3.22 159.99 ± 3.92 158.33 ± 3.72 160.12 ± 4.09 159.11 ± 3.74
Number 40 8 8 8 8 8
Having chosen the participants according to the inclusion criteria, the consent formwas completed, and the COVID-19 protocols were observed for all the people who playeda role in the study, including the subjects, their parents, and the examiners. All the healthprotocols were applied to all of the individuals, according to the COVID-19 requirements.All procedures and measurements complied with the Declaration of Helsinki (54th Revision2008, Korea) regarding human subjects.
2.2. Design
A pretest and post-test design, with retention and transfer tests, was chosen for thisstudy. Then, a futsal shooting skill was evaluated as an example of learning a gross motorskill. The chronological schedule of the design is shown in Table 2. After the pretest, allthe subjects participated in a 12-week intervention period, with two 20-min sessions perweek. Ten minutes after the last intervention, a post-test was conducted. One week afterthe post-test, all the subjects participated in the retention and transfer tests.
3
Int. J. Environ. Res. Public Health 2022, 19, 317
Table 2. Study design.
Groups Pretest Training Post-Test Retention Test Transfer Test
DL/EFBefore the start of the
training period, a futsalshoot pretest had beentaken by all the groups.
12-week DL exercises (two20-min sessions per week)
with external focusTen minutes after the
end of the lasttraining session, thefutsal shooting test
was taken.
One week after thepost-test, all the
groups performed afutsal shooting test.
One week after thepost-test, the futsal
shoot transfer test (inthe presence of
spectators),immediately after the
retention test wasperformed.
DL/IF12-week DL exercises (two20-min sessions per week)
with internal focus
DL/C12-week DL exercises (two20-min sessions per week)
with no attention instruction
T/EF12-week traditional exercises
(two 20-min sessions perweek) with external focus
T/C
12-week traditional exercises(two 20-min sessions perweek) with no attention
instruction
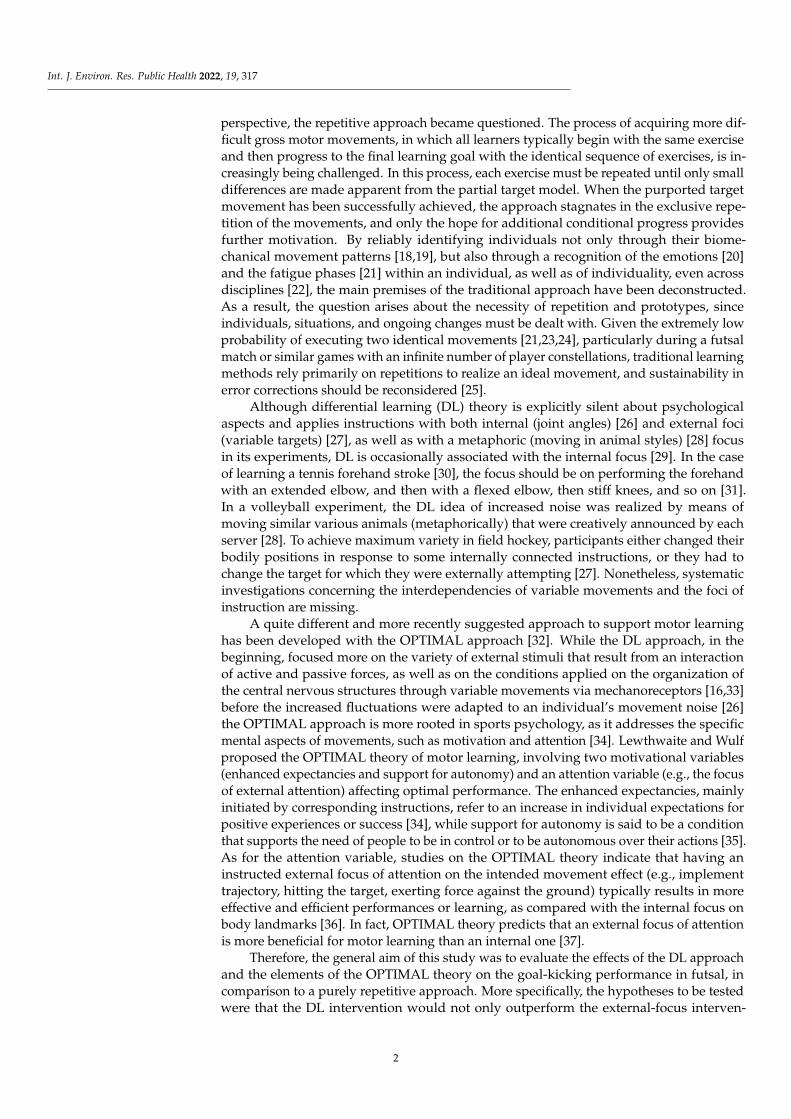
2.3. Tests
All tests and interventions were executed applying a standard futsal ball and a stan-dard futsal goal in a standard indoor futsal court.
In the goal-shooting test, participants had to shoot the ball from a 6-m line towardsthe goal, without a goalkeeper, in seven different situations, with each one repeated fivetimes. Overall, each participant performed 35 shooting movements in a blocked order(7 situations × 5 times = 35 trials). We used the average scores obtained in the 35 trials asthe final score of each person in the shooting test. The goal-shooting test was adopted fromSchöllhorn [26,39]. The seven different goal-shooting situations were as follows:
1. Five immobile futsal balls were shot towards the goal after a short approach fromPosition 1 (Figure 1);
2. Five futsal balls were shot towards the goal after 10 m of dribbling from Position 1(Figure 1);
3. Five futsal balls were shot towards the goal after 5 m of dribbling from Position 2(Figure 1);
4. Five futsal balls were shot towards the goal from Position 1 after a pass from the right(Figure 1);
5. Five futsal balls were shot towards the goal after 5 m of dribbling from Position 3(Figure 1);
6. Five futsal balls were shot towards the goal from Position 1 after a pass from the left(Figure 1);
7. Five futsal balls were shot towards the goal from Position 1 after crossing a 40-cmheight obstacle with a vertical jump (Figure 1).
Figure 1. Participant positions for goal-shooting.
4

Int. J. Environ. Res. Public Health 2022, 19, 317
The participants’ shooting positions, and the ways in which they scored their shots,are shown in Figure 1.
The precision of the shots was measured by dividing the goal into scoring zones. Thezones were chosen based on the likelihood that a goal would be scored in each one of them.Meanwhile, because of this, the regions that were more difficult to reach by a goalkeeperwere scored higher, and vice versa. Shots that closely missed the goal still scored 1 point(Figure 2) [39]. Additional spectators were asked to produce a more stressful environment,and to monitor the learned content for stability against psychological disturbances duringthe transfer test. According to the findings by Henz et al. [31,40], differential learningis accompanied by a downregulation of the frontal lobe that is associated with higherstress resistance, and it should consequently lead to better test performances in the DLintervention groups.
Figure 2. The goal-shooting test scores (Schöllhorn et al., 2012).
2.4. Interventions
The DL exercises are described in Table 3. Each exercise was assigned a number. Thenumbers were written on slips of paper and were all put in a box. The slips of paper withthe numbers were then randomly drawn from the box during each intervention session.The assigned exercises were then performed by the participants. Up to three of the exerciseslisted in Table 3 were combined.
5

Int. J. Environ. Res. Public Health 2022, 19, 317
Table 3. DL Exercises [41,42].
Standing position Smooth and vertical, bend forward and bend backward
Joint position The maximal fixed, the middle position, and the maximal stretched
Hand of the standing foot side Overhead, under the hip, in front, back, and lateral
Joint movement Flexion, extention, abduction, adduction, internal and external rotation
Standing foot Standing on toes, standing on heels, and standing on the whole feet
Shooting direction Shooting to the center, the left, the right, the center, the top, and the bottom
Movement velocity Slow, submaximal, and maximal
Hand of the shooting leg side Overhead, under the hip, in front, back, and lateral
Eyes Both eyes open, both eyes closed, left eye closed, and right eye closed
Foot position Left foot front, right foot front, and feet parallel
Ball Large, small, heavy, light balls, and other sports balls
Muscles Maximally tensed, activated, and relaxed
Depending on the focus of each group, the participants received the following instruc-tions, with respect to their focus of attention during the kicking movement. The specificinstructions were specified as follows:
DL/EF Practices: Firstly, the DL/EF practice group received verbal instructions for themovement to be executed according to the combinations chosen from Table 3, and secondly,they received a verbal instruction for the external focus, where they had to focus on a targetrelated to the area of the goal they intended to shoot at (e.g., shooting the ball with themiddle of the foot while focusing on the upper left corner of the goal).
DL/IF Practices: The DL/IF practice group received, firstly, verbal instructions for themovement that had to be executed according to the combinations chosen from Table 3, andsecondly, a verbal instruction for the internal focus, aimed at focusing on a body-relatedzone (e.g., shooting the ball with the midfoot, and focusing on the moment the foot hitsthe ball.)
DL/C Practices: The DL/C practice group received only verbal instructions for themovement that had to be executed according to the combinations chosen from Table 3 (e.g.,shooting the ball with the middle of the foot).
T/EF Practices: The T/EF practice group received a visual nonverbal demonstrationfor the most common futsal shooting pattern provided by the teacher. Then, the participantswere asked to follow the prototype pattern provided, with an additional instruction for anexternal focus of attention (e.g., shooting the ball with the toes and focusing on the upperleft corner of the goal).
T/C Practices: The T/C practice group only received a visual nonverbal demonstrationfor the most common futsal shooting pattern, provided by the teacher to compellingly beimitated (e.g., shooting at the goal with your toes).
All the practice sessions and instructions were administered by one of the authors ofthis article, who is also a futsal expert.
2.5. Statistical Analysis
The acquisition and learning rates were assessed using a one-way ANOVA test. Thevariables were tested to assess the normality (Shapiro–Wilk Test), homoscedasticity (Lev-ene’s test), and sphericity (Mauchly’s test) (p > 0.05). The effect sizes (r or η2) were alsoestimated for all of the comparisons [43], and they were comparatively classified as a smalleffect (r = 0.10 ~ d = 0.2 or η2 = 0.01), a medium effect (r = 0.25 ~ d = 0.5 or η2 = 0.06), or alarge effect ((r = 0.37 ~ d = 0.8 or η2 = 0.14) [44]. The level of significance was set to 0.05, andthe statistical analyses were conducted using SPSS 23.0 (IBM Corp., Armonk, NY, USA).
6

Int. J. Environ. Res. Public Health 2022, 19, 317
3. Results
The descriptive results obtained after all four tests were conducted on all five groupsare graphically displayed in Figure 3. Specifically, the highest acquisition rates wereachieved by the differential training groups. Within the DL groups, the group with an exter-nal focus achieved the highest scores in the post-test and in the retention and transfer tests.
η
η
Figure 3. Average scores and standard deviations of pre-, post-, retention and transfer test results for
the five intervention groups. DL/EF: differential learning with an external focus; DL/IF: differential
learning with an internal focus; DL/C: differential learning without a specific focus; T/EF: traditional
repetitive training with an external focus; T/C: traditional repetitive training without a specific focus.
* Major statistically significant differences between groups (in all tests, a significant difference was
observed between all groups).
The one-way ANOVA test showed that there was no difference between the subjectsin the pretest, but for the post-test, the data showed a statistically significant differencebetween the groups with a large effect size (F(35.4) = 698.55, p = 0.001, η2 = 0.98). Moreover,the results of the LSD post hoc test revealed a statistically significant difference between theDL/EF, DL/IF, and DL/C groups compared to the T/EF and T/C groups (p < 0.05; r > 0.83),with the external, internal, control differential, external, and control traditional groupsaccounting for the highest scores, followed by the control traditional group. Moreover, anANOVA of the retention test data indicated a statistically significant difference betweenthe groups (F(35.4) = 2104.9, p = 0.001, η2 = 0.99). The LSD post hoc test results show astatistically significant difference between the DL/EF, DL/IF, and DL/C groups and theT/EF and T/C groups (p < 0.05; r > 0.82), and the highest scores indicate the DL groupswith external and internal foci, as well as the control group with no focus instructions,followed by the traditionally repetitive external and control groups (Table 4).
7

Int. J. Environ. Res. Public Health 2022, 19, 317
Table 4. Fisher’s least significant differences (LSDs) of averages comparing changes in pre- and post-
retention and transfer tests. * Deemed to be statistically highly significant, as observed.
Prepost Test Preretention Test Pretransfer Test
(I) Group (J) GroupMean
Difference (I-J)SD
ES(r)
MeanDifference (I-J)
SDES(r)
MeanDifference (I-J)
SDES(r)
DL/EF
DL/IF 1.01 * 0.07 0.95 1.05 * 0.04 0.98 1.21 * 0.07 0.96
DL/C 2.02 * 0.07 0.98 2.06 * 0.04 0.99 2.44 * 0.07 0.99
T/EF 3.05 * 0.07 0.98 3.01 * 0.04 0.99 2.83 * 0.07 0.99
T/C 3.54 * 0.07 0.99 3.3 * 0.04 0.99 3.8 * 0.07 0.99
DL/IF
DL/C 1 * 0.07 0.99 1 * 0.04 0.99 1.23 * 0.07 0.97
T/EF 2.03 * 0.07 0.98 1.95 * 0.04 0.99 1.62 * 0.07 0.98
T/C 2.52 * 0.07 0.99 2.24 * 0.04 0.99 2.58 * 0.07 0.99
DL/CT/EF 1.02 * 0.07 0.95 0.95 * 0.04 0.98 0.38 * 0.07 0.74
T/C 1.52 * 0.07 0.99 1.23 * 0.04 0.99 1.35 * 0.07 0.98
T/EF T/C 0.49 * 0.07 0.83 0.28 * 0.04 0.82 0.96 * 0.07 0.96
The ANOVA of the transfer test revealed a statistically significant difference betweenthe groups (F(35.4) = 739.28, p = 0.001, η2 = 0.98). Furthermore, the LSD post hoc test resultsshow a statistically significant difference between the DL/EF, DL/IF, and DL/C groupsand the T/EF and T/C groups (p < 0.05; r > 0.74), and the highest scores related to theexternal, internal, control differential, external, and control traditional groups (Table 4).Most intriguingly, all the effect sizes were large in both the ANOVA and in all of the posthoc tests, on the basis of Cohen’s classification [44].
4. Discussion
The purpose of this study was to explore the distinguished effects of various forms ofthe differential learning approach [16], combined with elements of OPTIMAL theory [32],on learning the futsal goal-shooting skill. The statistical analysis revealed significantdifferences between the interventions DL/EF, DL/IF, DL/C, T/EF, and T/C training in thepost-, retention, and transfer tests. The present test results were consistent with previousresearch conducted on DL (e.g., [45–47]), which show the advantages of DL in comparisonto the rather repetitive approaches in the acquisition and learning phases. However, gendermust be kept in mind as a possible moderator, as other studies have examined students ofthe same age, but only male students.
A 12-week intervention was used in this study, as opposed to the 4-to-6-week inter-ventions used in earlier DL-related football studies [26,39]. Compared to repetition-basedtraining, it appears that the benefits of differential learning increase over time. This has alsobeen observed in research on tennis, with varying intervention durations, where the risingadvantage of DL increased over time [48–50]. As the intervention duration increases, the DLadvantages are mainly gained over traditional training in the acquisition phase, and theyremain for the learning phase. These results are also consistent with the assumption that, inthe DL approach, fluctuations in learning subsystems are advantageously used for learningby destabilizing the system to prepare a self-organized phase transition [45]. By amplifyingsuch fluctuations, the system can potentially experience new solutions, involving newcombinations of given activations [19]. As a result, a self-organizing process is initiated andexploited that stimulates the system to develop a new coordination strategy that typicallyresults in more effective or stable patterns of movement [45]. The amplified fluctuationsand intermittencies tend to increase the variances in other anatomical regions of the body,and lead to a highly unpredictable adaptation process [45]. The whole process finallycorresponds to the somehow unspecific formulated cybernetic law of requisite variety [51],or to the “bliss of abundance” [52,53]. The first was formulated with “only variety candestroy variety”, in general, as a law in cybernetics for the regulation of processes in nature
8
Int. J. Environ. Res. Public Health 2022, 19, 317
and can be observed impressively in this study and the studies connected with DL: Theadditional variation in exercise caused the initial large variation in the hit performance to“destroy” it, resulting in a greater hit performance. Gelfand and Latash [52,53] formulatedsomething similar, but more poetically, with the “bliss of abundance” as an alternativeview of movement variety that occurs even in repetitive motor learning processes, and thusplead for a rethinking of the traditional motor control theories that are mainly based onsingular solutions.
In contrast to traditional prototypical training, DL exercises encourage learners toactively perform movement errors (e.g., throwing to the left instead of forwarding), ratherthan avoid them [54]. Participants performed shooting to the left, to the right, upwards,and shooting straight. Errors are considered as neutral fluctuations (“you never know,what they are good for”) and are not only experienced to know what is correct, which wasalready included in contrast learning and would give the learner convergent guidance incontrast to divergent self-organization. In DL the fluctuations are essential elements for amore stable training of the neural nets involved.
Our findings are consistent with those of other researchers [55–57] who have examinedthe typology of attention focus, which, according to the OPTIMAL theory, suggests thatan external focus of attention results in increased learning skills when compared to aninternal focus of attention. Nevertheless, based on the results, the focus of external attentioncombined with DL, as in the DL/EF condition, resulted in a higher, statistically significantimprovement than the T/EF. These results provide an indication of the stronger influenceof the physically dominated variations of the DL approach, compared to the mentallysupportive traditional training method. Regarding the futsal goal-shooting transfer test,statistically, significant differences were observed between all five intervention groups.
A neurophysiological explanation for these phenomena would be appealing but has, sofar, been problematic. This is because the available EEG studies on both DL and external focialways refer to acute effects, but not to medium-term effects, after multiple interventions.This is complicated by the fact that the EEG studies on DL focus on the effects immediatelyafter a whole series of movements, whereas the studies on an external focus tend to focuson the EEG activation immediately before and during a single movement. The EEG studieson DL show an increase in power primarily in the frontal brain areas in the alpha andtheta frequency bands after the intervention [31,40] whereas a reduction in these frequencybands in the central brain areas is observed during external focus tasks [58]. A decreasein alpha power was also observed during a dart-throwing task with an external focus, incomparison to one with an internal focus [59], but, unfortunately, the theta band was notanalyzed, which is assumed to be of major interest for high-concentration tasks [60]. Thedegree to which these phenomena depend on the complexity of the movement task, theperformance level, or the age of the subjects requires further investigation [61,62]. Thesame applies to the question of the extent to which a decrease in the alpha frequenciesduring training leads to an increase in the alpha frequencies after training, or the extentto which a sustained increase during sleep leads to a permanent change. Nonetheless, thepractical interventions derived from OPTIMAL theory seem to be a complement to DL thatcould be of great interest when it comes to the absolute limits of performance.
The current study findings were based on two assumptions. First, that DL exerciseslead to detecting adaptive solutions through increased fluctuations in the individual, andthey appear to support learning ability [46]. Second, that DL exercise, using an optimalrelation of the internal and external noise frequencies [63], moves the brain to a morestress-resilient state by downregulating frontal lobe activation [31]. The participants in allthe DL-related groups were able to establish an adaptive response to the task modification,even though we included spectators in the test and created a more stressful environment.
Epistemologically, the applied statistics and methodology do not claim to be general-izable. Therefore, what is often interpreted as a limitation turns out, upon closer inspection,to be an aspect to be considered in future studies. One such aspect is related to the influenceof the sex of the subjects. While this study was conducted on pubescent girls, it would
9

Int. J. Environ. Res. Public Health 2022, 19, 317
be of interest to perform the same study with boys or adults. Moreover, in this research,long-term follow-ups were not conducted, which should be used in future research. Giventhat the present research was performed on beginners in a certain culture, future researchshould be performed on skilled individuals with different cultural backgrounds as well.In future research, other sports skills, including team behavior, should also be considered.In this study, the highly variable intervention method of differential learning, with as-sumingly chaotic characteristics, was used to teach a single futsal skill. In the search foroptimal variation structures, future studies should also differentiate gradual and chaoticdifferential learning approaches by adapting the noise of the exercises to the noise inherentto the learner to find the optimal stochastic resonance [49], as well as their interactionswith internal and external foci. Another interesting question is the influence of the testsequence. Future research would have to clarify to what extent the interventions havedifferent influences on blocked or random test orders.
5. Conclusions
Since all the DL interventions, whether with external or internal foci, showed betterperformance in the post-, retention, and transfer tests than all combinations of traditionaltraining with the foci, the results suggest the more beneficial influence of the DL train-ing method compared to the traditional training methods, and compared to the focusinterventions. Nonetheless, attentional foci seem to provide a kind of positive fine-tuningin addition to DL intervention. It would be of great interest to know what additionalinfluences the other aspects of OPTIMAL theory have in connection with DL, or whetherthese are possibly formed and promoted precisely by DL.
The DL and the OPTIMAL approaches are both still in the beginning stages of theirresearch course development. Thus, what has been obtained from the present study can beadded as further evidence to the body of theoretical basics in these theories. To enhanceand create more effective exercises for the acquisition of motor skills, research findingsshould be made available to instructional and learning designers [64].
Author Contributions: Conceptualization, S.O., A.B., R.Y. and F.G.; methodology, S.O., A.B., R.Y.,
F.G. and W.I.S.; formal analysis, S.O.; validation, S.O., A.B., R.Y., F.G. and W.I.S., investigation, S.O.;
resources, S.O.; data curation, S.O.; writing—original draft preparation, S.O.; writing—review and
editing, S.O., A.B., R.Y., F.G. and W.I.S.; visualization, S.O., A.B., R.Y., F.G. and W.I.S.; supervision,
R.Y.; project administration, S.O. All authors have read and agreed to the published version of
the manuscript.
Funding: This research received no external funding.
Institutional Review Board Statement: The study was conducted according to the guidelines of the
Declaration of Helsinki and approved by the Institutional Review Board of Kharazmi University,
Teheran, Iran, with the ethics code of “IR.KHU.REC.1399.04”.
Informed Consent Statement: Written informed consent was obtained from all the parents of the
participants involved in the study.
Data Availability Statement: The data that support the findings of this study are available from the
corresponding author, S.O., upon reasonable request.
Acknowledgments: This paper is based on a research project that was conducted by the spiritual
aids of research affairs at the Kharazmi University of Tehran.
Conflicts of Interest: The authors declare no conflict of interest.
References
1. Schöllhorn, W.I. Individualität-ein vernachlässigter Parameter. Leistungssport 1999, 29, 7–11.
2. Miller, G.A.; Galanter, E.; Pribram, K.H. Plans and the Structure of Behavior; Holt, Rhinehart, & Winston: New York, NY, USA, 1960.
3. Abernethy, B.; Maxwell, J.P.; Masters, R.S.; Van Der Kamp, J.; Jackson, R.C. Attentional Processes in Skill Learning and ExpertPerformance. In Handbook of Sport Psychology, 3rd ed.; John Wiley & Sons, Inc.: Hoboken, NJ, USA, 2007; pp. 245–263.
10
Int. J. Environ. Res. Public Health 2022, 19, 317
4. Farrow, D.; Reid, M. The effect of equipment scaling on the skill acquisition of beginning tennis players. J. Sports Sci. 2010, 28,
723–732. [CrossRef]
5. Ludgate, K.E. The effect of manual guidance upon maze learning. Psychol. Monogr. 1923, 33. [CrossRef]
6. Koch, H.L. The influence of mechanical guidance upon maze learning. Psychol. Monogr. 1923, 32. [CrossRef]
7. Mendoza, L.; Schöllhorn, W.I. Training of the sprint start technique with biomechanical feedback. J. Sports Sci. 1993, 11, 25–29.
[CrossRef] [PubMed]
8. Gray, R. Comparing the constraints led approach, differential learning and prescriptive instruction for training opposite-field
hitting in baseball. Psychol. Sport Exerc. 2020, 51, 101797. [CrossRef]
9. Wang, T.L. The influence of tuition in the acquisition of skill. Psychol. Monogr. 1925, 34, 51. [CrossRef]
10. Melcher, R.T. Children’s Motor Learning with and without Vision. Child. Dev. 1934, 5, 315–350. [CrossRef]
11. Von Wright, J.M. A Note on Role of ‘Guidance’ in Learning. Br. J. Psychol. 1957, 48, 133–137. [CrossRef] [PubMed]
12. Holding, D.H.; Macrae, A.W. Guidance, Restriction and Knowledge of Results. Ergonomics 1964, 7, 289–295. [CrossRef]
13. Adams, J.A. Historical review and appraisal of research on the learning, retention, and transfer of human motor skills. Psychol.Bull. 1987, 101, 41–74. [CrossRef]
14. Newell, K.M. Physical Education in Higher Education: Chaos Out of Order. Quest 1990, 42, 227–242. [CrossRef]
15. Lee, M.C.Y.; Chow, J.Y.; Komar, J.; Tan, C.W.K.; Button, C. Nonlinear Pedagogy: An Effective Approach to Cater for Individual
Differences in Learning a Sports Skill. PLoS ONE 2014, 9, e104744. [CrossRef] [PubMed]
16. Schöllhorn, W.I. Practical consequences of systems dynamic approach to technique and strength training. Acta Acad. Olymp. Est.2000, 8, 25–37.
17. Williams, A.M.; Hodges, N.J. Practice, instruction, and skill acquisition in soccer: Challenging tradition. J. Sports Sci. 2005, 23,
637–650. [CrossRef]
18. Schöllhorn, W.I.; Bauer, H.U. Identifying Individual Movement Styles in High Performance Sports by Means of Self-Organizing
Kohonen Maps. In Proceedings of the XVI International Symposium on Biomechanics in Sports, Konstanz, Germany, 21–25 July
1998; pp. 574–577.
19. Schöllhorn, W.I.; Nigg, B.M.; Stefanyshyn, D.J.; Liu, W. Identification of individual walking patterns using time discrete and time
continuous data sets. Gait Posture 2002, 15, 180–186. [CrossRef]
20. Janssen, D.; Schöllhorn, W.I.; Lubienetzki, J.; Fölling, K.; Kokenge, H.; Davids, K. Recognition of Emotions in Gait Patterns by
Means of Artificial Neural Nets. J. Nonverb. Behav. 2008, 32, 79–92. [CrossRef]
21. Burdack, J.; Horst, F.; Aragonés, D.; Eekhoff, A.; Schöllhorn, W.I. Fatigue-Related and Timescale-Dependent Changes in Individual
Movement Patterns Identified Using Support Vector Machine. Front. Psychol. 2020, 11, 2273. [CrossRef]
22. Horst, F.; Janssen, D.; Beckmann, H.; Schöllhorn, W.I. Can Individual Movement Characteristics Across Different Throwing
Disciplines Be Identified in High-Performance Decathletes? Front. Psychol. 2020, 11, 2262. [CrossRef]
23. Bernstein, N.A. The Co-Ordination and Regulation of Movements; PergamonPress Ltd.: Oxford, UK, 1967.
24. Hatze, H. Motion Variability—its Definition, Quantification, and Origin. J. Mot. Behav. 1986, 18, 5–16. [CrossRef]
25. Schöllhorn, W.I.; Michelbrink, M.; Welminsiki, D.; Davids, K. Increasing stochastic perturbations enhances acquisition and
learning of complex sport movements. In Perspectives on Cognition and Action in Sport; Raab, M., Araujo, D., Ripoll, H., Eds.; Nova
Science Publishers: Hauppauge, NY, USA, 2009; pp. 59–73.
26. Schöllhorn, W.I.; Beckmann, H.; Michelbrink, M.; Sechelmann, M.; Trockel, M.; Davids, K. Does Noise Provide a Basis for the
Unification of Motor Learning Theories? Int. J. Sport Psychol. 2006, 37, 186–206.
27. Beckmann, H.; Winkel, C.; Schöllhorn, W.I. Optimal range of variation in hockey technique training. Int. J. Sport Psychol. 2010, 41,
5–45.
28. Römer, J.; Schöllhorn, W.I.; Jaitner, T.; Preiss, R. Differenzielles lernen im Volleyball. Sportunterricht 2009, 58, 41–45.
29. Serrien, B.; Tassignon, B.; Baeyens, J.-P.; Clijsen, R. A critical review on the theoretical framework of differential motor learning
and meta-analytic review on the empirical evidence of differential motor learning. SportRxiv 2018. [CrossRef]
30. Schöllhorn, W.I.; Humpert, V.; Oelenberg, M.; Michelbrink, M.; Beckmann, H. Differenzielles und mentales Training im Tennis.
Leistungssport 2008, 38, 10–14.
31. Henz, D.; John, A.; Merz, C.; Schöllhorn, W.I. Post-task effects on EEG brain activity differ for various differential learning and
contextual interference protocols. Front. Hum. Neurosci. 2018, 12, 19. [CrossRef] [PubMed]
32. Wulf, G.; Lewthwaite, R. Optimizing performance through intrinsic motivation and attention for learning: The OPTIMAL theory
of motor learning. Psychon. Bull. Rev. 2016, 23, 1382–1414. [CrossRef] [PubMed]
33. Bauer, H.U.; Schöllhorn, W.I. Self-Organizing Maps for the Analysis of Complex Movement Patterns. Neural Process. Lett. 1997, 5,
193–199. [CrossRef]
34. Lewthwaite, R.; Wulf, G. Optimizing motivation and attention for motor performance and learning. Curr. Opin. Psychol. 2017, 16,
38–42. [CrossRef] [PubMed]
35. Elias, L.J.; Bryden, M.P.; Bulman-Fleming, M.B. Footedness is a better predictor than is handedness of emotional lateralization.
Neuropsychologia 1998, 36, 37–43. [CrossRef]
36. Chua, L.K.; Wulf, G.; Lewthwaite, R. Onward and upward: Optimizing motor performance. Hum. Mov. Sci. 2018, 60, 107–114.
[CrossRef] [PubMed]
11

Int. J. Environ. Res. Public Health 2022, 19, 317
37. An, J.; Wulf, G.; Kim, S. Increased carry distance and X-factor stretch in golf through an external focus of attention. J. Motor. LearnDev. 2013, 1, 2–11. [CrossRef]
38. Schöllhorn, W.I.; Sechelmann, M.; Trockel, M.; Westers, R. Nie das Richtige trainieren, um richtig zu spielen. Leistungssport 2004,
5, 13–17.
39. Schöllhorn, W.I.; Hegen, P.; Davids, K. The nonlinear nature of learning-A differential learning approach. Open Sports Sci. J. 2012,
5, 100–112. [CrossRef]
40. Henz, D.; Schöllhorn, W.I. Differential training facilitates early consolidation in motor learning. Front. Behav. Neurosci. 2016,
10, 199. [CrossRef]
41. Wagner, H. Optimierung Komplexer Bewegungsmuster Bei Wurfbewegungen; Meyer & Meyer: Osnabrück, Germany, 2005.
42. Wagner, H.; Müller, E. The effects of differential and variable training on the quality parameters of a handball throw. SportsBiomech. 2008, 7, 54–71. [CrossRef]
43. Field, A. Discovering Statistics Using SPSS; Sage Publications: Thousand Oaks, CA, USA, 2009.
44. Cohen, J. Statistical Power Analysis in the Behavioral, 2nd ed.; Lawrence Erlbaum Associates: Hillsdale, NJ, USA, 1988; pp. 18–74.
45. Bozkurt, S. The Effects of Differential Learning and Traditional Learning Trainings on Technical Development of Football Players.
Educ. Train. 2018, 6, 25–29. [CrossRef]
46. Yaali, R.; Faezi, G.; Oftadeh, S. The effect of type practice of Differential Learning and Contextual Interference on the Retention
and Transfer of Badminton backhand short serve. J. Res. Sports Manag. Mot. Behav. 2010. Available online: https://jrsm.khu.ac.ir/
article-1-2935-fa.html (accessed on 7 October 2021). (In Persian)
47. Tassignon, B.; Verschueren, J.; Baeyens, J.P.; Benjaminse, A.; Gokeler, A.; Serrien, B.; Clijsen, R. An Exploratory Meta-Analytic
Review on the Empirical Evidence of Differential Learning as an Enhanced Motor Learning Method. Front. Psych. 2021, 12, 1186.
[CrossRef]
48. Schöllhorn, W.I.; Oelenberg, M.; Michelbrink, M. Can Mental Training Enhance the Learning Effect After Differencial Training? A
Tennis Serve Task. In Proceedings of the 12th European Congress of Sport Psychology, Kallithea, Halkidiki, Greece, 4–9 September
2007; p. 241.
49. Schöllhorn, W.I.; Mayer-Kress, G.; Newell, K.; Michelbrink, M. Time scales of adaptive behavior and motor learning in the
presence of stochastic perturbations. Hum. Mov. Sci. 2009, 28, 319–333. [CrossRef]
50. Yildirim, Y.; Kizilet, A. The Effects of Differential Learning Method on the Tennis Ground Stroke Accuracy and Mobility. Educ.Learn. 2020, 9, 146–154. [CrossRef]
51. Ashby, W.R. An Introduction to Cybernetics; Chapman & Hall Ltd.: London, UK, 1961.
52. Gelfand, I.M.; Latash, M.L. On the problem of adequate language in motor control. Mot. Contr. 1998, 2, 306–313. [CrossRef]
[PubMed]
53. Latash, M.L. The bliss (not the problem) of motor abundance (not redundancy). Exp. Brain Res. 2012, 217, 1–5. [CrossRef]
54. Frank, T.D.; Michelbrink, M.; Beckmann, H.; Schöllhorn, W.I. A quantitative dynamical systems approach to differential learning:
Self-organization principle and order parameter equations. Biol. Cybern. 2008, 98, 19–31. [CrossRef]
55. Lohse, K.R.; Sherwood, D.E.; Healy, A.F. How changing the focus of attention affects performance, kinematics, and electromyog-
raphy in dart throwing. Hum. Mov. Sci. 2010, 29, 542–555. [CrossRef]
56. Wulf, G.; Chiviacowsky, S.; Drews, R. External focus and autonomy support: Two important factors in motor learning have
additive benefits. Hum. Mov. Sci. 2015, 40, 176–184. [CrossRef]
57. Simpson, T.; Cronin, L.; Ellison, P.; Carnegie, E.; Marchant, D. A test of optimal theory on young adolescents’ standing long jump
performance and motivation. Hum. Mov. Sci. 2020, 72, 102651. [CrossRef]
58. Magosso, E.; De Crescenzio, F.; Ricci, G.; Piastra, S.; Ursino, M. EEG alpha power is modulated by attentional changes during
cognitive tasks and virtual reality immersion. Comput. Intell. Neurosci. 2019, 2019, 7051079. [CrossRef]
59. Hatami, F.; Tahmasbi, F.; Hadi, H. The effect of internal and external focus of attention on EEG changes in darts throwing skill.
Neuropsychology 2018, 3, 115–130.
60. Sauseng, P.; Klimesch, W.; Schabus, M.; Doppelmayr, M. Fronto-parietal EEG coherence in theta and upper alpha reflect central
executive functions of working memory. Int. J. Psychophysiol. 2005, 57, 97–103. [CrossRef] [PubMed]
61. Ray, W.J.; Cole, H.W. EEG alpha activity reflects attentional demands, and beta activity reflects emotional and cognitive processes.
Science 1985, 228, 750–752. [CrossRef] [PubMed]
62. Perkins-Ceccato, N.; Passmore, S.R.; Lee, T.D. Effects of focus of attention depend on golfers’ skill. J. Sports Sci. 2003, 21, 593–600.
[CrossRef]
63. John, A.; Schöllhorn, W.I. Acute effects of instructed and self-created variable rope skipping on EEG brain activity and heart rate
variability. Front. Behav. Neurosci. 2018, 12, 311. [CrossRef]
64. Conole, G.; Fill, K. A learning design toolkit to create pedagogically effective learning activities. J. Interact. Media Educ. 2005, 1.
[CrossRef]
12
International Journal of
Environmental Research
and Public Health
Article
How the Number of Players and Floaters’ Positioning Changesthe Offensive Performance during Futsal Small-Sided andConditioned Games
David Pizarro 1,*, Alba Práxedes 1 , Bruno Travassos 2,3 , Bruno Gonçalves 3,4,5 and Alberto Moreno 6
�����������������
Citation: Pizarro, D.; Práxedes, A.;
Travassos, B.; Gonçalves, B.; Moreno,
A. How the Number of Players and
Floaters’ Positioning Changes the
Offensive Performance during Futsal
Small-Sided and Conditioned Games.
Int. J. Environ. Res. Public Health 2021,
18, 7557. https://doi.org/10.3390/
ijerph18147557
Academic Editor: Jorge Pérez-Gómez
Received: 15 June 2021
Accepted: 14 July 2021
Published: 15 July 2021
Publisher’s Note: MDPI stays neutral
with regard to jurisdictional claims in
published maps and institutional affil-
iations.
Copyright: © 2021 by the authors.
Licensee MDPI, Basel, Switzerland.
This article is an open access article
distributed under the terms and
conditions of the Creative Commons
Attribution (CC BY) license (https://
creativecommons.org/licenses/by/
4.0/).
1 Faculty of Life Sciences and Nature, University of Nebrija, 28015 Madrid, Spain; [email protected] Research Center in Sport Sciences, Health and Human Development (CIDESD), Department of Sport Sciences,
University of Beira Interior, 6201-001 Covilhã, Portugal; [email protected] Portugal Football School, Portuguese Football Federation, 5001-801 Oeiras, Portugal; [email protected] Departamento de Desporto e Saúde, Escola de Saúde e Desenvolvimento Humano, Universidade de Évora,
7004-516 Évora, Portugal5 Comprehensive Health Research Centre (CHRC), Universidade de Évora, 7004-516 Évora, Portugal6 Faculty of Sport Sciences, University of Extremadura, 06006 Cáceres, Spain; [email protected]
* Correspondence: [email protected]
Abstract: This study aims to analyse the effects of floater positioning within futsal Gk + 3vs3 + Gk
and Gk + 2vs2 + Gk small-sided and conditioned games (SSCG) on youth offensive performance
on an action per minute per player basis. Three experimental conditions were carried out through
the manipulation of floater positioning: floaters off (FO), final line floaters (FLF) and lateral floaters
(LF). Thirty male futsal players (U19 age category) participated in the study and played once within
each situation in a random order on different days. Offensive performance based on “action per
minute per player” was analysed through indirect and external systematic observation. Results
showed significant differences between both SSCGs (2vs2 and 3vs3). Specifically, according to the
game principles analysed, 3vs3 is associated with higher values of passing and dribbling action to
progress towards the goal without beating a defensive line (moderate to large effect size), while
2vs2 is associated with higher values of passing and dribbling actions that beating a defensive line
(moderate to very large effect size). In addition, 2vs2 is associated with dribbling and shooting actions
to shoot at goal with the lowest level of opposition (moderate effect size). Indeed, whilst the 2vs2
game format seems to promote more 1vs1 situations, the 3vs3 game format encourages more ball
possession and collective tactical behaviours. Thus, training tasks intended to improve dribbling and
shooting actions should use a smaller number of players whereas tasks intended to improve passing
actions for ball possession should include a higher number of players with or without floaters. It
seems that the number of players can influence the tactical behaviour of the team. These findings
should be considered for the design of futsal training tasks, according to the main objective of the
training session. For example, if the coach aims to promote the number of dribbles and shots within
a SSCG, 2vs2 SSCG situations should be prioritised.
Keywords: ecological dynamics; training tasks; technical–tactical training; game principles
1. Introduction
In team sports such as futsal, in which open motor skills predominate, it is requiredthat players continuously co-adapt their actions such as positioning, passes, dribbles,or shots to the movements of opponents, teammates, and the surrounding environment,leading to the emergence of opportunities for action [1–3] and to ensure functional collectivebehaviour [4–6]. In the last few decades, based on the ecological dynamics approach,non-linear pedagogy has emerged as a new teaching–learning perspective to promote aholistic approach that highlights the need to maintain the perception–action couple onthe design of practice tasks [5]. For example, manipulating small-sided and conditioned
13

Int. J. Environ. Res. Public Health 2021, 18, 7557
games (SSCG), coaches can highlight the actions and the information that will supportplayers’ performance. SSCG (commonly used modified games that take place in tightspaces, involving small numbers of players and with modified rules) are modified gamesthat optimize the physical, physiological, technical, and tactical demands of sports insteadof replicating a real match [7]. However, the advantages of playing SSCG are dependenton the task’s goals and design [8] that guides players to explore the functional behavioursof each task according to the coaches’ primary purposes [9].
The manipulation of task constraints in SSCG seems to be an effective approach to skillacquisition [10] that allows coaches to optimize specific offensive or defensive behavioursof players by breaking the game into specific game subunits, i.e., Gk + 1vs1 + Gk untilGk + 3vs3 + Gk [11]. This is likely to maintain the perceptual-motor demands of the matchand the spatial-temporal relations between teammates and opponents, instead of replicatingthe technical and tactical demands of sports [7]. Indeed, coaches should go from simplifiedunits with a low number of players to highlight the informational constraints that promotethe development of offensive or defensive foundations of players to more complex unitsuntil the numerical relation of the game to develop the game principles and strategicrequirements that support collective behaviour of teams according to the perceptual andaction demands of competition [11].
Previous studies have attempted to provide a broader comprehension of the im-pact of altering SSCG characteristics (task constraints), such as the number of playersper team [12,13], the court size [1], number of targets [14] or even the manipulation of thenumerical relation between teams using floaters (jokers in other studies) [15–21]. Inter-estingly, one of the task constraints that have been studied recently is the accomplishingof tactical principles of attack performance [22]. These are referred to as keep possession,progress towards the goal (with or without beating a defensive line), or shoot at goal withthe lowest level of opposition [23]. For example, regarding the manipulation of floaters,previous studies suggested that the use of on-field floaters increased players’ decision-making efficiency due to their distribution over the breadth of the field [24]. Moreover,on-field floaters might have afforded more opportunities for passing the ball, allowing theteam to maintain ball possession [15]. Hence, manipulation of the relevant task constraints(e.g., presence of floaters and their positioning) for each goal can guide players to explorethe environment of play, improving their tactical and creative behaviour [25].
The effects of such manipulations to design appropriate learning environments thathelp players’ development of adaptative technical–tactical behaviours to changes in thegame environment [8] must be well understood by coaches, particularly in futsal. Thisperspective explains the interest of researchers and practitioners in this topic and thegrowing number of studies over the last few years [7,26,27]. However, no informationexists regarding the technical–tactical changes promoted by the manipulation of the numberof players and floater positioning. Thus, the main purpose of this study was to analysethe manipulation on the number of players (Gk + 3vs3 + Gk and Gk + 2vs2 + Gk) andfloater positioning on youth players’ technical–tactical offensive actions according togame principles.
2. Materials and Methods
2.1. Participants
Thirty male futsal players from the under-19 (U19) category (age, M = 17.714 andSD = 0.713) of four different Spanish clubs agreed to participate in this study. All theparticipants had the same level of expertise (i.e., average skill level) and participated in thesame competition (the first regional league). All teams had the same amount of training(i.e., players perform two training sessions of 60 min per week with an official match playedon weekends).
14

Int. J. Environ. Res. Public Health 2021, 18, 7557
2.2. Design and Procedures
The study designed consisted of an independent measure approach under threeexperimental conditions (three SSCG) that manipulated the floater positioning. TheseSSCG (Gk + 3vs3 + Gk; Gk + 2vs2 + Gk) were designed using the presence and absence of“Floaters” (2 Floaters; one per team) as key task constraints: (a) “Floaters Off” (FO); (b) “Fi-nal Line Floaters” (FLF) (associated with the 3-1 offensive system) and (c) “Lateral Floaters”(LF) (associated with the 4-0 offensive system). In 3vs3 situations, tests were conducted ona 30 m long by 15 m wide field. In 2vs2 situations, tests were conducted on a 20 m long by10 m wide field (see Figure 1). These measures respected the player-space ratio used byfutsal players according to the maximum length and width dimensions (40 m × 20 m) ofthe real game (for each team player, 10 m large and 5 m regular, excluding goalkeepers).
Figure 1. 3vs3 and 2vs2 experimental conditions. (a) FO: Floaters Off; (b) FLF: Final Line Floaters;
(c) LF: Lateral Floaters.
Players were randomly distributed into five groups of six individuals for 3vs3 SSCG(G1 to G5); seven groups of four individuals for 2vs2 SSCG (G1 to G7, two players wererandomly excluded for 2vs2; goalkeepers and floaters with goalkeepers and floaters nomeasurements were taken). All participants played once in each situation in randomorder and on a different day. Each 3vs3 testing had the following organization: warm-up(12′) + SSCG of 12′: 3′-1′-3′-1′-3′-1′ (3′ period = playing; 1′ period = resting); and 2vs2 test-ing: warm-up (10′) + SSCG of 10′: 2′-1′-2′-1′-2′-1′ (2′ period = playing; 1′ period = resting).During the rest intervals between bouts, players could drink water.
Game situations were explained, and participants were asked to play at their bestlevel to succeed in the SSCG (score in the opposite goal). Coaches and experimenters didnot provide any verbal feedback during the SSCG. Floater players were only allowed toperform offensive actions, with a maximum of two touches, and their actions were limitedto the space between two marks parallel to each line (side or final) and could not score agoal. In addition, goalkeepers could not leave the goal line, and a throw-in was grantedafter the ball crossed the lines delimiting the floaters’ area. During the test, players wereasked not to go inside the floaters’ area and balls were placed around the field to allowa quick restart of the game if the ball went out of play. In between bouts, players wereallowed to drink water.
2.3. Data Collection
All game actions within SSCGs were recorded using a video camera, recording angleconversion lens (×0.75): VCL-HGA07B and a Hama Gamma tripod Series. The camerawas placed in the corner of the playing field, at the height of 4 m, guaranteeing an optimalview of all the game actions (see Figure 2). Videos were transferred to a computer (AcerAspire E15). Subsequently, data were recorded on a Microsoft Office Excel 2010 sheet andexported to SPSS Inc., Released 2009 (PASW Statistics for Windows, Version 18.0, Page: 4
15

Int. J. Environ. Res. Public Health 2021, 18, 7557
SPSS Inc., Chicago, IL, USA). Offensive performance measured as “action per minute perplayer” was analysed through indirect and external systematic observation, a methodologyused in previous studies to measure players’ behaviour in real game situations [28].
Figure 2. Pitch size and camera positioning.
Two external researchers conducted the observations. As a preparatory stage to theobservations, the expert met with the observer to clarify possible doubts about the ob-servation instrument and the coding criteria of the dependent variable on the actionsmentioned. Then, the observations were carried out using more than 10% of the sam-ple (n = xxx) [29]. Interobserver reliability was calculated using the following formula:agreements/(agreements + disagreements) × 100. Once this value was calculated, theCohen kappa index was used. Values above 0.90 were obtained for all training sessions,surpassing the value of 0.81 from which adequate concordance is considered [30], thusachieving the necessary reliability for the subsequent coding of the dependent variables.To guarantee the time reliability of the measurement, the same coding was performed attwo different moments, with a time difference of 10 days. Cohen kappa values were foundto be higher than 0.92, which reflected a reliable concordance.
All the passing, dribbling, and shooting actions of each player in the team wereanalysed according to the following game principles: 1st principle—to keep possession(BP) (for passing and dribbling, when the action was developed horizontally or backwards);2nd A principle—to progress towards the goal without beating a defensive line (P) (forpassing and dribbling, when the action developed was forward, not beating a defensiveline); 2nd B principle—to progress towards the goal beating a defensive line (PDL) (forpassing and dribbling, when the action developed was forward, beating a defensive line);3rd principle—to shoot at goal with the lowest level of opposition (S) (for passing anddribbling, when the action ended at the first touch after it, regardless of its direction; andfor any shooting action).
2.4. Statistical Analysis
The statistical analysis was completed using The Jamovi Project (Jamovi). A descrip-tive analysis is presented on Table 1, with mean and standard deviation (Mean ± SD).An independent sample t-test was performed to identify differences in considered vari-ables between the game formats 2vs2 vs. 3vs3. Statistical significance was set at p < 0.05.Additionally, to overcome the shortcomings associated with traditional N-P null hypothe-sis significance testing, the standardized Cohen’s d, with 95% confidence intervals wereused as the effect size (ES) of the differences [31–33]. Thresholds for effect size statisticswere: 0.0–0.19, trivial; 0.20–0.59, small; 0.6–1.19, moderate; 1.2–1.99, large; and ≥2.0, verylarge [33].
16
Int. J. Environ. Res. Public Health 2021, 18, 7557
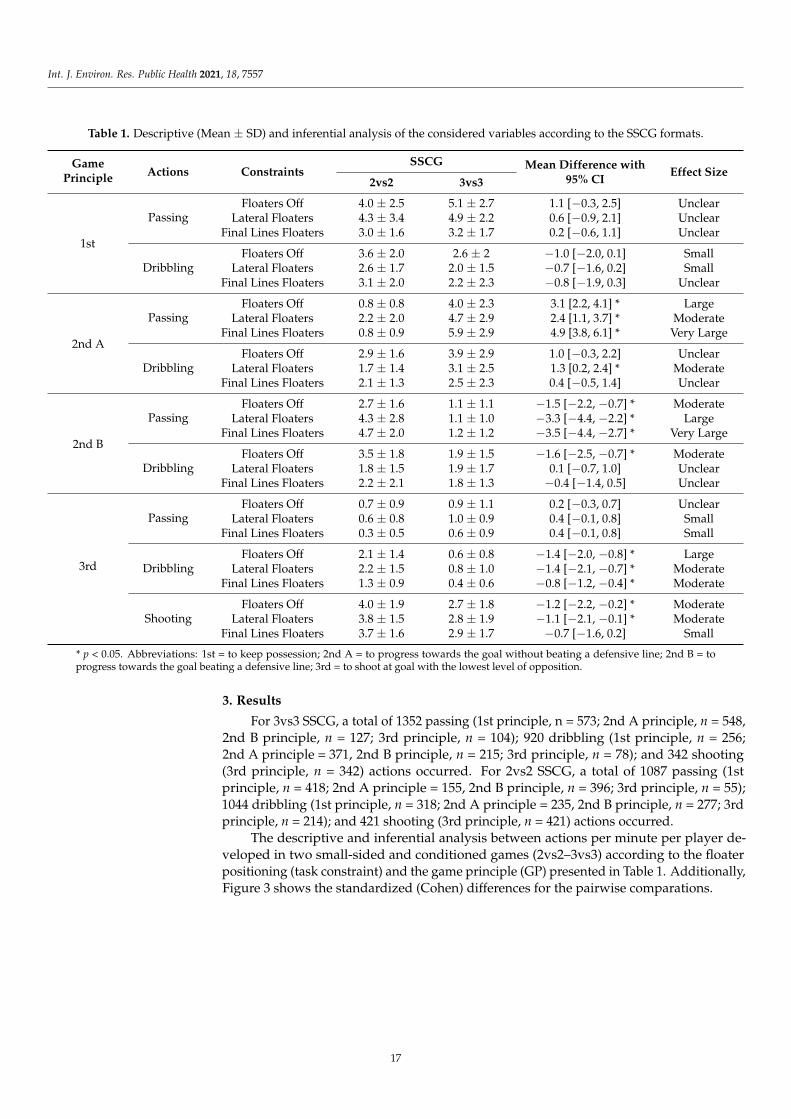
Table 1. Descriptive (Mean ± SD) and inferential analysis of the considered variables according to the SSCG formats.
GamePrinciple
Actions ConstraintsSSCG Mean Difference with
95% CIEffect Size
2vs2 3vs3
1st
PassingFloaters Off 4.0 ± 2.5 5.1 ± 2.7 1.1 [−0.3, 2.5] Unclear
Lateral Floaters 4.3 ± 3.4 4.9 ± 2.2 0.6 [−0.9, 2.1] UnclearFinal Lines Floaters 3.0 ± 1.6 3.2 ± 1.7 0.2 [−0.6, 1.1] Unclear
DribblingFloaters Off 3.6 ± 2.0 2.6 ± 2 −1.0 [−2.0, 0.1] Small
Lateral Floaters 2.6 ± 1.7 2.0 ± 1.5 −0.7 [−1.6, 0.2] SmallFinal Lines Floaters 3.1 ± 2.0 2.2 ± 2.3 −0.8 [−1.9, 0.3] Unclear
2nd A
PassingFloaters Off 0.8 ± 0.8 4.0 ± 2.3 3.1 [2.2, 4.1] * Large
Lateral Floaters 2.2 ± 2.0 4.7 ± 2.9 2.4 [1.1, 3.7] * ModerateFinal Lines Floaters 0.8 ± 0.9 5.9 ± 2.9 4.9 [3.8, 6.1] * Very Large
DribblingFloaters Off 2.9 ± 1.6 3.9 ± 2.9 1.0 [−0.3, 2.2] Unclear
Lateral Floaters 1.7 ± 1.4 3.1 ± 2.5 1.3 [0.2, 2.4] * ModerateFinal Lines Floaters 2.1 ± 1.3 2.5 ± 2.3 0.4 [−0.5, 1.4] Unclear
2nd B
PassingFloaters Off 2.7 ± 1.6 1.1 ± 1.1 −1.5 [−2.2, −0.7] * Moderate
Lateral Floaters 4.3 ± 2.8 1.1 ± 1.0 −3.3 [−4.4, −2.2] * LargeFinal Lines Floaters 4.7 ± 2.0 1.2 ± 1.2 −3.5 [−4.4, −2.7] * Very Large
DribblingFloaters Off 3.5 ± 1.8 1.9 ± 1.5 −1.6 [−2.5, −0.7] * Moderate
Lateral Floaters 1.8 ± 1.5 1.9 ± 1.7 0.1 [−0.7, 1.0] UnclearFinal Lines Floaters 2.2 ± 2.1 1.8 ± 1.3 −0.4 [−1.4, 0.5] Unclear
3rd
PassingFloaters Off 0.7 ± 0.9 0.9 ± 1.1 0.2 [−0.3, 0.7] Unclear
Lateral Floaters 0.6 ± 0.8 1.0 ± 0.9 0.4 [−0.1, 0.8] SmallFinal Lines Floaters 0.3 ± 0.5 0.6 ± 0.9 0.4 [−0.1, 0.8] Small
DribblingFloaters Off 2.1 ± 1.4 0.6 ± 0.8 −1.4 [−2.0, −0.8] * Large
Lateral Floaters 2.2 ± 1.5 0.8 ± 1.0 −1.4 [−2.1, −0.7] * ModerateFinal Lines Floaters 1.3 ± 0.9 0.4 ± 0.6 −0.8 [−1.2, −0.4] * Moderate
ShootingFloaters Off 4.0 ± 1.9 2.7 ± 1.8 −1.2 [−2.2, −0.2] * Moderate
Lateral Floaters 3.8 ± 1.5 2.8 ± 1.9 −1.1 [−2.1, −0.1] * ModerateFinal Lines Floaters 3.7 ± 1.6 2.9 ± 1.7 −0.7 [−1.6, 0.2] Small
* p < 0.05. Abbreviations: 1st = to keep possession; 2nd A = to progress towards the goal without beating a defensive line; 2nd B = toprogress towards the goal beating a defensive line; 3rd = to shoot at goal with the lowest level of opposition.
3. Results
For 3vs3 SSCG, a total of 1352 passing (1st principle, n = 573; 2nd A principle, n = 548,2nd B principle, n = 127; 3rd principle, n = 104); 920 dribbling (1st principle, n = 256;2nd A principle = 371, 2nd B principle, n = 215; 3rd principle, n = 78); and 342 shooting(3rd principle, n = 342) actions occurred. For 2vs2 SSCG, a total of 1087 passing (1stprinciple, n = 418; 2nd A principle = 155, 2nd B principle, n = 396; 3rd principle, n = 55);1044 dribbling (1st principle, n = 318; 2nd A principle = 235, 2nd B principle, n = 277; 3rdprinciple, n = 214); and 421 shooting (3rd principle, n = 421) actions occurred.
The descriptive and inferential analysis between actions per minute per player de-veloped in two small-sided and conditioned games (2vs2–3vs3) according to the floaterpositioning (task constraint) and the game principle (GP) presented in Table 1. Additionally,Figure 3 shows the standardized (Cohen) differences for the pairwise comparations.
17

Int. J. Environ. Res. Public Health 2021, 18, 7557
Figure 3. Standardized Cohen differences for the pairwise comparations between 2vs2 and 3vs3 for
each action and game principle considered.
Non-significant differences were identified for passing and dribbling actions in the 1stprinciple (BP) for any task constraints between both SSCG. According to passing actionsin 2nd A principle (P), the results showed significantly higher values in 3vs3 than in 2vs2SSCG in FO (mean differences [95% confidence interval]; 3.1 [2.2, 4.1], p < 0.01, large ES),LF (2.4 [1.1, 3.7], p < 0.01, moderate ES) and FLF (4.9 [3.8, 6.1], p < 0.01, large ES). Regardingdribbling actions in 2nd A principle (P), results showed significantly higher values in 3vs3than in 2vs2 SSCG in LF (1.3 [0.2, 2.4], p < 0.05, moderate ES).
When considering the passing actions in 2nd B principle (PDL), results showedsignificantly higher values in 2vs2 than in 3vs3 SSCG in FO (−1.5 [−2.2, −0.7], p < 0.01,moderate ES), LF (−3.3 [−4.4, −2.2], p < 0.01, large ES), and FLF (−3.5 [−4.4, −2.7], p < 0.01,very large ES). Regarding dribbling actions in 2nd B principle (PDL), results showedsignificantly higher values in 2vs2 than in 3vs3 SSCG in FO SSCG (−1.6 [−2.5, −0.7],p < 0.01, moderate ES).
For passing actions in the 3rd principle (S), no significant difference was identified. Fordribbling actions performed in 3rd principle (S), results showed significantly higher valuesin 2vs2 than in 3vs3 SSCG in FO (−1.4 [−2.0, −0.8], p < 0.01, large ES), LF (−1.4 [−2.1, −0.7],p < 0.01, moderate ES) and FLF (−0.8 [−1.2, −0.4], p < 0.01, moderate ES). Finally, for theshooting actions in 3rd principle (S), results showed significantly higher values in 2vs2 thanin 3vs3 SSCG in FO (−1.2 [−2.2, −0.2], p < 0.05, moderate ES) and LF (−1.1 [−2.1, −0.1],p < 0.05, moderate ES).
4. Discussion
This study aimed to analyse the manipulation of the number of players (Gk + 3vs3 + Gkand Gk + 2vs2 + Gk) and floater positioning on youth players’ technical–tactical offensiveactions according to game principles. The highest values of passing were observed in the3vs3 SSCG, where most dribbles and shots occurred in the 2vs2 SSCG. These results seemto indicate that the number of players per team as a task constraint can influence playersand teams’ possibilities for action, and consequently their tactical behaviour. One of thefirst constraints that coaches need to consider when designing the practice tasks is thenumber of players involved [34]. When the goal is to create passing lines and maintainball possession through passing, the 3vs3 SSCG should be used whereas if the focus is ondribbling and shooting, the 2vs2 situation can ensure a greater number of these actions.
18
Int. J. Environ. Res. Public Health 2021, 18, 7557
Furthermore, the manipulation of the number of players constrains not only the actions perse but the emergence of each action in relation to the game principles that support differentpurposes of the teams [35]. However, further studies are required with more participantsfrom different levels of practice to generalize our results.
4.1. First Game Principle (1st = to Keep Possession)
With regard to the first game principle (BP), no significant difference was observedbetween the 2vs2 and the 3vs3 SSCG or the addition of floaters in the side or final lineof the field. Contrary to previous research [15], a different number of players or floatersseems not to influence the number of passing or dribbling actions by players to maintainball possession. Thus, a link between the goal and the manipulations promoted shouldbe considered to understand the impacts of such manipulations on players’ and teams’tactical behaviour [36].
4.2. Second Game Principle (2nd = to Progress towards the Goal)
Regarding the second game principle, two different categories were considered: 2nd Aprinciple—to progress towards the goal without beating a defensive line (P) and 2nd Bprinciple—to progress towards the goal by beating a defensive line (PDL).
Results of the 2nd A principle (P) revealed significantly higher values of passing infor the 3vs3 compared to the 2vs2 situation when players try to progress towards the goalwithout beating a defensive line in all experimental conditions (FO, FLF and LF). Thus, thenumber of players per team might be more determining for the emergence of progressionwithout breaking a defensive line compared to the presence or absence of floaters. Inagreement with previous research, the use of 3vs3 could be considered a more balanceddefensive structure of play, defined by two defensive lines, not allowing an easy effectiveprogression. As Gonçalves et al. (2016) and Vilar et al. (2014) pointed out, manipulating thenumber of players per team stimulates the emergence of new play patterns that supportthe emergence of different individual action possibilities for both attacking and defendingplayers. Thus, it could be that in the 2vs2 the number of passing possibilities of the attackingteam is limited (specifically, only one), so the defending team increases the pressure onthe attacking players and the possibilities to do successful penetration (i.e., beating adefensive line) increases too. On the contrary, in the 3vs3 the defending team could retreatits position on the field by decreasing the distance between teammates and their owngoal. As Pizarro et al. (2021) pointed out, when the defending team retreats its position,the distance between attacking and defending players increases and consequently, theprobability of developing passing actions without beating the line increases. Furthermore,in 2vs2 teams, there is only one defensive line, which affords more advantage to progress,compared to the two existing defensive lines of the 3vs3 conditions that allows a betterspace equilibrium. Indeed, when a team has more players, the game is more positional andless variable, increasing the balance between teams [36].
No significant differences were observed for dribbling except for the condition LF,which revealed a higher number of dribbling actions favouring 3vs3. For the other side,the floater in the side-line allows more opportunities for dribbling in 2vs2. In line withprevious research, the addition of the floater probably promoted a retreat of defenderson the field to guarantee the protection of space near the goal. Usually, when playingagainst unfavourable numerical relationships, the defender tends to decrease the spacefor action [27], maintaining the space equilibrium between defensive lines, not allowingpassing actions, but inviting more 1vs1 dribbling situations [20,37]. Due to the 3vs3structure allowing more than one defensive line, usually, such dribbling actions also do notafford the possibility to beat defensive lines.
Conversely, regarding the 2nd B principle (PDL), results revealed significantly highervalues of passing in favour of 2vs2 when players try to progress towards the goal beating adefensive line in all experimental conditions (FO, FLF and LF). Interestingly, the effect tendsto increase with the addition of floaters. With the increase in floaters, the number of passing
19
Int. J. Environ. Res. Public Health 2021, 18, 7557
actions that beat defensive lines in the 2vs2 conditions tends to increase in comparisonwith the 3vs3 conditions. In line with previous assumptions, the use of fewer defensiveplayers decreased the number of defensive lines, increasing the need for each player tomark the opponent to maintain the spatial-temporal relations not to allow progression. Itopens new possibilities to increase the mobility of attacking players to create passing linesfor progression [38]. The addition of floaters promoted a numerical unbalance betweenteams, giving an advantage to attacking teams and allowing them to progress on the field,and consequently putting less pressure from defenders on the ball carrier, opening up morepassing lines to the floaters [38]. The use of floaters in the final line in particular increasesthe number of passing lines and defenders attracted to the ball and seems to promotehigher spatial unbalance for the emergence of passing opportunities.
Regarding dribbling actions, higher values were obtained in favour of 2vs2 whenplayers try to progress towards the goal, beating a defensive line without the presenceof floaters. In line with previous research, the absence of floaters and the small numberof players (2vs2) seems to promote the emergence of 1vs1 situations, thus enabling theattacking players to perform more dribbling actions towards the opposite goal and beatinga defensive line [20,37]. As previously stated, the addition of floaters tends to decreasethe pressure of defenders on a ball carrier’s possibilities for passing actions instead ofpossibilities for dribbling [39].
4.3. Third Game Principle (3rd = to Shoot at Goal with the Lowest Level of Opposition)
Concerning the third game principle, only the dribbling and shooting revealed signifi-cant differences between conditions. No significant differences were observed for passingactions. The emergence of passing actions that support the shoot is quite similar for bothconditions used, revealing the lower values of actions to support shooting.
The analysis of dribbling actions revealed significant differences in all the experimen-tal conditions. Specifically, significantly higher values were obtained in favour of 2vs2 incomparison with 3vs3. Despite defenders in both seeking to maintain their position be-tween the ball and the goal, not allowing a misalignment between the ball and the goal [40],variability in the attacking players’ relations with opponents and the ball is attributedto their constant explorative performances as they seek to break the symmetry with thedefending players because of creating opportunities for scoring goals [41]. However, theexplorative behaviours of the attacking team take place under the constraints imposedby the defending team. As noted, the defensive team tries to maintain spatiotemporalrelations with the offensive team. In contrast, the offensive team attempts to disrupt thestatus quo at opportune times by advancing their position on the field, reaching the freeattacking player, and finding chances for goal-scoring possibilities [42]. Therefore, therelevant issue is how players change their exploratory behaviours that disrupt the statusquo: in 3vs3 through passing actions and in 2vs2 through dribbling and shooting.
4.4. Study Limitations and Future Research
As this research only involved male futsal players under 19, the generalization offindings to more diverse samples is limited. Additionally, the small sample size may refrainfrom achieving more robust inferences. Future research should overcome these issues andutilize players of varying ages, ability, and gender. On the other hand, this intervention wascarried out in a natural context, where some contextual variables are challenging to control.
5. Conclusions and Practical Implications
This study has shown that manipulating the number of players (Gk + 3vs3 + Gk andGk + 2vs2 + Gk) and floater positioning influence players´ technical–tactical behavioursin 3vs3 and 2vs2 SSCG. In the 2vs2, players perform more dribbling and shooting actionsthan in the 3vs3, where players developed more passing actions. However, these resultsvary depending on the game principle analysed. Specifically, 3vs3 is associated withpassing and dribbling action to progress towards the goal without beating a defensive line,
20
Int. J. Environ. Res. Public Health 2021, 18, 7557
while 2vs2 is associated with passing and dribbling actions aimed at beating a defensiveline. It probably happens because the defending team in 3vs3 form a zonal defence,necessitating the prioritization of avoiding creating penetrative passing lines and shootingat goal and increasing the pressure on the attacking players. Thus, within 2vs2 thereseems to be more opportunities for 1vs1. According to the development steps, the overallresults stress that the 2vs2 seems to highlight individual actions even with the presence offloaters, while the 3vs3 highlights more relational actions and collective tactical behaviours.However, as results have shown, there are differences between the individual actionsdeveloped according to the SSCG and the game principle. According to the main objectiveof training sessions, such information may support coaches in designing training tasks bymanipulating task constraints (number of players and floaters that should be assigned toeach goal).
Author Contributions: Conceptualization, all authors; methodology, D.P., A.P. and A.M.; software,
B.G. and B.T.; validation, all authors; formal analysis, D.P. and B.G.; investigation, D.P., A.P., B.T. and
A.M.; data curation, D.P. and B.G.; writing—original draft preparation, D.P., A.P., B.T., and A.M.;
writing—review and editing, D.P., A.P., B.G. and B.T.; visualization, all authors; supervision, all
authors. All authors have read and agreed to the published version of the manuscript.
Funding: This research received no external funding.
Institutional Review Board Statement: The study was conducted according to the guidelines of
the Declaration of Helsinki and approved by the Ethics Committee of Universidad de Extremadura
(239/2019).
Informed Consent Statement: Informed consent was obtained from all subjects involved in the study.
Acknowledgments: This study has been carried out thanks to the contribution of the Junta de
Extremadura through the European Regional Development Fund. A way to make Europe (GR18129).
Conflicts of Interest: The authors declare no conflict of interest.
References
1. Coutinho, D.; Gonçalves, B.; Wong, D.P.; Travassos, B.; Coutts, A.J.; Sampaio, J. Exploring the effects of mental and muscular
fatigue in soccer players’ performance. Hum. Mov. Sci. 2018, 58, 287–296. [CrossRef] [PubMed]
2. Travassos, B.; Araújo, D.; Duarte, R.; McGarry, T. Spatiotemporal coordination behaviors in futsal (indoor football) are guided by
informational game constraints. Hum. Mov. Sci. 2012, 31, 932–945. [CrossRef]
3. Travassos, B.; Duarte, R.; Vilar, L.; Davids, K.; Araújo, D. Practice task design in team sports: Representativeness enhanced by
increasing opportunities for action. J. Sports Sci. 2012, 30, 1447–1454. [CrossRef]
4. Araújo, D.; Davids, K. Team Synergies in Sport: Theory and Measures. Front. Psychol. 2016, 7, 1449. [CrossRef]
5. Chow, J.Y.; Davids, K.; Button, C.; Renshaw, I. Nonlinear Pedagogy in Skills Acquisition: An Introduction; Routletge: New York, NY,
USA, 2016.
6. Ric, A.; Hristovski, R.; Gonçalves, B.; Torres, L.; Sampaio, J.; Torrents, C. Timescales for exploratory tactical behaviour in football
small-sided games. J. Sports Sci. 2016, 34, 1723–1730. [CrossRef] [PubMed]
7. Sarmento, H.; Clemente, F.M.; Harper, L.D.; Da Costa, I.T.; Owen, A.; Figueiredo, A.J. Small-sided games in soccer. A systematic
review. Int. J. Perform. Anal. Sport 2018, 18, 693–749. [CrossRef]
8. Davids, K.; Araújo, D.; Correia, V.; Vilar, L. How Small-Sided and Conditioned Games Enhance Acquisition of Movement and
Decision-Making Skills. Exerc. Sport Sci. Rev. 2013, 41, 154–161. [CrossRef]
9. Passos, P.; Araújo, D.; Davids, K.; Shuttleworth, R. Manipulating Constraints to Train Decision Making in Rugby Union. Int. J.Sports Sci. Coach. 2008, 3, 125–140. [CrossRef]
10. Sgrò, F.; Bracco, S.; Pignato, S.; Lipoma, M. Small-Sided Games and Technical Skills in Soccer Training: Systematic Review and
Implications for Sport and Physical Education Practitioners. J. Sports Sci. 2018, 6, 9–19. [CrossRef]
11. Sampaio, J.; Macas, V. Measuring Tactical Behaviour in Football. Int. J. Sports Med. 2012, 33, 395–401. [CrossRef]
12. Clemente, F.M.; Wong, D.P.; Martins, F.M.L.; Mendes, R.S. Acute Effects of the Number of Players and Scoring Method on
Physiological, Physical, and Technical Performance in Small-sided Soccer Games. Res. Sports Med. 2014, 22, 380–397. [CrossRef]
13. Práxedes, A.; Moreno, A.; Gil-Arias, A.; Claver, F.; Del Villar, F. The effect of small-sided games with different levels of oppo-sition
on the tactical behaviour of young footballers with different levels of sport expertise. PLoS ONE 2018, 13, e0190157. [CrossRef]
14. Travassos, B.; Coutinho, D.; Gonçalves, B.; Pedroso, P.; Sampaio, J. Effects of manipulating the number of targets in U9, U11, U15
and U17 futsal players’ tactical behaviour. Hum. Mov. Sci. 2018, 61, 19–26. [CrossRef]
21

Int. J. Environ. Res. Public Health 2021, 18, 7557
15. Castellano, J.; Silva, P.; Usabiaga, O.; Barreira, D. The influence of scoring targets and outer-floaters on attacking and defending
team dispersion, shape and creation of space during small-sided soccer games. J. Hum. Kinet. 2016, 51, 153–163. [CrossRef]
16. Clemente, F.; Dellal, A.; Wong, D.; Martins, F.L.; Mendes, R. Heart rate responses and distance coverage during 1 vs. 1 duel in
soccer: Effects of neutral player and different task conditions. Sci. Sports 2016, 31, e155–e161. [CrossRef]
17. Clemente, F.M.; Wong, D.P.; Martins, F.M.L.; Mendes, R. Differences in U14 football players’ performance between different
small-sided conditioned games. RICYDE. Rev. Int. Cienc. Deporte 2015, 11, 376–386. [CrossRef]
18. Clemente, F.M.; Martins, F.M.L.; Mendes, R.S.; Campos, F. Inspecting the performance of neutral players in different small-sided
games. Mot. Rev. Educ. Física 2015, 21, 45–53. [CrossRef]
19. Hill-Haas, S.V.; Dowson, B.T.; Couts, A.J.; Rowsell, G.J. Time-motion characteristics and physiological responses of small-sided
games in elite youth players: The influence of player number and rule changes. J. Strength Cond. Res. 2010, 24, 2149–2156.
[CrossRef] [PubMed]
20. Padilha, M.B.; Guilherme, J.; Serra-Olivares, J.; Roca, A.; Teoldo, I. The influence of floaters on players’ tactical behaviour in
small-sided and conditioned soccer games. Int. J. Perform. Anal. Sport 2017, 17, 721–736. [CrossRef]
21. Pizarro, D.; Práxedes, A.; Travassos, B.; Gonçalves, B.; Domínguez, A.M. Floaters as coach’s joker? Effects of the floaters
positioning in 3vs3 small-sided games in futsal. Int. J. Perform. Anal. Sport 2021, 21, 197–214. [CrossRef]
22. Serra-Olivares, J.; González-Víllora, S.; López, L.M.G.; Araújo, D. Game-Based Approaches’ Pedagogical Principles: Exploring
Task Constraints in Youth Soccer. J. Hum. Kinet. 2015, 46, 251–261. [CrossRef]
23. Bayer, C. The Teaching of Collective Sports Games; Hispano Europea: Barcelona, Spain, 1992.
24. Ric, Á.; Hristovski, R.; Torrents, C. Can joker players favor the exploratory behavior in football small-sided games? Res. Phys.Educ. Sport Health 2015, 4, 35–39.
25. Gonçalves, B.; Marcelino, R.; Torres-Ronda, L.; Torrents, C.; Sampaio, J. Effects of emphasising opposition and cooperation on
collective movement behaviour during football small-sided games. J. Sports Sci. 2016, 34, 1346–1354. [CrossRef]
26. Gonçalves, B.; Esteves, P.T.; Folgado, H.; Ric, A.; Torrents, C.; Sampaio, J. Effects of Pitch Area-Restrictions on Tactical Behavior,
Physical, and Physiological Performances in Soccer Large-Sided Games. J. Strength Cond. Res. 2017, 31, 2398–2408. [CrossRef]
[PubMed]
27. Travassos, B.; Gonçalves, B.; Marcelino, R.; Monteiro, R.; Sampaio, J. How perceiving additional targets modifies teams’ tactical
behavior during football small-sided games. Hum. Mov. Sci. 2014, 38, 241–250. [CrossRef] [PubMed]
28. Travassos, B.; Araújo, D.; Davids, K.; O’Hara, K.; Leitão, J.; Cortinhas, A. Expertise effects on decision-making in sport are
constrained by requisite response behaviours—A meta-analysis. Psychol. Sport Exerc. 2013, 14, 211–219. [CrossRef]
29. Tabachnick, B.G.; Fidell, L.S. Using Multivariate Statistics; Pearson Education Inc: New York, NY, USA, 2007.
30. Fleiss, J.L.; Levi, B.; Cho Paik, M. Statistical Methods for Rates and Proportions; Wiley: New York, NY, USA, 2003.
31. Cumming, G. Understanding the New Statistics: Effect Sizes, Confidence Intervals, and Meta-Analysis; Routledge: New York, NY,
USA, 2012.
32. Ho, J.; Tumkaya, T.; Aryal, S.; Choi, H.; Claridge-Chang, A. Moving beyond P values: Data analysis with estimation graphics.
Nat. Methods 2019, 16, 565–566. [CrossRef] [PubMed]
33. Hopkins, W.G.; Marshall, S.W.; Batterham, A.M.; Hanin, J. Progressive Statistics for Studies in Sports Medicine and Exercise
Science. Med. Sci. Sports Exerc. 2009, 41, 3–12. [CrossRef]
34. Sullivan, M.O.; Woods, C.T.; Vaughan, J.; Davids, K. Towards a contemporary player learning in development framework for
sports practitioners. Int. J. Sports Sci. Coach. 2021, 17479541211002335. [CrossRef]
35. Pizarro, A.P.; Práxedes, A.; Travassos, B.; del Villar, F.; Moreno, A. The effects of a nonlinear pedagogy training program in the
technical-tactical behaviour of youth futsal players. Int. J. Sports Sci. Coach. 2019, 14, 15–23. [CrossRef]
36. Travassos, B. Manipulação de Exercícios de Treino no Futsal. Da Conceptualização à Práctica [Manipulating Training Exercises in Futsal.From Conceptualization to Practice]; Prime Books: Estoril, Portugal, 2020.
37. Duarte, R.; Araújo, D.; Davids, K.; Travassos, B.; Gazimba, V.; Sampaio, J. Interpersonal coordination tendencies shape 1-vs-1
sub-phase performance outcomes in youth soccer. J. Sports Sci. 2012, 30, 871–877. [CrossRef]
38. Vilar, L.; Esteves, P.T.; Travassos, B.; Passos, P.; Lago-Peñas, C.; Davids, K. Varying numbers of players in small-sided soccer
games modifies action opportunities during training. Int. J. Sports Sci. Coach. 2014, 9, 1007–1018. [CrossRef]
39. Travassos, B.; Araújo, D.; Davids, K.; Vilar, L.; Esteves, P.T.; Correia, V. Informational constraints shape emergent functional
behaviors during performance of interceptive actions in team sports. Psychol. Sport Exerc. 2012, 13, 216–223. [CrossRef]
40. Vilar, L.; Araújo, D.; Davids, K.; Button, C. The role of ecological dynamics in analysing performance in team sports. Sports Med.2012, 42, 1–10. [CrossRef] [PubMed]
41. Corrêa, U.C.; Alegre, F.A.M.; Freudenheim, A.; Dos Santos, S.; Tani, G. The game of futsal as an adaptive process. Nonlinear Dyn.Psychol. Life Sci. 2012, 16, 185–204.
42. Travassos, B.; Vilar, L.; Araújo, D.; McGarry, T. Tactical performance changes with equal vs unequal numbers of players in
small-sided football games. Int. J. Perform. Anal. Sport 2014, 14. [CrossRef]
22

International Journal of
Environmental Research
and Public Health
Article
The Effect of Differential Repeated Sprint Training on PhysicalPerformance in Female Basketball Players: A Pilot Study
Jorge Arede 1,2,3,* , Sogand Poureghbali 4, Tomás Freitas 5,6,7 , John Fernandes 8, Wolfgang I. Schöllhorn 9 and
Nuno Leite 1,10
�����������������
Citation: Arede, J.; Poureghbali, S.;
Freitas, T.; Fernandes, J.; Schöllhorn,
W.I.; Leite, N. The Effect of
Differential Repeated Sprint Training
on Physical Performance in Female
Basketball Players: A Pilot Study. Int.
J. Environ. Res. Public Health 2021, 18,
12616. https://doi.org/10.3390/
ijerph182312616
Academic Editors: António
Carlos Sousa and Paul B. Tchounwou
Received: 18 October 2021
Accepted: 25 November 2021
Published: 30 November 2021
Publisher’s Note: MDPI stays neutral
with regard to jurisdictional claims in
published maps and institutional affil-
iations.
Copyright: © 2021 by the authors.
Licensee MDPI, Basel, Switzerland.
This article is an open access article
distributed under the terms and
conditions of the Creative Commons
Attribution (CC BY) license (https://
creativecommons.org/licenses/by/
4.0/).
1 Department of Sports Sciences, Exercise and Health, University of Trás-os-Montes and Alto Douro,
5001-801 Vila Real, Portugal; [email protected] School of Education, Polytechnic Institute of Viseu, 3504-501 Viseu, Portugal3 Department of Sports, Higher Institute of Educational Sciences of the Douro, 4560-708 Penafiel, Portugal4 Institute of Sport Science, Otto-von-Guericke-Universität Magdeburg, 39104 Magdeburg, Germany;
[email protected] UCAM Research Center for High Performance Sport, Catholic University of Murcia (UCAM),
30107 Murcia, Spain; [email protected] NAR-Nucleus of High Performance in Sport, São Paulo 04753-060, Brazil7 Faculty of Sport Sciences, Catholic University of Murcia (UCAM), 30107 Murcia, Spain8 School of Sport and Health Sciences, Cardiff Metropolitan University, Cardiff CF23 6XD, UK;
[email protected] Institute of Sport Science, Training and Movement Science, University of Mainz, 55122 Mainz, Germany;
[email protected] Research Center in Sports Sciences, Health Sciences and Human Development, CIDESD,
University of Trás-os-Montes and Alto Douro, 5001-801 Vila Real, Portugal
* Correspondence: [email protected]
Abstract: This pilot study aimed to determine the effects of differential learning in sprint running with
and without changes of direction (COD) on physical performance parameters in female basketball
players and to determine the feasibility of the training protocol. Nine female basketball players
completed 4 weeks of repeated sprint training (RST) with (COD, n = 4) or without (NCOD, n = 5)
changes of direction. A battery of sprints (0–10 and 0–25 m), vertical jumps (counter movement jump
(CMJ), drop jump, and single-leg CMJs), and COD tests were conducted before and after intervention.
NCOD completed two sets of ten sprints of 20 m, whereas COD performed 20 m sprints with a
180 degree turn at 10 m, returning to the starting line. Before each sprint, participants were instructed
to provide different fluctuations (i.e., differential learning) in terms of varying the sprint. Both groups
had 30 s of passive recovery between two sprints and 3 min between sets. A significant effect of time
for the 0–10 m sprint, CMJ, and single leg-CMJ asymmetries were observed. Adding “erroneous”
fluctuation during RST seems to be a suitable and feasible strategy for coaches to enhance physical
performance in young female basketball players. However, further studies including larger samples
and controlled designs are recommended to strengthen present findings.
Keywords: jumping; sprinting; change-of-direction; fluctuations; bilateral asymmetry
1. Introduction
The success of team sports depends, to a large extent, on the physical abilities of aplayer but also on the technical and tactical skills [1]. In team sports (e.g., basketball),repeated bouts of high-intensity activities (i.e., sprinting, jumping) are interspersed withperiods of low-to-moderate activity or passive recovery [1]. Moreover, the physical de-mands are complex and challenge athletes to have highly and simultaneously developedspeed, agility, strength, power, and endurance qualities [1]. Therefore, it seems plausiblethat practitioners working within team sports design training regimes that adequatelymatch the specific team sport requirements.
23

Int. J. Environ. Res. Public Health 2021, 18, 12616
Players’ ability to perform repeated sprints is one of the critical determinants of teamsports performance [2], including in basketball [3]. In team sports, sprinting activitiescorrespond to a small percentage of total distance covered or number of activities [4,5];however, short sprint activities are intercepted by a short period of time (i.e., every 21 to39 s), for example, in basketball [6]. In this regard, although the total distance coveredduring competition has not changed over the years, the requirement for high-intensityrunning and longer sprint distances has increased [7]. Consequently, it is astute thatpractitioners develop methods of enhancing sprint and repeat sprint ability (RSA) in teamsports athletes. Moreover, since sprints in these contexts are not exclusively straight-line, itis considered beneficial to prepare athletes to sprint in different directions, challenging thetechnical model.
Various methods are used to develop sprint and change of direction (COD) perfor-mance, including assisted and resisted sprinting techniques, resistance training, plyo-metrics, and rotational flywheel training [8–10]. A comparison between RSA- and COD-training revealed comparable performance improvements in soccer-relevant physical per-formance factors [11]. However, evidence suggests that sprints with COD and short shuttleruns are more demanding than linear sprints [12], resulting in higher cardiorespiratoryinvolvement and blood lactate accumulation [12]. Moreover, sprints with COD include de-celeration and acceleration efforts, creating heightened metabolic and mechanical demandsneeded to overcome inertia and rapidly generate propulsive forces in a new direction [13].This might evoke more significant stimuli in performance components associated with neu-romuscular factors such as jumps, sprints, and repeated sprint performance [14]. However,sprints and sprints with COD are performed during the game in unpredictable situationsand in different contexts, so it is warranted to employ training methods that promote boththe ability to adapt and the development of the necessary physical capabilities.
From a dynamical systems perspective, fluctuations play a key role in the adaptationof living systems when transiting from one stable state to another [15]. On the basis ofbio-mechanically identified, different levels of fluctuations in several highly automatizedmovements [16,17], the differential learning (DL) model proposed a concrete practicaltransfer of the system dynamics approach to gross motor movements by utilising andactively increasing fluctuations in an athlete’s movement learning process [18]. In contrastto the traditional training strategy, where fluctuations are considered errors that must beminimized, the DL approach considers the fluctuations in moving systems as potentialsources and necessary for learning. In an analogy to artificial neural nets that are modellingphenomena of real neurons [19], an increase of noise during the learning phase fosters theprocess of interpolation and, as a consequence, allows the system a better performance inthe subsequent application phase [15]. Evidence for better performance by interpolationcompared to extrapolation in natural neuro-motor systems was provided by a study byCatalano and Kleiner [20]. The experiment shows significantly better performance whentesting within the trained range than when testing outside. Accordingly, the DL theoryrecommends increasing the range already during training to increase the probability ofbeing able to interpolate in case of emergency or already during the next movement aloneand thus to be able to react more adequately to the new elements that will surely come.Fluctuations can be increased along a neuromechanical strategy [18] in which the angles,angular velocities, and angular accelerations of all joints or their rhythms are varied, sinceeach biomechanical variable can be associated with a physiological proprioceptor thatprovides the information necessary for training to the central nervous system for reorgani-zation. Fluctuations also can be increased by all kinds of instructions (e.g., or metaphors) ormodification of the surrounding in form of restrictions or enriched environments. Thereby,a major intention of DL is to increase the possibilities of the athlete rather than constrainingthem. Meanwhile, evidence is provided that fluctuations that can be quantified by theamount or structure of noise can also be increased or modified by means of emotions [21]or fatigue [22,23].
24

Int. J. Environ. Res. Public Health 2021, 18, 12616
Increasing the noise serves to destabilize the learning system and to launch a genuineself-organizing process. In its most extreme form, DL leads to movement variations withoutrepetition and without correction [24]. Movement corrections in DL are avoided to enablethe athlete to find their own optimal solution (which would not be the case if the athletewould be guided by information about “errors”). Moreover, external feedback can beoverestimated and redundant in case of enough variation [25]. Here, it is important todifferentiate augmented (or external) feedback from receiving emotional support, whichcould have a different influence on the training process but has not been the subject ofDL research so far. The continuous confrontation with new movement challenges in DLtraining results in flexible and adaptable movement patterns [26,27]. According to DLtheory, increased fluctuations result in better skill acquisition and better learning rates thantraditional models [28,29]. Hereby, the noise should be optimized rather than maximized,which is covered by the stochastic resonance principle of the DL-theory [24,27]. Thereby,in the ideal case, the noise provided by the given exercises should be adapted to theindividual and momentary noise provided by athlete. Epistemologically, the majority ofstudies on DL follow the strategy of conceptual replication instead of direct replication orreproduction, which logically fall too short because of the Duhem–Quine thesis, and so farprovide corroboration (not verification) of the DL theory [30]. However, a differentiationof effects comparing models that were influenced and inspired by DL theory, such as therather eclectic constraints-led approach [31] or the gradual and stochastic DL [26], arepending. Indeed, the benefits of the training programs based on DL in both technical andphysical skills have been reported in team sports [32–35].
Based on the previous, including the DL approach, fluctuation in repeated sprintsand sprints with COD in a training program is assumed to have the potential for elicitingphysical performance improvements. Therefore, the aim of this study was to examine theeffect of a four-week training intervention involving repeated differential sprint trainingwith COD (COD) vs. without COD (NCOD) on a series of physical tests (i.e., jumping,landing, sprinting, and cutting). A better understanding of the effects of differentialrepeated sprint training on various aspects of physical performance may help practitionersto better schedule and design training tasks to improve these aspects. Due to the lack ofcomparable findings, we propose the null hypothesis, i.e., that there will be no difference inthe efficacy of the repeated differential sprint training with or without COD. Furthermore,we hypothesised that repeated differential sprint training is a feasible training strategy andbeneficial for physical parameters.
2. Materials and Methods
2.1. Participants
Sixteen female basketball players from the under-19 age group up to the amateursenior level volunteered in this study. All participants completed, in sum, about 270 minof basketball training (three basketball sessions/week, 90 min/session) and one to twocompetitive matches per week. Only participants who participated in at least 90% ofthe workouts were considered for data analysis, which resulted in the exclusion of sevenplayers from post-testing analysis (NCOD, n = 5; COD, n = 4). Nine players were finallyassessed. Post hoc observed power calculations (G*Power, version 3.1.9.7; University ofDüsseldorf; Düsseldorf, Germany) for repeated measures ANOVA, including two groupsand two measurements (α = 0.05, d = 0.25), revealed power (β) between 0.11 and 0.25. Writ-ten and informed consent was obtained from all participants’ parents, and player approvalwas obtained before the beginning of this investigation. The present study was approvedby the Institutional Research Ethics Committee and conformed to the recommendations ofthe Declaration of Helsinki.
2.2. Procedures
This pilot study incorporated a parallel-groups, repeated measures design, wherebyparticipants were randomly divided into two groups with repeated sprinting training with
25
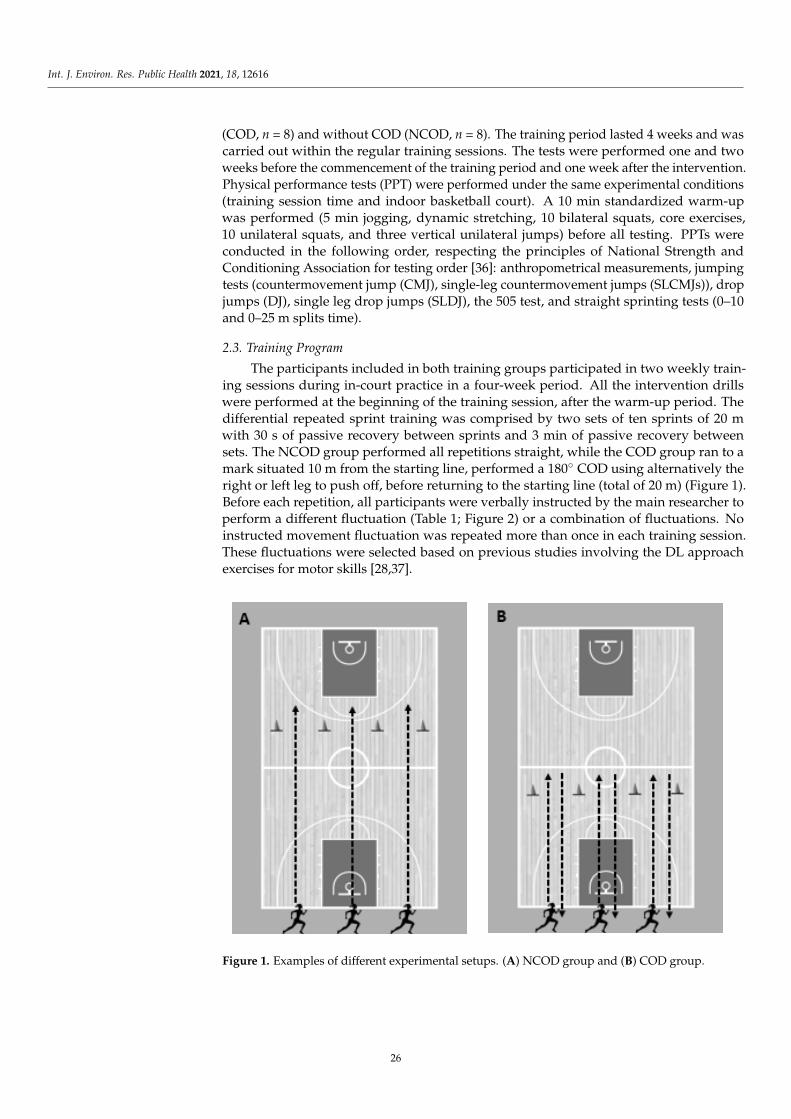
Int. J. Environ. Res. Public Health 2021, 18, 12616
(COD, n = 8) and without COD (NCOD, n = 8). The training period lasted 4 weeks and wascarried out within the regular training sessions. The tests were performed one and twoweeks before the commencement of the training period and one week after the intervention.Physical performance tests (PPT) were performed under the same experimental conditions(training session time and indoor basketball court). A 10 min standardized warm-upwas performed (5 min jogging, dynamic stretching, 10 bilateral squats, core exercises,10 unilateral squats, and three vertical unilateral jumps) before all testing. PPTs wereconducted in the following order, respecting the principles of National Strength andConditioning Association for testing order [36]: anthropometrical measurements, jumpingtests (countermovement jump (CMJ), single-leg countermovement jumps (SLCMJs)), dropjumps (DJ), single leg drop jumps (SLDJ), the 505 test, and straight sprinting tests (0–10and 0–25 m splits time).
2.3. Training Program
The participants included in both training groups participated in two weekly train-ing sessions during in-court practice in a four-week period. All the intervention drillswere performed at the beginning of the training session, after the warm-up period. Thedifferential repeated sprint training was comprised by two sets of ten sprints of 20 mwith 30 s of passive recovery between sprints and 3 min of passive recovery betweensets. The NCOD group performed all repetitions straight, while the COD group ran to amark situated 10 m from the starting line, performed a 180◦ COD using alternatively theright or left leg to push off, before returning to the starting line (total of 20 m) (Figure 1).Before each repetition, all participants were verbally instructed by the main researcher toperform a different fluctuation (Table 1; Figure 2) or a combination of fluctuations. Noinstructed movement fluctuation was repeated more than once in each training session.These fluctuations were selected based on previous studies involving the DL approachexercises for motor skills [28,37].
Figure 1. Examples of different experimental setups. (A) NCOD group and (B) COD group.
26

Int. J. Environ. Res. Public Health 2021, 18, 12616
Table 1. Examples of the fluctuations performed during differential repeated sprint training interventions.
# Body Part Fluctuations # Body Part Fluctuations
1
Head
Head back 29
Trunk
Trunk rotation to the left2 Head forward 30 Trunk rotation to the right3 Head back and forth 31 Trunk tilted laterally to the left4 Head rotated to the left 32 Trunk angled laterally to the right5 Head rotated to the right 33 Torso tilted back6 Head rotated left and right 34 Trunk tilted forward
7 Head tilted to the left 35
Hands
Hands on hip8 Head tilted to the right 36 Right hand on hip
9
Eyes
Closed right eye 37 Left hands on hip10 Left eye closed 38 Hands behind head11 Blinking eyes 39 Hands on forehead12 Look to the right 40 Right hand behind head13 Look left 41 Left hand behind head
14
Arms
Two arms up 42 Hands behind back15 Two arms close to the torso 43 Right hand behind back16 Arm rotation forward 44 Left hand behind back17 Arm rotation back 45 Clapping ahead18 Alternate forward arm rotation 46 Clap behind back19 Alternate backward arm rotation 47 Clap front and back
20 Arms open to the side21 Arms open down22 Crossed arms23 Arms stretched forward24 Arms stretched back25 Right arm up + left arm down26 Left arm up + right arm down27 Left arm up + right arm to the side28 Right arm up + left arm to the side
Figure 2. Examples of differential repeated sprint training fluctuations.
27

Int. J. Environ. Res. Public Health 2021, 18, 12616
2.4. Measurements
Bilateral and Unilateral Countermovement Jumps (CMJ). CMJs were assessed accord-ing to the Bosco Protocol. Participants performed three successful SLCMJs with each legin the vertical and horizontal directions. Participants began standing on one leg, thendescended into a countermovement before extending the stance leg to jump as far or ashigh as possible in the vertical and horizontal directions. The landing was performedon both feet simultaneously. A successful trial included hands remaining on the hipsthroughout the movement and balance being maintained for at least 3 s after landing. If thetrial was considered unsuccessful, a new trial was performed. In the horizontal direction,the participants started with the selected leg positioned just behind a starting line. Thejump height was recorded using an infrared optical system (OptoJump Next—Microgate,Bolzano, Italy).
Bilateral and Unilateral Rebound Drop Jumps (DJ). Participants stood on top of a 30 cmhigh box with hands placed on the hips. Then, they dropped down, landed on both legs,and jumped vertically as high as possible with the shortest ground contact time possible. Inunilateral rebound jumps (SLRJ), they hopped down diagonally (45◦ anterolateral), landedon the same leg within the infrared optical system, and then jumped vertically as highas possible with the shortest contact time possible [38]. The reactive strength index (RSI)was automatically calculated using Optojump Next software, version 1.12.1.0, through thefollowing formula: jump height/contact time [38].
The 505 test (COD). Each participant was instructed to run to a mark situated 10 mfrom the starting line, perform a 180◦ COD using the right or left leg to push off, andreturn to a mark located 5 m away, covering a total of 15 m [39]. The participants wereasked to pass the line indicated on the ground with their entire foot at each turn. The505 test total time was recorded with 90 cm height photoelectric cells separated by 1.5 m(Witty, Microgate, Bolzano, Italy). Each participant performed three sprints with COD foreach side with 2 min of rest between them. Players began each trial in standing positionswith their feet 0.5 m behind the first timing gate. The lower limb asymmetry index (ASI)was determined by adhering to the procedures described by Bishop and colleagues [40]using the following formula: ASI = 100/Max Value (right and left)*Min Value (right andleft)* − 1 + 100. The COD deficit (CODD) for the double 180◦ COD test for each leg wascalculated via the following formula: mean double 180◦ COD time—mean 10 m time [39].
Speed tests. The average running speeds were evaluated by 10 m (0–10 m) and 25 m(0–25 m) split times. Running times were recorded with 90 cm high photoelectric cellsseparated by 1.5 m. Each participant performed three trials with 2 min of rest between eachof the trials. Players began each trial in an upright standing position with their feet 0.5 mbehind the first timing gate.
2.5. Statistical Analyses
Data are presented as mean ± standard deviation (SD). Reliability of test measurescomputed using an average measures two-way random intraclass correlation coefficient(ICC) with absolute agreement, inclusive of 90% confidence intervals, and the coefficient ofvariation (CV). The ICC was interpreted as poor (<0.5), moderate (0.5–0.74), good (0.75–0.9),and excellent (>0.9) [41]. Coefficient of variation values were considered acceptable if<10% [42]. A paired-samples t-test was used to analyse within-group changes [43]. Thethreshold values for Cohen’s d for within-group effect sizes (ES) statistics were 0–0.2 trivial,>0.2–0.6 small, >0.6–1.2 moderate, >1.2–2.0 large, and >2.0 very large [44]. A 2 × 2 repeated-measure analysis of variance (ANOVA) was performed based on the absolute values ofall parameters to determine the main effects between groups (NCOD and COD group)and time (pre- and post-test) [43]. Effect size was evaluated with partial eta squared (η2
p),and the threshold values were no effect (η2
p < 0.04), minimum effect (0.04 < η2p < 0.25),
moderate effect (0.25 < η2p < 0.64), and strong effect (η2
p > 0.64) [45]. This measure hasbeen widely cited as a measure of effect size and predominantly provided by statisticalsoftware [46]. Tukey’s post-hoc analysis was used to examine the differences between times
28
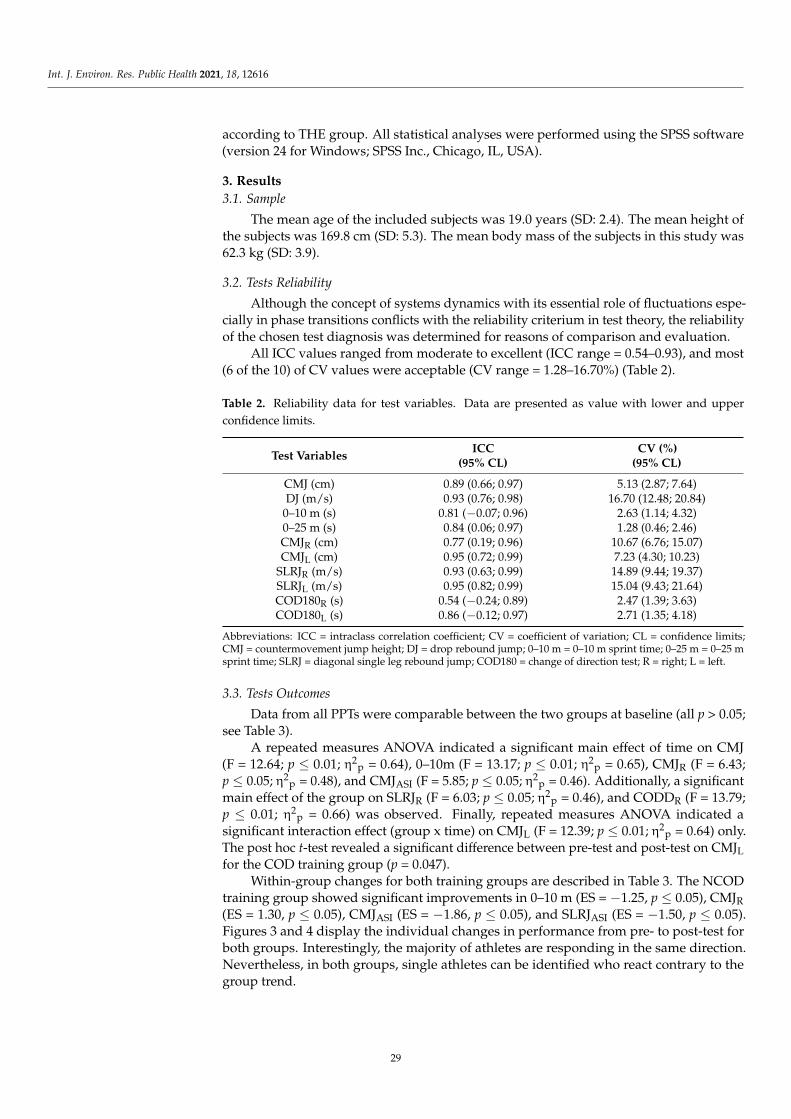
Int. J. Environ. Res. Public Health 2021, 18, 12616
according to THE group. All statistical analyses were performed using the SPSS software(version 24 for Windows; SPSS Inc., Chicago, IL, USA).
3. Results
3.1. Sample
The mean age of the included subjects was 19.0 years (SD: 2.4). The mean height ofthe subjects was 169.8 cm (SD: 5.3). The mean body mass of the subjects in this study was62.3 kg (SD: 3.9).
3.2. Tests Reliability
Although the concept of systems dynamics with its essential role of fluctuations espe-cially in phase transitions conflicts with the reliability criterium in test theory, the reliabilityof the chosen test diagnosis was determined for reasons of comparison and evaluation.
All ICC values ranged from moderate to excellent (ICC range = 0.54–0.93), and most(6 of the 10) of CV values were acceptable (CV range = 1.28–16.70%) (Table 2).
Table 2. Reliability data for test variables. Data are presented as value with lower and upper
confidence limits.
Test VariablesICC
(95% CL)CV (%)
(95% CL)
CMJ (cm) 0.89 (0.66; 0.97) 5.13 (2.87; 7.64)DJ (m/s) 0.93 (0.76; 0.98) 16.70 (12.48; 20.84)
0–10 m (s) 0.81 (−0.07; 0.96) 2.63 (1.14; 4.32)0–25 m (s) 0.84 (0.06; 0.97) 1.28 (0.46; 2.46)CMJR (cm) 0.77 (0.19; 0.96) 10.67 (6.76; 15.07)CMJL (cm) 0.95 (0.72; 0.99) 7.23 (4.30; 10.23)
SLRJR (m/s) 0.93 (0.63; 0.99) 14.89 (9.44; 19.37)SLRJL (m/s) 0.95 (0.82; 0.99) 15.04 (9.43; 21.64)COD180R (s) 0.54 (−0.24; 0.89) 2.47 (1.39; 3.63)COD180L (s) 0.86 (−0.12; 0.97) 2.71 (1.35; 4.18)
Abbreviations: ICC = intraclass correlation coefficient; CV = coefficient of variation; CL = confidence limits;CMJ = countermovement jump height; DJ = drop rebound jump; 0–10 m = 0–10 m sprint time; 0–25 m = 0–25 msprint time; SLRJ = diagonal single leg rebound jump; COD180 = change of direction test; R = right; L = left.
3.3. Tests Outcomes
Data from all PPTs were comparable between the two groups at baseline (all p > 0.05;see Table 3).
A repeated measures ANOVA indicated a significant main effect of time on CMJ(F = 12.64; p ≤ 0.01; η2
p = 0.64), 0–10m (F = 13.17; p ≤ 0.01; η2p = 0.65), CMJR (F = 6.43;
p ≤ 0.05; η2p = 0.48), and CMJASI (F = 5.85; p ≤ 0.05; η2
p = 0.46). Additionally, a significantmain effect of the group on SLRJR (F = 6.03; p ≤ 0.05; η2
p = 0.46), and CODDR (F = 13.79;p ≤ 0.01; η2
p = 0.66) was observed. Finally, repeated measures ANOVA indicated asignificant interaction effect (group x time) on CMJL (F = 12.39; p ≤ 0.01; η2
p = 0.64) only.The post hoc t-test revealed a significant difference between pre-test and post-test on CMJL
for the COD training group (p = 0.047).Within-group changes for both training groups are described in Table 3. The NCOD
training group showed significant improvements in 0–10 m (ES = −1.25, p ≤ 0.05), CMJR
(ES = 1.30, p ≤ 0.05), CMJASI (ES = −1.86, p ≤ 0.05), and SLRJASI (ES = −1.50, p ≤ 0.05).Figures 3 and 4 display the individual changes in performance from pre- to post-test forboth groups. Interestingly, the majority of athletes are responding in the same direction.Nevertheless, in both groups, single athletes can be identified who react contrary to thegroup trend.
29

Int. J. Environ. Res. Public Health 2021, 18, 12616
Table 3. Inferences of the training programs intervention on player’s performance measures.
VariablesPretest,
Mean ± SDPostest,
Mean ± SDp
Within-GroupEffect Size
Between-GroupsPretest
Differences (p)
Between-GroupEffect Size
CMJ (cm)NCOD 23.74 ± 3.47 25.17 ± 2.58 0.061 1.16
0.530 0.44COD 22.55 ± 0.90 24.53 ± 1.19 0.095 1.21
DJ (m/s)NCOD 0.79 ± 0.32 0.86 ± 0.27 0.418 0.40
0.340 0.67COD 0.61 ± 0.18 0.63 ± 0.14 0.686 0.22
0–10 m (s)NCOD 2.09 ± 0.09 2.02 ± 0.07 0.035 * −1.25
0.730 −0.24COD 2.12 ± 0.10 2.06 ± 0.07 0.132 −1.03
0–25 m (s)NCOD 4.34 ± 0.17 4.29 ± 0.13 0.322 −0.61
0.266 −0.81COD 4.46 ± 0.10 4.37 ± 0.14 0.183 −0.86
CMJR (cm)NCOD 15.10 ± 2.47 16.05 ± 2.45 0.044 * 1.30
0.110 1.22COD 12.70 ± 0.87 14.90 ± 2.04 0.202 0.82
CMJL (cm)NCOD 15.96 ± 3.28 14.84 ± 2.91 0.122 −0.87
0.074 1.41COD 11.83 ± 2.38 14.61 ± 2.53 0.073 1.36
CMJASI (%)NCOD 21.86 ± 6.93 11.68 ± 2.87 0.014 * −1.86
0.881 −0.10COD 22.43 ± 2.50 20.30 ± 7.25 0.691 0.22
SLRJR (m/s)NCOD 0.43 ± 0.12 0.42 ± 0.10 0.672 −0.20
0.123 1.18COD 0.32 ± 0.06 0.31 ± 0.03 0.847 0.11
SLRJL (m/s)NCOD 0.42 ± 0.12 0.43 ± 0.10 0.859 0.09
0.063 1.48COD 0.32 ± 0.06 0.31 ± 0.03 0.073 −0.10
SLRJASI (%)NCOD 27.67 ± 15.53 22.01 ± 14.10 0.028 * −1.50
0.262 −0.82COD 39.19 ± 11.92 31.80 ± 8.03 0.405 −0.48
COD180R (s)NCOD 4.78 ± 0.11 4.76 ± 0.17 0.703 −0.18
0.361 −1.00COD 4.86 ± 0.13 5.00 ± 0.11 0.131 1.03
COD180L (s)NCOD 4.78 ± 0.36 4.80 ± 0.18 0.824 0.10
0.550 −0.42COD 4.91 ± 0.21 4.93 ± 0.18 0.690 0.22
CODASY (%)NCOD 7.16 ± 2.19 4.44 ± 2.43 0.196 −0.69
0.336 0.69COD 5.38 ± 3.02 2.77 ± 0.92 0.190 −0.85
CODDR (s)NCOD 2.74 ± 0.09 2.73 ± 0.14 0.895 −0.06
0.176 −1.01COD 2.82 ± 0.05 2.98 ± 0.06 0.009 ** 3.06
CODDL (s)NCOD 2.74 ± 0.24 2.79 ± 0.18 0.533 0.30
0.515 −0.46COD 2.84 ± 0.16 2.90 ± 0.14 0.074 1.35
Abbreviations: CMJ = countermovement jump height; DJ = drop rebound jump; 0–10 m = 0–10 m sprint time; 0–25 m = 0–25 m sprint time;SLRJ = diagonal single leg rebound jump; COD180 = change of direction test; CODD = COD deficit; R = right; L = left; ASI = bilateralasymmetry; * significant differences at p < 0.05; ** significant differences at p < 0.01.
30

Int. J. Environ. Res. Public Health 2021, 18, 12616
Figure 3. Individual changes from pretest to posttest for physical performance in NCOD group.
31

Int. J. Environ. Res. Public Health 2021, 18, 12616
Figure 4. Individual changes from pretest to posttest for physical performance in COD group.
32
Int. J. Environ. Res. Public Health 2021, 18, 12616
4. Discussion
This pilot study aimed to investigate the effects of the DL approach applied to sprinttraining with and without COD on physical tests in female basketball players. Methodically,in addition to the classical mean statistics, the presentation of individual results waschosen, since, on the one hand, epistemologically, from mean values only to other meanvalues can be concluded, but not to the individual athlete, and, on the other hand, for theeffectiveness of training measures, individual reactions to interventions are increasinglyof interest [47–49]. Considering findings and the absence of injuries and complaints,this study showed that it is feasible to implement DL principles in a repeated sprinttraining to improve physical performance. Moreover, the study provided indicationsthat differential repeated sprint training has a beneficial effect on CMJ, 0–10 m, CMJR,and CMJASI. Performing differential repeated sprint training without COD resulted inimproved 0–10 m, CMJR, CMJASI, and SLRJASI for all group participants. Furthermore,including COD during differential repeated sprint training resulted in improved 0–25 msprint time and CMJL for all COD group participants.
Differential repeated sprinting training resulted in increased CMJ performance after4 weeks. This beneficial transfer effect is similar to previous training protocols exploringDL in team sports [32,35], which suggests common underlying mechanisms explaining theimproved jumping performance. Recent studies using electroencephalography to analysebrain activation patterns demonstrated neural activation after DL training in frequencybands and brain areas that are assumed to be supportive, especially for motor learning [50].Improved motor learning and coordination (i.e., neural adaptations) dominate in theearly phase of training [36]. That said, most participants may have benefited from theincreased experiences of the various combinations of movement fluctuations and repeatedhighly intensive neuromuscular activations to improve jumping ability on the short-termscale. Specifically, increased neural drive is associated with enhanced agonist musclerecruitment, improved neuronal firing rates, and greater synchronization in the timing ofneural discharge [36]. Likewise, central adaptations arising from higher neural activationcan lead to increased motor unit activation, resulting in increased high-intensity muscularcontraction and increased stiffness (i.e., jumping) [36]. Nevertheless, two of the participantshad contrary responses (one per group) in CMJ, indicating that combining movementfluctuations and high-intensity muscular contractions places large stress either on theirbody or mind, inhibiting their performance. Thus, the present results need to be analysedwith caution, with the need to examine the training response on an individual basis.Furthermore, practitioners should be aware that training volume, intensity, duration, oreven the frequency of changes can be adjusted for negative or non-responders [51]. Morestudies with emphasis on individual responses are needed to better understand the effectsof manipulating these variables on differential repeated sprint training [51].
The present findings suggest that an improvement in CMJ accompanied an increasein sprint performance. This is in accordance with the relationship between CMJ heightand 0–10 m sprint time (r = −0.51) previously reported in female athletic populations [52].The underlying commonality is seen in the fact that both activities take advantage ofthe stretch-shortening cycle (SSC), where an eccentric action (i.e., stretching) precludes aconcentric action (i.e., shortening) [36]. The use of variable movements generates greaterneuromuscular [53] and neurophysiological adaptations than movement repetitions [50]and increases the storage of elastic energy during the eccentric phase, leading to largerrelease of kinetic energy during the concentric phase. This better exploitation of the SSCmay have allowed a greater training stimulus to occur over time, which, in turn, resultedin improved sprinting and jumping performance. In fact, after differential repeated sprinttraining, participants improved their 0–10 m sprint time. Notably, all participants ofNCOD were positive responders in this test, which can be related to the specificity versusvariability of the practice paradigm [54]. Possibly, the NCOD group may have benefitedfrom better dynamic similarities between the movement patterns in differential repeatedsprint training and the 0–10 m sprint test [36]. Additionally, the straight sprint and sprint
33

Int. J. Environ. Res. Public Health 2021, 18, 12616
with COD require specific running techniques [36], since during the COD training protocol,participants not only reduced their velocity prior to the 180◦ directional change at 10 mbut also, due to the slowing down, caused increased eccentric contractions, while NCODincreased their velocity until 20 m.
After the differential repeated sprint training program, participants displayed highervalues of CMJR compared to the pre-test values. This improvement in unilateral jumpingmay be indicative of increased strength of ankle- and hip-joint muscles and both static anddynamic postural balance [9]. However, to what extent these specific reactions dependon the individual preferences of the jump and play leg or laterality in general shouldbe clarified by future research. A study analysing the effect of differential jump trainingon balance performance and postural control of female volleyball players during singleleg stance observed a decreased sway area and anterior–posterior and mediolateral sway,indicative of improvements on the aforementioned qualities [34]. Thus, the implementationof movement variations through DL principles during training generates neuromuscularstimuli that may result in improved balance performance and ankle stabilization [55], andconsequently, in improved unilateral jumping. Furthermore, previous results demonstratedimpaired postural control (i.e., increased body sway) after high-intensity repeated sprints(i.e., ten 30 m sprints with two 180◦ COD (10 + 10 + 10 m), interspaced by 30 s of passiverecovery between sprints) [56]. These findings suggest that repeated sprints result in alter-ations in the sensory information from the proprioceptive and exteroceptive systems [56].Thus, continuous exposure to the combination of increased movement fluctuations accom-panied by high-intensity muscular contractions can generate beneficial adaptations at theproprioceptive and exteroceptive levels that can result in positive transfer to the unilateraljumping performance in controlled settings. Notwithstanding, apart from one subject, allparticipants in the COD group improved CMJR and CMJL after training, including superiorimprovements in CMJL when compared to the NCOD group. Although the figures withindividual results are no proof of individuality [48], the different effects on performanceindicate that not all athletes achieved similar adaptations.
Following the principle of stochastic resonance idea within DL-theory [28], futureresearch should match the noise of the coach’s fluctuations to that of the athletes. Thereby,the extent to which this involves the amount or structure of noise will also need to beclarified [57]. This is particularly important in team sports since improving and strengthen-ing all team members is crucial. The present findings suggest that the inclusion of CODduring differential repeated sprint training can yet be more beneficial in unilateral jumping.Optimal movement variability during 180◦ COD could increase the need for lower-limbstabilisation to maintain balance, therefore requiring input from muscular involvementduring triple flexion [58]. Moreover, the 180◦ COD involves the application of considerablebraking and propulsive forces (particularly horizontal) within the final foot contact [59,60],demanding higher muscle activity of the ankle, knee, and hip-joint stabilizers. That said,improvements in unilateral jumping are expected based on the neuromuscular stimulifrom simultaneously performing 180◦ COD with movement variation.
The overall adherence to the training programs is highly associated with the injuryrate, enjoyment, motivation, and satisfaction with progress [61]. In this regard, the absenceof injuries or complaints and the improvements in physical performance observed duringthis pilot study, in conjunction with previous adherence in experimental studies [32,35,62],bring increased expectations for a good adherence to the training program in further studies.These expectations are also sustained in brain activation patterns associated with enhancedattentional processes and improved learning processes from the use of differential learningin different motor tasks [50,63,64]. That said, continuous exposure to fluctuations can resultin favorable neurophysiological adaptations, which may induce subjects to be more likelyto be engaged in a training program, including differential learning approach.
We consider this investigation a pilot study due to the small sample size arising fromthe dropout rate, frequently observed in youth studies [34,37]. Since we mainly rely on theoriginal Fisher statistics, extended by the effect sizes according to Neyman–Pearson [65],
34

Int. J. Environ. Res. Public Health 2021, 18, 12616
there is no claim for generalization [66]. Rather, we show further supportive evidence forthe effectivity of an alternative training approach that encourages self-organization withina divergent learner-oriented teaching/coaching style [67]. In agreement with the Fisher’sstatistics, we conclude, based on the p < 0.05 results, that further research on differentialtraining is promising. Further investigations in less-experienced, semi-professional andprofessional players is recommended. Furthermore, it may be worth pursuing longitudi-nal studies wherein the same participants are tested over months in order to fathom thecomplexity of the individual’s continuous changes even more [49]. The original publica-tion on DL in 1999 was especially focused on “Individuality—a neglected parameter” toemphasize the need for alternative theoretical and practical approaches for the dominantgroup and average oriented streams. Longitudinal changes in each variable could helpbetter understand the long-term training effects and further support our results.
5. Conclusions
Counterintuitively, the findings of the present study displayed positive effects byadding “erroneous” fluctuation during sprint training not only in sprint but also in severaljumping performances. Although it is a pilot study with no claim to generalisation, the sig-nificant changes from pre- to post-test indicate, according to Fisher’s original interpretation,that pursuing this research field is worthwhile. Whether the results due to increased noiseare side or main effects demands further research. The higher variability of stimuli duringthe training also suggests looking for additional effects on prevention of injuries or chokingin basketball of female players. This training type is recommended for further experimentsin female basketball, where coaches and fitness trainers might go beyond their learnedtools and switch from convergent and teacher-oriented training to more divergent thinkingapproaches with athlete-oriented training. Fluctuations within repeated sprint trainingmay influence the individual’s movement patterns towards more effective and stabilizedskills. From an epistemological point of view, together with all the other studies on DL, theresults can be considered as a further corroboration of the DL theory. Nonetheless, muchmore research on the structure and amount of noise with respect to the individuality of theathletes and their momentary physiological and emotional states is necessary.
Author Contributions: Data curation, J.A.; formal analysis, J.A.; funding acquisition, N.L.; inves-
tigation, J.A. and N.L.; methodology, J.A. and N.L.; project administration, J.A.; validation, J.A.;
visualization, J.A.; writing—original draft, J.A., S.P., T.F., J.F., W.I.S. and N.L.; writing—review and
editing, J.A., T.F., J.F., W.I.S. and N.L. All authors have read and agreed to the published version of
the manuscript.
Funding: This work was supported by the Foundation for Science and Technology (FCT, Portugal),
under the project: SFRH/BD/122259/2016 and UID04045/2020.
Institutional Review Board Statement: The present study was approved by the Institutional Research
Ethics Committee and conformed to the recommendations of the Declaration of Helsinki.University of
Trás-os-Montes and Alto Douro, UID04045/2020.
Informed Consent Statement: Informed consent was obtained from all subjects involved in the study.
Data Availability Statement: The data that support the findings of this study are available from the
corresponding author, J.A., upon reasonable request.
Conflicts of Interest: The authors declare no conflict of interest.
References
1. Ziv, G.; Lidor, R. Physical Attributes, Physiological Characteristics, On-Court Performances and Nutritional Strategies of Female
and Male Basketball Players. Sport Med. 2016, 39, 547–568. [CrossRef] [PubMed]
2. Rampinini, E.; Bishop, D.; Marcora, S.M.; Ferrari Bravo, D.; Sassi, R.; Impellizzeri, F.M. Validity of simple field tests as indicators
of match-related physical performance in top-level professional soccer players. Int. J. Sports Med. 2007, 28, 228–235. [CrossRef]
[PubMed]
3. Castagna, C.; Manzi, V.; D’Ottavio, S.; Annino, G.; Padua, E.; Bishop, D. Relation between maximal aerobic power and the ability
to repeat sprints in young basketball players. J. Strength Cond. Res. 2007, 21, 1172–1176. [PubMed]
35
Int. J. Environ. Res. Public Health 2021, 18, 12616
4. Gabbett, T.; King, T.; Jenkins, D. Applied physiology of rugby league. Sport Med. 2008, 38, 119–138. [CrossRef] [PubMed]
5. Conte, D.; Favero, T.G.; Lupo, C.; Francioni, F.M.; Capranica, L.; Tessitore, A. Time-motion analysis of Italian elite women’s
basketball games: Individual and team analyses. J. Strength Cond. Res. 2015, 29, 144–150. [CrossRef]
6. Stojanovic, E.; Stojiljkovic, N.; Scanlan, A.T.; Dalbo, V.J.; Berkelmans, D.M.; Milanovic, Z. The Activity Demands and Physiological
Responses Encountered During Basketball Match-Play: A Systematic Review. Sport Med. 2018, 48, 111–135. [CrossRef]
7. Fernando, P.B.; Suarez-Arrones, L.; Rodríguez-Rosell, D.; López-Segovia, M.; Jiménez-Reyes, P.; Bachero-Mena, B.; González-
Badillo, J.J. Evolution of determinant factors of repeated sprint ability. J. Hum. Kinet. 2016, 54, 115–126.
8. Arede, J.; Vaz, R.; Gonzalo-Skok, O.; Balsalobre-Fernandéz, C.; Varela-Olalla, D.; Madruga-Parera, M.; Leite, N. Repetitions in
reserve vs. maximum effort resistance training programs in youth female athletes. J. Sports Med. Phys. Fit. 2020, 60, 1231–1239.
[CrossRef]
9. Arede, J.; Gonzalo-Skok, O.; Bishop, C.; Schöllhorn, W.I.; Leite, N. Rotational flywheel training in youth female team sport
athletes: Could inter-repetition movement variability be beneficial? J. Sports Med. Phys. Fit. 2020, 60, 1444–1452. [CrossRef]
[PubMed]
10. Arede, J.; Vaz, R.; Francheschi, A.; Gonzalo-Skok, O.; Leite, N. Effects of a combined strength and conditioning training program
on physical abilities in adolescent male basketball players. J. Sports Med. Phys. Fit. 2019, 59, 1298–1305. [CrossRef]
11. Beato, M.; Coratella, G.; Bianchi, M.; Costa, E.; Merlini, M. Short-Term Repeated-Sprint Training (Straight Sprint vs. Changes of
Direction) in Soccer Players. J. Hum. Kinet. 2019, 70, 183–190. [CrossRef] [PubMed]
12. Zamparo, P.; Zadro, I.; Lazzer, S.; Beato, M.; Sepulcri, L. Energetics of shuttle runs: The effects of distance and change of direction.
Int. J. Sports Physiol. Perform. 2014, 9, 1033–1039. [CrossRef] [PubMed]
13. Spencer, M.; Bishop, D.; Dawson, B.; Goodman, C. Physiological and metabolic responses of repeated-sprint activities: Specific to
field-based team sports. Sport Med. 2005, 35, 1025–1044. [CrossRef]
14. Bishop, D.; Girard, O.; Mendez-Villanueva, A. Repeated-sprint ability part II: Recommendations for training. Sport Med. 2011, 41,
741–756. [CrossRef]
15. Schöllhorn, W. Application of system dynamic principles to technique and strength training. Acta Acad. Olymp. Est. 2000, 8,
67–85.
16. Bauer, H.; Schöllhorn, W. Self-Organizing Maps for the Analysis of Complex Movement Patterns. Neural Process. Lett. 1997, 5,
193–199. [CrossRef]
17. Schöllhorn, W.I.; Nigg, B.M.; Stefanyshyn, D.J.; Liu, W. Identification of individual walking patterns using time discrete and time
continuous data sets. Gait Posture 2002, 15, 180–186. [CrossRef]
18. Schöllhorn, W. Practical Consequences of Biomechanically Determined Individuality and Fluctuations on Motor Learning.
In Proceedings of the International Society of Biomechanics, Calgary, AB, Canada, 8–13 August 1999.
19. Haykin, S. Neural Network: A Comprehensive Foundation, 1st ed; McMaster University: Hamilton, ONT, Canada, 1994.
20. Catalano, J.F.; Kleiner, B.M. Distant Transfer in Coincident Timing as a Function of Variability of Practice. Percept. Mot. Ski. 1984,
58, 851–856. [CrossRef]
21. Janssen, D.; Schöllhorn, W.I.; Lubienetzki, J.; Fölling, K.; Kokenge, H.; Davids, K. Recognition of Emotions in Gait Patterns by
Means of Artificial Neural Nets. J. Nonverbal Behav. 2008, 32, 79–92. [CrossRef]
22. Janssen, D.; Schöllhorn, W.I.; Newell, K.M.; Jäger, J.M.; Rost, F.; Vehof, K. Diagnosing fatigue in gait patterns by support vector
machines and self-organizing maps. Hum. Mov. Sci. 2011, 30, 966–975. [CrossRef]
23. Burdack, J.; Horst, F.; Aragonés, D.; Eekhoff, A.; Schöllhorn, W.I. Fatigue-Related and Timescale-Dependent Changes in Individual
Movement Patterns Identified Using Support Vector Machine. Front. Psychol. 2020, 11, 2273. [CrossRef]
24. Schöllhorn, W.; Michelbrink, M.; Welminsiki, D.; Davids, K. Increasing Stochastic Perturbations Enhances Acquisition and
Learning of Complex Sport Movements. In Perspectives on Cognition and Action in Sport; Nova Science Publishers: Hauppauge,
NY, USA, 2009; pp. 59–73.
25. Buekers, M.J.A.; Magill, R.A.; Hall, K.G. The Effect of Erroneous Knowledge of Results on Skill Acquisition when Augmented
Information is Redundant. Q. J. Exp. Psychol. Sect. A 1992, 44, 105–117. [CrossRef]
26. Henz, D.; John, A.; Merz, C.; Schöllhorn, W.I. Post-task Effects on EEG Brain Activity Differ for Various Differential Learning and
Contextual Interference Protocols. Front. Hum. Neurosci. 2018, 12, 19. [CrossRef] [PubMed]
27. Schöllhorn, W.; Horst, F. Effects of complex movements on the brain as a result of increased decision-making. J. Complex. HealthSci. 2020, 2, 40–45.
28. Schöllhorn, W.I.; Beckmann, H.; Michelbrink, M.; Sechelmann, M.; Trockel, M.; Davids, K. Does noise provide a basis for the
unification of motor learning theories? Int. J. Sport Psychol. 2006, 37, 186–206.
29. Schöllhorn, W.; Röber, F.; Jaitner, T.; Hellstem, W.; Käubler, W. Discrete and continuous effects of traditional and differencial
sprint training. In Proceedings of the 6th Annual Congress of the European College of Sport Science, Cologne, Germany, 24–28
July 2001.
30. Feest, U. Why Replication Is Overrated. Philos. Sci. 2019, 86, 895–905. [CrossRef]
31. Davids, K.; Glazier, P.; Araújo, D.; Bartlett, R. Movement systems as dynamical systems: The functional role of variability and its
implications for sports medicine. Sport Med. 2003, 33, 245–260. [CrossRef]
32. Gaspar, A.; Santos, S.; Coutinho, D.; Gonçalves, B.; Sampaio, J.; Leite, N. Acute effects of differential learning on football kicking
performance and in countermovement jump. PLoS ONE 2019, 14, e0224280. [CrossRef]
36

Int. J. Environ. Res. Public Health 2021, 18, 12616
33. Fuchs, P.X.; Fusco, A.; Bell, J.W.; von Duvillard, S.P.; Cortis, C.; Wagner, H. Effect of differential training on female volleyball
spike-jump technique and performance. Int. J. Sports Physiol. Perform. 2020, 15, 1019–1025. [CrossRef]
34. Fuchs, P.X.; Fusco, A.; Cortis, C.; Wagner, H. Effects of Differential Jump Training on Balance Performance in Female Volleyball
Players. Appl. Sci. 2020, 10, 5921. [CrossRef]
35. Coutinho, D.; Santos, S.; Gonçalves, B.; Travassos, B.; Wong, P.; Schöllhorn, W.; Sampaio, J. The effects of an enrichment training
program for youth football attackers. PLoS ONE 2018, 13, e0199008. [CrossRef]
36. National Strength and Conditioning Association. Essentials of Strength Training and Conditioning, 4th ed.; Haff, G., Triplett, T., Eds.;
Human Kinetics: Champaign, IL, USA, 2016.
37. Schöllhorn, W. The Nonlinear Nature of Learning-A Differential Learning Approach. Open Sports Sci. J. 2012, 5, 100–112.
[CrossRef]
38. Kunugi, S.; Masunari, A.; Koumura, T.; Fujimoto, A. Altered lower limb kinematics and muscle activities in soccer players with
chronic ankle instability. Phys. Ther. Sport 2018, 34, 28–35. [CrossRef] [PubMed]
39. Nimphius, S.; Callaghan, S.J.; Spiteri, T.; Lockie, R.G. Change of Direction Deficit: A More Isolated Measure of Change of Direction
Performance Than Total 505 Time. J. Strength Cond. Res. 2016, 30, 3024–3032. [CrossRef] [PubMed]
40. Bishop, C.; Read, P.; Lake, J.; Chavda, S.; Turner, A. Inter-limb asymmetries: Understanding how to calculate differences from
bilateral and unilateral tests. Strength Cond. J. 2018, 40, 1–6. [CrossRef]
41. Koo, T.K.; Li, M.Y. A Guideline of Selecting and Reporting Intraclass Correlation Coefficients for Reliability Research. J. Chiropr.Med. 2016, 15, 155–163. [CrossRef] [PubMed]
42. Cormack, S.; Newton, R.U.; McGuigan, M.R.; Doyle, T.L.A. Reliability of Measures Obtained During Single and Repeated
Countermovement Jumps. Int. J. Sports Physiol. Perform. 2008, 3, 131–144. [CrossRef]
43. Marôco, J. Análise Estatística com o SPSS Statistics, 6a ed.; Pêro Pinheiro: Report Number: Análise e Gestão da Informacão; Edições
Sílabo: Lisbon, Portugal, 2014.
44. Hopkins, W.; Marshall, S.W.; Batterham, A.M.; Hanin, J. Progressive Statistics for Studies in Sports Medicine and Exercise Science.
Med. Sci. Sports Exerc. 2009, 41, 3–13. [CrossRef]
45. Ferguson, C.J. An Effect Size Primer: A Guide for Clinicians and Researchers. Prof. Psychol. Res. Pract. 2009, 40, 532–538.
[CrossRef]
46. Lakens, D. Calculating and reporting effect sizes to facilitate cumulative science: A practical primer for t -tests and ANOVAs.
Front Psychol. 2013, 4, 1–12. [CrossRef]
47. Schöllhorn, W.I. Individualität—Ein vernachlässigter Parameter? Leistungssport 1999, 29, 5–12.
48. Horst, F.; Janssen, D.; Beckmann, H.; Schöllhorn, W.I. Can Individual Movement Characteristics Across Different Throwing
Disciplines Be Identified in High-Performance Decathletes? Front. Psychol. 2020, 11, 2262. [CrossRef]
49. Schöllhorn, W. Biomechanische Einzelfallanalyse im Diskuswur. Leistungssport 1993, 23, 55–58.
50. Henz, D.; Schöllhorn, W.I. Differential Training Facilitates Early Consolidation in Motor Learning. Front. Hum. Neurosci. 2016,
10, 199. [CrossRef]
51. Pickering, C.; Kiely, J. Do Non-Responders to Exercise Exist—and If So, What Should We Do About Them? Sport Med. 2019, 49,
1–7. [CrossRef] [PubMed]
52. Kulakowski, E.; Lockie, R.G.; Johnson, Q.R.; Lindsay, K.G.; Dawes, J.J. Relationships of Lower-body Power Measures to Sprint
and Change of Direction Speed among NCAA Division II Women’s Lacrosse Players: An Exploratory Study. Int. J. Exerc. Sci.2020, 13, 1667–1676. [PubMed]
53. Horst, F.; Rupprecht, C.; Schmitt, M.; Hegen, P.; Schöllhorn, W.I. Muscular Activity in Conventional and Differential Back Squat
Exercise. In Book of Abstracts 20th Annual Congress of the European College of Sport Science, Malmö, Sweden, 24–27 June 2015; European
College of Sport Science: Malmö, Sweden, 2016.
54. Shea, C.H.; Kohl, R.M. Specificity and variability of practice. Res. Q. Exerc. Sport 1990, 61, 169–177. [CrossRef]
55. Michelbrink, M.; Schöllhorn, W. Differencial learning and random walk analysis in human posture. Gait Posture 2005, 21, 148–149.
[CrossRef]
56. Barbieri, F.A.; Rodrigues, S.T.; Polastri, P.F.; Barbieri, R.A.; de Paula, P.H.A.; Milioni, F.; Redkva, P.E.; Zagatto, A.M. High intensity
repeated sprints impair postural control, but with no effects on free throwing accuracy, in under-19 basketball players. Hum. Mov.Sci. 2017, 54, 191–196. [CrossRef]
57. Schöllhorn, W.I. Invited commentary: Differential learning is different from contextual interference learning. Hum. Mov. Sci. 2016,
47, 240–245. [CrossRef]
58. Soria-Grila, M.; Chirosa, I.J.; Bautista, I.J.; Baena, S.; Chirosa, L.J. Effects of variable resistance training on maximal strength:
A meta-analysis. J. Strength Cond. Res. 2015, 29, 3260–3270. [CrossRef]
59. Dos’Santos, T.; Thomas, C.; Jones, P.; Comfort, P. Mechanical determinants of faster change of direction speed perforamance in
male athletes. J. Strength Cond. Res. 2017, 31, 696–705. [CrossRef] [PubMed]
60. Spiteri, T.; Newton, R.U.; Binetti, M.; Hart, N.; Sheppard, J.M.; Nimphius, S. Mechanical determinants of faster change of direction
and agility performance in female basketball athletes. J. Strength Cond. Res. 2015, 29, 2205–2214. [CrossRef] [PubMed]
61. Stevinson, C.; Plateau, C.R.; Plunkett, S.; Fitzpatrick, E.J.; Ojo, M.; Moran, M.; Clemes, S.A. Adherence and Health-Related
Outcomes of Beginner Running Programs: A 10-Week Observational Study. Res. Q. Exerc. Sport 2020, 1–9. [CrossRef] [PubMed]
37

Int. J. Environ. Res. Public Health 2021, 18, 12616
62. Santos, S.; Coutinho, D.; Gonçalves, B.; Schöllhorn, W.; Sampaio, J.; Leite, N. Differential Learning as a Key Training Approach to
Improve Creative and Tactical Behavior in Soccer. Res. Q. Exerc. Sport 2018, 89, 11–24. [CrossRef]
63. John, A.; Schöllhorn, W.I. Acute Effects of Instructed and Self-Created Variable Rope Skipping on EEG Brain Activity and Heart
Rate Variability. Front. Behav. Neurosci. 2018, 12, 311. [CrossRef] [PubMed]
64. Henz, D.; Schöllhorn, W.I. Dynamic Office Environments Improve Brain Activity and Attentional Performance Mediated by
Increased Motor Activity. Front. Hum. Neurosci. 2019, 13, 121. [CrossRef]
65. Neyman, J.; Pearson, E.S. On the Problem of the Most Efficient Tests of Statistical Hypotheses. In Breakthroughs in Statistics; Kotz,
S., Johnson, N.L., Eds.; Springer: New York, NY, USA, 1992; pp. 73–108.
66. Nuzzo, R. Scientific method: Statistical errors. Nature 2014, 506, 150–152. [CrossRef]
67. Mosston, M.; Ashworth, S.; Block, B. Teaching Physical Education, 5th ed.; Benjamin Cummings: Boston, MA, USA, 2008.
38

International Journal of
Environmental Research
and Public Health
Article
Local and Remote Ischemic Preconditioning Improves SprintInterval Exercise Performance in Team Sport Athletes
Ching-Feng Cheng 1,2,*,† , Yu-Hsuan Kuo 3,† , Wei-Chieh Hsu 2,4, Chu Chen 2,5 and Chi-Hsueh Pan 2,5
�����������������
Citation: Cheng, C.-F.; Kuo, Y.-H.;
Hsu, W.-C.; Chen, C.; Pan, C.-H. Local
and Remote Ischemic Preconditioning
Improves Sprint Interval Exercise
Performance in Team Sport Athletes.
Int. J. Environ. Res. Public Health 2021,
18, 10653. https://doi.org/10.3390/
ijerph182010653
Academic Editors: Bruno Gonçalves,
Jorge Bravo and Hugo Folgado
Received: 20 September 2021
Accepted: 8 October 2021
Published: 12 October 2021
Publisher’s Note: MDPI stays neutral
with regard to jurisdictional claims in
published maps and institutional affil-
iations.
Copyright: © 2021 by the authors.
Licensee MDPI, Basel, Switzerland.
This article is an open access article
distributed under the terms and
conditions of the Creative Commons
Attribution (CC BY) license (https://
creativecommons.org/licenses/by/
4.0/).
1 Department of Athletic Performance, National Taiwan Normal University, Taipei 11677, Taiwan2 Sports Performance Lab, National Taiwan Normal University, Taipei 11677, Taiwan;
[email protected] (W.-C.H.); [email protected] (C.C.); [email protected] (C.-H.P.)3 Department of Physical Education, Chinese Culture University, Taipei 11114, Taiwan;
[email protected] Graduate Institute of Sports Training, University of Taipei, Taipei 11153, Taiwan5 Department of Physical Education and Sport Sciences, National Taiwan Normal University,
Taipei 10610, Taiwan
* Correspondence: [email protected]; Tel.: +886-277496831
† C.-F.C. and Y.-H.K. contributed equally to this work.
Abstract: The aim of this study was to investigate the effects of local (LIPC) and remote (RIPC)
ischemic preconditioning on sprint interval exercise (SIE) performance. Fifteen male collegiate
basketball players underwent a LIPC, RIPC, sham (SHAM), or control (CON) trial before conducting
six sets of a 30-s Wingate-based SIE test. The oxygen uptake and heart rate were continuously
measured during SIE test. The total work in the LIPC (+2.2%) and RIPC (+2.5%) conditions was
significantly higher than that in the CON condition (p < 0.05). The mean power output (MPO) at the
third and fourth sprint in the LIPC (+4.5%) and RIPC (+4.9%) conditions was significantly higher
than that in the CON condition (p < 0.05). The percentage decrement score for MPO in the LIPC and
RIPC condition was significantly lower than that in the CON condition (p < 0.05). No significant
interaction effects were found in pH and blood lactate concentrations. There were no significant
differences in the accumulated exercise time at ≥80%, 90%, and 100% of maximal oxygen uptake
during SIE. Overall, both LIPC and RIPC could improve metabolic efficiency and performance during
SIE in athletes.
Keywords: anaerobic capacity; blood flow occlusion; fatigue resistance; high-intensity interval
training
1. Introduction
In 2010, de Groot et al. [1] extended the concept of ischemic preconditioning (IPC),which involves brief cycles of ischemia and reperfusion, from the medical field to thesports science field, and discovered that IPC could help increase maximal oxygen uptake
(.
VO2max). Since then, many studies have explored the benefits and possible mechanismsof IPC on sports performance. IPC can be divided into local (LIPC) and remote (RIPC)ischemic preconditioning according to its location of function. The difference betweenthe two approaches is whether blood flow is occluded in the same muscle group that issubsequently used during exercise. For example, for cycling exercise, LIPC refers to appli-cation of blood flow occlusion to the legs, whereas RIPC refers to application of blood flowocclusion to the arms. At present, it is thought that both LIPC and RIPC may improve func-tioning of the mitochondrial ATP-dependent potassium channel, attenuate ATP depletion,promote phosphocreatine (PCr) resynthesis, enhance metabolic efficiency, and increasevasodilation, oxygen delivery and extraction, thereby enhancing subsequent enduranceperformance [2,3]. However, the acute effect of IPC on the performance of repeated orinterval sprints, in which aerobic contribution is predominant [4], remains controversial.
39

Int. J. Environ. Res. Public Health 2021, 18, 10653
Some studies have suggested that LIPC can improve subsequent repeated sprintperformance, including the 12 × 6-s cycling sprint [5], 3 × (6 × [15 + 15-m]) shuttlesprints [6], and 6 × 50-m swimming sprint [7]. However, others have reported the opposite,i.e., that for repeated sprints with a short overall exercise time, including 5 × 6-s [8]and 10 × 6-s cycling sprints [9], LIPC does not enhance performance. Alternatively,application of LIPC to single short-duration sprints, such as 10–30-m sprints, revealedno obvious benefits [10,11]. Some studies have indicated that LIPC may be beneficialonly in single sprints powered by glycolysis, such as 50-m swimming sprint [12] and 60-scycling sprints [13]. In contrast, a study by Paixao et al. [14] has reported that LIPC cannotimprove the power output of three sets of 30-s Wingate-based sprint with 10-min restintervals. During a single 30-s Wingate-based sprint, PCr availability can be restored to65% of the rest value after 1.5 min of post-exercise rest, or 86% after 6 min of post-exerciserest [15]. Therefore, LIPC cannot enhance the performance of repeated 30-s Wingate-basedsprints, probably because most PCr availability can be restored through passive recoveryduring long rest intervals. It would be relevant to explore whether LIPC can improve theperformance of the subsequent 4–6 sets of 30-s Wingate-based sprint interval exercise (SIE)with short (4-min) rest intervals, as it is an exercise intervention commonly adopted toimprove aerobic capacity and performance in untrained and trained individuals [16].
For the RIPC research, some studies have suggested that RIPC does not enhanceaerobic or anaerobic performance in exercises such as the 1-h cycling time trial [17], 7 × 200-m incremental swimming test [18], and 6 × 6-s and 30-s cycling sprint [19]. On the otherhand, others have reported that RIPC can help to shorten the time needed for swimming100 m [18] and can extend the time to task failure during handgrip exercise [20]. Morerecent studies have indicated that RIPC can increase the number of repetitions and totaltraining volume during resistance exercise [21,22]. Kraus et al. [23] pointed out that RIPCof bilateral rather than unilateral upper limbs can increase the power output during foursets of 30-s Wingate-based SIE. They also suggested that inconsistent results may be relatedto the number of muscle groups involved during the application of IPC. Therefore, whetherthe acute effect of LIPC on the performance of SIE is superior to that of RIPC requiresfurther clarification.
For team-sport athletes, sprint and high-intensity interval training programs havebeen shown to be effective approaches to enhance aerobic capacity and performance [24].Coaches and sports scientists often find ways to further improve training quality andtraining adaptation. Therefore, the purpose of this study was to investigate the acute effectsof LIPC and RIPC on SIE performance in athletes. We hypothesized that both LIPC andRIPC could improve SIE performance, in terms of both power output and fatigue resistance,and that LIPC would be more effective than RIPC in this respect. We also hypothesizedthat LIPC and RIPC could increase metabolic efficiency during SIE.
2. Materials and Methods
2.1. Participants
Fifteen male Division I collegiate basketball players (age 21 ± 2 years; height 1.87 ± 0.08 m;
body mass 86 ± 13 kg;.
VO2max, 51.9 ± 7.8 mL·kg−1·min−1; blood pressure 126/68 mmHg)were recruited to complete this repeated measured crossover study. The priori poweranalysis (G*Power 3.1.9.4) was used to calculate the appropriate sample size. Based ona previous meta-analysis study [3] on the overall impact of IPC on exercise performance(effect size = 0.43), the minimum sample size of n = 9 was required for this study (α = 0.05,β = 0.20). All participants completed a medical history and health questionnaire, andsigned informed consent forms before participating in the experiment. The participantsrefrained from drinking alcoholic or caffeinated beverages for 24 h before the experimentsbegan and fasted for at least 4 h prior to visiting the laboratory, in order to reduce the inter-ference of food in the experiment. The study was conducted according to the guidelines ofthe Declaration of Helsinki, and approved by the Research Ethics Committee of NationalTaiwan Normal University, Taipei, Taiwan (Approval code: 201612HM010).
40
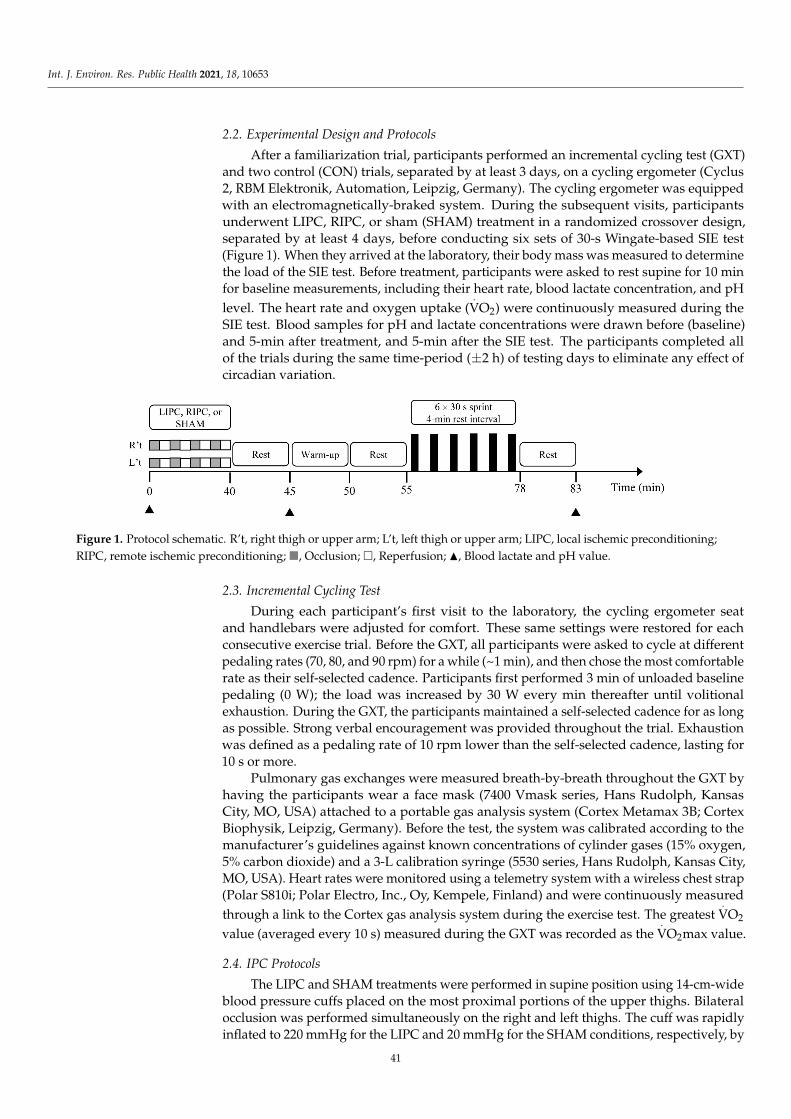
Int. J. Environ. Res. Public Health 2021, 18, 10653
2.2. Experimental Design and Protocols
After a familiarization trial, participants performed an incremental cycling test (GXT)and two control (CON) trials, separated by at least 3 days, on a cycling ergometer (Cyclus2, RBM Elektronik, Automation, Leipzig, Germany). The cycling ergometer was equippedwith an electromagnetically-braked system. During the subsequent visits, participantsunderwent LIPC, RIPC, or sham (SHAM) treatment in a randomized crossover design,separated by at least 4 days, before conducting six sets of 30-s Wingate-based SIE test(Figure 1). When they arrived at the laboratory, their body mass was measured to determinethe load of the SIE test. Before treatment, participants were asked to rest supine for 10 minfor baseline measurements, including their heart rate, blood lactate concentration, and pH
level. The heart rate and oxygen uptake (.
VO2) were continuously measured during theSIE test. Blood samples for pH and lactate concentrations were drawn before (baseline)and 5-min after treatment, and 5-min after the SIE test. The participants completed allof the trials during the same time-period (±2 h) of testing days to eliminate any effect ofcircadian variation.
.V
■ □ ▲
Figure 1. Protocol schematic. R’t, right thigh or upper arm; L’t, left thigh or upper arm; LIPC, local ischemic preconditioning;
RIPC, remote ischemic preconditioning; �, Occlusion; �, Reperfusion; N, Blood lactate and pH value.
2.3. Incremental Cycling Test
During each participant’s first visit to the laboratory, the cycling ergometer seatand handlebars were adjusted for comfort. These same settings were restored for eachconsecutive exercise trial. Before the GXT, all participants were asked to cycle at differentpedaling rates (70, 80, and 90 rpm) for a while (~1 min), and then chose the most comfortablerate as their self-selected cadence. Participants first performed 3 min of unloaded baselinepedaling (0 W); the load was increased by 30 W every min thereafter until volitionalexhaustion. During the GXT, the participants maintained a self-selected cadence for as longas possible. Strong verbal encouragement was provided throughout the trial. Exhaustionwas defined as a pedaling rate of 10 rpm lower than the self-selected cadence, lasting for10 s or more.
Pulmonary gas exchanges were measured breath-by-breath throughout the GXT byhaving the participants wear a face mask (7400 Vmask series, Hans Rudolph, KansasCity, MO, USA) attached to a portable gas analysis system (Cortex Metamax 3B; CortexBiophysik, Leipzig, Germany). Before the test, the system was calibrated according to themanufacturer’s guidelines against known concentrations of cylinder gases (15% oxygen,5% carbon dioxide) and a 3-L calibration syringe (5530 series, Hans Rudolph, Kansas City,MO, USA). Heart rates were monitored using a telemetry system with a wireless chest strap(Polar S810i; Polar Electro, Inc., Oy, Kempele, Finland) and were continuously measured
through a link to the Cortex gas analysis system during the exercise test. The greatest.
VO2
value (averaged every 10 s) measured during the GXT was recorded as the.
VO2max value.
2.4. IPC Protocols
The LIPC and SHAM treatments were performed in supine position using 14-cm-wideblood pressure cuffs placed on the most proximal portions of the upper thighs. Bilateralocclusion was performed simultaneously on the right and left thighs. The cuff was rapidlyinflated to 220 mmHg for the LIPC and 20 mmHg for the SHAM conditions, respectively, by
41

Int. J. Environ. Res. Public Health 2021, 18, 10653
means of a cuff inflator (CK-113P, Spirit Corp, Taipei, Taiwan). Absolute cuff pressure wasused in SHAM to allow direct comparison with relevant studies [5,12–14]. This occlusionprocedure was repeated 4 times, each separated by 5 min of reperfusion, as this protocol hasbeen successfully applied in previous studies investigating the ergogenic effects of LIPCon exercise performance [5,6,13]. In RIPC treatment, the same blood pressure cuffs wereplaced bilaterally on the proximal parts of upper arms. Both cuffs were simultaneouslyinflated to 30 mmHg above systolic arterial pressure for 5 min, followed by 5 min deflation.The average cuff pressure in RIPC was 156 ± 7 mmHg. The cuffs were inflated and deflated4 times in total, according with a previous study about the effect of RIPC on four sets of30-s Wingate-based SIE performance [23]. In CON treatment, participants performed a5-min standardized warm-up followed by a 5-min passive rest without any blood occlusionbefore SIE test.
2.5. Wingate-Based 6 × 30-s Sprint Interval Exercise
Prior to each trial, all participants performed a standardized warm-up comprising5 min of submaximal cycling at 50 W (60–75 rpm), in which three bouts of maximalaccelerations (approximately 5 s) at the end of the second, third and fourth minutes wereperformed. After the warm-up, participants rested for 5 min on the cycle ergometer. TheSIE protocol involved participants to complete six sets (S1–S6) of 30-s Wingate-based SIEwith a 4-min rest interval against the given load ([0.7 × body mass]/0.173) as fast aspossible [25]. Thirty seconds before starting each sprint, participants were informed to rideat a moderate pedal cadence (50–60 rpm), from a seated position. Ten seconds before theinitiation of each sprint, participants were instructed to increase pedaling rate to 80–85 rpmuntil given the signal to start pedaling maximally. During the last 2 s of the recoveryperiod, participants were required to increase the pedaling rate to over 100 rpm (0 N) forthe convenience of the subsequent 30-s cycling sprint test. At the end of the sprint, theparticipants remained seated on the bike for recovering between sets. Participants weregiven strong verbal encouragement by the same researchers throughout the entire trial.
The total work, peak (PPO) and mean (MPO) power outputs, and percentage decre-ment score (100 − [{total sprint power outputs/ideal sprint power outputs} × 100]) werecalculated at each cycling sprint. The total sprint power was calculated as the sum of thepeak/mean power outputs from all sprints. The ideal sprint power was defined as thenumber of sprints × highest peak/mean power output. The accumulated exercise time at
≥80%, 90%, and 100%.
VO2max were also calculated during SIE.
2.6. Blood Sampling and Analysis
Capillary blood samples were taken by ear lobe puncture to evaluate lactate concen-trations. The first blood samples were discarded, and the second blood samples (ca. 0.3 µL)were used to analyze the lactate concentrations using a lactate chemistry analyzer (LactatePro2, Arkray, Inc., Kyoto, Japan). To measure blood pH values, whole blood samples(ca. 1 mL) were drawn from an antecubital venous catheter and assessed by a blood gasanalyzer (OPTI CCA-TS; OPTI Medical System, Inc., Roswell, GA, USA).
2.7. Statistical Analysis
The Shapiro–Wilk normality test was performed to determine the homogeneity of thesample. The performance data (total work, PPO, MPO, percentage decrement score, andaccumulated exercise time), blood lactate and pH values were assessed using repeated-measures ANOVA. The LSD post-hoc test was applied if a significant difference wasfound. The effect size (Cohen’s d) was calculated by dividing the difference betweenthe mean values of the conditions by the pooled SD. Cohen’s d of <0.5, 0.5–0.79, and≥0.8 were considered as small, moderate, and large effects, respectively. The intraclasscorrelation coefficient (ICC) was used to assess the test–retest reliability of the SIE testin CON conditions. Statistical significance was set at p < 0.05 and all procedures wereconducted using SPSS for Windows (Version 17, IBM SPSS Inc., Chicago, IL USA).
42
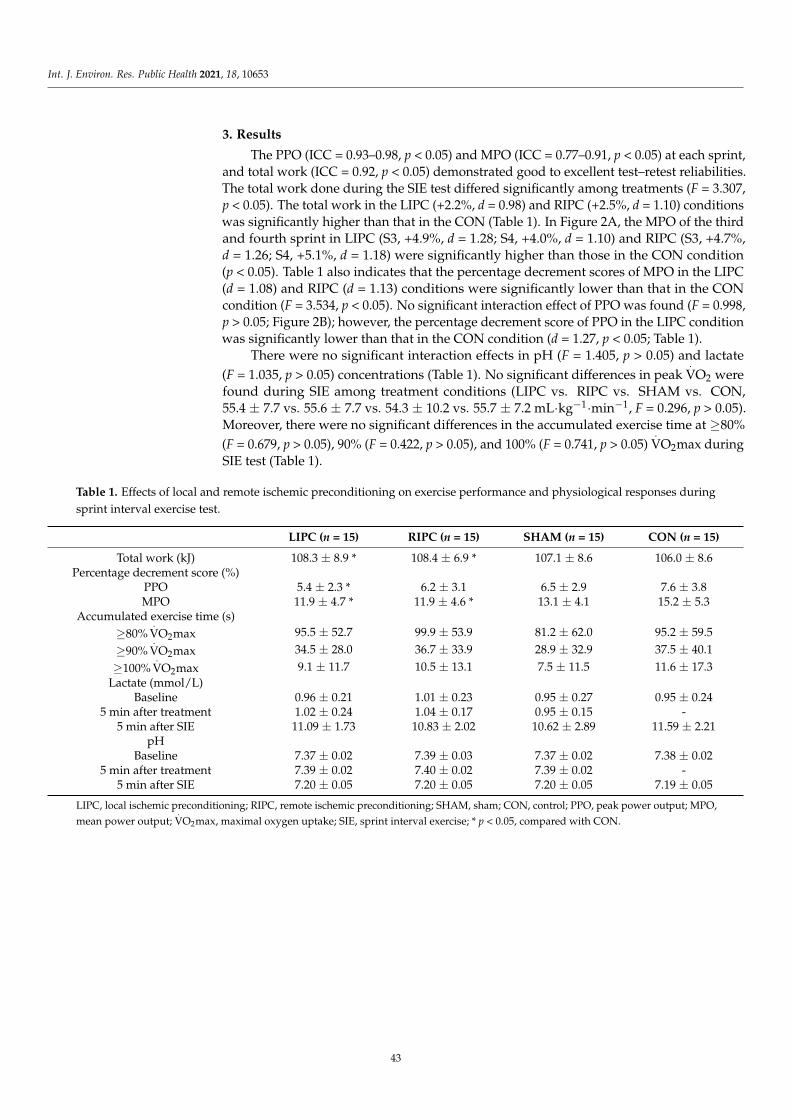
Int. J. Environ. Res. Public Health 2021, 18, 10653
3. Results
The PPO (ICC = 0.93–0.98, p < 0.05) and MPO (ICC = 0.77–0.91, p < 0.05) at each sprint,and total work (ICC = 0.92, p < 0.05) demonstrated good to excellent test–retest reliabilities.The total work done during the SIE test differed significantly among treatments (F = 3.307,p < 0.05). The total work in the LIPC (+2.2%, d = 0.98) and RIPC (+2.5%, d = 1.10) conditionswas significantly higher than that in the CON (Table 1). In Figure 2A, the MPO of the thirdand fourth sprint in LIPC (S3, +4.9%, d = 1.28; S4, +4.0%, d = 1.10) and RIPC (S3, +4.7%,d = 1.26; S4, +5.1%, d = 1.18) were significantly higher than those in the CON condition(p < 0.05). Table 1 also indicates that the percentage decrement scores of MPO in the LIPC(d = 1.08) and RIPC (d = 1.13) conditions were significantly lower than that in the CONcondition (F = 3.534, p < 0.05). No significant interaction effect of PPO was found (F = 0.998,p > 0.05; Figure 2B); however, the percentage decrement score of PPO in the LIPC conditionwas significantly lower than that in the CON condition (d = 1.27, p < 0.05; Table 1).
There were no significant interaction effects in pH (F = 1.405, p > 0.05) and lactate
(F = 1.035, p > 0.05) concentrations (Table 1). No significant differences in peak.
VO2 werefound during SIE among treatment conditions (LIPC vs. RIPC vs. SHAM vs. CON,55.4 ± 7.7 vs. 55.6 ± 7.7 vs. 54.3 ± 10.2 vs. 55.7 ± 7.2 mL·kg−1·min−1, F = 0.296, p > 0.05).Moreover, there were no significant differences in the accumulated exercise time at ≥80%
(F = 0.679, p > 0.05), 90% (F = 0.422, p > 0.05), and 100% (F = 0.741, p > 0.05).
VO2max duringSIE test (Table 1).
Table 1. Effects of local and remote ischemic preconditioning on exercise performance and physiological responses during
sprint interval exercise test.
LIPC (n = 15) RIPC (n = 15) SHAM (n = 15) CON (n = 15)
Total work (kJ) 108.3 ± 8.9 * 108.4 ± 6.9 * 107.1 ± 8.6 106.0 ± 8.6Percentage decrement score (%)
PPO 5.4 ± 2.3 * 6.2 ± 3.1 6.5 ± 2.9 7.6 ± 3.8MPO 11.9 ± 4.7 * 11.9 ± 4.6 * 13.1 ± 4.1 15.2 ± 5.3
Accumulated exercise time (s)
≥80%.
VO2max 95.5 ± 52.7 99.9 ± 53.9 81.2 ± 62.0 95.2 ± 59.5
≥90%.
VO2max 34.5 ± 28.0 36.7 ± 33.9 28.9 ± 32.9 37.5 ± 40.1
≥100%.
VO2max 9.1 ± 11.7 10.5 ± 13.1 7.5 ± 11.5 11.6 ± 17.3
Lactate (mmol/L)Baseline 0.96 ± 0.21 1.01 ± 0.23 0.95 ± 0.27 0.95 ± 0.24
5 min after treatment 1.02 ± 0.24 1.04 ± 0.17 0.95 ± 0.15 -5 min after SIE 11.09 ± 1.73 10.83 ± 2.02 10.62 ± 2.89 11.59 ± 2.21
pHBaseline 7.37 ± 0.02 7.39 ± 0.03 7.37 ± 0.02 7.38 ± 0.02
5 min after treatment 7.39 ± 0.02 7.40 ± 0.02 7.39 ± 0.02 -5 min after SIE 7.20 ± 0.05 7.20 ± 0.05 7.20 ± 0.05 7.19 ± 0.05
LIPC, local ischemic preconditioning; RIPC, remote ischemic preconditioning; SHAM, sham; CON, control; PPO, peak power output; MPO,
mean power output;.
VO2max, maximal oxygen uptake; SIE, sprint interval exercise; * p < 0.05, compared with CON.
43
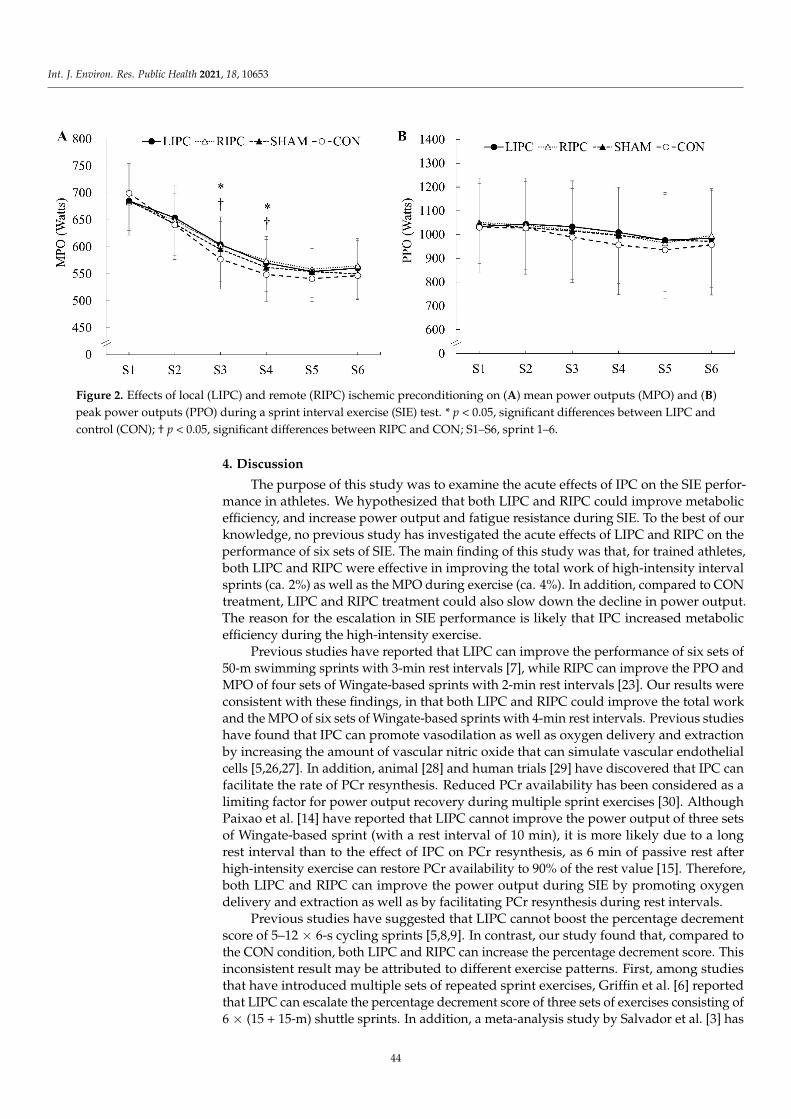
Int. J. Environ. Res. Public Health 2021, 18, 10653
.V
.V
− −
≥.
V
Figure 2. Effects of local (LIPC) and remote (RIPC) ischemic preconditioning on (A) mean power outputs (MPO) and (B)
peak power outputs (PPO) during a sprint interval exercise (SIE) test. * p < 0.05, significant differences between LIPC and
control (CON); † p < 0.05, significant differences between RIPC and CON; S1–S6, sprint 1–6.
4. Discussion
The purpose of this study was to examine the acute effects of IPC on the SIE perfor-mance in athletes. We hypothesized that both LIPC and RIPC could improve metabolicefficiency, and increase power output and fatigue resistance during SIE. To the best of ourknowledge, no previous study has investigated the acute effects of LIPC and RIPC on theperformance of six sets of SIE. The main finding of this study was that, for trained athletes,both LIPC and RIPC were effective in improving the total work of high-intensity intervalsprints (ca. 2%) as well as the MPO during exercise (ca. 4%). In addition, compared to CONtreatment, LIPC and RIPC treatment could also slow down the decline in power output.The reason for the escalation in SIE performance is likely that IPC increased metabolicefficiency during the high-intensity exercise.
Previous studies have reported that LIPC can improve the performance of six sets of50-m swimming sprints with 3-min rest intervals [7], while RIPC can improve the PPO andMPO of four sets of Wingate-based sprints with 2-min rest intervals [23]. Our results wereconsistent with these findings, in that both LIPC and RIPC could improve the total workand the MPO of six sets of Wingate-based sprints with 4-min rest intervals. Previous studieshave found that IPC can promote vasodilation as well as oxygen delivery and extractionby increasing the amount of vascular nitric oxide that can simulate vascular endothelialcells [5,26,27]. In addition, animal [28] and human trials [29] have discovered that IPC canfacilitate the rate of PCr resynthesis. Reduced PCr availability has been considered as alimiting factor for power output recovery during multiple sprint exercises [30]. AlthoughPaixao et al. [14] have reported that LIPC cannot improve the power output of three setsof Wingate-based sprint (with a rest interval of 10 min), it is more likely due to a longrest interval than to the effect of IPC on PCr resynthesis, as 6 min of passive rest afterhigh-intensity exercise can restore PCr availability to 90% of the rest value [15]. Therefore,both LIPC and RIPC can improve the power output during SIE by promoting oxygendelivery and extraction as well as by facilitating PCr resynthesis during rest intervals.
Previous studies have suggested that LIPC cannot boost the percentage decrementscore of 5–12 × 6-s cycling sprints [5,8,9]. In contrast, our study found that, compared tothe CON condition, both LIPC and RIPC can increase the percentage decrement score. Thisinconsistent result may be attributed to different exercise patterns. First, among studiesthat have introduced multiple sets of repeated sprint exercises, Griffin et al. [6] reportedthat LIPC can escalate the percentage decrement score of three sets of exercises consisting of6 × (15 + 15-m) shuttle sprints. In addition, a meta-analysis study by Salvador et al. [3] has
44

Int. J. Environ. Res. Public Health 2021, 18, 10653
indicated that, while IPC may have a >99% and a 57.9% chance of benefiting aerobic (>90 s)and anaerobic (10–90 s) exercise performance, respectively, its effect on the performance ofsprints with a duration of less than 10 s is negligible. Similarly, other studies have pointedout that LIPC cannot improve the performance of 10–30 m sprints [10,11], while RIPCcannot enhance the power output and the fatigue index of a single 30-s Wingate sprint [19].However, LIPC has been shown to improve the power output of both 60 s [13] and 3 minall-out [31] cycling sprint. Therefore, it appears that IPC can only facilitate repeated sprintexercises, with an extended single exercise time or total exercise time. Second, some studieshave found that, for SIE, neither LIPC [14] nor RIPC [23] can consistently improve thefatigue index of every single 30-s Wingate sprint, in contradiction to our results. This ispossibly due to different calculation methods, as these studies [14,23] only calculated theindividual fatigue index of each sprint. As mentioned earlier, LIPC and RIPC can increasethe total work as well as the percentage decrement score, thereby improving the fatigueresistance of SIE. Although this is probably associated with the promotion of muscle bloodflow and PCr resynthesis during the rest interval, further research is required to explorethe physiological and biochemical effects of LIPC and RIPC on the rest interval of SIE.
For further improvement in cardiopulmonary endurance, the exercise protocols mustallow athletes to work for as much time as possible at an intensity close to or very close
to.
VO2max to expand the stimulating effect on the cardiopulmonary system [32]. Thepresent study revealed that, compared to the CON condition, LIPC and RIPC did notchange the accumulated time spent at high-intensity during SIE, and did not alter the bloodlactate concentration or the H+ concentration post-SIE. This is consistent with the results ofprevious studies, which reported that the blood lactate concentration remains the sameafter high-intensity exercise if LIPC or RIPC is adopted [5–8,14,23,31]. Thus, LIPC andRIPC can improve the total work and the fatigue resistance of SIE without contributingto the acidic environment in the body, which indicates that LIPC and RIPC can improvethe metabolic efficiency of SIE. Similarly, Incognito et al. [2] reported that, by increasingmetabolic efficiency, IPC can improve the performance of subsequent exercises. Since LIPCand RIPC can escalate metabolic efficiency and total work, they can strengthen the trainingquality of a sprint interval training (SIT) program. This finding has partly supported theresult of a study conducted by Paradis-Deschênes et al. [33], who found that the inclusionof LIPC in a 4-week SIT program could improve the aerobic and anaerobic performance ofendurance athletes. However, at present, there has been no research on the chronic effect ofRIPC interventions. Based on the results of this study, the inclusion of RIPC in the long-termSIT program in future studies is expected to provide additional adaptation benefits.
One limitation of this study was that participants were not completely blinded duringthe study. The presence of the placebo effect in IPC experiments remains controversial,with some studies finding [34,35] and others not findings evidence for this [7,36]. Theuse of placebo is a standard control component of most clinical trials, and it attemptsto clarify the potential effect of treatment. It should be noted that a placebo effect relieson the assumption that participants believe (through conscious or unconscious cues)an intervention will change outcomes [37]. In general, previous IPC studies used low-pressure control conditions (e.g., 20 mmHg) as placebo conditions [5,12–14]. Although wedid not inform participants which intervention we thought could improve their exerciseperformance, the participants could still distinguish the pressure difference between IPCand SHAM. The study of Marocolo et al. [35], who informed participants that both IPCand SHAM (20 mmHg cuff pressure) can increase exercise performance before startingthe experiment, found that compared with CON, both IPC and SHAM could significantlyincrease the number of repetitions during the leg extension exercise. However, the study byFerreira et al. [7], who told participants that both IPC and SHAM can enhance performanceprior to experiment, using 1-min blood flow occlusions (200 mmHg cuff pressure) as SHAMto simulate the potential nocebo effect of IPC. The results indicated that SHAM inducedsimilar levels of discomfort to IPC but comparable exercise performance outcomes to theCON [7]. In the study of Cheung et al. [36], they informed participants that the effects
45

Int. J. Environ. Res. Public Health 2021, 18, 10653
of IPC and SHAM on exercise performance were unclear before starting the study, andused the therapeutic ultrasound procedure as SHAM condition. They reported that 69%of participants believed that IPC would hinder exercise performance, whereas SHAMultrasound could improve performance [36]. Nevertheless, the results indicated that onlyIPC could significantly increase time to exhaustion during incremental cycling test [36].Therefore, the placebo/nocebo effects still seem to be a limitation of studies focusing onIPC and exercise performance.
Another limitation of this study was that the external validity and applicability of theresults of this study are limited, as they can be influenced by the particular exercise mode aswell as the training status, sex, and age of the participant. For example, participants in thisstudy received 6 weeks of structured training using SIT 6 months before the experiment.Therefore, it needs to be verified whether the same promotion effect is observed whenLIPC and RIPC are applied to untrained and obese individuals or diabetes patients, whoare common research participants in SIT programs.
5. Conclusions
This study found that, for trained athletes, LIPC and RIPC were both ergogenic aidsthat could improve the performance and fatigue resistance of SIE. In addition, they did notalter the stimulus that SIE demonstrated on the cardiopulmonary system, which indicatedthat IPC could increase metabolic efficiency during high-intensity interval exercise. Furtherresearch is required to specify the possible mechanism by which IPC improves poweroutput and delays fatigue during SIE.
Author Contributions: C.-F.C. and Y.-H.K. conceived and designed the study as well as drafted the
manuscript. C.-F.C., Y.-H.K. and W.-C.H. performed the data analysis and interpretation. Y.-H.K.,
W.-C.H. and C.C. conducted the experiments. C.C. and C.-H.P. contributed methodological advice
and data interpretation. C.-F.C. is the main corresponding author. C.-F.C. and Y.-H.K. contributed
equally to this work. All authors have read and agreed to the published version of the manuscript.
Funding: This study was supported by a grant from the Ministry of Science and Technology, Taiwan
(MOST 106-2628-H-003-008-MY2).
Institutional Review Board Statement: The study was conducted according to the guidelines of the
Declaration of Helsinki, and approved by the Research Ethics Committee of National Taiwan Normal
University, Taipei, Taiwan (Approval code: 201612HM010).
Informed Consent Statement: Informed consent was obtained from all subjects involved in the study.
Data Availability Statement: Data sharing not applicable.
Acknowledgments: The authors would like to thank the participants who contributed their time
and effort to undertake this study, as well as Yu-Hsiang Chiang and Yu-Sheng Lin for their assistance
in data collection.
Conflicts of Interest: The authors declare that they have no conflict of interest.
References
1. De Groot, P.C.; Thijssen, D.H.; Sanchez, M.; Ellenkamp, R.; Hopman, M.T. Ischemic preconditioning improves maximal
performance in humans. Eur. J. Appl. Physiol. 2010, 108, 141–146. [CrossRef] [PubMed]
2. Incognito, A.V.; Burr, J.F.; Millar, P.J. The effects of ischemic preconditioning on human exercise performance. Sports Med. 2016,
46, 531–544. [CrossRef] [PubMed]
3. Salvador, A.F.; De Aguiar, R.A.; Lisboa, F.D.; Pereira, K.L.; Cruz, R.S.; Caputo, F. Ischemic preconditioning and exercise
performance: A systematic review and meta-analysis. Int. J. Sports Physiol. Perform. 2016, 11, 4–14. [CrossRef] [PubMed]
4. Bishop, D.; Spencer, M. Determinants of repeated-sprint ability in well-trained team-sport athletes and endurance-trained athletes.
J. Sports Med. Phys. Fitness 2004, 44, 1–7. [PubMed]
5. Patterson, S.D.; Bezodis, N.E.; Glaister, M.; Pattison, J.R. The effect of ischemic preconditioning on repeated sprint cycling
performance. Med. Sci. Sports Exerc. 2015, 47, 1652–1658. [CrossRef] [PubMed]
6. Griffin, P.J.; Hughes, L.; Gissane, C.; Patterson, S.D. Effects of local versus remote ischemic preconditioning on repeated sprint
running performance. J. Sports Med. Phys. Fitness 2019, 59, 187–194. [CrossRef] [PubMed]
46

Int. J. Environ. Res. Public Health 2021, 18, 10653
7. Ferreira, T.N.; Sabino-Carvalho, J.L.; Lopes, T.R.; Ribeiro, I.C.; Succi, J.E.; AC, D.A.S.; Silva, B.M. Ischemic preconditioning and
repeated sprint swimming: A placebo and nocebo study. Med. Sci. Sports Exerc. 2016, 48, 1967–1975. [CrossRef] [PubMed]
8. Gibson, N.; Mahony, B.; Tracey, C.; Fawkner, S.; Murray, A. Effect of ischemic preconditioning on repeated sprint ability in team
sport athletes. J. Sports Sci. 2015, 33, 1182–1188. [CrossRef] [PubMed]
9. Cocking, S.; Ihsan, M.; Jones, H.; Hansen, C.; Timothy Cable, N.; Thijssen, D.; Wilson, M.G. Repeated sprint cycling performance
is not enhanced by ischaemic preconditioning or muscle heating strategies. Eur. J. Sport Sci. 2021, 21, 166–175. [CrossRef]
10. Gibson, N.; White, J.; Neish, M.; Murray, A. Effect of ischemic preconditioning on land-based sprinting in team-sport athletes. Int.J. Sports Physiol. Perform. 2013, 8, 671–676. [CrossRef]
11. Thompson, K.M.A.; Whinton, A.K.; Ferth, S.; Spriet, L.L.; Burr, J.F. Ischemic preconditioning: No influence on maximal sprint
acceleration performance. Int. J. Sports Physiol. Perform. 2018, 13, 986–990. [CrossRef]
12. Lisbôa, F.D.; Turnes, T.; Cruz, R.S.; Raimundo, J.A.; Pereira, G.S.; Caputo, F. The time dependence of the effect of ischemic
preconditioning on successive sprint swimming performance. J. Sci. Med. Sport 2017, 20, 507–511. [CrossRef]
13. Cruz, R.S.; de Aguiar, R.A.; Turnes, T.; Salvador, A.F.; Caputo, F. Effects of ischemic preconditioning on short-duration cycling
performance. Appl. Physiol. Nutr. Metab. 2016, 41, 825–831. [CrossRef]
14. Paixao, R.C.; da Mota, G.R.; Marocolo, M. Acute effect of ischemic preconditioning is detrimental to anaerobic performance in
cyclists. Int. J. Sports Med. 2014, 35, 912–915. [CrossRef]
15. Bogdanis, G.C.; Nevill, M.E.; Boobis, L.H.; Lakomy, H.K.; Nevill, A.M. Recovery of power output and muscle metabolites
following 30 s of maximal sprint cycling in man. J. Physiol. 1995, 482, 467–480. [CrossRef]
16. Gibala, M.J.; McGee, S.L. Metabolic adaptations to short-term high-intensity interval training: A little pain for a lot of gain? Exerc.Sport Sci. Rev. 2008, 36, 58–63. [CrossRef]
17. Cocking, S.; Landman, T.; Benson, M.; Lord, R.; Jones, H.; Gaze, D.; Thijssen, D.; George, K. The impact of remote ischemic
preconditioning on cardiac biomarker and functional response to endurance exercise. Scand. J. Med. Sci. Sports 2017, 27, 1061–1069.
[CrossRef]
18. Jean-St-Michel, E.; Manlhiot, C.; Li, J.; Tropak, M.; Michelsen, M.M.; Schmidt, M.R.; McCrindle, B.W.; Wells, G.D.; Redington, A.N.
Remote preconditioning improves maximal performance in highly trained athletes. Med. Sci. Sports Exerc. 2011, 43, 1280–1286.
[CrossRef]
19. Lalonde, F.; Curnier, D.Y. Can anaerobic performance be improved by remote ischemic preconditioning? J. Strength Cond. Res.2015, 29, 80–85. [CrossRef]
20. Barbosa, T.C.; Machado, A.C.; Braz, I.D.; Fernandes, I.A.; Vianna, L.C.; Nobrega, A.C.; Silva, B.M. Remote ischemic precondition-
ing delays fatigue development during handgrip exercise. Scand. J. Med. Sci. Sports 2015, 25, 356–364. [CrossRef]
21. Da Silva Novaes, J.; da Silva Telles, L.G.; Monteiro, E.R.; da Silva Araujo, G.; Vingren, J.L.; Silva Panza, P.; Reis, V.M.; Laterza,
M.C.; Vianna, J.M. Ischemic preconditioning improves resistance training session performance. J. Strength Cond. Res. 2020. online
ahead of print. [CrossRef]
22. Da Silva Telles, L.G.; Carelli, L.C.; Bráz, I.D.; Junqueira, C.; Monteiro, E.R.; Reis, V.M.; Vianna, J.M.; da Silva Novaes, J. Effects of
ischemic preconditioning as a warm-up on leg press and bench press performance. J. Hum. Kinet. 2020, 75, 267–277. [CrossRef]
23. Kraus, A.S.; Pasha, E.P.; Machin, D.R.; Alkatan, M.; Kloner, R.A.; Tanaka, H. Bilateral upper limb remote ischemic preconditioning
improves anaerobic power. Open Sports Med. J. 2015, 9, 1–6. [CrossRef]
24. Buchheit, M.; Laursen, P.B. High-intensity interval training, solutions to the programming puzzle: Part I: Cardiopulmonary
emphasis. Sports Med. 2013, 43, 313–338. [CrossRef]
25. Cheng, C.F.; Hsu, W.C.; Kuo, Y.H.; Chen, T.W.; Kuo, Y.C. Acute effect of inspiratory resistive loading on sprint interval exercise
performance in team-sport athletes. Respir. Physiol. Neurobiol. 2020, 282, 103531. [CrossRef]
26. Costa, F.; Christensen, N.J.; Farley, G.; Biaggioni, I. NO modulates norepinephrine release in human skeletal muscle: Implications
for neural preconditioning. Am. J. Physiol. Regul. Integr. Comp. Physiol. 2001, 280, R1494–R1498. [CrossRef]
27. Rassaf, T.; Totzeck, M.; Hendgen-Cotta, U.B.; Shiva, S.; Heusch, G.; Kelm, M. Circulating nitrite contributes to cardioprotection by
remote ischemic preconditioning. Circ. Res. 2014, 114, 1601–1610. [CrossRef]
28. Kida, M.; Fujiwara, H.; Ishida, M.; Kawai, C.; Ohura, M.; Miura, I.; Yabuuchi, Y. Ischemic preconditioning preserves creatine
phosphate and intracellular pH. Circulation 1991, 84, 2495–2503. [CrossRef] [PubMed]
29. Andreas, M.; Schmid, A.I.; Keilani, M.; Doberer, D.; Bartko, J.; Crevenna, R.; Moser, E.; Wolzt, M. Effect of ischemic preconditioning
in skeletal muscle measured by functional magnetic resonance imaging and spectroscopy: A randomized crossover trial. J.Cardiovasc. Magn. Reson. 2011, 13, 32. [CrossRef]
30. Bogdanis, G.C.; Nevill, M.E.; Boobis, L.H.; Lakomy, H.K. Contribution of phosphocreatine and aerobic metabolism to energy
supply during repeated sprint exercise. J. Appl. Physiol. 1996, 80, 876–884. [CrossRef] [PubMed]
31. Griffin, P.J.; Ferguson, R.A.; Gissane, C.; Bailey, S.J.; Patterson, S.D. Ischemic preconditioning enhances critical power during a 3
min all-out cycling test. J. Sports Sci. 2018, 36, 1038–1043. [CrossRef] [PubMed]
32. Midgley, A.W.; McNaughton, L.R.; Wilkinson, M. Is there an optimal training intensity for enhancing the maximal oxygen uptake
of distance runners?: Empirical research findings, current opinions, physiological rationale and practical recommendations.
Sports Med. 2006, 36, 117–132. [CrossRef] [PubMed]
47

Int. J. Environ. Res. Public Health 2021, 18, 10653
33. Paradis-Deschênes, P.; Joanisse, D.R.; Mauriège, P.; Billaut, F. Ischemic preconditioning enhances aerobic adaptations to sprint-
interval training in athletes without altering systemic hypoxic signaling and immune function. Front. Sports Act. Living 2020, 2,
41. [CrossRef] [PubMed]
34. Marocolo, M.; da Mota, G.R.; Pelegrini, V.; Appell Coriolano, H.J. Are the beneficial effects of ischemic preconditioning on
performance partly a placebo effect? Int. J. Sports Med. 2015, 36, 822–825. [CrossRef]
35. Marocolo, M.; Willardson, J.M.; Marocolo, I.C.; da Mota, G.R.; Simão, R.; Maior, A.S. Ischemic preconditioning and placebo
intervention improves resistance exercise performance. J. Strength Cond. Res. 2016, 30, 1462–1469. [CrossRef]
36. Cheung, C.P.; Slysz, J.T.; Burr, J.F. Ischemic preconditioning: Improved cycling performance despite nocebo expectation. Int. J.Sports Physiol. Perform. 2019, 15, 354–360. [CrossRef]
37. Jensen, K.B.; Kaptchuk, T.J.; Kirsch, I.; Raicek, J.; Lindstrom, K.M.; Berna, C.; Gollub, R.L.; Ingvar, M.; Kong, J. Nonconscious
activation of placebo and nocebo pain responses. Proc. Natl. Acad. Sci. USA 2012, 109, 15959–15964. [CrossRef]
48

International Journal of
Environmental Research
and Public Health
Article
Repetition without Repetition or Differential Learning ofMultiple Techniques in Volleyball?
Julius B. Apidogo 1,2, Johannes Burdack 1,* and Wolfgang I. Schöllhorn 1
�����������������
Citation: Apidogo, J.B.; Burdack, J.;
Schöllhorn, W.I. Repetition without
Repetition or Differential Learning of
Multiple Techniques in Volleyball?
Int. J. Environ. Res. Public Health 2021,
18, 10499. https://doi.org/10.3390/
ijerph181910499
Academic Editor: Ricardo
J. Fernandes
Received: 8 September 2021
Accepted: 3 October 2021
Published: 6 October 2021
Publisher’s Note: MDPI stays neutral
with regard to jurisdictional claims in
published maps and institutional affil-
iations.
Copyright: © 2021 by the authors.
Licensee MDPI, Basel, Switzerland.
This article is an open access article
distributed under the terms and
conditions of the Creative Commons
Attribution (CC BY) license (https://
creativecommons.org/licenses/by/
4.0/).
1 Department of Training and Movement Science, Institute of Sport Science,
Johannes Gutenberg-University Mainz, 55099 Mainz, Germany; [email protected] (J.B.A.);
[email protected] (W.I.S.)2 Akanten Appiah-Menka University of Skills Training and Entrepreneurial Development,
Kumasi AK-039, Ghana
* Correspondence: [email protected]
Abstract: A variety of approaches have been proposed for teaching several volleyball techniques to
beginners, ranging from general ball familiarization to model-oriented repetition to highly variable
learning. This study compared the effects of acquiring three volleyball techniques in parallel with
three approaches. Female secondary school students (N = 42; 15.6 ± 0.54 years) participated in a
pretest for three different volleyball techniques (underhand pass, overhand pass, and overhead serve)
with an emphasis on accuracy. Based on their results, they were parallelized into three practice
protocols, a repetitive learning group (RG), a differential learning group (DG), and a control group
(CG). After a period of six weeks with 12 intervention sessions, all participants attended a posttest.
An additional retention test after two weeks revealed a statistically significant difference between
DG, RG, and CG for all single techniques as well as the combined multiple technique. In each
technique—the overhand pass, the underhand pass, the overhand service, and the combination of
the three techniques—DG performed best (each p < 0.001).
Keywords: motor learning; differential learning; volleyball; overhand service; overhand pass; under-
hand pass; multiple techniques; skill acquisition
1. Introduction
Coaches and physical education teachers are always faced with the challenge ofteaching multiple techniques and fostering athlete performance in the most time efficientmanner. To achieve this goal, coaches and athletic trainers are always looking for themost effective and efficient learning approaches. The four most popular and widely usedapproaches to teaching and improving performance and learning, which include innovativeelements that had not been previously considered, are listed in a historical order:
(a) The repetition method approach. This method was first mentioned by Plato(450 B.C.) in the context of learning by contrast and was later investigated in more detail byGentile [1]. The repetitive method approach is based on the assumption that there is anideal type of movement that can be perfected by several repetitions of the target movementduring the learning process. This method is still considered the method of choice by manyphysical education teachers and coaches.
(b) The original purpose of the methodical series of exercise approach [2] is to learnmore complex target movements through a streamlined (blocked) sequence of preliminaryexercises increasingly similar to the target movement. In this process, each preparatoryexercise follows the logic of the RM. This method is still chosen the most for learningsingular complex movements.
(c) The variability of practice approach [3] is based on Schmidt’s schema theory [4],which coarsely indicates that invariant elements such as relative timing or relative forcesof an already automatized movement become more stable when trained in combination
49

Int. J. Environ. Res. Public Health 2021, 18, 10499
with variable parameters such as absolute forces or absolute durations. Nevertheless, eachexercise is trained repetitively (=blocked), oriented on subgoals as prototype. Althoughthe area of application was limited to movements without the influence of gravitationalforces [5], this approach inspired teachers and coaches to make the training of a singletechnique more variable once it has been learned.
(d) The contextual interference was originally operationalized by Battig [6,7] in thecontext of verbal learning and later applied to fine motor learning by Shea and Morgan [8].From its origin, contextual interference approach is a learning approach in which oneskill is practiced in the context of other skills. The approach is typically associated withtwo phenomena, namely impaired acquisition on the one hand, and enhanced learningon the other [9,10]. Three models from cognitive psychology have been proposed toexplain these phenomena: the elaboration [11], the reconstruction [12], and the retroactiveinhibition hypothesis [13]. All three models assume that a higher cognitive effort is requiredfor the random schedule compared to a blocked schedule, which is typically associatedwith immediately poorer performance due to working memory overload but leads tobetter retention.
Originally focused only on the learning of a single (text) motion interspersed withadditional motions (=context), the contextual interference approach is now primarily inves-tigated for the parallel learning of multiple movements. The approach is still strugglingwith its application in sports practice, since, among other things, systematic effects haveonly been found for movements with a small number of degrees of freedom [10,14] despiteisolated evidence of positive effects in movements with more degrees of freedom [15].
(e) The differential learning approach [16,17] assumes that improving the performanceor learning of a movement depends largely on an individual’s characteristics and experi-ences, which are assumed to be embodied in individual neuro-(muscular) structures thatneed to be stimulated individually in varying contexts in order to achieve an effectiverestructuring for changes in behavior. The reciprocal matching of the exercises providedby the trainer to the nature or extent of the learner’s individual variations is described bythe principle of stochastic resonance [18–20]. Because the differential learning approach isthe most recent approach proposed to increase technical performance and since it is theprimary subject of the study, it is discussed in some detail below.
The parallel observation of analogies related to fluctuations in three research areasserved as the inspiration for the differential learning approach. First, within the research onthe identification of individual movement patterns, constant fluctuations of biomechanicalparameters were observed [21–23]; second, fluctuations in the field of dissipative dynamicsystems were assigned an essential role especially in phase transitions [24]; third, in the fieldof research on artificial neural networks, it was known that they perform better when addedwith noisy information during the training phase [25–27]. It is postulated that the learner’sbehavior should be the focus of interest rather than the idea of a collective movementideal. Supposedly destructive deviations from the movement ideal became reinterpretedas constructive fluctuations that should make the learning system unstable and enable self-organized learning [17,19]. Whereas differential learning was initially applied and studiedonly in sports for learning and improving individual techniques [18,28–30], there are nowalso confirming studies on its effectiveness in fine motor [31–33] or everyday movements,as well as in the field of tactics [34,35], strength [36,37], and endurance training. Isolatedstudies on the parallel acquisition of two techniques [38,39] suggest its application in thelearning of multiple techniques as well.
The only approach that so far tries to explain the learning of multiple techniques is thecontextual interference approach. However, the studies on the simultaneous acquisitionof multiple techniques in volleyball using this approach have led to ambiguous results.The acquisition of two volleyball techniques showed partial or no support for benefitsof contextual interference in the form of random compared to blocked order [40]. Fialho,Benda, and Ugrinovich [41] could not find significant differences between blocked andinterleaved training groups for either the post or the retention test when training two
50
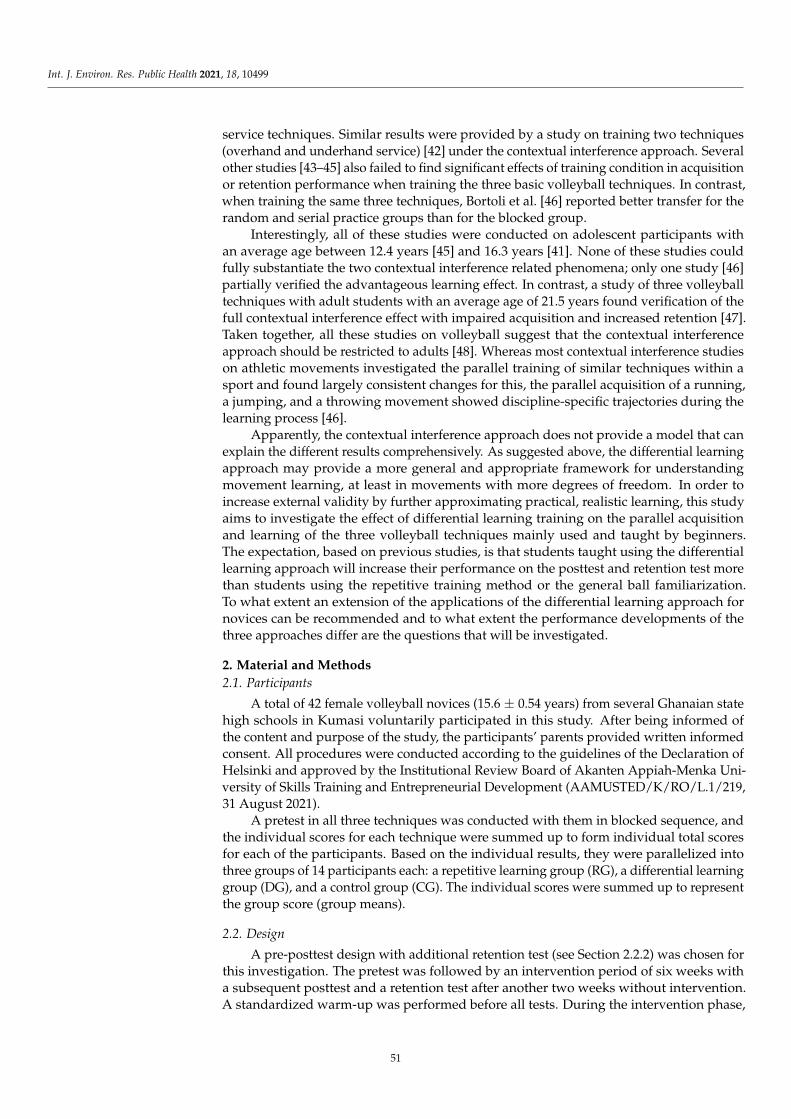
Int. J. Environ. Res. Public Health 2021, 18, 10499
service techniques. Similar results were provided by a study on training two techniques(overhand and underhand service) [42] under the contextual interference approach. Severalother studies [43–45] also failed to find significant effects of training condition in acquisitionor retention performance when training the three basic volleyball techniques. In contrast,when training the same three techniques, Bortoli et al. [46] reported better transfer for therandom and serial practice groups than for the blocked group.
Interestingly, all of these studies were conducted on adolescent participants withan average age between 12.4 years [45] and 16.3 years [41]. None of these studies couldfully substantiate the two contextual interference related phenomena; only one study [46]partially verified the advantageous learning effect. In contrast, a study of three volleyballtechniques with adult students with an average age of 21.5 years found verification of thefull contextual interference effect with impaired acquisition and increased retention [47].Taken together, all these studies on volleyball suggest that the contextual interferenceapproach should be restricted to adults [48]. Whereas most contextual interference studieson athletic movements investigated the parallel training of similar techniques within asport and found largely consistent changes for this, the parallel acquisition of a running,a jumping, and a throwing movement showed discipline-specific trajectories during thelearning process [46].
Apparently, the contextual interference approach does not provide a model that canexplain the different results comprehensively. As suggested above, the differential learningapproach may provide a more general and appropriate framework for understandingmovement learning, at least in movements with more degrees of freedom. In order toincrease external validity by further approximating practical, realistic learning, this studyaims to investigate the effect of differential learning training on the parallel acquisitionand learning of the three volleyball techniques mainly used and taught by beginners.The expectation, based on previous studies, is that students taught using the differentiallearning approach will increase their performance on the posttest and retention test morethan students using the repetitive training method or the general ball familiarization.To what extent an extension of the applications of the differential learning approach fornovices can be recommended and to what extent the performance developments of thethree approaches differ are the questions that will be investigated.
2. Material and Methods
2.1. Participants
A total of 42 female volleyball novices (15.6 ± 0.54 years) from several Ghanaian statehigh schools in Kumasi voluntarily participated in this study. After being informed ofthe content and purpose of the study, the participants’ parents provided written informedconsent. All procedures were conducted according to the guidelines of the Declaration ofHelsinki and approved by the Institutional Review Board of Akanten Appiah-Menka Uni-versity of Skills Training and Entrepreneurial Development (AAMUSTED/K/RO/L.1/219,31 August 2021).
A pretest in all three techniques was conducted with them in blocked sequence, andthe individual scores for each technique were summed up to form individual total scoresfor each of the participants. Based on the individual results, they were parallelized intothree groups of 14 participants each: a repetitive learning group (RG), a differential learninggroup (DG), and a control group (CG). The individual scores were summed up to representthe group score (group means).
2.2. Design
A pre-posttest design with additional retention test (see Section 2.2.2) was chosen forthis investigation. The pretest was followed by an intervention period of six weeks witha subsequent posttest and a retention test after another two weeks without intervention.A standardized warm-up was performed before all tests. During the intervention phase,
51

Int. J. Environ. Res. Public Health 2021, 18, 10499
the participants trained twice a week (always on Mondays and Thursdays), where eachtraining session lasted one hour.
2.2.1. Intervention
The RG trained according to the Federation International de volleyball Coaches man-ual [49]. Each training session was preceded by a five-minute warm-up activity, whichconsisted of minor games, such as “three-on-one”, “chase and catch”, and “seven-on-one”.After completing the warm-up activities, the participants proceeded directly to practicein their respective groups. After the group training, the session was finished. The RGtraining was characterized by taking one of the techniques per session repeating it 15 timesin the blocked form, from overhand service (S) to overhand pass (O), to underhand pass(U) (SSS . . . , OOO . . . , UUU . . . ) following that order repeatedly with corrective feedbackper session.
The DG training corresponded to the training sequence of the RG in block; however,their training was characterized first by no repetitions by adding stochastic perturbationsto the three techniques to be learned and second by no corrections. Appendix A Table A1contains a list of all given tasks from which a number was randomly selected to instructthe group. Each participant in both intervention groups had 15 trials per training sessionfor each technique. In total, each participant had 180 relevant ball contacts over theentire period.
The control group (CG) engaged in ball familiarization games that were not directlyrelated to volleyball, such as ball throwing and catching games.
2.2.2. Test Design
The test as presented in Figure 1 comprised of three subtests, each corresponding toone of the techniques to be learned: underhand pass, overhand pass, overhand service. Allsubtests were carried out according to the AAHPERD volleyball skill test manual [50] on aregular outdoor volleyball court.
Subtest underhand pass (Figure 1A): To test the underhand pass accuracy, the studentstood in a 2 m2 square on the right-hand side of the volleyball court (zone Z5) and receiveda ball thrown from zone 2 of the other court and passed the ball over a rope (height 2.24 m)into a 3 m × 2 m target area in zone Z2 of the participant’s court for which 4 points areawarded if ball lands in the target area and 2 points if it lands on the lines of the target area.
Subtest overhand pass (Figure 1B): To test the accuracy of the overhand pass, theparticipant stood in zone Z2, received the ball from zone Z6, and passed the ball over a2.24 m high rope into two 1 m × 2 m target areas, with the one farther from the participantscoring 4 points, the one closer scoring 2 points, and the line in between scoring 3 points.
Subtest overhand service (Figure 1C): The participants stood at the end of the fieldin a central 2 m wide area and served the ball over their head to the other field over the2.24 m high net into the 2 m × 2 m rectangular target areas, with points awarded for eacharea. The further back and sideways the target area that was hit, the more points a serveresulted in, ranging from 1 to 4 points. In between the zones, the two zone points wereadded and divided by two and the points given.
For all subtests, a score of zero was given if the ball did not land within the targetzones or did not touch any of the lines of the marked target areas. The participantsperformed 10 trials in each subtest. The maximum score for each subtest was 40 points anda minimum of 0. The test was performed in the order from underhand pass to overhandpass to overhand service and on the same day under comparable conditions.
Six research assistants were trained to assist in the process of training and conductingthe test. The execution of an attempt was counted only if the ball thrown by the researchassistant was receivable by the participant within the marked area. Otherwise, the attemptwas repeated.
52
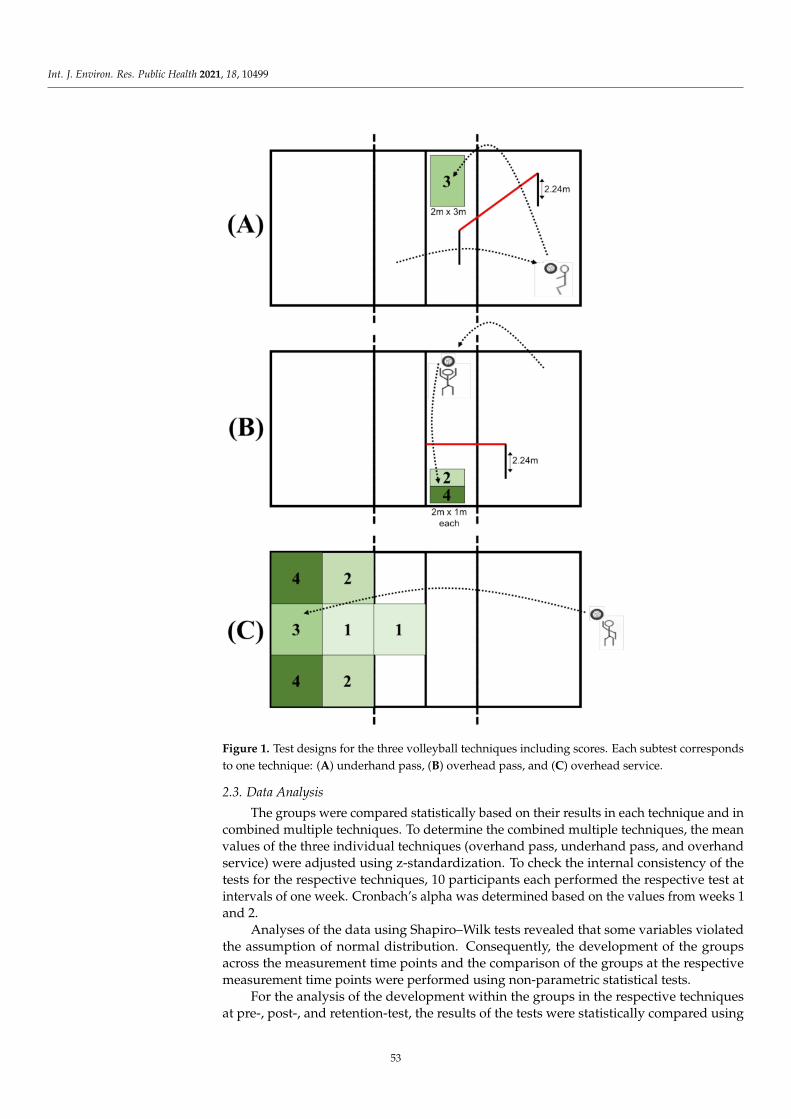
Int. J. Environ. Res. Public Health 2021, 18, 10499
Figure 1. Test designs for the three volleyball techniques including scores. Each subtest corresponds
to one technique: (A) underhand pass, (B) overhead pass, and (C) overhead service.
2.3. Data Analysis
The groups were compared statistically based on their results in each technique and incombined multiple techniques. To determine the combined multiple techniques, the meanvalues of the three individual techniques (overhand pass, underhand pass, and overhandservice) were adjusted using z-standardization. To check the internal consistency of thetests for the respective techniques, 10 participants each performed the respective test atintervals of one week. Cronbach’s alpha was determined based on the values from weeks 1and 2.
Analyses of the data using Shapiro–Wilk tests revealed that some variables violatedthe assumption of normal distribution. Consequently, the development of the groupsacross the measurement time points and the comparison of the groups at the respectivemeasurement time points were performed using non-parametric statistical tests.
For the analysis of the development within the groups in the respective techniquesat pre-, post-, and retention-test, the results of the tests were statistically compared using
53

Int. J. Environ. Res. Public Health 2021, 18, 10499
Friedman ANOVA. In case of significant results, pairwise Bonferroni-corrected post hocDunn–Bonferroni tests were performed.
In order to compare the different groups at the respective pre-, post-, and retention test,the test results of the specific techniques were compared statistically using Kruskal–Wallistests. The comparison at the time of the pretest here also represents the basis of the testfor homogeneity. Significant results were further statistically compared using pairwiseBonferroni-corrected post hoc Dunn–Bonferroni tests.
In addition, the effect size r was calculated for the pairwise post-hoc tests of theFriedman and Kruskal–Wallis tests, respectively. Thereby, 0.1 ≤ r < 0.3 corresponds to aweak effect, 0.3 ≤ r < 0.5 to a medium effect, and r ≥ 0.5 to a strong effect [51].
The p-value at which it is considered worthwhile to continue research [52] was setat p = 0.05, with decreasing p increasing the probability that the null hypothesis does notexplain all the facts.
3. Results
The proof for internal consistency of the tests showed acceptable or good results forthe overhand pass (α = 0.774), underhand pass (α = 0.812), and for combined multipletechniques (α = 0.889) tests. Only the overhand service test was just below the threshold inthe questionable interval (α = 0.678). The test results of each technique and the combinedz-standardized values of each test are shown in Figure 2A–D. The results of the statisticalanalyses are presented in Table 1.
Table 1. Statistical comparisons at the three measurement time points within and between groups.
Comparison Friedman-Test or Kruskal-Wallis-Test (Rank Scores) Post Hoc Dunn-Bonferroni-Tests
Overhand Pass
RG:Pre—Post—Ret
χ2(2) = 3.720, p = 0.156
(Pre: 1.61; Post: 2.25; Ret: 2.14)–
DG:Pre—Post—Ret
χ2(2) = 25.529, p < 0.001 ***
(Pre: 1.04; Post: 1.96; Ret: 3.00)Pre vs. Ret: p < 0.001 ***, r = 0.544 +++
Post vs. Ret: p = 0.024 *, r = 0.288 +
CG:Pre—Post—Ret
χ2(2) = 11.306, p = 0.004 **
(Pre: 1.57; Post: 2.68; Ret: 1.75)Pre vs. Post: p = 0.010 *, r = 0.296 +
Post vs. Ret: p = 0.042 *, r = 0.248 +
Pre:RG—DG—CG
χ2(2) = 1.709, p = 0.426
(RG: 24.14; DG: 22.11; CG: 18.25)–
Post:RG—DG—CG
χ2(2) = 7.758, p = 0.021 *
(RG: 18.04; DG: 28.89; CG: 17.57)CG vs. DG: p = 0.042 *, r = 0.465 ++
Ret:RG—DG—CG
χ2(2) = 15.508, p < 0.001 ***
(RG: 18.36; DG: 31.42; CG: 13.96)RG vs. DG: p = 0.013 *, r = 0.550 +++
DG vs. CG: p < 0.001 ***, r = 0.732 +++
Underhand Pass
RG:Pre—Post—Ret
χ2(2) = 21.714, p < 0.001 ***
(Pre: 1.07; Post: 2.29; Ret: 2.64)Pre vs. Post: p = 0.004 **, r = 0.324 ++
Pre vs. Ret: p < 0.001 ***, r = 0.420 ++
DG:Pre—Post—Ret
χ2(2) = 23.306, p < 0.001 ***
(Pre: 1.00; Post: 2.19; Ret: 2.81)Pre vs. Post: p = 0.007 **, r = 0.319 ++
Pre vs. Ret: p < 0.001 ***, r = 0.483 ++
CG:Pre—Post—Ret
χ2(2) = 14.000, p < 0.001 ***
(Pre: 1.82; Post: 2.64; Ret: 1.54)Post vs. Ret: p = 0.010 *, r = 0.296 +
Pre:RG—DG—CG
χ2(2) = 0.392, p = 0.822
(RG: 22.79; DG: 20.86; CG: 20.86)
Post:RG—DG—CG
χ2(2) = 31.014, p < 0.001 ***
(RG: 20.36; DG: 34.50; CG: 9.64)
RG vs. DG: p = 0.005 **, r = 0.597 +++
RG vs. CG: p = 0.05 *, r = 0.452 ++
DG vs. CG: p < 0.001 ***, r = 1.049 +++
Ret:RG—DG—CG
χ2(2) = 36.687, p < 0.001 ***
(RG: 21.43; DG: 35.00; CG: 7.57)
RG vs. DG: p < 0.008 **, r = 0.577 +++
RG vs. CG: p < 0.005 **, r = 0.589 +++
CG vs. DG: p < 0.001 ***, r = 1.165 +++
Overhand Service
RG:Pre—Post—Ret
χ2(2) = 8.000, p = 0.018 *
(Pre: 1.86; Post: 2.43; Ret: 1.71)–
DG:Pre—Post—Ret
χ2(2) = 21.347, p < 0.001 ***
(Pre: 1.00; Post: 2.35; Ret: 2.65)Pre vs. Post: p = 0.002 **, r = 0.360 ++
Pre vs. Ret: p < 0.001 ***, r = 0.442 ++
CG:Pre—Post—Ret
χ2(2) = 9.172, p = 0.010 *
(Pre: 1.96; Post: 1.61; Ret: 2.43)–
54

Int. J. Environ. Res. Public Health 2021, 18, 10499
Table 1. Cont.
Comparison Friedman-Test or Kruskal-Wallis-Test (Rank Scores) Post Hoc Dunn-Bonferroni-Tests
Pre:RG—DG—CG
χ2(2) = 14.235, p < 0.001 ***
(RG: 16.39; DG: 17.86; CG: 30.25)RG vs. CG: p = 0.002 **, r = 0.649 +++
DG vs. CG: p = 0.006 **, r = 0.580 +++
Post:RG—DG—CG
χ2(2) = 29.276, p < 0.001 ***
(RG: 14.39; DG: 35.43; CG: 14.68)RG vs. DG: p < 0.001 ***, r = 0.892 +++
DG vs. CG: p < 0.001 ***, r = 0.879 +++
Ret:RG—DG—CG
χ2(2) = 35.229, p < 0.001 ***
(RG: 8.21; DG: 34.85; CG: 20.93)
RG vs. DG: p < 0.001 ***, r = 1.142 +++
RG vs. CG: p = 0.012 *, r = 0.546 +++
DG vs. CG: p = 0.006 **, r = 0.597 +++
Combined multiple techniques
RG:Pre—Post—Ret
χ2(2) = 18.582, p < 0.001 ***
(Pre: 1.07; Post: 2.54; Ret: 2.39)Pre vs. Post: p < 0.001 ***, r = 0.391 ++
Pre vs. Ret: p = 0.001 **, r = 0.353 ++
DG:Pre—Post—Ret
χ2(2) = 24.571, p < 0.001 ***
(Pre: 1.00; Post: 2.14; Ret: 2.86)Pre vs. Post: p = 0.007 **, r = 0.305 ++
Pre vs. Ret: p < 0.001 ***, r = 0.496 ++
CG:Pre—Post—Ret
χ2(2) = 11.259, p = 0.004 *
(Pre: 1.57; Post: 2.71; Ret: 1.71)Pre vs. Post: p = 0.007 **, r = 0.305 ++
Post vs. Ret: p = 0.024 *, r = 0.267 +
Pre:RG—DG—CG
χ2(2) = 0.288, p = 0.866
(RG: 16.39; DG: 17.86; CG: 30.25)–
Post:RG—DG—CG
χ2(2) = 28.127, p < 0.001 ***
(RG: 14.39; DG: 35.43; CG: 14.68)RG vs. DG: p < 0.001 ***, r = 0.775 +++
DG vs. CG: p < 0.001 ***, r = 0.938 +++
Ret:RG—DG—CG
χ2(2) = 30.205, p < 0.001 ***
(RG: 8.21; DG: 34.85; CG: 20.93)RG vs. DG: p = 0.001 ***, r = 0.700 +++
DG vs. CG: p < 0.001 ***, r = 1.015 +++
Note. All p-values of the post hoc tests are Bonferroni-corrected. RG = repetitive learning group; DG = differential learning group;CG = control group; Pre = pretest; Post = posttest; Ret = retention test. * p ≤ 0.05. ** p ≤ 0.01. *** p ≤ 0.001. + 0.1 ≤ r < 0.3. ++ 0.3 ≤ r < 0.5.+++ r ≥ 0.5.
3.1. Development within Groups over Measurement Time Points
The DG improved statistically significantly over the course of the study in all threetechniques and also in the combined multiple techniques (p < 0.001) and the effect sizewas at least medium each time (r > 0.442). In the subtests for the underhand pass, theoverhand service, and the combined multiple techniques, there was a statistically significantimprovement with a medium effect size in each case in the acquisition phase (p < 0.007,r > 0.305) and a further, however, not significant, improvement in the retention phase.Solely in the case of the overhand pass there was only a statistical trend in the acquisitionphase (p = 0.056, r = 0.256), although there was a significant increase in the retention phase(p = 0.024, r = 0.288).
In the overall course, the performance level of RG tended to develop similarly to theDG in the techniques of the underhand pass and in the combined multiple technique. Theresults showed a significant improvement with a medium effect size (p < 0.001, r > 0.391).In both techniques, significant improvement was also observed in the acquisition phase(p < 0.004, r > 0.324). However, no significant improvement was shown in the overhandservice and the overhand pass.
The performance level of CG never changed significantly, neither positively nornegatively, over the course of the study. Nonetheless, significant improvements frompretest to posttest were seen in the underhand pass and the overhand pass, each followedby significant decreases to the retention test. In the case of the overhand service, the exactopposite development was observed.
55
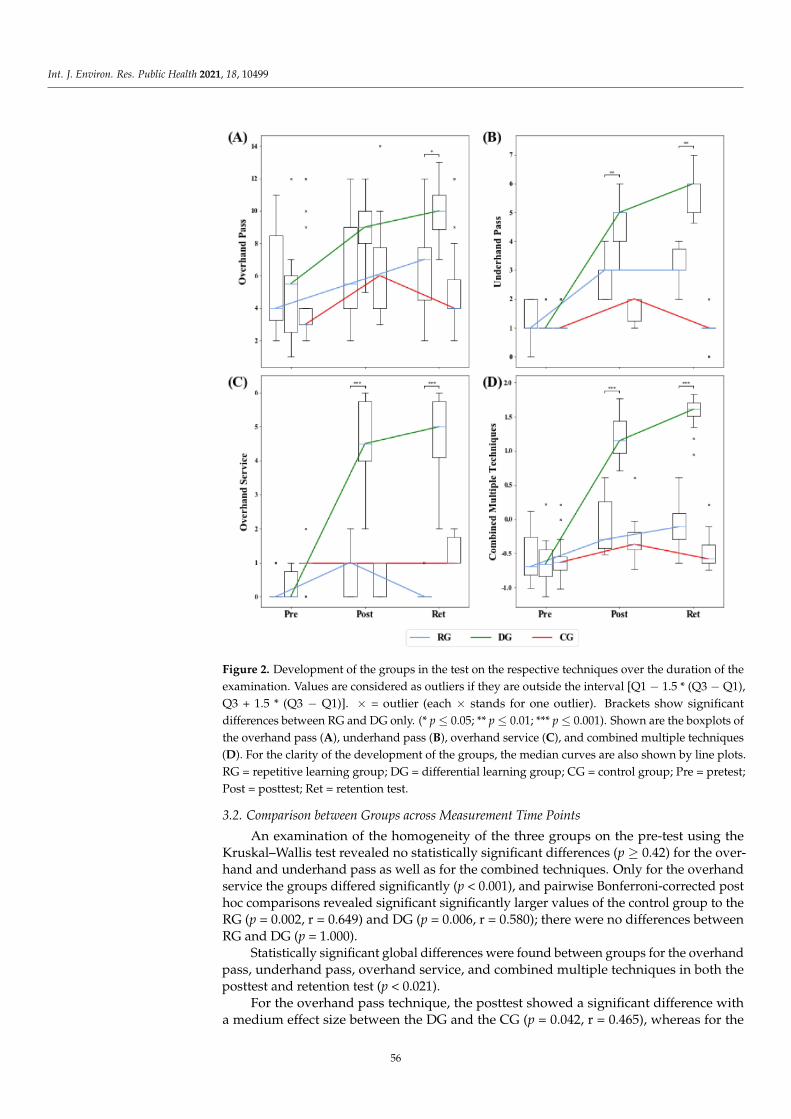
Int. J. Environ. Res. Public Health 2021, 18, 10499
Figure 2. Development of the groups in the test on the respective techniques over the duration of the
examination. Values are considered as outliers if they are outside the interval [Q1 − 1.5 * (Q3 − Q1),
Q3 + 1.5 * (Q3 − Q1)]. × = outlier (each × stands for one outlier). Brackets show significant
differences between RG and DG only. (* p ≤ 0.05; ** p ≤ 0.01; *** p ≤ 0.001). Shown are the boxplots of
the overhand pass (A), underhand pass (B), overhand service (C), and combined multiple techniques
(D). For the clarity of the development of the groups, the median curves are also shown by line plots.
RG = repetitive learning group; DG = differential learning group; CG = control group; Pre = pretest;
Post = posttest; Ret = retention test.
3.2. Comparison between Groups across Measurement Time Points
An examination of the homogeneity of the three groups on the pre-test using theKruskal–Wallis test revealed no statistically significant differences (p ≥ 0.42) for the over-hand and underhand pass as well as for the combined techniques. Only for the overhandservice the groups differed significantly (p < 0.001), and pairwise Bonferroni-corrected posthoc comparisons revealed significant significantly larger values of the control group to theRG (p = 0.002, r = 0.649) and DG (p = 0.006, r = 0.580); there were no differences betweenRG and DG (p = 1.000).
Statistically significant global differences were found between groups for the overhandpass, underhand pass, overhand service, and combined multiple techniques in both theposttest and retention test (p < 0.021).
For the overhand pass technique, the posttest showed a significant difference witha medium effect size between the DG and the CG (p = 0.042, r = 0.465), whereas for the
56
Int. J. Environ. Res. Public Health 2021, 18, 10499
retention test, the DG performed significantly better than the RG (p = 0.013, r = 0.550) andthe CG (p < 0.001, r = 0.732) with each a strong effect size.
Pairwise post hoc comparisons in the underhand pass technique showed that in theposttest and retention test, the DG performed significantly better and with strong effectsize than the RG (p = 0.005, r = 0.597) and the CG (p < 0.001, r = 1.165), with the RG alsoperforming significantly with a medium effect size better than the CG (p = 0.050, r = 0.452).
The post hoc tests for the overhand service, although the CG was still significantlybetter than the RG and DG at pretest, showed that the DG performed significantly betterthan the RG (p < 0.001, r > 0.892) and CG (p < 0.006, r > 0.597) in both the post and retentiontests with a strong effect size. The RG also scored significantly better with a strong effectsize than the CG at the retention test (p = 0.012, r = 0.546).
The same picture of DG outperforming RG (p < 0.001, r > 0.700) and CG (p < 0.001,r > 0.938) in both the post and retention test with strong effect sizes can also be seen in thecombined multiple techniques; there was no statistical difference between RG and CG.
4. Discussion
The purpose of this study was to compare the effects of the repetition-oriented learning(RG) approach with the differential learning (DG) approach of teaching three volleyballtechniques (underhand pass, overhand pass, and overhand service) to adolescent femalenovices in parallel, compared to general ball familiarization exercises (CG). All threegroups started from the same performance level but developed differently depending onthe learning approach. The changes of the CG, whose activities can be understood ashaving no direct relation to volleyball techniques, are statistically within the chance leveland represent a fair reference to the other two interventions. The performance of the RGand DG each improved from pre to posttest, with the DG performing better than the RG onaverage for all comparisons. From the post to the retention test, the DG improved a furthertime in each technique, although only statistically significantly in the overhand pass. Atthe time of the retention test, the DG outperformed the RG in every single technique aswell as in the multiple technique in a statistically significant manner.
First, we consider the results in the acquisition phase from pretest to posttest. Withrespect to each of the techniques individually, these findings are in accordance with ear-lier studies on the comparison of differential learning with repetitive-corrective learn-ing [18,53–56]. Looking at the results from pre- to posttest as a whole, however, it issomewhat surprising how clearly the DG outperformed the RG in the individual tech-niques as well as in the combined multiple technique in the posttest and later in theretention test. This suggests that the parallel learning of multiple techniques in one sportwith the differential learning approach might have had a particularly positive effect onlearning the respective single techniques.
In order to understand the increased learning outcomes of the combination of indi-vidual techniques in a theoretical framework, it seems reasonable to use the contextualinterference approach, which is currently the most widely used explanatory approach.Interestingly, however, the results contradict explanatory models within the contextualinterference theory. These models predicted posttest advantages for the repetition-orientedgroups, because the working memories were so adversely overloaded in the DG that itwas even more likely to perform worse. The effect had to be larger, because the DG wasexposed to such a large number of different movements, which has never been observed instudies on the contextual interference effect. Surprisingly, the absence of posttest benefitson the side of blocked-training groups can also be observed in several contextual interfer-ence studies on athletic movements [43,46]. Within the contextual interference framework,the favorable results of the DG group at posttest are even more surprising from anotherpoint of view. The theory postulates at least a certain number of correct repetitions ofthe prototypical movement as a mandatory prerequisite for successful acquisition andlearning [11].
57

Int. J. Environ. Res. Public Health 2021, 18, 10499
In contrast, however, the results of the combined techniques can also be explainedby means of the theory of differential learning. According to this approach, training isassociated with successful learning even without having performed the “ideal” prototypi-cal movement once, just by practicing mainly movements surrounding the theoreticallypresumed target movement. According to differential learning theory, a neural networkbecomes more robust to perturbations, which can be considered as the deviations from agiven ideal, when trained with variable input. According to the knowledge of the behaviorof artificial neural networks, which derive their original principles from the properties ofthe neurons [25,26,57,58], differential learning theory expects the system to be trained withadditional noise so that the individual not only finds a more global solution [19], but alsoprepares the system for more and larger deviations from a mentally constructed prototypethat are highly likely to occur in the future [59]. Moreover, this noise could be amplified bylearning multiple techniques in parallel to the correct degree, which in turn could providea rationale for more efficient learning. By training an athlete’s neural network for a widersolution space, the system uses the ability to interpolate, which appears to be superior toextrapolation [17]. In addition to what is now generally known about this property in artifi-cial neural networks, Catalano and Kleiner [60] provided evidence for its validity in humanbehavior. They showed that in speed-based tasks variable-trained participants performedbetter than block-trained ones not only within the trained range, but also outside of it.Analogously, differential learning theory recommends increasing the range of experience tohave a higher probability of using the interpolation in the next movement, which is sure tocontain something new. In this context, it is important to mention that the space of solutionis an abstract image that is highly dimensional and spanned by all joint angles, angularvelocities, angular accelerations, spatial limb orientation, muscles activations, and manyother influencing variables. Due to the high dimensionality of the solution space, it seemsvery unlikely to find variables that do not change individually and situationally. A veryfirst computational approach was suggested with the Uncontrolled Manifold Theory [61],which could so far only be successfully applied to fine motor movements due to the limitednumber of influencing variables.
Nevertheless, the contextual interference theory has been developed for explainingthe interference phenomenon after acquisition that can be systematically observed in fine-motor movements in the laboratory, such as keypress or barrier knock-down tasks. Sincedifferential learning theory has failed to explain this so far, it is strongly recommended todevelop differentiated explanatory models for fine and for gross motor movements andabstain from attempts to generalize the theory beyond the original model purpose [62,63].One starting point could be the differentiated inclusion of various relative demands ondifferent sensory systems during the specific movement task. Whereas the majority ofcontextual interference experiments for small motor movements contain dominant visual-spatial components (sequence of buttons, sequence of wooden blocks to be thrown) thatare primarily processed sequentially, the majority of experiments for large motor sportsmovements contain a dominant proprioceptive and kinesthetic component that is primarilyprocessed in parallel. When the importance of the visual component increases in gross-motor movements, such as in baseball [64], where the batter’s decision is highly dependenton the ability to read approaching balls with different speeds, spin, and directions, orin basketball [65] and pistol shooting [66], with the problem of estimating the distanceto the basket or the launch angle, the likelihood of finding support for the contextualinterference paradigm also seems to increase. Whether the relative importance of visualand kinesthetic influence shifts over the course of a long-term learning process or is alsoage-dependent in volleyball needs to be clarified by future studies. A suggestion to explorethe interdependencies of the visual and motor systems is given by Gestalt psychologistswith their analysis of the “motor outline of optical shapes” [67].
The relative retention test performances of the RG and the DG can be explicatedby both theories, the differential learning and the contextual interference theory. Thegroup with more variation during acquisition performs significantly better than the other.
58
Int. J. Environ. Res. Public Health 2021, 18, 10499
The contextual interference theory, however, only expects better results in the relativecomparison, which would occur if both groups decreased in performance, the RG morethan the DG. In contrast, based on the majority of experiments to date, differential learningis expected to show a further increase in performance on the retention test compared tothe posttest.
If, in addition to the results of the two experimental groups RG and DG, we takeinto account the results of the control group CG for analysis, we can notice a relationto both the “specificity–versus–generalization” problem [68,69] and the resonance prob-lem [18,19,70], which, strictly speaking, can be considered as the same problem on differ-ent scales. Whereas the specificity–versus–generalization problem is binary coded (spe-cific/general), the stochastic resonance with its optimum function is at first sight ternarycoded (too much/exact/too little). Because of its continuous frequency and learning ratescale, the SR model can actually be viewed as a decimal scale that provides informationon how much noise needs to be added or reduced to achieve optimal resonance. Lookingat the higher improvement rates of the two volleyball-specific approaches (RG and DG)after acquisition, it is obvious that the interventions of the CG for volleyball were toogeneral and most likely outside the specific solution space. The interpretation based onthe stochastic resonance phenomenon takes it one step further. The previous distinctionbecomes more sophisticated and, analogous to the other two, identifies too much noise forthe CG, but too little noise for the RG and in between the optimal noise in the interventionsfor the DG.
From a more application-oriented point of view, this study presents a picture thatalleged errors in movement during the acquisition process should not be regarded asdetrimental to learning, but rather as an advantage for learning [16], indicative of the factthat the learning base has been broadened. This is because in the differential learningparadigm, error identification and correction during acquisition were completely absent,which allowed for self-organization. In the same context, a few issues in motor learningneed more attention in terms of classical learning theories:
(1) Traditional motor learning theories point out errors and seek to correct them (motorlearning), implying that there is a specific way to perform a movement, technique,or skill [1,11]. These error corrections aim to improve or perfect performance withina feedback loop [71]. However, from the results of the study, it appears that thesecorrections limit the potential of learners by making them stick to certain movementpatterns that are considered the best movements in the techniques to be learned. Thisin a way controls the actual potential of the learner and leads to role model learningthat does not allow the learner’s originality and innovation to shine.
(2) Learning theories also attempt to repeat the movement being learned multiple timesin order to perfect the movement. Considering judgment errors only as fluctuationshas the potential to destabilize the system to allow true self-organization [16,17,72].An intermediate step between teacher-oriented and self-organized learning is alreadyoffered by reform pedagogical approaches according to Basedow, Pestalozzi, orDewey, where discovery-based learning is allowed within given limits. Either way,coaches and trainers may have to reconsider what errors are and to rethink theidea of role modeling (ideal movement), because learners are not given the freedomand opportunity to learn and develop naturally as individuals. Again, the physicaleducation teacher’s task to teach gross-motor movements in sports to beginnersmay involve revising their approach towards their lessons, as well as the methodsthey employ.
The individual technique performance by the three groups shows that the DG hadmore participants who improved their performance throughout the experiment than the RGand CG. This is at least an indication that constant repetition—even without “repetition”in Bernstein’s sense [73,74]—is not the only approach to motor skill acquisition, doesnot really improve performance quickly, can limit the learner, and hardly allows forsystem adaptation.
59
Int. J. Environ. Res. Public Health 2021, 18, 10499
This study also had some attendant challenges; (1) the age of the participants, whowere female, indicated that they were undergoing physical maturation and development,so they were reluctant to be active during the exercises and tests at a time when someof them had physical changes. (2) Facilities such as playing courts and volleyballs werenot enough; at least three playing courts would be better. (3) The single-hour physicaleducation class might have been too short to practice adequately.
5. Conclusions
This study compared the effects of the general (CG), repetitive (RG), and differentialmotor learning (DG) approaches in parallel acquisition of three volleyball techniques (un-derhand pass, overhand pass, and overhand service). The results indicate the advantagesof the differential learning approach in comparison to the general ball familiarization andthe repetitive prescriptive approaches not only during the acquisition, but also duringthe learning phase. Through differential learning, where no movement was repeated, theadolescent girls who were absolute beginners in volleyball seemed to have experienced abroader spectrum of movements compared to before, which allowed their neuro-motorsystem to adapt more efficiently to the demands of the three techniques.
Previous models of variable [4] or interleaved practice [8] fail to explain this phe-nomenon, since they assume either memorization of the to-be learned movements or atleast parts (invariants) of the movements through correct repetitions. Noisy training isassociated with the theory and behavior of artificial neural networks in connection withthe principles of system dynamics. In the first case, noise leads to more stability in thesubsequent application, and in the second case, the increase of noise is a condition for aself-organized change of states. Although more research will be necessary to understand indetail the form and extent of the variations (noise) on the situations (e.g., learning phases)and individuals or groups, the results in conjunction with the findings of other studiesindicate an essential role of increased noise in learning processes of multiple movements.Learning multiple movements in parallel appears to further positively influence this “dif-ferential learning effect”. In addition, the highly variable differential learning exerciseprotocol could expand the space of experience and thus better prepare athletes to solvefuture problems more adequately, as indicated by the retention tests.
Although the statistics applied do not allow for generalization, the numerous signifi-cant results with corresponding effect sizes may, on the one hand, encourage researchers(according to Fisher’s original interpretation of his statistics) to continue the study of differ-ential learning and, on the other hand, provide coaches and physical education teacherswith an effective and time-saving method to support motor learning.
Author Contributions: Conceptualization, J.B.A. and W.I.S.; methodology, J.B.A. and W.I.S.; vali-
dation, J.B.A., W.I.S. and J.B.; formal analysis, J.B.A. and J.B.; investigation, J.B.A.; resources, J.B.A.
and W.I.S.; data curation, J.B.A.; writing—original draft preparation, J.B.A., J.B. and W.I.S.; writing—
review and editing, J.B.A., W.I.S. and J.B.; visualization, J.B.A., J.B. and W.I.S.; supervision, W.I.S.;
project administration, W.I.S.; funding acquisition, None. All authors have read and agreed to the
published version of the manuscript.
Funding: This research received no external funding.
Institutional Review Board Statement: The study was conducted according to the guidelines of the
Declaration of Helsinki and approved by the Institutional Review Board of Akanten Appiah-Menka
University of Skills Training and Entrepreneurial Development (AAMUSTED/K/RO/L.1/219, 31
August 2021).
Informed Consent Statement: Informed consent was obtained from all subjects involved in the study.
Data Availability Statement: The data that support the findings of this study are available from the
corresponding author, J.B., upon reasonable request.
Conflicts of Interest: The authors declare no conflict of interest.
60
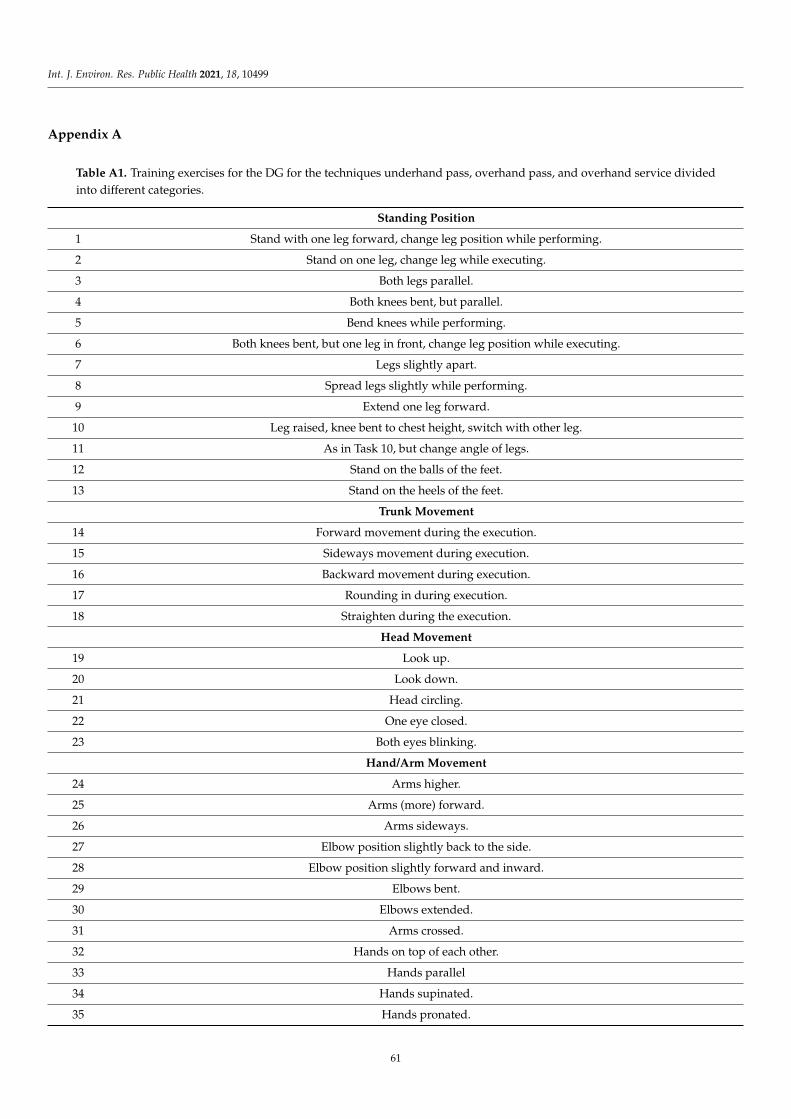
Int. J. Environ. Res. Public Health 2021, 18, 10499
Appendix A
Table A1. Training exercises for the DG for the techniques underhand pass, overhand pass, and overhand service divided
into different categories.
Standing Position
1 Stand with one leg forward, change leg position while performing.
2 Stand on one leg, change leg while executing.
3 Both legs parallel.
4 Both knees bent, but parallel.
5 Bend knees while performing.
6 Both knees bent, but one leg in front, change leg position while executing.
7 Legs slightly apart.
8 Spread legs slightly while performing.
9 Extend one leg forward.
10 Leg raised, knee bent to chest height, switch with other leg.
11 As in Task 10, but change angle of legs.
12 Stand on the balls of the feet.
13 Stand on the heels of the feet.
Trunk Movement
14 Forward movement during the execution.
15 Sideways movement during execution.
16 Backward movement during execution.
17 Rounding in during execution.
18 Straighten during the execution.
Head Movement
19 Look up.
20 Look down.
21 Head circling.
22 One eye closed.
23 Both eyes blinking.
Hand/Arm Movement
24 Arms higher.
25 Arms (more) forward.
26 Arms sideways.
27 Elbow position slightly back to the side.
28 Elbow position slightly forward and inward.
29 Elbows bent.
30 Elbows extended.
31 Arms crossed.
32 Hands on top of each other.
33 Hands parallel
34 Hands supinated.
35 Hands pronated.
61

Int. J. Environ. Res. Public Health 2021, 18, 10499
Table A1. Cont.
Standing Position
36 Hands as fists.
37 Hands wide open.
Mass Movement (Velocity Change)
38 One step forward during the execution.
39 Two steps forward during the execution.
40 One step backward during execution.
41 Two steps backward during the execution.
42 Side steps to the left and right during execution.
43 Moving one leg forward, backward, left, right during the execution.
44 During execution one quick step forward.
45 During execution one quick step backward.
46 During the execution two quick steps to the front.
47 During execution two quick steps backward.
48 During the execution quick lateral steps to the left and right.
49 Quick one-legged movement forward, backward, left, right during execution.
Jumps/Hops
50 During the execution single-leg hops to the front, back, left, right.
51 While performing two-legged hop forward, backward, left, right.
52 Jump with execution of the technique before landing.
53 Jump with execution of the technique exactly at the landing.
Running
54 Fast runs to the execution position.
55 Fast and slow runs during the performance.
Twist and Turns
56 Half turn left/right on command immediately before execution.
57 Execution with hip position 60◦, 120◦, 180◦, 240◦, 300◦ to the stroke direction.
Position Changes
58 Execution in seated position with legs crossed, legs forward, hurdle seat position, legs wide apart, one leg bent.
59 Execution in a seated position with legs crossed, legs forward, hurdle seat position, legs wide apart, one leg bent.
60 Execution lying bent, stretched, on the side.
61 60, but faster.
62 60, but slower.
63 Execution backwards.
Combine at Least two of all Above
64 Jump and turn left while performing.
65 27 and 46 while execution
66 21 and 32 while execution
67 Different type of balls.
68 Different terrains (e.g., on sand, grass, soft floor mat, . . . )
62

Int. J. Environ. Res. Public Health 2021, 18, 10499
References
1. Gentile, A.M. A working model of skill acquisition with application to teaching. Quest 1972, 17, 3–23. [CrossRef]
2. Gaulhofer, K.; Streicher, M. Grundzüge des Österreichischen Schulturnens; Deutscher Verlag für Jugend und Volk: Wien, Austria,
1924.
3. Moxley, S.E. Schema: The Variability of Practice Hypothesis. J. Mot. Behav. 1979, 11, 65–70. [CrossRef]
4. Schmidt, R.A. A schema theory of discrete motor skill learning. Psychol. Rev. 1975, 82, 225–260. [CrossRef]
5. Schmidt, R.A. Motor Schema Theory after 27 Years: Reflections and Implications for a New Theory. Res. Q. Exerc. Sport 2003, 74,
366–375. [CrossRef] [PubMed]
6. Battig, W.F. Facilitation and interference. In Acquisition of Skill; Bilodeau, A., Ed.; Academic Press: New York, NY, USA, 1966;
pp. 215–224.
7. Battig, W.F. The flexibility of human memory. In Levels of Processing in Human Memory; Cermak, L.S., Craik, F.I., Eds.; Erlbaum:
Hillsdale, NJ, USA, 1979; pp. 23–44.
8. Shea, J.B.; Morgan, R.L. Contextual interference effects on the acquisition, retention, and transfer of a motor skill. J. Exp. Psychol.Hum. Learn. Mem. 1979, 5, 179–187. [CrossRef]
9. Magill, R.A.; Hall, K.G. A review of the contextual interference effect in motor skill acquisition. Hum. Mov. Sci. 1990, 9, 241–289.
[CrossRef]
10. Brady, F. Contextual Interference: A Meta-Analytic Study. Percept. Mot. Skills 2004, 99, 116–126. [CrossRef]
11. Shea, J.B.; Zimny, S.T. Context effects in memory and learning movement information. In Memory and Control of Action; Magill,
R.A., Ed.; North-Holland: New York, NY, USA, 1983; pp. 345–366.
12. Lee, T.D.; Magill, R.A. The locus of contextual interference in motor-skill acquisition. J. Exp. Psychol. Learn. Mem. Cogn. 1983, 9,
730–746. [CrossRef]
13. Shewokis, P.A.; Rey, P.D.; Simpson, K.J. A Test of Retroactive Inhibition as an Explanation of Contextual Interference. Res. Q.Exerc. Sport 1998, 69, 70–74. [CrossRef]
14. Barreiros, J.; Figueiredo, T.; Godinho, M. The contextual interference effect in applied settings. Eur. Phys. Educ. Rev. 2007, 13,
195–208. [CrossRef]
15. Goode, S.; Magill, R.A. Contextual Interference Effects in Learning Three Badminton Serves. Res. Q. Exerc. Sport 1986, 57, 308–314.
[CrossRef]
16. Schöllhorn, W.I. Individualitaet—Ein vernachlässigter Parameter. Leistungssport 1999, 7–12.
17. Schöllhorn, W.I. Applications of systems dynamic principles to technique and strenght training. Acta Acad. Olympiquae Est. 2000,
67–85.
18. Schöllhorn, W.I.; Beckmann, H.; Michelbrink, M.; Sechelmann, M.; Trockel, M.; Davids, K. Does noise provide a basis for the
unification of motor learning theories? Int. J. Sport Psychol. 2006, 37, 186–206.
19. Schöllhorn, W.I.; Mayer-Kress, G.; Newell, K.M.; Michelbrink, M. Time scales of adaptive behavior and motor learning in the
presence of stochastic perturbations. Hum. Mov. Sci. 2009, 28, 319–333. [CrossRef]
20. Beckmann, H.; Schöllhorn, W.I. Increasing noise improves signal-noise-ratio in motor learning. In 2nd European Workshop onMovement Sciences; Peham, C., Schöllhorn, W.I., Verwey, W., Eds.; Sport & Buch Strauß: Köln, Germany, 2005; pp. 139–140.
21. Schöllhorn, W.I.; Bauer, H.U. Identifying individual movement styles in high performance sports by means of self-organizing
Kohonen maps. In Proceedings of the XVI Annual Conference of the International Society for Biomechanics in Sport, Konstanz,
Germany, 21–25 July 1998; 1998; pp. 574–577.
22. Schöllhorn, W.I.; Nigg, B.M.; Stefanyshyn, D.J.; Liu, W. Identification of individual walking patterns using time discrete and time
continuous data sets. Gait Posture 2002, 15, 180–186. [CrossRef]
23. Horst, F.; Eekhoff, A.; Newell, K.M.; Schöllhorn, W.I. Intra-individual gait patterns across different time-scales as revealed by
means of a supervised learning model using kernel-based discriminant regression. PLoS ONE 2017, 12, e0179738. [CrossRef]
[PubMed]
24. Schöner, G.; Haken, H.; Kelso, J.A.S. A stochastic theory of phase transitions in human hand movement. Biol. Cybern. 1986, 53,
247–257. [CrossRef]
25. Haykin, S. Neural Networks: A Comprehensive Foundation, 1st ed.; McMaster University: Toronto, OT, Canada, 1994.
26. Miglino, O.; Lund, H.H.; Nolfi, S. Evolving mobile robots in simulated and real environments. Artif. Life 1995, 2, 417–434.
[CrossRef] [PubMed]
27. Schöllhorn, W.I.; Stefanysbyn, D.J.; Nigg, B.M.; Liu, W. Recognition of individual walking patterns by means of artificial neural
nets. Gait Posture 1999, 10, 85–86. [CrossRef]
28. Römer, J.; Schöllhorn, W.I.; Jaitner, T.; Preiss, R. Differenzielles Lernen bei der Aufschlagannahme im Volleyball. In Messplätze,Messplatztraining, Motorisches Lernen; Krug, J., Müller, T., Eds.; Academia Verlag: Sankt Augustin, Germany, 2003; pp. 129–133.
29. Beckmann, H.; Schöllhorn, W.I. Differencial learning in shot put. In 1st European Workshop on Movement; Schöllhorn, W.I., Bohn,
C., Jäger, J.M., Schaper, H., Alichmann, M., Eds.; Sport & Buch Strauß: Köln, Germany, 2003; p. 68.
30. Savelsbergh, G.J.P.; Kamper, W.J.; Rabius, J.; De Koning, J.J.; Schöllhorn, W. New methods to learn to start in speed skating: A
differencial learning approach. Int. J. Sport Psychol. 2010, 41, 415–427.
31. Pabel, S.-O.; Pabel, A.-K.; Schmickler, J.; Schulz, X.; Wiegand, A. Impact of a Differential Learning Approach on Practical Exam
Performance: A Controlled Study in a Preclinical Dental Course. J. Dent. Educ. 2017, 81, 1108–1113. [CrossRef] [PubMed]
63

Int. J. Environ. Res. Public Health 2021, 18, 10499
32. Pabel, S.-O.; Freitag, F.; Hrasky, V.; Zapf, A.; Wiegand, A. Randomised controlled trial on differential learning of toothbrushing in
6- to 9-year-old children. Clin. Oral Investig. 2018, 22, 2219–2228. [CrossRef]
33. Serrien, B.; Tassignon, B.; Verschueren, J.; Meeusen, R.; Baeyens, J.-P. Short-term effects of differential learning and contextual
interference in a goalkeeper-like task: Visuomotor response time and motor control. Eur. J. Sport Sci. 2020, 20, 1061–1071.
[CrossRef] [PubMed]
34. Santos, S.; Coutinho, D.; Gonçalves, B.; Schöllhorn, W.I.; Sampaio, J.; Leite, N. Differential Learning as a Key Training Approach
to Improve Creative and Tactical Behavior in Soccer. Res. Q. Exerc. Sport 2018, 89, 11–24. [CrossRef] [PubMed]
35. Poureghbali, S.; Arede, J.; Rehfeld, K.; Schöllhorn, W.I.; Leite, N. Want to Impact Physical, Technical, and Tactical Performance
during Basketball Small-Sided Games in Youth Athletes? Try Differential Learning Beforehand. Int. J. Environ. Res. Public Health2020, 17, 9279. [CrossRef] [PubMed]
36. Hegen, P.; Polywka, G.; Schöllhorn, W.I. The Differential Learning Approach in Strength Training. In Proceedings of the Book of
Abstract of 20th annual Congress of the European College of Sport Science, Malmö, Sweden, 24–27 June 2015; Radmann, A.,
Hedenborg, S., Tsolakidis, E., Eds.; University of Malmö: Malmö, Sweden, 2015; p. 590.
37. Horst, F.; Rupprecht, C.; Schmitt, M.; Hegen, P.; Schöllhorn, W.I. Muscular Activity in Conventional and Differential Back Squat
Exercise. In Proceedings of the 21st Annual Congress of the European College of Sport Science, Vienna, Austria, 6–9 July 2016; p.
516.
38. Schöllhorn, W.I.; Paschke, M.; Beckmann, H. Differenzielles Training im Volleyball beim Erlernen von zwei Techniken. In Volleyball2005—Beach-WM; Langolf, K., Roth, R., Eds.; Czwalina: Hamburg, Germany, 2006; pp. 97–105.
39. Hegen, P.; Schöllhorn, W.I. Gleichzeitig in verschiedenen Bereichen besser werden, ohne zu wiederholen? Paralleles differenzielles
Training von zwei Techniken im Fußball. Leistungssport 2012, 42, 17–23.
40. French, K.; Rink, J.; Rikard, L.; Mays, A.; Lynn, S.; Werner, P. The Effects of Practice Progressions on Learning Two Volleyball
Skills. J. Teach. Phys. Educ. 1991, 10, 261–274. [CrossRef]
41. Fialho, J.V.A.P.; Benda, R.N.; Ugrinowitsch, H. The contextual interference effect in a serve skill acquisition with experienced
volleyball players. J. Hum. Mov. Stud. 2006, 50, 65–77.
42. Meira, J.R.; Tani, G. Contextual interference effects assessed by extended transfer trials in the acquisition of the volleyball serve. J.Hum. Mov. Stud. 2003, 45, 449–468.
43. French, K.E.; Rink, J.E.; Werner, P.H. Effects of Contextual Interference on Retention of Three Volleyball Skills. Percept. Mot. Ski.1990, 71, 179–186. [CrossRef]
44. Jones, L.; French, K. Effects of contextual interference on acquisition and retention of three volleyball skills. Percept. Mot. Skills2007, 105, 883–890. [CrossRef] [PubMed]
45. Zetou, E.; Michalopoulou, M.; Giazitzi, K.; Kioumourtzoglou, E. Contextual Interference Effects in Learning Volleyball Skills.
Percept. Mot. Skills 2007, 104, 995–1004. [CrossRef]
46. Bortoli, L.; Robazza, C.; Durigon, V.; Carra, C. Effects of Contextual Interference on Learning Technical Sports Skills. Percept. Mot.Skills 1992, 75, 555–562. [CrossRef] [PubMed]
47. Kalkhoran, J.F.; Shariati, A. The Effects of Contextual Interference on Learning Volleyball Motor Skills. J. Sport Sci. 2015, 6, 12–24.
48. Pollock, B.J.; Lee, T.D. Dissociated contextual interference effects in children and adults. Percept. Mot. Skills 1997, 84, 851–858.
[CrossRef]
49. FIVB Coaches Manual. Available online: https://www.fivb.com/en/development/education/toolsandresourcecentre (accessed
on 4 October 2021).
50. American Association for Health, Physical Education, and Recreation (AAHPERD). AAHPER Skills Test Manual: Volleyball;American Association for Health, Physical Education, and Recreation: Washington, DC, USA, 1969.
51. Cohen, J. The Concepts of Power Analysis BT—Statistical Power Analysis for the Behavioral Sciences (Revised Edition); Hillsdale, N.J.,
Ed.; Lawrence Erlbaum Associates Inc.: Mahwah, NJ, USA, 1988; ISBN 9780805802832.
52. Fisher, R.A. On the Mathematical Foundations of Theoretical Statistics. Philos. Trans. R. Soc. A Math. Phys. Eng. Sci. 1922, 222,
309–368. [CrossRef]
53. Reynoso, S.R.; Sabido Solana, R.; Reina Vaíllo, R.; Moreno Hernández, F.J. Differential learning applied to volleyball serves in
novice athletes. Apunt. Educ. Fis. Esports 2013, 114, 45–52.
54. Savelsbergh, G.J.P.; Cañal-Bruland, R.; van der Kamp, J. Error Reduction during Practice: A Novel Method for Learning to Kick
Free-Kicks in Soccer. Int. J. Sports Sci. Coach. 2012, 7, 47–56. [CrossRef]
55. Wagner, H.; Müller, E. The effects of differential and variable training on the quality parameters of a handball throw. Sport.Biomech. 2008, 7, 54–71. [CrossRef]
56. Fuchs, P.; Fusco, A.; Bell, J.; Von Duvillard, S.; Cortis, C.; Wagner, H. Effect of Differential Training on Female Volleyball
Spike-Jump Technique and Performance. Int. J. Sports Physiol. Perform. 2020, 15, 1019–1025. [CrossRef] [PubMed]
57. Horak, M. The utility of connectionism for motor learning: A reinterpretation of contextual interference in movement schemas. J.Mot. Behav. 1992, 24, 58–66. [CrossRef]
58. Shea, J.B.; Graf, R.C. A Model for Contextual Interference Effects in Motor Learning. Cogn. Assess. 1994, 73–87. [CrossRef]
59. Schöllhorn, W.I. Practical consequences of biomechanically determined individuality and fluctuations on motor learning. In
Proceedings of the XVII Conference of the International Society of Biomechanics, Calgary, AB, Canada, 8–13 August 1999.
64

Int. J. Environ. Res. Public Health 2021, 18, 10499
60. Catalano, J.F.; Kleiner, B.M. Distant Transfer in Coincident Timing as a Function of Variability of Practice. Percept. Mot. Skills 1984,
58, 851–856. [CrossRef]
61. Scholz, J.P.; Schöner, G. The uncontrolled manifold concept: Identifying control variables for a functional task. Exp. Brain Res.1999, 126, 289–306. [CrossRef]
62. Newell, K.M.; Kugler, P.N.; Van Emmerik, R.E.A.; McDonald, P.V. Search strategies and the acquisition of coordination. Adv.Psychol. 1989, 61, 85–122. [CrossRef]
63. Wulf, G.; Shea, C.H. Principles derived from the study of simple skills do not generalize to complex skill learning. Psychon. Bull.Rev. 2002, 9, 185–211. [CrossRef]
64. Hall, K.G.; Domingues, D.A.; Cavazos, R. Contextual Interference Effects with Skilled Baseball Players. Percept. Mot. Skills 1994,
78, 835–841. [CrossRef]
65. Porter, C.; Greenwood, D.; Panchuk, D.; Pepping, G.-J. Learner-adapted practice promotes skill transfer in unskilled adults
learning the basketball set shot. Eur. J. Sport. Sci. 2019, 20, 61–71. [CrossRef]
66. Boyce, B.A.; Del Rey, P. Designing applied research in a naturalistic setting using a contextual interference paradigm. J. Hum.Mov. Stud. 1990, 18, 189–200.
67. Kern, G.; Krüger, F. Motorische Umreißung optischer Gestalten. Neue Psychol. Stud. 1933, 9, 65–104.
68. Shea, C.H.; Kohl, R.; Indermill, C. Contextual interference: Contributions of practice. Acta Psychol. 1990, 73, 145–157. [CrossRef]
69. Willey, C.R.; Liu, Z. Limited generalization with varied, as compared to specific, practice in short-term motor learning. ActaPsychol. 2018, 182, 39–45. [CrossRef]
70. McDonnell, M.D.; Stocks, N.G.; Pearce, C.E.M.; Abbott, D. Stochastic Resonance: From Suprathreshold Stochastic Resonance toStochastic Signal Quantization; University Press: Cambridge, UK, 2008; ISBN 978-0-521-88262-0.
71. Adams, J.A. Historical review and appraisal of research on the learning, retention, and transfer of human motor skills. Psychol.Bull. 1987, 101, 41–74. [CrossRef]
72. Kelso, J.A.S.; Zanone, P.G. Coordination dynamics of learning and transfer across different effector systems. J. Exp. Psychol. Hum.Percept. Perform. 2002, 28, 776–797. [CrossRef] [PubMed]
73. Bernstein, N.A. The Co-Ordination and Regulation of Movements; Pergamon Press: Oxford, UK, 1967.
74. Ranganathan, R.; Lee, M.-H.; Newell, K.M. Repetition Without Repetition: Challenges in Understanding Behavioral Flexibility in
Motor Skill. Front. Psychol. 2020, 11, 2018. [CrossRef] [PubMed]
65


International Journal of
Environmental Research
and Public Health
Article
The Effect of Eight-Week Sprint Interval Training on AerobicPerformance of Elite Badminton Players
Haochong Liu 1, Bo Leng 2, Qian Li 2, Ye Liu 1, Dapeng Bao 1,* and Yixiong Cui 3,*
�����������������
Citation: Liu, H.; Leng, B.; Li, Q.;
Liu, Y.; Bao, D.; Cui, Y. The Effect of
Eight-Week Sprint Interval Training
on Aerobic Performance of Elite
Badminton Players. Int. J. Environ.
Res. Public Health 2021, 18, 638.
https://doi.org/10.3390/ijerph
18020638
Received: 27 November 2020
Accepted: 8 January 2021
Published: 13 January 2021
Publisher’s Note: MDPI stays neu-
tral with regard to jurisdictional clai-
ms in published maps and institutio-
nal affiliations.
Copyright: © 2021 by the authors. Li-
censee MDPI, Basel, Switzerland.
This article is an open access article
distributed under the terms and con-
ditions of the Creative Commons At-
tribution (CC BY) license (https://
creativecommons.org/licenses/by/
4.0/).
1 China Institute of Sport and Health Science, Beijing Sport University, Beijing 100084, China;
[email protected] (H.L.); [email protected] (Y.L.)2 Sports Coaching College, Beijing Sport University, Beijing 100084, China; [email protected] (B.L.);
[email protected] (Q.L.)3 AI Sports Engineering Lab, School of Sports Engineering, Beijing Sport University, Beijing 100084, China
* Correspondence: [email protected] (D.B.); [email protected] (Y.C.)
Abstract: This study was aimed to: (1) investigate the effects of physiological functions of sprint
interval training (SIT) on the aerobic capacity of elite badminton players; and (2) explore the potential
mechanisms of oxygen uptake, transport and recovery within the process. Thirty-two elite badminton
players volunteered to participate and were randomly divided into experimental (Male-SIT and
Female-SIT group) and control groups (Male-CON and Female-CON) within each gender. During
a total of eight weeks, SIT group performed three times of SIT training per week, including two
power bike trainings and one multi-ball training, while the CON group undertook two Fartlek
runs and one regular multi-ball training. The distance of YO-YO IR2 test (which evaluates player’s
ability to recover between high intensity intermittent exercises) for Male-SIT and Female-SIT groups
increased from 1083.0 ± 205.8 m to 1217.5 ± 190.5 m, and from 725 ± 132.9 m to 840 ± 126.5 m
(p < 0.05), respectively, which were significantly higher than both CON groups (p < 0.05). For the Male-
SIT group, the ventilatory anaerobic threshold and ventilatory anaerobic threshold in percentage of
VO2max significantly increased from 3088.4 ± 450.9 mL/min to 3665.3 ± 263.5 mL/min (p < 0.05),and
from 74 ± 10% to 85 ± 3% (p < 0.05) after the intervention, and the increases were significantly
higher than the Male-CON group (p < 0.05); for the Female-SIT group, the ventilatory anaerobic
threshold and ventilatory anaerobic threshold in percentage of VO2max were significantly elevated
from 1940.1 ± 112.8 mL/min to 2176.9 ± 78.6 mL/min, and from 75 ± 4% to 82 ± 4% (p < 0.05)
after the intervention, which also were significantly higher than those of the Female-CON group
(p < 0.05). Finally, the lactate clearance rate was raised from 13 ± 3% to 21 ± 4% (p < 0.05) and from
21 ± 5% to 27 ± 4% for both Male-SIT and Female-SIT groups when compared to the pre-test, and
this increase was significantly higher than the control groups (p < 0.05). As a training method, SIT
could substantially improve maximum aerobic capacity and aerobic recovery ability by improving
the oxygen uptake and delivery, thus enhancing their rapid repeated sprinting ability.
Keywords: interval training; badminton; aerobic; repeated sprint; testing
1. Introduction
Badminton is a fast and dynamic sport, which has high requirements for the player’srapid reaction, fast action and high-speed hitting ability. Studies have shown that thereare on average 5–9 strokes in badminton games [1]. Due to its fastball speed, high swingfrequency and short interval time, badminton requires players to mainly compete with fastrunning, sudden acceleration, abrupt stop, change of direction and continuously high inten-sity of multiple rallies, which requires a player’s well-developed aerobic endurance [2,3].Due to the influence of players’ strength level, badminton competition is easy to forma multi-round competition, which requires higher aerobic working capacity. Particularly,a relevant study has indicated that badminton players usually reach an average heart rateof over 90% of their HRmax during competitive games, which is demanding to both aerobic
67

Int. J. Environ. Res. Public Health 2021, 18, 638
and anaerobic systems: 60–70% on the aerobic system and 30% on the anaerobic system,with a greater demand on alactic metabolism [3].
Previous research [3,4] has shown that various physiological parameters had a strongcorrelation with badminton performance. Particularly, aerobic capacity and intermit-tent exercise performance are positively correlated, involving VO2max, lactate/anaerobicthreshold and running efficiency [5]. However, practically, due to the limited trainingtime, the traditional long-period aerobic endurance training would not be the most suitablemodality for the actual needs of current competition. Therefore, it is essential to exploretime-efficient and badminton-specific fitness training programs.
As one of the advocated alternatives to traditional continuous aerobic training, SprintInterval Training (SIT) is a training approach that asks athletes to complete the requiredactions at maximum effort in a short period of time, and takes active rest with limitedrecovery time between two sets of training. Meanwhile, as the active rest often lastsonly 3–5 min between multiple short and full sprint training, SIT can effectively improvethe performance of athletes in intermittent sports with substantially lower overall trainingvolume [6].
In recent years, there have been many studies on the training effect of SIT on sportsperformance in other intermittent sports such as soccer, basketball, volleyball and fieldhockey [7]. Among them, Buchan [8] and Bayati et al. [9] conducted a 6-week 30-s full-speed sprint running and rowing training experiment. Each training was carried outin 4–6 rounds, with 4 min of low-intensity activities serving as an active rest interval be-tween groups. The results showed that the maximum oxygen uptake, peak power, averagepower and aerobic capacity significantly improved compared with those of the controlgroup. Meanwhile, the study by Jone et al. [10] proved that field hockey players’ muscleoxygenation kinetics and performance during the 30–15 intermittent fitness test (30-s shut-tle runs with 15-s passive recovery) were significantly improved after 6-week of SprintInterval Cycling. Additionally, Burgomaster [11] and Gibala et al. [12] also conductedsimilar comparative experiments between traditional endurance training and SIT on younghealthy individuals. Their results showed that the SIT group shortened the training timeby about 80%, and the participants’ aerobic capacity was significantly improved.
Nonetheless, currently, there are few attempts to investigate the application of SITto badminton training. This study was, therefore aimed to explore the effect of SIT onimproving players’ aerobic capacity, as well as the mechanism of oxygen uptake andtransport, by testing the changes of badminton players’ rapid and repeated sprintingability and related aerobic capacity parameters before and after 8 weeks of SIT. It washypothesized that such training would induce greater improvement in before-mentionedparameters compared to traditional continuous aerobic training.
2. Materials and Methods
2.1. Participants
Thirty-two elite players from who had played in or beyond the semi-finals of Bad-minton Championship at National level volunteered to participate in the study. There weresixteen male and female players, respectively, and they were randomly divided into maleSprint Interval Training (SIT) group (n = 8) and control (CON) group (n = 8), and femaleSIT group (n = 8) and CON group (n = 8). Detailed information about different groups canbe found in Table 1. All subjects were in good health and had no severe injuries duringthe last six months before the study. Prior to the formal experiment and test, the nature andpossible risks were explained to the participants, and they provided their written informedconsent to participate. The tests were conducted at least 48 h after competitive match orheavy training session. The subjects participated in all the training sessions as well as pre-and post- training tests. All procedures were approved by Research Ethics Committee ofBeijing Sport University (Approval number: 2020008H). All procedures were conductedin accordance with the Declaration of Helsinki.
68
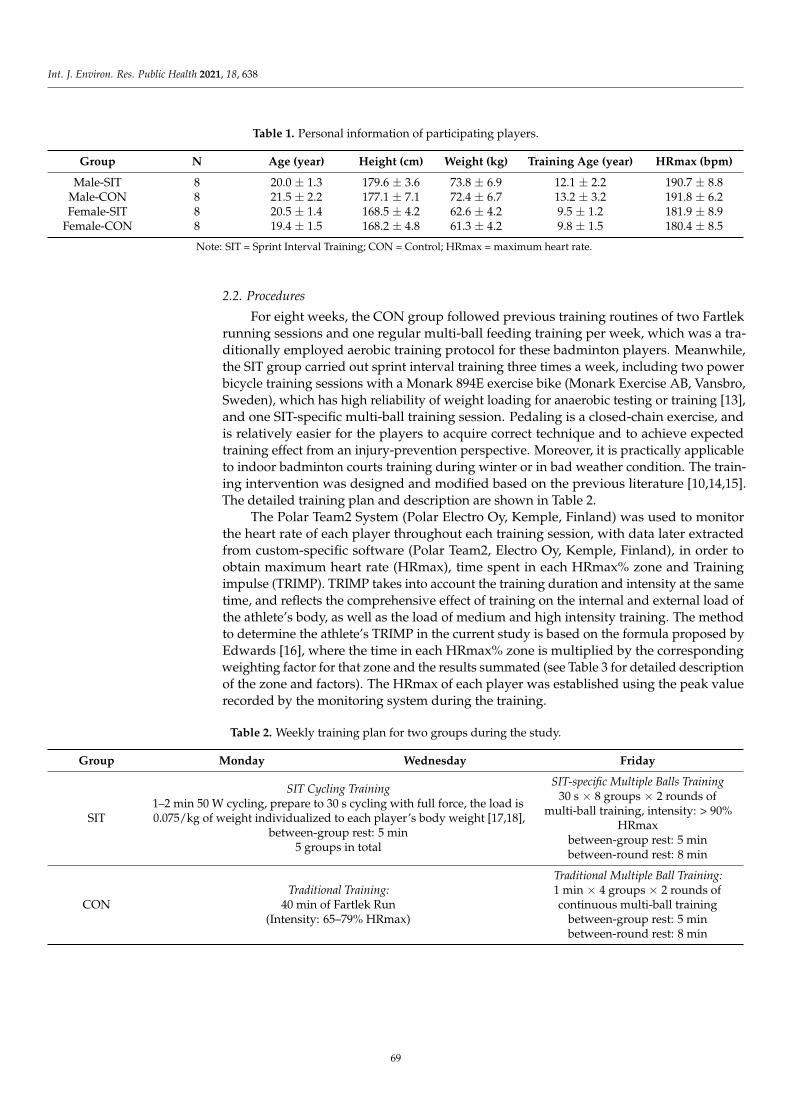
Int. J. Environ. Res. Public Health 2021, 18, 638
Table 1. Personal information of participating players.
Group N Age (year) Height (cm) Weight (kg) Training Age (year) HRmax (bpm)
Male-SIT 8 20.0 ± 1.3 179.6 ± 3.6 73.8 ± 6.9 12.1 ± 2.2 190.7 ± 8.8Male-CON 8 21.5 ± 2.2 177.1 ± 7.1 72.4 ± 6.7 13.2 ± 3.2 191.8 ± 6.2Female-SIT 8 20.5 ± 1.4 168.5 ± 4.2 62.6 ± 4.2 9.5 ± 1.2 181.9 ± 8.9
Female-CON 8 19.4 ± 1.5 168.2 ± 4.8 61.3 ± 4.2 9.8 ± 1.5 180.4 ± 8.5
Note: SIT = Sprint Interval Training; CON = Control; HRmax = maximum heart rate.
2.2. Procedures
For eight weeks, the CON group followed previous training routines of two Fartlekrunning sessions and one regular multi-ball feeding training per week, which was a tra-ditionally employed aerobic training protocol for these badminton players. Meanwhile,the SIT group carried out sprint interval training three times a week, including two powerbicycle training sessions with a Monark 894E exercise bike (Monark Exercise AB, Vansbro,Sweden), which has high reliability of weight loading for anaerobic testing or training [13],and one SIT-specific multi-ball training session. Pedaling is a closed-chain exercise, andis relatively easier for the players to acquire correct technique and to achieve expectedtraining effect from an injury-prevention perspective. Moreover, it is practically applicableto indoor badminton courts training during winter or in bad weather condition. The train-ing intervention was designed and modified based on the previous literature [10,14,15].The detailed training plan and description are shown in Table 2.
The Polar Team2 System (Polar Electro Oy, Kemple, Finland) was used to monitorthe heart rate of each player throughout each training session, with data later extractedfrom custom-specific software (Polar Team2, Electro Oy, Kemple, Finland), in order toobtain maximum heart rate (HRmax), time spent in each HRmax% zone and Trainingimpulse (TRIMP). TRIMP takes into account the training duration and intensity at the sametime, and reflects the comprehensive effect of training on the internal and external load ofthe athlete’s body, as well as the load of medium and high intensity training. The methodto determine the athlete’s TRIMP in the current study is based on the formula proposed byEdwards [16], where the time in each HRmax% zone is multiplied by the correspondingweighting factor for that zone and the results summated (see Table 3 for detailed descriptionof the zone and factors). The HRmax of each player was established using the peak valuerecorded by the monitoring system during the training.
Table 2. Weekly training plan for two groups during the study.
Group Monday Wednesday Friday
SIT
SIT Cycling Training1–2 min 50 W cycling, prepare to 30 s cycling with full force, the load is0.075/kg of weight individualized to each player’s body weight [17,18],
between-group rest: 5 min5 groups in total
SIT-specific Multiple Balls Training30 s × 8 groups × 2 rounds of
multi-ball training, intensity: > 90%HRmax
between-group rest: 5 minbetween-round rest: 8 min
CONTraditional Training:
40 min of Fartlek Run(Intensity: 65–79% HRmax)
Traditional Multiple Ball Training:1 min × 4 groups × 2 rounds ofcontinuous multi-ball training
between-group rest: 5 minbetween-round rest: 8 min
69

Int. J. Environ. Res. Public Health 2021, 18, 638
Table 3. HRmax% zones and corresponding weighting factors.
Zone Weighting Factor HRmax%
I 1 50–60%II 2 60–70%III 3 70–80%IV 4 80–90%V 5 90–100%
2.3. Test Program
Before and after 8 weeks of training, four groups all participated in a set of testing,which included YO-YO IR2 intermittent recovery test, analysis of the increasing load gasmetabolism and lactate clearance rate test.
2.3.1. YO-YO Intermittent Recovery Test Level 2 (YO-YO IR2 Test)
Speed endurance level is generally reflected by short bursts of repetitive sprints (RS),which requires subjects to try their best to accomplish the fastest speed in each repetitivesprint, and this ability is generally evaluated via the YO-YO IR2 test during field-test [6].The test is based on increasing and intermittent load protocol, and evaluates player’s abilityto recover between high intensity intermittent exercises. Moreover, it has been proven tovalidly monitor training effects [19].
After dynamic warm-up, players perform a combination of running to and fro ona 20 m course and a 10-s interval of active rest after 40 m, and players quit the test whenthe subjective exhaustion occurs or when they drop behind the required pace or make oneof the errors listed below for a second time:
(i) does not come to a complete stop before starting the next 40 m run;(ii) starts the run before the audio signal;(iii) does not reach/either line before the audio signal;(iv) turns at the 20 m mark without touching or crossing the line (therefore running short).
The starting speed starts at 13 km/h, and increases to 15 km/h, 16 km/h, and thenincreases by 0.5 km/h thereafter. The final running distance is then recorded. The speed ofeach bout is controlled by an audio recorder. All subjects were familiarized with the testwithin a one-minute trial.
2.3.2. Analysis of Increasing Load of Gas Metabolism and Test of Lactate Clearance Rate
An incremental load test was performed using an incremental load treadmill (H/PCosmos, Germany). Warm-up exercises should be performed for 5–10 min before each test.At the beginning of the test, the starting speed of the treadmill was set at 6 km/h, increasingby 1 km/h per minute, until 16 km/h, when the speed was stopped and the slope increasedby 1.5% per minute, until the subject was exhausted. Relevant ventilation indicators suchas maximum oxygen uptake (VO2max), ventilatory anaerobic threshold (VT-VO2) andventilatory anaerobic threshold in percentage of VO2max (VT/VO2max) were measuredusing a gas metabolism analyzer (Max I, Physio-Dyne Instrument Corp., New York, USA).Among them, VT is determined according to the following criteria:
In the incremental load test, the VT value is determined (i) when the ratio of ventilation(VE) to carbon dioxide production (VCO2) shows a non-linear increase in the inflectionpoint, and (ii) when the load intensity reaches a certain level, and the ratio of VE tooxygen consumption (VO2) increases sharply [20]. VT is determined by two independentinvestigators. When they are not coherent, and if the difference between the two selectedresults is remarkable, the value of VT needs to be determined again, while, if the differencecould be overlooked, the average value is taken.
Next, in order to analyze the aerobic recovery speed of athletes after increasing loadand to evaluate their recovery ability after aerobic exercise, blood samples were collectedfor rest (before testing with players being seated) and 0, 1, 3, 5, 7 and 10 min immediately
70

Int. J. Environ. Res. Public Health 2021, 18, 638
after the increasing load test via a volume of 20 microliters of fingertip blood. The EKFBiosen s-line automatic blood lactate analyzer (EKF-diagnostic GmbH, Barleben, Germany)was used to measure blood lactate, with the results being later recorded with the lactateclearance rate being calculated using the following formula [21]:
LA10% =
LAmax − LA10
LAmax − LArest× 100%
where LA10% means the lactate clearance rate at 10 min after testing, LAmax representsthe peak lactic value after testing, LA10 is the lactate value at 10 min after testing and LArest
the value of lactate before testing.
2.4. Statistical Analysis
Experimental data were processed by SPSS statistical software package (version 23.0,Chicago, IL, USA); all test results before and after training were presented using the average± standard deviation (x ± s). The normality of the tests results was checked beforethe subsequent analysis. A repetitive measure analysis of variance was then used tocompare the within and between group difference in test outcomes for both genders, withthe statistical significance level defined as p < 0.05. Pairwise differences and post hoccomparisons were tested with the Bonferroni post hoc test. Besides, the effect size (ES) wascalculated using Cohen’s d to quantify the amount of change before and after each groupof training and to reflect the comparison of training effects between SIT and CON groupsbased on the following scales: <0.2 trivial, 0.2–0.6 small, 0.6–1.2 moderate, 1.2–2.0 largeand >2.0 very large [22].
3. Results
3.1. Training Intensity and Time Used During Training
Table 4 shows the descriptive statistics of heartrate and time within the 8-week training,and the results show that the average heart rate and maximum heart rate of both male andfemale SIT groups during training were significantly higher than those of the CON groups(p < 0.05). Moreover, the effective training time of the former was significantly less thanthat of the latter (p < 0.05).
Table 4. Intensity monitoring during training.
Group N Avg HR (bpm) HRmax (bpm) Total Training Time (min) Effective Training Time (min)
Male-SIT 8 132.7 ± 7.3 * 190.7 ± 8.8 * 52.7 ± 4.1 19.8 ± 3.0 *Male-CON 8 126.0 ± 10.2 169.8 ± 6.2 78.5 ± 4.5 40.2 ± 1.8Female-SIT 8 134.1 ± 6.0 * 181.9 ± 8.9 * 52.7 ± 4.1 19.8 ± 3.0 *
Female-CON 8 115.4 ± 8.4 169.4 ± 8.5 78.5 ± 4.5 40.2 ± 1.8
Note: Values are expressed as means ± SD. * indicates significant difference between SIT and CON group, p < 0.05.
During the 8-week training, the mean weekly effective training time (time spent within50–100% HRmax zone) and TRIMP in the 80–100% HRmax intensity range of the Male-SITgroup were significantly higher than those in the Male-CON group (p < 0.05), while the totalweekly effective training time and TRIMP for the former were significantly lower thanthe latter (p < 0.05). As for female players, the average weekly effective training time andTRIMP in the 90–100%HRmax intensity range for the Female-SIT group were significantlyhigher than those in the Female-CON group (p < 0.05). However, in the intensity rangeof 80–90% HRmax, no differences were found between the F-SIT and F-CON groups.The overall effective training time and TRIMP for Female-SIT were significantly lower thanthose in Female-CON as well (p < 0.05), as is shown in Figure 1.
71

Int. J. Environ. Res. Public Health 2021, 18, 638
Figure 1. Comparisons of weekly effective training time and training impulse (TRIMP) between SIT and CON groups. Note:
* Indicates a significant difference between SIT and CON group, p < 0.05.
3.2. Comparisons of Testing Results Before and After Training Intervention
After training, the running distance of the YO-YO IR2 and the lactate clearance rate at10 min after testing (LA10%) significantly increased in both the Male-SIT and the Female-SITgroup (p < 0.05), and such improvement was significantly higher than that of the CONgroups (p < 0.05), as is shown in Figure 2.
Meanwhile, as Table 5 demonstrates, VO2max, VT-VO2 and VT/VO2max for the SITgroup significantly improved after the intervention (p < 0.05), and the improvement wassignificantly higher than that in the Male-CON group and Female-CON group (p < 0.05),as is shown in Table 4.
72
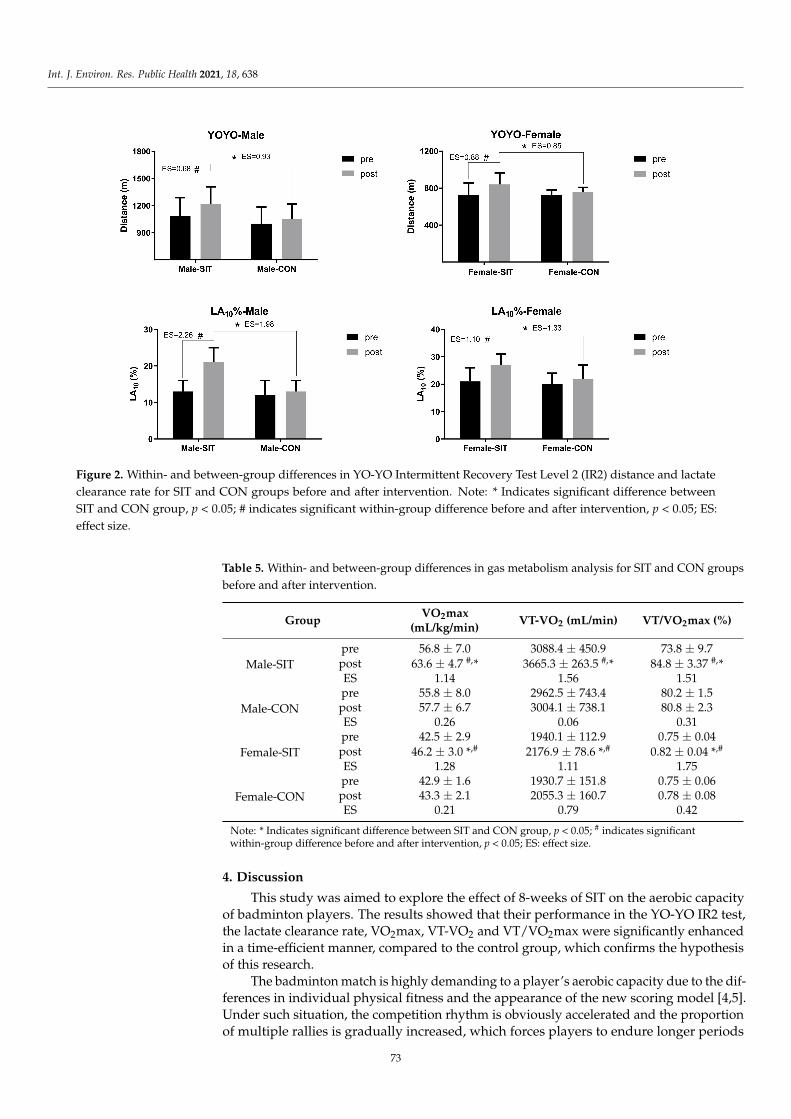
Int. J. Environ. Res. Public Health 2021, 18, 638
Figure 2. Within- and between-group differences in YO-YO Intermittent Recovery Test Level 2 (IR2) distance and lactate
clearance rate for SIT and CON groups before and after intervention. Note: * Indicates significant difference between
SIT and CON group, p < 0.05; # indicates significant within-group difference before and after intervention, p < 0.05; ES:
effect size.
Table 5. Within- and between-group differences in gas metabolism analysis for SIT and CON groups
before and after intervention.
GroupVO2max
(mL/kg/min)VT-VO2 (mL/min) VT/VO2max (%)
Male-SIT
pre 56.8 ± 7.0 3088.4 ± 450.9 73.8 ± 9.7post 63.6 ± 4.7 #,* 3665.3 ± 263.5 #,* 84.8 ± 3.37 #,*ES 1.14 1.56 1.51
Male-CON
pre 55.8 ± 8.0 2962.5 ± 743.4 80.2 ± 1.5post 57.7 ± 6.7 3004.1 ± 738.1 80.8 ± 2.3ES 0.26 0.06 0.31
Female-SIT
pre 42.5 ± 2.9 1940.1 ± 112.9 0.75 ± 0.04post 46.2 ± 3.0 *,# 2176.9 ± 78.6 *,# 0.82 ± 0.04 *,#
ES 1.28 1.11 1.75
Female-CON
pre 42.9 ± 1.6 1930.7 ± 151.8 0.75 ± 0.06post 43.3 ± 2.1 2055.3 ± 160.7 0.78 ± 0.08ES 0.21 0.79 0.42
Note: * Indicates significant difference between SIT and CON group, p < 0.05; # indicates significantwithin-group difference before and after intervention, p < 0.05; ES: effect size.
4. Discussion
This study was aimed to explore the effect of 8-weeks of SIT on the aerobic capacityof badminton players. The results showed that their performance in the YO-YO IR2 test,the lactate clearance rate, VO2max, VT-VO2 and VT/VO2max were significantly enhancedin a time-efficient manner, compared to the control group, which confirms the hypothesisof this research.
The badminton match is highly demanding to a player’s aerobic capacity due to the dif-ferences in individual physical fitness and the appearance of the new scoring model [4,5].Under such situation, the competition rhythm is obviously accelerated and the proportionof multiple rallies is gradually increased, which forces players to endure longer periods
73
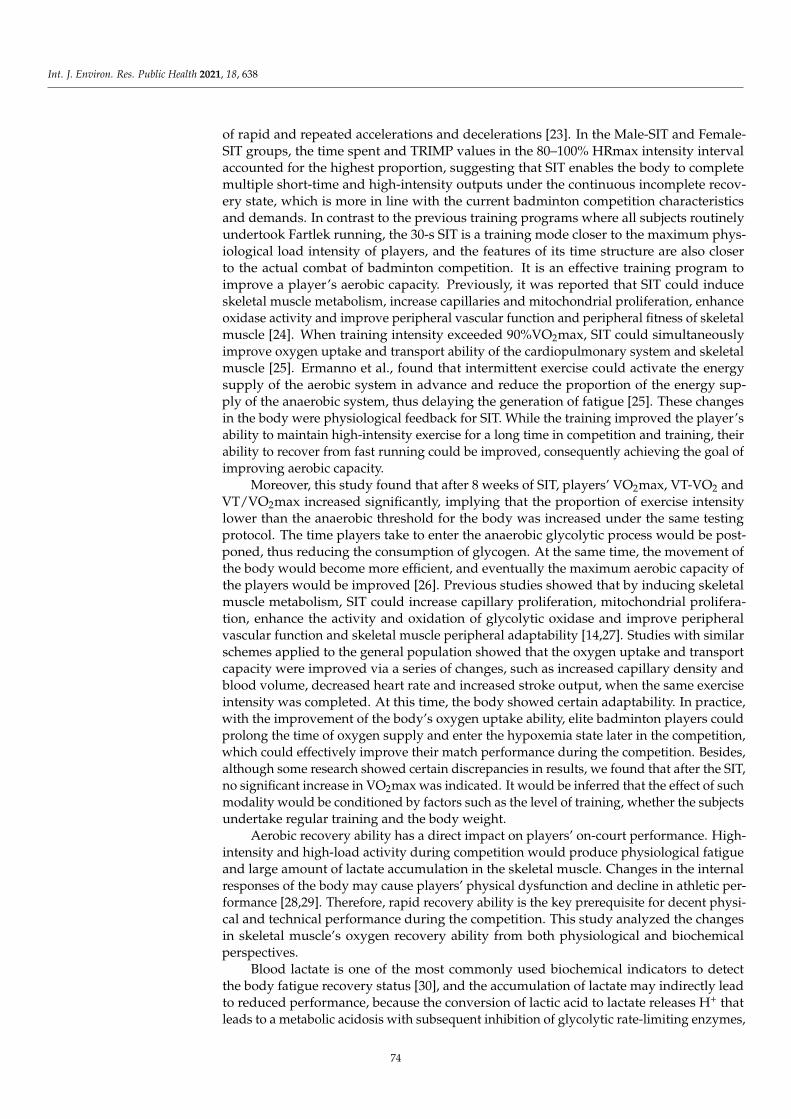
Int. J. Environ. Res. Public Health 2021, 18, 638
of rapid and repeated accelerations and decelerations [23]. In the Male-SIT and Female-SIT groups, the time spent and TRIMP values in the 80–100% HRmax intensity intervalaccounted for the highest proportion, suggesting that SIT enables the body to completemultiple short-time and high-intensity outputs under the continuous incomplete recov-ery state, which is more in line with the current badminton competition characteristicsand demands. In contrast to the previous training programs where all subjects routinelyundertook Fartlek running, the 30-s SIT is a training mode closer to the maximum phys-iological load intensity of players, and the features of its time structure are also closerto the actual combat of badminton competition. It is an effective training program toimprove a player’s aerobic capacity. Previously, it was reported that SIT could induceskeletal muscle metabolism, increase capillaries and mitochondrial proliferation, enhanceoxidase activity and improve peripheral vascular function and peripheral fitness of skeletalmuscle [24]. When training intensity exceeded 90%VO2max, SIT could simultaneouslyimprove oxygen uptake and transport ability of the cardiopulmonary system and skeletalmuscle [25]. Ermanno et al., found that intermittent exercise could activate the energysupply of the aerobic system in advance and reduce the proportion of the energy sup-ply of the anaerobic system, thus delaying the generation of fatigue [25]. These changesin the body were physiological feedback for SIT. While the training improved the player’sability to maintain high-intensity exercise for a long time in competition and training, theirability to recover from fast running could be improved, consequently achieving the goal ofimproving aerobic capacity.
Moreover, this study found that after 8 weeks of SIT, players’ VO2max, VT-VO2 andVT/VO2max increased significantly, implying that the proportion of exercise intensitylower than the anaerobic threshold for the body was increased under the same testingprotocol. The time players take to enter the anaerobic glycolytic process would be post-poned, thus reducing the consumption of glycogen. At the same time, the movement ofthe body would become more efficient, and eventually the maximum aerobic capacity ofthe players would be improved [26]. Previous studies showed that by inducing skeletalmuscle metabolism, SIT could increase capillary proliferation, mitochondrial prolifera-tion, enhance the activity and oxidation of glycolytic oxidase and improve peripheralvascular function and skeletal muscle peripheral adaptability [14,27]. Studies with similarschemes applied to the general population showed that the oxygen uptake and transportcapacity were improved via a series of changes, such as increased capillary density andblood volume, decreased heart rate and increased stroke output, when the same exerciseintensity was completed. At this time, the body showed certain adaptability. In practice,with the improvement of the body’s oxygen uptake ability, elite badminton players couldprolong the time of oxygen supply and enter the hypoxemia state later in the competition,which could effectively improve their match performance during the competition. Besides,although some research showed certain discrepancies in results, we found that after the SIT,no significant increase in VO2max was indicated. It would be inferred that the effect of suchmodality would be conditioned by factors such as the level of training, whether the subjectsundertake regular training and the body weight.
Aerobic recovery ability has a direct impact on players’ on-court performance. High-intensity and high-load activity during competition would produce physiological fatigueand large amount of lactate accumulation in the skeletal muscle. Changes in the internalresponses of the body may cause players’ physical dysfunction and decline in athletic per-formance [28,29]. Therefore, rapid recovery ability is the key prerequisite for decent physi-cal and technical performance during the competition. This study analyzed the changesin skeletal muscle’s oxygen recovery ability from both physiological and biochemicalperspectives.
Blood lactate is one of the most commonly used biochemical indicators to detectthe body fatigue recovery status [30], and the accumulation of lactate may indirectly leadto reduced performance, because the conversion of lactic acid to lactate releases H+ thatleads to a metabolic acidosis with subsequent inhibition of glycolytic rate-limiting enzymes,
74

Int. J. Environ. Res. Public Health 2021, 18, 638
lipolysis and contractility of the skeletal muscles [31]. From the results, it was shown thatSIT performed at a higher level of intensity could positively influence the clearance oflactate after exercise, increasing intra-cellular alkali reserve and slowing the pH reductionin muscles, and delaying the onset of fatigue [21]. Consequently, players’ ability to recoverfrom intermittent activities was enhanced and they would be better prepared for the nextpoint and game [32]. In particular, at the final game and the last points of each game, eachpoint would be ended with prolonged multiple-strokes and high-intensity movements,which might even last couple of minutes. Under such circumstances, possessing rapidaerobic recovery would become a key factor determining elite player’s aerobic enduranceand technical-tactical performance in the next point [33]. In the study conducted by Joneset al. [10], near-infrared spectroscopy was used to measure muscle oxygenation of the vastuslateralis of elite women hockey players for SIT groups and endurance training groups.Their results showed that there were significant increases in tissue deoxyhaemoglobin +deoxymyoglobin (HHb + HMb) and tissue oxygenation (TSI%), and a significant decreasein tissue oxyhaemoglobin + oxymyoglobin (HbO2 + MbO2), which indicated ‘positiveperipheral muscle oxygen adaptations’ occurring in response to SIT training. Moreover,existing literature also stated that the higher exercise intensity provided during SIT wouldincrease the probability of favorable adaptations in both type one and type two fibersas opposed to the generally lower intensity of endurance training [34]. Although asa limitation, the current study was unable to measure blood saturation, it could be impliedthat the SIT protocol might promote the skeletal muscle oxidative capacity of badmintonplayers after the training. Nonetheless, future studies should look into the changes ofEPOC (excess post-exercise oxygen consumption), body temperature and ventilation tocomprehensively verify the improvement in recovery after such intervention.
5. Conclusions
Eight-week SIT effectively improved the aerobic exercise capacity of elite badmintonplayers, particularly considering oxygen uptake and recovery ability, and the adaptabilityof skeletal muscle to exercising load. Eventually, the rapidly repeated sprint ability andphysical performance of players were enhanced. The study has provided evidence-basedfindings that as a time-efficient training alternative, SIT could be suitable to be includedin the training routine for badminton players.
However, it is acknowledged that this study also has certain limitations. The technicaland tactical performance was not considered, which might be another representativeindicator of improved aerobic capacity. Moreover, anaerobic endurance training, strengthtraining and functional training are also of vital importance for badminton players and theirjoint effect on aerobic training was not investigated within the current program. Futureresearch is suggested to look into these aspects to better inform sport-specific trainingprescription.
Author Contributions: Conceptualization, H.L., Q.L. and D.B.; methodology, H.L., B.L., Q.L. and
D.B.; software, Q.L. and Y.C.; validation, H.L., Q.L., D.B. and Y.C.; formal analysis, H.L., Q.L. and Y.C.;
investigation, H.L., Q.L. and Y.L.; resources, B.L. and D.B.; data curation, H.L. and Q.L.; writing—
original draft preparation, H.L., Q.L., D.B. and Y.C.; writing—review and editing, H.L., Q.L. and
Y.C.; visualization, Q.L. and Y.C.; supervision, D.B. and Y.C.; project administration, D.B. and Y.C.;
funding acquisition, D.B. and Y.C. All authors have read and agreed to the published version of
the manuscript.
Funding: This work was supported in part by the National Key Research and Development Program
of China under grants 2020AAA0103404 and 2018YFC2000600, and by National Natural Science
Foundation of China under grant 72071018. The corresponding author (Y.C.) was supported by
the China Postdoctoral Science Foundation (2020T130067).
Institutional Review Board Statement: The study was conducted according to the guidelines of
the Declaration of Helsinki, and approved by the Ethics Committee of Beijing Sport University
(2020008H, 17/01/2020).
75
Int. J. Environ. Res. Public Health 2021, 18, 638
Informed Consent Statement: Informed consent was obtained from all subjects involved in the study.
Conflicts of Interest: The authors declare no conflict of interest.
References
1. Jan, C.; Petr, S. Serve and Return in Badminton: Gender Differences of Elite Badminton Players. Int. J. Phys. Educ. Fit. Sports 2020,
9, 44–48. [CrossRef]
2. Nhan, D.T.; Klyce, W.; Lee, R.J. Epidemiological Patterns of Alternative Racquet-Sport Injuries in the United States, 1997–2016.
Orthop. J. Sports Med. 2018, 6, 2325967118786237. [CrossRef] [PubMed]
3. Phomsoupha, M.; Laffaye, G. The science of badminton: Game characteristics, anthropometry, physiology, visual fitness and
biomechanics. Sports Med. 2015, 45, 473–495. [CrossRef] [PubMed]
4. Laffaye, G.; Phomsoupha, M.; Dor, F. Changes in the Game Characteristics of a Badminton Match: A Longitudinal Study through
the Olympic Game Finals Analysis in Men’s Singles. J. Sports Sci. Med. 2015, 14, 584–590. [PubMed]
5. Faude, O.; Meyer, T.; Rosenberger, F.; Fries, M.; Huber, G.; Kindermann, W. Physiological characteristics of badminton match play.
Eur. J. Appl. Physiol. 2007, 100, 479–485. [CrossRef]
6. Bangsbo, J.; Iaia, F.M.; Krustrup, P. The Yo-Yo intermittent recovery test: A useful tool for evaluation of physical performance
in intermittent sports. Sports Med. 2008, 38, 37–51. [CrossRef]
7. Kelly, D.T.; Tobin, C.; Egan, B.; McCarren, A.; O’Connor, P.L.; McCaffrey, N.; Moyna, N.M. Comparison of Sprint Interval and
Endurance Training in Team Sport Athletes. J. Strength Cond. Res. 2018, 32, 3051–3058. [CrossRef]
8. Buchan, D.S.; Ollis, S.; Young, J.D.; Thomas, N.E.; Cooper, S.M.; Tong, T.K.; Nie, J.; Malina, R.M.; Baker, J.S. The effects of time
and intensity of exercise on novel and established markers of CVD in adolescent youth. Am. J. Hum. Biol. 2011, 23, 517–526.
[CrossRef]
9. Bayati, M.; Farzad, B.; Gharakhanlou, R.; Agha-Alinejad, H. A practical model of low-volume high-intensity interval training induces
performance and metabolic adaptations that resemble ‘all-out’ sprint interval training. J. Sports Sci. Med. 2011, 10, 571–576.
10. Jones, B.; Hamilton, D.K.; Cooper, C.E. Muscle Oxygen Changes following Sprint Interval Cycling Training in Elite Field Hockey
Players. PLoS ONE 2015, 10, e0120338. [CrossRef]
11. Burgomaster, K.A.; Heigenhauser, G.J.; Gibala, M.J. Effect of short-term sprint interval training on human skeletal muscle
carbohydrate metabolism during exercise and time-trial performance. J. Appl. Physiol. 2006, 100, 2041–2047. [CrossRef] [PubMed]
12. Gibala, M.J.; Little, J.P.; van Essen, M.; Wilkin, G.P.; Burgomaster, K.A.; Safdar, A.; Raha, S.; Tarnopolsky, M.A. Short-term sprint
interval versus traditional endurance training: Similar initial adaptations in human skeletal muscle and exercise performance.
J. Physiol. 2006, 575, 901–911. [CrossRef] [PubMed]
13. Lunn, W.R.; Axtell, R.S. Validity and Reliability of the Lode Excalibur Sport Cycle Ergometer for the Wingate Anaerobic Test.
J. Strength Cond. Res. 2019. [CrossRef] [PubMed]
14. Gist, N.H.; Fedewa, M.V.; Dishman, R.K.; Cureton, K.J. Sprint interval training effects on aerobic capacity: A systematic review
and meta-analysis. Sports Med. 2014, 44, 269–279. [CrossRef]
15. Hostrup, M.; Gunnarsson, T.P.; Fiorenza, M.; Mørch, K.; Onslev, J.; Pedersen, K.M.; Bangsbo, J. In-season adaptations to intense
intermittent training and sprint interval training in sub-elite football players. Scand. J. Med. Sci. Sports 2019, 29, 669–677.
[CrossRef]
16. Edwards, S. The Heart Rate Monitor Book. Med. Sci. Sports Exerc. 1994, 26, 647. [CrossRef]
17. Bar-Or, O.; Dotan, R.; Inbar, O. A 30 second all-out ergometric test-its reliability and validity for anaerobic capacity. Isr. J. Med. Sci.1977, 13, 126.
18. Laurent, C.M.; Meyers, M.C.; Robinson, C.A.; Green, J.M. Cross-validation of the 20-versus 30-s Wingate anaerobic test. Eur.J. Appl. Physiol. 2007, 100, 645–651. [CrossRef]
19. Schmitz, B.; Pfeifer, C.; Kreitz, K.; Borowski, M.; Faldum, A.; Brand, S.M. The Yo-Yo Intermittent Tests: A Systematic Review and
Structured Compendium of Test Results. Front. Physiol. 2018, 9, 870. [CrossRef]
20. Binder, R.K.; Wonisch, M.; Corra, U.; Cohen-Solal, A.; Vanhees, L.; Saner, H.; Schmid, J.-P. Methodological approach to the first
and second lactate threshold in incremental cardiopulmonary exercise testing. Eur. J. Cardiovasc. Prev. Rehabil. 2008, 15, 726–734.
[CrossRef]
21. Wang, J.; Qiu, J.; Yi, L.; Hou, Z.; Benardot, D.; Cao, W. Effect of sodium bicarbonate ingestion during 6 weeks of HIIT on anaerobic
performance of college students. J. Int. Soc. Sports Nutr. 2019, 16, 1–10. [CrossRef]
22. Hopkins, W.; Marshall, S.; Batterham, A.; Hanin, J. Progressive statistics for studies in sports medicine and exercise science.
Med. Sci. Sports Exerc. 2009, 41, 3–12. [CrossRef] [PubMed]
23. Gomez, M.A.; Rivas, F.; Connor, J.D.; Leicht, A.S. Performance Differences of Temporal Parameters and Point Outcome between
Elite Men’s and Women’s Badminton Players According to Match-Related Contexts. Int. J. Environ. Res. Public Health 2019, 16.
[CrossRef]
24. Buchheit, M.; Abbiss, C.R.; Peiffer, J.J.; Laursen, P.B. Performance and physiological responses during a sprint interval training
session: Relationships with muscle oxygenation and pulmonary oxygen uptake kinetics. Eur. J. Appl. Physiol. 2012, 112, 767–779.
[CrossRef] [PubMed]
25. Koral, J.; Oranchuk, D.J.; Herrera, R.; Millet, G.Y. Six Sessions of Sprint Interval Training Improves Running Performance
in Trained Athletes. J. Strength Cond. Res. 2018, 32, 617–623. [CrossRef] [PubMed]
76

Int. J. Environ. Res. Public Health 2021, 18, 638
26. Connolly, D.A. The anaerobic threshold: Over-valued or under-utilized? A novel concept to enhance lipid optimization! Curr Opin.Clin. Nutr. Metab. Care 2012, 15, 430–435. [CrossRef] [PubMed]
27. Phillips, S.M.; Sproule, J.; Turner, A.P. Carbohydrate ingestion during team games exercise: Current knowledge and areas for
future investigation. Sports Med. 2011, 41, 559–585. [CrossRef] [PubMed]
28. Meeusen, R.; Watson, P.; Hasegawa, H.; Roelands, B.; Piacentini, M.F. Central fatigue: The serotonin hypothesis and beyond.
Sports Med. 2006, 36, 881–909.
29. Welsh, R.S.; Davis, J.M.; Burke, J.R.; Williams, H.G. Carbohydrates and physical/mental performance during intermittent exercise
to fatigue. Med. Sci. Sports Exerc. 2002, 34, 723–731. [CrossRef]
30. Robergs, R.A.; McNulty, C.R.; Minett, G.M.; Holland, J.; Trajano, G. Lactate, not lactic acid, is produced by cellular cytosolic
energy catabolism. Physiology 2018, 33, 10–12.
31. Menzies, P.; Menzies, C.; McIntyre, L.; Paterson, P.; Wilson, J.; Kemi, O.J. Blood lactate clearance during active recovery after
an intense running bout depends on the intensity of the active recovery. J. Sports Sci. 2010, 28, 975–982. [CrossRef] [PubMed]
32. Fukuoka, Y.; Iihoshi, M.; Nazunin, J.T.; Abe, D.; Fukuba, Y. Dynamic Characteristics of Ventilatory and Gas Exchange during
Sinusoidal Walking in Humans. PLoS ONE 2017, 12, e0168517. [CrossRef] [PubMed]
33. Andersen, L.L.; Larsson, B.; Overgaard, H.; Aagaard, P. Torque–velocity characteristics and contractile rate of force development
in elite badminton players. Eur. J. Sport Sci. 2007, 7, 127–134. [CrossRef]
34. Hood, D.A. Invited Review: Contractile activity-induced mitochondrial biogenesis in skeletal muscle. J. Appl. Physiol. 2001, 90,
1137–1157. [CrossRef]
77


International Journal of
Environmental Research
and Public Health
Article
Using Anthropometric Data and Physical Fitness Scores toPredict Selection in a National U19 Rugby Union Team †
Luis Vaz 1,2,* , Wilbur Kraak 3 , Marco Batista 4 , Samuel Honório 4 and Hélder Miguel Fernandes 2,5
�����������������
Citation: Vaz, L.; Kraak, W.; Batista,
M.; Honório, S.; Miguel Fernandes, H.
Using Anthropometric Data and
Physical Fitness Scores to Predict
Selection in a National U19 Rugby
Union Team. Int. J. Environ. Res.
Public Health 2021, 18, 1499.
https://doi.org/10.3390/
ijerph18041499
Academic Editor: Mathieu Gayda
Received: 21 December 2020
Accepted: 26 January 2021
Published: 5 February 2021
Publisher’s Note: MDPI stays neutral
with regard to jurisdictional claims in
published maps and institutional affil-
iations.
Copyright: © 2021 by the authors.
Licensee MDPI, Basel, Switzerland.
This article is an open access article
distributed under the terms and
conditions of the Creative Commons
Attribution (CC BY) license (https://
creativecommons.org/licenses/by/
4.0/).
1 Department of Sport Science, Exercise and Health, School of Life and Environmental Sciences,
University of Trás-os-Montes and Alto Douro, 5000-801 Vila Real, Portugal2 Research Centre in Sports Sciences, Health Sciences and Human Development (CIDESD),
5000-801 Vila Real, Portugal; [email protected] Department of Sport Science, Faculty of Medicine and Health Sciences, Stellenbosch University,
Stellenbosch 7600, South Africa; [email protected] Department of Sports and Well-Being, Polytechnic Institute of Castelo Branco, SHERU (Sport, Health and
Exercise Research Unit), 6000-084 Castelo Branco, Portugal; [email protected] (M.B.);
[email protected] (S.H.)5 Research in Education and Community Intervention, RECI, 3500 Viseu, Portugal
* Correspondence: [email protected]; Tel.: +351-965079370
† A preliminary version of this paper was presented as oral communication in the International Seminar of
Physical Education, Leisure and Health, 17–19 June 2019. Castelo Branco, Portugal.
Abstract: The purpose of this study was to compare measures of anthropometry characteristics and
physical fitness performance between rugby union players (17.9 ± 0.5 years old) recruited (n = 39)
and non-recruited (n = 145) to the Portuguese under-19 (U19) national team, controlling for their
playing position (forwards or backs). Standardized anthropometric, physical, and performance
assessment tests included players’ body mass and height, push up and pull-up test, squat test, sit-
and-reach test, 20 m shuttle run test, flexed arm hang test, Sargent test, handgrip strength test, Illinois
agility test, and 20-m and 50-m sprint test. Results showed that recruited forwards players had better
agility scores (p = 0.02, ES = −0.55) than the non-recruited forwards, whereas recruited backs players
had higher right (p < 0.01, ES = 0.84) and left (p = 0.01, ES = 0.74) handgrip strength scores than their
counterparts. Logistic regression showed that better agility (for the forwards) and right handgrip
strength scores (for the backs) were the only variables significantly associated with an increased
likelihood of being recruited to the national team. In sum, these findings suggest that certain well-
developed physical qualities, namely, agility for the forwards players and upper-body strength for
the back players, partially explain the selection of U19 rugby players to their national team.
Keywords: talent identification; rugby union; prediction of performance outcomes; selective factors.
1. Introduction
The expanded professionalism in rugby union has elicited fast changes in the athleticprofile of rugby elite players [1]. Effective talent identification is an important issue inrugby union, as success at the international level conveys significant commercial bene-fits. Usually, the recruitment and development of rugby union players have focused ontraining interventions and game-play performance, with less attention on the anthropo-metric and physical performance characteristics [2]. However, the understanding of therugby union movement patterns during competition, and the related physical demands, iscritical to developing effective rugby training programs aiming to improve both athletes’and teams’ performance [3]. Previous investigations have shown differences in fitnessand morphological aspects between teams [4,5], levels of competition [6,7], and players’positions [8,9].
According to this reasoning, some studies [10] reported that elite rugby players (backsand forwards) have specific skills, motor and physical abilities, and anthropometrical
79
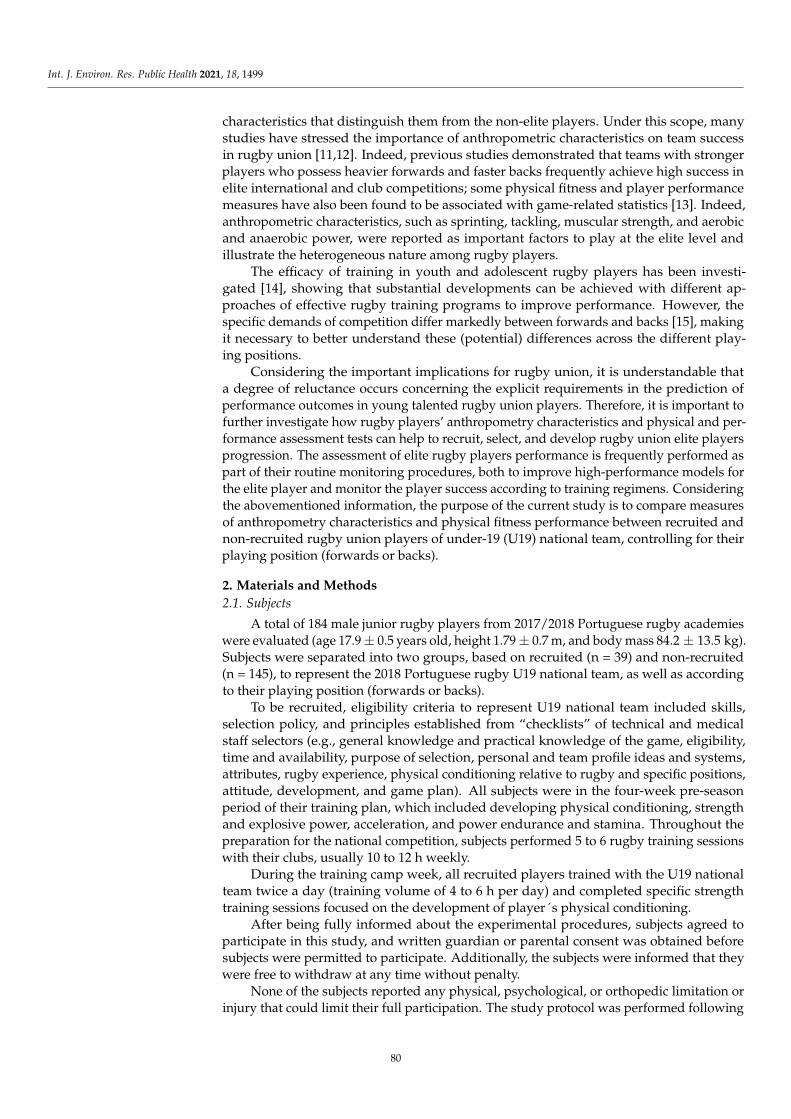
Int. J. Environ. Res. Public Health 2021, 18, 1499
characteristics that distinguish them from the non-elite players. Under this scope, manystudies have stressed the importance of anthropometric characteristics on team successin rugby union [11,12]. Indeed, previous studies demonstrated that teams with strongerplayers who possess heavier forwards and faster backs frequently achieve high success inelite international and club competitions; some physical fitness and player performancemeasures have also been found to be associated with game-related statistics [13]. Indeed,anthropometric characteristics, such as sprinting, tackling, muscular strength, and aerobicand anaerobic power, were reported as important factors to play at the elite level andillustrate the heterogeneous nature among rugby players.
The efficacy of training in youth and adolescent rugby players has been investi-gated [14], showing that substantial developments can be achieved with different ap-proaches of effective rugby training programs to improve performance. However, thespecific demands of competition differ markedly between forwards and backs [15], makingit necessary to better understand these (potential) differences across the different play-ing positions.
Considering the important implications for rugby union, it is understandable thata degree of reluctance occurs concerning the explicit requirements in the prediction ofperformance outcomes in young talented rugby union players. Therefore, it is important tofurther investigate how rugby players’ anthropometry characteristics and physical and per-formance assessment tests can help to recruit, select, and develop rugby union elite playersprogression. The assessment of elite rugby players performance is frequently performed aspart of their routine monitoring procedures, both to improve high-performance models forthe elite player and monitor the player success according to training regimens. Consideringthe abovementioned information, the purpose of the current study is to compare measuresof anthropometry characteristics and physical fitness performance between recruited andnon-recruited rugby union players of under-19 (U19) national team, controlling for theirplaying position (forwards or backs).
2. Materials and Methods
2.1. Subjects
A total of 184 male junior rugby players from 2017/2018 Portuguese rugby academieswere evaluated (age 17.9 ± 0.5 years old, height 1.79 ± 0.7 m, and body mass 84.2 ± 13.5 kg).Subjects were separated into two groups, based on recruited (n = 39) and non-recruited(n = 145), to represent the 2018 Portuguese rugby U19 national team, as well as accordingto their playing position (forwards or backs).
To be recruited, eligibility criteria to represent U19 national team included skills,selection policy, and principles established from “checklists” of technical and medicalstaff selectors (e.g., general knowledge and practical knowledge of the game, eligibility,time and availability, purpose of selection, personal and team profile ideas and systems,attributes, rugby experience, physical conditioning relative to rugby and specific positions,attitude, development, and game plan). All subjects were in the four-week pre-seasonperiod of their training plan, which included developing physical conditioning, strengthand explosive power, acceleration, and power endurance and stamina. Throughout thepreparation for the national competition, subjects performed 5 to 6 rugby training sessionswith their clubs, usually 10 to 12 h weekly.
During the training camp week, all recruited players trained with the U19 nationalteam twice a day (training volume of 4 to 6 h per day) and completed specific strengthtraining sessions focused on the development of player´s physical conditioning.
After being fully informed about the experimental procedures, subjects agreed toparticipate in this study, and written guardian or parental consent was obtained beforesubjects were permitted to participate. Additionally, the subjects were informed that theywere free to withdraw at any time without penalty.
None of the subjects reported any physical, psychological, or orthopedic limitation orinjury that could limit their full participation. The study protocol was performed following
80

Int. J. Environ. Res. Public Health 2021, 18, 1499
the guidelines stated in the Declaration of Helsinki and was approved by the institutionalUniversity Ethical Committee (CE.UTAD 27/2016).
2.2. Anthropometric, Physical, and Performance Assessment Tests
Fitness testing results from the rugby elite development national academies repre-sentative squads were collected for each participant during the pre-season phase in thenational camp each year. The total sample executed a set of anthropometric measures andphysical tests on the initial day of the training camp week, as planned by the Portugalrugby U19 technical staff. All the tests were accomplished in a single day and under similarenvironmental conditions; the local temperature in October was 14.0 ± 2 ◦C, comparedto 16.1 ± 2 ◦C in March. While the anthropometrics assessments started in the morning(≈9 a.m.) in a kinanthropometry laboratory, the physical performance assessment testswere held in the afternoon and were performed in outdoor natural turf rugby pitch and onrunning track (finished at ≈5 p.m.).
All assessments were carried out by medical and technical supervision of the staffof Portuguese rugby U19 team. Testing was led by competent technical staff who wereadequately trained to use the devices and had the ability to perform the testing protocols.
A full dynamic warm-up drill with a gradual progression through a series of rugbymovements was performed, including running at a moderate intensity, squats for 5-min,followed by 5-min of lunge twist active stretching and detailed exercises (e.g., submaximaljumps and accelerations before Sargent test, agility test, and acceleration and speed tests).After the warm-up (±3-min), players were required to perform the tests. Moreover, stretch-ing exercises and a standardized recovery protocol were completed by all players after thefinal test sessions of the day. As part of these players’ training routines in rugby academies,all subjects were highly familiarized with the anthropometric and physical performancetests.
Players were allowed to ingest water during recovery periods (3 ± 2 min.). Anthro-pometrics measurements only included body height (m) and body mass (kg), whereasfitness testing battery included pull-up test, push up test, and free-standing squat [16]. Theweight lifted and the number of repetitions done was used to calculate the 1RM [17]. Theoutdoor assessment tests included: Sargent test, flexed arm hang test, sit-and-reach test,and maximal aerobic power (20 m shuttle-run test) [18]. The VO2 max was estimated usingregression equations described by [19]. Handgrip strength test (left and right hand) wasperformed as described by [20]. Acceleration and speed (10, 20, and 50 m sprint) usingelectronic timing gates and Illinois agility test (10 × 5 m) [21] were performed. A moredetailed description of all tests may also be found in Table S1 (Supplementary Material).Test-retest reliability, typical error, and validity of measurement of all assessment testsused for this study have been previously confirmed in literature and their descriptions aredocumented elsewhere [22–24].
2.3. Procedures and Data Processing
Initially, data were inspected for normality using visual inspection (histograms andQ-Q plots of residuals) and analysis of skewness and kurtosis. Both procedures showedappropriate distributions and values.
Independent t-tests were used to identify significant differences between groups.Cohen’s d effect size statistics were calculated (ES), and respective 95% confidence intervalswere also computed. Magnitudes of observed effects, and thresholds, were 0–0.20, trivial;0.20–0.60, small; 0.60–1.20, moderate; 1.20–2.00, large; and >2.00, very large [25].
Multivariable forward logistic regression analyses [26] were performed separately foreach playing position in order to identify potential significant predictors of being selectedto the national team.
Statistical significance was set at p < 0.05, and calculations were carried out using SPSSsoftware, 23.0, Version (IBM SPSS Statistics for Windows, Armonk, NY, USA: IBM Corp.).
81

Int. J. Environ. Res. Public Health 2021, 18, 1499
3. Results
The descriptive results of the anthropometry characteristics and physical fitnessmeasures are shown in Table 1 for the total sample and for playing positions (forwardsand backs).
Table 1. Descriptive statistics of the anthropometry characteristics and physical fitness performance measures for the total
sample and for playing positions.
VariablesTotal Sample (n = 184)
M ± SDForwards (n = 106)
M ± SDBacks (n = 78)
M ± SD
Body mass (kg) 84.28 ± 13.53 87.58 ± 13.38 79.81 ± 12.48Body height (m) 1.79 ± 0.07 1.81 ± 0.07 1.78 ± 0.05Push up test (reps) 43.25 ± 11.10 44.68 ± 12.00 41.30 ± 9.46Pull up test (reps) 11.83 ± 4.29 10.96 ± 4.67 13.00 ± 3.40Flexed arm hang test (s) 40.42 ± 13.63 39.75 ± 13.99 41.33 ± 13.15Handgrip strength—right (kg) 48.00 ± 4.88 47.84 ± 4.16 48.21 ± 5.75Handgrip strength—left (kg) 46.03 ± 4.65 45.28 ± 4.00 47.06 ± 5.27Free standing squat (1RM) 140.77 ± 31.09 143.80 ± 31.89 136.67 ± 29.68Sargent test (cm) 44.95 ± 5.06 45.07 ± 5.49 44.80 ± 4.4520 m sprint (s) 2.99 ± 0.18 3.08 ± 0.13 2.89 ± 0.1850 m sprint (s) 6.85 ± 0.27 6.91 ± 0.27 6.78 ± 0.26Illinois agility test (s) 15.15 ± 0.96 15.37 ± 1.15 14.86 ± 0.49Sit-and-reach test (cm) 32.93 ± 4.88 31.85 ± 5.26 34.38 ± 3.90
VO2max (mL kg−1 min−1) 49.69 ± 3.96 49.43 ± 3.93 50.03 ± 3.99
Forward players had greater body mass (p < 0.001, ES = 0.60), body height (p < 0.01,ES = 0.48), and push up performance (p = 0.04, ES = 0.31), whereas back players showedgreater pull up (p < 0.01, ES = −0.49), left handgrip strength (p = 0.01, ES = −0.39),20 m sprint (p < 0.001, ES = 1.26), 50 m sprint (p < 0.001, ES = 0.51), agility (p < 0.001,ES = 0.56), and flexibility performance (p < 0.001, ES = −0.53). No between-group sig-nificant differences were observed in the flexed arm hang (ES = −0.12), right handgripstrength (ES = −0.08), free standing squat (ES = 0.23), Sargent (ES = 0.05), and VO2maxtests (ES = −0.15).
Table 2 presents the comparison results of the anthropometry characteristics andphysical fitness scores between the recruited (n = 23) and non-recruited forwards (n = 83).
Table 2. Descriptive and comparative statistics of the anthropometry characteristics and physical fitness performance
between recruited and non-recruited forwards.
VariablesRecruited (n = 23)
M ± SDNon-Recruited (n = 83)
M ± SDp
ES(95%CI)
Body mass (kg) 89.97 ± 14.36 86.91 ± 13.11 0.33 0.23 (−0.24, 0.69)Body height (m) 1.82 ± 0.11 1.81 ± 0.07 0.31 0.24 (−0.22, 0.71)Push up test (reps) 43.83 ± 14.56 44.92 ± 11.29 0.70 −0.09 (−0.55, 0.37)Pull up test (reps) 11.78 ± 5.13 10.74 ± 4.54 0.34 0.22 (−0.24, 0.69)Flexed arm hang test (s) 36.60 ± 10.44 40.62 ± 14.76 0.22 −0.29 (−0.75, 0.18)Handgrip strength—right (kg) 48.53 ± 5.39 47.65 ± 3.76 0.38 0.21 (−0.25, 0.67)Handgrip strength—left (kg) 46.35 ± 5.04 44.98 ± 3.64 0.15 0.34 (−0.12, 0.81)Free standing squat (1RM) 140.57 ± 34.36 144.70 ± 31.33 0.59 −0.13 (−0.59, 0.33)Sargent test (cm) 44.96 ± 4.71 45.10 ± 5.71 0.91 −0.03 (−0.49, 0.44)20 m sprint (s) 3.05 ± 0.14 3.09 ± 0.13 0.16 −0.33 (−0.80, 0.13)50 m sprint (s) 6.88 ± 0.31 6.92 ± 0.26 0.55 −0.14 (−0.60, 0.32)Illinois agility test (s) 14.89 ± 1.40 15.50 ± 1.04 0.02 −0.55 (−1.01,−0.08)Sit-and-reach test (cm) 32.09 ± 5.36 31.80 ± 5.26 0.81 0.06 (−0.41, 0.52)
VO2max (mL kg−1 min−1) 49.34 ± 4.77 49.46 ± 3.69 0.90 −0.03 (−0.49, 0.43)
82
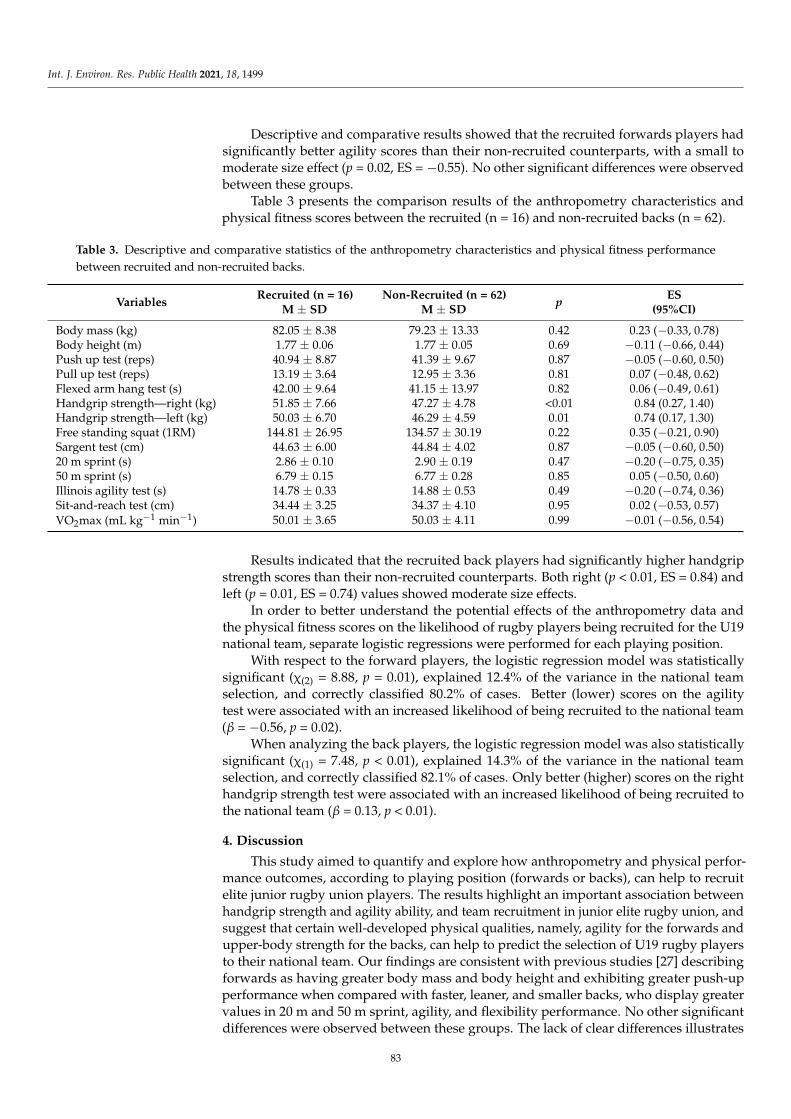
Int. J. Environ. Res. Public Health 2021, 18, 1499
Descriptive and comparative results showed that the recruited forwards players hadsignificantly better agility scores than their non-recruited counterparts, with a small tomoderate size effect (p = 0.02, ES = −0.55). No other significant differences were observedbetween these groups.
Table 3 presents the comparison results of the anthropometry characteristics andphysical fitness scores between the recruited (n = 16) and non-recruited backs (n = 62).
Table 3. Descriptive and comparative statistics of the anthropometry characteristics and physical fitness performance
between recruited and non-recruited backs.
VariablesRecruited (n = 16)
M ± SDNon-Recruited (n = 62)
M ± SDp
ES(95%CI)
Body mass (kg) 82.05 ± 8.38 79.23 ± 13.33 0.42 0.23 (−0.33, 0.78)Body height (m) 1.77 ± 0.06 1.77 ± 0.05 0.69 −0.11 (−0.66, 0.44)Push up test (reps) 40.94 ± 8.87 41.39 ± 9.67 0.87 −0.05 (−0.60, 0.50)Pull up test (reps) 13.19 ± 3.64 12.95 ± 3.36 0.81 0.07 (−0.48, 0.62)Flexed arm hang test (s) 42.00 ± 9.64 41.15 ± 13.97 0.82 0.06 (−0.49, 0.61)Handgrip strength—right (kg) 51.85 ± 7.66 47.27 ± 4.78 <0.01 0.84 (0.27, 1.40)Handgrip strength—left (kg) 50.03 ± 6.70 46.29 ± 4.59 0.01 0.74 (0.17, 1.30)Free standing squat (1RM) 144.81 ± 26.95 134.57 ± 30.19 0.22 0.35 (−0.21, 0.90)Sargent test (cm) 44.63 ± 6.00 44.84 ± 4.02 0.87 −0.05 (−0.60, 0.50)20 m sprint (s) 2.86 ± 0.10 2.90 ± 0.19 0.47 −0.20 (−0.75, 0.35)50 m sprint (s) 6.79 ± 0.15 6.77 ± 0.28 0.85 0.05 (−0.50, 0.60)Illinois agility test (s) 14.78 ± 0.33 14.88 ± 0.53 0.49 −0.20 (−0.74, 0.36)Sit-and-reach test (cm) 34.44 ± 3.25 34.37 ± 4.10 0.95 0.02 (−0.53, 0.57)
VO2max (mL kg−1 min−1) 50.01 ± 3.65 50.03 ± 4.11 0.99 −0.01 (−0.56, 0.54)
Results indicated that the recruited back players had significantly higher handgripstrength scores than their non-recruited counterparts. Both right (p < 0.01, ES = 0.84) andleft (p = 0.01, ES = 0.74) values showed moderate size effects.
In order to better understand the potential effects of the anthropometry data andthe physical fitness scores on the likelihood of rugby players being recruited for the U19national team, separate logistic regressions were performed for each playing position.
With respect to the forward players, the logistic regression model was statisticallysignificant (χ(2) = 8.88, p = 0.01), explained 12.4% of the variance in the national teamselection, and correctly classified 80.2% of cases. Better (lower) scores on the agilitytest were associated with an increased likelihood of being recruited to the national team(β = −0.56, p = 0.02).
When analyzing the back players, the logistic regression model was also statisticallysignificant (χ(1) = 7.48, p < 0.01), explained 14.3% of the variance in the national teamselection, and correctly classified 82.1% of cases. Only better (higher) scores on the righthandgrip strength test were associated with an increased likelihood of being recruited tothe national team (β = 0.13, p < 0.01).
4. Discussion
This study aimed to quantify and explore how anthropometry and physical perfor-mance outcomes, according to playing position (forwards or backs), can help to recruitelite junior rugby union players. The results highlight an important association betweenhandgrip strength and agility ability, and team recruitment in junior elite rugby union, andsuggest that certain well-developed physical qualities, namely, agility for the forwards andupper-body strength for the backs, can help to predict the selection of U19 rugby playersto their national team. Our findings are consistent with previous studies [27] describingforwards as having greater body mass and body height and exhibiting greater push-upperformance when compared with faster, leaner, and smaller backs, who display greatervalues in 20 m and 50 m sprint, agility, and flexibility performance. No other significantdifferences were observed between these groups. The lack of clear differences illustrates
83
Int. J. Environ. Res. Public Health 2021, 18, 1499
the importance of supervision if the rugby development program aims to improve physi-cal attributes. Therefore, physical characteristics should be developed from an early ageto ensure the rugby player is physically ready for elite professional rugby union. Bodycomposition, greater levels of strength and power, agility, and sprint ability appear to beimportant physical characteristics in rugby union players due to superior performances athigher playing levels and their relationship with game behaviors. Furthermore, the logisticregression results showed better agility scores for forwards and better right handgripstrength scores for backs. These variables were significantly associated with an increasedlikelihood of being recruited for the U19 Portugal team. The results indicate that handstrength can be considered an important capability and selective factor in elite junior rugbyunion players, especially considering that no previous study has examined the importanceof the handgrip strength test in rugby players. In general, the evaluation of the importanceof the handgrip strength used in rugby is not explored; however, hand dynamometryis simple, not expensive, and is a well-established method for assessing the strength ofhand muscles.
In fact, the reliable evaluation of handgrip strength in rugby players appears tobe an essential and somehow neglected component in strength monitoring, planningof strength training programs, as well as injury prevention and recovery. This test issuitable to assess players as it is a simple, inexpensive, and important diagnostic criterion.Frequently measured as a proxy for global muscle strength, this test is a well-establishedand recognized protocol and method for assessing hand strength [28].
In order to better understand the potential effects of the anthropometry data andthe physical fitness scores on the likelihood of rugby players being recruited for theU19 national team, separate logistic regressions were performed for each playing position.Overall, the results were generally consistent with those of other rugby union studies [29,30]which demonstrated that different characteristics between forwards and backs playerscan be caused by specific player-position demands. Backs need to be leaner, faster, andaerobically fitter to defend in more open spaces, cover more distance during a rugby unionmatch, perform more accelerations, and try to score more opportunities [31]. Conversely,forwards [32] need to be larger and stronger for scrumming with more force and to assistteammates winning line outs. Moreover, they need to gain and retain possession of the balland receive more collisions (i.e., tackles, ball carries, and collisions).
Although we limited our investigation to the anthropometric characteristics and phys-ical performances that discriminated between recruited and non-recruited rugby playersaccording to playing position (forwards or backs) to U19 national team, it was previouslyreported that technical, tactical, and psychological skills were positively associated withgame-specific position and performance measures; therefore, they can help to discriminaterugby elite players [33]. Indeed, the ability to make the appropriate decisions in game-playand during interactions between players is also a significant aspect of performance [34].
The non-use of motivation, learning effect, motor coordination, individual trainingstatus, and biomechanical factors (e.g., hand size) is another limitation of the currentinvestigation. It is a possible claim that concentric or eccentric measures should have beenevaluated rather than isometric strength. However, it should be noted that assessment ofisometric strength can be easily obtained in practical contexts. To date, no studies havetested the possibility of using these study measures to understand this conflict’s effects tohelp improve the task of effective selection in elite junior rugby union players. Therefore,further research is required to understand the contribution of handgrip strength with othervariables (e.g., physical training programs, player progress, strength control practices,and game behaviors). Lastly, a small sample size of subjects within each positional group(forwards and backs) would be useful for establishing a reliable testing protocol and/or thenormative values for rugby players and to help selectors in the evaluation and recruitmentof rugby union players.
84

Int. J. Environ. Res. Public Health 2021, 18, 1499
5. Conclusions
In sum, the results of this study demonstrate the importance of handgrip strength andagility ability for the rugby national team selection process. Furthermore, objective mea-sures can be useful for quantifying and evaluating player anthropometric characteristicsand physical fitness performance progress. Thus, by combining further objective measures,rugby player recruitment and progress will be better monitored.
Indeed, the variables used allowed us to distinguish between recruited and non-recruited rugby union players for the Portugal U19 team. In addition to normal age-groupcriteria, subjective evaluation, or training and game perception aspects of performance,coaches can use this information to help in player recruitment approaches. The mainfindings have several implications for the effective selection process design, particularly byhelping to identify and to improve the accuracy of elite junior rugby talent identificationprograms through a physical fitness assessment.
Supplementary Materials: The following are available online at https://www.mdpi.com/1660
-4601/18/4/1499/s1, Table S1: Anthropometric, physiological and performance assessment test
measurements/procedures.
Author Contributions: Conceptualization: L.V., W.K., M.B., S.H., and H.M.F.; methodology: L.V.,
W.K., M.B., S.H., and H.M.F.; investigation: L.V., W.K., M.B., S.H., and H.M.F.; writing—original draft
preparation: L.V., W.K., M.B., S.H., and H.M.F.; writing—review and editing: all authors. All authors
have read and agreed to the published version of the manuscript.
Funding: This work was supported by a funding source through Portuguese Foundation for Science
and Technology under the project UID04045/2020.
Institutional Review Board Statement: The study was conducted according to the guidelines of the
Declaration of Helsinki, and approved by Ethics Committee of University of Trás-os-Montes and
Alto Douro (CE.UTAD 27/2016).
Informed Consent Statement: Informed consent was obtained from all subjects involved in the study.
Data Availability Statement: The data presented in this study are available on request from the
corresponding author. The data are not publicly available due to privacy and ethical restrictions.
Acknowledgments: The authors would like to thank all junior rugby players, coaching, and medical.
Conflicts of Interest: The authors did not report any potential conflict of interest.
References
1. Duthie, G.; Pyne, D.; Hooper, S. Applied physiology and game analysis of rugby union. Sports Med. 2003, 33, 973–991. [CrossRef]
2. Spamer, E. Talent identification and development in youth rugby players: A research review. S. Afr. J. Res. Sport Phys. Educ. Recreat.2009, 31, 109–118. [CrossRef]
3. Maud, P.J. Physiological and anthropometric parameters that describe a rugby union team. Br. J. Sports Med. 1983, 17, 16–23.
[CrossRef]
4. Fontana, F.Y.; Colosio, A.L.; De Roia, G.F.; Da Lozzo, G.; Pogliaghi, S. Anthropometrics of Italian Senior Male Rugby Union
Players: From Elite to Second Division. Int. J. Sports Physiol. Perform. 2015, 10, 674–680. [CrossRef] [PubMed]
5. Posthumus, L.; MacGregor, C.; Winwood, P.; Tout, J.; Morton, L.; Driller, M.; Gill, N. The Physical Characteristics of Elite Female
Rugby Union Players. Int. J. Environ. Res. Public Health 2020, 17, 6457. [CrossRef]
6. Smart, D.J.; Hopkins, W.G.; Gill, N.D. Differences and Changes in the Physical Characteristics of Professional and Amateur Rugby
Union Players. J. Strength Cond. Res. 2013, 27, 3033–3044. [CrossRef] [PubMed]
7. Vaz, L.; Van Rooyen, M.; Sampaio, J. Rugby Game-Related Statistics that Discriminate Between Winning and Losing Teams in Irb
and Super Twelve Close Games. J. Sports Sci. Med. 2010, 9, 51–55.
8. James, N.; Mellalieu, S.D.; Jones, N. The development of position-specific performance indicators in professional rugby union.
J. Sports Sci. 2005, 23, 63–72. [CrossRef]
9. Nakamura, F.Y.; Pereira, L.A.; E Moraes, J.; Kobal, R.; Kitamura, K.; Abad, C.C.C.; Vaz, L.M.T.; LoTurco, I. Physical and
physiological differences of backs and forwards from the Brazilian National rugby union team. J. Sports Med. Phys. Fit. 2016, 57,
1549–1556.
10. Adendorff, L.; Pienaar, A.E.; Malan, D.D.J.; Hare, E. Physical and motor abilities, rugby skills and anthropometric characteristics:
A follow-up investigation of suc-cessful and less successful rugby players. J. Hum. Mov. Stud. 2004, 46, 441–457.
85

Int. J. Environ. Res. Public Health 2021, 18, 1499
11. Barr, M.J.; Newton, R.U.; Sheppard, J.M. Were Height and Mass Related to Performance at the 2007 and 2011 Rugby World Cups?
Int. J. Sports Sci. Coach. 2014, 9, 671–680. [CrossRef]
12. Sedeaud, A.; Marc, A.; Schipman, J.; Tafflet, M.; Hager, J.-P.; Toussaint, J.-F. How they won Rugby World Cup through height,
mass and collective experience. Br. J. Sports Med. 2012, 46, 580–584. [CrossRef]
13. Smart, D.; Hopkins, W.G.; Quarrie, K.L.; Gill, N. The relationship between physical fitness and game behaviours in rugby union
players. Eur. J. Sport Sci. 2011, 14, S8–S17. [CrossRef]
14. Hartwig, T.B.; Naughton, G.A.; Searl, J. Motion Analyses of Adolescent Rugby Union Players: A Comparison of Training and
Game Demands. J. Strength Cond. Res. 2011, 25, 966–972. [CrossRef]
15. Brazier, J.; Antrobus, M.; Stebbings, G.K.; Day, S.H.; Callus, P.; Erskine, R.M.; Bennett, M.A.; Kilduff, L.P.; Williams, A.G.
Anthropometric and Physiological Characteristics of Elite Male Rugby Athletes. J. Strength Cond. Res. 2020, 34, 1790–1801.
[CrossRef] [PubMed]
16. Chiwaridzo, M.; Oorschot, S.; Dambi, J.M.; Ferguson, G.D.; Bonney, E.; Mudawarima, T.; Tadyanemhandu, C.; Smits-Engelsman,
B. A systematic review investigating measurement properties of physiological tests in rugby. BMC Sports Sci. Med. Rehabil. 2017,
9, 24. [CrossRef]
17. LeSuer, D.A.; McCormick, J.H.; Mayhew, J.L.; Wasserstein, R.L.; Arnold, M.D. The Accuracy of Prediction Equations for Estimating
1-RM Performance in the Bench Press, Squat, and Deadlift. J. Strength Cond. Res. 1997, 11, 211–213.
18. Owen, C.; Till, K.; Weakley, J.J.S.; Jones, B. Testing methods and physical qualities of male age grade rugby union players:
A systematic review. PLoS ONE 2020, 15, e0233796. [CrossRef]
19. Moore, A.; Murphy, A. Development of an anaerobic capacity test for field sport athletes. J. Sci. Med. Sport 2003, 6, 275–284.
[CrossRef]
20. Tabacchi, G.; Sánchez, G.F.L.; Sahin, F.N.; Kizilyalli, M.; Genchi, R.; Basile, M.; Kirkar, M.; Silva, C.; Loureiro, N.; Teixeira, E.; et al.
Field-Based Tests for the Assessment of Physical Fitness in Children and Adolescents Practicing Sport: A Systematic Review
within the ESA Program. Sustainability 2019, 11, 7187. [CrossRef]
21. Green, B.S.; Blake, C.; Caulfield, B.M. A Valid Field Test Protocol of Linear Speed and Agility in Rugby Union. J. Strength Cond. Res.2011, 25, 1256–1262. [CrossRef]
22. Lambert, M. Physiological Testing for the Athlete: Hype or Help? Int. J. Sports Sci. Coach. 2006, 1, 199–208. [CrossRef]
23. Wenger, H.A.; Green, H.J. Physiological Testing of the High Performance Athlete; Human Kinetics: Champaign, IL, USA, 1991;
pp. 223–308.
24. Vaz, L.M.T.; Morais, T.; Rocha, H.; James, N. Fitness Profiles of Elite Portuguese Rugby Union Players. J. Hum. Kinet. 2014, 41,
235–244. [CrossRef] [PubMed]
25. Hopkins, W.G.; Schabort, E.J.; Hawley, J.A. Reliability of Power in Physical Performance Tests. Sports Med. 2001, 31, 211–234.
[CrossRef]
26. Chen, P.Y.; Krauss, A.D. The SAGE Encyclopedia of Social Science Research Methods; SAGE Publications, Inc.: Thousand Oaks, CA,
USA, 2004.
27. Darrall-Jones, J.D.; Jones, B.; Till, K. Anthropometric and Physical Profiles of English Academy Rugby Union Players. J. StrengthCond. Res. 2015, 29, 2086–2096. [CrossRef] [PubMed]
28. Argus, C.K.; Gill, N.D.; Keogh, J.W.L. Characterization of the Differences in Strength and Power Between Different Levels of
Competition in Rugby Union Athletes. J. Strength Cond. Res. 2012, 26, 2698–2704. [CrossRef]
29. Quarrie, K.L.; Hopkins, W.G.; Anthony, M.J.; Gill, N.D. Positional demands of international rugby union: Evaluation of player
actions and movements. J. Sci. Med. Sport 2013, 16, 353–359. [CrossRef] [PubMed]
30. Roberts, S.P.; Trewartha, G.; Higgitt, R.J.; El-Abd, J.; Stokes, K.A. The physical demands of elite English rugby union. J. Sports Sci.2008, 26, 825–833. [CrossRef]
31. Pasin, F.; Caroli, B.; Spigoni, V.; Dei Cas, A.; Volpi, R.; Galli, C.; Passeri, G. Performance and antrhropometric characteristics of
Elite Rugby Players. Acta Biomed. 2017, 88, 172–177.
32. Gabbett, T.; Jenkins, D.G.; Abernethy, B. Physiological and Anthropometric Correlates of Tackling Ability in Junior Elite and
Subelite Rugby League Players. J. Strength Cond. Res. 2010, 24, 2989–2995. [CrossRef] [PubMed]
33. Fernandes, H.M.; Batista, M.; Vaz, L. Relationships between psychological skills and European U19 rugby union tournament
outcomes and per-formance indicators. J. Hum. Sport Exec. 2019, 14, 1246–1249.
34. Vaz, L.M.T.; Leite, N.; João, P.V.; Gonçalves, B.; Sampaio, J. Differences between Experienced and Novice Rugby Union Players
during Small-Sided Games. Percept. Mot. Ski. 2012, 115, 594–604. [CrossRef] [PubMed]
86
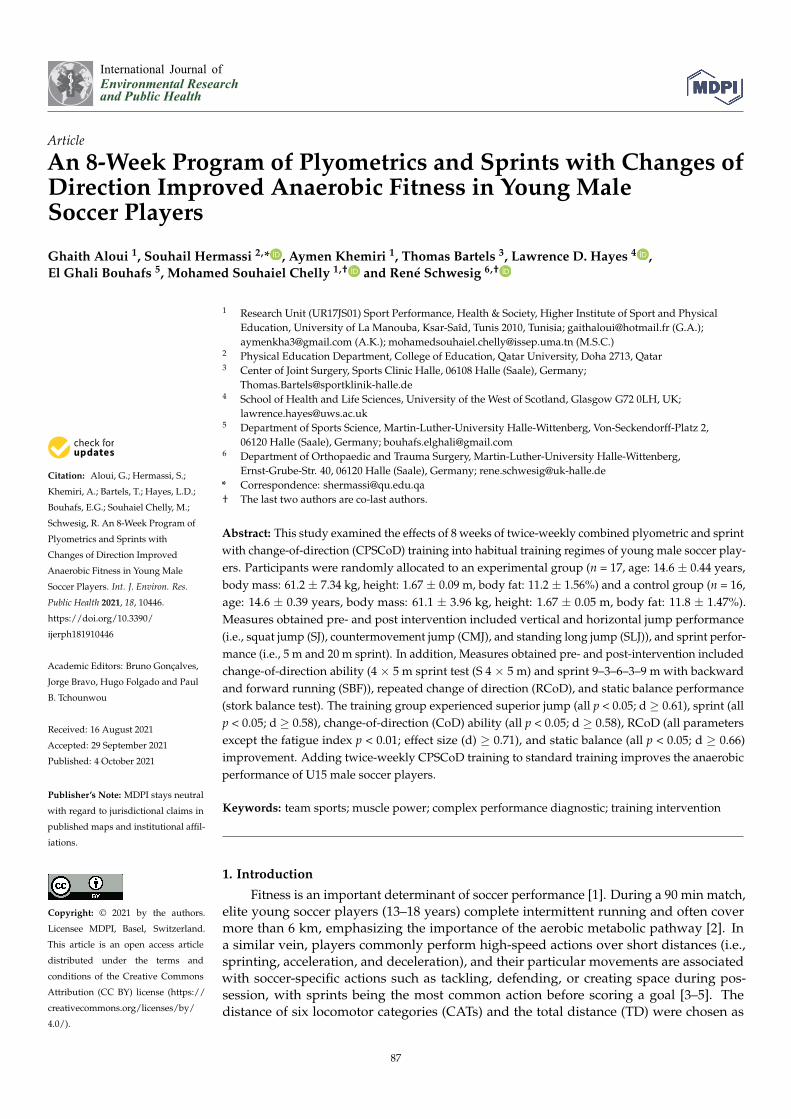
International Journal of
Environmental Research
and Public Health
Article
An 8-Week Program of Plyometrics and Sprints with Changes ofDirection Improved Anaerobic Fitness in Young MaleSoccer Players
Ghaith Aloui 1, Souhail Hermassi 2,* , Aymen Khemiri 1, Thomas Bartels 3, Lawrence D. Hayes 4 ,
El Ghali Bouhafs 5, Mohamed Souhaiel Chelly 1,† and René Schwesig 6,†
�����������������
Citation: Aloui, G.; Hermassi, S.;
Khemiri, A.; Bartels, T.; Hayes, L.D.;
Bouhafs, E.G.; Souhaiel Chelly, M.;
Schwesig, R. An 8-Week Program of
Plyometrics and Sprints with
Changes of Direction Improved
Anaerobic Fitness in Young Male
Soccer Players. Int. J. Environ. Res.
Public Health 2021, 18, 10446.
https://doi.org/10.3390/
ijerph181910446
Academic Editors: Bruno Gonçalves,
Jorge Bravo, Hugo Folgado and Paul
B. Tchounwou
Received: 16 August 2021
Accepted: 29 September 2021
Published: 4 October 2021
Publisher’s Note: MDPI stays neutral
with regard to jurisdictional claims in
published maps and institutional affil-
iations.
Copyright: © 2021 by the authors.
Licensee MDPI, Basel, Switzerland.
This article is an open access article
distributed under the terms and
conditions of the Creative Commons
Attribution (CC BY) license (https://
creativecommons.org/licenses/by/
4.0/).
1 Research Unit (UR17JS01) Sport Performance, Health & Society, Higher Institute of Sport and Physical
Education, University of La Manouba, Ksar-Saîd, Tunis 2010, Tunisia; [email protected] (G.A.);
[email protected] (A.K.); [email protected] (M.S.C.)2 Physical Education Department, College of Education, Qatar University, Doha 2713, Qatar3 Center of Joint Surgery, Sports Clinic Halle, 06108 Halle (Saale), Germany;
[email protected] School of Health and Life Sciences, University of the West of Scotland, Glasgow G72 0LH, UK;
[email protected] Department of Sports Science, Martin-Luther-University Halle-Wittenberg, Von-Seckendorff-Platz 2,
06120 Halle (Saale), Germany; [email protected] Department of Orthopaedic and Trauma Surgery, Martin-Luther-University Halle-Wittenberg,
Ernst-Grube-Str. 40, 06120 Halle (Saale), Germany; [email protected]
* Correspondence: [email protected]
† The last two authors are co-last authors.
Abstract: This study examined the effects of 8 weeks of twice-weekly combined plyometric and sprint
with change-of-direction (CPSCoD) training into habitual training regimes of young male soccer play-
ers. Participants were randomly allocated to an experimental group (n = 17, age: 14.6 ± 0.44 years,
body mass: 61.2 ± 7.34 kg, height: 1.67 ± 0.09 m, body fat: 11.2 ± 1.56%) and a control group (n = 16,
age: 14.6 ± 0.39 years, body mass: 61.1 ± 3.96 kg, height: 1.67 ± 0.05 m, body fat: 11.8 ± 1.47%).
Measures obtained pre- and post intervention included vertical and horizontal jump performance
(i.e., squat jump (SJ), countermovement jump (CMJ), and standing long jump (SLJ)), and sprint perfor-
mance (i.e., 5 m and 20 m sprint). In addition, Measures obtained pre- and post-intervention included
change-of-direction ability (4 × 5 m sprint test (S 4 × 5 m) and sprint 9–3–6–3–9 m with backward
and forward running (SBF)), repeated change of direction (RCoD), and static balance performance
(stork balance test). The training group experienced superior jump (all p < 0.05; d ≥ 0.61), sprint (all
p < 0.05; d ≥ 0.58), change-of-direction (CoD) ability (all p < 0.05; d ≥ 0.58), RCoD (all parameters
except the fatigue index p < 0.01; effect size (d) ≥ 0.71), and static balance (all p < 0.05; d ≥ 0.66)
improvement. Adding twice-weekly CPSCoD training to standard training improves the anaerobic
performance of U15 male soccer players.
Keywords: team sports; muscle power; complex performance diagnostic; training intervention
1. Introduction
Fitness is an important determinant of soccer performance [1]. During a 90 min match,elite young soccer players (13–18 years) complete intermittent running and often covermore than 6 km, emphasizing the importance of the aerobic metabolic pathway [2]. Ina similar vein, players commonly perform high-speed actions over short distances (i.e.,sprinting, acceleration, and deceleration), and their particular movements are associatedwith soccer-specific actions such as tackling, defending, or creating space during pos-session, with sprints being the most common action before scoring a goal [3–5]. Thedistance of six locomotor categories (CATs) and the total distance (TD) were chosen as
87
Int. J. Environ. Res. Public Health 2021, 18, 10446
performance results [6]. The following CATs were analyzed: standing (0.0–0.7 km/h),walking (0.7–7.2 km/h), jogging (7.2–14.4 km/h), running (14.4–19.8 km/h), high-speedrunning (19.8–25.2 km/h), and sprinting (>25.2 km/h). To quantify high-to-moderate ac-celerations, the number of peaks above a threshold of 2 ms−2 was determined [7,8]. In thiscontext, Di Salvo et al. [9] investigated the physical demands of Spanish Premier Leaguefootball players in relation to their playing position. These researchers reported that wide(11,990 m) and central (12,027 m) midfielders covered the greatest distance. In addition,they reported that wide midfielders covered the greatest distances in high-intensity speedzones (19.1–23.0 km/h: 738 m; >23.0 km/h: 446 m), as well as central midfielders had thehighest volume in the mid-intensity zones (11.1 to 14.0 km/h: 1965 m; 14.1 to 19.0 km/h:2116 m). Furthermore, soccer players complete an average of 50 turns per match [10] andcomplete a total of 723 ± 203 turns and dodges in a match [11].
Analysis of physical matches has shown that in elite soccer matches, players perform asignificant number of high-intensity changes of direction (CoDs) using a broad spectrum ofturning angles [11,12]. Some authors have proposed that the number and quality of CoDsin a match influence the outcome of the match in professional soccer [13,14]. Possibly as aresult of this association, the ability to perform CoDs in a match is considered an importantfitness component in all soccer abilities, and levels of competitions [14–16]. Recently,Lloyd et al. [17] reported that the application of optimal CoD training stimulus during theduration of athlete development was crucial for effective programming and improvementof CoD performance in youth. Several studies have reported CoD training improved CoDability, [11,13]. However, more encouraging for practitioners is the efficacious nature ofCoD training on other parameters such as jumping performance, sprint performance, andbalance ability in young soccer players [11,13].
Plyometric training is effective at improving jump performance [14] (the mean rel-ative improvement varied between 14% and 29% on vertical jump), given the specificnature of the training method [14–16]. However, much similar to CoD, the cross-trainingeffects on CoD ability and sprint performance are encouraging for practitioners and ath-letes alike [14–16]. In addition to performance benefits, plyometric training also exertshealthogenic effects such as increased bone mineral density, improved neuromuscularfunction, body mass control, improved psychosocial well-being, improved cardiovascularrisk profile, and decreased risk of [18–20]. A recent systematic review [21] indicated that atwice-weekly plyometric training for 8 to 10 weeks with a 72 h rest period between trainingsessions improves high-intensity physical abilities (e.g., jump, sprint, agility) in the youngsoccer player population aged 10 to 17 years, in both sexes.
Despite the increasingly abundant literature on combined training in several sportdisciplines and different age categories, there is little research related to applications ofthis training method in young male soccer players [22–25]. Recently, Aloui et al. [22]studied the effects of 8 weeks bi-weekly combined plyometric and sprint with change-of-direction (CPSCoD) training in elite under-17 (U17) soccer players. Jumping (∆19%on a squat jump; ∆21% on countermovement jump), sprinting (∆−11% on 5 m; ∆−8%on 20 m) and changing-direction ability (∆−9% sprint 4 × 5 m test), repeated sprintingability performance (∆−7% on fastest time; ∆−8% on mean time), and balance performanceimproved as a result of this training method. Additionally, Beato et al. [23] noted thatCPSCoD training improved jump and sprint performance in elite U19 soccer players.Additionally, Jlid et al. [26] reported multidirectional plyometric training improved jumpperformance, CoD ability, and dynamic postural control in prepubertal soccer players.
Despite the efficacious nature of CPSCoD training to enhance anaerobic fitness insoccer, there are only a handful of studies that have examined this phenomenon, andmostly in adolescents >15 years of age. Therefore, the purpose of this investigation was toexamine the effects of 8 weeks of twice-weekly CPSCoD training on anaerobic performance(i.e., jumping, speed, and CoD ability) and balance ability in elite male U15 soccer playersduring the competitive season. Particular tests of interest were vertical and horizontal jumpperformance (i.e., squat jump (SJ), countermovement-jump (CMJA), standing long jump
88
Int. J. Environ. Res. Public Health 2021, 18, 10446
test (SLJ)), sprint performance (i.e., 5 m and 20 m sprint), and CoD ability (4 × 5 m sprinttest (S 4 × 5 m) and sprint 9–3–6–3–9 m with backward and forward running (SBF). Inaddition, repeated CoD (RCoD) ability and static balance performance (stork balance test)were examined. We hypothesized a priori that CPSCoD would improve physical fitness,particularly jump performance, sprint performance, and CoD ability, when compared witha control group, who maintained regular training during the season.
2. Materials and Methods
2.1. Participants
The 33 participants of all playing positions from a single male soccer team in the firstnational division took part in this study. Participants had 4.6 ± 0.9 years of systematicsoccer training background comprising of five training sessions per week. Participantswere examined by the team physician to ensure players were healthy enough to completeCPSCoD training. Participants were randomly assigned between an experimental group(n = 17, age: 14.6 ± 0.44 years, body mass: 61.2 ± 7.3 kg, height: 1.67 ± 0.09 m, body fat:11.2 ± 1.6%) and a control group (n = 16, age: 14.6 ± 0.4 years, body mass: 61.1 ± 4.0 kg,height: 1.67 ± 0.05 m, body fat: 11.8 ± 1.5%). Participants were free from injury duringthe 6-month period before the beginning of the study and throughout the study. Nobaseline inter-group differences existed for anthropometric characteristics between groups(p ≥ 0.05).
Prior to the study, participants had completed a 6-week preparation period (pre-season training) (5–6 sessions per week). The first 3 of these weeks were to focus onimproving aerobic capacity by following low-to-moderate intensity interval training, andon improving resistance and muscle strength by following low-to-moderate intensity circuittraining resistance. The last 3 weeks have been focused on improving aerobic power byfollowing high-intensity interval training (HIIT) and small-sided games, and improvingmuscle power by following high-intensity circuit training, supplemented participation in anon-competitive training match.
Procedures were approved by the University Institutional Review Committee forethical human experimentation (reference number: KS000002020 and date of approval10 December 2020). Participants (and their guardians, in the case of minors) providedinformed written consent. Two familiarization sessions were conducted 2 weeks beforetesting, which was 2 months into the competitive season.
2.2. Experimental Design
Participants’ only physical training during the experimental phase was associatedwith the soccer team and one weekly 60 min school physical education session. The usualmicro-training cycle for both groups consists of five sessions per week (approximately90 min each session), with a competitive game each weekend. During the first three sessionsof micro-cycle training each week, approximately 60% of the total time of the session wasfocused on technical–tactical training, as well as 40% of the time was focused on physicaltraining. In addition, during the last two training sessions of each week, approximately75% of the micro-cycle of training was focused on technical–tactical training, as well as 25%of the time was focused on physical training (Table 1).
The control group maintained its normal training program throughout the interventionof 8 weeks. While every Tuesday and Thursday, the experimental group replaced thetechnical–tactical part of their standard training program with a combined plyometric andsprint with CoD training. Indeed, the first session of the micro-cycle training of each weekwas focused on the development of aerobic capacity through skill drills/circuit trainingwith medium volume and low intensity. The second training session included HIIT andsmall-sided games aimed at developing maximum aerobic power [27]. The third trainingsession included dynamic exercises based on bodyweight only and jumping and sprintingexercises aimed at maximum anaerobic power. The fourth and fifth training sessions ofeach week included agility and vivacity training, respectively.
89

Int. J. Environ. Res. Public Health 2021, 18, 10446
Table 1. Details of general training routine during the week performed by both control and experi-
mental groups over the 8-week intervention.
Days Objectives
Mondays RestTuesdays Aerobic capacity training and defensive tactics training
Wednesdays Aerobic power training and defensive tactics trainingThursdays Power anaerobic training and defensive and offensive tactics training
Fridays Agility training and technical training and offensive tactics trainingSaturdays Vivacity training and technical training and offensive tactics training
Sunday Official matches
The investigation was completed during a local soccer season in 2020/2021.
2.3. Details of Combined Plyometric and Short Sprints with Change-of-Direction Training
The CPSCoD training program consisted of four drills, with increasing repetitions overthe training period, twice per week (as visualized in Figure 1 and quantified in Table 2).
Each CPSCoD drill began with plyometric exercises and finished with a sprint withCoD. It should be noted that participants were used to applying plyometrics and CoD drillsand had achieved good technical competency through training activities before starting theinvestigation.
Plyometric training variables were based on recommendations for volume and inten-sity from Bedoya et al. [21]. Furthermore, CoD angles were based on previously publishedrecommendations [23].
Figure 1. Exercise used in combined plyometric and sprint with a change-of-direction training program.
90

Int. J. Environ. Res. Public Health 2021, 18, 10446
Table 2. Plyometric components were introduced into the program of the experimental group.
Week Drill 1 Drill 2 Drill 3 Drill 4 Total (Contact)
1 3 Repetitions 3 Repetitions 3 Repetitions 3 Repetitions 722 3 Repetitions 3 Repetitions 3 Repetitions 3 Repetitions 723 4 Repetitions 4 Repetitions 4 Repetitions 4 Repetitions 964 4 Repetitions 4 Repetitions 4 Repetitions 4 Repetitions 965 5 Repetitions 5 Repetitions 5 Repetitions 5 Repetitions 1206 5 Repetitions 5 Repetitions 5 Repetitions 5 Repetitions 1207 6 Repetitions 6 Repetitions 6 Repetitions 6 Repetitions 1448 6 Repetitions 6 Repetitions 6 Repetitions 6 Repetitions 144
All repetitions and sessions were separated by 90 s recovery intervals.
2.4. Testing Schedule
Tests were conducted at least 3 days after the last competitive match and 5–9 days afterthe previous training session. Testing was conducted on a tartan surface, which was partof the players’ weekly training schedule. Standardized warm-up preceded each test. Testswere completed over three separate testing days in the following order: anthropometricassessment, squat jump (SJ), countermovement jump (CMJ), sprint 4 × 5 m test (S 4 × 5 m)(all day 1); the stork balance test, 5 and 20 m sprint, and sprint 9–3–6–3–9 m with backwardand forward running (SBF) (all day 2); the standing long jump (SLJ) and the repeated CoDability (RCoD) (both day 3).
The 5 and 20 m sprint performance, S 4 × 5 m, SBF, SJ, CMJ, SLJ, stork balance test,and the RCoD have all been previously described in detail [28–30] and therefore are notdetailed here to avoid self-plagiarism. Anthropometric characteristics (body mass andbody fat percentage) were evaluated after an overnight fast, in the morning (7–8 am), barefoot, with the bioelectrical impedance analysis (BIA) method (BC-602, Tanita Co., Tokyo,Japan) [31].
2.5. Statistical Analyses
All analysis was conducted on SPSS version 25.0 for Windows (IBM, Armonk, NY,USA). Normal distribution was tested using the Shapiro–Wilk test. Homogeneity ofvariance was determined using Levene’s test. Independent samples t-tests examinedbetween-group differences at baseline. An effect of training was considered by a mixedmethod of two-way (time × group) analysis of variance (ANOVA) with repeated measures.Subsequently, dependent samples t-tests tested for within-group training changes from pre-to post intervention were examined with Tukey’s post hoc procedure applied to avoid typeI error. Alpha level is reported as exact p values, as suggested by the American StatisticalAssociation [31]. The effect size for paired comparisons is reported as Cohen’s d [32] andinterpreted as trivial (<0.35), small (≥0.35–0.80), moderate (≥0.80–1.50), and large (≥1.50),based on the recommendations of Rhea [33] for recreationally trained subjects. Percentagechanges were calculated as ((post-training value−pre-training value)/pre-training value)×100. Reliability was evaluated using intraclass correlation coefficients (ICC) [34] andthe coefficients of variation (CV) over consecutive pairs of intra-participant trials [35]. Allperformance measures had an ICC > 0.80 and a CV < 5% (Table 3). Data are reported asmean ± standard deviation (SD).
91
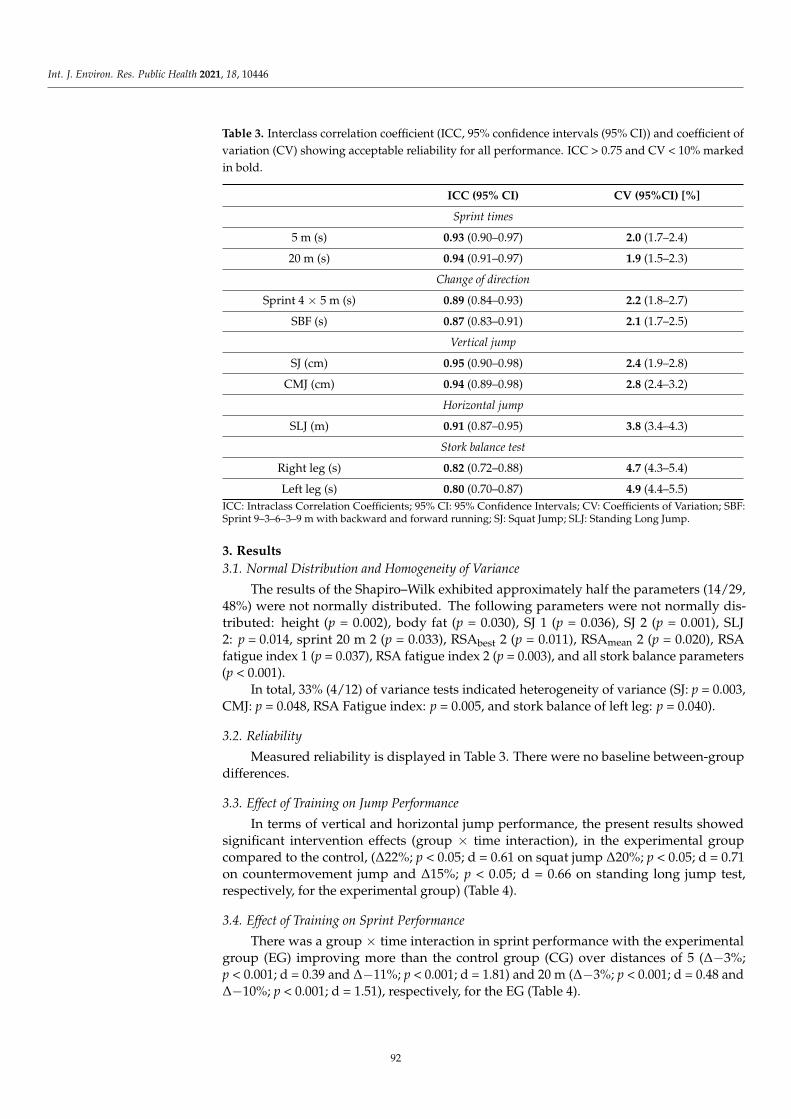
Int. J. Environ. Res. Public Health 2021, 18, 10446
Table 3. Interclass correlation coefficient (ICC, 95% confidence intervals (95% CI)) and coefficient of
variation (CV) showing acceptable reliability for all performance. ICC > 0.75 and CV < 10% marked
in bold.
ICC (95% CI) CV (95%CI) [%]
Sprint times
5 m (s) 0.93 (0.90–0.97) 2.0 (1.7–2.4)
20 m (s) 0.94 (0.91–0.97) 1.9 (1.5–2.3)
Change of direction
Sprint 4 × 5 m (s) 0.89 (0.84–0.93) 2.2 (1.8–2.7)
SBF (s) 0.87 (0.83–0.91) 2.1 (1.7–2.5)
Vertical jump
SJ (cm) 0.95 (0.90–0.98) 2.4 (1.9–2.8)
CMJ (cm) 0.94 (0.89–0.98) 2.8 (2.4–3.2)
Horizontal jump
SLJ (m) 0.91 (0.87–0.95) 3.8 (3.4–4.3)
Stork balance test
Right leg (s) 0.82 (0.72–0.88) 4.7 (4.3–5.4)
Left leg (s) 0.80 (0.70–0.87) 4.9 (4.4–5.5)
ICC: Intraclass Correlation Coefficients; 95% CI: 95% Confidence Intervals; CV: Coefficients of Variation; SBF:Sprint 9–3–6–3–9 m with backward and forward running; SJ: Squat Jump; SLJ: Standing Long Jump.
3. Results
3.1. Normal Distribution and Homogeneity of Variance
The results of the Shapiro–Wilk exhibited approximately half the parameters (14/29,48%) were not normally distributed. The following parameters were not normally dis-tributed: height (p = 0.002), body fat (p = 0.030), SJ 1 (p = 0.036), SJ 2 (p = 0.001), SLJ2: p = 0.014, sprint 20 m 2 (p = 0.033), RSAbest 2 (p = 0.011), RSAmean 2 (p = 0.020), RSAfatigue index 1 (p = 0.037), RSA fatigue index 2 (p = 0.003), and all stork balance parameters(p < 0.001).
In total, 33% (4/12) of variance tests indicated heterogeneity of variance (SJ: p = 0.003,CMJ: p = 0.048, RSA Fatigue index: p = 0.005, and stork balance of left leg: p = 0.040).
3.2. Reliability
Measured reliability is displayed in Table 3. There were no baseline between-groupdifferences.
3.3. Effect of Training on Jump Performance
In terms of vertical and horizontal jump performance, the present results showedsignificant intervention effects (group × time interaction), in the experimental groupcompared to the control, (∆22%; p < 0.05; d = 0.61 on squat jump ∆20%; p < 0.05; d = 0.71on countermovement jump and ∆15%; p < 0.05; d = 0.66 on standing long jump test,respectively, for the experimental group) (Table 4).
3.4. Effect of Training on Sprint Performance
There was a group × time interaction in sprint performance with the experimentalgroup (EG) improving more than the control group (CG) over distances of 5 (∆−3%;p < 0.001; d = 0.39 and ∆−11%; p < 0.001; d = 1.81) and 20 m (∆−3%; p < 0.001; d = 0.48 and∆−10%; p < 0.001; d = 1.51), respectively, for the EG (Table 4).
92
Int. J. Environ. Res. Public Health 2021, 18, 10446
3.5. Effect of Training on Change-of-Direction Ability
The sprint 4 × 5 m test displayed the largest group × time interaction effect (p = 0.002,d = 0.82) for all jump and change-of-direction performance parameters (Table 4). Especially,the EG (p < 0.001, d = 2.12) benefited from the intervention compared with the CG (p < 0.001,d = 0.68).
The SBF test showed an intervention effect with the EG improving more than CG(∆−3%; p < 0.001; d = 0.62 and ∆−8%; p < 0.001; d = 1.65, respectively, for the EG) (Table 4).
3.6. Effect of Training on Repeated Change-of-Direction Ability
The RCoD test showed group × time interactions for RCoDfastest (p = 0.006, d = 0.72)and RCoDmean (p = 0.006, d = 0.71). Over the time, the improvement of performancewas much higher in the EG (dfastest = 2.01, dmean = 2.02) than in the CG (dfastest = 0.42,dmean = 0.43) (Table 5).
3.7. Effect of Training on Balance Performance
Balance performance was improved more in the experimental group, compared withthe control group (right leg: ∆68%; p < 0.05; d = 0.66; left leg: ∆79%; p < 0.01; d = 0.72,respectively for the experimental group) (Table 5).
93
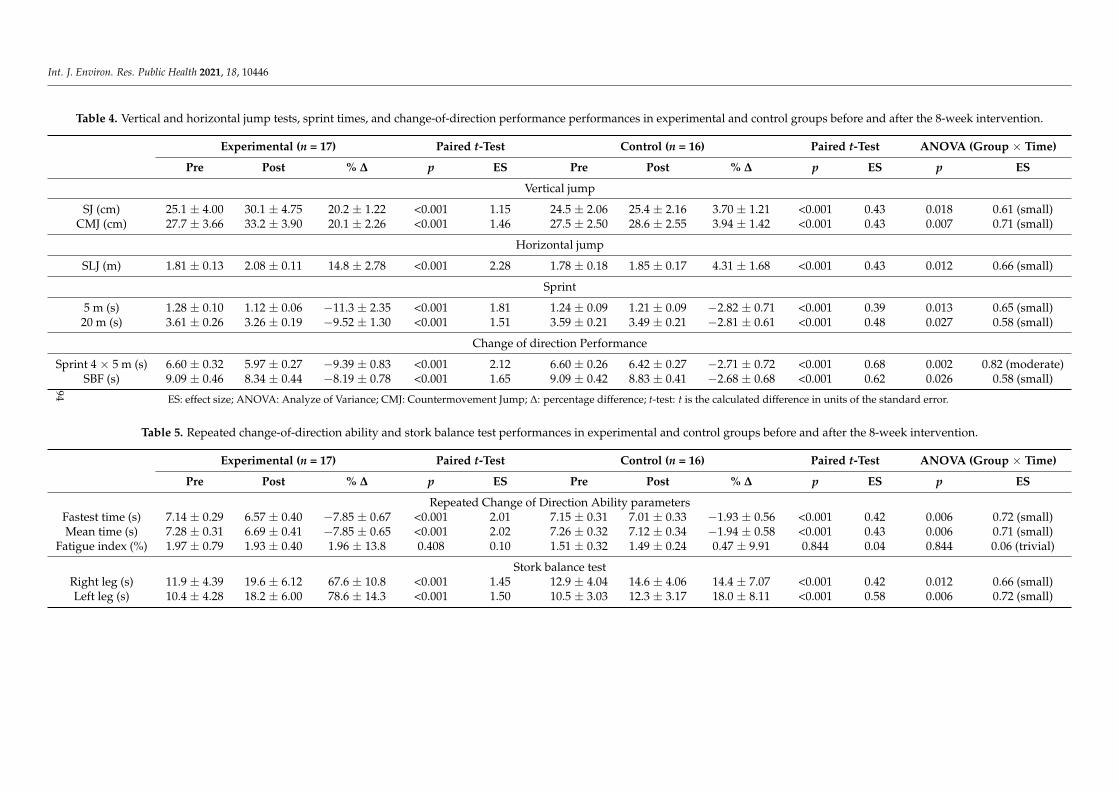
Int. J. Environ. Res. Public Health 2021, 18, 10446
Table 4. Vertical and horizontal jump tests, sprint times, and change-of-direction performance performances in experimental and control groups before and after the 8-week intervention.
Experimental (n = 17) Paired t-Test Control (n = 16) Paired t-Test ANOVA (Group × Time)
Pre Post % ∆ p ES Pre Post % ∆ p ES p ES
Vertical jump
SJ (cm) 25.1 ± 4.00 30.1 ± 4.75 20.2 ± 1.22 <0.001 1.15 24.5 ± 2.06 25.4 ± 2.16 3.70 ± 1.21 <0.001 0.43 0.018 0.61 (small)CMJ (cm) 27.7 ± 3.66 33.2 ± 3.90 20.1 ± 2.26 <0.001 1.46 27.5 ± 2.50 28.6 ± 2.55 3.94 ± 1.42 <0.001 0.43 0.007 0.71 (small)
Horizontal jump
SLJ (m) 1.81 ± 0.13 2.08 ± 0.11 14.8 ± 2.78 <0.001 2.28 1.78 ± 0.18 1.85 ± 0.17 4.31 ± 1.68 <0.001 0.43 0.012 0.66 (small)
Sprint
5 m (s) 1.28 ± 0.10 1.12 ± 0.06 −11.3 ± 2.35 <0.001 1.81 1.24 ± 0.09 1.21 ± 0.09 −2.82 ± 0.71 <0.001 0.39 0.013 0.65 (small)20 m (s) 3.61 ± 0.26 3.26 ± 0.19 −9.52 ± 1.30 <0.001 1.51 3.59 ± 0.21 3.49 ± 0.21 −2.81 ± 0.61 <0.001 0.48 0.027 0.58 (small)
Change of direction Performance
Sprint 4 × 5 m (s) 6.60 ± 0.32 5.97 ± 0.27 −9.39 ± 0.83 <0.001 2.12 6.60 ± 0.26 6.42 ± 0.27 −2.71 ± 0.72 <0.001 0.68 0.002 0.82 (moderate)SBF (s) 9.09 ± 0.46 8.34 ± 0.44 −8.19 ± 0.78 <0.001 1.65 9.09 ± 0.42 8.83 ± 0.41 −2.68 ± 0.68 <0.001 0.62 0.026 0.58 (small)
ES: effect size; ANOVA: Analyze of Variance; CMJ: Countermovement Jump; ∆: percentage difference; t-test: t is the calculated difference in units of the standard error.
Table 5. Repeated change-of-direction ability and stork balance test performances in experimental and control groups before and after the 8-week intervention.
Experimental (n = 17) Paired t-Test Control (n = 16) Paired t-Test ANOVA (Group × Time)
Pre Post % ∆ p ES Pre Post % ∆ p ES p ES
Repeated Change of Direction Ability parametersFastest time (s) 7.14 ± 0.29 6.57 ± 0.40 −7.85 ± 0.67 <0.001 2.01 7.15 ± 0.31 7.01 ± 0.33 −1.93 ± 0.56 <0.001 0.42 0.006 0.72 (small)Mean time (s) 7.28 ± 0.31 6.69 ± 0.41 −7.85 ± 0.65 <0.001 2.02 7.26 ± 0.32 7.12 ± 0.34 −1.94 ± 0.58 <0.001 0.43 0.006 0.71 (small)
Fatigue index (%) 1.97 ± 0.79 1.93 ± 0.40 1.96 ± 13.8 0.408 0.10 1.51 ± 0.32 1.49 ± 0.24 0.47 ± 9.91 0.844 0.04 0.844 0.06 (trivial)
Stork balance testRight leg (s) 11.9 ± 4.39 19.6 ± 6.12 67.6 ± 10.8 <0.001 1.45 12.9 ± 4.04 14.6 ± 4.06 14.4 ± 7.07 <0.001 0.42 0.012 0.66 (small)Left leg (s) 10.4 ± 4.28 18.2 ± 6.00 78.6 ± 14.3 <0.001 1.50 10.5 ± 3.03 12.3 ± 3.17 18.0 ± 8.11 <0.001 0.58 0.006 0.72 (small)
94

Int. J. Environ. Res. Public Health 2021, 18, 10446
4. Discussion
This investigation examined the effect of 8 weeks of CPSCoD training on anaerobicperformance and balance ability in elite U15 soccer players. We observed that addingCPSCoD to habitual training enhanced jump performance, sprint performance, CoD ability,RCoD ability, and balance performance.
4.1. Effect of Training on Jump Performance
In soccer, vertical jumps are performed when a player jumps toward a ball in anattempt to head direct the ball for an attacking (scoring/passing) or defensive (clear-ance/interception) task and is decisive action during matches [32]. We observed inter-vention effects in the experimental group, compared with the control, on vertical andhorizontal jump performance (Table 4). The positive effects of CPSCoD in the presentinvestigation are in line with Aloui et al. [22], who studied the effects of 8 weeks of CPSCoDtraining on U17 male soccer players and found this type of training improved vertical andhorizontal jump performance. In addition, Beato et al. [23] reported significant increases inhorizontal jump performance following CPSCoD training, in male young soccer players(U18). Although mechanisms for adaptation cannot be fully determined in the presentstudy, it is likely improved jump performance was mediated by neural adaptation suchas motor unit recruitment and the Hoffman reflex [20,33]. We suggest eccentric muscularcontractions necessitated by the plyometric training are able to produce greater force andthus may provide a large stimulus above and beyond concentric contractions alone [34].
4.2. Effect of Training on Sprint Performance
In professional soccer match play, sprints in a straight line (45%), followed by verticaljumping (16%) were the two most commonly observed actions immediately prior to a goalbeing scored [35]. It is well known that muscle strength and contraction speed (i.e., musclepower) are determining factors in sprint speed [36–38], and the improved sprint abilityevoked by CPSCoD training in the present study may translate to enhanced match playabilities and preferential match outcomes. We observed intervention effects in the EG,compared with the control for CoD ability (Table 4). Our results are aligned with those ofHammami et al. [28], who reported improved sprint performance over 5 and 20 m followingCPSCoD training in young male handball players. Similarly, Michailidis et al. [25] observedimproved 10 m, but not 30 m, sprint performance after CPSCoD training in prepubertalmale soccer players. Improvement in sprinting performance after CoD training could bedue to improved leg extensor power and the ability to produce lower limb strength moreeffectively after training [39,40]. In addition, temporal sequencing of muscle activation formore efficient movement, preferential recruitment of the fastest motor units, or increasednerve conduction speed promoted by plyometric training may be responsible for theimproved sprint times [41].
4.3. Effect of Training on Change-of-Direction Ability
The CoD improvement observed herein following CPSCoD training is encouragingfor trainers, as CoD ability is an important trait in competitive soccer [42,43]. Our data,especially the moderate interaction (d = 0.82) and the large (d = 2.12) effect for the EGregarding sprint 4 × 5 m, are in accordance with the existing literature, which has demon-strated improved CoD ability after several programs, including CPSCoD training [22–24],plyometric training [28,44], and CoD training [45,46]. Recently, Michailidis et al. [25] andMakhlouf et al. [24] reported improved CoD ability following CPSCoD training in prepu-bertal males. Improvements may have been caused by reduced contact times as a result ofincreased muscle strength and power, and efficiency of movement, as this has been notedpreviously following plyometric [20,47]. Similarly, enhanced eccentric lower limb strengthcould enhance the ability to accelerate and decelerate during CoDs [48]. In this context,Chaalali et al. [45] suggested the observed CoD enhancement may be related to improvedCoD technique and increased strength and power of the leg extensors, after CoD training.
95
Int. J. Environ. Res. Public Health 2021, 18, 10446
4.4. Effect of Training on Repeated Change-of-Direction Ability
Soccer players must complete high-intensity repeated efforts and/or sprints to com-pete at a high level [49]. We reported improved RCoD ability in the EG, compared with theCG for all parameters except the fatigue index. Reinforcing our results, Aloui et al. [22]observed improvement in RCoD ability following CPSCoD training in male U17 soccerplayers. Conversely, Hammami et al. [28] reported no improvement in RCoD ability fol-lowing CPSCoD training in U15 male handball players. Improved RCoD observed hereinwas likely resultant from improved anaerobic fitness such as CoD ability, sprint ability,and jumping ability [50,51]. Particularly, RCoD ability improvements were most likely theresult of improvements in stretch-shortening cycle efficiency, motor unit synchronization,or tendon stiffness [52].
4.5. Effect of Training on Balance Performance
Balance is the ability to maintain postural control during an and is classified can beclassified as dynamic and static [53]. In soccer, players benefit from the ability to regainpostural control to attenuate injury risk while landing from a dynamic movement, suchas a pronounced deceleration, cut, or jump [54]. The EG in this study improved the staticbalance, compared with the control group, which confirms the results of Aloui et al. [22],who observed improved static balance after CPSCoD training in U17 male soccer players.Recently, Makhlouf et al. [18] reported improved static and dynamic balance followingCPSCoD training in prepubertal male soccer players. These adaptations may be causedby neural factors such as improved reaction time or precision of movement [55]. Anotherpossible reason for improved balance performance could be the increase in muscle strengthof the lower limbs, the increase in muscle coordination, and the facilitation of fast-twitchmotor units [56]. Ondra et al. [57] reported that a high level of postural stability is believedto be the factor reducing the risk of lower limb injury, emphasizing the importance ofbalance in this cohort.
4.6. Limitations
Results of this study suggest CPSCoD training confers advantages in anaerobic capac-ity and balance performance in elite U15 soccer players. These mostly small adaptationswere observed after only 8 weeks, alongside other in-season training, and should be relatedto the higher risk of injury from performing plyometric movements. Thus, CPSCoD train-ing during the in-season period may promote reduced injury risk in addition to improvedanaerobic fitness. However, before we can promote CPSCoD training for all soccer squads,a larger confirmatory study may be required to elucidate if these effects are manifest acrossall age groups, players levels, and sexes. Moreover, as our participants were alreadywell-trained and well-versed in the type of training included in the CPSCoD program,caution should be exercised when inducting untrained or novice athletes onto a CPSCoDtraining program.
5. Conclusions
CPSCoD training enhanced balance performance and anaerobic capacity (jumping,sprinting, CoD ability, and RCoD ability) during the competition season. However, 83%(10/12) of the interaction effects were small. Only for sprint 4 × 5 m, a moderate effect wasobserved. Note that during the intervention period, no injury was reported. Therefore,CPSCoD training can be considered safe for well-trained and well-versed young malesoccer players provided progression guidelines are followed.
Author Contributions: Conceptualization, G.A. and A.K.; methodology, G.A.; software, M.S.C.;
validation, G.A., M.S.C., A.K. and R.S.; formal analysis, M.S.C.; investigation, G.A.; resources, G.A.
and A.K.; data curation, M.S.C.; writing—original draft preparation, G.A., and S.H.; writing—review
and editing, L.D.H. and S.H.; visualization, A.K. and T.B.; supervision, E.G.B.; project administration,
G.A. and A.K.; funding acquisition, R.S. All authors have read and agreed to the published version
of the manuscript.
96
Int. J. Environ. Res. Public Health 2021, 18, 10446
Funding: The authors thank the “Ministry of Higher Education and Scientific Research, Tunis,
Tunisia” for financial support.
Institutional Review Board Statement: The study was conducted according to the guidelines of
the Declaration of Helsinki and approved by the Institutional Review Board of Research Unit
(UR17JS01) Sport Performance, Health & Society, Higher Institute of Sport and Physical Education,
Ksar-Saîd, University.
Informed Consent Statement: Informed consent was obtained from all subjects involved in the study.
Data Availability Statement: The raw data supporting the conclusions of this article will be made
available by the authors without undue reservation.
Conflicts of Interest: The authors declare no conflict of interest.
References
1. Howard, N.; Stavrianeas, S. In-season high-intensity interval training improves conditioning in high school soccer players. Int. J.Exerc. Sci. 2017, 10, 713–720.
2. Buchheit, M.; Mendez-Villanueva, A.; Simpson, B.M.; Bourdon, P.C. Match running performance and fitness in youth soccer. Int.J. Exerc. Sci. 2010, 31, 818–825. [CrossRef]
3. Buchheit, M.; Al Haddad, H.; Simpson, B.M.; Palazzi, D.; Bourdon, P.C.; Di Salvo, V.; Mendez-Villanueva, A. Monitoring
accelerations with GPS in football: Time to slow down? Int. J. Sports Physiol. Perform. 2014, 9, 442–445. [CrossRef] [PubMed]
4. Cochrane, D.J.; Monaghan, D. Using sprint velocity decrement to enhance acute sprint performance. J. Strength Cond. Res. 2021,
35, 442–448. [CrossRef]
5. Mara, J.; Thompson, K.G.; Pumpa, K.L.; Morgan, S. The acceleration and deceleration profiles of elite female soccer players
during competitive matches. J. Sci. Med. Sports 2017, 20, 867–872. [CrossRef] [PubMed]
6. Rampinini, E.; Bishop, D.; Marcora, S.M.; Bravo, D.F.; Sassi, R.; Impellizzeri, F.M. Validity of simple field tests as indicators of
match-related physical performance in top-level professional soccer players. Int. J. Sports Med. 2007, 28, 228–235. [CrossRef]
[PubMed]
7. Sæterbakken, A.; Haug, V.; Fransson, D.; Grendstad, H.N.; Gundersen, H.S.; Moe, V.F.; Ylvisaker, E.; Shaw, M.; Riiser, A.;
Andersen, V. Match running performance on three different competitive standards in norwegian soccer. Sports Med. Int. Open2019, 3, E82–E88. [CrossRef]
8. Akenhead, R.; Hayes, P.; Thompson, K.; French, D. Diminutions of acceleration and deceleration output during professional
football match play. J. Sci. Med. Sport 2013, 16, 556–561. [CrossRef] [PubMed]
9. Di Salvo, V.; Baron, R.; Tschan, H.; Montero, F.C.; Bachl, N.; Pigozzi, F. Performance characteristics according to playing position
in elite soccer. Int. J. Sports Med. 2007, 28, 222–227. [CrossRef]
10. Withers, R.; Maricic, Z.; Wasilewski, S.; Kelly, L. Match analysis of Australian professional soccer players. J. Hum. Mov. Stud. 1982,
8, 159–176.
11. Bloomfield, J.; Polman, R.; O’Donoghue, P. Deceleration movements performed during FA premier league soccer matches. J.Sports Sci. Med. 2007, 6, 63–70.
12. Bloomfield, J.; Polman, R.; O’Donoghue, P. Turning movements performed during FA premier league soccer matches. J. Sports Sci.Med. 2007, 6, 9–10.
13. Faude, O.; Koch, T.; Meyer, T. Straight sprinting is the most frequent action in goal situations in professional football. J. Sports Sci.2012, 30, 625–631. [CrossRef]
14. Stølen, T.; Chamari, K.; Castagna, C.; Wisløff, U. Physiology of soccer: An update. Sports Med. 2005, 35, 501–536. [CrossRef]
15. Reilly, T.; Bangsbo, J.; Franks, A.L. Anthropometric and physiological predispositions for elite soccer. J. Sports Sci. 2000, 18,
669–683. [CrossRef] [PubMed]
16. Reilly, T.; Williams, A.M.; Nevill, A.; Franks, A. A multidisciplinary approach to talent identification in soccer. J. Sports Sci. 2000,
18, 695–702. [CrossRef]
17. Lloyd, R.S.; Oliver, J.L.; Faigenbaum, A.D.; Howard, R.; De Ste Croix, M.B.; Williams, C.A.; Best, T.M.; Alvar, B.A.; Micheli, L.J.;
Thomas, D.P.; et al. Long-Term Athletic Development- Part 1: A pathway for all youth. J. Strength Cond. Res. 2015, 29, 1439–1450.
[CrossRef]
18. Behm, D.G.; Faigenbaum, A.D.; Falk, B.; Klentrou, P. Canadian society for exercise physiology position paper: Resistance training
in children and adolescents. Appl. Physiol. Nutr. Metab. 2008, 33, 547–561. [CrossRef] [PubMed]
19. Lloyd, R.; Meyers, R.; Oliver, J. The natural development and trainability of plyometric ability during child-hood. Strength Cond.J. 2011, 33, 23–30. [CrossRef]
20. Markovic, G.; Mikulic, P. Neuro-musculoskeletal and performance adaptations to lower-extremity plyometric training. SportsMed. 2010, 40, 859–895. [CrossRef]
21. Bedoya, A.A.; Miltenberger, M.R.; Lopez, R. Plyometric training effects on athletic performance in youth soccer athletes: A
systematic review. J. Strength Cond. Res. 2015, 29, 2351–2360. [CrossRef] [PubMed]
97
Int. J. Environ. Res. Public Health 2021, 18, 10446
22. Aloui, G.; Hermassi, S.; Hayes, L.; Hayes, N.S.; Bouhafs, E.; Chelly, M.; Schwesig, R. Effects of plyometric and short sprint with
change-of-direction training in male U17 soccer players. Appl. Sci. 2021, 11, 4767. [CrossRef]
23. Beato, M.; Bianchi, M.; Coratella, G.; Merlini, M.; Drust, B. Effects of plyometric and directional training on speed and jump
performance in elite youth soccer players. J. Strength Cond. Res. 2018, 32, 289–296. [CrossRef]
24. Makhlouf, I.; Chaouachi, A.; Chaouachi, M.; Ben Othman, A.; Granacher, U.; Behm, D.G. Combination of agility and plyometric
training provides similar training benefits as combined balance and plyometric training in young soccer players. Front. Physiol.2018, 9, 1611. [CrossRef]
25. Michailidis, Y.; Tabouris, A.; Metaxas, T. Effects of plyometric and directional training on physical fitness parameters in youth
soccer players. Int. J. Sports Physiol. Perform. 2019, 14, 392–398. [CrossRef]
26. Jlid, M.C.; Racil, G.; Coquart, J.; Paillard, T.; Bisciotti, G.N.; Chamari, K. Multidirectional plyometric training: Very efficient way
to improve vertical jump performance, change of direction performance and dynamic postural control in young soccer players.
Front. Physiol. 2019, 10, 1462. [CrossRef] [PubMed]
27. Karahan, M. Effect of skill-based training vs. small-sided games on physical performance improvement in young soccer players.
Biol. Sport 2020, 37, 305–312. [CrossRef]
28. Hammami, M.; Gaamouri, N.; Aloui, G.; Shephard, R.J.; Chelly, M.S. Effects of combined plyometric and short sprint with
change-of-direction training on athletic performance of male u15 handball players. J. Strength Cond. Res. 2019, 33, 662–675.
[CrossRef]
29. Negra, Y.; Chaabene, H.; Sammoud, S.; Prieske, O.; Moran, J.; Ramirez-Campillo, R.; Nejmaoui, A.; Granacher, U. The increased
effectiveness of loaded versus unloaded plyometric jump training in improving muscle power, speed, change of direction, and
kicking-distance performance in prepubertal male soccer players. Int. J. Sports Physiol. Perform. 2020, 15, 189–195. [CrossRef]
30. Sporis, G.; Jukic, I.; Milanovic, L.; Vucetic, V. Reliability and factorial validity of agility tests for soccer players. J. Strength Cond.Res. 2010, 24, 679–686. [CrossRef]
31. Sitko, S.; Cirer-Sastre, R.; Corbi, F.; Laval, I.L. Effects of a low-carbohydrate diet on body composition and performance in road
cycling: A randomized, controlled trial. Nutr. Hosp. 2020, 37, 1022–1027. [CrossRef]
32. Fílter, A.; Jabalera, J.O.; Molina-Molina, A.; Suárez-Arrones, L.; Robles-Rodríguez, J.; Dos’Santos, T.; Loturco, I.; Requena, B.;
Santalla, A. Effect of ball inclusion on jump performance in soccer players: A biomechanical approach. Sci. Med. Football 2021,
1–7. [CrossRef]
33. Hammami, M.; Negra, Y.; Shephard, R.J.; Chelly, M.S. The effect of standard strength vs. contrast strength training on the
development of sprint, agility, repeated change of direction, and jump in junior male soccer players. J. Strength Cond. Res. 2017,
31, 901–912. [CrossRef]
34. Douglas, J.; Pearson, S.; Ross, A.; McGuigan, M. Eccentric exercise: Physiological characteristics and acute responses. Sports Med.2017, 47, 663–675. [CrossRef] [PubMed]
35. Faude, O.; Roth, R.; Di Giovine, D.; Zahner, L.; Donath, L. Combined strength and power training in high-level amateur football
during the competitive season: A randomised-controlled trial. J. Sports Sci. 2013, 31, 1460–1467. [CrossRef] [PubMed]
36. Comfort, P.; Stewart, A.; Bloom, L.; Clarkson, B. Relationships between strength, sprint, and jump performance in well-trained
youth soccer players. J. Strength Cond. Res. 2014, 28, 173–177. [CrossRef] [PubMed]
37. Lockie, R.G.; Stage, A.A.; Stokes, J.J.; Orjalo, A.J.; Davis, D.L.; Giuliano, D.V.; Moreno, M.R.; Risso, F.G.; Lazar, A.; Birmingham-
Babauta, S.A.; et al. Relationships and predictive capabilities of jump assessments to soccer-specific field test performance in
division i collegiate players. Sports 2016, 4, 56. [CrossRef] [PubMed]
38. McFarland, I.T.; Dawes, J.J.; Elder, C.L.; Lockie, R.G. Relationship of two vertical jumping tests to sprint and change of direction
speed among male and female collegiate soccer players. Sports 2016, 4, 11. [CrossRef]
39. Baker, D.A. Comparison of running speed and quickness between elite professional and young rugby league players. StrengthCond. Coach 1999, 7, 3–7.
40. Sayers, M. Running techniques for field sport players. Sports Coach Autumn 2000, 23, 26–27.
41. De Villarreal, E.S.-S.; Kellis, E.; Kraemer, W.J.; Izquierdo, M. Determining variables of plyometric training for improving vertical
jump height performance: A meta-analysis. J. Strength Cond. Res. 2009, 23, 495–506. [CrossRef]
42. Göral, K. Examination of agility performances of soccer players according to their playing positions. Sport J. 2015, 6, 1–9.
[CrossRef]
43. Muniroglou, S.; Subak, E. Acomparison of 5, 10, 30 Meters sprint, modified t-test, ar rowhead and illinois agility tests on football
referees. J. Educ. Train. Stud. 2018, 6, 70–76. [CrossRef]
44. Rædergård, H.G.; Falch, H.N.; Tillaar, R.V.D. Effects of strength vs. plyometric training on change of direction performance in
experienced soccer players. Sports 2020, 8, 144. [CrossRef]
45. Chaalali, A.; Rouissi, M.; Chtara, M.; Owen, A.; Bragazzi, N.L.; Moalla, W.; Chaouachi, A.; Amri, M.; Chamari, K. Agility training
in young elite soccer players: Promising results compared to change of direction drills. Biol. Sport 2016, 33, 345–351. [CrossRef]
[PubMed]
46. Sariati, D.; Hammami, R.; Zouhal, H.; Clark, C.C.T.; Nebigh, A.; Chtara, M.; Chortane, S.G.; Hackney, A.C.; Souissi, N.; Granacher,
U.; et al. Improvement of physical performance following a 6 week change-of-direction training program in elite youth soccer
players of different maturity levels. Front. Physiol. 2021, 12, 668437. [CrossRef]
98

Int. J. Environ. Res. Public Health 2021, 18, 10446
47. Asadi, A. Plyometric type neuromuscular exercise is a treatment to postural control deficits of volleyball players: A case study.
Rev. Andal. Med. Deport. 2016, 9, 75–79. [CrossRef]
48. Markovic, G.; Newton, R.U. Does plyometric training improve vertical jump height? A meta-analytical review. Br. J. Sports Med.2007, 41, 349–355. [CrossRef]
49. Buchheit, M.; Mendez-Villanueva, A. Changes in repeated-sprint performance in relation to change in locomotor profile in
highly-trained young soccer players. J. Sports Sci. 2014, 32, 1309–1317. [CrossRef]
50. Buchheit, M.; Mendez-Villanueva, A.; Delhomel, G.; Brughelli, M.; Ahmaidi, S. Improving repeated sprint ability in young elite
soccer players: Repeated shuttle sprints vs. explosive strength training. J. Strength Cond. Res. 2010, 24, 2715–2722. [CrossRef]
51. Negra, Y.; Chaabene, H.; Fernandez-Fernandez, J.; Sammoud, S.; Bouguezzi, R.; Prieske, O.; Granacher, U. Short-term plyometric
jump training improves repeated-sprint ability in prepuberal male soccer players. J. Strength Cond. Res. 2020, 34, 3241–3249.
[CrossRef] [PubMed]
52. Harris, N.; Cronin, J.; Keogh, J. Contraction force specificity and its relationship to functional performance. J. Sports Sci. 2007, 25,
201–212. [CrossRef] [PubMed]
53. Pollock, A.S.; Durward, B.R.; Rowe, P.J.; Paul, J.P. What is balance? Clin. Rehabil. 2000, 14, 402–406. [CrossRef]
54. Azevedo, R.R.; da Rocha, E.; Franco, P.S.; Carpes, F.P. Plantar pressure asymmetry and risk of stress injuries in the foot of young
soccer players. Phys. Ther. Sport 2017, 24, 39–43. [CrossRef] [PubMed]
55. Manolopoulos, K.; Gissis, I.; Galazoulas, C.; Manolopoulos, E.; Patikas, D.; Gollhofer, A.; Kotzamanidis, C. Effect of combined
sensorimotor-resistance training on strength, balance, and jumping performance of soccer players. J. Strength Cond. Res. 2016, 30,
53–59. [CrossRef]
56. Young, W.; Metzl, J.D. Strength training for the young athlete. Pediatr. Ann. 2010, 39, 293–299. [CrossRef]
57. Ondra, L.; Nátesta, P.; Bizovská, L.; Kubonová, E.; Svoboda, Z. Effect of in-season neuromuscular and proprioceptive training on
postural stability in male youth basketball players. Acta Gymnica 2017, 47, 144–149. [CrossRef]
99


International Journal of
Environmental Research
and Public Health
Article
Different Pitch Configurations Constrain the Playing Tacticsand the Creation of Goal Scoring Opportunities during SmallSided Games in Youth Soccer Players
Joaquín González-Rodenas 1,*, Rodrigo Aranda-Malavés 2,3, Andrés Tudela-Desantes 2, Pedro de Matías-Cid 2
and Rafael Aranda 2,*
�����������������
Citation: González-Rodenas, J.;
Aranda-Malavés, R.; Tudela-Desantes,
A.; de Matías-Cid, P.; Aranda, R.
Different Pitch Configurations
Constrain the Playing Tactics and the
Creation of Goal Scoring Opportunities
during Small Sided Games in Youth
Soccer Players. Int. J. Environ. Res.
Public Health 2021, 18, 10500. https://
doi.org/10.3390/ijerph181910500
Academic Editors: Jorge Bravo,
Hugo Folgado and Bruno Gonçalves
Received: 31 August 2021
Accepted: 30 September 2021
Published: 6 October 2021
Publisher’s Note: MDPI stays neutral
with regard to jurisdictional claims in
published maps and institutional affil-
iations.
Copyright: © 2021 by the authors.
Licensee MDPI, Basel, Switzerland.
This article is an open access article
distributed under the terms and
conditions of the Creative Commons
Attribution (CC BY) license (https://
creativecommons.org/licenses/by/
4.0/).
1 Centre for Sport Studies, Rey Juan Carlos University, 28942 Madrid, Spain2 Department of Physical Education and Sports, University of Valencia, 46010 Valencia, Spain;
[email protected] (R.A.-M.); [email protected] (A.T.-D.); [email protected] (P.d.M.-C.)3 Doctoral School, Catholic University San Vicente Mártir, 46001 Valencia, Spain
* Correspondence: [email protected] (J.G.-R.); [email protected] (R.A.)
Abstract: The aim of this study was to explore the tactical effects of different pitch configurations on
the collective playing tactics and the creation of goal scoring opportunities (GSO) during small sided
soccer games (SSG) in youth players. A total of 22 players performed a 7 vs. 7 + 1 floater (including
goalkeepers) under three different pitch configurations (“Standard”, 53 × 38 m; “Long”, 63 × 32 m;
and “Wide”, 43 × 47 m). Eleven tactical indicators related to the development and the end of the team
possessions were evaluated by systematic observation. Friedman tests (non-parametric ANOVA for
repeated measures) revealed that the long and wide configurations produced more counterattacks
(p = 0.0028; ES = 0.3), higher offensive penetration (p = 0.007; ES = 0.41), and more GSO (p = 0.018;
ES = 0.30) than the standard format. Regarding the creation of GSO, the wide configuration produced
more assists in the form of crosses than the long and standard formats (p = 0.025; ES = 0.31), more
utilization of wide subspaces to assist the final player (p = 0.022; ES = 0.35), more number of headers
as the final action (p = 0.022; ES = 0.32), and less assists in the form of passes in behind the defense
(p = 0.034; ES = 0.28), than the long configuration. The modulation of the pitch configuration during
SSG produced different tactical demands, requiring players to implement different tactical solutions
to create GSO.
Keywords: non-linear pedagogy; constraints led approach; sport pedagogy; practice design;
football training
1. Introduction
The key offensive aim of soccer is to disorder the defensive organization of the op-posing team to achieve goal scoring opportunities (GSO) and goals. During that process,the last actions such as the assist and the final shot are decisive and both depend on thespatial–temporal relationship between the penultimate and the last player as well as theinteraction between the offensive and defensive organizations [1–4]. Due to its complex-ity and importance, one of the most challenging duties of professional soccer clubs is todevelop or recruit players who have the capacity to score or create high amounts of GSO.In fact, recent studies have observed that goal scorers and players with high quantity ofassists demonstrated to have higher levels of cognitive functions such as creativity andworking memory, compared with other players [5,6]. In addition, the study of Kempe andMemmet [7] observed that showing high creativity in the last two actions before the actualshot on goal proved to be the best predictor for game success in elite soccer.
Regarding the tactical development of GSO and goals, existing literature found thatthe actions that led to goal were predominantly originated in central and advanced areasof the opposing half, while the crosses have been shown to represent around 30–40% of
101

Int. J. Environ. Res. Public Health 2021, 18, 10500
the goal assists [8]. Furthermore, the majority of goals and GSO seem to be produced bycollective plays, so that the individual actions produced less than 20% of them [9–11]. Forinstance, the study of González-Rodenas et al. [12] analyzed 1172 GSO from top Europeanteams and observed that crosses comprised the 19.6% of penultimate actions prior to GSO,while passes comprised the 62.4% and individual actions the 9.1%.
Nevertheless, the tactical actions performed prior to goals or GSO are influenced bythe interaction with the opposing team [2,3,13] In this regard, González-Rodenas et al. [4]observed that crosses were more frequent against organized defenses, while passes inbehind the defense or actions as dribbling or running with the ball had a greater percentageof goals against circumstantial defenses. Regarding the final action, 70.1% of the goalswere scored by using only one contact to the ball in organized defenses but 46.6% incircumstantial defenses. These tactical facts suggest that players should be able to adapt tothe defensive context and interact with their teammates to choose the best solution in orderto disrupt the opposing team and create a GSO or a goal.
However, despite the growing emergence of research about small sided games (SSG) insoccer [14], there is a lack of studies that specifically focus on how different types of SSG caninfluence the way GSO and goals are achieved in training. In recent years, the analysis ofSSG in soccer has focused on physiological variables [15], motion analysis [16,17], collectivebehavior [18,19], and technical and tactical performance of players [20–22].
Consequently, it seems necessary to explore training methods to optimize the creationof GSO in youth soccer. In this sense, the constraints-led approach based on non-linealpedagogy has emerged as an optimal framework to create representative learning designsin collective sports [23]. Under this framework, coaches should manipulate task constraintsduring the SSG such as space, time, rules, goals, or number of players in order to createlearning environments where players can interact with their teammates and opponents toexplore opportunities for action and adapt to the specific tactical context. This manipulationof task constrains encourage the player’s co-adaptive and exploratory behavior to searchfor effective solutions, embracing problem-solving situations [24].
One of the easiest constraints for coaches to modify in SSG is the space. In this sense,the effect of the manipulation of the space size on physical and technical demands has beenanalyzed in multiple studies about SSG [25]. However, no study to date has analyzed theeffect of modifying the pitch configuration on the playing tactics and creation of GSO insoccer. In this sense, Coutinho et al. [19] analyzed the effect of different pitch configurationon the physical demands and movement behavior in young players, concluding that usingdifferent pitch configurations might help players to improve their ability to identify themost relevant cues that support the emergence of functional behaviors. Likewise, Folgadoet al. [26] observed that a longer pitch configuration (40 × 30 m) during a 4 vs. 4 + GKsgame registered more distance covered at high intensities, more passes, and dribbles thana wider format (30 × 40 m), which had more lateral passes and shots and a wider teampositioning.
According to this background, our hypothesis is that the design of SSG with differentpitch configurations (i.e., wide pitch vs. long pitch vs. standard pitch) may modulate theemergence of collective tactical behaviors and encourage players to explore different waysto build and create GSO. Therefore, the aim of this study was to check the tactical effectsof different pitch configurations on the collective playing tactics and the creation of GSOduring SSG in youth players.
2. Materials and Methods
2.1. Sample
A total of 22 elite youth players (age: 13.80 ± 0.58, years of experience: 6.30 ± 0.95)from an American professional soccer club participated in the study. The participants,parents, and the club were informed about the research procedures and provided writteninformed consent. This study followed the ethical standards for study in humans asoutlined in the Declaration of Helsinki. The sample comprised 296 offensive possessions
102
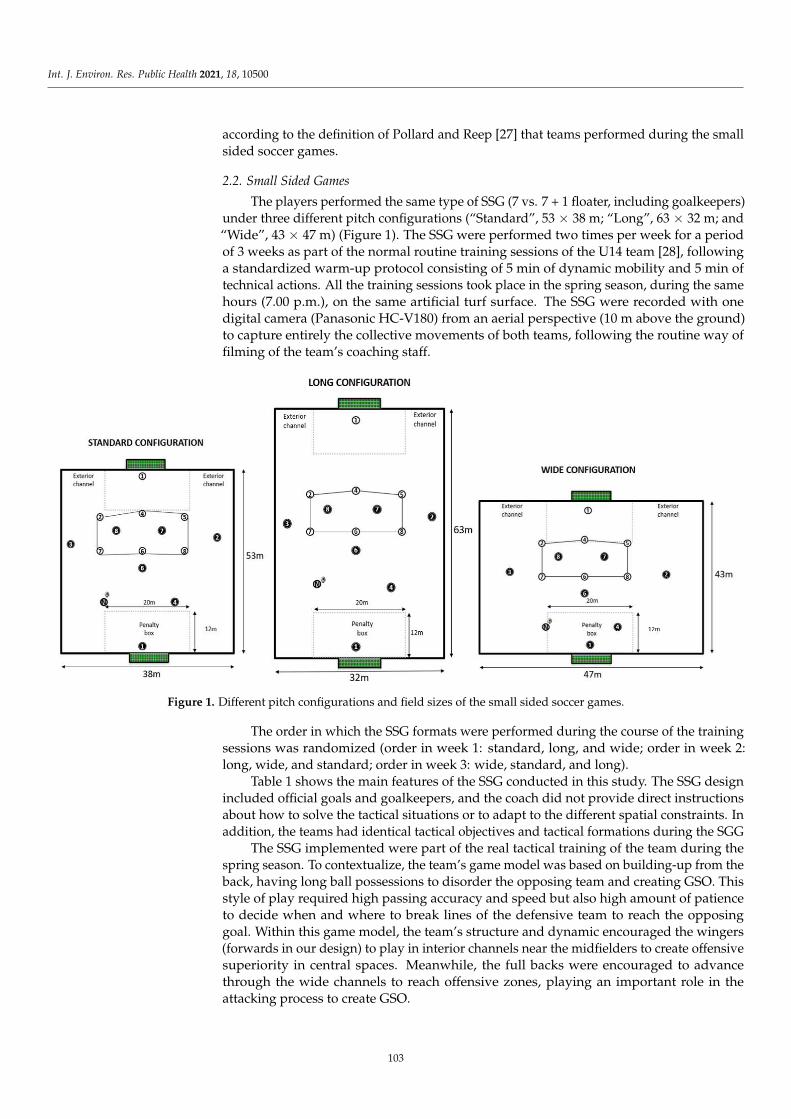
Int. J. Environ. Res. Public Health 2021, 18, 10500
according to the definition of Pollard and Reep [27] that teams performed during the smallsided soccer games.
2.2. Small Sided Games
The players performed the same type of SSG (7 vs. 7 + 1 floater, including goalkeepers)under three different pitch configurations (“Standard”, 53 × 38 m; “Long”, 63 × 32 m; and“Wide”, 43 × 47 m) (Figure 1). The SSG were performed two times per week for a periodof 3 weeks as part of the normal routine training sessions of the U14 team [28], followinga standardized warm-up protocol consisting of 5 min of dynamic mobility and 5 min oftechnical actions. All the training sessions took place in the spring season, during the samehours (7.00 p.m.), on the same artificial turf surface. The SSG were recorded with onedigital camera (Panasonic HC-V180) from an aerial perspective (10 m above the ground)to capture entirely the collective movements of both teams, following the routine way offilming of the team’s coaching staff.
(“Standard”, 53 ; “Long”, 63 “Wide”, 43
’
Figure 1. Different pitch configurations and field sizes of the small sided soccer games.
The order in which the SSG formats were performed during the course of the trainingsessions was randomized (order in week 1: standard, long, and wide; order in week 2:long, wide, and standard; order in week 3: wide, standard, and long).
Table 1 shows the main features of the SSG conducted in this study. The SSG designincluded official goals and goalkeepers, and the coach did not provide direct instructionsabout how to solve the tactical situations or to adapt to the different spatial constraints. Inaddition, the teams had identical tactical objectives and tactical formations during the SGG
The SSG implemented were part of the real tactical training of the team during thespring season. To contextualize, the team’s game model was based on building-up from theback, having long ball possessions to disorder the opposing team and creating GSO. Thisstyle of play required high passing accuracy and speed but also high amount of patienceto decide when and where to break lines of the defensive team to reach the opposinggoal. Within this game model, the team’s structure and dynamic encouraged the wingers(forwards in our design) to play in interior channels near the midfielders to create offensivesuperiority in central spaces. Meanwhile, the full backs were encouraged to advancethrough the wide channels to reach offensive zones, playing an important role in theattacking process to create GSO.
103

Int. J. Environ. Res. Public Health 2021, 18, 10500
Table 1. Design of the small sided games.
Task Constraints Description
Player number (including goalkeepers) 7 vs. 7
Floaters 1 (playing as a central back)
Area per player (m2) 132 m2
Time (work: passive recovery) (5:2 min)
Tactical objectiveOffensive: To create goal scoring opportunities and goals
Defensive: To stay compact in a low block defense to protect the goal
Team systemsOffensive: 1.2.3.2
Defensive: 1.3.3
Feedback No direct instructions
RulesOfficial soccer rules (including offside). The only exception is that all the restarts
are taken as goal kicks (no throw ins, corner kicks, or free kicks)
Pitch configurations
Standard (53 × 38 m)
Long (63 × 32 m)
Wide (43 × 47 m)
Due to this tactical context, the objective of the coaching staff was to design repre-sentative learning designs [29] for players to experience different spatial scenarios whereto dominate the ball possession and to create GSO, while they could interact with theirteammates and opponents in their real positions.
Therefore, the team’s system during the SSG (Figure 2B) tried to reproduce the actualgame model in the attacking moment, having:
- One goalkeeper and one central back that should lead the process of building-up fromthe back.
- One midfielder that had the role of connecting the build-up with the finishing process.- Two forwards that should occupy interior channels to create superiority in the build-
up process and to play a relevant role in the finishing process.- Two full backs that, in addition to build-up, had an important role reaching offensive
zones and creating GSO.- Additionally, one offensive in-floater was added to, according to the existing sci-
entific literature, increase the passing possibilities and interactions of the attackingteam [30,31] as well as to encourage the defensive team to stay compact and to priori-tize the protection of the goal, [32], as we can observe in Figure 2A.
It is important to mention that although teams were structured in specific positionsand roles, players were free to make their own decisions, movements, and actions to solvethe different tactical situations during the SSG, in interaction with their teammates.
Regarding the pitch sizes and configurations selected, the coaching staff decided tocompare the standard configuration with an extra-wide and an extra-long format, in orderto expose players to different spatial constraints. The final design was based on the workof previous studies [19,26,33] that suggested that modifying the pitch configurations bychanging the width and length affects team’s spatial and temporal interaction. Althoughthe pitch configuration was changed, the area per player was maintained stable across thethree formats. This size (132 m2 per player) was established considering previous literatureon SSG [14,25] since most of the studies used pitch sizes that involved a range between100 and 150 m2 per player.
Furthermore, in order to promote the build-up of GSO from the back, the SSG didnot have throw-ins, corner kicks, or free kicks, so that all the restarts were initiated as goalkicks by the team in possession of the ball.
104
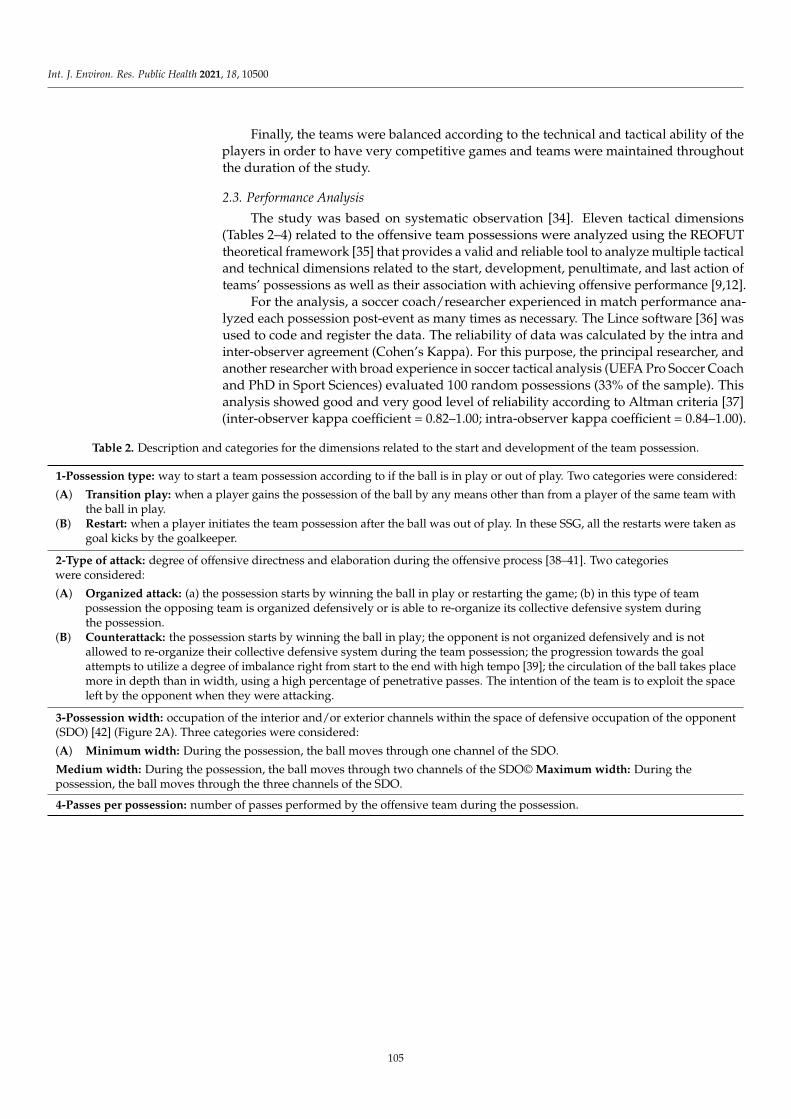
Int. J. Environ. Res. Public Health 2021, 18, 10500
Finally, the teams were balanced according to the technical and tactical ability of theplayers in order to have very competitive games and teams were maintained throughoutthe duration of the study.
2.3. Performance Analysis
The study was based on systematic observation [34]. Eleven tactical dimensions(Tables 2–4) related to the offensive team possessions were analyzed using the REOFUTtheoretical framework [35] that provides a valid and reliable tool to analyze multiple tacticaland technical dimensions related to the start, development, penultimate, and last action ofteams’ possessions as well as their association with achieving offensive performance [9,12].
For the analysis, a soccer coach/researcher experienced in match performance ana-lyzed each possession post-event as many times as necessary. The Lince software [36] wasused to code and register the data. The reliability of data was calculated by the intra andinter-observer agreement (Cohen’s Kappa). For this purpose, the principal researcher, andanother researcher with broad experience in soccer tactical analysis (UEFA Pro Soccer Coachand PhD in Sport Sciences) evaluated 100 random possessions (33% of the sample). Thisanalysis showed good and very good level of reliability according to Altman criteria [37](inter-observer kappa coefficient = 0.82–1.00; intra-observer kappa coefficient = 0.84–1.00).
Table 2. Description and categories for the dimensions related to the start and development of the team possession.
1-Possession type: way to start a team possession according to if the ball is in play or out of play. Two categories were considered:
(A) Transition play: when a player gains the possession of the ball by any means other than from a player of the same team withthe ball in play.
(B) Restart: when a player initiates the team possession after the ball was out of play. In these SSG, all the restarts were taken asgoal kicks by the goalkeeper.
2-Type of attack: degree of offensive directness and elaboration during the offensive process [38–41]. Two categorieswere considered:
(A) Organized attack: (a) the possession starts by winning the ball in play or restarting the game; (b) in this type of teampossession the opposing team is organized defensively or is able to re-organize its collective defensive system duringthe possession.
(B) Counterattack: the possession starts by winning the ball in play; the opponent is not organized defensively and is notallowed to re-organize their collective defensive system during the team possession; the progression towards the goalattempts to utilize a degree of imbalance right from start to the end with high tempo [39]; the circulation of the ball takes placemore in depth than in width, using a high percentage of penetrative passes. The intention of the team is to exploit the spaceleft by the opponent when they were attacking.
3-Possession width: occupation of the interior and/or exterior channels within the space of defensive occupation of the opponent(SDO) [42] (Figure 2A). Three categories were considered:
(A) Minimum width: During the possession, the ball moves through one channel of the SDO.
Medium width: During the possession, the ball moves through two channels of the SDO© Maximum width: During thepossession, the ball moves through the three channels of the SDO.
4-Passes per possession: number of passes performed by the offensive team during the possession.
105

Int. J. Environ. Res. Public Health 2021, 18, 10500
Table 3. Description and categories for the dimensions related to the penultimate and last action of the possession.
5-Penultimate action: technical-tactical action performed immediately before the final action that allows the final player to havethe opportunity of shooting at goal. This action may be performed by the same player that shoots at goal (individual action) or by ateammate that pass the ball to the final player (collective play). Four categories were considered:
(A) Individual action: the final player receives the ball without having a scoring opportunity but he succeeds in creating one bymeans of an individual action such as dribbling, running with the ball, collecting a free ball, or shooting from distance (theplayers shoot from outside the penalty box (Figure 1).
(B) Collective play: the penultimate player in the team possession performs a pass that allows the last player to have animmediate scoring opportunity. This category has three sub-categories.
(C) b.1 Pass in behind the defense: pass from central channels of the field that breaks the opposing defensive line and allows thereceiver to have an immediate scoring opportunity in front of the goalkeeper.
(D) b.2 Cross: pass performed from the wide channels of the field in the opposing half (Figure 1) towards the penalty box [28]that allows the receiver to have an immediate scoring opportunity.
(E) b.3. Goal pass: the final player receives an assist in form of a pass (different from a pass in behind and cross) from a differentplayer that allows him to have an immediate scoring opportunity.
6-Penultimate player: specific position of the player that performs the penultimate action. Five categories were considered(A) Goalkeeper, (B) Central defender, (C) Full back, (D) Central midfielder, (EF) Forward
7-Penultimate invasive subspace: area within the space of defensive occupation (SDO) [42] of the opponent where penultimateaction is done (Figure 2A). Three categories were considered:
(A) Subspaces behind the defense (WBL, CB, WBR).(B) Defensive subspace. (WDL, CD, WDL).(C) Forward subspace (WFR, CF, WFL).
8-Last player: specific position of the player that performs the last action. Five categories were considered (A) Goalkeeper,(B) Central defender, (C) Full back, (D) Central midfielder, EF) Forward.
9-Last action: technical action performed by the last player who had the GSO. Three categories were considered:
(A) Shoot with 1 contact: the possession ends with a shot on goal by means of a single contact.(B) Shoot with 2 or more contacts: the possession ends with a shot on goal by means of two or more contacts.(C) Header: the final player shoots at goal by heading the ball.
10-Offensive performance: degree of offensive success of the possession, based on the degree of penetration over the opposingteam and the achievement of GSO and goals. Three categories were considered:
(A) Scoring opportunity: the possession ends with a clear chance of scoring a goal during team possession (goals are included).This includes all shots and all the chances of shooting that one player has inside the penalty box (the player is facing the goal,there is not any opponents between him and the goal, and he has enough space and time to make a playing decision). Theshots taken from outside the penalty box are considered GSO when the ball passes near the goal (2 m or less with respect tothe goal).
(B) Offensive penetration: the team possession achieves to beat the forwards and midfielders’ lines of the opponent and facedirectly the defensive line during the offensive sequence. However, the possession ends without creating any GSO. Theplayer(s) facing the defensive line has/have enough time and space to perform intended actions on the ball at the moment ofreceiving the ball.
(C) No offensive penetration: the team possession does not achieve disorder and beat the forwards or midfielders’ lines of theopposing team during the offensive sequence.
11-Last invasive zone: area within the space of defensive occupation (SDO) [42] of the opponent where last action is performed(Figure 2A). Three categories and nine sub-categories were considered:
(A) Subspaces behind the defense (WBL, CB, WBR).(B) Defensive subspace. (WDL, CD, WDL).(C) Forward subspace (WFR, CF, WFL).
106
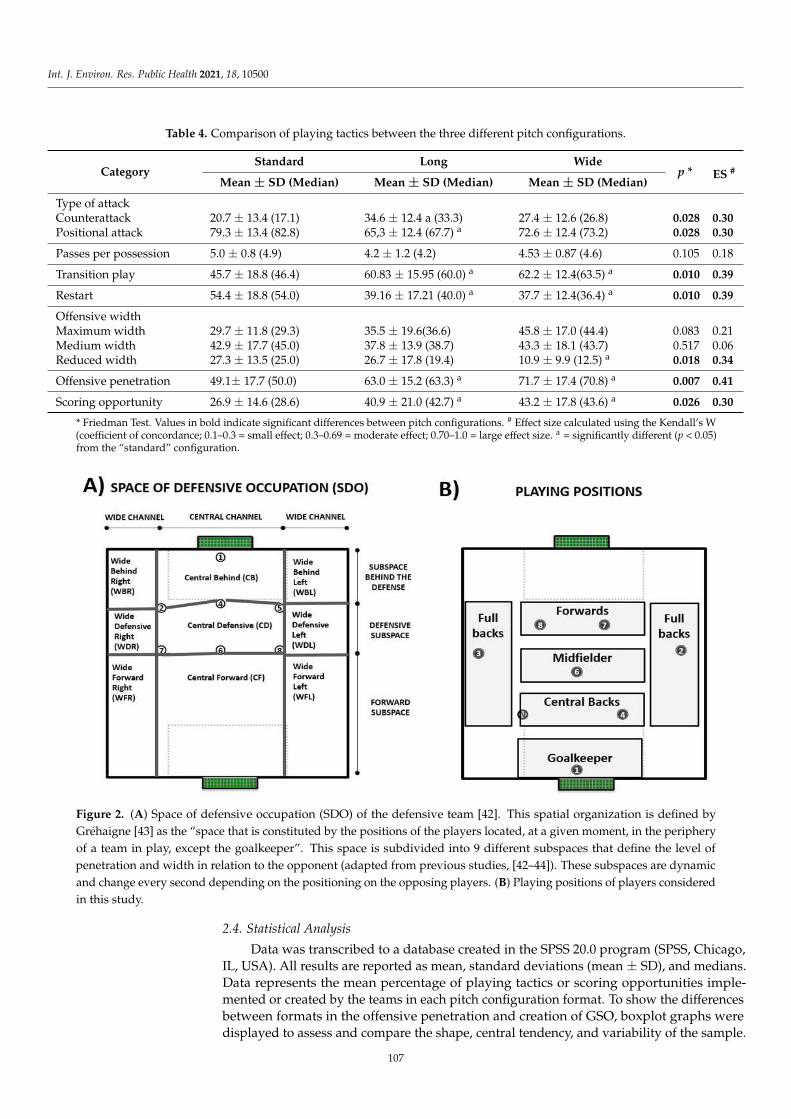
Int. J. Environ. Res. Public Health 2021, 18, 10500
Table 4. Comparison of playing tactics between the three different pitch configurations.
CategoryStandard Long Wide
p * ES #
Mean ± SD (Median) Mean ± SD (Median) Mean ± SD (Median)
Type of attackCounterattack 20.7 ± 13.4 (17.1) 34.6 ± 12.4 a (33.3) 27.4 ± 12.6 (26.8) 0.028 0.30Positional attack 79.3 ± 13.4 (82.8) 65,3 ± 12.4 (67.7) a 72.6 ± 12.4 (73.2) 0.028 0.30
Passes per possession 5.0 ± 0.8 (4.9) 4.2 ± 1.2 (4.2) 4.53 ± 0.87 (4.6) 0.105 0.18
Transition play 45.7 ± 18.8 (46.4) 60.83 ± 15.95 (60.0) a 62.2 ± 12.4(63.5) a 0.010 0.39
Restart 54.4 ± 18.8 (54.0) 39.16 ± 17.21 (40.0) a 37.7 ± 12.4(36.4) a 0.010 0.39
Offensive widthMaximum width 29.7 ± 11.8 (29.3) 35.5 ± 19.6(36.6) 45.8 ± 17.0 (44.4) 0.083 0.21Medium width 42.9 ± 17.7 (45.0) 37.8 ± 13.9 (38.7) 43.3 ± 18.1 (43.7) 0.517 0.06Reduced width 27.3 ± 13.5 (25.0) 26.7 ± 17.8 (19.4) 10.9 ± 9.9 (12.5) a 0.018 0.34
Offensive penetration 49.1± 17.7 (50.0) 63.0 ± 15.2 (63.3) a 71.7 ± 17.4 (70.8) a 0.007 0.41
Scoring opportunity 26.9 ± 14.6 (28.6) 40.9 ± 21.0 (42.7) a 43.2 ± 17.8 (43.6) a 0.026 0.30
* Friedman Test. Values in bold indicate significant differences between pitch configurations. # Effect size calculated using the Kendall’s W(coefficient of concordance; 0.1–0.3 = small effect; 0.3–0.69 = moderate effect; 0.70–1.0 = large effect size. a = significantly different (p < 0.05)from the “standard” configuration.
Gréhaigne [43] as the “space that is constituted by the positions of the players located, at a given moment, in the peripherythe goalkeeper”. This space is subdivided into 9 different subspaces that define the level of
–
–
–
– ––
˂
˂
˂
Figure 2. (A) Space of defensive occupation (SDO) of the defensive team [42]. This spatial organization is defined by
Gréhaigne [43] as the “space that is constituted by the positions of the players located, at a given moment, in the periphery
of a team in play, except the goalkeeper”. This space is subdivided into 9 different subspaces that define the level of
penetration and width in relation to the opponent (adapted from previous studies, [42–44]). These subspaces are dynamic
and change every second depending on the positioning on the opposing players. (B) Playing positions of players considered
in this study.
2.4. Statistical Analysis
Data was transcribed to a database created in the SPSS 20.0 program (SPSS, Chicago,IL, USA). All results are reported as mean, standard deviations (mean ± SD), and medians.Data represents the mean percentage of playing tactics or scoring opportunities imple-mented or created by the teams in each pitch configuration format. To show the differencesbetween formats in the offensive penetration and creation of GSO, boxplot graphs weredisplayed to assess and compare the shape, central tendency, and variability of the sample.
107

Int. J. Environ. Res. Public Health 2021, 18, 10500
The non-normality of the data was verified using the Shapiro–Wilk test. The Friedmantest (non-parametric ANOVA for repeated measures) was used to detect tactical differences(dependent variables) between the three pitch configurations (independent variables).Dunn–Bonferroni post hoc tests were carried out to determine the differences betweenpairs. The confidence interval was set at 95%. The effect sizes were calculated using theKendall’s W (coefficient of concordance), (0.1–0.3 = small effect; 0.3–0.69 = moderate effect;0.69–1.0 = large effect size).
3. Results
3.1. Collective Playing Tactics
Table 4 shows the playing tactics implemented by the teams during the SSG withdifferent pitch configurations. The long configuration registered higher percentage ofcounterattacks (34.6 ± 12.4%) than the standard one (20.7 ± 13.4%) (p < 0.05) and bothlong and wide had more team possessions that started by means of transition play than thestandard format (60.8 ± 15.9% and 62.2 ± 12.4% vs. 45.7 ± 18.8%, respectively) (p < 0.05).Additionally, the wide configuration registered less team possessions that achieved reducedwidth (10.9 ± 9.9%) in comparison with the standard format (27.3 ± 13.5%) (p < 0.05).3.2. Offensive Performance
Figure 3 shows that both long (63.0 ± 15.2%) and wide (71.7 ± 17.4%) formats achievedmore offensive penetration than the standard format (49.1 ± 17.7%) (p < 0.05). In addition,both long (40.9 ± 21.0%) and wide (43.2 ± 17.8%) were more effective in creating GSO thanthe standard configuration (26.9 ± 14.6%) (p < 0.05).
– – –˂ “standard” configuration.
˂
˂
˂ 0.05) from the “standard” configuration.
Figure 3. Box plot of the percentage of team possession that achieved (A) goal scoring opportunities
and (B) offensive penetration during the different pitch configuration of the SSG. The box indicates
the 25th and 75th quartiles and the central line is the median. The ends of the whiskers are the 2.5%
and 97.5% values. Values outside the range of the whiskers are extreme values. Mean is represented
with a black dot. a = significantly different (p < 0.05) from the “standard” configuration.
108
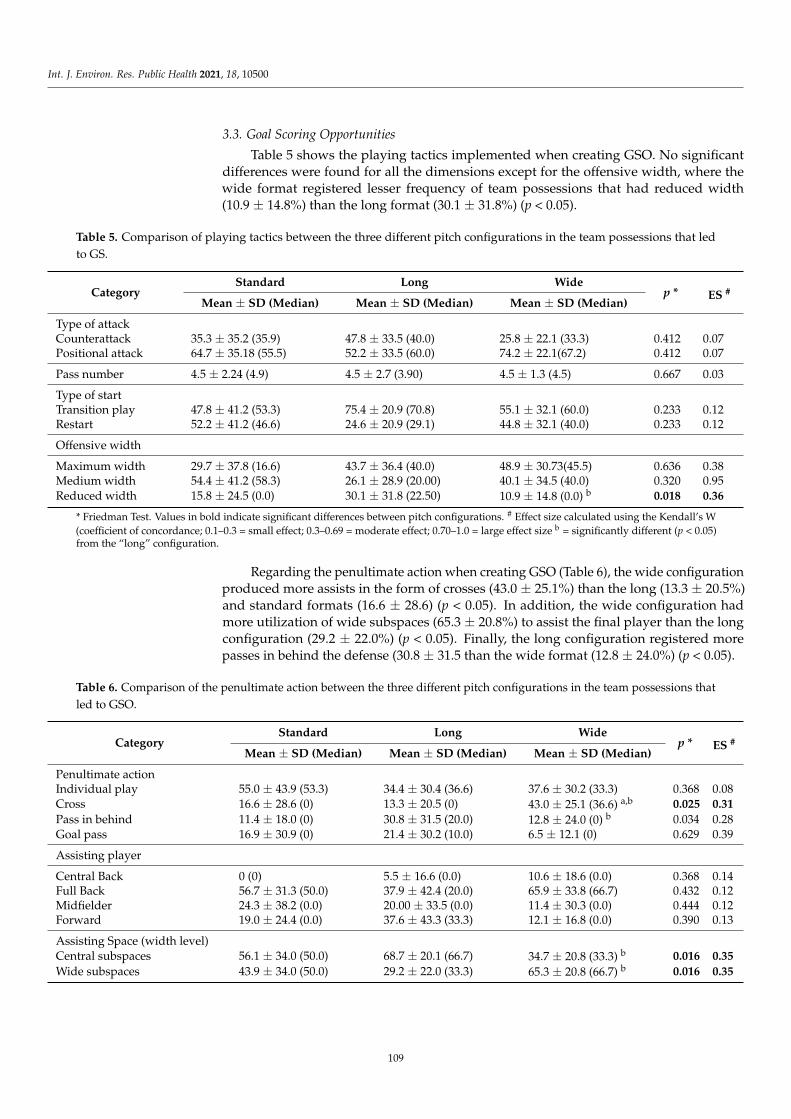
Int. J. Environ. Res. Public Health 2021, 18, 10500
3.3. Goal Scoring Opportunities
Table 5 shows the playing tactics implemented when creating GSO. No significantdifferences were found for all the dimensions except for the offensive width, where thewide format registered lesser frequency of team possessions that had reduced width(10.9 ± 14.8%) than the long format (30.1 ± 31.8%) (p < 0.05).
Table 5. Comparison of playing tactics between the three different pitch configurations in the team possessions that led
to GS.
CategoryStandard Long Wide
p * ES #
Mean ± SD (Median) Mean ± SD (Median) Mean ± SD (Median)
Type of attackCounterattack 35.3 ± 35.2 (35.9) 47.8 ± 33.5 (40.0) 25.8 ± 22.1 (33.3) 0.412 0.07Positional attack 64.7 ± 35.18 (55.5) 52.2 ± 33.5 (60.0) 74.2 ± 22.1(67.2) 0.412 0.07
Pass number 4.5 ± 2.24 (4.9) 4.5 ± 2.7 (3.90) 4.5 ± 1.3 (4.5) 0.667 0.03
Type of startTransition play 47.8 ± 41.2 (53.3) 75.4 ± 20.9 (70.8) 55.1 ± 32.1 (60.0) 0.233 0.12Restart 52.2 ± 41.2 (46.6) 24.6 ± 20.9 (29.1) 44.8 ± 32.1 (40.0) 0.233 0.12
Offensive width
Maximum width 29.7 ± 37.8 (16.6) 43.7 ± 36.4 (40.0) 48.9 ± 30.73(45.5) 0.636 0.38Medium width 54.4 ± 41.2 (58.3) 26.1 ± 28.9 (20.00) 40.1 ± 34.5 (40.0) 0.320 0.95Reduced width 15.8 ± 24.5 (0.0) 30.1 ± 31.8 (22.50) 10.9 ± 14.8 (0.0) b 0.018 0.36
* Friedman Test. Values in bold indicate significant differences between pitch configurations. # Effect size calculated using the Kendall’s W
(coefficient of concordance; 0.1–0.3 = small effect; 0.3–0.69 = moderate effect; 0.70–1.0 = large effect size b = significantly different (p < 0.05)from the “long” configuration.
Regarding the penultimate action when creating GSO (Table 6), the wide configurationproduced more assists in the form of crosses (43.0 ± 25.1%) than the long (13.3 ± 20.5%)and standard formats (16.6 ± 28.6) (p < 0.05). In addition, the wide configuration hadmore utilization of wide subspaces (65.3 ± 20.8%) to assist the final player than the longconfiguration (29.2 ± 22.0%) (p < 0.05). Finally, the long configuration registered morepasses in behind the defense (30.8 ± 31.5 than the wide format (12.8 ± 24.0%) (p < 0.05).
Table 6. Comparison of the penultimate action between the three different pitch configurations in the team possessions that
led to GSO.
CategoryStandard Long Wide
p * ES #
Mean ± SD (Median) Mean ± SD (Median) Mean ± SD (Median)
Penultimate actionIndividual play 55.0 ± 43.9 (53.3) 34.4 ± 30.4 (36.6) 37.6 ± 30.2 (33.3) 0.368 0.08Cross 16.6 ± 28.6 (0) 13.3 ± 20.5 (0) 43.0 ± 25.1 (36.6) a,b 0.025 0.31
Pass in behind 11.4 ± 18.0 (0) 30.8 ± 31.5 (20.0) 12.8 ± 24.0 (0) b 0.034 0.28Goal pass 16.9 ± 30.9 (0) 21.4 ± 30.2 (10.0) 6.5 ± 12.1 (0) 0.629 0.39
Assisting player
Central Back 0 (0) 5.5 ± 16.6 (0.0) 10.6 ± 18.6 (0.0) 0.368 0.14Full Back 56.7 ± 31.3 (50.0) 37.9 ± 42.4 (20.0) 65.9 ± 33.8 (66.7) 0.432 0.12Midfielder 24.3 ± 38.2 (0.0) 20.00 ± 33.5 (0.0) 11.4 ± 30.3 (0.0) 0.444 0.12Forward 19.0 ± 24.4 (0.0) 37.6 ± 43.3 (33.3) 12.1 ± 16.8 (0.0) 0.390 0.13
Assisting Space (width level)Central subspaces 56.1 ± 34.0 (50.0) 68.7 ± 20.1 (66.7) 34.7 ± 20.8 (33.3) b 0.016 0.35
Wide subspaces 43.9 ± 34.0 (50.0) 29.2 ± 22.0 (33.3) 65.3 ± 20.8 (66.7) b 0.016 0.35
109
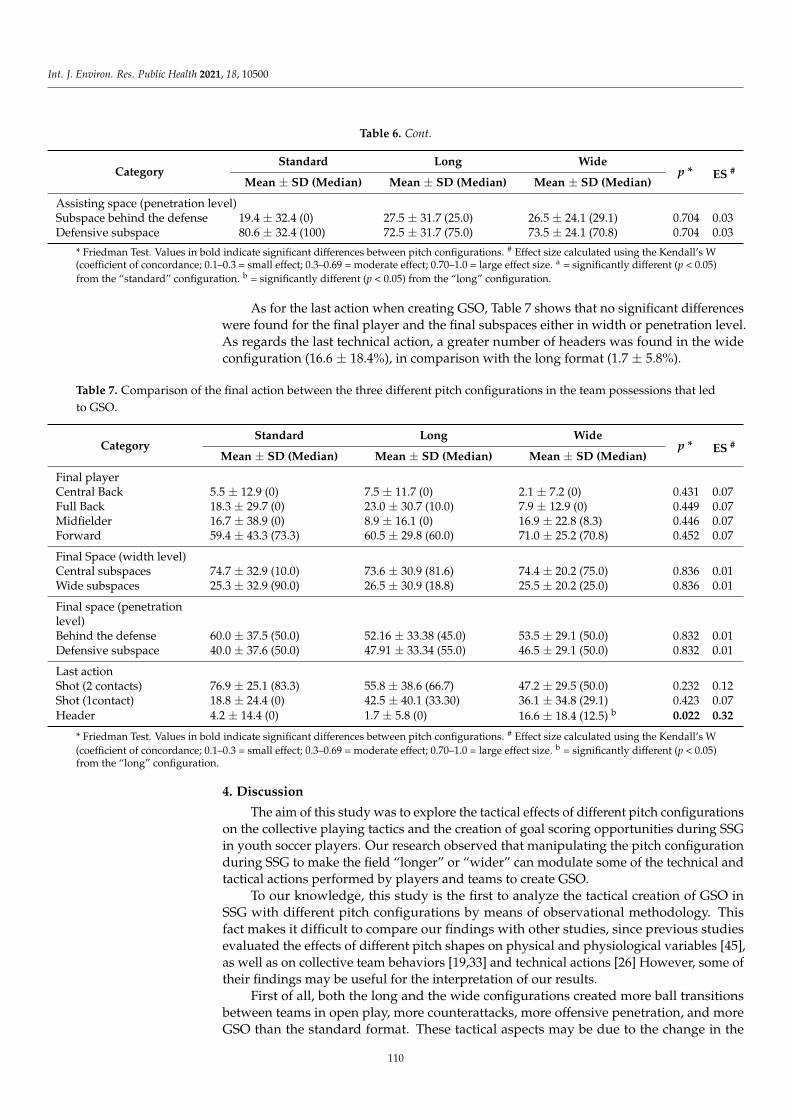
Int. J. Environ. Res. Public Health 2021, 18, 10500
Table 6. Cont.
CategoryStandard Long Wide
p * ES #
Mean ± SD (Median) Mean ± SD (Median) Mean ± SD (Median)
Assisting space (penetration level)Subspace behind the defense 19.4 ± 32.4 (0) 27.5 ± 31.7 (25.0) 26.5 ± 24.1 (29.1) 0.704 0.03Defensive subspace 80.6 ± 32.4 (100) 72.5 ± 31.7 (75.0) 73.5 ± 24.1 (70.8) 0.704 0.03
* Friedman Test. Values in bold indicate significant differences between pitch configurations. # Effect size calculated using the Kendall’s W(coefficient of concordance; 0.1–0.3 = small effect; 0.3–0.69 = moderate effect; 0.70–1.0 = large effect size. a = significantly different (p < 0.05)
from the “standard” configuration. b = significantly different (p < 0.05) from the “long” configuration.
As for the last action when creating GSO, Table 7 shows that no significant differenceswere found for the final player and the final subspaces either in width or penetration level.As regards the last technical action, a greater number of headers was found in the wideconfiguration (16.6 ± 18.4%), in comparison with the long format (1.7 ± 5.8%).
Table 7. Comparison of the final action between the three different pitch configurations in the team possessions that led
to GSO.
CategoryStandard Long Wide
p * ES #
Mean ± SD (Median) Mean ± SD (Median) Mean ± SD (Median)
Final playerCentral Back 5.5 ± 12.9 (0) 7.5 ± 11.7 (0) 2.1 ± 7.2 (0) 0.431 0.07Full Back 18.3 ± 29.7 (0) 23.0 ± 30.7 (10.0) 7.9 ± 12.9 (0) 0.449 0.07Midfielder 16.7 ± 38.9 (0) 8.9 ± 16.1 (0) 16.9 ± 22.8 (8.3) 0.446 0.07Forward 59.4 ± 43.3 (73.3) 60.5 ± 29.8 (60.0) 71.0 ± 25.2 (70.8) 0.452 0.07
Final Space (width level)Central subspaces 74.7 ± 32.9 (10.0) 73.6 ± 30.9 (81.6) 74.4 ± 20.2 (75.0) 0.836 0.01Wide subspaces 25.3 ± 32.9 (90.0) 26.5 ± 30.9 (18.8) 25.5 ± 20.2 (25.0) 0.836 0.01
Final space (penetrationlevel)Behind the defense 60.0 ± 37.5 (50.0) 52.16 ± 33.38 (45.0) 53.5 ± 29.1 (50.0) 0.832 0.01Defensive subspace 40.0 ± 37.6 (50.0) 47.91 ± 33.34 (55.0) 46.5 ± 29.1 (50.0) 0.832 0.01
Last actionShot (2 contacts) 76.9 ± 25.1 (83.3) 55.8 ± 38.6 (66.7) 47.2 ± 29.5 (50.0) 0.232 0.12Shot (1contact) 18.8 ± 24.4 (0) 42.5 ± 40.1 (33.30) 36.1 ± 34.8 (29.1) 0.423 0.07Header 4.2 ± 14.4 (0) 1.7 ± 5.8 (0) 16.6 ± 18.4 (12.5) b 0.022 0.32
* Friedman Test. Values in bold indicate significant differences between pitch configurations. # Effect size calculated using the Kendall’s W
(coefficient of concordance; 0.1–0.3 = small effect; 0.3–0.69 = moderate effect; 0.70–1.0 = large effect size. b = significantly different (p < 0.05)from the “long” configuration.
4. Discussion
The aim of this study was to explore the tactical effects of different pitch configurationson the collective playing tactics and the creation of goal scoring opportunities during SSGin youth soccer players. Our research observed that manipulating the pitch configurationduring SSG to make the field “longer” or “wider” can modulate some of the technical andtactical actions performed by players and teams to create GSO.
To our knowledge, this study is the first to analyze the tactical creation of GSO inSSG with different pitch configurations by means of observational methodology. Thisfact makes it difficult to compare our findings with other studies, since previous studiesevaluated the effects of different pitch shapes on physical and physiological variables [45],as well as on collective team behaviors [19,33] and technical actions [26] However, some oftheir findings may be useful for the interpretation of our results.
First of all, both the long and the wide configurations created more ball transitionsbetween teams in open play, more counterattacks, more offensive penetration, and moreGSO than the standard format. These tactical aspects may be due to the change in the
110
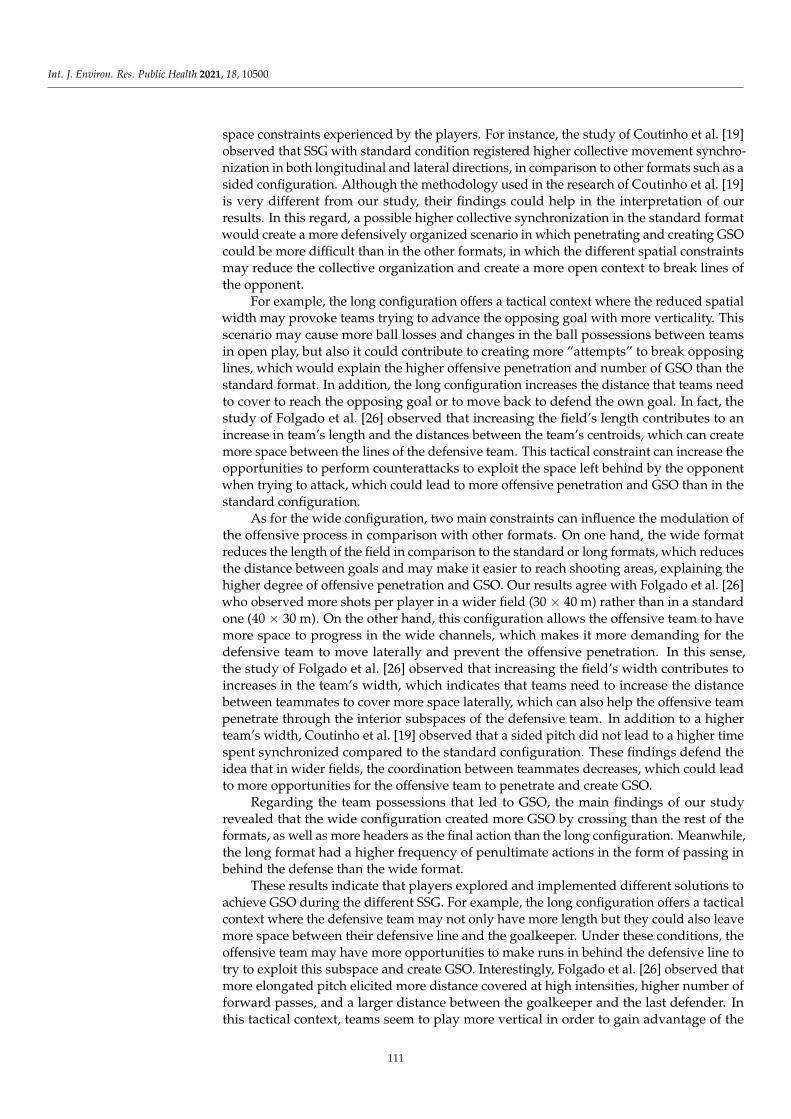
Int. J. Environ. Res. Public Health 2021, 18, 10500
space constraints experienced by the players. For instance, the study of Coutinho et al. [19]observed that SSG with standard condition registered higher collective movement synchro-nization in both longitudinal and lateral directions, in comparison to other formats such as asided configuration. Although the methodology used in the research of Coutinho et al. [19]is very different from our study, their findings could help in the interpretation of ourresults. In this regard, a possible higher collective synchronization in the standard formatwould create a more defensively organized scenario in which penetrating and creating GSOcould be more difficult than in the other formats, in which the different spatial constraintsmay reduce the collective organization and create a more open context to break lines ofthe opponent.
For example, the long configuration offers a tactical context where the reduced spatialwidth may provoke teams trying to advance the opposing goal with more verticality. Thisscenario may cause more ball losses and changes in the ball possessions between teamsin open play, but also it could contribute to creating more “attempts” to break opposinglines, which would explain the higher offensive penetration and number of GSO than thestandard format. In addition, the long configuration increases the distance that teams needto cover to reach the opposing goal or to move back to defend the own goal. In fact, thestudy of Folgado et al. [26] observed that increasing the field’s length contributes to anincrease in team’s length and the distances between the team’s centroids, which can createmore space between the lines of the defensive team. This tactical constraint can increase theopportunities to perform counterattacks to exploit the space left behind by the opponentwhen trying to attack, which could lead to more offensive penetration and GSO than in thestandard configuration.
As for the wide configuration, two main constraints can influence the modulation ofthe offensive process in comparison with other formats. On one hand, the wide formatreduces the length of the field in comparison to the standard or long formats, which reducesthe distance between goals and may make it easier to reach shooting areas, explaining thehigher degree of offensive penetration and GSO. Our results agree with Folgado et al. [26]who observed more shots per player in a wider field (30 × 40 m) rather than in a standardone (40 × 30 m). On the other hand, this configuration allows the offensive team to havemore space to progress in the wide channels, which makes it more demanding for thedefensive team to move laterally and prevent the offensive penetration. In this sense,the study of Folgado et al. [26] observed that increasing the field’s width contributes toincreases in the team’s width, which indicates that teams need to increase the distancebetween teammates to cover more space laterally, which can also help the offensive teampenetrate through the interior subspaces of the defensive team. In addition to a higherteam’s width, Coutinho et al. [19] observed that a sided pitch did not lead to a higher timespent synchronized compared to the standard configuration. These findings defend theidea that in wider fields, the coordination between teammates decreases, which could leadto more opportunities for the offensive team to penetrate and create GSO.
Regarding the team possessions that led to GSO, the main findings of our studyrevealed that the wide configuration created more GSO by crossing than the rest of theformats, as well as more headers as the final action than the long configuration. Meanwhile,the long format had a higher frequency of penultimate actions in the form of passing inbehind the defense than the wide format.
These results indicate that players explored and implemented different solutions toachieve GSO during the different SSG. For example, the long configuration offers a tacticalcontext where the defensive team may not only have more length but they could also leavemore space between their defensive line and the goalkeeper. Under these conditions, theoffensive team may have more opportunities to make runs in behind the defensive line totry to exploit this subspace and create GSO. Interestingly, Folgado et al. [26] observed thatmore elongated pitch elicited more distance covered at high intensities, higher number offorward passes, and a larger distance between the goalkeeper and the last defender. Inthis tactical context, teams seem to play more vertical in order to gain advantage of the
111
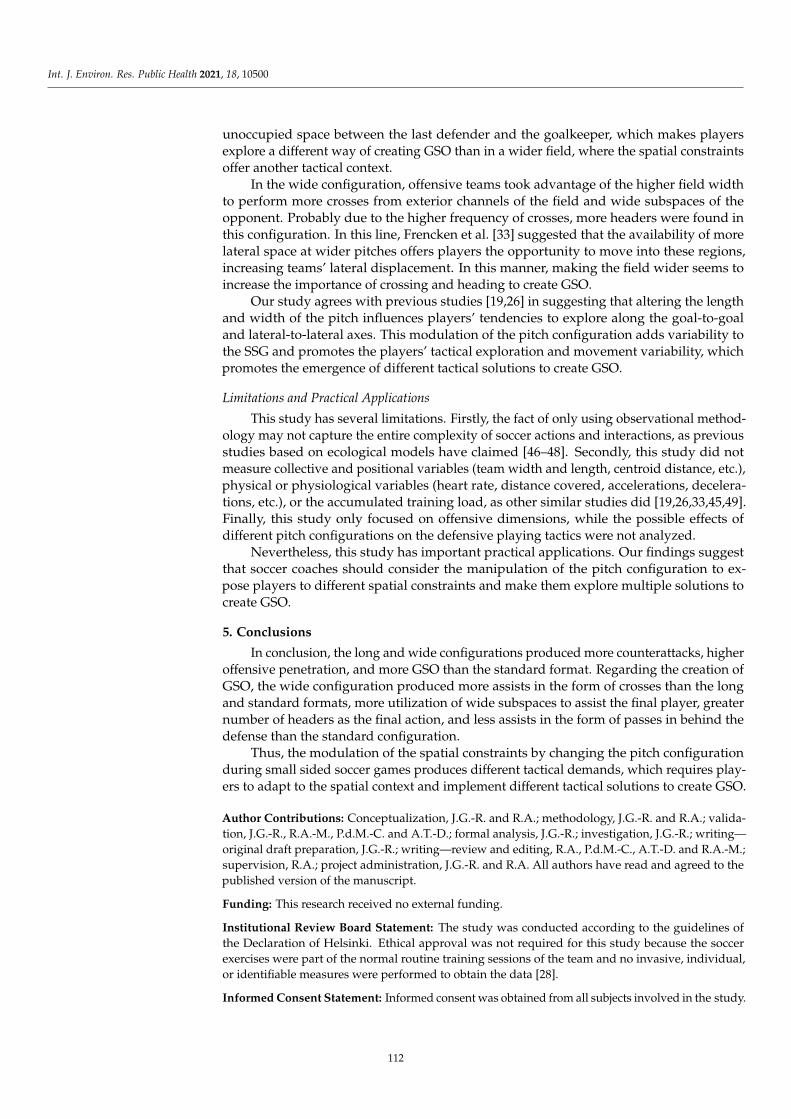
Int. J. Environ. Res. Public Health 2021, 18, 10500
unoccupied space between the last defender and the goalkeeper, which makes playersexplore a different way of creating GSO than in a wider field, where the spatial constraintsoffer another tactical context.
In the wide configuration, offensive teams took advantage of the higher field widthto perform more crosses from exterior channels of the field and wide subspaces of theopponent. Probably due to the higher frequency of crosses, more headers were found inthis configuration. In this line, Frencken et al. [33] suggested that the availability of morelateral space at wider pitches offers players the opportunity to move into these regions,increasing teams’ lateral displacement. In this manner, making the field wider seems toincrease the importance of crossing and heading to create GSO.
Our study agrees with previous studies [19,26] in suggesting that altering the lengthand width of the pitch influences players’ tendencies to explore along the goal-to-goaland lateral-to-lateral axes. This modulation of the pitch configuration adds variability tothe SSG and promotes the players’ tactical exploration and movement variability, whichpromotes the emergence of different tactical solutions to create GSO.
Limitations and Practical Applications
This study has several limitations. Firstly, the fact of only using observational method-ology may not capture the entire complexity of soccer actions and interactions, as previousstudies based on ecological models have claimed [46–48]. Secondly, this study did notmeasure collective and positional variables (team width and length, centroid distance, etc.),physical or physiological variables (heart rate, distance covered, accelerations, decelera-tions, etc.), or the accumulated training load, as other similar studies did [19,26,33,45,49].Finally, this study only focused on offensive dimensions, while the possible effects ofdifferent pitch configurations on the defensive playing tactics were not analyzed.
Nevertheless, this study has important practical applications. Our findings suggestthat soccer coaches should consider the manipulation of the pitch configuration to ex-pose players to different spatial constraints and make them explore multiple solutions tocreate GSO.
5. Conclusions
In conclusion, the long and wide configurations produced more counterattacks, higheroffensive penetration, and more GSO than the standard format. Regarding the creation ofGSO, the wide configuration produced more assists in the form of crosses than the longand standard formats, more utilization of wide subspaces to assist the final player, greaternumber of headers as the final action, and less assists in the form of passes in behind thedefense than the standard configuration.
Thus, the modulation of the spatial constraints by changing the pitch configurationduring small sided soccer games produces different tactical demands, which requires play-ers to adapt to the spatial context and implement different tactical solutions to create GSO.
Author Contributions: Conceptualization, J.G.-R. and R.A.; methodology, J.G.-R. and R.A.; valida-
tion, J.G.-R., R.A.-M., P.d.M.-C. and A.T.-D.; formal analysis, J.G.-R.; investigation, J.G.-R.; writing—
original draft preparation, J.G.-R.; writing—review and editing, R.A., P.d.M.-C., A.T.-D. and R.A.-M.;
supervision, R.A.; project administration, J.G.-R. and R.A. All authors have read and agreed to the
published version of the manuscript.
Funding: This research received no external funding.
Institutional Review Board Statement: The study was conducted according to the guidelines of
the Declaration of Helsinki. Ethical approval was not required for this study because the soccer
exercises were part of the normal routine training sessions of the team and no invasive, individual,
or identifiable measures were performed to obtain the data [28].
Informed Consent Statement: Informed consent was obtained from all subjects involved in the study.
112
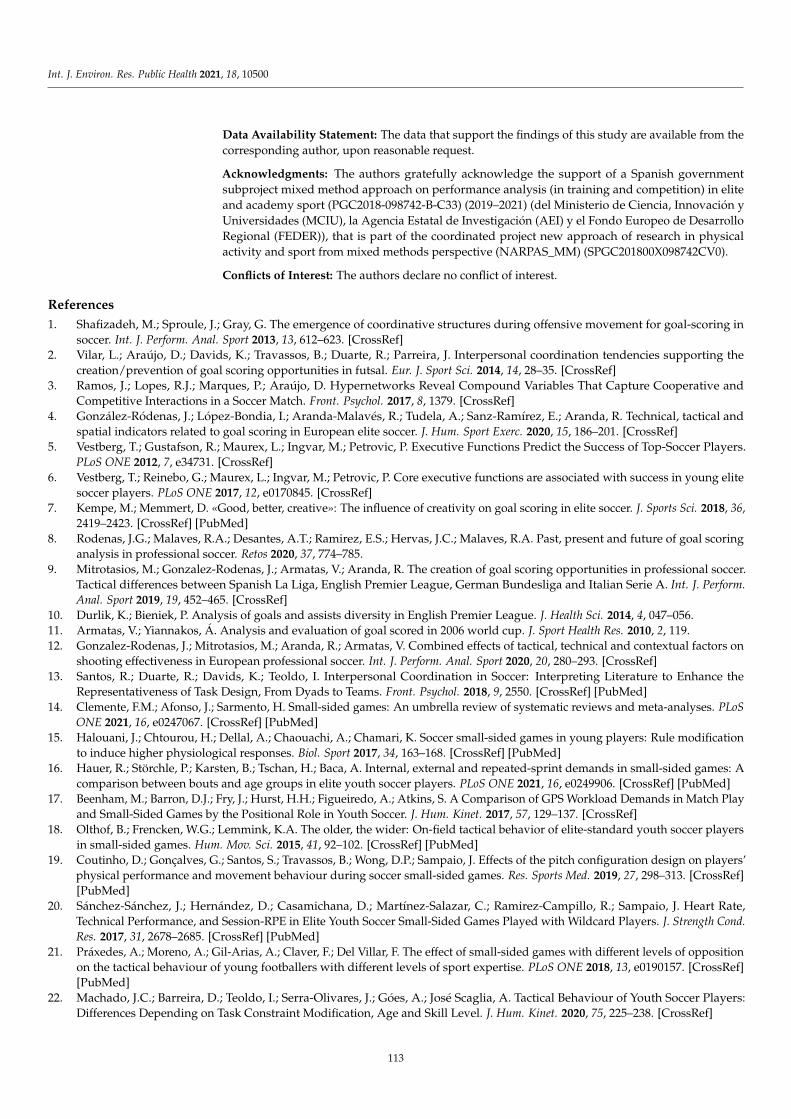
Int. J. Environ. Res. Public Health 2021, 18, 10500
Data Availability Statement: The data that support the findings of this study are available from the
corresponding author, upon reasonable request.
Acknowledgments: The authors gratefully acknowledge the support of a Spanish government
subproject mixed method approach on performance analysis (in training and competition) in elite
and academy sport (PGC2018-098742-B-C33) (2019–2021) (del Ministerio de Ciencia, Innovación y
Universidades (MCIU), la Agencia Estatal de Investigación (AEI) y el Fondo Europeo de Desarrollo
Regional (FEDER)), that is part of the coordinated project new approach of research in physical
activity and sport from mixed methods perspective (NARPAS_MM) (SPGC201800X098742CV0).
Conflicts of Interest: The authors declare no conflict of interest.
References
1. Shafizadeh, M.; Sproule, J.; Gray, G. The emergence of coordinative structures during offensive movement for goal-scoring in
soccer. Int. J. Perform. Anal. Sport 2013, 13, 612–623. [CrossRef]
2. Vilar, L.; Araújo, D.; Davids, K.; Travassos, B.; Duarte, R.; Parreira, J. Interpersonal coordination tendencies supporting the
creation/prevention of goal scoring opportunities in futsal. Eur. J. Sport Sci. 2014, 14, 28–35. [CrossRef]
3. Ramos, J.; Lopes, R.J.; Marques, P.; Araújo, D. Hypernetworks Reveal Compound Variables That Capture Cooperative and
Competitive Interactions in a Soccer Match. Front. Psychol. 2017, 8, 1379. [CrossRef]
4. González-Ródenas, J.; López-Bondia, I.; Aranda-Malavés, R.; Tudela, A.; Sanz-Ramírez, E.; Aranda, R. Technical, tactical and
spatial indicators related to goal scoring in European elite soccer. J. Hum. Sport Exerc. 2020, 15, 186–201. [CrossRef]
5. Vestberg, T.; Gustafson, R.; Maurex, L.; Ingvar, M.; Petrovic, P. Executive Functions Predict the Success of Top-Soccer Players.
PLoS ONE 2012, 7, e34731. [CrossRef]
6. Vestberg, T.; Reinebo, G.; Maurex, L.; Ingvar, M.; Petrovic, P. Core executive functions are associated with success in young elite
soccer players. PLoS ONE 2017, 12, e0170845. [CrossRef]
7. Kempe, M.; Memmert, D. «Good, better, creative»: The influence of creativity on goal scoring in elite soccer. J. Sports Sci. 2018, 36,
2419–2423. [CrossRef] [PubMed]
8. Rodenas, J.G.; Malaves, R.A.; Desantes, A.T.; Ramirez, E.S.; Hervas, J.C.; Malaves, R.A. Past, present and future of goal scoring
analysis in professional soccer. Retos 2020, 37, 774–785.
9. Mitrotasios, M.; Gonzalez-Rodenas, J.; Armatas, V.; Aranda, R. The creation of goal scoring opportunities in professional soccer.
Tactical differences between Spanish La Liga, English Premier League, German Bundesliga and Italian Serie A. Int. J. Perform.Anal. Sport 2019, 19, 452–465. [CrossRef]
10. Durlik, K.; Bieniek, P. Analysis of goals and assists diversity in English Premier League. J. Health Sci. 2014, 4, 047–056.
11. Armatas, V.; Yiannakos, Á. Analysis and evaluation of goal scored in 2006 world cup. J. Sport Health Res. 2010, 2, 119.
12. Gonzalez-Rodenas, J.; Mitrotasios, M.; Aranda, R.; Armatas, V. Combined effects of tactical, technical and contextual factors on
shooting effectiveness in European professional soccer. Int. J. Perform. Anal. Sport 2020, 20, 280–293. [CrossRef]
13. Santos, R.; Duarte, R.; Davids, K.; Teoldo, I. Interpersonal Coordination in Soccer: Interpreting Literature to Enhance the
Representativeness of Task Design, From Dyads to Teams. Front. Psychol. 2018, 9, 2550. [CrossRef] [PubMed]
14. Clemente, F.M.; Afonso, J.; Sarmento, H. Small-sided games: An umbrella review of systematic reviews and meta-analyses. PLoSONE 2021, 16, e0247067. [CrossRef] [PubMed]
15. Halouani, J.; Chtourou, H.; Dellal, A.; Chaouachi, A.; Chamari, K. Soccer small-sided games in young players: Rule modification
to induce higher physiological responses. Biol. Sport 2017, 34, 163–168. [CrossRef] [PubMed]
16. Hauer, R.; Störchle, P.; Karsten, B.; Tschan, H.; Baca, A. Internal, external and repeated-sprint demands in small-sided games: A
comparison between bouts and age groups in elite youth soccer players. PLoS ONE 2021, 16, e0249906. [CrossRef] [PubMed]
17. Beenham, M.; Barron, D.J.; Fry, J.; Hurst, H.H.; Figueiredo, A.; Atkins, S. A Comparison of GPS Workload Demands in Match Play
and Small-Sided Games by the Positional Role in Youth Soccer. J. Hum. Kinet. 2017, 57, 129–137. [CrossRef]
18. Olthof, B.; Frencken, W.G.; Lemmink, K.A. The older, the wider: On-field tactical behavior of elite-standard youth soccer players
in small-sided games. Hum. Mov. Sci. 2015, 41, 92–102. [CrossRef] [PubMed]
19. Coutinho, D.; Gonçalves, G.; Santos, S.; Travassos, B.; Wong, D.P.; Sampaio, J. Effects of the pitch configuration design on players’
physical performance and movement behaviour during soccer small-sided games. Res. Sports Med. 2019, 27, 298–313. [CrossRef]
[PubMed]
20. Sánchez-Sánchez, J.; Hernández, D.; Casamichana, D.; Martínez-Salazar, C.; Ramirez-Campillo, R.; Sampaio, J. Heart Rate,
Technical Performance, and Session-RPE in Elite Youth Soccer Small-Sided Games Played with Wildcard Players. J. Strength Cond.Res. 2017, 31, 2678–2685. [CrossRef] [PubMed]
21. Práxedes, A.; Moreno, A.; Gil-Arias, A.; Claver, F.; Del Villar, F. The effect of small-sided games with different levels of opposition
on the tactical behaviour of young footballers with different levels of sport expertise. PLoS ONE 2018, 13, e0190157. [CrossRef]
[PubMed]
22. Machado, J.C.; Barreira, D.; Teoldo, I.; Serra-Olivares, J.; Góes, A.; José Scaglia, A. Tactical Behaviour of Youth Soccer Players:
Differences Depending on Task Constraint Modification, Age and Skill Level. J. Hum. Kinet. 2020, 75, 225–238. [CrossRef]
113
Int. J. Environ. Res. Public Health 2021, 18, 10500
23. Ramos, A.; Coutinho, P.; Leitão, J.C.; Cortinhas, A.; Davids, K.; Mesquita, I. The constraint-led approach to enhancing team
synergies in sport—What do we currently know and how can we move forward? A systematic review and meta-analyses. Psychol.Sport Exerc. 2020, 50, 101754. [CrossRef]
24. Davids, K.; Araújo, D.; Shuttleworth, R.; Button, C. Acquiring skill in sport: A constraints-led perspective. Int. J. Comput. Sci.Sport 2003, 2, 31–39.
25. Sarmento, H.; Clemente, F.M.; Harper, L.D.; Da Costa, I.T.; Owen, A.; Figueiredo, A.J. Small sided games in soccer—A systematic
review. Int. J. Perform. Anal. Sport 2018, 18, 693–749. [CrossRef]
26. Folgado, H.; Bravo, J.; Pereira, P.; Sampaio, J. Towards the use of multidimensional performance indicators in football small-sided
games: The effects of pitch orientation. J. Sports Sci. 2019, 37, 1064–1071. [CrossRef] [PubMed]
27. Pollard, R.; Reep, C. Measuring the effectiveness of playing strategies at soccer. J. R. Stat. Soc. Ser. D 1997, 46, 541–550. [CrossRef]
28. Winter, E.M.; Maughan, R.J. Requirements for ethics approvals. J. Sports Sci. 2009, 27, 985. [CrossRef]
29. Passos, P.J.; Davids, K. Learning design to facilitate interactive behaviours in Team Sports. RICYDE 2015, 11, 18–32.
30. Vilar, L.; Esteves, P.T.; Travassos, B.; Passos, P.; Lago-Peñas, C.; Davids, K. Varying Numbers of Players in Small-Sided Soccer
Games Modifies Action Opportunities During Training. Int. J. Sports Sci. Coach. 2014, 9, 1007–1018. [CrossRef]
31. Praça, G.M.; Clemente, F.M.; Andrade, A.G.P.; De Morales, J.C.P.; Greco, P.J. Network Analysis in Small-Sided and Conditioned
Soccer Games: The Influence of Additional Players and Playing Position. Kinesiology 2017, 49, 185–193. [CrossRef]
32. Padilha, M.B.; Guilherme, J.; Serra-Olivares, J.; Roca, A.; Teoldo, I. The influence of floaters on players’ tactical behaviour in
small-sided and conditioned soccer games. Int. J. Perform. Anal. Sport 2017, 17, 721–736. [CrossRef]
33. Frencken, W.; Van Der Plaats, J.; Visscher, C.; Lemmink, K. Size matters: Pitch dimensions constrain interactive team behaviour in
soccer. J. Syst. Sci. Complex. 2013, 26, 85–93. [CrossRef]
34. Anguera, M.T.; Hernández-Mendo, A. La metodología observacional en el ámbito del deporte [Observational methodology in
sport sciences]. E-Balonmano.com Rev. De Cienc. Del Deporte 2013, 9, 135–160.
35. Aranda, R.; González-Ródenas, J.; López-Bondia, I.; Aranda-Malavés, R.; Tudela-Desantes, A.; Anguera, M.T. “REOFUT” as an
Observation Tool for Tactical Analysis on Offensive Performance in Soccer: Mixed Method Perspective. Front. Psychol. 2019,
10, 1476. [CrossRef]
36. Gabin, B.; Camerino, O.; Anguera, M.T.; Castañer, M. Lince: Multiplatform sport analysis software. Procedia Soc. Behav. Sci. 2012,
46, 4692–4694. [CrossRef]
37. Altman, D.G. Some common problems in medical research. In Practical Statistics for Medical Research; Altman, D.G., Ed.; Chapman
y Hall: London, UK, 1991.
38. Bangsbo, J.; Peitersen, B. Soccer Systems and Strategies; Human Kinetics: Champaign, IL, USA, 2000.
39. Tenga, A.; Kanstad, D.; Ronglan, L.T.; Bahr, R. Developing a new method for team match performance analysis in professional
soccer and testing its reliability. Int. J. Perform. Anal. Sport 2009, 9, 8–25. [CrossRef]
40. Sarmento, H.; Anguera, M.T.; Campaniço, J.; Leito, J. Development and validation of a notational system to study the offensive
process in football. Medicina 2010, 46, 401–407. [CrossRef]
41. Lago-Ballesteros, J.; Lago, C.; Rey, E. The effect of playing tactics and situational variables on achieving score-box possessions in a
professional soccer team. J. Sports Sci. 2012, 30, 1455–1461. [CrossRef]
42. Seabra, F.; Dantas, L. Space definition for match analysis in soccer. Int. J. Perform. Anal. Sport 2006, 6, 97–113. [CrossRef]
43. Gréhaigne, J. La Organización del Juego en el Fútbol [Game Organization in Football]; INDE: Barcelona, Spain, 2001.
44. Castellano, J.; Hernández Mendo, A. La observación de la acción de juego en fútbol. Contextualización de los acontecimientos
[Game action observation in football. Events contextualization]. El Entren. Español 2001, 90, 15–20.
45. Casamichana, D.; Bradley, P.S.; Castellano, J. Influence of the Varied Pitch Shape on Soccer Players Physiological Responses and
Time-Motion Characteristics during Small-Sided Games. J. Hum. Kinet. 2018, 64, 171–180. [CrossRef] [PubMed]
46. Araújo, D.; Davids, K.; Hristovski, R. The ecological dynamics of decision making in sport. Psychol. Sport Exerc. 2006, 7, 653–676.
[CrossRef]
47. Vilar, L.; Araújo, D.; Davids, K.; Button, C. The Role of Ecological Dynamics in Analysing Performance in Team Sports. SportsMed. 2012, 42, 1–10. [CrossRef] [PubMed]
48. Travassos, B.; Davids, K.; Araújo, D.; Esteves, T.P. Performance analysis in team sports: Advances from an Ecological Dynamics
approach. Int. J. Perform. Anal. Sport 2013, 13, 83–95. [CrossRef]
49. Teixeira, J.; Forte, P.; Ferraz, R.; Leal, M.; Ribeiro, J.; Silva, A.; Barbosa, T.; Monteiro, A. Monitoring accumulated training and
match load in football: A systematic review. Int. J. Environ. Res. Public Health 2021, 18, 3906. [CrossRef] [PubMed]
114
International Journal of
Environmental Research
and Public Health
Article
Substantiation of Methods for Predicting Success inArtistic Swimming
Olha Podrihalo 1, Leonid Podrigalo 2, Władysław Jagiełło 3 , Sergii Iermakov 3 and Tetiana Yermakova 4,*
�����������������
Citation: Podrihalo, O.; Podrigalo, L.;
Jagiełło, W.; Iermakov, S.; Yermakova,
T. Substantiation of Methods for
Predicting Success in Artistic
Swimming. Int. J. Environ. Res. Public
Health 2021, 18, 8739. https://
doi.org/10.3390/ijerph18168739
Academic Editors: Paul
B. Tchounwou, Bruno Gonçalves,
Jorge Bravo and Hugo Folgado
Received: 3 June 2021
Accepted: 13 August 2021
Published: 19 August 2021
Publisher’s Note: MDPI stays neutral
with regard to jurisdictional claims in
published maps and institutional affil-
iations.
Copyright: © 2021 by the authors.
Licensee MDPI, Basel, Switzerland.
This article is an open access article
distributed under the terms and
conditions of the Creative Commons
Attribution (CC BY) license (https://
creativecommons.org/licenses/by/
4.0/).
1 Department of Biological Science, Kharkiv State Academy of Physical Culture, 61022 Kharkiv, Ukraine;
[email protected] Department of Medical Science, Kharkiv State Academy of Physical Culture, 61022 Kharkiv, Ukraine;
[email protected] Department of Sport, Gdansk University of Physical Education and Sports, 80-854 Gdansk, Poland;
[email protected] (W.J.); [email protected] (S.I.)4 Department of Pedagogy, Kharkiv State Academy of Design and Arts, 61002 Kharkiv, Ukraine
* Correspondence: [email protected]
Abstract: To develop a methodology for predicting success in artistic swimming based on a set of
morphofunctional indicators and indices, 30 schoolgirls, average age (12.00 ± 0.22), were divided
into two groups. Group 1: 15 athletes, training experience 4–5 years. Group 2: 15 schoolgirls without
training experience. For each participant, we determined the length and weight of the body, the
circumference of the chest, vital lung capacity, and the circumference of the biceps in a tense and
at rest. The Erisman index, biceps index, and the ratio of proper and actual vital lung capacity
was calculated. Them, we conducted the Stange and Genchi hypoxic tests, and flexibility tests for
“Split”, “Crab position”, and “Forward bend”. Prediction was conducted using the Wald test with
the calculation of predictive coefficients and their informativeness. A predictive table containing
results of functional tests and indices of artistic swimming athletes is developed. It includes nine
criteria, which informativeness varied in the range of 395.70–31.98. The content of the prediction
consists of evaluating the results, determining the appropriate predictive coefficient, and summing
these coefficients before reaching one of the predictive thresholds. The conducted research allowed
us to substantiate and develop a method for predicting the success of female athletes with the use of
morphofunctional indicators and indices.
Keywords: artistic swimming; prognosis; success; morphofunctional; indicators; indices; func-
tional tests
1. Introduction
The selection and prediction of the growth of athletes’ skills are the priority tasks ofmodern sports science [1–4]. Predicting, in a broad sense, means anticipatory reflection ofthe future and the identification of trends in the dynamics of a particular object based onan analysis of its condition in the past and present. The development of the prediction inthe narrow sense is a special scientific research of concrete development prospects of anyphenomenon. Predicting sports performance involves identifying predictors of success,analyzing their informativeness and making the dependent between them.
Sports prediction is an important part of sports statistics, the development of which isclosely related to interdisciplinary integration. Huang and Shen [5] analyzed research onsports prediction and highlighted the main problems and shortcomings. It is concludedthat the theory of sports predicting requires improvement.
Another study analyzed the possibility of applying different methods for sports pre-diction of results [6]. The authors concluded that the combination of methods significantlyincreases the probability of prediction. The study by Roberts et al. [7] was dedicated toidentifying talented athletes based on predicting. The review and meta-analysis revealed akey topic of “coach instinct” as a main component of talent identification decisions.
115

Int. J. Environ. Res. Public Health 2021, 18, 8739
Other authors suggest that the application of various mathematical methods allowsus to obtain more accurate predictions in sports than subjective expert assessments [8]. Itis argued that statistics and analytical methods are becoming increasingly important inbasketball [9]. It is determined that players’ performance prediction is a serious problem.The authors propose a methodology based on methods of processing rare and irregulardata. The results demonstrate the competitiveness of the approach used.
Analyzing the features of sports prediction, Aldous [10] concludes that the use ofspecial algorithms is important. Sports prediction should consider the rating system,answering questions arising in the process of model analysis. Other researchers developeda method for predicting an increase in the efficiency of training 400 m runners [11]. Thismethod allows us to quickly assess the dynamics of physical fitness. It ensures the reliabilityand quality of prediction based on the training plan.
Other studies present approaches to assess the probability of talent selection in hand-ball [12]. The system used included the general and special tests; assessments made byqualified professionals during training camp; and analysis of athletes’ activities in the gamebased on video. The results of tests revealed the major coincidence of predictions.
Kalina et al. [13] justified the use of various tests to diagnose the abilities and capabili-ties of athletes. A conclusion is made about the effectiveness of hardware and simulationtechniques. Another study considered predicting the results of an anaerobic sprint and800 m running test at critical speed [14]. The ability of anaerobic distance was determinedto be a significant predictor of anaerobic sprint test results and 800 m running results.
Thus, the available literature suggests the possibility of predicting success in sportsbased on the use of functional tests and the application of various mathematical methods.However, in artistic swimming (AS), this problem does not yet have a final solution. Thisdetermined the relevance of this study.
The aim of the study is to develop a method for predicting the success in artisticswimming based on a set of morphofunctional indicators and indices.
2. Materials and Methods
2.1. Ethics Statement and Participants
This study was approved by the Bioethics Committee for Clinical Research and con-ducted according to the Declaration of Helsinki (protocol of the Commission on Bioethicsof the Kharkiv State Academy of Physical Culture No. 25).
The results of the survey of 30 schoolgirls, average age (12.00 ± 0.22) was used asthe main materials of the study. The participants were divided into two groups. The firstgroup included 15 AS athletes with 4–5 years training experience, and the second groupincluded 15 schoolgirls who are not engaged in sports. All participants and their parentswere informed about the purpose and objectives of the study, informed about the absenceof possible harm to their health and gave the written consent to participate in the study.
2.2. The Design of the Study
The following parameters were determined to assess physical development: the bodylength (BL) and body weight (BW), chest circumference (CC) in the pause, vital lungcapacity (VLC), and biceps circumference in a tense and at rest. The measurements wereperformed according to the requirements of the international unified methodology ofanthropometric research [15].
The level and harmony of physical development was determined using the availableage and gender standards of physical development of schoolchildren [16]. The regressionscale method was used. The interval represented by body length determined the level ofphysical development. Development was considered harmonious if body weight and chestcircumference were in the range M ± δR.
The following indices of physical development were calculated:(1) Erisman index
ie = t − 0.5 · l (1)
116
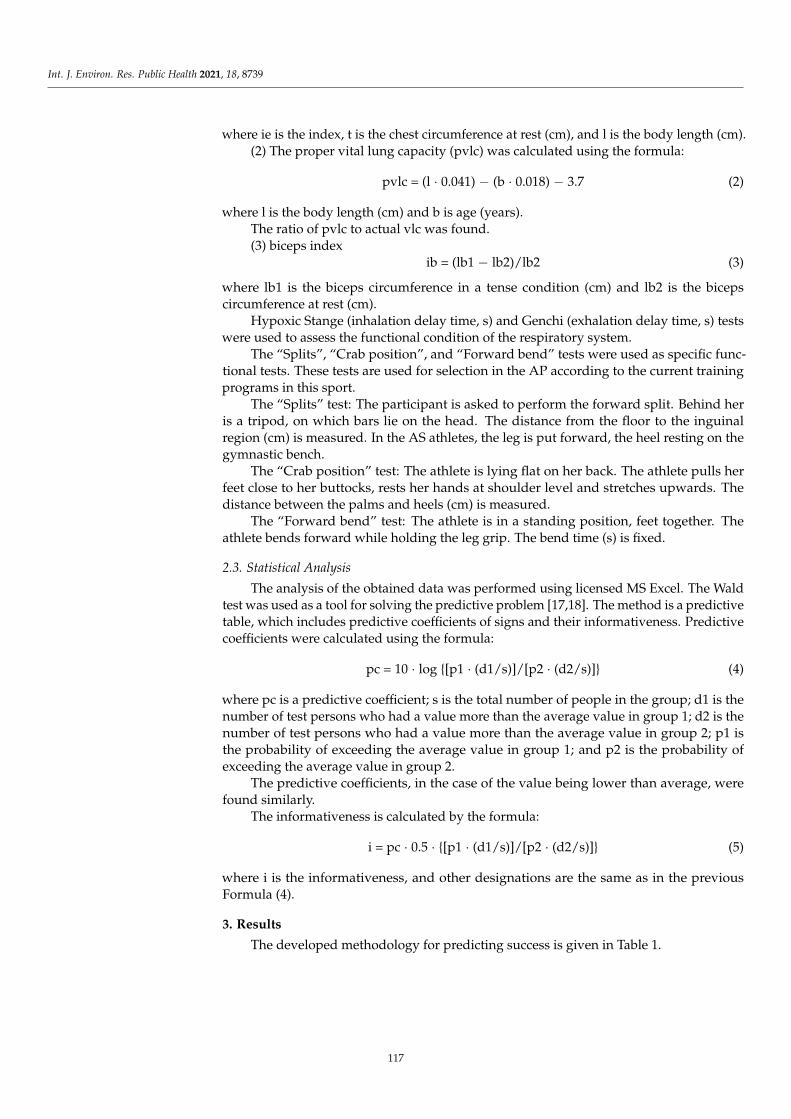
Int. J. Environ. Res. Public Health 2021, 18, 8739
where ie is the index, t is the chest circumference at rest (cm), and l is the body length (cm).(2) The proper vital lung capacity (pvlc) was calculated using the formula:
pvlc = (l · 0.041) − (b · 0.018) − 3.7 (2)
where l is the body length (cm) and b is age (years).The ratio of pvlc to actual vlc was found.(3) biceps index
ib = (lb1 − lb2)/lb2 (3)
where lb1 is the biceps circumference in a tense condition (cm) and lb2 is the bicepscircumference at rest (cm).
Hypoxic Stange (inhalation delay time, s) and Genchi (exhalation delay time, s) testswere used to assess the functional condition of the respiratory system.
The “Splits”, “Crab position”, and “Forward bend” tests were used as specific func-tional tests. These tests are used for selection in the AP according to the current trainingprograms in this sport.
The “Splits” test: The participant is asked to perform the forward split. Behind heris a tripod, on which bars lie on the head. The distance from the floor to the inguinalregion (cm) is measured. In the AS athletes, the leg is put forward, the heel resting on thegymnastic bench.
The “Crab position” test: The athlete is lying flat on her back. The athlete pulls herfeet close to her buttocks, rests her hands at shoulder level and stretches upwards. Thedistance between the palms and heels (cm) is measured.
The “Forward bend” test: The athlete is in a standing position, feet together. Theathlete bends forward while holding the leg grip. The bend time (s) is fixed.
2.3. Statistical Analysis
The analysis of the obtained data was performed using licensed MS Excel. The Waldtest was used as a tool for solving the predictive problem [17,18]. The method is a predictivetable, which includes predictive coefficients of signs and their informativeness. Predictivecoefficients were calculated using the formula:
pc = 10 · log {[p1 · (d1/s)]/[p2 · (d2/s)]} (4)
where pc is a predictive coefficient; s is the total number of people in the group; d1 is thenumber of test persons who had a value more than the average value in group 1; d2 is thenumber of test persons who had a value more than the average value in group 2; p1 isthe probability of exceeding the average value in group 1; and p2 is the probability ofexceeding the average value in group 2.
The predictive coefficients, in the case of the value being lower than average, werefound similarly.
The informativeness is calculated by the formula:
i = pc · 0.5 · {[p1 · (d1/s)]/[p2 · (d2/s)]} (5)
where i is the informativeness, and other designations are the same as in the previousFormula (4).
3. Results
The developed methodology for predicting success is given in Table 1.
117

Int. J. Environ. Res. Public Health 2021, 18, 8739
Table 1. Methods for predicting the athletes’ success in artistic swimming.
IndicatorsPredictive Coefficients
InformativenessAvailability Absence
The ratio of VLC to the PVLC ismore than 1
10.8 −6.7 395.70
Biceps index more 6.7% 10.0 −4.5 300.00Weight deficit of body in relation to
age norms9.5 −3.7 254.46
The time to perform the “Forwardbend” test more than 10 s
6.7 −10.8 245.30
Splits less than 0 cm 6.7 −10.8 245.30The result of the Stange test higher
than the age norm, s3.8 −5.2 88.72
The result of the Genchi test higherthan the age norm, s
3.0 −4.8 60.21
The Erisman index less than 0 cm 2.4 −8.5 48.61The “Crab position” test result is less
than 60 cm1.9 −7.8 31.98
The predictive table includes the indicator title, the value of its predictive coefficientsand the value of informativeness. The indicators in the table are arranged in descendingorder of informativeness. This minimizes the number of steps in the predicting procedureand reduces the number of possible errors. In the case of the same value of informativeness,the order of location is determined randomly. The value of informativeness below 30.0 isconsidered insignificant. Indicators with the same or less informativeness are excluded inthe table.
The individual prediction is made by successive summation of the values of the predic-tive coefficients peculiar to the inspected before reaching one of the thresholds. When theindicator specified in the table is performed, the availability indicator is summed. When theindicator specified in the table is not performed, the absence factor is summed. The valueof the allowable error is 5%, which corresponds to the value of the threshold of 13 points.Upon reaching the threshold (+13), a conclusion is made about the high probability ofsuccess and growth of athletes’ skills (p < 0.05). Upon reaching the threshold (−13), aconclusion is made about the low probability of success (p < 0.05). If, after completion ofthe table, none of the thresholds are reached, it is concluded that the prediction is uncertainand additional research is necessary.
4. Discussion
Artistic swimming is a unique sport with complex choreographic exercises performedboth above the water surface and underwater. This sport requires athletes to have a highlevel of physical training, mastery of complex technical skills, and artistry. Viana et al. [19]emphasizes the high physical and physiological requirements for the athlete in this sport.The most significant are the need to adapt to long periods of apnea underwater duringperforming intense activities.
The development of a methodology for predicting success is most relevant at thestage of preliminary basic training. It is due to the specifics of this stage. Athletes had acertain level of morphofunctional indicator development, important for success. The levelof mastering specific technical skills and abilities is still insufficient. Thus, predicting atthis stage allows us to determine the feasibility of further training of athletes.
The Wald test is widely used in biomedical research for prediction [17,18]. Theapplication of this method allowed us to develop methods for predicting the success ofarm wrestling athletes [20] and kickboxing athletes [21]. The advantages of this methodinclude the ability to choose the probability of prediction [17,18]. The probability of theprediction can vary in the range of 80–99.9%, depending on the selected threshold value(8–30 points). It allows us to significantly increase the efficiency of the prediction. To obtain
118

Int. J. Environ. Res. Public Health 2021, 18, 8739
a reliable prediction, 7–10 indicators in the prediction table are enough. The techniquedeveloped by us includes nine indicators. This allows us to consider it informative.
The sequential analysis procedure requires a comparison of two groups. In the contextof our study, these are groups of AS athletes and non-athletes. Such a research design iscommon in sports science.
Li et al. [22] compared the condition of the elite AS athletes with the condition of non-athlete female students of the same age. A similar design was used in another study [23].The authors compared anthropometric data of preschool children. It is a positive effectof the AS classes on the physical development of children. Another review presents datafrom the analysis of physiological parameters of the AS athletes and persons who did notengage in this sport [24]. The authors note the need to standardize the results.
The developed predictive table includes indices and results of functional tests, whichdetermine the success in AS. This approach allows us to provide an integrated assessmentof the condition of athletes, to increase the efficiency of the prediction. Similar data areavailable in the literature. Solana-Tramunt et al. [25] studied the possibility of monitoringthe effect of training of AS athletes. The conclusion is made about the need for an integratedapproach, with the use of various methods and indicators.
The available results confirm the legitimacy of including the results of functionaltests in the predictive methodology. Escriva-Selles et al. [26] note the prospects of usingfunctional tests to assess the effectiveness of training in the AS.
The index method is used for sports selection and prediction [27–29]. Harty et al. [30]used a fat mass index for selection in AS. The values of this index were significantly lowerthan in strength sport athletes. It is assessed as an illustration of the specifics of the impactof sport on the body of female athletes.
The functional state of the respiratory system should be recognized as a major factor inthe success of AS athletes. The index of the ratio of actual and proper VLC and the resultsof Stange and Genchi tests are used for predicting. An increase in this index confirms thegrowth of functionality. The results of functional tests exceeding the age norm illustratehigh resistance to hypoxia. It reflects the expansion of the functionality of athletes.
The data available in the literature confirm the validity of these assumptions. Garciaet al. [28] reported an increase in hypoxia resistance of the elite AS athletes compared toage standards.
Rovnaya et al. [31] confirmed the increased functionality of the external respiratorysystem of AS athletes. There was a direct correlation between the increase in functionalityand the level of sportsmanship in the AS. The maximum value of the tidal volume and theminimum value of the respiratory rate were established at all stages of the hypoxic test inelite athletes of artistic swimming in comparison with beginners and sub-elite athletes.
The results of the biceps index obtained by us confirm the high level of developmentof shoulder muscles in AS athletes. It also illustrates the specifics of training in this sport.Exercises for the arm muscles are an important component of training; this quality isnecessary to perform complex technical elements in such a sport as AS.
Similar results were obtained in another study [32]. The authors conclude that it isnecessary to perform weightlifting exercises in the training of the AS athletes. Anotherstudy confirmed the importance of shoulder muscle balance in the AS athletes [33].
The deficit of body weight in AS athletes is due to the peculiarities of their mor-phological and nutritional status. Gracilization is one of the predictors of success in thissport. Its main manifestation is a deficit of body weight due to the reduction in the fatcomponent. This coincides with the available literature data. It is determined that theincrease in training experience in AS contributes to the increase in disharmony of physicaldevelopment due to body weight deficit [34].
The assumption confirmed by the Erisman index, which is included in the predictivemethod. This index reflects the harmony of physical development due to the body muscles.The negative value of this indicator confirms the disharmony of development.
119
Int. J. Environ. Res. Public Health 2021, 18, 8739
Other researchers provided similar data [35]. The authors determine changes in thehomeostatic status of the AS athletes. This refers to changes in body weight under theinfluence of prolonged and intense training.
Similar results were obtained by Grznar et al. [36]. The authors concluded that thepredictor of success in AS is low body weight (lower percentage of fat). In another study, thefeatures of body composition and nutritional status in AS athletes were investigated [37].
A review by Robertson and Mountjoy [38] reported a high prevalence of specificenergy deficiency syndrome in sports (RED-S) in AS athletes. This syndrome refers toimpaired physiological function, including metabolic rate, menstrual function, bone health,immunity, protein synthesis, and cardiovascular health. It leads to psychological conse-quences that can either precede (due to restrictive dietary habits) or be the result of RED-S.
The motor tests “Crab position,” “Forward bend”, and “Splits” allow us to estimatethe level of flexibility of AS athletes. The high level of flexibility allows athletes to performdifficult technical elements of such a sport as AS. The importance of this quality for successin AS has also been confirmed by a number of studies. Cho et al. [39] determine thatsynchronous swimmers had an increased range of motion in the joints of the spine andupper and lower extremities compared to swimming athletes. Other authors have studiedthe diagnostic validity of various functional tests in the AS athletes to assess functionaldisorders of the upper extremities [40]. The amplitude of movements of the shoulder andelbow joint can be used as tests of the strength of the upper extremities, criteria for theeffectiveness of rehabilitation after injury.
5. Conclusions
Our research allowed us to develop a method for predicting success in the AS. Themethod is based on the Wald test and includes morphological parameters, results offunctional tests, and indices based on them. The proposed method is a simple, informative,and objective tool for monitoring and managing the condition of AS athletes. Determiningthe indicators used is simple and accessible. It allows us to conclude the availability, clarity,and financial feasibility of the prediction.
The developed methodology can be used by coaches when selecting for artistic swim-ming, as well as a tool for controlling the fitness of athletes. In monitoring the state ofartistic swimming athletes, it is necessary to use a set of indicators reflecting physicaldevelopment (body weight deficit), indices of the state of the respiratory system (ratio ofVLC to proper VLC), muscular system (Erisman index and biceps index), results of tests ofthe state of the respiratory system (Stange test and Genchi test) and flexibility (tests “Crabposition”, “Forward bend”, and “Splits”).
Author Contributions: Conceptualization, O.P., L.P., W.J., S.I. and T.Y.; methodology, L.P., W.J. and
S.I.; validation, O.P., L.P. and S.I.; formal analysis, W.J. and T.Y.; investigation, L.P.; resources, O.P.,
L.P., W.J., S.I. and T.Y.; writing—original draft preparation, O.P., L.P., W.J., S.I. and T.Y.; visualization,
W.J. and S.I.; supervision, S.I. and T.Y.; project administration, O.P. and L.P.; and funding acquisition,
W.J. and S.I. All authors have read and agreed to the published version of the manuscript.
Funding: This research received no external funding.
Institutional Review Board Statement: This study was approved by the Bioethics Committee for
Clinical Research and con-ducted according to the Declaration of Helsinki (protocol of the Commis-
sion on Bioethics of the Kharkiv State Academy of Physical Culture No. 25).
Informed Consent Statement: All participants and their parents were informed about the purpose
and objectives of the study, informed about the absence of possible harm to their health and gave the
written consent to participate in the study.
Conflicts of Interest: The authors declare no conflict of interest.
120
Int. J. Environ. Res. Public Health 2021, 18, 8739
References
1. Osipov, A.Y.; Kudryavtsev, M.D.; Iermakov, S.S.; Jagiello, W. Criteria for Effective Sports Selection in Judo Schools–on Example of
Sportsmanship’s Progress of Young Judo Athletes in Russian Federation. Arch. Budo 2017, 13, 179–186.
2. Vinogradova, O.A.; Sovenko, S.P. Improving technical fitness of race walkers on the basis of special exercises to focus on key
parameters of movements. Pedagog. Phys. Cult. Sports 2020, 24, 100–105. [CrossRef]
3. Vrublevskiy, E.; Skrypko, A.; Asienkiewicz, R. Individualization of selection and training of female athletes in speed-power
athletics from the perspective of gender identity. Phys. Educ. Stud. 2020, 24, 227–234. [CrossRef]
4. Till, K.; Baker, J. Challenges and [Possible] Solutions to Optimizing Talent Identification and Development in Sport. Front. Psychol.2020, 11, 664. [CrossRef] [PubMed]
5. Huang, C.; Shen, W. Characters and Development Tendency Analysis on Sports Prediction Scientific Research Papers in China. In
Proceedings of the 2011 International Conference on Human Health and Biomedical Engineering, Jilin, China, 19–21 August 2011;
pp. 814–819.
6. Spann, M.; Skiera, B. Sports Forecasting: A Comparison of the Forecast Accuracy of Prediction Markets, Betting Odds and
Tipsters. J. Forecast. 2009, 28, 55–72. [CrossRef]
7. Roberts, A.H.; Greenwood, D.A.; Stanley, M.; Humberstone, C.; Iredale, F.; Raynor, A. Coach Knowledge in Talent Identification:
A Systematic Review and Meta-Synthesis. J. Sci. Med. Sport 2019, 22, 1163–1172. [CrossRef]
8. Romanchenko, B.; Sperkach, M.; Zhdanova, O. Predicting of sports events results. HAIT 2019, 2, 278–287. [CrossRef]
9. Vinué, G.; Epifanio, I. Forecasting Basketball Players’ Performance Using Sparse Functional Data. Stat. Anal. Data Min. ASA DataSci. J. 2019, 12, 534–547. [CrossRef]
10. Aldous, D. Elo Ratings and the Sports Model: A Neglected Topic in Applied Probability? Stat. Sci. 2017, 32, 616–629. [CrossRef]
11. Bobkova, E.; Parfianovich, E. Neural networks for forecasting and modeling training in track-and-field athletics. HSM 2018, 18,
115–119. [CrossRef]
12. Schorer, J.; Rienhoff, R.; Fischer, L.; Baker, J. Long-Term Prognostic Validity of Talent Selections: Comparing National and Regional
Coaches, Laypersons and Novices. Front Psychol. 2017, 8, 1146. [CrossRef] [PubMed]
13. Kalina, R.M.; Jagiełło, W. Non-apparatus, Quasi-apparatus and Simulations Tests in Diagnosis Positive Health and Survival
Abilities. In Advances in Human Factors in Sports, Injury Prevention and Outdoor Recreation; Ahram, T., Ed.; Advances in Intelligent
Systems and Computing; Springer International Publishing: Cham, Switzerland, 2018; Volume 603, pp. 121–128.
14. Arı, E.; Deliceoglu, G. The Prediction of Repeated Sprint and Speed Endurance Performance by Parameters of Critical Velocity
Models in Soccer. Pedagog. Phys. Cult. Sports 2021, 25, 132–143. [CrossRef]
15. Marfell-Jones, M.; Olds, T.; Stewart, A.; Lindsay Carter, L.E. ISAK Manual, International Standards for Anthropometric Assessment;International Society for the Advancement of Kinanthropometry; The University of South Australia Holbrooks Rd: Underdale,
Australia, 2012.
16. Serdiuk, A.M. Standards for Assessing the Physical Development of Schoolchildren; Fairy Tale: Kiev, Ukraine, 2010. (In Ukrainian)
17. Antomonov, M.I. Processing and Analysis of Biomedical Data; Medinform: Kiev, Ukraine, 2018. (In Russian)
18. Gubler, E.V. Information in Pathology, Clinical Medicine and Pediatry; Kazan Medical: Leningrad, Russian, 1990. (In Russian)
19. Viana, E.; Bentley, D.J.; Logan-Sprenger, H.M. A Physiological Overview of the Demands, Characteristics, and Adaptations of
Highly Trained Artistic Swimmers: A Literature Review. Sports Med. Open 2019, 5, 16. [CrossRef]
20. Podrigalo, L.V.; Galashko, M.N.; Iermakov, S.S.; Rovnaya, O.A.; Bulashev, A.Y. Prognostication of successfulness in arm-wrestling
on the base of morphological functional indicators’ analysis. Phys. Educ. Stud. 2017, 21, 46–51. [CrossRef]
21. Podrigalo, L.V.; Volodchenko, A.A.; Rovnaya, O.A.; Podavalenko, O.V.; Grynova, T.I. The Prediction of Success in Kickboxing
Based on the Analysis of Morphofunctional, Physiological, Biomechanical and Psychophysiological Indicators. Phys. Educ. Stud.2018, 22, 51–56. [CrossRef]
22. Li, F.; Bai, M.; Xu, J.; Zhu, L.; Liu, C.; Duan, R. Long-Term Exercise Alters the Profiles of Circulating Micro-RNAs in the Plasma of
Young Women. Front Physiol. 2020, 11, 372. [CrossRef] [PubMed]
23. Domika, R.; Supsup, A.A.; Petric, V. valuation of the programme of synchronized swimming for pre-school children. ActaKinesiol. 2018, 12, 41–45.
24. Ponciano, K.; Miranda, M.L.d.J.; Homma, M.; Miranda, J.M.Q.; Figueira Júnior, A.J.; Meira Júnior, C.D.M.; Bocalini, D.S.
Physiological Responses during the Practice of Synchronized Swimming: A Systematic Review. Clin. Physiol. Funct. Imaging 2018,
38, 163–175. [CrossRef] [PubMed]
25. Solana-Tramunt, M.; Arboix-Alio, J.; Aguilera-Castells, J. Is Heart Rate Variablity a Suitable method for Monitoring the Effect of a
Training Session in Synchronized Swimming? Med. Sci. Sports Exerc. 2019, 51, 28. [CrossRef]
26. Escrivá-Sellés, F.R.; González-Badillo, J.J. Efecto de Dos Periodos de Entrenamiento de Fuerza Sobre El Rendimiento En Los
Ejercicios de Salto Vertical, Barracuda y Boost En Natación Sincronizada. Apunts 2020, 4, 35–45. [CrossRef]
27. Dorofieieva, O.; Yarymbash, K.; Skrypchenko, I.; Joksimovic, M.; Mytsak, A. Complex Assessment of Athletes’ Operative Status
and Its Correction during Competitions, Based on the Body Impedance Analysis. Pedagog. Phys. Cult. Sports 2021, 25, 66–73.
[CrossRef]
28. García, I.; Drobnic, F.; Pons, V.; Viscor, G. Changes in Lung Diffusing Capacity of Elite Artistic Swimmers during Training. Int. J.Sports Med. 2021, 42, 227–233. [CrossRef]
121
Int. J. Environ. Res. Public Health 2021, 18, 8739
29. Müller, W.; Fürhapter-Rieger, A.; Ahammer, H.; Lohman, T.G.; Meyer, N.L.; Sardinha, L.B.; Stewart, A.D.; Maughan, R.J.;
Sundgot-Borgen, J.; Müller, T.; et al. Relative Body Weight and Standardised Brightness-Mode Ultrasound Measurement of
Subcutaneous Fat in Athletes: An International Multicentre Reliability Study, under the Auspices of the IOC Medical Commission.
Sports Med. 2020, 50, 597–614. [CrossRef]
30. Harty, P.S.; Zabriskie, H.A.; Stecker, R.A.; Currier, B.S.; Moon, J.M.; Jagim, A.R.; Kerksick, C.M. Upper and Lower Thresholds of
Fat-Free Mass Index in a Large Cohort of Female Collegiate Athletes. J. Sport Sci. 2019, 37, 2381–2388. [CrossRef]
31. Rovnaya, O.A.; Podrigalo, L.V.; Aghyppo, O.Y.; Cieslicka, M.; Stankiewicz, B. Study of Functional Potentials of Different
Portsmanship Level Synchronous Swimming Sportswomen under Impact of Hypoxia. Res. J. Pharm. Biol. Chem. Sci. 2016, 7,
1210–1219.
32. Bellver, M.; Del Rio, L.; Jovell, E.; Drobnic, F.; Trilla, A. Bone Mineral Density and Bone Mineral Content among Female Elite
Athletes. Bone 2019, 127, 393–400. [CrossRef]
33. Aguado-Henche, S.; Slocker de Arce, A.; Carrascosa-Sánchez, J.; Bosch-Martín, A.; Cristóbal-Aguado, S. Isokinetic Assessment
of Shoulder Complex Strength in Adolescent Elite Synchronized Swimmers. J. Bodyw. Mov. Ther. 2018, 22, 968–971. [CrossRef]
[PubMed]
34. Podrihalo, L.; Rovna, O.; Sokol, K.; Maksechko, O. Studying the peculiarities of physical development and functional state of
female athletes engaged in synchronized swimming for educational process optimization. Sci. Educ. 2016, 8, 132–137. [CrossRef]
35. Carrasco-Marginet, M.; Castizo-Olier, J.; Rodríguez-Zamora, L.; Iglesias, X.; Rodríguez, F.A.; Chaverri, D.; Brotons, D.; Irurtia, A.
Bioelectrical Impedance Vector Analysis (BIVA) for Measuring the Hydration Status in Young Elite Synchronized Swimmers.
PLoS ONE 2017, 12, e0178819. [CrossRef]
36. Grznar, L.; Labudova, J.; Ryzkova, E.E.A. Anthropometry, body composition and ace genotype of elite female competitive
swimmers and synchronized swimmers. In Proceedings of the 11th International Conference on Kinanthropology—Sport and
Quality of Life, Brno, Czech Republic, 29 November–1 December 2017; pp. 162–171.
37. Costa, P.B.; Richmond, S.R.; Smith, C.R.; Currier, B.; Stecker, R.A.; Gieske, B.T.; Kemp, K.; Witherbee, K.E.; Kerksick, C.M.
Physiologic, Metabolic and Nutritional Attributes of Collegiate Synchronized Swimmers. Int. J. Sports Physiol. Perform. 2019, 14,
658–664. [CrossRef] [PubMed]
38. Robertson, S.; Mountjoy, M. A Review of Prevention, Diagnosis and Treatment of Relative Energy Deficiency in Sport in Artistic
(Synchronized) Swimming. Int. J. Sport Nutr. Exerc. 2018, 28, 375–384. [CrossRef] [PubMed]
39. Cho, N.M.Y.; Giorgi, H.P.; Liu, K.P.Y.; Bae, Y.-H.; Chung, L.M.Y.; Kaewkaen, K.; Fong, S.S.M. Proprioception and Flexibility
Profiles of Elite Synchronized Swimmers. Percept. Mot. Skills 2017, 124, 1151–1163. [CrossRef] [PubMed]
40. Gaudet, S.; Begon, M.; Tremblay, J. Cluster Analysis Using Physical Performance and Self-Report Measures to Identify Shoulder
Injury in Overhead Female Athletes. J. Sci. Med. Sport 2019, 22, 269–274. [CrossRef] [PubMed]
122
International Journal of
Environmental Research
and Public Health
Article
The Acute Effects of a Swimming Session on the ShoulderRotators Strength and Balance of Age Group Swimmers
Nuno Batalha 1,2,* , Jose A. Parraca 1,2 , Daniel A. Marinho 3,4 , Ana Conceição 4,5, Hugo Louro 4,5,
António J. Silva 4,6 and Mário J. Costa 4,7
�����������������
Citation: Batalha, N.; Parraca, J.A.;
Marinho, D.A.; Conceição, A.; Louro,
H.; Silva, A.J.; Costa, M.J. The Acute
Effects of a Swimming Session on the
Shoulder Rotators Strength and
Balance of Age Group Swimmers. Int.
J. Environ. Res. Public Health 2021, 18,
8109. https://doi.org/10.3390/
ijerph18158109
Academic Editor: Paul B. Tchounwou
Received: 23 June 2021
Accepted: 28 July 2021
Published: 30 July 2021
Publisher’s Note: MDPI stays neutral
with regard to jurisdictional claims in
published maps and institutional affil-
iations.
Copyright: © 2021 by the authors.
Licensee MDPI, Basel, Switzerland.
This article is an open access article
distributed under the terms and
conditions of the Creative Commons
Attribution (CC BY) license (https://
creativecommons.org/licenses/by/
4.0/).
1 Departamento de Desporto e Saúde, Escola de Saúde e Desenvolvimento Humano, Universidade de Évora,
7000-654 Évora, Portugal; [email protected] Comprehensive Health Research Centre (CHRC), Universidade de Évora, 7000-654 Évora, Portugal3 Department of Sport Sciences, University of Beira Interior, 6201-001 Covilhã, Portugal; [email protected] Research Centre in Sports, Health and Human Development (CIDESD), 5000-801 Vila Real, Portugal;
[email protected] (A.C.); [email protected] (H.L.); [email protected] (A.J.S.);
[email protected] (M.J.C.)5 Department of Sport Sciences, Sport Sciences School of Rio Maior, 2040-413 Rio Maior, Portugal6 Department of Sports Sciences, University of Trás-os-Montes and Alto Douro, 5000-801 Vila Real, Portugal7 Department of Sports Sciences, Polytechnic Institute of Guarda, 6300-559 Guarda, Portugal
* Correspondence: [email protected]
Abstract: The purpose of this study was to analyze the acute effects of a standardized water training
session on the shoulder rotators strength and balance in age group swimmers, in order to understand
whether a muscle-strengthening workout immediately after the water training is appropriate. A
repeated measures design was implemented with two measurements performed before and after a
standardized swim session. 127 participants were assembled in male (n = 72; age: 16.28 ± 1.55 years,
height: 174.15 ± 7.89 cm, weight: 63.97 ± 6.51 kg) and female (n = 55; age: 15.29 ± 1.28 years,
height: 163.03 ± 7.19 cm, weight: 52.72 ± 5.48 kg) cohorts. The isometric torque of the shoulder
internal (IR) and external (ER) rotators, as well as the ER/IR ratios, were assessed using a hand-held
dynamometer. Paired sample t-tests and effect sizes (Cohen’s d) were used (p ≤ 0.05). No significant
differences were found on the shoulder rotators strength or balance in males after training. Females
exhibited unchanged strength values after practice, but there was a considerable decrease in the
shoulder rotators balance of the non-dominant limb (p < 0.01 d = 0.366). This indicates that a single
practice seems not to affect the shoulders strength and balance of adolescent swimmers, but this
can be a gender specific phenomenon. While muscle-strengthening workout after the water session
may be appropriate for males, it can be questionable regarding females. Swimming coaches should
regularly assess shoulder strength levels in order to individually identify swimmers who may or
may not be able to practice muscle strengthening after the water training.
Keywords: swimming; isometric strength; muscle balance; shoulder rotators
1. Introduction
The shoulder rotator muscles play a critical role in providing stability and mobilityto the glenohumeral joint and shoulder joint complex [1]. In competitive swimming, thepropulsive forces responsible for the total body displacement are produced mainly by theupper limbs through the arm adduction and shoulder internal rotation [2]. As such, theswimmers are classified as overhead athletes [3] because high levels of stress are installedin the upper body sections.
There is evidence that water training induces shoulder muscle imbalances [4]. Theshoulder adductor and the internal rotator (IR) show a tendency to become proportionallystronger when compared to their antagonists. In addition, higher volumes of swimmingtraining are associated with shoulder pain and injury [5]. Without the addition of preven-tive measures, this can lead to an acute or chronic injury process [6].
123

Int. J. Environ. Res. Public Health 2021, 18, 8109
Shoulder strengthening programs are part of the training season and require detailedplanning [3,7]. Evidence suggests that dryland workouts must be maintained throughoutthe entire sports season, otherwise the effects of detraining are felt [4]. Few studies havefocused on shoulder rotator strengthening in competitive swimmers. Batalha et al. [8] foundthat a 10-week dryland training program reduced muscle imbalance and fatigue. Kluemperet al. [2] also reported increases in the shoulder rotators strength after a 6-week trainingprogram with consequent postural improvements. So, regular shoulder strength workoutsare essential to maintain the integrity and longevity of the swimmers’ glenohumeraljoint [8].
Most times dryland strength training and in-water training are applied within thesame training session. Coaches regularly assign dryland strength training before theswimming practice due to time-consuming issues [3,9]. However, it remains unclear whenthese workouts should be implemented and the impact an in-water session has on shoulderfatigue. It is not consensual if a single water session will compromise the shoulder jointand muscles, and what would be the degree of fatigue installed. The increasing fatigue inshoulder muscles, especially in the rotator cuff group, was identified as a possible cause ofshoulder dysfunction [10] and was associated with performance decrements and a higherrisk of injury [11]. Regarding the performance of muscle strengthening programs before thewater training, Batalha et al. [9] evaluated the acute effects on the shoulder rotator strength.They concluded that shoulder rotator endurance and balance do not seem to be impairedafter undergoing a shoulder rotator injury-prevention training program. However, to thebest of our knowledge, there are no studies that assess the effects water training may haveon the strength and balance of the shoulder rotators. Hence, it is crucial to understandwhether it would be possible to implement a shoulder rotator strengthening programafter swimming practice. Thus, the aim of this study was to analyze the acute effects of astandardized water training session on the strength and balance of the shoulder rotatorsin adolescent swimmers. It was hypothesized that a swimming training session wouldsignificantly reduce the shoulder rotator strength levels and muscle balance, limiting theperformance of the dryland training afterward.
2. Materials and Methods
2.1. Participants
One hundred and twenty-seven national-level adolescent swimmers participatedin this study. All participants were recruited from the clubs that agreed to participatein the study. Seventy two participants were males (age: 16.28 ± 1.55 years, height:174.15 ± 7.89 cm, weight: 63.97 ± 6.51 kg, training/week: 6.75 ± 0.86 sessions, train-ing time/day: 126 ± 26.39 min), and 55 were females (age: 15.29 ± 1.28 years, height:163.03 ± 7.19 cm, weight: 52.72 ± 5.48 kg, training/week: 6.52 ± 0.57 sessions, trainingtime/day: 115 ± 16.23 min) who met the following inclusion criteria: (i) do not have anyclinical history of upper limb disorders; (ii) compete at the national level; and (iii) havea minimum of 10 h of training per week. The main goals of the study were explainedto all participants and their legal guardians, who signed an informed consent allowingtheir participation. This research was approved by the ethics committee of the seedinginstitution. The research was undertaken in compliance with the Declaration of Helsinkiand the international principles governing research on humans and animals.
2.2. Procedures
Before the data collection, all participants completed a questionnaire that includedquestions on hand dominance, shoulder injury, pain, and swimming training frequency. Allsubjects performed a 5-min shoulder warm-up with articular mobility and resistance tubingwith the same directions used for testing. The IR and ER cuff strength data were collectedduring isometric actions performed with the microfet 2™ Digital Handheld Muscle Tester(Hoggan health, Draper, UT, USA), which is an accurate, portable Force Evaluation andTesting device, with a sample frequency of 10 sample/second. It is a modern adaptation
124
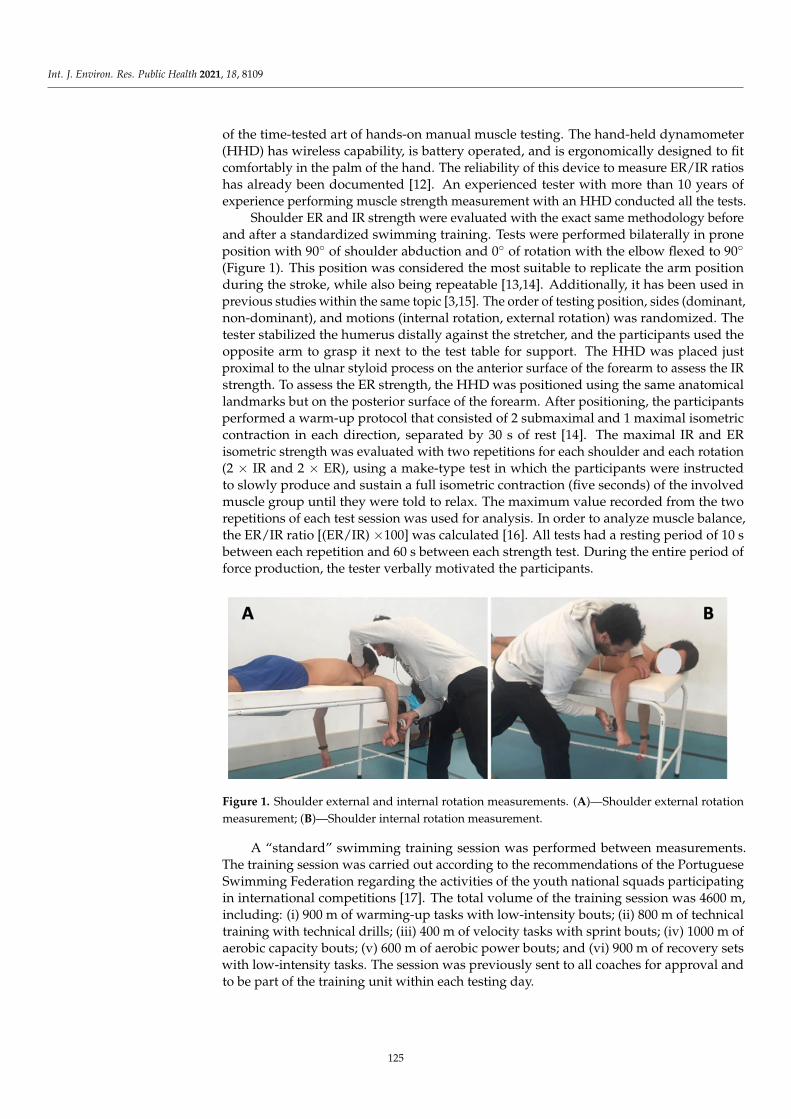
Int. J. Environ. Res. Public Health 2021, 18, 8109
of the time-tested art of hands-on manual muscle testing. The hand-held dynamometer(HHD) has wireless capability, is battery operated, and is ergonomically designed to fitcomfortably in the palm of the hand. The reliability of this device to measure ER/IR ratioshas already been documented [12]. An experienced tester with more than 10 years ofexperience performing muscle strength measurement with an HHD conducted all the tests.
Shoulder ER and IR strength were evaluated with the exact same methodology beforeand after a standardized swimming training. Tests were performed bilaterally in proneposition with 90◦ of shoulder abduction and 0◦ of rotation with the elbow flexed to 90◦
(Figure 1). This position was considered the most suitable to replicate the arm positionduring the stroke, while also being repeatable [13,14]. Additionally, it has been used inprevious studies within the same topic [3,15]. The order of testing position, sides (dominant,non-dominant), and motions (internal rotation, external rotation) was randomized. Thetester stabilized the humerus distally against the stretcher, and the participants used theopposite arm to grasp it next to the test table for support. The HHD was placed justproximal to the ulnar styloid process on the anterior surface of the forearm to assess the IRstrength. To assess the ER strength, the HHD was positioned using the same anatomicallandmarks but on the posterior surface of the forearm. After positioning, the participantsperformed a warm-up protocol that consisted of 2 submaximal and 1 maximal isometriccontraction in each direction, separated by 30 s of rest [14]. The maximal IR and ERisometric strength was evaluated with two repetitions for each shoulder and each rotation(2 × IR and 2 × ER), using a make-type test in which the participants were instructedto slowly produce and sustain a full isometric contraction (five seconds) of the involvedmuscle group until they were told to relax. The maximum value recorded from the tworepetitions of each test session was used for analysis. In order to analyze muscle balance,the ER/IR ratio [(ER/IR) ×100] was calculated [16]. All tests had a resting period of 10 sbetween each repetition and 60 s between each strength test. During the entire period offorce production, the tester verbally motivated the participants.
Int. J. Environ. Res. Public Health 2021, 18, 8109 3 of 9
collected during isometric actions performed with the microfet 2™ Digital Handheld Muscle Tester (Hoggan health, Draper, UT, USA), which is an accurate, portable Force Evaluation and Testing device, with a sample frequency of 10 sample/second. It is a mod-ern adaptation of the time-tested art of hands-on manual muscle testing. The hand-held dynamometer (HHD) has wireless capability, is battery operated, and is ergonomically designed to fit comfortably in the palm of the hand. The reliability of this device to meas-ure ER/IR ratios has already been documented [12]. An experienced tester with more than 10 years of experience performing muscle strength measurement with an HHD conducted all the tests.
Shoulder ER and IR strength were evaluated with the exact same methodology before and after a standardized swimming training. Tests were performed bilaterally in prone position with 90° of shoulder abduction and 0° of rotation with the elbow flexed to 90° (Figure 1). This position was considered the most suitable to replicate the arm position during the stroke, while also being repeatable [13,14]. Additionally, it has been used in previous studies within the same topic [3,15]. The order of testing position, sides (domi-nant, non-dominant), and motions (internal rotation, external rotation) was randomized. The tester stabilized the humerus distally against the stretcher, and the participants used the opposite arm to grasp it next to the test table for support. The HHD was placed just proximal to the ulnar styloid process on the anterior surface of the forearm to assess the IR strength. To assess the ER strength, the HHD was positioned using the same anatomical landmarks but on the posterior surface of the forearm. After positioning, the participants performed a warm-up protocol that consisted of 2 submaximal and 1 maximal isometric contraction in each direction, separated by 30 s of rest [14]. The maximal IR and ER iso-metric strength was evaluated with two repetitions for each shoulder and each rotation (2 × IR and 2 × ER), using a make-type test in which the participants were instructed to slowly produce and sustain a full isometric contraction (five seconds) of the involved muscle group until they were told to relax. The maximum value recorded from the two repetitions of each test session was used for analysis. In order to analyze muscle balance, the ER/IR ratio [(ER/IR) ×100] was calculated [16]. All tests had a resting period of 10 s between each repetition and 60 s between each strength test. During the entire period of force produc-tion, the tester verbally motivated the participants.
Figure 1. Shoulder external and internal rotation measurements. (A)—Shoulder external rotation measurement; (B)—Shoulder internal rotation measurement.
A “standard” swimming training session was performed between measurements. The training session was carried out according to the recommendations of the Portuguese Swimming Federation regarding the activities of the youth national squads participating in international competitions [17]. The total volume of the training session was 4600 m, including: (i) 900 m of warming-up tasks with low-intensity bouts; (ii) 800 m of technical training with technical drills; (iii) 400 m of velocity tasks with sprint bouts; (iv) 1000 m of aerobic capacity bouts; (v) 600 m of aerobic power bouts; and (vi) 900 m of recovery sets
Figure 1. Shoulder external and internal rotation measurements. (A)—Shoulder external rotation
measurement; (B)—Shoulder internal rotation measurement.
A “standard” swimming training session was performed between measurements.The training session was carried out according to the recommendations of the PortugueseSwimming Federation regarding the activities of the youth national squads participatingin international competitions [17]. The total volume of the training session was 4600 m,including: (i) 900 m of warming-up tasks with low-intensity bouts; (ii) 800 m of technicaltraining with technical drills; (iii) 400 m of velocity tasks with sprint bouts; (iv) 1000 m ofaerobic capacity bouts; (v) 600 m of aerobic power bouts; and (vi) 900 m of recovery setswith low-intensity tasks. The session was previously sent to all coaches for approval andto be part of the training unit within each testing day.
125
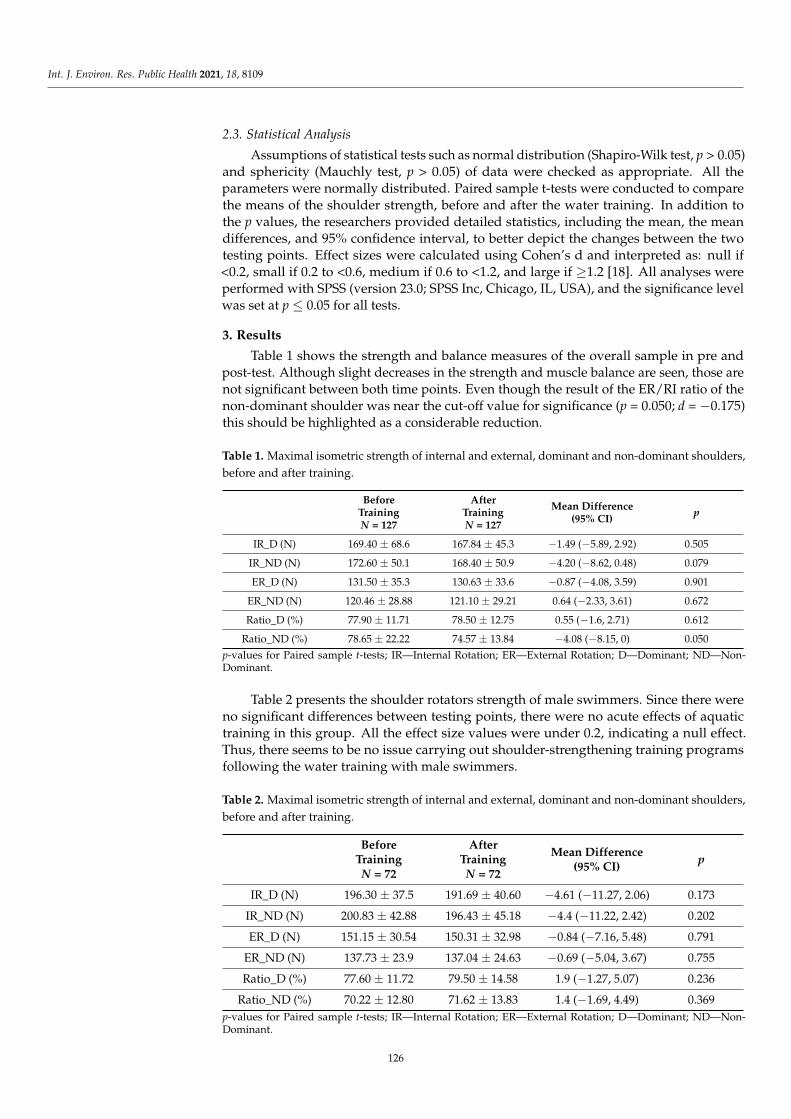
Int. J. Environ. Res. Public Health 2021, 18, 8109
2.3. Statistical Analysis
Assumptions of statistical tests such as normal distribution (Shapiro-Wilk test, p > 0.05)and sphericity (Mauchly test, p > 0.05) of data were checked as appropriate. All theparameters were normally distributed. Paired sample t-tests were conducted to comparethe means of the shoulder strength, before and after the water training. In addition tothe p values, the researchers provided detailed statistics, including the mean, the meandifferences, and 95% confidence interval, to better depict the changes between the twotesting points. Effect sizes were calculated using Cohen’s d and interpreted as: null if<0.2, small if 0.2 to <0.6, medium if 0.6 to <1.2, and large if ≥1.2 [18]. All analyses wereperformed with SPSS (version 23.0; SPSS Inc, Chicago, IL, USA), and the significance levelwas set at p ≤ 0.05 for all tests.
3. Results
Table 1 shows the strength and balance measures of the overall sample in pre andpost-test. Although slight decreases in the strength and muscle balance are seen, those arenot significant between both time points. Even though the result of the ER/RI ratio of thenon-dominant shoulder was near the cut-off value for significance (p = 0.050; d = −0.175)this should be highlighted as a considerable reduction.
Table 1. Maximal isometric strength of internal and external, dominant and non-dominant shoulders,
before and after training.
BeforeTrainingN = 127
AfterTrainingN = 127
Mean Difference(95% CI)
p
IR_D (N) 169.40 ± 68.6 167.84 ± 45.3 −1.49 (−5.89, 2.92) 0.505
IR_ND (N) 172.60 ± 50.1 168.40 ± 50.9 −4.20 (−8.62, 0.48) 0.079
ER_D (N) 131.50 ± 35.3 130.63 ± 33.6 −0.87 (−4.08, 3.59) 0.901
ER_ND (N) 120.46 ± 28.88 121.10 ± 29.21 0.64 (−2.33, 3.61) 0.672
Ratio_D (%) 77.90 ± 11.71 78.50 ± 12.75 0.55 (−1.6, 2.71) 0.612
Ratio_ND (%) 78.65 ± 22.22 74.57 ± 13.84 −4.08 (−8.15, 0) 0.050
p-values for Paired sample t-tests; IR—Internal Rotation; ER—External Rotation; D—Dominant; ND—Non-Dominant.
Table 2 presents the shoulder rotators strength of male swimmers. Since there wereno significant differences between testing points, there were no acute effects of aquatictraining in this group. All the effect size values were under 0.2, indicating a null effect.Thus, there seems to be no issue carrying out shoulder-strengthening training programsfollowing the water training with male swimmers.
Table 2. Maximal isometric strength of internal and external, dominant and non-dominant shoulders,
before and after training.
BeforeTrainingN = 72
AfterTrainingN = 72
Mean Difference(95% CI)
p
IR_D (N) 196.30 ± 37.5 191.69 ± 40.60 −4.61 (−11.27, 2.06) 0.173
IR_ND (N) 200.83 ± 42.88 196.43 ± 45.18 −4.4 (−11.22, 2.42) 0.202
ER_D (N) 151.15 ± 30.54 150.31 ± 32.98 −0.84 (−7.16, 5.48) 0.791
ER_ND (N) 137.73 ± 23.9 137.04 ± 24.63 −0.69 (−5.04, 3.67) 0.755
Ratio_D (%) 77.60 ± 11.72 79.50 ± 14.58 1.9 (−1.27, 5.07) 0.236
Ratio_ND (%) 70.22 ± 12.80 71.62 ± 13.83 1.4 (−1.69, 4.49) 0.369
p-values for Paired sample t-tests; IR—Internal Rotation; ER—External Rotation; D—Dominant; ND—Non-Dominant.
126
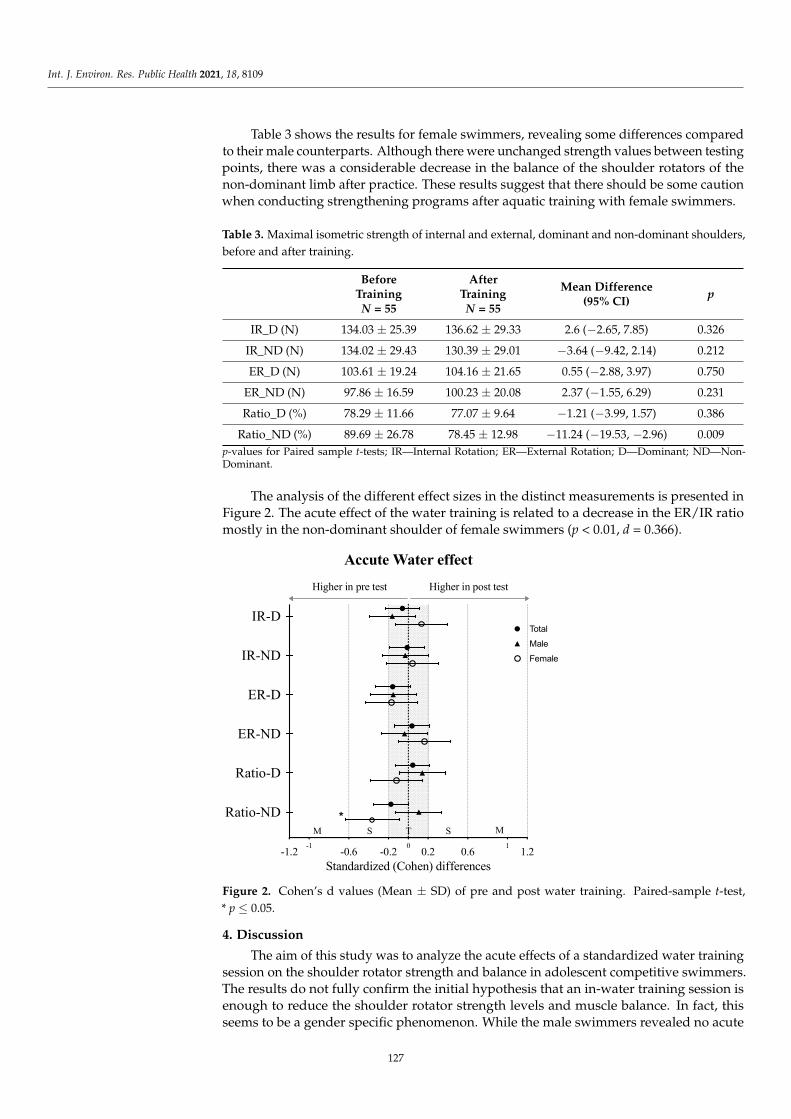
Int. J. Environ. Res. Public Health 2021, 18, 8109
Table 3 shows the results for female swimmers, revealing some differences comparedto their male counterparts. Although there were unchanged strength values between testingpoints, there was a considerable decrease in the balance of the shoulder rotators of thenon-dominant limb after practice. These results suggest that there should be some cautionwhen conducting strengthening programs after aquatic training with female swimmers.
Table 3. Maximal isometric strength of internal and external, dominant and non-dominant shoulders,
before and after training.
BeforeTrainingN = 55
AfterTrainingN = 55
Mean Difference(95% CI)
p
IR_D (N) 134.03 ± 25.39 136.62 ± 29.33 2.6 (−2.65, 7.85) 0.326
IR_ND (N) 134.02 ± 29.43 130.39 ± 29.01 −3.64 (−9.42, 2.14) 0.212
ER_D (N) 103.61 ± 19.24 104.16 ± 21.65 0.55 (−2.88, 3.97) 0.750
ER_ND (N) 97.86 ± 16.59 100.23 ± 20.08 2.37 (−1.55, 6.29) 0.231
Ratio_D (%) 78.29 ± 11.66 77.07 ± 9.64 −1.21 (−3.99, 1.57) 0.386
Ratio_ND (%) 89.69 ± 26.78 78.45 ± 12.98 −11.24 (−19.53, −2.96) 0.009
p-values for Paired sample t-tests; IR—Internal Rotation; ER—External Rotation; D—Dominant; ND—Non-Dominant.
The analysis of the different effect sizes in the distinct measurements is presented inFigure 2. The acute effect of the water training is related to a decrease in the ER/IR ratiomostly in the non-dominant shoulder of female swimmers (p < 0.01, d = 0.366).
Int. J. Environ. Res. Public Health 2021, 18, 8109 5 of 9
p-values for Paired sample t-tests; IR—Internal Rotation; ER—External Rotation; D—Dominant; ND—Non-Dominant.
Table 3 shows the results for female swimmers, revealing some differences compared to their male counterparts. Although there were unchanged strength values between test-ing points, there was a considerable decrease in the balance of the shoulder rotators of the non-dominant limb after practice. These results suggest that there should be some caution when conducting strengthening programs after aquatic training with female swimmers.
Table 3. Maximal isometric strength of internal and external, dominant and non-dominant shoul-ders, before and after training.
Before
Training N = 55
After Training
N = 55
Mean Difference (95% CI) p
IR_D (N) 134.03 ± 25.39 136.62 ± 29.33 2.6 (−2.65, 7.85) 0.326 IR_ND (N) 134.02 ± 29.43 130.39 ± 29.01 −3.64 (−9.42, 2.14) 0.212 ER_D (N) 103.61 ± 19.24 104.16 ± 21.65 0.55 (−2.88, 3.97) 0.750
ER_ND (N) 97.86 ± 16.59 100.23 ± 20.08 2.37 (−1.55, 6.29) 0.231 Ratio_D (%) 78.29 ± 11.66 77.07 ± 9.64 −1.21 (−3.99, 1.57) 0.386
Ratio_ND (%) 89.69 ± 26.78 78.45 ± 12.98 −11.24 (−19.53, −2.96) 0.009 p-values for Paired sample t-tests; IR—Internal Rotation; ER—External Rotation; D—Dominant; ND—Non-Dominant.
The analysis of the different effect sizes in the distinct measurements is presented in Figure 2. The acute effect of the water training is related to a decrease in the ER/IR ratio mostly in the non-dominant shoulder of female swimmers (p < 0.01, d = 0.366).
Figure 2. Cohen’s d values (Mean ± SD) of pre and post water training. Paired-sample t-test, * p ≤ 0.05.
-1 0 1-1.2 -0.6 -0.2 0.2 0.6 1.2
Ratio-ND
Ratio-D
ER-ND
ER-D
IR-ND
IR-D
Standardized (Cohen) differences
Accute Water effect
T
Higher in pre test Higher in post test
S MSM
FemaleMaleTotal
*
Figure 2. Cohen’s d values (Mean ± SD) of pre and post water training. Paired-sample t-test,
* p ≤ 0.05.
4. Discussion
The aim of this study was to analyze the acute effects of a standardized water trainingsession on the shoulder rotator strength and balance in adolescent competitive swimmers.The results do not fully confirm the initial hypothesis that an in-water training session isenough to reduce the shoulder rotator strength levels and muscle balance. In fact, thisseems to be a gender specific phenomenon. While the male swimmers revealed no acute
127
Int. J. Environ. Res. Public Health 2021, 18, 8109
effect after the water session, the female swimmers showed a significant increase in muscleimbalance in the non-dominant shoulder.
The comparative analysis of the strength levels between ER and IR is consistentin the total sample and between genders. This allows us to confirm that the musclegroups responsible for the internal rotation are in fact the strongest, and this is in linewith previous studies that included swimmers [3,9], athletes from other sports [6,19], andsedentary people [20]. This can be explained by the size and number of the muscles aroundthe glenohumeral joint. The muscular groups which produce the IR are not only greater innumber, but are also anatomically larger and naturally stronger than their antagonists [21].
Additionally, in relation to IR and ER strength, it is a fact that shoulder muscles fatigueinduces sensory motor perturbations that consequently alter the kinematics of the shoulderjoint, overloading different structures in order to maintain the level of performance [22].It is still unclear whether rotator cuff-specific muscle fatigue or general scapular musclefatigue has the greatest influence on upper limb malfunction; however, it is a fact thatthere is a difference in the behavior and reaction regarding muscle fatigue around theshoulder joint, IRs appearing to be more fatigue-resistant than ERs in both physically-active people [23] and sedentary ones [20]. Our results do not fully support this statementsince, in general, the IR strength values showed greater reductions compared to the ER,although with no significant values. In the analysis of the total sample results (Table 1),we can see that, despite there being no significant differences between the pre and postaquatic training, the reductions in the IRs strength levels are higher than those of the ERs(in the non-dominant shoulder there was no reduction). These results may point out that,contrary to what happens in other sports, swimming induces a greater degree of fatiguein the IR, which can be explained by the predominant internal-rotator forces that occurduring pull-out and recovery [24]. During all stroke phases, the subscapularis muscle isalways active, stabilizing the glenohumeral joint, because of the repetitive internal rotatorforces [25]. It should be emphasized that IRs strength deficits may affect stroke dynamicsand should be considered an important injury risk factor for swimmers [26].
When analyzing the results of the ER and IR strength values by gender, there was noacute effect in any of the variables after performing the aquatic training, but it showedsome specific trends. In male swimmers, the strength values slightly decreased in thepost-test, mostly in the IRs. Contrarily, in females, there was only a reduction in the IRvalues for the non-dominant shoulder, which can be seen as an alarming cue. Overall,the results for both genders are in agreement with the study by Matthews et al. [27]. Theauthors reported no significant strength differences between pre- and post-fatigue in theinternal and external rotators of both shoulders. The changes were exclusively reductionsin the stroke length, and in the IR and ER range of motion on both shoulders. Morerecently, Yoma et al. [24] observed that shoulder rotation isometric peak torque decreasedimmediately after a high-intensity training session but remained unchanged after a low-intensity session. These results highlight the importance of evaluating the strength valuesof the shoulder rotators, while controlling the training intensity. In this study, we didnot perform an effective control of intensity, so no conclusions can be drawn. However,considering the characteristics of the swimming tasks (pointing to a medium/low intensityeffort), we may argue that the intensity was not enough to induce fatigue as it happened inprevious studies.
Regarding the shoulder rotators balance (ER/IR ratios), numerous studies reportedthat swimmers had greater IRs strength because of the repetitive concentric actions requiredduring the propulsive phases of the swimming strokes [3,7]. In contrast, ER strength isweaker, which often leads to shoulder muscle imbalances. The ER/IR ratio assessmentcan be a useful measure to identify muscle imbalances in the swimmers’ shoulders, andit is also associated with shoulder injuries [28], and scapular dyskinesis [29]. Previousnormative data consider ER/IR ratios between 66 and 75% to be adequate [28,30]. Val-ues below this threshold are commonly associated with muscle imbalance and instabilityin the glenohumeral joint [23]. In this study, the ER/IR ratios are within the consid-
128

Int. J. Environ. Res. Public Health 2021, 18, 8109
ered normal standards for a healthy joint [28,30], varying between 70.22% ± 12.80% and79.50% ± 14.58% in male swimmers, and between 77.07% ± 9.64% and 89.69 ± 26.78%in female swimmers in pre- and post-tests. In addition, these results are in line withprevious studies that included swimmers [12], in which the authors carried out a relia-bility study, with the same evaluation technique, with ratios between 78.71% ± 9.36 and81.81% ± 10.24%. The similarity of the results remained when compared to the studyby Batalha et al. [9], but in this case the authors evaluated swimmers with an isokineticdynamometer. The ratios were between 72.31% ± 15.66% and 77.37% ± 16.40%. On theother hand, Riemann et al. [14], in order to compare different evaluation positions with ahandheld dynamometer, used a position and methodology similar to the one used in thecurrent study. The ER/IR ratios presented were considerably higher (between 90% and92% in boys, and 98 and 99% in girls). However, the sample was composed of healthynon-sports individuals, which may prove that swimmers have greater shoulder muscleimbalances when compared to non-sports individuals [20].
When we analyze the results of the ER/IR ratios, we can see that in male swimmersthere was no acute effect of aquatic training on the shoulder rotators balance, since theratio values are practically identical in pre- and post-training. In female swimmers, therewas a slight reduction in the ratio in the dominant limb, although without a significantresult. However, in the non-dominant shoulder there was a considerable acute effectof the water training (p = 0.009; d = 0.366). While this significant reduction is withinthe normal thresholds [30], coaches must be aware of it. Since the muscular strengthbalance between agonist and antagonist muscles is crucial for joint stability and ensures adynamic centralization of the humeral head [29], this can be even more compromised if astrengthening training is to be implemented after a swim session.
Some limitations should be considered for further discussion: (i) no strict control of thetraining intensity may have compromised the strength response from swimmers; althoughthe session was carefully planned, the effort during each training task was dependent onthe athlete (ii) the assessment of strength deficits after the swimming practice was limitedto the shoulder group, not allowing the study of those effects in other muscles in action.
5. Conclusions
The results of this study indicate that a single practice seems not to affect shouldersstrength and balance of adolescent swimmers, but this can be a gender specific phenomenon.While a muscle-strengthening workout after the water session may be appropriate for males,this can be questionable for females, since the shoulder rotators’ muscular balance, mostlyof the non-dominant limbs, was compromised after training.
We believe these results have important practical implications for swimmers andcoaches. In fact, swimming coaches should be careful if they intend to carry out shoulder-strengthening programs immediately after swim practice. It should be important to identifydeficits in post swim rotation strength, serving as a practical way to reduce the athlete’ssusceptibility to shoulder injury. In addition, an individualized regular exercise program toimprove shoulder rotation strength should be performed to minimize the post swimmingadaptations. Finally, we believe that if swimming coaches regularly assess strength levels,they can easily find a method to check individual trends and see who will be able or not tomaintain the strengthening workouts after the water training sessions.
Author Contributions: Conceptualization, N.B., J.A.P. and D.A.M.; methodology, N.B., A.C. and H.L.;
software, M.J.C.; validation, N.B. and A.J.S.; formal analysis, N.B., J.A.P. and D.A.M.; investigation,
N.B. and M.J.C.; resources, N.B., A.C. and H.L.; data curation, N.B. and A.J.S.; writing—original
draft preparation, N.B., D.A.M. and M.J.C.; writing—review and editing, N.B., D.A.M. and M.J.C.;
visualization, J.A.P.; supervision, N.B., M.J.C. and D.A.M.; project administration, N.B.; funding
acquisition, N.B., J.A.P. and M.J.C. All authors have read and agreed to the published version of
the manuscript.
129
Int. J. Environ. Res. Public Health 2021, 18, 8109
Funding: The present publication was funded by Fundação Ciência e Tecnologia, IP national sup-
port through CHRC (UIDP/04923/2020). The English proofreading was funded by the project
UIDB/04045/2020.
Institutional Review Board Statement: The study was conducted according with the guidelines of
the Declaration of Helsinki and approved by the Institutional Ethics Committee of the University of
Évora (proceeding 16019/2016).
Informed Consent Statement: Informed consent was obtained from all subjects involved in the
study. Written informed consent has been obtained from the patient(s) to publish this paper.
Data Availability Statement: The data presented in this study are available on request from the
corresponding author. The data are not publicly available due to privacy restrictions.
Acknowledgments: The authors would like to thank all clubs, coaches, and swimmers who were
available to participate in this study.
Conflicts of Interest: The authors declare no conflict of interest.
References
1. Boettcher, C.E.; Cathers, I.; Ginn, K.A. The role of shoulder muscles is task specific. J. Sci. Med. Sport 2010, 13, 651–656. [CrossRef]
[PubMed]
2. Kluemper, M.; Uhl, T.; Hazelrigg, H. Effect of stretching and strengthening shoulder muscles on forward shoulder posture in
competitive swimmers. J. Sport Rehabil. 2006, 15, 58–70. [CrossRef]
3. Sawdon-Bea, J.; Benson, J. The Effects of a 6-Week Dry Land Exercise Program for High School Swimmers. J. Phys. Educ. SportsManag. 2015, 2, 1–17. [CrossRef]
4. Batalha, N.M.; Raimundo, A.M.; Tomas-Carus, P.; Marques, M.A.; Silva, A.J. Does an in-season detraining period affect the
shoulder rotator cuff strength and balance of young swimmers? J. Strength Cond. Res. 2014, 28, 2054–2062. [CrossRef] [PubMed]
5. Feijen, S.; Tate, A.; Kuppens, K.; Claes, A.; Struyf, F. Swim-Training Volume and Shoulder Pain Across the Life Span of the
Competitive Swimmer: A Systematic Review. J. Athl. Train. 2020, 55, 32–41. [CrossRef]
6. Byram, I.R.; Bushnell, B.D.; Dugger, K.; Charron, K.; Harrell, F.E.; Noonan, T.J. Preseason Shoulder Strength Measurements in
Professional Baseball Pitchers Identifying Players at Risk for Injury. Am. J. Sports Med. 2010, 38, 1375–1382. [CrossRef]
7. Batalha, N.; Marmeleira, J.; Garrido, N.; Silva, A.J. Does a water-training macrocycle really create imbalances in swimmers’
shoulder rotator muscles? Eur. J. Sport Sci. 2015, 15, 167–172. [CrossRef] [PubMed]
8. Batalha, N.; Dias, S.; Marinho, D.A.; Parraca, J.A. The Effectiveness of Land and Water Based Resistance Training on Shoulder
Rotator Cuff Strength and Balance of Youth Swimmers. J. Hum. Kinet. 2018, 62, 91–102. [CrossRef]
9. Batalha, N.; Paixao, C.; Silva, A.J.; Costa, M.J.; Mullen, J.; Barbosa, T.M. The Effectiveness of a Dry-Land Shoulder Rotators
Strength Training Program in Injury Prevention in Competitive Swimmers. J. Hum. Kinet. 2020, 71, 11–20. [CrossRef] [PubMed]
10. Roy, J.S.; Ma, B.; Macdermid, J.C.; Woodhouse, L.J. Shoulder muscle endurance: The development of a standardized and reliable
protocol. Sports Med. Arthrosc. Rehabil. Ther. Technol. 2011, 3, 1–14. [CrossRef]
11. Ebaugh, D.D.; McClure, P.W.; Karduna, A.R. Effects of shoulder muscle fatigue caused by repetitive overhead activities on
scapulothoracic and glenohumeral kinematics. J. Electromyogr. Kinesiol. 2006, 16, 224–235. [CrossRef]
12. Conceicao, A.; Parraca, J.; Marinho, D.; Costa, M.; Louro, H.; Silva, A.; Batalha, N. Assessment of isometric strength of the
shoulder rotators in swimmers using a handheld dynamometer: A reliability study. Acta Bioeng. Biomech. 2018, 20, 113–119.
[CrossRef]
13. Cools, A.M.J.; Vanderstukken, F.; Vereecken, F.; Duprez, M.; Heyman, K.; Goethals, N.; Johansson, F. Eccentric and isometric
shoulder rotator cuff strength testing using a hand-held dynamometer: Reference values for overhead athletes. Knee Surg. SportsTraumatol. Arthrosc. 2016, 24, 3838–3847. [CrossRef] [PubMed]
14. Riemann, B.L.; Davies, G.J.; Ludwig, L.; Gardenhour, H. Hand-held dynamometer testing of the internal and external rotator
musculature based on selected positions to establish normative data and unilateral ratios. J. Shoulder Elb. Surg. 2010, 19, 1175–1183.
[CrossRef] [PubMed]
15. Ramsi, M.; Swanik, K.A.; Swanik, C.B.; Straub, S.; Mattacola, C. Shoulder-rotator strength of high school swimmers over the
course of a competitive season. J. Sport Rehabil. 2004, 13, 9–18. [CrossRef]
16. Wang, H.K.; Cochrane, T. Mobility impairment, muscle imbalance, muscle weakness, scapular asymmetry and shoulder injury in
elite volleyball athletes. J. Sports Med. Phys. Fit. 2001, 41, 403–410.
17. Marinho, D.; Machado, J.; Silva, A. Política Desportiva FPN–Natação Pura. Identificação E Desenvolvimento Do Talento Em Natação;
Federação Portuguesa de Natação: Lisboa, Portugal, 2020.
18. Cohen, J. Statistical Power Analysis for the Behavioral-Sciences, 2nd ed.; Academic Press: New York, NY, USA, 1988.
19. Pontaga, I. Shoulder external/internal rotation peak torques ratio side-asymmetry, mean work and power ratios balance
worsening due to different fatigue resistance of the rotator muscles in male handball players. MLTJ 2018, 8, 513–519. [CrossRef]
130
Int. J. Environ. Res. Public Health 2021, 18, 8109
20. Forthomme, B.; Dvir, Z.; Crielaard, J.M.; Croisier, J.L. Isokinetic assessment of the shoulder rotators: A study of optimal test
position. Clin. Physiol. Funct. Imaging 2011, 31, 227–232. [CrossRef]
21. Dark, A.; Ginn, K.A.; Halaki, M. Shoulder muscle recruitment patterns during commonly used rotator cuff exercises: An
electromyographic study. Phys. Ther. 2007, 87, 1039–1046. [CrossRef]
22. Stackhouse, S.K.; Stapleton, M.R.; Wagner, D.A.; McClure, P.W. Voluntary activation of the infraspinatus muscle in nonfatigued
and fatigued states. J. Shoulder Elb. Surg. 2010, 19, 224–229. [CrossRef] [PubMed]
23. Ellenbecker, T.S.; Roetert, E.P. Testing isokinetic muscular fatigue of shoulder internal and external rotation in elite junior tennis
players. J. Orthop. Sports Phys. Ther. 1999, 29, 275–281. [CrossRef] [PubMed]
24. Yoma, M.; Herrington, L.; Mackenzie, T.A.; Almond, T.A. Training Intensity and Shoulder Musculoskeletal Physical Quality
Responses in Competitive Swimmers. J. Athl. Train. 2021, 56, 54–63. [CrossRef] [PubMed]
25. Pink, M.; Perry, J.; Browne, A.; Scovazzo, M.L.; Kerrigan, J. The normal shoulder during freestyle swimming. An electromyo-
graphic and cinematographic analysis of twelve muscles. Am. J. Sports Med. 1991, 19, 569–576. [CrossRef]
26. Tate, A.; Turner, G.N.; Knab, S.E.; Jorgensen, C.; Strittmatter, A.; Michener, L.A. Risk factors associated with shoulder pain and
disability across the lifespan of competitive swimmers. J. Athl. Train. 2012, 47, 149–158. [CrossRef]
27. Matthews, M.J.; Green, D.; Matthews, H.; Swanwick, E. The effects of swimming fatigue on shoulder strength, range of motion,
joint control, and performance in swimmers. Phys. Ther. Sport 2017, 23, 118–122. [CrossRef]
28. Ellenbecker, T.S.; Davies, G.J. The application of isokinetics in testing and rehabilitation of the shoulder complex. J. Athl. Train.2000, 35, 338–350. [PubMed]
29. Madsen, P.H.; Bak, K.; Jensen, S.; Welter, U. Training induces scapular dyskinesis in pain-free competitive swimmers: A reliability
and observational study. Clin. J. Sport Med. 2011, 21, 109–113. [CrossRef] [PubMed]
30. Van Cingel, R.; Kleinrensink, G.J.; Mulder, P.; De Bie, R.; Kuipers, H. Isokinetic strength values, conventional ratio and dynamic
control ratio of shoulder rotator muscles in elite badminton players. Isokinet. Exerc. Sci. 2007, 15, 287–293. [CrossRef]
131

International Journal of
Environmental Research
and Public Health
Review
Effects on Strength, Power and Speed Execution Using ExerciseBalls, Semi-Sphere Balance Balls and Suspension TrainingDevices: A Systematic Review
Moisés Marquina , Jorge Lorenzo-Calvo * , Jesús Rivilla-García , Abraham García-Aliaga and
Ignacio Refoyo Román
�����������������
Citation: Marquina, M.;
Lorenzo-Calvo, J.; Rivilla-García, J.;
García-Aliaga, A.; Refoyo Román, I.
Effects on Strength, Power and Speed
Execution Using Exercise Balls,
Semi-Sphere Balance Balls and
Suspension Training Devices: A
Systematic Review. Int. J. Environ.
Res. Public Health 2021, 18, 1026.
https://doi.org/10.3390/ijerph
18031026
Academic Editors: Bruno Gonçalves,
Hugo Folgado, Jorge Bravo and
Pantelis T. Nikolaidis
Received: 26 November 2020
Accepted: 21 January 2021
Published: 24 January 2021
Publisher’s Note: MDPI stays neutral
with regard to jurisdictional claims in
published maps and institutional affil-
iations.
Copyright: © 2021 by the authors.
Licensee MDPI, Basel, Switzerland.
This article is an open access article
distributed under the terms and
conditions of the Creative Commons
Attribution (CC BY) license (https://
creativecommons.org/licenses/by/
4.0/).
Facultad de Ciencias de la Actividad Física y del Deporte (INEF—Sports Department), Universidad Politécnica
de Madrid, 28040 Madrid, Spain; [email protected] (M.M.); [email protected] (J.R.-G.);
[email protected] (A.G.-A.); [email protected] (I.R.R.)
* Correspondence: [email protected]; Tel.: +34-910-678-023
Abstract: Research in instability has focused on the analysis of muscle activation. The aim of this
systematic review was to analyse the effects of unstable devices on speed, strength and muscle power
measurements administered in the form of controlled trials to healthy individuals in adulthood. A
computerized systematic literature search was performed through electronic databases. According to
the criteria for preparing systematic reviews PRISMA, nine studies met the inclusion criteria. The
quality of the selected studies was evaluated using STROBE. The average score was 14.3 points,
and the highest scores were located in ‘Introduction’ (100%) and ‘Discussion’ (80%). There is great
heterogeneity in terms of performance variables. However, instability seems to affect these variables
negatively. The strength variable was affected to a greater degree, but with intensities near to the
1RM, no differences are observed. As for power, a greater number of repetitions seems to benefit
the production of this variable in instability in the upper limb. Instability, in comparison to a
stable condition, decreases the parameters of strength, power, and muscular speed in adults. The
differences shown are quite significant in most situations although slight decreases can be seen in
certain situations.
Keywords: instability; resistance training; exercise ball; suspension training; performance
1. Introduction
Strength training under unstable conditions, as well as destabilizing devices, havegained popularity in the last decade for athletes in order to strengthen core muscles, im-prove balance, proprioception and increase performance [1–4]. Muscle power is consideredto be one of the main determinants of many short-term explosive sporting events [5].Power has been defined by different authors throughout history. Bompa [6], defined mus-cle power as the ability to perform different actions, developing maximum strength in ashort period. For this reason, power is a manifestation of the strength that most athletes indifferent disciplines consider to be of greater importance for the development of certainmovements [7–12].
A potential reason for similar training-induced adaptations observed after unstablesituations compared to stable ones could be related to similar or even higher levels of mus-cle activation in favour of unstable conditions [13,14]. In the case of the evidence shownconcerning the use of unstable situations concerning strength, power and speed, maximumtests have been used to evaluate muscle strength; and tests to determine muscle power (i.e.,abdominal power test, medicine ball throwing and different types of jumps) [15–20]. How-ever, current results indicate that at least for non-elite athletes, there is a stress/strength andpower training intensity pathway that is sufficient to induce positive training adaptations.In their review, Behm and Colado [21] reported that the average strength deficit in unstable
133

Int. J. Environ. Res. Public Health 2021, 18, 1026
situations compared to similar stable exercises was 29%. Furthermore, in healthy youngadults, strength training with low loads compared to high loads is equally effective whenimproving muscle strength [22,23].
Because sport is not usually practised under stable conditions, such as throws, jumps,changes of direction, where the body must be stabilized while a specific action is beingperformed, training should try to represent the requirements of the specific sport [24–27].Also, training under unstable conditions or unbalanced conditions can resemble trainingand daily activities, providing effective transference [1]. The use of unstable traininghas been proposed to improve movement specific effect through increased activation ofstabilizers and core muscles [14,25,27].
Although initially unstable surface training was reserved for rehabilitation and pre-vention programs to reduce the rate of injury, due to the proprioceptive overload theyprovide [28–31] this type of training is now included in strength and conditioning pro-grams [10,32–34]. Currently, the use of these devices has been incorporated into traditionalexercises to promote neuromuscular coordination and recruitment but there is contro-versy regarding the effects of this combination on sports performance and core stabilityactivation [27,35].
There are various ways of generating instability in the performance of exercises butthe most common has been through the use of different devices [36–39]. The use of unstabledevices in strength training has led to the development of numerous investigations focusedon the analysis of muscle activation [40–46]. Nowadays, the use of different trainingmethods that retain the stabilising capacity of athletes has become a common and frequentpractice. The use of specific devices to create unstable environments, such as exercise orSwiss ball [47], the semi-sphere balance balls, like BOSU [48] and the suspension devices,like TRX [49] have been widely used in sports centres and are widely used throughout thepopulation. Therefore, this review has focused on testing the use of these types of devicesand not others, to clarify their influence on sports performance.
1.1. Swiss Balls or Exercise Balls
Swiss ball are air-filled balls covered with soft elastic material with a diameter ofapproximately 35 to 85 cm [47]. The use of unstable surfaces, such as the exercise ball,began to be used in strength and muscle conditioning training as a method of strengtheningcore, stabilizing muscles, that is the musculature with a deep location which is responsiblefor a good body posture both in our daily life and in the practice of sports [36,50–52]. Theresponse of muscle activity to this unstable surface can be variable and depends on the typeof exercise or muscles being tested. Patterns of muscle activation during bench presses havereported variable results based on muscle function. In the stabilising or core muscles, it hasbeen shown that there is an increase in the activation of the internal obliques, the externalobliques and the rectus abdominis [25,53–56] and spinal erectors [56] while having minimaleffect on the rectus abdominis [13,56]. In the upper extremities, compared with a stablebench press, a greater increase in anterior deltoid, pectoralis major, triceps and serratusanterior activity has been demonstrated during execution on a stability ball [30,51,55,57–59].However, improvement in muscle activation has not always been evident. In the case ofthe central or stabilising muscles, other studies have not shown any change in the obliqueand internal spinal erectors [60]. In addition, other studies have shown higher data forthe stable condition as opposed to the unstable condition, in the main motor musculatureresponsible for movement, as in the case of the pectorals and triceps in the bench press [43],or no main motor muscle in the shoulder press [59].
1.2. Semi-Sphere of Balance
The BOSU Balance Trainer ® (DW Fitness, LLC, Clifton, NJ, USA), or “both sidesup” is an exercise device used to improve balance, core muscle or torso strength, andproprioception created for military service veterans [61]. The flat part of the device is a25-inch platform with two built-in handles, and the other part is an inflatable rubber dome
134

Int. J. Environ. Res. Public Health 2021, 18, 1026
that rises about one foot above the ground. Each side can be used in different ways tocreate different situations depending on the exercise.
Different studies have analyzed the influence of the semi-sphere ball for training,providing a great variety of results. Authors found increased muscle activity in the rec-tus abdominis and external oblique in the performance of abdominal plates and glutealbridge [53]. Anderson and Behm [14] reported increased EMG activity in the vast lat-eral, soleus and superficial trunk muscles, but not in the femoral biceps when comparingsquatting with free weight on a stable versus an unstable surface. In bench press, greateractivation of the internal oblique, spinal erector, soleus and biceps femoris was also evi-dent [56]. However, Willardson et al. [35] compared EMG activity in the core performing50% of 1RM in squats on a stable surface and in a semi-sphere ball and observed no dif-ferences between conditions. Authors examined the activity of the brachial triceps, spinalerector, rectus abdominis, internal oblique, and soleus while performing traditional andunstable bending in a single (hands or feet on the unstable surface) or dual (both handsand feet on the unstable surface) instability and found that the dual condition caused thehighest percentage of change (>150%) for all muscles analyzed; compared with the otherconditions [62].
1.3. Suspension Training Devices
A new method available to increase muscle activation is suspension training. Thistype of training uses the principles of body weight and strength boosting to improve motorunit recruitment [63]. The most applied suspension device is the TRX Home SuspensionTraining Kit (Fitness Anywhere LLC, San Francisco, CA, USA). In suspension training, aspecific device is required to create an unstable condition. This method uses a system ofstraps with handles on the bottom and which are attached to a single anchor point [64].Among the different strength training possibilities, suspension training is widely appliedin various contexts. It is considered an effective technique for improving neuromuscularactivation that precedes the use of heavy loads in traditional exercises [65]. Besides,improvements in speed and strength indicators have been found by the use of suspensiontraining, suggesting increased recruitment of core/stabilizing muscles [66].
Regarding evidence from suspension devices, the effects of usage on both lower bodymuscle activity [41,67,68] and trunk stabilizing muscle [65,69–71] have been investigated.Clear evidence has been established regarding these devices that witnessed increasedmuscle activation in the stabilizing and synergistic muscles when performing exercisesunder these conditions [65,69,71,72]. Concerning lower body exercises, very high activa-tion has been shown for the femoral and semitendinous biceps (>90% MVIC) [68], thehamstring, the gluteus maximus, the gluteus medius and the long adductor. Althoughno significant differences were found in the rectus femoris [41,67]. Also for the Bulgariansquat exercise, no difference in muscle activation was found between the stable and thesuspended condition [64]. For the exercises of the upper part of the trunk and the stabilisingmuscles, they have been studied with the performance of the Push-up exercise. It hasbeen shown that greater muscular activation in the core, rectus abdominis and externaloblique muscles [69,73], however, the stable situation reported greater activation for thepectoral and deltoid muscles [65,69,71] the brachial triceps [65] and the clavicular portionof the pectoralis [71]. However, for the frontal plate exercise, Byrne et al. [70] reported nosignificant differences when studying exercise with suspension devices.
Research has focused on the analysis of muscle activation, determining differentconsiderations, claiming their strengths and weaknesses. However, when the trainingobjective is hypertrophy, or gain in muscle mass, strength, or power, it has not beenrecommended that the exercises be carried out using unstable situations [5].
As mentioned earlier, muscle activation has been shown to improve the stabilisingmuscles and reduce the main motor muscles involved in performing the task, but it is notknown whether these activations can lead to improved performance.
135

Int. J. Environ. Res. Public Health 2021, 18, 1026
In terms of the choice of devices, the 3 devices have been widely used for bothrehabilitation, proprioception, and development of muscular capacity. With any one ofthem, there are numerous proposals for working on muscular strength, and all of themfocus on the argument of greater activation of the central or core muscles. In fact, the useof suspension devices alone cannot bring about an improvement in strength or power byitself, since one always works with one’s own body weight, without external loads thatincrease the intensity of the tasks to be carried out. Semi-spherical and exercise ball devicesare not only an implement that increases instability, but there are concrete references thatindicate that it could be a way to improve strength and power [30,43,59,74]. Although itcould have certain limitations, therefore it has been decided to include it, to be able toevaluate all devices and tools that generate instability to a greater or lesser degree.
Therefore, a synthesis of the literature seems necessary to determine whether per-forming exercises with unstable material provides additional effects on measures of speed,strength and muscle power compared to stable execution. The existing controversy re-garding the use and results provided by instability training, and the variability of surfaces,devices, instability positions, samples and exercises generated a heterogeneity of resultsthat makes this review necessary. The aim of this systematic review was to provide ascientifically based study regarding the effects of unstable devices on speed, strengthand muscle power measurements administered in the form of controlled trials to healthyindividuals in adulthood, apart from muscular activation. It is hypothesized that unstabledevices produce similar or not excessively inferior performance improvements to stableconditions because performance with instability is very demanding on the neuromuscularsystem (i.e., additional stability of joints and posture during exercise is required).
2. Materials and Methods
The present research was designed to qualitatively synthesize the available scientificevidence concerning the effect of instability in strength, power, and speed training. Thestages of the review procedure and subsequent analysis of the original articles stayedwithin the guidelines set out in the Preferred Reporting Items for Systematic Reviews andMeta-Analysis (PRISMA) [75] checklist and the Population, Interventions, Comparisons,Outcomes and Study Design (PICOS) question model for the definition of inclusion criteria.
2.1. Study Selection and Eligibility Criteria
Primary and original studies to evaluate the strength, power or execution speedin instability were included. Furthermore, studies had to have been published in anylanguage, in peer-reviewed journals with an impact factor included in the Journal CitationReports of the Web of Science (JCR of WoS) or Scimago Journal & Country Rank (SJR ofScopus) until November 2020.
According to the ‘PICOS’ question model, the inclusion criteria were: (1) ‘Population’:physically active and healthy participants (both men and women) between 18 and 65 years.This age range includes all participants considered to be of adult age; (2) ‘Intervention’:acute training effects on strength, power and/or speed of execution using a Swiss ball, semi-sphere ball or suspension devices; (3) ‘Comparison’: differences in tasks multi-articularupper or lower limb between the execution of exercises in stable conditions and executionin unstable situations; (4) ‘Outcomes’: at least one strength, power and/or speed resulthad to be reported in the study; (5) ‘Study Design’: descriptive and quasi-experimentalresearch based on a comparison between stable and unstable situations.
The exclusion criteria were: (1) the studies were for intervention periods, randomizedcontrol trials, and clinical trials; (2) they included patients or persons with disease or injury;(3) any data about muscle activation, because it is not a performance variable; (4) thesubjects were not of adult age (under 18; e.g., children and adolescents and over 65’s asthe elderly) (5) the chronic effects of the situations under investigation were assessed; (6)Any other type of unstable device other than Swiss ball, semi-sphere ball or suspensiondevices, because these are the most frequently used devices; (7) any measurement that
136

Int. J. Environ. Res. Public Health 2021, 18, 1026
includes unilateral exercises or with different types of support such as exercises executedin a monopodal position.
2.2. Literature Search
A systematic computerized literature search of the Web of Science, PubMed and EB-SCOhost with full text was conducted until November 2020 to capture all relevant articlesinvestigating the effectiveness of instability versus stability. The following Boolean searchstrategy was applied using the operators ‘AND’, ‘OR’ and ‘NOT’: (‘instability resistancetraining’ OR ‘instability strength training’ OR ‘free-weight training’ OR ‘suspension train-ing’ OR ‘unstable devices’) AND (‘power’ OR ‘power performance’ OR ‘speed’) AND(‘strength’ OR ‘muscle strength’ OR ‘muscle power’ OR ‘muscular power’) NOT (‘naturalsurfaces’) AND (‘stability balls’ OR ‘bosu’ OR ‘suspension devices’ OR ‘unstable devices’).The unrestricted language search was limited to the human species and the availabilityof the full text of original articles reporting on a quasi-experimental trial in an academicjournal. Also, we checked the reference lists of each included article and reviewed relevantreview articles to identify additional studies suitable for inclusion in the database.
2.3. Systematic Review Protocol
The authors worked separately and independently to ensure the reliability of theprocess and the suitable eligibility of the studies. According to the criteria for prepar-ing systematic reviews “Preferred Reporting Items for Systematic Reviews and Meta-Analysis”—PRISMA [75], the protocol carried out in the months of July, August andSeptember 2020 and it was made up of four stages (Figure 1): (1) Identification: the firstauthor (M.M.) found 167 studies in the four digital databases; (2) Screening: the firstauthor (M.M.) eliminated the duplicate files (n = 8) and excluded those considered notrelevant through a previous reading of the title, abstract and keywords (n = 90). Further-more, the first author (M.M.), jointly with the second (J.L.C.) and third (J.R.G.), rejectedthe studies linked to the instability according to the exclusion criteria through a full-textreading (n = 55); (3) Eligibility: the first (M.M.), second (J.L.C.) and third author (J.R.G.)eliminated full-text studies from the selection process by the eligibility criteria (n = 45); (4)Inclusion: the remaining studies (n = 8) based on the relationship between the execution ofthe exercises in a stable condition and their execution in an unstable condition were finallyconsidered. An additional article was identified from the reference lists of included papersand review articles already published [24,63,76,77].
2.4. Data Extraction and Management
A standardized form was used to extract data from the studies included in the reviewfor assessment study quality and scientific evidence. Thus, information about (A) ‘authorsand year of publication’, (B) ‘sample experience’ (C) ‘sample size and sex’ (number ofplayers, sex), (D) ‘sample characteristics’ (age, height and weight), (E) ‘variable measured’(strength, power and/or speed), (F) ‘type of exercise’ (G) ‘number of situations’ whetherthe tasks were executed by comparing only the stable condition vs. the unstable conditionor whether more variations were included), (H) ‘device’ (unstable device implemented),(I) ‘training volume’ (number of sets/repeats/rest per exercise), (J) ‘intensity’ (percentageof one maximum repetition (1RM)), (K) ‘strength results’ (maximum strength (e.g., 1RM),mean strength), (L) ‘power results’ (maximum power, mean power and concentric phasepower) and (M) ‘speed results’ (maximum and mean speed) were collected. The resultsdata reflect the percentage of decrease or increase in instability concerning stability. If theincluded studies did not report the results (i.e., means and standard deviations) of thepre-and post-tests, the authors of those studies were contacted.
137

Int. J. Environ. Res. Public Health 2021, 18, 1026
nce. Thus, information about (A) ‘authors and year of publication’, (B) ‘sample experience’ (C) ‘sample ’ (number of
), (D) ‘sample ’ (age, height and weight), (E) ‘variable measured’ F) ‘type of exercise’ (G) ‘number of ’ whether
or whether more variations were included), (H) ‘device’ (unstable device implemented),(I) ‘training volume’ (number of sets/repeats/rest per exercise), (J) ‘intensity’ (percentage of one maximum repetition (1RM)), (K) ‘strength results’ (maximum strength (e.g.mean strength), (L) ‘power results’ (maximum power, mean power and concentric phase
M) ‘speed results’ (maximum and mean speed) were collected. The results
strengthening the reporting of observational studies in epidemiology “STROBE”
–
Figure 1. Flow chart illustrating the different phases of search and survey selection.
2.5. Study Quality Assessment
The quality of all eligible cross-sectional studies was evaluated using the criteria forstrengthening the reporting of observational studies in epidemiology “STROBE” [78]. Thefollowing scale was used to rate the quality of studies: (a) good quality (>14 points, lowrisk of major or minor bias), (b) acceptable quality (7–4 points, moderate risk of majorbias), and (c) poor quality (<7 points, high risk of major bias). The score was obtainedthrough the 22 points on the STROBE checklist. Two independent reviewers (M.M. andJ.L.) conducted study quality assessment. Rating disagreements were resolved by J.R. andinter-rater reliability calculated.
3. Results
3.1. Synthesis of Findings (Qualitative Analysis)
Scientific evidence on the sample characteristics (B, C, D), variables (E), exercise andvariation (F, G) device used (H) volume and intensity training (I, J) and results for strength,power and speed is shown in Tables 1–3. Format and design, including the author andthe year of publication, the sample characteristics (overall number, gender, age, heightand weight), the variable measured (strength, power and/or speed), type and number ofvariations, the device used (exercise ball, semi-sphere ball or suspension device), trainingvolume (number of sets/repeats/rest per exercise), intensity training (percentage of onemaximum repetition (1RM)), strength results (maximum strength, mean strength), powerresults (maximum power, mean power and concentric phase power) and speed results(maximum and mean speed) are included.
138

Int. J. Environ. Res. Public Health 2021, 18, 1026
Table 1. Scientific evidence on the sample characteristics (B, C, D) and variables (E).
Reference (A)Sample Variables (E)
Experience (B) Size and Sex (C) Characteristics (D)
Anderson et al. (2004) [13]Trained in strength, Instability
1 year earlier10 (M)
a: 26.2 ± 6.0 yearsStrengthh: 177.3 ± 6.0 cm
w: 87.3 ± 12.2 kg
Behm et al. (2002) [79] Trained 8 (M)a: 24.3 ± 6.7 years
Strengthh:178.1 ± 6.1 cmw: 82.3 ± 8.9 kg
Chulvi-Medrano (2010) [80]Trained in strength Experience
with instability31 (M)
a: 24.29 ± 0.48 yearsStrengthh: 167.98 ± 8,11 cm
w: 79.08 ± 2,37 kg
Goodman et al. (2008) [81] Recreational 13 (10 M, 3 W)a: 24.1 ± 1.6 years
Strengthh: 176.7 ± 3.0 cmw: 76.0 ± 3.9 kg
Koshida et al. (2008) [82] Trained 20 (M)a: 21.3 ± 1.5 years Strengthh: 167.7 ± 7.7 cm Powerw: 75.9 ± 17.5 kg Speed
Saeterbakken & Fimland(2013) [83]
Trained 15 (M)a: 23.3 ± 2.7
Strengthh: 181 ± 0.09 cmw: 80.5 ± 8.5 kg
Sannicandro et al. (2015) [84]No previous experience in
strength or instability isindicated
24 (M)a: 17.8 ± 0.8 years
StrengthPower
h: 179.1 ± 5.6 cmw: 73 ± 4.9 kg
Zemkova (2012) [85]Trained in strength, noexperience in instability
16 (M)a: 23.4 ± 1.9 years
Powerh: 181.5 ± 6.1cmw: 75.1 ± 6.1 kg
Zemkova et al. (2017) [86]Trained in strength, noexperience in instability
24 (M)a: 22.1 ± 1.8 years
Powerh: 184.5 ± 8.3 cmw: 79.8 ± 9.4 kg
M = men; W = women; a = age; h = height; w = weight; cm = centimetres; kg = kilograms.
3.2. Sample Characteristics
Table 1 shows scientific evidence on the sample characteristics (B, C, D) and variables(E). Format and design, including the author and the year of publication, the samplecharacteristics (overall number, gender, age, height, and weight), the variable measured(strength, power and/or speed).
Evaluation of the characteristics of the sample: (B) Experience. The experience of thesample was quite heterogeneous, with the participants standing out trained (n = 3; 33.34%);trained in strength without experience in instability (n = 2; 22.22%), trained in strengthand instability 1 year earlier (n = 2; 22.22%); recreational (n = 1; 11.11%); no previousexperience in strength or instability indicated (n = 1; 11.11%); (C) Sex. The distributionof the sample was very unbalanced with more male participants (n = 158; 98.14%) thanfemale participants (n = 3; 1.86%); (D) Characteristics of the sample. The whole samplewas identified as being between 18 (lower limit) and 25 (upper limit) years of age. Theheight range was identified as 167 cm to 185 cm. The weight range was identified as 79 kgto 88 kg.
139
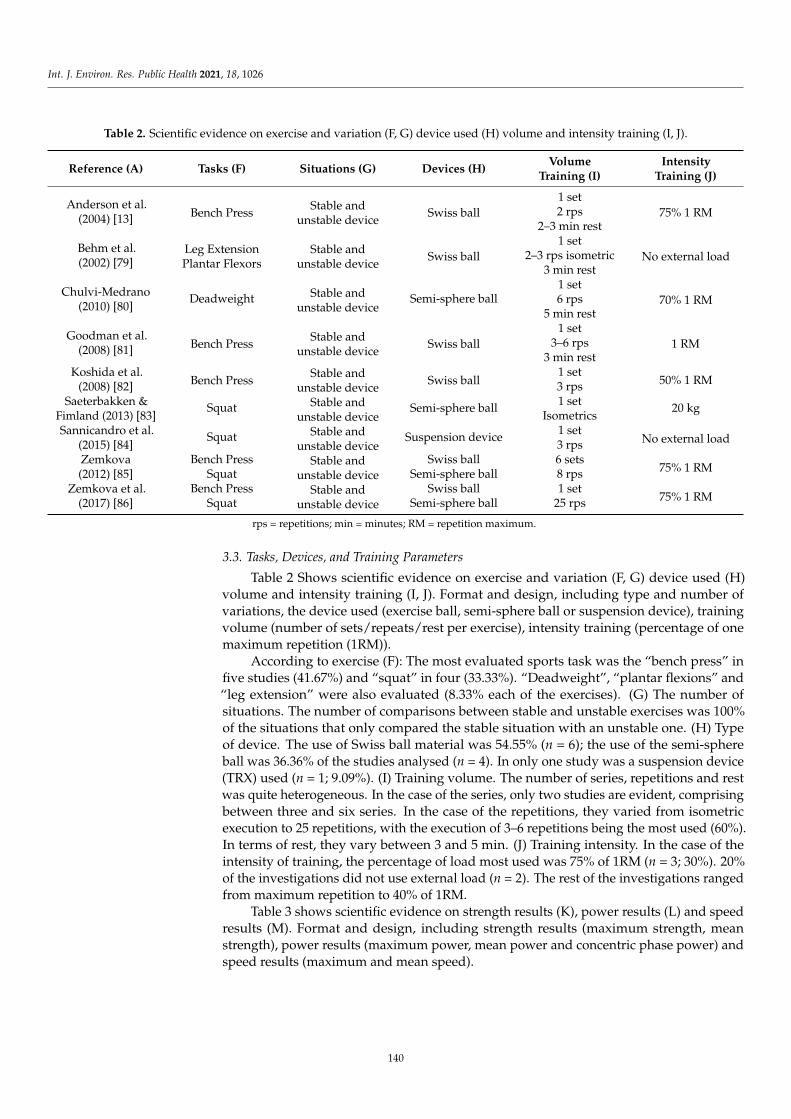
Int. J. Environ. Res. Public Health 2021, 18, 1026
Table 2. Scientific evidence on exercise and variation (F, G) device used (H) volume and intensity training (I, J).
Reference (A) Tasks (F) Situations (G) Devices (H)Volume
Training (I)Intensity
Training (J)
Anderson et al.(2004) [13]
Bench PressStable and
unstable deviceSwiss ball
1 set
75% 1 RM2 rps2–3 min rest
Behm et al.(2002) [79]
Leg ExtensionPlantar Flexors
Stable andunstable device
Swiss ball
1 set
No external load2–3 rps isometric3 min rest
Chulvi-Medrano(2010) [80]
Deadweight Stable andunstable device
Semi-sphere ball1 set
70% 1 RM6 rps5 min rest
Goodman et al.(2008) [81]
Bench PressStable and
unstable deviceSwiss ball
1 set
1 RM3–6 rps3 min rest
Koshida et al.(2008) [82]
Bench PressStable and
unstable deviceSwiss ball
1 set50% 1 RM
3 rpsSaeterbakken &
Fimland (2013) [83]Squat Stable and
unstable deviceSemi-sphere ball
1 set20 kg
IsometricsSannicandro et al.
(2015) [84]Squat Stable and
unstable deviceSuspension device
1 setNo external load
3 rpsZemkova(2012) [85]
Bench Press Stable andunstable device
Swiss ball 6 sets75% 1 RM
Squat Semi-sphere ball 8 rpsZemkova et al.
(2017) [86]Bench Press Stable and
unstable device
Swiss ball 1 set75% 1 RM
Squat Semi-sphere ball 25 rps
rps = repetitions; min = minutes; RM = repetition maximum.
3.3. Tasks, Devices, and Training Parameters
Table 2 Shows scientific evidence on exercise and variation (F, G) device used (H)volume and intensity training (I, J). Format and design, including type and number ofvariations, the device used (exercise ball, semi-sphere ball or suspension device), trainingvolume (number of sets/repeats/rest per exercise), intensity training (percentage of onemaximum repetition (1RM)).
According to exercise (F): The most evaluated sports task was the “bench press” infive studies (41.67%) and “squat” in four (33.33%). “Deadweight”, “plantar flexions” and“leg extension” were also evaluated (8.33% each of the exercises). (G) The number ofsituations. The number of comparisons between stable and unstable exercises was 100%of the situations that only compared the stable situation with an unstable one. (H) Typeof device. The use of Swiss ball material was 54.55% (n = 6); the use of the semi-sphereball was 36.36% of the studies analysed (n = 4). In only one study was a suspension device(TRX) used (n = 1; 9.09%). (I) Training volume. The number of series, repetitions and restwas quite heterogeneous. In the case of the series, only two studies are evident, comprisingbetween three and six series. In the case of the repetitions, they varied from isometricexecution to 25 repetitions, with the execution of 3–6 repetitions being the most used (60%).In terms of rest, they vary between 3 and 5 min. (J) Training intensity. In the case of theintensity of training, the percentage of load most used was 75% of 1RM (n = 3; 30%). 20%of the investigations did not use external load (n = 2). The rest of the investigations rangedfrom maximum repetition to 40% of 1RM.
Table 3 shows scientific evidence on strength results (K), power results (L) and speedresults (M). Format and design, including strength results (maximum strength, meanstrength), power results (maximum power, mean power and concentric phase power) andspeed results (maximum and mean speed).
140
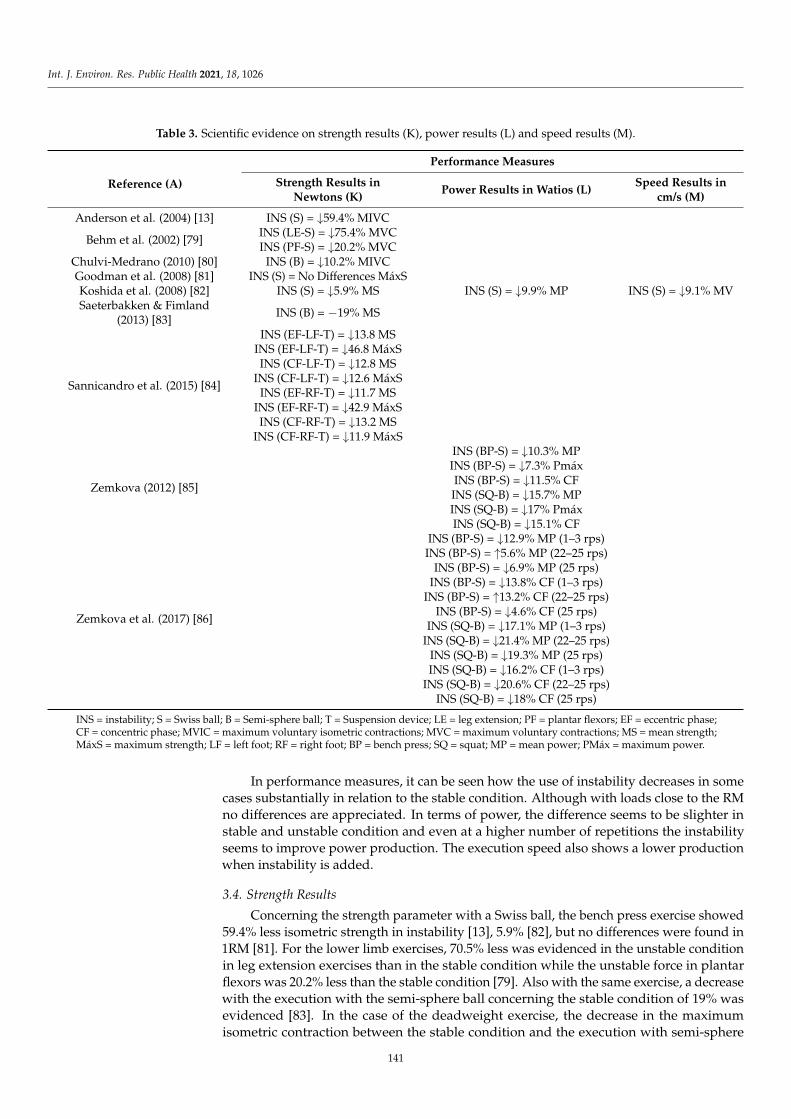
Int. J. Environ. Res. Public Health 2021, 18, 1026
Table 3. Scientific evidence on strength results (K), power results (L) and speed results (M).
Reference (A)
Performance Measures
Strength Results inNewtons (K)
Power Results in Watios (L)Speed Results in
cm/s (M)
Anderson et al. (2004) [13] INS (S) = ↓59.4% MIVC
Behm et al. (2002) [79]INS (LE-S) = ↓75.4% MVCINS (PF-S) = ↓20.2% MVC
Chulvi-Medrano (2010) [80] INS (B) = ↓10.2% MIVCGoodman et al. (2008) [81] INS (S) = No Differences MáxSKoshida et al. (2008) [82] INS (S) = ↓5.9% MS INS (S) = ↓9.9% MP INS (S) = ↓9.1% MVSaeterbakken & Fimland
(2013) [83]INS (B) = −19% MS
Sannicandro et al. (2015) [84]
INS (EF-LF-T) = ↓13.8 MSINS (EF-LF-T) = ↓46.8 MáxSINS (CF-LF-T) = ↓12.8 MS
INS (CF-LF-T) = ↓12.6 MáxSINS (EF-RF-T) = ↓11.7 MS
INS (EF-RF-T) = ↓42.9 MáxSINS (CF-RF-T) = ↓13.2 MS
INS (CF-RF-T) = ↓11.9 MáxS
Zemkova (2012) [85]
INS (BP-S) = ↓10.3% MPINS (BP-S) = ↓7.3% PmáxINS (BP-S) = ↓11.5% CFINS (SQ-B) = ↓15.7% MPINS (SQ-B) = ↓17% PmáxINS (SQ-B) = ↓15.1% CF
Zemkova et al. (2017) [86]
INS (BP-S) = ↓12.9% MP (1–3 rps)INS (BP-S) = ↑5.6% MP (22–25 rps)
INS (BP-S) = ↓6.9% MP (25 rps)INS (BP-S) = ↓13.8% CF (1–3 rps)
INS (BP-S) = ↑13.2% CF (22–25 rps)INS (BP-S) = ↓4.6% CF (25 rps)
INS (SQ-B) = ↓17.1% MP (1–3 rps)INS (SQ-B) = ↓21.4% MP (22–25 rps)
INS (SQ-B) = ↓19.3% MP (25 rps)INS (SQ-B) = ↓16.2% CF (1–3 rps)
INS (SQ-B) = ↓20.6% CF (22–25 rps)INS (SQ-B) = ↓18% CF (25 rps)
INS = instability; S = Swiss ball; B = Semi-sphere ball; T = Suspension device; LE = leg extension; PF = plantar flexors; EF = eccentric phase;CF = concentric phase; MVIC = maximum voluntary isometric contractions; MVC = maximum voluntary contractions; MS = mean strength;MáxS = maximum strength; LF = left foot; RF = right foot; BP = bench press; SQ = squat; MP = mean power; PMáx = maximum power.
In performance measures, it can be seen how the use of instability decreases in somecases substantially in relation to the stable condition. Although with loads close to the RMno differences are appreciated. In terms of power, the difference seems to be slighter instable and unstable condition and even at a higher number of repetitions the instabilityseems to improve power production. The execution speed also shows a lower productionwhen instability is added.
3.4. Strength Results
Concerning the strength parameter with a Swiss ball, the bench press exercise showed59.4% less isometric strength in instability [13], 5.9% [82], but no differences were found in1RM [81]. For the lower limb exercises, 70.5% less was evidenced in the unstable conditionin leg extension exercises than in the stable condition while the unstable force in plantarflexors was 20.2% less than the stable condition [79]. Also with the same exercise, a decreasewith the execution with the semi-sphere ball concerning the stable condition of 19% wasevidenced [83]. In the case of the deadweight exercise, the decrease in the maximumisometric contraction between the stable condition and the execution with semi-sphere
141

Int. J. Environ. Res. Public Health 2021, 18, 1026
ball was 10.2% [80]. Regarding suspension training squat exercise with bipodal execution,in the eccentric phase, peak and average force showed a decrease of 46.8% and 13.8%respectively for the lower left limb. In the concentric phase, the use of the suspensiontraining tool caused a decrease of 12.6% in peak force and 12.8% in mean force. For theright lower limb, in the eccentric phase, during execution with the suspension trainingtool, the force decreased by 42.9% and the mean force by 11.7%. In the concentric phase,during execution with the suspension training tool, the peak and average force decreasedrespectively by 11.9% and 13.2%. During monopodal execution, the eccentric phase in theleft limb, the peak force suffered a decrease of 41.8% and the average force a decrease of18.1%. In the concentric phase, on the other hand, the use of the suspension training toolcaused a decrease of 13.5% in peak force and 15.8% in average force. For the right limbduring monopodal execution, in the eccentric phase, the force has decreased by 45.1% andthe average force by 17.4%. In the concentric phase, the use of the suspension training toolcaused a decrease of 12.4% in the force and 14.3% in the mean force [84].
3.5. Power Results
For the variable of power with a Swiss ball, a decrease in the unstable situation of9.9% concerning the stable situation has been evidenced with the chest press exercise [82],and of 10.3% in the average power, 7.3% in the maximum power and 11.5% in the powerexercised in the concentric phase [85]. For the average power, with the execution of 25repetitions, a decrease of 6.9% was found in the unstable bench press, although in the lastthree repetitions the average power exercised in the unstable condition was 5.6% higherthan the stable condition. On the contrary, among the first three repetitions, the unstabledata was 12.9% lower than the stable condition. The power exercised in the concentricphase of the bench press was reported to be 4.6% lower in the unstable bench press,although in the last three repetitions the power exercised in the concentric phase of theunstable condition was 13.2% higher than the stable condition. On the contrary, among thefirst three repetitions, the unstable data was 13.8% lower than the stable condition [86]. Toaverage power, 25 repetitions showed a decrease of 19.3% in the unstable squat, althoughin the last three repetitions the average power exercised in the unstable condition was21.4% higher than the stable condition. On the contrary, among the first three repetitions,the unstable condition was 17.1% lower than the stable condition. The power exercisedin the concentric phase of the squat was reported to be 18% lower in the unstable squat,although in the last three repetitions the power exercised in the concentric phase of theunstable condition was 20.6% lower than the stable condition. On the contrary, among thefirst 3 repetitions, the unstable condition was 16.2% lower than the stable condition [86].
3.6. Speed Results
Only one research study has been shown to consider the execution speed of strengthexercises measured in instability. In the case of the speed variable with a Swiss ball, therehas been a 9.1% decrease in the unstable condition concerning the stable banking press [82].
3.7. Study Selection and Assessment (Qualitative Analysis)
The quality analysis (STROBE’ checklist) yielded the following results (Table 4): (a)The quality scores ranged from 13–16; (b) The average score was 14.3 points; (c) Of the 9included studies, 5 (55.55%) were considered to ‘fair quality’ (13–14 points); and 4 (44.44%)were categorized as ‘good quality’ (15–16 points).
142

Int. J. Environ. Res. Public Health 2021, 18, 1026
Table 4. The study quality analysis (STROBE’ checklist).
Reference
Title andAbstract
Introduction Methods ResultsOther
AnalysisDiscussion
OtherInformation
StrobePoints
StudyQuality
1 2 3 4 5 6 7 8 9 10 11 12 13 14 15 16 17 18 19 20 21 22
Anderson et al.(2004) [13]
+ + + - - + + + - - + + - - + + - + - + + - 13 FAIR
Behm et al.(2002) [79]
+ + + - - + + + - - + + - - + + + + - + + - 14 FAIR
Chulvi-Medrano(2010) [80]
+ + + + + + + + - - + + - - + + - + + + + - 16 GOOD
Goodman et al.(2008) [81]
+ + + + + + + + - - + + - - + + + + - + + - 16 GOOD
Koshida et al.(2008) [82]
+ + + + - + + + - - + + - - + + - + + + + - 15 GOOD
Saeterbakken &Fimland (2013) [83]
+ + + + - + + + - - + + - - + + - + - + + - 13 FAIR
Sannicandro et al.(2015) [84]
+ + + - - + + + - - + + - - + + + + - + + + 15 GOOD
Zemkova(2012) [85]
+ + + - - + + + - - + + - - + + - + + + + + 14 FAIR
Zemkova et al.(2017) [86]
+ + + - - + + + - - + + - - + + - + - + + - 13 FAIR
143
Int. J. Environ. Res. Public Health 2021, 18, 1026
By sections, the highest scores were located in ‘introduction’ (100%) and ‘discussion’(80%) and among the highest quality studies, items no. 2 (background/rationale); no. 3(‘Objectives—State specific objectives and/or any pre-specified hypothesis’); no. 6 (par-ticipants); no. 7 (variables); no. 8 (‘data source—procedure for determining performancemeasurement’), no. 11 (‘descriptive results—the number (absolute frequency) or percentage(relative frequency) of participants found in each grouping category and subcategory’); no.12 (statistical methods); no. 15 (outcome data); no. 16 (main results); no. 18 (‘key results—asummary of key results concerning study objectives’); no. 20 (interpretation) and no. 21(generalisability) were considered complete (100%), while the most commonly absent orincomplete item (0 points) was found in items no. 9, 10, 13 and 14 (‘main results—a measureof effect size’). The lowest scores were found in the ‘funding’ section (20%).
4. Discussion
This is the first systematic review of the literature to examine the effects of instabilityon measures of muscle strength, power, and speed, administered in the form of quasi-experimental studies in healthy individuals during adulthood.
About the production of force, for the exercises of the upper limb, high decreasesin values have been observed for the unstable condition. These differences have rangedfrom 20 to 75% loss in force development in unstable conditions. According to Kornecki,Kebel, and Siemienski [87], the stabilising function of the skeletal muscles is necessary forthe coordinated performance of any voluntary movement, and it significantly influencesmuscle coordination patterns. Therefore, significant reductions in muscle productionprobably occurred because the muscles around the shoulder complex needed to givepriority to stability over force production. Furthermore, under conditions of instability, thestiffness of the joints that act can limit gains in strength, power and speed of movement [88].
However, in the data evidenced in the study by Koshida et al. [82], the losses in forcevalues are much lower than in the rest of the studies (5.9% loss in instability) comparedwith 59.4% loss in Anderson and Behm [13] and in the case of Goodman et al. [81], nosignificant differences are observed. This inconsistency between the previous research canbe attributed to the type of muscle contraction, the degree of instability during the recordedtask and the equipment. In Koshida et al. [82] the bench press movement was performedin a supine position with the Swiss ball placed in the thoracic area, which provided abroader support base than for other activities performed in a sitting or standing position.Therefore, the instability imposed on the trunk stabilising muscles would probably be lesssignificant than in previous research. Besides, both studies used dynamic contractionswith an Olympic bar with weight plates, while Anderson and Behm [13] used isometriccontractions with two independent handles held by straps to force the transducers intothe ground. The difference in equipment could impose different levels of instability on theshoulder joint and trunk muscles. Although bilateral contractions were performed in bothstudies, the independence of each hand in the study by Anderson and Behm [13] may haveincreased the effort required to maintain balance and the need for the muscles to stabilizeduring maximum isometric contractions, therefore reducing the net force output. In thecase of Goodman et al. [81], where no differences were found, it could be due to the use ofdifferent loads, since 1RM was used while in Anderson and Behm [13] 75% of 1RM loadswere used and in Goodman et al. [81] were used 50% of 1RM. These data could indicatethat the percentage of external load can influence the effect of the instability in the training.
In the case of force production in the lower limbs, there have been notable decreaseswhen comparing tasks performed in instability concerning stable conditions. These de-creases ranged from 10% to 19%, so it seems that instability affects the upper body morethan the lower. With the use of the semi-sphere ball, analysed in terms of strength, withthe performance of a dominant hip exercise such as deadweight the decrease in strengthwas 10.2% [80] while with a dominant knee exercise such as squat it was 19% [83]. Thiscould indicate that certain movements could be affected to a lesser extent depending onthe instability. However, as detailed above the methods and loads used were very different.
144
Int. J. Environ. Res. Public Health 2021, 18, 1026
It is noteworthy that many of the studies to check force production in the lower limb usingisometric contractions. However, isometric contractions are not usually used in strengthtraining. Despite this, results obtained under isometric contractions have reported thatconditions are strongly correlated with dynamic mobility performance [89]. However, dueto the isometric test mode, subjects could gradually build up strength while stabilizingand maintaining balance on different surfaces. During the 3 s of maximum effort, thesubjects may have been able to stabilize the limbs and trunk and therefore be able to exerta considerable amount of force in unstable conditions. We only know of one study thatinvestigates the production of maximum force in squats on a stable and unstable surface [3].These researchers used an inflatable balance disk and reported a decrease of approximately46% in peak force. Although there was a greater decrease in force in that study, it could beattributed to the lack of a familiarization session, which the rest of the studies did considerappropriate.
In terms of strength, there seems to be a differentiation in the data concerning thedevices used. When the main movement involves the muscles of the upper body the Swissball has been used and in the case of the main movement being performed on the lowerbody, the semi-sphere ball has been used. The exceptional case was the execution of anexercise such as squatting where the instability with the device in suspension was placedin the upper body. In the case of the Swiss ball, it seems to have a greater influence onthe decrease of the force values (differences of 20–75%) compared to the semi-sphere ball(differences between the and 10% and 19%) suspended device (detriments between 12–47%). However, in some cases, the Swiss ball did not produce any differences between theconditions. So, it does not seem to be a determining factor in the case of muscle strength.
Concerning the production of muscular power in the upper limb, decreases in theunstable condition have been observed. Decreases with the unstable condition rangedfrom 7% to 17%. The data found in the studies that analyzed the bench press with Swissball reported a very similar percentage decrease in terms of average power (10.3% [85];9.9% [82]; and 12.9% [86]). These small deviations found may again be due to the differentpercentage of load used (50% vs. 75%) and the different volume of training applied.However, in some situations, instability has produced better power data than a stablecondition. These better data have been produced in the last repetitions of the executionswith high numbers of repetitions in the exercise (22–25 repetitions). The improvementsobserved in average power were 5.6% and in the concentric phase 13.2%.
The increase in power observed could be due to previous evidence that has shownthat producing a high power output with a light to moderate load would be more effectivein developing maximum power than using a heavy load [90,91]. Thus, it appears thatsuch a low rate of reduction may still allow muscle power to be gained from strengthexercise in the unstable condition. The mechanism of energy production using the stretch-shortening cycle employs the energy storage capacity of several elastic components and thestimulation of the stretching reflex to facilitate muscle contraction for a minimum period.The concentric muscle action does not occur immediately after the eccentric, the storedenergy is dissipated and lost in the form of heat and also the strengthening stretching reflexis not activated. Resistance to instability exercise can compromise the three phases of thestretching-shortening cycle, including the amortization phase. Around this turning point,where the eccentric phase becomes concentric, the maximum force is produced. At thesame time, the subjects must stabilize the torso on an unstable surface to provide firmsupport for the contracted muscles. This additional task can compromise the contraction ofthe muscles acting on the bar. Their less intense contraction not only prolongs the changeof direction of movement but, due to the lower maximum force, impairs the accumulationof elastic energy. The consequence is less speed and power in the subsequent concentricphase [92,93]. However, the subjects of the study by Zemkova et al. [86] were able toproduce greater power during the executions on an unstable surface than on a stable one.This higher energy production can be attributed to the so-called ball bounce effect.
145
Int. J. Environ. Res. Public Health 2021, 18, 1026
In terms of power, there seems to be a differentiation in the data about the devicesused. The use of semi-sphere ball seems to have a greater influence on the decrease inpower since the detriments with this device varied between 15% and 22%. In the case of theSwiss ball, the decrease in power oscillated between 7% and 14%, with better power databeing found in unstable conditions with this device (5–13%). However, when the instabilitywas placed where there was no movement, as in the case of the device in suspensionand the squat, improvements of between 5% and 10% in power production were shown.Therefore, placing the instability where the main movement does not occur seems to be agood option for power improvement.
Finally, about the speed of execution, a decrease in the values in unstable conditionsin comparison to stable conditions is observed, but the analysis of this variable has hardlybeen studied. According to Adkin et al. [94], a postural threat in a subject (fear of falling)will lead to a reduction in the magnitude and speed of voluntary movements. Thus, musclestabilization seems to compromise gains in strength, power and speed of movement [95].It should also be noted that new patterns of movement are generally learned at low speed,while sport-specific motor actions are executed at high speed [26].
The great heterogeneity in terms of volume and intensity of the load is remarkable.Also, instability seems to affect the force variable to a higher degree, but with intensitiesclose to 1RM no differences are observed. As for power, a greater number of repetitionsseems to benefit the production of this variable in instability in the upper limb. Finally,speed has barely been analysed and seems to show losses of speed in instability but notexcessively so.
5. Implications for Practice
The great heterogeneity found is a limitation of the study, however, the results ofthis study can be applied in various ways. It would be interesting to include trainingin instability in athletes trained in this type of situation. All the information about thisis with beginner athletes, and what is interesting about the application of instability isthe individualization of the subjects. Unstable surfaces can be very interesting tools foroptimising training, because although decreases in performance variables have been shown,this may not be the case for experienced athletes. As for integrated work, where besidesstrength, power and speed, other qualities such as balance can be analysed. Also, the angleswith which the work is done in instability are different concerning stable conditions, sothat other complementary muscles are worked. Finally, variety in environments, methodsand exercises is one of the principles of training and these unstable situations provide it.
The complexity of execution in this type of unstable situation, where the techniquecan be affected, is noteworthy. For this reason, the level of experience of the athletes isimportant to be able to apply this type of training. Besides, the population requires thehelp of a qualified professional who can help and direct the sessions or tasks with this typeof device, with an appropriate and individualised programme according to the differentusers.
6. Conclusions
The main findings of this review were that there is great heterogeneity in analysingthe acute effects of instability on performance variables. Instability compared to a stablecondition decreases the parameters of strength, power, and muscular speed in adults. Thedifferences shown are quite significant in most situations although slight decreases can beseen in certain situations. However, for the upper limb, a greater number of repetitionsseems to increase the power values in instability compared to the stable situation. Thevariables of force, power and speed seem to be affected when instability is implemented.However, it seems necessary to extend the investigation of instability with the performancevariables because the results are very heterogeneous and there are no unified criteria toevaluate the different conditions, subjects, tasks and devices.
146
Int. J. Environ. Res. Public Health 2021, 18, 1026
Author Contributions: Conceptualization, M.M. and J.L.-C.; methodology, M.M., J.L.-C. and J.R.-G.;
software, M.M.; validation, J.L.-C. and I.R.R.; formal analysis, M.M.; investigation, M.M.; resources,
M.M. and. J.L.-C.; data curation, M.M. and A.G.-A.; writing—original draft preparation, M.M.;
writing—review and editing, J.L.-C., J.R.-G. and I.R.R.; visualization, M.M., J.L.-C., J.R.-G., A.G.-A.
and I.R.R.; supervision, J.L.-C. and J.R.-G.; project administration, J.L.-C., J.R.-G. and I.R.R.; funding
acquisition, A.G.-A. and I.R.R. All authors have read and agreed to the published version of the
manuscript.
Funding: This research received no external funding.
Institutional Review Board Statement: Not applicable.
Informed Consent Statement: Not applicable.
Acknowledgments: We wish to thank all athletes who completed the experimental protocol. We
would also like to thank the Faculty of Physical Activity and Sport Sciences (INEF) and the Universi-
dad Politécnica de Madrid (UPM) for their support.
Conflicts of Interest: The authors declare no conflict of interest.
References
1. Ignjatovic, A.M.; Radovanovic, D.S.; Kocic, J. Effects of eight weeks of bench press and squat power training on stable and
unstable surfaces on 1RM and peak power in different testing conditions. Isokinet. Exerc. Sci. 2019, 27, 203–212. [CrossRef]
2. Kohler, J.M.; Flanagan, S.P.; Whiting, W.C. Muscle activation patterns while lifting stable and unstable loads on stable and
unstable surfaces. J. Strength Cond. Res. 2010, 24, 313–321. [CrossRef] [PubMed]
3. McBride, J.M.; Cormie, P.; Deane, R. Isometric squat force output and muscle activity in stable and unstable conditions. J. StrengthCond. Res. 2006, 20, 915–918. [CrossRef] [PubMed]
4. Nascimento, V.Y.S.; Torres, R.J.B.; Beltrão, N.B.; dos Santos, P.S.; Pirauá, A.L.T.; de Oliveira, V.M.A.; Pitangui, A.C.R.; de Araújo,
R.C. Shoulder muscle activation levels during exercises with axial and rotational load on stable and unstable surfaces. J. Appl.Biomech. 2017, 33, 118–123. [CrossRef] [PubMed]
5. Wang, R.; Hoffman, J.R.; Sadres, E.; Bartolomei, S.; Muddle, T.W.; Fukuda, D.H.; Stout, J.R. Effects of different relative loads on
power performance during the ballistic push-up. J. Strength Cond. Res. 2017, 31, 3411–3416. [CrossRef] [PubMed]
6. Bompa, T.O.; Haff, G.G. Periodization: Theory and Methodology of Training, 5th ed.; Human Kinetics: Champaign, IL, USA, 2009;
ISBN 978-0-7360-7483-4.
7. Arriscado Alsina, D.; Martínez, J. Muscular strength training in young football players. J. Sport Heal. Res. 2017, 9, 329–338.
8. Billich, R.; Stvrtna, J.; Jelen, K. Optimal velocity to achieve maximum power. KInanthropologica 2014, 50, 37–46. [CrossRef]
9. Dallas, G.; Kirialanis, P.; Mellos, V. The acute effect of whole body vibration training on flexibility and explosive strenght of
young gymnasts. Biol. Sport 2014, 31, 233–237. [CrossRef]
10. Górski, M.; Starczewski, M.; Pastuszak, A.; Mazur-Rózycka, J.; Gajewski, J.; Busko, K. Changes of strength and maximum power
of lower extremities in adolescent handball players during a two-year training cycle. J. Hum. Kinet. 2018, 63, 95–103. [CrossRef]
11. Pereira, L.A.; Nimphius, S.; Kobal, R.; Kitamura, K.; Turisco, L.A.L.; Orsi, R.C.; Cal Abad, C.C.; Loturco, I. Relationship between
change of direction, speed and power in male and female national olympic team handball athletes. J. Strength Cond. Res. 2018, 63,
1. [CrossRef]
12. Spieszny, M.; Zubik, M. Modification of strength training programs in handball players and its influence on power during the
competitive period. J. Hum. Kinet. 2018, 63, 149–160. [CrossRef] [PubMed]
13. Anderson, K.G.; Behm, D.G. Maintenance of EMG activity and loss of force output with instability. J. Strength Cond. Res. 2004, 18,
637. [CrossRef] [PubMed]
14. Anderson, K.; Behm, D.G. Trunk Muscle Activity Increases With Unstable Squat Movements. Can. J. Appl. Physiol. 2005, 30, 33–45.
[CrossRef] [PubMed]
15. Alagesan, J. Effect of Instability Resistance Training of Abdominal Muscles in Healthy Young Females-An Experimental Study.
Int. J. Pharm. Sci. Health Care 2012, 2, 91–97.
16. Marinkovic, M.; Bratic, M.; Ignjatovic, A.; Radovanovic, D. Effects of 8-Week Instability Resistance Training on Maximal Strength
in Inexperienced Young Individuals. Serbian J. Sport. Sci. 2012, 6, 17–21.
17. Sukalinggam, C.; Sukalinggam, G.; Kasim, F.; Yusof, A. Stability ball training on lower back strength has greater effect in untrained
female compared to male. J. Hum. Kinet. 2012, 33, 133–141. [CrossRef]
18. Sparkes, R.; Behm, D.G. Training Adaptations Associated With an 8-Week Instability Resistance Training Program With Recre-
ationally Active Individuals. J. Strength Cond. Res. 2010, 24, 1931–1941. [CrossRef]
19. Cowley, P.; Swensen, T.; Sforzo, G. Efficacy of Instability Resistance Training. Int. J. Sports Med. 2007, 28, 829–835. [CrossRef]
20. Maté-Muñoz, J.L.; Antón, A.J.M.; Jiménez, P.J.; Garnacho-Castaño, M.V. Effects of instability versus traditional resistance training
on strength, power and velocity in untrained men. J. Sport. Sci. Med. 2014, 13, 460–468. [CrossRef]
147

Int. J. Environ. Res. Public Health 2021, 18, 1026
21. Behm, D.G.; Colado Sanchez, J.C. Instability Resistance Training Across the Exercise Continuum. Sports Health 2013, 5, 500–503.
[CrossRef]
22. Tanimoto, M.; Sanada, K.; Yamamoto, K.; Kawano, H.; Gando, Y.; Tabata, I.; Ishii, N.; Miyachi, M. Effects of whole-body
low-intensity resistance training with slow movement and tonic force generation on muscular size and strength in young men. J.Strength Cond. Res. 2008, 22, 1926–1938. [CrossRef] [PubMed]
23. Kanehisa, H.; Nagareda, H.; Kawakami, Y.; Akima, H.; Masani, K.; Kouzaki, M.; Fukunaga, T. Effects of equivolume isometric
training programs comprising medium or high resistance on muscle size and strength. Eur. J. Appl. Physiol. 2002, 87, 112–119.
[CrossRef] [PubMed]
24. Behm, D.G.; Drinkwater, E.J.; Willardson, J.M.; Cowley, P.M. The use of instability to train the core musculature. Appl. Physiol.Nutr. Metab. 2010, 35, 91–108. [CrossRef]
25. Behm, D.G.; Leonard, A.M.; Young, W.B.; Bonsey, W.A.C.; MacKinnon, S.N. Trunk muscle electromyographic activity with
unstable and unilateral exercises. J. Strength Cond. Res. 2005, 19, 193–201. [CrossRef] [PubMed]
26. Behm, D.G. Neuromuscular Implications and Applications of Resistance Training. J. Strength Cond. Res. 1995, 9, 264–274.
[CrossRef]
27. Behm, D.G.; Anderson, K.G. The Role of Instability With Resistance Training. J. Strength Cond. Res. 2006, 20, 716. [CrossRef]
28. Chapman, D.W.; Needham, K.J.; Allison, G.T.; Lay, B.; Edwards, D.J. Effects of experience in a dynamic environment on postural
control. Br. J. Sports Med. 2007, 42, 16–21. [CrossRef]
29. Drake, J.D.M.; Fischer, S.L.; Brown, S.H.M.; Callaghan, J.P. Do Exercise Balls Provide a Training Advantage for Trunk Extensor
Exercises? A Biomechanical Evaluation. J. Manipulative Physiol. Ther. 2006, 29, 354–362. [CrossRef]
30. Nairn, B.C.; Sutherland, C.A.; Drake, J.D.M. Location of Instability During a Bench Press Alters Movement Patterns and
Electromyographical Activity. J. Strength Cond. Res. 2015, 29, 3162–3170. [CrossRef]
31. Paillard, T.; Margnes, E.; Portet, M.; Breucq, A. Postural ability reflects the athletic skill level of surfers. Eur. J. Appl. Physiol. 2011,
111, 1619–1623. [CrossRef]
32. Hornsby, W.; Gentles, J.; MacDonald, C.; Mizuguchi, S.; Ramsey, M.; Stone, M. Maximum Strength, Rate of Force Development,
Jump Height, and Peak Power Alterations in Weightlifters across Five Months of Training. Sports 2017, 5, 78. [CrossRef] [PubMed]
33. Prieske, O.; Muehlbauer, T.; Borde, R.; Gube, M.; Bruhn, S.; Behm, D.G.; Granacher, U. Neuromuscular and athletic performance
following core strength training in elite youth soccer: Role of instability. Scand. J. Med. Sci. Sport. 2016, 26, 48–56. [CrossRef]
[PubMed]
34. Dolezal, S.M.; Frese, D.L.; Llewellyn, T.L. The effects of eccentric, velocity-based training on strength and power in collegiate
athletes. Int. J. Exerc. Sci. 2016, 9, 657–666.
35. Willardson, J.M.; Fontana, F.E.; Bressel, E. Effect of Surface Stability on Core Muscle Activity for Dynamic Resistance Exercises.
Int. J. Sports Physiol. Perform. 2009, 4, 97–109. [CrossRef] [PubMed]
36. Escamilla, R.F.; Lewis, C.; Bell, D.; Bramblet, G.; Daffron, J.; Lambert, S.; Pecson, A.; Imamura, R.; Paulos, L.; Andrews, J.R.
Core Muscle Activation During Swiss Ball and Traditional Abdominal Exercises. J. Orthop. Sport. Phys. Ther. 2010, 40, 265–276.
[CrossRef] [PubMed]
37. Fredericson, M.; Moore, T. Muscular Balance, Core Stability, and Injury Prevention for Middle- and Long-Distance Runners. Phys.Med. Rehabil. Clin. N. Am. 2005, 16, 669–689. [CrossRef] [PubMed]
38. Kibler, W.B.; Press, J.; Sciascia, A. The Role of Core Stability in Athletic Function. Sport. Med. 2006, 36, 189–198. [CrossRef]
[PubMed]
39. Schwanbeck, S.; Chilibeck, P.D.; Binsted, G. A Comparison of Free Weight Squat to Smith Machine Squat Using Electromyography.
J. Strength Cond. Res. 2009, 23, 2588–2591. [CrossRef]
40. Saeterbakken, A.H.; Solstad, T.E.J.; Behm, D.G.; Stien, N.; Shaw, M.P.; Pedersen, H.; Andersen, V. Muscle activity in asymmetric
bench press among resistance-trained individuals. Eur. J. Appl. Physiol. 2020. [CrossRef]
41. Miller, W.M.; Barnes, J.T.; Sofo, S.S.; Wagganer, J.D. Comparison of Myoelectric Activity During a Suspension-Based and
Traditional Split Squat. J. Strength Cond. Res. 2019, 33, 3236–3241. [CrossRef]
42. Saeterbakken, A.H.; Fimland, M.S. Muscle activity of the core during bilateral, unilateral, seated and standing resistance exercise.
Eur. J. Appl. Physiol. 2012, 112, 1671–1678. [CrossRef]
43. Saeterbakken, A.H.; Fimland, M.S. Electromyographic activity and 6RM strength in bench press on stable and unstable surfaces.
J. Strength Cond. Res. 2013, 27, 1101–1107. [CrossRef]
44. Saeterbakken, A.; Andersen, V.; Brudeseth, A.; Lund, H.; Fimland, M.S. The effect of performing bi- and unilateral row exercises
on core muscle activation. Int. J. Sports Med. 2015, 36, 900–905. [CrossRef]
45. Dunnick, D.D.; Brown, L.E.; Coburn, J.W.; Lynn, S.K.; Barillas, S.R. Bench press upper-body muscle activation between stable and
unstable loads. J. Strength Cond. Res. 2015, 29, 3279–3283. [CrossRef]
46. Gonzalo-Skok, O.; Tous-Fajardo, J.; Suarez-Arrones, L.; Arjol-Serrano, J.L.; Casajús, J.A.; Mendez-Villanueva, A. Single-leg power
output and between-limbs imbalances in team-sport players: Unilateral versus bilateral combined resistance training. Int. J.Sports Physiol. Perform. 2016, 12, 106–114. [CrossRef]
47. Jakubek, M.D. Stability Balls: Reviewing the Literature Regarding Their Use and Effectiveness. Strength Cond. J. 2007, 29, 58–63.
[CrossRef]
48. Ruiz, R.; Richardson, M.T. Using a Domed Device. Strength Cond. J. 2005, 27, 50–55. [CrossRef]
148

Int. J. Environ. Res. Public Health 2021, 18, 1026
49. Bettendorf, B. TRX Suspension Training Bodyweight Exercises: Scientific Foundations and Practical Applications, 1st ed.; Fitness
Anywhere Inc.: San Francisco, CA, USA, 2010.
50. Imai, K.; Keele, L.; Tingley, D. A general approach to causal mediation analysis. Psychol. Methods 2010, 15, 309–334. [CrossRef]
51. Lehman, G.J.; Gilas, D.; Patel, U. An unstable support surface does not increase scapulothoracic stabilizing muscle activity during
push up and push up plus exercises. Man. Ther. 2008, 13, 500–506. [CrossRef]
52. Vera-Garcia, F.J.; Grenier, S.G.; McGill, S.M. Abdominal muscle response during curl-ups on both stable and labile surfaces. Phys.Ther. 2000, 80, 564–569. [CrossRef]
53. Czaprowski, D.; Afeltowicz, A.; Gebicka, A.; Pawłowska, P.; Kedra, A.; Barrios, C.; Hadała, M. Abdominal muscle EMG-activity
during bridge exercises on stable and unstable surfaces. Phys. Ther. Sport 2014, 15, 162–168. [CrossRef] [PubMed]
54. Feldwieser, F.M.; Sheeran, L.; Meana-Esteban, A.; Sparkes, V. Electromyographic analysis of trunk-muscle activity during stable,
unstable and unilateral bridging exercises in healthy individuals. Eur. Spine J. 2012, 21. [CrossRef] [PubMed]
55. Marshall, P.W.M.; Murphy, B.A. Increased Deltoid and Abdominal Muscle Activity During Swiss Ball Bench Press. J. StrengthCond. Res. 2006, 20, 745. [CrossRef]
56. Norwood, J.T.; Anderson, G.S.; Gaetz, M.B.; Twist, P.W. Electromyographic activity of the trunk stabilizers during stable and
unstable bench press. J. Strength Cond. Res. 2007, 21, 343–347. [CrossRef] [PubMed]
57. Barros Beltrão, N.; Torres Pirauá, A.L. Analysis of muscle activity during the bench press exercise performed with the pre-
activation method on stable and unstable surfaces. Kinesiology 2017, 49, 161–168. [CrossRef]
58. de Oliveira, A.S.; de Morais Carvalho, M.; de Brum, D.P.C. Activation of the shoulder and arm muscles during axial load exercises
on a stable base of support and on a medicine ball. J. Electromyogr. Kinesiol. 2008, 18, 472–479. [CrossRef] [PubMed]
59. Uribe, B.P.; Coburn, J.W.; Brown, L.E.; Judelson, D.A.; Khamoui, A.V.; Nguyen, D. Muscle Activation When Performing the Chest
Press and Shoulder Press on a Stable Bench vs. a Swiss Ball. J. Strength Cond. Res. 2010, 24, 1028–1033. [CrossRef]
60. Lehman, G.J.; Hoda, W.; Oliver, S. Trunk muscle activity during bridging exercises on and off a swissball. Chiropr. Osteopat. 2005,
13, 1–8. [CrossRef]
61. Brooks, D.; Brooks, C. BOSU Balance Trainer: Integrated Balance Training; DW Fitness LLC: Greater Manchester, UK, 2002.
62. Anderson, G.S.; Gaetz, M.; Holzmann, M.; Twist, P. Comparison of EMG activity during stable and unstable push-up protocols.
Eur. J. Sport Sci. 2013, 13, 42–48. [CrossRef]
63. Aguilera-Castells, J.; Buscà, B.; Fort-Vanmeerhaeghe, A.; Montalvo, A.M.; Peña, J. Muscle activation in suspension training: A
systematic review. Sport. Biomech. 2020, 19, 55–75. [CrossRef]
64. Aguilera-Castells, J.; Buscà, B.; Morales, J.; Solana-Tramunt, M.; Fort-Vanmeerhaeghe, A.; Rey-Abella, F.; Bantulà, J.; Peña, J.
Muscle activity of Bulgarian squat. Effects of additional vibration, suspension and unstable surface. PLoS ONE 2019, 14, 1–20.
[CrossRef] [PubMed]
65. Snarr, R.L.; Esco, M.R. Electromyographic comparison of traditional and suspension push-ups. J. Hum. Kinet. 2013, 39, 75–83.
[CrossRef]
66. Coswig, V.S.; Dall’Agnol, C.; Del Vecchio, F.B. Anthropometric measurements usage to control the exercise intensity during the
performance of suspension rowing and back squats. Rev. Andaluza Med. Deport. 2016, 9, 119–123. [CrossRef]
67. Krause, D.A.; Elliott, J.J.; Fraboni, D.F.; McWilliams, T.J.; Rebhan, R.L.; Hollman, J.H. Electromyography of the hip and thigh
muscles during two variations of the lunge exercise: A cross-sectional study. Int. J. Sports Phys. Ther. 2018, 13, 137–142. [CrossRef]
[PubMed]
68. Malliaropoulos, N.; Panagiotis, T.; Jurdan, M.; Vasilis, K.; Debasish, P.; Peter, M.; Tsapralis, K. Muscle and intensity based
hamstring exercise classification in elite female track and field athletes: Implications for exercise selection during rehabilitation.
Open Access J. Sport. Med. 2015, 209. [CrossRef]
69. Borreani, S.; Calatayud, J.; Colado, J.C.; Moya-Nájera, D.; Triplett, N.T.; Martin, F. Muscle activation during push-ups performed
under stable and unstable conditions. J. Exerc. Sci. Fit. 2015, 13, 94–98. [CrossRef]
70. Byrne, J.M.; Bishop, N.S.; Caines, A.M.; Crane, K.A.; Feaver, A.M.; Pearcey, G.E.P. Effect of Using a Suspension Training System
on Muscle Activation During the Performance of a Front Plank Exercise. J. Strength Cond. Res. 2014, 28, 3049–3055. [CrossRef]
71. Calatayud, J.; Borreani, S.; Colado, J.C.; Martin, F.; Batalha, N.; Silva, A. Muscle activation differences between stable push-ups
and push-ups with a unilateral v-shaped suspension system at different heights. Motricidade 2014, 10, 84–93. [CrossRef]
72. Snarr, R.L.; Hallmark, A.V.; Nickerson, B.S.; Esco, M.R. Electromyographical comparison of pike variations performed with and
without instability devices. J. Strength Cond. Res. 2016, 30, 3436–3442. [CrossRef]
73. Cugliari, G.; Boccia, G. Core muscle activation in suspension training exercises. J. Hum. Kinet. 2017, 56, 61–71. [CrossRef]
74. Nairn, B.C.; Sutherland, C.A.; Drake, J.D.M. Motion and muscle activity are affected by instability location during a squat exercise.
J. Strength Cond. Res. 2017, 31, 677–685. [CrossRef] [PubMed]
75. Moher, D.; Shamseer, L.; Clarke, M.; Ghersi, D.; Liberati, A.; Petticrew, M.; Shekelle, P.; Stewart, L.A. Preferred reporting items for
systematic review and meta-analysis protocols (PRISMA-P) 2015 statement. Syst. Rev. 2015, 4, 1. [CrossRef] [PubMed]
76. Behm, D.G.; Muehlbauer, T.; Kibele, A.; Granacher, U. Effects of strength training using unstable surfaces on strength, power and
balance performance across the lifespan: A systematic review and meta-analysis. Sport. Med. 2015, 45, 1645–1669. [CrossRef]
[PubMed]
77. Tan, B. Variables to Optimize Maximum Strength in Men: A Review. J. Strength Cond. Res. 1999, 13, 289–304. [CrossRef]
149

Int. J. Environ. Res. Public Health 2021, 18, 1026
78. Vandenbroucke, J.P.; Von Elm, E.; Altman, D.G.; Gøtzsche, P.C.; Mulrow, C.D.; Pocock, S.J.; Poole, C.; Schlesselman, J.J.; Egger, M.
Strengthening the Reporting of Observational Studies in Epidemiology (STROBE): Explanation and elaboration. PLoS Med. 2007,
4, 1628–1654. [CrossRef]
79. Behm, D.; Anderson, K.G.; Curnew, R.S. Muscle force and activation under stable and unstable conditions. J. Strength Cond. Res.2002, 16, 416–422. [CrossRef]
80. Chulvi-Medrano, I.; García-Massó, X.; Colado, J.C.; Pablos, C.; de Moraes, J.A.; Fuster, M.A. Deadlift muscle force and activation
under stable and unstable conditions. J. Strength Cond. Res. 2010, 24, 2723–2730. [CrossRef]
81. Goodman, C.A.; Pearce, A.J.; Nicholes, C.J.; Gatt, B.M.; Fairweather, I.H. No difference in 1RM strength and muscle activation
during the barbell chest press on a stable and unstable surface. J. Strength Cond. Res. 2008, 22, 88–94. [CrossRef]
82. Koshida, S.; Urabe, Y.; Miyashita, K.; Iwai, K.; Kagimori, A. Muscular outputs during dynamic bench press under stable versus
unstable conditions. J. Strength Cond. Res. 2008, 22, 1584–1588. [CrossRef]
83. Saeterbakken, A.H.; Fimland, M.S. Muscle force output and electromyographic activity in squats with various unstable surfaces.
J. Strength Cond. Res. 2013, 27, 130–136. [CrossRef]
84. Sannicandro, I.; Cofano, G.; Rosa, A.R. Strength and power analysis in half squat exercise with suspension training tools. J. Phys.Educ. Sport 2015, 15, 433–440. [CrossRef]
85. Zemková, E.; Jelen, M.; Kováciková, Z.; Ollé, G.; Vilman, T.; Hamar, D. Power outputs in the concentric phase of resistance
exercises performed in the interval mode on stable and unstable surfaces. J. Strength Cond. Res. 2012, 26, 3230–3236. [CrossRef]
86. Zemkova, E.; Jelen, M.; Radman, I.; Svilar, L.; Hamar, D. L’effetto delle condizioni di sollevamento stabili e instabili sulla forza
muscolare e sul tasso di affaticamento durante esercizi di resistenza. Med. Dello Sport 2017, 70, 36–49. [CrossRef]
87. Kornecki, S.; Kebel, A.; Siemienski, A. Muscular co-operation during joint stabilisation, as reflected by EMG. Eur. J. Appl. Physiol.2001, 84, 453–461. [CrossRef]
88. Carpenter, M.; Frank, J.; Silcher, C.; Peysar, G. The influence of postural threat on the control of upright stance. Exp. Brain Res.2001, 138, 210–218. [CrossRef]
89. Stone, M.H.; Sanborn, K.; O’Bryant, H.S.; Hartman, M.; Stone, M.E.; Proulx, C.; Ward, B.; Hruby, J. Maximum Strength-Power-
Performance Relationships in Collegiate Throwers. J. Strength Cond. Res. 2003, 17, 739. [CrossRef]
90. Häkkinen, K. Neuromuscular and hormonal adaptations during strength and power training. A review. J. Sports Med. Phys.Fitness 1989, 29, 9–26.
91. Wilson, G.J.; Newton, R.U.; Murphy, A.J.; Humphries, B.J. The optimal training load for the development of dynamic athletic
performance. Med. Sci. Sports Exerc. 1993, 25, 1279–1286. [CrossRef]
92. Komi, P.V.; Bosco, C. Utilization of stored elastic energy in leg extensor muscles by men and women. Med. Sci. Sports 1978, 10,
261–265.
93. González Badillo, J.J.; Gorostiaga Ayestarán, E. Fundamentos del Entrenamiento de La Fuerza. Aplicación al Alto Rendimiento Deportivo;
INDE: Barcelona, Spain, 1995; ISBN 9788487330384.
94. Adkin, A.L.; Frank, J.S.; Carpenter, M.G.; Peysar, G.W. Fear of falling modifies anticipatory postural control. Exp. Brain Res. 2002,
143, 160–170. [CrossRef]
95. Kornecki, S.; Zschorlich, V. The nature of the stabilizing functions of skeletal muscles. J. Biomech. 1994, 27, 215–225. [CrossRef]
150
International Journal of
Environmental Research
and Public Health
Systematic Review
Exercise Intensity in Patients with Cardiovascular Diseases:Systematic Review with Meta-Analysis
Catarina Gonçalves 1,2 , Armando Raimundo 1,2 , Ana Abreu 3 and Jorge Bravo 1,2,*
�����������������
Citation: Gonçalves, C.; Raimundo,
A.; Abreu, A.; Bravo, J. Exercise
Intensity in Patients with
Cardiovascular Diseases: Systematic
Review with Meta-Analysis. Int. J.
Environ. Res. Public Health 2021, 18,
3574. https://doi.org/10.3390/
ijerph18073574
Academic Editor: Paul B. Tchounwou
Received: 23 February 2021
Accepted: 25 March 2021
Published: 30 March 2021
Publisher’s Note: MDPI stays neutral
with regard to jurisdictional claims in
published maps and institutional affil-
iations.
Copyright: © 2021 by the authors.
Licensee MDPI, Basel, Switzerland.
This article is an open access article
distributed under the terms and
conditions of the Creative Commons
Attribution (CC BY) license (https://
creativecommons.org/licenses/by/
4.0/).
1 Departamento de Desporto e Saúde, Escola de Saúde e Desenvolvimento Humano, Universidade de Évora,
Largo dos Colegiais, 7000 Évora, Portugal; [email protected] (C.G.); [email protected] (A.R.)2 Comprehensive Health Research Centre (CHRC), Universidade de Évora, Largo dos Colegiais,
7000 Évora, Portugal3 Servico de Cardiologia, Hospital Universitário de Santa Maria/Centro Hospitalar Universitário Lisboa
Norte (CHULN), Centro Académico de Medicina de Lisboa (CAML), Centro Cardiovascular da Universidade
de Lisboa (CCUL), Faculdade de Medicina, Universidade de Lisboa, 1649-028 Lisboa, Portugal;
* Correspondence: [email protected]
Abstract: Exercise-induced improvements in the VO2peak of cardiac rehabilitation participants
are well documented. However, optimal exercise intensity remains doubtful. This study aimed
to identify the optimal exercise intensity and program length to improve VO2peak in patients
with cardiovascular diseases (CVDs) following cardiac rehabilitation. Randomized controlled trials
(RCTs) included a control group and at least one exercise group. RCTs assessed cardiorespira-
tory fitness (CRF) changes resulting from exercise interventions and reported exercise intensity,
risk ratio, and confidence intervals (CIs). The primary outcome was CRF (VO2peak or VO2 at
anaerobic threshold). Two hundred and twenty-one studies were found from the initial search
(CENTRAL, MEDLINE, CINAHL and SPORTDiscus). Following inclusion criteria, 16 RCTs were
considered. Meta-regression analyses revealed that VO2peak significantly increased in all intensity
categories. Moderate-intensity interventions were associated with a moderate increase in relative
VO2peak (SMD = 0.71 mL-kg−1-min−1; 95% CI = [0.27–1.15]; p = 0.001) with moderate heterogeneity
(I2 = 45%). Moderate-to-vigorous-intensity and vigorous-intensity interventions were associated
with a large increase in relative VO2peak (SMD = 1.84 mL-kg−1-min−1; 95% CI = [1.18–2.50],
p < 0.001 and SMD = 1.80 mL-kg−1-min−1; 95% CI = [0.82–2.78] p = 0.001, respectively), and were also
highly heterogeneous with I2 values of 91% and 95% (p < 0.001), respectively. Moderate-to-vigorous
and vigorous-intensity interventions, conducted for 6–12 weeks, were more effective at improving
CVD patients’ CRF.
Keywords: cardiac rehabilitation; cardiorespiratory fitness; exercise therapy; heart diseases;
high-intensity intermittent exercise
1. Introduction
Cardiovascular diseases (CVDs) are the leading cause of mortality in today’s society,being responsible for up to one-third of all deaths worldwide and 50% of all deaths inEurope, and this scenario is expected to worsen in the coming years [1].
The concept of cardiac rehabilitation (CR) has been defined as the effort towardscardiovascular risk factor reduction, designed to lessen the chance of a subsequent cardiacevent, and to slow and perhaps stop the progression of the disease process. In the contextof CR programs, exercise training has been recognized as one of the main components,combined with education, control, pharmacological adherence and lifestyle changes ofcardiovascular risk factors [2]. Physical exercise inclusion in CR programs resulted inseveral beneficial effects on cardiovascular functional capacity, quality of life, risk factormodification, psychological profile, hospital readmissions, and mortality [3,4]. Such ben-efits can be justified by a 20% reduction in mortality from all causes and in the levels of
151
Int. J. Environ. Res. Public Health 2021, 18, 3574
cardiorespiratory fitness (CRF) for each metabolic equivalent improvement (MET) in CRFof patients with CVD [5].
Exercise programs for patients with CVD traditionally involve mostly low- to moderate-intensity continuous aerobic exercise training, with the consensus that one of the benefits ofaerobic exercise is the increase in peak oxygen uptake (VO2peak) [6–8]. Continuous aerobicexercise training implicates higher durations under moderate-intensity and nonvariableaerobic activity (60–80% of VO2peak) [9–12], compared to high-intensity protocols, whichconsist of intermittent, short high-intensity work periods (85–100% of VO2peak) withrelative resting periods [13,14].
Exercise intensity appears to influence the number of cardioprotective benefits achievedfrom aerobic exercise [15,16]. The current consensus recommends that exercise intensityprescribed for patients with CVD should be approximately 60% of the maximal heart rate(MHR), 50% of the heart rate reserve (HRR), or 12–13 on the Borg scale. Intensities around85% MHR, 80% HRR, or 15–16 on the Borg scale should represent the upper limits [6]. Ad-ditionally, high-intensity protocols (85–100% of VO2peak) appear to be of particular interestto scientists, considering their application in patients with CVD based on the effects on thecardiorespiratory and muscle systems [7]. High-intensity protocols elicit a greater trainingstimulus than moderate continuous exercise in improving maximal aerobic capacity [8–19].In addition, high-intensity exercise appears to improve the limiting factors of VO2peak,and VO2peak itself has been found to be more effective in improving cardiovascular riskfactors than moderate-intensity exercise [17,19].
Training sessions based on moderate-intensity continuous exercise have shown im-provements in HRR after eight weeks [20] and after 12 weeks [21,22]. Moderate- to high-intensity continuous exercise (6 and 12 MET, corresponding to 21 and 42 mL-kg−1-min−1
of VO2peak) has also been shown to reduce all-cause mortality in healthy individuals,independent of activity duration [7], and reduce the risk of heart disease [15], supportingthe need to further investigate the potential health effects of protocols based on higherintensities. Therefore, during the last two decades, several studies have demonstratedthat high-intensity exercise protocols induce more beneficial cardiovascular adaptations inpatients with mild-to-severe heart disease when compared to moderate-intensity exerciseprotocols [8,17–19].
A recent meta-analysis [23] reported higher improvements in maximal aerobic capacityafter high-intensity interval training (HIIT) programs compared to moderate-intensityprograms. Nevertheless, the optimum exercise intensity prescription in patients with CVDis still a subject of debate. A recent systematic review on the topic [24] did not reportoptimal intensity prescription (e.g., the intensity interval that is most effective duringexercise interventions to induce favorable changes in aerobic capacity). Thus, despitethe literature being replete with studies showing that regular and structured exercise isbeneficial for CVD patients, the optimal intensity and length of exercise interventionsthat bring about greater benefits remain equivocal. Hence, the objective of this systematicreview with meta-analysis was to identify, through Randomized Controlled Trials (RCTs) ofexercise-based CR, the most effective exercise intensity and intervention length to optimizeVO2peak in patients with CVD.
2. Materials and Methods
This systematic review was undertaken as detailed in the protocol registered withPROSPERO (Registration Number CRD42018097319).
2.1. Search Strategy
The search strategies were designed in accordance with the methods suggested bythe Cochrane Handbook for Systematic Reviews of Interventions [25]. The followingdatabases were searched from their inception to January 2021: Cochrane Central Registerof Controlled Trials (CENTRAL), MEDLINE (Ovid), CINAHL (EBSCO) and SPORTDiscus.Data are provided as the risk difference (95% CI), based on RCTs published until January
152
Int. J. Environ. Res. Public Health 2021, 18, 3574
2021, ensuring that all studies have been included if reporting data on established outcomes.Reference lists of eligible studies were also systematically searched.
We used the PICO model [26] to identify free text terms and controlled vocabularyterms to create our searches. The following key concepts were chosen: “Patients withcardiovascular diseases” AND “Cardiac Rehabilitation” AND “Exercise Intensity” AND“Cardiorespiratory Fitness”. The search strategy for the MEDLINE (Ovid) database isavailable in the Supplementary Materials of this manuscript.
2.2. Inclusion Criteria
The inclusion criteria were full-length research articles published in peer-reviewedjournals in the English language with no limits set on the date of first publication or gender.Only RCTs up to January 2021 were eligible. Studies included participants who werediagnosed with CVD, such as those involved in some exercise programs, assessed byanalyzing expired air during a maximal cardiopulmonary exercise test at baseline andpostintervention.
We included RCTs to compare aerobic capacity changes resulting from exercise inter-ventions, with an exercise group (or groups), that described exercise intensities, includingdata for risk ratio and CI.
Studies were required to detail the exercise prescription in patients with CVD, in-cluding the frequency, intensity and duration of each session, mode of exercise and theoverall length of intervention. The main authors of studies and experts in this field wereasked for any missed, unreported, or ongoing trials. The quantitative synthesis includedstudies reporting sample size and the mean and standard deviations (SDs) for VO2peakpreintervention and postintervention.
2.3. Exclusion Criteria
Abstracts, conference presentations or posters, letters to editors or book chapters,unpublished papers, and retrospective design studies were excluded. In addition, studieswere excluded if participants had documented heart failure (ejection fraction < 40%) orarrhythmia, they were targeting a specific comorbidity (e.g., diabetes, chronic obstructivepulmonary disease, or stroke) and they featured interventions involving resistance exercisesonly. We also excluded studies based on exercise prescriptions including testing foodsupplements and nutritional or pharmacological aids.
Studies were also excluded if baseline or postintervention data were not published,and the authors were not available for contact or did not wish to provide the missing data.
2.4. Study Selection and Data Extraction
All data were extracted by the principal investigator and their accuracy was assessedby the second author. The EndNote software (Clarivate Analytics, Philadelphia, PA, USA)was used to import, manage and remove duplicated articles for final review. After removingthe duplicates, the two reviewers independently reviewed titles and abstracts against theinclusion/exclusion criteria. If in doubt, the full texts were evaluated to verify if they metthe criteria. Subsequently, abstracts were selected for eligibility, and full manuscripts wereretrieved for further evaluation of eligibility. Discrepancies were resolved between bothauthors, and a third expert, not involved in the previous procedures, was consulted toverify the ratings. The selection process was entered into a Preferred Reporting Items forSystematic Reviews and Meta-analysis (PRISMA) diagram [27] (Figure 1).
153

Int. J. Environ. Res. Public Health 2021, 18, 3574
−1 −1 −
− −1
Figure 1. Preferred Reporting Items for Systematic Reviews and Meta-analysis (PRISMA) diagram of literature
search strategies.
For each RCT, the author, year of publication, participant characteristics (age, gender,and primary diagnosis), description of the exercise testing protocol and description of
154
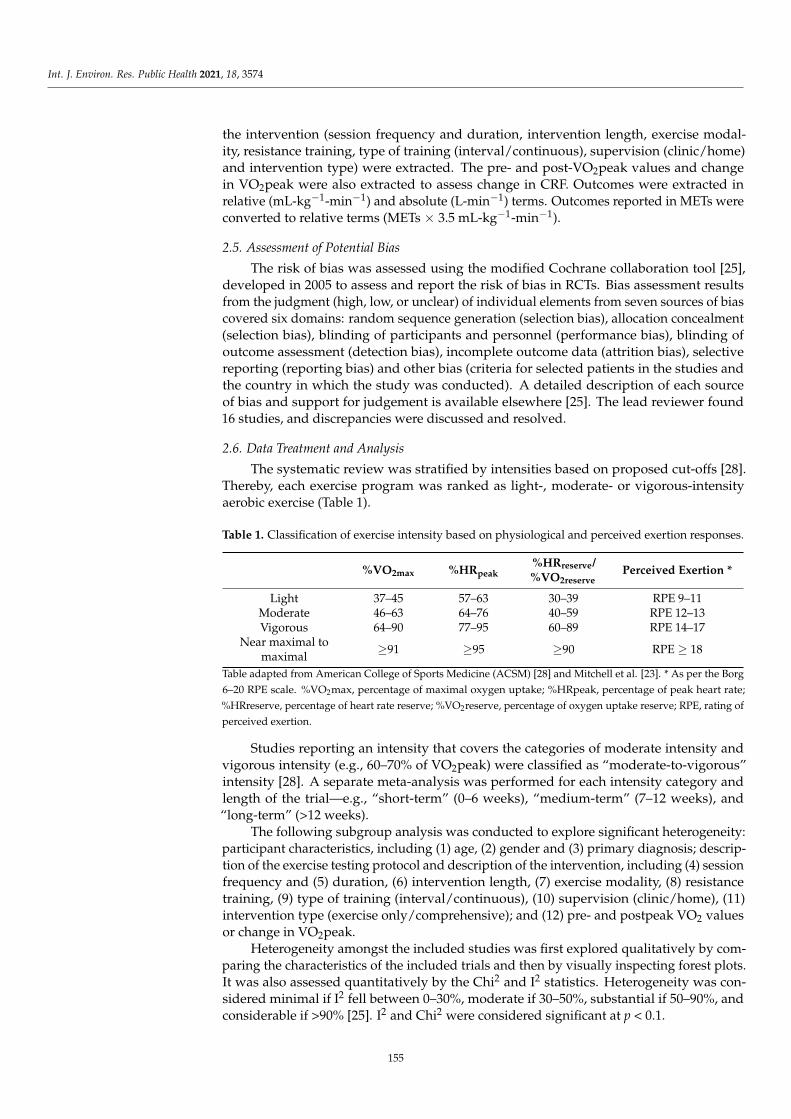
Int. J. Environ. Res. Public Health 2021, 18, 3574
the intervention (session frequency and duration, intervention length, exercise modal-ity, resistance training, type of training (interval/continuous), supervision (clinic/home)and intervention type) were extracted. The pre- and post-VO2peak values and changein VO2peak were also extracted to assess change in CRF. Outcomes were extracted inrelative (mL-kg−1-min−1) and absolute (L-min−1) terms. Outcomes reported in METs wereconverted to relative terms (METs × 3.5 mL-kg−1-min−1).
2.5. Assessment of Potential Bias
The risk of bias was assessed using the modified Cochrane collaboration tool [25],developed in 2005 to assess and report the risk of bias in RCTs. Bias assessment resultsfrom the judgment (high, low, or unclear) of individual elements from seven sources of biascovered six domains: random sequence generation (selection bias), allocation concealment(selection bias), blinding of participants and personnel (performance bias), blinding ofoutcome assessment (detection bias), incomplete outcome data (attrition bias), selectivereporting (reporting bias) and other bias (criteria for selected patients in the studies andthe country in which the study was conducted). A detailed description of each sourceof bias and support for judgement is available elsewhere [25]. The lead reviewer found16 studies, and discrepancies were discussed and resolved.
2.6. Data Treatment and Analysis
The systematic review was stratified by intensities based on proposed cut-offs [28].Thereby, each exercise program was ranked as light-, moderate- or vigorous-intensityaerobic exercise (Table 1).
Table 1. Classification of exercise intensity based on physiological and perceived exertion responses.
%VO2max %HRpeak%HRreserve/%VO2reserve
Perceived Exertion *
Light 37–45 57–63 30–39 RPE 9–11Moderate 46–63 64–76 40–59 RPE 12–13Vigorous 64–90 77–95 60–89 RPE 14–17
Near maximal tomaximal
≥91 ≥95 ≥90 RPE ≥ 18
Table adapted from American College of Sports Medicine (ACSM) [28] and Mitchell et al. [23]. * As per the Borg
6–20 RPE scale. %VO2max, percentage of maximal oxygen uptake; %HRpeak, percentage of peak heart rate;
%HRreserve, percentage of heart rate reserve; %VO2reserve, percentage of oxygen uptake reserve; RPE, rating of
perceived exertion.
Studies reporting an intensity that covers the categories of moderate intensity andvigorous intensity (e.g., 60–70% of VO2peak) were classified as “moderate-to-vigorous”intensity [28]. A separate meta-analysis was performed for each intensity category andlength of the trial—e.g., “short-term” (0–6 weeks), “medium-term” (7–12 weeks), and“long-term” (>12 weeks).
The following subgroup analysis was conducted to explore significant heterogeneity:participant characteristics, including (1) age, (2) gender and (3) primary diagnosis; descrip-tion of the exercise testing protocol and description of the intervention, including (4) sessionfrequency and (5) duration, (6) intervention length, (7) exercise modality, (8) resistancetraining, (9) type of training (interval/continuous), (10) supervision (clinic/home), (11)intervention type (exercise only/comprehensive); and (12) pre- and postpeak VO2 valuesor change in VO2peak.
Heterogeneity amongst the included studies was first explored qualitatively by com-paring the characteristics of the included trials and then by visually inspecting forest plots.It was also assessed quantitatively by the Chi2 and I2 statistics. Heterogeneity was con-sidered minimal if I2 fell between 0–30%, moderate if 30–50%, substantial if 50–90%, andconsiderable if >90% [25]. I2 and Chi2 were considered significant at p < 0.1.
155
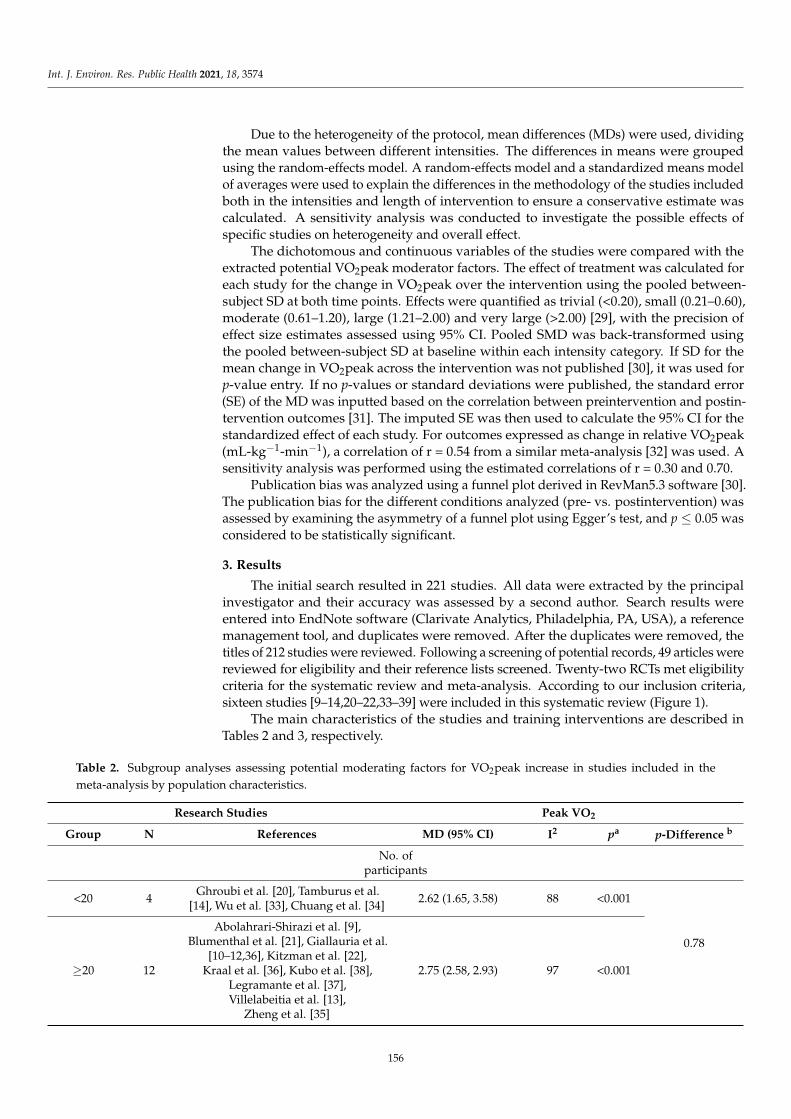
Int. J. Environ. Res. Public Health 2021, 18, 3574
Due to the heterogeneity of the protocol, mean differences (MDs) were used, dividingthe mean values between different intensities. The differences in means were groupedusing the random-effects model. A random-effects model and a standardized means modelof averages were used to explain the differences in the methodology of the studies includedboth in the intensities and length of intervention to ensure a conservative estimate wascalculated. A sensitivity analysis was conducted to investigate the possible effects ofspecific studies on heterogeneity and overall effect.
The dichotomous and continuous variables of the studies were compared with theextracted potential VO2peak moderator factors. The effect of treatment was calculated foreach study for the change in VO2peak over the intervention using the pooled between-subject SD at both time points. Effects were quantified as trivial (<0.20), small (0.21–0.60),moderate (0.61–1.20), large (1.21–2.00) and very large (>2.00) [29], with the precision ofeffect size estimates assessed using 95% CI. Pooled SMD was back-transformed usingthe pooled between-subject SD at baseline within each intensity category. If SD for themean change in VO2peak across the intervention was not published [30], it was used forp-value entry. If no p-values or standard deviations were published, the standard error(SE) of the MD was inputted based on the correlation between preintervention and postin-tervention outcomes [31]. The imputed SE was then used to calculate the 95% CI for thestandardized effect of each study. For outcomes expressed as change in relative VO2peak(mL-kg−1-min−1), a correlation of r = 0.54 from a similar meta-analysis [32] was used. Asensitivity analysis was performed using the estimated correlations of r = 0.30 and 0.70.
Publication bias was analyzed using a funnel plot derived in RevMan5.3 software [30].The publication bias for the different conditions analyzed (pre- vs. postintervention) wasassessed by examining the asymmetry of a funnel plot using Egger’s test, and p ≤ 0.05 wasconsidered to be statistically significant.
3. Results
The initial search resulted in 221 studies. All data were extracted by the principalinvestigator and their accuracy was assessed by a second author. Search results wereentered into EndNote software (Clarivate Analytics, Philadelphia, PA, USA), a referencemanagement tool, and duplicates were removed. After the duplicates were removed, thetitles of 212 studies were reviewed. Following a screening of potential records, 49 articles werereviewed for eligibility and their reference lists screened. Twenty-two RCTs met eligibilitycriteria for the systematic review and meta-analysis. According to our inclusion criteria,sixteen studies [9–14,20–22,33–39] were included in this systematic review (Figure 1).
The main characteristics of the studies and training interventions are described inTables 2 and 3, respectively.
Table 2. Subgroup analyses assessing potential moderating factors for VO2peak increase in studies included in the
meta-analysis by population characteristics.
Research Studies Peak VO2
Group N References MD (95% CI) I2 pa p-Difference b
No. ofparticipants
<20 4Ghroubi et al. [20], Tamburus et al.
[14], Wu et al. [33], Chuang et al. [34]2.62 (1.65, 3.58) 88 <0.001
0.78
≥20 12
Abolahrari-Shirazi et al. [9],Blumenthal et al. [21], Giallauria et al.
[10–12,36], Kitzman et al. [22],Kraal et al. [36], Kubo et al. [38],
Legramante et al. [37],Villelabeitia et al. [13],
Zheng et al. [35]
2.75 (2.58, 2.93) 97 <0.001
156

Int. J. Environ. Res. Public Health 2021, 18, 3574
Table 2. Cont.
Research Studies Peak VO2
Group N References MD (95% CI) I2 pa p-Difference b
Age, years
<60 9
Abolahrari-Shirazi et al. [9],Ghroubi et al. [20], Giallauria et al.
[10,12,36], Kraal et al. [39], Kubo et al.[38], Tamburus et al. [14],
Villelabeitia et al. [13]
4.40 (0.79, 8.01) 97 0.02
0.75
≥60 6
Blumenthal et al. [21], Chuang et al.[34], Giallauria et al. [11],
Kitzman et al. [22], Legramante et al.[37], Wu et al. [33]
3.48 (2.09, 4.87) 79 <0.001
Notreported
1 Zheng et al. [35] 3.10 (2.06, 4.14) 0 <0.001
Diagnosis
CAD only 3Blumenthal et al. [21], Tamburus et al.
[14], Villelabeitia et al. [13]6.41 (−2.70, 15.53) 99 0.17
0.03
CABGonly
4Chuang et al. [34], Ghroubi et al. [20],Legramante et al. [37], Wu et al. [33]
4.27 (1.60, 6.94) 85 0.002
PCI only 1 Abolahrari-Shirazi et al. [9] 8.20 (4.68, 11.72) 0 <0.001
CABG/PCI 1 Kraal et al. [39] 3.20 (0.36, 6.04) 0 0.03
MI 6Giallauria et al. [10–12,36], Kubo et al.
[38], Zheng et al. [35]2.65 (0.56, 4.74) 91 0.01
FMD 1 Kitzman et al. [22] 1.60 (−0.13, 3.33) 0 0.07
Study location
America 2Kitzman et al. [22],
Tamburus et al. [14]1.38 (0.39, 2.36) 0 0.006
0.01
Africa 1 Ghroubi et al. [20] 1.70 (−1.07, 4.47) 0 0.23
Asia 5Abolahrari-Shirazi et al. [9], Chuanget al. [34], Kubo et al. [38], Wu et al.
[33], Zheng et al. [35]5.33 (2.90, 7.76) 80 <0.001
Europe 8
Blumenthal et al. [21], Giallauria et al.[10–12,36], Kraal et al. [39],
Legramante et al. [37],Villelabeitia et al. [13]
4.23 (1.50, 6.95) 98 0.002
95% CI, 95% confidence interval. I2, heterogeneity. MD, mean difference. Peak VO2, peak oxygen uptake. Conditions: MI, myocardialinfarction. CABG, coronary artery bypass graft. PCI, percutaneous coronary intervention. CAD, coronary artery disease. FMD, endothelial-dependent flow-mediated arterial dilation. Certain enrolled studies were not included because the value used for subgroup analysis wasnot reported in them. a Test for overall effect. b Test for subgroup differences.
157

Int. J. Environ. Res. Public Health 2021, 18, 3574
Table 3. Subgroup analyses assessing potential moderating factors for VO2peak increase in studies included in the
meta-analysis by population characteristics.
Research Studies Peak VO2
Group N References MD (95% CI) I2 p a p-Difference b
Length, weeks
<6 1 Legramante et al. [37] 2.60 (2.41, 2.79) 0 <0.001
0.426–12 9
Abolahrari-Shirazi et al. [9],Chuang et al. [34], Ghroubi et al. [20],
Giallauria et al. [10,36], Kraal et al. [39],Kubo et al. [38], Villelabeitia et al. [13],
Wu et al. [33]
5.31 (1.24, 9.38) 97 0.01
>12 6Blumenthal et al. [21], Giallauria et al.
[11,12], Kitzman et al. [22],Tamburus et al. [14], Zheng et al. [35]
2.50 (1.60, 3.41) 52 <0.001
Frequency, sessions/week
1–2 2 Chuang et al. [34], Kraal et al. [39] 3.98 (1.96, 6.01) 0 0.001
0.173–4 13
Abolahrari-Shirazi et al. [9],Blumenthal et al. [21], Ghroubi et al.
[20], Giallauria et al. [10–12,36],Kitzman et al. [22], Kubo et al. [38],
Tamburus et al. [14], Villelabeitia et al.[13], Wu et al. [33], Zheng et al. [35]
4.21 (1.82, 6.60) 96 0.006
5–7 1 Legramante et al. [37] 2.60 (2.41, 2.79) 0 <0.001
Supervision
Clinic 12
Blumenthal et al. [21], Chuang et al.[34], Ghroubi et al. [20], Giallauria et al.[10–12], Kitzman et al. [22], Kubo et al.[38], Legramante et al. [37], Tamburus
et al. [14], Villelabeitia et al. [13],Zheng et al. [35]
4.01 (2.30, 5.72) 96 <0.001
0.02
Home 1 Wu et al. [33] 8.50 (5.78, 11.22) 0 <0.001
Mixed 3Abolahrari-Shirazi et al. [9], Giallauria
et al. [36], Kraal et al. [39]2.99 (−2.89, 8.87) 94 0.32
Intervention type
Continuous 13
Abolahrari-Shirazi et al. [9],Blumenthal et al. [21], Chuang et al.
[34], Giallauria et al. [11,12,36],Kitzman et al. [22], Kraal et al. [39],
Kubo et al. [38], Legramante et al. [37],Wu et al. [33], Zheng et al. [35]
3.27 (2.23, 4.32) 87 <0.001
0.44
Interval 2Tamburus et al. [14],
Villelabeitia et al. [13]8.67 (−5.86, 23.21) 99 0.24
Mixed 1 Ghroubi et al. [20] 1.70 (−1.07, 4.47) 0 0.23
158
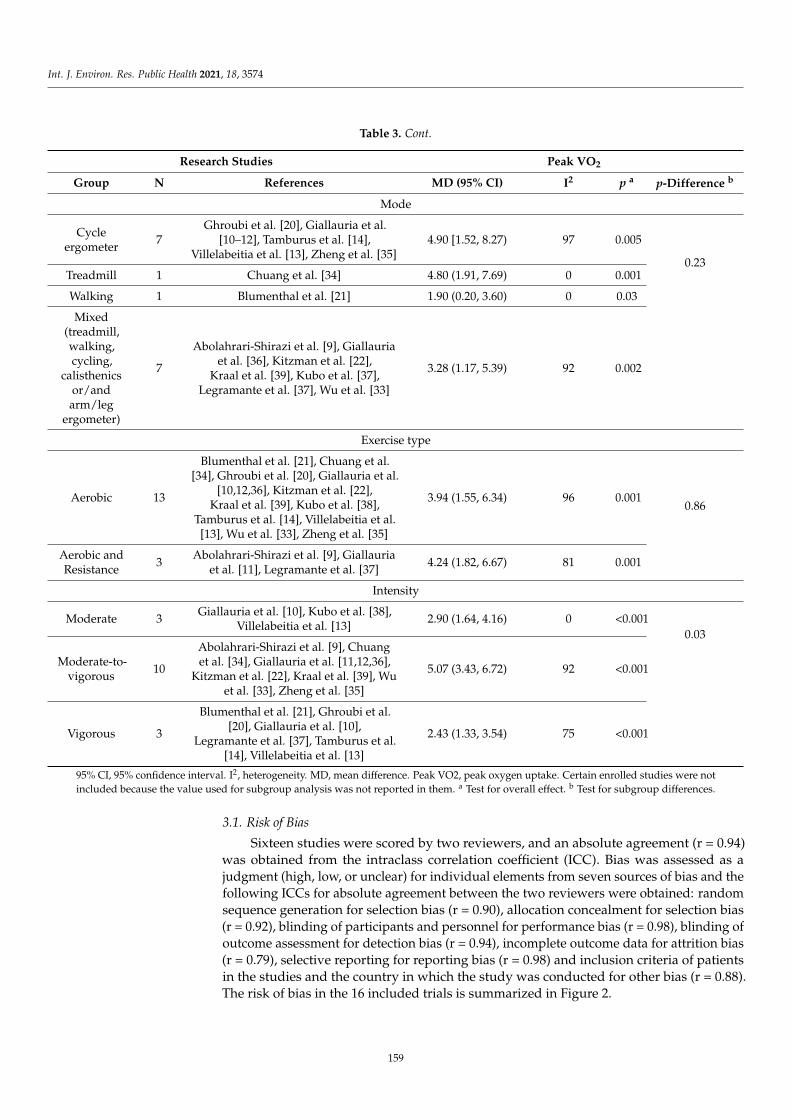
Int. J. Environ. Res. Public Health 2021, 18, 3574
Table 3. Cont.
Research Studies Peak VO2
Group N References MD (95% CI) I2 p a p-Difference b
Mode
Cycleergometer
7Ghroubi et al. [20], Giallauria et al.
[10–12], Tamburus et al. [14],Villelabeitia et al. [13], Zheng et al. [35]
4.90 [1.52, 8.27) 97 0.005
0.23Treadmill 1 Chuang et al. [34] 4.80 (1.91, 7.69) 0 0.001
Walking 1 Blumenthal et al. [21] 1.90 (0.20, 3.60) 0 0.03
Mixed(treadmill,walking,cycling,
calisthenicsor/andarm/leg
ergometer)
7
Abolahrari-Shirazi et al. [9], Giallauriaet al. [36], Kitzman et al. [22],
Kraal et al. [39], Kubo et al. [37],Legramante et al. [37], Wu et al. [33]
3.28 (1.17, 5.39) 92 0.002
Exercise type
Aerobic 13
Blumenthal et al. [21], Chuang et al.[34], Ghroubi et al. [20], Giallauria et al.
[10,12,36], Kitzman et al. [22],Kraal et al. [39], Kubo et al. [38],
Tamburus et al. [14], Villelabeitia et al.[13], Wu et al. [33], Zheng et al. [35]
3.94 (1.55, 6.34) 96 0.0010.86
Aerobic andResistance
3Abolahrari-Shirazi et al. [9], Giallauria
et al. [11], Legramante et al. [37]4.24 (1.82, 6.67) 81 0.001
Intensity
Moderate 3Giallauria et al. [10], Kubo et al. [38],
Villelabeitia et al. [13]2.90 (1.64, 4.16) 0 <0.001
0.03
Moderate-to-vigorous
10
Abolahrari-Shirazi et al. [9], Chuanget al. [34], Giallauria et al. [11,12,36],
Kitzman et al. [22], Kraal et al. [39], Wuet al. [33], Zheng et al. [35]
5.07 (3.43, 6.72) 92 <0.001
Vigorous 3
Blumenthal et al. [21], Ghroubi et al.[20], Giallauria et al. [10],
Legramante et al. [37], Tamburus et al.[14], Villelabeitia et al. [13]
2.43 (1.33, 3.54) 75 <0.001
95% CI, 95% confidence interval. I2, heterogeneity. MD, mean difference. Peak VO2, peak oxygen uptake. Certain enrolled studies were not
included because the value used for subgroup analysis was not reported in them. a Test for overall effect. b Test for subgroup differences.
3.1. Risk of Bias
Sixteen studies were scored by two reviewers, and an absolute agreement (r = 0.94)was obtained from the intraclass correlation coefficient (ICC). Bias was assessed as ajudgment (high, low, or unclear) for individual elements from seven sources of bias and thefollowing ICCs for absolute agreement between the two reviewers were obtained: randomsequence generation for selection bias (r = 0.90), allocation concealment for selection bias(r = 0.92), blinding of participants and personnel for performance bias (r = 0.98), blinding ofoutcome assessment for detection bias (r = 0.94), incomplete outcome data for attrition bias(r = 0.79), selective reporting for reporting bias (r = 0.98) and inclusion criteria of patientsin the studies and the country in which the study was conducted for other bias (r = 0.88).The risk of bias in the 16 included trials is summarized in Figure 2.
159
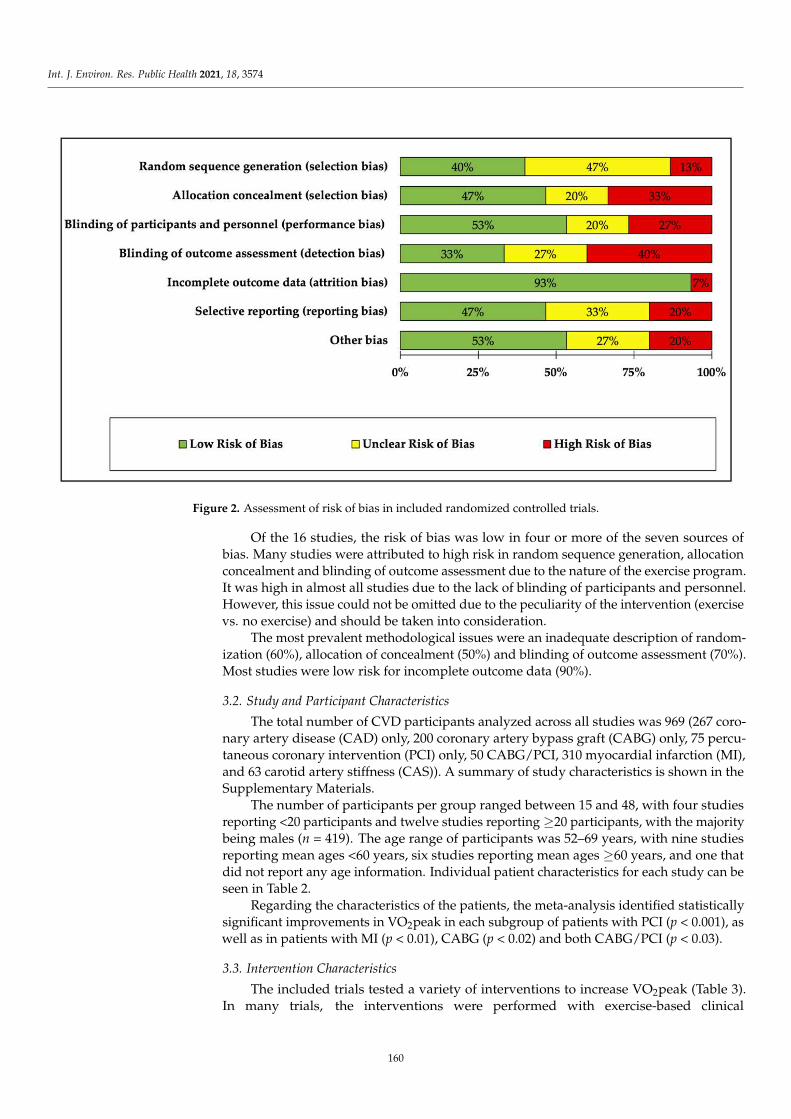
Int. J. Environ. Res. Public Health 2021, 18, 3574
≥–
≥
Figure 2. Assessment of risk of bias in included randomized controlled trials.
Of the 16 studies, the risk of bias was low in four or more of the seven sources ofbias. Many studies were attributed to high risk in random sequence generation, allocationconcealment and blinding of outcome assessment due to the nature of the exercise program.It was high in almost all studies due to the lack of blinding of participants and personnel.However, this issue could not be omitted due to the peculiarity of the intervention (exercisevs. no exercise) and should be taken into consideration.
The most prevalent methodological issues were an inadequate description of random-ization (60%), allocation of concealment (50%) and blinding of outcome assessment (70%).Most studies were low risk for incomplete outcome data (90%).
3.2. Study and Participant Characteristics
The total number of CVD participants analyzed across all studies was 969 (267 coro-nary artery disease (CAD) only, 200 coronary artery bypass graft (CABG) only, 75 percu-taneous coronary intervention (PCI) only, 50 CABG/PCI, 310 myocardial infarction (MI),and 63 carotid artery stiffness (CAS)). A summary of study characteristics is shown in theSupplementary Materials.
The number of participants per group ranged between 15 and 48, with four studiesreporting <20 participants and twelve studies reporting ≥20 participants, with the majoritybeing males (n = 419). The age range of participants was 52–69 years, with nine studiesreporting mean ages <60 years, six studies reporting mean ages ≥60 years, and one thatdid not report any age information. Individual patient characteristics for each study can beseen in Table 2.
Regarding the characteristics of the patients, the meta-analysis identified statisticallysignificant improvements in VO2peak in each subgroup of patients with PCI (p < 0.001), aswell as in patients with MI (p < 0.01), CABG (p < 0.02) and both CABG/PCI (p < 0.03).
3.3. Intervention Characteristics
The included trials tested a variety of interventions to increase VO2peak (Table 3).In many trials, the interventions were performed with exercise-based clinical
160

Int. J. Environ. Res. Public Health 2021, 18, 3574
supervision [10–14,20–22,34,37,38], a few studies implemented an unsupervised home-based program [33], and some studies performed both programs [9,30,36].
Exercise training was typically continuous [9–12,21,22,33–39], as opposed to inter-val [13,14], or mixed training [20], and this type of training was shown to be significantlysuperior in improving VO2peak (3.27 mL-kg−1-min−1; 95% CI = 2.23–4.32; p < 0.001;I2 = 87%).
The frequency of training was typically 3–4 days/week [9–14,20–22,33–35,38], andaerobic training was the most used type of intervention [10,12–14,20–22,33–36,38,39]. Threestudies tested aerobic and resistance training together during the intervention [9,11,37].The meta-analysis identified that cycle-ergometers (p < 0.05) and treadmill (p < 0.01)significantly favored changes in VO2peak.
Studies were separated into three groups depending upon length (<six, 6–12,and >12 weeks). The intervention length ranged from two to 24 weeks, with one study thatreported data for less than six weeks [37], nine studies reported data for 6 to12 weeks [9,10,13,20,31,33,34,36,37], and six studies reported data for>12 weeks [11,12,14,21,22,35]. The subgroup that included studies of >12 weeks in lengthwas significantly superior in terms of improvements in VO2peak (2.50 mL-kg−1-min−1;95% CI = 2.23–4.32; p < 0.001; I2 = 52%). Interventions 6 to 12 weeks in length also produceda large increase (p < 0.01), demonstrating moderate heterogeneity (5.31 mL-kg−1-min−1;95% CI = 1.24–9.38; I2 = 52%).
Based on the American College of Sports Medicine (ACSM) [28] cut-off points, threestudies prescribed moderate-intensity exercise (n = 18, 75%) [10,33,38], threeprescribed vigorous-intensity exercise (n = 18, 75%) [14,20,21] and ten interventions(n = 62,5%) [9,11,13,22,35–37,39] prescribed a range of intensities that placed them withinboth the moderate-intensity and vigorous-intensity categories. The meta-analyzed effectsfound the intervention was beneficial in terms of changing VO2peak in both intensities(p < 0.001).
3.4. Subgroup Analyses—Intensity
When interpreting these results (Figure 3), it is essential to consider how exerciseintensity was classified. We used a categorical-based approach, in which interventionswere categorized according to the prescribed exercise intensity reported in each study,based on the recommendations of the ACSM [28].
The meta-regression analysis displayed in Figure 3 revealed that relative VO2peakwas significantly increased in all intensity categories. Moderate-intensity interventions pro-duced a moderate increase in relative VO2peak (0.71 mL-kg−1-min−1;95% CI = 0.27–1.15; p = 0.001) with moderate heterogeneity (I2 = 45%). Moderate-to-vigorous-intensity and vigorous-intensity interventions produced a large increase in rela-tive VO2peak (1.84 mL-kg−1-min−1; 95% CI = 1.18–2.50; p < 0.001 and 1.80 mL-kg−1-min−1;95% CI = 0.82–2.78; p = 0.0003, respectively), and were also highly heterogeneous with I2
values of 91 and 95% (p < 0.001), respectively.
3.5. Subgroup Analyses—Intensity and Length
In the analyses of studies lasting less than six weeks, we evaluated studies that ex-ercised at vigorous intensity. The results (Figure 4) showed a large increase in VO2peak(3.81 mL-kg−1-min−1; 95% CI = 0.16–7.45; p = 0.04) and demonstrated significant hetero-geneity (I2 = 98%).
161
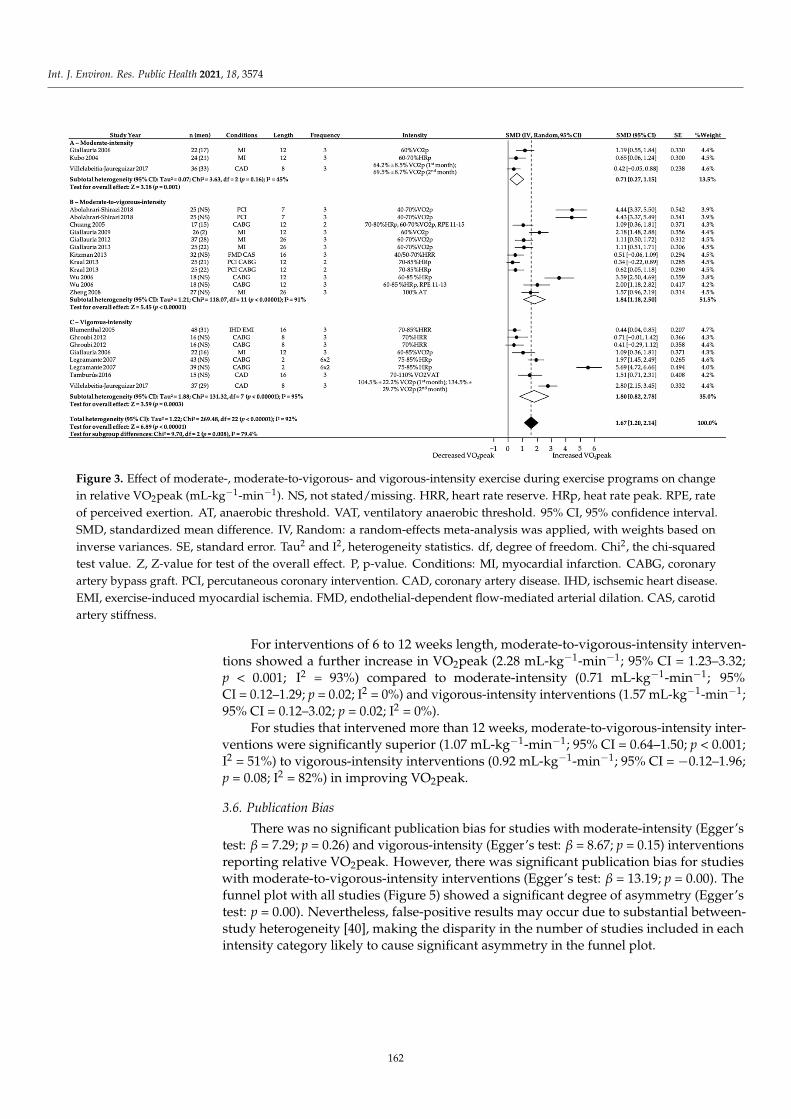
Int. J. Environ. Res. Public Health 2021, 18, 3574
−1 −1
−1 −1 –
−1
−1 – −1 −1 –
—
−1 −1 –
Figure 3. Effect of moderate-, moderate-to-vigorous- and vigorous-intensity exercise during exercise programs on change
in relative VO2peak (mL-kg−1-min−1). NS, not stated/missing. HRR, heart rate reserve. HRp, heat rate peak. RPE, rate
of perceived exertion. AT, anaerobic threshold. VAT, ventilatory anaerobic threshold. 95% CI, 95% confidence interval.
SMD, standardized mean difference. IV, Random: a random-effects meta-analysis was applied, with weights based on
inverse variances. SE, standard error. Tau2 and I2, heterogeneity statistics. df, degree of freedom. Chi2, the chi-squared
test value. Z, Z-value for test of the overall effect. P, p-value. Conditions: MI, myocardial infarction. CABG, coronary
artery bypass graft. PCI, percutaneous coronary intervention. CAD, coronary artery disease. IHD, ischsemic heart disease.
EMI, exercise-induced myocardial ischemia. FMD, endothelial-dependent flow-mediated arterial dilation. CAS, carotid
artery stiffness.
For interventions of 6 to 12 weeks length, moderate-to-vigorous-intensity interven-tions showed a further increase in VO2peak (2.28 mL-kg−1-min−1; 95% CI = 1.23–3.32;p < 0.001; I2 = 93%) compared to moderate-intensity (0.71 mL-kg−1-min−1; 95%CI = 0.12–1.29; p = 0.02; I2 = 0%) and vigorous-intensity interventions (1.57 mL-kg−1-min−1;95% CI = 0.12–3.02; p = 0.02; I2 = 0%).
For studies that intervened more than 12 weeks, moderate-to-vigorous-intensity inter-ventions were significantly superior (1.07 mL-kg−1-min−1; 95% CI = 0.64–1.50; p < 0.001;I2 = 51%) to vigorous-intensity interventions (0.92 mL-kg−1-min−1; 95% CI = −0.12–1.96;p = 0.08; I2 = 82%) in improving VO2peak.
3.6. Publication Bias
There was no significant publication bias for studies with moderate-intensity (Egger’stest: β = 7.29; p = 0.26) and vigorous-intensity (Egger’s test: β = 8.67; p = 0.15) interventionsreporting relative VO2peak. However, there was significant publication bias for studieswith moderate-to-vigorous-intensity interventions (Egger’s test: β = 13.19; p = 0.00). Thefunnel plot with all studies (Figure 5) showed a significant degree of asymmetry (Egger’stest: p = 0.00). Nevertheless, false-positive results may occur due to substantial between-study heterogeneity [40], making the disparity in the number of studies included in eachintensity category likely to cause significant asymmetry in the funnel plot.
162

Int. J. Environ. Res. Public Health 2021, 18, 3574
−1 −1
−1 −1 –−1 −1 –
−1 −1 –
−1 −1 –−1 −1 −0 –
ger’s test: β intensity (Egger’s test: β
er’s test: β
Figure 4. Effect of length in moderate-, moderate-to-vigorous- and vigorous-intensity exercise during exercise programs on
change in relative VO2peak (mL-kg−1-min−1). NS, not stated/missing. HRR, heart rate reserve. HRp, heat rate peak. RPE,
rate of perceived exertion. AT, anaerobic threshold. VAT, ventilatory anaerobic threshold. 95% CI, 95% confidence interval.
SMD, standardized mean differences. IV, Random: a random-effects meta-analysis is applied, with weights based on inverse
variances. SE, standard error. Tau2 and I2, heterogeneity statistics. df, degrees of freedom. Chi2, the chi-squared test value. Z,
Z-value for test of the overall effect. P, p-value. Conditions: MI, myocardial infarction. CABG, coronary artery bypass graft.
PCI, percutaneous coronary intervention. CAD, coronary artery disease. IHD, ischemic heart disease. EMI, exercise-induced
myocardial ischemia. FMD, endothelial-dependent flow-mediated arterial dilation. CAS, carotid artery stiffness.
ger’s test:
−1 −1
−1 −1
−1
−1
−1 −1
−1 −1
Figure 5. Funnel plot with pseudo 95% confidence intervals for change in relative VO2peak (mL-kg−1-min−1) by exercise
intensity (moderate, moderate-to-vigorous, vigorous). SMD, standardized mean difference. SE SMD, standard error of
standardized mean differences. 163
Int. J. Environ. Res. Public Health 2021, 18, 3574
4. Discussion
The main aim of this systematic review and meta-analysis was to identify the opti-mal intensity to optimize VO2peak in patients with CVD following exercise programs.Furthermore, we aimed to gauge whether the length of interventions had an effect onthe results.
Our results support the crucial role of physical exercise in patients with CVD. Theyhave shown significant improvements for all cardiac impairments at all ages, regardless ofthe aerobic exercise mode.
A comparison of the mean effects between intensity classifications showed signif-icant improvements, with moderate-to-vigorous-intensity interventions providing thegreatest improvements of VO2peak. The differences were considered clinically significant(p = 0.03) and the retro transformation of the SMD suggested that the difference betweenthe intensities was 3.92 mL-kg−1-min−1. However, when comparing the effects groupedamong the intensity classifications, it was found that moderate-to-vigorous-intensity exer-cises can provide the most significant improvements in VO2peak. Even so, the differenceswere not considered clinically significant once the retro transformation of the SMD sug-gested that the differences between the intensities were, at most, only 1.67 mL-kg−1-min−1.In this regard, our study confirmed the results of previous systematic reviews, pointingout that moderate-to-vigorous- and vigorous-intensity interventions improved CRF to alarger extent than moderate-intensity ones [23].
The difference between moderate-to-vigorous- and vigorous-intensity in our studywas 0.4 mL-kg−1-min−1 and the difference between moderate- and moderate-to-vigorous-intensity was more significant (1.13 mL-kg−1-min−1). Although these analyses did notyield any consistent findings, they highlighted considerable variability in outcomes forinterventions based on VO2peak that appeared to be consistent across intensities. Althoughunexpected, this finding is not surprising. Given that VO2 is not an appropriate variableto regulate intensity during training, in practice, prescriptions are converted to heart rate(HR) estimated to elicit the target VO2. This approach is confounded in a CR settingby medications (e.g., β-blockers) that alter HR responses, which may cause dissociationof the HR and VO2 relationship, where a small change in HR may result in varied anddisproportionate changes to work rate or VO2peak [8,17,22].
The first meta-analyses that investigated improvements in CRF following exercise-based CR reported a small improvement in CRF (SMD ±: 95% CI = 0.46 ± 0.02) [41]. Ourstudy confirmed the results of Mitchell et al. [23] who verified that moderate- and moderate-to-vigorous-intensity interventions were associated with a moderate increase in relativeVO2peak (SMD ±: 95% CI = 0.94 ± 0.30 and 0.93 ± 0.17, respectively), and vigorous-intensity exercise with a large increase (SMD ±: 95% CI = 1.10 ± 0.25), and moderate- andvigorous-intensity interventions were associated with moderate improvements in absoluteVO2peak (SMD ±: 95% CI = 0.63 ± 0.34 and SMD ±: 95% CI = 0.93 ± 0.20, respectively),whereas moderate-to-vigorous- intensity interventions elicited a large effect (SMD ±: 95%CI = 1.27 ± 0.75).
When we subdivided the intensities by length to obtain a more in-depth view of theeffect of the different intensities, we found that the vigorous-intensity interventions belowsix weeks had more significant results in improving the VO2peak (3.81 mL-kg−1-min−1).Based on the sensitivity analysis, although the results suggest that interventions conductedbidirectionally six times a week resulted in more significant gains of CRF favoring vigorousintensity, the analysis only included two studies and may not be practical to implement. Inthis sense, not being able to compare with other studies and other intensities within thedivision by length, the best result obtained was between 6 and 12 weeks in moderate-to-vigorous-intensity exercise, in which there was a significant increase in VO2peak in relationto the vigorous- and moderate-intensity categories.
Interventions >12 weeks did not show significantly greater gains in CRF compared toother lengths. However, there was a significant improvement in VO2peak with moderate-to-vigorous intensity. Additionally, there was no significant improvement in VO2peak
164

Int. J. Environ. Res. Public Health 2021, 18, 3574
with vigorous-intensity interventions, and there were no studies of moderate-intensityRCTs available for comparison. Furthermore, patients with CVD did not obtain significantVO2peak improvements when the vigorous-intensity protocol was >12 weeks.
Our results indicate that moderate-to-vigorous-intensity exercise is superior to otherintensities in improving aerobic capacity and is likely to be an underestimation of the truedifferences between groups. This is supported by the methodological decisions favoringthe use of a conservative approach in the meta-analysis (by choosing random effects andSMDs) and using the highest calculated SD for studies where no information was publishedto allow SD calculations.
Thereby, our findings suggest higher benefits from moderate-to-vigorous-intensity ex-ercise lasting 6 to 12 weeks in terms of VO2peak improvements in patients with CVD. Over-all, our findings are in agreement with reports from previous meta-analyses [19,23,32,42,43].Hannan et al. [24] concluded that HIIT (e.g., of moderate-to-vigorous- and vigorous inten-sity) is more effective than moderate-intensity exercise in improving CRF in participantsof CR (0.34 mL-kg−1-min−1; 95% CI = 0.2–0.48; p < 0.001; I2 = 28%). Still, improvementsin CRF were higher in >six-week exercise programs, and the largest improvements inCRF for patients with CAD resulted from programs lasting 7 to 12 weeks, as our studyconfirmed [24].
Some limitations of this systematic review and meta-analysis should be considered.First, the poor level of reporting within the available RCTs made it difficult to evaluatethe most effective doses of intensity on CRF in cardiac patients. Second, the RCTs didnot use the same methods to control the exercise intensity and the different variablesused to establish exercise intensity added complexity to the analyses. While the variableswere based on interrelated physiological constructs (e.g., HR and VO2), they were notdirectly comparable. Even in what appears to be the narrow domain of HIIT, there is muchheterogeneity in clearly defining what high intensity is.
In our study, each reported intervention was categorized according to the prescribedexercise intensity, based on ACSM recommendations [28]. This approach has two limita-tions. While some studies reported precise exercise intensities (e.g., 60% VO2peak), most CRstudies prescribed large intervals based on HR responses to exercise(e.g., 40–70% VO2peak). As these studies often covered several intensity categories, makingthem difficult to categorize, it was necessary to add an extra intensity category, moderate-to-vigorous intensity. In this category, participants were assumed to have performedsimilar training interventions, when in fact they may have experienced quite differentexercise prescriptions.
We recognized the lack of available data for some intensity analyses when split byprogram length. For example, in the analysis of subgroups of studies below six weeks, weonly had studies that prescribed vigorous-intensity exercise, as well as in the length above12 weeks, we had no studies that used in their intervention a moderate-intensity program.Furthermore, subgroup analyses for the combined effect of vigorous-intensity programswith lengths below six weeks were based on only two groups of patients, both from thesame study that completed the same intervention. As such, we recommend caution wheninterpreting results where the lack of available data may have limited analyses.
We should consider that medication can influence exercise and therefore should beconsidered by the therapist when prescribing exercise. Beta-blockers decrease exercisecapacity because they create a ceiling effect, meaning the HR will not rise beyond a certainpoint. Thus, the target HR for monitoring should not be used. Rather, the therapist shoulduse the rate of perceived exertion or calculate the target HR with a graded stress test whilethe patient is using the medication. Similarly, vasodilators and alpha- and calcium channelblockers may lead to a sudden blood pressure drop while exercising or afterwards.
Therefore, the variables that should be taken into consideration are trainability (resultof CRF level, muscular endurance and strength) and risk stratification on the basis ofcompleted medical history. Consequently, these factors may provide options for theoptimal type of exercise and intensity level.
165

Int. J. Environ. Res. Public Health 2021, 18, 3574
Future studies would benefit from being between 6 and 12 weeks in length withan intervention activity carried out at least three times weekly, ensuring that the correctintensity is maintained. For example, appropriate goals for vigorous-intensity exerciseinclude ≥85% VO2peak or ≥85% HRR or ≥90% HRM and, for moderate intensity, 50–75%VO2peak or 50–75% HRR or 50–80% HRM. In addition, large ranges of exercise intensitiesshould not be prescribed based on HR responses to exercise. This would allow a moreaccurate calculation of the exact effects of intensities on CRF and to determine the idealand most effective “dose” for people with heart problems. Future research should includemethods to appropriately describe the compliance of participants with the prescribedexercise intensity and attendance of exercise sessions.
Studies should report standard deviations, conceal allocation, and blind assessors toimprove study quality. Moreover, future studies should aim to recruit more women andolder participants (<76 years) to ensure vigorous-intensity interventions are more effectivethan moderate-intensity ones in improving CRF for a broader range of patients withCVD. Finally, further studies that investigate the longer-term benefits of vigorous-intensityinterventions and whether these adaptations are maintained would also be beneficial.
5. Conclusions
The most effective doses of exercise intensity to optimize CRF were moderate-to-vigorous and vigorous exercise. Interventions to enhance CRF in patients with CVD aremost effective if conducted for 6 to 12 weeks. More research is needed to understand withinthe moderate-to-vigorous-intensity category which percentage results in increased CRF,assisting in the design of specific prescription protocols.
This review may suggest that countries without guidelines for patients with CVDregarding the intensity of exercise programs, as well as countries with guidelines thatrecommend lower intensity exercise, should include moderate-to-vigorous intensity andvigorous intensity.
What is already known:
� Cardiovascular diseases are the leading causes of mortality in today’s society. Theyare responsible for up to 30% of all deaths worldwide and 48% of deaths in Europe,and it is expected that these figures will increase in the coming years.
� Exercise programs in patients with cardiovascular disease have several beneficialeffects on cardiovascular functional capacity, quality of life, risk factors modification,psychological profile, hospital readmissions, and mortality.
� Exercise-based interventions seem to significantly improve cardiorespiratory fitnessin patients following a cardiac event or surgery, but little is known regarding thedifferential effects of prescribed exercise intensity.
What are the new findings?
� Exercise interventions for patients with cardiovascular disease tend include largeranges of exercise intensities based on heart rate responses to exercise.
� The most effective doses of exercise intensity to optimize cardiorespiratory fitnesswere moderate-to-vigorous and vigorous-intensity exercises, being more effectivewhen conducted for 6 to 12 weeks.
� More research is needed to understand within the moderate-to-vigorous- and vigorous-intensity categories the percentage that specifically helps to increase cardiorespiratoryfitness and the ability to establish specific prescription protocols.
Supplementary Materials: The following are available online at https://www.mdpi.com/article/10
.3390/ijerph18073574/s1, Table S1: Complete search strategy for MEDLINE, searched from inception
until January 2021; Figure S2: Summary of study characteristics; Figure S3: Outcome of the risk of
bias assessment; Figure S4: List of references for included studies.
Author Contributions: Conceptualization, C.G., J.B., A.A. and A.R.; methodology, C.G. and J.B.;
software, C.G.; validation, C.G. and J.B.; formal analysis, C.G. and J.B.; investigation, C.G. and
166

Int. J. Environ. Res. Public Health 2021, 18, 3574
J.B.; resources, C.G. and J.B.; data curation, C.G. and J.B.; writing—original draft preparation, C.G.;
writing—review and editing, C.G., J.B., A.A. and A.R.; visualization, C.G., J.B., A.A. and A.R.;
supervision, C.G., J.B. and A.R.; project administration, C.G., J.B. and A.R.; funding acquisition, C.G.,
A.A. and A.R. All authors have read and agreed to the published version of the manuscript.
Funding: This research was funded by Fundação para a Ciência e Tecnologia (Portugal), grant
number SFRH/BD/138326/2018.
Institutional Review Board Statement: Not applicable.
Informed Consent Statement: Not applicable.
Data Availability Statement: The data that support the findings of this study are available from the
corresponding author, C.G., upon reasonable request.
Acknowledgments: This work was supported by the Fundação para a Ciência e a Tecnologia
(Portugal). We thank all authors of the original works cited in the present study, who readily assisted
us by sharing their manuscripts for this systematic review with meta-analysis.
Conflicts of Interest: The authors declare no conflict of interest. The funders had no role in the design
of the study; in the collection, analyses, or interpretation of data; in the writing of the manuscript, or
in the decision to publish the results.
References
1. World Health Organization. Cardiovascular Disease; Fact Sheet N 317; WHO: Geneva, Switzerland, 2011.
2. EACPR Committee for Science Guidelines; Corrà, U.; Piepoli, M.F.; Carré, F.; Heuschmann, P.; Hoffmann, U.; Verschuren, M.;
Halcox, J.; Giannuzzi, P.; Saner, H.; et al. Secondary prevention through cardiac rehabilitation: Physical activity counselling and
exercise training: Key components of the position paper from the Cardiac Rehabilitation Section of the European Association of
Cardiovascular Prevention and Rehabilitation. Eur. Heart J. 2010, 31, 1967–1974. [CrossRef]
3. Mohammed, H.G.; Shabana, A.M. Effect of cardiac rehabilitation on cardiovascular risk factors in chronic heart failure patients.
Egypt Heart J. 2018, 70, 77–82. [CrossRef] [PubMed]
4. Arnett, D.K.; Blumenthal, R.S.; Albert, M.A.; Buroker, A.B.; Goldberger, Z.D.; Hahn, E.J.; Himmelfarb, C.D.; Khera, A.; Lloyd-
Jones, D.; McEvoy, J.W.; et al. 2019 ACC/AHA Guideline on the Primary Prevention of Cardiovascular Disease: A Report of the
American College of Cardiology/American Heart Association Task Force on Clinical Practice Guidelines. Circulation 2019, 140,
e596–e646. [CrossRef]
5. Anderson, L.; Oldridge, N.; Thompson, D.R.; Zwisler, A.-D.; Rees, K.; Martin, N.; Taylor, R.S. Exercise-Based Cardiac Rehabilita-
tion for Coronary Heart Disease. J. Am. Coll. Cardiol. 2016, 67, 1–12. [CrossRef] [PubMed]
6. Mezzani, A.; Hamm, L.F.; Jones, A.M.; McBride, P.E.; Moholdt, T.; Stoner, J.A.; Urhausen, A.; Williams, A.M. Aerobic exercise
intensity assessment and prescription in cardiac rehabilitation: A joint position statement of the European Association for
Cardiovascular Prevention and Rehabilitation, the American Association of Cardiovascular and Pulmonary Rehabilitation and
the Canadian Association of Cardiac Rehabilitation. Eur. J. Prev. Cardiol. 2013, 20, 442–467. [CrossRef]
7. Moholdt, T.; Aamot, I.L.; Granøien, I.; Gjerde, L.; Myklebust, G.; Walderhaug, L.; Brattbakk, L.; Hole, T.; Graven, T.; Stølen, O.T.;
et al. Aerobic interval training increases peak oxygen uptake more than usual care exercise training in myocardial infarction
patients: A randomized controlled study. Clin. Rehabil. 2011, 26, 33–44. [CrossRef]
8. Wisloff, U.; Stoylen, A.; Loennechen, J.P.; Bruvold, M.; Rognmo, Ø.; Haram, P.M.; Tjonna, A.E.; Stig, J.H.; Slørdahl, S.A.; Lee, S.J.;
et al. Superior cardiovascular effect of aerobic interval training versus moderate continuous training in heart failure patients: A
randomized study. Circulation 2007, 115, 3086–3094. [CrossRef] [PubMed]
9. Rojhani-Shirazi, Z.; Abolahrari-Shirazi, S.; Kojuri, J.; Bagheri, Z. Efficacy of combined endurance-resistance training versus
endurance training in patients with heart failure after percutaneous coronary intervention: A randomized controlled trial. J. Res.Med. Sci. 2018, 23, 12. [CrossRef] [PubMed]
10. Giallauria, F.; Lucci, R.; D’Agostino, M.; Vitelli, A.; Maresca, L.; Mancini, M.; Aurino, M.; Del Forno, D.; Giannuzzi, P.; Vigorito,
C. Two-year multicomprehensive secondary prevention program: Favorable effects on cardiovascular functional capacity and
coronary risk profile after acute myocardial infarction. J. Cardiovasc. Med. 2009, 10, 772–780. [CrossRef] [PubMed]
11. Giallauria, F.; Acampa, W.; Ricci, F.; Vitelli, A.; Maresca, L.; Mancini, M.; Grieco, A.; Gallicchio, R.; Xhoxhi, E.; Spinelli, L.; et al.
Effects of exercise training started within 2 weeks after acute myocardial infarction on myocardial perfusion and left ventricular
function: A gated SPECT imaging study. Eur. J. Prev. Cardiol. 2012, 19, 1410–1419. [CrossRef] [PubMed]
12. Giallauria, F.; Acampa, W.; Ricci, F.; Vitelli, A.; Torella, G.; Lucci, R.; Del Prete, G.; Zampella, E.; Assante, R.; Rengo, G.; et al.
Exercise training early after acute myocardial infarction reduces stress-induced hypoperfusion and improves left ventricular
function. Eur. J. Nucl. Med. Mol. Imaging 2013, 40, 315–324. [CrossRef]
13. Villelabeitia-Jaureguizar, K.; Vicente-Campos, D.; Senen, A.B.; Jiménez, V.H.; Garrido-Lestache, M.E.B.; Chicharro, J.L. Effects of
high-intensity interval versus continuous exercise training on post-exercise heart rate recovery in coronary heart-disease patients.
Int. J. Cardiol. 2017, 244, 17–23. [CrossRef]
167
Int. J. Environ. Res. Public Health 2021, 18, 3574
14. Tamburús, N.Y.; Kunz, V.C.; Salviati, M.R.; Simões, V.C.; Catai, A.M.; Da Silva, E. Interval training based on ventilatory anaerobic
threshold improves aerobic functional capacity and metabolic profile: A randomized controlled trial in coronary artery disease
patients. Eur. J. Phys. Rehabil Med. 2015, 52, 1–11. [PubMed]
15. Beckie, T.M.; Beckstead, J.W.; Kip, K.E.; Fletcher, G. Improvements in Heart Rate Recovery Among Women After Cardiac
Rehabilitation Completion. J. Cardiovasc. Nurs. 2014, 29, 38–47. [CrossRef] [PubMed]
16. Rivera-Brown, A.M.; Frontera, W.R. Principles of exercise physiology: Responses to acute exercise and long-term adaptations to
training. PM R. 2012, 4, 797–804. [CrossRef] [PubMed]
17. Warburton, D.E.; McKenzie, D.C.; Haykowsky, M.J.; Taylor, A.; Shoemaker, P.; Ignaszewski, A.P.; Chan, S.Y. Effectiveness of
High-Intensity Interval Training for the Rehabilitation of Patients with Coronary Artery Disease. Am. J. Cardiol. 2005, 95,
1080–1084. [CrossRef]
18. Rognmo, Ø.; Hetland, E.; Helgerud, J.; Hoff, J.; Slørdahl, S.A. High intensity aerobic interval exercise is superior to moderate
intensity exercise for increasing aerobic capacity in patients with coronary artery disease. Eur. J. Cardiovasc. Prev. Rehabil. 2004, 11,
216–222. [CrossRef]
19. Cornish, A.K.; Broadbent, S.; Cheema, B.S. Interval training for patients with coronary artery disease: A systematic review.
Graefe’s Arch. Clin. Exp. Ophthalmol. 2010, 111, 579–589. [CrossRef] [PubMed]
20. Ghroubi, S.; Elleuch, W.; Abid, L.; Kammoun, S.; Elleuch, M.-H. The effects of cardiovascular rehabilitation after coronary stenting,
Apport de la readaptation cardiovasculaire dans les suites d’une angioplastie transluminale. Ann. Phys. Rehabil. Med. 2012, 55,
e307–e309. [CrossRef]
21. Blumenthal, J.A.; Sherwood, A.; Babyak, M.A.; Watkins, L.L.; Waugh, R.; Georgiades, A.; Bacon, S.L.; Hayano, J.; Coleman, E.R.;
Hinderliter, A. Effects of exercise and stress management training on markers of cardiovascular risk in patients with ischemic
heart disease—A randomized controlled trial. JAMA 2005, 293, 1626–1634. [CrossRef]
22. Kitzman, D.W.; Brubaker, P.H.; Herrington, D.M.; Morgan, T.M.; Stewart, K.P.; Hundley, W.G.; Abdelhamed, A.; Haykowsky,
M.J. Effect of endurance exercise training on endothelial function and arterial stiffness in older patients with heart failure and
preserved ejection fraction: A randomized, controlled, single-blind trial. J. Am. Coll. Cardiol. 2013, 62, 584–592. [CrossRef]
23. Mitchell, B.L.; Lock, M.J.; Davison, K.; Parfitt, G.; Buckley, J.P.; Eston, R.G. What is the effect of aerobic exercise intensity on
cardiorespiratory fitness in those undergoing cardiac rehabilitation? A systematic review with meta-analysis. Br. J. Sports Med.2018, 53, 1341–1351. [CrossRef] [PubMed]
24. Hannan, A.L.; Hing, W.; Simas, V.; Climstein, M.; Coombes, J.S.; Jayasinghe, R.; Byrnes, J.; Furness, J. High-intensity interval
training versus moderate-intensity continuous training within cardiac rehabilitation: A systematic review and meta-analysis.
Open Access J. Sports Med. 2018, 9, 1–17. [CrossRef]
25. Higgins, J.; Green, S. Cochrane Handbook for Systematic Reviews of Interventions; John Wiley & Sons Ltd.: Chichester, UK, 2011.
26. Leonardo, R. PICO: Model for Clinical Questions. Evid. Based Med. Pract. 2018, 3, 1–2.
27. Moher, D.; Liberati, A.; Tetzlaff, J.; Altman, D.G.; PRISMA Group. Preferred reporting items for systematic reviews and
meta-analyses: The PRISMA statement. PLoS Med. 2009, 6, e1000097. [CrossRef] [PubMed]
28. American College of Sports Medicine. ACSM’s Guidelines for Exercise Testing and Prescription, 10th ed.; Lippincott Williams &
Wilkins: Baltimore, MD, USA, 2017.
29. Hopkins, W.G.; Marshall, S.W.; Batterham, A.M.; Hanin, J. Progressive Statistics for Studies in Sports Medicine and Exercise
Science. Med. Sci. Sports Exerc. 2009, 41, 3–13. [CrossRef]
30. Review Manager (RevMan); Version 5.3.; The Nordic Cochrane Centre, The Cochrane Collaboration: Copenhagen, Denmark, 2014;
Available online: http://community.cochrane.org/tools/review-production-tools/revman-5 (accessed on 21 January 2021).
31. Elbourne, D.R.; Altman, D.G.; Higgins, J.P.T.; Curtin, F.; Worthingtond, H.V.; Vaile, A. Meta-analyses involving cross-over trials:
Methodological issues. Int. J. Epidemiol. 2002, 31, 140–149. [CrossRef]
32. Sandercock, G.; Hurtado, V.; Cardoso, F. Changes in cardiorespiratory fitness in cardiac rehabilitation patients: A meta-analysis.
Int. J. Cardiol. 2013, 167, 894–902. [CrossRef] [PubMed]
33. Wu, S.K.; Lin, Y.W.; Chen, C.L.; Tsai, S.W. Cardiac rehabilitation vs. home exercise after coronary artery bypass graft surgery: A
comparison of heart rate recovery. Am. J. Phys. Med. Rehabil. 2006, 85, 711–717. [CrossRef]
34. Chuang, T.-Y.; Sung, W.-H.; Lin, C.-Y. Application of a Virtual Reality–Enhanced Exercise Protocol in Patients After Coronary
Bypass. Arch. Phys. Med. Rehabil. 2005, 86, 1929–1932. [CrossRef]
35. Zheng, H.; Luo, M.; Shen, Y.; Kang, W. Effects of 6 months exercise training on ventricular remodelling and autonomic tone in
patients with acute myocardial infarction and percutaneous coronary intervention. J. Rehabil. Med. 2008, 40, 776–779. [PubMed]
36. Giallauria, F.; De Lorenzo, A.; Pilerci, F.; Manakos, A.; Lucci, R.; Psaroudaki, M.; D’Agostino, M.; Del Forno, D.; Vigorito, C.
Long-term effects of cardiac rehabilitation on end-exercise heart rate recovery after myocardial infarction. Eur. J. Cardiovasc. Prev.Rehabil. 2006, 13, 544–550. [CrossRef] [PubMed]
37. Legramante, J.M.; Iellamo, F.; Massaro, M.; Sacco, S.; Galante, A. Effects of residential exercise training on heart rate recovery in
coronary artery patients. Am. J. Physiol. Circ. Physiol. 2007, 292, H510–H515. [CrossRef] [PubMed]
38. Kubo, N.; Ohmura, N.; Nakada, I.; Yasu, T.; Katsuki, T.; Fujii, M.; Saito, M. Exercise at ventilatory threshold aggravates left
ventricular remodeling in patients with extensive anterior acute myocardial infarction. Am. Heart J. 2004, 147, 113–120. [CrossRef]
168

Int. J. Environ. Res. Public Health 2021, 18, 3574
39. Kraal, J.J.; Peek, N.; Van den Akker-Van Marle, M.E.; Kemps, M.C.H. Effects and costs of home-based training with telemonitoring
guidance in low to moderate risk patients entering cardiac rehabilitation: The FIT@Home study. BMC Cardiovasc. Disord. 2013, 13,
82. [CrossRef]
40. Harbord, R.M.; Harris, R.J.; Sterne, J.A.C. Updated Tests for Small-study Effects in Meta-analyses. Stata J. Promot. Commun. Stat.Stata 2009, 9, 197–210. [CrossRef]
41. Conn, V.S.; Hafdahl, A.R.; Moore, S.M.; Nielsen, P.J.; Brown, L.M. Meta-analysis of interventions to increase physical activity
among cardiac sub-jects. Int. J. Cardiol. 2009, 133, 307–320. [CrossRef]
42. Vromen, T.; Kraal, J.J.; Kuiper, J.; Spee, R.F.; Peek, N.; Kemps, H.M. The influence of training characteristics on the effect of aerobic
exercise training in patients with chronic heart failure: A meta-regression analysis. Int. J. Cardiol. 2016, 208, 120–127. [CrossRef]
43. Anderson, L.; Taylor, R.S. Cardiac rehabilitation for people with heart disease: An overview of Cochrane systematic reviews.
Cochrane Database Syst. Rev. 2014, 12, CD011273. [CrossRef]
169


MDPI
St. Alban-Anlage 66
4052 Basel
Switzerland
Tel. +41 61 683 77 34
Fax +41 61 302 89 18
www.mdpi.com
International Journal of Environmental Research and Public Health Editorial Office
E-mail: [email protected]
www.mdpi.com/journal/ijerph


MDPI
St. Alban-Anlage 66
4052 Basel
Switzerland
Tel: +41 61 683 77 34
Fax: +41 61 302 89 18
www.mdpi.com ISBN 978-3-0365-2966-0