Trade structure and economic growth
38
Trade Structure and Economic Growth Raja Kali a , Fabio Méndez a , and Javier Reyes a,b a Department of Economics, Business Building Room 402, Sam M. Walton College of Business, University of Arkansas, Fayetteville, AR, 72701, USA. b Corresponding author. Tel: +(479) 575-6079. E-mail address: [email protected] October 30 th , 2006. Acknowledgements: The authors greatly benefited from comments and suggestions provided by participants of the Midwest International Economics Group Fall 2005 Meetings and the Fifth Workshop of the Regional Integration Network (sponsored by LACEA), as well as Rossitza B. Wooster, Christopher Laincz, Christopher P. Ball, and Ari Van Assche. Additionally the authors would like to acknowledge that partial research funding was provided by the Summer Research Grant program of the Sam M. Walton College of Business at the University of Arkansas.
-
Upload
independent -
Category
Documents
-
view
4 -
download
0
Transcript of Trade structure and economic growth

Trade Structure and Economic Growth
Raja Kalia, Fabio Méndez a, and Javier Reyesa,b
a Department of Economics, Business Building Room 402, Sam M. Walton College of Business, University of Arkansas, Fayetteville, AR, 72701, USA. b Corresponding author. Tel: +(479) 575-6079. E-mail address: [email protected]
October 30th, 2006.
Acknowledgements: The authors greatly benefited from comments and suggestions provided by participants of the Midwest International Economics Group Fall 2005 Meetings and the Fifth Workshop of the Regional Integration Network (sponsored by LACEA), as well as Rossitza B. Wooster, Christopher Laincz, Christopher P. Ball, and Ari Van Assche. Additionally the authors would like to acknowledge that partial research funding was provided by the Summer Research Grant program of the Sam M. Walton College of Business at the University of Arkansas.
Trade Structure and Economic Growth
Abstract
How do the number of trade partners and the concentration of trade among partners affect
the economic growth of a country? We refer to these characteristics as the structure of
trade, and explore this question empirically in this study. We find that the structure of
trade, independently from of the level of trade itself, has an important effect on the rate of
economic growth. The results of the study suggest that the number of trading partners is
positively correlated with growth across all countries, and this effect is more pronounced
for rich countries. Trade concentration is positively correlated with growth for all
countries, and the effect is concentrated in poor countries. Previous work has overlooked
these characteristics of trade, though we find them to be quite relevant and that they could
lead to new ways of understanding the trade-growth relationship.
JEL classifications: O1; F43; O47; F0; O4 Keywords: Trade; Growth; Trade Structure; Trade Concentration.
1
1 Introduction
The effects of international trade on economic growth have been the subject of a rich
debate. Still, the main question of whether (and how) trade enhances growth remains
unanswered, as the conclusions of both theoretical and empirical studies are highly
sensitive to changes in the assumptions made, the variables used to measure trade
openness, the sample data used, and the econometric technique employed (see, for
example, Grossman and Helpman (1991), Matsuyama (1992), Walde and Wood (2005),
Rodriguez and Rodrik (2000), Yannikkaya (2003)).
Noticeably, most of the analysis within this debate involves trade measures regarding
export and import volumes or shares, trade policies regarding tariffs or custom barriers,
and related measures of trade openness1. Little or no attention has been given to the trade
strategies followed and the types of trade relations established; even though they too have
been subject to noticeable changes. Just in the last ten years, over 130 regional trade
agreements have been reported to the World Trade Organization (compared to 124
reported during 1948-1994)2 and key players, like the United States and the European
Union, have adopted a more aggressive pace in their bilateral trade negotiations.
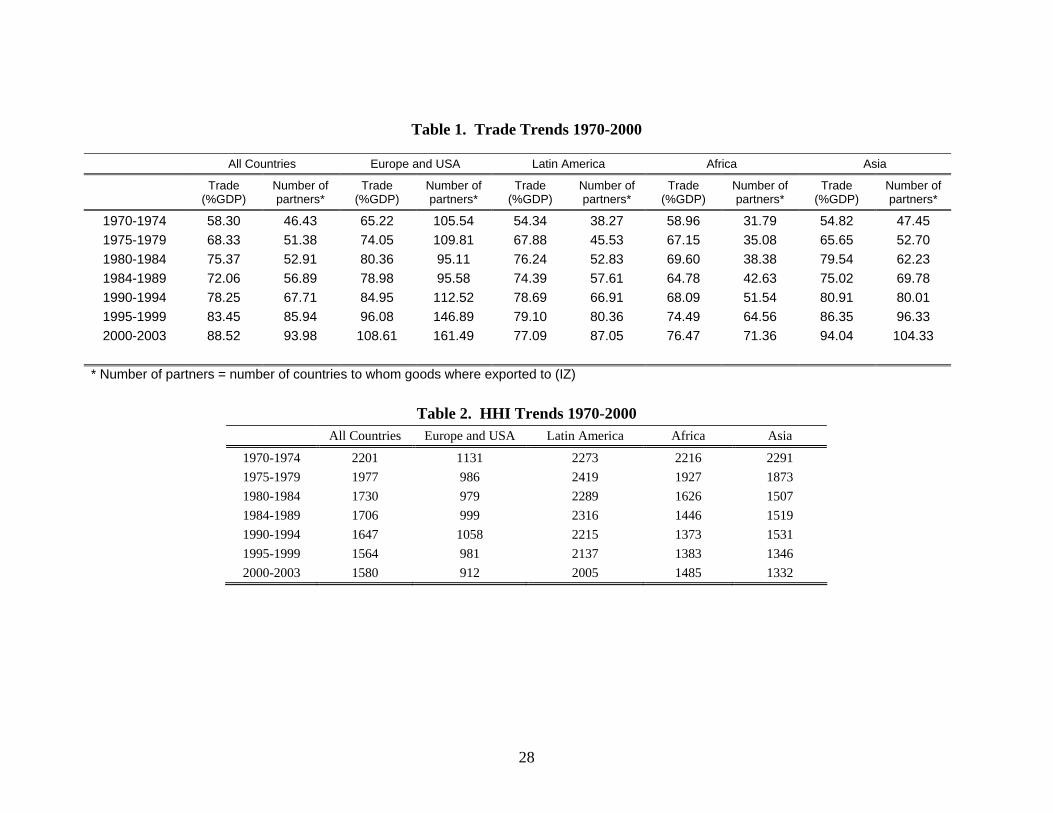
In fact, the changes experienced over the last decades of globalization are more
pronounced in terms of the structure of trade than in the volume of trade itself (or in the
average trade policies). As shown in Table 1, while the share of total trade in GDP for
the average economy went from 58.3% in 1970 to 88.5% in 2003, the average number of
trading partners more than doubled as it went from 46.4 to 93.9 in that same period.
Similarly, as shown in Table 2, when measuring the trade concentration with the standard
Herfindahl index, trade concentration decreases from 2201 to 1580 for the average

2
economy between 1970 and 2003. Today, most countries are less reliant on one trading
partner (or group of partners) than they were 30 years ago.
There are reasons to believe that such characteristics regarding the structure of trade
have significant implications for economic growth. In this paper, we study these
implications. Specifically, in this paper, we assemble a dataset that tracks the number of
trading partners for a given country and the volume of exports and imports. We then
construct a measure of the concentration of trade and use these variables to examine the
relationship between the international trade structure and economic growth in a panel of
over 155 countries for the period 1980-2000.
Our results provide new insights into the mechanisms that make international trade a
positive influence for growth. We find that the structure of trade, independently from
trade openness, has an important effect on the rate of economic growth. The number of
trading partners is found to be positively correlated with growth across all countries; this
effect is found to be greater for rich countries. Trade concentration is also found to be
positively correlated with growth for all countries in general; but this correlation is
mostly attributed to poor countries only. These results are robust to changes in the
econometric specification used, the number of explanatory variables included, and
corrections for heteroskedasticity and endogeneity.
In terms of policy, understanding the effects of trade structure on growth is important.
As our empirical results suggest, the effects of trade structure on growth vary
significantly between poor and rich economies. Additionally, the results present
evidence supporting the argument that trade relations established with rich countries are
3
more beneficial than those established with poor countries. Understanding these
differences should yield better policy prescriptions.
Even though the structure of trade is a complex concept that might be relevant in more
than one sense, we regard our efforts as a first step in this new direction. Empirical
measures of trade characteristics or trade patterns and configuration are scarce.
Theoretical models that incorporate those elements and guide our intuition are rare as
well. As this paper demonstrates, however, the study of trade structure characteristics
could lead to new ways of understanding the trade-growth relationship.
Several other studies have gone beyond the simpler measures of trade. Dollar
(1992), Sachs and Warner (1995) and Warcziarg (1998), for example, create their own
indicators of openness. However, as pointed out by Rodriguez and Rodrik (2000), these
measures might not achieve the purpose they were conceived for, since they are likely
proxies for a wide range of policy and institutional differences. The measures of the
number of trading partners and the concentration of trade used in this paper, in contrast,
are clearly related to trade and are simpler to interpret.
Additionally, there is a related branch of the literature that has looked for evidence
regarding the effects of trade on total factor productivity. Representative papers of this
literature include Coe and Helpman (1995), Keller (1998) and Edwards (1998). While
these papers look for changes on productivity that arise as the result of increased trade
openness (ratio of total trade to GDP), we look for changes that arise as the result of the
structure of trade, independently from trade openness.
The remainder of the paper is organized as follows: The next section describes the
conceptual arguments that characterize the expected empirical relationship between our
4
measures of trade structure and the rate of output growth. Section 3 presents the
econometric specifications employed to test these arguments. Section 4 introduces the
dataset and discusses the trade structure variables employed. Section 5 presents the
empirical results obtained and, finally, the last section summarizes our conclusions.
2 Theoretical Background
The likely effects of international trade on economic growth can be formally derived
from endogenous growth models that study the creation, diffusion and adoption of better
production technologies. Some of these models are now well known in the literature, as
is the case for Romer (1990), Grossman and Helpmann (1991), and Rivera-Batiz and
Romer (1991), and the idea that trade promotes growth through the transmission and
creation of knowledge is widely accepted among economists3.
In these models, the trade of goods and services can generate positive effects on
economic growth from at least two sources: First, international trade may generate
“knowledge spillovers” that expand the number of intermediate goods known by
domestic producers, where these intermediate goods can be understood as new ideas,
designs, or managerial processes that lead to increased productivity. That is,
international trade may act as a diffusion mechanism for foreign technologies.
Second, international trade may produce incentives for local research and
development. Trade expands the number of potential buyers and thus, the potential for
economic profits associated with innovation, brand recognition, patent registrations, and
any improvements over competing firm’s products. Trading goods with foreign markets
also forces the producer to react to a new environment and innovate in the process.

5
These innovations might take the form of necessary adjustments to packaging and
transportation methods due to local climates and infrastructure, product adjustments
made to entice consumers with different tastes, innovations in the production process that
comply with foreign sanitary regulations, etc.
What is still to be explained are the actual mechanisms that diffuse technology across
countries and the process through which countries adopt these newer technologies. In
this paper, we argue that both the number of trading partners and the concentration of
trade among partners are important elements of those mechanisms.
2.1 Economic growth and the number of trading partners
Every country generates knowledge through research or experience; some countries
generate more knowledge than others. But when countries trade the goods and services
that embody those original ideas, the knowledge is indirectly transferred to the trading
partner who learns by induction. In this manner, international trade facilitates the
transmission of technologies across countries; where the amount of technological
diffusion depends on how much a country trades and with how many partners.
In our econometric specification, besides including a measure of trade openness, we
also include the number of trading partners. For any given amount of goods traded, the
exposure to new ideas is greater when the number of countries involved in the trade
grows larger, as each partner contributes an original amount of knowledge. Thus, ceteris
paribus, countries with more trading partners would be expected to face a greater number
of foreign technologies and to experience greater economic growth as the adoption of
those technologies increases productivity.
6
In addition, as the number of trading partners increases, the potential market in which
domestic producers can sell their products expands both in size and diversity. Both
effects are expected to support growth. The expanded size of the potential market attracts
local and foreign investments. These investments, in turn, have been shown to play an
important role for technological diffusion and innovation (Grossman and Helpman
(1991)). Noticeably, the size of the potential market is related to the number of trading
partners but is not necessarily related to traditional measures of trade openness that
capture actual volumes of imports and exports.
In turn, the expanded diversity of the market puts all producers in contact with a wider
rage of consumer tastes, government regulations, climates, etc. As local producers seek
to compete in more foreign markets, they accommodate to the particular characteristics of
these markets and innovate in the process. The greater the number of trading partners,
the greater the innovations that become necessary. As mentioned before, these
innovations might take the form of necessary adjustments to packaging and transportation
methods, product adjustments made to entice alien consumers, innovations in the
production process that comply with foreign sanitary regulations, and others.
Finally, as the number and diversity of partner countries increases, the number of
potential competitors for the local market increases as well. Competition, in turn, leads
to higher productivity and greater economic growth. Evidence on the effects of
competition on productive efficiency can be found in Vickers and Yarrow (1991) and
Bourbakri and Cosset (1998).
The marginal benefit of an additional trading partner, however, could be different in
poor economies than in rich economies. On the one hand, if newer technologies increase

7
the productivity of older technologies, then the effect of an additional trading partner on
growth should be smaller for a poor economy since they have a smaller stock of
knowledge to begin with. On the other hand, because the stock of knowledge is smaller
in poor countries, the contribution of an additional trading partner in terms of new
knowledge (and thus, its impact on growth) is likely to be greater for undeveloped
economies. While these effects operate in opposite directions, they both suggest
asymmetry between rich and poor countries.
Similarly, the effects of having a greater number of rich (technologically superior)
trading partners could be different from those of having a greater number of poor
(technologically inferior) trading partners. If the benefits of trade come mainly from
technological diffusion, then it could be expected that a country learns more by trading
with a rich partner than by trading with a poor partner; as the imports from richer
countries are likely to be composed of relatively more technology intensive goods (see
Schneider (2005) for an empirical analysis of a similar argument).
In our econometric specifications we explore both the possibility that an increase in
the number of trading partners generates an effect on economic growth that differs
between poor and rich countries, and the possibility that the effect of increasing the
number of rich trading partners is different from the effect of increasing the number of
poor trading partners.
2.2 Economic growth and the concentration of trade
There are also reasons to expect that the concentration of trade among trading partners
may have a positive impact on output growth. First, whenever technologies from
8
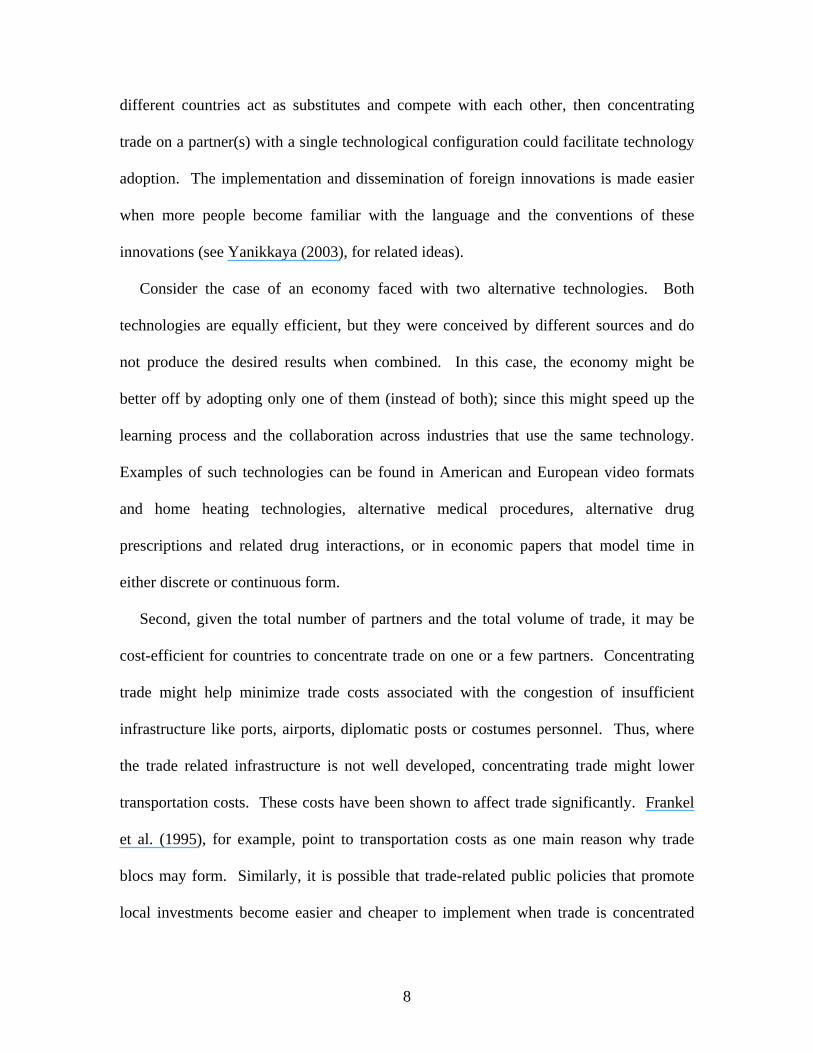
different countries act as substitutes and compete with each other, then concentrating
trade on a partner(s) with a single technological configuration could facilitate technology
adoption. The implementation and dissemination of foreign innovations is made easier
when more people become familiar with the language and the conventions of these
innovations (see Yanikkaya (2003), for related ideas).
Consider the case of an economy faced with two alternative technologies. Both
technologies are equally efficient, but they were conceived by different sources and do
not produce the desired results when combined. In this case, the economy might be
better off by adopting only one of them (instead of both); since this might speed up the
learning process and the collaboration across industries that use the same technology.
Examples of such technologies can be found in American and European video formats
and home heating technologies, alternative medical procedures, alternative drug
prescriptions and related drug interactions, or in economic papers that model time in
either discrete or continuous form.
Second, given the total number of partners and the total volume of trade, it may be
cost-efficient for countries to concentrate trade on one or a few partners. Concentrating
trade might help minimize trade costs associated with the congestion of insufficient
infrastructure like ports, airports, diplomatic posts or costumes personnel. Thus, where
the trade related infrastructure is not well developed, concentrating trade might lower
transportation costs. These costs have been shown to affect trade significantly. Frankel
et al. (1995), for example, point to transportation costs as one main reason why trade
blocs may form. Similarly, it is possible that trade-related public policies that promote
local investments become easier and cheaper to implement when trade is concentrated
9
among few partners. Such policies might include, for example, the dissemination of
foreign regulation manuals, public information regarding national and foreign trade
barriers, the coordination of national and international sanitary regulations, etc.
Finally, small economies that depend on certain industries for a significant share of
their GDP might benefit from greater trade concentration as far as these specific
industries benefit from greater concentration. As suggested by Pickering and Sheldon
(1984), concentration at the industry level might lead to economies of scale in production
and marketing, as well as stronger competitive positions.
As with the number of trading partners, the asymmetry between rich and poor
countries can also be expected from the effects of trade concentration on economic
growth. Because rich countries hold and create more knowledge to begin with, have a
more diversified economy, have better infrastructure and more efficient governments,
they would be expected to benefit less from trade concentration than poor countries do.
3 Econometric Specifications
In what follows, we marshal the conceptual arguments presented above to explore the
following hypothesis:
− There is an empirical relationship between trade structure and economic growth.
Past empirical studies that fail to control for trade structure may suffer from
omitted variable biases.
− An increase in the number of partners is associated with an increase in the rate of
economic growth. This effect differs between rich and poor countries.

10
− Given the volume of trade and the number of trading partners, an increase on the
concentration of trade is associated with an increase in the rate of economic
growth. This effect is smaller for rich countries.
Empirically, the relationship between trade and growth has been tested in a variety of
econometric specifications. The earlier literature, represented by Feder (1982), focused
on the relationship between exports and growth. More recent empirical studies, however,
have used an empirical formulation closer to that of Barro (1991) or Levine and Renelt
(1992). We will use the latter, more recent specification for most of the analysis and use
the former only as a robustness test of our results.
Following Barro (1991) and Levine and Renelt (1992), the rate of growth of GDP per-
capita ( yy& ) is regressed against a vector Cr
of standard explanatory variables and an
additional set of explanatory variables that capture the issues of interest. The vector Cr
is
composed of measures of the initial per-capita level of income (y0), the rate of population
growth ( LL& ), the secondary school enrollment ratio (SED), and the ratio of investment
to GDP (I/Y)4.
With respect to the variables measuring trade, a wide variety of measures have been
used in the empirical growth literature. The most commonly used measure is the ratio of
total trade (exports plus imports) to GDP (see, for example, Easterly, Loayza and Montiel
(1997), or Frankel and Romer (1999)). Other, less common measures include composite
indices of openness (Dollar (1992), Sachs and Warner (1995), Wacziarg (1998)) and
measures of trade restrictions and policies such as tariffs and export taxes (as in Harrison
(1996) and Edwards (1988)). Since our focus of attention is not on the volume of trade or
11
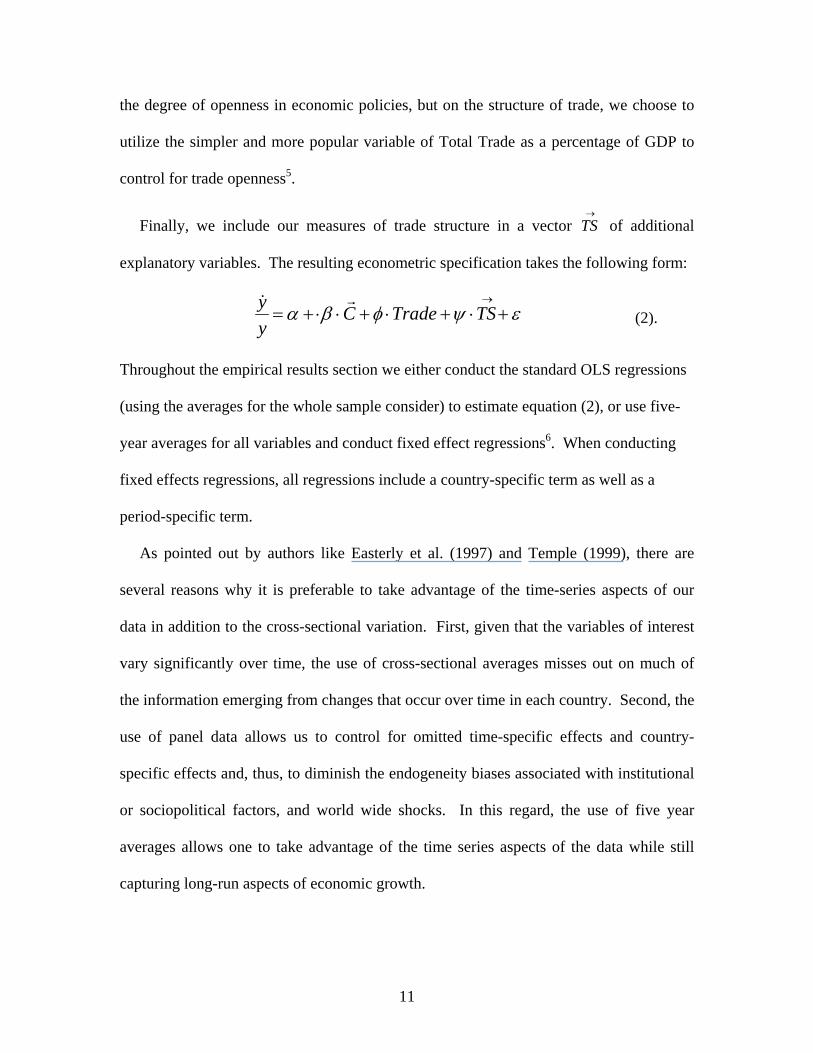
the degree of openness in economic policies, but on the structure of trade, we choose to
utilize the simpler and more popular variable of Total Trade as a percentage of GDP to
control for trade openness5.
Finally, we include our measures of trade structure in a vector →
TS of additional
explanatory variables. The resulting econometric specification takes the following form:
εψφβα +⋅+⋅+⋅⋅+=→
TSTradeCyy r&
(2).
Throughout the empirical results section we either conduct the standard OLS regressions
(using the averages for the whole sample consider) to estimate equation (2), or use five-
year averages for all variables and conduct fixed effect regressions6. When conducting
fixed effects regressions, all regressions include a country-specific term as well as a
period-specific term.
As pointed out by authors like Easterly et al. (1997) and Temple (1999), there are
several reasons why it is preferable to take advantage of the time-series aspects of our
data in addition to the cross-sectional variation. First, given that the variables of interest
vary significantly over time, the use of cross-sectional averages misses out on much of
the information emerging from changes that occur over time in each country. Second, the
use of panel data allows us to control for omitted time-specific effects and country-
specific effects and, thus, to diminish the endogeneity biases associated with institutional
or sociopolitical factors, and world wide shocks. In this regard, the use of five year
averages allows one to take advantage of the time series aspects of the data while still
capturing long-run aspects of economic growth.

12
As mentioned earlier, we use the alternative specification proposed by Feder (1982)
to test the robustness of our results. Feder (1982) tested a two-sector model of growth in
which export goods generate positive externalities for domestic production. In his basic
econometric formulation, the rate of growth of output ( YY& ) is determined by the
investment to output ratio (I/Y), the rate of population growth ( LL& ) and the product of
the exports to output ratio (X/Y) and the rate of growth of exports ( XX& ).
We modify Feder’s formulation in two ways. First, when studying the effects of
exports on growth we also control for the structure of trade as described by our data.
Second, we reformulate the specification so that per-capita income growth (y) is used as
the dependent variable. The resulting specification is summarized in equation (3):
εχγβα +⋅+⎟⎟⎠
⎞⎜⎜⎝
⎛⋅⋅+⎟⎟
⎠
⎞⎜⎜⎝
⎛⋅+⎟
⎠⎞
⎜⎝⎛⋅=
→
TSYX
XX
LL
YI
yy &&&
)( (3)
Other authors contemporaneous to Feder (1982), like Balassa (1978) or Tyler (1981)
used simpler one-sector models for which the relevant exports-related regressor in the
econometric specification was ( )XX& instead of ( ) ( )YXXX ⋅& as in equation (3). In
our robustness tests we allow for these possibilities as well.
4 Data Description and Trade Structure Variables
The empirical analysis uses data from a large sample of countries during the period
1980-2000. Values of annual population growth (POP), real income per capita (GDP),
annual GDP growth, secondary school enrollment rates (SED), the investment share of
GDP (Investment), the share of total trade to GDP (Trade Openness), and the share of

13
government expenditures in GDP (Government) were extracted from World Bank's
World Development indicators (2004).
With respect to the variables capturing the structure of trade, we incorporate two
variables into the analysis: the total number of trade partners a country had at each point
in time and the concentration of trade volumes among these partners. The number of
trading partners for each country was extracted from the Direction of Trade Statistics
database (DOT) from the International Monetary Fund.
Also from the DOT database, we use the monetary values of total imports and total
exports for each country/trading partner pair and construct a Herfindahl-Hirschman
concentration index of trade (HHI) for all countries. This index measures the
concentration of trade among all trading partners; where a low number indicates low
concentration. The index was computed as follows:
2
∑∑ ⎟⎟
⎟
⎠
⎞
⎜⎜⎜
⎝
⎛=
→
→N
jN
j ji
ji
T
THHI
Where N and jiT → denote the total number of trading partners and the total value of trade
(exports plus imports) between countries i and j, respectively7. Table 2 presents
summary statistics for the HHI across regions of the world and confirms our initial claim
that the changes on the trade structure have been more pronounced than changes on the
levels of trade.
It should be noted that even though the HHI index described above is a function
of the number of trading partners, these two variables are not necessarily related and, a
priori, there should not be a multicolinearity problem for the regression analysis. The
addition of a new trading partner could result in a higher, lower, or constant degree of
14
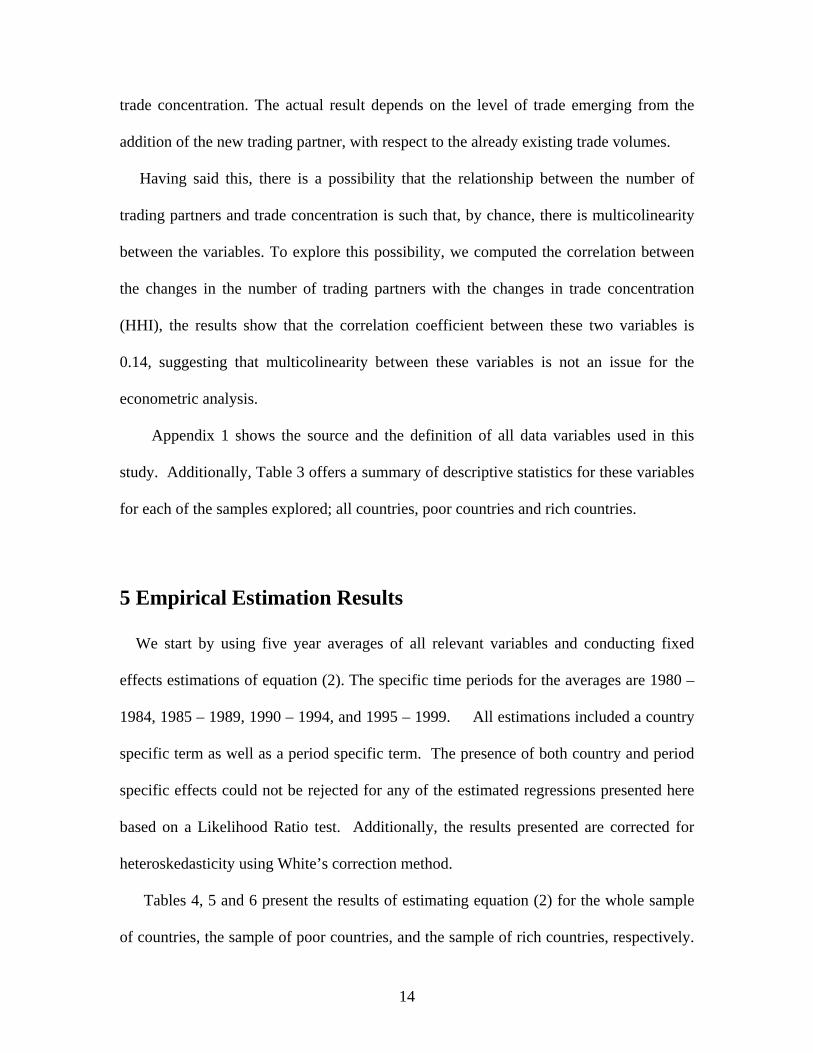
trade concentration. The actual result depends on the level of trade emerging from the
addition of the new trading partner, with respect to the already existing trade volumes.
Having said this, there is a possibility that the relationship between the number of
trading partners and trade concentration is such that, by chance, there is multicolinearity
between the variables. To explore this possibility, we computed the correlation between
the changes in the number of trading partners with the changes in trade concentration
(HHI), the results show that the correlation coefficient between these two variables is
0.14, suggesting that multicolinearity between these variables is not an issue for the
econometric analysis.
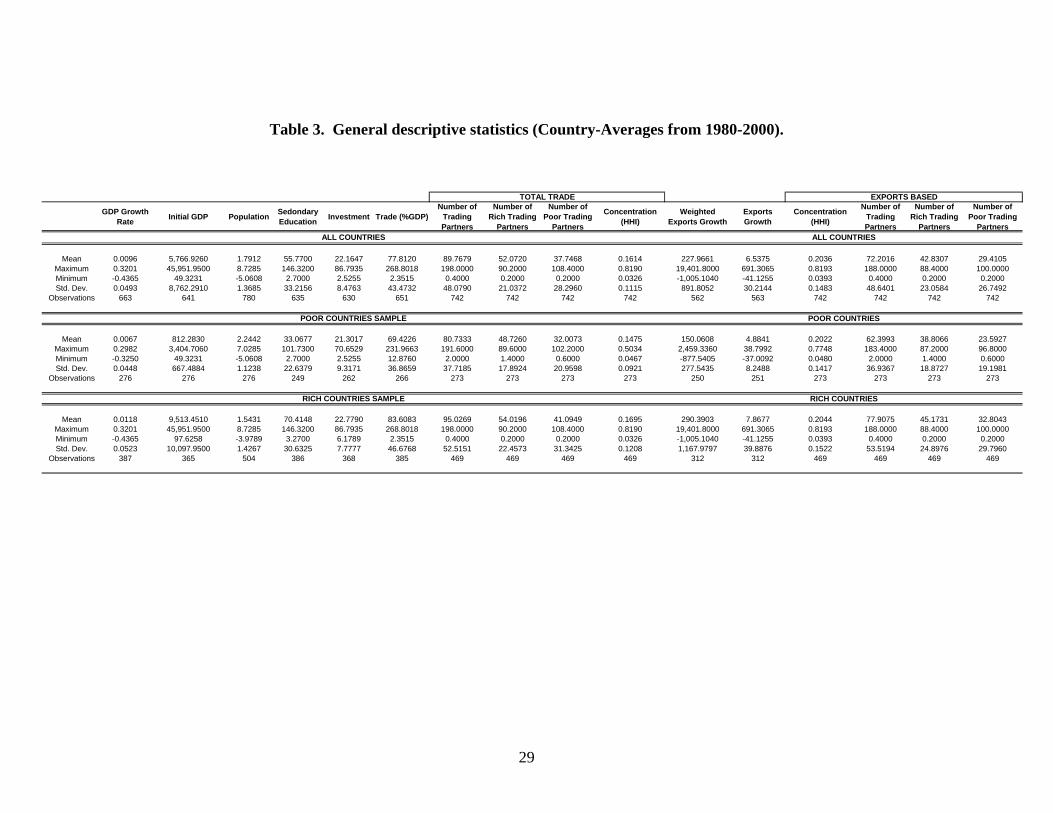
Appendix 1 shows the source and the definition of all data variables used in this
study. Additionally, Table 3 offers a summary of descriptive statistics for these variables
for each of the samples explored; all countries, poor countries and rich countries.
5 Empirical Estimation Results
We start by using five year averages of all relevant variables and conducting fixed
effects estimations of equation (2). The specific time periods for the averages are 1980 –
1984, 1985 – 1989, 1990 – 1994, and 1995 – 1999. All estimations included a country
specific term as well as a period specific term. The presence of both country and period
specific effects could not be rejected for any of the estimated regressions presented here
based on a Likelihood Ratio test. Additionally, the results presented are corrected for
heteroskedasticity using White’s correction method.
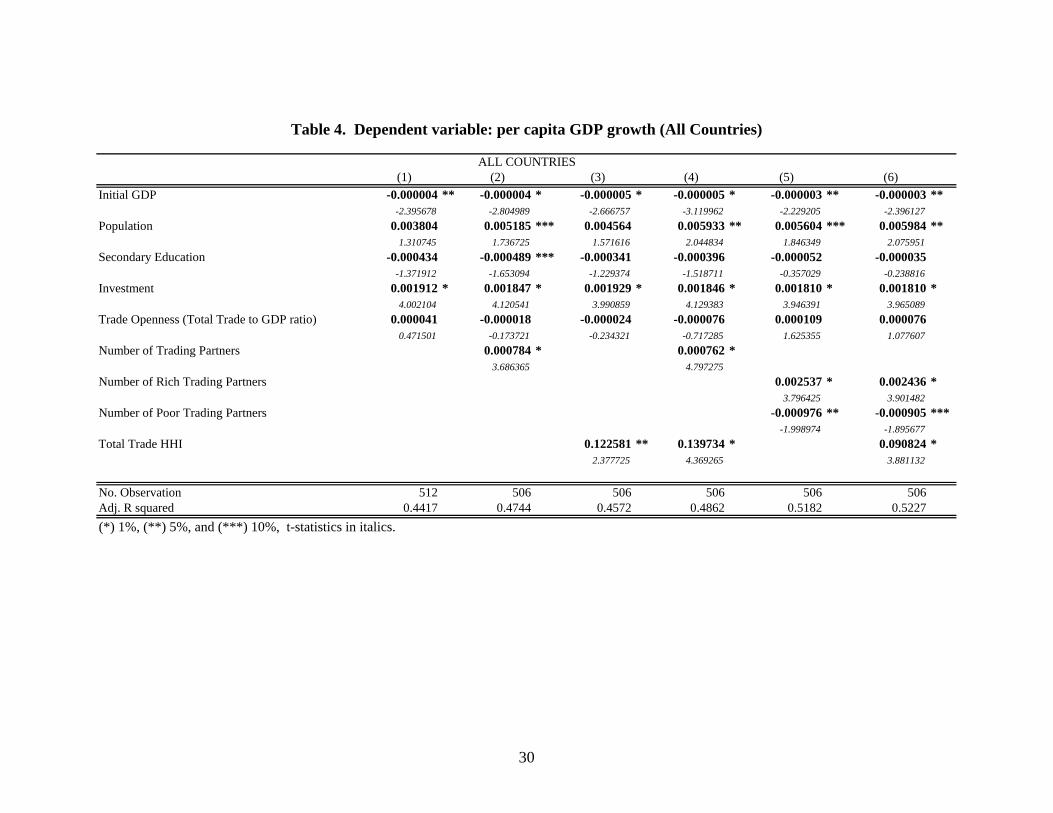
Tables 4, 5 and 6 present the results of estimating equation (2) for the whole sample
of countries, the sample of poor countries, and the sample of rich countries, respectively.
15
In all these tables, column (1) presents the estimation results for the base specification
where the trade structure variables are not included, while columns (2) - (6) present those
obtained for specifications that include the trade structure variables. Columns (2) – (4)
present the main results for the trade structure variables and columns (5) - (6) explore the
possibility that the effect of increasing the number of rich trading partners is different
from the effect of increasing the number of poor trading partners. To this effect we
compute the number of rich and poor trading partners and include them separately in the
regression analysis. A country was categorized as poor if its income in 1980 was smaller
than the income of the median economy in 1980.
The results of the basic specification regarding trade openness as measured by total
trade to GDP ratio resemble those of other studies that use similar methodologies and
data (see, for example, Harrison (1996), Yannikaya (2003)). Trade openness has a
positive and significant coefficient for the poor countries sample, a mostly positive but
statistically insignificant coefficient for the total sample, and a negative but mostly
insignificant coefficient for the rich countries sub-sample. It is only for poor countries
that the level of trade openness appears to impact growth positively and significantly.
With respect to the number of trading partners, the estimated coefficient is positive and
statistically significant for almost all of the econometric specifications across the three
samples explored in the analysis8. Additionally, the value of the estimated coefficients
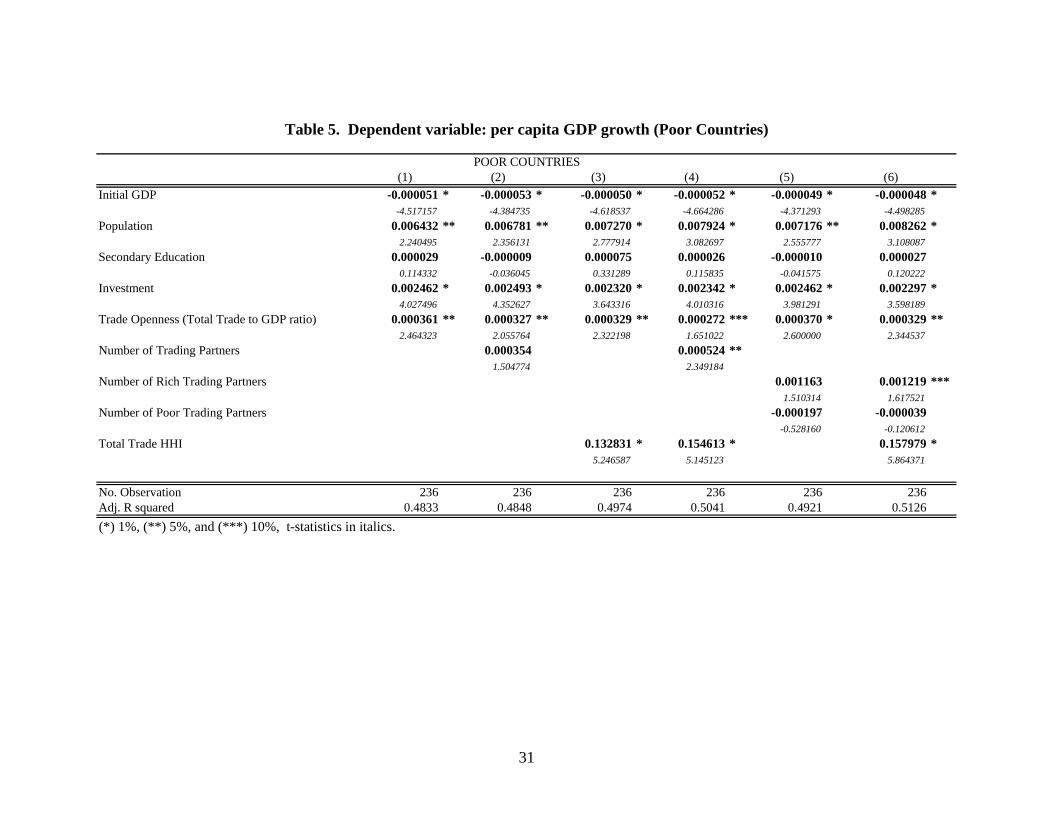
for the number of trading partners imply that the effects of this variable on GPD growth
rates is of considerable economic magnitude. Focusing on Table 5, where the results of
the estimation for the poor countries sample are presented, we see that the estimated
coefficient for the number of trading partners, in column (4), is approximately 0.00052.
16
This coefficient implies that, everything else constant, increasing the number of trading
partners by 10 (just a fourth of the standard deviation) is associated with an increase in
the rate of growth of 0.52 percentage points9. Given that the average rate of annual
growth in most undeveloped countries lies beneath one percent, the potential benefits of
increasing the number of trading partners appears to be substantial.
When the sample is divided into rich and poor countries, the estimated effect of an
additional trading partner is much smaller for the poor countries sub sample than for the
rich countries sub sample. The average value for the estimated coefficient is
approximately 0.0004 for poor countries and 0.0008 for rich countries (see Tables 5 and
6). As explained before, poor countries are likely to benefit less from additional trading
partners when different technologies act as complementary inputs and when the
acquisition of knowledge is mostly channeled through one relatively advanced trading
partner.
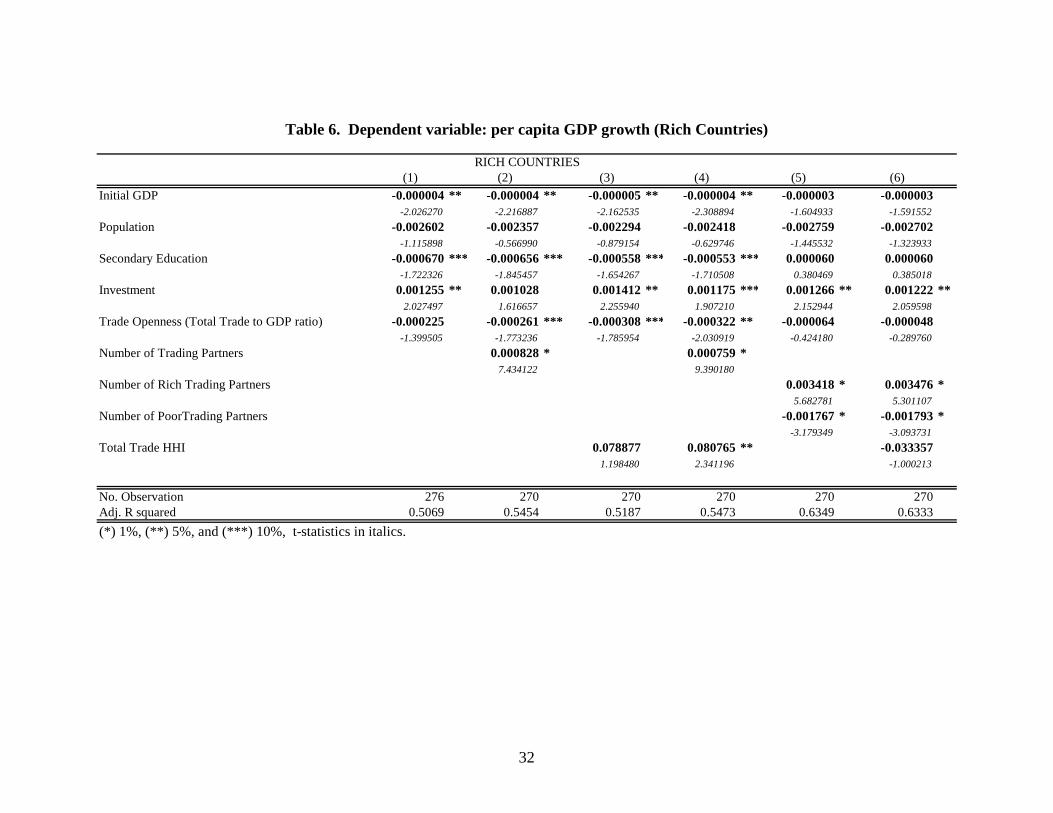
We now turn to the discussion of the effects that trade concentration has on economic
growth. The estimated coefficients for the trade concentration variable were, for most of
the cases considered, positive and statistically significant for both the total sample and the
poor countries sub sample. In contrast, for the rich countries sub sample, the estimated
coefficient was often insignificant and in some cases negative. Since the level of
concentration increases as the HHI index increases, the results imply that poor countries
benefit from more concentrated trade while the evidence for the rich countries is mixed at
best.
The estimated coefficients for the index of concentration show that the economic
magnitude of the effects from trade concentration could also be considerable. For
17
example, the coefficients for the poor and rich countries sub samples, reported in column
4 of Tables 5 and 6, imply that for poor countries a one standard deviation increase in the
level of trade concentration (HHI index) leads to an increase in the GDP growth rate of
0.32 of a standard deviation (1.42 percentage points), while for rich countries the
corresponding increase in the GDP growth rate is 0.19 of a standard deviation (0.97
percentage points)10. Again, the economic impact is significant.
As noted before, columns (5) - (6) in Tables 4 through 6 present the results obtained
for the analysis of the hypothesis regarding technological diffusion arising mainly from
rich trading partners. The evidence provided from this expanded analysis generally favors
this argument. The estimated coefficient for the number of rich trading partners is mostly
positive and statistically significant for all samples studied, while the coefficient for the
number of poor trading partners is always negative, but only significant for the whole
sample and the rich countries sub sample.
The conclusion that emerges from the arguments stated in section 2 and the empirical
evidence presented above is that the elements that characterize the structure of trade do
influence the rate of economic growth in a significant manner beyond the effects of trade
openness. The evidence also supports our hypothesis regarding the differences between
rich and poor countries. While both groups of countries seem to benefit from a greater
number of trading partners, rich countries appear to benefit more and these benefits (for
all countries) come mainly from trading with rich countries. Finally, while more trade
concentration is beneficial in general, it seems to be more significant for poor countries
than for developed economies.
18
5.1 Robustness of the Empirical Findings: Alternative Specification
As a first robustness test for our results, we use the alternative econometric
specification introduced by Feder (1982). Once again, the main modifications are the
inclusion of the number of countries to which a given country exports to and the HHI
index as explanatory variables of the economic growth rate. The resulting base
econometric specification is that presented in equation (3). We should emphasize here
that the specification presented in equation (3) is based on the argument that the effects of
trade on economic growth arise from exporting activities, therefore the HHI index used in
these regressions is computed only using export data for each country.
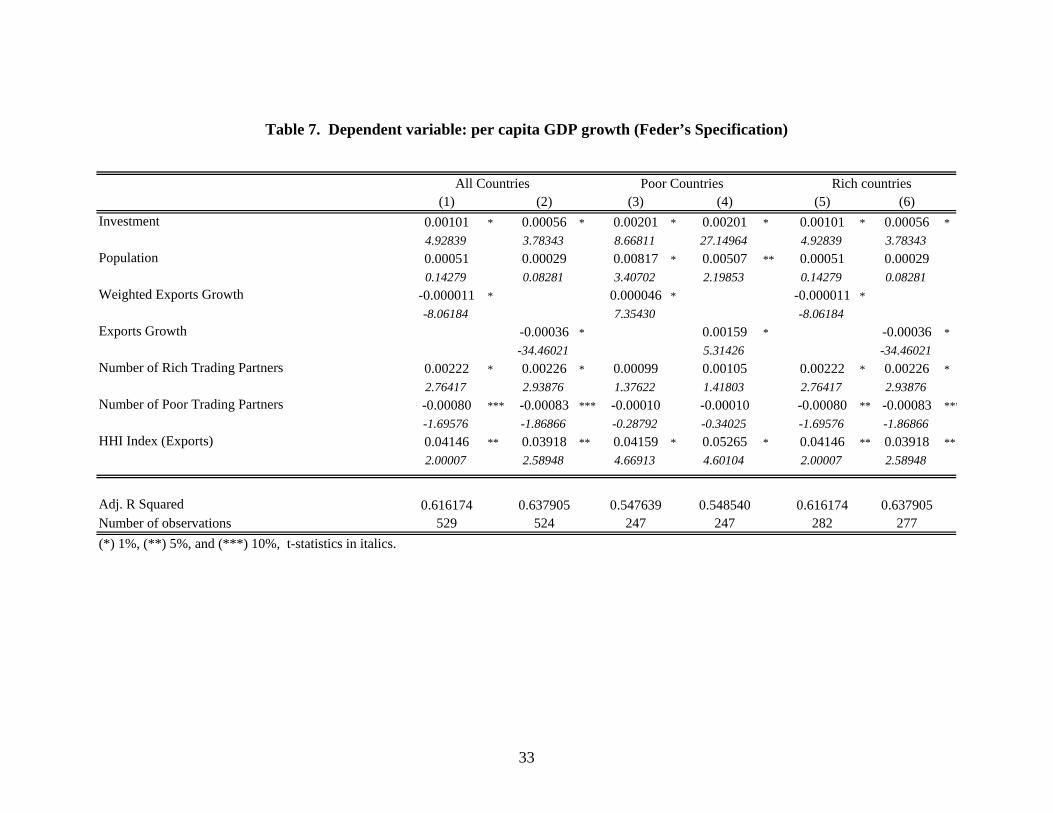
Tables 7 presents the results for the whole sample of countries, the poor countries
sample, and the rich countries sample, respectively. The estimated coefficients for the
export growth term in Table 7 (all countries) are not statistically significant. At first
glance, this result seems to be at odds with previous studies that reported a positive and
significant coefficient for this variable. Noticeably, however, past studies often based
their main results on samples of poor or “less developed” countries (including Feder
(1982), Balasa (1978) and Tyler (1981)). In columns (3) through (6), where we consider
the two sub samples, poor and rich countries respectively, the results are more similar to
prior studies. The coefficient for exports growth is positive and significant poor countries,
while it is negative for rich countries.
With respect to the effect of the number of trading partners on growth, our previous
conclusions remained unaltered. The estimated coefficient for the number of rich trading
partners is mostly positive and significant across the three samples considered, while the
one for the number of poor trading partners is negative and often insignificant. Thus, the
19
results from this alternative specification also suggest that the benefits of established
trading relationships on economic growth arise from trade links with rich countries.
Similarly, the results obtained for the trade concentration match those obtained with
the original econometric specification to the extent that trade concentration affects
growth positively. The estimated coefficients for the trade concentration, in this case
measured by export concentration, on the GDP growth rate are always positive and
significant.
5.2 Robustness of the Empirical Findings: Addressing endogeneity
A separate concern regarding the robustness of our results is that the number of
trading partners could be contemporaneously correlated with the error term, i.e., presence
of endogeneity. The logic behind this concern is that as a country’s GDP expands, this
country will search for other markets in which to sell its products and/or other countries
will look to establish trading relationships with this country. If this is so, then the results
presented so far might be biased.
With respect to the trade structure variables, there are a couple of reasons why we do
not think endogeneity biases are too severe in our results. First, although one could be
concerned that the rate of growth of output might influence the rate of growth in the
number of partners, it does not seem apparent why the rate of growth of output should
affect the total number of trading partners. We are considering level effects, while the
endogeneity concern seems more plausible for rate of growth effects. Second, trading
relationships (and in some cases bilateral trade volumes) are at least partially influenced
by governments’ international trade policies; which can be viewed as exogenous.
20
Finally, regarding trade concentration levels, there is no reason to believe that higher or
lower GDP growth rates could lead to higher or lower trade concentration among trading
partners. Therefore we do not believe that endogeneity could be an issue when using
trade concentration variable.
Still, we make an effort to correct for any potential endogeneity by using Instrumental
Variables in our previous estimations. As a first step, we perform an OLS regression for
the whole sample using long run averages (1980-2000) for all variables included in the
estimation of equation (2). We then compute the IV estimation and compare the results.
As for our choice of instrumental variables, we use physical access to international waters
and tropical climate, both obtained from the Sachs and Warner dataset11, and a variable
for the type of political regime, obtained from Easterly and Lu’s Global Development
Network Growth Database12. Geographic and socio-political variables should serve as
good instruments for the number of trading partners since trade relationships are partly
determined by geographical characteristics of countries, as well as political relations.
The results of these estimations for the total sample are presented in columns (1) and
(2) of Table 8. As mentioned above, the fixed effects approach is preferable to OLS,
therefore we just use this set of results as a first step in our efforts to address the
possibility of our results being affected by endogeneity. The results presented in Table 8
show that the effects of the total number of trading partners are strongly significant for
both the OLS and the OLS - IV estimation13.
Unfortunately, the instruments used for the OLS regression cannot be used for the
fixed effects regressions because they do not change over time. Therefore, following
Bloom et. al. (2004) and Ranis et. al. (2000), we use predetermined but not strictly

21
exogenous variables as instruments for the IV estimation. The predetermined variables
that are used in the auxiliary regression are the values for the previous period for GDP
per capita, trade openness, and the number of trading partners. The argument for using
these variables in the auxiliary regression is that endogneity, if present, emerges because
an increase in economic growth could result in a higher level of trade and higher number
of trading partners. Therefore by using the lag values of the number of trading partners,
GDP per capita, and trade openness as instrumental variables, we break the possible
contemporaneous effect between economic growth and the number of trading partners.
This methodology is justified since the correlation between the residuals at time t are not
correlated with the lagged variables. This approach can also be used for the cases where
we split the number of trading partners into rich and poor. The only variation is that in
that case the auxiliary regression uses the lagged value of the number of rich and poor
trading partners.
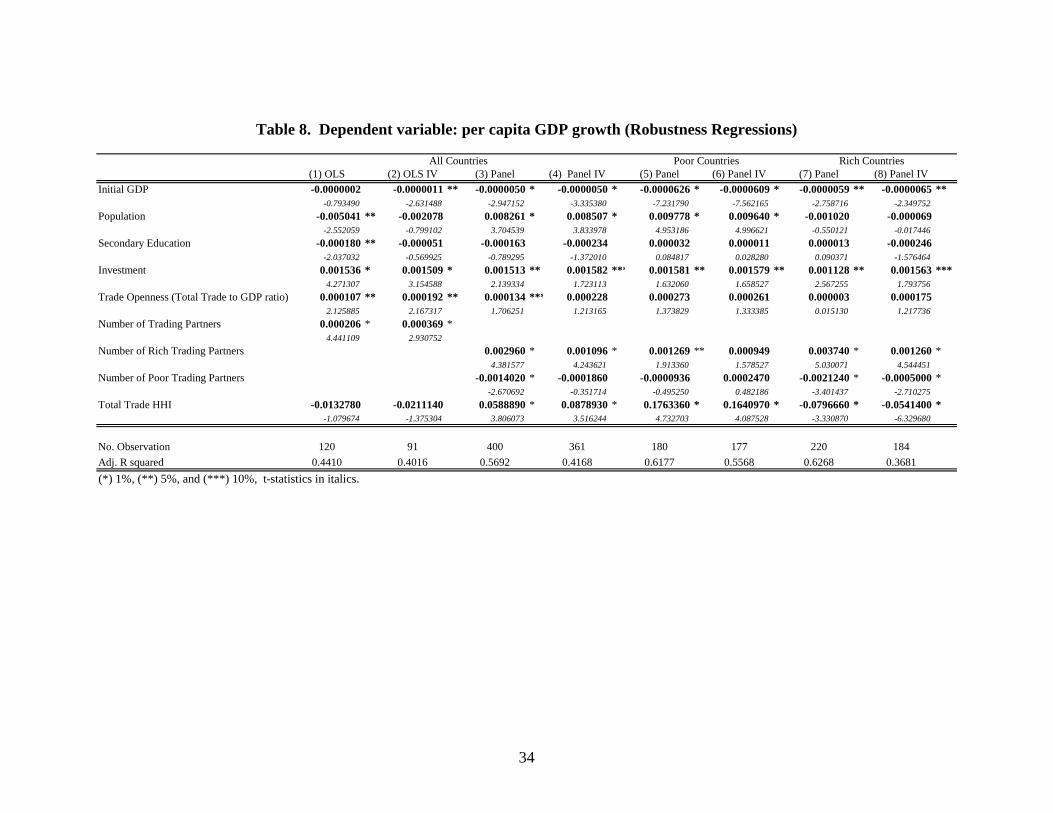
Columns (3)-(8) of Table 8 present the results obtained for the three samples
considered in the analysis. We present the results for the regressions for which the
number of trading partners was divided into rich and poor partners, but the same
conclusions are reached for the case where the total number of trading partners is
considered. For comparison purposes, columns (3), (5), and (7) report the results for the
original panel regression for the adjusted sample (i.e. removing the first cross section in
order to match the time period considered for the IV estimation). Columns (4), (6), and
(8) report the results for the IV estimation.
It is clear from the results presented that the conclusions regarding the relevancy of
the number of rich and poor trading partners for rich countries and the whole sample still
22
hold. A higher number of rich trading partners has a positive effect on the economic
growth rate for these two samples, while a higher number of poor trading partners has a
negative effect. Regarding trade concentration, the results show that it affects growth
positively for the overall sample and the poor countries sub sample, but has a negative
effect on economic growth for the rich countries. Once again consistent with the original
results presented in Tables 4 through 6.
Finally, the results presented in columns (3), (5), and (7) of Table 8 can also be
used as a robustness check for our original results when these results are compared to
those presented in column (6) of Tables 4, 5 and 6. In this case the robustness check is
with respect to the sample period. The results of Table 8 are based on a sample period
that would correspond to the cross sections of 1985 – 1989, 1990 – 1994, and 1995 –
1999, while those presented in Tables 4, 5, and 6 also include the cross section of 1980 –
1984. When the results are compared across the two sample periods, the signs are the
same, and the magnitudes and statistical significance are relatively similar. This suggests
that our results are robust to sample period selection as well.
6 Conclusions and Future Research
There are reasons to believe that the structure of trade has significant implications for
the rate of economic growth. Most empirical studies overlook the conditions under
which trade takes place and concentrate mostly on trade volumes and measures of
openness. In this paper, instead of concentrating on the level of trade volumes or the
degree of openness of an economy, we give attention to the structure of trade as
23
characterized by the number of trading partners a country has, and the concentration of
trade among those partners.
We find that the number of trading partners is positively correlated with growth across
all countries; this effect is greater for rich countries. Trade concentration is positively
correlated with growth for all countries in general; this effect is mostly attributed to poor
countries. These results are robust to changes in the econometric specification used, the
number of explanatory variables included, and corrections for heteroskedasticity.
In terms of policy, our findings may inform policy makers’ as well as the international
community that ponders the benefits of international trade agreements. In particular, our
findings suggest that high trade concentration, such as is the case for developing
countries whose trade is concentrated with a major economic power14, may not be a
matter of serious concern.
24
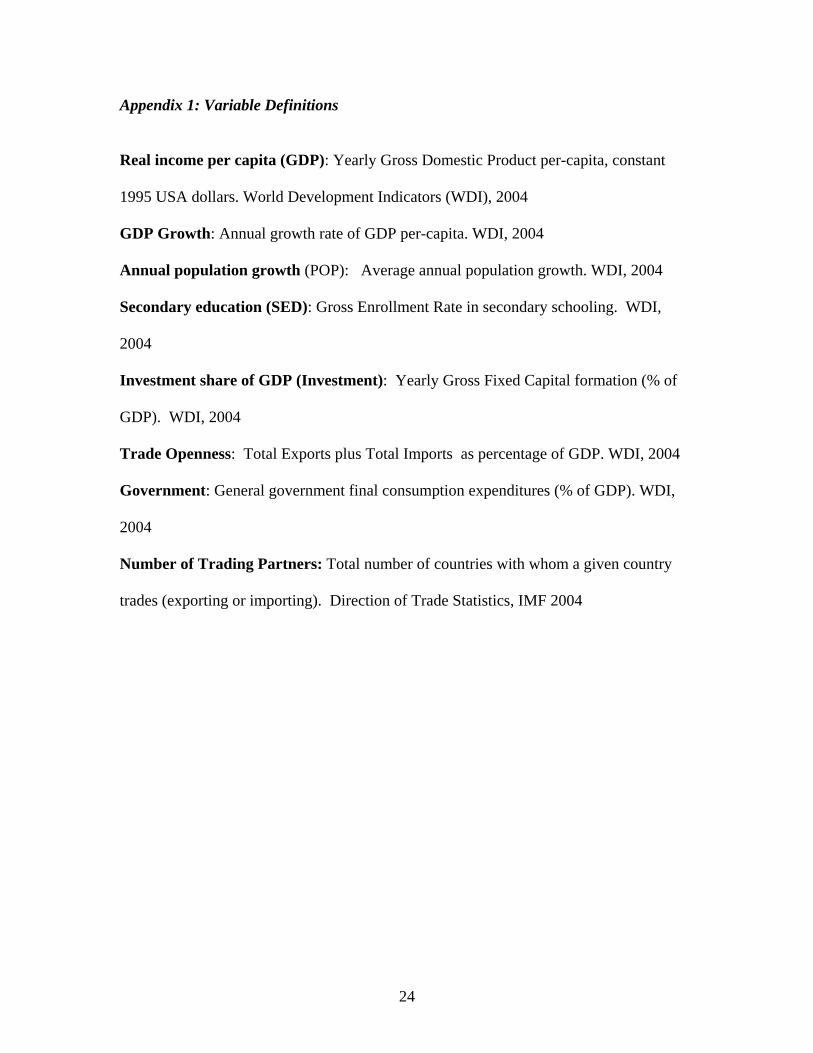
Appendix 1: Variable Definitions
Real income per capita (GDP): Yearly Gross Domestic Product per-capita, constant
1995 USA dollars. World Development Indicators (WDI), 2004
GDP Growth: Annual growth rate of GDP per-capita. WDI, 2004
Annual population growth (POP): Average annual population growth. WDI, 2004
Secondary education (SED): Gross Enrollment Rate in secondary schooling. WDI,
2004
Investment share of GDP (Investment): Yearly Gross Fixed Capital formation (% of
GDP). WDI, 2004
Trade Openness: Total Exports plus Total Imports as percentage of GDP. WDI, 2004
Government: General government final consumption expenditures (% of GDP). WDI,
2004
Number of Trading Partners: Total number of countries with whom a given country
trades (exporting or importing). Direction of Trade Statistics, IMF 2004

25
References Balassa, Bela (1978), “Exports and Economic Growth: Further Evidence”, Journal of
Development Economics, vol. 5, no. 2, pp. 181-189.
Barro, Robert J. (1991), “Economic Growth in a Cross-Section of Countries”, Quarterly
Journal of Economics, vol. 106, no. 2, pp. 407-443.
Bloom DE, Canning D, Sevilla J. (2004) “The effect of health on economic growth: a
production function approach”, World Development, vol. 32, pp 1-13.
Boubakri, Narjess and Jean-Claude Cosset (1998). “The Financial and Operating
Performance of Newly Privatized Firms: Evidence from Developing Countries”, The
Journal of Finance, vol. 53, no. 3, pp 1081-1110.
Coe, David T. and Elhanan Helpman (1995), “International R&D Spillovers”, European
Economic Review, vol. 39, no. 5, pp 859-887.
Dollar, David (1992), “Outward-Oriented Developing Economies Really Do Grow More
Rapidly: Evidence from 95 LDCs, 1976-1985”, Economic Development and Cultural
Change, vol. 40, no. 3, pp. 523-544.
Easterly, William, Norman Loayza and Peter Montiel (1997), “Has Latin America’s post-
reform Growth Been Disappointing?”, Journal of International Economics, vol. 43,
no. 2, pp. 287-311.
Edwards, Sebastian (1993), “Openness, Trade Liberalizations, and Growth in Developing
Countries”, Journal of Economic Literature, vol. 31, no. 3, pp. 1358-1393.
Edwards, Sebastian (1998), “Openness, Productivity and Growth: What Do We Really
Know?”, The Economic Journal, vol. 108, no. 447, pp. 383-398.
Feder, Gershon (1982), “On Exports and Economic Growth”, Journal of Development
Economics, vol. 12, no. 1, pp. 59-73.

26
Frankel, Jeffrey A. and David Romer (1999), “Does Trade Cause Growth?” The
American Economic Review, vol. 89, no. 3, pp. 379-399.
Frankel, Jeffrey A. Ernesto Stein and Shang-jin Wei (1995), “Trading Blocs and the
Americas: The Natural, the Unnatural, and the Super-natural”. Journal of
Development Economics, vol. 47, no. 1, pp. 61-95.
Grossman, G. and E. Helpman (1991), Innovation and Growth in the Global Economy,
MIT Press, Cambridge, MA.
Harrison, Ann (1996), “Openness and Growth: A Time-Series, Cross-Country Analysis
for Developing Countries”, Journal of Development Economics, vol. 48, no.2, pp.
419-447.
Keller, Wolfgang (1998), “Are International R&D Spillovers Trade-Related? Analyzing
Spillovers Among Randomly Matched Trade Partners”, European Economic Review,
vol. 42, no. 8, pp. 1469-1481.
Levine, Ross and David Renelt (1992). A Sensitivity Analysis of Cross-Country Growth
Regressions. The American Economic Review, vol. 82, no. 4, pp. 942-963
Matsuyama, Kiminori (1992), “Agricultural Productivity, Comparative Advantage, and
Economic Growth”, Journal of Economic Theory, vol. 58, no. 2, pp. 317-334.
Pickering, J.F. and I.M. Sheldon (1984), “International Trade performance and
concentration in British industry”, Applied Economics, Vol. 16, pp. 421-442.
Ranis G, Stewart F, Ramirez A. (2000), “Economic growth and human development.
World Development, vol. 28, pp 197-219.
Rivera-Batiz, Luis and Paul M. Romer (1991), “Economic Integration and Endogenous
Growth”, The Quarterly Journal of Economics, vol. 106, no. 2, pp. 531-555.
27
Rodriguez, Francisco and Dani Rodrik (2001), “Trade Policy and Economic Growth: A
Sceptic’s Guide to the Cross-National Evidence”, NBER Macroeconomics Annual
2000. Cambridge, MA: MIT Press, pp. 261-324.
Romer, Paul (1990),“Endogenous Technological Change”, Journal of Political Economy,
vol. 98, no. 5, pp. S71-S102.
Sachs, Jeffrey and Andrew Warner (1995), “Economic reform and the process of global
integration”, Brookings Papers on Economic Activity, vol. 1, pp. 1-118.
Schneider, Patricia Higinio (2005), International trade, economic growth and intellectual
property rights: A panel data study of developed and developing countries”, Journal
of Development Economics, vol 78, pp. 529-547.
Temple, Jonathan (1999), “The New Growth Evidence”, Journal of Economic Literature,
vol. 37, no. 1, pp. 112-156.
Tyler, William G. (1981), “Growth and Export Expansion in Developing Countries:
Some Empirical Evidence”, Journal of Development Economics, vol. 9, no. 3, pp.
121-130.
Vickers, John and George Yarrow (1991). “Economic Perspectives on Privatization”,
The Journal of Economic Perspectives, vol. 5, issue 2, pp. 111-132
Wacziarg, Romain (1998), “Measuring the Dynamic Gains from Trade”, The World
Bank Economic Review, vol. 15, no. 3, pp. 393-429
Walde, Klaus and Christina Wood (2005), “The Empirics of Trade and Growth: Where
are the Policy Recommendations?”, International Economics and Economic Policy,
vol. 1, no. 2-3, pp. 275-292.
Yanikkaya, Halit (2003), “Trade Openness and Economic Growth: A Cross-Country
Empirical Investigation”, Journal of Development Economics, vol. 72, no. 1, pp. 57-
89.
28
Table 1. Trade Trends 1970-2000
All Countries Europe and USA Latin America Africa Asia
Trade (%GDP)
Number of partners*
Trade (%GDP)
Number of partners*
Trade (%GDP)
Number of partners*
Trade (%GDP)
Number of partners*
Trade (%GDP)
Number of partners*
1970-1974 58.30 46.43 65.22 105.54 54.34 38.27 58.96 31.79 54.82 47.45 1975-1979 68.33 51.38 74.05 109.81 67.88 45.53 67.15 35.08 65.65 52.70 1980-1984 75.37 52.91 80.36 95.11 76.24 52.83 69.60 38.38 79.54 62.23 1984-1989 72.06 56.89 78.98 95.58 74.39 57.61 64.78 42.63 75.02 69.78 1990-1994 78.25 67.71 84.95 112.52 78.69 66.91 68.09 51.54 80.91 80.01 1995-1999 83.45 85.94 96.08 146.89 79.10 80.36 74.49 64.56 86.35 96.33 2000-2003 88.52 93.98 108.61 161.49 77.09 87.05 76.47 71.36 94.04 104.33
* Number of partners = number of countries to whom goods where exported to (IZ)
Table 2. HHI Trends 1970-2000
All Countries Europe and USA Latin America Africa Asia
1970-1974 2201 1131 2273 2216 2291 1975-1979 1977 986 2419 1927 1873 1980-1984 1730 979 2289 1626 1507 1984-1989 1706 999 2316 1446 1519 1990-1994 1647 1058 2215 1373 1531 1995-1999 1564 981 2137 1383 1346 2000-2003 1580 912 2005 1485 1332
29
Table 3. General descriptive statistics (Country-Averages from 1980-2000).
GDP Growth Rate Initial GDP Population Sedondary
Education Investment Trade (%GDP)Number of
Trading Partners
Number of Rich Trading
Partners
Number of Poor Trading
Partners
Concentration (HHI)
Weighted Exports Growth
Exports Growth
Concentration (HHI)
Number of Trading Partners
Number of Rich Trading
Partners
Number of Poor Trading
Partners
Mean 0.0096 5,766.9260 1.7912 55.7700 22.1647 77.8120 89.7679 52.0720 37.7468 0.1614 227.9661 6.5375 0.2036 72.2016 42.8307 29.4105 Maximum 0.3201 45,951.9500 8.7285 146.3200 86.7935 268.8018 198.0000 90.2000 108.4000 0.8190 19,401.8000 691.3065 0.8193 188.0000 88.4000 100.0000 Minimum -0.4365 49.3231 -5.0608 2.7000 2.5255 2.3515 0.4000 0.2000 0.2000 0.0326 -1,005.1040 -41.1255 0.0393 0.4000 0.2000 0.2000 Std. Dev. 0.0493 8,762.2910 1.3685 33.2156 8.4763 43.4732 48.0790 21.0372 28.2960 0.1115 891.8052 30.2144 0.1483 48.6401 23.0584 26.7492
Observations 663 641 780 635 630 651 742 742 742 742 562 563 742 742 742 742
Mean 0.0067 812.2830 2.2442 33.0677 21.3017 69.4226 80.7333 48.7260 32.0073 0.1475 150.0608 4.8841 0.2022 62.3993 38.8066 23.5927 Maximum 0.2982 3,404.7060 7.0285 101.7300 70.6529 231.9663 191.6000 89.6000 102.2000 0.5034 2,459.3360 38.7992 0.7748 183.4000 87.2000 96.8000 Minimum -0.3250 49.3231 -5.0608 2.7000 2.5255 12.8760 2.0000 1.4000 0.6000 0.0467 -877.5405 -37.0092 0.0480 2.0000 1.4000 0.6000 Std. Dev. 0.0448 667.4884 1.1238 22.6379 9.3171 36.8659 37.7185 17.8924 20.9598 0.0921 277.5435 8.2488 0.1417 36.9367 18.8727 19.1981
Observations 276 276 276 249 262 266 273 273 273 273 250 251 273 273 273 273
Mean 0.0118 9,513.4510 1.5431 70.4148 22.7790 83.6083 95.0269 54.0196 41.0949 0.1695 290.3903 7.8677 0.2044 77.9075 45.1731 32.8043 Maximum 0.3201 45,951.9500 8.7285 146.3200 86.7935 268.8018 198.0000 90.2000 108.4000 0.8190 19,401.8000 691.3065 0.8193 188.0000 88.4000 100.0000 Minimum -0.4365 97.6258 -3.9789 3.2700 6.1789 2.3515 0.4000 0.2000 0.2000 0.0326 -1,005.1040 -41.1255 0.0393 0.4000 0.2000 0.2000 Std. Dev. 0.0523 10,097.9500 1.4267 30.6325 7.7777 46.6768 52.5151 22.4573 31.3425 0.1208 1,167.9797 39.8876 0.1522 53.5194 24.8976 29.7960
Observations 387 365 504 386 368 385 469 469 469 469 312 312 469 469 469 469
POOR COUNTRIES
RICH COUNTRIES
EXPORTS BASEDTOTAL TRADE
ALL COUNTRIES
POOR COUNTRIES SAMPLE
RICH COUNTRIES SAMPLE
ALL COUNTRIES
30
Table 4. Dependent variable: per capita GDP growth (All Countries)
(1) (2) (3) (4) (5) (6)Initial GDP -0.000004 ** -0.000004 * -0.000005 * -0.000005 * -0.000003 ** -0.000003 **
-2.395678 -2.804989 -2.666757 -3.119962 -2.229205 -2.396127Population 0.003804 0.005185 *** 0.004564 0.005933 ** 0.005604 *** 0.005984 **
1.310745 1.736725 1.571616 2.044834 1.846349 2.075951Secondary Education -0.000434 -0.000489 *** -0.000341 -0.000396 -0.000052 -0.000035
-1.371912 -1.653094 -1.229374 -1.518711 -0.357029 -0.238816Investment 0.001912 * 0.001847 * 0.001929 * 0.001846 * 0.001810 * 0.001810 *
4.002104 4.120541 3.990859 4.129383 3.946391 3.965089Trade Openness (Total Trade to GDP ratio) 0.000041 -0.000018 -0.000024 -0.000076 0.000109 0.000076
0.471501 -0.173721 -0.234321 -0.717285 1.625355 1.077607Number of Trading Partners 0.000784 * 0.000762 *
3.686365 4.797275Number of Rich Trading Partners 0.002537 * 0.002436 *
3.796425 3.901482Number of Poor Trading Partners -0.000976 ** -0.000905 ***
-1.998974 -1.895677Total Trade HHI 0.122581 ** 0.139734 * 0.090824 *
2.377725 4.369265 3.881132
No. Observation 512 506 506 506 506 506Adj. R squared 0.4417 0.4744 0.4572 0.4862 0.5182 0.5227(*) 1%, (**) 5%, and (***) 10%, t-statistics in italics.
ALL COUNTRIES
31
Table 5. Dependent variable: per capita GDP growth (Poor Countries)
(1) (2) (3) (4) (5) (6)Initial GDP -0.000051 * -0.000053 * -0.000050 * -0.000052 * -0.000049 * -0.000048 *
-4.517157 -4.384735 -4.618537 -4.664286 -4.371293 -4.498285Population 0.006432 ** 0.006781 ** 0.007270 * 0.007924 * 0.007176 ** 0.008262 *
2.240495 2.356131 2.777914 3.082697 2.555777 3.108087Secondary Education 0.000029 -0.000009 0.000075 0.000026 -0.000010 0.000027
0.114332 -0.036045 0.331289 0.115835 -0.041575 0.120222Investment 0.002462 * 0.002493 * 0.002320 * 0.002342 * 0.002462 * 0.002297 *
4.027496 4.352627 3.643316 4.010316 3.981291 3.598189Trade Openness (Total Trade to GDP ratio) 0.000361 ** 0.000327 ** 0.000329 ** 0.000272 *** 0.000370 * 0.000329 **
2.464323 2.055764 2.322198 1.651022 2.600000 2.344537Number of Trading Partners 0.000354 0.000524 **
1.504774 2.349184Number of Rich Trading Partners 0.001163 0.001219 ***
1.510314 1.617521Number of Poor Trading Partners -0.000197 -0.000039
-0.528160 -0.120612Total Trade HHI 0.132831 * 0.154613 * 0.157979 *
5.246587 5.145123 5.864371
No. Observation 236 236 236 236 236 236Adj. R squared 0.4833 0.4848 0.4974 0.5041 0.4921 0.5126(*) 1%, (**) 5%, and (***) 10%, t-statistics in italics.
POOR COUNTRIES
32
Table 6. Dependent variable: per capita GDP growth (Rich Countries)
(1) (2) (3) (4) (5) (6)Initial GDP -0.000004 ** -0.000004 ** -0.000005 ** -0.000004 ** -0.000003 -0.000003
-2.026270 -2.216887 -2.162535 -2.308894 -1.604933 -1.591552Population -0.002602 -0.002357 -0.002294 -0.002418 -0.002759 -0.002702
-1.115898 -0.566990 -0.879154 -0.629746 -1.445532 -1.323933Secondary Education -0.000670 *** -0.000656 *** -0.000558 *** -0.000553 *** 0.000060 0.000060
-1.722326 -1.845457 -1.654267 -1.710508 0.380469 0.385018Investment 0.001255 ** 0.001028 0.001412 ** 0.001175 *** 0.001266 ** 0.001222 **
2.027497 1.616657 2.255940 1.907210 2.152944 2.059598Trade Openness (Total Trade to GDP ratio) -0.000225 -0.000261 *** -0.000308 *** -0.000322 ** -0.000064 -0.000048
-1.399505 -1.773236 -1.785954 -2.030919 -0.424180 -0.289760Number of Trading Partners 0.000828 * 0.000759 *
7.434122 9.390180Number of Rich Trading Partners 0.003418 * 0.003476 *
5.682781 5.301107Number of PoorTrading Partners -0.001767 * -0.001793 *
-3.179349 -3.093731Total Trade HHI 0.078877 0.080765 ** -0.033357
1.198480 2.341196 -1.000213
No. Observation 276 270 270 270 270 270Adj. R squared 0.5069 0.5454 0.5187 0.5473 0.6349 0.6333(*) 1%, (**) 5%, and (***) 10%, t-statistics in italics.
RICH COUNTRIES
33
Table 7. Dependent variable: per capita GDP growth (Feder’s Specification)
(1) (2) (3) (4) (5) (6)Investment 0.00101 * 0.00056 * 0.00201 * 0.00201 * 0.00101 * 0.00056 *
4.92839 3.78343 8.66811 27.14964 4.92839 3.78343Population 0.00051 0.00029 0.00817 * 0.00507 ** 0.00051 0.00029
0.14279 0.08281 3.40702 2.19853 0.14279 0.08281Weighted Exports Growth -0.000011 * 0.000046 * -0.000011 *
-8.06184 7.35430 -8.06184Exports Growth -0.00036 * 0.00159 * -0.00036 *
-34.46021 5.31426 -34.46021Number of Rich Trading Partners 0.00222 * 0.00226 * 0.00099 0.00105 0.00222 * 0.00226 *
2.76417 2.93876 1.37622 1.41803 2.76417 2.93876Number of Poor Trading Partners -0.00080 *** -0.00083 *** -0.00010 -0.00010 -0.00080 ** -0.00083 ***
-1.69576 -1.86866 -0.28792 -0.34025 -1.69576 -1.86866HHI Index (Exports) 0.04146 ** 0.03918 ** 0.04159 * 0.05265 * 0.04146 ** 0.03918 **
2.00007 2.58948 4.66913 4.60104 2.00007 2.58948
Adj. R Squared 0.616174 0.637905 0.547639 0.548540 0.616174 0.637905Number of observations 529 524 247 247 282 277(*) 1%, (**) 5%, and (***) 10%, t-statistics in italics.
All Countries Poor Countries Rich countries
34
Table 8. Dependent variable: per capita GDP growth (Robustness Regressions)
(1) OLS (2) OLS IV (3) Panel (4) Panel IV (5) Panel (6) Panel IV (7) Panel (8) Panel IVInitial GDP -0.0000002 -0.0000011 ** -0.0000050 * -0.0000050 * -0.0000626 * -0.0000609 * -0.0000059 ** -0.0000065 **
-0.793490 -2.631488 -2.947152 -3.335380 -7.231790 -7.562165 -2.758716 -2.349752Population -0.005041 ** -0.002078 0.008261 * 0.008507 * 0.009778 * 0.009640 * -0.001020 -0.000069
-2.552059 -0.799102 3.704539 3.833978 4.953186 4.996621 -0.550121 -0.017446Secondary Education -0.000180 ** -0.000051 -0.000163 -0.000234 0.000032 0.000011 0.000013 -0.000246
-2.037032 -0.569925 -0.789295 -1.372010 0.084817 0.028280 0.090371 -1.576464Investment 0.001536 * 0.001509 * 0.001513 ** 0.001582 *** 0.001581 ** 0.001579 ** 0.001128 ** 0.001563 ***
4.271307 3.154588 2.139334 1.723113 1.632060 1.658527 2.567255 1.793756Trade Openness (Total Trade to GDP ratio) 0.000107 ** 0.000192 ** 0.000134 *** 0.000228 0.000273 0.000261 0.000003 0.000175
2.125885 2.167317 1.706251 1.213165 1.373829 1.333385 0.015130 1.217736Number of Trading Partners 0.000206 * 0.000369 *
4.441109 2.930752Number of Rich Trading Partners 0.002960 * 0.001096 * 0.001269 ** 0.000949 0.003740 * 0.001260 *
4.381577 4.243621 1.913360 1.578527 5.030071 4.544451Number of Poor Trading Partners -0.0014020 * -0.0001860 -0.0000936 0.0002470 -0.0021240 * -0.0005000 *
-2.670692 -0.351714 -0.495250 0.482186 -3.401437 -2.710275Total Trade HHI -0.0132780 -0.0211140 0.0588890 * 0.0878930 * 0.1763360 * 0.1640970 * -0.0796660 * -0.0541400 *
-1.079674 -1.375304 3.806073 3.516244 4.732703 4.087528 -3.330870 -6.329680
No. Observation 120 91 400 361 180 177 220 184Adj. R squared 0.4410 0.4016 0.5692 0.4168 0.6177 0.5568 0.6268 0.3681(*) 1%, (**) 5%, and (***) 10%, t-statistics in italics.
All Countries Poor Countries Rich Countries

35
1 For a more details on this see Edwards (1993), Temple (1999) and Walde and Wood
(2005) for literature reviews. 2 Many more are in the works. See the WTO secretariat web link
http://www.wto.org/english/tratop_e/region_e/regfac_e.htm).
3 Other authors like Feder (1982) or Matsuyama (1992) have modeled growth in two
sector models where the exporting sector generates positive externalities for the rest of
the economy. While these models are different from the one by Romer (1990), the
intuition behind the effects of trade through the exchange of ideas is similar.
4 In order to check for the robustness of the results, additional explanatory variables like
the ratio of government expenditures to GDP or the primary school enrollment were also
included inCr
. Including these other variables produced no changes in our results.
5 Authors like Harrison (1996) and Edwards (1998), however, have argued that most
measures of trade openness and trade policy used in the literature capture roughly the
same aspects and could be used interchangeably.
6 When conducting fixed effects regressions, the variable for the initial income level per-
capita is the value at the beginning of each five-year period.
7 When equation (3) is estimated, the data used to calculate this index was limited to
Export volumes instead of Trade volumes.
8 The exception is the estimated coefficient for column (2) of Table 5.
9 Throughout the study, gross growth rates were used and the size of the coefficients
reflects this choice. For example, a one percent growth rate was recorded in the data as
0.01.
36
10 The descriptive statistics, Table 3, report that the standard deviation of the GDP growth
rate is equal to 0.044, while that for the HHI index is 0.092. Therefore a one standard
deviation of the HHI index implies a change of (0.154*0.092)=0.0142, or 1.42
percentage points, in the GDP growth rate, which is about 0.32 of a standard deviation of
the dependent variable (0.0142/0.044).
11 Sachs and Warner data set is published on the Center for International Development
Web site accessible from http://www.cid.harvard.edu/
12 http://www.worldbank.org/research/growth/GDNdata.htm
13 The results for the poor and rich country samples are not presented here for matters of
space, but the conclusions follow those discussed for the overall sample, in other words
they statistical significance and signs of the relevant variables remain.
14 Mexico’s trade with the U.S., for instance.