
TR HL-85-1 "General spillway investigation
65
·-r A7 l/J 4 nu.lll .. · B ··1 REFERENCE FLOW 0.5 ' PLAN VIEW PIER 1.44' EL EVATION VIEW TECHNICAL REPORT HL -85-1 GENERAL SPILLWAY INVESTIGATION Hydraulic Model Investigation by Stephen T. Maynord Hydraulics Laboratory DEPARTMENT OF THE ARMY Waterways Experiment Station, Corps of Engineers PO Box 631 Vicksburg , Mississippi 39180-0631 BOOKS ARE ACCOUNTABLE PROPERTY CHARGED TO AN INDIVIDUAL BY NAME. PLEASE DO NOT LEND TO OTHERS WITHOUT CLEARING YOURSELF. March 1985 Final Report Approved For Public Release; Drstribution Unlrmited LIBRARY BRANCH .t TECHNICAl fNFORMA TION CENTER Ui •MY ENGINEER WATERWAYS EXPERIMENT STATK>I MISSISSIPPI Prepared tor DEPARTMENT OF THE ARMY US Army Corps of En g in ee rs Washington, DC 20314-1 000 Under Civil Works Investi gatio n Work Unit 030200/31177
-
Upload
khangminh22 -
Category
Documents
-
view
0 -
download
0
Transcript of TR HL-85-1 "General spillway investigation

·-r A7 l/J ~~ 4 nu.lll .. ·
B ~:.i ··1
~·
REFERENCE
FLOW
0.5 '
PLAN VIEW
PIER
1.44 '
ELEVATION VIEW
TECHNICAL REPORT HL-85-1
GENERAL SPILLWAY INVESTIGATION
Hydraulic Model Investigation
by
Stephen T . Maynord
Hydraulics Laboratory
DEPARTMENT OF THE ARMY Waterways Experiment Station, Corps of Engineers
PO Box 631 Vicksburg , Mississippi 39180-0631
BOOKS ARE ACCOUNTABLE PROPERTY CHARGED TO AN INDIVIDUAL BY NAME. PLEASE DO NOT LEND TO OTHERS WITHOUT CLEARING YOURSELF.
March 1985
Final Report
Approved For Public Release; Drstribution Unlrmited
LIBRARY BRANCH . t TECHNICAl fNFORMA TION CENTER
Ui •MY ENGINEER WATERWAYS EXPERIMENT STATK>I ~CKSBURG, MISSISSIPPI
Prepared tor DEPARTMENT OF THE ARMY US Army Corps of Eng ineers Washington, DC 20314-1 000
Under Civi l Works Investigation Work Uni t 030200/31177

Unclassified SECURITY CLASSIFICATION OF TH I S PAGE (When Data E t d) n ere
REPORT DOCUMENTATION PAOE READ INSTRUCTIONS BEFORE COMPLETING FORM
I . REPORT NUMBER 2. GOVT A CCESS IO N NO. 3. RECIPIENT'S CATALOG NUMBER
Technical Report HL-85-1
4 . TITLE (and Subtitle) 5 . TYPE OF REPORT & PERIOD COVERED
GENERAL SPILLWAY INVESTIGATION; Hydraul ic Final report Model Investigation
6 . PERFORMING ORG. REPORT N UMBER
7. AUTHOR(a) 8. CONTRACT OR GRANT NUMB ER(e)
Stephen T. Maynard
9 . PERFORMING ORGANIZATION NAME AND ADDRESS 10. PROGRAM ELEMENT, PROJECT, TASK US Army Engineer Waterways Experiment Station AREA a WORK UNIT NUMBERS
Hydraulics Laboratory Civil Works Investigation PO Box 631' Vicksburg, Mississippi 39180-0631 Work Unit 030200/31177
II. CONTROLLING OFFICE NAME AND ADDRESS 12. REPORT DATE
DEPARTMENT OF THE ARMY March 1985 us Corps of Engineers 13. NUMBER OF PAGES
Washington, DC 20314-1000 63 T4. MONITORING AGENCY NAME a ADDRESS(II dl llaran t from Contr o lllnQ Office) IS. SECURITY CLASS. (of thfa report)
Unclassified IS a . DECL ASS I Fl CATION/ DOWN GRADING
SCHEDULE
16. DISTRIBUTION STATEMENT (of thla Report)
Approved for public release; distribution unlimited.
' 17. DI ST Rl BUTION STATEMENT (of tha abe tract entered In Block 20, II different /rom Report)
18. SUPPLEMENTARY NOTES
Available from National Technical Information Service, 5285 Port Royal Road ,
Springfield, Virginia 22161.
19. KEY WORDS (Con t i nua on revere a aida II nacaaaary and identify by block number)
Spil lway crests (WES) Spillway--design and construction (LC)
20. ABSTRACT (Comlau• an,..,.,_ at'tlla I I n-=-•aty -d /danJ/fy by block number)
A design procedure for spillway crests has been developed that is appli-
cable to a wide range of approach depths, upstream slopes, and heads on t he
crest. This report presents the results of systematic model tests of spill-
way crests designed US1ng the procedure and cover1ng a wide range of design
conditions. Discharge coefficients, c rest pressures, and water-surface pro-
files were determined both with and without piers on the crest.
DD FOR .. I JAN 7l 1473 EDfTION OF ' NOV 65 IS OBSOLETE Unclassified
SECURITY CLASSIF ICATION O F THIS PA GE ( lf?tan D ata Entered)

PREFACE
The study described herein was performed at the U. S. Army Engineer
Waterways Experiment Station (WES), during the period 1977 to 1982, for the
Office, Chief of Engineers, U. S. Army, as part of the Civil Works Research
and Development program. Funds utilized were allotted under Civil Works In
vestigation, Work Unit 030200/31177, "General Spillway Tests." The study was
accomplished under the direction of Messrs. H. B. Simmons, Chief of the Hy
draulics Laboratory, J. L. Grace, Jr . , Chief of the Hydraulic Structures Divi
sion, and N. R. Oswalt, Chief of the Spillways and Channels Branch. Mr . T. E.
Murphy (retired) provided guidance throughout the course of the study. This
report was prepared by Mr. S. T. Maynord.
Commanders and Directors of WES during the period of this study and
the preparation and publication of this report were COL G. H. Hilt, CE,
COL John L. Cannon, CE, COL Nelson P . Conover, CE, COL Tilford C. Creel, CE,
and COL Robert C. Lee, CE. Technical Director was Mr. F. R. Brown.
1

CONTENTS
PREFACE . . . . . . • • • • • • • • • • • • • • • • • • • • • • • • •
CONVERSION FACTORS, US CUSTOMARY TO METRIC (SI) UNITS OF MEASUREMENr . . . . . . . . . . . . . . . . . • • . . • • • •
PART I: . . • • • • • • • • • • • • •
PART II:
INTRODUCTION . . . .
PERTINENT LITERATURE . . . • • • • • • • •
PART III: MODEL APPURTENANCES AND TEST PROCEDURES
PART IV: TEST RESULTS . . . . . . . . . . . . . . Discharge Characteristics - Uncontrolled Crest Crest Pressures - Uncontrolled Crest . . . . Water-Surface Profiles - Uncontrolled Crest .
• • • • • • • •
• • • • • • • • • •
• • • • • • • •
• • • • • • • • •
• • • • • • • • • •
Pier Contraction Coefficients . . . . • • • • • • • • • • • • • •
Crest Pressures - Controlled Crest . . . . . . . • • • • • • • •
Water-Surface Profiles - Controlled Crest . . • • • • • • • • • •
PART V:
REFERENCES
TABLES 1-8
PLATES 1-24
DISCUSSION OF RESULTS • • •
. . . . . . . . . . . . . .
2
• • • • • • • • • • • • • •
• • • • • • • • • • • • • •
Page
1
3
4
12
22
23
23 25 26 26 27 27
28
30
CONVERSION FACTORS, US CUSTOMARY TO METRIC (SI) UNITS OF MEASUREMENT
US customary units of measurement used in this report can be converted to
metric (SI) units as follows:
Multiply
cubic feet per second
feet
inches
By
0.02831685
0.3048
25.4
3
To Obtain
cubic metres per second
metres
millimetres

GENERAL SPILLWAY INV~STIGATION
Hydraulic Model Investigation
PART I: INTRODUCTION
1. Considerable work has been don~ to determine the shape of the crest
of an overflow spillway and different methods are available that depend on the
relative height and upstream face slope of the spillway. With few exceptions,
these methods are derived from the extensive data taken by the U. S. Bureau of
Reclamation (USBR) (USBR 1948) defining the profile of the lower nappe of flow
over a sharp-crested weir for a wide range of relative heights and upstream
face slopes. The design methods presented by the U. S. Army Engineer Water
ways Experiment Station (WES) (USACE 1952) and the USBR (1974) are probably
the most widely used methods in this country.
2. The Corps of Engineers design guidance for shaping the crest of
spillways having a vertical upstream face and negligible velocity of approach
is shown in Figures la and lb. In Figure la, the small radius R = 0.04Hd
that connects the curved portion of the crest to the upstream face was added
to eliminate the surface discontinuity. This resulted in improved pressure
conditions and discharge coefficients at heads exceeding the design head. In
Figure lb, an alternate method for shaping the upstream quadrant of crests
having vertical upstream faces and negligible velocity of approach is found in
Engineer Manual 1110-2-1603 (OCE 1965). Corps design guidance for shaping the
crests of spillways having sloping upstream faces and negligible velocity of
approach is shown in Figures 2a, 2b, and 2c for sloping faces of 3V on 1H, 3V
on 2H, and 3V on 3H, respectively. Note that the crest designs shown in Fig
ure 2 have a discontinuity at the upstream face. Corps of Engineers guidance
for shaping the crest of spillways having appreciable velocity of approach and
a 3V-on-3H upstream face is given in Figure 3. No guidance is presented for
other upstream face slopes where the velocity of approach is appreciable.
3. The USBR criteria (1974) for shaping the crests of spillways is
shown in Figure 4. These crests have a surface discontinuity at the intersec
tion of the curved portion of the crest and the upstream face of the crest.
4. A design procedure for shaping spillway crests was needed that elimi
nated the surface discontinuity at the upstream face and was applicable to a
4


wide range of approach velocities and upstream face slopes. Crests with this
surface discontinuity experience low pressures just downstream of the discon-.
tinuity (Abecasis 1961). Murphy (1973) proposed a design procedure using an
elliptical upstream quadrant that is tangent to the upstream face and appli-•
cable to any approach velocity or upstream face slope. The axes of the el
lipse were varied with approach velocity to obtain the best fit of the USBR
data defining the lower nappe of flow over a sharp-crested weir. Plots of
ellipse axes versus approach depths, all as ratios of design head, are shown
in Figure 5. If a sloping upstream face of the spillway is desirable then an
ellipse the same as that for a vertical face is used, and the sloping face 1s
attached tangent to the ellipse. For the downstream quadrant, the values n
and k in the Corps of Engineers equation
n n-1 X - kHd y
were determined using the USBR data. It was found that the USBR data for a
vertical plate could be matched closely by maintaining n at a value of 1.85
for all depths of approach and varying k with depth of approach as shown in
Figure 5. The downstream quadrants for spillways with sloped upstream face
are designed using Figure 5 for vertical upstream face. A full development of
this design procedure is found in Murphy (1973).
5. This design procedure has been verified for spillways having a neg
ligible velocity of approach by Melsheimer and Murphy (1970). The objective
of this investigation was to conduct systematic physical model tests to verify
Murphy's procedure for spillways covering a wide range of approach velocities
and upstream face slopes. Future references in this report to approach veloc
ity or approach depth will be discussed in terms of the ratio P/Hd , the ap
proach depth/design head on the crest. This report covers P/Hd values of
0.25 to 2.0. For each value of P/Hd , a range of upstream face slopes was
tested. Discharge coefficients, pressures, and water-surface profiles were
determined both with and without p1ers. Height of crest above the downstream
apron floor was always greater than 2Hd so that free flow conditions were
maintained. Either design head (Hd) or design energy head is used to denote
the head on the crest which determines the shape of the crest and always in
cludes the velocity head in the approach flow.
10


PART II: PERTINENT LITERATURE
6. Excellent history of the development of spillway crest design tech
niques can be found in Borland (1946), USBR (1948), Thorson (1953), and Cassidy
(1964). A bibliography on the hydraulic design of spillways can be found in
American Society of Civil Engineers (ASCE 1963). A literature search as part
of the present investigation was conducted to identify the following:
a. Past work to compare with the design procedure by Murphy (1973) (paragraphs 7 to 14).
b. Past work on scale effects and model-prototype comparisons of spillway performance to aid in selecting the proper model size to be used in this investigation (paragraphs 15 to 25).
7. The most important difference of the crest shape proposed by Murphy
(1973) is the shape of the crest at the intersection of the curved portion of
the crest and the upstream face. Lower nappe profiles over sharp-crested
weirs (Bazin 1890, USBR 1948) show a sharp break in slope at this point. Most
crest shape design procedures reflect this sharp break in slope (Figures 2 and
4). McCormmach (1968) reported that this sharp break in slope might result in
rapid development of the boundary layer, an increase in the amount of a1r en
trainment, and possibly a need for higher sidewalls in some designs. Murphy's
procedure results in the curved portion of the crest being tangent with the
upstream face for any P/Hd or upstream face slope. Rouse and Reid (1935) re
ported that the profile of the lower nappe over a sharp-crested weir is af
fected by surface tension at the weir crest that is not present with flow over
a solid crest. Rouse and Reid (1935) slightly altered the upstream quadrant
profile to obtain atmospheric pressure along the face of the spillway at the
design head. This alteration also resulted in an increase in discharge coef
ficient. Abecasis (1961) conducted tests of various crest shapes to determine
the effect of rounding the intersection of the upstream quadrant and the up
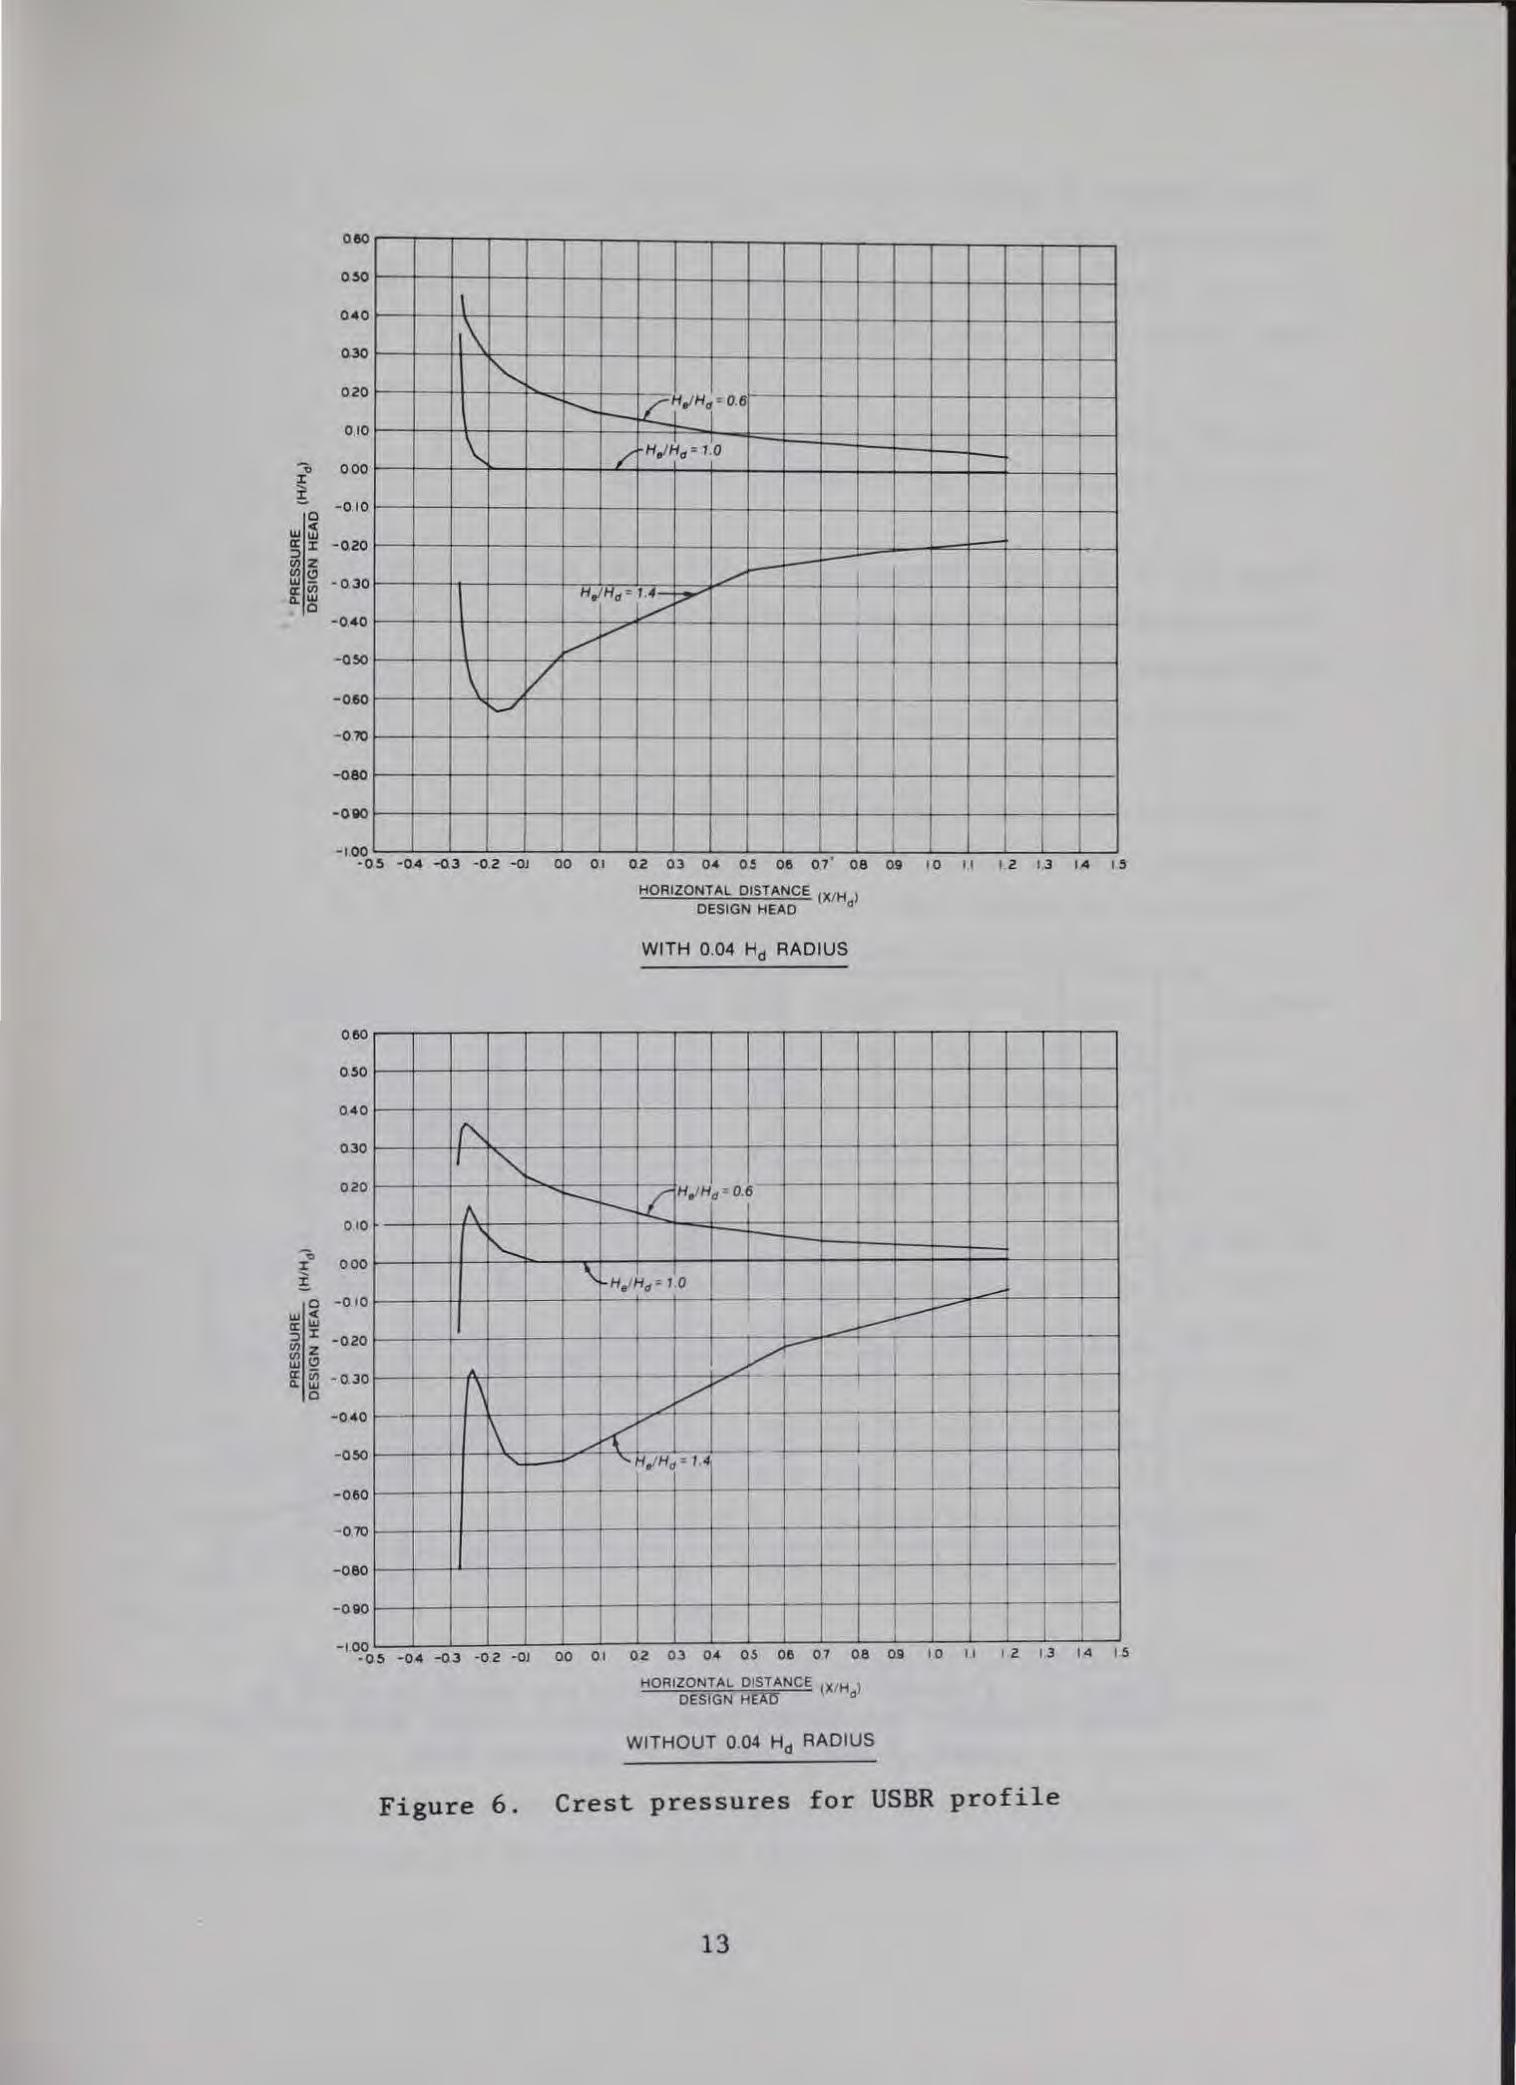
stream face of the spillway. Abecasis' results showed that a 0.04Hd radius
(Figure 1a) should be used at the intersection of the upstream face and up
stream quadrants for both the USBR and WES spillways. This radius eliminated
the area of high negative pressure located just downstream of the intersection
of the upstream face. Pressures for the USBR profile with and without the
0.04Hd radius are shown in Figure 6. Abecasis' work was limited to vertical
face spillways having negligible velocity of approach. Abecasis also con
ducted pressure measurements of various crest shapes including tests in a
12
0&0
0.50
0.40
0.30
\
i\ "-.,_
020
010
~
000 , ~
................... ,..-~./Hi= 0.6 -
\ ..1. .1
/ H0!Hd = 1.0
- -0.10 c w ~ a: ::t -0.20 :::;) en z en ~ w iii -0.30 a: Q. w c
-040
-050
-oeo
./ I H,!Hd = 1.4 ? I v
v v i
\ v i ~
' I I
-010 I I I
-100 ·05 04 -o.J 02 OJ 0.0 01 0.2 0.3 04 05 0& 07 08 0.9 10 II 1.2 I J 1.4 IS
-0.80
-0.110
I I '
T • I I
I I I I
- - - . HORIZONTAL DISTANCE (XIH )
DESIGN HEAD d
WITH 0.04 Hd RADIUS
o.eo
050
0.40
0.30
020
010
" 000 :I: .... !.
c -010 w <(
a: w :::;) :I: -020 en en z w ~ ~ iii -0.30 w
c
1'-
""' ..... " -----L
H,fHd =0 6
' I'- I I \ !
I I -H,!Hd =IO I ' -I , __..------:--- I ~
I
A I \ /;
, I I -040
- 050 \ K1 /
/ -:-'- H,! Hd = 1.4 -
-0.60 ..
- 010
-080
-0.90
-100 ·05 -04 -o3 -0.2 ·OJ 00 01 02 03 04 OS 0.& 07 08 09 10 I I 12 IJ 14 15
HORIZONTAL DISTANCE (X/H ) DESIGN HEAD d
WITHOUT 0.04 Hd RADIUS
Figure 6. Crest pressures for USBR profile
13

vacuum channel to predict incipient cavitalion along Lhe face of a spillway
crest (Figure 7).
8. Dillman (1933) used an ellipse to form the upstream quadrant of a
high (large f/Hd) crest according to the equation
2 X
(0.24K)2
+ 2
y
(0.11K) 2 - 1
where K ~s the index head measured above the sharp-crested weir used to
shape the crest. In terms of Hd (measured above top of crest), Dillman's
equation becomes
2 -:--.L.Y---.-- - 1
(o. 130Hd)2
60
50
40
1-
\ \
1\ CAVITATION ZONE
\ u.. 30 1\.
"" "0
I NO CAVITATION
20
10
ZONE ""-
"' '-""""' ~
-0
1.0 1.1 1.2 1.3 1.4 1.6 1.7 1.8 1.9 2.0
Figure 7. Proposed limit for cavitation based on tests in vacuum channel. Replotted from Abecasis (1961) USBR profile
with 0.04Hd radius at upstream face
14

Murphy's (1973) equation for high spillways (P/Hd > 2.0) 1s
2 X
which is similar to Dillman's equation. Dillman concluded that for the high
spillway, higher discharge coefficients resulted from the vertical upstream
face than with the inclined upstream face.
9. Bradley (1952) gives the effect of irregular spillway crest shapes
for 34 free overfall spillways. Discharge coefficients from the original
model study are compared with the discharge coefficient for the correct spill
way shape. Included are data on Wilson Dam which used an ellipse on the up
stream quadrant of the crest.
10. Thorson (1953) conducted tests of flow over sharp-crested weirs and
found that the flow springs free from the weir face along a curve tangent to
the weir face at the upstream edge of the crest. The radius of curvature is
at first small but steadily 1ncreases with distance from the weir.
11. McNown, Hsu, and Yih (1955) used relaxation techniques to determine
the profile of the lower nappe of flow over a very high sharp-crested weir.
This method results in the lower nappe leaving the weir tangent to the upstream
face of the crest and is the basis for the shape presented in Figure lb.
12. Underdesigning the spillway crest is the procedure of selecting a
design head which is less than the maximum head anticipated. This results in
obtaining the higher discharge coefficients that occur at heads higher than
the design head. The amount to which a c rest may be underdesigned depends on
the magnitude of the negative pressures that occur at heads higher than the
design head. Webster (1959) reported on the use of underdesigned crests in
the Pacific Northwest. Crests were designed for a head equal to 75 percent of
the maximum head and significant savings in the cost of the structure were
realized by reducing the number of gate bays required to pass the maximum
discharge.
13. Cassidy (1964) compared results by means of potential flow theory
with experimental data and found good agreement of water-surface profiles and
pressure. Cassidy also concludes that the close agreement of the pressure
distributions for the potential flow and physical models indicates that the
effects of vis cosity are negligible, and thus the pressure characteris t ics of
15

the spillway ace functions of geometry alone for the size model spillway (Hd
= 0.267 ft*) used in his investigation. Discharge coefficients for the poten
tial flow theory were approximately 1 to 2 percent greater than those measured
experimentally.
14. Cassidy (1970) reported on the benefits of designing a crest for a
given negative pressure rather than some percentage of the maximum head as re
ported by Webster (1959).
15. Model scale effects and model-prototype conformity concerning flow
over we1rs and spillway crests have received considerable study over the years.
The extensive research on flow over sharp-crested weirs by Schoder and Turner
(1929) shows that heads classified as extremely low (<0.2 ft) deviate signifi
cantly from the predictive equations.
16. Nagler and Davis (1930) reported on a model-prototype comparison of
a 1:11-scale model and Keokuk Dam. Model heads were greater than 0.4 ft for
all discharges. The effect of surface roughness of the model crest was in
vestigated and found to be negligible. Model and prototype discharges were
within 1 percent. Groat (1930) states "hydraulic friction is of little or no
account in its effects on weir discharge, unless the head is abnormally small
or the kinematic viscosity abnormally large."
17. Eisner (1933) conducted overfall (weir) tests with sharp-crested
we1rs at various scale ratios and found that discharge coefficients determined
at overfall heads of 0.16 ft differed from prototype discharges by up to 7 per
cent. Randolph (1938) found that prototype measurements of discharge resulted
1n values up to 13 percent higher than those measured in the model.
18. Hickox (1944) reported on a model-prototype comparison of Norris
Dam and a 1:72-scale model by the USBR. Results indicated an average model
discharge coefficient of 3.9 percent greater than that observed in the proto-·
type. Stevens and Cochrane (1944) reported on a model-prototype comparison of
Bonneville Dam and 1:5-scale model of a 10-ft-wide section of the prototype
crest. Pressures along the face of the spillway were measured at the same
locations in the model and in the prototype. A vertical control gate is used
at Bonneville Dam and can be positioned either 9 ft upstream or 8 ft down
stream of the center line of the crest. Tests were conducted with the gate at
* A table of factors for converting U. S. customary units of measurements to metric (SI) units is presented on page 3.
16

each location in both the model and the prototype and the results were com
pared. When the gate was in the downstream position, the pressures "checked
fairly well." When the gate was in the upstream position, there was consider
able disagreement between model and prototype pressures.
19. Testing by Soucek (1944) compared a 1:12-scale model with the pro
totype which has heads up to 6.3 ft and concluded that the model discharges
averaged approximately 5 percent less than comparable discharges obtained for
the prototype. Soucek stated that it was by no means certain that the dis
crepancy is chargeable to the model and went on to say that "the discharge in
dicated by a well-designed spillway model, when the model head exceeds 3 or
4 in., is fully as accurate as that obtainable by any field method in current
use." Johnson (1944) reported on a study where models having scales of 1:25,
1:40, and 1:100 were constructed of the Upper Narrows Dam. To investigate the
effects of model roughness, fine sand was attached to the surface of the 1:25-
and 1:40-scale models. Both the 1:25- and the 1:40-scale models predicted the
same discharge relation with or without the roughened surface. The 1:100-scale
model predicted discharge coefficients approximately 4 percent less than the
larger models.
20. The USBR (1948) conducted extensive tests to measure the profile of
the lower nappe of flow over a sharp-crested weir and used heads of greater
than 0.4 ft in all but a few tests to eliminate scale effects that were at
tributed to surface tension effects.
21. Peterka (1954) reported a comparison of 1:21.5-scale model and the
Heart Butte Dam morning glory spillway. Three measurements in the prototype
resulted in differences of 4.6, 1.1, and 1.7 percent between model and proto
type. A fourth reading at a lower discharge was 27.4 percent in error. How
ever, several problems in obtaining an accurate reading of both stage and dis
charge in the prototype were noted for this fourth reading. Ownbey (1949)
reported on three models, constructed at scale ratios of 1:50, 1:100, and
1:200, of the Pickwick Landing Spillway. Discharge coefficients for the three
models were compared and no significant variation with model size was found.
Manning (1951) conducted tests to determine viscous effects on flow over model
weirs and reported that model heads below 0.30 ft are affected by viscous
effects.
22. Guyton (1958) reported excellent agreement of model and prototype
Ch . f J h D These tests were conducted at 1.1 times crest pressures at 1e osep am.
17

Llte desig11 head for bolh gated aud free flows. Lomax (1965) reported that the
1:50-scale model discharges averaged 1.1 percent less than the measured proto
type discharges for Rock Island Dam. Maxwell and Weggel (1969) reported that
surface tension has little effect on the limiting size of a Froude model.
Other effects such as accuracy of reference data, accuracy of data obtained,
and accuracy of model construction (including roughness) limit the size of
model required before surface tension effects limit model size. The influence
of viscosity may outweigh all of the above but viscosity was not studied in
their investigation.
23. Sarginson (1972) reported that surface tension effects are negli
gible with heads above 0.10 ft for circular-crested weirs. Varshney (1977)
reported on a method for estimating the discharge coefficient of a prototype
spillway from a scale model depending on model Reynolds number and the forma
tion of the boundary layer along the crest. Results by Varshney (1977) showed
the following model discharge coefficients for a prototype having a design
head of 1.63 ft and a design discharge coefficient cd = 3.97 • •
Model Model Model Percent
cd Scale Head Error
1:40 0.041 3.09 22
1:30 0.054 3.25 18
1:20 0.082 3.43 14
1:14 0.109 3.58 10
1:10 0.163 3.73 6
24. Raju and Asawa (1977) reported that viscous and surface tension ef
fects are responsible for errors in sharp-crested we1r measurements at low
heads. At heads greater than 0.36 ft the effects are negligible. At heads of
0.2 ft predicted discharges are 5 percent low.
25. The following information is shown in Figure 8 relative to the ef
fect of model head on discharge coefficient:
a. Results of testing different scale models by Varshney (1977) and Eisner (1933), and a comparison of discharge coefficients for model crest having design heads of 3.0 ft and 0.8 ft that were conducted for this investigation.
b. Model-prototype comparisons conducted by Randolph (1938), Soucek (1944), and Johnson (1944).
c. Unpublished results of Civil Works Investigation 801 (Figure 9). Available prototype data show that the discharge coefficient
18 \

0.7r------..-------.,-------r-.-----..-------r-,----~
• 0.6 i- -
0.5 ~ -• 0 VARSHNEY (1977)
• EISNER (1933)
~ f:. RANDOLPH (1938) u. 0.4 ~ • SOUCEK (1944)
' -c 0 JOHNSON (1944) <( w V THIS INVESTIGATION :I: _, • I CWI 801 (UNPUBLISHED) w •• c
0.3 0 - -:!!
• • 0.2 -v • -
• c <t • v • •• c ••
v D 8~ 0.1 ~ •o -v 0
v 0
0 I I I I I
0 5 10 15 20 25 30
% ERROR IN MODEL DISCHARGE COEFFICIENT
Figure 8. Percent error in model discharge coefficient
19

1.4 r----r---r---r----r--"T""--r----r---r---r---...,.---.----
1 . .2
0 <( DESIGN HEAD w J:
z (.!)
en w 0
0 1-1-en 0.8 w a: (.)
z 0
MODEL Hd = 0.75 FT
0 <( w J: 0.6 u. 0 0 1-<( a: . 'C
J: '0, 0.4 J:
0.2
2.0
FROM MODEL
1-!••--IND/CATED BY / PROTOTYPE
I I
I
2.5 3.0 3.5
COEFFICIENT OF DISCHARGE C = Q LH3/2
e
4.0
Figure 9. Results of unpublished Civil Works Investigation
20
4 .5

for a round-crested weir approaches that for a broad-crested weir (C = 3.087) at heads on the crest approaching zero. This is shown by the dashed line in Figure 9 which is compared with the measured model coefficient by the solid line.
Figure 8 shows considerable scatter in the data but significant errors in
model discharge coefficient can be expected at heads that are too small. For
this investigation, a minimum head of 0.30 ft will be used to minimize model
scale effects .
•
21

PART III: MODEL APPu~TENANCES AND TEST PROCEDURES
26. A 2.5-ft-wide flume (Plate 1) with a horizontal floor and vertical
sides lined with sheet metal was used in the investigation. Baffles were used
at the inlet to distribute flow approaching the crest as uniformly as reason
ably possible.
27 Discharges were measured in 8- by 4- and 20- by 10-in. venturi
meters. These meters were calibrated against a 90-deg V-notch weir, and the
empirical curve for the venturi meters and the measured curve based on the
V-notch agreed to within less than 1 percent for both meters. Water-surface
elevations were measured with a point gage mounted on rails set to grade along
the sides of the flume.
28. The crests used 1n the investigation were constructed of sheet
metal to conform to the shapes required for the design head of 0.80 ft. Sim
ple piezometers were installed along the face of the crest to measure the
average pressures acting on the crest. A typical crest with piezometers is
shown in Plate 2.
29. Tests were conducted at discharges which resulted in values of
He/Hd from about 0.4 to 1.5. Each test began with determination of the dis
charge coefficient C . Next, pressures along the face of the crest and
water-surface profiles were measured. Then piers were attached to the crests
and the pier contraction coefficients were determined. Finally, pressures and
water-surface profiles were measured at the center line of the bay and along
the piers.
22

PART IV: TEST RESULTS
Discharge Characteristics - Uncontrolled Crest
30. The spillway crests tested to determine discharge coefficients are
shown 1n Table 1. An uncontrolled crest refers to a crest that does not have
p1ers or gates that will affect or control flow. The following two alterna
tives were considered for analyzing the spillway data taken in this
investigation:
a. Determine discharge coefficient C to fit the standard weir equation
where Q -c -L -
H -e
discharge
Q - CLH1.5 e
discharge coefficient crest length energy head on crest
The discharge coefficient C will vary with approach depth, stream face slope, and relative head on the crest, H /Hd . This approach with C usually given as a function ofe H /H is taken in the Hydraulic Design Criteria (USACE 1952) aftd d is used in this investigation.
b. Determine C and A to fit the following weir equation:
up-
This alternative would be an improvement over the first if A and/or C were constant for either approach depth, upstream slope, or relative head on the crest. This alternative was investigated at length and both A and C vary with approach depth and relative head on the crest. Using this method as a general design procedure would be more difficult than the first method since there are two variables (A, C) instead of one (C). Either technique, a or b, will result in the same accuracy in predicting discharge.
31. The Hydraulic Design Charts (HDC) utilize the power function
23

where
Q - discharge at
Qd - discharge at
H e
design energy head
H - energy head on crest e
Hd - design energy head on crest
to determine discharge over the crest at heads other than the design head on
the crest. Use of this method was considered for the present investigation
but the power (1.6 in HDC) was found to vary with P/Hd . This method was
compared with data given in the HDC for both high and low spillway crests
(Plate 3), and the power function does not reproduce the C versus He/Hd
curves and will not be used in this investigation. Borland (1946) showed
that a power function relating C/Cd and He/Hd resulted in C - 0 at
He/Hd = 0 . At He/Hd = 0 , C should be 3.08 or slightly less due to fric
tion effects.
32. Model discharge, static head, and computed energy head are shown in
Tables 2-5 for P/Hd of 0.25, 0.50, 1.0, and 2.0, respectively. Static head
measurements for the P/Hd = 0.25 crests were difficult at heads greater than
0.8 ft because of significant turbulence in the approach flow. The energy
correction factor a was assumed equal to 1.0 for all computations. The re
lationship of discharge coefficients as a function of the relative head on the
crest, He/Hd , is shown in Plates 4-7 for P/Hd of 0.25, 0.50, 1.0, and 2.0,
respectively. Murphy's procedure (Figure 5) was used for the crest shapes
(see example in Plate 2).
33. The curves of Plates 4-7 were used to develop the suggested design
curves shown in Plates 8 and 9 for upstream face slopes of vertical and
lV on 1H, respectively. Because of the possible scale effects mentioned
earlier, discharge coefficients were not available at He/Hd < 0.4 . Proto-.
type experience has shown that spillway crests at very low heads exhibit the
same discharge characteristics as a broad-crested weir. This indicates that
the discharge coefficient at He/Hd = 0 should be 3.08 and this value was
used in Plates 8 and 9. The curve for He/Hd = 0.2 was developed by interpo
lating between model discharge coefficient data at He/Hd = 0.4 and the pro
totype C = 3.08 at He/Hd = 0 .
24

Crest Pressures - Uncontrolled Crest
34. Pressures along the face of the uncontrolled crests were measured
for the following crests and are shown in the plates indicated:
•
0.25
0.25
0.50
0.50
1.00
1.00
Upstream Face Slope
Vertical
1V on 1H
Vertical
1V on lH
Vertical
1V on 1H
Plate No.
10
10
11
11
12
12
In Plate 13, crest pressures from Melsheimer and Murphy (1970) are shown for a
crest with P/Hd of 3.4.
35. These pressures indicate variations, some of which are caused by
the method of constructing the model crests. As pointed out in PART III, the
crests were constructed of sheet metal. Plastic crests were used by Melsheimer
and Murphy (1970) in their tests and were considered the best method of repro
ducing the true shape of the crest. The chance for an imperfect shape existed
even with the machined plastic crests because a machine buffing of the plastic
crests formed by a planer was necessary to smooth out the individual cuts and
steps used to approximate the true crest shape. Considering the number of
crests needed and used in this investigation, the use of machined plastic
crests would have resulted in costs above available funds. Sheet-metal crests
are much less difficult to construct and give a good representation of the
crest shape. The only problem is that the sheet metal may not bend 1n a true
arc but in a series of small cords which can lead to local variation of the
pressures measured on the crest. This problem may have a positive aspect in
that prototype construction methods may not result in relative tolerances any
better than the sheet-metal crests used in the model.
and
36.
1.0
At P/Hd = 0.25 , pressures were only measured for He/Hd = 0.50
because using an underdesigned crest for this low P/Hd crest does
not result in increased discharge coefficients above He/Hd = 1.0 .
37. From pressures for P/Hd of 0.50 to 3.4 the maximum negative pres-
sure for each value of He/Hd does not vary with P/Hd . The maximum
25

negative pressure as a function of H /H e d
is shown in Plate 14 for values of
P/Hd greater than 0.50. The spillway design head Hd is selected so that
the minimum crest pressure for the maximum expected head H e
is no lower than
-15 to -20 ft of water to ensure cavitation-free operation. Comparison of
Plate 14 and the work of Abecasis (1961) (Figure 7) shows that his recommended
curve corresponds to a minimum crest pressure of -25 ft of water.
Water-Surface Profiles - Uncontrolled Crest
38. Water-surface profile data for uncontrolled crests were taken for
crests with P/Hd of 0.25, 0.50, and 1.0 and are shown in Plate 15. Water
surface profile data for high crests can be found in Hydraulic Design Criteria
(USACE 1952). Different upstream face slopes
.i 0.5' 0.214' L---+-...L.-....
T FLOW
0.5'
PLAN VIEW
PIER
1.44'
ELEVATION VIEW
Figure 10. Crest p1er details
had little effect on water-surface elevations
for use in designing walls, determining clear-
ances, etc.
Pier Contraction Coefficients
39. Pier contraction coefficients K p
were determined for P/Hd of 0.25, 0.50, and
1.0. Two piers were placed on the 2.5-ft-wide
crests and located as shown in Figure 10. The
pier nose used for all crests was the type 3
shown in HDC 111-5. The pier nose was located
in the same plane as the upstream face for the
vertical spillway. For the 1V-on-1H upstream
slope, the pier nose location was determined
by maintaining the same distance from pier
nose to crest axis as used in the vertical
upstream-faced crest. Basic data for upstream
face slopes of vertical and 1V on 1H and P/Hd
of 0.25, 0 . 50, and 1.0 are shown in Tables 6-8.
A plot of Kp as a function of He/Hd
shown in Plate 16.
26
is

Crest Pressures - Controlled Crest
40. A controlled crest is one having p1ers that affect flow over the
crest. The effects of spillway gates were not included in this investigation.
Pressures were measured along the face of the controlled crest for the follow
ing crests and are shown in the plates indicated:
0.25 0.25 0.25 0.25
0.50 0.50 0.50 0.50
1.0 1.0 1.0 1.0
Upstream Face Slope
Vertical Vertical 1V on lH 1V on 1H
Vertical Vertical lV on 1H 1V on 1H
Vertical Vertical 1V on 1H 1V on 1H
Location
Center line of bay Along piers Center line of bay Along piers
Center line of bay Along piers Center line of bay Along piers
Center line of bay Along piers Center line of bay Along piers
Plate
17 17 17 17
18 18 18 18
19 19 19 19
Piezometers along the p1ers were located 0.02 ft from the edge of the pier to
the center line of the hole. Plates 20 and 21 are the plots of crest pres
sures for a P/Hd of 3.4 for center line of gate bay and along piers, re
spectively, taken from Melsheimer and Murphy (1970).
Water-Surface Profiles - Controlled Crest
41. Water-surface profile data for controlled crests were taken from
the following crests:
P/Hd
0.25
0.50
1.0
Plate
22
23
24
Water-surface profile data for high controlled crests can also be found in
Hydraulic Design Criteria (USACE 1952).
27

PART V: DISCUSSION OF RESULTS
42. A search of the literature confirms the accuracy of model tests 1n
predicting prototype performance of spillway crests if the model heads are not
too low. It is likely that the accuracy of the model crest is within the ac
curacy of prototype measuring techniques particularly when comparing discharge
over the crest.
43. Testing of a relatively low crest having a P/Hd = 0.25 resulted
in no significant increase in discharge coefficients above He/Hd = 1 .
44. Discharge coefficients increase with P/Hd for the same crest
shape and upstream face slope. For P/Hd > 0.25 , the flatter upstream slopes
result 1n lower discharge coefficients. The concept of an underdesigned crest
should be utilized for P/Hd > 0.5 since discharge coefficients increase
above He/Hd = 1.0 . Use of the power function presented in Hydraulic Design
Criteria (USACE 1952) for determining discharges at heads other than the de
sign head resulted in poor correlation with measured values. The relationship
of C , He/Hd , P/Hd , and upstream face slope are presented 1n Plates 8 and
9 and result in greater accuracy than the power function.
45. Pressures on the uncontrolled crest are close to atmospheric at
He/Hd = 1.0 which confirms the shape proposed by Murphy (1973). Pressures
become negative at heads greater than the design head at a point on the crest
located just upstream of the crest axis.
46. Pier contraction coefficients should be used with caution because
the angle of flow approaching the spillway has a significant bearing on the
pier coefficients.
47. Negative pressures at the center line of the bay do not become ad
versely negative when underdesigning the crest. Negative pressures along the
piers are similar in magnitude to the uncontrolled crest and must be considered
when underdesigning a controlled crest. One caution is to extend the piers on
the crest far enough downstream beyond the location of low pressure, or aera
tion of the nappe can occur leading to possible separation and flutter. Gate
slots should also be away from the core of low pressure. Aeration of the
nappe occurred in the model when the gate slots were centered on the crest.
48. These test results provide a range of discharge coefficients, pres
sures, and water-surface profiles that allow Murphy's (1973) design procedure
to be used for a wide range of spillway crest designs.
28

REFERENCES
Abecasis, F. M. M. 1961. "Spillways, Some Special Problems," Memorandum No. 175, National Laboratory of Civil Engineering, Lisbon, Portugal.
American Society of Civil Engineers. 1963 (Jul). "Bibliography on the Hydraulic Design of Spillways," Progress Report, Task Force on Hydraulic Des~g~ ~f Spillw~ys, Co~ittee on Hydraulic Structures, Journal, Hydraulics D1v1s1on, Amer1can Soc1ety of Civil Engineers, Vol 89, No. HY4.
Bazin, M. 1890 (Jan). "Recent Experiment on the Flow of Water over Weirs " ' Proceedings, Engineers Club of Philadelphia, Vol VII, No. 5.
Borland, W. M. 1946. "Flow over Rounded Crest Weirs," Hydraulics Laboratory Report No. Hyrl-219, US Bureau of Reclamation, Denver, Colo.
Bradley, J. N. 1952. "Discharge Coefficients for Irregular Overfall Spillways," Engineering Monograph No. 9, US Bureau of Reclamation, Denver, Colo.
Cassidy, J. J. 1964. Spillway Discharge at Other than Design Head, Ph. D. Dissertation, University of Iowa, Iowa City, Iowa.
_____ . 1970 (Mar). "Design Spillway Crests for High-Head Operation," Journal, Hydraulics Division, American Society of Civil Engineers, Vol 96, No. HY3.
Department of the Army, Office, Chief of Engineers. 1965. "Hydraulic Design of Spillways," Engineer Manual 1110-2-1603, Washington, DC.
Dillman, 0. 1933. "Investigation of Flow over Weirs," Translation by H. N. Eaton, 1935, National Bureau of Standards.
Eisner, F. 1933. "Overfall Tests to Various Model Scales," Translation No. 42-9, US Army Engineer Waterways Experiment Station, Vicksburg, Miss.
Groat, B. F. 1930. "Comments on Paper by Nagler and Davis," Transactions, American Society of Civil Engineers, Vol 94.
Guyton, B. 1958 (Feb). "Field Investigations of Spillways and Outlet Journal, Hydraulics Division, American Society of Civil Engineers, Vol No. HY1.
Works " ' 84,
Hickox, G. H. 1944. "Spillway Coefficients, Norris Dam," Transactions, American Society of Civil Engineers, Vol 109.
Johnson, J. W. 1944. "Discussion of Papers on Model-Prototype Conformity," Transactions, American Society of Civil Engineers, Vol 109.
Lomax, C. 1965 (Mar). "Spillway Discharge Coefficients for Rock Island Dam," Journal, Hydraulics Division, American Society of Civil Engineers, Vol 91, No. HY3. Manning, J. 1951. Effect of Viscosity on Discharge Coefficient Ogee Weir, M.S. Thesis, Louisiana State University, Baton Rouge, La .
Maxwell, W. H. C., and Weggel, J. R. 1969 (Mar). "Surface Tension in Froude Models," Journal, Hydraulics Division, American Society of Civil Engineers, Vol 95, No. HY2.
29

McCormrnach, A. L. 1968 (Jul). "Dworshak Dam Spillway and Outlets Hydraulic Design," ~J~o~u~r~n~a~l~,~H~y~d~r~a~u~l~i~c~s~D~i~v_1~·s~i_o~n~, __ Am~e~r~i_c_a_n __ S_o_c __ i_e_tLy __ o_f __ C __ i_v_i_l __ E_n~g~in __ e_e_r_s-L, Vol 95, No. HY4.
McNown , J. S . , Hsu, E., and Yih, C. 1955. "Application of the Relaxation Technique in Fluid Mechanics," Transactions, American Society of Civil Engineers, V~l . 120.
Melsheimer, E., and Murphy, T. of the Upstream Quadrant of the Investigation," Research Report Station, Vicksburg, Miss.
1970 (Jan). "Investigations of Various Shapes Crest of a High Spillway; Hydraulic Laboratory H-70-1, US Army Engineer Waterways Experiment
Murphy, T. E. 1973 (Dec ). "Spillway Crest Design," Miscellaneous Paper H-73- 5, US Army Engineer Waterways Experiment Station, Vicksburg, Miss.
Nagler, F. A., and Davis, A. 1930. "Experiments on Discharge over Spillways and Models, Keokuk Dam," Transactions, American Society of Civil Engineers, Vol 94.
Ownbey, C. R. 1949. A Study of the Effect of Model Size on Spillway Coefficient," M.S. Thesis, University of Tennessee, Knoxville, Tenn.
Peterka, A. J. 1954. Engineering Monograph
"Spillway Tests Confirm Model-Prototype Conformance," No. 16, US Bureau of Reclamation.
Raju, K. G. R., and Asawa, G. L. 1977 (Oct). "Viscosity and Surface Effects on Weir Flow, " Journal, Hydrauli cs Division, American Society Engineers, Vol 103, No. HY10.
Randolph, R. R. 1938. "Hydraulic Tests on the Spillway of the Madden Transactions, American Society of Civil Engineers, Vol 103.
Tension of Civil
Dam " '
Rouse, H., and Reid, L. 1935 (Jan). "Model Research on Spillway Crests," Civil Engineering, Vol 5, No. 1.
Sarginson, E. J. 1972. "The Influence of Surface Tension on Weir Flow," IAHR Journal of Hydraulic Research, Vol 10, No. 4.
Schoder, E. W., and Turner, B. T. 1929 . "Precise Weir Measurements," Transactions, American Society of Civil Engineers, Vol 93.
Soucek, E. 1944. "Meter Measurement of Discharge, University Transactions, American Society of Civil Engineers, Vol 109.
Dam 11
'
Stevens, J . C., and Cochrane, R. B. 1944. "Pressure Heads on Bonneville Dam," Transactions, American Society of Civil Engineers, Vol 109.
Thorson, D. A. 1953 . Nappe Characteristics for Flow over Sharp-Crested Weirs, M. S. Thesis, Colorado Agricultural and Mechanical College, Fort Collins, Colo.
US Army Corps of Engineers. 1952. "Hydraulic Design Criteria," prepared for Office, Chief of Engineers, by US Army Engineer Waterways Experiment Station, Vicksburg, Miss., issued serially since 1952.
US Bureau of Reclamation . 1948. Boulder Canyon Project; Part VI: Denver, Colo .
"Studies of Crests for Overfall Dams, Hydraulic Investigations," Bulletin 3,
1974. "Design of Small Dams," Washington, DC.
30

Varshney, D. V. Water Power and
1977 (Apr). "Model Scale and the Discharge Coefficient," Dam Construction, Vol 29, No. 4.
Webster, M. J . 1959 (Aug). "Spillway Design for Pacific Northwest Projects," Journal, Hydraulics Division, American Society of Civil Engineers, Vol 85, No. HY8.
31

Table 1
Crests Tested to Determine Discharge Coefficients
Upstream Crest
P/Hd Face
Number Slope
1 0.25 Vertical
2 0.25 3V on 2H •
3 0.25 1V on 1H
4 0.25 2V on 3H
5 0.25 1V on 2H
6 0.50 Vertical
7 0.50 4V on 1H
8 0.50 3V on 2H
9 0.50 1V on 1H
10 0.50 2V on 3H
11 1.00 Vertical
12 1.00 4V on 1H
13 1.00 2V on 1H
14 1.00 1V on 1H
15 1.00 2V on 3H
16 2.00 Vertical
17 2.00 1V on lH
-------------------------------~

Table 2
Basic Data, P/Hd = 0.25 , No Piers
Upstream Face Slope Vertical 3V on 2H IV on IH 2V on 3H IV on 2H
Q H H Q H H Q H H Q H H Q H H e e e e e
cfs ft ft cfs ft ft cfs ft ft cfs ft ft cfs ft ft
1.51 0.2927• 0.315 1.49 0.285* 0.308 1.5I 0.288* 0.3I2 I.49 0.286* 0.309 1.60 0.303* 0.328 1. 97 0. 341 ;\- 0.374 2.01 0.337* 0.372 2.01 0.338* 0.373 2.01 0. 339;\- 0.374 2.02 0.34I* 0.376 2.51 0. 385;\- 0.431 2.51 0.381* 0.427 2.50 0.381* 0.427 2.55 0. 386;', 0.433 2.48 0. 3847• 0.429 2.99 0. 419'k 0.477 2.97 0.415;"' 0.473 3.01 0.416* 0.475 2.98 0. 417"'" 0.475 2.98 0. 42P"' 0.478 3.52 0.452* 0.525 3.52 0. 452"k 0.525 3.54 0. 454'"''" 0.527 3.52 0. 458"'"' 0.529 3.52 0. 46P\' 0.532
4.01 0. 484-1• 0.569 3.99 0. 4 79')\- 0.565 3.98 0.479;'' 0.564 4.00 0. 483'i'• 0.568 3.98 0. 485"'' 0.569 4.51 0.517* 0.615 4.54 0. 513;\- 0.614 4.51 0.514;\- 0.613 4.54 0. 519;\- 0.618 4.52 0.517* 0.616 5.04 0.545-1• 0.659 5.06 0.541'i'• 0.657 5.05 0.540* 0.656 5.05 0.546* 0.660 5.07 0.547* 0.662 5.53 0. 57 4'"'' 0.701 5.51 0.573* 0.699 5.54 0. 564'i'• 0.695 5.52 0.585* 0.708 5.51 0.585* 0.708 6.01 0. 600;\- 0. 740 6.01 0.593-1• 0.736 5.97 0.595* 0.735 6.04 0.595* 0.739 6.05 0. 602"" 0.744
6.54 0. 623"'" 0.780 6.50 0. 616*;\- 0.774 6.38 0 . 618;\";\- 0.769 6.46 0. 630*"' 0.781 6.54 0. 622;\'-J; 0.779 7.06 0. 645*;\- 0.819 7.02 0.631'i'd• 0.809 6.97 0. 628;\'-J( 0.804 6.99 0. 650'i'd.- 0.818 7.06 0. 651"'-* 0.822 7.59 0. 683;'(';\- 0.867 7.61 0. 6 7 4-J, ;, 0.863 7.55 0.67P'd.- 0.858 7.61 0. 684;\-i'; 0.868 7.68 0. 688;\-i'.· 0.874 8.13 0.671-ld.- 0.888 8.1I 0. 662-1•* 0.882 7.94 0. 656-1.-;\' 0.870 8. 14 0. 669-ld.- 0.887 8.07 0. 6 71'"''* 0.885 8.65 0.691-1•-k 0.925 8.68 0. 69 7-ki\- 0.930 8.68 0 . 6 9 9;\-;\- 0.931 8.62 0. 705*;\- 0.931 8.68 0. 704'i'd.- 0.933
9.02 0. 715*;': 0.957 9.06 0. 717*-1' 0.960 9.02 0.714-Jd.- 0.956 9.11 0. 722*"''- 0.965 9.13 0. 7 23'\--J.- 0.966 9.48 0. 736*":- 0.991 9.51 0. 738;\-k 0.994 9.57 0.739** 0.997 9.57 0. 7 43-f..-k 0.999 9.46 0. 7 43;"* 0.993 9.98 0. 755-1•* 1.027 10.03 0. 7637d.- 1.033 10.03 0.756** 1.03 9.98 0. 762*'":- 1.030 10.08 0. 7 66;\-7; 1.037
10.55 0. 77}ih'. 1.065 10.58 0. 775--l'* 1.068 10.53 0 . 7 68;';;\- I.062 10.62 0 . 7 7 87:;\- 1.071 10.38 0. 7 7 7;\-;\- 1.058 10.95 0. 764'i'd\ 1.085 11.05 0 . 7 7 2;\-;\- 1.093 10.9I 0. 764;'d.- 1.083 11.00 0 . 7 7 O;'n\- 1.090 11.01 0. 776;h\- 1.093
11.52 0. 800"'ih\- 1.13 11.50 0. 798;'d.- 1.128 11.50 0. 806;'d: 1.131 11.45 0. 800;\-7.- 1.126 11.54 0 . 81 0-,h'> 1.135 12.14 0 . 8 4 9;\-i\- 1.182 I2.02 0. 842*;\- 1.173 11.97 0. 846;''* 1.172 II. 97 0. 844*;\- 1.171 11.97 0. 849*'" 1. I73 12.54 0.881*'"'' 1. 216 12.64 0. 88 7;\--i'\ 1.223 12.43 0 . 8 8 7;',-;'.- 1. 212 I2.51 0.881** 1. 214 I2.47 0. 888'"''* 1. 215 12.99 0.916 .. "* 1.253 12.99 0. 914-l•k 1.252 12.91 0.917** 1.249 13.15 0. 924-f..-·k 1.264 12.98 0. 916'i'd\ 1.253 13.60 0. 944-1•* 1.296 13.60 0 . 9 48;\-;\- 1.297 13.57 0 . 9 42'i'd.- 1. 293 13.64 0. 951-f.."* I.300 13.42 0. 94 7*;\- 1.288
Note: Hd = 0.8 ft. * Measured head on crest excluding velocity head measured 4.0 x Hd upstream of crest.
m\- Represents average of six readings of stage.

Table 3
Basic Data, P/Hd = 0.5 , No Piers
Upstream Face Slope Vertical 4V on 1H 3V on 2H 1V on 1H 2V on 3H
Q H H Q H H Q H H Q H H Q H H e e e e e
cfs ft ft cfs ft ft cfs ft ft cfs ft ft cfs ft ft
1.51 0.300* 0.312 1.51 0.297* 0.309 1.51 0. 300'1( 0.312 1.51 0.301* 0.313 1.51 0.301* 0.313 2.01 0.354* 0.372 2.01 0.350* 0.368 2.01 0. 353';\- 0.371 2.01 0.355* 0.373 2.01 0.356* 0.374 2.50 0.401* 0.425 2.50 0.397* 0.421 2.50 0. 400'1" 0.424 2.50 0.403* 0.427 2.50 0.403* 0.427 2.98 0.438* 0.469 2.98 0. 44 7';" 0.478 2.98 0 . 43 7';"' 0.469 2.98 0.434* 0.466 2.98 0.441* 0.472 3.52 0.484* 0.523 3.52 0.474* 0.514 3.52 0.482* 0.522 3.52 0.474* 0.514 3.52 0.479* 0.519
3.98 0.518* 0.565 4.02 0.512* 0.560 3.98 0.521''-- 0.567 3.98 0.521* 0.567 3.98 0. 522;'\ 0.568 4.54 0.560* 0.616 4.50 0.547* 0.603 4.50 0.556* 0.611 4.50 0.559* 0.614 4.50 0.556* 0.611 5.03 0.589* 0.653 5.03 0 . 5 86';"' 0.651 5.03 0.587';" 0.652 5.03 0.591* 0.655 5.03 0.593* 0.657 5.52 0.618* 0.691 5.54 0.616';"' 0.690 5.52 0. 617';'\ 0.690 5.52 0.625* 0.697 5.52 0.633* 0.704 6.01 0.639* 0.722 6.04 0.634* 0.719 6.01 0. 639''-- 0.722 6.01 0.646* 0.728 6.01 0. 65 li'- 0.732
6.54 0 . 666*';"' 0.760 6.54 0. 669*'1• 0.762 6.54 0. 6 78-k'i"' 0.770 6.54 0.671-lc-k 0.764 6. 54 0. 678*'k 0.770 6.99 0. 698i"'* 0.799 6.91 0. 696*';"' 0.795 7.13 0 . 7 0 0 -;\--i\· 0.805 6.99 0. 698'~'"* 0.799 6.99 0. 705-;h'\ 0.805 7.55 0. 7 23.,."* 0.835 7.48 0 . 7 2 1 ..,__,._, 0.832 7.55 0. 730-;'rn 0.841 7.55 0 . 7 33'~'""'' 0.843 7.55 0 . 7 40-;\-;\- 0.849 8.07 0. 753*'k 0.875 8.07 0. 751';"'* 0.873 8.07 0.757** 0.878 8.07 0. 759-;'rn 0.880 8.07 0. 778-!..-k 0.895 8.56 0 . 7 7 2*'~'" 0.905 8.68 0. 7781c-k 0.913 8.56 0.775** 0.907 8.56 0.787** 0.916 8.56 0. 79S*'k 0.923
9.02 0.796** 0.937 9.02 0.799** 0.940 9.02 0 . 7 9 8'i'n'-- 0.939 9.02 0. 8071--* 0.946 9.02 0. 813"'d" 0.951 9.46 0 . 813-1;;\- 0.964 9.46 0. 816*1' 0.967 9.46 0. 814*'~'• 0.965 9.46 0. 820*";" 0.970 9.46 0.831-ld\ 0.978 9.98 0.842** 1.003 9.98 0.841** 1.002 9.98 0. 836*";\- 0.998 9.98 0. 852.,'-"* 1.01 9.98 0.857-!.."* 1.014
10.58 0.859-!.."* 1.035 10.43 0. 854'~''* 1.026 10.48 0.862** 1.034 10.48 0.866** 1.036 10.58 0 . 8 7 4 .!,..-.,._, 1.046 10.91 0. 880*'k 1.061 10.96 0.877-!n'\ 1.060 10.95 o. 869m" 1.054 10.95 0. 896-!..-k 1.074 10.95 0. 895*',._. 1.073
11.50 0. 902-fc-k 1.096 11.46 0.898** 1.092 11.50 0. 905";\+. 1.098 11.50 0. 910*'k 1.102 11.50 0. 918-!..-k 1.107 12.02 0. 909-l'* 1.119 11.97 0. 901";'\-1( 1.112 12.02 0 . 913'~''7" 1.121 12.02 0.921"''* 1.127 12.02 0. 929m\- 1.132 12.60 0. 932*i" 1.155 12.51 0. 926*";" 1.147 12.51 0. 926~k 1.147 12.51 0.941** 1.157 12.51 0. 939'1d\ 1.156 13.07 0. 952-k-k 1.184 12.99 0. 954";\-k 1.183 12.99 0.953** 1.182 12.99 0.954** 1.183 12.99 0.955** 1.184 13.53 0. 9587..~ 1.205 13.53 0. 970-1\-l( 1.213 13.53 0. 97 4--"* 1.215 13.53 0. 982~k 1.220 13.53 0. 992-k-k 1.227
Note: Hd = 0.8 ft. -·- head 1\ Measured on crest excluding velocity head measured 4.0 X Hd upstream of crest.
* ,', Represents average of six readings of stage.

Table 4
Basic Data, P/Hd = 1.0 , No Piers
UEstream Face SloEe Vertical 4V on 1H 2V on 1H 1V on 1H 2V on 3H
Q H H Q H H Q H H Q H H Q H H e e e e e cfs ft ft cfs ft ft cfs ft ft cfs ft ft cfs ft . ft
1.50 0.307* 0.312 1.51 0.305* 0.310 1.51 0.305* 0.310 1.51 0.307* 0.312 1.51 0.308* 0.313 2.01 0.366* 0.373 2.01 0.367* 0.374 2.01 0.362* 0.369 2.02 0.366* 0.373 2.01 0.365* 0.372 2.50 0.414* 0.425 2.50 0.414* 0.425 2.50 0. 412'i'<' 0.423 2.50 0.415* 0.426 2.50 0.416* 0.427 2.99 0.457* 0.471 3.03 0. 461'i'<' 0.475 2.98 0. 44 7'i'<' 0.461 2.98 0.459* 0.473 2.99 0.460* 0.474 3.51 0.50P'" 0.519 3.52 0.506* 0.524 3.52 0 .500* 0.518 3.54 0. 509;'( 0.527 3.54 0.511* 0.529
3.99 0.54P'" 0.563 3.98 0.5407'( 0.562 4.00 0.538* 0.560 3.98 0.545* 0.567 3.98 0.545* 0.567 4.50 0.579* 0.605 4.52 0.579* 0.606 5.50 0.575* 0.602 4.49 0.585* 0.611 4.50 0.585* 0.611 5.05 0. 6191.- 0.651 5.05 0.618* 0.650 5.03 0.612* 0.644 5.07 0.626* 0.657 5.06 0.625* 0.656 5.53 0. 6531" 0.689 5.52 0.648* 0.684 5.49 0 .. 6467'( 0.682 5.53 0.657* 0.693 5.52 0.659* 0.695 6.03 0.686* 0.727 6.01 0.683* 0.724 5.98 0.678* 0.719 6.02 0.691* 0.732 6.01 0.691* 0.731
6.54 0.716m'<' 0.762 6.54 0 . 719'i'<* 0.765 6.54 0.716** 0.762 6.61 0. 724~~ 0.771 6.69 0. 728-k'-k 0.776 6.99 0. 746m'<' 0.797 6.99 0.746** 0.797 7.06 0.752** 0.803 7.06 0. 754-k--k 0.805 6.99 0. 7 4 7'i'"* 0.798 7.68 0.785** 0.843 7.55 0. 772'i''* 0.829 7.55 0.773** 0.830 7.61 0. 7867"* 0.843 7.55 0.781** 0.838 8.09 0. 810*"'" 0.873 8.07 0.803** 0.866 8.07 0. 801-k--k 0.864 7.94 0 . 80 7'i'<* 0.868 8.13 0.808** 0.872 8.56 0. 8351<* 0.903 8.56 0.830** 0.899 8.56 0.828** 0.897 8.62 0.841** 0.910 8.56 0.837** 0.905
9.02 0.858** 0.932 9.02 0.860** 0.933 8.91 0.858** 0.930 9.02 0.861** 0.934 8.96 0.864** 0.936 9.46 0.882** 0.961 9.46 0.881** 0.960 9.51 0.877** 0.957 9.46 0.886** 0.964 9.46 0.890'i'-""* 0.968 9.98 0.907** 0.992 10.01 0.906** 0.992 9.98 0. 904-1<* 0.989 10.08 0.917** 1.003 9.98 0.914** 0.998
10.50 0.933** 1.024 10.48 0.927** 1.019 10.48 0. 929'i'<* 1.020 10.53 0 . 9 3 7'i'-""* 1.028 10.48 0.940** 1.03 10.91 0.954** 1.050 10.95 0. 9507"* 1.047 11.00 0.958** 1.055 11.00 0. 963-k'i'( 1.060 10.95 0.960** 1.056
11.59 0. 980'i'<* 1.085 11.50 0.980** 1.084 11.50 0.974** 1.079 11.54 0.990** 1.093 11.50 0.993** 1.095 12.02 1. 002'i'<* 1.113 12.02 0.999** 1.110 12.06 1.003** 1.114 12.06 1. 010** 1.120 12.02 1.013** 1.122 12.47 1.025** 1.141 12.51 1.022** 1.139 12.43 1.023** 1.139 12.56 1.033** 1.150 12.51 1.033** 1.149 12.99 1.042** 1.166 12.99 1.039** 1.163 12.91 1. 041*"'" 1.163 13.07 1.056** 1.179 13.03 1.053** 1.176 13.53 1.068** 1.199 13.53 1.064** 1.195 13.45 1. 058-k'i'.- 1.188 13.60 1.079** 1.209 13.53 1.082** 1.211
Note: Hd = 0.8 ft. * Measured head on crest excluding velocity head measured 4.0 x Hd upstream of crest.
** Represents average of six readings of stage.

Table 5
Basic Data, P/Hd = 2.0 , No Piers
UEstream Face Slope Vertical IV on lH
Q H H Q H H
e e cfs ft ft cfs ft ft
1.52 0.316* 0.318 1.49 0.311i• 0.313 2.00 0.372* 0.375 2.01 0.373* 0.376 2.50 0.424* 0.428 2.49 0.424* 0.428 2.98 0.466* 0.471 3.00 0.473* 0.478 3.52 0.517* 0.524 3.54 0.519* 0.526
3.96 0.554* 0.562 3.98 0. S64i• 0.572 4.47 0.592-;\' 0.602 4.50 0. 602-;\' 0.612 5.03 0.635* 0.648 5.00 0. 6331• 0.645 5.53 0.669* 0.684 5.51 0.672* 0.687 6.00 0.707* 0.724 5.98 0.710* 0.727
6.54 0. 7 391d' 0.758 6.66 0 . 7 5 2-;'rl, 0.772 6.99 0. 770*'k 0.792 6.97 0 . 7 7 2'#1• 0.793 7.61 0.809** 0.834 7.41 0. 797~'-- 0.821 8.07 0. 832 ... '--* 0.859 8.04 0 . 8 3 8 -;\'*";'( 0.865 8.68 0 . 8681n\' 0.899 8.60 0. 8761'* 0.906
9.02 0. 895-1'* 0.928 9.02 0. 897~'-- 0.929 9.44 0. 913 ... '--* 0.948 9.49 0. 9 24 ... '--•" 0.959 9.88 0. 946-ld• 0.983 9.98 0. 955* ... " 0.993
10.42 0. 968*t'- 1.009 10.53 0 . 9 8 6 -;', ...... 1.027 10.86 0 . 9 9 0* ... " 1.034 10.91 1. 0071~k 1.051
11.62 1. 030-l~k 1.079 11.54 1 . 041 1n\- 1.088 11.85 1. 046~k 1.096 11.97 1.064** 1.114 12.43 1. 072*-;', 1.126 12.47 1. 075";'\1( 1.129 13.07 1. 106-ln\' 1.164 12.95 1. 1 og ... ._...._ 1.166 13.58 1. 127*t\- 1.189 13.49 1. 13 5 'i\-1.- 1.196
Note: Hd = 0.8 ft. * Measured head on crest excluding velocity head measured 4.0 X Hd up
stream of crest. 1n\' Represents average of six readings of stage.
•

Table 6
Basic Data, P/Hd = 0.25 , with Piers
Upstream Face SloEe Vertical 1V on 1H
Q H H H e Q H e cfs ft ft cfs ft ft
1.51 0.333 0.353 1.52 0.330 0.350 2.01 0.392 0.421 2.02 0.392 0.421 2.50 0.443 0.481 2.52 0.444 0.482 2.98 0.488 0.535 2.98 0.483 0.530 3.52 0.533 0.590 3.52 0.526 0.584
3.98 0.564 0.632 3.98 0.559 0.627 4.50 0.599 0.678 4.50 0.598 0.677 5.03 0.632 0.723 5.03 0.634 0.724 5.52 0.664 0.766 5.52 0.662 0.764 6.01 0.689 0.803 6.01 0.682 0.798
6.54 0.717 0.844 6.54 0.715 0.842 6.99 0.739 0.877 6.99 0.741 0.878 7 . 55 0.759 0.913 7.55 0.758 0.913 8.07 0.789 0.955 8.07 0.789 0.955 8.56 0.813 0.991 8.56 0.800 0.982
9.02 0.837 1.025 9.02 0.833 1.023 9.46 0.842 1.047 9.46 0.847 1.050 9.98 0.850 1.075 9.98 0.853 1.076
10.48 0.886 1.118 10.48 0.871 1.109 10.96 0.902 1.148 10.95 0.904 1.149
11.50 0.917 1.181 11.50 0.927 1.186 12.10 0.945 1.223 12.02 0.946 1.220
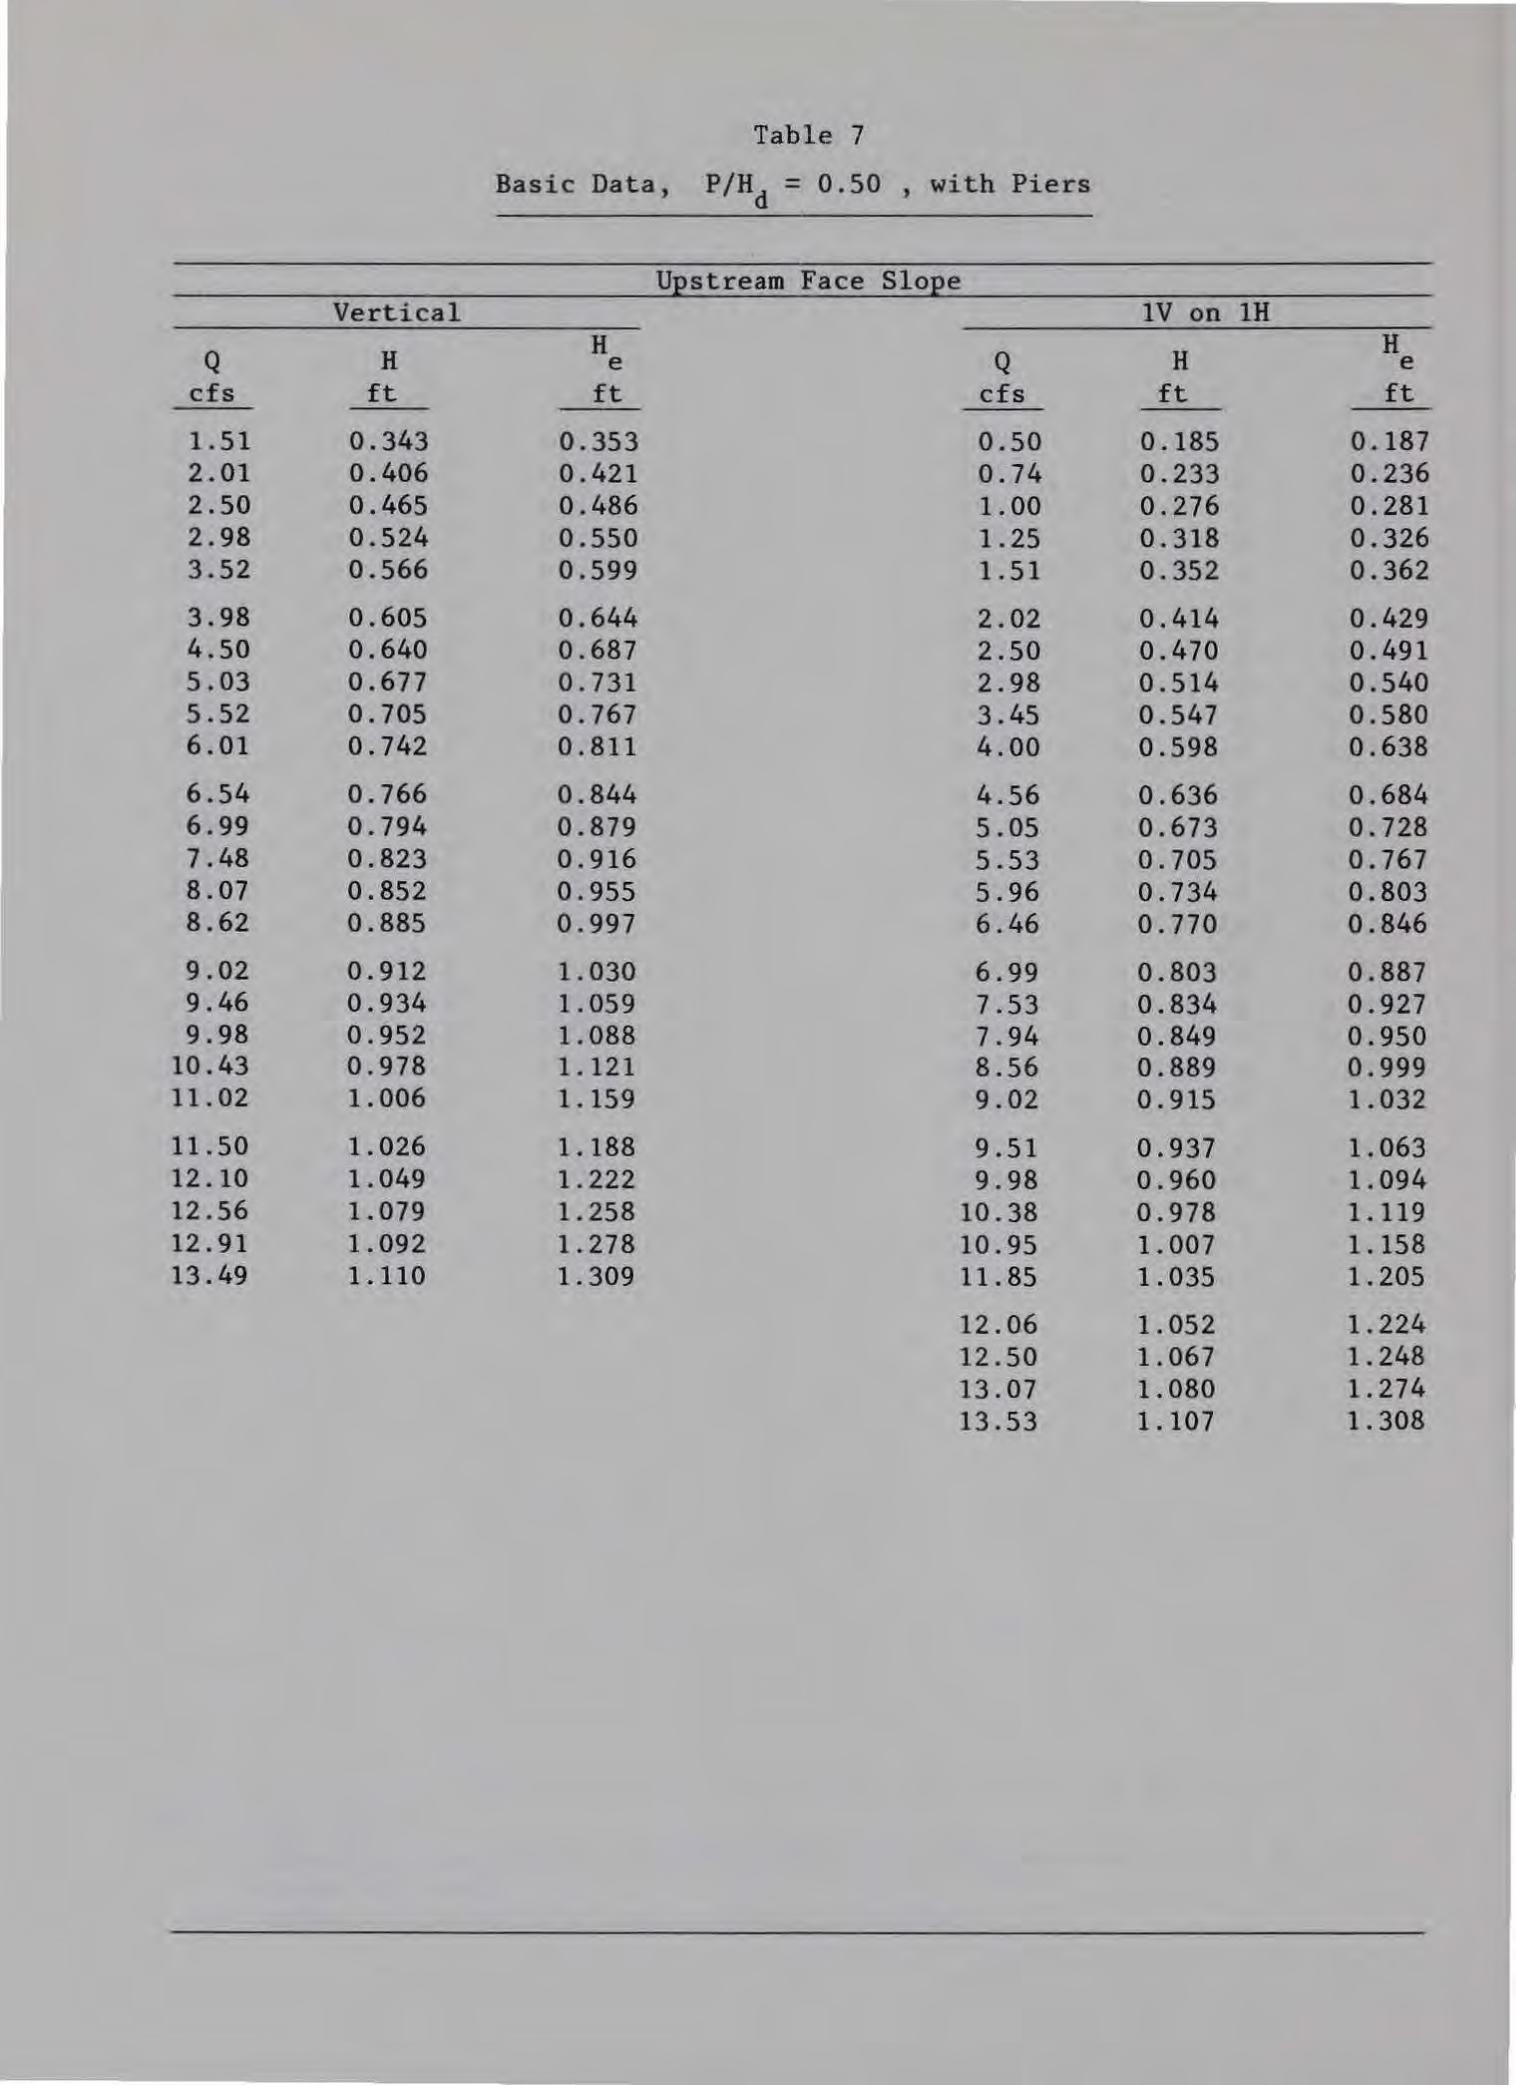
Table 7
Basic Data, P/Hd = 0.50 , with Piers
UEstream Face SloEe Vertical IV on lH
Q H H Q H H e e
cfs ft ft cfs ft ft
1.51 0.343 0.353 0.50 0.185 0.187 2.01 0.406 0.421 0.74 0.233 0.236 2.50 0.465 0.486 1.00 0.276 0.281 2.98 0.524 0.550 1.25 0.318 0.326 3.52 0.566 0.599 1.51 0.352 0.362
3.98 0.605 0.644 2.02 0.414 0.429 4.50 0.640 0.687 2.50 0.470 0.491 5.03 0.677 0.731 2.98 0.514 0.540 5.52 0.705 0.767 3.45 0.547 0.580 6.01 0.742 0.811 4.00 0.598 0.638
6.54 0.766 0.844 4.56 0.636 0.684 6.99 0.794 0.879 5.05 0.673 0.728 7.48 0.823 0.916 5.53 0.705 0.767 8.07 0.852 0.955 5.96 0.734 0.803 8.62 0.885 0.997 6.46 0.770 0.846
9.02 0.912 1.030 6 . 99 0.803 0.887 9.46 0.934 1.059 7.53 0.834 0.927 9.98 0.952 1.088 7.94 0.849 0.950
10.43 0.978 1.121 8.56 0.889 0.999 11.02 1.006 1.159 9.02 0.915 1.032
11.50 1.026 1.188 9.51 0.937 1.063 12. 10 1.049 1.222 9.98 0.960 1.094 12.56 1.079 1.258 10.38 0.978 1.119 12.91 1.092 1.278 10.95 1.007 1.158 13.49 1.110 1.309 11.85 1.035 1.205
12.06 1.052 1.224 12.50 1.067 1.248 13.07 1.080 1.274 13.53 1.107 1.308

Table 8
Basic Data, P/Hd = 1.0 , with Piers
UEstream Face SloEe Vertical 1V on 1H
Q H H H e Q H e cfs ft ft cfs ft ft
1.49 0.340 0.344 1.52 0.350 0.354 2.03 0.414 0.421 2.02 0.418 0.425 2 . 51 0.468 0.478 2.52 0.474 0.484 3.03 0.521 0.534 2.98 0.521 0.534 3.54 0.560 0.577 3.52 0.574 0.590
3.98 0.611 0.631 3.98 0.613 0.633 4.51 0.652 0.676 4.50 0.661 0.685 5.03 0.693 0.721 5.03 0.702 0.730 5.46 0.730 0.762 5.52 0.738 0 . 770 6.00 0.767 0.803 6.01 0.772 0.808
6.38 0.793 0.833 6.54 0.811 0.852 6 . 99 0.837 0.882 6.99 0.845 0 . 890 7.27 0.862 0.910 7.55 0.881 0.931 7.94 0.882 0.937 8.07 0.909 0.964 8.91 0.954 1.018 8.56 0.938 0.998
9.24 0.973 1.041 9.02 0.971 1.036 9.57 0.994 1.065 9.46 0.994 1.063 9.98 1.007 1.083 9.98 1.024 1.098
10.48 1.041 1.122 10.48 1.054 1.133
10.95 1.068 1.153 10.95 1.078 1.163
11.41 1.086 1.177 11.50 1.108 1.198
11.97 1.117 1.214 12.02 1.124 1.221
12.43 1.132 1.235 12.51 1.162 1.263
12.99 1.152 1.262 12.99 1.181 1.288
13.53 1.174 1. 291 13.53 1. 211 1.324

"'0 r )> ..... m -
t z 0 i= < > w ..J w
8r
4 -HORSEHAIR BAFFLE i
QINFLOW~ -o~
INFLOW
8 r -
I
~HORSEHAIR I BAFFLE
4 1-
~~ t 0
I I 1 l
0 4 8 12
1·
i i I I SPILLWAY I I CREST I I I 1 ~ I I I I I I I I I I I
l _L _j
16 20 24
V-NOTCH WEIR I
: LSPILLWAY I TAILBAY
I CREST I I RETURN
FLOW I LINE _ l
PLAN VIEW
OVER AND /"HORSEHAIR ,rV-NOTCH WEIR UNDER BAFFLE-....., BAFFLE
'""' I FLOW ..
1/ I I
l ELEVATION VIEW
RETURN LINE--.
_L _l 1 1 I I 1 I I 1 I I
28 32 36 40 44 48 52 56 60 64 68 70 DISTANCE, FT
GENERAL SPILLWAY MODEL LAYOUT

~~-------------------------------------------------------------------------------------------------------------, r )> -i m t-V
0 1.0 0 If
x2 y2 0.038 + 0.013 =
1
"0 5 :r: ._ 0... 4
3
2
tii w cr u
'\._ ORIGIN OF ELLIPSE
~
GENERAL SPILLWAY CREST DETAILS AND PIEZOMETER LOCATIONS
P/ Hd = 0.50 Hd = 0.80 FT VERTICAL UPSTREAM FACE

-u r )> __... m
1 .6 r-----w----r--""T""--~--y-----.
1-----f---4-- POWER FUNCTION -+----t 1.4 FOR P! Hd = 0.33
I I
PIH d -= 0. 33 -. ...
1 .2 t-----t---t----+---+---1-~
"0 I
0.8 ....... Q)
I
0.6
0.4 •
POWER FUNCTION FOR P!Hd = 1.33
o --~~----L--~-3.0 3.2 3.4 3.6
C = 0 / LH 3 12 e
3.8 4 .0
a . FROM HOC 122··1 , LOW OGEE CREST
NOTE: He = ENERGY HEAD ON CREST, FT Hd = DESIGN H EA D ON CREST, FT C = DISCHARGE COEFF ICIENT Cd = DESIGN D ISCHARGE COEFF ICIENT Q = DISCHARGE . CFS Qd = DESIGN DISCHARG E. CFS L = NET LENGTH OF CREST, FT P = HEIGHT OF CREST ABOVE
APPROACH CHANNEL, FT
4 .2
"0 I .......
Q)
I
1.8
1.0
0.8
0.6
0 .4
1.6
1.4
1.2
0.2
' I
l I I If lj
f H YDRAULIC _ _; DESIGN CRITERIA
/ ~I •
// ~ ~ /
/,, ~0/Q = (H /H ) 1.60 ~
d e d -~? ~
0 3.0 3.2 3.4 3.6 3.8 4 .0 4 .2 4 .4
C = 0/LH 312 e
b. FROM HOC 111 - 3 , HIGH OVERFLOW DAMS
DISCHARGE AT HEADS OTHER THAN DESIGN HEAD
HOC POWER FUNCTION
w ~--------------------------------------------------------------------------------------------------------------~

'"0 r )> -t m ~
.,, , J: J:
.,, , J: J:
1.6
1.4
1.4
1.2
1.0
0.8
0.6
4.0
VERTICAL UPSTREAM FACE
• • • •
2V ON 3H UPSTREAM FACE
1.6
1.4
1.2
1.0
0.8
0.6
0.4
0.2 L..-.L.-~....1.-.....L........L..--t...-.L.--1--''---..__....___. 3.0 3.2 3.4 3.6 3.8 4.0 4.2
a c = 312 LH 8
3V ON 2H UPSTREAM FACE
1.4
1.2
• 1.0
0.8
0.6
0.4
3.4 3.6 3.8 4.0 4.2
1V ON 2H UPSTREAM FACE
1.6
1.4
1V ON 1H UPSTREAM FACE
LEGEND
H8 =ENERGY HEAD ON CREST, FT Hd = DESIGN HEAD ON CREST, FT C =DISCHARGE COEFFICIENT a = DISCHARGE, CFS L = NET LENGTH OF CREST, FT P = HEIGHT OF CREST ABOVE
APPROACH CHANNEL, FT
DISCHARGE COEFFICIENTS P/Hd = 0.25

\)
r )> ~ m
"'I "" J: J:
"'I "" J: J:
0.6
0.4
0.2 3.0 3.2 3.4 3.6 3.8 4.0 4.2
1 4
1 2
1 0
VERTICAL UPSTREAM FACE
•
•
3.4 3.6 3.8
•• •
4.0 4.2
1 V ON 1 H UPSTREAM FACE
0.6 •
0.4
0.2 3.0 3.2 3.4 3.6 3.8 4.0 4.2
C= Q
LH 312 e
4V ON 1H UPSTREAM FACE
1.4
1.2
1.0
0.8
0.6
0.4
0.2 I....-...1..-...I---L..--L.----L--1-1--..1..-...1-~--'-.-J
ao a2 a4 3.6 Q
c = 3/2 LH 8
3.8 4 0 42
2V ON 3H UPSTREAM FACE
1 4 I
1 2
1.0
0.8
0.6
0.4
0.2 30 3.2 3.4 3.6 3.8 4.0 4.2
3V ON 2H UPSTREAM FACE
LEGEND
H8
= ENERGY HEAD ON CREST. FT Hd = DESIGN HEAD ON CREST, FT C = DISCHARGE COEFFICIENT Q = DISCHARGE, CFS L = NET LENGTH OF CREST, FT P = HEIGHT OF CREST ABOVE
APPROACH CHANNEL, FT
DISCHARGE COEFFICIENTS P/ Hd = 0.50
~L------------------------------------------------------------------------------------------------------------'

-u r )> -f m o-
.,, "0
J: J:
.,, "0
J: J:
1.6
1.4
1.4
1.2
1.0
0.8
0.6
0.4
1.6
1.4
VERTICAL UPSTREAM FACE 4V ON 1 H UPSTREAM FACE
1.4
1.2
1.0
0.8
0.6
0.4
0.2 '--.l--..L--'---'--'---'---'---'---'-'---...___. 3.6 3.8 4.0 4.2 3.0 3.2 3.4 3.6 3.8 4.0 4.2
0 c = 3/2
LHe
1V ON 1H UPSTREAM FACE 2V ON 3H UPSTREAM FACE
1.6
1.4
1.2
1.0
0.8
0.6
0.4
2V ON 1 H UPSTREAM FACE
LEGEND
He = ENERGY HEAD ON CREST, FT Hd = DESIGN HEAD ON CREST, FT C = DISCHARGE COEFFICIENT 0 =DISCHARGE, CFS L = NET LENGTH OF CREST, FT P =HEIGHT OF CREST ABOVE
APPROACH CHANNEL, FT
DISCHARGE COEFFICIENTS P/Hd = 1.0

"'U r )> -i m
Q)l "0 I I
1.4
1.2
1.0
0.8
0.6
0.4
3.4 3.6 3.8 4.0
VERTICAL UPSTREAM FACE
LEGEND
He =ENERGY HEAD ON CREST, FT Hd = DESIGN HEAD ON CREST, FT C =DISCHARGE COEFFIC IENT Q = DISCHARGE, CFS L = NET LENGTH OF CREST, FT P = HEIGHT OF CREST ABOVE
APPROACH CHANNEL, FT
1.4
1.2
1.0
0.8
0.6
0.4
4.2
Q c = 3/2
LH 9
3.4 3.6 3.8 4.0 4.2
1V ON 1H UPSTREAM FACE
DISCHARGE COEFFICIENTS P/Hd = 2.0
~L-----------------------------------------------------------------------------------------------~

""0 r )>
I -f
t>
0 m
I
00
m ~
-;
X
m
:r -i
r (j
) :I
J (j
) )>
I
-o
m
z r
0 -
<
~
m
m
r G
) )>
m
(j
) -;
:I
J -i
m
-m
)>
G
) z
0 z
)>
0 0
-;
~
0 c
z :I
J -o
I -<
__.
(!) "' 0 ~
(') II e r
0 J:
<1
> w
.._
<
(J)
,...,
m
0 :0
.....
I
-<
)>
0 )>
mJJ
r
JJG
) c
(J)m
-u
c
(/)
())0
.....
""
00
:0
m
.....
...._m
)> I,
s:: 0
. , -
11
0
)>
-0
m
m
z --i
w
b w
iv
w ~
w
a,
w
00
~
b ~
,...,
~
~
0 ,...,
n n.
n. o--..
.. Q
~
-
0 (11
, 0 "' <
(
0 0
0 0
a,
"'
00
to
....
,..., ) <. )
( >
(' )
( )
( ) '\
--
I I
He
!Hd
=
0
He
!Hd
= 0.
2
---
---
--
I>
He
/Hd
= 0
.4
------
---
-,_
t>
He
!Hd
= 0.
6
-. ....
-. f.
---
--~-
-I>
He
!Hd
0
.8
---
----
---
-~
He
!Hd
1.
0 ,..
._ -
--r
l-· 1
--~-
~ H
e!H
d
1.2
~-
---r
-r--
f--.
""l>
-1
-H
e!H
d =
1.
4
-v-
.. --~-
-~ -
1-
1--~
1---
-H
e!H
d =
1
.5_
----
-1
-

0 -~
(J)
<
0 0
I z
<)>
~
m:n
I
JJ
G)
c C
J>m
IJ
c
(J)
CJ>
O
~
:n
-uo
m
)>
........_
m
~ I,
a.
..,., -
'"Tl
0 )>
0
m
""'0
m
z r
-1
)>
-1
m
-o
(') II e ,... :I: ... w
.....
. 1
\,)
w
0 w
0)
~
co
.::.
0 .::.
1\,
)
.::. :.:.
..... - ..... - 0 ..... - o-
0 w
0 U'l ')
..
< <
;l...
( c ( ( c
I ~
I
'r'
(
' H
efH
d =
0
) H
efH
d =
0.2
)
He
fHd
= 0
.4
He
!Hd
0
.6
He
fHd
0
.8
He
fHd
1.
0
1 ' H
e!H
d
1.2
I H
e!H
d
1.4
I
He
!Hd
1.
5

PLATE 10
060
0.50 \ 0.40
0.30
020
010
" o.oo :r .... !. -010
t\ 0.50
" ~ ( \
~ t-1.00 ............ t---
/ ..... ~ J· - ... r-. ~
-...... v "' -"""'
.... .......
I'+ 0
r a:w -0.20 =>:r "'z W(!) -0.30 a:-n_Cil
w 0 -0.40
-050
-0.60
- 0 .70
-0.80
-0.90
-1.00 - 0.5 -0.4 -o.3 -0.2 -OJ 00 0.1 0.2 0.3 0.4 0.5 0.6 0 .7 0.8 09 1.0 1.1 1.2 1.3 1.4 1.5
HORIZONTAL DISTANCE (X/ H ) DESIGN HEAD d
IV ON IH UPSTREAM FACE
0.60 ~
0.50 --
0.40
0.30
0.20
0 10
" o.oo :r .... !. -o 10
~ ~~
0.50
~ ~ _....
' / 1.00
.,....,
""" ....
w..t .... '"' ~ .... A ....... ~ - "'... ............_
""' - 1\ .. w 0 ~ a: w -020
:::> :r "' "' z w (!) - O.JO a: n. "' w
' I
0 -0.40
-050
I -0.60
-070
-0.80 J I
-0.90 I
-1.00 -05 -04 -o3 -0.2 -OJ 00 0 .1 0.2 03 0 4 0.5 0.6 07 0.8 0.9 10 1.1 1.2 13 1.4 15
NOTE. NUMBERED CURVES REFER TO VALUES OF HefHd
HORIZONTAL DISTANCE (X/H ) DESIGN HEAD d
VERTICAL UPSTREAM FACE
SPILLWAY CREST PRESSURES NO PIERS P/Hd = 0.25

-
060
050
Q-40
030
020
~ I -... I ~' 11..-
\ ..... ~ 0.5
010
.... 000 I ..... !.
-010 0
~· ~ - 0.20 :::> I
~· z w (!) -030 a: iii c.. w
0 -0-40
-050
-060
-010
-080
..._-I ... ...
./' v .0 ' "'
..... ~ ~ ~
f,r,J' " / -.i. -:: ~ ..J
.. ' ~
~ "' v-1.? ... ....
_. A. ........
~ ~ ~ 1\...) .... r-- rG.A
~ ~ / \_,~ r .... ~ :,-a.. i'\ I" ~ ..
' lt. r ~ I '\ v .,... 1.33_./ j'l(' -
"- ~ l-.c 1.50 -..,. y 7 --
"' J -'"\ I ....
v ! I I I
I I
! i I
l ~ I I -o~
-100 - --05 0 4 -Q3 0.2 -OJ QO 01 02 0 3 04 05 OJI 07 08 Q.9 10 1.1 I 2 L3 14 15
HORIZONTAL DISTANCE (X/H ) DESIGN HEAD d
1V ON 1 H UPSTREAM FACE
060
0.50
0 40
030
020
010
.... 000 I ..... !. - 010
0 w ~ a: -020 :::> J: en z en w (!) -QJO a: iii c.. w
0 -0 40
-050
-060
-0 10
-·-~
I,~ '-· --............. / - 05
\. -' .... ~ 1 o ....
\.,.· -...... .. .. ... \..
..._ / ...__ • - ~ / n /.
v -" ~
~ \ -- ' ._/--. --.
v< ~ ./ ! -- I ~
~1\? I 17 / f.- 1 33 -. - ? ... ~ ...._ ~ ,...... \ , : r~ ~
I
~ r I 50-...
~ .J.- ~
')!
I I 'If- ·
I
/ - I· -
~
-080 I -o~
i -100
-05 -04 -Q3 -0.2 -OJ 00 01 02 03 04 05 06 07 08 Q.9 10 1.1 12 13 14 15
HORIZONTAL DISTANCE (X/H ) DESIGN HEAD d
VERTICAL UPSTREAM FACE
NOTE NUMBERED CURVES REFER TO VALUES OF H,.JHd
SPILLWAY CREST PRESSURES NO PIERS
P/ Hd = 0.50
PLATE 11

PLATE 12
060
050 \
040
030
020
010
, 000 :r ....
~ 0 - 010
UJ ~ a: :r -020 ::J en z en (.!) UJ a: en -0.30 14 UJ
0 -040
~ 1.33--,·, ; a.. w _./ ~ 1---1--l--++I~J.+-+ \.J,c.. >"'"'- I ./
1--t--t---H--.-Hi-l,n...,fl\. f\ ~ v ~I.L-1 .50 . " I l.,~ ll: ,.~~v .,.
1---f--l--f---a-l -- --11---f--1---l---l--1--+-+-+-~
-050 I 1--+-+--4-H--+11-4-1-- !--t--+--t--t--f-+-t--+--1--+- + - 1-----.j ~lll
-060
- 01'0 ! - 080
I -090
I
-100 I -05 -0.4 -o.3 -0.2 -OJ 00 01 02 03 0 4 05 0.& 07 08 09 10 1.1 I 2 13 lA 15
HORIZONTAL DISTANCE X/H ) DESIGN HEAD
1 d
IV ON IH UPSTREAM FACE
0.60
0.50
0.40 ~ 0.30
020
010
, 000 :r ....
~ - 0 10
0 UJ <( a: UJ ::J :r -0.20 en z en UJ (.!) a: en - 030 14 UJ
0 -04 0
- 050
1\t
~ .._
r--.. 1----~
,......, ,..,..... ~ _. /
- 05
1 0 _j
:V '~ ..._ 1\ -*-- ~
~ ..... I 'ttl
..... 6 -" -.:::::-- ·,._ ~-.......~
~~ '7 ~ .... [",./ ........ v .1 ~ ,;j 133 w ..... I I"J v .. ...; \ / ~ ~ "-"' I ... )(
I .>L.)C ,./ ...,
~ / 7 / I I
~ 1.50 -.... y ..... .... I
~ ~ rl' -
j w-
-060
- 070 l.j
-0.80
- 100 - 05 - 04 -o3 -02 -OJ 00 01 02 03 04 05 06 07 0 8 09 10 I I I 2 13 lA 1.5
HORIZONTAL DISTANCE (X/H ) DESIGN HEAD d
VERTICAL UPSTREAM FACE
NOTE NUMBERED CURVES REFER TO VALUES OF H8 / Hd
SPILLWAY CREST PRESSURES NO PIERS
P/ Hd = 1.0

_g.j J:"'C
w c a: ct
0.3
0.2
0.1
0
-0.1
w ::> J: -0.2 tl) tl) w a: a..
z (.!) u; -0.3 w c
-0.4
-0.5
-0.6
-0.7
-0.8
-0.9
-:-1 .0
T
H- .l '
i
- + .. ' '
+
-.-
I
l
' H/Hd 1.00
i H- ' I
1.17 1'\
T
l
-0.3 -0.2 -0.1 0
t +
I
.L
I •""f· T
1.33 ~-
1.50
I
i'"!" I
L
j_
' rf:- H . t ·! c· I -t-!- . I
' I I
I I
' .
f-
1-
. ~
-~-
t
I
-,
H r·!-
-.-
--
r
' '
'
0.1 0.2 0.3 0.4 0.5 0.6 0.7 0 .8 0.9 1.0 1.1 1.2 1.3
HORIZONTAL DISTANCE X -DESIGN HEAD Hd
CREST PRESSURES WITHOUT PIERS
P/ Hd = 3.4 VERTICAL UPSTREAM FACE
(FROM MELSHEIMER AND MURPHY (1970))
PLATE 13

PLATE 14
0
.. ['\'\
'\ -0. 1 '\.
"\
" ' & -0.2
,~,
.\
- 0.3 \ \ A
-0.4
SUGGESTED ~ DESIGN CURVE \
"0 :J: ......
a. :J:
- 0.5
-0 .6
-0 .7
-0.8
-0.9 1.0 1 .1
LEGEND
e VERTICAL UPSTREAM FACE
A 1V ON 1H UPSTREAM FACE
HP = PRESSURE ON CREST, FT
Hd = DESIGN HEAD, FT
He = ENERGY HEAD, FT
P = APPROACH DEPTH, FT
' • \•
\
•
1.2 1.3
\ \ ~
~
\
1.4
\ \ \~ • ,~ ' ' ~
\ 1.5 1.6
MAXIMUM NEGATIVE PRESSURE VS He/Hd
UNCONTROLLED CREST P/Hd > 0.50

•
He
Hd
X -Hd
- 1.0 - 0.8 -0.6 -0.4 -0.2 0.0 0.2 0.4 0.6 0.8 1.0 1.2 1.4
-1.0 -0.8 - 0.6 -0.4 -0.2 0.0 0.2 0.4 0.6 0.8 1.0 1.2 1.4
p Hd = 0.25
0.50
-0.452 -0.452 -0.446 -0.435 -0.414 -0.378 -0.319 -0.233 -0.120 0.020 0.188 0.375 0.578
0.50
-0.479 -0.472 -0.462 -0.445 -0.419 -0.377 -0.318 -0.219 -0.102 0.041 0.218 0.412 0.629
y -Hd
p
1.0
-0.768 -0.759 -0.750 - 0.735 - 0.712 -0.678 -0.629 - 0.550 -0.453 - 0.331 -0.172 0.008 0.212
1.0
1.0
-0.897 -0.879 -0.857 -0.829 -0.792 -0.742 -0.677 -0.579 -0.465 -0.328 -0.160 0.033 0.243
He
Hd
X
Hd
-1.0 -0.8 -0.6 - 0.4 -0.2 0.0 0.2 0.4 0.6 0.8 1.0 1.2 1.4
1.50
- 1.259 - 1.241 - 1.213 -1.178 - 1.130 - 1.073 - 1.000 -0.912 -0.811 -0.692 -0.542 -0.367 -0.175
p -- 0.50 Hd
0.50 1.0 1.50
y
Hd
-0.467 -0.849 -1.169 -0.463 -0.840 -1.161 -0.452 -Q.822 -1.141 -0.436 -0.796 -1.1 14 -0.409 -0.764 -1.073 -0.365 -0.714 -1.016 -0.297 -0.647 -0.953 -0.199 -0.557 -0.866 -0.076 -0.449 -0.770 0.071 -0.307 -0.641 0.244 -0.140 -0.481 0.445 0.059 -0.300 0.661 0.278 -0.100
---..._QD UPPER NAPPE ~ -::;:"'
X 1.85 - KH0.85 y d
1 /1 , ~:; ~.: or . :. r .. X .: ... : y ' : 0,. . .r . . . .
• 0 • ., . •,4 , 0 ., 0 0
t ~CREST
DEFINITION SKETCH
WATER-SURFACE PROFILES
UNCONTROLLED CREST
PLATE 15

\J r > -f m
:x:4:x:"t>
1.6
1.4
1.2
1.0
0.8
0.6
0.4
0.2
1.6
1.4
• 1.2
• • • ~-. 1.0
... • • 0.8
•• •• • 0.6
•• • 0.4
• 0.2
0.05 0.10 0.15 -0.10 -0.05
P/ Hd = 0.25
LEGEND
e IV:IH UPSTREAM FACE A VERTICAL UPSTREAM FACE
•• • M
y \1 • •• # • •• •• •• • • • • • •
• • • •
• • • •
0.05 0.10
P/ Hd = 0.50
0.15
1.6
~ 1.4 ~ f
1.2 • .. ) 1.0 J
' • • • • 0.8 • • • • 0.6 I
• •• • 0.4
0.2
0 ~~--L-~~--~~--~~--~~--~ -0.15 -0.10 -0.05 0.0
Kp
0.05
P/ Hd = 1.0
0.10 0.15
PIER CONTRACTION COEFFICIENTS
P/Hd = 0.25, 0.50, AND 1.0

""0 r )> ...... m
060
0 50
0 40
030
020
•
~ • ~+
--t .
1 • I
~ ..__ +-
r." 0 10 :-----"~~:::-":::::,....:___ ~~::::::::~:=:;:::'--.~ 0001----
!. 0 --0 10
w<t a:W-020 :>:I:
~Z--030 w a:-0. ~ -0 40
0 -0 50
-0 60
·0 70
-0 80
t _.
~
,_
l
- 1 ,_ 1
• .. -.--+
-'--
t
....
-+-~r - -; .. • .
t 1 ~
_I j_ - --< •
-+- ~- • 1 ~i -t
-o9or-~-t--~-~-+-~-+-r-1-- ..
I
t !
' ---
~
+
t
.,. --'--
.....
·100L-~~-L--L~-~_L~~~_L~L_~~--~~~-L--L~__J
· 0 5 -0 4 ·0.3 --0 2 -0 1 0.0 0.1 0 .2 0 3 0 4 0.5 0 6 0 7 0 8 0 9 1 0 1 1 1 2 1 3 1 4 1.5
HORIZONTAL DISTANCE (X/H ) DESIGN HEAD d
CENTER LINE OF BAY
..,
060
0.50
~ 0.00 1-__;_!.
..
0 --0 101-~--w<t ~ ~ --0.201------
~ z --0.301---~wC a:-"- ~ --0.40
0 ·0.501---il--
·0.601---
*
· 0.70 1---'--1
--0.801---t-
·0.901-----+----
t ~
-'- ~
.. rr- r- ...
I ' • i • I ' O$ ~ • +
I - ~ --:.. ---
t
i ' -
j j
1-
I _ _! I I
--- --- .... ----1
f--+------,----- ----1
-l.OOL---~--...__-'-~--~-L~--~-L-~~-L___.'----L--.__ ___ ---.~ -0 .5 ·0.4 -o 3 ·0.2 ·0 1 0 0 () 1 <I~ 0 .3 0 4 0 5 0.6 0 .1 0.8 0.9 1 0 1.1 1.2 1.3 1 4 1 5
HORIZONTAL DISTANCE DESIGN HEAD
ALONG PIERS VERTICAL UPSTREAM FACE
060
050
0 40
030
0 20
0 10 ..... J: 000 :t -
0 -0 10
w <t a: w -0 20 :> J:
~ w ~ -030 a: ~ -0 40 0.
0 -0.50
-0 60
.l 1----1
• +
+ -- -, . -- . .J. --r r + f •
-t--+--0 70 ... • ~ - ... -----1 -0.80 r ·090 --r----------'-+----'------t------ 100 L---~-----L~-~-L~~~~~--~-L~~~-L--~--~~
-0 5 -0 4 -0 3 -0 2 ·0 1 0 0 0.1 0 2 0 3 0 4 0 5 0 6 0 7 0 8 0 9 1 0 1 1 1 2 1 3 1 4 1.5
HORIZONTAL DISTANCE (X/ H ) DESIGN HEAD d
CENTER LINE OF BAY
0.60 r-~~-.,-;-r--;--r---r--,---.---r---r---:---r----r--,-...-----,
0.50 1--;-----\ 1-
040
030 T
0.20 t
.., ~ 0 00 I--__;. J:
0 --0.10 w<t a: w -020 ;:,J:
~ ~ --0.30 a:"-~ -0.40
0 ·0.50
--0.60
·0.70
--0.80
-·
r -o 901---+--
I , ... ..,
-100~~~~~~~~~~~~~~~~~~~~-~~~-7~~~~~-7 -0 5 -0 4 -0 3 -0 2 --0 1 0 0 0 1 0 2 0 3 0 4 0 5 0 6 0 7 0.8 0 9 1 0 1.1 1 2 1.3 1 4 1 5
HORIZONTAL DISTANCE DESIGN HEAD
ALONG PIERS CREST PRESSURES
WITH PIERS NOTE NUMBERED CURVES REFER TO VALUES OF H,.fHd. 1V ON 1H UPSTREAM FACE P/ Hd = 0.25
-~ L---------------------------------------------------------------------------------------------------------------------~

~P-------------------------------------------------------------------------------------------------------------, r o 60 .--..---.,..-..,....----r1 --r----.--,-.--.--..---..---..---.,-1-r,---r1 ----r-.~.--,.--, 1
o.6o .--..--..---~-.---.-...,.---.---.----.-----.----.----.--.---r--r----r---,.--.--,.---r-11 ~ o 5o t--r-- ~ , I ! +-[ o 5o 1--1--1~..~-~--~-t--1--1--+--4--+-+--l--l--l--!-+ +--
m • ., - • K i -~ - t=t=I+ f I ,.. ·- __,,__,;r---t--t--t-_.~..._,. -~-t 00 :::: _!I '~~,-+rt;~~~· },h--. . [{ o 5 , ; l t--'-+-~ - : :: "- _+--+----i~i r\;~~~¢~:;J.;., ~;-+: j _-__ ~_+--+-_ -..... --::o:5f=\::=:~;-:--t-_:-i
'} 0 10 I \ I 17 ;:--F=t=~-4~~:::=-l--t__L----+--·+-+-1-Y '} 0 10 / , - t- t--+---1
!_ [\ ,,.. L\ ro.l L _. !_ . _-...... -'t0:( ~ ~( I -'! I
o ooo • I ·t· ~ o o.oo . r-..... ,..... ~ -r :::! ~ -o 10 ,___ 1~ \--1l'11<{--....L:::.~~T-:~i"-±=;::===J:--::-. - .d". - ' :::! ~ -o 10 1-·
1 1111 · 1 "- I r so -+ .....--
CI)CI)=> z:x: ".20 - • - \ V 1 33 I __......- CI)CI)=> :x:z "20 ·---'---~--1 ~~ =- J}C......~I:..::=:-.:-=-----~:----'r-1 w Cl -v \ ' ~-;---, :::! ~ -v \. I ~ ~/ I L g; ~ -:0~: ~ ~ I ~r --
1_ _ t -+- : · L~ t--1=+--.... ~--_ ~ ~ ~: :: =-j-~.;__ ,~ -.--HI ~ I r 1 - - : l + ~~
-0.51-r--:- _j jt- 1 ! I .. : -0.501--1-1 --1---li--H,\--lo,., -r-L t- -1-1 __.,:,----t-t- 1 t-~:-;: t _ ..... 1___,1--!_j __ l~---+--+-t---;-t-1 =~~ ~~~:~-----------t----:----1 ~:-:::_=-1 -·~-------- ~ : -+~ -!-' j_+ r·+-~->--:--t--t---'----+--1 -0.60 1- --t--+-11 ....:;r---.---+l-!--1 _,.'~---.--. _ _,_I __ , ---:---1 -o60:- : ~ i \ , : ~ : ! ! ! I :
-ooor-~-r-+~-r---~-t--4--~T'~-r-1 +---~-------~ -ooo --+-~~----=--+--+-~----~------~ -1. 00.'-:--:~ I ~! ~-:'-':--:-",:--:'-:-:--:----:'-:-::-'-:-: 1:'-:-: ~~::-':: i' :-~ ,· :-::":-:-''::--:''':-:-'::'-:"='-:I :'-:--:' 1 - 1 00 I I I ' I I l I
-o.5 -o.4 -o 3 -o 2 -o. 1 o o o. 1 o 2 o.3 o.4 o 5 o.6 0.1 o 8 o 9 1 o 1 1 1 2 1 3 1.4 1 5 -o 5-o 4 -o.3 -0.2 -o 1 o o 0.1 0.2 o.3 o.4 o 5 o.6 o 1 o 8 o.9 1.0 1.1 1 2 1.3 1.4 1 5 HORIZONTAL DISTANCE (X/H )
DESIGN HEAD d HORIZONTAL DISTANCE (X/H )
DESIGN HEAD d
CENTER LINE OF BAY ALONG PIERS VERTICAL UPSTREAM FACE
0.60
0.50
0.40
030
0.20 ~ :I: 0 10 -:I:
0 0.00 w<t a: w -o. 10 :>:I:
::l z -0 20 wt!l a:-Q. :3 -0.30
0 ·0.40
-050
-{)60
-0 70
-080
-o.90
-1 00
I I \ ' I I I '-~~) I \ ' I
~-, j ·r
~J • --~~ r
!\.?-~ ;to.5 ~ro./1
_f t-... _.. ,, ~ ~ 1'--- ~
1-------- _._ I 17 . ... _I )/
----.33) ..,.-
-"'~ ' ~ t- -· -- - -- . ' - r - ·V- - ....-1" l. - ~ t 1-- - r I " t .p! I I I
l rr I I 1 +- • i -I ~ l ; I t ! I I
I
- - ~ - -I , I I
... • . - - + ---'- + ..._ I . .. ~ --. I -'
I _l
• _I
: I I I I '
T . -
_[ ' I l I ' I ; I I ' -o 5-o 4 -o 3 -o 2 -o 1 o o o 1 o 2 o 3 o 4 o.5 0.6 0.1 0.8 o 9 1 o 1 1 1 2 1.3 1.4 1 5
060
050
040
1 \ I
I I
I J''\ I
1- t t-
0.30
0 20 ~ :I: 0 10 -!. 000
1- -~\_. 1715 1 o-.,
>-' . ._,.._ ; p _. _ _...v,.. I
I I lV: I ,;J. Y~r 33
~
I / ~ ' t .,, + -I / rso' I
I v, I I - - -. T: I I I
-+ r I ~ I I . -I If I I
I ~ L ....._ i
- l I + r l- I I
I I I I I j
; : I I
-050
-0 60
-070 -0 60
-0 90
-1 00 -0.5-0 4 -0.3 -0.2 -0.1 0.0 0 1 0.2 0.3 0.4 0.5 0.6 0 7 0.8 0.9 1.0 1.1
I +--
- r --
I
-I - · I _,
I ;
I I 1.2 1 3 1 4 1.5
HORIZONTAL DISTANCE (X/H 1 DESIGN HEAD d
CENTER LINE OF BAY 1V ON 1H UPSTREAM FACE
HORIZONTAL DISTANCE (X/H ) DESIGN HEAD d
ALONG PIERS CREST PRESSURES
WITH PIERS NOTE NUMBERED CURVES REFER TO
VALUES OF H.,tHd P/ Hd = 0.50

-u r > --i m
a :; 0 10
X -0
OOOf----
w< a: w ·0 10 ::lx
~ ~ ·0.20 a:-ll. f:l ·0.30
0 ·0 40
·050
·0 60
·0 70
-oeo~
·090
..... ---,.- •
+
150
-- .
---
·1.00L_ ___________ ~-----'------"----___J
-0 5 ·0 4 -0 3 ·0 2 ·0 1 0.0 0.1 0 2 0 3 0.4 0.5 0.6 0.7 0 8 0.9 1.0 1.1 1.2 1.3 1.4 1.5
HORIZONTAL DISTANCE (X/ H ) DESIGN HEAD d CENTER LINE OF BAY
a X -
060
050
040
0.30
0 20
010
-r
t ~ '
X 0 000~---
w< ;z: w ·0 10 :>I: 'i)z :il ~ ·0.20 O::iii 11. w -o 30 f---
o -0 40f---
·0 50
·0.60
·0.70
-0 80
·090
-
I I --- .
I - ~ ~~ .-1 j_t j •
~JJ_' •
+-
~--
- ~-. ----
' -1 00 I
-0.5 ·0.4 -0.3 -0.2 ·0.1 0.0 0.1 0.2 0 .3 0.4 0.5 0.6 0.7 0 .8 0.9 1.0 1.1 1.2 1 3 1.4 1.5
HORIZONTAL DISTANCE (X/ H ) DESIGN HEAD d
ALONG PIERS VERTICAL UPSTREAM FACE
a :r :r -0
w < a: w ::l :r
"' z "' w ~ a: iii ll. w
0
060
0 50
040
030
020
010
0 .00
·0 10
-0 20
-030
·0 40
-0 50
-060 ---·0 70
-0 80~ ·0.90L- -
· 100 ---------~~-----~---~------~ 01 02 03 04 05 06 07 08 09 10 , 1 12 13 14 , 5
HORIZONTAL DISTANCE (X/H )
-0 5 -0 4 -0 3 ·0 2 -0 1 0 0
DESIGN HEAD d
a :r -!.
w a: ::l
"' (/) w a: ll.
060r--~--~-r-.-r-,-~--~~~--r--~~-~----
0.50 f--+--+ r J. 0.40
030
0 20
010
000
-010
-0 20
-0 30
·0 40
·0.50
-oso
-0 70
·0 80
·0 90
T
---~
- -·--.. - --f-r--
-~----
. ---·100L_---'-----~--~--L-~~~~~~~~~~-L~--L_~~
-0 5-o 4 -0 3 -0 2 -0 1 0 0 0.1 0.2 0 3 0 4 0 5 0.6 0 7 0 8 0 9 1.0 1.1 , 2 1 3 1 4 1 s
HORIZONTAL DISTANCE (X/H ) DESIGN HEAD d
ALONG PIERS CENTER LINE OF BAY
NOTE NUMBERED CURVES REFER TO 1V ON 1H UPSTREAM FACE
CREST PRESSURES WITH PIERS
P/Hd=1.0 VALUES OF H0 /Hd - -
I

0 w <{ a: w ::> J:
0.6
0.5
0.2
0 .1
-0.1
Cl) Cl) w a: Q..
z (!) Cl) -0.3 : ' ' w 0
-0.4
-0 .5 I-tt
-0.6
-0.7
-0.8
-0 .9
- 1.0
"' ' I
, I
I
-0.3 -0.2 -0.1
' I
I
'
I
I
0
I
1. 17 h-;-l I
I _L_LJ I
7 H/Hd 1.33
1.50 ......
I
i
I I • !
i
I
I-
Lt 1- f-- 1 ·~ -
' ' ,-, .
' T
i
T , ,
-.-
,,, I
I
T
I '
.-r I
••
-.-
, ,
I
T
I I
' T
'
t-H+·. f- :-r- '
i t--H-.-' ...,._.L.f- '"±
i i ' ! ! I
I I I
i
I
I
• I I
' I
L
1
0.1 0 .2 0.3 0.4 0.5 0 .6 0 .7 0 .8 0 .9 1.0 1.1 1.2 1.3
HORIZONTAL DISTANCE X DESIGN HEAD Hd
CREST PRESSURES CENTER LINE OF GATE BAY
P/ Hd = 3.4 VERTICAL UPSTREAM FACE
(FROM MELSHEIMER AND MURPHY (1970) )
PLATE 20

0.3
0.1
-0.1
-0.9
-l-; I -1.0 J
-0.3 -0.2
I
'I r' I
• --.: 1 I I 7 +-1 A
/ I I; 1-1
I I I TT7
I ;
I j
L
f. 1/
I
TT
l I
'
TT
T
' T
. --+-- "?" -.---1- •
' -~ -t--· . . ~~~ -4- f ! . ~.;,. -r-
' ' ' .
F=: H!Hd 1.33 .J-. . •. __ ,.! ..!. •• ' '
I ' ' +--· .,.,. ~ . ~ ,..
' T -:-;- i ' --- - ~ ' ; I -H-' / l '""' ' ' ' ' .
·-r ~ .,.,
' I rr-:-~
= H!Hd 1.50 I
I !+·I ~---+ • ' . I 'I 1
' <---;-· " ,-, ' ; . ; '
i j 1 : I I i T TT _!_L.l _L 1 Iii T
- ; ~ +•·+-+- • ~ + ...!..J-1+ ~~~I , .__
:-1- ____;:- ..j_ I I ...; . ' .. -"-!--; " r:q:: - ' I I T
• I : I I I -4-i'-l,..;#~'--H. L
' ' I I ~ i ·
T ; .
• I : "
-+l+ T !T ! I ; ' i I+H • .J,. • -,- . q:::j= ·1-L-. I I l H-H f-
. ......_ .... ~~~ I ! i I I
I I
' _, _ ' I _-f.:.:- . t · H-i-- -' -'-"- H-i- t ·1-H +--
+- I TT
' l f- ~· h-+;
- -r -;-;-'-• __;__ i -r+- ....:....1 i • ., ' ; ' ; I T . I i ! I I I -t-'
.. L ' • ; I I
'I I I I I
-0.1 0 0.1 0 .2 0 .3 0.4 0.5 0 .6 0.7 0.8 0.9 1.0 1 .1 1.2 1 .3
HORIZONTAL DISTANCE X DESIGN HEAD Hd
CREST PRESSURES ALONG PIER
P/Hd = 3.4 VERTICAL UPSTREAM FACE
(FROM MELSHEIMER AND MURPHY (1970))
PLATE 21
-

PL:A. TE 22
CENTER LINE OF GATE BAY
H e Hd 0.50 1.0
X y -Hd Hd
-1 .0 -0.469 -0.850 -0.8 -0.469 -0.848 - 0.6 -0.464 -0.839 - 0.4 - 0.454 -0.823 - 0.2 -0.438 -0.796
0.0 -0.405 -0.758 0.2 -0.358 -0.715 0.4 -0.260 -0.640 0.6 - 0.151 -0.553 0.8 - 0.018 -0.448 1.0 0.135 -0.303 1.2 0.315 -0.135 1.4 0.528 +0.045
UPPER NAPPE
X
X 1.85 = \ .85 y
. , '~ . . 4 • . ••• • .• ·~ • • . .. o. y r . . r .. f . . •. . • .
. . r . ' .· ' . ": . - . ~CREST
DEFINITION SKETCH
ALONG PIERS
He Hd 0.50 1.0
X y - -Hd Hd
-1 .0 -0.469 - 0.838 -0.8 -0.469 - 0.835 -0.6 - 0.466 - 0.833 -0.4 - 0.469 -0.835 - 0.2 - 0.488 - 0.894 0.0 - 0.414 - 0.900 0.2 - 0.286 - 0.756 0.4 -0.175 - 0.615 0.6 -0.066 -0.471 0.8 +0.061 - 0.311 1.0 +0.209 - 0.139 1.2 +0.378 +0.044 1.4 +0.577 +0.250
WATER-SURFACE PROFILES
CONTROLLED CREST P/ Hd = 0.25

CENTER LINE OF GATE BAY
He -Hd
X
Hd
- 1 0 - 0.8 - 0.6 -0.4 -0.2
0.0 0.2 0.4 0.6 0.8 1.0 1.2 1.4
0.50 1.0
y
Hd
-0.483 -0.894 -0.479 -0.886 -0.471 -0.871 -0.454 -0.851 -0.429 -0.824 -0.388 -0.783 -0.329 -0.728 -0.241 -0.655 -0.123 -0.570 +0.019 -0.458 +0.198 -0.300 +0.394 -0.104 +0.613 +0.119
I X .r;·:r•: ~. . -•~
·. 4: · ·.: , ••.. y ~·.~·:. ·p . f . I> • • ·. .. . ~ :,. ' . . •. : ~CREST .
H e 1.5 Hd
X
Hd
-1.254 -1.0 - 1.244 -0.8 -1.229 -0.6
-1.208 -0.4
-1.183 -0.2
-1.149 -0.15 0.0
- 1.099 0.2 - 1.034 0.4 -0.951 0.6 -0.856 0.8 -0.753 1.0 -0.631 1.2 -0.426 1.4
UPPER NAPPE
X 1.85 _ KH 0.85 y d
\
DEFINITION SKETCH
ALONG PIERS
0.50 1.0 1.5
y
Hd
-0.483 -0.889 -1.257 -0.481 -0.880 -1.248 -0.477 -0.869 -1.233 -0.480 -0.880 -1.243 -0.467 -0.917 - 1.338 -0.450 -0.910 -1.373 -0.356 -0.825 -1.324 -0.252 -0.677 -1.176 -0.159 -0.541 -1.029 -0.055 -0.414 -0.885 0.081 -0.258 -0.735 0.256 -0.089 -0.566 0.477 0.105 -0.383 0.672 0.319 -0.188
WATER-SURFACE PROFILES
CONTROLLED CREST P/ Hd = 0.50
PLATE 23

CENTER LINE OF GATE BAY
H He e - 0.50. 1.0 1.5 -Hd Hd
X y X Hd Hd Hd
- 1.0 - 0.494 -0.939 -1 .311 -1.0 -0.8 -0.488 -0.925 -1.300 -0.8 -0.6 -0.483 -0.913 -1.275 -0.6
- 0.4 -0.476 - 0.888 -1.248 -0.4
-0.2 -0.445 - 0.855 -1.210 -0.2 -0.15
0.0 - 0.403 -0.808 -1.162 0.0
0.2 - 0.335 -0.743 -1.102 0.2 0.4 - 0.240 -0.666 -1 .029 0.4 0.6 - 0.116 - 0.573 -0.938 0.6 0.8 +0.029 - 0.454 -0.833 0.8 1.0 0.201 - 0.291 -0.707 1.0 1.2 0.403 - 0.086 -0.562 1.2 1.4 0.626 +0.150 -0.395 1.4
-UPPER NAPPE
~----~~1~- X~ /1:1_.~ .. ~ : ... , -.;: ~ : ll Y t ·r·. · :r. . .- X 7.85 _ KH 0,85 y f ~ - '" . . . -~ .. ·. -:.. .• - d 1- .. . F• ··f •
~:r ~CREST . ·: ·:. \
DEFINITION SKETCH
PLATE 24
ALONG PIERS
0.50 1.0 1.5
y
Hd -0.489 -0.933 -1 .311 -0.483 -0.925 -1 .300 -0.475 -0.918 -1.280 -0.488 -0.931 -1.313 -0.463 -0.935 -1 .375 -0.438 -0.915 -1.383 -0.369 -0.829 -1.315 -0.264 -0.695 -1.171 -0.170 -0.571 -1.023 -0.063 -0.441 -Q.882 0.069 -0.298 -0.730 0.234 -0.128 -0.555 0.431 0.065 -0.362 0.651 0.278 -0.140
WATER-SURFACE PROFILES
CONTROLLED CREST P/ Hd = 1.0