TOXICOKINETICS OF PERMETHRIN AS A ... - GETD - UGA
180
TOXICOKINETICS OF PERMETHRIN AS A FUNCTION OF AGE, SEX, AND ISOMER by TANZIR B. MORTUZA (Under the Direction of James V. Bruckner and Catherine A. White) ABSTRACT Pyrethroids are widely utilized in many parts of the world as insecticides. Permethrin (PER), a class I pyrethroid, has been used in many household insecticidal products as an active ingredient. Though exposure to PER is very common, only limited toxicokinetic (TK) data for human risk assessment is available in the literature, particularly for children. The objective of this study was to assess the relative TK and target tissue (brain) uptake of cis- versus trans- permethrin (CIS vs. TRANS) as a function of stage of maturity and sex. A high-performance liquid chromatography (HPLC) analytical method was developed to rapidly quantify the large number of biological samples for TK studies. Groups of preweanlings (postnatal day 15 - PND 15), weanlings (PND 21) and adult (PND 90) rats were orally administered CIS or TRANS and euthanized at intervals for up to 24 h for collection of plasma, brain, liver, muscle and fat for isomer analysis by HPLC. The TK of CIS and TRANS was age-dependent. Pups manifested much lower clearance and higher peak concentrations of CIS and TRANS than adults, which resulted in significantly higher plasma and tissue levels of both isomers. Sex differences were only observed in the plasma and liver of adults dosed with CIS. Brain uptake studies revealed that the uptake of PER is inversely related to age. There was no sex difference observed in brain
-
Upload
khangminh22 -
Category
Documents
-
view
3 -
download
0
Transcript of TOXICOKINETICS OF PERMETHRIN AS A ... - GETD - UGA

TOXICOKINETICS OF PERMETHRIN AS A FUNCTION OF AGE, SEX, AND ISOMER
by
TANZIR B. MORTUZA
(Under the Direction of James V. Bruckner and Catherine A. White)
ABSTRACT
Pyrethroids are widely utilized in many parts of the world as insecticides. Permethrin
(PER), a class I pyrethroid, has been used in many household insecticidal products as an active
ingredient. Though exposure to PER is very common, only limited toxicokinetic (TK) data for
human risk assessment is available in the literature, particularly for children. The objective of
this study was to assess the relative TK and target tissue (brain) uptake of cis- versus trans-
permethrin (CIS vs. TRANS) as a function of stage of maturity and sex. A high-performance
liquid chromatography (HPLC) analytical method was developed to rapidly quantify the large
number of biological samples for TK studies. Groups of preweanlings (postnatal day 15 - PND
15), weanlings (PND 21) and adult (PND 90) rats were orally administered CIS or TRANS and
euthanized at intervals for up to 24 h for collection of plasma, brain, liver, muscle and fat for
isomer analysis by HPLC. The TK of CIS and TRANS was age-dependent. Pups manifested
much lower clearance and higher peak concentrations of CIS and TRANS than adults, which
resulted in significantly higher plasma and tissue levels of both isomers. Sex differences were
only observed in the plasma and liver of adults dosed with CIS. Brain uptake studies revealed
that the uptake of PER is inversely related to age. There was no sex difference observed in brain

uptake of CIS or TRANS. The parent compounds/isomers are the proximate neuroactive
moieties. Different TK and brain dosimetry profile outlined the greater toxic potency of CIS than
TRANS. Brain uptake studies along with TK studies provided a comprehensive understanding of
the time courses of plasma and tissue disposition the PER. This study provides TK data to reduce
uncertainties in risk assessments of PER in children and adults.
INDEX WORDS: toxicokinetics, HPLC-method, cis-permethrin, trans-permethrin, age-
dependent, brain uptake

TOXICOKINETICS OF PERMETHRIN AS A FUNCTION OF AGE, SEX, AND ISOMER
by
TANZIR B. MORTUZA
B.S. University of Georgia, Athens, GA, 2009
A Dissertation Submitted to the Graduate Faculty of The University of Georgia in Partial
Fulfillment of the Requirements for the Degree
DOCTOR OF PHILOSOPHY
ATHENS, GEORGIA
2018

© 2018
Tanzir B. Mortuza
All Rights Reserved

TOXICOKINETICS OF PERMETHRIN AS A FUNCTION OF AGE, SEX, AND ISOMER
by
TANZIR B. MORTUZA
Major Professor: James V. Bruckner Catherine A. White Committee: Brian S. Cummings Michael G. Bartlett Randall L. Tackett Electronic Version Approved: Suzanne Barbour Dean of the Graduate School The University of Georgia December 2018

iv
DEDICATION
I would like to dedicate this dissertation to my wife Tazeen Hussain, my parents Shahana
and Mohammed Mortuza who gave me strength to overcome all challenges during my Ph.D.

v
ACKNOWLEDGEMENTS
In the name of Allah, most gracious, most merciful. I would like to thank Allah almighty
to provide me enough strength to overcome all hurdles during my Ph.D. I am thankful to my
major advisors, Dr. James V. Bruckner and Dr. Catherine A. White for providing me guidance
and help with my research and writing. I would like to thank my committee members; Dr. Brian
S. Cummings, Dr. Michael G. Bartlett, and Dr. Randall L. Tackett for their advice during this
process. Special thanks goes to Dr. Deborah Elder and Dr. Phillip Greenspan for their
encouragement and guidance during my Ph.D. This work would not have been complete without
the help of my fellow laboratory personnel Mr. Srinivasa Muralidhara, Dr. Jing Pang, and Mr.
Vandan Patel. I would like to thank my in-laws (Mrs. and Mr. Dilruba and Shakhawat Hussain),
friends and family who helped me along this process. Finally, I would like to thank my parents
Shahana and Mohammed Mortuza and my sister Subanti Mortuza who helped me throughout my
life to be a better person and encouraged me to be a fighter. Last but not least I would like to
thank my loving and caring wife Tazeen Hussain. Without her help this Ph.D. would not have
been possible.

vi
TABLE OF CONTENTS
Page
ACKNOWLEDGEMENTS .............................................................................................................v
LIST OF TABLES ........................................................................................................................ vii
LIST OF FIGURES ....................................................................................................................... ix
ABBREVIATIONS ...................................................................................................................... xii
CHAPTERS
1 INTRODUCTION AND LITERATURE REVIEW .....................................................1
2 RAPID DETERMINATION OF THE INSECTICIDES CIS- AND TRANS-
PERMETHRIN IN RAT PLASMA AND TISSUES BY HIGH PERFORMACE
LIQUID CHROMATOGRAPHY ...............................................................................30
3 TOXICOKINETICS OF PERMETHRIN AS A FUNCTION OF AGE, SEX, AND
ISOMER ......................................................................................................................75
4 IN SITU BRAIN DEPOSITION OF CIS- AND TRANS-PERMETHRIN AS A
FUNCTION OF AGE AND SEX ..............................................................................131
5 SUMMARY ...............................................................................................................156

vii
LIST OF TABLES
Page
Table 2.1: Intra-day precision (% RSD) and accuracy (% Bias) of CIS extracted from rat plasma
and tissue homogenates......................................................................................................51
Table 2.2: Inter-day precision (% RSD) and accuracy (% Bias) of CIS extracted from rat plasma
and tissue homogenates......................................................................................................52
Table 2.3: Intra-day precision (% RSD) and accuracy (% Bias) of TRANS extracted from rat
plasma and tissue homogenates. ........................................................................................53
Table 2.4: Inter-day precision (% RSD) and accuracy (% Bias) of TRANS extracted from rat
plasma and tissue homogenate. ..........................................................................................54
Table 2.5: Absolute recovery (%) of CIS in rat plasma and tissues. .............................................55
Table 2.6: Absolute recovery (%) of TRANS in rat plasma and tissues. ......................................56
Table 2.7: Autosampler stability (%) of CIS in rat plasma and tissues. ........................................57
Table 2.8: Freeze-thaw stability (%) of CIS in rat plasma and tissues. .........................................58
Table 2.9: Autosampler Stability (%) of TRANS in rat plasma and tissues..................................59
Table 2.10: Freeze-thaw Stability (%) of TRANS in rat plasma and tissues. ...............................60
Table 2.11: Maximum concentration (Cmax), area under the curve (AUC) and time to peak
(Tmax) of CIS and TRANS in rat plasma and tissues. ......................................................61
Table 3.1: TK parameters of 60 and 120 mg CIS/kg in adult rats ...............................................103
Table 3.2: TK parameters of 60 and 90 mg CIS/kg in PND 21 rats ............................................104
Table 3.3: TK parameters of 15, 30, and 45 mg CIS/kg in PND 15 rats. ....................................105

viii
Table 3.4: Age-dependent plasma TK parameters of CIS ...........................................................106
Table 3.5: Dose normalizes tissue: plasma ratio of CIS. .............................................................107
Table 3.6: Age-dependent Cmax and AUC in plasma and tissues of 300 mg TRANS/kg..........108
Table 3.7: Age-dependent plasma TK parameters of TRANS. ...................................................109
Table 3.8: Dose normalized TRANS tissue:plasma ratio. ...........................................................110
Table 3.9: Sex-dependent Cmax and AUCs of CIS and TRANS ................................................111
Table 3.10: CIS and TRANS TK parameters plasma 120 mg/kg ................................................112
Table 3.11: Dose normalized CIS: TRANS ratio of plasma and brain. .......................................113
Supplementary Table 3.1: TK parameters of 120 and 300 mg TRANS/kg in adult rats. ............114
Supplementary Table 3.2: TK parameters of 300 and 450 mg TRANS/kg in PND 21 rats ........115
Supplementary Table 3.3: TK parameters of 300 and 450 mg TRANS/kg in PND 15 rats ........116
Table 4.1: Age-dependent brain uptake of CIS (pmol/g). ...........................................................148
Table 4.2: Age-dependent brain uptake of TRANS (pmol/g)......................................................149
Table 4.3: Age-dependent comparison of brain uptake of CIS. ..................................................150
Table 4.4: Age-dependent comparison of brain uptake of TRANS.............................................151

ix
LIST OF FIGURES
Page
Figure 1.1: Chemical structure of (A) cis-permethrin (CIS), (B) trans-permethrin (TRANS), and
(C) deltamethrin (DLM). ...................................................................................................28
Figure 1.2: Metabolism of cis- and trans-permethrin (CIS and TRANS) in rats. ..........................29
Figure 2.1: Chemical structure of (A) pipernoyl butoxide (PBO), (B) cis-permethrin (CIS), and
(C) trans-permethrin (TRANS) ..........................................................................................62
Figure 2.2: Method flow chart of cis-permethrin (CIS) or trans-permethrin (TRANS) extraction63
Figure 2.3: Chromatograms of (A) blank plasma and (B) cis-permethrin (CIS) plasma lower limit
of quantification (LLOQ). ..................................................................................................64
Figure 2.4: Chromatograms of (A) blank brain and (B) cis-permethrin (CIS) brain lower limit of
quantification (LLOQ). ......................................................................................................65
Figure 2.5: Chromatograms of (A) liver blank and (B) cis-permethrin (CIS) liver lower limit of
quantification (LLOQ). ......................................................................................................66
Figure 2.6: Chromatograms of (A) blank muscle and (B) cis-permethrin (CIS) muscle lower limit
of quantification (LLOQ). ..................................................................................................67
Figure 2.7: Chromatograms of (A) blank fat and (B) cis-permethrin (CIS) fat lower limit of
quantification (LLOQ). ......................................................................................................68
Figure 2.8: Chromatograms of (A) blank plasma and (B) trans-permethrin (TRANS) plasma
lower limit of quantification (LLOQ). ...............................................................................69

x
Figure 2.9: Chromatograms of (A) blank brain and (B) trans-permethrin (TRANS) brain lower
limit of quantification (LLOQ). .........................................................................................70
Figure 2.10: Chromatograms of (A) blank liver and (B) trans-permethrin (TRANS) liver lower
limit of quantification (LLOQ). .........................................................................................71
Figure 2.11: Chromatograms of (A) blank muscle and (B) trans-permethrin (TRANS) muscle
lower limit of quantification (LLOQ). ...............................................................................72
Figure 2.12: Chromatograms of (A) blank fat and (B) trans-permethrin (TRANS) fat lower limit
of quantification (LLOQ). ..................................................................................................73
Figure 2.13: Concentration time-course of cis-permethrin (CIS) and trans-permethrin (TRANS)
for (A) plasma, (B) brain, (C) liver, (D) muscle, and (E) fat. ............................................74
Figure 3.1: Dose normalized concentration time-course of cis-permethrin (CIS) of postnatal day
(PND) 15 (45 mg/kg), PND 21 (60 mg/kg), and adult rats (60 mg/kg); (A) plasma, (B)
brain, (C) liver.. ................................................................................................................117
Figure 3.2: Concentration time-course of 60 mg CIS/kg of adult rats; (A) plasma, brain, and liver
and (B) plasma, muscle, and fat. ......................................................................................118
Figure 3.3: Concentration time-course of 60 mg CIS/kg of PND 21 rats; (A) plasma, brain, and
liver, (B) plasma, muscle, and fat. ...................................................................................119
Figure 3.4: Concentration time-course of 45 mg CIS/kg of PND 15 rats; (A) plasma, brain, and
liver, (B) plasma, and muscle. .........................................................................................120
Figure 3.5: Dose normalized comparison of (A) Cmax and (B) AUCs of cis-permethrin (CIS) for
PND 15, PND 21, and adult rats. .....................................................................................121
Figure 3.6: Concentration time-course of 300 mg TRANS/kg of PND 15, PND 21, and adult rats;
(A) plasma, (B) brain, (C) liver. ......................................................................................122

xi
Figure 3.7: Concentration time-course of 300 mg TRANS/kg of adult rats; (A) plasma, brain, and
liver, (B) plasma, muscle, and fat. ...................................................................................123
Figure 3.8: Concentration time-course of 300 mg TRANS/kg of PND 21 rats; (A) plasma, brain,
and liver, (B) plasma, muscle, and fat. ............................................................................124
Figure 3.9: Concentration time-course of 300 mg TRANS/kg of PND 15 rats; (A) plasma, brain,
and liver, (B) plasma, and muscle. ...................................................................................125
Figure 3.10: Dose normalized comparison of (A) Cmax and (B) AUCs of trans-permethrin
(TRANS) for PND 15, PND 21, and adult rats................................................................126
Figure 3.11: Concentration time-course of 60 mg CIS/kg of male and female; (A) plasma, (B)
brain, (C) liver ..................................................................................................................127
Figure 3.12: Concentration time-course of 300 mg TRANS/kg of male and female; (A) plasma,
(B) brain, (C) liver. ..........................................................................................................128
Figure 3.13: Concentration time-course of cis-permethrin (CIS) and trans-permethrin (TRANS)
120 mg/kg plasma. ...........................................................................................................129
Figure 3.14: Dose normalized comparison of Cmax and AUC in (A) plasma and (B) brain of cis-
permethrin (CIS) and trans-permethrin (TRANS) ...........................................................130
Figure 4.1: Age-dependent brain uptake of (A) cis-permethrin (CIS) and (B) trans-permethrin
(TRANS) in PND 15, PND 21, and PND 90 (adult) rats. ...............................................152
Figure 4.2: Concentration-dependent brain uptake of (A) cis-permethrin (CIS) and (B) trans-
permethrin (TRANS) by PND 15, 21, and 90 (adult) rats. ..............................................153
Figure 4.3: Influence of sex on brain uptake of CIS and TRANS. ..............................................154
Figure 4.4: Influence of isomer on brain uptake in (A) PND 15, (B) PND 21, and (C) PND 90
(adult) rats. .......................................................................................................................155

xii
ABBREVIATIONS
3-PBA = 3-phenoxybenzoic acid
3-PBAlc = 3-phenoxybenzylealcohol
3-PBAld = 3-phenoxybenzaldehyde
ACN = Acetonitrile
ANOVA = analysis of variance
AUC = area under the curve
BBB = blood brain barrier
CaEs = carboxylesterases
CIS = cis-permethrin
CIS-DCCA = cis-3-(2,2, chlorovinyl)-2,2-dimethyl-(1-cyclopropane) carboxylic acid
CL/F = oral clearance
Cmax = maximum plasma concentration
CNS = central nervous system
CO = corn oil
CYP = cytochrome P450
DLM = deltamethrin
GI = gastrointestinal
hCEs = human carboxylesterases
HPLC = high performance liquid chromatography
HSA = human serum albumin

xiii
IS = internal standard
LD 50 = lethal dose 50
LOD = limit of detection
LLOQ = lower limit of quantification
PBO = piperonyl butoxide
PBTK = physiologically based toxicokinetic
PER = permethrin
P-gp = p-glycoprotein
PND = postnatal day
S-D = Sprague-Dawley
SD = standard deviation
TK = toxicokinetics
Tmax = time of maximum plasma concentration
TRANS = trans-permethrin
t1/2 = half-life
TRANS-DCCA = trans-3-(2,2, chlorovinyl)-2,2-dimethyl-(1-cyclopropane) carboxylic acid
VSSC/VGSC = voltage sensitive sodium channels/ voltage gated sodium channels

1
CHAPTER 1
INTRODUCTION AND LITERATURE REVIEW
BACKGROUND
Pyrethroids are synthetic derivatives of pyrethrins, natural extracts from Chrysanthemum
flowers. Pyrethroids have been synthesized in the U.S. for over five decades. This group of
insecticides is one of the most widely utilized pesticides in the U.S., European Union and other
parts of the world due to the phasing out of organophosphates (Williams et al. 2008). Generally,
pyrethroids are used against a number of pests and insects in household, agricultural, and
commercial settings (Frankowski et al. 2002).
Pyrethroids have several standard features; an alcohol moiety and an acid moiety attached
with a central ester bond (Soderlund et al. 2002). There are two main types of pyrethroids: type I
(e.g. permethrin) and type II (e.g. deltamethrin). The structural difference between type I and II
pyrethroids is the cyano group at the alpha carbon of the alcohol moiety (Fig. 1.1). The acid
moiety usually consists of two chiral carbons and the alcohol moiety has one which indicates the
presence of different stereoisomers. There may be 8 different conformations of a single
pyrethroid (Shafer et al. 2005). The in vivo toxicity profiles are much different between type I
and II pyrethroids in laboratory animals and humans. Type I pyrethroids manifest fine tremors,
aggressive sparring and increased sensitivity to external stimuli. Alternatively, type II
pyrethroids produce salivation, pawing and burrowing, and coarse tremor progressing to
choreoathetosis (involuntary movement of extremities) and clonic seizures (Verschoyle and
Aldridge 1980).

2
More than 200 pyrethroids have been synthesized, and approximately 16 are approved for
commercial usage. Permethrin (PER) was first synthesized in 1973 and marketed as an
insecticide in 1977 (Wang et al. 2012). It is typically sold as a brown or yellowish liquid with a
mixture of cis- and trans-isomers (CIS and TRANS) in different ratios. The lethal dose (LD) 50
of CIS and TRANS is quite different from each other mostly due to rapid metabolism of TRANS
in plasma and liver in laboratory animals and humans. In rats, i.v. LD 50s of CIS and TRANS
are >135 and >270 mg/kg, respectively. The oral LD 50 is 2000 mg/kg PER with an isomeric
mixture in rats. In mice, the LD 50s are several fold lower (intraperitoneal > 500 mg PER/kg)
(Casida et al. 1983).
Epidemiological studies conducted in recent years demonstrate the adverse events related
to PER and other pyrethroids. EPA’s Stochastic Human Exposure and Dose Simulation
(SHEDS)-multimedia model evaluated pyrethroid exposure of 7 different pyrethroids in children.
PER counts for about 60% of all pyrethroid exposures (Xue et al. 2014). Though comparatively
safe, pyrethroids cause a number of neuronal dysfunctions in both adult and neonatal brain
(Saillenfait et al. 2015). Magby and Richardson (2017) reported that pyrethroid exposure causes
decreases sodium channel expression in laboratory mice that lasts up to 10 or 11 months of age.
Sinha et al. (2004) investigated the blood-brain permeability in developing brain and reported
that pyrethroid-based mosquito repellent induces dysfunction in the neonatal brain. Hossain et al.
(2015) studied endoplasmic reticulum stress and related that to a learning deficit that follows
pyrethroid related exposures.
There are concerns that the human population may also be susceptible to these neuronal
dysfunctions, notably children. Several researchers have investigated children’s exposure to PER
and other pyrethroids in household and environmental settings. Li et al. (2016) examined many

3
fresh fruits and vegetables and found a significant amount of pesticides in them. CIS and
TRANS were found in green apples and lettuce in local grocery stores. Morgan and Jones (2013)
used urinary biomonitoring to predict exposure to pyrethroid insecticides. They found that
children are mostly exposed to PER through food in household settings. Furthermore, Morgan et
al. (2007) conducted an observational study of 127 preschool children in Ohio to investigate the
environmental pathway of CIS and TRANS exposure. Morgan et al. (2007) found a large
quantity of CIS and TRANS in house dust and soil around homes and daycare centers. Wason et
al. (2013) studied exposure to organophosphates and pyrethroids for children living in an urban
low-income housing and concluded that children from the neighborhoods are exposed to many
insecticides in their homes. Viel et al. (2015) studied pregnant women and their children to
correlate pyrethroid insecticide exposure and augmented disabilities in children. Shelton et al.
(2014) studied 970 children diagnosed with developmental delay and autism disorders between
the years of 1997 to 2008 and concluded that children of mothers residing near pyrethroid
application sites were at the higher risk of developmental delay and autism disorders. The
epidemiological studies concerning PER exposure have increased in orders of magnitude in
recent years. There are only a few age-dependent toxicokinetic (TK) studies that examined
exposure in younger animals. Therefore, one of the primary goals of this project is to generate
juvenile animal TK data to predict human exposure and tissue dosimetry of PER.
MECHANISM OF ACTION
PER and other pyrethroids act on the voltage-sensitive sodium channels (VSSC) in the
axons of peripheral and central nervous system (Wang et al. 2012). Pyrethroids delay the
activation and deactivation of VSSCs. The VSSCs stay open for an extended period.
Additionally, pyrethroids lower the activation potential moving towards a more hyperpolarized

4
state (Narahashi 1996; Shafer et al. 2005). As it takes less energy to open the channel, the VSSCs
open at a different energy state and stays open for longer period. Typically type II pyrethroids
keep the VSSCs open for a more extended period than the type I pyrethroids. DLM, a type II
pyrethroid, keeps the gate open more than 200-fold longer compared to the usual state, whereas,
tetramethrin, a type I pyrethroid, keeps the channel open ~10-fold longer. Type II pyrethroids
create a depolarization-dependent block that holds the channel open at a state where the channel
becomes wholly depolarized (Shafer et al. 2005).
Both PER and DLM act on voltage-gated calcium channels and initiate the spontaneous
release of calcium (Soderlund et al. 2002). Typically, only type II pyrethroids act on voltage-
gated chloride channels (Forshaw and Bradbury 1983; Forshaw et al. 1987, 1993). Casida et al.
(1983), Lawrence and Casida (1983), and Casida and Lawrence (1985) investigated 37
pyrethroids and reported that only type II pyrethroids inhibit the activity of GABA receptors.
Alternatively, most of the type I pyrethroids are potent inhibitors of nicotinic acetylcholine
receptors (Abbassy et al. 1983a, 1983b). Both types of pyrethroids inhibit the activity of
glutamate receptors (Staatzbenson and Hosko 1986).
METABOLISM
The tissue distribution and metabolism of PER have been well studied in the literature.
Gaughan et al. (1978) examined the tissue distribution and metabolism of CIS and TRANS in
laying hens. Ivie and Hunt (1980) conducted similar studies in lactating goats. One of the first
small animal metabolism studies of PER was conducted by Gaughan et al. (1977) in rats. Several
in vitro and in vivo studies have been undertaken to identify the metabolic fate of PER. More
than 80 metabolites have been identified in different species. Metabolism of CIS and TRANS
have been investigated in mice, rats, Rhesus monkeys, rainbow trout, and livestock such as

5
goats, cows, and hens (Ueda et al. 1975; Gaughan et al. 1977, 1978; Casida et al. 1979; Casida
and Ruzo 1980; Ivie and Hunt 1980; Crawford et al. 1981). Among all metabolites, the following
have been widely investigated and well characterized in most species; 3-phenoxybenzoic acid (3-
PBA), 3-phenoxybenzylalcohol (3-PBAlc), 3-phenoxybenzaldehyde (3-PBAld), and cis-or trans-
3-(2,2, chlorovinyl)-2,2-dimethyl-(1-cyclopropane) carboxylic acid (CIS-DCCA and TRANS-
DCCA) (Casida et al. 1979).
PER is metabolized via two major pathways: oxidation by cytochrome P450s (CYPs) and
hydrolysis by carboxylesterases (CaE). The metabolic pathways of CIS and TRANS are quite
different from each other. In both rat and humans, CIS is primarily metabolized by CYPs. On the
other hand, TRANS is extensively metabolized by CaE in rats (65%) and humans (41%)
(Scollon et al. 2009). CaE is a serine hydrolase which metabolizes via a ping-pong bi-bi
mechanism. In this process, a conformational change takes place at the enzyme after attachment
of the first substrate and a tetrahedral intermediate is produced. Due to the conformational
change the enzyme is able to attach to another substrate. Substrates bind to Glu 335 and His 448
on CaE. After that, Ser 203 with Gly 123-124 creates an oxyanion hole where the substrate binds
for metabolism (Satoh and Hosokawa 1998). The main reason CaE does not readily metabolize
CIS is because of steric hindrance caused by its conformation. Nakamura et al. (2007) indicated
that esterase (ES)-3 and -10, members of CaEs 1 family in rat hepatocytes and intestine are
responsible for the metabolism of TRANS. These CaEs do not metabolize CIS at a great extent.
A simple metabolic pathway of CIS and TRANS is outlined in Fig. 1.2.
Metabolic capacities of younger rats are much different than the older ones. Anand et al.
(2006) reported that metabolism of DLM is age-dependent. The Vmax and intrinsic clearance of
plasma CaE, liver CaE and CYPs are significantly different between young and adult rats. The

6
ontogeny of hepatic CaE in humans is also age-dependent. Both mitochondrial and cytosolic CaE
1 and 2 are significantly lower in individuals less than 3 weeks of age compared to older
individuals (> than 6 years of age) in humans (Hines et al. 2016).
McPhail et al. (2016) studied the ontogeny of a number of rat hepatic CYPs and
correlated that to chemical risks associated with children. During the developmental stage, a
difference between males and females were also observed. In laboratory animals, prenatal
exposure to DLM, a type II pyrethroid, induced a number of CYPs. Pregnant rats were given
0.25, 0.50, or 1 mg/kg DLM by oral gavage between gestation day 5 and 21. The offspring
showed higher mRNA levels of CYP 1A1, 1A2, 2B1, 2B2, and 2E1 than the control animals
(Johri et al. 2006). In rats, CIS and TRANS are primarily metabolized by CYP 2C6 and 2C11.
The minor contributors are CYP 1A1, 1A2, and 3A2. CYP 3A1 participates in CIS metabolism
but not in TRANS metabolism (Scollon et al. 2009). CYP 2C6 and 2C11 were not present during
prenatal (gestation day 15-21) or perinatal (1-day old) stages. During the neonatal (5-15-day old)
phase, weak activity of CYPs have been detected. The CYPs mature during the weanling (21-35-
day-old) stage of rats (Rich and Boobis 1997). In humans, the main contributor to CIS and
TRANS metabolism is CYP 2C19. The minor contributors are CYP 1A1, 1A2, and 2C8. CYP
3A4 and 2C9*1 are involved in CIS metabolism only. Alternatively, CYP 2C9*2 is responsible
for only TRANS metabolism. CYP 2C9 and 2C19 levels increase significantly after birth as
levels raise several fold in the first 5 months after birth. After 5 months, the levels of these CYPs
are equivalent to adult levels (Koukouritaki et al. 2004; Blake et al. 2005).
Marchetti et al. (1997) conducted a metabolism study to demonstrate metabolic
differences between sex and strain. CYPs activity in two different strains of rats were statistical
different in males and females. In Sprague-Dawley (S-D) rats, the CYPs activities were 0.59 and

7
0.48 nmol/kg protein for male and female rats, respectively. Similarly, CYP levels were
significantly different between male (50 nmol/kg) and female (35 nmol/kg) in hairless rats. CYP
1A2 and 2E1 levels were higher in female than in male rats. Alternatively, male rats expressed
more CYP 2B1/2 and CYP 3A than females (Marchetti et al. 1997). Kato and Yamazoe (1992)
reported CYPs are expressed at a higher level in male rats than in female rats including the ones
responsible for PER metabolism. CYP 2C11 (20-fold increase) and 3A2 (5-fold increase) were
higher in male than in female rats (Kato and Yamazoe 1992). CYP 2C11 and 3A2 are a major
and a minor contributor, respectively of PER metabolism. Adult plasma and liver CaE were not
different between male and female rats (Moser et al. 1998; De Zwart et al. 2008).
TK IN ADLUTS
DLM, bifenthrin, lambda-cyhalothrin, and PER TK were studied in rats (Anadon et al.
1991, 2006; Kim et al. 2008, 2010; Tornero-Velez et al. 2010, 2012; Hughes et al. 2016;
Willemin et al. 2016). Hughes et al. (2016) administered 0.3 and 3 mg/kg i.v. or oral dose of
bifenthrin and studied TK parameters in plasma, brain, liver, and fat. The elimination half-life
and bioavailability were 8 h and 30%. Anadón et al. (2006) investigated the plasma and tissue
TK of lambda-cyhalothrin with an i.v. dose of 3 mg/kg and an oral dose of 20 mg/kg. The
elimination half-lives were 7.55 and 10.27 h after the i.v. and oral dosing, respectively.
Bioavailability was found to be 67.37%.
PER TKs were investigated in broiler chickens (Gögebakan and Eraslan 2015). The TK
of PER was investigated via i.v. and intra-crop dosing to gain an understanding of bioavailability
and TK differences between the exposure routes. The elimination half-lives were 4.73 and 5.44 h
for i.v. and intra-crop administration, respectively. Intra-crop bioavailability was 11% in this
study. Anadon et al. (1991) investigated the TK of PER in a 25:75 mixture of CIS:TRANS.

8
Doses of 460 mg/kg (p.o) and 46 mg/kg (i.v) were administered to the study animals. The
elimination half-lives were 8.67 and 12.37 h after i.v. and oral administration, respectively. The
oral bioavailability was 60.67%. To our knowledge, there was only one TK study conducted on
human volunteers (Ratelle et al. 2015). Healthy human individuals ingested 0.1 mg/kg PER
(TRANS:CIS; 60:40). Blood and urine samples were collected for up to 4 days after exposure to
examine the major metabolites; CIS-DCCA, TRANS-DCCA, and PBA. Surprisingly enough,
parent compound was not monitored in this study. Starr et al. (2014) examined a number of
pyrethroid mixtures and reported that plasma half-life was almost identical for CIS and TRANS
when provided in a mixture with other pyrethroids but the brain half-life of TRANS was half of
CIS under the same conditions (Starr et al. 2014). Separate TK evaluation of CIS or TRANS are
not available in the literature. Therefore, one of the major objective of this study was to evaluate
the TK of CIS and TRANS separately to gain a comprehensive understanding of PER TK.
AGE-DEPENDENT TK
Despite the extensive use of pyrethroids, only a few studies have characterized age-
dependent TK of pyrethroids. Bruckner (2000) examined a number of chemicals and xenobiotics
in rats and observed that younger animals were more vulnerable to the toxic insult of the
compounds. One of first studies that illustrated neurotoxicity of DLM in younger species was
conducted by Sheets et al. (1994). In another study, Sheets (2000) determined that the LD 50 of
several pyrethroids for three age groups in rats; post-natal day (PND) 11, PND 21 and PND 72
and showed the LD 50s in younger age groups was lower than the adult group.
Kim et al. (2010) and Mortuza et al. (2018) conducted comprehensive studies to evaluate
DLM TK in young and adult rats. Dose, vehicle effect, tissue disposition, and low-dose age-
equivalent studies were conducted in several age groups at different doses. DLM uptake was

9
rapid and somewhat extensive when dosed in an aqueous solvent such as glycerol formal, as
compared to an oil vehicle. The younger age groups showed higher concentrations in plasma and
tissues at lower dose levels compared to adults. However, the differences were diminished at an
environmentally relevant dose (Mortuza et al. 2018). No age-dependent study related to CIS or
TRANS was available in the literature. Therefore, one of the main objective of this project is to
evaluate the age-dependent TK of CIS and TRANS.
SEX-DEPENDENT TK
There are several pharmacokinetic and pharmacodynamic differences between males and
females that include gastric and hepatic enzyme expression (Arthur et al. 1984; Parlesak et al.
2002) and transporter expression (Tamai et al. 1997; Jovanovic et al. 2008). Males and females
also differ in body fat composition and cardiac output (Young and Tensuan 1963). Lipophilic
compounds, like PER, may adhere to body fat which includes lipids in the brain, and thus may
manifest different distribution of xenobiotics in females than in males. There are a limited
number of studies performed in the literature to illustrate sex-dependent TK. Abe et al. (2015)
studied the metabolism of profluthrin, a type I pyrethroid. Male and female rats were orally
gavaged 1 or 60 mg/kg of profluthrin to evaluate TK profile and sex-dependent metabolism. A
comprehensive study of a number of tissues revealed little or no difference between male and
female rats. Ueyama et al. (2010) studied the toxicokinetics of pyrethroid metabolites in males
and female rats. Hydrolytic metabolites of PER, 3-phenoxybenzoic acid (3-PBA), 3-
phenoxybenzaldehyde (3-PBAld), and 3-phenoxybenzoic alcohol (3-PBAlc), were evaluated in
plasma and tissues. There was a significant difference between TK parameters of 3-PBA and 3-
PBAlc between male and female rats. The half-lives in male plasma of 3-PBAlc and 3-PBA were
2.22 and 1.56 h, respectively. Alternatively, the half-lives were 0.57 and 1.21 h in females.

10
Tissue distribution of 3-PBAlc showed differences in fat and kidney between male and female
rats. Three-PBAld did not show any significant sex differences (Ueyama et al. 2010). As there
are such limited data available for sex-dependent TKs of CIS and TRANS, an important
objective of this study is to examine the sex-dependent TKs of CIS and TRANS.
TARGET TISSUE UPTAKE
Amaraneni et al. (2017) demonstrated that brain uptake of DLM, a type II pyrethroid, is
inversely related to age and differences between the older age groups were less pronounced.
Blood-brain barrier (BBB) maturation and vascularization of the brain in rats have been studied
(Caley and Maxwell 1970; Bär and Wolff 1972; Schulze and Firth 1992). The tightening of the
endothelial junctions was associated with increasing thickness of the basement membrane and
envelopment by pericytes. The structural integrity of the endothelial tight junctions was
maintained by a basement membrane, pericytes and astrocytes (Liebner et al. 2011; Hagan and
Ben-Zvi 2015). Studies were conducted in embryonic and postnatal morphological changes of
the cerebral microvasculature of rats (Caley and Maxwell 1970; Bär and Wolff 1972; Schulze
and Firth 1992). In these studies, major structural components such as vessel wall endothelium,
basement membrane, pericytes, and astrocytes were monitored. The structural integrity and
maturity were achieved by PND 21. This indicates that PND 21 and adult animals are quite
similar to each other regarding blood-brain barrier integrity. Liebner et al. (2011) suggested that
the maturity of the BBB is a gradual process starting at embryogenesis and progresses through
the early lifespan of the animal. Stewart and Hayakawa (1987) demonstrated that blood-brain
barrier permeability to horseradish peroxide in maturing rats proportionally decreased with the
reduction of numbers and width of clefts between adjacent cerebral capillary endothelial cells.
Ferguson and Woodbury (1969) investigated the brain uptake of inulin as a function of blood-

11
brain barrier maturity and reported that the brain uptake of this water-soluble drugs was inversely
related to age from PND 4-26. Larger animals such as pigs were also investigated. Lee et al.
(1995) found that PND 2 had higher levels of unconjugated brain bilirubin level than PND 14.
As unconjugated bilirubin is an excellent indicator of greater BBB permeability (Brito et al.
2014), these findings indicated that younger animals have higher BBB permeability than older
animals.
Unlike rats, human BBB development has not been studied extensively. A number of
investigators indicated that the human brain has an effective BBB mechanism in the newborn by
providing morphological and molecular evidence (Ek et al. 2012; Engelhardt and Liebner 2014).
The investigator acknowledges their limitations and noted that some of the barrier mechanisms
may not function as in adults. The maturation of the human blood-brain barrier ranged from 2
weeks to 9 months depending on the study (Widell 1958; Misra et al. 1987; Wong et al. 2000;
Shah et al. 2011). Misra et al. (1987) investigated the entry of sodium fluorescein in
cerebrospinal fluid (CSF) subjects up to 6 months old and reported that a significant drop of CSF
sodium fluorescein uptake was observed during the first 2 weeks of life. Shah et al. (2011)
conducted a comprehensive study with a large group of infants and reported that the CSF protein
levels were lowest during the first 4 weeks of birth. Statz and Felgenhauer (1983) and (Wong et
al. 2000) reported the CSF protein levels rapidly drop by 6 months of age. Widell (1958)
conducted a study with 98 healthy children between 0-13 years of age to evaluate CSF protein
levels. Total protein levels diminished after the first 9-month post-birth. Sengupta (2013)
reported that 13.3 rat days is comparable to 1 human year based on comparisons conducted on
the weight of eye lens, teeth, endosteal layers of tibia, and musculoskeletal examination. Rats
and humans reach the desired blood-brain integrity at 3 weeks and 6 months, respectively.

12
Therefore, it appears the functional maturity in the human blood-brain barrier occurs at an earlier
life stage than rat.
As females tend to have more body fat males, lipophilic compounds like PER may adhere
to body fat thus manifests different distribution. Though structural differences between male and
female blood-brain barrier have not been well differentiated in the literature, sex-dependent brain
uptake of antidepressant drugs in humans (Khan et al. 2005) and rodents (Walker et al. 2006) has
been demonstrated. Ren (2011) reported that extracellular sodium, potassium and calcium ions
influence the excitability of dopaminergic receptor (target of many antidepressants). PER acts
on voltage gated sodium channels (VGSCs) in the central nervous system (CNS) that also are
controlled by the extracellular sodium. Therefore, it was worth identifying whether there are
differences between adult male and female brain uptake.
Amaraneni et al. (2016) reported that the transport mechanism of DLM, CIS, and
TRANS is a non-saturable passive diffusion process and does not include any solute carrier and
ATP binding cassette transporters such as P-gp in the export process in the blood-brain barrier.
Though these pyrethroids are not an inhibitor or a substrate of P-gp efflux transporters, it is
possible that a low-affinity transporter may contribute to PER uptake into the brain (Amaraneni
et al. 2016). The molecular weight of PER is relatively high (391.28), and the logP is higher than
5. Both of these physicochemical properties concur with Lipinski’s rule of five for low
membrane permeability (Lipinski et al. 2012). Furthermore, compounds with a high logP value
have high lipid partitioning and exhibit non-specific hydrophobic bonding which reduces the flux
of highly lipophilic compounds through the BBB. Thus, the target organ uptake may be limited
for PER and other pyrethroids. However, studies have not been performed to investigate the role

13
of blood-brain barrier in restricting the uptake of PER. Evaluation of the age- and sex-dependent
target tissue uptake of CIS and TRANS will reduce the knowledge gap in target organ dosimetry.
TOXICOKINETIC MODEL OF PER
A number of biological models have been constructed to obtain a clear indication of
internal dose and tissue dosimetry of PER and other pyrethroids in laboratory animals
(Mirfazaelian et al. 2006; Godin et al. 2010; Tornero-Velez et al. 2010, 2012; Willemin et al.
2016) and human (Appel et al. 2008; Ratelle et al. 2015; Li et al. 2016). Wei et al. (2012)
constructed a physiologically based pharmacokinetic (PBPK) model of PER exposure in flight
attendants and indicated that inhalation exposure was the primary route of exposure for pre-flight
spraying, and dermal and oral routes were predominant under a residual treatment scenario. Cote
et al. (2014) constructed a toxicokinetic model in humans from biomarker data of cypermethrin
and PER and their metabolites. This model predicts a urinary time course for major metabolites
of PER. One of the first PBPK models of pyrethroids was constructed by Mirfazaelian et al.
(2006) who constructed a PBPK model of PER in adult rats. An age-dependent DLM PBPK
model was constructed by Tornero-Velez et al. (2010). This model predicted plasma and tissue
dosimetry for PND 10, PND 21, PND 40, and PND 90 in plasma and other target tissues.
Tornero-Velez et al. (2012) modeled CIS and TRANS in rats and humans for aggregate exposure
scenarios which included oral exposure data of rats and humans while Willemin et al. (2016)
modeled CIS and TRANS including their metabolites in rats. Neonatal data was not included in
the model to identify tissue dosimetry of younger species. The current study will provide age-
dependent TK data at different dose levels of CIS and TRANS to construct a comprehensive
PBTK model for these compounds.

14
Typically, a 10-fold uncertainity factor is associated with intra- and inter-species
extrapolation in risk assessment to compensate for toxicokinetic and toxicodynamic data gap
(Renwick 1998). There are only limited number of TK data available in the literature to
demonstrate the age and sex-dependency of PER as well as other pyrethroids. Therefore, an
attempt was taken to investigate the age dependent TK and brain uptake of both isomers of PER.
The overall hypothesis of the project was:
TK and target organ uptake of PER is age-, sex- and isomer-dependent.
The overall Study Objectives of this Project were:
1. Examine the influence of age on the TK of CIS and TRANS in PND 15, PND 21, and
adult Sprague Dawley (SD) rats
2. Evaluate the TK differences of CIS and TRANS in adult male and female SD rats
3. Assess the isomeric effect of TK of CIS and TRANS in all three age groups
4. Study the brain uptake of CIS and TRANS in rats as a function of maturation of blood-
brain barrier and sex

15
REFERENCES
Abbassy, M., M. Eldefrawi and A. Eldefrawi (1983a). "Influence of the alcohol moiety of
pyrethroids on their interactions with the nicotinic acetylcholine receptor." Journal of Toxicology
and Environmental Health, Part A Current Issues 12(4-6): 575-590.
Abbassy, M., M. Eldefrawi and A. Eldefrawi (1983b). "Pyrethroid action on the nicotinic
acetylcholine receptor/channel." Pesticide Biochemistry and Physiology 19(3): 299-308.
Abe, J., H. Nagahori, R. Omori, K. Mikata, M. Kurosawa, Y. Tomigahara and N. Isobe (2015).
"Metabolism of (Z)-(1 R, 3 R)-profluthrin in Rats." Journal of Agricultural and Food Chemistry
63(39): 8651-8661.
Amaraneni, M., J. Pang, T. B. Mortuza, S. Muralidhara, B. S. Cummings, C. A. White, C. V.
Vorhees, J. Zastre and J. V. Bruckner (2017). "Brain uptake of deltamethrin in rats as a function
of plasma protein binding and blood-brain barrier maturation." Neurotoxicology 62: 24-29.
Amaraneni, M., A. Sharma, J. Pang, S. Muralidhara, B. S. Cummings, C. A. White, J. V.
Bruckner and J. Zastre (2016). "Plasma protein binding limits the blood brain barrier permeation
of the pyrethroid insecticide, deltamethrin." Toxicology Letters 250: 21-28.
Anadón, A., M. Martínez, M. Martínez, M. Díaz and M. Martínez-Larrañaga (2006).
"Toxicokinetics of lambda-cyhalothrin in rats." Toxicology Letters 165(1): 47-56.
Anadon, A., M. R. Martinezlarranaga, M. J. Diaz and P. Bringas (1991). "Toxicokinetics of
Permethrin in the Rat." Toxicology and Applied Pharmacology 110(1): 1-8.
Anand, S. S., K.-B. Kim, S. Padilla, H. J. Kim, J. W. Fisher and J. V. Bruckner (2006).
"Ontogeny of hepatic and plasma metabolism of deltamethrin in vitro: role in age-dependent
acute neurotoxicity." Drug Metabolism and Disposition 34(3) 389-397.

16
Appel, K. E., U. Gundert-Remy, H. Fischer, M. Faulde, K. G. Mross, S. Letzel and B. Rossbach
(2008). "Risk assessment of Bundeswehr (German Federal Armed Forces) permethrin-
impregnated battle dress uniforms (BDU)." International Journal of Hygiene and Environmental
Health 211(1-2): 88-104.
Arthur, M., A. Lee and R. Wright (1984). "Sex differences in the metabolism of ethanol and
acetaldehyde in normal subjects." Clinical Science 67(4): 397-401.
Bär, T. and J. Wolff (1972). "The formation of capillary basement membranes during internal
vascularization of the rat's cerebral cortex." Zeitschrift für Zellforschung und mikroskopische
Anatomie 133(2): 231-248.
Blake, M. J., L. Castro, J. S. Leeder and G. L. Kearns (2005). Ontogeny of drug metabolizing
enzymes in the neonate. Seminars in Fetal and Neonatal Medicine, Elsevier 10(2): 123-138.
Brito, M. A., I. Palmela, F. L. Cardoso, I. Sá-Pereira and D. Brites (2014). "Blood–brain barrier
and bilirubin: clinical aspects and experimental data." Archives of Medical Research 45(8): 660-
676.
Bruckner, J. V. (2000). "Differences in sensitivity of children and adults to chemical toxicity: the
NAS panel report." Regulatory Toxicology and Pharmacology 31(3): 280-285.
Caley, D. W. and D. S. Maxwell (1970). "Development of the blood vessels and extracellular
spaces during postnatal maturation of rat cerebral cortex." Journal of Comparative Neurology
138(1): 31-47.
Casida, J. E., D. W. Gammon, A. H. Glickman and L. J. Lawrence (1983). "Mechanisms of
selective action of pyrethroid insecticides." Annual Review of Pharmacology and Toxicology
23(1): 413-438.

17
Casida, J. E., L. C. Gaughan and L. O. Ruzo (1979). Comparative metabolism of pyrethroids
derived from 3-phenoxybenzyl and α-cyano-3-phenoxybenzyl alcohols. Synthesis of Pesticides
Chemical Structure and Biological Activity Natural Products with Biological Activity, Elsevier:
182-189.
Casida, J. E. and L. J. Lawrence (1985). "Structure-activity correlations for interactions of
bicyclophosphorus esters and some polychlorocycloalkane and pyrethroid insecticides with the
brain-specific t-butylbicyclophosphorothionate receptor." Environmental Health Perspectives 61:
123.
Casida, J. E. and L. O. Ruzo (1980). "Metabolic chemistry of pyrethroid insecticides." Pesticide
Science 11(2): 257-269.
Cote, J., Y. Bonvalot, G. Carrier, C. Lapointe, U. Fuhr, D. Tomalik-Scharte, B. Wachall and M.
Bouchard (2014). "A novel toxicokinetic modeling of cypermethrin and permethrin and their
metabolites in humans for dose reconstruction from biomarker data." PLoS One 9(2): e88517.
Crawford, M. J., A. Croucher and D. H. Hutson (1981). "Metabolism of cis-and trans-
cypermethrin in rats. Balance and tissue retention study." Journal of Agricultural and Food
Chemistry 29(1): 130-135.
De Zwart, L., M. Scholten, J. Monbaliu, L. De Schaepdrijver, G. Bailey, C. Tim, C. Werner, J.
Van Houdt and M. Geert (2008). "The ontogeny of drug-metabolizing enzymes and transporters
in the rat." Drug Metabolism Reviews 38: 107-108.
Ek, C. J., K. M. Dziegielewska, M. D. Habgood and N. R. Saunders (2012). "Barriers in the
developing brain and neurotoxicology." Neurotoxicology 33(3): 586-604.
Engelhardt, B. and S. Liebner (2014). "Novel insights into the development and maintenance of
the blood-brain barrier." Cell & Tissue Research 355(3): 687-699.

18
Ferguson, R. K. and D. M. Woodbury (1969). "Penetration of 14C-inulin and 14C-sucrose into
brain, cerebrospinal fluid, and skeletal muscle of developing rats." Experimental Brain Research
7(3): 181-194.
Forshaw, P., T. Lister and D. Ray (1993). "Inhibition of a neuronal voltage-dependent chloride
channel by the type II pyrethroid, deltamethrin." Neuropharmacology 32(2): 105-111.
Forshaw, P. J. and J. E. Bradbury (1983). "Pharmacological effects of pyrethroids on the
cardiovascular system of the rat." European Journal of Pharmacology 91(2-3): 207-213.
Forshaw, P. J., T. Lister and D. E. Ray (1987). "The effects of two types of pyrethroid on rat
skeletal muscle." European Journal of Pharmacology 134(1): 89-96.
Frankowski, B. L., L. B. Weiner, Committee on School Health, & Committee on Infectious
Diseases (2002). "Head lice." Pediatrics 110(3): 638-643.
Gaughan, L. C., R. A. Robinson and J. E. Casida (1978). "Distribution and metabolic fate of
trans-and cis-permethrin in laying hens." Journal of Agricultural and Food Chemistry 26(6):
1374-1380.
Gaughan, L. C., T. Unai and J. E. Casida (1977). "Permethrin metabolism in rats." Journal of
Agricultural and Food Chemistry 25(1): 9-17.
Godin, S. J., M. J. DeVito, M. F. Hughes, D. G. Ross, E. J. Scollon, J. M. Starr, R. W. Setzer, R.
B. Conolly and R. Tornero-Velez (2010). "Physiologically based pharmacokinetic modeling of
deltamethrin: development of a rat and human diffusion-limited model." Toxicological Sciences
115(2): 330-343.
Gögebakan, T. and G. Eraslan (2015). "Single-dose toxicokinetics of permethrin in broiler
chickens." British Poultry Science 56(5): 605-611.

19
Hagan, N. and A. Ben-Zvi (2015). The molecular, cellular, and morphological components of
blood–brain barrier development during embryogenesis. Seminars in Cell and Developmental
Biology, Elsevier 38: 7-15.
Hines, R. N., P. M. Simpson and D. G. McCarver (2016). "Age-dependent human hepatic
carboxylesterase 1 (CES1) and carboxylesterase 2 (CES2) postnatal ontogeny." Drug
Metabolism and Disposition 44(7): 959-966.
Hossain, M. M., E. DiCicco-Bloom and J. R. Richardson (2015). "Hippocampal ER stress and
learning deficits following repeated pyrethroid exposure." Toxicological Sciences 143(1): 220-
228.
Hughes, M. F., D. G. Ross, B. C. Edwards, M. J. DeVito and J. M. Starr (2016). "Tissue time
course and bioavailability of the pyrethroid insecticide bifenthrin in the Long-Evans rat."
Xenobiotica 46(5): 430-438.
Ivie, G. W. and L. M. Hunt (1980). "Metabolites of cis-permethrin and trans-permethrin in
lactating goats." Journal of Agricultural and Food Chemistry 28(6): 1131-1138.
Johri, A., A. Dhawan, R. L. Singh and D. Parmar (2006). "Effect of prenatal exposure of
deltamethrin on the ontogeny of xenobiotic metabolizing cytochrome P450s in the brain and
liver of offsprings." Toxicology and Applied Pharmacology 214(3): 279-289.
Jovanovic, H., J. Lundberg, P. Karlsson, A. Cerin, T. Saijo, A. Varrone, C. Halldin and A. L.
Nordstrom (2008). "Sex differences in the serotonin 1A receptor and serotonin transporter
binding in the human brain measured by PET." Neuroimage 39(3): 1408-1419.
Kato, R. and Y. Yamazoe (1992). "Sex-specific cytochrome P450 as a cause of sex- and species-
related differences in drug toxicity." Toxicology Letters 64-65 Spec No: 661-667.

20
Khan, A., A. E. Brodhead, K. A. Schwartz, R. L. Kolts and W. A. Brown (2005). "Sex
differences in antidepressant response in recent antidepressant clinical trials." Journal of Clinical
Psychopharmacology 25(4): 318-324.
Kim, K.-B., S. S. Anand, H. J. Kim, C. A. White, J. W. Fisher, R. Tornero-Velez and J. V.
Bruckner (2010). "Age, dose, and time-dependency of plasma and tissue distribution of
deltamethrin in immature rats." Toxicological Sciences 115(2): 354-368.
Kim, K. B., S. S. Anand, H. J. Kim, C. A. White and J. V. Bruckner (2008). "Toxicokinetics and
tissue distribution of deltamethrin in adult Sprague-Dawley rats." Toxicological Sciences 101(2):
197-205.
Koukouritaki, S. B., J. R. Manro, S. A. Marsh, J. C. Stevens, A. E. Rettie, D. G. McCarver and
R. N. Hines (2004). "Developmental expression of human hepatic CYP2C9 and CYP2C19."
Journal of Pharmacology and Experimental Therapeutics 308(3): 965-974.
Lawrence, L. J. and J. E. Casida (1983). "Stereospecific action of pyrethroid insecticides on the
gamma-aminobutyric acid receptor ionophore complex." Science 221(4618): 1399-1401.
Lee, C., B. S. Stonestreet, W. Oh, E. W. Outerbridge and W. J. Cashore (1995). "Postnatal
maturation of the blood-brain-barrier for unbound bilirubin in newborn piglets." Brain Research
689(2): 233-238.
Li, W. W., M. K. Morgan, S. E. Graham and J. M. Starr (2016). "Measurement of pyrethroids
and their environmental degradation products in fresh fruits and vegetables using a modification
of the quick easy cheap effective rugged safe (QuEChERS) method." Talanta 151: 42-50.
Liebner, S., C. J. Czupalla and H. Wolburg (2011). "Current concepts of blood-brain barrier
development." International Journal of Developmental Biology 55(4-5): 467-476.

21
Lipinski, C. A., F. Lombardo, B. W. Dominy and P. J. Feeney (2012). "Experimental and
computational approaches to estimate solubility and permeability in drug discovery and
development settings." Advanced Drug Delivery Reviews 64: 4-17.
Magby, J. P. and J. R. Richardson (2017). "Developmental pyrethroid exposure causes long-term
decreases of neuronal sodium channel expression." Neurotoxicology 60: 274-279.
Marchetti, M. N., E. Sampol, H. Bun, H. Scoma, B. Lacarelle and A. Durand (1997). "In vitro
metabolism of three major isomers of retinoic acid in rats - Intersex and interstrain comparison."
Drug Metabolism and Disposition 25(5): 637-646.
McPhail, B. T., C. A. White, B. S. Cummings, S. Muralidhara, J. T. Wilson and J. V. Bruckner
(2016). "The immature rat as a potential model for chemical risks to children: Ontogeny of
selected hepatic P450s." Chemico-Biological Interactions 256: 167-177.
Mirfazaelian, A., K. B. Kim, S. S. Anand, H. J. Kim, R. Tornero-Velez, J. V. Bruckner and J. W.
Fisher (2006). "Development of a physiologically based pharmacokinetic model for deltamethrin
in the adult male Sprague-Dawley rat." Toxicological Sciences 93(2): 432-442.
Misra, P. K., A. Gulati, A. K. Mahesh, B. Sharma, G. K. Malik and K. N. Dhawan (1987).
"Maturity of blood-brain-barrier in children." Indian Journal of Medical Research 85: 401-403.
Morgan, M. K. and P. A. Jones (2013). "Dietary predictors of young children's exposure to
current-use pesticides using urinary biomonitoring." Food and Chemical Toxicology 62: 131-
141.
Morgan, M. K., L. S. Sheldon, C. W. Croghan, P. A. Jones, J. C. Chuang and N. K. Wilson
(2007). "An observational study of 127 preschool children at their homes and daycare centers in
Ohio: Environmental pathways to cis- and trans-permethrin exposure." Environmental Research
104(2): 266-274.

22
Mortuza, T., C. Chen, C. A. White, B. S. Cummings, S. Muralidhara, D. Gullick and J. V.
Bruckner (2018). "Toxicokinetics of deltamethrin: Dosage dependency, vehicle effects, and low-
dose age-equivalent dosimetry in rats." Toxicological Sciences 162(1): 327-336.
Moser, V. C., S. M. Chanda, S. R. Mortensen and S. Padilla (1998). "Age- and gender-related
differences in sensitivity to chlorpyrifos in the rat reflect developmental profiles of esterase
activities." Toxicological Sciences 46(2): 211-222.
Nakamura, Y., K. Sugihara, T. Sone, M. Isobe, S. Ohta and S. Kitamura (2007). "The in vitro
metabolism of a pyrethroid insecticide, permethrin, and its hydrolysis products in rats."
Toxicology 235(3): 176-184.
Narahashi, T. (1996). "Neuronal ion channels as the target sites of insecticides." Pharmacology
& Toxicology 79(1): 1-14.
Parlesak, A., M. H. U. Billinger, C. Bode and J. C. Bode (2002). "Gastric alcohol dehydrogenase
activity in man: Influence of gender, age, alcohol consumption and smoking in a caucasian
population." Alcohol and Alcoholism 37(4): 388-393.
Ratelle, M., J. Cote and M. Bouchard (2015). "Time profiles and toxicokinetic parameters of key
biomarkers of exposure to cypermethrin in orally exposed volunteers compared with previously
available kinetic data following permethrin exposure." Journal of Applied Toxicology 35(12):
1586-1593.
Ren, D. J. (2011). "Sodium Leak Channels in Neuronal Excitability and Rhythmic Behaviors."
Neuron 72(6): 899-911.
Renwick, A. G. (1998). "Toxicokinetics in infants and children in relation to the ADI and TDI."
Food Additives and Contaminants 15 Suppl: 17-35.

23
Rich, K. J. and A. R. Boobis (1997). "Expression and inducibility of P450 enzymes during liver
ontogeny." Microscopy Research and Technique 39(5): 424-435.
Saillenfait, A. M., D. Ndiaye and J. P. Sabate (2015). "Pyrethroids: Exposure and health effects -
An update." International Journal of Hygiene and Environmental Health 218(3): 281-292.
Satoh, T. and M. Hosokawa (1998). "The mammalian carboxylesterases: From molecules to
functions." Annual Review of Pharmacology and Toxicology 38: 257-288.
Schulze, C. and J. A. Firth (1992). "Interendothelial junctions during blood-brain-barrier
development in the rat - Morphological-changes at the level of individual tight junctional
contacts." Developmental Brain Research 69(1): 85-95.
Scollon, E. J., J. M. Starr, S. J. Godin, M. J. DeVito and M. F. Hughes (2009). "In vitro
metabolism of pyrethroid pesticides by rat and human hepatic microsomes and cytochrome P450
isoforms." Drug Metabolism and Disposition 37(1): 221-228.
Sengupta, P. (2013). "The laboratory rat: Relating its age with human's." International Journal of
Preventive Medicine 4(6): 624-630.
Shafer, T. J., D. A. Meyer and K. M. Crofton (2005). "Developmental neurotoxicity of
pyrethroid insecticides: critical review and future research needs." Environmental Health
Perspectives 113(2): 123.
Shah, S. S., J. Ebberson, L. A. Kestenbaum, R. L. Hodinka and J. J. Zorc (2011). "Age-specific
reference values for cerebrospinal fluid protein concentration in neonates and young infants."
Journal of Hospital Medicine 6(1): 22-27.
Sheets, L. P. (2000). "A consideration of age-dependent differences in susceptibility to
organophosphorus and pyrethroid insecticides." Neurotoxicology 21(1-2): 57-63.

24
Sheets, L. P., J. D. Doherty, M. W. Law, L. W. Reiter and K. M. Crofton (1994). "Age-
dependent differences in the susceptibility of rats to deltamethrin." Toxicology and Applied
Pharmacology 126(1): 186-190.
Shelton, J. F., E. M. Geraghty, D. J. Tancredi, L. D. Delwiche, R. J. Schmidt, B. Ritz, R. L.
Hansen and I. Hertz-Picciotto (2014). "Neurodevelopmental disorders and prenatal residential
proximity to agricultural pesticides: The CHARGE Study." Environmental Health Perspectives
122(10): 1103-1109.
Sinha, C., A. K. Agrawal, F. Islam, K. Seth, R. K. Chaturvedi, S. Shukla and P. K. Seth (2004).
"Mosquito repellent (pyrethroid-based) induced dysfunction of blood-brain barrier permeability
in developing brain." International Journal of Developmental Neuroscience 22(1): 31-37.
Soderlund, D. M., J. M. Clark, L. P. Sheets, L. S. Mullin, V. J. Piccirillo, D. Sargent, J. T.
Stevens and M. L. Weiner (2002). "Mechanisms of pyrethroid neurotoxicity: implications for
cumulative risk assessment." Toxicology 171(1): 3-59.
Staatzbenson, C. G. and M. J. Hosko (1986). "Interaction of pyrethroids with mammalian spinal
neurons." Pesticide Biochemistry and Physiology 25(1): 19-30.
Starr, J. M., S. E. Graham, D. G. Ross, R. Tornero-Velez, E. J. Scollon, M. J. DeVito, K. M.
Crofton, M. J. Wolansky and M. F. Hughes (2014). "Environmentally relevant mixing ratios in
cumulative assessments: A study of the kinetics of pyrethroids and their ester cleavage
metabolites in blood and brain; and the effect of a pyrethroid mixture on the motor activity of
rats." Toxicology 320: 15-24.
Statz, A. and K. Felgenhauer (1983). "Development of the blood-CSF barrier." Developmental
Medicine and Child Neurology 25(2): 152-161.

25
Stewart, P. A. and E. M. Hayakawa (1987). "Interendothelial junctional changes underlie the
developmental tightening of the blood-brain-barrier." Developmental Brain Research 32(2): 271-
281.
Tamai, I., A. Saheki, R. Saitoh, Y. Sai, I. Yamada and A. Tsuji (1997). "Nonlinear intestinal
absorption of 5-hydroxytryptamine receptor antagonist caused by absorptive and secretory
transporters." Journal of Pharmacology and Experimental Therapeutics 283(1): 108-115.
Tornero-Velez, R., J. Davis, E. J. Scollon, J. M. Starr, R. W. Setzer, M. R. Goldsmith, D. T.
Chang, J. Xue, V. Zartarian, M. J. DeVito and M. F. Hughes (2012). "A pharmacokinetic model
of cis- and trans-permethrin disposition in rats and humans with aggregate exposure application."
Toxicological Sciences 130(1): 33-47.
Tornero-Velez, R., A. Mirfazaelian, K. B. Kim, S. S. Anand, H. J. Kim, W. T. Haines, J. V.
Bruckner and J. W. Fisher (2010). "Evaluation of deltamethrin kinetics and dosimetry in the
maturing rat using a PBPK model." Toxicology and Applied Pharmacology 244(2): 208-217.
Ueda, K., L. C. Gaughan and J. E. Casida (1975). "Metabolism of (+)-trans-and (+)-cis-
resmethrin in rats." Journal of Agricultural and Food Chemistry 23(1): 106-115.
Ueyama, J., N. Hirosawa, A. Mochizuki, A. Kimata, M. Kamijima, T. Kondo, K. Takagi, S.
Wakusawa and T. Hasegawa (2010). "Toxicokinetics of pyrethroid metabolites in male and
female rats." Environmental Toxicology and Pharmacology 30(1): 88-91.
Verschoyle, R. D. and W. N. Aldridge (1980). "Structure-activity-relationships of some
pyrethroids in rats." Archives of Toxicology 45(4): 325-329.
Viel, J. F., C. Warembourg, G. Le Maner-Idrissi, A. Lacroix, G. Limon, F. Rouget, C. Monfort,
G. Durand, S. Cordier and C. Chevrier (2015). "Pyrethroid insecticide exposure and cognitive

26
developmental disabilities in children: The PELAGIE mother-child cohort." Environment
International 82: 69-75.
Walker, Q. D., R. Ray and C. M. Kuhn (2006). "Sex differences in neurochemical effects of
dopaminergic drugs in rat striatum." Neuropsychopharmacology 31(6): 1193-1202.
Wang, D., H. Naito and T. Nakajima (2012). "The Toxicity of Fenitrothion and Permethrin."
Insecticides - Pest Engineering: 85-98.
Wason, S. C., R. Julien, M. J. Perry, T. J. Smith and J. I. Levy (2013). "Modeling exposures to
organophosphates and pyrethroids for children living in an urban low-income environment."
Environmental Research 124: 13-22.
Wei, B. N., K. R. Mohan and C. P. Weisel (2012). "Exposure of flight attendants to pyrethroid
insecticides on commercial flights: Urinary metabolite levels and implications." International
Journal of Hygiene and Environmental Health 215(4): 465-473.
Widell, S. (1958). "On the cerebrospinal fluid in normal children and in patients with acute
abacterial meningo-encephalitis." Acta Paediatrica Supplement 47(Suppl 115): 1-102.
Willemin, M. E., D. C. Sophie, R. Le Grand, F. Lestremau, F. A. Zeman, E. Leclerc, C. Moesch
and C. Brochot (2016). "PBPK modeling of the cis- and trans-permethrin isomers and their
major urinary metabolites in rats." Toxicology and Applied Pharmacology 294: 65-77.
Williams, M. K., A. Rundle, D. Holmes, M. Reyes, L. A. Hoepner, D. B. Barr, D. E. Camann, F.
P. Perera and R. M. Whyatt (2008). "Changes in pest infestation levels, self-reported pesticide
use, and permethrin exposure during pregnancy after the 2000–2001 US Environmental
Protection Agency restriction of organophosphates." Environmental Health Perspectives
116(12): 1681-1688.

27
Wong, M., B. L. Schlaggar, R. S. Buller, G. A. Storch and M. Landt (2000). "Cerebrospinal fluid
protein concentration in pediatric patients - Defining clinically relevant reference values."
Archives of Pediatrics & Adolescent Medicine 154(8): 827-831.
Xue, J. P., V. Zartarian, R. Tornero-Velez and N. S. Tulve (2014). "EPA's SHEDS-multimedia
model: Children's cumulative pyrethroid exposure estimates and evaluation against NHANES
biomarker data." Environment International 73: 304-311.
Young, C. and R. Tensuan (1963). "Estimating the lean body mass of young women. Use of
skeletal measurements." Journal of the American Dietetic Association 42: 46-51.

28
FIGURES
A (CIS)
B (TRANS)
C (DLM)
Fig. 1.1 Chemical structure of (A) cis-permethrin (CIS), (B) trans-permethrin (TRANS), and (C)
deltamethrin (DLM). The structures were derived from ChemDraw software.

29
Fig. 1.2 Metabolism of cis- and trans-permethrin (CIS and TRANS) in rats. Figure adopted from
Nakamura et al. (2007). The metabolism of CIS and TRANS result from CaEs (ES 10/ ES 3)
mediated hydrolysis and CYPs mediated oxidation. Alcohol dehydrogenase and aldehyde
dehydrogenase coupled with CYPs are responsible for oxidation at one or more sites in the acid
or alcohol moieties. The metabolites from hydrolytic or oxidative pathway are further conjugated
with sulfates or glucuronides prior to excretion.

30
CHAPTER 2
RAPID DETERMINATION OF THE INSECTICIDES CIS- AND TRANS-
PERMETHRIN IN RAT PLASMA AND TISSUES BY HIGH PERFORMACE LIQUID
CHROMATOGRAPHY
Tanzir B. Mortuza, Jing Pang, Michael G. Bartlett, James V. Bruckner, and Catherine A. White;
To be submitted to the Journal of Liquid Chromatography and Related Technologies
31
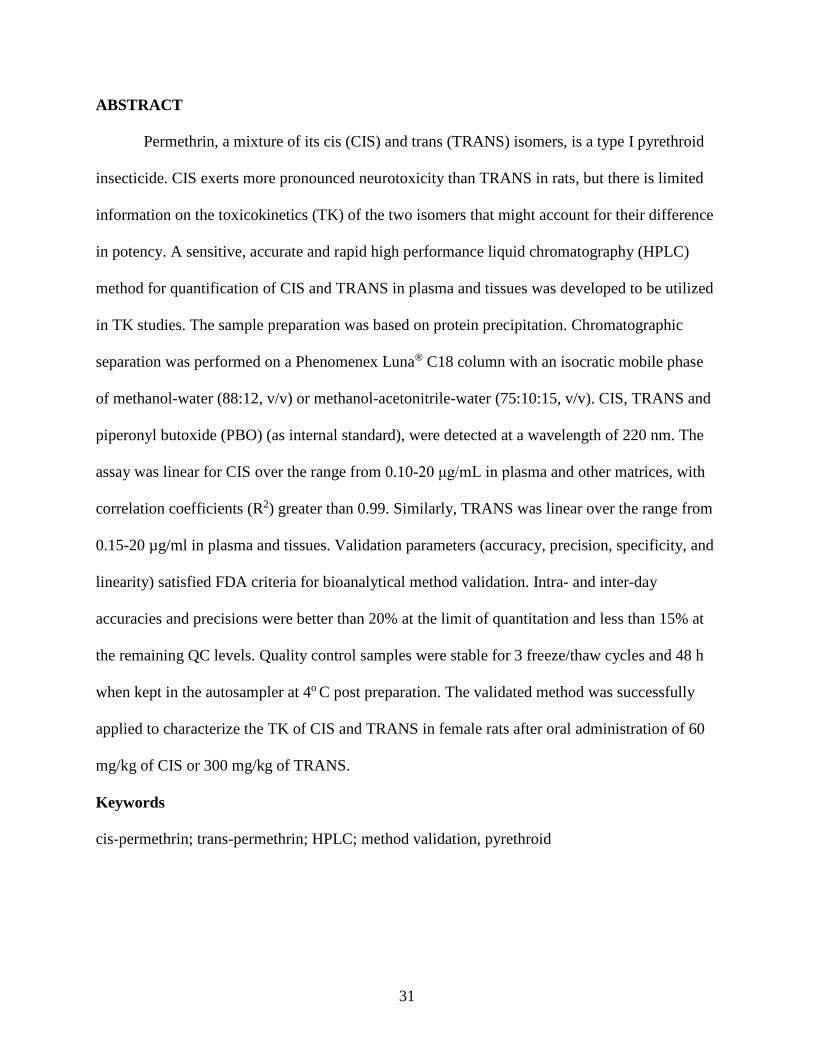
ABSTRACT
Permethrin, a mixture of its cis (CIS) and trans (TRANS) isomers, is a type I pyrethroid
insecticide. CIS exerts more pronounced neurotoxicity than TRANS in rats, but there is limited
information on the toxicokinetics (TK) of the two isomers that might account for their difference
in potency. A sensitive, accurate and rapid high performance liquid chromatography (HPLC)
method for quantification of CIS and TRANS in plasma and tissues was developed to be utilized
in TK studies. The sample preparation was based on protein precipitation. Chromatographic
separation was performed on a Phenomenex Luna® C18 column with an isocratic mobile phase
of methanol-water (88:12, v/v) or methanol-acetonitrile-water (75:10:15, v/v). CIS, TRANS and
piperonyl butoxide (PBO) (as internal standard), were detected at a wavelength of 220 nm. The
assay was linear for CIS over the range from 0.10-20 μg/mL in plasma and other matrices, with
correlation coefficients (R2) greater than 0.99. Similarly, TRANS was linear over the range from
0.15-20 µg/ml in plasma and tissues. Validation parameters (accuracy, precision, specificity, and
linearity) satisfied FDA criteria for bioanalytical method validation. Intra- and inter-day
accuracies and precisions were better than 20% at the limit of quantitation and less than 15% at
the remaining QC levels. Quality control samples were stable for 3 freeze/thaw cycles and 48 h
when kept in the autosampler at 4o C post preparation. The validated method was successfully
applied to characterize the TK of CIS and TRANS in female rats after oral administration of 60
mg/kg of CIS or 300 mg/kg of TRANS.
Keywords
cis-permethrin; trans-permethrin; HPLC; method validation, pyrethroid

32
INTRODUCTION
The use of pyrethroid insecticides has increased dramatically over the last two decades in
the U.S., Canada and the European Union due to their effectiveness and increasing restrictions
on organophosphate pesticides (Williams et al. 2008). Pyrethroids are utilized on gardens, crops,
livestock and pets, as well as indoor/outdoor residential settings. Permethrin (PER), marketed as
a mixture of its cis (CIS) and trans (TRANS) isomers, is the most frequently utilized household
insecticide in the U.S.(Barr et al. 2010). PER is also commonly used for scabies and head lice
treatment of humans. Large-scale screening studies of the general population (Barr et al. 2010;
Saillenfait et al. 2015) show that most people have been exposed to PER and other pyrethroids.
Children typically have higher urinary levels of pyrethroid metabolites than adolescents or
adults. Some recent epidemiology studies (Viel et al. 2015; Wagner-Schuman et al. 2015) have
raised concerns about possible links between long-term exposure to pyrethroids and
neurobehavioral disorders such as ADHD, although two groups of investigations (Horton et al.
2011; Quirós-Alcalá et al. 2014) failed to find an association between prenatal PER exposure and
adverse neurodevelopment in offspring.
Pyrethroids can be acutely neurotoxic, although their potency varies widely (Wolansky et
al. 2005). High doses of PER cause tremors and hyperactivity in animals (Wolansky et al. 2005),
although the insecticide has limited acute toxicity potential in humans. The parent isomers are
the neuroactive moieties. Their primary mechanism of action is binding and interference with the
voltage-sensitive sodium channels (VSSC) in neurons, resulting in a stimulus-dependent
depolarization block (Soderlund 2012). There is increasing evidence that disturbance of VSSC
function during maturation may lead to residual impairment of neurological functions (Shafer et
al. 2005; Richardson et al. 2015).

33
Toxicokinetic (TK) studies are playing an increasingly important role in risk assessment
by providing data needed to interpret differences in potency and duration of action of chemicals.
TK studies were conducted to learn why immature rats were much more susceptible than adults
to the acute toxicity of deltamethrin (DLM), a relatively potent pyrethroid (Kim et al. 2010). A
HPLC method was utilized to quantify DLM in the test animals’ blood and tissues. Young rats
exhibited relatively high blood and brain levels of DLM, due to their less efficient metabolic
clearance and increased blood-brain barrier (BBB) permeability (Amaraneni et al. 2017).
Preliminary experiments in our laboratory revealed that CIS was more acutely neurotoxic than
TRANS. This may be attributable to the slower metabolic detoxification and systemic
elimination of CIS (Scollon et al. 2009).
HPLC has been utilized to determine PER concentrations in a variety of biological and
environmental matrices. Some of the first papers describing HPLC analysis of PER were
published in 1978 (Kikta Jr and Shierling 1978; Lam and Grushka 1978). Pyrethroids widespread
use during the subsequent 40 years led to numerous applications of HPLC to assess the extent of
their contamination of water and soil (Galera et al. 1996; Tong and Chen 2013), as well as
foodstuffs (Dong et al. 2008; Cheng et al. 2009; Debbab et al. 2014). To date, monitoring of
pyrethroids and their metabolites in laboratory animals (Anadon et al. 1991; Abu-Qare and
Abou-Donia 2001) and humans (Gotoh et al. 1998; Lu et al. 2009; Wei et al. 2012) by HPLC has
been limited largely to plasma and urine. HPLC has been utilized in vitro biotransformation
studies to quantify pyrethroid metabolites (Baynes et al. 1997; Choi et al. 2002; Ross et al.
2006). More sensitive mass-spectroscopy (MS) methods to quantify CIS and TRANS (Starr et al.
2012; Lestremau et al. 2014; Hooshfar et al. 2017) were reported, but they require quite long
sample processing and analysis times. (Kim et al. 2010) employed HPLC to monitor the

34
distribution and time-course of DLM in the blood, brain, liver and other tissues of rats. The
decision was made to adapt this method to CIS and TRANS, as a HPLC technique suitable for
multiple tissue analyses has not been previously reported.
The objective of the current project was to develop and fully characterize, using FDA
validation criteria, a HPLC technique suitable for conducting TK studies of CIS and TRANS in
small animals. As such studies involve serial sampling of small volumes from multiple animals,
the method had to be relatively simple and rapid, yet sensitive and precise.
MATERIALS AND METHOD
Chemicals and materials
CIS and TRANS, as white powders of 99.3 % and 99.0% purity, were kindly supplied by
FMC Agricultural Products (Princeton, NJ) with batch numbers FMC-035171 and FMC-030960,
respectively. Piperonyl butoxide (PBO), which served as internal standard (IS), sodium fluoride
(NaF), and glycerol formal (GF) were purchased from Sigma-Aldrich (St. Louis, MO). The
chemical structures of PBO, CIS, and TRANS are shown in Fig. 2.1. HPLC-grade methanol
(CH3OH), acetonitrile (ACN) and HPLC-grade water were purchased from Fisher Scientific
(Hampton, NH).
Instrumentation and analytical conditions
The quantification of CIS and TRANS was performed on an Agilent 1100 High
Performance Liquid Chromatograph (HPLC). System control and data analysis were provided by
Chemstation (Rev. A. 10.02 [1757], copyright Agilent Technologies 1990-2003). The
chromatographic separation was performed on a Phenomenex Luna C18 column (150 x 4.6 mm,
5 µm) at 35 °C. The mobile phase was delivered at a flow rate of 1 ml/min in an isocratic elution
consisting of a mixture of CH3OH and water (88:12, v/v) for CIS and CH3OH, ACN, and water

35
(75:10:15, v/v) for TRANS. The overall run times were 16 min for CIS and 18 min for TRANS
for each injection. The autosampler was set at an injection volume of 50 μl and programed for a
needle wash after each injection with mobile phase. The wavelength of the UV detector was 220
nm.
Preparation of calibration standards and quality control (QC) standards
Stock solutions were prepared by dissolving CIS and TRANS in GF at a concentration of
1 mg/ml and stored at room temperature for up to 6 months. The working solutions for
calibration and quality controls were prepared by serial dilution of the stock solution with GF to
appropriate concentrations (5 or 7.5, 10, 25, 50, 100, 250, and 500 μg/ml for the calibration
standards; and 5 or 7.5, 15, 150, and 800 μg/ml for LLOQ and quality controls). All of the
working solutions were stored at room temperature for no more than 6 months. A 2.5-mg/ml
solution of PBO in ACN was prepared as the as the stock solution of the IS. One ml was added
to 99 ml of ACN to obtain a final extraction solution before use.
Preparation of calibration and QC standards in plasma
Calibration standards were prepared by spiking 108 μl of blank rat plasma (98 μl of
plasma and 10 μl of 0.64 M NaF) with 2 μl of different concentrations of the working solutions.
NaF was added to inhibit carboxylesterases (CaEs), which catalyze hydrolysis of pyrethroids.
The calibration curve was constructed with eight standards at 0.1 or 0.15, 0.2, 0.5, 1, 2, 5, 10,
and 20 μg/ml. Lower limit of quantification (LLOQ) and quality control (QC) standards were
prepared in the same way at concentrations of 0.1 or 0.15, 0.3, 3, and 16 μg/ml. The analytical
standards and QC samples were freshly prepared each day from the stock solutions.

36
Preparation of calibration and QC standards in tissue samples
Two ml (for brain and liver) or 3 ml (for muscle and fat) of HPLC-grade water were
added to each g of tissue for preparation of tissue homogenates. Ninety-eight µl of tissue
homogenate were spiked with 2 µl of working solutions to provide CIS/TRANS calibration
standards of different concentrations. Taking the dilution factors into account, the calibration
standards were established at 0.3 or 0.45, 0.6, 1.5, 3, 6, 15, 30, and 60 µg/g (for brain and liver
homogenates) or 0.4 or 0.6, 0.8, 2, 4, 8, 20, 40, and 80 µg/g (for muscle and fat homogenates).
LLOQ and QC standards were prepared in the same way at 0.3 or 0.45, 0.9, 9, and 48 µg/g (for
brain and liver) and 0.4, 1.2, 12, and 64 µg/g (for muscle and fat homogenates). The analytical
standards and QC samples were freshly prepared each day from the stock solutions.
Sample preparation
Rat plasma and tissue samples were thawed at room temperature before analysis. Briefly,
2 ml (for brain and liver) or 3 ml (for muscle and fat) of water were added to each g of tissue for
homogenization with a Tekmar Tissumizer® (Cincinnati, OH). Plasma with 10 µl of NaF (100
µl) or tissue homogenate (100 µl) was extracted with 400 µl ACN and 25 µl/ml PBO, vortexed
for 4 min and centrifuged at 13300 rpm for 10 min to denature and precipitate the proteins. The
supernatant was transferred to a 1.5-ml Lobind micro-centrifuge tube and evaporated to dryness
in a heated vacuum centrifuge at 65 ºC for approximately 85 min. Eighty µl of mobile phase
were added to the dried sample, which was vortexed for 4 min and centrifuged at 13300 rpm for
10 min. Finally, 70 µl of supernatant were carefully transferred to an autosampler vial equipped
with a 300-µl insert, and 50 µl injected into the HPLC system for quantitative analysis. The step
by step extraction method is diagrammed in Figure. 2.2.

37
Method validation
Method validation was performed according to U.S. Food and Drug Administration
(FDA) guidance for the validation of bioanalytical methods (Food and Administration 2017).
Selectivity of the assay was assessed by comparing the chromatograms of blank plasma
and tissue homogenates from 6 rats with CIS or TRANS at the lower limit of quantification
(LLOQ). Any endogenous interference at the retention time of either isomer should be <20% of
the LLOQ. Moreover, no significant interfering peaks should be present at the retention time of
the internal standard or the either isomer.
Linearity was determined by evaluating the calibration standards using linear least-
squares regression with a weighting index of 1/x2. The deviation of ±15% for the back-calculated
concentrations from the nominal concentrations was considered acceptable with an exception of
± 20% for the LLOQ. LLOQ was defined as the lowest concentration in the calibration curve
with qualified accuracy (80−120 %) and precision (<20 %).
Intra-day and inter-day accuracy and precision were assessed by analyzing 6 replicates of
QC standards at the LLOQ for 3 concentrations the same day, as well as on 3 different days.
Accuracy was calculated as (mean measured concentration) / (nominal concentration) × 100 %,
and precision was expressed by the relative standard deviation (RSD). The accuracies should be
within ±15%, and the precisions should not exceed 15% at all QC levels except the LLOQ.
Blank plasma from 6 individual runs was used to assess the extraction recovery of CIS and
TRANS at 3 QC levels. Extraction recovery was determined by comparing the peak area of CIS
or TRANS in the QC sample with that of the peak area response of the neat solutions of CIS or
TRANS.

38
The stability of CIS and TRANS in rat plasma was assessed by analyzing QC samples at
3 concentrations in 5 replicates under a variety of sample storage conditions. Bench-top stability
was assessed by analyzing QC samples kept at ambient temperature for 8 h. Long-term stability
was performed by evaluating QC samples stored at −20 °C for 1 month. Freeze-thaw stability
was determined after 3 freeze-thaw cycles. Autosampler stability was evaluated by analyzing QC
samples stored in an autosampler at room temperature for 48 h.
Application to TK study of CIS and TRANS
The TK of pyrethroids in female rats has apparently not been reported in the literature. As
body-fat composition of females is higher than in males (Young and Tensuan 1963), tissue
deposition and TK of lipophilic compounds such as CIS or TRANS may be different in males
and females. Studies of CIS or TRANS have utilized only male rats (Anadon et al. 1991;
Tornero-Velez et al. 2012; Willemin et al. 2016). Therefore, female rats were selected to
characterize the TK of CIS and TRANS. A minimum of 3 rats per time point is required to
conduct a TK time-course study. Twenty-four female Sprague-Dawley (SD) rats weighing 300 ±
50 g (3 rats for each of 4 time points, 2 isomers) were purchased from Charles River Labs
(Raleigh, NC). Upon receipt, all animals were inspected by a qualified animal technician,
quarantined, and monitored for 7 days. The rats were acclimated to a 12-h light/dark cycle (light
0700 – 1900 h) in a temperature- (25º) and humidity- (40%) controlled room. Tap water and
food (Purina Rat Chow #5001, Brentwood, MO) were available ad libitum. The experimental
protocol was reviewed and approved by the University of Georgia Animal Care Committee. The
study was conducted in accordance with the NIH Guide for the Care and Use of Laboratory
Animals.

39
Appropriate amounts of CIS and TRANS were dissolved in corn oil (CO) in order to
administer doses of 60 mg CIS/kg and 300 mg TRANS/kg in 5 ml CO/kg body weight. The
solution was given by oral gavage with a curved, ball-tipped intubation needle.
Serial sacrifices were conducted 2, 4, 8, and 12 h post dosing to collect blood and
selected tissues (whole brain, liver, skeletal muscle, and perirenal fat). Liver was perfused with
10 ml saline to remove excess blood before tissue collection. Blood samples were centrifuged to
separate the plasma, and 10 μl of NaF solution were added per 100 μl of plasma to inhibit
esterase activity. Tissues were flash frozen in liquid nitrogen immediately after collection.
Plasma and tissue samples were stored at −20 °C until analysis. Samples were processed
according to the method described in “sample preparation” section.
Statistical analysis
Mean, standard deviation (SD), accuracy, and precision for each data set were calculated
using Microsoft Excel (Microsoft Co., Redmond, WA). Maximum plasma concentration (Cmax),
area under the plasma and tissue concentration curve (AUC) and time of maximum plasma
concentration (Tmax) were calculated using WinNonlin (ver 6.4.1) noncompartmental analysis
(Pharsight, Cary, NC).
RESULTS AND DISCUSSION
Validation of the analytical method
The present HPLC method for analysis of CIS and TRANS in blood and tissues proved to
be rapid and sensitive. A HPLC method utilized by Choi et al. (2002) to quantify for PER and its
metabolites required several solutions with different pHs for the mobile phase. Sample
preparation by this method was also labor intensive. Anadon et al. (1991) utilized a HPLC
method that required several extraction steps for quantification of PER in plasma, brain and liver.

40
With the current method, plasma was extracted in one step with ACN. Tissues were simply
homogenized with HPLC water and extracted with ACN. To obtain better homogenization brain
and liver were homogenized with twice their volume of water, while muscle and fat were
homogenized with 3 times their volume. An evaporation step was utilized for sample clean-up
and to enhance sensitivity. More than 100 samples could be uploaded at the same time to the
evaporator. Protein precipitation by ACN assured efficient extraction of the highly lipophilic
pyrethroids. The time required for analysis by the current method was about half of that
necessary for the multistep GC-MS techniques of Hooshfar et al. (2017) and Lestremau et al.
(2014). Our selection of the mobile phase was based on the consideration of the CIS and TRANS
peak shapes. The mobile phase provided good separation of endogenous substances from each
isomer.
CIS and TRANS contain an ester linkage (Fig. 2.1) that can be hydrolyzed by CaEs in
some biological matrices. Our preliminary experiments indicated that CIS and TRANS were
much more unstable in rat plasma than in tissues. Therefore, only plasma samples were stabilized
by adding NaF as an esterase inhibitor.
Full validations including verification of specificity, linearity, precision, accuracy,
extraction recovery and stability were conducted with rat plasma, brain, liver, muscle, and fat
according to FDA guidelines (Food and Administration 2017). All parameters were shown to
meet the FDA requirements for bioanalytical method validation.
Specificity
Specificity was evaluated by comparing the chromatograms of blank and spiked rat
plasma and tissues. When compared to spiked samples, all blank samples from 6 rats were found
to be free from interference by endogenous substances at the retention times of CIS, TRANS,

41
and PBO. Fig. 2.3 to 2.12 show the chromatograms of blank and CIS or TRANS spiked LLOQ
in plasma and tissues.
Linearity and sensitivity
LLOQs were 0.1 μg/ml for CIS and 0.15 μg/ml for TRANS for plasma and tissues.
Taking the dilution factors in account, standard calibration curves of CIS and TRANS in each
matrix showed good linearity with typical equations of y= mx+b with a R2 value of 0.998 or
better in all cases over the range of 0.1 or 0.15 -20 μg/ml for plasma, 0.3 or 0.45 -60 μg/g for
brain and liver, and 0.4 or 0.6 -80 μg/g for muscle and fat. The back-calculated value at each
nominal concentration was within the acceptable range for each tissue at each concentration. The
limit of detection (LOD) was defined where a signal to noise ratio was 3. To our knowledge, no
fully validated HPLC method in the literature was conducted according to FDA guidelines.
Furthermore, no published HPLC method had better analytical sensitivity.
Accuracy and precision
The accuracies and precisions for the tested levels were all within the defined acceptance
criteria. Intra- and inter-day accuracy and precision were reproducible. Intra- and inter-day
precisions and accuracies of the assay were determined by analyzing quality control (QC)
standards at the LLOQ and 3 higher concentrations on the same day (n = 6) and on three
different days (n = 18). The CIS LLOQ was 0.1 µg CIS/ml. CIS intra- and inter-day accuracy
and precision were determined by using 0.1, 0.3, 3, and 16 µg CIS/ml (Tables 2.1 and 2.3). The
TRANS LLOQ was 0.15 µg TRANS/ml. The other QC standards were the same for CIS and
TRANS. Intra- and inter-day accuracy and precision for TRANS are illustrated in Tables 2.2 and
2.4. The intra- and inter-day accuracy and precision for CIS in plasma and tissues were between
0.17 and 12.44 (% Bias) and 1.93 and 11.47 (% RSD), respectively. TRANS intra- and inter-day

42
accuracy and precision were between 0.76 and 10.50 (% Bias) and 1.9 and 14.27 (% RSD),
respectively. Greater deviations in accuracy and precision were found in the LLOQ and low QC
(0.3 µg/ml) for both isomers. However, intra- and inter-day accuracy and precision were slightly
better than for the GC-MS methods described by Hooshfar et al. (2017) and Lestremau et al.
(2014)
Extraction recovery
As shown in Tables 2.5 and 2.6, extraction recoveries of CIS and TRANS were close to
80% for tissues except plasma and fat. Recovery from plasma was close to 60% for CIS and
TRANS. Recovery from fat was the lowest from any matrix. These results may be explained by
the isomers’ high lipophilicity and by residual esterase activity in the plasma. The consistency of
recoveries for individual runs and different concentrations support the application of this method.
Stability
Results from the stability study are summarized in Tables 2.7 – 2.10. No significant
degradation of CIS or TRANS occurred in plasma or tissues in the autosampler at room
temperature for 48 h or after 3 freeze-thaw cycles. Low, mid, and high QC samples (n=6 at each
level) were analyzed to assess autosampler and freeze-thaw stability. Accuracy, precision, and
mean recovery were calculated for plasma and tissues for each concentration. The recovery
ranges for CIS autosampler and freeze-thaw stability were 91.41 and 116.07 (%) and 90.32 and
119.75 (%), respectively. TRANS stability values were similar to the CIS values. The ranges of
autosampler and freeze-thaw stability for TRANS were 82.61 and 113.94 (%) and 84.13 and
113.94 (%), respectively. Moreover, stability tests confirmed that CIS and TRANS stock
solutions were stable for 6 months at room temperature (data not shown).
TK of CIS and TRANS in rats

43
In the current study, the validated HPLC method was successfully applied to quantify of
CIS and TRANS concentrations in female SD rats’ plasma and tissues. Adult females were
administered 60 mg CIS/kg or 300 mg TRANS/kg, given as a single oral bolus in 5 ml CO/kg.
The doses were based on the study conducted by Anadon et al. (1991) that utilized 460 mg
PER/kg with a 25:75 mixture of CIS and TRANS. Fig. 2.13 shows the time-course profiles of
CIS and TRANS in plasma and tissue for up to 12 h following dosing. CIS maximum
concentrations (Cmax) and time to peak concentrations (Tmax) were observed between 4 and 8 h
in plasma and tissues (Table 2.11). Plasma and tissues other than fat reached maximum
concentrations around 4 h for TRANS. CIS and TRANS concentrations in fat increased
gradually and stayed elevated during the monitoring period. Concentrations in plasma and the
other tissues decreased rapidly between 8 and 12 h. Though a 5-fold higher dose of TRANS was
administered, the Cmax and AUC values were notably lower than those observed for CIS (Table
2.11). This reflected much more extensive metabolism of TRANS in plasma and other tissues
than of CIS. CIS remains in the systemic circulation longer due to slower metabolism than
TRANS (Scollon et al. 2009; Tornero-Velez et al. 2012; Willemin et al. 2016). Therefore, the
toxic effects and potency of CIS are higher than for TRANS. These findings are consistent with
other TK data in the literature (Lestremau et al. 2014; Hooshfar et al. 2017). The brain exhibited
lower concentrations and AUCs than plasma, indicating limited uptake in the target organ.
CONCLUSIONS
Though the use of PER is very common in the U.S., there is not a validated HPLC
method that can be used to rapidly analyze large numbers of biological samples produced in TK
studies. As there are pronounced metabolic differences between the isomers, it is relevant to
characterize the TK of each isomer separately. A relatively simple, rapid HPLC method for

44
quantification of CIS and TRANS in plasma, brain, liver, skeletal muscle, and fat has been
developed and validated. The assay has a relatively high recovery from most tissues, is sensitive,
and has excellent reproducibility. Primary advantages of this method are its rapid extraction and
short analysis time. Extraction and quantification of CIS and TRANS in ~100 samples can be
performed by one person during an 8-h day. CIS or TRANS have not previously been measured
(Anadon et al. 1991; Choi et al. 2002; Ross et al. 2006) in muscle or fat by HPLC. PER, like
other pyrethroids, is highly lipophilic and thus accumulates in body fat. The current method has
been fully validated for muscle and fat as well as plasma, brain and liver. This method is
successfully used to characterize the time-course of CIS and TRANS in plasma and tissues of
female rats.

45
REFERENCES
Abu-Qare, A. W. and M. B. Abou-Donia (2001). "Determination of diazinon, chlorpyrifos, and
their metabolites in rat plasma and urine by high-performance liquid chromatography." Journal
of Chromatographic Science 39(5): 200-204.
Amaraneni, M., J. Pang, T. B. Mortuza, S. Muralidhara, B. S. Cummings, C. A. White, C. V.
Vorhees, J. Zastre and J. V. Bruckner (2017). "Brain uptake of deltamethrin in rats as a function
of plasma protein binding and blood-brain barrier maturation." Neurotoxicology 62: 24-29.
Anadon, A., M. R. Martinezlarranaga, M. J. Diaz and P. Bringas (1991). "Toxicokinetics of
Permethrin in the Rat." Toxicology and Applied Pharmacology 110(1): 1-8.
Barr, D. B., A. O. Olsson, L. Y. Wong, S. Udunka, S. E. Baker, R. D. Whitehead, M. S.
Magsumbol, B. L. Williams and L. L. Needham (2010). "Urinary concentrations of metabolites
of pyrethroid insecticides in the general US population: National health and nutrition
examination survey 1999-2002." Environmental Health Perspectives 118(6): 742-748.
Baynes, R. E., K. B. Halling and J. E. Riviere (1997). "The influence of diethyl-m-toluamide
(DEET) on the percutaneous absorption of permethrin and carbaryl." Toxicology and Applied
Pharmacology 144(2): 332-339.
Cheng, J. H., M. Liu, Y. Yu, X. P. Wang, H. Q. Zhang, L. Ding and H. Y. Jin (2009).
"Determination of pyrethroids in porcine tissues by matrix solid-phase dispersion extraction and
high-performance liquid chromatography." Meat Science 82(4): 407-412.
Choi, J., R. L. Rose and E. Hodgson (2002). "In vitro human metabolism of permethrin: the role
of human alcohol and aldehyde dehydrogenases." Pesticide Biochemistry and Physiology 74(3):
117-128.

46
Debbab, M., S. El-Hajjaji, A. H. Aly, A. Dahchour, M. El Azzouz and A. Zrineh (2014).
"Cypermethrin residues in fresh vegetables: Detection by HPLC and LC-ESI MS and their effect
on antioxidant activity." Journal of Materials and Environmental Science 5: 2257-2266.
Dong, H., P. Bi and Y. Xi (2008). "Determination of pyrethroid pesticide residues in vegetables
by solvent sublation followed by high-performance liquid chromatography." Journal of
Chromatographic Science 46(7): 622-626.
Food and Drug Administration (2017). Analytical procedures and methods validation for drugs
and biologics–guidance for industry.
Galera, M. M., J. M. Vidal, A. G. Frenich and M. G. Garcia (1996). "Determination of
cypermethrin, fenvalerate and cis-and trans-permethrin in soil and groundwater by high-
performance liquid chromatography using partial least-squares regression." Journal of
Chromatography A 727(1): 39-46.
Gotoh, Y., M. Kawakami, N. Matsumoto and Y. Okada (1998). "Permethrin emulsion ingestion:
clinical manifestations and clearance of isomers." Journal of Toxicology: Clinical Toxicology
36(1-2): 57-61.
Hooshfar, S., D. R. Gullick, M. R. Linzey, T. Mortuza, M. H. A. Rahman, C. A. Rogers, J. V.
Bruckner, C. A. White and M. G. Bartlett (2017). "Simultaneous determination of cis-permethrin
and trans-permethrin in rat plasma and brain tissue using gas chromatography–negative chemical
ionization mass spectrometry." Journal of Chromatography B 1060: 291-299.
Horton, M. K., A. Rundle, D. E. Camann, D. B. Barr, V. A. Rauh and R. M. Whyatt (2011).
"Impact of prenatal exposure to piperonyl butoxide and permethrin on 36-month
neurodevelopment." Pediatrics: peds. 2010-0133.

47
Kikta Jr, E. and J. Shierling (1978). "The liquid chromatographic assay of permethrin." Journal
of Chromatography A 150(1): 229-232.
Kim, K.-B., S. S. Anand, H. J. Kim, C. A. White, J. W. Fisher, R. Tornero-Velez and J. V.
Bruckner (2010). "Age, dose, and time-dependency of plasma and tissue distribution of
deltamethrin in immature rats." Toxicological Sciences 115(2): 354-368.
Lam, S. and E. Grushka (1978). "Separation of permethrin and some of its degradation products
by high-performance liquid chromatography." Journal of Chromatography A 154(2): 318-320.
Lestremau, F., M.-E. Willemin, C. Chatellier, S. Desmots and C. Brochot (2014). "Determination
of cis-permethrin, trans-permethrin and associated metabolites in rat blood and organs by gas
chromatography–ion trap mass spectrometry." Analytical and Bioanalytical Chemistry 406(14):
3477-3487.
Lu, C., D. B. Barr, M. A. Pearson, L. A. Walker and R. Bravo (2009). "The attribution of urban
and suburban children's exposure to synthetic pyrethroid insecticides: a longitudinal assessment."
Journal of Exposure Science and Environmental Epidemiology 19(1): 69-78.
Quirós-Alcalá, L., S. Mehta and B. Eskenazi (2014). "Pyrethroid pesticide exposure and parental
report of learning disability and attention deficit/hyperactivity disorder in US children: NHANES
1999–2002." Environmental Health Perspectives 122(12): 1336-1342.
Richardson, J. R., M. M. Taylor, S. L. Shalat, T. S. Guillot III, W. M. Caudle, M. M. Hossain, T.
A. Mathews, S. R. Jones, D. A. Cory-Slechta and G. W. Miller (2015). "Developmental pesticide
exposure reproduces features of attention deficit hyperactivity disorder." The FASEB Journal
29(5): 1960-1972.

48
Ross, M. K., A. Borazjani, C. C. Edwards and P. M. Potter (2006). "Hydrolytic metabolism of
pyrethroids by human and other mammalian carboxylesterases." Biochemical Pharmacology
71(5): 657-669.
Saillenfait, A.-M., D. Ndiaye and J.-P. Sabaté (2015). "Pyrethroids: exposure and health effects–
an update." International Journal of Hygiene and Environmental Health 218(3): 281-292.
Scollon, E. J., J. M. Starr, S. J. Godin, M. J. DeVito and M. F. Hughes (2009). "In vitro
metabolism of pyrethroid pesticides by rat and human hepatic microsomes and cytochrome p450
isoforms." Drug Metabolism and Disposition 37(1): 221-228.
Shafer, T. J., D. A. Meyer and K. M. Crofton (2005). "Developmental neurotoxicity of
pyrethroid insecticides: critical review and future research needs." Environmental Health
Perspectives 113(2): 123.
Soderlund, D. M. (2012). "Molecular mechanisms of pyrethroid insecticide neurotoxicity: recent
advances." Archives of Toxicology 86(2): 165-181.
Starr, J. M., E. J. Scollon, M. F. Hughes, D. G. Ross, S. E. Graham, K. M. Crofton, M. J.
Wolansky, M. J. DeVito and R. Tornero-Velez (2012). "Environmentally relevant mixtures in
cumulative assessments: an acute study of toxicokinetics and effects on motor activity in rats
exposed to a mixture of pyrethroids." Toxicological Sciences 130(2): 309-318.
Tong, J. and L. G. Chen (2013). "Determination of pyrethroids in environmental waters using
magnetic chitosan extraction coupled with high performance liquid chromatography detection."
Analytical Letters 46(8): 1183-1197.
Tornero-Velez, R., J. Davis, E. J. Scollon, J. M. Starr, R. W. Setzer, M. R. Goldsmith, D. T.
Chang, J. Xue, V. Zartarian, M. J. DeVito and M. F. Hughes (2012). "A pharmacokinetic model

49
of cis- and trans-permethrin disposition in rats and humans with aggregate exposure application."
Toxicological Sciences 130(1): 33-47.
Viel, J. F., C. Warembourg, G. Le Maner-Idrissi, A. Lacroix, G. Limon, F. Rouget, C. Monfort,
G. Durand, S. Cordier and C. Chevrier (2015). "Pyrethroid insecticide exposure and cognitive
developmental disabilities in children: The PELAGIE mother-child cohort." Environment
International 82: 69-75.
Wagner-Schuman, M., J. R. Richardson, P. Auinger, J. M. Braun, B. P. Lanphear, J. N. Epstein,
K. Yolton and T. E. Froehlich (2015). "Association of pyrethroid pesticide exposure with
attention-deficit/hyperactivity disorder in a nationally representative sample of US children."
Environmental Health 14: 44.
Wei, B. N., K. R. Mohan and C. P. Weisel (2012). "Exposure of flight attendants to pyrethroid
insecticides on commercial flights: Urinary metabolite levels and implications." International
Journal of Hygiene and Environmental Health 215(4): 465-473.
Willemin, M. E., D. C. Sophie, R. Le Grand, F. Lestremau, F. A. Zeman, E. Leclerc, C. Moesch
and C. Brochot (2016). "PBPK modeling of the cis- and trans-permethrin isomers and their
major urinary metabolites in rats." Toxicology and Applied Pharmacology 294: 65-77.
Williams, M. K., A. Rundle, D. Holmes, M. Reyes, L. A. Hoepner, D. B. Barr, D. E. Camann, F.
P. Perera and R. M. Whyatt (2008). "Changes in pest infestation levels, self-reported pesticide
use, and permethrin exposure during pregnancy after the 2000–2001 US Environmental
Protection Agency restriction of organophosphates." Environmental Health Perspectives
116(12): 1681-1688.
Wolansky, M., C. Gennings and K. Crofton (2005). "Relative potencies for acute effects of
pyrethroids on motor function in rats." Toxicological Sciences 89(1): 271-277.

50
Young, C. and R. Tensuan (1963). "Estimating the lean body mass of young women. Use of
skeletal measurements." Journal of the American Dietetic Association 42: 46-51.

51
TABLES
Table 2.1 - Intra-day precision (% RSD) and accuracy (% Bias) of CIS extracted from rat plasma
and tissue homogenates.
Matrix n Concentration added (µg/ml) Mean Conc. Precision
(% RSD) Accuracy (% Bias)
Plasma 6 0.1 (LLOQ) 0.105 ± 0.009 8.53 4.50
0.3 (Low QC) 0.320 ± 0.028 8.62 6.67
3 (Mid QC) 3.253 ± 0.107 3.29 8.44 16 (High QC) 16.933 ± 0.583 3.44 5.83
Brain 6 0.1 (LLOQ) 0.109 ± 0.006 5.81 9.17
0.3 (Low QC) 0.300 ± 0.017 5.71 0.17
3 (Mid QC) 3.272 ± 0.160 4.88 9.06 16 (High QC) 16.607 ± 0.442 2.66 3.79
Liver 6 0.1 (LLOQ) 0.102 ± 0.007 7.16 2.40
0.3 (Low QC) 0.276 ± 0.027 9.72 7.94
3 (Mid QC) 2.932 ± 0.158 5.93 2.28 16 (High QC) 16.043 ± 0.847 5.28 0.27
Muscle 6 0.1 (LLOQ) 0.104 ± 0.006 6.23 4.00
0.3 (Low QC) 0.328 ± 0.006 1.93 9.39
3 (Mid QC) 3.013 ± 0.059 1.94 0.44 16 (High QC) 15.673 ± 0.270 1.73 2.04
Fat 6 0.1 (LLOQ) 0.093± 0.006 6.63 6.75
0.3 (Low QC) 0.334± 0.019 5.75 11.20
3 (Mid QC) 2.875± 0.065 2.25 4.17 16 (High QC) 15.972± 0.720 4.51 0.18
Mean concentrations are represented as mean ± SD.

52
Table 2.2 - Inter-day precision (% RSD) and accuracy (% Bias) of CIS extracted from rat plasma
and tissue homogenates.
Matrix n Concentration added (µg/ml) Mean Conc. Precision
(% RSD) Accuracy (% Bias)
Plasma 18 0.1 (LLOQ) 0.104 ± 0.009 8.59 4.07
0.3 (Low QC) 0.331 ± 0.026 7.80 10.33
3 (Mid QC) 3.144 ± 0.113 3.61 4.80 16 (High QC) 16.521 ± 0.604 3.66 3.26
Brain 18 0.1 (LLOQ) 0.110 ± 0.011 10.36 10.00
0.3 (Low QC) 0.325 ± 0.020 6.27 8.29
3 (Mid QC) 3.107 ± 0.203 6.52 3.58 16 (High QC) 16.207 ± 0.693 4.28 1.30
Liver 18 0.1 (LLOQ) 0.104 ± 0.012 11.47 3.93
0.3 (Low QC) 0.301 ± 0.051 7.05 0.35
3 (Mid QC) 2.933 ± 0.138 4.97 2.22 16 (High QC) 16.116 ± 0.598 3.71 0.73
Muscle 18 0.1 (LLOQ) 0.109 ± 0.006 5.37 8.88
0.3 (Low QC) 0.337 ± 0.015 4.46 12.24
3 (Mid QC) 2.961 ± 0.151 5.09 1.30 16 (High QC) 15.831 ± 0.802 5.07 1.06
Fat 18 0.1 (LLOQ) 0.101 ± 0.010 10.21 1.19
0.3 (Low QC) 0.325 ± 0.027 8.22 8.20
3 (Mid QC) 3.026 ± 0.185 6.13 0.87 16 (High QC) 15.266 ± 0.901 5.90 4.59
Mean concentrations are represented as mean ± SD.

53
Table 2.3 - Intra-day precision (% RSD) and accuracy (% Bias) of TRANS extracted from rat
plasma and tissue homogenates.
Matrix n Concentration added (ug/ml) Mean Conc. Precision
(% RSD) Accuracy (% Bias)
Plasma 6 0.15 (LLOQ) 0.142 ± 0.007 4.87 5.67
0.3 (Low QC) 0.279 ± 0.021 7.58 7.17
3 (Mid QC) 3.095 ± 0.249 8.06 3.17 16 (High QC) 15.507 ± 1.059 6.83 3.08
Brain 6 0.15 (LLOQ) 0.148 ± 0.005 3.13 1.33
0.3 (Low QC) 0.297 ± 0.006 2.16 1.07
3 (Mid QC) 2.858 ± 0.185 6.48 4.72 16 (High QC) 16.121 ± 0.460 2.86 0.76
Liver 6 0.15 (LLOQ) 0.155 ± 0.006 3.67 3.33
0.3 (Low QC) 0.318 ± 0.025 7.94 6.11
3 (Mid QC) 3.294 ± 0.164 4.98 9.81 16 (High QC) 16.518 ± 1.076 6.52 3.24
Muscle 6 0.15 (LLOQ) 0.143 ± 0.010 6.72 4.93
0.3 (Low QC) 0.308 ± 0.015 4.71 2.67
3 (Mid QC) 3.102 ± 0.051 1.65 3.41 16 (High QC) 15.525 ± 0.295 1.9 2.97
Fat 6 0.15 (LLOQ) 0.161 ± 0.019 11.76 7.5
0.3 (Low QC) 0.336 ± 0.024 7.23 8.09
3 (Mid QC) 3.185 ± 0.105 3.31 6.16 16 (High QC) 16.374 ± 0.579 3.54 2.34
Mean concentrations are represented as mean ± SD.

54
Table 2.4 - Inter-day precision (% RSD) and accuracy (% Bias) of TRANS extracted from rat
plasma and tissue homogenate.
Matrix n Concentration added (ug/ml) Mean Conc. Precision
(% RSD) Accuracy (% Bias)
Plasma 18 0.15 (LLOQ) 0.166 ± 0.021 12.48 10.50 0.3 (Low QC) 0.311 ± 0.031 10.06 3.61 3 (Mid QC) 3.209 ± 0.214 6.67 6.98 16 (High QC) 16.721 ± 1.458 8.72 4.50
Brain 18 0.15 (LLOQ) 0.141 ± 0.011 7.75 6.31 0.3 (Low QC) 0.292 ± 0.024 8.32 2.75 3 (Mid QC) 3.057 ± 0.236 7.73 1.89 16 (High QC) 15.189 ± 0.929 6.12 5.07
Liver 18 0.15 (LLOQ) 0.153 ± 0.015 9.52 2.33 0.3 (Low QC) 0.321 ± 0.030 9.48 7.04 3 (Mid QC) 3.177 ± 0.303 5.87 9.59 16 (High QC) 15.759 ± 1.702 10.80 1.51
Muscle 18 0.15 (LLOQ) 0.143 ± 0.020 13.73 4.36 0.3 (Low QC) 0.308 ± 0.030 9.64 2.76 3 (Mid QC) 2.980 ± 0.155 5.19 0.66 16 (High QC) 14.912 ± 0.946 6.35 6.80
Fat 18 0.15 (LLOQ) 0.145 ± 0.021 14.27 3.42 0.3 (Low QC) 0.307 ± 0.039 12.61 2.18 3 (Mid QC) 3.073 ± 0.225 7.33 2.44 16 (High QC) 15.669 ± 0.851 5.43 2.07
Mean concentrations are represented as mean ± SD.

55
Table 2.5 - Absolute recovery (%) of CIS in rat plasma and tissues.
Matrix n CIS Concentration added (µg/ml) Absolute recovery (%)
Plasma 6 0.3 63.02 ± 8.94
3 65.79 ± 2.36
16 63.74 ± 9.46 Brain 6 0.3 88.36 ± 9.01
3 80.16 ± 1.92 16 83.07 ± 11.88
Liver 6 0.3 75.33 ± 11.01
3 80.62 ± 3.61
16 83.04 ± 4.12 Muscle 6 0.3 92.94 ± 9.75
3 86.40 ± 6.81 16 96.35 ± 10.01
Fat 6 0.3 61.89 ± 8.85
3 67.07 ± 3.98
16 65.63 ± 4.96 Absolute recoveries are represented as mean ± SD.

56
Table 2.6 - Absolute recovery (%) of TRANS in rat plasma and tissues.
Matrix n TRANS Concentration added (µg/ml)
Absolute recovery (%)
Plasma 6 0.3 70.54 ± 10.18
3 59.05 ± 4.71
16 57.15 ± 4.93 Brain 6 0.3 79.71 ± 8.81
3 87.62 ± 6.86 16 85.23 ± 9.55
Liver 6 0.3 68.42 ± 5.21
3 81.28 ± 8.02
16 63.36 ± 9.65 Muscle 6 0.3 80.71 ± 6.25
3 85.56 ± 7.41 16 77.63 ± 6.74
Fat 6 0.3 53.95 ± 4.04
3 53.76 ± 3.32
16 57.98 ± 2.12 Absolute recoveries are represented as mean ± SD.

57
Table 2.7 - Autosampler stability (%) of CIS in rat plasma and tissues.
Matrix n CIS Concentration added (µg/ml)
Precision (% RSD)
Accuracy (% Bias)
Mean Recovery (%)
Plasma 6 0.3 8.45 14.47 114.47
3 2.97 3.22 103.22
16 4.34 4.80 104.80 Brain 6 0.3 5.06 5.39 105.39
3 2.12 4.67 95.33 16 1.62 7.97 92.03
Liver 6 0.3 7.61 15.00 115.00
3 6.23 0.07 100.07
16 0.63 0.74 100.74 Muscle 6 0.3 2.58 16.07 116.07
3 4.92 2.11 102.11 16 7.03 1.65 101.65
Fat 6 0.3 11.09 3.20 96.80
3 3.59 4.53 95.47
16 1.86 8.59 91.41

58
Table 2.8 - Freeze-thaw stability (%) of CIS in rat plasma and tissues.
Matrix n CIS Concentration added (µg/ml)
Precision (% RSD)
Accuracy (% Bias)
Mean Recovery (%)
Plasma 6 0.3 6.82 12.27 112.47
3 7.81 0.87 100.87
16 5.43 2.75 95.25 Brain 6 0.3 5.02 2.39 102.39
3 3.49 0.56 99.44 16 3.87 1.74 98.26
Liver 6 0.3 5.48 19.75 119.75
3 16.88 7.11 107.11
16 5.35 1.26 98.74 Muscle 6 0.3 8.89 7.08 107.08
3 1.96 5.67 105.67 16 3.11 5.18 105.18
Fat 6 0.3 8.67 12.07 112.07
3 1.96 7.17 93.84
16 0.92 9.68 90.32

59
Table 2.9 - Autosampler Stability (%) of TRANS in rat plasma and tissues.
Matrix n TRANS Concentration added (µg/ml)
Precision (% RSD)
Accuracy (% Bias)
Mean Recovery (%)
Plasma 6 0.3 1.44 13.94 113.94
3 2.77 9.00 91.00
16 4.90 8.51 91.49 Brain 6 0.3 7.22 14.78 85.22
3 6.48 12.82 112.82 16 2.39 6.70 106.70
Liver 6 0.3 9.13 13.42 113.42
3 1.53 15.81 115.81
16 2.06 5.71 105.71 Muscle 6 0.3 6.55 1.72 101.72
3 2.21 6.23 93.77 16 2.72 17.39 82.61
Fat 6 0.3 4.59 5.00 95.00
3 5.42 2.06 97.94
16 3.32 6.87 93.13

60
Table 2.10 - Freeze-thaw Stability (%) of TRANS in rat plasma and tissues.
Matrix n TRANS Concentration added (µg/ml)
Precision (% RSD)
Accuracy (% Bias)
Mean Recovery (%)
Plasma 6 0.3 3.89 13.94 113.94
3 3.58 9.00 91.00
16 7.80 8.51 91.49 Brain 6 0.3 7.28 16.06 84.94
3 3.41 8.18 91.82 16 0.92 15.87 84.13
Liver 6 0.3 4.00 3.58 103.58
3 8.48 12.48 112.48
16 11.59 6.65 106.65 Muscle 6 0.3 14.14 5.61 94.39
3 1.32 2.78 97.22 16 3.23 8.22 91.78
Fat 6 0.3 8.44 14.83 114.83
3 3.89 4.24 104.24
16 5.45 1.54 101.54

61
Table 2.11 - Maximum concentration (Cmax), area under the curve (AUC) and time to peak
(Tmax) of CIS and TRANS in rat plasma and tissues.
Matrix CIS (60 mg/kg) TRANS (300 mg/kg)
Tmax
(h)
Cmax
(µg/ml)
AUC
(h*µg/ml)
Tmax
(h)
Cmax
(µg/ml)
AUC
(h*µg/ml)
Plasma 4 3.83 ± 0.73 18.3 4 2.59 ± 1.71 11.1
Brain 8 1.70 ± 0.14 11.6 4 0.86 ± 0.37 4.3
Liver 4 5.58 ± 1.57 37.3 4 2.58 ± 1.10 13.4
Muscle 8 1.96 ± 0.23 14.4 4 2.14 ± 054 11.1
Fat 8 13.20 ± 3.27 74.4 12 9.38 ± 3.74 62.1
Cmax is represented as mean ± SD (n = 3).

62
FIGURES
A (PBO)
B (CIS)
C (TRANS)
Fig. 2.1 - Chemical structure of (A) pipernoyl butoxide (PBO), (B) cis-permethrin (CIS), and (C)
trans-permethrin (TRANS). The structures were derived from ChemDraw software.

63
Fig. 2.2 - Method flow chart of cis-permethrin (CIS) or trans-permethrin (TRANS) extraction.

64
Fig. 2.3 – Chromatograms of (A) blank plasma and (B) cis-permethrin (CIS) plasma lower limit
of quantification (LLOQ). LLOQ plasma was spiked with 0.1 µg CIS/ml. Peak elutes ~ 12min.
Peak is represented with a red arrow (↓).

65
Fig. 2.4 – Chromatograms of (A) blank brain and (B) cis-permethrin (CIS) brain lower limit of
quantification (LLOQ). LLOQ brain was spiked with 0.1 µg CIS/ml. Peak elutes ~ 12 min. Peak
is represented with a red arrow (↓).

66
Fig. 2.5 – Chromatograms of (A) liver blank and (B) cis-permethrin (CIS) liver lower limit of
quantification (LLOQ). LLOQ liver was spiked with 0.1 µg CIS/ml. Peak elutes ~ 12 min. Peak
is represented with a red arrow (↓).

67
Fig. 2.6 – Chromatograms of (A) blank muscle and (B) cis-permethrin (CIS) muscle lower limit
of quantification (LLOQ). LLOQ muscle was spiked with 0.1 µg CIS/ml. Peak elutes ~ 12 min.
Peak is represented with a red arrow (↓).

68
Fig. 2.7 – Chromatograms of (A) blank fat and (B) cis-permethrin (CIS) fat lower limit of
quantification (LLOQ). LLOQ fat was spiked with 0.1 µg CIS/ml. Peak elutes ~ 12 min. Peak is
represented with a red arrow (↓).

69
Fig. 2.8 - Chromatograms of (A) blank plasma and (B) trans-permethrin (TRANS) plasma lower
limit of quantification (LLOQ). LLOQ plasma spiked with 0.15 µg TRANS/ml. Peak elutes ~ 12
min. Peak is represented with a red arrow (↓).

70
Fig. 2.9 - Chromatograms of (A) blank brain and (B) trans-permethrin (TRANS) brain lower
limit of quantification (LLOQ). LLOQ brain was spiked with 0.15 µg TRANS/ml. Peak elutes ~
12 min. Peak is represented with a red arrow (↓).

71
Fig. 2.10 - Chromatograms of (A) blank liver and (B) trans-permethrin (TRANS) liver lower
limit of quantification (LLOQ). LLOQ liver was spiked with 0.15 µg TRANS/ml. Peak elutes ~
12 min. Peak is represented with a red arrow (↓).

72
Fig. 2.11 - Chromatograms of (A) blank muscle and (B) trans-permethrin (TRANS) muscle
lower limit of quantification (LLOQ). LLOQ muscle was spiked with 0.15 µg TRANS/ml. Peak
elutes ~ 12 min. Peak is represented with a red arrow (↓).

73
Fig. 2.12 - Chromatograms of (A) blank fat and (B) trans-permethrin (TRANS) fat lower limit of
quantification (LLOQ). LLOQ fat was spiked with 0.15 µg TRANS/ml. Peak elutes ~ 12 min.
Peak is represented with a red arrow (↓).

74
Fig. 2.13 - Concentration time-course of cis-permethrin (CIS) and trans-permethrin (TRANS) for
(A) plasma, (B) brain, (C) liver, (D) muscle, and (E) fat. Data obtained from female rats (n=3 or
4) after oral administration of 60 mg CIS/kg or 300 mg TRANS/kg. Each data point represents
mean concentration ± SD.
Plasma
0 2 4 6 8 10 120.1
1
10
CIS 60 mg/kgTRANS 300 mg/kg
A
Time (h)
Conc
entra
tion (
µg/m
l)Brain
0 2 4 6 8 10 120.1
1
10
CIS 60 mg/kgTRANS 300 mg/kg
B
Time (h)
Conc
entra
tion (
µg/m
l)
Liver
0 2 4 6 8 10 120.1
1
10
TRANS 300 mg/kgCIS 60 mg/kg
C
Time (h)
Conc
entra
tion (
µg/m
l)
Muscle
0 2 4 6 8 10 120.1
1
10CIS 60 mg/kgTRANS 300 mg/kg
D
Time (h)
Conc
entra
tion (
µg/m
l)
Fat
0 2 4 6 8 10 120.1
1
10
100
CIS 60 mg/kgTRANS 300 mg/kg
E
Time (h)
Conc
entra
tion (
µg/m
l)

75
CHAPTER 3
TOXICOKINETICS OF PERMETHRIN AS A FUNCTION OF AGE, SEX, AND
ISOMER
Tanzir B. Mortuza, Jing Pang, Srinivasa Muralidhara, James V. Bruckner, Brian S. Cummings,
and Catherine A. White; To be submitted to the Toxicological Sciences

76
ABSTRACT
Permethrin, a class I pyrethroid, is used extensively as an insecticide throughout the
world. Nevertheless, there are limited TK data for risk assessments, notably for children. The
objective of this study was to assess the relative TK of cis- versus trans-permethrin (CIS vs.
TRANS) isomer as a function of stage of maturity and sex, using the rat as an animal model.
Groups of preweanlings (PND 15), weanlings (PND 21) and adult (PND 90) rats were
administered CIS or TRANS as a single oral bolus and euthanized at intervals for up to 24 h for
collection of plasma, brain, liver, muscle and fat for isomer analysis by HPLC. Both CIS and
TRANS attained higher concentrations in plasma, brain, and liver in pups than in adults. The
lower clearance and higher peak concentrations in PND 15 animals resulted in significantly
higher plasma and tissue levels than in adults for both isomers. CIS and TRANS clearance and
AUC024 values were inversely related to age in the PND 15, 21 and 90 animals. Adult plasma
CIS Cmax and AUCs were 3 to 4 times higher than TRANS values, reflecting more rapid
metabolic clearance of TRANS. Significant differences were also observed in dose normalized
brain Cmax and AUCs for CIS and TRANS, as CIS values were significantly higher than
TRANS values in all age groups. Sex differences were only observed in adult plasma and liver
for CIS. No sex difference was observed for TRANS. These data demonstrate that the TK of
permethrin in rats is age-, and to some extent isomer-dependent.
Key words: cis-permethrin, trans-permethrin, age-dependent toxicokinetics, sex-dependent
toxicokinetics

77
INTRODUCTION
Pyrethroids, synthetic derivatives of naturally occurring pyrethrins, are sold as
insecticides throughout much of the world. They are frequently utilized in a variety of
agricultural, commercial, transportation and residential settings. Permethrin (PER) and other
pyrethroids are applied to treat ectoparasites on livestock, pets and humans (Anadon et al. 1991;
Frankowski et al. 2002). Pyrethroid uses and sales have substantially increased over the last two
decades in the US due to their effectiveness and restrictions on organophosphates (Williams et
al. 2008). Therefore, it is not surprising that a large segment of the general population of
advanced nations is exposed to pyrethroids (Saillenfait et al. 2015). Children were found to have
higher urinary pyrethroid metabolite levels than adolescents or adults in a national survey in the
US (Barr et al. 2010). Morgan and Jones (2013) compiled data from 15 published studies of
pyrethroid exposure of children in homes and day care centers. PER was most often detected.
PER, marketed as a mixture of its cis (CIS)- and trans (TRANS)-isomers, is the most frequently
utilized residential insecticide in the US. The most common source of childhood exposure was
hand to mouth activity involving contaminated dust, carpet and pets. Consumption of
contaminated food was of secondary importance in terms of exposure (Lu et al. 2006; Morgan
and Jones 2013).
PER, like other pyrethroids, exerts its acute neurotoxicity by binding and interfering with
the voltage sensitive sodium channels (VSSC), producing stimulus dependent depolarization
block in neurons (Soderlund 2012). Pyrethroids are divided into two categories: type I and II.
Tremors and parathesias are the primary sign of poisoning by type I compounds such as PER.
Salivation, hyperexcitability, oral apoptosis, and seizures are major signs of type II poisoning.
Both type I and II compounds are the proximate neurotoxicity moieties. Immature rodents are

78
more susceptible to the acute neurotoxicity than adults. Susceptibility of rat pups to PER and
cypermethrin (type II) lethality was found to be inversely related to age (Cantalamessa 1993).
Sheets et al. (1994) reported the same phenomenon with deltamethrin (DLM) (type II) although
it was unknown whether the age dependency was the result of toxicodynamic (TK) and/or
toxicokinetic (TK) factors.
Central nervous system (CNS) development would appear to be particularly sensitive to
harmful effects of chemicals. CNS maturation in human involves billions of neurons that
undergo replication, migration, differentiation, synaptogenesis, selective cell loss and
myelinization (Benjamin 2003). Pertubations of VSSC during maturation may lead to residual
neurological impairment (Shafer et al. 2005). Disruption of catecholaminergic systems, notably
the dopamine system, has been reported to be associated with attention deficit hyperactivity
behavior in DLM treated mice (Richardson et al. 2015). Concerned that long-term, low-level
pyrethroid exposure of children can lead to such behavioral disorders has been raised by several
epidemiology studies (Richardson et al. 2015; Viel et al. 2015; Wagner-Schuman et al. 2015).
Other researchers, however, have not found such an association between prenatal (Horton et al.
2011) and postnatal (Quirós-Alcalá et al. 2014) PER exposure.
There is increasing evidence that biochemical and physiological changes during
maturation can significantly alter internal dosimetry and hence the neurotoxic potential of
pyrethroids. The younger and more immature a subject is, the greater the age difference in many
processes that can impact the TK of pyrethroids and other xenobiotics (Bruckner 2000).
Weanling rats that ingested a 6.7-fold lower dose of DLM than adults exhibit brain DLM
concentrations comparable to those in the adults at the time of death (Sheets et al. 1994).
Deficiency in metabolic inactivation/clearance in immature rats appears to be an important

79
contributor to the inverse relationship between life stage and brain levels of DLM (Kim et al.
2010; Mortuza et al. 2018). Anand et al. (2006) observed progressive increases in intrinsic
clearance of DLM by cytochrome P450s (CYPs) and carboxylesterases (CaEs) in rats during
maturation. Sethi et al. (2014) reported that DLM, CIS and TRANS were highly bound to plasma
proteins and lipooproteins. Plasma binding of DLM increased during maturation (Sethi et al.
2016). Deficiency of adipose tissue in pups and increased permeability of the immature blood-
brain barrier may also be expected to enhance CNS deposition and neurotoxicity in the very
young (Amaraneni et al. 2017).
Drug metabolizing enzymes in some male and female species are expressed differently.
Studies have shown that expression of certain CYPs in male rat livers is up to 20 times higher
than in female livers (Kato and Yamazoe 1992). These enzymes are responsible for metabolism
of PER in plasma and liver (Shafer et al. 2005). Thus, such disparity may be a significant
contributor to sex differences in the TK of CIS and TRANS.
The primary objectives of the current investigation in rats were three-fold: (1) to
characterize and contrast the time-course of CIS and TRANS in plasma and tissues; (2) to
investigate sex-dependency of CIS and TRANS TK; and (3) to determine whether the TK of CIS
and TRANS vary during maturation. Information on the TK of PER is limited to that provided
by a single dose study by Anadon et al. (1991) and to in silico projects in which limited blood
and tissue time-course data were obtained to validate physiologically-based toxicokinetic
(PBTK) models for PER for adults (Tornero-Velez et al. 2012; Willemin et al. 2016). TRANS is
known to be metabolized in vitro by CaEs and CYPs to a far greater extent in rats than CIS
(Scollon et al. 2009). Therefore, it can be hypothesized that CIS will be more toxic than TRANS.

80
Furthermore, TRANS will exhibit more rapid elimination of the neurotoxic parent compound
than CIS in vivo.
MATERIALS AND METHODS
Chemicals
CIS and TRANS, as white powders of 99.3 % and 99.0% purity, were kindly supplied by
FMC Agricultural Products with batch numbers of FMC-035171 and FMC-030960, respectively.
Piperonyl butoxide (PBO), which served as the internal standard (IS), sodium fluoride (NaF),
and glycerol formal (GF) were purchased from Sigma-Aldrich (St. Louis, MO). HPLC-grade
methanol (CH3OH), acetonitrile (ACN) and water were purchased from Fisher Scientific
(Hampton, NH). All other chemicals were of the highest grade commercially available.
Animals
The Life Sciences Animal Facility at the University of Georgia (UGA) is an AAALAC-
accredited animal facility. Adult male and female Sprague-Dawley (S-D) rats (~ 275 g) were
purchased from Charles River Labs (Raleigh, NC) and delivered to the animal care facility. Upon
receipt, the animals were quarantined in groups of 4 in polycarbonate cages. The rats were
quarantined, and one week of acclimation time was provided before performing experiments. For
experiments with immature rats, pregnant female S-D rats were also purchased from Charles
River Labs (Raleigh, NC). The pregnant mothers gave birth at the animal care facility, where
they were kept until experiments were performed. The pups were allowed to reach 15 or 21 days
of age (PND 15 or PND 21) before being used for experiments. The study was conducted in
accordance with the NIH Guide for the Care and Use of Laboratory Animals. Purina Irradiated
Lab Diet 5053 (Brentwood, MO) and tap water were provided ad libitum. A 12-h light/dark
cycle (light 7 AM - 7 PM) was maintained.

81
Animal preparation for age-dependence TK study
Adult male and female S-D rats were fasted for ~12 h before dosing. Mixed-sex 20-day-
old pups were taken from their mother at 12 AM the day of experimentation and fasted in a
separate cage for 10 h before dosing. Solid food was provided for these pups and the adults 4 h
after CIS or TRANS administration. Water was available ad libitum. Mixed-sexed 15-day-old
pups were not fasted, and were kept with her mother throughout the experiment. Food and water
were available to the mother at all times.
Age-dependence TK study
A range of doses was administered to the animals for age-dependent TK studies. These
doses were based of previous study conducted by Anadon et al. (1991) that administered 460 mg
PER/kg with 25:75 mixture of CIS and TRANS. Appropriate amounts of CIS were dissolved in
5 ml CO/kg, so that doses of 60 or 120 mg CIS/kg were administered to the adult (PND 90) rats.
Weanlings (PND 21) rats were administered 60 or 90 mg CIS/kg. Preweanlings (PND 15)
manifested adverse effects at the doses provided to the PND 21 and adult rats, therefore, lower
doses were administered to the youngest group. Fifteen, 30, or 45 mg CIS/kg were given to the
preweanlings (PND 15) rats. Metabolism and clearance of TRANS is much faster than for CIS.
Therefore, only limited time-courses could be obtained for TRANS at the dose levels of CIS that
were administered. Thus, TRANS had to be given at a much higher dose. Adults were given 120
or 300 mg TRANS/kg. Preweanlings and weanlings were given 300 or 450 mg TRANS/kg.
Serial sacrifices of 5 rats per group were conducted periodically for up to 24 h post dosing.
Blood was withdrawn by cardiac puncture, and samples of whole brain and liver were taken for
CIS and TRANS quantitation. Approximately 1 mg of skeletal muscle was collected from each
animal. Abdominal fat was also collected from the adult animals. Preweanlings and weanlings

82
had no visible body fat. Blood was collected in 1.5-ml Lo-bind Eppendorf tubes. Ten µl of 0.64
M NaF were added to every 100 µl of blood to inhibit CaE activity. The blood samples were
immediately centrifuged after collection and the plasma stored at -80° C until analysis. The
tissue samples were flash frozen with liquid nitrogen and stored at -20° C until analysis.
CIS and TRANS analyses of biological samples
The quantification of CIS and TRANS was performed on an Agilent 1100 High
Performance Liquid Chromatograph (HPLC). System control and data analysis were provided by
Chemstation, Agilent Techonogies©. The mobile phase was delivered at a flow rate of 1 ml/min
in an isocratic elution consisting of a mixture of CH3OH and water (88:12, v/v) for CIS and
CH3OH, ACN, and water (75:10:15, v/v/v) for TRANS. Briefly, 100 μl of plasma were mixed
with 10 μl of sodium fluoride to inhibit CIS or TRANS hydrolysis by CaEs. ACN (400 μl)
containing 25 µg/ml PBO as the internal standard were added and mixed to extract samples. The
supernatant was dried and reconstituted in the mobile phase before analysis. The lower limits of
quantification (LLOQ) in the plasma was 0.1 µg/ml for CIS and 0.15 µg/ml for TRANS.
Tissue samples for CIS and TRANS analyses were handled in a similar method. Briefly,
2 ml (for brain and liver) or 3 ml (for muscle and fat) of water were added to each g of tissue for
homogenization with a Tekmar Tissumizer® (Cincinnati, OH). Tissue homogenate (100 μl) was
mixed with 400 µl ACN with 25 µl/ml PBO final extraction solution, vortexed for 4 min and
centrifuged at 13300 rpm for 10 min to denature and precipitate the proteins. The supernatant
was transferred to a 1.5-ml Lobind micro-centrifuge tube and evaporated to dryness in a heated
vacuum centrifuge at 65º C for 85 min. Eighty µl of mobile phase were added to the dried
sample, which was vortexed for 4 min, and centrifuged at 13300 rpm for 10 min. Finally, 70 µl
of supernatant were carefully transferred to an autosampler vial equipped with a 300-µl insert,

83
and 50 µl injected into the HPLC system for quantitative analysis. The lower limits of detection
quantification (LLOQ) in the tissues were 0.1 µg/ml for CIS and 0.15 µg/ml for TRANS
(Chapter 2).
Data analyses
Means and standard deviations (SDs) were calculated using Microsoft Excel (Microsoft
Co., Redmond, WA). TK parameters, including maximum plasma concentration (Cmax),
observed time of maximum plasma concentration (Tmax), elimination half-life (t1/2) and area
under the plasma concentration versus time curve (AUC∘ 24 and AUC∘ ∞) were calculated using
WinNonlin (ver 6.4.1) noncompartmental analysis (Pharsight, Cary, NC). AUCs were calculated
using the log/linear trapezoidal rule. The statistical significance of age-, sex-, and isomer-
dependent differences in mean values was assessed with a one-way ANOVA, followed by
Tukey’s Multiple Comparison Test using Prism (5.01) (GraphPad Software, Inc., San Diego,
CA).
RESULTS
Age-dependent TK of CIS
Our experimental protocol facilitated characterization of the age-dependent TK of CIS.
Dose-normalized time-courses of CIS in the plasma and tissues are shown in Fig. 3.1. Estimated
TK parameters are shown in Tables 3.1 - 3.3. The PND 15 pups had significantly higher CIS
concentrations in their plasma and tissues (Fig. 3.1) throughout most of the 24-h- monitoring
period, which resulted in considerably higher AUCs than for the other two age groups.
The plasma AUCs indicated that CIS followed linear TK, as AUC024 and AUC0
∞ were
roughly proportional to dose. However, the liver AUC and Cmax increased disproportionally
with the increase in dose (Table 3.1 – 3.3) in all age groups, yielding 3.5- to 5.5-fold increases in

84
AUC with 0.5- to 3-fold increases in dose. The increase in the liver AUC was as follows: PND
15> PND 21 > adult. Liver concentration-time profiles closely mirrored the plasma profiles in
each age group (Fig. 3.2 – 3.4), which might be expected for a highly perfused tissue. The brain
Cmax for CIS was lower than the plasma or liver Cmax (Tables 3.1 – 3.3). In all age groups,
levels of CIS in the brain increased more slowly and attained a lower Cmax than in liver or
plasma (Tables 3.1 – 3.3 and Fig. 3.1 – 3.4). CIS was then more slowly eliminated from the brain
than from plasma. Muscle and fat (adult) concentrations were significantly higher and achieved
at later times (Tables 3.1 – 3.3, Fig. 3.2 – 3.4). CIS concentrations in fat progressively rose
during the 24-h monitoring period, reaching levels far higher than in other matrices.
The brain AUC in adults given 120 mg CIS/kg was equivalent to that in PND 21 rats
given 90 mg/kg dose and PND 15 receiving 30 mg/kg (Tables 3.1 – 3.3). Due to significantly
higher brain deposition, PND 15 pups would be expected to exhibit more pronounced toxic
effects by CIS. Oral clearance of CIS (CL/F) was similar in adult and PND 21 rats; however,
PND 15 rats exhibited a 4-fold lower CL/F (Table 3.4). Fig. 3.5 illustrates the age-dependent
Cmax and AUC differences of CIS. Plasma and tissue CIS Cmax and AUC (Fig. 3.5) values
were age-dependent, which is consistent with the lower clearance in the younger animals. PND
21 Cmax and AUCs appeared to be somewhat higher than for adults, but no statistically
significant differences were noted.
CIS brain:plasma ratios were not significantly different among the age groups, as the
ratios were approximately 1 for Cmax (0.6-0.9) and AUC (1.2) for all age groups (Table 3.5).
Liver ratios for Cmax and AUC increased significantly with age. PND 15 and PND 21 liver
ratios were much higher than adults. Muscle Cmax and AUC ratios were equivalent in PND 21

85
and adults. PND 15 pups had a significantly higher Cmax ratio for muscle than the other two age
group, however, muscle AUCs were similar to the other age groups.
Age-dependent TK of TRANS
The TK of TRANS was age-dependent. Concentration time-course profiles for plasma
and tissues are shown in Fig. 3.6 – 3.9. Plasma, brain, and liver concentrations were highest in
PND 15 pups during much of the 24-h monitoring period (Fig. 3.6). Plasma, brain, and liver
concentrations were usually lowest in the adults. PND 21 (weanlings) typically exhibited
intermediate TRANS plasma and tissue levels. Plasma and tissue TRANS appeared to attain the
highest levels and decline at the slowest rates in the youngest animals. Estimated TK parameters
are presented in Supplementary Tables 3.1 – 3.3.
In adults, plasma and liver time-courses were virtually identical to each other (Fig. 3.7A).
Concentrations of TRANS were much lower in the brain than in plasma or liver, although the
same time-course was evident. Muscle concentrations were similar to plasma concentrations for
6 h in adults; but diminished more slowly (Fig. 3.7B). Fat attained much higher levels which
persisted throughout the monitoring period. TRANS concentration time-courses for PND 15 and
PND 21 pups differed somewhat from adults. Liver concentrations in PND 15 rats were slightly
higher than plasma concentrations (Fig. 3.8A and 3.9A). Muscle attained significantly higher
levels than plasma in both PND 15 and PND 21 groups (Fig. 3.8B and 3.9B).
Values in Table 3.6 illustrate the age-dependency for TK of the 300 mg TRANS/kg dose.
In plasma, Cmax increased by approximately 2.7-fold in PND 21 rats and 4.5-fold in PND 15
rats over adults. AUCs increased by 2.3- and 4.5-fold in PND 21 and PND 15 rats, respectively,
over adults. Brain Cmax values were 4 and 8 times higher in PND 21 and PND 15 than in
adults. Brain AUCs followed a similar pattern. Muscle AUCs showed the most pronounced

86
difference among the age groups (Table 3.6). Oral clearance increased as age increased (Table
3.7). Clearance in adult animals was 3 and 5 times higher than in PND 21 and PND 15 pups,
respectively, for the 300 mg/kg dose. Elimination half-lives of TRANS, however, were inversely
related to age. Plasma elimination half-lives were approximately 3- and 5-fold longer in PND 21
and PND 15 pups than in adults (Table 3.7), suggesting the difference in oral clearance is largely
responsible for the increase in elimination half-life.
TRANS Cmax and AUC values (Fig. 3.10) of PND 15 pups were significantly greater
than in PND 21 and adult rats. However, Cmax or AUCs were not significantly different in PND
21 and adults in most cases. TRANS tissue to plasma ratios also showed age-dependency (Table
3.8). Brain:plasma Cmax and AUCs for the two groups of immature rats, while quite similar to
one another, although significantly higher than in adults. The higher brain:plasma ratios in the
two immature groups may be indicative of increased permeability of the immature blood-brain
barrier to pyrethroids. Fat is the major depot for a highly lipophilic compound such as TRANS.
Younger age groups have less fat; therefore, a significant amount of TRANS is deposited in
muscle in preweanlings and weanlings, yielding a relatively high muscle:plasma AUC ratio
(Table 3.8).
Sex-dependent TK of CIS and TRANS:
CIS and TRANS concentration-time profiles in adult male and female rats are shown in
Fig. 3.11 and 3.12. TK parameters are presented in Table 3.9. CIS plasma Cmax and AUC values
were approximately 2-fold higher in female adult rats than in males. Similarly, CIS liver Cmax
and AUC values were significantly higher for female rats. Brain, muscle, and fat did not exhibit
sex-dependent TK for CIS, as the time-courses, Cmax, and AUCs were similar in female and
male rats. No sex difference was noted in TK of TRANS plasma or other tissues (Table 3.9).

87
Isomer-dependent TK
Isomer-dependent TK parameters are included in Table 3.10 and 3.11. TRANS levels are
substantially lower than CIS levels in adult rats administered 120 mg/kg of either isomer (Fig.
3.13). The CIS Cmax and AUC are significantly higher than those for the same oral dose of
TRANS. Systemic clearance of TRANS is ~3 times more rapid than in CIS (Table 3.10).
As illustrated in Fig. 3.14, dose-normalized CIS and TRANS Cmax and AUCs for plasma and
brain were significantly different in all age groups. Plasma CIS Cmax and AUCs were 2.5 to 5
times higher. The isomeric differences in brain Cmax and AUCs were even more pronounced
than for plasma. Dose-normalized CIS Cmax and AUCs were approximately 6- and 4-times
higher in PND 15 and PND 21 groups, respectively, than TRANS values (Table 3.11), which is
consistent with the higher clearance of TRANS in adults.
DISCUSSION
Despite extensive use, there are a relatively limited number of TK studies of pyrethroids.
The TK of a few pyrethroids such as DLM, bifenthrin and lambda-cyhalothrin has been
investigated in adult rats (Anadón et al. 2006; Kim et al. 2008, 2010; Hughes et al. 2016). A
limited number of doses of PER was studied in rats (Anadon et al. 1991; Tornero-Velez et al.
2012; Willemin et al. 2016). There has been only one TK study conducted in human volunteers
(Ratelle et al. 2015). Furthermore, there are only a limited number of age-dependent TK studies
available in the literature for pyrethroids (Kim et al. 2010; Mortuza et al. 2018). Both Kim et al.
(2010) and Mortuza et al. (2018) investigated DLM, a type II pyrethroid, in young and adult rats.
In the current study, a comprehensive evaluation of age-dependent TK of CIS and TRANS was
conducted. The TK of CIS and TRANS was age-dependent. Both Cmax and AUCs were
inversely related to age for each isomer. Plasma AUCs were generally proportional to dose in all
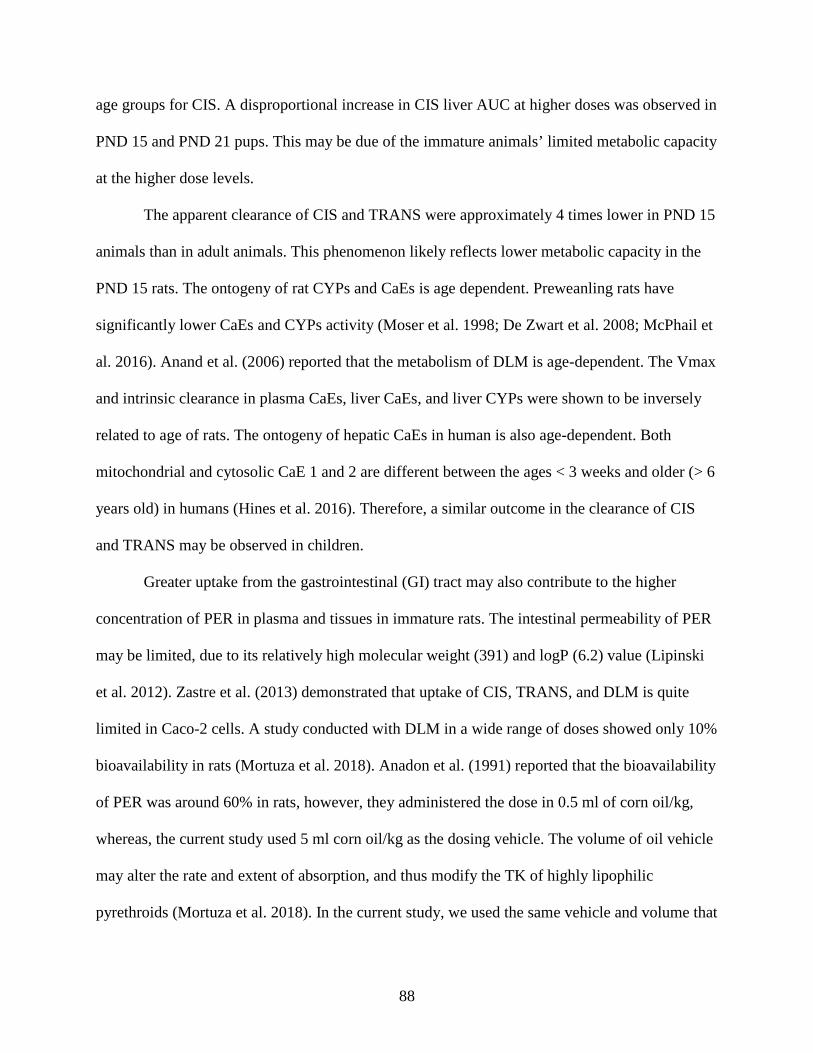
88
age groups for CIS. A disproportional increase in CIS liver AUC at higher doses was observed in
PND 15 and PND 21 pups. This may be due of the immature animals’ limited metabolic capacity
at the higher dose levels.
The apparent clearance of CIS and TRANS were approximately 4 times lower in PND 15
animals than in adult animals. This phenomenon likely reflects lower metabolic capacity in the
PND 15 rats. The ontogeny of rat CYPs and CaEs is age dependent. Preweanling rats have
significantly lower CaEs and CYPs activity (Moser et al. 1998; De Zwart et al. 2008; McPhail et
al. 2016). Anand et al. (2006) reported that the metabolism of DLM is age-dependent. The Vmax
and intrinsic clearance in plasma CaEs, liver CaEs, and liver CYPs were shown to be inversely
related to age of rats. The ontogeny of hepatic CaEs in human is also age-dependent. Both
mitochondrial and cytosolic CaE 1 and 2 are different between the ages < 3 weeks and older (> 6
years old) in humans (Hines et al. 2016). Therefore, a similar outcome in the clearance of CIS
and TRANS may be observed in children.
Greater uptake from the gastrointestinal (GI) tract may also contribute to the higher
concentration of PER in plasma and tissues in immature rats. The intestinal permeability of PER
may be limited, due to its relatively high molecular weight (391) and logP (6.2) value (Lipinski
et al. 2012). Zastre et al. (2013) demonstrated that uptake of CIS, TRANS, and DLM is quite
limited in Caco-2 cells. A study conducted with DLM in a wide range of doses showed only 10%
bioavailability in rats (Mortuza et al. 2018). Anadon et al. (1991) reported that the bioavailability
of PER was around 60% in rats, however, they administered the dose in 0.5 ml of corn oil/kg,
whereas, the current study used 5 ml corn oil/kg as the dosing vehicle. The volume of oil vehicle
may alter the rate and extent of absorption, and thus modify the TK of highly lipophilic
pyrethroids (Mortuza et al. 2018). In the current study, we used the same vehicle and volume that

89
was used by Mortuza et al. (2018). Age-dependent GI uptake and bioavailibity have not been
studies for pyrethroids. It is possible that immature GI epithelium may be more permeable to
pyrethroids, should pinocytosis be more pronounced.
Examination of tissue:plasma ratios revealed little apparent age difference in the
distribution of CIS. Brain:plasma AUC ratios were somewhat higher than 1 reflected relatively
slow elimination of CIS from the brain (Table 3.5). TRANS tissue:plasma Cmax and AUC ratios
showed an age-dependent increase between adults and two immature age-groups. TRANS
deposition in the brain was lower than for CIS. Kim et al. (2010) reported DLM brain:plasma
ratios of approximately 0.25 for PND 10, 21, 40 and 90 rats, indicating little evidence of age-
dependency. Therefore, age-dependent brain deposition may be a determinant of neurotoxicity of
CIS and TRANS, but not DLM.
Anadon et al. (1991) conducted a TK study of PER in which they administered 46 mg/kg
i.v. and 460 mg/kg p.o. in a 25:75 mixture of two isomers to rats. Unfortunately, they did not
measure levels of each isomer. Tornero-Velez et al. (2012) administered 1 or 10 mg/kg PER in a
40:60 mixture and evaluated each isomer separately. Willemin et al. (2016) administered 25
mg/kg of CIS or TRANS separately. The TK characterized by Tornero-Velez et al. (2012) and
Willemin et al. (2016) was linear, as their plasma and tissue AUCs were proportional to dose. In
the current study, the adult rats were given 120 mg CIS or TRANS/kg, which is approximately 5
times higher than the highest dose administered by Willemin et al. (2016). The plasma AUCs for
both CIS and TRANS were also approximately 5 times higher in the current study, indicating
that the TK of CIS and TRANS is linear within this dosage range. Furthermore, plasma and
tissue AUCs were proportional to dose between 120 and 300 mg/kg of TRANS. Brain empirical
distribution ratios (AUCbrain: AUCblood) of CIS and TRANS in the current study were
90
comparable to those of Tornero-Velez et al. (2012). The current study utilized a wider range of
concentrations that was also linear, a dose-normalized approach was applied to compare the age-
dependent TK of CIS and TRANS.
In the current study, dose-normalized plasma and brain CIS and TRANS Cmax and
AUCs were significantly different in all age groups. Plasma AUCs of PND 15, PND 21, and
adult rats were from 2.5 to 5 times higher for CIS than for TRANS. Metabolic differences
between CIS and TRANS may be one of the major determinants of the different plasma TK of
the isomers. In rats, CIS is predominantly oxidized by CYPs, alternatively, a substantial amount
of TRANS (65%) is hydrolyzed by hepatic CaEs. In humans, 41% of TRANS is metabolized
through the hydrolytic pathway. The intrinsic clearance of these two isomers is quite different
(Scollon et al. 2009). TRANS was metabolized much faster than CIS. Therefore, differences
between the TK of CIS and TRANS are due primarily to the more rapid metabolism of TRANS.
Brain AUCs showed an even more pronounced difference than did plasma, as CIS AUCs were >
6 times greater than TRANS AUCs in all age groups. Faster elimination from the brain may be a
result of metabolism in the brain, especially in adult rats. Starr et al. (2014) examined a group
pyrethroid mixtures in rats and reported that plasma half-lives were almost identical for CIS and
TRANS when dosed as a mixture. However, the brain half-life of TRANS was half that of CIS in
the same scenario. Similar observations were made by Willemin et al. (2016). These findings
suggest the concentrations in the brain may be limited by metabolism.
Many pharmacokinetic and pharmacodynamic parameters are different in males and
females such as; enzyme (Arthur et al. 1984; Parlesak et al. 2002) and transporter expression
(Tamai et al. 1997; Jovanovic et al. 2008). Males and females also have different body fat
composition and cardiac output (Young and Tensuan 1963). Our data indicate that lipophilic

91
compounds like PER are largely distributed to body fat. One of the primary objectives of this
study is to evaluate the sex-difference of CIS and TRANS. There are only a few studies that
addressed sex-differences in the TK of pyrethroids and metabolites. Abe et al. (2015) studied the
metabolism of profluthrin, a type I pyrethroid and found no sex-related differences in the TK.
Ueyama et al. (2010) examined the TK of three primary pyrethroid metabolites in males and
females and found significant differences in TK parameters for 3-phenoxybenzoic acid (3-PBA)
and 3-phenoxybenzoic alcohol (3-PBAlc). In the current study, sex-differences were observed
only in the TK of CIS. CIS plasma and liver Cmax and AUCs were 2- to 3-times larger in female
than in male rats. Brain, muscle and fat levels were similar in males and females for both
isomers. No sex-differences were observed in TRANS plasma and tissues TK. Additionally,
preliminary experiments conducted with male and female rats indicated that there were no
apparent sex-differences in PND 15 or 21 pups. The sex-dependent TK differences between
males and females may be due to the difference in metabolism between the two isomers. The
contribution of different oxidative and hydrolytic metabolic pathway for CIS and TRANS has
previously been discussed. Marchetti et al. (1997) measured CYPs in two different strains of rats
and reported that total CYPs expression in adult males were significantly higher than in female
rats. Kato and Yamazoe (1992) examined the ontogeny of hepatic CYPs and reported that
several CYPs are expressed at a higher level in male rats than in females including the ones
responsible for PER metabolism. CIS is predominantly metabolized by CYP 2C11 and 2C6 in
rats (Scollon et al. 2009). Interestingly, CYP 2C11 in male rats is expressed 20 times more than
in female rats. In adult rats, plasma CaE levels in males and females are largely the same (De
Zwart et al. 2008). Additionally, De Zwart et al. (2008) and McPhail et al. (2016) demonstrated
that there were no pronounced sex-differences in the expression of most CYPs in immature rats.

92
In the current investigation differences were minor between male and female rats in TRANS TK.
The significant role played by CYPs catalysis in the metabolism of CIS could be the primary
cause of the sex-dependent changes in its TK.
Some studies have linked pyrethroid exposures to neuronal dysfunctions in both adult and
neonatal brain (Saillenfait et al. 2015). Magby and Richardson (2017) reported that pyrethroid
exposure causes lower expression of sodium channels in laboratory mice. Endoplasmic reticulum
stress and learning deficits that follow pyrethroid related exposure were investigated by Hossain
et al. (2015). Sinha et al. (2004) examined the blood-brain permeability in developing brain and
reported that pyrethroid-based mosquito repellent during pregnancy induces dysfunction in the
neonatal rat brain of the offspring. This study also showed that young rats had a significant
increase in brain uptake of pyrethroids. There are concerns that the human population may also
be susceptible to neuronal dysfunctions, notably children. Several researchers have investigated
children’s exposure to PER and other pyrethroids in the household and environmental settings
(Morgan et al. 2007; Morgan and Jones 2013; Wason et al. 2013; Shelton et al. 2014; Viel et al.
2015; Li et al. 2016). There are only a few age-dependent TK studies that examined exposure to
younger species. The only human research conducted in healthy volunteers did not monitor the
parent compound, the primary neurotoxic moiety (Ratelle et al. 2015). This project provided a
comprehensive TK study that outlined exposure to different age groups for both CIS and TRANS
isomers of PER. The data can be extrapolated to construct a comprehensive human risk
assessment of PER, notably in children.
A number of biological models have been constructed to obtain predictions of internal
dose and tissue dosimetry of PER and other pyrethroids in laboratory animals (Mirfazaelian et al.
2006; Tornero-Velez et al. 2010, 2012; Willemin et al. 2016) and in humans (Appel et al. 2008;

93
Wei et al. 2012; Cote et al. 2014). Tornero-Velez et al. (2012) modeled CIS and TRANS in rats
and humans for aggregate exposure scenarios while Willemin et al. (2016) modeled CIS and
TRANS including the metabolites in rats. Neither of the investigators expanded their model to
predict tissue dosimetry in human subpopulations, notably children. The current study provides
age- and sex-dependent TK data at different dose levels of CIS and TRANS to facilitate
construction and validation of a comprehensive PBTK model of PER.
In conclusion, this study demonstrated that the TK of both CIS and TRANS is inversely
related to age. Young animals, especially PND 15 pups have relatively low systemic clearance,
which results in higher concentrations in plasma and other tissues. There was a pronounced age-
and isomeric- difference in brain levels of CIS and TRANS. Brain deposition of CIS showed
comparatively less age-dependency than TRANS. However, CIS brain concentrations reached a
much higher level in all age groups. Sex-differences did not impact the brain disposition of either
isomer. The only sex difference was observed in CIS plasma and liver concentration. This study
will facilitate the age-and sex-dependent human risk assessment of human subpopulations (e.g.,
children) that may be vulnerable to PER exposure.

94
REFERENCES
Abe, J., H. Nagahori, R. Omori, K. Mikata, M. Kurosawa, Y. Tomigahara and N. Isobe (2015).
"Metabolism of (Z)-(1 R, 3 R)-profluthrin in rats." Journal of Agricultural and Food Chemistry
63(39): 8651-8661.
Amaraneni, M., J. Pang, T. B. Mortuza, S. Muralidhara, B. S. Cummings, C. A. White, C. V.
Vorhees, J. Zastre and J. V. Bruckner (2017). "Brain uptake of deltamethrin in rats as a function
of plasma protein binding and blood-brain barrier maturation." Neurotoxicology 62: 24-29.
Anadón, A., M. Martínez, M. Martínez, M. Díaz and M. Martínez-Larrañaga (2006).
"Toxicokinetics of lambda-cyhalothrin in rats." Toxicology Letters 165(1): 47-56.
Anadon, A., M. R. Martinezlarranaga, M. J. Diaz and P. Bringas (1991). "Toxicokinetics of
Permethrin in the Rat." Toxicology and Applied Pharmacology 110(1): 1-8.
Anand, S. S., K.-B. Kim, S. Padilla, H. J. Kim, J. W. Fisher and J. V. Bruckner (2006).
"Ontogeny of hepatic and plasma metabolism of deltamethrin in vitro: role in age-dependent
acute neurotoxicity." Drug Metabolism and Disposition 34(3) 389-397.
Appel, K. E., U. Gundert-Remy, H. Fischer, M. Faulde, K. G. Mross, S. Letzel and B. Rossbach
(2008). "Risk assessment of Bundeswehr (German Federal Armed Forces) permethrin-
impregnated battle dress uniforms (BDU)." International Journal of Hygiene and Environmental
Health 211(1-2): 88-104.
Arthur, M., A. Lee and R. Wright (1984). "Sex differences in the metabolism of ethanol and
acetaldehyde in normal subjects." Clinical Science 67(4): 397-401.
Barr, D. B., A. O. Olsson, L. Y. Wong, S. Udunka, S. E. Baker, R. D. Whitehead, M. S.
Magsumbol, B. L. Williams and L. L. Needham (2010). "Urinary concentrations of metabolites

95
of pyrethroid insecticides in the general US population: National health and nutrition
examination survey 1999-2002." Environmental Health Perspectives 118(6): 742-748.
Benjamin, S. (2003). "Brain injury and mental retardation: Psychopharmacology and
neuropsychiatry." Journal of Clinical Psychiatry 64(12): 1522-1523.
Bruckner, J. V. (2000). "Differences in sensitivity of children and adults to chemical toxicity: the
NAS panel report." Regulatory Toxicology and Pharmacology 31(3): 280-285.
Cantalamessa, F. (1993). "Acute toxicity of two pyrethroids, permethrin, and cypermethrin in
neonatal and adult rats." Archives of Toxicology 67(7): 510-513.
Cote, J., Y. Bonvalot, G. Carrier, C. Lapointe, U. Fuhr, D. Tomalik-Scharte, B. Wachall and M.
Bouchard (2014). "A novel toxicokinetic modeling of cypermethrin and permethrin and their
metabolites in humans for dose reconstruction from biomarker data." PLoS One 9(2): e88517.
De Zwart, L., M. Scholten, J. Monbaliu, L. De Schaepdrijver, G. Bailey, C. Tim, C. Werner, J.
Van Houdt and M. Geert (2008). "The ontogeny of drug-metabolizing enzymes and transporters
in the rat." Drug Metabolism Reviews 38: 107-108.
Frankowski, B. L., L. B. Weiner, Committee of School Health and Committee of Infectious
Diseases (2002). "Head lice." Pediatrics 110(3): 638-643.
Hines, R. N., P. M. Simpson and D. G. McCarver (2016). "Age-dependent human hepatic
carboxylesterase 1 (CES1) and carboxylesterase 2 (CES2) postnatal ontogeny." Drug
Metabolism and Disposition 44(7): 959-966.
Horton, M. K., A. Rundle, D. E. Camann, D. B. Barr, V. A. Rauh and R. M. Whyatt (2011).
"Impact of prenatal exposure to piperonyl butoxide and permethrin on 36-month
neurodevelopment." Pediatrics: peds. 2010-0133.

96
Hossain, M. M., E. DiCicco-Bloom and J. R. Richardson (2015). "Hippocampal ER stress and
learning deficits following repeated pyrethroid exposure." Toxicological Sciences 143(1): 220-
228.
Hughes, M. F., D. G. Ross, B. C. Edwards, M. J. DeVito and J. M. Starr (2016). "Tissue time
course and bioavailability of the pyrethroid insecticide bifenthrin in the Long-Evans rat."
Xenobiotica 46(5): 430-438.
Jovanovic, H., J. Lundberg, P. Karlsson, A. Cerin, T. Saijo, A. Varrone, C. Halldin and A. L.
Nordstrom (2008). "Sex differences in the serotonin 1A receptor and serotonin transporter
binding in the human brain measured by PET." Neuroimage 39(3): 1408-1419.
Kato, R. and Y. Yamazoe (1992). "Sex-specific cytochrome P450 as a cause of sex- and species-
related differences in drug toxicity." Toxicology Letters 64-65 Spec No: 661-667.
Kim, K.-B., S. S. Anand, H. J. Kim, C. A. White, J. W. Fisher, R. Tornero-Velez and J. V.
Bruckner (2010). "Age, dose, and time-dependency of plasma and tissue distribution of
deltamethrin in immature rats." Toxicological Sciences 115(2): 354-368.
Kim, K. B., S. S. Anand, H. J. Kim, C. A. White and J. V. Bruckner (2008). "Toxicokinetics and
tissue distribution of deltamethrin in adult Sprague-Dawley rats." Toxicological Sciences 101(2):
197-205.
Li, W. W., M. K. Morgan, S. E. Graham and J. M. Starr (2016). "Measurement of pyrethroids
and their environmental degradation products in fresh fruits and vegetables using a modification
of the quick easy cheap effective rugged safe (QuEChERS) method." Talanta 151: 42-50.
Lipinski, C. A., F. Lombardo, B. W. Dominy and P. J. Feeney (2012). "Experimental and
computational approaches to estimate solubility and permeability in drug discovery and
development settings." Advanced Drug Delivery Reviews 64: 4-17.

97
Lu, C., D. B. Barr, M. Pearson, S. Bartell and R. Bravo (2006). "A longitudinal approach to
assessing urban and suburban children's exposure to pyrethroid pesticides." Environmental
Health Perspectives 114(9): 1419-1423.
Magby, J. P. and J. R. Richardson (2017). "Developmental pyrethroid exposure causes long-term
decreases of neuronal sodium channel expression." Neurotoxicology 60: 274-279.
Marchetti, M. N., E. Sampol, H. Bun, H. Scoma, B. Lacarelle and A. Durand (1997). "In vitro
metabolism of three major isomers of retinoic acid in rats - Intersex and interstrain comparison."
Drug Metabolism and Disposition 25(5): 637-646.
McPhail, B. T., C. A. White, B. S. Cummings, S. Muralidhara, J. T. Wilson and J. V. Bruckner
(2016). "The immature rat as a potential model for chemical risks to children: Ontogeny of
selected hepatic P450s." Chemico-Biological Interactions 256: 167-177.
Mirfazaelian, A., K. B. Kim, S. S. Anand, H. J. Kim, R. Tornero-Velez, J. V. Bruckner and J. W.
Fisher (2006). "Development of a physiologically based pharmacokinetic model for deltamethrin
in the adult male Sprague-Dawley rat." Toxicological Sciences 93(2): 432-442.
Morgan, M. K. and P. A. Jones (2013). "Dietary predictors of young children's exposure to
current-use pesticides using urinary biomonitoring." Food and Chemical Toxicology 62: 131-
141.
Morgan, M. K., L. S. Sheldon, C. W. Croghan, P. A. Jones, J. C. Chuang and N. K. Wilson
(2007). "An observational study of 127 preschool children at their homes and daycare centers in
Ohio: Environmental pathways to cis- and trans-permethrin exposure." Environmental Research
104(2): 266-274.

98
Mortuza, T., C. Chen, C. A. White, B. S. Cummings, S. Muralidhara, D. Gullick and J. V.
Bruckner (2018). "Toxicokinetics of deltamethrin: Dosage dependency, vehicle effects, and low-
dose age-equivalent dosimetry in rats." Toxicological Sciences 162(1): 327-336.
Moser, V. C., S. M. Chanda, S. R. Mortensen and S. Padilla (1998). "Age- and gender-related
differences in sensitivity to chlorpyrifos in the rat reflect developmental profiles of esterase
activities." Toxicological Sciences 46(2): 211-222.
Parlesak, A., M. H. U. Billinger, C. Bode and J. C. Bode (2002). "Gastric alcohol dehydrogenase
activity in man: Influence of gender, age, alcohol consumption and smoking in a caucasian
population." Alcohol and Alcoholism 37(4): 388-393.
Quirós-Alcalá, L., S. Mehta and B. Eskenazi (2014). "Pyrethroid pesticide exposure and parental
report of learning disability and attention deficit/hyperactivity disorder in US children: NHANES
1999–2002." Environmental Health Perspectives 122(12): 1336-1342.
Ratelle, M., J. Cote and M. Bouchard (2015). "Time profiles and toxicokinetic parameters of key
biomarkers of exposure to cypermethrin in orally exposed volunteers compared with previously
available kinetic data following permethrin exposure." Journal of Applied Toxicology 35(12):
1586-1593.
Richardson, J. R., M. M. Taylor, S. L. Shalat, T. S. Guillot III, W. M. Caudle, M. M. Hossain, T.
A. Mathews, S. R. Jones, D. A. Cory-Slechta and G. W. Miller (2015). "Developmental pesticide
exposure reproduces features of attention deficit hyperactivity disorder." The FASEB Journal
29(5): 1960-1972.
Saillenfait, A.-M., D. Ndiaye and J.-P. Sabaté (2015). "Pyrethroids: exposure and health effects–
an update." International Journal of Hygiene and Environmental Health 218(3): 281-292.

99
Scollon, E. J., J. M. Starr, S. J. Godin, M. J. DeVito and M. F. Hughes (2009). "In vitro
metabolism of pyrethroid pesticides by rat and human hepatic microsomes and cytochrome P450
isoforms." Drug Metabolism and Disposition 37(1): 221-228.
Sethi, P. K., S. Muralidhara, J. V. Bruckner and C. A. White (2014). "Measurement of plasma
protein and lipoprotein binding of pyrethroids." Journal of Pharmacological and Toxicological
Methods 70(1): 106-111.
Sethi, P. K., C. A. White, B. S. Cummings, R. N. Hines, S. Muralidhara and J. V. Bruckner
(2016). "Ontogeny of plasma proteins, albumin and binding of diazepam, cyclosporine, and
deltamethrin." Pediatric Research 79(3): 409-415.
Shafer, T. J., D. A. Meyer and K. M. Crofton (2005). "Developmental neurotoxicity of
pyrethroid insecticides: critical review and future research needs." Environmental Health
Perspectives 113(2): 123.
Sheets, L. P., J. D. Doherty, M. W. Law, L. W. Reiter and K. M. Crofton (1994). "Age-
dependent differences in the susceptibility of rats to deltamethrin." Toxicology and Applied
Pharmacology 126(1): 186-190.
Shelton, J. F., E. M. Geraghty, D. J. Tancredi, L. D. Delwiche, R. J. Schmidt, B. Ritz, R. L.
Hansen and I. Hertz-Picciotto (2014). "Neurodevelopmental disorders and prenatal residential
proximity to agricultural pesticides: The CHARGE Study." Environmental Health Perspectives
122(10): 1103-1109.
Sinha, C., A. K. Agrawal, F. Islam, K. Seth, R. K. Chaturvedi, S. Shukla and P. K. Seth (2004).
"Mosquito repellent (pyrethroid-based) induced dysfunction of blood-brain barrier permeability
in developing brain." International Journal of Developmental Neuroscience 22(1): 31-37.

100
Soderlund, D. M. (2012). "Molecular mechanisms of pyrethroid insecticide neurotoxicity: recent
advances." Archives of Toxicology 86(2): 165-181.
Starr, J. M., S. E. Graham, D. G. Ross, R. Tornero-Velez, E. J. Scollon, M. J. DeVito, K. M.
Crofton, M. J. Wolansky and M. F. Hughes (2014). "Environmentally relevant mixing ratios in
cumulative assessments: A study of the kinetics of pyrethroids and their ester cleavage
metabolites in blood and brain; and the effect of a pyrethroid mixture on the motor activity of
rats." Toxicology 320: 15-24.
Tamai, I., A. Saheki, R. Saitoh, Y. Sai, I. Yamada and A. Tsuji (1997). "Nonlinear intestinal
absorption of 5-hydroxytryptamine receptor antagonist caused by absorptive and secretory
transporters." Journal of Pharmacology and Experimental Therapeutics 283(1): 108-115.
Tornero-Velez, R., J. Davis, E. J. Scollon, J. M. Starr, R. W. Setzer, M. R. Goldsmith, D. T.
Chang, J. Xue, V. Zartarian, M. J. DeVito and M. F. Hughes (2012). "A pharmacokinetic model
of cis- and trans-permethrin disposition in rats and humans with aggregate exposure application."
Toxicological Sciences 130(1): 33-47.
Tornero-Velez, R., A. Mirfazaelian, K. B. Kim, S. S. Anand, H. J. Kim, W. T. Haines, J. V.
Bruckner and J. W. Fisher (2010). "Evaluation of deltamethrin kinetics and dosimetry in the
maturing rat using a PBPK model." Toxicology and Applied Pharmacology 244(2): 208-217.
Ueyama, J., N. Hirosawa, A. Mochizuki, A. Kimata, M. Kamijima, T. Kondo, K. Takagi, S.
Wakusawa and T. Hasegawa (2010). "Toxicokinetics of pyrethroid metabolites in male and
female rats." Environmental Toxicology and Pharmacology 30(1): 88-91.
Viel, J. F., C. Warembourg, G. Le Maner-Idrissi, A. Lacroix, G. Limon, F. Rouget, C. Monfort,
G. Durand, S. Cordier and C. Chevrier (2015). "Pyrethroid insecticide exposure and cognitive

101
developmental disabilities in children: The PELAGIE mother-child cohort." Environment
International 82: 69-75.
Wagner-Schuman, M., J. R. Richardson, P. Auinger, J. M. Braun, B. P. Lanphear, J. N. Epstein,
K. Yolton and T. E. Froehlich (2015). "Association of pyrethroid pesticide exposure with
attention-deficit/hyperactivity disorder in a nationally representative sample of US children."
Environmental Health 14: 44.
Wason, S. C., R. Julien, M. J. Perry, T. J. Smith and J. I. Levy (2013). "Modeling exposures to
organophosphates and pyrethroids for children living in an urban low-income environment."
Environmental Research 124: 13-22.
Wei, B. N., K. R. Mohan and C. P. Weisel (2012). "Exposure of flight attendants to pyrethroid
insecticides on commercial flights: Urinary metabolite levels and implications." International
Journal of Hygiene and Environmental Health 215(4): 465-473.
Willemin, M. E., D. C. Sophie, R. Le Grand, F. Lestremau, F. A. Zeman, E. Leclerc, C. Moesch
and C. Brochot (2016). "PBPK modeling of the cis- and trans-permethrin isomers and their
major urinary metabolites in rats." Toxicology and Applied Pharmacology 294: 65-77.
Williams, M. K., A. Rundle, D. Holmes, M. Reyes, L. A. Hoepner, D. B. Barr, D. E. Camann, F.
P. Perera and R. M. Whyatt (2008). "Changes in pest infestation levels, self-reported pesticide
use, and permethrin exposure during pregnancy after the 2000–2001 US Environmental
Protection Agency restriction of organophosphates." Environmental Health Perspectives
116(12): 1681-1688.
Young, C. and R. Tensuan (1963). "Estimating the lean body mass of young women. Use of
skeletal measurements." Journal of the American Dietetic Association 42: 46-51.

102
Zastre, J., C. Dowd, J. Bruckner and A. Popovici (2013). "Lack of P-glycoprotein-mediated
efflux and the potential involvement of an influx transport process contributing to the intestinal
uptake of deltamethrin, cis-permethrin, and trans-permethrin." Toxicological Sciences 136(2):
284-293.

103
TABLES
Table 3.1: TK parameters of 60 and 120 mg CIS/kg in adult rats.
Dose
(mg/kg) Tmax
(h) Cmax
(μg/mL) AUC (0-∞) (h-µg/mL)
AUC (0-24) (h-μg/mL)
Half-life (t 1/2) (h)
CL/F (L/h-kg)
Plasma 60 4 1.7 ± 1.0 12.6 12.5 3.4 4.8
120 4 8.9 ± 4.4 28.9 28.7 4.3 4.2
Brain 60 6 1.3 ± 0.9 20.3 15.5 9.7
120 6 4.1 ± 1.3 29.8 29.2 3.8
Liver 60 4 1.8 ± 0.5 13.0 12.7 3.8
120 6 8.5 ± 2.2 45.6 45.3 3.6
Muscle 60 8 2.5 ± 1.3 38.5 28.4 10.0
120 6 5.7 ± 1.5 77.8 54.3 14.4
Fat 60 24 10.2 ± 2.1 ND 162.6 ND
120 24 21.7 ± 8.7 ND 306.4 ND
TK parameters derived from Phoenix win-non-lin. Cmax is represented as mean ± SD (n = 3-5).
ND represents not determined.

104
Table 3.2: TK parameters of 60 and 90 mg CIS/kg in PND 21 rats.
Dose
(mg/kg) Tmax
(h) Cmax
(μg/mL) AUC (0-∞) (h-µg/mL)
AUC (0-24) (h-μg/mL)
Half-life (t 1/2) (h)
CL/F (L/h-kg)
Plasma 60 4 2.9 ± 0.7 15.3 14.3 1.5 3.9
90 2 5.9 ± 1.8 22.2 21.8 2.0 4.1
Brain 60 4 2.5 ± 0.8 18.3 13.5 2.4
90 6 4.3 ± 2.2 28.7 26.8 2.2
Liver 60 4 4.8 ± 0.6 23.2 20.5 2.1
90 4 22.0 ± 12.6 96.7 96.3 1.2
Muscle 60 4 3.8 ± 1.0 56.9 21.3 6.7
90 4 6.1 ± 2.6 48.8 35.5 5.4
TK parameters derived from Phoenix win-non-lin. Cmax is represented as mean ± SD (n = 3-5).

105
Table 3.3: TK parameters of 15, 30, and 45 mg CIS/kg in PND 15 rats.
Dose
(mg/kg) Tmax
(h) Cmax
(μg/mL) AUC (0-∞) (h-µg/mL)
AUC (0-24) (h-μg/mL)
Half-life (t 1/2) (h)
CL/F (L/h-kg)
Plasma
15 4 2.0 ± 0.8 10.7 10.7 3.3 1.4
30 2 2.3 ± 0.3 26.3 25.2 4.0 1.1
45 4 5.4 ± 1.6 40.7 40.2 1.8 1.1
Brain
15 8 1.7 ± 1.1 16.7 15.6 5.0
30 6 2.3 ± 0.6 27.7 26.3 6.3
45 6 4.6 ± 0.5 42.8 42.1 3.2
Liver
15 4 3.7 ± 1.8 20.3 20.1 1.5
30 6 7.1 ± 3.9 57.1 56.7 2.3
45 6 16.2 ± 5.4 111.3 111.1 1.4
Muscle
15 2 3.9 ± 2.6 32.6 28.9 5.5
30 6 4.4 ± 1.0 70.0 57.8 7.0
45 6 7.6 ± 0.6 85.45 77.3 3.0
TK parameters derived from Phoenix win-non-lin. Cmax is represented as mean ± SD (n = 3-5).

106
Table 3.4 – Age-dependent plasma TK parameters of CIS.
Dose
(mg/kg) Tmax
(h) Cmax
(μg/mL) AUC (0-∞)
(h-µg/mL) AUC (0-24)
(h-μg/mL) Half-life
(t 1/2) (h) CL/F
(L/h-kg)
PND 15
15 4 2.0 ± 0.8 10.7 10.7 3.3 1.4
30 2 2.3 ± 0.3 26.3 25.2 4.0 1.1
45 4 5.4 ± 1.6 40.7 40.2 1.8 1.1
PND 21 60 4 2.9 ± 0.7 15.3 14.3 1.5 3.9
90 2 5.9 ± 1.8 22.2 21.8 2.0 4.1
Adult 60 4 1.7 ± 1.0 12.6 12.5 3.4 4.8
120 4 8.9 ± 4.4 28.9 28.7 4.3 4.2
TK parameters were computed for PND 15, PND 21 and adult rats using Phoenix win-non-lin.
Cmax is represented as mean ± SD (n = 3-5).

107
Table 3.5: Dose normalizes tissue: plasma ratio of CIS.
Adult PND 21 PND 15
Brain Cmax 0.60 ± 0.20 0.79 ± 0.09 0.90 ± 0.09
AUC 1.23 ± 0.41 1.28 ± 0.07 1.21 ± 0.29
Liver Cmax 0.99 ± 0.05 2.33 ± 1.20 2.63 ± 0.67*
AUC 1.63 ± 0.63 2.51 ± 1.60 2.24 ± 0.41
Muscle Cmax 1.04 ± 0.57 1.16 ± 0.18 1.76 ± 0.29#
AUC 2.52 ± 0.63 2.59 ± 0.99 2.57 ± 0.48
Dose normalized Cmax and AUC values represented as mean ± SD. (*) – denotes significantly
different from adult (p < 0.05). (#) – denotes significantly different from PND 21 (p < 0.05).

108
Table 3.6: Age-dependent Cmax and AUC in plasma and tissues of 300 mg TRANS/kg.
Age-group Cmax (µg/mL) AUC (0-∞) (µg-h/mL)
Plasma
Adult 3.1 (1) 16.2 (1)
PND 21 8.5 (2.7) 37.8 (2.3)
PND 15 14.1 (4.5) 73.6 (4.5)
Brain
Adult 0.9 (1) 4.9 (1)
PND 21 3.4 (4) 14.5 (3)
PND 15 6.9 (8.1) 50.9 (10.5)
Liver
Adult 3.2 (1) 14.9 (1)
PND 21 10.8 (3.4) 38.3 (2.6)
PND 15 20.1 (6.3) 122.2 (8.2)
Muscle
Adult 2.3 (1) 13.6 (1)
PND 21 11.0 (4.8) 75.6 (5.6)
PND 15 20.5 (8.9) 207.4 (15.3)
Data represents Cmax and AUCs of plasma, brain, liver and muscle (PND 15 or PND 21 / adult).

109
Table 3.7: Age-dependent plasma TK parameters of TRANS.
Dose
(mg/kg) Tmax
(h) Cmax
(μg/mL) AUC (0-∞)
(h-µg/mL) AUC (0-24)
(h-μg/mL) Half-life
(t ½) (h) CL/F
(L/h-kg)
PND 15 300 2 14.1 ± 5.5 73.6 70.4 5.2 4.08
450 2 27.6 ± 5.9 143.3 140.8 4.3 3.14
PND 21 300 2 8.5 ± 4.5 37.8 37.7 3.6 7.9
450 2 9.9 ± 4.4 74.2 72.2 5.0 6.1
Adult 120 4 2.0 ± 1.0 9.0 8.8 1.6 13.3
300 4 3.1 ± 0.6 15.7 15.7 0.9 19.1
TK parameters were computed for PND 15, PND 21 and adult rats using Phoenix win-non-lin.
Cmax is represented as mean ± SD (n = 3-5).

110
Table 3.8: Dose normalized TRANS tissue:plasma ratio.
Adult PND 21 PND 15
Brain Cmax 0.22 ± 0.08 0.45 ± 0.07* 0.47 ± 0.03*
AUC 0.26 ± 0.06 0.64 ± 0.13* 0.69 ± 0.01*
Liver Cmax 0.89 ± 0.20 1.26 ± 0.02* 1.23 ± 0.28
AUC 0.84 ± 0.16 1.12 ± 0.19 1.51 ± 0.14*#
Muscle Cmax 0.51 ± 0.33 1.34 ± 0.05* 1.31 ± 0.21*
AUC 0.92 ± 0.07 2.50 ± 0.71* 2.77 ± 0.89*
Dose normalized Cmax and AUCs represented as mean ± SD. (*) – denotes significantly
different from adult (p < 0.05). (#) – denotes significantly different from PND 21 (p < 0.05).

111
Table 3.9: Sex-dependent Cmax and AUCs of CIS and TRANS.
TK
parameter Sex Plasma Brain Liver Muscle Fat
CIS
(60 mg/kg)
Cmax (µg/g)
Male 1.7 ± 1.0 1.3 ± 0.9 1.8 ± 0.5 2.5 ± 1.3 15.4 ± 10.6
Female 3.8 ± 0.7* 1.7 ± 0.1 5.6 ± 1.6* 2.0 ± 0.2 19.3 ± 7.8
AUC (0-∞) (μg-h/g)
Male 12.6 20.3 13.0 38.5 −
Female 20.3 19.9 40.7 34.3 −
TRANS
(300 mg/kg)
Cmax (µg/g)
Male 3.1 ± 0.6 0.9 ± 0.5 3.2 ± 0.8 2.3 ± 0.9 10.4 ± 3.4
Female 3.8 ± 0.7 0.9 ± 0.4 2.6 ± 1.1 2.1 ± 0.5 9.5 ± 0.7
AUC (0-∞) (μg-h/g)
Male 15.7 4.9 16.1 13.6 −
Female 14.2 6.1 19.9 14.2 −
Data represents male and female Cmax and AUCs of 60 mg CIS/kg and 300 mg TRANS/kg in
plasma, brain, liver, muscle, and fat. Cmax is represented as mean ± SD (n = 3-5). (*) – denotes
significantly different from male (p < 0.05).

112
Table 3.10: CIS and TRANS TK parameters plasma 120 mg/kg.
Adult (120 mg/kg)
Cmax (µg/ml)
AUC (0-∞) (µg-h/ml)
Cl/F (L/h/kg)
CIS 8.9 ± 4.4* 28.9 4.1
TRANS 2.0 ± 1.0 9 13.3
Cmax is represented as mean ± SD (n = 3-5). (*) – denotes significantly different from TRANS
(p < 0.05).

113
Table 3.11: Dose normalized CIS: TRANS ratio of plasma and brain.
Plasma Brain
Cmax/D*103
(ug/ml/mg) AUC/D*103
(h*ug/ml/mg) Cmax/D*103
(ug/g/mg) AUC/D*103 (h*ug/g/mg)
PND 15 CIS 110.5 ± 28.8 (2.4) 840.9 ± 105.8 (3.2) 97.4 ± 17.5 (5.9) 995.9 ± 102.5 (6)
TRANS 44.8 ± 17.6 (1) 263.8 ± 48.1 (1) 16.7 ± 5.8 (1) 167.0 ± 10.6 (1)
PND 21 CIS 57.4 ± 11.8 (2.7) 291.4 ± 70.2 (2.4) 44.98 ± 4.1 (3.9) 374.5 ± 108.5(5.3)
TRANS 21.2 ± 7.4 (1) 123.4 ± 39.6 (1) 11.53 ± 5.0 (1) 71.1 ± 41.2 (1)
Adult CIS 51.1 ± 32.0 (3.6) 229.5 ± 16.9 (3.5) 27.6 ± 8.9 (10.8) 293.6 ± 63.6 (17.4)
TRANS 14.1 ± 3.4 (1) 65.8 ± 11.8 (1) 2.6 ± 0.4 (1) 16.9 ± 1.6 (1)
Dose normalized comparison of Cmax and AUCs of plasma and brain in PND 15, PND 21, and
adult rats represented as Cmax/D*103 or AUC/D*103 ± SD (TRANS/CIS).

114
Supplementary Table 3.1: TK parameters of 120 and 300 mg TRANS/kg in adult rats.
Dose
(mg/kg) Tmax
(h) Cmax
(μg/mL) AUC (0-∞) (h-µg/mL)
AUC (0-24) (h-μg/mL)
Half-life (t ½) (h)
CL/F (L/h-kg)
Plasma 120 4 2.0 ± 1.0 9.0 8.8 1.6 13.3
300 4 3.1 ± 0.6 15.7 15.7 0.9 19.1
Brain 120 8 0.3 ± 0.2 2.2 2.2 ND
300 6 0.9 ± 0.5 5.1 5.0 0.69
Liver 120 6 1.5 ± 1.1 6.5 6.5 ND
300 6 3.2 ± 0.8 14.9 14.6 0.58
Muscle 120 8 0.5 ± 0.3 8.7 8.0 ND
300 6 2.3 ± 0.9 13.6 13.2 1.67
Fat 120 8 5.9 ± 1.1 ND 38.5 ND
300 6 10.3 ± 3.4 ND 78.4 ND
TK parameters derived from Phoenix win-non-lin. Cmax is represented as mean ± SD (n = 3-5).
ND represents not determined.

115
Supplementary Table 3.2: TK parameters of 300 and 450 mg TRANS/kg in PND 21 rats.
Dose
(mg/kg) Tmax
(h) Cmax
(μg/mL) AUC (0-∞) (h-µg/mL)
AUC (0-24) (h-μg/mL)
Half-life (t ½) (h)
CL/F (L/h-kg)
Plasma 300 2 8.5 ± 4.4 37.8 37.7 3.6 7.9
450 2 9.9 ± 4.4 74.2 72.2 5.0 6.1
Brain 300 4 3.4 ± 0.8 14.9 14.7 2.08
450 4 7.5 ± 1.8 53.4 52.5 2.58
Liver 300 4 10.8 ± 5.8 38.3 35.9 2.19
450 1 12.3 ± 7.6 97.6 89.1 9.42
Muscle 300 4 11.0 ± 3.5 75.6 62.0 11.46
450 4 22.1 ± 2.6 218.5 204.7 5.94
TK parameters derived from Phoenix win-non-lin. Cmax is represented as mean ± SD (n = 3-5).

116
Supplementary Table 3.3: TK parameters of 300 and 450 mg TRANS/kg in PND 15 rats.
Dose
(mg/kg) Tmax
(h) Cmax
(μg/mL) AUC (0-∞) (h-µg/mL)
AUC (0-24) (h-μg/mL)
Half-life (t ½) (h)
CL/F (L/h-kg)
Plasma 300 2 14.1 ± 5.5 73.6 70.4 5.2 4.1
450 2 27.6 ± 5.9 143.3 140.8 4.3 3.1
Brain 300 4 6.9 ± 2.3 50.9 50.2 3.62 450 4 6.8 ± 2.0 79.2 77.2 4.05
Liver 300 2 20.1 ± 7.8 122.24 116.43 6.10 450 4 19.6 ± 6.5 210.6 207.26 3.69
Muscle 300 4 20.5 ± 5.7 207.4 155.6 13.21 450 4 19.5 ± 3.7 266.8 238.8 7.10
TK parameters derived from Phoenix win-non-lin. Cmax is represented as mean ± SD (n = 3-5).

117
FIGURES:
CIS Plasma(Dose Normalized)
0 4 8 12 16 20 240.1
1
10
100
1000
AdultPND21PND15A
Time (h)
Conc
entra
tion x
103 (µg
/ml/m
g)
CIS Brain(Dose Normalized)
0 4 8 12 16 20 240.1
1
10
100
1000
AdultPND21PND15B
Time (h)
Conc
entra
tion x
103 (µ
g/g/m
g)
CIS Liver(Dose Normalized)
0 4 8 12 16 20 240.1
1
10
100
1000
AdultPND21PND15C
Time (h)
Conc
entra
tion x
103 (µg
/ml/m
g)
Fig. 3.1 - Dose normalized concentration time-course of cis-permethrin (CIS) of postnatal day
(PND) 15 (45 mg/kg), PND 21 (60 mg/kg), and adult rats (60 mg/kg); (A) plasma, (B) brain, (C)
liver. Rats were orally dosed in 5 ml corn oil (CO)/kg. Concentrations at each time point were
divided by appropriate dose and multiplied by 103 to obtain dose normalized concentrations.
Each point on the time-course represents mean value ± SD (n = 3-5).
118
Adult 60 mg CIS/kg
0 4 8 12 16 20 240.01
0.1
1
10
100
PlasmaBrainLiver
A
Time (h)
µ g C
IS/g
Adult 60 mg CIS/kg
0 4 8 12 16 20 240.01
0.1
1
10
100
Plasma
FatMuscle
B
Time (h)
µ g C
IS/g
Fig. 3.2 – Concentration time-course of 60 mg CIS/kg of adult rats; (A) plasma, brain, and liver
and (B) plasma, muscle, and fat. Adult male rats were administered 60 mg CIS/kg as a single
oral bolus dose in 5 ml corn oil (CO)/kg. Serial sacrifice (n = 3-5) was conducted at each time
point up to 24 h. Each point on the time-course represents mean ± SD (n = 3-5).

119
PND 21 - 60 mg CIS/kg
0 4 8 12 16 20 240.01
0.1
1
10
100PlasmaBrainLiver
A
Time (h)
µ g C
IS/g
PND 21 - 60 mg CIS/kg
0 4 8 12 16 20 240.01
0.1
1
10
100
PlasmaMuscle
B
Time (h)
µ g C
IS/g
Fig. 3.3 – Concentration time-course of 60 mg CIS/kg of PND 21 rats; (A) plasma, brain, and
liver, (B) plasma, muscle, and fat. Mixed-sex PND 21 rats were administered 60 mg CIS/kg as a
single oral bolus dose in 5 ml corn oil (CO)/kg. Serial sacrifice (n = 3-5) was conducted at each
time point up to 24 h. Each point on the time-course represents mean ± SD (n= 3-5).

120
PND 15 - 45 mg CIS/kg
0 4 8 12 16 20 240.01
0.1
1
10
100
PlasmaBrainLiver
A
Time (h)
µ g C
IS/g
PND 15 - 45 mg CIS/kg
0 4 8 12 16 20 240.01
0.1
1
10
100
PlasmaMuscle
B
Time (h)
µ g C
IS/g
Fig. 3.4 – Concentration time-course of 45 mg CIS/kg of PND 15 rats; (A) plasma, brain, and
liver, (B) plasma, and muscle. Mixed-sex PND 15 rats were administered 45 mg CIS/kg as a
single oral bolus dose in 5 ml corn oil (CO)/kg. Serial sacrifice (n = 3-5) was conducted at each
time point up to 24 h. Each point on the time-course represents mean ± SD (n = 3-5).

121
Plasma Cmax
PND15PND21
Adult0.00
0.05
0.10
0.15
*CI
S ( µg
/ml/m
g)Brain Cmax
PND15PND21
Adult0.00
0.05
0.10
0.15
* #
CIS
( µg/g/
mg)
Liver Cmax
PND15PND21
Adult0.0
0.1
0.2
0.3
0.4
*
CIS
( µg/g/
mg)
Muscle Cmax
PND15PND21
Adult0.0
0.1
0.2
0.3
0.4
* #
CIS
( µg/g/
mg)
Plsama AUC
PND15PND21
Adult0.0
0.5
1.0
1.5
* #
CIS
(h*µg
/mL/m
g)
Brain AUC
PND15PND21
Adult0.0
0.5
1.0
1.5
* #
CIS
(h*µg
/g/mg
)
Liver AUC
PND15PND21
Adult0
1
2
3
* #
CIS
(h*µg
/g/mg
)
Muscle AUC
PND15PND21
Adult0
1
2
3
* #
CIS
(h*µg
/g/mg
)B
A
Fig. 3.5 - Dose normalized comparison of (A) Cmax and (B) AUCs of cis-permethrin (CIS) for
PND 15, PND 21, and adult rats. Dose normalized plasma, brain, liver, and muscle Cmax
andAUCs were derived from dividing Cmax or AUCs by the appropriate dose. (*) - denotes
significant difference from adults (p < 0.05). (#) - denotes significant difference from PND 21 (p
< 0.05).

122
Plasma - 300 mg TRANS/kg
0 4 8 12 16 20 240.01
0.1
1
10
100AdultPND21PND15
A
Time (h)
µ g T
RANS
/ml
Brain - 300 mg TRANS/kg
0 4 8 12 16 20 240.01
0.1
1
10
100AdultPND21PND15
B
Time (h)
µ g TR
ANS/
g
Liver - 300 mg TRANS/kg
0 4 8 12 16 20 240.01
0.1
1
10
100 AdultPND21PND15
C
Time (h)
µ g TR
ANS/
g
Fig. 3.6 – Concentration time-course of 300 mg TRANS/kg of PND 15, PND 21, and adult rats;
(A) plasma, (B) brain, (C) liver. Rats were orally dosed with 300 mg TRANS/kg in 5 ml corn oil
(CO)/kg. Each point on the time-course represents mean value ± SD (n = 3-5).

123
Adult - 300 mg TRANS/kg
0 4 8 120.01
0.1
1
10
100
PlasmaBrainLiver
A
Time (h)
µ g T
RANS
/g
Adult - 300 mg TRANS/kg
0 4 8 120.01
0.1
1
10
100
Plasma
FatMuscleB
Time (h)
µ g T
RANS
/g
Fig. 3.7 – Concentration time-course of 300 mg TRANS/kg of adult rats; (A) plasma, brain, and
liver, (B) plasma, muscle, and fat. Adult male rats were administered 300 mg TRANS/kg as a
single oral bolus dose in 5 ml corn oil (CO)/kg. Serial sacrifice (n = 3-5) was conducted at each
time point up to 12 h. Each point on the time-course represents mean ± SD (n= 3-5).

124
PND 21 - 300 mg/kg (TRANS)
0 4 8 12 16 20 240.01
0.1
1
10
100
PlasmaBrainLiverA
Time (h)
µ g T
RANS
/g
PND 21 - 300 mg TRANS/kg
0 4 8 12 16 20 240.01
0.1
1
10
100
PlasmaMuscleB
Time (h)
µ g T
RANS
/g
Fig. 3.8 – Concentration time-course of 300 mg TRANS/kg of PND 21 rats; (A) plasma, brain,
and liver, (B) plasma, muscle, and fat. Mixed-sex PND 21 rats were administered 300 mg
TRANS/kg as a single oral bolus dose in 5 ml corn oil (CO)/kg. Serial sacrifice (n = 3-5) was
conducted at each time point up to 24 h. Each point on the time-course represents mean ± SD (n
= 3-5).

125
PND 15 - 300 mg TRANS/kg
0 4 8 12 16 20 240.1
1
10
100
PlasmaBrainLiver
A
Time (h)
µ g TR
ANS/g
PND 15 - 300 mg TRANS/kg
0 4 8 12 16 20 240.1
1
10
100
PlasmaMuscleB
Time (h)
µ g TR
ANS/g
Fig. 3.9 – Concentration time-course of 300 mg TRANS/kg of PND 15 rats; (A) plasma, brain,
and liver, (B) plasma, and muscle. Mixed-sex PND 15 rats were administered 300 mg
TRANS/kg as a single oral bolus dose in 5 ml corn oil (CO)/kg. Serial sacrifice (n = 3-5) was
conducted at each time point up to 24 h. Each point on the time-course represents mean ± SD (n=
3-5).

126
Plsama Cmax
PND15PND21
Adult0.00
0.02
0.04
0.06
0.08
*TR
ANS
( µg/m
l/mg)
Brain Cmax
PND15PND21
Adult0.00
0.01
0.02
0.03
0.04
*
TRAN
S ( µ
g/g/m
g)
Liver Cmax
PND15PND21
Adult0.00
0.02
0.04
0.06
0.08
*
*
TRAN
S ( µ
g/g/m
g)
Muscle Cmax
PND15PND21
Adult0.00
0.02
0.04
0.06
0.08
*
TRAN
S ( µ
g/g/m
g)Plasma AUC
PND15PND21
Adult0.0
0.1
0.2
0.3
0.4
0.5
* #
TRAN
S (h*
µg/m
L/mg)
Brain AUC
PND15PND21
Adult0.00
0.05
0.10
0.15
0.20
0.25
* #
TRAN
S (h*
µg/g/
mg)
Liver AUC
PND15PND21
Adult0.0
0.1
0.2
0.3
0.4
0.5 * #
TRAN
S (h*
µg/g/
mg)
Muscle AUC
PND15PND21
Adult0.0
0.2
0.4
0.6
0.8
1.0
* #
TRAN
S (h*
µg/g/
mg)
A
B
Fig. 3.10 - Dose normalized comparison of (A) Cmax and (B) AUCs of trans-permethrin
(TRANS) for PND 15, PND 21, and adult rats. Dose normalized plasma, brain, liver, and muscle
Cmax and AUCs were derived from dividing Cmax or AUCs by the appropriate dose. Result
represents mean ± SD (n = 3-5). (*) - denotes significant difference from adults and (#) - denotes
significant difference from PND 21 (p < 0.05).

127
CIS - Plasma
0 4 8 12 16 20 240.01
0.1
1
10
MaleFemale
A
Time (h)
µ g/m
l
CIS- Brain
0 4 8 12 16 20 240.01
0.1
1
10
MaleFemale
B
Time (h)
µ g/g
CIS - Liver
0 4 8 12 16 20 240.01
0.1
1
10
MaleFemale
C
Time (h)
µg/g
Fig. 3.11 – Concentration time-course of 60 mg CIS/kg of male and female; (A) plasma, (B)
brain, (C) liver. Adult male or female rats were administered 60 mg CIS/kg as a single oral bolus
dose in 5 ml corn oil (CO)/kg. Serial sacrifice (n = 3-5) was conducted at each time point up to
24 h. Each point on the time-course represents mean ± SD (n= 3-5).

128
Fig. 3.12 – Concentration time-course of 300 mg TRANS/kg of male and female; (A) plasma,
(B) brain, (C) liver. Adult male or female rats were administered 300 mg TRANS/kg as a single
oral bolus dose in 5 ml corn oil (CO)/kg. Serial sacrifice (n = 3-5) was conducted at each time
point up to 24 h. Each point on the time-course represents mean ± SD (n = 3-5).
TRANS - Plasma
0 4 8 12 16 20 240.01
0.1
1
10
MaleFemale
A
Time (h)
µg/m
l
TRANS - Brain
0 4 8 12 16 20 240.01
0.1
1
10
MaleFemale
B
Time (h)
µg/g
TRANS - Liver
0 4 8 12 16 20 240.01
0.1
1
10
MaleFemale
C
Time (h)
µ g/g

129
Plasma
0 4 8 12 16 20 240.01
0.1
1
10
100
CISTRANS
Time (h)
µ g/m
l
Fig. 3.13 – Concentration time-course of cis-permethrin (CIS) and trans-permethrin (TRANS)
120 mg/kg plasma. Adult male rats were administered 120 mg CIS or TRANS/kg in 5 ml corn
oil (CO)/kg. Each point on the time-course represents mean ± SD (n = 3-5).

130
Fig. 3.14 – Dose normalized comparison of Cmax and AUC in (A) plasma and (B) brain of cis-
permethrin (CIS) and trans-permethrin (TRANS). Dose normalized Cmax and AUCs were
derived from dividing Cmax or AUCs by the appropriate CIS or TRANS dose. Comparison
were conducted between CIS and TRANS at three age groups (PND 15, PND 21, and Adult
rats). Bar graph represents dose normalized mean ± SD. (*) - denotes significantly different from
CIS.
Cmax Plasma(Dose Normalized)
PND15
PND21
Adult0.00
0.05
0.10
0.15
CISTRANS
*
**
Age
Con
cent
ratio
n (µ
g/g/
mg)
AUC Plasma(Dose Normalized)
PND15
PND21Adult
0.0
0.2
0.4
0.6
0.8
1.0
CISTRANS
*
*
*
Age
AUC
0∞(h
*µg/
mL/
mg)
Cmax Brain(Dose normalized)
PND15
PND21
Adult0.00
0.05
0.10
0.15
CISTRANS
**
*
Age
Con
cent
ratio
n (µ
g/g/
mg)
AUC Brain(Dose Normalized)
PND15
PND21
Adult0.0
0.5
1.0
1.5
CISTRANS
**
*
Age
AUC
0∞(h
*µg/
g/m
g)
A
B

131
CHAPTER 4
IN SITU BRAIN DEPOSITION OF CIS- AND TRANS-PERMETHRIN AS A FUNCTION
OF AGE AND SEX
Tanzir B. Mortuza, Gaylen Edwards, Catherine A. White, Brian S. Cummings, Vandan Patel and
James V. Bruckner; To be submitted to the Drug Metabolism and Disposition

132
ABSTRACT
Permethrin (PER), a type I pyrethroid, is extensively used as an insecticide in the US.
Cis-permethrin (CIS) and trans-permethrin (TRANS) are two isomers of PER that exhibit
significantly different neurotoxicities and LD 50s. It was hypothesized that maturation of the
blood-brain barrier impacts the deposition of PER in immature rats by allowing more PER into
immature brain. Studies were carried out to evaluate in situ brain uptake of CIS and TRANS in
15-day-old (PND 15), 21-day-old (PND 21), and adult (PND 90) rats. Rats were anesthetized,
and the left carotid artery was exposed. One, 10 or 50 µM of 14C-CIS or -TRANS in 4% human
serum albumin (HSA) was perfused into the left brain for 2 or 4 min. A group of adult female
rats was perfused with 1 µM of 14C-CIS or -TRANS in 4% HSA into the left brain for 2 min to
examine sex-dependent uptake. Deposition in the PND 15 brain was significantly higher than
the other two age groups. All three age groups showed linear uptake over the range of
concentrations, indicating a non-saturable, passive diffusion uptake. There was not a significant
difference in male and female brain uptake. At higher concentrations, TRANS deposition was
slightly lower than CIS in adults. Isomer dependent differences were significant at the highest
concentration in adults but not in the other two age groups. Brain deposition of CIS and TRANS
were inversely related to age with maturation of the blood-brain barrier (BBB) was the
determinant factor in target organ dosimetry.
Key words: cis-permethrin, trans-permethrin, blood-brain barrier, brain deposition

133
INTRODUCTION
Pyrethroids are one of the most frequently-used types insecticides in the US, Canada, and
Europe. Over the last few decades, the use of these insecticides has increased exponentially as
more restrictions were imposed on organophosphates (Williams et al. 2008). Pyrethroids are used
in both the agricultural and household settings. Though their basic structure is similar,
pyrethroids exhibit a wide range of toxicities (Soderlund 2012). There are two types of
pyrethroids based on the structure and toxicity. Type I pyrethroids (e.g. – Permethrin) are mostly
used in household settings as flea treatments for pets or lice treatments for children, and
household insect killers (Frankowski et al. 2002). Due to the common use of these compounds,
most of the US population is exposed. Metabolites are present in the urine of the majority of the
population of the US (Barr et al. 2010). Younger children are more frequently exposed to these
compounds, because of hand to mouth contact during indoor and outdoor activities (Lu et al.
2009). These compounds are also ingested via food (Lu et al. 2009).
Pyrethroids are highly lipophilic and neurotoxic at high doses. Their primary mechanism
of action is inhibition of the voltage-gated sodium channels (VGSC) of neuron axons (Shafer et
al. 2005). These compounds also act on voltage-gated calcium channels (VGSC) and GABA
receptors (Soderlund 2012). Pyrethroids delay the closure of the VGSCs and modify them such
that the regulation of sodium current cannot be properly controlled. Subjects exposed to type I
pyrethroids exhibit tremors and sensitivity to external stimuli. Type II pyrethroids elicit
salivation and hyperexcitability, which may lead to choreoathetosis (Soderlund 2012).
It has been known for over two decades that immature rats are more susceptible to acute, high
doses of pyrethroid than adults (Sheets et al. 1994). This may be due to a more permeable
immature blood-brain barrier (BBB) and higher levels of unbound pyrethroids in plasma (Sethi

134
et al. 2016). As only the free fraction of the drug is available for penetration into the central
nervous system, younger animals have higher brain deposition of many xenobiotics (Gupta et al.
1999). Furthermore, younger rats have lower pyrethroid metabolic capacity than adults (Anand et
al. 2006), which contributes to greater deposition in the brain. Thus there is concern that infants
and children may be susceptible to low-level chronic exposure to these compounds. As PER is
highly lipophilic, it is assumed that it can penetrate the BBB relatively easily. Surprisingly, there
is very limited information on the ability of the mature or immature blood-brain barrier to restrict
PER and other pyrethroids from the CNS.
Uptake and deposition of many drugs and xenobiotics can differ in the brain of males and
females (Simpson and Kelly 2012). Brain deposition of a number of drugs tends to be higher in
females than males, especially antidepressants (Walker et al. 2006). This appears to be primarily
due to physiological and pharmacokinetic differences between sexes (Soldin and Mattison 2009).
Extracellular sodium, potassium, and calcium ions influences the excitability of the target site of
antidepressants (Ren 2011). As the PER and other pyrethroids act on the VGSCs, there may be a
pronounced difference in brain uptake of PER. However, sex-dependent brain uptake of PER and
other insecticides has not been characterized in the literature.
We hypothesize that the immature BBB will allow a greater penetration of both PER
isomers. The overall objective of the current study was to gain a better understanding of the BBB
that limits the brain uptake of PER for both CIS and TRANS. Studies were conducted to
determine whether PER deposition in the rat brain was significantly influenced by age and sex.
Furthermore, a direct comparison was conducted to determine whether there were differences
between CIS and TRANS. Traditionally, rodent models have been used in risk assessment of
chronic and low-level exposure to the younger human population. This study will provide a

135
better understanding of the potential role of BBB permeation by PER, as a representative of
highly lipophilic compounds.
MATERIALS AND METHODS
Chemicals and reagents
14C – CIS and 14C– TRANS (61.0 mCi/mmol) (99.9% radiochemical purity) were
provided by Moravic Inc. (Brea, CA). Hanks balanced salt solution (HBSS) buffer was obtained
from Mediatech (Manassas, VA). Human serum albumin (HSA) was purchased from Golden
West Biologicals (Temecula, CA). Ecolite scintillation cocktail was obtained from MP
Biochemicals (Solon, OH). Glycerol formal (GF) was obtained from Sigma Aldrich (St. Louis,
MO).
Animals
All test animals were housed at the AAALAC-accredited University of Georgia (UGA)
Life Sciences animal care facility. Adult, male (~ 300 g), female dams with 10 pups (~ 3-10 day
old) and pregnant female (~17-19 gestation day) Sprague-Dawley (S-D) rats were obtained from
Charles River Laboratories (Raleigh, NC). They were acclimated to a 12-h light/dark cycle
(light 0700 – 1900 h) in a temperature- (25º) and humidity- (40%) controlled room for at least 1
week prior to use. Tap water and food (Purina Rat Chow #5001) were available ad libitum
during this period. All animals were kept in polycarbonate cages. Adult rats were housed 4 per
cage, and pregnant mothers were housed 1 per cage. The delivery date was defined as postnatal
day 0 for pups. The pups were housed with their mother until PND 15 or PND 21. Groups of 5
pups or 4 adults per experiment were used for the brain uptake studies. The study protocol was
approved by the animal care and use committee of UGA. The study was conducted in accordance
with the NIH Guide for the Care and Use of Laboratory Animals.

136
Preparation of dosing solution
The initial activity of the radioactive compounds was 61 mCi/mmol. The chemicals were
obtained in solid form. A stock solution was prepared by dissolving the solid chemicals in 2 ml
of glycerol formal. Aliquots from the stock solution were obtained to prepare three working
solutions of 500, 100, and 10 µM in GF. Two hundred µl of working solution were added to
1800 µl of 4% HSA in HBSS to obtain final concentrations of 1, 10, or 50 µM for dosing
solutions.
Surgical and perfusion protocols
Rats were anesthetized by IP or IM injection of 0.1 ml/100g bw of ketamine,
acepromazine malate, and xylazine HCl (3:2:1, v/v/v) “cocktail”. The left common carotid artery
was exposed and cannulated with tubing attached to a needle for injection of perfusion fluid
toward the brain. For adult animals, a 23G needle and PE50 tubing were used. PE10 tubing with
a 30G needle were used for PND 15 and PND 21 pups, due to the smaller diameter of the carotid
artery. Each animal’s major ventricles were cut to stop the heart before perfusion to ensure the
cessation of blood flow to the brain. Two ml or 0.5 ml of sterile saline were slowly injected into
the carotid cannula of the rats to remove blood present in the brain. The perfusion of PER was
then performed through a syringe for 2 min for the adult brain and 4 min in the neonatal brain at
the rate of 500 µl or 250 µl per min. After completion of the perfusion, 2 ml or 0.5 ml of saline
were slowly perfused into the cannula to flush residual compound from the brain vasculature.
Radioactive quantification of PER in brain
As the perfusion was done through the left common carotid artery, only the left half of
the brain was collected and processed for quantification of the test compounds. Isolated brain
tissues were homogenized with the Tekmar Tissuemizer IKA Ultra-Turrax homogenizer

137
(Cridersville, OH) in two volumes of ice-cold distilled water by weight. One ml of the brain
homogenate was added to 4 ml of Ecolite scintillation cocktail. CIS or TRANS were quantified
by a Beckman Counter LS 6500 and normalized for tissue weight to obtain pM/g brain.
Brain uptake of PER
Three sets of PND 15, PND 21, and adult rats are used in the brain uptake studies to
evaluate the influence of age. A group of adult female rats was also used to compare the brain
uptake in females versus males for each isomer. One, 10, or 50 µM CIS or TRANS in 4% HSA
solution in HBSS buffer were perfused into PND 15, PND 21, and adult rats. Adult females were
perfused with 1 µM of CIS or TRANS. All dosing solutions were incubated for 15 min at 37°C
in an orbital shaker. Prior to perfusion, adult males and females were perfused with a constant
rate of 500 µL per min for 2 min using a Harvard 22 syringe infusion pump. The younger age
groups were infused at a constant rate of 250 µL per min for 4 min to avoid rupture of BBB
microvessels.
Statistical analysis
A minimum of 3 animals where used for each experiment. The data were expressed as
mean ± SD by using Microsoft Excel (Microsoft Co., Redmond, WA). The statistical
significance of differences between groups were evaluated using one-way ANOVA, followed by
Tukey’s multiple comparison test, with the significance level of P < 0.05 using GraphPad Prism
(5.01) (GraphPad Software, Inc., San Diego, CA).
RESULTS
Brain Uptake: Age dependency
Brain uptake of 3 different concentrations (1, 10, and 50 µM) of CIS or TRANS was
evaluated in each age group of rats. The uptake in the brain was quite limited in all age groups.

138
However, maturation of the BBB had a pronounced impact on penetration of both CIS and
TRANS. Uptake was inversely proportional to age. At each concentration, significantly higher
uptake of PER was observed in PND 15 and 21 rats as compared to adults. Additionally, PND 15
rats took up approximately 2-fold more PER than PND 21 (Tables 4.1 and 4.2). Brain uptake by
PND 15 rats was significantly higher than by PND 21 and adult rats. PND 21 was significantly
different from adults at only the lowest concentration of both of the isomers (Fig. 4.1).
Both CIS and TRANS brain uptake was linear between the concentrations of 1 and 50
µM for each age groups. The linearity for each age group was reflected by an R2 value of greater
than 0.999. The linearity among the age groups is illustrated in Fig. 4.2. Brain uptake in PND 15
rats was 3 to 5 times higher than in adults for both CIS and TRANS. PND 21 weanlings and
adults showed the smallest differences. Differences between PND 21 and adult brain uptake
varied from 1.3- to 2.5-fold. The largest difference was observed between PND15 and adults at
the lowest concentration (1 µM) (Tables 4.3 and 4.4).
Brain Uptake: Sex dependency
There were no statistically significant sex-dependent differences observed for brain
uptake of CIS and TRANS (Fig. 4.3). Both isomers were taken up in the brain to a similar extent.
Adult male and female brain concentrations were 9.71 and 8.33 pM/g for CIS, and 9.49 and 8.75
pM/g for TRANS.
Brain Uptake: Isomer dependency
Uptake of 1 µM CIS and TRANS by the brain was essentially the same within each age
group. As perfusion concentrations increased, a trend was observed for CIS uptake to be greater
than TRANS. However, only the adult rats showed statistically significant differences in uptake
between the two isomers at the highest dose (Fig. 4.4).

139
DISCUSSION
In this study, we clearly demonstrated that brain uptake of both CIS and TRANS was
inversely related to stage of maturity. Brain uptake in the PND 15 rats was approximately 2-to 5-
times greater than in adults. The difference between weanlings and adults was just 1.5 to 2.5
times. The lowest dose had the most pronounced difference in brain uptake between PND 15 and
adult rats. This may be an indication of extensive brain metabolism in adult rats. As the
concentration increases, only a limited amount of PER can be metabolized in the brain during the
perfusion window. Thus, the difference becomes smaller at the higher doses.
No work has been done to evaluate the ability of the BBB to restrict permeation by PER
and other type I pyrethroids. Amaraneni et al. (2017) demonstrated that brain uptake of
deltamethrin, a type II pyrethroid was inversely related to age. Studies have been conducted of
embryonic and postnatal morphological changes of the cerebral microvasculature of rats (Caley
and Maxwell 1970; Bär and Wolff 1972; Schulze and Firth 1992). In these studies, major
structural components such as vessel wall endothelium, basement membrane, pericytes, and
astrocytes were monitored. Structural integrity and maturity appeared to be achieved by PND 21,
suggesting PND 21 and adult animals should be quite similar to one another in terms of BBB
permeability. Stewart and Hayakawa (1987) reported that BBB permeability to horseradish
peroxide in maturing rats proportionally decreased with the reduction of numbers and width of
clefts between adjacent cerebral capillary endothelial cells. Brain uptake of inulin, a water
soluble compound, was inversely related to age when administered in rats between the age of
PND 4 to 26 (Ferguson and Woodbury 1969). In the current study, we provided evidence that
brain uptake of CIS and TRANS was also inversely related to age. The difference between the

140
weanlings and adults compared to PND 15 were least pronounced. This indicates the maturation
of the BBB in PND 21 approximates that of adults.
Only a limited number of studies have been conducted to demonstrate the development of
the BBB in humans. The time of maturation of human BBB has been reported to range from 2
weeks to 9 months, depending upon the study. Shah et al. (2011) conducted a comprehensive
investigation with a large group of infants. Cerebrospinal fluid (CSF) protein levels were lowest
during the first 4 weeks after birth. Statz and Felgenhauer (1983) and Wong et al. (2000)
observed that the CSF protein levels dropped rapidly by 6 months of age. Few studies have
conducted to monitor dye penetration in CSF. Misra et al. (1987) investigated sodium fluorescein
uptake in CSF of subjects up to 6 months old and reported that a significant drop was observed
during the first 2 weeks of life. Widell (1958) conducted a study with 98 normal children
between 0-13 years to evaluate CSF protein levels and dye penetration. The findings indicated
that total protein levels diminished during 9 months’ post birth. Sengupta (2013) reported that
13.3 rat days are comparable to 1 human year based on weight of eye lens, teeth, endosteal layer
in tibia and epiphyseal closure. It is rational to assume that rats and humans reach the desired
BBB integrity 3 weeks and 6 months, respectively, after birth. This would indicate that brain
dosimetry of xenobiotics in humans may reach adult levels faster than rats.
Several pharmacokinetic and pharmacodynamic differences are observed in males and
females, including gastric and metabolic enzyme expression (Arthur et al. 1984; Parlesak et al.
2002), and transporter expression (Tamai et al. 1997; Jovanovic et al. 2008). Physiological sex
differences influence xenobiotic uptake in males and females in mice, rats and humans (Lash et
al. 1998; Tanaka 1999). Males and females also differ in body fat composition and cardiac
output (Young and Tensuan 1963). Lipophilic compounds, like PER, may adhere to body fat,

141
thus, influence the distribution of a compound in females. Though structural differences between
the male and female BBB have not been described in the literature, some studies have observed
differences in brain uptake of antidepressant drugs in men and women (Khan et al. 2005). A
similar observation has been made in rodents (Walker et al. 2006). Ren (2011) reported that
extracellular sodium, potassium and calcium ions influence the excitability of dopaminergic
receptors (target of a number of antidepressants). As PER acts on VGSCs in the CNS that are
also controlled by the extracellular sodium, it was worth identifying whether there were
differences between brain uptake of adult males and females. The current study showed there
were no sex differences in brain uptake of CIS or TRANS.
Waterhouse (2003) reported that highly lipophilic compounds tend to exhibit high lipid
partitioning and non-specific hydrophobic bonding that traps the compound within the BBB. Due
to this phenomenon, highly lipophilic compounds may have limited uptake in the brain. Adult
animals have a more mature BBB than the younger ones. Thus, poor uptake of PER, a highly
lipophilic compound (logP 6.2) into the brain may be a result of this phenomenon, especially in
the adult animals.
The free fraction of a xenobiotic in plasma is a major determinant of tissue deposition of
the compound. Typically, only the free fraction of a compound is may be able to cross the BBB
and other tissue barrier. Binding to major plasma proteins is one of the important determinants of
free CIS or TRANS fractions in plasma. Amaraneni et al. (2017) demonstrated that in situ brain
uptake of deltamethrin (DLM), a type II pyrethroid was not altered in physiologically relevant
albumin concentrations that were present in young and mature rats. Sethi et al. (2014) reported
that the extent of plasma protein binding of DLM, CIS, and TRANS is similar over a wide range

142
of concentrations. Therefore, plasma protein binding may not be a determinant of age-dependent
uptake of CIS and TRANS.
In conclusion, the outcome of this investigation outlines the extent of brain uptake of CIS
and TRANS in preweanlings (PND 15), weanlings (PND 21), and adult (PND 90) rats. We
demonstrated that the brain uptake of CIS and TRANS was dependent on the maturity of BBB.
This study also showed that BBB uptake of CIS and TRANS was linear over a wide range of
concentrations within each age group. This was an indication of a non-saturable passive diffusion
process which did not appear to involve a solute carrier and ATP binding cassette transporters
such as P-gp (Amaraneni et al. 2017). Our results were widely consistent with those of
Amaraneni et al. (2017) who investigated brain uptake of DLM. Additionally, we provided
evidence that there was no sex difference in brain uptake of either isomer.

143
REFERENCES
Amaraneni, M., J. Pang, T. B. Mortuza, S. Muralidhara, B. S. Cummings, C. A. White, C. V.
Vorhees, J. Zastre and J. V. Bruckner (2017). "Brain uptake of deltamethrin in rats as a function
of plasma protein binding and blood-brain barrier maturation." Neurotoxicology 62: 24-29.
Anand, S. S., K.-B. Kim, S. Padilla, H. J. Kim, J. W. Fisher and J. V. Bruckner (2006).
"Ontogeny of hepatic and plasma metabolism of deltamethrin in vitro: role in age-dependent
acute neurotoxicity." Drug Metabolism and Disposition 34(3) 389-397.
Arthur, M., A. Lee and R. Wright (1984). "Sex differences in the metabolism of ethanol and
acetaldehyde in normal subjects." Clinical Science 67(4): 397-401.
Bär, T. and J. Wolff (1972). "The formation of capillary basement membranes during internal
vascularization of the rat's cerebral cortex." Zeitschrift für Zellforschung und mikroskopische
Anatomie 133(2): 231-248.
Barr, D. B., A. O. Olsson, L. Y. Wong, S. Udunka, S. E. Baker, R. D. Whitehead, M. S.
Magsumbol, B. L. Williams and L. L. Needham (2010). "Urinary concentrations of metabolites
of pyrethroid insecticides in the general US population: national health and nutrition examination
survey 1999-2002." Environmental Health Perspectives 118(6): 742-748.
Caley, D. W. and D. S. Maxwell (1970). "Development of the blood vessels and extracellular
spaces during postnatal maturation of rat cerebral cortex." Journal of Comparative Neurology
138(1): 31-47.
Ferguson, R. K. and D. M. Woodbury (1969). "Penetration of 14C-inulin and 14C-sucrose into
brain, cerebrospinal fluid, and skeletal muscle of developing rats." Experimental Brain Research
7(3): 181-194.

144
Frankowski, B. L., L. B. Weiner, Committee on School Health, & Committee on Infectious
Diseases (2002). "Head lice." Pediatrics 110(3): 638-643.
Gupta, A., R. Agarwal and G. S. Shukla (1999). "Functional impairment of blood-brain barrier
following pesticide exposure during early development in rats." Human & Experimental
Toxicology 18(3): 174-179.
Jovanovic, H., J. Lundberg, P. Karlsson, A. Cerin, T. Saijo, A. Varrone, C. Halldin and A. L.
Nordstrom (2008). "Sex differences in the serotonin 1A receptor and serotonin transporter
binding in the human brain measured by PET." Neuroimage 39(3): 1408-1419.
Khan, A., A. E. Brodhead, K. A. Schwartz, R. L. Kolts and W. A. Brown (2005). "Sex
differences in antidepressant response in recent antidepressant clinical trials." Journal of Clinical
Psychopharmacology 25(4): 318-324.
Lash, L. H., W. Qian, D. A. Putt, K. Jacobs, A. A. Elfarra, R. J. Krause and J. C. Parker (1998).
"Glutathione conjugation of trichloroethylene in rats and mice: Sex-, species-, and tissue-
dependent differences." Drug Metabolism and Disposition 26(1): 12-19.
Lu, C., D. B. Barr, M. A. Pearson, L. A. Walker and R. Bravo (2009). "The attribution of urban
and suburban children's exposure to synthetic pyrethroid insecticides: a longitudinal assessment."
Journal of Exposure Science and Environmental Epidemiology 19(1): 69-78.
Misra, P. K., A. Gulati, A. K. Mahesh, B. Sharma, G. K. Malik and K. N. Dhawan (1987).
"Maturity of Blood-Brain-Barrier in Children." Indian Journal of Medical Research 85: 401-403.
Parlesak, A., M. H. U. Billinger, C. Bode and J. C. Bode (2002). "Gastric alcohol dehydrogenase
activity in man: Influence of gender, age, alcohol consumption and smoking in a caucasian
population." Alcohol and Alcoholism 37(4): 388-393.

145
Ren, D. J. (2011). "Sodium Leak Channels in Neuronal Excitability and Rhythmic Behaviors."
Neuron 72(6): 899-911.
Schulze, C. and J. A. Firth (1992). "Interendothelial Junctions during Blood-Brain-Barrier
Development in the Rat - Morphological-Changes at the Level of Individual Tight Junctional
Contacts." Developmental Brain Research 69(1): 85-95.
Sengupta, P. (2013). "The Laboratory Rat: Relating Its Age with Human's." International Journal
of Preventive Medicine 4(6): 624-630.
Sethi, P. K., S. Muralidhara, J. V. Bruckner and C. A. White (2014). "Measurement of plasma
protein and lipoprotein binding of pyrethroids." Journal of Pharmacological and Toxicological
Methods 70(1): 106-111.
Sethi, P. K., C. A. White, B. S. Cummings, R. N. Hines, S. Muralidhara and J. V. Bruckner
(2016). "Ontogeny of plasma proteins, albumin and binding of diazepam, cyclosporine, and
deltamethrin." Pediatric Research 79(3): 409-415.
Shafer, T. J., D. A. Meyer and K. M. Crofton (2005). "Developmental neurotoxicity of
pyrethroid insecticides: critical review and future research needs." Environmental Health
Perspectives 113(2): 123-136.
Shah, S. S., J. Ebberson, L. A. Kestenbaum, R. L. Hodinka and J. J. Zorc (2011). "Age-Specific
Reference Values for Cerebrospinal Fluid Protein Concentration in Neonates and Young
Infants." Journal of Hospital Medicine 6(1): 22-27.
Sheets, L. P., J. D. Doherty, M. W. Law, L. W. Reiter and K. M. Crofton (1994). "Age-
dependent differences in the susceptibility of rats to deltamethrin." Toxicology and Applied
Pharmacology 126(1): 186-190.

146
Simpson, J. and J. P. Kelly (2012). "An investigation of whether there are sex differences in
certain behavioural and neurochemical parameters in the rat." Behavioural Brain Research
229(1): 289-300.
Soderlund, D. M. (2012). "Molecular mechanisms of pyrethroid insecticide neurotoxicity: recent
advances." Archives of Toxicology 86(2): 165-181.
Soldin, O. P. and D. R. Mattison (2009). "Sex differences in pharmacokinetics and
pharmacodynamics." Clinical Pharmacokinetics 48(3): 143-157.
Statz, A. and K. Felgenhauer (1983). "Development of the blood-CSF barrier." Developmental
Medicine and Child Neurology 25(2): 152-161.
Stewart, P. A. and E. M. Hayakawa (1987). "Interendothelial junctional changes underlie the
developmental tightening of the blood-brain-barrier." Developmental Brain Research 32(2): 271-
281.
Tamai, I., A. Saheki, R. Saitoh, Y. Sai, I. Yamada and A. Tsuji (1997). "Nonlinear intestinal
absorption of 5-hydroxytryptamine receptor antagonist caused by absorptive and secretory
transporters." Journal of Pharmacology and Experimental Therapeutics 283(1): 108-115.
Tanaka, E. (1999). "Gender-related differences in pharmacokinetics and their clinical
significance." Journal of Clinical Pharmacy and Therapeutics 24(5): 339-346.
Walker, Q. D., R. Ray and C. M. Kuhn (2006). "Sex differences in neurochemical effects of
dopaminergic drugs in rat striatum." Neuropsychopharmacology 31(6): 1193-1202.
Waterhouse, R. N. (2003). "Determination of lipophilicity and its use as a predictor of blood-
brain barrier penetration of molecular imaging agents." Molecular Imaging and Biology 5(6):
376-389.

147
Widell, S. (1958). "On the cerebrospinal fluid in normal children and in patients with acute
abacterial meningo-encephalitis." Acta Paediatrica, Supplement 47(Suppl 115): 1-102.
Williams, M. K., A. Rundle, D. Holmes, M. Reyes, L. A. Hoepner, D. B. Barr, D. E. Camann, F.
P. Perera and R. M. Whyatt (2008). "Changes in pest infestation levels, self-reported pesticide
use, and permethrin exposure during pregnancy after the 2000–2001 US Environmental
Protection Agency restriction of organophosphates." Environmental Health Perspectives
116(12): 1681-1688.
Wong, M., B. L. Schlaggar, R. S. Buller, G. A. Storch and M. Landt (2000). "Cerebrospinal fluid
protein concentration in pediatric patients - Defining clinically relevant reference values."
Archives of Pediatrics & Adolescent Medicine 154(8): 827-831.
Young, C. and R. Tensuan (1963). "Estimating the lean body mass of young women. Use of
skeletal measurements." Journal of the American Dietetic Association 42: 46-51.

148
TABLES
Table 4.1: Age-dependent brain uptake of CIS (pmol/g).
Concentration (µM) PND15 PND21 PND90
1 52.81± 5.64*# 23.10± 4.60* 9.71± 1.37
10 497.83± 69.67*# 187.88± 24.46 136.28± 21.48
50 2044.08± 414.98*# 900.02± 217.79 666.31± 54.94
Data at each age-group represented as mean ± SD (n = 3-5). (*) denotes - significant difference
(p < 0.05) from adults (PND 90) and (#) – denotes significant difference (p < 0.05) from PND
21.

149
Table 4.2: Age-dependent brain uptake of TRANS (pmol/g).
Concentration (µM) PND15 PND21 PND90
1 52.03± 15.14*# 23.83± 5.20* 9.49± 0.44
10 404.72± 65.27*# 145.60± 15.83 109.54± 8.79
50 1918.16± 632.26*# 753.48± 145.75 509.86± 79.83
Data at each age-group represented as mean ± SD (n = 3-5). (*) - denotes significant difference
(p < 0.05) from adults (PND 90) and (#) - denotes significant difference (p < 0.05) from PND 21.

150
Table 4.3: Age-dependent comparison of brain uptake of CIS.
Concentration (µM) PND 15 vs PND 21 PND 15 vs PND 90 PND 21 vs PND 90
1 2.3 5.4 2.4
10 2.6 3.7 1.4
50 2.3 3.1 1.4

151
Table 4.4: Age-dependent comparison of Brain uptake of TRANS.
Concentration (uM) PND 15 vs PND 21 PND 15 vs PND 90 PND 21 vs PND 90
1 2.2 5.5 2.5
10 2.8 3.7 1.3
50 2.5 3.8 1.5

152
FIGURES
Fig. 4.1: Age-dependent brain uptake of (A) cis-permethrin (CIS) and (B) trans-permethrin
(TRANS) in PND 15, PND 21, and PND 90 (adult) rats. Rats were infused with 1, 10, or 50 µM
of 14C-CIS or 14C-TRANS. Results represent mean ± SD (n = 3-5). Statistical significance was
assessed by one-way ANOVA and Tukey’s post ad-hoc test. (*) - denotes significant difference
(p < 0.05) from adults, and (#) - denotes significant difference from PND 21 group (p < 0.05).
1 10 500
1000
2000
3000PND15PND21PND90
* #*
* #
* #
A
pmol
CIS/
g Br
ain
1 10 500
1000
2000
3000 PND15PND21PND90
** #
* #
* #
B
Concentration (µM)
pmol
TRAN
S/g
Brain

153
CIS
0 10 20 30 40 500
1000
2000
3000PND15PND21PND90
Concentration (uM)
pmol
/g B
rain
TRANS
0 10 20 30 40 500
1000
2000
3000 PND15PND21PND90
Concentration (uM)
pmol
/g B
rain
A
B
Fig. 4.2 - Concentration-dependent brain uptake of (A) cis-permethrin (CIS) and (B) trans-
permethrin (TRANS) by PND 15, 21, and 90 (adult) rats. Rats were infused with 1, 10, or 50 µM
14CIS or 14TRANS. Linear regression was conducted by GraphPad Prism. R2 values > 0.999 were
obtained for each group. Each point represents mean ± SD (n = 3-5).

154
Fig. 4.3: Influence of sex on brain uptake of CIS and TRANS. Groups of adult male and female
S-D rats were infused with 1 µM of 14C-CIS or 14C-TRANS. Bar graphs represent mean ± SD (n
= 3-5).
Brain Uptake ( 1µM)
CIS
TRANS0
5
10
15MaleFemale
pmol
/g B
rain

155
Fig. 4.4: Influence of isomer on brain uptake in (A) PND 15, (B) PND 21, and (C) PND 90
(adult) rats. One, 10, or 50 µM of 14C-CIS or 14C-TRANS were infused into the brain of PND 15
(A), 21 (B), or 90 (C). Results represent mean ± SD (n = 3-5). One-way ANOVA and Tukey’s
post ad-hoc test was conducted to obtain statistical significance. (*) - denotes significant
difference from TRANS (p<0.05).
PND 15
1 10 500
1000
2000
3000CISTRANS
A
Concentration (µM)
pmol/
g Brai
n
PND 21
1 10 500
1000
2000
3000
CISTRANS
B
Concentration (µM)
pmol/
g Brai
n
PND 90
1 10 500
1000
2000
3000CISTRANS
*
C
Concentration (µM)
pmol/
g Brai
n

156
CHAPTER 5
SUMMARY
Pyrethroids are widely used insecticides. More than 200 different kinds of pyrethroid
compounds have been synthesized, and 16 of them are approved for the commercial market.
Most of these compounds are neurotoxic and highly lipophilic. The toxicity profiles of
pyrethroids are compound-specific. Permethrin (PER) is one of the major pyrethroids used in
pharmaceutical and household products including, lice treatments for children and pet sprays.
More than one million pounds of permethrin are used in the domestic US market every year.
Permethrin is present as a mixture of its cis and trans isomer (CIS and TRANS) in commercial
products. Metabolism of these two isomers is significantly different. Children between the ages
of one and three are most likely to ingest these compounds by hand to mouth contact. Despite
such extensive use, there are limited toxicokinetic (TK) data available for PER. Furthermore, no
comprehensive studies have investigated the age-dependent TKs of PER. Additionally, there are
no studies to characterize age-dependent differences between CIS and TRANS target organ
dosimetry.
Though the use of PER is widespread in the U.S., HPLC methods have been mostly
limited to plasma and urine monitoring of PER and its metabolites in laboratory animals and
humans. There is not a validated HPLC method that can be used to rapidly analyze large
numbers of biological samples produced in TK studies. Sensitive mass-spectroscopy (MS)
methods to quantify CIS and TRANS were reported, but they require quite lengthy sample
processing and analysis times. In our laboratory, we employed an HPLC method to monitor the

157
distribution and time-course of deltamethrin (DLM), a type II pyrethroid in the blood, brain, liver
and other tissues of rats. This method was relatively simple yet sensitive HPLC method for
quantification of DLM. Therefore, we employed a similar method to rapidly quantify CIS and
TRANS a large number of plasma and biological tissue samples obtained from TK studies.
CIS and TRANS quantification were performed on an Agilent 1100 High-Performance
Liquid Chromatograph (HPLC). Method validation was performed according to the US Food and
Drug Administration (FDA) guidance for the validation of bioanalytical methods. The
chromatographic separation was achieved on a Phenomenex Luna C18 column (150 x 4.6 mm, 5
µm) at 35 °C. The mobile phase was delivered at a flow rate of 1 ml/min in an isocratic elution
consisting of a mixture of CH3OH and water (88:12, v/v) for CIS and CH3OH, ACN, and water
(75:10:15, v/v) for TRANS. Overall run times were 16 min for CIS and 18 min for TRANS for
each injection. The autosampler was set at an injection volume of 50 μl, and the wavelength of
the UV detector was 220 nm.
CIS LLOQ was 0.1 µg CIS/ml, and TRANS LLOQ was 0.15 µg TRANS/ml. CIS and
TRANS intra- and inter-day accuracy and precision were determined by using 0.1 or 0.15, 0.3, 3,
and 16 µg CIS/ml. Intra- and inter-day precisions and accuracies were determined by analyzing
quality control (QC) standards at the LLOQ and 3 higher concentration levels on the same day (n
= 6) and on three different days (n = 18). The intra- and inter-day accuracy and precision for CIS
plasma and tissues were between 0.17 and 12.44 (% Bias) and 1.93 and 11.47 (% RSD),
respectively. TRANS intra- and inter-day accuracy and precision were between 0.76 and 10.50
(% Bias) and 1.9 and 14.27 (% RSD), respectively. Greater deviation in accuracy and precision
were found in the LLOQ and low QC (0.3 µg/ml) for both isomers. Degradation of CIS or
TRANS did not occur in plasma or tissues in the autosampler at room temperature for 48 h or

158
after 3 freeze-thaw cycles. The range of recoveries for CIS autosampler and freeze-thaw stability
were 91.41 and 116.07 (%) and 90.32 and 119.75 (%), respectively. TRANS stability values
were similar to the CIS values. The range of autosampler and freeze-thaw stability for TRANS
were 82.61 and 113.94 (%) and 84.13 and 113.94 (%), respectively. Extraction recoveries of CIS
and TRANS were close to 80% for tissues except for plasma and fat. Plasma and fat tended to
show lower absolute recovery. Recovery from plasma was close to 60% for CIS and TRANS.
Recovery from fat was the lowest from any matrix.
The validated assay has a relatively high recovery from most tissues, was sensitive, and
has excellent reproducibility. This was the first time an HPLC analytical method was developed
for fat and muscle. The technique has rapid extraction procedure and shorter analysis time. As
such, extraction and quantification of around 100 samples can be done by one person within 8-h.
The validated method applied to quantify CIS and TRANS concentration in plasma and tissues
including fat and muscle in TK studies.
The primary aim of the study was to demonstrate the dose- and age-related TKs for each
isomer of permethrin. Anadon et al. (1991) gave an oral bolus dose of 460 mg/kg of a 25:75
mixture of cis: trans permethrin to adult rats. Tornero-Velez et al. (2012) administered 1 or 10
mg/kg PER in a 40:60 mixtures and evaluated each isomer separately in adult rats. Willemin et
al. (2016) also investigated TK in adult rats and administered 25 mg/kg of CIS or TRANS
separately. Both Tornero-Velez et al. (2012) and Willemin et al. (2016) used a GC-MS method
to quantify CIS and TRANS. In the current study, TK of each isomer was separately evaluated
with the validated HPLC method. Adult male and two groups of young (15- and 21-day-old;
PND 15 and PND 21) SD rats of mixed gender were administered several doses of CIS and
TRANS as a single oral bolus in 5 mL corn oil/kg. The adult rats were given 60, and 120 mg

159
CIS/kg; weanlings (PND 21) were dosed with 60 and 90 mg CIS/kg; and pre-weanlings (PND
15) were dosed 15, 30, and 45 mg CIS/kg. A group of female rats were administered 60 mg
CIS/kg. TRANS is hydrolyzed by carboxylesterases (CaEs) and oxidized by cytochrome P450s
(CYPs) in both rats and humans. CIS was minimally susceptible to hydrolysis and was therefore
primarily metabolized by CYPs in both species. This difference impacted the overall TKs of
these isomers. TRANS was metabolized at a greater extent than CIS. As a result, TRANS is
eliminated faster than CIS. To successfully quantify TRANS in all biological matrices, higher
doses of TRANS have been administered in rats. The adult male rats were given 120 and 300 mg
TRANS/kg; preweanlings (PND 15) and weanlings (PND 21) were dosed with 300 and 450 mg
TRANS/kg. A group of female rats were dosed 300 mg TRANS/kg. Serial sacrifices were
performed (n = 4/time-point) 1, 2, 4, 6, 8, 12, and 24 hr post-dosing for collection of plasma and
tissues for analysis by HPLC. Brain, liver, fat and skeletal muscle were collected from each
animal to quantify concentrations in these tissues.
CIS exhibited age-dependent TK. The time-course of CIS illustrated that PND 15 had
significantly higher concentrations in plasma and tissues which resulted in considerably higher
AUCs in plasma and tissues. CIS concentrations in PND 15 plasma and tissues were higher for
most of the time-course than PND 21 and adults. Oral clearance in PND 21 and adult rats was
similar; however, oral clearance in PND 15 rats was 4-fold lower than PND 21 or adults. Dose
normalized Cmax and AUCs of plasma and tissues for PND 15 rats were significantly higher
than adults. Plasma and tissue AUCs were different in PND 15 and 21. No significant differences
in Cmax or AUCs were noted between PND 21 and adult rats. The brain AUC of 30 mg CIS/kg
in PND 15 was similar to the brain AUCs at a much higher dose of PND 21 or adults. Therefore,
PND 15 could be more susceptible to neurotoxicity of CIS. PND 15 and 21 had a much higher

160
Cmax and AUCs ratios of liver:plasma than adults. Brain or muscle ratios with plasma did not
show significant age-dependent differences for CIS.
The kinetics of TRANS were also age-dependent. Investigating the 300 mg TRANS/kg
dose, Cmax increased approximately 2.7-fold in PND 21 and 4.6-fold in PND15 rats than in
adult rats. AUC increased approximately 2- and 5-fold in PND 21 and 15 rats, respectively, over
adult values. Clearance values were as follows: adult rats (19.1 l/h/kg); PND 21 (7.9 l/h/kg); and
PND 15 (4.1 l/h/kg). This age-dependent change in clearance was most likely due to decreased
metabolism of TRANS in the younger rats. Decreased CaEs and CYPs activities have been
reported in younger rats. Brain and liver concentration-time profiles also showed age-
dependence. Cmax values for PND 15 and 21 rats were significantly higher for brain and liver
(3- and 7-fold for PND 21 and 15 pups, respectively) than in adults. AUCs followed a similar
pattern concerning age. Plasma and tissue TRANS time-courses generally resembled those for
CIS, but some significant TK differences were observed. The brain Cmax and AUC levels were
much lower than plasma in all age groups. The apparent clearance was age dependent. Clearance
in adult animals for 300 mg/kg dose were 3 and 5 times higher than PND 21 and PND 15,
respectively.
TRANS levels were substantially lower than CIS levels in adult rats administered 120
mg/kg of either isomer. The Cmax and AUC values for CIS (8.9 µg/ml and 28.9 µg*h/ml,
respectively) were significantly higher than those for the same oral dosage of TRANS (2 µg/ml
and 9 µg*h/ml, respectively). Clearance of TRANS was ~3 times more rapid than CIS (CIS 13.3
l/h/kg; TRANS 4.1 l/h/kg). Plasma AUCs of PND 15, PND 21, and adult rats were between 2.5
and 5 times higher for CIS than in TRANS. Adult brain AUCs of CIS were 17 times higher than
of TRANS and showed the most pronounced difference among the age groups. It was assumed

161
that the elimination from the brain would be slower due to a high lipid content in the brain
compared to plasma. Therefore, brain AUCs most likely to be larger than plasma AUC. This
was only true for CIS as brain:plasma ratio of CIS AUCs was between 1.21 and 1.28 for the age
groups. Interestingly, the brain:plasma AUC ratios were between 0.26 to 0.69 for TRANS.
Adults showed the least brain disposition for TRANS. Faster elimination from the brain may be a
result of brain metabolism that may occur in the brain, especially in adult rats.
One of the primary objectives of this study was to evaluate the sex-difference of CIS and
TRANS. Plasma and liver Cmax and AUC were approximately 2- to 3-fold higher in female
adult rats for CIS than in males; however, no sex difference was noted in plasma and liver TK
for TRANS. Brain and muscle had equivalent Cmax and AUCs for both CIS and TRANS. This
may be due to the difference in metabolism between CIS and TRANS. CYPs expression in male
rats were significantly higher than in female rats (Marchetti et al. 1997). CIS is predominantly
metabolized by CYP 2C11 and 2C6 in rats (Scollon et al. 2009). Interestingly, CYP 2C11 in
male rats was expressed 20 times more than in female rats Kato and Yamazoe (1992). In adult
rats, plasma CaEs levels in males and females are mostly the same (De Zwart et al. 2006).
Therefore, the TK differences were minor in TRANS between male and female rats. The
significant role played by CYPs catalysis in the metabolism of CIS could be the primary cause of
sex-dependent toxicokinetics.
Though PER and other pyrethroids are neurotoxic and it has been established over
several decades that immature rats are more susceptible to acute and high doses of pyrethroids
than adults (Sheets et al. 1994). This may be due to a more permeable immature blood-brain
barrier (BBB) that influences younger animals to have higher brain deposition of many
xenobiotics. A juvenile BBB coupled with lower metabolic capacity contributes to greater

162
deposition in the target organ, brain. Thus there is concern that infants and children may be
susceptible to low-level chronic exposure to PER and other pyrethroids. As PER is highly
lipophilic, it is assumed that it can penetrate the BBB relatively easily. Surprisingly, there is
insufficient information on the ability of the mature or immature blood-brain barrier to restrict
PER and other pyrethroids from the central nervous system (CNS). To further investigate the
target organ dosimetry and outline the isomeric differences, in situ brain uptake studies were
conducted in groups (n = 4-5) of PND 15, PND 21, and adult rats to investigate the influence of
age in brain uptake. To study the sex-differences for each isomer, a group of adult female rats
was also utilized to compare the brain uptake in females and males. One, 10, or 50 µM CIS or
TRANS in 4% HSA solution in HBSS buffer were perfused into the animal brain through a
catheter. Adult females were infused with 1 µM of CIS or TRANS.
The investigation examines that the extent of CIS and TRANS in the target organ, brain.
As the parent compounds, CIS and TRANS are mostly responsible for the neurotoxic effects; it
is essential to evaluate the role of the BBB in restricting the uptake of CIS or TRANS. The
uptake in the brain was quite limited in all age groups. However, uptake in the brain was
inversely proportional to age. Brain uptake in PND 15 was approximately 2-fold higher than in
PND 21 at each concentration for both isomers. Differences between PND 15 and adults were
more than 3 fold. PND 21 and adults showed the least difference as the BBB was quite mature in
weanling rats (PND 21). In all dose levels, PND 15 had significantly higher brain uptake than
PND 21 or adults. PND 21 was different than adults only at the lowest concentration. This study
also showed that the BBB uptake of CIS and TRANS was linear over a wide range of
concentrations (1-50 µM) within each age group as the R2 value was higher than 0.999 in each
case. The maturity of BBB was the primary determinant of the significantly higher levels in the

163
neonatal brain. This was a non-saturable passive diffusion process which did not appear to
involve a solute carrier and ATP binding cassette transporters such as P-gp as investigated by
other researchers in our laboratory who examined DLM, type II pyrethroid (Amaraneni et al.
2017). Additionally, we demonstrated that a sex difference was not found in brain uptake of
either isomer.
The current study provides age- and sex-dependent TK and brain uptake data at different
dose levels of CIS and TRANS to facilitate a comprehensive physiologically based toxicokinetic
(PBTK) model of PER. Overall, we demonstrated that the TK and target tissue uptake was age-
dependent. These studies reduced the knowledge gap of age-dependent TK of pyrethroids. There
are no models that examined and constructed a model to demonstrate children exposure and
tissue dosimetry to these compound. These studies will enhance the models built by Tornero-
Velez et al. (2012) and Willemin et al. (2016) who modeled CIS and TRANS for aggregate
exposure routes and metabolites in rats but did not expand their model to predict tissue dosimetry
in human subpopulations, notably children.
Future directions of this project may involve characterization and quantification of the
brain CYPs and CaEs that are responsible brain metabolism of CIS and TRANS. These studies
may include collecting the microsomal and cytosolic fraction of brain from different age groups
and sex to conduct comprehensive studies to examine age- and sex-dependent brain, the target
tissue metabolism.
Another set of studies may involve investigating the geriatric TK evaluation of PER and
other pyrethroids. To our knowledge, studies have not been conducted in geriatric animal species
to study the plasma and target organ dosimetry. As the life expectancy of the human population
has increased substantially in last few decades, the risk associated with PER and other

164
pyrethroids may need to evaluated in older species to have a comprehensive understanding of the
TKs of PER and other pyrethroids.
REFERENCES
Amaraneni, M., J. Pang, T. B. Mortuza, S. Muralidhara, B. S. Cummings, C. A. White, C. V.
Vorhees, J. Zastre and J. V. Bruckner (2017). "Brain uptake of deltamethrin in rats as a function
of plasma protein binding and blood-brain barrier maturation." Neurotoxicology 62: 24-29.
Anadon, A., M. R. Martinezlarranaga, M. J. Diaz and P. Bringas (1991). "Toxicokinetics of
permethrin in the rat." Toxicology and Applied Pharmacology 110(1): 1-8.
De Zwart, L., M. Scholten, J. Monbaliu, L. De Schaepdrijver, G. Bailey, C. Tim, C. Werner, J.
Van Houdt and M. Geert (2006). "The ontogeny of drug-metabolizing enzymes and transporters
in the rat." Drug Metabolism Reviews 38: 107-108.
Kato, R. and Y. Yamazoe (1992). "Sex-specific cytochrome P450 as a cause of sex- and species-
related differences in drug toxicity." Toxicology Letters 64-65 Spec No: 661-667.
Marchetti, M. N., E. Sampol, H. Bun, H. Scoma, B. Lacarelle and A. Durand (1997). "In vitro
metabolism of three major isomers of retinoic acid in rats - Intersex and interstrain comparison."
Drug Metabolism and Disposition 25(5): 637-646.
Scollon, E. J., J. M. Starr, S. J. Godin, M. J. DeVito and M. F. Hughes (2009). "In vitro
metabolism of pyrethroid pesticides by rat and human hepatic microsomes and cytochrome P450
isoforms." Drug Metabolism and Disposition 37(1): 221-228.
Sheets, L. P., J. D. Doherty, M. W. Law, L. W. Reiter and K. M. Crofton (1994). "Age-
dependent differences in the susceptibility of rats to deltamethrin." Toxicology and Applied
Pharmacology 126(1): 186-190.

165
Tornero-Velez, R., J. Davis, E. J. Scollon, J. M. Starr, R. W. Setzer, M. R. Goldsmith, D. T.
Chang, J. Xue, V. Zartarian, M. J. DeVito and M. F. Hughes (2012). "A pharmacokinetic model
of cis- and trans-permethrin disposition in rats and humans with aggregate exposure application."
Toxicological Sciences 130(1): 33-47.
Willemin, M. E., D. C. Sophie, R. Le Grand, F. Lestremau, F. A. Zeman, E. Leclerc, C. Moesch
and C. Brochot (2016). "PBPK modeling of the cis- and trans-permethrin isomers and their
major urinary metabolites in rats." Toxicology and Applied Pharmacology 294: 65-77.