F act B ook 2017 - Office of Institutional Research - UGA
114
Fact Book 2017
-
Upload
khangminh22 -
Category
Documents
-
view
1 -
download
0
Transcript of F act B ook 2017 - Office of Institutional Research - UGA

www.oir.uga.edu
TH
E U
NI
VE
RS
IT
Y O
F G
EO
RG
IA
Fact Book 2017 49
th Edition

Fact Book 2017
Cover design by Timothy P. Welsh, Bulldog Print + Design
CoverA commitment to excellence in research, scholarship, and creative endeavors are a core mission at the University of Georgia, the nation’s oldest land-grant institution. Whether in a classroom, a campus laboratory, or in the field half a world away, the faculty, staff, and students at UGA vigorously pursue this mission daily. The results have both an economic and social impact here in Georgia and throughout the world.
Front Cover Photos (Clockwise from top right)Chemistry professor Richard Dluhy uses a nanotechnology-based method that uses laser light beams to more accurately predict emerging influenza strains. Photo by Andrew Davis Tucker, UGA Photographic Services
Assistant professor of genetics Dave Nelson monitors seed germination in plates inside of an incubator in his lab in the Davidson Life Sciences Building. Photo by Andrew Davis Tucker, UGA Photographic Services
Lisa Olenderski and Devin Dumont of the UGA Aquarium, operated by the UGA Marine Extension Service, release a three year old loggerhead sea turtle on Wassaw Island National Wildlife Refuge. Photo by Andrew Davis Tucker, UGA Photographic Services
As part of the Experience UGA program, Clarke Central 9th graders touch a live starfish with the help of fisheries & wildlife major Samantha Askin in the Marine Sciences Department. Photo by Andrew Davis Tucker, UGA Photographic Services
Dr. Ramaraja Ramasamy, a researcher at UGA is working on ways to get electricity from plants. Photo by Robert Newcomb, UGA Photographic Services
Biological Science major and CURO student Adrea Mueller trains a one day old turkey poult to drink from a water source in pens while assisting in setting up a research trial inside the Poultry Science Lab of Dr. Robert Beckstead. Photo by Andrew Davis Tucker, UGA Photographic Services
Back Cover Photos (Clockwise from top right)UGA offers undergraduate and graduate students access to state-of-the-art computer labs and sophisticated graphics workstations to analyze information using GIS mapping techniques. Photo by Andrew Davis Tucker, UGA Photographic Services
Postdoctoral scientist Dr. Yunzhou Wei examines DNA following gel electrophoresis as part of his research in the lab of Dr. Michael Terns and Dr. Rebecca Terns. Photo by Andrew Davis Tucker, UGA Photographic Services
A pharmacy student prepares IV solutions in a lab. Photo by Robert Newcomb, UGA Photographic Services
With the assistance of research professional Shelly Helmes in the Department of Infectious Diseases, Clarke Central 9th graders don personal protective equipment as part of the Experience UGA program. Photo by Andrew Davis Tucker, UGA Photographic Services
Microbiology major and CURO student Hiral Patel measures the flowers and petals of sunflowers while working on research under distinguished research professor Lisa Donovan. Photo by Andrew Davis Tucker, UGA Photographic Services

Fact Book 2017

ii
UGA Fact Book 2017
THE UNIVERSITY OF GEORGIA FACT BOOK 2017 49th Edition Edited By: Mary T. Moore Office of Institutional Research 110 East Clayton Street, Suite 505 The University of Georgia Athens, Georgia 30602-5279 Published By: Office of Institutional Research Paul Klute, Director 110 East Clayton Street, Suite 505 The University of Georgia Athens, Georgia 30602-5279 (706) 425-3183 (706) 425-3200, fax Printed By: Bulldog Print + Design Harold Waters, Jr., Manager 255 Spring Street Athens, Georgia 30605 Copyright © 2017 By: The University of Georgia Office of the Vice President for Research Paul D. Coverdell Center for Biomedical & Health Sciences Athens, Georgia 30602
In the fall of 2014, The University of Georgia implemented a new student information system, ATHENA, to replace a legacy system which had been in place for 30 years and served as the source for much of the information published in previous Fact Books. ATHENA manages information related to the areas of Admissions, Student Records, Curriculum, Financial Aid, and Student Accounts. As with any major system change, reconciling the new system with the legacy system presented a number of challenges in this edition of the Fact Book, and every effort has been made to maintain reporting consistency with previous years. We would like to extend our sincere appreciation to our colleagues across campus who have contributed to the 2017 Fact Book by providing data, guidance and support as we continue to expand our knowledge of the potential this new system affords the University of Georgia.
Web All material contained in this book is also available at the Office of Institutional Research website. http://www.oir.uga.edu This book is intended as a reference and may be quoted using accepted scholarly citation without permission. Reproduction of complete tables, figures, or text must include a University of Georgia Fact Book 2017 notation and page number.

iii
UGA Fact Book 2017
TABLE OF CONTENTS
Page
List of Figures............................................................................................................................................................. vi
GENERAL INFORMATIONAbout the Institution ........................................................................................................................................... 2The Mission of The University of Georgia .......................................................................................................... 3The University of Georgia 2020 Strategic Plan .................................................................................................. 4
ADMINISTRATIONBoard of Regents ............................................................................................................................................... 6University System of Georgia Administrative Staff ............................................................................................. 6University Cabinet: Fall 2017 ............................................................................................................................. 7Deans of Colleges and Schools: Fall 2017 ........................................................................................................ 7The University of Georgia Foundation: 2017-18 Trustees.................................................................................. 9
ADMISSIONSNew Freshmen: Fall Terms 2008-2017............................................................................................................ 12Mean Scholastic Aptitude Test (New SAT) Scores for Entering Freshmen: Fall 2017..................................... 13Mean Scholastic Aptitude Test (Old SAT) Scores for Entering Freshmen: Fall Terms 2013-2017 .................. 13Georgia High Schools of Entering Freshmen: Fall 2017 .................................................................................. 14Academic Scholarships: Academic Years 2015-16 and 2016-17..................................................................... 15Undergraduate Transfers: Fall Terms 2008-2017 ............................................................................................ 15Georgia Colleges and Universities from Which Undergraduate Students Transferred
to The University of Georgia: Fall 2017..................................................................................................... 16Graduate School Admissions: Fall Terms 2008-2017...................................................................................... 17Average Entrance Test Scores of Accepted Degree-Seeking Graduate Students: Fall Terms 2008-2017...... 17
ENROLLMENTEnrollment by Class: Fall Terms 2008-2017 .................................................................................................... 20Characteristics of Enrolled Students by Class: Fall 2017................................................................................. 21Enrollment by College and School, Athens and Extended Campuses: Fall Terms 2013-2017 ........................ 22Enrollment by College and School, UGA Extended Campuses: Fall Terms 2013-2017 .................................. 23Enrolled Non-US Citizens by Country of Origin and UGA Student Level: Fall 2017 ........................................ 25Enrollment by State of Origin and UGA Student Level: Fall 2017 .................................................................... 26Enrolled Georgia Residents by County of Residence and UGA Student Level: Fall 2017 ............................... 28Popular Degree Majors: Fall 2017 ................................................................................................................... 30Retention Rates for First-Time Full-Time Undergraduates: Entering Cohorts 2007-2016................................ 31
DEGREES CONFERREDDegrees Conferred by School or College and Degree Level: Fiscal Year 2016-17 ......................................... 34Degrees Conferred by Degree Level: Fiscal Years 2012-13 through 2016-17................................................. 35Summary of Degrees Conferred by Program Classification: Fiscal Year 2016-17........................................... 36Degree Programs and Majors, Athens Campus............................................................................................... 37Degree Programs and Majors, Extended Campuses....................................................................................... 41Completion Rates for First-Time Full-Time Undergraduates: Entering Cohorts 2007-2016 ............................. 42

iv
UGA Fact Book 2017
ACADEMIC INFORMATIONTotal University Student Credit Hours: Fiscal Year 2016-17 ............................................................................ 46Distribution of Grades by Class: Academic Year 2016-17 ............................................................................... 47Honors Program Enrollment and Sections: Fiscal Year 2016-17 ..................................................................... 48Honors Program Awards: Fiscal Years 2007-08 through 2016-17................................................................... 48Graduate Assistantships: Fall 2017.................................................................................................................. 49Graduate Fellowships and Assistantships Awarded Through the Graduate School: Fall 2017........................ 49National Academic Awards Awarded to UGA Students ................................................................................... 49Participation in Education Abroad at the University of Georgia: Academic Years
2012-13 through 2016-17.......................................................................................................................... 52Participation in Education Abroad by Top Countries of Study, Academic Year 2016-17 ................................. 53Tuition and Fees: Fall 2017-Spring 2018 ......................................................................................................... 54Estimated Cost of Attendance: Academic Years 2008-09 through 2017-18 .................................................... 55Annual Cost of Attendance for Resident Undergraduates, UGA and Selected Peers:
Academic Year 2016-17............................................................................................................................ 55University of Georgia Libraries: National Rankings.......................................................................................... 56Library Visitors by Location, Fiscal Years 2014-15 to 2015-16 ........................................................................ 56
STUDENT RELATED INFORMATIONStudent Financial Aid Programs: Fiscal Year 2016-17..................................................................................... 58Student Housing Summary: Fall 2017.............................................................................................................. 59Social Sororities and Fraternities ..................................................................................................................... 60Participation in Social Sororities and Fraternities: Fall 2017 ............................................................................ 60Honorary Fraternities and Societies ................................................................................................................. 61UGA Career Center: Class of 2016 Career Plans............................................................................................ 62UGA Alumni Association 2017-18 Executive Committee ................................................................................. 63Number of Living Alumni by Class Year of Most Recent Degree: 1946-2017 .................................................. 63University of Georgia Alumni by State of Residence........................................................................................ 64University of Georgia Alumni by Georgia County of Residence ....................................................................... 66University of Georgia Athletic Association........................................................................................................ 68National Collegiate Athletic Association Postgraduate Scholarships ............................................................... 68Intercollegiate Athletes at The University of Georgia: Fall 2017....................................................................... 69Crime Statistics: January 1, 2016 - December 31, 2016 .................................................................................. 70
FACULTY AND STAFFFull-Time Faculty and Allied Professional Staff by Rank and Function: Fall 2017 ........................................... 72Tenure Status of Full-Time Professorial Faculty by Rank and Gender: Fall 2017............................................ 72Full-Time Professorial Faculty by Rank and Ethnicity: Fall 2017 ..................................................................... 73Full-Time Professorial Faculty by Age Range and Rank: Fall 2017 ................................................................. 73Full-Time Professorial Graduate Faculty Membership by Rank: Fall 2017 ...................................................... 73Highest Earned Degrees of Full-Time Professorial Faculty by Rank: Fall 2017............................................... 74Average Academic Year Salaries of Instructional Faculty, UGA and Selected Peers:
Academic Year 2016-17............................................................................................................................ 75University Employees by Occupational Classification: October 31, 2017 ........................................................ 76University Employees by Occupational Classification and Ethnicity: October 31, 2017................................... 77University Employees by Occupational Classification and Gender: October 31, 2017 ...................................... 77

v
UGA Fact Book 2017
FINANCIAL INFORMATIONSources of Revenue: Fiscal Year 2016-17....................................................................................................... 80Revenue by Source: Fiscal Years 2007-08 through 2016-17........................................................................... 81Expenditures by Function: Fiscal Year 2016-17............................................................................................... 82Expenditures by Function: Fiscal Years 2007-08 through 2016-17.................................................................. 83Total Sponsored Awards by Project Type: Fiscal Years 2012-13 through 2016-17 ......................................... 84Total Research Awards by Sponsor Type: Fiscal Years 2012-13 through 2016-17......................................... 85Total Sponsored Awards by Agency: Fiscal Year 2016-17 .............................................................................. 86Total Sponsored Awards by Major Unit: Fiscal Year 2016-17.......................................................................... 87Sources of All Public Service and Outreach Funds: Fiscal Year 2016-17........................................................ 88History of Fundraising: Fiscal Years 1983-2017 .............................................................................................. 89
PHYSICAL FACILITIESUniversity Buildings by Major Use, Athens Campus: Fall 2017........................................................................ 92Number of Rooms by Basic Room Type, Athens Campus: Fall 2017 .............................................................. 92Undergraduate Class Size: Fall Terms 2007-2016 .......................................................................................... 92Space Assignment by Room Use and Building Location: Fall 2017................................................................. 93Space Assignment by Program Classification and Building Location: Fall 2017.............................................. 93Building Summary by Year of Completion: Athens Campus Fall 2017............................................................. 94Academic and Administrative Buildings, Date of Initial Occupancy, Athens Campus: Fall 2017...................... 95Major Building Projects by Date of Completion: 2016-2017 ............................................................................. 97Major Building Projects Currently Under Construction: Fall 2017 .................................................................... 98Authorized Projects in Design Phase: Fall 2017 .............................................................................................. 98University of Georgia Land Holdings: As of June 30, 2017 .............................................................................. 99
CAMPUS MAP AND LEGENDUniversity of Georgia Map Legend................................................................................................................. 102

vi
UGA Fact Book 2017
LIST OF FIGURES
Figure 1. The University of Georgia Administrative Organization ................................................................... 8Figure 2. Freshman Applicants by Admission Status: Fall Terms 2008-2017 ................................................ 12Figure 3. Mean Scholastic Aptitude Test (New SAT) Scores for Entering Freshmen: Fall 2017 .................... 13Figure 4. Enrollment by Class: Fall Terms 2008-2017.................................................................................... 20Figure 5. Distribution of Total Enrollment by State of Origin: Fall 2017 .......................................................... 27Figure 6. Distribution of Enrolled Georgia Residents by County: Fall 2017 .................................................... 29Figure 7. Degrees Conferred by Level: Fiscal Year 2016-17.......................................................................... 34Figure 8. Degrees Conferred by Level: Fiscal Years 2012-13 through 2016-17............................................. 35Figure 9. Average Completion Rates for First-Time Full-Time Undergraduates:
Entering Cohorts 2007-2016 ..................................................................................................... 43Figure 10. Total University Student Credit Hours: Fiscal Years 2012-13 through 2016-17 ................................ 46Figure 11. Participation in Education Abroad by School or College: Academic Year 2016-17 ......................... 53Figure 12. Distribution of Alumni by State ........................................................................................................ 65Figure 13. Distribution of Resident Georgia Alumni by County of Residence................................................... 67Figure 14. Scholarship Athletes at the University of Georgia: Fall Terms 2013-2017 ...................................... 69Figure 15. Highest Earned Degrees of Full-Time Professorial Faculty: Fall 2017 ............................................ 74Figure 16. Average Academic Year Salary of Instructional Faculty, University of Georgia
(All Ranks): Academic Years 2012-13 through 2016-17............................................................ 75Figure 17. Full-Time University Employees by Occupational Classification ..................................................... 76Figure 18. Distribution of Revenue by Source: Fiscal Year 2016-17 ................................................................ 81Figure 19. Distribution of Expenditures by Function: Fiscal Year 2016-17 ....................................................... 83Figure 20. Total Sponsored Awards by Project Type: Fiscal Years 2012-13 through 2016-17 ........................ 84Figure 21. Total Research Awards: Fiscal Years 2012-13 through 2016-17 .................................................... 85Figure 22. Distribution of Space by Building Age, Athens Campus: Fall 2017 ................................................. 94Figure 23. University of Georgia Athens Campus Map................................................................................... 103

General Information

2
UGA Fact Book 2017 General Information
ABOUT THE INSTITUTION
History and Location: Chartered by the Georgia General Assembly on January 27, 1785, The University of Georgia is the nation’s first state-chartered university. In 1872, the University of Georgia was designated the state’s land-grant institution and in 1980 was accorded sea-grant college status. The University’s main campus is located in Athens-Clarke County, Georgia, approximately 60 miles northeast of the state capital of Atlanta.
Academic Schools and Colleges: The University is comprised of seventeen schools and colleges: Agricultural and Environmental Sciences, Arts and Sciences, Business, Ecology,Education, Engineering, Environment and Design, Family and Consumer Sciences, Forestry and Natural Resources, Graduate School, Journalism and Mass Communication, Law, Pharmacy,Public Health, Public and International Affairs, Social Work, and Veterinary Medicine.
Academic Programs and Degrees Conferred: The University of Georgia is accredited by the Southern Association of Colleges and Schools Commission on Colleges as well as a variety of discipline-specific accrediting agencies. Academic offerings include 24 bachelor’s degrees in 142major fields; 29 master’s degrees in 130 major fields; the specialist in education degree in 8 major fields; 4 doctoral degrees in 94 major fields; and professional degrees in Law, Pharmacy, and Veterinary Medicine. During the 2016-17 fiscal year, the University awarded 7,128 bachelor’s degrees, 1,751 master’s and specialist degrees, 543 doctoral degrees, and 424 professional degrees.
Faculty: Full-time professorial faculty for the fall 2017 totaled 1,822. 94% of the full-time facultywere tenured or tenure-track, and 98% hold the doctorate or other terminal degree. Average salaries for the fiscal year 2017 were $126,400 for professors; $94,500 for associate professors;and $86,400 for assistant professors.
Enrollment: Fall 2017 enrollment totaled 37,606, which included 28,848 undergraduates, 7,158graduate students, and 1,600 first professional students. 94% of undergraduates and 78% of graduate and professional students were enrolled on a full-time basis. The undergraduate student body was 43% male and 30% minority. There were 123 foreign countries represented among the 1,153 undergraduate and 1,569 graduate and professional non-US citizens enrolled in fall 2017.
Admissions/Retention: 5,824 first-time freshmen enrolled for fall 2017. 45% of all admitted freshmen enrolled, and 24% of all freshman applicants enrolled. Based on the new SAT test, theaverage total SAT score for entering freshmen was 1281. 5,013 or 86% of new freshmen attended 462 Georgia high schools. On average, 94.6% of first-time full-time freshmen return for their sophomore year. 71% of all undergraduate transfer applicants were accepted, and 1,354enrolled for fall 2017. 52% of accepted new graduate students enrolled in fall 2017.
Costs: Academic year 2017-18 tuition and fees totaled $11,818 for new resident undergraduates and $30,392 for new nonresident undergraduates. Academic year 2017-18 estimated cost of attendance for resident undergraduates totaled $26,404. This amount included tuition and mandatory fees, books and supplies, room and board, and other expenses.
Finance: For fiscal year 2017, total revenues exceeded $1.66 billion and included $436 million from state appropriations. 19.8% of total operating expenditures were designated for instruction and 25.3% for research. Sponsored awards for fiscal year 2017 totaled $260,650,095.
Physical Facilities: The University occupies and maintains over 22 million square feet of space. The main campus includes 475 buildings for a total of 17,733,878 square feet. Ten major building projects were completed during 2017 for a total cost of over $157 million. The University’s fall 2017 land holdings totaled 38,878 acres in 30 Georgia counties.

3
UGA Fact Book 2017 General Information
THE MISSION OF THE UNIVERSITY OF GEORGIA
The University of Georgia, a land-grant and sea-grant university with statewide commitments and responsibilities, is the state's oldest, most comprehensive and most diversified institution of higher education. Its motto, "to teach, to serve, and to inquire into the nature of things," reflects the University's integral and unique role in the conservation and enhancement of the state's and nation's intellectual, cultural, and environmental heritage.
The University of Georgia shares with the other research universities of the University System of Georgia the following core characteristics:
• a statewide responsibility and commitment to excellence and academic achievements having national and international recognition;
• a commitment to excellence in a teaching/learning environment dedicated to serving a diverse and well-prepared student body, to promoting high levels of student achievement, and to providingappropriate academic support services;
• a commitment to excellence in research, scholarship, and creative endeavors that are focused on organized programs to create, maintain, and apply new knowledge and theories; that promote instructional quality and effectiveness; and that enhance institutionally relevant faculty qualifications;
• a commitment to excellence in public service, economic development, and technical assistance activities designed to address the strategic needs of the state of Georgia along with a comprehensive offering of continuing education designed to meet the needs of Georgia's citizens in life-long learning and professional education;
• a wide range of academic and professional programming at the baccalaureate, master's, and doctoral levels.
With its statewide mission and core characteristics, the University of Georgia endeavors to prepare theUniversity community and the state for full participation in the global society of the twenty-first century. Through its programs and practices, it seeks to foster the understanding of and respect for cultural differences necessary for an enlightened and educated citizenry. It further provides for cultural, ethnic, gender, and racial diversity in the faculty, staff, and student body. The University is committed to preparing the University community to appreciate the critical importance of a quality environment to an interdependent global society.
As a comprehensive land-grant and sea-grant institution, the University of Georgia offers baccalaureate, master's, doctoral, and professional degrees in the arts, humanities, social sciences, biological sciences, physical sciences, agricultural and environmental sciences, business, ecology, engineering, environmental design, family and consumer sciences, forest resources, journalism and mass communication, education, law, pharmacy, public health, social work, and veterinary medicine. The university is also home to the Augusta University/University of Georgia Medical Partnership.
The University attracts students nationally and internationally as well as from within Georgia. It offers the state's broadest array of possibilities in graduate and professional education, and thus a large minority of the student body is post-baccalaureate. The predominantly Georgian undergraduate student body is a mix of highly qualified students originally admitted as freshmen and selected transfer students principally from other University System institutions.
With original scholarship, basic and applied research, and creative activities constituting an essential core from which to draw, the impact of the land-grant and sea-grant mission is reflected throughout the state. Cooperative extension, continuing education, public service, experiment stations, and technology transfer are all designed to enhance the well-being of the citizens of Georgia through their roles in economic, social, and community development.
As it has been historically, the University of Georgia is responsive to the evolution of the state's educational, social, and economic needs. It aspires through its strategic planning to even closer contact and interaction with public and private institutions throughout the state as well as with the citizens it serves.

4
UGA Fact Book 2017 General Information
THE UNIVERSITY OF GEORGIA 2020 STRATEGIC PLAN
“BUILDING ON EXCELLENCE”
During 2009, the University of Georgia Strategic Planning Committee, comprised of faculty, administrators and students, examined the strategic framework of the University for the coming decade and identified seven strategic directions to guide institutional development from 2010-2020. In 2012, a team of faculty and administrator “champions” updated the original plan with priority actions for each strategic direction. The University Council approved the updated plan at its November 28, 2012 meeting. The 2020 Strategic Plan ensures that the University’s well-established system of planning, evaluation and continuous improvement will guide UGA through the current decade.
Below are the seven strategic directions included in the plan.
• Building on Excellence in Undergraduate Education
• Enhancing Graduate and Professional Programs
• Investing in Proven and Emerging Areas of Research Excellence at UGA
• Serving the Citizens of the State of Georgia and Beyond
• Improving Faculty Recruitment, Retention and Development
• Improving and Maintaining Facilities and Infrastructure to Provide Excellence in Instruction, Research and Service
• Improving Stewardship of Natural Resources and Advancing Campus Sustainability
The University continues to develop and implement innovative projects and initiatives designed to achieve the goals of the 2020 plan. In addition, the plan serves as the conceptual framework foundation for the University’s capital campaign. The University Council Strategic Planning Committee, in collaboration with the Office of Accreditation and Institutional Effectiveness, monitors the University’s progress on the plan and makes recommendations for improvement and revision to the senior administration and the faculty.
Source: Office of the Senior Vice President for Academic Affairs and Provost

Administration

6
UGA Fact Book 2017 Administration
Regent Residence District Term of Office
James M. Hull, Chair Augusta State-at-Large 2016-2023Don L. Waters, Vice Chair Savannah First 2018-2024W. Paul Bowers Atlanta State-at-Large 2014-2020Erin Hames Atlanta State-at-Large 2018-2023Donald M. Leebern, Jr. Athens State-at-Large 2012-2019Thomas Rogers Wade Sandy Springs State-at-Large 2013-2020Bàrbara Rivera Holmes Albany Second 2018-2024C. Thomas Hopkins, Jr. Griffin Third 2018-2024C. Dean Alford Conyers Fourth 2012-2019Sarah-Elizabeth Reed Atlanta Fifth 2017-2024Kessel Stelling, Jr. Marietta Sixth 2015-2022Richard L. Tucker Suwanee Seventh 2012-2019W. Allen Gudenrath Macon Eighth 2018-2024Philip A. Wilheit, Sr. Gainesville Ninth 2015-2022Benjamin J. Tarbutton, III Sandersville Tenth 2013-2020Neil L. Pruitt, Jr. Atlanta Eleventh 2017-2024Laura Marsh Statesboro Twelfth 2016-2020Sachin Shailendra Atlanta Thirteenth 2014-2021E. Scott Smith Ringgold Fourteenth 2013-2020
Staff Member
Chancellor Steve W. WrigleyExecutive Vice Chancellor of Administration & Chief Operating Officer Tricia P. ChastainExecutive Vice Chancellor & Chief Academic Officer Tristan DenleyExecutive Vice Chancellor of Strategy & Fiscal Affairs Shelly C. NickelVice Chancellor - Communications & Governmental Affairs Charles SutliveVice Chancellor - Development Karen McCauleyVice Chancellor - Facilities Jim JamesVice Chancellor - Fiscal Affairs Tracey CookVice Chancellor - Human Resources Marion L. FedrickVice Chancellor - Information Technology Services & Chief Information Officer Robert H. Laurine, Jr.Vice Chancellor - Internal Audit & Compliance & Chief Audit Officer Stephon Terrell ThompsonVice Chancellor - Organizational Effectiveness John M. Fuchko, IIIVice Chancellor - Legal Affairs & Secretary to the Board Edward TateVice Chancellor - Student Affairs Joyce A. Jones
Source: University System of Georgia
BOARD OF REGENTS
UNIVERSITY SYSTEM OF GEORGIA ADMINISTRATIVE STAFF
Position

7
UGA Fact Book 2017 Administration
Office Officer
President Jere W. Morehead Chief of Staff and Vice President for Institutional Affairs Kathy R. Pharr General Counsel Michael M. Raeber Vice President for Development and Alumni Relations Kelly Kerner Vice President for Finance and Administration Ryan A. Nesbit Vice President for Government Relations J. Griffin Doyle Vice President for Marketing and Communications Karri Hobson-Pape Director of Athletics Greg McGaritySenior Vice President for Academic Affairs and Provost Pamela S. Whitten Vice Provost for Academic Affairs Russell J. Mumper Vice Provost for Diversity and Inclusion
and Strategic University Initiatives Michelle Garfield Cook Vice President for Information Technology Timothy M. Chester Vice President for Instruction Rahul Shrivastav Vice President for Public Service and Outreach Laura Meadows, Interim Vice President for Research David C. Lee Vice President for Student Affairs Victor K. Wilson Associate Provost for Academic Fiscal Affairs Christina J. Miller Associate Provost for Faculty Affairs Sarah F. Covert Associate Provost and Director, Honors Program David S. Williams Associate Provost for International Education Noel Fallows Associate Provost and University Librarian Toby Graham
College/School
Franklin College of Arts and Sciences (1801) Alan T. DorseyCollege of Agricultural & Environmental Sciences (1859) Samuel L. PardueSchool of Law (1859) Peter B. RutledgeRobert C. Wilson College of Pharmacy (1903) Svein ØieDaniel B. Warnell School of Forestry and Natural Resources (1906) W. Dale GreeneCollege of Education (1908) Craig H. KennedyGraduate School (1910) Suzanne E. BarbourC. Herman and Mary Virginia Terry College of Business (1912) Benjamin C. AyersHenry W. Grady College of Journalism and Mass Communication (1915) Charles N. DavisCollege of Family and Consumer Sciences (1933) Linda K. FoxCollege of Veterinary Medicine (1946) Lisa K. NolanSchool of Social Work (1964) Anna M. ScheyettCollege of Environment and Design (2001) Daniel J. NadenicekSchool of Public and International Affairs (2001) Matthew AuerCollege of Public Health (2005) Phillip L. WilliamsEugene P. Odum School of Ecology (2007) John L. GittlemanAU/UGA Medical Partnership (2009) Michelle A. Nuss, Campus DeanCollege of Engineering (2012) Donald J. Leo
(Date college or school established)
UNIVERSITY CABINET
Dean
DEANS OF COLLEGES AND SCHOOLS
FALL 2017
FALL 2017

8
UGA Fact Book 2017 Administration
CHAN
CELL
OR
PRES
IDEN
T
VIC
E PR
ESID
ENT
DEV
ELO
PMEN
T &
A
LUM
NI R
ELA
TNS
SR V
ICE
PRES
IDEN
TA
CA
DEM
IC A
FFA
IRS
AN
D P
RO
VOST
VIC
E PR
ESID
ENT
RES
EAR
CH
VIC
E PR
ESID
ENT
INST
RU
CTI
ON
VIC
E PR
ESID
ENT
INFO
RM
ATI
ON
TEC
HN
OLO
GY
VIC
E PR
ESID
ENT
PUB
LIC
SER
VIC
E&
OU
TREA
CH
ASS
OC
PR
OVO
ST
AC
AD
EMIC
FIS
CA
LA
FFA
IRS
ASS
OC
PR
OVO
STFA
CU
LTY
AFF
AIR
S
ASS
OC
PR
OVO
STIN
TER
NA
TIO
NA
LED
UC
ATI
ON
DEA
NC
OLL
EGE
OF
FAM
ILY
&C
ONS
UM
ER S
CI
DEA
NSC
HO
OL
OF
FOR
ESTR
Y &
NAT
URA
L R
ES
DEA
NC
OLL
EGE
OF
JOUR
NAL
ISM
&M
ASS
CO
MM
DEA
NC
OLL
EGE
OF
PHA
RMA
CY
DEA
NSC
HO
OL
OF
PUB
LIC
& IN
TLA
FFAI
RS
DEA
NC
OLL
EGE
OF
ENVI
RO
NM
ENT
& D
ESIG
N
DEA
NC
OLL
EGE
OF
EDU
CATI
ON
DEA
NC
OLL
EGE
OF
BUS
INES
S
DEA
NC
OLL
EGE
OF
AG
RIC
ULT
RAL
&EN
VIR
ON
SCI
DEA
NC
OLL
EGE
OF
ENG
INEE
RING
DEA
NSC
HO
OL
OF
ECO
LOG
Y
DEA
N C
OLL
EGE
OF
ART
S &
SC
IEN
CES
DEA
NG
RAD
UATE
SCH
OO
L
DEA
NC
OLL
EGE
OF
PUB
LIC
HEA
LTH
Figu
re 1
THE
UN
IVER
SITY
OF
GEO
RG
IAA
DM
INIS
TRA
TIVE
OR
GA
NIZ
ATI
ON
NO
VEM
BER
201
7
BO
AR
D O
F R
EGEN
TS
.. .
.
UN
IVER
SITY
LIB
RA
RIA
N &
ASS
OC
PR
OVO
ST
DEA
NC
OLL
EGE
OF
VETE
RIN
ARY
MED
ICIN
E
DEA
NSC
HO
OL
OF
LAW
VIC
E PR
ESID
ENT
STU
DEN
TA
FFA
IRS
DEA
NSC
HO
OL
OF
SOC
IAL
WO
RK
VIC
E PR
ESID
ENT
FIN
AN
CE
AN
D
AD
MIN
ISTR
ATI
ON
VIC
E PR
ESID
ENT
GO
VER
NMEN
T R
ELA
TIO
NS
DIR
ECTO
RA
THLE
TIC
S
VIC
E PR
ESID
ENT
MA
RK
ETIN
G &
C
OM
MU
NIC
ATI
ON
S
VIC
E PR
OVO
STD
IVER
SITY
& IN
CLU
SIO
N;
STR
ATE
GIC
UN
IVER
SITY
IN
ITIA
TIVE
S
CAM
PUS
DEA
N
AU/
UG
A
MED
ICA
L PA
RTN
ERSH
IP
VIC
E PR
OVO
STA
CA
DEM
IC A
FFA
IRS
ASS
OC
PR
OVO
ST&
DIR
ECTO
R,
HO
NO
RS
PRO
GR
AM
C
HIE
F O
F ST
AFF
& A
SSO
C V
P FO
R IN
STIT
UTI
ON
AL
AFF
AIR
S
G
ENER
AL
CO
UN
SEL

9
UGA Fact Book 2017 Administration
Term Term Trustees Expires Trustees Expires
Daniel P. Amos Columbus, GA 2019 Emily Dunlap Lawson Gainesville, GA 2019
Kathryn L. Ash Charlotte, NC 2020 Michael Lewis Athens, GA Ex-officio,
Allison Ausband Atlanta, GA 2020 Non-Voting
David M. Battle New York, NY 2018 Russell C. Lindner Washington, DC 2020
Eleanor F. Banister Atlanta, GA 2019 John F. Mangan, Jr. Charlotte, NC 2018
Garry W. Bridgeman Atlanta, GA 2021 Ted McMullan Atlanta, GA 2019
Michael J. Boudens Newton, MA 2021 Jere W. Morehead Athens, GA Ex-officio,
Christopher W. Brown Washington, DC 2021 Voting
Elizabeth W. Camp Atlanta, GA 2021 C. Read Morton, Jr. Atlanta, GA 2019
Mark B. Chandler Atlanta, GA 2019 John S. Neel, Jr. Macon, GA 2018
James W. Childs Atlanta, GA 2020 Ryan A. Nesbit Athens, GA Ex-officio,
Alston D. Correll, Jr. Atlanta, GA 2020 Non-Voting
Victor E. Corrigan Atlanta, GA 2021 John R. Parker, Jr. Athens, GA 2021
Richard W. Courts, IV Atlanta, GA 2018 Thomas H. Paris, III Atlanta, GA 2018
John H. Crawford, IV Atlanta, GA 2018 Scott Pegan Athens, GA Ex-officio,
William W. Douglas, III Atlanta, GA 2019 Voting
Hillel A. Feinberg Dallas, TX 2018 Neal J. Quirk Atlanta, GA 2020
Jennifer G. Flanagan Atlanta, GA 2019 Stanley W. Shelton Wayland, MD 2019
Frank D. Foley, III Columbus, GA 2020 Bonney Shuman St. Simons, GA Ex-officio,
Samuel D. Holmes Atlanta, GA 2018 Voting
Kenneth G. Jackson Dalton, GA 2019 Stephen W. Smith Atlanta, GA 2019
Stephen M. Joiner Atlanta, GA 2019 Robert H. Stolz Charlotte, NC 2020
Steve C. Jones Atlanta, GA 2021 Barry L. Storey Augusta, GA 2021
Cameron Keen Athens, GA Ex-officio, Larry D. Thompson St. Simons, GA 2020Non-Voting Susan C. Waltman Pelham, NY 2019
Kelly K. Kerner Athens, GA Ex-officio, Pamela S. Whitten Athens, GA Ex-officio,Non-Voting Non-Voting
Charles E. Knox Augusta, GA Advisory William D. Young, Jr. Atlanta, GA 2018
Source: Office of Financial Services, Division of Development and Alumni Relations
THE UNIVERSITY OF GEORGIA FOUNDATION2017-18 TRUSTEES
Business / Residence
Business / Residence

10
UGA Fact Book 2017 Administration

Admissions

12
UGA Fact Book 2017Admissions
Fall % of AppliedTerm Accepted Accepted
2008 17,326 9,625 56 4,799 28 502009 17,886 9,584 54 4,686 26 492010 17,730 10,331 58 4,690 26 452011 17,823 11,170 63 5,517 31 492012 18,735 10,449 56 4,967 27 482013 20,340 11,054 54 5,258 26 482014 20,918 11,655 56 5,243 25 452015 21,945 11,604 53 5,262 24 452016 22,694 12,232 54 5,420 24 442017 24,165 13,052 54 5,824 24 45
*New first-year students include summer and fall matriculants.
Figure 2FRESHMAN APPLICANTS BY ADMISSION STATUS
Source: Office of Institutional Research
FALL TERMS 2008-2017
FALL TERMS 2008-2017
Applied Enrolled
NEW FRESHMEN*
% of Accepted Enrolled
% of Applied Enrolled
3,000
5,000
7,000
9,000
11,000
13,000
15,000
17,000
19,000
21,000
23,000
25,000
2008 2009 2010 2011 2012 2013 2014 2015 2016 2017FALL TERM
APPLIED
ACCEPTED
ENROLLED

13
UGA Fact Book 2017 Admissions
Fall Number UGA Nat'l State UGA Nat'l State UGA Nat'l StateTerm of Scores Mean Mean Mean Mean Mean Mean Mean Mean Mean
2017 2,239 648 533 535 633 527 515 1281 1060 1050
Fall Number UGA Nat'l State UGA Nat'l State UGA Nat'l StateTerm of Scores Mean Mean Mean Mean Mean Mean Mean Mean Mean
2013 3,221 620 496 490 629 514 487 1249 1010 9772014 2,878 622 497 488 630 513 485 1252 1010 9732015 2,526 625 495 490 633 511 485 1258 1006 9752016 2,571 626 494 493 632 508 490 1258 1002 9832017 419 646 655 1300
Note: Due to rounding, the UGA Total Score may not equal the sum of the UGA Critical Reading and Math Scores.
Source: Office of Institutional Research, The College Board 2017 SAT Suite of Assessments Annual Report
Critical Reading Score Mathematics Score Total Score
Figure 3MEAN SCHOLASTIC APTITUDE TEST (NEW SAT ) SCORES FOR ENTERING FRESHMEN
FALL 2017
Evidence-Based Reading and Writing Score (ERW) Mathematics Score (MATH) Total Score
MEAN SCHOLASTIC APTITUDE TEST (OLD SAT ) SCORES FOR ENTERING FRESHMENFALL TERMS 2013-2017
MEAN SCHOLASTIC APTITUDE TEST (NEW SAT ) SCORES FOR ENTERING FRESHMENFALL 2017
0
200
400
600
800
1000
1200
1400
ERW MATH TOTAL
SA
T S
CO
RE
UGA National State
14
UGA Fact Book 2017Admissions
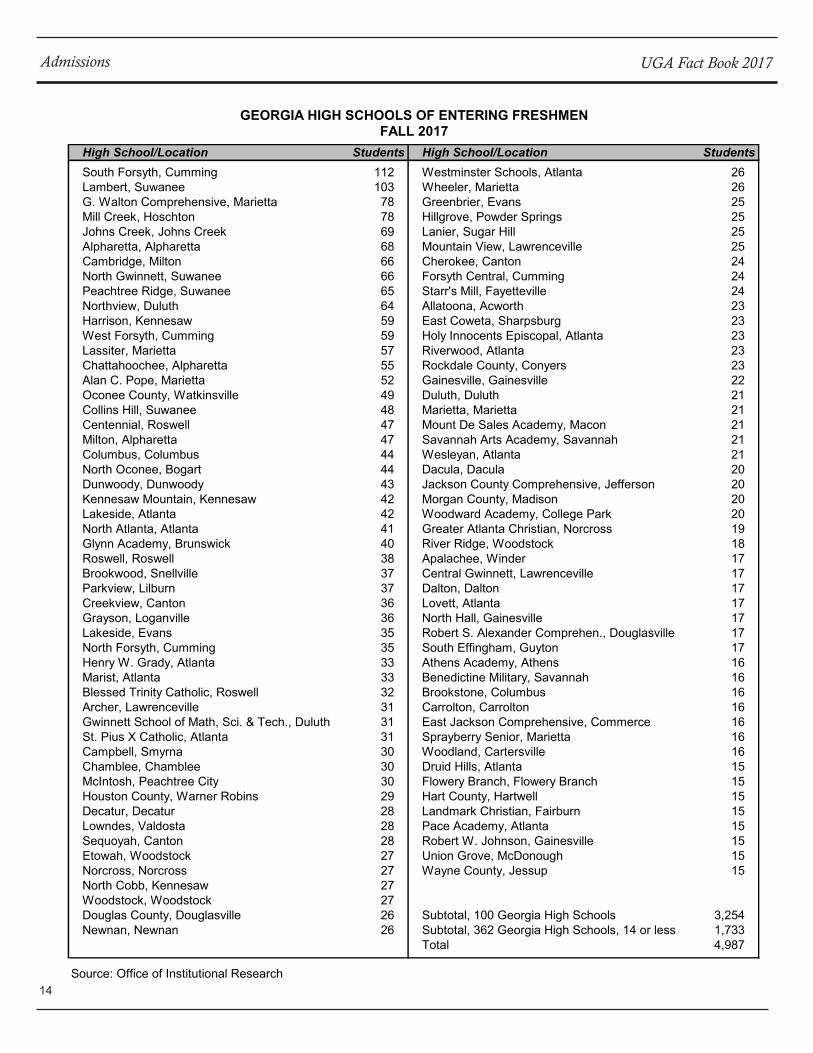
High School/Location Students High School/Location StudentsSouth Forsyth, Cumming 112 Westminster Schools, Atlanta 26Lambert, Suwanee 103 Wheeler, Marietta 26G. Walton Comprehensive, Marietta 78 Greenbrier, Evans 25Mill Creek, Hoschton 78 Hillgrove, Powder Springs 25Johns Creek, Johns Creek 69 Lanier, Sugar Hill 25Alpharetta, Alpharetta 68 Mountain View, Lawrenceville 25Cambridge, Milton 66 Cherokee, Canton 24North Gwinnett, Suwanee 66 Forsyth Central, Cumming 24Peachtree Ridge, Suwanee 65 Starr's Mill, Fayetteville 24Northview, Duluth 64 Allatoona, Acworth 23Harrison, Kennesaw 59 East Coweta, Sharpsburg 23West Forsyth, Cumming 59 Holy Innocents Episcopal, Atlanta 23Lassiter, Marietta 57 Riverwood, Atlanta 23Chattahoochee, Alpharetta 55 Rockdale County, Conyers 23Alan C. Pope, Marietta 52 Gainesville, Gainesville 22Oconee County, Watkinsville 49 Duluth, Duluth 21Collins Hill, Suwanee 48 Marietta, Marietta 21Centennial, Roswell 47 Mount De Sales Academy, Macon 21Milton, Alpharetta 47 Savannah Arts Academy, Savannah 21Columbus, Columbus 44 Wesleyan, Atlanta 21North Oconee, Bogart 44 Dacula, Dacula 20Dunwoody, Dunwoody 43 Jackson County Comprehensive, Jefferson 20Kennesaw Mountain, Kennesaw 42 Morgan County, Madison 20Lakeside, Atlanta 42 Woodward Academy, College Park 20North Atlanta, Atlanta 41 Greater Atlanta Christian, Norcross 19Glynn Academy, Brunswick 40 River Ridge, Woodstock 18Roswell, Roswell 38 Apalachee, Winder 17Brookwood, Snellville 37 Central Gwinnett, Lawrenceville 17Parkview, Lilburn 37 Dalton, Dalton 17Creekview, Canton 36 Lovett, Atlanta 17Grayson, Loganville 36 North Hall, Gainesville 17Lakeside, Evans 35 Robert S. Alexander Comprehen., Douglasville 17North Forsyth, Cumming 35 South Effingham, Guyton 17Henry W. Grady, Atlanta 33 Athens Academy, Athens 16Marist, Atlanta 33 Benedictine Military, Savannah 16Blessed Trinity Catholic, Roswell 32 Brookstone, Columbus 16Archer, Lawrenceville 31 Carrolton, Carrolton 16Gwinnett School of Math, Sci. & Tech., Duluth 31 East Jackson Comprehensive, Commerce 16St. Pius X Catholic, Atlanta 31 Sprayberry Senior, Marietta 16Campbell, Smyrna 30 Woodland, Cartersville 16Chamblee, Chamblee 30 Druid Hills, Atlanta 15McIntosh, Peachtree City 30 Flowery Branch, Flowery Branch 15Houston County, Warner Robins 29 Hart County, Hartwell 15Decatur, Decatur 28 Landmark Christian, Fairburn 15Lowndes, Valdosta 28 Pace Academy, Atlanta 15Sequoyah, Canton 28 Robert W. Johnson, Gainesville 15Etowah, Woodstock 27 Union Grove, McDonough 15Norcross, Norcross 27 Wayne County, Jessup 15North Cobb, Kennesaw 27Woodstock, Woodstock 27Douglas County, Douglasville 26 Subtotal, 100 Georgia High Schools 3,254Newnan, Newnan 26 Subtotal, 362 Georgia High Schools, 14 or less 1,733
Total 4,987
Source: Office of Institutional Research
GEORGIA HIGH SCHOOLS OF ENTERING FRESHMENFALL 2017

15
UGA Fact Book 2017 Admissions
2008 2,743 1,589 58 1,135 41 712009 2,989 1,749 59 1,355 45 772010 3,017 1,821 60 1,196 40 662011 2,467 1,472 60 1,121 45 762012 2,476 1,556 63 1,148 46 742013 2,729 1,651 61 1,078 40 652014 2,386 1,541 65 1,128 47 732015 2,642 1,728 65 1,293 49 752016 2,355 1,663 71 1,247 53 752017 2,537 1,848 73 1,354 53 73
* Does not include Gwinnett, Tifton or Griffin enrollments
Source: Office of Institutional Research
UNDERGRADUATE TRANSFERSFALL TERMS 2008-2017
Fall* Term Applied Accepted
% of Applied
Accepted
% of Applied Enrolled
% of Accepted EnrolledEnrolled
Scholarship Program
Bernard Ramsey Honors 7 8 19 17 26 25Charter 232 210 696 703 928 913Coca-Cola First Generation 32 24 32 24Georgia Incentive 33 21 69 77 102 98Goizueta Foundation Scholarship 26 10 70 64 96 74Harris 11 15 26 21 37 36National Merit/Achievement 27 30 100 85 127 115One UGA II 37 40 98 96 135 136Other Scholarships* 5 3 17 13 22 16Presidential Scholarship 38 67 110 98 148 165UGA Foundation Fellowships 21 17 77 69 98 86
Total 437 421 1,314 1,267 1,751 1,688
*Other Scholarships consist of the following: Alumni Association Endowed, Bradley-Turner Leadership Scholars, Henry King Stanford Scholarship, and Woodruff Scholarship.
Source: Office of Student Financial Aid
2015-16 2016-172015-16 2016-17 2016-172015-16
ACADEMIC YEARS 2015-16 AND 2016-17ACADEMIC SCHOLARSHIPS
TotalScholarships
NewFreshmen
ContinuingStudents

16
UGA Fact Book 2017Admissions
College/University Students College/University
University of North Georgia 192 Reinhardt College 7Georgia State University 160 Georgia Piedmont Technical College 6Kennesaw State University 130 Piedmont College 6Georgia College and State University 100 West Georgia Technical College 6Georgia Southern University 53 Albany State University 5Georgia Gwinnett College 47 Berry College 5University of West Georgia 28 Central Georgia Technical College 5Georgia Military College 25 Southern Regional Technical College 5Clayton State University 22 Georgia Northwestern Technical College 4Georgia Highlands College 22 Mercer Univesity 3Valdosta State University 22 Emanuel College 2Abraham Baldwin Agricultural College 20 Georgia Institute of Technology 2Dalton State College 19 Lanier Technical College 2Middle Georgia State College 19 Morehouse College 2Athens Technical College 17 Oglethorpe University 2Augusta University 17 Oxford College of Emory University 2Armstrong State University 11 Point University 2Truett McConnell College 10 Savannah State University 2Young Harris College 10 Shorter University 2Bainbridge College 9 Southern Cresent Technical College 2Columbus State University 9 Toccoa Falls College 2Gwinnett Technical College 9 Wiregrass Georgia Technical College 2Gordon College 8 Albany Technical College 1North Georgia Technical College 8 Andrew College 1
South Georgia State College 8 Art Institute of Atlanta 1
Chattahoochee Technical College 7 Brewton-Parker College 1
College of Coastal Georgia 7 South Georgia Technical College 1
Darton College 7 Thomas University 1
East Georgia College 7 Wesleyan College 1
Georgia Southwestern State University 7
Total, 59 Georgia Colleges 1,093
Source: Office of Institutional Research
GEORGIA COLLEGES AND UNIVERSITIES FROM WHICH UNDERGRADUATESTUDENTS TRANSFERRED TO THE UNIVERSITY OF GEORGIA
FALL 2017
Students

17
UGA Fact Book 2017 Admissions
Fall % Applied % Applied % AcceptedTerms Applied Accepted Accepted Enrolled Enrolled Enrolled2008 8,167 3,230 40 1,860 23 582009 8,683 3,301 38 1,963 23 592010 8,585 3,309 39 1,860 22 562011 8,624 3,283 38 1,693 20 522012 9,070 3,265 36 1,661 18 512013 8,946 3,273 37 1,740 19 532014 8,825 3,727 42 1,889 21 512015 8,824 3,899 44 1,988 23 512016 8,429 3,947 47 1,917 23 492017 8,143 3,934 48 2,031 25 52
GRADUATE SCHOOL ADMISSIONSFALL TERMS 2008-2017
Fall GRETerms GRE GRE Analytical GMAT
Verbal Quantitative Writing Total2008 528 639 4.3 5912009 530 640 4.3 5902010 528 637 4.2 5872011 534 644 4.0 581
2012* 155 152 4.0 539
2013 155 154 4.0 5012014 154 154 3.9 5982015 154 154 3.9 6022016 154 154 3.8 6002017 154 155 3.9 600
Source: Graduate Admissions
AVERAGE ENTRANCE TEST SCORES OF ACCEPTEDDEGREE-SEEKING GRADUATE STUDENTS
FALL TERMS 2008 - 2017
* For tests taken on or after 8/1/2011 the GRE Verbal and Quantitative scores are reported on a 130-170 point range in 1 point increments.

18
UGA Fact Book 2017Admissions

Enrollment

20
UGA Fact Book 2017Enrollment
Class 2008 2009 2010 2011 2012 2013 2014 2015 2016 2017Freshman (FR)* 5,155 4,974 4,889 5,672 5,168 5,239 5,197 5,292 5,256 5,463Sophomore (SO) 5,594 5,912 5,565 5,546 6,099 5,892 6,126 6,149 6,396 6,753Junior (JR) 6,659 6,746 6,860 6,613 6,477 6,971 6,937 7,246 7,317 7,496Senior (SR) 7,755 8,258 8,409 8,371 8,344 8,050 8,506 8,685 8,907 9,057Unclassified (UC)** 304 252 224 171 171 126 116 175 75 79
Total Undergraduate 25,467 26,142 25,947 26,373 26,259 26,278 26,882 27,547 27,951 28,848
Professional (PR) 1,553 1,607 1,653 1,677 1,654 1,627 1,569 1,609 1,593 1,600Graduate (GR) 7,160 7,136 7,077 6,766 6,606 6,631 6,746 6,974 7,030 7,158
Total University*** 34,180 34,885 34,677 34,816 34,519 34,536 35,197 36,130 36,574 37,606
* Includes Dual Enrolled and Developmental Studies students.** Includes Transients, Independent and Distance Learning students (2008 - 2012) and other non-degree undergraduates.
Source: Office of Institutional Research
ENROLLMENT BY CLASS
FALL TERMS 2008-2017
FALL TERMS 2008-2017
Figure 4ENROLLMENT BY CLASS
0
5,000
10,000
15,000
20,000
25,000
30,000
35,000
40,000
2008 2009 2010 2011 2012 2013 2014 2015 2016 2017
EN
RO
LLM
EN
T
FALL TERMSFR SO JR SR GR PR UC

21
UGA Fact Book 2017 Enrollment
*Frosh Soph Junior **Senior TransientTotal
Ugrad Prof GradGrand Total
Total Class 5,463 6,753 7,496 9,057 79 28,848 1,600 7,158 37,606Registration Status
Full-Time 5,415 6,590 7,181 7,879 77 27,142 1,591 5,234 33,967Part-Time 48 163 315 1,178 2 1,706 9 1,924 3,639Full-Time Equivalent 5,448 6,708 7,400 8,628 78 28,262 1,596 6,312 36,169
SexMale 2,086 2,916 3,388 4,043 31 12,464 594 2,959 16,017Female 3,376 3,830 4,079 4,953 48 16,286 1,005 4,173 21,464Not Reported 1 7 29 61 98 1 26 125
Ethnic OriginAmerican Indian 4 8 12 5 29 3 17 49Asian 630 829 864 1,024 17 3,364 174 306 3,844Black/African-American 505 519 570 674 3 2,271 104 805 3,180Hawaiian/Pacific Islander 3 6 5 10 24 2 26Hispanic 373 409 473 519 12 1,786 76 140 2,002Multiracial 213 251 288 343 1,095 52 191 1,338White 3,691 4,687 5,216 6,376 41 20,011 1,162 4,196 25,369Not Reported 44 44 68 106 6 268 29 1,501 1,798
Citizenship StatusU.S. Citizen 5,252 6,528 7,198 8,696 21 27,695 1,563 5,626 34,884Resident Alien 112 142 183 199 1 637 22 131 790Non-Resident Alien 99 83 115 162 57 516 15 1,401 1,932
Residency StatusGeorgia Resident 4,657 6,089 6,808 8,261 6 25,821 1,368 3,674 30,863Non-Georgia Resident 710 584 577 636 16 2,523 217 2,078 4,818International 96 80 111 160 57 504 15 1,406 1,925
Age17 or under 117 26 7 150 15018-20 5,321 6,256 4,575 670 42 16,864 14 21 16,89921-24 23 438 2,737 7,777 36 11,011 956 1,908 13,87525-29 1 25 116 385 527 524 2,490 3,54130-34 1 3 30 85 119 74 1,275 1,46835-39 15 51 1 67 22 627 71640-49 1 11 46 58 9 588 65550-61 2 4 20 26 1 204 23162 and older 2 1 23 26 45 71Average Age 18 19 21 22 21 20 25 30 22
* Includes 26 dual enrolled high school students.** Includes 32 post-baccalaureate students.
Source: Office of Institutional Research
CHARACTERISTICS OF ENROLLED STUDENTS BY CLASSFALL 2017

22
UGA Fact Book 2017Enrollment
College/School 2013 2014 2015 2016 2017Undergraduate 1,616 1,526 1,535 1,455 1,404Graduate 413 415 467 475 514Total 2,029 1,941 2,002 1,930 1,918Undergraduate 13,903 9,350 9,033 8,972 9,135Graduate 1,790 1,782 1,817 1,804 1,826Total 15,693 11,132 10,850 10,776 10,961Undergraduate 2,548 6,514 7,140 7,538 7,931Graduate 647 701 754 761 756Total 3,195 7,215 7,894 8,299 8,687Undergraduate 73 74 99 122 143Graduate 86 74 76 71 75Total 159 148 175 193 218Undergraduate 2,450 2,368 2,245 2,255 2,249Graduate 1,835 1,870 1,862 1,839 1,668Total 4,285 4,238 4,107 4,094 3,917Undergraduate 916 1,233 1,531 1,807 1,967Graduate 73 77 87 107 128Total 989 1,310 1,618 1,914 2,095Undergraduate 177 159 181 172 180Graduate 156 140 141 154 148Total 333 299 322 326 328Undergraduate 1,265 1,243 1,258 1,226 1,324Graduate 155 153 166 168 199Total 1,420 1,396 1,424 1,394 1,523Undergraduate 325 344 340 297 289Graduate 214 183 187 189 193Total 539 527 527 486 482Undergraduate 1,144 1,961 1,971 1,937 1,932Graduate 99 106 108 136 169Total 1,243 2,067 2,079 2,073 2,101Professional 623 577 575 555 568Graduate 17 21 23 23 25Total 640 598 598 578 593Undergraduate 49 183 236 260 277Professional 579 568 575 562 557Graduate 102 95 108 114 116Total 681 663 919 936 950Undergraduate 478 533 545 580 597Graduate 251 268 244 236 257Total 729 801 789 816 854Undergraduate 1,203 1,143 1,080 1,052 1,140Graduate 256 241 259 266 273Total 1,459 1,384 1,339 1,318 1,413Undergraduate 131 132 143 159 157Graduate 360 394 408 402 405Total 491 526 551 561 562Professional 425 424 459 476 475Graduate 150 142 170 185 216Total 575 566 629 661 691
Family & Consumer Sciences
Forestry & Natural Resources
Journalism & Mass Communication
Law
Veterinary Medicine
Pharmacy
Public Health
Social Work
Public & International Affairs
Note: Prior to Fall 2014, students in a pre-business or pre-journalism major were enrolled in the College of Arts & Sciences. Beginning Fall 2014 those students are enrolled in the College of Business and the College of Journalism & Mass Communication respectively.
ENROLLMENT BY COLLEGE AND SCHOOLATHENS AND EXTENDED CAMPUSES, FALL TERMS 2013 - 2017
Agricultural & Environmental Sci
Arts & Sciences
Business
Ecology
Education
Engineering
Environment & Design

23
UGA Fact Book 2017 Enrollment
College/School 2013 2014 2015 2016 2017Graduate 9 15 22Total 9 15 22Graduate 27 22 30 32 34Total 27 22 30 32 34Graduate 75Total 75Undergraduate 119 210 119 119 123Graduate 62 58 53 53 59Total 181 268 172 172 182Undergraduate 26,278 26,882 27,547 27,951 28,848Professional 1,627 1,569 1,609 1,593 1,600Graduate 6,631 6,746 6,974 7,030 7,158Total 34,536 35,197 36,130 36,574 37,606
* Prior to Fall 2017, student enrollment in Higher Education programs was reported under the College of Education.
College/School 2013 2014 2015 2016 2017Undergraduate 10 8 14 21 12Graduate 2 1Total 12 8 14 21 13Undergraduate 3 10 14 15 7Total 3 10 14 15 7Undergraduate 13 18 19 13 10Total 13 18 19 13 10Undergraduate 25 13 9 9 8Graduate 50 63 81 84 83Total 75 76 90 93 91Undergraduate 15 14 8 7 6Total 15 14 8 7 6Undergraduate 2Graduate 1Total 2 1
College/School 2013 2014 2015 2016 2017Graduate 6 1Total 6 1Graduate 34 56 43 42Total 34 56 43 42Graduate 70 69 78 72 72Total 70 69 78 72 72Graduate 246 229 249 221 199Total 246 229 249 221 199Graduate 4 6 6 5 3Total 4 6 6 5 3Graduate 26 * * * *Total 26Graduate 16Total 16Graduate 18 21 23 13 23Total 18 21 23 13 23Graduate 110 137 150 142 137Total 110 137 150 142 137
CONT'D: ENROLLMENT BY COLLEGE AND SCHOOL, ATHENS AND EXTENDED CAMPUSES, FALL TERMS 2013 - 2017
UGA EXTENDED CAMPUSES, FALL TERMS 2013 - 2017ENROLLMENT BY COLLEGE AND SCHOOL
UGA GRIFFIN CAMPUS
Institute of BioinformaticsBiomedical & Health Sciences Institute
No College Designated
Total University Enrollment
Institute of Higher Education *
Agricultural & Environmental Sci
Arts & Sciences
Business
Education
Family & Consumer Sciences
* The program in pharmacy at UGA Gwinnett is an online program and is reported as such effective Fall 2014.
Public Health
No College Designated
UGA GWINNETT CAMPUS
Agricultural & Environmental Sci
Arts & Sciences
Business
Public & International Affairs
Social Work
EducationEnvironment & DesignPharmacy

24
UGA Fact Book 2017Enrollment
CONT'D: ENROLLMENT BY COLLEGE AND SCHOOL, UGA EXTENDED CAMPUSES FALL TERMS 2013 - 2017
College/School 2013 2014 2015 2016 2017Undergraduate 28 34 40 43 46Graduate 6 8 24 25 12Total 34 42 64 68 58
College/School 2013 2014 2015 2016 2017Graduate 225 268 294 310 317Total 225 268 294 310 317Graduate 17 15 15 17 18Total 17 15 15 17 18
College/School 2013 2014 2015 2016 2017Graduate 2 5 10 19Total 2 5 10 19Undergraduate 2 3 3Graduate 4 5 13Total 6 8 16Undergraduate 31 61 97Graduate 10 22 26 33Total 10 53 87 130Undergraduate 7 19 30 37Graduate 99 110 123 169Total 106 129 153 206Graduate 6 20 28 41Total 6 20 28 41Graduate 17 37 52Total 17 37 52Graduate 19 20 26 22Total 19 20 26 22Graduate 2 5 13 12Total 2 5 13 12
Source: Office of Institutional Research
TERRY EXECUTIVE EDUCATION CENTER IN ATLANTA
UGA TIFTON CAMPUS
UGA ONLINE
Agricultural & Environmental Sci
Business
Institute of Higher Education
Journalism & Mass Communication
Pharmacy
Veterinary Medicine
Agricultural & Environmental Sci
Arts & Sciences
Business
Education
Family & Consumer Sciences

25
UGA Fact Book 2017 Enrollment
Grad/ Grad/ Grad/Country Ugrad Prof Total Country Ugrad Prof Total Country Ugrad Prof TotalAfghanistan 1 1 Greece 2 6 8 Paraguay 1 1Algeria 1 1 Guatemala 3 2 5 Peru 9 5 14Angola 1 1 Haiti 1 2 3 Philippines 6 6 12Antigua & Barbuda 1 1 Honduras 4 3 7 Poland 1 3 4Argentina 1 4 5 Hong Kong 7 5 12 Portugal 2 4 6Armenia 1 1 Hungary 1 1 Romania 6 3 9Australia 8 3 11 Iceland 2 2 Russia 4 16 20Austria 1 1 2 India 129 227 356 Rwanda 1 1 2Bahamas 1 3 4 Indonesia 12 6 18 Saudi Arabia 1 16 17Bangladesh 8 16 24 Iran 10 60 70 Senegal 2 2Belarus 3 3 Iraq 1 1 Serbia 2 2Belgium 4 1 5 Ireland 1 1 Sierra Leone 2 2Belize 1 1 Isle of Man 1 1 Singapore 2 1 3Bermuda 2 1 3 Israel 3 1 4 Slovakia 1 2 3Bolivia 2 1 3 Italy 1 9 10 South Africa 13 6 19Bosnia & Herzegovina 1 1 Ivory Coast 1 1 2 Spain 7 13 20Brazil 13 53 66 Jamaica 9 8 17 Sri Lanka 9 9Bulgaria 2 2 Japan 15 8 23 St. Lucia 1 1Burkina 1 1 2 Jordan 1 3 4 St. Vincent & the 1 1Cambodia 1 1 Kazakhstan 1 1 GrenadinesCameroon 1 1 2 Kenya 5 8 13 Sweden 6 1 7Canada 36 37 73 Kiribati 2 2 Switzerland 3 1 4Chad 1 1 Korea, North 6 1 7 Taiwan 6 39 45Chile 2 7 9 Korea, South 225 173 398 Tanzania 1 1China 305 499 804 Lebanon 1 7 8 Thailand 4 6 10Colombia 15 25 40 Liberia 2 2 4 Togo 1 1 2Congo 2 2 Lithuania 2 2 Trinidad & Tobago 1 4 5Costa Rica 1 4 5 Macau 1 1 Tunisia 1 1Croatia 2 2 Malawi 1 1 Turkey 2 34 36Cuba 1 1 2 Malaysia 3 4 7 Uganda 1 8 9Cyprus 3 1 4 Mexico 33 6 39 Ukraine 1 2 3Czech Republic 1 1 2 Moldova 1 1 United Arab Emirates 1 1 2Ecuador 5 4 9 Morocco 1 1 United Kingdom 38 16 54Egypt 5 7 12 Mozambique 1 1 Uruguay 3 1 4El Salvador 2 2 Namibia 1 1 Venezuela 9 2 11Eritrea 2 2 Nepal 4 30 34 Vietnam 23 14 37Estonia 2 2 Netherlands 9 3 12 Zambia 3 3Ethiopia 7 4 11 New Zealand 3 1 4 Zimbabwe 3 3Finland 1 2 3 Nicaragua 3 3France 6 7 13 Nigeria 19 18 37Gambia 1 1 Norway 4 1 5Germany 18 18 36 Pakistan 7 10 17Ghana 8 10 18 Panama 1 1 Total, 123 Countries 1,153 1,569 2,722
Note: Country of origin is country of citizenship at time of application. This includes 790 students who hold permanent residentstatus in the U.S. and 1,932 international students who hold U.S. visas or other temporary status in the U.S.
Source: Office of Institutional Research
ENROLLED NON-US CITIZENS BY COUNTRY OF ORIGIN AND UGA STUDENT LEVELFALL 2017

26
UGA Fact Book 2017Enrollment
Under- Grad/ Under- Grad/ State graduate Prof Total State graduate Prof Total
Alabama 76 89 165 New Mexico 3 11 14Alaska 5 5 10 New York 104 82 186Arizona 11 31 42 North Carolina 287 216 503Arkansas 8 15 23 North Dakota 6 6California 100 127 227 Ohio 51 65 116Colorado 43 35 78 Oklahoma 13 15 28Connecticut 35 21 56 Oregon 3 13 16Delaware 9 18 27 Pennsylvania 70 84 154District of Columbia 15 14 29 Rhode Island 7 9 16Florida 250 212 462 South Carolina 154 250 404Georgia 25,121 4,886 30,007 South Dakota 2 4 6Hawaii 1 1 2 Tennessee 187 125 312Idaho 2 3 5 Texas 254 117 371Illinois 75 68 143 Utah 1 14 15Indiana 14 31 45 Vermont 5 3 8Iowa 16 16 Virginia 204 109 313Kansas 10 10 20 Washington 9 22 31Kentucky 29 55 84 West Virginia 5 11 16Louisiana 81 30 111 Wisconsin 18 31 49Maine 5 5 10 Wyoming 1 4 5Maryland 162 46 208 State of Origin, Unknown 7 3 10Massachusetts 35 40 75Michigan 30 64 94 American TerritoriesMinnesota 12 27 39Mississippi 15 32 47 Puerto Rico 1 17 18Missouri 31 33 64Montana 6 6 U.S. Assoc.,Nebraska 3 8 11 APO & FPO 2 3 5
Nevada 5 4 9 Foreign, Unknown 1,153 1,569 2,722New Hampshire 5 6 11New Jersey 119 37 156 Total 28,848 8,758 37,606
Note: State of origin is the state of residence at the time of application to the University.
Source: Office of Institutional Research
ENROLLMENT BY STATE OF ORIGIN AND UGA STUDENT LEVELFALL 2017

27
UGA Fact Book 2017 Enrollment

28
UGA Fact Book 2017Enrollment
Under- Grad/ Under- Grad/ Under- Grad/County grad Prof Total County grad Prof Total County grad Prof TotalAppling 26 4 30 Fannin 34 2 36 Oglethorpe 65 19 84Atkinson 6 1 7 Fayette 585 54 639 Paulding 239 25 264Bacon 4 3 7 Floyd 155 31 186 Peach 22 4 26Baker 5 3 8 Forsyth 1,451 107 1,558 Pickens 49 4 53Baldwin 49 25 74 Franklin 49 14 63 Pierce 36 5 41Banks 24 11 35 Fulton 3,569 614 4,183 Pike 40 7 47Barrow 195 50 245 Gilmer 36 7 43 Polk 44 3 47Bartow 136 20 156 Glascock 7 7 Pulaski 23 5 28Ben Hill 18 18 Glynn 164 28 192 Putnam 36 9 45Berrien 8 2 10 Gordon 99 11 110 Quitman 1 1Bibb 273 45 318 Grady 30 4 34 Rabun 33 4 37Bleckley 18 6 24 Greene 38 4 42 Randolph 6 1 7Brantley 16 1 17 Gwinnett 3,743 613 4,356 Richmond 180 36 216Brooks 4 5 9 Habersham 61 12 73 Rockdale 186 40 226Bryan 66 13 79 Hall 447 94 541 Schley 8 8Bulloch 104 28 132 Hancock 6 2 8 Screven 11 2 13Burke 30 3 33 Haralson 33 3 36 Seminole 21 1 22Butts 30 4 34 Harris 61 7 68 Spalding 76 24 100Calhoun 5 1 6 Hart 66 9 75 Stephens 44 12 56Camden 69 8 77 Heard 12 2 14 Stewart 1 1Candler 18 2 20 Henry 405 82 487 Sumter 37 5 42Carroll 155 33 188 Houston 343 54 397 Talbot 4 2 6Catoosa 77 9 86 Irwin 14 4 18 Taliaferro 0Charlton 9 1 10 Jackson 273 53 326 Tattnall 18 4 22Chatham 415 87 502 Jasper 17 5 22 Taylor 4 1 5Chattahoochee 2 2 4 Jeff Davis 12 1 13 Telfair 6 6Chattooga 13 3 16 Jefferson 26 2 28 Terrell 8 8Cherokee 785 81 866 Jenkins 5 1 6 Thomas 95 8 103Clarke 618 835 1,453 Johnson 6 2 8 Tift 61 21 82Clay 1 1 Jones 39 7 46 Toombs 42 7 49Clayton 170 45 215 Lamar 8 4 12 Towns 13 5 18Clinch 12 2 14 Lanier 6 3 9 Treutlen 5 1 6Cobb 2,606 346 2,952 Laurens 69 11 80 Troup 103 12 115Coffee 36 10 46 Lee 93 10 103 Turner 14 4 18Colquitt 59 14 73 Liberty 43 6 49 Twiggs 3 2 5Columbia 500 69 569 Lincoln 20 5 25 Union 39 2 41Cook 17 5 22 Long 2 2 Upson 39 12 51Coweta 334 37 371 Lowndes 206 30 236 Walker 82 7 89Crawford 1 1 2 Lumpkin 29 16 45 Walton 299 40 339Crisp 18 8 26 Macon 11 2 13 Ware 43 6 49Dade 11 2 13 Madison 100 33 133 Warren 2 2Dawson 53 8 61 Marion 13 1 14 Washington 37 8 45Decatur 76 8 84 McDuffie 24 9 33 Wayne 42 6 48DeKalb 1,238 391 1,629 McIntosh 8 2 10 Webster 1 1Dodge 10 4 14 Meriwether 12 5 17 Wheeler 5 2 7Dooly 9 2 11 Miller 10 10 White 34 11 45Dougherty 95 10 105 Mitchell 20 6 26 Whitfield 183 14 197Douglas 265 27 292 Monroe 60 8 68 Wilcox 5 2 7Early 4 3 7 Montgomery 12 12 Wilkes 17 4 21Echols 2 2 Morgan 120 20 140 Wilkinson 6 1 7Effingham 139 10 149 Murray 32 5 37 Worth 16 2 18Elbert 35 7 42 Muscogee 335 34 369Emanuel 22 1 23 Newton 191 41 232 Total 25,121 4,886 30,007Evans 19 2 21 Oconee 617 118 735
Note: County of residence is defined as county of residence at time of application to the University.
Source: Office of Institutional Research
ENROLLED GEORGIA RESIDENTS BY COUNTY OF RESIDENCE AND UGA STUDENT LEVELFALL 2017

29
UGA Fact Book 2017 Enrollment

30
UGA Fact Book 2017Enrollment
Major Undergraduate Professional Total
Biology 2,472 2,472Psychology 1,593 116 1,709Finance 1,499 1,499Computer Science 1,072 182 1,254International Affairs 893 893Marketing 770 770Political Science 759 759Accounting 561 145 706Pharmacy 557 92 649Management Information Systems 606 606Law 576 9 585Biochemistry & Molecular Biology 478 66 544Business Administration 543 543Economics 480 21 501Management 493 493English 410 76 486Human Development & Family Science 444 41 485Social Work 66 403 469Veterinary Medicine 462 462Communication Studies 414 38 452Risk Management & Insurance 447 447Journalism 432 432Biological Science 424 424Chemistry 268 156 424Advertising 409 409Public Relations 379 379Mathematics 311 56 367Mechanical Engineering 361 361Art 286 67 353Early Childhood Education 258 79 337
Notes: Includes only those students officially accepted to a major program of study. Students pursuing multiple degrees/majors are counted in each declared major.
Source: Office of Institutional Research
Enrollment by UGA Degree Level
POPULAR DEGREE MAJORSFALL 2017
Graduate

31
UGA Fact Book 2017 Enrollment
Class and Year 1Yr 2Yrs 3Yrs 4Yrs 5Yrs 6Yrs
UGA Freshmen2007 93.6 89.2 87.7 84.5 84.6 84.62008 94.5 90.5 88.2 85.6 85.6 85.82009 94.5 91.0 88.7 86.7 86.2 86.72010 94.5 90.0 87.4 85.9 85.8 85.72011 94.1 89.7 88.2 86.7 86.4 86.52012 94.2 90.7 89.0 87.5 86.92013 94.2 91.3 89.3 87.72014 95.2 92.0 89.82015 95.2 91.62016 95.5 Average 94.6 90.7 88.5 86.4 85.9 85.9
Transfer Sophomores2007 86.9 83.6 81.5 82.4 82.7 82.42008 92.2 86.5 81.6 83.2 83.9 84.32009 91.5 88.7 83.5 82.7 83.3 84.42010 90.0 85.0 82.4 82.4 82.1 82.12011 91.2 85.5 81.5 81.7 81.7 81.72012 87.3 85.1 81.7 80.5 82.02013 88.3 84.6 82.1 81.82014 90.2 85.9 83.02015 91.3 85.22016 93.5 Average 90.2 85.6 82.2 82.1 82.6 83.0
Transfer Juniors2007 91.2 86.5 84.8 85.2 85.4 85.22008 90.3 87.2 85.6 86.5 86.5 86.72009 91.9 86.9 84.9 85.4 85.7 85.82010 93.9 89.9 88.4 87.9 88.4 88.62011 90.1 85.2 85.8 86.0 86.4 86.42012 90.9 87.8 87.8 87.1 87.22013 90.4 88.2 87.1 87.62014 93.5 90.6 87.62015 92.8 89.32016 92.7 Average 91.8 88.0 86.5 86.5 86.6 86.5
Source: Office of Institutional Research
Notes: Retention rate is the percentage of students in a given cohort who are enrolled the following fall term; who have graduated between matriculation and that fall term; or who have matriculated into a professional program. UGA Freshman cohorts include both summer and fall matriculants. Sophomore and Junior Transfer cohorts include fall matriculants only.
RETENTION RATES FOR FIRST-TIME FULL-TIME UNDERGRADUATESENTERING COHORTS 2007 - 2016
Percentage Still Enrolled or Graduated as of the Following Fall Term

32
UGA Fact Book 2017Enrollment

Degrees Conferred

34
UGA Fact Book 2017Degrees Conferred
College/School Bachelor's Master's* Doctoral Total
Agricultural & Environmental Sciences 386 91 36 513Arts & Sciences 2,347 192 196 2,735Business 1,839 412 8 2,259Ecology 28 10 8 46Education 594 514 173 1,281Engineering 240 14 15 269Environment & Design 36 47 83Family & Consumer Sciences 414 32 20 466Forestry & Natural Resources 99 46 9 154Journalism & Mass Communication 573 37 6 616Law 18 182 200Pharmacy 14 10 138 8 170Public Health 151 66 23 240Public & International Affairs 362 72 14 448Social Work 45 165 5 215Veterinary Medicine 13 104 17 134Biomedical & Health Sciences Institute 9 2 11Institute of Bioinformatics 2 2Institute of Higher Education** 1 3 4Total 7,128 1,751 424 543 9,846
* Includes Educational Specialist degrees (Ed.S.)Source: Office of Institutional Research
FISCAL YEAR 2016-17
Professional
** Degrees conferred prior to Spring 2017 appear under Education. Those conferred in Spring 2017 appear under Institute of Higher Education.
DEGREES CONFERRED BY SCHOOL OR COLLEGE AND DEGREE LEVELFISCAL YEAR 2016-17
Degree Level
Figure 7DEGREES CONFERRED BY LEVEL
DOCTORAL5.5%
MASTER'S*17.8%
PROFESSIONAL4.3%
BACHELOR'S72.4%

35
UGA Fact Book 2017 Degrees Conferred
Degree Level 2012-13 2013-14 2014-15 2015-16 2016-17Bachelor's 6,872 6,609 6,935 6,991 7,128Master's* 1,744 1,693 1,656 1,679 1,751Professional 461 485 425 441 424Doctoral 440 463 467 526 543
TOTAL 9,517 9,250 9,483 9,637 9,846
* Includes Educational Specialist degrees (Ed.S.)
Source: Office of Institutional Research
Figure 8DEGREES CONFERRED BY LEVEL
FISCAL YEARS 2012-13 THROUGH 2016-17
DEGREES CONFERRED BY DEGREE LEVELFISCAL YEARS 2012-13 THROUGH 2016-17
Fiscal Year
0 1,000 2,000 3,000 4,000 5,000 6,000 7,000 8,000 9,000 10,000
2012-13
2013-14
2014-15
2015-16
2016-17
DEGREES CONFERRED
FIS
CA
L YE
AR
BACHELOR'S MASTER'S* PROFESSIONAL DOCTORAL

36
UGA Fact Book 2017Degrees Conferred
Program or Field of Study*
Agriculture, Ag Operations, & Related Sciences 227 80 23 330Architecture & Related Services 36 36 72Area, Ethnic, Cultural, Gender, & Group Studies 19 19Biological & Biomedical Sciences 640 37 78 755Business, Management, Marketing, & Related Support Services 1,816 432 8 2,256Communication, Journalism, & Related Programs 686 40 8 734Computer & Information Sciences & Support Services 147 32 10 189Education 355 343 127 825Engineering 240 14 15 269English Language & Literatures/Letters 132 3 15 150Family & Consumer Sciences/Human Sciences 266 32 18 316Foreign Languages, Literatures, & Linguistics 170 27 8 205Health Professions & Related Programs 306 132 242 36 716History 83 5 7 95Legal Professions & Studies 18 182 200Liberal Arts & Sciences, General Studies, & Humanities 17 17Mathematics & Statistics 91 33 13 137Multi/Interdisciplinary Studies 163 11 174Natural Resources & Conservation 104 49 9 162Parks, Recreation, Leisure, & Fitness Studies 196 76 13 285Philosophy & Religious Studies 30 4 9 43Physical Sciences 79 12 38 129Psychology 419 68 51 538Public Administration & Social Service Professions 45 207 9 261Security & Protective Services 67 67Social Sciences 579 27 26 632Visual & Performing Arts 215 33 22 270Total 7,128 1,751 424 543 9,846
* Program/Field classifications and degree levels defined by the National Center for Educational Statistics (NCES) in theClassification of Instructional Programs (CIP) 2010.
** Includes Educational Specialist degrees (Ed.S.).
Source: Office of Institutional Research
Master'sDegrees** Degrees
DoctoralDegrees
SUMMARY OF DEGREES CONFERRED BY PROGRAM CLASSIFICATIONFISCAL YEAR 2016-17
Degree Level
DegreesTotalBachelor's
DegreesProf

37
UGA Fact Book 2017 Degrees Conferred
Agribusiness Animal Health Food ScienceAgricultural Communication Animal Science Honors Interdisciplinary StudiesAgricultural & Applied Economics Avian Biology HorticultureAgricultural Education Biological Science Poultry ScienceAgriscience & Environmental Dairy Science Turfgrass Management
Systems Food Industry Marketing & AdminEntomology Environmental Resource ScienceEnvironmental Econ & Mgmt Water & Soil Resources
Bachelor of Science in Applied Biotechnology (B.S.A.B.)Master of Science (M.S.) Agricultural & Applied Economics Food Science Poultry Science
Animal & Dairy Science Horticulture Soil, Water & EnvironmentalCrop & Soil Science Plant Breeding, Genetics & Sciences**Entomology Genomics ToxicologyEnvironmental Economics Plant Pathology
Master of Agribusiness (M.A.B.)Master of Agricultural & Environmental Education (M.A.E.E.)*Master of Food Technology (M.F.T.)*Master of Plant Protection & Pest Management (M.P.P.P.M.)Doctor of Philosophy (Ph.D.) Agricultural & Applied Economics Entomology Plant Pathology
Animal & Dairy Science Food Science Poultry ScienceAnimal Nutrition Horticulture ToxicologyCrop & Soil Science Plant Breeding, Genetics & Genomics
COLLEGE OF ARTS & SCIENCESBachelor of Arts (A.B.) African-American Studies Film Studies Linguistics
Anthropology French MusicArabic Geography PhilosophyArt History Geology ReligionAsian Language & Literature German Romance LanguagesClassics History RussianCognitive Science Honors Interdisciplinary Studies SociologyCommunication Studies Interdisciplinary Art & Design SpanishComparative Literature Interdisciplinary Studies TheatreCriminal Justice Latin American & Women's StudiesDance Caribbean StudiesEnglish
Bachelor of Fine Arts (B.F.A.) Art Dance Interdisciplinary StudiesArt Education
Bachelor of Music (B.Mus.) Music Composition Music Performance Music TherapyMusic Education Music Theory
Bachelor of Science (B.S.) Atmospheric Sciences Genetics MicrobiologyBiochemistry & Molecular Biology Geography PhysicsBiology Geology Physics & AstronomyCellular Biology Honors Interdisciplinary Studies Plant BiologyChemistry Interdisciplinary Studies PsychologyComputer Science Mathematics Statistics
Bachelor of Science in Chemistry (B.S.Chem.)Master of Applied Mathematical Sciences (M.A.M.S.)Master of Arts (M.A.) Anthropology Geography Music
Art History German PhilosophyClassical Languages History ReligionCommunication Studies Latin Romance LanguagesComparative Literature Linguistics SociologyEnglish Mathematics Spanish
* Program also offered online.** Program offered online only.
DEGREE PROGRAMS AND MAJORS - ATHENS CAMPUS
COLLEGE OF AGRICULTURAL & ENVIRONMENTAL SCIENCESBachelor of Science in Agriculture (B.S.A.)
Bachelor of Science in Environmental Sciences (B.S.E.S.)

38
UGA Fact Book 2017Degrees Conferred
Master of Fine Arts (M.F.A.) Art TheatreMaster of Music (M.M.)
Master of Science (M.S.) Archaeology Resource Mgmt Computer Science MicrobiologyArtificial Intelligence Genetics PhysicsBiochemistry & Molecular Biology Geography Plant BiologyCellular Biology Geology PsychologyChemistry Marine Sciences Statistics
Doctor of Musical Arts (D.M.A.) MusicDoctor of Philosophy (Ph.D.) Anthropology Geography Philosophy
Art Geology PhysicsBiochemistry & Molecular Biology History Plant BiologyCellular Biology Integrative Conserv/Anthropology PsychologyChemistry Integrative Conserv/Geography ReligionCommunication Studies Linguistics Romance LanguagesComparative Literature Marine Sciences SociologyComputer Science Mathematics StatisticsEnglish Microbiology TheatreGenetics Music
COLLEGE OF BUSINESSBachelor of Arts (A.B.) EconomicsBachelor of Business Accounting International Business Marketing Administration (B.B.A.) Economics Management Real Estate
Finance Management Information Risk Management & InsuranceGeneral Business** Systems
Master of Accountancy (M.Acc.) AccountingMaster of Applied Mathematical Sciences (M.A.M.S.)Master of Arts (M.A.) Business Administration EconomicsMaster of Business Administration (M.B.A.)Master of Business & Technology (M.B.T.)**Master of Marketing Research (M.M.R.)Doctor of Philosophy (Ph.D.) Business Administration EconomicsSCHOOL OF ECOLOGYBachelor of Arts (A.B.) Ecology
Bachelor of Science (B.S.) EcologyMaster of Science (M.S.)
Ecology ToxicologyDoctor of Philosophy (Ph.D.) Ecology Integrative Conserv/Ecology ToxicologyCOLLEGE OF EDUCATIONBachelor of Science in Athletic Training Exercise & Sport Science Social Studies EducationEducation (B.S.Ed.) Communication Sciences & Health & Physical Education Special Education*
Disorders Mathematics Education Sport ManagementEarly Childhood Education Middle Grades Education World Language EducationEnglish Education Science Education
Master of Art Education (M.A.Ed.)*Master of Arts (M.A.) Communication Sciences & Education Educational Psychology
DisordersMaster of Arts in Teaching Early Childhood Education Science Education Teaching English to Speakers(M.A.T.) English Education Social Studies Education of Other Languages (TESOL)
Mathematics Education Special Education Workforce EducationMiddle Grades Education World Language Education
* Program also offered online.** Program offered online only.
DEGREE PROGRAMS AND MAJORS - ATHENS CAMPUS
COLLEGE OF ARTS & SCIENCES, CONT'D.
Conservation Ecology & Sustainable Development
Master of Music Education (M.M.Ed.)*

39
UGA Fact Book 2017 Degrees Conferred
Master of Education (M.Ed.) College Student Affairs Admin Learning, Leadership & Reading Education*Communication Sci & Disorders Organization Development* Science EducationEarly Childhood Education Learning, Design & Technology* Social Studies Education*Educational Admin & Policy Mathematics Education Special EducationEducational Psychology* Middle Grades Education* Teacher LeadershipEnglish Education Music Education TESOL and World Language Ed
Professional Counseling Workforce Education*
Master of Science (M.S.) Kinesiology Applied Behavior AnalysisSpecialist in Education (Ed.S.) Education Learning, Design & Technology Professional School Counseling
Educational Admin & Policy Mathematics Education Science EducationEducational Psychology* Music Education
Doctor of Education (Ed.D) Educational Leadership Music Education Student Affairs LeadershipLearning, Leadership & Science Education Workforce Education
Organization DevelopmentDoctor of Philosophy (Ph.D.) Communication Sci & Disorders Kinesiology Qualitative Research &
Counseling & Student Pers Svcs Language & Literacy Education Evaluation MethodologiesCounseling Psychology Learning, Design & Technology Science EducationEducational Admin & Policy Learning, Leadership & Special EducationEducational Psychology Organization Development Workforce EducationEducational Theory & Practice Mathematics Education
COLLEGE OF ENGINEERING
Bachelor of Science in Environmental Engineering (B.S.Env.E.)
Master of Science (M.S.) Agricultural Engineering Biological Engineering Environmental EngineeringBiochemical Engineering Engineering
Doctor of Philosophy (Ph.D.) Engineering Biological & Agricultural EngineeringCOLLEGE OF ENVIRONMENT & DESIGNBachelor of Landscape Architecture (B.L.A.)Master of Environmental Planning & Design (M.E.P.D.)Master of Historic Preservation (M.H.P.)Master of Landscape Architecture (M.L.A.)Doctor of Philosophy (Ph.D.) Environmental Design & PlanningCOLLEGE OF FAMILY & CONSUMER SCIENCES
Consumer Economics Family & Consumer Sci Educ Honors Interdisciplinary StudiesConsumer Foods Fashion Merchandising Housing Management & PolicyConsumer Journalism Financial Planning Human Dev & Family SciDietetics Furnishings & Interiors Nutritional SciencesFoods & Nutrition* Human Development Textiles, MerchandisingFinancial Planning, Housing & Family Science & Interiors
& Consumer Economics*Doctor of Philosophy (Ph.D.) Foods & Nutrition Human Development Polymer, Fiber
Financial Planning, Housing & Family Science & Textile Sciences& Consumer Economics
* Program also offered online.
Master of Science (M.S.)
DEGREE PROGRAMS AND MAJORS - ATHENS CAMPUS
COLLEGE OF EDUCATION, CONT'D.
Master of Music Education (M.M.Ed.)*
Bachelor of Science in Family & Consumer Sciences (B.S.F.C.S.)
Bachelor of Science in Biochemical Engineering (B.S.Bch.E.)
Bachelor of Science in Computer Systems Engineering (B.S.C.S.E.)Bachelor of Science in Civil Engineering (B.S.C.E.)
Bachelor of Science in Mechanical Engineering (B.S.M.E.)
Bachelor of Science in Electrical & Electronics Engineering (B.S.E.E.)
Bachelor of Science in Agricultural Engineering (B.S.A.E.)
Bachelor of Science in Biological Engineering (B.S.B.E.)

40
UGA Fact Book 2017Degrees Conferred
SCHOOL OF FORESTRY & NATURAL RESOURCESFisheries & Wildlife Natural Resource Management Natural Resources Recreation Forestry & Sustainability & Tourism
Master of Science (M.S.) Forest Resources ToxicologyDoctor of Philosophy (Ph.D.) Forest Resources Integ Cons/Forestry & Nat Res Toxicology
Bachelor of Arts (A.B.) Advertising Honors Interdisciplinary Studies Public RelationsEntertainment & Media Studies Journalism
Master of Arts (M.A.)Master of Fine Arts (M.F.A.) Narrative Media Writing**Doctor of Philosophy (Ph.D.) Mass CommunicationSCHOOL OF LAWJuris Doctor (J.D.)Master of Laws (L.L.M.) Master in the Study of Law (M.S.L.)
Bachelor of Science (B.S.) Pharmaceutical SciencesMaster of Science (M.S.) Pharmacy* ToxicologyDoctor of Pharmacy (Pharm.D.)Doctor of Philosophy (Ph.D.) Pharmacy ToxicologyCOLLEGE OF PUBLIC HEALTH
Master of Arts (M.A.) Health Promotion & BehaviorMaster of Public Health (M.P.H.)Master of Science (M.S.) Biostatistics Environmental Health ToxicologyDoctor of Philosophy (Ph.D.) Biostatistics Epidemiology Toxicology
Environmental Health Science Health Promotion & Behavior
SCHOOL OF PUBLIC & INTERNATIONAL AFFAIRSBachelor of Arts (A.B.) International Affairs Political ScienceMaster of Arts (M.A.)
Doctor of Philosophy (Ph.D.) Political Science & International Affairs Public Admin & PolicySCHOOL OF SOCIAL WORK
Master of Arts (M.A.) Nonprofit Management & Leadership
Doctor of Philosophy (Ph.D.) Social WorkCOLLEGE OF VETERINARY MEDICINE
Master of Science (M.S.) Toxicology Comparative Biomedical Sciences*Doctor of Philosophy (Ph.D.) Comparative Biomedical Sciences Integrative Physiology Toxicology
Infectious Diseases & Pharmacology Veterinary PathologyINSTITUTE OF BIOINFORMATICSMaster of Science (M.S.) Bioinformatics Doctor of Philosophy (Ph.D.) BioinformaticsBIOMEDICAL & HEALTH SCIENCES INSTITUTEMaster of Biomanufacturing & Bioprocessing (M.B.B.)Doctor of Philosophy (Ph.D.) NeuroscienceINSTITUTE OF HIGHER EDUCATIONMaster of Education (M.Ed.) Higher EducationDoctor of Philosophy (Ph.D.) Higher Education
* Program also offered online.** Program offered online only.
Master of Social Work (M.S.W.)
Doctor of Veterinary Medicine (D.V.M.)
Interdisciplinary Biomedical Sciences
Bachelor of Social Work (B.S.W.)
DEGREE PROGRAMS AND MAJORS - ATHENS CAMPUS
COLLEGE OF JOURNALISM & MASS COMMUNICATION
Journalism & Mass Communication
COLLEGE OF PHARMACY
Bachelor of Science in Environmental Health (B.S.E.H.)
Bachelor of Science in Forest Resources (B.S.F.R.)Master of Forest Resources (M.F.R.)Master of Natural Resources (M.N.R.)
Bachelor of Science in Health Promotion (B.S.H.P.)
Doctor of Public Health (Dr.P.H.)
Political Science & International AffairsMaster of International Policy (M.I.P.)Master of Public Administration (M.P.A.)

41
UGA Fact Book 2017 Degrees Conferred
COLLEGE OF BUSINESS
INSTITUTE OF HIGHER EDUCATIONDoctor of Education (Ed.D.) - Executive
COLLEGE OF AGRICULTURAL & ENVIRONMENTAL SCIENCESBachelor of Science in Agriculture (B.S.A.) Agribusiness Biological Science
Agricultural Education Food Industry Marketing & AdminEnvironmental Resource Science
Master of Plant Protection & Pest Management (M.P.P.P.M.)COLLEGE OF ARTS & SCIENCESBachelor of Arts (A.B.) Interdisciplinary StudiesBachelor of Science (B.S.) MicrobiologyCOLLEGE OF BUSINESS
General Business*COLLEGE OF EDUCATION
Special Education*Master of Education (M.Ed.) Mathematics Education Workforce Education*Specialist in Education (Ed.S.) Education Mathematics EducationDoctor of Education (Ed.D.) Educational Leadership Student Affairs Leadership Workforce EducationCOLLEGE OF FAMILY & CONSUMER SCIENCES
Consumer EconomicsMaster of Science (M.S.) Financial Planning, Housing & Consumer Economics*
COLLEGE OF AGRICULTURAL & ENVIRONMENTAL SCIENCES
COLLEGE OF ARTS & SCIENCESIndustrial-Organizational Psychology
Doctor of Musical Arts (D.M.A.) MusicDoctor of Philosophy (Ph.D.) Psychology
COLLEGE OF EDUCATIONMaster of Arts(M.A.) Education Master of Arts in Teaching (M.A.T.) Science Education Workforce EducationMaster of Education (M.Ed.) Educational Admin & Policy Learning, Leadership & Learning, Design & Technology*
Organization Development* Science EducationMaster of Science (M.S.) KinesiologySpecialist in Education (Ed.S.) Education Learning, Design & Technology Professional School Counseling
Educational Admin & PolicyDoctor of Education (Ed.D.) Educational Leadership Learning, Leadership & Workforce Education
Organization DevelopmentDoctor of Philosophy (Ph.D.) Counseling & Student Pers Svcs Learning, Leadership & Learning, Design & Technology
Educational Psychology Organization Development Workforce EducationCOLLEGE OF PUBLIC HEALTH
SCHOOL OF PUBLIC & INTERNATIONAL AFFAIRSMaster of Public Administration (M.P.A.)SCHOOL OF SOCIAL WORKMaster of Social Work (M.S.W.)
COLLEGE OF AGRICULTURAL & ENVIRONMENTAL SCIENCEAgribusiness Agriscience & Environmental SystemsAgricultural Education Biological Science
Master of Plant Protection & Pest Management (M.P.P.P.M.) * Program also offered online.
Master of Agricultural & Environmental Education (M.A.E.E.)*
Bachelor of Science in Agriculture (B.S.A.)
UGA TIFTON CAMPUS
Bachelor of Science in Education (B.S.Ed.)
Bachelor of Science in Family & Consumer Sciences (B.S.F.C.S.)
UGA GWINNETT CAMPUS
Master of Food Technology (M.F.T.)*
COLLEGE OF BUSINESSMaster of Business Administration (M.B.A.) - Professional
Master of Agricultural & Environmental Education (M.A.E.E.)*
Master of Arts (M.A.)
Doctor of Public Health (Dr.P.H.)
Bachelor of Business Administration (B.B.A.)
DEGREE PROGRAMS AND MAJORS - EXTENDED CAMPUSES
UGA GRIFFIN CAMPUS
Bachelor of Science in Environmental Sciences (B.S.E.S.)Master of Agricultural & Environmental Education (M.A.E.E.)*
TERRY EXECUTIVE EDUCATION CENTER in ATLANTA
Master of Business Administration (M.B.A.) - Executive & Professional

42
UGA Fact Book 2017Degrees Conferred
Class and Year 1Yr 2Yrs 3Yrs 4Yrs 5Yrs 6YrsUGA Freshmen
2007 0.8 3.0 57.8 80.7 83.22008 0.8 3.3 60.8 82.1 84.62009 0.6 2.5 62.5 82.9 85.32010 0.6 3.1 63.1 82.4 84.82011 0.6 3.0 62.7 82.6 85.32012 0.7 3.6 66.2 83.52013 0.2 3.8 66.22014 0.3 4.02015 0.22016 Average 0.5 3.3 62.8 82.4 84.6
Transfer Sophomores2007 13.6 57.8 78.9 81.0 82.42008 9.2 58.5 78.3 82.7 84.12009 9.4 56.2 77.9 82.3 83.52010 8.2 64.2 79.2 80.8 81.32011 13.1 62.5 77.9 79.1 80.82012 11.5 60.2 78.0 81.22013 10.5 60.4 76.02014 11.8 63.52015 10.42016 Average 10.9 60.4 78.0 81.2 82.4
Transfer Juniors2007 39.0 73.7 83.1 84.8 85.02008 42.0 77.7 84.5 86.1 86.32009 41.1 76.4 84.0 85.2 85.22010 0.8 42.7 79.7 86.3 87.7 87.92011 40.5 76.7 84.2 86.2 86.42012 0.6 41.6 78.7 85.0 86.72013 41.4 77.1 85.32014 43.4 80.12015 0.6 44.72016 Average 0.7 41.8 77.5 84.6 86.1 86.2
Source: Office of Institutional Research
COMPLETION RATES FOR FIRST-TIME FULL-TIME UNDERGRADUATESENTERING COHORTS 2007 - 2016
Cumulative Percentage Graduated Since Matriculation
Note: UGA Freshman cohorts include both summer and fall matriculants. Sophomore and Junior Transfer cohorts include fall matriculants only. Completion rates include bachelor degree recipients and students matriculating into professional programs.

43
UGA Fact Book 2017 Degrees Conferred
Data from page 42
Source: Office of Institutional Research
Figure 9AVERAGE COMPLETION RATES FOR FIRST-TIME FULL-TIME UNDERGRADUATES
ENTERING COHORTS 2007 - 2016
TRANSFER JUNIORSTRANSFER SOPHOMORES
UGA FRESHMEN
0.0
10.0
20.0
30.0
40.0
50.0
60.0
70.0
80.0
90.0
100.0
1 2 3 4 5 6
PER
CEN
T G
RAD
UAT
ED
LAPSED TIME IN YEARS
TRANSFER JUNIORS
TRANSFER SOPHOMORES
UGA FRESHMEN

44
UGA Fact Book 2017Degrees Conferred

Academic Information

46
UGA Fact Book 2017Academic Information
Credit Hour Lower Upper Professional Source Division Division Division Division Total
Athens Campus 396,812 356,325 48,559 166,310 968,006
Terry Exec. Ed. Center (Buckhead) 7,768 7,768
UGA Griffin Campus 21 1,036 2,904 3,961
UGA Gwinnett Campus 9,174 9,174
UGA Tifton Campus 9 918 27 2,156 3,110
Field Study 170 2,709 676 740 4,295
Off Campus Sites 21 6,165 9,062 3,242 18,490
Online 19,536 15,487 1,202 10,465 46,690
Study Abroad 1,032 10,634 127 580 12,373
TOTAL 417,601 393,274 59,653 203,339 1,073,867
Source: Office of Institutional Research
Figure 10TOTAL UNIVERSITY STUDENT CREDIT HOURS
FISCAL YEARS 2012-13 THROUGH 2016-17
TOTAL UNIVERSITY STUDENT CREDIT HOURSFISCAL YEAR 2016-17
Graduate
980,000
990,000
1,000,000
1,010,000
1,020,000
1,030,000
1,040,000
1,050,000
1,060,000
1,070,000
1,080,000
2012-13 2013-14 2014-15 2015-16 2016-17
TOTA
L C
RE
DIT
HO
UR
S
FISCAL YEAR

47
UGA Fact Book 2017 Academic Information
FALL
201
6A
A-
B+
BB
-C
+C
C-
DF
SU
IW
Oth
erFr
eshm
an39
.95
13.3
110
.24
13.1
74.
992.
783.
681.
071.
280.
803.
170.
010.
295.
220.
03S
opho
mor
e35
.12
13.9
310
.13
12.7
65.
423.
244.
431.
232.
071.
162.
930.
000.
217.
330.
03Ju
nior
34.0
013
.91
10.3
713
.11
5.68
3.52
4.74
1.28
1.98
1.29
3.02
0.01
0.34
6.69
0.04
Sen
ior
37.9
513
.34
9.47
11.8
45.
003.
204.
310.
941.
471.
255.
770.
030.
434.
940.
06To
tal U
nder
grad
uate
36.7
013
.62
10.0
212
.66
5.27
3.20
4.32
1.12
1.70
1.14
3.85
0.02
0.32
6.00
0.04
Pro
fess
iona
l31
.85
12.9
111
.19
13.3
75.
982.
712.
670.
880.
360.
1317
.21
0.05
0.24
0.30
0.16
Gra
duat
e41
.12
9.53
4.61
4.27
1.32
0.31
0.49
0.08
0.09
0.14
34.4
80.
151.
071.
500.
84G
rand
Tot
al37
.00
13.0
19.
3511
.55
4.77
2.77
3.68
0.96
1.39
0.94
8.95
0.04
0.42
5.01
0.16
SPR
ING
201
7A
A-
B+
BB
-C
+C
C-
DF
SU
IW
Oth
erFr
eshm
an31
.27
15.4
411
.52
14.2
65.
603.
344.
641.
552.
011.
402.
030.
020.
226.
620.
08S
opho
mor
e36
.70
14.4
410
.35
12.8
05.
323.
324.
151.
321.
821.
182.
230.
020.
226.
110.
03Ju
nior
36.4
013
.81
9.53
12.4
45.
563.
414.
681.
361.
981.
372.
850.
020.
326.
090.
17S
enio
r38
.22
12.7
99.
4111
.65
4.74
3.02
4.48
0.84
1.47
1.20
7.62
0.05
0.26
4.10
0.15
Tota
l Und
ergr
adua
te36
.48
13.8
19.
9412
.48
5.21
3.24
4.47
1.19
1.76
1.27
4.28
0.03
0.26
5.46
0.11
Pro
fess
iona
l28
.26
11.2
410
.20
14.5
46.
203.
093.
120.
710.
320.
1021
.71
0.07
0.06
0.39
0.00
Gra
duat
e42
.25
8.94
4.28
4.44
1.20
0.41
0.41
0.10
0.07
0.16
34.2
70.
240.
861.
460.
91G
rand
Tot
al36
.72
12.9
49.
1611
.49
4.71
2.83
3.80
1.00
1.42
1.03
9.76
0.06
0.33
4.53
0.22
Ath
ens
and
onlin
e ca
mpu
ses
only
. Doe
s no
t inc
lude
ext
ende
d ca
mpu
ses.
Pro
fess
iona
l inc
lude
s La
w, P
harm
acy,
and
Vet
erin
ary
Med
icin
e.
Key
: S =
Sat
isfa
ctor
y, U
= U
nsat
isfa
ctor
y, I
= In
com
plet
e, W
= W
ithdr
awn,
Oth
er =
Aud
its, N
ot R
epor
ted
grad
es.
+/- G
radi
ng S
yste
m im
plem
ente
d ef
fect
ive
Sum
mer
Sem
este
r, 20
06.
Sou
rce:
Offi
ce o
f Ins
titut
iona
l Res
earc
h
DIS
TRIB
UTI
ON
OF
GR
ADES
BY
CLA
SSAC
ADEM
IC Y
EAR
201
6-17
Perc
ent o
f Gra
des
Perc
ent o
f Gra
des

48
UGA Fact Book 2017Academic Information
School/Students/Sections TotalArts & Sciences
Students 78 1,681 1,372 3,131Sections 26 141 131 298Average Students Per Section 3.0 11.9 10.5 10.5
BusinessStudents 5 219 241 465Sections 1 9 9 19Average Students Per Section 5.0 24.3 26.8 24.5
Education and Family & Consumer SciencesStudents 14 33 47Sections 2 5 7Average Students Per Section 7.0 6.6 6.7
Journalism & Mass CommunicationStudents 32 25 57Sections 2 2 4Average Students Per Section 16.0 12.5 14.3
Public and International AffairsStudents 72 109 181Sections 5 7 12Average Students Per Section 14.4 15.6 15.1
Agricultural & Environmental Sciences, Ecology, Engineering, Pharmacy and Veterinary Medicine
Students 14 62 70 146Sections 1 17 12 30Average Students Per Section 14.0 3.6 5.8 4.9
TotalStudents 97 2,080 1,850 4,027Sections 28 176 166 370Average Students Per Section 3.5 11.8 11.1 10.9
Note: Does not include enrollment in directed study honors courses.Source: Office of Institutional Research
Graduates Graduates With Graduates withYear With Honors High Honors Highest Honors
2007-08 283 56 702008-09 299 42 682009-10 284 47 642010-11 320 45 412011-12 296 66 532012-13 356 58 672013-14 320 67 622014-15 256 42 542015-16 297 50 692016-17 391 54 83
Source: Honors Program
HONORS PROGRAM AWARDSFISCAL YEARS 2007-08 THROUGH 2016-17
HONORS PROGRAM ENROLLMENT AND SECTIONSFISCAL YEAR 2016-17
Summer Fall Spring

49
UGA Fact Book 2017 Academic Information
Number of Number ofType Assistantships AssistantsGraduate Assistants 1,064 1,053Graduate Laboratory Assistants 263 260Graduate Research Assistants 1,560 1,495Graduate Teaching Assistants 716 702
Total 3,603 3,510
Source: UGA Budget System
Number ofType AssistantsNational Science Foundation (NSF) Fellows 36Graduate School Assistants 171Dissertation Completion Awards 14Presidential Graduate Fellows 29
Total 250
Source: Dean of the Graduate School
FALL 2017
GRADUATE ASSISTANTSHIPSFALL 2017
GRADUATE FELLOWSHIPS AND ASSISTANTSHIPSAWARDED THROUGH THE GRADUATE SCHOOL
Award/ScholarshipRhodes ScholarshipR. P. Brooks 1904 Thomas J. Hamilton, Jr. 1928 Scott A. Hershovitz 1998H. L. J. Williams 1908 Milton P. Jarnigan III 1931 Beth Shapiro 1999E. W. Moise 1911 E. T. Booth, Jr. 1934 Adam S. Cureton 2003George S. Whitehead 1916 Benson E. L. (Lane) Timmons 1938 Deep Shah 2008F. W. Harrold 1919 Morris B. Abram 1939 Kate Vyborny 2008E. Way Highsmith 1922 Robert Edge 1960 Tracy Yang 2011H. M. Cleckley 1924 Fred F. Manget 1973 Juliet Elizabeth Allan 2013Allen Post 1927 Robert M. Sutherland 1996 Laura Courchesne 2017Carnegie Junior Research FellowshipBenjamin Bain 2005 Yuliya Bila 2014 Bert Thompson 2016Kate Vyborny 2005Gates Cambridge ScholarshipSemil P. Choksi 2001 Yi S. Lee 2002 Muktha Natrajan 2011William Hollingsworth 2002 Amanda Casto 2004 Patricia A. Fearon 2017Barry M. Goldwater Scholarship (1997 - 2017)Adrian J. Daigle 1997 Laura E. Downs 2003 Michael Burel 2011Jennifer A. Harrelson 1997 Rebekah Rogers 2004 Amar Mirza 2011Laura L. Feldman 1998 Amy Sexauer 2004 Victoria DeLeo 2012Jessica L. Metcalf 1998 James C. Tarr 2004 Marianne Ligon 2012William B. Schomaker 1998 Melissa A. Cabinian 2005 Theresa Stratmann 2012Dhea M. Tolla 1998 Caelin A. Cubenas 2005 Buck Trible 2012Melissa Bugbee 1999 Phillip B. Ham III 2006 Philip Grayeski 2013Rachel J. Wisniewski 1999 Douglas M. Jackson 2006 Tuan Nguyen 2014Beth N. Orcutt 2001 Yunjiang Jiang 2006 Amy Webster 2014Paul P. Pollack 2001 Teerawit Supakorndej 2006 Lauren Dennison 2015Steven C. Smith 2001 Jessica M. Bryant 2007 Erin Hollander 2015Lakshmi Swamy 2001 Nithya M. Natrajan 2007 Karishma Sriram 2015Jennifer Gibson 2002 Vanessa del Valle 2008 Catherine Callaway 2016Kathryn Smith 2002 Muktha Natrajan 2009 Morrison Nolan 2016Jennifer Srygley 2002 Christine Akoh 2010 Morgan Gibbs 2017John Woodruff 2002 Meagan Cauble 2010 Mallory Harris 2017Amanda M. Casto 2003 Victoria Akin 2011
NATIONAL ACADEMIC AWARDS AWARDED TO UGA STUDENTS

50
UGA Fact Book 2017Academic Information
Award/Scholarship
Marshall ScholarshipJoseph Harris 1965 Matthew Crim 2005 Meredith Paker 2016John H. Woodruff 2003 Jayanthi Narain 2007Joseph Wolpin 2004 Matthew Sellers 2012
Merage American Dream FellowshipOluwamuye F. Akinbote 2006 Edmond Fomunung 2008 Lindel Krige 2010Katrin Usifo 2007 Tulsi Patel 2009 Yasmin Yonis 2011
George J. Mitchell Postgraduate ScholarshipChristina Faust 2009 Stephen Dorner 2010 Elizabeth Katz 2011
National Security Education Program - David Boren Undergraduate Scholarship (2007 - 2017)Yael Miller 2007 Christian Conroy 2012 Melanie Kent 2015Lee Moore 2008 David Gutiérrez 2012 Cecilia Kuehnel 2015Puja Chebrolu 2009 Malena Lopez-Sotelo 2012 Katie Mann 2015Laura Eaton 2009 John Rodriguez 2012 Kevin Steele 2015Dan Healy 2009 Alice Nagshineh 2013 Chenee Tracey 2015Daniel Jackson 2009 Callan Thomas 2013 Carver Goodhue 2016Winn Davis 2010 Kara Fambrough 2014 Joanna Keen 2016Logan Krusac 2010 Andrew Jarnagin 2014 Aaron Rawls 2016Rosemary Gay 2011 Rodrigo Tapia 2014 Rebeka Worick 2016Neenah Williams 2011 Blake Traeger 2014 Stephanie Stewart 2017Tia Ayele 2012 Brent Buck 2015
Beinecke ScholarshipShawn Foster 2017
Schwarzman ScholarshipTorre Lavell 2016
Harry S. Truman ScholarshipJonathan Gould 1982 Bonny I. Ling 1997 Christina Faust 2008Frank Hanna 1982 R. Patrick Lucas 1997 Tracy Yang 2010John Hammond 1986 Ellen J. Sutherland 1998 Yasmin Yonis 2010David Kleber 1988 Virginia L. Barton 2003 Smitha Ganeshan 2013Meredith Hobbs 1989 Matthew Crim 2004 Sarah Mirza 2014Chaly Jo Wright 1992 Sarah Sattelmeyer 2004 Kathleen Wilson 2015Amanda Wojtalik 1994 Deep J. Shah 2007
Morris K. Udall Scholarship (2006 - 2017)Lisa A. Rivard 2006 Todd Pierson 2011 Ian Karra 2013Christina Faust 2008 Heather Hatzenbuhler 2012 Torre Lavelle 2015Ashley Dronenburg 2009 Malavika Rajeev 2012 Jonah Driggers 2016Mark Milby 2009 Theresa Stratmann 2012 Shreya Ganeshan 2017Muktha Natrajan 2010 Sara Black 2013 Elizabeth Wilkes 2017
Phi Kappa Phi National Graduate FellowshipPaul Matthews 1990 Laura A. Feldman 1999 Ryan McLynn 2013Nevada Waugh 1992 Cynthia E. Lester 2000 Smitha Ganeshan 2014Amanda Wojtalik 1995 Tina Rakkhit 2002 Parker Evans 2015Stephen J. Tate 1996 Julie Orlemanski 2004 Kirstie Hostetter 2016Jennifer A. Harrelson 1998 Anjali Shroff 2008 Juhi Varshney 2017
Fulbright Scholarship (2011 - 2017)Marie Porterfield Barry, Turkey 2011 Caroline Strelitz, Brazil 2011 Leasa Weimer, Finland 2011Andrea Bessey, Thailand 2011 Christopher Ward, Indonesia 2011 Andrew Arnold, South Korea 2012Heather Gallivan, Indonesia 2011 Brinkley Warren, New Zealand 2011 Rebeca de Jesus-Crespo,David Meek, Brazil 2011 Brian Watts, South Korea 2011 Costa Rica 2012
CONT'D: NATIONAL ACADEMIC AWARDS AWARDED TO UGA STUDENTS

51
UGA Fact Book 2017 Academic Information
Award/Scholarship
Fulbright Scholarship (2011 - 2017) cont'd.Isha Ghodke, Germany 2012 Tiffany Brown, Colombia 2014 Walker DePuy, Indonesia 2016Louise Goodman, Brazil 2012 DeAnne Cantrell, Germany 2014 Elizabeth Guinessey, Costa Rica 2016David Gutiérrez, Mexico 2012 Christian Conroy, China 2014 Samuel Hine, Spain 2016Genevieve Holdridge, Mexico 2012 Winn Davis, Croatia 2014 Isaac Hopkins, Canada 2016Alex Knoblock, Brazil 2012 Brett Heimlich, Malawi 2014 Lorien Jordan, New Zealand 2016Oksana Lutsyshyna, Poland 2012 Sara Hobe, Germany 2014 Sydney Laseter, Montenegro 2016Morgann Lyles, France 2012 Christine Pardue, Bulgaria 2014 Alice Naghshineh, Tajikistan 2016Ann MacFadyen, Vietnam 2012 Lauren Satterfield, Cyprus 2014 Julianne O'Connell, Indonesia 2016Kimberly Moxley, Spain 2012 McKinley Alden, Bulgaria 2015 Hannah Reiss, India 2016Thomas Stewart, Slovak Republic 2012 Tiffany Chu, South Korea 2015 Leighton Rowell, Brazil 2016Linnea West, Hungary 2012 Emily Horton, Brazil 2015 Christina Varian, Panama 2016David Zweig, New Zealand 2012 Margaret Johnston, South Korea 2015 Asad Delawalla, South Korea 2017Derek Bentley, Mexico 2013 Peter McDonald, Greece 2015 Anna Forrester, Turkey 2017Katherine Lacksen, Australia 2013 Aaron Sayama, Timor-Leste 2015 Margaret Harney, Spain 2017Gregory Moss, Germany 2013 Ashleigh Starnes, Turkey 2015 John Rodriguez, France 2017Geoffrey Nolan, Colombia 2013 June Brawner, Hungary 2016 Samuel Schaffer, Mexico 2017Tierney O'Sullivan, Tasmania 2013 Franziska Brunner, Austria 2016 James Thompson, Germany 2017Alyson Pittman, Rwanda 2013 Kimberly Buice, Laos 2016Melissa Siegel, Malaysia 2013 Rebecca Carter, United Kingdom 2016
National Science Foundation Graduate Research Fellowship (2011 - 2017)Dale Broder 2011 Erin Abernethy 2014 Sarah Harrison 2016Jennifer Lee Claggett 2011 Karson Brooks 2014 Travis Jones 2016Doug Eudy 2011 Michael Burel 2014 Allison Koch 2016Jessica Mitchell 2011 Emily Carpinone 2014 Katharine Korunes 2016Muktha Natrajan 2011 Nicholas Kalivoda 2014 Kerri Miazgowicz 2016Tulsi Patel 2011 Michael Lonneman 2014 Micah Miles 2016Katy Riccione 2011 Tatum Mortimer 2014 Paige Miller 2016David Schaeffer 2011 Lauren Pinson 2014 Michael Paxhia 2016Amy Styer 2011 Rachel Smith 2014 Emma Shipman 2016Stanley Underwood 2011 Allison Williams 2014 Sarah Tammen 2016Amelia Villasenor 2011 Addison Wright 2014 Michelle Ziadie 2016Mark Wiest 2011 Catherine Debban 2015 Henry Adams 2017Jessica Winek 2011 Courtney Kathleen Ellison 2015 Sara Black 2017Christopher Abin 2012 Eilidh Geddes 2015 William Booker 2017Christine Akoh 2012 Devon Paul Humphreys 2015 Caitlin Conn 2017Ariel Chan 2012 Ayan Hussein 2015 Abigail Courtney 2017Ashley Edwards 2012 Jake Phillip Moskowitz 2015 Michael Dibble 2017Eric Goolsby 2012 Liza Diep Ngo 2015 Austin Garner 2017Katie Orlemanksi 2012 Hilde Oliver 2015 Eilidh Geddes 2017Amanda Perofsky 2012 Tomas Pickering 2015 Alexandra Harris 2017Dara Satterfield 2012 Todd Pierson 2015 Robert Holmes 2017Matthew Schultz 2012 Malavika Rajeev 2015 Kathryn Moore 2017Troy Simon 2012 Daniel John Read 2015 Mariel Pfeifer 2017Daniel Joseph Becker 2013 Francisco Jesus Sarabia 2015 Sydney Plummer 2017Doug Booher 2013 Olivia Ann Thompson 2015 Matthew Powers 2017Cameron Brown 2013 Amy Webster 2015 Robert Richards 2017Kao-Wie Chua 2013 Castle Adam Williams 2015 Claire Teitelbaum 2017Caitlin Elizabeth Conn 2013 Lydia Babcock-Adams 2016 David Vasquez 2017Chelsea Cunard 2013 Grover Brown 2016 Sheena Vasquez 2017Robert Daniel Harris 2013 Jennifer Cyr 2016 Elizabeth Watts 2017Caitlin Ishibashi 2013 Michelle Evans 2016 Avery Wiens 2017Uma Jyothi Nagendra 2013 Aileen Ferraro 2016Carly Phillips 2013 Maite Ghazaleh 2016
Source: Honors Program
CONT'D: NATIONAL ACADEMIC AWARDS AWARDED TO UGA STUDENTS

52
UGA Fact Book 2017Academic Information
2012-13 2013-14 2014-15 2015-16 2016-17Undergraduate 1,692 1,677 2,010 2,217 2,297Graduate 289 199 180 239 281Non-designated 73 376 131Total UGA degree-seeking 2,054 2,252 2,321 2,456 2,578% change in participation 0.9% 9.6% 3.1% 5.8% 5.0%% of graduating class 22.7% 25.0% 26.5% 27.0% 27.6%Non-UGA degree seeking 114 132 118 156 118
2012-13 2013-14 2014-15 2015-16 2016-17Female 1,375 1,564 1,549 1,735 1,807Male 667 680 666 713 764Not reported 12 8 106 8 7Total 2,054 2,252 2,321 2,456 2,578
2012-13 2013-14 2014-15 2015-16 2016-17Asian/Pacific Islander 5 1 28 184 216Black/African-American 110 151 107 125 167Hispanic 77 106 106 140 140Multiracial 51 50 57 87 88Native American 1 3 2 2 2White 1,603 1,736 1,596 1,817 1,926Not reported 207 205 425 101 39Total 2,054 2,252 2,321 2,456 2,578
2012-13 2013-14 2014-15 2015-16 2016-17Semester 328 289 503 469 505Short-Term 1,644 1,879 1,795 1,957 2,047Academic Year 25 27 23 30 25Other 57 57 0 1Total 2,054 2,252 2,321 2,456 2,578
2012-13 2013-14 2014-15 2015-16 2016-17UGA Faculty-Led Program 961 1,214 1,310 1,304 1,419UGA Residential Center 542 530 510 552 585UGA Exchange 80 82 77 81 95UGA Independent Experience 182 90 82 148 58Non-UGA Program 289 336 342 371 421Total 2,054 2,252 2,321 2,456 2,578
Source: Office of International Education
Participation by Race/Ethnicity Academic Year
Participation by Program Duration
Academic Year
Participation by Program Type Academic Year
PARTICIPATION IN EDUCATION ABROAD AT THE UNIVERSITY OF GEORGIAACADEMIC YEARS 2012-13 THROUGH 2016-17
Academic YearParticipation by Student Level
Participation by Gender Academic Year

53
UGA Fact Book 2017 Academic Information
United Kingdom 448 13.8%Italy 435 13.4%Australia 266 8.2%France 219 6.8%Costa Rica 213 6.6%Austria 181 5.6%Spain 175 5.4%New Zealand 161 5.0%Germany 135 4.2%China 115 3.5%All Other Countries Combined 892 27.5%Total 3,240 100.0%
Source: Office of International Education
Percent
Note: Total includes students who participated in programs conducted in multiple countries.
Figure 11PARTICIPATION IN EDUCATION ABROAD BY SCHOOL OR COLLEGE
ACADEMIC YEAR 2016-17
PARTICIPATION IN EDUCATION ABROAD BY TOP COUNTRIES OF STUDYACADEMIC YEAR 2016-17
Country Number of Participants
1,0771,006
355313
154 148 13773
52 40 33 32 20 17 17 15 7 50
200
400
600
800
1,000
1,200
NU
MBE
R O
F ST
UD
ENTS

54
UGA Fact Book 2017Academic Information
12 or more Semester HoursUndergraduate (Standard Rate)* $ 4,776 $ 9,287 $ 1,133 $ 5,909 $ 15,196Forest Resources (BSFR) 5,263 10,873 1,133 6,396 17,269Landscape Architecture (BLA) 5,287 9,993 1,133 6,420 16,413Graduate (Standard Rate) 4,352 7,994 1,133 5,485 13,479Biomanufacturing & Bioprocessing (MBB) 7,412 9,934 1,133 8,545 18,479Business
(MACC) 6,252 7,509 1,133 7,385 14,894(MBA) 6,702 9,354 1,133 7,835 17,189
Education† 4,913 7,818 1,133 6,046 13,864Landscape Architecture
(MLA, MHP & MEPD) 5,143 7,918 1,133 6,276 14,194Law
(JD) 8,715 9,219 1,133 9,848 19,067(LLM, MSL) 8,422 10,393 1,133 9,555 19,948
Pharmacy (PharmD) 8,155 10,270 1,133 9,288 19,558Public Health
(DrPH) 5,041 7,841 1,133 6,174 14,015(MPH) 4,773 7,882 1,133 5,906 13,788
Public & International Affairs (MPA) 4,913 7,818 1,133 6,046 13,864Social Work (MSW) 4,737 8,106 1,133 5,870 13,976Veterinary Medicine (DVM) ‡ 8,585 14,540 1,133 9,718 24,258UGA Gwinnett Campus
Graduate (Standard Rate) 4,352 7,994 642 4,994 12,988Public & International Affairs (MPA) 4,913 7,818 642 5,555 13,373Social Work (MSW) 4,737 8,106 642 5,379 13,485
UGA Griffin Campus* 4,776 9,287 642 5,418 14,705UGA Tifton Campus* 4,776 9,287 710 5,486 14,773
Executive Programs (Total Program Cost )Executive MBA 77,000 77,000 77,000Professional MBA 56,400 15,600 56,400 72,000Executive EDD 59,084 37,257 59,084 96,341
Activity/ GreenStudent Fees Total***Semester $1,133
* Tuition rate is the rate assessed new undergraduate students entering Fall 2017.
** Student fees for extended campuses include mandatory fees only. For updated information regarding studentfees at these locations, please visit http://www.bursar.uga.edu.
*** Total student fees include a mandatory institutional fee of $450 per semester.† Fee structure is applicable only to students enrolled in certain graduate programs.
Please visit http://www.bursar.uga.edu for program-specific costs.
‡ The College of Veterinary Medicine joined the SREB common market in Fall 1975. Students from participatingstates enroll on an in-state basis.
Source: Bursar's Office, Office of the Vice President for Finance and Administration
TUITION AND FEES FALL 2017 - SPRING 2018
Resident Tuition
Nonresident Additional
Tuition Student Fees**
Total Resident Tuition &
Fees
Total Nonresident
Tuition & Fees
AthleticStudent
Facilities Transpor-
Recreation Fee Health ConnectUGA tationTechnology/
11693 53 3 199 75 144

55
UGA Fact Book 2017 Academic Information
Academic Year2008-09 $16,758*2009-10 $18,0002010-11 $19,7362011-12 $20,8202012-13 $21,2502013-14 $22,0642014-15 $22,6802015-16 $25,1342016-17 $26,2082017-18 $26,404
This estimated cost of attending the University of Georgia for an academic year is used by theOffice of Student Financial Aid to determine aid eligibility for undergraduate Georgia residents;it includes tuition, fees, books & supplies, room & board, transportation & personal expenses.
*Estimated cost of attendance for entering freshmen under the Guaranteed Tuition Plan.Source: Office of Student Financial Aid
Ranked by Total Costs
Peer Institution 1. University of California - Davis $14,046 $1,601 $14,838 $4,482 $34,967 2. University of Kentucky $11,484 $1,000 $12,184 $3,260 $27,928 3. Michigan State University $14,062 $1,076 $9,784 $2,368 $27,290 4. University of Arizona $11,769 $800 $11,300 $3,300 $27,169 5. University of Georgia $11,634 $1,006 $9,616 $3,952 $26,208 6. University of Maryland - College Park $10,181 $1,200 $12,078 $2,604 $26,063 7. University of Missouri - Columbia $9,518 $1,344 $10,298 $4,756 $25,916 8. Ohio State University $10,037 $1,234 $11,706 $2,870 $25,847 9. Virginia Polytech. Inst. & State Univ. $12,852 $1,210 $8,720 $2,980 $25,76210. Indiana University $10,388 $1,290 $10,041 $3,090 $24,80911. Stony Brook University $8,999 $900 $12,882 $1,868 $24,64912. North Carolina State University $8,880 $1,082 $10,635 $2,442 $23,03913. Purdue University-Main Campus $10,002 $1,220 $10,030 $1,780 $23,03214. University of Iowa $8,575 $950 $10,108 $2,242 $21,87515. University of Florida $6,381 $1,210 $9,910 $3,750 $21,25116. Iowa State University $8,219 $995 $8,356 $2,430 $20,000*Other Expenses includes items such as laundry, transportation, entertainment, and furnishings.
Source: National Center for Education Statistics, Integrated Postsecondary Education Data System (IPEDS)
In-State Tuition &
FeesBooks & Supplies
Room & Board
Other Expenses* Total
Cost ofAttendance
ACADEMIC YEAR 2016-17
ESTIMATED COST OF ATTENDANCEACADEMIC YEARS 2008-09 THROUGH 2017-18
ANNUAL COST OF ATTENDANCE FOR RESIDENT UNDERGRADUATESUGA AND SELECTED PEERS

56
UGA Fact Book 2017Academic Information
2016 Increase Total ARL (Decrease) Total
Resources/Services 6/30/2015 Ranking* 2015 to 2016 6/30/2016
Library ResourcesVolumes 5,173,337 43 67,880 5,241,217
Library StaffProfessional 78 59 5 83Support 152 16 9 161
Total (includes student assistants) 288 35 3 291
Library ExpendituresMaterials 13,178,359$ 42 198,319$ 13,376,678$ Salaries & Wages 10,204,642 46 1,212,054 11,416,696Binding & Other Expenditures 1,735,013 68 440,346 2,175,359
Total Expenditures 25,118,014$ 50 1,850,719$ 26,968,733$
Library ServicesInterlibrary Lending 30,652 57 (2,225) 28,427Interlibrary Borrowing 9,303 97 1,010 10,313Initial Circulation 183,663 42 (7,697) 175,966
Use of Electronic Resources Full Text Downloads 3,446,779 37 388,471 3,835,250Regular Searches 9,475,346 22 (198,449) 9,276,897
Patron and Visitors 2,845,456 23 31,361 2,876,817
* Ranking among the 125 academic libraries of the Association of Research Libraries (ARL)
Library FY 2015 FY 2016 # Visitors PercentSpecial Collections Library 23,057 49,571 26,514 115.0
Miller Learning Center 1,921,647 1,808,616 (113,031) (5.9)
Main and Science Libraries 990,752 994,905 4,153 0.4
Total 2,935,456 2,853,092 (82,364) (2.8)
Source: University Librarian and Associate Provost, University of Georgia Libraries
UNIVERSITY OF GEORGIA LIBRARIESNATIONAL RANKINGS
Increase (Decrease) 2015 to 2016
LIBRARY VISITORS BY LOCATIONFISCAL YEARS 2014-15 TO 2015-16

Student Related Information

58
UGA Fact Book 2017Student Related Information
Student Aid ProgramsNumber of
AwardsAmount
AwardedNumber of
AwardsAmount
Awarded
Grants/ScholarshipsFederal Pell Grants 6,569 $27,107,550 $Federal Supplemental Grants 726 $717,502
Federal (Other) Grants/Scholarships 70 $46,378
HOPE Scholarships 12,925 $73,982,810 94 $395,476
Zell Miller Scholarships 9,493 $88,115,904 190 $1,297,893
State (Other) Grants/Scholarships 58 $237,947 2 $667
Institutional Grants/Scholarships 5,168 $20,352,329 1,499 $7,994,259
Athletic Scholarships 643 $11,098,809 17 $380,856
Graduate Assistantship Tuition Waivers 3,815 $89,016,945
Miscellaneous Tuition/Fee Payments/Waivers 1,248 $9,602,480 1,073 $9,810,707
Other (External) Grants/Scholarships 2,356 $6,524,576 166 $1,003,259
Subtotal 39,256 237,786,285$ 6,856 109,900,062$
LoansFederal Perkins Loans 338 $1,306,165 15 $112,602
Federal PLUS Loans 3,072 $35,614,956 1,429 $17,162,884
Federal Direct Loans - Subsidized 7,465 $29,965,891
Federal Direct Loans - Unsubsidized 9,305 $37,996,943 3,453 $65,293,544
State (Other) Loans 97 $464,870
Other Loans 839 $8,838,365 96 $1,357,055
Subtotal 21,116 114,187,190$ 4,993 83,926,085$
Student EmploymentFederal Work-Study Programs 364 $755,204 9 $13,599
Total 60,736 352,728,679$ 11,858 193,839,746$
Unduplicated Number of Student Aid Recipients
Total Unduplicated Number
Total Amount
Note: Includes aid administered by the Office of Student Financial Aid (OSFA) as well as aid reported to OSFA bystudent donors, colleges/schools, etc. The Institutional Grants/Scholarships category includes the value oftuition waivers that accompany scholarships. The above totals include aid received by nonresident aliens.
Source: Office of Student Financial Aid
Undergraduate Graduate/Professional
STUDENT FINANCIAL AID PROGRAMSFISCAL YEAR 2016-17
35,660
$546,568,425
27,553 8,107

59
UGA Fact Book 2017 Student Related Information
Number ofType of Residence Buildings Occupancy 1 Capacity
2 262 25519 6,886 6,83021 7,148 7,085
20 814 8319 45 47
29 859 878
2 107 11116 922 1,03618 1,029 1,147
6 107 12720 463 49026 570 617
Total 94 9,606 9,727
Number ofType of Residence Buildings Occupancy Capacity
Women's Student Housing 20 1,291 1,402Men's Student Housing 26 570 617Coeducational Housing 19 6,886 2 6,830Apartment Housing 29 859 3 878
Total 94 9,606 9,727
2 Russell Hall closed 2017-2018
of individual contracts available per apartment.
Sources: University Housing & Greek Life Office
3 University Village apartment and Health Sciences Campus townhome occupancy determined by the number
Student Housing Summary
Townhomes (Health Sciences Campus)3
Subtotal Apartments
Subtotal Residence Halls
Women's Residence Halls
Subtotal Sorority Houses
Subtotal Fraternity HousesFraternity-Owned Houses
University Village (Main Campus)3
1 Occupancy tabulated on August 28, 2017
University-Owned Sorority HousesSorority-Owned Houses
STUDENT HOUSING SUMMARYFALL 2017
Student Residences Summary
University-Owned Fraternity Houses
Coeducational Residence Halls2

60
UGA Fact Book 2017Student Related Information
Date Established Date EstablishedSorority on Campus Sorority on Campus
Alpha Chi Omega 1938 Gamma Eta 2009Alpha Delta Pi 1933 Gamma Phi Beta 1982Alpha Gamma Delta 1923 Kappa Alpha Theta 1937Alpha Phi 2017 Kappa Delta 1924Alpha Omicron Pi 1934 Kappa Kappa Gamma 1947Alpha Sigma Rho 1998 Lambda Theta Alpha 2005Chi Omega 1922 Phi Mu 1921Delta Delta Delta 1933 Pi Beta Phi 1936Delta Gamma 1967 Sigma Delta Tau 1924Delta Phi Epsilon 2015 Sigma Gamma Rho 1988Delta Phi Lambda 1998 Sigma Kappa 1964Delta Phi Omega 2010 Sigma Sigma Rho 2007Delta Sigma Theta 1969 Zeta Phi Beta 1977Delta Zeta 1987 Zeta Tau Alpha 1949
Date Established Date EstablishedFraternity on Campus Fraternity on Campus
Alpha Epsilon Pi 1926 Omega Psi Phi 1973Alpha Gamma Rho 1927 Phi Beta Sigma 1974Alpha Phi Alpha 1969 Phi Delta Theta 1871Alpha Tau Omega 1878 Phi Gamma Delta 1871Beta Theta Pi 1984 Phi Kappa Psi 1968Beta Upsilon Chi 2005 Pi Kappa Alpha 1908Chi Phi 1867 Pi Kappa Phi 1915Chi Psi 1890 Sigma Alpha Epsilon 1865Delta Epsilon Psi 2010 Sigma Beta Rho 2004Delta Sigma Phi 2001 Sigma Chi 1869Delta Tau Delta 1882 Sigma Nu 1872Kappa Alpha 1868 Sigma Phi Epsilon 1873Kappa Alpha Psi 1971 Sigma Pi 1948Kappa Sigma 1901 Tau Epsilon Phi 1919Lambda Chi Alpha 1915 Tau Kappa Epsilon 1972Lambda Phi Epsilon 2000 Theta Chi 1949Lambda Sigma Upsilon 2006 Xi Kappa 1998Lambda Theta Phi 2007 Zeta Beta Tau 1915
SOCIAL SORORITIES AND FRATERNITIES
5,004 (31% of Undergraduate Females)2,587 (21% of Undergraduate Males)
Total 7,591 (26% of Total Undergraduates)
Source: Department of Campus Life, Greek Life Office
PARTICIPATION IN SOCIAL SORORITIES AND FRATERNITIES FALL 20117
SororitiesFraternities

61
UGA Fact Book 2017 Student Related Information
Date Date Honorary Established Honorary EstablishedFraternities/Societies on Campus Fraternities/Societies on Campus
Abeneefoo Kuo Honor Society 1977 Phi Alpha Theta 1956
AGHON 1920 Phi Kappa Phi 1923
Alpha Epsilon Delta 1932 Phi Sigma Pi *
Alpha Kappa Delta 2015 Phi Upsilon Omicron 1936
Alpha Lambda Delta 1934 Pi Sigma Alpha 1948
Blue Key Honor Society 1926 Psi Chi 1929
Delta Epsilon Iota 1994 Sigma Delta Pi 1955
Eta Sigma Phi 1991 Sigma Iota Rho *
Golden Key International Honor Society 1978 Sigma Lambda Alpha 1977
Kappa Delta Pi 1929 Sigma Phi Omega 2010‡
National Society of Collegiate Scholars 1999 Sigma Tau Delta 1991
Omicron Delta Kappa 1935 Tau Sigma 2012
Order of Omega 1980 Triota 2006
Phi Alpha 2001 Xi Sigma Pi 1941
* Date undetermined‡ Earliest date determined
Source: Division of Student Affairs
HONORARY FRATERNITIES AND SOCIETIES

62
UGA Fact Book 2017Student Related Information
Status Number of Respondents Percent
Employed Full-Time 4,819 66Attending Graduate School 1,423 19Seeking Employment 375 5Not Seeking Employment 40 1Internship 348 5Employed Part-Time 276 4Self-Employed 50 1Total Responding 7,331 100
Aon KrogerAT&T Macy'sBanfield Pet Hospital Newell BrandsCenters for Disease Control and Prevention PricewaterhouseCoopersChick-fil-A ProtivitiChildren's Healthcare of Atlanta State Farm InsuranceCVS Health Sun Trust BankDeloitte The Home DepotDelta Air Lines The University of GeorgiaErnst & Young UPSGeorgia-Pacific WalmartInsight Global Wells FargoKPMG
Armstrong State University Philadelphia College of Osteopathic MedicineAugusta University University of AlabamaColumbus State University University of Alabama at BirminghamDuke University University of FloridaEmory University University of GeorgiaGeorgetown University University of North Carolina at Chapel HillGeorgia Institute of Technology University of South CarolinaGeorgia Southern University University of ViginiaGeorgia State University University of West GeorgiaKennesaw State University Valdosta State UniversityMercer University Vanderbilt UniversityNew York University Wake Forest UniversityNorth Carolina State University
Source: UGA Career Center
Top Graduate and Professional Schools
The Graduation Survey provides a snapshot of postgraduation career status for each class. Each year, the Career Center surveys the graduating class (August, December, and May graduates) through a variety of methods including paper, email, postcards, and follow-up phone calls.
UGA CAREER CENTERCLASS OF 2016 CAREER PLANS
Respondents 6 to 12 Months After Graduation
Top Employers Hiring UGA Class of 2016(listed alphabetically)
for UGA Class of 2016 (listed alphabetically)

63
UGA Fact Book 2017 Student Related Information
Number Number Number NumberClass on File Class on File Class on File Class on File1946 100 1964 1,691 1982 4,493 2000 6,0741947 175 1965 1,975 1983 4,648 2001 6,4451948 276 1966 2,272 1984 4,547 2002 6,7701949 435 1967 2,332 1985 4,973 2003 7,0101950 505 1968 3,050 1986 4,747 2004 7,2641951 469 1969 3,591 1987 4,765 2005 7,2981952 434 1970 3,833 1988 4,768 2006 7,1681953 436 1971 4,134 1989 4,991 2007 7,8241954 471 1972 4,360 1990 5,248 2008 7,4381955 429 1973 4,512 1991 5,481 2009 7,5101956 527 1974 4,807 1992 5,738 2010 7,8881957 716 1975 5,179 1993 6,059 2011 7,9071958 762 1976 4,609 1994 5,887 2012 7,9561959 845 1977 4,648 1995 5,793 2013 7,9461960 1,007 1978 4,419 1996 5,912 2014 7,6201961 1,003 1979 4,556 1997 6,151 2015 8,1291962 1,232 1980 4,444 1998 7,231 2016 8,1831963 1,381 1981 4,491 1999 6,233 2017 6,506
Source: Office of Financial Services, Division of Development and Alumni Relations
NUMBER OF LIVING ALUMNI BY CLASS YEAR OF MOST RECENT DEGREE1946 - 2017
As of September 2017
Note: Includes all degree levels, individuals with multiple degrees and all UGA campuses. Individuals with multiple degrees are counted only once in the year of their most recent degree.
President Bonney Shuman, St. Simons Island, GAVice President Brian Dill, Carrollton, GASecretary Bill Thomas, Dunwoody,GAImmediate Past President Ruth Ann Bartlett, Hilton Head Island, SC
Executive Committee Respresentatives: Craig Camuso, Lawrenceville, GAJoan Hood, Lawrenceville, GAKim Metcalf, Watkinsville, GABob Watts, Atlanta, GA
Source: Division of Development and Alumni Relations
Executive Committee Officers
UGA ALUMNI ASSOCIATION2017-18 EXECUTIVE COMMITTEE
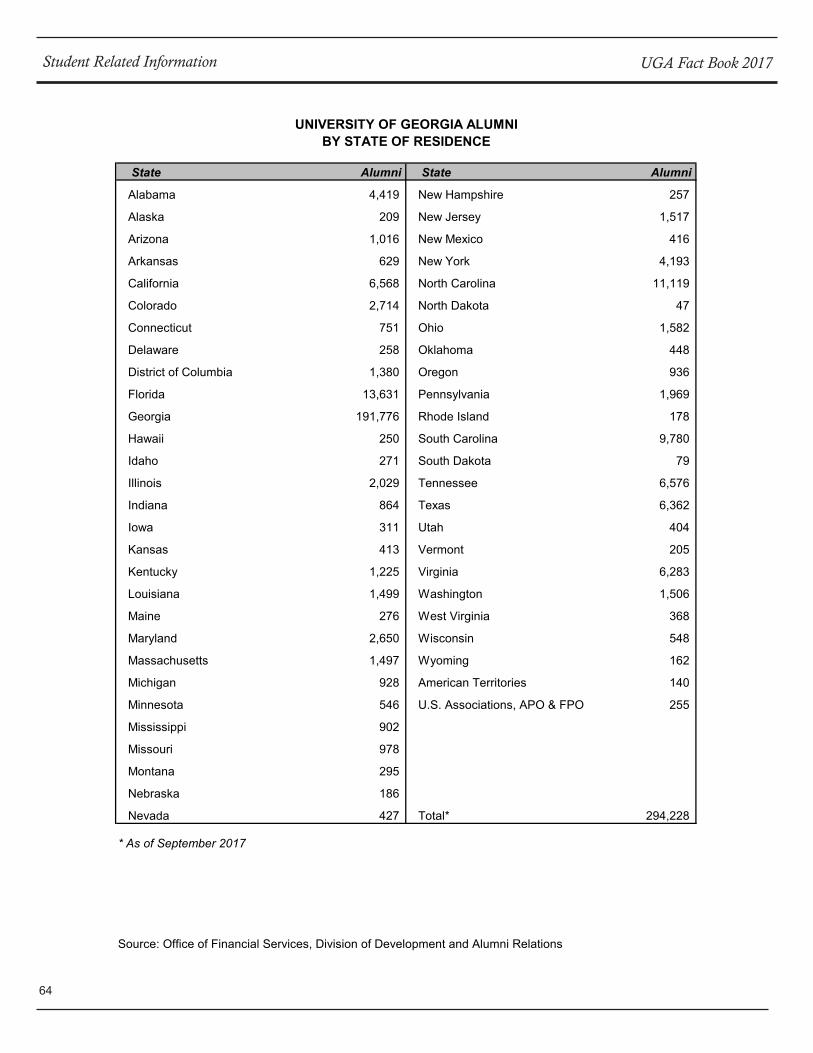
64
UGA Fact Book 2017Student Related Information
State Alumni State Alumni
Alabama 4,419 New Hampshire 257
Alaska 209 New Jersey 1,517
Arizona 1,016 New Mexico 416
Arkansas 629 New York 4,193
California 6,568 North Carolina 11,119
Colorado 2,714 North Dakota 47
Connecticut 751 Ohio 1,582
Delaware 258 Oklahoma 448
District of Columbia 1,380 Oregon 936
Florida 13,631 Pennsylvania 1,969
Georgia 191,776 Rhode Island 178
Hawaii 250 South Carolina 9,780
Idaho 271 South Dakota 79
Illinois 2,029 Tennessee 6,576
Indiana 864 Texas 6,362
Iowa 311 Utah 404
Kansas 413 Vermont 205
Kentucky 1,225 Virginia 6,283
Louisiana 1,499 Washington 1,506
Maine 276 West Virginia 368
Maryland 2,650 Wisconsin 548
Massachusetts 1,497 Wyoming 162
Michigan 928 American Territories 140
Minnesota 546 U.S. Associations, APO & FPO 255
Mississippi 902
Missouri 978
Montana 295
Nebraska 186
Nevada 427 Total* 294,228
* As of September 2017
Source: Office of Financial Services, Division of Development and Alumni Relations
UNIVERSITY OF GEORGIA ALUMNIBY STATE OF RESIDENCE

65
UGA Fact Book 2017 Student Related Information

66
UGA Fact Book 2017Student Related Information
County Alumni County Alumni County AlumniAppling 137 Fayette 2,538 Peach 235Atkinson 40 Floyd 1,457 Pickens 591Bacon 117 Forsyth 5,614 Pierce 237Baker 43 Franklin 610 Pike 326Baldwin 568 Fulton 28,479 Polk 215Banks 325 Gilmer 385 Pulaski 132Barrow 1,919 Glascock 20 Putnam 489Bartow 1,026 Glynn 1,949 Quitman 7Ben Hill 155 Gordon 526 Rabun 444Berrien 161 Grady 243 Randolph 65Bibb 2,670 Greene 577 Richmond 2,190Bleckley 223 Gwinnett 18,636 Rockdale 1,053Brantley 86 Habersham 963 Schley 37Brooks 99 Hall 4,797 Screven 164Bryan 369 Hancock 77 Seminole 118Bulloch 811 Haralson 146 Spalding 762Burke 228 Harris 455 Stephens 548Butts 221 Hart 717 Stewart 21Calhoun 63 Heard 62 Sumter 321Camden 362 Henry 1,998 Talbot 30Candler 118 Houston 1,802 Taliaferro 27Carroll 928 Irwin 147 Tattnall 121Catoosa 491 Jackson 2,470 Taylor 57Charlton 62 Jasper 173 Telfair 102Chatham 4,484 Jeff Davis 93 Terrell 88Chattahoochee 15 Jefferson 185 Thomas 697Chattooga 162 Jenkins 88 Tift 788Cherokee 4,689 Johnson 83 Toombs 325Clarke 13,625 Jones 364 Towns 229Clay 23 Lamar 228 Treutlen 70Clayton 865 Lanier 32 Troup 599Clinch 63 Laurens 752 Turner 117Cobb 16,847 Lee 499 Twiggs 42Coffee 465 Liberty 156 Union 392Colquitt 582 Lincoln 132 Upson 375Columbia 2,526 Long 25 Walker 518Cook 101 Lowndes 934 Walton 2,458Coweta 1,851 Lumpkin 416 Ware 390Crawford 82 Macon 87 Warren 48Crisp 316 Madison 1,333 Washington 260Dade 92 Marion 37 Wayne 280Dawson 411 McDuffie 316 Webster 22Decatur 346 McIntosh 146 Wheeler 40DeKalb 16,073 Meriwether 174 White 539Dodge 210 Miller 78 Whitfield 1,246Dooly 118 Mitchell 218 Wilcox 80Dougherty 1,148 Monroe 593 Wilkes 261Douglas 878 Montgomery 89 Wilkinson 55Early 146 Morgan 939 Worth 182Echols 12 Murray 227Effingham 367 Muscogee 1,892 County, Unknown 413Elbert 551 Newton 1,283Emanuel 259 Oconee 5,916Evans 86 Oglethorpe 866Fannin 327 Paulding 1,006 Total 191,776
* As of September 2017Source: Office of Financial Services, Division of Development and Alumni Relations
UNIVERSITY OF GEORGIA ALUMNIBY GEORGIA COUNTY OF RESIDENCE

67
UGA Fact Book 2017 Student Related Information

68
UGA Fact Book 2017Student Related Information
Faculty Members Alumni Members Elected Student RepresentativeK. Paige Carmichael Chris Cummiskey C. Jacob FucetolaTimothy L. Grey Steve C. Jones Student Athlete RepresentativesJanet E. Frick Kessel Stelling, Jr. Summer BurnettAnnette B. Poulsen Jon C. Stinchcomb Jonathan PelhamGreg H. Robinson Lisa G. Wood President Alumni AssociationJ. Marshall Shepherd Joel O. Wooten, Jr. Bonney E. Shuman
William D. Young, Jr.
Director of Athletics Greg McGarityDeputy Director of Athletics & Senior Women Administrator Vacant
Baseball Scott Stricklin Soccer Billy LesesneBasketball, Men's Mark Fox Softball Lu Harris-ChamperBasketball, Women's Joni Crenshaw Taylor Swimming & Diving Jack BauerleEquestrian Meghan Boenig Tennis, Men's Manuel DiazFootball Kirby Smart Tennis, Women's Jeff WallaceGolf, Men's Christopher Haack Track Petros KyprianouGolf, Women's Josh Brewer Volleyball Tom BlackGymnastics Courtney Kupets Carter
Scholar Sport Year Scholar Sport Year
Julia Boros Golf 1998 Lisa Caprioglio Swimming 2010Jenni Beathard Gymnastics 1999 Hunter Lainhart Swimming 2010Sarah Miller Swimming 1999 Grace Taylor Gymnastics 2010Matt Stinchcomb Football 1999 Bridget Lyons Track and Field 2011Kristy Kowal Swimming 2000 Mark Dylla Swimming 2011Jennifer Mihalik Swimming 2000 Chelsea Nauta Swimming 2011Joey Pitts Tennis 2000 Wendy Trott Swimming 2012Kim Black Swimming 2001 Noel Couch Gymnastics 2013Kelly Miller Basketball 2001 Andrew Gemmell Swimming 2014Marc P. Lindsay Swimming 2002 Laura Ryan Diving 2014Brian P. Scannell Swimming 2002 Shannon Vreeland Swimming 2014Johnathan C. Stinchcomb Football 2002 Nicolas Fink Swimming 2015Corrin Drakulich Track and Field 2004 Lauren Herring Tennis 2015Julie Hardt Swimming 2004 Madeline Locus Swimming 2015Kinsey Rowe Gymnastics 2004 Jordan Mattern Swimming 2015Samantha J. Arsenault Swimming 2005 Hali Flickinger Swimming 2016Claire Maust Swimming 2007 Ty Stewart Swimming 2016Karen Guilkey Swimming 2008 Chantal Van Landeghem Swimming 2017Rebecca Rowsey Basketball 2008 Rachel Zilinskas Swimming 2017Michael Green Golf 2009 Ben Wagland Tennis 2017Courtney Kupets Gymnastics 2009
Source: Director of Athletics
National Collegiate Athletic AssociationPostgraduate Scholarships
Administrators
Georgia Head Coaches
UNIVERSITY OF GEORGIA ATHLETIC ASSOCIATION Board of Directors
Jere W. Morehead, ChairmanPamela S. Whitten, Vice Chairman
Ryan A. Nesbit, TreasurerDavid Shipley, Secretary and Faculty Athletics Representative
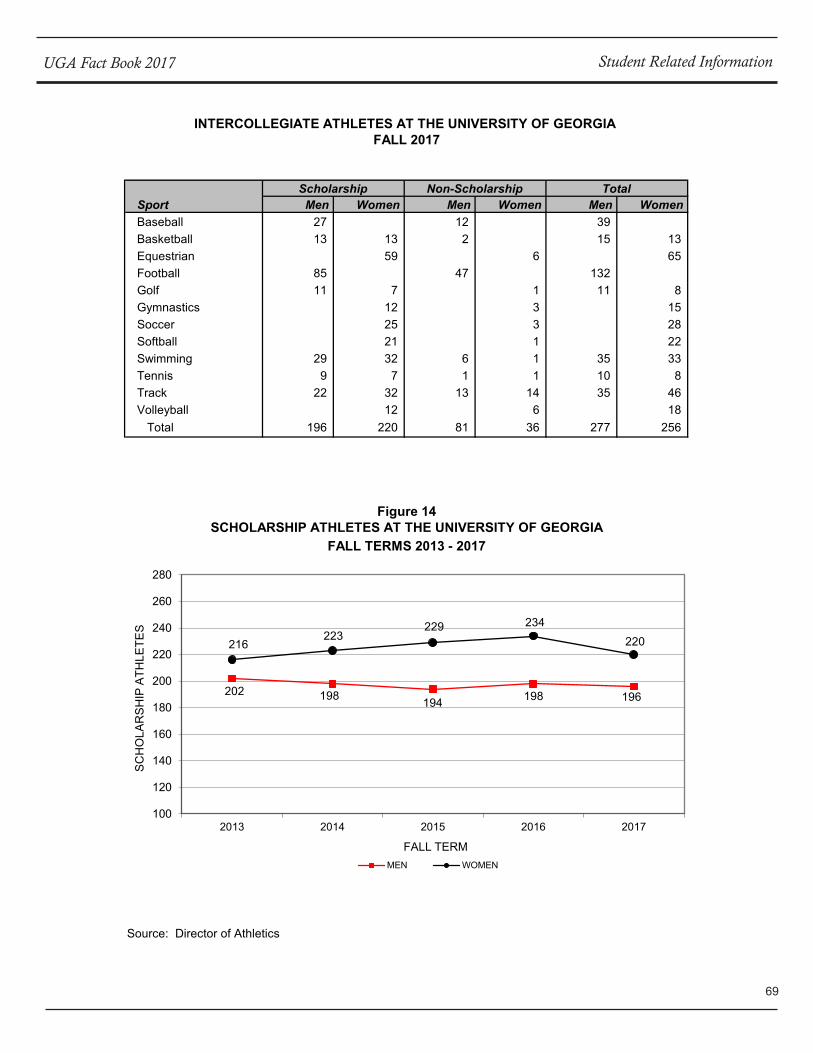
69
UGA Fact Book 2017 Student Related Information
Sport Men Women Men Women Men WomenBaseball 27 12 39Basketball 13 13 2 15 13Equestrian 59 6 65Football 85 47 132Golf 11 7 1 11 8Gymnastics 12 3 15Soccer 25 3 28Softball 21 1 22Swimming 29 32 6 1 35 33Tennis 9 7 1 1 10 8Track 22 32 13 14 35 46Volleyball 12 6 18
Total 196 220 81 36 277 256
Source: Director of Athletics
Figure 14SCHOLARSHIP ATHLETES AT THE UNIVERSITY OF GEORGIA
FALL TERMS 2013 - 2017
INTERCOLLEGIATE ATHLETES AT THE UNIVERSITY OF GEORGIA FALL 2017
Non-Scholarship TotalScholarship
202 198 194 198 196
216223
229 234220
100
120
140
160
180
200
220
240
260
280
2013 2014 2015 2016 2017
SC
HO
LAR
SH
IP A
THLE
TES
FALL TERMMEN WOMEN
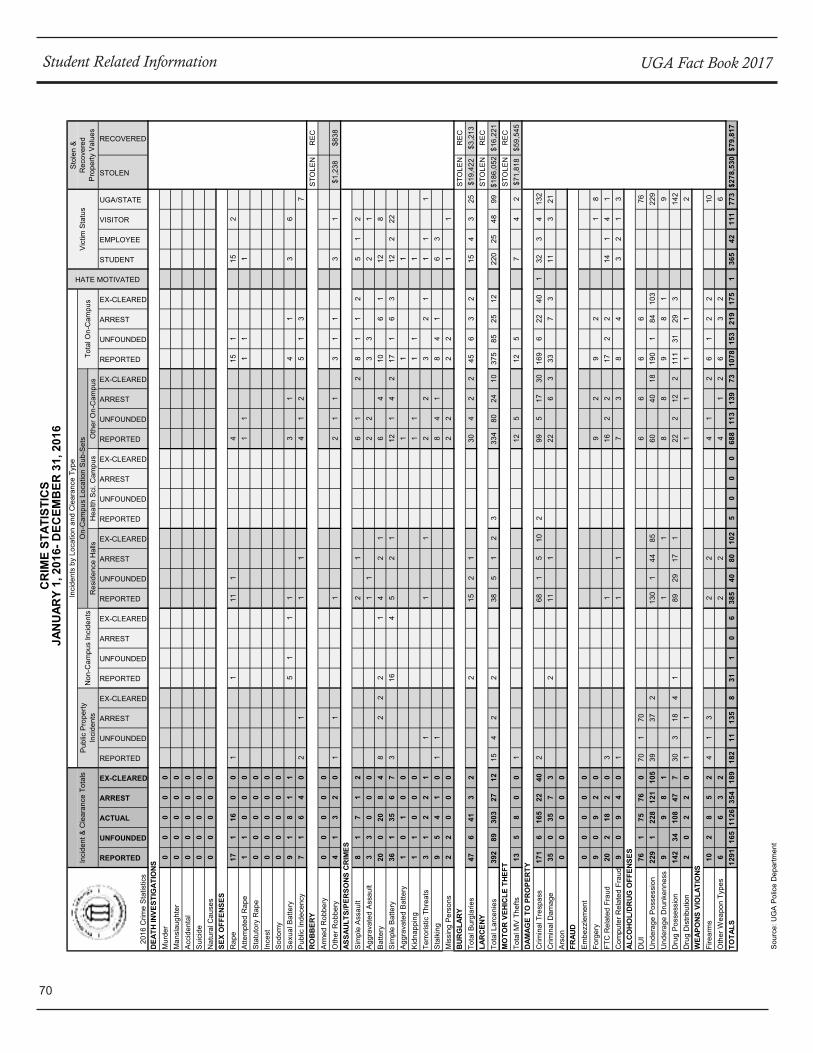
70
UGA Fact Book 2017Student Related Information
REPORTED
UNFOUNDED
ACTUAL
ARREST
EX-CLEARED
REPORTED
UNFOUNDED
ARREST
EX-CLEARED
REPORTED
UNFOUNDED
ARREST
EX-CLEARED
REPORTED
UNFOUNDED
ARREST
EX-CLEARED
REPORTED
UNFOUNDED
ARREST
EX-CLEARED
REPORTED
UNFOUNDED
ARREST
EX-CLEARED
REPORTED
UNFOUNDED
ARREST
EX-CLEARED
STUDENT
EMPLOYEE
VISITOR
UGA/STATE
STOLEN
RECOVERED
Mur
der
00
00
0M
ansl
augh
ter
00
00
0Ac
cide
ntal
00
00
0Su
icid
e0
00
00
Nat
ural
Cau
ses
00
00
0
Rap
e17
116
00
11
111
415
115
2At
tem
pted
Rap
e1
10
00
11
11
1St
atut
ory
Rap
e0
00
00
Ince
st0
00
00
Sodo
my
00
00
0Se
xual
Bat
tery
91
81
1
51
1
1
31
41
36
Publ
ic In
dece
ncy
71
64
02
11
14
12
51
37
STO
LEN
REC
Arm
ed R
obbe
ry0
00
00
Oth
er R
obbe
ry4
13
20
11
12
11
31
13
1$1
,238
$838
Sim
ple
Assa
ult
81
71
22
1
61
28
11
2
51
2Ag
grav
ated
Ass
ault
33
00
01
12
23
3
21
Batte
ry20
020
84
82
22
14
21
64
106
112
8Si
mpl
e Ba
ttery
361
356
73
164
52
112
14
217
16
312
222
Aggr
avat
ed B
atte
ry1
01
00
11
1
Kidn
appi
ng1
10
00
11
11
1Te
rroris
tic T
hrea
ts3
12
21
11
1
22
3
21
11
1St
alki
ng9
54
10
11
84
18
41
63
Mis
sing
Per
sons
22
00
02
22
21
1ST
OLE
NR
ECTo
tal B
urgl
arie
s47
641
32
215
21
304
22
456
32
154
325
$19,
422
$3,2
13ST
OLE
NR
ECTo
tal L
arce
nies
392
8930
327
1215
42
2
38
51
23
334
8024
1037
585
2512
220
2548
99$1
86,0
52$1
6,22
1ST
OLE
NR
ECTo
tal M
V Th
efts
135
80
01
12
5
12
5
7
4
2$7
1,81
8$5
9,54
5
Crim
inal
Tre
spas
s17
16
165
2240
2
681
510
299
517
3016
96
2240
132
34
132
Crim
inal
Dam
age
350
357
3
211
122
6
333
7
311
3
21Ar
son
00
00
0
Embe
zzle
men
t0
00
00
Forg
ery
90
92
0
9
29
2
1
8FT
C R
elat
ed F
raud
202
182
03
1
16
22
172
214
14
1C
ompu
ter R
elat
ed F
raud
90
94
01
1
17
3
8
43
21
3
DU
I76
175
760
701
706
6
6
6
76
Und
erag
e Po
sses
sion
229
122
812
110
539
372
130
144
8560
4018
190
184
103
229
Und
erag
e D
runk
enne
ss9
98
11
18
89
81
9D
rug
Poss
essi
on14
234
108
477
303
184
1
8929
171
222
122
111
3129
314
2D
rug
Dis
tribu
tion
20
22
01
1
1
11
12
Fire
arm
s10
28
52
41
32
24
1
26
12
210
Oth
er W
eapo
n Ty
pes
6
63
2
2
2
4
12
6
32
6TO
TALS
1291
165
1126
354
189
182
1113
58
311
06
385
4080
102
50
00
688
113
139
7310
7815
321
917
51
365
4211
177
3$2
78,5
30$7
9,81
7
Sour
ce: U
GA
Polic
e D
epar
tmen
t
RO
BB
ERY
ASSA
ULTS
/PER
SONS
CR
IMES
Publ
ic P
rope
rty
Inci
dent
sN
on-C
ampu
s In
cide
nts
On-
Cam
pus
Loca
tion
Sub-
Sets
Tota
l On-
Cam
pus
Res
iden
ce H
alls
Hea
lth S
ci. C
ampu
sO
ther
On-
Cam
pus
CR
IME
STAT
ISTI
CS
JAN
UAR
Y 1,
201
6- D
ECEM
BER
31,
201
6
DEA
TH IN
VEST
IGAT
IONS
SEX
OFF
ENSE
S
Vict
im S
tatu
sSt
olen
&
Rec
over
ed
Prop
erty
Val
ues
2016
Crim
e St
atis
tics
Inci
dent
& C
lear
ance
Tot
als
Inci
dent
s by
Loc
atio
n an
d C
lear
ance
Typ
e
HATE MOTIVATED
BUR
GLA
RY
LAR
CEN
Y
WEA
PONS
VIO
LATI
ONS
MO
TOR
VEH
ICLE
THE
FT
DAM
AGE
TO P
RO
PER
TY
FRAU
D
ALC
OHO
L/D
RUG
OFF
ENSE
S

Faculty and Staff

72
UGA Fact Book 2017Faculty and Staff
Assoc Asst Subtotal Rsch* Serv** Function Prof Prof Prof Inst Faculty Lect Assoc Assoc Libr Other+ TotalAdministration 15 4 5 24 1 1 1 58 85Student Welfare 53 53Libraries 76 4 80Instruction 695 493 357 76 1,621 216 82 27 1 174 2,121General Research 19 4 5 28 45 1 4 78Experiment Stations 50 14 23 87 16 5 1 2 111Coop Extension Service 29 12 12 53 1 318 1 373Extension & Public Service 6 3 9 126 8 143Total 814 530 402 76 1,822 217 145 477 79 304 3,044
* Senior Research Scientists, Associate Research Scientists, Assistant Research Scientists, Agricultural Research Scientists, ResearchScientists, Research Associates. Does not include Postdoctoral Associates.
** Senior Public Service Associates, Public Service Associates, Public Service Assistants, Public Service Representatives, ExtensionAssociates, Public Service Specialists.
+ Academic Professionals, Administrative Staff, Physicians, Clinical Ranks.
FULL-TIME FACULTY AND ALLIED PROFESSIONAL STAFF BY RANK AND FUNCTION FALL 2017
Rank
No. % No. % No. % No. % No. %Professor Male 587 73% 3 100% 2 100% 592 73%
Female 222 27% 222 27%Total 809 100% 3 100% 2 100% 814 100%
Associate Male 298 59% 12 57% 310 58%Professor Female 211 41% 9 43% 220 42%
Total 509 100% 21 100% 530 100%Assistant Male 1 100% 213 57% 16 57% 230 57%Professor Female 160 43% 12 43% 172 43%
Total 1 100% 373 100% 28 100% 402 100%Instructor Male 36 47% 36 47%
Female 40 53% 40 53%Total 76 100% 76 100%
Total Male 886 67% 225 57% 3 100% 54 51% 1,168 64%Female 433 33% 169 43% 52 49% 654 36%
Total 1,319 100% 394 100% 3 100% 106 100% 1,822 100%
Source: Office of Institutional Research
Non-Ten/On TrackTenure Status
Rank & Gender
TENURE STATUS OF FULL-TIME PROFESSORIAL FACULTY BY RANK AND GENDERFALL 2017
Tenured Non-Ten Position TotalNot On Ten Trk

73
UGA Fact Book 2017 Faculty and Staff
Ethnicity No. % No. % No. % No. % No. %American Indian 4 * 1 * 1 1% 6 *Asian 66 8% 69 13% 50 12% 2 3% 187 10%Black/African Amer 51 6% 31 6% 17 4% 99 5%Hawaiian/Pac IslanderHispanic 26 3% 28 5% 14 3% 9 12% 77 4%Multiracial 3 * 3 1% 1 * 7 *White 640 79% 380 72% 236 59% 57 75% 1,313 72%Not Reported 24 3% 19 4% 83 21% 7 9% 133 7%Total 814 100% 530 100% 402 100% 76 100% 1,822 100%
Rank
*Less than 1.0%
FULL-TIME PROFESSORIAL FACULTY BY RANK AND ETHNICITYFALL 2017
TotalAssociate
Professor Professor Professor InstructorAssistant
Rank No. % No. % No. % No. % No. % No. %Professor 6 1% 122 15% 324 40% 362 44% 814 100%Associate Professor 65 12% 254 48% 135 25% 76 14% 530 100%Assistant Professor 18 4% 253 63% 106 26% 23 6% 2 * 402 100%Instructor 2 3% 25 33% 25 33% 12 16% 12 16% 76 100%Total 20 1% 349 19% 507 28% 494 27% 452 25% 1,822 100%
*Less than 1.0%
FULL-TIME PROFESSORIAL FACULTY BY AGE RANGE AND RANKFALL 2017
Age20-29 30-39 40-49 50-59 60-Up
TotalIn Rank
No. % No.814 45% 751530 29% 502402 22% 348
76 4%1,822 100% 1,601
Source: Office of Institutional Research
FULL-TIME PROFESSORIAL GRADUATE FACULTY MEMBERSHIP BY RANKFALL 2017
Faculty RankProf Faculty
Graduate Faculty Membership% of
University% Total
Graduate
Total
Rank
TotalFull-Time
ProfessorAssociate ProfessorAssistant ProfessorInstructor
88%
47% 92%95%87%
31%22%
100%

74
UGA Fact Book 2017Faculty and Staff
Rank No. % No. % No. % No. % No. %Professor 738 90.7% 49 6.0% 26 3.2% 1 0.1% 814 100.0%
Associate Professor 463 87.4% 53 10.0% 14 2.6% 530 100.0%
Assistant Professor 375 93.3% 18 4.5% 8 2.0% 1 0.2% 402 100.0%
Instructor 23 30.3% 45 59.2% 8 10.5% 76 100.0%
TOTAL 1,599 87.7% 165 9.1% 56 3.1% 2 0.1% 1,822 100.0%
* Includes Educational Specialist degrees (Ed.S.)
Source: Office of Institutional Research
Bachelor's/None Total
HIGHEST EARNED DEGREES OF FULL-TIME PROFESSORIAL FACULTY BY RANKFALL 2017
Doctoral Master's* Professional
Figure 15HIGHEST EARNED DEGREES OF FULL-TIME PROFESSORIAL FACULTY
FALL 2017
DOCTORAL87.7%
MASTER'S*9.1%
PROFESSIONAL3.1%
BACHELOR'S/NONE0.1%

75
UGA Fact Book 2017 Faculty and Staff
Ranked by All Ranks Salaries
Institution Name 1. University of California - Davis 160,100$ 110,800$ 92,400$ 129,000$ 2. University of Maryland - College Park 160,100$ 110,200$ 95,700$ 118,100$ 3. Ohio State University 149,500$ 99,800$ 87,300$ 118,000$ 4. Michigan State University 150,100$ 99,600$ 79,700$ 112,700$ 5. Purdue University 145,500$ 100,800$ 89,700$ 110,900$ 6. Stony Brook University 152,400$ 104,700$ 87,400$ 109,400$ 7. Indiana University 140,000$ 95,700$ 96,300$ 105,300$ 8. University of Florida 137,500$ 91,600$ 80,700$ 102,400$ 9. Virginia Polytech. Inst. & State Univ. 137,700$ 96,900$ 85,500$ 102,000$10. University of Georgia 126,400$ 94,500$ 86,400$ 100,400$11. Iowa State University 131,000$ 97,600$ 83,800$ 100,000$12. University of Iowa 138,300$ 96,100$ 84,300$ 99,200$13. North Carolina State University 128,700$ 93,200$ 79,700$ 98,700$14. University of Arizona 129,400$ 91,300$ 80,100$ 97,600$15. University of Kentucky 122,600$ 91,200$ 81,700$ 94,500$16. University of Missouri - Columbia 122,300$ 81,300$ 69,000$ 91,300$
Source: American Association of University Professors
AVERAGE ACADEMIC YEAR SALARIES OF INSTRUCTIONAL FACULTYUGA AND SELECTED PEERS
ACADEMIC YEAR 2016-17
* All Ranks includes the ranks of instructor, lecturer and the category of "No Rank."
Professor
ACADEMIC YEARS 2012-13 THROUGH 2016-17
Associate Professor
Assistant Professor All Ranks*
Figure 16AVERAGE ACADEMIC YEAR SALARY OF INSTRUCTIONAL FACULTY
UNIVERSITY OF GEORGIA (ALL RANKS)
Eleven or twelve-month salaries are converted to a standard academic-year basis by applying a factor of 81.8% (9/11) with the exception of California - Davis where a factor of 86.6% has been applied.
88,700 88,600
93,800
98,300
100,400
84,000
86,000
88,000
90,000
92,000
94,000
96,000
98,000
100,000
102,000
2012-13 2013-14 2014-15 2015-16 2016-17
SA
LAR
Y ($
)
ACADEMIC YEAR

76
UGA Fact Book 2017Faculty and Staff
Occupational Classification Full-Time Part-Time TotalExecutive/Admin/Managerial 407 3 410
Faculty 2,725 320 3,045
Other Professional 2,490 70 2,560
Clerical/Secretarial 1,038 55 1,093
Technical/Paraprofessional 1,863 81 1,944
Skilled Crafts 328 1 329
Service/Maintenance 1,342 18 1,360
Total 10,193 548 10,741
NOTE: Employees are assigned to an occupational classification based on their University System of Georgia job category (effective Fall 2003). Totals do not include temporary classified employees.
Source: Office of Human Resources
October 31, 2017FULL-TIME UNIVERSITY EMPLOYEES BY OCCUPATIONAL CLASSIFICATION
Employees As Of 10/31/17
UNIVERSITY EMPLOYEES BY OCCUPATIONAL CLASSIFICATIONOctober 31, 2017
Figure 17
EXEC/ADMIN/MANAGERIAL
4.0%
FACULTY26.7%
OTHER PROFESSIONAL
24.4%
CLERICAL/SECRETARIAL
10.2%
TECHNICAL/PARA-PROFESSIONAL
18.3%SKILLEDCRAFTS
3.2%
SERVICE/ MAINTENANCE
13.2%

77
UGA Fact Book 2017 Faculty and Staff
Occupational Classification
Exec/Admin/Mgr 3 0.7 14 3.4 28 6.8 6 1.5 2 0.5 333 81.2 24 5.9 410
Faculty 6 0.2 259 8.5 1 * 169 5.6 108 3.5 15 0.5 2,267 74.4 220 7.2 3,045
Other Professional 4 0.2 156 6.1 3 0.1 171 6.7 53 2.1 12 0.5 1,879 73.4 282 11.0 2,560
Clerical/Secretarial 6 0.5 150 13.7 31 2.8 8 0.7 783 71.6 115 10.5 1,093
Technical/Paraprof 1 0.1 80 4.1 1 0.1 148 7.6 62 3.2 10 0.5 1,432 73.7 210 10.8 1,944
Skilled Crafts 2 0.6 30 9.1 10 3.0 263 79.9 24 7.3 329
Service/Maintenance 13 1.0 626 46.0 78 5.7 7 0.5 548 40.3 88 6.5 1,360
Total 14 0.1 530 4.9 5 * 1,322 12.3 348 3.2 54 0.5 7,505 69.9 963 9.0 10,741
* Less than 0.1%
Ethnic Origin
%
American Indian Asian
Hawaiian/ Pacific Isl
Black/ Afric Amer Hispanic
%No.
Multi- racial White
Not Reported Total
No. % No. % No. No.
UNIVERSITY EMPLOYEES BY OCCUPATIONAL CLASSIFICATION AND ETHNICITYOctober 31, 2017
% No. % No.No. % No. %
Total
Executive/Administrative/Managerial 256 62.4 154 37.6 410
Faculty 1,692 55.6 1,353 44.4 3,045
Other Professional 1,168 45.6 1,392 54.4 2,560
Clerical/Secretarial 100 9.1 993 90.9 1,093
Technical/Paraprofessional 794 40.8 1,150 59.2 1,944
Skilled Crafts 319 97.0 10 3.0 329
Service/Maintenance 736 54.1 624 45.9 1,360
5,065 47.2 5,676 52.8 10,741
NOTE: Employees are assigned to an occupational classification based on their University System of Georgia job category (effective Fall 2003). Totals do not include temporary classified employees.
Source: Office of Human Resources
% No. % No.
UNIVERSITY EMPLOYEES BY OCCUPATIONAL CLASSIFICATION AND GENDEROctober 31, 2017
Total
Occupational ClassificationMale Female
No.

78
UGA Fact Book 2017Faculty and Staff

Financial Information
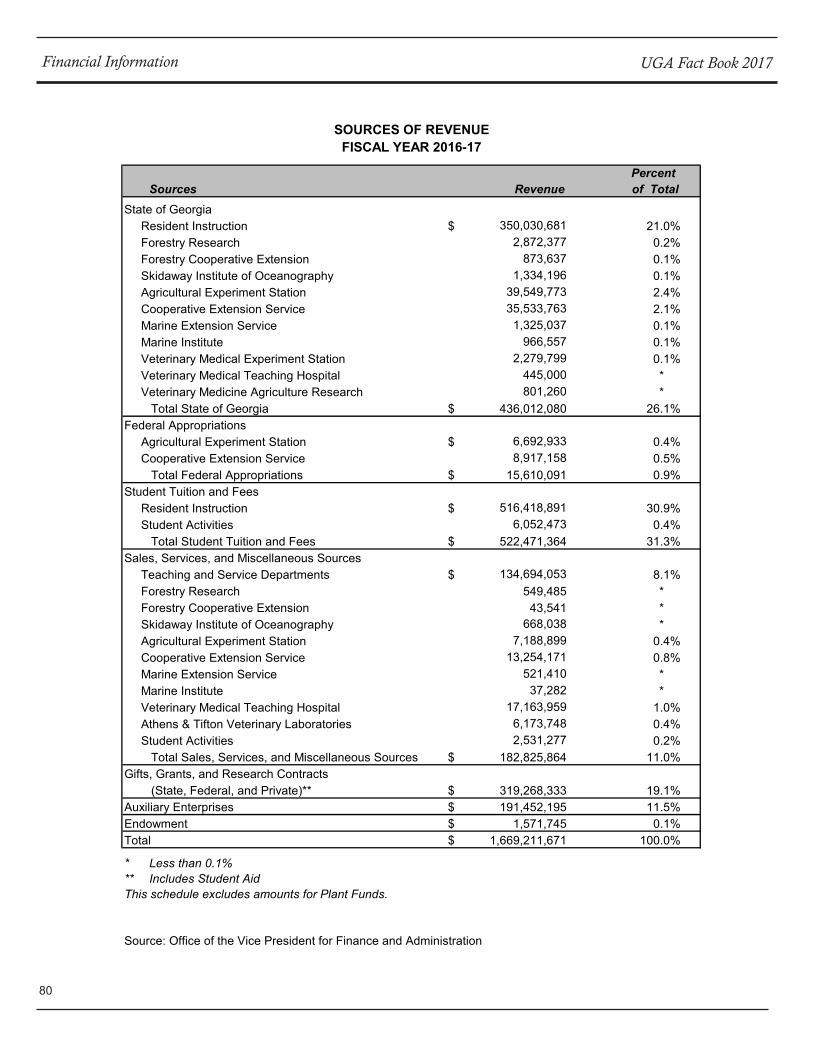
80
UGA Fact Book 2017Financial Information
Percent Sources Revenue of Total
State of Georgia Resident Instruction $ 350,030,681 21.0% Forestry Research 2,872,377 0.2% Forestry Cooperative Extension 873,637 0.1% Skidaway Institute of Oceanography 1,334,196 0.1% Agricultural Experiment Station 39,549,773 2.4% Cooperative Extension Service 35,533,763 2.1% Marine Extension Service 1,325,037 0.1% Marine Institute 966,557 0.1% Veterinary Medical Experiment Station 2,279,799 0.1% Veterinary Medical Teaching Hospital 445,000 * Veterinary Medicine Agriculture Research 801,260 * Total State of Georgia $ 436,012,080 26.1%Federal Appropriations Agricultural Experiment Station $ 6,692,933 0.4% Cooperative Extension Service 8,917,158 0.5% Total Federal Appropriations $ 15,610,091 0.9%Student Tuition and Fees Resident Instruction $ 516,418,891 30.9% Student Activities 6,052,473 0.4% Total Student Tuition and Fees $ 522,471,364 31.3%Sales, Services, and Miscellaneous Sources Teaching and Service Departments $ 134,694,053 8.1% Forestry Research 549,485 * Forestry Cooperative Extension 43,541 * Skidaway Institute of Oceanography 668,038 * Agricultural Experiment Station 7,188,899 0.4% Cooperative Extension Service 13,254,171 0.8% Marine Extension Service 521,410 * Marine Institute 37,282 * Veterinary Medical Teaching Hospital 17,163,959 1.0% Athens & Tifton Veterinary Laboratories 6,173,748 0.4% Student Activities 2,531,277 0.2% Total Sales, Services, and Miscellaneous Sources $ 182,825,864 11.0%Gifts, Grants, and Research Contracts (State, Federal, and Private)** $ 319,268,333 19.1%Auxiliary Enterprises $ 191,452,195 11.5%Endowment $ 1,571,745 0.1%Total $ 1,669,211,671 100.0%
* Less than 0.1%** Includes Student AidThis schedule excludes amounts for Plant Funds.
Source: Office of the Vice President for Finance and Administration
SOURCES OF REVENUEFISCAL YEAR 2016-17

81
UGA Fact Book 2017 Financial Information
Source
State of Georgia 39.0 % 36.4 % 29.7 % 29.7 % 27.2 % 26.8 % 27.3 % 26.7 % 26.1 % 26.1 %
Federal Appropriations 1.3 1.2 0.9 0.8 0.9 0.9 0.9 1.0 1.0 0.9
Student Tuition and Fees 22.8 23.8 25.5 27.6 28.9 30.1 30.3 31.2 31.9 31.3
Sales, Services, and
Miscellaneous 6.6 7.1 12.1 8.9 10.5 11.4 11.1 11.0 10.8 11.0
Gifts, Grants, Contracts 19.3 20.1 20.2 21.1 20.4 18.7 17.9 17.9 18.4 19.1
Auxiliary Enterprises 10.9 11.3 11.5 11.8 12.0 12.0 12.4 12.0 11.7 11.5
Endowment 0.1 0.1 0.1 0.1 0.1 0.1 0.1 0.2 0.1 0.1
Source: Office of the Vice President for Finance and Administration
11-12 12-13 13-14
Figure 18DISTRIBUTION OF REVENUE BY SOURCE
FISCAL YEAR 2016-17
14-15 15-16 16-17 Fiscal Year
REVENUE BY SOURCE FISCAL YEARS 2007-08 THROUGH 2016-17
07-08 08-09 09-10 10-11
26.1%
0.9%
31.3%
11.0%
19.1%
11.5% 0.1%
STATE OF GEORGIA
ENDOWMENTAUXILIARY
ENTERPRISES
GIFTS, GRANTS,CONTRACTS
SALES, SERVICES, MISCELLANEOUS
STUDENT TUITION AND FEES
FEDERAL APPROPRIATIONS

82
UGA Fact Book 2017Financial Information
Budgetary Function ExpendituresInstruction Resident Instruction (RI) $328,172,611 19.8%Research Resident Instruction 312,517,565 18.9%
Gwinnett Campus - RI 126,555 *Griffin Campus - RI 113,282 *AU/UGA Medical Partnership 1,144,823 0.1%Forestry Research 11,736,135 0.7%Skidaway Institute of Oceanography 4,581,891 0.3%Agricultural Experiment Station 82,060,287 5.0%Marine Extension Service 642,629 *Marine Institute 1,625,502 0.1%Veterinary Medical Experiment Station 2,279,799 0.1%Athens & Tifton Veterinary Laboratories 412,390 *Veterinary Medicine Agriculture Research 801,260 0.1% Subtotal $418,042,119 25.3%
Public Service Resident Instruction 98,021,849 5.9%Gwinnett Campus - RI 382,324 *Griffin Campus - RI 64,213 *Forestry Cooperative Extension 1,419,819 0.1%Skidaway Institute of Oceanography 7,671 *Cooperative Extension Service 68,116,162 4.1%Marine Extension Service 1,794,305 0.1%Athens & Tifton Veterinary Laboratories 6,095,105 0.4% Subtotal $175,901,448 10.6%
Academic Support Resident Instruction 93,888,977 5.7%Gwinnett Campus - RI 55,563 *Griffin Campus - RI 167,092 *AU/UGA Medical Partnership 15,000 *Skidaway Institute of Oceanography 140,871 *Agricultural Experiment Station 289,088 *Veterinary Medical Teaching Hospital 17,065,761 1.0% Subtotal $111,622,353 6.7%
Student Services Resident Instruction 37,923,738 2.3%Gwinnett Campus - RI 189,968 *Griffin Campus - RI 105,670 *Student Activities 9,490,183 0.6% Subtotal $47,709,559 2.9%
Institutional Support Resident Instruction 99,582,920 6.0%Skidaway Institute of Oceanography 162,586 * Subtotal $99,745,507 6.0%
Physical Plant Resident Instruction 116,764,700 7.1%Gwinnett Campus - RI 216,706 *Griffin Campus - RI 270,625 *AU/UGA Medical Partnership 472,986 *Forestry Research 853,953 0.1%Skidaway Institute of Oceanography 1,043,356 0.1%Agricultural Experiment Station 5,097,549 0.3%Cooperative Extension Service 2,372,545 0.1%Marine Extension Service 102,433 *Marine Institute 70,201 *Athens & Tifton Veterinary Laboratories 3,600 * Subtotal $127,268,654 7.7%
Scholarships and Resident Instruction 167,067,909 10.1%Fellowships Forestry Research 42,983 *
Skidaway Institute of Oceanography 23,071 *Agricultural Experiment Station 177,907 *Cooperative Extension Service 4,434 *Marine Extension Service 2,000 * Subtotal $167,318,304 10.1%
Auxiliary Enterprises $180,749,419 10.9%Total $1,656,529,972 100.0%
* Less than 0.1 percent.This schedule excludes amounts for Plant Funds.
Source: Office of the Vice President for Finance and Administration
EXPENDITURES BY FUNCTIONFISCAL YEAR 2016-17
Percent of Total

83
UGA Fact Book 2017 Financial Information
Function
Instruction 18.8 % 19.4 % 19.1 % 18.3 % 18.8 % 19.1 % 18.9 % 19.0 % 19.6 % 19.8 %Research 24.2 23.8 23.5 23.4 24 23.6 23.3 23.3 23.8 25.3Public Service 13.3 13.9 12.7 11.9 11.7 11.6 11.8 11.4 11.0 10.6Academic Support 9.5 6.9 6.7 7.0 7.1 6.6 6.8 6.8 6.8 6.7Student Services 2.4 2.6 2.8 2.6 3.3 3.0 2.9 3.0 2.9 2.9Institutional Support 5.8 5.6 5.5 5.2 5.2 5.9 5.5 5.5 6.7 6.0Physical Plant 7.4 8.7 9.5 9.9 8.6 8.7 8.8 9.4 7.8 7.7Scholarships and Fellowships 8.1 8.4 9.4 9.9 9.8 10.0 10.4 10.3 10.3 10.1Auxiliary Enterprises 10.5 10.7 10.8 11.8 11.5 11.5 11.6 11.3 11.1 10.9
13-14 14-15 15-16 16-1707-08 08-09 09-10 10-11 11-12 12-13
Source: Office of the Vice President for Finance and Administration
FISCAL YEAR 2016-17
Figure 19DISTRIBUTION OF EXPENDITURES BY FUNCTION
EXPENDITURES BY FUNCTIONFISCAL YEARS 2007-08 THROUGH 2016-17
Fiscal Year
19.8%
25.3%
10.6%6.7%
2.9%
6.0%
7.7%
10.1%
10.9%
AUXILIARY ENTERPRISES
INSTRUCTION
SCHOLARSHIPS & FELLOWSHIPS
PHYSICALPLANT
RESEARCH
INSTITUTIONALSUPPORT
STUDENT SERVICES
ACADEMIC SUPPORT PUBLIC
SERVICE

84
UGA Fact Book 2017Financial Information
Project Type 2012-13 2013-14 2014-15 2015-16 2016-17Cooperative Extension $ 11,093,313 $ 11,210,833 $ 12,344,755 $ 15,238,856 $ 11,146,377Instruction 6,794,753 5,260,385 5,903,825 8,981,467 8,525,141Public Service 31,993,333 35,555,515 26,989,590 31,500,122 29,359,913Research* 134,502,224 168,898,278 185,888,120 208,777,303 211,618,664
Total $184,383,623 $220,925,012 $231,126,290 $264,497,749 $260,650,095
previous fiscal years have been adjusted to reflect changes and allow comparisons.
TOTAL SPONSORED AWARDS BY PROJECT TYPEFISCAL YEARS 2012-13 THROUGH 2016-17
Fiscal Year
Source: Office of the Vice President for Research, Office of Research Analytics
Figure 20TOTAL SPONSORED AWARDS BY PROJECT TYPE
FISCAL YEARS 2012-13 THROUGH 2016-17
* Research awards include both Agricultural Experiment Station awards and general research awards.
Note: Beginning in FY14, all OVPR reporting excludes the following sources of funding: UGA Athletic Association,UGA Foundation, UGA Research Foundation, UGA Real Estate Foundation, UGA and Endowments. Funds for
0
25
50
75
100
125
150
175
200
225
250
275
2012-13 2013-14 2014-15 2015-16 2016-17
134.5
168.9185.9
208.8 211.6
32.0
35.627.0
31.5 29.4
6.8
5.35.9
9.0 8.5
11.1
11.212.3
15.2 11.1
MIL
LIO
NS
FISCAL YEAR
RESEARCH PUBLIC SERV INSTRUCTION COOP EXT

85
UGA Fact Book 2017 Financial Information
Sponsor Type 2012-13 2013-14 2014-15 2015-16 2016-17Business $6,046,456 $6,522,137 $8,502,480 $15,714,804 $11,720,910Non-profit Organizations 12,551,741 12,033,154 23,400,000 19,396,836 24,743,716State & Local Government 5,032,963 5,267,218 8,314,489 6,556,243 11,673,205US Federal Government 110,871,064 145,075,769 145,671,151 167,109,420 163,480,832
Total $134,502,224 $168,898,278 $185,888,119 $208,777,303 $211,618,664
TOTAL RESEARCH AWARDS BY SPONSOR TYPEFISCAL YEARS 2012-13 THROUGH 2016-17
Fiscal Year
Figure 21TOTAL RESEARCH AWARDS
FISCAL YEARS 2012-13 THROUGH 2016-17
UGA Foundation, UGA Research Foundation, UGA Real Estate Foundation, UGA and Endowments. Funds for
Source: Office of the Vice President for Research, Office of Research Analytics
Note: Beginning in FY14, all OVPR reporting excludes the following sources of funding: UGA Athletic Association,
previous fiscal years have been adjusted to reflect changes and allow comparisons.
0
25
50
75
100
125
150
175
200
2012-13 2013-14 2014-15 2015-16 2016-17
$134,502,224
$168,898,278
$185,888,119
$208,777,303$211,618,664
MIL
LIO
NS
FISCAL YEAR
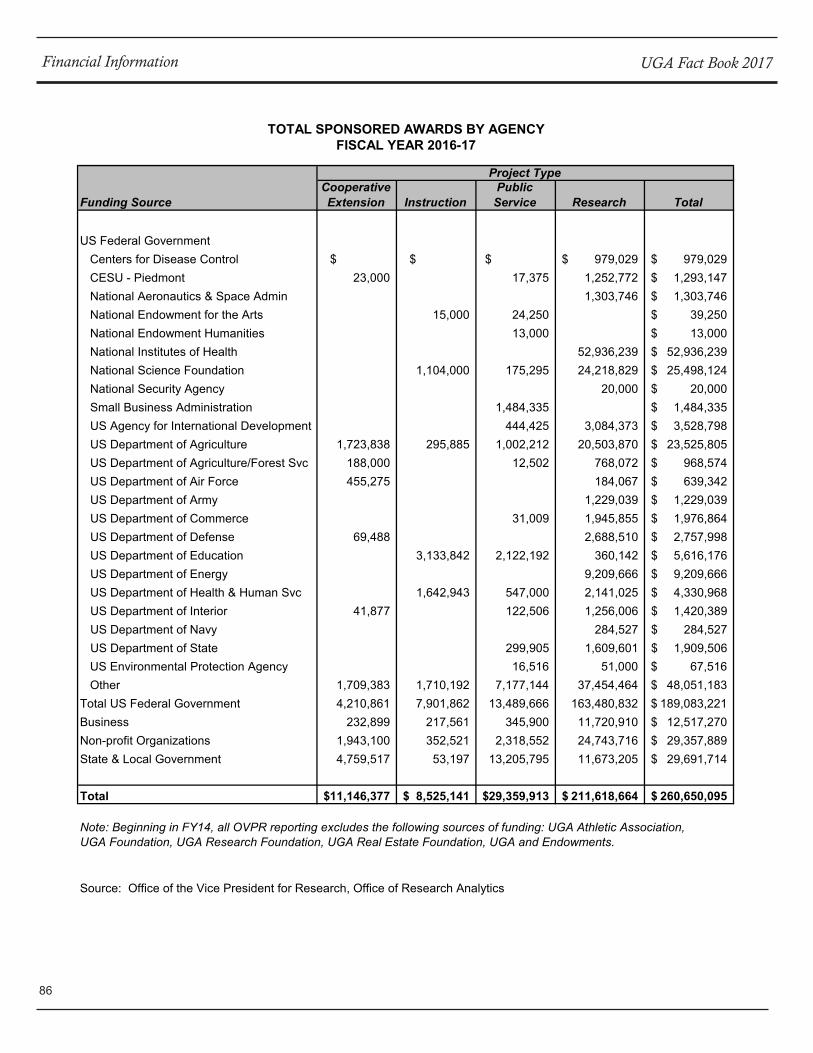
86
UGA Fact Book 2017Financial Information
Funding SourceCooperative Extension Instruction
Public Service Research Total
US Federal GovernmentCenters for Disease Control $ $ $ 979,029$ 979,029$CESU - Piedmont 23,000 17,375 1,252,772 1,293,147$National Aeronautics & Space Admin 1,303,746 1,303,746$National Endowment for the Arts 15,000 24,250 39,250$National Endowment Humanities 13,000 13,000$National Institutes of Health 52,936,239 52,936,239$National Science Foundation 1,104,000 175,295 24,218,829 25,498,124$National Security Agency 20,000 20,000$Small Business Administration 1,484,335 1,484,335$US Agency for International Development 444,425 3,084,373 3,528,798$US Department of Agriculture 1,723,838 295,885 1,002,212 20,503,870 23,525,805$US Department of Agriculture/Forest Svc 188,000 12,502 768,072 968,574$US Department of Air Force 455,275 184,067 639,342$US Department of Army 1,229,039 1,229,039$US Department of Commerce 31,009 1,945,855 1,976,864$US Department of Defense 69,488 2,688,510 2,757,998$US Department of Education 3,133,842 2,122,192 360,142 5,616,176$US Department of Energy 9,209,666 9,209,666$US Department of Health & Human Svc 1,642,943 547,000 2,141,025 4,330,968$US Department of Interior 41,877 122,506 1,256,006 1,420,389$US Department of Navy 284,527 284,527$US Department of State 299,905 1,609,601 1,909,506$US Environmental Protection Agency 16,516 51,000 67,516$Other 1,709,383 1,710,192 7,177,144 37,454,464 48,051,183$
Total US Federal Government 4,210,861 7,901,862 13,489,666 163,480,832 189,083,221$Business 232,899 217,561 345,900 11,720,910 12,517,270$Non-profit Organizations 1,943,100 352,521 2,318,552 24,743,716 29,357,889$State & Local Government 4,759,517 53,197 13,205,795 11,673,205 29,691,714$
Total 11,146,377$ 8,525,141$ 29,359,913$ 211,618,664$ 260,650,095$
Source: Office of the Vice President for Research, Office of Research Analytics
TOTAL SPONSORED AWARDS BY AGENCYFISCAL YEAR 2016-17
Note: Beginning in FY14, all OVPR reporting excludes the following sources of funding: UGA Athletic Association,UGA Foundation, UGA Research Foundation, UGA Real Estate Foundation, UGA and Endowments.
Project Type

87
UGA Fact Book 2017 Financial Information
Cooperative PublicBudgetary Unit Extension Instruction Service Research
Colleges/SchoolsAgricultural & Environmental Sci 10,343,752$ 358,705$ 37,853,190$ 48,555,647$Arts & Sciences 1,523,797 231,567 45,631,241 47,386,605Business 291,633 291,633Ecology 221,330 2,107,623 2,328,953Education 2,839,031 2,445,498 5,795,077 11,079,606Engineering 310,731 7,019,138 7,329,869Environment & Design 178,734 146,244 324,978Family & Consumer Sciences 400,341 99,564 3,492,977 480,164 4,473,046Forestry & Natural Resources 402,284 222,756 11,491,139 12,116,179Journalism & Mass Comm 1,000 362,612 363,612Law 510,675 510,675Pharmacy 3,851,583 3,851,583Public Health 103,677 1,061,483 10,328,337 11,493,497Public & International Affairs 276,008 2,223,032 2,499,040Social Work 1,766,464 107,166 1,873,630Veterinary Medicine 337,303 327,406 27,572,935 28,237,644
Other UGA UnitsSr VP Academic Affairs &
Provost Units 1,240,178 1,606,968 6,553,462 9,400,608VP Finance & Administration 56,000 56,000VP Instruction Units 255,422 1,813,166 35,007 2,103,595VP Public Serv & Outreach Units 16,592,614 668,687 17,261,301VP Research Units 12,000 49,100,393 49,112,393
Total 11,146,377$ 8,525,141$ 29,359,913$ 211,618,664$ 260,650,095$
Source: Office of the Vice President for Research, Office of Research Analytics
UGA Foundation, UGA Research Foundation, UGA Real Estate Foundation, UGA and Endowments.
* Award dollars are provided to units based on the academic credit contributed by PIs, co-PIs and other senior project personnel. Prior to FY13 this report listed the dollars based on the management unit of the award.
TOTAL SPONSORED AWARDS BY MAJOR UNIT*FISCAL YEAR 2016-17
Total
Note: Beginning in FY14, all OVPR reporting excludes the following sources of funding: UGA Athletic Association,

88
UGA Fact Book 2017Financial Information
IndirectCost
Budgetary Unit RecoveriesResident Instruction Agricultural & Environmental Sciences 809,841$ 13,085$ $ 223,300$ 1,046,226$ Archway Partnership Project 1,323,070 122,216 110,121 1,555,407 Arts & Sciences 144,880 425,635 525,369 1,095,884 Business 695,350 1,997,537 322,562 3,015,449 Carl Vinson Institute of Government 6,620,817 6,601,002 102,579 4,899,640 18,224,038 Ecology 36,576 47,533 7,626 91,735 Education 4,471,050 1,157,169 54,337 2,497,610 8,180,166 Engineering 102,080 44,367 7,767 154,214 Environment & Design 241,695 81,547 323,242 Family & Consumer Sciences 1,447,505 204,197 1,702 3,954,254 5,607,658 Forestry & Natural Resources 319,109 193,919 13,442 526,470 General Institutional Expense 619,809 619,809 Georgia Center (Auxiliary excluded) 3,336,093 8,486,059 48,897 7,088 11,878,137 J. W. Fanning Institute for Leadership 2,111,439 586,562 12,751 1,109,093 3,819,845 Journalism & Mass Communication 817,505 234,160 1,263,154 2,314,819 Law 371,393 3,124 32,219 406,736 Pharmacy 1,006,225 239,810 1,127 1,247,162 Public Health 372,082 213,919 3,165 134,101 723,267 Public & International Affairs 8,000 137,921 16,146 98,570 260,637 Sea Grant 19,886 859 20,745 Service Learning 486,225 10,962 497,187 Small Business Development Center 4,389,942 69,950 82,460 3,166,469 7,708,821 Social Work 382,498 1,371 332,563 716,432 Staff Benefits - Resident Instruction 1,533,274 1,533,274 State Botanical Garden of Georgia 1,580,488 447,283 41,490 2,069,261 Veterinary Medicine 5,517,601 6,188,995 2,235,635 13,942,231 Senior VP for Academic Affairs & 214,061 31,127 245,188 Provost VP for Development & Alumni 42,785 42,785 Relations VP for Instruction 335,862 537,449 147,910 1,021,221 VP for Public Service & Outreach 2,375,044 23,780 11,790 28,360 2,438,974 VP for Research 269 269
Total Resident Instruction 41,475,340$ 28,315,705$ 333,827$ 21,202,418$ 91,327,290$
Athens and Tifton Veterinary Labs 6,095,105 39,292 373,098 6,507,495Cooperative Extension Service* 42,078,377 10,766,024 429,035 12,564,460 65,837,896Forestry Cooperative Extension Service 873,637 48,156 13,012 485,014 1,419,819Marine Extension Service 1,744,014 105,935 236,557 2,086,506
Total Public Service and Outreach Funds 86,171,368$ 45,224,990$ 921,101$ 34,861,547$ 167,179,006$Percent of Total 51.5% 27.1% 0.6% 20.9% 100.0%
* Includes Federal Smith-Lever funds
Source: Office of the Vice President for Public Service and Outreach
SOURCES OF ALL PUBLIC SERVICE AND OUTREACH FUNDSFISCAL YEAR 2016-17
State Appropriated
Funds
Sales, Services, and
Fees
Contracts and
Grants
Total Public Service and
Outreach

89
UGA Fact Book 2017 Financial Information
Fiscal Year
Arch Foundation
UGA Foundation UGA
UGA Athletic Association* UGA Other**
Joint Tech/Georgia Development
FundTotal
Contributions
1983 5,133,268 13,655,651 3,476,928 370,519 172,099 22,808,4651984 9,681,219 12,910,124 3,847,000 476,072 177,471 27,091,8861985 24,054,680 17,574,797 4,085,192 622,403 151,765 46,488,8371986 12,644,211 18,791,252 4,394,188 581,985 179,842 36,591,4781987 8,848,621 5,818,047 4,390,013 797,435 190,912 20,045,0281988 9,448,864 5,184,590 4,617,761 665,985 192,066 20,109,2661989 9,306,518 7,515,184 4,763,837 1,058,957 179,090 22,823,5861990 18,601,037 7,760,063 4,928,056 459,516 160,131 31,908,8031991 13,268,809 11,836,847 5,021,212 996,917 160,264 31,284,0491992 15,243,445 11,103,856 5,000,564 545,939 160,139 32,053,9431993 23,435,284 16,373,700 5,339,520 470,105 92,568 45,711,1771994 14,309,927 12,246,328 4,986,966 766,203 144,860 32,454,2841995 16,216,697 10,488,603 5,859,233 319,676 44,199 32,928,4081996 19,362,563 7,550,780 6,418,346 275,910 33,607,5991997 42,396,086 8,970,374 7,248,448 301,917 58,916,8251998 23,082,033 9,827,914 8,084,316 520,532 41,514,7951999 32,310,124 11,800,200 8,805,410 1,016,035 53,931,7692000 26,967,910 10,639,324 10,181,466 523,993 48,312,6932001 33,238,528 8,971,993 10,665,055 1,571,916 54,447,4922002 32,775,680 15,739,873 12,699,323 1,572,250 62,787,1262003 45,452,213 10,469,868 15,455,176 670,912 72,048,1692004 42,313,103 15,099,891 19,566,501 838,564 77,818,0592005 58,309,663 12,017,095 25,522,241 1,068,277 96,917,2762006 43,556,639 26,110,776 12,188,309 25,317,487 1,164,635 108,337,8462007 34,790,964 27,870,617 15,199,483 26,620,819 1,948,455 106,430,3382008 32,194,387 21,088,957 19,102,301 29,912,192 1,568,727 103,866,5642009 30,727,867 15,403,228 36,049,713 27,358,305 1,257,435 110,796,5482010 44,852,972 17,655,990 9,520,782 26,660,663 3,240,404 101,930,8112011 27,060,870 15,048,521 10,234,243 28,037,228 45,862,950 126,243,8122012 59,779,923 13,758,467 27,443,931 1,751,133 102,733,4542013 70,006,940 17,466,045 28,107,994 1,699,586 117,280,5652014 68,781,933 26,487,864 29,187,504 1,941,046 126,398,3472015 92,231,735 16,287,413 31,101,810 4,537,632 144,158,5902016 126,539,239 26,552,692 29,422,551 1,346,447 183,860,9292017 148,271,827 44,959,551 31,933,691 2,670,067 227,835,136
* Previously reported as the Georgia Student Educational Fund.** Includes 4-H Foundation, Botanical Garden, Springfield Legacy Foundation, etc. Note: The Joint Tech/Georgia Development Fund program was disbanded during 1994 - 95.
The Arch Foundation merged with the UGA Foundation July 1, 2011.
Source: Office of Financial Services, Division of Development and Alumni Relations
HISTORY OF FUNDRAISINGFISCAL YEARS 1983 - 2017

90
UGA Fact Book 2017Financial Information
Physical Facilities

92
UGA Fact Book 2017Physical Facilities
Principal Use Number of Gross Areaof Buildings Buildings Square Feet*
Administration 11 204,626 1.2%Academic 177 7,879,216 44.4%Public Service 35 496,010 2.8%Residential 74 2,885,769 16.3%Student Services 28 1,144,378 6.5%University Support 150 5,123,879 28.9%Total 475 17,733,878 100.0%
* Does not include leased space.
Room Use Number*Classrooms 384Teaching Laboratories 184Distance Learning Classrooms 10Open Laboratories 317Research Laboratories 1,546Offices 8,921
* Does not include leased space.
Source: Office of Institutional Research
ATHENS CAMPUSFALL 2017
UNIVERSITY BUILDINGS BY MAJOR USE ATHENS CAMPUS
FALL 2017
% Total SquareFootage
NUMBER OF ROOMS BY BASIC ROOM TYPE
Class size 2007 2008 2009 2010 2011 2012 2013 2014 2015 20162 - 19 students 38.3 36.6 35.5 35.4 38.6 39.2 39.6 38.8 41.8 45.520-49 students 50.5 51.8 51.9 52.3 50.6 50.3 49.2 49.4 45.7 43.550 students or more 11.2 11.5 12.6 12.2 10.8 10.6 11.2 11.8 12.5 11.0
Source: U.S. News & World Report Survey Submissions, 2007-2016
UNDERGRADUATE CLASS SIZEFALL TERMS 2007-2016
Percent of Classes

93
UGA Fact Book 2017 Physical Facilities
Room UseAthens
CampusCollege Station
Coastal Plain
StationGeorgia Station
Agricul Branch Stations
Coop Extension
Service Other TotalClassroom 432,787 1,692 13,463 1,265 19,310 468,517Laboratory 1,443,931 86,300 207,849 129,413 40,494 17,565 246,074 2,171,626Office 2,146,796 17,579 61,403 54,582 9,297 44,154 123,399 2,457,210Study 509,038 210 3,711 10,131 212 16,237 539,539Special Use 1,222,122 338,653 254,407 75,795 256,890 19,662 158,905 2,326,434General Use 947,985 6,285 21,151 19,737 11,635 337,413 50,424 1,394,630Supporting 2,831,306 45,582 91,983 68,560 44,766 59,723 81,012 3,222,932Health Care 232,097 3,690 2,549 238,336Residential 1,757,573 10,724 12,216 2,832 36,191 177,954 101,119 2,098,609Nonassignable 6,413,374 100,479 127,459 208,996 34,822 219,622 197,242 7,301,994Total 17,937,009 605,812 781,871 583,509 434,095 881,260 996,271 22,219,827
Program ClassAthens
CampusCollege Station
Coastal Plain
StationGeorgia Station
Agricul Branch Stations
Coop Extension
Service Other TotalInstruction 2,035,404 5,170 1,180 25,230 140,625 2,207,609Organized Research 1,485,033 471,267 599,083 305,986 341,193 13,799 485,896 3,702,257Public Service 442,186 873 2,927 6,241 2,689 637,629 85,698 1,178,243Academic Support 1,099,685 6,252 17,189 5,573 58,071 1,186,770Student Services 3,579,030 6,667 400 94 8,360 3,594,551Institutional Support 2,879,871 21,356 44,265 19,867 39,940 4,543 20,379 3,030,221Indep Operations 2,426 305 15,451 18,182Nonassignable 6,413,374 100,479 127,459 208,996 34,822 219,622 197,242 7,301,994Total 17,937,009 605,812 781,871 583,509 434,095 881,260 996,271 22,219,827
Source: Office of Institutional Research
Building Location
Building Location
SPACE ASSIGNMENT BY ROOM USE AND BUILDING LOCATION(SQUARE FEET)
FALL 2017
SPACE ASSIGNMENT BY PROGRAM CLASSIFICATION AND BUILDING LOCATION(SQUARE FEET)
FALL 2017

94
UGA Fact Book 2017Physical Facilities
Percent ofNumber of Total Gross Total Square
Year Buildings Square Feet* FootagePre-1910 39 737,741 4.2 %1910-1959 95 3,792,978 21.41960-1984 128 4,827,107 27.31985-1994 51 1,661,846 9.41995-2004 89 3,969,621 22.42005-2014 44 1,938,831 11.02015-2017** 28 769,704 4.3Total 474 17,697,828 100.0 %
* Does not include leased space and space in some buildings acquired by the Universityafter construction.
** Does not include Phase III of the Terry Business Learning Community (36,050 sf) scheduledfor completion in 2017.
Source: Office of Institutional Research
Figure 22DISTRIBUTION OF SPACE BY BUILDING AGE
ATHENS CAMPUSFALL 2017
BUILDING SUMMARY BY YEAR OF COMPLETIONATHENS CAMPUS
FALL 2017
0-10 YRS13.0%
11-25 YRS27.0%
26-50 YRS22.1%
51-75 YRS21.7%
76-100 YRS11.5%
100+ YRS4.7%

95
UGA Fact Book 2017 Physical Facilities
Initial InitialBuilding Name Occupancy Building Name Occupancy
Aderhold Hall 1971 Denmark Hall* 1901Administration Building* 1907 Driftmier Engineering Center* 1965Ag and Environmental Services Laboratory 1997 Driftmier Engineering Center Annex 1968Amos Hall 2017 Ecology 1974Automotive Center 1971 Ecology Annex 1979Auxiliary Services Warehouse 2002 Edgar L. Rhodes Ctr for Animal & Dairy Sci 1998Baldwin Hall* 1938 Environmental Health Science* 1939Barrow Hall* 1911 Environmental Safety (Campus Mail) 1992
Barrow Hall Lab - 1936*; Addition - 1952* Family Housing Office 1970Benson Hall 2017 Family Science Center I* 1940Biological Sciences* 1960 Family Science Center II* 1940
Biological Sciences Addition - 1972 Fine Arts* 1941Bishop House (1837)* 1942 Fine Arts Scenery Workshop - 1988Bolton Dining Hall 2014 Foley Field Baseball Stadium 1990Botanical Garden Visitor Center/Conservatory 1985 Food Science* 1959 Horticultural Complex - 2010 Forest Resources* 1938Boyd Graduate Studies Research Center 1968 Forest Resources Additions - 1968, 1993Broad Street Studio 1 (1955)* 2001 Forestry Utilization Lab and Greenhouse 1991Broad Street Studio 2 (1949)* 2001 Fred C. Davison Life Sciences Complex 1989Broad Street Studio 3 (1949)* 2001 Founders House (Garden Club of Georgia)* 1850Brooks Hall* 1924 Garden Club of Georgia Headquarters 1998
Brooks Hall Addition - 1972 Geography/Geology* 1960Business Services (1939)* 1967 Geology Hydrothermal Lab* 1962Business Services Annex (1948)* 1969 Georgia Center for Continuing Education* 1956Butts-Mehre Heritage Hall 1987 Georgia Center Additions - 1966*, 1989 Expansion and Renovation - 2011 Georgia Center Auditorium - 1991Caldwell Hall 1981 Georgia Museum of Art 1995Candler Hall* 1901 Georgia Museum of Art Expansion - 2010Cedar Street Art* 1948 Gilbert Hall (1939)* 1942Center for Applied Genetic Technologies 2002 Gilbert Hall Addition - 1973Center for Applied Isotope Study 1981 Greenhouse Complex 1969Center for Molecular Medicine 2017 Hardman Hall* 1918Central Research Stores 1969 Hodgon Oil Building (1920)* 1990Ceramics Building 2010 Hoke Smith* (Cooperative Extension Service) 1937Chapel* 1832 Hoke Smith Annex* 1940Chemistry* 1960 Holmes/Hunter Academic* 1831
Chemistry Addition - 1971; Annex - 1997 Housing Research Center* 1940Chicopee Complex (1847)* 1980 Hudson Hall - Hlth Sci Campus (1961)* 2011Child Development Lab* 1940 Human Resources (1951)* 1971
Child Development Lab Addition - 1970 Instructional Plaza 1969Clark Howell Hall* 1936 International Education Building (1964)* 1967Cobb House (1938)* 1987 International Ed Building Renovation - 2011Coliseum Training Facility 2007 Jackson Street Building* 1961Complex Carbohydrate Research Center 2003 J. W. Fanning Building 2002Conner Hall* 1908 Joe Brown Hall* 1932
Conner Hall Renovation - 1975 Joe Frank Harris Commons 2004Consumer Research Center* 1940 Journalism 1969Correll Hall 2015 Journalism Renovation - 2010Dawson Hall* 1932 Law School* 1932
Dawson Hall Addition - 1971 Law School Add. - 1967*; Library Add. - 1981Dean Rusk Hall 1996 Law School Renovation - 2011Demosthenian Hall* 1824
(Date Constructed)* 50 years old and older
ACADEMIC AND ADMINISTRATIVE BUILDINGS DATE OF INITIAL OCCUPANCYATHENS CAMPUS, FALL 2017

96
UGA Fact Book 2017Physical Facilities
Initial InitialBuilding Name Occupancy Building Name Occupancy
Library, Main: Ilah Dunlap Little* 1952 Russell Hall - Hlth Sci Campus (1973) 2011Library, Main Addition - 1974 Sanford Hall 1997
Library, Science: Boyd Graduate Studies 1968 Sanford Stadium* 1929Life Sciences Fermentation Plant 1992 Expansion - 1967; Additions - 1981, 1991Livestock Instructional Arena 2001 School of Social Work (1901)* 2009Lucy Cobb (1858)* 1954 Science Learning Center 2016Lucy Cobb-Carriage House (1808)* 1954 Scott Hall - Hlth Sci Campus (1963)* 2011Lucy Cobb-Margaret Hall (1898)* 1954 Snelling Hall* 1940Lucy Cobb-Carl Vinson Hall 1991 Renovation - 1969; Addition - 1979Lucy Cobb-Seney-Stovall Chapel (1882)* 1954 Soil Testing Lab 1970Lumpkin House* 1850 Soil Testing Lab Addition - 1989Lustrat House* 1847 South Milledge Turfgrass Research Facility 2014Main Art Building 2006 Statistics/Computing Services/Museum* 1958Marine Sciences/Dance* 1928 Statistics/ Computing Svcs Addition - 1970
Addition - 1969 Museum Addition - 1990Meigs Hall* 1905 Museum Annex A - 1968; Annex B - 1969Memorial Hall* 1923 Stegeman Coliseum* 1964Military: Army ROTC* 1931 Stegeman Coliseum Renovation - 2010Milledge Hall* 1921 Structural Engineering Testing Hub 2013Miller Hall - Hlth Sci Campus (1917)* 2011 Tanner Building (1912)* 1997Miller Plant Sciences 1972 Tate Student Center 1983Moore College* 1874 Tate Expansion - 2009Moore-Rooker Hall 2017 Tennis Hall of Fame 1984Music Building 1995 Terrell Hall* 1904New College* 1823 Thomas Street South (1890)* 1968 New College Renovation - 2010 Thomas Street Studio 1976Old College* 1806 Thomas Street Sculpture 1992 Old College Renovation - 2006 Training and Development Center 1984Park Hall* 1938 Training and Dev. Ctr Addition - 1999
Park Hall Addition - 1970 Treanor House (1850)* 1987Paul D. Coverdell Ctr for Biomed. & Hlth Sci. 2005 Tucker Hall* 1961Peabody Hall* 1913 University Bookstore 1968Performing Arts Center 1995 University Bookstore Addition - 1987Pharmacy South 2007 University Foundation Building (1964)* 1990Phi Kappa Hall* 1834 University Health Center 1998Physics* 1959 University Health Center Addition - 2009
Addition - 1969; Renov. & Expansion - 2009 Veterinary BioResources Facility 2004Poultry Diagnostic and Research Center* 1953 Veterinary Medicine* 1949
Addition - 1998 Veterinary Medicine Additions - 1973, 1979Poultry Science* 1960 Veterinary Medicine Animal Resources 1991President's House (1856)* 1949 Veterinary Medicine Diagnostic Lab - Athens 2001
President's House Renovations - 1956*, 2010 VMC Veterinary Education Center 2015Printing 1977 VMC Veterinary Teaching Hospital 2015Psychology 1969 Visitors Center / Four Towers* 1937Ramsey Student Physical Activities Center 1995 Waddel Hall* 1821Rankin M. Smith, Sr. Stud Athl Acad Center 2002 Whitehall Office Complex 2013Rhodes Hall - Hlth Sci Campus (1906)* 2011 Wildlife Health 1971Richard B. Russell Special Collections Library 2007 Winnie Davis Hall - Hlth Sci Campus (1902)* 2011Riverbend Research North 1974 Wray-Nicholson House (1860)* 2000Riverbend Research South 1989 Zell B. Miller Learning Center 2003River's Crossing (1972) 1996 240 S. Hull Street (1910)* 2000Robert C. Wilson Pharmacy Building* 1964 290 S. Hull Street (1910)* 2000
(Date Constructed)* 50 years old and olderSource: Office of Institutional Research
CONT'D: ACADEMIC AND ADMINISTRATIVE BUILDINGS, FALL 2017

97
UGA Fact Book 2017 Physical Facilities
ProjectDate
CompletedTotal Project
Costs
Rock Eagle Cabin Replacement, 1/2016 2,750,000 b 2,750,000 Cabins 49-54Tift Building Renovation, Tifton Campus 5/2016 4,700,000 b 4,700,000Science Learning Center 7/2016 48,000,000 b 48,000,000Pharmacy in Augusta 8/2016 2,100,000 ig 1,600,000 p 3,700,000Redcoat Practice Field Upgrade 8/2016 260,000 ig 190,000 p 450,000CVM Center for Vaccine Development 8/2016 1,800,000 ig 3,500,000
1,700,000 b
Health Sciences Campus Renovation 9/2016 2,950,000 ig 2,950,000 (Commissary Building)
Total 2016 $0 $64,260,000 $1,790,000 $66,050,000
Griffin Food Product Innovation & 1/2017 1,880,000 f 3,500,000 b 1,000,000 p 7,380,000 Commercialization Center 1,000,000 ig
Indoor Athletic Facility 1/2017 30,200,000 a 30,200,000Sapelo Island Main Lab Infrastructure 4/2017 876,000 m 876,000 RenovationAmos, Benson, & Moore-Rooker Halls 6/2017 49,000,000 b 14,000,000 p 63,000,000Baldwin Hall Expansion/Renovation 7/2017 7,750,000 b 8,750,000
1,000,000 ig
Center for Molecular Medicine 7/2017 17,000,000 b 5,000,000 p 25,000,0003,000,000 a
Turfgrass Research & Education 7/2017 9,450,000 b 9,450,000 Facility (Griffin)Clark Howell Hall Renovation 8/2017 5,000,000 b 6,000,000
1,000,000 ig
Soccer Grandstands & Press Box 8/2017 4,575,000 a 4,575,000 ReplacementTurfgrass Research & Education 8/2017 2,050,000 b 2,050,000 Facility (Athens & Tifton)
Total 2017 $157,281,000
a Athletic Association f Federal Funds m MRR Fundsae Auxiliary Enterprises ig Internal UGA Gen Funds p Private Giftsb Bond
Source: Office of the Vice President for Finance and Administration
$135,401,000 $20,000,000
MAJOR BUILDING PROJECTS BY DATE OF COMPLETION2016 - 2017
University & State Funds Other Funds
$1,880,000
Federal Funds

98
UGA Fact Book 2017Physical Facilities
Project
Estimated Completion
DateTotal Project
Costs
Stegeman Coliseum Interior 9/2017 6,466,000 a 6,466,000 Improvements - Phase IIRock Eagle Cabin Replacement, 10/2017 4,400,000 b 4,400,000 Cabins 43-48ADS Building Renovation, 12/2017 5,000,000 b 5,000,000 Tifton CampusBoyd Golf Clubhouse 12/2017 4,350,000 a 4,350,000 Renovation/AdditionLake Herrick Phase I: Oconee 2/2018 439,000 ig 140,000 p 579,000 Forest Pond RestorationLake Herrick Phase II: Lake 4/2018 198,000 ig 442,000 p 640,000 Herrick Shoreline EnhancementRussell Hall Renovation 6/2018 44,500,000 ae 44,500,000Sanford Stadium West End 7/2018 63,000,000 a 63,000,000 ImprovementsSkidaway Island Barn Bio Lab 7/2018 3,000,000 b 3,000,000 RenovationTerry Business Learning 7/2019 20,300,000 b 21,700,000 p 42,000,000
Community, Phase III
Total $0 $151,653,000 $22,282,000 $173,935,000
ProjectTotal Project
Costs
4,000,000 p 4,000,000
1,025,000 p 1,025,000
252,000 m 604,000 p 921,00065,000 ig
13,850,000 ae 13,850,00045,000,000 b 65,000,00020,000,000 ig
5,000,000 b 5,000,0002,543,000 b 3,450,000
907,000 ig
2,650,000 ae 2,650,000
Total $0 $90,267,000 $95,896,000
a Athletic Association b Bond m MRR Fundsae Auxiliary Enterprises ig Internal UGA Gen Funds p Private Gifts
Source: Office of the Vice President for Finance and Administration
University & State Funds Other Funds
$5,629,000
MAJOR BUILDING PROJECTS
CURRENTLY UNDER CONSTRUCTION, FALL 2017
AUTHORIZED PROJECTS IN DESIGN PHASE, FALL 2017
Federal Funds
University & State Funds Other Funds
Federal Funds
Alice B Richards Children's Garden at theState Botanical Garden
Dundee Community Association Mule Barn Café, Griffin Campus
Family & Consumer Sciences House B
Georgia Center ImprovementsInterdisciplinary STEM Building
Poultry Science Research FacilitiesRock Eagle Cabin Replacement, Cabins 38-42
UHC Blue & Green Clinic Renovation

99
UGA Fact Book 2017 Physical Facilities
Land Holdings County Acreage Land Holdings (cont.) County AcreageThe University of Georgia Campus Cooperative Extension Service
Main Campus Clarke 767 Bamboo Farm & Coastal Gdns Chatham 50Health Sciences Campus Clarke 56 Burton 4-H Center Chatham 7Related Areas Clarke/Oconee 738 Fortson 4-H Center Henry/Clayton 76
Total Acres 1,561 Rock Eagle 4-H Center Putnam 1,474Botanical Garden Clarke/Oconee 319 4-H Youth Development Ctr Jasper 112College Station Wahsega 4-H Camp Lumpkin 30
Double Bridges Farm Clarke/Oglethorpe 233 Vidalia Onion & Vegetable Research Toombs 142Dairy Cattle Rsrch Farm (Sams) Clarke/Oglethorpe 557 Center/Page NurseryAnimal Science Farm Clarke 226 Total Acres 1,891Poultry Research Center Clarke 85 College of Arts & SciencesBeef Cattle Rsrch Farm (Clarke) Clarke 109 Marine Res-Fisheries Ext, Brunswick Glynn 3Iron Horse Farm (Curtis) Greene/Oglethorpe 660 Singer-Moye Indian Mound Complex Stewart 248Plant Sci Farm-Hort (Durham) Oconee 90 Total Acres 251
School of EcologyTotal Acres 1,960 Horseshoe Bend - Ecology Rsch Clarke 61
Georgia Research and Education Centers Odom Watershed Madison 151Georgia Mountain Union 414 Marshlands Camden 1,162Northwest Georgia Floyd 904 McGarity Wetlands Jasper 137Northwest Georgia Gordon 676 Total Acres 1,511J. P. Campbell Oconee 1,055 College of Environment & DesignCentral Georgia Putnam 1,605 Wormsloe Plantation Chatham 15Central Georgia Morgan 95 Total Acres 15Attapulgus Research Farm Decatur 293 School of Forestry & Natural ResourcesSoutheast Georgia Burke 724 Oconee Forest Park Clarke 114Southwest Georgia Sumter 514 Whitehall Forest & An Support Flds Clarke 968
Total Acres 6,280 Nathaniel D. Arnold Memorial Clarke/Oconee 28Georgia Station Bishop F. Grant Memorial Forest Morgan/Putnam 12,612
Main Areas Spalding 950 Hardman Memorial Forest Park Jackson 462Bledsoe Farm Pike 151 Thompson Mill Forest Jackson 318Nix Property Pike 53 Central Georgia - Loyd Farm Jasper 209
Total Acres 1,154 Satilla River Forest Camden 1,517Coastal Plain Station Watson Springs Forest Greene 590
Main Areas Tift 1,871 Cohutta Fisheries Center Whitfield 64Bowen Farm Tift 75 Total Acres 16,882Gibbs Farm Tift 311 College of Veterinary MedicineLang Farm Tift 156 Barnett Shoals Farm Clarke 120Ponder Farm Tift 201 Avian Medicine - S. Milledge Clarke 21Rigdon Farm Tift 96 Poultry Diagnostic & Research Ctr Clarke 31Ponder Farm Worth 104 PDRC - Sikes Farm Clarke 8Range Grazing Station (Alapaha) Berrien 2,804 Riverbend Farm Clarke 51Hampton Farm Irwin 255 Animal Diagnostic Lab Tift 31
Total Acres 5,873 Wiley Farm Oconee 209Skidaway Island Chatham 710 Total Acres 471
Total Acres 710 Total UGA Land Holdings 38,878
Land Holdings County Acreage Land Holdings (cont.) County AcreageCortona Italy 2 School of Forestry & Natural ResourcesOxford England 1 Effingham County Effingham 3,252San Luis Costa Rica 169 Grady County Grady 1,018Washington, D.C. (Delta Hall) 1 Jackson County Jackson 13Hardin/Miller Stiles Properties Clarke 70 Lee/Sumter Counties Lee/Sumter 2,494Library Repository Facility Clarke 4 Lowndes County Lowndes 530School of Ecology, Broad River Madison 112 Oglethorpe County Oglethorpe 54
Total UGA Affiliated Foundations 7,720
Source: Office of the Vice President for Finance and Administration
UNIVERSITY OF GEORGIA LAND HOLDINGSAS OF JUNE 30, 2017
Various UGA Affiliated Foundations

100
UGA Fact Book 2017Physical Facilities

Campus Map and Legend

102
UGA Fact Book 2017LegendN
AM
EM
AP
BLD
G#
NA
ME
MA
PB
LDG
#N
AM
EM
AP
BLD
G#
NA
ME
MA
PB
LDG
#A
derh
old
Hal
lC
- 4,
D -
410
60EC
V-B
ldg
1516
E - 5
1516
Lind
sey
Hop
kins
Indo
orB
- 4
2623
Riv
erbe
nd R
srch
Lab
Nor
thE
- 621
25A
dmin
istra
tion
Bld
gC
- 1
0631
East
Vill
age
Dec
kE
- 515
10Te
nnis
Sta
dium
Riv
erbe
nd R
srch
Lab
Sou
thE
- 624
18A
g &
Env
iron
Srvc
s Lab
Vet
Med
2842
Ecol
ogy
C -
410
33Li
psco
mb
Hal
lB
- 2
2208
Riv
ers C
ross
ing
Col
l Sta
tion
2639
Alp
ha C
hi O
meg
aB
- 3
2218
Ento
mol
ogy
F - 6
2425
Live
stoc
k In
stru
c A
rena
So M
illed
ge15
04R
ooke
r Hal
lE
- 515
13A
lpha
Eps
ilon
PiD
- 4
2232
Envi
ron
Des
ign
Stud
ios
B -
107
66Lu
mpk
in H
ouse
C -
310
12R
usse
ll H
all
A -
222
12A
lpha
Psi
B -
422
55En
viro
n H
ealth
Sci
ence
sC
- 4
1050
Lust
rat H
ouse
C -
106
32R
usse
ll H
all (
HSC
)H
ealth
Sci
1909
Am
os H
all
B -
207
36En
viro
nmen
tal S
afet
yE
- 621
18M
ain
Libr
ary
C -
200
54R
uthe
rfor
d H
all
B -
3, C
- 3
1215
Ani
mal
Hea
lth R
srch
Ctr
C -
4, D
- 4
1077
Faci
l Man
agem
ent S
outh
D -
416
42M
arin
e Sc
ienc
eC
- 3
1030
Sanf
ord
Hal
lC
-200
58A
uxili
ary
Serv
ices
B -
321
19Fi
ne A
rts B
uild
ing
C -
200
60M
ary
Lynd
on H
all
B -
3, C
- 3
1221
Sanf
ord
Stad
ium
C -
2, C
- 3
0678
Bal
dwin
Hal
lD
- 2
0050
Fole
y B
aseb
all S
tad
A -
4, B
- 4
1685
McP
haul
Chi
ld D
evel
Lab
B -
4, C
- 4
1652
Scho
ol o
f Soc
ial W
ork
Bld
gD
- 2
0033
Bar
row
Hal
lC
- 3
1021
Food
Sci
ence
Bld
gD
- 3
1020
McW
horte
r Hal
lE
- 515
15Sc
ienc
e Le
arni
ng C
trC
- 4
1035
Ben
son
Hal
lB
- 2
0735
Fore
stry
Res
ourc
es 1
C -
410
40M
eigs
Hal
lC
- 1
0024
Scie
nce
Libr
ary
C -
316
21B
iolo
gica
l Sci
ence
s Bld
gC
- 3,
D -
310
00Fo
rest
ry R
esou
rces
2C
- 4
1140
Mel
l Hal
lB
- 2
2209
Scot
t Hal
lH
ealth
Sci
1908
Bis
hop
Hou
seC
- 1
0032
Fore
stry
Res
ourc
es 3
C -
410
44M
emor
ial H
all
C -
206
70Se
rvic
e Le
arni
ngA
- 3
2627
Bog
gs H
all
B -
322
16Fo
rest
ry R
esou
rces
4C
- 4
1046
Mili
tary
Bld
g-A
rmy
RO
TCC
- 2
0061
Sigm
a D
elta
Tau
A -
422
20B
olto
n D
inin
g C
omm
ons
B -
222
65Fo
unde
rs H
ouse
C -
206
50M
illed
ge H
all
D -
202
71Si
gma
Nu
D -
322
91B
otan
ical
Gar
den
Vis
Ctr
So M
illed
ge23
35Fo
ur T
ower
sD
- 5
2835
Mill
er H
all
Hea
lth S
ci19
02Sn
ellin
g D
inin
g H
all
C -
316
43B
otan
y G
reen
hous
esC
oll S
tatio
n24
15Fr
ankl
in H
ouse
C -
100
05M
iller
Pla
nt S
cien
ces
C -
410
61So
ule
Hal
lC
- 3
1220
Boy
d G
radu
ate
Rsr
ch C
trC
- 3
1023
Geo
grap
hy a
nd G
eolo
gyC
- 3
1002
Moo
re C
olle
geC
- 1
0025
Sout
h C
ampu
s Dec
kB
- 3
1139
Bro
oks H
all
C -
100
55G
eol H
ydro
ther
mal
Lab
C -
200
90M
oore
-Roo
ker H
all
B -
2 07
36Sp
ec T
owns
Tra
ckB
- 4
1667
Bro
wn
Hal
lH
ealth
Sci
1907
Geo
rge
D. B
usbe
e H
all
E - 5
1512
Mor
ris H
all
B -
222
04Sp
eirs
Hal
lC
- 3
1010
Bru
mby
Hal
lA
- 2
2213
Geo
rge
Hal
lH
ealth
Sci
1910
Mye
rs H
all
B -
312
22St
aff T
rain
ing
& D
evel
opD
- 1
2685
Bus
ines
s Ser
vice
sC
- 1
0110
Geo
rgia
Ctr
for C
ont E
dB
- 3,
B -
416
40N
atur
al H
isto
ry M
useu
mD
- 3
1130
Stat
& C
ompu
ter S
rvcs
D -
311
30B
usin
ess S
ervi
ces A
nnex
C -
101
21G
eorg
ia M
useu
m o
f Art
D -
416
93N
ew C
olle
geC
- 1
0030
Steg
eman
Col
iseu
mB
- 4
1654
But
ts-M
ehre
Bui
ldin
gA
- 4
1671
Gilb
ert H
all
C -
106
40N
orth
Cam
pus D
eck
C -
1, D
- 1
0122
Tann
er B
ldg
C -
101
23C
aldw
ell H
all
C -
100
46G
over
nmen
t Rel
atio
nsB
- 1
0756
Ogl
etho
rpe
Din
ing
Com
mon
sB
- 3
2257
Tate
Ctr
Park
ing
Dec
kC
- 2
0669
Cam
pus T
rans
it Fa
cilit
yD
- 8
1637
Har
dman
Hal
lC
- 3
1031
Ogl
etho
rpe
Hou
seB
- 3
2217
Tate
Stu
dent
Ctr
C -
206
72C
andl
er H
all
C -
100
31H
enry
Fei
ld T
enni
s Sta
dB
- 4
2622
Old
Col
lege
C -
101
30Ta
u Ep
silo
n Ph
iD
- 3
2292
Car
lton
Stre
et D
eck
B -
411
10H
ill H
all
B -
222
14O
meg
a Ta
u Si
gma
B -
422
56Te
nnis
Hal
l of F
ame
B -
416
70C
arne
gie
Libr
ary
Mus
eum
Hea
lth S
ci19
04H
irsch
Hal
lC
- 1
0043
Park
Hal
lC
- 2
0056
Terr
ell H
all
C -
100
23C
tr fo
r App
Gen
etic
Tec
hF
- 624
38H
odgs
on O
il B
ldg
D -
100
19Pa
ul D
. Cov
erde
ll C
trB
- 4,
C -
411
11Th
omas
Stre
et A
rt C
mpl
xD
- 1
Ctr
for A
pp Is
otop
e St
dyE
- 621
27H
oke
Smith
Ann
exB
- 4
1042
Payn
e H
all
D -
202
70Tr
ansg
enic
Pou
ltry
So M
illed
ge28
70C
tr fo
r Mol
ecul
ar M
edic
ine
E - 7
2395
Hol
mes
/Hun
ter A
cad
Bld
gC
- 1
0120
Peab
ody
Hal
lC
- 1
0042
Trea
nor H
ouse
B -
316
57C
entra
l Foo
d St
orag
eE
- 621
22H
udso
n H
all
Hea
lth S
ci19
11Pe
rfor
min
g A
rts C
trD
- 4
1692
Tuck
er H
all
D -
412
50C
eram
ics
D -
421
31H
ugh
Hod
gson
Sch
of M
usD
- 4,
E -
416
91Pe
rfor
min
g A
rts C
tr D
eck
D -
416
99Tu
rner
Soc
cer C
mpl
xSo
Mill
edge
1807
Cha
pel
C -
100
22H
ull S
treet
Dec
kB
- 2
0082
Phar
mac
y So
uth
C -
410
38U
GA
Gol
f Cou
rse
So M
illed
geC
hem
istry
C -
310
01H
uman
Res
ourc
esC
- 1
0620
Phi D
elta
The
taD
- 3
2296
UG
A H
ealth
Cen
ter
D -
517
01C
hem
istry
Ann
exC
- 3
1004
Indo
or A
thle
tic F
acili
tyB
- 4
1671
Phi K
appa
Hal
lC
- 1
0020
Uni
vers
ity A
rchi
tect
sC
- 1
0113
Chi
cope
e C
mpl
xE
- 0, E
- 1
Inst
ruct
iona
l Pla
zaC
- 2
0066
Phys
ics B
uild
ing
C -
310
03U
nive
rsity
Boo
ksto
reC
- 2
0671
Chu
rch
Hal
lB
- 2,
B -
322
15In
terio
r Des
ign
Stud
ios
B -
107
67Pi
Kap
pa A
lpha
D -
322
94U
nive
rsity
Chi
ld C
are
Ctr
Hea
lth S
ci19
21C
lark
How
ell H
all
B -
2, C
- 2
0290
Inte
rnat
iona
l Edu
c B
ldg
A -
422
19Po
ultry
Dia
g R
srch
Ctr
Col
l Sta
tion
2300
Uni
vers
ity V
illag
eC
- 5
Clu
b Sp
orts
Com
plex
So M
illed
geIn
tram
ural
Fie
lds D
eck
D -
629
72Po
ultry
Hou
ses
Vet
Med
Uni
v V
illag
e C
omm
unity
Off
ice
B -
622
38C
obb
Hou
seB
- 3
1656
J.W. F
anni
ng B
ldg
B -
316
75Po
ultry
Sci
ence
D -
310
13V
andi
ver H
all
E - 5
1514
Col
iseu
m T
rain
Fac
ility
B -
416
87Ja
ck T
urne
r Sof
tbal
l Sta
dSo
Mill
edge
1802
Poul
try S
cien
ceSo
Mill
edge
Veh
icle
Tra
nspo
rt &
Mai
ntE
- 7
1634
Com
plex
Car
b R
sch
Ctr
E - 7
2419
Jack
son
Stre
et B
uild
ing
C -
1, D
- 1
0040
Poun
d H
all
Hea
lth S
ci19
06V
eter
inar
y M
edic
al C
trV
et M
edC
onne
r Hal
lC
- 3
1011
Joe
Fran
k H
arris
Com
mon
sD
- 5
1511
Psyc
holo
gy B
ldg
C -
2, D
- 2
0064
Vet
erin
ary
Med
icin
eC
- 4
1070
Coo
p Ex
t-Hok
e Sm
ithB
- 4
1043
Jose
ph E
. Bro
wn
Hal
lC
- 2
0250
Qua
rters
BH
ealth
Sci
1901
Vet
Med
-Bio
Res
ourc
esC
- 5
1084
Cor
rell
Hal
lB
- 2
0739
Jour
nalis
m B
uild
ing
C -
200
62R
ober
t C. W
ilson
Pha
rmac
yC
- 4
1041
Vet
Med
-Dia
gnos
tic L
abC
- 4
1079
Cre
swel
l Hal
lB
- 2
2211
Kap
pa S
igm
a Fr
ater
nity
D -
322
33R
amse
y St
uden
t Ctr
D -
516
90V
isito
rs C
ente
rD
- 5
2835
Dan
Mag
ill T
enni
s Cm
plx
B -
4La
ke H
erric
k Pa
vilio
nD
- 6
2440
Ran
kin
M. S
mith
Stu
dent
B -
416
73W
adde
l Hal
lC
- 1
0041
Dan
ceC
- 3
1030
Lam
ar D
odd
Scho
ol o
f Art
D -
4, E
- 4
1694
Ath
lete
Aca
d C
trW
est C
ampu
s Dec
kA
- 3
2136
Dav
ison
Life
Sci
Cm
plx
D -
410
57La
t Am
er &
Car
ib S
tud
Inst
B -
107
53R
edco
at B
and
Fiel
dC
- 7
Whe
eler
Hal
lH
ealth
Sci
1915
Daw
son
Hal
lC
- 3
1010
Law
Lib
rary
Ann
exC
- 1
0043
Ree
d H
all
C -
2, D
- 2
0280
Whi
teha
ll Fo
rest
So M
illed
geD
ean
Rus
k H
all
C -
100
45La
w S
choo
l Add
ition
C -
100
43R
hode
s Ani
mal
Sci
Ctr
- AD
-5,
E - 5
1501
Wild
life
Hea
lthC
- 5
1082
Dem
osth
enia
n H
all
C -
100
21Le
arni
ng A
llyB
- 2
2614
Rho
des A
nim
al S
ci C
tr - B
E - 5
1502
Win
nie
Dav
is H
all
Hea
lth S
ci19
03D
enm
ark
Hal
lC
- 1
0044
LeC
onte
Hal
lC
- 2
0053
Rho
des A
nim
al S
ci C
tr - C
E - 5
1503
Wra
y-N
icho
lson
Hou
seB
- 1
0751
Dra
win
g &
Pai
ntin
g St
udio
B -
107
68Le
gion
Poo
lB
- 2
2604
Rho
des H
all
Hea
lth S
ci19
05W
right
Hal
lH
ealth
Sci
1912
Drif
tmie
r Eng
inee
ring
Ctr
C -
510
90Li
brar
y R
epos
itory
So M
illed
ge24
96R
icha
rd B
. Rus
sell
Spec
ial
B -
207
40Ze
ll B
. Mill
er L
earn
ing
Ctr
C -
200
81Ea
st C
ampu
s Dec
kD
- 5
1698
Col
lect
ions
Lib
rary

103
UGA Fact Book 2017 Campus Map
!
!
!
!
!
!
!
!
!
!
!
!
!
!
!
!
!
!
!
!
!
!
!
!
!
!
!
!
!
!
!
!
!
!
!
!!
!
!
!
!
!
!
!
!
!
!
!
!
!
!
!
!
!
!
!
!
!
!
!
!
!
!
!
!
!
!
!
!
!
!
!
!
!
!
!
!
!
!
!!
!
!
!
!
!
!
!
!
!
!
!
!
!
!
!
!
!
!
!
!
!
!
!!
!
!!
!!
!!
!!
!
!
!!!
!
!
!
!
!
!
!
!
!
! ! ! ! ! ! !! ! ! !
!
!!
!
!
!
!
!
!
!
!
!
!
!
!
!
!
!
!
!
!
!
!
!
!
!
!!
!
!
!
!!
!!
!
!
!
!
!
!
!
!!
!
!
!
!
!
!
!
!
!!
!
!
!
!
!
!
!
!
!
!
!
!
!!
!
!
!
!
!
!
!
!
!
!
!
!
!
!
!
!
!
!
!
!
!
!
!
!
!
!
!
!
!
!
!
!
!
!
!
!
!
!
!
!
!
!
!
!
!
!
!
!
!
!
!
!
!
!!
!
!
!
!
!
!
!
!!
!
!
!
!
!
!
! !
!
!
! !
!
!
!
!
!
!
!
!
!
!
!
!
!
!
!
!
!
!
!
!
!
!
!
!
!
!
!
!
!
!! !
!
!
!
!
!
!
!
!
!
!!
!!
!!!!!!!!
!
!
!
!
!
!
!
!
!
!
!
!
!
!
!
!!
!
!!
!
!
!
!
!
!
!
!
!
!
!
!
!
!
!
!
!
!!
!
!
!
!
!
!
!
!
!
!
!
!
!
!
!
!
! !
!
!
!
!
!!
!
!
!
!
!
!
!
!
!
!
!
!
!
!
!
!
!
!
!
!
!
!
!
!
!
!
!
!
!
!!
!
!!
!
!
!
!
!
!
!
!
!
!
!
!
!
!
!
!
!
!
!
!
!
!
!
!
!
!
!
!
!
!
!
!
!
!
!!
!
!
!
!
!
! !
!
!
!
!
!
!
!
!
!
!
!
!
!
!
!
!
!
!
!!
!
!
!
!
!
!
!
!
!
!
!
!
!
!
!
!
!
!
!
!
!
!
!
!
!
!
!
!
!
!
!
!
!
!
! !
!
!
!
!
!
!
!
!
!
!
!
!
!
!
!
!
!
!
!
!
!
!
!
!
! !
!!
!!
!!
!!
!!
!
!
!
!
!
!
!
!
!
!
!
!
!
!
!
!
!
!
!
!
!
!
!
!
!
!
!!
!
!
!!
!
!
!
!
!
!
!!!
!
!
!
!
!
!
!
!
! ! ! !
!
!
!
!
!
!
!
!
!
!
!
!
!
!
!!
!
!
!!
!
!
!
!
!
!
!
!
!
!
!
!
!
!
!
!
!
!
!
!
!
!!
!
!
!
!
!
!
!
!
!
!
!
!
!
!
!
!
!
!!
!
!
!! !
!
!!!
!
!
!
!
!
!
! !
!!
!!
!
!
!
!
!
!
!
!!
!
!
!
!
!
!
!
!
!
!
!
!
!
!
!
!
!
!
!
!
!
!!
!
!
!
!
!
!
!
!
!
!
!
!
!
!
!
!
!
!
!
!
!
!
!
!
!
!
!
!
!
!
!!
!
!
!
!
!
!
!
!
!
!
!
!
!
!
!
!
!
!
!
!
!
!
!!!
!
!
!
!
!
!
!!
!!!
!
!
!
!
!
!
!!
!!
!!
!!!!!!!
!!
!!
!
!!
!!
!
!!
!
!
!
!
!
!
!
!
!
!
!
!
!
!
!
!
!
!
!
!
!
!
!
!
!
!
!
!
!
!
!
!
!
!
!
!!
!!
!!
!
!
!
!
!
!
!
!
!
!
!
!
!
!
!!
!!
!
!
!
!
!
!
!
!
!
!
!
!
!
!!
!! !
!
!
!!
!
!!
!
!
!!
!
!
!
!
!
! !
!
!
!
!
!!
!
!
!
!
!
!
!!
!
!!
!!
!!
!
!
!
!
!
!
!
!
!
!
!
!
!
!
!
!
!! !
!! !
!
!
!
!
!
! ! !!
!
!
! !
!
!
!
!!
!
!!!!!
!!
!!
!
!!
!
!
!
!
!
!!
!
!
!
!
!
DWBrooksMall
Jack
son
Stre
etC
emet
ery
LA
KE
HE
RR
ICK
Woo
druf
fFi
eld
Spec
Tow
ns T
rack
Fole
y B
aseb
all
Fiel
d
Fam
ily &
Gra
duat
e H
ousi
ngU
nive
rsity
Vill
age
Fam
ily &
Gra
duat
e H
ousi
ng /
Bra
ndon
Oak
s
Fam
ily &
Gra
duat
e H
ousi
ng /
Rog
ers
Roa
d
Uni
vers
ity V
illag
eC
omm
unity
Offi
ce
Intr
amur
al F
ield
s
Lake
Her
rick
Pavi
lionO
cone
e H
illC
emet
ery
Fam
ily &
Gra
duat
e H
ousi
ngU
nive
rsity
Vill
age
RIV
ERB
END
RD
Bot
any
Gre
enho
uses
Gre
enho
uses
Riv
erbe
ndR
esea
rch
Lab
Nor
th
Riv
erbe
ndR
esea
rch
Lab
Sout
h
Cen
ter f
or
App
lied
Isot
ope
Stud
y
Cen
tral
Foo
dSt
orag
eEn
viro
nmen
tal S
afet
y Se
rvic
es/
Cam
pus
Mai
l
Cen
ter f
or A
pplie
dG
enet
ic T
echn
olog
ies
Vehi
cle
Tran
spor
tatio
n&
Mai
nten
ance
CC
RC
Uni
vers
ityH
ealth
Cen
ter
CA
ES
Act
ivity
Cen
ter
Visi
tors
Cen
ter
(Fou
r Tow
ers)
Rho
des
Ani
mal
Scie
nce
Cen
ter
East
Cam
pus
Dec
kR
amse
yC
ente
r
Joe
Fran
k H
arris
Com
mon
s
East
Villa
geD
eck
Lam
ar D
odd
Scho
ol o
f Art
Hug
h H
odgs
onSc
hool
of M
usic
Geo
rgia
M
useu
m
of A
rtPerf
orm
ing
Art
s
NO
RT H
OC
O N E E R I V E R
Bui
ldin
g 21
30
RIV
ERRD
Poul
try
Scie
nce Fo
odSc
ienc
e
Sanf
ord
Stad
ium
Tate
Stu
dent
Cen
ter
FIEL
DST
SANFORDDR
Phys
ics
Che
mis
try
CC
QC
Bio
logi
cal
Scie
nces
Mye
rs
Mar
yLy
ndon
Rut
herf
ord
Daw
son
Soul
e Scie
nce
Libr
ary
Boy
dG
rad
Stud
ies
Sout
hD
eck
Geo
rgia
Cen
ter
For C
ontin
uing
Educ
atio
n
Ogl
etho
rpe
Din
ing
Com
mon
s
Dan
ceSn
ellin
gD
inin
gC
omm
ons
Mar
ine
Scie
nce
McP
haul
Chi
ldD
evel
opm
ent
Steg
eman
Col
iseu
mM
iller
Pla
ntSc
ienc
es
Ade
rhol
dDav
ison
Life
Scie
nces
Ecol
ogy
Wils
onPh
arm
acy
Fore
stry
Res
ourc
es
Envi
ronm
enta
lH
ealth
Scie
nces
Har
dman
Faci
litie
sM
anag
emen
tSo
uth
EITS
/Sta
tistic
s/N
atur
al H
isto
ry
CARLTON ST
EAST
GR
EEN
STU
S Fo
rest
Serv
ice
Ani
mal
Hea
lthR
esea
rch
Cen
ter
Cov
erde
llC
ente
r
Car
lton
Stre
etD
eck
Dan
Mag
illTe
nnis
Com
plex
Ran
kin
M. S
mith
Stud
ent A
thle
teA
cade
mic
Cen
ter
Lind
sey
Hop
kins
Indo
or T
enni
sSt
adiu
m
Wild
life
Hea
lth
Drif
tmie
rEn
gine
erin
gC
ente
r
Vete
rinar
yM
edic
ine
But
ts-M
ehre
Bui
ldin
g
LUM
PKIN
ST
PINECREST DRRU
THER
FORD
ST
SMITH ST
DWBROOKSDR
AGRICULTURE DR
SOU
THVI
EWD
R
RIVERRD
Tuck
er
CED
AR
ST
SOU
LEST
WES
TG
REE
NST
DW BROOKS DRCon
ner
Lum
pkin
Hou
se Bar
row
Cla
rkH
owel
lG
eolo
gyLa
b
Zell
B. M
iller
Lear
ning
Cen
ter
Boo
ksto
re
Ree
dMill
edgePa
yne
Mem
oria
lH
all
Inst
ruct
iona
lPl
aza
Jour
nalis
m
Psyc
holo
gyM
ilita
ryFi
ne A
rts
Bal
dwin
Mai
nLi
brar
y
Hirs
chH
all
Jack
son
Stre
etB
uild
ing
Peab
ody
Old
Col
lege
New
Col
lege
Law
Libr
ary
Gilb
ert
Can
dler
Mei
gsM
oore
Bro
oks
Park
Joe
Bro
wn
LeC
onte
Sanf
ord
Dea
nR
usk
Foun
ders
Mem
oria
lG
arde
nDen
mar
k
Cal
dwel
l
S HERTY DR
JACKSON ST
THOMAS ST
BA
LDW
INS
T
HO
OPE
RST
EAST CAMPUS RD
BA
XTER
ST
Hul
l Str
eet
Dec
k Lips
com
bM
ell
Legi
onPo
ol
Cre
swel
l
Hill
Chu
rch
Chu
rch
Bog
gs
CLOVERHURSTAVE
CHURCH STBru
mby
Rus
sell
Wes
tC
ampu
sD
eck
Ogl
etho
rpe
Hou
se
FINLEY ST
Trea
nor
Hou
se
JW F
anni
ngB
uild
ing
Aux
iliar
ySe
rvic
es
N HERTY DR
BR
OA
DST H
olm
es/H
unte
rA
cade
mic
Dem
osth
enia
nC
hape
l
Phi
Kap
pa
Terr
ell
Adm
inis
trat
ion B
isho
p
Wad
del
Lust
rat
Hum
anR
esou
rces
Bus
ines
sSe
rvic
esA
nnexB
usin
ess
Serv
ices
OU
A
Thom
asSt
reet
Art
Com
plex
Tann
er
Trai
ning
&D
evel
opm
ent
Cen
ter
Chi
cope
e C
ompl
ex
EB
RO
AD
ST
Mor
ris
Wra
y-N
icho
lson
Hou
se(A
lum
ni A
ssoc
iatio
n)
LAC
SI
Envi
ronm
enta
lD
esig
nSt
udio
sD
raw
ing
&Pa
intin
gSt
udio
sIn
terio
rD
esig
nSt
udio
s
WR
AY
ST
WA
DD
ELL
ST
HULL STATHENSPERIMETER/LOOP10
Nor
thD
eck
Lear
ning
Ally
Coo
p E
xt S
ervi
ce/H
oke
Smith
Hok
e Sm
ithA
nnex
Geo
rge
D.
Bus
bee
Hal
lM
cWho
rter
Hal
l
Roo
ker
Hal
l
Vand
iver
Hal
l
T A N Y A R D C RE
EK
Gov
ernm
ent
Rel
atio
ns
B
A
C
D
J
K
L
E
F
G
H
1260
Sou
thLu
mpk
in S
t.
Sigm
aD
elta
Tau
Inte
rnat
iona
lEd
ucat
ion
Bui
ldin
g
Offi
ce o
fSe
rvic
e-Le
arni
ng
Cob
bH
ouse
Alp
haC
hiO
meg
a
Kap
paSi
gma
Alp
haEp
silo
nPi
Bio
Res
ourc
es
1
2
6
Loco
mot
ive
Dia
gnos
ticC
ente
r11
10
Com
m.
Prac
tice
Clin
ic
1312
5A5D5C
Om
ega
Tau
Sigm
a
Alp
haPs
i
MT
U V
N
P
Q
R
Oco
nee
Fore
st P
ark
Spei
rs
Hod
gson
Oil
Bui
ldin
g
CO
LLEG
EST
ATI
ON
RD
A
B
C
Col
iseu
mTr
aini
ngFa
cilit
y
Hos
chLa
wLi
brar
yA
nnex
Vete
rinar
yD
iagn
ostic
La
bLaw
Scho
ol
Dow
ntow
n A
then
sA
cade
mic
Plan
ning
EC
LAYT
ON
ST
Phar
mac
y So
uth
Tate
Cen
ter
Dec
k
Scho
ol o
fSo
cial
Wor
kB
uild
ing
WILLIAMSST
PAC
D
eck
Intr
amur
al F
ield
sD
eck
1516
Faci
litie
sM
gmt.
East
Geo
grap
hy/
Geo
logy
The
Red
coat
Ban
dPr
actic
e Fi
eld
Geo
rgia
Qua
d
Tria
lG
arde
ns
Sigm
aN
uTa
u Ep
silo
nPh
iPi
Kap
paA
lpha
Phi D
elta
Thet
a
CARLTONST
Rus
sell
Spec
ial
Col
lect
ions
Bui
ldin
g
Cer
amic
s
LakeHerrickDr
EASTCAMPUSRDRee
dPl
aza
Dis
tric
t Ene
rgy
Plan
t #1
Bol
ton
Din
ing
Com
mon
s
Cor
rell
Hal
l
Scie
nce
Lear
ning
Cen
ter
Indo
orA
thle
ticFa
cilit
y
Am
osH
all
Ben
son
Hal
l
Moo
re-
Roo
ker
Hal
l
CM
M
AB
CD
EF
654321
"7
050
025
0Fe
et
UG
A G
IS
AB
CD
EF
7654321
MA
IN C
AM
PU
S M
AP
Aug
ust 2
017
LE
GE
ND
ACC
Bui
ldin
gs
Rai
lroad
UG
A B
uild
ings
Side
wal
ks
Rec
reat
ion
Are
as
Wat
er F
eatu
res
UG
A P
rope
rty
Park
ing
Are
as
!
!
!
!

103
UGA Fact Book 2017 Campus Map
Figure 23THE UNIVERSITY OF GEORGIA
ATHENS CAMPUS MAP
additional maps on the back page

!
!
!
!
!
!
!
!
!
!
!
!
!
!
!
!
!
!
!
!
!
!
!
!
!
!
!
!
!
!
!
!
!
!
!
!
!
!
!
!
!
!
!
!
!
!
!
!
!
!
!
!
!
!
!
!
!
!
!
!
!
!
!
!
!
!
!
!
!
!
!
!
!
!
!
!
!
!
!
!
!
!
!
!
!
!
!
!
!
!
!
!
!
!
!
!
!
!
!
!
!
!
!
!
!
!
!
!
!
!
!
!
!
!
!
!
!
!
!
!
!
!
!
!
!
!
!
!
!
!
!
!
!
!
!
!
!
!
!
!
!
!
!
!
!
!
!
Vet
erin
ary
Med
ical
Cen
ter
Ag
ricu
ltu
ral &
En
viro
nm
enta
lS
ervi
ces
Lab
ora
tori
es
Po
ult
ry H
ou
ses
CO
LL
EG
E S
TA
TIO
N R
D
BARNETT SHOALS RD
Th
e S
tati
on
S
Bo
tan
ical
Gar
den
V
isit
or’
s C
ente
r
Lib
rary
Rep
osi
tory
Liv
esto
ckIn
stru
ctio
nal
Are
na
Gre
enh
ou
ses
CA
ES
Clu
b S
po
rts
Co
mp
lex
Po
ult
ry S
cien
ce
Jack
Tu
rner
S
oft
bal
l S
tad
ium
Go
lf C
ou
rse
Wh
iteh
all F
ore
st
SOUTH MILLEDGE AVE
WH
ITEH
ALL
RO
AD
PHOENIX RD
SOUTH MILLEDGE AVE
WHITEHALL ROAD
Sta
teB
ota
nic
al G
ard
en
of
Geo
rgia
Tra
nsg
enic
Po
ult
ry
Tu
rner
So
ccer
C
om
ple
x
UG
A S
occ
er
Sta
diu
m
Bo
tan
y G
reen
ho
use
s
En
tom
olo
gy
Gre
enh
ou
ses
Cen
ter
for
Ap
plie
d Is
oto
pe
Stu
dy
Cen
tral
Fo
od
Sto
rag
e
En
viro
nm
enta
l Saf
ety
Ser
vice
s/
Ca
mp
us
Mai
l
Veh
icle
Tra
nsp
ort
atio
n&
Mai
nte
nan
ce
Riv
erb
end
Res
earc
hL
ab N
ort
h
Cen
ter
for
Ap
plie
dG
enet
ic T
ech
no
log
ies
(CA
GT
EC
H)
Riv
erb
end
Res
earc
hL
ab S
ou
th
RIVERBEND RD
Intr
amu
ral
Fie
lds
Lak
e H
erri
ck
Pav
ilio
n
Fam
ily &
Gra
du
ate
Ho
usi
ng
Un
iver
sity
Vill
age
Un
iver
sity
Hea
lth
Cen
ter
Vis
ito
rsC
ente
r(F
ou
r T
ow
ers)
Intr
amu
ral F
ield
s D
eck
Lak
e H
erri
ck
Riv
ers
Cro
ssin
g
Co
mp
lex
Car
bo
hyd
rate
R
esea
rch
Cen
ter
CO
LLE
GE
STA
TIO
N R
D
COLLEGE STATION RD
Po
ult
ryD
iag
no
stic
R
esea
rch
C
ente
r
Cam
pu
sT
ran
sit
Fac
ility
US
EP
A
The
Uni
vers
ity
Of G
eorg
ia •
EX
TEN
DED
CA
MPU
S •
Cla
rke
Cou
nty
Hea
lth S
cien
ces V
eter
inar
yM
edic
ine
Hos
pita
l
Sout
h M
illed
ge Col
lege
Sta
tion

www.oir.uga.edu
TH
E U
NI
VE
RS
IT
Y O
F G
EO
RG
IA
Fact Book 2017 49
th Edition