TOWN OF PAYSON ANNUAL BUDGET 2017 / 2018
398
T TOWN OF PAYSON ANNUAL BUDGET 2017 / 2018
-
Upload
khangminh22 -
Category
Documents
-
view
3 -
download
0
Transcript of TOWN OF PAYSON ANNUAL BUDGET 2017 / 2018

TTOWN OF PAYSON ANNUAL BUDGET
2017 / 2018

GFOA BUDGET AWARD
2017 ANNUAL BUDGET
i

TABLE OF CONTENTS
2017 ANNUAL BUDGET
ii

TABLE OF CONTENTS
2017 ANNUAL BUDGET
iii

INTRODUCTION
2017 ANNUAL BUDGET
ELECTED TOWN OFFICIALS July 1, 2017
Mayor Craig Swartwood Vice Mayor Fred Carpenter Councilmember Su Connell Councilmember Barbara Underwood Councilmember Rick Croy Councilmember Chris Higgins Councilmember Janell Sterner
1

2

INTRODUCTION
2017 ANNUAL BUDGET
3

Citizenry
TownCouncil
MagistrateDorothy Little
Boards andCommissions
Town of Payson Management Organizational Chart
Town AttorneyHector Figueroa
Donald EnglerDeputy Town Mgr.
Public Safety
VacantAsst. Town Mgr.
Deborah Barber Chief Fiscal
Officer
Silvia SmithTown Clerk
LaRon GarrettTown Manager
VacantPublic Works Dir.
Dave StaubFire Chief
Donald EnglerPolice Chief
Tanner HenryWater
Sheila DeSchaafPlanning & Dev.
Ray LaHayeBuilding Services
Tim RydenStreets
Emily Linkey Library
Cameron DavisRec & Tourism
Steve DeHaanIT
Vacant Deputy Town MgrAdmin. Services
EmergencyManagement
4

MISSIO
N STAT
EM
EN
T
The Town of Payson is dedicated to enhancing the quality of life for our citizens by working hard to provide a superior level of service in the most
effective and efficient manner while exercising fiscal responsibility.
We…
Value open communication Encourage citizen participation Operate honestly and fairly Conduct ourselves through unity and team-work Respect our differences Treasure our natural resources and unique environment
5

CORE VALUES
6

Town of Payson 303 N. Beeline Highway Payson, Arizona 85541-4306
Town Hall (928) 474-5242 Fax (928) 474-4610
7

8

.
Estimated ProposedFund Type Revenues Expenditures
General Fund 17,330,500$ 17,641,100$ Special Revenue Fund 7,066,500$ 7,380,000$ Capital Project Fund 3,355,000$ 3,597,771$ Debt Service Fund 616,900$ 578,500$ Enterprise Fund 30,663,500$ 31,744,200$
Total 59,032,400$ 60,941,571$
29%
12%
6%1%
52%
General Fund
Special Revenue Fund
Capital Project Fund
Debt Service Fund
Enterprise Fund
27%
15%
4%
50%
2% 2%
Personnel Services
Operating Expenditures
Debt Service
Capital Outlay
Other
Transfers Out
9

10

1.1%
27.3%
1.3%
3.1%
11.9%
0.2%4.1%
8.5%
40.7%
1.8%
Property TaxesOther TaxesLicenses & PermitsIntergovernmentalCharges for ServiceFines & ForfeituresGrantsMiscellaneousDebt ProceedsInternal Service Transfers
11

12

2.
13

14
15
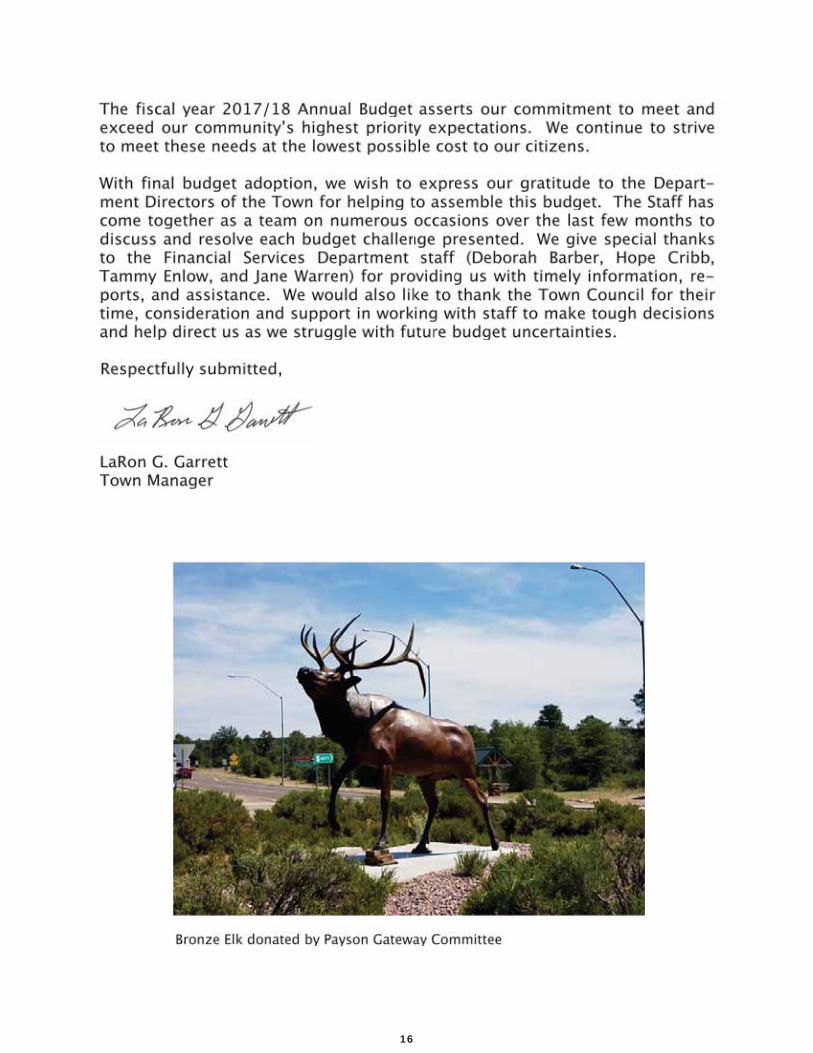
16

INTRODUCTION
2017 ANNUAL BUDGET
Quick Reference Guide
This Quick Reference Guide will help you find answers to commonly asked budget questions. The Table of Contents will lead you to specific sections of the budget with more detail.
If you have this question… Refer to Page
How much is the 2017/18 budget? Town Manager's Budget Message 7Sources & Uses 110Total Financial Program 113
What is the breakdown of dollars for Total Financial Program 113the 2017/18 budget by fund?
What are the primary sources of revenue Budget Summary: Revenue 106for the Town? Revenue Summary by Category 152
Revenue Detail 153
What does the Town spend its money on? Town Manager's Budget Message 7Budget Summary: Expenditures 107Expenditure Summary 168Expense Detail - All Funds 169
What is the Town's budget process Budget Process Overview 90timeline? Budget Calendar 96
What are the budgeted dollars for each Total Financial Program 113department? Expenditure Summary 168
Department Budgets 177-350
How is the economy of the Town? Town Manager's Budget Message 7
What are the capital improvement Capital Improvement Plan 81projects? Capital Project Funds 141
What planning documents influence General Plan 25budget priorities? Corporate Strategic Plan (CSP) 41
Capital Improvement Plan (CIP) 78
17

INTRODUCTION
2017 ANNUAL BUDGET
18

Where is Payson, Arizona?
19

INTRODUCTION
2017 ANNUAL BUDGET
20

INTRODUCTION
2017 ANNUAL BUDGET
Town Manager’s Department
Town Clerk Department
Financial Services Department
Human Resources Department
21

INTRODUCTION
2017 ANNUAL BUDGET
Legal Department
Law Enforcement Department
Fire Department
Community Development Department
Building Services Department
Planning & Development Department
22

INTRODUCTION
2017 ANNUAL BUDGET
Recreation & Tourism Department
Public Works Department
Library
23

PLANNING & PERFORMANCE
24

GENERAL PLAN
2017 ANNUAL BUDGET
25

GENERAL PLAN
2017 ANNUAL BUDGET
26

GENERAL PLAN
2017 ANNUAL BUDGET
27

GENERAL PLAN
2017 ANNUAL BUDGET
28

GENERAL PLAN
2017 ANNUAL BUDGET
29

GENERAL PLAN
2017 ANNUAL BUDGET
30

GENERAL PLAN
2017 ANNUAL BUDGET
31

GENERAL PLAN
2017 ANNUAL BUDGET
32

GENERAL PLAN
2017 ANNUAL BUDGET
33

GENERAL PLAN
2017 ANNUAL BUDGET
34

GENERAL PLAN
2017 ANNUAL BUDGET
35

GENERAL PLAN
2017 ANNUAL BUDGET
36

GENERAL PLAN
2017 ANNUAL BUDGET
37

GENERAL PLAN
2017 ANNUAL BUDGET
38

GENERAL PLAN
2017 ANNUAL BUDGET
39

GENERAL PLAN
2017 ANNUAL BUDGET
40

CORPORATE STRATEGIC PLAN
2017 ANNUAL BUDGET
41

CORPORATE STRATEGIC PLAN
2017 ANNUAL BUDGET
.
42

CORPORATE STRATEGIC PLAN
2017 ANNUAL BUDGET
43

CORPORATE STRATEGIC PLAN
2017 ANNUAL BUDGET
KRA Intended Department FY16/17 FY16/17 FY17/18Priority # Outcome Responsible Goal Actual Goal
4 Implement TourismMaster Plan Tourism 50% 50% 55%(% completed)
4 Increase # of events Events Center 44 35 37 held at Events Center
4 Increase # of days Event Events Center 155 137 140 Center is in use
4 Visits to tourism Tourism 1,000,000 1,072,123 1,100,000 website
4 # of views on the Tourism 2,250,000 3,450,000 3,500,000 tourism website
4 # of media mentionsin the Valley promoting Tourism 3,000 3,210 3,225 Payson tourism/events
44

CORPORATE STRATEGIC PLAN
2017 ANNUAL BUDGET
45

CORPORATE STRATEGIC PLAN
2017 ANNUAL BUDGET
46

CORPORATE STRATEGIC PLAN
2017 ANNUAL BUDGET
KRA Intended Department FY16/17 FY16/17 FY17/18Priority # Outcome Responsible Goal Actual Goal
4 GFOA Certificate ofAchievement for Finance Receive Received ReceiveExcellence in Award Award AwardFinancial Reporting
4 GFOA DistinguishedBudget Presentation Finance Receive Received ReceiveAward Award Award Award
4 GFOA Certificatefor the Popular Finance Receive Received ReceiveAnnual Financial Award Award AwardReport
47

CORPORATE STRATEGIC PLAN
2017 ANNUAL BUDGET
48

CORPORATE STRATEGIC PLAN
2017 ANNUAL BUDGET
49

CORPORATE STRATEGIC PLAN
2017 ANNUAL BUDGET
50

CORPORATE STRATEGIC PLAN
2017 ANNUAL BUDGET
KRA Intended Department FY16/17 FY16/17 FY17/18Priority # Outcome Responsible Goal Actual Goal
1 Street improvements Streets 1000 500 1000completed in linear feet
1 Maintain / Increase# of neighborhood Streets 1 2 1drainage sites improved
1 Implementation oftraffic study priorities Streets 20% 20% 25%(total % completed)
2 Implement AirportMaster Plan Airport 30% 30% 40%(total % completed)
3 Maintain water usagelevels at 80-90 gallons Water Achieve Achieved Achieveper capita per day
3 C.C.Cragin Project Water 75% 75% 90%Total % Completed
51

CORPORATE STRATEGIC PLAN
2017 ANNUAL BUDGET
52

CORPORATE STRATEGIC PLAN
2017 ANNUAL BUDGET
53
CORPORATE STRATEGIC PLAN
2017 ANNUAL BUDGET
54

CORPORATE STRATEGIC PLAN
2017 ANNUAL BUDGET
KRA Intended Department FY16/17 FY16/17 FY17/18Priority # Outcome Responsible Goal Actual Goal
4 & 5 Visits to websites All Gov't 210,000 347,000 350,000 Tourism 1,000,000 1,072,123 1,100,000
4 & 5 Articles/press releases Tourism 475 513 550 in local newspaper
4 & 5 Public e-mail All Gov't 2,500 2,450 2,500 distribution list Tourism 250,000 256,345 257,000
4 & 5 TOP Talk Programs 23 23 23 # of employee presenters Clerk 30 59 60 # of guests 60 60 65
4 & 5 Radio appearances Tourism 75 75 75 4 & 5 Public speaking Tourism 50 62 65
Engagements
55

CORPORATE STRATEGIC PLAN
2017 ANNUAL BUDGET
56

2017 ANNUAL BUDGET
CORPORATE STRATEGIC PLAN 57

2017 ANNUAL BUDGET
CORPORATE STRATEGIC PLAN 58

CORPORATE STRATEGIC PLAN
2017 ANNUAL BUDGET
KRA Intended Department FY16/17 FY16/17 FY17/18Priority # Outcome Responsible Goal Actual Goal
1 # of unsightly properties Planning 190 80 100investigated(workload indicator)
1 # of unsightly properties Planning 200 78 100investigations closed
1 Completion of 87/260beautification plan Planning 6% 10% 15%(percent completed)
3 # of programs offeredto the public Recreation 125 56 70
3 # of registrationsfor programs Recreation 5,200 4,961 5,000
3 # of facilityreservations Recreation 360 426 425
5 # of reference questions(workload indicator) Library 10,000 11,412 10,000
5 total circulation Library 125,000 130,380 130,5005 # of children's programs Library 201 205 2005 total attendance at
children's programs Library 4,825 5,067 5,0005 # of teen programs Library 76 89 895 total attendance at
teen programs Library 750 995 9955 # of adult programs Library 125 114 1155 total attendance at
adult programs Library 1,625 1,865 1,875
59

CORPORATE STRATEGIC PLAN
2017 ANNUAL BUDGET
.
60

CORPORATE STRATEGIC PLAN
2017 ANNUAL BUDGET
KRA Intended Department FY16/17 FY16/17 FY17/18Priority # Outcome Responsible Goal Actual Goal
Complete rehabilitation1 & 2 projects for income- Planning 3 2 3
qualified homeownersMake referrals to
1 & 2 income-qualified Planning 15 16 15housing facilitiesProvide technical
1 & 2 assistance to potential Planning 6 8 6applicants for housingrehabilitation
61

CORPORATE STRATEGIC PLAN
2017 ANNUAL BUDGET
62

CORPORATE STRATEGIC PLAN
2017 ANNUAL BUDGET
63

CORPORATE STRATEGIC PLAN
2017 ANNUAL BUDGET
64

CORPORATE STRATEGIC PLAN
2017 ANNUAL BUDGET
KRA Intended Department FY16/17 FY16/17 FY17/18Priority # Outcome Responsible Goal Actual Goal
2 Conduct Employee Human Yes No YesHealth Fair Resources
4 & 6 Structural Fire TrainingCompleted (hours) Fire 2,500 8,669 2,500
4 & 6 Non-structural TrainingCompleted (hours) Fire 2,500 1,752 2,000
4 & 6 Emergency MedicalTraining Completed (hours) Fire 2,000 1,321 1,500
4 & 6 Average Training Hoursper Firefighter Fire 225.0 345.4 225.0
5 # of volunteers Police 70 54 70Fire 12 10 12
5 # of volunteers hoursPolice 9,500 7,738 9,500
65

CORPORATE STRATEGIC PLAN
2017 ANNUAL BUDGET
66

CORPORATE STRATEGIC PLAN
2017 ANNUAL BUDGET
67

CORPORATE STRATEGIC PLAN
2017 ANNUAL BUDGET
68

CORPORATE STRATEGIC PLAN
2017 ANNUAL BUDGET
KRA Intended Department FY16/17 FY16/17 FY17/18Priority # Outcome Responsible Goal Actual Goal
2 & 3 ISO rating Fire Class 3 Class 3 Class 33 Improve Response Time Fire below 6:00 5:29 below 6:001 Conduct CPR Classes:
# of Citizens Trained Fire 950 851 9001 Car Seats Inspected Fire 300 400 3003 Structure Fire Save ratio Fire above 85% 34% above 85%1 Taught 10 week DARE
program to 5th graders Police complete completed complete1 Host Community Policing Programs:
Block Watch Program Police Yes Yes YesWatch Your Vehicle Program Police Yes No YesVehicle VIN Etching Program Police Yes No YesClick It or Ticket Campaign Police Yes Yes YesBicycle Safety Program Police Yes No YesDrive Hammered Get NailedCampaign Police Yes Yes Yes
1,2,3 Reduce Uniform CrimeReporting (UCR) Activity Police below 700 Yes below 700
3 Calls for service below below(workload indicator) Police 25,000 21,224 25,000
69

CORPORATE STRATEGIC PLAN
2017 ANNUAL BUDGET
70

CORPORATE STRATEGIC PLAN
2017 ANNUAL BUDGET
71

CORPORATE STRATEGIC PLAN
2017 ANNUAL BUDGET
KRA Intended Department FY16/17 FY16/17 FY17/18Priority # Outcome Responsible Goal Actual Goal
Encourage participation Water:1 & 3 in toilet Residential 2 3 2
rebate program * Commercial 1 0 1Maintain water usage
1 & 3 levels at 80-90 gallons Water Achieve Achieved Achieveper capita per dayPresent In-School
1 & 3 Water Conservation Water 165 200 200program (# of students)Hold electronic
1 & 3 waste E-cycling event Water Resources 1 0 0Hold latex paint
1 & 3 recycling event Water Resources 1 0 0Hold household
1 & 3 hazardous waste event Water Resources 1 0 1Establish / maintain
1 & 3 Antifreeze recycling Water Available Available Available*These numbers will continue to decline as customers get converted to low use toilets
72

CORPORATE STRATEGIC PLAN
2017 ANNUAL BUDGET
73

CORPORATE STRATEGIC PLAN
2017 ANNUAL BUDGET
74

CORPORATE STRATEGIC PLAN
2017 ANNUAL BUDGET
KRA Intended Department FY16/17 FY16/17 FY17/18Priority # Outcome Responsible Goal Actual Goal
3 E-Gov availability Info Services 3% 10% 15%for all departments *
3 Visits to websites All Gov't 210,000 347,000 350,000 Tourism 1,000,000 3,450,000 3,550,000
3 # of pages viewedon Tourism website Tourism 2,250,000 3,450,000 3,500,000
3 Public e-mail All Gov't 2,500 2,450 2,500 distribution list Tourism 250,000 256,345 257,000
3 # of Facebookfriends Tourism 9,000 11,700 12,000
* Researching ability and cost to increase Town-wide usage
75

2017 Annual Budget PLANNING & PERFORMANCE
Land Growth Circulation Parks, Trails, Environmental Water Cost ofKRA: Use Area & Open Spaces Planning Resources Development
Priority:Strategy LU GA C PT EP WR CD
KRA MATRIX
:
1:4:A X1:4:E X1:4:G X2:1:All X2:2:All X X2:3:All X2:4:All X3:1:A X3:1:B X3:1:C X3:1:D X3:1:E X3:1:F X3:1:G X3:2:A X3:2:B X3:2:C X3:2:D X X3:3:A X3:3:B X X3:3:D X X3:3:E X3:4:B X3:4:C X3:4:D X3:4:E X
76

2017 Annual Budget PLANNING & PERFORMANCE
Land Growth Circulation Parks, Trails, Environmental Water Cost ofKRA: Use Area & Open Spaces Planning Resources Development
Priority:Strategy LU GA C PT EP WR CD
5:1:A X5:1:B X5:1:C X5:1:D X5:1:E X5:1:F X5:1:G X5:1:H X5:1:I X5:2:A X5:2:B X5:2:C X X5:2:D X X5:2:D X X5:3:A X5:3:B X5:3:C X5:3:D X5:3:E X X5:3:F X X5:4:C X6:1:C X8:6:All X X9:1:All X X9:1:B X9:1:C X
77

CAPITAL IMPROVEMENT PLAN
2017 ANNUAL BUDGET
78

CAPITAL IMPROVEMENT PLAN
2017 ANNUAL BUDGET
79

CAPITAL IMPROVEMENT PLAN
2017 ANNUAL BUDGET
80

CAPITAL IMPROVEMENT PLAN
2017 ANNUAL BUDGET
Project # Dept / Division Description Fiscal Year
2017/18Fiscal Year
2018/19Fiscal Year
2019/20Fiscal Year
2020/21Fiscal Year
2021/22 5 Year Total Future Years Grand Total KRA Link*0910-82 Airport New Terminal Building - 2,145,000 2,145,000 3:20910-85 Airport Construct Service Roads - 470,000 470,000 3:20910-86 Airport Construct Vehicle Parking - 245,000 245,000 3:2
0910-88 AirportConstruct Various Buildings - 1,163,000 1,163,000 3:2
1011-10 AirportNew/Expanded Parking Ramps - 2,990,000 2,990,000 3:2
1213-05 AirportConstruct New West Taxiways - 650,000 650,000 3:2
1415-02 AirportConstruct Aircraft Wash Rack 150,000 150,000 150,000 3:2
1415-03 Airport Install Taxiway Lighting 550,000 550,000 550,000 3:2
1415-04 AirportConstruct Snow Removal Equipment Building 400,000 400,000 400,000 3:2
1415-06 AirportConstruct ADA Accessible Route to Ramps 5,000 5,000 5,000 3:2
1415-23 AirportExpand East Side Aircraft Parking Apron E - 600,000 600,000 3:2
1617-02 AirportConstruct By-Pass Taxiway for Runway 24 300,000 300,000 300,000 3:2
1617-03 Airport Install PAPI & REIL 230,000 230,000 230,000 3:2
1718-11 AirportReconstruct Ramps A&D / Install Fencing 1,313,800 1,313,800 1,313,800 3:2Total Airport Capital Projects 1,313,800 1,085,000 400,000 150,000 - 2,948,800 8,263,000 11,211,800
0910-35 Gen Gov'tRecycling Program Enhancements - 250,000 250,000 3:3/9:1,2
1718-01Gen Gov't - IT
Mobile Switch Replacement 30,000 30,000 30,000 8:2/10:1,2
1718-02Gen Gov't - IT
Offsite Data Storage-Disaster Recovery Plan 50,000 50,000 50,000 10:1,2,3Total Gen Gov't Capital Projects 80,000 - - - - 80,000 250,000 330,000
0910-42 Parks Maint Amphitheater Lighting 150,000 150,000 150,000 3:4/5:3
0910-43 Parks MaintGreen Valley Park Ramada Improvements 150,000 150,000 150,000 3:4/5:3
0910-44 Parks MaintGreen Valley Park Maintenance Building 10,000 250,000 260,000 260,000 3:4/5:3
0910-47 Parks Maint Rumsey Park Restrooms 80,000 80,000 160,000 160,000 3:4/5:30910-48 Parks Maint Rumsey Park Drainage 10,000 150,000 160,000 160,000 3:1,4/5:3
0910-49 Parks MaintRumsey Park Pedestrian Circulation Improvements 50,000 50,000 100,000 150,000 3:1,4/5:3
1011-06 Parks MaintRumsey Playground Equipment 150,000 150,000 150,000 3:4
1415-21 Parks MaintRumsey Park Basketball Court Replacement 40,000 40,000 40,000 3:4/5:3
1617-04 Parks MaintRumsey Park Maintenance Building 42,000 42,000 42,000 3:4
1718-07 Parks MaintTurf Repl - N Rumsey MultiPurpose Field 256,000 256,000 256,000 3:4
1718-08 Parks Maint Turf Repl - Rumsey 3 97,000 97,000 97,000 3:41718-09 Parks Maint Turf Repl - Dbacks Fields 532,000 532,000 532,000 3:41718-12 Parks Maint GV Playground 71,000 71,000 71,000 3:4
Total Parks Maint Capital Projects 111,000 545,000 912,000 550,000 - 2,118,000 100,000 2,218,000
81

CAPITAL IMPROVEMENT PLAN
2017 ANNUAL BUDGET
Project # Dept / Division Description Fiscal Year
2017/18Fiscal Year
2018/19Fiscal Year
2019/20Fiscal Year
2020/21Fiscal Year
2021/22 5 Year Total Future Years Grand Total KRA Link*
0910-76Planning & Dev
Main Street Enhancements - 500,000 500,000 1:3/3:1/5:1
0910-77Planning & Dev
Highway Landscape Improvements 200,000 200,000 200,000 150,000 750,000 750,000 3:2/5:1
1617-06Planning & Dev Americal Gulch 150,000 400,000 500,000 500,000 500,000 2,050,000 8,100,000 10,150,000 KRA 1,3,5
Total Planning & Dev Projects 150,000 600,000 700,000 700,000 650,000 2,800,000 8,600,000 11,400,000
0910-01 Police Building Remodel 65,500 65,500 65,500 3:4/8:2
0910-02 PoliceParking Lot Improvements 63,800 63,800 63,800 3:4/8:2
1314-03 Police Building Addition 212,000 212,000 212,000 3:4/8:21314-04 Police Communications Remodel 55,000 55,000 55,000 3:4/8:21415-07 Police Storage Building 92,000 92,000 92,000 3:4/8:2
Total Police Capital Projects - 488,300 - - - 488,300 - 488,300
0910-39Recreation & Tourism PATS Continuation 125,000 125,000 150,000 150,000 550,000 875,000 1,425,000 3:1,2,4
0910-40Recreation & Tourism Trails Master Plan 60,000 60,000 120,000 120,000 3:1,2,4
0910-41Recreation & Tourism Parks Master Plan 50,000 95,000 145,000 145,000 3:4/5:3
0910-46Recreation & Tourism Land Purchase 1,000,000 1,000,000 1,000,000 1:3/3:4/5:3
1213-01Recreation & Tourism Multi-Purpose Bldg 1,500,000 1,500,000 1,500,000 3:4
1718-03Recreation & Tourism
Event Center Master Plan & Improvements 50,000 7,000,000 7,050,000 7,050,000 3:1,2,4
1718-04Recreation & Tourism
LED Marketing Message Board - 350,000 350,000 1:4
1718-05Recreation & Tourism
Dbacks Fields Control Building 250,000 250,000 250,000 3:4
1718-06Recreation & Tourism
Community Recreation Center 8,500,000 8,500,000 8,500,000 3:4Total Rec & Tourism Capital Projects 50,000 2,080,000 8,685,000 8,150,000 150,000 19,115,000 1,225,000 20,340,000
0910-04 Streets Mud Springs Rd Phase II 1,300,000 1,300,000 1,300,000 3:1,2
0910-05 StreetsMud Springs Rd -Cedar to Frontier - 855,000 855,000 3:1,2
0910-06 * StreetsRumsey Rd - WalMart to McLane - - 3:1,2
0910-07 ** Streets Bonita St 60,000 60,000 60,000 3:1,2
0910-10 StreetsColcord Rd - Main to Longhorn 75,000 125,000 600,000 1,200,000 2,000,000 2,000,000 3:1,2
0910-11 StreetsMcLane Rd - Airport to Payson Ranchos 100,000 500,000 650,000 1,250,000 1,250,000 3:1,2
0910-12 StreetsMcLane Rd - Main to Phoenix St 80,000 875,000 955,000 955,000 3:1,2
0910-14 StreetsGoodnow - Hwy 260 to Bonita 40,000 650,000 690,000 690,000 3:1,2
0910-15 StreetsEasy St - Evergreen to Forest 405,000 325,000 730,000 730,000 3:1,2
0910-16 Streets Easy St - Forest to Gila - 1,290,000 1,290,000 3:1,20910-17 Streets Easy St - Gila to Bradley - 1,270,000 1,270,000 3:1,2
* This is a Private Developer Funded project. No Town funds or bonding capacity will be used on this project. ** This is a State funded project. In previous years, the Town contributed funds totaling $50,000 towards the State project. The total project cost is $1,575,000.
82

CAPITAL IMPROVEMENT PLAN
2017 ANNUAL BUDGET
Project # Dept / Division Description Fiscal Year
2017/18Fiscal Year
2018/19Fiscal Year
2019/20Fiscal Year
2020/21Fiscal Year
2021/22 5 Year Total Future Years Grand Total KRA Link*
0910-18 StreetsRim Club Parkway - Rim Club to Granite Dells Rd - 1,230,000 1,230,000 3:1,2
0910-19 StreetsFrontier St - SR87 to McLane - 2,100,000 2,100,000 3:1,2
0910-20 StreetsGranite Dells Roundabout Landscaping 45,000 45,000 45,000 3:1,2
0910-21 StreetsGranite Dells Roundabout Lighting 45,000 45,000 45,000 3:1,2
0910-23 StreetsAirport Rd Roundabout Landscaping 45,000 45,000 45,000 3:1,2
0910-26 Streets Pavement Preservation 500,000 525,000 550,000 550,000 550,000 2,675,000 3,500,000 6,175,000 3:1,2
0910-28 StreetsTown Aerial Photo Update 45,000 45,000 100,000 145,000 3:1,2
0910-29 StreetsGreen Valley Parking Lot Expansion 300,000 300,000 300,000 3:1,2,4
0910-30 Streets
McLane Rd - Payson Ranchos to Payson Pines Subdivisions 80,000 900,000 980,000 980,000 3:1,2
0910-31 Streets Longhorn Sidewalks 225,000 225,000 225,000 3:1,2
0910-32 StreetsPhoenix St - Hwy 87 to Sycamore 110,000 50,000 500,000 200,000 860,000 860,000 3:1,2
1415-16 Streets Town Boundary Fence 47,500 47,500 47,500 47,500 190,000 190,000 3:1,2
1516-03 StreetsEast Bonita Street Sidewalk - 125,000 125,000 3:1,2
1516-04 Streets East Frontier Drainage 25,000 25,000 25,000 3:1,2
1516-07 StreetsRegional Storm Water Detention Basin 200,000 250,000 450,000 450,000 3:1,2
1516-08 StreetsManzanita Roundabout Street Lighting 45,000 45,000 45,000 3:1,2
1516-09 StreetsMcLane Rd-Phx St to GV Prkwy - 1,090,000 1,090,000 3:1,2
1617-01 StreetsWesterly Rd Parking Lot Lights 30,000 30,000 30,000 3:1,2
1617-07 Streets Timber Ridge I.D. *** 2,060,000 2,060,000 2,060,000 3:1,2Total Streets Capital Projects 2,620,000 2,977,500 1,792,500 3,742,500 3,872,500 15,005,000 11,560,000 26,565,000
0910-50 Water CC Cragin Pipeline 10,000,000 10,000,000 10,000,000 3:3
0910-51 WaterCC Cragin Water Treatment Plant 14,000,000 14,000,000 14,000,000 3:3
0910-58 Water Wells 75,000 75,000 75,000 75,000 75,000 375,000 75,000 450,000 3:3
0910-61 WaterRadon Gas Treatment System 45,000 45,000 45,000 3:3
0910-62 Water Water Lines 250,000 250,000 250,000 250,000 250,000 1,250,000 250,000 1,500,000 3:31314-02 Water Environmental Project 128,271 128,271 128,271 3:31415-11 Water Tank Mixing Systems 50,000 50,000 50,000 3:3
1415-12 WaterChlorine Generator Conversions 35,000 35,000 35,000 3:3
1415-13 Water Pressure Blowoff Valves 20,000 20,000 20,000 3:3
1415-14 WaterHydropneumatic Surge Tanks 45,000 45,000 45,000 3:3Total Water Capital Projects 24,648,271 325,000 325,000 325,000 325,000 25,948,271 325,000 26,273,271
TO TAL ALL CAPITAL PRO JECTS 28,973,071 8,100,800 12,814,500 13,617,500 4,997,500 68,503,371 30,323,000 98,826,371
*** The Town’s share of the project will be determined if / when the Improvement District is approved.
83

CAPITAL IMPROVEMENT PLAN
2017 ANNUAL BUDGET
Project #Department /
Division DescriptionFiscal Year
2017/18Fiscal Year
2018/19Fiscal Year
2019/20Fiscal Year
2020/21Fiscal Year
2021/22 5 Year TotalFuture Years
Grand Total KRA Link*
1415-06M Airport Snow Removal Equipment 195,000 195,000 195,000 3:21516-12M Airport Pickup Truck 30,000 30,000 30,000 3:21718-03M Airport Flail Mower for Kubota Tractor 5,800 5,800 5,800 3:2
Total Airport 5,800 30,000 - 195,000 - 230,800 - 230,800
0910-35M Building Vehicle Replacement 25,000 25,000 50,000 50,000 3:1/5:1,2Total Building - 25,000 25,000 - - 50,000 - 50,000
0910-13M Fire Utility Truck Replacement 350,000 350,000 350,000 8:20910-14M Fire Water Tender 350,000 350,000 350,000 8:20910-15M Fire Utility Pickup Truck Replacement 45,000 45,000 45,000 8:20910-16M Fire Staff Vehicle Replacement 55,000 55,000 55,000 110,000 8:20910-17M Fire Command Vehicle Replacement 70,000 70,000 140,000 140,000 8:20910-19M Fire Ladder Truck 111 Replacement 1,200,000 1,200,000 1,200,000 8:20910-23M Fire Rehab/Support Vehicle 150,000 150,000 150,000 8:20910-25M Fire Ambulance Replacement 200,000 200,000 200,000 8:20910-27M Fire Type 1 Engine Replacement 847,800 575,000 575,000 575,000 2,572,800 2,572,800 8:20910-28M Fire Type 6 Engine Replacement - 360,000 360,000 8:21314-05M Fire Radio Repeater 20,000 20,000 20,000 8:2/10:2
Total Fire Department 847,800 3,015,000 645,000 575,000 - 5,082,800 415,000 5,497,800
0910-10M Gen Gov't Financial Software 75,000 75,000 75,000 10:2Total General Government - 75,000 - - - 75,000 - 75,000
1516-13M Parks Maint Kawasaki Mule Utility Vehicle 13,500 13,500 13,500 3:4/5:3Total Parks Maintenance - - 13,500 - - 13,500 - 13,500
1516-14M Planning&Dev Vehicle Replacement 23,000 23,000 23,000 3:1/5:1,2Total Planning & Development - 23,000 - - - 23,000 - 23,000
0910-01M Police Vehicle Replacement 72,300 165,000 165,000 165,000 165,000 732,300 550,000 1,282,300 8:21415-14M Police CAD Communications Equipment 114,500 114,500 114,500 8:2/10:21516-02M Police SHSGP Elk Ridge Base Radio 20,700 20,700 20,700 8:2/10:21516-04M Police GOHS Accident Measurement Device 36,500 36,500 36,500 8:21617-02M Police 911 Recording Device 52,000 52,000 52,000 8:2/10:21718-01M Police Body Worn Camera Proposal 30,000 30,000 30,000 90,000 90,000 8:2/10:21718-02M Police Crisis Response Systems 28,000 28,000 28,000 8:2/10:2
Total Police Department 272,000 247,000 195,000 195,000 165,000 1,074,000 550,000 1,624,000
1617-03M Rec/Tourism Chevy Colorado Pickup 29,000 29,000 29,000 5:31617-04M Rec/Tourism Chevy Tahoe 32,000 32,000 32,000 5:3
Total Rec/Tourism 32,000 29,000 - - - 61,000 - 61,000
0910-05M Streets Heavy Equipment 100,000 100,000 100,000 100,000 400,000 200,000 600,000 3:1,20910-07M Streets Crack Seal Machine Replacement 45,000 45,000 45,000 3:1,20910-08M Streets Trucks 30,000 30,000 30,000 30,000 120,000 120,000 240,000 3:1,21516-07M Streets Skidster 40,000 40,000 40,000 3:1,21516-09M Streets Dump Truck with Snow Plow 138,900 138,900 138,900 3:1,21516-10M Streets Loader 178,100 178,100 178,100 3:1,21718-04M Streets Skidster 92,000 92,000 92,000 3:1,2
Total Streets Department 317,000 222,000 170,000 175,000 130,000 1,014,000 320,000 1,334,000
0910-33M Water Service Truck Replacement 52,000 54,000 56,000 58,000 58,000 278,000 75,000 353,000 3:30910-34M Water Well Pump Replacements 75,000 77,000 82,000 88,000 88,000 410,000 250,000 660,000 3:31011-04M Water Fire Hydrant Program 5,000 5,000 5,000 5,000 20,000 25,000 45,000 3:31011-05M Water Computer Equipment 30,000 20,000 20,000 20,000 20,000 110,000 100,000 210,000 3:31415-05M Water Ground Penetrating Radar 25,000 25,000 25,000 3:31617-05M Water Equipment 100,000 100,000 100,000 100,000 100,000 500,000 500,000 3:3
Total Water Division 257,000 256,000 288,000 271,000 271,000 1,343,000 450,000 1,793,000
Total Capital Machinery & Equipment 1,731,600 3,922,000 1,336,500 1,411,000 566,000 8,967,100 1,735,000 10,702,100
84

2017 Annual Budget CAPITAL PROJECTS
85

2017 Annual Budget CAPITAL PROJECTS
Annual Annual Annual AnnualDepartment CIP Project Concepts Utilities Maintenance Supplies Personnel
Airport Construct Aircraft Wash Rack 1,200 - - - Airport Install Taxiway Lighting 2,000 - - - Airport Construct Equipment Building 600 500 - - Airport Install PAPI & REIL 600 - - - Police Building Remodel 500 - - - Police Storage Building 600 500 - - Rec&Tourism PATS Continuation - 250 - - Rec&Tourism Multi-Purpose Event Center Bldg 1,200 2,000 600 - Rec&Tourism LED Marketing Message Billboard 600 1,000 - - Rec&Tourism Diamondback Fields Control Bldg 600 1,000 300 - Rec&Tourism Community Recreation Center 7,200 1,000 3,000 313,200 Parks Maint Amphitheater Lighting 350 - - - Parks Maint GV Park Maintenance Bldg 600 500 - - Parks Maint Rumsey Park Maintenance Bldg 600 500 - - Streets Granite Dells Roundabout 400 500 - -
LandscapingStreets Granite Dells Roundabout 600 - - -
LightingStreets Airport Road Roundabout 400 500 - -
LandscapingStreets GV Parking Lot Expansion - 300 - - Streets Town Boundary Fence - - 300 300 Streets Manzanita Roundabout 600 - - -
Street LightingStreets Parking Lot Lights-Westerly Rd 600 500 - -
86

LONG-TERM PLANNING
2017 ANNUAL BUDGET
87

2014
/15
Act
ual
2015
/16
Act
ual
2016
/17
Ado
pted
2017
/18
Pr
opos
ed20
18/1
9 Pr
ojec
ted
2019
/20
Proj
ecte
d20
20/2
1 Pr
ojec
ted
2021
/22
Proj
ecte
d20
22/2
3 Pr
ojec
ted
REV
ENUE
STa
xes
10,9
90,3
20
11,3
97,8
44
11,6
78,4
00
14,4
81,0
00
14,9
15,4
30
15
,362
,893
15
,823
,780
16
,298
,493
16
,787
,448
Li
cens
es &
Per
mits
702,
278
75
0,63
7
896,
500
78
8,50
0
804,
270
82
0,35
5
836,
763
85
3,49
8
870,
568
In
terg
over
nmen
tal
206,
029
24
5,67
1
874,
700
66
3,50
0
676,
770
69
0,30
5
704,
112
71
8,19
4
732,
558
Ch
arge
s fo
r Ser
vice
667,
603
72
5,66
8
927,
500
82
2,60
0
904,
860
99
5,34
6
1,09
4,88
1
1,
204,
369
1,32
4,80
6
Fi
nes
& F
orfe
iture
s12
2,86
3
110,
837
11
0,00
0
90,0
00
90
,900
91,8
09
92
,727
93,6
54
94
,591
Gran
ts27
,177
17,1
91
89
,100
91,6
00
50
,000
50,0
00
50
,000
50,0
00
50
,000
Mis
cella
neou
s45
8,89
3
947,
208
19
5,60
0
33,3
00
33
,300
33,3
00
33
,300
33,3
00
33
,300
Tran
sfer
s In
95,8
06
15
0,30
4
147,
000
36
0,00
0
360,
000
36
0,00
0
360,
000
36
0,00
0
360,
000
To
tal R
even
ues
13,2
70,9
69
14,3
45,3
60
14,9
18,8
00
17,3
30,5
00
17,8
35,5
30
18,4
04,0
09
18,9
95,5
61
19,6
11,5
08
20,2
53,2
70
Less
: E
XPE
ND
ITUR
ESPe
rson
nel S
ervi
ces
9,79
9,94
1
10
,444
,246
11
,556
,400
13
,263
,800
13
,661
,714
14,0
71,5
65
14,4
93,7
12
14,9
28,5
24
15,3
76,3
79
Ope
ratin
g Ex
pens
es2,
589,
635
2,78
7,13
6
3,
588,
700
3,35
7,30
0
3,
434,
518
3,47
9,16
7
3,
538,
312
3,61
0,14
0
3,
683,
426
Capi
tal O
utla
y95
,830
782,
324
20
,000
310,
000
10
0,00
0
100,
000
10
0,00
0
100,
000
10
0,00
0
Tran
sfer
s O
ut41
1,36
7
302,
973
44
2,10
0
710,
000
71
7,10
0
724,
271
73
1,51
4
738,
829
74
6,21
7
Tota
l Exp
endi
ture
s12
,896
,773
14
,316
,679
15
,607
,200
17
,641
,100
17
,913
,332
18
,375
,003
18
,863
,539
19
,377
,493
19
,906
,023
Rev
enue
(und
er)/o
ver
Expe
nditu
res
374,
196
28
,681
(688
,400
)
(310
,600
)
(77,
802)
29,0
06
13
2,02
3
234,
015
34
7,24
7
88

LONG-TERM PLANNING
2017 ANNUAL BUDGET
89

THE BUDGET PROCESS
90

BUDGET PROCESS OVERVIEW
2017 ANNUAL BUDGET
The Annual Budget serves four essential purposes:
Town Manager
Deputy Town Manager
Planning & Dev Director
CFO Budget Analyst
.
Deputy CFO
91

BUDGET PROCESS OVERVIEW
2017 ANNUAL BUDGET
92

BUDGET PROCESS OVERVIEW
2017 ANNUAL BUDGET
March
April
93

BUDGET PROCESS OVERVIEW
2017 ANNUAL BUDGET
May
July
June
94

BUDGET PROCESS OVERVIEW
2017 ANNUAL BUDGET
95

BUDGET CALENDAR
2017 ANNUAL BUDGET
BUDGET CALENDAR
Budget input open to departments 03/01/2017Budget Team meeting for revenue projections 03/06/2017Budget Team meeting for revenue projections (continued) 03/07/2017Corporate Strategic Plan public meeting * 03/07/2017Capital Improvement Plan public meeting * 03/21/2017Department budget input completed and submitted to Financial Services 03/25/2017Finance Manager submits initial budget to Budget Team 03/29/2017Budget Team reviews department requests 03/29/2017Budget Team holds department budget meetings Week of 04/03/2017Budget Team finalizes figures for budget presentation to Council 04/20/2017Executive Summary of Budget (presentation) to Council 04/28/2017Council Work Study w/ Department Heads * 05/02/2017Council Work Study w/ Department Heads (continued) * 05/04/2017Budget Team Meeting to Revise Budget & S&U 05/09/2017Revised Budget to Council * 05/16/2017Adopt the Fee Schedule (if changed) * 06/01/2017Adopt Tentative Budget & hold Expenditure Limitation Hearing * 06/01/2017Publish Budget Summary once a week for two consecutive weeks: 06/06/2017
06/13/2017Hold public hearing and adopt Final Budget * 06/22/2017Make property values provided by Assessor available for inspection 06/29/2017
(Must be available 7 days prior to adoption of tax levy)Adopt property tax levy * 07/06/2017
(Levy must be adopted not less than seven days after Final Budget buton or before the third Monday in August)
Forward certified copy of tax levy ordinance to County by the third 07/13/2017Monday in August
* Special Council Meeting
96

UNDERSTANDING THE
BUDGET
97

UNDERSTANDING THE BUDGET
2017 ANNUAL BUDGET
.
.
General Fund
98

UNDERSTANDING THE BUDGET
2017 ANNUAL BUDGET
Special Revenue Funds
Capital Project Funds
Debt Service Funds
99

UNDERSTANDING THE BUDGET
2017 ANNUAL BUDGET
Enterprise Fund
100

UNDERSTANDING THE BUDGET
2017 ANNUAL BUDGET
101

UNDERSTANDING THE BUDGET
2017 ANNUAL BUDGET
102

UNDERSTANDING THE BUDGET
2017 ANNUAL BUDGET
103

UNDERSTANDING THE BUDGET
2017 ANNUAL BUDGET
104

BUDGET SUMMARIES
105

BUDGET SUMMARY
2017 ANNUAL BUDGET
Taxes28%
Licenses & Permits
1%
Intergovernmental
3%Charges for
Service12%Fines &
Forfeitures0.2%
Grants4%
Debt Proceeds41%
Miscellaneous9%
Internal Service Transfers
2%
2014/15 2015/16 2016/17 2017/18Category Actual Actual Budget Proposed
Taxes 13,106,702 13,567,221 13,911,200 16,797,400 Licenses & Permits 702,278 750,637 896,500 788,500 Intergovernmental 716,622 1,305,797 1,874,700 1,814,900 Charges for Service 5,640,538 6,254,147 6,801,200 7,044,800 Fines & Forfeitures 141,979 127,648 127,000 107,000 Grants 1,035,020 236,718 867,000 2,419,400 Debt Proceeds - 1,000,000 18,700,000 24,000,000 Miscellaneous 2,755,541 3,831,122 2,763,000 4,991,100 Transfers 676,107 602,573 684,300 1,069,300 Total Operating Revenues 24,774,787$ 27,675,863$ 46,624,900$ 59,032,400$
106

BUDGET SUMMARY
2017 ANNUAL BUDGET
27%
15%
4%
50%
2% 2%
Personnel Services
Operating Expenditures
Debt Service
Capital Outlay
Other
Transfers Out
107
BUDGET SUMMARY
2017 ANNUAL BUDGET
$0
$5,000,000
$10,000,000
$15,000,000
$20,000,000
$25,000,000
2016/17 Proposed 2017/18 Proposed
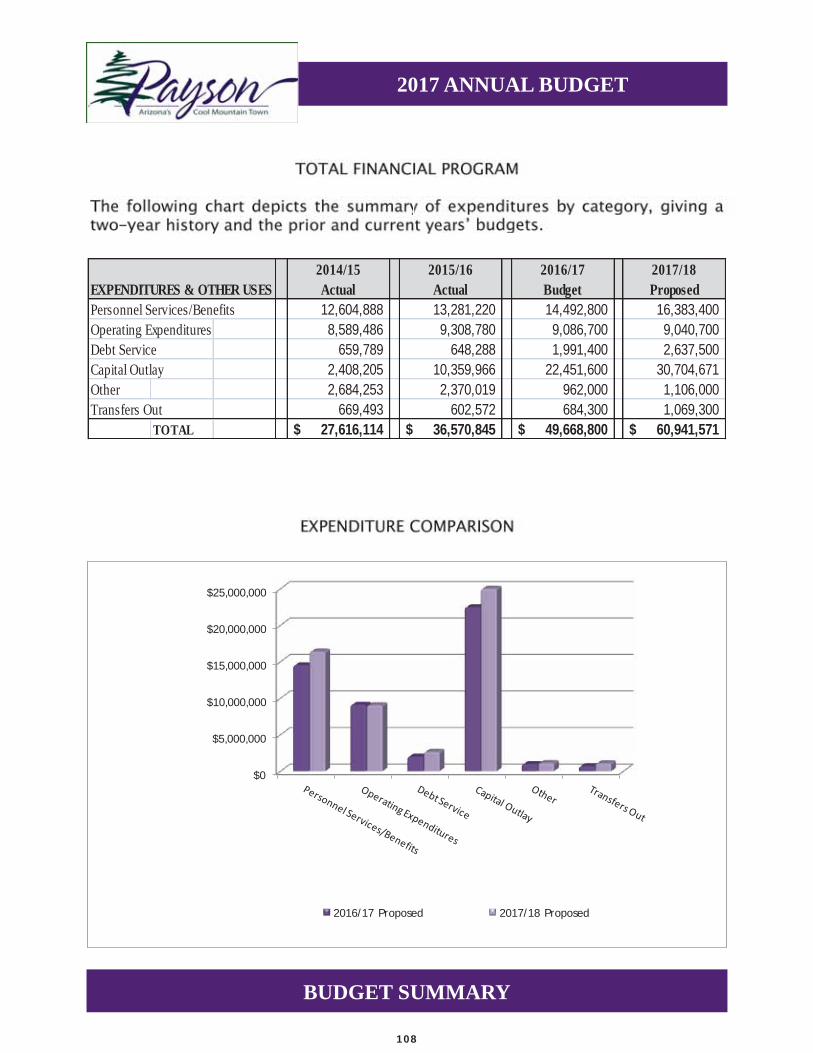
2014/15 2015/16 2016/17 2017/18EXPENDITURES & OTHER USES Actual Actual Budget ProposedPersonnel Services/Benefits 12,604,888 13,281,220 14,492,800 16,383,400 Operating Expenditures 8,589,486 9,308,780 9,086,700 9,040,700 Debt Service 659,789 648,288 1,991,400 2,637,500 Capital Outlay 2,408,205 10,359,966 22,451,600 30,704,671 Other 2,684,253 2,370,019 962,000 1,106,000 Transfers Out 669,493 602,572 684,300 1,069,300
TOTAL 27,616,114$ 36,570,845$ 49,668,800$ 60,941,571$
108

BUDGET SUMMARY
2017 ANNUAL BUDGET
2016/17 2017/18 $ %FUND BUDGET PROPOSED Inc/Dec Inc/Dec
Total General Fund 15,607,200$ 17,641,100$ 2,033,900$ 13.03%Special Revenue: HURF Fund 2,998,600 2,715,600 (283,000)$ -9.44% Parks Facility Imp Fee - 62,000 62,000$ 100.00% Bed Tax Fund 307,900 423,600 115,700$ 37.58% Police Dept of Justice 40,500 102,300 61,800$ 152.59% Library Fund 378,700 428,300 49,600$ 13.10% Airport Fund 255,900 1,472,300 1,216,400$ 475.34% Event Center Fund 167,500 222,200 54,700$ 32.66% Insurance Fund 2,024,000 1,953,700 (70,300)$ -3.47%Total Special Revenue Funds 6,173,100$ 7,380,000$ 1,206,900$ 19.55%Debt Service: General Debt Service Fund 52,900 - (52,900) -100.00% Westerly Rd Debt Service Fund 82,300 78,900 (3,400)$ -4.13% Excise Tax Revenue Obligation 132,000 128,000 (4,000)$ -3.03% General Obligation Bonds 385,300 331,600 (53,700)$ -13.94% Timber Ridge Debt Service Fund 40,000 40,000 -$ 0.00%Total Debt Service Funds 692,500$ 578,500$ (114,000)$ -16.46%Capital Project: Grant Capital Project Fund 667,100 1,105,000 437,900$ 65.64% Public Safety Construction Fund 150,100 114,500 (35,600)$ -23.72% American Gulch Improvement Dist - 150,000 150,000$ 100.00% Timber Ridge Improvement District 2,100,000 2,100,000 -$ 0.00% CAP Trust Fund 225,000 128,271 (96,729)$ -42.99%Total Capital Project Funds 3,142,200$ 3,597,771$ 455,571$ 14.50%Total Enterprise Fund 24,053,800$ 31,744,200$ 7,690,400$ 31.97%
TOTAL - ALL FUNDS 49,668,800$ 60,941,571$ 11,272,771$ 22.70%
109

BUDGET SUMMARY
2017 ANNUAL BUDGET
110

BUDGET SUMMARY
2017 ANNUAL BUDGET
Restricted Debt Utility TotalGeneral Restricted Capital Service Enterprise Budgeted
Fund Funds Funds Funds Funds FundsSOURCES OF FUNDS Beginning Budget Resources 1,043,144$ 713,457$ 242,825$ 399,645$ 3,827,146$ 6,226,217$ Revenues 15,768,600 5,053,300 150,000 427,600 6,481,000 27,880,500 Grants/One Time Revenues 635,100 1,304,200 1,064,600 - - 3,003,900 Debt Services Proceeds - - 2,100,000 - 24,000,000 26,100,000 Other 566,800 229,400 - - - 796,200 Operating Transfers In 360,000 479,600 40,400 189,300 182,500 1,251,800 TOTAL SOURCES OF FUNDS 18,373,644$ 7,779,957$ 3,597,825$ 1,016,545$ 34,490,646$ 65,258,617$
USES OF FUNDS Town Council 102,500$ -$ -$ -$ -$ 102,500$ Clerk/Elections 237,700 - - - - 237,700 Town Manager/Information Svs 943,900 - - - - 943,900 Financial Svcs/General Services 1,872,700 - - - - 1,872,700 Town Attorney/Magistrate Court 661,800 - - - - 661,800 Tourism 129,400 176,400 - - - 305,800 Human Resources 238,100 - - - - 238,100 Police 6,448,100 79,000 - - - 6,527,100 Fire 3,804,100 - - - - 3,804,100 Community Development 989,900 - 200,000 - - 1,189,900 Public Works - 1,838,600 - - - 1,838,600 Library - 428,300 - - - 428,300 Airport - 152,700 - - - 152,700 Recreation 1,192,900 244,200 - - - 1,437,100 Insurance - 1,953,700 - - - 1,953,700 Water - - - - 4,653,600 4,653,600 TOTAL OPERATIONS 16,621,100$ 4,872,900$ 200,000$ -$ 4,653,600$ 26,347,600$
TOTAL DEBT SERVICE -$ -$ -$ 578,500$ 2,059,000$ 2,637,500$
AVAILABLE FOR CAPITAL 1,752,544$ 2,907,057$ 3,397,825$ 438,045$ 27,778,046$ 36,273,517$
TOTAL CAPITAL PROJECTS 310,000$ 2,259,900$ 3,357,771$ -$ 24,777,000$ 30,704,671$
OTHER USES Operating Transfers 527,500$ 247,200$ 40,000$ -$ 254,600$ 1,069,300$ Loans Payable 182,500 - - - - 182,500 TOTAL OTHER USES 710,000$ 247,200$ 40,000$ -$ 254,600$ 1,251,800$
TOTAL USES OF FUNDS 17,641,100$ 7,380,000$ 3,597,771$ 578,500$ 31,744,200$ 60,941,571$
ENDING BUDGET RESOURCES 732,544$ 399,957$ 54$ 438,045$ 2,746,446$ 4,317,046$
Sources and Uses by Fund Group2017/2018 Budget
111

BUDGET SUMMARY
2017 ANNUAL BUDGET
Special Debt CapitalGeneral Revenue Services Project Enterprise Total
Fund Activity Fund Funds Funds Funds Fund FundsBeg Fund Bal 1,043,144$ 713,457$ 399,645$ 242,825$ 3,827,146$ 6,226,217$ Revenue 15,768,600 5,053,300 427,600 150,000 6,481,000 27,880,500 Grants & Other Sources 1,201,900 1,533,600 - 3,164,600 24,000,000 29,900,100 Transfers, net (350,000) 232,400 189,300 400 (72,100) - Expenditures 16,931,100 7,132,800 578,500 3,557,771 31,489,600 59,689,771 Fund Bal Change (310,600) (313,500) 38,400 (242,771) (1,080,700) (1,909,171) Ending Fund Balance 732,544$ 399,957$ 438,045$ 54$ 2,746,446$ 4,317,046$
112

BUDGET SUMMARY
2017 ANNUAL BUDGET
2014/15 Actual
2015/16 Actual
2016/17 Budget
2017/18 Proposed
REVENUESTaxes 13,106,702 13,567,221 13,911,200 16,797,400 Licenses & Permits 702,278 750,637 896,500 788,500 Intergovernmental 716,622 1,305,797 1,874,700 1,814,900 Charges for Service 5,640,538 6,254,147 6,801,200 7,044,800 Fines & Forfeitures 141,979 127,648 127,000 107,000 Grants 1,035,020 236,718 867,000 2,419,400 Debt Proceeds - 1,000,000 18,700,000 24,000,000 Miscellaneous 2,755,541 3,831,122 2,763,000 4,991,100 Transfers In 676,107 602,573 684,300 1,069,300 Total Revenues 24,774,787$ 27,675,863$ 46,624,900$ 59,032,400$
Less: EXPENDITURESSalaries & Wages 8,767,779 9,117,890 9,582,400 10,329,000 Personnel Benefits 3,837,109 4,163,330 4,910,400 6,054,400 Supplies 1,102,110 1,045,810 1,278,100 1,303,300 Services 686,725 706,775 1,142,300 1,097,600 Utilities 969,746 1,069,763 1,131,500 1,183,100 Travel 90,397 95,909 151,200 176,900 Advertising & Public Relations 36,814 35,559 46,700 50,900 Rentals 63,342 177,318 256,000 256,700 Insurance 2,255,172 2,354,942 2,518,000 2,490,800 Repair & Maintenance 715,329 925,031 1,263,100 1,318,600 Miscellaneous 2,669,851 2,897,673 1,299,800 3,182,800 Capital Outlay 2,408,205 10,359,966 22,451,600 28,684,671 Debt Service 659,789 648,288 1,991,400 2,637,500 Depreciation 2,684,253 2,370,019 962,000 1,106,000 Transfers Out 669,493 602,572 684,300 1,069,300 Total Expenditures 27,616,114$ 36,570,845$ 49,668,800$ 60,941,571$
Revenue (under)/Over Expenditures (2,841,327) (8,894,982) (3,043,900) (1,909,171)
2017/18 FINANCIAL OVERVIEW - ALL FUNDS
113

Tota
l Bud
get
$60,
941,
571
Gen
eral
Fun
d$1
7,64
1,10
0E
nter
pris
e Fu
nd$3
1,74
4,20
0
Spe
cial
Rev
enue
Fu
nds
$7,3
80,0
00
Tow
n C
ounc
il$1
02,5
00
Tow
n C
lerk
/El
ectio
ns$2
37,7
00
Tow
n M
anag
er$2
20,4
00
Pol
ice
Dep
artm
ent
$6,5
25,1
00
Info
rmat
ion
Serv
ices
$803
,500
Tow
nAt
torn
ey$4
48,7
00
Fire
Dep
artm
ent
$3,8
04,1
00
Hum
anR
esou
rces
$238
,100
Com
mun
ityD
ev A
dmin
$108
,800
Mag
istra
te
Cou
rt$2
13,1
00
Rec
reat
ion/
Tour
ism
$1,4
75,3
00
Fina
ncia
lS
ervi
ce$5
31,6
00
Cen
traliz
edS
ervi
ces
$1,3
41,1
00
Bui
ldin
g S
ervi
ces
$
Ope
ratin
g Bu
dget
s$5
6,76
5,30
0
HU
RF
$2,7
15,6
00
Pol
ice
–D
ept o
fJu
stic
e$1
02,3
00
Bed
Tax
$423
,600
Eve
nt C
ente
r $2
22,2
00
Libr
ary
$428
,300
Airp
ort
$1,4
72,3
00
Insu
ranc
e$1
,953
,700
Deb
t Ser
vice
s$5
78,5
00
Tim
ber R
idge
Deb
t Se
rv$4
0,00
0
G.O
. Bon
dsS
erie
s 20
04$3
31,6
00
Wes
terly
Rd
Imp
Dis
trict
$78,
900
Exc
ise
Tax
Obl
igat
ions
$128
,000
Cap
ital P
roje
cts
$3,5
97,7
71
Pub
lic S
afet
y Bo
nd$1
14,5
00
Gra
nt F
unde
d C
apita
l Pro
ject
s$1
,105
,000
CA
P Tr
ust F
und
$128
,271
Tow
n of
Pay
son
Bud
get
Fisc
al Y
ear 2
017/
18
Tran
sfer
s$7
10,0
00
Am
Gul
ch
Impr
ovem
ent D
ist.
$150
,000
Tim
ber R
idge
Impr
ovem
ent D
ist.
$2,1
00,0
00
Bui
ldin
g S
ervi
ces
$364
,200
Par
ks F
acili
ty
Impr
ovem
ent F
ee$6
2,00
0
Pla
nnin
g &
Dev
$516
,900
Wat
er O
pera
tions
$4,8
64,4
00
Wat
er C
apita
l$7
77,0
00
C.C
.Cra
gin
$24,
043,
800
Wat
er D
ebt S
ervi
ce$2
,059
,000
114

THE BUDGET A CLOSER LOOK
115

2017 Annual Budget OPERATING BUDGET OVERVIEW
>>>> GENERAL FUND—REVENUE <<<
General Fund
.
2016/17 2017/18 INCREASE PERCENTMAJOR REVENUE SOURCES BUDGET PROPOSED (DECREASE) CHANGETaxes 11,678,400 14,481,000 2,802,600 24%Licenses & Permits 896,500 788,500 (108,000) -12%Intergovernmental 825,500 663,500 (162,000) -20%Grants 138,300 91,600 (46,700) -34%Charges for Service 927,500 822,600 (104,900) -11%Fines & Forfeitures 110,000 90,000 (20,000) -18%Miscellaneous 195,600 33,300 (162,300) -83%Transfers In 147,000 360,000 213,000 145%TOTAL 14,918,800$ 17,330,500$ 2,411,700$ 16%
116

2017 Annual Budget OPERATING BUDGET OVERVIEW
>>>> TAXES <<<
.
Sales Tax Revenue
$0 $2 $4 $6 $8 $10
2012/132013/142014/152015/16
2016/17B2017/18B
Millions
Sales Tax Revenue
City Sales Tax State Shared Sales Tax
117

2017 Annual Budget OPERATING BUDGET OVERVIEW
Changes in Sales Tax Revenue
07/08 08/09 09/10 10/11 11/12 12/13 13/14 14/15 15/16 16/17B
17/18B
state shared -3.3% -13.4% -7.8% 4.2% 1.4% 4.7% 6.3% 5.0% 3.2% 0.1% 0.9%local sales tax -1.1% -10.5%-10.5% -1.5% 2.3% -0.7% 6.6% 6.7% 5.6% 2.2% 39.6%
-20.0%
-10.0%
0.0%
10.0%
20.0%
30.0%
40.0%
50.0%
118

2017 Annual Budget OPERATING BUDGET OVERVIEW
State Shared Income Tax
.
Vehicle License Tax (VLT)
13/14
14/15
15/16
16/17B
17/18B
STATE SHARED INCOME TAX
13/14
14/15
15/16
16/17B
17/18B
VEHICLE LICENSE REVENUE
119

2017 Annual Budget OPERATING BUDGET OVERVIEW
Property Tax—General
$155 $160 $165 $170 $175 $180
14/15
15/16
16/17B
17/18B
Millions
Net Assessed Value
$610 $620 $630 $640 $650 $660 $670 $680
14/15
15/16
16/17B
17/18B
Thousands
Primary Property Tax
120

2017 Annual Budget OPERATING BUDGET OVERVIEW
>>>>LICENSES & PERMITS <<<<
Permits
Franchise Fees
12/13
13/14
14/15
15/16
16/17B
17/18B
Construction Related Revenue
$345,000 $355,000 $365,000 $375,000 $385,000
13/1414/1515/16
16/17B17/18B
Franchise Fee Revenues - Thousands
121

2017 Annual Budget OPERATING BUDGET OVERVIEW
. Intergovernmental
Fines & Forfeits
Miscellaneous
>>>> GENERAL FUND—EXPENDITURES >>>
EXPENDITURE SUMMARY BY DEPARTMENT—GENERAL FUND ONLY*
*Transfers not included
2014/15 2015/16 2016/17 2017/18DEPARTMENT ACTUAL ACTUAL BUDGET PROPOSEDTown Council 89,842 83,524 106,700 102,500 Town Clerk/Elections 247,067 211,598 253,600 237,700 Town Manager 180,239 317,299 210,700 220,400 Town Attorney 352,201 367,128 425,700 448,700 Financial Services 320,398 357,791 369,900 531,600 Other Governmental Services 1,184,461 1,303,823 1,343,100 1,341,100 Information Services 521,213 567,464 624,900 723,500 Tourism 118,493 126,283 122,700 129,400 Magistrate Court 174,792 206,881 198,100 213,100 Police 4,302,110 4,517,671 5,557,600 6,448,100 Fire 3,071,654 3,152,524 3,386,300 3,804,100 Community Development 672,682 813,032 1,217,800 989,900 Public Works 528,560 630,515 648,000 - Parks & Recreation 326,802 370,062 453,500 1,192,900 Human Resources 230,806 205,786 226,500 238,100 TOTAL 12,321,320$ 13,231,381$ 15,145,100$ 16,621,100$
122

2017 Annual Budget OPERATING BUDGET OVERVIEW
EXPENDITURE SUMMARY BY CATEGORY—GENERAL FUND*
Personnel Services
*Transfers not included
2016/17 2017/18 INCREASE PERCENTMAJOR EXPENDITURE BUDGET PROPOSED (DECREASE) CHANGEPersonnel Services/Benefits 11,556,400 13,263,800 1,707,400 14.8%Operating Expenditures 3,588,700 3,357,300 (231,400) -6.4%TOTAL 15,145,100$ 16,621,100$ 1,476,000$ 9.7%
$0
$2
$4
$6
$8
$10
$12
$14
2014/15 2015/16 2016/17B 2017/18B
Milli
ons
Personnel Services
123

2017 Annual Budget OPERATING BUDGET OVERVIEW
Operating Expenditures
: Transfers Out
$1.0
$1.5
$2.0
$2.5
$3.0
$3.5
$4.0
14/15 15/16 16/17B 17/18B
Mill
ions
Operating Expenditures
To Library 181,900 To Airport 105,900 To Rainy Day Fund 50,000 To Grant Capital Project 40,400 To Westerly Dr. Imprv. Debt Service 21,300 Excise Bond Debt Service Fund 128,000 To Water Dept - Loan Repayment 182,500
$ 710,000 $0
$200
$400
$600
$800
14/15 15/16 16/17B 17/18B
Thou
sand
s
Transfers Out
124

2017 Annual Budget OPERATING BUDGET OVERVIEW
Summary of General Fund Revenues & Expenditures (Operating Only)
:
*Estimated
PERCENT PERCENTYEAR REVENUES CHANGE EXPENDITURES CHANGE DIFFERENCE
2008/09 12,973,526 -8.9% 12,832,838 -12.5% 140,688 2009/10 11,687,516 -9.9% 12,203,549 -4.9% (516,033) 2010/11 11,298,741 -3.3% 10,964,437 -10.2% 334,304 2011/12 11,500,661 1.8% 11,695,090 6.7% (194,429) 2012/13 11,993,742 4.3% 11,424,504 -2.3% 569,238 2013/14 12,957,462 8.0% 12,712,900 11.3% 244,562 2014/15 13,270,968 2.4% 12,896,773 1.4% 374,195 2015/16 14,345,360 8.1% 14,316,680 11.0% 28,680 2016/17* 14,918,800 4.0% 15,607,200 9.0% (688,400) 2017/18* 17,330,500 16.2% 17,641,100 13.0% (310,600)
125

2017 Annual Budget OPERATING BUDGET OVERVIEW
.
Special Revenue Funds
126

2017 Annual Budget OPERATING BUDGET OVERVIEW
.
127

2017 Annual Budget OPERATING BUDGET OVERVIEW
>>>>>> SPECIAL REVENUE FUND—REVENUE <<<<<
2016/17 2017/18 Increase PercentCategory Budget Proposed (Decrease) Change
Taxes 1,862,800 1,946,400 83,600 4%Intergovernmental 1,049,200 1,116,400 67,200 6%Grants 87,500 1,263,200 1,175,700 1344%Charges for Service 232,200 276,200 44,000 19%Fines & Forfeitures 17,000 17,000 - 0%Miscellaneous 2,095,300 1,967,700 (127,600) -6%Transfers In 260,700 479,600 218,900 84%Total Operating Revenues 5,604,700$ 7,066,500$ 1,461,800$ 26%
128

2017 Annual Budget OPERATING BUDGET OVERVIEW
>>>>> TAXES <<<<<
Highway User Gas Tax
The Arizona Department of Trans-portation provides the HURF esti-mate. This revenue is projected to be approximately 7.6% higher than last year’s projection. As the econ-omy continues to improve, this revenue is projected to continue to rise.
Gila County 1/2 Cent Transportation Excise Tax
This revenue source has remained very consistent and has been a wel-come boost to the Town’s funding for streets projects. Like the HURF funding, this revenue is projected to increase as the economy continues to improve.
$1.0 $1.1 $1.2 $1.3 $1.4 $1.5 $1.6 $1.7
2013/14
2014/15
2015/16
2016/17B
2017/18 B
Millions
HURF Revenue
$0 $200 $400 $600 $800 $1,000
2014/15
2015/16
2016/17B
2017/18 B
Thousands
Gila County 1/2 Cent Transportation Tax
129

2017 Annual Budget OPERATING BUDGET OVERVIEW
Bed Tax
Continued efforts to promote lo-cal events have helped boost this revenue source despite the slow economy. Actual numbers for FY15/16 are well above projec-tions and the initial figures for FY16/17 appear to be trending in the same direction indicating that the budgeted estimate was low.
2013/14
2014/15
2015/16
2016/17B
2017/18B
Thousands
Bed Tax Revenue
>>>>> SPECIAL REVENUE FUND—EXPENDITURES <<<<<
The Special Revenue Funds budget for FY2017/18 totals $7,380,000 and is 19.55% higher than the FY2016/17 budget. The main reason for the increase is the opportunity for a grant-funded airport project.
2014/15 2015/16 2016/17 2017/18FUND ACTUAL ACTUAL BUDGET PROPOSED
HURF Fund 1,621,141 2,373,444 2,998,600 2,715,600 P&R Facility Improvement Fees - - - 62,000 Gifts & Grants Fund 11,528 55,304 - - Bed Tax Fund 269,963 248,050 307,900 423,600 Police Dept of Justice 89,244 76,302 40,500 102,300 Library fund 332,904 345,651 378,700 428,300 Airport Fund 989,429 230,496 255,900 1,472,300 Event Center Fund 174,322 171,141 167,500 222,200 Medical Insurance Fund 1,801,964 1,880,294 2,024,000 1,953,700 TOTAL 5,290,495$ 5,380,682$ 6,173,100$ 7,380,000$
EXPENDITURE SUMMARY BY FUND—SPECIAL REVENUE FUNDS
130

2017 Annual Budget OPERATING BUDGET OVERVIEW
EXPENDITURE SUMMARY BY CATEGORY
.
.
. .
2016/17 2017/18 INCREASE PERCENTMAJOR EXPENDITURE BUDGET PROPOSED (DECREASE) CHANGEPersonnel Services 1,636,200 1,750,500 114,300 7.0%Operating Expenditures 3,149,400 3,122,400 (27,000) -0.9%Capital Outlay 1,180,000 2,259,900 1,079,900 91.5%Transfers Out 207,500 247,200 39,700 19.1%TOTAL 6,173,100$ 7,380,000$ 1,206,900$ 19.6%
131

2017 Annual Budget OPERATING BUDGET OVERVIEW
BUDGET SUMMARY BY FUND For Special Revenue Funds
2014/15 2015/16 2016/17 2017/18FUND Actual Actual Budget Proposed
HURF Fund 1,878,808 2,678,536 2,435,600 2,549,000 Parks & Rec Improvement Fee Fund 15,295 15,055 15,000 15,000 Gifts & Grant Fund 6,679 12,000 12,000 - Bed Tax Fund 289,988 318,814 270,000 300,000 Police Dept of Justice Fund 62,854 64,570 45,000 68,000 Police Impound Fee - - - 7,000 Library Fund 332,903 345,651 378,700 428,300 Magistrate Court 1,149 1,222 1,000 1,000 Airport Fund 965,263 230,496 255,900 1,472,300 Event Center Fund 174,322 171,142 167,500 222,200 Contingency Fund - - - 50,000 Insurance Fund 1,801,857 1,877,406 2,024,000 1,953,700 Total Revenues $ 5,529,118 $ 5,714,892 $ 5,604,700 $ 7,066,500
HURF Fund 1,621,141 2,373,444 2,998,600 2,715,600 P&R Facility Improvement Fees - - - 62,000 Gifts & Grants Fund 11,528 55,304 - - Bed Tax Fund 269,963 248,050 307,900 423,600 Police Dept of Justice 89,244 76,302 40,500 102,300 Library fund 332,904 345,651 378,700 428,300 Airport Fund 989,429 230,496 255,900 1,472,300 Event Center Fund 174,322 171,141 167,500 222,200 Insurance Fund 1,801,964 1,880,294 2,024,000 1,953,700 Total Expenditures $ 5,290,495 $ 5,380,682 $ 6,173,100 $ 7,380,000
132

2017 Annual Budget OPERATING BUDGET OVERVIEW
.
DEBT SERVICE FUNDS
General Obligation Debt Service as of July 1, 2017
Excise TaxYear Bonds Interest Total
2017 125,000 2,891 127,891 Totals 125,000$ 2,891$ 127,891$
133

2017 Annual Budget OPERATING BUDGET OVERVIEW
Revenue Backed Debt Service as of July 1, 2017(Principal Only)
Westerly RdImprovement Fire
Year District Bonds
2017 65,000 305,000 2018 70,000 320,000 2019 70,000 325,000 2020 75,000 2021 80,000
360,000$ 950,000$
General Town of Payson Debt 1,310,000$
134

2017 Annual Budget OPERATING BUDGET OVERVIEW
WATER ENTERPRISE REVENUE BACKED DEBT
.
135

2017 Annual Budget OPERATING BUDGET OVERVIEW
WATER ENTERPRISE DEBT
Revenue Backed Debt Service as of July 1, 2017 (Principal Only)
Water Enterprise Debt
WIFA WIFA WIFA WIFA WIFAYear Loan 1b Loan 2 Loan 3 Loan 4 Loan 5 Total
2017 177,408 265,091 255,603 247,078 229,962 1,175,142 2018 182,537 272,514 261,226 252,711 235,573 1,204,561 2019 187,815 280,144 266,973 258,473 241,321 1,234,726 2020 193,244 287,988 272,847 264,366 247,210 1,265,655 2021 198,831 296,052 278,849 270,394 253,242 1,297,368 2022 204,579 304,342 284,984 276,559 259,421 1,329,885 2023 210,494 312,863 291,254 282,864 265,751 1,363,226 2024 216,579 321,623 297,661 289,314 272,235 1,397,412 2025 222,840 330,629 304,210 295,910 278,877 1,432,466 2026 229,282 339,886 310,902 302,657 285,682 1,468,409 2027 235,911 349,403 317,742 309,557 292,653 1,505,266 2028 242,731 359,187 324,732 316,615 299,793 1,543,058 2029 248,598 369,244 331,877 323,834 307,108 1,580,661 2030 - 379,583 339,178 331,218 314,602 1,364,581 2031 - 390,211 346,640 338,769 322,278 1,397,898 2032 - 401,138 354,266 346,493 330,142 1,432,039 2033 - - 362,060 354,393 338,197 1,054,650 2034 - - 370,025 36,274 346,449 752,748 2035 - - 378,166 370,738 354,902 1,103,806 2036 - - 386,485 379,191 363,562 1,129,238 2037 - - 394,988 387,836 372,433 1,155,257 2038 - - 403,678 396,679 381,520 1,181,877 2039 - - 412,559 405,723 390,829 1,209,111 2040 - - 421,635 44,974 400,366 866,975 2041 - - 430,911 424,435 410,135 1,265,481 2042 - - 440,391 434,112 420,142 1,294,645 2043 - - 450,079 444,010 430,393 1,324,482 2044 - - 459,981 454,133 440,895 1,355,009 2045 - - - 464,488 451,653 916,141 2046 462,673 462,673
2,750,849$ 5,259,898$ 9,749,899$ 9,303,798$ 9,999,999$ 37,064,443$
Total Enterprise Debt 37,064,443$
136

2017 Annual Budget OPERATING BUDGET OVERVIEW
CONTRACT/LEASE DEBT
Total Contract / Lease Debt Service as of July 1, 2017 (Principal Only)
TotalBallfield Field Sweeper/ Mower Contract/Lease
Year Lights Turf BackhoeLoader Lease/Purchase Debt
2017 32,055 44,970 68,278 13,954 159,257 2018 33,678 46,153 69,823 1 149,655 2019 35,383 47,367 71,403 154,153 2020 37,175 48,613 36,305 122,093 2021 39,057 49,891 88,949 2022 41,035 41,035 2023 43,113 43,113 2024 45,296 45,296 2025 47,590 47,590
TOTAL 354,383$ 236,994$ 245,810$ 13,955$ 851,142$
137

2017 Annual Budget OPERATING BUDGET OVERVIEW
INTER-FUND DEBT
LEGAL DEBT MARGIN
Net Secondary Assessed Valuation 172,579,944$
Water, Sewer, Light, Parks, Open Space and Recreational Facility Bonds
Debt limit - 20% of secondary net assessed valuation 34,515,989
Net debt applicable to limit -
20% legal debt margin 34,515,989$
All other general obligation bonds
Debt limit - 6% of secondary net assessed valuation 10,354,797
Net debt applicable to limit 645,000
6% legal debt margin 9,709,797$
Total Legal Debt Margin 44,225,785$
138

2017 Annual Budget CAPITAL PROJECTS
CAPITAL PROJECT FUNDS
139

2017 Annual Budget CAPITAL PROJECTS
.
. . . CAPITAL IMPROVEMENTS . . .
.
. . . CAPITAL IMPROVEMENT PLAN . . .
.
140

2017 Annual Budget CAPITAL PROJECTS
2017 / 2018 Proposed CAPITAL Projects
PROJECT ESTIMATEDCOST
PUBLIC WORKS - STREETS202 Equipment 317,000 202 Pavement Preservation 500,000 202 Bonita Street Reconstruction 60,000
877,000$
FIRE403 Fire Truck Grant 847,800
847,800$
WATER460 Environmental Project 128,271 661 Machinery & Equipment 100,000 661 Wells 75,000 661 Radon Removal Study 45,000 661 Water Line 250,000 661 Pumps for Wells 75,000 661 Computer Equipment 30,000 661 Chlorine Generator 35,000 661 Service Truck 52,000 661 Surge Tank 45,000 661 Pressure Blowoff Valves 20,000 661 Tank Mixing System 50,000 661 CC Cragin Pipeline 24,000,000
24,905,271$
POLICE101 Vehicles 49,000 101 LE Crisis Team Equipment 28,000 215 Defense 1033 - LE Vehicle 23,300 403 HSG Radio Program 20,700 403 GOHS Law Enf Grant 36,500 425 CAD Communications Equipment 114,500
272,000$
ADMINISTRATION101 Computer Equipment 80,000
80,000$
141

2017 Annual Budget CAPITAL PROJECTS
2017 / 2018 Proposed CAPITAL Projects
PROPOSED CAPITAL PROJECTS BY DEPARTMENTFISCAL YEAR 2017/2018
PUBLIC SAFETY
WATER
ADMIN
AIRPORT
COMMUNITY DEV
PARKS/REC/TOURISM
PUBLIC WORKS
PROJECT ESTIMATEDCOST
PARKS & REC101 GV Park Improvements 71,000 101 Vehicle 32,000 101 Master Plan 50,000 206 Basketball Court Replacement 40,000
193,000$
COMMUNITY DEVELOPMENT429 American Gulch Improvements 150,000 434 Timber Ridge Improvement District 2,060,000
2,210,000$
AIRPORT260 Equipment 5,800 260 Ramp Repair A&D / Fence 1,313,800
1,319,600$
TOTAL 30,704,671$
142

2017 Annual Budget CAPITAL PROJECTS
CAPITAL PROJECT DETAIL BY ACCOUNTING
2014/15 2015/16 2016/17 2017/18ACTUAL ACTUAL BUDGET PROPOSED
101-5-1408-00-8004 Capital Equipment 25,091 48,309 20,000 50,000 101-5-2408-01-8004 Machinery & Equipment 51,290 - - 30,000 101-5-2421-02-8003 Vehicle - - - 49,000 101-5-2421-02-8536 LE Crisis Team Equipment - - - 28,000 101-5-2426-01-8409 e-PCR 19,448 - - - 101-5-3442-01-8779 Rumsey Park Improvements - 734,015 - - 101-5-3442-01-8780 GV Park Improvements - - - 71,000 101-5-4460-00-8003 Vehicle - - - 32,000 101-5-4460-00-8781 Master Plan - - - 50,000
202-5-3442-00-8004 Equipment 56,574 345,406 225,000 317,000 202-5-3442-00-8713 Pavement Preservation 33,122 252,727 500,000 500,000 202-5-3442-00-8737 Green Valley Parking Lot Ph 1 - 32,491 - - 202-5-3442-00-8742 Bonita Street Reconstruction 25,657 - - 60,000 202-5-3442-00-8743 Manzanita Drive Constr - 110,341 340,000 -
206-5-4460-00-8783 Basketball Court Replacement - - - 40,000
214-5-1410-00-8521 Machinery & Equipment 12,891 - - -
215-5-2421-02-8510 Defense 1033 - LE Vehicle 72,830 68,050 20,000 23,300
260-5-4445-00-8509 Equipment 7,350 - - 5,800 260-5-4445-00-8813 Echo Ramp Expansion & Taxiway 396,453 - - - 260-5-4445-00-8814 Ramp Repair A&D/Fence - - - 1,313,800 260-5-4445-00-8820 Boundary Fence - - 95,000 - 260-5-4445-00-8821 Runway 24 Run up Apron 409,533 - - - 260-5-4445-00-8823 Infield Drainage 5,870 96,901 - -
265-5-4465-00-8000 Buildings 28,875 - - - 265-5-4465-00-8004 Equipment - 55,174 - -
403-5-2412-01-8772 Law Enforce-HSG Radio Prog - 15,471 36,500 20,700 403-5-2412-01-8773 SHSGP Mobile Repeaters 32,020 - - - 403-5-2412-01-8774 SHSGP Radios/Headsets - - 44,500 - 403-5-2421-01-8762 Law Enf-GOHS Grant - - 34,300 36,500 403-5-2426-03-8758 Miscellaneous Fire Grants - - - 847,800 403-5-2426-03-8771 AFG SCBA Grant - - 334,300 -
This schedule does not reflect CDBG Housing grants.
143

2017 Annual Budget CAPITAL PROJECTS
This schedule does not reflect CDBG Housing grants.
CAPITAL PROJECT DETAIL BY ACCOUNTING
2014/15 2015/16 2016/17 2017/18ACTUAL ACTUAL BUDGET PROPOSED
408-5-4463-00-8782 Pickle Ball Court 47,125 - - -
409-5-2421-01-8772 LE - Radio Program 47,595 - - -
417-5-6428-01-8785 Main Street Improvements 34,060 - - -
425-5-2421-16-8407 CAD Police/Fire Comm Eq 7,645 35,644 141,000 114,500
429-5-3442-00-8738 American Gulch Improvement - - - 150,000
434-5-3442-00-8742 Timber Ridge ID - - 2,060,000 2,060,000
460-5-5451-00-8594 Environmental Project - 113,461 225,000 128,271
661-5-5451-08-8002 Machinery & Equipment 8,000 31,203 - 100,000 661-5-5451-08-8007 Wells - - 75,000 75,000 661-5-5451-08-8009 Waterlines 107,426 49,297 780,000 250,000 661-5-5451-08-8313 Radon Removal Engineer Stdy - - 45,000 45,000 661-5-5451-08-8524 Computer Equipment 5,435 7,110 19,000 30,000 661-5-5451-08-8528 Service Truck 35,614 28,906 100,000 52,000 661-5-5451-08-8529 SCADA Equip-Wells/Tanks 16,199 - 20,000 - 661-5-5451-08-8530 Surge Tank - 6,810 60,000 45,000 661-5-5451-08-8581 Chlorine Generator - - 35,000 35,000 661-5-5451-08-8582 Pressure Blowoff Valves - - 20,000 20,000 661-5-5451-08-8587 Security Gate Installation - 7,559 - - 661-5-5451-08-8589 Fish Fence Project 11,168 - - - 661-5-5451-08-8793 Tank Mixing System - - 50,000 50,000 661-5-5451-08-8794 Pumps for Wells - 34,608 72,000 75,000 661-5-5451-20-8010 CC Cragin Pipeline (SRP) 289,172 783,805 500,000 500,000 661-5-5451-20-8600 CCC Pipeline Constr 621,761 7,502,677 16,600,000 23,500,000
TOTAL CAPITAL PROJECTS 2,408,205$ 10,359,965$ 22,451,600$ 30,704,671$
144

145

»
»
» »
»
»
146

C.C. CRAGIN PROJECT HISTORY & TIMELINE
1962- 1965* Phelps- Dodge built the "Blue Ridge Project" Dam to capture and exchange water for the
Morenci Copper Mine* Special Use Permit was issued by the U.S. Forest Service* Planned 11- mile tunnel to the East Verde River was abandoned after 4400' due to mud
and caving conditions. Project altered to include:* Pumping station (which has seven pumps & one submersible priming pump)* 11 miles of pipeline* Priming reservoir (two- million gallons)* Powerhouse / Generating Station at Washington Park* Power lines (APS added in a 2nd power line & agreed to maintain both)
2005* Acquired by SRP to provide water for SRP water users, No. Gila County & others* Ownership transferred to U.S. Bureau of Reclamation (SRP became the contract operator)* Town acquires 3,000 acre feet reights to C.C.Cragin water
2006- Current* Dam inspection by U.S Bureau of Raclamation* Electrical wiring updated (pump &/or powerhouse)* Mechanical relays were replaced with digital versions* Twenty- two above graound sections of pipeline on top of and below Mogollon Rim have
been repaired or replaced between the dam and the power generating station* U.S. Forest Service / U.S. Bureau of Reclamation jurisdictional issues have been resolved
PAYSON C.C. CRAGIN PROJECT TIMELINE
2011- 2015* Ductile iron pipe purchased* Obtained a Special Use Permit from the National Forest Service to construct the water
project on Tonto National Forest* Tailrace connection completed & water moved through system into the East Verdy River* Power and phone line installed for monitoring* Six projects of pipeline installed within the Town of Payson, and two projects outside of
town on East Houston Mesa Road* Executed a contract with Payson Water Company for water service to Mesa Del Caballo* Hydro Electric Generator & Water Treatment Plant Design* Raw Water Design* Finalizing land purchase for new Water Treatment Plant* In negotiations with the Federal Government for water service to the Tonto Apache* Reservation Aquifer Storage & Recovery (ASR) Project* Construction planned for pipeline project line "A" on North Beeline Highway
What's Next?* 2015- 2016 Construction of 3- 5 ASR Wells* 2015- 2016 Construction of the Raw Water pipeline* 2016- 2017 Construction of the Hydro Electric Plant* 2017- 2018 Construction of the Water Treatment Plant* 2017- 2018 Construction planned for pipeline project Line "F" along East Highway 260
147

2017 Annual Budget ENTERPRISE FUNDS
ENTERPRISE FUNDS
Residential Water
Commercial Water
Fire Protection Service
Bulk Water Sales
New Service Installations
Reconnect & Turn On Fees
148

2017 Annual Budget ENTERPRISE FUNDS
$0 $1 $2 $3 $4 $5
2013/14
2014/15
2015/16
2016/17B
2017/18B
Millions
RESIDENTIAL WATER USER FEES
$0 $200 $400 $600 $800 $1,000 $1,200
2013/14
2014/15
2015/16
2016/17B
2017/18B
Thousands
COMMERCIAL WATER USER FEES
149

REVENUE INFORMATION
150

2017 Annual Budget REVENUE SUMMARY
>>>REVENUE SUMMARY BY FUND<<<
$59,032,400
2014/15 2015/16 2016/17 2017/18Fund Actual Actual Budget Proposed
General Fund 13,270,969 14,345,360 14,918,800 17,330,500 HURF Fund 1,878,808 2,678,536 2,435,600 2,549,000 Parks & Rec Improvement Fee Fund 15,295 15,055 15,000 15,000 Gifts & Grant Fund 6,679 12,000 12,000 - Bed Tax Fund 289,988 318,814 270,000 300,000 Police Dept of Justice Fund 62,854 64,570 45,000 68,000 Police Impound Fee Fund - - - 7,000 Library Fund 332,903 345,651 378,700 428,300 Magistrate Court 1,149 1,222 1,000 1,000 Airport Fund 965,263 230,496 255,900 1,472,300 Event Center Fund 174,322 171,142 167,500 222,200 Contingency Fund - - - 50,000 Medical Insurance Fund 1,801,857 1,877,406 2,024,000 1,953,700 Grant Capital Projects Fund 113,030 89,016 667,100 1,105,000 Park Development Fund 323 - - - Public Safety Development Fund 6,289 - - - American Gulch Improvement District Fund - - - 150,000 Timber Ridge I.D. - - 2,100,000 2,100,000 Central Arizona Project Trust Fund - 5 - - General Debt Service 145,087 105,749 52,900 - Westerly Rd Improvement Fund 83,663 85,500 82,300 78,900 Excise Tax Obligation Debt Service Fund 124,963 134,242 132,000 128,000 General Obligation Bonds Fund 372,509 393,429 370,000 370,000 Timber Ridge ID Debt Service - - 40,000 40,000 Water Funds 5,128,836 6,807,670 22,657,100 30,663,500
Total Revenues All Funds 24,774,787$ 27,675,863$ 46,624,900$ 59,032,400$
151

2017 Annual Budget REVENUE SUMMARY
>>>REVENUE SUMMARY BY CATEGORY<<<
2014/15 2015/16 2016/17 2017/18Category Actual Actual Budget Proposed
Taxes 13,106,702 13,567,221 13,911,200 16,797,400 Licenses & Permits 702,278 750,637 896,500 788,500 Intergovernmental 716,622 1,305,797 1,874,700 1,814,900 Charges for Service 5,640,538 6,254,147 6,801,200 7,044,800 Fines & Forfeitures 141,979 127,648 127,000 107,000 Grants 1,035,020 236,718 867,000 2,419,400 Debt Proceeds - 1,000,000 18,700,000 24,000,000 Miscellaneous 2,755,541 3,831,122 2,763,000 4,991,100 Transfers 676,107 602,573 684,300 1,069,300 Total Operating Revenues 24,774,787$ 27,675,863$ 46,624,900$ 59,032,400$
$0
$5
$10
$15
$20
$25
2014/15 2015/16 2016/17 2017/18
Mill
ions
Taxes
Licenses & Permits
Intergovernmental
Charges for Service
Fines & Forfeitures
Grants
Debt Proceeds
Miscellaneous
Transfers
152

2017 Annual Budget REVENUE SUMMARY
REVENUE DETAIL
NON-RESTRICTED GENERAL FUND REVENUESTaxes
101-4-1300-110 Sales Tax - State Shared 1,398,339 1,443,371 1,445,300 1,459,000 101-4-1300-120 Income Tax - State Shared 1,852,281 1,842,238 1,878,500 1,926,000 101-4-1300-130 Vehicle License Tax - Auto Lieu 874,316 917,957 982,100 1,071,000 101-4-1300-310 Sales Tax - Town 6,208,485 6,557,158 6,700,000 9,350,000 101-4-1300-330 Property Tax Levy 647,063 634,475 662,500 670,000 101-4-1300-335 Property Tax Levy - PY 9,836 2,645 10,000 5,000
Taxes 10,990,320 11,397,844 11,678,400 14,481,000
Licenses & Permits101-4-4300-371 Franchise Fees - Electricity 245,855 247,948 251,500 253,000 101-4-4300-372 Franchise Fees - Gas 49,931 58,260 55,000 55,000 101-4-4300-373 Franchise Fees - Cable TV 68,278 74,205 72,500 72,000 101-4-4300-410 Business License 70,745 71,482 71,000 72,000 101-4-4300-715 Liquor License Fees 1,900 550 1,500 1,500 101-4-4328-410 Building Permits 242,237 278,696 425,000 330,000 101-4-4328-420 ROW Permits 9,458 5,697 5,000 5,000 101-4-4372-410 Animal Control Licenses 13,874 13,799 15,000 -
Licenses & Permits 702,278 750,637 896,500 788,500
Intergovernmental101-4-2300-989 Tonto Apache Tribe-Prop 202 23,423 24,342 12,000 20,000 101-4-2300-990 Misc Intergovernmental Revenue 961 26,341 21,700 55,000 101-4-2318-110 DOJ Victims Rights Grant 15,818 17,191 21,600 21,600 101-4-2324-120 Law Enf - School Resource 61,452 61,452 61,000 122,000 101-4-2324-130 Gila County Intergovernmental - - 658,500 298,500 101-4-2324-140 LE Property Prog Adm Fee 17,947 19,637 10,000 25,000 101-4-2324-248 GOHS Traffic 11,359 - - 25,000 101-4-2324-253 2016 Step & Radar - 5,377 7,000 10,000 101-4-2324-254 GOHS 2016 PBTs - 1,770 - - 101-4-2324-255 3016-17 Bullet Proof Vest - - 6,000 5,000 101-4-2326-270 Fire-SAFER Grant 91,820 - - - 101-4-2326-280 Fire Hazardous Fuels Grant - - 67,500 - 101-4-2326-767 Police Misc Intgvt Revenue 3,712 3,936 3,000 3,000 101-4-2327-750 Fire-Wildlands/Urban 6,714 102,816 73,000 100,000 101-4-2328-110 REDE Grant - - 22,500 50,000 101-4-2328-111 AZCEI Grant - - - 20,000
Intergovernmental 233,206 262,862 963,800 755,100
2014/15 2015/16 2016/17 2017/18Account Revenue Source Actual Actual Budget Proposed
153

2017 Annual Budget REVENUE SUMMARY
REVENUE DETAIL
Charges for Services101-4-5316-520 Prosecution Fees 35,649 31,928 35,000 30,000 101-4-5316-521 Deferred Prosecution Fees 13,369 12,090 14,000 15,000 101-4-5323-926 Clean & Lien 1,134 9,766 - 2,500 101-4-5324-710 Law Enf - Police Reports 3,946 2,642 4,000 2,600 101-4-5324-765 Law Enf - Vehicle Storage 210 - 2,500 - 101-4-5326-710 Fire Code Plan Review 4,403 7,002 5,000 6,000 101-4-5326-750 Fire Svc Agreement Fees 287,498 321,456 380,000 400,000 101-4-5326-757 Fire Svc Fees - Training 4,350 9,630 15,000 5,000 101-4-5326-758 Fire Svc Fees-Cost Recovery 883 6,400 1,000 1,000 101-4-5326-760 Police Service Fee-Cost Recovery 14,743 3,772 7,500 5,000 101-4-5326-765 Police - Tribe Dispatch Services - - 51,000 41,000 101-4-5328-710 Plan Review Fees 136,263 140,350 225,000 150,000 101-4-5328-720 Zoning & Subdivision Fees 37,974 49,418 30,000 25,000 101-4-5328-730 Building - Spec Inspections 7,630 7,970 10,000 7,500 101-4-5341-710 Engineering - Review Fees 7,787 7,408 20,000 10,000 101-4-5363-710 Ramada & Ballfield Fees 10,194 9,676 12,000 12,000 101-4-5364-700 Event Revenue 22,796 20,307 25,000 22,000 101-4-5367-710 Recreation Program Fees 62,886 63,733 63,000 70,000 101-4-5367-715 Outdoor Rec Programming 480 160 500 500 101-4-5369-710 Swimming Pool Fees 13,758 19,373 25,000 15,000 101-4-5369-910 Concessions 1,650 2,587 2,000 2,500
Charges for Services 667,603 725,668 927,500 822,600
Fines & Forfeitures101-4-3316-510 Court Fines & Fees 122,863 110,837 110,000 90,000
Fines & Forfeitures 122,863 110,837 110,000 90,000
Miscellaneous101-4-6323-920 Contributions - Volunteer Police - 50 100 200 101-4-6324-920 Donations - Police - 228 500 - 101-4-6325-923 Guardian Angel Donations - 625 300 600 101-4-6326-920 Donations - Fire - - 500 - 101-4-6367-920 Donations - Parks & Rec - 250 - 5,000 101-4-9300-855 Debt Proceeds Capital Leases - 734,015 - - 101-4-9300-910 Interest Earnings 1,485 4,674 5,000 7,500 101-4-9300-970 Insurance Recoveries 17,214 2,829 5,000 2,500 101-4-9300-971 Risk Insurance 128,371 - - - 101-4-9300-980 Overhead 250,000 154,400 154,400 - 101-4-9300-990 Other Revenue 6,724 (2,335) 5,000 1,000
2014/15 2015/16 2016/17 2017/18Account Revenue Source Actual Actual Budget Proposed
154

2017 Annual Budget REVENUE SUMMARY
REVENUE DETAIL
101-4-9300-992 Sale of Capital Assets - 9,444 - - 101-4-9300-993 Facilities Lease Fees 11,220 12,062 11,300 11,500 101-4-9300-996 Public Surplus Sale 24,133 27,053 10,000 2,500 101-4-9326-757 Fire Svc Fees Other 17,531 1,181 2,000 1,000 101-4-9341-730 Map Sales 1,755 2,422 1,500 1,500 101-4-9341-734 Plan Storage Boxes / Code Books 460 310 - -
Miscellaneous 458,893 947,208 195,600 33,300
Transfers In 101-4-9399-xxx Operations 95,806 150,304 147,000 360,000
Transfers In 95,806 150,304 147,000 360,000 Non-Restricted General Fund Revenues 13,270,969$ 14,345,360$ 14,918,800$ 17,330,500$
RESTRICTED OPERATING REVENUES
HURF Fund (202)Taxes
202-4-1342-110 Highway Users Gas Tax 1,453,885 1,457,134 1,592,800 1,646,400 Taxes 1,453,885 1,457,134 1,592,800 1,646,400
Intergovernmental202-4-1342-140 Integov'l from Gila County 313,538 806,453 800,000 825,000 202-4-2342-279 ADOT Grants 66,129 18,992 - -
Intergovernmental 379,667 825,445 800,000 825,000
Charges for Services202-4-5300-710 Special Inspection Fees 6,832 - 10,000 30,000
Charges for Services 6,832 - 10,000 30,000
Miscellaneous202-4-9300-855 Proceeds from Capital Leases - 345,406 - - 202-4-9300-980 Enterprise Fund Overhead 32,600 25,800 25,800 - 202-4-9300-990 Other Revenue 5,824 601 2,000 1,000 202-4-9300-996 Public Surplus Sales - 24,150 5,000 5,000
Miscellaneous 38,424 395,957 32,800 6,000
2014/15 2015/16 2016/17 2017/18Account Revenue Source Actual Actual Budget Proposed
155

2017 Annual Budget REVENUE SUMMARY
REVENUE DETAIL
Transfers In202-4-9399-xxx Operations - - - 41,600
Transfers In - - - 41,600
HURF Fund 1,878,808 2,678,536 2,435,600 2,549,000
Parks & Rec Improvement Fee Fund (206)Charges for Service
206-4-5367-710 Facility Improvement Fee 15,295 15,055 15,000 15,000 Charges for Service 15,295 15,055 15,000 15,000 Parks Improvement Fee Fund 15,295 15,055 15,000 15,000
Gifts & Grants Fund (210)
Intergovernmental210-4-2446-200 TEV Arts Grant 2,000 - - -
Intergovernmental 2,000 - - -
Miscellaneous210-4-6300-920 Contributions - Gen Gov't 1,000 12,000 12,000 - 210-4-6323-920 Contributions - Volunteer Police 60 - - - 210-4-6324-920 Contributions - DARE Court 359 - - - 210-4-6324-923 Contributions - Guardian Angels 1,735 - - - 210-4-6326-920 Donations - Fire Projects 1,525 - - -
Miscellaneous 4,679 12,000 12,000 - Gifts & Grants Fund 6,679 12,000 12,000 -
Bed Tax Fund (214)
Taxes214-4-1300-370 Bed Tax 289,988 318,814 270,000 300,000
Taxes 289,988 318,814 270,000 300,000 Bed Tax Fund 289,988 318,814 270,000 300,000
Police Department of Justice (215)
Intergovernmental215-4-2324-121 Local RICO Revenue - 2,619 - 1,000
2014/15 2015/16 2016/17 2017/18Account Revenue Source Actual Actual Budget Proposed
156

2017 Annual Budget REVENUE SUMMARY
REVENUE DETAIL
215-4-2324-151 Defense 1033 Revenue 19,250 20,500 20,000 20,000 215-4-2324-250 GOHS Grant - - - 41,000
Intergovernmental 19,250 23,119 20,000 62,000
Miscellaneous215-4-9300-990 Other Revenue 31 - - - 215-4-9300-996 Public Surplus Sales 43,573 41,451 25,000 6,000
Miscellaneous 43,604 41,451 25,000 6,000 Police Dept of Defense 62,854 64,570 45,000 68,000
Police Impound Fee (216)
Charges for Service216-4-5326-761 Impound Fee - - - 7,000
Charges for Service - - - 7,000 Police Impound Fee - - - 7,000
Library (224)
Intergovernmental224-4-2361-389 Gila County Library District 218,880 230,400 229,200 229,400
Intergovernmental 218,880 230,400 229,200 229,400
Miscellaneous224-4-9300-990 Other Revenue - 5,923 - -
Miscellaneous - 5,923 - -
Fines & Forfeitures224-4-3300-510 Library Fines 19,116 16,811 17,000 17,000
Fines & Forfeitures 19,116 16,811 17,000 17,000
Transfers In224-4-9399-xxx Operations 94,907 92,517 132,500 181,900
Transfers In 94,907 92,517 132,500 181,900 Library 332,903 345,651 378,700 428,300
2014/15 2015/16 2016/17 2017/18Account Revenue Source Actual Actual Budget Proposed
157

2017 Annual Budget REVENUE SUMMARY
REVENUE DETAIL
Magistrate Court (231, 233)
Miscellaneous233-4-6300-921 Donations/Contributions 1,149 1,222 1,000 1,000
Miscellaneous 1,149 1,222 1,000 1,000 Magistrate Court 1,149 1,222 1,000 1,000
Airport (260)
Intergovernmental260-4-2300-239 Federal Grant 360,810 - - 1,208,600 260-4-2300-248 ADOT Grant 385,413 87,019 85,500 52,600
Intergovernmental 746,223 87,019 85,500 1,261,200
Charges for Services260-4-5345-710 Tie Down Fees 9,780 10,130 10,000 10,000 260-4-5345-720 Gate Fees 9,420 9,150 9,600 9,600 260-4-5345-740 Ground Leases 18,054 18,054 18,100 18,100 260-4-5345-741 Hangar Leases 56,510 56,736 55,000 55,000 260-4-5345-760 Fuel Sales 3,421 4,644 4,000 4,000 260-4-5345-770 Emergency Support 4,892 11,265 5,000 7,000 260-4-5345-780 Campground Use Fee 390 381 500 500
Charges for Services 102,467 110,360 102,200 104,200
Miscellaneous
260-4-9300-980 Overhead 7,700 - - - 260-4-9300-990 Other Revenue 510 940 500 1,000
Miscellaneous 8,210 940 500 1,000
Transfers In260-4-9399-101 from General Fund 57,592 25,240 58,200 53,300 260-4-9399-994 Grant/Capital Match 50,771 6,937 9,500 52,600
Transfers In 108,363 32,177 67,700 105,900 Airport 965,263 230,496 255,900 1,472,300
Event Center (265)
Intergovernmental265-4-2446-200 TEV Arts Grant - 2,000 2,000 2,000
Intergovernmental - 2,000 2,000 2,000
2014/15 2015/16 2016/17 2017/18Account Revenue Source Actual Actual Budget Proposed
158
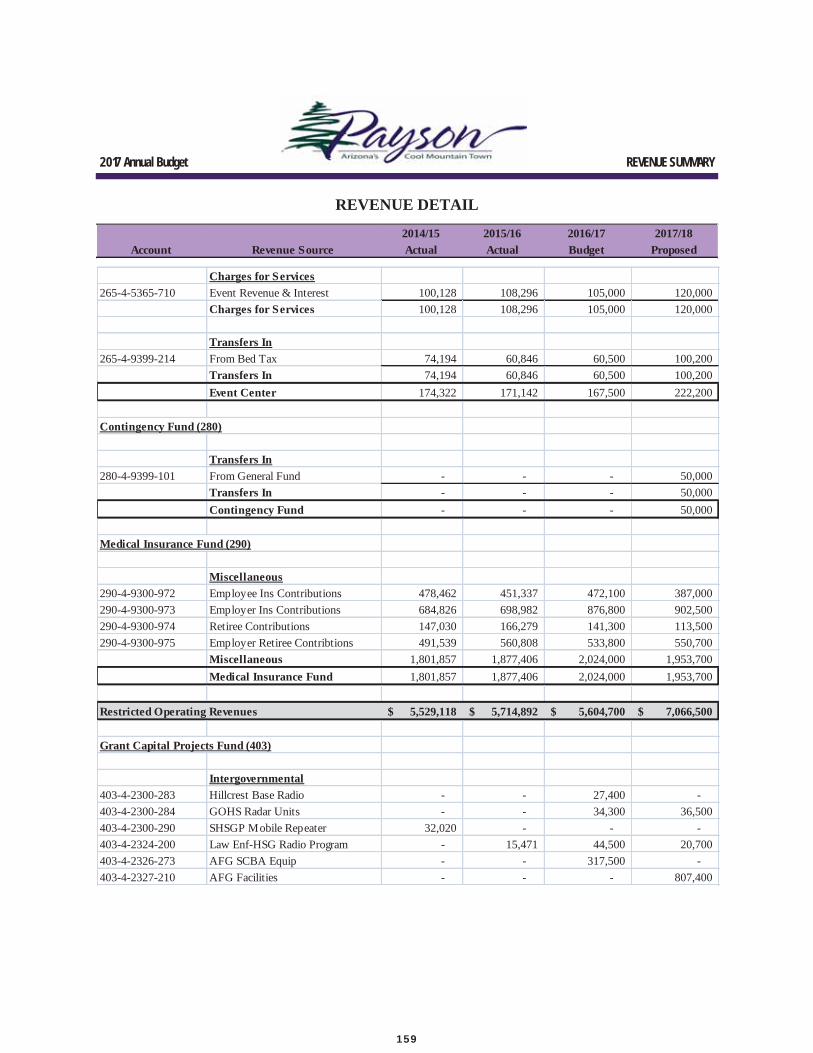
2017 Annual Budget REVENUE SUMMARY
REVENUE DETAIL
2014/15 2015/16 2016/17 2017/18Account Revenue Source Actual Actual Budget Proposed
Charges for Services265-4-5365-710 Event Revenue & Interest 100,128 108,296 105,000 120,000
Charges for Services 100,128 108,296 105,000 120,000
Transfers In265-4-9399-214 From Bed Tax 74,194 60,846 60,500 100,200
Transfers In 74,194 60,846 60,500 100,200 Event Center 174,322 171,142 167,500 222,200
Contingency Fund (280)
Transfers In280-4-9399-101 From General Fund - - - 50,000
Transfers In - - - 50,000 Contingency Fund - - - 50,000
Medical Insurance Fund (290)
Miscellaneous290-4-9300-972 Employee Ins Contributions 478,462 451,337 472,100 387,000 290-4-9300-973 Employer Ins Contributions 684,826 698,982 876,800 902,500 290-4-9300-974 Retiree Contributions 147,030 166,279 141,300 113,500 290-4-9300-975 Employer Retiree Contribtions 491,539 560,808 533,800 550,700
Miscellaneous 1,801,857 1,877,406 2,024,000 1,953,700 Medical Insurance Fund 1,801,857 1,877,406 2,024,000 1,953,700
Restricted Operating Revenues 5,529,118$ 5,714,892$ 5,604,700$ 7,066,500$
Grant Capital Projects Fund (403)
Intergovernmental403-4-2300-283 Hillcrest Base Radio - - 27,400 - 403-4-2300-284 GOHS Radar Units - - 34,300 36,500 403-4-2300-290 SHSGP Mobile Repeater 32,020 - - - 403-4-2324-200 Law Enf-HSG Radio Program - 15,471 44,500 20,700 403-4-2326-273 AFG SCBA Equip - - 317,500 - 403-4-2327-210 AFG Facilities - - - 807,400
159

2017 Annual Budget REVENUE SUMMARY
REVENUE DETAIL
403-4-2331-257 CDBG 2010 Housing Rehab 44,880 - - - 403-4-2331-259 CDBG Housing 2014-16 36,130 73,545 139,000 - 403-4-2331-260 CDBG Housing 2017-19 - - 78,500 200,000
Intergovernmental 113,030 89,016 641,200 1,064,600
Transfer In403-4-9399-101 From General Fund - - 16,800 40,400 403-4-9399-425 From Public Safety Bond Fund - - 9,100 -
Transfer In - - 25,900 40,400 Grant Capital Projects Fund 113,030 89,016 667,100 1,105,000
Park Development Fund (408)
Transfers In408-4-9399-101 From General Fund 323 - - -
Transfers In 323 - - - Park Development Fund 323 - - -
Public Safety Development Fund (409)
Transfer In409-4-9399-425 From Public Safety 6,289 - - -
Transfer In 6,289 - - - Public Safety Development Fund 6,289 - - -
American Gulch Improvement District (429)
Miscellaneous429-4-6300-929 Donations / Contributions - - - 150,000
Miscellaneous - - - 150,000 American Gulch Imp District - - - 150,000
Timber Ridge I.D. Fund (434)
Miscellaneous434-4-9300-855 Debt Proceeds - - 2,100,000 2,100,000
Miscellaneous - - 2,100,000 2,100,000 Timber Ridge I.D. Fund - - 2,100,000 2,100,000
2014/15 2015/16 2016/17 2017/18Account Revenue Source Actual Actual Budget Proposed
160

2017 Annual Budget REVENUE SUMMARY
REVENUE DETAIL
Central Arizona Project Trust Fund (460)
Miscellaneous460-4-9300-910 Interest Earnings - 5 - -
Miscellaneous - 5 - -
Central Az Project Trust Fund - 5 - -
Restricted Capital Revenues 119,642$ 89,021$ 2,767,100$ 3,355,000$
DEBT SERVICE REVENUES
General Debt Service Fund (801)
Transfers In801-4-9399-xxx Operations 145,087 105,749 52,900 -
Transfers In 145,087 105,749 52,900 - General Debt Service Fund 145,087 105,749 52,900 -
Westerly Rd Improvement District (812)Miscellaneous
812-4-9300-801 Assessment - Principal 38,135 41,601 41,600 45,100 812-4-9300-802 Assessment - Interest 19,353 17,161 14,900 12,500
Miscellaneous 57,488 58,762 56,500 57,600
Transfers In812-4-9399-xxx Operations 26,175 26,738 25,800 21,300
Transfers In 26,175 26,738 25,800 21,300 Westerly Rd Imp District 83,663 85,500 82,300 78,900
Excise Tax Obligation 2003 (822)
Transfers In822-4-9399-101 From General Fund 124,963 134,242 132,000 128,000
Transfers In 124,963 134,242 132,000 128,000 Excise Tax Obligation 2003 124,963 134,242 132,000 128,000
2014/15 2015/16 2016/17 2017/18Account Revenue Source Actual Actual Budget Proposed
161

2017 Annual Budget REVENUE SUMMARY
REVENUE DETAIL
General Obligation Bonds (823)
Taxes823-4-1300-310 Sales Tax - Town 372,509 393,429 370,000 370,000
Taxes 372,509 393,429 370,000 370,000 General Obligation Bonds 372,509 393,429 370,000 370,000
Timber Ridge ID Debt Service
Transfers In824-4-9399-434 From ID Fund - - 40,000 40,000
Transfers In - - 40,000 40,000 - - 40,000 40,000
Debt Service Revenues 726,222$ 718,920$ 677,200$ 616,900$
UTILITY ENTERPRISE FUNDS
Water (661)
Intergovernmental661-4-2300-990 Misc Intgov Rev 39,386 22,654 - 35,000
Intergovernmental 39,386 22,654 - 35,000
Charges For Service661-4-5351-701 Residential Water 3,753,124 4,123,082 4,500,000 4,700,000 661-4-5351-702 Commercial Water 831,528 898,584 974,000 1,050,000 661-4-5351-703 Fire Protection Service 29,349 32,165 29,000 35,000 661-4-5351-704 Bulk Water Sales 97,207 187,966 100,000 125,000 661-4-5351-710 New Service Installation Fees 33,800 49,850 35,000 35,000 661-4-5351-715 Illegal Turn On - 616 500 - 661-4-5351-716 Reconnect & Turn On Fees 3,205 2,505 3,000 1,000
Charges For Service 4,748,213 5,294,768 5,641,500 5,946,000
Miscellaneous661-4-5300-722 CC Cragin Devel Imp Fees 187,419 329,538 225,000 340,000 661-4-9300-855 Debt Proceeds - 1,000,000 16,600,000 24,000,000 661-4-9300-910 Interest Earnings 3,131 22,742 4,000 40,000
2014/15 2015/16 2016/17 2017/18Account Revenue Source Actual Actual Budget Proposed
162

2017 Annual Budget REVENUE SUMMARY
REVENUE DETAIL
661-4-9300-980 Enterprise Fund Overhead - 23,800 47,600 - 661-4-9300-990 Other Revenue 1,409 1,847 1,200 3,000 661-4-9300-992 Sale of Fixed Asset - (1,340) - - 661-4-9300-993 Facility Lease Fees 72,369 62,079 50,500 62,000 661-4-9300-994 Miscellaneous Revenue 59,109 34,282 20,000 55,000 661-4-9300-996 Public Surplus Sales 500 - - - 661-4-9399-101 Loan Repay from GF 17,300 17,300 67,300 182,500
Miscellaneous 341,237 1,490,248 17,015,600 24,682,500 Water 5,128,836$ 6,807,670$ 22,657,100$ 30,663,500$
TOTALS 24,774,787$ 27,675,863$ 46,624,900$ 59,032,400$
2014/15 2015/16 2016/17 2017/18Account Revenue Source Actual Actual Budget Proposed
163

FEE SCHEDULE CHANGES
2017 ANNUAL BUDGET
DEPT CHANGE DESCRIPTION FY2016/17 AMOUNT FY2017/18 AMOUNT
Comm Dev Change Use of outside consultants for plan Actual cost to the jurisdiction, Actual cost to the jurisdiction,check and inspections, or both plus 10% plus 20%
Event Cntr Change Barrel Series $5-35 per night per event $10-40 per night per eventEvent Cntr Change Cowboy Tri $5-40 per person per discipline $10-45 per person per disciplineEvent Cntr Change Time Only Practice Runs $3-5 per run - $5-6 per run -
one time only $3 or 2 for $5 one time only $5 or 2 for $6Event Cntr Change Turn and Burn $5-35 per night per event $5-$40 per night per eventEvent Cntr Change Turn and Burn $10-35 per person for various $10-40 per person for various
age group jackpots age group jackpotsEvent Cntr Change Equip Rental - Electrical Spider Box $55 per event and/or location $60 per event and/or locationEvent Cntr Change Equip Rental - PA System $55 per event and/or location $75 per event and/or locationEvent Cntr Change Equip Rental - Portable Storage $155 per event and/or location $160 per event and/or locationEvent Cntr Delete Equip Rental - Plastic Fence Panel $20 per panel per event - Event Cntr Change Alcohol permit $15 each event $20 each eventEvent Cntr Change Arena lights $25 per hour $30 per hourEvent Cntr Change Arena Preparation $60 per prep $65 per prepEvent Cntr Change Facility Supervision / Assistance $20 per hour per employee $25 pe hour per employeeEvent Cntr Change Main arena use $180 per day $185 per dayEvent Cntr Change On call staff $30 per hour per person $35 per hour per personEvent Cntr Change Security deposit $300 $305Event Cntr Change Vendor lights $15 per hour $20 per hourEvent Cntr Change Stall fee $10-50 per night per stall $10-55 per night per stallEvent Cntr Change Stall fee unauthorized use $25-50 per stall per offense $30-55 per stall per offense
per event per eventEvent Cntr Change Special event application fee $20 $25Event Cntr Change Water usage fee Actual usage, $25 minimum Actual usage, $30 minimumEvent Cntr Change Vendor fee $55-155 per event per endor $60-160 per event per vendorParks Change Court Rental - Basketball $15 per hour per court $20 per hour per courtParks Change Dog park rental $15 per hour for each reserved area $20 per hour for each reserved area
or $20 per hour for both areas or $25 per hour for both areasParks Change Skate park rental $20 per hour per court $25 per hour per court
164

FEE SCHEDULE CHANGES
2017 ANNUAL BUDGET
DEPT CHANGE DESCRIPTION FY2016/17 AMOUNT FY2017/18 AMOUNT
Parks Change Tennis court rental $15 per hour per court $20 per hour per courtParks Change Volleyball court rental $15 per hour per court $20 per hour per courtParks Change Athletic field rental $20 per hour $25 per hourParks Change Athletic field preparation $20 min. per man hour + materials $25 min. per man hour + materialsParks Change Rumsey concession rental $55 min. per day/unit $60 min. per day/unitParks Change Rumsey - Tournament $75 per day per field $80 per day per fieldParks Change Ramada rentals all rates increased $5-11Parks Add 3 v 3 basketball $150 per teamParks Change Basketball, adult $305 per team $310 per teamParks Change Basketball, youth $30 per child $35 per childParks Change Biddy basketball / startsmart $25 per child $30 per childParks Change 3 on 3 basketball tournament $35 per team $50 per teamParks Change Fishing, Kyle fishing class $10 per child $15 per childParks Change Football, adult flag $255 per team $260 per teamParks Change Hike, guided - AZGFD $10 per person $15 per personParks Change Mountain bike 101 $20 per person $25 per personParks Change Moth & butterflies $10 per person $15 per personParks Change Skills Contests Free to $40 per child per program Free to $45 per child per programParks Add Recreation camps Contract for ServiceParks Add Recreation camps $20-80 per childParks Change Soccer, Spring & Fall $30 per child $35 per childParks Change Softball, co-ed Spring $255 per team $285 per teamParks Change Softball, co-ed Fall $255 per team $285 per teamParks Change Softball, Summer $280 per team $310 per teamParks Change Sports tournaments $50-475 per team $50-600 per teamParks Change Sports Tournament Vendors $55 per event per vendor $60-155 per event per vendorParks Delete ASA softball team registration fee $25 per teamParks Add Star gazing & astronomy class Contract for ServiceParks Change T-ball $30 per child $35 per childParks Change Volleyball, youth $30 per child $35 per childParks Change Volleyball, co-ed $190 per team $195 per teamParks Change Volleyball, men's / women's $190 per team $195 per teamParks Change Volleyball, sand $105 per team $110 per teamParks Change Event sponsorship fees $100-5,000 depending on event $105-5,005 depending on eventParks Change Late registration fee up to $20 per event up to $25 per eventParks Add Special event vendor fee $50-500Parks Add Merchandise fee $5-100 depending on itemParks Change 5K run $5-85 per person $30-90 per personParks Change Fiddlers contest $4-8 per person/per seat/entry fee $5-15 per person/per seat/entry feeParks Change 4th of July vendor - food $305 per vendor $310 per vendorParks Change 4th of July vendor - non food $155 per vendor $160 per vendorParks Change Summer concert vendor $55 per vendor $60 per vendorParks Change Summer concert vendor $205 per vendor - entire season $210 per vendor - entire seasonParks Change Halloween festival vendor $55 per vendor $80 per vendorParks Add Halloween festival vendor booth $30Parks Change Music festival vendor - food $80 $85Parks Change Mtn High Games vendor - food $80 per vendor $85 per vendorParks Change Mtn High Games vendor - non food $55 per vendor $60 per vendorParks Change Electric Light Parade - $30 per entry $35 per entry
vehicle towed entry
165

FEE SCHEDULE CHANGES
2017 ANNUAL BUDGET
DEPT CHANGE DESCRIPTION FY2016/17 AMOUNT FY2017/18 AMOUNT
Dec-14 Oct-15 Oct-16 Oct-17 Oct-18Consumption:0 to 2,000 Gallons (Minimum) 28.31 30.43 35.00 40.25 43.26
Rates Per 1,000 Gallons Over Minimum2,001 to 5,000 Gallons 3.82 4.11 4.72 5.43 5.84 5,001 to 10,000 Gallons 5.04 5.42 6.23 7.17 7.70 10,001 to 20,000 Gallons 5.76 6.20 7.13 8.20 8.81 20,001 + Gallons 7.20 7.74 8.90 10.24 11.01
Parks Change Electric Light Parade - $20 per entry $25 per entryany motorized vehicle entry
Parks Change Electric Light Parade - $15 per entry $20 per entrywalking participant
Aquatics Change Open swim $2 per person $3 per personAquatics Change Pool parties $60 per hour - up to 50 people $125 per hour - up to 50 peopleAquatics Change Pool parties $125 per hour - 51 to 100 people $200 per hour - 51 to 100 peopleAquatics Change Swim lessons $25 per session $40 per sessionAquatics Change Swim team $75 per child $80 per personAquatics Change Water aerobics $2 per person/$70 season pass $3 per person/$80 season passAquatics Change Lap swim $2 per person/$70 season pass $3 per person/$80 season pass
166

EXPENDITURE INFORMATION
167

2017 Annual Budget EXPENDITURES
EXPENDITURES (ALL FUNDS) 2017/18 Budget
(1) Legislative includes: Town Council and Town Clerk Departments(2)Administrative includes: Town Manager, Financial Services, Information Services, Human Resources, Other Governmental Services,
Property Management, Centralized Services, and Self Insurance(3)Community Development includes: Planning & Zoning, Building, Housing
Legislative(1)0.6%
Administrative(2)8.2%
Police10.7%
Fire6.2%
Community Development(3)
2.0%
Public Works3.0%
Library0.7%Airport
0.3%Parks/Rec. & Tourism
2.9%
Water7.6%
Debts & Loans4.6%
Capital Projects50.4%
Transfers Out1.8%
General FundRestricted
FundsRestricted
Capital FundsDebt
Service Funds Utility Funds All Funds % Total
Legislative(1) 340,200 - - - - 340,200 0.6%Administrative(2) 3,054,700 1,953,700 - - - 5,008,400 8.2%Town Attorney & Court 661,800 - - - - 661,800 1.1%Police 6,448,100 79,000 - - - 6,527,100 10.7%Fire 3,804,100 - - - - 3,804,100 6.2%Community Development(3) 989,900 - 200,000 - - 1,189,900 2.0%Public Works - 1,838,600 - - - 1,838,600 3.0%Library - 428,300 - - - 428,300 0.7%Airport - 152,700 - - - 152,700 0.3%Parks/Rec. & Tourism 1,322,300 420,600 - - - 1,742,900 2.9%Water - - - - 4,653,600 4,653,600 7.6%Debts & Loans 182,500 - - 578,500 2,059,000 2,820,000 4.6%Capital Projects 310,000 2,259,900 3,357,771 - 24,777,000.00 30,704,671 50.4%Transfers Out 527,500 247,200 40,000 - 254,600 1,069,300 1.8% Total Expenditures 17,641,100$ 7,380,000$ 3,597,771$ 578,500$ 31,744,200$ 60,941,571$ 100.0%% of Total 28.95% 12.11% 5.90% 0.95% 52.09% 100.00%
168

2017 Annual Budget EXPENDITURES
EXPENSE DETAIL—ALL FUNDS
Salaries & Wagesxxx-x-xxxx-xx- 5001 Full Time Employees 7,658,565 7,887,687 8,330,500 8,949,800 xxx-x-xxxx-xx- 5002 Part Time Employees 192,694 216,026 241,800 220,500 xxx-x-xxxx-xx- 5003 Temporary Employees 59,662 76,289 138,800 142,400 xxx-x-xxxx-xx- 5005 Paid On Call Employees 36,880 20,254 80,000 80,000 xxx-x-xxxx-xx- 5006 Standby Pay 8,588 8,535 9,000 7,500 xxx-x-xxxx-xx- 50xx Misc Compensation 30,810 27,938 38,400 36,400 xxx-x-xxxx-xx- 52xx Overtime Compensation 738,764 844,502 697,900 845,400 xxx-x-xxxx-xx- 5990 Shift Differential Pay 41,816 36,659 46,000 47,000
8,767,779 9,117,890 9,582,400 10,329,000 Personnel Benefitsxxx-x-xxxx-xx- 5501 FICA 513,994 533,037 615,800 664,000 xxx-x-xxxx-xx- 5504 Penisons & Retirement 1,550,618 1,796,279 2,154,100 2,805,100 xxx-x-xxxx-xx- 5505 Retirement Offset Pension (2,660) (2,435) - 500,000 xxx-x-xxxx-xx- 5600 Deferred Compensation 9,133 2,499 - - xxx-x-xxxx-xx- 5700 Health/Life Insurance 1,177,287 1,238,897 1,410,600 1,444,000 xxx-x-xxxx-xx- 5800 Workers Comp Insurance 533,554 533,510 657,700 568,700 xxx-x-xxxx-xx- 5701 Disability Insurance 5,602 5,844 7,500 9,900 xxx-x-xxxx-xx- 5801 Unemployment Comp 4,800 2,880 6,000 3,000 xxx-x-xxxx-xx- 5901 Uniform Allowance 44,781 52,819 58,700 59,700
3,837,109 4,163,330 4,910,400 6,054,400 Suppliesxxx-x-xxxx-xx- 6001 Office Supplies 54,987 50,951 61,800 62,200 xxx-x-xxxx-xx- 6002 Coffee Supplies 1,081 892 1,200 1,200 xxx-x-xxxx-xx- 6003 Cleaning Supplies 14,111 10,746 15,500 16,400 xxx-x-xxxx-xx- 6008 Chemicals 41,039 32,874 71,800 137,000 xxx-x-xxxx-xx- 6100 Medical/Lab Supplies 17,027 25,145 21,900 28,900 xxx-x-xxxx-xx- 6101 Canine Supplies 3,000 1,541 3,000 3,000 xxx-x-xxxx-xx- 6102 Weapons/Training Supplies 11,925 9,651 15,500 15,500 xxx-x-xxxx-xx- 6005 Safety Program Supplies 18,126 18,411 16,800 18,300 xxx-x-xxxx-xx- 6006 Clothing/Uniforms 14,856 20,951 24,100 25,000 xxx-x-xxxx-xx- 6007 PPE Equipment/Clothing 18,635 23,778 25,000 25,000 xxx-x-xxxx-xx- 6010 Books, Maps & Periodicals 9,208 7,187 10,100 8,100 xxx-x-xxxx-xx- 6011 Small Tools/Minor Equipment 80,281 69,000 102,700 113,100 xxx-x-xxxx-xx- 6012 Communications Eq Supplies 6,107 5,058 5,000 6,500 xxx-x-xxxx-xx- 6013 Computer Supplies 33,464 31,216 53,000 59,000 xxx-x-xxxx-xx- 6016 Park Furnishing 770 740 1,000 1,000 xxx-x-xxxx-xx- 6300 Motor Fuel 213,653 163,798 240,500 199,200 xxx-x-xxxx-xx- 6302 Vehicle Supplies 158,901 192,360 158,100 174,000
Category Description 2014/15 Actual
2015/16 Actual
2016/17 Budget
2017/18 Proposed
169

2017 Annual Budget EXPENDITURES
EXPENSE DETAIL—ALL FUNDS
xxx-x-xxxx-xx- 6401 Drainage Supplies 1,829 29,739 65,000 20,000 xxx-x-xxxx-xx- 6402 Street/Sidewalk Supplies 116,567 69,675 80,000 70,000 xxx-x-xxxx-xx- 6201 Bldg Materials & Supplies 52,114 39,553 88,200 67,500 xxx-x-xxxx-xx- 6400 Hdwr, Electric & Plumbing Sup 17,471 22,818 20,000 20,400 xxx-x-xxxx-xx- 6900 Other Supplies 515 2,926 1,000 - xxx-x-xxxx-xx- 6014 Landscape Materials 10,777 13,359 10,500 10,500 xxx-x-xxxx-xx- 6202 Misc R&M Supplies 55,914 76,860 84,400 81,500 xxx-x-xxxx-xx- 6015 Signs 64,610 36,782 7,000 5,000 xxx-x-xxxx-xx- 6602 Promotional Supplies 85,142 89,799 95,000 135,000
1,102,110 1,045,810 1,278,100 1,303,300 Servicesxxx-x-xxxx-xx- 6603 Election Services - - - - xxx-x-xxxx-xx- 7004 Compliance/Lab Analysis 29,205 31,900 45,000 125,000 xxx-x-xxxx-xx- 7002 Acounting/Auditing Services 39,000 63,775 40,700 60,700 xxx-x-xxxx-xx- 7100 Legal Services 31,512 12,120 44,500 63,000 xxx-x-xxxx-xx- 7101 Indigent Defense 37,200 33,800 45,000 45,000 xxx-x-xxxx-xx- 7102 Court Services 102,753 133,271 110,000 125,000 xxx-x-xxxx-xx- 7103 Prosecution Services 1,500 - 1,000 1,000 xxx-x-xxxx-xx- 7900 Other Professional Services 401,165 380,967 788,400 563,000 xxx-x-xxxx-xx- 7104 Settlements - 10,000 20,000 20,000 xxx-x-xxxx-xx- 7005 Computer Software 29,866 26,884 31,000 80,200 xxx-x-xxxx-xx- 7003 Computer Services 14,404 14,058 14,700 14,700 xxx-x-xxxx-xx- 7602 Safety Training Services 120 - 2,000 -
686,725 706,775 1,142,300 1,097,600 Utilitiesxxx-x-xxxx-xx- 7300 Electricity 597,529 657,052 657,700 692,500 xxx-x-xxxx-xx- 7301 Propane Gas 34,605 29,462 43,400 38,400 xxx-x-xxxx-xx- 7302 Water Service 46,343 54,898 54,700 64,000 xxx-x-xxxx-xx- 7304 Sewer Service 13,215 12,903 14,400 14,100 xxx-x-xxxx-xx- 7305 Garbage Service 26,974 27,170 31,700 34,200 xxx-x-xxxx-xx- 7306 Telephone 212,325 244,341 285,800 294,300 xxx-x-xxxx-xx- 7307 Postage 38,755 43,937 43,800 45,600
969,746 1,069,763 1,131,500 1,183,100 Travelxxx-x-xxxx-xx- 7600 Travel 40,511 41,818 73,300 92,200 xxx-x-xxxx-xx- 7601 Registrations 49,886 54,091 77,900 84,700
90,397 95,909 151,200 176,900
Category Description 2014/15 Actual
2015/16 Actual
2016/17 Budget
2017/18 Proposed
170

2017 Annual Budget EXPENDITURES
EXPENSE DETAIL—ALL FUNDS
Advertising & Publishingxxx-x-xxxx-xx- 6600 Public Relations 16,420 13,157 21,200 24,900 xxx-x-xxxx-xx- 7907 Advertising 20,394 22,402 25,500 26,000
36,814 35,559 46,700 50,900 Rentalsxxx-x-xxxx-xx- 7500 Land & Buildings 11,341 7,371 11,800 11,800 xxx-x-xxxx-xx- 7501 Work Eq & Machine Rental 202 476 500 500 xxx-x-xxxx-xx- 7502 Office Equipment Rental 51,799 169,471 243,700 244,400
63,342 177,318 256,000 256,700 Insurancexxx-x-xxxx-xx- 7903 Insurance 446,604 461,934 487,000 532,100 xxx-x-xxxx-xx- 7904 Insurance Deductibles 6,604 12,714 7,000 5,000 xxx-x-xxxx-xx- 7908 Insurance Premium 1,801,964 1,880,294 2,024,000 1,953,700
2,255,172 2,354,942 2,518,000 2,490,800
Repair & Maintenancexxx-x-xxxx-xx- 6200 Hydrant R&M 10,069 14,138 33,000 33,000 xxx-x-xxxx-xx- 65xx Water R&M 195,921 214,954 316,500 351,500 xxx-x-xxxx-xx- 7400 Grounds R&M - 13,651 10,000 32,000 xxx-x-xxxx-xx- 7401 Bldg/Fixture R&M 83,977 57,707 96,700 163,800 xxx-x-xxxx-xx- 7402 Office Equipment R&M 7,227 3,551 11,100 11,300 xxx-x-xxxx-xx- 7403 Computer Equipment R&M 235,637 240,081 254,100 264,500 xxx-x-xxxx-xx- 7404 Communication Eq R&M 106,702 289,356 293,000 292,700 xxx-x-xxxx-xx- 7405 Work Equipment R&M 61,880 35,428 55,300 61,800 xxx-x-xxxx-xx- 7406 Street Light R&M 6,625 12,623 108,400 48,000 xxx-x-xxxx-xx- 7407 R & M Wells - 2,354 20,000 20,000 xxx-x-xxxx-xx- 7408 Street/Sidewalk Repair Serv 7,291 41,188 65,000 40,000
715,329 925,031 1,263,100 1,318,600 Miscellaneousxxx-x-xxxx-xx- 6700 Dues & Memberships 58,040 44,449 80,800 82,800 xxx-x-xxxx-xx- 6901 Taxes & Assessments 10,258 4,478 500 500 xxx-x-xxxx-xx- 6903 Bank Fees 39,356 32,061 32,000 31,000 xxx-x-xxxx-xx- 6905 Bad Debt 1,204 570 2,200 1,100 xxx-x-xxxx-xx- 6009 Program Costs 155,402 162,589 209,900 226,200 xxx-x-xxxx-xx- 6990 Other Expense 27,781 20,254 42,900 43,700 xxx-x-xxxx-xx- 6991 Other Expense-Law Enforce 8,440 7,291 10,000 13,000 xxx-x-xxxx-xx- 6992 Other Expense-DARE 3,370 3,670 3,500 4,000 xxx-x-xxxx-xx- 7001 Program Overhead 2,068 2,055 5,000 15,000 xxx-x-xxxx-xx- 7901 Lien & Clean - 5,811 10,000 12,500
Category Description 2014/15 Actual
2015/16 Actual
2016/17 Budget
2017/18 Proposed
171

2017 Annual Budget EXPENDITURES
EXPENSE DETAIL—ALL FUNDS
xxx-x-xxxx-xx- 7902 Reimburseable Impound Costs - - 2,500 3,000 xxx-x-xxxx-xx- 7906 Law Enf. Property Purchase 1,777,257 2,018,718 - - xxx-x-xxxx-xx- 7910 Printing & Binding 16,536 14,114 17,500 19,500 xxx-x-xxxx-xx- 7920 Hydrant Program - - - - xxx-x-xxxx-xx- 72xx Councilmember Expenses 9,691 5,384 21,900 14,900 xxx-x-xxxx-xx- 7912 Grant Expenses 4,121 25,261 122,900 70,000 xxx-x-xxxx-xx- 7913 Housing Expense 49,720 104,835 139,000 - xxx-x-xxxx-xx- 7914 Contributions / Donations 7,407 - 78,500 200,000 xxx-x-xxxx-xx- 7915 Overhead 290,300 204,000 227,800 - xxx-x-xxxx-xx- 7990 Contribution to Other Agencie 191,600 224,833 225,600 243,100 xxx-x-xxxx-xx- 9661 Repay Water Loan 17,300 17,300 67,300 182,500
2,669,851 2,897,673 1,299,800 1,162,800 Capital Outlayxxx-x-xxxx-xx- 8xxx Event Center Building 28,875 - - - xxx-x-xxxx-xx- 8xxx Airport Projects 811,856 96,901 95,000 1,313,800 xxx-x-xxxx-xx- 8xxx Street Improvements 58,779 395,559 840,000 560,000 xxx-x-xxxx-xx- 8xxx Computer Software/Hardware 23,844 83,953 - 80,000 xxx-x-xxxx-xx- 8xxx Timber Ridge ID - - 2,060,000 2,060,000 xxx-x-xxxx-xx- 8xxx Machinery & Equipment 186,079 438,893 245,000 595,300 xxx-x-xxxx-xx- 8xxx Vehicular Equipment 108,444 96,956 20,000 156,300 xxx-x-xxxx-xx- 8xxx Parks Development 47,125 734,015 - 161,000 xxx-x-xxxx-xx- 8xxx Grant Funded Projects 79,615 15,471 590,600 905,000 xxx-x-xxxx-xx- 8xxx Main Street Improvements 34,060 - - - xxx-x-xxxx-xx- 8xxx American Gulch Imp Dist - - - 150,000 xxx-x-xxxx-xx- 8xxx Water Projects 1,029,527 8,498,218 18,601,000 24,723,271
2,408,205 10,359,966 22,451,600 30,704,671 Debt Servicexxx-x-xxxx-xx- 6901 Debt Service Fees 10,258 5,100 1,600 xxx-x-xxxx-xx- 7950 Principal 544,512 562,473 1,207,700 2,549,000 xxx-x-xxxx-xx- 7951 Interest 105,019 85,815 778,600 86,900
659,789 648,288 1,991,400 2,637,500 Depreciationxxx-x-xxxx-xx- 8005 Depreciation - Infrastructure 654,938 689,587 - - xxx-x-xxxx-xx- 8100 Depreciation - Buildings 318,723 315,431 25,000 25,000 xxx-x-xxxx-xx- 8101 Depreciation - Non Buildings 1,236,084 1,176,962 900,000 985,000 xxx-x-xxxx-xx- 8104 Depreciation - Furniture/Eq 3,643 3,645 5,000 5,000 xxx-x-xxxx-xx- 8103 Depreciation - Vehicles 243 55,682 1,000 60,000 xxx-x-xxxx-xx- 8102 Depreciation - Machinery/Eq 464,682 122,772 25,000 25,000 xxx-x-xxxx-xx- 82xx Amortization 5,940 5,940 6,000 6,000
2,684,253 2,370,019 962,000 1,106,000
Category Description 2014/15 Actual
2015/16 Actual
2016/17 Budget
2017/18 Proposed
172

2017 Annual Budget EXPENDITURES
EXPENSE DETAIL—ALL FUNDS
EXPENSE SUMMARY BY CATEGORY—ALL FUNDS
Category Description 2014/15 Actual
2015/16 Actual
2016/17 Budget
2017/18 Proposed
Transfers Outxxx-x-xxxx-xx- 9101 To General Fund 95,806 150,304 147,000 360,000 xxx-x-xxxx-xx- 9202 To HURF - - - 41,600 xxx-x-xxxx-xx- 9210 To Gifts & Grants Fund - - - - xxx-x-xxxx-xx- 9224 To Library 94,907 92,517 132,500 181,900 xxx-x-xxxx-xx- 9260 To Airport 108,362 32,176 67,700 105,900 xxx-x-xxxx-xx- 9265 To Event Center 74,194 60,846 60,500 100,200 xxx-x-xxxx-xx- 9280 To Rainy Day Fund - - - 50,000 xxx-x-xxxx-xx- 9403 To Grant Capital Project - - 25,900 40,400 xxx-x-xxxx-xx- 9430 To Const Bonita St - - - - xxx-x-xxxx-xx- 9460 To CAP Trust Fund - - - - xxx-x-xxxx-xx- 9661 To Water Department - - - - xxx-x-xxxx-xx- 98xx To Debt Service 296,224 266,729 250,700 189,300 xxx-x-xxxx-xx- 9999 To Various - - - -
669,493 602,572 684,300 1,069,300
TOTAL 27,616,114$ 36,570,845$ 49,668,800$ 60,941,571$
Personnel Services/Benefits 12,604,888 13,281,220 14,492,800 16,383,400 Operating Expenditures 8,589,486 9,308,780 9,086,700 9,040,700 Debt Service 659,789 648,288 1,991,400 2,637,500 Capital Outlay 2,408,205 10,359,966 22,451,600 30,704,671 Other 2,684,253 2,370,019 962,000 1,106,000 Transfers Out 669,493 602,572 684,300 1,069,300
27,616,114$ 36,570,845$ 49,668,800$ 60,941,571$
Category 2014/15 Actual
2015/16 Actual
2016/17 Budget
2017/18 Proposed
173

DEPARTMENT DETAIL
174

Function and Fund Type Matrix
General Special Capital EnterpriseFunctional Unit Fund Revenue Project Funds
Funds Funds
Page # Fund/Page# Fund/Page# Fund/Page#
Town Council 181Town Manager 188Human Resources 198Information Services 192Town Clerk 204Elections 207Property Management 223Central Supplies 226Other Government Services 228Medical Insurance 230 290/230Financial Services 217Magistrate Courts 233Legal 212Police - Communications 239Police - Operations 242 403/243
409/243425/243
Police - Special Operations 246-50 215/248Fire - Operations 256 210/257 403/257Fire - Wildlands/Urban Program 260Public Works - Engineering 324Public Works - Streets 202/327Public Works - Airport 260/331Rec & Tourism - Tourism Division 295 214/295Rec & Tourism - Trails & Open Spaces 307Rec & Toursim - Recreation Division 299-303 206/299Rec & Tourism - Event Center 265/312Rec & Tourism - Aquatics 315Rec & Tourism - Parks Operations 318Community Dev Administration 263Planning & Zoning 275 417/275Building Services 268Economic Development 278Affordable Housing 403/281Library 224/287
175

General Special Capital EnterpriseFunctional Unit Fund Revenue Project Funds
Funds Funds
Page # Fund/Page# Fund/Page# Fund/Page#
Water - Administration 661/338Water - Accounting & Collections 661/340Water - Transmittion & Distribution 661/341Water - Operations & Maintenance 661/342Water - Resources 661/344Water - Production O&M 661/345Water - Green Valley Park Maintenance 661/346Water - WQARF 661/347Water - Treatment Plant 661/348Water - CC Cragin 661/349Water Capital Trust Fund 460/350
176

177

TOWN COUNCIL
2017 ANNUAL BUDGET
TownCouncil
2016/17 2017/18
Town Council Members 7.0 7.0
Total Positions 7.0 7.0
2014/15 2015/16 2016/17 2017/18Operating Division Actual Actual Budget Proposed
Town Council 89,841 83,525 106,700 102,500
Total Expenditures 89,841$ 83,525$ 106,700$ 102,500$
178

√ √
√
√
√ √ √
TOWN COUNCIL
179

Significant Budget Changes: Changes in Personnel Benefits reflect the changes in Council members’ benefits FY15/16 Supplies & Services—Council is always conservative in their spending and rarely spends everything that is allocated in the budget FY17/18 Other Services—Council members elected to apply a portion of their annual budget to help fund new carpeting for the Legal Department
%Description Change
Salaries & Wages 46,800 46,800 0.0% 46,800 0.0%Personnel Benefits 28,061 34,000 21.2% 36,800 8.2%Supplies 55 500 809.1% 500 0.0%Other Services & Charges 8,609 25,400 195.0% 18,400 -27.6%Total Town Council 83,525$ 106,700$ 27.7% 102,500$ -3.9%
Actual Budget Change Proposed2016/172015/16 % 2017/18
2014/15 2015/16 2016/17 2017/18 2018/19 2019/20Classification Actual Actual Budget Proposed Estimate Estimate
Personnel Services 73,986 74,861 80,800 83,600 87,780 92,169 Supplies 3,181 55 500 500 525 551 Services & Charges 12,674 8,609 25,400 18,400 19,320 20,286 Total Town Council 89,841$ 83,525$ 106,700$ 102,500$ 107,625$ 113,006$
$0
$20,000
$40,000
$60,000
$80,000
$100,000
$120,000
Services & Charges
Supplies
Personnel Services
180

ANNUAL BUDGET
TOWN COUNCIL2014/15 2015/16 2016/17 2017/18
ACTUAL ACTUAL BUDGET PROPOSEDSALARIES & WAGES101-5-1411-00-5001 Full Time Employees 47,300 46,800 46,800 46,800
Total Salaries & Wages 47,300 46,800 46,800 46,800
PERSONNEL BENEFITS101-5-1411-00-5501 FICA 2,353 2,223 3,600 3,600101-5-1411-00-5700 Health Insurance 24,101 25,598 30,100 33,000101-5-1411-00-5800 Worker's Comp Insurance 232 240 300 200
Total Personnel Benefits 26,686 28,061 34,000 36,800
SUPPLIES101-5-1411-00-6001 Office Supplies 2,884 55 500 500101-5-1411-00-6600 Public Relations 297 - - -
Total Supplies 3,181 55 500 500
OTHER SERVICES & CHARGES101-5-1411-00-7306 Telephone Charges 2,984 3,225 3,500 3,500101-5-1411-00-72xx Council Member Expenses 9,690 5,384 21,900 14,900
Total Other Services & Charge 12,674 8,609 25,400 18,400
TOTAL TOWN COUNCIL 89,841$ 83,525$ 106,700$ 102,500$
TOWN COUNCIL
181

.
182

TOWN MANAGER’S DEPARTMENT
2017 ANNUAL BUDGET
Town Manager
Town Manager
InformationServices
2014/15 2015/16 2016/17 2017/18Operating Division Actual Actual Budget Proposed
Town Manager 180,240 317,298 210,700 220,400 Information Services 597,594 615,772 644,900 803,500 Total Expenditures 777,834$ 933,070$ 855,600$ 1,023,900$
2016/17 2017/18Town Manager 1.0 1.0 Information Technology Manager 1.0 1.0 Information Technology Technician 1.0 1.0 Total Town Manager 3.0 3.0
183

TOWN MANAGER’S DEPARTMENT
2017 ANNUAL BUDGET
Note: Explanations of significant budget changes are addressed within the individual divisions’ sections that follow
%Description Change
Salaries & Wages 409,488 284,100 -30.6% 302,100 6.3%Personnel Benefits 67,529 75,500 11.8% 86,500 14.6%Supplies 28,804 56,200 95.1% 56,200 0.0%Other Services & Charges 378,940 419,800 10.8% 499,100 18.9%Capital Outlay 48,309 20,000 -58.6% 80,000 300.0%Total Town Manager 933,070$ 855,600$ -8.3% 1,023,900$ 19.7%
%Change
2017/18Proposed
2015/16Actual
2016/17Budget
2014/15 2015/16 2016/17 2017/18 2018/19 2019/20Classification Actual Actual Budget Proposed Estimate Estimate
Personnel Services 331,851 477,017 359,600 388,600 408,030 428,432 Supplies 35,124 28,804 56,200 56,200 59,010 61,961 Services & Charges 334,478 378,940 419,800 499,100 524,055 550,258 Capital Outlay 76,381 48,309 20,000 80,000 84,000 88,200 Total Town Manager 777,834$ 933,070$ 855,600$ 1,023,900$ 1,075,095$ 1,128,850$
$0
$200,000
$400,000
$600,000
$800,000
$1,000,000
$1,200,000
Capital Outlay
Services & Charges
Supplies
Personnel Services
184

√ √ √
√
√ √ √
√
TOWN MANAGER DIVISION
CONTACT INFORMATION
LaRon Garrett Town Manager (928) 474-5242
PHYSICAL LOCATION
Payson Town Complex
Town Hall Building 303 N. Beeline Hwy. Payson, AZ 85541
185

√
√
√
√
√
√
√
√
186

Significant Budget Changes: FY15/16 Salaries & Wages included payout for previous Town Manager FY16/17 Personnel Benefits reflects increases in health & workers comp insurance FY16/17 Supplies—increased funding for various supplies FY16/17 Services—increased for travel / registrations FY17/18 Personnel Benefits—legal decision required additional contribution to retirement FY17/18 Supplies—reflects reduced office supplies and fuel FY17/18 Services—reduction in travel
` %Description Change
Salaries & Wages 274,773 149,200 -45.7% 153,100 2.6%Personnel Benefits 35,014 41,800 19.4% 50,200 20.1%Supplies 5,802 13,700 136.1% 11,700 -14.6%Other Services & Charges 1,709 6,000 251.1% 5,400 -10.0%Town Manager 317,298$ 210,700$ -33.6% 220,400$ 4.6%
2017/18Proposed
2015/16Actual
2016/17Budget
%Change
2014/15 2015/16 2016/17 2017/18 2018/19 2019/20Classification Actual Actual Budget Proposed Estimate Estimate
Personnel Services 170,330 309,787 191,000 203,300 213,465 224,138 Supplies 5,127 5,802 13,700 11,700 12,285 12,899 Services & Charges 4,783 1,709 6,000 5,400 5,670 5,954 Town Manager 180,240$ 317,298$ 210,700$ 220,400$ 231,420$ 242,991$
$0
$50,000
$100,000
$150,000
$200,000
$250,000
$300,000
$350,000
Services & Charges
Supplies
Personnel Services
187

ANNUAL BUDGET
TOWN MANAGER2014/15 2015/16 2016/17 2017/18
ACTUAL ACTUAL BUDGET PROPOSEDSALARIES & WAGES101-5-1405-00-5001 Full Time Employees 132,744 274,773 149,200 153,100
Total Salaries & Wages 132,744 274,773 149,200 153,100
PERSONNEL BENEFITS101-5-1405-00-5501 FICA 9,292 13,583 11,400 11,700101-5-1405-00-5504 Retirement 15,234 12,036 16,900 30,400101-5-1405-00-5600 Deferred Compensation 9,133 2,499 - -101-5-1405-00-5700 Health/Life Insurance 3,126 4,434 7,100 7,100101-5-1405-00-5701 Disability Insurance 159 128 200 300101-5-1405-00-5800 Workers Compensation 642 2,334 6,200 700
Total Personnel Benefits 37,586 35,014 41,800 50,200
SUPPLIES101-5-1405-00-6001 Office Supplies 895 105 2,800 400101-5-1405-00-6005 Safety Supplies - - 100 100101-5-1405-00-6006 Uniforms / Clothing - - - 300101-5-1405-00-6010 Books & Periodicals - - 500 500101-5-1405-00-6011 Small Tools/Minor Equipment - - 200 200101-5-1405-00-6300 Gasoline,Fuels,Lubricant - - 1,500 1,200101-5-1405-00-6302 R&M Supplies Vehicle - - 100 500101-5-1405-00-6600 Public Relations 2,553 4,366 6,000 6,000101-5-1405-00-6700 Dues & Memberships 1,653 1,331 2,500 2,500101-5-1405-00-6990 Other Expense 26 - - -
Total Supplies 5,127 5,802 13,700 11,700
OTHER SERVICES & CHARGES101-5-1405-00-7306 Telephone Charges 702 43 900 800101-5-1405-00-7600 Travel 1,862 796 2,500 2,000101-5-1405-00-7601 Registrations 2,219 870 2,600 2,600
Total Other Svcs & Charges 4,783 1,709 6,000 5,400
TOTAL TOWN MANAGER 180,240$ 317,298$ 210,700$ 220,400$
TOWN MANAGER
188

√ √ √ √ √ √ √ √ √ √ √ √ √ √
√ √ √
INFORMATION SERVICES DIVISION
189

190

Significant Budget Changes: FY16/17 Supplies—additional funds budgeted for computer equipment/supplies FY15/16 & 16/17 Capital—the only capital budgeted was Council Chamber upgrades / TV Equipment which spanned both fiscal years FY17/18 Services—reflects increased cost for software licensing and telephone charges FY17/18 Capital—includes funding for two new capital projects for offsite data storage and mobile switch replacement
%Description Proposed ChangeSalaries & Wages 134,715 134,900 0.1% 149,000 10.5%Personnel Benefits 32,515 33,700 3.6% 36,300 7.7%Supplies 23,002 42,500 84.8% 44,500 4.7%Other Services & Charges 377,231 413,800 9.7% 493,700 19.3%Capital 48,309 20,000 -58.6% 80,000 300.0%Total Information Services 615,772$ 644,900$ 4.7% 803,500$ 24.6%
2017/18Actual Budget Change
2015/16 2016/17 %
2014/15 2015/16 2016/17 2017/18 2018/19 2019/20Classification Actual Actual Budget Proposed Estimate Estimate
Personnel Services 161,521 167,230 168,600 185,300 194,565 204,293 Supplies 29,997 23,002 42,500 44,500 46,725 49,061 Services & Charges 329,695 377,231 413,800 493,700 518,385 544,304 Capital Outlay 76,381 48,309 20,000 80,000 84,000 88,200 Total Information Serv 597,594$ 615,772$ 644,900$ 803,500$ 843,675$ 885,859$
$0$100,000$200,000$300,000$400,000$500,000$600,000$700,000$800,000$900,000
$1,000,000
Capital Outlay
Services & Charges
Supplies
Personnel Services
191

ANNUAL BUDGET
INFORMATION SERVICES2014/15 2015/16 2016/17 2017/18
ACTUAL ACTUAL BUDGET PROPOSEDSALARIES & WAGES101-5-1408-00-5001 Full Time Employees 130,459 134,715 134,900 146,000101-5-1408-00-5200 Overtime Pay - - - 3,000
Total Salaries & Wages 130,459 134,715 134,900 149,000
PERSONNEL BENEFITS101-5-1408-00-5501 FICA 9,351 9,815 10,300 11,400101-5-1408-00-5504 Retirement 14,680 15,226 15,300 16,900101-5-1408-00-5700 Health/Life Insurance 6,253 6,627 7,100 7,100101-5-1408-00-5701 Disability Insurance 153 162 200 200101-5-1408-00-5800 Workers Compensation 625 685 800 700101-5-1408-00-5990 Miscellaneous - - - -
Total Personnel Benefits 31,062 32,515 33,700 36,300
SUPPLIES101-5-x408-0x-6013 Computer Equipment/Supplies 29,997 23,002 42,500 44,500
Total Supplies 29,997 23,002 42,500 44,500
OTHER SERVICES & CHARGES
101-5-1408-00-7005 Software Licensing 29,866 26,884 31,000 80,200101-5-x408-0x-7306 Telephone Charges 79,482 126,733 146,700 167,000101-5-x408-0x-7403 Computer Equipment R&M 216,547 219,697 229,100 239,500101-5-1408-00-7900 Other Professional Services 3,800 3,917 7,000 7,000
Total Other Svcs & Charges 329,695 377,231 413,800 493,700
CAPITAL OUTLAY101-5-1408-00-8004 Machinery & Equipment 25,091 48,309 20,000 50,000101-5-2408-01-8004 Machinery & Equipment 51,290 - - 30,000
Total Capital Outlay 76,381 48,309 20,000 80,000
TOTAL INFORMATION SERVICES 597,594$ 615,772$ 644,900$ 803,500$
TOWN MANAGER
192
T
Facilitating the productivity and effectiveness of the Town of Payson
Development of employees in ways that are satisfying to the individual and
beneficial to the Town
Anticipating, providing and administrating human resources services consistent
with the changing needs of the Town
Prompting safety first in the work place in order to provide the employees a
safer environment
193

HUMAN RESOURCES DEPARTMENT
2017 ANNUAL BUDGET
Human Resources
2016/17 2017/18Human Resources Manager 1.0 1.0 Human Resources Analyst 1.0 1.0 Payroll Specialist 1.0 1.0 Total Human Resources 3.0 3.0
2014/15 2015/16 2016/17 2017/18Operating Division Actual Actual Budget Proposed
Human Resources 230,805 205,786 226,500 238,100 Total Expenditures 230,805$ 205,786$ 226,500$ 238,100$
194

√
√
√
√ √
√
√ √ √
√ √ √ √ √ √ √ √ √ √
HUMAN RESOURCES DEPARTMENT
195

196

Significant Budget Changes: FY16/17 Personnel Benefits—reflects increase in insurance related expenses FY16/17 Supplies—new HR Manager requested budget for memberships FY16/17 Other Services—new HR Manager requested increase in registrations and addi-tional funds for pre-employment testing & processing FY17/18 Other Services—previous year’s budget for pre-employment testing & process-ing was reduced based on updated data on actual costs
2015/16 2016/17 % 2017/18 %Description Actual Budget Change Proposed Change
Salaries & Wages 140,579 141,400 0.6% 155,200 9.8%Personnel Benefits 39,218 45,500 16.0% 48,400 6.4%Supplies 3,480 5,000 43.7% 5,500 10.0%Other Services & Charges 22,509 34,600 53.7% 29,000 -16.2%Total Human Resources 205,786$ 226,500$ 10.1% 238,100$ 15.7%
2014/15 2015/16 2016/17 2017/18 2018/19 2019/20Classification Actual Actual Budget Proposed Estimate Estimate
Personnel Services 188,852 179,797 186,900 203,600 213,780 224,469 Supplies 3,021 3,480 5,000 5,500 5,775 6,064 Services & Charges 38,932 22,509 34,600 29,000 30,450 31,973 Total Human Resource 230,805$ 205,786$ 226,500$ 238,100$ 250,005$ 262,505$
$0
$50,000
$100,000
$150,000
$200,000
$250,000
$300,000
Services & Charges
Supplies
Personnel Services
197

ANNUAL BUDGET
HUMAN RESOURCES2014/15 2015/16 2016/17 2017/18
ACTUAL ACTUAL BUDGET PROPOSEDSALARIES & WAGES101-5-1406-00-5001 Full Time Employees 144,231 140,579 141,400 152,200101-5-1406-00-5200 Overtime Pay - - - 3,000
Total Salaries & Wages 144,231 140,579 141,400 155,200
PERSONNEL BENEFITS101-5-1406-00-5501 FICA 9,962 9,653 10,900 11,900101-5-1406-00-5504 Retirement 16,552 14,198 16,100 17,600101-5-1406-00-5700 Health/Life Insurance 17,230 14,576 17,500 18,000101-5-1406-00-5701 Disability Insurance 173 151 200 200101-5-1406-00-5800 Workers Compensation 704 640 800 700
Total Personnel Benefits 44,621 39,218 45,500 48,400
SUPPLIES101-5-1406-00-6001 Office Supplies 1,499 1,496 2,000 2,000101-5-1406-00-6005 Program Supplies 1,394 1,879 2,200 2,200101-5-1406-00-6300 Gasoline/Fuels/Lubricant 51 105 - 200101-5-1406-00-6700 Memberships/Dues/Subsc - - 800 1,100101-5-1406-00-6990 Other Expense 77 - - -
Total Supplies 3,021 3,480 5,000 5,500
OTHER SERVICES & CHARGES101-5-1406-00-7306 Telephone Charges 705 399 500 500101-5-1406-00-7600 Travel Expenses 719 622 900 800101-5-1406-00-7601 Registration 298 1,373 3,200 3,200101-5-1406-00-7900 Other Professional Services 30,444 16,016 25,000 20,000101-5-1406-00-7907 Advertising 6,766 4,099 5,000 4,500
Total Other Svcs & Charges 38,932 22,509 34,600 29,000
TOTAL HUMAN RESOURCES 230,805$ 205,786$ 226,500$ 238,100$
HUMAN RESOURCES
198

.
199

TOWN CLERK’S DEPARTMENT
2017 ANNUAL BUDGET
Town Clerk
Clerks
Elections
2016/17 2017/18Town Clerk 1.0 1.0 Chief Deputy Town Clerk 1.0 1.0 Total Filled Positions 2.0 2.0
2014/15 2015/16 2016/17 2017/18Operating Division Actual Actual Budget ProposedTown Clerk 209,958 210,700 212,600 221,700 Elections 37,109 898 41,000 16,000 Total Department 247,067$ 211,598$ 253,600$ 237,700$
200

TOWN CLERK’S DEPARTMENT
2017 ANNUAL BUDGET
Note: Explanations of significant budget changes are addressed within the individual divisions’ sections that follow
$-
$50,000
$100,000
$150,000
$200,000
$250,000
$300,000
Capital Outlay
Services & Charges
Supplies
Personnel Services
%Description Proposed Change
Salaries & Wages 145,558 139,900 -3.9% 146,300 4.6%Personnel Benefits 35,776 36,600 2.3% 38,000 3.8%Supplies 1,833 2,300 25.5% 2,600 13.0%Other Services & Charges 28,432 74,800 163.1% 50,800 -32.1%Total Town Clerk Dept. 211,599$ 253,600$ 19.8% 237,700$ -6.3%
2015/16 2016/17 % 2017/18Actual Budget Change
2014/15 2015/16 2016/17 2017/18 2018/19 2019/20Classification Actual Actual Budget Proposed Estimate Estimate
Personnel Services 178,858 181,334 176,500 184,300 193,515 203,191 Supplies 1,699 1,833 2,300 2,600 2,730 2,867 Services & Charges 66,510 28,432 74,800 50,800 53,340 56,007 Capital Outlay - - - - - - Total Clerk Dept 247,067$ 211,599$ 253,600$ 237,700$ 249,585$ 262,064$
201

√
√
√
TOWN CLERK DIVISION
202

FY15/16 Salaries & Wages—included a PTO buy back program that caused wages to be higher than normal FY16/17 Supplies— reflect an increase in the cost of office supplies and the inclusion of a uniform allowance that was not part of the previous years’ budgets FY17/18 Supplies—Small Tools were increased to allow for the purchase of an office chair
%Description Proposed Change
Salaries & Wages 145,558 138,100 -5.1% 146,300 5.9%Personnel Benefits 35,776 38,400 7.3% 38,000 -1.0%Supplies 1,833 2,300 25.5% 2,600 13.0%Other Services & Charges 27,533 33,800 22.8% 34,800 3.0%Total Town Clerk Division 210,700$ 212,600$ 0.9% 221,700$ 4.3%
2015/16 2016/17 % 2017/18Actual Budget Change
2014/15 2015/16 2016/17 2017/18 2018/19 2019/20Classification Actual Actual Budget Proposed Estimate Estimate
Personnel Services 178,858 181,334 176,500 184,300 193,515 203,191 Supplies 1,699 1,833 2,300 2,600 2,730 2,867 Services & Charges 29,401 27,533 33,800 34,800 36,540 38,367 Capital Outlay - - - - - - Total Clerks 209,958$ 210,700$ 212,600$ 221,700$ 232,785$ 244,424$
$0
$50,000
$100,000
$150,000
$200,000
$250,000
$300,000
Capital Outlay
Services & Charges
Supplies
Personnel Services
203

ANNUAL BUDGET TOWN CLERK
TOWN CLERK2014/15 2015/16 2016/17 2017/18
ACTUAL ACTUAL BUDGET PROPOSEDSALARIES & WAGES101-5-1402-00-5001 Full Time Employees 143,755 145,558 138,100 145,300101-5-1402-00-5200 Overtime Pay - - - 1,000
Total Salaries & Wages 143,755 145,558 138,100 146,300
PERSONNEL BENEFITS101-5-1402-00-5501 FICA 10,550 10,672 10,600 11,200101-5-1402-00-5504 Retirement 16,498 16,520 15,700 16,600101-5-1402-00-5700 Health/Life Insurance 7,179 7,665 9,000 9,200101-5-1402-00-5701 Disability Insurance 173 176 200 300101-5-1402-00-5800 Workers Comp Insurance 703 743 800 700101-5-1402-00-5990 Miscellaneous - - 2,100 -
Total Personnel Benefits 35,103 35,776 38,400 38,000
SUPPLIES101-5-1402-00-6001 Office Supplies 1,118 1,403 1,400 1,400101-5-1402-00-6006 Uniforms / Clothing - - 200 200101-5-1402-00-6011 Small Tools / Minor Equipment - - - 300101-5-1402-00-6700 Dues & Memberships 581 430 700 700
Total Supplies 1,699 1,833 2,300 2,600
OTHER SERVICES & CHARGES101-5-1402-00-7003 Computer Services 14,404 14,058 14,700 14,700101-5-1402-00-7306 Telephone 582 747 700 700101-5-1402-00-7600 Travel 221 1,372 3,200 4,600101-5-1402-00-7601 Registrations 265 380 2,200 1,800101-5-1402-00-7900 Other Professional Services 8,158 5,737 8,000 8,000101-5-1402-00-7907 Advertising 5,771 5,239 5,000 5,000
Total Other Svcs & Charges 29,401 27,533 33,800 34,800
TOTAL TOWN CLERK 209,958$ 210,700$ 212,600$ 221,700$
204

√
ELECTION DIVISION
205

Significant Budget Changes:
FY16/17 Services—Changes in the budget are due to the implementation of consolidated elections FY17/18 Services—Budget was reduced because a regular election will not be required during the fiscal year
2014/15 2015/16 2016/17 2017/18 2018/19 2019/20Classification Actual Actual Budget Proposed Estimate Estimate
Services & Charges 37,109 898 41,000 16,000 16,800 17,640 Total Election 37,109$ 898$ 41,000$ 16,000$ 16,800$ 17,640$
%Description Proposed Change
Other Services & Charges 899 41,000 4460.6% 16,000 -61.0%Total Election Division 899$ 41,000$ 4460.6% 16,000$ -61.0%
2017/18Actual Budget Change
2015/16 2016/17 %
$0$5,000
$10,000$15,000$20,000$25,000$30,000$35,000$40,000$45,000
Services & Charges
Services & Charges
206

ANNUAL BUDGET TOWN CLERK
ELECTIONS2014/15 2015/16 2016/17 2017/18
ACTUAL ACTUAL BUDGET PROPOSED
OTHER SERVICES & CHARGES101-5-1403-00-7900 Other Professional Services 37,065 26 40,000 15,000101-5-1403-00-7907 Advertising 44 873 1,000 1,000
Total Other Svcs & Charges 37,109 899 41,000 16,000
TOTAL ELECTIONS 37,109$ 899$ 41,000$ 16,000$
207

208

LEGAL DEPARTMENT
2017 ANNUAL BUDGET
Legal(Town Attorney)
P/T Office Clerk position is a grant funded Victim Rights position
*
2016/17 2017/18Town Attorney 1.0 1.0 Prosecutor 1.0 1.0 Office Clerk * 1.5 1.5 Office Manager 1.0 1.0 Total Positions 4.5 4.5
2014/15 2015/16 2016/17 2017/18Operating Division Actual Actual Budget Proposed
Legal 352,200 367,128 425,700 448,700 Total Expenditures 352,200$ 367,128$ 425,700$ 448,700$
209

CONTACT INFORMATION Hector Figueroa—Town Attorney
(928) 472-5020 [email protected]
PHYSICAL LOCATION Payson Town Complex—Legal Dept.
303 N. Beeline Hwy. Payson, AZ 85541
210

Significant Budget Changes:
FY16/17 Salaries & Benefits—reflects wage adjustments and changes in insurance plan se-lections FY16/17 Supplies—reflects decrease in budget for office and other supplies FY16/17 Services—each year, funds are budgeted for potential building repairs but in FY15/16 only a small portion of those funds was used
%Description Change
Salaries & Wages 277,308 306,000 10.3% 323,300 5.7%Personnel Benefits 68,302 84,400 23.6% 89,800 6.4%Supplies 10,332 8,600 -16.8% 9,500 10.5%Other Services & Charges 11,186 26,700 138.7% 26,100 -2.2%Total 367,128$ 425,700$ 16.0% 448,700$ 5.4%
2015/16 2016/17 % 2017/18Actual Budget Change Proposed
2014/15 2015/16 2016/17 2017/18 2018/19 2019/20Classification Actual Actual Budget Proposed Estimate Estimate
Personnel Services 322,627 345,610 390,400 413,100 433,755 455,443 Supplies 10,204 10,332 8,600 9,500 9,975 10,474 Services & Charges 19,369 11,186 26,700 26,100 27,405 28,775 Total 352,200$ 367,128$ 425,700$ 448,700$ 471,135$ 494,692$
$0
$100,000
$200,000
$300,000
$400,000
$500,000
$600,000
Services & Charges
Supplies
Personnel Services
211

ANNUAL BUDGET
LEGAL 2014/15 2015/16 2016/17 2017/18ACTUAL ACTUAL BUDGET PROPOSED
SALARIES & WAGES101-5-1418-00-5001 Full Time Employees 220,242 246,897 290,400 306,300101-5-1418-00-5002 Part Time Employees 43,015 30,411 15,600 16,500101-5-1418-00-5200 Overtime Pay - - - 500
Total Salaries & Wages 263,257 277,308 306,000 323,300
PERSONNEL BENEFITS101-5-1418-00-5501 FICA 19,429 20,326 23,400 24,700101-5-1418-00-5504 Retirement 26,169 30,948 34,400 36,300101-5-1418-00-5700 Health/Life Insurance 12,471 15,432 24,600 26,900101-5-1418-00-5701 Disability Insurance 232 306 400 500101-5-1418-00-5800 Workers Compensation 1,069 1,290 1,600 1,400
Total Personnel Benefits 59,370 68,302 84,400 89,800
SUPPLIES101-5-1418-00-6001 Office Supplies 4,614 3,691 2,600 3,000101-5-1418-00-6010 Books & Periodicals 3,712 4,258 4,000 4,000101-5-1418-00-6013 Computer Equipment/Supplies - - - -101-5-1418-00-6201 Building Repair Materials 409 18 500 500101-5-1418-00-6700 Memberships/Dues/Subscript 1,280 1,240 1,300 1,400101-5-1418-00-6990 Other Supplies 189 1,125 200 600
Total Supplies 10,204 10,332 8,600 9,500
OTHER SERVICES & CHARGES101-5-1418-00-7100 Legal Services 9,170 1,320 3,000 3,000101-5-1418-00-7103 Prosecution Services 1,500 - 1,000 1,000101-5-1418-00-7300 Electricity Charges 1,458 1,693 2,200 2,000101-5-1418-00-7301 Propane Gas Charges 1,121 1,063 1,200 1,200101-5-1418-00-7306 Telephone 586 1,023 1,000 1,000101-5-1418-00-7307 Postage / Freight 41 19 100 100101-5-1418-00-7401 Building Repair & Maintenance 840 386 10,000 10,000101-5-1418-00-7402 Office Equipment R&M 715 - 800 800101-5-1418-00-7502 Lease Equipment - 806 - -101-5-1418-00-7600 Travel 1,928 1,983 4,000 3,000101-5-1418-00-7601 Registrations 738 1,453 2,000 2,000101-5-1418-00-7900 Other Professional Services 1,272 1,440 1,400 2,000
Total Other Services & Charges 19,369 11,186 26,700 26,100
TOTAL LEGAL 352,200$ 367,128$ 425,700$ 448,700$
LEGAL
212

213

FINANCIAL SERVICES DEPARTMENT
2017 ANNUAL BUDGET
Financial Services
2014/15 2015/16 2016/17 2017/18Operating Division Actual Actual Budget Proposed
Financial Services 320,399 357,791 369,900 531,600
Total Financial Serv Dept 320,399$ 357,791$ 369,900$ 531,600$
2016/17 2017/18CFO 0.0 1.0Deputy CFO 0.0 1.0Finance Manager 1.0 0.0Accountant II 1.0 1.0Budget Analyst I 1.0 1.0Senior Finance Clerk 1.0 1.0Grants Coordinator 0.5 0.5Total Budgeted Positions 4.5 5.5
214

√ √
√ √
√ √ √
FINANCE DEPARTMENT
215

Significant Budget Changes:
FY16/17 & FY17/18 Salaries/Wages & Personnel Benefits—higher due to anticipated hiring of a CFO in 4th quarter of fiscal year FY16/17 Supplies—increased for additional office supplies FY16/17 Services—reduced since an actuarial study was not needed this fiscal year FY17/18 Supplies—included funds for the purchase of varidesks FY17/18 Services—increased due to the need for an actuarial study
2015/16 2016/17 % 2017/18 %Description Actual Budget Change Proposed Change
Salaries & Wages 249,019 264,100 6.1% 368,700 39.6%Personnel Benefits 63,437 72,100 13.7% 106,900 48.3%Supplies 3,164 5,100 61.2% 7,100 39.2%Other Services & Charges 42,171 28,600 -32.2% 48,900 71.0%Total Finance Services 357,791$ 369,900$ 3.4% 531,600$ 43.7%
2014/15 2015/16 2016/17 2017/18 2018/19 2019/20Classification Actual Actual Budget Proposed Estimate Estimate
Personnel Services 300,674 312,456 336,200 475,600 499,380 524,349 Supplies 2,904 3,164 5,100 7,100 7,455 7,828 Services & Charges 16,821 42,171 28,600 48,900 51,345 53,912 Total Financial Serv 320,399$ 357,791$ 369,900$ 531,600$ 558,180$ 586,089$
$0
$100,000
$200,000
$300,000
$400,000
$500,000
$600,000
$700,000
Services & Charges
Supplies
Personnel Services
216

ANNUAL BUDGET
FINANCIAL SERVICES2014/15 2015/16 2016/17 2017/18
ACTUAL ACTUAL BUDGET PROPOSEDSALARIES & WAGES101-5-1407-00-5001 Full Time Employees 197,703 208,410 212,800 315,700101-5-1407-00-5002 Part Time Employees 43,532 40,609 51,300 53,000
Total Salaries & Wages 241,235 249,019 264,100 368,700
PERSONNEL BENEFITS101-5-1407-00-5501 FICA 16,853 17,429 20,200 28,200101-5-1407-00-5504 Retirement 27,685 28,263 29,900 41,800101-5-1407-00-5700 Health/Life Insurance 13,432 16,174 20,100 34,600101-5-1407-00-5701 Disability Insurance 289 301 400 600101-5-1407-00-5800 Workers Comp Insurance 1,180 1,270 1,500 1,700
Total Personnel Benefits 59,439 63,437 72,100 106,900
SUPPLIES101-5-1407-00-6001 Office Supplies 1,628 1,558 3,000 3,000101-5-1407-00-6010 Books & Periodicals - 126 300 300101-5-1407-00-6011 Small Tools/Minor Equipment 36 - 100 2,100101-5-1407-00-6700 Membership/Dues/Subscript 250 490 700 700101-5-1407-00-6990 Other Expenses 990 990 1,000 1,000
Total Supplies 2,904 3,164 5,100 7,100
OTHER SERVICES & CHARGES101-5-1407-00-7002 Accounting/Auditing Services 15,600 35,990 16,400 36,400101-5-1407-00-7306 Telephone 717 804 800 1,100101-5-1407-00-7402 Office Equipment R&M - - 400 400101-5-1407-00-7600 Travel 354 2,389 5,000 5,000101-5-1407-00-7601 Registrations - 2,988 6,000 6,000101-5-1407-00-7900 Other Professional Services 150 - - -
Total Other Svcs & Charges 16,821 42,171 28,600 48,900
TOTAL FINANCIAL SERVICES 320,399$ 357,791$ 369,900$ 531,600$
FINANCIAL SERVICES
217

218

CENTRAL SERVICES DEPARTMENT
2017 ANNUAL BUDGET
Centralized
Services
CentralizedSupplies
OtherGovernmental
Services
PropertyManagement
MedicalInsurance
2016/17 2017/18
Office Clerk III 1.0 1.0
Total Positions 1.0 1.0
2014/15 2015/16 2016/17 2017/18Operating Division Actual Actual Proposed ProposedProperty Management 111,422 94,305 105,000 128,200 Centralized Supplies 114,493 99,863 104,800 108,800 Other Governmental Services 475,453 559,866 657,300 729,400 Medical Insurance 2,302,116 2,447,383 2,567,300 2,510,900 Total Department 3,003,484$ 3,201,417$ 3,434,400$ 3,477,300$
219

CENTRAL SERVICES DEPARTMENT
2017 ANNUAL BUDGET
Note: Explanations of significant budget changes are addressed within the individual divisions’ sections that follow
$-
$500,000
$1,000,000
$1,500,000
$2,000,000
$2,500,000
$3,000,000
$3,500,000
$4,000,000
$4,500,000
Intergovernmental
Services & Charges
Supplies
Personnel Services
2015/16 2016/17 % 2017/18 %Description Actual Budget Change Proposed Change
Salaries & Wages 32,060 34,900 8.9% 35,700 2.3%Personnel Benefits 573,194 550,100 -4.0% 564,000 2.5%Supplies 50,880 53,100 4.4% 54,300 2.3%Other Services & Charges 1,985,417 2,139,000 7.7% 2,093,900 -2.1%Intergovernmental Services 559,866 657,300 17.4% 729,400 11.0%Total Central Services 3,201,417$ 3,434,400$ 7.3% 3,477,300$ 1.2%
2014/15 2015/16 2016/17 2017/18 2018/19 2019/20Classification Actual Actual Budget Proposed Estimate Estimate
Personnel Services 536,998 605,254 585,000 599,700 629,685 661,169 Supplies 70,369 50,880 53,100 54,300 57,015 59,866 Services & Charges 1,920,664 1,985,417 2,139,000 2,093,900 2,198,595 2,308,525 Intergovernmental 475,453 559,866 657,300 729,400 765,870 804,164 Total Central Services 3,003,484$ 3,201,417$ 3,434,400$ 3,477,300$ 3,651,165$ 3,833,723$
220

PROPERTY MANAGEMENT DIVISION
√
√
221

Significant Budget Changes:
FY16/17 Services—includes increases in various utilities and equipment repair/maintenance FY17/18 Services—R&M Building increased for anticipated repairs
2015/16 2016/17 % 2017/18 %Description Actual Budget Change Proposed Change
Other Services & Charges 94,305 105,000 11.3% 128,200 22.1%Total Property Management 94,305$ 105,000$ 11.3% 128,200$ 22.1%
2014/15 2015/16 2016/17 2017/18 2018/19 2019/20Classification Actual Actual Budget Proposed Estimate Estimate
Services & Charges 111,422 94,305 105,000 128,200 134,610 141,341 Total Property Mgmt 111,422$ 94,305$ 105,000$ 128,200$ 134,610$ 141,341$
$0
$20,000
$40,000
$60,000
$80,000
$100,000
$120,000
$140,000
$160,000
Services & Charges
222

ANNUAL BUDGET CENTRALIZED SERVICES
PROPERTY MANAGEMENT - TOWN HALL2014/15 2015/16 2016/17 2017/18
ACTUAL ACTUAL BUDGET PROPOSED
OTHER SERVICES & CHARGES101-5-1401-00-7900 Other Professional Services 8,089 11,349 9,000 10,000101-5-1401-00-7300 Electricity 21,150 19,682 23,000 25,000101-5-1401-00-7301 Propane Gas 3,311 2,554 3,000 3,000101-5-1401-00-7302 Water 602 740 900 900101-5-1401-00-7304 Sewer 468 468 500 500101-5-1401-00-7305 Refuse Disposal 517 468 600 600101-5-1401-00-7306 Telephone 35,069 32,696 36,000 29,000101-5-1401-00-7401 Building R&M 14,584 13,595 10,000 37,000101-5-1401-00-7402 Office Equipment R&M - - 500 500101-5-1401-00-7404 Equipment R&M 15,546 1,685 6,500 6,700101-5-1401-00-7502 Leased Equipment 12,086 11,068 15,000 15,000
Total Other Svcs & Charges 111,422 94,305 105,000 128,200
TOTAL PROPERTY MGMT - TOWN HALL 111,422$ 94,305$ 105,000$ 128,200$
223

√
√
CENTRAL SUPPLIES DIVISION
224

Significant Budget Changes:
FY16/17 Salaries & Wages and Personnel Benefits— reflects fluctuation in number of scheduled work hours FY17/18 Services—increase in budget for postage
$-
$20,000
$40,000
$60,000
$80,000
$100,000
$120,000
$140,000
Services & Charges
Supplies
Personnel Services
2015/16 2016/17 % 2017/18 %Description Actual Budget Change Proposed Change
Salaries & Wages 32,060 34,900 8.9% 35,700 2.3%Personnel Benefits 6,105 6,800 11.4% 6,800 0.0%Supplies 50,880 53,100 4.4% 54,300 2.3%Other Services & Charges 10,818 10,000 -7.6% 12,000 20.0%Total Centralized Supplies 99,863$ 104,800$ 4.9% 108,800$ 3.8%
2014/15 2015/16 2016/17 2017/18 2018/19 2019/20Classification Actual Actual Budget Proposed Estimate Estimate
Personnel Services 36,846 38,165 41,700 42,500 44,625 46,856 Supplies 70,369 50,880 53,100 54,300 57,015 59,866 Services & Charges 7,278 10,818 10,000 12,000 12,600 13,230 Total Central Supplies 114,493$ 99,863$ 104,800$ 108,800$ 114,240$ 119,952$
225

ANNUAL BUDGET CENTRALIZED SERVICES
CENTRAL SUPPLIES2014/15 2015/16 2016/17 2017/18
ACTUAL ACTUAL BUDGET PROPOSEDSALARIES & WAGES101-5-1401-00-5001 Full Time Employees - - - -101-5-1401-00-5002 Part Time Employees 30,899 32,060 34,900 35,700
Total Salaries & Wages 30,899 32,060 34,900 35,700
PERSONNEL BENEFITS101-5-1401-00-5501 FICA 2,364 2,453 2,700 2,700101-5-1401-00-5504 Retirement 3,546 3,614 4,000 4,000101-5-1401-00-5700 Health/Life Insurance - - - -101-5-1401-00-5701 Disability Insurance 37 38 100 100
Total Personnel Benefits 5,947 6,105 6,800 6,800
SUPPLIES101-5-1401-00-6001 Office Supplies 3,515 3,747 5,000 5,000101-5-1401-00-6002 Coffee Supplies 590 388 600 600101-5-1401-00-6003 Cleaning Supplies 1,286 1,382 1,200 1,200101-5-1401-00-6005 Safety Supplies 221 321 300 500101-5-1401-00-6011 Small Tools/Minor Equip 53 18 100 2,100101-5-1401-00-6201 R & M Supplies Building 2,154 416 500 500101-5-1401-00-6300 Gasoline/Fuels/Lubricant - 31 100 100101-5-1401-00-6302 R&M Supplies-Vehicle 300 32 500 700101-5-1401-00-6700 Dues & Memberships 24,255 20,450 21,500 22,100101-5-1401-00-6901 Taxes & Fees 7,343 383 300 500101-5-1401-00-6903 Banking Fees 30,627 23,712 23,000 21,000101-5-1401-00-6990 Other Expenses 25 - - -
Total Supplies 70,369 50,880 53,100 54,300
OTHER SERVICES & CHARGES101-5-1401-00-7307 Postage 7,278 10,818 10,000 12,000
Total Other Svcs & Charges 7,278 10,818 10,000 12,000
TOTAL CENTRAL SUPPLIES 114,493$ 99,863$ 104,800$ 108,800$
226

OTHER GOVERNMENTAL SERVICES DIVISION
Significant Budget Changes:
FY16/17 Services—includes increase in Water loan repayment FY17/18 Services—includes additional increase in Water loan repayment and reduction in overhead transfer
2014/15 2015/16 2016/17 2017/18 2018/19 2019/20Classification Actual Actual Budget Proposed Estimate Estimate
Intergovernmental 475,453 559,866 657,300 729,400 765,870 804,164 Total Other Govt Serv 475,453$ 559,866$ 657,300$ 729,400$ 765,870$ 804,164$
2015/16 2016/17 % 2017/18 %Description Actual Budget Change Proposed Change
Intergovernmental 559,866 657,300 17.4% 729,400 11.0%Total Other Govt'l Services 559,866$ 657,300$ 17.4% 729,400$ 11.0%
$0
$100,000
$200,000
$300,000
$400,000
$500,000
$600,000
$700,000
$800,000
$900,000
Intergovernmental
227

ANNUAL BUDGET CENTRALIZED SERVICES
OTHER GOVERNMENTAL SERVICES2014/15 2015/16 2016/17 2017/18
ACTUAL ACTUAL BUDGET PROPOSED
SERVICES & CHARGES(Intergovernmental)101-5-1401-00-7903 Property /Liability Insurance 335,149 346,419 365,000 400,000101-5-1401-00-7904 Insurance Deductibles 6,604 12,714 7,000 5,000101-5-1401-00-7104 Settlements - 10,000 20,000 20,000101-5-1401-00-7915 Overhead - 23,800 47,600 -101-5-1401-00-7990 Contributions to Other Agencies - 33,233 34,000 34,000101-5-7401-03-7990 Contribution to Senior Center 80,400 80,400 80,400 80,400101-5-7401-03-7990 Contribution to Brush Pit - - - 7,500101-5-7401-03-7990 Contribution to Chamber of Commerce 36,000 36,000 36,000 -101-5-9997-00-9661 Loan Repay - Water 17,300 17,300 67,300 182,500
Total Services & Charges 475,453 559,866 657,300 729,400
TOTAL OTHER GOVERNMENTAL SERVICES 475,453$ 559,866$ 657,300$ 729,400$
228

MEDICAL INSURANCE DIVISION
No Significant Budget Change
2015/16 2016/17 % 2017/18 %Description Actual Budget Change Proposed Change
Personnel Benefits 567,089 543,300 -4.2% 557,200 2.6%Other Services & Charges 1,880,294 2,024,000 7.6% 1,953,700 -3.5%Total Medical Insurance 2,447,383$ 2,567,300$ 4.9% 2,510,900$ -2.2%
2014/15 2015/16 2016/17 2017/18 2018/19 2019/20Classification Actual Actual Budget Proposed Estimate Estimate
Personnel Services 500,152 567,089 543,300 557,200 585,060 614,313 Services & Charges 1,801,964 1,880,294 2,024,000 1,953,700 2,051,385 2,153,954 Total Medical Insurance 2,302,116$ 2,447,383$ 2,567,300$ 2,510,900$ 2,636,445$ 2,768,267$
$0
$500,000
$1,000,000
$1,500,000
$2,000,000
$2,500,000
$3,000,000
Services & Charges
Personnel Services
229

ANNUAL BUDGET CENTRALIZED SERVICES
MEDICAL INSURANCE BENEFIT2014/15 2015/16 2016/17 2017/18
ACTUAL ACTUAL BUDGET PROPOSEDPERSONNEL BENEFITS101-5-1401-00-5700 Health/Life Insurance 491,539 560,808 533,800 550,700101-5-1401-00-5800 Workers Comp Insurance 3,813 3,401 3,500 3,500101-5-1401-00-5801 Unemployment Compensation 4,800 2,880 6,000 3,000
Total Personnel Benefits 500,152 567,089 543,300 557,200
OTHER SERVICES & CHARGES290-5-1401-01-7908 Insurance Premium 1,801,964 1,880,294 2,024,000 1,953,700
Total Other Svcs & Charges 1,801,964 1,880,294 2,024,000 1,953,700
TOTAL MEDICAL INSURANCE BENEFIT 2,302,116$ 2,447,383$ 2,567,300$ 2,510,900$
230
231

Significant Budget Changes:
FY16/17 Salaries/Wages & Personnel Benefits—budgeted for anticipated increase FY16/17 & FY17/18 Services—Court Contract costs vary from year to year
%Description Change
Salaries & Wages 33,451 40,000 19.6% 40,000 0.0%Personnel Benefits 2,559 3,100 21.1% 3,100 0.0%Other Services & Charges 170,871 155,000 -9.3% 170,000 9.7%Total Magistrate Court 206,881$ 198,100$ -4.2% 213,100$ 7.6%
Actual Budget Change Proposed2015/16 2016/17 % 2017/18
2014/15 2015/16 2016/17 2017/18 2018/19 2019/20Classification Actual Actual Budget Proposed Estimate Estimate
Personnel Services 34,839 36,010 43,100 43,100 45,255 47,518 Services & Charges 139,953 170,871 155,000 170,000 178,500 187,425 Total Magistrate Court 174,792$ 206,881$ 198,100$ 213,100$ 223,755$ 234,943$
$0
$50,000
$100,000
$150,000
$200,000
$250,000
Services & Charges
Personnel Services
232

ANNUAL BUDGET
MAGISTRATE COURT2014/15 2015/16 2016/17 2017/18
ACTUAL ACTUAL BUDGET PROPOSEDSALARIES & WAGES101-5-1416-00-5001 Full Time Employees 32,363 33,451 40,000 40,000
Total Salaries & Wages 32,363 33,451 40,000 40,000
PERSONNEL BENEFITS101-5-1416-00-5501 FICA 2,476 2,559 3,100 3,100
Total Personnel Benefits 2,476 2,559 3,100 3,100
OTHER SERVICES & CHARGES101-5-1416-00-7002 Accounting & Auditing - 3,800 - -101-5-1416-00-7101 Indigent Defense 37,200 33,800 45,000 45,000101-5-1416-00-7102 Prof Service-Court Contract 102,753 133,271 110,000 125,000
Total Other Services & Charges 139,953 170,871 155,000 170,000
TOTAL MAGISTRATE COURT 174,792$ 206,881$ 198,100$ 213,100$
MAGISTRATE COURT
233

Need logo
234

POLICE DEPARTMENT
2017 ANNUAL BUDGET
Police
Department
Communications
Operations
SpecialOperations
2016/17 2017/18Deputy Town Manager / Public Safety 1.0 1.0Police Commander 0.0 1.0Lieutenant 1.0 1.0Sergeant 4.0 4.0Detective/Investigator I & II 4.0 4.0Police Officer I & II 16.0 15.0Special Enforcement Officer 1.0 1.0Executive Assistant 1.0 1.0Property & Equipment Manager 1.0 1.0Property Technician 1.0 1.0Records Clerk 2.0 2.0Records Administrator 1.0 1.0Office Clerk (Grant Funded) 0.0 1.0Communications Supervisor 1.0 1.0Dispatch Shift Leader 2.0 2.0Dispatchers 14.0 14.0Animal Control 1.0 1.0Total Positions 51.0 52.0
2014/15 2015/16 2016/17 2017/18Operating Division Actual Actual Budget Proposed
Communications 482,893 624,729 1,136,900 1,168,800 Operations 3,729,072 3,735,043 4,459,100 6,034,000 Special Operations 265,589 281,200 258,400 444,100 Total Expenditures 4,477,554$ 4,640,972$ 5,854,400$ 7,646,900$
235

POLICE DEPARTMENT
2017 ANNUAL BUDGET
Note: Explanations of significant budget changes are addressed within the individual divisions’ sections that follow
$3,000,000
$4,000,000
$5,000,000
$6,000,000
$7,000,000
$8,000,000
$9,000,000
Capital Outlay
Services & Charges
Supplies
Personnel Services
2015/16 2016/17 % 2017/18 %Description Actual Budget Change Proposed Change
Salaries & Wages 2,518,360 2,972,500 18.0% 3,197,600 7.6%Personnel Benefits 1,441,179 1,987,800 37.9% 2,702,400 35.9%Supplies 223,571 302,000 35.1% 261,500 -13.4%Other Services & Charges 338,697 335,800 -0.9% 365,600 8.9%Capital Outlay 119,165 256,300 115.1% 1,119,800 336.9%Total Police Dept 4,640,972$ 5,854,400$ 26.1% 7,646,900$ 30.6%
2014/15 2015/16 2016/17 2017/18 2018/19 2019/20Classification Actual Actual Budget Proposed Estimate Estimate
Personnel Services 3,759,038 3,959,539 4,960,300 5,900,000 6,195,000 6,504,750 Supplies 236,372 223,571 302,000 261,500 274,575 288,304 Services & Charges 322,054 338,697 335,800 365,600 383,880 403,074 Capital Outlay 160,090 119,165 256,300 1,119,800 1,175,790 1,234,580 Total Police 4,477,554$ 4,640,972$ 5,854,400$ 7,646,900$ 8,029,245$ 8,430,707$
236
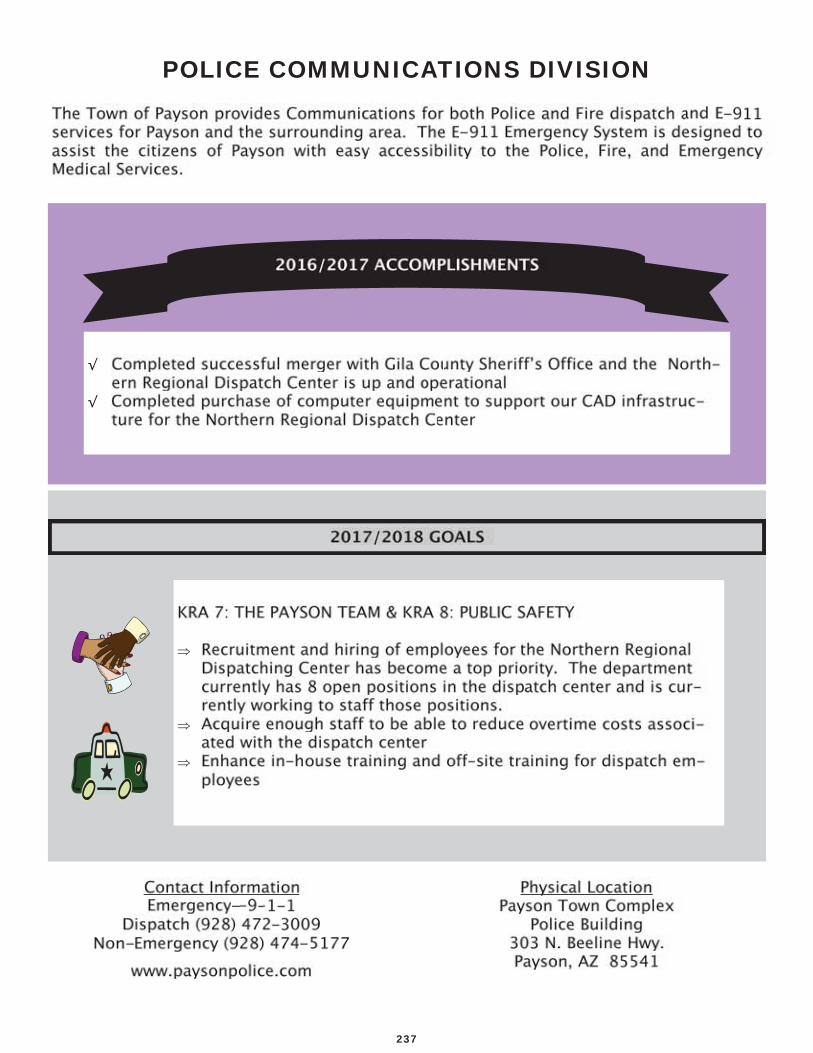
POLICE COMMUNICATIONS DIVISION
√
√
237

Significant Budget Changes:
FY16/17 Salaries / Benefits—staffing increased as the Town of Payson assumed the responsi-bility of dispatching for the Sheriff’s Office through an IGA FY16/17 & FY17/18 Supplies—reflects increases in office supplies and small tools to support increased staffing FY16/17 Services—increased budget for travel & registration for new staff
$(100,000)
$100,000
$300,000
$500,000
$700,000
$900,000
$1,100,000
$1,300,000
Services & Charges
Supplies
Personnel Services
2015/16 2016/17 % 2017/18 %Description Actual Budget Change Proposed Change
Salaries & Wages 494,650 829,000 67.6% 851,800 2.8%Personnel Benefits 121,317 289,200 138.4% 297,300 2.8%Supplies 3,379 6,900 104.2% 7,900 14.5%Other Services & Charges 5,383 11,800 119.2% 11,800 0.0%Total Communications 624,729$ 1,136,900$ 82.0% 1,168,800$ 2.8%
2014/15 2015/16 2016/17 2017/18 2018/19 2019/20Classification Actual Actual Budget Proposed Estimate Estimate
Personnel Services 472,147 615,967 1,118,200 1,149,100 1,206,555 1,266,883 Supplies 5,149 3,379 6,900 7,900 8,295 8,710 Services & Charges 5,597 5,383 11,800 11,800 12,390 13,010 Total Communications 482,893$ 624,729$ 1,136,900$ 1,168,800$ 1,227,240$ 1,288,602$
238

ANNUAL BUDGET
COMMUNICATIONS2014/15 2015/16 2016/17 2017/18
ACTUAL ACTUAL BUDGET PROPOSEDSALARIES & WAGES101-5-2421-00-5001 Salaries & Wages - Full Time 316,286 354,569 717,800 766,800101-5-2421-00-5002 Salaries & Wages - Part Time - - 15,000 -101-5-2421-00-520X Overtime Pay 50,582 128,118 81,200 70,000101-5-2421-00-5990 Shift Differential 12,516 11,963 15,000 15,000
Total Salaries & Wages 379,384 494,650 829,000 851,800
PERSONNEL BENEFITS101-5-2421-00-5501 FICA 27,784 36,488 64,300 67,000101-5-2421-00-5504 Retirement 43,294 59,194 95,500 99,300101-5-2421-00-5700 Health/Life Insurance 19,467 22,800 123,800 125,500101-5-2421-00-5701 Disability Insurance 452 582 800 1,400101-5-2421-00-5800 Workers Comp Insurance 1,766 2,253 4,800 4,100
Total Personnel Benefits 92,763 121,317 289,200 297,300
SUPPLIES101-5-2124-00-6001 Office Supplies 2,247 751 3,000 3,000101-5-2421-00-6011 Small Tools/Minor Equipment 2,073 2,074 3,000 4,000101-5-2421-00-6600 Public Relations 478 412 400 400101-5-2421-00-6700 Memberships/Dues/Subscript 351 142 500 500
Total Supplies 5,149 3,379 6,900 7,900
OTHER SERVICES & CHARGES101-5-2421-00-7402 Office Equipment R&M 1,079 2,033 2,800 2,800101-5-2421-00-7502 Lease Equipment 296 506 500 500101-5-2421-00-7600 Travel 1,001 5 2,500 2,500101-5-2421-00-7601 Registrations 1,571 439 3,000 3,000101-5-2421-00-7900 Other Professional Services 1,650 2,400 3,000 3,000
Total Other Svcs & Charges 5,597 5,383 11,800 11,800
TOTAL COMMUNICATIONS 482,893$ 624,729$ 1,136,900$ 1,168,800$
POLICE DEPARTMENT
239

POLICE OPERATIONS DIVISION
√
√
√
240

Significant Budget Changes:
FY16/17 Personnel Benefits— reflects Public Safety Retirement rate increase of 6.19% FY17/18 Personnel Benefits—reflects Public Safety Retirement rate increase of 15.54% FY17/18 Personnel Benefits—an additional pension payment of $375,000 was made to PSPRS to pay down the retirement obligation FY16/17 Supplies—reflected an anticipated increase in the cost of fuel and ammunition Changes in Capital reflect the availability of grant funding
$-
$1,000,000
$2,000,000
$3,000,000
$4,000,000
$5,000,000
$6,000,000
$7,000,000
Capital Outlay
Services & Charges
Supplies
Personnel Services
2015/16 2016/17 % 2017/18 %Description Actual Budget Change Proposed Change
Salaries & Wages 1,948,451 2,065,400 6.0% 2,182,200 5.7%Personnel Benefits 1,271,349 1,642,900 29.2% 2,271,300 38.2%Supplies 213,784 255,500 19.5% 232,200 -9.1%Other Services & Charges 250,344 239,000 -4.5% 251,800 5.4%Capital 51,115 256,300 401.4% 1,096,500 327.8%Total Operations 3,735,043$ 4,459,100$ 19.4% 6,034,000$ 35.3%
2014/15 2015/16 2016/17 2017/18 2018/19 2019/20Classification Actual Actual Budget Proposed Estimate Estimate
Personnel Services 3,190,092 3,219,800 3,708,300 4,453,500 4,676,175 4,909,984 Supplies 218,737 213,784 255,500 232,200 243,810 256,001 Services & Charges 232,983 250,344 239,000 251,800 264,390 277,610 Capital Outlay 87,260 51,115 256,300 1,096,500 1,151,325 1,208,891 Total Operations 3,729,072$ 3,735,043$ 4,459,100$ 6,034,000$ 6,335,700$ 6,652,485$
241

ANNUAL BUDGET
OPERATIONS2014/15 2015/16 2016/17 2017/18
ACTUAL ACTUAL BUDGET PROPOSEDSALARIES & WAGES101-5-2421-01-50xx Full Time Employees 1,725,800 1,667,767 1,784,100 1,864,000101-5-2421-01-5xxx Overtime Pay 248,326 255,988 250,300 262,200101-5-2421-11-5200 Overtime Pay-GOHS - - - 25,000101-5-2421-01-5990 Shift Differential 29,300 24,696 31,000 31,000
Total Salaries & Wages 2,003,426 1,948,451 2,065,400 2,182,200
PERSONNEL BENEFITS101-5-2421-01-5501 FICA 145,237 141,392 162,400 170,100101-5-2421-01-5504 Retirement 681,827 814,430 1,078,400 1,385,200101-5-2421-01-5505 Unfunded Pension Payment - - - 375,000101-5-2421-01-5700 Health/Life Insurance 158,135 137,829 173,200 142,200101-5-2421-01-5701 Disability Insurance 246 254 300 400101-5-2421-01-5800 Workers Comp Insurance 184,507 153,902 200,600 170,400101-5-2421-01-5901 Uniform Allowance 16,714 23,542 28,000 28,000
Total Personnel Benefits 1,186,666 1,271,349 1,642,900 2,271,300
SUPPLIES101-5-2421-01-6001 Office Supplies 11,550 10,684 12,000 12,000101-5-2421-01-6002 Coffee Supplies 492 504 600 600101-5-2421-01-6003 Cleaning Supplies 1,775 1,635 2,000 1,500101-5-2421-01-6005 Safety/Program Suppplies 2,904 3,088 3,100 3,100101-5-2421-01-6006 Clothing Reimbursement 2,870 7,261 7,000 7,000101-5-2421-01-6009 Volunteer Program 2,664 2,658 4,000 5,000101-5-2421-01-6010 Books & Periodicals - 2,013 2,000 -101-5-2421-01-6011 Small Tools/Minor Equip 35,751 29,609 37,000 40,000101-5-2421-02-6011 Small Tools/Minor Equip - - 6,000 -101-5-2421-01-6101 Canine Supplies 3,000 1,541 3,000 3,000101-5-2421-01-6102 Weapons/Ammunition 11,925 9,651 15,500 15,500101-5-2421-01-6201 Building R&M Supplies 5,840 2,580 3,000 3,000101-5-2421-01-6300 Vehicle Fuels 71,571 53,866 85,500 60,000101-5-2421-01-6302 Vehicle R&M Parts 52,493 75,682 57,000 60,000101-5-2421-01-6600 Public Relations 808 755 800 1,000101-5-2421-01-6700 Dues & Memberships 3,284 1,296 3,500 3,500101-5-2421-01-699x Other Expenses 11,810 10,961 13,500 17,000
Total Supplies 218,737 213,784 255,500 232,200
OTHER SERVICES & CHARGES101-5-2421-01-7300 Electricity 22,306 24,903 25,000 27,000101-5-2421-01-7301 Propane Gas 5,087 3,944 7,000 5,000101-5-2421-01-7302 Water 1,309 1,327 1,500 1,500101-5-2421-01-7304 Sewage 405 180 500 200
POLICE DEPARTMENT
242

ANNUAL BUDGET POLICE DEPARTMENT
OPERATIONS2014/15 2015/16 2016/17 2017/18
ACTUAL ACTUAL BUDGET PROPOSED101-5-2421-01-7305 Refuse Disposal 626 489 600 600101-5-2421-01-7306 Telephone 27,342 25,957 30,000 30,000101-5-2421-01-7307 Postage 234 261 400 500101-5-2421-01-7401 Building R&M 8,111 11,420 14,000 20,000101-5-2421-01-7402 Office Equipment R&M 410 - 500 500101-5-2421-01-7404 Equipment R&M 5,086 7,224 5,000 6,000101-5-2421-01-7405 Vehicle R&M 5,342 8,076 9,000 10,000101-5-2421-01-7500 Rental of Land & Buildings 11,342 7,371 10,000 10,000101-5-2421-01-7502 Leased Equipment 4,199 8,726 9,500 9,500101-5-2421-01-7600 Travel 12,120 14,058 11,000 15,000101-5-2421-02-7600 Travel - - 3,000 -101-5-2421-01-7601 Registrations 5,139 6,317 7,000 10,000101-5-2421-02-7601 Registrations - - 1,000 -101-5-2421-01-7900 Other Professional Services 109,850 126,974 99,000 99,000101-5-2421-01-7902 Impound Vehicle Tow - - 2,500 3,000101-5-2421-01-7910 Printing & Binding 3,432 1,347 2,500 4,000101-5-2421-01-7912 Grant Expense - 1,770 - -210-5-2421-01-7912 JAG Recovery Act 4,121 - - -210-5-2421-01-7914 Donations 6,522 - - -
Total Other Services & Charg 232,983 250,344 239,000 251,800
CAPITAL OUTLAY101-5-2421-02-8003 Vehicles - - - 49,000101-5-2421-02-8536 LE Crisis Team Equip - - - 28,000403-5-2412-01-8772 Law Enforce-HSG Radio Prog - 15,471 36,500 20,700403-5-2412-01-8773 Mobile Repeaters 32,020 - - -403-5-2412-01-8774 SHSGP Radios/Headsets - - 44,500 -403-5-2421-01-8762 Law Enf - GOHS Grant - - 34,300 36,500403-5-2426-03-8758 Misc Fire Grants - - - 847,800409-5-2421-01-8772 LE Radio Program 47,595 - - -425-5-2421-16-8407 CAD Police/Fire Comm 7,645 35,644 141,000 114,500
Total Capital Outlay 87,260 51,115 256,300 1,096,500
TOTAL OPERATIONS 3,729,072$ 3,735,043$ 4,459,100$ 6,034,000$
243

POLICE—SPECIAL OPERATIONS DIVISION
√
√
244

Significant Budget Changes:
FY16/17 & FY17/18 Salaries & Benefits—reflects wage adjustment and change in insurance FY16/17 Supplies—new budget line item added for Program Supplies
$-
$20,000
$40,000
$60,000
$80,000
$100,000
$120,000
$140,000
$160,000
Services & Charges
Supplies
Personnel Services
2015/16 2016/17 % 2017/18 %Description Actual Budget Change Proposed Change
Salaries & Wages 32,004 36,000 12.5% 38,700 7.5%Personnel Benefits 11,698 16,600 41.9% 13,500 -18.7%Supplies 4,738 6,100 28.7% 6,400 4.9%Other Services & Charges 76,416 77,000 0.8% 77,000 0.0%Total Animal Control 124,856$ 135,700$ 8.7% 135,600$ -0.1%
2014/15 2015/16 2016/17 2017/18 2018/19 2019/20Classification Actual Actual Budget Proposed Estimate Estimate
Personnel Services 32,378 43,702 52,600 52,200 54,810 57,551 Supplies 2,722 4,738 6,100 6,400 6,720 7,056 Services & Charges 76,824 76,416 77,000 77,000 80,850 84,893 Total Animal Control 111,924$ 124,856$ 135,700$ 135,600$ 142,380$ 149,499$
245

ANNUAL BUDGET
ANIMAL CONTROL2014/15 2015/16 2016/17 2017/18
ACTUAL ACTUAL BUDGET PROPOSEDSALARIES & WAGES101-5-7421-17-5001 Full Time Employees 23,169 31,815 35,500 37,300101-5-7421-17-5200 Overtime Pay 100 189 500 1,400
Total Salaries & Wages 23,269 32,004 36,000 38,700
PERSONNEL BENEFITS101-5-7421-17-5501 FICA 1,688 2,343 2,800 3,000101-5-7421-17-5504 Retirement 2,670 3,632 4,100 4,300101-5-7421-17-5700 Health/Life Insurance 2,441 3,314 6,700 3,500101-5-7421-17-5701 Disability Insurance 28 39 100 100101-5-7421-17-5800 Workers Compensation 1,035 1,530 2,000 1,700101-5-7421-17-5901 Uniform/Clothing Allow 1,247 840 900 900
Total Personnel Benefits 9,109 11,698 16,600 13,500
SUPPLIES101-5-7421-17-6009 Program Supplies - 527 600 600101-5-7421-17-6011 Small Tools/Minor Equipment 943 1,783 1,200 1,500101-5-7421-17-6300 Vehicle Fuels 1,719 2,393 4,200 4,200101-5-7421-17-6700 Memberships/Dues/Subscript 60 35 100 100
Total Supplies 2,722 4,738 6,100 6,400
OTHER SERVICES & CHARGES101-5-7421-17-7306 Telephone 417 502 500 500101-5-7421-17-7307 Postage/Freight 62 31 100 100101-5-7421-17-7600 Travel Expense 585 55 600 600101-5-7421-17-7601 Registrations 560 628 600 600101-5-7421-17-7990 Humane Society 75,200 75,200 75,200 75,200
Total Other Svcs & Charges 76,824 76,416 77,000 77,000
TOTAL ANIMAL CONTROL 111,924$ 124,856$ 135,700$ 135,600$
POLICE DEPARTMENT
246

Significant Budget Changes:
FY17/18 Salaries & Benefits—adding grant funded employee to assist with various grant pro-grams FY16/17 & FY17/18 Supplies & Services—expenditures fluctuate depending the availability of grant funding FY15/16 & FY17/18 Capital—utilized grant funding to obtain and/or equip patrol vehicles
2015/16 2016/17 % 2017/18 %Description Actual Budget Change Proposed Change
Salaries & Wages - Full Time - - 0.0% 26,700 100.0%Personnel Benefits - - 0.0% 14,300 100.0%Supplies 1,670 33,500 1906.0% 15,000 -55.2%Services 6,581 7,000 6.4% 23,000 228.6%Capital Outlay 68,050 - -100.0% 23,300 100.0%Total Police Grants 76,301$ 40,500$ -46.9% 102,300$ 152.6%
2014/15 2015/16 2016/17 2017/18 2018/19 2019/20Classification Actual Actual Budget Proposed Estimate Estimate
Personnel Services - - - 41,000 43,050 45,203 Supplies 9,764 1,670 33,500 15,000 15,750 16,538 Services & Charges 6,650 6,581 7,000 23,000 24,150 25,358 Capital Outlay 72,830 68,050 - 23,300 24,465 25,688 Total Grants 89,244$ 76,301$ 40,500$ 102,300$ 107,415$ 112,786$
$0
$20,000
$40,000
$60,000
$80,000
$100,000
$120,000
Capital Outlay
Services & Charges
Supplies
Personnel Services
247

ANNUAL BUDGET POLICE DEPARTMENT
DEPT OF JUSTICE FUND &VARIOUS GRANTS
2014/15 2015/16 2016/17 2017/18ACTUAL ACTUAL BUDGET PROPOSED
SALARIES & WAGES215-5-2421-02-5001 Salaries & Wages - Full Time - - - 26,700
Total Salaries & Wages - - - 26,700
PERSONNEL BENEFITS215-5-2421-02-5501 FICA - - - 2,000215-5-2421-02-5504 Retirement - - - 2,900215-5-2421-02-5700 Insurance Benefit - - - 9,200215-5-2421-02-5701 Disability Insurance - - - 100215-5-2421-02-5800 Workers Comp Insurance - - - 100
- - - 14,300
SUPPLIES215-5-2421-02-6011 Small Tools 9,764 1,670 13,500 15,000215-5-2421-02-6302 R&M Supplies Vehicle - - 20,000 -
Total Supplies 9,764 1,670 33,500 15,000
SERVICES215-5-2421-02-7600 Travel 2,650 2,397 2,500 15,000215-5-2421-02-7601 Registrations 950 1,181 1,500 5,000215-5-2421-02-7900 Other Prof Services 3,050 3,003 3,000 3,000
Total Supplies 6,650 6,581 7,000 23,000
CAPITAL OUTLAY215-5-2421-02-8510 Defense 1033 - LE Vehicle 72,830 68,050 - 23,300
Total Capital 72,830 68,050 - 23,300
TOTAL GRANTS 89,244$ 76,301$ 40,500$ 102,300$
248

Significant Budget Changes:
FY16/17 Services—added budget line item for travel so new SRO could attend training classes FY17/18 Salaries & Benefits—anticipate adding additional SRO if grant is approved FY17/18 Services—increased training budget for additional SRO
2015/16 2016/17 % 2017/18 %Description Actual Budget Change Proposed Change
Salaries & Wages 43,255 42,100 -2.7% 98,200 133.3%Personnel Benefits 36,815 39,100 6.2% 106,000 171.1%Services (27) 1,000 -3803.7% 2,000 100.0%Total School Resource 80,043$ 82,200$ 2.7% 206,200$ 150.9%
2014/15 2015/16 2016/17 2017/18 2018/19 2019/20Classification Actual Actual Budget Proposed Estimate Estimate
Personnel Services 64,421 80,070 81,200 204,200 214,410 225,131 Services - (27) 1,000 2,000 2,100 2,205 Total SRO 64,421$ 80,043$ 82,200$ 206,200$ 216,510$ 227,336$
$0
$50,000
$100,000
$150,000
$200,000
$250,000
Services
Personnel Services
249

ANNUAL BUDGET
SCHOOL RESOURCE OFFICER2014/15 2015/16 2016/17 2017/18
ACTUAL ACTUAL BUDGET PROPOSEDSALARIES & WAGES101-5-2421-04-5001 Full Time Employees 35,536 41,090 38,100 86,800101-5-2421-04-520x Overtime Pay 1,879 2,165 4,000 11,400
Total Salaries & Wages 37,415 43,255 42,100 98,200
PERSONNEL BENEFITS101-5-2421-04-5501 FICA 2,457 2,952 2,900 7,000101-5-2421-04-5504 Retirement 15,102 22,510 24,200 72,800101-5-2421-04-5700 Health/Life Insurance 5,586 6,109 7,100 15,200101-5-2421-04-5800 Workers Comp Insurance 3,361 4,744 3,900 8,000101-5-2421-04-5901 Clothing Allowance 500 500 1,000 2,000101-5-2421-04-5990 Miscellaneous - - - 1,000
Total Personnel Benefits 27,006 36,815 39,100 106,000
SERVICES101-5-2421-04-7600 Travel - (27) 1,000 2,000
Total Services - (27) 1,000 2,000
TOTAL SCHOOL RESOURCE OFFICER 64,421$ 80,043$ 82,200$ 206,200$
POLICE DEPARTMENT
250

251

FIRE DEPARTMENT
2017 ANNUAL BUDGET
Fire Department
Operations
Wildlands/UrbanProgram
2016/17 2017/18Fire Chief 1.0 1.0Battalion Chief 3.0 3.0Captain 9.0 9.0Engineer 9.0 9.0Firefighter 9.0 9.0Administrative Secretary 1.0 1.0Total Positions 32.0 32.0
2014/15 2015/16 2016/17 2017/18Operating Division Actual Actual Budget ProposedFire Operations 3,069,074 3,083,020 3,647,600 4,551,900 Wildland/Urban Program 3,463 69,508 73,000 100,000 Total Department 3,072,537$ 3,152,528$ 3,720,600$ 4,651,900$
252

FIRE DEPARTMENT
2017 ANNUAL BUDGET
Note: Explanations of significant budget changes are addressed within the individual divisions’ sections that follow
2015/16 2016/17 % 2017/18 %Description Actual Budget Change Proposed Change
Salaries & Wages 2,100,277 2,114,100 0.7% 2,254,900 6.7%Personnel Benefits 793,126 891,000 12.3% 1,219,200 36.8%Supplies 104,268 124,000 18.9% 133,500 7.7%Other Services & Charges 154,857 257,200 66.1% 196,500 -23.6%Capital Outlay - 334,300 100.0% 847,800 153.6%Total Fire 3,152,528$ 3,720,600$ 18.0% 4,651,900$ 25.0%
2014/15 2015/16 2016/17 2017/18 2018/19 2019/20Classification Actual Actual Budget Proposed Estimate Estimate
Personnel Services 2,754,284 2,893,403 3,005,100 3,474,100 3,647,805 3,830,195 Supplies 115,925 104,268 124,000 133,500 140,175 147,184 Services & Charges 182,880 154,857 257,200 196,500 206,325 216,641 Capital Outlay 19,448 - 334,300 847,800 - - Total Fire 3,072,537$ 3,152,528$ 3,720,600$ 4,651,900$ 3,994,305$ 4,194,020$
$0
$500,000
$1,000,000
$1,500,000
$2,000,000
$2,500,000
$3,000,000
$3,500,000
$4,000,000
$4,500,000
$5,000,000
Capital Outlay
Services & Charges
Supplies
Personnel Services
253

FIRE OPERATIONS DIVISION
√ √ √
√
254

Significant Budget Changes:
FY16/17 Personnel Benefits—reflects insurance and retirement contribution increases FY17/18 Personnel Benefits—reflects Public Safety Retirement rate increase of 8.96% FY17/18 Personnel Benefits—an additional pension payment of $125,000 was made to PSPRS to pay down the retirement obligation Changes in Other Services and Capital reflect fluctuations in grant availability
2015/16 2016/17 % 2017/18 %Description Actual Budget Change Proposed Change
Salaries & Wages 2,049,368 2,077,100 1.4% 2,190,900 5.5%Personnel Benefits 777,235 872,000 12.2% 1,200,200 37.6%Supplies 103,334 112,000 8.4% 121,500 8.5%Other Services & Charges 153,083 252,200 64.7% 191,500 -24.1%Capital - 334,300 100.0% 847,800 153.6%Total Fire Operations 3,083,020$ 3,647,600$ 18.3% 4,551,900$ 24.8%
2014/15 2015/16 2016/17 2017/18 2018/19 2019/20Classification Actual Actual Budget Proposed Estimate Estimate
Personnel Services 2,750,821 2,826,603 2,949,100 3,391,100 3,560,655 3,738,688 Supplies 115,925 103,334 112,000 121,500 127,575 133,954 Services & Charges 182,880 153,083 252,200 191,500 201,075 211,129 Capital Outlay 19,448 - 334,300 847,800 - - Total Fire Operations 3,069,074$ 3,083,020$ 3,647,600$ 4,551,900$ 3,889,305$ 4,083,770$
$0$500,000
$1,000,000$1,500,000$2,000,000$2,500,000$3,000,000$3,500,000$4,000,000$4,500,000$5,000,000
Capital Outlay
Services & Charges
Supplies
Personnel Services
255

ANNUAL BUDGET
FIRE OPERATIONS2014/15 2015/16 2016/17 2017/18
ACTUAL ACTUAL BUDGET PROPOSED
SALARIES & WAGES101-5-2426-01-5001 Full Time Employees 1,586,503 1,599,726 1,634,200 1,721,100101-5-2426-01-5005 Paid On Call 36,880 20,254 80,000 80,000101-5-2426-01-5030 Out of Class Pay 19,103 19,723 18,000 18,000101-5-2426-01-52xx Overtime Pay 418,259 409,665 344,900 371,800
Total Salaries & Wages 2,060,745 2,049,368 2,077,100 2,190,900PERSONNEL BENEFITS101-5-2426-01-5501 FICA 32,583 32,333 37,500 39,900101-5-2426-01-5504 Retirement 341,661 419,090 459,800 694,500101-5-2426-01-5505 Unfunded Pension Payment - - - 125,000101-5-2426-01-5700 Health/Life Insurance 155,171 155,427 174,300 159,500101-5-2426-01-5701 Disability Insurance 49 48 100 200101-5-2426-01-5800 Workers Comp Insurance 134,292 142,399 171,500 152,300101-5-2426-01-5901 Uniform/Clothing Allowance 26,320 27,938 28,800 28,800
Total Personnel Benefits 690,076 777,235 872,000 1,200,200
SUPPLIES101-5-2426-01-6001 Office Supplies 1,346 2,161 2,000 2,000101-5-2426-01-6003 Foam/ Cleaners 2,651 379 2,500 4,000101-5-2426-01-6005 Safety/Program Supplies 9,541 8,528 6,000 6,000101-5-2426-01-6007 Equipment/Clothing 18,635 23,778 25,000 25,000101-5-2426-01-6009 Program Supplies 525 433 1,200 2,000101-5-2426-01-6010 Books & Periodicals - 408 500 500101-5-2426-01-6011 Small Tools/Minor Equipment 4,991 835 3,000 3,500101-5-2426-01-6012 Radio Equipment 6,107 5,058 5,000 6,500101-5-2426-01-6013 Computer Equip / Supplies - 3,817 4,000 6,000101-5-2426-01-6100 Medical Supplies 15,642 16,115 15,000 20,000101-5-2426-01-6200 R&M Supplies Equipment 1,881 943 2,000 2,000101-5-2426-01-6201 R&M Supplies Building 14,444 9,201 7,500 8,000101-5-2426-01-6300 Vehicle Fuels 25,495 20,000 22,500 20,000101-5-2426-01-6302 R&M Supplies Vehicle 8,443 7,111 9,000 9,000101-5-2426-01-6400 Shop Supplies 786 1,111 500 1,000101-5-2426-01-6600 Public Relations 1,584 1,182 3,000 2,500101-5-2426-01-6700 Memberships/Dues/Subscript 2,341 1,442 1,800 2,000101-5-2426-01-6990 Other Expenses 1,513 832 1,500 1,500
Total Supplies 115,925 103,334 112,000 121,500
OTHER SERVICES & CHARGES
101-5-2426-01-7300 Electricity 22,610 25,110 25,000 25,000101-5-2426-01-7301 Propane Gas 7,808 8,247 10,000 10,000101-5-2426-01-7302 Water 3,099 3,291 2,800 3,000101-5-2426-01-7304 Sewage 1,080 1,080 1,000 1,100101-5-2426-01-7305 Refuse Disposal 1,267 1,427 1,400 1,400101-5-2426-01-7306 Telephone 29,575 22,640 28,000 26,000101-5-2426-01-7401 R&M Building 6,291 5,828 6,000 7,000
FIRE DEPARTMENT
256

ANNUAL BUDGET
FIRE OPERATIONS2014/15 2015/16 2016/17 2017/18
ACTUAL ACTUAL BUDGET PROPOSED
FIRE DEPARTMENT
101-5-2426-01-7402 R&M Office Equipment 546 670 600 800101-5-2426-01-7404 R&M Equipment 3,816 5,468 11,200 10,000101-5-2426-01-7405 R&M Vehicle 52,406 21,973 30,000 35,000101-5-2426-01-7502 Lease Equipment 6,418 7,841 8,200 8,200101-5-2426-01-7600 Travel 3,570 4,972 4,000 5,000101-5-2426-01-7601 Registrations 21,498 20,539 17,500 22,500101-5-2426-01-7900 Other Professional Services 19,491 21,118 30,000 35,000101-5-2426-01-7910 Printing & Binding 2,520 2,879 1,500 1,500101-5-2426-01-7912 Fire Grant Expense - - 75,000 -210-5-2426-01-7912 Miscellaneous Grant Expenses - - - -210-5-2426-01-7914 Donations 885 - - -
Total Other Svcs & Charges 182,880 153,083 252,200 191,500
CAPITAL OUTLAY101-5-2426-01-8409 e-PCR 19,448 - - -403-5-2426-03-87xx Various Grants - - 334,300 847,800
Total Capital Outlay 19,448 - 334,300 847,800
TOTAL FIRE OPERATIONS 3,069,074$ 3,083,020$ 3,647,600$ 4,551,900$
257

WILDLAND DIVISION
√
√ √
258

Significant Budget Changes: Each year, funds are budgeted for the potential cost of wildland fires. Actual expenditures de-pend on the severity of the fire season.
$-
$20,000
$40,000
$60,000
$80,000
$100,000
$120,000
Services & Charges
Supplies
Personnel Services
2015/16 2016/17 % 2017/18 %Description Actual Budget Change Proposed Change
Salaries & Wages 50,909 37,000 -27.3% 64,000 73.0%Personnel Benefits 15,891 19,000 19.6% 19,000 0.0%Supplies 934 12,000 1184.8% 12,000 0.0%Other Services & Charges 1,774 5,000 181.8% 5,000 0.0%Total Wildlands 69,508$ 73,000$ 5.0% 100,000$ 37.0%
2014/15 2015/16 2016/17 2017/18 2018/19 2019/20Classification Actual Actual Budget Proposed Estimate Estimate
Personnel Services 3,463 66,800 56,000 83,000 87,150 91,508 Supplies - 934 12,000 12,000 12,600 13,230 Services & Charges - 1,774 5,000 5,000 5,250 5,513 Total Wildlands 3,463$ 69,508$ 73,000$ 100,000$ 105,000$ 110,250$
259

ANNUAL BUDGET
WILDLANDS/URBAN PROGRAM2014/15 2015/16 2016/17 2017/18
ACTUAL ACTUAL BUDGET PROPOSEDSALARIES & WAGES101-5-2426-02-5001 Full Time Employees - 13,270 31,000 31,000101-5-2426-02-5003 Temporary Employees - - 3,000 3,000101-5-2426-02-5200 Overtime 2,600 37,639 3,000 30,000
Total Salaries & Wages 2,600 50,909 37,000 64,000
PERSONNEL BENEFITS101-5-2426-02-5501 FICA 33 794 2,000 2,000101-5-2426-02-5504 Retirement 535 12,299 14,000 14,000101-5-2426-02-5700 Insurance Benefit 295 2,798 - -101-5-2426-02-5800 Workers Comp Insurance - - 3,000 3,000
Total Personnel Benefits 863 15,891 19,000 19,000
SUPPLIES101-5-2426-02-6009 Safety/Program Supplies - - 3,000 3,000101-5-2426-02-6011 Small Tools/Minor Equipment - 265 2,000 2,000101-5-2426-02-6202 R&M Supplies Other - - 2,000 2,000101-5-2426-02-6300 Gasoline, Fuel - 414 2,000 2,000101-5-2426-02-6302 R&M Supplies Vehicles - 255 2,000 2,000101-5-2426-02-6990 Other Expenses - - 1,000 1,000
Total Supplies - 934 12,000 12,000
OTHER SERVICES & CHARGES101-5-2426-02-7600 Travel - 1,774 5,000 5,000
Total Other Svcs & Charges - 1,774 5,000 5,000
TOTAL WILDLANDS/URBAN PROGRAM 3,463$ 69,508$ 73,000$ 100,000$
FIRE DEPARTMENT
260

261

COMMUNITY DEVELOPMENT-ADMINISTRATION
2017 ANNUAL BUDGET
Community Development
2016/17 2017/18Executive Assistant 1.0 1.0Total Positions 1.0 1.0
2014/15 2015/16 2016/17 2017/18Operating Division Actual Actual Budget ProposedAdministration 106,265 92,671 105,000 108,800 Total Administration 106,265$ 92,671$ 105,000$ 108,800$
262

ANNUAL BUDGET
CD - ADMINISTRATION2014/15 2015/16 2016/17 2017/18
ACTUAL ACTUAL BUDGET PROPOSEDSALARIES & WAGES101-5-6428-00-5001 Full Time Employees 52,867 47,847 50,500 52,200101-5-6428-00-5200 Overtime - - - 500
Total Salaries & Wages 52,867 47,847 50,500 52,700
PERSONNEL BENEFITS101-5-6428-00-5501 FICA 3,509 3,120 3,900 4,000101-5-6428-00-5504 Retirement 6,066 5,430 5,800 6,000101-5-6428-00-5700 Health/Life Insurance 6,933 7,062 6,200 6,400101-5-6428-00-5701 Disability Insurance 63 58 100 100101-5-6428-00-5800 Workers Comp Insurance 29 - 300 200
Total Personnel Benefits 16,600 15,670 16,300 16,700
SUPPLIES101-5-6428-00-6001 Office Supplies 5,402 4,760 6,500 6,500101-5-6428-00-6003 Cleaning Supplies 762 610 800 800101-5-6428-00-6005 Safety Supplies 267 217 500 500101-5-6428-00-6201 R&M Supplies-Building - 52 - -101-5-6428-00-6300 Gasoline/Fuels/Lubricants 5,017 3,582 5,000 5,000101-5-6428-00-6302 R&M Vehicle 648 2,369 1,500 1,500
Total Supplies 12,096 11,590 14,300 14,300
OTHER SERVICES & CHARGES101-5-6428-00-7300 Electricity 6,665 6,583 7,000 7,500101-5-6428-00-7301 Propane Gas 719 773 1,000 1,000101-5-6428-00-7302 Water 408 401 500 500101-5-6428-00-7401 R&M Building 8,902 616 5,000 5,000101-5-6428-00-7402 R&M Office Equipment - - 500 500101-5-6428-00-7405 R&M Vehicle - - 500 500101-5-6428-00-7502 Lease Equipment 4,808 5,351 5,300 6,000101-5-6428-00-7900 Other Professional Services 3,200 3,840 4,100 4,100
Total Other Svcs & Charges 24,702 17,564 23,900 25,100
TOTAL CD - ADMINISTRATION 106,265$ 92,671$ 105,000$ 108,800$
COMMUNITY DEVELOPMENT ADMIN
263

264

BUILDING SERVICES DEPARTMENT
2017 ANNUAL BUDGET
Building
2016/17 2017/18Chief Building Official 1.0 1.0Building Inspector 1.0 1.0Plans Examiner 0.0 0.0Business License Specialist 1.0 1.0Permit Technician 1.0 1.0Total Positions 4.0 4.0
2014/15 2015/16 2016/17 2017/18Operating Division Actual Actual Budget ProposedBuilding Services 312,828 313,988 375,900 364,200 Total Building Services 312,828$ 313,988$ 375,900$ 364,200$
265
√
√
√
√
BUILDING SERVICES
266

Significant Budget Changes:
FY16/17 Supplies—reflects increase for books / periodicals & dues / memberships FY16/17 & FY17/18 Other Services—Other Professional Services was increased to cover plan review contract work that might be required during potential college construction project
2015/16 2016/17 % 2017/18 %Description Actual Budget Change Proposed Change
Salaries & Wages 230,615 226,500 -1.8% 238,600 5.3%Personnel Benefits 73,727 76,700 4.0% 73,700 -3.9%Supplies 2,302 4,000 73.8% 4,200 5.0%Other Services & Charges 7,344 68,700 835.5% 47,700 -30.6%Total Building 313,988$ 375,900$ 19.7% 364,200$ -3.1%
$0$50,000
$100,000$150,000$200,000$250,000$300,000$350,000$400,000$450,000
Services & Charges
Supplies
Personnel Services
2014/15 2015/16 2016/17 2017/18 2018/19 2019/20Classification Actual Actual Budget Proposed Estimate Estimate
Personnel Services 292,441 304,342 303,200 312,300 327,915 344,311 Supplies 5,976 2,302 4,000 4,200 4,410 4,631 Services & Charges 14,411 7,344 68,700 47,700 50,085 52,589 Total Building 312,828$ 313,988$ 375,900$ 364,200$ 382,410$ 401,531$
267

ANNUAL BUDGET
BUILDING SERVICES2014/15 2015/16 2016/17 2017/18
ACTUAL ACTUAL BUDGET PROPOSEDSALARIES & WAGES101-5-6428-03-5001 Full Time Employees 222,323 230,615 226,500 236,600101-5-6428-03-5200 Overtime Pay 33 - - 2,000
Total Salaries & Wages 222,356 230,615 226,500 238,600
PERSONNEL BENEFITS101-5-6428-03-5501 FICA 15,248 16,016 17,400 18,300101-5-6428-03-5504 Retirement 25,518 26,174 25,700 27,000101-5-6428-03-5700 Health/Life Insurance 23,674 25,468 27,100 22,600101-5-6428-03-5701 Disability Insurance 267 278 300 400101-5-6428-03-5800 Workers Comp Insurance 5,378 5,791 6,200 5,400
Total Personnel Benefits 70,085 73,727 76,700 73,700
SUPPLIES101-5-6428-03-6006 Uniforms/Clothing - 798 800 1,000101-5-6428-03-6010 Books & Periodicals 4,580 320 1,500 1,500101-5-6428-03-6011 Small Tools & Minor Equipment 687 886 1,000 1,000101-5-6428-03-6700 Dues & Memberships 709 298 700 700
Total Supplies 5,976 2,302 4,000 4,200
OTHER SERVICES & CHARGES101-5-6428-03-7306 Telephone 1,198 1,146 1,400 1,200101-5-6428-03-7307 Utilities Postage/Freight 42 86 200 200101-5-6428-03-7600 Travel 4,482 2,583 3,800 3,800101-5-6428-03-7601 Registrations 2,215 1,962 2,800 2,000101-5-6428-03-7900 Other Professional Services 6,474 1,460 60,000 40,000101-5-6428-03-7910 Printing & Binding - 107 500 500
Total Other Svcs & Charges 14,411 7,344 68,700 47,700
TOTAL BUILDING SERVICES 312,828$ 313,988$ 375,900$ 364,200$
BUILDING SERVICES
268

269

PLANNING & DEVELOPMENT DEPARTMENT
2017 ANNUAL BUDGET
Planning & Development
Planning / Zoning /Code Enforcement
Housing
EconomicDevelopment
2016/17 2017/18Planning & Dev Director 1.0 1.0Code Compliance Specialist 1.0 1.0Planning Technician 1.0 0.0Planning Specialist I & II 1.0 2.0Economic Dev Specialist 1.0 1.0Total Positions 5.0 5.0
2014/15 2015/16 2016/17 2017/18Operating Division Actual Actual Budget ProposedPlanning/Zoning/Code Enforcement 282,763 300,146 321,000 335,600 Economic Development 719 106,226 415,900 181,300 Housing Programs 49,720 104,835 217,500 200,000 Total Planning & Development 333,202$ 511,207$ 954,400$ 716,900$
270

PLANNING & DEVELOPMENT DEPARTMENT
2017 ANNUAL BUDGET
Note: Explanations of significant budget changes are addressed within the individual divisions’ sections that follow
$-$100,000 $200,000 $300,000 $400,000 $500,000 $600,000 $700,000 $800,000 $900,000
$1,000,000
Capital
Services & Charges
Supplies
Personnel Services
2015/16 2016/17 % 2017/18 %Description Actual Budget Change Proposed Change
Salaries & Wages 262,553 265,900 1.3% 289,600 8.9%Personnel Benefits 86,159 94,100 9.2% 87,700 -6.8%Supplies 3,070 6,000 95.4% 15,700 161.7%Other Services & Charges 159,425 588,400 269.1% 323,900 -45.0%Capital - - 0.0% - 0.0%Total Planning & Development 511,207$ 954,400$ 86.7% 716,900$ -24.9%
2014/15 2015/16 2016/17 2017/18 2018/19 2019/20Classification Actual Actual Budget Proposed Estimate Estimate
Personnel Services 242,737 348,712 360,000 377,300 396,165 415,973 Supplies 1,525 3,070 6,000 15,700 16,485 17,309 Services & Charges 54,880 159,425 588,400 323,900 340,095 357,100 Capital 34,060 - - - - - Total Planning & Dev 333,202$ 511,207$ 954,400$ 716,900$ 752,745$ 790,382$
271

√
√
√
√
√
√
√
√
√
√
PLANNING/ZONING/CODE ENFORCEMENT DIVISION
272

273

Significant Budget Changes:
FY16/17 Supplies—increases in uniforms/clothing and memberships/dues/subscriptions FY16/17 Other Services—reflects increase in grant expense and building R&M
2015/16 2016/17 % 2017/18 %Description Actual Budget Change Proposed Change
Salaries & Wages 195,116 197,100 1.0% 217,200 10.2%Personnel Benefits 69,507 76,400 9.9% 70,100 -8.2%Supplies 1,965 4,000 103.6% 3,700 -7.5%Other Services & Charges 33,558 43,500 29.6% 44,600 2.5%Total Planning 300,146$ 321,000$ 6.9% 335,600$ 4.5%
2014/15 2015/16 2016/17 2017/18 2018/19 2019/20Classification Actual Actual Budget Proposed Estimate Estimate
Personnel Services 242,018 264,623 273,500 287,300 301,665 316,748 Supplies 1,525 1,965 4,000 3,700 3,885 4,079 Services & Charges 5,160 33,558 43,500 44,600 46,830 49,172 Total Planning 282,763$ 300,146$ 321,000$ 335,600$ 352,380$ 369,999$
$0$50,000
$100,000$150,000$200,000$250,000$300,000$350,000$400,000
Services & Charges
Supplies
Personnel Services
274

ANNUAL BUDGET
PLANNING2014/15 2015/16 2016/17 2017/18
ACTUAL ACTUAL BUDGET PROPOSEDSALARIES & WAGES101-5-6428-01-5001 Full Time Employees 178,117 195,116 197,100 214,200101-5-6428-01-5200 Overtime Pay - - - 3,000
Total Salaries & Wages 178,117 195,116 197,100 217,200
PERSONNEL BENEFITS101-5-6428-01-5501 FICA 12,237 13,391 15,100 16,600101-5-6428-01-5504 Retirement 20,440 22,145 22,400 24,600101-5-6428-01-5700 Health/Life Insurance 21,453 23,619 26,600 23,000101-5-6428-01-5701 Disability Insurance 214 236 300 400101-5-6428-01-5800 Workers Comp Insurance 9,557 10,116 12,000 5,500
Total Personnel Benefits 63,901 69,507 76,400 70,100
SUPPLIES101-5-6428-01-6006 Uniforms/Clothing 254 750 1,200 1,200101-5-6428-01-6010 Books & Periodicals - - 200 200101-5-6428-01-6011 Small Tools & Minor Equipment 315 303 400 400101-5-6428-01-6300 Gasoline/Fuels/Lubricant - 156 - -101-5-6428-01-6700 Memberships/Dues/Subscript 956 756 2,200 1,900
Total Supplies 1,525 1,965 4,000 3,700
OTHER SERVICES & CHARGES101-5-6428-01-7306 Telephone 1,228 1,588 1,600 1,600101-5-6428-01-7307 Postage - - 200 200101-5-6428-01-7600 Travel 475 1,709 2,500 4,000101-5-6428-01-7601 Registrations 580 2,765 2,800 2,800101-5-6428-01-7901 Lien & Clean - 5,811 10,000 12,500101-5-6428-01-7907 Advertising 2,077 1,863 3,000 3,000101-5-6428-01-7910 Printing & Binding 800 452 500 500101-5-6428-01-7912 Grant Expense - 19,370 22,900 20,000
Total Other Svcs & Charges 5,160 33,558 43,500 44,600
CAPITAL417-5-6428-01-8785 Main Street Improvements 34,060 - - -
34,060 - - -
TOTAL PLANNING 282,763$ 300,146$ 321,000$ 335,600$
PLANNING & DEVELOPMENT
275

ECONOMIC DEVELOPMENT DIVISION
√
√
√
√ √
√
276

Significant Budget Changes:
FY16/17 Supplies—reflects increase in memberships/dues/subscriptions FY17/18 Supplies—line item added for promotional event expense FY16/17 & FY17/18 Services—reflects fluctuation in grant funding
2015/16 2016/17 % 2017/18 %Description Actual Budget Change Proposed Change
Salaries & Wages 67,437 68,800 2.0% 72,400 5.2%Personnel Benefits 16,652 17,700 6.3% 17,600 -0.6%Supplies 1,105 2,000 81.0% 12,000 500.0%Other Services & Charges 21,032 327,400 1456.7% 79,300 -75.8%Total Economic Development 106,226$ 415,900$ 291.5% 181,300$ -56.4%
2014/15 2015/16 2016/17 2017/18 2018/19 2019/20Classification Actual Actual Budget Proposed Estimate Estimate
Personnel Services 719 84,089 86,500 90,000 94,500 99,225 Supplies - 1,105 2,000 12,000 12,600 13,230 Services & Charges - 21,032 327,400 79,300 83,265 87,428 Total Economic Dev 719$ 106,226$ 415,900$ 181,300$ 190,365$ 199,883$
$0
$100,000
$200,000
$300,000
$400,000
$500,000
Services & Charges
Supplies
Personnel Services
277

ANNUAL BUDGET
ECONOMIC DEVELOPMENT2014/15 2015/16 2016/17 2017/18
ACTUAL ACTUAL BUDGET PROPOSED
SALARIES & WAGES101-5-6428-02-5001 Salaries & Wages Full Time 603 67,437 68,800 72,400
Total Salaries & Wages 603 67,437 68,800 72,400
PERSONNEL BENEFITS101-5-6428-02-5501 FICA 46 5,156 5,300 5,500101-5-6428-02-5504 Retirement 68 7,654 7,800 8,200101-5-6428-02-5700 Insurance Benefit 1 58 300 100101-5-6428-02-5701 Disability Insurance 1 81 100 100101-5-6428-02-5800 Workers Compensation Ins - 3,703 4,200 3,700
116 16,652 17,700 17,600
SUPPLIES101-5-6428-02-6006 Uniforms/Clothing - 39 200 200101-5-6428-02-6011 Small Tools / Minor Equip - 383 500 500101-5-6428-02-6602 Promotional Events - - - 10,000101-5-6428-02-6700 Membership/Dues/Subscript - 683 1,300 1,300
Total Supplies - 1,105 2,000 12,000
OTHER SERVICES & CHARGES101-5-6428-02-7306 Telephone Charges - 225 300 300101-5-6428-02-7600 Travel - 2,798 3,500 4,700101-5-6428-02-7601 Registrations - 3,287 2,000 2,000101-5-6428-02-7900 Other Professional Services - 12,566 293,600 19,300101-5-6428-02-7907 Advertising - 2,121 2,000 2,000101-5-6428-02-7910 Printing & Binding - 35 1,000 1,000101-5-6428-02-7912 Grant Expense - - 25,000 50,000
Total Other Svcs & Charges - 21,032 327,400 79,300
TOTAL ECONOMIC DEVELOPMENT 719$ 106,226$ 415,900$ 181,300$
PLANNING & DEVELOPMENT
278

√
√
√
√ √
√
√
HOUSING DIVISION
279

HOUSING DIVISION BUDGET CHANGES—3 YEARS
HOUSING DIVISION BUDGET ANALYSIS HISTORIC AND FORECAST
Significant Budget Changes:
Changes were due to the availability of CDBG funding
2014/15 2015/16 2016/17 2017/18 2018/19 2019/20Classification Actual Actual Budget Proposed Estimate Estimate
Services & Charges 49,720 104,835 217,500 200,000 210,000 220,500 Total Housing 49,720$ 104,835$ 217,500$ 200,000$ 210,000$ 220,500$
2015/16 2016/17 % 2017/18 %Description Actual Budget Change Proposed Change
Other Services & Charges 104,835 217,500 107.5% 200,000 -8.0%Total Housing 104,835$ 217,500$ 107.5% 200,000$ -8.0%
$0$50,000
$100,000$150,000$200,000$250,000$300,000$350,000$400,000$450,000
Services & Charges
Supplies
Personnel Services
280

ANNUAL BUDGET
AFFORDABLE HOUSING2014/15 2015/16 2016/17 2017/18
ACTUAL ACTUAL BUDGET PROPOSED
OTHER SERVICES & CHARGES403-5-6428-21-7913 Housing Exp 2010 44,880 - - -403-5-6428-22-7913 CDBG Housing 2014-16 4,840 104,835 139,000 -403-5-6428-22-7914 CDBG Housing 2017-19 - - 78,500 200,000
Total Other Svcs & Charges 49,720 104,835 217,500 200,000
TOTAL HOUSING 49,720$ 104,835$ 217,500$ 200,000$
PLANNING & DEVELOPMENT
281

.
282
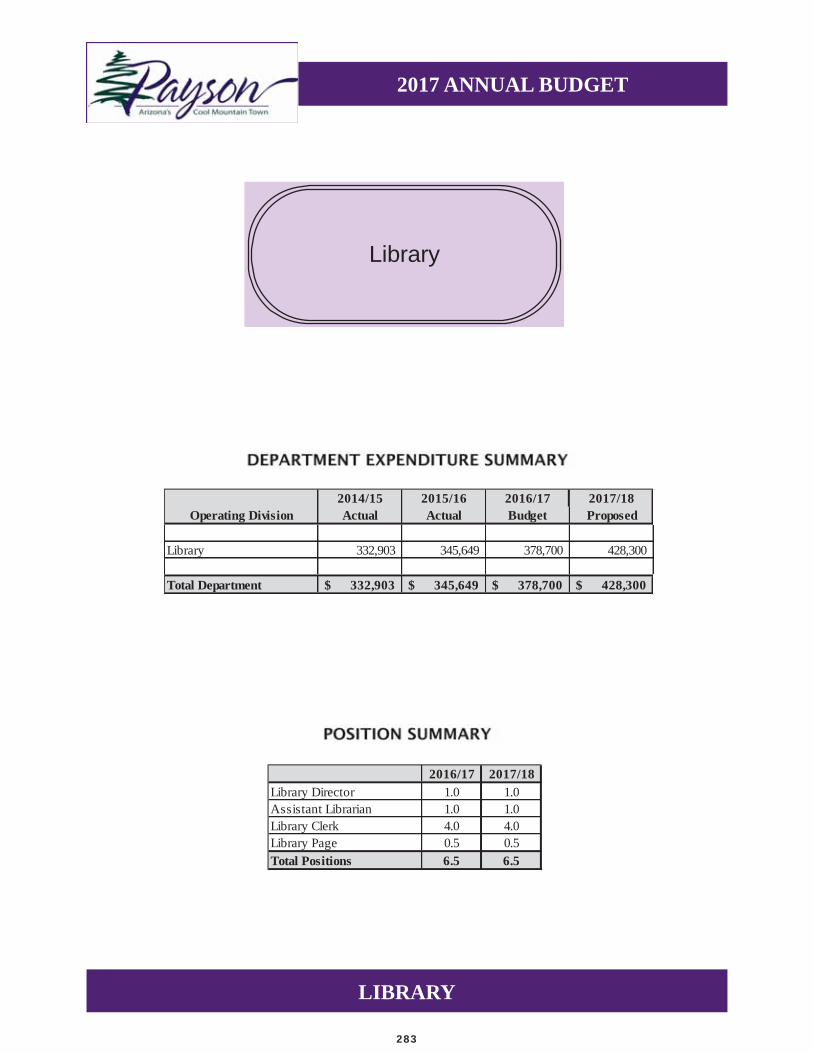
LIBRARY
2017 ANNUAL BUDGET
Library
2016/17 2017/18Library Director 1.0 1.0Assistant Librarian 1.0 1.0Library Clerk 4.0 4.0Library Page 0.5 0.5Total Positions 6.5 6.5
2014/15 2015/16 2016/17 2017/18Operating Division Actual Actual Budget Proposed
Library 332,903 345,649 378,700 428,300 Total Department 332,903$ 345,649$ 378,700$ 428,300$
283

LIBRARY DIVISION
√
√
√
√
√
√
284

285

Significant Budget Changes: FY16/17 Supplies—expanded programs required increased budget for office supplies, cleaning supplies, and various other supplies FY16/17 Services—increase in R&M Building to cover a few large building repairs FY17/18 Services—added contract for janitorial services
2015/16 2016/17 % 2017/18 %Description Actual Budget Change Proposed Change
Salaries & Wages 228,967 239,700 4.7% 241,100 0.6%Personnel Benefits 51,555 54,100 4.9% 58,500 8.1%Supplies 11,047 12,700 15.0% 13,500 6.3%Other Services & Charges 54,080 72,200 33.5% 115,200 59.6%Total Library 345,649$ 378,700$ 9.6% 428,300$ 13.1%
2014/15 2015/16 2016/17 2017/18 2018/19 2019/20Classification Actual Actual Proposed Proposed Estimate Estimate
Personnel Services 271,452 280,522 293,800 299,600 314,580 330,309 Supplies 10,353 11,047 12,700 13,500 14,175 14,884 Services & Charges 51,098 54,080 72,200 115,200 120,960 127,008 Total Library 332,903$ 345,649$ 378,700$ 428,300$ 449,715$ 472,201$
$0
$50,000
$100,000
$150,000
$200,000
$250,000
$300,000
$350,000
$400,000
$450,000
$500,000
Services & Charges
Supplies
Personnel Services
286

ANNUAL BUDGET LIBRARY
LIBRARY2014/15 2015/16 2016/17 2017/18
ACTUAL ACTUAL BUDGET PROPOSEDSALARIES & WAGES224-5-4461-00-5001 Full Time Employees 166,065 141,913 138,400 168,700224-5-4461-00-5002 Part Time Employees 50,459 87,054 101,300 72,400
Total Salaries & Wages 216,524 228,967 239,700 241,100
PERSONNEL BENEFITS224-5-4461-00-5501 FICA 16,053 17,154 18,300 18,500224-5-4461-00-5504 Retirement 24,683 22,989 24,000 24,800224-5-4461-00-5700 Health/Life Insurance 10,044 7,081 7,100 10,700224-5-4461-00-5701 Disability Insurance 258 244 300 400224-5-4461-00-5800 Workers Comp Insurance 3,890 4,087 4,400 4,100
Total Personnel Benefits 54,928 51,555 54,100 58,500
SUPPLIES224-5-4461-00-6001 Office Supplies 3,521 3,425 4,000 4,500224-5-4461-00-6003 Cleaning/Sanitary Supplies 1,493 1,841 2,000 2,000224-5-4461-00-6013 Computer Equip/ Supplies 1,011 1,979 2,000 2,000224-5-4461-00-6201 Building R&M 1,187 696 1,200 1,500224-5-4461-00-6700 Dues & Memberships 3,141 3,106 3,500 3,500
Total Supplies 10,353 11,047 12,700 13,500
OTHER SERVICES & CHARGES224-5-4461-00-7300 Electricity 30,578 34,148 32,000 32,000224-5-4461-00-7302 Water 1,828 1,818 2,000 2,000224-5-4461-00-7304 Sewage 590 590 600 600224-5-4461-00-7305 Refuse Disposal 351 324 500 500224-5-4461-00-7306 Telephone 2,627 2,391 3,000 2,500224-5-4461-00-7307 Postage 1,851 1,539 2,000 2,000224-5-4461-00-7401 R&M Building 11,370 11,859 30,000 63,900224-5-4461-00-7402 R&M Office Equip 75 - - -224-5-4461-00-7502 Lease-Equipment 1,367 1,396 1,400 1,400224-5-4461-00-7900 Other Professional Services - - - 9,600224-5-4461-00-7910 Printing & Binding 461 15 700 700
Total Other Svcs & Charges 51,098 54,080 72,200 115,200
TOTAL LIBRARY 332,903$ 345,649$ 378,700$ 428,300$
287

288

PARKS, RECREATION & TOURISM
2017 ANNUAL BUDGET
2016/17 2017/18Parks Rec & Tourim Director 1.0 1.0Recreation Supervisor 2.0 2.0Executive Assistant 1.0 1.0Parks Supervisor 1.0 1.0General Maintenance Worker 4.0 5.0Event Center Coordinator 1.0 1.0Total Positions 10.0 11.0
Note: One General Maintenance Worker to be shared by Parks Operations & Event Center
Parks, Recreation& Tourism
Trails and Outdoor Recreation
Event Center
Recreation
Aquatics
Tourism Parks Operations
2014/15 2015/16 2016/17 2017/18Operating Division Actual Actual Budget ProposedTourism 206,371 218,487 223,100 305,800 Parks Maintenance 528,560 1,360,857 648,000 787,500 Trails 2,057 5,541 8,950 8,900 Recreation 267,886 289,805 329,550 507,000 Event Center 174,322 171,141 167,500 222,200 Aquatics 56,859 74,722 115,000 104,500 Total Department 1,236,055$ 2,120,553$ 1,492,100$ 1,935,900$
289

PARKS, RECREATION & TOURISM
2017 ANNUAL BUDGET
Note: Explanations of significant budget changes are addressed within the individual divisions’ sections that follow
$-
$500,000
$1,000,000
$1,500,000
$2,000,000
$2,500,000
Capital
Services & Charges
Supplies
Personnel Services
2015/16 2016/17 % 2017/18 %Description Actual Budget Change Proposed Change
Salaries & Wages 540,154 595,400 10.2% 689,500 15.8%Personnel Benefits 150,649 166,700 10.7% 191,900 15.1%Supplies 331,004 392,700 18.6% 439,000 11.8%Other Services & Charges 309,557 337,300 9.0% 422,500 25.3%Capital 789,189 - 0.0% 193,000 100.0%Total Rec & Tourism 2,120,553$ 1,492,100$ -29.6% 1,935,900$ 29.7%
2014/15 2015/16 2016/17 2017/18 2018/19 2019/20Classification Actual Actual Budget Proposed Estimate Estimate
Personnel Services 676,572 690,803 762,100 881,400 925,470 971,744 Supplies 315,243 331,004 392,700 439,000 460,950 483,998 Services & Charges 215,365 309,557 337,300 422,500 443,625 465,806 Capital 28,875 789,189 - 193,000 202,650 212,783 Total Rec & Tourism 1,236,055$ 2,120,553$ 1,492,100$ 1,935,900$ 2,032,695$ 2,134,330$
290

TOURISM DIVISION
√
√
√
√
√
√
√
√
√
√ √
√
291
TOURISM DIVISION
√
√
√
√
√
√
√
√
√
√
√
√
√
292

293

Significant Budget Changes:
FY16/17 Services—increase use of social media as a method of advertising caused a reduction in overall advertising budget FY17/18 Supplies—includes increase funding for promotional events FY17/18 Services—reflects contribution to the Chamber of Commerce
$0
$50,000
$100,000
$150,000
$200,000
$250,000
$300,000
$350,000
$400,000
Services & Charges
Supplies
Personnel Services
2015/16 2016/17 % 2017/18 %Description Actual Budget Change Proposed Change
Salaries & Wages 93,900 93,700 -0.2% 96,000 2.5%Personnel Benefits 25,501 26,600 4.3% 27,400 3.0%Supplies 90,083 96,500 7.1% 126,500 31.1%Other Services & Charges 9,003 6,300 -30.0% 55,900 787.3%Total Tourism 218,487$ 223,100$ 2.1% 305,800$ 37.1%
2014/15 2015/16 2016/17 2017/18 2018/19 2019/20Classification Actual Actual Budget Proposed Estimate Estimate
Personnel Services 115,453 119,401 120,300 123,400 129,570 136,049 Supplies 85,877 90,083 96,500 126,500 132,825 139,466 Services & Charges 5,041 9,003 6,300 55,900 58,695 61,630 Total Tourism 206,371$ 218,487$ 223,100$ 305,800$ 321,090$ 337,145$
294

ANNUAL BUDGET
TOURISM2014/15 2015/16 2016/17 2017/18
ACTUAL ACTUAL BUDGET PROPOSEDSALARIES & WAGES101-5-1410-00-5001 Full Time Employees 88,353 91,246 88,700 91,000214-5-1410-00-5003 Temporary Employees 2,539 2,654 5,000 5,000
Total Salaries & Wages 90,892 93,900 93,700 96,000
PERSONNEL BENEFITS101-5-1410-00-5501 FICA 6,400 6,597 6,700 7,000214-5-1410-00-5501 FICA 194 203 400 400101-5-1410-00-5504 Retirement 10,140 10,356 10,100 10,300101-5-1410-00-5700 Health/Life Insurance 7,121 7,607 8,800 9,100101-5-1410-00-5701 Disability Insurance 106 110 100 200214-5-1410-00-5701 Disability Insurance 3 - - -101-5-1410-00-5800 Workers Comp Insurance 597 628 500 400
Total Personnel Benefits 24,561 25,501 26,600 27,400
SUPPLIES101-5-1410-00-6011 Small Tools & Minor Equipment 735 284 1,500 1,500101-5-1410-00-6602 Promotional Supplies - 451 - -214-5-1410-00-6602 Promotional Events 85,142 89,348 95,000 125,000
Total Supplies 85,877 90,083 96,500 126,500
OTHER SERVICES & CHARGES101-5-1410-00-7306 Telephone 921 788 800 800101-5-1410-00-7307 Postage/Freight - 6 - 100101-5-1410-00-7600 Travel Expenses - - - 2,000101-5-1410-00-7601 Registrations - - - 500101-5-1410-00-7900 Other Professional Services 375 2,323 1,500 1,500101-5-1410-00-7907 Advertising 3,620 5,886 4,000 5,000101-5-1410-00-7910 Printing & Binding 125 - - -214-5-1410-00-7990 Contributions to Other Agencies - - - 46,000
Total Other Svcs & Charges 5,041 9,003 6,300 55,900
TOTAL TOURISM 206,371$ 218,487$ 223,100$ 305,800$
REC & TOURISM
295

RECREATION DIVISION
√
√
√ √
√
√
√
√ √
√
√
√ √ √
√
296

297

Significant Budget Changes:
FY15/16 Services—budget for R&M Building was increased for a few anticipated repairs FY16/17 Supplies—reflects increases in fuel & office supplies FY17/18 Personnel Benefits—decreased due to change in benefits FY17/18 Services—line item added for facilities maintenance fee funded project FY17/18 Capital—reflects various capital purchases
$-
$50,000
$100,000
$150,000
$200,000
$250,000
Capital
Services & Charges
Supplies
Personnel Services
2015/16 2016/17 % 2017/18 %Description Actual Budget Change Proposed Change
Salaries & Wages 33,795 34,700 2.7% 36,300 4.6%Personnel Benefits 9,685 10,300 6.4% 7,100 -31.1%Supplies 6,830 11,800 72.8% 11,500 -2.5%Other Services & Charges 20,855 14,000 -32.9% 34,800 148.6%Capital - - 0.0% 122,000 100.0%Total Administration 71,165$ 70,800$ -0.5% 211,700$ 199.0%
2014/15 2015/16 2016/17 2017/18 2018/19 2019/20Classification Actual Actual Budget Proposed Estimate Estimate
Personnel Services 37,269 43,480 45,000 43,400 45,570 47,849 Supplies 8,329 6,830 11,800 11,500 12,075 12,679 Services & Charges 15,088 20,855 14,000 34,800 36,540 38,367 Capital - - - 122,000 128,100 134,505 Total Administration 60,686$ 71,165$ 70,800$ 211,700$ 222,285$ 233,399$
298

ANNUAL BUDGET RECREATION & TOURISM
ADMINISTRATION2014/15 2015/16 2016/17 2017/18
ACTUAL ACTUAL BUDGET PROPOSED
SALARIES & WAGES101-5-4460-00-5001 Full Time Employees 30,234 33,795 34,700 34,800101-5-4460-00-5200 Overtime Pay - - - 1,500
Total Salaries & Wages 30,234 33,795 34,700 36,300
PERSONNEL BENEFITS101-5-4460-00-5501 FICA 2,239 2,322 2,700 2,800101-5-4460-00-5504 Retirement 3,468 3,836 3,900 4,000101-5-4460-00-5700 Health/Life Insurance 1,145 3,314 3,400 -101-5-4460-00-5701 Disability Insurance 36 41 100 100101-5-4460-00-5800 Workers Comp Insurance 147 172 200 200
Total Personnel Benefits 7,035 9,685 10,300 7,100
SUPPLIES101-5-4460-00-6001 Office Supplies 4,232 3,827 4,500 4,500101-5-4460-00-6003 Cleaning Supplies 180 155 200 200101-5-4460-00-6006 Clothing/Uniform Reimburse 287 68 300 300101-5-4460-00-6009 Program Supplies 153 - - -101-5-4460-00-6011 Small Tools/Minor Equipment 557 365 2,000 2,000101-5-4460-00-6201 R&M Supplies - Bldg 18 687 500 500101-5-4460-00-6300 Gasoline/Fuels/Lubricants 1,607 916 2,500 2,500101-5-4460-00-6302 R&M Supplies - Vehicle 439 630 1,000 800101-5-446x-00-6700 Memberships/Dues/Subscription 45 78 600 600101-5-446x-00-6905 Bad Debt Expense 811 104 200 100
Total Supplies 8,329 6,830 11,800 11,500
OTHER SERVICES & CHARGES101-5-446x-00-7306 Telephone 5,337 1,444 3,000 900101-5-446x-00-7307 Postage 9 - 100 100206-5-4460-00-7400 R&M Grounds - - - 22,000101-5-446x-00-7401 R&M Building 264 8,969 500 400101-5-446x-00-7502 Lease-Equipment 4,195 5,512 5,000 5,000101-5-4460-00-7600 Travel Expense - 456 400 400101-5-4460-00-7900 Other Professional Services 270 - - -101-5-4460-00-7910 Printing & Binding 5,013 4,474 5,000 6,000
Total Other Svcs & Charges 15,088 20,855 14,000 34,800
CAPITAL101-5-4460-00-8003 Vehicle - - - 32,000101-5-4460-00-8781 Master Plan - - - 50,000206-5-4460-00-8783 Basketball Court Replacement - - - 40,000
- - - 122,000
TOTAL ADMINISTRATION 60,686$ 71,165$ 70,800$ 211,700$
299

Significant Budget Changes:
FY16/17 Personnel Benefits—reflects increase in benefits FY16/17 Supplies—increase in Program Supplies for expanded events FY16/17 Services—decrease in Advertising budget due to increased use of social media FY17/18 Salaries & Wages—temporary staffing budget was increased and some overtime was added
$-
$20,000
$40,000
$60,000
$80,000
$100,000
$120,000
$140,000
Services & Charges
Supplies
Personnel Services
2015/16 2016/17 % 2017/18 %Description Actual Budget Change Proposed Change
Salaries & Wages 53,293 53,500 0.4% 65,100 21.7%Personnel Benefits 16,825 18,700 11.1% 19,100 2.1%Supplies 27,178 32,600 19.9% 34,600 6.1%Other Services & Charges 1,584 1,100 -30.6% 1,200 9.1%Total Rec Div A 98,880$ 105,900$ 7.1% 120,000$ 13.3%
2014/15 2015/16 2016/17 2017/18 2017/18 2018/19Classification Actual Actual Budget Proposed Estimate Estimate
Personnel Services 68,501 70,118 72,200 84,200 88,410 92,831 Supplies 31,644 27,178 32,600 34,600 36,330 38,147 Services & Charges 1,023 1,584 1,100 1,200 1,260 1,323 Total Rec Div A 101,168$ 98,880$ 105,900$ 120,000$ 126,000$ 132,300$
300

ANNUAL BUDGET RECREATION & TOURISM
RECREATION-DIVISION A2014/15 2015/16 2016/17 2017/18
ACTUAL ACTUAL BUDGET PROPOSED
SALARIES & WAGES101-5-4466-00-5001 Full Time Employees 41,118 43,308 43,300 45,600101-5-4466-00-5003 Temporary Employees 10,919 9,985 10,200 13,000101-5-4466-00-5200 Overtime Pay 401 - - 6,500
Total Salaries & Wages 52,438 53,293 53,500 65,100
PERSONNEL BENEFITS101-5-4466-00-5501 FICA 3,464 3,564 4,100 5,000101-5-4466-00-5504 Retirement 4,688 4,915 4,900 5,900101-5-4466-00-5700 Health/Life Insurance 7,121 7,402 8,600 7,100101-5-4466-00-5701 Disability Insurance 49 52 100 100101-5-4466-00-5800 Workers Comp Insurance 741 892 1,000 1,000
Total Personnel Benefits 16,063 16,825 18,700 19,100
SUPPLIES101-5-4466-00-6006 Clothing/Uniform 100 96 100 300101-5-4466-00-6009 Program Supplies 31,544 27,082 32,500 34,300
Total Supplies 31,644 27,178 32,600 34,600
OTHER SERVICES & CHARGES101-5-4466-00-7306 Telephone 673 691 600 700101-5-446x-00-7907 Advertising 350 893 500 500
Total Other Svcs & Charges 1,023 1,584 1,100 1,200
TOTAL RECREATION - DIVISION A 101,168$ 98,880$ 105,900$ 120,000$
301

Significant Budget Changes:
FY16/17 & FY17/18 Salaries & Benefits—increased funding for temporary staffing and re-lated benefits FY17/18 Salaries & Benefits—overtime and related benefits added to budget FY16/17 Supplies—program supplies budget was increased due to the addition of new pro-grams and anticipated increases in program participation FY17/18 Services—increased cost of telephone services
$-
$50,000
$100,000
$150,000
$200,000
$250,000
Services & Charges
Supplies
Personnel Services
2015/16 2016/17 % 2017/18 %Description Actual Budget Change Proposed Change
Salaries & Wages 61,169 71,700 17.2% 88,200 23.0%Personnel Benefits 13,632 15,600 14.4% 18,000 15.4%Supplies 44,381 64,950 46.3% 68,300 5.2%Other Services & Charges 578 600 3.8% 800 33.3%Total Rec Div B 119,760$ 152,850$ 27.6% 175,300$ 14.7%
2014/15 2015/16 2016/17 2017/18 2018/19 2019/20Classification Actual Actual Budget Proposed Estimate Estimate
Personnel Services 67,298 74,801 87,300 106,200 111,510 117,086 Supplies 38,151 44,381 64,950 68,300 71,715 75,301 Services & Charges 583 578 600 800 840 882 Total Rec Div B 106,032$ 119,760$ 152,850$ 175,300$ 184,065$ 193,268$
302

ANNUAL BUDGET RECREATION & TOURISM
RECREATION-DIVISION B2014/15 2015/16 2016/17 2017/18
ACTUAL ACTUAL BUDGET PROPOSED
SALARIES & WAGES101-5-4467-00-5001 Full Time Employees 35,226 36,381 42,100 44,600101-5-4467-00-5003 Temporary Employees 19,546 24,788 29,600 35,600101-5-4467-00-5200 Overtime Pay - - - 8,000
Total Salaries & Wages 54,772 61,169 71,700 88,200
PERSONNEL BENEFITS101-5-4467-00-5501 FICA 4,045 4,527 5,500 6,700101-5-4467-00-5504 Retirement 4,207 4,194 4,800 6,000101-5-4467-00-5700 Health/Life Insurance 2,859 3,008 3,100 2,800101-5-4467-00-5701 Disability Insurance 43 44 100 100101-5-4467-00-5800 Workers Comp Insurance 1,372 1,859 2,100 2,400
Total Personnel Benefits 12,526 13,632 15,600 18,000
SUPPLIES101-5-4467-00-6003 Cleaning Supplies 98 - 100 100101-5-4467-00-6005 Safety/Program Supplies 190 - 200 200101-5-4467-00-6006 Clothing/Uniform - 72 100 300101-5-4467-00-6009 Program Supplies 37,863 44,309 64,550 67,700
Total Supplies 38,151 44,381 64,950 68,300
OTHER SERVICES & CHARGES101-5-4467-00-7306 Telephone 583 578 600 800
Total Other Svcs & Charges 583 578 600 800
TOTAL RECREATION - DIVISION B 106,032$ 119,760$ 152,850$ 175,300$
303

2016/2017 ACCOMPLISHMENTS
√
√
√
√
√
√
√
304

305

Significant Budget Changes:
For FY16/17— increased budget for wages, benefits, and supplies to support plan to revitalize trails maintenance program
$-$2,000 $4,000 $6,000 $8,000
$10,000 $12,000
Services & Charges
Supplies
Personnel Services
2015/16 2016/17 % 2017/18 %Description Actual Budget Change Proposed Change
Salaries & Wages 3,527 5,400 53.1% 5,400 0.0%Personnel Benefits 369 500 35.5% 400 -20.0%Supplies 1,438 2,850 98.2% 2,900 1.8%Other Services & Charges 207 200 -3.4% 200 0.0%Total Trails & Open Space 5,541$ 8,950$ 61.5% 8,900$ -0.6%
2014/15 2015/16 2016/17 2017/18 2018/19 2019/20Classification Actual Actual Budget Proposed Estimate Estimate
Personnel Services 1,106 3,896 5,900 5,800 6,090 6,395 Supplies 951 1,438 2,850 2,900 3,045 3,197 Services & Charges - 207 200 200 210 221
Total Trails 2,057$ 5,541$ 8,950$ 8,900$ 9,345$ 9,812$
306

ANNUAL BUDGET RECREATION & TOURISM
TRAILS & OPEN SPACE2014/15 2015/16 2016/17 2017/18
ACTUAL ACTUAL BUDGET PROPOSED
SALARIES & WAGES101-5-4464-00-5003 Temporary 1,018 2,015 3,000 3,000101-5-4464-00-5009 Contract/Instructor Pay - 1,512 2,400 2,400
Total Salaries & Wages 1,018 3,527 5,400 5,400PERSONNEL BENEFITS101-5-4464-00-5501 FICA 57 154 300 200101-5-4464-00-5504 Retirement - 70 - -101-5-4464-00-5800 Workers Comp Insurance 31 145 200 200
Total Personnel Benefits 88 369 500 400SUPPLIES101-5-4464-00-6003 Cleaning Supplies 21 - - -101-5-4464-00-6006 Clothing/Uniform - 50 - -101-5-4464-00-6009 Program Supplies 930 1,388 2,350 2,400101-5-4464-00-6011 Small Tools/Minor Equipment - - 500 500
Total Supplies 951 1,438 2,850 2,900
OTHER SERVICES & CHARGES101-5-4464-00-7910 Printing & Binding - 207 200 200
Total Other Svcs & Charges - 207 200 200
TOTAL TRAILS & OPEN SPACE 2,057$ 5,541$ 8,950$ 8,900$
307

To D
oll B
aby
Ran
chEa
st V
erde
Riv
er
Beeline Hwy
Peac
h O
rcha
rd T
rail
Round Valley Trail
Roun
d Va
lley
Trai
l
Peac
h Lo
op T
rail
Cou
ntry
Clu
b R
d.
Doll
Bab
y R
anch
Rd.
Gre
en V
alle
y Pa
rk
Peach Orchard Trail
American Gulch Trail
HW
Y 26
0
Beeline Hwy
Phoe
nix
St.
Phoe
nix
St.
Mai
n St
.
Ponderosa St.
Mud Springs Rd
Granite
Dell
s
McLane Rd.
Payson Parkway
Pay
son
Eve
ntC
ente
r
Pay
son
Tow
n H
all
Cyp
ress
Tra
il
Cypre
ss Tra
il
1 m
i.
Grani
te D
ells
Bou
lder
s So
uth
Trai
l
Bou
lder
s N
orth
Tra
il
Mon
umen
t Pea
k Tr
ail
Mon
umen
t Pea
k Tr
ail
1.7
mi1 m
i.
Amer
ican
Gul
ch T
rail
Airp
ort R
d.
Beeline HwyBeeline HwyHouston M
esa Rd.
Tyle
r Par
kway
HW
Y 26
0
Tyler Parkway
Airp
ort R
d.
McLane Rd. Rum
sey
Dr.
Park
Dr
Chapparal Pines Dr.
Hou
ston
Tra
il
Houston Trail
3 m
i.
1.2
mi.
0.6
mi.
HW
Y 26
0
May
field
Can
yon
Rd.
Hou
ston
Loo
p Tr
ail
3.6
mi.
Hou
ston
Mes
aTr
ailh
ead
Peac
h O
rcha
rdTr
ailh
ead
To O
xbow
Esta
tes
Col
lege
Cen
ter
Rum
sey
Cen
ter
Boul
ders
Tr
ailh
ead
Mon
umen
t Pea
kLo
op T
railh
ead
Gre
en V
alle
yC
ente
r
Gra
ff Tr
ailh
ead
Cyp
ress
Trai
l Acc
ess
Cyp
ress
Trai
l Acc
ess
Saw
mill
Cen
ter
To E
ast V
erde
Riv
er
PAYS
ON
AR
EA T
RAI
LS S
YSTE
M
Trai
l Typ
es
Side
wal
ksEx
istin
g Tr
ails
Prop
osed
Tra
ils
Leve
l of D
iffic
ulty Ea
sy
Mod
erat
e
Stre
nuou
s0
0.5
11.
52
0.25
Mile
s 30
8
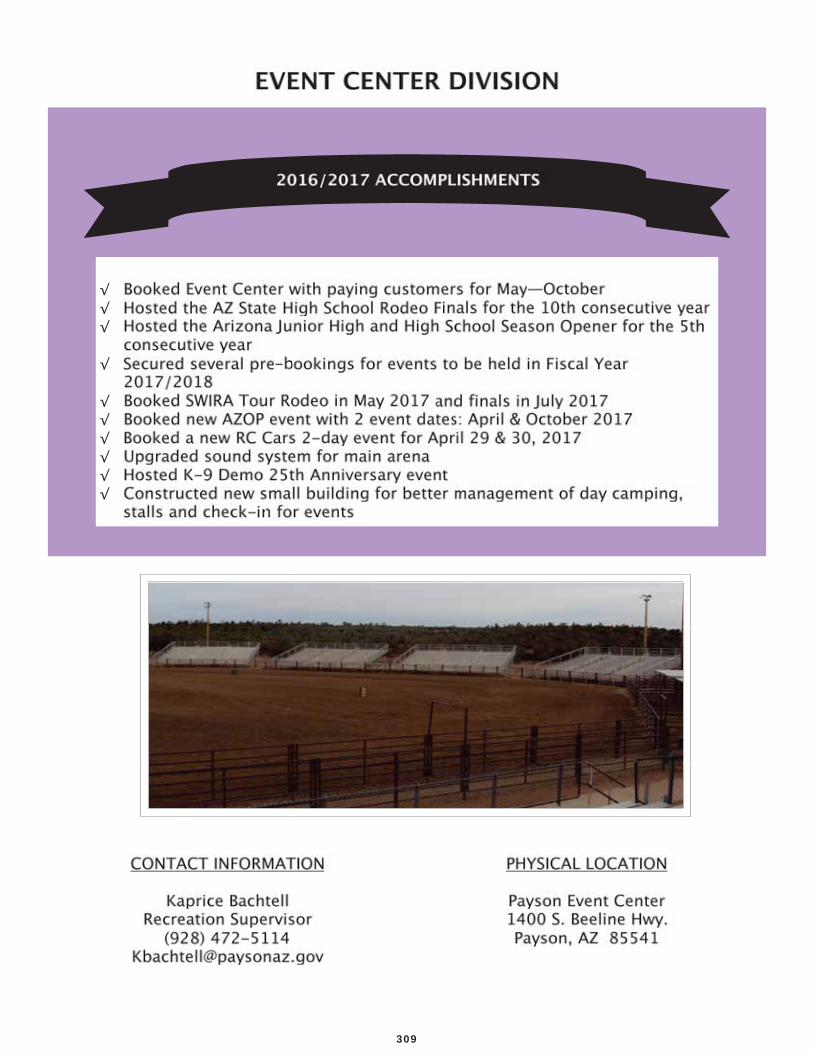
√ √ √
√
√ √ √ √ √ √
309

310

Significant Budget Changes:
FY15/16 & FY16/17—Fluctuations in Salaries & Benefits were caused by staffing changes FY17/18 Salaries & Benefits—increased staffing at facility FY16/17 & FY17/18 Supplies—increased budget for program supplies due to increased par-ticipation in events FY16/17 & FY17/18 Services—increased budget for utilities and building maintenance due to increased participation in events
$-
$50,000
$100,000
$150,000
$200,000
$250,000
$300,000
Services & Charges
Supplies
Personnel Services
2015/16 2016/17 % 2017/18 %Description Actual Budget Change Proposed Change
Salaries & Wages 21,316 45,400 113.0% 72,300 59.3%Personnel Benefits 4,230 8,800 108.0% 23,600 168.2%Supplies 68,812 88,500 28.6% 97,000 9.6%Other Services & Charges 21,609 24,800 14.8% 29,300 18.1%Capital 55,174 - -100.0% - 0.0%Total Event Center 171,141$ 167,500$ -2.1% 222,200$ 32.7%
2014/15 2015/16 2016/17 2017/18 2018/19 2019/20Classification Actual Actual Budget Proposed Estimate Estimate
Personnel Services 48,836 25,546 54,200 95,900 100,695 105,730 Supplies 68,732 68,812 88,500 97,000 101,850 106,943 Services & Charges 27,879 21,609 24,800 29,300 30,765 32,303 Capital 28,875 55,174 - - - - Total Event Center 174,322$ 171,141$ 167,500$ 222,200$ 233,310$ 244,976$
311

ANNUAL BUDGET RECREATION & TOURISM
EVENT CENTER2014/15 2015/16 2016/17 2017/18
ACTUAL ACTUAL BUDGET PROPOSED
SALARIES & WAGES265-5-4465-00-5001 Full Time Employees 36,392 16,462 35,400 55,300265-5-4465-00-5003 Temporary 3,602 4,854 10,000 12,000265-5-4465-00-5200 Overtime Pay - - - 5,000
Total Salaries & Wages 39,994 21,316 45,400 72,300
PERSONNEL BENEFITS265-5-4465-00-5501 FICA 2,974 1,627 3,500 5,500265-5-4465-00-5504 Retirement 3,773 1,835 4,000 6,900265-5-4465-00-5700 Insurance Benefit 1,679 76 200 6,900265-5-4465-00-5701 Disability Insurance 39 20 100 100265-5-4465-00-5800 Workers Comp Insurance 377 672 1,000 4,200
Total Personnel Benefits 8,842 4,230 8,800 23,600SUPPLIES265-5-4465-00-6009 Program Service Costs 58,120 64,132 78,500 88,000265-5-4465-00-6011 Small Tools/Minor Equip 300 - - -265-5-4465-00-6201 R&M Supplies Buidling 8,216 1,474 5,000 8,500265-5-4465-00-6202 R&M Supplies Other 1,529 192 3,500 -265-5-4465-00-6302 R&M Supplies Vehicle - 88 500 500265-5-4465-00-6900 Other Supplies 515 2,926 1,000 -265-5-4465-00-6990 Other Expense 52 - - -
Total Supplies 68,732 68,812 88,500 97,000
OTHER SERVICES & CHARGES265-5-4465-00-7300 Electricity 9,428 7,664 10,000 10,000265-5-4465-00-7302 Water 2,587 7,562 5,000 7,500265-5-4465-00-7304 Sewer 353 180 200 200265-5-4465-00-7305 Refuse Disposal 4,349 3,914 5,500 5,500265-5-4465-00-7306 Telephone 541 489 600 800265-5-4465-00-7401 R&M Building 7,385 - - 1,000265-5-4465-00-7502 Lease-Equipment 2,736 1,800 3,500 3,500265-5-4465-00-7600 Travel Expenses - - - 800265-5-4465-00-7900 Other Professional Services 500 - - -
Total Other Svcs & Charges 27,879 21,609 24,800 29,300
CAPITAL265-5-4465-00-8000 Building 28,875 - - -265-5-4465-00-8004 Equipment - 55,174 - -
28,875 55,174 - -
TOTAL EVENT CENTER 174,322$ 171,141$ 167,500$ 222,200$
312

√ √
√
√
√ √ √ √ √
313

Significant Budget Changes:
In FY15/16, pool operations changed from contracted to Town in-house operated. Conserva-tive estimates were budgeted until actual numbers could be established for all expenditure categories.
2014/15 2015/16 2016/17 2017/18 2018/19 2019/20Classification Actual Actual Budget Proposed Estimate Estimate
Personnel Services 16,434 34,380 61,600 51,100 53,655 56,338 Supplies 17,332 19,429 30,400 30,400 31,920 33,516 Services & Charges 23,093 20,913 23,000 23,000 24,150 25,358 Total Aquatics 56,859$ 74,722$ 115,000$ 104,500$ 109,725$ 115,211$
2015/16 2016/17 % 2017/18 %Description Actual Budget Change Proposed Change
Salaries & Wages 29,995 53,000 76.7% 45,000 -15.1%Personnel Benefits 4,385 8,600 96.1% 6,100 -29.1%Supplies 19,429 30,400 56.5% 30,400 0.0%Other Services & Charges 20,913 23,000 10.0% 23,000 0.0%Total Aquatics 74,722$ 115,000$ 53.9% 104,500$ -9.1%
$0
$20,000
$40,000
$60,000
$80,000
$100,000
$120,000
$140,000
Services & Charges
Supplies
Personnel Services
314

ANNUAL BUDGET RECREATION & TOURISM
AQUATICS2014/15 2015/16 2016/17 2017/18
ACTUAL ACTUAL BUDGET PROPOSED
SALARIES & WAGES101-5-4469-00-5003 Salaries & Wages - Temporary 14,564 29,995 53,000 45,000
Total Salaries & Wages 14,564 29,995 53,000 45,000
PERSONNEL BENEFITS101-5-4469-00-5501 FICA 1,114 2,295 4,100 3,400101-5-4469-00-5800 Workers Compensation 756 2,090 4,500 2,700
1,870 4,385 8,600 6,100
SUPPLIES101-5-4469-00-6001 Office Supplies - 57 100 100101-5-4469-00-6003 Cleaning Supplies - 51 400 400101-5-4469-00-6005 Program Supplies - 623 200 200101-5-4469-00-6006 Uniforms/Clothing 632 928 1,500 1,500101-5-4469-00-6008 Chemicals 11,723 9,868 13,000 13,000101-5-4469-00-6009 Program Supplies 3,603 2,061 3,200 3,200101-5-4469-00-6201 R&M Supplies Building 565 2,139 11,000 11,000101-5-4469-00-6202 R&M Supplies Other 809 3,702 1,000 1,000
Total Supplies 17,332 19,429 30,400 30,400
OTHER SERVICES & CHARGES101-5-4469-00-7300 Electricity 9,317 10,551 10,000 10,000101-5-4469-00-7301 Propane Gas 5,342 3,141 6,000 6,000101-5-4469-00-7302 Water 2,373 2,613 2,800 2,800101-5-4469-00-7304 Sewage 1,575 2,100 2,100 2,100101-5-4469-00-7306 Telephone 451 404 600 600101-5-4469-00-7401 R&M Building - 35 - -101-5-4469-00-7601 Registration - 1,934 1,500 1,500101-5-4469-00-7900 Other Proessionalf Services 4,035 135 - -
Total Other Svcs & Charges 23,093 20,913 23,000 23,000
TOTAL AQUATICS 56,859$ 74,722$ 115,000$ 104,500$
315

PARKS OPERATIONS DIVISION
√ √ √ √
√
√
316

Significant budget changes: FY15/16 Supplies— increased budget for materials needed to complete various Parks repairs FY16/17 Services—increased for the acquisition of leased equipment FY17/18 Salaries & Benefits—reflects increased part time staffing and the addition of overtime pay to the budget Capital funding allotted for various park improvements
$0
$200,000
$400,000
$600,000
$800,000
$1,000,000
$1,200,000
$1,400,000
$1,600,000
Capital
Services & Charges
Supplies
Personnel Services
2015/16 2016/17 % 2017/18 %Description Actual Budget Change Proposed Change
Salaries & Wages 243,159 238,000 -2.1% 281,200 18.2%Personnel Benefits 76,022 77,600 2.1% 90,200 16.2%Supplies 72,853 65,100 -10.6% 67,800 4.1%Other Services & Charges 234,808 267,300 13.8% 277,300 3.7%Capital 734,015 - -100.0% 71,000 100.0%Total Parks Operations 1,360,857$ 648,000$ -52.4% 787,500$ 21.5%
2014/15 2015/16 2016/17 2017/18 2018/19 2019/20Classification Actual Actual Budget Proposed Estimate Estimate
Personnel Services 321,675 319,181 315,600 371,400 389,970 409,469 Supplies 64,227 72,853 65,100 67,800 71,190 74,750 Services & Charges 142,658 234,808 267,300 277,300 291,165 305,723 Capital - 734,015 - 71,000 74,550 78,278 Total Parks Operations 528,560$ 1,360,857$ 648,000$ 787,500$ 826,875$ 868,219$
317

ANNUAL BUDGET REC & TOURISM
PARKS OPERATIONS2014/15 2015/16 2016/17 2017/18
ACTUAL ACTUAL BUDGET PROPOSEDSALARIES & WAGES101-5-3442-01-5001 Full Time Employees 218,171 217,267 214,300 226,200101-5-3442-01-5002 Part Time Employees 24,789 25,892 23,700 42,900101-5-3442-01-5200 Overtime Pay - - - 12,100
Total Salaries & Wages 242,960 243,159 238,000 281,200
PERSONNEL BENEFITS101-5-3442-01-5501 FICA 17,137 17,582 18,100 21,500101-5-3442-01-5504 Retirement 24,698 24,567 24,100 27,000101-5-3442-01-5700 Health/Life Insurance 21,419 17,644 17,800 24,200101-5-3442-01-5701 Disability Insurance 258 262 300 400101-5-3442-01-5800 Workers Comp Insurance 15,203 15,967 17,300 17,100
Total Personnel Benefits 78,715 76,022 77,600 90,200
SUPPLIES101-5-3442-01-6001 Office Supplies 191 162 200 300101-5-3442-01-6003 Cleaning Supplies 4,141 3,883 4,000 4,000101-5-3442-01-6005 Safety/Program Supplies 534 603 500 1,500101-5-3442-01-6006 Clothing/Uniform 1,335 1,367 1,600 1,600101-5-3442-01-6008 Chemicals 1,403 1,508 1,500 1,500101-5-3442-01-6011 Small Tools/Minor Equipment 1,432 2,263 2,000 2,000101-5-3442-01-6014 Grounds Mtce Materials 10,777 13,359 10,500 10,500101-5-3442-01-6016 Park Furnishings 770 740 1,000 1,000101-5-3442-01-6201 Building Repair Materials 10,653 8,245 10,000 10,000101-5-3442-01-6202 Other R&M Materials 10,878 20,998 10,900 12,000101-5-3442-01-6300 Vehicle Fuels 12,615 8,808 12,000 12,000101-5-3442-01-6302 Vehicle R&M 6,651 7,242 7,500 8,000101-5-3442-01-6400 Shop Supplies 2,377 3,197 3,000 3,000101-5-3442-01-6700 Dues & Memberships 470 478 400 400
Total Supplies 64,227 72,853 65,100 67,800
OTHER SERVICES & CHARGES101-5-3442-01-7300 Utilities Electricity 70,736 76,176 75,000 80,000101-5-3442-01-7301 Utilities Propane Gas 1,769 1,634 1,500 1,500101-5-3442-01-7302 Utilities Water 26,402 29,915 32,500 35,000101-5-3442-01-7304 Utilities Sewage 5,785 5,650 6,000 6,000101-5-3442-01-7305 Utilities Refuse Disposal 15,656 14,226 16,000 16,000101-5-3442-01-7306 Utilities Telephone 2,149 2,303 2,000 2,000101-5-3442-01-7307 Utilities Postage/Freight 14 - - -101-5-3442-01-7400 R&M Grounds - 13,651 10,000 10,000101-5-3442-01-7401 R&M Building 1,378 2,181 3,000 3,000101-5-3442-01-7405 R&M Vehicles 360 58 500 1,000101-5-3442-01-7501 Rental of Equip & Vehicles 202 476 500 500101-5-3442-01-7502 Leased Equipment 15,693 86,065 116,900 116,900101-5-3442-01-7600 Travel 186 161 500 500101-5-3442-01-7601 Registrations 1,367 1,087 1,400 1,400101-5-3442-01-7900 Other Professional Services 961 1,225 1,500 3,500
318

ANNUAL BUDGET REC & TOURISM
PARKS OPERATIONS2014/15 2015/16 2016/17 2017/18
ACTUAL ACTUAL BUDGET PROPOSEDTotal Other Svcs & Charges 142,658 234,808 267,300 277,300
CAPITAL101-5-3442-01-8779 Rumsey Park Improvements - 734,015 - -101-5-3442-01-8780 GV Park Improvements - - - 71,000
- 734,015 - 71,000
TOTAL PARKS OPERATIONS 528,560$ 1,360,857$ 648,000$ 787,500$
319

.
320

PUBLIC WORKS
2017 ANNUAL BUDGET
Public Works
Airport Water
Streets
2016/17 2017/18Town Engineer 1.0 1.0Engineering Technician 1.0 1.0Administrative Secretary 1.0 1.0Mechanic 2.0 2.0Senior Mechanic 1.0 1.0Crew Leader 2.0 2.0Streets Operations Manager 1.0 1.0Streets/Airport Maint. Worker 11.0 11.0Airport Coordinator 1.0 1.0Total Positions 21.0 21.0
2014/15 2015/16 2016/17 2017/18Operating Division Actual Actual Budget Proposed
Town Engineer 3,536 3,674 - - Highway Users Fund (HURF) 1,621,137 2,373,444 2,998,600 2,715,600 Airport 989,428 230,493 255,900 1,472,300 Total Department 2,614,101$ 2,607,611$ 3,254,500$ 4,187,900$
321

PUBLIC WORKS
016 ANNUAL BUDGET
Note: Explanations of significant budget changes are addressed within the individual divisions’ sec-tions that follow
$-
$500,000
$1,000,000
$1,500,000
$2,000,000
$2,500,000
$3,000,000
$3,500,000
$4,000,000
$4,500,000
$5,000,000
Capital Outlay
Services & Charges
Supplies
Personnel Services
2015/16 2016/17 % 2017/18 %Description Actual Budget Change Proposed Change
Salaries & Wages 816,882 893,700 9.4% 920,600 3.0%Personnel Benefits 327,062 389,100 19.0% 388,000 -0.3%Supplies 316,681 355,500 12.3% 287,700 -19.1%Other Services & Charges 309,120 456,200 47.6% 395,000 -13.4%Capital Outlay 837,866 1,160,000 38.4% 2,196,600 89.4%Total Public Works 2,607,611$ 3,254,500$ 24.8% 4,187,900$ 28.7%
2014/15 2015/16 2016/17 2017/18 2018/19 2019/20Classification Actual Actual Budget Proposed Estimate Estimate
Personnel Services 1,059,638 1,143,944 1,282,800 1,308,600 1,374,030 1,442,732 Supplies 354,463 316,681 355,500 287,700 302,085 317,189 Services & Charges 265,441 309,120 456,200 395,000 414,750 435,488 Capital Outlay 934,559 837,866 1,160,000 2,196,600 2,306,430 2,421,752
Total Public Works 2,614,101$ 2,607,611$ 3,254,500$ 4,187,900$ 4,397,295$ 4,617,160$
322

ENGINEERING DIVISION
2014/15 2015/16 2016/17 2017/18 2018/19 2019/20Classification Actual Actual Budget Proposed Estimate Estimate
Supplies 2,926 2,913 - - - - Services & Charges 610 761 - - - -
Total Town Engineer 3,536$ 3,674$ -$ -$ -$ -$
2015/16 2016/17 % 2017/18 %Description Actual Budget Change Proposed Change
Supplies 2,913 - -100.0% - 0.0%Other Services & Charges 761 - -100.0% - 0.0%Total Engineer 3,674$ -$ -100.0% -$ 0.0%
$0
$500
$1,000
$1,500
$2,000
$2,500
$3,000
$3,500
$4,000
Services & Charges
Supplies
323

ANNUAL BUDGET PUBLIC WORKS
TOWN ENGINEER2014/15 2015/16 2016/17 2017/18
ACTUAL ACTUAL BUDGET PROPOSED
SUPPLIES101-5-3441-00-6001 Office Supplies 1,594 1,925 - -101-5-3441-00-6005 Program Supplies - 61 - -101-5-3441-00-6011 Small Tools/Minor Equip - 46 - -101-5-3441-00-6300 Vehicle Fuel 930 626 - -101-5-3441-00-6302 Vehicle R&M Parts 8 - - -101-5-3441-00-6700 Dues & Memberships 394 255 - -
Total Supplies 2,926 2,913 - -
OTHER SERVICES & CHARGES101-5-3441-00-7306 Telephone 594 723 - -101-5-3441-00-7405 R&M Vehicles 16 16 - -101-5-3441-00-7600 Travel Expenses - 22 - -
Total Other Svcs & Charges 610 761 - -
TOTAL TOWN ENGINEER 3,536$ 3,674$ -$ -$
324

STREETS DIVISION
√ √ √ √
√ √ √
√ √ √
325

Significant Budget Changes:
FY15/16 Salaries & Benefits—two positions included in the budget were not filled until the end of the fiscal year FY16/17 Salaries & Benefits—added a line item for overtime pay FY16/17 Services—increase in leased equipment for a sweeper and backhoe/loader FY16/17 Capital Outlay—increased as additional funding was allocated for streets projects FY 17/18—adjusted budget based on analysis of historic spending trends
2015/16 2016/17 % 2017/18 %Description Actual Budget Change Proposed Change
Salaries & Wages 754,607 829,100 9.9% 849,200 2.4%Personnel Benefits 310,525 370,900 19.4% 368,800 -0.6%Supplies 289,437 323,100 11.6% 267,400 -17.2%Other Services & Charges 277,910 410,500 47.7% 353,200 -14.0%Capital Outlay 740,965 1,065,000 43.7% 877,000 -17.7%Total Streets 2,373,444$ 2,998,600$ 26.3% 2,715,600$ -9.4%
2014/15 2015/16 2016/17 2017/18 2018/19 2019/20Classification Actual Actual Budget Proposed Estimate Estimate
Personnel Services 981,383 1,065,132 1,200,000 1,218,000 1,278,900 1,342,845 Supplies 337,733 289,437 323,100 267,400 280,770 294,809 Services & Charges 186,668 277,910 410,500 353,200 370,860 389,403 Capital Outlay 115,353 740,965 1,065,000 877,000 920,850 966,893 Total Streets 1,621,137$ 2,373,444$ 2,998,600$ 2,715,600$ 2,851,380$ 2,993,949$
$0
$500,000
$1,000,000
$1,500,000
$2,000,000
$2,500,000
$3,000,000
$3,500,000
Capital Outlay
Services & Charges
Supplies
Personnel Services
326

ANNUAL BUDGET PUBLIC WORKS
STREETS2014/15 2015/16 2016/17 2017/18
ACTUAL ACTUAL BUDGET PROPOSEDSALARIES & WAGES202-5-3442-00-5001 Full Time Employees 697,831 754,607 813,100 830,200202-5-3442-00-5200 Overtime Pay 527 - 16,000 19,000
Total Salaries & Wages 698,358 754,607 829,100 849,200
PERSONNEL BENEFITS202-5-3442-00-5501 FICA 50,096 54,277 63,100 65,100202-5-3442-00-5504 Retirement 79,674 85,344 93,600 96,400202-5-3442-00-5700 Health/Life Insurance 58,574 65,363 83,500 98,800202-5-3442-00-5701 Disability Insurance 833 907 1,100 1,400202-5-3442-00-5800 Workers Comp Insurance 93,848 104,634 129,600 107,100
Total Personnel Benefits 283,025 310,525 370,900 368,800
SUPPLIES202-5-3442-00-6001 Office Supplies 1,107 1,034 1,500 3,500202-5-3442-00-6003 Cleaning/Sanitation Supplies 161 153 500 500202-5-3442-00-6005 Safety Supplies 888 782 900 1,200202-5-3442-00-6006 Clothing Reimbursement 3,234 3,782 4,500 4,500202-5-3442-00-6008 Chemicals 4,464 10,344 15,000 15,000202-5-3442-00-6011 Small Tools/Minor Equipment 10,115 11,042 12,000 12,000202-5-3442-00-6015 Signs 61,940 35,404 6,000 4,000202-5-3442-00-6100 Medical/Lab Supplies - 390 400 400202-5-3442-00-6201 R&M Building 563 807 1,500 1,500202-5-3442-00-6202 R&M Materials Other 3,379 2,261 4,000 3,000202-5-3442-00-6300 Gasoline/Fuels/Lubricant 57,868 40,249 62,000 52,000202-5-3442-00-6302 R&M Supplies Vehicle 67,949 75,081 60,000 70,000202-5-3442-00-6400 Shop Supplies 7,239 8,413 8,000 8,000202-5-3442-00-6401 Drainage Supplies 1,829 29,739 65,000 20,000202-5-3442-00-6402 Street & Sidewalk Supplies 116,567 69,675 80,000 70,000202-5-3442-00-6700 Memberships/Dues/Subscription 430 275 1,300 1,300202-5-3442-00-6990 Other Expense - 6 500 500
Total Supplies 337,733 289,437 323,100 267,400
OTHER SERVICES & CHARGES202-5-3442-00-7002 Accounting & Auditing 6,240 6,396 6,500 6,500202-5-3442-00-7300 Electricity 93,390 106,074 96,000 100,000202-5-3442-00-7301 Propane 1,152 1,345 1,800 1,800202-5-3442-00-7302 Water 1,506 2,803 2,000 4,000
327

ANNUAL BUDGET PUBLIC WORKS
STREETS2014/15 2015/16 2016/17 2017/18
ACTUAL ACTUAL BUDGET PROPOSED202-5-3442-00-7304 Sewer 907 907 700 900202-5-3442-00-7305 Refuse Disposal 1,928 1,903 2,400 2,400202-5-3442-00-7306 Telephone 5,921 6,628 9,100 9,100202-5-3442-00-7307 Postage 8 26 100 100202-5-3442-00-7401 Building R&M 604 1,032 1,000 1,000202-5-3442-00-7404 Radio Equipment R&M 4,789 4,030 3,000 7,000202-5-3442-00-7405 R&M Vehicles 263 3,052 5,000 5,000202-5-3442-00-7406 R&M Street Light - - 75,500 25,000202-5-3442-00-7408 Street/Sidewalk Repair Serv 7,291 41,188 65,000 40,000202-5-3442-00-7502 LeaseEquipment - 36,714 73,400 73,400202-5-3442-00-7600 Travel Expenses 391 206 1,400 1,400202-5-3442-00-7601 Registrations 1,877 981 1,500 1,500202-5-3442-00-7900 Other Professional Services 2,694 4,596 3,000 6,000202-5-3442-00-7903 General Insurance 57,416 59,579 63,000 68,000202-5-3442-00-7907 Advertising - 367 - -202-5-3442-00-7910 Printing & Binding 291 83 100 100
Total Other Svcs & Charges 186,668 277,910 410,500 353,200
CAPITAL OUTLAY202-5-3442-00-8004 Equipment 56,574 345,406 225,000 317,000202-5-3442-00-8713 Pavement Preservation Prog 33,122 252,727 500,000 500,000202-5-3442-00-8737 GV Park Lot Phase I - 32,491 - -202-5-3442-00-8742 Bonita Street Reconstruction 25,657 - - 60,000202-5-3442-00-8743 Manzanita Dr Constr - 110,341 340,000 -
Total Capital Outlay 115,353 740,965 1,065,000 877,000
TOTAL STREETS 1,621,137$ 2,373,444$ 2,998,600$ 2,715,600$
328
AIRPORT DIVISION
√
√
√
√
√
√
329

Significant budget changes:
FY16/17 Supplies—included extra funds in the budget for anticipated repair & maintenance projects and FY17/18 budget was restored to normal level FY16/17 Other Services—increased due to anticipated equipment repairs FY17/18 Salaries & Wages—implementation of market study wage adjustments Changes in Capital Outlay are due to fluctuations in availability of grant funding
2015/16 2016/17 % 2017/18 %Description Actual Budget Change Proposed ChangeSalaries & Wages 62,275 64,600 3.7% 71,400 10.5%Personnel Benefits 16,537 18,200 10.1% 19,200 5.5%Supplies 24,331 32,400 33.2% 20,300 -37.3%Other Services & Charges 30,449 45,700 50.1% 41,800 -8.5%Capital Outlay 96,901 95,000 -2.0% 1,319,600 1289.1%Total Airport 230,493$ 255,900$ 11.0% 1,472,300$ 475.3%
2014/15 2015/16 2016/17 2017/18 2018/19 2019/20Classification Actual Actual Budget Proposed Estimate Estimate
Personnel Services 78,255 78,812 82,800 90,600 95,130 99,887 Supplies 13,804 24,331 32,400 20,300 21,315 22,381 Services & Charges 78,163 30,449 45,700 41,800 43,890 46,085 Capital Outlay 819,206 96,901 95,000 1,319,600 1,385,580 1,454,859 Total Airport 989,428$ 230,493$ 255,900$ 1,472,300$ 1,545,915$ 1,623,211$
$0$200,000$400,000$600,000$800,000
$1,000,000$1,200,000$1,400,000$1,600,000$1,800,000
Capital Outlay
Services & Charges
Supplies
Personnel Services
330

ANNUAL BUDGET
AIRPORT 2014/15 2015/16 2016/17 2017/18ACTUAL ACTUAL BUDGET PROPOSED
SALARIES & WAGES260-5-4445-00-5001 Full Time Employees 61,735 62,275 64,600 69,400260-5-4445-00-5200 Overtime - - - 2,000
Total Salaries & Wages 61,735 62,275 64,600 71,400
PERSONNEL BENEFITS260-5-4445-00-5501 FICA 4,723 4,764 5,000 5,500260-5-4445-00-5504 Retirement 7,085 7,068 7,300 8,100260-5-4445-00-5700 Insurance Benefit - - 200 -260-5-4445-00-5701 Disability Insurance 74 75 100 100260-5-4445-00-5800 Workers Compensation Ins 4,638 4,630 5,600 5,500
Total Personnel Benefits 16,520 16,537 18,200 19,200
SUPPLIES260-5-4445-00-6001 Office Supplies 420 497 700 500260-5-4445-00-6003 Cleaning Supplies 62 47 300 200260-5-4445-00-6006 Uniforms/Clothing 228 286 400 400260-5-4445-00-6008 Chemicals 23 - 300 500260-5-4445-00-6010 Books & Periodicals 40 63 100 100260-5-4445-00-6011 Small Tools/Minor Equip 369 4,615 3,900 1,200260-5-4445-00-6015 Signs 2,670 1,378 1,000 1,000260-5-4445-00-6202 R&M Supplies Other 5,217 12,715 19,500 10,000260-5-4445-00-6300 Gasoline/Fuels/Lubricant 2,760 2,096 3,200 2,500260-5-4445-00-6302 R&M Supplies Vehicle 926 2,255 1,500 3,000260-5-4445-00-6400 Shop Supplies 274 304 500 400260-5-4445-00-6700 Memberships/Dues/Subscriptio 815 75 1,000 500
Total Supplies 13,804 24,331 32,400 20,300
OTHER SERVICES & CHARGES260-5-4445-00-7300 Utilities Electicity 13,259 10,928 10,500 13,000260-5-4445-00-7301 Utilities Propane Gas 783 643 900 900260-5-4445-00-7302 Utilities Water 2,231 2,167 2,200 3,300260-5-4445-00-7304 Utilities Sewer 820 420 800 500260-5-4445-00-7305 Refuse Disposal 436 384 700 700260-5-4445-00-7306 Utilities Telephone 1,672 1,603 2,300 1,600260-5-4445-00-7307 Utilities Postage/Freight 21 1 100 100260-5-4445-00-7401 R&M Building 1,306 458 4,700 3,000260-5-4445-00-7404 R&M Equipment 5,273 6,637 12,800 8,000260-5-4445-00-7405 R&M Vehicle - 160 300 300260-5-4445-00-7600 Travel Expense 433 953 1,000 1,000260-5-4445-00-7601 Registrations 125 660 800 800260-5-4445-00-7900 Other Professional Svcs 1,068 1,511 4,000 4,000260-5-4445-00-7903 General Insurance 3,690 3,690 4,100 4,100
AIRPORT
331

ANNUAL BUDGET
2014/15 2015/16 2016/17 2017/18ACTUAL ACTUAL BUDGET PROPOSED
260-5-4445-00-7907 Advertising 146 234 500 500260-5-4445-00-7915 Overhead 46,900 - - -
Total Other Svcs & Charges 78,163 30,449 45,700 41,800
CAPITAL OUTLAY260-5-4445-00-8509 Equipment 7,350 - - 5,800260-5-4445-00-8813 Echo Ramp Expansion & 396,453 - - -260-5-4445-00-8814 Ramp Repair A&D / Fence - - - 1,313,800260-5-4445-00-8820 Boundary Fence - - 95,000 -260-5-4445-00-8821 Runway Grading 409,533 - - -260-5-4445-00-8823 Infield Drainage 5,870 96,901 - -
Total Capital Outlay 819,206 96,901 95,000 1,319,600
TOTAL AIRPORT 989,428$ 230,493$ 255,900$ 1,472,300$
AIRPORT
332

Water Department
Resources
ProductionO & M
Operations &Maintenance
TransmissionDistribution
Green ValleyPark Mtce
WQARFSite O & M
Accounting &Collections
CAP Trust
Administration
C.C.Cragin Treatment Plant
333

POSITION SUMMARY
EXPENDITURE SUMMARY
Authorized Personnel 2016/17 2017/18Water Division Manager 1.0 1.0Water System Operations Supvr 1.0 1.0Water Production Supervisor 1.0 1.0Customer Service Manager 1.0 1.0Water System Operator 3.0 3.0Utility Services Rep I, II 3.0 3.0System Crew Leader 4.0 4.0Water Quality Specialist 1.0 1.0Water Resource Specialist 1.0 1.0Electrician 1.0 1.0Water Infrastructure Specialist 1.0 1.0Water System Operator Basic 1.0 1.0Total Positions 19.0 19.0
2014/15 2015/16 2016/17 2017/18Operating Division Actual Actual Budget Proposed
Administration 880,809 719,171 1,817,200 1,185,200 Accounting & Collection 439,697 440,803 370,200 385,300 Transmission/Distribution 567,102 719,852 812,200 800,000 Operations & Maintenance 1,459,391 1,504,158 2,809,600 3,690,800 Water Resources 265,466 277,117 347,800 457,600 Production O & M 367,980 531,857 536,300 584,500 Green Valley Park Maintenance 58,250 42,856 68,100 73,100 WQARF Site O & M 33,483 31,361 144,600 133,300Treatment Plant - - - 136,000 CC Cragin Project 936,694 8,288,091 17,145,800 24,043,800CAP Trust Fund 2,200 115,661 225,000 128,271Total Expenditures 5,011,072$ 12,670,927$ 24,276,800$ 31,617,871$
334

2016/2017 ACCOMPLISHMENTS
√
√
√ √ √ √ √
√
√ √ √
√ √ √ √ √ √ √ √ √
√
WATER DIVISION
335

336

Significant Budget Changes:
FY16/17 & FY17/18 Supplies—budget includes placeholder to fund potential repair & maintenance projects including hydrant, pump, and water tank repairs FY16/17 & FY17/18 Services—budget includes placeholder for potential maintenance projects that will require contracted services FY16/17 & FY17/18 Capital—utilizing WIFA loan funding available to continue the C.C. Cragin construction project
$-
$5,000,000
$10,000,000
$15,000,000
$20,000,000
$25,000,000
$30,000,000
$35,000,000
Capital Outlay
Services & Charges
Supplies
Personnel Services
2015/16 2016/17 % 2017/18 %Description Actual Budget Change Proposed Change
Salaries & Wages 1,037,971 964,900 -7.0% 1,025,300 6.3%Personnel Benefits 346,132 333,300 -3.7% 343,800 3.2%Supplies 457,093 708,600 55.0% 809,900 14.3%Other Services & Charges 2,264,295 3,669,000 62.0% 4,533,600 23.6%Capital Outlay 8,565,436 18,601,000 117.2% 24,905,271 33.9%Total Water 12,670,927$ 24,276,800$ 91.6% 31,617,871$ 30.2%
2014/15 2015/16 2016/17 2017/18 2018/19 2019/20Classification Actual Actual Budget Proposed Estimate Estimate
Personnel Services 1,422,288 1,384,103 1,298,200 1,369,100 1,437,555 1,509,433 Supplies 445,975 457,093 708,600 809,900 850,395 892,915 Services & Charges 2,048,034 2,377,756 3,894,000 4,661,871 4,894,965 5,139,713 Capital Outlay 1,094,775 8,451,975 18,376,000 24,777,000 6,194,250 1,548,563 Total Water 5,011,072$ 12,670,927$ 24,276,800$ 31,617,871$ 13,377,165$ 9,090,623$
337

ANNUAL BUDGET
ADMINISTRATION2014/15 2015/16 2016/17 2017/18
ACTUAL ACTUAL BUDGET PROPOSEDSALARIES & WAGES661-5-5451-00-5001 Full Time Employees 176,999 129,725 83,500 86,100
Total Salaries & Wages 176,999 129,725 83,500 86,100
PERSONNEL BENEFITS661-5-5451-00-5501 FICA 14,845 10,923 6,400 6,600661-5-5451-00-5504 Retirement 24,015 18,595 9,500 9,800661-5-5451-00-5505 Retirement Offset Pension (2,660) (2,435) - -661-5-5451-00-5700 Health/Life Insurance 7,179 3,859 400 100661-5-5451-00-5701 Disability Insurance 251 197 100 100661-5-5451-00-5800 Workers Compensation 9,951 9,239 6,800 5,900
Total Personnel Benefits 53,581 40,378 23,200 22,500
SUPPLIES661-5-5451-00-6001 Office Supplies 985 1,231 1,000 1,000661-5-5451-00-6005 Safety Supplies - 137 300 300661-5-5451-00-6006 Uniforms / Clothing 100 120 200 200661-5-5451-00-6009 Fireworks 20,000 20,000 20,000 20,000661-5-5451-00-6010 Books & Periodicals 875 - 1,000 1,000661-5-5451-00-6011 Small Tools/Minor Equip 685 783 800 800661-5-5451-00-6013 Computer Equipment Supplies 703 1,593 1,500 1,500661-5-5451-00-6201 R&M Supplies - Bldg 3,035 1,622 2,500 2,500661-5-5451-00-6300 Gasoline/Fuels/Fubricant 2,339 2,288 2,500 2,500661-5-5451-00-6302 R&M Supplies Vehicle 3,009 394 3,000 3,000661-5-5451-00-6700 Memberships/Dues/Subscription 12,248 8,574 29,100 29,000661-5-5451-00-6990 Other Supplies 6,508 3,055 3,600 4,000
Total Supplies 50,487 39,797 65,500 65,800
OTHER SERVICES & CHARGES661-5-5451-00-7100 Legal Fees/Forfeiture Costs - 10,800 1,500 20,000661-5-5451-00-7401 R&M Building 21,990 - 10,000 10,000661-5-5451-00-7402 R&M Office Equipment 2,357 849 2,500 2,500661-5-5451-00-7404 R&M Equipment - 1,103 - 2,500661-5-5451-00-7405 R&M Vehicles 18 20 2,000 2,000661-5-5451-00-7500 Rental of Land & Bldg - - 1,800 1,800661-5-5451-00-7600 Travel 714 705 2,000 2,000661-5-5451-00-7601 Registrations 1,070 880 2,000 2,000661-5-5451-00-7602 Safety Training Services 120 - 2,000 -661-5-5451-00-7900 Other Professional Services 95,882 96,955 107,600 128,500661-5-5451-00-7903 General Insurance 50,349 52,246 54,900 60,000661-5-5451-00-7907 Advertising - - 2,500 2,500661-5-5451-00-7910 Printing & Binding - 20 - -661-5-5451-00-7915 Overhead 243,400 180,200 180,200 -
Total Other Svcs & Charges 415,900 343,778 369,000 233,800
CAPITAL661-5-5451-08-8002 Machinery & Equipment 8,000 31,203 - 100,000661-5-5451-08-8007 Wells - - 75,000 75,000661-5-5451-08-8009 Water Lines 107,426 49,297 780,000 250,000
WATER DEPARTMENT
338

ANNUAL BUDGET
2014/15 2015/16 2016/17 2017/18ACTUAL ACTUAL BUDGET PROPOSED
661-5-5451-08-8313 Radon Removal Engineering - - 45,000 45,000661-5-5451-08-8524 Computer Equipment 5,435 7,110 19,000 30,000661-5-5451-08-8528 Replace Service Trucks 35,614 28,906 100,000 52,000661-5-5451-08-8529 SCADA Equip-Wells/Tanks 16,199 - 20,000 -661-5-5451-08-8530 Surge Tanks - 6,810 60,000 45,000661-5-5451-08-8581 Chlorine Generator - - 35,000 35,000661-5-5451-08-8582 Pressure Blow Off Valves - - 20,000 20,000661-5-5451-08-8587 Security Gate Installation - 7,559 - -661-5-5451-08-8589 Fish Fence Project 11,168 - - -661-5-5451-08-8793 Tank Mixing System - - 50,000 50,000661-5-5451-08-8794 Pumps for Wells - 34,608 72,000 75,000
Total Capital 183,842 165,493 1,276,000 777,000
TOTAL WATER-ADMINISTRATION 880,809$ 719,171$ 1,817,200$ 1,185,200$
WATER DEPARTMENT
339

ANNUAL BUDGET
ACCOUNTING & COLLECTION2014/15 2015/16 2016/17 2017/18
ACTUAL ACTUAL BUDGET PROPOSEDSALARIES & WAGES661-5-5451-01-5001 Full Time Employees 253,885 260,107 181,500 192,500661-5-5451-01-5006 Standby Pay 1,155 1,787 2,000 -661-5-5451-01-5200 Overtime 2,857 3,403 2,500 3,000
Total Salaries & Wages 257,897 265,297 186,000 195,500
PERSONNEL BENEFITS661-5-5451-01-5501 FICA 17,757 18,691 14,200 15,000661-5-5451-01-5504 Retirement 29,002 26,403 21,100 22,200661-5-5451-01-5700 Health/Life Insurance 31,958 25,019 20,700 18,900661-5-5451-01-5701 Disability Insurance 303 281 300 300661-5-5451-01-5800 Workers Compensation 7,944 8,221 3,800 3,300
Total Personnel Benefits 86,964 78,615 60,100 59,700
SUPPLIES661-5-5451-01-6001 Office Supplies 2,693 4,094 3,500 4,500661-5-5451-01-6006 Clothing/Uniform Reimb 703 500 700 700661-5-5451-01-6011 Small Tools/Minor Equip 778 3,070 3,000 4,000661-5-5451-01-6013 Computer Equipment Supplies - 307 1,000 3,000661-5-5451-01-6300 Gasoline/Fuels/Lubricant 5,114 3,966 7,000 5,000661-5-5451-01-6302 R&M Supplies Vehicle 2,084 601 3,000 3,000661-5-5451-01-6600 Public Relations 73 155 1,000 5,000661-5-5451-01-6901 Taxes (2,599) (2,780) - -661-5-5451-01-6903 Banking / Merchant Fees 8,729 8,349 9,000 10,000661-5-5451-01-6905 Bad Debt Expense 320 466 2,000 1,000661-5-5451-01-6990 Other Supplies - 47 100 100
Total Supplies 17,895 18,775 30,300 36,300
OTHER SERVICES & CHARGES661-5-5451-01-7002 Accounting & Auditing 17,160 17,589 17,800 17,800661-5-5451-01-7307 Postage / Freight 29,112 31,141 30,000 30,000661-5-5451-01-7402 R&M Office Equipment 2,045 - 2,500 2,500661-5-5451-01-7403 R&M Computer Equipment 19,090 20,383 25,000 25,000661-5-5451-01-7404 R&M Other Equipment 2,239 68 1,500 1,500661-5-5451-01-7405 R&M Vehicles - - 1,000 1,000661-5-5451-01-7502 Lease Equipment - 3,687 5,000 5,000661-5-5451-01-7600 Travel 1,521 129 3,500 3,500661-5-5451-01-7601 Registrations 2,101 1,037 3,000 3,000661-5-5451-01-7910 Printing & Binding 3,673 4,082 4,500 4,500
Total Other Svcs & Charges 76,941 78,116 93,800 93,800
TOTAL WATER - ACCTING & COLLECTION 439,697$ 440,803$ 370,200$ 385,300$
WATER DEPARTMENT
340

ANNUAL BUDGET
TRANSMISSION/DISTRIBUTION2014/15 2015/16 2016/17 2017/18
ACTUAL ACTUAL BUDGET PROPOSEDSALARIES & WAGES661-5-5451-02-5001 Full Time Employees 137,431 131,684 158,400 153,700661-5-5451-02-5200 Overtime 1,330 635 1,000 1,500
Total Salaries & Wages 138,761 132,319 159,400 155,200
PERSONNEL BENEFITS661-5-5451-02-5501 FICA 10,006 9,436 12,200 11,900661-5-5451-02-5504 Retirement 15,925 15,018 18,100 17,600661-5-5451-02-5700 Health/Life Insurance 13,116 13,240 15,800 16,600661-5-5451-02-5701 Disability Insurance 167 160 200 200
Total Personnel Benefits 39,214 37,854 46,300 46,300
SUPPLIES661-5-5451-02-6008 Chemicals 23,414 11,153 10,000 25,000661-5-5451-02-6200 R&M Supplies Hydrants 3,166 2,851 15,000 15,000661-5-5451-02-6201 R&M Supplies - Water Tank 2,550 2,832 35,000 10,000661-5-5451-02-6202 R&M Supplies Other - SCADA 16,036 30,790 30,000 30,000661-5-5451-02-6501 R&M Supplies - Pumps 1,754 1,033 15,000 15,000661-5-5451-02-6502 R&M Supplies - Mains 43,421 30,345 45,000 45,000661-5-5451-02-6503 R&M Supplies Meters 30,559 51,093 45,000 45,000661-5-5451-02-6504 R&M Supplies - Cust Install 4,493 - 1,500 1,500661-5-5451-02-6506 R&M Supplies - Chlorinator 16,105 14,910 20,000 15,000661-5-5451-02-6507 R&M Supplies - Existing Serv 39,675 29,229 35,000 35,000661-5-5451-02-6508 R&M Supplies - New Service 43,774 36,888 40,000 40,000
Total Supplies 224,947 211,124 291,500 276,500
OTHER SERVICES & CHARGES661-5-5451-02-7300 Electricity 45,330 47,447 50,000 52,000661-5-5451-02-7404 R&M Water Tanks 61,231 225,802 200,000 200,000661-5-5451-02-7407 R&M Mains - 2,354 5,000 5,000661-5-5451-02-7900 Other Professional Services 57,619 62,952 60,000 65,000
Total Other Svcs & Charges 164,180 338,555 315,000 322,000
TOTAL WATER-TRANSMISSION/DISTRIB 567,102$ 719,852$ 812,200$ 800,000$
WATER DEPARTMENT
341

ANNUAL BUDGET
OPERATIONS & MAINTENANCE2014/15 2015/16 2016/17 2017/18
ACTUAL ACTUAL BUDGET PROPOSEDSALARIES & WAGES661-5-5451-03-5001 Full Time Employees 178,414 156,462 179,100 192,900661-5-5451-03-5003 Temporary Employees 7,474 1,999 25,000 25,800661-5-5451-03-5006 Standby Pay 7,434 6,747 7,000 7,500661-5-5451-03-5200 Overtime 11,264 10,857 10,000 15,000
Total Salaries & Wages 204,586 176,065 221,100 241,200
PERSONNEL BENEFITS661-5-5451-03-5501 FICA 14,545 12,439 16,900 18,500661-5-5451-03-5504 Retirement 22,620 19,756 22,700 24,400661-5-5451-03-5700 Insurance Benefit 17,612 18,753 17,900 20,600661-5-5451-03-5701 Disability Insurance 237 210 300 300661-5-5451-03-5800 Workers Compensation 31,261 33,052 43,100 38,600
Total Personnel Benefits 86,275 84,210 100,900 102,400
SUPPLIES661-5-5451-03-6001 Office Supplies 700 1,546 1,500 1,500661-5-5451-03-6003 Cleaning Supplies 1,480 610 1,500 1,500661-5-5451-03-6005 Safety Supplies 2,041 2,161 2,000 2,000661-5-5451-03-6006 Uniform / Clothing 4,577 4,345 4,600 4,600661-5-5451-03-6008 Chemicals 12 - - -661-5-5451-03-6011 Small Tools/Minor Equip 10,108 7,236 7,500 15,000661-5-5451-03-6100 Medical/Lab Supplies 382 103 500 500661-5-5451-03-6200 R&M Supplies Equip 5,023 10,345 16,000 16,000661-5-5451-03-6201 R&M Supplies Building 2,480 8,784 10,000 10,000661-5-5451-03-6202 R&M Supplies Other 3,250 2,255 5,000 5,000661-5-5451-03-6300 Gasoline/Fuels/Lubricant 23,638 21,878 27,000 27,000661-5-5451-03-6302 R&M Supplies Vehicle 15,587 19,981 10,000 10,000661-5-5451-03-6400 Shop Supplies 6,795 9,793 8,000 8,000661-5-5451-03-6700 Memberships/Dues/Subscript - - 1,300 3,000661-5-5451-03-6901 Taxes 180 425 200 -
Total Supplies 76,253 89,462 95,100 104,100
OTHER SERVICES & CHARGES661-5-5451-03-7300 Electricity 22,029 27,426 30,000 32,000661-5-5451-03-7301 Propane Gas 6,956 5,987 9,000 6,000661-5-5451-03-7302 Water 3,999 2,258 2,500 3,500661-5-5451-03-7304 Sewer 1,232 1,327 2,000 2,000661-5-5451-03-7305 Refuse Disposal 1,844 2,449 2,000 2,500661-5-5451-03-7306 Telephone 8,753 7,656 9,500 9,500661-5-5451-03-7401 R&M Building 952 1,329 2,500 2,500661-5-5451-03-7404 R&M Equipment 7,941 491 10,000 10,000
WATER DEPARTMENT
342

ANNUAL BUDGET
OPERATIONS & MAINTENANCE2014/15 2015/16 2016/17 2017/18
ACTUAL ACTUAL BUDGET PROPOSED
661-5-5451-03-7405 R&M Vehicles 3,381 2,074 5,000 5,000661-5-5451-03-7600 Travel 234 350 500 600661-5-5451-03-7601 Registrations 3,012 1,254 3,000 3,000661-5-5451-03-7900 Other Professional Services 899 1,399 2,700 1,500661-5-5451-03-7950 Debt Serv-Prinicpal 36 4,614 680,400 2,059,000661-5-5451-03-7951 Debt Serv-Interest 21 42 671,400 -661-5-5451-03-8100 Depreciation-Buildings 23,109 22,717 25,000 25,000661-5-5451-03-8101 Depr-Infrastructure 975,858 984,901 900,000 985,000661-5-5451-03-8102 Depreciation-Machinery & Eq 22,195 22,880 25,000 25,000661-5-5451-03-8103 Depreciation-Vehicles 243 55,682 1,000 60,000661-5-5451-03-8104 Depr-Office Furn & Equip 3,643 3,645 5,000 5,000661-5-5451-03-8200 Amort-Goodwill 2,678 2,678 2,700 2,700661-5-5451-03-8201 Amort-License Permit 3,262 3,262 3,300 3,300
Total Other Svcs & Charges 1,092,277 1,154,421 2,392,500 3,243,100
TOTAL WATER-OPERATIONS & MTCE 1,459,391$ 1,504,158$ 2,809,600$ 3,690,800$
WATER DEPARTMENT
343

ANNUAL BUDGET
RESOURCES2014/15 2015/16 2016/17 2017/18
ACTUAL ACTUAL BUDGET PROPOSEDSALARIES & WAGES661-5-5451-04-5001 Full Time Employees 157,392 161,066 164,000 173,700661-5-5451-04-5200 Overtime 591 2,545 2,000 2,000
Total Salaries & Wages 157,983 163,611 166,000 175,700
PERSONNEL BENEFITS661-5-5451-04-5501 FICA 10,994 11,683 12,800 13,400661-5-5451-04-5504 Retirement 17,368 18,569 18,800 19,900661-5-5451-04-5700 Insurance Benefits 16,783 13,934 13,700 16,000661-5-5451-04-5701 Disability Insurance 182 197 200 300661-5-5451-04-5800 Workers Compensation Ins 10,724 12,181 13,600 12,000
Total Personnel Benefits 56,051 56,564 59,100 61,600
SUPPLIES661-5-5451-04-6001 Office Supplies 2,635 2,742 4,000 3,000661-5-5451-04-6005 Safety Supplies 145 11 500 500661-5-5451-04-6006 Uniforms / Clothing 536 490 700 700661-5-5451-04-6011 Small Tools/Minor Equip 517 1,468 1,500 1,500661-5-5451-04-6013 Computer Equipment Supplies 1,753 518 2,000 2,000661-5-5451-04-6100 Lab Supplies 1,003 8,538 6,000 8,000661-5-5451-04-6202 R&M Supplies - Backflow - 283 1,500 1,500661-5-5451-04-6300 Gasoline/Fuels/Lubricant 2,930 2,424 3,500 3,000661-5-5451-04-6302 R&M Supplies Vehicle 363 639 1,500 2,000661-5-5451-04-6600 Public Relations 10,627 6,287 10,000 10,000661-5-5451-04-6700 Memberships/Dues/Subscriptio 4,325 3,017 6,000 6,000
Total Supplies 24,834 26,417 37,200 38,200
OTHER SERVICES & CHARGES661-5-5451-04-7004 Lab Analysis 21,570 26,596 35,000 105,000661-5-5451-04-7306 Utilities Telephone - - 500 -661-5-5451-04-7307 Postage / Freight 84 8 500 100661-5-5451-04-7404 R&M Equipment 781 - 3,000 1,000661-5-5451-04-7405 R&M Vehicles 93 - 2,000 2,000661-5-5451-04-7600 Travel 1,137 580 6,000 6,000661-5-5451-04-7601 Registrations 1,802 2,076 10,500 7,500661-5-5451-04-7900 Other Professional Services - 23 25,000 58,000661-5-5451-04-7907 Advertising 960 828 2,000 2,000661-5-5451-04-7910 Printing & Binding 171 414 1,000 500
Total Other Svcs & Charges 26,598 30,525 85,500 182,100
TOTAL WATER-RESOURCES 265,466$ 277,117$ 347,800$ 457,600$
WATER DEPARTMENT
344

ANNUAL BUDGET
PRODUCTION O&M2014/15 2015/16 2016/17 2017/18
ACTUAL ACTUAL BUDGET PROPOSEDSALARIES & WAGES661-5-5451-05-5001 Full Time Employees 103,530 147,603 122,400 143,400661-5-5451-05-5200 Overtime 14 - 500 1,000
Total Salaries & Wages 103,544 147,603 122,900 144,400
PERSONNEL BENEFITS661-5-5451-05-5501 FICA 7,404 10,449 9,500 11,000661-5-5451-05-5504 Retirement 11,883 16,752 14,000 16,400661-5-5451-05-5700 Insurance Benefit 9,520 14,239 12,200 15,500661-5-5451-05-5701 Disability Insurance 124 178 200 200
Total Personnel Benefits 28,931 41,618 35,900 43,100
SUPPLIES661-5-5451-05-6202 R&M Supplies Other 5,220 1,913 5,000 5,000661-5-5451-05-6500 R&M Supplies Wells 902 39,778 30,000 40,000661-5-5451-05-6501 R&M Supplies - Pumps 5,433 - 25,000 25,000661-5-5451-05-6502 R&M Supplies - Elec Equip 8,804 10,406 25,000 15,000661-5-5451-05-6505 R&M Supplies - Pump Booster - 961 15,000 15,000
Total Supplies 20,359 53,058 100,000 100,000
OTHER SERVICES & CHARGES661-5-5451-05-7300 Electricity 209,676 242,247 230,000 250,000661-5-5451-05-7301 Propane Gas 558 133 2,000 2,000661-5-5451-05-7306 Telephone 487 350 500 -661-5-5451-05-7404 R&M Pumps - 36,848 25,000 25,000661-5-5451-05-7406 R&M Other 4,425 10,000 20,000 10,000661-5-5451-05-7900 Other Prof Serv - - - 10,000
Total Other Svcs & Charges 215,146 289,578 277,500 297,000
TOTAL WATER-PRODUCTION O&M 367,980$ 531,857$ 536,300$ 584,500$
WATER DIVISION
345

ANNUAL BUDGET
GREEN VALLEY PARK MAINT.2014/15 2015/16 2016/17 2017/18
ACTUAL ACTUAL BUDGET PROPOSEDSALARIES & WAGES661-5-5451-06-5001 Full Time Employees 21,658 17,563 20,200 22,400
Total Salaries & Wages 21,658 17,563 20,200 22,400
PERSONNEL BENEFITS661-5-5451-06-5501 FICA 1,613 1,247 1,600 1,700661-5-5451-06-5504 Retirement 2,486 1,993 2,300 2,500661-5-5451-06-5700 Insurance Benefit 2,288 1,874 2,000 2,400661-5-5451-06-5701 Disability Insurance 26 21 100 100
Total Personnel Benefits 6,413 5,135 6,000 6,700
SUPPLIES661-5-5451-06-6202 R&M Supplies Other 9,578 1,750 2,000 2,000661-5-5451-06-6990 Other Expense 18,401 14,199 35,000 35,000
Total Supplies 27,979 15,949 37,000 37,000
SERVICES661-5-5451-06-7305 Refuse Disposal - 1,586 2,000 4,000661-5-5451-06-7406 R&M Other 2,200 2,623 2,900 3,000
2,200 4,209 4,900 7,000
TOTAL WATER-GV PARK MAINTENANCE 58,250$ 42,856$ 68,100$ 73,100$
WATER DIVISION
346

ANNUAL BUDGET
WQARF SITE O&M2014/15 2015/16 2016/17 2017/18
ACTUAL ACTUAL BUDGET PROPOSEDSALARIES & WAGES661-5-5451-07-5001 Full Time Employees 2,619 5,788 5,800 4,800
Total Salaries & Wages 2,619 5,788 5,800 4,800
PERSONNEL BENEFITS661-5-5451-07-5501 FICA 182 406 500 400661-5-5451-07-5504 Retirement 300 657 700 500661-5-5451-07-5700 Insurance Benefit 327 688 600 500661-5-5451-07-5701 Disability Insurance 3 7 - 100
Total Personnel Benefits 812 1,758 1,800 1,500
SUPPLIES661-5-5451-07-6008 Chemicals - - 32,000 32,000661-5-5451-07-6202 R&M Supplies Other 18 - - -661-5-5451-07-6500 R&M Supplies Wells - 31 5,000 5,000661-5-5451-07-6501 R&M Supplies Pumps 1,003 - 10,000 10,000661-5-5451-07-6502 R&M Supplies Elec Equip - 280 5,000 5,000
Total Supplies 1,021 311 52,000 52,000
OTHER SERVICES & CHARGES661-5-5451-07-7001 Program Oversight 2,068 2,055 5,000 5,000661-5-5451-07-7004 Compliance Sampling 7,635 5,304 10,000 10,000661-5-5451-07-7300 Electricity 19,328 16,145 30,000 20,000661-5-5451-07-7404 R&M Pumps - - 15,000 15,000661-5-5451-07-7406 R&M Equipment - - 10,000 10,000661-5-5451-07-7407 R&M Wells - - 15,000 15,000
Total Other Svcs & Charges 29,031 23,504 85,000 75,000
TOTAL WATER-WQARF SITE O&M 33,483$ 31,361$ 144,600$ 133,300$
WATER DIVISION
347

ANNUAL BUDGET
TREATMENT PLANT2014/15 2015/16 2016/17 2017/18
ACTUAL ACTUAL BUDGET PROPOSED
SUPPLIES661-5-5451-10-6008 Chemicals - - - 50,000661-5-5451-10-6202 R&M Supplies Other - - - 10,000661-5-5451-10-6500 R&M Supplies Hydro - - - 20,000661-5-5451-10-6501 R&M Supplies Pumps - - - 10,000661-5-5451-10-6502 R&M Supplies Equip - - - 10,000
Total Supplies - - - 100,000
SERVICES661-5-5451-10-7001 Program Oversight - - - 10,000661-5-5451-10-7004 Compliance / Lab Analysis - - - 10,000661-5-5451-10-7300 Electricity - - - 5,000661-5-5451-10-7306 Telephone / Cable - - - 1,000661-5-5451-10-7900 Other Professional Serv - - - 10,000
Total Other Svcs & Charges - - - 36,000
TOTAL TREATMENT PLANT -$ -$ -$ 136,000$
WATER DIVISION
348

ANNUAL BUDGET
CC CRAGIN PROJECT2014/15 2015/16 2016/17 2017/18
ACTUAL ACTUAL BUDGET PROPOSED
OTHER SERVICES & CHARGES661-5-5451-20-7100 Legal Services 22,342 - 40,000 40,000661-5-5451-20-7300 Electricity 270 275 2,000 2,000661-5-5451-20-7306 Telephone 646 564 800 800661-5-5451-20-7600 Travel 2,503 770 3,000 1,000
Total Other Svcs & Charges 25,761 1,609 45,800 43,800
CAPITAL661-5-5451-20-8010 CC Cragin Pipeline (SRP) 289,172 783,805 500,000 500,000661-5-5451-20-8600 CCC Pipeline Constr 621,761 7,502,677 16,600,000 23,500,000
Total Capital 910,933 8,286,482 17,100,000 24,000,000
TOTAL WATER - CC CRAGIN PROJECT 936,694$ 8,288,091$ 17,145,800$ 24,043,800$
WATER DEPARTMENT
349

ANNUAL BUDGET
CAP TRUST FUND2014/15 2015/16 2016/17 2017/18
ACTUAL ACTUAL BUDGET PROPOSED
SUPPLIES460-5-5451-00-6901 Taxes & Fees 2,200 2,200 - -
Total Supplies 2,200 2,200 - -
CAPITAL OUTLAY460-5-5451-00-8594 Environmental Project - 113,461 225,000 128,271
Total Capital Outlay - 113,461 225,000 128,271
TOTAL WATER-CAP TRUST FUND 2,200$ 115,661$ 225,000$ 128,271$
WATER DIVISION
350

SUPPLEMENTAL INFORMATION
351

352

353

354

355

356

357

358

359

360

FINANCIAL POLICIES
2017 ANNUAL BUDGET
361

FINANCIAL POLICIES
2017 ANNUAL BUDGET
362

FINANCIAL POLICIES
2017 ANNUAL BUDGET
363

FINANCIAL POLICIES
2017 ANNUAL BUDGET
364

FINANCIAL POLICIES
2017 ANNUAL BUDGET
365

FINANCIAL POLICIES
2017 ANNUAL BUDGET
366

FINANCIAL POLICIES
2017 ANNUAL BUDGET
367

FINANCIAL POLICIES
2017 ANNUAL BUDGET
368

FINANCIAL POLICIES
2017 ANNUAL BUDGET
369

FINANCIAL POLICIES
2017 ANNUAL BUDGET
370

FINANCIAL POLICIES
2017 ANNUAL BUDGET
371

FINANCIAL POLICIES
2017 ANNUAL BUDGET
372

FINANCIAL POLICIES
2017 ANNUAL BUDGET
373

FINANCIAL POLICIES
2017 ANNUAL BUDGET
374

FINANCIAL POLICIES
2017 ANNUAL BUDGET
375

FINANCIAL POLICIES
2017 ANNUAL BUDGET
376

FINANCIAL POLICIES
2017 ANNUAL BUDGET
377

FINANCIAL POLICIES
2017 ANNUAL BUDGET
378

FINANCIAL POLICIES
2017 ANNUAL BUDGET
379

FINANCIAL POLICIES
2017 ANNUAL BUDGET
380

2017 Annual Budget SUPPLEMENTAL
Department/Division 08/09 09/10 10/11 11/12 12/13 13/14 14/15 15/16 16/17 17/18
Town Manager 2.00 5.00 5.00 5.00 4.00 4.00 5.00 4.00 4.00 4.00Town Attorney 4.50 4.50 4.00 4.00 4.00 4.50 4.50 4.50 4.50 4.50Town Clerk 6.00 4.00 4.00 4.00 4.00 3.00 3.00 3.00 3.00 3.00Central Services 0.00 0.00 0.00 0.00 0.00 1.50 1.50 1.00 1.00 1.00Financial Services 6.00 6.00 6.00 6.00 7.00 7.00 7.00 7.00 7.00 6.00Police 48.00 48.00 48.00 48.00 48.00 50.00 51.00 52.00 57.00 58.00Fire 25.00 25.00 24.00 27.00 33.00 32.00 32.00 32.00 32.00 32.00Human Resources 1.00 2.00 3.00 3.00 3.00 3.00 3.00 3.00 3.00 3.00Community Dev 2.00 2.00 2.00 2.00 2.00 2.00 2.00 2.00 2.00 2.00Building 8.00 8.00 8.00 8.00 8.00 8.00 6.00 5.00 5.00 5.00Planning 4.00 4.00 4.00 4.00 4.00 2.00 4.00 5.00 5.00 5.00Airport 1.00 1.00 1.00 1.50 1.50 1.50 1.50 2.00 2.00 2.00Public Works 17.00 22.50 22.50 22.00 22.00 22.00 22.00 24.00 24.00 19.00Water Department 19.00 19.00 22.00 21.00 21.00 20.00 20.00 20.00 19.00 19.00Library 8.00 8.00 8.00 8.00 8.00 8.00 8.00 7.50 7.50 7.50Recreation & Tourism 11.50 7.00 7.00 6.50 6.50 6.50 6.50 6.00 6.00 12.00Authorized Positions 163.00 166.00 168.50 170.00 176.00 175.00 177.00 178.00 182.00 183.00Frozen Positions 14.00 16.00 15.00 19.00 15.00 14.00 10.00 14.50 12.50 Total Authorized to Fill 163.00 152.00 152.50 155.00 157.00 160.00 163.00 168.00 167.50 170.50
Department Division Title FY13/14 FY14/15 FY15/16 FY16/17 FY 17/18Town Manager Town Manager Executive Assistant 1.00 1.00 1.00 1.00 1.00 Town Clerk Town Clerk Chief Deputy Clerk 1.00 1.00 1.00 1.00 1.00 Financial Services Financial Services CFO 1.00 1.00 - 1.00 - Financial Services Financial Services Deputy CFO 1.00 1.00 1.00 1.00 - Police Operations Sergeant 1.00 1.00 1.00 1.00 1.00 Police Operations Officer 2.00 2.00 2.00 5.00 5.00 Police Operations Secretary / Property Tech 1.00 - - - - Building Building Plans Review Specialist 1.00 1.00 - 1.00 1.00 Building Building Building Inspector 1.00 1.00 - - - Community Development Admin Community Development Director 1.00 1.00 1.00 1.00 1.00 Public Works Streets Street Maintenance Worker 1.00 1.00 - - - Library Library Library Clerk 1.00 1.00 1.00 1.00 1.00 Recreation & Tourism Trails Recreation Coordinator 1.00 1.00 1.00 1.00 1.00
14.00 13.00 9.00 14.00 12.00
In addition, the following full-time positions are currently filled with part-time staff pending economic recovery:Town Attorney Town Attorney Legal Secretary 0.50 0.50 0.50 - - Financial Services Financial Services Grant Coordinator 0.50 0.50 0.50 0.50 0.50
1.00 1.00 1.00 0.50 0.50
381

2017 Annual Budget SUPPLEMENTAL
FY FY FY FY FYDepartment 13/14 14/15 15/16 16/17 17/18
Town Manager 3.00 4.00 3.00 3.00 3.00Town Attorney 4.00 4.00 4.00 4.50 4.50Town Clerk 2.00 2.00 2.00 2.00 2.00Central Services 1.50 1.50 1.00 1.00 1.00Financial Services 4.50 4.50 5.50 4.50 5.50Police 46.00 47.00 49.00 51.00 52.00Fire 32.00 32.00 32.00 32.00 32.00Human Resources 3.00 3.00 3.00 3.00 3.00Community Dev 1.00 1.00 1.00 1.00 1.00Building 5.00 5.00 5.00 4.00 4.00Planning 2.00 3.00 5.00 5.00 5.00Airport 2.00 2.00 2.00 2.00 2.00Public Works 21.00 21.00 24.00 24.00 19.00Water Department 19.00 19.00 20.00 19.00 19.00Library 6.50 6.50 6.50 6.50 6.50Recreation & Tourism 5.00 5.00 5.00 5.00 11.00
157.50 160.50 168.00 167.50 170.50
382

2017 Annual Budget SUPPLEMENTAL
PRINCIPAL EMPLOYERS
Sources: Human Resource and Personnel Departments of the above-mentioned businesses
DEMOGRAPHIC AND ECONOMIC STATISTICS
Median PerHousehold Capita
Calendar Income Personal Median School UnemploymentYear Population Income Age Enrollment Rate2008 16,965 39,973 n/a 50.5 2,712 4.6%2009 17,281 40,993 n/a 49.3 2,657 7.3%2010 17,281 40,993 n/a 49.3 2,352 7.9%2011 15,301 36,764 n/a 54.2 2,420 7.7%2012 15,301 42,342 25,716 53.1 2,225 9.6%2013 15,215 43,741 24,914 53.1 2,415 9.6%2014 15,245 43,535 24,690 52.9 2,485 7.5%2015 15,551 44,661 23,668 52.7 2,450 4.5%2016 15,345 42,987 23,784 55.5 2,420 3.9%2017 15,476 42,856 23,461 56.9 2,445 8.2%
Sources: Payson Unified School District, Sperling's Best Places, and US Census Bureau 2011-2015 American Community Survey 5-Year Estimates
Employer Employees Employees325 344287 397
Banner Payson / PRMC 225 340Gila County 225 225
220 310183 162152 122149 115148 130
Safeway Supermarket 138 115130 10774 7950 - 37 40
Chili's Restaurant 33 - Big Lots 20 - Five Guys Burgers 13 - Little Caesars Pizza 13 -
Total 2,422 2,486
Mazatzal Casino
US Forest Service
Payson Unified School District
Culvers
Town of PaysonPayson Care Center / Life Care Center
Chapman Auto
Bashas' Supermarket
Walmart
Home Dept
Rim Country Health
383

2017 Annual Budget SUPPLEMENTAL
SCHOOL ENROLLMENT
Combined total for public Elementary School, Junior High School, and High School enrollment as of the start of each school year.
Source: Payson Unified School District
2008 2,712 2009 2,657 2010 2,352 2011 2,420 2012 2,225 2013 2,485 2014 2,415 2015 2,450 2016 2,420 2017 2,445
2,000
2,100
2,200
2,300
2,400
2,500
2,600
2,700
2,800
2008
2009
2010
2011
2012
2013
2014
2015
2016
2017
384

2017 Annual Budget SUPPLEMENTAL
EDUCATIONAL ATTAINMENT
POPULATION BY SEX AND AGE
Population 25 years and over: 12,324
Less than 9th grade 3.9%9th to 12th grade, no diploma 7.8%High school graduate (includes equivalency) 28.1%Some college, no degree 26.7%Associate's Degree 11.0%Bachelor's Degree 13.4%Master's Degree 9.1%
Source: U.S. Census Bureau, 2011-2015 American Community Survey 5-Year Estimate
Total Population 15,476 Male 46.90%Female 53.10%
Under 4 years 3.60%5 to 9 years 4.20%10 to 14 years 4.10%15 to 19 years 3.80%20 to 24 years 3.50%25 to 34 years 8.00%35 to 44 years 7.00%45 to 54 years 12.00%55 to 59 years 8.20%60 to 64 years 9.50%65 to 74 years 20.50%75 to 84 years 11.60%85 years and over 4.00%
Source: U.S. Census Bureau, 2011-2015 American Community Survey 5-Year Estimate
385

2017 Annual Budget SUPPLEMENTAL
COMPARISON OF GENERAL HOUSING STATISTICS
VALUE OF OWNER-OCCUPIED HOUSING HOUSING UNITS BY YEAR STRUCTURE BUILT
Payson, Arizona United States
Median Home Age: 24 37Median Home Cost: 212,100$ 185,800$ Homes Owned 52.49% 56.34%Homes Rented 22.01% 31.21%Homes Vacant 25.50% 12.45%
Average Rent for Homes / Apartments: Studio Apartment 636$ 712$ 1 Bedroom Home / Apartment 640$ 825$ 2 Bedroom Home / Apartment 823$ 1,027$ 3 Bedroom Home / Apartment 1,124$ 1,379$ 4 Bedroom Home / Apartment 1,128$ 1,601$
Source: Sperling's Best Places
Less than $20,000 10.70%$20,000 to $39,999 1.31%$40,000 to $59,999 1.46%$60,000 to $79,999 1.89%$80,000 to $99,999 6.26%$100,000 to $149,999 13.48%$150,000 to $199,999 17.75%$200,000 to $299,999 29.26%$300,000 to $399,999 11.55%$400,000 to $499,999 1.95%$500,000 to $749,999 4.03%$750,000 to $999,999 0.32%$1,000,000 or more 0.04%
Source: Sperling's Best Places
2014 and newer 0.60%2010 to 2013 0.50%2000 to 2009 18.20%1990 to 1999 27.30%1980 to 1989 29.30%1970 to 1979 17.20%1960 to 1969 4.30%1950 to 1959 1.70%1940 to 1949 0.40%
Source: US Census Bureau2011-2015 American CommunitySurvey 5-Year Estimate
386

Town of Payson, Arizona
Glossary of Budget- Related Terms
ACCOUNT A separate financial reporting unit for budgeting, management, or accounting purposes. All budgetary transactions, whether revenue or expenditure, are recorded in accounts.
ACCOUNTING SYSTEM The total set of records and procedures used to record, classify, and report information on the financial status and operations of an entity.
ACCOUNTS PAYABLE A short- term liability account reflecting amounts owed to private persons or organizations for goods and services received by a government (but not including amounts due to other funds of the same government or to other governments).
ACCOUNTS RECEIVABLE An asset account reflecting amounts owed by private individuals or organizations for goods and services furnished by a government.
ACCRUAL BASIS Refers to the accounting of revenues and expenditures on the basis of when they are incurred or committed, rather than when they are made or received.
ADOPTION For budget purposes, a formal action taken by Council that sets the spending limits for the fiscal year.
APPROPRIATED BUDGET The expenditure authority created by the appropriation resolution/ordinance, which is signed into law, and the related estimated revenues. The appropriated budget would include all reserves, transfers, allocations, supplemental appropriations and other legally authorized and executive changes.
APPROPRIATED FUND BALANCE The amount of fund balance budgeted as revenue to offset expenses that exceed current revenue.
APPROPRIATION Legal authorization adopted annually, by the legislative body (Town Council) to make expenditures and obligate money for specific purposes. An appropriation is limited in the amount and the period of time in which it may be expended.
ARBITRAGE The investment of bond proceeds in higher yielding securities, resulting in interest revenue in excess of interest costs.
ASSESSED VALUATION A determination of the value of real or personal property as a basis for levying taxes.
ASSET Resources owned or held by a government, which have monetary value.
AUDIT An examination, usually by an official or private accounting firm that reports on the accuracy of the annual financial report.
AVAILABLE (UNDESIGNATED) FUND BALANCE Refers to funds remaining from the prior year that are available for appropriation and expenditure in the current year.
BALANCE SHEET The basic financial statement, which discloses the assets, liabilities, and equities of an entity at a specified date in conformity with GAAP.
BALANCED BUDGET The expenses/expenditures do not exceed the budgeted revenue plus the unreserved fund balance.
387

BEGINNING FUND BALANCE An account used to record estimated and actual resources available for expenditure in one fiscal year because of revenues collected in excess of the budget and/or under-expenditure of the prior years’ budget.
BENEFITS The Town provided employee benefits such as retirement, worker’s compensation, life insurance, medical insurance and dental insurance.
BOND A certificate obligating the payment of a specified sum of money which includes the principal or face value, plus interest, to be computed at a specified rate on a specified date or dates in the future or the maturity date(s).
BONDED DEBT That portion of indebtedness represented by outstanding bonds.
BOND RATING A grade indicating a governmental unit’s investment qualities. Generally speaking, the higher the bond rating, the more favorable the interest rate and the lower the cost of financing of capital projects funded by bonds. A high rating is indicative of the government’s strong financial position.
BOND REFERENDUM An election in which registered voters vote on whether the Town will be allowed to issue debt in the form of interest- bearing bonds.
BUDGET A plan of financial operation embodying an estimate of proposed expenditures for a given period and the proposed revenue, or means of financing the expenditures.
BUDGET CALENDAR The schedule of key dates or events, which the Town follows in the preparation, adoption and administration of the budget.
BUDGET MESSAGE A written general dialogue of the budget, presented by the budget making authority. It provides Council & Citizens with a general summary of the most important budget issues, changes from recent fiscal years and recommendations regarding the financial policy for the coming year.
BUDGETARY BASIS This refers to the basis of accounting used to estimate financing sources and uses in the budget. This generally takes one of two forms: cash or modified accrual.
BUDGETARY CONTROL The control or management of a governmental unit or enterprise in accordance with an approved budget for the purpose of keeping expenditures within the limitations of authorized appropriations and available revenues.
CAPITAL ASSET Tangible assets having a life over one year obtained or controlled as a result of financial transactions, events or circumstances. Capital assets include buildings, equipment, improvements other than buildings and land.
CAPITAL IMPROVEMENT PLAN (CIP) A plan which prioritizes and schedules proposed capital construction projects and major equipment acquisition.
CAPITAL OUTLAY Expenditures resulting in the acquisition or addition to the government’s general capital assets. These assets usually have a useful life of more than one year.
CAPITAL PROJECTS Projects which purchase or construct capital assets. Typically a capital project encompasses a purchase of land and/or the construction of a building or facility.
CAPITAL PROJECT CONSTRUCTION FUNDS A type of fund that accounts for major general government construction projects financed by long- term obligations or other financing.
CASH BASIS ACCOUNTING The method of accounting where revenues are recorded when received and expenditures are recorded when paid.
388

CHART OF ACCOUNTS A chart that assigns a unique number to each type of transaction and to each budgetary unit in the organization.
COMMUNITY DEVELOPMENT BLOCK GRANT (CDBG) An annual federal grant that can be used to revitalize neighborhoods and expand affordable housing.
COMPREHENSIVE PLAN A plan required by the state for the future growth and development of the Town.
CONSUMER PRICE INDEX (CPI) A statistical description of price levels provided by the U.S. Department of Labor. The index is used as a measure of the increase in the cost of living (economic inflation).
CONTRACTUAL SERVICES The costs related to services performed for the Town by individuals, businesses, or utilities.
COST The amount of money or other consideration exchanged for goods or services. Costs may be incurred even before money is paid; that is, as soon as liability is incurred. Ultimately, however, money or other consideration must be given in exchange.
COST OF LIVING ADJUSTMENT (COLA) An increase in salaries to offset the adverse effect of inflation on compensation.
CURRENT ASSETS Assets that are available or can be made readily available to finance current operations or to pay current liabilities. Assets that will be used up or converted into cash within one year. Some examples are cash and temporary investments.
CURRENT LIABILITIES Debt or other legal obligation arising out of transactions in the past, which must be liquidated, renewed, or refunded within one year.
DEBT SERVICE The process of accumulating resources for and making payment of long- term debt principal and interest.
DEBT SERVICE FUND A fund used to account for the accumulation of resources for, and the payment of, general long- term debt principal and interest.
DEBT SERVICE/LEASE A cost category which typically reflects the repayment of short- term (less than 5 years) debt associated with the acquisition of capital equipment.
DEFICIT The amount by which expenditures exceed revenues during an accounting period.
DEPARTMENT An organizational or budgetary unit. Each department serves a specific function as a distinct organizational unit of government, having budget accountability.
DEPRECIATION Consumption of the service life of capital assets, due to normal wear, deterioration, environmental elements, passage of time and obsolescence. The portion of the cost of a capital asset charged as an expense during a specified period based on service life of the asset and ultimately expending the entire cost of the asset.
DESIGNATED FUND BALANCE Monies over the years that remain unspent after all budgeted expenditures have been made, but which are reserved for specific purposes and are unavailable forappropriation.
DEVELOPMENT- RELATED FEES Those fees and charges generated by building, development and growth in a community. Included are building and street permits, development review fees, and zoning, platting and subdivision fees.
389

DISTINGUSHED BUDGET PRESENTATION AWARD A voluntary awards program administered by the Government Finance Officers Association (GFOA) to encourage governments to prepare effective budget documents.
ENCUMBRANCES Commitments related to unperformed contracts for good or services. Used in budgeting, encumbrances are not GAAP expenditures or liabilities, but represent the estimated amount of expenditure ultimately to result if unperformed contracts in process are completed.
ENTERPRISE FUNDS A type of proprietary fund that contains activities which are operated in a manner similar to private businesses. In Payson, the only Enterprise Fund is the Water Fund.
EXEMPT Personnel who are not eligible to receive overtime pay and are expected to put in whatever hours are necessary to complete their job assignments. The respective department head, as partial compensation for overtime hours worked, may allow compensatory time off.
EXPENDITURE An outlay of current resources for goods and services. Expenditures reduce the remaining budget authorization (appropriation) available.
FIDUCIARY FUND A category of funds used to report assets held in a trustee or agency capacity for others and which therefore cannot be used to support the government’s own programs.
FISCAL YEAR (FY) A 12- month period to which the annual operating budget applies and at the end of which a government determines its financial position and the results of its operations.
FIXED ASSETS Assets of significant value which have a useful life of more than one year.
FRANCHISE A special privilege granted by a government, permitting the continued use of public property, such as city streets, and usually involving the elements of monopoly and regulation.
FRANCHISE FEE A fee paid by public service businesses for the special privilege to use Town streets, alleys and property in providing their services to the citizens of the community.
FULL TIME EQUIVALENT (FTE) Employee position converted to the decimal equivalent based on 2080 hours per year.
FUNCTION Activity which is performed by one or more organizational units for the purpose of accomplishing a goal.
FUND An accounting entity having a set of self- balancing accounts and records for all financial transactions for specific activities or government functions in attaining certain objectives governed by special regulations, restrictions or limitations.
FUND BALANCE Generally thought of as fund equity. In the budget, part of fund balance may be designated and appropriated as a resource to support the fund expenditures.
GENERAL FUND The fund used to account for the receipt and expenditure of general governmental revenues such as taxes, fees for service and state- shared revenues that are not earmarked for specific functions. The General Fund accounts for services customarily provided by general purpose local governments, including fire and police protection, park and recreation facilities, land use planning and the administrative and support services associated with these activities.
GENEARL OBLIGATION BONDS Bonds backed by the full faith and credit of the issuing government. In issuing its general obligation bonds, the Town pledges to levy whatever property tax is needed to repay the bonds for any particular year. Bonds cannot be issued without voter approval and are usually issued with maturities of between 15 and 30 years.
390

GENERALLY ACCEPTED ACCOUNTING PRINCIPLES (GAAP) Accounting principles determined through common practice or as promulgated by accounting standard setting bodies.
GOAL The end toward which an endeavor is directed. A Town department may have several goals in the accomplishing of its mission.
GOVERNMENT FINANCE OFFICERS ASSOCIATION (GFOA) A professional association of state/provincial and local finance officers dedicated to the sound management of government financial resources.
GOVERNMENTAL FUND Those funds through which most governmental functions typically are financed.
GRANTS A contribution of assets (usually cash) by one governmental unit or other organization to be used or spent for a specified purpose, activity, or facility. Typically, these contributions are made to local governments from the State and Federal government.
IMPACT FEE Fees charged to developers or individuals to cover, in whole or in part, the anticipated cost of improvements that will be necessary as a result of the development.
INFRASTRUCTURE The underlying permanent foundation or basic framework e.g., streets, water, sewer, public buildings, and parks
INTERFUND TRANSFERS Amounts transferred from one Town fund to another.
INTERGOVERNMENTAL Referring to activities or transactions (contracts, grants, etc.) occurring between government jurisdictions (e.g., towns and counties) such as “intergovernmental revenues”.
INTERNAL SERVICE FUNDS A type of proprietary fund which accounts for the goods and services which are provided as internal services of the Town; such as equipment rental.
INTRAGOVERNMENTAL Referring to activities or transactions occurring within a single government jurisdiction.
KEY RESULT AREAS (KRA) Major priority areas within the Corporate Strategic Plan.
LEVY To impose a tax, special assessment or service charge for the support of government activities. The total amount of taxes, special assessments or service charges imposed by a government. The term most commonly refers to the real and personal property tax levy.
LEVY RATE The rate at which taxes, special assessments or service charges are imposed. For example, the real and personal property tax levy is the rate at which property is taxed per $100 assessed valuation.
LIABILITY Debt or other legal obligation arising out of transactions in the past that must be liquidated, renewed or refunded at some future date. Does not include encumbrances.
LICENSES AND PERMITS Charges for the issuance of licenses and permits. Licenses are required by municipalities for selected trades, occupations and other activities for regulatory purposes. Permits are issued to aid regulation of new business activities.
LINE- ITEM BUDGET A budget prepared along departmental lines that focuses on what is to be bought.
MAINTENANCE The upkeep of physical properties in condition for use or occupancy. Examples are the inspection of equipment to detect defects and the making of repairs.
MISSION The overall purpose for which a unit of Government exists.
MODIFIED ACCRUAL ACCOUNTING The accrual basis of accounting adapted to the governmental fund type Spending Measurement Focus. Under it, revenues are recognized when they become both
391

“measurable and available to finance expenditures of the current period”. Expenditures are recognized when the related fund liability is incurred except for: inventories, prepaid insurance, unpaid benefit amounts or principal and interest.
NET BONDED DEBT The amount calculated as gross bonded debt less debt service monies available at year- end less debt payable from Enterprise Revenues, which ultimately equates to amounts to be repaid through property taxes.
NON- EXEMPT Personnel eligible to receive overtime pay when overtime work has been authorized or requested by the supervisor.
OBJECT (OF EXPENDITURE) The budget accounting term for the previously used “line item budget” level. The lowest level of detail used in the budget to designate the item or service to be purchased or obtained as the result of an expenditure, e.g., postage, printing, etc.
OBJECTIVE In a budgetary context, an objective is some event, activity or opinion poll result, which can be evaluated to measure progress towards defined goals.
OPERATING BUDGET A budget which includes all expenditures and revenues expected to be made during a year for ongoing operations of a government entity. The operating budget carries on the traditional services of a governmental entity. Such a budget generally excludes amounts budgeted for major capital projects.
OPERATING TRANSFERS IN/OUT Specifically identifies the transfer of resources from one fund to another made to support the normal level of operations of the receiving fund.
ORDINANCE A law passed by the legislative authority of a local jurisdiction (town or county).
PERFORMANCE INDICATORS Measurable means of evaluating the effectiveness of a department or cost center in accomplishing its defined objectives.
PERSONNEL SERVICES Costs related to compensating employees, including wages, insurance, payroll taxes, retirement contributions, and allowances for clothing and automobiles.
PRIMARY PROPERTY TAX A limited tax levy used to support general government operations.
PROPERTY TAX A levy upon the assessed valuation of property within the Town. Arizona has two types of property tax: primary property tax and secondary property tax.
PROPRIETARY FUND A fund used to account for operations that are financed and operating in a manner similar to business enterprises. Such a fund is established as a self- supporting operation with revenues provided principally from fees, charges or contracts for services.
PURCHASE ORDER (PO) A document that authorizes the delivery of specified merchandise or the rendering of certain services and the making of a charge for them.
RESERVE An account used to indicate that a portion of fund resources is restricted for a specific purpose, or is not available for appropriation and subsequent spending.
RESOLUTION A special or temporary order of a legislative body requiring less legal formality than an ordinance or statute.
RESOURCES The dollars available for appropriation, including estimated revenues, interfund transfers and in some cases, a beginning fund balance.
392

REVENUE Income received by the Town to support programs or services to the community. It includes such items as taxes, fees, user charges, grants, fines, forfeitures, interest income and miscellaneous revenue.
RISK MANAGEMENT An organized attempt to protect a government’s assets against accidental loss in the most economical method.
SALARIES AND WAGES Amounts paid for services rendered by employees in accordance with rates, hours, terms and conditions authorized by law or stated in employment contracts. This category also includes overtime and temporary help.
SECONDARY PROPERTY TAX Voter approved tax levy which can only be used to retire general bonded debt obligations.
SPECIAL ASSESSMENT A compulsory levy made against certain properties to defray all or part of the cost of a specific capital improvement or service deemed to benefit primarily those properties.
SPECIAL REVENUE FUND A fund used to account for the proceeds of specific revenue sources that are legally restricted to expenditures for specified purposes.
STRUCTURALLY BALANCED BUDGET A balanced budget that supports financial sustainability for multiple years into the future. A government needs to make sure that it is aware of the distinction between satisfying the statutory definition and achieving a true structurally balanced budget.
SUPPLIES A cost category for minor items (individually priced at less than $5,000) required by departments to conduct their operations.
SURPLUS The amount by which revenues exceed expenditures.
TAX BASE The wealth of the community available to be taxed by various forms of Town taxes. It is commonly thought of as the assessed value of the community.
TAX LEVY The total amount to be raised by general property taxes for the purposes specified in the Tax Levy Ordinance.
TAXES Compulsory charges levied by a government for the purpose of financing services performed for the common benefit of the people. This term does not include specific charges made against particular persons or property for current or permanent benefit, such as special assessments.
TENTATIVE BUDGET A tool that gives policymakers an idea of the Town’s relative fiscal position for the coming budget period based on projected revenues and expenditures.
TRUST AND AGENCY FUNDS A type of fiduciary fund which accounts for funds held by the Town as a trustee.
UNRESERVED FUND BALANCE Undesignated monies available for appropriations.
USER CHARGES The payment of a fee for direct receipt of a public service by the party who benefits from the service.
WORKLOAD INDICATORS Specific quantitative measures of work performed within an activity or program (e.g., total miles of streets cleaned).
393

Common Acronyms
AFFH Affirmatively Furthering Fair Housing
ARRA American Recovery and Reinvestment Act of 2009
BARS Budgeting, Accounting and Reporting System
CAFR Comprehensive Annual Financial Report
CDBG Community Development Block Grant
CIP Capital Improvement Plan
COLA Cost of Living Adjustment
CPI Consumer Price Index
CSP Corporate Strategic Plan
FAA Federal Aviation Administration
FT Full- time
FTE Full- time Equivalent
FY Fiscal Year
GAAP Generally Accepted Accounting Principles
GASB Governmental Accounting Standards Board
GFOA Government Finance Officers Association
GO Bonds General Obligation Bonds
HURF Highway Users Revenue Fund
KRA Key Result Areas
LID Local Improvement District
OPEB Other Post Employment Benefits
OSHA Occupational Safety and Health Act
PO Purchase Order
PT Part- time
RFP Request for Proposal
SCADA Supervisory Control and Data Acquisition
WIFA Water Infrastructure Financing Authority
394